raiders of lost value
TRANSCRIPT


RAIDERS OF LOST VALUE
Annu Kotiranta – Martti Kulvik – Sirpa Maijanen – Antti Tahvanainen – Leopoldo Trieste –
Giuseppe Turchetti – Marja Tähtinen
ETLA – Research Institute of the Finnish Economy

ETLA – Research Institute of the Finnish Economy Series B267 ISSN 0356-7443 ISBN 978-951-628-632-0 (printed) ISBN 978-951-628-633-7 (pdf)
Publisher: Taloustieto Oy, Helsinki, 2015 Cover: Anni-Julia Tuomisto, Anni-Julia Oy Printed in: Nykypaino Oy, Helsinki 2015
Suggested citation: Kotiranta, Annu, Kulvik, Martti, Maijanen, Sirpa, Tahvanainen, Antti, Trieste, Leopoldo, Turchetti, Giuseppe, Tähtinen, Marja (2015). Raiders of Lost Value Helsinki: Taloustieto Oy.

AcknowledgementsAuthors
Executive summary 9
About the intangible assets – Discussions with my mother, aged 76 13
1 Legacy of Dead Companies – A Treasure to be Discovered 21 Introduction 22 The legacy of dead companies 24 The new course of the capital 25 Mechanisms of capital transformation and transmission 26 Factors that erode the legacy of failed firms 29 Conclusions 30
2 Finnish Biotech in Numbers 35 The emergence of a new industry: High hopes and high stakes 36 Funding for biotechnology dries up 37 Biotechnology – petite and steady 40 Less companies – more value 43 A closer look at the exits 45 Excellence in research as the driving force of Finnish biotechnology 49
3 Cases of Finnish Biotechnology 51 Case: Carbion Oy 53 Case: CNServices Oy 61 Case: CTT Cancer Targeting Technologies Oy 69 Case: Fibrogen Europe Oy 79 Case: Hormos Medical Oy 87 Case: Ipsat Therapies Oy 97 Case: Karyon Oy 107 Case: Plexpress Oy 117
Table of contents

4 Biotechnology in Italy 127 Funding 129 The Italian drug discovery pipeline is considered balanced and productive 130 University spin-offs and start-ups in the Italian biotechnology industry 131 Intellectual capital: examples from Italy 132 Built on human capital 134 Relational capital expanding the possibilities 135 Stabilized in structures 136 Recycling 138 Conclusions 139
5 Blowing the Dust off Treasures – Extracts from 24 Stories 143 Lesson to learn: Expanding the human capital towards sustainable entrepreneurship 144 Lesson to learn: Attention to the industry structure 148 Lesson to learn: Developing relational capital from the bottom up 150 Capturing intangible value: a Company Refinery 152
6 Constructing a Recycling Probe 157 The intangible universe 158 From value... 159 ... to valuable 160 How it goes: An example 166 How it shows: A case 169 There is potential in failure 172
7 Final Remarks 177 Still alive: Biotech in Finland and in Italy 178 European strength: Dealing with failure 178 Creating value... 180 Created value... 182 Capturing the intangible value... 183 Believing in the mission 186

Acknowledgements
We want to express our deepest gratitude to 30 anonymous company leaders from Finland and Italy for interesting and time-consuming in-terviews, and for sharing their valuable experience and opinions on our countries’ biotechnology and pharmaceutical sectors.
Mario Bonaccorso, Antti Eskola, Barbara Goodman, Raine Hermans, Katri Lehtonen, Alicia Löffler, Pekka Pesonen, Markku Rajala, Petri Rou-vinen, Timo Seppälä, Joel Shalowitz, Minna Suutari, Erkki Tenhunen, Leonardo Vingiani, Sangeeta Vohra, and a very special Mother have con-tributed to this book through additional interviews, discussions, back-ground information, comments and advice during this project.
We are grateful for Anni-Julia Tuomisto’s cover art: in times of distress it provided us the crucial inspiration to finish our raid. Without the end-less support of Kimmo Aaltonen, Jyrki Ali-Yrkkö and Laila Riekkinen this book would never have materialized in the first place.
Finally, the contributions of Matias Kalm, Tuomo Nikulainen and Mika Pajarinen to this book are invaluable. Matias and Tuomo have been key members of the team, from initial planning to performing interviews. We wish them best of luck in their new US careers.
This research has been realized within the project Value Creation and Capture – The Impact of Recycling and Global Dispersion of Intangible Capital funded by the Finnish Funding Agency for Innovation Tekes.


Authors
Annu Kotiranta, MSc (econ.) Researcher, Etlatieto Ltd (Finland)
Martti Kulvik, MD, MBA Chief Research Scientist, Etlatieto Ltd (Finland) Clinical Researcher, Dept. of Neurology, Helsinki University Central Hospital (Finland)
Sirpa Maijanen, MD Researcher, Etlatieto Ltd (Finland)
Antti Tahvanainen, PhD (Eng.) Chief Research Scientist, Etlatieto Ltd (Finland)
Leopoldo Trieste, PhD Researcher, Institute of Management Scuola Superiore Sant’Anna, Pisa (Italy)
Giuseppe Turchetti, PhD, Fulbright Scholar Professor of Economics and Management, Institute of Management Scuola Superiore Sant’Anna, Pisa (Italy)
Marja Tähtinen, PhD, MBA Researcher, Etlatieto Ltd (Finland)
Additional material is available at this book’s homepages: www.etla.fi/raiders


9
Executive summary
Biotechnology employs 22 million citizens in Europe, turns over €2 tril-lion in revenues, and has produced multiple new techniques, applica-tions, and potential treatments (EY and EuropaBio, 2014). Yet biotech-nology is still in “progress towards the ‘Golden Age’ of biotechnology, in which economic, environmental, or health and well-being benefits are realized” (Gartland et al., 2013). High hopes for a better future have been the basis for the emergence of the biotechnology industry (Nightingale and Martin, 2004; Sexton, 2011).
Biotechnology has been one in a row of business hypes, preceded by the dot-com boom and followed by megatrends such as nanotechnology and cleantech. Common to all is the challenge of creating value from re-search and development-based intangibles. However, research-intensive companies typically operate in fields in which failure is an inherent risk. This combination of high-intensity R&D and high risks creates a prob-lem for both private and public investors.
The created value primarily finds form in intangible assets, which are poorly captured by traditional accounting standards and for which no well-established alternative metrics exist. Consequently, in the case of a company failure, most of the created value added is considered lost; it is frequently assumed that knowledge created by and embodied in a failed organization simply disappears. Odd? To say the least! Even in-sane? Probably. And, as if that were not enough, failure not only chal-lenges the justification of related government support policies but al-so typically leads to the public rebound effects of disappointment and cheeky hindsight. Both are detrimental to the growth and premises of any fledgling industry.
Yet this is precisely the story of both the Finnish and Italian biotechnol-ogy industries.
In this book we took a fresh look at biotechnology as a business. Tradi-tional metrics of the Finnish biotechnology industry revealed that our common perception of a failing industry sector does not fully match the realities of the real world: The value added by the industry has risen steadily since the beginning of this millennium, outperforming the in-dustry average growth more than ten-fold.

10
Intrigued by the finding, we dug deeper and assessed the company ex-it rate. Surprisingly, we found the rate to be comparable to the Finnish transportation industry – and actually one of the lowest among the six industry sectors on which we had data1.
The finding is highly counterintuitive to the common perception of a sci-ence-based, technology-driven, high-risk, bankruptcy- and entry-prone sector. It seems that the gale of creative destruction has spared the Finn-ish biotechnology sector from the worst. Whether this is good or bad, we could not tell. Would industry growth have been stronger if underper-forming companies had been weeded out more effectively? Or had we perhaps missed something important?
To exclude the latter possibility, we decided to raid the dark side of the moon: the unsung, unseen, and forgotten cohort of failed and vanished companies. It turned out to be an interesting journey.
As it turns out, eighteen Finnish biotechnology companies that had al-ready been publicly written off as abandoned, failed, or lost from the map of commercial biotechnology had created and nurtured a vivid mix of intellectual capital (IC). This combination of knowledge, skills, intel-lectual property, and practices – often invisible to traditional account-ing practices – has indeed been recycled and developed further in vari-ous ways after the companies’ alleged failure. In sheer numbers, the IC created in our case companies is estimated to generate sales exceeding 1 billion euros.
This book tells the story of our raid and the treasure of lost value – hid-den from public perception – that we found. The story starts off with a raider’s discussions with mother, explaining what intellectual capital is about in the first place. In chapter one we look at the treasure map, try-ing to figure out what literature has to tell us about the legacy of dead companies. Our statistical treatment of the Finnish biotechnology in-dustry in chapter two reveals a vivid, growing industry. In chapter three we open the proverbial tomb and examine the hidden treasures left there by Finnish companies that seemed to be dead and forgotten. In chapter four we raid Italian companies for the sake of comparison, as the Finnish and Italian biotechnology sectors seem to have a lot in common. Turn-ing gained insights into practical recommendations, chapter five collects
1 The other industry sectors were, in order of annual company exit rate: 1. social, health, education, and personal services; 2. knowledge-intensive services; 3. real estate, ad-ministration, and support services; 4. traditional industry (incl. water, environment, and energy maintenance); and 5. transportation.

11
learning points shared by thirty interviewees and suggests the establish-ment of a refinery centre for companies in distress; and – to provide a tool for the job – chapter six presents an IC accounting instrument that was developed based on analyses of six Italian companies. We finish our journey with concluding remarks in chapter seven.
To end on an anecdotal note, one of the authors had a godfather who would have been the perfect spiritual patron to this book. Mr Hansen was born in Finland to a Danish father, made his career in the US, and became a legend, as the crew transport ships he commanded never took a hit when the Pacific was on fire. Once retired, he returned to Finland and began to share all of his stories from the seven seas. Sometimes the stories seemed almost too good to be true.
We leave it up to the reader to judge our story of Finnish biotechnology. But we conclude by quoting Lucky Hansen:
“If you don’t believe this story, I’ll tell you another one!” Capt. Hans E. Hansen

12
References
EY and EuropaBio (2014): Biotechnology in Europe. The tax, finance and regulatory framework and global policy comparison. http://www.europabio.org/sites/default/files/report/ey-europabio_report_final_1.pdf.
Gartland, K., Bruschi, F., Diundar, M. and Gahan, P. (2013): Progress towards the “Golden Age” of biotechnology. Current Opinion in Biotechnology, Issue 24.
Nightingale, P. and Martin, P. (2004): The myth of the biotech revolution. TRENDS in Biotechnology, 22(11), pp. 564–569.
Sexton, S. (2011). The Future is Now: Genetic Promises and Speculative Finance. Global Health Watch 3, s.l.: An Alternative World Health Report.

13
About the intangible assets – Discussions with my mother, aged 76
This chapter describes some elements of the intangible capital concept. The chapter is based on actual discussions with the mother of one of the raid-ers – with the mother’s permission of course.
Episode #1: Recycling
“So you are starting a new project. What is it about?” asked my mother.“It deals with failed companies. I mean companies that have gone
bankrupt or had to be sold against their plans due to a crisis, or compa-nies that had to fire most or all of the personnel”.
“That’s sad. So many people lose their jobs nowadays. Think about your cousin Sam. He has been waiting for a month now to hear wheth-er he can keep his job or not. It has been a very stressful time”, said my mother passionately.
“Yes, it is. And it is even nastier for those who lose their jobs”.
“But what are you looking for?” asked my mother, still feeling sorry for cousin Sam.
“Well, we are trying to discover the valuable things these companies still have ...”
“That’s an important point”, interrupted my mother, and then contin-ued: “People are valuable and they should not be treated like losers even though they face a crisis or a failure. It is the people who make the com-panies, not the machines. These people deserve a new chance”, conclud-ed my mother.
“You know, we are looking for the possibilities to recycle the valuable things”.
“Recycling? Yes, I am for that! You know how I hate to waste anything. In my youth we had to save on everything and we utilized everything as carefully as we could. Today you always buy a new thing to replace a bro-ken one – or even things that are out of date. That’s waste”, declared my mother, and she continued excitedly: “And look what it does to the envi-ronment: The dumb pits are bursting with things that could still be used. I can’t understand how people can afford this kind of consumption”.

14
A moment of silence and then my mother carried on with a quiet and worried voice: “I can’t understand how our country can afford not to uti-lize all the good things the failed companies have”.
Episode #2: Capital
“I want a mobile phone – a mobile only to make phone calls and send text messages, nothing more! All the other things are useless for me!” declared my mother when we presented the properties of new mobiles to her.
A week later she gladly reported: “This new mobile is marvellous! I can take pictures and send them! Do you know if I can get internet and email to this?”
“Of course you can. Welcome to the information era! By the way, did you know that the development of ICT technology has improved the performance of employees by allowing them to utilize their intellectual capital in a more productive manner and the result can be seen in the sky-rocketing market value capitalization of the corporates?”
“Sounds interesting”, said my mother politely, “but what on earth are you talking about? Intellectual what?”
“Ah, intellectual capital, or intangible capital or knowledge. It means things that are immaterial, things that are invisible but important when doing something. Let’s take cooking, for example. You have the oven and then you have flour and sugar and eggs. Those are the material things, the tangible capital. But that’s not enough to make food. You need to know the recipe; you need to have skills and experience to apply the rec-ipe and motivation ...”
“I got it, I got it!” my mother called out, starting to giggle. “It was not your motivation, but it was your intellectual attention capital that was directed into the wrong things when you forgot to put the minced meat into the meatloaf. And because of that we had roasted sour cream for dinner”, laughed my mother from the bottom of her heart.
Episode #3: Infinite
“I have been thinking about what you said about the intangible capital”, said mother. “It seems to be a big issue”.
“Yes, that’s true. There are over 100 intangibles that apply to compa-nies”.
“So many?” wondered my mother.

15
“Yes. The intangibles are like the universe. If you look at the night sky, you see a glimpse of the universe around us, with the moon and the stars and the planets and the space between them. What you can see is part-ly visible and mostly invisible to our eyes. It is not enough to describe the sun to describe the universe; in fact, all the descriptions define some parts of it. It’s the same with intangibles – one perspective is not enough to describe the whole concept. Economists talk about intangible cap-ital and humanists talk about intellectual capital or intellectual assets. Epistemologists talk about knowledge that people have and sociologists about the knowledge and the way it is used in the communities. If we compare the universe and the intangible capital, the sun, for example, resembles the value creation power in which the managers are interest-ed. As constellations, Orion and Big Bear resemble the forms in which intangible capital is seen by the researchers. The North Star resembles the guidelines that can be drawn from intangibles, especially by business consultants. They all talk about the same phenomenon, but from differ-ent perspectives”.
“No wonder it is so hard to describe it”, pondered my mother. “‘Intan-gible capital’ ... It sounds too obscure, so theoretical. Can you somehow classify it to make it more understandable?”
“The usual way is to divide it into human, structural, and relational capital. Human capital refers to expertise, experience, skills, competenc-es, attitudes, motivation, and so on, things that people have”.
“It is important that the value of people be recognized”, said my moth-er. “By the way, did you hear that little Eliza said her first word? It was ‘bunny’”, said my mother, with pride in her voice. “You know, this ‘hu-man capital’ develops so fast when children are young. Little Eliza is so lively that her parents have their hands full in trying to raise her”, com-mented my mother.
“Oh, what was the next intangible?”“It is structural capital. It refers to things that organizations have, such
as their goals, the ways and the principles used to run them, and in busi-ness the ways to protect their ideas, like trademarks or patents”.
“I think I understand. There was an interesting interview in yester-day’s newspaper about an entrepreneur who is almost blind, and he had turned his vision problems into a business idea which helps us all, not just those with vision problems. Can you imagine that?” said my mother enthusiastically.

16
“And relational capital is about the organizations’ relationships to oth-ers, like customers, suppliers, distributors ...”
“Oh, interrupted my mother. Do you remember the wonderful sales-person, who convinced me to buy that yellow winter coat? She is the best seller I have ever met! I would have never even looked at that coat if she hadn’t encouraged me, and it has been the most comfy coat I have ever had”.
“Yes, I remember it. We could never lose you in the crowd when you were dressed from head to toe in that bright canary yellow coat”.
Episode #4: Value
“I visited my friend Mary at the nursing home yesterday”, said my mother.
“How was she?”“She was a little absent-minded, but of course her pains make her feel
uncomfortable. I took her for a walk with her wheelchair to the neigh-bouring park. You should have seen how she revived in the sunlight lis-tening to the birds, and the smile on her face when a tame squirrel came to beg for treats and took nuts from her hand”.
“She has a beautiful smile”.“Yes. But in the same ward there are many other people who have not
been out for a long time; the personnel simply do not have time for that. It is not their fault, as they are trying to cope with the resources they have”, continued my mother with mixed feelings.
“That’s true – their resources are barely sufficient for the physical needs”.
“One thing I don’t like in present-day society is that everything is measured with money. I do understand that we – all of us – have to live according to what is in our wallets, but still ... It seems that as a boss money hides the value of all other things”, commented my mother, upset.
“There was a study that showed that when companies have financial problems they tend to underestimate the value of the intangibles they have”.
“But maybe it is even worse than that”, continued my mother. “We lose sight of what is important; the important things are left on the dark side of the moon”.

17
Episode #5: Maintenance
“But you have to be the leader”, said my mother emphatically after I had told her how my dog Jolly had woken me up three times last night, twice for a reason and once just to go out and enjoy a walk in the early dawn. “You have to establish the limits for him!” she continued.
“He has his limits”, I argued. “He needs another kind of leadership now when things are changing. He needs to be shown that I take care of him, he does not have to bear the stress of taking care of me”.
Jolly started barking vigorously. “What happened? Why is he bark-ing?” asked my mother as I hushed Jolly.
“He’s preventing dementia; he believed you when you said that talking prevents dementia” ;)
“You know, leadership is in fact a challenging job, especially when a new manager comes in. I do still have nightmares of the time when we got a new manager and everything changed—everything, including the things that were working well”, said my mother, recollecting events from twenty years ago.
“Unfortunately that is one way of showing leadership”.“Yes, but in acting like that you lose the experience the people have”,
concluded my mother and then continued. “I have seen how things are changing and development ... Well, it is developing fast. Yet the people who actually are doing the job know a lot about it. They have ... what do you call it?”
“Tacit knowledge?”“Yes, tacit knowledge of the job. And it is important to recognize that
and take care of it too”, stated my mother.
Carrying on with the topic, my mother asked: “By the way, now that we are talking about structural reforms, have you been thinking about who you will vote for in the elections to come?”
Episode #6: Renewal
“Good morning, mother!” “Hmmmm”.“You sound terrible. What has happened?”“Your cousin Sam – he lost his job!”“That’s terrible news!”

18
“His father told me yesterday that Sam is still in shock. I have stayed awake all night thinking about Sam and his family. They said that the company aims to be more profitable and that’s why they decided to ‘re-lease resources’. Release resources!!! How can they even imagine that they can make a profit if they don’t have people?”
A couple of months later my mother brought up cousin Sam’s situa-tion.
“I had a long talk with your cousin Sam, and I have to admire his guts. He decided not to give up. He applied for polytechnics to update his knowledge and they accepted him. And they told him that this new education combined with his previous experience and skills would open new doors for him”.
Episode #7: Epilogue
“I have both glad and sad news”, said my mother on one morning. “Your cousin Sam has decided to establish a company of his own. Sam said that he felt that his layoff was unfair and that’s why he has decided to create a socially responsible company”.
“Good for him”.
“And then the sad news: Mary’s daughter called me yesterday. Mary passed away on Monday evening”, said my mother with sorrow in her voice.
“I am sorry to hear that. She was such a kind-hearted person”.“Yes, she was”, said my mother longingly. “The last time I visited her
she told me how happy she was that we had set up the ‘Granny-team’ and had managed to get others along to visit the people in the ward”.
A couple of weeks later my mother had had visitors. “Little Eliza and her parents visited me yesterday”, my mother said joyfully. “We had such a lovely day playing with dolls and building sand castles with little Eliza”.
My mother moved back in time a little and said: “When you were ba-bies and had colic, my grandmother showed me how to help you. Nowa-days the same method is accepted as an official treatment method, but now it is called ‘baby gym’. The old folks had a lot of practical wisdom”, concluded my mother, more determined than ever that her ‘noble duty’ was to pass on her own and her ancestors’ wisdom and human capital to us, the younger generation.

19
References
Adams, M. and Huibregtse, S. (2013): Changing how you think about intangibles: Creating value for your company through active intangibles management. [Online] Available at: https://www.youtube.com/watch?v=XfdbNRbDU5c [Accessed 23 02 2015].
Brennan, N. and Connell, B. (2000): Intellectual capital: current issues and policy implications. Journal of Intellectual Capital, 1(3), pp. 206–240.
Kaufmann, L. and Schneider, Y. (2004): Intangibles: a synthesis of current research. Journal of Intellectual Capital, 5(3), pp. 1469–1930.
Kesti, M. (2012): The Tacit Signal Method in Human Competence based Organization Performance Development. Lapin Yliopistokustannus.
Lev, B. and Daum, J. H. (2004): The dominance of intangible assets: consequences for enterprise management and corporate reporting. Measuring Business Excellence 8(1), pp. 6–17.
Marr, B. (2008): Management Accounting Guideline. Impacting Future Value:How to Manage your Intellectual Capital. s.l.: The Society of Management Accountants of Canada (CMA Canada),the American Institute of Certified Public Accountants, Inc. (AICPA) and The Chartered Institute of Management Accountants (CIMA).
Marr, B., Schiuma G. and Neely, A. (2004): Intellectual capital – defining key performance indicators for organizational knowledge assets. Business Process Management Journal 10(5), pp. 551–569.
Nahapiet, J. and Ghoshal, S. (1998): Social Capital, Intellectual Capital and the Organizational Advantage. Academy of Management Review 23(2), pp. 242–266.
Nonaka, I. and Takeuchi, H. (1995): The knowledge creating company: how Japanese companies create the dynamics of innovation. New York: Oxford University Press, p. 284.
Roos, G. and Roos, J. (1997): Measuring your Company’s Intellectual Performance. Long Range Planning. Special Issue on Intellectual Capital 30(3), pp. 413–426.
Sveiby, K.-E. (1997): The new organizational wealth: Managing & measuring knowledge-based assets. s.l.: Berrett-Koehler Publishers.
Sveiby, K.-E. (2001): A knowledge-based theory of the firm to guide in strategy formulation. Journal of Intellectual Capital 2(4), pp. 344–358.
Yunus, M. (2009): Creating a World Without Poverty: Social Business and the Future of Capitalism. PublicAffairs. p. 320.
My mother’s references
Kotikokki (2015): Easy meatloaf [in Finnish: Helppo lihamureke]. [Online] http://www.kotikokki.net/reseptit/nayta/294331/HELPPO%20LIHAMUREKE/ [haettu 11.3.2015].
Saarinen, J. (2015): Sokea Jukka Jokiniemi hylkäsi rahakkaan eläkkeen ja rakensi menestyvän valaisinyrityksen. (The blind Jukka Jokiniemi abandoned his lucrative pension and built a successful lighting company; in Finnish). Helsingin Sanomat 18.1.2015. [Online] http://www.hs.fi/talous/a1421471902601 [haettu 11.3.2015].

20

21
Chapter 1
Legacy of Dead Companies – A Treasure to be Discovered
“By failing to prepare, you are preparing to fail.” Inspired by Benjamin Frank-lin’s wise words, we concede that attempting a raid on the dark side of the moon would be folly without first investing into proper preparation. A natural start-ing point is to take stock of what is already known about and what remains to be discovered at our shadowy destination.
Establishing the base camp for our raid, this chapter reviews what extant lit-erature reveals about the after-life of failed companies. With a special focus on the companies’ legacy of intangible assets, the analysis revisits the endur-ing characteristics of intangible assets, the mechanisms of their transformation and transmission to new use, and factors that potentially erode and endanger the legacy of failed firms.
As it turns out, not much is known about the transformation and transmis-sion mechanisms of legacy assets. To discover, measure and enhance this legacy, may help entrepreneurs, venture capitalists, financial institutions, and policy makers to better evaluate the nature, quality and return of the investments they have made into fostering the biotechnology industry. This analysis could inspire new and more grounded innovation and industrial policies.

22
Introduction
The biotechnology industry is one of the most interesting industrial sec-tors for academicians, economists, managers, private and public inves-tors, as well as public authorities. In particular, in the last twenty years the biotechnology industry has constituted a great natural experiment for researchers to observe the emergence of a new industry. The main question has been: Can Science Be a Business? (Pisano, 2006.)
Considering the numerous investments and funds assigned to scientific programs2 the answer is – in many cases – yes: Science could be a business in the technology market for science and biotechnology.
Nine years after Pisano’s article, there are some additional answers to Pisano’s question. On one hand, the high potential of the biotechnology industry has been stressed for 20 years, and concrete and positive results have been observed, particularly for medium and large companies. On the other hand, although the biotechnology industry is potentially one of the most important markets for medical and life science applications and demand is expected to sustain profits in the future, the sector reg-isters high rates of failure that may cast a shadow on the potential and high expectations for future revenues of biotechnology companies. This may reduce the impact of several interesting success stories, discourag-ing public and private institutions from investing in the sector.
Historically, a mix of factors has contributed to show that the multiplier for investment in the productivity of R&D and revenues of the biotech-nology industry is less than one and the reason why failures of new bio-technology firms are relatively high. These factors, among others, are the traditional weakness of contacts and linkage between scientists and the industrial sector, the absence or little and uncoordinated support of gov-ernments, and the lack of biotechnology business expertise among re-searchers and investors, as occurred in Italy (Orsenigo, 2001).
Revenue in the sector dramatically increased from 1980 to 2004 (Pisano, 2006), and then the operating income became stationary, meaning that costs increased at similar rates, although biotechnology is nowadays the main provider of new drug innovations. Biotechnology’s role in pharma R&D productivity as well as – and perhaps even more – in other fields of
2 See for example the Large Hadron Collider (LCH) at CERN and the investment of inter-national organizations in programs aiming to support agricultural biotechnology for developing countries facing the challenges of food insecurity and climate change (Fao, 2010).

23
application is still underestimated and not entirely clear to public regu-latory bodies.
The worldwide increase in R&D costs, the reduction of profits also in those areas in which R&D costs decrease,3 and the high substitutability of the products – which means high competition regarding prices – do not help the smaller biotechnology companies in their struggle. In addi-tion, the smaller biotechnology companies are handicapped by compar-atively lower capacity and lack of resources.
While relatively bigger biotechnology companies have a large portfolio of products that reduces their risk of failure, small biotechnology firms –many of them spin-off companies originating from universities (Orseni-go, 2001) – are focused on a more restricted number of products that can compete in the market. The biggest biotechnology firms, such as Amgen, Biogen, Genentech, and Genzyme, operate strategically on the product portfolio, while small biotechnology spin-offs spend a lot of time and resources to commercialize single products lacking fundamental assets like a direct distribution system, industry experience, and industry mar-ket share (Mitchell, 1989). For medium-sized and large firms a low rate of adoption for a product can be balanced by new revenues from prod-ucts that are not related to the first one. A low rate of diffusion and adop-tion, whatever the cause, of the product in which a small firm has invest-ed its future may really mean the failure of the firm.
Firm size and entry time in the biotechnology sector and subsectors matter in the probability of firm failure. Considering the biotechnology sector as a whole, the first mover usually wins the competition against its followers. Considering singular and new subsectors, firm size and tech-nological capabilities rather than the entry time matter in the probability of winning the market competition. The winners are medium-sized and relatively larger firms; i.e. the oldest pioneers of the biotechnology in-dustry, as both first and second movers in new subsectors are very small and young companies with little experience, with limited technological capabilities (Franco et al., 2009), and an unbalanced cash flow due to a high percentage of uncollected credits. In fact, many companies para-doxically die with many credits to be collected. The Italian experience is emblematic of inefficient use of public funds. Small firms and spin-offs receive funds for 2- or 3-year projects from public institutions that pay their debts to these companies with an unsustainable delay.
3 The reduction of profits was two times the reduction of R&D costs between 2011 and 2012 in the US biotechnology industry (EY 2013 industrial report).

24
Therefore, in analyzing the market dynamics and the high rate of firm failures superficially, we may be driven to perceive that in the biotech-nology industry science may not be a business. As a consequence, public regulatory and funding bodies may conclude that it is not convenient to invest in the biotechnology industry by incentivizing the birth of new firms or supporting the existing ones.
However, if we analyze in more detail the evolution of the biotechnology industry, considering both its successful and the unsuccessful stories, we do believe that the answer to the question with which we have opened this paper is yes – particularly if we try to answer new, as yet unexplored questions: Did the failed companies create value? Did this value disap-pear or diffuse into the market, creating a positive externality to the sur-viving or new companies? Have failed companies left a valuable legacy to the market?
The present paper tries – relying on published scientific literature, but without being a systematic review – to provide an answer to these fasci-nating questions.
The legacy of dead companies
The current debate on the biotechnology industry does not take into ac-count the impact and the legacy of failed firms on the sector. The point is that in all markets some firms win and others lose the game, but the contribution of the losers to the performance and dynamics of the win-
ners is not zero, and it should be taken into ac-count. The Etruscans lost the war against the Ro-mans but the influence of the losers in improving the building techniques of Romans has been very impressive. In more recent times, the failure and closure of European research centres and labora-tories because of racial laws, which contributed to
laying off a large number of scientists that had to migrate, contributed to the technological and scientific supremacy of the United States of Amer-ica in the years to come. Apart from these two examples, there is a huge list of failures that produced societal, financial, and psychological costs4,
4 See Ucbasaran et al., 2012, which reviews and analyses the literature on the effects of failure from the societal, psychological, and financial perspectives. Surprisingly, the re-view does not consider the legacy of failures in terms of experiences, skills, and com-petences that increase the probability that the entrepreneur is still able to play a role in the industry after the failure.
The contribution of the losers to the performance and dynamics
of the winners is not zero

25
but also positive outcomes; the role and legacy of failed experiments on the improvement of science is a paradigmatic example. In the same way, the idea behind a business can be brilliant, but the way in which it has been managed and promoted could be wrong. New challenges for a dif-ferent way to support a brilliant idea can produce revenues and contrib-ute to the success of new or existing firms.
The biotechnology sector shares the same problem of innovation – high uncertainty and high risk of failure – but this does not mean that we should not invest in innovation, since failures are the most important challenge for qualitative jumps toward a more efficient and productive path (Edmonson, 2011).
In order to say that investing in biotechnology is still a convenient choice, we should extend the analysis to the role of firm failures in the dynam-ics of the biotechnology sectors, i.e., we should analyse how the stock of capital generated by dead companies survives in the market and contrib-utes to the success and competitiveness of new or existing firms.
The new course of the capital
The legacy of dead companies in the biotechnology market may increase the competitiveness of existing firms with new contacts, new experience, skills, competencies, and new products and services. Entrepreneurial exits (a concept that is broader than failure) often have positive impacts not only on the entrepreneur, but also on the evolution of industries (De Tienne, 2010). If the failed is the incumbent, more productive companies will occupy the same market (Pe’er and Vertinsky, 2008), benefiting from the in-cumbent’s legacy.
If a company is not able to increase the productiv-ity of the capital employed, it does not mean that a different reorganization or a transformation of this stock of capital into different pieces of available knowledge may not able to increase the pro-ductivity of the firms that capture and use the original capital. This chal-lenge, however, remains unexplored, as at present the legacy of exiting companies is not utilized in a systematic way.
The legacy of the biotechnology firms that are not able to compete in the market is a stock of capital that depreciates at a rate that is lower than the rate at the time in which the firms operated in the market. This is be-
As at present the legacy of exiting companies is not utilized in a systematic way

26
cause this stock of capital changes its original characteristics, function, and objectives. The original stock of capital is fragmented and recollect-ed in pieces that contribute to increasing the competitiveness of the sur-viving firms in terms of new ideas and inventions, intellectual properties (intellectual capital), experiences, new skills and competences (human capital), and improving the dimension of the network (relational capi-tal) among intermediate and final producers and the related potential demand at a relatively low price. Company failures traditionally reduce prices of intellectual, human and relational capital without eroding its quality. In fact, failure could be good for the economy, generating posi-tive externalities (and obviously stopping negative ones) that are able to reduce industry costs (as in the case of the banking industry, analysed by Knott and Posen, 2005).
The legacy of the dead companies is the challenge of a new transfor-mation of capital into “potential energy” that is again transformed into new capital. In this process, relational capital is transformed into human capital and vice versa, enlarging and improving the infrastructures upon which the knowledge is transmitted for new challenges, producing new intellectual capital incorporated in the existing firms.
In a relative short amount of time, the original stock of capital may be the source of opportunities that sustain the increase of real and immaterial assets that actually affect the competitiveness of new and existing firms.
Mechanisms of capital transformation and transmission
With respect to the transformation of stocks of capital into other forms of capital, the literature is scarce. In effect, the literature mainly focuses on the transformation of intellectual, human, and socio-relational capital (separately considered) into economic value and returns for companies.
The legacy of dead firms in terms of intellectual capital
In those areas in which the market for intellectual properties (IPs) is effi-cient, the strategic use of IPs is able to separate the place in which knowl-edge, goods, and services are produced and the place in which they pro-duce revenues. When markets for IPs are not efficient, the psychological barriers of Not Invented Here (NIH) syndrome reduce interest in intel-lectual properties that are not used by other firms. In addition, the pos-sibility that a rival could be able to obtain revenues developing a prod-

27
uct from an unused patent of its competitor strongly reduces the role of secondary markets for IPs. In particular areas, these markets do not take off because the number of patents traded and the strategies of the related firms are not able to trigger the potentially high network externalities. However, this is a problem in the perspective of big firms. A small bio-technology firm often does not have the capability to use IPs left by oth-er failed companies. If it is a very small firm, its wish is to sell the idea or start a partnership with firms that have the capability to develop and commercialize a product that incorporates these IPs.
With respect to the case in which a company does not use its patents but does not sell them or part with them in the market because of the threat of losing potential revenues, the legacy of dead companies in terms of in-tellectual capital can be more easily exploited.
The temporary availability of patents or inventions and ideas (Singh and Agarwal, 2011) not related to an existing company makes the market po-tentially useful for both entrants and incumbents that can recruit skills and competences as well as the ideas and inventions of people previously employed in failed companies. This advantage should be taken into ac-count when one tries to obtain an idea of a market’s potential for invest-ment decisions.
However, the importance of and interest in the intellectual capital left by dead companies will not be completely appreciated if the importance of strategic use of IPs continues to be underestimated by companies that traditionally use about 5–7% of the total of IPs (Chesbrough, 2006).
The legacy of dead companies in terms of human and relational capital
Existing and new companies can capture the legacy of dead companies in terms of human and relational capital that is not destroyed by the firm’s failure. An entrepreneurial exit not only induces new entries but also increases entrepreneurial skills (Hessels et al., 2011).
When a firm dies, experienced, skilled, and competent people become available resources in the market.
Once costs, time, and the related resistances of a skilled individual in learning new routines and, on the opposite side of the coin, scepticism of the incumbent firm in adopting ideas and innovations coming from outside are overcome, the existing and new firms can intercept skilled la-bour supply and obtain some advantages. First, costs and time for train-

28
ing are strongly reduced, due to the accumulated experience and com-petences. Second, process and product innovation can be offered to the firm by people that have experienced alternative procedures and rou-tines, as well as different or existing solutions able to overcome prob-lems that the surviving company may not be able to resolve (Agarwal et al., 2009; Singh and Agarwal, 2011). Third, new information on what should be avoided becomes available. This experience helps both the em-ployees (Amankwah-Amoah, 2011), entrepreneurs, and managers who want to continue their activities in surviving companies or founding new firms5 in better monitoring evident and also hidden micro-dynam-ics and weaknesses avoiding risk of failure.
The role of learning from failure and its impact as a knowledge spill-over in the market is controversial. On one hand, enterprise failure can be seen as a particular asset in the hands of founders both in terms of competences, experiences, and reputation (Nobel, 2011). On the other hand, failures can strongly reduce innovation due to a sort of innova-
tion trauma that curbs investment in innova-tion (Baumard and Starbuck, 2005; Välikan-gas et al., 2009). The discussion and views on the topic are heterogeneous, as some authors stress the importance of learning from failures and some consider that bad experiences cre-ate barriers to learning (see for example Sitkin,
1992; McGrath, 1999; Cope, 2011; Minniti and Bygrave, 2001; Shepherd, 2003; Cannon and Edmonson, 2005; Rerup, 2005; Politis and Gabriels-son, 2009; Madsen and Desai, 2010; Desai, 2010). Should we abandon the conviction that we learn more from failures than from successes?
With respect to the relational capital, the network of subjects, institu-tions, and intermediate producers that took part in the supply chain of the dead companies and final adopters becomes available, increasing the relational capital of existing and potential new firms.
When two firms compete in the same market, their common set of rela-tions is a formal overlapping. The two companies are usually placed in a network that increases mutual knowledge and information that, instead of inducing cooperation and partnership that may increase the market share for both companies, is used to improve competitive strategies at a relative lower price.
5 After a failure, new activities made by entrepreneurs depend on the interaction be-tween attributions of causes of failure and whether the “explanatory style” is learned optimism rather than learned helplessness (Ucbasaran et al., 2003).
Should we abandon the conviction that we learn more from failures
than from successes?

29
If one of the above companies dies, its relational capital can be absorbed by the surviving company, which obtains a double advantage: It can en-large the relational capital with new nodes, and it can increase coop-eration between subjects that were only formally linked together. The increasing of social capital facilitates external knowledge acquisition (Yli-Renko et al., 2001). Enlarging social capital through new external relations that induce new knowledge acquisition and so on becomes a self-sustaining process in which business failures do not slow the rate of innovation and technical changes as the endogenous engine of industry dynamics.
Factors that erode the legacy of failed firms
The legacy of failed companies in terms of intellectual, human, and re-lational capital can be quantitatively and qualitatively reduced only by non-economic factors that, as the so-called animal spirits, deeply influ-ence the industry dynamics. Psychological factors strongly impact the possibility to transform failures into a qualitative and quantitative jump in the biotechnology industry’s performance. The generated capital can be transformed and becomes useful for new activities or for the surviv-ing companies if its potential is not eroded by psychological and human factors like pessimism and dissatisfaction, as well as some psychological biases in the perception of the causes of failures.
If positive processes become self-sustainable and fast, thanks to the net-work of institutions and subjects of which a market is made, it is also true that the same network is able quickly to diffuse factors that slow the in-dustry’s inner dynamics. The entrepreneur of a failed company can rap-idly lose the network of relations and contacts by himself because he may be afraid of interacting with people that he considers the cause of his fail-ure (entrepreneurs often attribute success and barriers to their success to internal and external drivers, respectively, as observed by Rogoff et al., 2004), or the other entrepreneurs can isolate them. As a consequence, relational and social capital is destroyed without a recovery mechanism.
There is also the possibility that unsatisfied entrepreneurs become risk seekers, since there is a sort of self-selection of opportunities that these entrepreneurs can capture. In trying to resolve their problems rapidly, these entrepreneurs can take risky actions that produce new failures (Si-mon et al., 2003).

30
Operation environment, e.g. how communities and different regions are able to salvage business closures or failures, influences the productiv-ity of dead companies’ legacies for existing or new firms (Cardon et al., 2011). If the environment attributes the main cause of failures to misfor-tune rather than mistakes, it could reduce the fear of failure and increase cases of success; but it is also true that an environment that assigns high importance to fortune and misfortune does not invest in looking for the real causes of failures, and also isolates failed and unlucky entrepreneurs no matter their skills and competences. As a consequence, the relational capital left by dead companies could be completely eroded.
Conclusions
As observed, scholars mainly look for a correlation between the level and characteristics of different capital assets employed in a company and the level and characteristics of its revenues. As a result, the transformation and the transmission mechanism for capital among firms is incomplete.
The entire transformation process of assets into value is relegated to how the demand assigns a value to a combination of factors embedded into a product that is the result of the employment of different capital assets. This approach underestimates the process of mutual transformation of the original capital. In this way, we cannot be able to observe how, for in-stance, relational capital is transformed into intellectual capital and how both of them increase human capital through a learning process. In the absence of a description of these mutual changes, we can only conclude, for instance, that the presence and use of the original intellectual capital (e.g., the number of patents in the firm’s portfolio) is not able to explain the level of revenues of this firm.
Attention should also be focused on the transmission mechanism and the presence and role of specific enzymes (to adopt medical terminol-ogy), a specific and appropriate operating environment, as well as the presence of a particular humus (which can be also produced by the con-tribution of dead firms) that facilitate or slow down the transmission and transformations of capital left as the legacy of closed businesses and failed companies.
A broader approach should be adopted to integrate the transformation of capital assets into revenues and value, as well as changes and transfor-mation of a form of capital into another in the analysis. Analysis of the

31
legacy and positive spill-over of dead companies on the market dynam-ics is one of the instruments we can adopt to select capital that has high potential to produce new changes and revenues; otherwise, we will lose the importance of how the legacy of dead companies contributes to the evolution and performance of the biotechnology industry. The current book adopts a perspective that – although it privileges a narrative, his-torical, and qualitative analysis – can be useful for the scope.
In a period of crisis, to miss this analysis means to say no to precious opportunities just because we describe potential markets in terms of ex-isting firms and the rate of failure. While doing this, we miss on the hu-mus and the capital that dead companies left in the market. Discovering, measuring, and enhancing this legacy may help entrepreneurs, venture capitalists, financial institutions, and, most importantly, policy makers, to better evaluate the nature, quality, and return of the investment they have made fostering the biotechnology industry. This analysis could in-spire new and more grounded innovation and industrial policies.
To paraphrase Shakespeare: There are more things in the market and bi-otechnology industry than are dreamt by current analyses.
32
References
Agarwal, R., Ganco, M. and Ziedonis, R. (2009): Reputations for Toughness in Patent Enforcement: Implications for Knowledge Spillovers via Inventor Mobility. Strategic Management Journal, 2009; 30: 1349–1474.
Amankwah-Amoah, J. (2011): Learning from the failures of others: The effects of post-exit knowledge spillovers on recipient firms. Journal of Workplace Learning, 2011; 23(6): 358–375.
Baumard, P. and Starbuck, W. H. (2005): Learning from failures: why it may not happen. Long Range Planning, 2005; 38: 281–298.
Cannon, M. D. and Edmonson, A. C. (2005): Failing to learn and learning to fail (intelligently). How great organizations put failure to work to innovate and improve. Long Range Planning, 2005; 38: 299–319.
Cardon, M. S., Stevens, C. E. and Potter, D. R. (2011): Misfortunes or mistakes? Cultural sensemaking of entrepreneurial failure. Journal of Business Venturing, 2011:26(1): 79–92.
Chesbrough, H. (2006): Open Business Model: How to Thrive in the New Innovation. Cambridge (MA): Harvard Business Press, 2006.
Cope, J. (2011): Entrepreneurial learning from failure: An interpretative phenomenological analysis. Journal of Business Venturing, 2011; 26(6): 604–623.
De Tienne, D. R. (2010): Entrepreneurial exit as a critical component of the entrepreneurial process: theoretical development. Journal of Business Venturing, 2010; 25(2): 203–215.
Desai, V. (2010): Learning to learn from failures: the impact of operating experience on railroad accident responses. Industrial and Corporate Change, 2010: 1–28, doi:10.1093/icc/dtq019.
Edmonson, A. C. (2011): Strategies for Learning from Failure. Harvard Business Review. April 2011.
Ernst & Young (2013): Beyond borders. Matters of evidence. Biotechnology Industry Report. 2013. Report available at: http://www.ey.com/Publication/vwLUAssets/Beyond_borders/$FILE/Beyond_borders.pdf.
FAO (2010): Agricultural biotechnologynologies in developing countries: Options and opportunities in crops, forestry, livestock, fisheries and agro-industry to face the challenges of food insecurity and climate change. FAO International Technical Conference 2010. Report available at: http://www.fao.org/docrep/meeting/019/k6993e.pdf.
Franco, A. M., Sarkar, M. B., Agarwal, R. and Echambadi, R. (2009): Swift and Smart: The Moderating Effects of Technological Capabilities on the Market Pioneering-Firm Survival Relationship. Management Science, 2009; 55(11): 1842–1860.
Hessels, J., Grilo, I. and Thruik, R. (2011): Entrepreneurial exit and entrepreneurial engagement. Journal of Evolutionary Economics, 2011; 21: 447–471.
Knott, A. M. and Posen, H. E. (2005): Is Failure Good? Strategic Management Journal, 2005; 26(7): 617–641.
Madsen, P. and Desai, V. (2010): Failing to learn? The effects of failure and success on organizational learning in the global orbital launch vehicle industry. Academy of Management Journal, 2010; 53(3): 451.

33
McGrath, R. G. (1999): Falling forward: Real options reasoning and entrepreneurial failure. Academy of Management Review, 1999; 24(1): 13–30.
Minniti, M. and Bygrave, W. (2001): A Dynamic Model of Entrepreneurial Learning. Entrepreneurship: Theory & Practice, 2001; 25(3): 5.
Mitchell, W. (1989): Whether and When? Probability and Timing of Incumbents’ Entry to Emerging Industrial Subfields. Administrative Science Quarterly, 1989; 34: 208–230.
Nobel, C. (2011): Why Companies Fail–and How Their Founders Can Bounce Back. Harvard Business School, Working Knowledge.
Orsenigo, L. (2001): The (Failed) Development of a Biotechnology Cluster: The Case of Lombardy. Small Business Economics, 2001; 17: 77–92.
Pe’er, A. and Vertinsky, I. (2008): Firm exits as a determinant of new entry: is there evidence of local creative destruction? Journal of Business Venturing, 2008; 23(3): 280–306.
Pisano, G. (2006): Can Science Be a Business? Lessons from Biotechnology. Harvard Business Review, October 2006.
Politis, D. and Gabrielsson, J. (2009): Entrepreneurs’ attitudes towards failure. International Journal of Entrepreneurial Behaviour & Research, 2009; 15(4): 364–383.
Rerup, C. (2005): Learning from past experience: Footnotes on mindfulness and habitual entrepreneurship. Scandinavian Journal of Management, 2005; 21(4): 451–472.
Rogoff, E. G., Lee, M. S. and Suh, D. C. (2004): “Who done it?” Attributions by entrepreneurs and experts of the factors that cause and impede small business success. Journal of Small Business Management, 2004; 42(4): 364–376.
Shepherd, D. A. (2003): Learning from business failure: Propositions of grief recovery for the self-employed. Academy of Management Review, 2003; 28(2): 318–328.
Simon, M., Houghton, S. M. and Savelli, S. (2003): Out of the frying pan...? Why small business managers introduce high-risk products. Journal of Business Venturing, 2003; 18(3): 419–440.
Singh, J. and Agrawal, A. (2011): Recruiting for Ideas: How Firms Exploit the Prior Inventions of New Hires. Management Science, 2011; 57(1): 129–150.
Sitkin, S. B. (1992): Learning through failure: The strategy of small losses. Research in Organizational Behavior, 1992; 14: 231–266.
Ucbasaran, D., Shepherd, D. A., Lockett, A. and Lyon, J. (2012): Life after Business Failure: The Process and Consequences of Business Failure for Entrepreneurs. CSME, Warwick Business School WP N.117, 2012.
Ucbasaran, D., Wright, M., Westhead, P. and Busenitz, L. (2003): The Impact of Entrepreneurial Experience on Opportunity Identification and Exploitation: Habitual and Novice Entrepreneurs. In Katz, J. and Shepherd, D. (eds.) Advances in Entrepreneurship, Firm Emergence and Growth, Volume 6: Cognition and Decision-Making in the Entrepreneurial Context: 231–264. Oxford: JAI, Elsevier, 2003.
Välikangas, L., Hoegl, M. and Gibbert, M. (2009): Why learning from failure isn’t easy (and what to do about it): innovation trauma at Sun Microsystems. European Management Journal, 2009; 225: 233.
Yli-Renko, H., Autio, E. and Sapienza, H. J. (2001): Social capital, knowledge acquisition, and knowledge exploitation in young, technology-based firms. Strategic Management Journal, 2001; 22: 587–613.

34

35
Chapter 2
Finnish Biotech in Numbers
Due to ambiguity, a thorough exploration of the concept of intellectual capital – not to mention its posthumous recycling – downright begs for its empirical treatment in a real-world context.
This chapter provides descriptive industry statistics to paint a backdrop for the book’s real world stage, the Finnish biotechnology industry.
The chapter examines the industry in numbers, exploring dimensions such as company renewal rate, value added, availability of funding, and exit rate. It al-so pits micro companies against their larger rivals to draw conclusions on their comparative survivability.
The analyses make surprising discoveries. Despite dwindling funding oppor-tunities for high-risk companies and a general downturn in the economy, the exit rate of companies has remained fairly low and the industry has been able to continuously increase its value added in the past decade and a half. Once a fragile infant industry, biotechnology has successfully mastered its rites of pas-sage to adulthood.

36
The emergence of a new industry: High hopes and high stakes
The Finnish biotechnology industry emerged in the latter 1980s as a science-based, technology-intensive industry. The generic nature of life sciences and its wide applicability in a variety of industries led to high growth expectations during the industry’s early years. Hopes were high and the investors and public impatient; already in 1994 Halme stated that at that point there were no real success stories among the 45 Finn-ish biotechnology companies that would have lived up to the expecta-tions of investors.
The hype for a fairly new and growing industry was followed by both pri-vate and public demand and the industry boomed in the late 90s. (Ni-kulainen et al., 2012) The volume of public funding guided through the Finnish Funding Agency for Innovation (Tekes) more than doubled in 1990–2003, and while Tekes’ public funding in 1990–1997 varied roughly between 5 and 12 million, in the peak year of 2002 more than 50 million in
public funding was invested in the biotechnology industry. Of these 50 million, more than 30 mil-lion was allocated to SMEs (Kulvik et al., 2013).
The high hopes and inputs were also reflected in the society: Several research centres were built around life sciences research, the number of an-
nual science master’s degree graduates rose between 1981 and 2007 from approximately 800 to 1500, and the number of PhDs doubled in twenty years (Unifi, 2011; Luonnontieteiden Akateemisten Liitto, 2014). These considerable inputs in the education, research, and infrastructures are considered a cornerstone of the current biotechnology industry’s suc-cess.
In an evaluation report published by the Academy of Finland (2002), the beginning of Finnish biotechnology was described as “admirable”, and it was stated that “[Finland] has a very real chance to become one of the most successful small countries in biotechnology”. The expectations were high not only for Finland, but also on the EU-level, as the biotech-nology sector was regarded as one of the most promising frontier tech-nologies in upcoming decades.
In terms of industry size, the investments in industry infrastructure, funding, and education bore fruit: By the beginning of the 2000s, the number of biotechnology companies had almost tripled from the mid-
Finland has a very real chance to become one of the most successful
small countries in biotechnology

37
90s. In the year 2000 there were 123 biotechnology companies (includ-ing large pharmaceutical companies), employing roughly 10 800 per-sons. Industry turnover totalled 1.86 billion euros, of which nearly two-thirds was created by pharmaceuticals (Academy of Finland, 2002).
Funding for biotechnology dries up
The burst of the global ICT bubble in the beginning of 2000 had an im-pact also on the biotechnology sector. The uncertainty combined with the industry’s difficulties in meeting the high and partially unrealistic ex-pectations resulted in a decline in the market value of the companies. Li-censing of technologies, IPOs, or other forms of lucrative exits remained minor, and, as a result, investors started to divest their stakes (Nikulainen et al., 2012). This cautiousness was also mirrored in the public funding.
In 2004 a major public investor, the Finnish innovation fund Sitra, de-cided to freeze its support to the life sciences industry. As a result, no new investments were made and only certain aspects of the existing portfolio were funded further. Sitra’s withdrawal was a significant draw-back for the whole industry; during 1999–2004 Sitra had invested rough-ly 100 million euros to ca. 50 Finnish start-up-phase life science compa-nies in the form of direct equity investments and subordinated convertible loans, but now signalled that there was no future in Finnish biotechnology (Hyvönen, 2004; Mikkonen, 2004; Kulvik et al., 2013). In hindsight it can be noted that Sitra’s investments in the life sciences sector did fulfil the overall goal of reclaiming its invested capital after all: In 2011 the cumulated ROI for Sitra’s life sciences investments was close to 0%, and has grown thereafter (Kulvik et al., 2013).
Tekes, the other major public investor, also started to decrease its bio-technology funding. “Tekes cannot be the sole driving force of Finnish biotechnology. We need to select our funding targets more closely in the future”, stated a representative of Tekesin in Helsingin Sanomat in Au-gust 2006 (Itkonen, 2006). Tekes’ funding to SMEs in the life sciences de-creased from 2004 to 2011 by roughly 40%, from more than 30 million to less than 20 million euros per year (Kulvik et al., 2013).
The shortage of funding and its drastic results were discussed in the newspapers. At the end of 2004, Finnish Talouselämä wrote that “if bio-technology companies cannot assure more funding the following year,
Sitra’s withdrawal was a significant drawback for the whole industry

38
they will face either shutting down the business, sales of operations, or bankruptcy”. (Holtari, 2004) The bio-boom had turned into a disap-pointed discussion with a bitter tang. Similar news continued in the fol-lowing years, as companies that had failed to receive the necessary fund-ing had to close down or sell their operations abroad. The drying up of
the public funding was followed by the pro-longed financial crisis in 2008.
Despite the difficulties of funding and some critical remarks in the press, the overall view towards biotechnology remained positive throughout the turbulent years: According to Eurobarometer (European commission,
2010), Finland was one of the very few European countries where opti-mism towards biotechnology and genetic engineering rose between 2005 and 2010.
The profound public support has been named as one of the strengths of the Finnish biotechnology industry. The drastic and partially unexpected decline of the public funding was, and still is, considered a severe setback for the industry’s development. However, according to the CEOs of bio-technology companies, Tekes is still by far the most influential supporting organization throughout the companies’ life cycles. (Kulvik et al., 2015)
Raiders of Lost Value, ETLA B267.
0,0
0,5
1,0
1,5
2,0
2,5
2007 2008 2009 2010 2011 2012 2013
Figure 2.1The volume of private equity in Europe has plummeted.All private equity funds invested into all industry sectors in Europe.Funds raised per year (bill. eur).
Source: European private equity activity data 2007–2013, EVCA.
Finland
Italy
Figure 2.1 The volume of private equity in Europe has plummeted. All private equity funds invested into all industry sectors in Europe. Funds raised per year (bill. eur).
Source: European private equity activity data 2007–2013, EVCA.
The drastic and partially unexpected decline of the public funding was, and still is, considered a severe setback for
the industry’s development

39
The shortage of funding is not only a Finnish phenomenon. According to the European Venture Capital Association (EVCA), the level of ven-ture financing relative to GDP was halved during 2007–2012, both in ab-solute terms and relative to GDP (Figure 2.1). It must, however, be noted that the drastic decrease is partly due to the very high funding volumes experienced in 2007 and 2008.
Despite the decreasing trend in the available private equity, the Europe-an life sciences6 sector has succeeded in maintaining its relative attrac-tiveness as an investment: According to EVCA, the life sciences sector was the industry attracting the most venture capital in Europe, receiv-ing more than 15% of all available venture capital investments in 2013 (Figure 2.2).
6 Two-thirds of the Finnish biotechnology sector operates in the field of life sciences, if we define life sciences as the molecular, cellular, and functional basis of therapy (see Figure 2.6). The term “life sciences” is used in very many meanings, spanning from health care applications to all fields of science that involve the scientific study of living organisms. Sometimes the terms “biotechnology” and “life sciences” are even used as synonyms. As biotechnology is contributing more and more to life sciences, we assume here that life science investments are the best proxy for investments available also to biotechnology companies out of the four investment categories reported by European Venture Capital Association.
Raiders of Lost Value, ETLA B267.
0
5
10
15
20
25
2007 2008 2009 2010 2011 2012 2013
Figure 2.2Biotechnology has sustained its attractiveness as an investment.Allocation of private equity funding among industry sectors in Europein 2007–2013 in Europe (share of all investments, %).
Source: European private equity activity data 2007–2013, EVCA.
Consumer goods & retail
Life sciences
Business &industrialproducts
Consumer services
Figure 2.2 Biotechnology has sustained its attractiveness as an investment. Allocation of private equity funding among industry sectors in Europe in 2007–2013 (share of all investments, %).
Source: European private equity activity data 2007–2013, EVCA.

40
Biotechnology – petite and steady
Despite the drastic changes in the funding environment, the number of biotechnology companies has remained rather stable during the 2000s. According to Nikulainen et al. (2012), in 2004 there were 111 and in 2010 there were 107 active SMEs in the life sciences sector in Finland. The average annual entry and exit rates during the period were 7% and 8%, respectively. This translates into an average annual turnover rate of roughly 15%. According to our updated data, the annual turnover or re-newal rate between 2002 and 2011 has fluctuated between 9% and 18%. Due to the rising trend in the exit rate and declining trend of the entry rate, the size of the industry in terms of number of companies is in mod-est decline (Figure 2.3).
In comparison to other industries, the renewal rate of the Finnish bio-technology sector is, in fact, surprisingly low: The company turnover rate is in the same league with transportation and traditional indus-try (Figure 2.4). As life sciences is a “science-based, technology-driven, high-risk, bankruptcy- and entry-prone” sector, the low entry and exit rates could also be interpreted as alarming (Nikulainen et al., 2012).
Raiders of Lost Value, ETLA B267.
0
2
4
6
8
10
12
14
2002 2003 2004 2005 2006 2007 2008 2009 2010 2011 2012
Figure 2.3More exits than entries.Shares of entries and exits in the Finnish biotechnology in 2001–2012(% of the company population).
Share of exits
Share of entries
The information is based on the companies’ balance sheets. The coverage of the data for year 2012 might still improve due to data updates.Sources: ETLA, Suomen Asiakastieto Oy.
Linear(Share of
exits)
Linear(Share of entries)
Figure 2.3 More exits than entries. Shares of entries and exits in the Finnish biotechnology in 2001–2012 (% of the company population).
The information is based on the companies’ balance sheets. Coverage of the data for 2012 might still improve due to data updates.Sources: ETLA, Suomen Asiakastieto Oy.

41
In the literature, the current business environment, bad reputation, and lack of funding have been suggested as potential reasons for the low mar-ket entry rate in biotechnology (Nikulainen et al., 2012). However, this is in part counterintuitive to the fact that life sciences [highly overlapping with biotechnology] has been one of the most attractive industries in the European investment markets (Figure 2.2). There seem to be several oth-er features specific to biotechnology that contribute to the comparatively slow renewal rate of the industry.
Firstly, establishment of a biotechnology company requires significant capital. The core of the industry is formed around an expensive and time-consuming combination of accumulated intangible assets and costly in-frastructure. It is also for these reasons that biotechnology companies are often dependent on public funding, especially in their first phases.
In the operating phase the demanding duo of necessary intangible and tangible assets is combined with long development cycles. This brings us to a second point: The process from an idea to cashing in, not to mention ready-to-sell product, is measured in several years, if not decades. In ad-
Raiders of Lost Value, ETLA B267.
Figure 2.4Industrial renewal of biotechnology sector is surprisingly low.Industrial renewal (summarized share of entries and exits) in selected Finnish industries and biotechnology during 2005–2011 in periods of 2.5 years.
Sources: Authors’ calculations, Ministry of Employment and the economy (2012).
0
10
20
30
40
50
60
1/2005–6/2007 1/2006–6/2008 1/2007–6/2009 1/2008–6/2010 1/2009–6/2011
Social, health, education, and personal services
Real estate, administration, and support services
Knowledge-intensive services
Traditional industry (incl. water, environment,and energy maintenance)
Transportation
Biotechnology
Figure 2.4 Industrial renewal of biotechnology sector is surprisingly low. Industrial renewal (summarized share of entries and exits, %) in selected Finnish industries and biotechnology during 2005–2011 in periods of 2.5 years.
The drop-outs and start-ups used for the calculation of industry turnover are defined solely by the data, i.e. has the company reported its fi-nancial statement and employment figures or not? Thus, the number of drop-outs includes companies that have been dissolved, faced bank-ruptcy, or gone into liquidation, but also companies that have been merged into other companies or changed their company ID. In addition, companies that have employed less than 0.5 persons during the financial year or have a turnover of less than €10 595 are not included in the database. For this reason, some very small companies can “disappear” from the data without actually exiting the market – although it can be well argued that these companies are in reality not operating fully.Sources: Authors’ calculations, Ministry of Employment and the Economy (2012).

42
Raiders of Lost Value, ETLA B267.
0
5
10
15
20
1975 1980 1985 1990 1995 2000 2005 2010
Figure 2.5The number of new biotechnology companies decreases.Establishment of new dedicated biotechnology companies by year(no. of companies).
Sources: ETLA, Suomen Asiakastieto Oy.
Figure 2.5 The number of new biotechnology companies decreases. Establishment of new dedicated biotechnology companies by year (no. of companies).
Sources: ETLA, Suomen Asiakastieto Oy.
Raiders of Lost Value, ETLA B267.
27
20
13
8
16
9
5
2
2
32
19
12
7
14
9
3
3
2
Drug development,oncolytic therapies
Diagnostics
Biomaterial
Bioinformatics
Food and feed
Equipment/manufacturing
Enzymes
Environment
Argo-life sciences
2010
2004
Figure 2.6The composition of application areas have remained almost unchanged.Fraction of companies in different life sciences sectors (%).
In 2010 23 companies represented two or more sectors, in line with 16 companies in 2004.Source: Nikulainen et al. (2012).
Figure 2.6 The composition of application areas have remained almost unchanged. Fraction of companies in different life sciences sectors (%).
In 2010, 23 companies represented two or more sectors, in line with 16 companies in 2004.Source: Nikulainen et al. (2012).

43
dition, the road from invention to financial success is not only long but also unsure. It is difficult to build a successful or profitable business over-night. Thus, it can be argued that only the most devoted and talented en-trepreneurs with projects that seem most probable to succeed even give it a try. If true, this high sifting prior to es-tablishing a biotechnology company can also contribute to the comparatively low exit rates.
According to our data, the peak years for es-tablishment of new dedicated biotechnology companies were 2001 and 2006. Both peaks are positioned between the most recent “crashes” – the burst of the dotcom bubble in 2000 and the global financial crisis in 2008. Since the 1990s, the number of new com-panies per year has fluctuated, and the trend line is set at roughly 7 new establishments per year (Figure 2.5).
In addition to the comparatively low entry and exit rates, the composi-tion of the industry has also remained rather unchanged (Figure 2.6). According to Nikulainen et al. (2012), the role of the most populated sec-tor, drug development, diminished during 2004–2010. It is followed by diagnostics and biomaterials, which have retained their positions as the next most populated sectors of Finnish life sciences.
Less companies – more value
Figure 2.7 summarizes the development of the biotechnology sector in terms of the number of companies during the past years. The high vol-umes of newcomers resulted in an increase in the number of companies until the financial crisis in 2008–2009. In the peak year of 2009 there were nearly 140 dedicated biotechnology companies operating in Fin-land – roughly 50% more than in 2001. The slowdown of the new estab-lishments, combined with the accelerated speed of drop-outs, has result-ed in a modest shrinkage of the industry during the past years7. Accord-ing to the information available at the end of 2014,8 the number of active companies has decreased to less than 130 in 2012.
7 Companies that have employed less than 0.5 persons during the financial year or have a turnover of less than €10 595 are not included in the database. For this reason, some very small companies can temporarily “disappear” from the data without actually exit-ing the market.
8 The information is based on the companies’ balance sheets. The coverage of the data for 2012 might still improve due to data updates.
The composition of the industry has also remained rather unchanged

44
Raiders of Lost Value, ETLA B267.
-20
0
20
40
60
80
100
120
140
2001 2002 2003 2004 2005 2006 2007 2008 2009 2010 2011 2012
Figure 2.7Number of Finnish biotechnology companies slowly shrinking.Development of the number of dedicated biotechnology companies.
Sources: ETLA, Suomen Asiakastieto Oy.
Total
Entries
Exits
Figure 2.7 Number of Finnish biotechnology companies slowly shrinking. Development of the number of dedicated biotechnology companies.
Sources: ETLA, Suomen Asiakastieto Oy.
Raiders of Lost Value, ETLA B267.
0
20
40
60
80
100
120
2000 2001 2002 2003 2004 2005 2006 2007 2008 2009 2010 2011 2012
Figure 2.8The value added of biotechnology companies has rocketed.Value added of biotech companies and all Finnish companies in 2000–2012(in year 2012's euros).
Sources: Mika Pajarinen/Etlatieto Oy, Suomen Asiakastieto Oy.
All biotech companies (mill. eur)
All companies (bill. eur)
Figure 2.8 The value added of biotechnology companies has rocketed. Value added of dedicated biotech companies and all Finnish companies in 2000–2012 (in 2012 euros).
Sources: Mika Pajarinen/Etlatieto Oy, Suomen Asiakastieto Oy.

45
In terms of value added, the Finnish biotechnology sector has been able to grow almost throughout the past decade, despite the recent decrease in the number of companies and difficulties in funding. In fact, the bi-otechnology sector seems to have survived the recent recession better than the Finnish company population on average. Between the years 2000 and 2012, the value added by the Finnish bi-otechnology industry has grown more than 570%. Despite the low starting level, this is a huge leap, especially when con-sidering the difficulties in funding and general economic situation (Figure 2.8). While the data on the compara-tively slow renewal rate (Figure 2.4) raised questions about the viability and attractiveness of the industry, the positive development of the value added relieves this anxiety; the statistics provide proof for the critical reader that the industry is viable – despite the modest renewal rate and thereby deprivation of “creative destruction”.
A closer look at the exits
In a typical industry review, survivors are the subjects of interest: Why did they survive and how? When an industry is built on knowledge and intangible assets, it is at least as interesting to take a look at those that exited. Why did companies exit and how? And, in particular, what hap-pened to the intangible assets of these companies?
In a recent study focusing on the former Tekes clients (i.e. those receiv-ing public innovation funding), the most dominant reason for a compa-ny’s exit among micro companies was bankruptcy or insolvency (66% of the companies), followed by merger (28%). As the company size grows, the reasons for exits change; among larger companies the exits were mostly due to mergers (Figure 2.9) (Tempo Economics, 2014).
Of the company population used in our analysis more than 60% are mi-cro enterprises. Similarly, the “entries” or start-ups also entail established units that have been provided with a new company ID as a result of or-ganizational arrangements.
In order to shed more light on the development of the industry, we have studied a subsection of companies established in 2000–2001 more close-ly. Of the 25 dedicated biotechnology companies established in 2000–2001, 17 were micro companies (employed less than 10 persons) and
In terms of value added, the Finnish biotechnology sector has been able to grow almost throughout the past decade

46
Raiders of Lost Value, ETLA B267.
65,9
28,3
5,8
39,6
53,5
6,8
21,9
67,1
11,0
49,2
44,1
6,7
Bankruptcy or insolvency Merger Other exit
Micro (<10)
Small (10-99)
Medium (100-250)
All
Figure 2.9Main reasons for exits are different for small andmedium sized companies.Reasons for exits among Tekes customers by company size (%).
Source: Tempo Economics (2014).
Figure 2.9 Main reasons for exits are different for small and medium sized companies. Reasons for exits among Tekes customers by company size (%).
Source: Tempo Economics (2014).
Raiders of Lost Value, ETLA B267.
17
3
8
6
16
0
5
10
15
20
25
2001 2002 2003 2004 2005 2006 2007 2008 2009 2010 2011 2012
Micros SMEs Exits
Figure 2.10More than 60 % of companies from early 2000 have exited.Development of dedicated biotechnology companies established in 2000–2001.
Sources: ETLA, Suomen Asiakastieto Oy.
Figure 2.10 More than 60% of companies from early 2000 have exited. Development of dedicated biotechnology companies established in 2000–2001 (No. of companies).
Sources: ETLA, Suomen Asiakastieto Oy.

47
the rest were SMEs. Out of the population of 25 companies, only 9 were still operating in 20129 (Figure 2.10). Of the 17 micro-sized companies established in 2000–2001, 12 exited, 2 grew into SMEs, and 3 continued operations as micro-sized businesses in 2012 (Figure 2.11).
When looking at the statistics for the subsection of biotechnology com-panies established in 2000–2001, two observations stick out (Figure 2.12). Firstly, in terms of number of employees, the ones about to exit are smaller; the “survivors” still operating in 2012 are already in the first year of the observation period nearly two times larger than those about to ex-it. This difference in sizes might result not only from success reflected in the higher number of employees, but also from the fact that some of the companies established in 2000–2001 are not genuine start-ups but new units formed due to companies’ organizational arrangements. Secondly, the “survivors” grow almost throughout the observation period. The av-erage size of the “survivors” grew from ca. 20 (in 2001) to nearly 34 em-ployees in 11 years. While during the first couple of years both company
9 These companies had returned their balance sheet for 2012. Companies that are very small (employ less than 0.5 persons) might be invisible in the data and therefore falsely interpreted as exits.
Raiders of Lost Value, ETLA B267.
17
3
2
12
0
2
4
6
8
10
12
14
16
18
2001 2002 2003 2004 2005 2006 2007 2008 2009 2010 2011 2012
Micros SMEs Exits
Figure 2.11The first decade is ruthless for the micro-sized biotechnology companies – less than one third still operating after 11 years.Development of dedicated micro-sized biotechnology companies establishedin 2000–2001.
Sources: ETLA, Suomen Asiakastieto Oy.
Figure 2.11 The first decade is ruthless for the micro-sized biotechnology companies – less than one third still operating after 11 years. Development of dedicated micro-sized biotechnology companies established in 2000–2001 (No. of companies).
Sources: ETLA, Suomen Asiakastieto Oy.

48
groups grow almost hand in hand, the beginning of the financial crisis in 2008 seems to be a watershed: The employment of the exiting companies plummets, while the “survivors” keep on growing.
The crude comparison of employment does not shed light on the “after-life” of these companies – or their intangible assets. According to Kulvik et al. (2013), “failed” companies also create value. This value is, however, often left on the table at the time of the insolvency or unforeseen sale of the company. This underpricing or overlooking of intellectual capital can indeed be described as a failure, not only from the company’s but also from the national perspective. Based on real-life company cases, the re-searchers conclude that the intangible assets created in the “failed com-panies” are often recyclable and sustainable. As a result, it is suggested that if possible these assets that are invisible in the traditional balance sheets should be restructured into a second-generation company in or-der to profitably “recycle” the accumulated intangible assets. This idea of recycling is also supported by Agarwal and Hoetker (2007), who argue that if companies are dissolved without a “second round”, the measurable but unidentified intangible assets are easily lost.
Raiders of Lost Value, ETLA B267.
0
5
10
15
20
25
30
35
2003 2004 2005 2006 2007 2008 2009 2010 2011 2012
Figure 2.12The ”survivors” of the biotechnology sector are larger interms of employees.Development of employment in companies that exited before year 2012 and those that still operated in 2012. Subsection of dedicated biotechnology companies established in 2000–2001.
Source: Authors’ calculations.
Companies that exited (n=16)
Companies that did not exit (n=10)
Figure 2.12 The “survivors” of the biotechnlogy sector are larger in terms of employees. Development of employment in companies that exited before 2012 and those that still operated in 2012. Subsection of the dedicated biotechnology companies established in 2000–2001.
Source: Authors’ calculations.

49
Excellence in research as the driving force of Finnish biotechnology
The availability of highly skilled professionals in the life sciences sec-tor is good. In fact, it is so good that Finland has been described as the “banana state for experts in Europe”; the supply of experts is almost ex-cessive. Although the supply of professionals constrains wage increase, the high quality of research attracts top-skilled professionals to stay in the country. However, it has been argued that the domestic biotechnol-ogy industry has not been able to utilize fully the comparatively dense networks of the small country: Year after year, small companies strug-gle with the same obstacles on their own. For example, the difficulties of reaching international markets could be eased with collective actions (Kulvik et al., 2015).
Biotechnology and especially life science related research in Finland is top quality when measured by the number of medical publications and number of citations per paper (Piispanen, 2011). This strong research background, combined with wide public support, forms the basis of the Finnish biotechnology industry. The knowledge and skills of the employ-ees are condensed into intangible capital, such as research publications, networks, patents and other forms of IPRs, and finally into sellable prod-ucts or services. The valuation, recycling, and utilization of this intellec-tual capital must not be overlooked when evaluating the success of the Finnish biotechnology sector.

50
References
Academy of Finland (2002): Biotechnology in Finland. Impact of public research funding and strategies for the future. Evaluation report. Publications of the Academy of Finland 11/2002.
Agarwal, R. and Hoetker, G. (2007): A faustian bargain? The growth of management and its relationship with related disciplines. Academy of Management Journal, 50(6), 1304-1322.
European commission (2010): Europeans and Biotechnology in 2010. Winds of change? Eurobarometer 2010.
Halme, K. (1994): Uudet yritykset biotekniikkasektorilla 1994. Working Papers, No 11/94, VTT, Espoo.
Holtari, S. (2004): Himot ja rypyt pelastavat biobisneksen. Taloussanomat 25.11.2004. Retrieved 1.3.2015. http://www.talouselama.fi/uutiset/himot+ja+rypyt+pelastavat+ biobisneksen/a2048511.
Hyvönen, V. (2004): Sitra hakee bio-omistukselleen kumppaneita ja lisää pääomia. Turun Sanomat 29.6.2004. Retrieved 1.3.2015. http://www.ts.fi/uutiset/talous/1073976264/ Sitra+hakee+bioomistukselleen+kumppaneita+ja+lisaa+paaomia.
Itkonen, R. (2006): Tekes miettii bioalan sijoituksiaan. Helsingin sanomat 5.8.2006. Retrieved 1.3.2015. http://www.hs.fi/paivanlehti/arkisto/Tekes+miettii+bioalan+ sijoituksiaan/aaHS20060805SI3TA01ebo.
Kulvik, M., Nikulainen, T., Peltonen, I. and Tahvanainen, A. (2015, forthcoming): Standpoints on strategies and future prospects of the Finnish biotechnology industry – compiled data from 72 company leader interviews. Research Project Report, Etlatieto Oy 2012.
Kulvik, M., Tähtinen, M. and Ylä-Anttila, P. (2013): Business and intellectual capital development in financial riptide: Case studies of Finnish biotechnology and pharmaceutical companies dispersing into global value chains. Etlatieto Oy 2013.
Luonnontieteiden Akateemisten Liitto (2014): OSUMA – oikea määrä oikeita ammattilaisia -hankkeen tilastopaketti 2014. Retrieved 1.3.2015. http://www.luonnontieteilijat.fi/filebank/2947-OSUMA_tilastopaketti_2014.pptx
Mikkonen (2004). Biolinnan Roope-Setä. Talouselämä 29.03.2004. Retrieved 1.3.2015. http://www.talouselama.fi/tyoelama/biolinnan+roopeseta/a2051244
Nikulainen, T., Tahvanainen, A. and Kulvik, M. (2012): Expectations, Reality and Performance in the Finnish Biotechnology Business. ETLA Discussion Paper 1286. 19 September 2012.
OECD (2015): http://www.oecd.org/sti/biotech/statisticaldefinitionofbiotechnology.htm. Retrieved 1.3.2015.
Piispanen, T. (2011): Suomen bioala 2010-2011.Health Bio Annual Seminar in Turku 13.9.2011. Retrieved 20.11.2012: http://www.healthbio.fi/healthbio.asp?viewID= 320&newsID=1288.
Tempo Economics (2014): Aineettoman pääoman siirtyminen Tekesin päättyneissä asiakasyrityksissä. Tutkimustiivistelmä 22.10.2014.
Unifi (2011): Luonnontieteellisen koulutusalan työryhmän loppuraportti 2011. Yliopistojen yhteinen koordinaatiohanke humanistisen, kasvatustieteellisen, luonnontieteellisen ja yhteiskuntatieteellisen koulutusalan rakenteelliseksi kehittämiseksi. Suomen Yliopistot ry – Finlands Universitet rf 2011.

51
Chapter 3
Cases of Finnish Biotechnology
Failure marks the ultimate end in a company’s life cycle. That’s the common perception. When a company runs aground and is forced to liquidate, the reac-tions of the stakeholders involved often reflect absolute finality; investors write off their respective stakes as unsalvageable, employees fear for their livelihood, and the founders are too often stigmatized for failing.
But is all truly gone? Is there nothing of value a company leaves behind? Sure, many times patents live on, but what happens to the skills, best practices, pro-totypes, and results achieved? This chapter addresses these questions by explor-ing the fate of intellectual capital in the afterlife of eight out of our sample of 18 failed biotechnology companies.
The findings suggest that valuable intellectual capital does indeed survive or-ganizational death. Often, companies that suffered from the unavailability of funding have sold their rights to well-endowed foreign companies, which have succeeded in taking the technologies to market. In other cases the entrepreneurs have recycled salvaged intellectual capital in new start-ups. At the very least, acquired skills and developed practices have been transferred to other compa-nies as employees have pursued new career opportunities.
In the end, very few original ideas go to the grave with a company. Many of the ideas presented here are still very much alive in one form or the other.
Additional material is available at this book’s homepages: www.etla.fi/raiders

52
Raiders’ basic guidelines – definitions of the essentials
Definition of a ”failed” company
We defined a “failed” company as fulfilling one or more of the following crite-ria: Imminent threat or realization of liquidation or bankruptcy, significant layoffs, forced sale of company [clearly against founders’ original strategy], or plunging sales.
Choosing case companies
Using the above described criteria for failure we went through all dedicated Finn-ish biotechnology companies in our compiled list. We identified all companies that might fulfill our criteria for failure, and divided them into four categories: 1. Clearly fulfilling our criteria for failure, 2. Most likely fulfilling the criteria but need verification from further data, 3. Unsure, requires further data and reassessment, 4. Not fulfilling our criteria of failure or sufficient data not available. Six cases were familiar to us from earlier, and they have been reported in Kulvik et al. (2013).
In the final step we started to cold call in random order leaders of companies in category 1, and in category 2 if further data had repositioned the company into category 1. Six cases As virtually all contacted persons agreed on an interview, the entire sample was collected from category 1.
Definition of biotechnology
The application of science and technology to living organisms, as well as parts, products and models thereof, to alter living or non-living materials for the pro-duction of knowledge, goods and services (OECD, 2015).
Definition of a dedicated biotechnology company
We used OECD’s definition of biotechnology for defining a biotechnology com-pany. As dedicated biotechnology companies we have identified companies, whose business is mostly or solely based on biotechnology.
Compiling the list of biotechnology companies
For the final listing of dedicated biotechnology companies we have first collected all companies that have been associated with biotechnology, based on listings of national interest groups, public funding institutions, VC funders, interviewees, and our own data banks. Each company in this comprehensive data set has been thoroughly analyzed by the authors, using their expertise and insights into the Finnish biotechnology sector. From the original list of 400 companies we sifted all companies that could be described as dedicated biotechnology companies. We drafted our first list of Finnish dedicated biotechnology companies in 2004, and it has been updated several times since; the latest update was conducted in the beginning of 2015.

53
Case: Carbion Oy
Chapter 3Carbion
Prosecarb Oy Carbion Oy
2000
Contral PharmaOyj
2001
Biotie TherapiesOy
BioTieTherapies Oyj
Glykos Oy
Tenboron Oy
2010
$
2002
2004
IPO
0
10
20
30
40
50
60
70
80
2000 2001 2002 2003 2004 2005 2006 2007 2008 2009 2010 2011 2012
Sources: ETLA, Suomen Asiakastieto Oy.
Chapter 3Carbion
BioTie Therapies Oyj
Carbion Oy Glykos Finland Oy
Source: Suomen Asiakastieto Oy.
Personnel in Finland
• Existence as a Finnish-owned private company: 1999–2002
• Location: Helsinki
• Total employment effect: ~50 man-years
• Cumulative sales: €18,000
• Total funding received: ~8 million euros
• Main sources of funding: Contral Pharma and Tekes
• Core competence: Glycobiology
• Note: The work of Carbion was continued in BioTie Therapies Oyj, Glykos Finland Oy, and Tenboron Oy
STORY IN A NUTSHELL

54
The story in brief
Carbion was a small spin-off company operating in Viikki Science Park in Helsinki; the original name, ProseCarb Oy, was later changed to Car-bion Oy.
Carbion’s story is relatively short, as the company existed for only a cou-ple of years. However, during those years, Carbion created a significant amount of intellectual capital that is still utilized by the Finnish biotech-nology sector.
Analytical platform for sugar structures foundation for business
The company was founded in 1999 by a group of enthusiastic research-ers at Helsinki University who had several years of experience in sugar research and analytical methods of carbohydrate structures using mass spectrophotometry and nuclear magnetic resonance (NMR). The com-plex carbohydrate structures present in human cells play an important role in a variety of biological events and disorders (e.g., infection, in-flammation, fertilization, embryonic development, cancer, and metas-tasis).
Carbion developed a glycobiology-based high-throughput technology platform for the analytics of sugar structures. In addition, the compa-ny invented multivalency technology, which significantly increased the number of various bioactive carbohydrates binding to a carrier mole-cule, thereby decreasing the needed dose in a potential carbohydrate drug. Furthermore, Carbion developed methods to produce carbohy-drate libraries for research purposes (BioTie Therapies Stock exchange release 7.6.2002).
Drug development as a contingency plan
In addition to various technologies, Carbion developed drugs for bac-terial or viral infections, particularly for the eradication of Helicobacter pylori and the prevention of Influenza infection. An important research topic was the binding of viruses and bacteria to cell membrane struc-tures. Furthermore, given that the sugar structures of cancer cells and corresponding normal cells differ from one another, the company devel-oped cancer diagnostics and cancer drugs based on carbohydrate moie-ties. Carbion’s knowledge base was unique, and only a few companies in the world operated in this sector.

55
Aggressive patenting strategy staked targeted markets
Carbion had an aggressive patenting policy to protect the developed car-bohydrate applications not only for drug and diagnostic use, but also for food-related innovations. Within a few years, Carbion filed eight patent applications, some of which have recently grown into patent families. All patents are currently owned by Glykos Finland Oy.
Reliance on external network for other business functions enabled internal focus on R&D
Carbion’s employers focused on research and development while obtain-ing expertise in administration, finance, legal issues, quality assurance, HRM, and clinical trials from its close collaborator and subsequent own-er, Contral Pharma. The maximum number of employees in the compa-ny was approximately 20 from 2002 to 2003, and 60% of them were at the doctorate level. Carbion also entered into numerous collaborations with various Finnish, Swedish, and Dutch research groups, VTT, and central hospitals. These collaborations were primarily research based, and the company found collaborators through university networks and from sci-entific conferences.
New majority owner boost to growth
As mentioned, Carbion Oy was founded in 1999, but during its early years the company largely focused on securing funding. Venture capital-ists were interested in seeking consolidation in sugar research; therefore, various funding scenarios were considered. Carbion’s actual operations began in January 2001, when Contral Pharma became the largest owner of Carbion, with 50.1 % of the shares. Contral Pharma brought needed capital to the company in the form of newly issued shares. In addition, the fusion brought knowledge in both drug and business development to Carbion because Contral Pharma, which began operations in 1997, had conducted clinical trials and had experience with the US Food and Drug Administration (FDA) approvals. Carbion’s contribution was that it brought novel products to the pipeline of Contral Pharma, which had previously focused on the development of its leading product, nalme-fene, an opioid receptor antagonist used to manage alcohol dependence and impulse control disorders (ICDs).
Carbion’s original business idea was to develop experimental drugs, un-dertake the clinical trials itself through Phase II, and then outsource

56
the investigational new drugs to Big Pharma. The costs of these actions were to be covered by contract research services and by the revenues that would be obtained when Contral Pharma’s leading product was licensed.
Yet another merger ended company’s independent status
Although there was a clear market need for carbohydrate research ser-vices, especially abroad, it soon became evident that investors did not want the company to allocate resources to a service business. Therefore, the idea of contract research was suspended, and the company’s only rev-enues of 18,000 euros were received in 2001 from analytical services. No products entered the market during Carbion’s existence.
The research projects proceeded well, but financial problems forced the company into novel arrangements. In October 2002, after Contral Phar-ma was able to raise 15 million euros through a share issue directed to-ward institutional investors, a further merger with Biotie Therapies oc-curred. The new listed company changed its name to BioTie Therapies Oyj (BioTie Therapies’ annual report, 2002). The purpose of the merger was to create a strong and balanced product portfolio, save costs, mini-mize risks, and achieve synergy from shared knowledge and production facilities. At the end of 2002, the novel company had 112 employees, a head office in Turku and subsidiaries in Helsinki and Espoo.
After the merger, Carbion’s representation among the leaders of the new company was limited, as none of Carbion’s management team was se-lected to the new management team or to the board of BioTie Therapies Oyj. Carbion’s former CEO, Dr. Juhani Saarinen, became a unit leader in the new company. Only one Carbion board member, Mr. Erkki Ten-hunen (who was also one of the founders of Contral Pharma), became a director and member of the management team of BioTie Therapies Oyj. However, he served in this position for only one year (BioTie Therapies’ annual report, 2002 and 2003).
Glycobiology remained an important area of focus in the new compa-ny’s strategy, with the lead molecules of this sector being bioheparin and modified polysaccharides as VAP-1/SSAO enzyme inhibitors. These in-novations originated from BioTie10. The Viikki unit continued research on cancer-specific sugar structures and on the use of multivalency tech-nology in carbohydrate-based drug development.
10 BioTie Therapies’ annual report, 2002.

57
In 2003, reorganizations throughout the company and prioritization of activities decreased the number of personnel to 55, and less than one-third of the personnel worked at Viikki11. In January 2004, BioTie Ther-apies decided to centralize its operations at Turku, provided notice to 14 employees in Helsinki, and closed the Viikki subsidiary in which Car-bion had operated12.
Carbion’s legacy to the Finnish biotechnology industry
Successful revival as new company under new name
All fixed assets, including equipment and reagents, were transferred to Turku; however, given the terms of the rental agreement, BioTie was re-quired to pay the rent of the Viikki unit until the end of 2004, although there were no longer any activities at the facilities. The previous Carbion staff never moved to Turku; rather, in March 2004, the founders of Car-bion established Glykos Oy, a company specializing in carbohydrate re-search that is still operational.
The carbohydrate-related intellectual capital that was originally devel-oped at Helsinki University and extended at Carbion Oy has increased over the years, and it currently enriches the Finnish biotechnology sec-tor in Glykos Oy. This company has experienced positive results from the beginning, and revenues almost exceeded 300,000 euros during the year of its establishment. Income has since steadily increased, and was more than 6 million euros in 2011. Income is expected to have increased further in 2012.
Customers of Glykos Oy consist of the leading pharmaceutical and food companies operating globally; approximately 5% of sales are derived from service businesses, and the remainder result from milestones, roy-alties, and FTE payments of research collaboration projects13.
The company uses state-of-the-art technologies for cancer, stem cell, and influenza research; for glycosylation of drug proteins; and for develop-ing bioactive food and feed substances. The company has approximately 50 employees and a patent portfolio of more than 40 patents or patent
11 BioTie Therapies’ annual report, 2003.
12 Ibid.
13 See Kulvik et al., 2013.

58
applications. Interestingly, the core team originating from the university has remained together throughout the years, which has been crucial for the preservation of the company’s intellectual capital.
Lessons learned
Carbion Oy is an example of a company that disappeared from the trade register, but its work has remained alive.
There were several reasons for the disappearance of this company, the most important of which were the global problems in life science fund-ing that led to the merger of the three companies in 2002. This merger was unsuccessful from the perspective of Carbion, as it created a situa-tion in which the research focus of the new company was in another di-rection, the lead molecules invented in old BioTie were prioritized, and there were inadequate resources to continue all of the pre-existing pro-jects of the three companies.
One may argue that because Carbion was not represented in the man-agement of the new company, the importance and possibilities of glyco-biology were not brought out clearly enough, and this lack of importance led to decisions made during 2002–2004 that favoured the Turku unit and its research. Further development of the Viikki unit and investments in research phase innovations were not in the interest of a listed compa-ny: The aim was to increase the short-term value of shares and bring the first product to market14.
One of Carbion’s weaknesses was the lack of attempts to commercialize its knowledge: The company was fixed to the general idea that the suit-able time for out-licensing was after Phase II; thus, the company did not contact possible customers and begin the marketing process at a suffi-ciently early point. It was also difficult to implement a customer-orient-ed business strategy in a university spin-off company in which most of the workers were purely scientists with no business background. Carbi-on could have focused more intensively on the development of products rather than conducting research.
Carbion did not have experience in communicating with investors, and because its knowledge was unique, investors may have lacked the com-
14 Subsequently, the lead product nalmefene was also suspended for a period of time but was ultimately licensed to Lundbeck (Denmark). The product was approved in Europe in Feb 2013 for the reduction of alcohol consumption in adult patients with alcohol de-pendence.

59
petence to evaluate and understand the potential of novel carbohydrate chemistry. Therefore, financial rounds were challenging, and the reluc-tance of investors to enter a service business further decreased the pos-sibility that Carbion would generate revenues and thereby remain an in-dependent private company.
The work of Carbion is now being continued at Glykos. However, if Carbion had continued uninterrupted, then the company could have reached an even more significant global position in the carbohydrate chemistry sector. During the slowdown that lasted for some years, other companies benefitted from a competitive advantage. Despite these draw-backs, Carbion, and later Glykos, showed that bioactive sugars have great potential and a variety of useful applications.
The know-how of Carbion and its successor Glykos is taking a further step in Tenboron Ltd, a company developing novel carrier molecules for treatments of cancer using boron neutron capture therapy (BNCT)15,16. The development is at present (March 2015) in the preclinical trials phase.
15 http://icnct16.org/
16 http://icnct16.org/wp-content/uploads/2013/09/ICNCT-16_Helsinki-2014_www3.pdf

60
References
BioTie Annual Reports 2002–2005.
Kulvik, M., Nikulainen, T., Peltonen, I. and Tahvanainen, A. (2013): Standpoints on strategies and future prospects of the Finnish biotechnology industry – compiled data from 72 company leader interviews. Etlatieto Oy.

61
Case: CNServices Oy
Source: Suomen Asiakastieto Oy.
Personnel in Finland
• Existence as a Finnish-owned private company: 2001–2011
• Total employment effect: ~3–4 man-years
• Cumulative sales: ~1,5 million euros
• Total funding received: ~200,000 euros
• Main sources of funding: Tekes, Finnvera, Founders
• Core competence: CRO (Contract Research Organization)
STORY IN A NUTSHELL
Chapter 3CNServies Oy
CNServices Oy
20022012
0
1
2
3
4
5
2003 2004 2005 2006 2007 2008 2009 2010
Sources: ETLA, Suomen Asiakastieto Oy.
Chapter 3CNServices Oy

62
The story in brief
University spin-off with a market niche
CNServices was a preclinical contract research company founded by sev-eral university professors and docents to provide research-based services to pharmaceutical and biotechnology companies. There were three main reasons to found a company. First, there was extensive know-how on central nervous system (CNS) related diseases and animal and cell cul-ture testing models at the university. Second, Tekes’ policy was that most university projects received funding only if they got support also from interested companies. Founding a company that could serve as a back-ground and potential commercialization partner for academic research seemed logical. Third, universities had adopted a policy with overhead charges taken from all services delivered to customers outside the uni-versity. The overhead charge had gradually increased, and it became ra-tional to avoid such overheads by offer the same services through a com-pany instead of the university.
CNServices launched its operations in 2001 with good prospects. The founders participated actively in the company development. As they all had strong academic background and no business knowledge, they kept their university posts and worked for the company only during special projects. The company hired an outside CEO having business but not pharmaceutical experience. One major reason for the decision was that the support grant from Tekes included CEO’s first year salary. CEO’s lack of substance lead, however, to problems, and the CEO was later substi-tuted by one of the founders.
Something old, something new, something borrowed...
CNServices was in a sense a virtual company, since – except for the CEO – it did not have permanent employees; workers were hired only when need-ed for company’s projects. In addition to the founders, CNServices em-ployed university scientists and students, who gained important work ex-perience at the company. However, turnover of personnel was high, as stu-dents often changed between projects. The maximal number of employees was 5–10, with 3–4 persons being the average for one single project.
CNServices had an office, but all laboratories, animal facilities as well as equipments were rented from the university. The company owned some minor devices.

63
CNServices offered preclinical testing services for pharmaceutical com-panies developing potential drug compounds for central nervous system (CNS) related diseases, such as Alzheimer’s disease, cerebral blood cir-culation disorders and epilepsy. CNServices helped these companies to validate and screen new compounds efficiently.
CNServices offered efficacy and safety tests which included pathophys-iological and histological analysis, imaging and behavioural tests for animals, and cell-culture based methods. The company used common methods widely used by scientists worldwide; CNServices did not itself possess patents. CNService may have had some trade secrets, but their importance was rather limited. Consequently, the company’s most im-portant intellectual property was its name, the brand.
Tapping on strong human and relational capital yielded a running start
The company’s key resources were its seven founders, the academic pro-fessors and scientist who had interdisciplinary knowledge on various CNS diseases. The founders were specialists in cerebral blood circula-tion, Alzheimer, epilepsy, electrophysiology, pathology, histology etc.
Development of CNService’s sales began positively, and the annual turn-over increased to 300–400 k€ within a couple of years. Customers were mainly big international pharmaceutical companies, and occasionally also a few Finnish enterprises needed preclinical testing services. The company’s businesses started and continued well up to peak years in 2006 and 2007. Income totaled approximately 1.5 M€.
The company did not invest in marketing: their main marketing chan-nels were their homepage and academic congresses, where the founders anyway participated as researchers. Marketing was mostly based on their good reputation as scientists, and on their existing networks.
Good as it is
CNServices was a company focusing purely on contract research; it had no R&D of its own. The company used well-known, reliable methods and did not create new ones. It did not identify any need to put spe-cial emphasis on business development, HR, improvement of regulatory know-how or company culture. The company tried to operate in a GLP-compliant manner, but no routine procedures could be applied to pro-jects where each one was different from the previous one. Therefore, the company was never accredited.

64
CNServices cooperated with its customers and with the local university. The latter is obvious, as the founders worked at the university, the com-pany employed students from the university, and it leased university’s facilities. In 2006, the company also developed a partnership with an Austrian CRO company. The partnership was mainly sales collaboration, and the relationship never advanced to a merger even though that was proposed. Outside these partners, the cooperation was limited. CNSer-vices was rather self-sufficient as it felt it didn’t need any particular R&D partners, or suppliers outside the university.
Investors were not that interested despite increasing turnover
The company received only minor support from Tekes and a small loan from Finnvera. Investors were not interested in this kind of service busi-ness where no own products were developed.
In 2009–2010, a small medical imaging company operating in Helsinki bought around 10–20 % of the company’s shares; the idea was to deepen the collaboration further. However, the buying company soon got into financial problems and the collaboration never realized.
After initial success the Business model kicked back
The company’s businesses began to deteriorate after the peak years in 2006 and 2007. There is no single explanation to this phenomenon that finally led to closing down.
CNServices’ expertise was on central nervous system and methods to investigate it; knowledge and research models for other diseases were lacking and as such, the business potential of the company turned out to be limited.
Another problem aroused from CNServices’ very key resource, the uni-versity. The company had no premises, equipment or animals of its own. The risk in total dependency on main “supplier” realized as the new Uni-versities Act (2010) changed the organization of universities in Finland; universities changed their financing and administrative practices mak-ing private contract research on university facilities more problematic.
Tekes changed its principles, and the professors who owned the com-pany were not able to participate in Tekes’ projects at the university if CNServices also was participating in that particular project.

65
Shrinking markets and increasing competition complicated the situation further
After the economic crisis in 2008, the global pharmaceutical industry decreased its outsourcing, leading to a decline in the need for services provided by CNServices. Big Pharmas experienced disappointments in the outcomes of CNS compounds that CNServices was specialized in. In addition, there was more competition for each project as a new CRO op-erating in the very same field had been founded in the same city where CNServices had had its main operations. The new company had a totally different strategy: own facilities, fulltime employees, variable operations, and VC backed funding. This company was run in a professional way and many customers started to outsource their projects to this competi-tor. This company was later sold to a big international CRO, and it is still operating in Finland.
Finally, founders’ interest began to fade and they no longer searched ac-tively projects for the company. All the issues above led to financial prob-lems for CNServices. The company tried to find a partner and external funding, but did not succeed.
An uncomplicated shutdown
The company was officially closed down because of financial difficulties in 2011. The closing process was quite simple, since the company had operated almost virtually, with only a few own pieces of equipment, and without any fulltime employees. Even the founders were working at the university simultaneously, and the fulltime CEO had been dismissed af-ter the first year. Since the company did not own any intellectual prop-erty, there were no intangible assets to sell.
CNServices’ legacy to the Finnish biotechnology industry
CNServices was a quite unique company among its Finnish peers, since it operated virtually without any permanent facilities or employees. This was possible as its founders had the knowledge needed in the CNS re-lated research, and the university environment was more flexible at that time. Another issue that separates CNServices from other Finnish bi-otechnology companies is that the founders did not have any specific technology that they wanted to commercialize.

66
The company was established to transfer some of the research from the university into services. In essence the transfer was done because the university was taking too large proportion of the funding to cover ad-ministration costs. Founders were never totally committed to the com-pany as they continued their other jobs at the university. Some of the founders may also have transferred their research projects to the com-pany only after not being able to do more research at the university on that project, or the projects were not academically interesting enough.
In the shining light of hindsight
CNServices is an example of how Finnish academic know-how, which is held in esteem not only in academia but also in global pharmaceuti-cal industry, can be used to create income as a service. As such, it could encourage other specialists to offer their expertise more energetically.
However, the university dependent business model would not work in today’s world, and the original motifs for funding a company were not necessarily that business-driven. Maybe these two issues together were a major explanation for the end result, as they also were the major dif-ferences between CNServices and the local, more successful competitor.
About recycling
The story of CNServices spanned for a decade, but the company was never really able to establish a permanent status. CNServices is quite dif-ferent compared to other companies in this study with respect to intel-lectual capital.
A virtual company has often little structural capital
Because CnServices was a research organization and it operated virtu-ally, both the generation and the recycling of the structural capital were rather limited. The company did not have anything patentable and, ac-tually, patents are quite difficult to generate in CNService’s industry. The company did not own trademarks, and the only form of structural capi-tal was certain trade secrets related to its working methods. Specific cor-porate culture is difficult to identify since each project was a different kind, founders were not very committed to the company, personnel var-ied and joined the company for short periods only, and there were no company premises where such a culture could be developed. Finally, the

67
company’s values were undefined and even though the company oper-ated in the service sector, focussed customer orientation seemed to be lacking.
Excelling in human capital
However, the company was relatively active in creating human capital. Its employees were mostly students, and they were needed only for a short time period at a time and hence employee turnover was high. The com-pany had to teach the actual research procedures to all new employees, who gained practical experience in their own field and who then later used the accumulated knowhow in their careers. Some of these tem-porary employees are now working in the pharmaceutical sector; they are maybe the biggest gainers, when considering recycling of the hu-man capital.
Also university scientists working for the company every now and then got a glimpse of business environment and the regulatory requirements of commercial research.
The founders developed their human capital also within the company, learning probably more about business than about the technology and research. To our knowledge, the re-use of this knowledge has been lim-ited a few of the founders, who serve as advisers in other companies.
Strong relational capital turning into an unforeseen weakness
CNServices had much relational capital already at the start - an academ-ic network and pharmaceutical contacts on which the business was built. However, the company’s restricted resources constrained creation of fur-ther networks, and the existing network did not advance or proceed to a less academic direction because the company was managed in a slightly amateurish way.
At the end, most of the relational capital was lost. Customers chose an-other, more professional company. Moreover, the key relational capital i.e. contacts to academy became problematic, as e.g. in the later stag-es CNServices could not participate in any project in which one of the founders as a university professor was the main claimant.
There is no direct descendant to the company. The founders have either retired or continued their work in the academia.

68

69
Case: CTT Cancer Targeting Technologies Oy
• Existence as a Finnish-owned private company: 2001–2008
• Location: Helsinki
• Total employment effect: ~40 man-years
• Cumulative sales: ~€0,2 million
• Total funding received: ~10 million euros
• Main sources of funding: Sitra, Varma, Tekes and Licentia
• Core competence: Peptide and nanoparticle-based drug carriers and imaging agents
• Note: Company merged with Karyon in 2006
STORY IN A NUTSHELL
Chapter 3CTT-Karyon
CTT Oy
2001
CTT-Karyon Oy2006
Isogenica (UK)
2007
2008
Karyon Oy KC-Holding 3 Oy
IPR
$
0
4
8
12
16
2002 2003 2004 2005 2006
Sources: ETLA, Suomen Asiakastieto Oy.
Chapter 3CTT-Karyon
CTT Cancer TargetingTechnologies Oy
Karyon Oy
Source: Suomen Asiakastieto Oy.
Personnel in Finland

70
The story in brief
Beginnings as much heralded start-up
CTT Cancer Targeting Technologies (CTT) was founded by academic researchers to commercialize the work done at the University of Hel-sinki. The founding researchers’ results describing a novel, potential an-ticancer therapy had been published a few years earlier in Nature Bio-technology (Koivunen et al., 1999), one of the most respected publica-tions in the field. In 2001, the team won first prize in the Finnish Venture Cup contest and was in second place at the Munich Entrepreneurship Competition European Workshop. This success provided them the capi-tal and especially the reputation needed to establish the company. In ad-dition to the prize, they received additional funding from investors, such as Sitra and Tekes, and began aggressively to develop their own prod-ucts. In 2005, the company received an honourable mention as one of the most successful start-up companies rewarded in Venture Cup dur-ing 2000–2004.
Fight against cancer
CTT Cancer Targeting Technologies was a biopharmaceutical company focusing on oncology and inflammatory diseases. The company utilized two core technologies: phage display technology for identifying bioac-tive peptides, and peptide-liposome technology for developing targeting therapeutics. The idea behind research was to design and develop pep-tides, which recognize specific proteins present particularly in cancer cells. These peptides could then be used to carry an anti-neoplastic drug to a cancerous tumour. Due to this specific targeting of malign tissue, the adverse effects towards healthy tissues – often related to anticancer drugs – could be minimized, and the dose of drug in tumour maximized.
CTT developed several peptide-based carriers, some of them intended also for inflammatory diseases. In addition, the company was develop-ing different applications for these carriers, such as using the peptides to carry imaging agents to various proteins occurring in a specific location and tissue.
In order to aggressively develop the product, the company built fairly ex-tensive laboratory facilities in Viikki. The developed carriers were aimed to be licensed by pharmaceutical companies, which would then continue with clinical testing as well as manufacturing of the end-products.

71
Boundary between company and university remained a blurred line
At the start, CTT had neither premises nor equipment, and for a short period it had to operate as a spin-off in university facilities. After a year, the company rented its own premises, with offices and laboratories from the newly constructed business incubator in Viikki Science Park, just op-posite university facilities. This enabled close collaboration with the uni-versity to be continued, particularly concerning university animal facili-ties and certain analytical services. The company’s patenting issues were taken care of by Licentia Ltd, a company focusing on commercializing of technological innovations and with a background at the University of Helsinki, Sitra, VTT, and Helsinki University of Technology.
The leader of the research group preferred science over business and wanted to stay at the university. Therefore, one of the doctoral students started as the CEO of the new company, one as the CSO, and a mutual acquaintance with both PhD and M.Sc. Econ degrees as the CFO. The medical director and scientific advisors were university professors. The rest of the original research fellows remained as scientific advisers and/or stakeholders, and in fact, besides the major owners, the company had almost 20 minority stakeholders who had contributed to the discovery.
Slow transformation from academic to commercial drive
At the beginning, the working culture of CTT was relatively academic – everything, except for the synthetization of peptide-conjugates conduct-ed in Switzerland, was done in-house. An interdisciplinary group was created; it fitted together well and had good team spirit and shared en-thusiasm. At its maximum, CTT employed around 15 persons.
But enthusiasm was not enough. CTT’s management was academic, re-search driven – but also inexperienced business-wise. Special emphasis had to be put on business planning, product development, marketing skills, and financial control, as well as on learning to optimize the use of human resources.
One laborious and time-consuming task was to make company’s opera-tions GLP compliant. As an example, standard operation procedures had to be written and verified for each process and equipment, animal ex-periments needed to be documented in an appropriate way, and data on each reagent had to be traceable. Some of the workers operated full time only for building the GLP system.

72
Later, CTT began to utilize outside service providers when something was not financially justifiable for the company to perform, e.g. routine administration and statistical analysis of research were outsourced. Con-sultants were used for making the business plan, and the company start-ed collaboration with suppliers, manufacturers, and preclinical CROs to a larger extent. After a couple of years, the company acquired a new, ex-perienced CEO with an industrial background, although not as such ex-plicit biomedical knowledge.
The company extensively patented its technologies and in total they filed approximately 15 patent families in 30 countries. To some extent, inno-vations were patented so widely that the patenting costs became a bur-den. In addition to actively pursuing patents, the company’s researchers were also active in academic publishing. This required the company to be careful with publishing timing since patenting is not possible if an in-novation is published before filing the patent.
Close collaboration with university researchers remained a key activity of the company, and valuable advice, certain animal studies, methods, and research material, such as cancer cell lines and tumour tissues were obtained from the university.
Early leads shaky...
CTT tried actively to develop relationships with potential licensors and investors and managed to enter into a research agreement in the area of targeted medical imaging with GE Healthcare in 2005. However, the first and only licensor of the company’s technology reported that it could not replicate the findings of CTT. Hence, the cooperation was ended with this particular partner in about a year.
In addition to GE Healthcare, preliminary research collaboration was done with the Japanese drug development company Nanocarrier, and representatives of various pharmaceutical companies and an important US-based biotechnology investor, Burrill Co, visited CTT’s premises and gained access to the company’s research results.
... but structural base sound
A key resource of the company was the support received from the aca-demic world, both in the form of tangible assets such as facilities and services, and intangible assets such as scientific know-how and academ-

73
ic networks. Most research contacts operated in Finland, but close col-laboration was done also with groups in The Netherlands and the US. This provided the company potential links for international growth and funding.
CTT had a sound idea and a multitalented group consisting of people with diverse professional education and experience; some of them had previ-ously been working in pharmaceutical or drug development companies. In addition, the company had a strong patent portfolio, appropriate facili-ties and equipment for preclinical work, and a central location in Helsin-ki Research Park, not far from the airport and international connections.
Success in securing investments
During its existence, CTT managed to raise €10 M in total from in-vestors. The company was funded by domestic investors Sitra, Varma, Tekes, and Licentia. Revenues received from research agreements were minor (~€0.2 M), as the research collaboration did not continue after preliminary experiments.
Technical failure major reason for trouble
The first signs of foundering were seen in 2004 when the company went into financial crisis. In addition to problems with financial resources, the company had problems with research results, which could not be re-peated by the licensee. Also, the development of stable peptide-liposome structures carrying anticancer drugs had been delayed due to technical problems.
Even though the main reason for CTT’s demise was the unsuccessful-ness of its peptide-based carriers, there were other important issues in the background. During the early days of the company, the management was inexperienced in business management and drug development. In-itially, the company’s strategy had to find its focus. In the shining light of hindsight, the company may have been developing too many carriers simultaneously, restricting its resources on developing the most promis-ing candidates. In addition, CTT had issues in corporate governance, as a few shareholder employees served on the company’s board, which may have created conflicting interests. The board also had internal disputes, which may have hampered efficient decision-making. Finally, in the be-ginning the board lacked members with relevant business experience from the pharmaceutical sector.

74
Salvation in merger?
However, new management was able to assure owners and investors that the company could continue its operations by reducing the size of the company and by better focusing the company’s development objectives. This led CTT to receive an additional investment from a large pension insurance company.
The new investment provided only a partial solution for the problems that the company was facing. Therefore, the new CEO started negotia-tions with Karyon Ltd. Karyon was a company also developing peptide-based carriers. The two companies were very similar: They had a simi-lar ownership structure, their technology was based on research done by the same research group at University of Helsinki, their research in-terests were parallel, their sales strategies were similar, and most impor-tantly, both companies were in financial difficulties. In fact, a question arose: Why was development done in two separate companies in the first place, especially when the base technology was from the same univer-sity source?
At this stage CTT was facing several issues, since it became clear that their carriers were not sufficiently specific. The carriers sought the right
proteins, but the proteins not only manifested in the tumours, but also in other parts of human body, e.g. near inflammations. Therefore, the de-veloped carriers were not ready to enter the mar-ket and their future was doubtful. To address these issues, Karyon and CTT began a due dili-
gence process, which culminated with an equal merger. The CEO of Kar-yon continued as the new CEO, and the CEO of CTT as a COO.
The merged company, Karyon-CTT, was practically closed down after one year. Before that, €5 M in new capital was raised and a very thorough research programme was completed with unsatisfactory results. Intellec-tual property rights and equipment of the merged company were sold to an English company, in which the holding company of Karyon-CTT al-so invested. The later stages of the merged company are discussed more thoroughly from page 111 (the Karyon case).
As hindsight analysis, it could be claimed that CTT had a very sound idea, but as indicated earlier the management lacked business and drug development experience at the beginning, of course. This is not a unique case, since at that time most Finnish start-up companies and especially
The investors of CTT-Karyon may get their investments back?

75
their CEOs had limited experience in the development of successful bi-otechnology businesses and products. Also, investors and venture capi-talists were not as active as they could have been in the management of CTT, since the board of directors lacked persons with relevant experi-ence the first couple of years. In early 2006 the company board was re-staffed with very qualified persons, but it was too late.
It is noteworthy to mention that the investors of CTT-Karyon may well get their investments back, since the aforementioned acquiring English company has shown success. It operates as a biologics discovery service company and utilizes a very similar phage display discovery technology for peptides as CTT did, but to our knowledge it has not exploited CTT’s patents in its operations.
CTT’s legacy to the Finnish biotechnology industry
CTT was finally unable to bring any product to regulatory preclinical testing and hence to the market, but the company has left a clear legacy of intellectual capital, which is described in the next section.
On the job education spread scientific expertise
CTT actively created structural, human, and relational capital during its entire existence. Already from the beginning, the company had a good academic background, scientific networks, and a reputation as a promis-ing new company with innovations having huge potential markets. The founders were, however, very well aware that the company had neither facilities nor equipment, human capital was limited to scientific know-how, and there was no knowledge on regulatory and quality issues re-lated to drug development processes. Therefore, the company invested in people by hiring persons with a drug development background, and, in fact, managed to create a relatively multidisciplinary team. CTT also offered education in quality systems and statistics to personnel, and in-creased team spirit by organizing outdoor activities, parties, and short trips abroad for all personnel. This worked well: Turnover of personnel was minimal, and the CTT team still – after ten years – meets at an an-nual gathering.
The CEO and founders were inexperienced business-wise. In general, this can lead to a situation where management is too easily influenced by scientific advisers, fellow scientists, board, and other stakeholders that

76
might have strong opinions. A new CEO in 2005 with a strong business background might have changed this balance of power. However, the business environment in biotechnology differs from other sectors, e.g. time from discovery to market is often much longer, quality is preferred over quantity, and specific medical or biochemical knowledge is needed to convince potential customers. Therefore, experience in other kinds of business does not always guarantee success in bio-business.
Structural capital found new commercial use
During the life cycle of CTT, structural capital was gained in a multi-tude of forms, such as patents, academic articles, one dissertation, agree-ments, methods, research results, documents, and as development of a quality system. After the merger and close-down of Karyon-CTT, all pat-ents, equipment, results, and methods were actively recycled and finally ended up in a foreign company.
Relational capital leveraged for re-employment of workforce
CTT created also relational capital and, especially in the later stages of the company, the generation of relational capital increased impressive-ly. This was a direct consequence of the company’s aim to increase the portion of outsourcing and preliminary collaboration with Finnish and foreign CROs. During the last year of operations as a separate company, outsourced activities incurred half of the total costs of CTT.
Unfortunately, contracts with suppliers and CROs, as well as the com-pany’s academic networks, were lost upon breakdown. These networks, however, offered new jobs for the workforce later on.
Accumulated human capital highly relevant in both commercial and academic spaces
Human capital was well recycled after the company was closed down. The human capital created at CTT was mostly related to peptides, nano-particles, preclinical studies, quality systems, regulatory administration, drug development and biotech funding. For persons with a university background, work at a company brought know-how on company prac-tices, which differ significantly from university practices, e.g. documen-tation of research is much more accurate at companies.

77
This developed capital was very important for many of the workers, as they were looking for new jobs after CTT, and, in fact, most of the em-ployees found work easily from other biotechnology companies, the public sector, or academia. One of the founders earned his PhD at CTT and now works in Germany as an appreciated scientist. Another of the scientists started quality education at CTT and now works as a quality manager in a medical device company. Several others from the staff work as specialists in human health hazard assessment, and in other regula-tory posts. Compared to many other biotechnology firms, very few per-sons went back to the academic world. Interestingly, the last CEO of CTT left the biotechnology sector for good.

78
References
Koivunen, E., Arap, W., Valtanen, H., Rainisalo, A., Medina, O. P., Heikkilä, P., Kantor, C., Gahmberg, C. G., Salo, T., Konttinen, Y. T., Sorsa, T., Ruoslahti, E. and Pasqualini, R. (1999): Tumor targeting with a selective gelatinase inhibitor. Nat Biotechnol. 17(8): 768–774.
Tiedote. 30.10.2014 http://www.google.fi/url?sa=t&rct=j&q=&esrc=s&source=web&cd=4&ved=0CDcQFjAD&url=http%3A%2F%2Fwww.finbio.net%2Fdownload%2Fpress_releases%2FNimitysTiedoteJari-MattiMehtoengl.doc&ei=owRSVMbTLennygP8ioLICQ&usg=AFQjCNFZjFKKieMzIAcq0Y4kmtMck-0K1w&bvm=bv.78597519,d.bGQ

79
Case: Fibrogen Europe Oy
Source: Suomen Asiakastieto Oy.
Personnel in Finland
• FibroGen Europe’s existence as a Finnish-operating private company: 1996–
• Location: Helsinki and Oulu
• Total employment effect: ~90 man-years
• Cumulative sales: under €100,000
• Total funding received: € 2,85 million euros
• Main sources of funding: FibroGen Inc., Tekes, other investors
• Core competence: technology for producing artificial human collagen and gelatin
STORY IN A NUTSHELL
Chapter 3Fibrogen Europe
Fibrogen (US)
1994
Fibrogen Inc. (US)
2014
1996
FibrogenEurope Oy
IPO
0
4
8
12
16
20
2001 2002 2003 2004 2005 2006 2007 2008 2009 2010 2011 2012 2013*
Sources: ETLA, Suomen Asiakastieto Oy.
Chapter 3Fibrogen Europe

80
The story in brief
Fibrogen’s case is a surprisingly unknown yet encouraging example of Finnish know-how and US business skills that combined have led to an extremely successful commercialization of state-of-the-art biotechnol-ogy research.
The story begins in the New World
Fibrogen Inc (US) has roots in two unrelated paths. Thomas B. Neff, an investment banker with a background in molecular biology and govern-ment, as well as economics and finance, established FibroGen Inc (US) in 199317. The company soon found research on fibrotic diseases, includ-ing collagen and gelatin, as a potential field within biotechnology.
Professor Kari Kivirikko and his group at the University of Oulu had done collagen research for decades. The original commercialization idea was to do research, development, and manufacturing of collagen and gelatin in Finland in collaboration with the University of Oulu. However, neither the domestic pharmaceutical companies nor venture capitalists were interested in developing a product from a pure academic work. The path to market was considered too long and expensive.
FibroGen Inc (US) soon identified the collagen research done by Profes-sor Kari Kivirikko and his group at the University of Oulu, as well as re-search by the US professor Darwin J. Prockop, as being particularly in-teresting. After swift negotiations the collagen know-how was gathered around FibroGen Inc (US).
FibroGen Inc (US) soon focused on producing recombinant human col-lagen and gelatin for use in medical device, pharmaceutical, and indus-trial applications, and at developing drugs for the treatment of the ex-cessive collagen accumulation in tissues such as liver, lung, and kidney in fibrotic diseases.
FibroGen Inc (US) had developed a multi-gene process for producing these recombinant proteins from human genes in yeast in cooperation with Professor Kivirikko and his team. The inventors, Darwin Prock-op, M.D., Ph.D.; Leena Ala-Kokko, M.D., Ph.D.; Andrzej Fertala, Ph.D.; Aleksander Sieron, Ph.D.; Kari Kivirikko, M.D., Ph.D.; Amy Geddis,
17 Prospectus for initial public offering: 8,100,000 Shares FibroGen Common Stock, No-vember 13, 2014; Goldman, Sachs & Co., Citigroup, Leerink Partners, RBC Capital Mar-kets, Stifel and William Blair, New York.

81
Ph.D.; and Taina Pihlajaniemi, M.D., Ph.D., along with their respective academic institutions (Thomas Jefferson University, Philadelphia; Acad-emy of Finland; and University of Oulu, Finland) transferred their rights on this technology to FibroGen18.
An unforeseen turn
The other initial main goal of FibroGen Inc (US) was to develop drugs for the treatment of fibrotic diseases. The amino acid hydroxyproline was believed to be found only in collagens and collagen-like proteins, its for-mation being catalysed by the enzymes collagen prolyl hydroxylases. It was therefore regarded as likely that compounds which inhibit prolyl hy-droxylase activity could be developed for drugs to treat fibrotic diseases.
In 2001 the laboratories of P. Ratcliffe and W. G. Kaelin, Jr. published two articles in Science indicating that hydroxyproline also plays a cru-cial role in the regulation of the hypoxia-inducible transcription factor (HIF), and subsequently these laboratories and a third laboratory iden-tified a previously unknown family of prolyl hydroxylases that catalyses the formation of hydroxyproline in HIF.
This finding turned out to be ground breaking for FibroGen Inc (US). They realized that if a suitable HIF prolyl hydroxylase inhibitor could be identified and produced efficiently, a new pathway for treating hypoxic diseases, including anaemias, was opened.
FibroGen Inc (US) already had a set of collagen prolyl hydroxylase in-hibitors. Professor Kivirikko’s group was within just months able to pro-duce the human HIF prolyl hydroxylases as active recombinant proteins in large yields by using cultured insect cells and to develop assays for testing potential inhibitors for these enzymes. The technology was trans-ferred to FibroGen Inc (US), which focused its efforts on this novel and unforeseen development option.
Roxadustat, component FG-4592, is now undergoing phase 3 trials for the treatment of anaemia in chronic kidney disease patients19. Its non-risk-adjusted peak year sales are estimated at USD 1–5 billion20.
18 http://www.prnewswire.com/news-releases/fibrogen-confirms-receipt-of-patent-on-recombinant-human-collagen-production-method-75597632.html. 10.2.2015
19 https://www.clinicaltrials.gov/ct2/show/NCT01750190?term=4592-060&rank=1
20 http://www.astrazeneca.se/pressrum/pressmeddelanden-och-nyheter/Article/astra-zeneca-issues-update-on-strategy-to-deliver-value-to, 10.2.2015

82
A new European subsidiary to take on the development of production processes
FibroGen Inc’s (US) subsidiary, FibroGen Europe, was founded in 1996. The role of the Finnish unit was to develop and optimise the manufac-turing process of the proteins. This development work was supported by the development and research done in the US by the parent compa-ny. The technology was patented in the US in 1997 and a few years lat-er in Australia. The business development unit of FibroGen Europe was granted European patent rights for collagen in 200021.
The process was the only commercially relevant method that was capable of producing synthetic collagen and gelatin with the same structure and performance as the natural proteins. Previously, collagen and gelatin had been extracted from animal tissues, but these animal-derived proteins contained risk for immunological reactions, bovine spongiform enceph-
alitis (“mad cow disease”) as well as other animal infections. In addition to less risky products, the new process produced more stable proteins.22
The company’s prospects were good: Collagen and gelatin are widely used in medical, pharma-ceutical, and consumer products. As an example,
collagen is used in hemostats, tissue sealants, wound dressing, implant coatings and cosmetics, and gelatin in vaccines, capsules, tablets, infu-sion solutions and food substances. In addition, recombinant collagen and gelatin are considered suitable materials for bioengineering, and they have been used, for example, in artificial cornea.
The first managing director of the European subsidiary came from Fi-broGen Inc (US), but in 2000 the company received a new CEO with a background in Finnish and European large industry biotechnology. At the start, FibroGen Europe had laboratory facilities in Oulu and an office in Helsinki. The amount of personnel in the Oulu R&D unit was origi-nally approximately 11; they were mainly scientists with experience in fermentation. Four persons at the Helsinki office took care of all business development and administration-related issues.
FibroGen Europe has to a large degree relied on FibroGen Inc (US), the main financier of the European subsidiary. Since Finnish investors and
21 http://www.thefreelibrary.com/FIBROGEN+EUROPE+GETS+NEW+LEADERSHIP%2FEXPANDS+PATENT+POSITION.-a060372590
22 http://www.evaluategroup.com/Universal/View.aspx?type=Story&id=86441
Collagen and gelatin are widely used in medical, pharmaceutical,
and consumer products

83
pharmaceutical companies were reluctant to invest in collagen and gela-tin research, this know-how was gradually transferred to be handled by FibroGen Inc (US). The parent company took care of all regulatory is-sues and IPR, in addition to financing.
As the roots of the research were in Oulu, FibroGen Europe and Fibro-Gen Inc (US) collaborated intensively with the University of Oulu, the collagen research unit of which was selected as a Centre of Excellence in Research in 2000–2005 by the Academy of Finland.
FibroGen Europe has not received significant incomes from sales. How-ever, the early years of FibroGen Europe were eventful, as the company had strong financial backing from the parent company FibroGen Inc (US). FibroGen Inc (US) has been able to raise capital from numerous institutional and private investors both inside the US and abroad, as well as from Finland. For example, the Finnish Innovation Fund Sitra has in-vested in FibroGen Inc (US), as well as several private investors23,24,25. The research has been partially supported by funding from the government of Finland, through its developmental agency, TEKES26.
Fibrogen Europe caught in the riptides of the biotechnology boom
In 2002 and 2003 the biotechnology boom burst. This had several con-sequences. Firstly, FibroGen Europe found that the parent was the only available source for additional funding. Secondly, it became clear dur-ing that time that large-scale collagen manufacturing and sales were still years away. The companies testing FibroGen’s proteins were interested in implementing human recombinant material into their novel applications but reluctant to replace animal-derived material in their existing prod-ucts already on the market.
Finally, with the discovery of novel therapeutics for anaemia and hypoxic diseases, FibroGen Inc’s (US) clinical activities focused on anaemia pro-grams and continuation of studies in fibrotic diseases, such as idiopathic pulmonary fibrosis. In addition, the company developed treatments for metastatic cancers27. These research streams have indeed been very suc-
23 http://www.sitra.fi/artikkelit/yritysrahoitus/sitran-paaomasijoitukset-yrityksittain, 19.1.2015
24 http://www.evaluategroup.com/Universal/View.aspx?type=Story&id=86441, 10.1.2015
25 http://www.kaleva.fi/uutiset/talous/rahoittaja-venyy-fibrogenissa/200388/, 19.1.2015
26 http://www.evaluategroup.com/Universal/View.aspx?type=Story&id=86441, 10.1.2015
27 http://investor.fibrogen.com/phoenix.zhtml?c=253783&p=irol-newsArticle&ID= 1984284, 19.1.2015

84
cessful, and FibroGen Inc. (US) has been able to sign at least two stra-tegic collaboration agreements worth several hundred million dollars28.
FibroGen Europe ended operations in Oulu in 2003, and in 2004 the sta-tus of the company changed from active to hibernation. The CEO works for FibroGen Europe as a part-time manager. The aim of this move was to wait until collagen and collagen-based products would be completed and regulatory approved to enter the markets. The management of Fi-broGen Europe and the parent saw this as the only option for the compa-ny; otherwise, it would have been closed permanently. The Finnish unit still holds rights to sell and manufacture collagen, gelatin, and collagen-related products in Europe.
Currently, FibroGen Europe is still in hibernation, but the parent is sell-ing small batches of collagen (www.fibrogen.com). A two-year Phase I clinical study has been made with the company’s proprietary collagen, showing that biosynthetic cornea restored vision and promoted nerve regeneration. In addition, a few scientific publications have shown that FibroGen’s biotechnically produced collagens and gelatins are highly pure and fully characterized replacements for animal-derived proteins in various medical device and pharmaceutical applications29.
FibroGen’s legacy in the Finnish biotechnology industry
The aim of FibroGen Europe was and still is to produce and sell colla-gen, gelatin, and collagen-based products especially for medical use. The original Finnish know-how generated during years of intense research and the investments put towards it have to some extent been considered lost. However, this notion is misleading.
Fibrogen Inc (US) has invested significant resources in research per-formed in Finland, and the cooperation still continues. FibroGen Inc (US) has had representatives also from Finland for more than a decade, and Finnish entities have a notable ownership in Fibrogen Inc (US). The present market capitalization of FibroGen Inc. is USD 1.6 billion (March 13, 2015).
28 Prospectus for initial public offering: 8,100,000 Shares FibroGen Common Stock, No-vember 13, 2014; Goldman, Sachs & Co., Citigroup, Leerink Partners, RBC Capital Mar-kets, Stifel and William Blair, New York.
29 http://investor.fibrogen.com/phoenix.zhtml?c=253783&p=irol-newsArticle&ID= 1984320, 19.1.2015

85
Human capital passed on to industry and the public sector
FibroGen Europe operated actively almost a decade, and during that pe-riod a substantial amount of intellectual capital was formed, especially in the form of human capital. The company employed 10–15 persons, mainly researchers with academic background, and the turnover was low. These people received training and education, e.g. in biotechnologi-cal manufacturing, product development, marketing and regulatory ap-proval processes. In addition, they learnt how companies operate and got a glimpse of US company culture. FibroGen Inc. (US) has since 1994 supported research at Oulu University, with e.g. acknowledgements in 30 PhD theses.
The human capital has been recycled to other companies and the pub-lic sector. Most employees found new posts quite easily and they were able to utilize their experiences from the previous job. As an example, the CFO of the company worked in CapMan private equity fund after FibroGen, as a CFO in Faron, and was a member of Bioretec’s board. He is also a member of the Innovation Committee of University of Helsin-ki and a member of the Investment Committee of Dasos Capital Fund I30. The former R&D and business development manager of FibroGen joined Tekes and at present she serves as the Director at the Centre for Health and Technology (CHT), Oulu, Finland. The person responsible for clinical trials started her own pharmacy.
Relational capital still ties the former US parent to Finland
FibroGen Europe cooperated mainly with the parent company and to some extent with other Finnish companies and research organization, and some relational capital was therefore formed. However, the most important relations between FibroGen and Finnish society were formed already before FibroGen Europe was established. FibroGen Inc (US) had close ties, e.g. with the University of Oulu, and two Finnish business sen-iors have served on the board of Fibrogen Inc (US) already since 1994 and 199631.
30 https://www.linkedin.com/vsearch/p?title=Member+of+Investment+Committee+of+Dasos+Capital+Fund+I&trk=prof-exp-title
31 Prospectus for initial public offering: 8,100,000 Shares of FibroGen Common Stock, No-vember 13, 2014; Goldman, Sachs & Co., Citigroup, Leerink Partners, RBC Capital Mar-kets, Stifel and William Blair, New York.

86
Structural capital mainly remains with FibroGen Inc (US)
The formation of structural capital has been negligible in FibroGen Eu-rope, since the company did not patent anything itself and only licensed rights to technologies related to collagen and gelatin production. Uni-versity of Oulu originally transferred the intellectual property rights re-lated to the technology to FibroGen Inc (US), and FibroGen Europe was granted the European patent rights in 200032. The development done in Finland contributed to research done in the USA and partially to the pat-ents filed by the parent company, whose responsibility the patenting was.
32 http://www.thefreelibrary.com/FIBROGEN+EUROPE+GETS+NEW+LEADERSHIP%2FEXPANDS+PATENT+POSITION.-a060372590
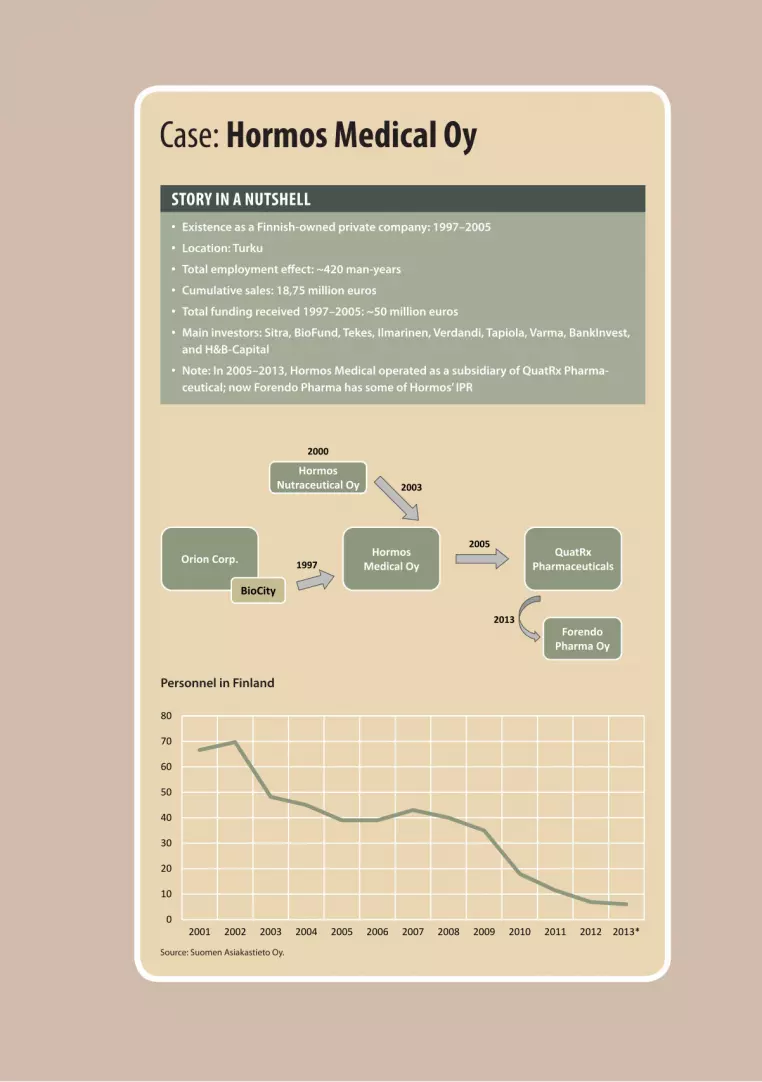
87
Case: Hormos Medical Oy
Source: Suomen Asiakastieto Oy.
Personnel in Finland
• Existence as a Finnish-owned private company: 1997–2005
• Location: Turku
• Total employment effect: ~420 man-years
• Cumulative sales: 18,75 million euros
• Total funding received 1997–2005: ~50 million euros
• Main investors: Sitra, BioFund, Tekes, Ilmarinen, Verdandi, Tapiola, Varma, BankInvest, and H&B-Capital
• Note: In 2005–2013, Hormos Medical operated as a subsidiary of QuatRx Pharma- ceutical; now Forendo Pharma has some of Hormos’ IPR
STORY IN A NUTSHELL
Chapter 3Hormos
Orion Corp.
2000
HormosMedical Oy
ForendoPharma Oy
QuatRxPharmaceuticals
2013
2005
BioCity
HormosNutraceutical Oy 2003
1997
0
10
20
30
40
50
60
70
80
2001 2002 2003 2004 2005 2006 2007 2008 2009 2010 2011 2012 2013*
Sources: ETLA, Suomen Asiakastieto Oy.
Chapter 3Hormos

88
The story in brief
From corporate spin-out to independent private enterprise
Hormos Medical was founded in 1997, when Orion Pharma decreased its non-clinical research portfolio and out-licensed some of its on-go-ing drug discovery projects. Simultaneously, Orion closed its BioCity re-search laboratory in Turku; therefore, continuing the promising projects in a new organization appeared to be the option with the greatest po-tential.
Hormos Medical moved into new PharmaCity facilities and optimis-tically signed a 10-year rental agreement33 in 2001. The company had more than 10 employees from the beginning, with a maximum of more than 70 employees in 2001–2002. The total employment effect of Hor-mos Medical has been approximately 420 man-years, with a median of 30 employees throughout fourteen years.
Hormos Medical’s original business idea was to develop new investiga-tional medicines up to Phase II and thereafter out-license them to other parties. The licensing profit received from these more mature products would have been used for novel discovery projects. The company also planned to become listed on the stock market, and it operated as a pub-lic company during the period from 2001 to 2005.
The company adopted an aggressive IPR policy which provided the com-pany with approximately 50 patent applications and patents, most of which have grown into global patent families (Espacenet database 2012).
Stringent regulations forced redirection of efforts in midst of promising campaign against ageing
Hormos Medical discovered and developed pharmaceutical products for the hormonal prevention and treatment of diseases related to ageing, with a core competence in the tissue-specific regulation of estrogen and androgen effects. Hormos Medical focused on selective estrogen recep-tor modulators (SERMs) and on 17-beta hydroxysteroid dehydrogenase (HSD) enzyme inhibitors.
33 PharmaCity required all companies to sign a rental agreement for a minimum of 10 years.

89
SERM drugs are molecules that modulate the effects of estrogen. The lead product is ospemifene (OsphenaTM), which was developed as an osteoporosis drug up to two Phase II studies. However, due to strict reg-ulatory demands in osteoporosis and licensing problems, the develop-ment focus changed in 2003 to the treatment of postmenopausal vaginal mucosa problems.
In 2005, the first Phase III study was initiated together with a US com-pany, QuatRx. During that same year, Hormos became a subsidiary of QuatRx Pharmaceuticals. The partners conducted two more phase III studies in which the drug showed statistically significant efficacy, and was safe and well tolerated (McCall and DeGregorio, 2010). In animals, it prevented and cured mammary gland tumours (Burich et al., 2012).
Another investigational drug discovered by Hormos Medical is fispemifene for testosterone deficiency and associated disorders in men. It has completed two Phase II clinical studies, where the drug was shown clearly to increase testosterone levels. The drug might also be used to treat chronic prostatitis and urinary symptoms.
Two sidetrack options did come with their own sticks and stones
HSD enzyme inhibitors prevent an estrogen response in certain tissues and offer a therapeutic approach with potential applications in treating diseases such as endometriosis, uterine fibroids and breast cancer. The early developmental work of these molecules was performed in collab-oration with Finnish universities and subsequently with Solvay Phar-maceutical (Belgium). Solvay signed a research agreement (2003–2005) and paid approximately 2 million euros/year for the discovery. However, the deal was discontinued after three years, as Solvay changed its busi-ness strategy. Hormos/QuatRx licenced back the HSD enzyme portfolio in 2006 and agreed to undertake all further commercialization activi-ties. The first HSD enzyme inhibitors, although effective in primate ed-nometriosis model, did not have satisfactory oral bioavailablility to be progressed to clinical studies. Thus further discovery work was needed. Interestingly, as the drug concept is new, it offers a business option with low competition.
A different type of R&D project occurred when Hormos and Åbo Aka-demi collaborated to develop HRMlignan, a highly purified lignan prod-uct. Lignan deficiency may be associated with increased risk of breast cancer and cardiovascular diseases (http://www.hmrlignan.com/). This product obtained new dietary ingredient (NDI) clearance from the FDA

90
in 2004, which allowed HMRlignan™-containing dietary supplements to be marketed in the USA. In 2005, an agreement giving worldwide licens-ing rights for this dietary supplement was signed with Linnea SA, a Swiss company specializing in the manufacture of botanical products. Hormos received a signing fee of 0.5 million euros. Linnea SA has continued pro-duction with estimated yearly sales of the active ingredient below million €, and the end products markets at few millions.
Subsequent development and production efforts advanced through numerous partnerships
Hormos had an organic synthesis laboratory within Oulu University, and preliminary development projects were undertaken in collabora-tion with Turku and Helsinki Universities, with Solvay and with Tess Diagnostics and Pharmaceuticals (CA, USA). Full-scale manufacturing was performed by Bayer and Orion. In addition, Hormos participated in three EU projects, thereby creating research relationships with various European countries.
Standard-grade activities formed the core of intangible assets
Quality systems (GLP, GCP, GMP) expertise was initially developed in-house, but subsequently outsourced from contract research organization (CRO) companies. The company had GLP-accredited bioanalytical ac-tivities and a GMP status for the analysis and release of pharmaceuticals. These quality assurance systems were audited on a regular basis by the Finnish Medicines Agency (FIMEA).
Institutional investors injected funding to fuel enthusiastic expansion towards potential public offering
Until 2001 Hormos was able to raise funding from both Finnish and foreign venture capitalists, and several institutional investors joined the owners. In addition, Tekes funded the company with annual grants and loans totalling 20.8 million euros. The loan instrument used by Tekes was mainly a capital loan that has had a significant effect on the future fate of the company. This effect will be discussed subsequently.

91
Setbacks in clinical trials and pessimistic financial market sentiments signals of trouble
By the end of 2002, Hormos faced more severe difficulties: The develop-ment of the drug candidate finrozole had to be discontinued because of certain negative effects that were found during the Phase II clinical trial (Heinonen, 2009). Simultaneously more funding would have been need-ed to proceed to the Phase III clinical trials with the lead candidate, os-pemiphene. This, along with the overall negative investment sentiment, significantly reduced the company valuation for new investments. Hor-mos attempted to obtain funding from foreign venture capitalists and some of them showed great interest. However, negotiations failed be-cause of the unreasonable terms required by the new investors.34 In 2003, the company began to reduce its personnel and focused its operations on revenue.
Hormos’ legacy to the Finnish biotechnology industry
Trade sale only viable exit in light of fundraising difficulties
In 2004, Hormos began negotiations with QuatRx (US) with regard to the out-licensing, but the negotiations ended in a merger in 2005 upon Hormos’ initiation. The company had realized that in the difficult fund-raising environment, consolidation with the US-based company offered the best possibility to continue operations and, in particular, to offer an exit opportunity for its investors. QuatRx had recently closed USD 70 M in private equity financing, and a plan was created to pursue an IPO on NAS-DAQ shortly after the transaction.
As a result, all Hormos shares were sold to QuatRx, which provided its own shares as payment to the owners of Hor-mos. In addition, the former CEO of Hormos joined the senior manage-ment team at QuatRx. The Tekes loans (20.8 million euros) remained at the Finnish subsidiary called Hormos Medical Ltd under the following conditions: The IPR must remain in Finland, future revenues from the Finnish IPR must be shared in proportion to the cumulative investments
34 Detailed information cannot be disclosed.
Future revenues from the Finnish IPR must be shared in proportion to the cumulative investments from both sides

92
from both sides, and the subsidiary must be financed only with own cap-ital instruments. As a final outcome from ospemifene revenue based on this agreement, the Finnish subsidiary would be entitled to more than half of the future cash flow from ospemifene.
Re-focus under new ownership
QuatRx focused its resources to continue the commercialization of os-pemifene and fispemiphene, and the out-licenced rights to HSD enzyme inhibitors were repurchased from Belgian Solvay Pharmaceutical. Three Phase III studies and the studies to complete the preclinical development package were conducted, and the NDA documents were put together for ospemifene.
After the merger, Hormos’ infrastructure was gradually decommis-sioned, as the US headquarters now managed the legal issues, financing, business development, and marketing. The amount of discovery that oc-curred in Turku decreased from the most active years, and some of the former Hormos scientists left for VTT and Orion. However, the merger had no effect on customer relationships with Solvay and Linnea.
QuatRx – a success story
In 2005–2013 Hormos Medical Oy operated as a subsidiary and as the main entity of QuatRx Pharmaceuticals. The previous infrastructure of Hormos Medical was replaced by a more virtual business model utiliz-ing outsourcing and fewer workers. Hormos received approximately 10 million euros in funding annually from the parent company, for a total of more than 50 million euros in investments from the US.
As a result of ospemifene’s excellent Phase III clinical trial results, Quat-rx entered into a licensing agreement with Shionogi & Company (Japan) for further development and global marketing. According to this agree-ment, QuatRx received USD 25 million in upfront payments and is eligi-ble to receive more than USD 100 million in development and regulatory milestone payments; the upfront payment share of the Turku unit was 12 million euros. In addition, QuatRx will receive milestone payments for each marketing approval outside of the US, as well as sales milestones and royalties on global sales of the product35. Three years ago it was es-
35 http://www.businessturku.fi/bt/fi/cms.nsf/PFBD/578F9DC059A0F8FDC22576DC0028A42A

93
timated that the approximately USD 100 million invested in the drug could be repaid ten-fold within the following ten years.
In 2012, QuatRx decided that all actions will be focused on obtaining marketing approval for ospemifene, and other products in the pipeline were shelved. Indeed, ospemifene was approved by the FDA in 2013 for the treatment of dyspareunia in postmenopausal women (Shionogi, 2013). The projected peak sales were estimated at as much as USD 495 million by 20173. The original founders of QuatRx have since been able to get their original investment repaid from the income of Osphena’s sales. The sales are increasing each quartile, but are at present (February 2015) still below USD 100 million a year.
Yet another twist to the story – Hormos Medical splits ways with QuatRx under a new name
In 2013 Hormos announced, with the permission of QuatRx, that it will sell the non-commercial assets to Forendo Pharma and will continue with opsemmifene and HMR-lignan assets. Forendo Pharma was estab-lished in June 2013 to continue the drug development programs for en-dometriosis and low testosterone, i.e. fispemifene and HSD enzyme in-hibitors.
Most of Forendo’s 16 employees have a background in Hormos: Half of them have worked for the company throughout the years and the rest have returned after working at the university or in FIMEA during the layoff. Also, the databases and molecular libraries have recycled back to Forendo; these are extremely valuable for the future discovery of novel drug substances
In October 2014 Forendo announced it had licensed US rights of fispemifene to Apricus Biosciences with an upfront licence fee of USD 12.5 million36. Moreover, Forendo receives clinical and regulatory mile-stone payments, commercial milestones, and tiered royalties based on any net sales achieved by Apricus37. Phase IIb clinical trials for hypog-onadism38 are anticipated to commence during the first half of 2015. In addition, Forendo will have access to all data and results produced in the clinical trials, enabling the company to look for further partners aiming at other global markets.
36 USD 5 million in cash and USD 7.5 million in Apricus common stock.
37 The milestone payments alone can add up to more than USD 300 million dollars.
38 http://www.b2match.eu/healthbio2011/participants/

94
After the announcement, Forendo Pharma has been able to close a 12 million euros financing round with corporate venture investors. Once getting corporate venture investors from major pharmaceutical compa-nies on board it is highly probable that Forendo will be able to attract further investors for any project that is estimated to be successful.
The bottomline
Hormos Medical’s greatest problem has been insufficient funding and the underdeveloped Finnish VC system model. Domestic VCs are small, and their total capital has been inadequate to cover long-term invest-ments and additional financing rounds. Hormos encountered severe ownership problems.
However, Hormos Medical is a positive example of a company that has managed to sustain its intellectual capital and operations in Finland, de-spite its ownership having moved not only across the border but also across the ocean. A research period of more than a decade has contrib-uted to the vesting of unique knowledge in Finland. Also, the dedication and quality of Finnish scientists, in addition to the existing local collab-oration networks, have been regarded as elements that are impossible to transfer to other locations.
Tekes has supported Hormos with significant R&D risk loans, part-ly capital loans, which is essentially a unique Finnish funding support instrument. Government risk loans provided bargaining power to the Finnish party during the merger; the foreign party agreed to ensure that
the IPRs remain in Finland and to sustain the Turku unit. This has, in part, enabled the recy-cling of the promising lead compounds back to Finland to further development.
Hormos has shown how flexibility in business strategies can assist a company in surviving dur-
ing difficult situations. Hormos changed the indication for its lead mole-cule, halted certain sidetrack projects to focus its resources, and the com-pany management adapted to a new owner and business culture.
Hormos Medical was established at a time when biotechnology hype was at its peak. The company began fearlessly and, in hindsight, used its money too optimistically: obtaining new facilities, developing most op-erations in-house, hiring dozens of employees initially, and having sever-al projects simultaneously in clinical trials or in preclinical testing. How-
Hormos has shown how flexibility in business strategies can assist
a company in surviving

95
ever, the company and its successors have displayed an interesting learn-ing curve, and they currently operate in a cost-effective manner by rely-ing on outsourcing and a virtual business model.
The value produced by Hormos so far could be estimated at 100 million euros, and the future value creation potential has to be regarded as very promising. Finally, Hormos’ innovations already provide relief to elderly patients who suffer from symptoms caused by hormonal dysfunction.

96
References
Burich, R. A., Mehta, N. R., Wurz, G. T., McCall, J. L., Greenberg, B. E., Bell, K. E., Griffey, S. M. and DeGregorio, M. W. (2012): Ospemifene and 4-hydroxyospemifene effectively prevent and treat breast cancer in the MTag.Tg transgenic mouse model. Menopause (1): 96–103.
McCall, J. L. and DeGregorio, M. W. (2010): Pharmacologic evaluation of ospemifene. Expert Opin Drug Metab Toxicol. 2010 6(6): 773–9.
Heinonen, L. (2009): On the pursuit of growth in technology-based companies.The role of public financing in the start-up process of Finnish drug development companies. Academic dissertation. Turku School of Economics.
Shionogi (2013): Shionogi receives FDA approval for Osphenatm (ospemifene) for the treatment of dyspareunia, a symptom of vulvar and vaginal atrophy (vva) due to menopause. Press release February 26, 2013.

97
Case: Ipsat Therapies Oy
Source: Suomen Asiakastieto Oy.
Personnel in Finland
• Existence as a Finnish-owned private company: 1998–2010
• Location: Helsinki
• Total employment effect: ~200 man-years
• Cumulative sales: None
• Total funding received: ~€30 M
• Main sources of funding: Tekes, Sitra, BioFund, Varma, and Innovations Kapital
• Core competence: Intestinal protection system in antibiotic treatment
• Note: Development of the lead product up to Phase II; IPR recycled to USA
STORY IN A NUTSHELL
Chapter 3Ipsat Therapies Oy
IpsatTherapies Oy
1998
$
2010
Privateinvestor (CH)
SyntethicBiologics Inc.
(US)2010
IPO
IPR
IPR
?
0
5
10
15
20
25
30
35
2001 2002 2003 2004 2005 2006 2007 2008 2009
Sources: ETLA, Suomen Asiakastieto Oy.
Chapter 3Ipsat Therapies Oy

98
The story in brief
A quest against antibiotic resistance
Ipsat Therapies Oy was established in 1998 to commercialize the concept of using certain enzymes for the inactivation of beta-lactams. The main target was to provide a solution for the growing medical problem of an-tibiotic resistance.
The core method was patented in Finland in 1994 by one of Ipsat’s found-ers. However, the actual research and development of these enzymes did not actually begin until Dr. Kai Lindevall and Dr. Lauri Jalkanen realized their market potential and the possibility of developing and producing them in the clean facilities of the National Public Health Institute (KTL, currently THL), which had recently closed down its vaccine production. Consequently, the company began in the premises of KTL and shortly thereafter earned its name, which describes its core competence: Intes-tinal Protection System in Antibiotic Treatment (IPSAT). The company moved to new facilities in Viikki Science Park in 2002.
Owners vs. advisers – A choice of focus
The complex bacterial community in the small intestine plays an im-portant role in human health. When antibiotics end up there, they may cause an undesirable effect on the balance of normal intestinal microbi-ota, resulting in diarrhoea, overgrowth of pathogenic bacteria and fungi, and the selection of antibiotic-resistance strains.
Ipsat Therapies developed bioengineered enzymes that are capable of breaking down excess antibiotics in the intestine; these enzymes were packed in coated pellets filled in hard gelatin capsules that were origi-nally developed in Germany. The capsules dissolved rapidly in the stom-ach, releasing coated drug pellets that mixed well with digested food and were transported to the upper part of the intestinal tract. There, in the lower pH, the enteric resistant outer layer of pellets gradually degraded to release the active enzymes. This gastro-resistant pH-dependent Ipsat P1A delivery system was chosen for its several beneficial characteristics, including the protection of the drug substance in acidic conditions and enzymatic degradation in the stomach.
During the early years of the company (2001–2002), an important de-cision with vast consequences had to be made: the selection of a lead

99
molecule and target. The scientific advisory board recommended that an enzyme with a broad range of activity against different types of beta-lactam antibiotics should be chosen, but the company’s board decided to continue with the enzyme P1A, which had already been in development for a few years.
The contingency plan
The company’s first drug candidate, P1A, was active only against certain penicillin types. However, the company also had in the pipeline second-generation products that showed more broad-range efficacies. In addi-tion, the company developed novel oral dosage formulations for orally administered enzymes.
Ipsat also developed cellular production and purification processes for protein drugs. Therapeutically useful enzymes are required in relatively tiny amounts but at high degrees of purity and specificity. The choice of an appropriate host and suitable production conditions is crucial for the downstream processing of a pharmaceutical recombinant protein. Ipsat decided to use the Bacillus subtilis strain because of its various advanta-geous characteristics: It does not produce toxins or virulence factors, it is cost-effective, and proteins produced in B. subtilis are correctly folded and secreted outside the bacteria and thus easier to purify.
International patents the core of the company’s structural capital
Because the license of the expression vector used for the production of proteins in Bacillus subtilis had expired, Ipsat Therapies did not need to invest in in-licensing of commercial rights. Instead, the company devel-oped the production organism in a less hazardous and environmentally friendly direction by inhibiting the formation of spores and growth out-side of culture media, which formed the core of its own initial patent.
Ipsat entered into close collaboration with Finnzymes, a company that had received the Bacillus strain producing the enzyme, and developed a purification method and a novel product for inhibiting resistance in cows treated with antibiotics against mastitis. Therefore, the original in-novation expanded to novel sectors – the food industry. Finnzymes also prepared the first batches of the product for Ipsat, and KTL prepared the following lab-scale batches. The pilot-scale production was subsequently outsourced to Medipolis GMP in Oulu.

100
Ipsat filed four patent applications, and a Finnish patent was issued to all of them during the lifetime of the company. Patent coverage in vari-ous other countries, including the USA, Poland, Australia, the UK, and Spain, was granted to some of the original Finnish patents.
Cross-border collaboration expanded the scope of application
The intellectual capital of Ipsat Therapies increased significantly over the years: The company developed patented production process and purifi-cation systems, hired animal physiology specialists capable of conduct-ing important proof-of-concept studies, and entered into close collabo-ration with scientists at several Finnish universities. In these studies, Ip-sat determined the optimal dose and exact time point for P1A adminis-tration to achieve the maximal protective effect in the gut. The company also collaborated with VTT in fermentation studies, with various clinical laboratories related to quality control issues, and with research groups in the USA, Spain, and Israel. These international connections contributed novel methods for analysing the effect of the enzymes, novel applications for the product in cattle, scientific publications, and important interna-tional recognition.
Regulatory know-how an important asset in commercialization
Ipsat’s expertise also increased when professionals with expertise in clin-ical trials, quality assurance, and regulatory issues joined the compa-ny. In 2006, the company employed its highest number of people (35). Moreover, Ipsat also employed several project workers in the academic sector during its existence.
Ipsat was audited by the National Agency of Medicine (currently Fimea), and the company received a medicinal product manufacturer certificate in 2001. The company also gained extensive experience in regulatory is-sues when it applied for permission for clinical trials from various Na-tional Agencies of Medicine.
Business model iterations
The business strategy of the company was to show the proof of concept of the enzyme, conduct the Phase I study, and then sell or license the product to a pharmaceutical company. At some point, the company even planned to become a new, fully integrated Finnish pharmaceutical com-

101
pany. The market potential of the company’s products appeared promis-ing, and the products encountered no competition in the area of antibi-otic treatment protection.
Promising trial results fuelled expansion
For several years, processes proceeded smoothly: preclinical studies showed that Ipsat’s P1A product was able to deactivate certain penicil-lin antibiotics in the small intestine of animals but had no effect on the serum level of the drug (Harmoinen et al., 2004). P1A treatment was al-so shown to prevent the colonization of human pathogens in the gut of mice during enzyme therapy (Stiefel et al., 2008).
The product was also tested in a Phase I clinical trial in France, in a phase IIa trial in Estonia, and in a phase IIb trial in Ukraine, in which P1A demonstrated efficacy in the gastrointestinal tract of both healthy vol-unteers and hospitalized patients (Pitout, 2009; Tarkkanen et al., 2009). Ipsat P1A was also well tolerated.
A thicket of challenges lead to loss of momentum
Ipsat Therapies began licensing negotiations in 2003 with several com-panies, including Roche, J&J, and Wyeth, and continued the process for several years. Despite the excellent scientific results and successful due diligence of the company, pharmaceutical companies were scepti-cal about the product. The quality of the clinical studies that were con-ducted in Ukraine did not fulfil FDA requirements, and the negotiation partners requested that Phase II should be conducted in a regulatory-compliant manner.
Moreover, the endpoints of the studies did not fulfil the criteria that had been established for an investigational drug, which is to cure or prevent a disease or to alleviate symptoms. The frequency of beneficial effects was also questionable because adverse effects with penicillin-type antibiot-ics are rare, as revealed by a search of the literature that was conducted at this late point. The pharmaceutical companies were more interested in the broad-efficacy candidates in the pipeline than in P1A; Ipsat was asked to “come back when you have some results”.
Another important issue also decreased the marketing potential of P1A was that the core patent would expire in November 2014, creating addi-tional pressure to accelerate the development process. However, if Ipsat

102
P1A was to be approved in the USA before November 2014, then five ad-ditional years of protection could be secured.
The unsuccessful licensing negotiations fuelled strategic changes at Ipsat. Ipsat considered alternate means of bringing the product to market as a medical device or supplement rather than as a drug. Moreover, the pos-sibility of limiting the testing of the drug to intensive care unit patients prone to severe infections was discussed. However, a new P1A Phase II study was planned based on the clinical endpoint requirements of the FDA, and foreign outsourced consulting was used to improve and pol-ish other operations of the company. The board approved the plan in late 2007.
To finance the new clinical trial, Ipsat directed an option loan of 8.5 M€ to old investors. The loan was subscribed in full, but Tekes declined Ip-sat’s request for an additional 5.9 M€ according to its principle of not funding repeated clinical trials. During 2008–2009, efforts were aimed at finding a new external investor and negotiations with venture capital-ists from France, Denmark, Sweden, and Switzerland were conducted; however, securing funding was impossible because of the collapsed mar-kets and the global economic recession. Efforts to find a collaborator for a joint deal also failed.
Simultaneously, the company confronted manufacturing problems. In the spring of 2008, Medipolis GMP, which had recently been acquired by an Indian pharmaceutical company, announced that it was no longer en-gaging in contract manufacturing, and Ipsat needed a new manufacturer. After a careful selection process, one of the world’s leading suppliers of bioproducts, Lonza in Switzerland, was chosen for this task. However, because Lonza operates at a larger scale, the technology transfer also in-cluded 10-fold upscaling of the production process. This upscaling be-came problematic: the first batches were produced in low yields and did not fulfil conformity requirements.
Prohibitive inefficiencies in production marked end of independent phase
The establishment of the production system ceased as the costs reached €2 M. Ironically, if production at Lonza had succeeded, the novel inves-tors would have been interested in funding the upcoming clinical trial. At this point, Ipsat was forced to shut down operations and lay off per-sonnel. The bankruptcy of Ipsat Therapies occurred in early 2010.

103
Ipsat’s legacy to the Finnish biotechnology industry
Just another liquidation?
The intellectual property of Ipsat, including patent families and 25,000 different regulatory documents that were prepared at the company, were sold for $20,000 to a private Swiss individual who had previously worked for a French venture capitalist and had been involved in the process of evaluating Ipsat Therapies.
After the bankruptcy, the fixed assets of the company were sold to VTT, Yliopiston Apteekki, and other biotechnology companies. The human intellectual capital was dispersed: Certain key persons retired, but the remainder of the staff sought employment at Finnzymes, Glycos, the Na-tional Institute for Health and Welfare, Fimea, universities, VTT, Ylio-piston Apteekki, and abroad. Some of the inventors and key persons no longer work in biotechnology.
Or the seedling of something big?
Although Ipsat Therapies was removed from the Finnish Trade Register on February 2011, its IPR still persists. A US patent expiring in 2027 was granted as late as August 2011 for an application originally filed by Ipsat. In addition, a novel patent was filed in May 2011, when Ipsat no longer existed. What had happened?
As already mentioned, the IPR was bought by a Swiss private entrepre-neur, who subsequently sold it to the US-based company PrevAb. Prev-ab increased the value of the IPR by filing a patent application that was prepared already at Ipsat but never filed by the company. Prevab sold the IPR to another US-based company, Synthetic Biologics, in 2012. The amount of sold assets were overwhelming: They included a pre-IND package for the novel enzyme, Phase I and Phase II clinical data for P1A, manufacturing processes and data, and a portfolio of issued and pend-ing US and international patents intended to support various licence ap-plications with the FDA (http://www.syntheticbiologics.com/SYN-004). Also, modified bacterial strains for manufacturing the enzymes have ended up in the USA.
Synthetic Biologics selected the enzymes developed at Ipsat as their key products. According to the company, approximately 14.4 million pa-tients are administered beta-lactam-type antibiotics annually, represent-

104
ing an estimated target market for novel enzymes of 117.6 million beta-lactam doses purchased by US hospitals (http://www.syntheticbiologics.com/SYN-004). The company is actively working towards a marketing approval of the novel enzymes and has already conducted a Phase Ib clinical trial39.
The accumulated human capital of Ipsat has been appreciated even af-ter the closure of Ipsat: Synthetic Biologics has recently consulted some of Ipsat’s inventors and employees, since their assent was critical for the novel patent application. In addition, their expertise has been important in various issues, such as process optimization. Also, the relational capi-tal created at Ipsat has been useful, as many of the previous consultants and subcontractors have entered into collaboration with Synthetic Bio-logics.
Lessons learned
Ipsat Therapies is an example of a company whose technology develop-ment proceeded as planned but whose fate was dictated by the hectic timetable created by patent expirations, unfavourable coincidences, and misevaluations in business development.
The market potential of the lead product was low and the possibility of entering the market through medical device status was also consid-ered at an excessively late stage. Choosing that commercialization op-tion could have saved both time and costs, and Ipsat Therapies had no excess of either.
Critical issues in the failure of Ipsat Therapies were the expiration of the core patent and the problems related to raising new funds and manufac-turing at Lonza, which destroyed the scheduled timetable. Ipsat Thera-pies also suffered from constantly changing management. The fast turn-over of key personnel caused problems in the transfer of knowledge and the continuity of processes, repetition of certain issues, and a negative and distracting atmosphere within the company. In addition, connec-tions with scientific advisors were lost when managers were replaced.
Similarly to many other biotechnology companies during their initial R&D phase, Ipsat Therapies had a constant need for new funding, and
39 http://www.syntheticbiologics.com/2015-02-10-Synthetic-Biologics-Announces-Posi-tive-Topline-Results-from-Phase-1b-Trial-of-SYN-004-to-Protect-the-Microbiome-and-Prevent-C-difficile-Infection

105
the company pursued several financing rounds. In addition, the com-pany’s infrastructure became more expensive than originally expected. Limited financial resources forced the company to make vague deci-sions, such as pursuing a Phase II study in Ukraine. As the study did not comply with regulations, it finally contributed no value to the overall de-velopment process.
Although Ipsat Therapies ceased operations, the company left perma-nent marks on the Finnish biotechnology industry. Several scientists re-ceived their first experiences of business life, regulatory issues, and sci-entific know-how while at Ipsat. As previously mentioned, this expertise is now dispersed in various sites across Finland. The company was also a significant biotechnology employer, in addition to the indirect effects on subcontractors, device providers, and universities through common research projects. Ipsat also offered a training site for doctoral thesis can-didates and students, and the company developed novel methods and bacteria modifications.

106
References
Harmoinen, J., Mentula, S., Heikkilä, M., van der Rest, M., Rajala-Schultz, P. J., Donskey, C. J., Frias, R., Koski, P., Wickstrand, N., Jousimies-Somer, H., Westermarck, E. and Lindevall, K. (2004): Orally administered targeted recombinant Beta-lactamase prevents ampicillin-induced selective pressure on the gut microbiota: a novel approach to reducing antimicrobial resistance. Antimicrob Agents Chemother. 48(1): 75–9.
Pitout, J. D. (2009): IPSAT P1A, a class A beta-lactamase therapy for the prevention of penicillin-induced disruption to the intestinal microflora. Curr Opin Investig Drugs. 10(8): 838–44.
Stiefel, U., Nerandzic, M. M., Koski, P. and Donskey, C. J. (2008): Orally administered beta-lactamase enzymes represent a novel strategy to prevent colonization by Clostridium difficile. J Antimicrob Chemother. 62 (5): 1105–1108.
Tarkkanen, A. M., Heinonen, T., Jõgi, R., Mentula, S., van der Rest, M.E., Donskey, C. J., Kemppainen, T., Gurbanov, K. and Nord, C. E. (2009): P1A recombinant beta-lactamase prevents emergence of antimicrobial resistance in gut microflora of healthy subjects during intravenous administration of ampicillin. Antimicrob Agents Chemother. 53(6): 2455–2462.

107
Case: Karyon Oy
• Existence as a Finnish-owned private company: 2001–2008
• Location: Helsinki
• Total employment effect: ~84 man-years
• Cumulative sales: €0
• Total funding received: ~10 million euros
• Main sources of funding: Sitra and Tekes
• Core competence: Cancer-targeting peptides
• Note: The patents of Karyon Oy were sold to Isogenica (UK) but never utilized
STORY IN A NUTSHELL
Chapter 3CTT-Karyon
CTT Oy
2001
CTT-Karyon Oy2006
Isogenica (UK)
2007
2008
Karyon Oy KC-Holding 3 Oy
IPR
$
0
4
8
12
16
2002 2003 2004 2005 2006
Sources: ETLA, Suomen Asiakastieto Oy.
Chapter 3CTT-Karyon
CTT Cancer TargetingTechnologies Oy
Karyon Oy
Source: Suomen Asiakastieto Oy.
Personnel in Finland

108
The story in brief
The business idea & firm establishment – Academics take on the fight against cancer during the biotech boom
Karyon was founded as a cancer drug development company in 2001 by several researchers and a few professors at Helsinki University. The group’s expertise, particularly in peptides, was to be utilized in finding solutions to the treatment of a variety of cancers.
The start of the company was somewhat peculiar. Most of the found-ers originated in the same research group as the founders of CTT Can-cer Targeting Technologies, and they all worked with peptides and had received research funding from the same sources (Academy of Finland, Tekes, Cancer Society of Finland). Interestingly, two separate companies were established, and both of them got support from Sitra and Tekes. Ex-pectations were high at the time, and it was generally believed that most of the biotechnology companies would make an IPO within a few years.
The background of the founders was academic: There were biochemists and chemists, a docent in molecular biology, a dentist, an agrobiologist, a patenting expert, a professor of pharmacy, and a professor of neurosci-ence. Most of the founders worked at the company in key positions; their ownership was diluted after several rounds of financing.
The business know-how was very limited until the financers found a new CEO with a bio-business background and persuaded him to join the company. Altogether, the number of employees was 11; it remained rela-tively constant throughout the years. There was a good team spirit and people were committed to making the company successful.
Karyon started at the premises of the university, but it moved into the novel Cultivator II building at Helsinki Business and Science Park in 2003. Animal studies were still done at the university’s animal facility, and analytical mass spectrometry services were bought from the univer-sity. Most of the equipment was leased.

109
The value proposition and customers – Harnessing peptides to boost delivery of clients’ drugs beyond the blood-brain barrier
Similarly to CTT, Karyon developed peptides that target malignant tis-sues. The aim was to use these peptides as carriers of medicine or im-aging agents; they could be used in theranostics, i.e. both in diagnostics and targeted therapy in cancer care.
Karyon’s specialities were peptides that targeted oral cancer, metastases, certain types of lung cancer, and brain tumours. Some of the investiga-tional peptides were able to cross the blood-brain barrier, which protects the brain but simultaneously restricts the passage of some therapeutics into the central nervous system.
The business idea of the company was that the peptides could be incor-porated into existing drug or imaging molecules as navigators, and the preliminary studies could be done in collaboration with the customer and the system licensed out after Phase I clinical trials. Potential custom-ers and collaborators were diagnostic or pharmaceutical companies de-veloping a product for end-users, i.e. cancer patients.
Karyon negotiated with various companies, but unfortunately the dis-cussions suggested Karyon’s research to be at a stage that was too early for the establishment of a business relationship. The only interested com-pany was the Japanese Nanocarrier, which collaborated also with CTT. The lung cancer peptide of Karyon was designed to fit into Nanocarrier’s anti-cancer drug, and the construct was about to enter preclinical tests. Due to financial difficulties, however, this never came to be.
Key activities – Strong R&D focus reflected in aggressive IP policy, lackadaisical business drive, and weak commercial connectivity
Karyon was a university spin-off company which focused on research and development (R&D). The developed peptides were investigational; they were synthesized in-house in small batches for research purpos-es. No quality system existed, and the animal studies were not done in GLP-compliant facilities. Regulatory know-how was limited and busi-ness development was exclusively the domain of the CEO, who collabo-rated with Sitra’s experts. Only at a later stage did the company hire ad-ditional consultants, whose task was to create connections to potential business partners and find novel R&D solutions.

110
Karyon had a very aggressive patenting policy to protect their carriers and related products. In total, Karyon filed for 10 different patent fami-lies40. The annual patenting fees were high, and they increased the com-pany’s financial burden. In addition, the lengthy patent application pro-cesses were troublesome for the academic partners, who wanted to pub-lish their research results as soon as possible. Yet the fees were paid until the company was shut down and the patents were given away.
Karyon collaborated mainly with a few research groups at University of Helsinki. In addition, peptide analytics and animal care were outsourced to the university. The company made preliminary plans to conduct pre-clinical toxicity tests in Oncodesign, France, but – as mentioned – this did not succeed. Karyon also participated in Tekes programmes such as “Lääke 2000”. Collaboration with other domestic SMEs was minimal, and CTT was considered a rival, not a facilitator. Despite this reluctance, Karyon was later forced to merge – first with Galilaeus and then with CTT.
Key resources – Strong team commitment and university relations strongholds in times of crises
A key resource of the company was the personnel and the team spirit that kept the group together, even during the financial crisis. Due to the small number of workers and low hierarchy, communication and spread of information was easy. Most of the employees even invested in Kary-on and became minor shareholders. The personnel were really commit-ted: after a 4-month lay-off period, everybody continued working for the company.
Another important factor was the close collaboration with the univer-sity; support was received in the form of tangible assets such as facilities and services, and intangible assets such as scientific know-how. Karyon collaborated with professors operating in different fields, and hence the company was able to enlarge the spectrum of potential applications (e.g. in oral, lung, and brain cancer).
As in the case of CTT, the company had a strong patent portfolio, ap-propriate facilities and equipment for preclinical work, and a central lo-cation in Helsinki Research Park, not far from the airport and interna-tional connections.
40 Based on an Espacenet online search.

111
Revenue streams – Investors were the sole source of financing for pre-revenue Karyon
Karyon’s aim was to sell its products to pharmaceutical companies, which then would combine their drugs with Karyon’s carrier. These companies, however, were not interested in products that were still under develop-ment. The companies wanted to see tangible results before making any decisions, and Karyon was not able to provide them. Hence, the sales channel was closed for Karyon and possibilities for revenue were non-existent.
In the case of Karyon, the biggest investor and shareholder was Sitra, but asignificant amount of funding was received also from Tekes. The aggregate amount of financing for Karyon totalled approximately €5 M. In addition, the merged company Karyon-CTT received another €3 M.
The end – Failure to meet the development ultimatum made investors push for UK trade sale
Karyon found itself in financial distress within two years. The specific-ity and binding capacity of the peptides turned out to be inadequate, and more time for peptide design would have been needed. In addi-tion, potential customers were not interested in collaboration, since the peptides were still in the discovery phase. Investors were anxious to see results and reluctant to fund basic research for several years. This issue was solved by first merging Karyon with Galilaeus, a company special-ized in the development of pharmaceuticals, in 200341. The merger was organized by Sitra and it was a prerequisite for the next financing round. It seemed reasonable, as both companies were exploring cancer drugs; Galilaeus already had products on the market, and it was assumed that Karyon’s peptides could be offered to Galilaeus’ customers. Unfortunate-ly, the two companies had differing opinions on the division of money, and the merger ended with a messy quarrel within a year. Galilaeus was closed due to insolvency in December 2014.
Next, Karyon was forced to merge with Cancer Targeting Technologies (CTT) in 200642. Both companies moved to new premises, and Kary-on’s CEO took over the lead of the merged company. The company was called Karyon-CTT, and it was funded by a newly established holding
41 http://www.tekniikkatalous.fi/kemia/galilaeus+ja+karyon+yhdistyvat/a28906
42 http://www.finbio.net/download/press_releases/Karyon-CTTEng.pdf

112
company, KC Holding Ltd, which consisted of the old institutional in-vestors and a few new private equity investors. The new board set a strict schedule, during which Karyon-CTT should have had both well-func-tioning peptides ready for marketing and interested customers at hand. To achieve the set objectives, the company hired international business development consultants, who had good contacts to the pharmaceuti-cal industry.
Unfortunately, the development of peptides did not proceed well. The management team realized that the company would not be able to accom-plish the set deadline, and the remaining capital would not be enough to finalize a product. Thus, Karyon-CTT was gradually shut down in 2008 and a consultant was brought in to help to relocate the employees to new jobs. The employee relocation service was a success, as most of the staff was able to find new jobs matching their skills. This was also the mecha-nism through which much of the intellectual capital of Karyon-CTT was transferred and reused in other biotechnology companies. Only two of the key employees left the biotech industry or academic research.
Interestingly, shortly before the closure of the company, the consultants found a UK company called Isogenica which was interested in the patent portfolio of Karyon-CTT. Isogenica was using a similar kind of technol-ogy to discover peptides that bind with high affinity and fine specificity to various targets. At this point, KC Holding had still over two million euros of capital to be invested into something more promising. As a re-sult, Isogenica acquired the intellectual property portfolio and the labo-ratory equipment of Karyon-CTT, and KC Holding received Isogenica’s shares in exchange for a £2 million cash investment. The board justified this decision by saying that the investment was financially better than in-vesting in Karyon-CTT43.
Today, Isogenica is still running a successful operation, and KC Hold-ing is one of the main owners of the company. The company has, how-ever, never utilized the patents obtained from Karyon-CTT. Isogenica is a discovery partner for companies that develop biological therapeutics or diagnostics. It has announced collaborations with companies such as Johnson & Johnson Pharmaceutical Research & Development, and Re-search Corporation Technologies, Inc. (RCT), of Tucson.
43 http://www.fiercebiotech.com/press-releases/isogenica-completes-acquisition-princi-pal-assets-karyon-ctt

113
Karyon’s legacy to the industry
Commendable re-employment plan for employees retained skills in the sector
Karyon is a prime example of a company in which academic research was incorporated at too early a stage. One key issue was that the research done inside the company was much more expensive than research done in a university environment – mostly due to larger overheads. There was also the additional risk associated with an untested technology, which materialized in the end.
After an interesting discovery, it should ideally be possible to continue conducting preliminary product development at the university before subjecting it to the harsh realities of a corporate realm. It should save both investors and the society considerable amounts of money, have a positive impact on the university’s brand, and further scientific inquiry by pushing it beyond basic research. Unfortunately, the Finnish funding system for academia has not encouraged applied research. The amount of publications and scientific excellence has been the most important, if not exclusive, criterion for the Academy of Finland, whereas Tekes’ pub-lic funding has been limited to select research areas. The old principles are slowly changing, with the first strategic research call of the Academy of Finland taking place in April 2015.
The strong patent portfolio of Karyon never materialized. Therefore, the only company-generated asset that has benefitted the life science sector is its personnel. Some of the employees returned to the university and carried the acquired commercial perspective and knowledge over into the academic world, while others have joined other biotechnology companies such as Glykos.
In addition, the investors have gained important experience: Too optimistic and credulous enthusiasm has been su-perseded by a more mature attitude and prudent investment strategies. Nowadays, it would be highly unlikely to see Sitra invest in two nearly identical companies that operate just across the street from each other!
Finally, biotechnology companies like Karyon were important employ-ers in the early 2000s, and several graduates, doctoral students, and post-docs earned their daily bread and butter in this sector. This is in clear
Biotechnology companies like Karyon were important employers in the early 2000s

114
contrast to the present situation, where the unemployment of chemists, biochemists, and biologists has increased over 60% within a decade, and is now considered a serious problem44.
Structural capital – Majority scooped up by foreign company
During the lifetime of Karyon, a rather large amount of intellectual cap-ital was accumulated, particularly in the forms of human capital and structural capital. Karyon’s structural capital consisted mostly of its intel-lectual property rights, i.e, patents and processes. These assets were sold to a UK-based company, which according to our interviewee has not re-used them. The same company also received all tangible assets like the laboratory equipment.
Human capital – Outplacement service spread skills within the sector
Human capital that was developed during the existence of Karyon was also recycled. Karyon’s core employees developed their competences substantially during the lifespan of the company, and this competence was spread widely into the biotech sector. This was facilitated by the out-placement service that Karyon-CTT used to guarantee a smooth transi-tion for its employees. The CEO of the company later used his experienc-es with Karyon when he had to shut down another biotechnology firm.
Relational capital – Lack of a collaborative network of commercial entities a critical weak spot
Karyon did not create much relational capital, since the competition with other SMEs developing cancer drugs was too hard. It is a great pity that the businesses of CTT and Karyon did not converge before they were forced to do so; collaboration with CTT could have provided syn-ergy for both parties in the form of marketing volume, shared opera-tional procedures, equipment, quality systems, and material purchase, for instance. The only form of relational capital created inside the com-pany came from the connections to the academic world and, later on, from contacts created by consultants. In fact, the most important rela-tional capital created was the connection between investors and Isogen-ica: This brought out an interesting and – so it seems – profitable target for Finnish investors.
44 http://www.luonnontieteilijat.fi/filebank/2537-kem314_lal.pdf

115
In hindsight – Pressure from the ecosystem one trigger for premature incorporation
In summary, hindsight suggests that due diligence analyses should have been more rigorous before the incorporation of the underlying academ-ic endeavours. This analysis should have highlighted that the peptide re-search was not ready to be transferred from the university to a commercial environment. However, the outside pressure to incorporate the research into a company may have been quite strong, as Finland was going through an uptrend in biotechnology during the early 2000s, and different public and private actors were proactively financing biotechnology companies. However, consid-ering the spread of human capital and novel investment possibilities, one may argue that the investments in Karyon and later Karyon-CTT were not entirely unproductive.
Peptide research was not ready to be transferred from the university to a commercial environment

116

117
Case: Plexpress Oy
• Existence as a Finnish-owned private company: 2007–2014
• Location: Viikki, Helsinki
• Total employment effect: ~50 man-years
• Cumulative sales: ~400,000 euros
• Total funding received: ~4 million euros
• Main sources of funding: Avera, The foundation of the University of Helsinki, Conor Venture Partners, Tekes, VTT Ventures
• Core competence: Gene expression analysis
STORY IN A NUTSHELL
Chapter 3Plexpress Oy
$
2014
2015
VTT
2007
Plexpress OyValiRx Plc (UK)
ValiFinn Oy
IPO
2009
0
2
4
6
8
10
2007 2008 2009 2010 2011 2012
Sources: ETLA, Suomen Asiakastieto Oy.
Chapter 3Plexpress
Source: Suomen Asiakastieto Oy.
Personnel in Finland

118
The story in brief
Origins as a professionally built, international research spin-off
Plexpress (PP) was a Finnish biotechnology company, which specialized in gene expression analysis and used novel technology enabling detec-tion of approximately 30 target genes from a large number of samples in a single assay. The technology had been developed at VTT Technical Re-search Center of Finland, and a patent application had been filed in 2002.
Plexpress was founded in 2007 with the aim of commercializing the novel technology. It was a spin-off of VTT, in which the founders had worked before they established the company. VTT became one of the founders approximately six months after the start of Plexpress and inter-estingly, Plexpress was one of the first spin-offs of VTT and as such, a pi-lot case both for VTT and for the management of the company.
The founders include one professor and a scientist who had been work-ing with the technology for several years and an external entrepreneur who was the first CEO of the company. Since the founding team had limited experience of international business development at that time and as the company targeted to global markets, a new CEO was sought from the USA with the help of INBAC (International Business Accel-eration Center). Plexpress hired an American CEO, who was an experi-enced entrepreneur and operated mainly in the USA in a small office at INBAC’s shelter.
The CEO’s main target was to build and boost potential customer space in the states and raise capital, but unfortunately, the global financial cri-sis in 2008 decreased investor’s and big pharma’s interest in novel com-panies and after a few years, the operations in the US were ceased. Due to the unsuccessful and expensive US strategy, the company replaced the CEO and its board of directors almost completely, and the company got a new, more experienced chairman, who helped to create a new and more focused business strategy.
Plexpress settled in Viikki Business Park, Helsinki, and began the hunt of European investors, potential business partners and customers. In addi-tion, the company continued the refinement and validation of the tech-nology, since minor modifications were still needed. The final version was launched in 2012.

119
In 2007–2013, altogether four persons served as the CEO of the com-pany; the turnover was high since investors were not satisfied with the business development. The company employed approximately 10 people mainly for product development, and gave also a few students the pos-sibility to make their graduate studies in Plexpress. The turnover of per-sonnel was also relatively high because of the uncertainty caused by con-stant financial problems.
Fast and cost-efficient gene expression analyses the core of multi-revenue stream business model
Plexpress specialized in TRAC (Transcript Analysis with the aid of Affin-ity Capture) gene expression analyses. The methodology provides infor-mation about expressions of a panel of selected genes in a sample, and it may be used in a range of applications, e.g. drug toxicity testing, cancer research and bioindustrial development of metabolically optimized mi-cro-organisms and production conditions. No RNA extraction or cDNA conversion or amplification is needed in Plexpress’ technology, degra-dation of RNA is decreased and the analysis procedure takes only four hours to complete. This makes it fast, simple and cost-effective to imple-ment, while lowering error rates and maximising accuracy (www.plex-press.fi).
The gene expression analysis is especially important for drug develop-ment companies, which need to show the effect of new drug compounds on certain metabolic enzymes as part of the compounds’ toxicity and drug metabolism profile. Fortunately, at the same time when Plexpress launched its TRAC technology to analyze genes of those enzymes, both FDA and EMEA gave guidance to industry, where they recommended the use of gene expression analysis instead of conventional protein anal-ysis for those targets. This certainly increased pharmaceutical compa-nies’ interest in Plexpress.
The company manufactured TRAC analysis kits, provided computer program for data analysis and offered TRAC analysis as a service. The pharmaceutical companies had three different ways to utilize Plexpress’ services: do the analysis using Plexpress’ TRAC kits themselves, buy the service from a CRO utilizing Plexpress’ technology, or send samples to Plexpress for analysis. The analytical service was time and resource con-suming and therefore, the company tried to increase the sales of kits ei-ther to pharmaceutical companies or to CROs making the analyses for pharma.

120
The limiting factor for the purchase of test kits was the need for an anal-ysis equipment, capillary-electrophoresis, which can be found in sev-eral molecular biology labs, but not necessarily in SMEs or in the same location where the customers were in large companies. The equipment was produced by third parties, and Plexpress tried to reach an agree-ment on joint development and marketing of devices and kits. The new product would combine existing products and services from both com-panies. Most of the competitors were selling equipment combined to the test kits. An interested business partner was found, but the plans finally stumbled into financial difficulties.
Initially broad marketing strategy helped to scan and home in on most lucrative opportunities
At the start, Plexpress’ strategy was quite widely defined and basically the company tried to sell everything related to its technology to everyone. This is a rather typical mistake for many start-up companies, but in the end it was beneficial for Plexpress as the company learned which mar-kets were the most suitable for its products. Hence, Plexpress started to specialise its services to specific market segments in 2010.
The main customers of Plexpress were pharmaceutical companies, and CRO companies conducting preclinical drug metabolism and toxicity tests for pharmaceutical companies. However, entering into a research agreement with big pharmaceutical companies turned out to be a tricky process, which could take almost two years. In many cases, Plexpress had to find ways to get the first contact, negotiations took time and a pilot study designed to comply with customer’s needs had to be done. Inves-tors, who live in a quartile economy, had often problems to understand this.
More than 50 % of income was received from pharmaceutical and CRO companies. Additional customers were bioindustrial companies devel-oping novel metabolic enzymes, research institutes and the mother or-ganization VTT, which needed the technology for research purposes. The technology worked well and customer feedback was very positive.

121
Excellent premises for sustainable business model only endangered by dependence on third-party devices
Plexpress was an R&D oriented company. Although the technology was developed and patented by VTT, there were minor defects and the com-pany had to focus on improving them during the first three years. In addition, each customer project was unique and analyses had to be tai-lored in collaboration with the customer. This included e.g. selection of genes of interest, probe design, and planning of other test parameters. In total, the company carried out over 100 projects using its proprietary technology.
The company collaborated also with various biotechnology firms and research institutes actively. A whole genome screen was developed and launched together with Phalanx Biotech (USA), and a cancer test for re-search purposes with MediSapiens (Finland). Diabetes research was per-formed with Metabolex (USA), and yeast studies with VTU Technology (Austria). In addition, Plexpress had important subcontractors in Ger-many and USA, and the company had plans to deepen the collaboration further. One bottle-neck for sales was the dependence on certain equip-ment, and - as mentioned – Plexpress was eager to start collaboration with companies developing these devices.
Plexpress also put special emphasis on establishing a quality system, and received the ISO9001 certificate in 2011. This defined the requirements for the quality management system the company used, and was a guar-antee that Plexpress was able to provide the services its customers need-ed. ISO9001 was very beneficial for Plexpress: it was flexible, it shortened project times, and it made the follow-up of projects easier. Reports be-came more systematic, job descriptions and division of labor more ac-curate, and customer feed-back was documented. Notably, all workers participated in preparing the final ISO9001 documents.
The IPR strategy of the company was straightforward: the technology used by Plexpress was patented by VTT, and there was no need for new patents. Patents covering Europe were transferred to the company as VTT became one of the shareholders, but US patents remained in VTT. They were supposed to be transferred to the company at a later phase, although this was finally not realized. However, Plexpress’ trade secrets related to the exact composition of its kits was the most essential intel-lectual property for the company. The company also owned TRACPACK trademarks in Europe, Canada and the USA.

122
Patented technology and solid business network core assets
Plexpress’ key resource was a good and patented technology that was ap-preciated also by customers. The technology had great potential as the leading regulatory authorities, FDA and EMEA, had recommended the use of such gene expression based technologies as analysis methods in certain drug metabolism and toxicity tests. These authorities stated that mRNA analysis should be used in drug interaction studies in order to increase the sensitivity of assays. In addition, the technology had several applications and could be used not only in the pharmaceutical sector and research, but also in biotechnological industry.
Another key resource for Plexpress was its good business and R&D net-works to various companies and research institutes. VTT offered impor-tant support through its contacts to the US as well as to various inves-tors. In addition, VTT provided Plexpress with a lot of support and ad-vice in legal and administrative issues and in business agreements. Dur-ing the company’s whole lifespan, Plexpress management was striving to increase the collaboration network further.
Investments provided early-stage financial resources
Plexpress began its operations in 2008 with great ambition. Since the customers were recognized to be mostly foreign, the company received “Born Global” funding from Tekes to support the company’s early stage. In 2009, the company received 2.75 million USD seed funding from Conor Technology Fund I, Veraventure, Helsinki University Fund and VTT.45
In 2012, Plexpress announced follow-on funding of up to 2.3 million USD to commercialize its novel TRAC platform; this funding consisted of an initial payment of 1.4 million USD and further milestone payments of up to 0.9 USD. Plexpress was also selected suitable for Tekes Young Innovative Companies –funding for 2012-2014. The initial phase fund-ing of it was 250 k€.46
During the first years, a lot of time and money was spent in the US trying to gain a foothold in global markets. Unfortunately, no break-through of the technology could be obtained, and sales remained low. They consist-ed mainly of research projects, and varied between 30–50 k€. In 2012,
45 http://www.conor.vc/conor-led-consortium-to-provide-usd-2-75m-in-seed-funding-for-Plexpress/#.VIay6slNflo; 7.12.2014
46 http://www.Plexpress.fi/about-us/news; 8.12.2014

123
when the new version of the technology had been launched and the new CEO had started an eager marketing campaign, the sales doubled to over 100 000 €. Customers were very satisfied and the company received in-quiries from potential new customers.
Wasteful exploration of US markets and dependence on third-party technology inhibited necessary scaling
Plexpress’ story was eventful considering that the company existed on-ly for seven years. The technology was promising, but the company met several challenges. Plexpress’ story clearly shows the consequences of how uninformed decision made in early stages of the life span can affect and hinder the company for a long time. In case of Plexpress, the first board of directors consisted of persons without relevant business expe-rience and, hence, they were not able to guide the CEO. Also, the first Finnish CEO had relatively little experience from business life and the selected US CEO did not provide the expected experience, networks or results to the company.
Plexpress’ investments into the US were not successful, and after a cou-ple of years the company closed its overseas operations. However, the efforts in USA helped the company to define a more focused strategy, which steered the development towards a specific course. The wander-ing in the beginning can be observed as a manifestation from inadequate understanding of the market, and maybe also of the industry. This can be observed also in Plexpress’ technological applications: the results need-ed to be analysed by quite an expensive device, which many customer companies did not have. This problem reduced demand for Plexpress’ kit products.
Plexpress had several financing rounds, where only one or two investors gave up investing further in the company. But the growth of the company did not proceed as expected, and since a lot of resource had been spent in the US, the investors were reluctant to invest more. In addition the limits these investors were able to invest per one company were reached. This meant that the company had to operate with limited resources for several years. The financial difficulties affected its workforce, since the company needed to lay off its employees both temporary and later permanently. Moreover, the company changed its CEO four times during the period.
Plexpress exploited every means to continue operations as an independ-ent company. It also tried to look for potential candidates to merge with,

124
and succeeded in finding a German partner, who – unfortunately – did not have a sound financing basis either. The operations were supposed to continue in Germany, and some of Plexpress’ workers were ready to move there, but in the end, plans for a better future broke down. As a plan B the company started to negotiate an asset deal with a British AIM listed Biotech company called ValiRx Plc having a daughter company ValiFinn Oy located in Oulu. Agreement was reached of the terms of the asset deal between the two companies. However, an approval from the biggest debtors for the deal was required. Tekes, which was the big-gest debtor, was not able to approve the terms of the asset deal according to the current legislation. After this, Plexpress ended in bankruptcy in 2014. The TRAC technology and related assets were acquired from the bankruptcy estate by ValiRx Plc at the very end of 2014. The service and business operations related to TRAC technology are now being contin-ued by ValiFinn Oy in Oulu.
Plexpress’ legacy to the Finnish biotechnology industry
Small investment injections couldn’t fuel necessary burn rate for sustainable growth
Plexpress was an interesting spin-off case which brought new experi-ence both to VTT, investors, and to the managers of Plexpress. It paved the path to regulatory drug metabolism and toxicity studies using nu-cleic acid based technologies in Finland. However, Plexpress may also be considered a warning example of a company having too ambitious goals in relation to its resources and business excellence. In spite of a great and patented technology, entering global markets without massive investment capacity, foreign business partners and critical mass turned out to be too difficult. The globalization and growth funding received in Finland was, and probably is, too small as compared to Europe and es-pecially US where financing rounds often exceed 5–10 million euros.
Plexpress managed to launch several products. The IPR was acquired by the biotech company ValiRx Plc, while the US patents are still owned by VTT. It is important to note that customers were satisfied with the technology, they increased their orders, and regulatory authorities rec-ommended the use of the kind of technology that Plexpress developed for regulatory toxicology studies. These issues encouraged the acquirer of the technology to continue the commercialization of the technology having more resources to sales and marketing than Plexpress did.

125
Assets have been effectively recycled in commercial space
Despite of the difficulties, Plexpress was able to create a significant amount of all three forms of intellectual capital, i.e. human, structural and relational capital.
At start, only a few people worked for Plexpress and they all had mainly a research background, which meant that their knowledge was overlap-ping and no interdisciplinarity could be found. However, the company managed to hire people from pharmaceutical industry and biotechno-logical SMEs, which increased the business and quality system know-how inside Plexpress. Furthermore, all workers participated in the crea-tion and implementation of ISO9001, and this has certainly been an in-structive experience for all. The workers also learnt important issues on funding, marketing, regulatory issues and creation of company culture. Interestingly, the human capital increased not only in Plexpress but al-so in VTT, which through the Plexpress experiences received important information on spin-off companies, US markets and market entry pos-sibilities. The refinement of the technology done by Plexpress has been beneficial for VTT and for the new owner of the technology.
The human capital has been well recycled, since the employee turnover has been quite high. Most of the former employees have found new jobs, and in many cases the employees have been able to utilize their experi-ence generated at Plexpress. Some of them became scientific advisers in pharmaceutical companies, one serves as a quality manager in a biomed-ical company, a few are now working as salesmen in the biotechnology field, and one scientists left abroad for postgraduate studies. One former manager continued as CEO in a drug development company, another works for a Biotech Start-Up Management entity, and one former man-ager began to import pharmaceuticals to the Nordic countries from Eu-rope. One of the employees was hired by ValiRx Plc to transfer the tech-nical know-how and related business operations to the new owner. Thus, the know-how created in Plexpress is dispersed to various instances.
When Plexpress was funded, the only structural capital it had was the patented technology that had been transferred from VTT to the com-pany. However, during the seven years that the company existed, it man-aged to develop processes for manufacturing kits, processes for analysis services, and a few readymade products that were launched. In addition to these trade secrets, the company owned TRACKPACK trade mark, software for data analysis, and analytical test equipment. Furthermore, the company managed to establish an Iso 9001 quality system, which was really useful in everyday operations of the company.

126
An important part of structural capital was the good reputation of the company: there were over 15 scientific publications about the technol-ogy, the company was interviewed by European Pharmaceutical Review, and it was selected as one of the YIC-funding companies by Tekes.
Unfortunately, most of the structural capital disappeared as the compa-ny got into financial problems. Due to limited resources, Plexpress could not keep its Iso 9001 system alive, and reputation was lost with bank-ruptcy. The key assets of the company, i.e. IPR, customer information, technical know-how and instruments, were acquired by ValiRx Plc that continues the commercial operations now in its daughter company Vali-Finn Oy located in Oulu.
The relational capital of the company consisted of collaborative relation-ships with its customers, mother organization and partners. The compa-ny conducted over 100 research and service projects with various organ-izations, and the collaborators included both companies and research institutes. Plexpress also managed to create joint service offerings with certain CROs and launch kits developed with partners. An important part of relational capital was customer satisfaction, which was recorded and became visible as an increase in orders. Although the story of Plex-press ended, the customer relationships are being transferred to the new owner of the technology that will continue offering the TRAC service and development of business relationships.

127
Chapter 4
Biotechnology in Italy
Taciturn Finns vs. passionate Italians; frosty Lapland vs. sun-kissed Tuscany; magical Northern Lights vs. mighty volcanoes. Finland and Italy, shadow and light, two European cultures that could not be more different.
But what about the treatment of intangibles? Is their value recognized and appreciated as differently as the two cultures approach life and its meaning? Could there be something in common; are there approaches that complement each other, perhaps?
Pursuing answers to these questions, the following chapter explores the recy-cling of intellectual capital in six Italian biotechnology companies. After an overview of the Italian biotechnology industry in numbers, the chapter takes stock of the companies’ intellectual legacy, element by element, and analyzes their fate after company failure.
The lack of a venture capital culture, weak university technology transfer poli-cies and problems with the implementation of public funding make an effec-tive exploitation of intellectual capital challenging. Fortunately, the Italian bio-technology sector has prerequisites to overcome these problems: a long history in life sciences, high-quality facilities and excellent expertise originating from universities.

128
Italy ranks as the third largest biotechnology country in Europe in terms of “pure biotechnology companies”. The turnover of Italian biotechnol-ogy companies has increased from 1.5 billion euro in 2004 to 7.05 bil-lion euro in 2013, a more than fourfold increase. The average turnover of a single company has remained fairly constant, rising from 14.4 M€ in 2004 to 17.3 M€ in 2013 (Censis, 2006; Ernst & Young, 2014). Between 2001 and 2013, the number of companies engaged in R&D in the field of biotechnology in Italy has more than doubled and the R&D investments have increased significantly – despite the global economic slowdown47 (Figure 4.1).
In terms of turnover, medical biotechnology (red biotechnology) is the most significant sub-sector of Italian biotechnology. More than half of the Italian biotechnology companies operates in red biotechnology, and, more importantly, these companies make up nearly 95% of the industry’s turnover. A vast majority of red biotechnology’s turnover is attributable to the relatively large pharmaceutical companies.
47 The numbers are collected from different sources and are therefore only suggestive.
Raiders of Lost Value, ETLA B267.
0
100
200
300
400
500
2001 2002 2003 2004 2005 2006 2007 2008 2009 2010 2011 2012 2013
Figure 4.1Number of biotechnology companies has increased.Biotechnology companies in Italy in 2001–2013.
Source: Ernst & Young, 2011–2014..
Pure biotech companies
All biotech companies
Figure 4.1 Number of biotechnology companies has increased. Biotechnology companies in Italy in 2001–2013.
Source: Ernst & Young, 2011–2014.

129
The lack of funding has resulted in a colourful bustle within the industry
Funding
Although Italy ranks third in terms of pure biotechnology companies, right after Germany and Great Britain, its biotechnology sector has re-cently suffered from a lack of funding and especially venture invest-ments. In 2013, Italian biotechnology companies were able to attract only 1.6% ($1.61 billion) of the total VC investments made in Europe; even small biotechnology countries such as Austria, Belgium, and Spain were able to attract 2–3 times more VC funding than Italy. The compara-tive fractions in other major biotechnology countries were 27.7% (UK), 11.7% (France), 10.5% (Germany), 9.2% (The Netherlands), and 8.4% (Denmark).
According to Ernst & Young (2013), the lack of funding has resulted in a colourful bustle within the industry. The amount of strategic alliances and sharing of resources and capabilities among companies have increased, and in 2013 the volume of alliances totalled €10 billion – €1.4 billion more than in 2012. The development is driven by agree-ments between large pharma and biotechnology companies, followed by an increasing amount of deals within the pure biotechnology industry.
In addition to strategic alliances, the amount and volume of mergers and acquisitions (M&A) have also shown a positive trend, and in 2013 there were 20 offers totalling €15 billion. Additionally, the M&A growth can be traced to a growing number of transactions among biotechnol-ogy companies with the addition of the trade between large pharma and biotechnology companies. However, in 2013 there were no Italian bio-technology companies among the 7 successfully closed initial public of-ferings (IPO).
Although the “commercial” investment field has quieted down, mainly as a result of the global economic turndown, Italian research groups have been successful in winning grants financed by the European Research Council (ERC). In 2013 Italian scientists received 46 ERC grants out of a total of 312. In fact, Italy was the second-largest grant receiver after Ger-many (48 grants), and followed by France (33), UK (31), and The Neth-erlands (27)48.
However, the Italian biotech sector seems to struggle with system-related public funding problems. Of the over €27 billion designated by the EU to Italy, the country was able to use only 28% of it (Ernst & Young, 2013).
48 Source: The Consolidator Grant 2013 scheme.

130
Moreover, the national public funding suffers from delays: The public administration debt to companies and development projects is estimated to exceed 50 billion euros, with the biotechnology sector’s share of these receivables comprising approximately 10 per cent49.
The Italian drug discovery pipeline is considered balanced and productive
In Italy the biopharmaceutical industry is also a major driver of the en-tire biotechnology sector. Out of the 400 biotechnology companies, 176 are involved in the development of molecules and therapies. The total volume of the therapeutic products is roughly 400, of which around 250 are in phases II or III clinical trials (Figure 4.2). In 2013 an important milestone was achieved as, for the first time, a product based on the re-search initiatives of a purely Italian biotechnology company was granted marketing authorization.
Big Pharma has been playing a major role in the life science sector in Italy, the fifth major pharmaceutical market in the world. Although the number of commercial offices of Big Pharma has remained stable, the
49 Several independent interviewees.
Raiders of Lost Value, ETLA B267.
67
108
108
46
46
126
126
123
123
0
100
200
300
400
500
Pre-clinicalphase
Phase I Phase II Phase III
Figure 4.2Italian drug discovery pipeline has products in all phases.Italian drug discovery pipeline in 2013.
Source: Assobiotec.
Totalpipeline
Discoveryphase Pipeline
Figure 4.2 Italian drug discovery pipeline has products in all phases. Italian drug discovery pipeline in 2013.
Source: Assobiotec (2014).

131
global trends have diminished the number of Big Pharma R&D sites, but some are still left. Out of the 400 therapeutic products being developed in Italy at present, 53% are developed in the subsidiaries of foreign compa-nies. While Italian therapeutic product development is concentrated in the beginning of the value chain (33% in phases II–III), the international companies are concentrating on late development (88% in phases II–III).
University spin-offs and start-ups in the Italian biotechnology industry
The Italian biotechnology industry is registering an increase of univer-sity spin-offs and start-ups. They usually originate from universities50 located in areas traditionally devoted to biotechnology and biomedical productions51. The distribution of the 9552 life science university spin-offs follows the regional diffusion of all university spin-offs: In 200953, out of the 873 university spin-offs, 50% of them took place in the north (50% of the biotechnology spin-offs), 28% in the centre (27%), and 22% in the south of Italy (23%).
However, the increasing number of start-ups has not resulted in the ex-pected increase in productivity, size, or profits of these firms (Bolzani et al, 2014). The level of entrepreneurial skills is considered low and the strategic planning perspective is often too short (Assobiomedica, 2012). In the biotechnology sector, university spin-offs in particular are often run by researchers without entrepreneurial expertise needed. Particu-larly in the start-up phase, researchers allocate their working hours be-tween academic and business careers, which can slow down or even hin-der the acceleration of the business development in the crucial first phas-es of the business.
The financial autonomy of university spin-offs is usually rather low. The required long period to develop a product for sale makes these compa-nies dependent on national and international research programme fund-ing. In practice, this results in situations where the success or failure
50 e.g., Milan Politecnico, Milan University, Turin Politecnico, Bologna University, Scuola Superiore Sant’Anna in Pisa, Udine University.
51 e.g., Piemonte, Lombardia, Emilia Romagna, Tuscany and Sardinia, Friuli-Venezia Giulia, Lazio, Veneto.
52 Source: Produzione, Ricerca e innovazione nel settore dei dispositivi medici in Italia. Assobiomedica 2012.
53 Source: Netval Report, 2011.

132
of implementation of publicly funded research programmes determines not only the time for development of a company, but also its potential to succeed. This dependency is often associated with very tight connections to the mother university – as a result, the financial independence of the start-ups is modest. It has also been implied that university incentives to promote spin-offs lie often in the need to show university dynamism, and that the efforts are more in the promotion of technology transfer than in developing entrepreneurial activity and selling innovative prod-
ucts. These reasons would logically hamper incen-tives for financial success.
Just as in Finland, the Italian biotechnology sec-tor is described as very dependent on public insti-tutions and the funding they provide, including
public operators in the health care sector. While these institutions are crucial for the development of the industry, in Italy they are also notori-ous for their overdue payments. In our interviews, Italian stakeholders indicated that at present outstanding public payments for the biotech-nology sector reach several billion euros, and in our case companies the delays in payments exceeded five years, with examples both in university spin-off companies and other companies.
The public sector has been criticized for its lack of industrial policies; fi-nancing is granted to projects without supporting the tangible and in-tangible infrastructures. These infrastructures are, however, commonly seen as crucial for the diffusion of information within the biotechnolo-gy sector, as well as between biotechnology and other industrial sectors.
Intellectual capital: examples from Italy
We took a deeper look into the intangibles of six Italian biotechnology companies that had been in distress, of which four were private spin-offs and two university spin-offs. These SME companies represented red bio-tech developing therapeutic molecules. They all utilized a biotech plat-form for the development work, and three of them also developed their platform as a product for research and business markets. Two of them had the ambitious goal of aiming at the customer markets, while others concentrated on business-to-business or business-to-research products.
The core expertise of these companies and their potential were impres-sive, yet our case company data showed that despite similarities in the companies’ potential for success, the outcomes were totally different, due
Public sector has been criticized for its lack of industrial policies

133
to things like strategic expertise, willingness to develop business exper-tise, orientation to the future, orientation of the driving passion, inter-nal mutual respect and peer support – things that seem totally second-ary when compared to the cornerstones of these companies, such as the business model, core expertise, funding and ownership, and the ecosys-tem of the company.
In all the cases a bundle of causes appearing in the same time period caused the distress. External conditions like the global economic crisis and the shift in the industry trends affected four of the companies, al-though those were not the only reasons for distress. What was more in-teresing is that the seeds for distress were embedded in the intangible capital of the company at its foundation in three of the cases. The hu-man, structural, and relational problems were recognized; leaving them unsolved for a multiple of reasons allowed the problems to cumulate and multiply, thus weakening the compa-nies’ ability to survive when the crisis hit with all its power.
The business legacy of these companies in the industry was impressive. All compa-nies contributed actively to knowledge cre-ation and dissemination within the industry. One of the companies man-aged to overcome the crisis with exceptional in-house development ef-forts. The R&D work of the other companies was carried out by other organizations: in two cases by the acquirer (Company A1 -> Company B1, Company A2 -> Big Pharma B2), in two cases by a new company (Company A3 -> Big Pharma B3 -> Company C3 (new), Company A4 -> Company B4 (new)), and in one case in the parent organization.
Three of the companies had their own “spin-offs”. This case group was also exceptional in the sense that three of them turned out to be early actors in a therapeutic molecule value chain leading to regulatory ap-proval/near approval. This is to be contrasted with the normal success rate from drug discovery to FDA drug approval of 1/3000–1/10 000 (Ra-jan, 2011).
Our conclusion is that intangible capital played a major role both from the survival point of view as well as through value creation. Due to our limited sample size the results are not comprehensive, but they do rep-resent findings that emerged when viewing these Italian case companies through the eyes of the intellectual capital framework.
Intangible capital played a major role both from the survival point of view as well as through value creation

134
Built on human capital
The founders’ core competence was the cornerstone of the companies. It was mainly complementary, partly overlapping, offering the found-ers the opportunity to support each other. The founders had had lead-ing roles in developing the platforms the companies used in the parent organizations, so it was not only the deep expertise of the founders in the specific area, but also their wider expertise on platforms that built up the core competence. The core competence was further strengthened by hiring R&D personnel usually from the parent unit, already acquainted with the core competence.
Biotechnology business expertise played a major role in the survival of the companies. In those companies where the founders had prior expe-rience from biotech business, external factors like the global economic crisis or changes in global trends of the industry destabilized the com-panies. In companies where the founders represented the biotechnology expertise and VCs’ business expertise, the lack of joint language led to a lack of biotech business expertise causing distress. The situation usu-
ally culminated in a “clash of clans” between biotech and business, immobilizing the survival and devel-opment mechanisms of the companies.
The soft entrepreneurship of the founders (part-time entrepreneurship)54 present in the university spin-offs affected the company’s development. If the
founders represented a complementary team, the development velocity was mainly affected by the operating culture inherited from the parent organization, whereas a non-complementary team turned out to be a re-source constraint for the company.
Attitude towards the future and the ability to visualize different sce-narios on the horizon and build accordingly flexible strategies were dis-tinguishing factors between the founders, all of whom were passionate about their companies. The future-oriented were more capable of deal-ing with the crisis and building after-crisis life than those whose energy was more focussed on the present, the every-day challenges.
54 Soft entrepreneurship refers to a setup where the entrepreneur does not have to take a final leap of faith, but may instead continue also in a salaried position, typically in a university or the equivalent.
The situation usually culminated in a “clash of clans” between
biotech and business

135
Relational capital expanding the possibilities
Ecosystem refers here to “a dynamic structure which consists of an inter-connected population of organizations. These organizations can be small firms, large corporations, universities, research centers, public sector or-ganizations, and other parties which influence the system” (Peltoniemi and Vuori, 2004).
The university spin-offs inherited a functioning ecosystem from their parent organization. It included not only the university with its facul-ties and non-profit organizations related to them, but also access to the scientific community at the national and international level. These eco-systems had permeable boundaries allowing a relatively free exchange of knowledge and personnel.
The private spin-offs did not have the same opportunity. The creation of their own dynamic ecosystem was a rare strategic choice: One company established an affiliate for talent pool purposes. A more common way was to establish a commercial network of R&D partners and suppliers/subcontractors.
Partnerships were built in all companies by participating in research projects, both national and international. Four of the companies had partnerships both with universities and with other companies. These partnerships served not only R&D activities, but also supported the fi-nancing of the companies.
Suppliers/subcontractors were used by three companies: Outsourcing was a strategic choice to focus the company’s own resources. The suppli-ers were both universities and other companies.
The activities of two of the companies were strongly dependent on the partner/supplier, and in one case the failure of the partner/supplier to deliver its results was in fact one cause for the company’s crisis.
Customer relationships in the common meaning were rare in these pre-revenue companies: Only one company actually had products to sell, and one was able to sell a licence for an existing patent application. However, it is important to note that some of the companies were able to create sales of intangibles: Instead of selling products or services, they sold a future in the form of milestones, licences of patents to be applied, as well as news.
The customer relationships of both the common and unconvention-al (intangible) forms of sales were based on founders’ contacts and the

136
ability to inform potential customers of the companies’ possibilities in a practical and reliable manner.
Stabilized in structures
The business models were seen as loose frameworks for companies’ ac-tivities. All case companies modified their business models along the life cycle of the company – some in a controlled way and some unnoticed as a reflection of the possibilities that were opened for the company. Par-ticularly within university spin-offs the entrepreneur did not always have business experience, and hence an outside business consultant was hired to build the business model. However, the consultant did not necessar-ily have deep experience from the field of biotechnology. In the end, the companies were forced to seek for justification of their business activi-ties from single and detached passages of the official business plan; as a result, the business plan did not match always real-life company needs.
The business models were also used as a tool for applying financing; however, the financing structure and ownership structure arising from venture capital were affected more by the biotech business expertise and the biotech-specialized VC contacts of the founders than the actual busi-ness model.
The financial structure was affected by the company’s origin. The pri-vate spin-offs usually had contacts to international biotechnology inves-tors. They managed to raise more equity from wealthier investors with more flexible conditions and more biotech business-supporting manage-ment than the university spin-offs, who were funded by local/regional investors with very limited risk-taking capacity and lacking biotechnol-ogy business expertise. Not even the Italian specialty state funding for professors starting a spin-off was able to help overcome the problems arising from these local funding arrangements. We, however, want to emphasize that at the time the university spin-offs were established, the public funding tools were under development and the kind of tools these companies would have needed did not exist.
There were frequent remarks on how national project funding did not work: Grants were awarded to the companies, but it took several years to get the money. Companies in a start-up situation for which the fund-ing was aimed had to arrange temporary funding from other sources to overcome this delay. The public administration debt to companies was said to be 80 billion euros. An extreme example of the consequences was

137
that one company was forced by their VCs to establish their headquar-ters in another country because the investors could not rely on the Ital-ian public sector for functional funding.
The ownership structure seemed to affect the performance of the com-panies significantly. In most cases the proportion owned by founders was 10% or less, meaning that the VCs with business backgrounds had the majority of shares. This kind of ownership structure seemed to cause a distortion in the biotechnology–business balance in the management of the company, and thereby incurred strategic so-lutions that hampered the company’s development.
Three of the companies went public to acquire fund-ing. IPOs were found to be challenging, because pri-vate investors have a long-term perspective in gain-ing a return on investments but public-offering investors a short-term perspective. The public ownership narrowed companies’ strategic op-tions significantly, especially when problems emerged.
Codified knowledge and practices were most commonly tacit, based on inherited procedures from the parent organizations. The problem with certifying good laboratory practices (GLP) or good manufacturing prac-tices (GMP) was the amount of time and other resources a certification required. Thus, when this type of certification was needed, companies cooperated with other companies that had the required status.
Patenting was seen as a major tool for protecting companies’ IPR, and the patent policy of the companies was aggressive. In the initial phase, most of the companies acquired patents/patent applications from their parent organizations. They also all filed their own applications, and about half of the companies got some or all their applications approved, while in oth-er companies the applications were still under the approval process when the crisis hit.
Patenting was seen as a financial value creator, both as a tradable product and as a supporter for financial negotiations. But the upkeep of the patents was costly, and some patents were abandoned when the crisis demanded expenses be cut. One learned thing that was taken to a new company was a more cautious patenting policy: patenting only when a financial outcome was seen, otherwise results were kept as trade secrets.
Academic institutions were seen as a potential resource for new technol-ogy. Some interviewers pointed out that the technology transfer from
The patent policy of the companies was aggressive
The technology transfer from academy to private sector was limited

138
academy to private sector was limited: They experienced the technology transfer business as concentrated only on patent policy.
The established company culture usually originated from the found-ers’ previous experiences. Low hierarchy and flexibility were regarded as supporting innovation and development activities. Human resource management was usually nourished by the founders’ passion, and the focus of HRM strategy was to emphasize commitment, highlighting fu-ture gains if the company was to succeed. Only a couple of the companies used ownership as an incentive for personnel.
Recycling
There were multiple ways as to how intangibles entered and left these firms. The types of recycling were affected by the phase of the company.
In the initial phase of a company’s life cycle, the common in-cycling methods were:
– knowledge in-cycling in the form of • core expertise and management expertise along with the founders, • method-related knowledge in forms of donated or acquired patents or patent applications, and
– tacit inheritance of the parent organizations’ • operating model and (codified) practices, • operating culture, • operating values, especially if the personnel was hired from the parent organization – this applied both to the founders and the VCs – and • personal contacts with other organizations (ecosystems, partnerships, informal contacts).
During their life cycle the companies actively developed those areas of intangibles they believed best supported the goal of the company, such
Recycling glossary
in-cycling = controlled acquisitions of intangibles into the companyout-cycling = controlled transfer of intangibles out of the companyrecycling = [someone] utilizing intangibles after crisis

139
as core expertise, or the expertise in supporting areas like administra-tion and financing. Of course, some intangible areas weakened – usual-ly when a company was exposed to an external threat and had to lay off personnel, as a consequence of the change in business model or in the partnership relationships, or as a consequence of the management val-ues, e.g. the tutoring of students required time and resources which took away resources from the development of a young company. During the lifecycle of the companies, common knowledge in-cycling methods in-cluded hiring personnel and participation in research projects and part-nerships. Common knowledge out-cycling methods were academic pub-lications, patent applications, and tutoring students.
After the crisis, the common recycling methods were knowledge recy-cling (personnel with the knowledge and experience gained during em-ployment or academic publications): knowledge-process package recy-cling (the old company’s development line with personnel) and process recycling (partnerships).
When a company is in crisis or facing failure it is “natural” to expect mergers and acquisitions and “releasing resources”; it is also “natural” to expect an R&D company to participate in research network projects or in publications. Thus, these recycling methods of the companies’ in-tangibles could be predicted. There were few, but only a few refreshing exceptions for these casual ways: One company created a talent pool or-ganization for future purposes and one company actually sold an invest-ment structure. We found it particularly interesting that the tacit inher-itance in the initial phase as well as the intangible recycling after crisis or failure seemed to be unplanned, with the exception of particular busi-ness arrangements – which seemed to be guided in most cases by per-sonal interests, not by the company perspective.
Conclusions
Despite its present challenges, the Italian biotech sector has strengths to overcome its problems: a long history of life sciences, often good facili-ties, and excellent expertise originating from the universities. Some of the hurdles have already been recognized, such as the lack of a venture capital culture, universities’ technology-transfer policies, and problems with public funding implementations. Other problems are being dealt with, such as improving the entrepreneurship skills of both the academic professionals and students through education.

140
In many respects the stories of the Italian biotechnology companies show surprising similarities with the much smaller and historically dif-ferent Finnish biotechnology sector companies. However, within the fates of Italian biotechnology companies we saw also interesting oppor-tunities that Finland lacks, and probably will lack at least far into the fu-ture. The most striking feature was Italy’s proximity to knowledgeable in-vestors and industry – the former due to geographical and probably also
mental closeness to science investors’ markets, and the latter connected both to Italy’s history of Big Pharma industry as well as to the nearby Swiss pharmaceuti-cal industry.
Our six cases revealed an intensive recycling of creat-ed intellectual capital, as well as creative solutions by
which the recycling was enabled using the above-mentioned opportuni-ties. Several of the cases turned out indeed to have created even signifi-cant value. However, we cannot rule out the possibility of a severe sample bias, and hence we can only conclude that the results from our case com-pany interviews indicate that a wider analysis of the intellectual capital of the sector seems warranted. There might be hidden value to discover.
Several of the cases turned out indeed to have created
even significant value

141
References
Assobiomedica (2012): Produzione, Ricerca e innovazione nel settore dei dispositive medici in Italia.
Assobiotec (2014): Rapporto sulle biotecnologie in Italia.
Bolzani, D., Fini, R., Grimaldi, R. and Sobrero, M. (2014): University Spin-Offs and Their Impact: Longitudinal Evidence from Italy (August 18, 2014). Journal of Industrial and Business Economics, 41 (4), 237–263. Available at SSRN: http://ssrn.com/abstract=2482184
Censis (2006): Italy Today: Social Picture and Trends, 2005. FrancoAngeli s.r.l., Milano.
Ernst & Young (2011): Italian Biotechnology Report. Bio in Italy. Report 2011.
Ernst & Young (2012): Italian Biotechnology Report. Bio in Italy. Report 2012.
Ernst & Young (2013): Italian Biotechnology Report. Bio in Italy. Report 2013.
Ernst & Young (2014): Italian Biotechnology Report. Bio in Italy. Report 2014.
Farmindustria (2013): Rapporto sulle biotecnologie del settore farmaceutico in Italia.
Farmindustria (2014): Rapporto sulle biotecnologie del settore farmaceutico in Italia.
Kulvik, M., Nikulainen, T., Peltonen, I. and Tahvanainen, A. (2012): Standpoints on strategies and future prospects of the Finnish biotechnology industry – compiled data from 72 company leader interviews. Etlatieto Oy Research Project Report: 16.4.2012.
Netval (2011): VIII rapport Netval sulla Valorizzazione della Ricerca nelle Università Italiane: Potenziamo la catena del valore. Maria Pacini Fazzi Editore.
Peltoniemi, M. and Vuori, E. (2004): Business ecosystem as the new approach to complex adaptive business environments. Tampere, Proceedings of the eBusiness Research Forum.
Rajan, R. (2011): Chapter 1: Doing More with Less: Front-loading Research and Development in Biotechnology. In Addison, E. and Husick, L. (eds.) Biotechnology Innovation: Doing More With Less. Managing Innovation in the Life Sciences. s.l.: The Johns Hopkins University, pp. 4–14.

142

143
Chapter 5
Blowing the Dust off Treasures – Extracts from 24 Stories
Our interviewees bring alive one of the key elements of intangible capital as de-scribed by Karl-Erik Sveiby: Knowledge shared is knowledge doubled. Despite past distress and sense of failure, our case company leaders were not only able to recognize the importance and value created in their companies, but also ca-pable of analysing the past to build the future.
This chapter summarizes some general patterns brought up by our interview-ees. Using Italian experiences as reference points and relaying Finnish company insights of over twenty interviewed experts we draw a map of the Finnish Bio-technology waters for others to navigate, to avoid banks and reefs discovered by these trailblazers.
The discoveries apply not only to individual entrepreneurs, but to the Finnish biotechnology sector as a community. To help uncover and salvage treasures being constantly created by our enterprises, this chapter proposes creating a special unit, a Company Refinery. With particular focus on the intangibles of companies in distress, its aim is sustaining and recycling these valuables in a best possible manner.

144
We have 24 different stories, each one filled with enthusiasm and disap-pointment. They have their own highlights and low points, and the va-riety of innovations described in these stories is extensive. One might think that they have nothing in common, but surprisingly the interviews revealed some patterns over and over again.
Thanks to the interviewees who shared and analysed their lost games, some generalizations can now be drawn. Thus, the misfortune of some can be taken as a legacy for everyone working in the biotechnology sec-tor. Learning from adversities definitely creates value.
Lesson to learn: Expanding the human capital towards sustainable entrepreneurship
Human capital in Finland
As in Italy, the basis of Finnish life science is in the excellent research conducted in universities and research institutes. In fact, Finnish re-search is considered some of the best in the world, as indicated by the largest number of citations per paper (Piispanen, 2011). But, of course, there is always more to learn.
In all cases, growth of human capital during the years was indisputa-ble. The growth in know-how could be identified in various areas, such as technology and process development, quality, patenting, regulatory practises, and financing and negotiation skills. Importantly, companies offered hundreds of academic researchers and students the possibility to see how things must be done in a commercial and regulatory compliant environment.
Human capital was the most prominent form of intellectual capital re-cycled. Although the closures caused a temporary unemployment pe-riod for many, most workers have now found new jobs in other biotech or pharmaceutical companies. Others returned to academia and a great deal ended up in such governmental organizations as Tekes, Academy of Finland, Tukes and Metla. Hence, the accrued human capital was dis-persed for the common good of the economy.
Figure 5.1 presents the levels of intellectual capital generated as well as recycled in some of the case companies of chapter 3. In line with findings from earlier and present interviews, the creation and recycling of human

145
Estimated human capital includes parameters such as new skills and knowledge, scientific and business experience, quality and regulatory know-how.Structural capital includes attribues such as patents and trademarks, processes, regulatory and quality documents and accreditations, records, developed software and data repositories, and company culture.Relational capital includes such issues as customer and supplier networks, scientific collaboration, relations to mother or-ganizations and financiers, and collaboration with other SMEs.
Source: Estimated by authors, scale: 1=not-at-all, 2=low, 3=medium, 4=high.
Figure 5.1 The level of intellectual capital generated by the company and the proportion recycled.
Raiders of Lost Value, ETLA B267.
0
1
2
3
4
Human capital Structural capital Relational capital
Generated Level of recycled
Figure 5.1The level of intellectual capital generated by the company and the proportion recycled.
Source: Estimated by authors, scale: 1=not-at-all, 2=low, 3=medium, 4=high.
Carbion Oy
Raiders of Lost Value, ETLA B267.
0
1
2
3
4
Human capital Structural capital Relational capital
Generated Level of recycled
Figure 5.1The level of intellectual capital generated by the company and the proportion recycled.
Source: Estimated by authors, scale: 1=not-at-all, 2=low, 3=medium, 4=high.
CNServices Oy
Raiders of Lost Value, ETLA B267.
0
1
2
3
4
Human capital Structural capital Relational capital
Generated Level of recycled
Figure 5.1The level of intellectual capital generated by the company and the proportion recycled.
Source: Estimated by authors, scale: 1=not-at-all, 2=low, 3=medium, 4=high.
CTT Cancer Targeting Technologies Oy
Raiders of Lost Value, ETLA B267.
0
1
2
3
4
Human capital Structural capital Relational capital
Generated Level of recycled
Figure 5.1The level of intellectual capital generated by the company and the proportion recycled.
Source: Estimated by authors, scale: 1=not-at-all, 2=low, 3=medium, 4=high.
Fibrogen Europe Oy
Raiders of Lost Value, ETLA B267.
0
1
2
3
4
Human capital Structural capital Relational capital
Generated Level of recycled
Figure 5.1The level of intellectual capital generated by the company and the proportion recycled.
Source: Estimated by authors, scale: 1=not-at-all, 2=low, 3=medium, 4=high.
Hormos Medical Oy
Raiders of Lost Value, ETLA B267.
0
1
2
3
4
Human capital Structural capital Relational capital
Generated Level of recycled
Figure 5.1The level of intellectual capital generated by the company and the proportion recycled.
Source: Estimated by authors, scale: 1=not-at-all, 2=low, 3=medium, 4=high.
Ipsat Therapies Oy
Raiders of Lost Value, ETLA B267.
0
1
2
3
4
Human capital Structural capital Relational capital
Generated Level of recycled
Figure 5.1The level of intellectual capital generated by the company and the proportion recycled.
Source: Estimated by authors, scale: 1=not-at-all, 2=low, 3=medium, 4=high.
Karyon Oy
Raiders of Lost Value, ETLA B267.
0
1
2
3
4
Human capital Structural capital Relational capital
Generated Level of recycled
Figure 5.1The level of intellectual capital generated by the company and the proportion recycled.
Source: Estimated by authors, scale: 1=not-at-all, 2=low, 3=medium, 4=high.
Plexpress Oy

146
capital forms the competitive backbone of Finnish biotechnology com-panies’ value creation potential (see e.g. Kulvik et al., 2013; Kulvik et al., 2015 with references therein). However, equally in line with our findings are the seemingly less pronounced positions of structural and especially relational capital creation and recycling.
Our estimation scale in Figure 5.1 for both creation and recycling has been 1=minor or not-at-all, 2=low, 3=medium, 4=high. It must be point-ed out that these estimations represent the opinions of the authors only, based on our collected data banks and authors’ insights into the biotech-nology industry. A person analyzing a single company may have a rather differing view.
Amplifying biotechnology entrepreneurship
Strengthening biotech business expertise training. Most Finnish com-panies were founded by professors and scientists with excellent academic backgrounds, but lacking business expertise. This led to the foundation of companies with little consideration of their usability, applicability and lead molecule manufacturing problems. It also delayed them in seek-ing help from business experts, thereby diminishing the possibilities for success. In Italy this lack of entrepreneurship combined with soft entre-
preneurship55 has been shown to slow down product development and prolong the return on investment time (see chapter 4).
This problem has been recognized both in Fin-land and in Italy. In Finland biobusiness cours-es are offered to natural scientists, and in Italy lessons in entrepreneurship are given to all ac-ademics, from students to professors. Yet run-
ning a biotech company requires particular business know-how, differ-ent from general business management. This was reflected in an inability to combine biotech and business expertise if the founder lacked previous experience from the business sector, and VCs from the biotech sector.
Furthermore, the challenges of scaling up processes for production sug-gests that productization and manufacturing principles should also be involved in this type of education.
55 Soft entrepreneurship refers to a setup where the entrepreneur does not have to take a final leap of faith, but may instead continue also in a salaried position, typically in a university or the equivalent.
“I learnt how to take care of difficult situations, and how to make a bank-
ruptcy with as little harm to personnel and various stakeholders as possible.”
An interviewee

147
Value from serial entrepreneurship. In Italy many of the interviewees mentioned that their present activities, i.e. new companies, would not have been possible without a prior failure and what they had learned from it; they emphasized the potential of serial entrepreneurship. Serial biotech management was also mentioned as a potential value-creating source.
Finnish entrepreneurs who have experienced bankruptcy have tradi-tionally carried the label of failure. However, the business expertise ob-tained by failure has begun to be more valued: Bankruptcy was in fact considered an educational experience.
Focus on strategic expertise and company dynamics. Strategic exper-tise was reported to be a key success factor both in Finland and in Italy. Biotech is an industry sensitive to trends determined by the relatively few big companies, and the ability to be able to monitor the horizon and proactively and reactively act according to the changes was a clear asset, particularly in hard times.
In Italian companies the founders’ prior business experience supported strategic management, which contributed to the investment level gained by the companies: Private spin-offs had multiple investments in compar-ison to university spin-offs.
Keeping the goal in mind when spending. Most Finnish interviewees brought up waste of resources, something they now have learnt to avoid: a product portfolio that is too large, heavy infrastructures in an attempt to have all activities in-house, effort put in planning, e.g. clinical trials even though they were very early in the development phase, and invest-ments in expensive marketing trials before the product was ready for it. In addition, money was sometimes used for premises and creating a prosperous facade. Our Italian interviewees mentioned this kind of waste of resources less often.
Common to both Finnish and Italian companies was an aggressive pat-enting strategy. Cost accrual could become critical if the company re-peatedly applied for patents without commercial exploitation in sight – however, something that was often demanded by the investor, who measured progress by the number of patents.

148
Lesson to learn: Attention to the industry structure
A short note on the dynamics of an industry
We have now looked at human capital in the light of our interviewees’ experiences. In the next section we will look at biotechnology as an [in-fant] industry sector. In order to be able to take full advantage of what we think aims at understanding the industry better, we need a framework on which to project our findings. Based on the 24 stories told, we apply Gunnar Eliasson’s theory of competence blocs.
Eliasson and Eliasson (1996) described the dynamic factors needed for the creation of a successful business concentration. We think the frame-work can be favourably applied also to the entire biotechnology sectors of Finland and Italy, as they are confined to geographical and financial limits within their countries. Eliasson and Eliasson (2002) defined five critical factors for success:
1. Inventors and researchers, who create new ideas and solutions2. Entrepreneurs and innovators, who recognize from all inventions
those which have commercial potential3. Investors and venture capitalists, who are able to identify success-
ful entrepreneurs, and are willing to fund start-ups and growing firms, as well as take on risks associated with such firms
4. A sufficiently developed capital market through which the inves-tors can exit their investments
5. Industrialists, who can expand the production [and marketing] of innovative products [and services] to an industrial scale.
Both Italy and Finland are strong in point one, and, as we have read in the previous chapters, entrepreneurship within biotechnology has also grown steadily during the last fifteen years. However, both Finland and Italy have encountered problems thereafter. We will now look at what the industry leaders have shared, particularly about the remaining three challenges of Eliasson’s framework.
Diversifying industry structure
Moving along the value chain in biotechnology requires more and more resources. Thus, a common feature for success is co-operation between smaller and larger companies, as well as between investors and compa-nies. This kind of co-operation is a win-win situation: The smaller com-

149
pany receives resources for its product, and the larger company acquires the technology together with the tacit knowledge tied to it (Rothaermel and Thursby, 2007).
Here the Finnish biotechnology structure has a weak link: It almost en-tirely lacks a supporting industry, hindering Finnish products from en-tering global markets. The Italian biotechnology landscape is more ver-satile: 75% of all biotechnology companies (87% of pure biotech compa-nies) are small56, 13% (9%) are of medium size, and 12% (4%) are large (Ernst & Young, 2013). Besides this, Italy has multinational subsidiaries: 15% of the whole biotech industry companies making 34% of all the bio-technology investments.
The lack of larger companies in Finland can also be seen in the funding structure. Finnish biotechnology companies are heavily dependent on a few public investors. This small number of actors is reflected in the man-agement of the companies: The boards of Finnish biotechnology compa-nies share a rather small pool of professionals.
In Italy there seems to be a larger number of potential investors available from local and regional to international investors. Also, the possibility to utilize the expertise of other companies is evident: Funding through strategic alliances and merger and acquisitions was 3.5-fold compared to the sector’s annual turnover in 2013 (Ernst & Young, 2013).
Long-term investment policy reaching beyond programme periods
Public funding for start-up biotech companies is regarded as crucial both in Italy and Finland; however, utilization of public funding strug-gles with some systemic issues in both countries.
EU funding is seen as an important source of resources for biotech com-panies still developing their products. Yet the average percentage of paid funds out of total allocated funds from the Commission was slightly over 50% in Finland and less than 30% in Italy (Ernst & Young, 2013).
While Italian companies struggled with delayed public payments (see Chapter 4), an important issue in the misfortune of biotechnology in Fin-land has, in contrast, been the investor policy. In 2004–2005, Sitra de-cided to give up biotechnology funding and published a new strategy fo-
56 We follow the OECD criteria on firm size, where small companies have less than 50 em-ployees, medium-sized companies between 50 and 250 employees, and large compa-nies more than 250 employees.

150
cusing, e.g. on India and Russia. The main domestic investor, declaring it would abandon the Finnish biotechnology sector, gave a strong message to both domestic and foreign investors. This economic drawback caused by changes in political winds (see Hermans et al., 2009) was the culmination
point for several of our interviewed companies. In hindsight, the domestic investors seemed to lack the expertise needed to understand the value cre-ation-process and timeline of biotechnology.
A similar phenomenon of understandable im-patience was seen in local and regional general investors in Italy: The lack of knowledge of the biotech business led to false profit expectations. However, international investors specializing in biotechnology not only had the knowledge, but
also the risk-taking capacity that local and regional investors lacked. To-day also Finnish companies have looked for and found necessary fund-ing and skills from abroad.
The objectives of the investors were reflected both in our Finnish as well as our Italian case companies. For example, in Finland the aim of the in-vestors seems to have been to mature the company enough to sell it, not in following up development of the product for markets. In our Italian cases the general financial situation originating from the global reces-sion affected also the investors’ liquidity, which put pressure on firms: The need to capitalize investments pushed some of the companies to-wards getting sold.
Lesson to learn: Developing relational capital from the bottom up
Customer relationships to be rediscovered
Most of the innovations in our cases were of a radical nature for the com-panies, requiring resources for the development work and as such lim-iting other activities in the companies. The short history of biotech in Finland meant that experience needed for customer relationships and marketing had not yet been accrued to be utilized by new companies. This could be seen in sometimes troublesome customer relationships. For example, customers were contacted at a late stage or the design of
“[The company] lives also thanks to public money. So the point is, I
think, that if you found a company and then you just use the company to drain public money, this is really
a fake, this is stupid.”
An interviewee

151
the product was not user-friendly. A customer basis that was too narrow turned out to be a problem for some case companies. However, of par-ticular interest is one interviewee who pointed out that in Finland, pub-lic and private funding could be obtained for research and development, but not for marketing, even though it is twice as expensive.
All Italian companies interviewed acted upstream in the red biotech value chain, aiming at filling a gap in the therapeutic palette; they had end-user contacts only in clinical trials, assuming they had entered that phase. The actual customer for most Italian cases was intended to be an-other company acquiring the lead products. This kind of customer ori-entation turned out to be sensitive to changes in global trends.
Networks needed to support viability
Benefits from co-operation. Finnish companies typically worked alone, with some university collaboration. Cooperation with other SMEs was rare. The firms participated in Tekes and EU programmes, but mainly for financial reasons and not so much as to create sustainable networks. Hence, the accrued relational capital was small. Italians, on the contra-ry, considered co-operation to be an important part of company culture, and they were active in networking; a majority was looking for collabo-ration and/or strategic alliances with universities and with other com-panies. The key element in networking was the number and quality of founders and owners’ contacts.
Supportive parenting. Finnish parent organizations’ support for com-panies was low within business, whereas university spin-offs got strong scientific support from their parent organizations, and could even act in the parent organizations’ premises, renting their equipment. Yet, the business value of this support was not significant. In Italy the situation was different. Private spin-offs received as a “dowry” the platforms they worked on, and sometimes also other necessary assets at very reasona-ble prices. University spin-offs benefited from the support of the parent organization, especially knowledge and personnel, throughout the com-panies’ life cycle – the universities were also co-owners of the company.
Universities as source of innovations for biotech industry
Versatile technology transfer. The Italians pointed out the important role of the universities as building the talent pool for the enterprises and developing new technologies. One of the pinpointed problems in tech-

152
nology transfer was the universities’ strategy of focussing only on com-mercialization of their IPR, the same problem being discovered in Fin-land (Kutvonen, 2014). A deeper co-operation and more versatile forms of technology transfer were missed by entrepreneurs.
Maturity to business. The division of labour between universities and the business sector in biotechnology is a fading line. In several of our Finnish cases the technology was not ready for commercialization. The company was established too early; more research done at the universi-ty would have been necessary to identify any faults before entering into the much more expensive company environment. However, the venture capitalists were keen on investing in biotech, and some academic found-ers were even prompted to establish a company after only one article in some of the leading scientific publications.
Capturing intangible value: a Company Refinery
Based on the value of learning points mentioned and recycling done by our case companies, we identified the need to systematically manage the intangibles also from a national point of view. To this end, we suggest establishing company refineries, or recycling centres, that are focussed particularly on failing companies. Their role is to assess research inten-sive companies’ accrued intangible capital, estimate their value-creation potential, aid the companies in sustaining and recycling as much as pos-sible of their intangible capital, and when needed manage the companies’ portfolios of human, structural, and relational capital.
Although the incentive for the refinery would be to support salvaging of value particularly into its country of origin, one key function would be to open channels of international funding and cooperation. The objective would be to create setups where the division between value flowing out and value remaining domestic would be better than at present.
Focus groups for the refinery. Such a Company Refinery should not be an entity between research and commercialisation (technology trans-fer office), but it should concentrate only on established companies that have a record of intangible capital development. However, the refinery could, and preferably should, as one of its services, offer both IPRs pro-duced by universities as well as knowledge, skills, and expertise that uni-versities can offer to companies as a service.

153
We have identified at least three different focus areas for the refinery. The first could be for a company that is not necessarily in distress but requires replenishment or refinery of its intellectual capital palette.
The second category could be companies that are in need of help, either regarding its value-creating potential or even simply financially. Such companies should be strictly evaluated both using classic financial meth-ods but also using metrics that give an assessment of the value creation and capture potential of the companies’ intellectual capital.
A third line of focus would be owners of companies in distress, having risk thereof, or wanting to get prepared for such occasions. The key issue would be to evaluate solutions through which the owners could secure ways of salvaging at least some of the [hidden] value-creation capacity of the companies’ intangible assets in case the company encounters seri-ous difficulties.
Tools for the refinery. In our analysis of the companies we have indicat-ed that Tekes has possessed such tools in the form of loan instruments with particular conditions in case of disruption or change of ownership. The re-activation of such instruments could be evaluated within the Finnish legislation, as it would be beneficial to implement such instru-ments as early as possible in a company’s value chain. When a company has already faced severe difficulties, the negotiation power is very low.
We want to stress the importance of the Company Refinery not being a place where failing companies go to get artificial life support. Instead, it is a professionally managed unit that has accumulated expertise and re-sources to sift out and support companies or pieces thereof that can be sustained, and have the courage and knowledge to let go where neces-sary. It was for this very purpose that we constructed the Probe Tool pre-sented in Chapter 6.
Organizing the Refinery. The Company Refinery must have sufficient and stable resources in order to be able to function sustainably. Due to the aforementioned lack of sufficient financial and venture markets in Europe, we think that the Company Refinery can include a public ac-tor, or even be managed by a public entity. The Company Refinery does not as such engage for long periods with any single company, but it must have channels to sufficient funding when such is needed for any compa-ny or recyclable component(s) thereof.

154
As per the definition, most of the Company Refinery companies are failing and are vulnerable. Our cases reveal several such fates. Hence, a Company Refinery must be transparent, add value for all stakeholders, and it must in a sufficiently trustful way be able to protect the company in distress from exploitation. The refinery should probably not have an ownership in the companies in order to avoid exercise of power and con-flicts of interest. It is equally important to protect the Company Refinery and thereby the companies from irrational actions – or a lack thereof – due to changes in political winds (see, e.g. Hermans et al., 2009; Kulvik et al., 2013 with references therein).
All the above being said, a company refinery in the form we have sug-gested is certainly not the only way of setting up such a player, but it could be a start in a new direction.

155
The Music Box
Applied research of intangibles – A composer’s look at the universe outside Orion
Ilkka Niemeläinen
So far the main focus of publicly funded research, at least in Finland, has been on tech-nological innovations, i.e. innovations that are describable and definable in terms of goals, structure, and costs, and which carry the wow factor: being able to produce a de-vice that does things no one has seen before. As a matter of fact, we have already cre-ated a lot of quite well-functioning gadgets and artefacts.
While technology has developed by leaps and bounds in the last couple of decades, in-troducing new innovations in our everyday life, human beings have not really changed that much. We still have the same instincts, senses, and physical abilities. Yet, in my ex-perience from the culture and arts branch, the need for multitasking abilities is increas-ing all the time, as the amount and complexity of processes that we need to control is increasing. The properties of new technology offering a continuously expanding uni-verse of features seem to override the basic idea of innovations: helping the user to perform his tasks.
In my opinion, more resources should be invested in user interface research and devel-opment. Technological innovations have reached a point where the focus should be targeted on the usability of the innovations, like the human-computer interaction. A key issue is that the innovation really meets the demands of convenience: Potentially helpful innovations should be accurately adapted with our abilities – or lack of abilities – in mind.
An all too familiar example is software with commonly used procedures and operations. The lack of standardization of working tools leads to frustration every time software is bought or updated: You have to learn to use your working tools over and over again.
Then there is the question of content. For example, in the arts and culture sector, the funding focus has been on hardware innovations, benefitting mainly the equipment manufacturers, operators, global net service, and entertainment providers. Yet the future problem will be the quantity of the material. Instead of creating new innova-tive gadgets for people to access as much content as possible as easily as possible, we should start concentrating on the development of the quality of the material. It is the only thing that ensures peoples’ interest in the long run.
There is also one interesting problem still to be solved: who captures the value of in-tangibles and how. A huge amount of audiovisual material is shared on the internet, irrespective of whether the producer of the content has wanted it to be there or not. For a professional producer this situation is unsustainable in the long run; professional content creators should get their fair share of the value created from their intangibles.
The importance of content is not an exclusive right for art and culture. It is, or it should be, the main starting point to all innovations. Instead of focussing on the tricks that your brainchild can do, you should think more of what is actually needed and how the end user can get the most out of the invention.

156
References
Eliasson, G. and Eliasson, Å. (1996): The Biotechnological Competence Bloc Revue D’économie Industrielle – n° 78, 4e trimestre 1996.
Eliasson, G. and Eliasson, Å. (2002): The Pharmaceutical and Biotechnological Competence Bloc and Development of Losec. In Carlsson, Bo (Ed.), Technological Systems and Industrial Dynamics. Kluwer.
Ernst & Young (2013): Italian Biotechnology Report. Bio in Italy. Report 2013.
Hermans, R., Kamien, M., Kulvik, M. and Tahvanainen, A.-J. (2009): The Effect of Technology Subsidies on Industry Strategies and Market Structure in Hermans, R., Kamien, M., Kulvik, M., Löffler, A. and Shalowitz, J. (Eds.) (2009): Medical Innovation and Government Intervention. Reconciling Interests To Create Stakeholder Value. ETLA and Kellogg School of Management, 2009: 184–225.
Kulvik, M., Tähtinen, M. and Ylä-Anttila, P. (2013): Business and intellectual capital development in financial riptide. Case studies of Finnish biotechnology and pharmaceutical companies dispersing into global value chains. ETLA Reports No. 17. Helsinki 2013.
Piispanen, T. (2011): Suomen bioala 2010–2011. Health Bio Annual Seminar in Turku 13.9.2011. Retrieved 20.11.2012: http://www.healthbio.fi/healthbio.asp?viewID= 320&newsID=1288
Rothaermel, F. T. and Thursby, M. (2007): The nanotech versus the biotech revolution: Sources of productivity in incumbent firm research. Research Policy 36 (2007): 832–849.

157
Chapter 6
Constructing a Recycling Probe
The share that intangible assets contribute to the market capitalization of com-panies has steadily been growing over the past few decades. The growth has been evident in an ever widening gap between the book and market values on corporate balance sheets. The newest estimates claim that intangibles account for a dominating 80 to 95 percent of the average market capitalization of com-panies.
Despite being a well-known problem, current accounting practices still fail to capture and quantify the value of distinct intangible assets in a standardized way. The problem is big enough for well established, large organizations that are able to provide comprehensive and fairly standardized documentation; for private pre-revenue start-ups the problem is enormous.
In the absence of revenues and other tangible artefacts of value, start-ups are particularly reliant – if not entirely dependent – on intangible assets as a basis for value generation. Unable to reliably convey information on the true value of the company to outsiders, the problem directly translates into challenges in obtaining funding, for instance.
To alleviate the information asymmetry problems, this chapter develops an in-strument – the Recycling Probe – which not only facilitates in the reliable as-sessment of current intangibles of a company but also helps to gauge its future value generation capabilities.

158
The intangible universe
Since the beginning of the 1980s, the difference between the market val-ue and bookkeeping value of companies has increased rapidly. Ocean Tomo (2014) evaluated the role of intangibles in total market capitaliza-tion (Figure 6.1). According to them, in 1980 the total market capitaliza-tion of companies consisted in practice of only the tangible book value. In 2001 the intangibles covered one-third of the companies’ book value, and the intangible information gap between market value and book val-ue was about 75% of the total market value.
“Within the last quarter century, the market value of the S&P 500 companies has deviated greatly from their book value. This “value gap” indicates that physical and financial accountable assets reflect-ed on a company’s balance sheet comprises less than 20% of the true value of the average firm”. (Ocean Tomo, 2014)
According to Ocean Tomo (Sherman, 2012), since 2001 the proportion of accountable intangibles has risen further, at the cost of a widening infor-mation gap. By 2005 the intangible value of total capitalization was more than 60% in all sectors and in 2010 it was estimated at 80–95% in most sectors. In particular, ICT companies attracted attention – the peaks in the difference seemed to happen when there was a breakthrough in ICT technology: First PCs, then the internet (Adams and Huibregtse, 2013).
Raiders of Lost Value, ETLA B267.
1732
6880 84
8368
3220 16
0
20
40
60
80
100
1975 1985 1995 2005 2015*
Intangible assets Tangible assets
Figure 5.1At present intangibles cover most of the companies’ market value.Components of S&P 500 market value (%)
* January 1, 2015.Source: Ocean Tomo.
Figure 6.1 At present intangibles cover most of the companies’ market value. Components of S&P 500 market value (%).
* January 1, 2015.Source: Ocean Tomo.

159
From value...
Such differences could not be explained with goodwill only: It seemed that the companies had something past tangibles and goodwill worth paying for. The development in ICT companies gave rise to the idea that there are both invisible financing and invisible assets that explain this difference (see Figure 6.2) (Sveiby, 1997). The tangibles were seen as the tip of the iceberg in the companies’ monetary value, while the intangibles represented the main body of that iceberg.
This kind of monetary-value-based thinking of intangibles reflects the past, as accounting always does. Our case companies were young pre-revenue companies lacking both a product and profitable financial dis-closure, but with value expectations situated in the future.
The value expectations of our case companies were mostly based on the potential to utilize intangible capital. This led to information asymme-try between the entrepreneurs and the investors, and different interpre-tations of the company’s potential value and future profit expectations. In fact, the monetary-based valuation of intangibles seemed to lead to situations where the potential of the intangible capital of the compa-nies could be implemented only sub-optimally. The monetary value of the intangibles varied unpredictably and could thus not be utilized as a
Raiders of Lost Value, ETLA B267.
Figure 5.2The knowledge balance sheet representing intangibles as“the invisible assets”.Visualization of the invisibles: intangible capital and invisible assets.
Source: Sveiby (1997).
Tangibleassets
Visiblefinance
Intangibleassets
Invisiblefinance
Short-term debt
Long-term loan
Shareholders’ visible equity
Shareholders’ invisible equity
Obligation
Cash
Accounts receivable
Computers, office space
Relational capital
Structural capital
Human capital
VISIBLE
INVISIBLE (under the
surface)
Figure 6.2 The knowledge balance sheet representing intangibles as “the invisible assets”. Visualization of the invisibles: intangible capital and invisible assets.
Source: Sveiby (1997).

160
source for evaluating recycling value of the case companies. Companies prefer a simple and easy evaluation approach to assess knowledge assets instead of converting knowledge assets into a common currency (Wu and Lin, 2013).
In our work, we used the definition of intangibles presented by Marr as our reference point:
“Together with physical and financial capital, intellectual capital is one of the three vital resources of organizations. Intellectual capital includes all non-tangible resources that (a) are attributed to an or-ganization, and (b) contribute to the delivery of the organization’s value proposition” (Marr, 2008).
Keeping in mind that our focus was in the recycling potential of failed companies, we concentrated particularly on intangibles with value crea-tion potential.
Definitions and classifications serve the purpose of measuring the in-tended aspect of the intangibles. In our study we used the common clas-sification of intangible assets into human, structural, and relational capi-tal to ensure that all relevant intangibles would be identified.
In our research, we define human capital as representing person-related things like skills, competences, and attitudes affecting the ability to act. Structural capital represents the company’s properties, internal struc-tures like the business model, ownership and financing, codified knowl-edge and practices, and established company culture. Relational capital represents external structures like customer and supplier relationships, partnerships, and companies’ ecosystems.
Even though we were able to identify a rather vast dissemination of knowl-edge in our case companies, the interviews gave us the impression that the companies would have had even more intangibles to offer. Thus, we need-ed a method to assess the value-creating intangibles of the companies.
... to valuable
With respect to the recycling of intangibles, the role of the intangibles in a company offers a promising approach. To rephrase the metaphor presented by Marr (Marr, 2006, p. 6), intangibles in a company can be compared to a tree, where intangibles, “the roots”, nourish the business processes, “the tree”, producing goods and profits, “the fruits”. Intangi-

161
bles are responsible for the future: In case of failure the intangibles offer a platform for renewal like the roots of the tree. So instead of hunting the value of all the intangibles, we should concentrate on hunting the valu-able, the value-creating intangibles.
There are numerous intangible assets and skills affecting the perfor-mance of a company, and each company has its own unique set of in-tangibles. The intangibles form networks and operate as a system (An-derson and Johnson, 1997). These intangibles create value through their interactions, interrelations, and interdepencies (Nahapiet and Ghoshal, 1998; Marr, 2008), and their value is de-fined by their relationship to the whole (Neill, 2007). While intangibles are im-portant value creators for the companies, they also create liabilities (Harvey and Lusch, 1999). In fact, the outcome of our case companies was affected by many cumulating chains of intangibles – components of human, structural, and relational capital, all mixed up and interacting with each other, showing both positive and negative vi-cious circles and balancing interactions.
This system of intangibles is usually a source of competitive advantage, and as such is challenging to copy and transfer
Raiders of Lost Value, ETLA B267.
Figure 5.3Success is a sum of several factors.Illustration of the components of successful strategic activities andthe effect of hiring.
Source: Authors’ case studies.
Successfulstrategicactivities
Hiringthe expert
Person withstrategicexpertise
Flexible,low-
hierarchysystem
SupportingR&D team
Figure 6.3 Success is a sum of several factors. Illustration of the components of successful strategic activities and the effect of hiring.
The transfer of intangibles: To optimize or not? A person is known to run successful strategic procedures. This has been possible not only due to the person’s strategic expertise, but also because the work environment has had a low hierarchy system with flexibility, and the person has had a supporting team. If this person is hired to a company with strong hierarchical culture and strict areas of responsibilities, the company’s ability to utilize the person’s strategic expertise will be less than the person’s previous history shows.Source: Authors’ case studies.

162
This system of intangibles is usually a source of competitive advantage, and as such is challenging to copy and transfer. To successfully transfer intangibles, the intangible system’s components with dynamic interac-tions have to be identified and evaluated. Figure 6.3 represents a com-mon situation, where human, relational, and structural intangibles form the recipe for success together.
If only one component of a system is transferred, a suboptimal result is gained unless the recipient organization is able to create an intangible environment optimal for success. This was actually seen in our case com-panies: After the failure of their original company, personnel became members of an acquiring company with a different culture. However, due to the change in culture the personnel were unsatisfied with their work, and consequently started to look for other jobs.
We introduce the preliminary idea of a recycling probe to evaluate com-panies’ intangible assets, with particular emphasis on aspects of recy-cling and intangible value refinement therein.
With this preliminary method, we aim at minimizing the uncertainty originating from information asymmetry in a company with lacking or contradictory market value by
• combining identified value-creating intangibles and their success characters with knowledge of ecosystem needs,
• studying the relationship between companies’ value drivers and intangibles in several and more nuanced ways,
• comparing companies, and• finding a method to help to find the best ”recycling fits”.
Starting from a balance sheet concept
Previous studies suggest that the assessment of intangibles is support-ed by using simple and easy approaches with models that are familiar to companies (Wu and Lin, 2013). The intangibles support a company’s processes. However, the intangibles do not create value in a linear pro-duction-type way – from intangibles through activities into outputs – but value is created in the networks of interactions between intangibles, and between intangibles and other assets (Marr et al., 2004; Allee, 2008).
The relationship between the balance sheet assets (property, tools) and liabilities (own equity and debts) is analogous with the relationship be-

163
tween the value drivers of the company (performance capacity and com-petitive advantage) and enabling intangibles (present own capital and fu-ture accountable capital). Based on this analogy, we build our “balance sheet” and its “chart of accounts”, represented in Table 6.1.
Value drivers channel the potential of enabling intangibles into out-comes. These value drivers are divided into the components of perfor-mance capacity and of the company’s competitive advantage. The en-abling intangibles consist of both present intangibles and intangibles whose effect will be or may be realized in the future. This structure rep-
Table 6.1 “Chart of accounts” for evaluating the potential of intangibles. “Chart of accounts” for evaluating the potential of intangibles, including examples of the contents. Note that the contents can vary between companies.
Source: Authors.
Performance capacity – knowledge capabilities • codified or qualified practices
– management capabilities • business, financial, IPR, HRM, juridical, strategic management
– marketing and sales capabilities • customer, market and sales related capabilities
– production capabilities • process development and manufacturing
– R&D capabilities related to intended outcome
Value drivers
Present own intangible capital – human capital • core competence, business expertise, marketing and sales expertise, production expertise and other expertise; attitudes and motivations
– structural capital • company culture and established customer loyalty
– relational capital • company’s ecosystem, partnerships and informal networks
Enabling intangibles
Competitive advantage – protective issues • IPR, trademarks and designs
– competitive drivers • product/service, cost-based competitive advantage, market niche, customer basis and customer relationships
– structural • ownership structure and financial structure
Future accountable intangible capital – accountabilities • investors’ expectations
– dependencies • on people, organizations and external factors
– external risks • changes in regulations, changes in global trends
– internal risks • lacking expertise, conflicts, hanging issues

164
resents the constant ontology of the “chart of accounts”. A more detailed classification can be defined according to companies’ needs, as in con-ventional accounting.
The identified and valued intangibles are entered into “intangible ac-counting”. We point out that the evaluations are company specific, but the utilization of common ontology and the modifiability of the chart of accounts according to the common ontology set up the basis for also comparing very different companies.
Evaluating value-creation potential
Intangibles differ from standard measurement-based economic research in that that perceptual measures satisfy the requirements of reliability and validity (Ketokivi and Schroeder, 2004) and are as good as or even better for evaluation than numeric measurements (Marr, 2008). Meth-ods with a general framework applied locally have been seen as strengths when assessing intangibles (Slaper and Hall, 2011).
Taking into account that intangible capital cannot be added up like fi-nancial capital (Roos and Roos, 1997), we chose to use the product of the intangible’s strength and its value-creating potential (related to the com-pany’s objectives) as the value representing the intangibles, both evalu-ated by us as external evaluators. This can be expressed as
V = S * P (1)
where V represents the value creating power of the intangible, S the strength of the intangible and P the value creation potential of the intan-gible in relation to company’s objectives.The strength of each intangible was assessed from 0–3 (0 = lacking, 3 = strong) and the intangible’s sig-nificance on value creation was assessed from -3 to +3 where “-” repre-sented negative and “+” positive impact.
Creating source documents for exports
The identification and assessment of intangibles and their dynamic rela-tions is the core activity when searching particularly for “hidden treas-ures” in a [failed or failing] company. We used the data from our semi-structural interviews for this purpose.
The common three-dimensional classification of intangibles used in the interview structure was valuable for comprehensively collecting all rele-

165
vant data. However, this classification seemed not to serve the purpose of analysing the development and interactions of the intangibles in particu-lar. The data showed that the business model, IPR strategy, R&D activi-ties, production, company culture, networking, customer relationships, and the financial structure of the company offered a better insight into the companies. We used this classification to collect company-specific families of intangibles that are linked together dynamically.
To this end, we constructed source documents using the themes of the business model, IPR strategy, R&D activities, production, company cul-ture, networking, customer relationships, and the financial structure. Each source document was a story relating what happened with intan-gibles connected to the specific theme (see Figure 6.4). We emphasized the development of the intangibles, dividing the story according to the company’s phase (the initial phase, during the life cycle, during the cri-
Figure 6.4 The source document logic is based on interdependencies. Here a trigger event affects directly one part of the system, and the effect is concomitantly expanded to other parts due to unavoidable interactions.
Source: Authors.
Raiders of Lost Value, ETLA B267.
Figure 5.4The source document logic is based on interdependencies.Here a trigger event affects directly one part of the system, and the effect is concomitantly expanded to other parts due to unavoidable interactions.
Performance capacity Present own intangible capital
Compentitive advantage Future accountable intangible capital
Source: Authors. Raiders ofLost Value,ETLA B267.
Diminishing key persons’ belief in the company
Weakening intellectualcapital
Initiation of ”cessation is the only solution” -strategy
Decreasing value of patent portfolio
Failure of the valuablepatent application
Other organization’sprocedures and attitudes
Diminished vc expectations
Diminishing dependency on other organization

166
sis, and after the crisis). Thus, we gained a description of a company-specific, unique set of intangibles, analogous to the companies’ unique expenditure structure.
We applied the “asset equals liabilities” rule familiar from casual ac-counting to describe the relationship between a company’s value drivers and enabling intangibles
(2)
where denotes value drivers and denotes enabling intangibles. The use of this rule originates from utilizing the analogy to chaos theory (the whole system seeks a predictable form even though the behaviour of single components cannot be predicted), operationalized through the basic accounting principle analogue that when the value creation poten-tial is evaluated component by component, the system of components must show a balance between value drivers and enabling intangibles. This rule was applied to all the company phases of the source document.
This “value drivers equal enabling intangibles” rule proved to be a useful tool for evaluating our own evaluation work. If this rule did not apply, then we were able to check whether we had picked all relevant intangi-bles from the source document and whether we had valuated the intan-gibles and tools in a way that was supported by the interviews.
How it goes: An example
We used Excel as a platform for the “accounting”. As a result of grouping, valuating, and designating intangibles and value drivers into our “book-keeping”, we created a database to be used for further analysis. The fol-lowing real case example shows the process.
First we collected the story. This example is chosen to show that although dealing with a similar issue (in this case patent applications) the char-acteristic of the intangible affects the outcome in the source document (here acquired vs. self-developed patent application). The identified in-tangibles related to IPR are underlined.
A company acquires patent application A, important to its ac-tivities when starting the company. This increases the company’s core expertise and also shareholders’ expectations of improved productivity and profits. However, the progress of the application is dependent on the selling organization. Due to an unfortunate
d eV V (2)
where dV denotes value drivers and eV denotes value enablers. The use of this rule originates from utilizing
the analogy to chaos theory (the whole system seeks a predictable form even though the behaviour of single components cannot be predicted), operationalized through the basic accounting principle analogue that when the value creation potential is evaluated component by component, the system of components must show a balance between value drivers and enabling intangibles. This rule was applied to all the company phases of the source document.
This “value drivers equal enabling intangibles” rule proved to be a useful tool for evaluating our own evaluation work. If this rule did not apply, then we were able to check whether we had picked all relevant intangibles from the source document and whether we had valuated the intangibles and tools in a way that was supported by the interviews.
How it goes: an example We used Excel as a platform for the “accounting”. As a result of grouping, valuating, and designating intangibles and value drivers into our “bookkeeping”, we created a database to be used for further analysis. The following real case example shows the process.
First we collected the story. This example is chosen to show that although dealing with a similar issue (in this case patent applications) the characteristic of the intangible affects the outcome in the source document (here acquired vs. self-developed patent application). The identified intangibles related to IPR are underlined.
A company acquires patent application A, important to its activities when starting the company. This increases the company’s core expertise and also shareholders’ expectations of improved productivity and profits. However, the progress of the application is dependent on the selling organization. Due to an unfortunate external mistake, the acquired patent application expires. Even though the company can still utilize the contents of the patent application, the value of the patent application diminishes and the value creation potential of its core expertise weakens. The shareholders’ expectations also decrease. However, the company was no longer dependent on the other organization on this issue.
Based on its core expertise, the company also develops a method and files patent application B, which improves the company’s competitive advantage. The filing of the application raises VCs’ expectations and strengthens team spirit in the company. Even though the application also supports the company’s reputation, the company does not allocate resources to promote the application and it is left hanging.
We collect the numerical information shown in table B using the 0–3 valuation for the strength, -3 to +3 to value creation potential, and using equation (1) where *V S P we get the following results .
Taulukon otsikko: Valuation of intangibles – an example

167
external mistake, the acquired patent application expires. Even though the company can still utilize the contents of the patent ap-plication, the value of the patent application diminishes and the value creation potential of its core expertise weakens. The share-holders’ expectations also decrease. However, the company was no longer dependent on the other organization on this issue.
Based on its core expertise, the company also develops a meth-od and files patent application B, which improves the company’s competitive advantage. The filing of the application raises VCs’ expectations and strengthens team spirit in the company. Even though the application also supports the company’s reputation, the company does not allocate resources to promote the applica-tion and it is left hanging.
We collect the numerical information shown in Table 6.2 using the 0–3 valuation for the strength, -3 to +3 to value creation potential, and using equation (1) where V = S * P we get the following results.
Table 6.2 Valuation of intangibles – an example. Valuation of intangibles utilizing the formula “value creating power” = “strength of the intangible” * “value creation potential of the intangible”.
Source: Authors’ case studies.
Initial: Acquisition of patent application A – acquisition of the patent application A 3*3=9
– increase in core expertise 2*2=4
– increase in shareholder expectations 2*2=4
– dependency on other organization 1*1=1
Patent application A
Initial
Patent application B
Lifecycle: Expiring of patent application A – expiring of the patent application A 3*-2=-6
– weakening in core expertise 2*-1=-2
– decreasing shareholders’ expectations 3*-1=-3
– lost dependency on other organization 1*-1=-1
Lifecycle – filing patent application B 2*2=4
– increase in competitive advantage 1*3=3
– increased shareholders’ expectations 2*2=4
– strengthen company spirit 3*1=3
– strengthening company’s reputation 1*2=2
– no dedicated resources to promote the application 1*2=2

168
Keeping in mind the “value drivers equals enabling intangibles” rule (2), we collect the numeric information to the “balance sheet” represented in Table 6.3.
This example describes only a small proportion of the intangible val-ue creation potential. After collecting and entering data from intangi-bles related to business model, IPR strategy, R&D activities, production, company culture, networking, customer relationships and the financial structure one can get a holistic view of the company.
Table 6.3 “Chart of accounts”– an example. Designating the identified and valued intangibles in the “chart of accounts”.
Source: Authors’ calculations / recycling probe engine.
Performance capacity 0
Competitive advantage 12
IPR patent appl. A – initial: acquisition 9 – lifecycle: expiring of application -6 patent appl. B – lifecycle: filing appl. B 4
Competitive advantage – lifecycle: appl. B 3
Reputation – lifecycle: appl. B 2
Value drivers total 12
Value drivers Value
Present own intangible capital 5
Core expertise – initial: improved by acquisition of appl. A 4 – lifecycle: weakened value creation potential due to expiring appl.A -2
Company culture – lifecycle: strengthening due to appl. B 3
Future accountable intangible capital 7
Shareholder expectations – initial: acquisition of appl. A 4 – lifecycle: expiring appl. A -3 – lifecycle: filing appl. B 4
Dependencies – initial: appl. A dependent on other org. 1 – lifecycle: exp. appl. A lost dependency -1
Internal risks – lifecycle: hanging appl. B 2
Enabling intangibles total 12
Enabling intangibles Value

169
How it shows: A case
The balance sheet – a cross-section of intangibles
A glance at the balance sheet that our tool creates gives us an impression of the company’s status – in this case just before the crisis. When look-ing at values produced by the model, the relations between the values are more important than the actual values. For an explanation on the catego-ries, see account scheme appendix at end of this chapter.
The values of the value drivers and of the enabling intangibles in our example are 92 and 92, respectively (Table 6.4) – equal according to the rule of balance. We believe that as in the casual accounting, this total value describes the company’s potential, and it can be compared to oth-ers of the same industry.
We can also see an imitation of SWOT in the numbers. In this case the performance capacity (67) scored higher than the competitive advan-tage (25). This relationship suggests that the company has used its intan-gible potential to develop internal processes at the cost of competitive
Table 6.4 First clues of the recycling potential and challenges. Balance sheet generated with recycling probe engine (more detailed description of chart of accounts in the appendix of this chapter).
01. Value drivers 92 01. Performance capacity 67
02. Management capabilities -7
04. Production capabilities 10
05. R&D capabilities 64
02. Competitive advantage 25 01. Protection 19 02. Competitive drivers 6 02. Enabling intangibles 92 01. Present own intangible capital 27 01. Expertise 20 02. Company culture 1 03. Networking 6
02. Future accountable intangible capital 65 01. Dependencies 32 02. Accountabilities 27 04. Internal risks 6
Source: Authors’ calculations / recycling probe engine.

170
advantage. This result reflects the case company’s strategy in concentrat-ing on R&D instead of doing business, causing the company to be de-pendent on external funding.
“The equity ratio” (present own intangible capital/future accountable intangible capital) in this example is 29%, meaning that despite the im-pressive core expertise, the company was dependent on other organi-zations’ good will. Finally, the “current ratio” (competitive advantage/accountabilities) is less than one here. Since the competitive advantage components describe a company’s actual present situation in the mar-ket (market niche, customer basis, patents, etc.) and accountabilities the shareholders’ expectations of the company’s future, the relationship be-tween them describes the possible existence of information asymmetry. In this case the present market situation scores lower than shareholders’ expectations, signalling this company might suffer from an information asymmetry, which might affect negotiations for further funding.
This kind of strategic choice is typical of young R&D companies struggling to overcome the information asymmetry by concentrating on R&D and thereby improve competitive advantage with aggressive patenting policy. The high scores in accountabilities show that at this stage the present in-vestors believed in the company and its future potential in the market.
R&D and expertise have high scores, showing that the most promising recycling targets can be found in the company’s R&D procedures and ex-pertise. Competitive advantage having a value above zero similarly indi-cates potential recycling material.
Company profile at a glance
With the company profile (Figure 6.5) showing both the initial phase and the life cycle phase, one can compare different value drivers and differ-ent enabling intangibles, as well as their development, and find further clues for value-creating intangibles. Also, the company profile graph is created automatically from the input of the basic, story-telling source documents.
In our example, the company profile confirms the concentration on R&D, which has yielded additional value to IPRs. This seems to be a consequence of increased expertise in the company. Thus, from the re-cycling point of view the most potential recyclables are IPRs and the combination of personnel (expertise) and R&D processes. In addition, R&D processes and expertise alone are worth consider recycling, even

171
though the stand-alone recycling of expertise means a loss of the inno-vation potential of the team, and the stand-alone recycling of R&D pro-cesses means a loss of tacit knowledge accumulated in the team during the development process.
The accountabilities have increased, representing elevated expectations of the investors. This indicates that the company’s investors are compas-sionate towards this type of company as well as the development in the company at the moment. From the recycling point of view, these inves-tors seem to understand the situation of these kinds of companies.
To evaluate the vitality of recyclables, the profile points to competitive drivers, production capabilities, and dependencies. In this case the competitive drivers show that despite the change of the company’s busi-ness model weakening, both the market niche and potential customer base still offer markets and potential customers for the company’s prod-ucts to come. The weakening of production capabilities was affected by the strong stake in R&D development, which indicates that the original production potential still exists. These both strongly suggest that there is commercial potential to recycling.
The dependencies were related to partnerships apart from the external funding. The partnerships were important for opening new production
Raiders of Lost Value, ETLA B267.
24
18
4
11
11
14
19
15
-2
6
3
14
2
1
9
-5
5
45
-5
-5 Initial Lifecycle
Figure 5.5Visualisation of company’s intangibles reveals the strengths and potential problems.Company profile showing the development of intangibles.
Source: Authors’ case studies.
04. Internal risks
02. E
nabl
ing
inta
ngib
les
02. F
utur
eac
coun
tabl
ein
tang
ible
capi
tal
01. V
alue
driv
ers
01.
Pres
ent o
wn
inta
ngib
leca
pita
l
02.
Com
petit
ive
adva
ntag
e
01.
Perfo
rman
ceca
paci
ty
02. Accountabilities
01. Dependencies
03. Networking
02. Company culture
01. Expertise
05. R&D capabilities
04. Production capabilities
02. Management capabilities
02. Competitive drivers
01. Protection
Potentialrecyclables
Potential problemsto be evaluatedbefore recycling
Figure 6.5 Visualisation of company’s intangibles reveals the strengths and potential problems. Company profile showing the development of intangibles.
Source: Authors’ calculations / recycling probe engine.

172
lines and developing the company’s ecosystem, which was not estab-lished at the time. On the other hand, the company had proven to be capable of independent R&D. Thus, the recycling of the personnel R&D package would most probably benefit from finding a way to utilize the partnerships.
If we look at the weaknesses – weakening of management, production, and competitive drivers combined with the increase in dependencies – these are minor compared to the company’s strengths. With manage-ment and biotech business expertise, the company might well have been able to overcome these hurdles.
There is potential in failure
When we compare these findings to what actually happened in the company, both the balance sheet cross section and the company profile match the image gained from our interview. When comparing the recy-cling potential to what actually happened, the model pointed out that there would have been a commercial potential for the personnel R&D development package – which, however, was not used.
The model also expanded the recyclable potential into investors and partnerships. Furthermore, it suggested that with some extra support the company could have been helped to overcome their problems and turned into a viable company.
Our case shows that this kind of evaluation is feasible also in companies with lacking market value or contradicting evaluations of market value.
This preliminary idea of a Recycling Probe shows flexibility needed in evaluating the recycling potential. The “chart of accounts” can be modi-fied against the company, keeping in mind the general guidelines. Also, the viewpoints used for source documents can vary; however, it is not necessary to follow the themes generated from our data – the main idea is to collect information on intangibles from viewpoints that give a ho-listic picture of the company’s intangibles.
We believe that this kind of thinking helps evaluators to assess compa-nies in crisis, and decide whether a company should be left to fail, wheth-er some components of the company could be recycled into other com-panies, or whether the company might have potential for renewal as an unbroken entity.

173
ReferencesAdams, M. and Huibregtse, S. (2013). Changing how you think about intangibles: Creating
value for your company through active intangibles management. [Online] Available at: https://www.youtube.com/watch?v=XfdbNRbDU5c [Haettu 23 02 2015].
Allee, V. (2008): Value Network Analysis and value conversion of tangible and intangible assets. Journal of Intellectual Capital, 9(1), pp. 5–24.
Anderson, V. and Johnson, L. (1997): Systems thinking basics. From concepts to causal loops. Waltham, Massachusetts: Pegasus Communications Inc.
Harvey, M. G. and Lusch, R. F. (1999): Balancing the Intellectual Capital Books: Intangible Liabilities. European Management Journal, 17(1), p. 85–92.
Ketokivi, M. A. and Schroeder, R. G. (2004): Perceptual Measures of Performance: Fact or Fiction? Journal of Operations Management, 22(3), pp. 247–264.
Marr, B. (2006): Strategic Perfomance Management. Leveraging and measuring your intangible drivers. First edition. Oxford: Elsevier Ltd.
Marr, B. (2008): Management Accounting Guideline. Impacting Future Value: How to Manage your Intellectual Capital. s.l.: The Society of Management Accountants of Canada (CMA Canada), the American Institute of Certified Public Accountants, Inc. (AICPA) and The Chartered Institute of Management Accountants (CIMA).
Marr, B., Schiuma, G. and Neely, A. (2004): The dynamics of value creation: mapping your intellectual performance drivers. Journal of Intellectual Capital, 5(2), pp. 312–325.
Nahapiet, J. and Ghoshal, S. (1998): Social capital, intellectual capital and the organizational advantage. Academy of Management Review, 23(2), pp. 242–266.
Neill, C. J. (2007): Systems thinking. Whole solutions for whole problems. Presentation at PSGV Open House, May 2007.
Ocean Tomo (2014): Annual Study of Intangible Asset Market Value from Ocean Tomo, LCC. [Online] Available at: http://www.oceantomo.com/2015/03/04/2015-intangible-asset-market-value-study/ [Haettu 11 03 2015].
Roos, G. and Roos, J. (1997): Measuring Your Company’s Intellectual Capital. Long Range Planning, 30(3), pp. 413–426.
Sherman, A. J. (2012): Harvesting Intangible Assets: Making the Most of Intellectual Property Management. Washington D.C.: The National Economists Club Hosted by NFIB April 5, 2012.
Slaper, T. F. and Hall, T. J. (2011): The Triple Bottom Line: What Is It and How Does It Work?. Indiana Business Review, 86(1).
Sveiby, K.-E. (1997): The new organizational wealth: Managing & measuring knowledge-based assets. s.l.: Berrett-Koehler Publishers.
Wu, J.-C. and Lin, C. (2013): A balance sheet for knowledge evaluation and reporting. Bangkok • Celje • Lubli, ToKnowPress.

174
01. V a l u e d r i v e r s 01. PERFORMANCE CAPACITY 01. Knowledge capabilities Qualified practices 1000 Good Laboratory Practise 1010 GMP (Good Manufacturing Practise) 1020 GCP (Good Clinical Practise) 1030 ISO standards 1040 Regulatory knowledge 02. Management capabilities Business management 1100 Business model 1110 Business management 1120 Financial management 1130 IPR management Other management 1140 Facility management 1150 HR management 1160 Juridical management 1170 Strategic management 03. Marketing and sales capabilities Customer related 1200 Customer relationship management 1210 Delivery management Marketing and sales related 1220 Marketing management 1230 Sales management 04. Production capabilities Manufacturing 1350 Manufacturing management Process development 1300 Process development management 05. R&D capabilities Compounds 1410 Compound development Methods 1400 Method development Projects 1420 Project management 02. COMPETITIVE ADVANTAGE 01. Protection Company related 1600 Trademark n 1610 Design n 1620 Copyright n 1630 Brand 1640 Trade secrets IPR 1501 Patent n 02. Competitive drivers Cost 1650 Cost based Customers 1700 Customer basis 1710 Customer loyalty Funding 1750 Financial structure Market niche 1660 Niche based Ownership 1760 Ownership structure Product/Service 1670 Product/Service based02. E n a b l i n g i n t a n g i b l e s 01. PRESENT OWN INTANGIBLE CAPITAL 01. Expertise 01. Core competence 2100 Founders 2110 CEO 2120 Employees 2130 Consultants 2140 Board 2150 VCs 2160 Company level
Account scheme appendix

175
02. Business expertise 2200 Founders 2210 CEO 2220 Employees 2230 Consultants 2240 Board 2250 VCs 03. Marketing and sales expertise 2300 Founders 2310 CEO 2320 Employees 2330 Consultants 2340 Board 2350 VCs 04. Production expertise 2400 Founders 2410 CEO 2420 Employees 2430 Consultants 2440 Board 2450 VCs 05. Other expertise 2500 Founders 2510 CEO 2520 Employees 2530 Consultants 2540 Board 2550 VCs 02. Company culture 01. Attitudes and motivation 2000 Company values 2010 Company spirit 2020 Employee engagement 2030 Management engagement 2040 Employee satisfaction 2050 Board engagement 2060 Promotion of internal entrepreneurship 2070 Promotion of creativity 2080 Promotion of flexibility 2090 VC engagement 03. Networking 01. Formal networks 2600 Ecosystem 2650 Partnerships 2660 Suppliers/Subcontractors 02. Supporting networks 2670 Informal networks 2700 Customer loyalty 02. FUTURE ACCOUNTABLE INTANGIBLE CAPITAL 01. Dependencies 01. Definite dependencies 3000 Dependent on a certain person 3010 Dependent on other organization 3020 Dependent on other know-how 02. General dependencies 3030 Dependent on regulation 02. Accountabilities 01. Accountancy for 3100 VC expectations 3110 Shareholder expectations 3120 Customer expectations 03. External risks 01. Environmental 3200 Global trends 04. Internal risks 01. Unfinished processes 3220 Drug molecules before regulatory approval 3230 Patent applications before approval 3240 Hanging patents 02. Lack of key expertise 3300 Lack of business expertise 3310 Lack of funding expertise 3320 Lack of resource management 3330 Lack of strategic management 03. Mismanagement 3340 Negative company culture

176

177
Chapter 7
Final Remarks
This book was inspired by dreams.
During our decades-long careers we the authors have made hundreds of in-depth interviews with key players in biotechnology. We have interviewed rook-ies in the field, as well as players that have gone through a lot – the first and the last being the very same person, but with time in between. We conducted our first interviews soon after the change of millennium, and the last ones in February 2015.
We have found an industry full of extremely high ambitions as well as heavy drawbacks. People in biotechnology do not seem to give up. They are passion-ate and they have dreams.

178
Still alive: Biotech in Finland and in Italy
A company is generally considered to be a failure in case of small or lack-ing profits, delayed, smaller than expected or lacking returns on venture capital investments, or in case of bankruptcy. Massive layoffs of the per-sonnel are also considered a sign of potential failure.
Biotechnology seems to carry the label of an “industry of failures”. It is true that returns on investments have been delayed – generally, the de-velopment of a biotech product from idea to revenues is 10–15 years. It is also true that biotechnology, especially drug development, has been an industry of risks: Only one in 3,000–10,000 therapeutic molecules turn out to be a success. Still, biotechnology is seen as a provider of the fu-ture. We have taken a closer look in two countries: What is the situation in this sector today?
Despite the global economic slowdown, the turnover in Italian biotech has remained stable and, in fact, the turnover of red biotech has even in-creased. In addition, R&D investments have been increasing since 2012.
The number of biotech companies has more than doubled between 2001 and 2013, yet the failure rate has been higher than in Finland.
As we described in Chapter 2, biotechnology has not died out in Finland either. Actually, the opposite has
occurred: With added value-creating capacity rising from 14 million to 95 million euros between January 2000 and December 2012 and a year-ly growth corresponding to 17,2 percent, the sector seems to live up to expectations. But there were failures too – not as many as in most other industry sectors, but failures all the same.
However, companies disappeared but not people or know-how, and not always even the original products. How could ideas and intangible as-sets be so resilient when there were well-documented company deaths?
European strength: Dealing with failure
In Europe, failure is regarded as something closer to shameful. Failure stigmatizes. You are not offered a second chance, and that’s why failure is a taboo. However, we made a fascinating finding, and it seems that there is more to it.
Companies disappeared but not people or know-how

179
We were able to trace and interview leaders of eighteen Finnish and six Italian biotechnology companies that have all received public monetary support for their R&D, but which have thereafter been regarded as aban-doned, failed, or virtually vanished from the map of biotechnology com-panies.
Our bold assumption was that value is created both in successful compa-nies and in failed companies. A significant share of such value is within intangible assets, such as scientific and technological expertise, experi-enced personnel, networks and contacts formed, and global recognition – and that intangible value remains valid even after company shares be-come worthless.
When preparing for this book, we usually cold-called the entrepreneurs. However nicely we put it, our message was clear: We wanted to have an in-depth interview about their failure – we wanted to dig up their loved one from its grave and give it a second look. The initial reaction could seldom be described as enthusiastic, but, to our amazement, virtually all Finnish entrepreneurs agreed to our two-hour interview request, and half a year later we had much of a similar experience in Italy, yielding a total of 24 interviewed companies.
However, the closest we came to an in-terview in the US was one response: “I’m not sure I’m comfortable with that”. Even though we were playing on European home ground and are dealing with single cases only, the result of 24–0 inspires some reflection. We ask our-selves whether in our raiding we have found by mistake one more hid-den treasure: a European way of looking at failure?
To share shame for the sake of common good might not be only Finnish-Italian, but something rather European. It goes deep into our history of attitudes and values concerning society: It is not a Wild West where the strongest individuals survive, but a different kind of society where com-mon good is seen as one resource of sustainability – typically reflected through our educational and health care systems.
Europe’s strength might paradoxically lie exactly in its business play-ers’ attitudes towards mistakes and failures. In hindsight, we feel that all 30 entrepreneurs we interviewed had a team spirit that outweighed the shame of failure. And, in fact, we are not convinced about that shame factor either.
Europe’s strength might paradoxically lie exactly in its business players’ attitudes towards mistakes

180
The readiness to transparently analyse a lost game in addition to con-centrating on the next one was, if not else, interesting. Even though the interviewees were not satisfied with the end results of their companies, they proudly presented their work. We think this might reflect inter-viewees’ deeper insight into the created value of biotechnology, and an untapped resource of future value creation potential in the form of ac-cruing – well, intangible capital.
We interpret our findings as telling us about a more nuanced difference between the US and Europe towards failures and mistakes. We think the scores might reflect differences in attitudes that in part are cultural, and hence deep-seated. We do not think they can be changed, just as we can-not create a European market that would be comparable to the dyna-mism of the US business environment, ready to churn and grind what-ever is fed into it. The US will sustain its overwhelming competitive ad-vantage into any foreseeable future.
Creating value...
... takes time
As we have argued in this book, the period from lab bench to market is exceptionally long within biotechnology – far beyond most technology industries. The development process in biotechnology resembles the pro-cess for radical innovation: New knowledge, new technology, and pos-sibly new markets are acquired in an unpredictable, iterative, long-term – usually at least 10–15-year – process. The radical innovations in bio-technology seem to be method related and extremely valuable for pro-ducers, but the end-result shows only incremental improvement for the end-user (Nightingale and Martin, 2004; (Hopkins et al., 2007). Piergio-vanni and Santarelli (2010) point out that medical development consists of incremental improvements with only random breakthroughs based on R&D. This is true not only for drug development57, but also for white [industrial] biotechnology58, as well as green [plant-based] biotechnol-ogy59. Creating value takes time.
57 See e.g. Hopkins et al., 2007; Hermans et al., 2009 with references therein.
58 See e.g. Kircher, 2010.
59 Hermans et al., 2006; Hermans et al., 2007.

181
... and money
It is important to realize that no traditional risk funding vehicle can withstand funding periods stretching even beyond 10 years. Biotechnol-ogy business simply has a compatibility issue with risk funding. In hind-sight it seems very understandable that both parties have needed re-ad-aptation; the biotechnology sector requires particular, different funding concepts. Funding and capital markets that were further along the learn-ing curve have been able to offer both capital and skills that outperform less experienced local entities.
... and work across borders
Patient and innovative funding seems to be an inherent requirement within the biotechnology sector. All our interviewees also stressed the importance of smart capital, i.e. knowledge and networks in addition to resources. In a small economy lacking what Eliasson describes as the industrialists, that is, a supporting industry and a strong sector-knowl-edgeable investment environment, smart capital is virtually impossible to attain solely from domestic actors. Hence, cooperation with interna-tional, especially large players is a prerequisite, and consequently owner-ship also has to be divided between domestic and international players.
The domestic industry is facing two virtual borders: the national border and the chasm of discontinuity when a company fails but there is still value to be captured.
The national border is partly a problem of metrics, as our statistical anal-ysis is confined mostly to data from within the country. But it is also a challenge of ownership.
The discontinuity chasm can be a black hole that failing companies are not able to cross. To prevent the loss of all companies, a small, open [and distant] economy needs to put emphasis also on the art of falling. It is evident that virtually all biotechnology entrepreneurs are extremely dedicated to their cause, and, as it seems, often for a reason: As we have seen, some failing companies hide true treasures, and most of them in-deed have more than residual value-creation potential. Most entrepre-neurs are ready to go on despite stumbling.

182
Created value...
The interviewees in both countries analysed their successes and mistakes, and shared learning points that they had accrued when going through the failure of what had most often been their true passion. Thus, the wounds were there alright; however, as indicated, so also was a surpris-ingly clear will to build on the past, with a spoken motivation of whether it could benefit the biotechnology sector.
However, there was no single setting. That is why we shared also differ-ent stories instead of only means, medians, and regression analyses – we try to recycle the learning points and reflections provided by the inter-viewees.
... has commercial value despite failure
In 4 out of the 18 Finnish companies we have not been able to identify any direct, commercial value-creating recycling of the original innova-tions. In 3 companies the intellectual capital has been recycled to active companies, but for various reasons we have not been able to identify any value-creating activities around the original innovations or their suc-cessors. The intellectual capital of the final cohort of 11 companies has evolved into several projects within a total of 11 companies. See figure 7.1 for a detailed description of the companies.
... but is diluted by ownership
Based on the interviews, companies’ webpages, internet searches, patent analyses, and our own data banks, we estimate Finnish-originated bio-technology innovations and their successors to play a central role in 11 out of our original 18 companies, both abroad and in Finland. In addi-tion, we found that Finnish ownership is at least to some extent still pre-sent in several of these companies, thus confirming the Finnish roots. However, in most cases the Finnish ownership has been heavily diluted, if not totally lost.
Interestingly, in some cases the original company idea has virtually dis-appeared, but its relational capital navigated new options for the ven-ture capitalists involved; see, e.g. CTT-Karyon and Fibrogen. Value is found not from the original direction, but from a path nearby. Without the original steps, this value might, and probably would have, remained undetected.

183
Tracking the fate of the 24 companies revealed that several companies had simply died, but the intangible assets of others had indeed been re-cycled, and some were alive in more or less their original form – some in new ownerships, while others had simply moved abroad and were there-fore not captured by our traditional industry-analysis approach.
However, it seems that at some point the original domestic ownership deteriorates, and we are no longer able to retain a value-capture ability that would parallel the locations of the risks associated with high tech-nology development – we conceive a detachment of returns from risks. In a small, open economy such as Finland this risk could be realized through an imbalance between supporting a very high educational lev-el through free education, thereby ensuring high-quality research that produces innovations, public support to early-stage companies, and the ability to retain at least some of the value-creation potential of the creat-ed companies within the country to support the continuation of free ed-ucation and public support. If the companies’ value is mostly lost abroad, there is an imminent risk of a lost sustainability.
Capturing the intangible value...
Cooperation across borders, working with large international companies [preferably through their local hubs], smart public funding for early-stage companies, evergreen biotechnology dedicated funds, and intro-ducing international corporate venturers to the Finnish market through forerunner companies are some of the suggested tools to promote our biotech industry60. Most probably, we need to work with a balanced mix of all of these tools – just as the biotechnology companies themselves try to do with their mix of human, relational, and structural capital.
We claim that, at least in the field of biotechnology, Finnish science is in-deed capable of producing both extremely high-quality results as well as relevant innovations. Moreover, our innovation system – with Tekes, the Finnish Funding Agency for Innovation in front – is capable of nourish-ing these innovations towards products with clear-cut market potential.
We think the key challenge is to capture a slightly larger share of the cre-ated value stemming from Finnish-originating innovations, and to this end we have in Chapter 6 presented a tool by which the value-capture potential can be evaluated and intellectual capital refined, recycled, or, when necessary, left aside.
60 For a further discussion of presented alternatives, see Kulvik et al. (2013).

184
... underlines recycling as a source of future value creation
In the US the financial and venture markets can absorb much of the val-uable items worth recycling. In most European countries we lack such a dynamic, large, and, maybe most importantly, knowledgeable market, and hence we need a specific entity that builds upon the knowledge and learning points that can be identified from earlier experiences. Some of this experience we have tried to collect for our Probe Tool in a system-atic way.
Much of this value has escaped us in our earlier research on Finnish bio-technology, at least partly because we made the mistake that was made by so many others too – we took a perspective that was too short. The created value may burst into bloom even years after the exit of a compa-ny. We have omitted to follow the paths of the created intellectual capital, not realizing the constant recycling so evident now in hindsight.
That being said, we claim there is much value to be captured. This is actu-ally about how to make the best out of a bad situation, how to fall softly in order to be able to rise again. It is un-sexy, virtually an unknown field with little research explorations – a dark side of the moon. But we think it’s also extremely important to recycle the value that has been created. Small economies cannot afford constant blood-letting.
Knowledge seldom disappears, be it tacit or structural. Failures even in biotechnology are surprisingly seldom technical, i.e. final failures; often the basic idea has viability and hence there is material to recycle. The bio-technology community is typically small, networks are intense, and peo-ple circulate. Even the funders are relatively few and share information.
As seen in our cases, recycling was not coordinated: A severe crisis scat-ters attention from managing the entire company to finding personal-level solutions. However, there seems to be value hidden in the intan-gible capital of failing companies also; and such value might be worth assessing – and capturing, when possible – in a systematic way. To deal with this challenge, we proposed in Chapter 5 the establishment of a re-finery, a unit to assess companies with forthcoming crises.
This book has told the story of our raid, and of the treasures of lost val-ue – hidden from public perception – that we found in 24 once-failing or failed biotechnology companies. Tables 7.1 and 7.2 summarize our findings.

185
Table 7.1 Value estimate of the Finnish case companies.
Biofons
Bionobile
Carbion
CTT-Karyon1
CNServices
Fibrogen Europe
GeneOS
Histola Research
Hormos Medical
Inion
Ipsat Therapies
Juvantia Pharma
Medicel
Medipolis GMP
Novagenesis
PlexPress
Unicrop
Where we started
BioNavis Oy
BN Products & Services Ab Oy
Glykos Oy / Tenboron Oy
Isogenica (UK) / KC-Holding 3 Oy
–
Fibrogen Inc. (US)
–
BioSite Histo Oy
QuatRx Pharmaceuticals (US) / Forendo Pharma Oy
Inion Oy / Naton
Synthetic Biologics Inc. (US)
Santhera Pharmaceuticals (CH)
Euformatics Oy
MedipolisGMP
Novagenesis Foundation (US)
ValiFinn Oy
Agragen Oy
Where we landed
Turnover in 2013: € 992 000
Turnover in 2012: € 93 000
Turnover of Glykos in 2012: € 3.34 M
The IPR of CTT-Karyon was sold for € 2 M + 20% of Isogenica’s shares2
–
Market Cap of Fibrogen $1.59 B (3/2015)
–
Turnover in 2013: € 147 000
QuatRx: Peak sales estimate $ 495 M in 20173. Forendo Pharma: Upfront license fee $12.5 M, milestones pay-ments up to $45 M, commercial milestone payments up to $260 M and tiered royalties4.
Turnover of Inion Oy in 2013: € 4.157 M
IPR sold for $ 20 000 to Swizerland5 and landed finally to Synthetic Biologics6. Market cap of Synthetic Biologics $ 217.54 M (3/2015)
Market Cap of Santhera Pharmaceuticals CHF 478.4 M. (Note: Juvantia’s IPR seem to have no significant role in the company value)
Turnover in 2013: € 198 000
Licencing agreement value € 5.3 M7
No information available
Aquisition price € 75 0008
No information available
Value estimate
Table 7.2 Value estimate of the Italian case companies.
6 case companies
Where we started
10 products, 1 search engine in further development; legacy of the 6 companies carried on in 13 companies.
Where we landed
€ 1.05 billion9
Value estimate
1 Includes the original companies CTT Cancer Targeting Technologies Oy and Karyon Oy.2 Source: Interview.3 http://www.fiercebiotech.com/special-reports/osphena-first-its-kind-treatment-painful-intercourse. Retrieved 1.3.2015.4 http://forendo.com/forendo-announces-us-licensing-fispemifene-apricus-biosciences/. Retrieved 1.3.2015.5 Source: Interview.6 See, for example, https://register.epo.org/application?number=EP07765926. Retrieved 1.3.2015.7 http://www.gabionline.net/Biosimilars/News/Bioton-and-Medipolis-sign-insulin-analogue-technology-licensing-agreement. Retrieved 1.3.2015.8 http://m.londonstockexchange.com/exchange/mobile/news/detail/12239221.html. Retrieved 1.3.2015.9 No information regarding value for one company, as well as the legacy of one company in phase I, traceable value of four companies based on available information
such as yearly turnover, market cap estimates, licensing or other similar agreements, company or product ownership sales, product sales estimates, IPO information, etc.

186
Believing in the mission
Finally, a word about Tekes, the main public financier in Finland and en-vied by several of our Italian biotechnology colleagues. Despite the fact that TEKES is also the one funding this raiding project and we hence could be regarded as biased, we think our last story deserves to be told.
Tekes’ mission is “to promote the development of industry and services by means of technology, innovations, and growth funding”. In the 1990s, the biotechnology sector was defined one of Tekes’ focus areas, and Tekes was indeed successful in its operations, as virtually all Finnish biotech-nology companies have received critical early-stage funding from Tekes.
However, Tekes was put under public and political pressure during and after the burst of the biotechnology bubble, as well as later, once Finn-ish biotechnology companies started to fail. Despite changing political winds, Tekes was able to withstand the gales of critique: Tekes followed its strategy and continued to fund the biotechnology sector.
In the light of our findings, it seems that by remaining robust and reli-able Tekes, in fact, was able to contribute to the creation of almost sur-prising success. Despite difficulties in sustaining Finnish ownership, the biotechnology sector has been able to increase its value-creation capac-ity [within Finland] with a pace exceeding the industry average by many times. Moreover, the intellectual capital in many companies that must have surely been classified as plain failures in Tekes’ statistics – not to mention our own statistics – has not only survived despite company fail-ures, but indeed even created value beyond all expectations.
If we interpret Tekes’ mission for biotechnology correctly, by defining it as a tap on the Finnish biotechnological science base to create value added, well, then, we are pleased to be able to conclude this book by con-firming:
Mission accomplished!
187
References
Hermans, R. and Kulvik, M. (2009): Risk and Return of Stringently Regulated Drug Development in Hermans, R., Kamien, M., Kulvik, M., Löffler, A. and Shalowitz, J. (Eds.) (2009). Medical Innovation and Government Intervention. Reconciling Interests to Create Stakeholder Value. ETLA and Kellogg School of Management, 2009: 151–183.
Hermans, R., Kulvik, M. and Nikinmaa, H. (Eds.) (2007): Biotechnology as a competitive edge for the Finnish Forest Cluster. ETLA series B227.
Hermans, R., Kulvik, M. and Tahvanainen, A.-J. (2006): The Biotechnology Industry in Finland. In Hermans, R. – Kulvik, M. (Eds.) (2006): Sustainable Biotechnology Development – New Insights into Finland, ETLA series B217.
Hopkins, M. M., Martin, P. A., Nightingale, P., Kraft, A. and Mahdi, S. (2007): The myth of the biotech revolution: An assessment of technological, clinical and organisational change. Research Policy 36, 566–589.
Kircher, M. (2010): Discussion Paper – Session Trends in Technology and Applications, OECD Workshop on “Outlook on Industrial Biotechnology.” OECD Working Party on Biotechnology, Vienna, Jan. 13–15, 2010.
Nightingale, P. and Martin, P. (2004): The myth of the biotech revolution. TRENDS in Biotechnology, 22(11), pp. 564–569.
Piergiovanni, R. and Santarelli, E. (2010): The More You Spend, the More You Get? The Effects of R&D and Capital Expenditures on thePatenting Activities of Biotechnology Firms. IPTS Working paper on Corporate R&D and innovation 6/2010.


