radionuclide release calculations for selected severe
TRANSCRIPT
XA04NO368NUREG/CR-4624
fNIS-XA-N--072 BMI-2139Vol. 2
Radionuclide Release Calculations forSelected Severe Accident Scenarios
PWR, Ice Condenser Design
Prepared by R. S. Denning, J. A. Gieseke, P. Cybulskis, K. W Lee,H. Jordan, L. A. Curtis, R. F. Kelly, V. Kogan, P. M. Schumacher
Battelle's Columbus Division
Prepared forU.S. Nuclear RegulatoryCommission
NOTICE
This report was prepared as an account of work sponsored by an agency of the United StatesGovernment. Neither the United States Government nor any agency thereof, or any of theiremployees, makes any warranty, expressed or implied, or assumes any legal liability of re-sponsibility for any third party's use, or the results of such use, of any information, apparatus,product or process disclosed in this report, or represents that its use by such third party wouldnot infringe privately owned rights.
__J
NOTICE
Availability of Reference Materials Cited in NRC Publications
Most documents cited in NRC publications will be available from one of the following sources:
1. The NRC Public Document Room, 1717 H Street, N.W.Washington, DC 20555
2. The Superintendent of Documents, U.S. Government Printing Ofice, Post Off ce Box 37082,Washington, DC 20013-7082
3. The National Technical Information Service, Springfield, VA 22161
Although the listing that follows represents the majority of documents cited in NRC publications,it is not intended to be exhaustive.
Referenced documents available for inspection and copying for a fee from the NRC Public Document Room include NRC correspondence and internal NRC memoranda; NRC Office of Inspectionand Enforcement bulletins, circulars, information notices, inspection and investigation notices;Licensee Event Reports; vendor reports and correspondence; Commission papers; and applicant andI icensee documents and correspondence.
The following documents in the NUREG series are available for purchase from the GPO SalesProgram: formal NRC staff and contractor reports, NRC-sponsored conference proceedings, andNRC booklets and brochures. Also availableare Regulatory Guides, NRC regulations in the CodeofFederal Regulations, and Nuclear Regulatory Commission Issuances.
Documents available from the National Technical Information Service include NUREG seriesreports and technical reports prepared by other federal agencies and reports prepared by the AtomicEnergy Commission, forerunner agency to the Nuclear Regulatory Commission.
Documents available from public and special technical libraries include all open literature iterns,such as books, journal and periodical articles, and transactions. Federal Register notices, federal andstate legislation, and congressional reports can usually be obtained from these libraries.
Documents such as theses, dissertations, foreign reports and translations, and non-N RC conferenceproceedings are available for purchase from the organization sponsoring the publication cited.
Single copies of NRC draft reports are available free, to the extent of supply, upon written requestto the Division of Technical Information and Document Control, U.S. Nucledr Regulatory Coinmission, Washington, DC 20555.
Copies of industry codes and standards used in a substantive manner in the N RC regulatory processare maintained at the NRC Library, 7920 Norfolk Avenue, Bethesda, Maryland, and are availablethere for reference use by the pblic. Codes and standards are usually copyrighted and may bepurchased from the originating organization or, if they are American National Standards, from theAmerican National Standards Institute, 1430 roadway, New York, NY 10018.
NUREG/CR-4624BMI-2139Vol. 2
Radionuclide Release Calculations forSelected Severe Accident Scenarios
MR, Ice Condenser Design
Manuscript Completed: May 1986Date Published: July 1986
Prepared yR. S. Denning, J. A. Gieseke, P. Cybulskis, K. W. Lee,H. Jordan, L. A. Curtis, R. F. Kelly, V. Kogan, P. M. Schumacher
Battelle's olumbus Division505 King- AvenueColumbus, OH 43201
Prepared forDivision of Risk Analysis and OperationsOffice of Nuclear Regulatory ResearchU.S. Nuclear Regulatory CommissionWashington, DC 20555NRC FIN A1322
ABSTRACT
This report presents results of analyses of the environmental releases offission products (source terms) for severe accident scenarios in a pressurizedwater reactor with an ice-condenser containment. The analyses were performedto support the Severe Accident Risk Reduction/Risk Rebaselininq Proqram (SARRP)which is being undertaken for the U.S. Nuclear Regulatory Commission bySandia National Laboratories. In the SARRP nroqram, risk estimates are beinggenerated for a number of reference plant designs. The equoyah Plant hasbeen used in this study as an example of a PWR ice-condenser plant,

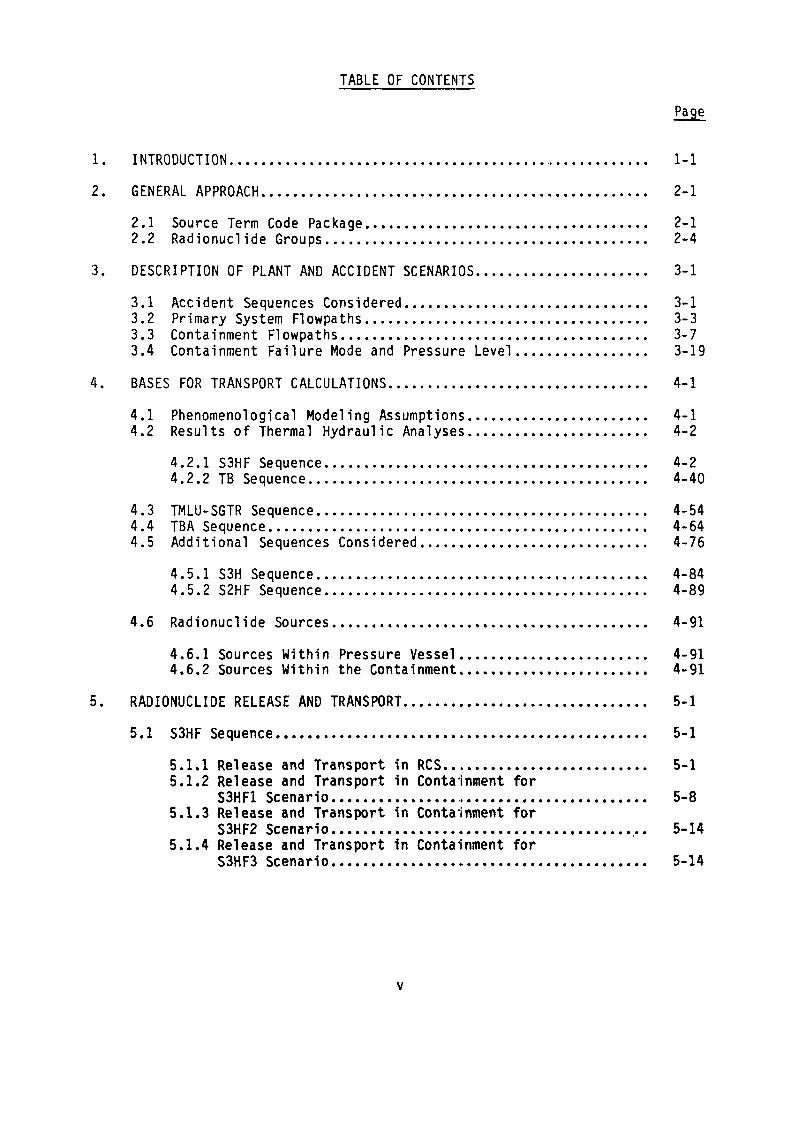
TABLE OF CONTENTS
ELge
1. INTRODUCTION ........................................ . ............ 1-1
.2. GENERAL APPROACH ................................................. 2-1
2.1 Source Term Code Package .................................... 2-12.2 Radionuclide Groups ......................................... 2-4
:3. DESCRIPTION OF PLANT AND ACCIDENT SCENARIOS ...................... 3-1
3.1 Accident Sequences Considered ............................... 3-13.2 Primary System Flowpaths .................................... 3-33.3 Containment Flowpaths ....................................... 3-73.4 Containment Failure Mode and Pressure Level ................. 3-19
4. BASES FOR TRANSPORT CALCULATIONS ................................. 4-1
4.1 Phenomenological Modeling Assumptions ....................... 4-14.2 Results of Thermal Hydraulic Analyses ....................... 4-2
4.2.1 S3HF Sequence ......................................... 4-24.2.2 TB Sequence ........................................... 4-40
4.3 TMLU-SGTR Sequence .......................................... 4-544.4 TBA Sequence ................................................ 4-644.5 Additional Sequences Considered ............................. 4-76
4.5.1 S3H Sequence .......................................... 4-844.5.2 S2HF Sequence ......................................... 4-89
4.6 Radionuclide Sources ........................................ 4-91
4.6.1 Sources Within Pressure Vessel ........................ 4-914.6.2 Sources Within the Containment ........................ 4-91
5. RADIONUCLIDE RELEASE AND TRANSPORT ............................... 5-1
5.1 S3HF Sequence ............................................... 5-1
5.1.1 Release and Transport in RCS ........................... 5-15.1.2 Release and Transport in Containment for
S3HF1 Scenario ......................................... 5-85.1.3 Release and Transport in Containment for
S3HF2 Scenario ......................................... 5-145.1.4 Release and Transport in Containment for
S3HF3 Scenario ......................................... 5-14
v
TABLE OF CONTENTS(Continued)
f�qe
5.2 TB Sequence ................................................. 5-21
5.2.1 Release and Transport in the RCS ...................... 5-215.2.2 Release and Transport in Containment .................. 5-21
5.3 TMLU-SGTR Sequence .......................................... 5-335.4 TBA Sequence ................................................ 5-41
5.4.1 Release and Transport in the RCS ...................... 5-415.4.2 Release and Transport in Containment .................. 5-55
5.5 Noble Gas and Energy Release to Environment ................. 5-61
5.6 Icebed Decontamination ...................................... 5-61
6. SUMMARY AND CONCLUSIONS .......................................... 6-1
7. REFERENCES ....................................................... 7-1
vi
LIST OF FIGURES
f,�2e
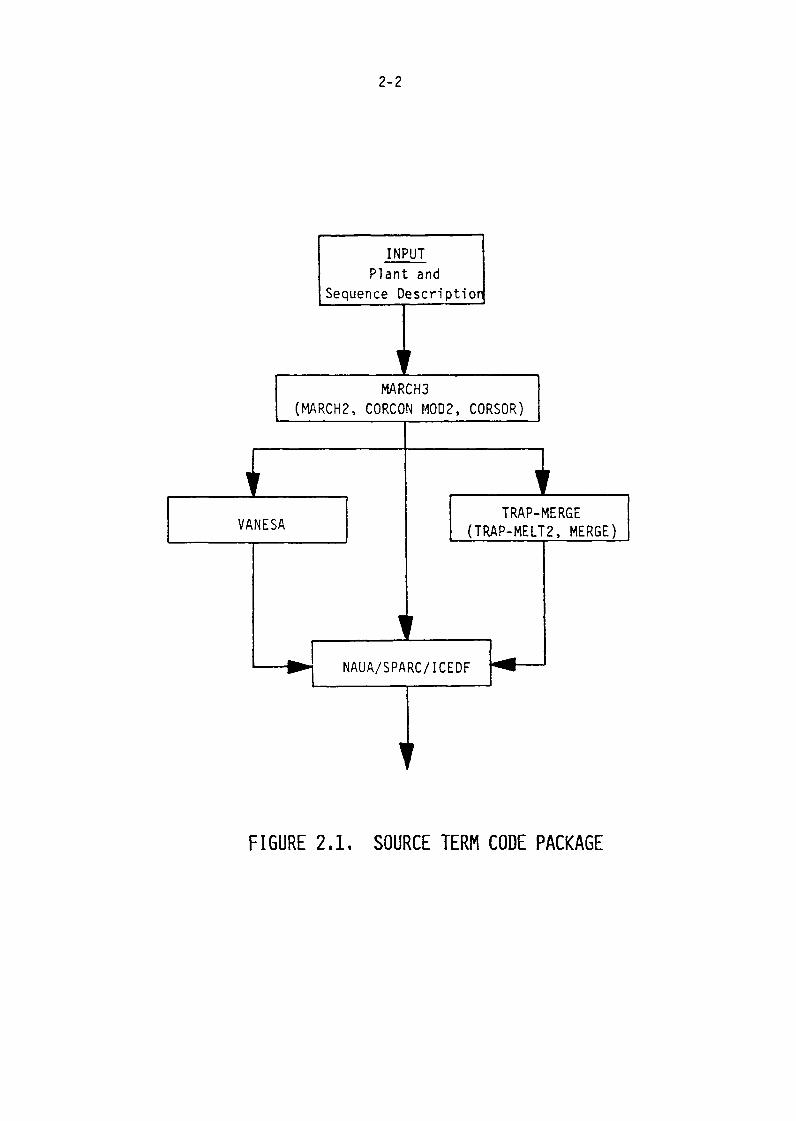
Figure 2.1 Source Term Code Package ................................. 2-2
Figure 31 Primary System Flowpath for Sequoyah Seal LOCA(S3) Sequences ........................................... 3-4
Figure 32 Schematic of TRAP-MERGE Control Volumes for SequoyahSeal LOCA (S3) Sequence .................................. 3-5
Figure 33 Fission Product Flowpaths for TMLU-SGTR Sequence ......... 3-6
Figure 34 Primary System Flowpaths for Steam Generator TubeRupture Accident ......................................... 3-8
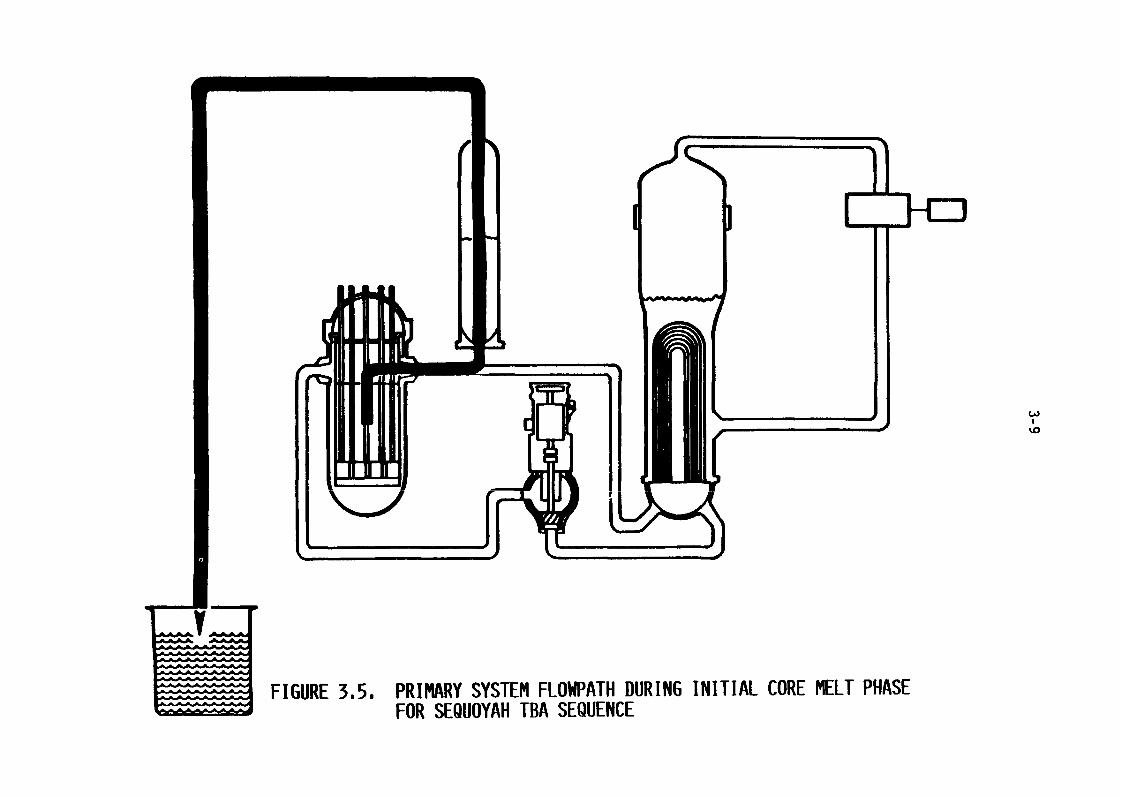
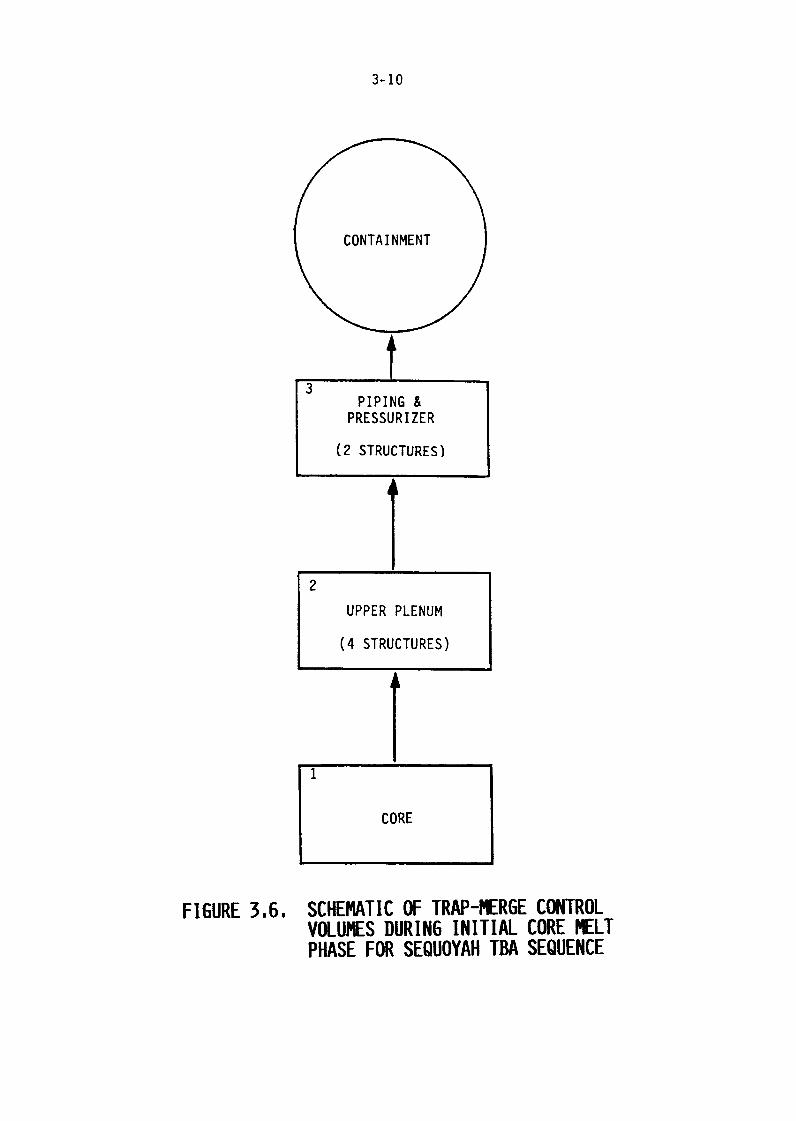
Figure 35 Primary System Flowpath During Initial Core MeltPhase for Sequoyah TBA Sequence .......................... 3-9
Figure 36 Schematic of TRAP-MERGE Control Volumes DuringInitial Core Melt Phase for Sequoyah TBA Sequence ........ 3-10
Figure 37 Primary System Flowpath During Later Core Melt Phasefor Sequoyah TBA Sequence ................................ 3-11
Figure 38 Schematic of TRAP-MERGE Control Volumes During LaterCore Melt Phase for Sequoyah TBA Sequence ................ 3-12
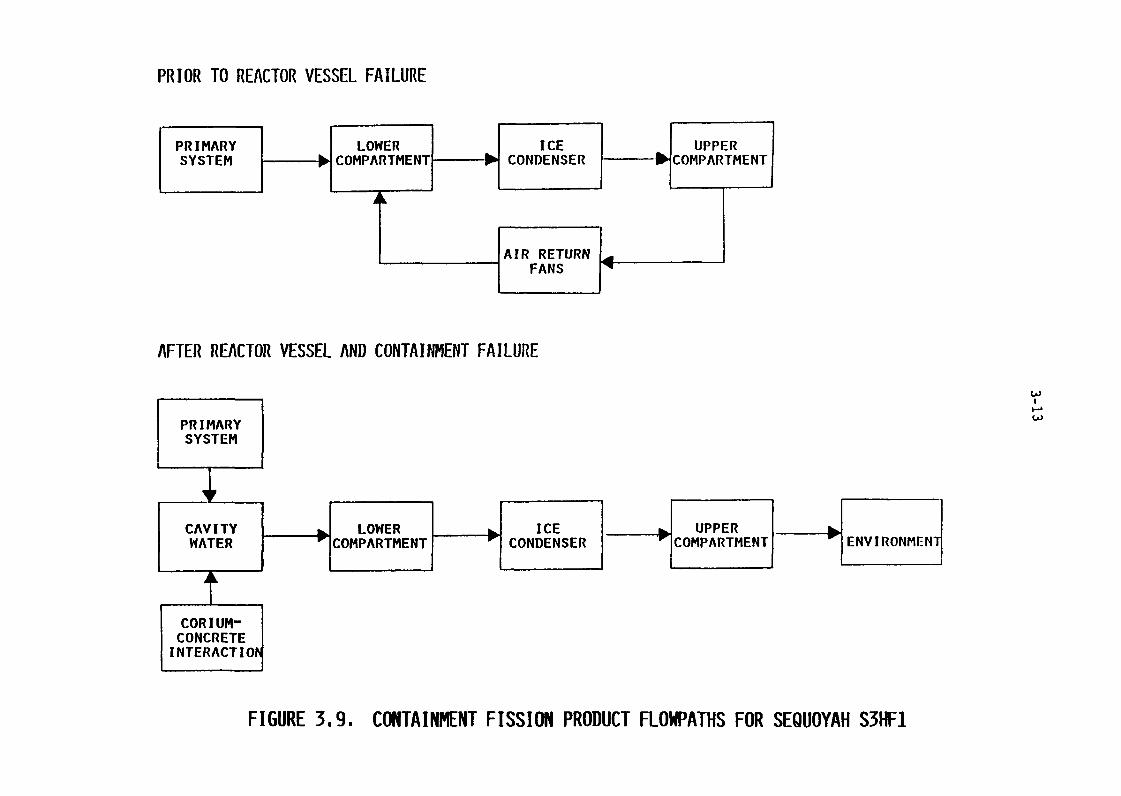
Figure 39 Containment Fission Product Flowpaths for Sequoyah S3HF1. 3-13
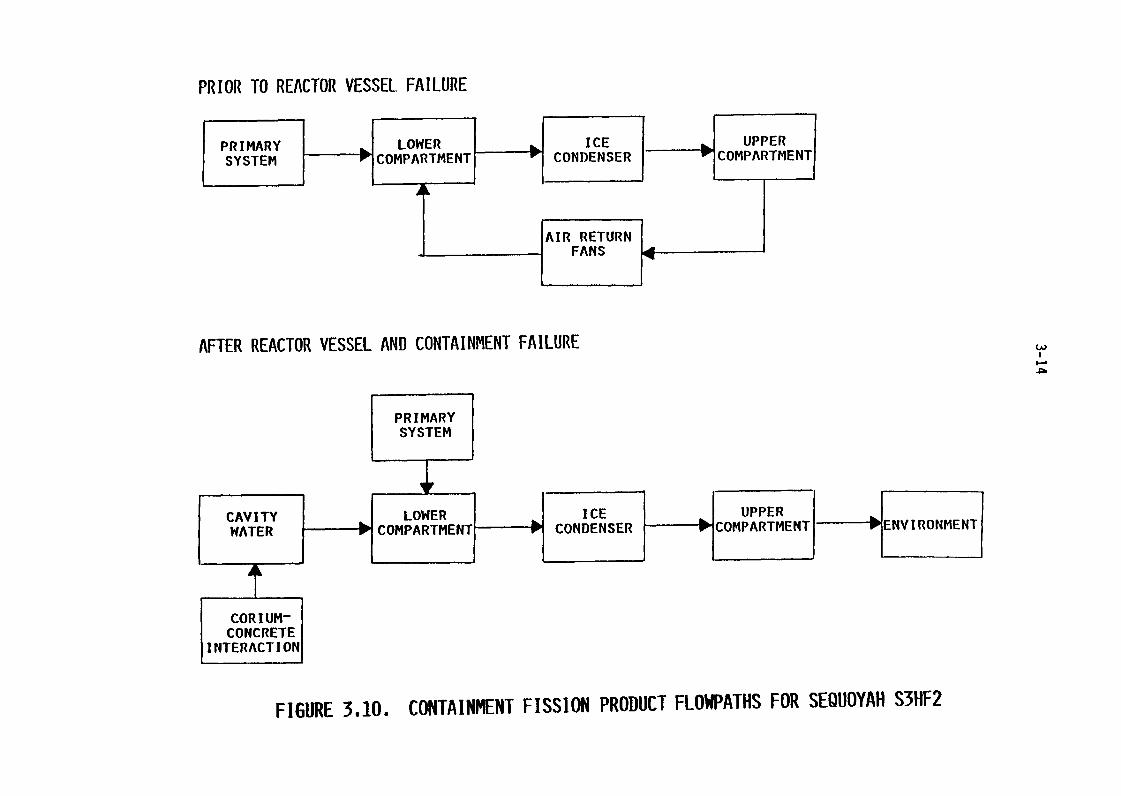
Figure 310 Containment Fission Product Flowpaths for Sequoyah S3HF2. 3-14
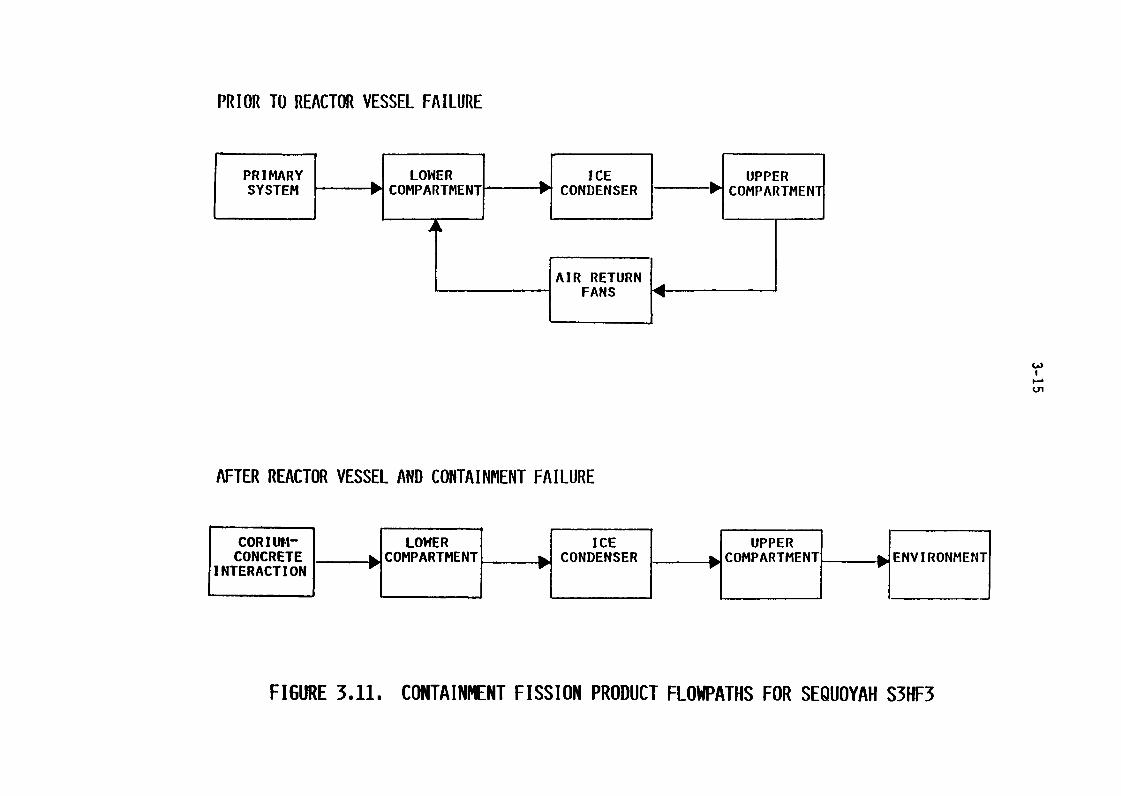
Figure 311 Containment Fission Product Flowpaths for Sequoyah S3HF3. 3-15
Figure 312 Containment Fission Product Flowpaths for Sequoyah TB(S3B) .................................................... 3-17
Figure 313 Containment Fission Product Flowpaths for SequoyahTBA Sequence ............................................. 3-18
Figure 41 Primary System Pressure Response or the S3HF Sequence... 4-13
Figure 42 Primary System Coolant Leakage for the S3HF Sequence ..... 4-14
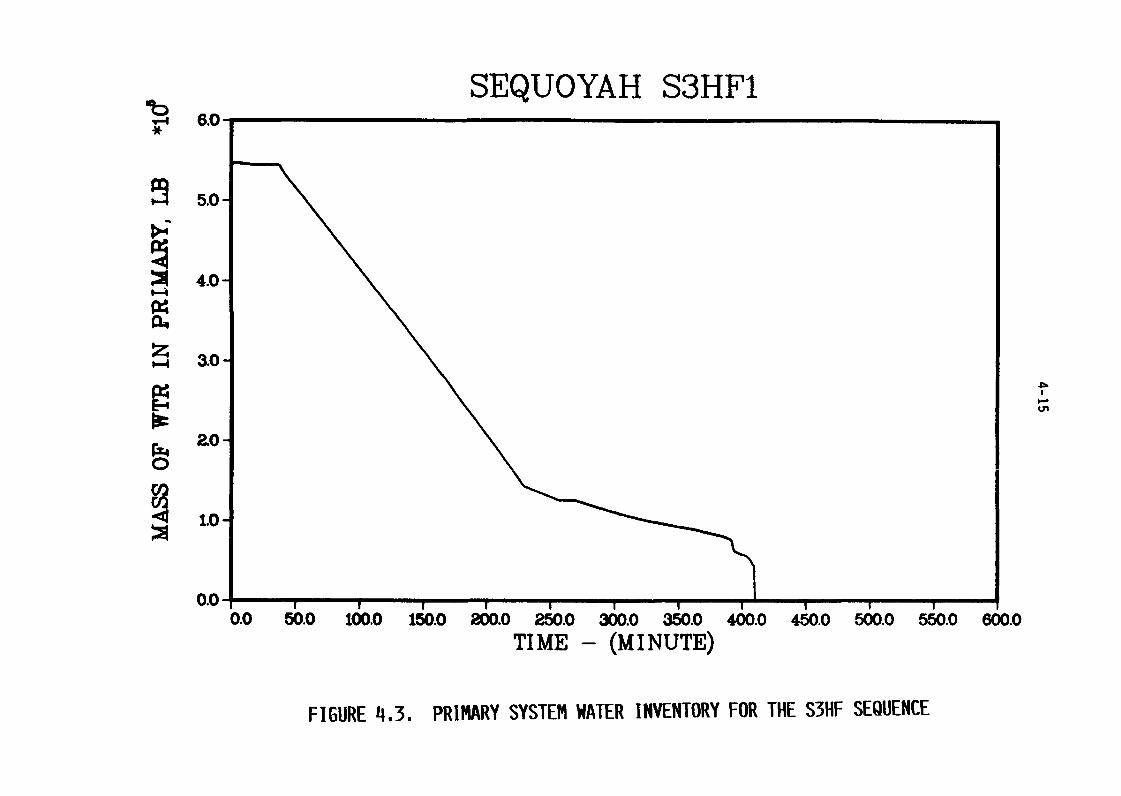
Figure 43 Primary System Water Inventory for the S3HF Sequence ..... 4-15
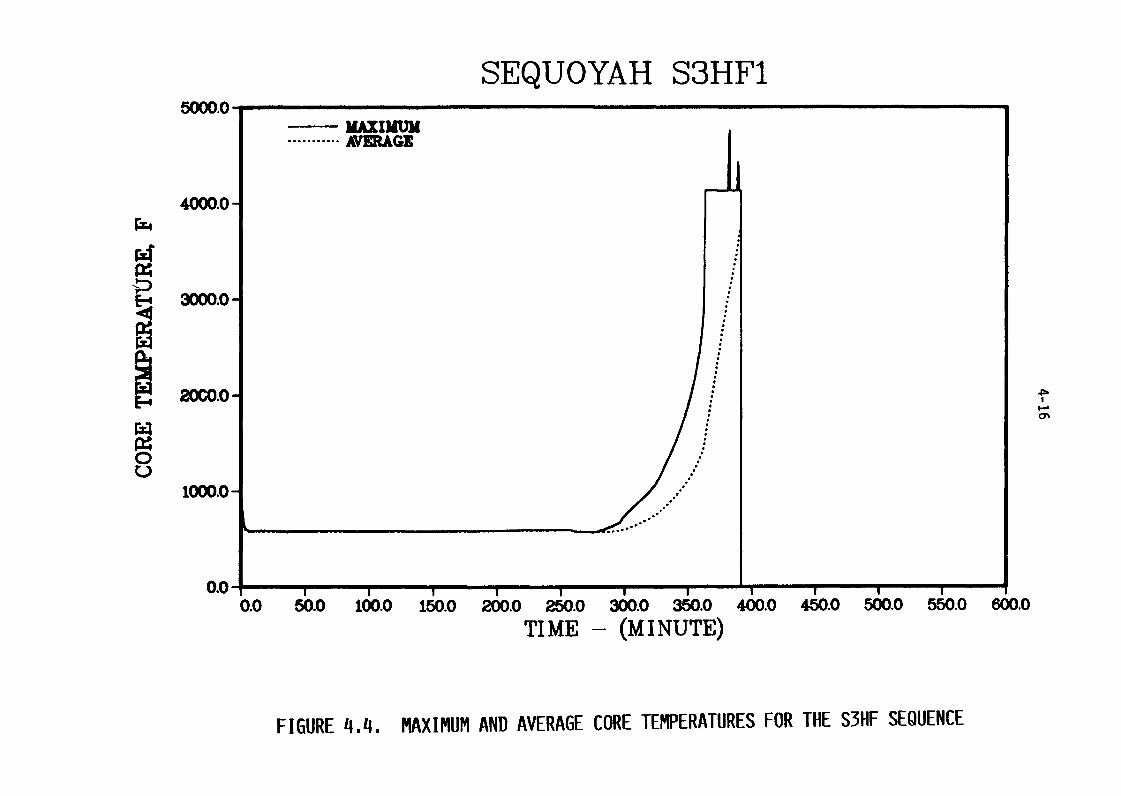
Figure 44 Maximum and Average Core Temperatures for the SUFSequence ................................................. 4-16
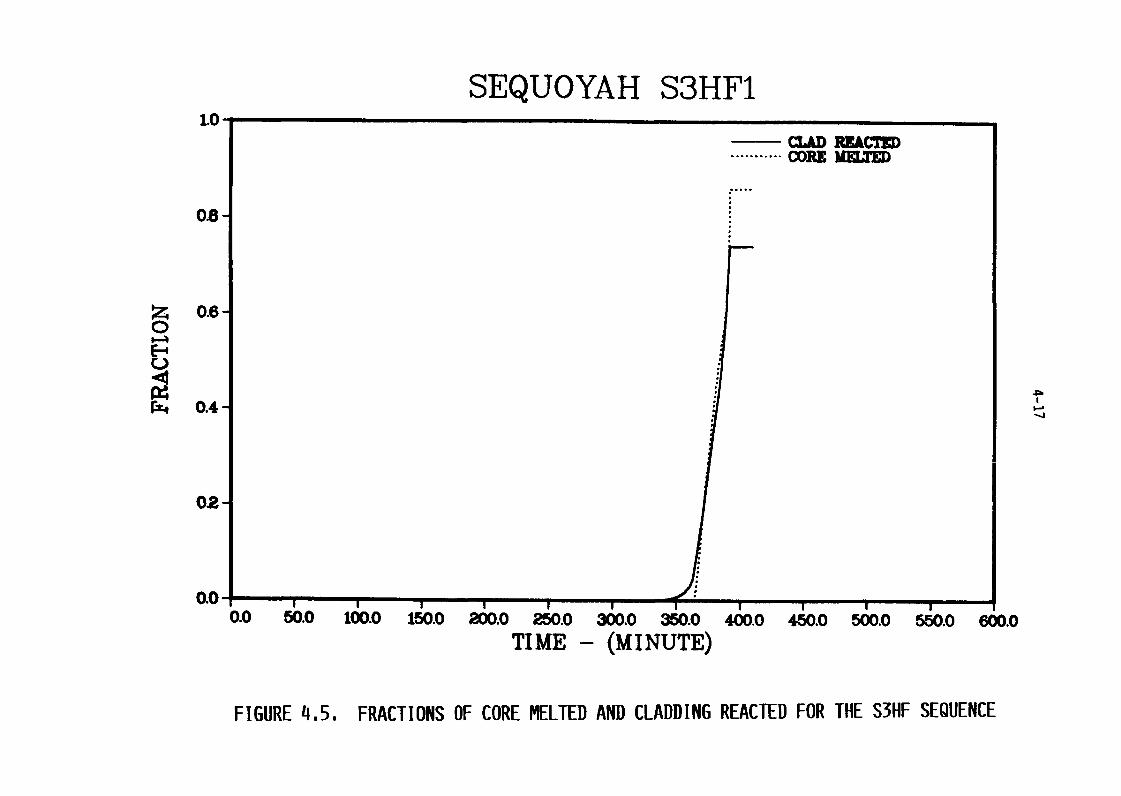
Figure 45 Fractions of Core Melted and Cladding Reacted forthe SU F Sequence ........................................ 4-17
Figure 46 Containment Pressure Response for S3HF1 .................. 4-18
vii
LIST OF FIGURES(Continued)
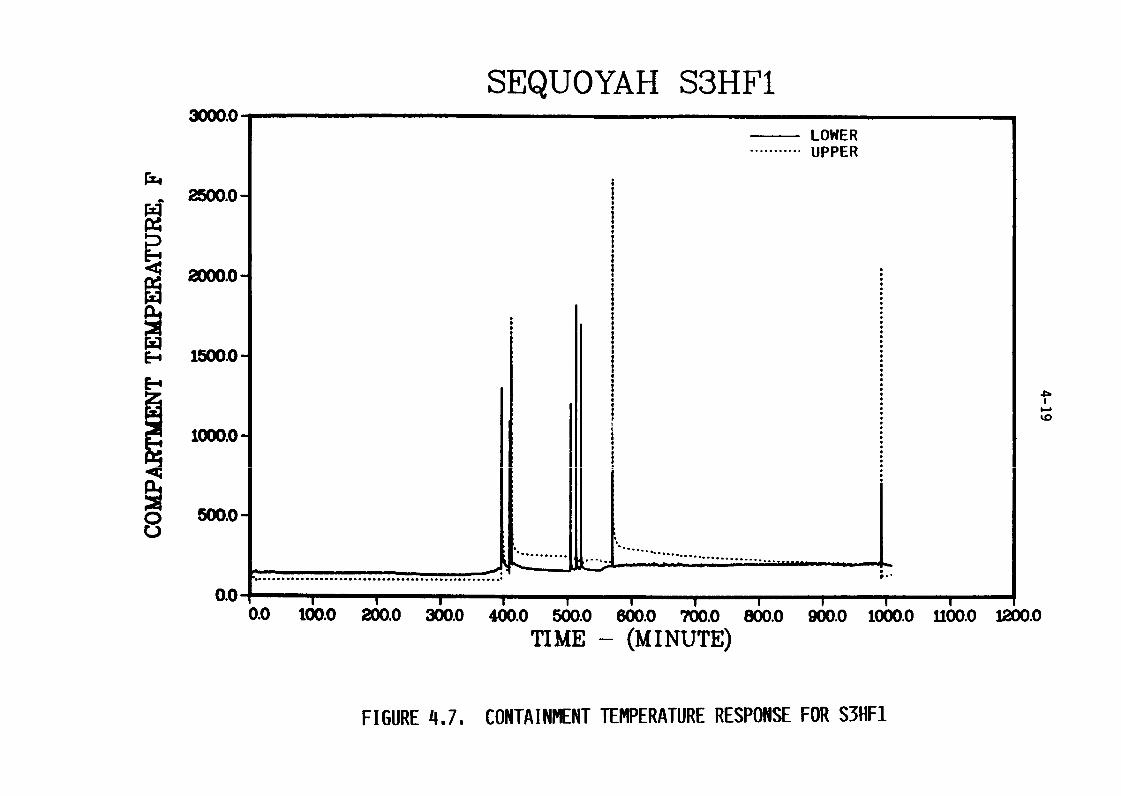
PaVeFigure 47 Containment Temperature Response for S3HF1 ............... 4 9
Figure 48 Containment Sump and Reactor Cavity WaterInventories for S3HF1 .................................... 4-21
Figure 49 Containment Sump and Reactor Cavity WaterTemperatures for S3HF1 ................................... 4-22
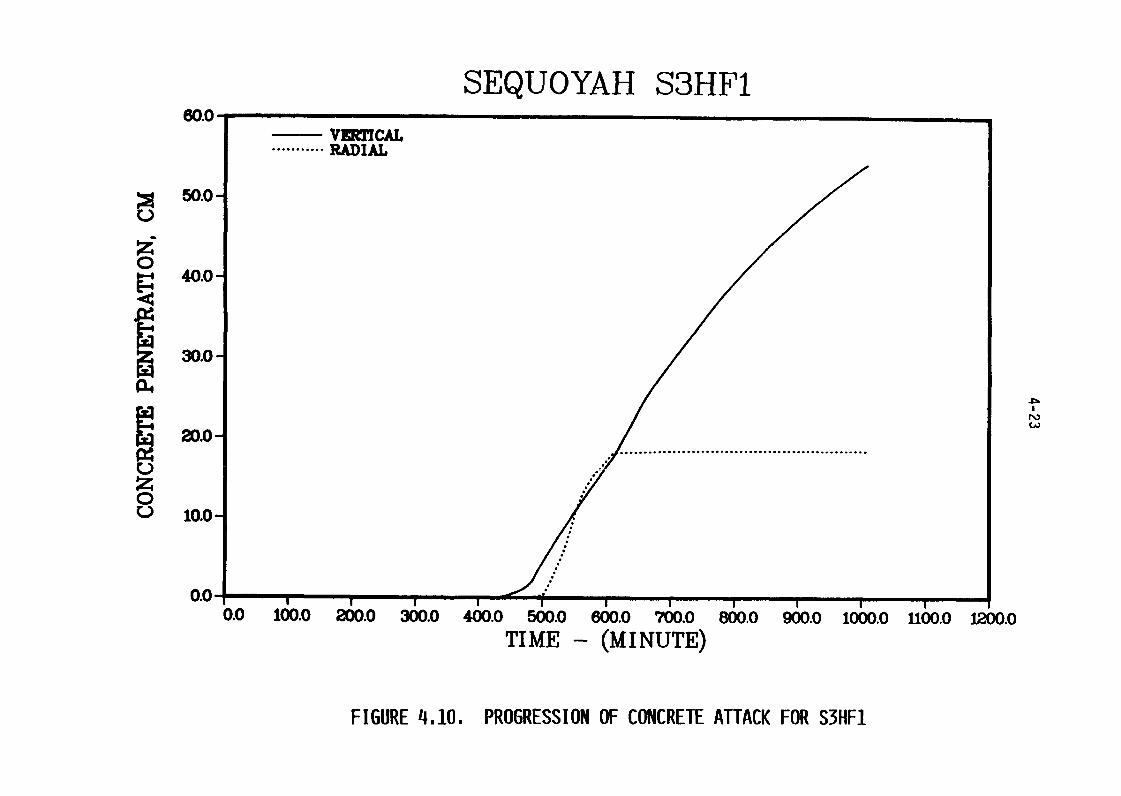
Figure 410 Progression of Concrete Attack for S3HF1 ................. 4-23
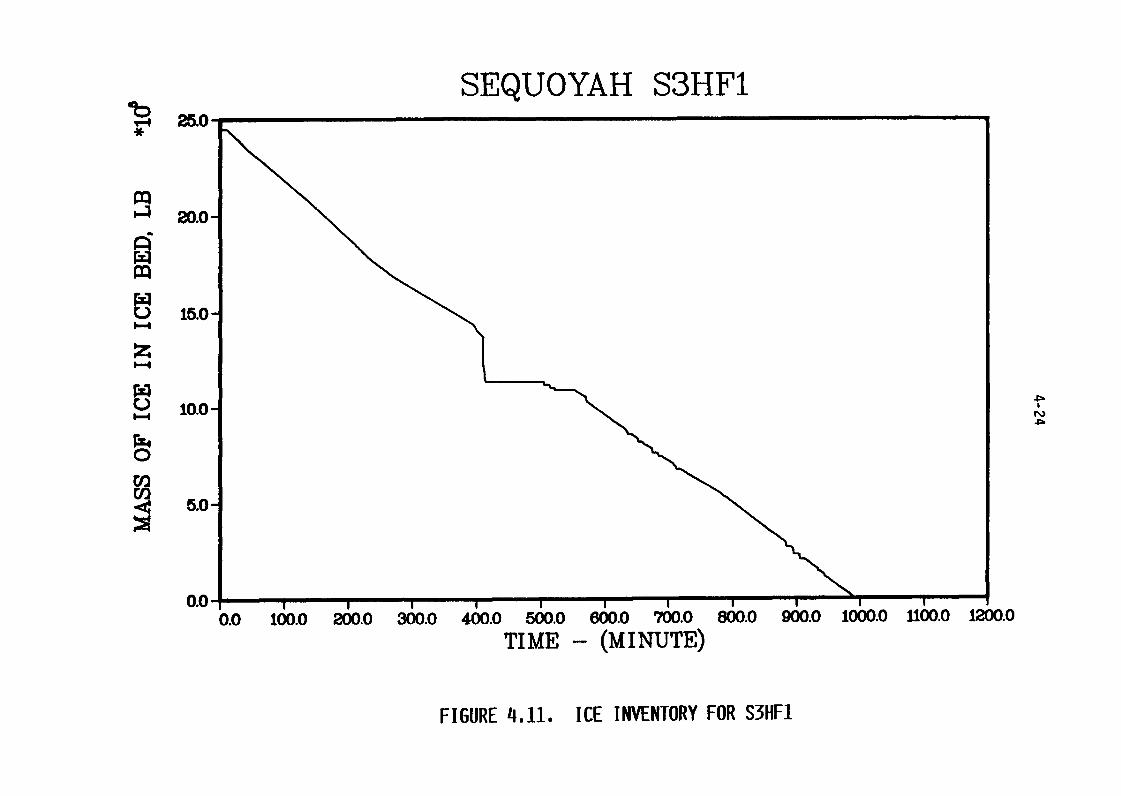
Figure 4.11 Ice Inventory for S3HF1 .................................. 4-24
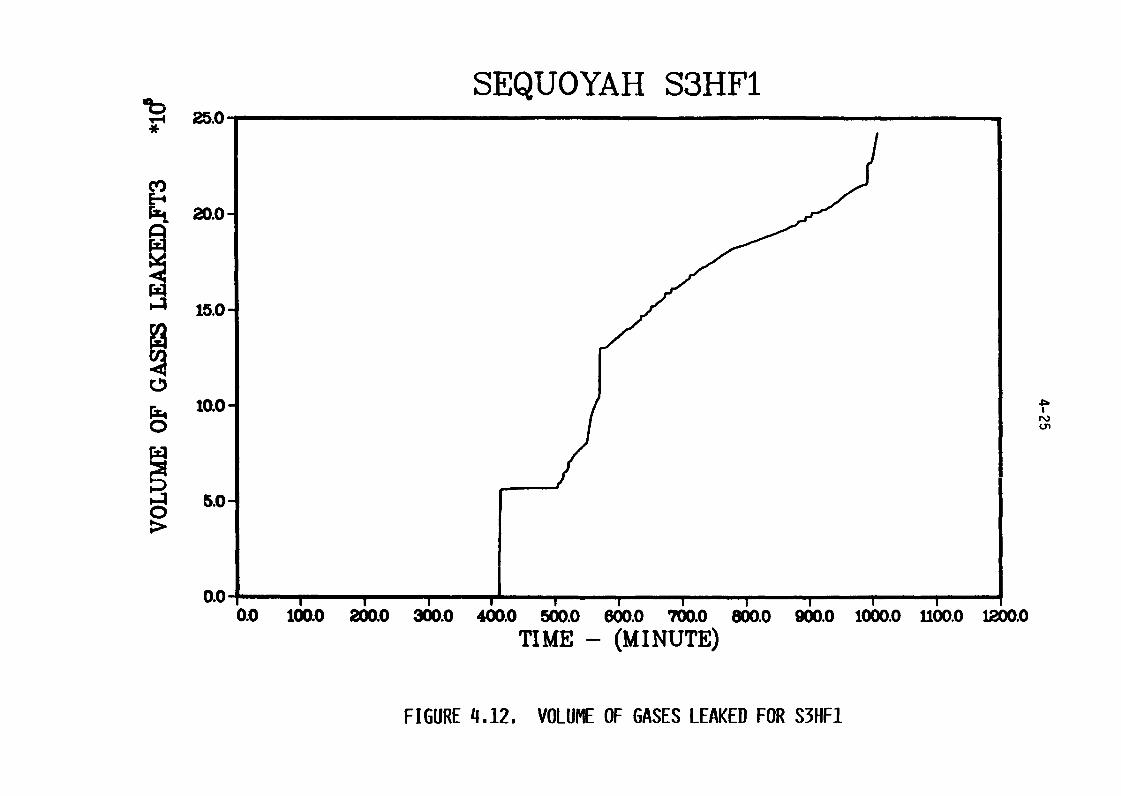
Figure 4.12 Volume of Gases Leaked for S3HF1 ......................... 4-25
Figure 4.13 Containment Pressure Response for S3HF2 .................. 4-31
Figure 4.14 Containment Temperature Responses for S3HF2 .............. 4-32
Figure 4.15 Containment Sump and Reactor Cavity WaterInventories for S3HF2 .................................... 4-33
Figure 4.16 Containment Sump and Reactor Cavity WaterTemperatures for S3HF2 ................................... 4-34
Figure 4.17 Progression of Concrete Attack for S3HF2 ................. 4-35
Figure 4.18 Ice Inventory for S3HF2 .................................. 4-36
Figure 4.19 Total Volume of Gases Leaked for S3HF2 ................... 4-37
Figure 4.20 Containment Pressure Response for S3HF3 .................. 4-38
Figure 4.21 Containment Temperature Responses for S3HF3 .............. 4-39
Figure 4.22 Containment Sump and Reactor Cavity WaterInventories for S3HF3 .................................... 4-41
Figure 4.23 Containment Sump and Reactor Cavity WaterTemperatures for S3HF3 ................................... 4-42
Figure 4.24 Progression of Concrete Attack for S3HF3 ................. 4-43
Figure 4.25 Ice Inventory for S3HF3 .................................. 4-44
Figure 4.26 Total Volume of Gases Leaked for S3HF3 ................... 4-45
Figure 4.27 Primary System Pressure Response for S3B ................. 4-47
Figure 4.28 Primary System Leak Rates for SH ........................ 4-48
Figure 4.29 Primary System Water Inventory for S3B ................... 4-49
Figure 4.30 Maximum and/-Average Core Temperatures for S3B ............ 4-50
viii
LIST OF FIGURES(Continued)
Page
Figure 431 Fractions of Clad Reacted and Core Melted for S3B ........ 4-51
Figure 432 Containment Pressure Response for S3B .................... 4-52
Figure 433 Containment Temperature Responses for S3B ................ 4-53
Figure 434 Containment Sump and Reactor Cavity WaterInventories for S3B ...................................... 4-55
Figure 435 Containment Sump and Reactor Cavity, WaterTemperatures for S3B ..................................... 4-56
Figure 436 Progression of Concrete Attack for S3B ................... 4-57
Figure 4.37 Ice Inventory for S3B .................................... 4-56
Fi(ure 438 Total Volume of Gases Leaked for SB ..................... 4-59
Fi(ure 439 Steam Generator Secondary Side Water InventoryFor TMLU-SGTR ............................................ 4-61
Figure 440 Primary System Pressure Response for TMLU-SGTR ........... 4-62
Figure 441 Primary System Water Inventory for TMLU-SGTR ............. 4-63
Figure 4.42 Maximum and Average Core Temperatures for TMLU-SGTR ...... 4-65
Figure 4.43 Fractions Cladding Reacted and Core Melted for TLU-SGTR. 4-66
Figure 4.44 Leakage Through Pressurizer Relief Valve for TMLU-SGTR ... 4-67
Figure 4.45 Leakage Through Ruptured Steam Generator Tubes forTMLU-SGTR ................................................ 4-68
Figure 4.46 Steam Generator Secondary Side Water InventoryDuring TBA Sequence ...................................... 4-70
Figure 4.47 Primary System Pressure History for, TBA Sequence ......... 4-71
Figure 4.48 Primary System Water Inventory for TBA Sequence .......... 4-72
Figure 4.49 Maximum and Average Core Temperatures for TBA Sequence ... 4-73
Figure 4.50 Fractions of Cladding Reacted and Core MeltedFor TBA Sequence ......................................... 4-74
Figure 4.51 Temperatures of Gases Leaving the Core and Leakingto Containment for TBA Sequence .......................... 4-75
ix
LIST OF FIGURES(Continued)
Page
Figure 452 Containment Pressure Response for TBA Sequence ........... 4-77
Figure 453 Containment Temperature Response for TBA Sequence ........ 4-78
Figure 4.54 Ice inventory for TBA Sequence ........................... 4-79
Figure 4.55 Containment Sump and Reactor Cavity WaterInventories for TBA Sequence ............................. 4-80
Figure 4.56 Concrete Attack for TBA Sequence ......................... 4-81
Figure 4.57 Total Volume of Gases Leaked for TBA Sequence ............ 4-82
Figure 4.58 Noble Gas Distribution for TBA Sequence .................. 4-83
Figure 5.1 Mass of CsI Released from Indicated RCS Component as aFunction of Time--S3HF Sequence .......................... 5-4
Figure 5.2 Mass of CsOH Released from Indicated RCS Componentas a Function of Time--S3HF Sequence ..................... 5-5
Figure 5.3 Mass of Te Released from Indicated RCS Component as aFunction of Time--S3HF Sequence .......................... 5-6
Figure 5.4 Mass of Aerosol Released from Indicated RCS Componentas a Function of Time--S3HF Sequence ..................... 5-7
Figure 5.5 Schematic Diagram Showing Containment CalculationProcedures for the S3HF1, S3HF2, S3HF3, and TB Scenarios. 5-10
Figure 5.6 Mass of CsI Released from Indicated RCS Component asa Function of Time--TB Sequence .......................... 5-25
Figure 5.7 Mass of CsOH Released from Indicated RCS Component asa Function of Time--TB Sequence .......................... 5-26
Figure 5.8 Mass of Te Released from Indicated RCS Component as aFunction of Time--TB Sequence ............................ 5-27
Figure 5.9 Mass of Aerosol Released form Indicated RCSComponent as a Function of Time--TB Sequence ............. 5-28
Figure 5.10 CsI Behavior in Steam Generator Secondary ................ 5-37
Figure 5.11 CsOH Behavior in Steam Generator Secondary ............... 5-38
Figure 5.12 Te Behavior in Steam Generator Secondary ................. 5-39
Figure 5.13 Particulate Behavior in Steam Generator Secondary ........ 5-40
x
LIST OF FIGURES(Conti-nued)
Page
Figure 514 CsI Behavior in the Primary System During InitialPhase of TBA Sequence .............. ...................... 5-45
Figure 5.15 CsOH Behavior in the Primary System During InitialPhase of TBA Sequence ..................................... 5-46
Figure 516 Te Behavior in the Primary System uring InitialPhase of TBA Sequence ..................................... 5-47
Figure 517 Particulate Behavior in the Primary System DuringInitial Phase of TBA Sequence ............................. 5-48
Figure 5.18 CsI Behavior in the Primary System During SecondPhase of TBA Sequence ..................................... 5-51
Figure 519 CsOH Behavior in the Primary System During SecondPhase of TBA Sequence ..................................... 5-52
Figure 520 Te Behavior in the Primary System uring SecondPhase of TBA Sequence ..................................... 5-53
Figure 521 Particulate Behavior in the Primary System DuringSecond Phase of TBA Sequence .............................. 5-54
xi
LIST OF TABLES
Page
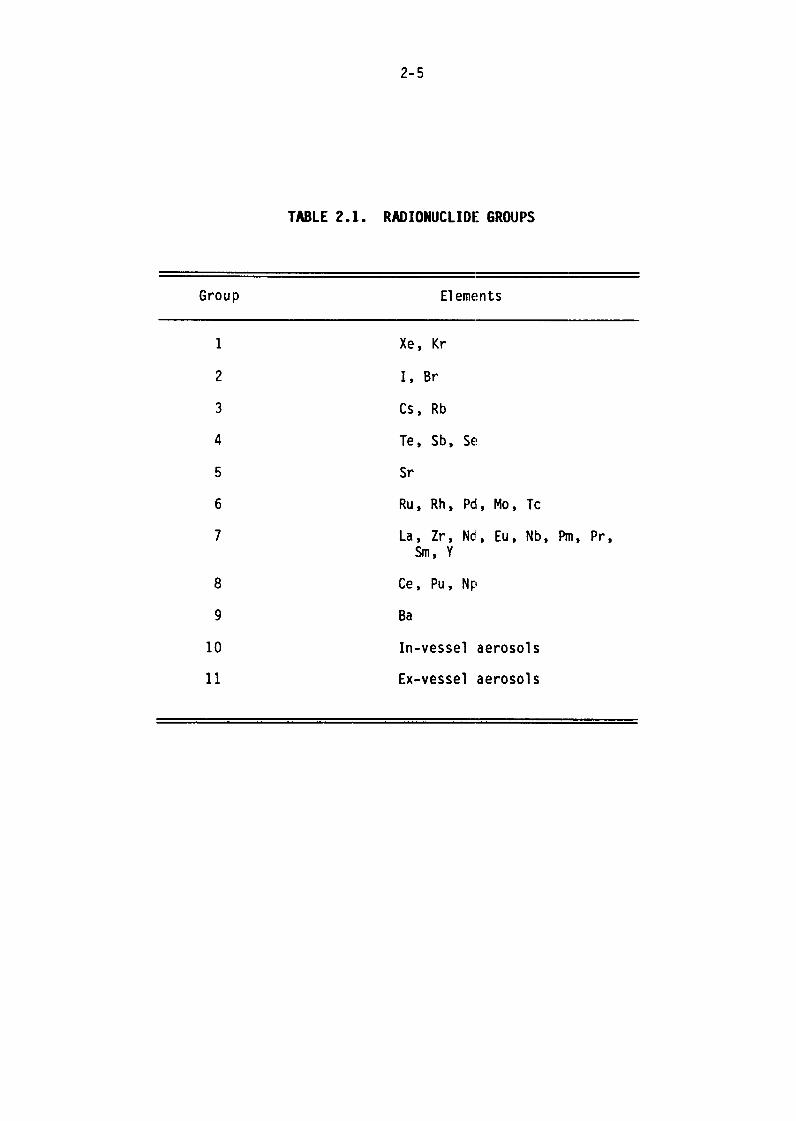
Table 2.1 Radionuclide Groups ...................................... 2-5
Table 4.1 Timing of Key Events ..................................... 4-4
Table 4.2 Core and Primary System Response ......................... 4-5
Table 4.3 Containment Response ..................................... 4-8
Table 4.4 Containment Leak Rates ................................... 4-26
Table 4.5 Inventories of Radionuclides and Structural Materials .... 4-92
Table 4.6 Inventory by Group ....................................... 4-93
Table 4.7 Inventory of Melt at the Time of Vessel Failurefor Sequoyah (kg) ........................................ 4-94
Table 4.8 Aerosol Release During Core-Concrete Attack forS3HF1/S3HF2 .............................................. 4-96
Table 4.9 Aerosol Release During Core-Concrete Attack for S3HF3 .... 4-100
Table 4.10 Aerosol Release During Core-Concrete Attack for TB ....... 4-104
Table 4.11 Aerosol Release During Core-Concrete Attack for TBA ...... 4-108
Table 5.1 Masses of Dominant Species Released from Fuel (Total)and Retained on RCS Structures (RET) as a Functionof Time--S3HF Sequence ................................... 5-2
Table 5.2 Masses of Radionuclide Released from Fuel andRetained on RCS (by Group)--S3HF Sequence ................ 5-3
Table 5.3 Summary of Release to Containment for the SUF Sequence.. 5-9
Table 5.4 Size Distribution of Aerosols in Containment--S3HFIScenario ................................................. 5-11
Table 5.5 Fraction of Core Inventory Released fromContainment--S3HF1 Scenario .............................. 5-12
Table 5.6 Distribution of Fission Products by Group--S3HF1Scenario ................................................. 5-13
Table 5.7 Size Distribution of Aerosols in Containment---S3HF2 Scenario ........................................... 5-15
Table 5.8 Fraction of Core Inventory Released fromContainment--S3HF2 Scenario .............................. 5-16
xii
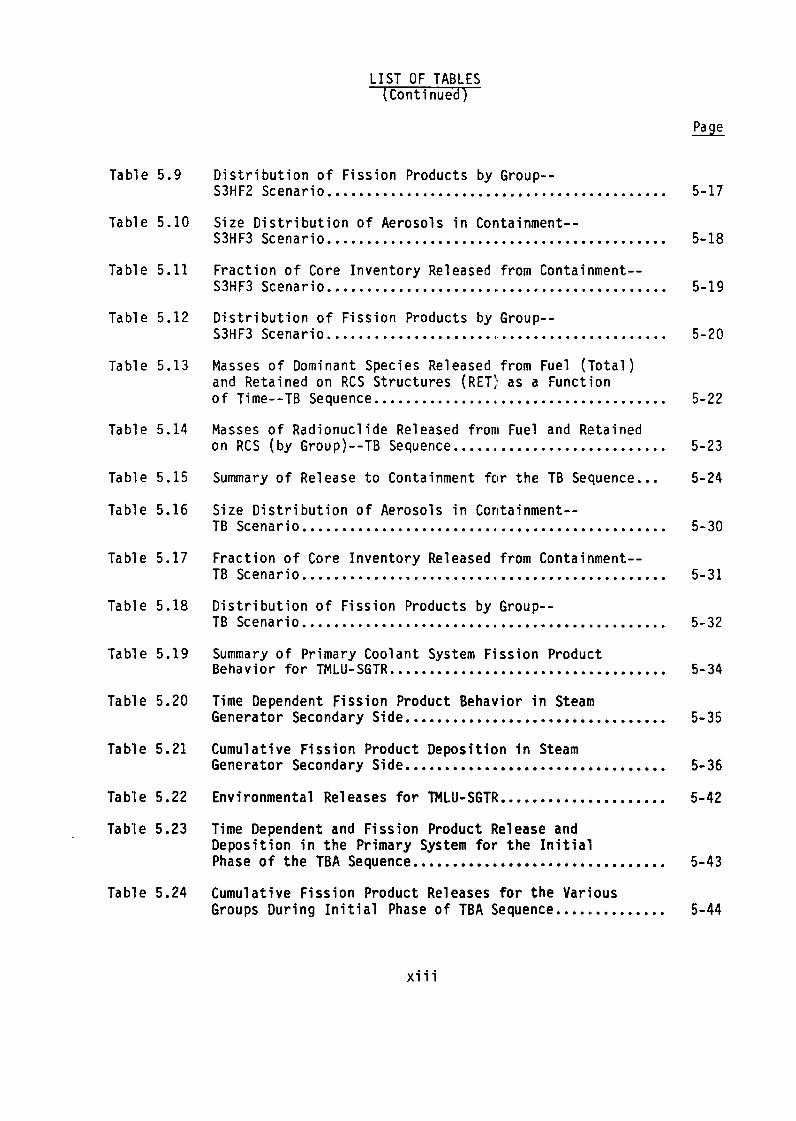
LIST OF TABLES(Continue97
Page
Table 59 Distribution of Fission Products by Group-S3HF2 Scenario ............................................ 5-17
Table 5.10 Size Distribution of Aerosols in Containment--S3HF3 Scenario ............................................ 5-18
Table 5.11 Fraction of Core Inventory Released from Containment-S3HF3 Scenario ............................................ 5-19
Table 512 Distribution of Fission Products by Group-S3HF3 Scenario ............................................ 5-20
Table 513 Masses of Dominant Species Released from Fuel (Total)and Retained on RCS Structures (RET) as a Functionof Time--TB Sequence ................ ..................... 5-22
Table 514 Masses of Radionuclide Released from Fuel and Retainedon RCS (by Group)--TB Sequence ........................... 5-23
Table 5.15 Summary of Release to Containment f the TB Sequence ... 5-24
Table 516 Size Distribution of Aerosols in Containment--TB Scenario .............................................. 5-30
Table 517 Fraction of Core Inventory Released from Containment-TB Scenario .............................................. 5-31
Table 5.18 Distribution of Fission Products by Group-TB Scenario .............................................. 5-32
Table 519 Summary of Primary Coolant System Fission ProductBehavior for TMLU-SGTR ................................... 5-34
Table 520 Time Dependent Fission Product Behavior in SteamGenerator Secondary Side ................................. 5-35
Table 521 Cumulative Fission Product Deposition in SteamGenerator Secondary Side ................................. 5-36
Table 522 Environmental Releases for Tl4LU-SGTR ..................... 5-42
Table 523 Time Dependent and Fission Product Release andDeposition in the Primary System for the InitialPhase of the TBA Sequence ................................ 5-43
Table 524 Cumulative Fission Product Releases for the VariousGroups During Initial Phase of TBA equence .............. 5-44
xiii
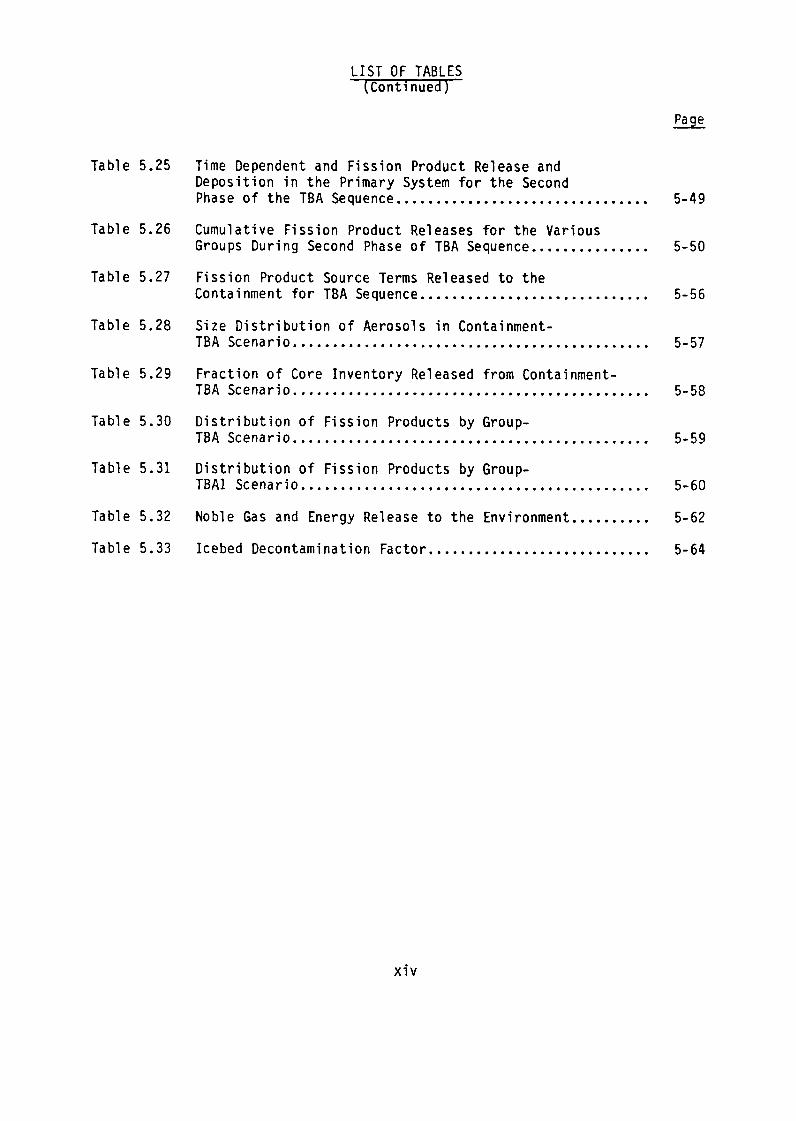
LIST OF TABLES(Continued)
Page
Table 525 Time Dependent and Fission Product Release andDeposition in the Primary System for the SecondPhase of the TBA Sequence ................................ 5-49
Table 526 Cumulative Fission Product Releases for the VariousGroups During Second Phase of TBA Sequence ............... 5-50
Table 527 Fission Product Source Terms Released to theContainment for TBA Sequence ............................. 5-56
Table 528 Size Distribution of Aerosols in Containment-TBA Scenario ............................................. 5-57
Table 529 Fraction of Core Inventory Released from Containment-TBA Scenario ............................................. 5-58
Table 530 Distribution of Fission Products by Group-TBA Scenario ............................................. 5-59
Table 531 Distribution of Fission Products by Group-TBAI Scenario ............................................ 5-60
Table 532 Noble Gas and Energy Release to the Environment .......... 5-62
Table 5.33 Icebed Decontamination Factor ............................ 5-64
xiv
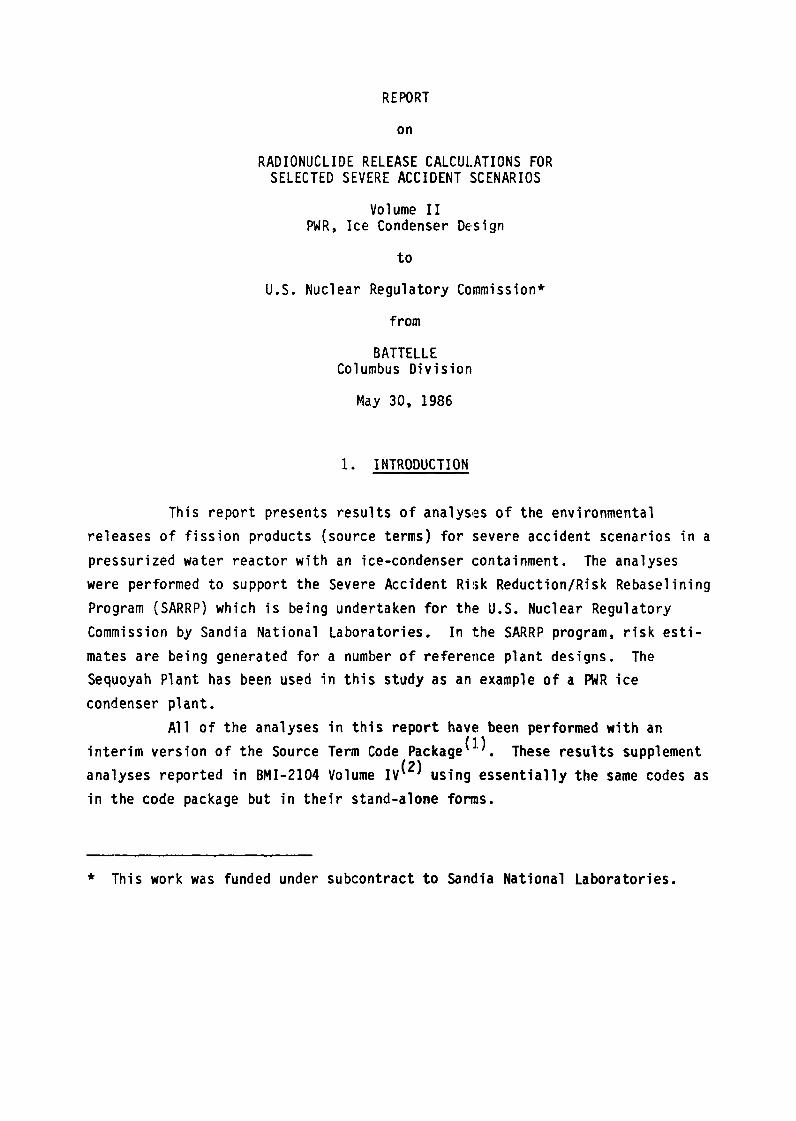
REPORT
on
RADIONUCLIDE RELEASE CALCULATIONS FORSELECTED SEVERE ACCIDENT SCENARIOS
Volume IIPWR, Ice Condenser DE-Sign
to
U.S. Nuclear Regulatory Commission*
from
BATTELLEColumbus Division
May 30, 1986
1. INTRODUCTION
This report presents results of analyses of the environmental
releases of fission products (source terms) for evere accident scenarios in a
pressurized water reactor with an ice-condenser ontainment. The analyses
were performed to support the Severe Accident Risk Reduction/Risk Rebaselining
Program (SARRP) which is being undertaken for the U.S. Nuclear Regulatory
Commission by Sandia National Laboratories. In the SARRP program, risk esti-
mates are being generated for a number of reference plant designs. The
Sequoyah Plant has been used in this study as an example of a PWR ice
condenser plant.
All of the analyses in this report have been performed with an0.)interim version of the Source Term Code Package . These results supplement
analyses reported in BMI-2104 Volume IV (2) using essentially the same codes as
in the code package but in their stand-alone forms.
* This work was funded under subcontract to Sandia National Laboratories.
2-1
2. GENERAL APPROACH
The accident scenarios analyzed in this report were selected on the
basis of being significant potential contributors to the risk profile of the
Sequoyah plant. Based on the results of these scenarios, source term bins*
will be developed by Sandia National Laboratories which describe the timing,
quantity, and characteristics of the release of fission products to the
environment.
The methods of analysis used to predict fission product release and
transport behavior are essentially the same as those presented in NUREG-0956,
"Reassessment of the Technical Basis for Estimating Source Terms" (3) . These
computer codes have been assembled as a Source Term Code Package which is
scheduled for public release in the spring of 1986. An interim version of the
code was used in this study.
2.1 Source Term Code Package
A number of changes have been made in the process of integrating the
BMI-2104 source term codes into a Source Term Code Package. Many of these
changes merely simplify the use of the codes by streamlining and automating
the data transfer between codes. Some of the canges, however, involve actual
improvements in the models or in the coupling btween models.
Figure 21 illustrates the manner in hich the codes are grouped in(4) (5) (6)the Source Term Code Package. The MARCH 2 , CORSOR , and CORCON-Mod 2
codes are now coupled. The CORSOR-M version of the CORSOR code, which uses an
Arrhenius form for the empirical correlation, has been incorporated into
MARCH. A consistent treatment can now be made f the release of fission
products and the transport of sources of decay heat from the fuel. Based on
model improvements suggested by ORNL, the release rates of silver and indium
from control rods has been reduced substantially from those in the earlier
version of CORSOR. Similarly, CORCON-Mod 2 is now used in the code package to
Each of the accident scenarios identified by the Accident SequenceEvaluation Program (ASEP) and the Severe Accident Risk Reduction/RiskRebaselining Program (SARRP) is mapped to one of the source term binsin the process of developing the risk profile for the plant.
2 2
INPUTPlant and
Sequence Descriptior
MARCH3(MARCH2, CORCON MD2, CORSOR)
TRAP-MERGEVANESA (TRAP-MELT2, MERGE)
v
NAUA/SPA C/ICEDF
FIGURE 21. SOURCE TERM CODE PACKAGE
2 3
predict the thermal-hydraulic loads on containment due to core-concrete
interactions and as input to the VANESA (7) code to calculate fission product
release. In BMI-2104 these processes were treated in a potentially
inconsistent manner with two different models, INTER (4) and CORCON-Mod 1(8)
Potentially significant changes also resulted from the intimate
coupling of the MERGEM and TRAP-MELT (10) codes in the code package. The
most important of these are listed below and sould be kept in mind when
comparing the present results to results presented in BMI-2104 for equivalent
accident sequences:
o The decay heat contribution to the thermal hydraulicsof the RCS is now considered.
o The fission product transport calculations (TRAP) arenodalized congruently with the thermal hydraulic calcu-lations (MERGE). This includes the use of structuresin control volumes that define the boundaries of con-vective, mixing flow. Previously, distinct structureshad to be nodalized as consecutive control volumes.
o Gas properties used in TRAP are those calculated byMERGE and now account for the presence of hydrogen.
o Heat transfer coefficients used in TRAP are supplied byMERGE; mass transfer is based on those using theChilton-Colburn analogy.
o Aerosol particles are allowed to all back to upstreamvolumes if orientation and geometry permit.
o Aerosol particles settling into the melt are instantan-eously revaporized by species constituents with conden-sed vapors revolatilizing as vapors and particlesregenerating as particles with nucleation size.
o The treatment of chemisorption on walls now accountsfor gas-phase mass transport, which can be limiting forsome flows, especially for the highly reactive Tespecies.
Each of the other codes is run separately in the Code Package. In
general, the interfaces between the codes have been automated so that an
output file from one code is used as the input file for the next.
2-4
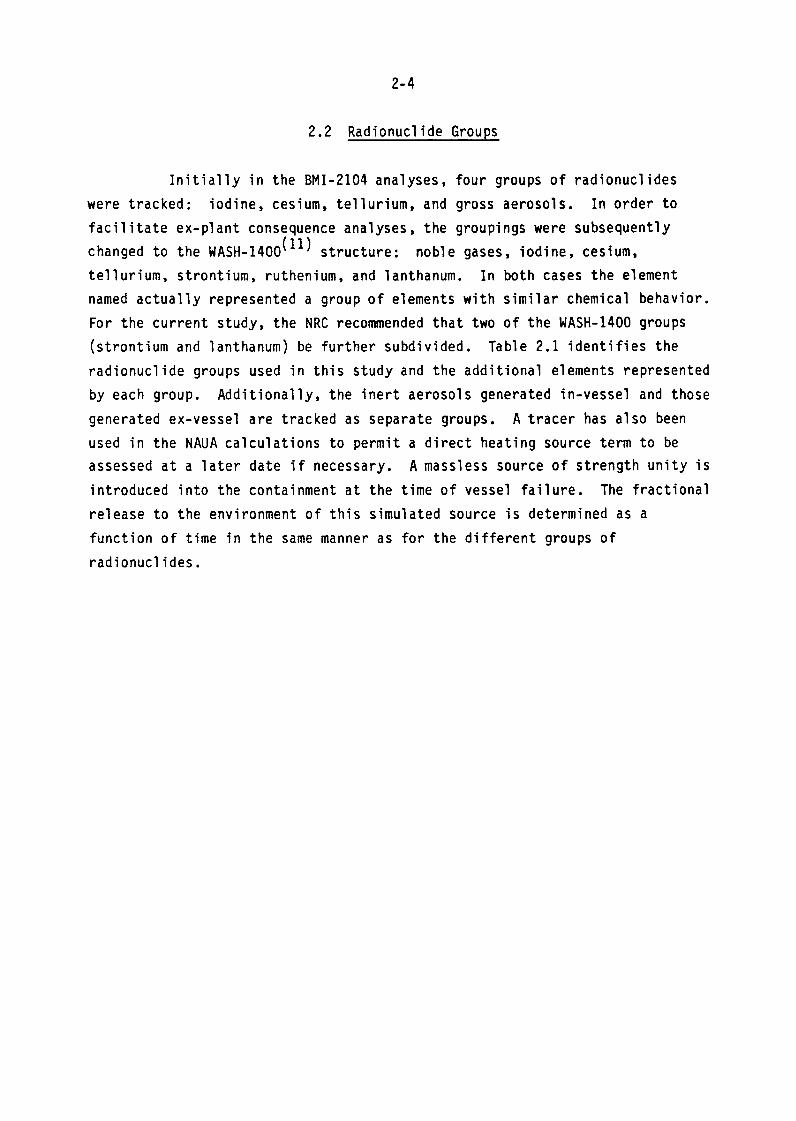
2.2 Radionuclide Groups
Initially in the BMI-2104 analyses, four groups of radionuclides
were tracked: iodine, cesium, tellurium, and gross aerosols. In order to
facilitate ex-plant consequence analyses, the groupings were subsequently
changed to the WASH-1400(ii) structure: noble gases, iodine, cesium,
tellurium, strontium, ruthenium, and lanthanum. In both cases the element
named actually represented a group of elements with similar chemical behavior.
For the current study, the NRC recommended that two of the WASH-1400 groups
(strontium and lanthanum) be further subdivided. Table 21 identifies the
radionuclide groups used in this study and the additional elements represented
by each group. Additionally, the inert aerosols generated in-vessel and those
generated ex-vessel are tracked as separate groups. A tracer has also been
used in the NAUA calculations to permit a direct heating source term to be
assessed at a later date if necessary. A massless source of strength unity is
introduced into the containment at the time of vessel failure. The fractional
release to the environment of this simulated source is determined as a
function of time in the same manner as for the different groups of
radionuclides.
2- 5
TABLE 21. RADIONUCLIDE GROUPS
Group Elements
1 Xe Kr
2 I, Br
3 Cs, Rb
4 Te, Sb, SE!
5 Sr
6 Ru, Rh, Pd, Mo, Tc
7 La, Zr, WI, Eu, Nb, Pm, Pr,sm Y
8 Ce, Pu, Np
9 Ba
10 In-vessel aerosols
11 Ex-vessel aerosols
3-1
3. DESCRIPTION OF PLANT AND ACIDENT SCENARIOS
The representation of the Sequoyah plant design in the present
analyses is substantially the same as that used in BMI-2104. A notable change
in the modeling of the plant is the updating of the volumes of the reactor
cavity and the containment floor prior to the overflow of water into the
cavity. Also, the present analyses take into ccount the fact that the bottom
of the reactor vessel would be submerged in water if the reactor cavity is
fully flooded.
3.1 Accident Sequences Considered
The accident sequences selected for ource term analyses for the
Sequoyah Ice Condenser PWR included: several ariations of a pump seal loss-
of-coolant-accident with emergency core coolini and containment spray
recirculation failure (S3HF), station blackout accompanied by a pump seal loss-
of-coolant-accident (TB or SH), an accident-induced steam generator tube
rupture with the TMLU sequence as the starting point (TMLU-SGTR), and a station
blackout accompanied by an accident-induced large break in the primary piping
(TBA). Each of these accident sequences are described more fully below.
The S3HF sequence consists of a pump seal loss-of-coolant-accident
accompanied by the failure of both the emergency core cooling and containment
spray systems in the recirculation mode. Analyses by the Accident Sequence
Evaluation Program (ASEP) have suggested that pump seal failure leak rates may
range from 50 to 500 gallons per minute; the value utilized in the present
analyses was near the top of this range. The dominant mode of failure for
both the emergency core cooling and containment spray recirculation systems has
been indicated to be failure of the valves required for this switchover; thus,
the recirculation systems would fail immediately after the injection phase of
operation. For purposes of defining the timing of refueling water storage tank
depletion, the available engineered safety systems have been assumed to
operate at their full capacities. Within the above framework three variations
of this sequence were evaluated:
- In the first variation, designated S3HF1, both the release from
the reactor vessel at the time of head failure as well as the
3-2
subsequent releases from corium-concrete interactions were
assumed to be scrubbed by the water in the reactor cavity. The
bottom head of the reactor vessel is expected to be submerged in
the cavity water for this sequence.
In the second variation, designated S3HF2, an accident induced
break in the hot leg piping is assumed prior to vessel head
failure; thus, the release from the primary system at the time
of vessel failure would not be scrubbed by the cavity water.
The releases from the corium-concrete interactions would again
be subject to scrubbing by the water in the cavity.
In the third variation of this sequence, S3HF3, only the water
discharged from the accumulators is assumed to be available for
fission product scrubbing. This variation is intended to be a
surrogate for the plugged containment drain scenarios in which
the reactor cavity would be expected to have minimal water.
In the station blackout sequence with early pump seal failure, or
essentially a small-break loss-of-coolant-accident accompanied by station
blackout (SH), the steam driven auxiliary feedwater system is the only active
safety system available. The latter would fail when the station batteries
became depleted, or the steam generators could lose their effectiveness due to
depletion of the primary system inventory through the break. In this case,
the reactor cavity would be expected to be dry except for the discharge of the
accumulators following reactor vessel failure.
The accident-induced steam generator tube rupture scenario assumed
the TMLU sequence as the starting point, with the tube rupture assumed to take
place near the end of the core melting phase of the accident but prior to
reactor vessel failure. The analyses for this sequence were focused on the
releases to the environment through the steam generator and did not address
the fate of the fission products released to the containment.
The TBA sequence is initiated by the complete loss of AC power with
the attendant loss of essentially all the active engineered safety features.
Part of the auxiliary feedwater system supplying water to the secondary side
of the steam generators is steam driven and would continue to operate as long
as DC control power is available. The latter is supplied by the station
batteries which have been estimated to last for five hours under these
3 3
circumstances. After the failure of the batteries and the auxiliary feedwater
system, the steam generators would dry out and boiloff of the primary system
coolant inventory through the pressurizer safety.-relief valves would ensue;
core uncovery and melting would follow. Some time after the start of core
melting it is postulated that a large break in te primary piping takes place;
such a break would be due to accident induced overheating of the hot leg
piping. Depressurization of the primary system hrough the large break leads
to the discharge of the accumulator water onto te partially molten core, with
recovery and quenching of the core. Boiloff of he accumulator water requires
considerable time and leads to a significant depletion of the ice. Eventually
the core remelts, fails the reactor vessel head, and falls into the reactor
cavity. The reactor cavity is expected to contain little or no water in this
scenario, thus concrete attack and associated fission product releases would
take place in a dry cavity.
In addition to the foregoing sequences for which detailed source
term analyses were performed, several other potentially important sequences
were the subject of more limited analyses; these are discussed in the next
chapter.
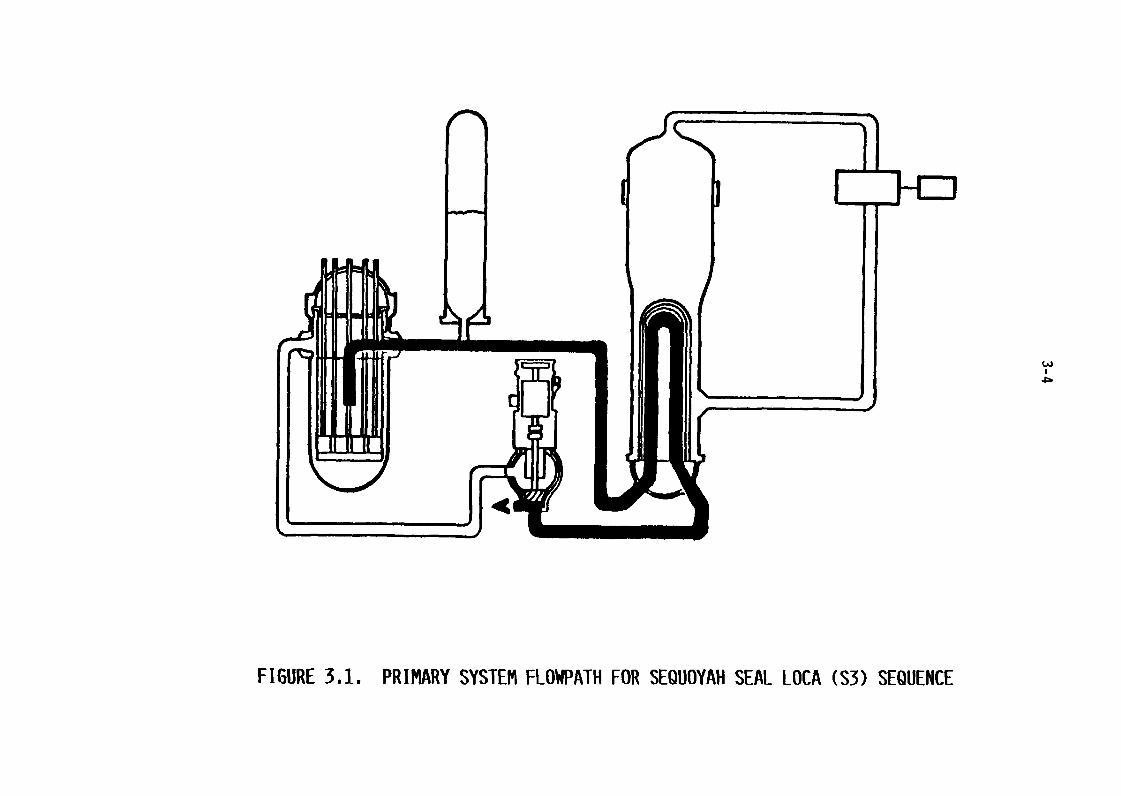
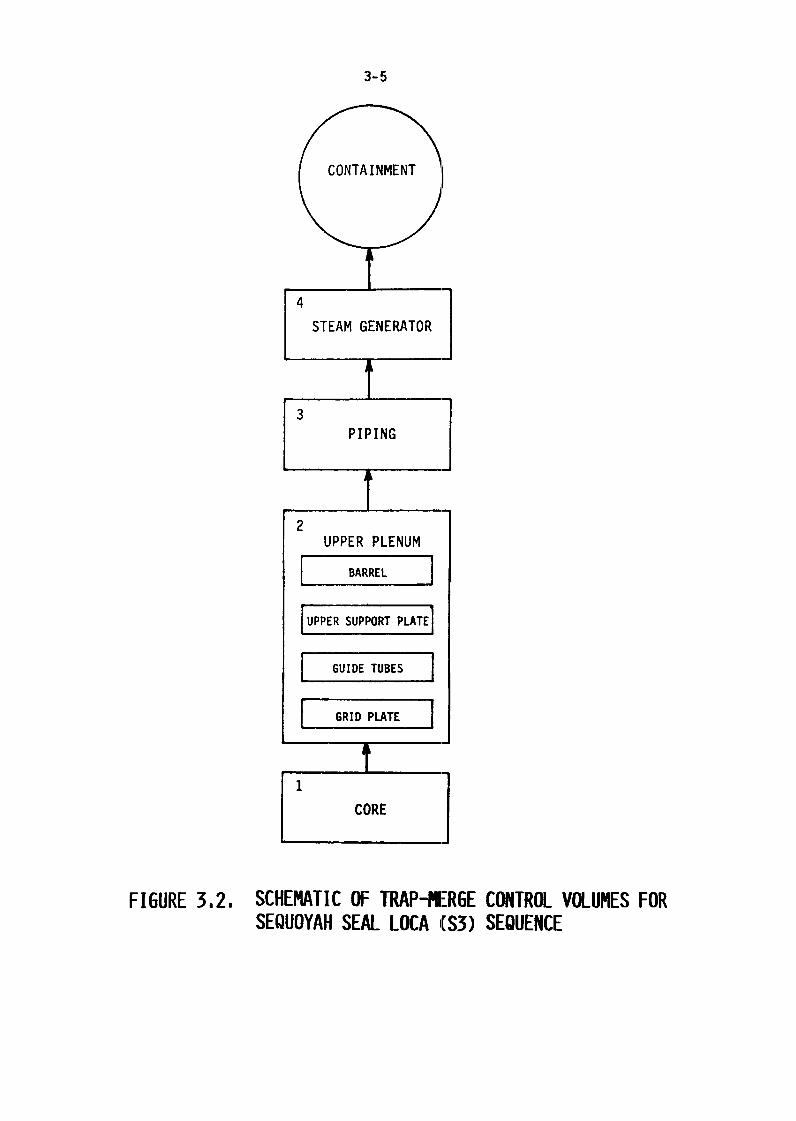
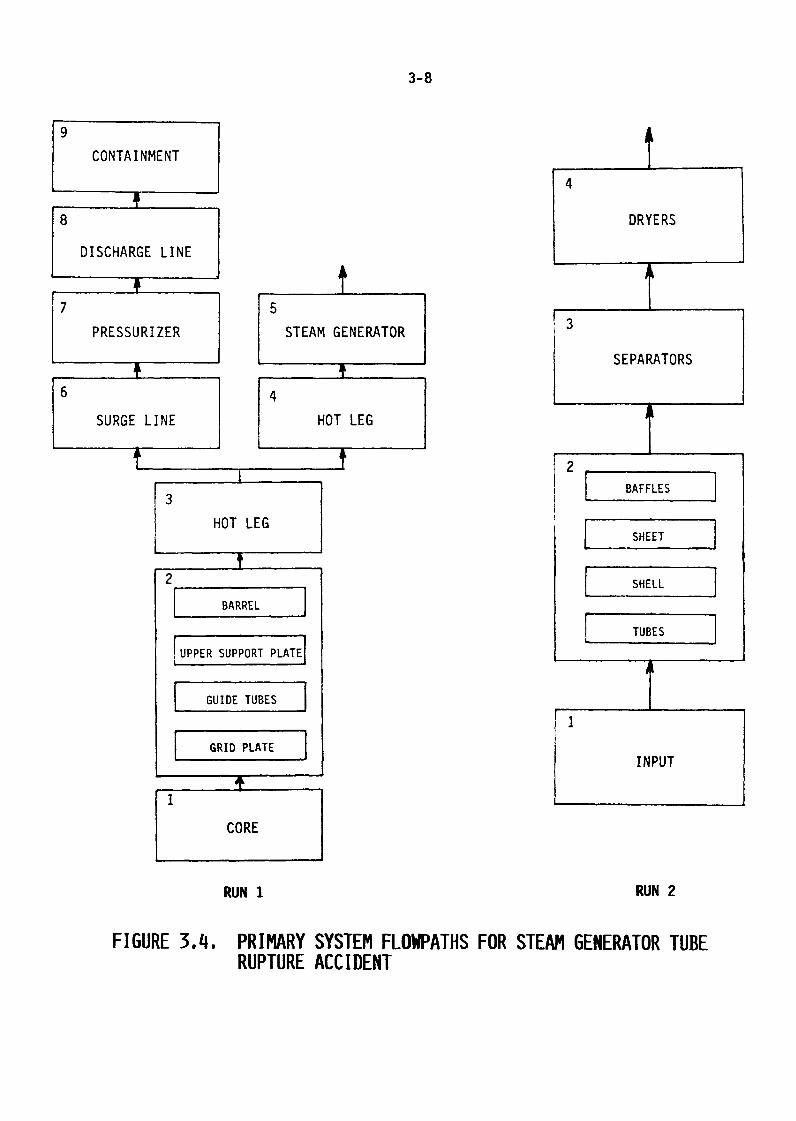
3.2 Primary System Flowpaths
The flowpaths for fission product transport within the reactor
coolant system for the S3 (seal failure LOCA) scenarios are illustrated
schematically in Figure 31. The TRAP-MERGE control volumes and their
connections used to model these flowpaths are illustrated in Figure 32. Upon
leaving the core region the fission products enter the upper plenum of the
reactor vessel; the latter is represented by a single well-mixed control
volume with four structures within it. The structures modeled include: the
upper core plate, the control rod guide tubes and support columns, the top
support structure, and the core barrel. From the upper plenum the fission
products flow through the hot leg piping to the steam generator, through the
steam generator tubes, and through the crossover pipe to the pump. The
fission products exit the primary system through the failed pump seal.
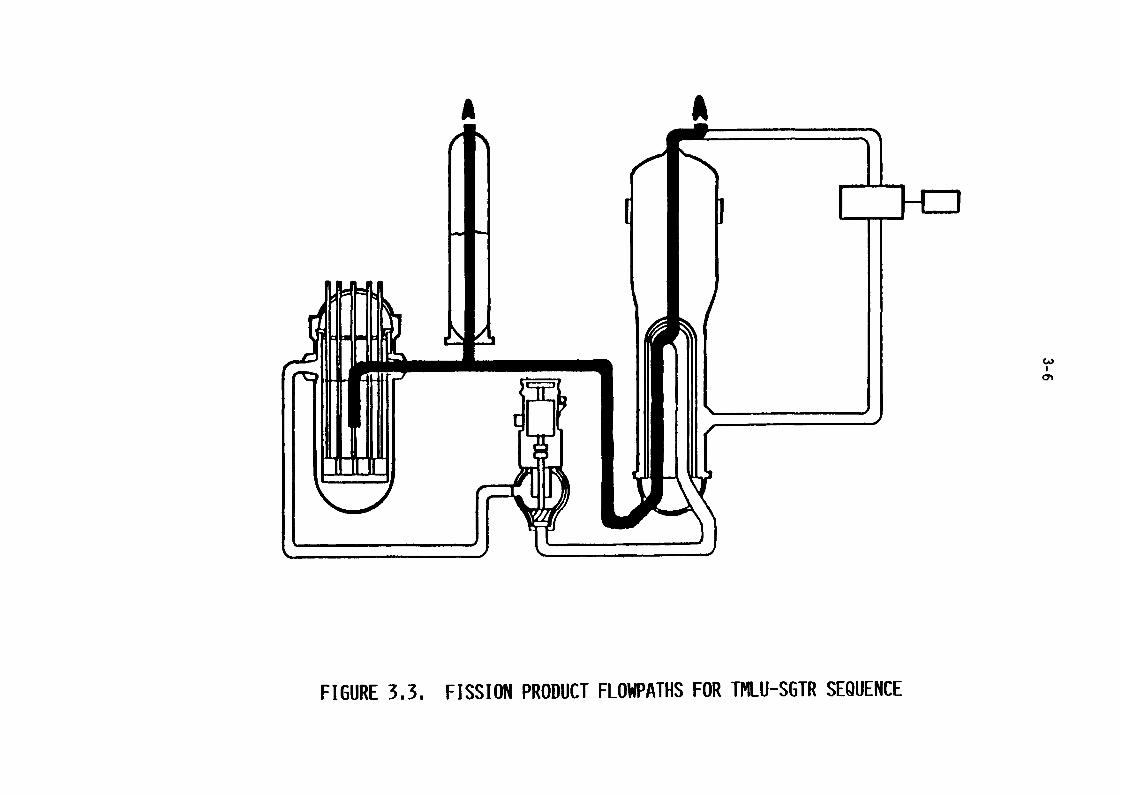
The primary system flowpaths for the TMLU-SGTR scenario are
illustrated schematically in Figure 33, with the TRAP-MERGE control volumes
I
w
.4
I C;L A
k-
FIGURE 31. PRIMARY SYSTEM FLOWPATH FOR SEQUOYAH SEAL LOCA (S3) SEQUENCE
3-5
4
STEAM GENERATOR
3PIPING
2UPPER PLENUM
BARREL
UPPER SUPPORT PLATE]
GUIDE TUBES
GRID PLATE
CORE
FIGURE 32. SCHEMATIC OF TRAP-MERGE CONTROL VOLUMES FORSEQUOYAH SEAL LOCA IIS3) SEQUENCE
A A
w
1%II
I
FIGURE 33. FISSION PRODUCT FLOWPATHS FOR TMLU-SGTR SEQUENCE
3-7
and their connection illustrated in Figure 34. The flowpaths in this
sequence change during the course of the accident. After leaving the core
region the fission products pass through the upper plenum of the reactor
vessel; the latter is represented as described bove. During the initial core
heatup and melting, prior to the induced steam enerator tube rupture, the
fission products flow from the hot leg piping trough the pressurizer surge
line into the pressurizer, and from there through the relief valve into the
containment. (It is assumed that by the time f fission product release the
pressurizer quench tank rupture disk has failed.) After the occurrence of the
steam generator tube rupture the fission product flowpath changes, going from
the hot leg piping to the steam generator, through the broken tubes into the
steam generator secondary side, and through the secondary side relief valves
to the environment.
The primary system fission product flowpaths during the initial core
melt phase of the TBA sequence are illustrated in Figure 35. The
corresponding TRAP-MERGE control volume breakdown is illustrated in
Figure 36. These flowpaths and their computational representation are
identical to those typically utilized for PWR, I-ML, and TMLB accident
sequences. Figure 37 illustrates the primary ystem fission product flowpath
following the accident-induced break in the primary system; the corresponding
TRAP-MERGE control volume breakdown is illustrated in Figure 38. The
accident-induced opening is assumed to be a larce hot leg opening.
3.3 Containment Flowpaths
The containment flowpaths for the three variations of the SUF
sequence are illustrated in Figures 39 310, and 311. Prior to the time of
reactor vessel failure the behavior is identical in all three variations. The
fission products released from the reactor coolant system are released to the
lower compartment of the ice condenser containment; from there they flow
through the ice condenser into the upper compartment. The air return fans
will transport some of the still airborne activity back down to the lower
compartment, with multiple passes through the ice condenser possible.
The three variations on the SUF sequence differ from one another
after the time of reactor vessel failure. Containment failure at or about the
3-8
9
CONTAINMENT
4
8 DRYERS
DISCHARGE LINE
7 5
PRESSURIZER STEAM GENERATOR 3
-y- SEPARATORS
6 4
SURGE LINE HOT LEG
2
BAFF ES73
HOT LEG 7ET7�]
2 SHELL
BARREL
TUBES
UPPER SUPPORT PLATE]
GUIDE TUBES
GRID PATE 7INPUT
CORE
RUN RUN 2
FIGURE 34. PRIMARY SYSTEM FLOWPATHS FOR STEAM GENERATOR TUBERUPTURE ACCIDENT
IUD [L
FIGURE 35. PRIMARY SYSTEM FLOWATH DURING INITIAL CORE MELT PHASEFOR SEQUOYAH TBA SEQUENCE
3-10
CONTAINMENT
3PIPING
PRESSURIZER
(2 STRUCTURES)
2
UPPER PLENUM
(4 STRUCTURES)
CORE
FIGURE 36. SCHEMATIC OF TRAP-MERGE CONTROLVOLUMES DURING INITIAL CORE MELTPHASE FOR SEQUOYAH TBA SEQUENCE
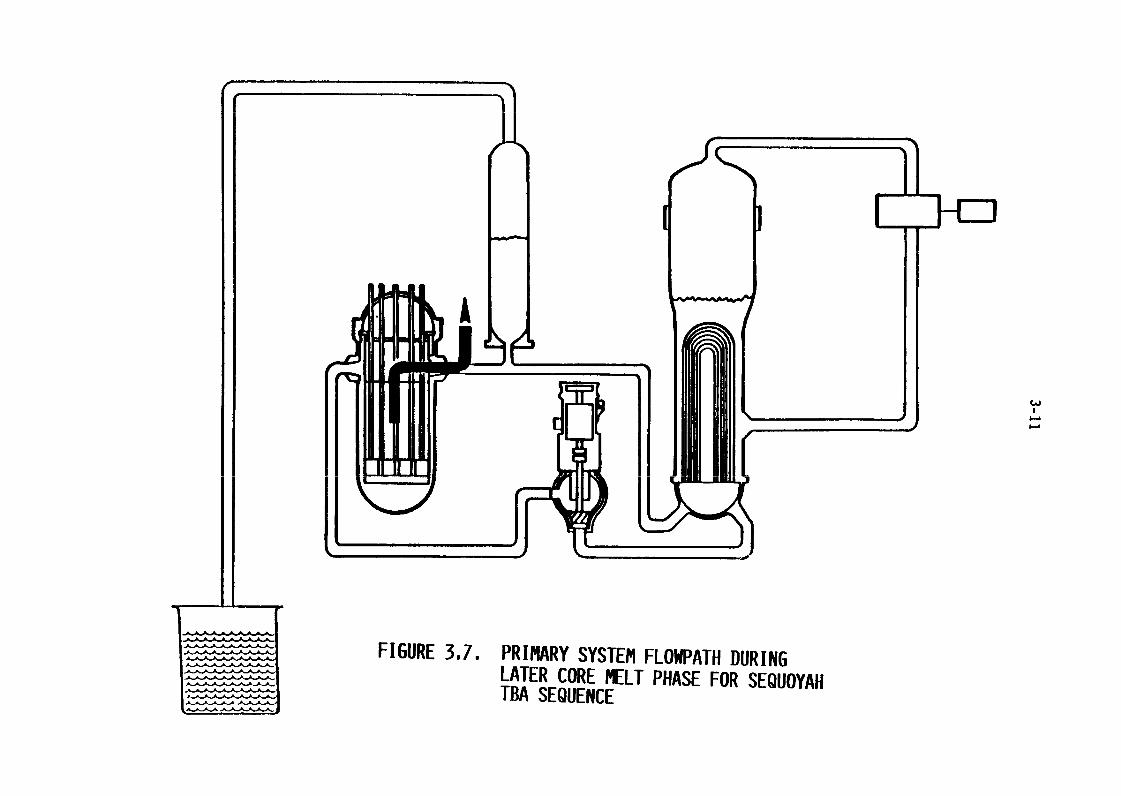
FIGURE 37. PRIMARY SYSTEM FLOWPATH DURINGLATER CORE MELT PHASE FOR SEQUOYAHTBA SEQUENCE
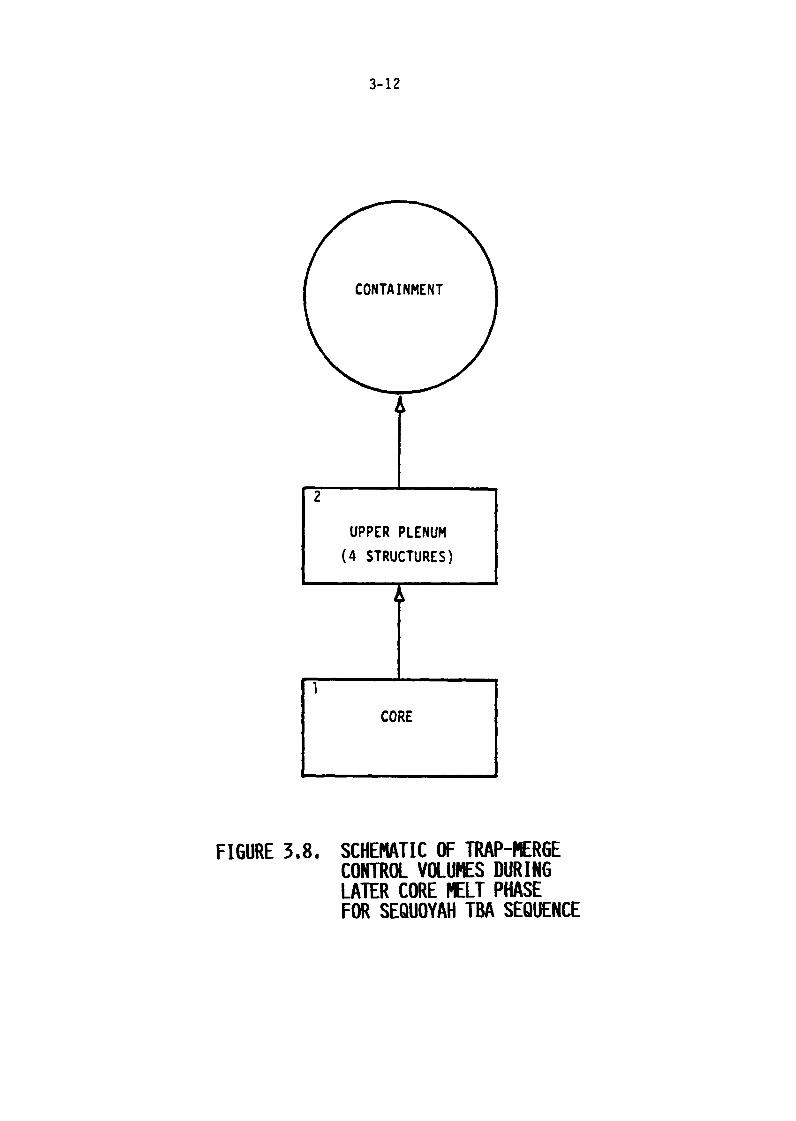
3-12
CONTAINMENT
12
UPPER PLENUM
(4 STRUCTURES)I I
_ I1
CORE
I
FIGURE 3.8. SCHEMATIC OF TRAP-MERGECONTROL VOLUMES DURINGLATER CORE MELT PHASEFOR SEQUOYAH TBA SEQUENCE
PRIOR TO REACTOR VESSEL FAILURE
PRIMARY LOWER ICE UPPERSYSTEM 110-COMPARTMENT CONDENSER � �bCOMPARTMENT
AIR RETURNFANS
AFTER REACTOR VESSEL AND CONTAINMENT FAILURE
PRIMARYSYSTEM
CAVITY LOWER ICE UPPERWATER COMPARTMENT CONDENSER COMPARTMENT ENVIRONMENT
CORIUM-CONCRETE
INTERACTIOh
FIGURE 39. CONTAINMENT FISSION PRODUCT FLOWPATHS FOR SEQUOYAH S3HF1
PRIOR TO REACTOR VESSEL, FAILURE
PRIMARY LOWER ICE UPPERSYSTEM COMPARTMENT CONDENSER COMPARTMENT
AIR RETURNFANS
AFTER REACTOR VESSEL AND CONTAINMENT FAILURE
PRIMARYSYSTEM
CAVITY LO ICE UPPERWATER 00 COMPARTM CONDENSER COMPARTMENT 10ENVIRONMENT
-T
CORTUM-CONCRETE
INTERACTION
FIGURE 3.10. CONTAINMENT FISSION PRODUCT FLOWPATHS FOR SEQUOYAH S3HF2
PRIOR TO REACTOR VESSEL FAILURE
PRIMARY LOWER ICE UPPERSYSTEM 10 COMPARTMENT CONDENSER COMPARTMENT
AL
AIR RETURNFANS
AFTER REACTOR VESSEL AND CONTAINMENT FAILURE
CORIUM- LOWER ICE UPPERCONCRETE oCOMPARTMENT P, CONDENSER COMPARTMENT. .pENVIRONMENT
INTERACTION
FIGURE 311. CONTAINMENT FISSION PRODUCT FLOWPATHS FOR SEQUOYAH S3HF3
3-16
time of vessel failure was predicted for all three cases; somewhat different
assumptions were made regarding the scrubbing of fission products by the water
in the reactor cavity. In the first variation or the base case (S3HF1) it
was recognized that the bottom of the reactor vessel would be submerged at the
time of vessel failure, and the fission products still suspended in the
primary system at that time were assumed to be scrubbed by the water in the
reactor cavity. Since the reactor cavity was flooded, the releases from the
corium-concrete interaction were also scrubbed by the water pool. In the
second variation (S3HF2) the puff release at the time of reactor vessel
failure was not subjected to scrubbing by the reactor cavity water; the
subsequent releases from the corium-concrete interaction were, as before,
scrubbed by the overlaying water pool. This variation was intended to
simulate the case of an induced hot leg rupture in the primary system prior to
the occurrence of vessel meltthrough. Whether the difference between the
first and second cases is significant will depend on the quantity of suspended
activity in the primary system at the time of vessel breach. The third
variation (S3HF3) was intended to simulate the plugged drain situation where
the reactor cavity would be dry, except for the water from the accumulators,
at the time of vessel breach. In this case the fission product scrubbing
would be limited to that afforded by the accumulator water before it is boiled
away.
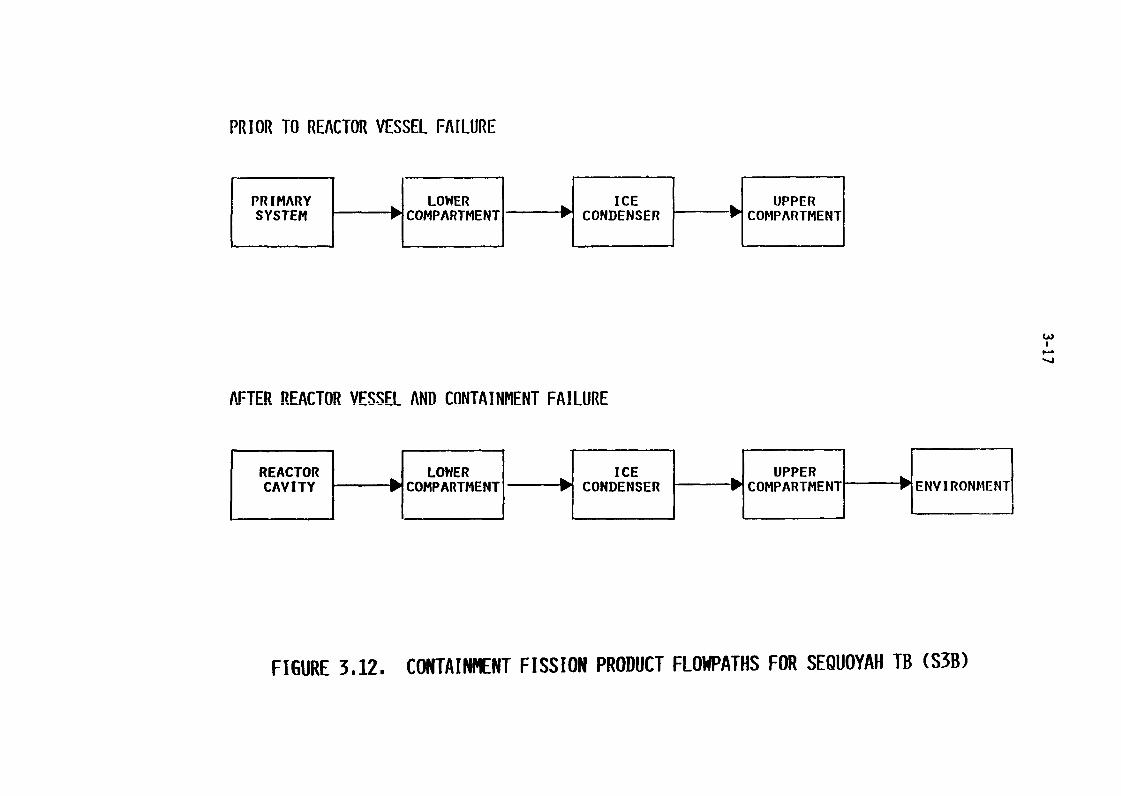
The containment fission product flowpaths for the TB (S3B) sequence
are illustrated in Figure 312. In this case the air return fans would not be
operating due to the loss of electric power. The fission products released
from the primary system would enter the lower compartment of the containment.
From there they would flow through the ice bed and into the upper compartment.
Some recirculation back to the lower compartment may be possible through the
leak paths between the two compartments. Following reactor vessel and
containment failure the airborne activity in the upper compartment would be
available for release to the environment. The reactor cavity in this sequence
would be dry at the time of vessel failure, but would receive the accumulator
discharge. Thus pool scrubbing would be limited to that provided by the
accumulator water.
The containment fission product flowpaths during the several stages
of the TBA accident sequence are illustrated schematically in Figure 3.13.
PRIOR TO REACTOR VESSEL FAILURE
PRIMARY LOWER ICE UPPERSYSTEM P-COMPARTMENT CONDENSER COMPARTMENT
AFTER REACTOR VESSEL AND CONTAINMENT FAILURE
REACTOR LOWER ICE UPPERCAVITY 10 COMPARTMENT CONDENSER COMPARTME T ENVIRONMENT
FIGURE 312. CONTAINMENT FISSION PRODUCT FLOWPATHS FOR SEQUOYAH TB (S3B)
PRIOR TO REACTOR VESSEL OR CONTAINMENT FAILURE
PRIMARY LOWER ICE UPPERSYSTEM COMPARTMENT CONDENSER 010 COMPARTMENT
AFTER CONTAINMENT FAILURE, BUT PRIOR TO REACTOR VESSEL FAILURE
PRIMARY LOWER ICE UPPER lh�SYSTEM COMPARTMENT CONDENSER COMPARTMENT ENVIRONMENT
AFTER REACTOR VESSEL AND CONTAINMENT FAILURE 00
REACTOR LOWER ICE UPPER ENVIRONMENTCAVITY COMPARTMENT bb- CONDENSER COMPARTMENT mk�
FIGURE 313. CONTAINMENT FISSION PRODUCT FLOWPATHS FOR SEQUOYAH TBA SEQUENCE
3-19
3.4 Containment Failure Mode and Pressure Level
The Sequoyah Unit No. primary containment is a cylindrical steel
shell with a hemispherical dome with a flat bottom. The containment is
surrounded by a reinforced concrete shield structure. The failure pressure
for the structure was assumed to be 65 psia in tese analyses based on a SARRP
evaluation of 65 6 psia. A value of 60 psia hd been assumed in the
BMI-2104 analyses.
4-1
4. BASES FOR TRANSPORT CALCULATIONS
4.1 Phenomenological Modeling Assumptions
The phenomenological modeling assumptions utilized for the present
analyses of the ice condenser PWR design are substantially the same as those
applied in the BMI-2104 analyses. Areas in which the present analyses differ
or involve new approaches are noted below.
In the base case S3HF sequence there is a large amount of water in
the reactor cavity at the time of predicted vessel failure. For the purposes
of the present source term analyses it has been assumed that concrete attack
begins shortly after reactor vessel failure, even with the water in the
cavity. This is equivalent to assuming no substantial fragmentation and
resultant quenching of the core debris upon contact with the water. An
alternate possibility would be debris fragmentation with rapid debris
quenching and the subsequent formation of coolable debris beds. In the latter
case concrete attack could be delayed until the -time that the water in the
cavity is all boiled off. Under the assumptions used here the fission product
releases from the early corium-concrete interactions are subject to scrubbing
by the overlaying water. Under the alternate assumptions noted above corium-
concrete interaction releases would be delayed cnsiderably in time, but would
not benefit from scrubbing by the cavity water. In the latter case it is also
possible that the ice would be melted by the time of the delayed concrete
attack.
In all three variations of the S3HF sequence the air return fans
were assumed to fail at the time of predicted containment failure. While it
does not necessarily follow that containment failure will also fail the fans,
the effectiveness of the fans becomes questionable; e.g., clearly the fans
would not function against the large pressure differentials associated with
depressurization following containment failure. Thus the assumption of air
return fan failure following containment failure is believed to be a
reasonable one and consistent with other assumptions in the analysis.
The steam generator tube rupture scenario considered in the present
analyses is intended to model the situation where the failure of the steam
generator tubes is the result of accident induced thermal loadings. Such a
4-2
postulate would be particularly appropriate if the accident scenario is
characterized by a large degree of steam and hydrogen recirculation within the
primary system as the core uncovers and overheats. Such recirculation
patterns have been postulated to result in substantial redistribution of
energy within the primary system, even to the point where failures of primary
system piping due to overheating have been postulated to take place prior to
core melting. The MARCH code cannot model the effects of the above noted
recirculation flows and their effect on primary system heat transfer. In
order to approximate the consequences of such postulated accident induced
primary system failures it has been assumed that steam generator tube rupture
takes place at the time of the start of core slumping. Core slumping as
treated in the MARCH analyses is typically accompanied by large steam and
hydrogen flows and the heating of structures downstream of the core. The
induced failure was represented by an area equal to five steam generator
tubes, with the primary system allowed to depressurize into the secondary side
of the steam generator; the latter was assumed to be maintained at 1100 psia.
The principal interest in this case involved the release to the environment
through the steam generator. After vessel failure it was assumed that the
secondary side relief valves would close. No subsequent failure of the
containment was considered. Clearly, in some related scenarios the release
through the steam generators would be accompanied by additional release if the
containment were to fail.
4.2 Results of Thermal Hydraulic Analyses
4.2.1 SUF Sequence
As noted previously, three variations of the SUF sequence were
explicitly considered as part of the present analyses. The in-vessel portion
was identical in all three variations, with the differences being in the
assumed behavior subsequent to the predicted time of reactor vessel failure.
In the base case for this sequence, designated as S3HF1, the bottom
of the reactor vessel is submerged by the water in the reactor cavity at the
time of predicted vessel failure. Thus the primary system blowdown was
assumed to go through the water in the reactor cavity. The water in the
4 3
reactor cavity was also assumed to scrub the products of the subsequent
corium-concrete interaction.
The accident event times for the S3HF1 scenario are given in Table
4.1. A summary of core and primary system conditions at key times during the
sequence is given in Table 42. Containment conditions at arious times
during the sequence are summarized in Table 43.
Figure 41 illustrates the primary system pressure, Figure 42 gives
the total water and steam leakage, and Figure 43 shows the primary system
water inventory for the S3HF sequence. The primary system pressure drops
rapidly initially in response to the break, then levels off as the break and
emergency core cooling system flows equilibrate. Failure of the emergency
core cooling system upon switchover to recirculation is followed by another
abrupt decrease in the primary system pressure, with the pressure leveling off
as the system approaches saturated conditions. The abrupt drop in the total
leak rate at about 225 minutes is associated with the change from a liquid to
a steam break, and can also be seen in the slower decrease in the primary
system inventory. The increase in the primary sytem pressure at about 400
minutes is associated with the slumping of the Cre into the vessel head.
Figure 44 illustrates the maximum and average core temperatures
during the in-vessel phase of the accident. The maximum temperature is seen
to arrest at 4130 F, the input effective melting temperature, except for brief
excursions due to rapid metal-water reactions as the molten fuel is relocated
within the core region. Figure 45 illustrates 'the fractions of core melted
and active cladding reacted during the sequence. The extended slow blowdown
in this sequence provides a continuing steam supply for metal-water reactions,
with the total fraction of cladding reacted in this case being higher than is
typically predicted.
Figures 46 and 47 illustrate the containment pressure and
temperature histories for the S3HF1 scenario. The hydrogen igniters are
available in this sequence; thus the timing of -ignition is governed by the
development of a combustible mixture in any of the containment compartments.
Examination of these figures indicates that there are two substantal hydrogen
burns prior to reactor vessel failure, but the brn leading to containment
failure in this case takes place shortly after vssel failure. Contrast of
the pressure and temperature responses illustrates that the burns that are
4-4
TABLE 41. TIMING OF KEY EVENTS
Time,Event minutes
Sequoyah S3HF1
ECCS On 1.0Fan On 10.8Spray On 11.3ECCS Recirculation Failure 36.0Spray Recirculation Failure 42.3Core Uncovery 272.4Start Melt 363.7Core Slump 391.8Core Collapse 393.4Hydrogen Burn 396.4Hydrogen Burn 409.6Bottom Head Failure 410.2Accumulators Empty 410.2Start Concrete Attack 410.2Hydrogen Burn/Containment Failure 412.0Fan Off 412.0Hydrogen Burn 504.7Hydrogen Burn 513.5Hydrogen Burn 521.0Hydrogen Burn 570.1Corium Layers Invert 610.5Ice Melt Complete 991.7Hydrogen Burn 992.7End Calculation 1010.2
Sequoyah S3HF2
ECCS On 1.0Fan On 10.8Spray On 11.3ECCS Recirculation Failure 36.0Spray Recirculation Failure 42.3Core Uncovery 272.4Start Melt 363.7Core Slump 391.8Core Collapse 393.4Hydrogen Burn 396.4Hydrogen Burn 409.9Bottom Head Failure 410.2Accumulators Empty 410.2Start Concrete Attack 410.2Hydrogen Burn/Containment Failure 411.8Fan Off 411.8Hydrogen Burn 504.5Hydrogen Burn 513.0Hydrogen Burn 520.5Hydrogen Burn 574.0Corium Layers Invert 610.2Hydrogen Burn 732.7Ice 1elt Complete 987.0End Calculation 1010.2
4- 4a
TABLE 41. TIMING OF KEY EVENTS(continued)
Time,Event minutes
Sequoyah S3HF3
ECCS On 1.0Fan On 10.8Spray On 11.3ECCS Recirculation Failure 36.0Spray Recirculation Failure 42.3Core Uncovery 272.4Start Melt 363.7Core Slump 391.8Core Collapse 393.4Hydrogen Burn 396.4Hydrogen Burn 409.9Bottom Head Failure/Hydrogen Burn 410.2Accumulators Empty 410.2Start Concrete Attact 410.2Hydrogen Burn/Containment Failure 411.8Fan Off 411.8Hydrogen Burn 546.8Hydrogen Burn 563.2Corium Layers Invert 610.2End Calculation 1010.2
Sequoyah S3B
Core Uncovery 236.6Start Melt 327.1Core Slump 354.4Core Collapse 356.0Hydrogen Burn 373.2Hydrogen Burn/Bottom Head Failure 373.6Hydrogen Burn/Containment Failure 373.6Hydrogen Burn/Start Concrete Attack 373.6Hydrogen Burn 497.6Hydrogen Burn 509.6Corium Layers Invert 528.1End Calculation 973.6
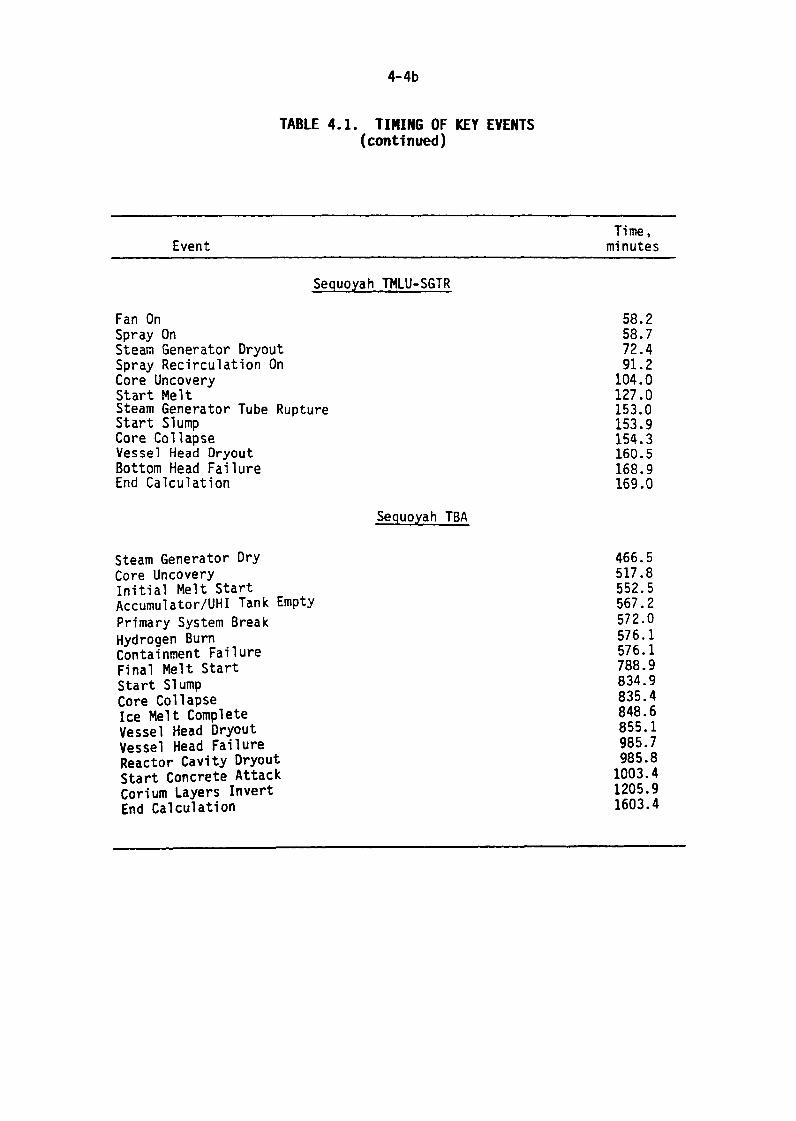
4- 4b
TABLE 41. TIMING OF KEY EVENTS(continued)
Time,Event minutes
Sequoyah TMLU-SGTR
Fan On 58.2Spray On 58.7Steam Generator Dryout 72.4Spray Recirculation On 91.2Core Uncovery 104.0Start Melt 127.0Steam Generator Tube Rupture 153.0Start Slump 153.9Core Collapse 154.3Vessel Head Dryout 160.5Bottom Head Failure 168.9End Calculation 169.0
Sequoyah TBA
Steam Generator Dry 466.5Core Uncovery 517.8Initial Melt Start 552.5Accumulator/UHI Tank Empty 567.2Primary System Break 572.0Hydrogen Burn 576.1Containment Failure 576.1Final Melt Start 788.9Start Slump 834.9Core Collapse 835.4Ice Melt Complete 848.6Vessel Head Dryout 855.1Vessel Head Failure 985.7Reactor Cavity Dryout 985.8Start Concrete Attack 1003.4Corium Layers Invert 1205.9End Calculation 1603.4
4- 4c
TABLE 41. TIMING OF KEY EVENTS(continued)
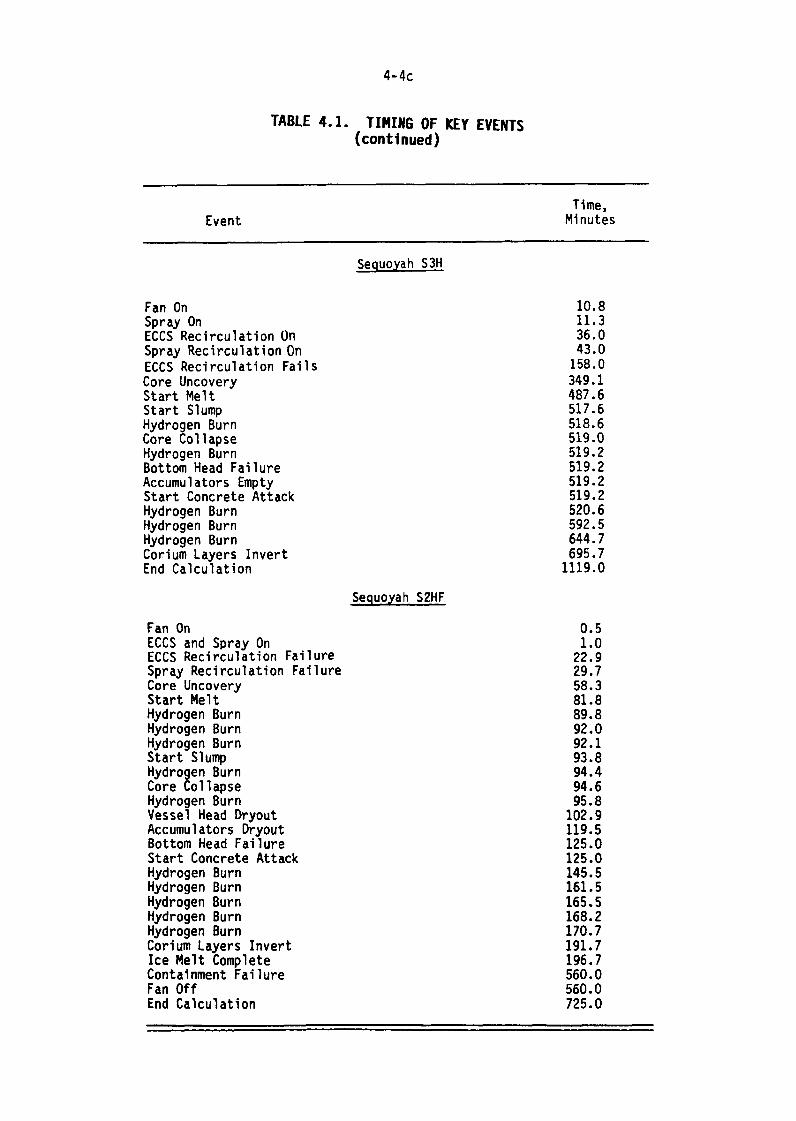
Time,Event Minutes
Sequoyah S3H
Fan On 10.8Spray On 11.3ECCS Recirculation on 36.0Spray Recirculation On 43.0ECCS Recirculation Fails 158.0Core Uncovery 349.1Start Melt 487.6Start Slump 517.6Hydrogen Burn 518.6Core Collapse 519.0Hydrogen Burn 519.2Bottom Head Failure 519.2Accumulators Empty 519.2Start Concrete Attack 519.2Hydrogen Burn 520.6Hydrogen Burn 592.5Hydrogen Burn 644.7Corium Layers Invert 695.7End Calculation 1119.0
Sequoyah S2HF
Fan On 0.5ECCS and Spray On 1.0ECCS Recirculation Failure 22.9Spray Recirculation Failure 29.7Core Uncovery 58.3Start Melt 81.8Hydrogen Burn 89.8Hydrogen Burn 92.0Hydrogen Burn 92.1Start Slump 93.8Hydrogen Burn 94.4Core Collapse 94.6Hydrogen Burn 95.8Vessel Head Dryout. 102.9Accumulators Dryout 119.5Bottom Head Failure 125.0Start Concrete Attack 125.0Hydrogen Burn 145.5Hydrogen Burn 161.5Hydrogen Burn 165.5Hydrogen Burn 168.2Hydrogen Burn 170.7Corium Layers Invert 191.7Ice Melt Complete 196.7Containment Failure 560.0Fan Off 560.0End Calculation 725.0
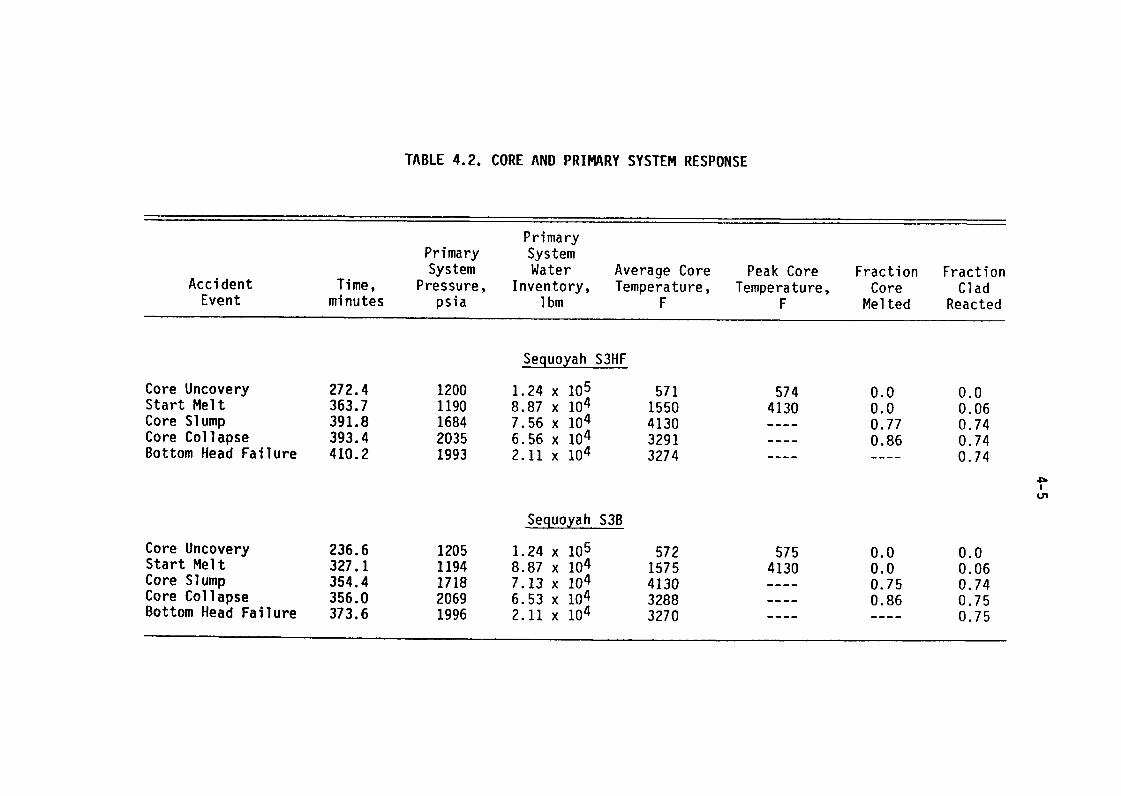
TABLE 42. CORE AND PRIMARY SYSTEM RESPONSE
PrimaryPrimary SystemSystem Water Average Core Peak Core Fraction Fraction
Accident Time, Pressure, Inventory, Temperature, Temperature, Core CladEvent minutes psia Ibm F F Melted Reacted
Sequoyah S3HF
Core Uncovery 272.4 1200 1.24 x 10⁵ 571 574 0.0 0.0Start Melt 363.7 1190 8.87 x 10⁴ 1550 4130 0.0 0.06Core Slump 391.8 1684 7.56 x 10⁴ 4130 ---- 0.77 0.74Core Collapse 393.4 2035 6.56 x 10⁴ 3291 ---- 0.86 0.74Bottom Head Failure 410.2 1993 2.11 x 10⁴ 3274 ---- ---- 0.74
Sequoyah S3B
Core Uncovery 236.6 1205 1.24 x 10⁵ 572 575 0.0 0.0Start Melt 327.1 1194 8.87 x 10⁴ 1575 4130 0.0 0.06Core Slump 354.4 1718 7.13 x 10⁴ 4130 ---- 0.75 0.74Core Collapse 356.0 2069 6.53 x 10⁴ 3288 ---- 0.86 0.75Bottom Head Failure 373.6 1996 2.11 x 10⁴ 3270 ---- ---- 0.75
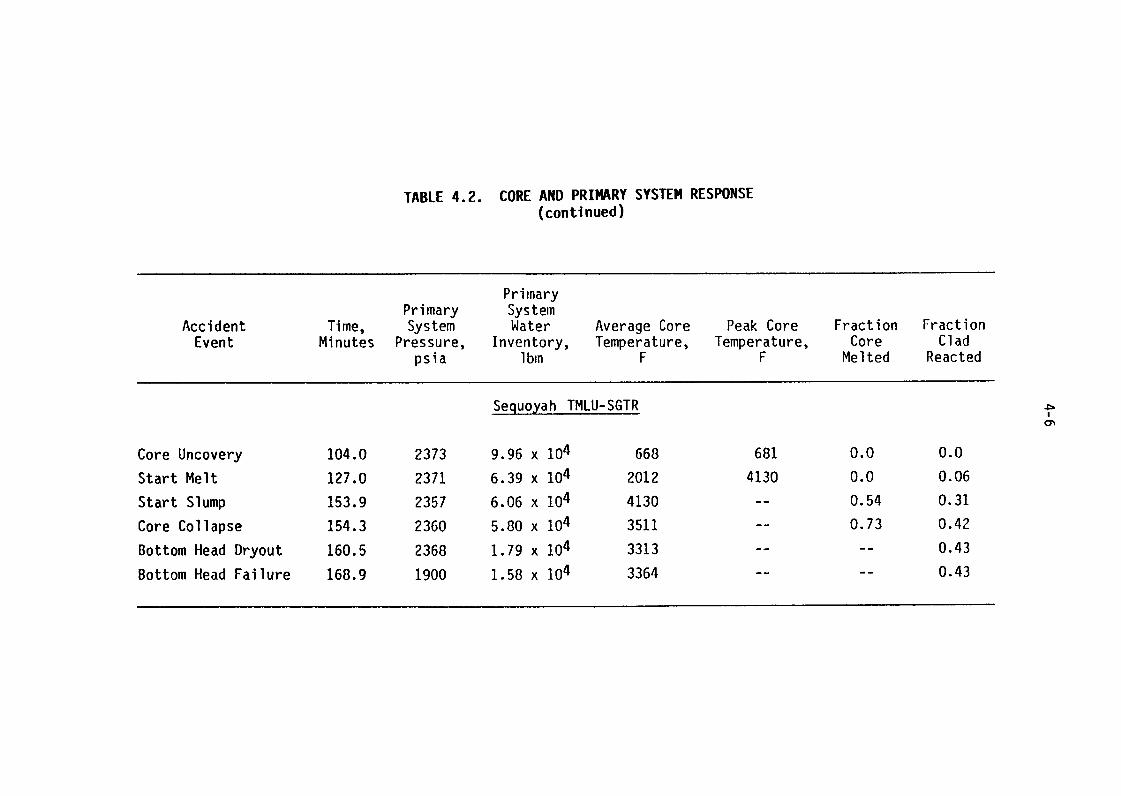
TABLE 42. CORE AND PRI14ARY SYSTEM RESPONSE(continued)
PrimaryPrimary System
Accident Time, System Water Average Core Peak Core Fraction FractionEvent Minutes Pressure, Inventory, Temperature, Temperature, Core Clad
psia 1 bin F F Melted Reacted
Sequoyah TMLU-SGTR
Core Uncovery 104.0 2373 9.96 x 10⁴ 668 681 0.0 0.0
Start Melt 127.0 2371 6.39 x 10⁴ 2012 4130 0.0 0.06
Start Slump 153.9 2357 6.06 x 10⁴ 4130 -- 0.54 0.31
Core Collapse 154.3 2360 5.80 x 10⁴ 3511 0.73 0.42
Bottom Head Dryout 160.5 2368 1.79 x 10⁴ 3313 -- 0.43
Bottom Head Failure 168.9 1900 1.58 x 10⁴ 3364 0.43
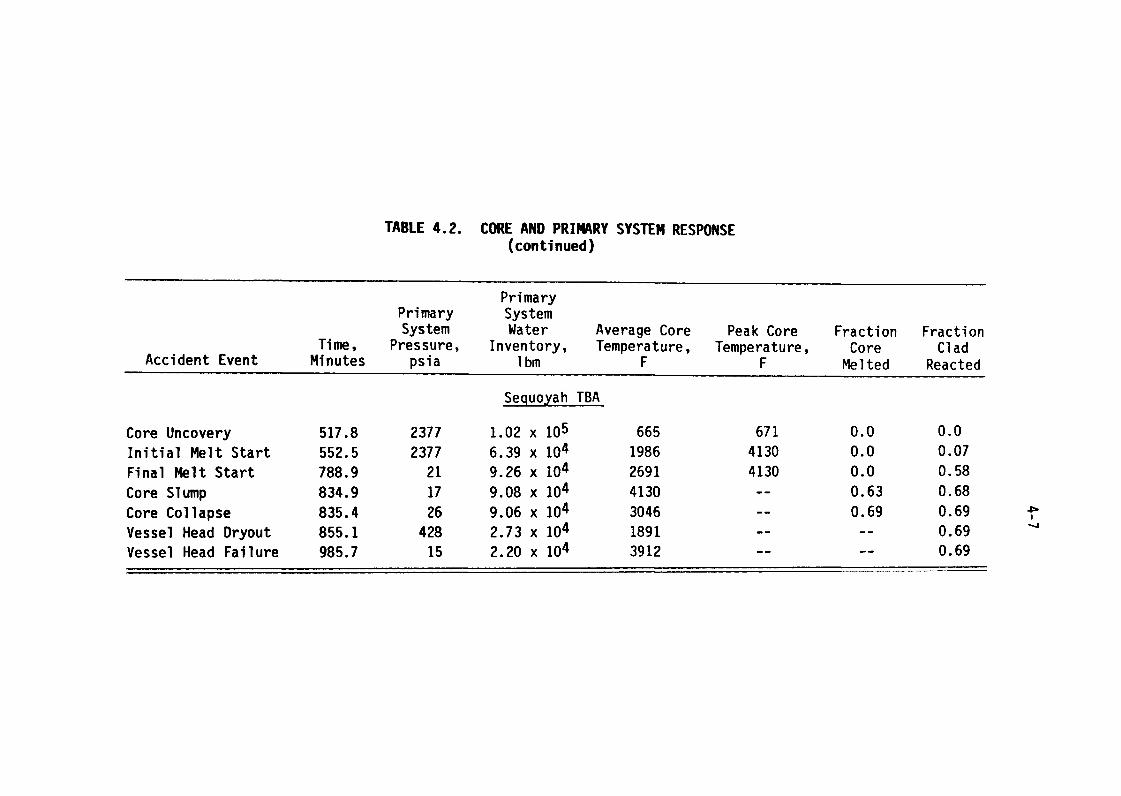
TABLE 42. CORE AND PRIMARY SYSTEM RESPONSE(continued)
PrimaryPrimary SystemSystem Water Average Core Peak Core Fraction Fraction
Time, Pressure, Inventory, Temperature, Temperature, Core CladAccident Event Minutes psia lbm F F Melted Reacted
Sequoyah TBA
Core Uncovery 517.8 2377 1.02 x 10⁵ 665 671 0.0 0.0Initial Melt Start 552.5 2377 6.39 x 10⁴ 1986 4130 0.0 0.07Final Melt Start 788.9 21 9.26 x 10⁴ 2691 4130 0.0 0.58Core Slump 834.9 17 9.08 x 10⁴ 4130 -- 0.63 0.68Core Collapse 835.4 26 9.06 x 10⁴ 3046 0.69 0.69Vessel Head Dryout 855.1 428 2.73 x 10⁴ 1891 -- 0.69Vessel Head Failure 985.7 15 2.20 x 10⁴ 3912 0.69
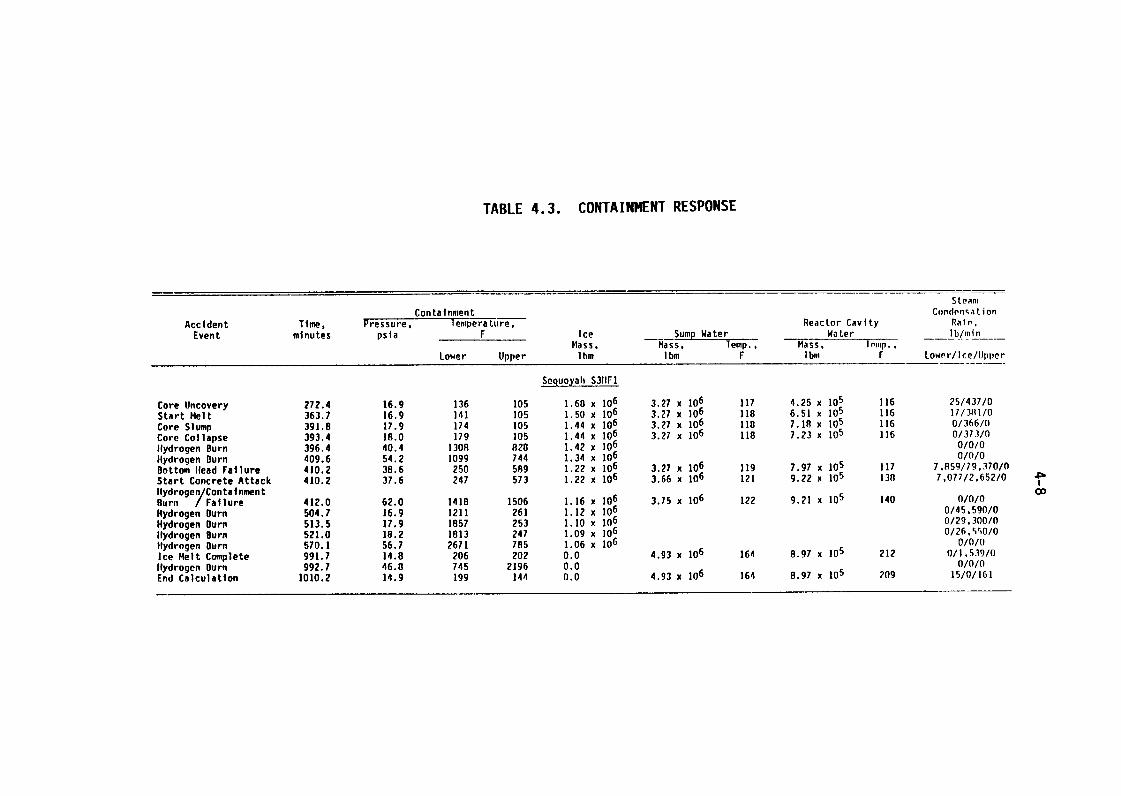
TABLE 43. CONTAINMENT RESPONSE
SteamContainment Condrn�. at ion
Accident Time, Pressure. 1 empe ra tu re, Reactor Cavity Rate,Event minutes psia F Ice Sump Water Wa ter I blininMass, Temp.,Mass, mass, I P111p.
Lower Upper Ibm Ibm F I bm F Lower/Ice/Upper
Sequoyah S311F1
Core Uncovery 272.4 16.9 136 105 1.60 x 10⁶ 3.27 x 10⁶ 117 4.25 x 10⁵ 116 25/437/0Start Melt 363.7 16.9 141 105 1.50 x 10⁶ 3.27 x 10⁶ 118 6.51 x 10⁵ 116 17138110Core Slump 391.8 17.9 174 105 1.44 x 10⁶ 3.27 x 10⁶ 118 7.18 x 10⁵ 116 0/366/0Core Collapse 393.4 18.0 179 105 1.44 x 10⁶ 3.27 x 10⁶ 118 7.23 x 10⁵ 116 0137310Hydrogen Burn 396.4 40.4 1308 828 1.42 x 10⁶ 0/0/0Hydrogen Burn 409.6 54.2 1099 7 44 1.34 x 10⁶ 0/(/OBottom ead Failure 410.2 38.6 250 589 1.22 x 10⁶ 3.27 x 10⁶ 119 7.97 x 10⁵ 117 7.859/79,370/0Start Concrete Attack 410.2 37.6 247 573 1.22 x 10⁶ 3.66 x 10⁶ 121 9.22 x 10⁵ 130 7,07712,65210Hydrogen/Containment 00Burn / Failure 412.0 62.0 1418 1506 1 16 x 106 3.75 x 10⁶ 122 9.21 x 10⁵ 140 0/0/0Hydrogen Burn 504.7 16.9 1211 261 1:12 x 106 0/45.590/0Hydrogen Burn 513.5 17.9 1857 253 1 1 x 10⁶ 0/29,300/0Hydrogen Burn 521.0 18.2 1813 247 1:09 x 106 0/26,�r0/0Hydrogen Burn 570.1 56.7 2671 785 1.06 x 10⁶ 0/0/(Ice Melt Complete 991.7 14.8 206 202 0.0 4.93 x 10⁶ 164 8.97 x 10⁵ 212 0/1,539/0Hydrogen Burn 992.7 46.8 745 2196 0.0 0/0/0End Calculation 1010.2 14.9 199 144 0.0 4.93 x 10⁶ 164 8.97 x 10⁵ 209 15/0/161
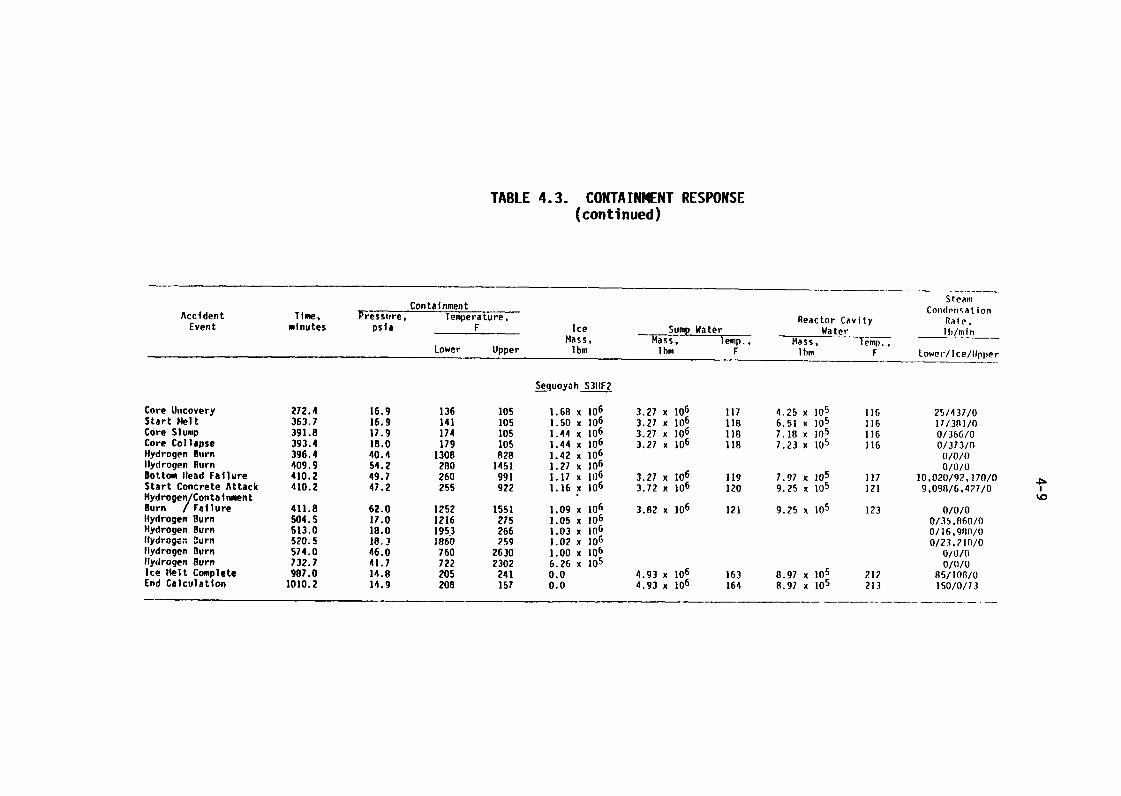
TABLE 43. CONTAINNENT RESPONSE(continued)
SteamContainment Condpii- at ion
Accident Time, Pressure, Temperature, Reactor Cavity Ra t e,Event minutes psia F Ice Sump Water Water Ib/111-in
Mass, Mass, Temp. Mas lemp.,Lower Upper Ibm Ibm F Ibm F Lowe r/ I c e /Upper
Sequoyah S310`2
Core Uncovery 272.4 16.9 136 105 1.68 x 10⁶ 3.27 x 10⁶ 117 4.25 x10⁵ 116 25/437/0Start Helt 363.7 1619 141 105 1.50 x 10⁶ 3.27 x 10⁶ 118 6.51 x10⁵ 116 17/381/0Core Slump 391.8 17.9 7 4 105 1.44 x 10⁶ 3.27 x 10⁶ 118 7.18 x10⁵ 116 0/366/0Core Collapse 393.4 18.0 179 105 1.44 x 10⁶ 3.27 x 10⁶ 118 7.23 xIU5 116 0137310Hydrogen Burn 396.4 40.4 1308 828 1.42 x 10⁶ 0/0/0Hydrogen urn 409.9 54.2 200 1451 1.27 x 1(6 0/(/OBottom ead Failure 410.2 49.7 260 991 1.17 x 10⁶ 3.27 x 10⁶ 119 7.97 x10⁵ 117 10.020/92,170/0Start Concrete Attack 410.2 47.2 255 922 1.16 x 10⁶ 3.72 x 10⁶ 120 9.25 x10⁵ 121 9,09fl/6.477/0Hydrogen/ContainmentBurn / Failure 411.8 62.0 1252 1551 1.09 x 10⁶ 3.82 x 10⁶ 121 9.25 x10⁵ 123 0/0/0Hydrogen Burn S04.S 17.0 1216 275 1.05 x 1(6 0/35.060/0Hydrogen Burn 513.0 18.0 1953 266 1.03 x 10⁶ 0/16,980/0ify'rogen Burn 520.5 N1.3 Iqrh 259 1.02 x 10⁶ 0123.21010Hydrogen Burn 574.0 46.0 760 2630 1.00 x 10⁶ 0/0/0Hydrogen Burn 732.7 41.7 722 2302 6.26 x 10⁵ 0/0/0Ice Melt Complete 987.0 14.8 205 241 0.0 4.93 x 10⁶ 163 8.97 105 212 85/108/0End Calculation 1010.2 14.9 208 157 0.0 4.93 x 10⁶ 164 8.97 x 10⁵ 213 150/0/73
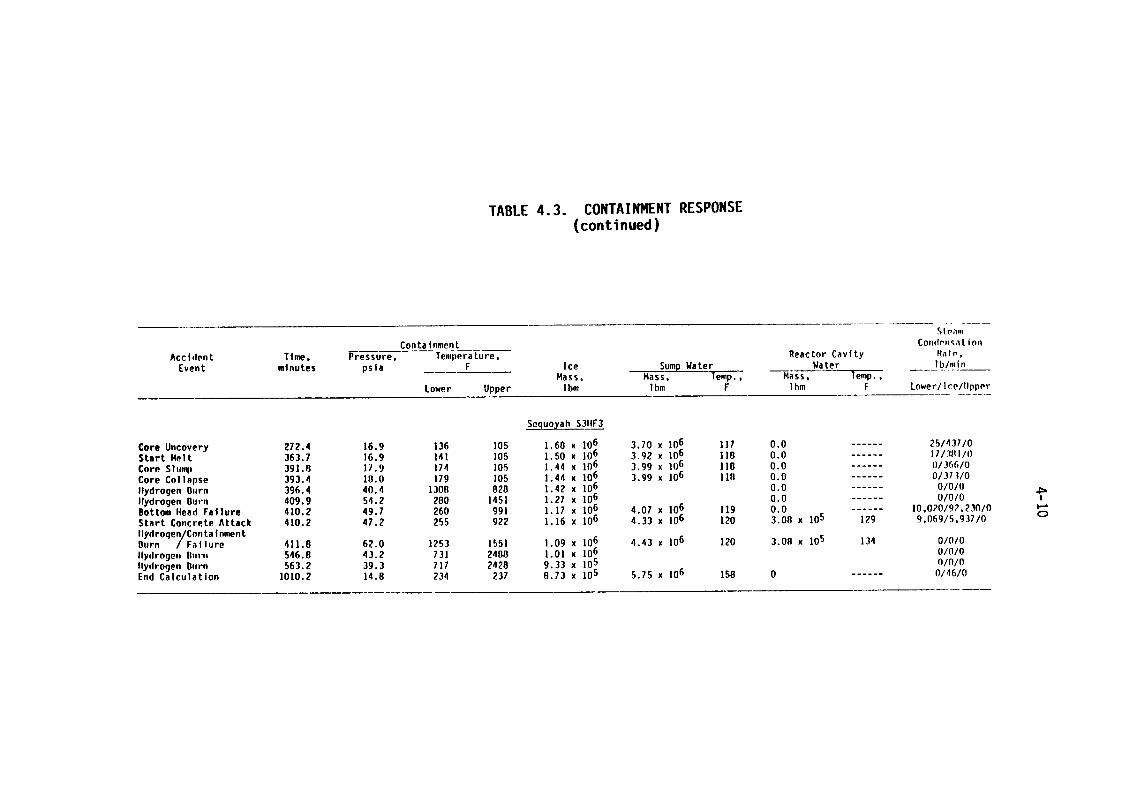
TABLE 43. CONTAINMENT RESPONSE(continued)
stpallContainment Colld(,ii,,at ion
Accident Time. Pressure, Temperature, Reactor Cavity Ra I P,Event minutes psla F Ice Sump Water Water lb/min
Mass, Mass, Temp., Mass, Temp.,Lower Upper Ibm Ibm F Ibm F Lower/Ice/Upper
Sequoyah S311F3
Core Uncovery 272.4 16.9 136 105 1.60 x10⁶ 3.70 x 10⁶ 117 0.0 ------ 25/4 37 /0Start Melt 363.7 16.9 141 105 1.50 x10⁶ 3.92 x 10⁶ 118 0.0 ------ 171311110Core Slump 391.8 17.9 17 4 105 1.44 x1(6 3.99 x 1(6 lie 0.0 ------ 0/366/0Core Collapse 393.4 18.0 179 105 1.44 x10⁶ 3.99 x 10⁶ 118 0.0 ------ 0/311/0Hydrogen Durn 396.4 40.4 1308 828 1.42 x10⁶ 0.0 ------ 0/0/0Hydrogen Burii 409.9 54.2 280 1451 1.27 x10⁶ 0.0 ------ 0/0/0Bottom Head Failure 410.2 49.7 260 991 1.17 x10⁶ 4.07 x 10⁶ 119 0.0 ------ 10,020/9?,230/0Start Concrete Attack 410.2 47.2 255 922 1.16 x10⁶ 4.33 x 10⁶ 120 3.08 x 15 129 9,069/5,937/0 C)
Ilydroge YContainment 1551 1.09 x10⁶ 6 120 3.0 x 15 134 0/0/0Burn Failure 411.8 62.0 1253 4.43 x 10Hydrogeti lhoro 546.8 43.2 7 31 2488 1.01 x10⁶ 0/(/OIlydrogen Durn 563.2 39.3 717 2428 9.33 x10⁵ 0/0/0End Calculation 1010.2 14.8 234 237 8.73 x10⁵ 5.75 x 10⁶ 158 0 ------ 0/46/0
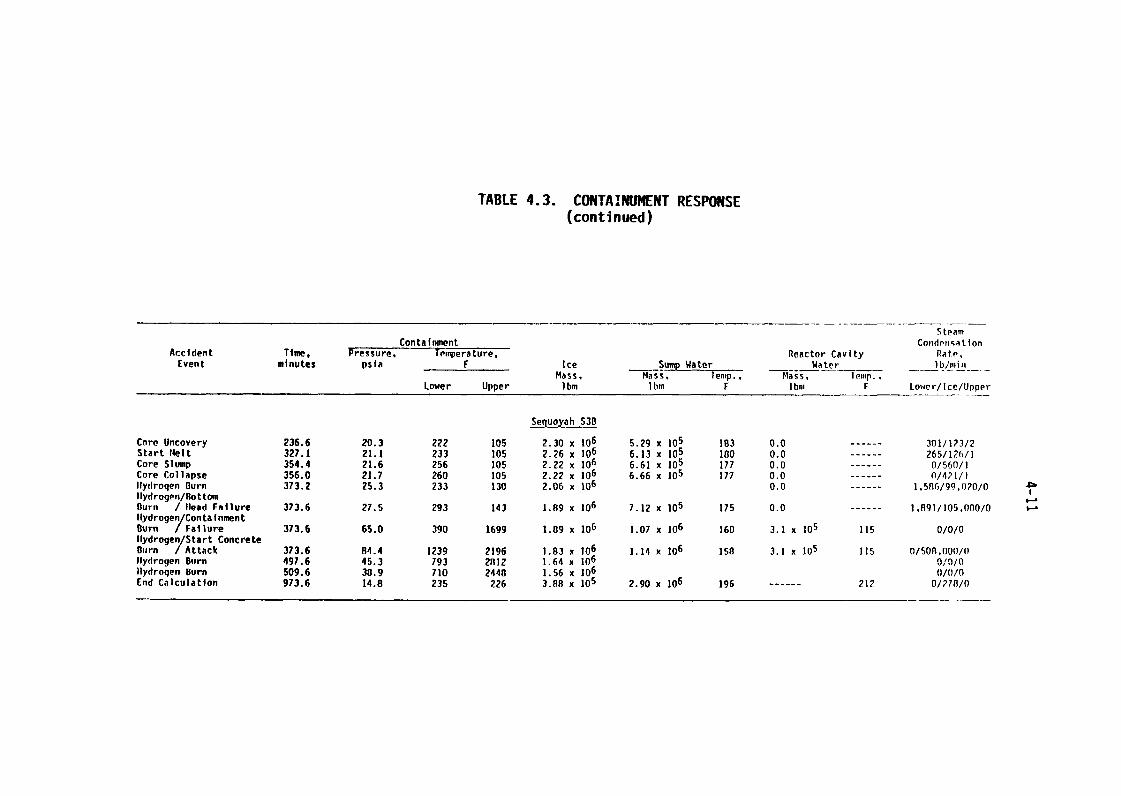
TABLE 43. r TATNUNENT RESPONSE(continued)
Containment Condmi" t ionAccident Time, Pressure, Tempera tu re, Reactor Cavity Ra te,
Event minutes psla F Ice - -- Sump Water - _ Water lb/minMass, Mass, emp. Mass, I Culp.
Lower Upper Ibm Ibm F I bm F Lower/ice/Upper
Inuoyah S3B
Core Uncovery 236.6 20.3 222 105 2.30 x10⁶ 5.29 x10⁵ 183 0.0 ------ 301112312Start et 327.1 21.1 233 105 2.26 x10⁶ 6.13 x10⁵ Ing 0.0 ------ 265/126/1Core Slump 354.4 21.6 256 105 2.22 x10⁶ 6.61 x10⁵ 177 0.0 ------ 0/560/1Core Collapse 356.0 21.7 260 105 2.22 x10⁶ 6.66 x10⁵ 177 0.0 ------ 0/421/1Ilydroqen Burn 373.2 25.3 233 130 2.06 x10⁶ 0.0 ------ 1.586/99.070/0Ilydrogpn/BottomBurn / lead Failure 373.6 27.5 293 143 1.89 x10⁶ 7.12 x10⁵ 175 0.0 ------ 1.891/105,000/0llydroge ContainmentBurn YF&iiure 373.6 65.0 390 1699 1.89 x10⁶ 1.07 x10⁶ 160 3.1 x 10⁵ 115 0/0/0llydroge Start ConcreteBurn YAttack 373.6 $4.4 1239 2196 I.g3 x106 1.14 x10⁶ 158 3.1 x 10⁵ 115 0/508.(O(/(Hydrogen Burn 497.6 45.3 793 21112 1.64 x10⁶Hydroqen Burn 509.6 38.9 710 2448 1.56 x10⁶ tN/;End Calculation 973.6 14.8 235 226 3.88 x10⁵ 2.90 x10⁶ 196 ------ 212 01?7810
TABLE 43. CONTAINMENT RESPONSE(continued)
SteamContainment Reactor Cavity Condensation
Temperature, Ice Sump Water Water Rate,Time, Pressure, F Mass, Mass, Temp., Mass, Temp., lb/min
Accident Event minutes Psia Uo-wer Upper lbm Ibm F lbm F Lower Ice Upper
Sequoyah TBA
Steam Generator Dryout 466.5 18.0 179 114 2.45 x10⁶ 5.67 x 10⁴ 175 0.0 828 0 0
Core Uncovery 517.8 22.0 233 109 1.85 x10⁶ 9.50 x 10⁵ 150 0.0 717 2008 0
initial Melt Start 552.5 21.1 226 104 1.78 x10⁶ 1.06 x 10⁶ 150 0.0 406 0 0
Accumulator/UHI Tank 567.2 23.2 273 104 1.38 x10⁶ 1.54 x 10⁶ 144 0.0 0 0 0Empty
Hydrogen Burn in 576.1 47.1 538 937 1.36 x10⁶ -- -- 0 180,000 0Upper Compartment 4-
Containment Failure 576.1 65.4 1090 1484 1.36 x10⁶ 1.56 x 10⁶ 145 0.0 0 0 0r-j
Hydrogen Burn in 576.1 78.5 1991 1853 1.34 x10⁶ -- -- 0 200,000 0Lower Compartment
Final Melt Start 788.9 14.7 215 227 9.25 x10⁵ 3.12 x10⁶ 151 0.0 49 25 0
Start Slump 834.9 14.7 207 228 8.97 x10⁵ 3.13 x10⁶ 154 0.0 I 0 0
Core Collapse 835.4 14.7 207 228 8.96 x10⁵ 3.13 x10⁶ 154 0.0 0 0 0
Ice Melt Complete 848.6 14.4 231 227 0.0 3.23 x10⁶ 154 0.0 0 0 0
Vessel Head Dyout 855.1 15.8 245 156 0.0 3.23 x10⁶ 164 -- 169 0 2401
Vessel Head Failure 985.7 14.8 191 167 0.0 3.23 x10⁶ 164 4.3 x 10⁴ 157 116 0 0
Reactor Cavity Dryout 985.8 32.8 253 230 0.0 3.23 x10⁶ 164 0.0 -- 16,540 0 20,740
Start Concrete Attack 1003.4 14.6 203 199 0.0 3.23 x1(6 166 2.4 x 1(4 165 13 0 0
Corium Layers Invert 1205.9 14.9 271 215 0.0 3.21 x10⁶ 180 1.7 x 10² 216 0 0 0
End Calculation 1603.4 14.9 251 203 0.0 3.15 x10⁶ 189 1.6 x 10² 216 0 0 0
SEQUOYAH S3HFI2=-o
-'e4
CL4 2=0
Iwo-o-
low-0-
=.O-
0.0
6.0 50.0 100.0 150.0 200.0 250.0 300.0 3W.0 400.0 450.0 5W.0 5W.0 .0
TI ME (M I NUTE)
FIGURE 41. PRIMARY SYSTEM PRESSURE RESPONSE FOR THE S3HF SEQUENCE
SEQUOYAH S3HF13=-0
3=02
am-0
WW-o
15W.0
E--4 low-0
5W.00
0.0
6.0 MO 00.0 1W.0 W0 00 W0 M0 4W.0 450.0 500.0 5W.0 60TI ME (M I NUTE)
FIGURE 42. PRIMARY SYSTEM COOLANT LEAKAGE FOR THE S3HF SEQUENCE
lb SEQUOYAH S3HF16.0
5.0-
4.0-
z0-4 3.0
zo
0
Ea1.0
0.0W W-0 I&O V60 260.0 2�0.0 ;&.0 W6 460D 4,0.0 560.0 5,0.0 6&.O
TIME (MINUTE)
FIGURE 43. PRIMARY SYSTEM WATER INVENTORY FOR THE S3HF SEQUENCE
SEQUOYAH S3HF15000.0
MAXIMUM........... AVERAGE
4000.0rZ4
3000.0
Ab2000.0
0
1000.0
0.00.0 50.0 1&-0 190.0 260.0 :�0-0 360.0 350.0 400.0 4,40.0 560.0 5W.0 6&.O
TI ME (M I NUTE)
FIGURE 44. MAXIMUM AND AVERAGE CORE TEMPERATURES FOR THE S3HF SEQUENCE
SEQUOYAH S3HF11.0
CLAD UCTED........... CDR. MELTED
Oa
z 0.6
E-4
Pk 0.4-
02
0.06.0 500 100 0 150 20 0 250 300 350 400.0 450 0 500 0 550 0 600 0
TI ME (M I NUTE)
FIGURE 45. FRACTIONS OF CORE MELTED AND CLADDING REACTED FOR THE S3HF SEQUENCE
SEQUOYAH S3HF170.0
60-0
50.0
40.0
PL4
30.0
00
20.0
PL4
�8 ii I III
010.0
0.0
0.0 100.0 260.0 Z&O 400.0 500.0 600.0 700.0 8W.0 900.0 1000.0 U00-0 1M.0TI ME (M I NUTE)
FIGURE 46. CONTAINMENT PRESSURE RESPONSE FOR S3HF1
SEQUOYAH S3HF1ww-o
LOWER........... UPPER
2500.0
P4
2000.0-
1500.0
E-4
1000.0
0 500.0u .............................
.............................. ..... .......
0.0 I I I I I I
0.0 100.0 200.0 300.0 400.0 500.0 600.0 700.0 8W.0 960.0 000.0 UOO. w0TIME (MINUTE)
FIGURE 47. CONTAINMENT TEMPERATURE RESPONSE FOR S3HF1
4-20
largely confined to the lower compartment of the containment lead to
significantly lower overall pressure rises than those that extend into the
upper compartment. It is interesting to note that several burns are predicted
to take place after the containment has failed.
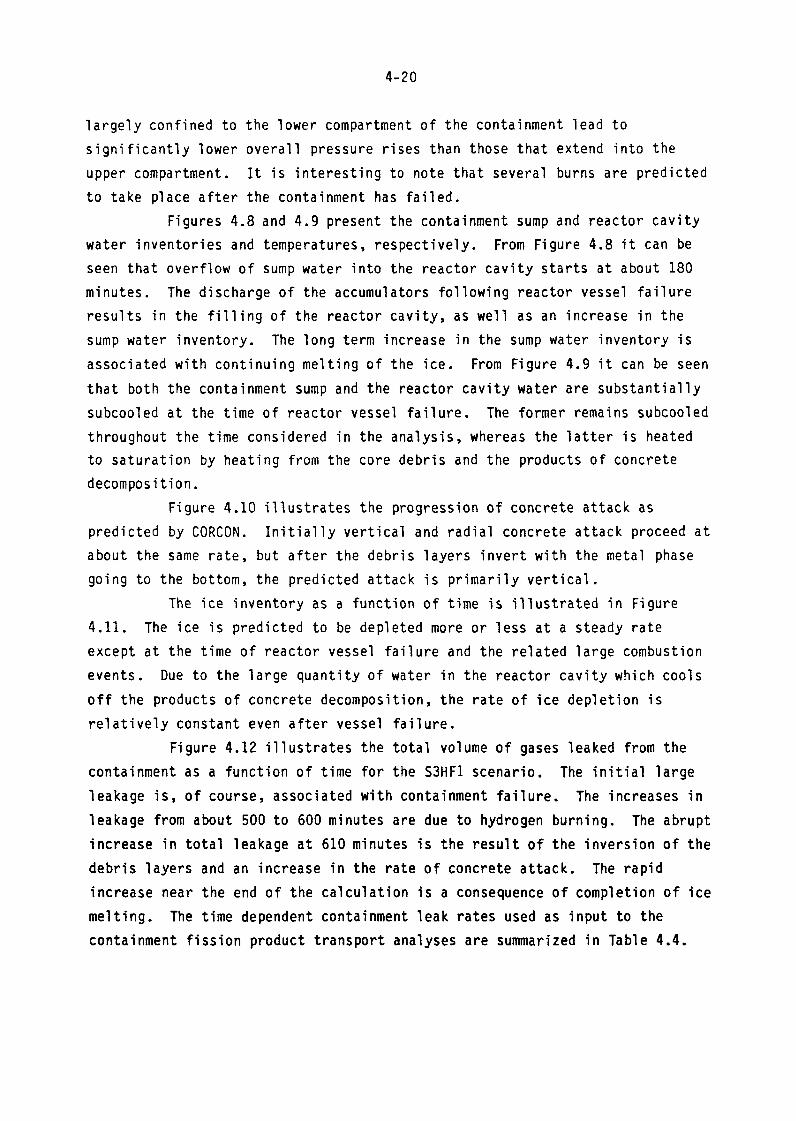
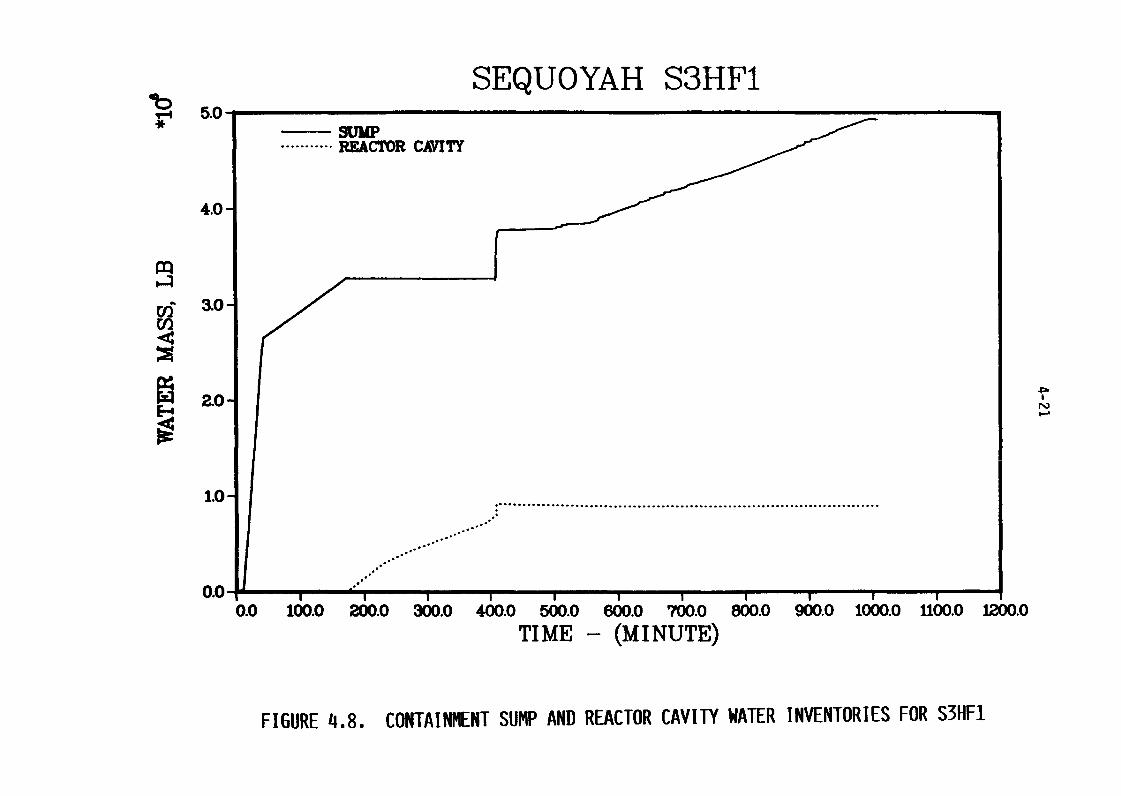
Figures 48 and 49 present the containment sump and reactor cavity
water inventories and temperatures, respectively. From Figure 48 it can be
seen that overflow of sump water into the reactor cavity starts at about 180
minutes. The discharge of the accumulators following reactor vessel failure
results in the filling of the reactor cavity, as well as an increase in the
sump water inventory. The long term increase in the sump water inventory is
associated with continuing melting of the ice. From Figure 49 it can be seen
that both the containment sump and the reactor cavity water are substantially
subcooled at the time of reactor vessel failure. The former remains subcooled
throughout the time considered in the analysis, whereas the latter is heated
to saturation by heating from the core debris and the products of concrete
decomposition.
Figure 410 illustrates the progression of concrete attack as
predicted by CORCON. Initially vertical and radial concrete attack proceed at
about the same rate, but after the debris layers invert with the metal phase
going to the bottom, the predicted attack is primarily vertical.
The ice inventory as a function of time is illustrated in Figure
4.11. The ice is predicted to be depleted more or less at a steady rate
except at the time of reactor vessel failure and the related large combustion
events. Due to the large quantity of water in the reactor cavity which cools
off the products of concrete decomposition, the rate of ice depletion is
relatively constant even after vessel failure.
Figure 412 illustrates the total volume of gases leaked from the
containment as a function of time for the S3HF1 scenario. The initial large
leakage is, of course, associated with containment failure. The increases in
leakage from about 500 to 600 minutes are due to hydrogen burning. The abrupt
increase in total leakage at 610 minutes is the result of the inversion of the
debris layers and an increase in the rate of concrete attack. The rapid
increase near the end of the calculation is a consequence of completion of ice
melting. The time dependent containment leak rates used as input to the
containment fission product transport analyses are summarized in Table 44.
00 SEQUOYAH S3HFl5.0
SUMP........... REACTOR CAVITY
4.0
3,0-
zo
1.0
0.0
0.0 100.0 200.0 30D.0 400.0 500.0 600.0 700.0 800.0 900.0 1000.0 UDO.0 .�O.o
TI ME (M I NUTE)
FIGURE 48. CONTAINMENT SUMP AND REACTOR CAVITY WATER INVENTORIES FOR S3HF1
SEQUOYAH S3HF1250.0
IN SUMP........... IN REACTOR CAVITY
........................
200.0-r=4
150.0
100.0 . ......................
E--4
50.0-
0.06.0 I&O 260.0 300.0 400.0 500.0 600.0 700.0 800.0 900.0 000.0 H.0 m.0
TI ME (M I NUTE)
FIGURE 49. CONTAINMENT SUMP AND REACTOR CAVITY WATER TEMPERATURES FOR S3HF1
SEQUOYAH S3HFI60.0
VEMCAL........... RADIAL
50.0
0 40.0-
049
30.0
20.0
z0
10.0
0.06.0 100.0 200.0 300.0 400.0 560.0 6W.O 760.0 8&o 960.0 060 U;0-0 mm-0
TI ME (M I NUTE)
FIGURE 4.10. PROGRESSION OF CONCRETE ATTACK FOR S3HF1
lb SEQUOYAH S3HF125.0
20.0
u 15.0
z
C-) 10.0 T,P-A P13
0
5.0
0.06.0 I&O 2&.0 360.0 460.0 5(6-0 W60 700-0 800.0 900.0 1000.0 1100.0 1200.0
TIME (MINUTE)
FIGURE 411. ICE INVENTORY FOR S3HF1
lb SEQUOYAH S3HF125.0
c1l)E-4rft 20.0-
pqPA 15.0
010.0
r=40
5.0
0.06.0 100.0 200.0 300.0 460.0 5(6.0 6&0 760.0 80'0-0 960.0 1060 U60.0 1260
TIME (MINUTE)
FIGURE 412. VOLUME OF GASES LEAKED FOR S3HFl
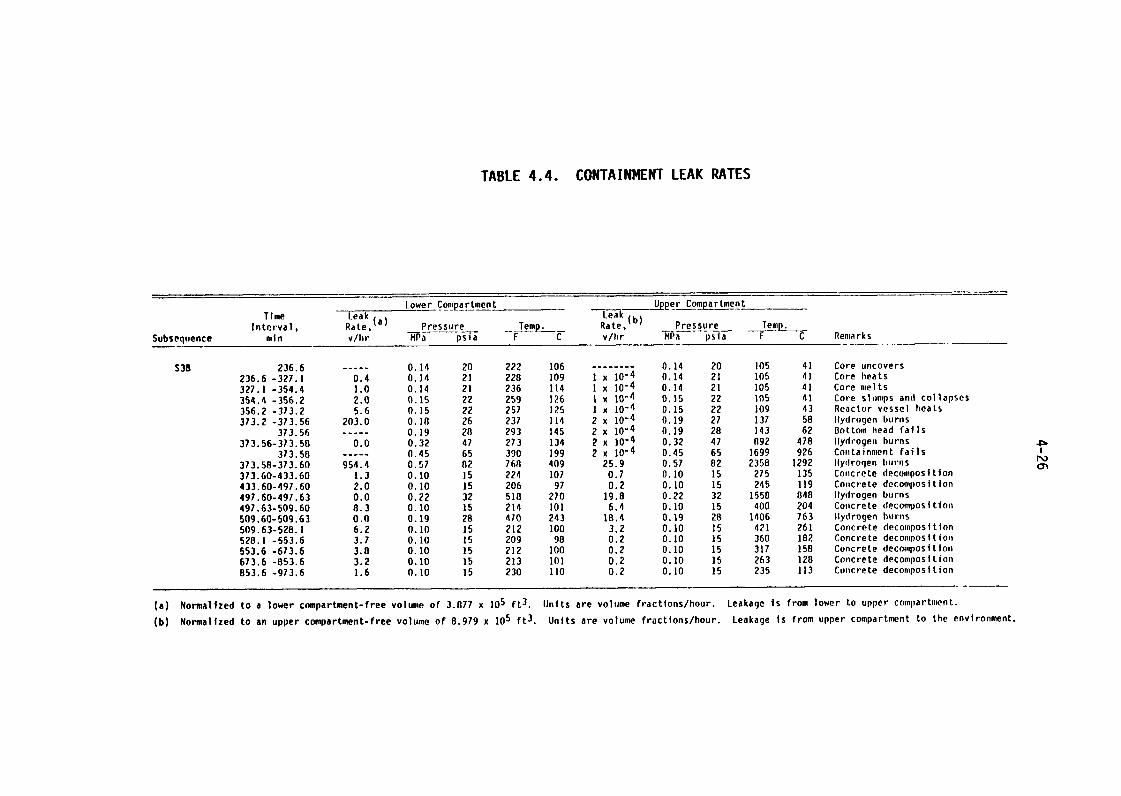
TABLE 44. CONTAINMENT LEAK RATES
Time Leak Lo!�r �qmp�rtment LeAk Uppqr CompaLt!�ent
Interval, Rate.(a) Pressure Temp. Rate, (b) Pressure Temp.Subsequence min Y/hr M a ps'a F C v/hr MPa psla F C Rema rk s
S38 236.6 ----- 0.14 20 222 106 -------- 0.14 20 105 41 Core ncovers236.6 327.1 0.4 0.14 21 228 109 1 x10⁻⁴ 0.14 21 105 41 Core eats327.1 354.4 1.0 0. 14 21 236 114 1 x10⁻⁴ 0.14 21 105 41 Core elts354.4 356.2 2.0 0.15 22 259 126 1 x10⁻⁴ 0.15 22 1 0 5 41 Core siumps and collapses356.2 373.2 5.6 0.15 22 257 125 1 x10⁻⁴ 0.15 22 109 43 Reactor vessel eats373.2 373.56 203.0 0.10 26 237 114 2 x10⁻⁴ 0.19 27 137 58 llydrogen brns
373.56 ----- 0.19 20 293 145 2 x10⁻⁴ 0.19 28 143 62 Bottom head fails373.56-373.58 0.0 0.32 47 273 134 2 x10⁻⁴ 0.32 47 092 478 Hydrogen burns
373.58 ----- 0.45 65 390 199 2 x10⁻⁴ 0.45 65 1699 926 Containment fails N3373.50-373.60 954.4 0.57 02 7613 409 25.9 0.57 82 2358 1292 Hydrogen burns ON373.60-433.60 1.3 0.10 15 224 107 0.7 0.10 15 27 135 Concrete decomposition433.60-497.60 2.0 0.10 15 206 97 0.2 0.10 15 245 119 Coiicrete decomposition497.60-497.63 0.0 0.22 32 510 270 19.8 0.22 32 1558 848 Ilydrogen burns497.63-509.60 8.3 0.10 15 214 101 6.4 0.10 15 400 204 Concrete decomposition509.60-509.63 0.0 0.19 28 410 243 18.4 0.19 28 1406 763 hydrogen burns509.63-528.1 6.2 0.10 15 212 100 3.2 0.10 15 421 261 Concrete decomposition520.1 553.6 3.7 0.10 15 209 98 0.2 0.10 15 360 102 Concrete decomposition553.6 673.6 3.8 0.10 15 212 100 0.2 0.10 15 317 158 Concrete decomposition673.6 83.6 3.2 0.10 15 213 101 0.2 0.10 is 263 128 Concrete decomposition853.6 973.6 1.6 0.10 15 230 110 0.2 0.10 15 235 113 Coocrete decomposition
(a) Normalized to a lower compartment-free volume of 3877 x 105 ft3. Units are volume fractions/hour. Leakage is from lower to upper compartment.
(b) Normalized to an upper compartment-free volume of 8979 x 105 ft3. Units are volume fractions/hour. Leakage is from upper compartment to the environment.
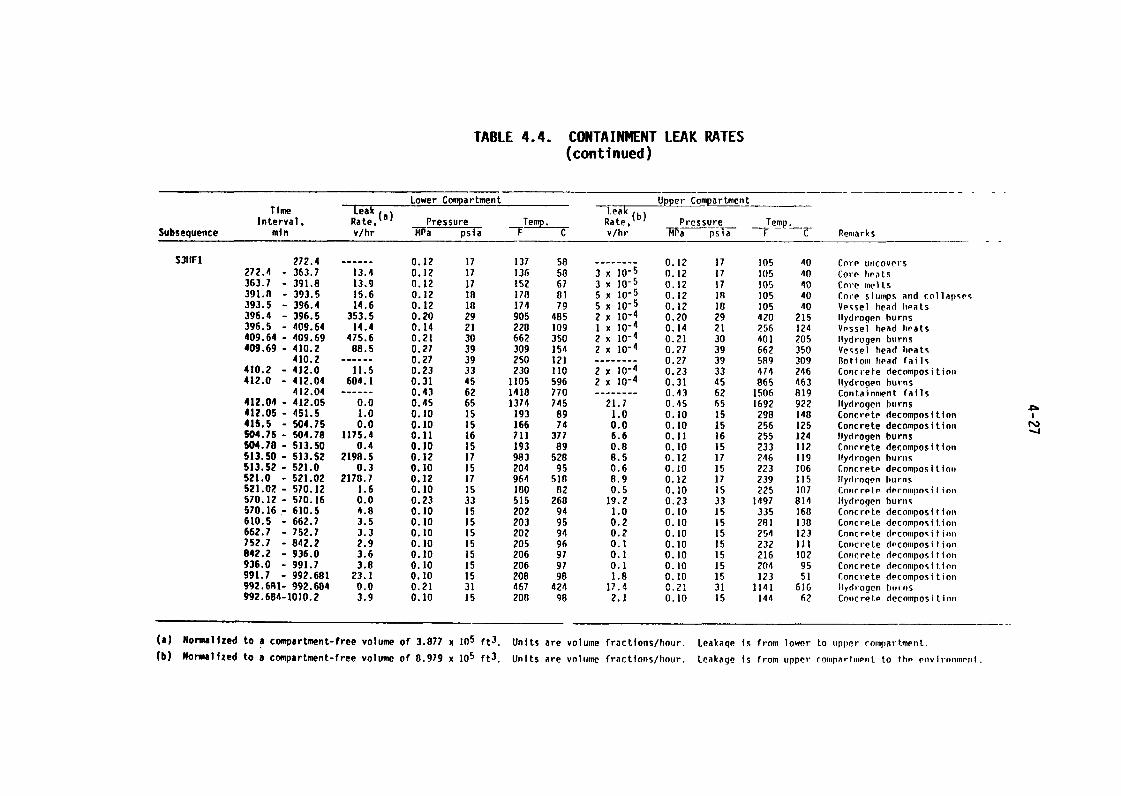
TABLE 44. CONTAINMENT LEAK RATES(continued)
Lower Compartment Upper CompartmentTime Leak (a) Leak (b)Interval, Rate, Pressure Tem Rate, Pressurei��. - Temp.Y i� p s i�a - - Ka psia F C RemarksSubsequence min v/hr F C v/hr
S3111`1 272.4 ------ 0.12 17 137 58 -------- 0.12 17 105 40 Corp ucovers272.4 -363.7 13.4 0.12 17 136 50 3 x 10⁻⁵ 0.12 17 IC15 40 Core 11pats363.7 -391.8 13.9 0.12 17 152 67 3 x 1(-5 0.12 17 105 40 Core meits391.8 -393.5 15.6 0.12 10 170 81 5 x 10⁻⁵ 0.12 IR 105 40 Core sips aiid collapse%393.5 -396.4 14.6 0.12 18 174 79 5 x 10⁻⁵ 0.12 le 105 40 Vesel ead hpats396.4 -396.5 353.5 0.20 29 905 485 2 x 10⁻⁴ 0.20 29 420 215 Hydrogen burns396.5 -409.64 14.4 0.14 21 228 109 1 x 10⁻⁴ 0.14 21 256 124 Vpssel head eats409.64 -409.69 475.6 0.21 30 662 350 2 x 10⁻⁴ 0.21 30 401 205 hydrogen brns409.69 -410.2 88.5 0.27 39 309 154 2 x 10⁻⁴ 0.27 39 662 350 Ve�sel head heats
410.2 ------ 0.27 39 250 121 -------- 0.27 39 589 309 Bottom had fils410.2 -412.0 11.5 0.23 33 230 110 2 x 10⁻⁴ 0.23 33 474 246 Concrete decomposition412.0 -412.04 604.1 0.31 45 1105 596 2 x 14 0.31 45 865 463 Ilydroqpn burns
412.04 ------ 0.43 62 1418 770 -------- 0.43 62 1506 819 Containment fails412.04 -412.05 0.0 0.45 65 1374 745 21.7 0.45 65 1692 922 Ilydrogen burns412.05 -451.5 1.0 0.10 is 193 89 1.0 0.10 15 298 148 Concrete decomposition41S.5 -504.75 0.0 0.10 15 166 74 0.0 0.10 15 256 125 Concrete decompos i t i nii504.75 -504.78 1175.4 0.11 16 711 377 6.6 0.11 16 255 124 Hydrogen burns$04.78 -513.50 0.4 0.10 15 193 89 0.8 0.10 15 233 112 Cniirrete decomposition513.50 -513.52 2198.5 0.12 17 983 528 8.5 0.12 17 246 119 hydrogen burtis513.52 -521.0 0.3 0.10 15 204 95 0.6 0.10 15 223 106 Concrete decomposition521.0 -521.02 2178.7 0.12 37 964 51S 8.9 0.12 17 239 115 Hydrogen burns521.02 -570.12 1.6 0.10 15 180 02 0.5 0.10 15 225 107 Cotirrptp derniujin% i f i on570.12 -570.16 0.0 0.23 33 515 268 19.2 0.23 33 1497 814 hydrogen burns570.16 610.5 4.8 0.10 is 202 94 1.0 0.10 15 335 168 Concrete decomposition610.5 -662.7 3.5 0.10 15 203 95 0.2 0.10 15 291 138 Concrete dvcnmpnsiHoii662.7 -752.7 3.3 0.10 15 202 94 0.2 0.10 15 254 123 Concrete decompoOtion752.7 -842.2 2.9 0.10 15 205 96 0.1 0.10 is 232 HI Coiicrete decomposition842.2 -936.0 3.6 0.10 15 206 97 0.1 0.10 15 216 102 Concrete dpcompos i t i on936.0 -991.7 3.8 0.10 15 206 97 0.1 0.10 15 204 95 Concrete decomposition991.7 -992.681 23.1 0.10 15 208 98 1.8 0.10 15 123 51 Concrete decomposition992.6RI- (92.684 0.0 0.21 31 467 424 17.4 I 1j,'i 616 Hydrogen burns992.684-1010.2 3.9 0.10 15 200 98 2.1 0. 10 15 144 62 Concrete decomposition
(a) Normalized to a compartment-free volume of 3877 x oS ft3. Units are volume fractions/hour. Leakage is from lower to pper rompartment.
W Normalized to a compartment-free volume of 8979 x 105 ft3. Units are vume fractions/hour. Leakage is from pper rompa r I moi to t rnv I rnivir I
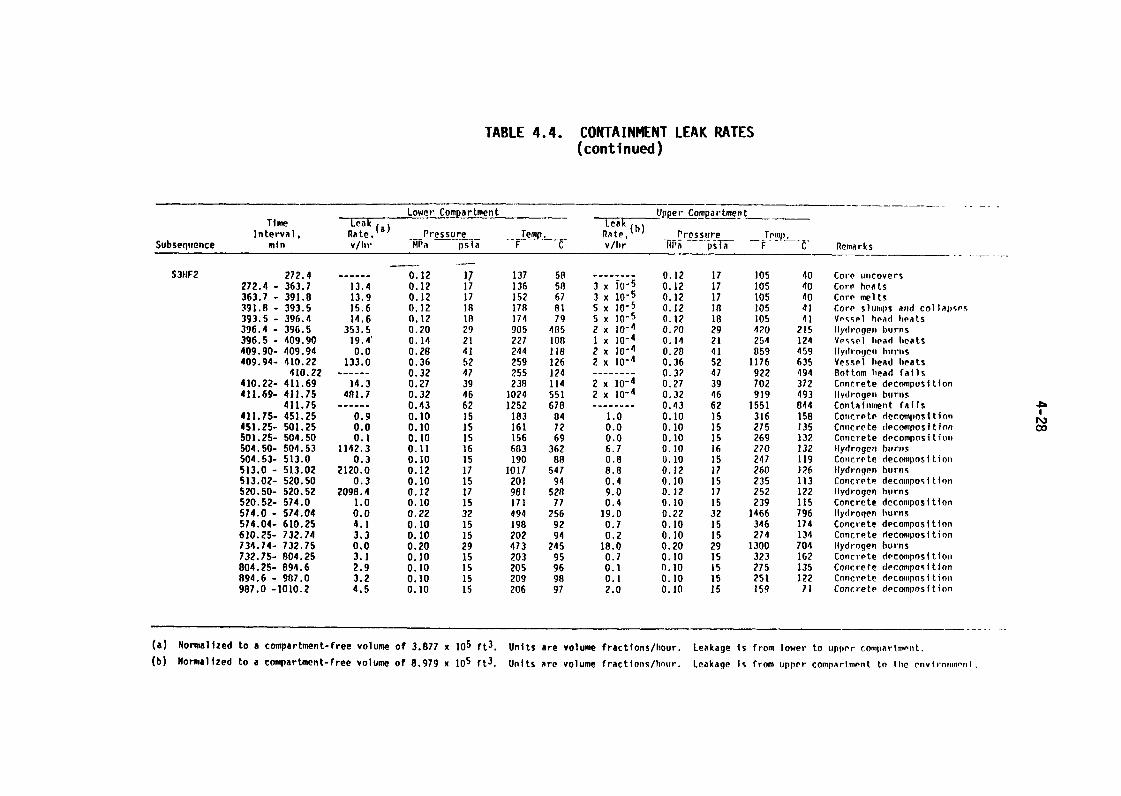
TABLE 44. CONTAINMENT LEAK RATES(continued)
Lower Compartment ljpq2_r qmpartme�tT i rite Leak Leak (b)
Interval, Rate.(a) Pressure Terlip. Rate, Pressure Temp.Subsequence min V/hr Pit ___F a F C v/hr 14fla -- p-SIT V_ C Remarks
S*1172 272.4 ------ 0.12 17 137 58 -------- 0.12 17 105 40 Core uncovers272.4 - 363.7 13.4 0.12 17 136 so 3 x jo-5 0.12 17 105 40 Core heats363.7 - 391.8 13.9 0.12 17 152 67 3 x 10⁻⁵ 0.12 17 105 40 Corp melts391.8 - 393.5 15.6 0.12 is 178 81 5 x 10⁻⁵ 0.12 la 105 41 Core smp ad collapse.-;393.5 - 396.4 14.6 0.12 in 17 4 79 5 x 10⁻⁵ 0.12 18 105 41 Vr,,;spl head heats396.4 - 396.5 353.5 0.20 29 905 485 2 x 1(-4 O.?O 29 420 215 Hydrogen burns396.5 - 409.90 19.4' 0.14 21 227 100 I x 10-4 0.14 21 254 124 VP,;wl hd eats409.90- 409.94 0.0 O.Z8 41 244 Ha 2 x 10⁻⁴ 0.28 41 859 459 Ilydrogen burns409.94- 410.22 133.0 0.36 52 259 126 2 x 10⁻⁴ 0.36 52 1176 635 Vespl ead heats
410.22 ------ 0.32 47 255 124 -------- 0.32 47 922 494 Bottom ead fails410.22- 411.69 14.3 0.27 39 238 114 2 x 10⁻⁴ 0.27 39 702 372 Concrete decomposition411.69- 411.75 481.7 0.32 46 1024 551 2 x 10⁻⁴ 0.32 46 919 493 Hydrogen brns
411.75 ------ 0.43 62 1252 678 -------- 0.43 62 1551 844 Containment fails 421.0.9 158 Concrete decomposition411.75- 451.25 0.10 15 183 84 1.0 0.10 15 316451.25- 501.25 0.0 0.10 15 161 72 0.0 0.10 15 275 135 Cniicrete decomposition 00501.25- 504.50 0.1 0.10 15 156 69 0.0 0.10 15 269 132 Concrete decomposition504.50- 504.53 1142.3 0.11 16 683 362 6.7 0.10 16 270 132 Ilydrogen burns504.53- 513.0 0.3 0.10 15 190 88 0.8 0.10 15 24 7 119 Covicrpte decomposition513.0 - 513.02 2120.0 0.12 17 1017 54 7 8.8 0.12 17 260 126 Ilydrogen burns513.02- 520.50 0.3 0.10 15 201 94 0.4 0.10 is 235 113 Cotic re te decompos i t I on520.50- 520.52 2098.4 0.12 17 981 528 9.0 0.12 17 252 122 Hydrogen burns520.52- 574.0 1.0 0.10 15 171 7 7 0.4 0.10 15 239 115 Concrete decomposition574.0 - 574.04 0.0 0.22 32 494 256 19.0 0.22 32 1466 796 Hydroqen burns574.04- 610.25 4.1 0.10 is 198 92 0.7 0.10 15 346 17 4 Concrete decomposition610.25- 732.74 3.3 0.10 15 202 94 0.2 0.10 15 274 134 Concrete decompo s I t i n734.74- 732.75 0.0 0.20 29 473 245 18.0 0.20 29 1300 704 Hydrogen burns732.75- 804.25 3.1 0.10 15 203 95 0.7 0.10 15 323 162 Concrete decompo I tioii804.25- 894.6 2.9 0.10 15 205 96 0.1 0.10 15 275 135 Cciiicrete decompo q f t f on894.6 - 987.0 3.2 0.10 15 209 98 0.1 0.10 15 251 122 Concrete dec oinpo s i t i on987.0 1010.2 4.5 0.10 15 206 97 2.0 0.10 15 159 71 Concrete decomposition
(a) Normalized to a compartment-free volume of 3877 x 105 ft3. Units are volume fractions/hour. Leakage is from lower to topper compartment.
W Normalized to a compartment-free volume of 8979 x 105 rt3. Units are volume fractions/hour. Leakage is from tipper compartment to the envfromn�nf.
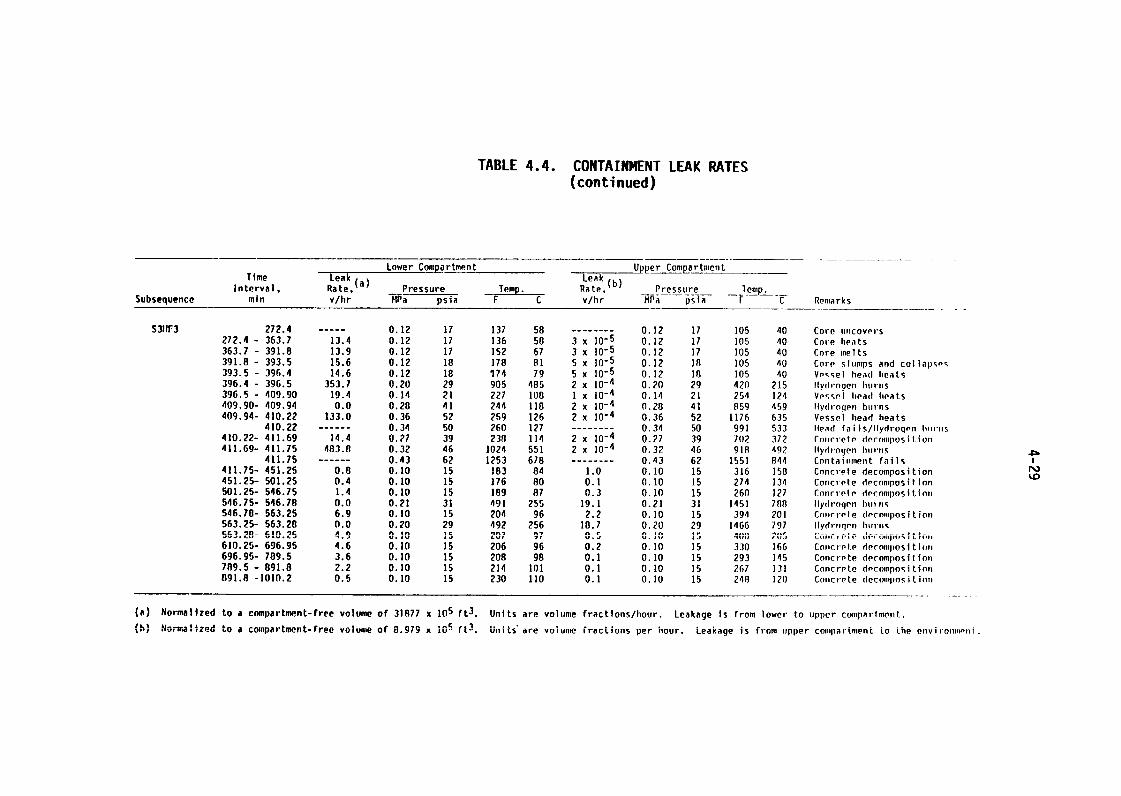
TABLE 44. CONTAINMENT LEAK RATES(continued)
Lower Compartment Upper CompartmentTime Leak Leak (b)
Interval. Rate, (a) Pressure Temp. Rate, -- Pressure Temp.Subsequence m1n v/hr MN psia F C v/hr mpa psia F C Remarks
S3111`3 272.4 ----- 0.12 17 1 37 58 -------- 0.12 17 105 40 Core wicovprs272.4 - 363.7 13.4 0.12 17 136 50 3 x 10⁻⁵ 0.12 17 105 40 Core ets363.7 - 391.8 13.9 0.12 17 152 67 3 x 10⁻⁵ 0.12 17 105 40 Core elts391.8 - 393.5 15.6 0.12 18 178 el 5 x 10⁻⁵ 0.12 is 105 40 Core slumps and collapses393.5 - 396.4 14.6 0.12 le 174 79 5 x 10⁻⁵ 0.12 18 105 40 Ves-el head hts396.4 - 396.5 353.7 0.20 29 905 485 2 x 10⁻⁴ 0.20 29 420 215 Hydrotiell hIII-lis396.5 - 409.90 19.4 0.14 21 227 IU0 I x 10-4 0.14 21 254 124 VP-,%Pi hoad eats409.90- 409.94 0.0 0.28 41 244 118 2 x 10⁻⁴ 0.28 41 859 459 Ilydro9pn brns409.94- 410.22 133.0 0.36 52 259 126 2 x 10⁻⁴ 0.36 52 1176 635 Vessel ead heats
410.22 ------ 0.34 50 260 127 -------- 0.34 50 991 533 11pad fails/11ydroqrn hiorfis410.22- 411.69 14.4 0.77 39 230 114 2 x 10⁻⁴ 0.27 39 702 37 2 rolirretp decomposition411.69- 411.75 403.0 0.32 46 1024 551 2 x 10⁻⁴ 0.32 46 918 492 Ilydrogell brlis
411.75 ------ 0.43 62 1253 678 -------- 0.43 62 1551 844 Contaimnetit fails411.75- 451.25 0.8 0.10 15 183 84 1.0 0.10 15 316 158 Concrete decomposition451.25- 501.25 0.4 0.10 15 176 80 0.1 0.10 15 274 134 Concrete decomposition501.25- 546.75 1.4 0.10 15 189 87 0.3 0.10 15 260 127 Concrele derompos i t i nii546.75- 546.78 0.0 0.21 31 491 255 19.1 0.21 31 1451 780 Hydroqvii but It,546.70- 563.25 6.9 0.10 15 204 96 2.2 0.10 15 394 201 Coti r I derninpos f L i oti563.25- 563.28 0.0 0.20 29 492 256 18.7 0.20 29 1466 7 97 Ilydrnrinii hurw;563.10- 610.25 4.9 n t. 1. �umr, pi deroo.por I t r..2007 97 00.5 0.10 All 4 0 'IOS610.25- 696.95 4.6 0.10 '5 20� 96 0.2 0.10 15 330 166 Coiict-(,I.(- dernmpos i t It.696.95- 789.5 3.6 0.10 15 208 98 0.1 0.10 15 293 14 Concrete derompos I in709.5 - 891.8 2.2 0.10 15 214 101 0.1 0.10 15 267 131 Concrete decninpo% i t iciii891.8 1010.2 0.5 0.10 15 230 110 0.1 0.10 15 240 120 Coiicrete decompos i L ioii
(a) Normalized to a compartment-free volume of 31077 15 ft3. Units are volume fractions/hour. Leakage is front ower to tipper comparlinont.
(h) Normalized to a compartment-free volume of 8979 x 105 ft3. Uflts'are volume ractions per hour. Leakage is fom tipper compartment Lo the environvinnt.
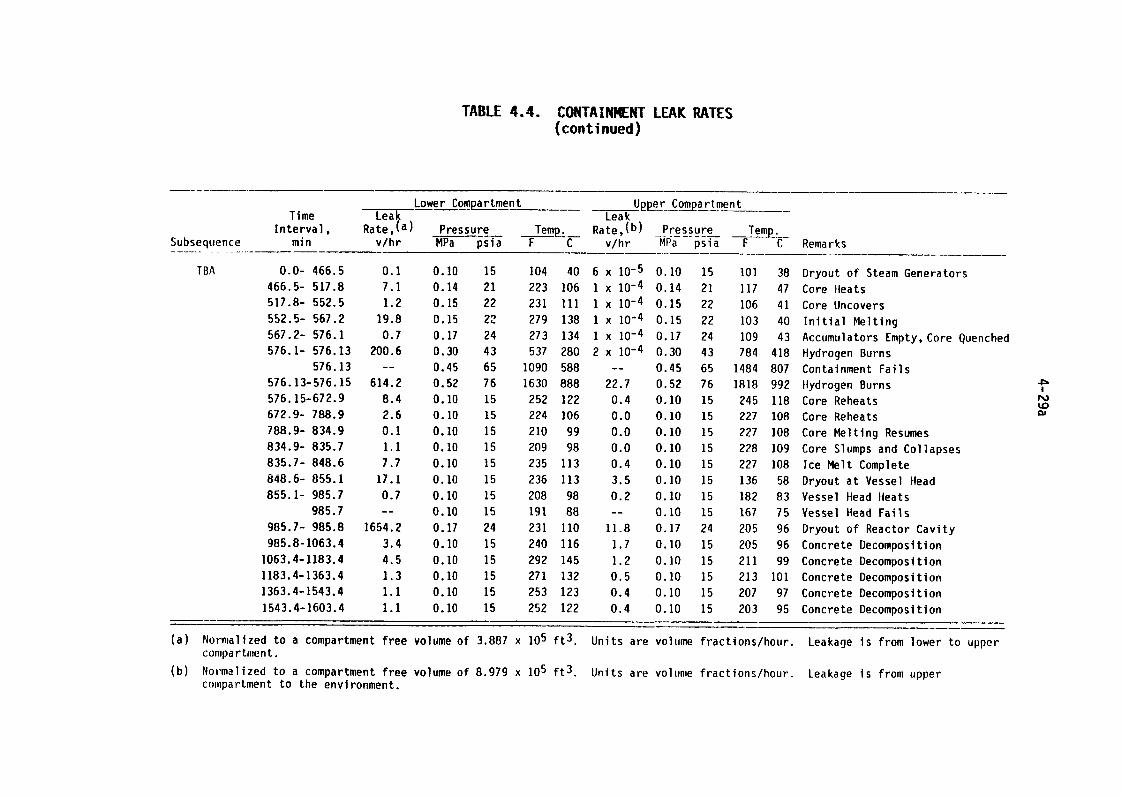
TABLE 44. CONTAINMENT LEAK RATES(continued)
Lower Compartment Upp(��- C2�!pLyjt �L� tTime Leak Leak
Interval Rate,(a) Pressure Temp. Rate,(b) Pressure ___Iemp -W - F C RemarksSubs eqtience min v/hr MPa sia F C v/hr a psia
TBA 0.0- 466.5 0.1 0.10 15 104 40 6x 10⁻⁵ 0.10 15 101 38 Dryout of Steam Generators466.5- 517.8 7.1 0.14 21 223 106 1x 10⁻⁴ 0.14 21 117 47 Core Heats517.8- 552.5 1.2 0.15 22 231 III Ix 10-4 0.15 22 106 41 Core Uncovers552.5- 567.2 19.8 0.15 22 279 138 1x 10⁻⁴ 0.15 22 103 40 Initial Melting567.2- 576.1 0.7 0.17 24 273 134 1x 10⁻⁴ 0.17 24 109 43 Accumulators Empty, Core Quenched576.1- 576.13 200.6 0.30 43 537 280 2x 10⁻⁴ 0.30 43 784 418 Hydrogen Burns
576.13 -- 0.45 65 1090 588 -- 0.45 65 1484 807 Containment Fails576.13-576.15 614.2 0.52 76 1630 888 22.7 0.52 76 1818 992 Hydrogen Burns576.15-672.9 8.4 0.10 15 252 122 0.4 0.10 15 245 118 Core Reheats LO672.9- 788.9 2.6 0.10 15 224 106 0.0 0.10 15 227 108 Core Reheats co788.9- 834.9 0.1 0.10 15 210 99 0.0 0.10 15 227 108 Core Melting Resumes834.9- 835.7 1.1 0.10 15 209 98 0.0 0.10 15 228 109 Core Slumps and Collapses835.7- 848.6 7.7 0.10 15 235 113 0.4 0.10 15 227 108 Ice Melt Complete848.6- 855.1 17.1 0.10 15 236 113 3.5 0.10 15 136 58 Dryout at Vessel Head855.1- 985.7 0.7 0.10 15 208 98 0.2 0.10 15 182 83 Vessel ead [feats
985.7 -- 0.10 15 191 88 -- 0.10 15 167 75 Vessel Head Fails985.7- 985.8 1654.2 0.17 24 231 110 11.8 0.17 24 205 96 Dryout of Reactor Cavity985.8-1063.4 3.4 0.10 15 240 116 1.7 0.10 15 205 96 Concrete Decomposition
1063.4-1183.4 4.5 0.10 15 292 145 1.2 0.10 15 211 99 Concrete Decomposition1183.4-1363.4 1.3 0.10 15 271 132 0.5 0.10 15 213 101 Concrete Decomposition1363.4-1543.4 1.1 0.10 15 253 123 0.4 0.10 15 207 97 Concrete Decomposition1543.4-1603.4 1.1 0.10 15 252 122 0.4 0.10 15 203 95 Concrete Decomposition
(a) Normalized to a compartment free volume of 3887 x 105 ft3. Units are volume fractions/hour. Leakage is from lower to uppercompartment.
(b) Normalized to a compartment free volume of 8979 x 105 ft3. Units are volume fractions/hour. Leakage is from uppercompartment to the environment.
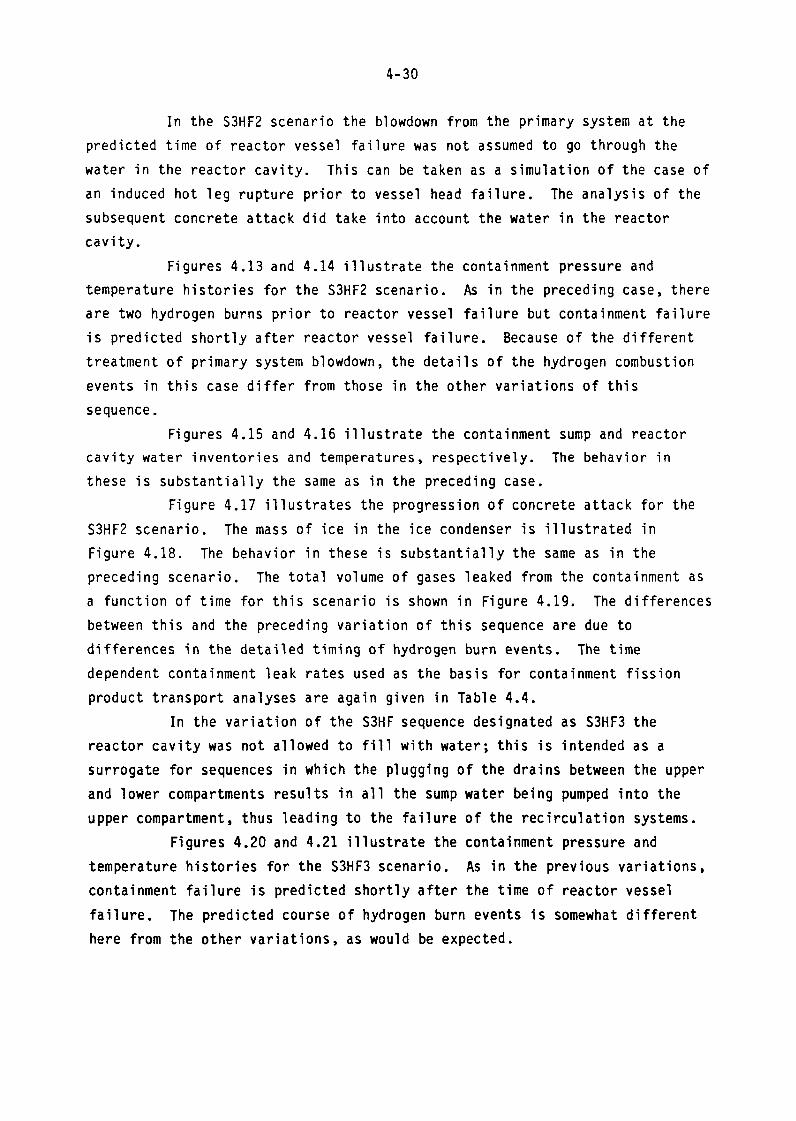
4 30
In the S3HF2 scenario the blowdown from the primary system at the
predicted time of reactor vessel failure was not assumed to go through the
water in the reactor cavity. This can be taken as a simulation of the case of
an induced hot leg rupture prior to vessel head failure. The analysis of the
subsequent concrete attack did take into account the water in the reactor
cavity.
Figures 413 and 414 illustrate the containment pressure and
temperature histories for the S3HF2 scenario. As in the preceding case, there
are two hydrogen burns prior to reactor vessel failure but containment failure
is predicted shortly after reactor vessel failure. Because of the different
treatment of primary system blowdown, the details of the hydrogen combustion
events in this case differ from those in the other variations of this
sequence.
Figures 415 and 416 illustrate the containment sump and reactor
cavity water inventories and temperatures, respectively. The behavior in
these is substantially the same as in the preceding case.
Figure 417 illustrates the progression of concrete attack for the
S3HF2 scenario. The mass of ice in the ice condenser is illustrated in
Figure 418. The behavior in these is substantially the same as in the
preceding scenario. The total volume of gases leaked from the containment as
a function of time for this scenario is shown in Figure 419. The differences
between this and the preceding variation of this sequence are due to
differences in the detailed timing of hydrogen burn events. The time
dependent containment leak rates used as the basis for containment fission
product transport analyses are again given in Table 44.
In the variation of the S3HF sequence designated as S3HF3 the
reactor cavity was not allowed to fill with water; this is intended as a
surrogate for sequences in which the plugging of the drains between the upper
and lower compartments results in all the sump water being pumped into the
upper compartment, thus leading to the failure of the recirculation systems.
Figures 420 and 421 illustrate the containment pressure and
temperature histories for the S3HF3 scenario. As in the previous variations,
containment failure is predicted shortly after the time of reactor vessel
failure. The predicted course of hydrogen burn events is somewhat different
here from the other variations, as would be expected.
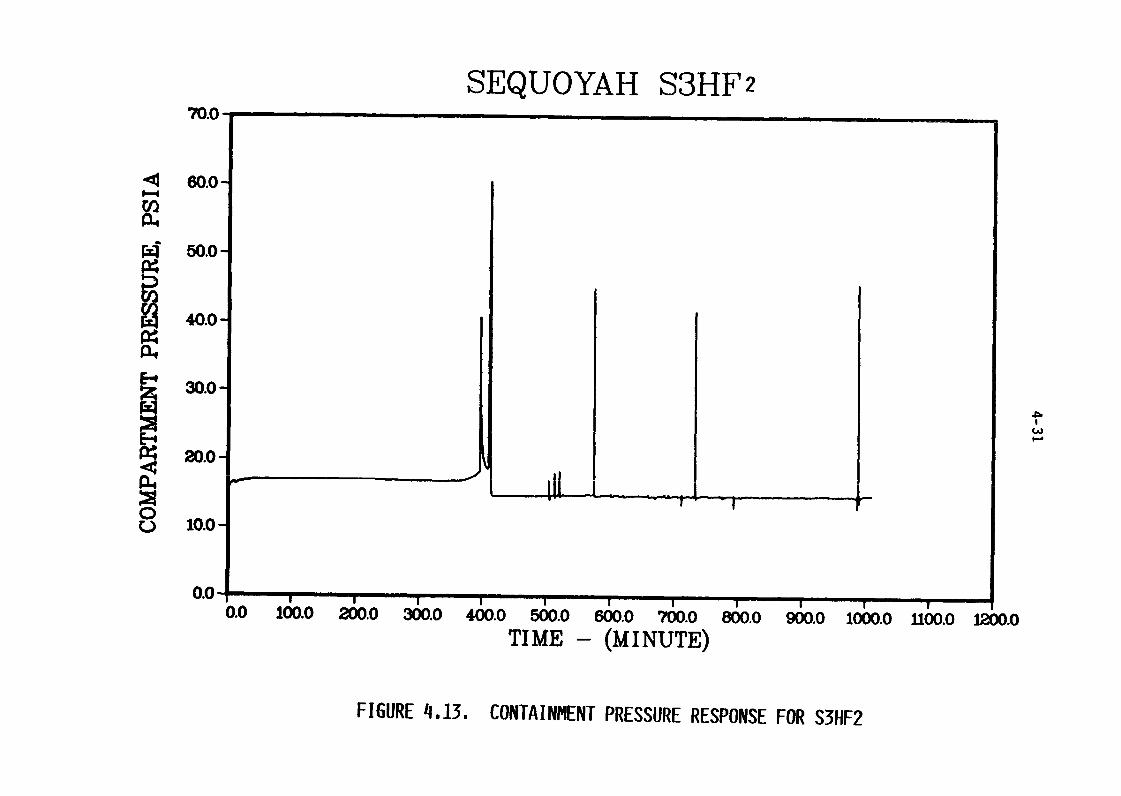
SEQUOYAH S3HF270.0
60.0
50.0
40.0
30.0
20.0
0 10.0
0.0 6.0 i00.0 200.0 300.0 400.0 500.0 600.0 700.0 &6 G&O 10000 U;oo 12�00
TI ME (M I NUTE)
FIGURE 413. CONTAINMENT PRESSURE RESPONSE FOR S3HF2
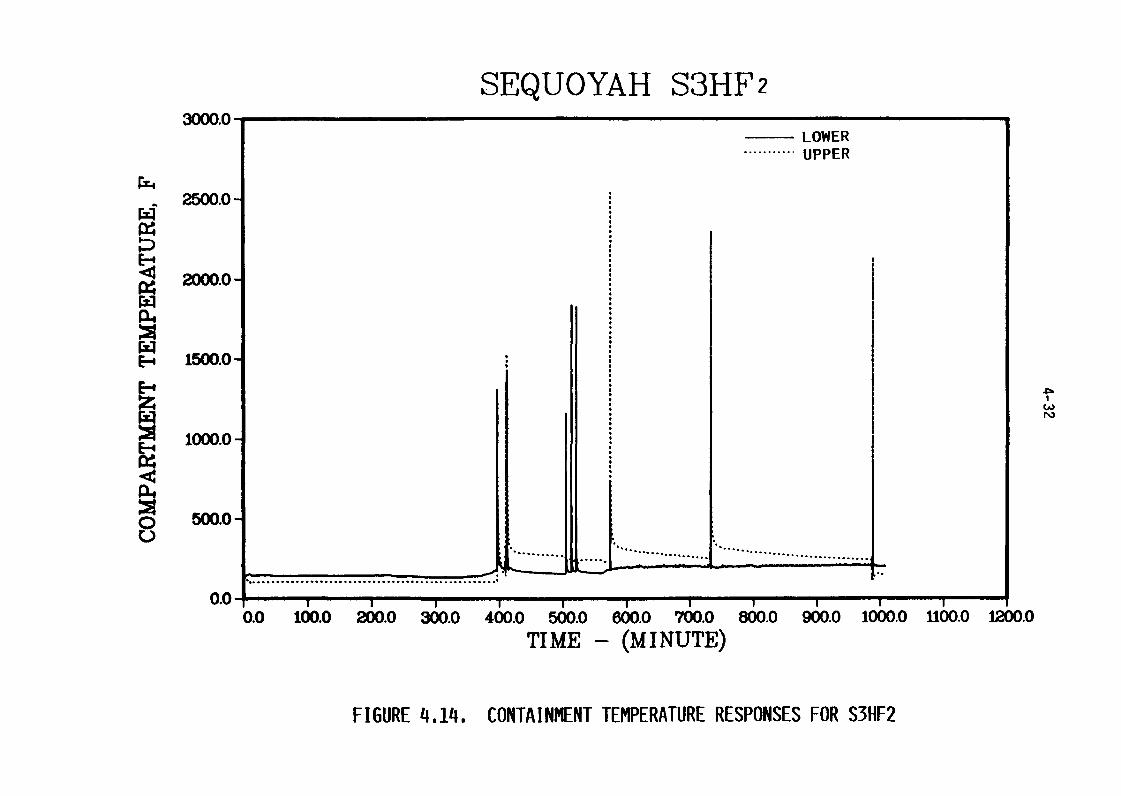
SEQUOYAH S3HF23=- -
LOWER........... UPPER
r=4
2500.0
2000.0W04
E-4 1500.0
E-4z
1000.0
laL4
�40 500.0-
........... I................. ...............................
.... ......................................
0.0
0.0 100.0 260.0 300.0 4�0-0 560.0 6W.O 7W.0 8M.0 900.0 1000.0 U M0TIME - (MINUTE)
FIGURE 414. CONTAINMENT TEMPERATURE RESPONSES FOR S3HF2
lb SEQUOYAH S3HF25.0
SUMP........... REACTOR CNI TY
4.0
3,0
zoE-4
1.0
0.0 --6.0 ido-0 260.0 300 400 500 0 600 7(� 0 1� 0 G&O 106-0 U; 0 1".0
TI ME (M I NUTE)
FIGURE 415. CONTAINMENT SUMP AND REACTOR CAVITY WATER INVENTORIES FOR S3HF2
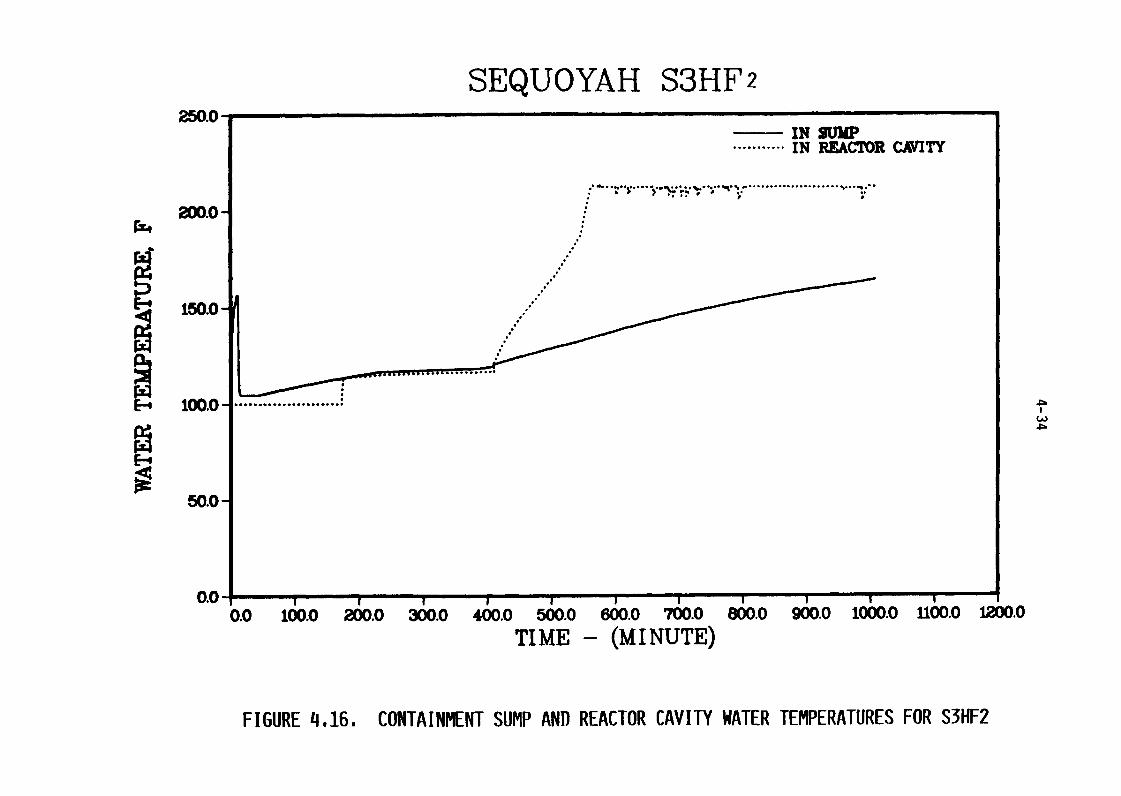
SEQUOYAH S3HF2250.0
IN SUMP........... IN REACTOR CAVITY
.....................
2W.0
150.0
E-q 100.0 ......................
50.0
0.0 6.0 100.0 200.0 300.0 400.0 500.0 6W.0 7M.0 W0.0 9W.0 1000.0 U00- W0
TI ME (M I NUTE)
FIGURE 416. CONTAINMENT SUMP AND REACTOR CAVITY WATER TEMPERATURES FOR S3HF2
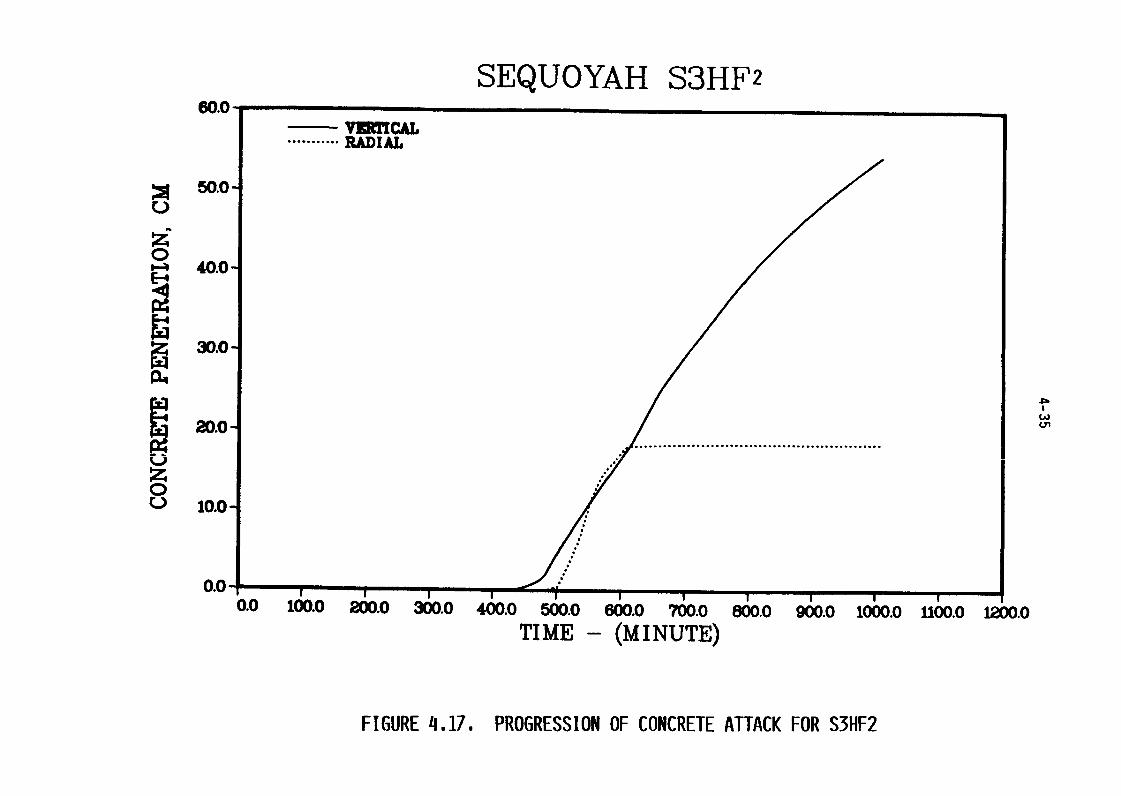
SEQUOYAH S3HF260.0
VERMAL........... PADIAL
50.0
Z.01--4 40.0E-4
a
ra30.0
W-0................................................
z0
10.0
0.00.0 100.0 2oo-o 3oo-o 4ooo 5ooo emo 7(6 86o.o 90'0.0 00 U00.0 M0
TIME (MINUTE)
FIGURE 417. PROGRESSION OF CONCRETE ATTACK FOR S3HF2
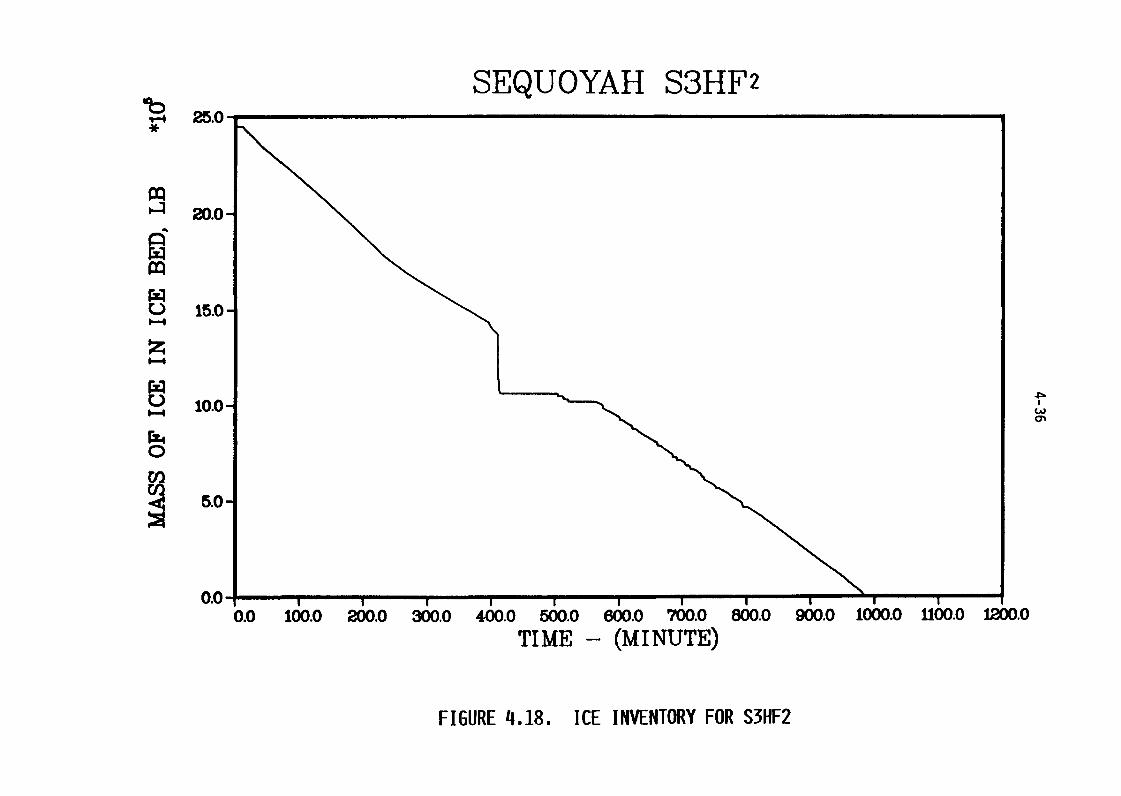
SEQUOYAH S3HF2'b 25.0
20.0-
WU 15.00-4
z1-4
Da
IL) 10.0
N40
5.0
0.00.0 100.0 260.0 360.0 4(6 580-0 6(6 760.0 f&o 900.0 060 ffoo.o two.0
TIME (MINUTE)
FIGURE 418. ICE INVENTORY FOR S3HF2

lb SEQUOYAH S3HF230.0
ce)E-4 25.0
20.0
cn 15.0
010.0
pa
5.0
0.00.0 100.0 200.0 300.0 40D.0 500.0 6(6-0 760.0 1�0-0 900.0 000.0 Hoo-0 "0
TIME (MINUTE)
FIGURE 419. TOTAL VOLUME OF GASES LEAKED FOR S3HF2
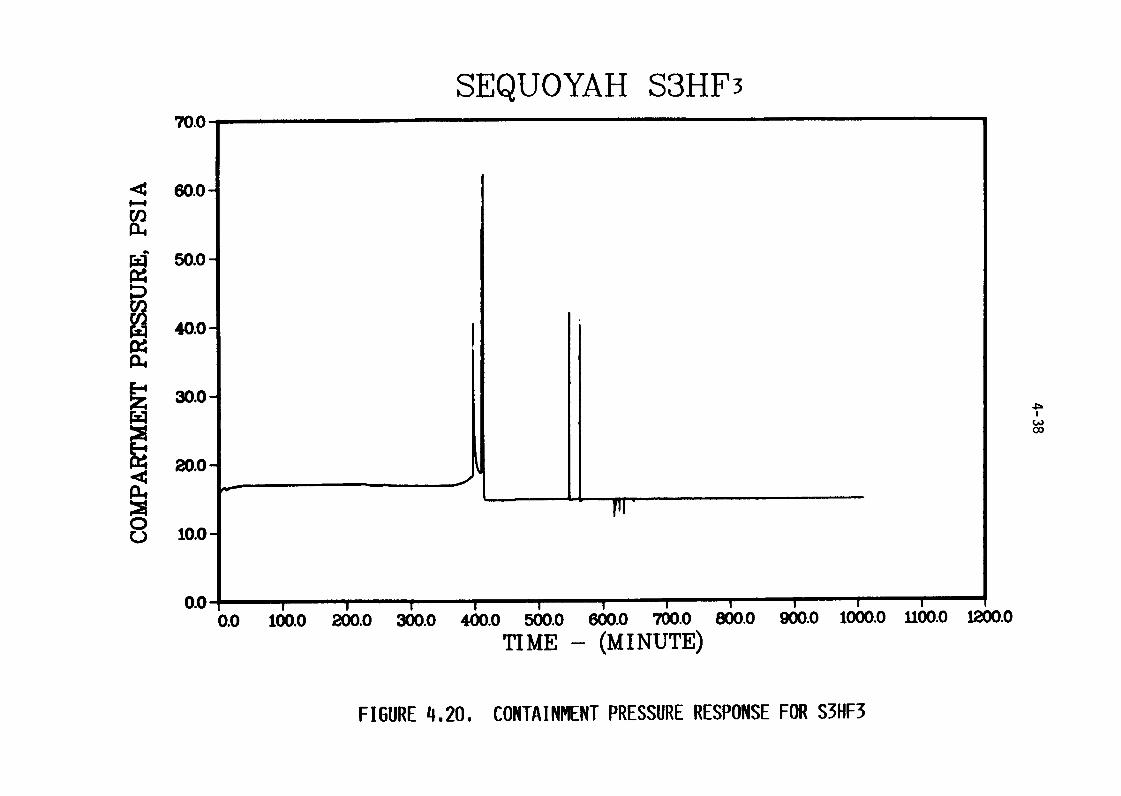
SEQUOYAH S3HF370.0
--194 60.01-4
En04
A4 50.0P4
40.0
30.0
co
20.0
PLO
010.0
0.06.0 I&O 260.0 :360.0 4W.o 5W.0 6W.0 7W.0 800.0 9W.0 1000.0 UOO-O IM-0
TIME (MINUTE)
FIGURE 420. CONTAINMENT PRESSURE RESPONSE FOR S3HF3
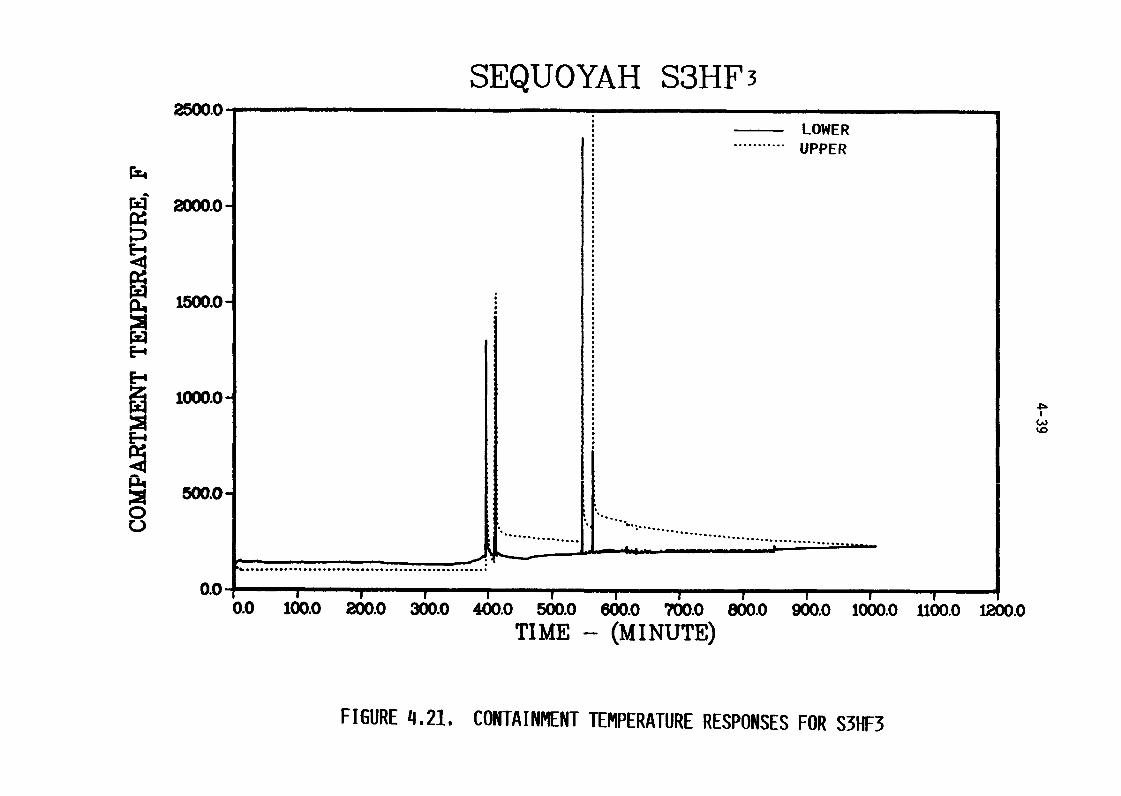
SEQUOYAH S3HF325M.0-
LOWER........... UPPER
rX4
P4 2000.0-
1500.0
E-41000.0
E-4
500.0-
................. . .........................................
......................................
0.0 I I i0.0 100.0 300.0 4&.0 tr�oo ew,.o -,�Oo 860.0 960.0 060 U;0.0 1260
TI ME (M I NUTE)
FIGURE 421. CONTAINMENT TEMPERATURE RESPONSES FOR S3HF3
4-40
Figures 422 and 423 give the containment sump and reactor cavity
water inventories and temperatures. The water in the reactor cavity in this
case is limited to that due to accumulator discharge, and is substantially
less than in the other variations. The water in the reactor cavity is
predicted to be boiled off during the course of the sequence. As in the other
variations, no fragmentation of the core debris was assumed in the analysis.
More rapid depletion of the water in the reactor cavity would be predicted if
debris fragmentation were assumed; debris quenching associated with such
fragmentation could delay the onset of concrete attack.
Figure 424 illustrates the progression of concrete attack for the
S3HF3 scenario. The behavior through the inversion of the debris layers is
very similar to that predicted for the other variations. It is interesting to
note, however, that the progression of radial attack is resumed in this case
after the water in the reactor cavity has been boiled off.
Figure 425 gives the ice condenser inventory for this scenario.
The behavior is similar to that of the other cases, except that the rate of
ice depletion is seen to decrease after the evaporation of cavity water.
The total volume of gases leaked is illustrated in Figure 426. The
overall behavior is similar to the other variations of this sequence, with
differences attributable to variations in the details of the hydrogen burn
events. The time dependent containment leak rates used as the basis for
containment fission product transport analyses are given in Table 44.
4.2.2 TB Sequence
The TB sequence consists of station blackout as the initiating event
accompanied by pump seal failure. Thus none of the active engineered safety
features, with the exception of the steam turbine driven auxiliary feedwater
systems, are available. It is essentially a small-small break loss of coolant
accident accompanied by loss of all electric power; it can also be designated
as S3B.
The predicted accident event times for the TB (S3B) sequence are
given in Table 41. The core and primary system conditions at key times
during the sequence are summarized in Table 42. Containment conditions at
various times during the sequence are summarized in Table 43.
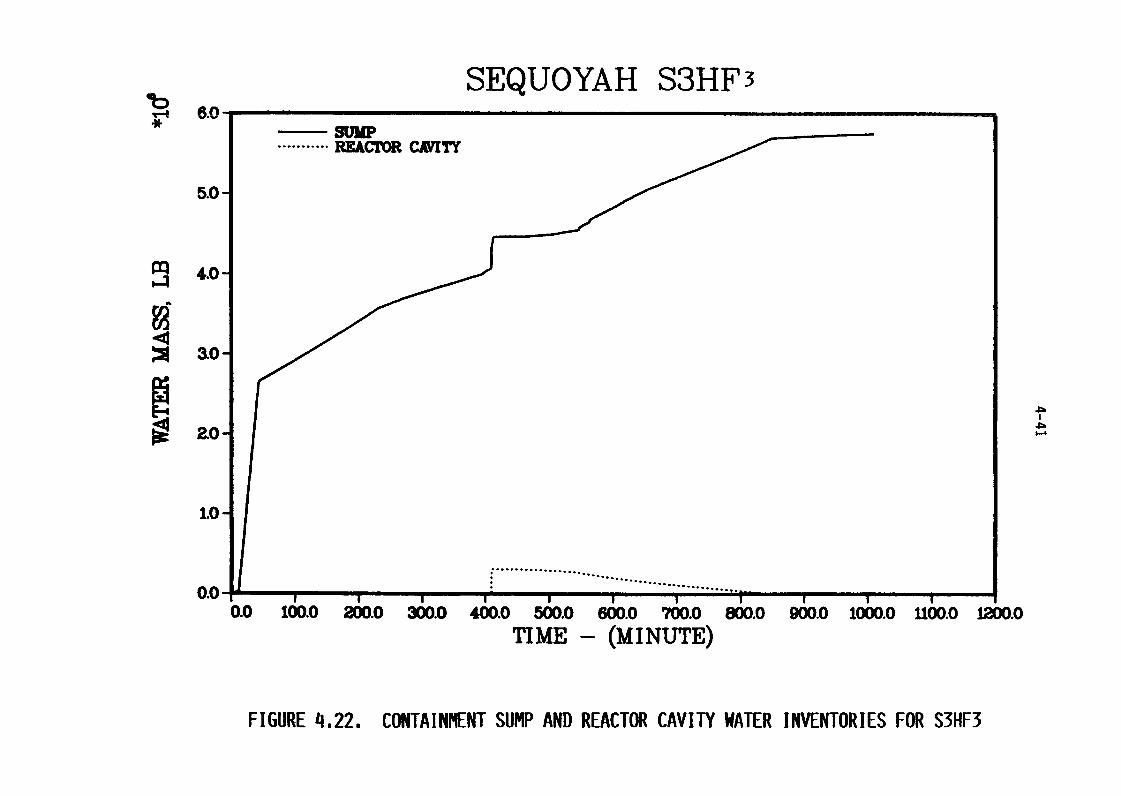
00 SEQUOYAH S3HF36.0
SUMP........... MCTOR cnri
5.0
4.0
ao-
zo
1.0
.............. .................................
0.0
1&.O 20.0 0�0-0 40.0 5 W1.0 mo -&o a&o 6oo io6.o ;o.o 126-oTI ME - M I NUTE)
FIGURE 422. CONTAINMENT SUMP AND REACTOR CAVITY WATER INVENTORIES FOR S3HF3
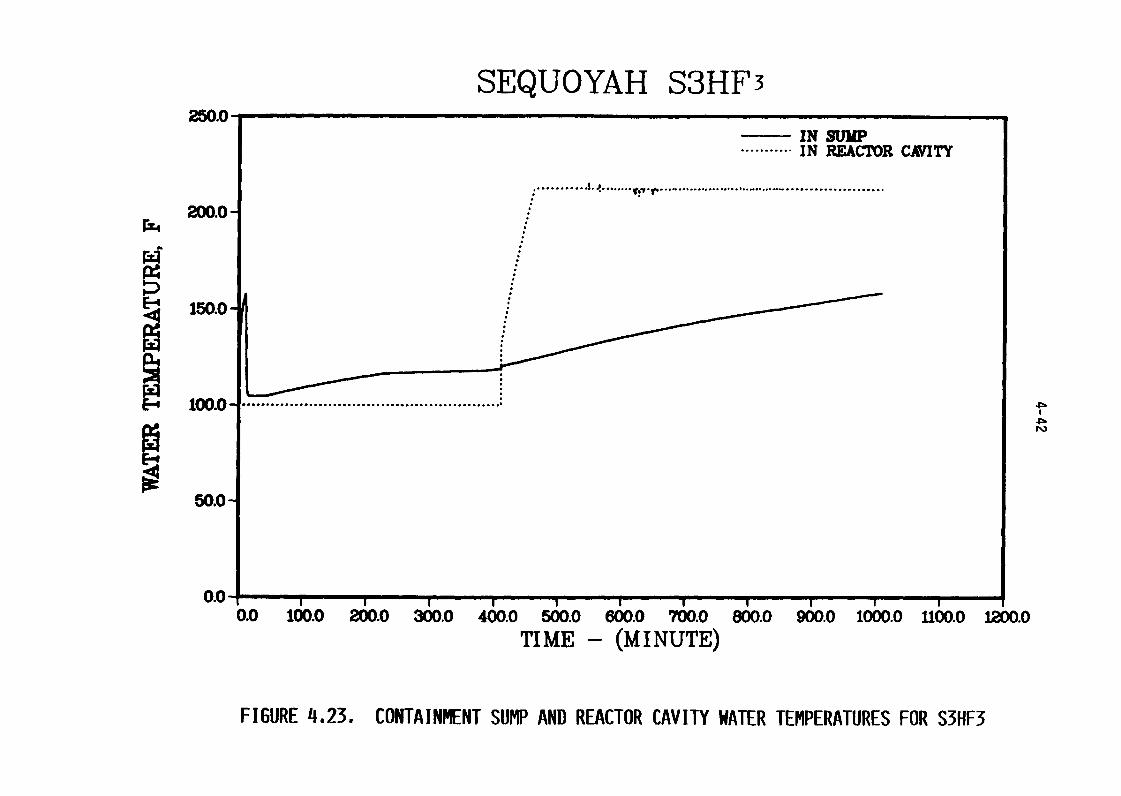
SEQUOYAH S3HF3250.0
IN SUMP........... IN REACTOR CAVITY
........... ........ .......... ................... . .....................
200.0-
E-4 150.0
E-4 100.0 . .......................................................
50.0
0.00.0 100.0 200.0 300.0 400.0 500.0 600.0 760.0 E&O 900.0 1000.0 U0O.O 1200.0
TI ME (M I NUTE)
FIGURE 423. CONTAINMENT SUMP AND REACTOR CAVITY WATER TEMPERATURES FOR S3HF3
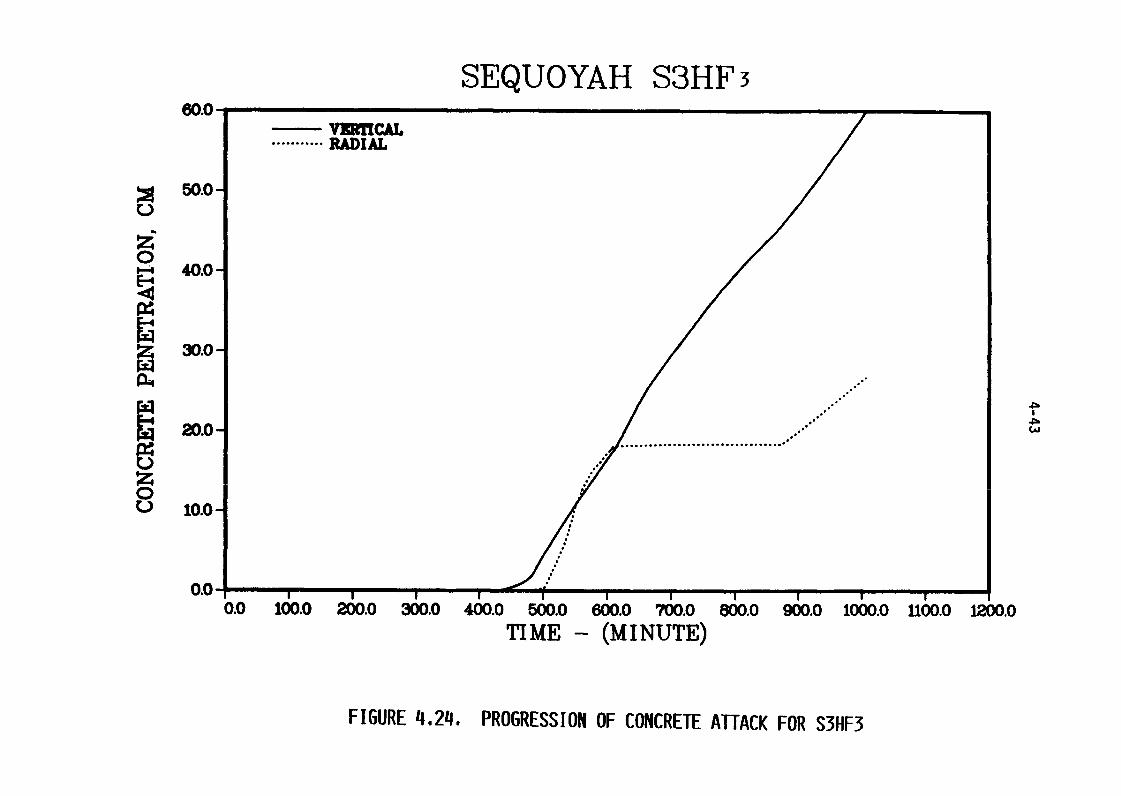
SEQUOYAH S3HF360.0
VEMCAL........... MIAL
50.0
040.0
30.0
20.0 ................................
10.0
0.00.0 100.0 200.0 300.0 4W.0 5W.0 6&0 760.0 1960.0 G&O 1060 U;0-0 mo-o
TIME (MINUTE)
FIGURE 424. PROGRESSION OF CONCRETE ATTACK FOR S3HF3

lb SEQUOYAH S3HF325.0
20.0-
0 15.0-0-4
z
Al.10.0-
0
5.0
0.06.0 1&.0 20.0 00 400.0 9ZO-0 01 0.0 700.0 800.0 900.0 1000.0 U M0
TI ME (M I NUTE)
FIGURE 425. ICE INVENTORY FOR S3HF3
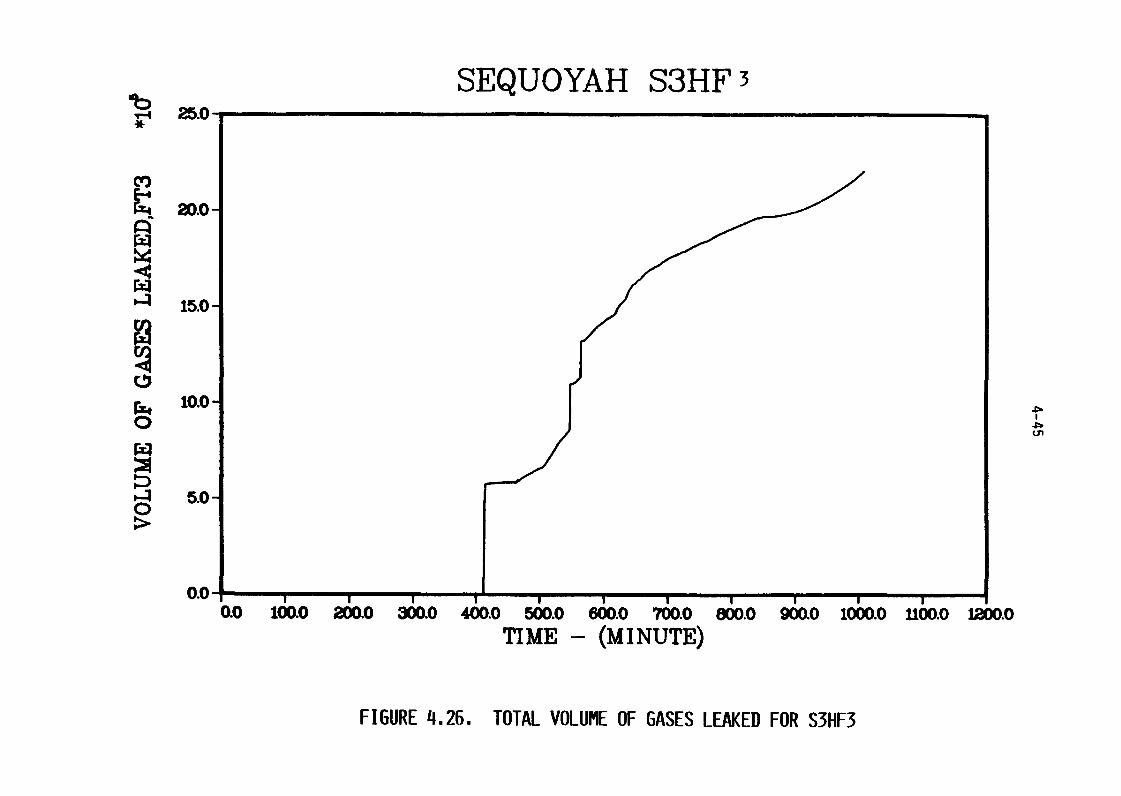
lb SEQUOYAH S3HF325.0
Cl)
V 20.0
El
15.0
10.0
0
5.00
0.00.0 100.0 200.0 300.0 400.0 500.0 600.0 700.0 OW-0 9W.0 1000.0 U00- L-0
TI ME (M I NUTE)
FIGURE 426. TOTAL VOLUME OF GASES LEAKED FOR S3HF3
4-46
Primary system pressures, leak rates, and water inventory for the TB
sequence are illustrated in Figures 427 428, and 429, respectively. The
primary system pressure decreases rapidly until saturated conditions are
reached. Subsequently, the pressure stays essentially constant as the primary
system water inventory steadily declines. When the break flow changes from
liquid to steam there is an abrupt change in the leak rate, which declines
further as the core becomes uncovered. Primary system repressurization near
the end of the in-vessel phase of the accident is associated with the slumping
of the core into the vessel bottom head.
Figure 430 illustrates the maximum and average core temperatures
for the TB sequence. As long as the core is covered it is well cooled and its
temperatures differ only slightly from that of the water coolant. After core
uncovery the temperatures increase in response to continued decay heating and
the energy input from cladding oxidation. The maximum core temperature is
seen to arrest at the input effective melting temperature, except for some
brief excursions due to rapid metal-water reactions. The average core
temperature is seen to increase monotonicaly after core uncovery up to the
time of core collapse into the vessel bottom head.
The fractions of core melted and active cladding reacted are
illustrated in Figure 431. The extended slow primary system depressurization
associated with pump seal failure provides a continuing supply of steam for
cladding oxidation; thus the extent of cladding reacted in this case is
somewhat higher than typically predicted.
The containment pressure and temperature responses for the TB
sequence are illustrated in Figures 432 and 433. Containment failure was
predicted shortly after vessel head failure and was due to the pressure rise
from hydrogen burning. In this sequence the hydrogen igniters were not
available due to the loss of electric power, and hydrogen ignition was assumed
to take place after vessel head failure with the hot debris acting as the
ignition source. From Figure 433 it can be seen that hydrogen burning is
predicted to take place largely in the upper compartment of the containment.
The same is also true for the burns that are predicted to take place after
containment failure.
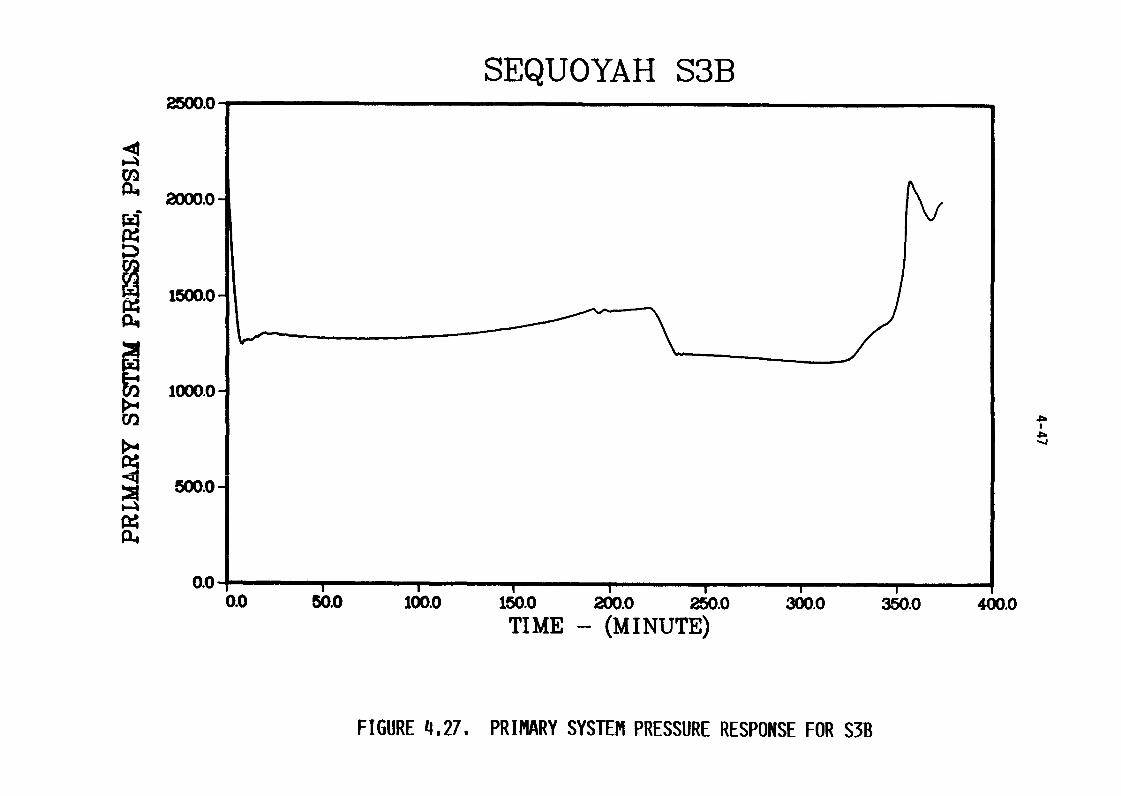
SEQUOYAH S3B
P4 2000.0
P4P4
1500.0-
1000.0
T,1>4
5W.0
P4P-4
0.0
0.0 56 IC6.0 1!6.0 200.0 360.0 350.0 4W.0
TI ME (M I NUTE)
FIGURE 427, PRIMARY SYSTEM PRESSURE RESPONSE FOR S3B
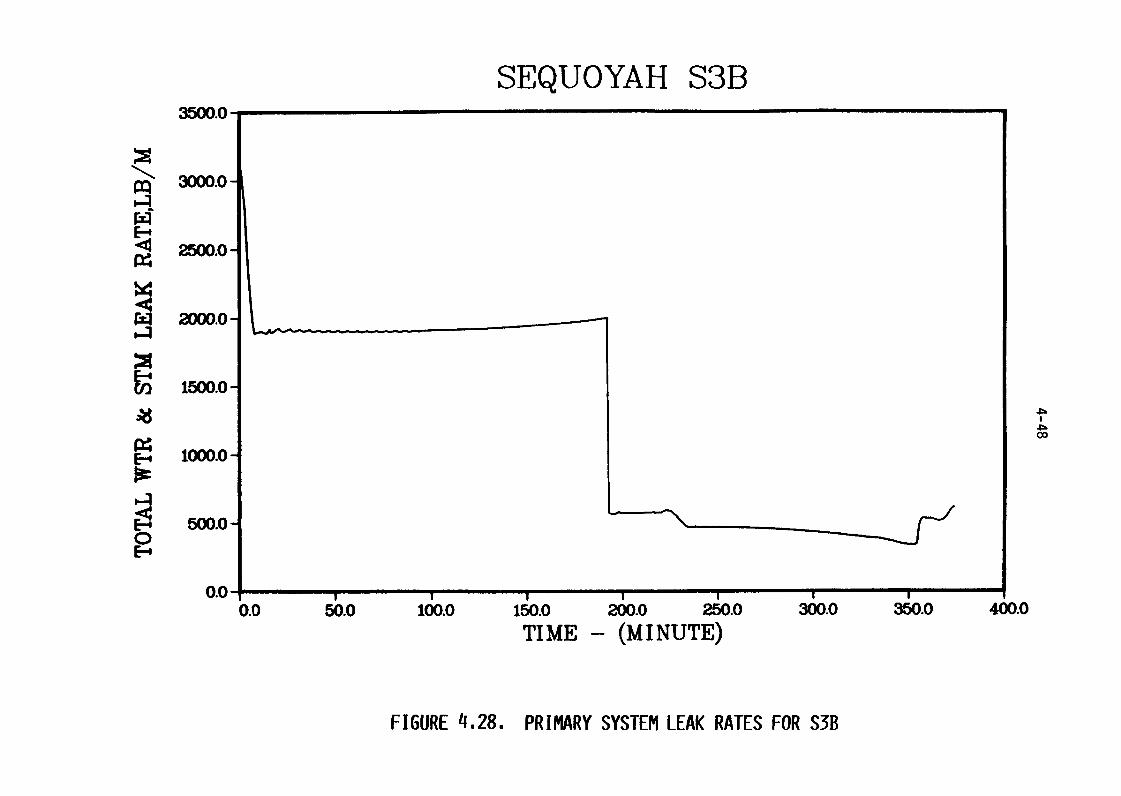
SEQUOYAH S3B3500.0
3000.0
2500.0-
W 2000.014
::4
1500.0
4-00
P4E-4 1000.0
500.0-0E--4
0.0 6.0 56.0 160.0 190.0 2�0-0 2W.0 :3;0.0 390.0 4&0
TI ME (M I NUTE)
FIGURE 428. PRIMARY SYSTEM LEAK RATES FOR B
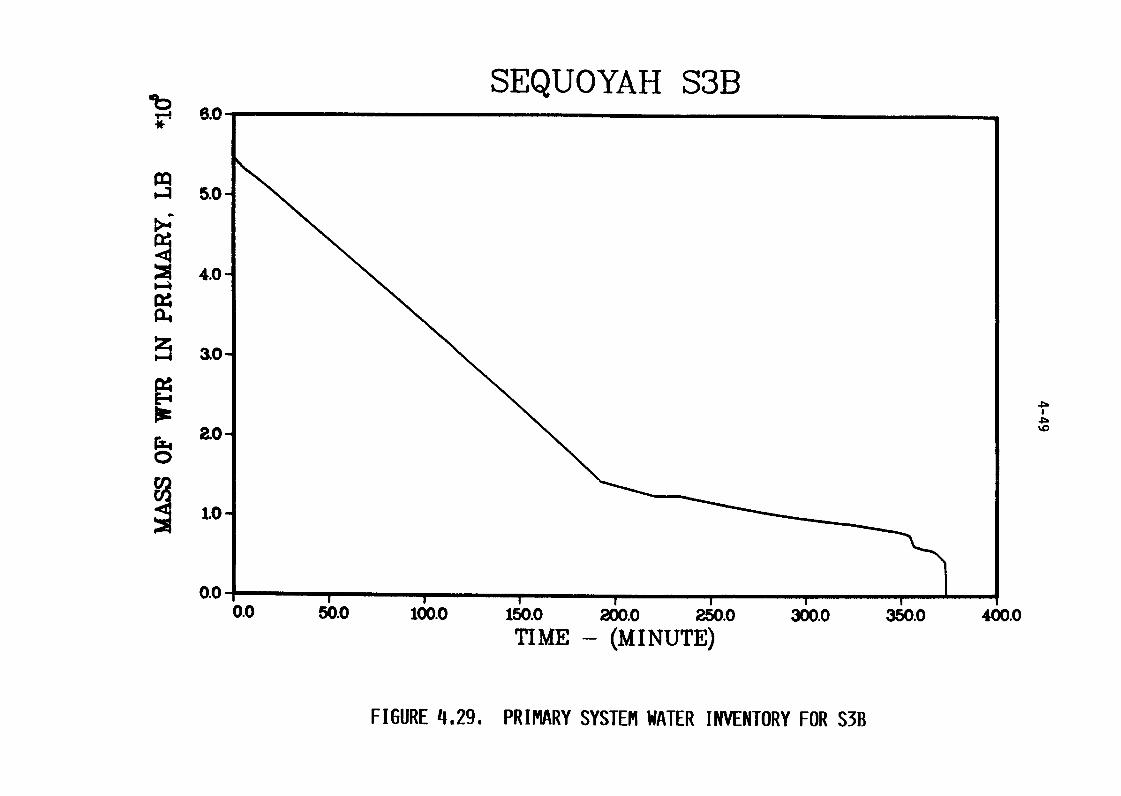
00 SEQUOYAH S3B6.0
$4 5.0
4.0
ao
zo-
cri1.0
0.00.0 16 160.0 150.0 250.0 -&o M6 4W.0
TI ME (M I NUTE)
FIGURE 429. PRIMARY SYSTEM WATER INVENTORY FOR S3B
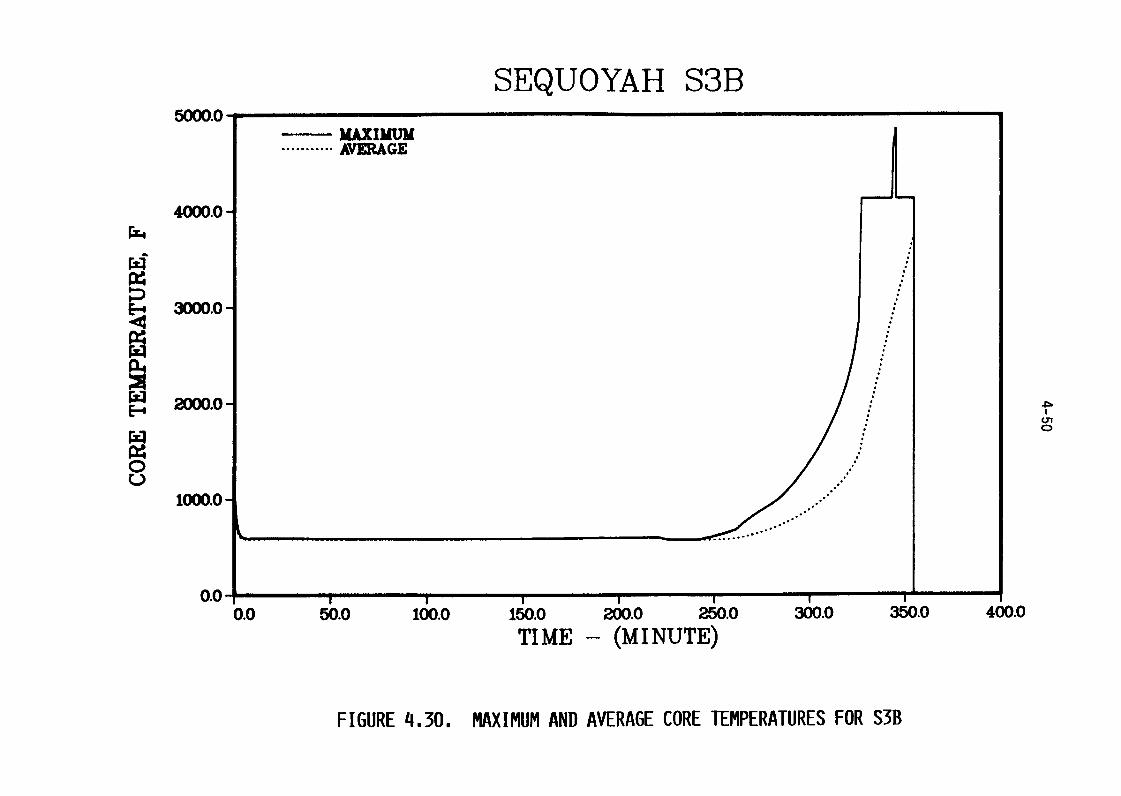
SEQUOYAH S3B5000.0
m"imm........... AVERAGE
4000.0-
3000.0
E-4 2000.0 4b-
1000.0
0.0 6-0 56.0 100.0 150.0 200.0 250.0 300.0 350.0 400.0TI ME (M I NUTE)
FIGURE 430. MAXIMUM AND AVERAGE CORE TEMPERATURES FOR S3B
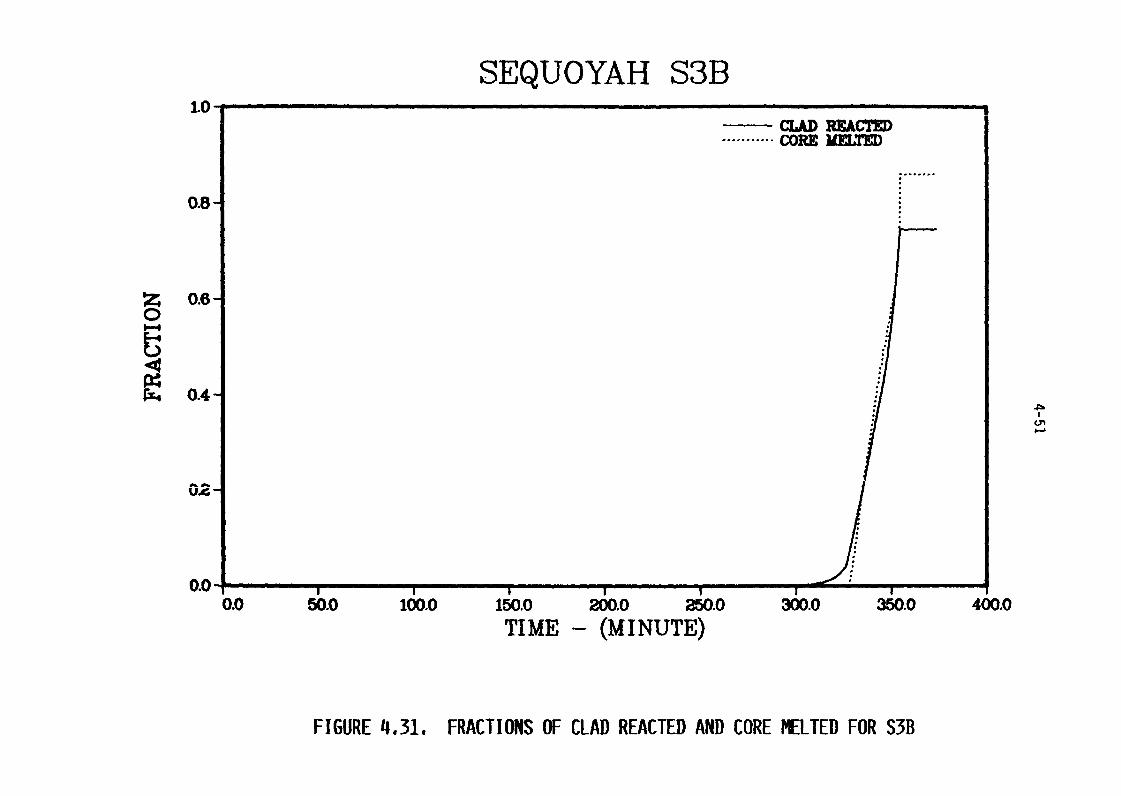
SEQUOYAH S3B1.0
CLAD REACTED..... ODRE MELTED
O's
z 0.60
44 0.4
0.0
56.0 100.0 150.0 200.0 250.0 3&.0 &W-0 460.0
TI ME (M I NUTE)
FIGURE 431. FRACTIONS OF CLAD REACTED AND CORE MELTED FOR S3B
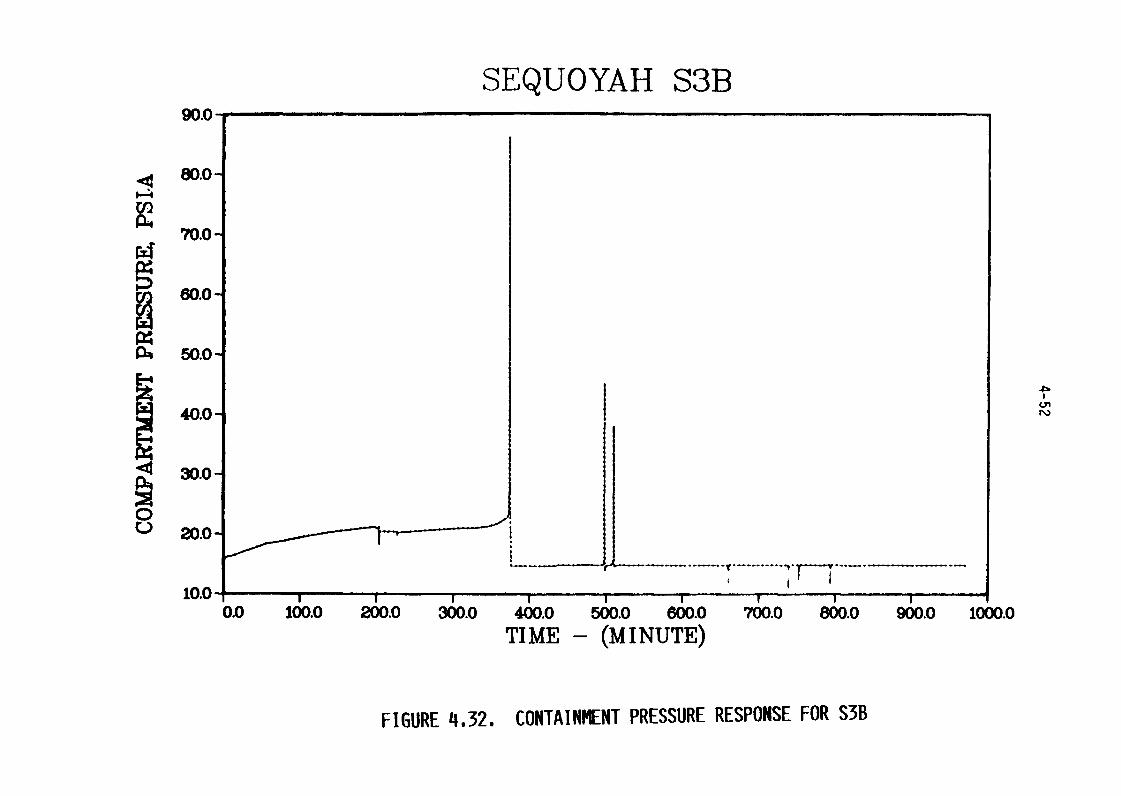
SEQUOYAH S3B90.0
-94 80.0
70.0
60.0-
50.0-
40.0-
30.0-
20.0-
10.00.0 100.0 200.0 360.0 400.0 500.0 6W.0 700.0 800.0 900.0 1000.0
TIME (M I NUTE)
FIGURE 432. CONTAINMENT PRESSURE RESPONSE FOR H
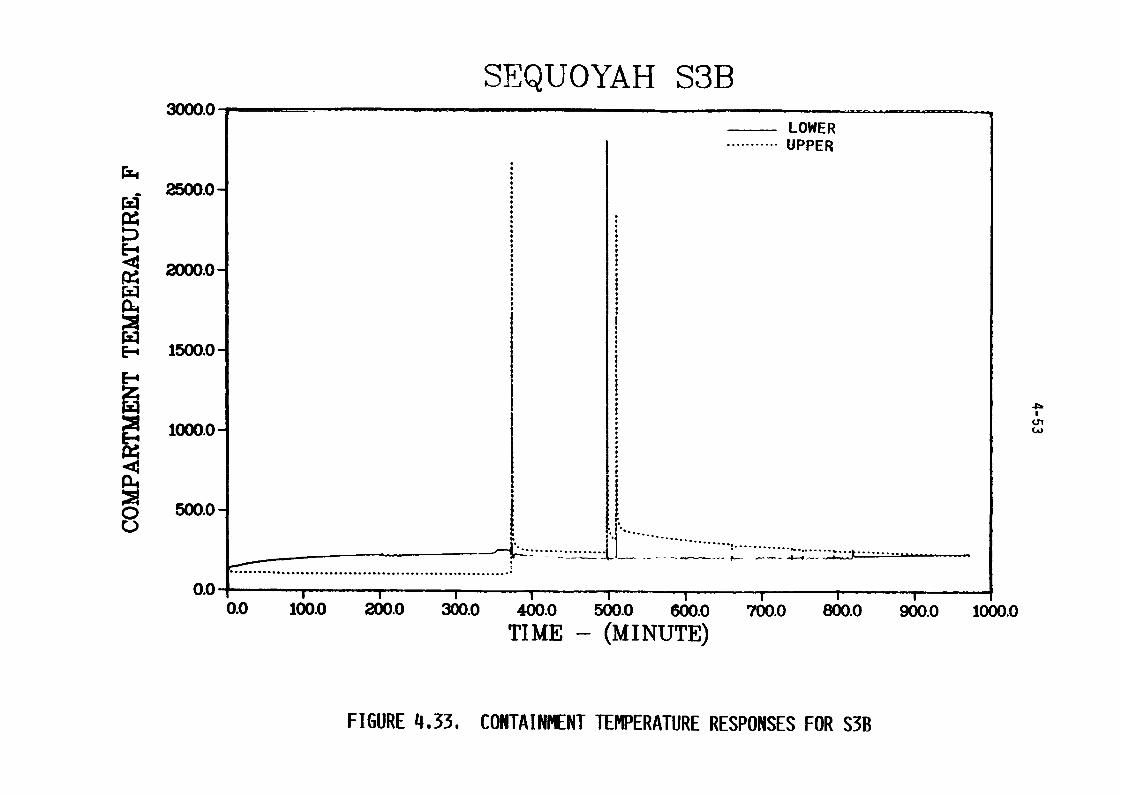
SEQUOYAH S3B3000.0-,
LOWER........... UPPER
r=4
2500.0-
2000.0-
E--4 1500.0-
E-4
1000.0-
P-4
�40
0 500-0-
.............. ..........................
..........
................................................
0.0 I I I
0.0 100.0 200.0 300.0 400.0 500.0 6W.0 700.0 800.0 qw.0 1060
TI ME - M I NUTE)
FIGURE 433. CONTAINMENT TEMPERATURE RESPONSES FOR S3B
4 54
Figures 434 and 435 illustrate the containment sump and reactor
cavity water inventories and temperatures, respectively. In this sequence the
water in the reactor cavity is limited to that from the accumulator discharge.
The water in the containment sump comes from the primary system inventory and
the melting of the ice. As can be seen from Figure 434, it takes a long time
for the water in the cavity to be boiled off since in this, as in the other
cases considered, no fragmentation of the core debris was assumed. With
fragmentation of the core debris assumed, the water in the cavity would have
been evaporated much more rapidly, but the start of concrete attack would have
been delayed.
The predicted progression of concrete attack is illustrated in
Figure 436. Initially approximately equal rates of concrete attack in the
vertical and radial directions are predicted. After the debris layers are
predicted to invert, with the metal phase going to the bottom, the attack is
predominantly in the vertical direction. The radial attack is predicted to
resume after the dryout of the reactor cavity.
The inventory of ice is illustrated in Figure 437. Ice depletion
is relatively slow in this case up to the time of reactor vessel failure, and
is all due to primary system blowdown. The rapid decrease in the ice
inventory at the time of vessel failure is due to the release of high pressure
steam from the primary system as well as due to containment depressurization
following failure.
The total volume of gases leaked from the containment is illustrated
in Figure 438. The initial large leakage is due to containment failure; the
subsequent abrupt increases are due to hydrogen burns. The longer gradual
increase in the total volume of gases leaked is due to corium-concrete
interactions. The time dependent containment leak rates used as input for the
containment fission product transport analyses are given in Table 44.
4.3 TMLU-SGTR Sequence
The TMLU sequence was selected as the basis for illustrating the
accident source terms that may be associated with accident induced steam
generator tube ruptures. The interest in this analysis is in the behavior of
the reactor primary and steam generator secondary systems; the containment
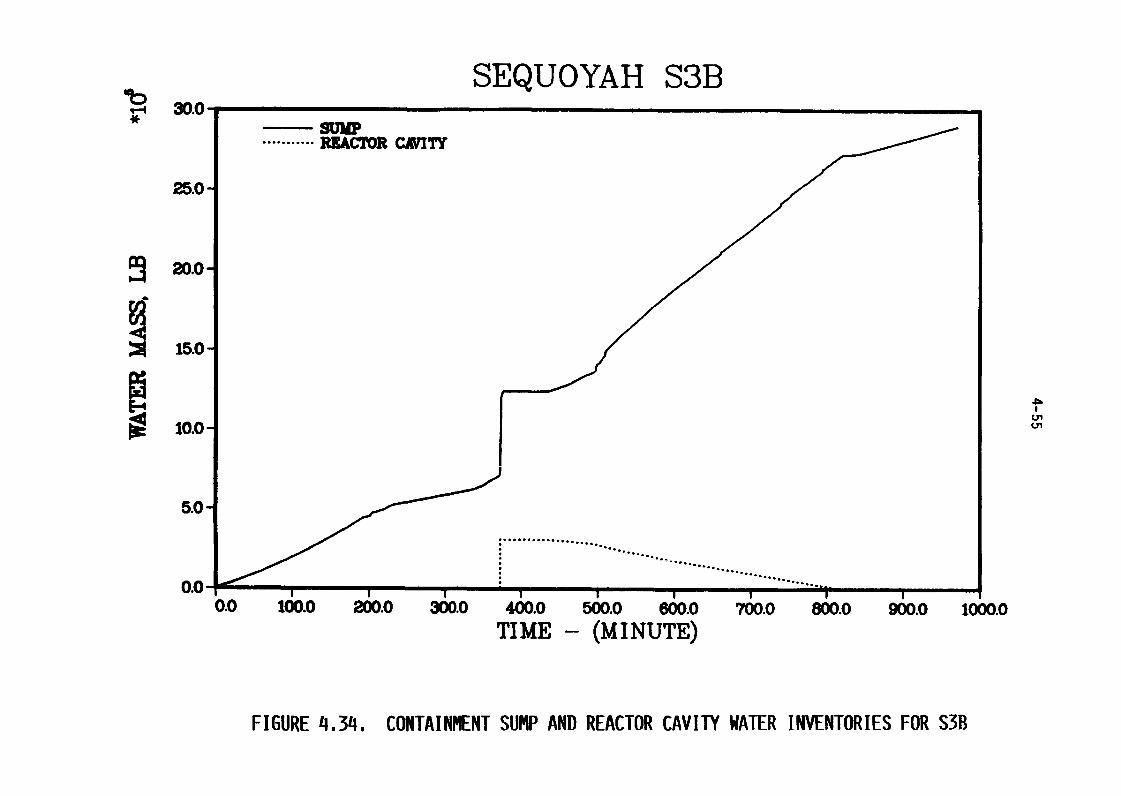
lb SEQUOYAH S3B30.0
SUMP........... REACTOR CRITY
25.0
20.0
15.0
10.0 qLn
5.0
..................
0.0 ----0.0 1(6.0 2(6.0 3(60 4&0 5(6.0 6(6.0 7&0 860.0 900.0 1060
TI ME (M I NUTE)
FIGURE 434. CONTAINMENT SUMP AND REACTOR CAVITY WATER INVENTORIES FOR S3B
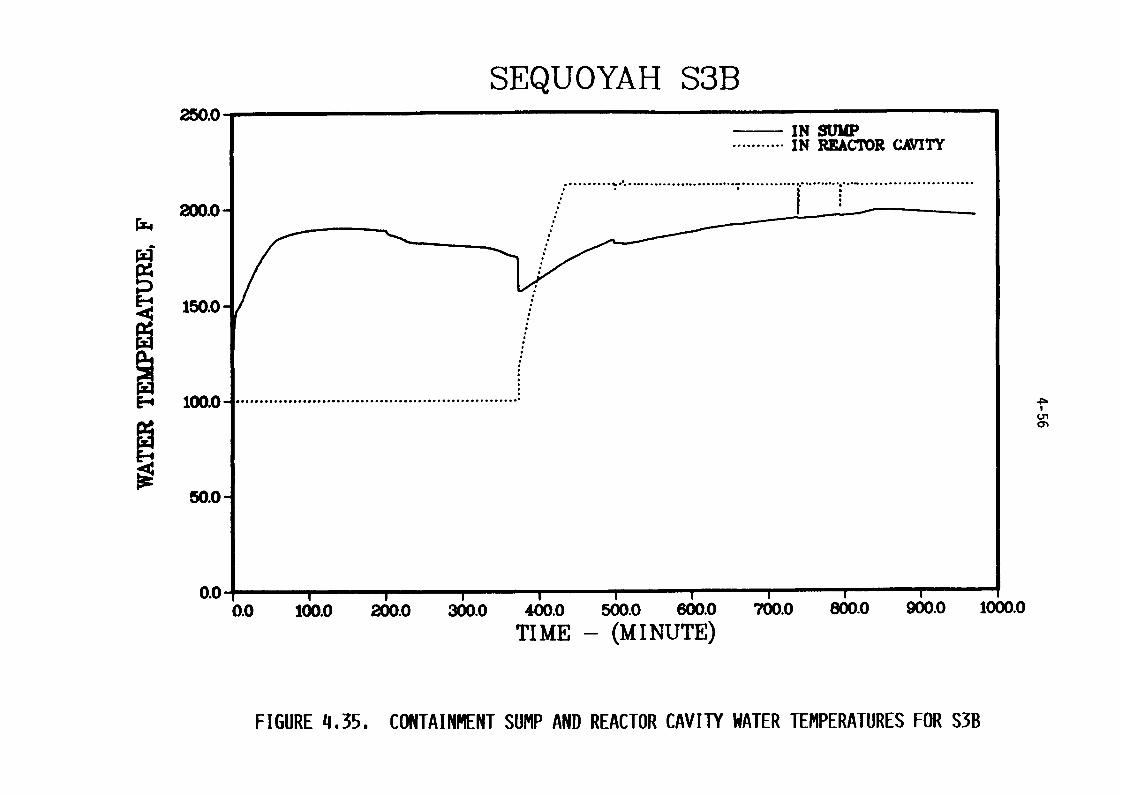
SEQUOYAH S3Bmo-0
IN SUMP........... IN REACTOR CAVITY
........... .......................................... ....... ...............................
200.0rZ4
150.0
100.0 ...........................................................
50.0
0.0 6.0 160.0 2&0 360.0 460.0 5&O M.0 7�0-0 1�0-0 G&O 1060TI ME (M I NUTE)
FIGURE 435. CONTAINMENT SUMP AND REACTOR CAVITY WATER TEMPERATURES FOR S3B
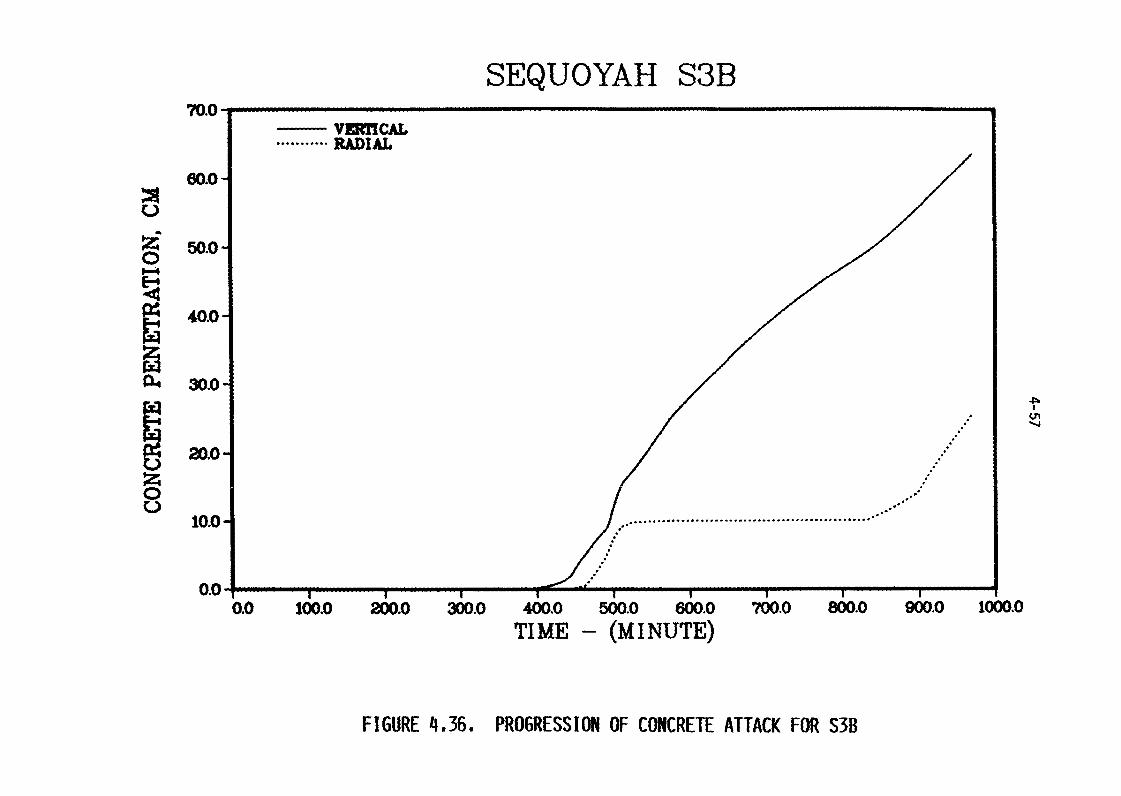
SEQUOYAH S3B70.0
VERMAL,........... RADIAL
60.0
50.0
40.0
30.0tb
20.0
z0
10.0 .. ................................................
0.00.0 100.0 200.0 300.0 400.0 5&0 6C� 0 7(6 8600 9000 lowo
TI ME (M I NUTE)
FIGURE 436. PROGRESSION OF CONCRETE ATTACK FOR H
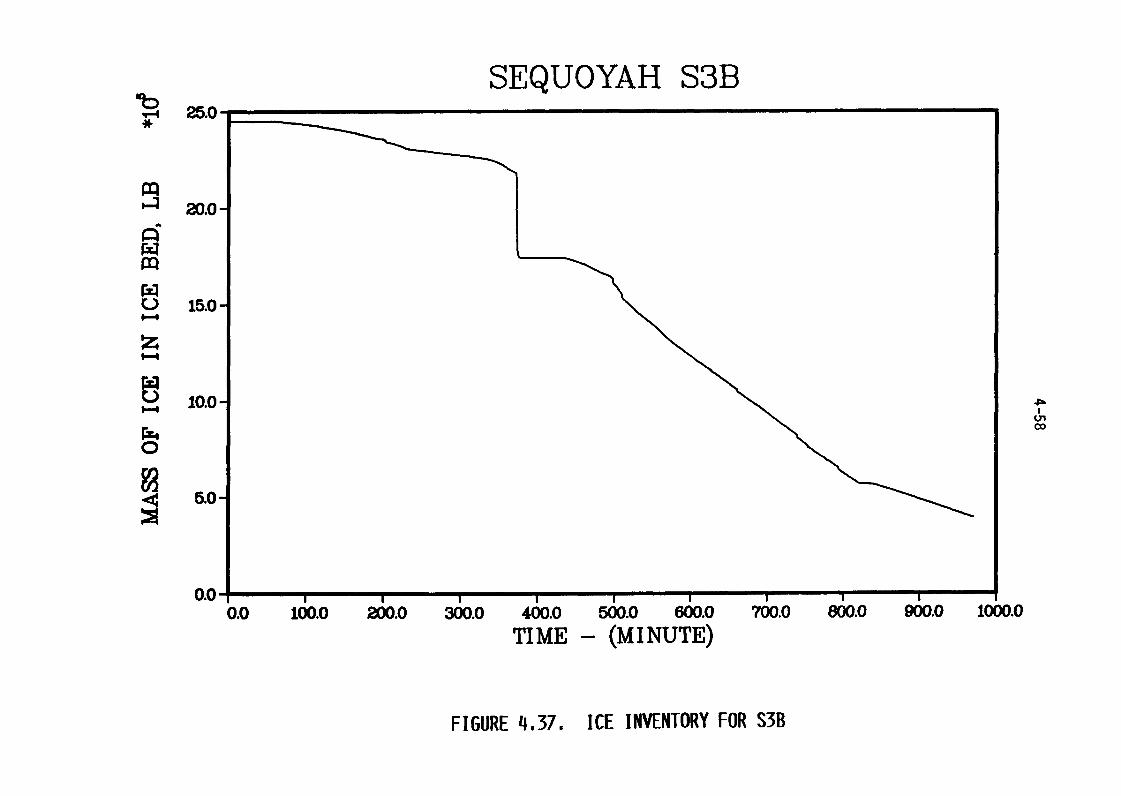
"b SEQUOYAH SH25.0
20.0-
15.0-
z0-4
WI-) 10.0 4�b
00
0
5.0
0.06.0 1&.0 260.0 3(6 4(6 560D 600.0 700.0 800.0 900.0 1000.0
TI ME (M I NUTE)
FIGURE 437. ICE INVENTORY FOR S3B

lb SEQUOYAH S3B25.0
E--4r=4 2D.0
ciDa
15.0
10.0rX4 OLn
0 9.0
9
�l 5.00
0.06.0 160.0 1260.0 360.0 4&.0 560.0 660.0 700.0 8000 900.0 1000.0
TI ME (M I NUTE)
FIGURE 438. TOTAL VOLUME OF GASES LEAKED FOR S3B
4-60
behavior will not be addressed here. In a TMLU type of sequence all makeup to
the primary and secondary systems is lost and continued decay heating boils
off first the steam generator secondary, and then, the primary coolant
inventory. The primary coolant boiloff takes place through the cycling
pressurizer relief valve; thus core overheating and melting take place at an
elevated pressure. As noted previously, for the present purposes it was
assumed that the events associated with core slumping would lead to the
rupture of the steam generator tubes, with the release of steam, hydrogen, as
well as fission products to the now dry secondary side of the steam generator.
The secondary side of the steam generator was assumed to be maintained at
1100 psia by the operation of the atmospheric dump valves. With the failure
of the reactor vessel head the flow through the steam generators was assumed
to cease and the present analysis was terminated at that point. It can, of
course, be postulated that the steam generator relief valves could stick open
with the continued release of radioactivity even after vessel head failure.
While such a course of events cannot be dismissed, it is believed to be of
lower probability.
Table 41 gives the timing of the principal accident events for the
TMLU-SGTR scenario; Table 42 summarizes the primary system conditions during
the time period of interest.
Figure 439 illustrates the steam generator secondary side water
inventory for this sequence. Initially there is very good thermal coupling
between the primary and secondary sides of the steam generators, with rapid
depletion of the secondary water inventory. This is further illustrated in
Figure 440 which shows the primary system pressure as a function of time.
The initially effective heat transfer to the steam generators cools off the
primary system water and results in a decrease in primary system pressure
below the normal operating conditions. As the steam generator effectiveness
decreases, due to the depletion of their water inventory, the primary system
pressure rises to the pressurizer relief valve setpoint. The primary system
water inventory is given in Figure 441. It can be seen that the pressurizer
relief valve first starts to discharge primary coolant at about 50 minutes; at
this point the primary system water is still somewhat subcooled and the water
continues to heat up even as some of it is expelled from the system. At about
80 minutes the primary system is essentially saturated, as reflected by the
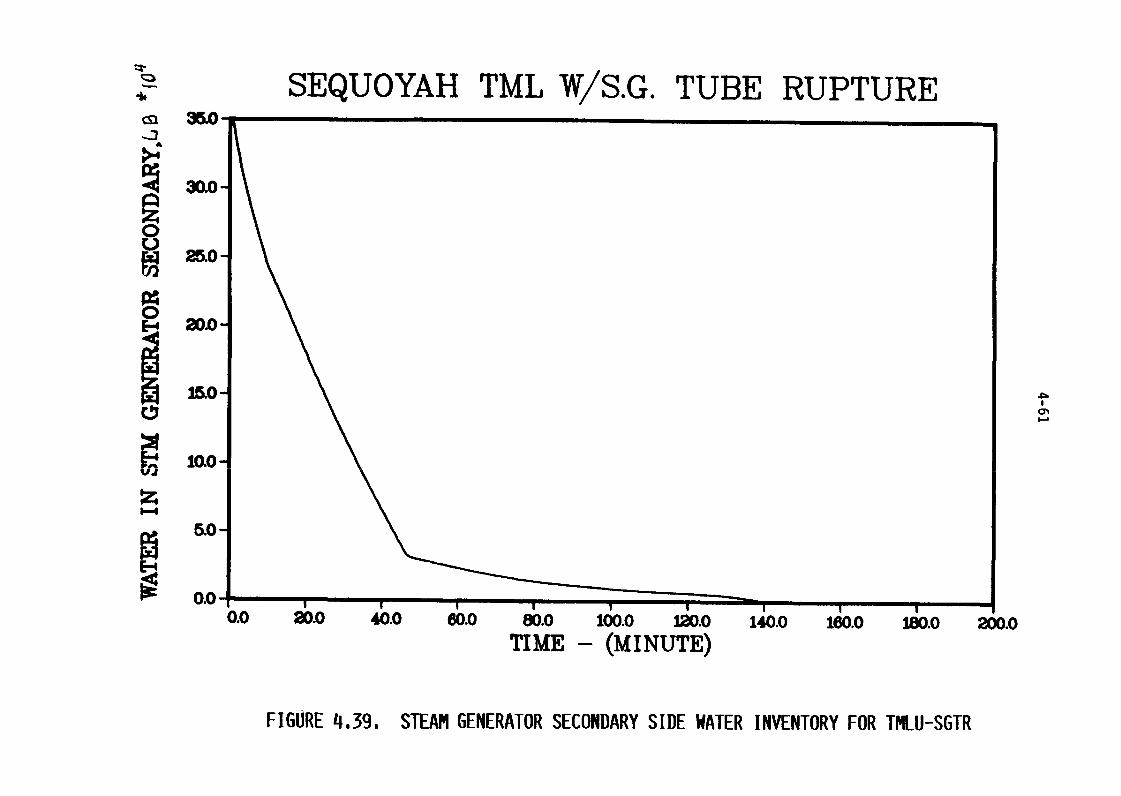
:21
SEQUOYAH TML W/S.G. TUBE RUPTURE3W
,3
no
0
M-0
9 -E-4 W-0
laoz
5.0
E-4
oo L6.0 26.0 46.0 60.0 �0-0 160.0 1�0-0 liao 160.0 1800 2000
TI ME (M I NUTE)
FIGURE 439. STEAM GENERATOR SECONDARY SIDE WATER INVENTORY FOR TMLU-SGTR
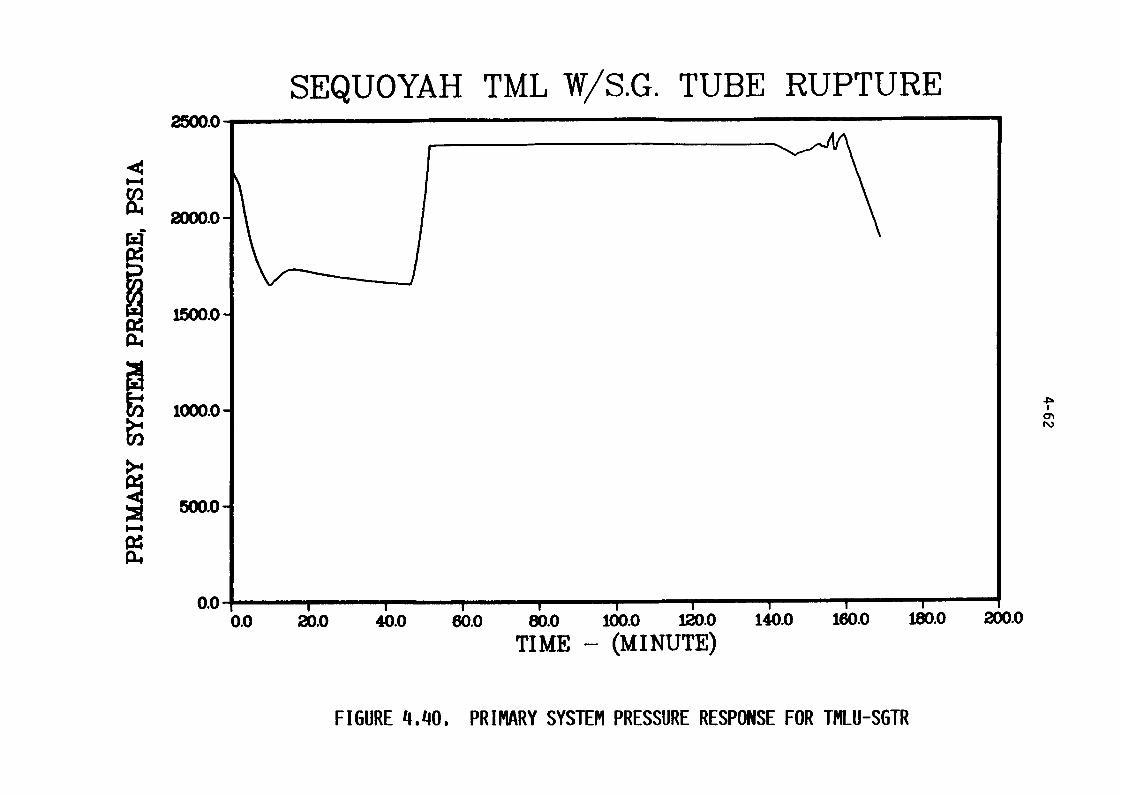
SEQUOYAH TML W/S.G. TUBE RUPTUREIM
0-4
2 2000.0-
P404
1500.0-
1000.0 T,m
>7
500.0
WPL4
0.0
0.0 26.o 46.0 66.o �0.0 I&O 1�0-0 1�0.0 lko lino 1.0TI ME (M I NUTE)
FIGURE 440. PRIMARY SYSTEM PRESSURE RESPONSE FOR TMLU-SGTR
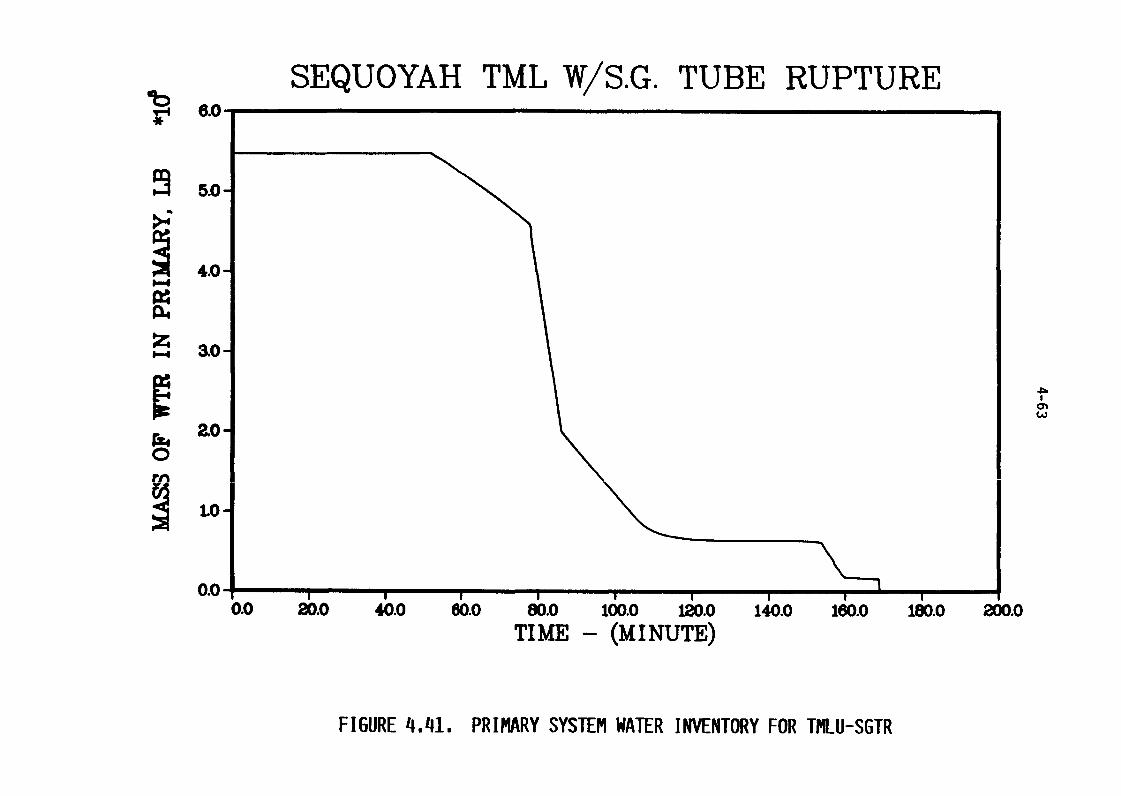
00 SEQUOYAH TML W/S.G. TUBE RUPTURE6.0
5.0
4.0
z0-4 ao
Pk zo0
m
LO
0.00.0 26.0 46 66.0 ko 100.0 tw-o 1�0.0 Im.0 1�0-0 L-0
TI ME (M I NUTE)
FIGURE 441. PRIMARY SYSTEM WATER INVENTORY FOR TMLU-SGTR
4-64
faster loss of inventory. With the switching from liquid to steam discharge
through the relief valve at about 85 minutes, due to the uncovering of the
pressurizer surge line, the rate of loss of inventory decreases. A further
slowdown in inventory loss takes place as the core begins to uncover at about
104 minutes. Core slumping starts at about 154 minutes, with a rapid boiloff
of the water in the vessel head from the interaction with the core debris.
Figure 442 illustrates the maximum and average core temperatures for this
sequence. The fraction of cladding reacted and core melted are shown in
Figure 443.
The steam generator tubes were assumed to fail at 153 minutes into
the accident, with head failure predicted at 168.9 minutes. Figures 444 and
4.45 illustrate the leak rates through the pressurizer relief valve and the
ruptured steam generator tubes, respectively. It is interesting to note that
immediately after core slumping there are considerable flows through both the
relief valve and the ruptured tubes; as the primary system pressure falls,
however, the relief valve closes and only the flow through the ruptured tubes
persists. The flow to the steam generator secondary is terminated at the time
of reactor vessel failure.
It may be noted that the flow split between the relief valve and
ruptured tubes would be sensitive to the number of tubes assumed to have
failed. For smaller number of tubes than considered here more flow would be
forced out of the relief line. For a larger number of failed tubes more of
the flow would tend to go out the break, but the primary system pressure would
drop faster, with an earlier termination of the flow through the secondary
side of the steam generator. The particular scenario chosen is believed to be
a representative illustration, but is by no means a unique description of the
possible outcome of steam generator tube rupture accidents.
4.4 TBA Sequence
The accident event times for the Sequoyah TBA sequence as calculated
by MARCH 3 are summarized in Table 4.1. Note that the time of the induced
primary system break was specified by input and was chosen to take place prior
to core slumping. The core and primary system conditions at key times during
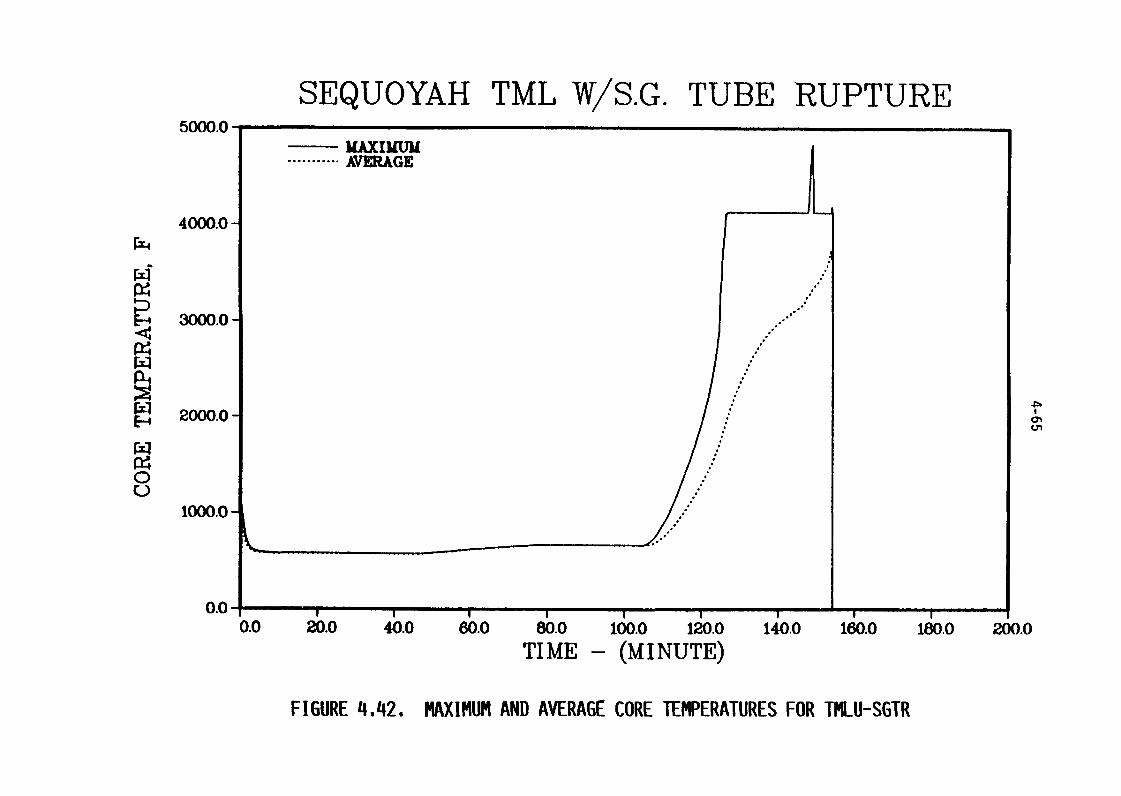
SEQUOYAH TML W/S.G. TUBE RUPTURE5000.0
MAXIMUM........... AVERAGE
4000.0
3000.0
2000.0E--4
0
1000.0
0.0
0.0 26.0 '16 k-0 80.0 100.0 120.0 140.0 160.0 1�0-0 260.0
TI ME (M I NUTE)
FIGURE 442. MAXIMUM AND AVERAGE CORE TEMPERATURES FOR TMLU-SGTR
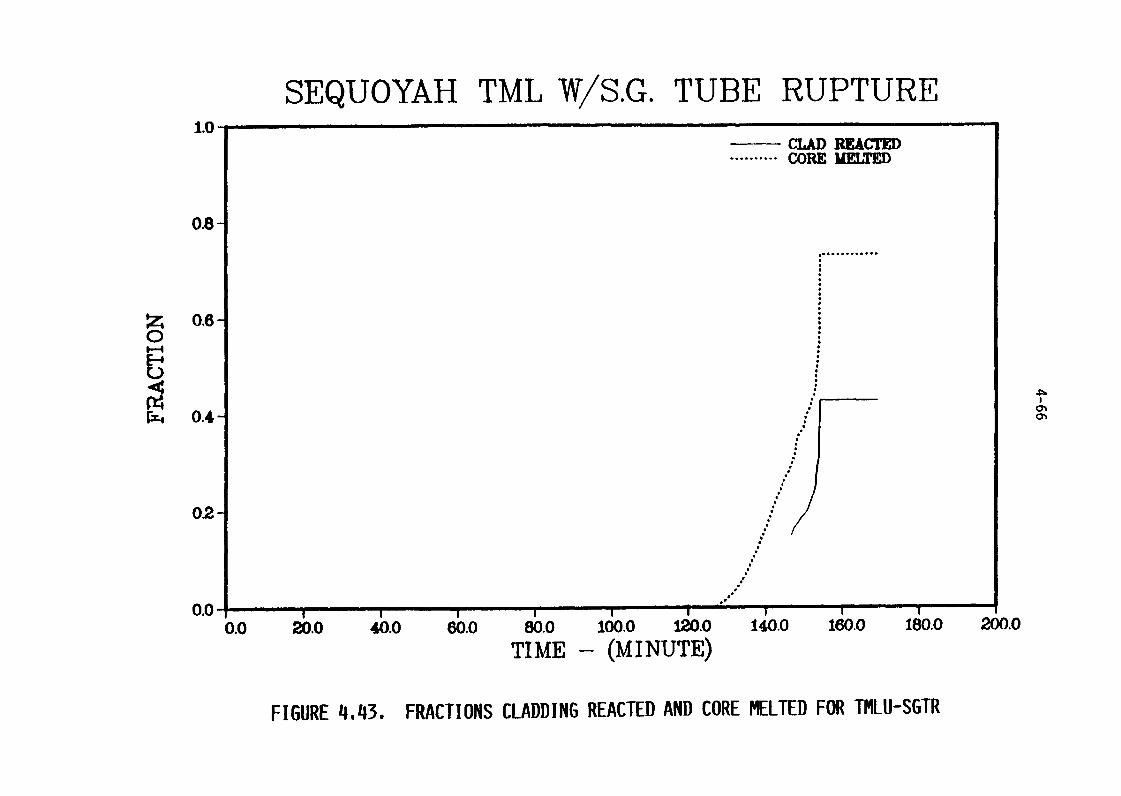
SEQUOYAH TML W/S.G. TUBE RUPTURE1.0-
CLAD REACTED.......... CORE MELTED
0.8
............
z 0.6 -0
Cm
02-
0.00.0 26.0 46.0 60.0 86.0 160.0 M-0 140.0 160.0 IkO 200.0
TI ME (M I NUTE)
FIGURE 443. FRACTIONS CLADDING REACTED AND CORE MELTED FOR TMLU-SGTR
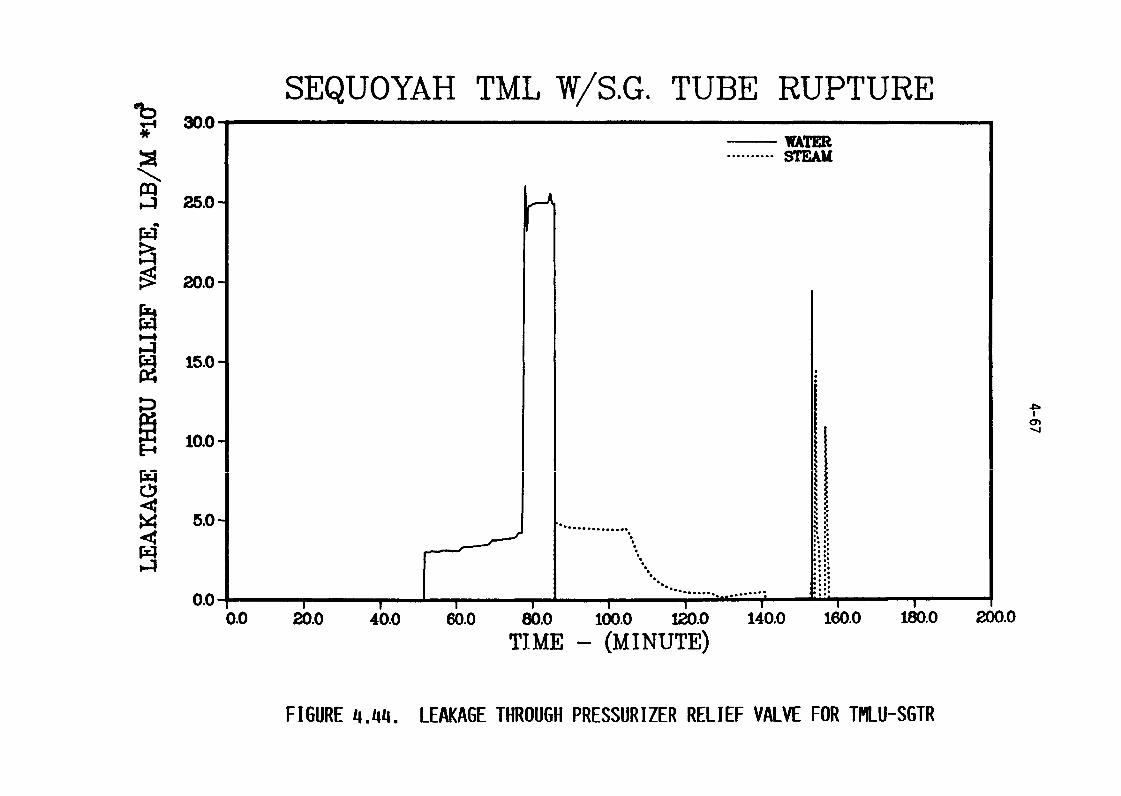
Ob SEQUOYAH TML W/S.G. TUBE RUPTURE30.
WA=..........
25.0
20.0-
W 15.0-
4-
14
10.0
�4 5.0
0.00.0 26.0 46-o i56-o 80.0 100.0 120.0 140.0 1�0.0 180.0 200.0
TI ME (M I NUTE)
FIGURE 444. LEAKAGE THROUGH PRESSURIZER RELIEF VALVE FOR TMLU-SGTR
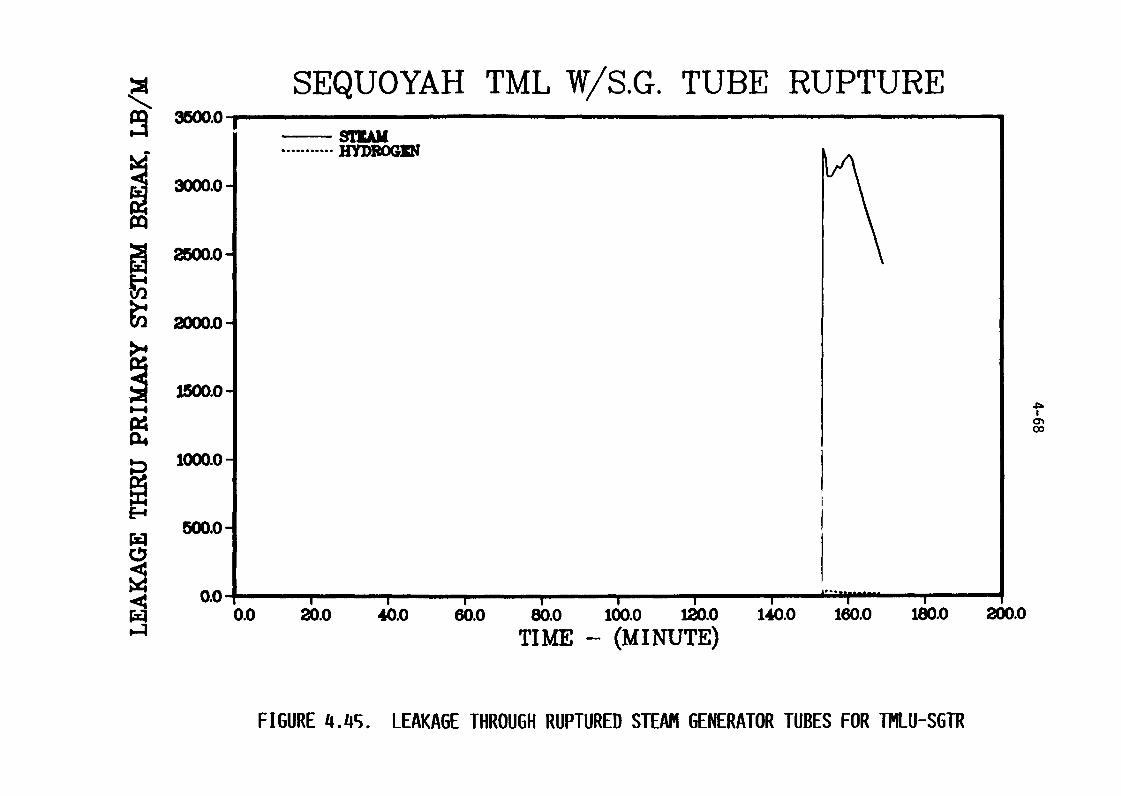
SEQUOYAH TML W/S.G. TUBE RUPTURE
sum...........3m-o
am-0
WW4
OW-0
co
low-0
5W.0
0.00.0 26.0 46.0 66.0 80.0 100.0 M-0 1�0.0 1W.0 100.0 260-0
TI ME (M I NUTE)
FIGURE 445. LEAKAGE THROUGH RUPTURED STEAM GENERATOR TUBES FOR TMLU-SGTR
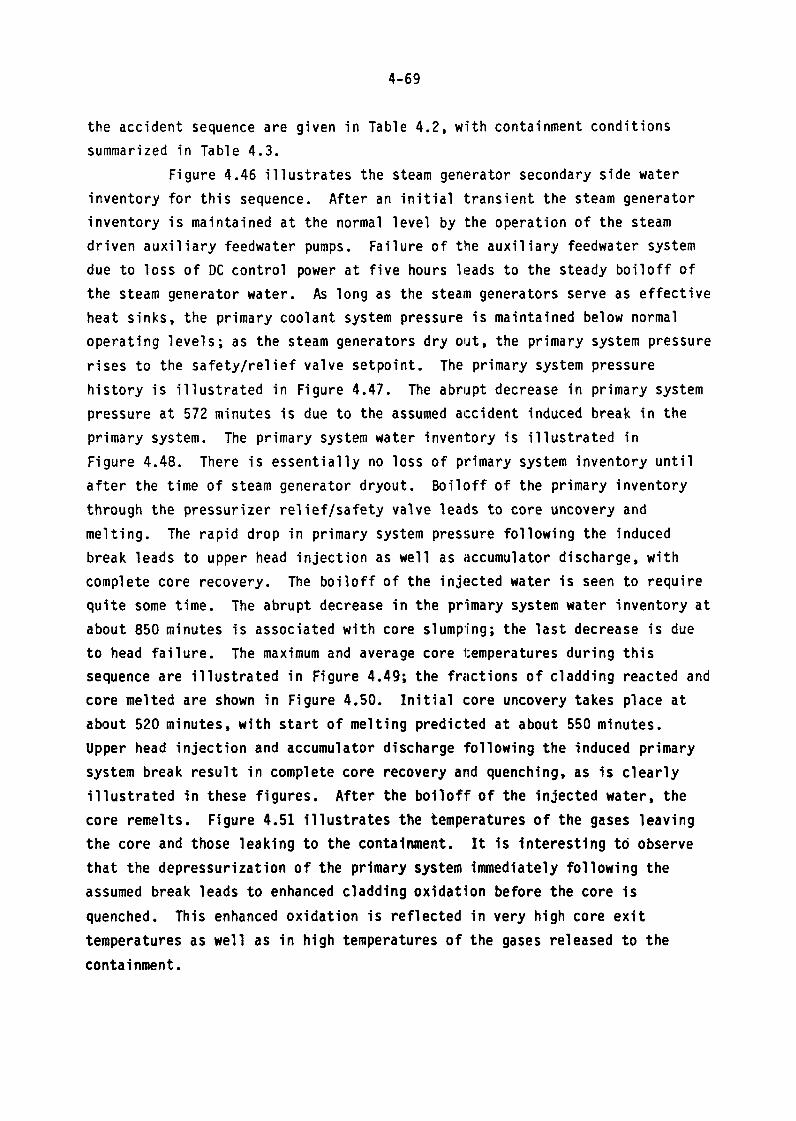
4-69
the accident sequence are given in Table 42, with containment conditions
summarized in Table 43.
Figure 446 illustrates the steam generator secondary side water
inventory for this sequence. After an initial -transient the steam generator
inventory is maintained at the normal level by the operation of the steam
driven auxiliary feedwater pumps. Failure of te auxiliary feedwater system
due to loss of DC control power at five hours lads to the steady boiloff of
the steam generator water. As long as the steam generators serve as effective
heat sinks, the primary coolant system pressure is maintained below normal
operating levels; as the steam generators dry ot, the primary system pressure
rises to the safety/relief valve setpoint. The primary system pressure
history is illustrated in Figure 447. The abrupt decrease in primary system
pressure at 572 minutes is due to the assumed accident induced break in the
primary system. The primary system water inventory is illustrated in
Figure 448. There is essentially no loss of pimary system inventory until
after the time of steam generator dryout. Boiloff of the primary inventory
through the pressurizer relief/safety valve leads to core uncovery and
melting. The rapid drop in primary system pressure following the induced
break leads to upper head injection as well as ccumulator discharge, with
complete core recovery. The boiloff of the injected water is seen to require
quite some time. The abrupt decrease in the primary system water inventory at
about 850 minutes is associated with core slumping; the last decrease is due
to head failure. The maximum and average core emperatures during this
sequence are illustrated in Figure 449; the fractions of cladding reacted and
core melted are shown in Figure 450. Initial ore uncovery takes place at
about 520 minutes, with start of melting predicted at about 550 minutes.
Upper head injection and accumulator discharge ollowing the induced primary
system break result in complete core recovery ad quenching, as is clearly
illustrated in these figures. After the boiloff of the injected water, the
core remelts. Figure 451 illustrates the temperatures of the gases leaving
the core and those leaking to the containment. It is interesting t observe
that the depressurization of the primary system immediately following the
assumed break leads to enhanced cladding oxidation before the core is
quenched. This enhanced oxidation is reflected in very high core exit
temperatures as well as in high temperatures of the gases released to the
containment.
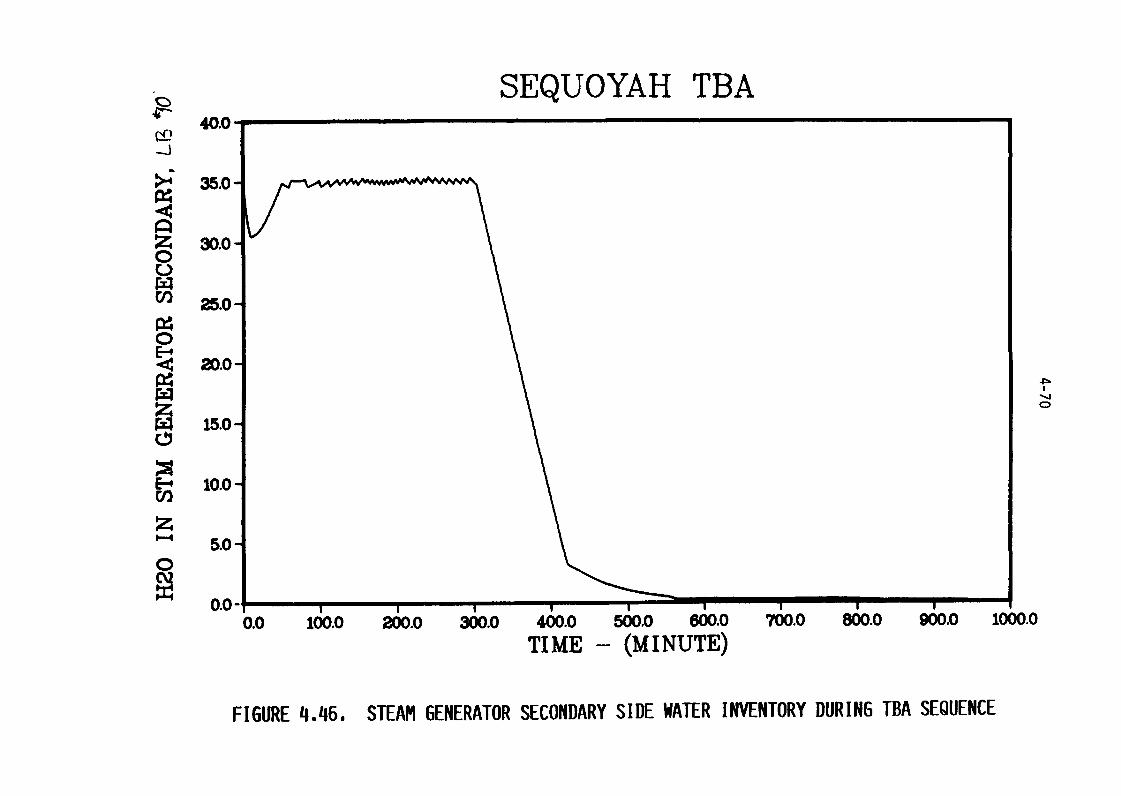
SEQUOYAH TBA40.0
>-4 35.004
Z 30.0
cn 25.0
W40
2D.0P4P4 14
z Cl
15.0
E-q 10.0cnz
5.0
0.0-0.0 100.0 2OD-o 300.0 400.0 5DO.0 6(6 760.0 E&O i&0 10DO-0
TI ME (M I NUTE)
FIGURE 446. STEAM GENERATOR SECONDARY SIDE WATER INVENTORY DURING TBA SEQUENCE

SEQUOYAH TBA
2000.0
1500.0
E-4C/) 1000.0
500.0
0.0
0.0 160.0 260.0 3&.0 4&-0 5&O 6&.0 760.0 960.0 1000-0TI ME (M I NUTE)
FIGURE 447. PRIMARY SYSTEM PRESSURE HISTORY FOR TBA SEQUENCE
SEQUOYAH TBA6.0
0.4 5.0
>-4
4.0
PL4
z 3.0
04E-4
rX4 zo
0
1.0
0.0
0.0 I&O 2�0.0 360.0 4�0.0 560.0 6(60 7�0-0 660.0 9w.0 1000.0
TI ME (M I NUTE)
FIGURE 448. PRIMARY SYSTEM WATER INVENTORY FOR TBA SEQUENCE
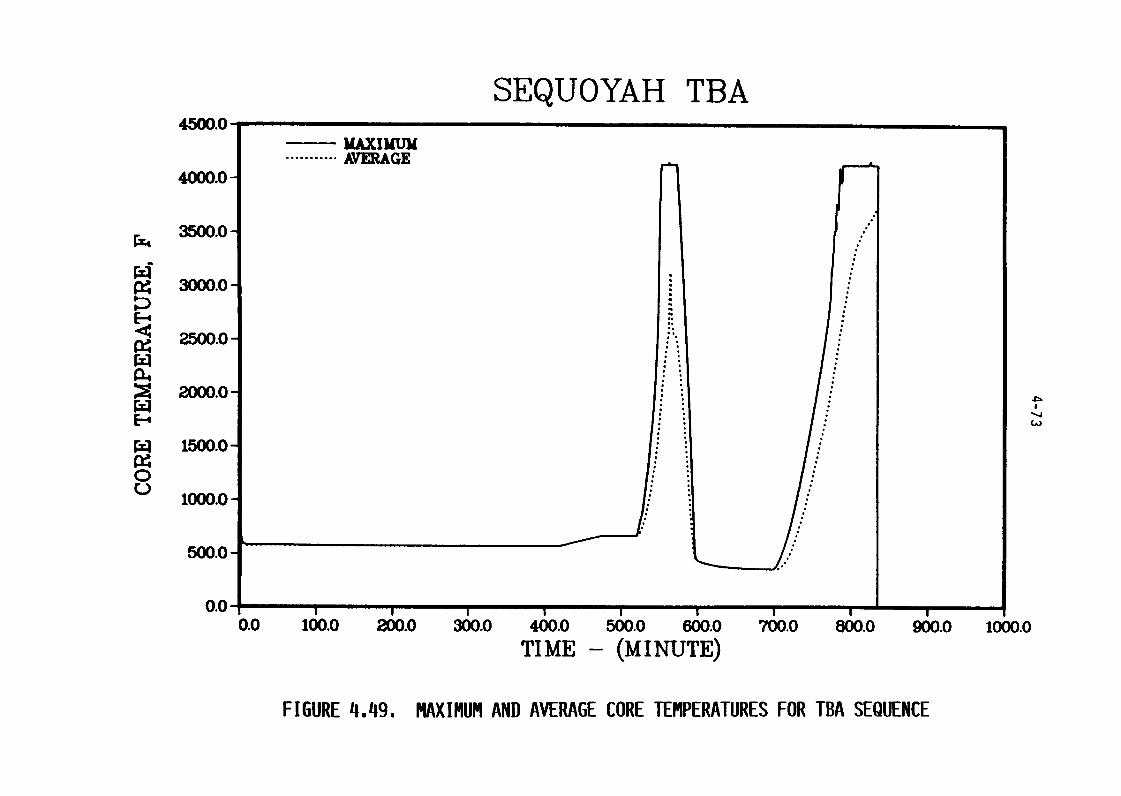
SEQUOYAH TBA4500.0
- MAXIMUM........... AVERAGE
4000.0
3500.0
3000.0
2500.0
2000.0paE-4
1500.0
1000.0
500.0
0.0'6.0 l&.0 2&.0 360D 4(6 560.0 600.0 700.0 800.0 900.0 1000.0
TI ME (M I NUTE)
FIGURE 449. MAXIMUM AND AVERAGE CORE TEMPERATURES FOR TBA SEQUENCE
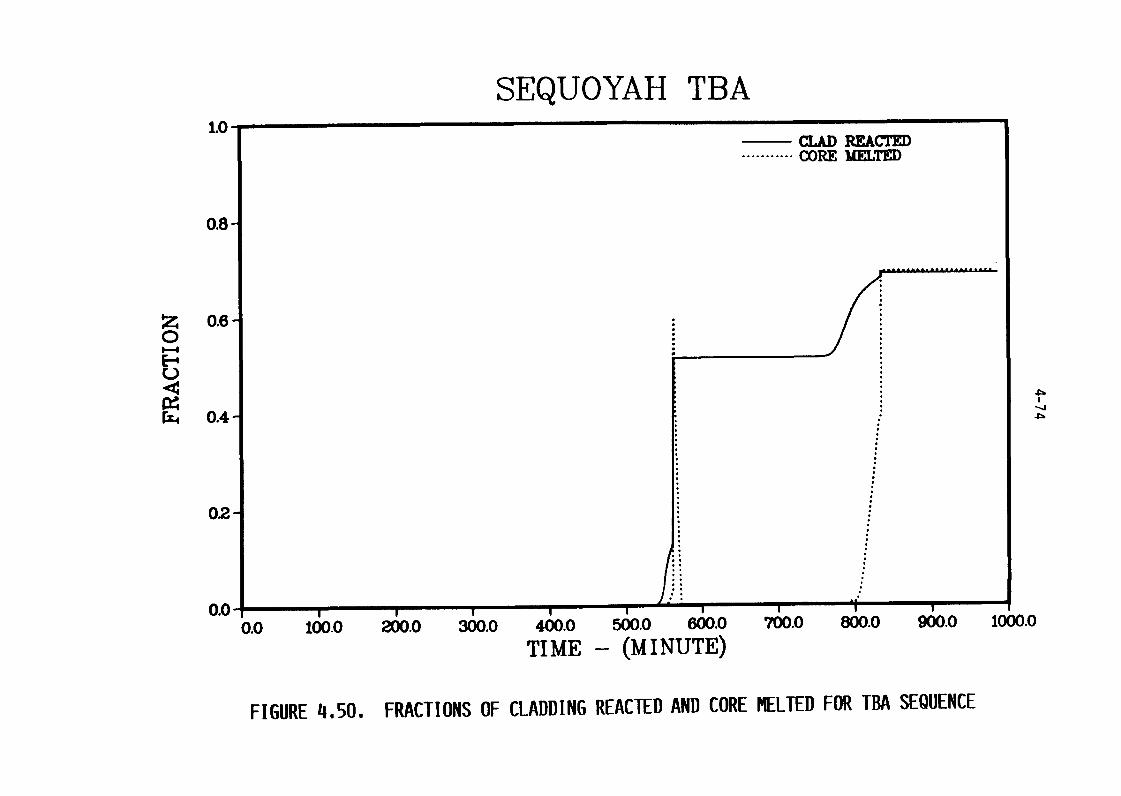
SEQUOYAH TBA1.0
CLAD REACTED........... CORE MTED
0.8-
Z 0.6-0E--4
T,
0.4-
02-
0.0 4:0.0 100.0 200.0 300.0 400.0 500.0 6W.0 700.0 800.0 900.0 1000.0
TI ME (M I NUTE)
FIGURE 450. FRACTIONS OF CLADDING REACTED AND CORE MELTED FOR TBA SEQUENCE
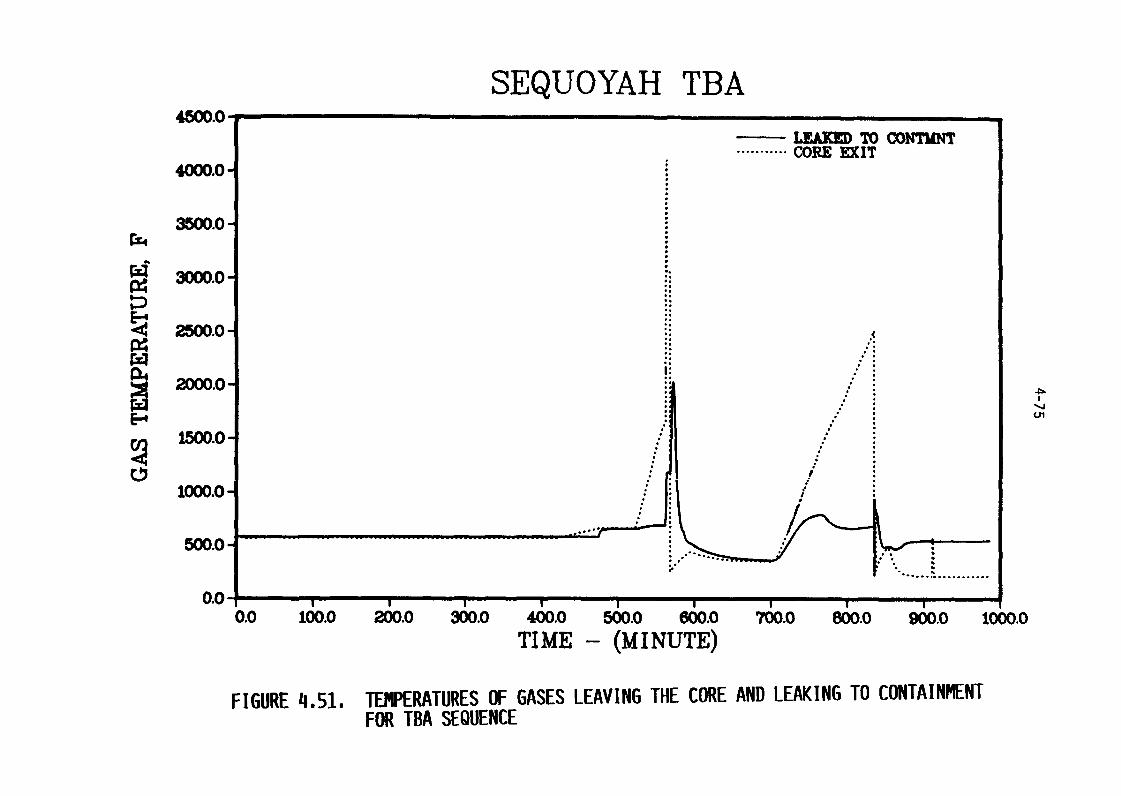
SEQUOYAH TBA4=.O
UFAM TO COMM........... CORE EXIT
4000.0
3500.0
3000.0
2WO-0
04 2000.0
E-415M.0
1000.0
500.0-
..................
0.0-10.0 100D 200.0 360.0 460.0 5(6 6W.0 7�0-0 860.0 S&O 1000.0
TI ME (M I NUTE)
FIGURE 451. TEMPERATURES OF GASES LEAVING THE CORE AND LEAKING TO CONTAINMENTFOR TBA SEQUENCE
4-76
Figures 452 and 453 illustrate the predicted containment pressure
and temperature histories for this sequence. Containment failure due to
hydrogen combustion was predicted to take place imediately after the
occurrence of the primary system break.
The mass of ice in the ice condenser is illustrated in Figure 454.
It is interesting to note that the ice is substantially melted by the time
that the core is predicted to undergo remelting, and is completely gone prior
to the predicted time of reactor vessel failure.
The containment sump and reactor cavity water inventories are
illustrated in Figure 455. The key point here is that the cavity is
essentially dry throughout this sequence, particularly during the corium-
concrete interaction. The predicted progression of concrete attack is
illustrated in Figure 456.
The total volume of gases leaked from the containment during this
sequence is illustrated in Figure 457. The MARCH 3 calculated distribution
of the noble gases during this sequence is given in Figure 458. The
containment leak rates used as input to the fission product transport analyses
in the containment are given in Table 44.
4.5 Additional Sequences Considered
In addition to the foregoing scenarios for which the analyses were
carried out through the release of fission products to the environment, a
number of other sequences were considered to a more limited extent.
Specifically, several sequences and variations of them were treated by MARCH 3
to determine their thermal hydraulic response. Since the thermal hydraulic
analyses indicated limited challenges to containment integrity, or limited
potential for fission product releases, these sequences were not extended
through the fission product transport analyses. The thermal hydraulic results
for the sequences considered are summarized below.
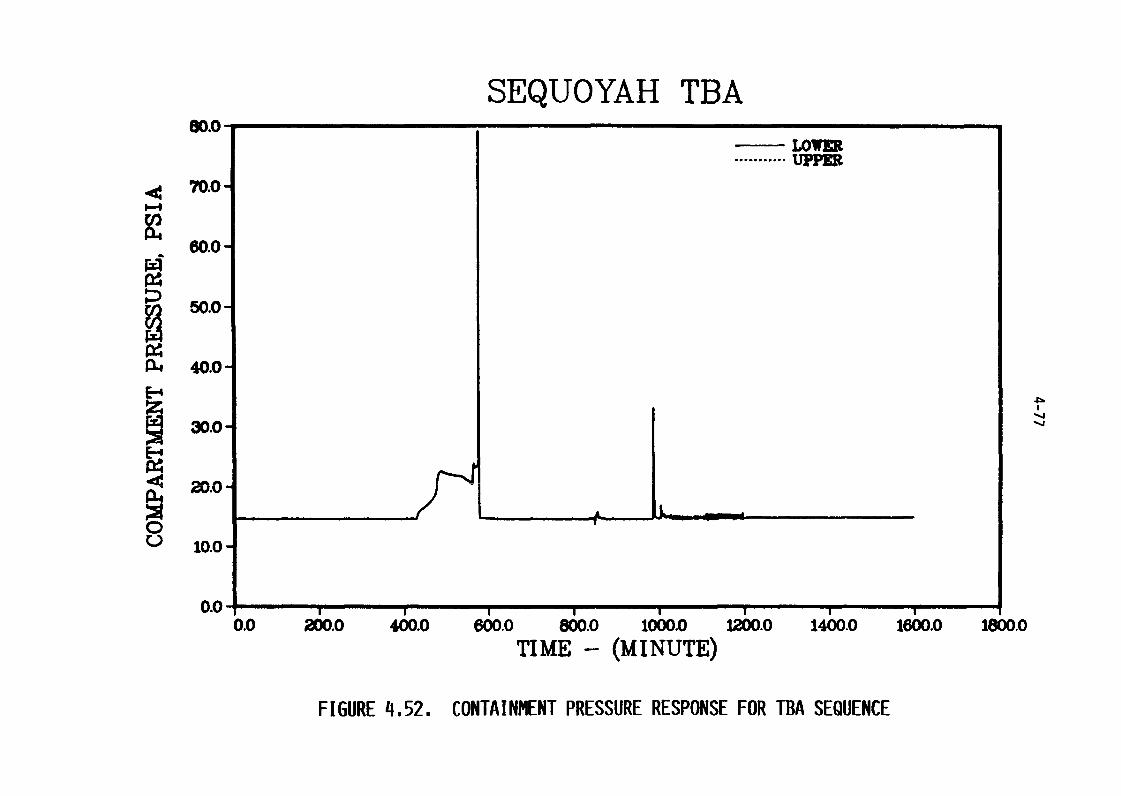
SEQUOYAH TBA80.0
Lom........... upm
".0
W-0
50.0
40.0
30.0
MD
o10.(
0.00.0 0�O-o 460.0 &6 E&O IC&O 126-0 14�0-0 16;0.0 1860
TI ME - M I NUTE)
FIGURE 452. CONTAINMENT PRESSURE RESPONSE FOR TBA SEQUENCE
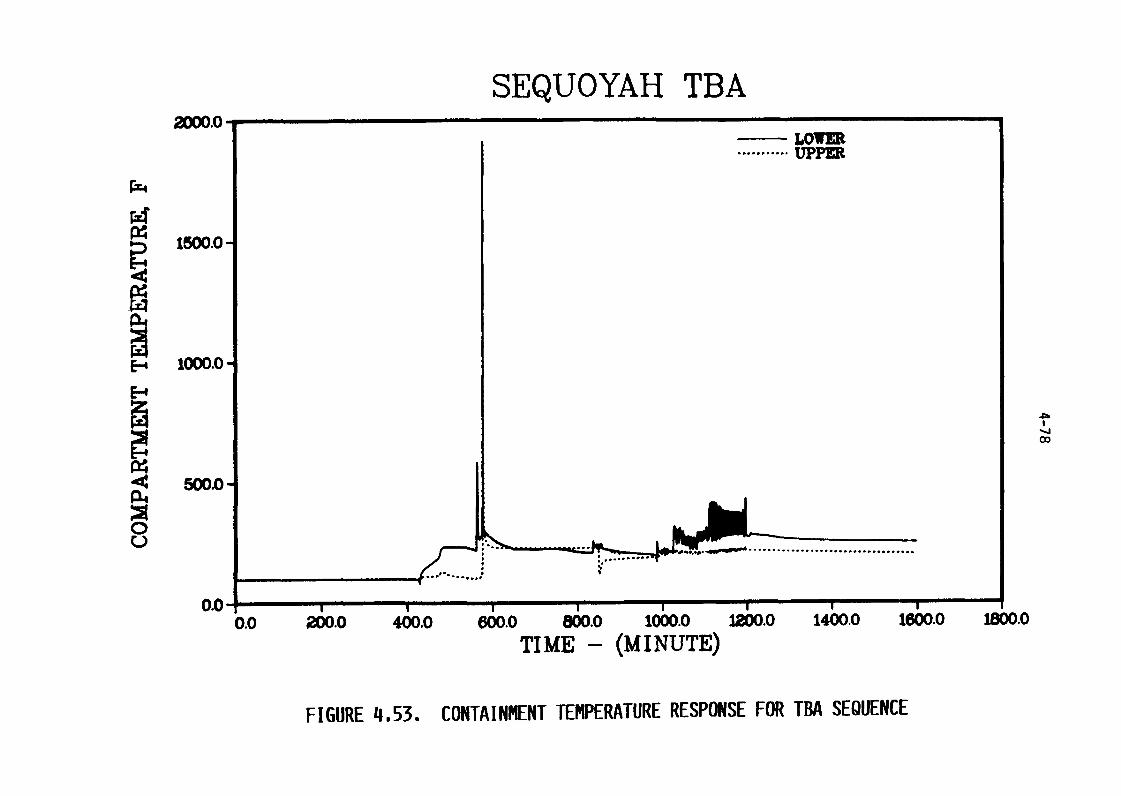
SEQUOYAH TBAmm.0
LOWER,........... UPPER
r=4
P$
1500.0
1000.0
Al-
co
500.0
0
...................................
0.0
0.0 200.0 4W.0 6(6 a6o.o 1060 U&O 1460 I�V-0 la;0.0TIME - (MINUTE)
FIGURE 453. CONTAINMENT TEMPERATURE RESPONSE FOR TBA SEQUENCE
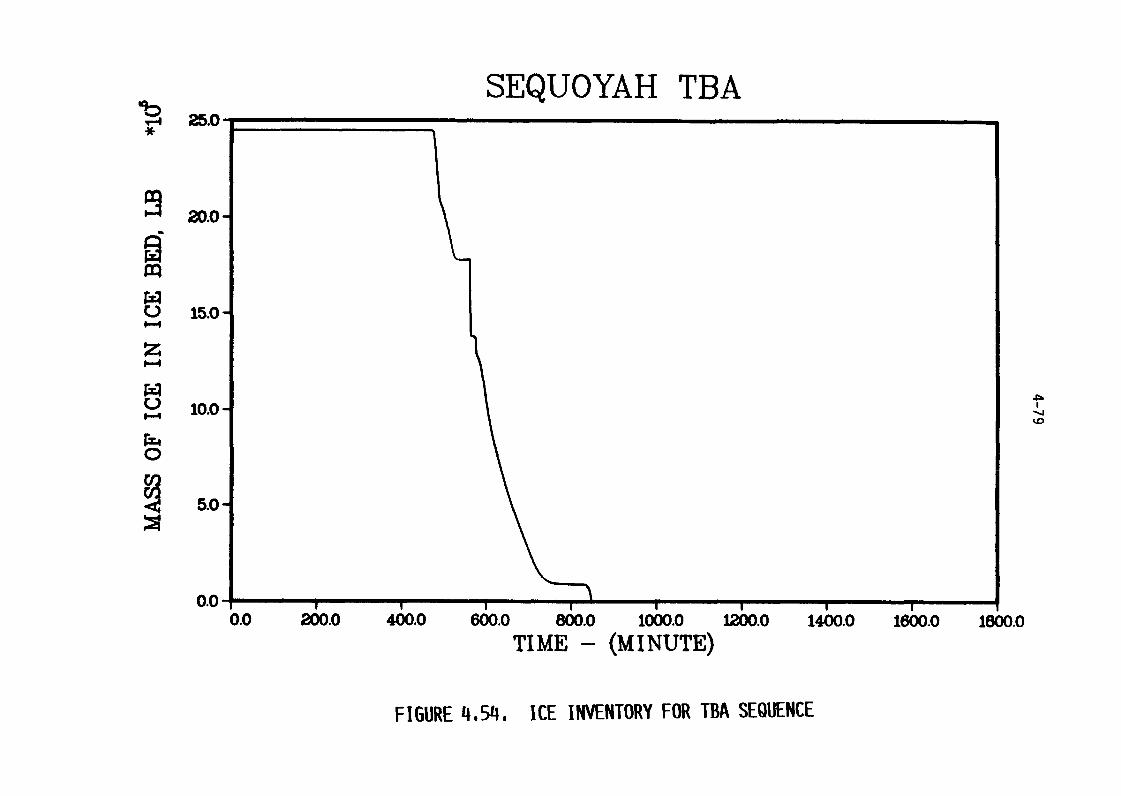
SEQUOYAH TBA25.0
20.0
0 15.00-4
z
L) 10.00--4
rZ4
0
5.0
0.06.0 260.0 460.0 660.0 800.0 1000.0 12;0.0 1460 1660 1860
TI ME - M I NUTE)
FIGURE 454. ICE INVENTORY FOR TBA SEQUENCE
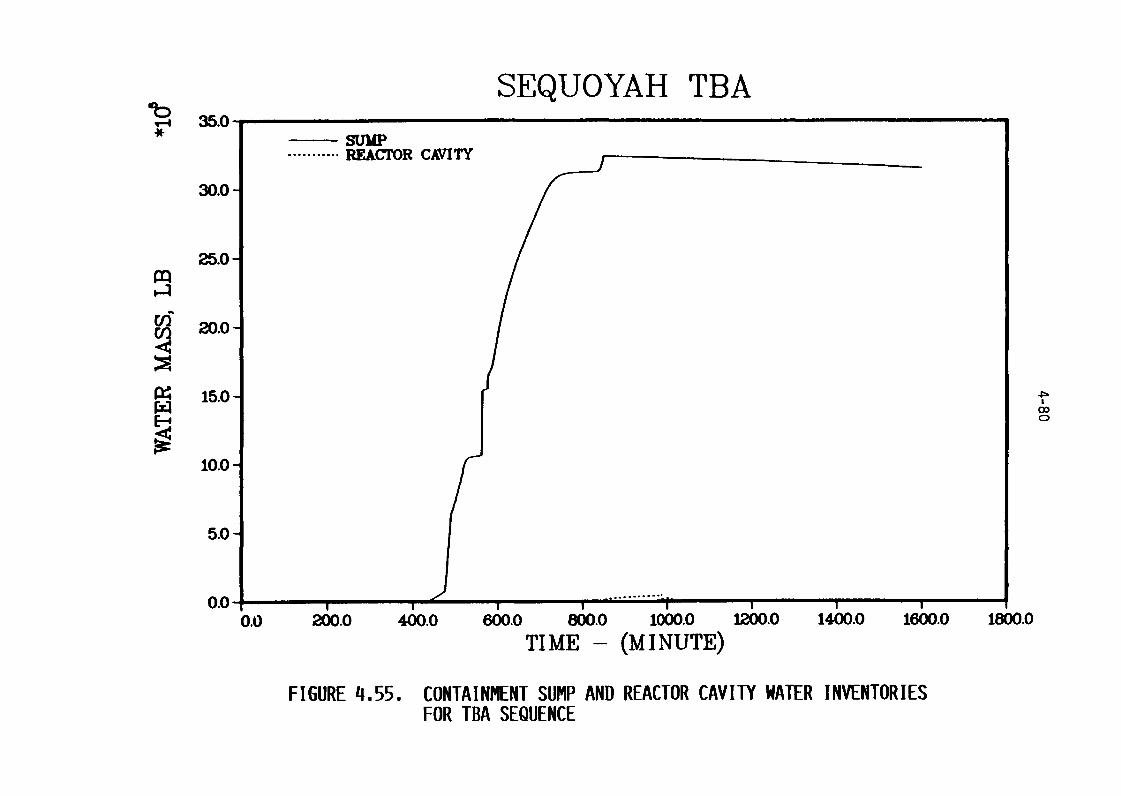
SEQUOYAH TBAlbv-4 35.0
SUMP........... REACTOR CAVITY
30.0
25.0
�4
20.0-
15.0-E-4
10.0
5.0
0.00.1) 200.0 4W.0 600.0 800.0 1000.0 t-,;O.O 140.0 1�)O.O 18;0.0
TI ME - M I NUTE)
FIGURE 455. CONTAINMENT SUMP AND REACTOR CAVITY WATER INVENTORIESFOR TBA SEQUENCE
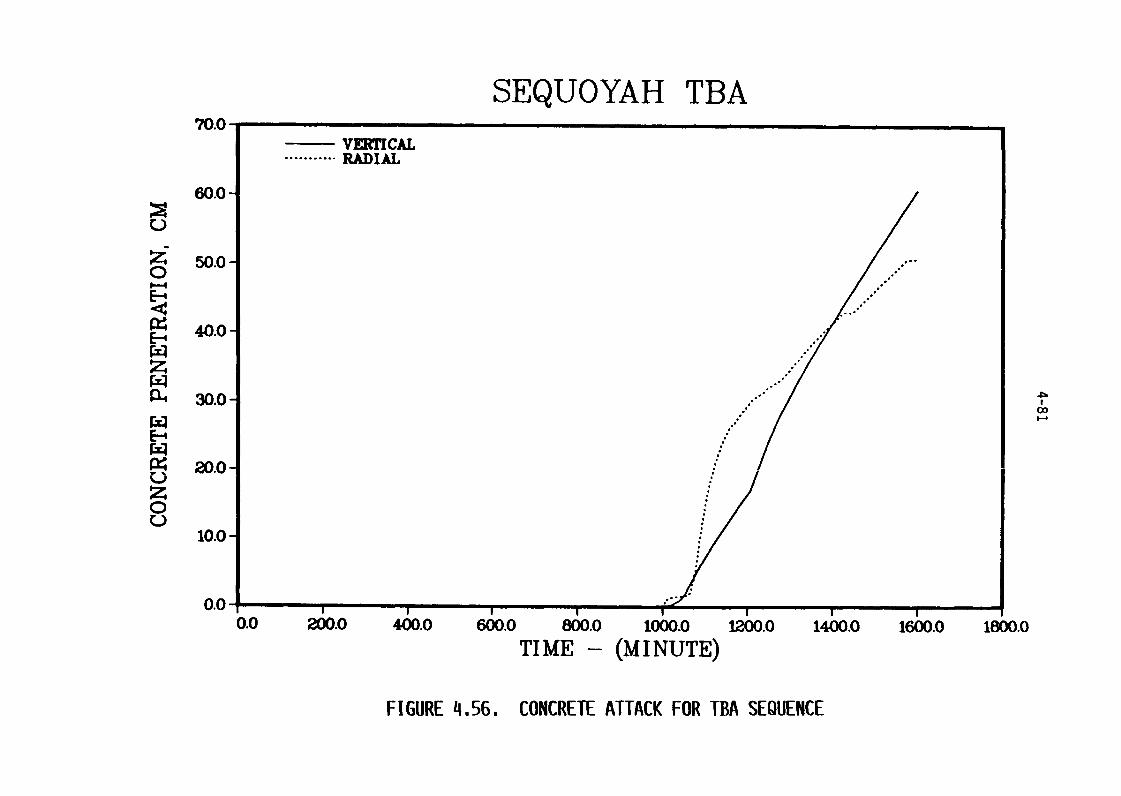
SEQUOYAH TBA70.0
VERTICAL........... RADIAL
60.0
Z 50.00
E--4
z
30.000
WE--4
20.0%-Jz0
10.0
0-00.0 260.0 4&0 60.0 E&O 1060 12�0-0 14�0-0 1660 18;0.0
TI ME - (MINUTE)
FIGURE 456. CONCRETE ATTACK FOR TBA SEQUENCE
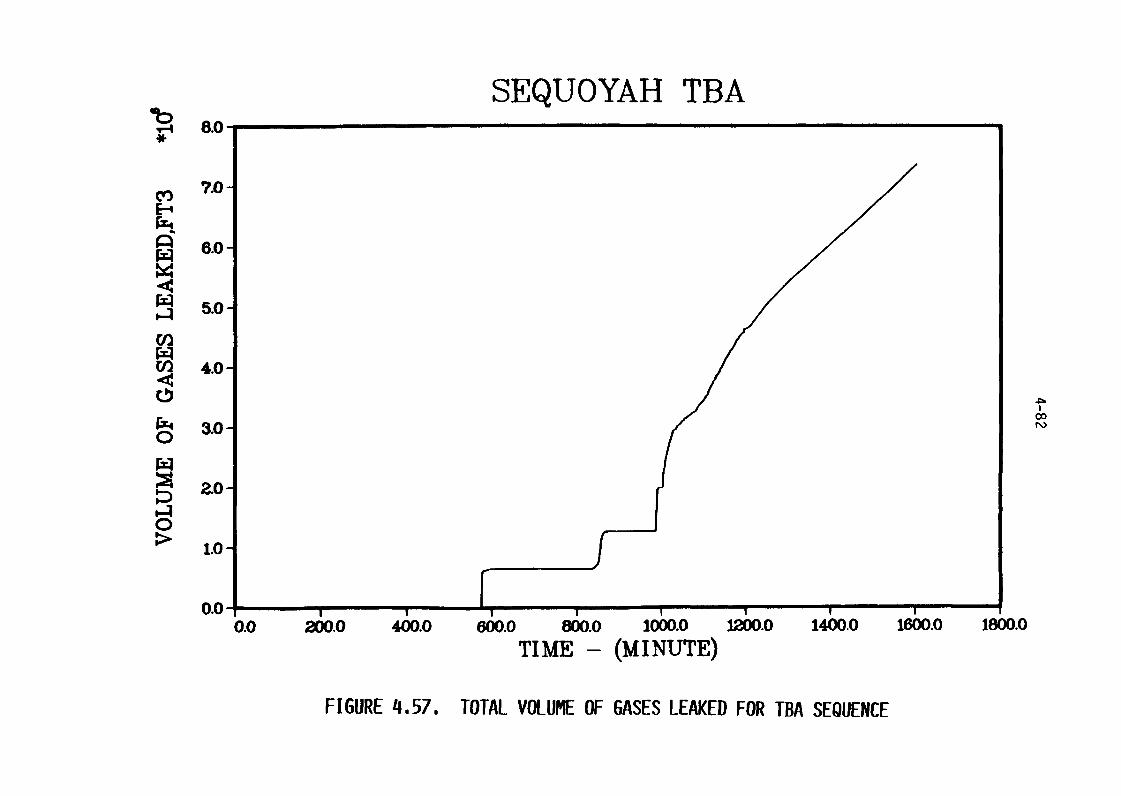
SEQUOYAH TBAlb
8.0
CO 7.0E-4fm4
6.0-
5.0
cl)
4.0
3.00
w
zo
0> 1.0
0.00.0 200.0 400.0 600.0 aw.0 1000.0 1200.0 1400.0 16W.0 18M.0
TIME - (MINUTE)
FIGURE 457. TOTAL VOLUME OF GASES LEAKED FOR TBA SEQUENCE
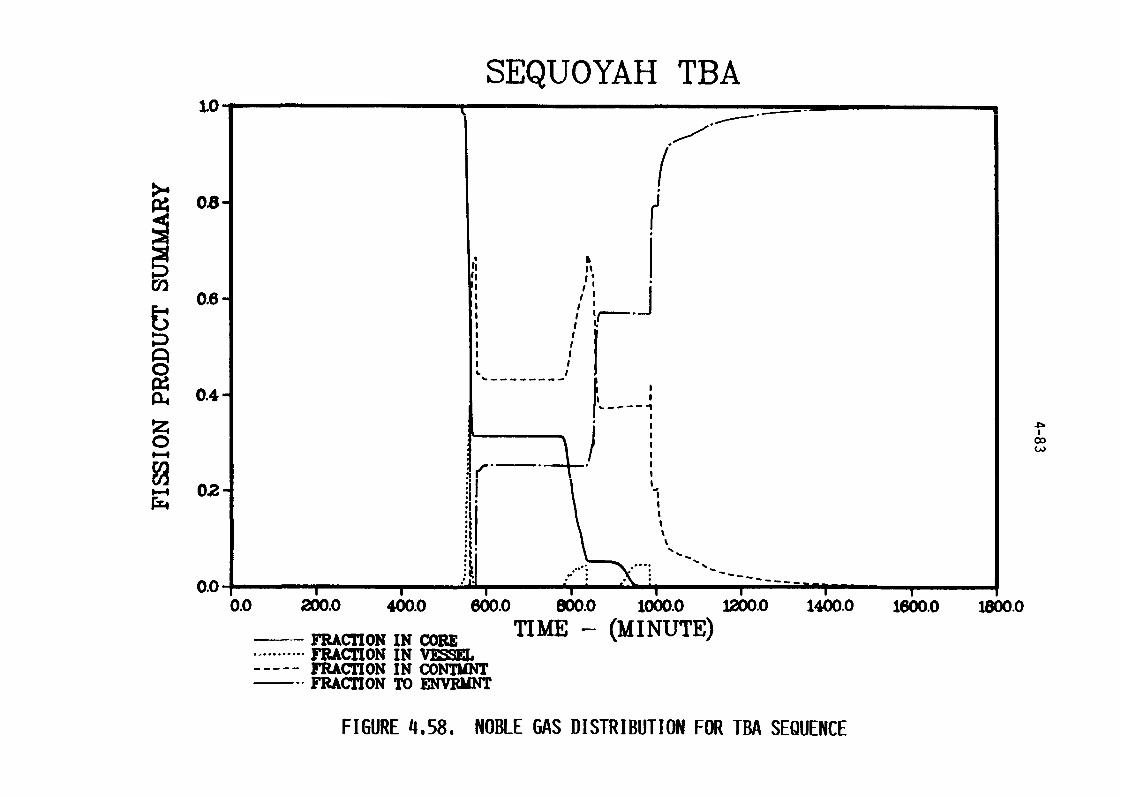
SEQUOYAH TBA1.0
>408-
0.6 -
----------W
04 0.4
z0
viP-4 02
0.0
0.0 260.0 460.0 6ko aw.0 1000.0 12W.0 1400.0 16W.0 um-0
�� MM= IN CORE TI ME - (MINUTE).1 ......... FRAMON IN VESSEL----- FRAcTioN IN NTmNT
FRAC17ON TO ENVRUNT
FIGURE 458. NOBLE GAS DISTRIBUTION FOR TBA SEQUENCE
4-84
The selection of specific accident sequences for source term
analyses was predicated in part on the assumption that at least some of these
sequences would involve core melting with the ice substantially melted. This
was part of the basis for selecting the S3HF and S3H sequences. It was also
anticipated that in these sequences there would be significant likelihood of
containment failure at the time of reactor vessel breach. ASEP analyses,
which became available after the initial sequence selections had been made,
however, indicated that by far the most probable time for the combined failure
of the emergency core cooling and containment spray recirculation systems (HF)
was upon initial switchover from injection. MARCH analyses for the
initiator and such early failure of the recirculation systems show that there
would be large quantities of ice still remaining during the period of core
melting. In the case of the S3H sequence the most probable cause of emergency
core cooling recirculation system failure was found to be lack of room
cooling, with failure at about two hours after switchover to recirculation.
In this case also, it was found that significant quantities of ice would be
present during core melting. In the S3HF sequence hydrogen burning at the
time of reactor vessel failure was found to lead to significant containment
pressurization. In the SH sequence, on the other hand, it was found that
hydrogen burning at the time of reactor vessel breach did not represent a
significant challenge to containment integrity. With the availability of the
igniters and with the containment sprays and air return fans operating at
their full capacities in the S3H sequence, sufficient hydrogen was predicted
to be burned off prior to vessel failure to limit the containment pressures at
head failure well below the nominal failure pressure as specified by SARRP.
In view of the foregoing findings, a number of analytical variations
on the S3H sequence were explored in order to examine the sensitivity to the
above conclusion to variations in modeling assumptions. These analyses and
the principal findings are discussed below.
4.5.1 S3H Sequence
The initiating event for the S3H sequence was assumed to be a pump
seal failure with a characteristic size equivalent to 075 inches in diameter.
The auxiliary feedwater, emergency core cooling, containment spray, and air
4-85
return systems were assumed to operate at their full capacities. The
emergency core cooling system was assumed to fail two hours after switchover
to recirculation due to lack of pump room cooling. The hydrogen igniters were
operable and were assumed to ignite hydrogen-air mixtures when the hydrogen
concentration reached eight volume percent, subject to the availability of
oxygen and consideration of inerting by diluents.
The general timing of events for the SM sequence is summarized in
Table 41. It may be observed that the timing of the switchover to
recirculation, and hence the subsequent timing of emergency core cooling
system failure, were governed by the depletion of the refueling water storage
tank by the containment sprays. With the assumed operation of the sprays at
their full capacity, i.e., two trains, the time to the switchover is rather
short. In the present analyses it was assumed that the containment sprays and
the air return fans were started when the containment pressure reached 2 psig
(16.7 psia). The predicted times of vessel failure varied in the individual
cases in accordance with the failure modes assumed. The containment responses
varied considerably from case to case and the ey observations for each will
be summarized later.
Primary System Response. With the relatively small break in the
primary system combined with the operation of -the auxiliary feedwater and
emergency core cooling systems, the primay system was found to depressurize
very slowly. Depressurization of the secondary side of the steam generators
was not assumed in the present analyses. With both the auxiliary feedwater
and emergency core cooling systems operating it was found that all the decay
heat could be removed from the primary system ith no net steam generation.
This time period was characterized by liquid fows out of the failed pump seal
of about 320 gallons per minute. Just prior to the time of the assumed
emergency core cooling system failure about 40 percent of the decay heat was
being removed by the steam generators. After emergency core cooling system
failure, the primary coolant temperature increased and the steam generators
became even more effective; just prior to core uncovery about 81 percent of
the decay heat was being removed by the steam generators. With only a
fraction of the decay heat being released to te containment, and the
4-86
entire sump inventory being available to absorb the released energy,
relatively slow ice depletion was predicted. At the time of the reactor
vessel failure about 50 percent of the initial ice inventory was still
remaining.
Containment Response. The predicted responses of the containment
pressure are summarized below for a number of variations in sequence
assumptions.
1. In the first case considered the failure of the vessel bottom
head was based on the development of a localized failure after
heatup of the head to a depth of 2 inches. The steam and
hydrogen released from the primary system were assumed to pass
through the water in the reactor cavity. A single hydrogen
burn with a peak containment pressure of 23 psia was predicted
prior to the time of reactor vessel failure for this case. A
burn at the time of vessel failure produced a peak pressure of
about 25 psia, and shortly thereafter another burn with a peak
containment pressure of 32 psia was predicted. These burns
consumed 279, 394, and 729 lb of hydrogen, respectively.. The
largest of the three events was confined to the lower
compartment. In the longer term, a number of additional
smaller burns were predicted to take place.
2. The second case considered was identical to the first except
that the primary system blowdown following vessel failure was
not assumed to go through the reactor cavity water. The
initial burn prior to vessel failure was identical to that of
the previous case. The burn at the time of vessel failure
involved 465 lb of hydrogen to yield a peak pressure of
27 psia. The subsequent burn shortly therafter consumed 745 lb
of hydrogen and produced a containment pressure of 34 psia.
3. The third case assumed a small hole in the reactor vessel
bottom head immediately after collapse of the core and no
cooling of the primary system effluent by the reactor cavity
water. The initial burn prior to reactor vessel failure was
again identical to those in the preceding cases. With the
4-87
earlier vessel breach a peak pressure of 43 psia from the
combustion of 832 lb of hydrogen was predicted. A number of
smaller combustion events were predicted later in time.
4. In the fourth case evaluated an induced primary system breach
was assumed at the time of core slumping, with head failure
coincident with core collapse following shortly thereafter. In
this case two closely spaced burns involving 285 and 138 lb of
hydrogen and producing pressures of 23 and 24 psia,
respectively, were predicted prior to vessel breach.
Immediately following vessel breach a burn of 735 lb of
hydrogen resulted in a pressure of 39 psia.
5. The foregoing cases were based on nominal spray height
characteristics. Since the water droplets suspended in the
atmosphere are included in the combustion energy balance and
appeared to be influencing the results of the calculations, the
factors affecting spray drop residence time in the atmosphere
were refined in the next case. This had the effect of reducing
the amount of water in the atmosphere at any point in time.
With the revised spray input and again assuming vessel failure
upon core collapse, an initial burn of 226 lb of hydrogen with
a pressure of 23 psia was predicted. At the time of vessel
failure the combustion of 859 lb of hydrogen with a peak
pressure of 53 psia was predicted. The latter burn was
confined to the upper compartment of the containment. A number
of smaller burns were predicted subsequently.
6. The next case was similar to the foregoing, except for turning
off the radiation heat transfer odel in the containment. For
this case the initial burn involved 278 lb of hydrogen and
produced a containment pressure f 24 psia. The burn following
reactor vessel breach consumed 807 lb of hydrogen and produced
a pressure of 53 psia. The latter burn was confined to the
upper compartment.
7. Since the suspended water droplets in the atmosphere appeared
to have a significant influence 'on the predicted results,
another case was selected in which the fallout of the blowdown
4-88
water was enhanced by increasing a user specified drop
diameter. This change should primarily affect the predicted
events in the lower compartment, since the sprays would
dominate the behavior in the upper compartment. With this
change the initial burn prior to vessel failure was predicted
to consume 385 lb of hydrogen and yield a pressure of 26 psia.
The burn after vessel failure consumed 707 lb of hydrogen and
produced a pressure of 49 psia.
8. In this case it was assumed that the collapse of the core into
the bottom head induced a break in the primary system which
allowed the release of steam and hydrogen to the containment,
but the core debris were released later, upon head failure.
With the depressurization of the primary system through the
induced break the failure of the vessel head was considerably
delayed. For this case four burns were predicted prior to the
delayed vessel failure. They involved 278, 117, 541, and 444
lb of hydrogen and produced containment pressures of 24, 23,
34, and 26 psia, respectively.
9. The next case utilized the revised spray height parameters, but
assumed an ignition threshold of 6 volume percent hydrogen
rather than the volume percent in the other cases. With the
lower ignition threshold two burns were predicted prior to
vessel breach. They involved the combustion of 62 and 179 lb
of hydrogen and produced containment pressures of 19 and 21
psia. The burn at the time of vessel breach consumed 747 lb of
hydrogen and produced a pressure of 37 psia. The latter was
initiated in the lower compartment and propagated into the
upper compartment, but apparently due to the relatively long
duration did not produce high pressures. The lower compartment
burn had a duration of about 4 seconds, while the upper
compartment burn lasted about 11 seconds.
All of the above cases produced pressures below the 65 6 psia
failure pressure adopted by SARRP. Thus early containment failure was not
indicated to be of significant probability for any of the cases considered
4-89
here. Further, with the timing of emergency core cooling system failure
defined by ASEP, there were substantial quantities of ice predicted to be
available at the time of reactor vessel breach to absorb combustion energy as
we'll as to retain airborne radioactivity. Thu,, even if the containment were
to fail, the consequences of this sequence would not be severe.
The containment pressurization for thE' S3H sequence as indicated
here is considerably less severe than would have been inferred from earlier
analyses. The smaller break size considered leads to a more protracted core
meltdown scenario with more opportunity to burn off the hydrogen early. The
relative effectiveness of the steam generators, also due to the small break
size, leads to low rates of ice depletion. The use of full spray capacity
rather than minimum as in earlier analyses increases the suspended water that
is available to absorb combustion energy. It may be noted that the models
used to describe spray behavior during hydrogen combustion have been revised
from those in earlier versions of MARCH. The use of maximum air return fan
flow rather than minimum levels leads to more mixing of the hydrogen within
the containment and reduces the likelihood of building up the high
concentrations required to produce high pressures. All of these factors
contribute to the somewhat different results of the present analyses in
comparison with earlier work.
4.5.2 S2HF Sequence
Since the S3H sequence did not appear to involve significant
likelihood of early containment failure, some attention was given to the
examination of another of the more probable core melt scenarios, namely S2HF.
The S2HF scenario is initiated by a small break in the primary
system; for purposes of the analysis the break was taken to be 2 inches in
diameter. The combined failure of the emergency, core cooling and containment
spy-ay recirculation systems (HF) was again specified to take place immediately
upon switchover from the injection mode. The air return fans and the hydrogen
igniters were operable.
The analyses of the S2HF scenario in BMI-2104 were based on the
plugged drains as being the cause for recirculation system failure. In that
event failure of the recirculation systems follows ice depletion. For the
4 90
present analyses the principal interest was in situations that also could lead
to core melting with little or no ice available to mitigate the consequences.
The first S2HF scenario considered was based on the break being located high
in the system so that only steam could leak out. A steam versus liquid or
two-phase leak tends to prolong the blowdown process and leads to enhanced ice
depletion. The timing of the accident events for this case is summarized in
Table 41. The time of the switchover to recirculation, and hence the timing
of core cooling failure, was determined by the depletion of the refueling
water storage tank by the containment sprays. With the relatively slow steam
blowdown, considerable time was required for core uncovery. The upper head
injection tanks were predicted to empty shortly after core uncovery. The
accumulators were emptied shortly after the start of core melting. At the
start of core melt only about percent of the initial ice inventory remained.
The ice was completely melted prior to vessel failure. Four hydrogen
combustion events, producing containment pressures of 21, 30, 23, and 33 psia
were predicted to take place prior to vessel failure. Since the primary
system was essentially depressurized by the time of vessel failure, there was
no serious challenge to the containment at the time of vessel breach. Thus,
while this steam break scenario did lead to major depletion of the ice prior
to core melt, it did not present any serious early challenges to containment
integrity.
Additional analyses were performed for the S2HF sequence with the
break elevation at the primary piping level, but assuming only 80 percent of
the initial ice inventory. The latter assumption is equivalent to saying that
the ice may not be fully effective at all times, e.g., nonuniform melting in
the ice beds may permit flow breakthrough before all the ice has melted. The
timing of the accident events is summarized in Table 41. As in the other
cases considered, the timing of the switch to recirculation and hence the
timing of the core cooling failure, is controlled by depletion of the
refueling water storage tank by the spray system. With the initial liquid
break the core is seen to uncover much earlier than in the preceding case. At
the start of core melting about 27 percent of the nominal, or 34 percent of
the reduced inventory of the ice was still remaining. Complete ice melting
was predicted about an hour after the start of concrete attack. Four hydrogen
burns were predicted prior to the time of vessel failure, with peak
4 91
containment pressures ranging from 21 to 31 psia. There was no burning
predicted immediately after vessel failure, but three large burns were
predicted some time later. These produced containment pressures of 45, 40,
and 52 psia. The last two burns involved combustion of carbon monoxide as
well as hydrogen. At the time of these three burn events there was still some
ice remaining. Containment failure by long-term overpressurization was
predicted about seven hours after vessel breach.
Thus, for the most probable variations of the S2HF sequence as
defined by ASEP and the SARRP specified failure ressure of 65 psia, early
containment failure does not appear likely based on the present analyses.
4.6 Radionuclide Sources
4.6.1 Sources Within Pressure Vessel
The inventory of fission products used in these analyses is the same
as in Volume IV of BMI-2104. Table 45 provides the inventories for each of
the key fission product, actinide and structural elements. The values for the
radionuclides are based on an ORIGEN analysis for end-of-cycle conditions in a
three-region model with burnups of 11,000/22,000,133,000 MW days/tonne. The
structural masses are based on values provided i the FSAR. In Table 46 the
elements are collected into the elemental groups used in this study.
4.6.2 Sources Within the Containment
The VANESA code was used to predict the release of fission products
and inert materials to the containment during core-concrete attack. The
composition of the core materials entering the cvity is provided in
Table 47. The total release rates and compositions of released materials are
given in Tables 48 through 411 for the different scenarios.
4-92
TABLE 45. INVENTORIES OF RADIONUCLIDES AND STRUCTURAL MATERIALS
Fission Products Actinides/StructuralElement Mass (Fg) Element Mass (kg)
Kr 17.0 u 89,000
Rb 18.7 Pu 596
Sr 60.9 Cr 0
y 29.1 Mn 0
Zr 227 Fe 8,690
Nb 3.5 Ni 0
MO 197 Zr 23,100
Tc 47.2 Sn 332
Ru 132 Gd 0
Rh 26.6 Ag 2,290
Pd 66.8 Cd 144
Te 31.7 In 421
I 15.2
Xe 330
Cs 166
Ba 77.7
La 79.2
ce 167
Pr 64.5
Nd 217
Sm 43.2
Eu 11.3
Np 33.0
PM 9.2
4-93
TABLE 46. INVENTORY BY GROUP
Total MassGroup Elements (kg)
I Xe, Kr 347
2 I, Br 15.2
3 Cs, Rb 185
4 Te, Sb, Se 31.7
5 Sr 60.9
6 Ru, Rh, Pd, Mo, Tc 470
7 La, Zr, Nd, Eu, Nb, Pm, Sm, Y 684
8 Ce, Pu, Np 796
9 Ba 77.7
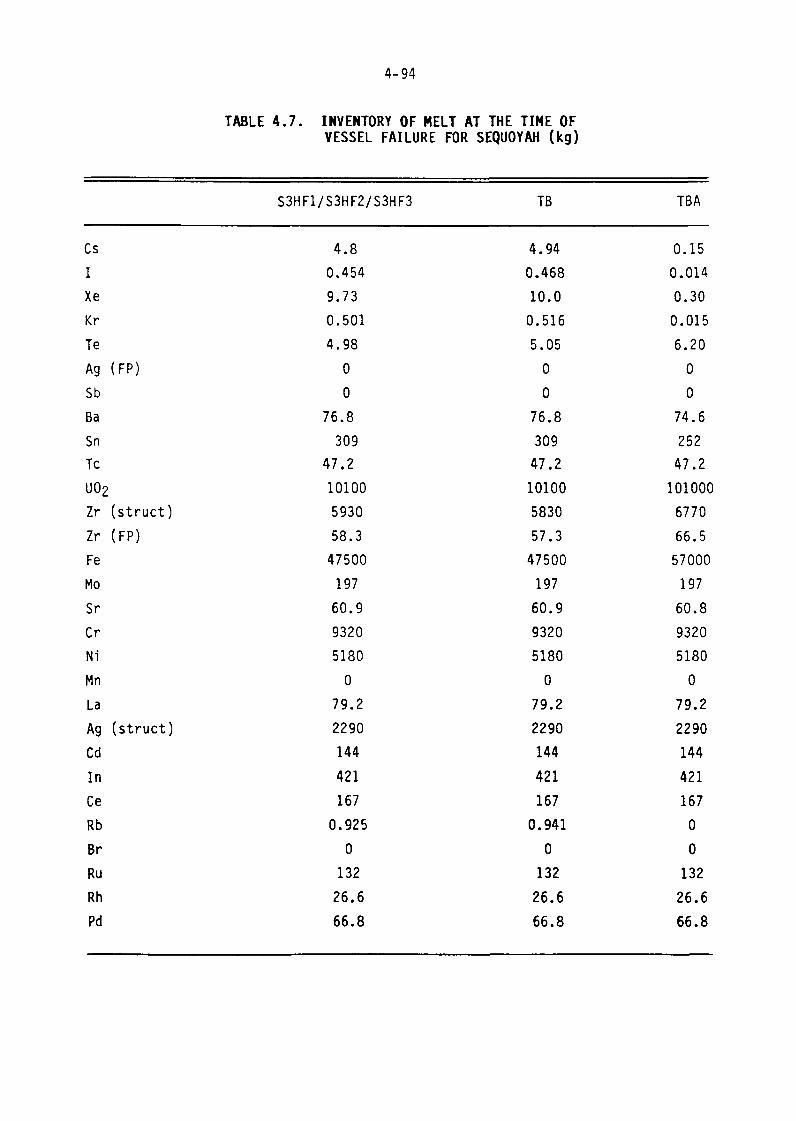
4 94
TABLE 47. INVENTORY OF MELT AT THE TIME OFVESSEL FAILURE FOR SEQUOYAH (kg)
S3HF1/S3HF2/S3HF3 TB TBA
Cs 4.8 4.94 0.15
I 0.454 0.468 0.014
Xe 9.73 10.0 0.30
Kr 0.501 0.516 0.015
Te 4.98 5.05 6.20
Ag (FP) 0 0 0
Sb 0 0 0
Ba 76.8 76.8 74.6
Sn 309 309 252
Tc 47.2 47.2 47.2
U02 10100 10100 101000
Zr (struct) 5930 5830 6770
Zr (FP) 58.3 57.3 66.5
Fe 47500 47500 57000
MO 197 197 197
Sr 60.9 60.9 60.8
Cr 9320 9320 9320
Ni 5180 5180 5180
Mn 0 0 0
La 79.2 79.2 79.2
Ag (struct) 2290 2290 2290
Cd 144 144 144
In 421 421 421
Ce 167 167 167
Rb 0.925 0.941 0
Br 0 0 0
Ru 132 132 132
Rh 26.6 26.6 26.6
Pd 66.8 66.8 66.8
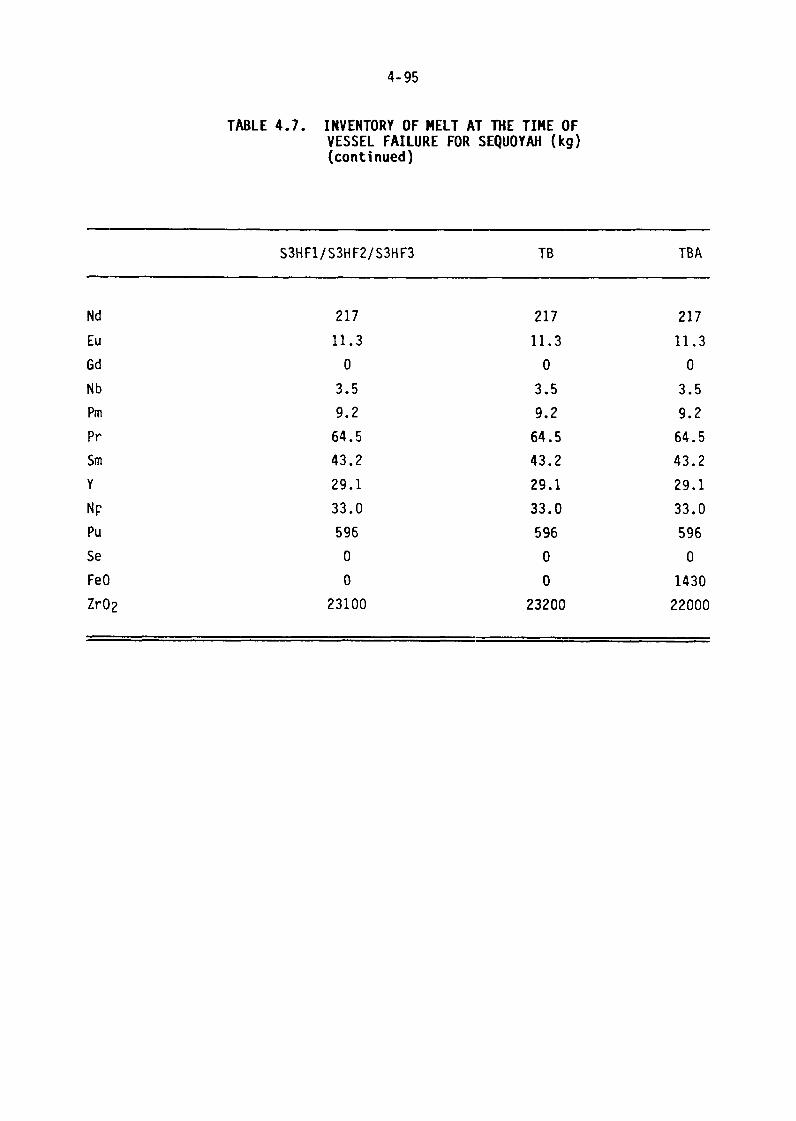
4 95
TABLE 47. INVENTORY OF MELT T THE TIME OFVESSEL FAILURE FOR SEQUOYAH (kg)(continued)
S3HF1/S3HF2/S3HF3 TB TBA
Nd 217 217 217
Eu 11.3 11.3 11.3
Gd 0 0 0
Nb 3.5 3.5 3.5
PM 9.2 9.2 9.2
Pr 64.5 64.5 64.5
Sm 43.2 43.2 43.2
y 29.1 29.1 29.1
Np 33.0 33.0 33.0
PU 596 596 596
Se 0 0 0
FeO 0 0 1430
ZrO2 23100 23200 22000
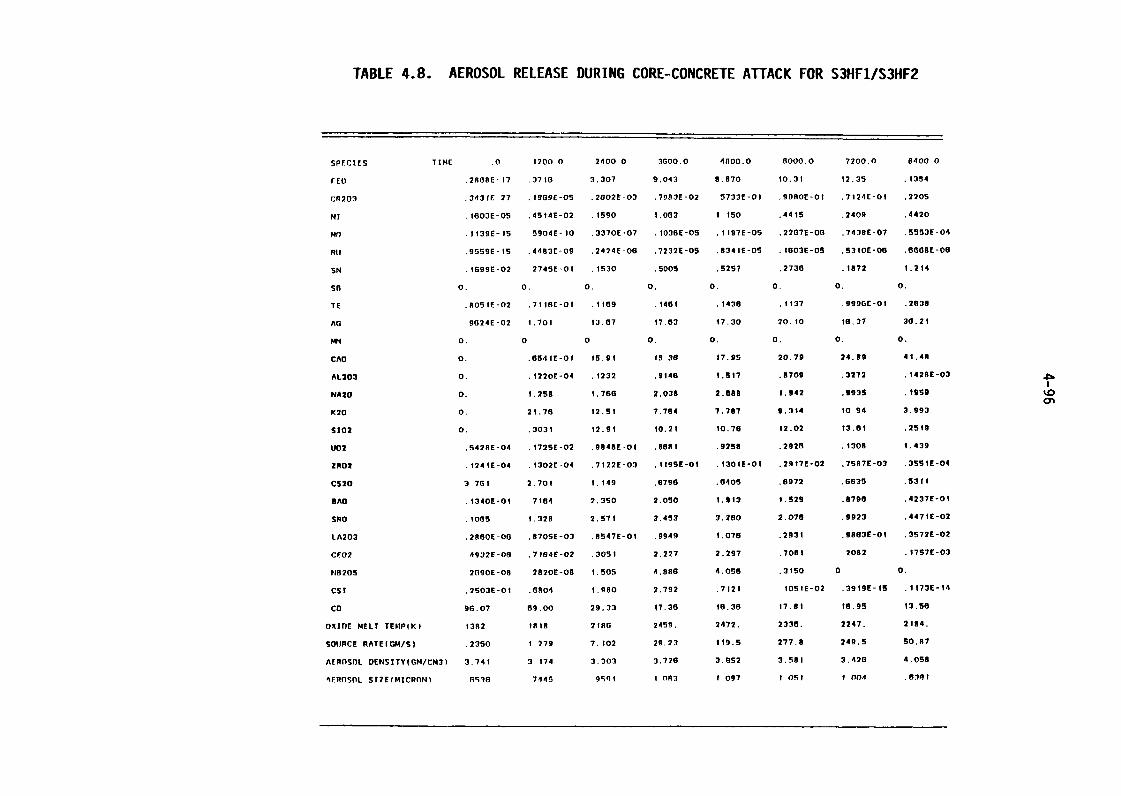
TABLE 48. AEROSOL RELEASE DURING CORE-CONCRETE ATTACK FOR S3HF1/S3HF2
SPECIES TIME 0 t200 0 2 400 3600.0 4000.0 6000.0 7200.0 8400
rEO .2RORE-t7 .37 16 3.307 9.043 B. 70 to. 1 12. 35 1394
CA203 .3431 2 fgogf-os .2802E-03 .798JE-02 5733E-01 '99ROE-01 .7 1241 -01 .2205
NI . 1603E-05 .4St4E-02 . 590 1.003 1 t5o 44 15 2409 .4420
Mn .1139E-15 5904E-10 .3370E-07 .103SE-05 .1197E-05 .2267E-06 .743BE-07 .5553E-04
Rif .9559E-15 .4483C-09 .2424E-06 .7232E-09 .8341E-05 .1003E-05 .53IOE-08 .66GRE-06
SN .1699E-02 27451-01 IS30 .5005 .5257 2736 .1872 1.214
SR 0. 0. 0. 0. 0. 0. 0. 0.
TE .80SIE-02 .711SE-01 .1169 .1461 .1436 tl37 .999CE-01 .2838
AG 96241-02 1.701 13.67 17.63 17.30 20.10 16.37 30.21
MN 0. 0 0 0. 0. 0. 0. 0.
CAO 0. .654tE-Of 15.91 f9 as 17.95 20.79 24.89 41.48
AL203 0. .12201-04 .1232 .9146 1.517 .8709 . 272 .142RE-02
NAZO 0. 1.258 1.766 2.036 2.888 1.942 .2935 t9S9
K20 0. 21.76 t2.51 7.784 7.787 9.314 10 94 3.993
S102 0. .3031 12.91 10.21 10.76 12.02 t3.61 .2519
U02 .5428E-04 .1725E-02 .984SE-01 .8681 .9258 .2928 .1308 1.439
ZR02 t241E-04 .1302E-04 .7122E-03 .119SE-01 .1301E-Ot .29t7E-02 .7587E-03 .39SIE-04
CS20 3 761 2.701 1.149 .6796 .040S .6972 .6635 .5311
SAO .1340E-01 7164 2.3SO 2.050 t.913 1.529 .8798 .4237E-01
SRO .1065 1.328 2.571 3.453 3.260 2.078 .9923 .4471E-02
LA203 28SOE-00 .870SE-03 .8547E-01 .9949 f.076 .2931 .9883E-01 .3572E-02
CEOZ 4932E-06 .7184E-02 .3051 2 227 2.297 .7081 .2082 .17S7E-03
H13205 2r90E-08 2820E-08 1.505 4.986 4.058 .3150 0 0.
CST �2503E-Ol .6804 1.990 2.792 .7121 IOSIE-02 .391SE-19 .1173E-14
co 96.07 69.00 29.33 17.36 16.36 t7.81 ts.95 13.SS
oxinc MELT TEMPIK) 13112 11118 2tRG 2459 2472. 2336. 2247. 2184.
SOURCE RATE(GM/S) .2350 1 279 7.102 29.23 119.5 277.8 249.S SOA7
AlpnsnL DENSITY(GM/CM3) 3 7 4 3 174 3.303 3.726 3.852 3.581 3.426 4.058
AFRnsnL SZEIMICRnN) rl�llfl 7145 99ni I 0113 1 097 f 051 1 004 .61"t
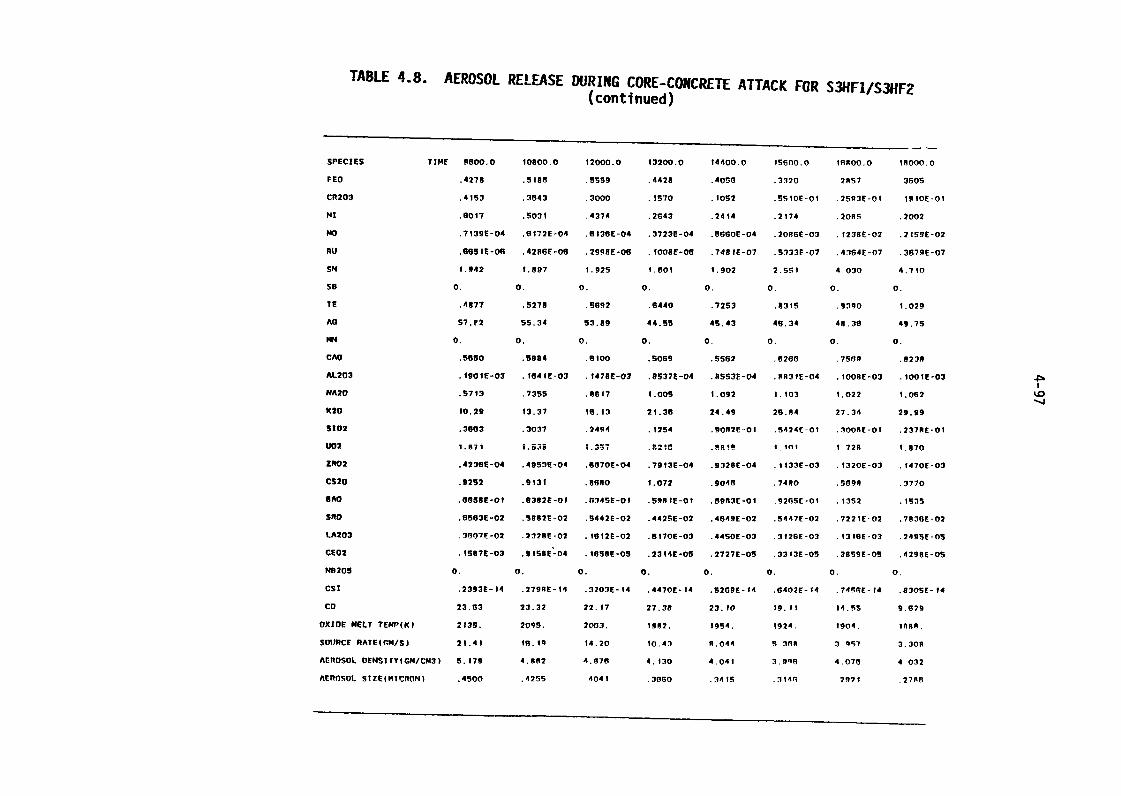
TABLE 48. AEROSOL RELEASE DURING CRE-CONCRETE ATTACK FOR S3HFlf'S3HF2(continued)
SPECIES TIME 9600. 0 10800.0 12000.0 13200.0 t4400.0 15600.0 ISROO.0 I OOO.
FEO .4278 Stag .5559 .4428 .4056 .3320 2RS7 360S
CR203 .41S3 .2643 .3000 .1570 .1052 .5510F-01 .2593E-01 ISIOE-01
NI .6017 .5031 .4374 .2043 .2414 .2174 .20RS .2002
Mc .7139E-04 .6172E-04 .613GE-04 .3723E-04 .6660E-04 .200SE-03 t239E-02 .2159E-02
RU .66stE-06 .4286E-09 .299RE-06 tooaf-os .7491c-ol SJ33F-07 .4164E-07 .3679E-07
SM 1.942 t.897 1.925 1.601 1.902 2,5ql 4 030 4.710
so 0. 0. 0. 0. 0. 0. 0. 0.
.4877 .9278 .5092 .6440 .7253 .8319 gjqo 1.029
AO S7.F2 S5.34 53.89 44.55 4S.43 46.34 48.30 49.75
mm 0. 0. 0. 0. 0. 0. 0. 0.
CAO .5650 .5884 .6100 .5069 S562 .6266 .7569 .823A
AL203 igotE-03 .1641E-03 .147SE-03 .8537E-04 .8553E-04 .8831E-04 .100SE-03 .1001-03
MA20 .5713 .7355 .0617 f.00S t.092 1.103 1.022 1.062
X20 10.29 13.37 16.13 21.38 24.49 26.94 27.34 29.99
S102 .3003 .3037 .2494 .1254 .90RU-01 .5424[-Ol .300RE-01 .237ME-01
W2 1.87i i.535 .92". .89!" 1.1m 1 729 1,870
ZRO2 .423SE-04 .4993E-04 .6670t-04 .7913E-04 .932BE-04 .1133E-03 t320E-03 .1470E-03
C320 .92S2 .9131 .8690 i.077 .9049 .74RO .5694 .3770
BAO .685se-ol .6382E-01 .6345E-01 .599IF-01 .9983E-01 .926SE-01 .13S2 .1535
SRO .6563E-02 S�82E-02 .5442E-02 .442SE-02 .4949E-02 .5447E-02 .7221E-02 .783GE-02
LA203 .3607F-02 �2328E-02 f612E-02 .6170E-03 .44SOE-03 .312SE-03 .131RE-03 .249SE-05
CE02 .1587E-03 .9156t'-04 .169DE-09 .2314E-05 .2727E-05 .3313E-05 .3959E-05 .429RE-05
N9209 0. 0. 0. 0. 0. 0. 0. 0,
CS1 .2393E-14 .279RE-14 .3203E-14 .4470E-t4 .5209E-14 .6402E-14 .74rgE-f4 .830SE-14
co 23.63 23.32 22.17 27.38 23.10 19.11 14.55 1�679
OXIOE MELT TEMP(kl 2135. 2095. 2003. 19R2. 19S4. 1924. t9O4. IMAR.
SOURCE RATEICM/S) 21.41 te.19 14.20 iO.43 8.044 5 rll 3 q 1; 7 3.30R
AEROSOL VENSITYfGM/CM3) 5.179 4.882 4.676 4.130 4.041 3.946 4.076 4 032
At"nSU SZE(MIr"ON1 .4500 .425S 4041 .3060 .3415 .3t4, 2971 .27AG

TABLE 48. AEROSOL RELEASE DURING CORE-CONCRETE ATACK FOR S3HF1/S3HF2(continued)
SPECIES TIME 19200 20400.0 2 1600 22800.0 24000.0 25200 26400.0 27600
rEO 40 f2 5444 5978 0309 6706 .895 7 14 7295
CR203 1072E - I 1472E-01 12119E-01 114GE-01 103SE-01 .94SIE-02 .07 ISE 02 8097E-02
Nt 1951 1978 1770 IGA3 Is 13 .1555 1505 1463
MO 24f3E-02 .255JE-02 .257RE-02 .26OOE-02 �2622E-02 2643E-02 2664E-02 268SE-02
RU 320it-07 2789E-07 .2444E-07 .21DOE-07 i980E-07 .1821E-07 1692E-07 .159SE-07
SN 4 50 5 072 5.003 4.944 4.899 4,960 4 829 4,1104
so 0 0. 0. 0. 0. 0. 0. 0.
YE 1.123 1.192 1 206 1.218 1.227 1 23S 1 242 I 748
AG 51.47 52 2 51.18 50.32 49.81 49 02 411 52 4R.09
mm 0. 0 0. 0. 0. 0. 0. 0.
CAD .8674 .11902 .8789 .8611t RS82 .8491 .8409 .9320
AL203 966SE-04 .9194E-04 .857RE-04 .8071E-04 .7062E-04 .7320E-04 .553JE-05 .5697E-09
NA20 1.156 1 220 I 241 1.252 1.259 1.264 1,267 1.270 -D.
K20 33.72 36.79 37.99 39.Ot 39.84 40.54 41.13 41.64 1�00
S102 .217SE-01 1992E-01 .1809E-01 .16BIE-01 t544E-01 .1447E-01 .136SE-01 .129SE-01
U02 1.787 i.668 1.517 1, 393 1.292 1.207 1.139 1,074
ZR02 .1619E-03 .1727E-03 .1737E-03 .1740E-03 .173DE-03 .1730E-03 .1723E-03 .17t4E-03
CS20 .1529 0. 0. 0. 0. 0. 0. 0.
BAD .1608 .1834 .1582 .1533 . f4as .1447 .1409
SRO .78ROE-02 .7812E-02 .742BE-02 .70SIE-02 .6781E-02 .6917E-02 .6292E-02 .6073E-02
LA203 .274SE-05 .2931E-05 .2947E-05 .2952E-05 .2947E-09 .2937E-05 .2924E-05 .290SE-05
CE02 .4734E-05 .5049E-05 .507SE-05 .508SE-09 .5077E-05 .5059E-05 .5037E-05 soloc-05
N8209 0. 0. 0. 0. 0. 0. 0. 0
Cst .9147E-114 .975GE-t4 .9811E-14 .9827E-14 .9809E-14 .977SE-14 .9732E-t4 .90ROE-14
CD 3.904 0 0. 0. 0. 0. 0. 0.
oxinE MELT TEMNK) 1875, IRS3. 1854. 1847. 1841. 1835. t83O. t828
SOURCE RATEIGM/Sl 2 8 1 2 524 2,309 2 085 1.896 1.741 1.012 1.907
AEROSOL DENSITYiGM/CM3) 3 945 1 ass 3.791 3.730 3.092 3 650 3.626 3.601
AEROSOL SIZEWICIIIIN) 2680 2609 .25811 .2571 .?q57 714M 7�16 7�,77
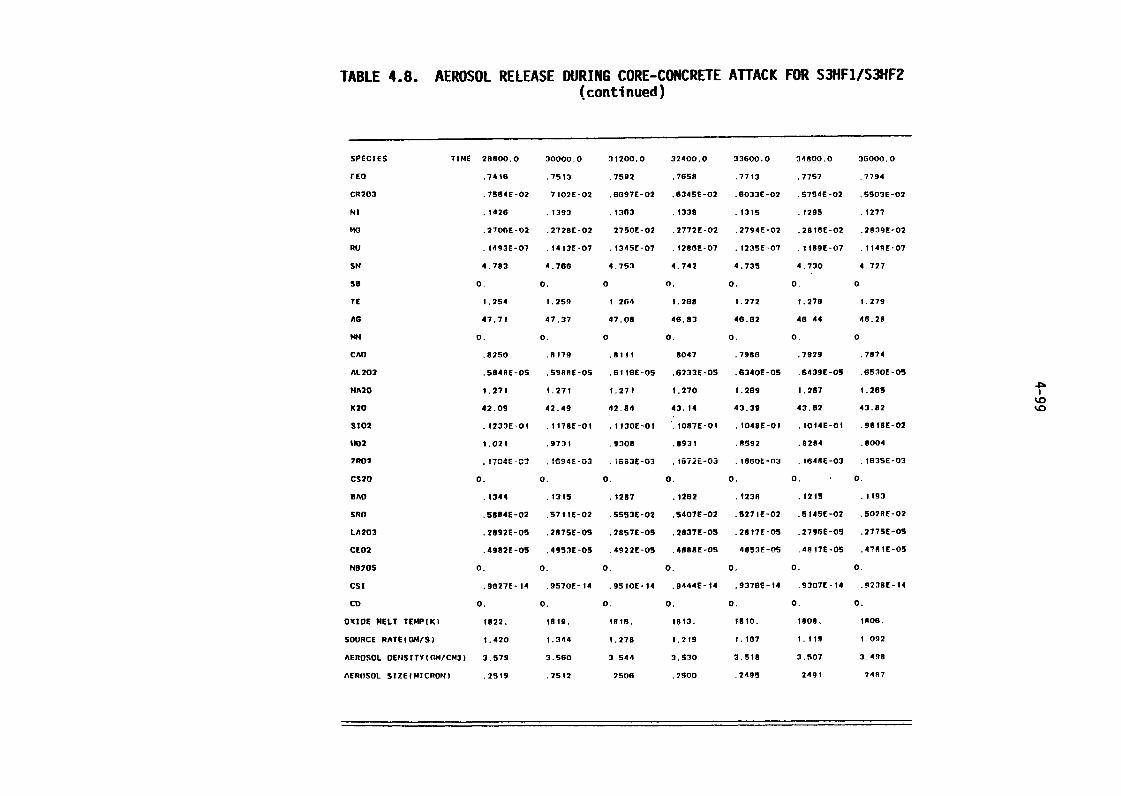
TABLE 48. AEROSOL RELEASE DURING CORE-CONCRETE ATTACK FOR SHF1/S3HF2(continued)
SPECIES TIME 28ROO.O 30000.0 31200.0 32400.0 33600.0 34800.0 36000.0
rEO .74iS .75i3 .7592 .7658 .7713 .7757 .7794
CR203 .7564E-02 7102E-02 .6697E-02 .634SE-02 .6033E-02 .5754E-02 SS03E-02
MI .1426 .1393 .1363 t338 .1315 .1295 .1277
Ma .270SE-02 .272BE-02 275OF-02 .2772E-02 .2794E-02 .29tGE-02 .2839E-02
RU .1493E-07 .14t3E-07 f345E-07 .1286E-07 .123SE-07 lt89E-07 .1149E-07
SN 4.783 4.706 4.753 4.742 4.735 4.730 4.727
se 0. 0. 0 0. 0. 0. 0
TE 1.254 1.259 24 1.268 1.272 t.276 1.279
AG 47.71 47.37 47.08 46.93 46.62 46 44 46.28
mm 0. 0. 0 0. 0. 0. 0
CAD .8250 8179 .8111 8047 .7986 .7929 .7874
AL203 .504RE-05 .598RE-05 .6ttSE-05 .6233E-05 .6340E-OS .6439E-OS GSJOE-05
NA20 1.271 1.27t t.271 1.270 1.289 1.267 1.269
K20 42.09 42.49 42.84 43.14 43.39 43.62 43.82
S102 t233E-01 .117SE-01 .1130E-01 .1087E-01 .104SE-01 .1014E-01 .981RE-02
002 1.021 .9731 .9308 .8931 .9592 .8284 .8004
7RO2 .170111-111 .1694E-03 i653E-03 i672E-03 .1660E-03 .164RE-03 .163SE-03
CS20 0. 0. 0. 0. 0. 0. 0.
SAO .1344 .1315 .1287 .1262 t23R .12ig ltg3
SRO .5884E-02 .57IIE-02 .5553E-02 .5407E-02 .5271E-02 .5145E-02 .502RE-02
LA203 .2892E-05 .2117SE-05 .2857E-09 .2837E-05 .28t7E-05 .279GE-09 .277SE-05
CE02 .4982E-05 .4953E-05 .4922E-05 .4088E-09 4853F-05 .4817E-09 .47RIE-05
N820S 0. 0. 0. 0. 0. 0. 0.
CS1 .9627E-t4 .9570E-t4 .95tOE-14 .9444E-14 .937GE-14 .9307E-14 .923SE- 14
co 0. 0. 0. 0. 0. 0. 0.
OXIDE MELT TEMP(K) t822. 1819. isle. 1813. islo. t8oll, 1006.
SOURCE ATE(GM/S) 1.420 1.344 1.278 1.219 1.107 I.tig t.092
AEROSOL E?4SITY(GM/CM3) 3.579 3. S130 3.544 3.530 3.S18 3.507 3. 498
AEROSOL SIZE(MICRON) 2519 .2512 2506 .2500 249S 2491 74R7
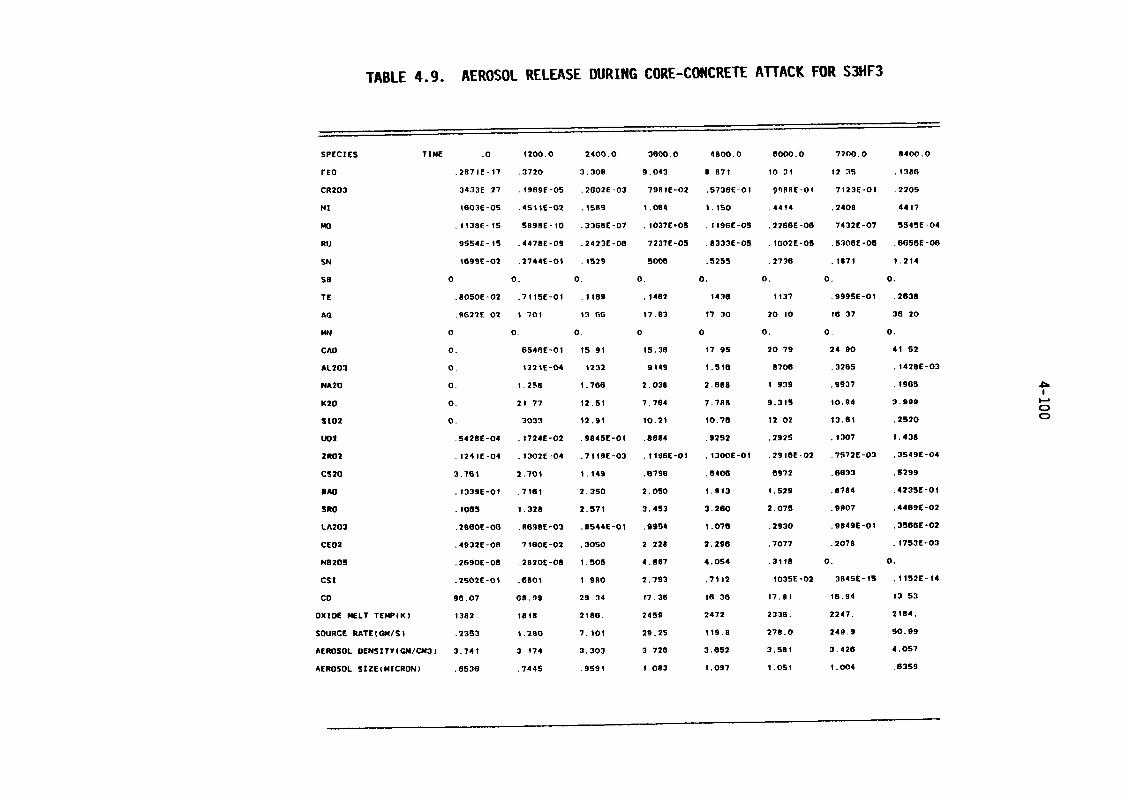
TABLE 4.9. AEROSOL RELEASE DURING CORE-CONCRETE ATTACK FOR SHF3
SPECIES TIME .0 1200.0 2400.0 3600.0 4800.0 5000.0 7200.0 8400.0
FEO .287JE-17 .3720 3.308 9.043 8 07t 10 1 12 35 .11180
CR203 3433E 27 .1969E-05 .2002E-03 79RIE-02 S73GE-01 99ABE-01 7123E-01 .2205
NI 1603E-OS .45IIE-02 iS89 1.064 i.150 W4 .2408 4417
MO .1138E-15 5898E-10 .336SE-07 tO37E-OS .119GE-05 .2266E-06 7432E-07 554SE-04
:U 554E-15 .4:7:E-0: .2542JE-06 7237E-05 .:333E-05 .:G02E-OS .5306E-06 .6656E-06
N :69SE 2 .2 4 -0 i 29 5008 . 255 . 736 .1871 i.2t4
So 0 0. 0. 0. 0. 0. 0. 0.
TE .8050E-02 .711SE-01 .1189 .1462 1436 1137 .999SE-01 .2638
AG .9622E-02 1 01 i 3 66 17.63 17 30 20 16 37 3 20
MN 0 0. 0 0 0 0. 0. 0.
CAD 0. 654SE-01 Is 91 15.38 17 9 20 79 24 90 41 52
AL203 0. 1121E-04 1232 Si49 1.516 8708 .3265 .142BE-03
MA20 0. 1.258 1.766 2.038 2.688 1 939 .9937 .1965
X20 0. 21 77 12.51 7.764 7.789 9.315 10.94 3.999
S102 0. 3033 i2.Si iO.21 10.78 12 02 13.81 .2520 C>
L002 .542SE-04 .1724E-02 .984SE-01 .8684 .9252 .2925 .1307 1.438
ZRO2 .1241E-04 .1302E-04 .7119E-03 tl96E-Ol .13OOE-01 .291GE-02 .7572E-03 .3549E-04
CS20 3.761 2.701 IA49 .6796 .6406 6972 .6633 .5299
BAD t339E-01 .7161 2.350 2.050 1.913 1.529 .8784 .4235E-01
Vto .1065 1.328 2.571 3.453 3.280 2.075 .9907 .4469E-02
LA203 .2860E-0(3 .869SE-03 SS44E-Oi .9954 i.078 .2930 .9849E-Oi .356GE-02
CE02 .4932E-06 71GOE-02 .3050 2 228 2.298 .7077 .2078 .1753E-03
N8205 .2690E-08 .2820E-08 1.505 4.887 4.054 .3118 0. 0.
CST .2502E-01 .680i i SRO 2.793 .7112 iO3SE-O2 304SE-15 il52E-14
co 96.07 68.99 29.34 17.36 t 3 t7.01 t6.94 13 53
OXIDE MELT TEMP(Ki 1382. lots 2t86. 2459 2472 2336, 2247. 2184.
SOURCE RATE(GMIS) .2353 i.280 7.101 29.2S 119.8 278.0 249.9 50.99
AEROSOL DENSITY(GM/CM3) 3. 74 t 3 i4 3.303 3 726 3.652 3.581 3.428 4.057
AEROSOL SIZEiMICRON) .6536 .7445 .959i i 083 1.097 1.051 1.004 .8359
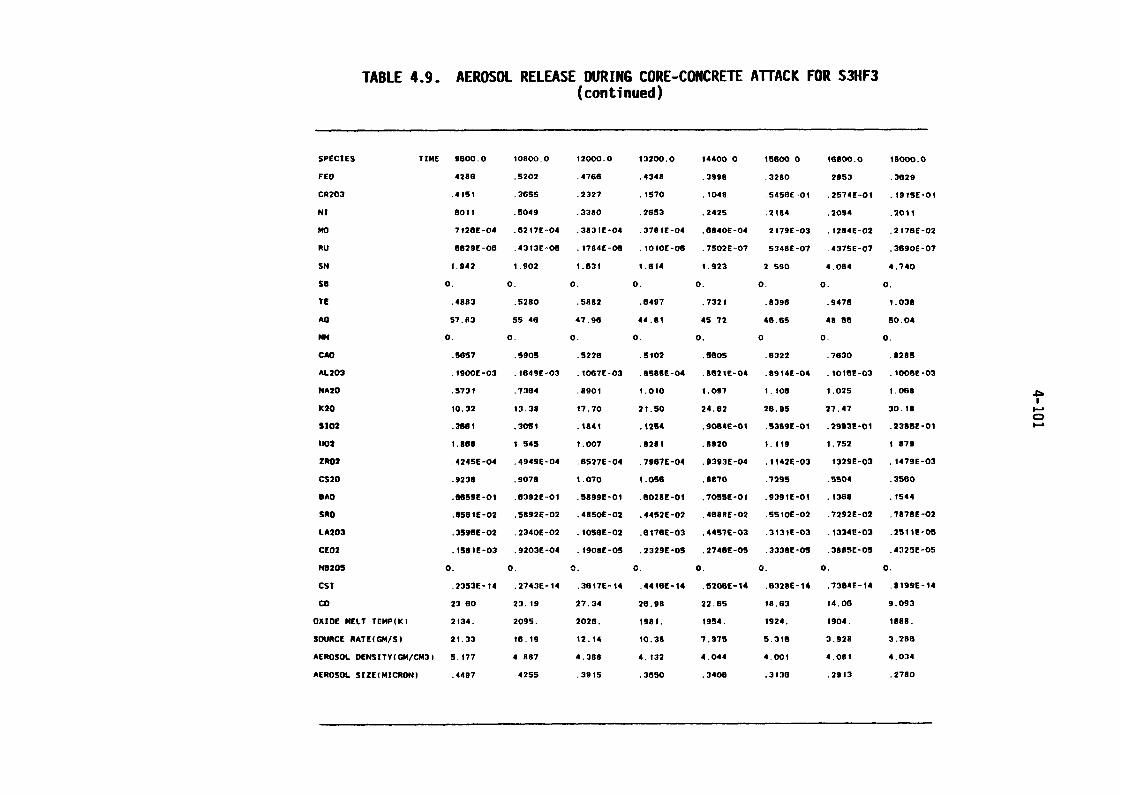
TABLE 49. AEROSOL RELEASE WRING CORE-CONCRETE ATTACK FOR SHF3(continued)
SPECIES TIME 9600.0 10900.0 12000.0 13200.0 14400 tssoo 0 16600.0 16000.0
FED 4286 .5202 .4766 .4348 .3998 .3280 2053 .3629
CR203 .4151 3655 .2327 .1570 .1048 .545SE-01 .2574E-01 .191SE-01
MI 8011 .5049 .3380 .2653 �242S .2164 .2094 .2011
MO 712SE-04 .6217E-04 .3831E-04 .37SIE-04 .8840E-04 2179E-03 .1284E-02 .217SE-02
U 6:2:E-06 .4313E-06 .17:4E-06 .10:OE-06 .7:02E-07 534:E-07 .437SE-07 .3600C-07
:N t 4 1.9 2 1. I 1. 4 t. 23 2 Ss 4.086 4.740
so 0. 0. 0. 0. 0. 0. 0. 0.
TE .4883 .5280 .5882 .6497 .7321 .8396 .9476 1.038
AG 57.93 5 4 47,96 44.81 45 72 46.6S 48 66 50.04
mm 0. 0. 0. 0. 0. 0 0. 0.
CAD .5657 .5905 .5220 .5102 .5605 .6322 .7630 .828S
AL203 .190OE-03 i849E-03 .1067E-03 .6S86E-04 .9621E-04 .9914E-04 .101SE-03 .100SE-03
MA20 .5731 .7364 .8901 i.010 t.097 1.106 1.025 1.068 4�b1
K20 10.32 13.38 17.70 21.50 24.62 26.9S 27.47 30.18 I.-
3102 .3661 .30sl �1841 .1254 .9064E-01 S36SE-01 .2SS3E-01 .238SE-01
1102 1.868 I 54S 1.007 .8281 .8920 1.119 1.752 1 879
ZRO2 .424SE-04 .494SE-04 .6527E-04 .7967E-04 .9393E-04 .1142E-03 1329E-03 .1479E-03
CS20 .9238 .9078 1.070 1.0se .6670 SS04 .3560
BAD .6659E-01 .6392E-01 .5899E-01 .602BE-01 .705SE-Ol .9391E-01 .1368 .1544
SRO .6561E-02 .5892E-02 .48SOE-02 .4452E-02 .468RE-02 SSIOE-02 .7292E-02 .7878E-02
LA203 .359GE-02 .2340E-02 .10SBE-02 .617SE-03 .4457E-03 .3i3lE-03 i324E-03 .251if-os
CE02 .1581E-03 .9203E-04 .190BE-05 .2329E-OS .274SE-OS .333SE-05 .3805E-05 .432SE-05
N0205 0. 0. 0. 0. 0. 0. 0. 0.
CST .2353E-14 .2743E-14 .3617E-14 .44i6f-14 .620SE-14 .632BE-14 .7364E-14 .319SE-14
co 23 0 23.19 27.34 26.96 22.65 18.63 14.06 9.093
OXIDE MELT TEMP(K) 2134. 2095. 2026. 1281. 1954. 1924. 1904. 1888.
SOURCE RATE(GM/S) 21.33 W19 12.14 10.36 7.975 S.3iB 3.928 3.286
AEROSOL DENSITY(GM/CM3) 5.t77 4 87 4.388 4.i32 4.044 4.001 4.081 4.034
AEROSOL SIZEIMICRON) .4497 4255 3915 .3650 .3406 .3136 .2913 .2780
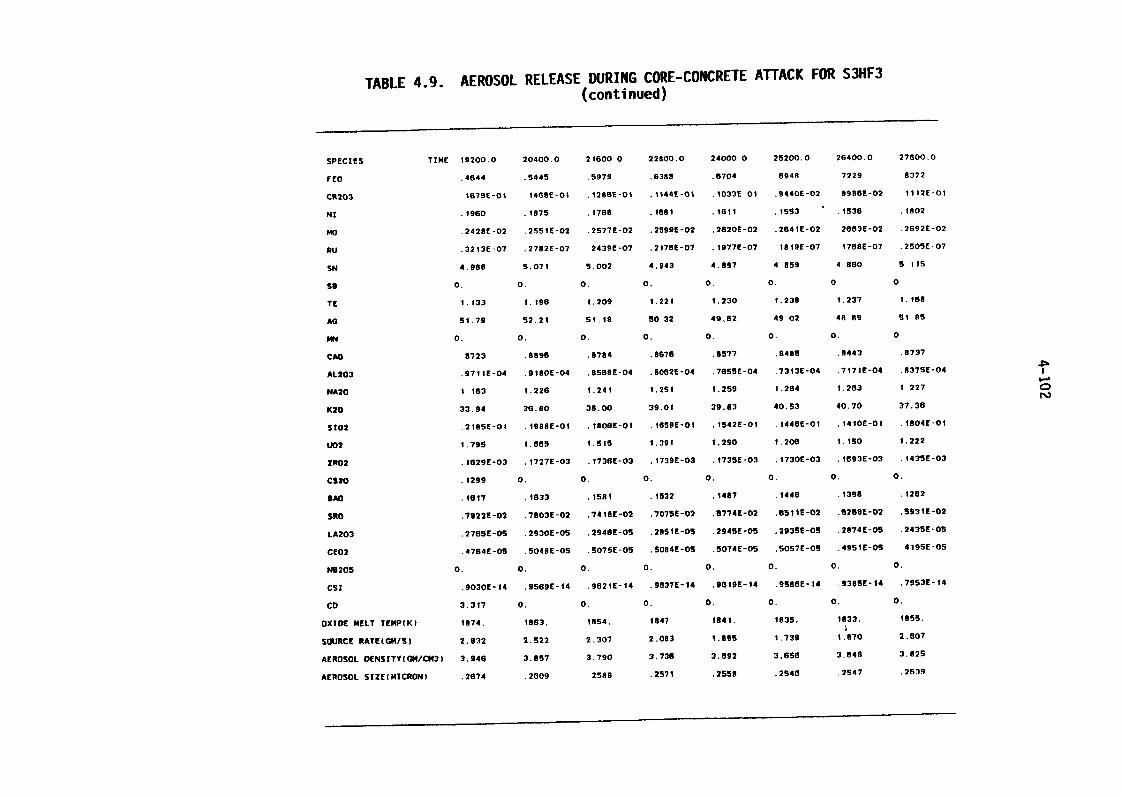
TABLE 49. AEROSOL RELEASE DURING CORE-CONCRETE ATTACK FOR S3HF3(continued)
SPECIES TIME 19200.0 20400.0 21600 22800.0 24000 25200.0 26400,0 27600,0
FED .4644 .5445 .5979 .6388 .6704 8948 7229 8322
CR203 i67SE-01 i4sSE-0i il86E-Oi iWE-Ol iO33E-Oi .944DE-02 9996E-02 lit2E-01
NI .1960 .1875 .1768 .1581 .1611 .1553 .1536 1802
MO .242SE-02 .25SIE-02 .2577E-02 .2599E-02 .2620E-02 .2541E-02 2683E-02 .2692E-02
RU .3213E-07 .2762E-07 2439E-07 .2176E-07 .1977E-07 ISISE-07 176SE-07 .250SE-07
SN 4.988 5.071 5.002 4.943 4.897 4 8 4 800 5 115
so 0. 0. 0. 0. 0. 0. 0 0
TE 1.133 1.196 t.209 1.221 1.230 1.238 1.237 1.168
AG 51.79 52�21 S1.18 50 32 49�62 49 02 48 89 5 as
mm 0. 0. 0. 0. 0. 0. 0. 0
CAD 8723 .8996 .8784 .8676 .8577 .8486 .8443 .8737
AL203 .97IIE-04 .9180E-04 .856SE-04 .8062E-04 .76559-04 .7313E-04 .7171E-04 .937SE-04
MA20 1 163 1.226 t.241 1.2SI 1.2S9 1.264 1.263 1 227 C)
K20 33.94 36.80 38.00 39.01 39.83 40.53 40.70 37.36
S102 .216SE-Ot .198SE-01 .180SE-01 .1659E-01 .1542E-01 .1446E-01 .14IOE-Ot .1804E-01
U02 1.795 1.665 I.Sts 1.391 1.290 1.206 1.1so 1.222
ZR02 .1629E-03 .1727E-03 t73SE-03 .1739E-03 .1735E-03 .1730E-03 .1693E-03 .143SE-03
C320 �1299 O� 0, 0� 0. 0. O� 0.
SAO .16t7 i633 .158i .1532 .1487 i446 .1398 .1262
SRO .7922E-02 .7803E-02 .741DE-02 .707SE-02 .8774E-02 .05liE-02 .629SE-02 .5931E-02
LA203 .276SE-05 .2930E-OS .294SE-05 .29SIE-05 .294SE-OS .293SE-05 .2874E-05 .243SE-05
CE02 .4764E-05 .504SE-05 .507SE-OS .5084E-05 .5074E-05 .5057E-05 .49SIE-05 419SE-05
N8205 0. 0. 0. 0. 0. 0. 0. 0.
CSI .9030E-14 .9569E-14 .962iE-14 .9637E-14 .960E-14 .958BE-14 .936SE-14 .7953E-14
CD 3.3i7 0. 0. 0. 0. 0. 0. 0.
OXIDE MELT TEMP(K) 1874. 1863. 1854. t847 184t. 183S. 1833. 1855.
SOURCE RATE(GM/S) 2.832 2.522 2.307 2.083 1.695 1.739 1. 670 2.607
AEROSOL DENSITY(GM/CM3) 3.946 3.857 3.790 3.738 3.892 3.658 3.648 3.825
AEROSOL SIZE(MICRON) .2674 .2609 2588 .2571 .2558 .2546 .2547 .2639
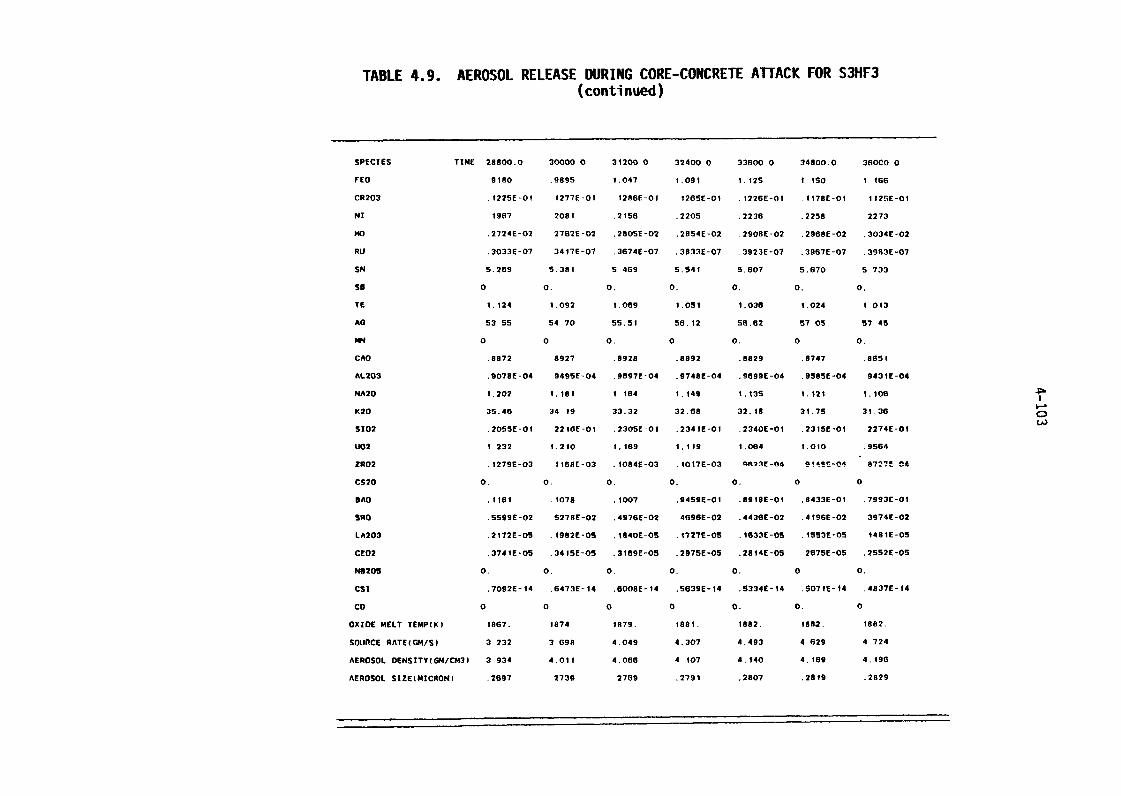
TABLE 49. AEROSOL RELEASE DURING CORE-CONCRETE ATTACK FOR S3HF3(continued)
SPECIES TIME 28800.0 30000 31200 32400 33600 34800.0 36000
rEo 9180 .989S 1.047 1.091 1.12S I ISO I t66
CR203 .122SE-01 1277E-01 1286E-01 126SE-01 .122GE-Ot .1178E-01 112rE-01
NI 1967 2081 .2156 .2205 .2236 .2258 2273
MD .2724E-07 2762E-02 .280SE-02 .2854E-02 .2908E-02 .296BE-02 .3034E-02
RU .3033E-07 3417E-07 .3674E-07 .3833E-07 .3923E-07 .3967E-07 .3993E-07
sm 5.269 5.391 5 469 5.54t 5.607 5.670 5 733
so 0 0. 0. 0. 0. 0. 0.
TE i.i24 1.092 1.069 1.051 1.038 1.024 1 013
AG 53 SS 54 70 55.51 W12 56.62 57 05 57 45
mm 0 0 0. 0 0. 0 0.
CAD .8872 8927 .0928 .8892 .8829 .8747 .8651
AL203 .907SE-04 949SE-04 .9697E-04 .9748E-04 .9699C-04 .958SE-04 943iE-04
NA20 t.202 1.181 1 184 t.149 1.13S 1.121 I.tOG
K20 35.46 34 19 33.32 32.68 32.18 31.75 31.36
S102 .205SE-01 221SE-01 .230SE-01 .2341E-01 .2340E-01 .231SE-01 2274E-01 w
W2 I 232 t.210 1.169 1.119 1.064 1.010 .9564
ZRO2 .1279E-03 116SE-03 �1084E-03 .1017E-03 967'AF-04 914SE-04 9727E-04
CS20 0. 0. 0. 0. 0. 0 0
BAD .1161 .1078 .1007 .2459E-01 .891BE-01 .0433E-01 .7993E-01
SRO SS99E-02 527RE-02 .497SE-02 4696E-02 .443SE-02 .4ig6E-02 3974E-02
LA203 .2172E-05 11982E-05 .1840E-OS .1727E-OS .1633E-05 iSS3E-OS 1,49IE-09
CE02 .3741E-05 .341SE-05 .3169E-05 .297SE-05 .2814E-05 267SE-05 .2552E-05
NO205 0. 0. 0. 0. 0. 0 0.
CS1 .7092E-14 .6473E-14 .6008E-14 .5639E-14 .5334E-14 .9071E-i4 .4837E-14
co 0 0 0 0 0. 0. 0
OXIDE MELT TEMP(K) 1867. 1874 1879. 1881. 1882. 1882. 1882.
SOURCE ATEIC.M/S) 3 232 3 9R 4.049 4.307 4.493 4 629 4 724
AEROSOL OENStTY(GM/CM31 3 934 4.011 4.066 4 107 4.140 4,189 4.196
AEROSOL SIZE(MICRON) .2697 2739 2769 .2791 2807 .2819 .2829
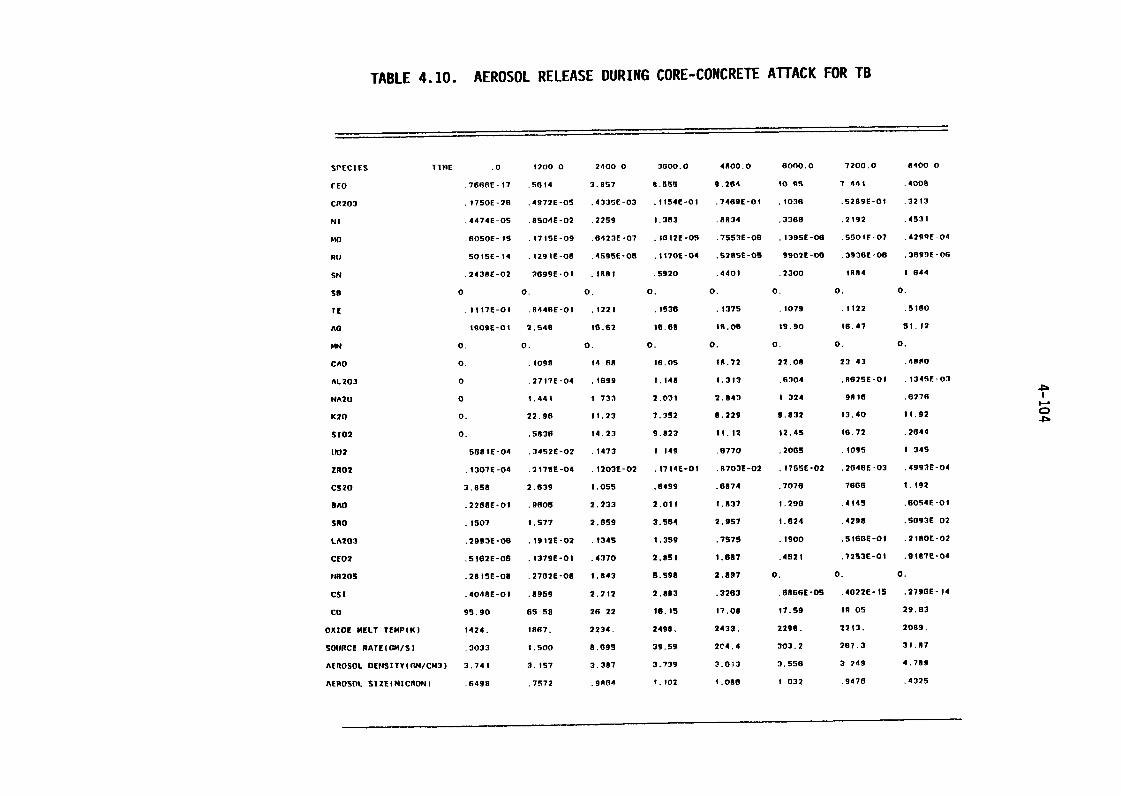
TABLE 410. AEROSOL RELEASE DURING CORE-CONCRETE ATTACK FOR TB
SPECIES TIME .0 1700 2400 3000.0 4ROO.0 6000.0 7200.0 R400
rEo .7666E-17 SG14 3.RS7 8.5139 2.264 10.9s 7 441 .40OR
CR203 .17SOE-26 .4972E-05 .433SE-03 .1154E-01 .7469E-Ot 1036 .5289E-01 .3213
ml .4474E-05 .850dE-02 .2259 1,363 .8834 .3368 .2192 .4531
MO .6050E-IS .171SE-09 .6423E-07 .1012E-05 .7593E-06 .139SE-06 Ssotr-o? .429q[-04
RIP SOISE-14 .1291E-os .459SE-06 .1120E-04 .526SE-05 9902E-05 .393GE-06 .3899E-06
SN .243RE-02 3699r-ot .1891 .5920 .4401 .2300 IR84 1 44
so 0 0. 0. 0. 0. 0. 0. 0.
If .1117E-01 .844SE-01 .1221 IS36 t37S .1079 .1122 .5160
AG tgOSE-01 2.546 16.62 16.69 18.06 19.90 16.47 51.12
mm 0. 0. 0. 0. 0. 0. 0. 0.
CAD 0. .1099 14 68 16.0s 10.72 22.08 23 4 3 .4800
AL203 0 .2717E-04 .1699 1.148 1.313 6304 .862SE-01 .134SE-03
NA20 o 1.441 I 31 2.031 2.843 1 324 9918 .677R
K20 0. 22.98 11.23 7.392 8.229 9.832 13.40 11.92 C)
S102 0. .5836 14.23 9.823 11.12 12.45 16.72 .2644
1102 56SIE-04 .3452E-02 .1473 1 t49 .0770 .2065 .1095 1 345
ZR02 i3olE-04 .2i7flE-04 .1203E-02 .1714E-01 .8703E-02 .175SE-02 .264GE-03 .4993E-04
CS20 3.858 2.839 1.055 .6499 .6074 .7076 7666 I.t92
�AO .226RE-01 .9608 2.233 2.011 t.837 1. 290 .4145 .6054E-01
SRO .1507 I.S77 2,859 3.564 2.957 1.824 .4298 .5093 02
LA203 .2993E-08 .1912E-02 .134S 1.359 .7579 .1900 .916GE-Ol .21ROE-02
C102 .51021-06 .1379E-01 .4370 2.8SI 1.687 A921 .72S3E-01 .2187E-04
P18205 .281SE-08 .2702E-08 1.843 5.598 2.897 0. 0. 0.
CSI .404RE-01 .8959 2.212 2.883 .3263 .686GE-05 .4022E-IS .279GE-14
co 9S.90 65 58 26 22 18.15 17.08 17.59 Iq 05 29.63
OXIDE MELT TEMP(K) 1424. f867 , 2234. 2498 . 2433. 2298. 220. 2089,
SOURCE RATE(GM/S) .3033 1.500 8.695 39.59 2C4.4 303.2 287.3 31.07
AEROSOL DEASITY((,M/CM3) 3.741 3.157 3.387 3.739 3.oi3 3.55G 3 749 4.789
AEROSOL SIZEIMICRON) .6498 .7572 .90104 1.102 1.088 1 032 .9476 .4325

TABLE 410. AEROSOL RELEASE DURING CORE-CONCRETE ATTACK FOR T8(continued)
SPECIES TIME 9600.0 10800.0 12000 13200.0 14400 15600.0 frA0 0 111000.0
rEO .4441 .4212 .3820 .3102 .3025 .4008 5055 .57GR
CR203 .2081 .148S .919SE-01 .4487E-01 .2291E-01 .1859E-ol 1644E-01 .143GE-01
Hi 3040 .2628 .2376 .2189 .2094 .2013 .1971 .1870
MO .3273E-04 .4192E-04 .861RE-04 �3618E-03 t72RE-02 .2267E-02 .249SE-02 .2564E-02
Rif .1449E-06 974BE-07 .7019E-07 .5214E-07 .4284E-07 .3620E-07 .3169E-07 .2763E-07
SH 1.537 1 sag 2.048 2.962 4.436 4.838 5.080 5.0115
se 0. 0. 0. 0. 0. 0. 0 0.
YE S9qA 6692 .7621 .8758 .9793 t.072 1 173 1.208
AG 45.54 44 97 45.89 47.39 49.15 50.59 52 55 52 14
Awl 0 0. 0. 0. 0. 0. 0 0
CAD .4904 .5180 .5734 .6671 .7897 .8405 .8R63 .8077
AL203 .9403E-04 8649E-04 .97OIE-04 .942SE-04 .1039E-03 .1004E-03 .971SE-04 .911SE-04
MA20 .8989 1.024 1.101 1.078 1.016 1.090 1.192 1 228CO
K20 18.27 21.91 25.08 26.80 27.65 30.97 34 94 36 as (J"
S102 .1613 .1198 .818SE-Of .4654E-01 .2740E-01 23SOE-Ol .2171E.01 .1974E-01
U02 .8974 8420 .9328 1.280 1.882 1.864 1.775 1 674
ZRO2 .6834E-04 .8119E-04 .9737E-04 .1177E-03 .13SIE-03 'ISOOE-03 .165SE-03 .1699E-03
CS70 1.183 1.059 .6728 .7042 .5177 .3067 S72RE-01 0.
BAD .572SE-01 .617tE-01 .745SE-01 .1044 .1443 .1555 .1627 .1800
SRO 460SE-02 .4479E-02 .4814E-02 .5959E-02 .7592E-02 7RBOE-02 .7919F-02 .767SE-02
LA203 asset-03 SgOOE-03 .412SE-03 .298SE-03 .1331E-03 .25489-05 .2807E-05 .2883E-05
CE02 .199BE-os .2373E-05 .294SE-OS .3439E-05 .39SOE-05 .4386E-05 .4R37E-05 .496GE-05
H82OS 0. 0. 0. 0. 0. 0. 0. 0.
CS1 .3827E-14 .4547E-t4 S453E-14 .6589E-14 .75GRE-14 .8403E-14 .920GE-14 AS14F-14
co 29.41 26.3f 21.87 17.50 12.67 7.623 1.424 0.
OXIDE MELT TEMP(k) 2012. 1978. 1948. 1921. t9ol. less. f872. t802.
SOURCE RATE(C.M/5) 0.02 10.67 7.589 5.047 3.916 3 308 2.824 2 524
AEROSOL DENSITYjGM/CM3) 4 26 4.122 4.035 4.037 4.098 4 021 3.932 3.854
AEP(ISOL STZE(MICRON) 3873 .1618 .3352 3082 .2081 27SR 761,2 2r1:1
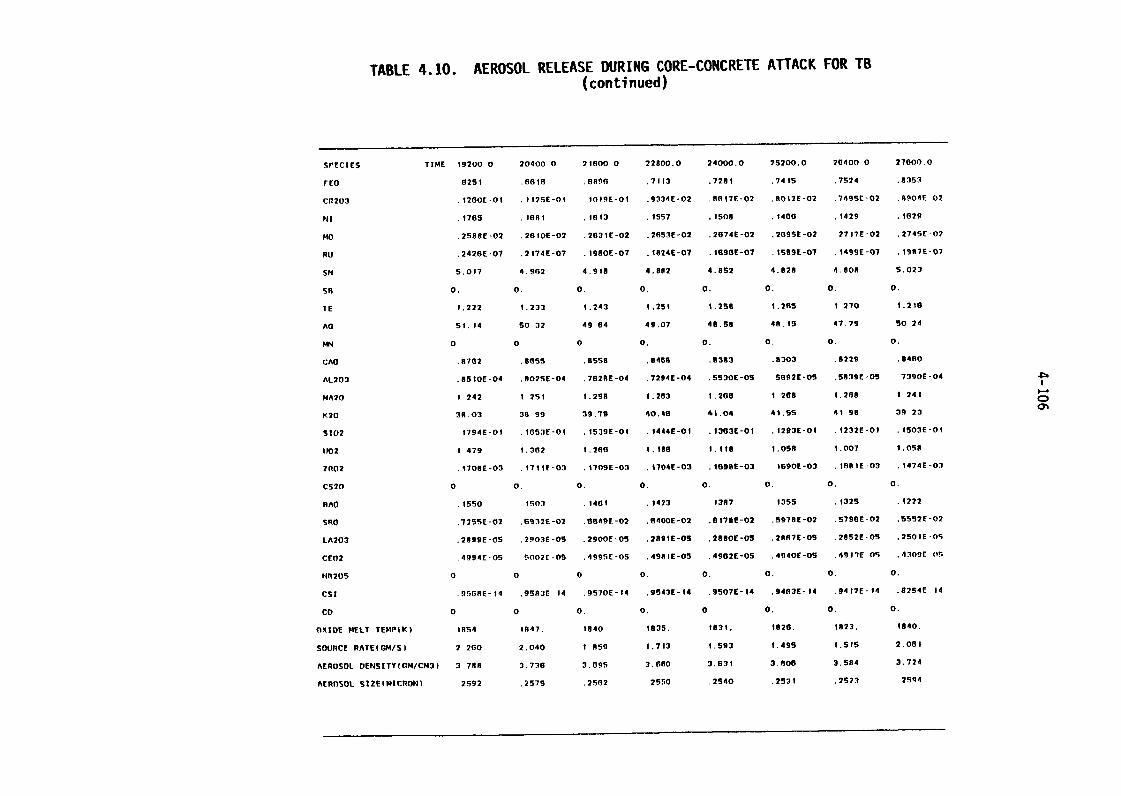
TABLE 410. AEROSOL RELEASE DURING CORE-CONCRETE ATTACK FOR T8(continued)
srEctes TIME 19200 20400 21600 22800.0 24000.0 75200.0 26400 27000.0
rEo 625 1 .6616 .689n . 7113 .7281 .74 15 .7524 .8353
CR203 1260C -01 . 112SE-01 1019E-ol .9334E-02 .8617E-02 ROt2E-02 .749SE-02 R9O4E 02
pit .1765 .1081 .1613 .1557 .1508 .14136 1429 t629
Ho .258BE-02 .20IOE-02 .263IF-02 .2653E-02 .2074E-02 .209SE-02 2717E-02 .274SE-02
RU .242SE-07 �2174E-07 .19ROE-07 A824E-07 .169GE-07 .156SE-07 .1499E-07 ISR7E-07
SN 5.017 4.962 4.918 4 882 4.852 4. 28 4.808 5.023
SR 0. 0. 0. 0. 0. 0. 0. 0.
IE 1.222 1.233 1.243 1.251 i.2SO 1.265 1 270 i.210
An 51.14 50 2 49 64 49.07 48.58 49.15 47.79 so 24
MN 0 0 0 0. 0. 0. 0. 0.
CAD .8702 Bass asse .64GR .6363 .8303 .8229 .8460
AL203 RSIOE-04 .802qE-04 �76211E-04 .7294E-04 .5530E-05 5002E-09 .5839E-05 7390E-04
NA20 1 242 1 251 1.2SR t.263 1.206 28 1,268 1 241 C)
K20 3R.03 38 99 39,79 40.46 4i.04 4i.SS 41 so 3 23
3102 1794E-01 165JE-01 .1539E-ol .1444E-01 .1363E-01 .120311-01 .1232E-01 .1503c-ot
U02 1 479 1.362 1,260 1,186 1.118 1.05R t.007 1.058
?no? .170SE-03 .111it-03 t7f9E_0l i7O4E-03 isgaf_03 16901-03 .1681E-03 .1474E-03
CS20 0 0. 0. 0. 0. 0. 0. 0.
"AO .1550 1503 .1461 .1423 1387 135S .1325 .1222
SRO .725SE-02 .6912E-02 .6649E-02 .64OOE-02 .6178S-02 .59791-02 .579SE-02 SS52E-02
LA203 .2899E-05 .2903E-05 .29OOE-05 .28gtE-05 .2880E-OS .2847E-05 .2852E-05 .25OIE-05
CFO2 .4994E-05 q002E-05 .4995E-05 .49SIE-05 .4902E-05 4940E-05 .4911E O .43091 or.
tin2os 0 0 0 0. 0. 0. 0. 0.
CSI .95GRE-14 .9583E-14 .9570E-14 .9543E-14 .9507E-14 .9403E-14 .9412E-14 .8254 14
CD 0 0 0. 0. 0 0. 0. 0.
OXIDE MELT EMPIX) 1854 11147. tB40 1835. ill3l. 1826. 1823. 1840.
SOUnCE RATE(GM/Sl 2 20 2.040 1 859 1.713 1.593 1.495 1.515 2.081
AEROSOL DENSITYIGM/CM3) 3 788 3.736 3.095 3.660 3.631 3.605 3.584 2.724
AEROSOL SIZEIMICRON) 2592 .2575 .2562 2550 .2540 .2531 .2S21 2Sq4
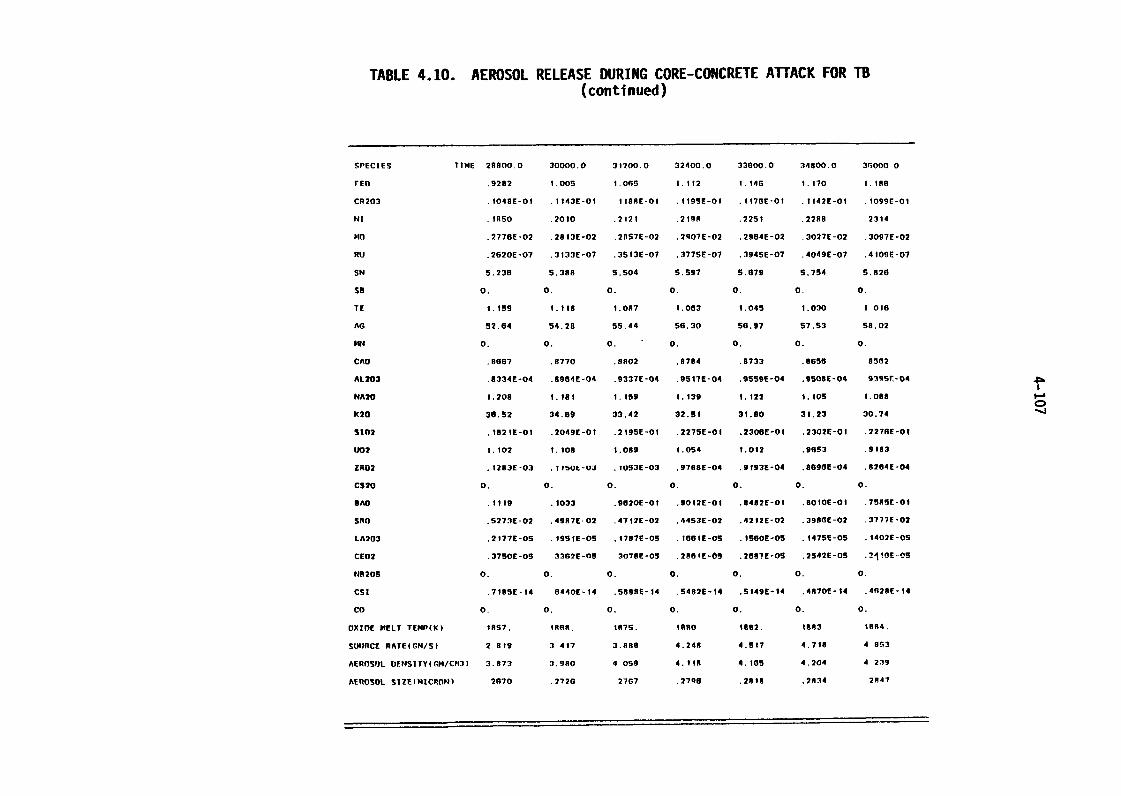
TABLE 410. AEROSOL RELEASE DURING CORE-CONCRETE ATTACK FOR TB,(continued)
SPECIES TIME 211800.0 30000.0 31200.0 32400.0 33600.0 34800.0 36000
rEo .9282 1.005 1.065 1.112 t.146 1.170 t.lRR
CR203 .104SE-01 .1143E-01 118SE-01 .119SE-01 .117BE-Of .1142E-01 .1099E-01
tit .1850 .2010 .2121 2198 .2251 .2288 2314
MD .277SE-02 .2813E-02 .2057E-02 .2907E-02 .2964E-02 .3027E-02 .3097E-02
RU .2620E-07 .3133E-07 .35f3E-07 .377SE-07 .394SE-07 .4049E-07 .4109E-07
SN 5.238 5.398 5.504 S.S97 S.879 5.754 5.1126
so 0. 0. 0. 0. 0. 0. 0.
TE 1.159 1.118 1.087 1.063 1.04S 1.030 1 Ole
AG 52.64 54.28 55.44 56.30 50.97 57,S3 S8.02
mm 0. 0. 0. 0. 0. 0. 0.
CAD .8667 .8770 .9802 8784 .8733 .8658 8562
AL203 .8334E-04 .6964E-04 .9337E-04 .951?E-04 gSSSE-04 SSOSE-04 939SE-04
MA20 I 208 1.181 1.159 l.t39 1.122 i.105 1.088CO
K20 36.52 34.69 33.42 32.51 31.80 31.23 30.74 -4
S102 .1821E-01 .2049E-01 .2tgSE-01 .227SE-01 .23OGE-Ol .2302E-01 .227SE-01
U02 1.102 1.108 1.089 1.0154 1.012 .9653 .9183
ZRG2 i;Is3E-uj .1150E-03 .1053E-03 .978SE-04 .9193E-04 .869GE-04 .8264E-04
CS20 0. 0. 0. 0. 0. 0. 0.
�AO .1ill? .1033 .9620E-Ot .9012E-01 .8482E-01 .6010E-01 .75051-01
SRO .5273E-02 .4987E-02 .4712E-02 .44S3E-02 .4212E-02 .396GE-02 .3777E-02
LA203 .2177E-OS .19SIE-05 t787E-03 t6slEOs ISSOE-OS .1475E-05 .14o2E-OS
CE02 .37SOE-05 33R2E-09 307RE-05 .28SIE-05 2687E-OS .2542E-05 .211GE-OS
PIR20S 0. 0. 0. 0. 0. 0. 0.
CSI .718SE-14 6440E-14 S89SE-14 .5492E-14 .514SE-14 .4870E-14 .4n28E-14
co 0. 0. 0. 0. 0. 0. 0.
OXIDE MELT TEMP(K) 1857. lase. 1675. JARO 1982. tRR3 IR94.
S01111CE RATE(GM/Sf 2 819 3 417 3.888 4 248 4.S17 4.718 4 83
AEROSOL DENSITY(C.M/CM3) 3.873 3.980 4 059 4.118 4.105 4.204 4 29
AEROSOL SZEIMICRON) 2970 .2720 2767 .2798 .21118 2434 21147
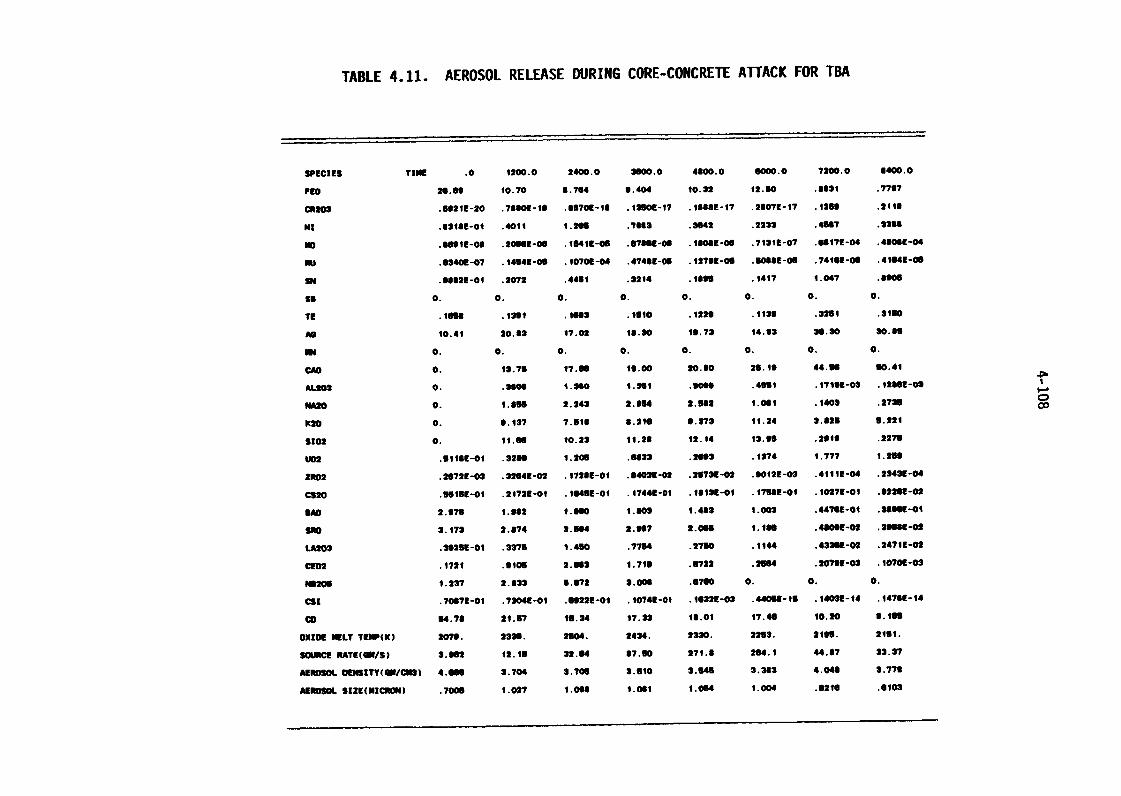
TABLE 411. AEROSOL RELEASE DURING CORE-CONCRETE ATTACK FOR TBA
WECIES TIINE .0 1200.0 2400.0 3000.0 4800.0 mmmm.o 7200.0 4400.0
FEO ". so 10.70 5.764 9.404 10.32 12.50 .8831 .7797
MM .5021E-20 .7880E-19 .9570E-14 .1250E-17 . ISISE-17 .2807E-17 . i269 .2119
"I .831st-ol .4011 1.264 .7063 .3942 .2233 .41147 .3366
.6019-00 .20069-00 .1541E-06 .670GE-08 . NME-00 .7131E-07 .8417E-04 .480BE-04
.6340E-07 .1454E-09 .1070E-04 .474GE-05 .1279E-05 .5088E-Os .741411-04 .4164E-08
sm .9882E-01 .2072 .4461 .2214 .1096 .1417 1.047 .8906
0. 0. 0. 0. 0. 0. 0. 0.
low I"I .1093 .1510 .1229 .1139 .2291 .3150
AG 10.41 20.83 17.02 12.30 19.73 14.93 30.30 90.88
IN 0. 0. 0. 0. 0. 0. 0. 0.
CAD 0. 13.76 17.06 Igloo 20.80 26.19 44. NO 90.41
AL202 0. so" I.S80 1.95i SO" .49111 .17199-03 .12*U-CM
NA20 0. 1.806 2.243 2.854 2.902 1.021 .1403 .2795 00
X20 0. 9.137 7.518 8.216 9473 Ii.24 3.825 5.221
S102 0. II.66 10.23 11.26 12.14 13.96 .2019 .2276
U02 .61181-01 .22" 1.208 .61032 .2093 .1274 1.777 I.M
ZM02 .2672E-03 .3264E-02 .172GE-01 .8402E-02 .2573E-02 .9012E-03 AME-04 .2343E-04
C520 .591SE-01 .2172E-01 .164SE-01 .1744E-01 .1413E-01 .170SE-01 .1027E-01 .92241-02
an 2.976 1.982 1.900 IAO3 1.403 1.003 .447GE-01 .281101-el
Sao 3.173 2.874 3.594 2.987 2.006 1. In .4809E-02 .3me-02
LA202 .392111-01 .3"s 1.450 .7794 .2750 .11" .43M-02 .2471E-02
CE02 .172t .9105 2. 983 1.719 .6722 .2584 .20799-03 .1070E-03
W205 1.237 2.833 5.672 3.006 .6790 0 . 0. 0.
csI .7087E-01 .7304E-01 ."22E-01 .1074E-01 .16222-03 .440SE-18 .1402E-14 .147SE-14
co 54.78 21.67 16.24 17.33 19.01 17.46 10.20 9. In
OXIDE ELT TEMPW 2070. 2328. 2504. 2434. 2330. 2253. 2199. 2191.
SOLMICE RATE(OW/5) 3.982 12.16 32.94 87.50 271.8 284.1 44.07 32.37
AE1OsOL DENSITY(401/00) 4.9810 3.704 2.706 3.610 2.549 3.393 4.044 3.778
AEROSOL SIZE(MICID ) .7008 1.027 1.099 1.001 1.054 1.004 .8216 .6103
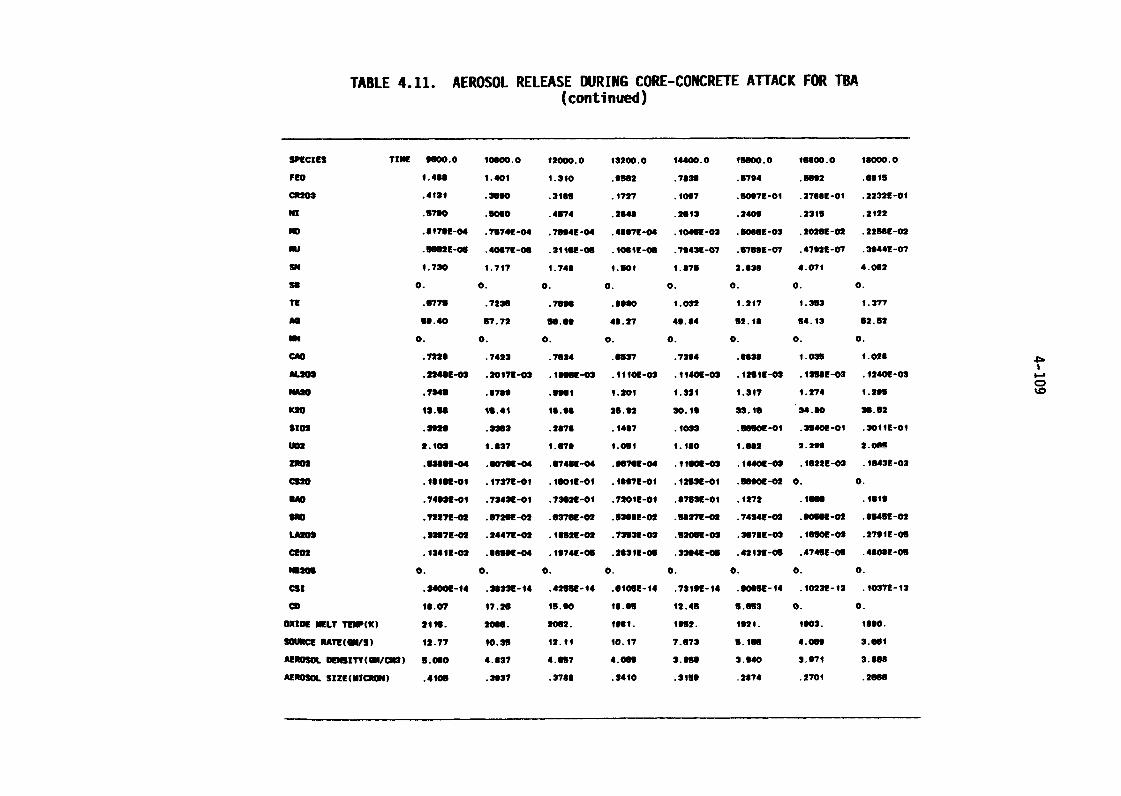
TABLE 411. AEROSOL RELEASE DURING CORE-CONCRETE ATTACK FOR TBA(continued)
SPECIES TIME 91100.0 Imerim.0 12000.0 13200.0 14400.0 104100.0 16800.0 18000.0
FED 1.489 1.401 1.310 .9562 .7938 .5794 .W92 .6815
=203 .4131 .3090 .3165 .1727 .1007 .909711-01 .27118E-01 .2232E-01
m .9790 .50110 .4574 .2846 .2613 .2409 .2315 .2122
.411792-04 .7574 04 .7694E-04 .4997E-04 .104GE-03 BME-03 .20M-02 .225BE-02
.91ME-08 .4067:--06 .311se-als .106it-08 .7943E-07 .1179GE-07 .47922-07 .3944E-07
gm f.730 1.717 1.748 1.501 1.879 2.838 4.071 4.082
SO 0. 0. 0. 0. 0. 0. 0. 0.
TE .6779 .7238 .7696 .8000 1.0" 1.217 1.353 1.377
50.40 $7.72 98.99 48.27 49.84 92.12 64.13 62.52
0. 0. 0. 0. 0. 0. 0. 0.
.7228 .7423 .7624 .6537 .7304 .0839 i.038 1.029
AL202 "48E-M .2017E-03 IME-03 .11IOE-03 .114OL-03 .1261E-03 .136SE-03 .12401-03
NA20 .7249 .8789 .9961 1.20i 1.321 1.317 1.274 1.295
K20 Is." 16.41 Well ". 02 Will 33.19 34.90 38.52
SIDE .2929 .3363 .2878 .1487 tO33 .91HPOE-01 .3540E-Ol .30ilE-01
U02 2.102 1.837 1.079 1.0111 i.190 1.622 2.290 2_0105
ZROM MM-04 .907W-04 .974SE-04 gay.1-04 . I low-as .144OL-03 .1922E-03 .1643E-03
C220 .1819E-Ol .1737E-01 .1901E-01 .1867E-01 .1263E-01 .98M-02 0. 0.
an .749211-oi .7343E-01 .7382E-01 .72019-01 .07539-01 .1272 I"� .1819
No .7227E-02 .972GE-02 .937SE-02 .938GE-02 U37E-02 .74249-02 .90ME-02 .854SE-02
LA208 .3297E-02 .2447E-02 .1492E-02 .7293E-02 .62ON-02 .367SE-03 .law-09 .27OIE-05
cm .1341E-03 .88SOE-04 .1974E-05 .2831E-08 .32949-00 .4213E-05 .474SE-05 .4808E-06
W209 0. 0. 0. 0. 0. 0. 0. 0.
CSI .34OOE-14 .38VA-14 .425a -14 .810BE-14 .73IOE-14 .9006E - 14 .10231!-13 .10971-i3
co i 9. 07 17.26 15.90 18.95 12.48 9.693 0. 0.
OXIDE MELT EW(K) 2119. 20". 2m. fell. 1962. Ml. 1003. 1890.
SOMM RATE(M/S) 12.77 10.39 12.11 10.17 7.672 5.196 4.069 3.861
AEROSOL ENSITY(M/Cna) 5.020 4.837 4.957 4.0119 3. 999 3.940 3.971 3.888
AEROSOL IZE(MI .4105 .3937 .3788 .3410 .3199 .2874 .2701 .20"
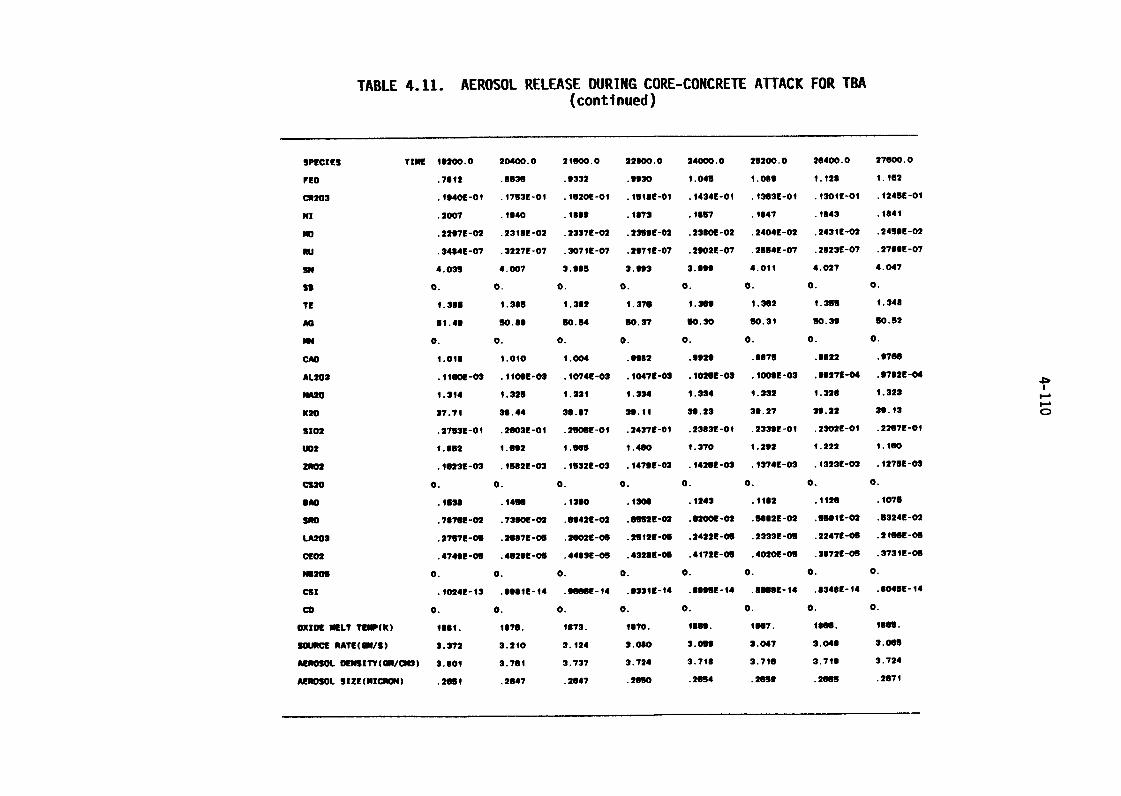
TABLE 411. AEROSOL RELEASE DURING CORE-CONCRETE ATTACK FOR TBA(continued)
SPECIES TIM 19200.0 20400.0 219M.0 22600.0 24000.0 25200.0 26400.0 276M. 0
PEO .7012 .8636 .9332 .9920 1.045 1.099 IA28 1.102
C0203 AME-01 .1753E-01 AME-01 .15189-01 .1434E-01 .1363E-01 .130if-ol .124SE-01
ml .2007 .1940 .1099 .1873 A887 .1847 .1843 .1841
'O .:2:7:-02 .231::-:2 .2337:-02 .2359:-02 .2380E-02 .2404:-02 .243::-02 .24:::-02
Itu 4 4 07 .322 - 7 .3071 07 .297i 07 .29022-07 .2854 07 .202 -07 .27 -07
sm 4.035 4.007 3.995 3.993 3.999 4.011 4.027 4.047
so 0. 0. 0. 0. 0. 0. 0. 0.
TE 1.286 1.389 i.322 1.376 1. 3" i.362 1.355 1.348
AG 51.49 90.89 50.54 50.37 90.30 50.31 50.39 50.52
m 0. 0. 0. 0. 0. 0. 0. 0.
CAO i.016 1.010 1.004 .9982 .9929 .9875 .9822 .9706
AL202 I IWE-03 A109E-03 .10749-03 .10471-03 .10202-03 .1008E-03 .99279-04 .9782E-04
NM 1.314 1.325 1.231 i.334 1.324 i.232 1.328 1.323
K20 27.71 38.44 38.67 I 39.23 39.27 39.22 39.13 CD
S102 .27532-Oi .29032-01 .25"E-01 .2437E-01 .2383E-01 .2339F-01 .2302E-Oi .2287E-01
W2 1.852 1.692 1.865 i.400 1.370 1.292 i.222 1.180
ZWO2 A6232-03 .1582E-03 .1532E-03 .14799-03 .1426E-03 A374E-03 .1323E-03 .12759-03
C520 0. 0. 0. 0. 0. 0. 0. 0.
VIAO .1538 .t4w .1300 .1908 .1243 .1182 A1218 .1075
sm .78799-02 .7300E-02 .6942E-02 .06529-02 .620OL-02 .9082E-02 .659it-02 .6324E-02
LA203 .2757E-05 .2687E-05 .26ME-06 .29121-05 .24221-06 .2322f-05 .22479-05 .216SE-05
CE02 .4749E-05 .4629E-05 .4483E-09 .43209-05 .4172E-05 .4020E-09 .38721-09 .3731E-05
W205 0. 0. 0. 0. 0. 0. 0. 0.
C31 .1024E-13 .99911-14 .911901-14 .93319-14 .999BE-14 SMOE-14 .8349E-14 .9045E-14
CD 0. 0. 0. 0. 0. 0. 0. 0.
OXIVE WLT TOW(K) loll. 1876. 1873. 1870. lose. 1867, low. lees.
6011 CE RAT11(001/2) 3.372 3.210 3.124 3.090 3.099 3.047 3.049 3.005
AER050 0EMITY(ON/CM) 3.801 3.761 3.737 3.724 3.718 3.716 3.719 3.724
AEMML SIZE(MIMM) .2661 .2647 .2947 .2690 .2694 .2099 .201155 .2671
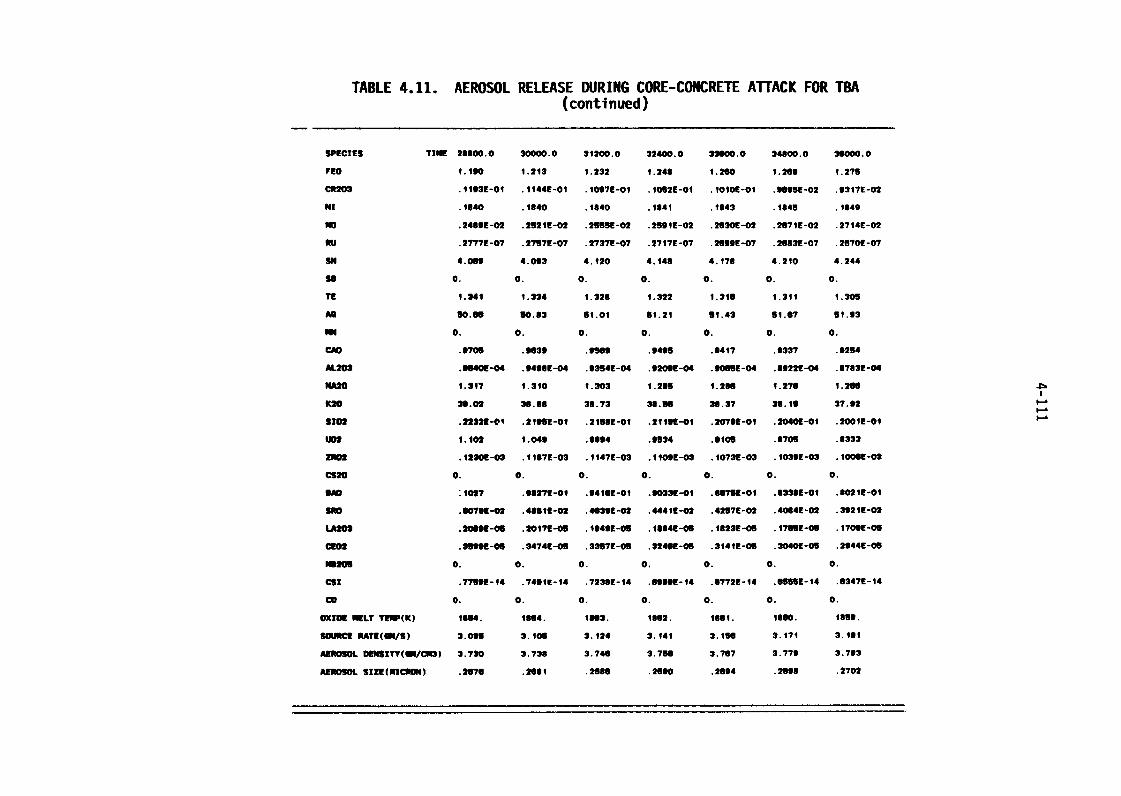
TABLE 411. AEROSOL RELEASE DURING CORE-CONCRETE ATTACK FOR TM(continued)
SPECIES TIM 28800.0 30000.0 31200.0 32400.0 33800.0 24800.0 38000.0
rEO i.190 1.213 1.232 1.248 1. m 1.269 1.275
CH203 iI931-01 Ii4ff-oi .1097E-01 W92E-01 . 10101!-Oi .989SE-02 .9317E-02
"I .1840 .1840 .1840 .1041 .1843 .1645 .1849
no .24SOE-02 .2521E-02 .25639-02 .2591E-02 .2630E-02 .2971E-02 .2714E-02
NJ .2777E-07 .2797E-07 .2737E-07 .2717E-07 .2999E-07 .2683E-07 .287OF-07
gm 4.069 4.093 4.120 4.i4d 4.178 4.210 4.244
se 0. 0. 0. 0. 0. 0. 0.
TE 1.341 i.334 1.228 1.222 1.319 1.31i 1.309
AG go. SO 50.83 51.01 51.21 51.43 91.67 51.93
RN 0 0. 0. 0. 0. 0. 0.
CAO .9705 ."39 . 9" .9495 W7 .9337 .9254
AL202 .964OE-04 .9498E-04 .9354E-04 .92091-04 .905SE-04 .8922E-04 .8783E-04
NM 1.317 i.310 1.303 1.295 1.286 1.276 1. "
920 39.02 39.88 30.73 38.96 38.27 38.19 37.92
3102 .22322-01 .21961-01 .2158E-01 .21192-01 .20799-01 .2040E-01 .200iE-01
tw2 1.102 1.049 .9994 .9524 .9105 .8705 .8333
ZRO2 .1230E-03 .1197E-03 .1147E-03 .1iOPE-03 .1073E-03 .1039E-03 .100GE-08
C520 . 0. 0. 0. 0. 0. 0.
VW '.1027 .98279-01 .94169-01 .9033E-01 .067SE-01 .233BE-01 .9021E-01
Sao .90792-02 .48912-02 .463VE-02 .444if-02 .4257E-02 .4064E-02 .3921E-02
LA202 .20492-06 .2Oi7E-05 WSE-05 .1804E-08 .1823E-05 .176SE-05 .1700E-05
cm .3999E-05 .3474E-00 .3357E-08 .324GE-08 .31411-05 .30409-05 .2944E-05
M205 0 . 0. 0. 0. 0. 0. 0.
Csl .7759E-14 .749it-i4 .723BE-14 .699ge-14 .8772E-14 MBE-14 .6347E-14
co 0. 0. 0. 0. 0. 0. 0.
OXIDE T IMM 1064. 1004. 1863. 1062. 1861. 1890. 1899.
SOURCE RATE(SP/2) 3.006 3.106 3.124 3.141 3.1se 3.171 3.191
AEROSOL OEWlTV(W/CW3) 3.720 3.738 3.746 3.756 3.787 3.779 3.793
AEROSOL SIZE(NICRON) .2670 .2601 .2880 .2690 .2694 .2998 .2702
5-1
5. RADIONUCLIDE RELEASE AND TRANSPORT
5.1 _S3HF Sequence
Three scenarios are examined which each have the same primary system
behavior.
5.1.1 Release and Transport in RCS
An overview of fission product behavior in the RCS during the period
from beginning of radionuclide release from fuel pins to the time of head
failure is provided in Tables 5.1 and 52 and Figures 5.1 through 54.
Table 5.1 gives the progression, in 23 minute intervals, of the
total deposit on RCS internal structural surfaces of three volatile fission
product species, CsI, CsOH, and Te, as well as that of aerosol material. For
comparison the total masses of these species released from the fuel as
functions of time are also presented. The data show a generally monotonic
increase in captured mass for all four species with slight reevaporation of
the volatile fission products late in the sequence. At the time of head
failure, 68.9 percent of CsI, 76.1 percent of CsOH, 91.0 percent of Te, and
74.1 percent of aerosol mass released from the fuel to that time are retained
on internal RCS structural surfaces. The differences between these retention
fractions tell the physico-chemical story. CsI can only condense on structural
surfaces. CsOH has a moderate reaction rate with stainless steel while Te has
a high reaction rate with stainless steel. Aerosol particles are removed
predominantly by settling, except in the steam generator, where high
turbulence, surface area, and plug flow combine -to yield inertial deposition as
the dominant process.
Table 52 gives a summary of conditions at the time of head failure
for each of the elemental groups of fission products.
Figure 5.1 through 54 give a more detailed view of fission product
and aerosol behavior in the RCS as a function of time. Released masses are
shown for CsI, CsOH, Te, and total aerosols for each control volume with time.
These are the masses of the given species that have transported beyond the
indicated control volume and are therefore no longer subject to capture by

TABLE 5.1. MASSES OF DOMINANT SPECIES RELEASED FRO14 FUEL (TOTAL)AND RETAINED ON RCS STRUCTURES (RET) AS A-FUNCTION OFTIME -- S3HF SEQUENCE
CS1 CSOH TE AEROSOLTIME PET TOTAL PET TOTAL PET TOTAL PET TOTAL(S) (KG) (KG) (KG) (KG) (KG) (KG) (KG) (KG)
21977. .2 1.7 3.2 i3.2 .2 .7 3.3 32.0
22115. 1.2 3.7 11.1 25.3 .8 1.3 17.5 47.4
22255. 2.8 6.3 22.0 40.6 1.3 2.2 32.3 64.6
22392. 4.8 9.1 35.2 57.1 2.1 3.3 47.5 85.6
22531. 6.9 12.i 5O.i 74.6 3.1 4.6 66.4 iO9.5
22669. 9.0 15.1 64.7 92.3 4.2 8.3 87.2 132.1
22810. 10.7 17.9 79.8 108.9 5.9 9.9 108.5 155.8
22950. 12.6 20.4 91.1 i23.5 8.1 il.8 130.0 179.2 Ln
23087. 15.6 22.4 101.4 135.7 10.8 14.2 153.3 203.3
23225. 18.1 24.2 12O.i 146.2 i3.7 17.i 178.8 228.1
23384. 19.9 25.8 132.0 155.8 16.9 20.9 204.0 254.7
23502. 2i.3 27.6 141.2 167.3 20.8 24.1 230.3 296.8
23641. 2i.6 29.6 143.6 i8O.2 23.3 25.5 258.4 329.9
23780. 2i.4 30.0 143.6 183.0 24.0 26.0 263.1 343.6
239i9. 21.i 30.1 i42.2 183.5 24.4 26.4 264.4 352.7
24059. 21.0 30.1 141.3 183.9 24.6 26.6 264.9 357.1
24i9g. 20.9 30.i 140.9 i84.i 24.5 28.7 265.1 357.5
24339. 20.9 30.2 140.4 i84.i 24.4 26.7 265.1 357.6
24475. 20.8 30.2 140.2 184.2 24.4 26.7 265�1 357.6
24618. 20:8 30.2 140.1 184.2 24.3 26.7 265.i 357.6
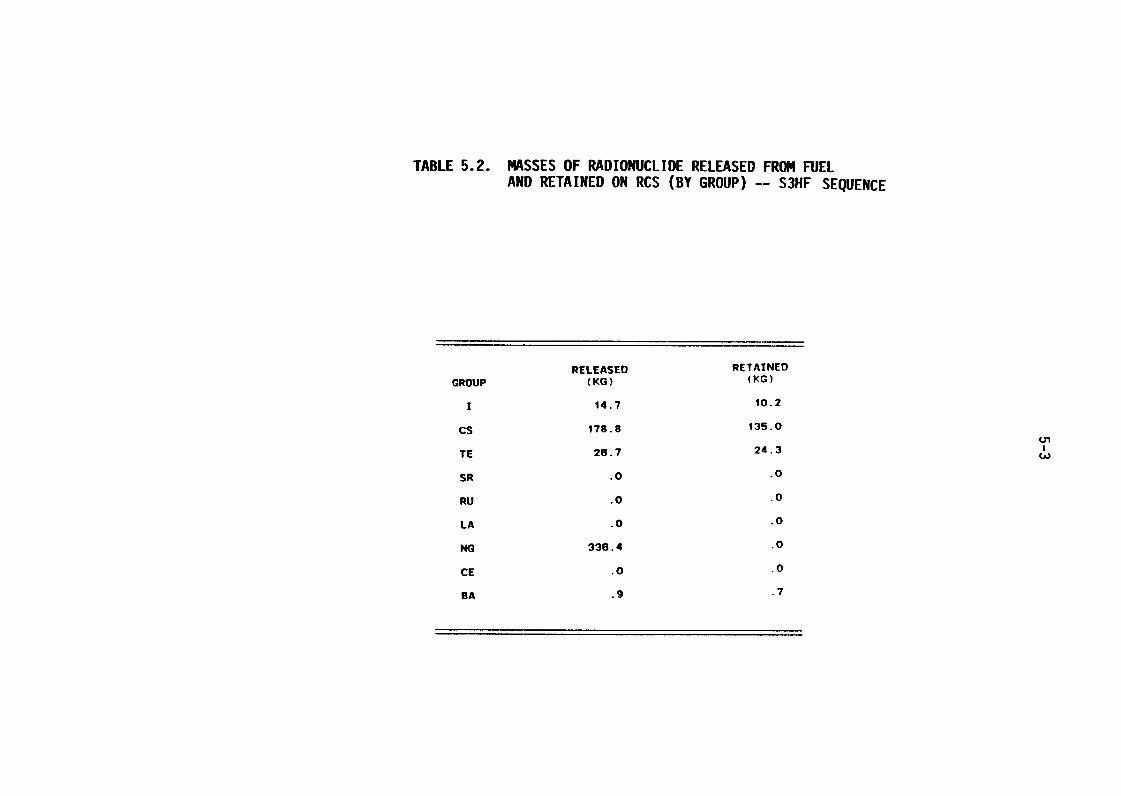
TABLE 52. MASSES OF RADIONUCLIDE RELEASED FROM FUELAND RETAINED ON RCS (BY GROUP) -- S3HF SEQUENCE
RELEASED RETAINEDGROUP (KG) (KG)
1 14.7 10.2
Cs 178.8 i35.0
TE 28.7 24.3
SR .0 .0
RU .0 .0
LA .0 .0
NG 336.4 .0
CE .0 .0
OA .9 .7
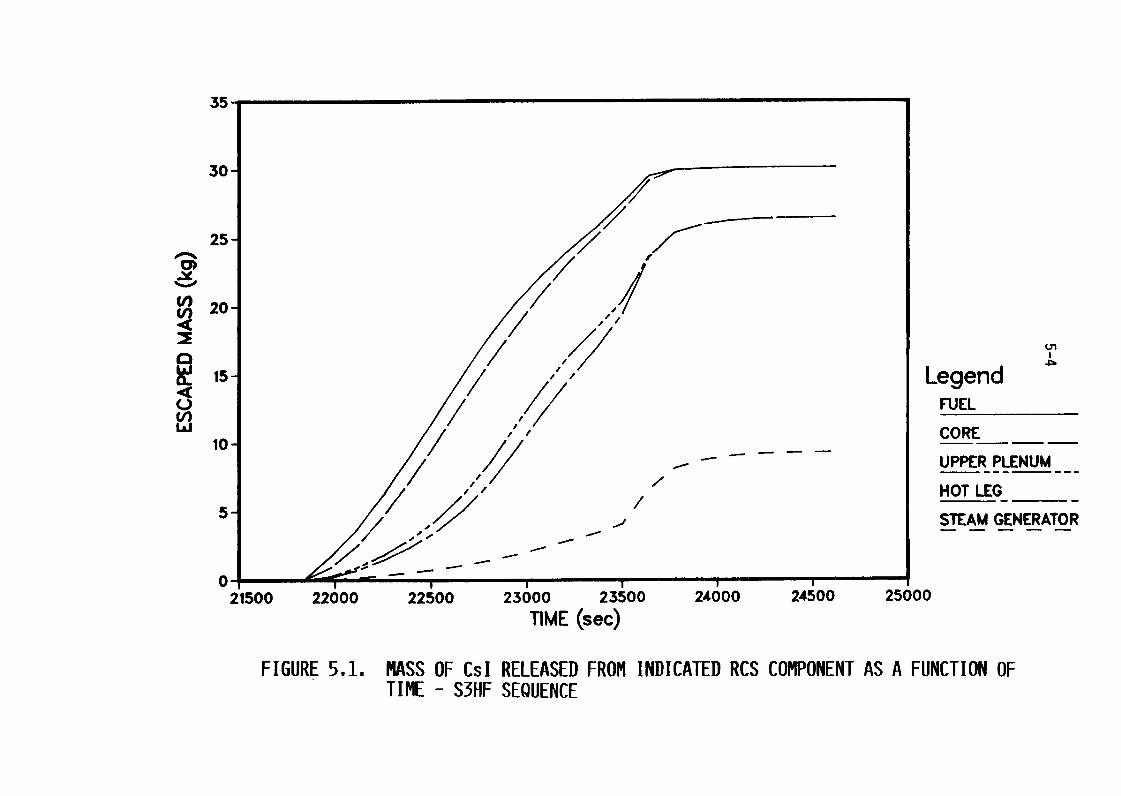
35
30
25-
20-
15- LegendFUEL
(nIAJ CORE
10
of UPPER PLENUMHOT LEG
STEAM GENERATOR
021500 22000 22500 23600 23500 24800 24900 25600
TIME (sec)
FIGURE 5.1. MASS OF CsI RELEASED FROM INDICATED RCS COMPONENT AS A FUNCTION OFTIME - 3HF SEQUENCE
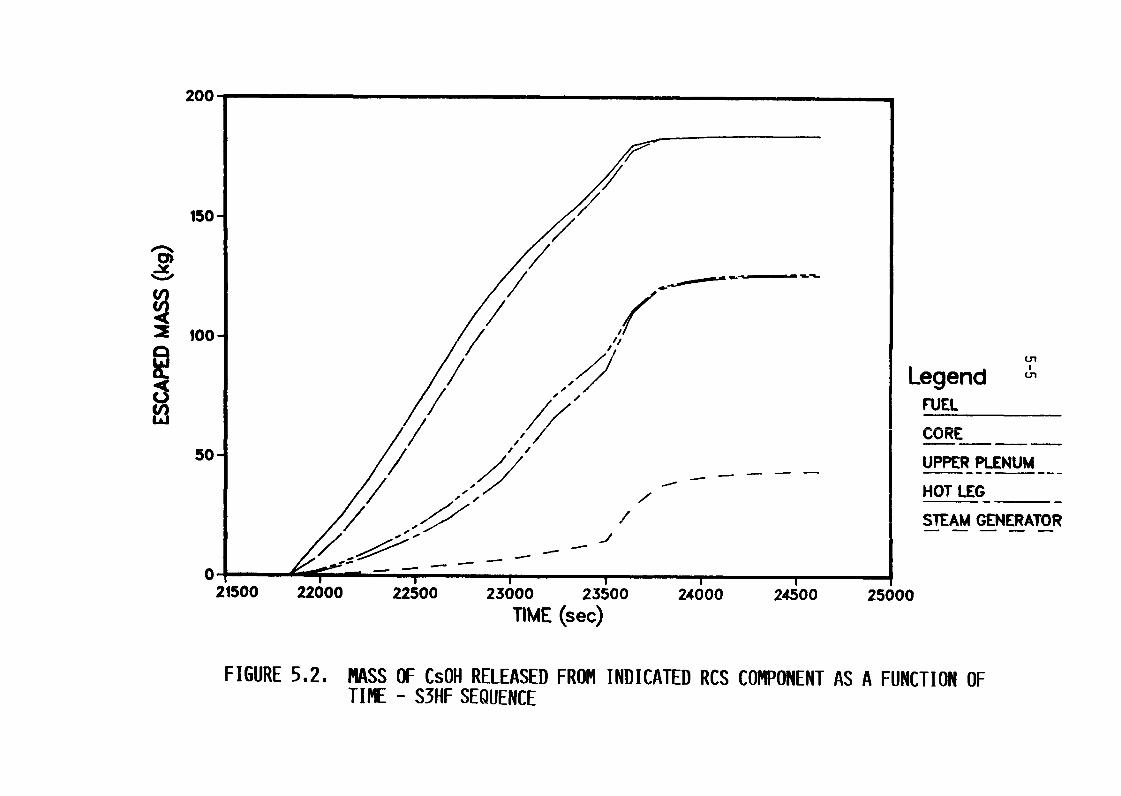
200
150
loo
LegendFUEL
CORE50 UPPER PLENUM
HOT LEG
STEAM GENERATOR
04-21500 22000 22500 23000 23500 24000 24500 25600
TIME (sec)
FIGURE 52. MASS OF CsOH RELEASED FROM INDICATED RCS COMPONENT AS A FUNCTION OFTIME - S3HF SEQUENCE
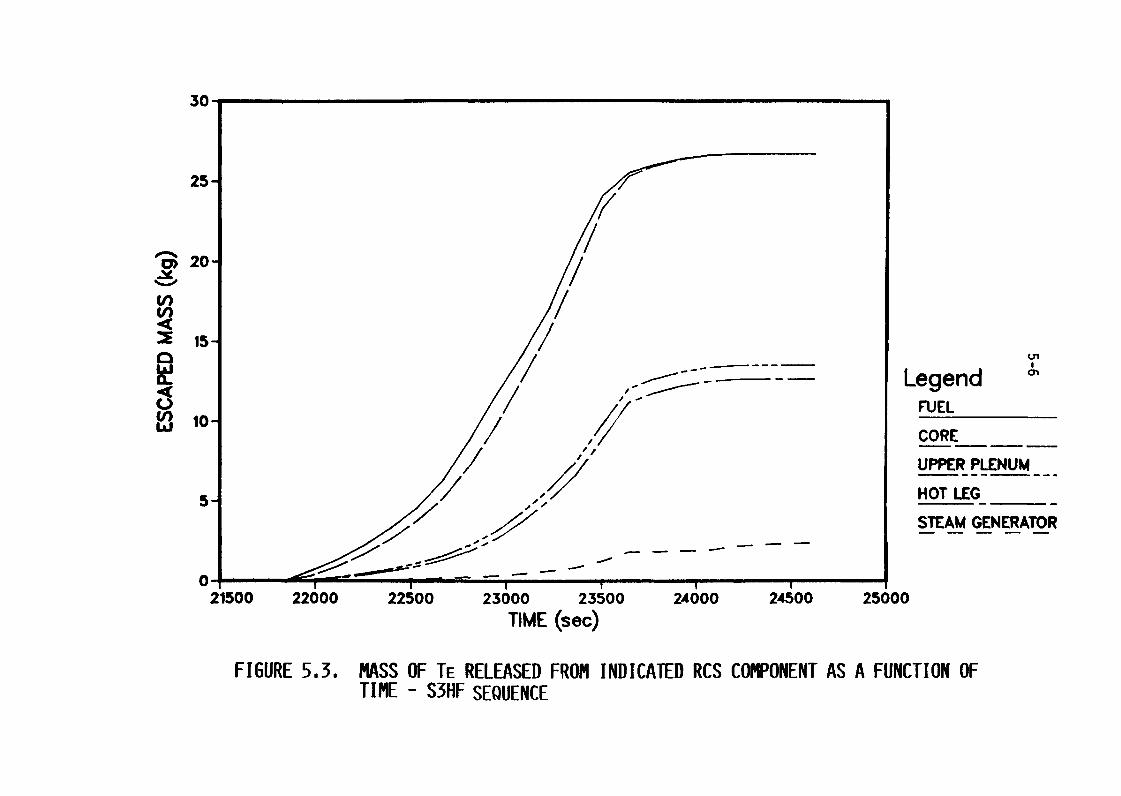
30-
25
20
15
LegendFUEL
loCORE
UPPER PLENUM
5 HOT LEGSTEAM GENERATOR
0i1500 22600 22iOO 23000 23500 24000 NgOO 25600
TIME (sec)
FIGURE 53. MASS OF TE RELEASED FROM INDICATED RCS COMPONENT AS A FUNCTION OFTIME - S3HF SEQUENCE
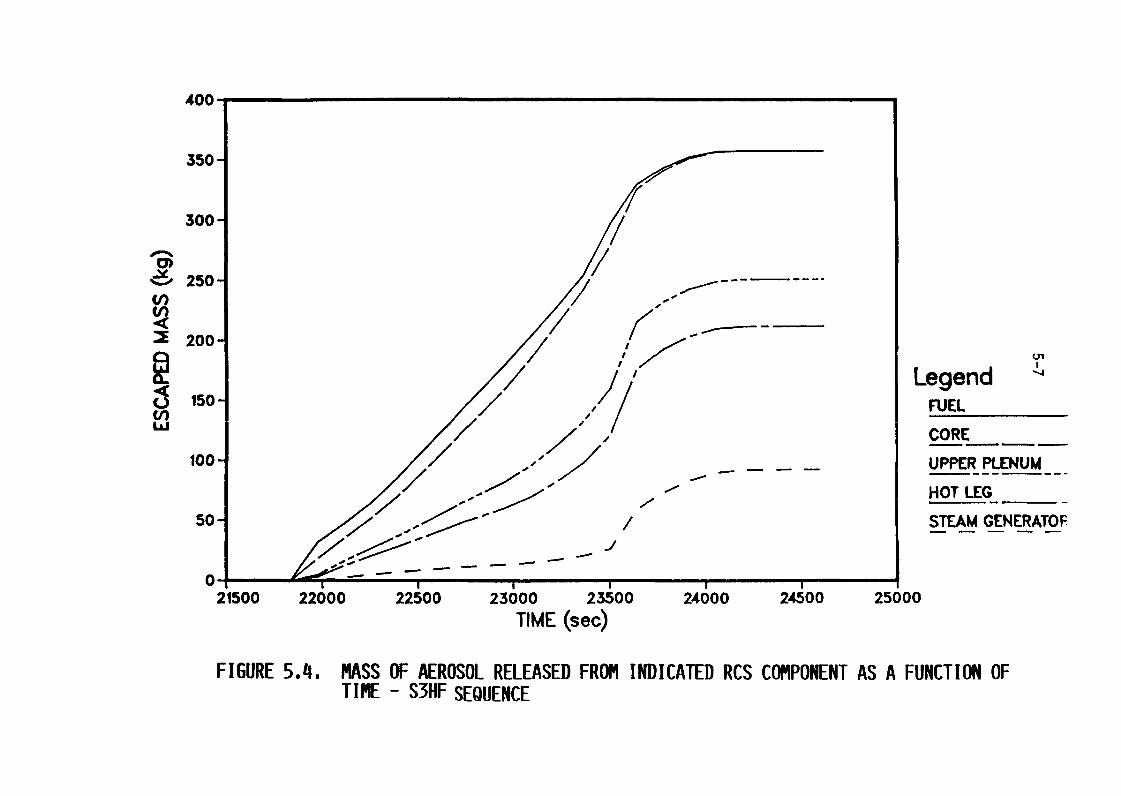
400-
350-
300-
op-%co
250-
200
Legend150 FUEL
CORE
100 UPPER PLENUM
HOT LEG
50 STEAM GENERATOF
J
021500 22000 22500 2.3000 2.3;00 24000 24�00 25000
TIME (sec)
FIGURE 54. MASS OF AEROSOL RELEASED FROM INDICATED RCS COMPONENT AS A FUNCTION OFTIME - 3HF SEQUENCE
5-8
that volume. The escaped mass from the steam generator is therefore the
(cumulative) mass released to the containment. The escaped mass from the fuel
gives the (cumulative) mass released for transport through the RCS. Only the
upper plenum and steam generator tubes are seen to play a significant role.
5.1.2 Release and Transport in Containmentfor SiHF1 Scenario
In this scenario fission products are released into the lower
compartment both before and after vessel failure. However, the fission
products released from the primary system after vessel failure are released
through the reactor cavity water and thus are subject to scrubbing. The
fission products are released into the lower compartment throughout the entire
release period. From the lower compartment the fission products flow through
the ice condenser and into the upper compartment, where they are released to
the environment. The calculational procedure for this scenario is given in
Figure 5.5.
Table 53 summarizes the release of radionuclides to the containment
from the reactor coolant system during the in-vessel melting period, the puff
at the time of vessel failure, and during core-concrete interaction.
The size distribution of airborne particles in the upper compartment
is shown in Table 54, and the fraction of the core inventory released to the
environment from the upper compartment is listed in Table 5.5. Table 56
presents the locational distribution of each fission product after the scenario
is completed.
As can be seen in Table 56, the majority of the fission products
which are released from the core are retained in the primary system, the
cavity water, or the ice condenser. The integrated decontamination factor for
the ice condenser varies somewhat with the species but is about 4 As a
result of these factors, the amount of fission product released to the
environment is fairly low, about percent of the I, 4 percent of the Cs, and
1 percent of the Te inventories. The decontamination factor for the ice
condenser will be discussed further in Section 56.
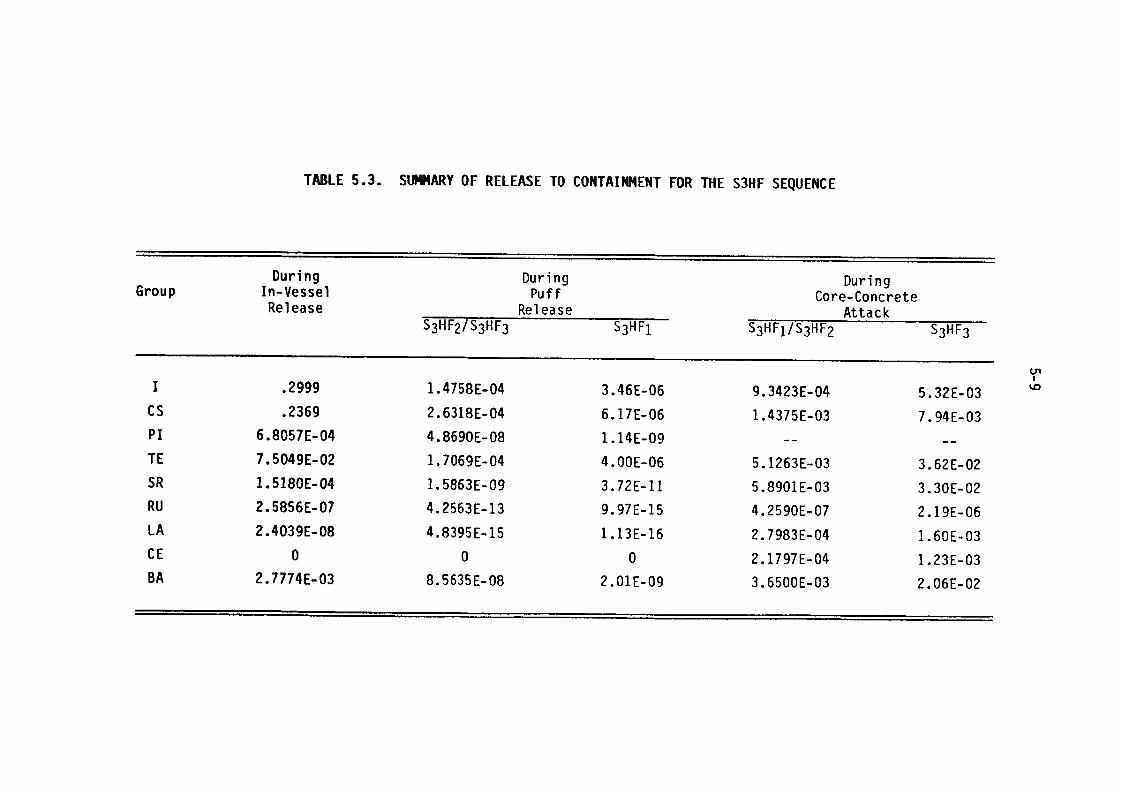
TABLE 53. SUMMARY OF RELEASE TO CONTAINMENT FOR THE S3HF SEQUENCE
During During DuringGroup In-Vessel Puff Core-Concrete
Release Release AttackS3HF2/S3HF3 S3HFj S3HFI/S3HF2 S3HF3
.2999 1.4758E-04 3.46E-06 9.3423E-04 5.32E-03
Cs .2369 2.6318E-04 6.17E-06 1.4375E-03 7.94E-03
Pi 6.8057E-04 4.8690E-08 1.14E-09
TE 7.5049E-02 1.7069E-04 4.OOE-06 5.1263E-03 3.62E-02
SR 1.5180E-04 1.5863E-09 3.72E-11 5.8901E-03 3.30E-02
RU 2.5856E-07 4.2563E-13 9.97E-15 4.2590E-07 2.19E-06
LA 2.4039E-08 4.8395E-15 1.13E-16 2.7983E-04 1.60E-01
CE 0 0 0 2.1797E-04 1.23E-03
BA 2.7774E-03 8.5635E-08 2.01E-09 3.65OOE-03 2.06E-02
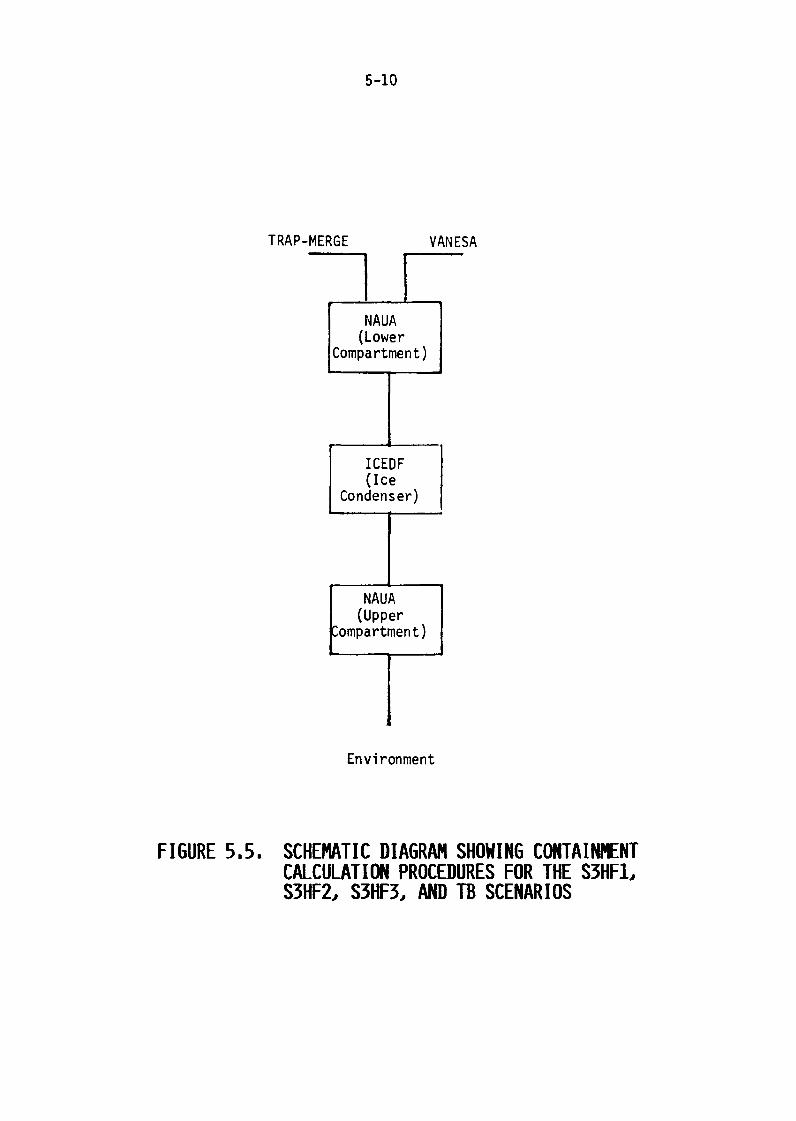
5-10
TRAP-MERGE VANESA
NA(Lower
Compartment)
ICEDF(Ice
Condenser)
NAUA(Upper
Compartment)
Environment
FIGURE 5.5. SCHEMATIC DIAGRAM SHOWING CONTAINMENTCALCULATION PROCEDURES FOR THE S3HFloS3HF2,o S3HF3.o AND TB SCENARIOS
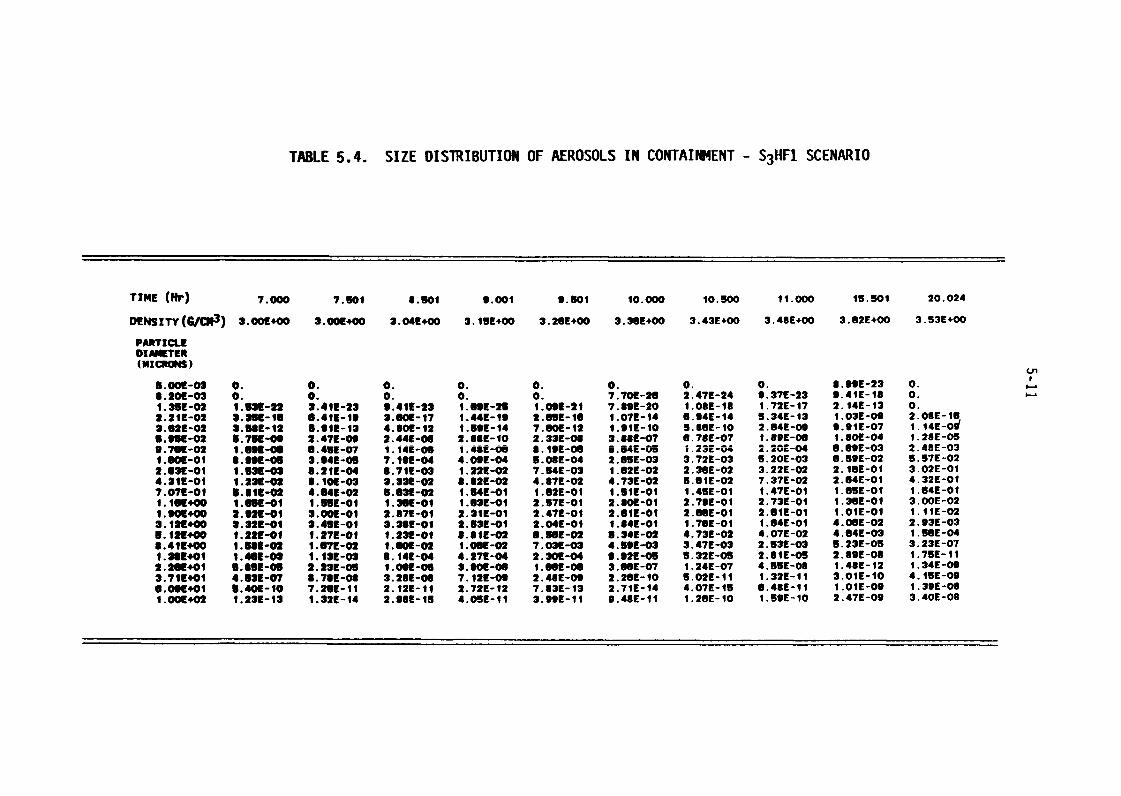
TABLE 54. SIZE DISTRIBUTION OF AEROSOLS IN CONTAINMENT - S3HF1 SCENARIO
T I ME (fr) 7.000 7.501 B. 01 9.001 9.501 10.000 10.500 11-000 Is. 01 20.024
DENSITY(G/CN3) 3OE*OO 3 OOE+00 3.04E+oo 3. 15E+00 3.26E+00 3. 3SE400 3.43E+00 3.48E+00 3.62E+00 3.53E+00
PARTICLEDIAMETER(MICRONS)
5.001!-03 0. 0. 0. 0. 0 . 0 . 0 . 0 . 8.99E-23 0 .8.20E-03 0. 0. 0. 0. 0. 7.70E-26 2.47E-24 9.37E-23 9.41E-18 0.1.352-02 I.M-22 3.412-23 9.411-23 i.69E-29 1.091-2i 7.89E-20 I.OBE-18 1.72E-17 2.14E-13 0.2.21E-02 2.359-16 9.41E-19 3.6OE-17 1.44E-19 2.659-16 1.079-14 6.94E-14 5.34E-13 1.03E-09 2.OGE-iS3.62E-02 3.UE-12 $.oil-13 4.901!-12 1.599-14 7.GM-12 1.919-10 5.86E-lo 2.64E-09 9.91E-07 1.14E-Od5.95E-02 8.75E-00 2.479-00 2.449-06 2.84E-10 2.33E-06 3.881-07 6.78E-07 1.89E-06 1.80E-04 1.28E-05
7GE-02 1.6911-00 6.451-07 1.142-09 i.481-00 l.i9E-OG 8.64E-05 i.23E-04 2.20EE-04 8.69E=03 ft.48E-039. 6.59E-02 ;.57E-021.90E-Ol 4.991-05 3.94E-05 7.itE-04 4.091-04 5.08E-04 2.GSE-O3 3.72E-03 5.20E-032.63E-01 1.629-03 8.21E-04 6.71E-03 1.22E-02 7.54E-03 1.62E-02 2.36E-02 3.22E-02 2.16E-Ol 3.02E-Ol4.31E-01 1.23E-02 8. IOE-03 3.33E-02 8.82E-02 4.87E-02 4.73E-02 5.61E-02 7.37E-02 2.64E-01 4.32E-017.079-01 5.811-02 4.94E-02 9.63E-02 1.54E-01 1.02E-01 1.91E-Ol 1.45E-01 1.47E-01 1.6SE-01 1.64E-011. l6E+O0 I.Me-01 1.98E-Ol 1 3SE-01 1.63E-01 2.57E-01 2.80E-Ol 2.79E-Oi 2.73E-01 1.36E-01 3.OOE-021. 01+00 2.92E-01 3.00E-Ol 2.87E-01 2.31E-01 2.472-01 2.619-01 2.66E-Ol 2.61E-Ol 1.01E-Ol 1.11E-023. 09+00 8.32E-01 2.46E-01 3.392-01 2.53E-01 2.04E-Ol 1.84E-01 1.76E-01 1.64E-01 4.OGE-O2 2.93E-035. 12E+W 1.221-01 1.27E-01 1.239-01 8.811-02 0.989-02 9.34E-02 4.73E-02 4.07E-02 4.64E-03 1.56E-048.419400 I.Mg-02 1.672-02 1.906-02 I.OGE-02 7.03E-03 4.599-03 3.47E-03 2.53E-03 5.23E-05 3.23E-071. =E+01 1.4611-03 1. 132-03 8.14E-04 4.279-04 2.30E-04 9.92E-05 5.32E-05 2.81E-03 2.89E-08 1.75E-112.2W+Ol 9.869-09 2.239-05 1.099-05 3.9OE-OG I.WE-06 3.96E-07 1.24E-07 4.53E-08 1.48E-12 i.34E-093.711+01 4.932-07 8.78E-08 3.289-08 7.12E-09 2.48E-09 2.28E-10 5.02E-11 1.32E-ii 3.01E-10 4.15E-096.09t+01 5.409-10 7."E-11 2.12E-11 2.72E-i2 7.83E-13 2.719-14 4.07E-15 6.48E-ii 1.01E-09 1.39E-081.001!+02 1.23E-13 1.32E-14 2.98E-13 4.OSE-11 3.99E-ii 9.48E-11 1.26E-10 1.59E-10 2.47E-09 3.40E-08
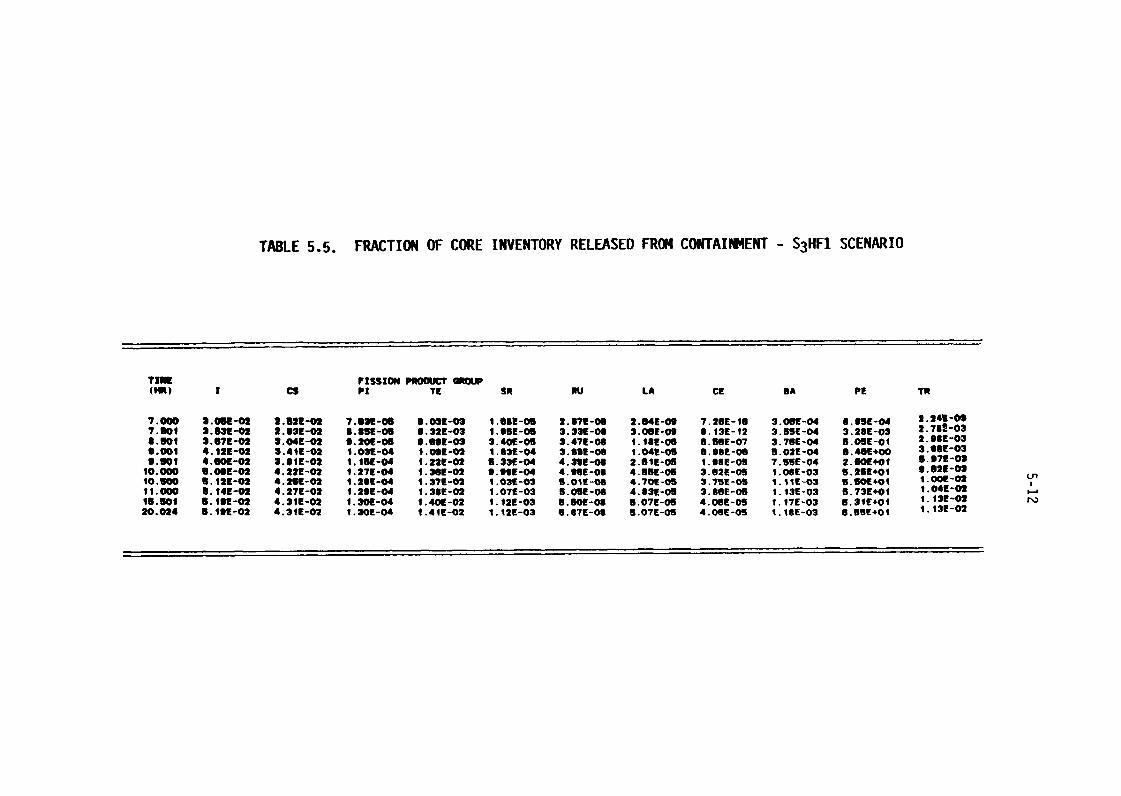
TABLE 5. FRACTION OF CORE IVENTORY RELEASED FROM COMMENT - S3HF1 SCENARIO
Tim FISSION PRODUCT(Hit) I Cs Pt TE SR PU LA CE BA PE Tot
7.000 3.0511-02 2.52t-oa 7. 3E 06 8.032-03 1.982-05 2. 87E 08 2.64E-09 T. 2GE- 16 3.08f-04 9. OSE-04 2.2419-os7.501 3.639-02 2.939-02 8.852-06 0. "E-03 1.95E_05 3.33E-08 2.06E_09 S. 13C - 12 3.59E-04 3.28E-03 2.752-032.501 3.679-02 3.04E-02 9.209-06 9.69E-03 3.40E-05 3.47E-00 i.IIE-06 6.56E-07 3.76E-04 5.05E-ol 2.98E-039.001 4.122-02 3.4it-02 1.03E-04 i.09E_02 1.632-04 3.812-09 1.04E-05 9.9st-06 5.021-04 6.499+00 3.261-03
1:.901 4.WE-02 3.8JE-02 1.159-04 1.22E-02 5.33E-04 4. ne -Os 2.61E-05 1.98E_05 7.55E-04 2. M+ 1 5.97f-os.000 5.09E-02 4.222-02 1.27E-04 i.36E-02 9.991-04 4. "E -08 4.581-05 3.62E-05 i.O$E-03 5.26f*ol 9.921E-03
10.5w 6.129-02 4.2ff-02 i.289-04 1.37E-02 1.03E-03 S.012-06 4.70E-05 3.75t-05 i.IIE-03 S.IM+01 1.00f-0211.000 5.14E-02 4.279-02 1.292-04 1.3$E-02 1.079-03 5.05E-08 4.03E-08 3.86E_05 1.13E-03 5.73E+01 1.04E-0219.501 6.191-02 4.31E-02 i.30E-04 1.40E-02 1.12E-03 5.wt-Oe 5.07E-05 4.08E-05 1.17E-03 1.139-02
5.19E-02 1.12E-03 6.67E-06 5.07E-05 4.0GE-05 1.19E-03 6.55f+of 1.13E-0220.024 4.31E-02 1.30E-04 1.41E-02 E*01
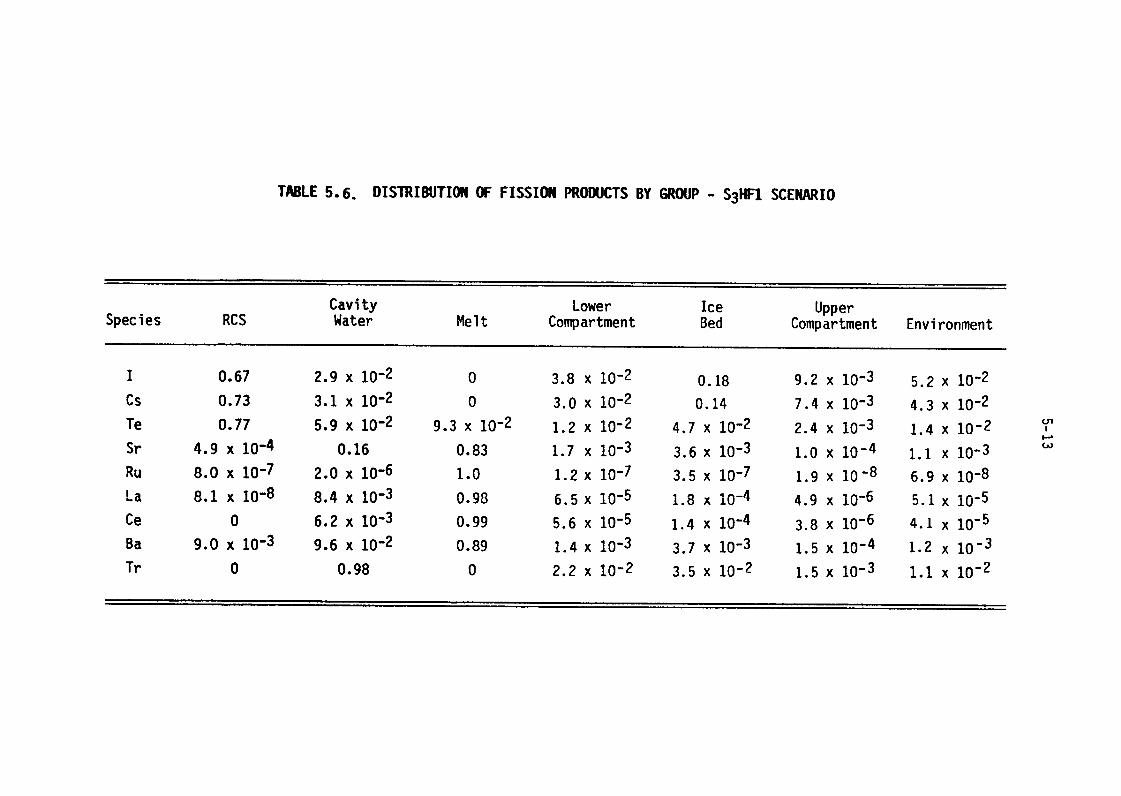
TABLE 56. DISTRIBUTION OF FISSION PRODUCTS BY GROUP - S3W1 SCENARIO
Cavity Lower Ice UpperSpecies RCS Water Melt Compartment Bed Compartment Environment
I 0.67 2.9 x 1-2 0 3.8 x 1-2 0.18 9.2 x 10⁻³ 5.2 x 1-2
Cs 0.73 3.1 x 1-2 0 3.0 x 10⁻² 0.14 7.4 x 10⁻³ 4.3 x 10⁻²
Te 0.77 5.9 12 9.3x 10⁻² 1.2 x 10⁻² 4.7 x 1-2 2.4 x 10⁻³ 1.4 x 10⁻² Ln
Sr 4.9 x10⁻⁴ 0.16 0.83 1.7 x 10⁻³ 3.6 x 10⁻³ 1.0 x 10⁻⁴ 1.1 x 10⁻³
Ru 8.0 x10⁻⁷ 2.0 x 10⁻⁶ 1.0 1.2 x 10⁻⁷ 3.5 x 10⁻⁷ 1.9 x 10⁻⁸ 6.9 x 10⁻⁸a 0 -IA-A A - I -1 1% nn , -- -, ._r . ^ q--A . - .-- c I .-
U..L AIV Q.'t A IV - V. 10 D.D x IV i.0 x IV -T 4. 1jxIu-V D.1 x lu-j
Ce 0 6.2 x 10⁻³ 0.99 5.6 x 10⁻⁵ 1.4 x 10⁻⁴ 3.8 x 10⁻⁶ 4.1 x 10⁻⁵
Ba 9.0 x10⁻³ 9.6 x 1-2 0.89 1.4 x 10⁻³ 3.7 x 10⁻³ 1.5 x 10⁻⁴ 1.2 x 10⁻³
Tr 0 0.98 0 2.2 x 10⁻² 3.5 x 10⁻² 1.5 x 10⁻³ 1.1 x 10⁻²
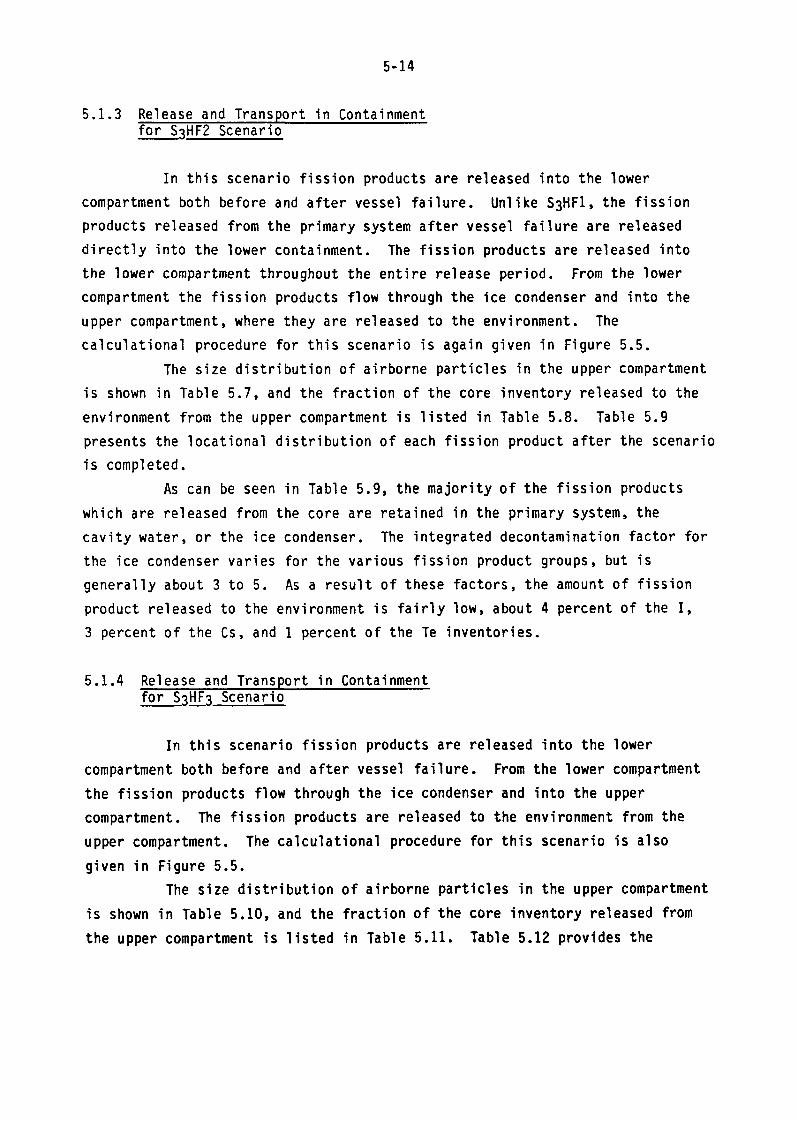
5-14
5.1.3 Release and Transport in Containmentfor SiHF2 Scenario
In this scenario fission products are released into the lower
compartment both before and after vessel failure. Unlike S3HF1, the fission
products released from the primary system after vessel failure are released
directly into the lower containment. The fission products are released into
the lower compartment throughout the entire release period. From the lower
compartment the fission products flow through the ice condenser and into the
upper compartment, where they are released to the environment. The
calculational procedure for this scenario is again given in Figure 5.5.
The size distribution of airborne particles in the upper compartment
is shown in Table 57, and the fraction of the core inventory released to the
environment from the upper compartment is listed in Table 5.8. Table 59
presents the locational distribution of each fission product after the scenario
is completed.
As can be seen in Table 59, the majority of the fission products
which are released from the core are retained in the primary system, the
cavity water, or the ice condenser. The integrated decontamination factor for
the ice condenser varies for the various fission product groups, but is
generally about 3 to 5. As a result of these factors, the amount of fission
product released to the environment is fairly low, about 4 percent of the I,
3 percent of the Cs, and percent of the Te inventories.
5.1.4 Release and Transport in Containmentfor SqHFq Scenario
In this scenario fission products are released into the lower
compartment both before and after vessel failure. From the lower compartment
the fission products flow through the ice condenser and into the upper
compartment. The fission products are released to the environment from the
upper compartment. The calculational procedure for this scenario is also
given in Figure 5.5.
The size distribution of airborne particles in the upper compartment
is shown in Table 5.10, and the fraction of the core inventory released from
the upper compartment is listed in Table 5.11. Table 512 provides the
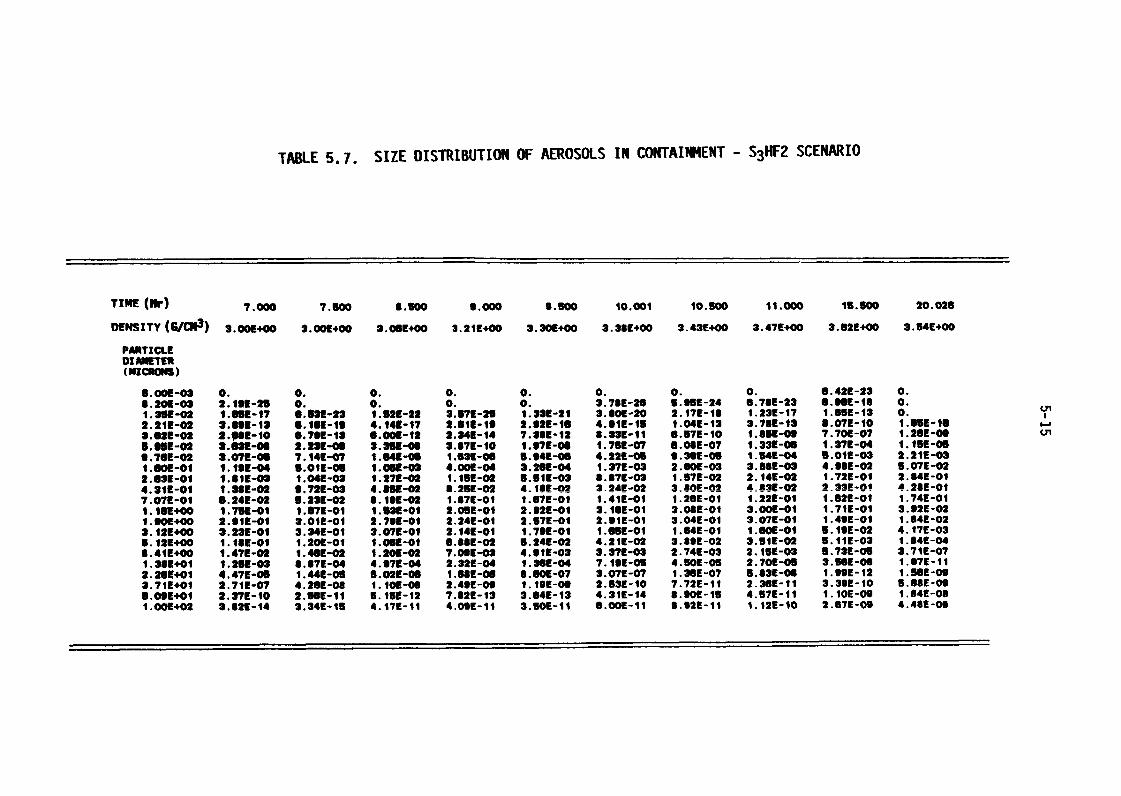
TABLE 57. SIZE DISTRIBUTION OF AEROSOLS IN CONTAINMENT - S3HF2 SCENARIO
TIME (r) 7.000 ?.GM 8.900 9.000 S. SW io.001 10.500 11.000 15.900 20.026
DENSITY (G/CN3) 3.ooE+oo 3.009+00 2. 06E+00 3.21E+00 3.30E+00 3.381!+00 3.43E+00 3.47E+00 3.62E+00 3.54E+oo
PMTICLEDIAWTER(Mir, la NO
S.00E-03 0. 0. 0. 0. 0. 0. 0. 0. 6. 42E-23 0 .8 2K-03 2.192-29 0. 0. 0. 0. 3.789-26 5.95E-24 6. 79E-23 6.96E-le 0 .1. 5E-02 1.661-17 9.9311-23 1.520-22 3.572-29 1. 3E-21 3.$OE-" 2.17E-14 1. 23E- 17 1.659-13 a 2.211-02 3.891-12 9.161-19 4.141-17 2.811-19 2.929-19 4.919-15 1.04E-13 3.761-13 8.07E-10 I.SSE-163.028-02 2."2-10 0.792-13 6.009-12 2.34E- 14 7.38E-12 8.339-11 6.57E-10 1.851-09 7.70L-07 1. 2SE 09B. ff-02 3AW-08 2.239-09 3.3u-" 3.87E-10 1.97E-04 1 75E-V? 6.08E-07 1.33E-06 1. 37E 04 1. ISE-059.71SE-02 3.079-08 7.14E-07 1.049-06 1.632-09 5.94E-09 4.221E-05 S. 3SE -05 1.54E-04 S.OVE-03 2.21E-031.190E-ol 1. ISE-04 5.01E-06 1.05[-03 4.OOE-04 3.29E-04 1.372-03 2.60E-03 3. SSE 03 4.98E-02 5.07E-022.63E-01 1.81E-03 i.041-02 1.279-02 1.15E-02 5.919-03 8.87E-03 1.57E-02 2.14E-02 1.72E-01 2.84E-014.3if-01 1.38E-02 9.729-03 4. am-02 2.2SE-0 4.141-02 3-241-02 3z�OE-0-2 4afff-02 2.331-01 4.29E-017.072-01 6.249-02 5.239-02 8.199-02 1.87E-01 i.679-01 1.41E-01 1.2SE-01 1.22E-01 1.62E-01 1.74E-01I.IGE+00 1.752-01 1.871-01 1.539-01 2.009-01 2.92E-01 3.16E-01 3.0�E-Oi 3.OOE-01 1.71E-01 3.92E-021.9"+00 2.919-01 3.01E-01 2.79E-01 2.24E-01 2.57E-01 2.91r-ol 3.04E-01 3.07E-01 1.49E-01 1.849-023.i2E+00 3.22E-01 3.341-01 3.079-01 2.14E-01 1.79E-01 1.19SE-01 1.64E-01 1.60E-01 5.19E-02 4.17E-039.12E+00 1.189-01 1.20E-01 1.059-01 6.8se-02 6.24E-02 4.21E-02 3.89E-02 3.51E-02 5.11E-03 1.84E-044.40+00 1.47E-02 1.46E-02 1.2011-02 7.09E-03 4.912-03 3.371-03 2.74E-03 2.151-03 5.73E-05 3.71E-071.309+01 1.259-03 8.87E-04 4.9711-04 2.321-04 1.3�E-04 7.19E-05 4.50E-05 2.70E-05 3.569-08 1.97E-112.269+01 4.471-05 1.449-05 5.029-08 I.SSE-08 S.60E-07 3.07F-07 1.3SE-07 5.8at-os 1.99E-12 I.SSE-093.71E+01 2.719-07 4. 209-08 1.10-08 2.49E-09 1.19E-09 2.639-10 7.72E-11 2.3SE-11 3.39E-10 5.68E-096.091+01 2.279-10 2.51SE-11 SASE-12 7.82E-13 3.64E-13 4.3it-14 8.90E-is 4.57E-11 1.10E-09 1.84E-081.001!+02 3.92E-14 3.34E-15 4.171-11 4.09E-ii 3.502-11 9.00E-11 8.92f-11 i.12E-10 2.97E-09 4.48E-08
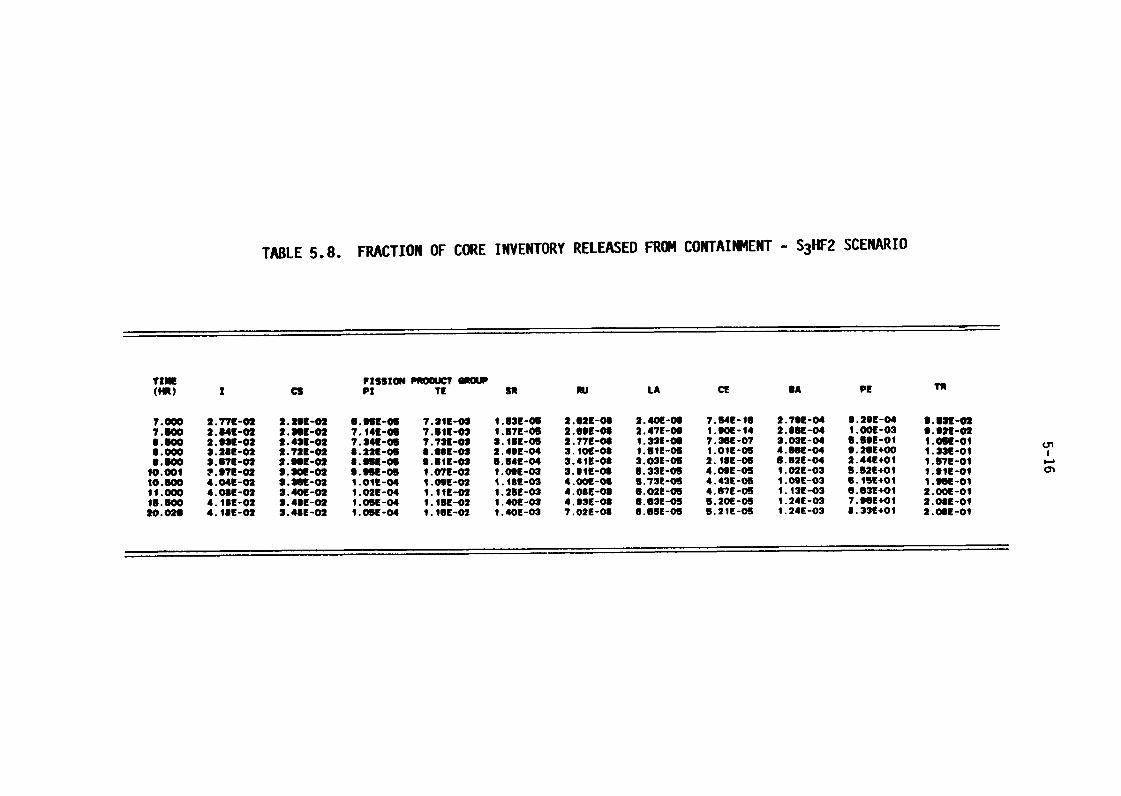
TABLE 5.8. FRACTION OF CORE INVENTORY RELEASED FROM CONTAINMENT - S3HF2 SCENARIO
lim fission PRooUclr GM"(MR) I Cs pi TE SR Ru LA CE DA PE TR
1.000 2.779-02 2.2911-02 S."t-06 7.211-03 1.53E-00 2.629-06 2.409-09 7.64E-16 2.799-04 9.29E-04 9.539-027. DM 2.849-02 2.39E-02 7.142-06 7.511-08 1.57E-05 2.699-08 2.47E-09 1.90E-14 2.86E-04 1.009-03 9.921-028.900 2.92K-02 2.431-02 7.24K-05 7.739-00 3.15E-05 2.779-08 1.231-06 7.3GE-07 2.03E-04 9.59E-01 1.051-01
000 3.28E-02 2.722-02 8.221-06 8.989-03 2.49E-04 3.101-08 1.51E-05 1.01E-05 4.961-04 9.26E+oo 1.33E-01:-Boo 3.67E-02 2."1-02 8.959-09 9.51E-os 5.54E-04 3.419-08 3.03E-05 2.18E-06 6.62f-04 2.449+01 i.57E-01
10:001 7.97E-02 3.30L-02 9.952-05 1.072-02 1.09E-03 3.919-09 5.33E-05 4.09E-05 1.02E-03 5.52E+01 1.91t-ol10. gm 4.046-02 3.31BE-02 1.011-04 1.0se-02 i.IBE-03 4.009-09 6.73E-013 4.43E-05 1.09E-03 O.iSE+Oi 1.992-0111.000 4.08E-02 3.40E-02 i.02E-04 i.liE-02 1.25E-03 4.08E-08 6.029-05 4.67E-05 1.13E-03 6.63E+01 2.0*E-0115.800 4.18E-02 3.49E-02 1.05E-04 1.15E-02 1.40E-03 4.939-08 6.63E-05 5.20E-05 1.24E-03 7.961+01 2.089-0120.026 4.18E-02 3."E-02 I-OSE-04 1.16E-02 1.40E-03 7.02E-08 6.69E-05 5.21E-05 1.24E-03 8.33f+01 2.0BE-01
TABLE 5 9 DISTRIBUTION OF FISSION PRODUCTS BY GROUP S3HF2 SCENARIO
Cavity Lower Ice UpperSpecies RCS Water Melt Compartment Bed Compartment Environment
I 0.67 2.9 x 1-2 0 4.2 x 1-2 0.19 7.5 x 10⁻³ 4.2 x 1-2
Cs 0.73 3.1 x 1-2 0 3.2 x 10⁻² 0.15 6.0 x 10⁻³ 3.4 x 10⁻²
Te 0.77 5.9 x 1-2 9.3 x 10⁻² 1.2 x 10⁻² 4.9 x 1-2 2.0 x 10⁻³ 1.2 x 10⁻²
Sr 4.9 x 10⁻⁴ 0.16 0.83 1.6 x 10⁻³ 2.7 x 10⁻³ 1.4 x 10⁻⁴ 1.4 x 10⁻³
Ru 8.0 x 10⁻⁷ 2.0 x 10⁻⁶ 1.0 1.3 x 10⁻⁷ 3.5 x 10⁻⁷ 1.1 x 10⁻⁸ 7.0 x 10⁻⁸
La 8.1 x 10⁻⁸ 8.4 x 10⁻³ 0.98 5.8 x jo-5 1.4 x in-4 7 n 10-6 r, r in-5
Ce 0 6.2 x 10⁻³ 0.99 5.1 x 10⁻⁵ 1.o x 10-4 5.4 x 10⁻⁶ 5.2 x 10⁻⁵
Ba. 9.0 x 10⁻³ 9.6 x 1-2 0.89 1.4 x 10⁻³ 3.3 x 10⁻³ 1.5 x 10⁻⁴ 1.2 x 10⁻³
Tr 0 0 0 0.31 0.38 2.9 x 10⁻² 0.21
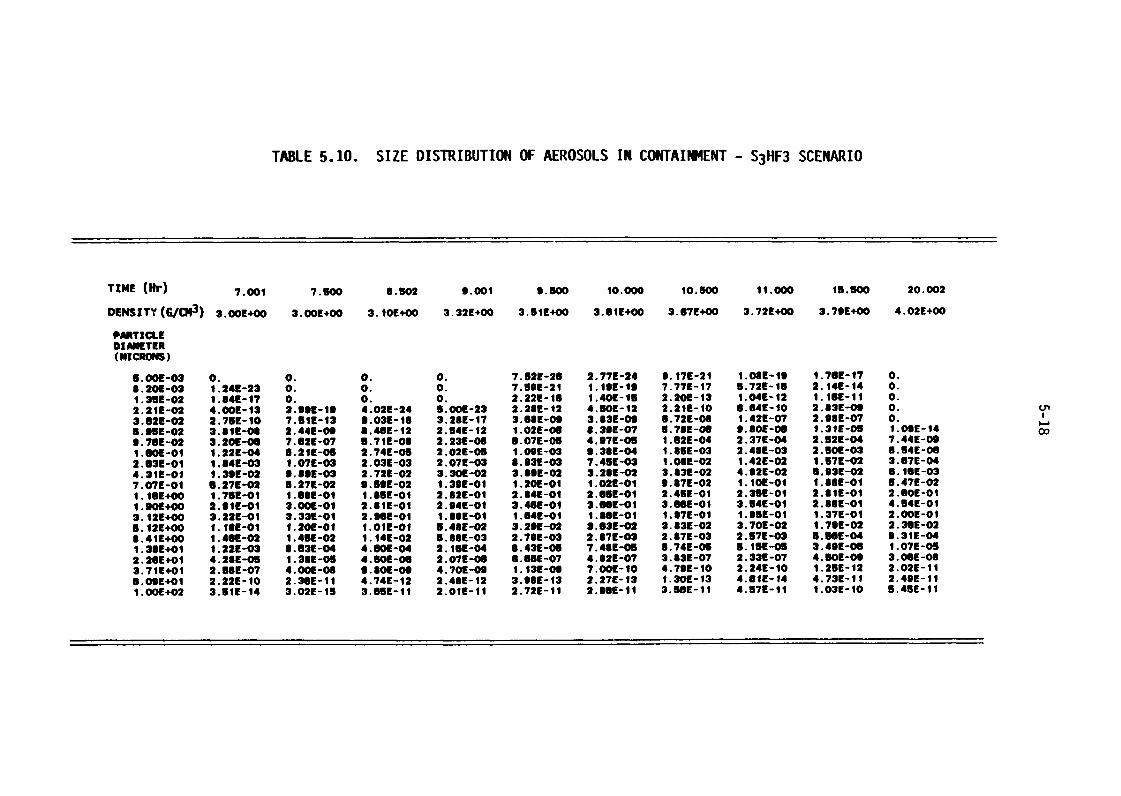
TABLE 5.10. SIZE DISTRIBUTION OF AEROSOLS IN CONTAINMENT - S3HF3 SCENARIO
TIME (r) 7.001 7.500 8.502 9.001 9 SW 10.000 10.500 11.000 15.500 20.002
DENSITY G/CN3) 3.OOE+00 3.OOE+00 3. iE+00 3.32E+00 3.51E+00 3.61E+00 3.67E+00 3.72E+00 3.79E+00 4.02E+00
PARTICLEDIAMETER(MICRONS)
S. OOE-03 0 0. 0. 0. 7.529-26 2.77E-24 9. i7E-21 I.OSE-19 1. 76E- 17 0 8.20E-03 1.24E-23 0. 0. 0. 7.59E-21 1.19E-19 7.77E-17 5.72E-16 2.14E-14 0.1.35E-02 1.84E-17 0. 0. 0. 2.22E-16 1.40E-15 2.20E-13 1.04E-12 1.1GE-11 O.2.21E-02 4.OOE-13 3.99E-19 4.02E-24 $.ODE-23 2.28E-12 4.50E-12 2.21E-10 6.64E-10 2.83E-09 0.3.921-02 2.75E-10 7.51E-13 9.03E-18 3.28E-17 3.68E-09 3.83E-00 6.72E-08 i.42E-07 2.98E-07 0.5.95E-02 3.81E-Ol 2.44E-09 8.46E-12 2.54E-12 1.02E-06 6.39E-07 5.7#E-08 9.80E-06 1.31E-05 i.09E-149.76E-02 3.20E-06 7.62E-07 5.71E-08 2.23E-08 6.07E-05 4.97E-05 1.62E-04 2.37E-04 2.52E-04 7.44E-09I.GOE-01 1.22E-04 5.21E-05 2.74E-05 2.029-05 1.09E-03 9.38E-04 1.45E-03 2.48E-03 2.50E-03 5.54E-082.63E-01 1.84E-03 1.079-03 2.03E-03 2.07E-03 8.93E-03 7.45E-03 I.OSE-02 1.42E-02 1.57E-02 3.67E-044.31E-01 1.39E-02 9.89E-03 2,72E-02 3.30E-02 3.99E-02 3.2GE-02 3.43E-02 4.92E-02 6.93E-02 6.1GE-037.07E-01 6.27E-02 5.27E-02 9.59E-02 1.39E-01 1.20E-01 1.02E-01 9.87E-02 1.10E-Ol 1.88E-Ol 5.47E-021.19E+00 1.75E-Ol 1.68E-Ol 1.85E-Ol 2.22E-01 2.84E-01 2.66E-Oi 2.45E-Ol 2.259-01 2.81E-Ol 2.60E-011.90E+00 2.911-01 3.OOE-O1 2.81E-Ol 2.94E-01 3.46E-01 3.WE-01 3.66E-01 3.54E-01 2.88E-Ol 4.54E-013.12E+00 3.22E-01 3.33E-01 2.96E-01 1.88E-01 1.04E-01 1.86E-Ol 1.97E-01 1.95E-Ol 1.37E-01 2.OOE-015.129+00 1.10E-Ol 1.20LI-Of I.Offf-of 5.48E-02 3.29E-02 3.63E-02 3.83E-02 3.702-02 1.79E-02 2.36E-028.4iE+00 i.499-02 1.451-02 1.14E-02 5.88E-03 2.79E-03 2.87E-03 2.47E-03 2.57E-03 G.WE-04 9.31E-041.3$E+01 1.22E-03 8.03E-04 4.GOE-04 2.16E-04 9.43E-05 7.4$E-05 6.74E-05 5.15E-05 3.49E-05 1.07E-052.26E+01 4.28E-05 1.38E-05 4.50E-06 2.07E-06 6.65E-07 4.82E-07 3.43E-07 2.33E-07 4.50E-09 3.0GE-083.71E+01 2.5&E-07 4.OOE-08 9.809-09 4.70E-09 1.13E-09 7.OOE-10 4.79E-10 2.24E-10 1.25E-12 2.02E-116.09E+01 2.22E-10 2.3GE-11 4.74E-12 2.48E-12 3.98E-13 2.27E-13 1.30E-13 4.efE-14 4.73E-11 2.49E-11I.OOE+02 3.51E-14 3.02E-15 3.SSE-11 2.01E-11 2.72E-11 2.8GE-11 3.5GE-11 4.57E-11 1.039-10 5.45E-li
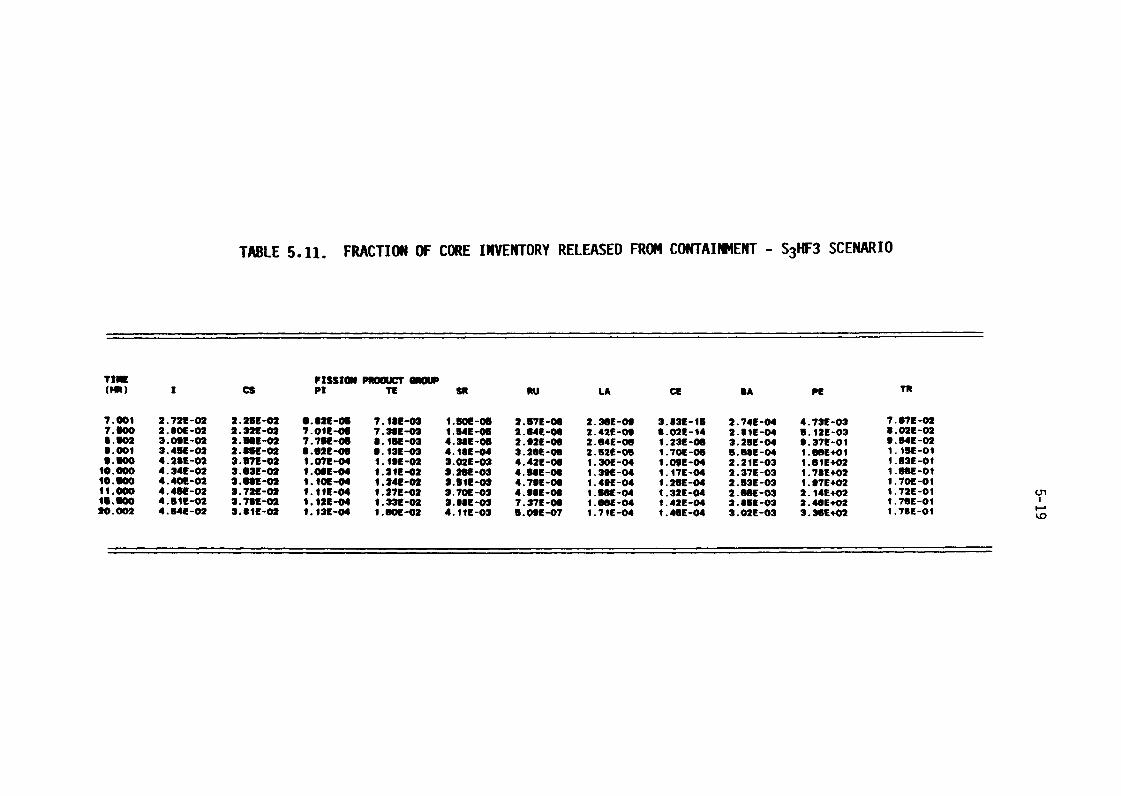
TABLE 5.11. FRACTION OF CORE INVENTORY RELEASED FROM CONTAINMENT - S3HF3 SCENARIO
Tin FISSION ROOMI on"(HP0 Cs pi TE itu LA CE BA Pe Tlt
7.001 2.72E-02 2.259-02 6.429-05 7.121-03 I-WE-06 2.57E-08 2.3GE-09 3.83E-15 2.74E-04 4.73E-03 7.679-02T. Om 2. IOE -02 2.329-02 7.01E-05 7.329-02 1.54t-os 2.64E-08 2.42E-09 8.021-14 2.812-04 S. 2E-03 8.022-029.902 3.09E-02 2.561-02 7.75E-05 8.159-03 4.38E-05 2.92E-00 2.64E-06 1. 23E-06 3.25E-04 9. 37E -0 I 9. 84E-02
001 3.459-02 2.8ff-02 2.02E-05 9.139-03 4.189-04 3.26E-08 2.52E-06 1. 70E-05 5.989-04 1.98E+01 1. ISE-01:-moo 4.29E-02 3.572-02 1.01YE-04 1. IOE-02 2.02E-03 4.429-08 1. 30L-04 1.09E-04 2.21E-03 1.61E+02 1. 63E -0 I
10.000 4.34E-02 3.03E-02 1.08E-04 1.219-02 2. 2SE-03 4. BIE-08 1. 39E-04 1. 7E-04 2.37E-03 1.78f+02 1.98E-ol10.000 4.40E-02 3.UE-02 1.1011-04 1. 24E-02 3.51E-03 4.79E-08 1.49E-04 1. ZOE-04 2.53E-03 1. 97E+02 1. 70E-Ol11.000 4.459-02 3.721!-02 1.119-04 1.27E-02 3. 70E -09 4.9SE-08 I.WE-04 1.32E-04 2.68E-03 2.14E+02 1.72E-0116.900 4.519-02 3.792-02 1.122-04 1. 33K-02 3.98E-03 7.27E-08 1.661-04 1.429-04 2.85E-03 2. "E+02 1.76E-0120. oo2 4.549-02 3.81E-02 1.139-04 1.�W-02 4. 1 IE-03 5.09E-07 1.71E-04 1.46E-04 3.02E-03 3.36E+02 1.7GE-0i
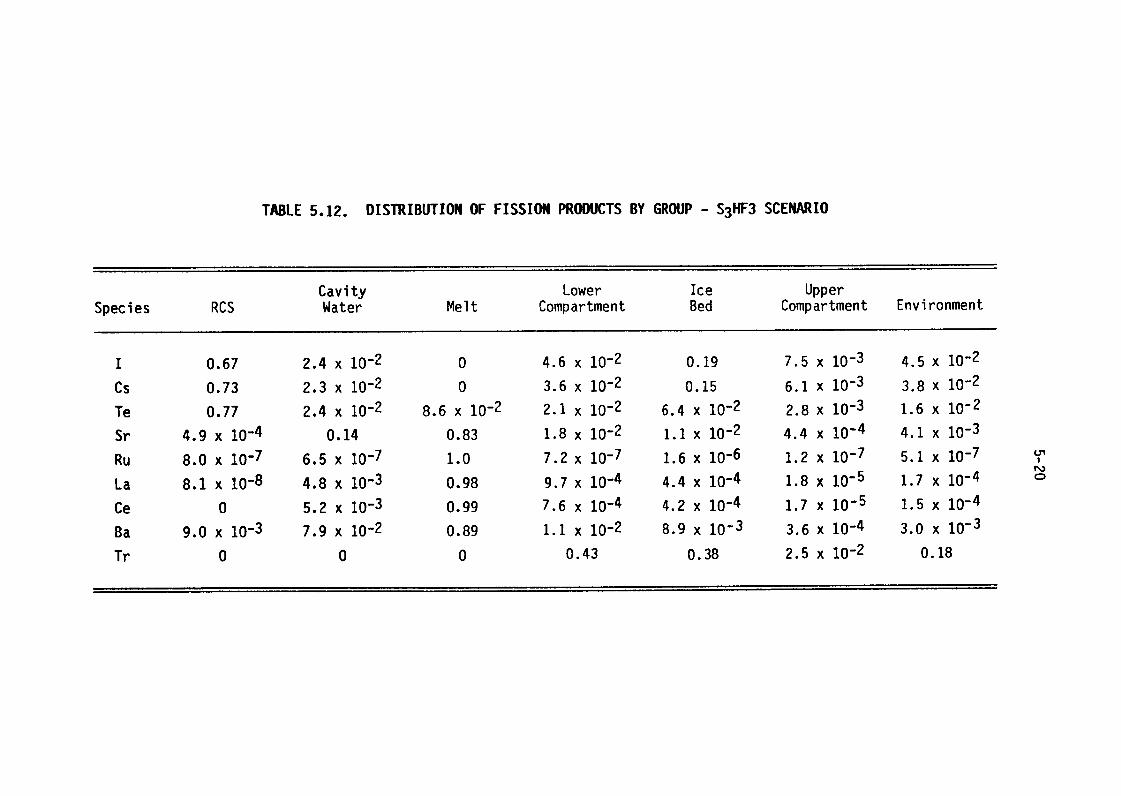
TABLE 512. DISTRIBUTION OF FISSION PRODUCTS BY GROUP - S3HF3 SCENARIO
Cavity Lower Ice UpperSpecies RCS Water Melt Compartment Bed Compartment Environment
I 0.67 2.4 x 1-2 0 4.6 x 1-2 0.19 7.5 x 10⁻³ 4.5 x 1-2
Cs 0.73 2.3 x 1-2 0 3.6 x 10⁻² 0.15 6.1 x 10⁻³ 3.8 x 10⁻²
Te 0.77 2.4 x 1-2 8.6 x 10⁻² 2.1 x 10⁻² 6.4 x 1-2 2.8 x 10⁻³ 1.6 x 10⁻²
Sr 4.9 x 10⁻⁴ 0.14 0.83 1.8 x 10⁻² 1.1 x 10⁻² 4.4 x 10⁻⁴ 4.1 x 10⁻³
Ru 8.0 x 10⁻⁷ 6.5 x 10⁻⁷ 1.0 7.2 x 10⁻⁷ 1.6 x 10⁻⁶ 1.2 x 10⁻⁷ 5.1 x 10⁻⁷
La 8.1 10-8 4.8 x 10⁻³ 0.98 9.7 x 10⁻⁴ 4.4 x 10⁻⁴ 1.8 x 10⁻⁵ 1.7 x 10⁻⁴ CD
Ce 0 5.2 x 10⁻³ 0.99 7.6 x 10⁻⁴ 4.2 x 10⁻⁴ 1.7 x 10⁻⁵ 1.5 x 10⁻⁴
Ba 9.0 x 10⁻³ 7.9 x 1-2 0.89 1.1 x 10⁻² 8.9 x 10⁻³ 3.6 x 10⁻⁴ 3.0 x 10⁻³
Tr 0 0 0 0.43 0.38 2.5 x 10⁻² 0.18
5-21
locational distribution of each fission product group at the end of the
scenario.
The predicted releases to the environment for S3HF3 fall between
those for S3HF1 and S3HF2 for I and Cs and are slightly higher for the other
fission product groups. This is expected because the cavity is dry before the
end of the ex-vessel release. The majority of the increase in fission
products leaving the reactor cavity has been dposited in either the lower
compartment or the ice condenser. In this scenario 19 percent of the I,
15 percent of the Cs, and 6 percent of the Te re retained in the ice
condenser. The ICEDF code indicates that there is very little difference in
the integrated decontamination factors predicted for the in-vessel release
period and the ex-vessel release period, the frmer being somewhat greater
than four and the latter a little less than fr.
5.2 TB Sequence
5.2.1 Release and Transport in the RCS
The TB sequence does not differ significantly from the SOF sequence
in the evolution of the RCS events because of he similar thermal-hydraulic
conditions. Retention of fission products in he RCS is therefore expected to
be similar for these scenarios as well. This is indeed the case as can be
seen from selected results of calculations in Tables 513 and Table 514 and
Figure 56 through Figure 59 which mirror the results for the S3HF1 scenario.
5.2.2 Release and Transport in Containment
In this scenario the fission products from both the primary system
and the reactor cavity are released into the lower compartment. The fission
product flow path is from the lower compartment to ice condenser, ice
condenser to upper compartment, and, after containment fails, upper
compartment to environment. The calculational procedure shown in Figure 5.5
was used for this scenario also.
Table 5.15 summarizes the release of radionuclides from the RCS
during core meltdown, the puff at the time of essel failure and the release
during core-concrete interactions.
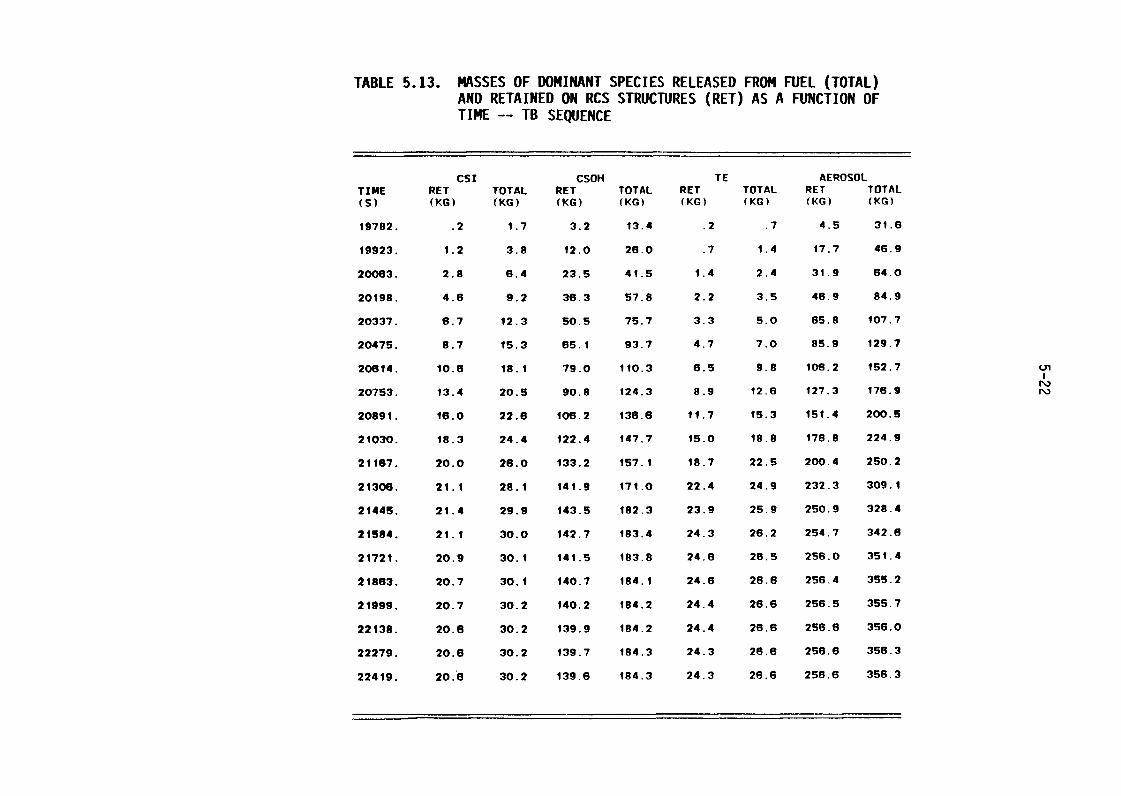
TABLE 513. MASSES OF DOMINANT SPECIES RELEASED FROM FUEL (TOTAL)AND RETAINED ON RCS STRUCTURES (RET) AS A FUNCTION OFTIME -- TB SEQUENCE
cSI CSOH TE AEROSOLTIME RET TOTAL RET TOTAL RET TOTAL RET TOTAL(S) (KG) (KG) (KG) (KG) (KG) (KG) (KG) (KG)
19782. .2 1.7 3.2 i3.4 .2 .7 4.5 31.8
19923. 1.2 3.8 12.0 26.0 .7 1.4 17.7 46.9
20063. 2.8 6.4 23.5 4i.5 1.4 2.4 31.9 64.0
20198. 4.6 9.2 38.3 57.8 2.2 3.5 46.9 84.9
20337. 6.7 12.3 50.5 75.7 3.3 5.0 65.8 iO7.7
20475. 8.7 15.3 65.1 93.7 4.7 7.0 85.9 129.7
20814. We le.i 79.0 110.3 6.5 9.8 106.2 152.7
20753. 13.4 20.5 90.8 124.3 8.9 12.6 127.3 i76.9
20891. 16.0 22.6 iO6.2 i36.6 11.7 15.3 i5l.4 200.5
21030. ig.3 24.4 122.4 i47.7 is.0 i8.8 178.8 224.9
21167. 20.0 28.0 133.2 157.1 18.7 22.5 200.4 250.2
21306. 21.1 28.1 141.9 171.0 22.4 24.9 232.3 309.1
21449. 21.4 29.9 i43.5 i82.3 23.9 25.9 250.9 329.4
2iS84. 21.1 30.0 142.7 183.4 24.3 26.2 254.7 342.6
21721. 20.9 30.1 i4i.5 183.8 24.6 26.5 256.0 351.4
21863. 20.7 30.1 140.7 184.1 24.6 26.6 256.4 355.2
21999. 20.7 30.2 140.2 i84.2 24.4 26.6 256.5 355.7
22i3g. 20.6 30.2 139.9 184.2 24.4 26.6 256.6 356.0
22279. 20.6 30.2 i39.7 i84.3 24.3 26.6 256.6 356.3
22419. 2O.'6 30.2 139.6 i84.3 24.3 26.6 256.6 356.3
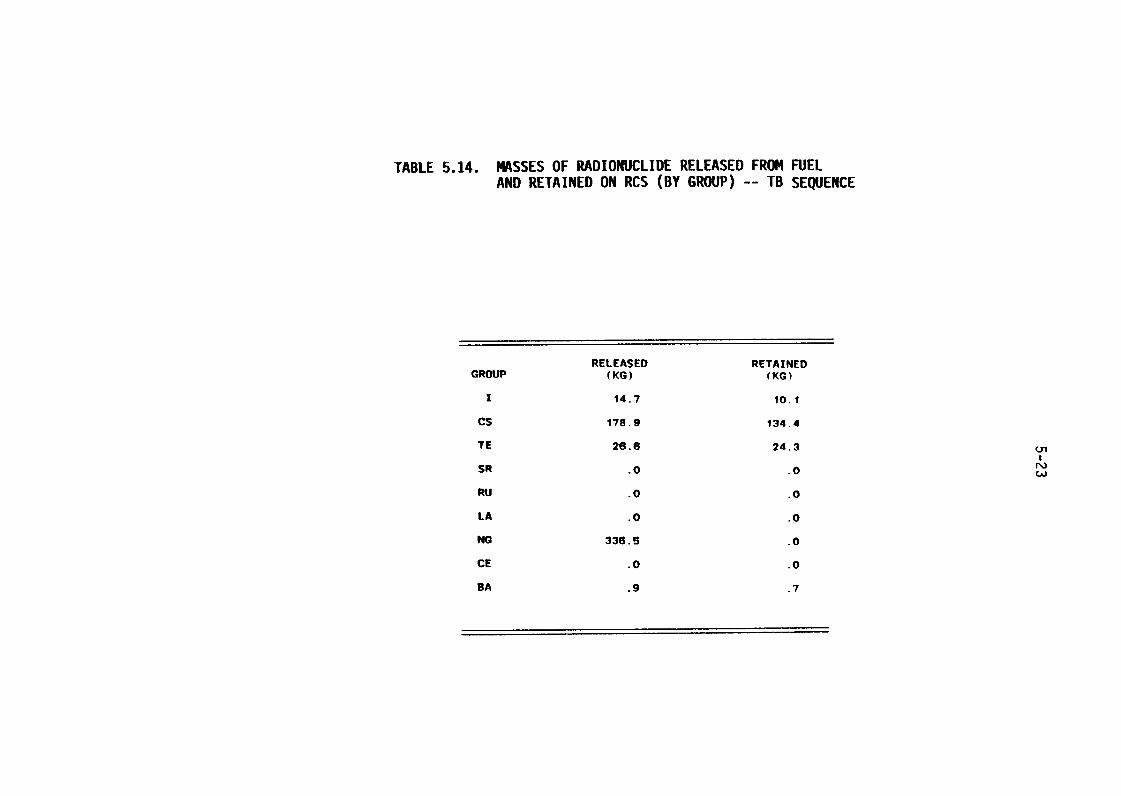
TABLE 514. MASSES OF RADIONUCLIDE RELEASED FROM FUELAND RETAINED ON RCS (BY GROUP) -- TB SEQUENCE
RELEASED RETAINEDGROUP (KG) (KG)
1 14.7 lo.i
Cs 178.9 134.4
TE 26.6 24.3 C"
SR .0 .0
RU .0 .0
LA .0 .0
NG 336.9 .0
CE .0 .0
BA .9 .7
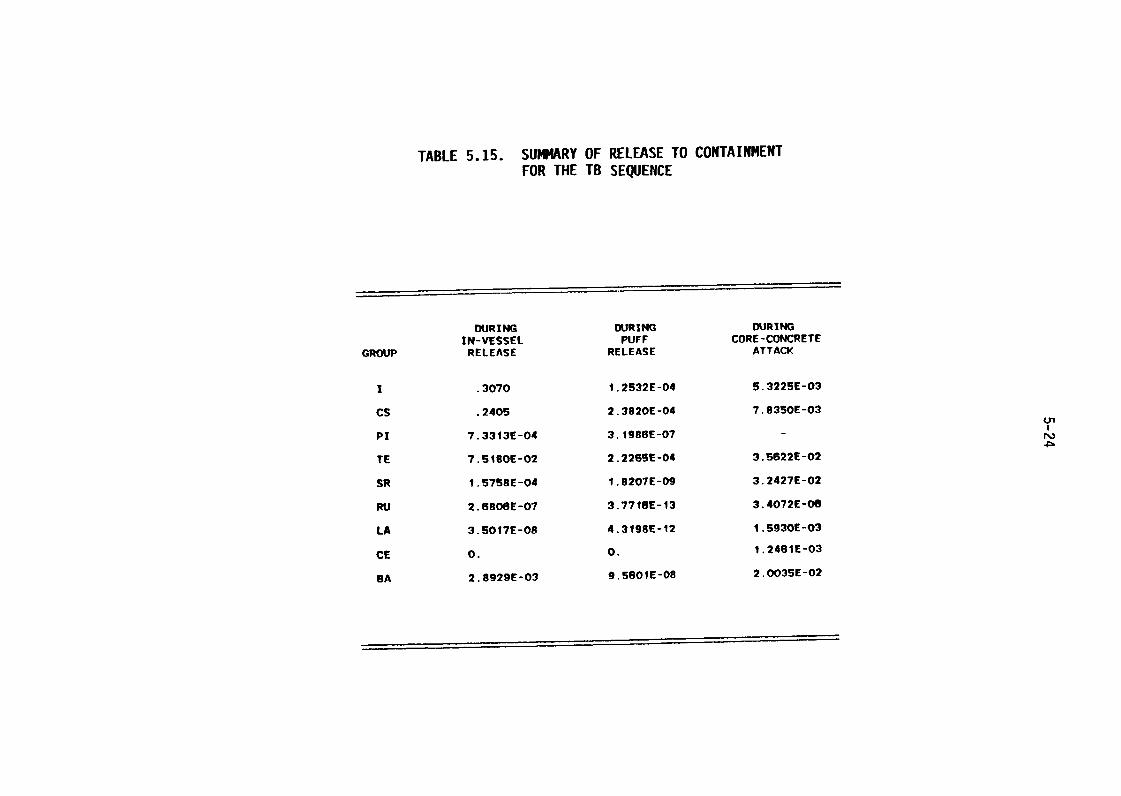
TABLE 5.15. SUMMARY OF RELEASE TO CONTAINMENTFOR THE TB SEQUENCE
DURING DURING DURINGIN-VESSEL PUFF CORE-CONCRETE
GROUP RELEASE RELEASE ATTACK
1 .3070 i.2532E-04 5.322SE-03
Cs .2405 2.3820E-04 7.83SOE-03
pi 7.3313E-04 3.198SE-07
TE 7.SIBOE-02 2.226SE-04 3.5622E-02
SR 1.5758E-04 i.8207E-09 3.2427E-02
RU 2.680SE-07 3.77i6E-i3 3.4072E-08
LA 3.50i7E-00 4.319SE-12 1.5930E-03
CE 0. 0. 1.246iE-03
BA 2.8929E-03 9.5601E-oe 2.003SE-02
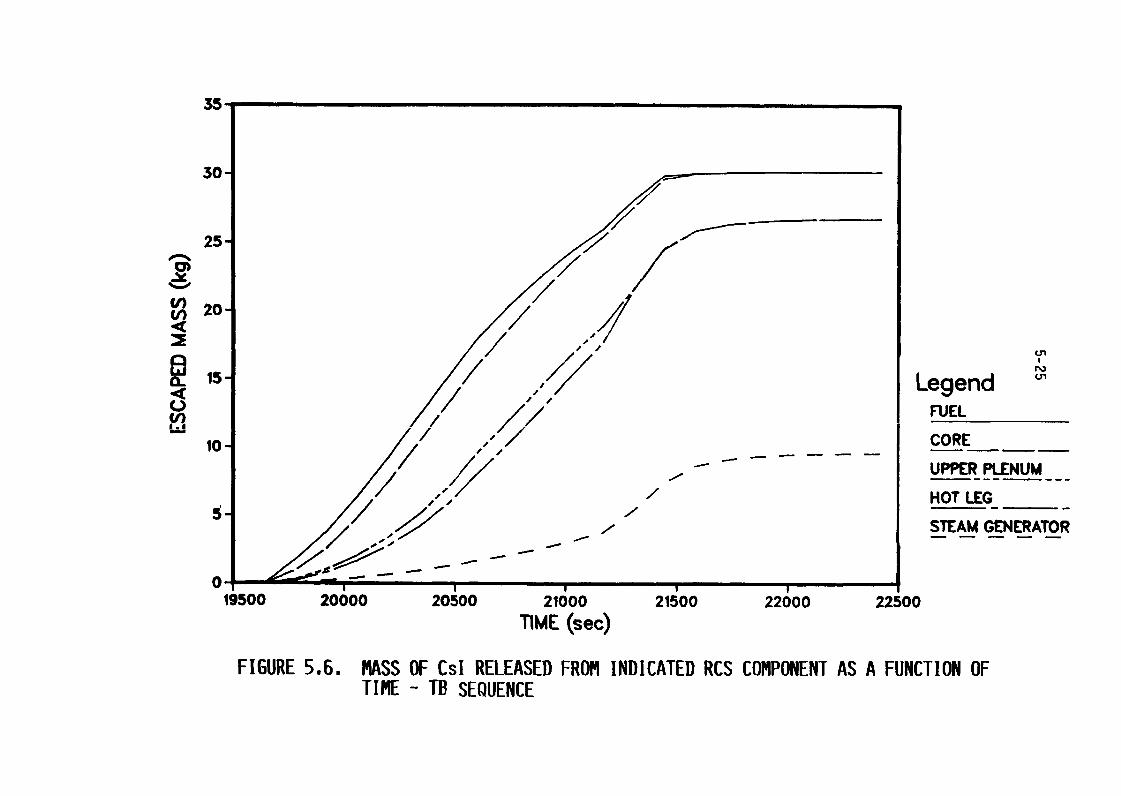
35
30
25
20
15 Legend ulFUEL
10 CORE
UPPER PLENUM
HOT LEG
STEAM GENERATOR
019500 20600 20500 21�00 21900 22600 22500
TIME (sec)
FIGURE 56. MASS OF CsI RELEASED FROM INDICATED RCS COMPONENT AS A FUNCTION OFTIME - TB SEQUENCE
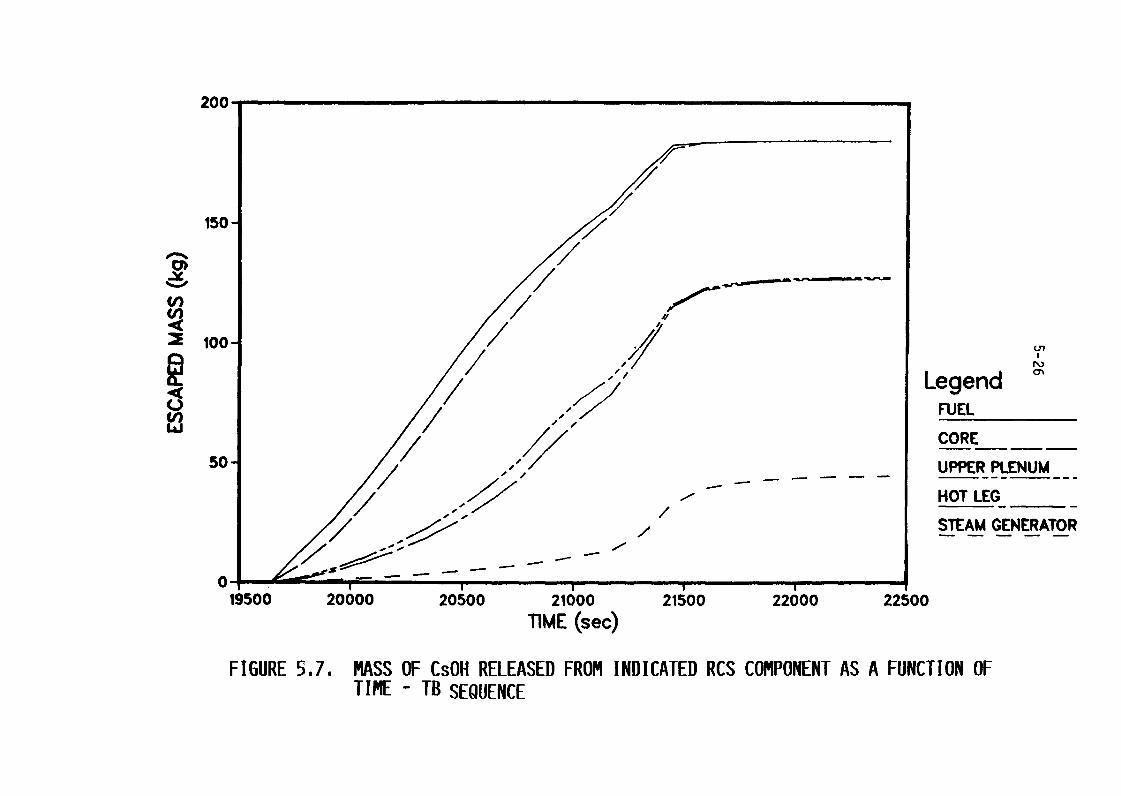
200-
150
loo
LegendFUEL
CORE50 UPPER PLENUM
HOT LEG
STEAM GENERATOR
01 -19500 20000 20;00 21000 21400 22600 22500
TIME (sec)
FIGURE 5.7. MASS OF CsOH RELEASED FROM INDICATED RCS COMPONENT AS A FUNCTION OFTIME - TB SEQUENCE
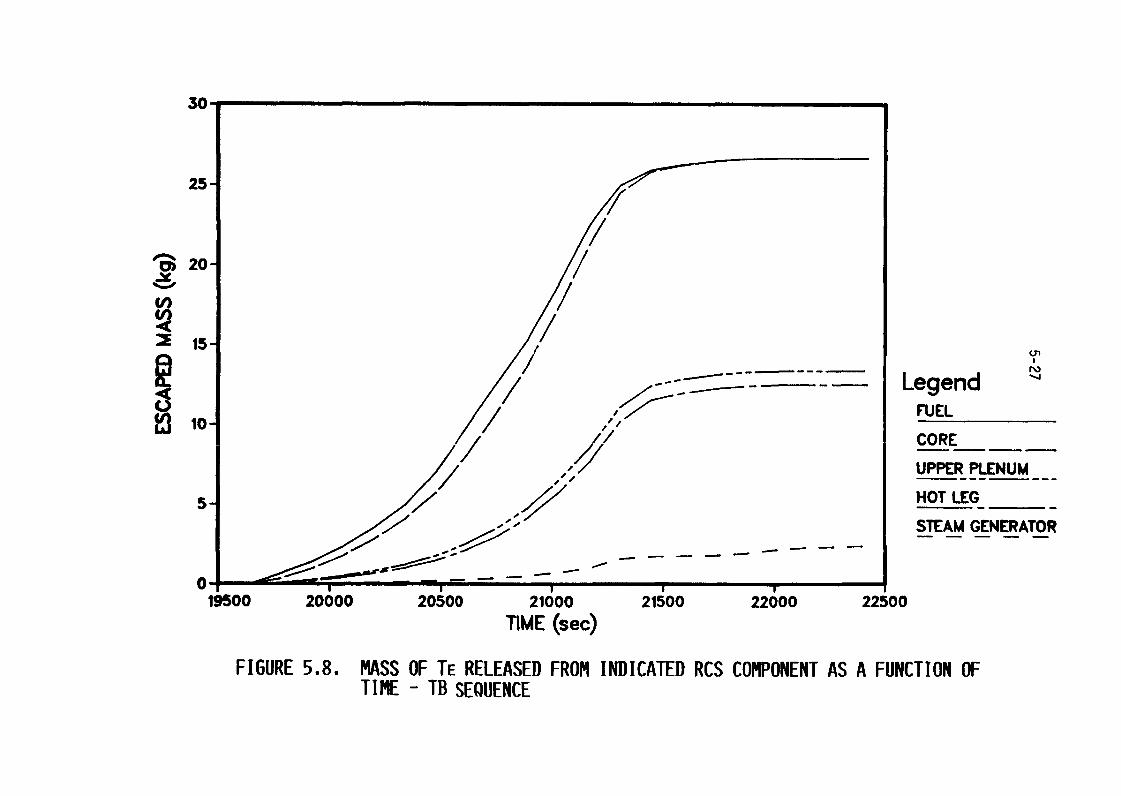
30
25
20
15
Legend 14
FUEL10
Wn R E
UPPER PLENUM
5 HOT LEG
STEAM GENERATOR
04500 20000 20500 21000 21900 22600 22500
TIME (sec)
FIGURE 5.8. MASS OF TE RELEASED FROM INDICATED RCS COMPONENT AS A FUNCTION OFTIME - TB SEQUENCE
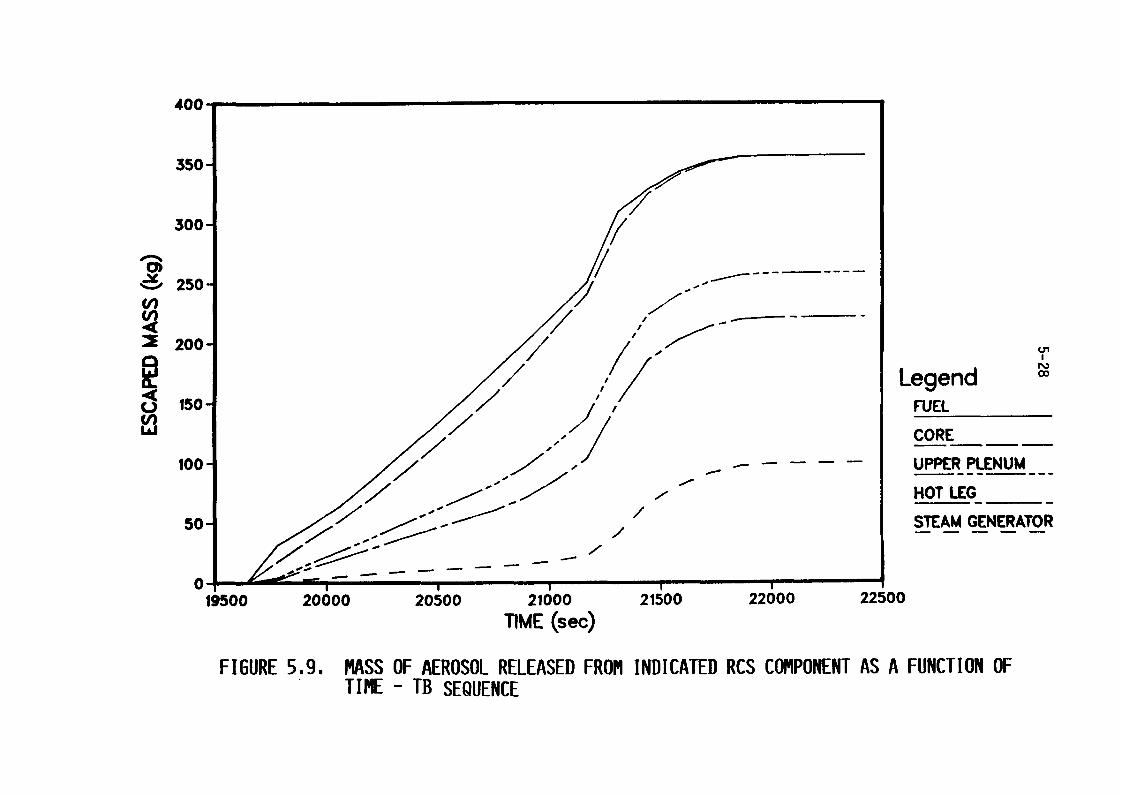
400
350
300
250
200
00Legend150 FUEL
CORE
100 "-Z UPPER PLENUM
HOT LEG
50 STEAM GENERATOR
019500 20000 20;00 21600 21500 22600 22500
TIME (sec)
FIGURE 59. 14ASS OF AEROSOL RELEASED FROM INDICATED RCS COMPONENT AS A FUNCTION OFTIME - TB SEQUENCE
5-29
The size distribution of airborne particles in the uper compartment
is shown in Table 516, and the fraction of the ore inventory released from
the upper compartment is listed in Table 517. 'Table 5.18 presents the
distribution of each fission product group in various locations within the
plant at the end of the accident.
As can be seen in Table 5.18, relatively little of the fission
product inventory is released to the environment. The maximum releases are
for the I and Cs groups at about 2 percent each. As seen in the previous
scenarios, the majority of the fission products eleased from the core are
found to remain in either the primary system or the reactor cavity water. Of
the fission products released into the containment, there is a significant
amount retained in the lower compartment and captured by the ice condenser.
The integrated ice condenser decontamination factors during the in-vessel phase
of the accident are between and 7 during the ex-vessel phase the overall
decontamination factors vary between 3 and 8. Te higher ice bed
decontamination factors seen in this case are the result of higher steam
fractions for the flow through the ice condenser.
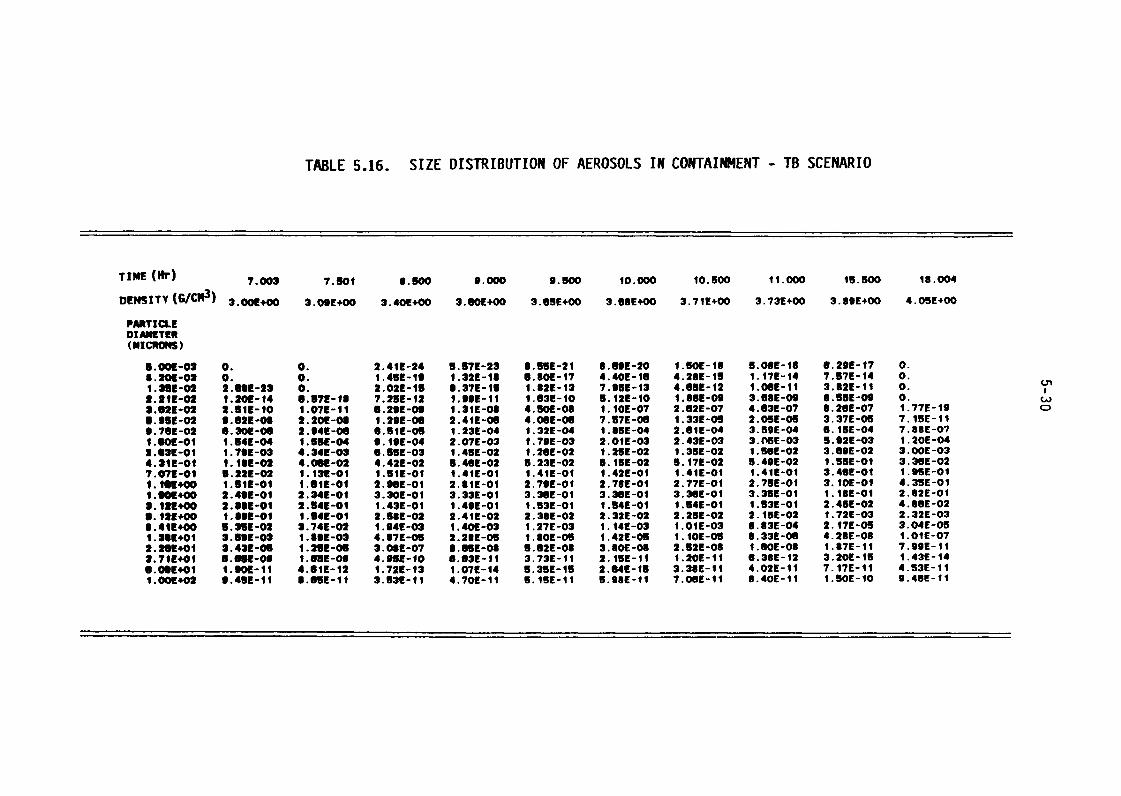
TABLE 516. SIZE DISTRIBUTION OF AEROSOLS IN CONTAINMENT - TB SCENARIO
TIME 010 7.003 7.5of 0.500 9.000 9. SW 10.000 10.500 11.000 15.500 18.004
DENSITY (ra/CN3) 3001!+00 3.09E+00 3.40E+00 3.$OE+00 3. 6SE+OO 3.GBE+00 3.71E+00 3.73E+00 3. 89E+00 4. 05E+00
PARTICLEDIAMETER(MICRONS)
5.00E-02 0. 0. 2.41E-24 5.57E-23 8.55E-21 8.692-20 1.50E-18 5.08E-18 8.20E-17 0.5.209-03 0. D. 1.4st-io 1.32E-18 6.80E-17 4.40E-16 4.28E-15 i-17E-14 7.57E-i4 0.1.382-02 2."1-23 0. 2.029-15 9.37E-15 1.82E-13 7.951-i3 4.65E-12 I-OGE-il 3.82E-ii 0. Ln2.219-02 1.20L-14 0.579-18 7.25E-12 1.999-11 1.03E-10 5.12E-10 1.86E-09 3.68E-09 8.55E-09 0. ILI3.92E-02 2.51E-10 1.07E-11 6.29E-09 1.31E-08 4.50E-08 l.iOE-07 2.62E-07 4.63E-07 8.26E-07 1.77E-19 CD5.95L-02 9.62E-08 2.20E-Ol 1.29E-06 2.41E-06 4.OGE-OG 7.57E-08 1.33E-05 2.05E-05 3.37E-05 7.15E-ii9.762-02 6-3OE-OG 2.94E-06 6.51E-05 1.23E-04 1.32E-04 i.SBE-04 2.61E-04 3.59E-04 6.15E-04 7.88E-07I.GOE-01 1.54E-04 1.55E-04 9.toff-04 2.07E-03 1.79E-03 2.01E-03 2.439-03 3.ME-03 5.92E-03 1.20E-042.43E-01 1.79E-03 4.341-03 6.55E-03 i.45E-02 1.26E-02 1.25E-02 1.35E-02 1.56E-02 3.69E-02 3.OOE-034.31E-01 1.18E-02 4.09E-02 4.42E-02 5.46E-02 5.23E-02 5.15E-02 5.17E-02 5.49E-02 1.55E-01 3.36E-027.071-01 9.229-02 1.13E-01 1.51E-01 1.41E-01 1.41E-01 1.42E-01 1.41E-01 1.41E-01 3.46E-01 1.95E-01I.IQE400 1.512-01 1.61E-Ol 2."E-01 2.81E-Ol 2.79E-01 2.78E-01 2.77E-01 2.75E-01 3.10E-Ol 4.35E-011. 900+00 2-49E-Ol 2.34E-01 3.30E-01 3.33E-01 3.3GE-O1 3.36E-01 3.36E-01 3.359-01 1.18E-01 2.82E-012.12a+oo 2.98E-Oi 2.54E-01 1.43E-01 1.49E-01 1.83E-01 1.54E-01 1.64E-01 1.53E-01 2.45E-02 4.66E-029.129+00 1.89E-Ol 1.54E-01 2.58E-02 2.412-02 2.38E-02 2.32E-02 2.25E-02 2.15E-02 1.72E-03 2.32E-038.41E+00 5.35E-02 3.74E-02 1.949-03 1.40E-03 1.27E-03 1.iff-03 1.01E-03 8.83E-04 2.t7E-05 3.04E-05i.S$E+01 3-59E-03 1.89E-03 4.87E-05 2.29E-06 1.80E-05 1.429-06 1.10E-09 8.33E-06 4.28E-08 I-OiE-072.269+01 3.43E-05 1.25E-06 3.089-07 8.65E-08 5.02E-08 3.80E-06 2.529-08 I.GOE-08 1.87E-11 7.99E-li2.719+01 8.699-08 1.63E-os 4.951-10 0.63E-11 3.73E-11 2.iSE-11 i.20E-ii 6.38E-12 3.20E-15 1.43E-i4G.O9E+O1 1.90E-11 4.61E-12 1.72E-13 i.07E-14 5.35E-15 2.64E-15 3.38E-11 4.02E-11 7.17E-ii 4.53E-11I.O*E+02 9.49E-11 8.65E-li 3.53E-11 4.70E-11 5.1SE-11 5-98E-11 7.OSE-11 8.40E-11 1.50E-10 9.46E-11
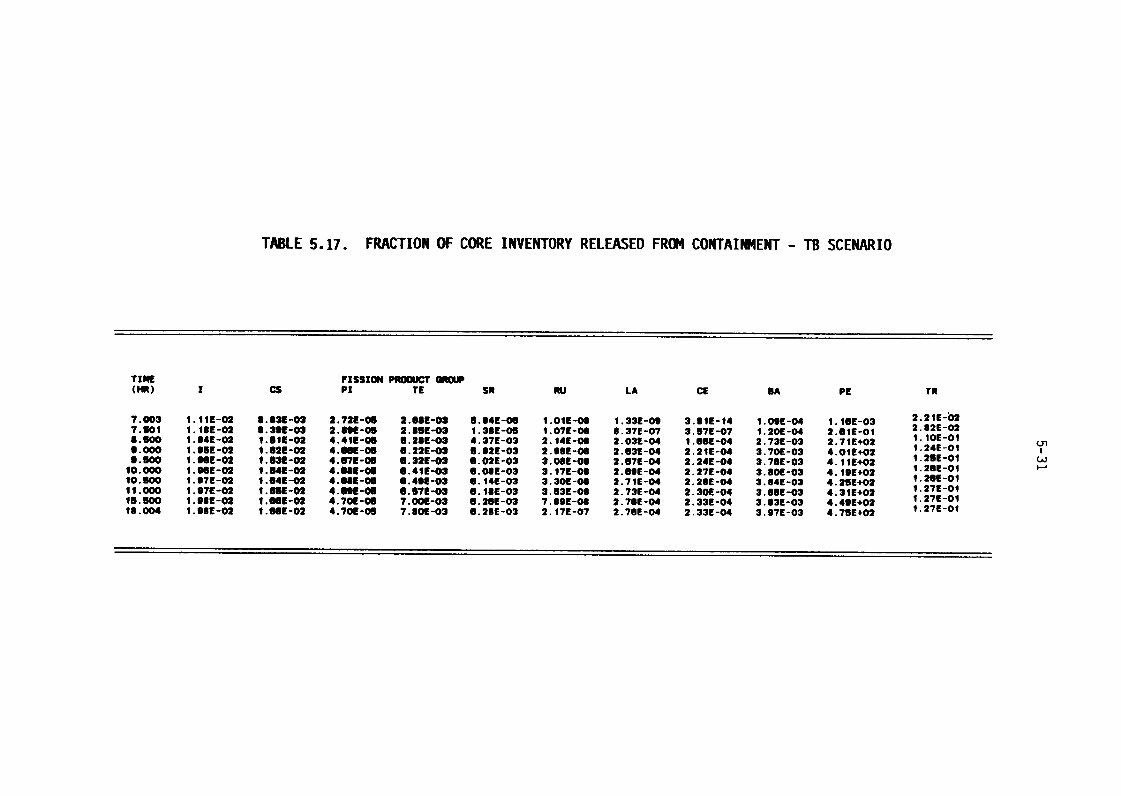
TABLE 517. FRACTION OF CORE INVENTORY RELEASED FROM CONTAINMENT - TB SCENARIO
T114E FISSION PRODUCT an"(M) I Cs pi TE SR pti LA CE OA PE TR
7.003 I-IIE-02 9.83E-03 2.72E-05 2.98E-02 8.94E-06 1.01E-Os 1.33E-09 3.91E-M 1.09E-04 1.16E-03 2.21E-b27.501 I-ISE-02 9.39E-03 2.8911-05 2.86E-03 1.38E-05 1.07E-08 0.37E-07 3.57E-07 1.20E-04 2.GiE-01 2.12 02:.600 ;.:4:-02 1.51E-02 4.41E-05 6.28E-03 4.37E-03 2.14E-00 2.03E-04 1.66E-04 2.73E-03 2.71E+02 1. O:-Ol
, 000 . 5 02 1.62E-02 4.06E-05 6.22E-03 5.92E-03 2.98E-Ol 2.63E-04 2.21E-04 3.70E-03 4.OiE+02 1.24E-019.500 1.96E-02 1.931-02 4.67E-05 0.321-03 6.02E-03 3.08E-08 2.67E-04 2.24E-04 3.76E-03 4.11E+02 1.252-01
10.000 1.969-02 1.04E-02 4.98E-Of 6.41E-03 O.OGE-03 3.17E-Ol 2.69E-04 2.27E-04 3.80E-03 4.19E+02 1.26E-Oi10.500 1.971-02 1.64E-02 4.68E-05 6.491-03 6.14E-03 3.30E-08 2.71E-04 2.28E-04 3.84E-03 4.25E+02 1.26E-0111.000 1.97E-02 i.ME-02 4.69E-05 9.672-03 G.ISE-03 3.53E-08 2.73E-04 2.30E-04 3.8GE-O3 4.31E+02 1.27E-0118.500 1.98E-02 I.ME-02 4.70E-05 7.OOZ-O3 6.26E-03 7.89E-08 2.76E-04 2.33E-04 3.93E-03 4.49E+02 1.27E-0118.004 1.98E-02 1.66E-02 4.70E-05 7.80E-03 6.28E-03 2.17E-07 2.76E-04 2.33E-04 3.97E-03 4.75E+02 1.27E-01
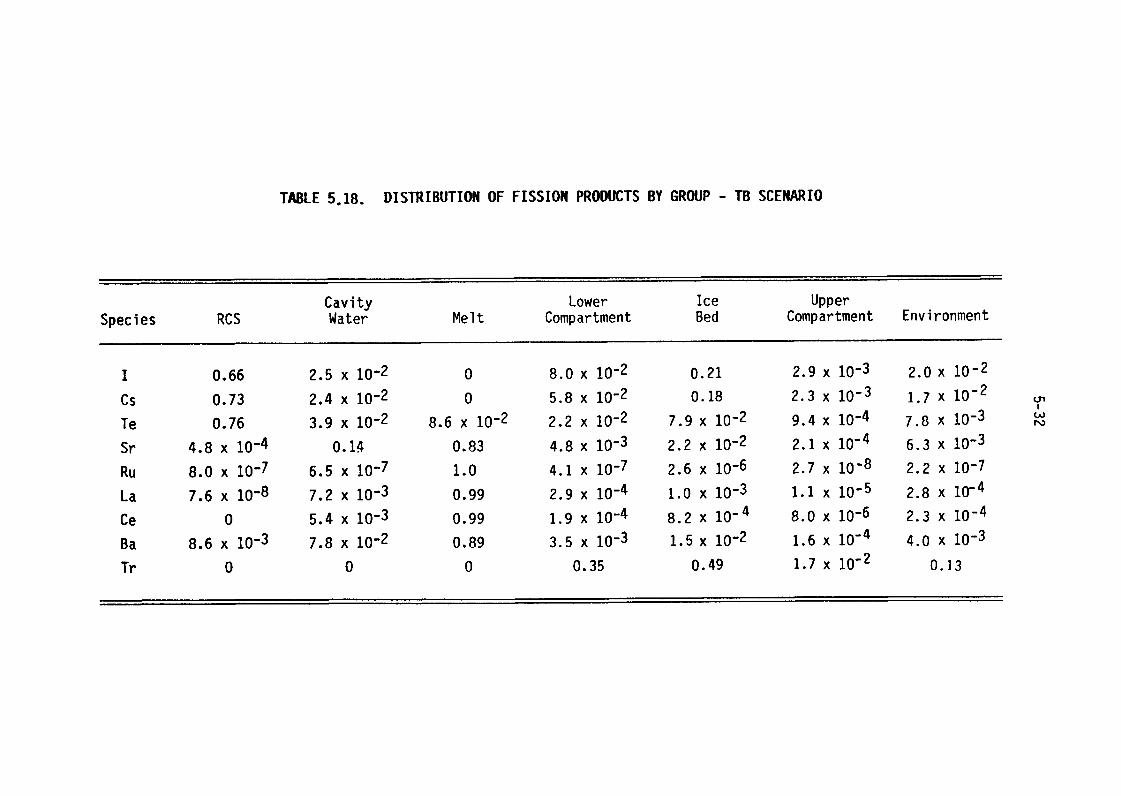
TABLE 5.18. DISTRIBUTION OF FISSION PRODUCTS BY GROUP - TB SCENARIO
Cavity Lower Ice UpperSpecies RCS Water Melt Compartment Bed Compartment Environment
1 0.66 2.5 x 1-2 0 8.0 12 0.21 2.9 x 10⁻³ 2.0 x 1-2
Cs 0.73 2.4 x 1-2 0 5.8 x 10⁻² 0.18 2.3 x 10⁻³ 1.7 x 10⁻²-2 -2 -2 7.9 x 1-2 9.4 x 10⁻⁴
Te 0.76 3.9 x 1 8.6 x 10 2.2 x 10 7.8 x 10-
Sr 4.8 x 10⁻⁴ 0.14 0.83 4.8 x 10⁻³ 2.2 x 10⁻² 2.1 x 10⁻⁴ 6.3 x 10⁻³
Ru 8.0 x10⁻⁷ 6.5 x 10⁻⁷ 1.0 4.1 x 10⁻⁷ 2.6 x 10⁻⁶ 2.7 x 10⁻⁸ 2.2 x 10⁻⁷
La 7.6 x10⁻⁸ 7.2 x 10⁻³ 0.99 2.9 x 10⁻⁴ 1.0 x 10⁻³ 1.1 x 10⁻⁵ 2.8 x 10⁻⁴
Ce 0 5.4 x 10⁻³ 0.99 1.9 x 10⁻⁴ 8.2 x 10⁻⁴ 8.0 x 10⁻⁶ 2.3 x 10⁻⁴
Ba 8.6 x10⁻³ 7.8 x 1-2 0.89 3.5 x 10⁻³ 1.5 x 10⁻² 1.6 x 10⁻⁴ 4.0 x 10⁻³
Tr 0 0 0 0.35 0.49 1.7 x 10⁻² 0.13
5-33
5.3 TMLU-SGTR Sequence
The analysis of the TMLU-SGTR sequence is focused on the behavior of
fission products in the reactor coolant system and in the secondary side of
the steam generator; the containment aspects were not addressed for this
sequence. For the present purposes it was assumed that the events associated
with core slumping lead to the rupture of the steam generator tubes, with the
release of steam, hydrogen, as well as fission roduct aerosols to the
secondary side of the steam generators. The steam generator secondary was
assumed to be maintained at 1100 psia by the operation of the atmospheric
steam dump valves. The flow through the steam enerators was assumed to cease
with the failure of the reactor vessel head and depressurization of the primary
system.
The analysis of this sequence involved two separate TRAP-MERGE runs.
The first evaluated the transport and deposition of the fission products
within the primary coolant system and defined te releases to the secondary
side of the steam generator. The second TRAP-MERGE analysis evaluated
transport and deposition in the secondary side f the steam generator. It was
not possible to treat both parts of the problem in a single run since the
pressures in the primary system and the steam gnerator secondary are not the
same. The initial TRAP-MERGE analysis was essentially the same as a typical
analysis of this type, except for the need to distinguish between the releases
to the containment and those to the steam generator secondary. The analysis
of fission product transport in the steam generator secondary side required
some additional manipulation of the MARCH thermal-hydraulic data to take into
account the depressurization of the flow through the ruptured steam generator
tubes. (Normally the MARCH data is used directly as input into TRAP-MERGE.)
Table 519 summarizes the results of the TRAP-MERGE analysis for the
reactor coolant system which defined the input to the steam generator
secondary. The behavior of the fission products in the steam generator
secondary is summarized in Tables 520 and 521 and Figures 5.10 through 513.
The deposition of all the species considered is seen to increase monotonically
with time in the steam generator. The principal deposition is predicted to
take place on the surface of the steam generator tubes and the steam dryers.
The releases to the environment from the secondary side of the steam generator,
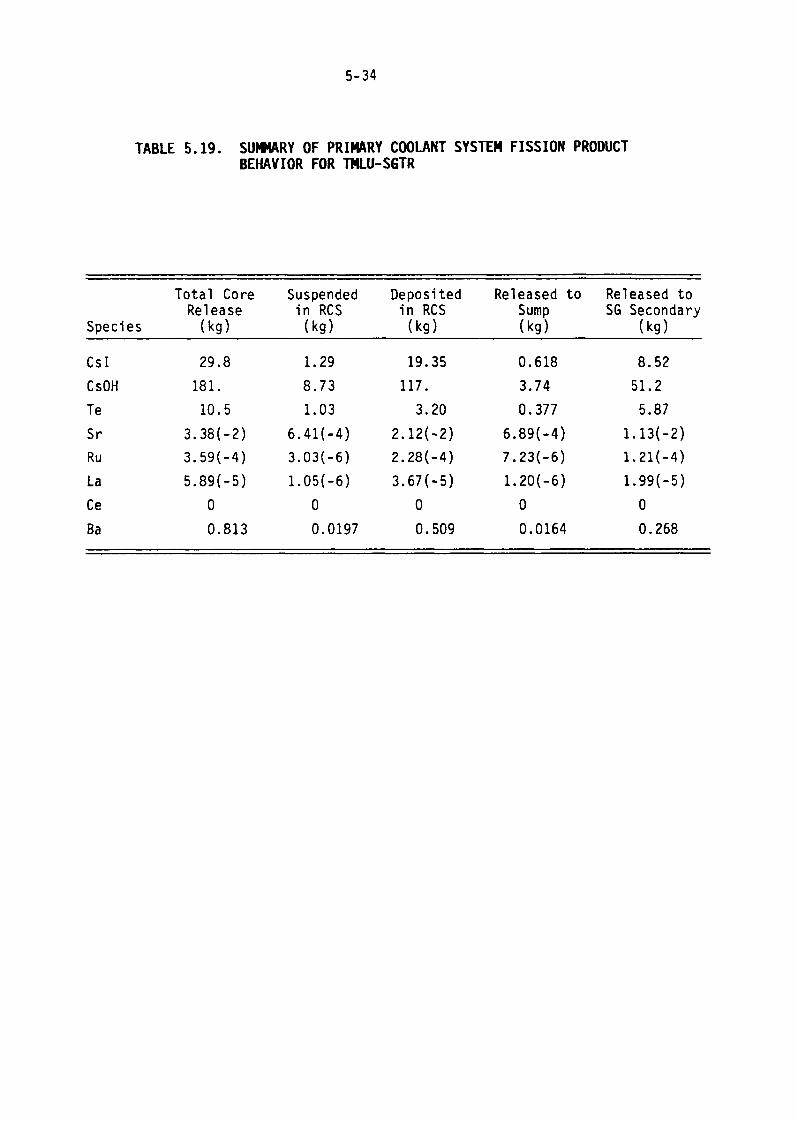
5 34
TABLE 519. SUMMARY OF PRIMARY COOLANT SYSTEM FISSION PRODUCTBEHAVIOR FOR TLU-SGTR
Total Core Suspended Deposited Released to Released toRelease in RCS in RCS Sump SG Secondary
Species (kg) (kg) (kg) (kg) (kg)
CSI 29.8 1.29 19.35 0.618 8.52
CsOH 181. 8.73 117. 3.74 51.2
Te 10.5 1.03 3.20 0.377 5.87
Sr 3.38(-2) 6.41(-4) 2.12(-2) 6.89(-4) 1.13(-2)
Ru 3.59(-4) 3.03(-6) 2.28(-4) 7.23(-6) 1.21(-4)
La 5.89(-5) 1.05(-6) 3.67(-5) 1.20(-6) 1.99(-5)
Ce 0 0 0 0 0
Ba 0.813 0.0197 0.509 0.0164 0.268
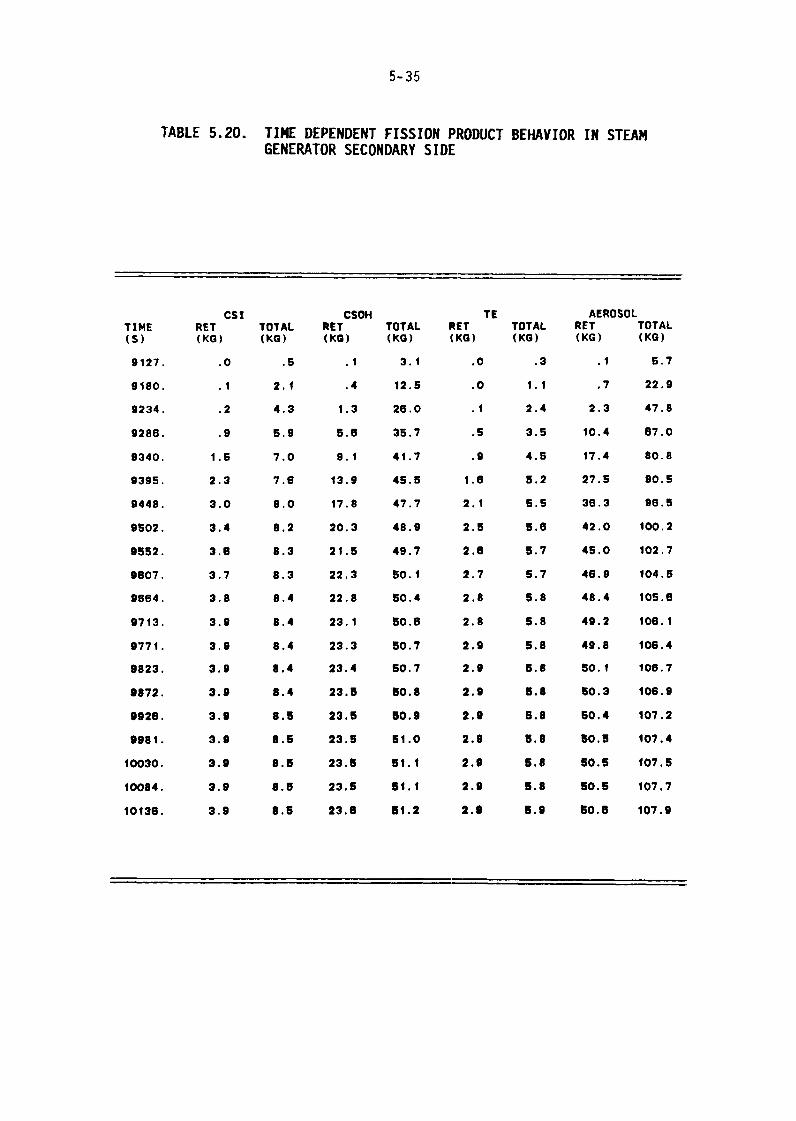
5 35
TABLE 520. TIME DEPENDENT FISSION PRODUCT BEHAVIOR IN STEAMGENERATOR SECONDARY SIDE
CS1 CSOH TE AEROSOLTIME RET TOTAL RET TOTAL RET TOTAL RET TOTAL(S) (KG) (KG) (KG) (KG) (KG) (KG) (KG) (KG)
9127. .0 .5 .1 3.1 .0 .3 i 5.7
9180. .1 2.1 .4 12.5 .0 1.1 .7 22.9
9234. .2 4.3 1.3 26.0 .1 2.4 2.3 47.8
9288. .9 5.9 5.13 35.7 .5 3.5 10.4 67.0
9340. 1.5 7.0 9.1 41.7 .9 4.5 17.4 80.8
9395. 2.3 7.6 13.9 45.5 1.6 5.2 27.5 90.5
9446. 3.0 8.0 i7.8 47.7 2.1 5.5 36.3 96.5
9502. 3.4 8.2 20.3 48.9 2.5 5.6 42.0 100.2
9552. 3.0 8.3 21.5 49.7 2.6 5.7 45.0 102.7
9607. 3.7 8.3 22.3 50.1 2.7 5.7 46.0 104.5
9664. 3.8 8.4 22.8 50.4 2.8 5.6 48.4 105.0
9713. 3.9 8.4 23.1 50.6 2.8 5.6 49.2 106.1
9771. 3.9 8.4 23.3 50.7 2.9 5.8 49.8 106.4
9823. 3.9 8.4 23.4 50.7 2.9 5.8 50.1 106.7
9872. 3.9 8.4 23.5 50.8 2.9 5.8 50.3 106.9
9926. 3.9 8.5 23.5 50.9 2.9 5.8 50.4 107.2
9981. 3.9 8.5 23.5 51.0 2.0 5.8 50.5 107.4
10030. 3.9 8.5 23.5 51.1 2.9 5.0 50.5 107.5
10084. 3.9 8.5 23.5 51.1 2.9 5.8 50.5 107.7
10138. 3.9 8.5 23.6 51.2 2.9 5.9 50.6 107.9
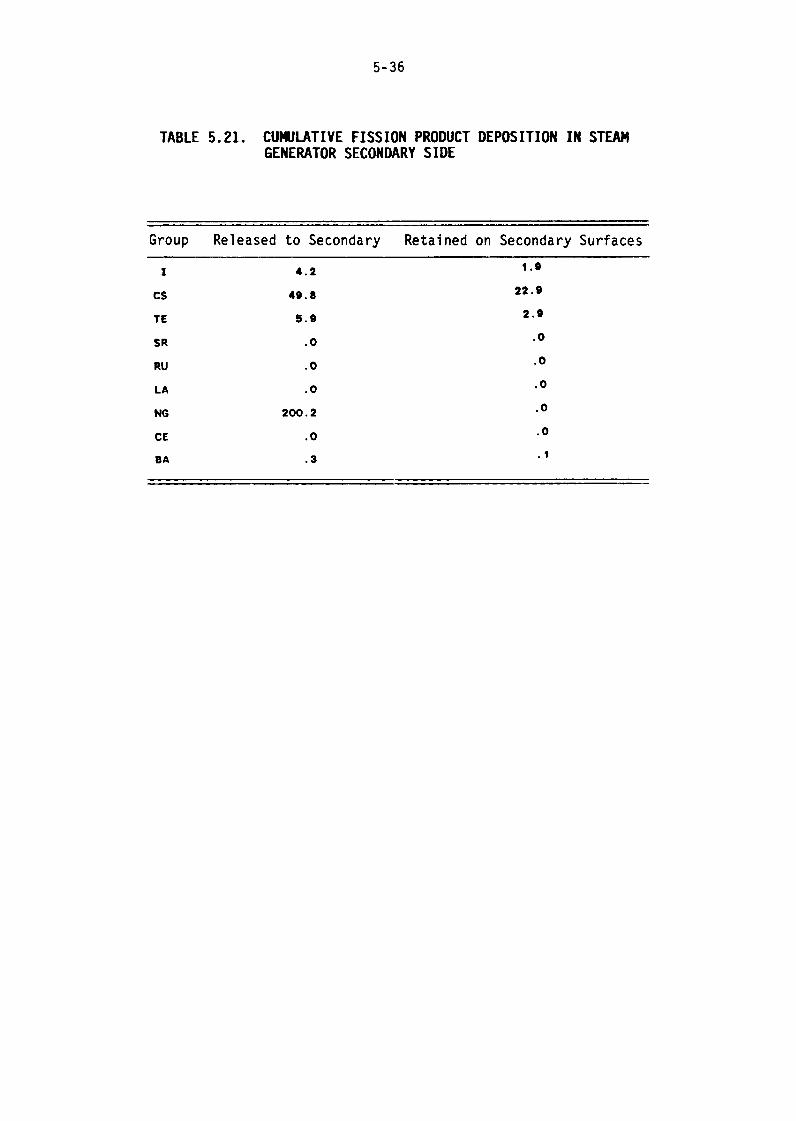
5 36
TABLE 521. CUMULATIVE FISSION PRODUCT DEPOSITION IN STEAMGENERATOR SECONDARY SIDE
Group Released to Secondary Retained on Secondary Surfaces
1 4.2 1.9
Cs 49.8 22.9
TE 5.9 2.9
SR .0 .0
RU .0 .0
LA . 0 .0
NG 200.2 .0
CE .0 .0
BA 3
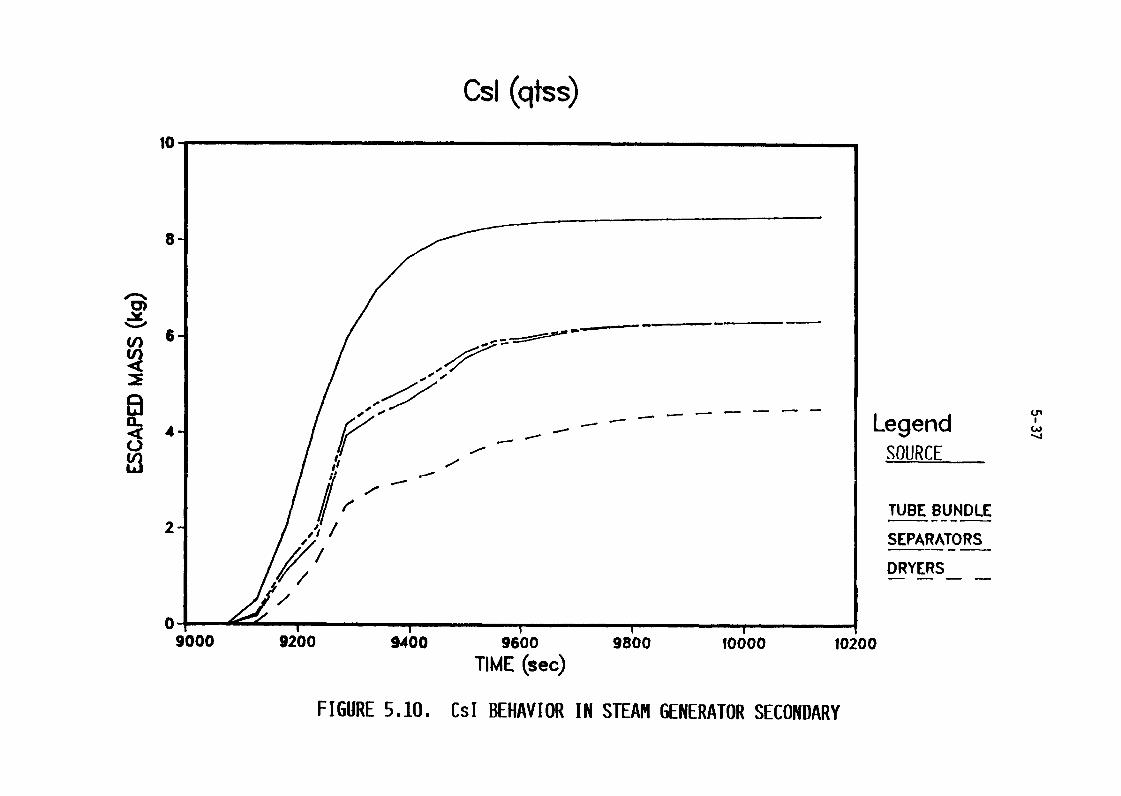
Csl (qtss)
10
.........
IL4- Legend
SOURCE
TUBE BUNDLE2
SEPARATORS
DRYERS-
09000 9200 9460 9600 98,00 lo�oo 10200
TIME (sec)
FIGURE 5.10. CsI BEHAVIOR IN STEAM GENERATOR SECONDARY
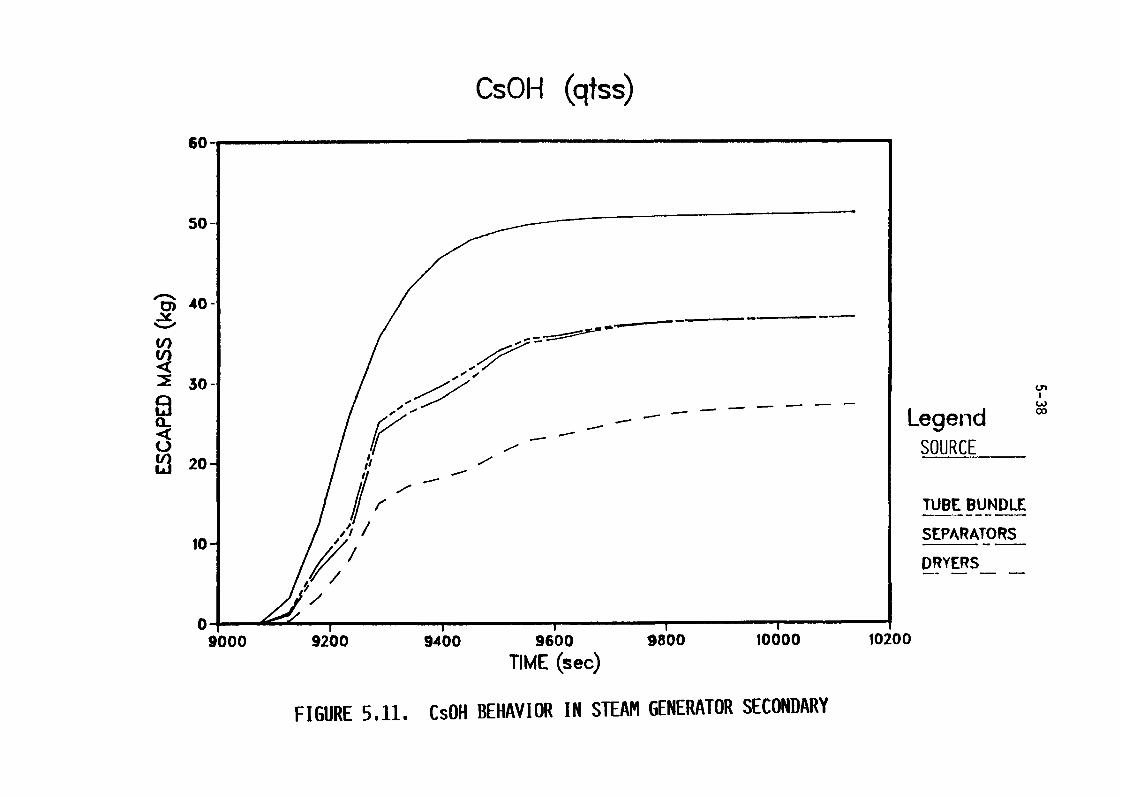
CsOH (qtss)
60
50-
40-
V)
Ln
IEl 00(L LegendQ SOURCEL 20-
TUBE BUNDLE
10- SEPARATORSDRYERS-
0 4-9000 9200 9400 96'00 9800 lo6oo loi0o
TIME (sec)
FIGURE 5.11. CsOH BEHAVIOR IN STEAM GENERATOR SECONDARY
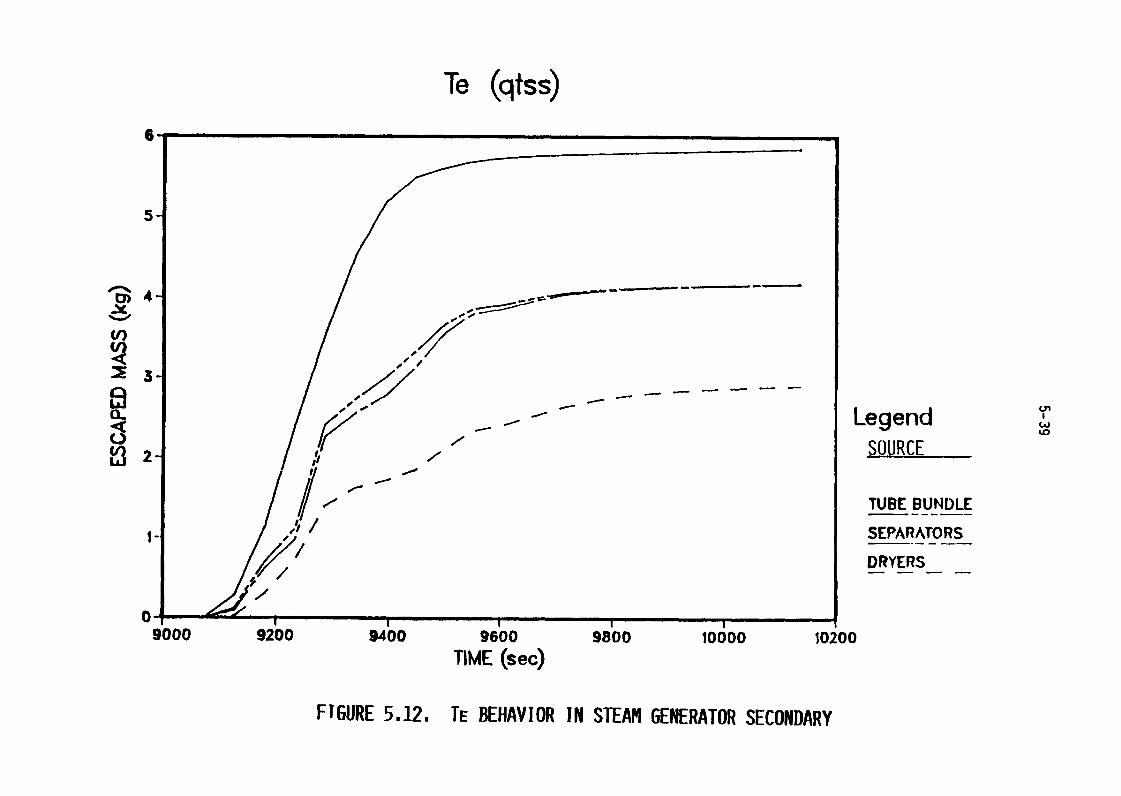
Te (qtss)6
0) 4-
3
IL LegendSOURCE2i
TUBE BUNDLE
SEPARATORS
DRYERS-
09000 9200 9460 9�00 9�00 10000 10�00
TIME (sec)
FTGURE 512. TE BEHAVIOR IN STEAM GENERATOR SECONDARY
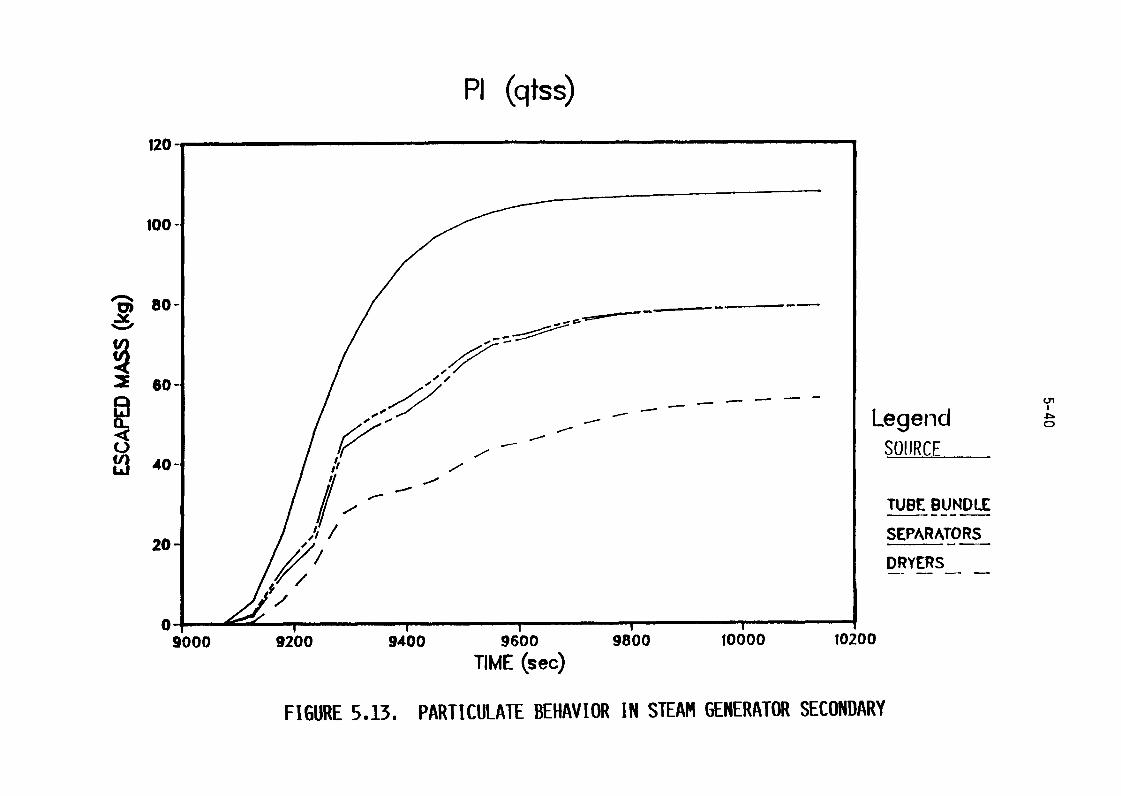
PI (qtss)
12
100-
80-
60
Legend CD
SOURCE40
TUBE BUNDLE
20- SEPARATORSDRYERS-
09000 9200 9400 9600 9800 10000 10�00
TIME (sec)
FIGURE 5.13. PARTICULATE BEHAVIOR IN STEAM GENERATOR SECONDARY
5-41
expressed as fractions of the initial core inventory, are summarized in
Table 522. The releases of the volatile species are seen to be considerable.
Approximately 38 percent of the noble gases were calculated to be
released to the environment through the steam generator relief valves. The
sensible energy release associated with the fission product releases was
calculated to be 529 x 106 Btu.
5.4 TBA Sequence
As has been previously described, in -the TBA sequence as considered
here, initial core uncovery and heatup take place under high primary system
pressure. An accident-induced primary system break is assumed to occur after
the onset of core melting, but prior to fuel smping out of the core region.
The depressurization of the primary system through the induced break leads to
accumulator discharge with recovery and quenching of the core. The accumulator
water eventually boils off and the core remelts..
5.4.1 Release and Transport in the RCS
The analysis of the fission product tansport within the reactor
primary system was accomplished by two separate TRAP-MERGE runs. The first
TRAP-MERGE anaysis treated the initial high pressure phase of the accident,
with release to the containment out of the pressurizer safety/relief valve.
The second TRAP-MERGE analysis was applied to the later remelting phase of the
accident when the primary system was depressurized; the releases to the
containment for this phase were through the break in the hot leg piping.
The results of the primary system fission product transport during
the initial heatup and melting phase of the accident are summarized in
Tables 523 and 524 as well as Figures 514 through 517. Relatively little
primary system deposition is predicted for this phase of the accident. The
depressurization of the primary system in response to the induced break is seen
to rapidly sweep the airborne species out of the primary system.
The primary system fission product transport analyses for the
remelting phase of this sequence are summarized in Tables 525 and 526 and
illustrated in Figures 5.18 through 521. More primary system retention of
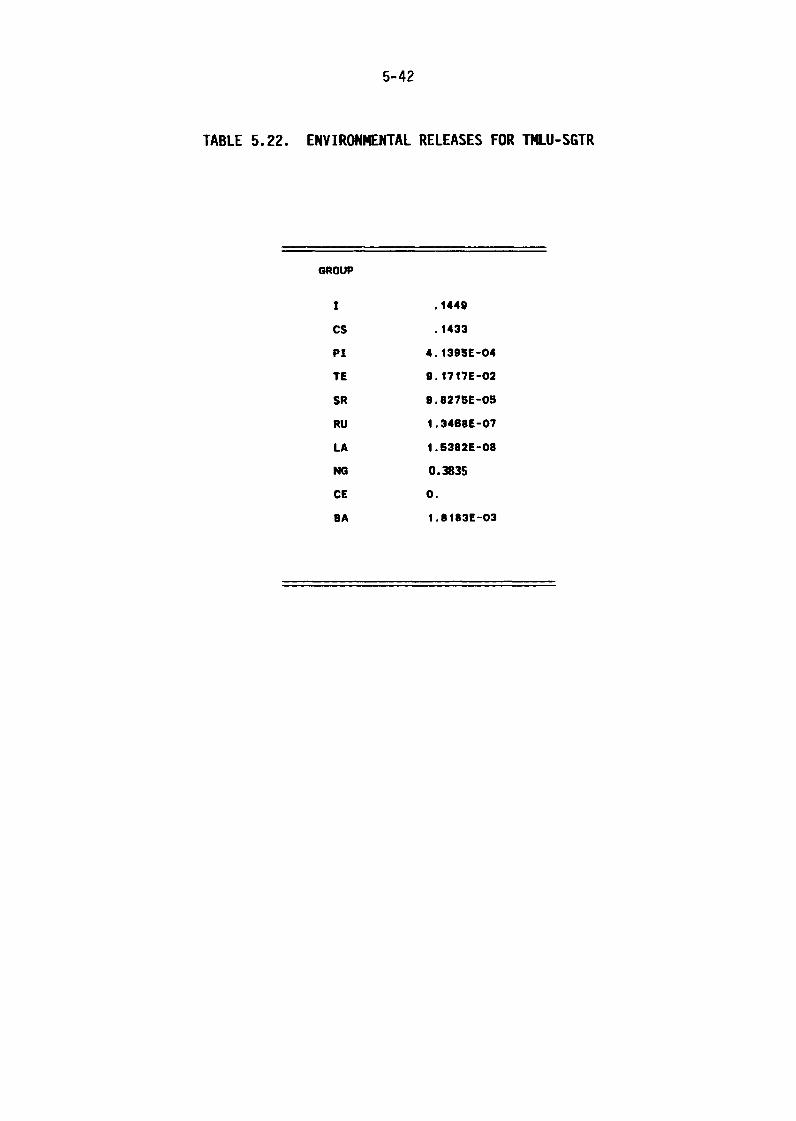
5-42
TABLE 522. ENVIRONMENTAL RELEASES FOR TMI-U-SGTR
GROUP
1 .1449
Cs .1433
pi 4.139SE-04
TE 9.1717E-02
SR 9.8275E-05
RU 1.346SE-07
LA 1.5382E-08
Ha 0.3835
CE 0.
BA 1.8183E-03
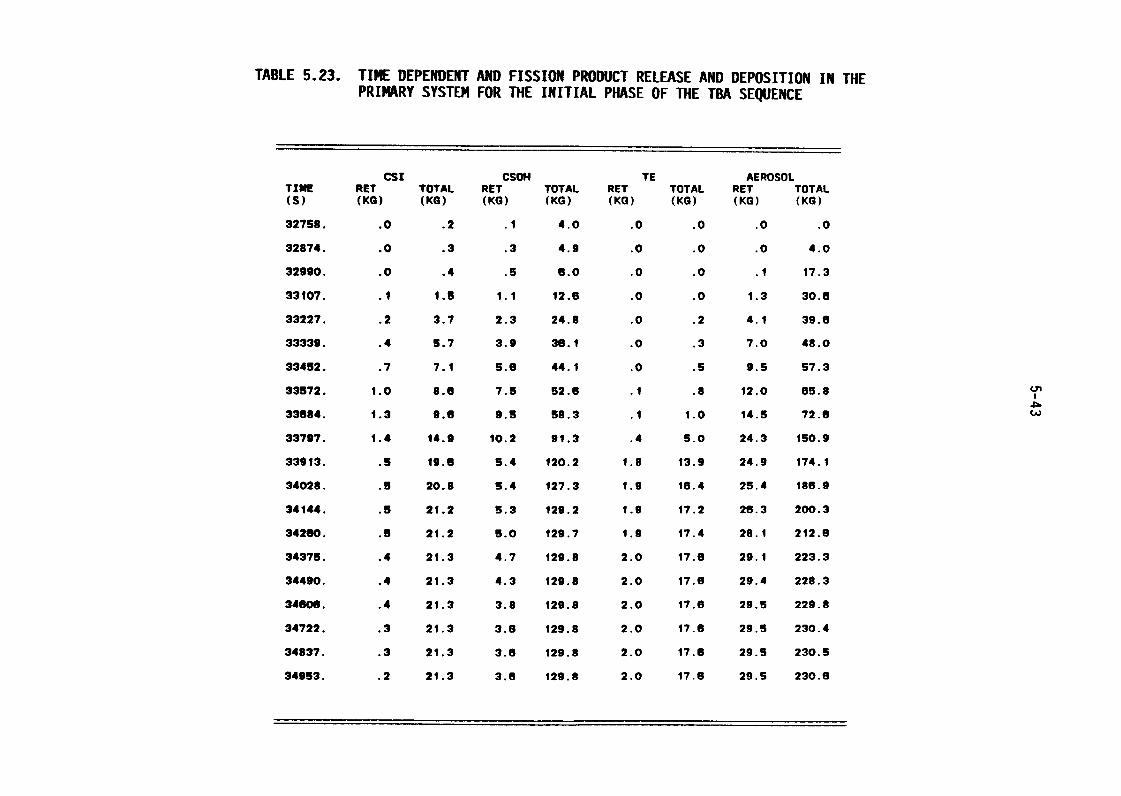
TABLE 523. TIME DEPENDENT AND FISSION PRODUCT RELEASE AND DEPOSITION IN THEPRIMARY SYSTEM FOR THE INITIAL PHASE OF THE TBA SEQUENCE
CS1 cSom TE AEROSOLTIME RET TOTAL RET TOTAL RET TOTAL RET TOTAL(S) (KG) (KG) (KG) (KG) (KG) (KG) (KG) (KG)
32759. .0 .2 .1 4.0 .0 .0 .0 .0
32874. .0 .3 .3 4.9 .0 .0 .0 4.0
32990. .0 .4 .5 6.0 .0 .0 .1 17.3
33107. .1 i.5 1.1 12.6 .0 .0 1.3 30.8
33227. .2 3.7 2.3 24.8 .0 .2 4.1 39.6
33339. .4 5.7 3.9 36.1 .0 .3 7.0 48.0
33452. .7 7.1 5.6 44.1 .0 .5 9.5 57.3
33572. 1.0 8.6 7.5 52.6 .1 .8 12.0 65.8
33884. 1.3 9.6 9.6 58.3 .1 1.0 14.5 72.6 CA)
33797. 1.4 14.9 10.2 91.3 .4 5.0 24.3 150.9
33913. .5 19.6 5.4 120.2 1.8 13.9 24.9 174.1
34028. .3 20.8 3.4 i27.3 1.9 16.4 25.4 186.9
34144. .5 21.2 5.3 129.2 1.9 17.2 26.3 200.3
34260. .5 21.2 5.0 129.7 1.9 17.4 28.1 212.6
34375. .4 21.3 4.7 129.8 2.0 17.6 29.1 223.3
34490. .4 21.3 4.3 129.8 2.0 17.6 29.4 228.3
34608. .4 21.3 3.8 i29.8 2.0 i7.8 29.5 229.8
34722. .3 V.3 3.8 129.9 2.0 17.6 29.5 230.4
34837. .3 2i.3 3.8 129.8 2.0 17.6 29.5 230.3
34933. .2 21.3 3.6 i29.8 2.0 17.8 29.5 230.8
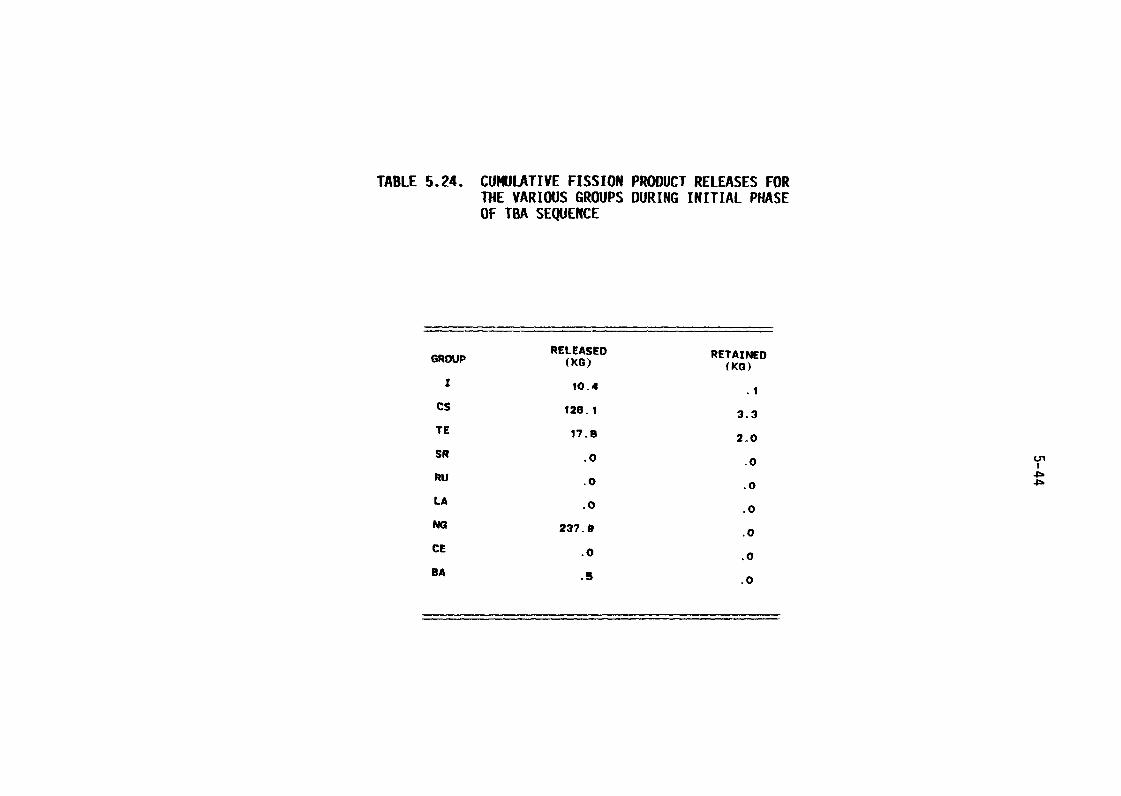
TABLE 524. CUMULATIVE FISSION PRODUCT RELEASES FORTHE VARIOUS GROUPS DURING INITIAL PASEOF TBA SEQUENCE
RELEASED RETAINEDGROUP (KG) (KG)
1 10.4 .1
Cs 126.1 3.3
TE 17.6 2.0
SP .0 .0
RU .0 .0
LA .0 .0
NG 237.9 .0
CE .0 .0
OA .5 .0
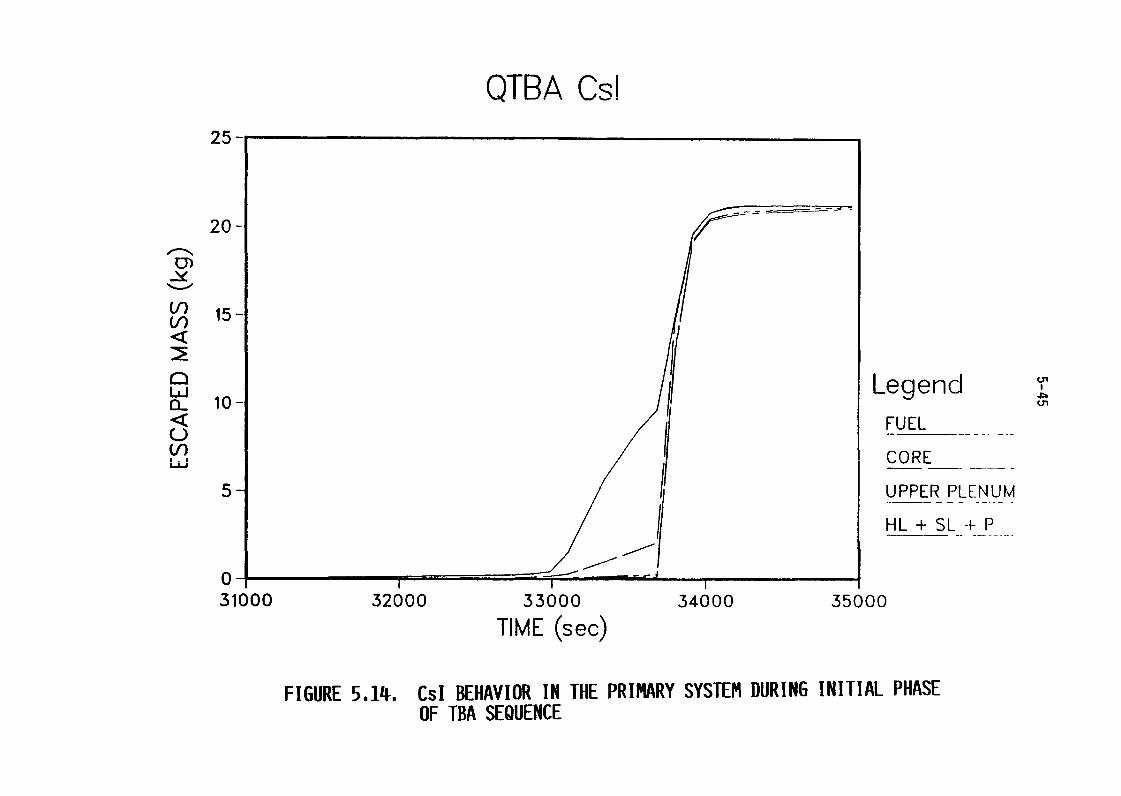
QTBA Cs!25 -
20 -
-y
1 -V)
LLI LegendCL 10 < FUELuV) c(pp-1-1Li-i
5- UPPER PLENUM
HL + SL
0 -J31600 32000 33000 34000 35000
TIME (sec)
FIGURE 514. Csl BEHAVIOR IN THE PRIMARY SYSTEM DURING INITIAL PHASEOF TBA SEQUENCE
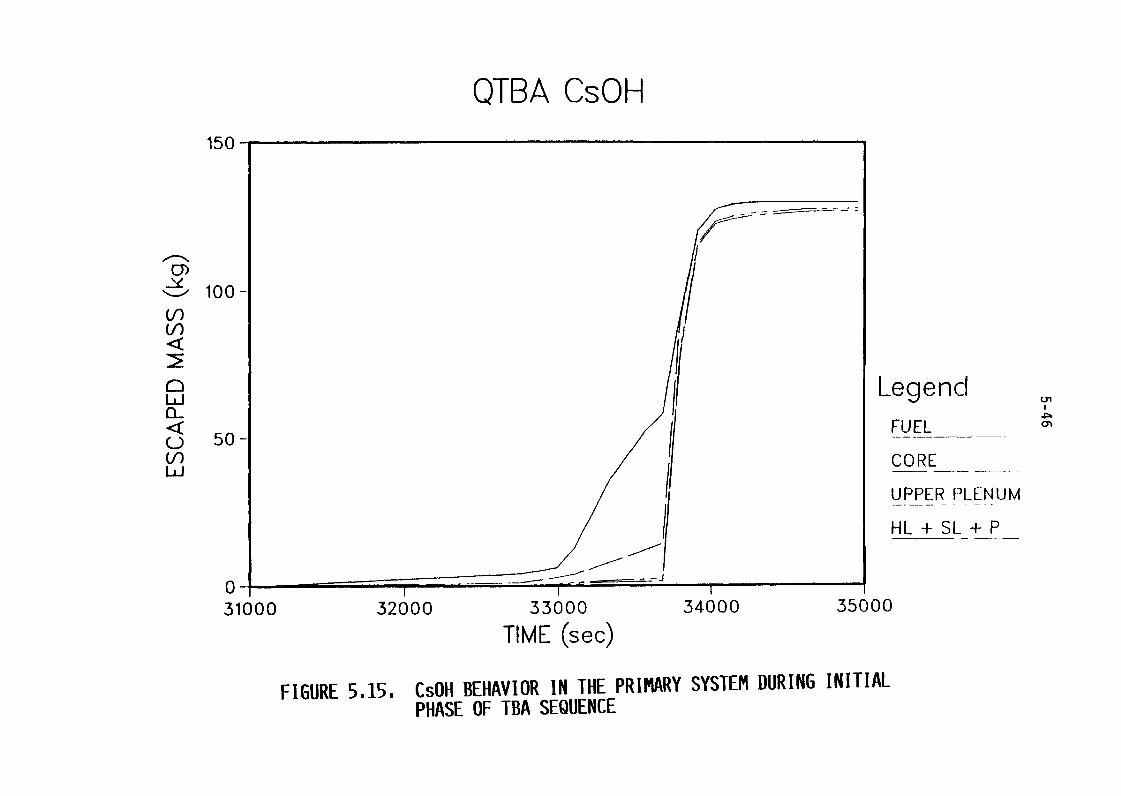
QTBA CsOH150
100
V)
(A
LegendLAJ
cl-
< FUELu 5 -V) CORELi UPPER PLENUM
HL + SL + P
031000 32000 33000 34000 35000
TIME (sec)
FIGURE 5.15. CsOH BEHAVIOR IN THE PRIMARY SYSTEM DURING INITIALPHASE OF TBA SEQUENCE
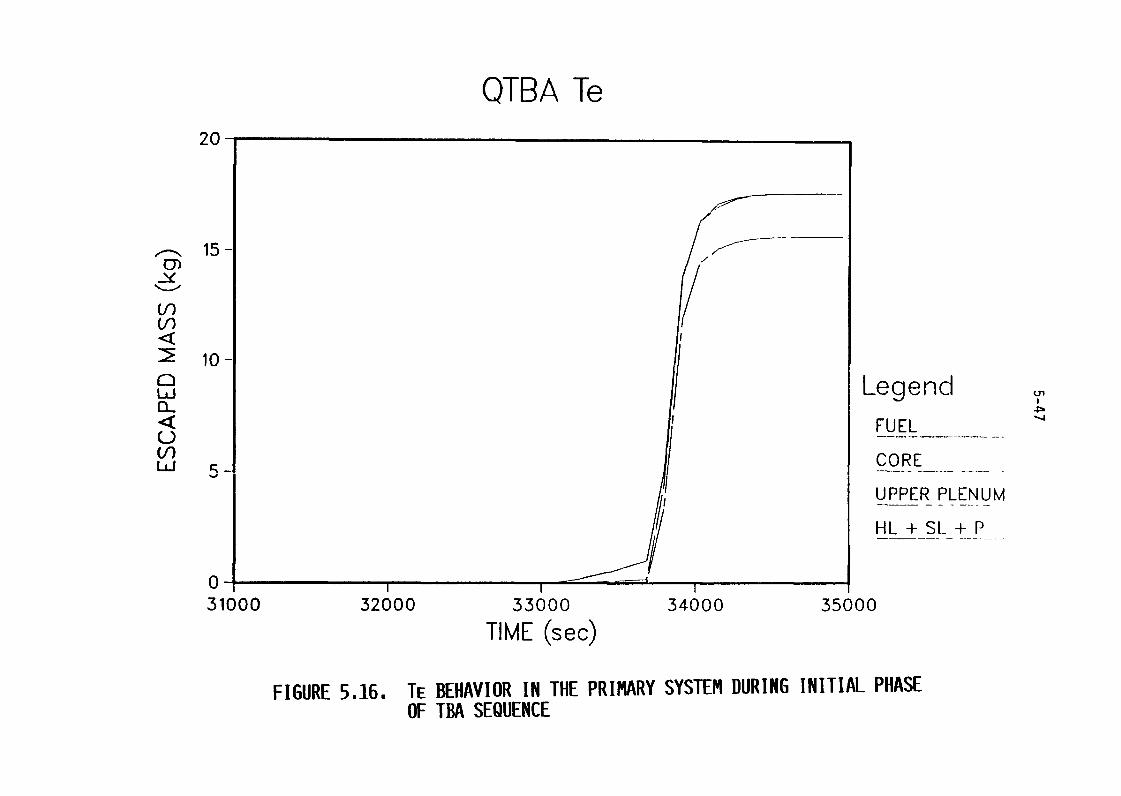
QTBA Te20
all, 150)
c/)
lo
Legend< FUEL
CORE
UPPER PLENUM
HL + SL A- P
0
31000 32000 33000 34000 35000
TIME (sec)
FIGURE 516. TE BEHAVIOR IN THE PRIMARY SYSTEM DURING INITIAL PHASEOF TBA SEQUENCE
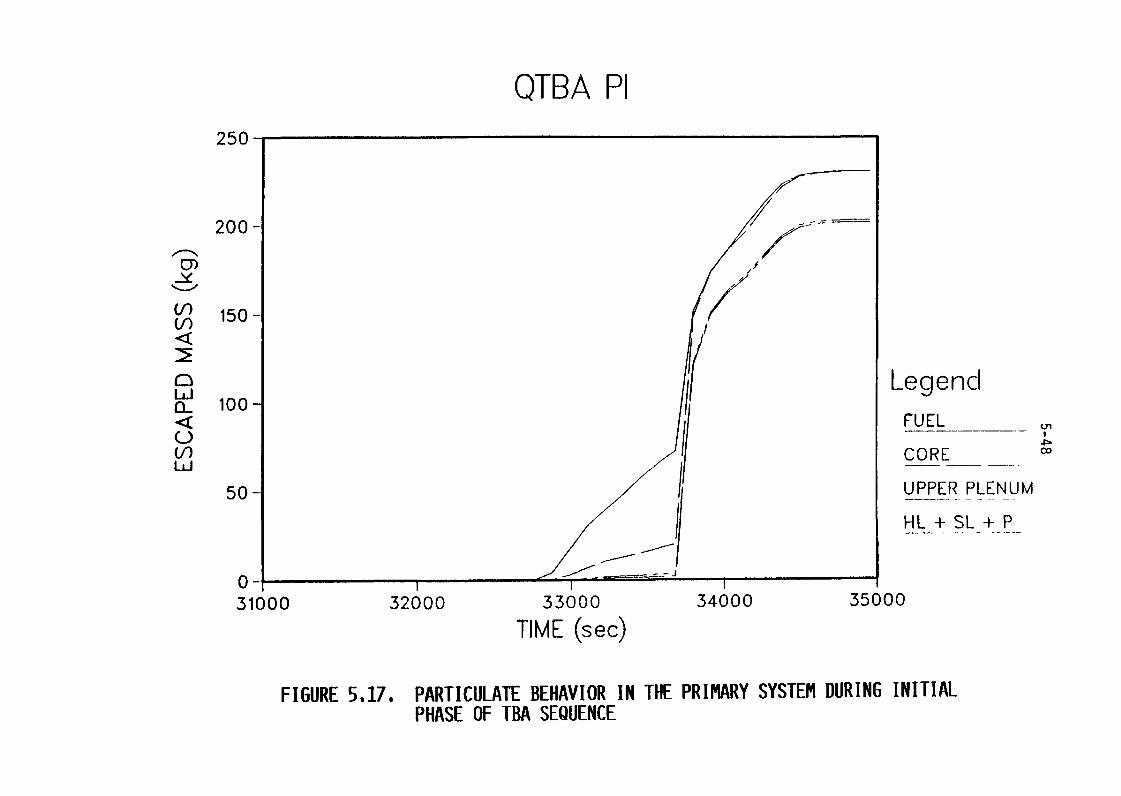
QTBA PI250
200 -
15 -U)
LegendbiCL 100 < FUEL
V) CORE coLi
5 - UPPER- PLENUM
HL + S-+-P-
0-1
31000 32000 33000 34000 35000
TIME (sec)
FIGURE 517. PARTICULATE BEHAVIOR IN THE PRIMARY SYSTEM DURING INITIALPHASE OF TBA SEQUENCE
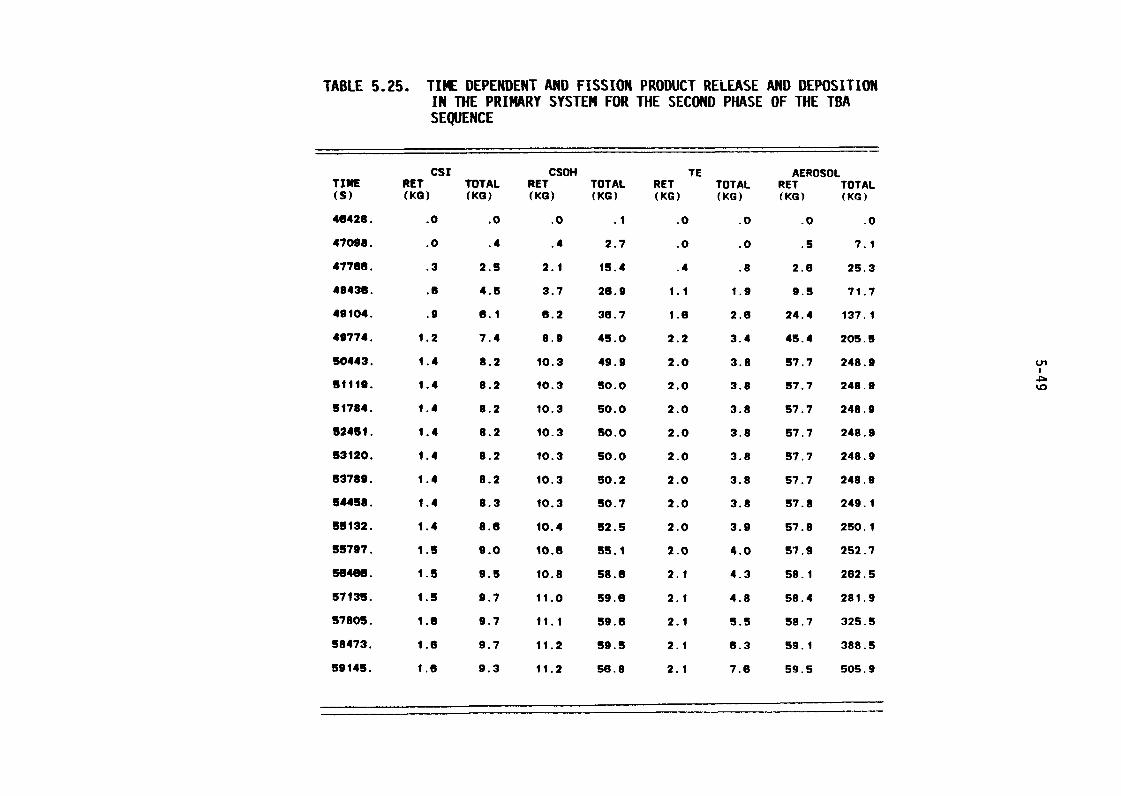
TABLE 525. T114E DEPENDENT AND FISSION PRODUCT RELEASE AND DEPOSITIONIN THE PRIMARY SYSTEM FOR THE SECOND PHASE OF THE TBASEQUENCE
CST Cso" TE AEROSOLTIME RET TOTAL RET TOTAL RET TOTAL RET TOTAL(s) (KG) (KG) (KG) (KG) (KG) (KG) (KG) (KG)
46426. .0 .0 .0 .1 .0 .0 .0 .0
47098. .0 .4 .4 2.7 .0 .0 .5 7.1
47766. .3 2.8 2.1 15.4 .4 .8 2.6 25.3
48436. .8 4.5 3.7 26.9 l.i 1.9 9.5 71.7
49104. .9 6.1 6.2 36.7 1.6 2.6 24.4 137.1
49774. 1.2 7.4 8.9 45.0 2.2 3.4 45.4 205.5
50443. i.4 8.2 10.3 49.9 2.0 3.8 57.7 249.9
Bills. i.4 9.2 10.3 50.0 2.0 3.8 57.7 248.9
51784. 1.4 8.2 10.3 50.0 2.0 3.8 57.7 248.9
5245i. i.4 8.2 10.3 50.0 2.0 3.8 57.7 248.9
53120. 1.4 8.2 10.3 50.0 2.0 3.8 57.7 248.9
53789. 1.4 8.2 10.3 50.2 2.0 3.8 57.7 248.9
54458. 1.4 8.3 10.3 50.7 2.0 3.8 57.8 249.1
55132. 1.4 8.6 10.4 52.5 2.0 3.9 57.8 250.1
55797. 1.5 9.0 10.6 55.1 2.0 4.0 57.9 252.7
56466. 1.5 9.5 10.8 58.6 2.1 4.3 58.1 262.5
57135. 1.5 9.7 11.0 59.6 2.i 4.8 58.4 281.9
57805. 1.6 9.7 11.1 59.6 2.1 5.5 58.7 325.5
58473. 1.8 9.7 11.2 59.5 2.1 6.3 99.1 388.5
59i4s. 1.6 9.3 11.2 58.8 2.1 7.6 59.5 505.9
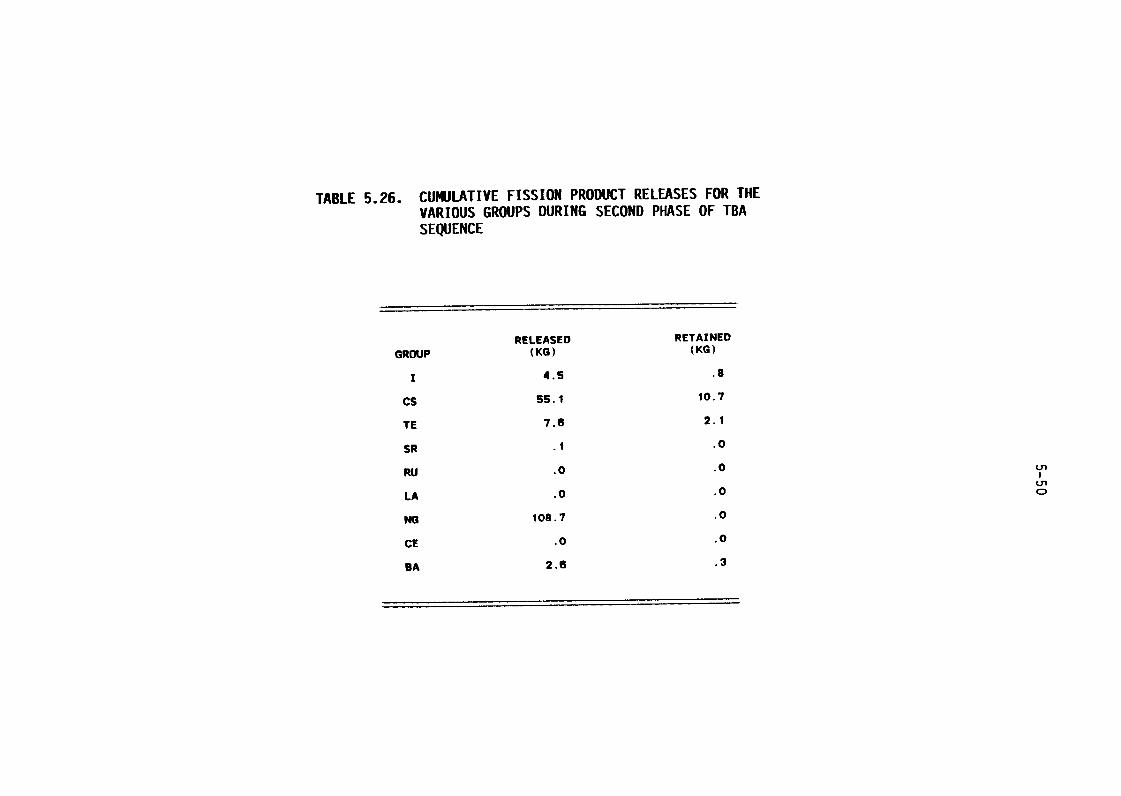
TABLE 526. CUMULATIVE FISSION PRODUCT RELEASES FOR THEVARIOUS GROUPS DURING SECOND PHASE OF TBASEQUENCE
RELEASED RETAINEDGROUP (KG) (KG)
1 4.5 .8
Cs 55.1 10.7
TE 7.6 2.1
SR i .0
RU .0 .0 c-n
LA .0 .0 CD
NG 109.7 .0
CE .0 .0
BA 2.6 .3
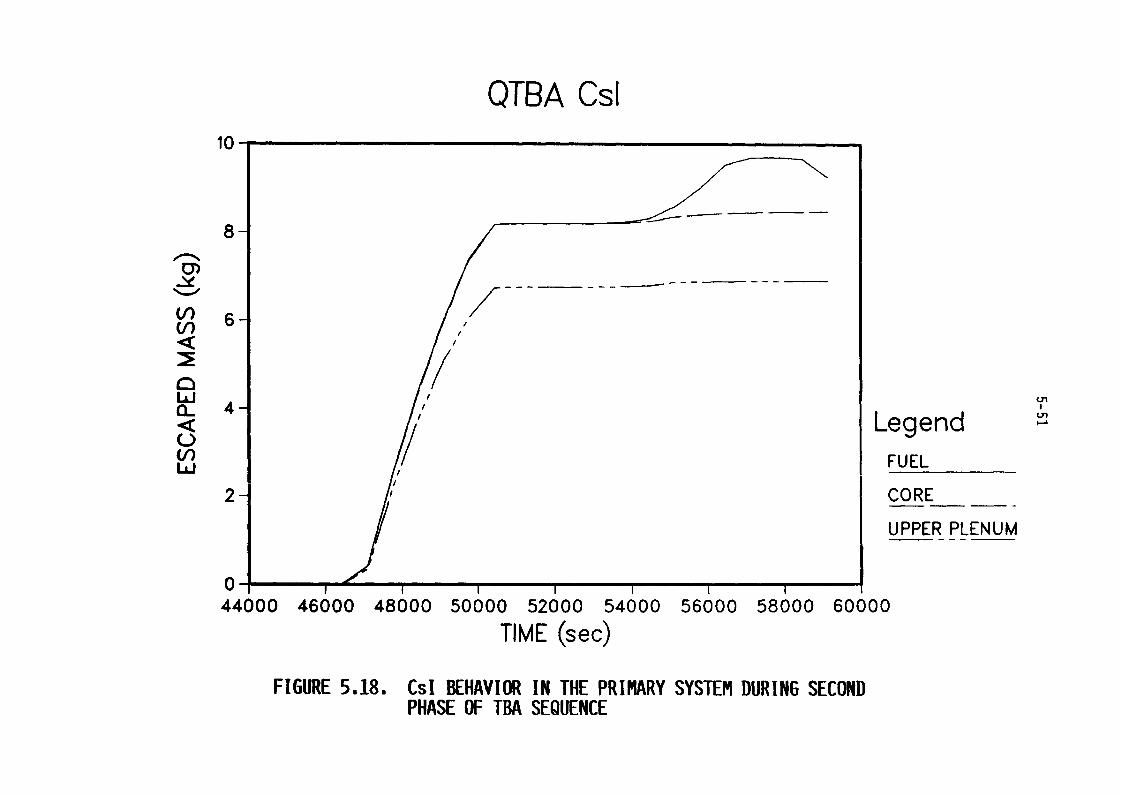
QTBA Csl10
-
V) 6-V)
Li 4-Legend
V) FUELLu
2- CORE
UPPER PLENUM
044000 46000 48000 50000 52000 54000 56000 58000 0000
TIME (sec)
FIGURE 5.18. CsI BEHAVIOR IN THE PRIMARY SYSTEM DURING SECONDPHASE OF TBA SEQUENCE
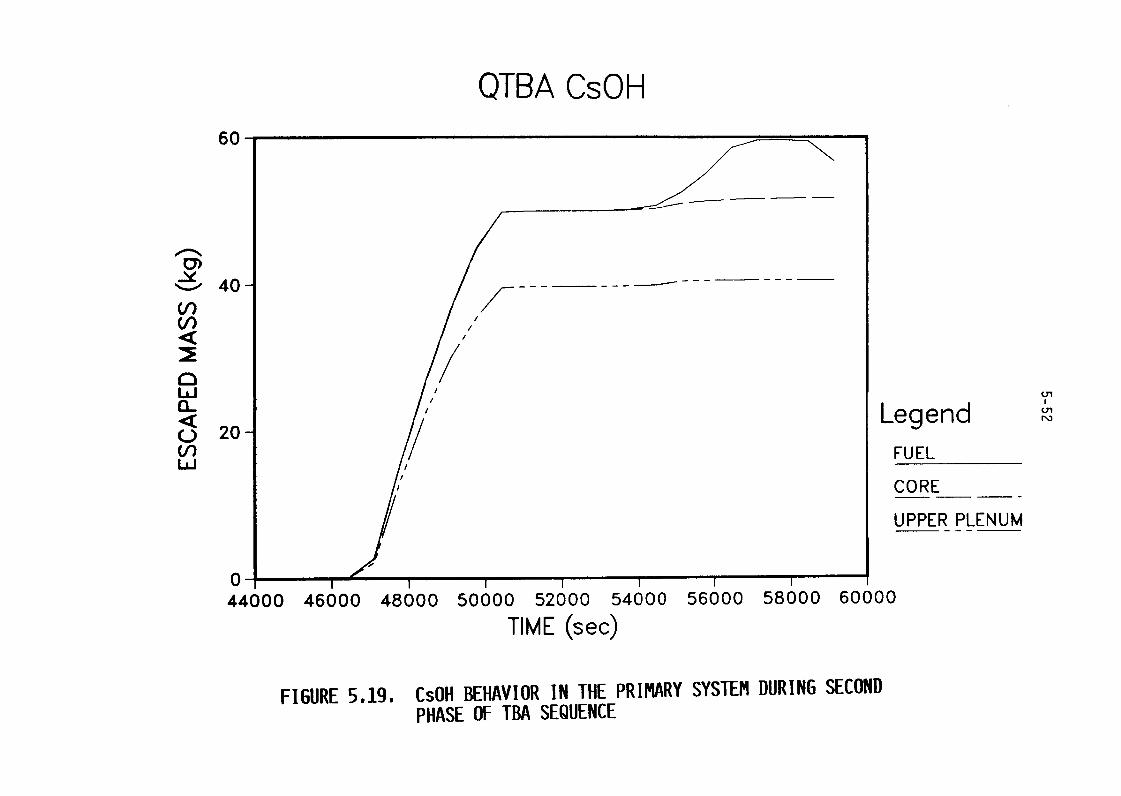
QTBA CsOH60
-y%%-." 40 - ---V)
LiCL< Legend0 20 -V) FUEL
CORE
UPPER PLENUM
044000 46000 48000 50000 52000 54000 56000 58000 bUUUU
TIME (sec)
FIGURE 519. CsOH BEHAVIOR IN THE PRIMARY SYSTEM DURING SECONDPHASE OF TBA SEQUENCE
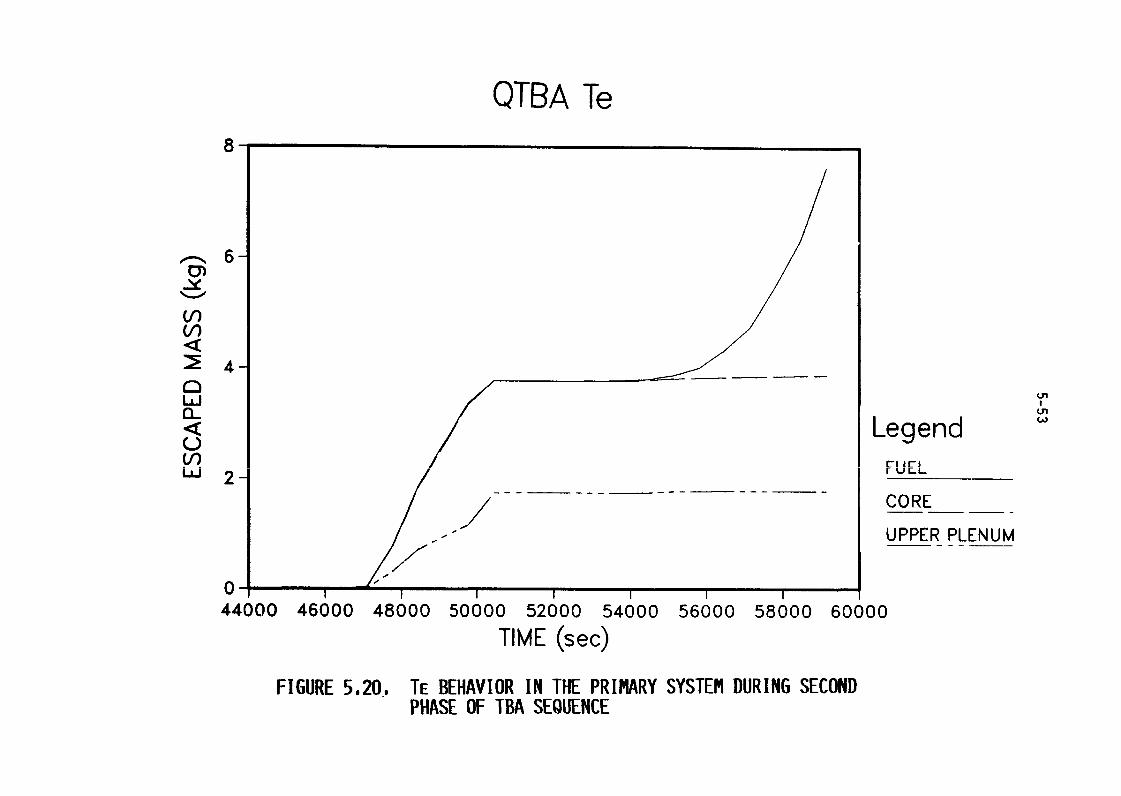
QTBA Te8
6
-y
V)V)
4-Ln
< LegenduV) r7 I l
U-1 F uc-i-
CORE
UPPER PLENUM
044000 46000 48000 50000 52000 54000 56000 58000 60000
TIME (sec)
FIGURE 520. TE BEHAVIOR IN THE PRIMARY SYSTEM DURING SECONDPHASE OF TBA SEQUENCE
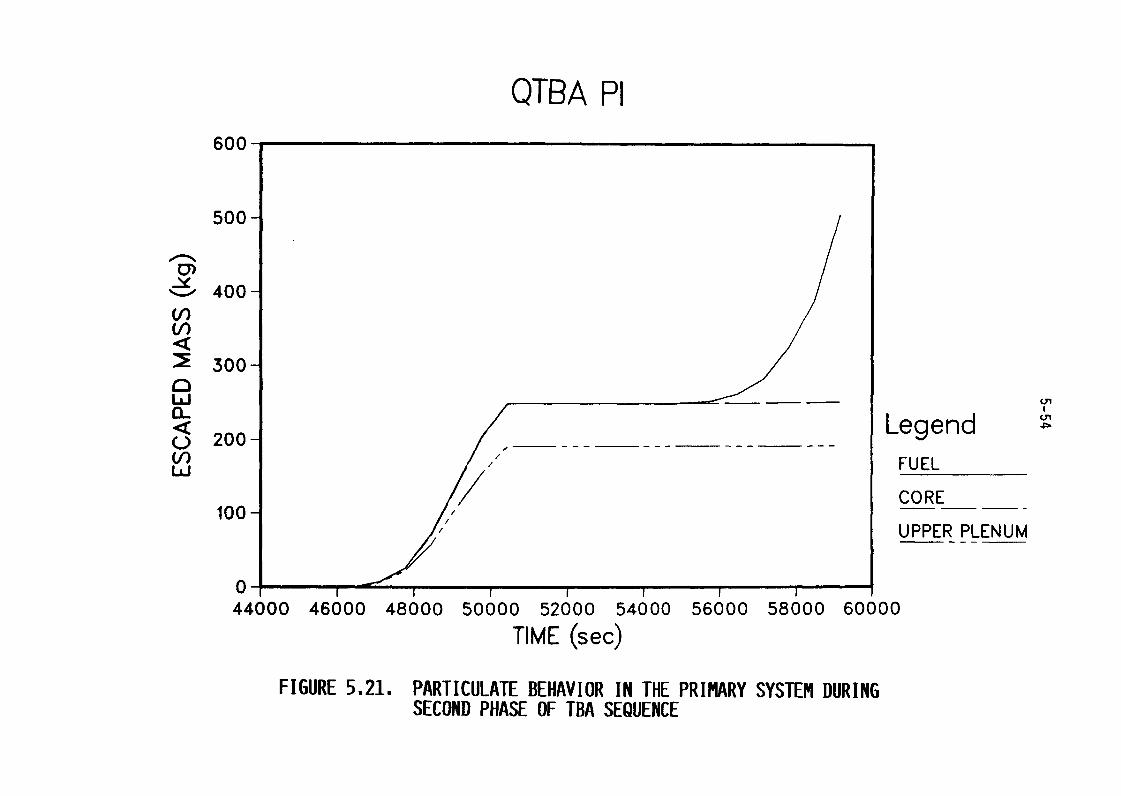
QTBA Pi600
50 -
400 -V)
300 -
Q-< Legend0 200 -V) FUELLi
CORE-100-
UPPER PLENUM
044000 46000 48000 50000 52000 54000 56000 58000 60600
TIME (sec)
FIGURE 521. PARTICULATE BEHAVIOR IN THE PRIMARY SYSTEM DURINGSECOND PHASE OF TBA SEQUENCE
5- 55
all the species considered is seen during the econd phase of the accident.
The indicated decrease of the CsI and CsOH releases from the fuel in
Figures 5.18 and 519 corresponds to the predicted settling of these species
back into the core region at late times in the sequence. It is also
interesting to note the significant releases o Te and particulates,
Figure 520 and 521, near the end of the in-vessel phase of the accident.
Since the primary system is depressurized, it takes considerable time for the
debris to melt through the vessel head; during this time the debris reheat and
release the above species.
5.4.2 Release and Transport in Containment
in this scenario the fission products from both the primary system
and the reactor cavity are released to the lower compartment of the ice
condenser containment. The fission product flowpath is from the lower
compartment to the ice condenser, from there to the upper compartment, and
after containment failure, to the environment. The calculational procedure
shown in Figure 5.5 is applicable to this sequence also. During the initial
core heatup phase of the accident, there is ample ice in the ice condenser;
during the later core remelt phase most of the ice is gone. The reactor
cavity is essentially dry throughout this accident sequence.
Table 527 summarizes the calculated fission product source terms to
the containment. The size distribution of the airborne particles in the upper
compartment is given in Table 528, and the fractions of core inventory
released to the environment for each of the fission product groups are given
in Table 529. The locational distribution of the various fission product
groups at the end of the calculation are given in Table 530.
The ice was predicted to be completely melted in this sequence prior
to the time of reactor vessel failure. To gain further insight on the
effectiveness of the ice in removing fission poducts, the above analyses was
repeated assuming no more fission product removal by the ice after 90 percent
of it had melted. This would correspond to nonuniform melting of the ice
with some flow breakthrough before all the ice had melted. The results of
this case are summarized in Table 531. From the changes in the releases to
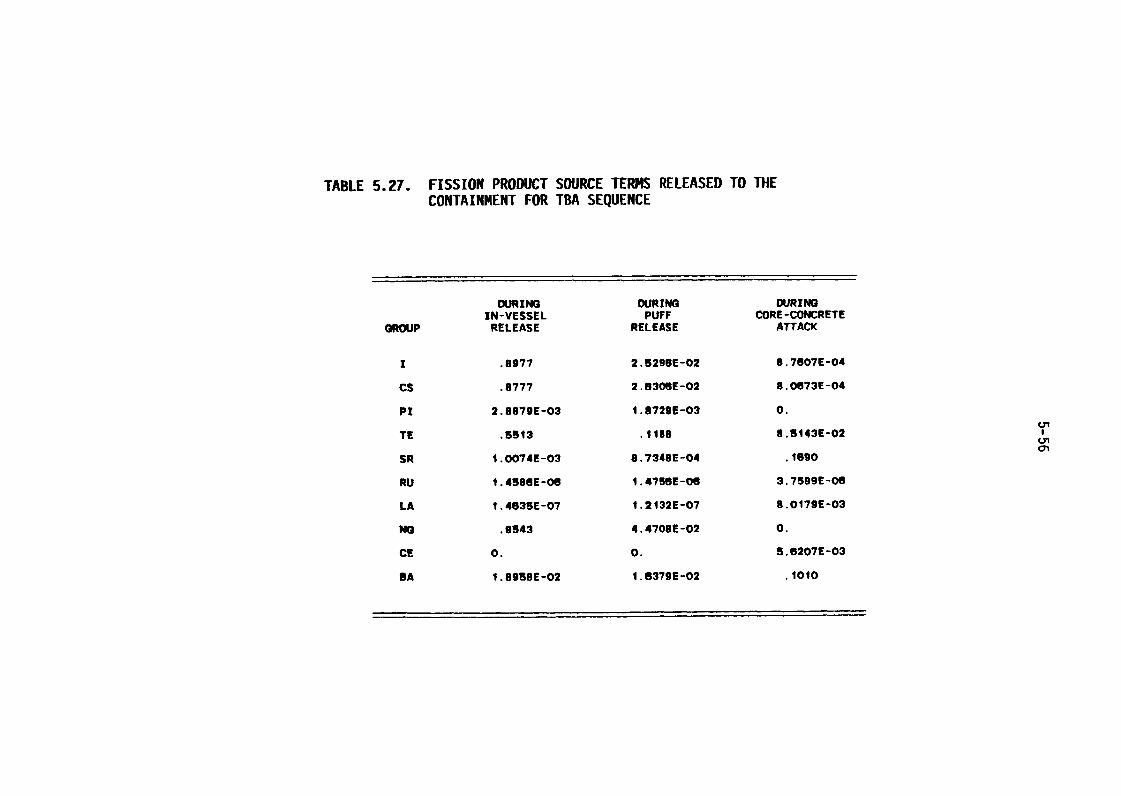
TABLE 527. FISSION PRODUCT SOURCE TERMS RELEASED TO THECONTAINMENT FOR TM SEQUENCE
DURING DURING DURINGIN-VESSEL PUFF CORE-CONCRETE
GROUP RELEASE RELEASE ATTACK
1 .8977 2.529SE-02 8.7607E-04
Cs .8777 2.830SE-02 8.0673E-04
pi 2.8879E-03 1.8729E-03 0.
TE .350 .1188 8.3143E-02
SR i.0074E-03 8.734BE-04 isgo
RU 1.458SE-08 1.475BE-06 3.7599E-08
LA 1.483SE-07 i.2132E-07 8.Oi79E-03
me .9543 4.470SE-02 0.
CE 0. 0. 5.6207E-03
OA 1.893SE-02 1.637SE-02 iOlo
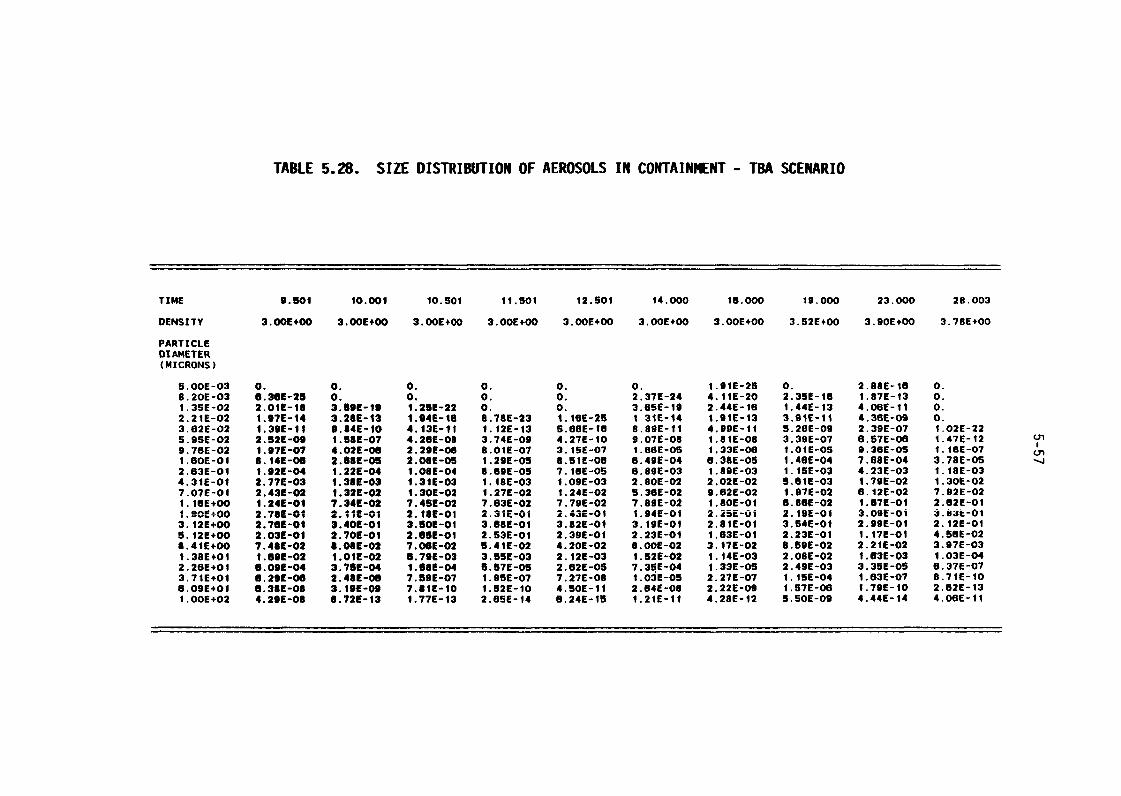
TABLE 528. SIZE DISTRIKJTION OF AEROSOLS IN CONTAIN14ENT - TBA SCENARIO
TIME 9.501 10.001 10.501 il.501 12.501 14.000 16.000 19.000 23.000 28.003
DENSITY 3.OOE+00 3.OOE+00 3.OOE+00 3.OOE+00 3.OOE+00 3.OOE+00 3.OOE+00 3.52E+00 3.90E+00 3.78E+00
PARTICLEDIAMETER(MICRONS)
5.00E-03 0. 0. 0. 0. 0. 0. 1.91E-25 0. 2.88E-la 0.8.20E-03 6.36E-25 0. 0. 0. 0. 2.37E-24 4.11E-20 2.35E-16 1.87E-13 0.1.35E-02 2.01E-18 3.59E-19 i.25E-22 0. 0. 3.65E-19 2.44E-16 1.44E-13 4.0GE-11 0.2.21E-02 1.97E-14 3.28E-13 1.94E-16 G.78E-23 1.16E-25 I 3E-14 1.91E-13 3.91E-11 4.36E-09 0.3.62E-02 1.39E-11 9.84E-10 4.13E-11 1.12E-13 5.68E-IG 8.89E-11 4.09E-11 5.26E-09 2.39E-07 1.02E-225.95E-02 2.52E-09 1.58E-07 4.26E-08 3.74E-09 4.27E-10 9.07E-08 1.81E-08 3.39E-07 0.57E-06 1.47E-12 Ln9.76E-02 1.97E-07 4.02E-06 2.299-06 8.01E-07 3.15E-07 1.88E-OS 1.33E-08 1.01E-05 9.36E-05 i.ISE-07 Ln1.60E-Ol 8.14E-00 2.68E-05 2.08E-05 1.29E-05 8.51E-00 6.49E-04 6.38E-05 1.46E-04 7.68E-04 3.78E-052.63E-01 1.92E-04 1.22E-04 1.08E-04 8.69E-05 7.1GE-O5 6.89E-03 1.89E-03 1.15E-03 4.23E-03 1.18E-034.31E-01 2.77E-03 1.38E-03 1.31E-03 1.48E-03 1.09E-03 2.80E-02 2.02E-02 5.61E-03 1.79E-02 1.30E-027.07E-01 2.43E-02 1.32E-02 1.30E-02 1.27E-02 1.24E-02 5.36E-02 9.62E-02 1.97E-02 6.12E-02 7.92E-021.16E+00 1.24E-01 7.349-02 7.45E-02 7.63E-02 7.79E-02 7.89E-02 1.80E-Ol 6.86E-02 1.67E-01 2.62E-014.9,E+00 2.78E�01 2.119-01 2.18E-01 2.31E-Oi 2.43E-01 1.94E-01 2.25E-01 2.igE-Oi 3.09E-oi 3.83E-eii.M+00 2.76E-01 3.40E-01 3.501-01 3.68E-01 3.82E-Oi 3.19E-01 2.81E-Ol 3.54E-Oi 2.99E-Ol 2.12E-015.12E+00 2.031-01 2.70E-01 2.65E-Ol 2.53E-Ol 2.39E-01 2.23E-Ol 1.63E-01 2.23E-Ol 1.17E-01 4.58E-028.41E+00 7.48E-02 8.08E-02 7.06E-02 5.41E-02 4.20E-02 S.OOE-02 3.17E-02 8.59E-02 2.21E-02 3.97E-031.38Ei-Ol 1.69E-02 1.01E-02 6.79E-03 3.55E-03 2.12E-03 1.52E-02 1.14E-03 2.08E-02 1.63E-03 1.03E-042.26E+01 6.09E-04 3.75E-04 1.8SE-04 5.57E-05 2.62E-05 7.35E-04 1.33E-05 2.49E-03 3.35E-05 8.37E-073.71E+01 0.299-06 2.48E-00 7.59E-07 1.95E-07 7.27E-08 1.03E-05 2.27E-07 1.15E-04 1.63E-07 8.71E-108.09E+01 6.385-08 3.19E-09 7.81E-10 1.52E-10 4.50E-11 2.84E-08 2.22E-09 1.57E-06 1.79E-10 2.62E-131.00E+02 4.299-08 8.72E-13 1.77E-13 2.65E-i4 6.24E-15 1.2iE-11 4.28E-i2 5.50E-09 4.44E-14 4.OGE-11
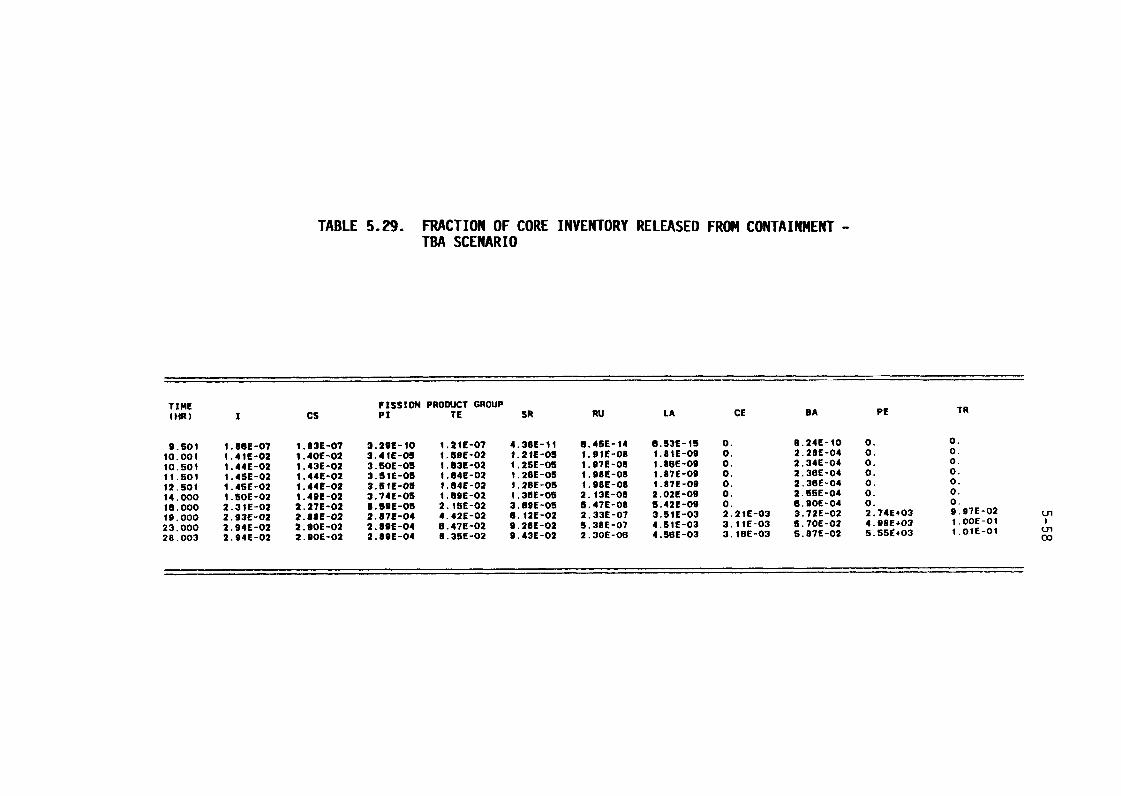
TABLE 529. FRACTION OF CORE INVENTORY RELEASED FROM CONTAINMENT -TBA SCENARIO
TIME FISSION PRODUCT GROUP(HR) I Cs pi TE SR RU LA CE BA PE TR
1:.:Ol 1.86E-07 1.83E-07 3.29E-10 1.21E-07 4.38E-11 6.45E-14 6.53E-15 0. 8.24E-10 0. D.01 1.41E-02 1.40E-02 3.41E-05 1.59E-02 1.21E-05 1.91E-08 1.81E-09 0. 2.28E-04 0. 0.
10,501 1.44E-02 1.43E-02 3.50E-05 1.63E-02 1.25E-05 1.97E-08 1.88E-09 D. 2.34E-04 0. 0.11,501 1,4 E02 1.44E-02 3.51E-05 1.64E-02 1.26E-05 1.9se-08 1.87E-09 0. 2.36E-04 0. 0.' 1 -09 2.36E-04 0. 0.12.90 1.4:E-02 1.44E-02 3.51E-05 1.84E-02 1.26E-05 1.98E-os 1.87E 0.14.000 1.50E-02 1.49E-02 3.74E-05 1.69E-02 1.36E-05 2.13E-08 2.02E-09 0. 2.55E-04 0. 0.
2.27E-02 8.59E-05 2.15E-02 3.69E-05 5.47E-08 5.42E-09 0. 6.90E-04 0. 0.16.000 2.31E-02 +03 9.97E-0219.000 2.93E-02 2.88E-02 2.87E-04 4.429-02 6.12E-02 2.33E-07 3.51E-03 2.21E-03 3.72E-02 2.74E23.000 2.94E-02 2.90E-02 2.89E-04 6.47E-02 9.26E-02 5.38E-07 4.51E-03 3.11E-03 5.70E-02 4.98E403 1.00E-0128.003 2.94E-02 2.90E-02 2.89E-04 8.35E-02 9.43E-02 2.30E-06 4.58E-03 3.16E-03 5.87E-02 5.S5f+03 1.01E-Ol 00
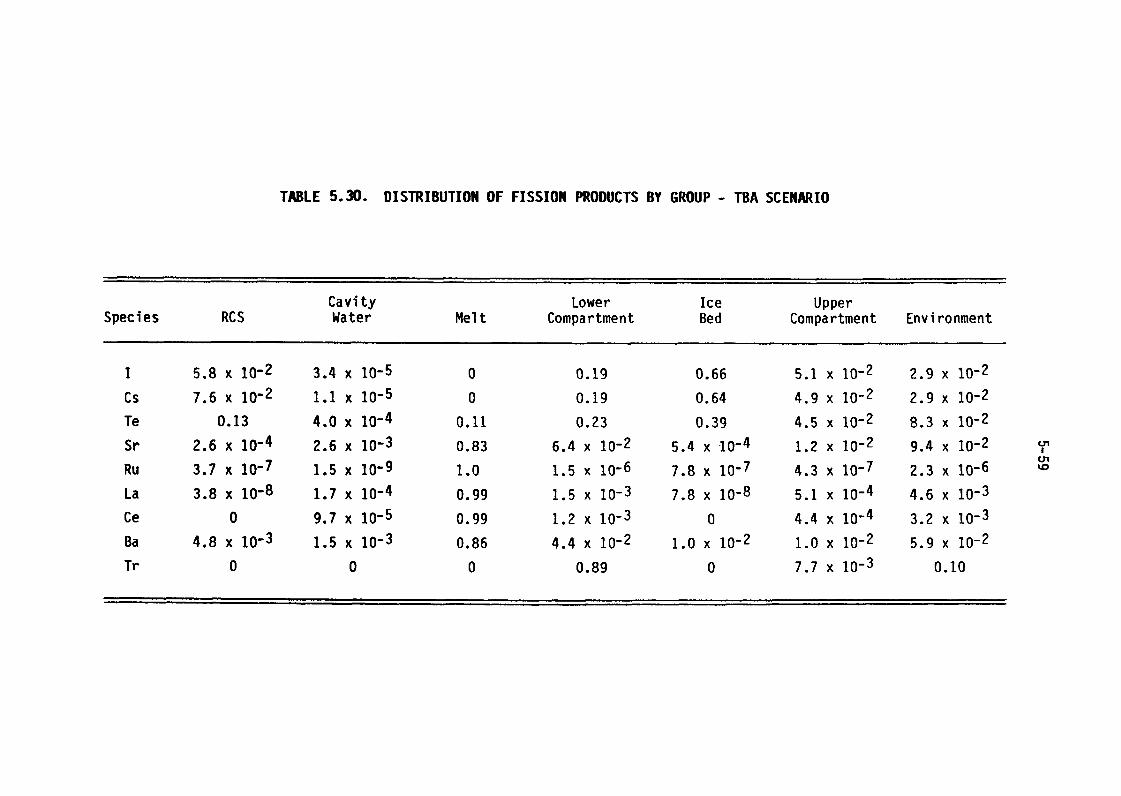
TABLE 5.30. DISTRIBUTION OF FISSION PRODUCTS BY GROUP - TBA SCENARIO
Cavity Lower Ice UpperSpecies RCS Water Melt Compartment Bed Compartment Environment
I 5.8 12 3.4 x 1-5 0 0.19 0.66 5.1 x 1-2 2.9 x 10⁻²
Cs 7.6 x 12 1.1 x 10⁻⁵ 0 0.19 0.64 4.9 x 10⁻² 2.9 x 10⁻²
Te 0.13 4.0 x 10⁻⁴ 0.11 0.23 0.39 4.5 x 10⁻² 8.3 x 10⁻²
Sr 2.6 x 10⁻⁴ 2.6 x 10⁻³ 0.83 6.4 x 10⁻² 5.4 x 10⁻⁴ 1.2 x 10⁻² 9.4 x 10⁻²Ln
Ru 3.7 x 10⁻⁷ 1.5 x 10⁻⁹ 1.0 1.5 x 10⁻⁶ 7.8 x 10⁻⁷ 4.3 x 10⁻⁷ 2.3 x 10⁻⁶ to
La 3.8 x 10⁻⁸ 1.7 x 10⁻⁴ 0.99 1.5 x 10⁻³ 7.8 x 10⁻⁸ 5.1 x 10⁻⁴ 4.6 x 10⁻³
Ce 0 9.7 x 10⁻⁵ 0.99 1.2 x 10⁻³ 0 4.4 x 10⁻⁴ 3.2 x 10⁻³
Ba 4.8 x 10⁻³ 1.5 x 10⁻³ 0.86 4.4 x 12 1.0 x 12 1.0 x 10⁻² 5.9 x 10⁻²
Tr 0 0 0 0.89 0 7.7 x 10⁻³ 0.10
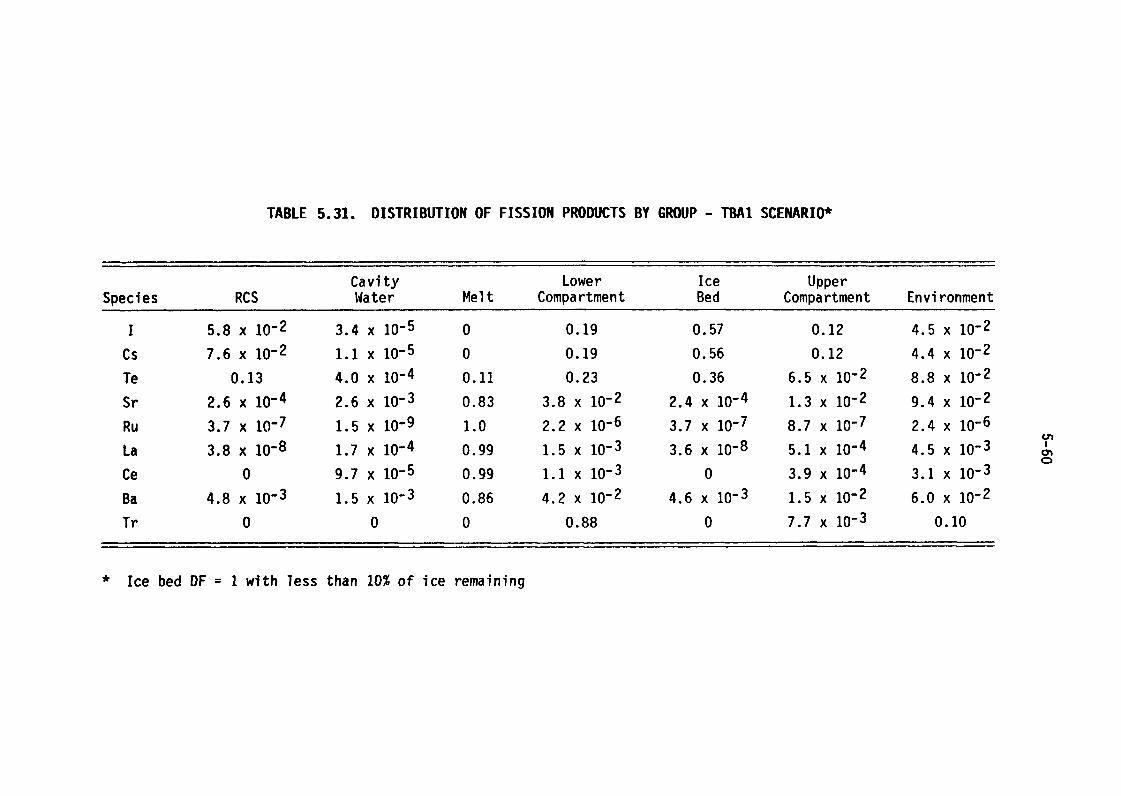
TABLE 531. DISTRIBUTION OF FISSION PRODUCTS BY GROUP - TBAI SCENARIO*
Cavity Lower Ice UpperSpecies RCS Water Melt Compartment Bed Compartment Environment
1 5.8 x 12 3.4 x 1-5 0 0.19 0.57 0.12 4.5 x 12
Cs 7.6 x 12 1.1 x10⁻⁵ 0 0.19 0.56 0.12 4.4 x 10⁻²
Te 0.13 4.0 x10⁻⁴ 0.11 0.23 0.36 6.5 x 12 8.8 x 10⁻²
Sr 2.6 x 10⁻⁴ 2.6 x10⁻³ 0.83 3.8 x 12 2.4 x 10⁻⁴ 1.3 x 10⁻² 9.4 x 10⁻²
Ru 3.7 x10⁻⁷ 1.5 x10⁻⁹ 1.0 2.2 x 10⁻⁶ 3.7 x 10⁻⁷ 8.7 x 10⁻⁷ 2.4 x 10⁻⁶
La 3.8 x10⁻⁸ 1.7 x10⁻⁴ 0.99 1.5 x 10⁻³ 3.6 x 10⁻⁸ 5.1 x 10⁻⁴ 4.5 x 10⁻³
Ce 0 9.7 x10⁻⁵ 0.99 1.1 x 10⁻³ 0 3.9 x 10⁻⁴ 3.1 x 10⁻³
Ba 4.8 x10⁻³ 1.5 x10⁻³ 0.86 4.2 x 12 4.6 x 10⁻³ 1.5 x 10⁻² 6.0 x 10⁻²
Tr 0 0 0 0.88 0 7.7 x 10⁻³ 0.10
Ice bed DF = I with less than 10% of ice remaining
5 61
the environment, it can be seen that the availability of the ice can have a
significant impact on predicted environmental eleases.
5.5 Noble Gas and Energy Release to Environment
The release of noble gases to the environment is calculated by the
MARCH 3 code rather than the fission product tansport codes TRAP and NAUA
since the noble gases are assumed to be transported with the bulk flow of
gases without attenuation. The energy associated with gases escaping the
containment is also calculated in the MARCH 3 code. The environmental
releases of noble gases and energy are tabulated in Table 532. The heat of
vaporization of the steam in the escaping gases is not included in the table.
For the TMLU-SGTR scenario the release is essentially a puff 20 minutes
duration) containing 38 percent of the noble gses and 529 x 106 Btu of
energy.
5.6 Icebed Decontamination
One of the important factors affecting the magnitude of source terms
for the ice-condenser plant is the availability of ice at the time of release
and the effectiveness with which decontamination occurs. The ICEDF computer
code was used in the Source Term Code Package to predict the amount of
decontamination of aerosols in the icebed. The principal mechanism for removal
is diffusiophoresis, the flow of aerosols to te ice with condensing steam.
As a result the decontamination factor is seen to be very sensitive to the
fraction of steam in the gases flowing through the bed. Table 533 provides.a
comparison of decontamination factors for two equences, S3HF1 and TB(S3B).
The decontamination factor is applied to the flow passing through the ice-bed.
If there is significant recirculation flow from the upper compartment to the
lower compartment, as in the S3HF1 sequence before head failure, the effective
decontamination factor can be higher than the ingle pass valve because the
aerosols have more than one opportunity to be captured in the ice. Up to the
time of bottom head failure 410 min) in the SHF1 sequence, the single pass
DF is quite low because the fans have circulated non-condensible gases back
into the lower compartment and the partial pressure of steam is low (-2.5 psi
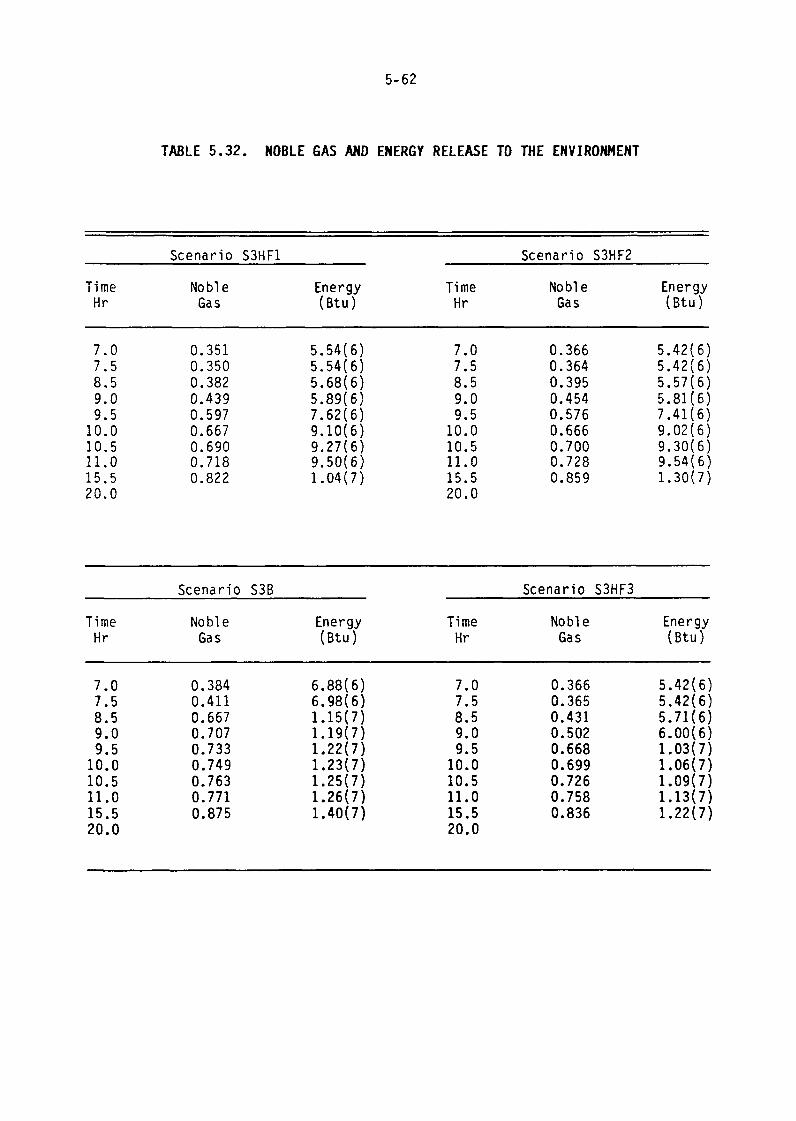
5 62
TABLE 532. NOBLE GAS AND ENERGY RELEASE TO THE ENVIRONMENT
Scenario S3HF1 Scenario S3HF2
Time Noble Energy Time Noble EnergyHr Gas (Btu) Hr Gas (Btu)
7.0 0.351 5.54(6) 7.0 0.366 5.42(6)7.5 0.350 5.54(6) 7.5 0.364 5.42(6)8.5 0.382 5.68(6) 8.5 0.395 5.57(6)9.0 0.439 5.89(6) 9.0 0.454 5.81(6)9.5 0.597 7.62(6) 9.5 0.576 7.41(6)
10.0 0.667 9.10(6) 10.0 0.666 9.02(6)10.5 0.690 9.27(6) 10.5 0.700 9.30(6)11.0 0.718 9.50(6) 11.0 0.728 9.54(6)15.5 0.822 1.04(7) 15.5 0.859 1.30(7)20.0 20.0
Scenario S3B Scenario S3HF3
Time Noble Energy Time Noble EnergyHr Gas (Btu) Hr Gas (Btu)
7.0 0.384 6.88(6) 7.0 0.366 5.42(6)7.5 0.411 6.98(6) 7.5 0.365 5.42(6)8.5 0.667 1.15(7) 8.5 0.431 5.71(6)9.0 0.707 1.19(7) 9.0 0.502 6.00(6)9.5 0.733 1.22(7) 9.5 0.668 1.03(7)
10.0 0.749 1.23(7) 10.0 0.699 1.06(7)10.5 0.763 1.25(7) 10.5 0.726 1.09(7)11.0 0.771 1.26(7) 11.0 0.758 1.13(7)15.5 0.875 1.40(7) 15.5 0.836 1.22(7)20.0 20.0
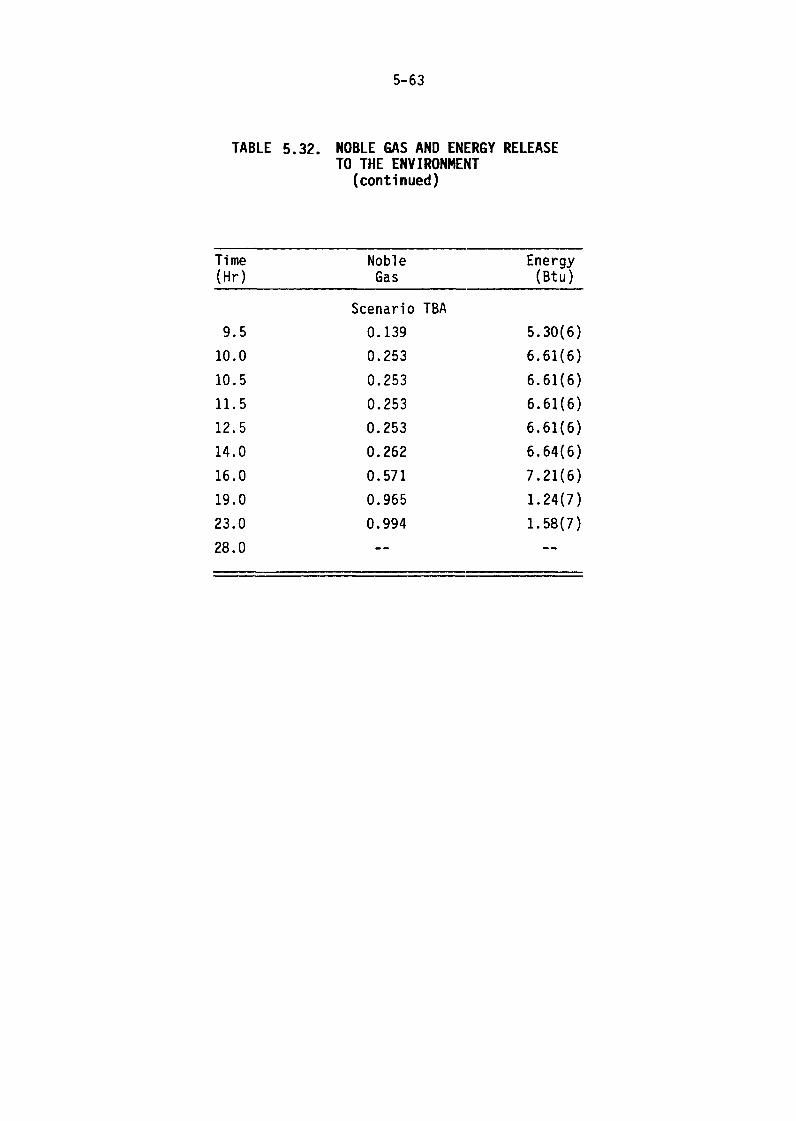
5-63
TABLE 532. NOBLE GAS AND ENERGY RELEASETO THE ENVIRONMENT
(continued)
Time Noble Energy(Hr) Gas (Btu)
Scenario TBA
9.5 0.139 5.30(6)
10.0 0.253 6.61(6)
10.5 0.253 6.61(6)
11.5 0.253 6.61(6)
12.5 0.253 6.61(6)
14.0 0.262 6.64(6)
16.0 0.571 7.21(6)
19.0 0.965 1.24(7)
23.0 0.994 1.58(7)
28.0 --
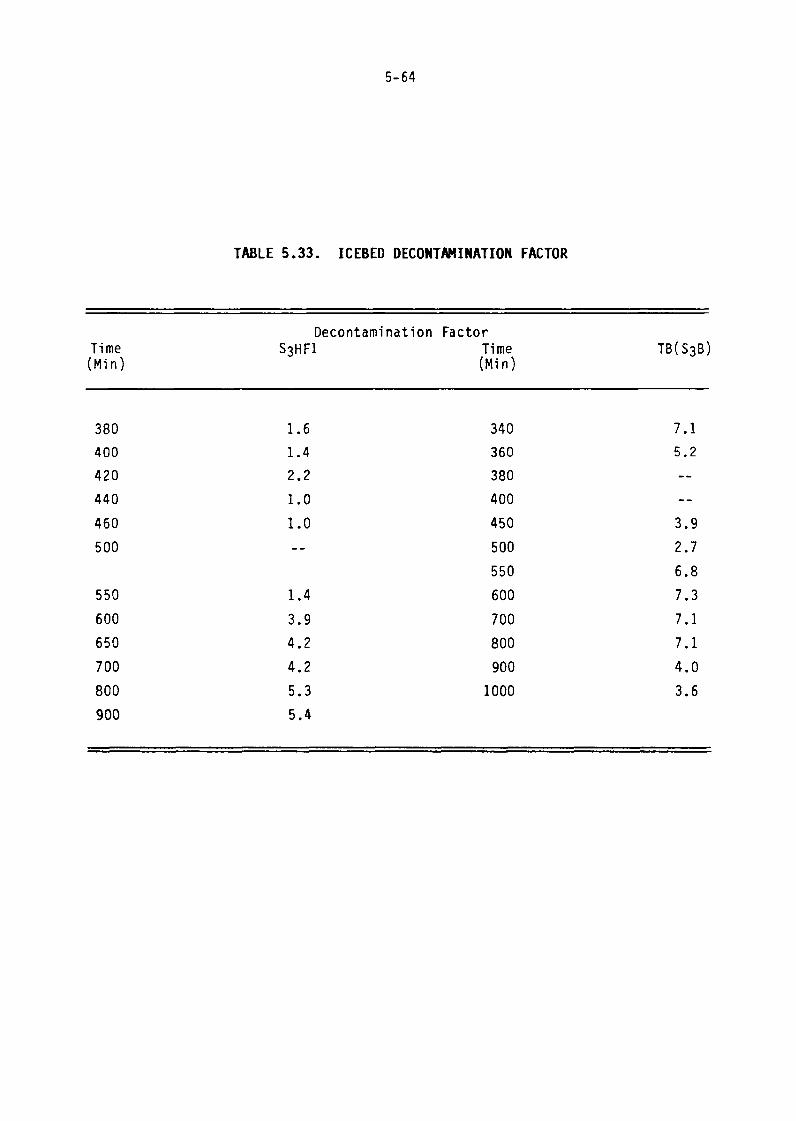
5 64
TABLE 533. ICEBED DECONTMINATION FACTOR
Decontamination FactorTime S3HF1 Time TB(S3B)(Min) (Min)
380 1.6 340 7.1
400 1.4 360 5.2
420 2.2 380 --
440 1.0 400 --
460 1.0 450 3.9
500 -- 500 2.7
550 6.8
550 1.4 600 7.3
600 3.9 700 7.1
650 4.2 800 7.1
700 4.2 900 4.0
800 5.3 1000 3.6
900 5.4
5 65
steam relative to a total pressure of 17 psi). In comparison, the DF during
this time period for the TB sequence (vessel failure occurs at 380 min in the
TS sequence) is substantially higher. In this sequence steam released from
the reactor coolant system has depleted the amount of non-condensible gases in
the lower plenum 18 psi steam out of a total of 21 psi). Throughout the
accident the predicted decontamination factors are closely correlated with the
fraction of steam in the lower compartment.
6-1
6. SUMMARY AND CONCLUSIONS
This report presents the results of Source Term Code Package
analyses for a number of postulated accident sequences in the Sequoyah ice
condenser containment PWR. The present results supplement the earlier
analyses reported in Vol. IV of BMI-2104. In addition to utilizing state-of-
the-art source term methodology, the work reported here reflects the latest
thinking on accident sequence identification and definition. Both of these
factors contribute to the nature of the results reported here.
As a result of the current view of the most likely modes of safety
system failure several accident sequences previously considered to be risk
significant no longer appear to be so; these include the S3H and S2HF
sequences. At the time of the most probable recirculation system failure in
these sequences there are still ample quantities of ice available to mitigate
the accident consequences. Also, under the current definition of these
sequences and the containment failure pressure aopted by SARRP, there appears
to be relatively low probability of early containment failure in these
sequences.
For several of the accident scenarios eamined there are substantial
quantities of water in the reactor cavity. This water may offer the potential
for termination of these accident scenarios if coolable debris beds are
formed; or, if the debris are uncoolable, the presence of this water has been
found to result in significant fission product rtention as well as reduction
of driving forces for leakage out of the containment.
In some of the accident sequences considered in this report the
water in the reactor cavity is predicted to be cmpletely evaporated; the re-
release of fission products retained by this water has not been included in
the present analyses.
For the accident sequences involving pump seal failures core over-
heating is predicted to occur at high primary system pressures and significant
retention of the volatile fission product species on primary system surfaces
is predicted. The potential long-term revaporization of these species and the
impact of such revaporization on the predicted evironmental releases has not
been addressed in the present study.
6-2
Included in this effort is the assessment of the environmental
source terms for an accident-induced steam generator tube rupture scenario.
The results presented here should also be applicable to other PWRs of similar
primary system design.
7- 1
7. REFERENCES
1. Gieseke, J. A., et al., "Source Term Code Pckage: A User's Guide",NUREG/CR-4587, Draft, April, 1986.
2. Gieseke, J. A., et al., "Radionuclide Release Under Specific LWR AccidentConditions", BMI-2104, Volume IV, Draft, July, 1984.
3.. Silberberg, M., et al., "Reassessment of the Technical Bases forEstimating Source Terms", NUREG-0956, Draft, July, 1985.
4. Wooton, R. O., Cybulskis, P., and Quayle, S. F., 11MARCH2 (MeltdownAccident Response Characteristics) Code Description and Usir's Manual",'�attelle'_s ColumbuTLaboratories, NUREG/CR-:3988, BMI-2115,September, 1984.
5. Kuhlman, M. R., Lehmicke, D. J., and Meyer, R. O., 1CORSOR User'sManual", Battelle's Columbus Laboratories, NUREG/CR-4173, BMI-2122,March, 1985.
6. Cole, R. K., Kelly, D. P., and Ellis, M. A., "CORCON MD2: A ComputerProgram for Analysis of Molten Core Concrete Interactions",NUREG/CR-3920, August, 1984.
7. Powers, D. A., Brockman, J. E., and Shiver, A. W., 11VANESA, A MechanisticModel of Radionuclide Release and Aerosol Gneration During Core DebrisInteractions with Concrete", Sandia National Laboratories, NUREG/CR-4308,SAND85-1370, Draft.
8. Muir, J. F., et al., 11CORCON-Mod 1: An Improved Model for Molten-Core/Concrete Interactions", Sandia National Laboratories, NUREG/CR-2142,SAND80-2415, July, 1981.
9. Freeman-Kelly, R., and Jung, R. G., "A User's Guide for MERGE",Battelle's Columbus Laboratories, NUREG/CR-4172, BMI-2121, March, 1985.
10. Jordan, H., and Kuhlman, M. R., TRAP-MELT2 User's Manual", Battelle'sColumbus Laboratories, NUREG/CR-4205, BMI-2124, May, 1985.
11. U.S. Nuclear Regulatory Commission, NReactor Safety Study - An Assessmentof Accident Risks in U.S. Commercial Nuclear Power Plants", WASH-1400(NUREG 75-104), October, 1975.
NFIC FORM 335 U S. NUCLEAR REGULATORY COMMISSION I REPORT NUMBER (Assg�edby TIDC, add Vol No, da�yj
(2-841NRCM 1102,3201,3202 BIBLIOGRAPHIC DATA SHEET NUREG/CR-4624, Vol. 2SEE INSTRUCTIONS ON THE REVERSE
2 TITLE AND SUBTITLE 3 LEAVE BLANK
Radionuclide Release Calculations fr Selected SevereAccident Scenarios, Volume 2 PWR, Ice CondenserDesign 4 DATE REPORT COMPLETED
MONTH YEAR
5 AUTHOR(S) Ma y IR S. Denning, J. A. Gieseke, P. Cybulskis, K. W. Lee, 6 DATE REPORT ISSUED
H Jordan, L. A. Curtis, R. F. Kelly,, V. Kogan, and MONTH YEAR
P. M. Schumacher July 19867 PERFORMING ORGANIZATION NAME AND MAILING ADDRESS fl-cl.deZp Cape; 8 PROJECT/TASK/WORK UNIT NUMBER
Battelle's Columbus Division 9 FIN OR GRANT NUMBER
505 King AvenueColumbus, Ohio 43201 A1322
10 SPONSORING ORGANIZATION NAME AND MAILING ADDRESS ndudeZp Cde) 1 la TYPE OF REPORT
Division of Risk Analysis and Operations Technical ReportOffice of Nuclear Regulatory Research b PERIOD COVERED (1-1.s- dtm)
U.S. Nuclear Regulatory CommissionWashington, D.C. 20555 6/85-7/86
12 SUPPLEMENTARY NOTES
13 ABSTRACT 200 wods o!e,,)
This report presents results of analyses of the environmental releases offission products (source terms) for severe accident scenarios in a pressurizedwater reactor with an ice-condenser containment. The analyses were performedto support the Severe Accident Risk Reduction/Risk Rebaselining Program (SARRP)which is being undertaken for the U.S. Nuclear Regulatory Commission bySandia National Laboratories. In the SARRP program, risk estimates are beinggenerated for a number of reference plant designs. The Sequoyah Plant hasbeen used in this study as an example of a PWR ice-condenser plant.
14 DOCUMENT ANALYSIS - KEYWORDS/DESCRiPTORS 15 AVAILABILITYSTATEMENT
Source TermsSevere Accidents UnlimitedFission Products 16 SECURITY CASSIFICATION
(Tha page)
b IDENTIFIERS/OPEN ENDED TERMS Unclas3ified(Thl� apolf)
I Inc a R i f i d17 NUMBER OF AGES
i8 PRICE

UNITED STATES SPEC AL FOURTH-CLASS RATEJANUCLEAR REGULATORY COMMISSION POSTAGE Et FEES PAIDUSNRC
WASHINGTON, D.C. 2DW WASH. D.C.PERMIT No. G67_
OFFICIAL BUSINESS
PENALTY FOR PRIVATE USE, 300