queensland regional tourism satellite account scoping study
TRANSCRIPT

QUEENSLAND REGIONAL TOURISM SATELLITE ACCOUNT SCOPING STUDY Tien Pham, Larry Dwyer, Ray Spurr, Lisa Ruhanen and Noel Scott

QUEENSLAND REGIONAL TOURISM SATELLITE ACCOUNT SCOPING STUDY
ii
TECHNICAL REPORTS The technical reports present data and its analysis, meta-studies and conceptual studies, and are considered to be of value to industry, government or other researchers. Unlike the STCRC's Monograph series, these reports have not been subjected to an external peer review process. As such, the scientific accuracy and merit of the research reported here is the responsibility of the authors, who should be contacted for clarification of any content. Author contact details are at the back of this report.
National Library of Australia Cataloguing-in-Publication entry Pham, Tien Queensland regional tourism satellite account: Scoping study ISBN: 9781920965556 Tourism—Economic aspects—Queensland. Tourism—Queensland. Bibliography Other Authors: Larry Dwyer, Ray Spurr, Lisa Ruhanen and Noel Scott 338.4791943
Copyright © CRC for Sustainable Tourism Pty Ltd 2008 All rights reserved. Apart from fair dealing for the purposes of study, research, criticism or review as permitted under the Copyright Act, no part of this book may be reproduced by any process without written permission from the publisher. Any enquiries should be directed to: General Manager Communications & Industry Extension, Amber Brown, [[email protected]] or Publishing Manager, Brooke Pickering [[email protected]]. First published in Australia in 2008 by CRC for Sustainable Tourism Pty Ltd Printed in Australia (Gold Coast, Queensland) Cover designed by Sin Design

QUEENSLAND REGIONAL TOURISM SATELLITE ACCOUNT SCOPING STUDY
iii
CONTENTS
ABSTRACT________________________________________________________________________________ V
ACKNOWLEDGEMENTS _______________________________________________________________________V SUMMARY ________________________________________________________________________________VI
OBJECTIVES OF STUDY ______________________________________________________________________ VI KEY FINDINGS ____________________________________________________________________________ VI
CHAPTER 1 INTRODUCTION ________________________________________________________________ 1 STRUCTURE OF THE REPORT ___________________________________________________________________ 1
CHAPTER 2 THE CONCEPTUAL FRAMEWORK: SNA AND TSA_________________________________ 2 THE SYSTEM OF NATIONAL ACCOUNT: INPUT-OUTPUT TABLES________________________________________ 2 WHAT IS A TSA?____________________________________________________________________________ 2 THE ROLE OF TSA __________________________________________________________________________ 5
TSA in the Regional Context ________________________________________________________________ 5 REQUIREMENT TO CONSTRUCT TSA FOR REGIONS OF QUEENSLAND ____________________________________ 6
CHAPTER 3 THE PROPOSED APPROACH_____________________________________________________ 7 CHAPTER 4 DATA SOURCES ________________________________________________________________ 8
REGIONAL IO TABLES________________________________________________________________________ 8 STATE TSA________________________________________________________________________________ 8 TOURISM RESEARCH AUSTRALIA DATA __________________________________________________________ 9
CHAPTER 5 EXPENDITURE ALLOCATION: DEMAND SIDE ___________________________________ 10 DOMESTIC OVERNIGHT VISITOR EXPENDITURE ___________________________________________________ 11
Decomposition of Package Tour ____________________________________________________________ 11 Deriving regional tourism expenditure _______________________________________________________ 13
DOMESTIC DAY VISITOR EXPENDITURE _________________________________________________________ 18 INTERNATIONAL VISITOR EXPENDITURE_________________________________________________________ 19 INTRAREGIONAL, INTERREGIONAL AND INTERSTATE TOURISM EXPENDITURE DISAGGREGATION _____________ 20
CHAPTER 6 PRODUCTION ALLOCATION: SUPPLY SIDE _____________________________________ 22 VALUE ADDED COMPONENTS _________________________________________________________________ 22 EMPLOYMENT _____________________________________________________________________________ 23
CHAPTER 7 OTHER ISSUES ________________________________________________________________ 25 TOURISM REGIONS OF QUEENSLAND ___________________________________________________________ 25 SAMPLE ERROR____________________________________________________________________________ 27
CHAPTER 8 CONCLUSION _________________________________________________________________ 29 REFERENCES _____________________________________________________________________________ 31 GLOSSARY________________________________________________________________________________ 32 AUTHORS_________________________________________________________________________________ 34

QUEENSLAND REGIONAL TOURISM SATELLITE ACCOUNT SCOPING STUDY
iv
LIST OF TABLES Table 1: Tables recommended for Tourism Satellite Account _______________________________________ 3 Table 2: TRA expenditure items by travelling group classification __________________________________ 10 Table 3: State TSA expenditure products ______________________________________________________ 11 Table 4: A hypothetical example of regional expenditure items _____________________________________ 13 Table 5: A hypothetical example of regional expenditure items - percentage __________________________ 14 Table 6: Mapping TRA expenditure items and TSA products for domestic overnight visitors ______________ 14 Table 7: Aggregated TSA products for domestic overnight expenditure ______________________________ 15 Table 8: Regional (aggregated) tourism expenditure _____________________________________________ 15 Table 9: Mapping TSA products and TRA expenditure items for domestic overnight visitors ______________ 16 Table 10: Mapping TRA expenditure items and TSA products for domestic overnight ___________________ 17 Table 11: Mapping TSA products to TRA expenditure items for domestic day visitors ___________________ 18 Table 12: Reconciliation between TRA tourism regions and ABS statistical division regions ______________ 25 Table 13: Tourism regions for regional update by Tourism Queensland ______________________________ 26 Table 14: Reconciliation between temporary TSA regions and TQ tourism regions _____________________ 26 Table 15: Relative standard error and sample size error of TRA regions _____________________________ 27
LIST OF FIGURES Figure 1: The structure of IO tables ___________________________________________________________ 2 Figure 2: Flowchart of the construction process _________________________________________________ 7 Figure 3: Decomposition of package tour item__________________________________________________ 13 Figure 4: Stage of analysis _________________________________________________________________ 18 Figure 5: Decomposition of transport fares and package food _____________________________________ 18 Figure 6: Derivation of expenditure data for overseas visitor expenditure ____________________________ 20 Figure 7: Purchasers’ prices and components __________________________________________________ 22 Figure 8: A cost effective mechanism to produce regional TSA _____________________________________ 29
LIST OF BOXES Box 1: Tourism Satellite Account definitions ____________________________________________________ 4 Box 2: Tourism Regional Economic Contribution—a recommended name _____________________________ 6 Box 3: Recommended TSA regional breakdown _________________________________________________ 30

QUEENSLAND REGIONAL TOURISM SATELLITE ACCOUNT SCOPING STUDY
v
ABSTRACT
Stemming from the STCRC’s State Tourism Satellite Account (TSA) and CGE modelling project, and the outcomes of the Queensland Tourism Strategy to provide enhanced regional data, a scoping study was undertaken in conjunction with Tourism Queensland (TQ) to investigate the feasibility of developing Queensland regional TSAs. The objective of the scoping study was to specify the data requirements, process and methodology for developing Queensland regional TSAs. Specifically, the project team sought to focus on the methodology to derive the economic contribution of tourism to sub-regions of Queensland. More specifically, the scoping study reviewed existing methodologies and available data before exploring possible assumptions to fill the gaps of missing data in order to establish a solution to constructing such a tourism account for the regions of Queensland.
Acknowledgements The Sustainable Tourism Cooperative Research Centre, established and supported under the Australian Government’s Cooperative Research Centres Program, funded this research. The authors would also like to thank Mr Mark Kelso from Tourism Queensland, Dr Thiep Van Ho and Dr Djauhari Pambudi from Sustainable Tourism Cooperative Research Centre, Dr Darrian Collins and Ms Kathryn Galliano from Tourism Research Australia, and Mr. Jim Hurley from the Office of Economic and Statistical Research at Queensland Treasury for their helpful inputs to this paper.

QUEENSLAND REGIONAL TOURISM SATELLITE ACCOUNT SCOPING STUDY
vi
SUMMARY
Objectives of Study Stemming from the STCRC’s State Tourism Satellite Account (TSA) and CGE modelling project, and the outcomes of the Queensland Tourism Strategy to provide enhanced regional data, a scoping study was undertaken in conjunction with Tourism Queensland (TQ) to investigate the feasibility of developing an account to measure the significance and contribution of tourism activity to Queensland regional economies. In a way, this account follows as closely as possible to the guidelines set by the World Tourism Organisation in order to mirror the STCRC’s TSA at the lower-than-state level. The objective of the scoping study was to specify the data requirements, process and methodology.
The scoping study reviewed existing methodologies and available data before exploring possible assumptions to fill the gaps of missing data in order to establish a solution to constructing such a tourism account for the regions of Queensland. The report addresses:
• the conceptual framework of TSA and System of National Account to highlight the important role of TSA to policy makers;
• the approaches to calculating a regional TSA for Queensland: top-down versus bottom-up; • the available data sources for the task; and, • the step-by-step technical tasks for constructing the account.
The scoping study explicitly recommends a name for the account as the Tourism Regional Economic
Contribution (TREC) to reflect the differences by nature between the TREC and the state or national TSA due to the lack of tourism expenditure data at the regional level. However, the term regional TSA was used throughout the report because it was easier to use this well established TSA terminology to convey the concept at the regional level. Thus, the two terms TREC and Regional TSA are in fact interchangeable in the report as well as in this summary.
Key Findings The scoping study found that the task of creating TSA for the regions of Queensland is feasible. Undertaking TREC is valuable for policy development, marketing campaigns, informing policy on investment and assessing public funding, education and training relevant to labour force policies, and modelling and forecasting impacts of tourism on an economy. Thus, the scoping study points out the fact that the construction of the TREC is the beginning of an ongoing process to understand how the tourism sector can have impacts on a region and to reveal how policies can help develop tourism activity.
While a TSA for Queensland regions can be achieved, the number of recommended regions for the TREC purpose differs from TQ’s current tourism regions. The recommended regions include:
• Brisbane • Gold Coast • Sunshine Coast • Wide Bay-Burnett • Darling Downs • Fitzroy • Mackay • Northern • Far North Queensland • Outback

QUEENSLAND REGIONAL TOURISM SATELLITE ACCOUNT SCOPING STUDY
vii
The format of TREC follows the detailed breakdowns used in the ABS national and STCRC state TSAs:
Tourism Characteristic Products • travel agency and tour operator services • taxi fares • long distance passenger transportation • motor vehicle hire and lease • accommodation services • takeaway and restaurant meals • shopping (including gifts and souvenirs)
Tourism Connected Products • local area passenger transportation • repair and maintenance of motor vehicles • fuel • food products • alcoholic beverages and other beverages • motor vehicles, caravans and boats • recreational, cultural and sports services • gambling and betting services • education • actual and imputed rent on holiday houses
Other tourism and services
The breakdown of tourism products is comprehensive. The recommendation may not serve all purposes of using the TREC as one size does not fit all, in fact does not have to fit all. The detailed level of the above eighteen products may stretch the reliability of the data, particularly, for the less tourism intensive regions, or even exceeds the needs for some regions. However, for general purpose the reliability of the TREC at the level of eighteen products is acceptable. But care must be taken in cases when a large investment sum is being considered; it is therefore more desirable to aggregate the above TSA products down to a smaller set such as the set of the TRA expenditure items below to achieve the TREC with higher reliability for Queensland regions.
• travel agency • accommodation • food and drink • airfares • other transport • fuel • shopping • entertainment • other
The scoping study emphasises a crucial factor in the production of the TREC on an ongoing process: the
requirement of updating the regional IO tables on a regular basis. As such, the report went further and recommended that due TO the lack of regional IO tables available from the state official sources, the tourism industry should engage a research centre that has its own research interest in producing the regional IO tables regularly. Hence, all technical tasks to produce the TREC for one year can be automated to repeat for other years once the regional IO tables are available. This procedure is cost-effective and makes sure the production of the TREC will continue in all subsequent years.

QUEENSLAND REGIONAL TOURISM SATELLITE ACCOUNT SCOPING STUDY
viii

QUEENSLAND REGIONAL TOURISM SATELLITE ACCOUNT SCOPING STUDY
1
Chapter 1
INTRODUCTION
This report presents the results of a scoping study undertaken to examine the feasibility of constructing a regional Tourism Satellite Account (TSA) for the regions of Queensland. The construction of a regional TSA should not be considered the end of a process but rather as the beginning of an ongoing process to unfold the importance of the tourism sector at a level relevant to policy makers and provide them with policy relevant insights so that tourism activity can be adequately nurtured and stimulated at the right time and right place for sustainable regional economic development. As such, the study examined data availability and this report presents findings regarding the most suitable methodology for the task. The construction of a TSA at the regional level is a complex and potentially expensive task and the aim of this study has been to propose a methodology which will have long term application and which can be maintained and updated in an efficient and cost effective manner. The concept of a TSA is closely related to the System of National Accounts (SNA). To place the TSA discussion in context, this report highlights the relationship between the TSA and SNA, and the required intermediate steps between the two in the construction of a regional TSA. For readers who are already knowledgeable in this area some of the information contained in this report may therefore appear unnecessarily detailed. Inevitably, the process to derive regional TSA for Queensland has to be based on a number of assumptions. Instead of presenting a stand-alone list of all assumptions used in the scoping study, they are interspersed with the tasks so that it is easier to identify the positive and negative factors within the study context.
Structure of the Report • Provide a background to the conceptual framework of TSA and SNA to highlight the important role of
TSA to policy makers. • Explain the approaches to calculating a regional TSA for Queensland: top-down versus bottom-up. • Discuss the data sources that are available for the task of constructing a TSA for the regions of
Queensland. • Detail the technical tasks for constructing Regional TSA for Queensland.

QUEENSLAND REGIONAL TOURISM SATELLITE ACCOUNT SCOPING STUDY
2
Chapter 2
THE CONCEPTUAL FRAMEWORK: SNA AND TSA
The System of National Account: Input-Output Tables The System of National Account (SNA) is a framework that compiles and reconciles supply and demand data for goods and services in an economy. At the industry level, the Input-Output (IO) tables reflect the most comprehensive relationship between many areas of an economy. While a full explanation of the IO framework is beyond the scope of this report, a simple representation of an IO table is presented in Figure 1. For further information on IO tables see the Australian Bureau of Statistics (ABS) (http://www.abs.gov.au).
IndustryJ1 J2 J3 … Jn
Final DemandsHH INV GOV EXP
Value Added P1: Compensation of employees (COE) (not applicable)P2: Gross operating surplus & mixed income (not applicable)P3: Net taxes on productsP4: Net taxes on production (not applicable)P6: Imports
T2: Australian Production
Com
mod
ityC
m …
C3
C
2
C1
T1: Total Intermediate use
Total Supply
Figure 1: The structure of IO tables where HH: household final consumption INV: investment GOV: government final consumption EXP: exports The IO table (Figure 1) contains a number of measures to compare both the contribution of industries to an economy and the performance of an economy as a whole. For example, the most common measures are Gross Value Added (GVA) and Gross Domestic Product (GDP), which can be calculated as follows: GVA = P1 + P2 + P4 GDP = GVA + P3
What is a TSA? A common problem with measuring the economic significance of tourism spending is that the tourism sector or tourism industry does not exist explicitly among the j industries or the c commodities in the IO tables. The ‘tourism sector’ is used to describe the consumption of tourists, who require a wide range of goods and services that constitute only a part of the consumption reported in the IO tables. Thus both the terms tourism sector and

QUEENSLAND REGIONAL TOURISM SATELLITE ACCOUNT SCOPING STUDY
3
tourism industry are defined very loosely. In this report, the term industry or commodity has been used for those that are already well defined in the current SNA and the term sector for tourism where it includes more than one conventional industry or commodity. While tourism activity generates revenue just like many other conventional industries, the SNA provides no direct means to measure the contribution of tourism to an economy, let alone a comparison with other industries or across countries. From the above IO representation (Figure 1), tourism consumption is included among the final demand vectors (HH and EXP), and goods and services supplied to tourism activities are included among associated industries such as Food and Drink, and Accommodation, Hotel and Café. The need for an additional accounting system to address these issues is inevitable. During the last decade there has been a rapid expansion in the development of TSA around the world. There is now a quite extensive literature on TSA which for the most part is beyond the scope of this report. However, it is worth mentioning that Canada’s contribution to TSA development has been particularly significant. A TSA for the provinces of Canada was produced in 2003 (Barber-Dueck & Kotsovos 2003). The term satellite account refers to an additional account system which is used in conjunction with the SNA to measure the size and significance of a sector which is not adequately defined in the SNA. The Organisation for Economic Cooperation and Development (OECD), the Commission of the European Communities EUROSTAT, the United Nations World Tourism Organisation (UNWTO) and the United Nations (UN) jointly endorsed and standardised the TSA framework in 2001 (Eurostat, OECD, UNWTO & UN 2001). They provided a Recommended Methodological Framework (RMF) and encouraged all countries to follow the RMF framework as closely as possible in the construction of TSA so that the tourism sector can be compared across countries and over time. Essentially, the RMF focuses on bringing both demand and supply of the tourism sector together in a set of tables. Table 1 summarises the ten TSA tables proposed in the RMF. These tables are also attached in Appendix A.
Table 1: Tables recommended for Tourism Satellite Account Table list Coverage Table 1 Inbound tourism consumption Table 2 Domestic tourism consumption Table 3 Outbound tourism consumption Table 4 Internal tourism consumption Table 5 Production accounts of tourism industries and other industries Table 6 Domestic supply and internal tourism consumption Table 7 Employment in the tourism industries Table 8 Tourism gross fixed capital formation Table 9 Tourism collective consumption, by functions and levels of government Table 10 Non-monetary indicators
The procedure to construct a TSA is in fact a process of extracting the hidden components of tourism
expenditure data from the supply and demand sides in the IO system and presenting them in a format compatible with other conventional industries in the IO tables so that direct comparisons can be made. Ideally, if the information was available, the TSA would contain as much information on the tourism sector as those conventional industries and commodities from IO tables. To what extent this can be achieved depends on the availability of data in each country or economy. Hence the actual representation of TSA tables would be somewhat different. The cases of Australia, Queensland and the regions of Queensland are presented as examples.
At the national level, ABS has produced the following tourism statistics: • Tourism industry share of gross domestic product • Tourism industry GDP, by type of visitor • Tourism industry output at basic prices • Tourism industry gross value added • Tourism consumption, by type of visitor

QUEENSLAND REGIONAL TOURISM SATELLITE ACCOUNT SCOPING STUDY
4
• Domestic tourism consumption, by length of stay • Tourism consumption, by Australian residents—outbound trips • Tourism consumption, by non-residents—inbound trips • People employed in tourism, by industry • Number of trips • Short-term arrivals, international visitors—by country of residence • Short-term departures, Australian residents—by main destination
At the Queensland level for 2003 to 2004, the Sustainable Tourism Cooperative Research Centre (STCRC)
disaggregates the national TSA to include a list of the main statistics: • Tourism industry output at basic prices • Tourism industry gross value added • Tourism consumption, by type of visitor • International tourism consumption • Total tourism consumption, by length of stay • Tourism consumption, by Australian residents—outbound trips • Tourism consumption, by non-resident—inbound trips • Persons employed in tourism • Net taxes on tourism products
Queensland Treasury (OESR 2006) produced a TSA for Queensland for 2003 to 2004. Their main statistics include:
• Tourism GSP by type of visitor • Tourism GSP for Queensland and tourism GDP for Australia • Tourism GSP by tourist and business/other visitor • Shares of factor income, tourism and non-tourism • Share of factor income by industry • Tourism factor income by type of visitor • Tourism factor income by broad purpose of visit • Tourism employment by status • Tourism employment by industry • Tourism employment by industry by type of visitor • Tourism full-time equivalent employment by industry and type of visitor • Tourism employment by industry and broad purpose of visit • Visitor expenditure by visitor origin • Visitor expenditure in Queensland by expenditure item
At the Statistical Division level, OESR also produced tourism statistics for 1998 to 1999. A typical region in
the report would include: • Tourism gross regional product • Tourism related employment • Visitor expenditure levels by source of visitor • Visitor expenditure levels by purpose of visit
The TSA data available for Australia, Queensland and Queensland regions demonstrates that not all TSA
tables can be achieved. Indeed, this is the case for many countries where not all TSA tables can be constructed as not all of the required information is available.
The RMF is very comprehensive, covering an extensive range of definitions and terminologies to be adopted in the construction of a TSA. However, the most common definitions that are presented in the TSA constructed by ABS and STCRC are tourism characteristic products, tourism characteristic industry, tourism connected products and tourism connected industry. It is useful to repeat these definitions here and see how they are applied in the Australian context.
Box 1: Tourism Satellite Account definitions Tourism characteristic products are defined in the international TSA standard as those products which represent an important part of tourism consumption, or for which a significant proportion of the sales are to visitors. In the Australian TSA, for a product to be ‘characteristic’ it must account for at least 10 per cent of total tourism consumption and/or at least 25 per cent of the total output of the product must be consumed by visitors.
QUEENSLAND REGIONAL TOURISM SATELLITE ACCOUNT SCOPING STUDY
5
Tourism characteristic industries are defined as those industries that would either cease to exist in their present form, or would be significantly affected if tourism were to cease. In the Australian TSA, for an industry to be ‘characteristic’, at least 25 per cent of its output must be consumed by visitors. Tourism connected products and industries are those, other than those classified as tourism characteristic, for which a tourism product is directly identifiable (primary), and where the products are consumed by visitors in volumes which are significant for the visitors and/or the producer. Source: ABS 2006
The Role of TSA Apart from enabling direct comparison of the tourism sector with other industries in an economy, the existence of a TSA has a much more significant role in practice. The Australian government, as well as the state and territory governments in Australia, have long recognised that a TSA can serve as a tool for improving strategic management and planning for the tourism sector and enhance the effectiveness of industry policies. The policy relevance of a TSA can be described as:
• TSA can identify the type of tourists and their impacts on tourism expenditure for a state. On this basis, appropriate marketing campaigns can be established.
• Tourist expenditure patterns can reveal which commodity or industry a state needs to focus on when there is an increase in demand by tourists, or more precisely a type of tourist. In this way, a TSA provides critical information for informing policy on investment and assessing public funding policies.
• TSA is also relevant to labour force policies including in relation to education and training. • TSA provides a continuous flow back and forth between the supply and demand aspects of the tourism
sector. It provides information about the interaction of tourism with other industries in the economy. • The TSA thus becomes an important tourism forecasting and modelling tool for impact analysis.
Who should use TSA? Obviously, government at all levels should be among the major users to provide the
right ambient conditions for the tourism sector. In response, elements of the private sector for which tourism activity is important and tourism industry associations should be able to rely on the TSA data to inform their decisions. To the extent that it continues to be updated using a consistent and reliable methodology and inputs of data, a TSA can have considerable long term value and applications, particularly in supporting public policy making and by providing up-to-date and reliable information to all users of tourism economic data.
As previously mentioned, the construction of a TSA should not be considered as the end of a process with the compilation of tourism expenditure data. In fact, the construction of such an account should be considered as the beginning of an ongoing process to unfold the importance of the tourism sector at the most relevant level to policy makers and provide them with policy relevant insights to policy requirement so that the tourism sector can be adequately nurtured and stimulated at the right time and right place for sustainable regional economic development.
TSA in the regional context The above discussion has not been in reference to any specific level of operation. It covers general information on the TSA and SNA from the state level to the national level. The SNA concept is equally relevant for the state level as in fact both the state account (SA) and the national account (NA) contain very similar sets of data.
This scoping study focuses on the regions of Queensland, that is, below the state level. At this level, data are often not readily available from official sources. Where data is available this is frequently extremely limited compared to the data available at the national and state levels. There is no official System of Regional Account (SRA) on an ongoing basis to monitor the performance of regions over time. Queensland Treasury provided IO tables at the statistical division level for 1996 to 1997. But this seems to have been a one-off set of IO tables for the regions of Queensland. Few countries or states maintain regional IO tables on an ongoing basis.
It is because of this absence of an official SRA or regional Input-Output tables that the task of constructing TSA at the regional level becomes very challenging, as it requires TSA practitioners to construct both the tourism expenditure data as well as a set of IO tables for the regions involved. For this reason, there has been discussion in the tourism research literature of whether a TSA for small regions should still be classified as a ‘satellite account’—indeed a ‘satellite to what?’ Although the term Regional TSA is used throughout this report,

QUEENSLAND REGIONAL TOURISM SATELLITE ACCOUNT SCOPING STUDY
6
the term Tourism Regional Economic Contribution is actually recommended for the account.
Box 2: Tourism Regional Economic Contribution—a recommended name The concern about an adequate name for this TSA at the regional level is a valid point. The lack of detailed tourism expenditure data at the regional level makes it difficult to follow closely the strict guidelines determined by the World Tourism Organisation (UNWTO). As this study sets out only to explore the technical aspect of the construction of an account to measure the size and contribution of the tourism sector at the regional level, we have continued to use the term TSA in this report for simplicity, as the concept of TSA at the national and state level has been well established thus using it conveys the tasks of this scoping study much easier. In order to reflect the nature of such an account below the state level, our recommendation is to use the name: Tourism Regional Economic Contribution. As a result, the two terms Regional TSA and the Tourism Regional Economic Contribution are interchangeable although the term Regional TSA is used throughout this report. This recommendation is in line with the previous OESR publication (2002) titled as The Contribution of International and Domestic Visitor Expenditure to the Queensland Regional Economies 1998–1999. Perhaps the similarity is due to the same set of problems that OESR and the research team of this scoping study have to encounter.
Requirement to Construct TSA for Regions of Queensland As discussed, the construction of a TSA can only be constructed if the IO tables of the relevant economy are available. This is a necessary condition for the task. Usually, the construction of a TSA for the first time is very expensive, as it takes time to form a team of experts who understand both the IO framework and the principles behind the TSA recommended by the UNWTO. Inevitably, it also takes time to gain experience in efficiently linking the two accounts.
If the regional IO tables are updated on a regular basis, the majority of tasks required to construct the regional TSA can be undertaken with minimal effort, and as a result, the cost of producing regional TSA in subsequent years can be relatively cheaper. It is the lack of the regularly published regional IO tables that makes the process to produce TSA at the regional level onerous.
Given this background, an important strategic recommendation is that the tourism industry should engage with research centres that are keen to update their regional IO tables for Queensland on a regular basis for their own research interest. Over time, not only will the cost then be reduced but TQ can also ensure that it will be possible to produce the regional TSA in subsequent years.

QUEENSLAND REGIONAL TOURISM SATELLITE ACCOUNT SCOPING STUDY
7
Chapter 3
THE PROPOSED APPROACH
The construction of TSA for regions of Queensland could adopt either a bottom-up or top-down approach. The bottom-up approach builds TSA of the regions directly; the TSA of the state is a simple aggregation of all regions in the state. Although it can be quite difficult, this approach has the advantage of requiring one stage of construction only and TSA at both levels can be achieved simultaneously. Once the TSAs of regions are derived, no further reconciliation or adjustment to the regional TSAs is needed to match targets at the state level.
But if the state TSA is readily and officially available, it is possible to take advantage of the state TSA and apply the corresponding regional shares to disaggregate the state TSA into TSA of regions. This is the top-down approach. It is likely to be considerably less resource intensive and it is much simpler in terms of maintaining consistency and adding-up conditions between the state and the regional TSAs.
In the tourism literature, the bottom-up approach is referred to as R-TSA or regional TSA; the top-down approach is referred to as TSA-R or regionalisation of TSA. In this report, these terminologies have not been followed strictly. We have used the term regional TSA to refer to a TSA at the regional level without any reference to the way it is derived.
Given the availability of Queensland TSA (OESR 2006; STCRC 2007), a natural procedure to construct a TSA for Queensland regions would be a top-down approach. More precisely, the task described in this report should be considered as a further step to disaggregate the state TSA into the smaller regions of Queensland. Figure 2 illustrates the top-down approach to derive the regional TSA.
Demand side
TRA Data(Regional shares)
State TSA
Regional Tourism expenditure
Regional IO Tables
Supply side
TSA Tables
Regional TSADemand side
TRA Data(Regional shares)
State TSA
Regional Tourism expenditure
Regional IO Tables
Supply side
TSA Tables
Regional TSA
Figure 2: Flowchart of the construction process
Firstly, TRA data are used to derive regional shares and depending on the variables or the type of expenditure in the state TSA, the corresponding shares are obtained. These shares are then applied to the State TSA to obtain the tourism consumption at the regional level. At this stage, most of the tourism data on the demand side should have been calculated.
It is most likely that the regional IO database for regions of Queensland contain single output industries. Thus the expenditure of tourists by commodities can be considered as the outputs for the tourism purpose of the same industries. For each industry, this output level for the tourism purpose is used to calculate the proportion of tourism purpose in the total output supplied by the industry. This proportion is often defined as a tourism ratio. Once the tourism ratio is available, it is assumed that the industry uses a uniform technology to produce goods (or services) for both tourism and non-tourism purposes. This assumption allows us to derive further information on gross value added, gross regional product and employment levels for the tourism sector. Figure 2 illustrates a simplified procedure although in practice, there is more work involved between steps and these steps will be discussed in detail in the following sections.

QUEENSLAND REGIONAL TOURISM SATELLITE ACCOUNT SCOPING STUDY
8
Chapter 4
DATA SOURCES
As seen in Figure 2, there are three sources of data required to construct TSA for the regions of Queensland. While the regional IO tables are the necessary condition, the sufficient condition would require the availability of the state TSA and a set of regional data on tourism expenditure in order to implement the top-down approach. In this section, the availability of each set of the required data is discussed.
Regional IO Tables In terms of government official sources, the ABS produces IO tables at the national level only. The latest national IO tables for 2001 to 2002 were released in June 2006. Queensland Treasury in previous years produced IO tables for all statistical divisions of Queensland for 1996 to 1997.
There are two key academic sources available including the Centre of Policy Studies (CoPS) at Monash University and the University of Queensland (UQ). CoPS is well-known for its capability to undertake economic analysis using Computable General Equilibrium (CGE) modelling. The Centre has CGE models for all levels: national, state and regional. These models can be run in historical simulations to generate updated IO tables for recent years. Therefore, the set of regional IO tables for regions of Queensland would be available from CoPS. The CoPS IO tables were used for the derivation of state and territory level TSA by STCRC (2007).
The University of Queensland has undertaken a major economic model development in recent years. The project at UQ is developing a suite comprising an Econometric Input-Output Model (EIM) at the national level and a regional CGE model for all statistical divisions of Queensland. The database of the regional CGE model was developed from the latest ABS IO tables for 2001 to 2002. The research agenda of the modelling team at UQ is to apply historical simulations to study the structural change of regional economies of Queensland. The bi-product of this process is the updated regional IO tables for subsequent years.
Consequently, the regional IO database for Queensland can come from either CoPS or UQ. These are congruent databases for a given set of commodities thus the choice between the two sources of IO databases should not be a concern in this scoping study.
It is important to note that the regional IO data should account for output of industries in regions correctly so that use of regional IO tables provides a credible base for deriving tourism data. For example, among all regions of Queensland, refined petroleum products (including petrol, diesel, kerosene, jet fuel, fuel oil, gas and LPG) are mainly produced in Brisbane-Moreton, particularly from the two refineries at the mouth of the Brisbane River, the BP refinery at Bulwer and the Caltex refinery at Lytton.
Hence, an increase in demand by tourists visiting other regions of Queensland will be likely to generate a positive impact on the petrol supplier of the Brisbane-Moreton region due to a higher demand for petrol used by transportation. A similar situation is for beer production which occurs at either Milton or Yatala.
State TSA Currently, two sets of TSA at the state level for Queensland are available for 2003 to 2004: one from OESR (2006) and one from STCRC (2007). Usually, problems arise when data are not available but in this case, the problem is in fact the choice of the two sources of the state TSA. Either state TSA would form a suitable benchmark for the construction of the regional TSA. Given the likelihood that the STCRC state and territory TSA will be ongoing, the state TSA from STCRC (2007) has been used as the benchmark in this scoping study. STCRC (2007) is also currently being updated to take account of recent revisions in the national ABS TSA at which point it will also become more up to date than the OESR version. Otherwise there would be no intrinsic reason for preferring one state TSA over the other, however. Of course, using a different state TSA, the process of mapping commodities will be slightly different. It can be confusing if we attempt both here, thus it is recommended that, for consistency with other states and for benchmarking purposes, the TSA for Queensland as developed by the STCRC (2007) in its revised form be used to guide the development of the regional TSA.

QUEENSLAND REGIONAL TOURISM SATELLITE ACCOUNT SCOPING STUDY
9
Tourism Research Australia Data Tourism Research Australia (TRA) is the main research unit that conducts a comprehensive survey of the tourism sector in Australia. In the June 2004 survey, approximately 80,000 Australian residents were interviewed to obtain details of recent trips and 20,000 non-residents were interviewed at the departure lounge of all major airports to obtain details of overseas visitors in Australia. In later years, the sample size for both groups for has increased to approximately 120,000 people for domestic travellers and 40,000 people for overseas travellers. These surveys are designed to obtain not only characteristics and travel behaviours of domestic travellers within Australia and overseas visitors to Australia but also expenditure data related to their travel. The sample size in the domestic travellers is scaled to match the population size and the sample size of overseas visitors to match the actual number of visitors to Australia in a year provided by the Department of Immigration and Multicultural and Indigenous Affairs (DIMIA).
Data from TRA are classified into three main groups: • domestic day travellers • domestic overnight travellers • overseas visitors
Although domestic and overseas visitors could have visited many individual locations (stops) during a
complete trip (journey), the expenditure data collected from the surveys are for the entire journey, not for individual stops. TRA then adopts a very comprehensive procedure to allocate expenditure to each stop of the journey.
The explanation of the whole process to allocate expenditure to individual stops can be found in Cart and Collins (2005). It is worth noting that throughout the whole process, a modelling technique defined as the Iterative Process is used extensively. Full description of this Iterative Process is extracted from Carter and Collins (2005) and attached in Appendix B for reference. An implied assumption in this Iterative Process is that, for a destination, most visitors would have the same expenditure pattern as the representative visitor to that destination. In the scoping study methodology, this assumption has been adopted in subsequent steps to apply TRA data to the proposed procedure.

QUEENSLAND REGIONAL TOURISM SATELLITE ACCOUNT SCOPING STUDY
10
Chapter 5
EXPENDITURE ALLOCATION: DEMAND SIDE
This section addresses the process of merging TRA data and state TSA in Figure 2 above in order to produce regional tourism expenditure data. TRA uses 13 tourism regions, which are listed below. Discussion and recommendation on the number of regions will be addressed in a separate section. Here the focus is on the explanation of how TRA data are used to disaggregate the state TSA into regional expenditure data. Note that the number of regions is not pertinent to this discussion and that the region defined as Other will be excluded from the calculation for the simple reason that the sample size or the number of respondents for this region is very small; hence the corresponding data are not reliable.
• Gold Coast • Brisbane • Sunshine Coast • Hervey Bay/ Maryborough • Darling Downs • Bundaberg • Fitzroy • Mackay • Whitsundays • Northern • Tropical North Queensland • Outback • Other
The TRA can produce three unpublished expenditure tourism data sets for all regions of Queensland, namely:
Domestic Day Travellers, Domestic Overnight Travellers and Overseas Visitors. In the actual survey, the list of expenditure items is relatively detailed. However, at this regional level, the sets of published expenditure items are much more aggregated compared with what are available at the national as well as the state level due to TRA’s criteria for releasing meaningful data. Expenditure items for each group are aggregated differently to meet their criteria (Table 2), particularly low Relative Standard Error (RSE). The term expenditure item is borrowed from TRA. Items here are equivalent to product groups which can comprise more than one product or a mixed group of products in the state TSA (STCRC 2007). On the other hand, the list of Queensland TSA contains a very consistent list of expenditure products for all domestic and overseas travellers (Table 3). This list was defined by ABS, which includes the Actual and imputed rent on holiday houses, for that we cannot find it in the TRA data.
Table 2: TRA expenditure items by travelling group classification Domestic Day Domestic Overnight International Tourism
Transport fare and package Package Tour Accommodation, Food and Beverages Food and drink Accommodation Other Entertainment Food and drink Fuel Airfares Shopping Other Transport Other Entertainment Fuel Shopping Other

QUEENSLAND REGIONAL TOURISM SATELLITE ACCOUNT SCOPING STUDY
11
Table 3: State TSA expenditure products Tourism Characteristic Products Travel agency and tour operator services Taxi fares Long distance passenger transportation Motor vehicle hire and lease Accommodation services Takeaway and restaurant meals Shopping (including gifts and souvenirs) Tourism connected products Local area passenger transportation Repair and maintenance of motor vehicles Fuel Food products Alcoholic beverages and other beverages Motor vehicles, caravans and boats Recreational, cultural and sports services Gambling and betting services Education Actual and imputed rent on holiday houses Other tourism and services
Because of the mismatch of data classifications, the task of deriving regional expenditure is presented separately for each group of travellers so that an appropriate mapping procedure can be performed. To differentiate data from two sources, hereafter Items are referred to as data from TRA and Products are referred to as data from state TSA.
There is a possibility of accessing the Unit Record of TRA Data to help with the mapping process. However, this may well be very labour-intensive and costly.
Domestic Overnight Visitor Expenditure Comparing the list of expenditure items and expenditure products, it shows that, except for the Package Tour, each expenditure item (TRA) is an aggregate of some expenditure products (state TSA) in (loose) terms of the classification levels, not in terms of absolute numbers. Two steps are required before the regional expenditure data can be derived. The first is to dissolve the Package Tour among all other expenditure items while the total expenditure of all domestic overnight visitors in a region remains unchanged. The second task is to align items with products so that appropriate data merging can be undertaken.
Decomposition of Package Tour The Package Tour item includes a range of goods and services purchased by domestic overnight visitors. These include airfares, bus/coach fares, car hire, train fares, ship/boat fares, any other transport, accommodation, convention fees, restaurant meals, entertainment charges, other hire fees, or any other expenditure (Carter & Collins 2005). Unpublished TRA work (cited in Carter &Collins 2005) indicated that 60 per cent of the Package Tour is comprised of airfares, with the remaining 40 per cent for all other items. These ratios are applied by TRA in order to decompose the Package Tour item. STCRC (2007) breaks the Package Tour up using different shares. Nevertheless, both sources display a similarity in the way that their shares are applied uniformly to all states.
In the regional context, the cost (excluding airfares) per night of other goods and services in the package will be more likely to vary from region to region. Thus, using uniform shares for all regions of Queensland will remove the differences of regional cost of visiting.

QUEENSLAND REGIONAL TOURISM SATELLITE ACCOUNT SCOPING STUDY
12
From the list of goods and services included in the package tour an assumption can be made that a typical
Package Tour would include the services of a Travel Agency and Tour Operator, and most of expenditure items except Shopping and Other among the TRA item list (Carter and Collins, 2005).
In order to extract the amount of Travel Agency and Tour Operator Services out of the whole Package Tour, we have investigated ABS expenditure data for the Domestic Overnight group. Using ABS data, we now have to work with different classifications of expenditure products (refer to the ABS definitions on Tourism Characteristic Products and Tourism Connected Products mentioned earlier and Table 3 for more specific products in the two groups).
The activity of Package Tours is organised by travel agencies and tour operators for tourists to visit places with the most efficient effort. Thus it can be assumed that the package tour is likely to be largely tied to the products in the Tourism Characteristic Products while products in the Tourism Connected Products are more likely related to travellers who often organise the trips themselves. However, Shopping (in the Tourism Characteristic Products) is not assumed to be in the Package Tour as this is an expense that tourists do not normally incur through their travel agency. We also assume that Fuel is consumed by cars and motor vehicles in both groups. In a way we associate the total Package Tour to the total expenditure of the Tourism Characteristic Products plus Fuel but without Shopping expenses. One would argue that there might be a need to split up the total expenditure of Fuel into two components: one for the ‘Characteristic’ group and one for the ‘Connected’ group. The amount of expenditure on Fuel within the package tour is not very large thus the refined value of fuel will not make much difference to the ratio of Travel Agency and Tour Operator Services in the Package Tour.
Data from ABS (2006) reveal that the margin of travel agency and tour operator services in total Tourism Characteristic Products minus Shopping plus Fuel at the national level declined by approximately one percentage point (8.0–7.0) over the period from 1997 to 1998 and 2004 to 2005. The share of travel agency applied in STCRC (2007) was approximately five per cent as compared to 7.6 per cent at the national level for the year 2003 to 2004. Due to very limited information on these ratios at the regional level and also for consistency between regions and the state level, the same five per cent of Package Tours is recommended to be applied to derive the Travel Agency and Tour Operator Services for regions of Queensland. Thus the only cost share that is considered to be uniform across all regions of Queensland is Travel Agency and Tour Operator Services. The remaining 95 per cent of Package Tours is distributed among other expenditure items (TRA only) using region-specific shares of Airfares, Accommodation, Food and Drink, Other Transport, Entertainment and Fuel.
Figure 8 illustrates how the Package Tour item in the TRA data is decomposed and added to other items in a region. With this allocation, it is expected that expenditure on Accommodation, Food and Drink, Airfares, Other Transport, Entertainment and Fuel will be higher than before, while expenditure on Shopping and Other remain unchanged. It is important to make sure that the total expenditure of the region has not changed.
The nature of the Iterative Procedure seems to treat each travelling group in Table 2 as a representative tourist. This implies an assumption that on average most Domestic Day tourists, for example, would have the same expenditure pattern indicated by the pattern of the Domestic Day group, and similarly for Domestic Overnight as well as International visitors. The distribution of the remaining 95 per cent of Package Tours among the six expenditure items in a region using region-specific shares of these items conforms to the assumption implied by the Iterative Procedure that all visitors to a region have the same expenditure pattern.

QUEENSLAND REGIONAL TOURISM SATELLITE ACCOUNT SCOPING STUDY
13
Figure 3: Decomposition of package tour item
Original TRA Data
Tourism Region r in Queensland
Travel agency Accommodation Food and drink Airfares Other Transport Entertainment Fuel Shopping Other
5 per cent Modified TRA Data
95 per cent
Package Tour Accommodation Food and drink Airfares Other Transport Fuel Shopping Entertainment Other
The expected outcome of this step would be a matrix with monetary value for each item and each region of Queensland. In a hypothetical example presented in Table 4, it is assumed that there are only four regions in Queensland.
Table 4: A hypothetical example of regional expenditure items Reg 1 Reg 2 Reg 3 Reg 4 Queensland (TRA) Total Expenditure Items (million dollars) Travel Agency 1 2 3 4 10 Accommodation 20 31 12 45 108 Food and drink 2 3 4 7 16 Airfares 30 50 12 31 123 Other transport 2 5 8 9 24 Fuel 3 2 5 1 11 Shopping 12 34 56 46 148 Entertainment 2 7 9 4 22 Other 1 1 1 1 4
Deriving regional tourism expenditure Once regional data on all nine expenditure items have been obtained from the TRA data (Table 4), those regional data are used to derive regional shares, which will subsequently be used to apply to values in the state TSA to produce regional tourism expenditure. Table 5 converts Table 4 from values to shares. Before these shares are applied to the state TSA, it is necessary to reconcile the two sets of TRA expenditure items and TSA Products as these two sets do not directly match each other.

QUEENSLAND REGIONAL TOURISM SATELLITE ACCOUNT SCOPING STUDY
14
Table 5: A hypothetical example of regional expenditure items - percentage
Reg 1 Reg 2 Reg 3 Reg 4 Queensland (TRA) Total Expenditure Items Travel Agency 10% 20% 30% 40% 100% Accommodation 19% 29% 11% 42% 100% Food and drink 13% 19% 25% 44% 100% Airfares 24% 41% 10% 25% 100% Other transport 8% 21% 33% 38% 100% Fuel 27% 18% 45% 9% 100% Shopping 8% 23% 38% 31% 100% Entertainment 9% 32% 41% 18% 100% Other 25% 25% 25% 25% 100%
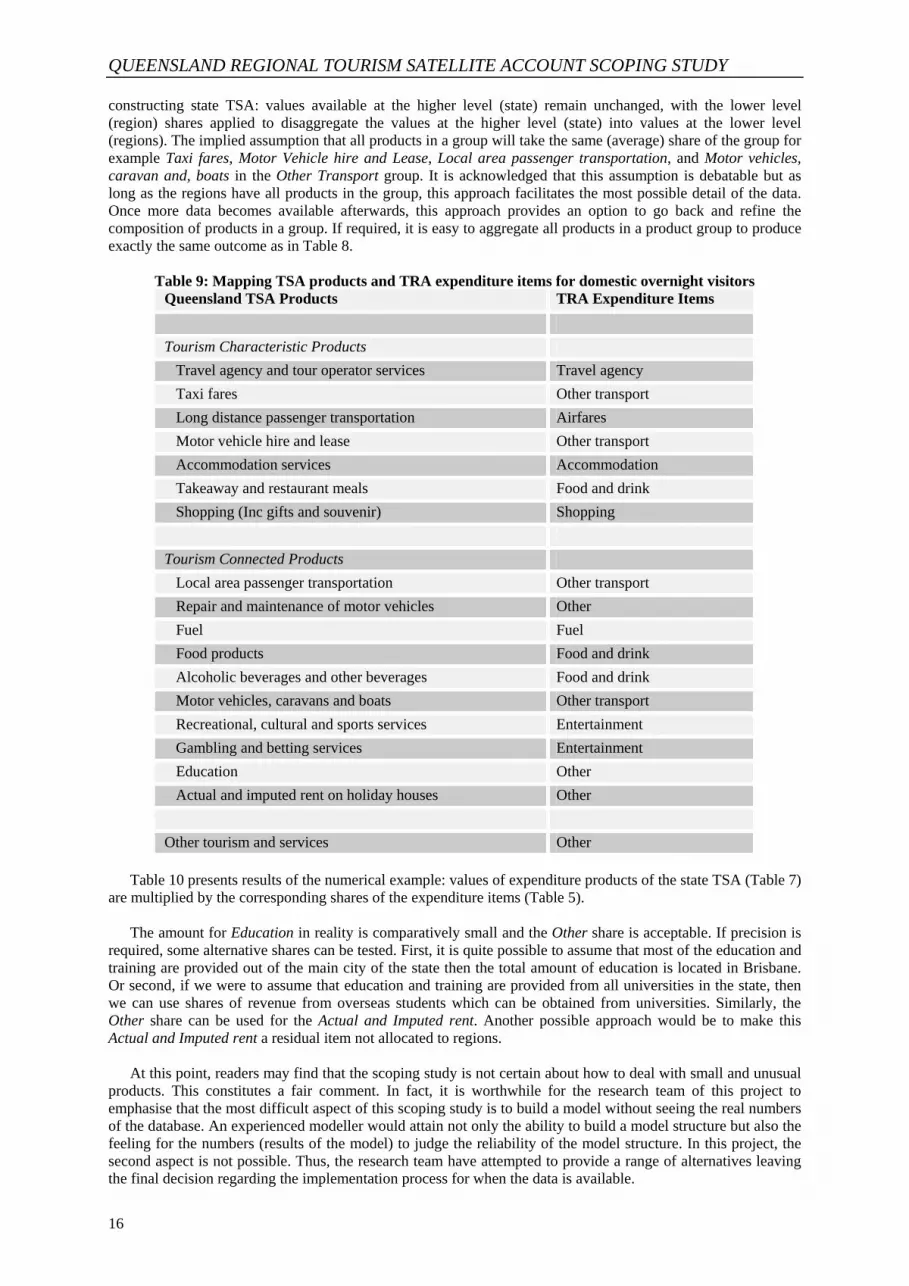
Table 6 represents how the two sets are related in terms of classification level. One way to apply regional
shares from Table 5 to the state TSA is to aggregate products in the state TSA by groups as indicated by Table 6 to match with the TRA expenditure items.
Table 6: Mapping TRA expenditure items and TSA products for domestic overnight visitors TRA Expenditure Items Queensland TSA Products
Travel agency Travel agency and tour operator services Accommodation Accommodation services Food and drink Takeaway and restaurant meals Food products Alcoholic beverages and other beverages Airfares Long distance passenger transportation Other transport Taxi fares Motor vehicle hire and lease Local area passenger transportation Motor vehicles, caravans and boats Fuel Fuel Shopping Shopping (including gifts and souvenir) Entertainment Recreational, cultural and sports services Gambling and betting services Other Repair and maintenance of motor vehicles Education Actual and imputed rent on holiday houses Other tourism and services
Table 7 gives a numerical example of the state TSA and illustrates the aggregation using the product groups
in Table 6. For simplicity, the names of the aggregated product groups are the same as the expenditure items. Note that the values for the state level from Table 7 are not exactly the same as the corresponding expenditure items from the TRA data (Table 4), as the derivation process for the state level has already gone through many

QUEENSLAND REGIONAL TOURISM SATELLITE ACCOUNT SCOPING STUDY
15
adjustments. In Table 8, shares in Table 5 are applied to Table 7 to derive regional tourism expenditure. The last column in Table 8 sums across all four hypothetical regions to check results. As noted from Table 8, this approach to deriving regional tourism expenditure will result in a loss of a number of TSA products that could have been carried from the state level to the regional level.
Table 7: Aggregated TSA products for domestic overnight expenditure
Queensland TSA Products State TSA Aggregate Products
Travel agency and tour operator services 18 Travel Agency 18 Accommodation services 100 Accommodation 100 Takeaway and restaurant meals 10 Food and drink 25 Food products 7 Alcoholic beverages and other beverages 8 Long distance passenger transportation 150 Airfares 150 Taxi fares 7 Other transport 25 Motor vehicle hire and lease 4 Local area passenger transportation 6 Motor vehicles, caravans and boats 8 Fuel 14 Fuel 14 Shopping (including gifts and souvenir) 160 Shopping 160 Recreational, cultural and sports services 15 Entertainment 25 Gambling and betting services 10 Repair and maintenance of motor vehicles 1 Other 10 Education 2 Actual and imputed rent on holiday houses 3 Other tourism and services 4 527 Total 527
Table 8: Regional (aggregated) tourism expenditure State total Reg 1 Reg 2 Reg 3 Reg 4 Sum TSA Aggregated Groups Travel Agency 18 1.80 3.60 5.40 7.20 18 Accommodation 100 18.52 28.70 11.11 41.67 100 Food and drink 25 3.13 4.69 6.25 10.94 25 Airfares 150 36.59 60.98 14.63 37.80 150 Other transport 25 2.08 5.21 8.33 9.38 25 Fuel 14 3.82 2.55 6.36 1.27 14 Shopping 160 12.97 36.76 60.54 49.73 160 Entertainment 25 2.27 7.95 10.23 4.55 25 Other 10 2.50 2.50 2.50 2.50 10 Total 527 83.68 152.93 125.36 165.03 527
Following is an alternative approach for deriving regional tourism expenditure which can carry all state TSA
products from the state level down to the regional level. Table 9 contains the same information as Table 6 but uses a different concept. As discussed the values of the state TSA products are the control totals for the regional level. All extra information derived from the regional shares using TRA data are just a means to transform the state TSA products into regional tourism expenditure while maintaining the control totals at the state level. The left column of Table 9 contains all state TSA products; the right column indicates which shares from the TRA data are applied to the state TSA products to calculate the corresponding regional expenditure values. This table reflects the top-down approach that has been adopted throughout the report, and similar to the method for
QUEENSLAND REGIONAL TOURISM SATELLITE ACCOUNT SCOPING STUDY
16
constructing state TSA: values available at the higher level (state) remain unchanged, with the lower level (region) shares applied to disaggregate the values at the higher level (state) into values at the lower level (regions). The implied assumption that all products in a group will take the same (average) share of the group for example Taxi fares, Motor Vehicle hire and Lease, Local area passenger transportation, and Motor vehicles, caravan and, boats in the Other Transport group. It is acknowledged that this assumption is debatable but as long as the regions have all products in the group, this approach facilitates the most possible detail of the data. Once more data becomes available afterwards, this approach provides an option to go back and refine the composition of products in a group. If required, it is easy to aggregate all products in a product group to produce exactly the same outcome as in Table 8.
Table 9: Mapping TSA products and TRA expenditure items for domestic overnight visitors Queensland TSA Products TRA Expenditure Items Tourism Characteristic Products Travel agency and tour operator services Travel agency Taxi fares Other transport Long distance passenger transportation Airfares Motor vehicle hire and lease Other transport Accommodation services Accommodation Takeaway and restaurant meals Food and drink Shopping (Inc gifts and souvenir) Shopping Tourism Connected Products Local area passenger transportation Other transport Repair and maintenance of motor vehicles Other Fuel Fuel Food products Food and drink Alcoholic beverages and other beverages Food and drink Motor vehicles, caravans and boats Other transport Recreational, cultural and sports services Entertainment Gambling and betting services Entertainment Education Other Actual and imputed rent on holiday houses Other Other tourism and services Other
Table 10 presents results of the numerical example: values of expenditure products of the state TSA (Table 7)
are multiplied by the corresponding shares of the expenditure items (Table 5).
The amount for Education in reality is comparatively small and the Other share is acceptable. If precision is required, some alternative shares can be tested. First, it is quite possible to assume that most of the education and training are provided out of the main city of the state then the total amount of education is located in Brisbane. Or second, if we were to assume that education and training are provided from all universities in the state, then we can use shares of revenue from overseas students which can be obtained from universities. Similarly, the Other share can be used for the Actual and Imputed rent. Another possible approach would be to make this Actual and Imputed rent a residual item not allocated to regions.
At this point, readers may find that the scoping study is not certain about how to deal with small and unusual products. This constitutes a fair comment. In fact, it is worthwhile for the research team of this project to emphasise that the most difficult aspect of this scoping study is to build a model without seeing the real numbers of the database. An experienced modeller would attain not only the ability to build a model structure but also the feeling for the numbers (results of the model) to judge the reliability of the model structure. In this project, the second aspect is not possible. Thus, the research team have attempted to provide a range of alternatives leaving the final decision regarding the implementation process for when the data is available.

QUEENSLAND REGIONAL TOURISM SATELLITE ACCOUNT SCOPING STUDY
17
Table 10: Mapping TRA expenditure items and TSA products for domestic overnight
Queensland TSA Products TRA Expenditure ItemsState TSA SumValues Region1 Region 2 Region 3 Region 4
Tourism Characteristic Products (million) Travel agency and tour operator services 18 Travel agency 1.80 3.60 5.40 7.20 18 Taxi fares 7 Other transport 0.58 1.46 2.33 2.63 7 Long distance passenger transportation 150 Airfares 36.59 60.98 14.63 37.80 150 Motor vehicle hire and lease 4 Other transport 0.33 0.83 1.33 1.50 4 Accommodation services 100 Accommodation 18.52 28.70 11.11 41.67 100 Takeaway and restaurant meals 10 Food and drink 1.25 1.88 2.50 4.38 10 Shopping (including gifts and souvenirs) 160 Shopping 12.97 36.76 60.54 49.73 160
Tourism Connected Products Local area passenger transportation 6 Other transport 0.50 1.25 2.00 2.25 6 Repair and maintenance of motor vehicles 1 Other 0.25 0.25 0.25 0.25 1 Fuel 14 Fuel 3.82 2.55 6.36 1.27 14 Food products 7 Food and drink 0.88 1.31 1.75 3.06 7 Alcoholic beverages and other beverages 8 Food and drink 1.00 1.50 2.00 3.50 8 Motor vehicles, caravans and boats 8 Other transport 0.67 1.67 2.67 3.00 8 Recreational, cultural and sports services 15 Entertainment 1.36 4.77 6.14 2.73 15 Gambling and betting services 10 Entertainment 0.91 3.18 4.09 1.82 10 Education 2 Other 0.50 0.50 0.50 0.50 2 Actual and imputed rent on holiday houses 3 Other 0.75 0.75 0.75 0.75 3
Other tourism and services 4 Other 1.00 1.00 1.00 1.00 4
Regional TSA Values
(million)
After allocating all of the expenditure items into TSA commodities at the regional level, the process does not guarantee that the sum of all TSA consumption in a region will be equal to the total expenditure of the region as provided by TRA. This is because STCRC (2007) involved a reconciliation or adjustment process to achieve the targets published in the ABS national TSA. Although TRA produces comprehensive tourism expenditure data, it is not necessarily the case that the ABS figures will match. How significant the differences will be is not known at this stage. This is very natural for a top-down approach since only the regional shares are utilised, the absolute value of the total expenditure of a region (TRA data) is not the target in the top-down approach.

QUEENSLAND REGIONAL TOURISM SATELLITE ACCOUNT SCOPING STUDY
18
Demand side
TRA Data(Regional shares)
State TSA
Regional Tourism expenditure
Regional IO Tables
Supply side
TSA Tables
Regional TSA
We are up to here
Demand side
TRA Data(Regional shares)
State TSA
Regional Tourism expenditure
Regional IO Tables
Supply side
TSA Tables
Regional TSA
We are up to here
Figure 4: Stage of analysis
Domestic Day Visitor Expenditure In this section, we follow the procedure that has been applied in the above Domestic Overnight section to derive the regional tourism expenditure for the Domestic Day group. Similarly, the only adjustment to this Domestic Day Visitor Expenditure is an allocation of Transport Fare and Packages among other items of TRA data. This expenditure item takes only a small share in the total Domestic Day expenditure in all regions, the largest is in Brisbane with only 6.6 per cent of the total (Carter & Collins 2005). The majority of this item is comprised of transport.
Data from ABS (2006) reveals that the nature of Domestic Day expenditure has an insignificant amount of Travel agency, in general only five per cent of the total expenditure of Travel agency, Taxi fares, Long distance passenger transportation, Motor Vehicle hire and lease, and Local area passenger transportation. It is recommended that only five per cent of the Transport Fare and Package item is extracted for Travel Agency. The remaining 95 per cent is then distributed as Transport in the region.
Figure 5: Decomposition of transport fares and package food
Transport fares and packages Food and drink Fuel Shopping Entertainment Other
Travel agency Transport Food and drink Fuel Shopping Entertainment Other
5 per cent
95 per cent
Region r in Queensland
Original TRA Modified TRA
These (modified TRA) regional data are used to derive regional shares to disaggregate the expenditure in the
Queensland TSA for the Domestic Day group into regions of Queensland. Table 11 provides a mapping between Queensland TSA commodities and TRA expenditure items.
Table 11: Mapping TSA products to TRA expenditure items for domestic day visitors Queensland TSA Products TRA Expenditure Items

QUEENSLAND REGIONAL TOURISM SATELLITE ACCOUNT SCOPING STUDY
19
Tourism Characteristic Products Travel agency and tour operator services Travel agency Taxi fares Transport Long distance passenger transportation Transport Motor vehicle hire and lease Transport Accommodation services no shares needed Takeaway and restaurant meals Food and Drink Shopping (including gifts and souvenirs) Shopping Tourism Connected Products Local area passenger transportation Transport Repair and maintenance of motor vehicles Other Fuel Fuel Food products Food and Drink Alcoholic beverages and other beverages Food and Drink Motor vehicles, caravans and boats Transport Recreational, cultural and sports services Entertainment Gambling and betting services Entertainment Education Other Actual and imputed rent on holiday houses Other Other tourism and services Other
International Visitor Expenditure This is a difficult area to deal with at the regional level of the TSA for Queensland. As seen in Table 2, TRA data only offers two broad expenditure items for each region of Queensland namely Accommodation, Food and Beverages, and Other. Fortunately, region-specific expenditure patterns can be obtained from TRA. These patterns are presented in terms of item shares in the total regional expenditure. These expenditure items include:
• accommodation • food and drink • fuel • transport • shopping • entertainment • education • other
Given the sum that TRA provides for international visitor expenditure of each region, it is relatively easy to
derive all eight expenditure items from the expenditure pattern. This step is illustrated in Figure 6.

QUEENSLAND REGIONAL TOURISM SATELLITE ACCOUNT SCOPING STUDY
20
Figure 6: Derivation of expenditure data for overseas visitor expenditure
Region r in Queensland
Accommodation, Food and Beverages
Accommodation Food and Drink Fuel Transport Shopping Entertainment Education Other
Original TRA Data New TRA Data
Other
Once all eight new TRA expenditure items are derived, the same approach to map TRA expenditure items to
state TSA products is used to calculate regional expenditure data for the overseas visitor group. That means we apply the regional shares to the state TSA to disaggregate the state values into the regional values.
Intraregional, Interregional and Interstate Tourism Expenditure Disaggregation The two matrices of expenditure for Domestic Overnight and Domestic Day include expenditure of tourists from within each region, from other regions of Queensland and also from other states. The structure of the TRA database should be able to identify home-destination pairs so that the number of Visitor Nights (VN) for Domestic Overnight and trips for Domestic Day can be obtained.
Using VN alone to split expenditure of Domestic Overnight into intraregional, interregional and interstate tourism expenditure will not provide an accurate system to locate expenditure into three sources: own region, from the rest of Queensland, and interstate; it only reflects the quantity side of the whole picture. The differences in the cost of visiting are not taken into account. This implies that three nights in the Sunshine Coast will cost the same as three nights in Outback Queensland. In order to capture the price effect, the regional cost indicator of the Iterative Procedure should also be used in conjunction with the number of VN. The regional cost indicator is also available from the TRA data. Let: VNij: the number of visitor nights for a tourist from home region i to destination j Rj: regional cost indicator of the destination region j. EXPij: expenditure in destination j from home region i. EXPij = VNij * Rj When: i = j, EXPij is intraregional component of region j;
i = other regions of Queensland, EXPij is interregional component of region j; and,
i = regions of other states, EXPij is the interstate component of region j.
It is important to note that Rj is constant in region j regardless where the visitors come from. During the process to disaggregate expenditure of the Domestic Overnight travellers, the expenditure on airfares for own region should be zero as we do not assume tourists from Brisbane would fly to Brisbane or even to Gold Coast and Sunshine Coast. Once EXPij is calculated, the shares can be applied uniformly to all TSA commodities in the region j to derive three sources of tourism expenditure. A similar approach should also be used for the Domestic Day. For the purpose of compiling regional TSA, the three sources of expenditure (own-region, the rest of Queensland, and interstate) are sufficient. Although it is not recommended, it is certainly very worthwhile for a modeller to attempt to flesh this out to the full extent to determine how good and how bad the trade flows of the tourism sector are in the first instance, and on that basis experts and industry partners can be consulted for the

QUEENSLAND REGIONAL TOURISM SATELLITE ACCOUNT SCOPING STUDY
21
information required to refine it. The full matrix is an important component for modelling tourism impact analysis task.
So far the three sets of tourism expenditure for all regions, which is part of the TSA from the demand side (consumption), have been presented. Figure 4 is reproduced again to indicate where we are in the whole scheme. In the next step, these expenditures will be applied to another process to derive the supply side of the regional TSA, for example Gross Value Added (GVA) and Gross Regional Product (GRP).
Figure 4: Stage of analysis
Demand side
TRA Data(Regional shares)
State TSA
Regional Tourism expenditure
Regional IO Tables
Supply side
TSA Tables
Regional TSA
We are up to here
Demand side
TRA Data(Regional shares)
State TSA
Regional Tourism expenditure
Regional IO Tables
Supply side
TSA Tables
Regional TSA
We are up to here

QUEENSLAND REGIONAL TOURISM SATELLITE ACCOUNT SCOPING STUDY
22
Chapter 6
PRODUCTION ALLOCATION: SUPPLY SIDE
Value Added Components
Figure 7: Purchasers’ prices and components
Basic Price Basic Price
Basic Price
Imports Wholesales, retail margins
Basic Price
Com Tax
Imports Imports
Basic price, received by domestic producers
Purchasers’ prices paid by consumers
Wholesales, retail margins
Figure 9 illustrates how goods move from a producer to a consumer in a process that collects additional costs to the initial cost of producing the goods. The basic price block represents the total cost of producing the goods by a domestic producer. Often, a domestic consumer also purchases a similar product from imported sources. A product from either a port or a factory gate requires transportation to move from a supplier to a consumer, which obviously attracts a transportation cost. In other cases, goods are stored in wholesale storage and retail outlets, which also attract wholesale and retail margins (there are more margins which are not mentioned here). Additionally, all consumers have to pay tax to the government. So, the size of the boxes and the layers of the margins represent changes in the costs at different points in time in a process from the factory gate to the consumer.
In the IO framework, outputs (of goods and services) of industries are measured at basic prices. In a simple explanation, output of an industry includes all intermediate materials plus net commodity taxes on these materials, compensation of employee (COE), gross operating surplus and mixed income (GOS), and net taxes on the production. The intermediate materials can be purchased from either a domestic or imported source. The ratios of inputs to output are important as they represent the requirement of inputs by a unit of output. Thus, given a level of output, the costs of all inputs, including materials, COE, GOS and net production taxes, can be derived using these ratios.
The tourism expenditure data collected by the TRA survey represents the amounts paid by the visitors. This means that the values of the goods and services were measured at the purchasers’ prices, which include all margins on top of the production cost (basic value of the output) that initially incurs to the corresponding industries.
In the state TSA, there are two types of tables. Any tables with a heading consumption contain expenditure data measured at the purchasers’ prices. And tables of industry data are clearly identified with the heading basic prices. It is important to recall that all data derived in the Expenditure Allocation section (previous section) are the consumption data, which is part of the regional TSA: the demand side.
Consequently, before proceeding to derive the supply side data for the regional TSA, all margins and imports have to be removed from the consumption data. The purpose of removing these margins is to obtain the right magnitude of the output level so that through the use of input/output ratios it is possible to correctly derive the contribution of value added components of the industry producing tourism products. The margin rates (at the national level) are available from IO tables (Table 4: reconciliation purchasers’ prices and basic prices). Using these rates implies an assumption that all regions have the same margin rates. This assumption and subsequent practice are adopted very often in reality as such margin information for specific regions of Queensland or any other states are difficult to obtain. The margin rates are also available from the regional CGE database. The step

QUEENSLAND REGIONAL TOURISM SATELLITE ACCOUNT SCOPING STUDY
23
to calculate the total output level measured at basic prices is simple: multiply the rates by the consumption data to get values of margins; these margin values are then subtracted from the consumption data, the remaining is the basic price component.
The basic price component is the output of the corresponding industries in a region. At this point, there are two alternatives to calculate the rest of the supply side data for the regional TSA. An easy approach would be to apply these regional output levels as regional shares to the state TSA supply side data to calculate the corresponding regional supply data for TSA. This approach has an advantage if the regional IO tables are not available, therefore assuming that similar industries in different regions would have the same inputs/output ratios to simplify the task: applying output shares to derive regional GVA, GRP and others from the corresponding state TSA data.
It is not always the case that similar industries in different regions would have the same cost structure. Similar industries in different regions interact with the rest of the region, the rest of Queensland as well as the rest of Australia in different ways, even though they produce very similar products. In Figure 7, the meaning of import was kept very generic, without mentioning whether imports were from overseas, from the rest of Queensland or from the rest of Australia.
The regional IO database specifies the amount of imports from all sources by each industry. The database also contains specific cost structure (input to output ratios) for each industry. It is almost certain that the regional IO database for the regions of Queensland would contain single output industries only. This means there is no need to convert industry output to commodity level. Thus for a given level of output, GVA and GRP can be derived directly.
It is important to note that conventional IO industries produce goods and services for many different consumers and tourists are just one group. Therefore we can broadly classify them into tourism and non-tourism categories. It is the tourism component that we want to calculate the supply side data for the regional TSA. There is no empirical evidence to indicate that the same industry would employ different technologies to produce outputs for tourism and non-tourism activities. It is legitimate to assume that the input/output ratios are broadly similar for both. Given the output level (the basic price component), the input/output ratios can be used to derive COE, GOS, commodity taxes on intermediate materials used by the industry, and the net taxes on production.
The above steps for deriving the TSA supply side data are in fact based on a bottom-up approach as state TSA has not been disaggregated down to the regional data level. Regional value added components are derived from their cost structure. Thus, it would be unusual if the sum of one particular value added component across all regions actually matches the value produced by STCRC (2007). In order to maintain the adding-up condition between the regional and the state level, it is necessary to scale the regional data to match the state TSA targets. Please note that the mapping between the state TSA products and the IO industries are listed in the ABS publication catalogue number 5249.0, pages 32–35.
Employment The contribution of the tourism sector to the labour market has become an increasingly important in an economy for its ability to create jobs. Jones et al. (2004 p.32) used the Canadian case as an example to point out that ‘the impact of tourism upon employment was proportionally greater than for output or value added, due to the labour-intensity of most tourism dependent industries’. However, measuring this aspect of the tourism sector is not an easy task. This is indeed the most difficult part of the task to measure contribution of the tourism sector because of its heterogeneous characteristic.
For the case of Australia and its states, employment numbers in the tourism sector have been estimated using various methods by different organisations such as the Australian Bureau of Statistics, Transport and Tourism Forum, the Office of Economic and Statistic Research (Queensland), Access Economics and the Sustainable Tourism Cooperative Research Centre. Estimates are not the same but it is hard to judge the accuracy of individual estimates. Nevertheless, most methods incorporate a broadly similar approach in that tourism expenditure data are obtained to derive tourism ratios, applying this tourism ratio to the number of employed (full time equivalent) persons of the corresponding industries to calculate the number of people employed in the industries for tourism purpose (ABS 2007).
The exception is the method used in the Tourism and Transport Forum’s Tourism Employment Atlas (TTF Australia National Tourism Atlas 2006). In the absence of state level TSA, and tourism related Input Output data at the regional level, TTF have used census data to allocate the ABS TSA’s national tourism employment estimates to Statistical Local Areas. This involves combining two data sets which are derived from very different

QUEENSLAND REGIONAL TOURISM SATELLITE ACCOUNT SCOPING STUDY
24
sources using different employment categories and collection methods (the ABS TSA relies primarily on the Labour Force Survey and individual industry surveys) while the census uses different employment descriptors completed by the employee rather than the employer. In addition, the census is only carried out every four years and the results take some time after that to emerge. The TTF approach thus requires significant adjustment.
In STCRC (2007) the approach went further to calculate adjustment ratios for individual industries so that the state employment figures are structurally consistent to that of the ABS. Since the adjustment has been carried out at the state level already, for regions of Queensland, COE shares derived from the supply side section are used to disaggregate the employment number from the state level down into regions of Queensland. This approach is recommended as it maintains the consistency with the ABS patterns and takes into account of industry structures in the regions concerned. There may be value in cross referencing the results to the TTF census based tourism employment estimates to draw attention to possible reliability problems, but we would recommend against the use of the census based data as a data primary source.

QUEENSLAND REGIONAL TOURISM SATELLITE ACCOUNT SCOPING STUDY
25
Chapter 7
OTHER ISSUES
Tourism Regions of Queensland The mapping of regions goes through two stages. First, regions in the regional CGE database are mapped to regions defined in TRA expenditure data. This mapping is applied throughout the procedure to derive tourism demand and supply data in this scoping study. Table 12 presents the list twelve TRA regions and the list of ten statistical division regions in the CGE database.
Table 12: Reconciliation between TRA tourism regions and ABS statistical division regions TRA Tourism Regions Equivalent ABS Statistical Divisions Gold Coast Brisbane Moreton Brisbane Brisbane Moreton Sunshine Coast Brisbane Moreton Hervey Bay/Maryborough Wide Bay-Burnett Darling Downs Darling Downs Bundaberg Wide Bay-Burnett Fitzroy Fitzroy Mackay Mackay Whitsundays Mackay Northern Northern Tropical North Queensland Far North Queensland Outback North West, Central West and South West
At the same time, the table superimposes a mapping between the two sets. The map requires that TRA Data
for Brisbane, Gold Coast and Sunshine Coast are aggregated to form tourism expenditure data for the Brisbane Moreton division, similarly Hervey Bay/Maryborough and Bundaberg to form Wide Bay-Burnett division, and Mackay and Whitsunday to form the Mackay division. However, North West, Central West and South West statistical divisions are aggregated together to map to the Outback region of TRA data.
The outcome of this mapping results in eight regions. For clear references, these regions are defined as Temporary TSA regions.
• Brisbane Moreton • Wide Bay-Burnett • Darling Downs • Fitzroy • Mackay • Northern • Far North Queensland • Outback
In the second stage, regional tourism data for the temporary TSA regions are mapped into TQ tourism
regions. Note that these regions are different from tourism regions defined by TRA previously.
Currently, Tourism Queensland produces a Regional Update publication for 14 tourism regions of Queensland. These regions are listed in Table 13. Table 14 broadly maps the TQ tourism regions presented in the Regional Update to eight temporary TSA regions. The two sets of regions are not mapped directly to each other. It will be complicated and require some effort to correct the discrepancy between the geographical regions between the two sets. However, since the benefit of having these regions corrected is marginal, it is recommended that the ten statistical divisions remain unchanged.

QUEENSLAND REGIONAL TOURISM SATELLITE ACCOUNT SCOPING STUDY
26
Table 13: Tourism regions for regional update by Tourism Queensland Regions Notes
Brisbane Bundaberg Excluding Mariam Vale, which is included here in ABS region Capricorn Fraser Coast (or Hervey Bay/ Maryborough)
Excluding Cooloola, which is included in the ABS Hervey Bay/Maryborough
Gladstone Mariam Vale is shifted to here from Bundaberg
Gold Coast Mackay Outback This Outback includes broadly three statistical divisions Central
West, North West and South West. However, the North West here excludes Burke, Carpentaria, Mornington and Incorporated Island. Similarly the South West here excludes Bungil, Roma, Bendermere, Waroo, Belonne
Southern Downs
Sunshine Coast Tropical North Queensland Toowoomba and Golden West Townsville Whitsundays
Table 14: Reconciliation between temporary TSA regions and TQ tourism regions Statistical Division Regions Equivalent TQ Tourism Regions Brisbane-Moreton SD Including Brisbane, Gold Coast and Sunshine Coast Tourism Regions Wide Bay-Burnett Bundaberg and Hervey Bay/ Maryborough Fitzroy Capricon and Gladstone MacKay MacKay and Whitsundays Outback Outback (not matching 100 per cent) Darling downs Southern Downs, and Toowoomba and Golden West Northern Townsville Far North Tropical North Queensland
Data from TRA indicates that although Brisbane, Gold Coast and Sunshine Coast are small areas, sub-
regions of Brisbane Moreton division, these regions attract a very large number of tourists compared with other regions. Therefore, individually TRA data for these regions are very reliable. Once the TSA for Brisbane-Moreton is available, it can be disaggregated into three smaller regions separately. For other TQ tourism regions, it is not recommended to be derived as TRA data for them are not reliable statistically.
This above approach was adopted by OESR previously to construct the regional TSA for regions of Queensland for 1998 to 1999. In order to disaggregate tourism data from Brisbane-Moreton region into three smaller regions for Brisbane, Gold Coast and Sunshine Coast, OESR applied employment data of the census to calculate corresponding shares. Note that these are employment by industry. Thus each industry is disaggregated separately using the employment proportion in the total employment of Brisbane-Moreton region. At a very low regional level such as Gold Coast, Sunshine Coast and Brisbane, labour mobility is very dynamic. Employment data from the census only reflects the location where workers live, although the majority of workers tend to work in the same location as their residence. However, there are workers who travel between Gold Coast and Brisbane to work. OESR explicitly acknowledged this effect and corrected it by taking into account journey to work data, also from the census, to correct the employment data for each region.

QUEENSLAND REGIONAL TOURISM SATELLITE ACCOUNT SCOPING STUDY
27
While we agree with OESR on their approach to disaggregating Brisbane-Moreton into three smaller regions as described above, it is also possible to derive tourism supply and demand data for these small regions directly.
The proposed approach here is that at the step from Table 12, instead of generating only one tourism ratio for an industry in the Brisbane-Moreton region, simultaneously three tourism ratios from the same industry can be derived for the three regions Brisbane, Gold Coast and Sunshine Coast and applying these ratios throughout the whole process in order to derive TSA data for Brisbane, Gold Coast and Sunshine Coast.
It may be desirable that both approaches are compared for sensitivity analysis. As the base year for the regional TSA is 2003 to 2004, a mid point of the 2001 and 2006 censuses, when the Census 2006 data become available, the average values of employment by industry of the two censuses can be used to derive the TSA data for the Gold Coast and Sunshine Coast to compare with the above proposed approach. In that case, the journey to work data for Gold Coast and Sunshine Coast should be used to correct the level of employment in the two regions for labour mobility as it was done in OESR State TSA report.
Consequently, regions recommended in this scoping study are exactly the same as regions reported in the regional TSA by OESR (2002). These include:
• Brisbane • Gold Coast • Sunshine Coast • Wide Bay-Burnett • Darling Downs • Fitzroy • Mackay • Northern • Far North Queensland • Outback
Sample Error Table 15 contains data extracted from Carter and Collins (2005) for the relative standard error criteria adopted by TRA. Relative standard error expresses the standard error of an estimate as percentage of the estimate. This is a convenient way of comparing variability of different samples with widely different estimates. There are six criteria that TRA adopts to control data quality for publishing.
1. Sample size is 50 observations or more. 2. RSE is less than 25 per cent. 3. No single observation accounts for more than one-third of the region’s total expenditure. 4. The estimate of the current year is reasonably consistent with the estimate from the previous year. 5. The estimate of expenditure per night is within reasonable bounds, currently between $50 and $150 per
night. Values outside this range are acceptable if criterion 4 is met, that is consistently low or consistently high over time.
6. The estimates are acceptable to stakeholders.
Table 15 has a full breakdown of TRA regions, which is not directly comparable to the recommended regions above. The first two criteria are most relevant and applicable in this scoping study. Based on these two criteria, Domestic Overnight visitor expenditure for all recommended regions are satisfied.
For the Domestic Day visitor expenditure, although Mackay and Whitsundays have their sample size less than 50 individually, the combined region is slightly above 50. Their current individual RSEs are less than 25 per cent already, thus the RSE for the combined region would likely produce RSE less than 25 per cent. It seems that Far North (Tropical North Queensland), with RSE of 39 per cent, is the only region that is not satisfied. The Overseas Visitor expenditure appears to be the group that has more variation, particularly Darling Downs, Fitzroy, Northern and Outback.
Table 15: Relative standard error and sample size error of TRA regions
Domestic Overnight Visitors
Domestic Day Visitors
Overseas visitors
TRA Regions Recommended TSA Regions
RSE (per cent)

QUEENSLAND REGIONAL TOURISM SATELLITE ACCOUNT SCOPING STUDY
28
Gold Coast Gold Coast 5 7 3 Brisbane Brisbane 4 6 5 Sunshine Coast Sunshine Coast 6 9 6 Hervey Bay/Marborough Wide Bay-Burnett 10 15 14 Darling Downs Darling Downs 14 11 33 Bundaberg Wide Bay-Burnett 16 21 23 Fitzroy Fitzroy 12 18 29 Mackay Mackay 16 25 26 Whitsundays Mackay 17 23 11 Northern Northern 11 14 28 Tropical North Queensland
Far North 7 39 3
Outback Outback 15 18 27 Sample size Gold Coast Gold Coast 852 395 2230 Brisbane Brisbane 1059 699 1574 Sunshine Coast Sunshine Coast 610 300 314 Hervey Bay/Marborough Wide Bay-Burnett 218 99 106 Darling Downs Darling Downs 259 141 53 Bundaberg Wide Bay-Burnett 94 45 28 Fitzroy Fitzroy 190 104 73 Mackay Mackay 111 38 37 Whitsundays Mackay 89 16 128 Northern Northern 176 82 92 Tropical North Queensland
Far North 355 128 1581
Outback Outback 104 31 27
Based on the above analysis, the set of the recommended regions could have been a more aggregated group. However, we took a broader view in recommending ten regions for the construction of TSA. This is not a step to follow the previous regional TSA by OESR (2002). Even though we agree with OESR, this is an independent recommendation indeed. The recommendation in this study is actually in line with TRA’s point of view.
TRA is reluctant to lay down general rules governing use of the regional expenditure estimates. This is partly because ‘one size does not fit all’, given the inherent variability of the estimates, but mainly because use of given estimates is a risk management issue, which is dependent on the circumstances. For example, if a substantial amount of investment or funding is to be allocated, then a more cautious or conservative approach would be called for. However, for other purposes, less reliable estimates may be acceptable. This is matter for individual judgment, depending on the context. (Carter & Collins 2005) As such, it is not justifiable to have a more aggregated group of regions in order to achieve the RSE and
sample size criteria for the Overseas Visitor expenditure group while losing a rich picture of the expenditure patterns of the Domestic Overnight Visitor group, which contributes much larger than the Overseas Visitor group to the total tourism expenditure of a region.
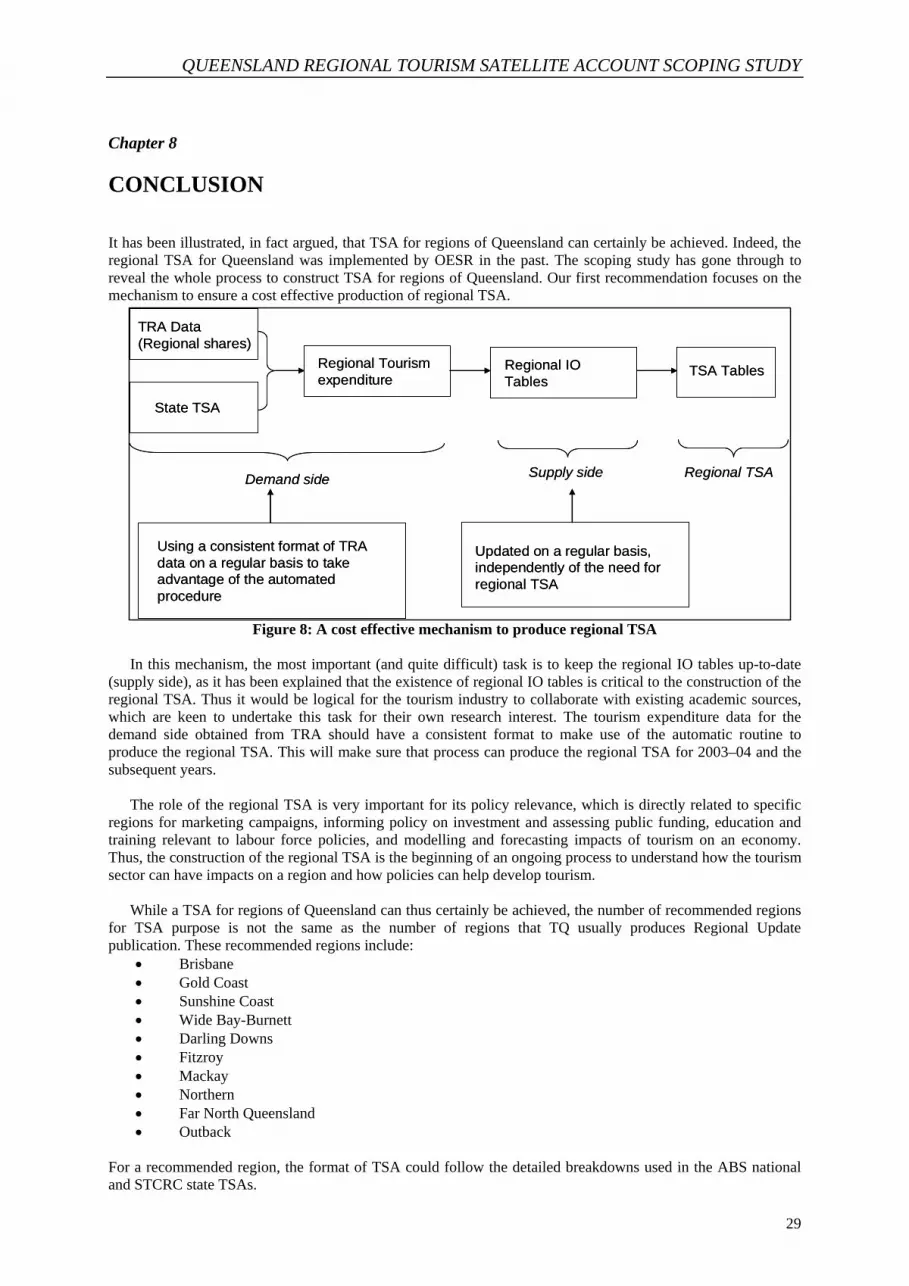
QUEENSLAND REGIONAL TOURISM SATELLITE ACCOUNT SCOPING STUDY
29
Chapter 8
CONCLUSION
It has been illustrated, in fact argued, that TSA for regions of Queensland can certainly be achieved. Indeed, the regional TSA for Queensland was implemented by OESR in the past. The scoping study has gone through to reveal the whole process to construct TSA for regions of Queensland. Our first recommendation focuses on the mechanism to ensure a cost effective production of regional TSA.
Figure 8: A cost effective mechanism to produce regional TSA
Updated on a regular basis, independently of the need for regional TSA
Using a consistent format of TRA data on a regular basis to take advantage of the automated procedure
Demand side
TRA Data(Regional shares)
State TSA
Regional Tourism expenditure
Regional IO Tables
Supply side
TSA Tables
Regional TSA
In this mechanism, the most important (and quite difficult) task is to keep the regional IO tables up-to-date
(supply side), as it has been explained that the existence of regional IO tables is critical to the construction of the regional TSA. Thus it would be logical for the tourism industry to collaborate with existing academic sources, which are keen to undertake this task for their own research interest. The tourism expenditure data for the demand side obtained from TRA should have a consistent format to make use of the automatic routine to produce the regional TSA. This will make sure that process can produce the regional TSA for 2003–04 and the subsequent years.
The role of the regional TSA is very important for its policy relevance, which is directly related to specific regions for marketing campaigns, informing policy on investment and assessing public funding, education and training relevant to labour force policies, and modelling and forecasting impacts of tourism on an economy. Thus, the construction of the regional TSA is the beginning of an ongoing process to understand how the tourism sector can have impacts on a region and how policies can help develop tourism.
While a TSA for regions of Queensland can thus certainly be achieved, the number of recommended regions for TSA purpose is not the same as the number of regions that TQ usually produces Regional Update publication. These recommended regions include:
• Brisbane • Gold Coast • Sunshine Coast • Wide Bay-Burnett • Darling Downs • Fitzroy • Mackay • Northern • Far North Queensland • Outback
For a recommended region, the format of TSA could follow the detailed breakdowns used in the ABS national and STCRC state TSAs.

QUEENSLAND REGIONAL TOURISM SATELLITE ACCOUNT SCOPING STUDY
30
Box 3: Recommended TSA regional breakdown
Tourism Characteristic Products Travel agency and tour operator services Taxi fares Long distance passenger transportation Motor vehicle hire and lease Accommodation services Takeaway and restaurant meals Shopping (including gifts and souvenirs)Tourism Connected Products Local area passenger transportation Repair and maintenance of motor vehicles Fuel Food products Alcoholic beverages and other beverages Motor vehicles, caravans and boats Recreational, cultural and sports services Gambling and betting services Education Actual and imputed rent on holiday housesOther tourism and services
However, the detailed level of 18 products may stretch the reliability of the data and particularly for the less
tourism intensive regions. It also seems that such a detailed breakdown by products may go beyond the needs for some regions. It is therefore also desirable to aggregate the above TSA products down to the set of the TRA expenditure items to achieve a more reliable TSA for regions (Table 8).

QUEENSLAND REGIONAL TOURISM SATELLITE ACCOUNT SCOPING STUDY
31
REFERENCES
Australian Bureau of Statistics (2006), Australian National Account, Tourism Satellite Account, 2004–05, Cat No. 5249.0,
ABS: Canberra. Australian Bureau of Statistics (2007), Estimating State/Territory Tourism Employment, Parts 1 and 2, unpublished report to
the Department of Industry, Tourism and Resources, February, Canberra. Barber-Dueck, C. and Kotsovos, D. (2003), The provincial and territorial tourism satellite account for Canada, 1998,
www.canadatourism.com Carter, P. and Collins, D. (2005), Travel Expenditure by Domestic and International Visitors in Australia’s Regions, 2004,
Tourism Research Australia, Canberra. Eurostat, OECD, UNWTO and UN (2001), Tourism Satellite Account: Recommended Methodological Framework,
Luxembourg, Madrid, New York, Paris, Published by UN World Tourism Organisation, Madrid. Jones, C., Munday, A. and Roberts, A. (2003), Regional Tourism Satellite Accounts: A Useful Policy Tool?, Urban Studies,
Vol. 40, No. 13, pp. 2777–94, December 2003. Jones, C., Munday, A., Bryan, J., Roberts, A., and McNicoll, I. (2004): First Steps Tourism Satellite Account Project: United
Kingdom, Welsh Economy Research Unit, Cardiff Business School. Office of Economic and Statistical Research (2002), The Contribution of International and Domestic Visitor Expenditure to
the Queensland Regional Economies: 1998–99, prepared for Tourism Queensland and the Department of tourism, Racing and Fair Trading Queensland Government, Treasury Department, Brisbane.
Spurr, R., Dwyer, L., Forsyth, P., Ho, T.V., Pambudi, D. and Hoque, S. (2007) Tourism Satellite Account for Queensland.
2003–04. Sustainable Tourism Cooperative Research Centre: Gold Coast.

QUEENSLAND REGIONAL TOURISM SATELLITE ACCOUNT SCOPING STUDY
32
GLOSSARY
basic prices The amount receivable by the producer from the purchaser for a unit of a good or service produced as output minus any tax payable, and plus any subsidy receivable, on that unit as a consequence of its production or sale. It excludes any transport charges invoiced separately by the producer. See also purchaser’s price. Computable General Equilibrium (CGE) CGE modelling technique which combines the optimisation of microeconomic theory and an Input Output database to overcome the limitations of the Input-Output multiplier modelling technique. CGE explicitly explains changes to an economy based on movement of relative prices; it also takes into account the effect of limited resources of an economy. Compensation of Employees (COE) COE consists of value of entitlement earned by employees from their employers for services rendered during the accounting period. It covers wages and salaries received by employees in cash and in kind, changes in provisions for future employee entitlements (although estimates of these are not yet included in the Australian system of National Account) and employers’ social contributions. Gross Domestic Product (GDP) Total market value of goods and services produced in a country in a given period after deducting the cost of goods and services used up in the process of production but before deducting allowances for consumption of capital. Gross Value Added (GVA) The value of output at basic prices minus the value of intermediate consumption at purchasers' prices. The term is used to describe gross product by industry and by sector. Basic prices valuation of output removes the distortion caused by variations in the incidence of commodity taxes and subsidies across the output of individual industries. See also output. Input-Output table A system of economic accounts which shows, in value terms, the supply and disposal of goods and services produced within an economy over one year. inbound visitor Overseas visitors visiting Australia, Queensland or regions of Queensland.
margins This is the difference between the resale price of a good and the cost to the retailer or wholesaler of the good sold. A transport margin consists of the transport charges paid separately by the purchaser in taking delivery of the good. other taxes on production Consists of all taxes that enterprises incur as a result of engaging in production, except taxes on products. Other taxes on production include: taxes related to the payroll or workforce numbers excluding compulsory social security contributions paid by employers and any taxes paid by the employees themselves out of their wages or salaries; recurrent taxes on land, buildings or other structures; some business and professional licences where no service is provided by the Government in return; taxes on the use of fixed assets or other activities; stamp duties; taxes on pollution; and taxes on international transactions. output This consists of those goods and services that are produced within an establishment that become available for use outside that establishment, plus any goods and services produced for own final use. See also Gross Value Added. outbound visitor In general, this means Australian residents travelling overseas. In this scoping study this particularly refers to Queensland residents travelling overseas. purchaser's price The purchaser's price is the amount paid by the purchaser, excluding any deductible tax, in order to take delivery of a unit of a good or service at the time and place required by the purchaser. The purchaser’s price of a good includes any transport charges paid separately by the purchaser to take delivery at the required time and place. See also basic prices. tourism Comprises the activities of persons travelling to and staying in places outside their usual environment for not more than one consecutive year for leisure, business and other purposes not related to the exercise of an activity remunerated from within the place visited.
QUEENSLAND REGIONAL TOURISM SATELLITE ACCOUNT SCOPING STUDY
33
Tourism Characteristic Products Products which represent an important part of tourism consumption, or for which a significant proportion of the sales are to visitors. In the Australian TSA, for a product to be ‘characteristic’ it must account for at least 10 per cent of total tourism consumption and/or at least 25 per cent of the total output of the product must be consumed by visitors. Tourism Characteristic Industries Industries that would either cease to exist in their present form, or would be significantly affected if tourism were to cease. In the Australian TSA, for an industry to be ‘characteristic’, at least 25 per cent of its output must be consumed by visitors. Tourism Connected Products Industries are those, other than those classified as tourism characteristic, for which a tourism product is directly identifiable (primary), and where the products are consumed by visitors in volumes which are significant for the visitors and/or the producer. tourism consumption The total consumption made by a visitor or on behalf of a visitor for and during his/her trip and stay at the destination.
Tourism GDP Tourism gross value added plus taxes paid less subsidies received on tourism related products as these are reflected in prices that visitors actually pay. Tourism GDP will generally have a higher value than tourism value added. Tourism GDP is a satellite account construct to enable a direct comparison with the most widely recognised national accounting aggregate, GDP. While it is useful in this context, the tourism gross value added measure should be used when making comparisons with other industries or between countries. See Tourism Gross Value Added. Tourism Gross Value Added Measures the value of tourism gross output at basic prices by all industries which supply tourism products, less the value of the inputs used in producing these tourism products. This measure is directly comparable with the value added of ‘conventional’ industries such as mining and manufacturing and should also be used for comparisons across countries. See Tourism GDP. tourism ratio The proportion of the total value added of an industry which is related to tourism.

QUEENSLAND REGIONAL TOURISM SATELLITE ACCOUNT SCOPING STUDY
34
AUTHORS
Dr Tien Pham Tien has substantial experience in CGE modelling, particularly in regional economic modelling. Prior to joining the University of Queensland, he had held a Senior Research Economist position (Senior Officer Grade C, Executive level 1) at the Productivity Commission, a Senior Research Officer position at ABARE. Tien is currently a post-doctoral research fellow of the University of Queensland. Tien is developing a sub-state level CGE model of the Queensland economy. Email: [email protected]
Professor Larry Dwyer Larry Dwyer PhD is Qantas Professor of Travel and Tourism Economics at the University of New South Wales, Australia. Larry is a member of the International Academy for the Study of Tourism and the International Advisory Board of the Business Enterprises for Sustainable Tourism Education Network (BESTEN). Larry is coordinator of the Sustainable Destinations research program of The Sustainable Tourism Cooperative Research Centre in Australia, a member of the STCRC Centre for Tourism Economics and Policy Research, and a member of the Standards of Excellence Assessment Panel of THE-ICE (International Centre of Excellence in Tourism and Hospitality Education). Larry is a founding member of the International Association for Tourism Economics. He is a member of the Editorial Boards of thirteen international tourism journals. Email: [email protected]
Mr Ray Spurr Ray Spurr is Director of the STCRC Centre for Tourism Economics and Policy Research, University of New South Wales. His tourism appointments include: Coordinator, New South Wales Network, STCRC; Program Coordinator, STCRC Sub-Program 3.3 Tourism Economics and Policy; Policy Adviser Asia/Pacific World Travel and Tourism Council; Leadership Forum of Advisers, World Tourism Organisation; Chairman, OECD Tourism Committee; Pacific Asia Travel Association Advisory Council; Alternate Member Australian Tourist Commission Board; Commonwealth Government Ecological Sustainable Tourism Working Group; Chair, Review of Australia’s Tourism Policy and the Australian Tourist Commission. His principal fields of research interest include: Public Policy in Relation to Tourism; Economics of Tourism; Tourism Marketing. Email: [email protected]
Dr Lisa Ruhanen Dr Lisa Ruhanen has a Bachelor of Business (Tourism Management) from the University of Queensland, an Honours degree in tourism from James Cook University, and a Graduate Certificate in Education (Higher Education) from The University of Queensland. In 2006 Lisa completed her PhD dissertation on sustainable tourism development planning in local government areas. Lisa has close ties with the United Nations World Tourism Organization (UNWTO) and is a Visiting Scholar with the UNWTO Department of Education and Knowledge Management. She is also a consultant for the UNWTO for their UNWTO.TedQual and UNWTO.Sbest certification programs. Additionally, she holds a coordination/organisational role for the UNWTO and UQ, as the current Chair of the Education Council. Recent funded research projects have included: UNWTO Study of Australia as an Outbound Market for Asia; Entrepreneurship in Indigenous Tourism and Events; Trends in Australian Undergraduate and Postgraduate Tourism Education; Research Adoption in the Australian Tourism Sector; and, Research Diffusion and Commercialisation Training Program. [email protected]
Dr Noel Scott Dr Noel Scott has extensive experience as a senior manager and consultant in tourism, marketing and strategy development, having worked in a variety of marketing, research and policy positions within Tourism Queensland (previously titled Queensland Tourist and Travel Corporation). Dr Scott joined the School of Tourism in 2002. He lectures at undergraduate and postgraduate levels and has published extensively in the areas as diverse as crises and disaster management in tourism, travel and tourism marketing, tourism research methods, destination image management and tourism from South East Asia. He has also managed or contributed to a number of the School's key industry consultations, including an Evaluation of Schoolies Week for the Queensland Government, Babyboomer drive tourism for Tourism Queensland and the Northern Territory Tourism, and Tourism Stakeholder Research for the Australian Sustainable Tourism Cooperative Research Centre. [email protected]

Chairman: Stephen Gregg
Chief Executive: Ian Kean
Director of Research: Prof. David Simmons
CRC For Sustainable Tourism Pty Ltd
Gold Coast Campus Griffith University
Queensland 4222 Australia ABN 53 077 407 286
Telephone: +61 7 5552 8172 Facsimile: +61 7 5552 8171
Website: www.crctourism.com.au
Bookshop: www.crctourism.com.au/bookshop
Email: [email protected]
I N D U S T R Y P A R T N E R S U N I V E R S I T Y P A R T N E R S C O M M E R C I A L I S A T I O N
EC3, a wholly-owned commercialisation company, takes the outcomes from the relevant STCRC research; develops them for market; and delivers them to industry as products and services. EC3 delivers significant benefits to the STCRC through the provision of a wide range of business services both nationally and internationally.
K E Y E C 3 P R O D U C T S
COMMERCIALISE
RESEARCHAND
DEVELOPMENT
EDUCATIONAND
TRAINING
UTILISE
COLLABORATION
CO
MM
UN
I CA
T I O N
I NN
OV
AT
IO
N
• Travel and tourism industry
• Academic researchers
• Government policy makers
• New products, services and technologies• Uptake of research finding by business, government and academe• Improved business productivity• Industry-ready post-graduate students• Public good benefits for tourism destinations
TOURISM NT NORTHERN TERRITORYAUSTRALIA

The Sustainable Tourism Cooperative Research Centre
(STCRC) is established under the Australian Government’s
Cooperative Research Centres Program. STCRC is the
world’s leading scientific institution delivering research to
support the sustainability of travel and tourism – one of
the world’s largest and fastest growing industries.
Introduction
The STCRC has grown to be the largest, dedicated tourism
research organisation in the world, with $187 million
invested in tourism research programs, commercialisation
and education since 1997.
The STCRC was established in July 2003 under the
Commonwealth Government’s CRC program and is an
extension of the previous Tourism CRC, which operated
from 1997 to 2003.
Role and responsibilities
The Commonwealth CRC program aims to turn research
outcomes into successful new products, services and
technologies. This enables Australian industries to be more
efficient, productive and competitive.
The program emphasises collaboration between businesses
and researchers to maximise the benefits of research
through utilisation, commercialisation and technology
transfer.
An education component focuses on producing graduates
with skills relevant to industry needs.
STCRC’s objectives are to enhance:
• the contribution of long-term scientific
and technological research and innovation
to Australia’s sustainable economic and social
development;
• thetransferofresearchoutputsintooutcomesof
economic, environmental or social benefit to Australia;
• thevalueofgraduateresearcherstoAustralia;
• collaborationamongresearchers,betweenresearchers
and industry or other users; and efficiency in the use of
intellectual and other research outcomes.