queensland state school reporting
TRANSCRIPT
DEPARTMENT OF EDUCATION, TRAINING AND EMPLOYMENT
Queensland State School Reporting – 2011
Crawford State School (0399)
Postal address MS 780 Kingaroy 4610
Phone (07) 4162 1038
Fax (07) 4162 3434
Email [email protected]
Webpages
Additional reporting information pertaining to Queensland state schools is located on the My School website and the Department’s Right to Information site.
Contact Person Kerryanne Hughes, Principal
Principal’s foreword Introduction
It is with pleasure that I present this report that outlines the achievements and activities of Crawford State School through 2011. Crawford State School is a small school set in rural Queensland, 8 km from Kingaroy and a short drive from the Bunya Mountains, providing opportunities for students to develop as members of today’s global world.
Crawford State School provides a learning environment that empowers each student to realise his or her full learning potential. We provide a supportive learning environment in a small school setting and endeavour to provide experiences for our students that will enable them to access chosen pathways and life beyond school. Our programs aim to produce students that exhibit the confidence, independence and motivation needed to deal with life’s challenges. Student learning is facilitated through a multi-age approach.
DEPARTMENT OF EDUCATION, TRAINING AND EMPLOYMENT
Queensland State School Reporting – 2011
Crawford State School (0399)
School progress towards its goals in 2011
The school worked towards meeting all its priorities in 2011. A Whole school strategy for addressing behaviour was successfully implemented. Staff professional development needs such as behaviour and readiness for the implementation of the National Curriculum in 2011 were identified and attended. The school’s 100th Anniversary was celebrated.
Future outlook
The key priorities for 2012 include: • Student Learning- Lifting of achievement of all students, with specific focus on
reading and deeper understanding in comprehension. • School Curriculum- Implementation of the Australian Curriculum (English, Maths
and Science), adapting the resources to suit school context and student needs. Implementation of core learning priorities of reading, spelling, grammar and punctuation.
• Teaching Practice- High quality pedagogical practice, supported by mentoring, coaching and professional development to further develop teacher capacity, especially in the analysis and use of data.
• Safe and Supportive Environments- Continue to advance student social and emotional development with the implementation of ‘The Leader In Me’ program.
Our school at a glance
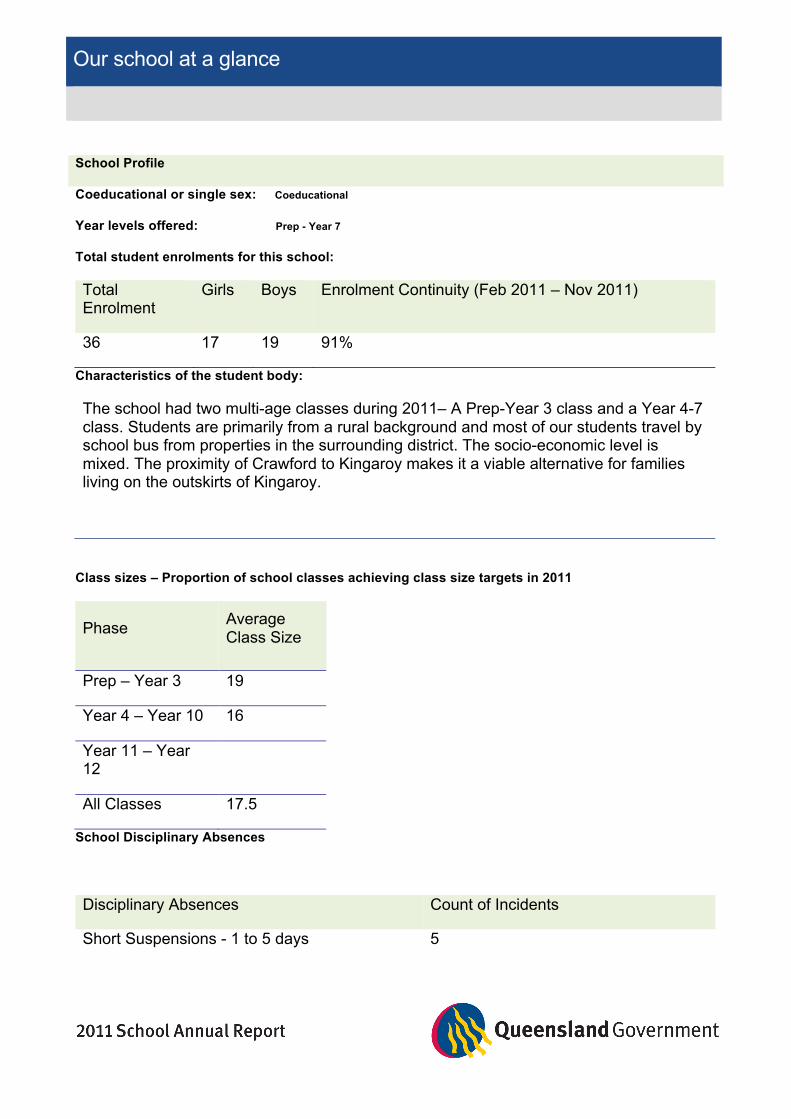
School Profile
Coeducational or single sex: Coeducational
Year levels offered: Prep - Year 7
Total student enrolments for this school:
Total Enrolment
Girls Boys Enrolment Continuity (Feb 2011 – Nov 2011)
36 17 19 91%
Characteristics of the student body:
The school had two multi-age classes during 2011– A Prep-Year 3 class and a Year 4-7 class. Students are primarily from a rural background and most of our students travel by school bus from properties in the surrounding district. The socio-economic level is mixed. The proximity of Crawford to Kingaroy makes it a viable alternative for families living on the outskirts of Kingaroy.
Class sizes – Proportion of school classes achieving class size targets in 2011
Phase Average Class Size
Prep – Year 3 19
Year 4 – Year 10 16
Year 11 – Year 12
All Classes 17.5
School Disciplinary Absences
Disciplinary Absences Count of Incidents
Short Suspensions - 1 to 5 days 5
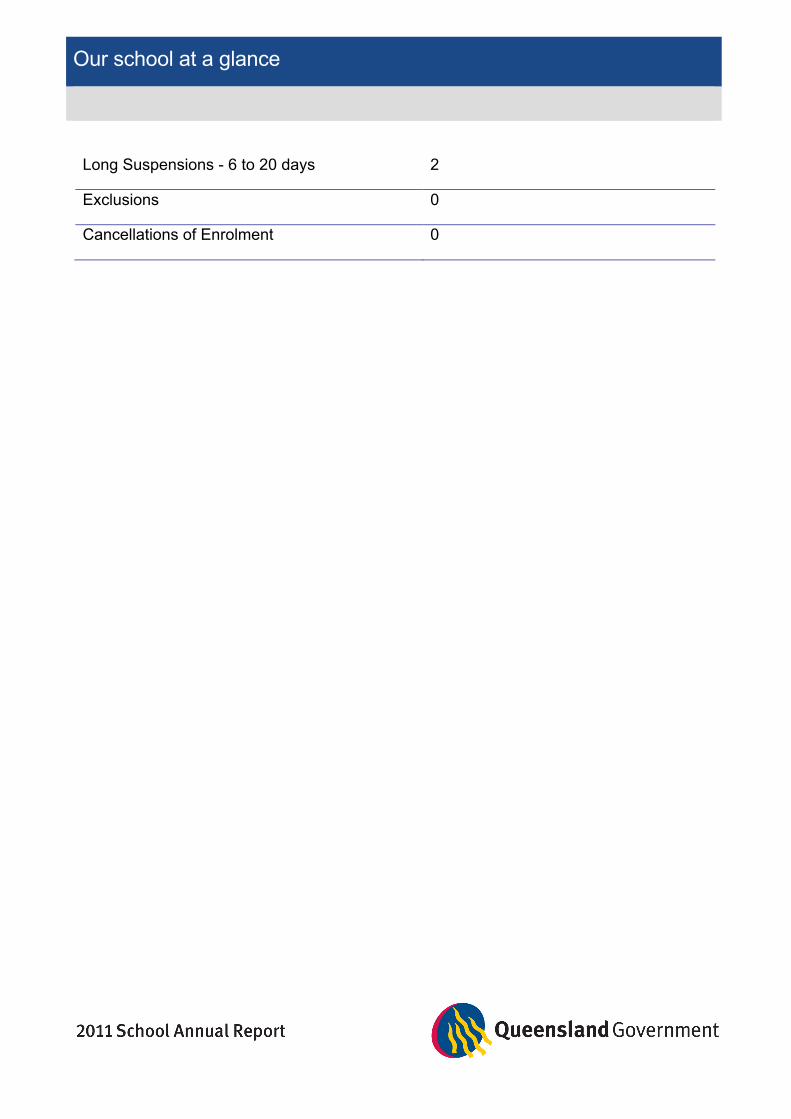
Our school at a glance
Long Suspensions - 6 to 20 days 2
Exclusions 0
Cancellations of Enrolment 0
Our school at a glance
Curriculum offerings
Our distinctive curriculum offerings
At Crawford State School student learning is facilitated through a multi-age approach. The two classes catered for four year levels, Prep–Year 3 and Years 4-7. The small school setting, enabled teachers to identify students’ needs and take opportunities to meet those needs, through extension or remediation, in different areas of the curriculum. The school purchased additional Teacher Aide time to cater for the needs of students when implementing learning programs and activities designed by class teachers.
A German specialist teacher visited the school weekly to provide instruction to year 6 and 7 students.
In partnership with BIEDO, Crawford State School, students participate in the Active Citizenship Program. This is linked to our curriculum offerings.
Students in Years 6 and 7 participate in our Leadership Program. Year 7, students have an opportunity to participate in an excellent cluster based leadership camp early in the year. This program not only supports the development of student leaders in Year 7 but also contributes to our Year 7 – 8-transition program as it develops stronger bonds between students from smaller schools.
Extra curricula activities
• Student council
• Excursions
• Participation in a regular summer and winter sports program. Crawford students combined with students from neighbouring small schools (Coolabunia, Wooroolin, and Tingoora) to form teams to play in the Kingaroy District competitions.
• Participation in the League Tag at Kumbia.
• Small school Athletics and Swimming carnivals
• Eisteddfod (German)
How Information and Communication Technologies are used to assist learning
Information and Communication Technologies (ICTs) were integrated across all curriculum areas and were a high priority at our school. 6 computers were located in each classroom for student use. Teachers planned learning experiences with the computers that develop knowledge, processes and skills of how to use a variety of programs and applications.
Our school at a glance
Other equipment regularly used by students included digital cameras, digital video cameras, printers, interactive whiteboards/data projectors and the internet.
Social climate
Students at Crawford State School were encouraged to be responsible and caring. A strong emphasis was placed upon respect of self, others and school. The school also placed emphasis on self-disciplined learning within a framework of high behavioural expectations. During Term 3 our school implemented a program titled ‘Ladder to Success’. This program gave students in Years 4-7 the motivation to develop the habits of respect, responsibility and resilience and rewarded students on a daily basis for practicing the habits. Previous to the introduction of this program, the behaviour issues had impacted severely on all aspects of the school’s management. This program has been very successful and has had a positive effect on our school climate, where students are now proud of their school and their achievements. The ‘Ladder to Success’ program has now been introduced across the whole school.
Parent, student and teacher satisfaction with the school
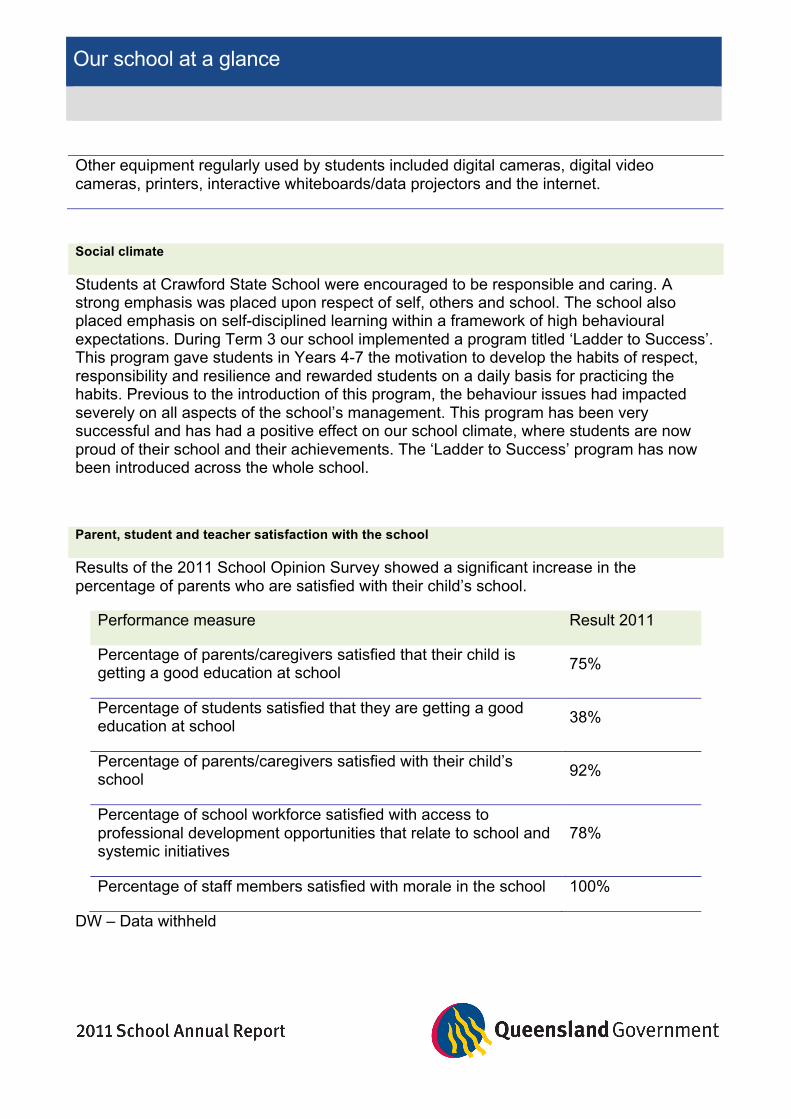
Results of the 2011 School Opinion Survey showed a significant increase in the percentage of parents who are satisfied with their child’s school.
Performance measure Result 2011
Percentage of parents/caregivers satisfied that their child is getting a good education at school 75%
Percentage of students satisfied that they are getting a good education at school 38%
Percentage of parents/caregivers satisfied with their child’s school 92%
Percentage of school workforce satisfied with access to professional development opportunities that relate to school and systemic initiatives
78%
Percentage of staff members satisfied with morale in the school 100%
DW – Data withheld
Our school at a glance
Involving parents in their child’s education
All parents are actively encouraged to take advantage of the school’s open door policy, to make themselves familiar with their child’s progress and the day-to-day functioning of the school. Some parents stop and have a chat before or after school when dropping off or collecting children. Parents are also encouraged to be involved in the activities of the school community. Regular information is available about all aspects of student activities via newsletters, letters to families, notice boards, etc. Opportunities for involvement include;
• Classroom Volunteers
• P&C Association (Meetings are held monthly and parents are invited to join at the time of enrolment)
• Grounds Improvement
Reducing the school’s environmental footprint
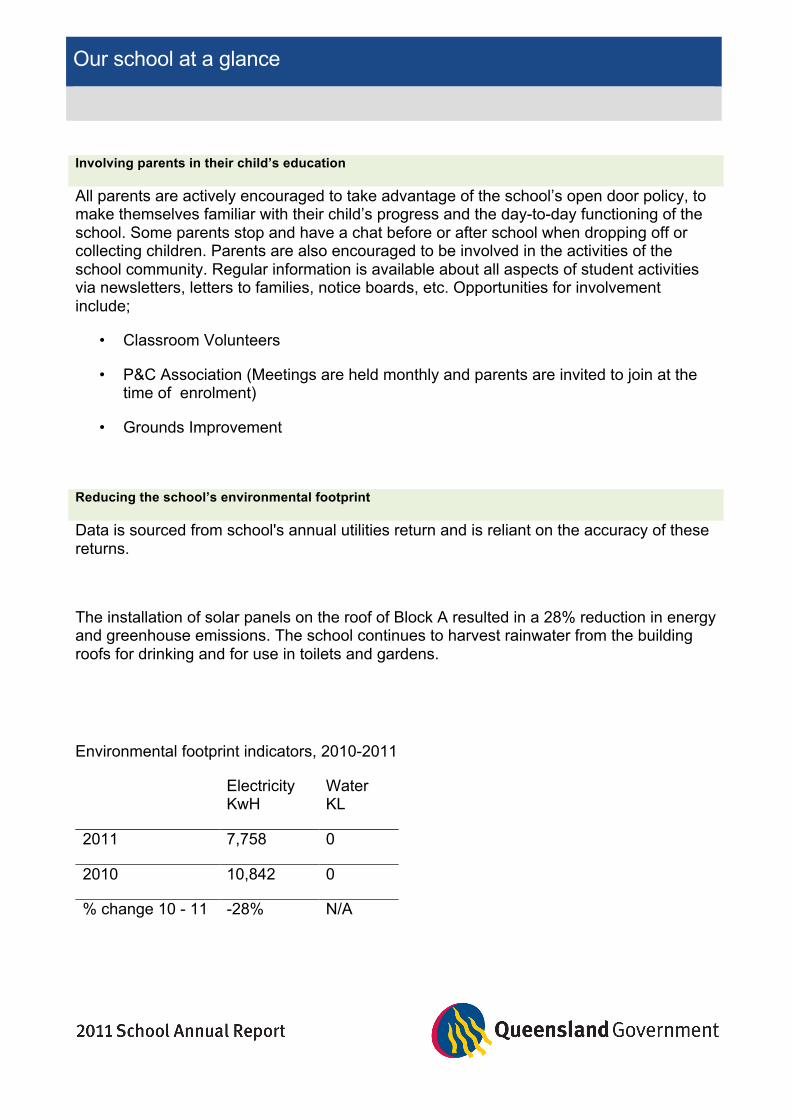
Data is sourced from school's annual utilities return and is reliant on the accuracy of these returns.
The installation of solar panels on the roof of Block A resulted in a 28% reduction in energy and greenhouse emissions. The school continues to harvest rainwater from the building roofs for drinking and for use in toilets and gardens.
Environmental footprint indicators, 2010-2011
Electricity KwH
Water KL
2011 7,758 0
2010 10,842 0
% change 10 - 11 -28% N/A
Our staff profile
Staff composition, including Indigenous staff
Workforce Composition Teaching Staff Non-teaching Staff Indigenous Staff
Headcounts 4 6 0
Full-time equivalents 2 2 0
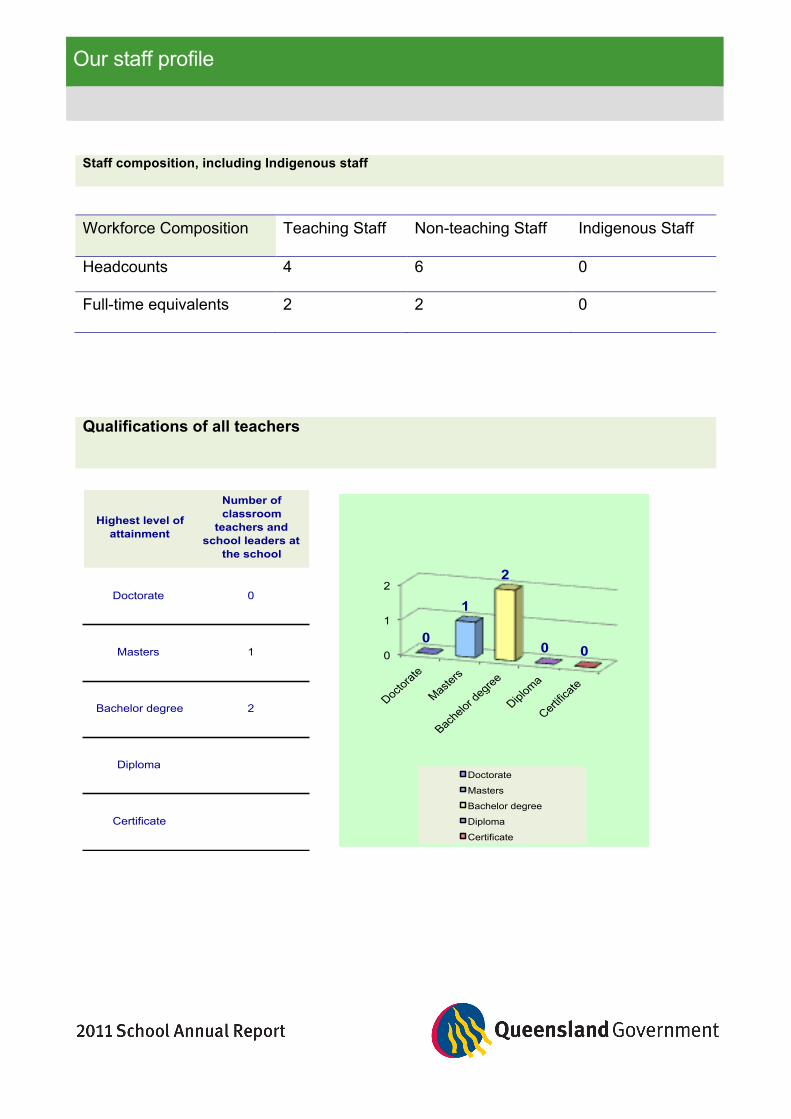
Qualifications of all teachers
Highest level of attainment
Number of classroom
teachers and school leaders at
the school
Doctorate 0
Masters 1
Bachelor degree 2
Diploma
Certificate
0
1
2
Doctor
ate
Master
s
Bache
lor de
gree
Diplom
a
Certific
ate
0
1
2
0 0
Doctorate
Masters
Bachelor degree
Diploma
Certificate
Our staff profile
Expenditure on and teacher participation in professional development
The total funds expended on teacher professional development in 2011 was $6848. The major professional development initiatives are as follows:
• ICT- eCurriculum
• Regional Leaders conference
• District Principal’s Meetings
• OneSchool Training
• Early Years Conference
• Reading
• Understanding Autistic Spectrum Disorder
• Administration, Budgeting and Planning
The proportion of the teaching staff involved in professional development activities during 2011 was 100%.
Average staff attendance
For permanent and temporary staff and school leaders, the staff attendance rate was 97% in 2011.
Proportion of staff retained from the previous school year
From the end of the previous school year, 100% of staff was retained by the school for the entire 2011 school year.
School income broken down by funding source
School income broken down by funding source is available via the My School website at http://www.myschool.edu.au/.
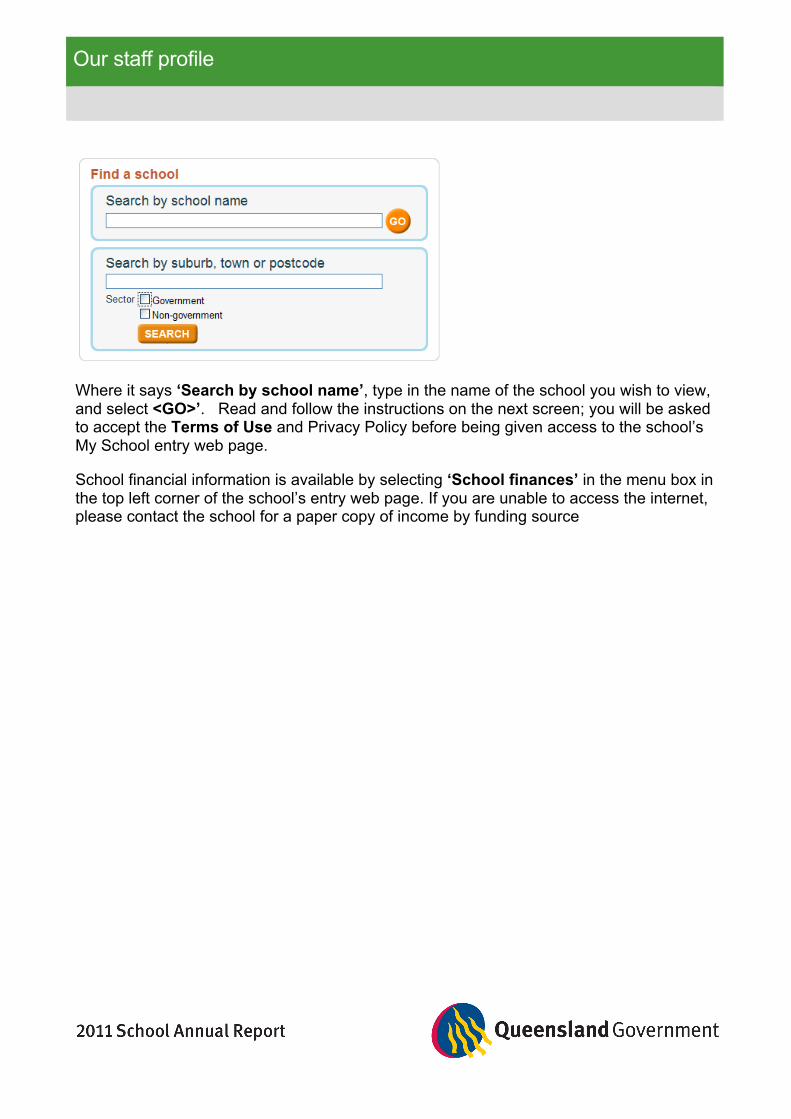
To access our income details, click on the My School link above. You will then be taken to the My School website with the following ‘Find a school’ text box.
Our staff profile
Where it says ‘Search by school name’, type in the name of the school you wish to view, and select <GO>’. Read and follow the instructions on the next screen; you will be asked to accept the Terms of Use and Privacy Policy before being given access to the school’s My School entry web page.
School financial information is available by selecting ‘School finances’ in the menu box in the top left corner of the school’s entry web page. If you are unable to access the internet, please contact the school for a paper copy of income by funding source
Performance of our students
Key student outcomes Student attendance - 2011
The overall attendance rate for the students at this school (shown as a percentage) in 2011 was 88%.
The overall attendance rate for all Queensland state Primary schools over the same period was 92%.
Student attendance rate for each year level
Year 1 Year 2 Year 3 Year 4 Year 5 Year 6 Year 7
86% 90% 90% 90% 95% 82% 93%
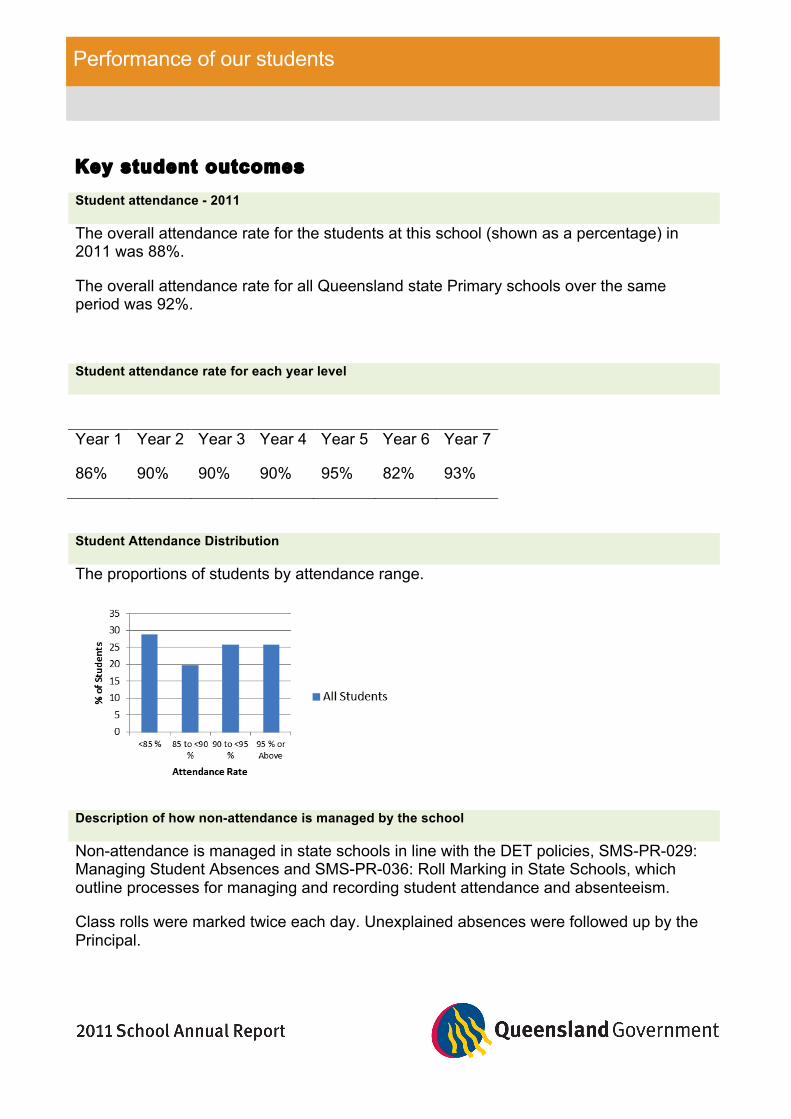
Student Attendance Distribution
The proportions of students by attendance range.
Description of how non-attendance is managed by the school
Non-attendance is managed in state schools in line with the DET policies, SMS-PR-029: Managing Student Absences and SMS-PR-036: Roll Marking in State Schools, which outline processes for managing and recording student attendance and absenteeism.
Class rolls were marked twice each day. Unexplained absences were followed up by the Principal.
Performance of our students
National Assessment Program – Literacy and Numeracy (NAPLAN) results – our reading, writing, spelling, grammar and punctuation, and numeracy results for the Years 3, 5, 7 and 9.
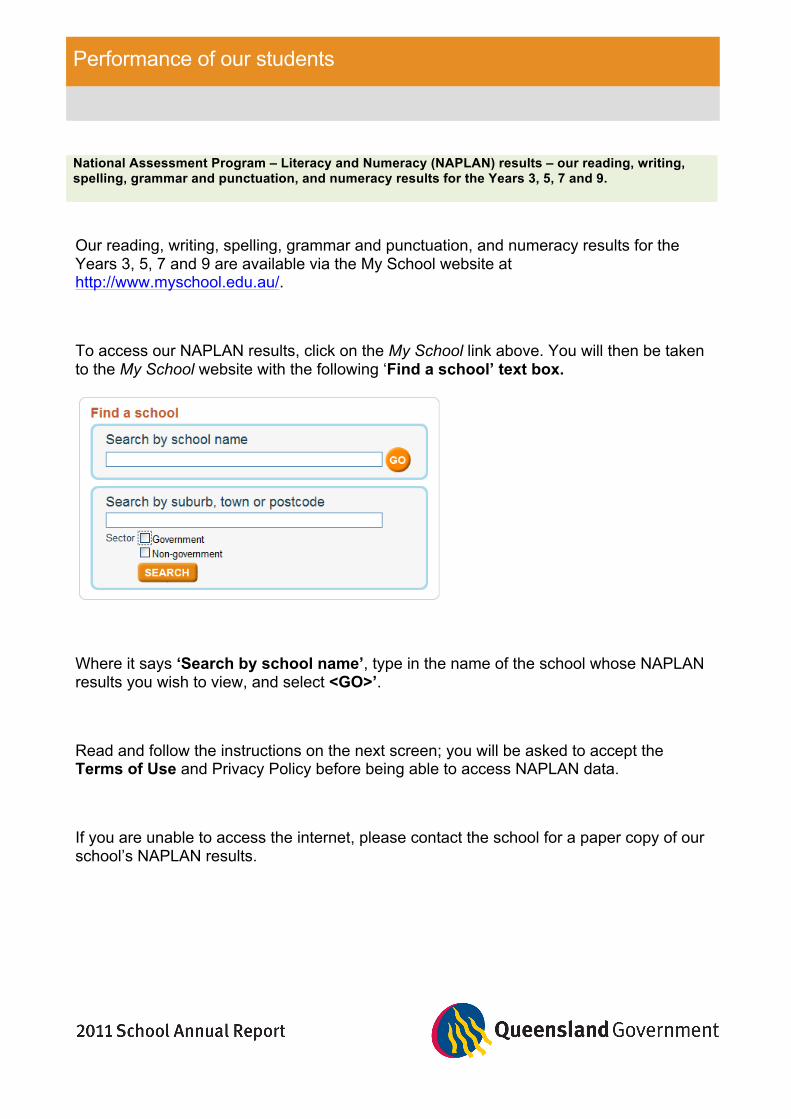
Our reading, writing, spelling, grammar and punctuation, and numeracy results for the Years 3, 5, 7 and 9 are available via the My School website at http://www.myschool.edu.au/.
To access our NAPLAN results, click on the My School link above. You will then be taken to the My School website with the following ‘Find a school’ text box.
Where it says ‘Search by school name’, type in the name of the school whose NAPLAN results you wish to view, and select <GO>’.
Read and follow the instructions on the next screen; you will be asked to accept the Terms of Use and Privacy Policy before being able to access NAPLAN data.
If you are unable to access the internet, please contact the school for a paper copy of our school’s NAPLAN results.
Performance of our students
Achievement – Closing the Gap
Using the school’s ‘Closing the Gap Report' it is noted that student attendance of indigenous students at Crawford State School in 2011 was 90.6%. Whilst this percentage is less than the state attendance average, it does exceed the school average.
Attainment and Achievement – Year