quantitative pharmacology influence and impact initiative
TRANSCRIPT
Quantitative Pharmacology Influence and Impact Initiative
Satyaprakash Nayak & Sandra Visser
Under leadership of ASCPT Quantitative Pharmacology Network leads:
Anne Heatherington & Karthik Venkatakrishnan
📧 📧
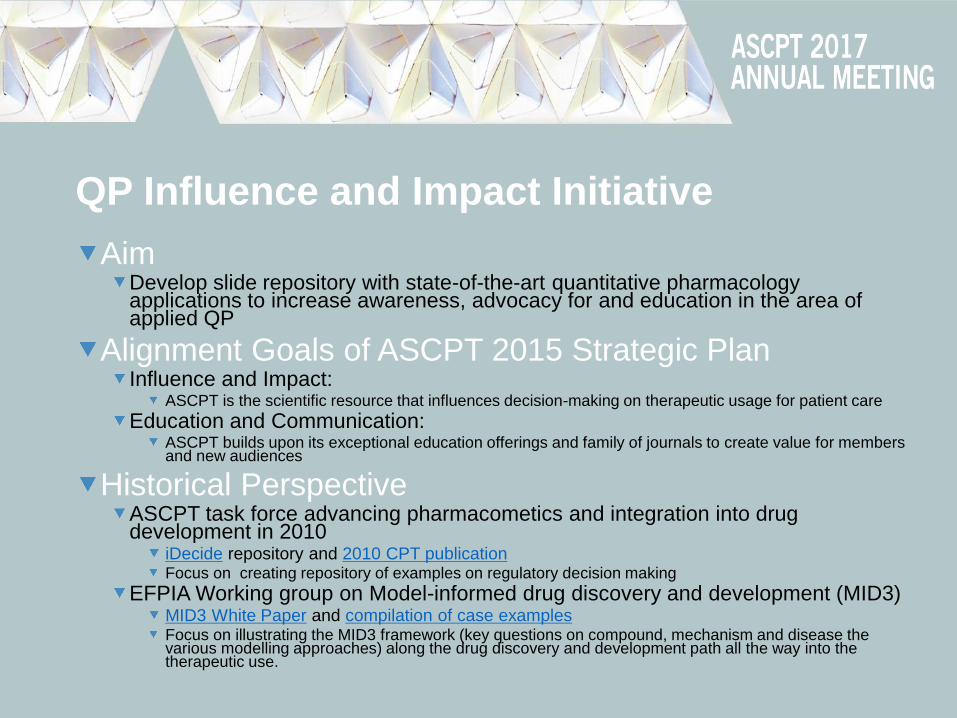
QP Influence and Impact Initiative
Aim Develop slide repository with state-of-the-art quantitative pharmacology applications to increase awareness, advocacy for and education in the area of applied QP
Alignment Goals of ASCPT 2015 Strategic Plan Influence and Impact:
ASCPT is the scientific resource that influences decision-making on therapeutic usage for patient care
Education and Communication: ASCPT builds upon its exceptional education offerings and family of journals to create value for members and new audiences
Historical Perspective ASCPT task force advancing pharmacometics and integration into drug development in 2010
iDecide repository and 2010 CPT publication Focus on creating repository of examples on regulatory decision making
EFPIA Working group on Model-informed drug discovery and development (MID3) MID3 White Paper and compilation of case examples Focus on illustrating the MID3 framework (key questions on compound, mechanism and disease the various modelling approaches) along the drug discovery and development path all the way into the therapeutic use.
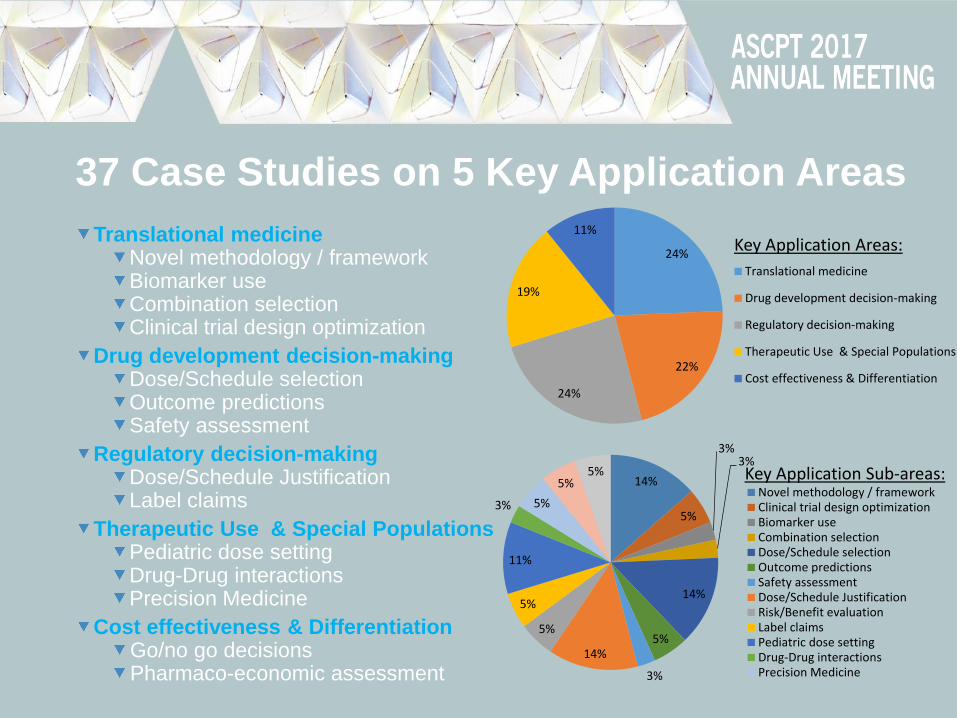
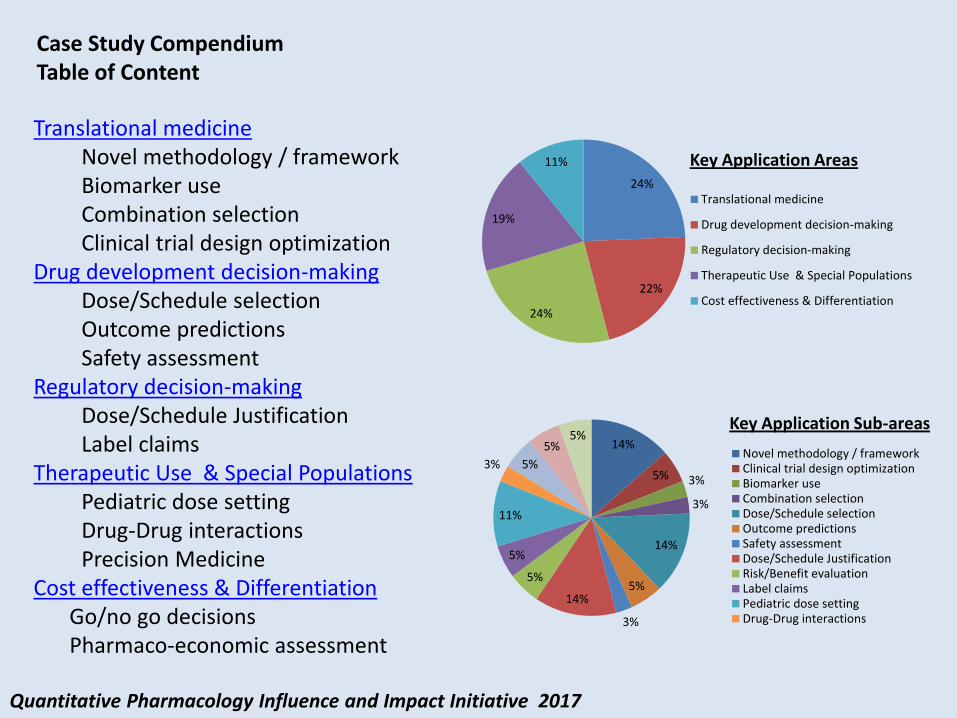
37 Case Studies on 5 Key Application Areas
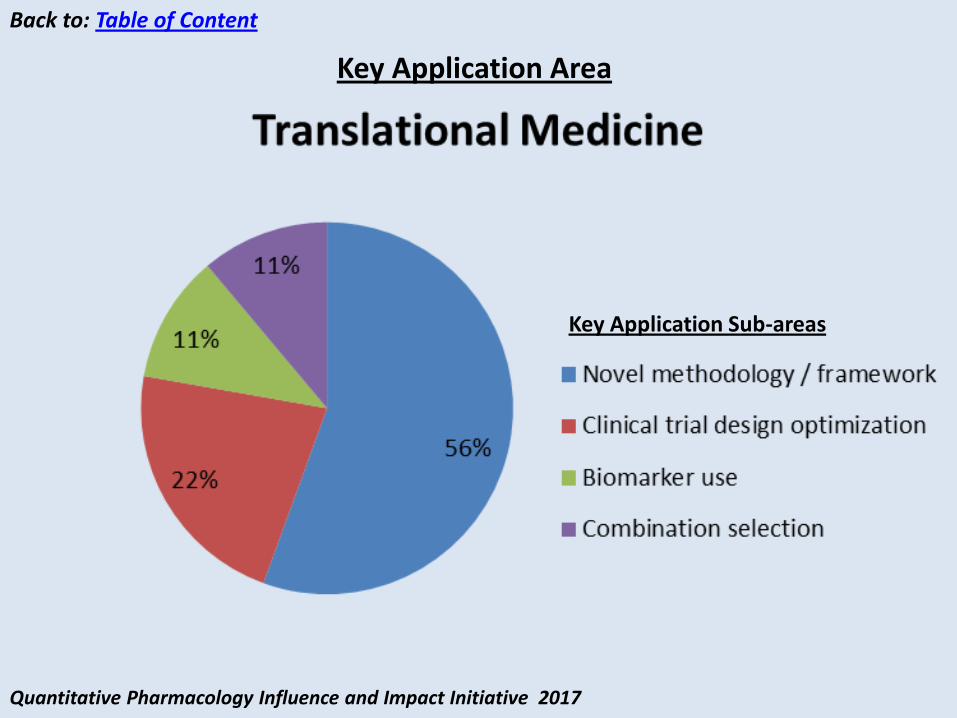
Translational medicine Novel methodology / framework Biomarker use Combination selection Clinical trial design optimization
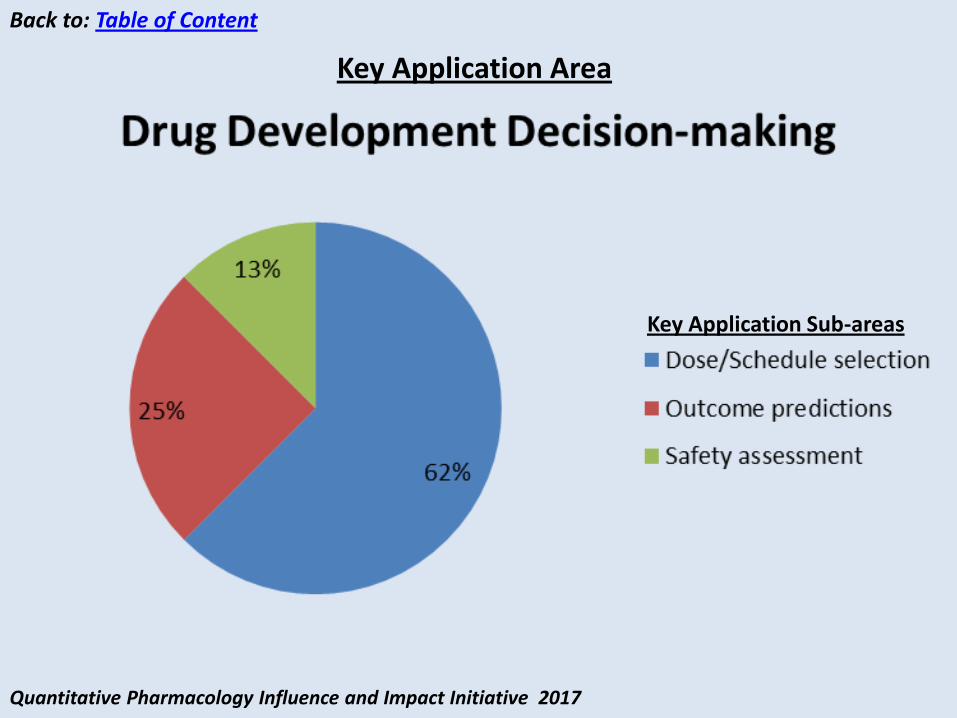
Drug development decision-making Dose/Schedule selection Outcome predictions Safety assessment
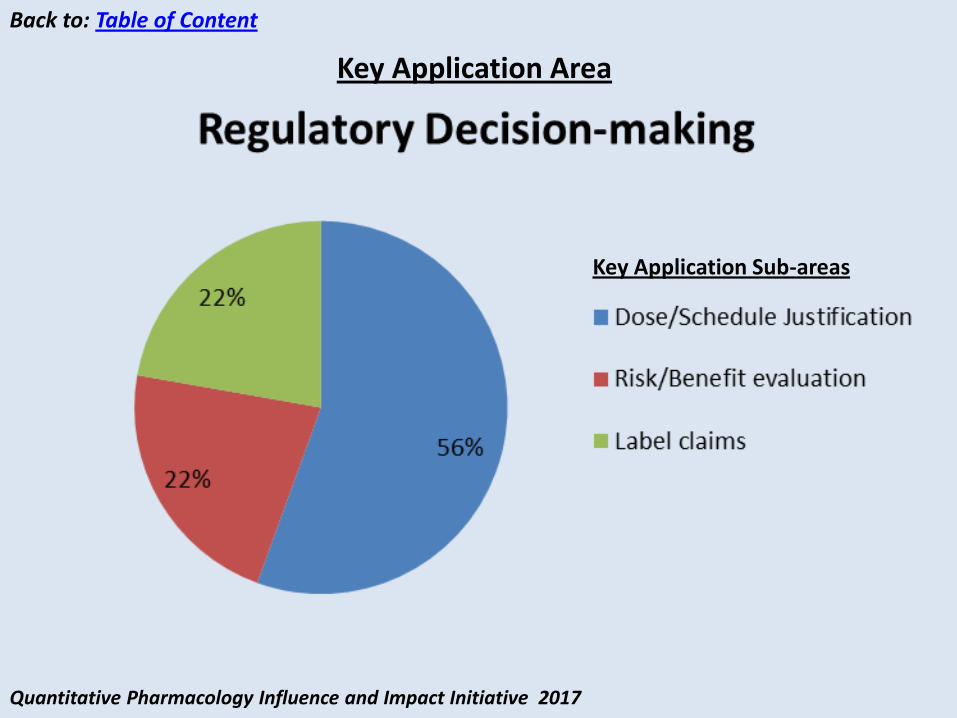
Regulatory decision-making Dose/Schedule Justification Label claims
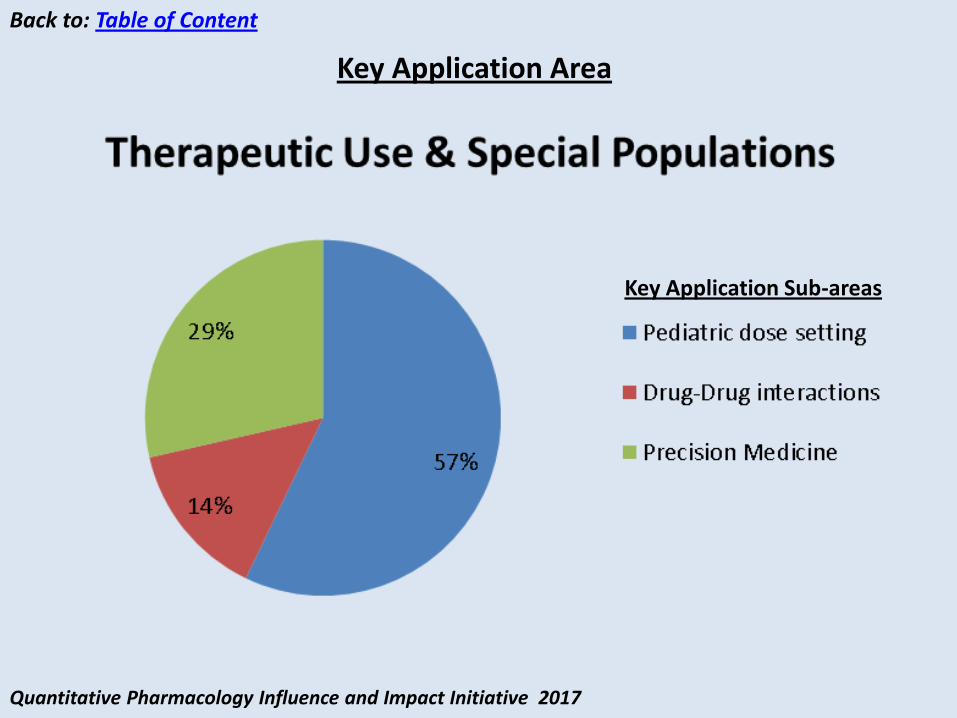
Therapeutic Use & Special Populations Pediatric dose setting Drug-Drug interactions Precision Medicine
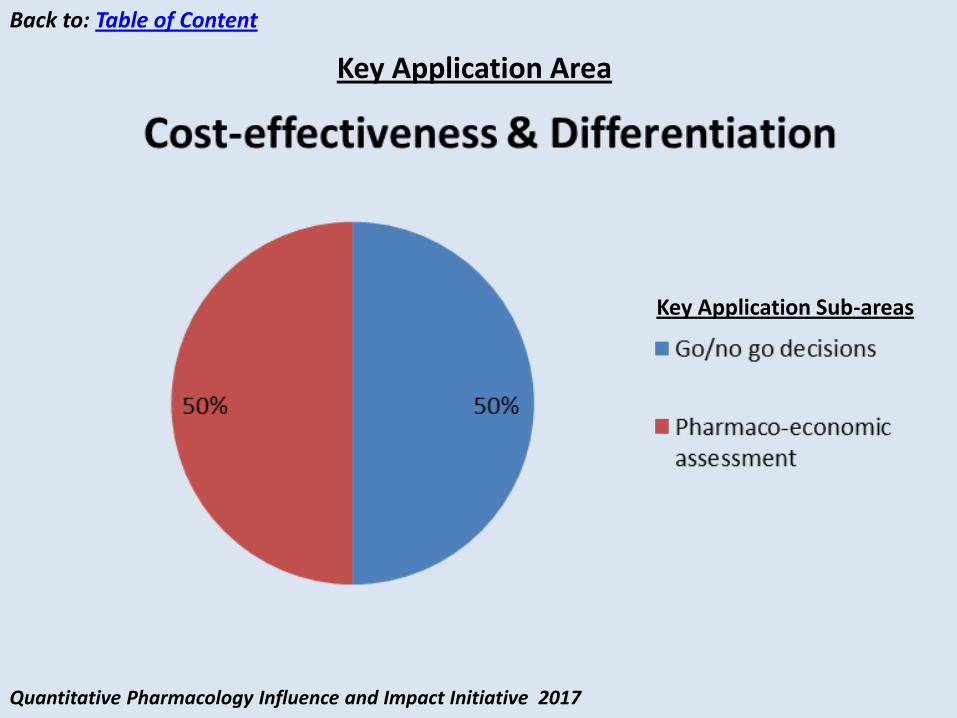
Cost effectiveness & Differentiation Go/no go decisions Pharmaco-economic assessment
24%
22%
24%
19%
11%
Translational medicine
Drug development decision-making
Regulatory decision-making
Therapeutic Use & Special Populations
Cost effectiveness & Differentiation
14%
5%
3% 3%
14%
5%
3%
14%
5%
5%
11%
3% 5%
5% 5%
Novel methodology / frameworkClinical trial design optimizationBiomarker useCombination selectionDose/Schedule selectionOutcome predictionsSafety assessmentDose/Schedule JustificationRisk/Benefit evaluationLabel claimsPediatric dose settingDrug-Drug interactionsPrecision Medicine
Key Application Areas:
Key Application Sub-areas:
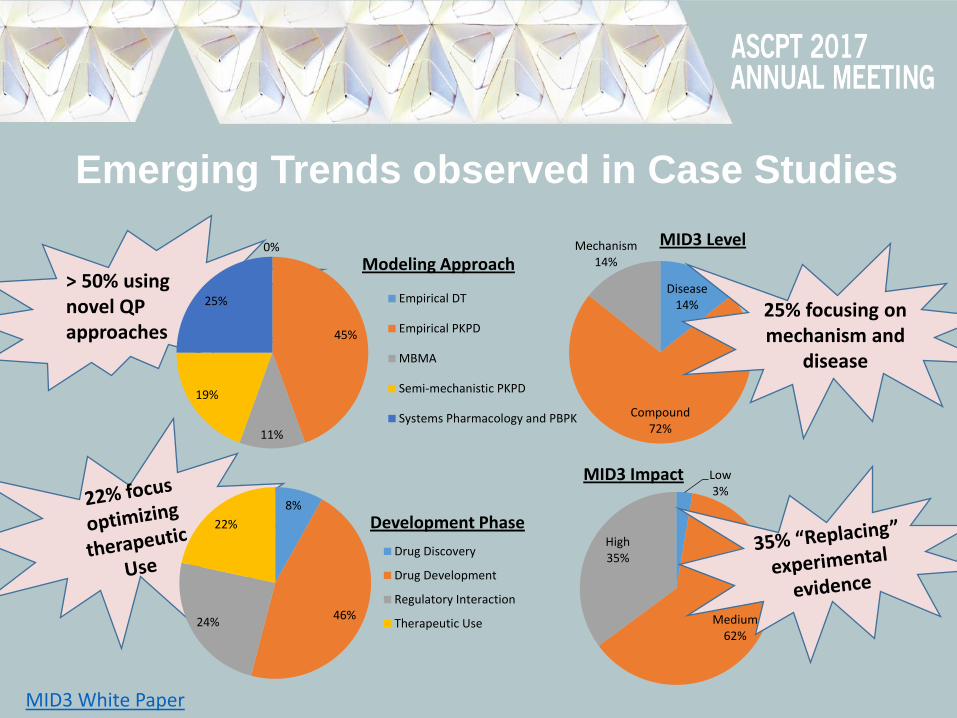
Emerging Trends observed in Case Studies
> 50% using novel QP approaches
0%
45%
11%
19%
25%
Modeling Approach
Empirical DT
Empirical PKPD
MBMA
Semi-mechanistic PKPD
Systems Pharmacology and PBPK
8%
46% 24%
22% Development Phase
Drug Discovery
Drug Development
Regulatory Interaction
Therapeutic Use
Disease 14%
Compound 72%
Mechanism 14%
25% focusing on mechanism and
disease
Low 3%
Medium 62%
High 35%
MID3 Impact
MID3 Level
MID3 White Paper

Continued Objectives for 2017-2018 QP Influence and Impact Initiative
Publish Compendium at ASCPT Website Link to compendium and speaker notes will be shared through ASCPT email burst
Sharing Learnings in depth at ASCPT Webinar Including 3-5 case studies
Call for New Case Studies and Volunteers Develop Version 2 of Compendium
Develop leading Publication in ASCPT journal Enhancing reputation of our QP community of practice

Feedback & Questions: Satyaprakash Nayak & Sandra Visser
Acknowledgements
QP network leads
Anne Heatherington & Karthik Venkatakrishnan
ASCPT
Lisa Williamson
List of Contributors
Agrawal, Shruti
Allen, Richard
Bottino, Dean
Caro, Luzelena
Chain, Anne
Chenel, Marylore
De Alwis, Dinesh
Fancourt, Craig
Girish, Sandhya
Goteti, Kosalaram
Gupta, Neeraj
Jain, Lokesh
Kanodia, Jitendra
Lamba, Manisha
Longo, Diane
Macha, Sreeraj
Musante, CJ
Nucci, Gianluca
Rieger, Ted
Sander, Oliver
Schmidt, Stephan
Simonsson, Ulrika
Sunkaraneni, Soujanya
Svensson, Elin
Vaddady, Pavan
Van Hasselt, Coen
Visser, Sandra
Yang, Kyunghee
Zhou, Diansong
📧 📧
Quantitative Pharmacology Influence and Impact Initiative 2017
Translational medicine Novel methodology / framework Biomarker use Combination selection Clinical trial design optimization
Drug development decision-making Dose/Schedule selection Outcome predictions Safety assessment
Regulatory decision-making Dose/Schedule Justification Label claims
Therapeutic Use & Special Populations Pediatric dose setting Drug-Drug interactions Precision Medicine
Cost effectiveness & Differentiation Go/no go decisions Pharmaco-economic assessment
14%
5% 3%
3%
14%
5%
3%
14%
5%
5%
11%
3% 5%
5% 5%
Novel methodology / frameworkClinical trial design optimizationBiomarker useCombination selectionDose/Schedule selectionOutcome predictionsSafety assessmentDose/Schedule JustificationRisk/Benefit evaluationLabel claimsPediatric dose settingDrug-Drug interactions
Case Study Compendium Table of Content
Key Application Sub-areas
24%
22%
24%
19%
11%
Translational medicine
Drug development decision-making
Regulatory decision-making
Therapeutic Use & Special Populations
Cost effectiveness & Differentiation
Key Application Areas
Quantitative Pharmacology Influence and Impact Initiative 2017
Back to: Table of Content
Key Application Sub-areas
Key Application Area
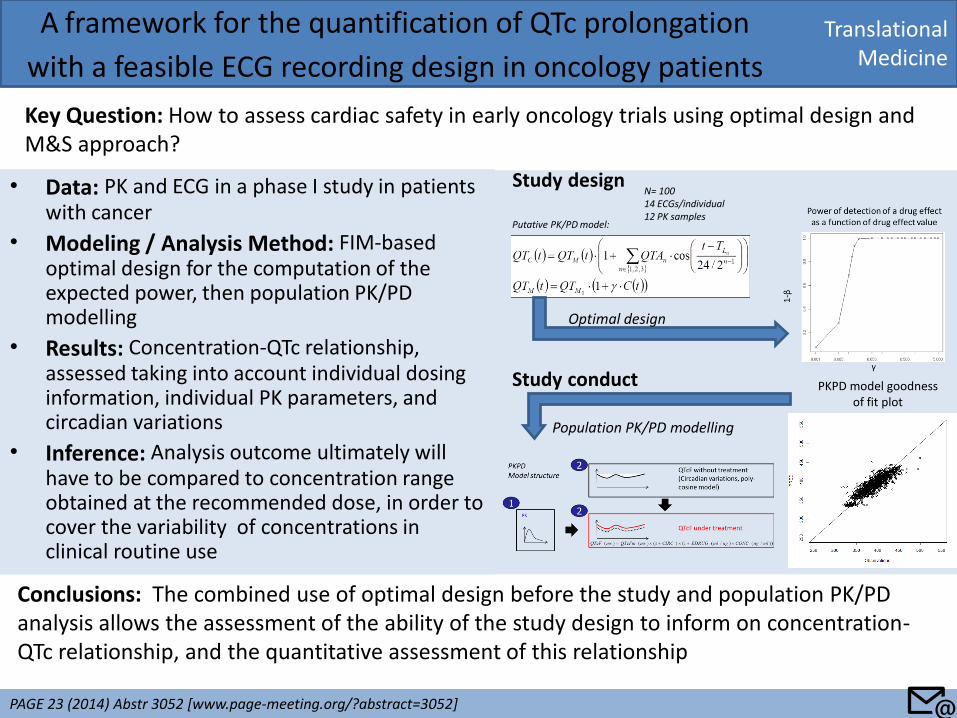
• Data: PK and ECG in a phase I study in patients with cancer
• Modeling / Analysis Method: FIM-based optimal design for the computation of the expected power, then population PK/PD modelling
• Results: Concentration-QTc relationship, assessed taking into account individual dosing information, individual PK parameters, and circadian variations
• Inference: Analysis outcome ultimately will have to be compared to concentration range obtained at the recommended dose, in order to cover the variability of concentrations in clinical routine use
Translational Medicine
A framework for the quantification of QTc prolongation
with a feasible ECG recording design in oncology patients
Key Question: How to assess cardiac safety in early oncology trials using optimal design and M&S approach?
PAGE 23 (2014) Abstr 3052 [www.page-meeting.org/?abstract=3052]
Conclusions: The combined use of optimal design before the study and population PK/PD analysis allows the assessment of the ability of the study design to inform on concentration-QTc relationship, and the quantitative assessment of this relationship
Study design
Study conduct
Optimal design
Population PK/PD modelling
PKPD model goodness of fit plot
N= 100 14 ECGs/individual 12 PK samples
Putative PK/PD model:
📧
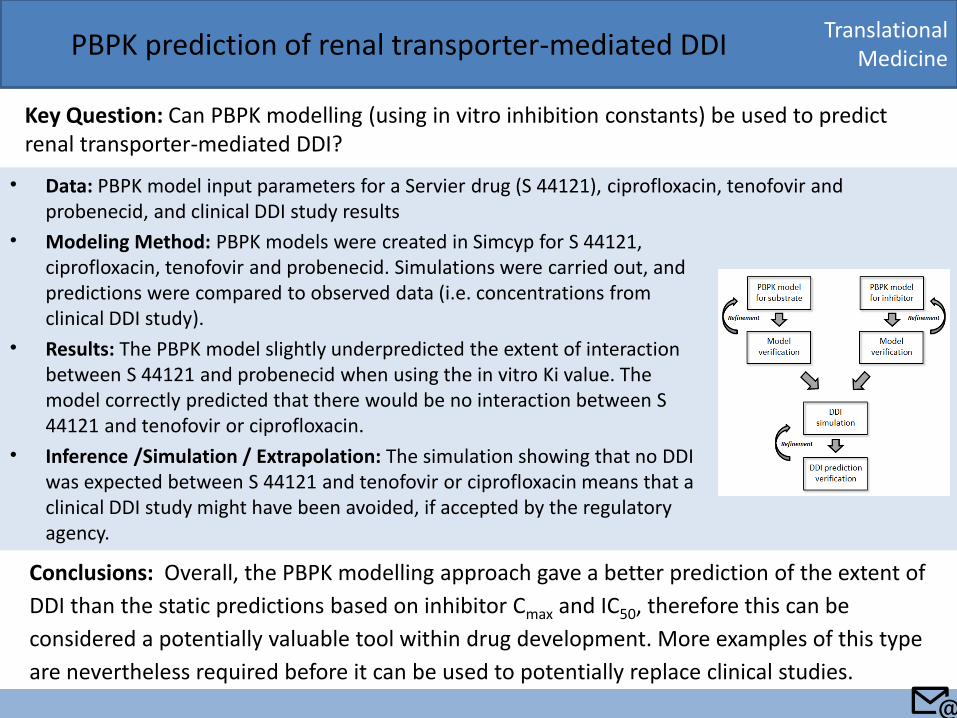
• Data: PBPK model input parameters for a Servier drug (S 44121), ciprofloxacin, tenofovir and probenecid, and clinical DDI study results
Translational Medicine PBPK prediction of renal transporter-mediated DDI
Key Question: Can PBPK modelling (using in vitro inhibition constants) be used to predict renal transporter-mediated DDI?
Conclusions: Overall, the PBPK modelling approach gave a better prediction of the extent of
DDI than the static predictions based on inhibitor Cmax and IC50, therefore this can be
considered a potentially valuable tool within drug development. More examples of this type
are nevertheless required before it can be used to potentially replace clinical studies.
• Modeling Method: PBPK models were created in Simcyp for S 44121, ciprofloxacin, tenofovir and probenecid. Simulations were carried out, and predictions were compared to observed data (i.e. concentrations from clinical DDI study).
• Results: The PBPK model slightly underpredicted the extent of interaction between S 44121 and probenecid when using the in vitro Ki value. The model correctly predicted that there would be no interaction between S 44121 and tenofovir or ciprofloxacin.
• Inference /Simulation / Extrapolation: The simulation showing that no DDI was expected between S 44121 and tenofovir or ciprofloxacin means that a clinical DDI study might have been avoided, if accepted by the regulatory agency.
📧
Translational Medicine
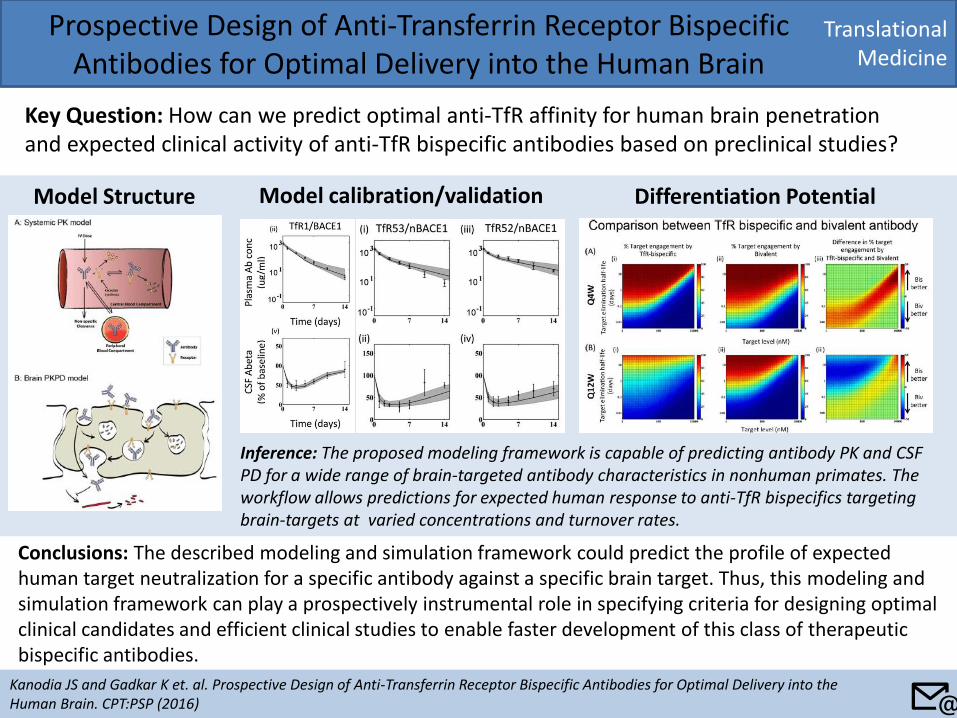
Prospective Design of Anti-Transferrin Receptor Bispecific Antibodies for Optimal Delivery into the Human Brain
Key Question: How can we predict optimal anti-TfR affinity for human brain penetration and expected clinical activity of anti-TfR bispecific antibodies based on preclinical studies?
Kanodia JS and Gadkar K et. al. Prospective Design of Anti-Transferrin Receptor Bispecific Antibodies for Optimal Delivery into the Human Brain. CPT:PSP (2016)
Conclusions: The described modeling and simulation framework could predict the profile of expected human target neutralization for a specific antibody against a specific brain target. Thus, this modeling and simulation framework can play a prospectively instrumental role in specifying criteria for designing optimal clinical candidates and efficient clinical studies to enable faster development of this class of therapeutic bispecific antibodies.
Model Structure Model calibration/validation Differentiation Potential
Inference: The proposed modeling framework is capable of predicting antibody PK and CSF PD for a wide range of brain-targeted antibody characteristics in nonhuman primates. The workflow allows predictions for expected human response to anti-TfR bispecifics targeting brain-targets at varied concentrations and turnover rates.
📧
Translational Medicine
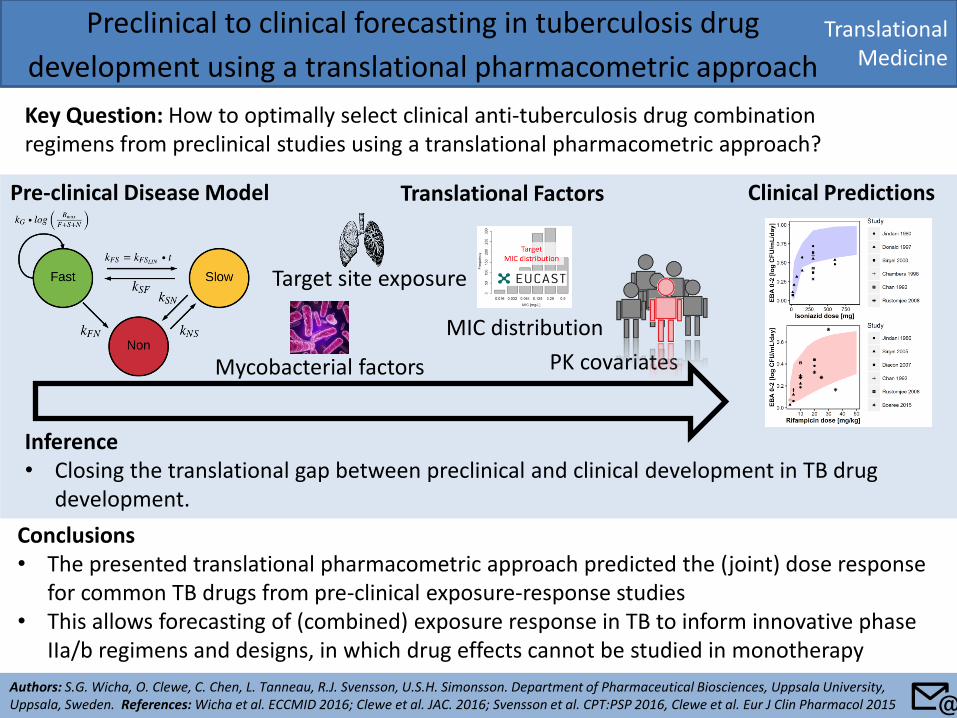
Preclinical to clinical forecasting in tuberculosis drug
development using a translational pharmacometric approach
Key Question: How to optimally select clinical anti-tuberculosis drug combination regimens from preclinical studies using a translational pharmacometric approach?
Authors: S.G. Wicha, O. Clewe, C. Chen, L. Tanneau, R.J. Svensson, U.S.H. Simonsson. Department of Pharmaceutical Biosciences, Uppsala University, Uppsala, Sweden. References: Wicha et al. ECCMID 2016; Clewe et al. JAC. 2016; Svensson et al. CPT:PSP 2016, Clewe et al. Eur J Clin Pharmacol 2015
Conclusions • The presented translational pharmacometric approach predicted the (joint) dose response
for common TB drugs from pre-clinical exposure-response studies • This allows forecasting of (combined) exposure response in TB to inform innovative phase
IIa/b regimens and designs, in which drug effects cannot be studied in monotherapy
Inference • Closing the translational gap between preclinical and clinical development in TB drug
development.
Target site exposure
Pre-clinical Disease Model Clinical Predictions Translational Factors
MIC distribution
Mycobacterial factors PK covariates
📧
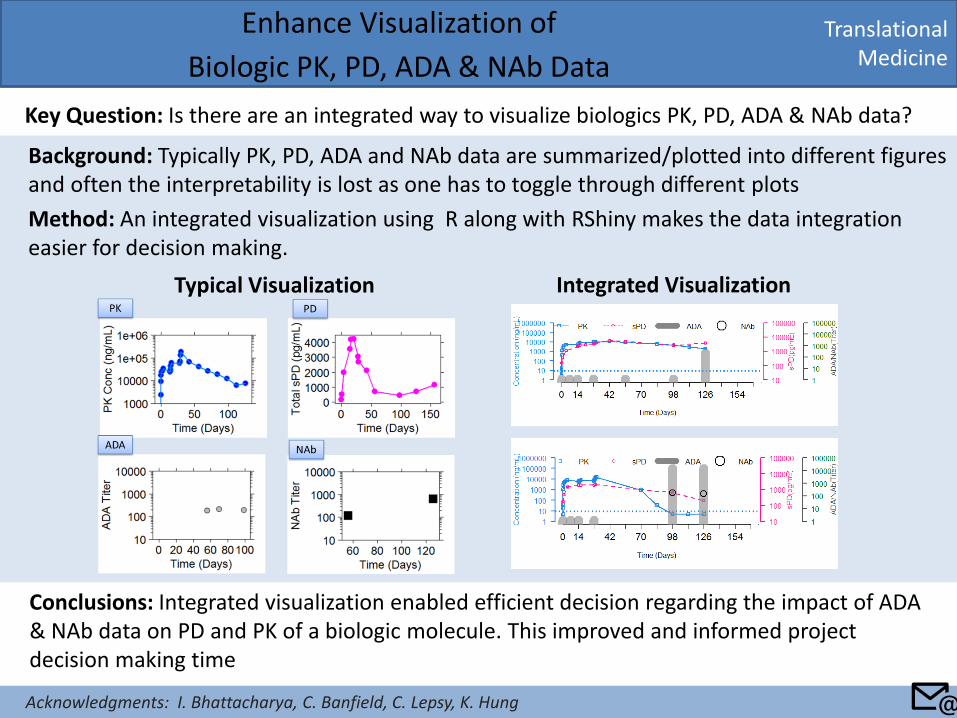
Background: Typically PK, PD, ADA and NAb data are summarized/plotted into different figures and often the interpretability is lost as one has to toggle through different plots
Method: An integrated visualization using R along with RShiny makes the data integration easier for decision making.
Translational Medicine
Enhance Visualization of
Biologic PK, PD, ADA & NAb Data
Key Question: Is there are an integrated way to visualize biologics PK, PD, ADA & NAb data?
Conclusions: Integrated visualization enabled efficient decision regarding the impact of ADA & NAb data on PD and PK of a biologic molecule. This improved and informed project decision making time
Typical Visualization Integrated Visualization
📧 Acknowledgments: I. Bhattacharya, C. Banfield, C. Lepsy, K. Hung
Translational Medicine
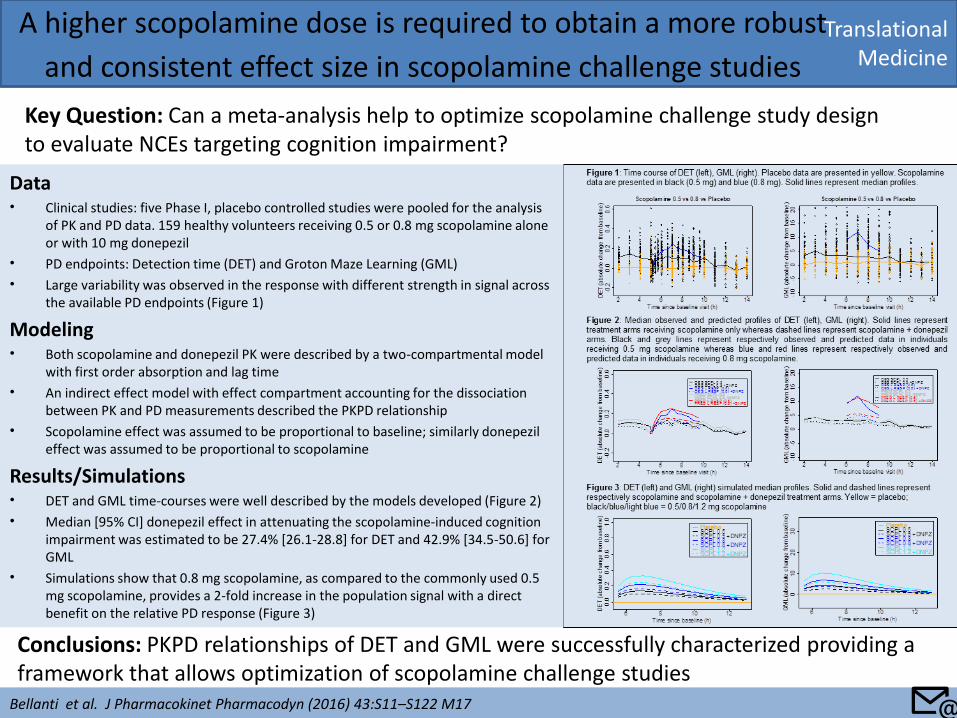
A higher scopolamine dose is required to obtain a more robust
and consistent effect size in scopolamine challenge studies
Key Question: Can a meta-analysis help to optimize scopolamine challenge study design to evaluate NCEs targeting cognition impairment?
Conclusions: PKPD relationships of DET and GML were successfully characterized providing a framework that allows optimization of scopolamine challenge studies
Data • Clinical studies: five Phase I, placebo controlled studies were pooled for the analysis
of PK and PD data. 159 healthy volunteers receiving 0.5 or 0.8 mg scopolamine alone or with 10 mg donepezil
• PD endpoints: Detection time (DET) and Groton Maze Learning (GML)
• Large variability was observed in the response with different strength in signal across the available PD endpoints (Figure 1)
Modeling • Both scopolamine and donepezil PK were described by a two-compartmental model
with first order absorption and lag time
• An indirect effect model with effect compartment accounting for the dissociation between PK and PD measurements described the PKPD relationship
• Scopolamine effect was assumed to be proportional to baseline; similarly donepezil effect was assumed to be proportional to scopolamine
Results/Simulations • DET and GML time-courses were well described by the models developed (Figure 2)
• Median [95% CI] donepezil effect in attenuating the scopolamine-induced cognition impairment was estimated to be 27.4% [26.1-28.8] for DET and 42.9% [34.5-50.6] for GML
• Simulations show that 0.8 mg scopolamine, as compared to the commonly used 0.5 mg scopolamine, provides a 2-fold increase in the population signal with a direct benefit on the relative PD response (Figure 3)
Bellanti et al. J Pharmacokinet Pharmacodyn (2016) 43:S11–S122 M17 📧
Translational Medicine
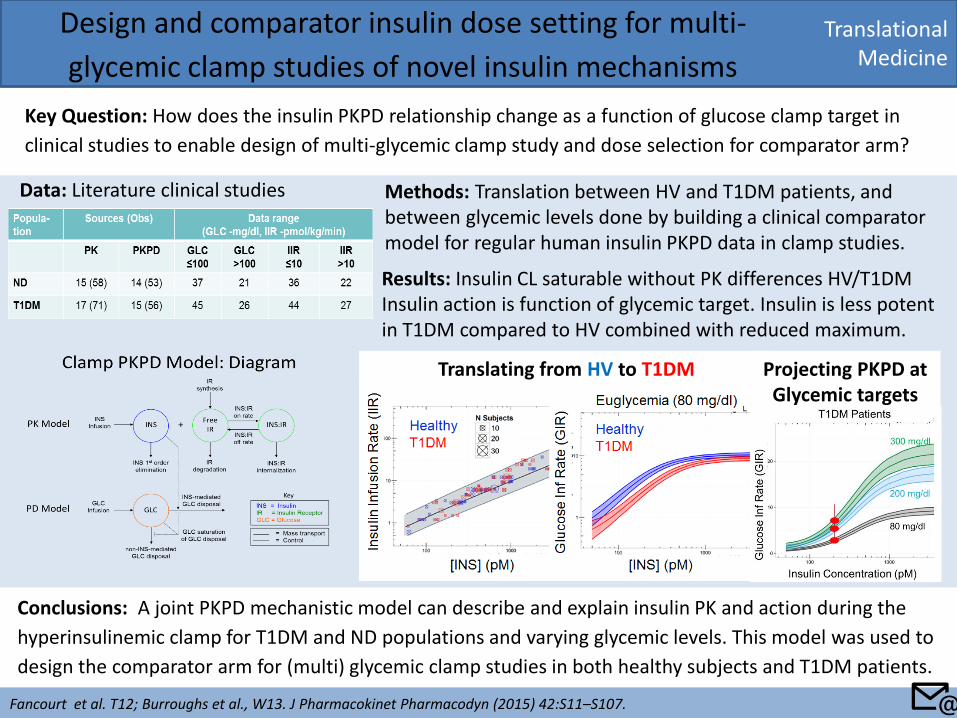
Design and comparator insulin dose setting for multi-
glycemic clamp studies of novel insulin mechanisms
Key Question: How does the insulin PKPD relationship change as a function of glucose clamp target in
clinical studies to enable design of multi-glycemic clamp study and dose selection for comparator arm?
Fancourt et al. T12; Burroughs et al., W13. J Pharmacokinet Pharmacodyn (2015) 42:S11–S107.
Conclusions: A joint PKPD mechanistic model can describe and explain insulin PK and action during the
hyperinsulinemic clamp for T1DM and ND populations and varying glycemic levels. This model was used to
design the comparator arm for (multi) glycemic clamp studies in both healthy subjects and T1DM patients.
Translating from HV to T1DM Projecting PKPD at Glycemic targets
Methods: Translation between HV and T1DM patients, and between glycemic levels done by building a clinical comparator model for regular human insulin PKPD data in clamp studies.
Data: Literature clinical studies
Results: Insulin CL saturable without PK differences HV/T1DM Insulin action is function of glycemic target. Insulin is less potent in T1DM compared to HV combined with reduced maximum.
📧
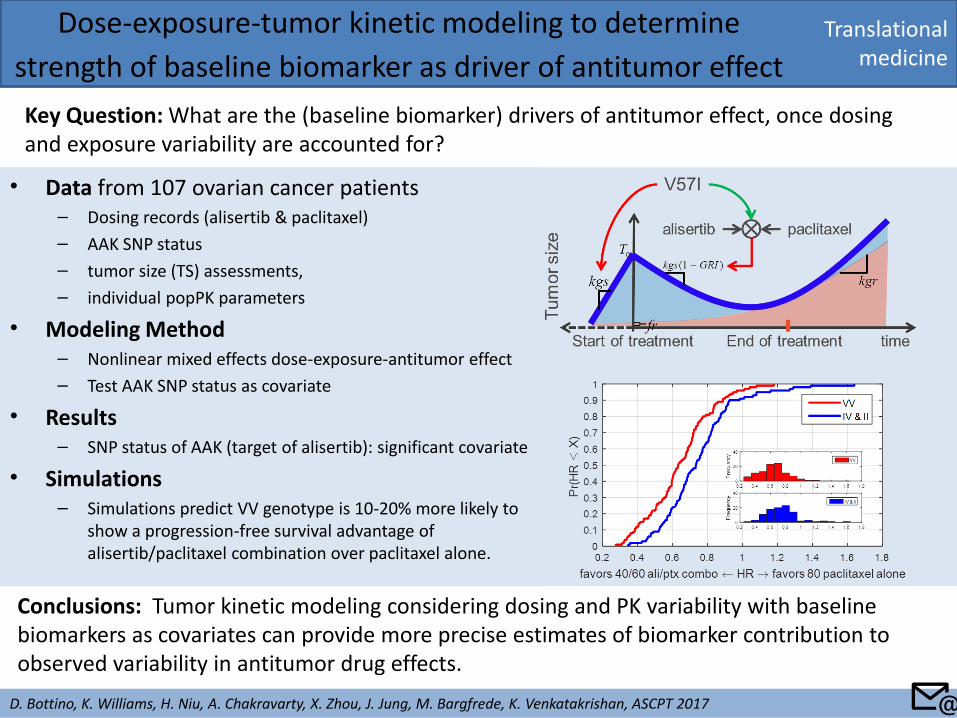
• Data from 107 ovarian cancer patients – Dosing records (alisertib & paclitaxel)
– AAK SNP status
– tumor size (TS) assessments,
– individual popPK parameters
• Modeling Method – Nonlinear mixed effects dose-exposure-antitumor effect
– Test AAK SNP status as covariate
• Results – SNP status of AAK (target of alisertib): significant covariate
• Simulations – Simulations predict VV genotype is 10-20% more likely to
show a progression-free survival advantage of alisertib/paclitaxel combination over paclitaxel alone.
Translational medicine
Dose-exposure-tumor kinetic modeling to determine
strength of baseline biomarker as driver of antitumor effect
Key Question: What are the (baseline biomarker) drivers of antitumor effect, once dosing and exposure variability are accounted for?
D. Bottino, K. Williams, H. Niu, A. Chakravarty, X. Zhou, J. Jung, M. Bargfrede, K. Venkatakrishan, ASCPT 2017
Conclusions: Tumor kinetic modeling considering dosing and PK variability with baseline biomarkers as covariates can provide more precise estimates of biomarker contribution to observed variability in antitumor drug effects.
📧
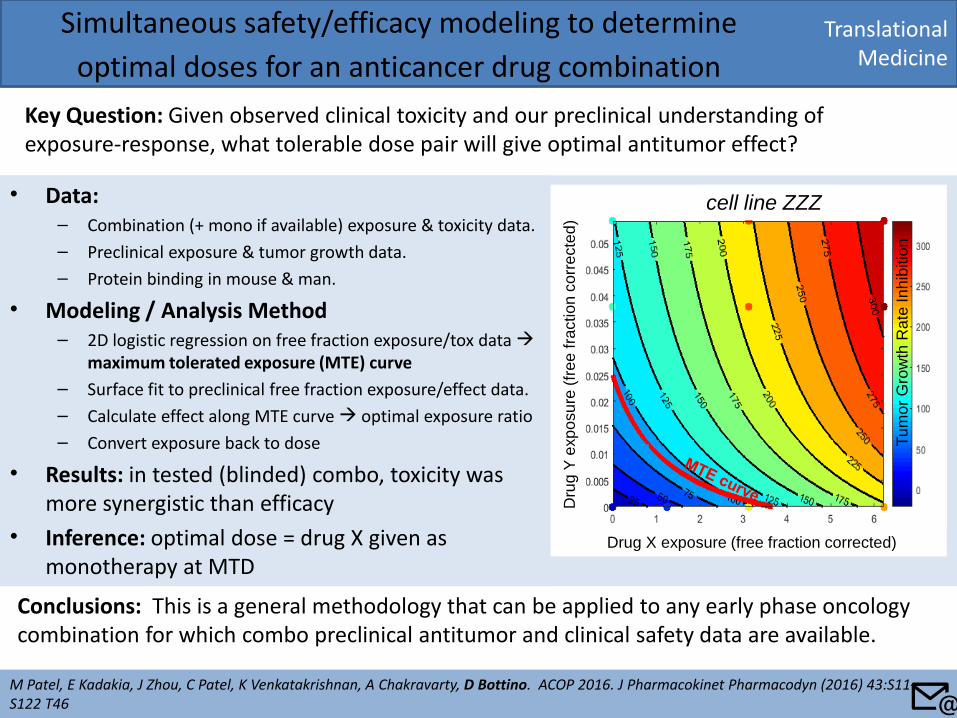
• Data: – Combination (+ mono if available) exposure & toxicity data.
– Preclinical exposure & tumor growth data.
– Protein binding in mouse & man.
• Modeling / Analysis Method – 2D logistic regression on free fraction exposure/tox data
maximum tolerated exposure (MTE) curve
– Surface fit to preclinical free fraction exposure/effect data.
– Calculate effect along MTE curve optimal exposure ratio
– Convert exposure back to dose
• Results: in tested (blinded) combo, toxicity was more synergistic than efficacy
• Inference: optimal dose = drug X given as monotherapy at MTD
Translational Medicine
Simultaneous safety/efficacy modeling to determine
optimal doses for an anticancer drug combination
Key Question: Given observed clinical toxicity and our preclinical understanding of exposure-response, what tolerable dose pair will give optimal antitumor effect?
M Patel, E Kadakia, J Zhou, C Patel, K Venkatakrishnan, A Chakravarty, D Bottino. ACOP 2016. J Pharmacokinet Pharmacodyn (2016) 43:S11–S122 T46
Conclusions: This is a general methodology that can be applied to any early phase oncology combination for which combo preclinical antitumor and clinical safety data are available.
Drug X exposure (free fraction corrected)
Dru
g Y
exp
osu
re (
free
fra
ction
co
rre
cte
d)
cell line ZZZ
Tu
mo
r G
row
th R
ate
In
hib
itio
n
📧
Quantitative Pharmacology Influence and Impact Initiative 2017
Back to: Table of Content
Key Application Sub-areas
Key Application Area
Drug Development Decision-making
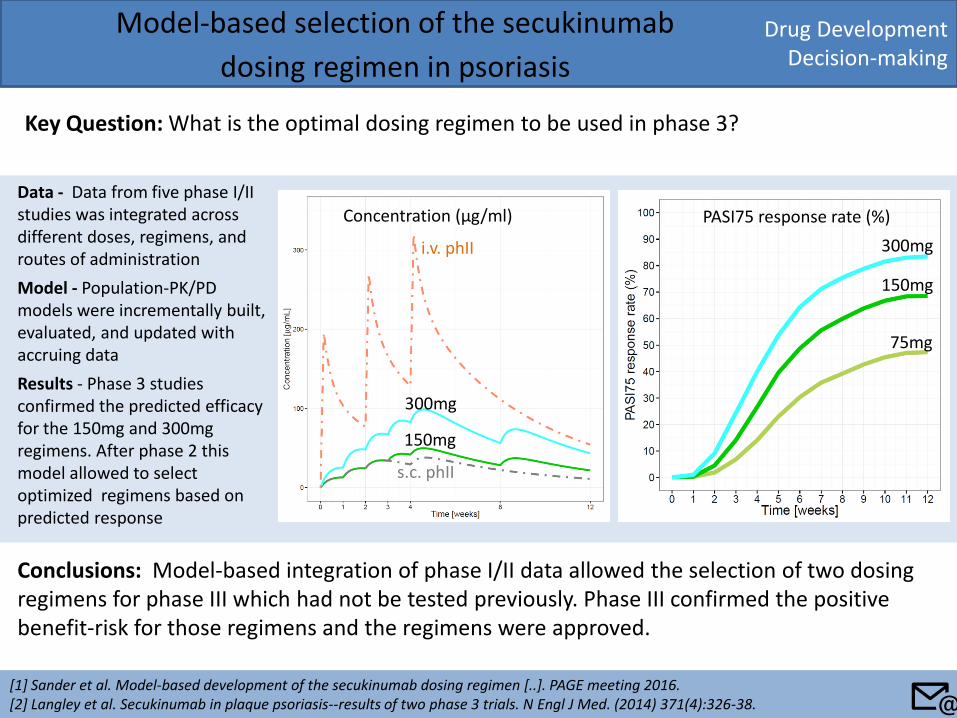
Model-based selection of the secukinumab
dosing regimen in psoriasis
Key Question: What is the optimal dosing regimen to be used in phase 3?
[1] Sander et al. Model-based development of the secukinumab dosing regimen [..]. PAGE meeting 2016. [2] Langley et al. Secukinumab in plaque psoriasis--results of two phase 3 trials. N Engl J Med. (2014) 371(4):326-38.
Conclusions: Model-based integration of phase I/II data allowed the selection of two dosing regimens for phase III which had not be tested previously. Phase III confirmed the positive benefit-risk for those regimens and the regimens were approved.
300mg
150mg
75mg
300mg
150mg
i.v. phII
s.c. phII
Data - Data from five phase I/II studies was integrated across different doses, regimens, and routes of administration
Model - Population-PK/PD models were incrementally built, evaluated, and updated with accruing data
Results - Phase 3 studies confirmed the predicted efficacy for the 150mg and 300mg regimens. After phase 2 this model allowed to select optimized regimens based on predicted response
Concentration (μg/ml) PASI75 response rate (%)
📧
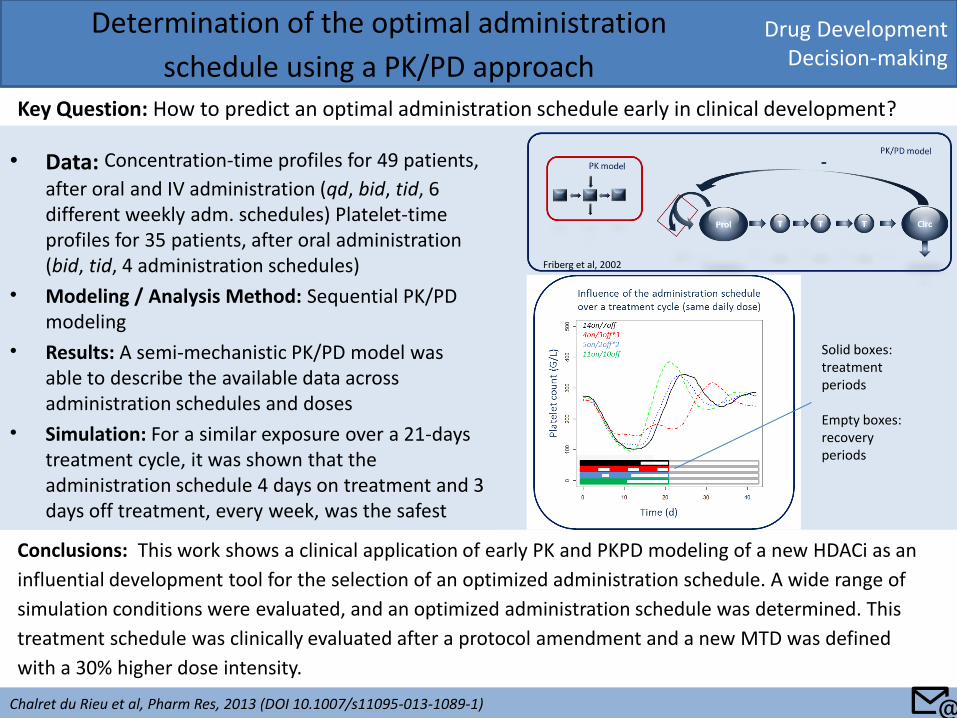
• Data: Concentration-time profiles for 49 patients,
after oral and IV administration (qd, bid, tid, 6 different weekly adm. schedules) Platelet-time profiles for 35 patients, after oral administration (bid, tid, 4 administration schedules)
• Modeling / Analysis Method: Sequential PK/PD modeling
• Results: A semi-mechanistic PK/PD model was able to describe the available data across administration schedules and doses
• Simulation: For a similar exposure over a 21-days treatment cycle, it was shown that the administration schedule 4 days on treatment and 3 days off treatment, every week, was the safest
Drug Development Decision-making
Determination of the optimal administration
schedule using a PK/PD approach Key Question: How to predict an optimal administration schedule early in clinical development?
Chalret du Rieu et al, Pharm Res, 2013 (DOI 10.1007/s11095-013-1089-1)
Conclusions: This work shows a clinical application of early PK and PKPD modeling of a new HDACi as an
influential development tool for the selection of an optimized administration schedule. A wide range of
simulation conditions were evaluated, and an optimized administration schedule was determined. This
treatment schedule was clinically evaluated after a protocol amendment and a new MTD was defined
with a 30% higher dose intensity.
Friberg et al, 2002
Solid boxes: treatment periods Empty boxes: recovery periods
📧
Drug Development Decision-making
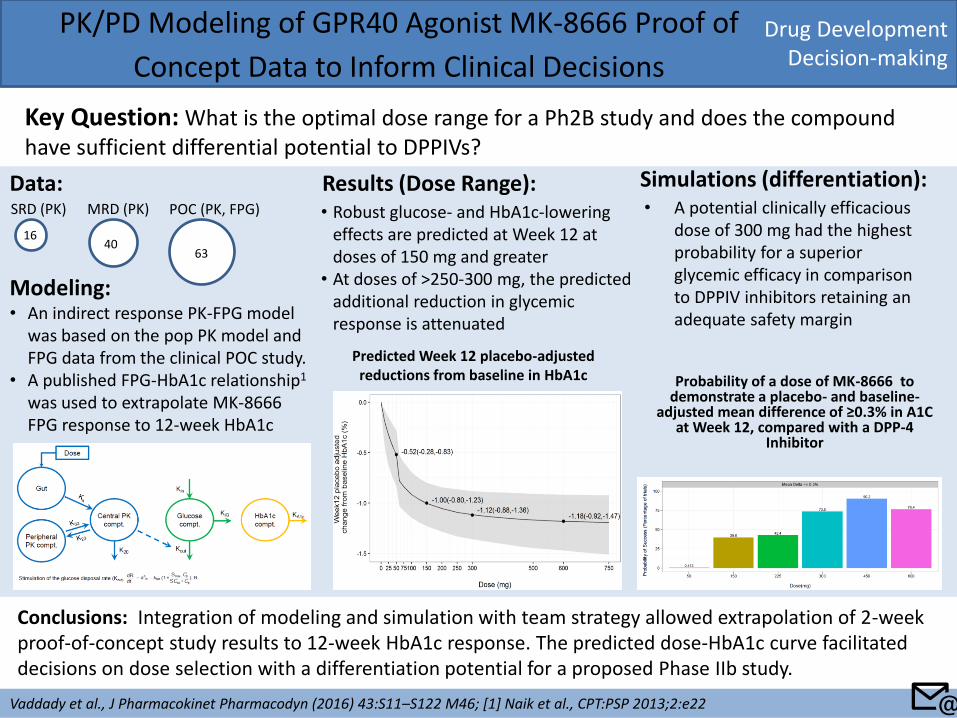
PK/PD Modeling of GPR40 Agonist MK-8666 Proof of
Concept Data to Inform Clinical Decisions
Key Question: What is the optimal dose range for a Ph2B study and does the compound have sufficient differential potential to DPPIVs?
Vaddady et al., J Pharmacokinet Pharmacodyn (2016) 43:S11–S122 M46; [1] Naik et al., CPT:PSP 2013;2:e22
Conclusions: Integration of modeling and simulation with team strategy allowed extrapolation of 2-week proof-of-concept study results to 12-week HbA1c response. The predicted dose-HbA1c curve facilitated decisions on dose selection with a differentiation potential for a proposed Phase IIb study.
Modeling: • An indirect response PK-FPG model
was based on the pop PK model and FPG data from the clinical POC study.
• A published FPG-HbA1c relationship1 was used to extrapolate MK-8666 FPG response to 12-week HbA1c
SRD (PK) MRD (PK) POC (PK, FPG)
16 40
63
Data: Results (Dose Range): • Robust glucose- and HbA1c-lowering
effects are predicted at Week 12 at doses of 150 mg and greater
• At doses of >250-300 mg, the predicted additional reduction in glycemic response is attenuated
Predicted Week 12 placebo-adjusted reductions from baseline in HbA1c Probability of a dose of MK-8666 to
demonstrate a placebo- and baseline-adjusted mean difference of ≥0.3% in A1C
at Week 12, compared with a DPP-4 Inhibitor
Simulations (differentiation): • A potential clinically efficacious
dose of 300 mg had the highest probability for a superior glycemic efficacy in comparison to DPPIV inhibitors retaining an adequate safety margin
📧
Drug Development Decision-making
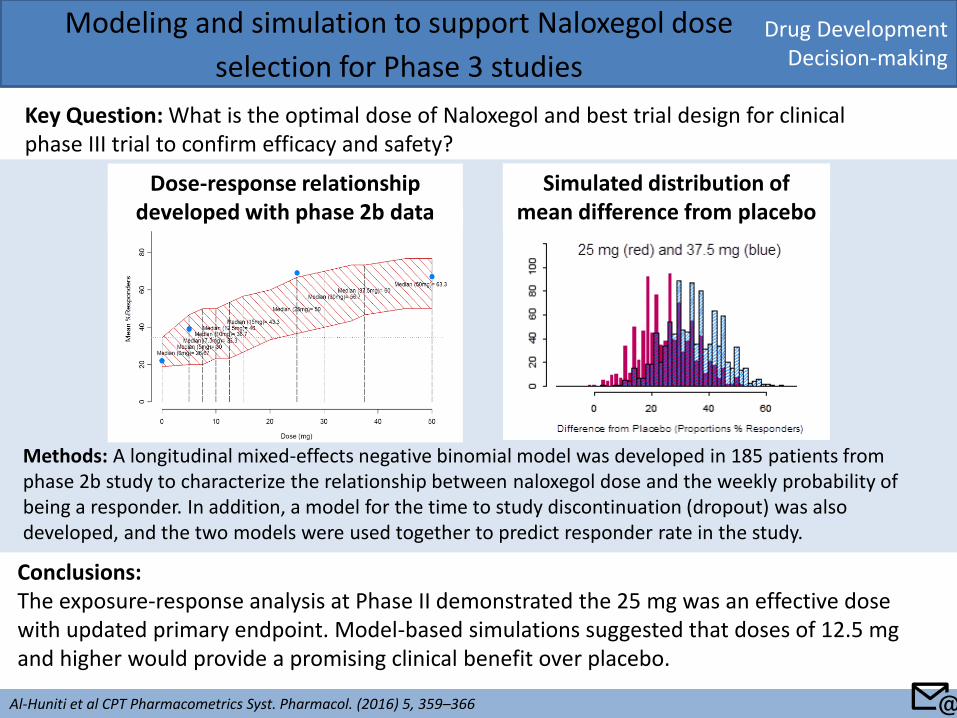
Modeling and simulation to support Naloxegol dose
selection for Phase 3 studies
Key Question: What is the optimal dose of Naloxegol and best trial design for clinical phase III trial to confirm efficacy and safety?
Al-Huniti et al CPT Pharmacometrics Syst. Pharmacol. (2016) 5, 359–366
Conclusions: The exposure-response analysis at Phase II demonstrated the 25 mg was an effective dose with updated primary endpoint. Model-based simulations suggested that doses of 12.5 mg and higher would provide a promising clinical benefit over placebo.
Methods: A longitudinal mixed-effects negative binomial model was developed in 185 patients from phase 2b study to characterize the relationship between naloxegol dose and the weekly probability of being a responder. In addition, a model for the time to study discontinuation (dropout) was also developed, and the two models were used together to predict responder rate in the study.
Dose-response relationship developed with phase 2b data
Simulated distribution of mean difference from placebo
📧
Drug Development Decision-making
Application of Quantitative Systems Pharmacology
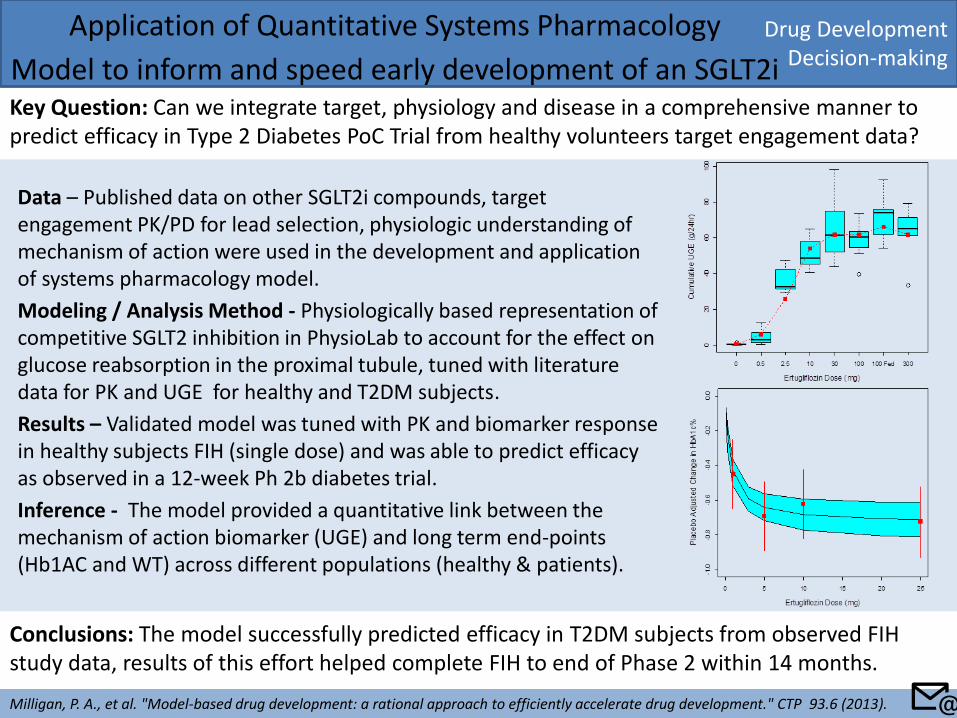
Model to inform and speed early development of an SGLT2i Key Question: Can we integrate target, physiology and disease in a comprehensive manner to predict efficacy in Type 2 Diabetes PoC Trial from healthy volunteers target engagement data?
Milligan, P. A., et al. "Model-based drug development: a rational approach to efficiently accelerate drug development." CTP 93.6 (2013).
Conclusions: The model successfully predicted efficacy in T2DM subjects from observed FIH study data, results of this effort helped complete FIH to end of Phase 2 within 14 months.
📧
Data – Published data on other SGLT2i compounds, target engagement PK/PD for lead selection, physiologic understanding of mechanism of action were used in the development and application of systems pharmacology model.
Modeling / Analysis Method - Physiologically based representation of competitive SGLT2 inhibition in PhysioLab to account for the effect on glucose reabsorption in the proximal tubule, tuned with literature data for PK and UGE for healthy and T2DM subjects.
Results – Validated model was tuned with PK and biomarker response in healthy subjects FIH (single dose) and was able to predict efficacy as observed in a 12-week Ph 2b diabetes trial.
Inference - The model provided a quantitative link between the mechanism of action biomarker (UGE) and long term end-points (Hb1AC and WT) across different populations (healthy & patients).
Drug Development Decision-making
Analysis and Translation of Phase II data to
Registration Endpoints in Chronic Kidney Disease
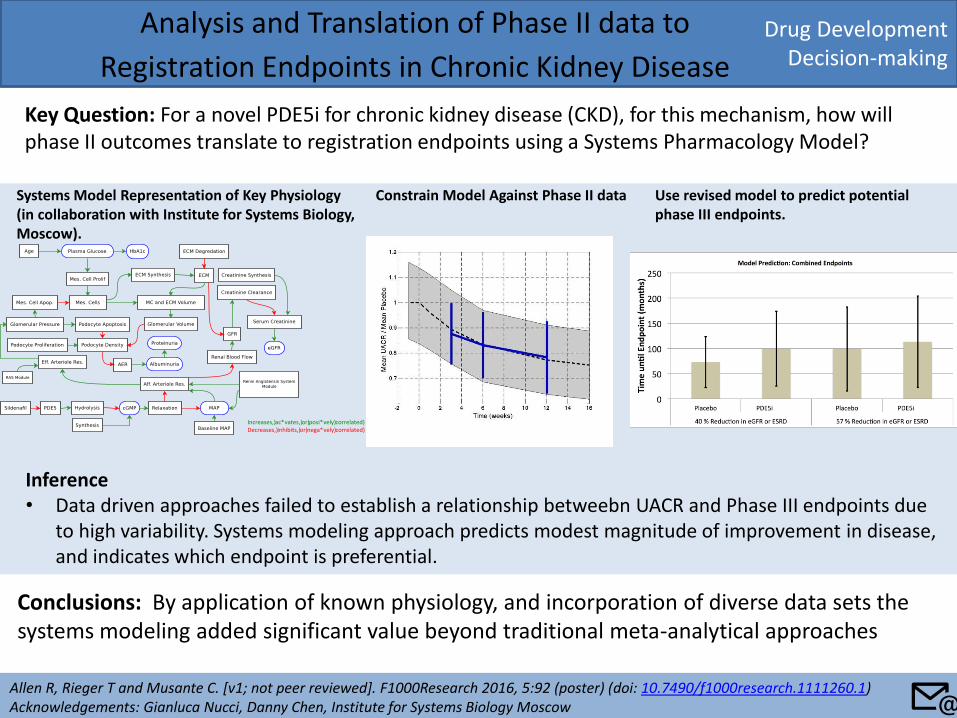
Key Question: For a novel PDE5i for chronic kidney disease (CKD), for this mechanism, how will phase II outcomes translate to registration endpoints using a Systems Pharmacology Model?
Allen R, Rieger T and Musante C. [v1; not peer reviewed]. F1000Research 2016, 5:92 (poster) (doi: 10.7490/f1000research.1111260.1) Acknowledgements: Gianluca Nucci, Danny Chen, Institute for Systems Biology Moscow
Conclusions: By application of known physiology, and incorporation of diverse data sets the systems modeling added significant value beyond traditional meta-analytical approaches
Systems Model Representation of Key Physiology (in collaboration with Institute for Systems Biology, Moscow).
Increases,)ac*vates,)or)posi*vely)correlated)Decreases,)inhibits,)or)nega*vely)correlated)
Constrain Model Against Phase II data Use revised model to predict potential phase III endpoints.
Inference • Data driven approaches failed to establish a relationship betweebn UACR and Phase III endpoints due
to high variability. Systems modeling approach predicts modest magnitude of improvement in disease, and indicates which endpoint is preferential.
📧
Drug Development Decision-making
Predicting the Potential Efficacy for a Novel
Treatment for Non-Alcoholic Fatty Liver Disease
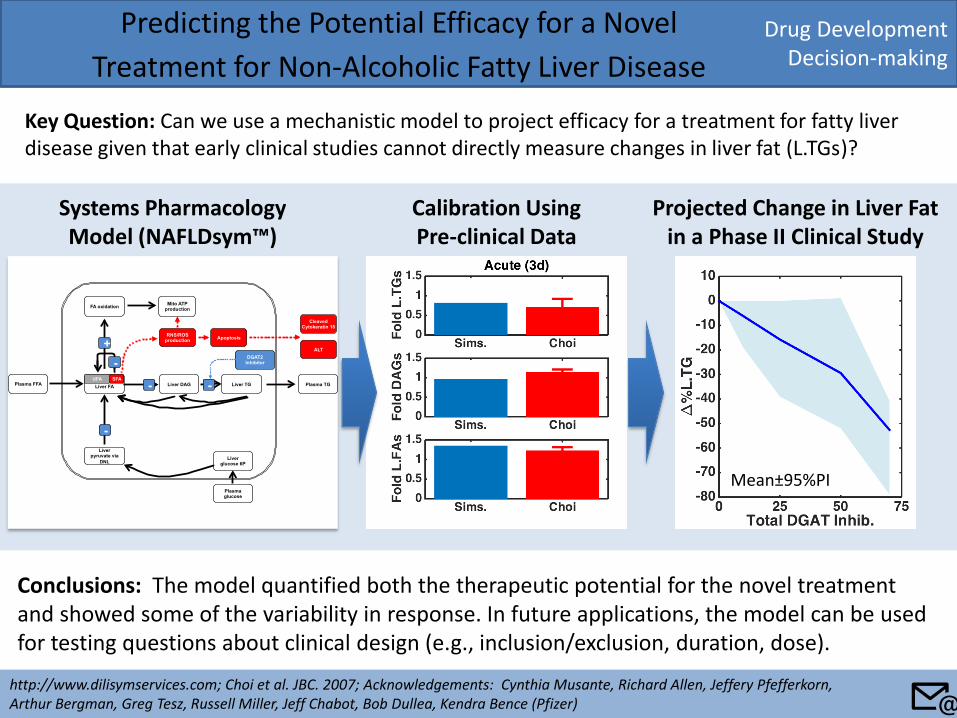
Key Question: Can we use a mechanistic model to project efficacy for a treatment for fatty liver disease given that early clinical studies cannot directly measure changes in liver fat (L.TGs)?
http://www.dilisymservices.com; Choi et al. JBC. 2007; Acknowledgements: Cynthia Musante, Richard Allen, Jeffery Pfefferkorn, Arthur Bergman, Greg Tesz, Russell Miller, Jeff Chabot, Bob Dullea, Kendra Bence (Pfizer)
Conclusions: The model quantified both the therapeutic potential for the novel treatment and showed some of the variability in response. In future applications, the model can be used for testing questions about clinical design (e.g., inclusion/exclusion, duration, dose).
Calibration Using Pre-clinical Data
Projected Change in Liver Fat in a Phase II Clinical Study
Liver FA
SFA
FA oxidation
Plasma FFA Plasma TG
Liver pyruvate via
DNL
Mito ATP production
RNS/ROS production
Liver TG UFA
Apoptosis
Liver DAG
DGAT2 Inhibitor
-
Cleaved Cytokeratin 18
ALT +
-
-
Liver glucose 6P
Plasma glucose
-
Systems Pharmacology Model (NAFLDsym™)
Mean±95%PI
📧
Drug Development Decision-making
Assessment of liver safety risk in
Phase 1 GGF2 clinical trials
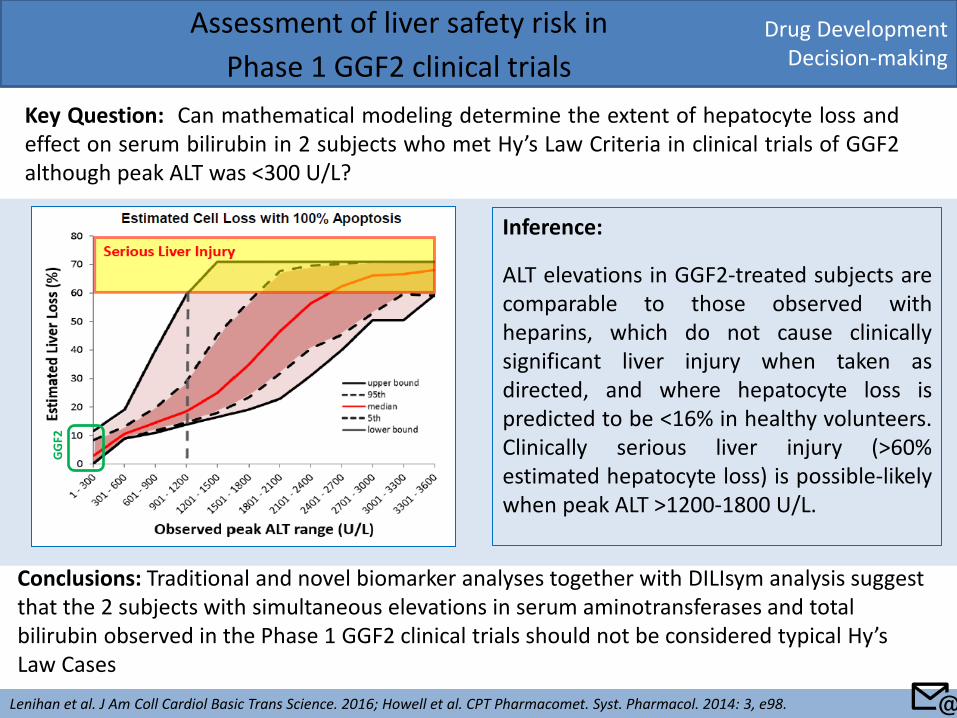
Key Question: Can mathematical modeling determine the extent of hepatocyte loss and effect on serum bilirubin in 2 subjects who met Hy’s Law Criteria in clinical trials of GGF2 although peak ALT was <300 U/L?
Lenihan et al. J Am Coll Cardiol Basic Trans Science. 2016; Howell et al. CPT Pharmacomet. Syst. Pharmacol. 2014: 3, e98.
Conclusions: Traditional and novel biomarker analyses together with DILIsym analysis suggest that the 2 subjects with simultaneous elevations in serum aminotransferases and total bilirubin observed in the Phase 1 GGF2 clinical trials should not be considered typical Hy’s Law Cases
Inference:
ALT elevations in GGF2-treated subjects are comparable to those observed with heparins, which do not cause clinically significant liver injury when taken as directed, and where hepatocyte loss is predicted to be <16% in healthy volunteers. Clinically serious liver injury (>60% estimated hepatocyte loss) is possible-likely when peak ALT >1200-1800 U/L.
GG
F2
📧
Quantitative Pharmacology Influence and Impact Initiative 2017
Back to: Table of Content
Key Application Sub-areas
Key Application Area
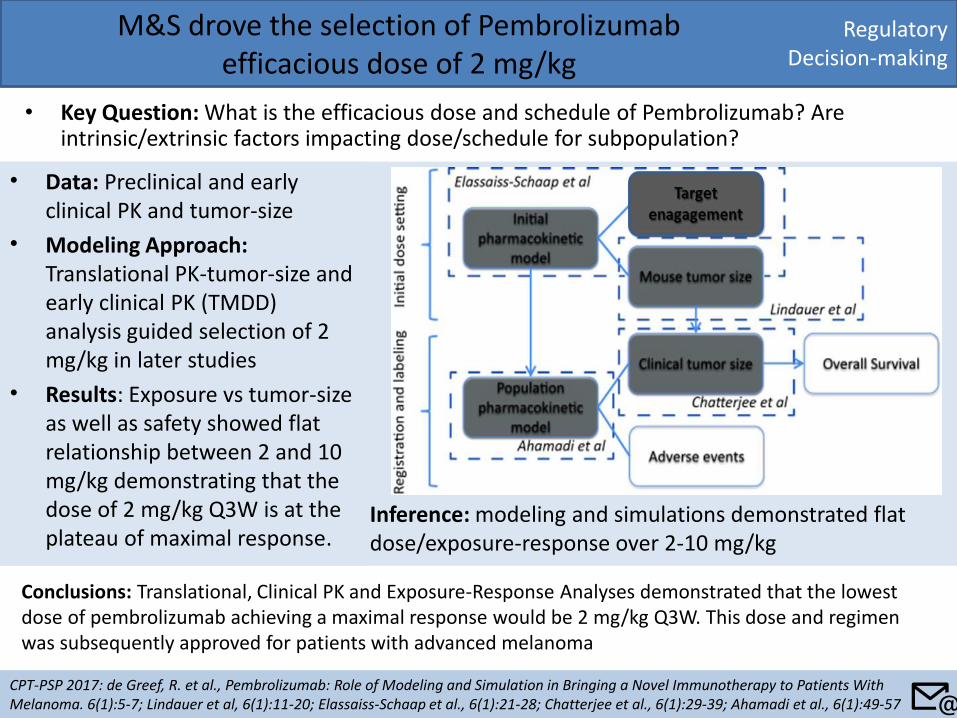
• Data: Preclinical and early clinical PK and tumor-size
• Modeling Approach: Translational PK-tumor-size and early clinical PK (TMDD) analysis guided selection of 2 mg/kg in later studies
• Results: Exposure vs tumor-size as well as safety showed flat relationship between 2 and 10 mg/kg demonstrating that the dose of 2 mg/kg Q3W is at the plateau of maximal response.
Regulatory Decision-making
M&S drove the selection of Pembrolizumab efficacious dose of 2 mg/kg
• Key Question: What is the efficacious dose and schedule of Pembrolizumab? Are intrinsic/extrinsic factors impacting dose/schedule for subpopulation?
CPT-PSP 2017: de Greef, R. et al., Pembrolizumab: Role of Modeling and Simulation in Bringing a Novel Immunotherapy to Patients With Melanoma. 6(1):5-7; Lindauer et al, 6(1):11-20; Elassaiss-Schaap et al., 6(1):21-28; Chatterjee et al., 6(1):29-39; Ahamadi et al., 6(1):49-57
Conclusions: Translational, Clinical PK and Exposure-Response Analyses demonstrated that the lowest dose of pembrolizumab achieving a maximal response would be 2 mg/kg Q3W. This dose and regimen was subsequently approved for patients with advanced melanoma
Inference: modeling and simulations demonstrated flat dose/exposure-response over 2-10 mg/kg
📧
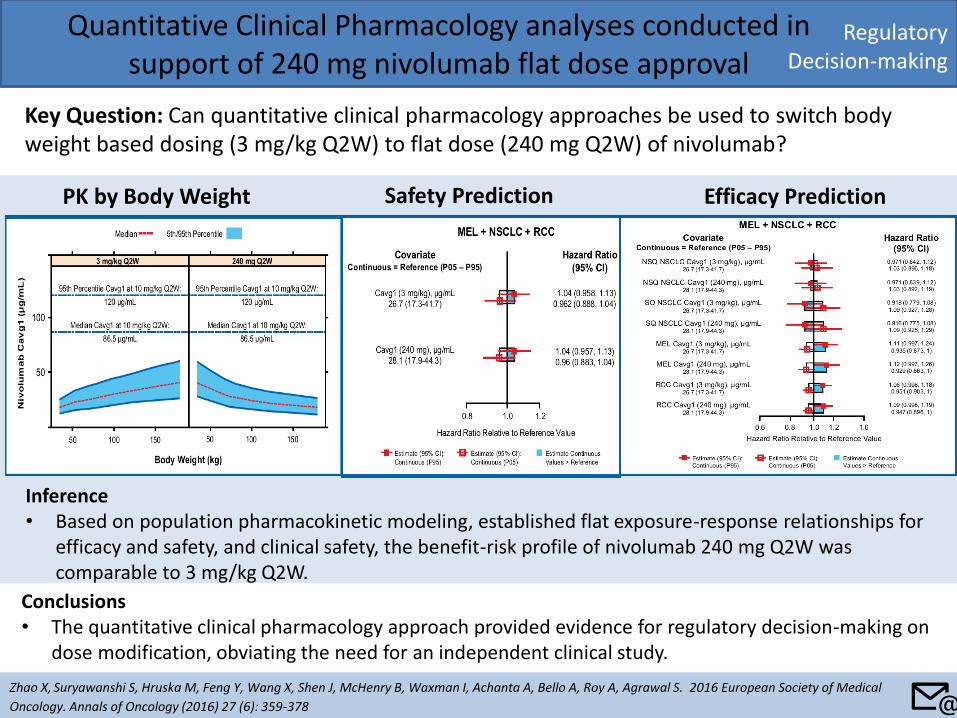
Quantitative Clinical Pharmacology analyses conducted in support of 240 mg nivolumab flat dose approval
Key Question: Can quantitative clinical pharmacology approaches be used to switch body weight based dosing (3 mg/kg Q2W) to flat dose (240 mg Q2W) of nivolumab?
Zhao X, Suryawanshi S, Hruska M, Feng Y, Wang X, Shen J, McHenry B, Waxman I, Achanta A, Bello A, Roy A, Agrawal S. 2016 European Society of Medical
Oncology. Annals of Oncology (2016) 27 (6): 359-378
Conclusions • The quantitative clinical pharmacology approach provided evidence for regulatory decision-making on
dose modification, obviating the need for an independent clinical study.
PK by Body Weight Safety Prediction Efficacy Prediction
Inference • Based on population pharmacokinetic modeling, established flat exposure-response relationships for
efficacy and safety, and clinical safety, the benefit-risk profile of nivolumab 240 mg Q2W was comparable to 3 mg/kg Q2W.
Regulatory Decision-making
📧
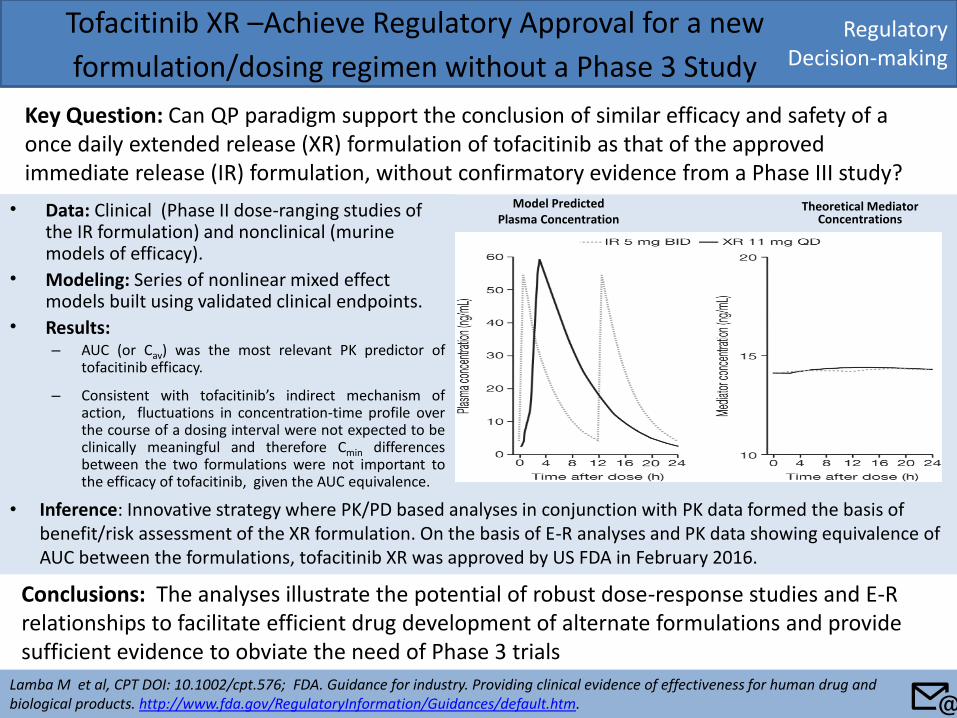
• Data: Clinical (Phase II dose-ranging studies of the IR formulation) and nonclinical (murine models of efficacy).
• Modeling: Series of nonlinear mixed effect models built using validated clinical endpoints.
• Results: – AUC (or Cav) was the most relevant PK predictor of
tofacitinib efficacy.
– Consistent with tofacitinib’s indirect mechanism of action, fluctuations in concentration-time profile over the course of a dosing interval were not expected to be clinically meaningful and therefore Cmin differences between the two formulations were not important to the efficacy of tofacitinib, given the AUC equivalence.
Regulatory Decision-making
Tofacitinib XR –Achieve Regulatory Approval for a new
formulation/dosing regimen without a Phase 3 Study
Key Question: Can QP paradigm support the conclusion of similar efficacy and safety of a once daily extended release (XR) formulation of tofacitinib as that of the approved immediate release (IR) formulation, without confirmatory evidence from a Phase III study?
Lamba M et al, CPT DOI: 10.1002/cpt.576; FDA. Guidance for industry. Providing clinical evidence of effectiveness for human drug and biological products. http://www.fda.gov/RegulatoryInformation/Guidances/default.htm.
Conclusions: The analyses illustrate the potential of robust dose-response studies and E-R relationships to facilitate efficient drug development of alternate formulations and provide sufficient evidence to obviate the need of Phase 3 trials
Model Predicted Plasma Concentration
Theoretical Mediator Concentrations
• Inference: Innovative strategy where PK/PD based analyses in conjunction with PK data formed the basis of benefit/risk assessment of the XR formulation. On the basis of E-R analyses and PK data showing equivalence of AUC between the formulations, tofacitinib XR was approved by US FDA in February 2016.
📧
Regulatory Decision-making
Pharmacometric analysis of phase 3 studies results to
influence regulatory decision making for naloxegol
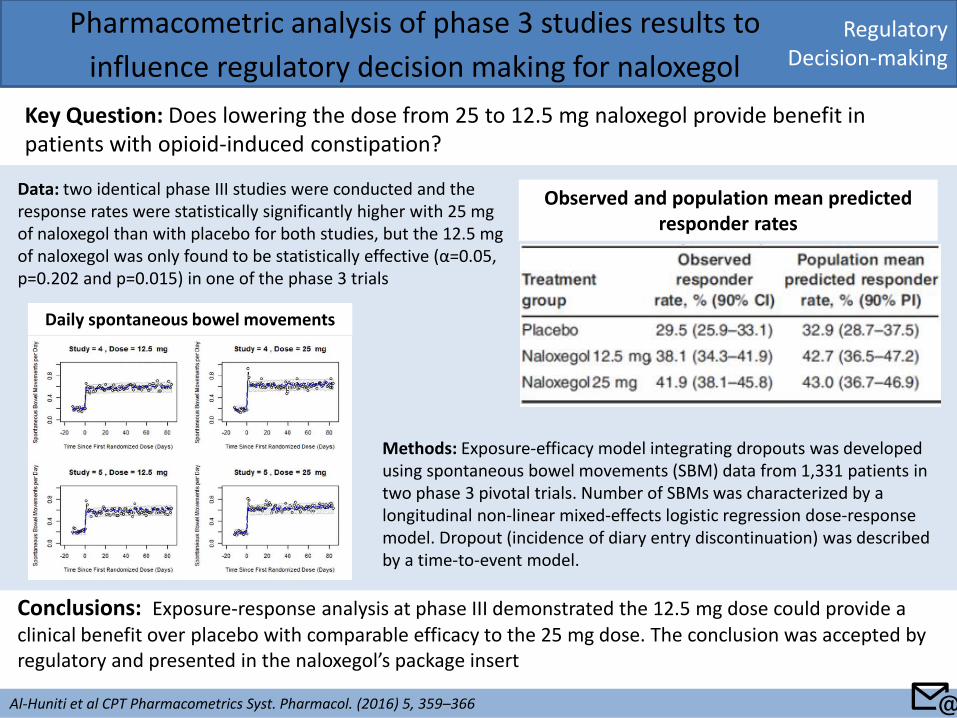
Key Question: Does lowering the dose from 25 to 12.5 mg naloxegol provide benefit in patients with opioid-induced constipation?
Al-Huniti et al CPT Pharmacometrics Syst. Pharmacol. (2016) 5, 359–366
Conclusions: Exposure-response analysis at phase III demonstrated the 12.5 mg dose could provide a clinical benefit over placebo with comparable efficacy to the 25 mg dose. The conclusion was accepted by regulatory and presented in the naloxegol’s package insert
Data: two identical phase III studies were conducted and the response rates were statistically significantly higher with 25 mg of naloxegol than with placebo for both studies, but the 12.5 mg of naloxegol was only found to be statistically effective (α=0.05, p=0.202 and p=0.015) in one of the phase 3 trials
Methods: Exposure-efficacy model integrating dropouts was developed using spontaneous bowel movements (SBM) data from 1,331 patients in two phase 3 pivotal trials. Number of SBMs was characterized by a longitudinal non-linear mixed-effects logistic regression dose-response model. Dropout (incidence of diary entry discontinuation) was described by a time-to-event model.
Daily spontaneous bowel movements
Observed and population mean predicted responder rates
📧
Regulatory Decision-making
Switch from BSA-based to fixed dosing simplified
dosing guidance and clinical development
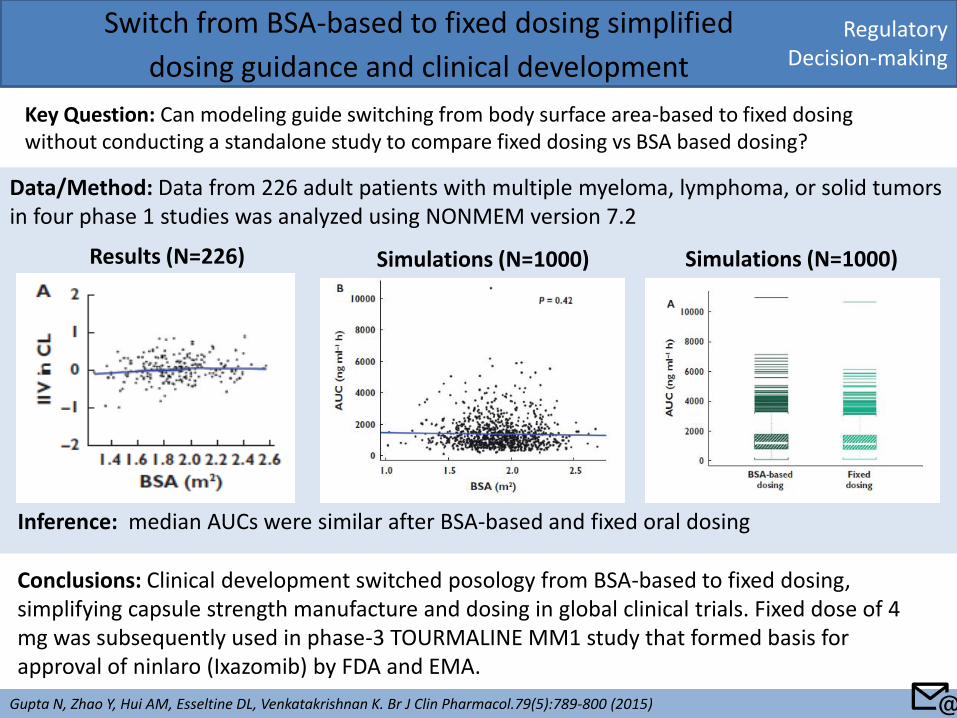
Key Question: Can modeling guide switching from body surface area-based to fixed dosing without conducting a standalone study to compare fixed dosing vs BSA based dosing?
Gupta N, Zhao Y, Hui AM, Esseltine DL, Venkatakrishnan K. Br J Clin Pharmacol.79(5):789-800 (2015)
Conclusions: Clinical development switched posology from BSA-based to fixed dosing, simplifying capsule strength manufacture and dosing in global clinical trials. Fixed dose of 4 mg was subsequently used in phase-3 TOURMALINE MM1 study that formed basis for approval of ninlaro (Ixazomib) by FDA and EMA.
Data/Method: Data from 226 adult patients with multiple myeloma, lymphoma, or solid tumors in four phase 1 studies was analyzed using NONMEM version 7.2
Results (N=226) Simulations (N=1000) Simulations (N=1000)
Inference: median AUCs were similar after BSA-based and fixed oral dosing
📧
Regulatory Decision-making
Investigation of Underlying Mechanisms of
Liver Enzyme Elevations by Macrolides
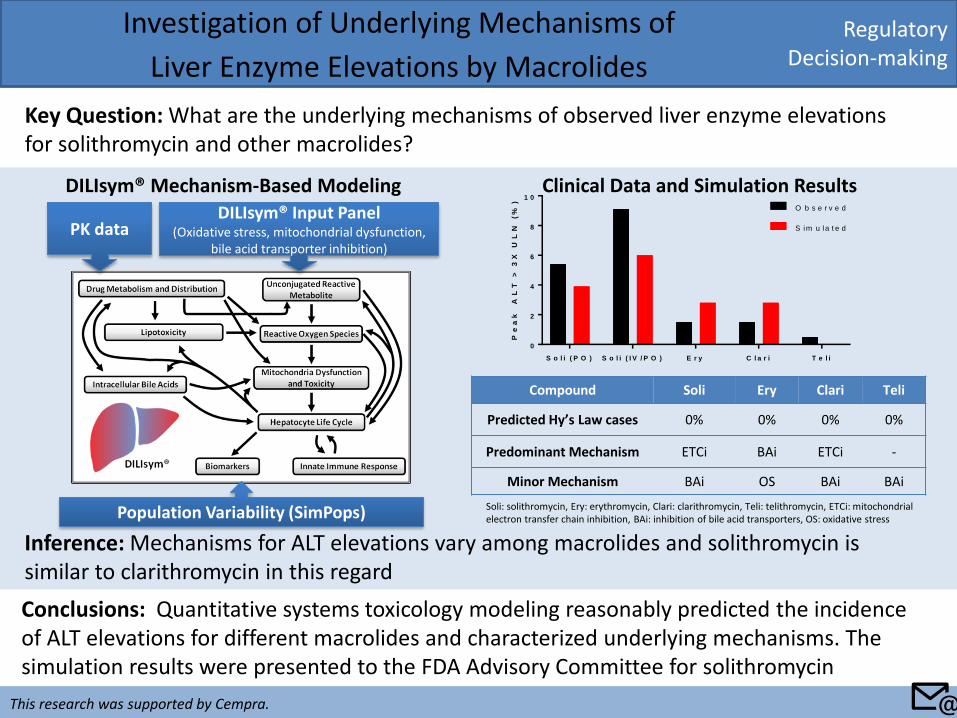
Key Question: What are the underlying mechanisms of observed liver enzyme elevations for solithromycin and other macrolides?
Conclusions: Quantitative systems toxicology modeling reasonably predicted the incidence of ALT elevations for different macrolides and characterized underlying mechanisms. The simulation results were presented to the FDA Advisory Committee for solithromycin
Inference: Mechanisms for ALT elevations vary among macrolides and solithromycin is similar to clarithromycin in this regard
Clinical Data and Simulation Results DILIsym® Mechanism-Based Modeling
S o l i ( P O ) S o l i ( I V / P O ) E r y C l a r i T e l i
0
2
4
6
8
1 0
Pe
ak
A
LT
> 3
X U
LN
(%
)
O b s e r v e d
S im u la t e d
Compound Soli Ery Clari Teli
Predicted Hy’s Law cases 0% 0% 0% 0%
Predominant Mechanism ETCi BAi ETCi -
Minor Mechanism BAi OS BAi BAi
Soli: solithromycin, Ery: erythromycin, Clari: clarithromycin, Teli: telithromycin, ETCi: mitochondrial electron transfer chain inhibition, BAi: inhibition of bile acid transporters, OS: oxidative stress
PK data DILIsym® Input Panel
(Oxidative stress, mitochondrial dysfunction, bile acid transporter inhibition)
This research was supported by Cempra. 📧
Population Variability (SimPops)
Regulatory Decision-making
Concentration–QTc modeling of phase 1 data to
obviate need for a dedicated clinical QTc study
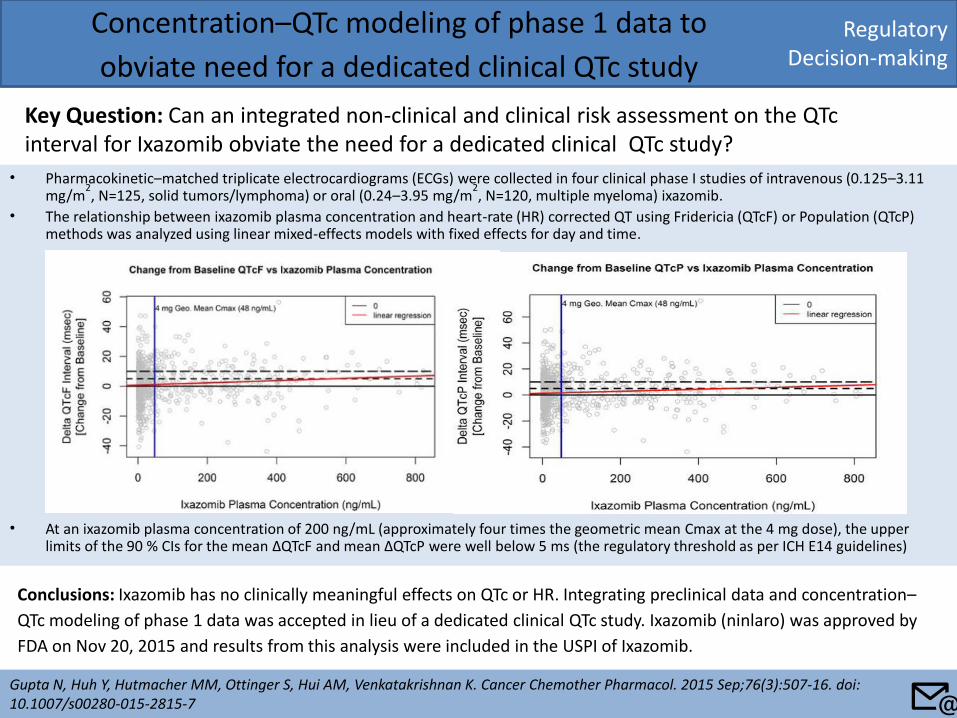
Key Question: Can an integrated non-clinical and clinical risk assessment on the QTc interval for Ixazomib obviate the need for a dedicated clinical QTc study?
Gupta N, Huh Y, Hutmacher MM, Ottinger S, Hui AM, Venkatakrishnan K. Cancer Chemother Pharmacol. 2015 Sep;76(3):507-16. doi: 10.1007/s00280-015-2815-7
Conclusions: Ixazomib has no clinically meaningful effects on QTc or HR. Integrating preclinical data and concentration–
QTc modeling of phase 1 data was accepted in lieu of a dedicated clinical QTc study. Ixazomib (ninlaro) was approved by
FDA on Nov 20, 2015 and results from this analysis were included in the USPI of Ixazomib.
• Pharmacokinetic–matched triplicate electrocardiograms (ECGs) were collected in four clinical phase I studies of intravenous (0.125–3.11 mg/m
2, N=125, solid tumors/lymphoma) or oral (0.24–3.95 mg/m
2, N=120, multiple myeloma) ixazomib.
• The relationship between ixazomib plasma concentration and heart-rate (HR) corrected QT using Fridericia (QTcF) or Population (QTcP) methods was analyzed using linear mixed-effects models with fixed effects for day and time.
• At an ixazomib plasma concentration of 200 ng/mL (approximately four times the geometric mean Cmax at the 4 mg dose), the upper limits of the 90 % CIs for the mean ΔQTcF and mean ΔQTcP were well below 5 ms (the regulatory threshold as per ICH E14 guidelines)
📧
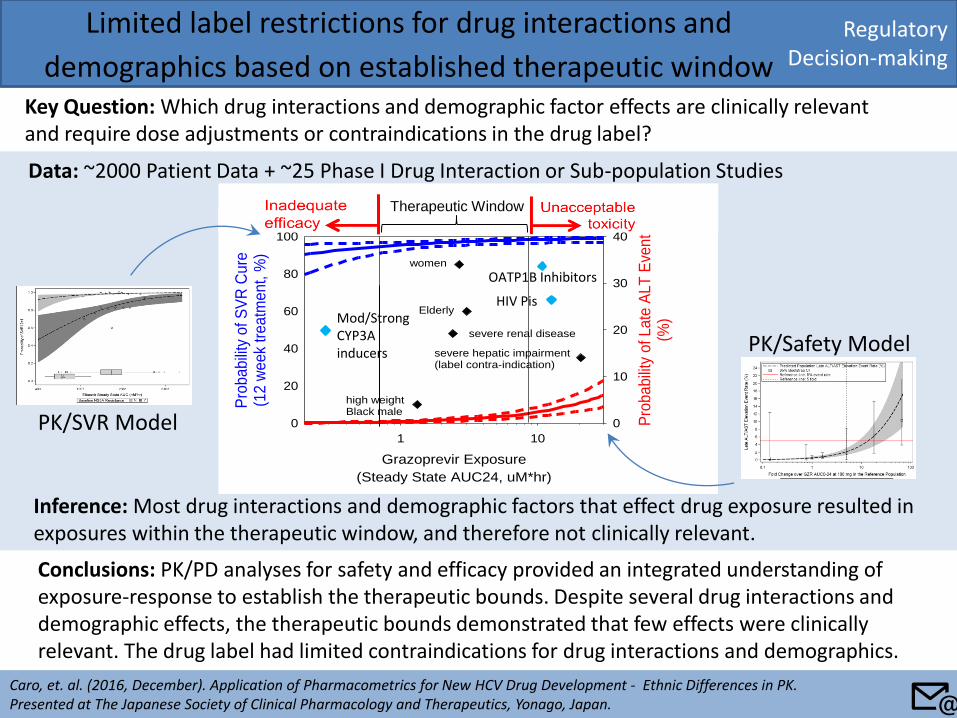
Data: ~2000 Patient Data + ~25 Phase I Drug Interaction or Sub-population Studies
Inference: Most drug interactions and demographic factors that effect drug exposure resulted in exposures within the therapeutic window, and therefore not clinically relevant.
Regulatory Decision-making
Limited label restrictions for drug interactions and
demographics based on established therapeutic window Key Question: Which drug interactions and demographic factor effects are clinically relevant and require dose adjustments or contraindications in the drug label?
Caro, et. al. (2016, December). Application of Pharmacometrics for New HCV Drug Development - Ethnic Differences in PK. Presented at The Japanese Society of Clinical Pharmacology and Therapeutics, Yonago, Japan.
Conclusions: PK/PD analyses for safety and efficacy provided an integrated understanding of exposure-response to establish the therapeutic bounds. Despite several drug interactions and demographic effects, the therapeutic bounds demonstrated that few effects were clinically relevant. The drug label had limited contraindications for drug interactions and demographics.
Grazoprevir Exposure
(Steady State AUC24, uM*hr)
1 10
Pro
babili
ty o
f S
VR
Cu
re(1
2 w
eek
treatm
ent, %
)
0
20
40
60
80
100
Pro
babili
ty o
f Late
ALT
Eve
nt
(%)
0
10
20
30
40
women
Asian
severe renal disease
Elderly
Asian female w/cirrhosis
high weight Black male
severe hepatic impairment(label contra-indication)
Therapeutic Window
Mod/Strong CYP3A inducers
HIV Pis
OATP1B Inhibitors
PK/SVR Model
PK/Safety Model
📧
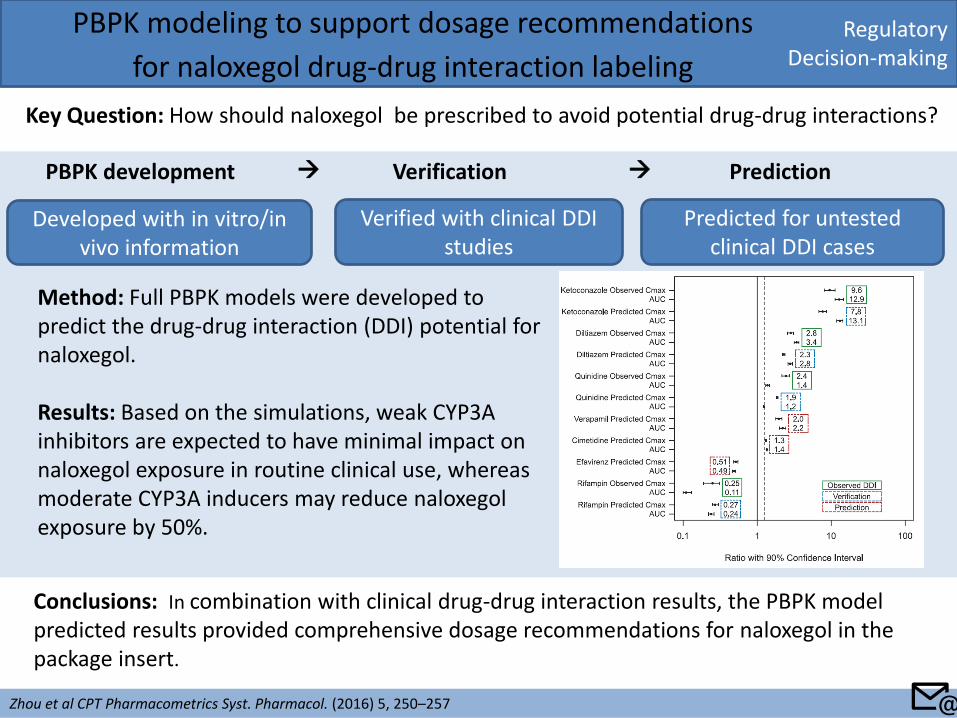
PBPK development Verification Prediction
Regulatory Decision-making
PBPK modeling to support dosage recommendations
for naloxegol drug-drug interaction labeling
Key Question: How should naloxegol be prescribed to avoid potential drug-drug interactions?
Zhou et al CPT Pharmacometrics Syst. Pharmacol. (2016) 5, 250–257
Conclusions: In combination with clinical drug-drug interaction results, the PBPK model predicted results provided comprehensive dosage recommendations for naloxegol in the package insert.
Developed with in vitro/in vivo information
Verified with clinical DDI studies
Predicted for untested clinical DDI cases
Method: Full PBPK models were developed to predict the drug-drug interaction (DDI) potential for naloxegol. Results: Based on the simulations, weak CYP3A inhibitors are expected to have minimal impact on naloxegol exposure in routine clinical use, whereas moderate CYP3A inducers may reduce naloxegol exposure by 50%.
📧
Quantitative Pharmacology Influence and Impact Initiative 2017
Back to: Table of Content
Key Application Sub-areas
Key Application Area
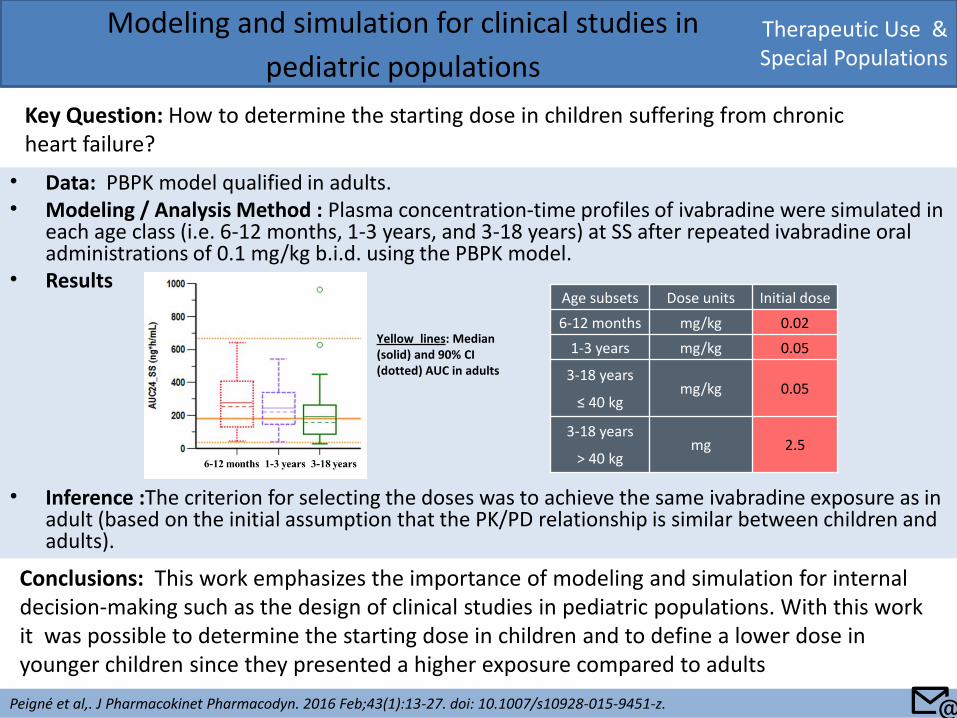
• Data: PBPK model qualified in adults. • Modeling / Analysis Method : Plasma concentration-time profiles of ivabradine were simulated in
each age class (i.e. 6-12 months, 1-3 years, and 3-18 years) at SS after repeated ivabradine oral administrations of 0.1 mg/kg b.i.d. using the PBPK model.
• Results
• Inference :The criterion for selecting the doses was to achieve the same ivabradine exposure as in adult (based on the initial assumption that the PK/PD relationship is similar between children and adults).
Therapeutic Use & Special Populations
Modeling and simulation for clinical studies in
pediatric populations
Key Question: How to determine the starting dose in children suffering from chronic heart failure?
Peigné et al,. J Pharmacokinet Pharmacodyn. 2016 Feb;43(1):13-27. doi: 10.1007/s10928-015-9451-z.
Conclusions: This work emphasizes the importance of modeling and simulation for internal decision-making such as the design of clinical studies in pediatric populations. With this work it was possible to determine the starting dose in children and to define a lower dose in younger children since they presented a higher exposure compared to adults
Age subsets Dose units Initial dose
6-12 months mg/kg 0.02
1-3 years mg/kg 0.05
3-18 years
≤ 40 kg mg/kg 0.05
3-18 years
> 40 kg mg 2.5
Yellow lines: Median (solid) and 90% CI (dotted) AUC in adults
📧
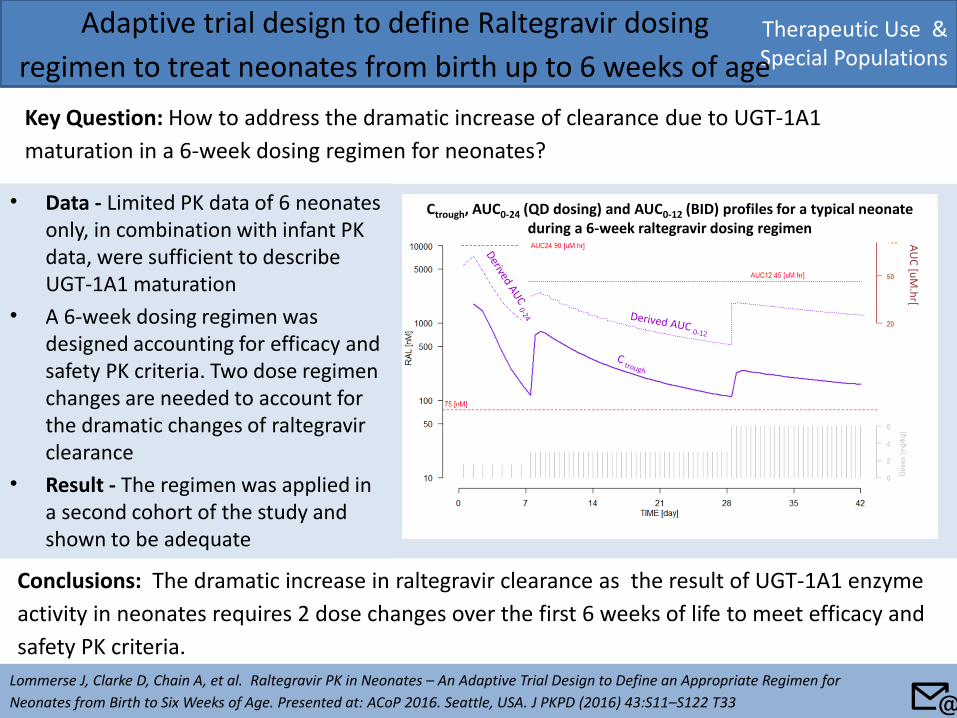
• Data - Limited PK data of 6 neonates only, in combination with infant PK data, were sufficient to describe UGT-1A1 maturation
• A 6-week dosing regimen was designed accounting for efficacy and safety PK criteria. Two dose regimen changes are needed to account for the dramatic changes of raltegravir clearance
• Result - The regimen was applied in a second cohort of the study and shown to be adequate
Therapeutic Use & Special Populations
Adaptive trial design to define Raltegravir dosing
regimen to treat neonates from birth up to 6 weeks of age
Key Question: How to address the dramatic increase of clearance due to UGT-1A1
maturation in a 6-week dosing regimen for neonates?
Lommerse J, Clarke D, Chain A, et al. Raltegravir PK in Neonates – An Adaptive Trial Design to Define an Appropriate Regimen for
Neonates from Birth to Six Weeks of Age. Presented at: ACoP 2016. Seattle, USA. J PKPD (2016) 43:S11–S122 T33
Conclusions: The dramatic increase in raltegravir clearance as the result of UGT-1A1 enzyme
activity in neonates requires 2 dose changes over the first 6 weeks of life to meet efficacy and
safety PK criteria.
AU
C [u
M.h
r[
Ctrough, AUC0-24 (QD dosing) and AUC0-12 (BID) profiles for a typical neonate during a 6-week raltegravir dosing regimen
📧
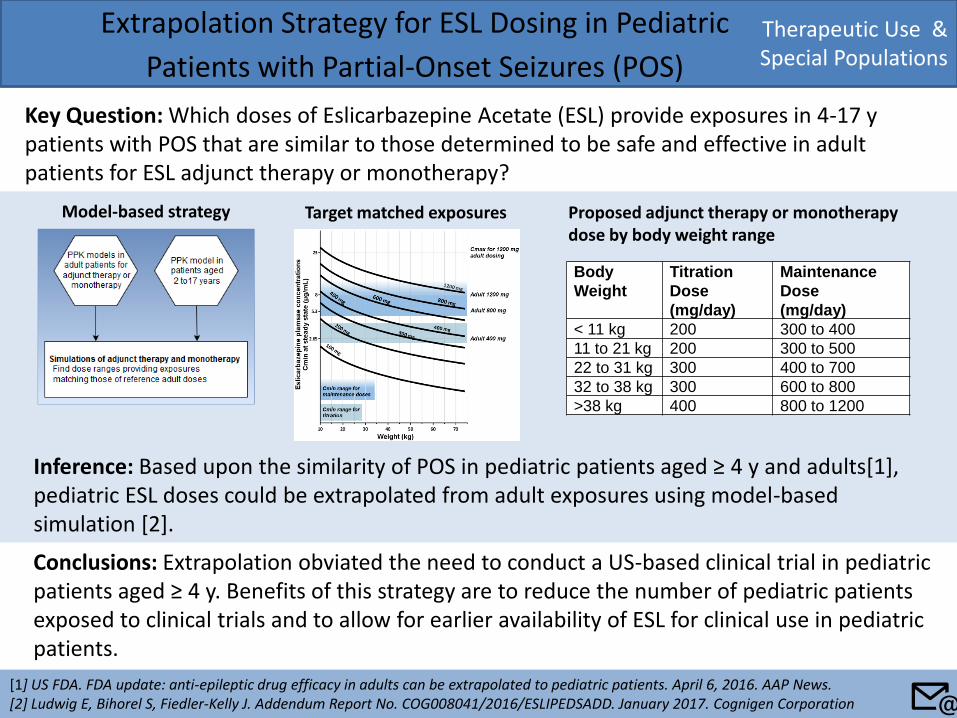
Therapeutic Use & Special Populations
Extrapolation Strategy for ESL Dosing in Pediatric
Patients with Partial-Onset Seizures (POS)
Key Question: Which doses of Eslicarbazepine Acetate (ESL) provide exposures in 4-17 y patients with POS that are similar to those determined to be safe and effective in adult patients for ESL adjunct therapy or monotherapy?
[1] US FDA. FDA update: anti-epileptic drug efficacy in adults can be extrapolated to pediatric patients. April 6, 2016. AAP News. [2] Ludwig E, Bihorel S, Fiedler-Kelly J. Addendum Report No. COG008041/2016/ESLIPEDSADD. January 2017. Cognigen Corporation
Conclusions: Extrapolation obviated the need to conduct a US-based clinical trial in pediatric patients aged ≥ 4 y. Benefits of this strategy are to reduce the number of pediatric patients exposed to clinical trials and to allow for earlier availability of ESL for clinical use in pediatric patients.
Inference: Based upon the similarity of POS in pediatric patients aged ≥ 4 y and adults[1], pediatric ESL doses could be extrapolated from adult exposures using model-based simulation [2].
Body
Weight
Titration
Dose
(mg/day)
Maintenance
Dose
(mg/day)
< 11 kg 200 300 to 400
11 to 21 kg 200 300 to 500
22 to 31 kg 300 400 to 700
32 to 38 kg 300 600 to 800
>38 kg 400 800 to 1200
Target matched exposures Proposed adjunct therapy or monotherapy dose by body weight range
📧
Model-based strategy
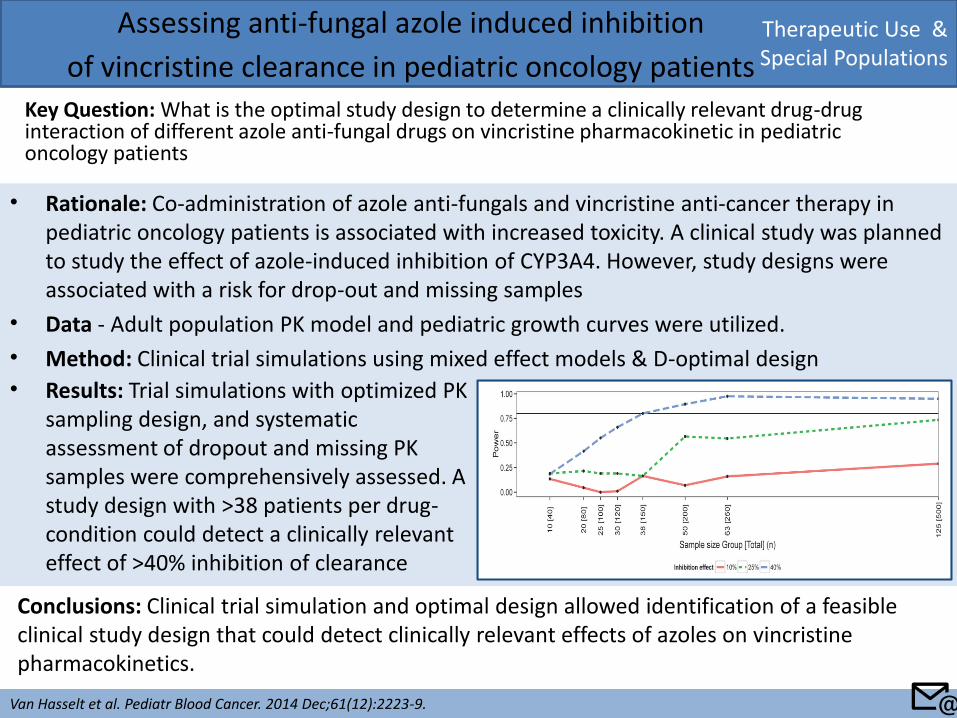
• Rationale: Co-administration of azole anti-fungals and vincristine anti-cancer therapy in pediatric oncology patients is associated with increased toxicity. A clinical study was planned to study the effect of azole-induced inhibition of CYP3A4. However, study designs were associated with a risk for drop-out and missing samples
• Data - Adult population PK model and pediatric growth curves were utilized.
• Method: Clinical trial simulations using mixed effect models & D-optimal design
Therapeutic Use & Special Populations
Assessing anti-fungal azole induced inhibition
of vincristine clearance in pediatric oncology patients Key Question: What is the optimal study design to determine a clinically relevant drug-drug interaction of different azole anti-fungal drugs on vincristine pharmacokinetic in pediatric oncology patients
Van Hasselt et al. Pediatr Blood Cancer. 2014 Dec;61(12):2223-9.
Conclusions: Clinical trial simulation and optimal design allowed identification of a feasible clinical study design that could detect clinically relevant effects of azoles on vincristine pharmacokinetics.
• Results: Trial simulations with optimized PK sampling design, and systematic assessment of dropout and missing PK samples were comprehensively assessed. A study design with >38 patients per drug-condition could detect a clinically relevant effect of >40% inhibition of clearance
📧
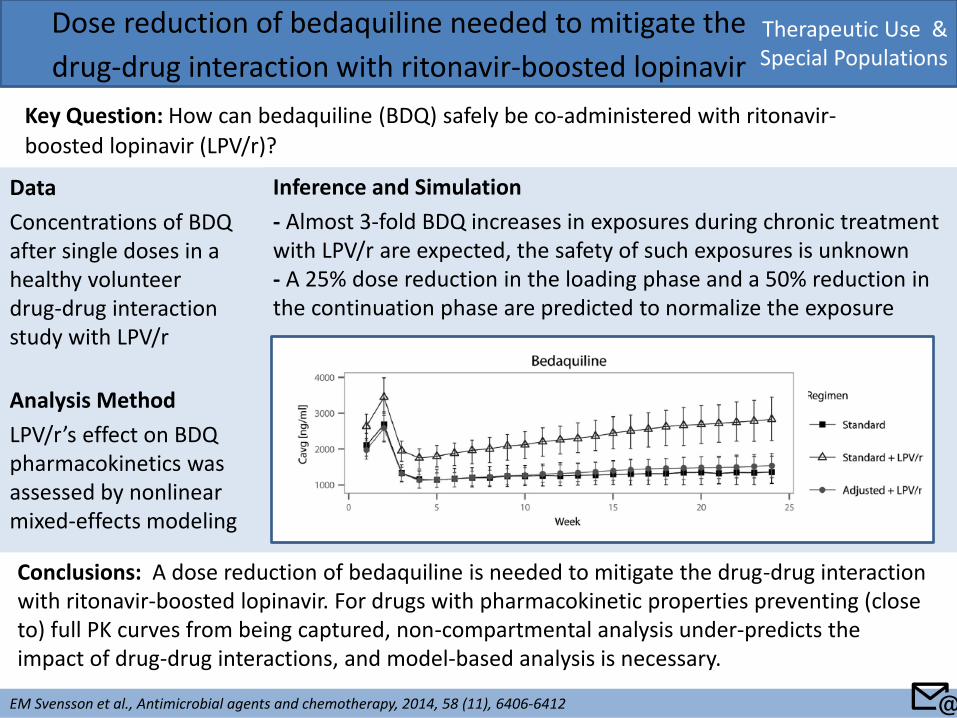
Data
Concentrations of BDQ after single doses in a healthy volunteer drug-drug interaction study with LPV/r
Analysis Method
LPV/r’s effect on BDQ pharmacokinetics was assessed by nonlinear mixed-effects modeling
Therapeutic Use & Special Populations
Dose reduction of bedaquiline needed to mitigate the
drug-drug interaction with ritonavir-boosted lopinavir
Key Question: How can bedaquiline (BDQ) safely be co-administered with ritonavir-
boosted lopinavir (LPV/r)?
EM Svensson et al., Antimicrobial agents and chemotherapy, 2014, 58 (11), 6406-6412
Conclusions: A dose reduction of bedaquiline is needed to mitigate the drug-drug interaction with ritonavir-boosted lopinavir. For drugs with pharmacokinetic properties preventing (close to) full PK curves from being captured, non-compartmental analysis under-predicts the impact of drug-drug interactions, and model-based analysis is necessary.
Inference and Simulation
- Almost 3-fold BDQ increases in exposures during chronic treatment with LPV/r are expected, the safety of such exposures is unknown - A 25% dose reduction in the loading phase and a 50% reduction in the continuation phase are predicted to normalize the exposure
📧
Therapeutic Use & Special Populations
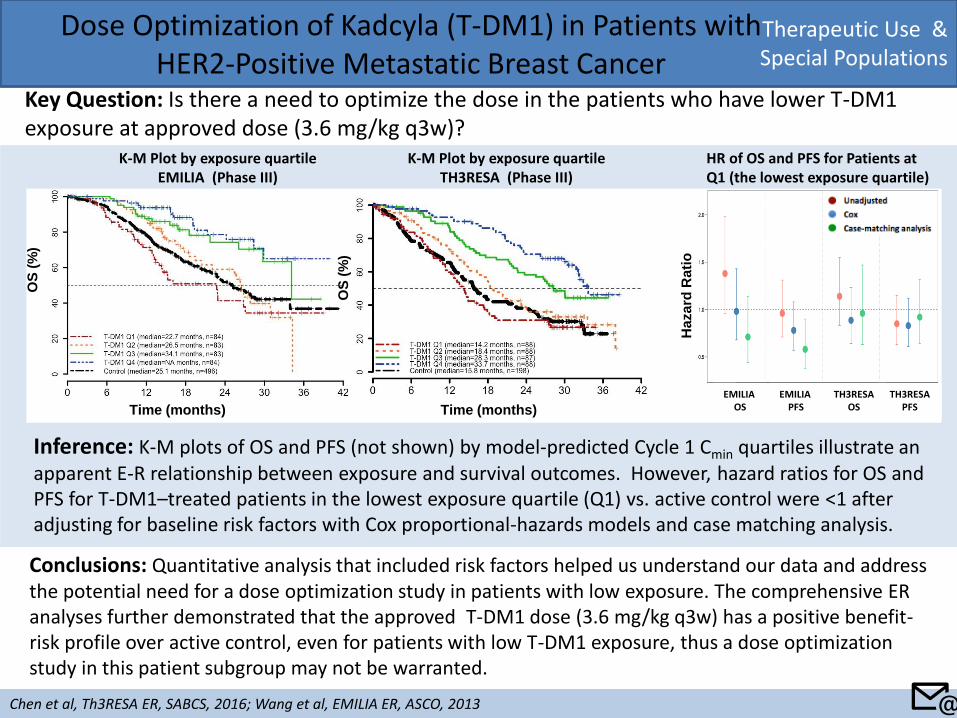
Dose Optimization of Kadcyla (T-DM1) in Patients with HER2-Positive Metastatic Breast Cancer
Key Question: Is there a need to optimize the dose in the patients who have lower T-DM1 exposure at approved dose (3.6 mg/kg q3w)?
Chen et al, Th3RESA ER, SABCS, 2016; Wang et al, EMILIA ER, ASCO, 2013
Conclusions: Quantitative analysis that included risk factors helped us understand our data and address the potential need for a dose optimization study in patients with low exposure. The comprehensive ER analyses further demonstrated that the approved T-DM1 dose (3.6 mg/kg q3w) has a positive benefit-risk profile over active control, even for patients with low T-DM1 exposure, thus a dose optimization study in this patient subgroup may not be warranted.
Inference: K-M plots of OS and PFS (not shown) by model-predicted Cycle 1 Cmin quartiles illustrate an apparent E-R relationship between exposure and survival outcomes. However, hazard ratios for OS and PFS for T-DM1–treated patients in the lowest exposure quartile (Q1) vs. active control were <1 after adjusting for baseline risk factors with Cox proportional-hazards models and case matching analysis.
K-M Plot by exposure quartile EMILIA (Phase III)
OS
(%
)
Time (months)
K-M Plot by exposure quartile TH3RESA (Phase III)
HR of OS and PFS for Patients at Q1 (the lowest exposure quartile)
Time (months)
OS
(%
)
Ha
za
rd R
ati
o
📧
EMILIA OS
EMILIA PFS
TH3RESA OS
TH3RESA PFS
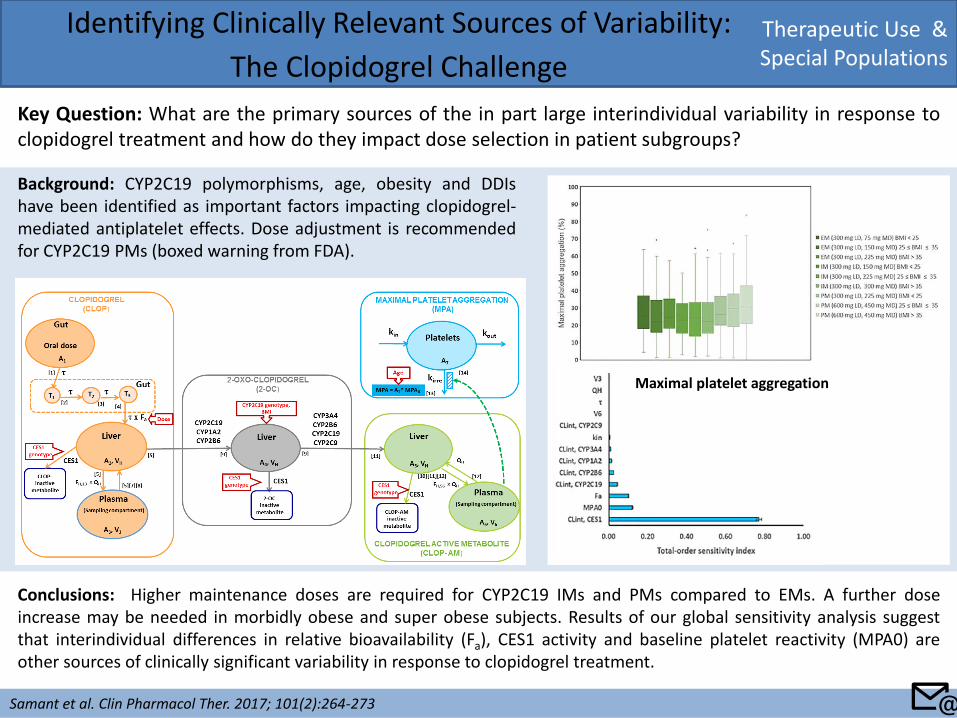
Therapeutic Use & Special Populations
Identifying Clinically Relevant Sources of Variability:
The Clopidogrel Challenge
Key Question: What are the primary sources of the in part large interindividual variability in response to clopidogrel treatment and how do they impact dose selection in patient subgroups?
Samant et al. Clin Pharmacol Ther. 2017; 101(2):264-273
Conclusions: Higher maintenance doses are required for CYP2C19 IMs and PMs compared to EMs. A further dose increase may be needed in morbidly obese and super obese subjects. Results of our global sensitivity analysis suggest that interindividual differences in relative bioavailability (Fa), CES1 activity and baseline platelet reactivity (MPA0) are other sources of clinically significant variability in response to clopidogrel treatment.
Maximal platelet aggregation
Background: CYP2C19 polymorphisms, age, obesity and DDIs have been identified as important factors impacting clopidogrel-mediated antiplatelet effects. Dose adjustment is recommended for CYP2C19 PMs (boxed warning from FDA).
📧
Quantitative Pharmacology Influence and Impact Initiative 2017
Back to: Table of Content
Key Application Sub-areas
Key Application Area
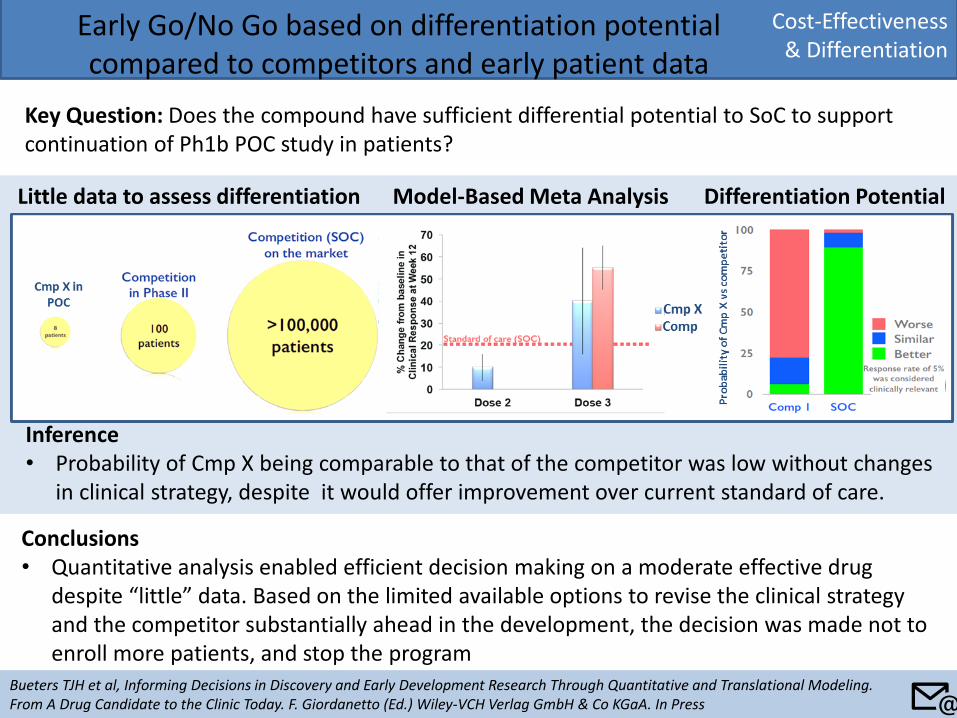
Cost-Effectiveness & Differentiation
Early Go/No Go based on differentiation potential compared to competitors and early patient data
Key Question: Does the compound have sufficient differential potential to SoC to support continuation of Ph1b POC study in patients?
Bueters TJH et al, Informing Decisions in Discovery and Early Development Research Through Quantitative and Translational Modeling. From A Drug Candidate to the Clinic Today. F. Giordanetto (Ed.) Wiley-VCH Verlag GmbH & Co KGaA. In Press
Conclusions • Quantitative analysis enabled efficient decision making on a moderate effective drug
despite “little” data. Based on the limited available options to revise the clinical strategy and the competitor substantially ahead in the development, the decision was made not to enroll more patients, and stop the program
Little data to assess differentiation Model-Based Meta Analysis Differentiation Potential
Inference • Probability of Cmp X being comparable to that of the competitor was low without changes
in clinical strategy, despite it would offer improvement over current standard of care.
📧
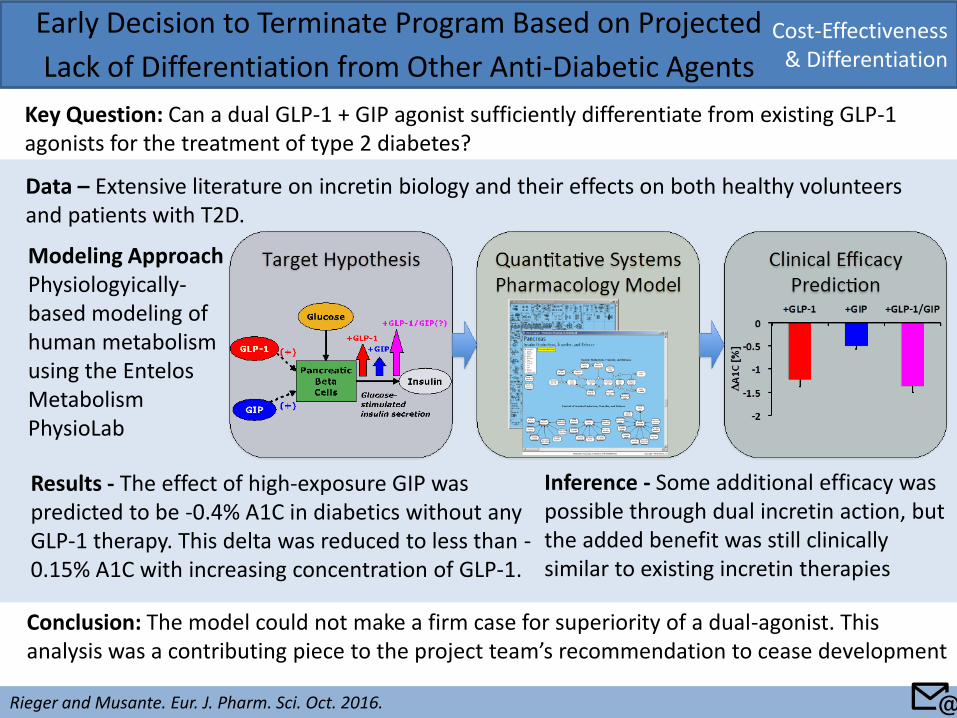
Cost-Effectiveness & Differentiation
Early Decision to Terminate Program Based on Projected
Lack of Differentiation from Other Anti-Diabetic Agents
Key Question: Can a dual GLP-1 + GIP agonist sufficiently differentiate from existing GLP-1 agonists for the treatment of type 2 diabetes?
Rieger and Musante. Eur. J. Pharm. Sci. Oct. 2016.
Modeling Approach Physiologyically-based modeling of human metabolism using the Entelos Metabolism PhysioLab
Conclusion: The model could not make a firm case for superiority of a dual-agonist. This analysis was a contributing piece to the project team’s recommendation to cease development
Inference - Some additional efficacy was possible through dual incretin action, but the added benefit was still clinically similar to existing incretin therapies
Results - The effect of high-exposure GIP was predicted to be -0.4% A1C in diabetics without any GLP-1 therapy. This delta was reduced to less than -0.15% A1C with increasing concentration of GLP-1.
Data – Extensive literature on incretin biology and their effects on both healthy volunteers and patients with T2D.
📧
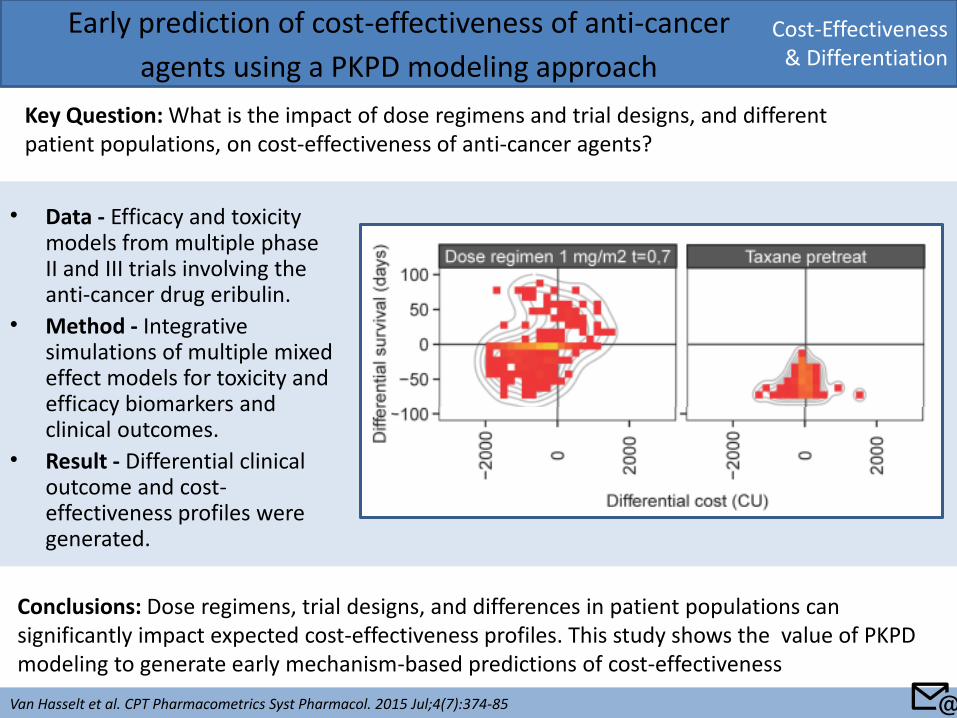
• Data - Efficacy and toxicity models from multiple phase II and III trials involving the anti-cancer drug eribulin.
• Method - Integrative simulations of multiple mixed effect models for toxicity and efficacy biomarkers and clinical outcomes.
• Result - Differential clinical outcome and cost-effectiveness profiles were generated.
Cost-Effectiveness & Differentiation
Early prediction of cost-effectiveness of anti-cancer
agents using a PKPD modeling approach
Key Question: What is the impact of dose regimens and trial designs, and different patient populations, on cost-effectiveness of anti-cancer agents?
Van Hasselt et al. CPT Pharmacometrics Syst Pharmacol. 2015 Jul;4(7):374-85
Conclusions: Dose regimens, trial designs, and differences in patient populations can significantly impact expected cost-effectiveness profiles. This study shows the value of PKPD modeling to generate early mechanism-based predictions of cost-effectiveness
📧
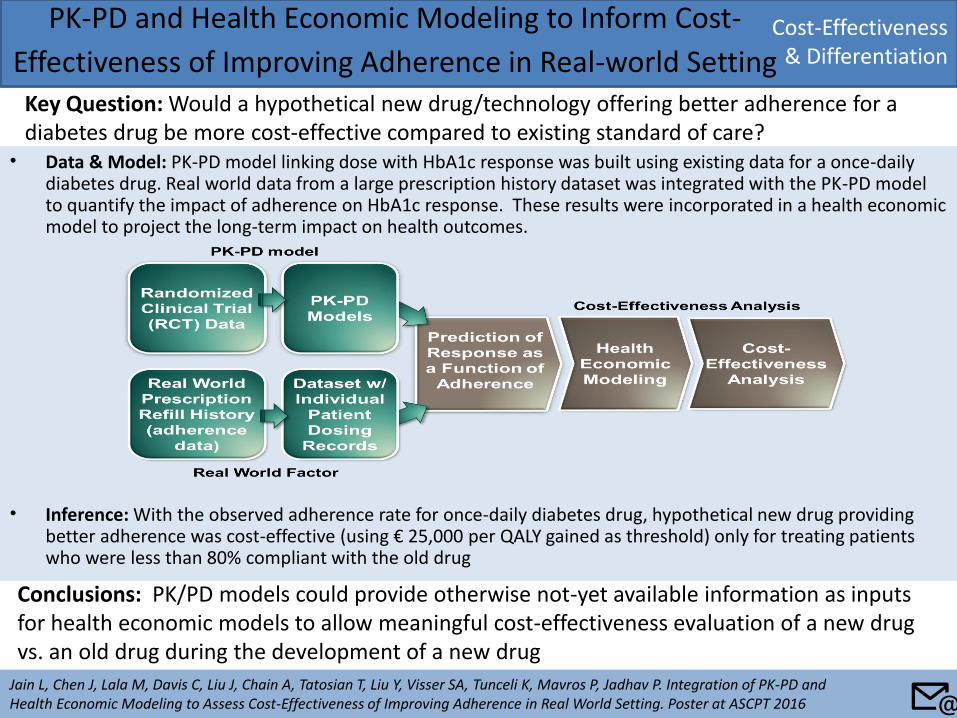
• Data & Model: PK-PD model linking dose with HbA1c response was built using existing data for a once-daily diabetes drug. Real world data from a large prescription history dataset was integrated with the PK-PD model to quantify the impact of adherence on HbA1c response. These results were incorporated in a health economic model to project the long-term impact on health outcomes.
• Inference: With the observed adherence rate for once-daily diabetes drug, hypothetical new drug providing better adherence was cost-effective (using € 25,000 per QALY gained as threshold) only for treating patients who were less than 80% compliant with the old drug
PK-PD and Health Economic Modeling to Inform Cost-
Effectiveness of Improving Adherence in Real-world Setting Key Question: Would a hypothetical new drug/technology offering better adherence for a diabetes drug be more cost-effective compared to existing standard of care?
Jain L, Chen J, Lala M, Davis C, Liu J, Chain A, Tatosian T, Liu Y, Visser SA, Tunceli K, Mavros P, Jadhav P. Integration of PK-PD and Health Economic Modeling to Assess Cost-Effectiveness of Improving Adherence in Real World Setting. Poster at ASCPT 2016
Conclusions: PK/PD models could provide otherwise not-yet available information as inputs for health economic models to allow meaningful cost-effectiveness evaluation of a new drug vs. an old drug during the development of a new drug
Cost-Effectiveness & Differentiation
📧