quantitative ftir analysis of gas phase cigarette smoke
TRANSCRIPT
Louisiana State UniversityLSU Digital Commons
LSU Historical Dissertations and Theses Graduate School
1990
Quantitative FTIR Analysis of Gas Phase CigaretteSmoke.Rafael CuetoLouisiana State University and Agricultural & Mechanical College
Follow this and additional works at: https://digitalcommons.lsu.edu/gradschool_disstheses
This Dissertation is brought to you for free and open access by the Graduate School at LSU Digital Commons. It has been accepted for inclusion inLSU Historical Dissertations and Theses by an authorized administrator of LSU Digital Commons. For more information, please [email protected].
Recommended CitationCueto, Rafael, "Quantitative FTIR Analysis of Gas Phase Cigarette Smoke." (1990). LSU Historical Dissertations and Theses. 5042.https://digitalcommons.lsu.edu/gradschool_disstheses/5042
UMIMICROFILMED 1991
Reproduced with permission of the copyright owner. Further reproduction prohibited without permission.t
INFORMATION TO USERS
This manuscript has been reproduced from the microfilm master. UMI films the text directly from the original or copy submitted. Thus, some thesis and dissertation copies are in typewriter face, while others may be from any type of computer printer.
The quality of this reproduction is dependent upon the quality of the copy submitted. Broken or indistinct print, colored or poor quality illustrations and photographs, print bleedthrough, substandard margins, and improper alignment can adversely affect reproduction.
In the unlikely event that the author did not send UMI a complete manuscript and there are missing pages, these will be noted. Also, if unauthorized copyright material had to be removed, a note will indicate the deletion.
Oversize materials (e.g., maps, drawings, charts) are reproduced by sectioning the original, beginning at the upper left-hand comer and continuing from left to right in equal sections with small overlaps. Each original is also photographed in one exposure and is included in reduced form at the back of the book.
Photographs included in the original manuscript have been reproduced xerographically in this copy. Higher quality 6” x 9" black and white photographic prints are available for any photographs or illustrations appearing in this copy for an additional charge. Contact UMI directly to order.
University Microfilms International A Bell & Howell Information Company
300 North Zeeb Road. Ann Arbor. Ml -16106-1346 USA 313/761-4700 800/521-0600
Reproduced with permission of the copyright owner. Further reproduction prohibited without permission.

Reproduced with permission of the copyright owner. Further reproduction prohibited without permission.
Order Number 0123185
Q uantitative F T U t analysis of gas phase cigarette smoke
Cueto, Rafael, Ph.D .
The Louisiana State University and Agricultural and Mechanical CoL, 1990
UMI3CG N. Zeeb Rd.Ann Aifoor. M I 48106
Reproduced with permission of the copyright owner. Further reproduction prohibited without permission.

Reproduced with permission of the copyright owner. Further reproduction prohibited without permission.
QUANTITATIVE FTIR ANALYSIS OF GAS PHASE CIGARETTE SMOKE
A dissertation
Submitted to the Graduate Faculty of the Louisiana State University and
Agricultural and Mechanical College in partial fulfillment of the requirements for the degree of
Doctor of Philosophy
in
The Department of Chemistry
byRafael Cueto
B.S., Universidad Nacional de Colombia, 1981 December 1990
Reproduced with permission of the copyright owner. Further reproduction prohibited without permission.
ACKNOWLEDGEMENT I would like to thank Dr. William A. Pryor for guiding
my research, and supporting me ur.til the end. Dr. D.F.Church for many helpful suggestions and advice, Susan Finley for all the help outside of the laboratory, my committee, Drs. R. Gale, A. Maverick, M. Barkley, and J. Robinson for reading and providing suggestions to make this work stronger, Dr. Pryors's group members for making my life more pleasant and my work easier.
I am also grateful to the Fullbright commission who made it possible for me to start my graduate education, and the National Foundation for Cancer Research and the National Institute of Health for financial support.
ii
Reproduced with permission of the copyright owner. Further reproduction prohibited without permission.
TABLE OF CONTENTS
ACKNOWLEDGEMENT....................................... ii
TABLE OF CONTENTS................................... iii
LIST OF T A B L E S ..................................... vii
LIST OF FIGURES..................................... viii
LIST OF ABBREVIATIONS.............................. xiii
A B S T R A C T ........................................... Xiv
INTRODUCTION ......................................... 1GAS PHASE CIGARETTE SMOKE CHEMISTRY............ 1NOx DETERMINATION TECHNIQUES .................... 3FTIR ADVANTAGES................................. 6OBJECTIVES ....................................... 7
MATERIALS AND EQUIPMENT .............................. 9G A S E S ........................................... 9LIQUIDS AND SOLIDS..... .......................... 9CIGARETTES ....................................... 9FOURIER TRANSFORM INFRARED SPECTROMETER ......... 10
iii
Reproduced with permission of the copyright owner. Further reproduction prohibited without permission.
GAS CHROMATOGRAPHY............................... 10MASS FLOW CONTROLLERS........................... 10
EXPERIMENTAL......................................... 11FTIR CONDITIONS................................. 11GAS C E L L ......................................... 12
Coating of gas-cell windows ................ 12GAS MIXTURES..................................... 14
Nitric oxide ............................... 18Organic components (Isoprene, acrolein,
acetaldehyde, or methanol) ............ 18M i x i n g ..................................... 19A g e i n g ..................................... 19
CALIBRATION..................................... 19PROCEDURE FOR SMOKING CIGARETTES ................ 20KINETIC R U N S ..................................... 21
Preliminary operations..................... 21Gas m i x t u r e s ............................... 21Cigarette smoke ............................. 23Kinetic calculations ....................... 23
RESULTS............................................... 24SELECTION OF FTIR CONDITIONS..................... 24
Resolution................................. 24Number of scans............................. 24
iv
Reproduced with permission of the copyright owner. Further reproduction prohibited without permission.
CALIBRATION.................................... 27Selection of frequencies .................. 27Calibration method ........................ 32Extinction coefficients for NO and N0Z . . . 35
CALCULATION OF CONCENTRATIONS IN CIGARETTE SMOKE . 35Concentration units ........................ 35Concentrations of N0Z in cigarette smoke . . 36
FTIR STUDY OF CIGARETTE S M O K E .................. 37Differential spectral kinetic profiles . . . 37Comparison of continuous flow and puff
protocols............................ 39KINETIC D A T A ..................................... 43
Kinetic profiles .......................... 43Other systems.............................. 47Rate constants............................ 55
PRODUCT ANALYSIS................................ 57
DISCUSSION........................................... 60GAS MIXTURES..................................... 60CONCENTRATION VALUES IN CIGARETTE S M O K E ........ 60KINETIC STUDIES ................................ 61
Study of profiles for NO disappearance, andN02 appearance and disappearance . . . . 61
NO in a i r .................................. 62NO/air/isoprene s y s t e m .......... 62NO/air/methanol ............................ 63
v
Reproduced with permission of the copyright owner. Further reproduction prohibited without permission.
NO/air/methanol/is opr e n e .................. 64Other m o d e l s ............................... 65Rate constants............................. 65Comparison of kinetic profiles with original
m o d e l ................................. 66
CONCLUSIONS........................................... 68
REFERENCES........................................... 69
V I T A ................................................. 87
Vi
Reproduced with permission of the copyright owner. Further reproduction prohibited without permission.
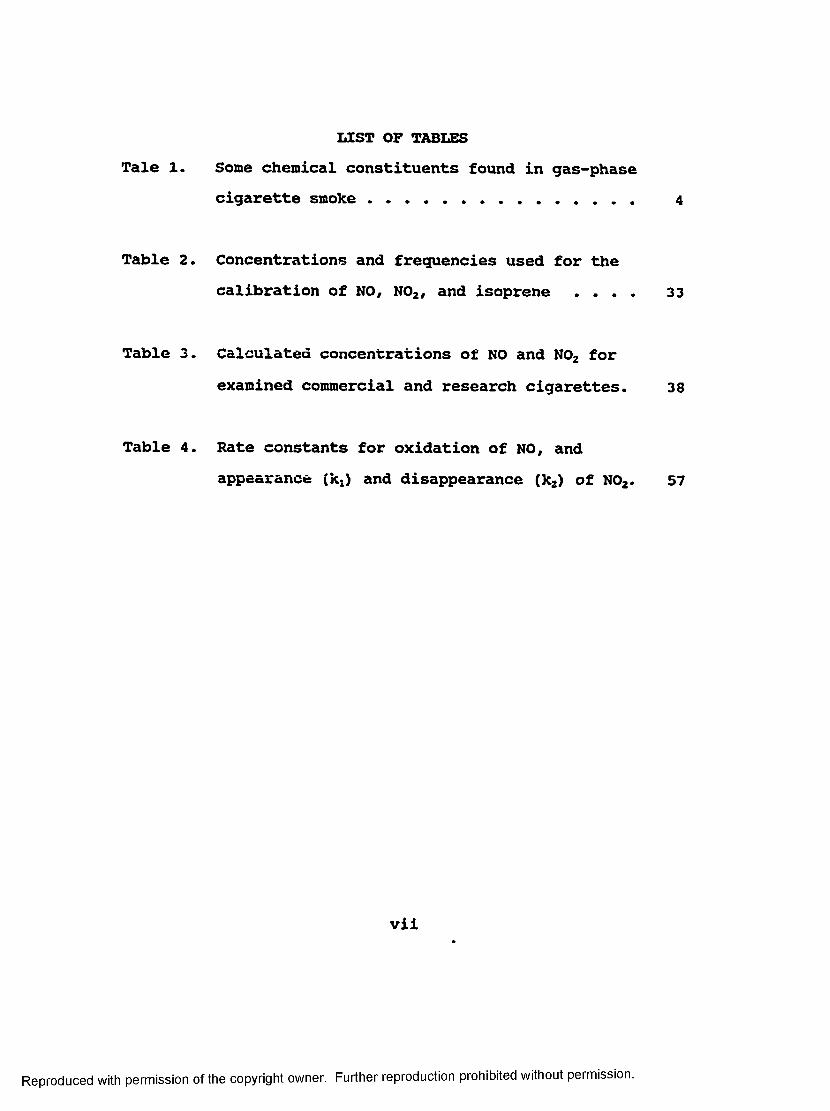
LIST OF TABLESTale 1. Some chemical constituents found in gas-phase
cigarette smoke ............................. 4
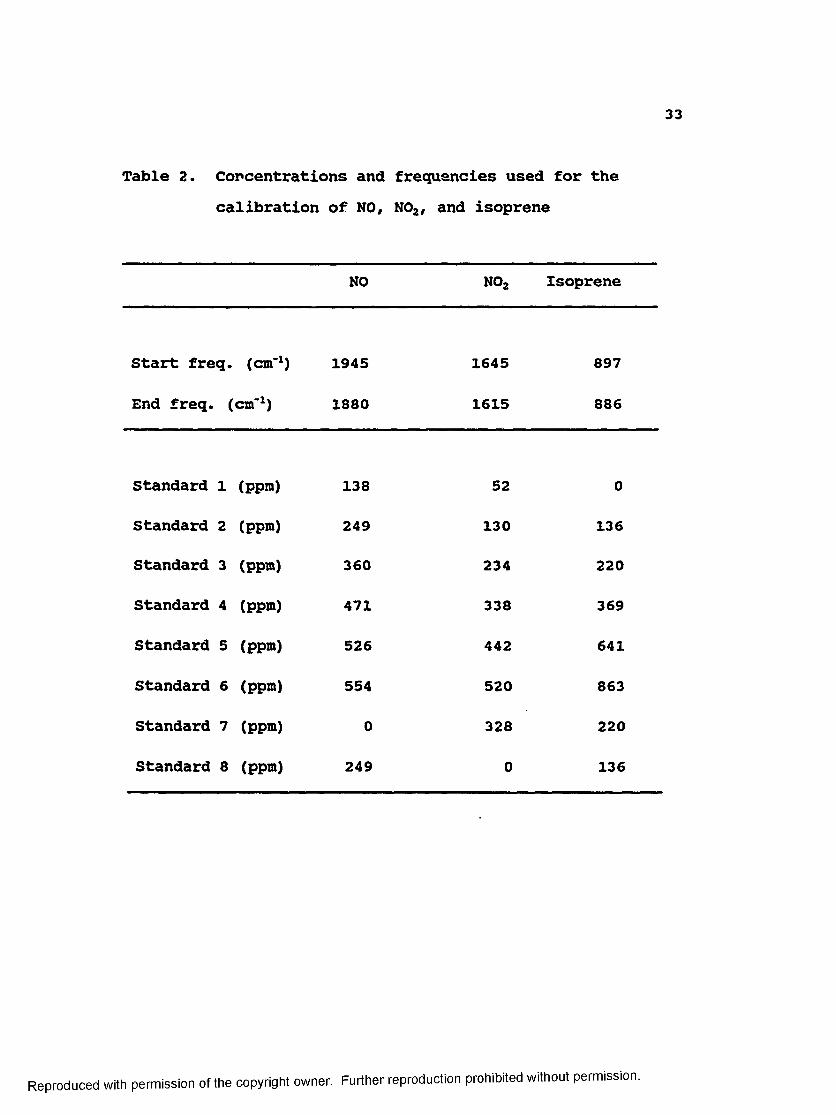
Table 2. Concentrations and frequencies used for thecalibration of NO, N02, and isoprene . . . . 33
Table 3. Calculated concentrations of NO and N02 forexamined commercial and research cigarettes. 38
Table 4. Rate constants for oxidation of NO, andappearance (kx) and disappearance (k2) of N02. 57
vii
Reproduced with permission of the copyright owner. Further reproduction prohibited without permission.
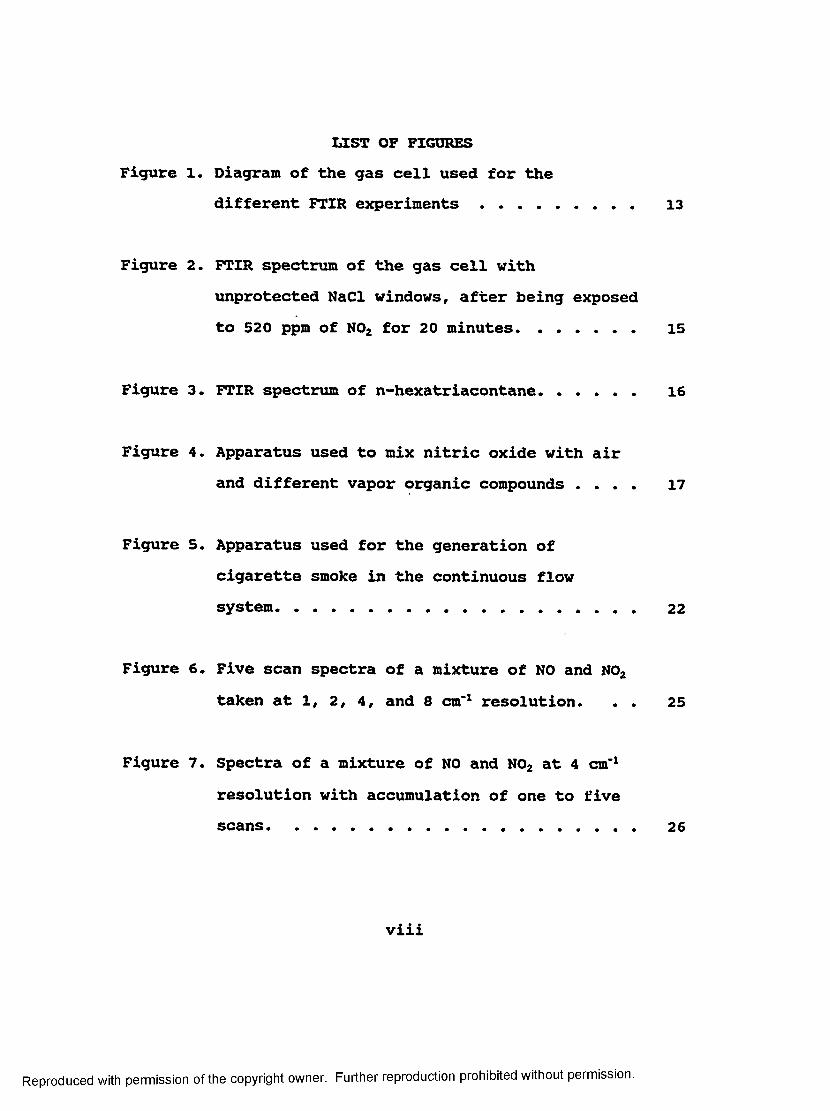
LIST OF FIGURESFigure 1. Diagram of the gas cell used for the
different FTIR experiments ................ 13
Figure 2. FTIR spectrum of the gas cell withunprotected NaCl windows, after being exposed to 520 ppm of N02 for 20 minutes............. 15
Figure 3. FTIR spectrum of n**hexatriacontane.......... 16
Figure 4. Apparatus used to mix nitric oxide with airand different vapor organic compounds . . . . 17
Figure 5. Apparatus used for the generation ofcigarette smoke in the continuous flowsystem....................................... 22
Figure 6. Five scan spectra of a mixture of NO and N02taken at 1, 2, 4, and 8 cm"1 resolution. . . 25
Figure 7. Spectra of a mixture of NO and N02 at 4 cm'1resolution with accumulation of one to five scans........................................ 26
viii
Reproduced with permission of the copyright owner. Further reproduction prohibited without permission.
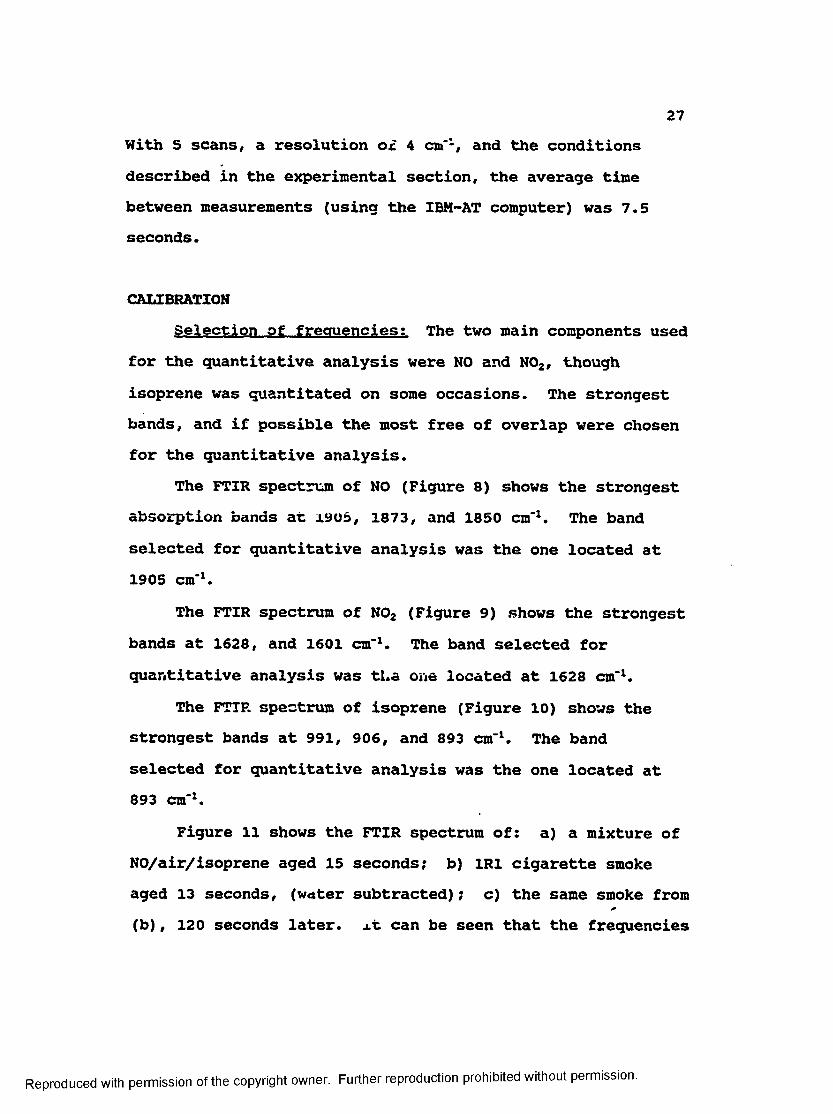
Figure 8. FTIR spectrum of nitric oxide taken with 5scans, at 4 cm'1 resolution................ 28
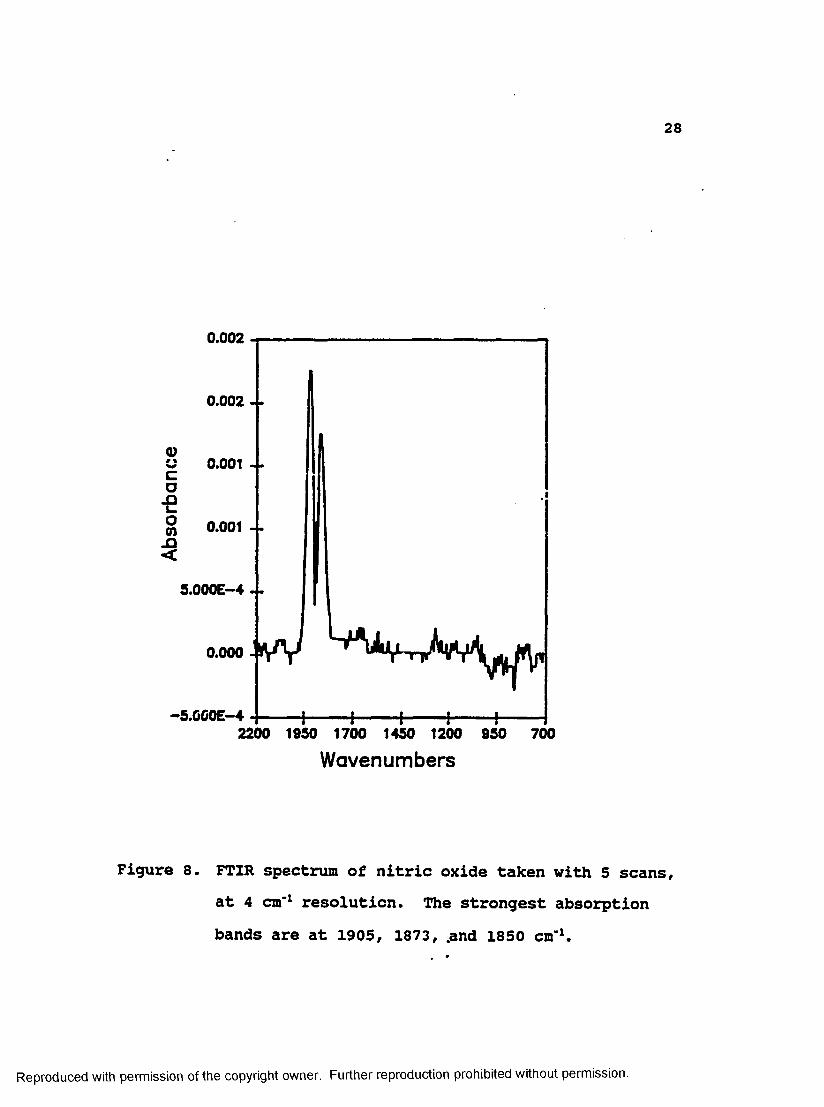
Figure 9. FTIR spectrum of nitrogen dioxide taken with5 scans, at 4 cm'1 resolution.............. 29
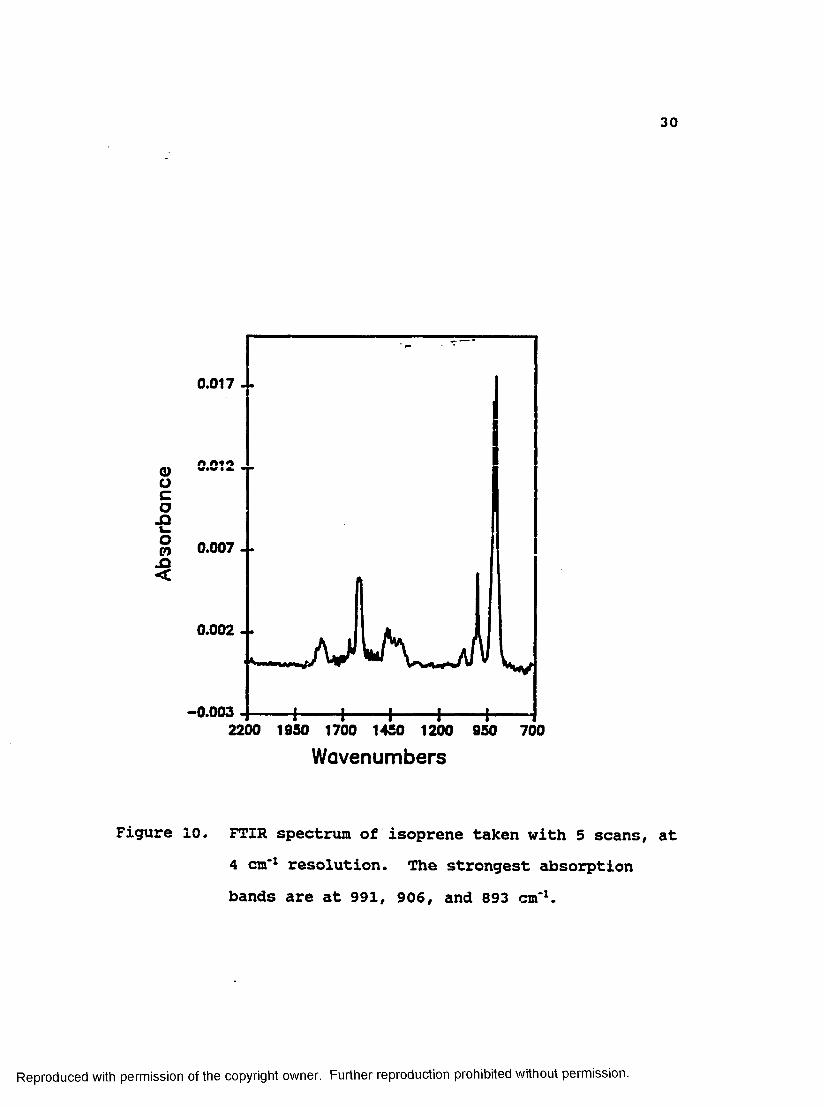
Figure 10. FTIR spectrum of isoprene taken with 5scans, at 4 cm'1 resolution .......... 30
Figure 11. A: FTIR spectrum of a mixture of NO(700 ppm), air, and isoprene (450 ppm), aged 15 seconds.
B: FTIR spectrum of 1R1 cigarette smokeaged 13 seconds.
C: FTIR spectrum of 1R1 cigarette smokeaged 133 seconds.................. 31
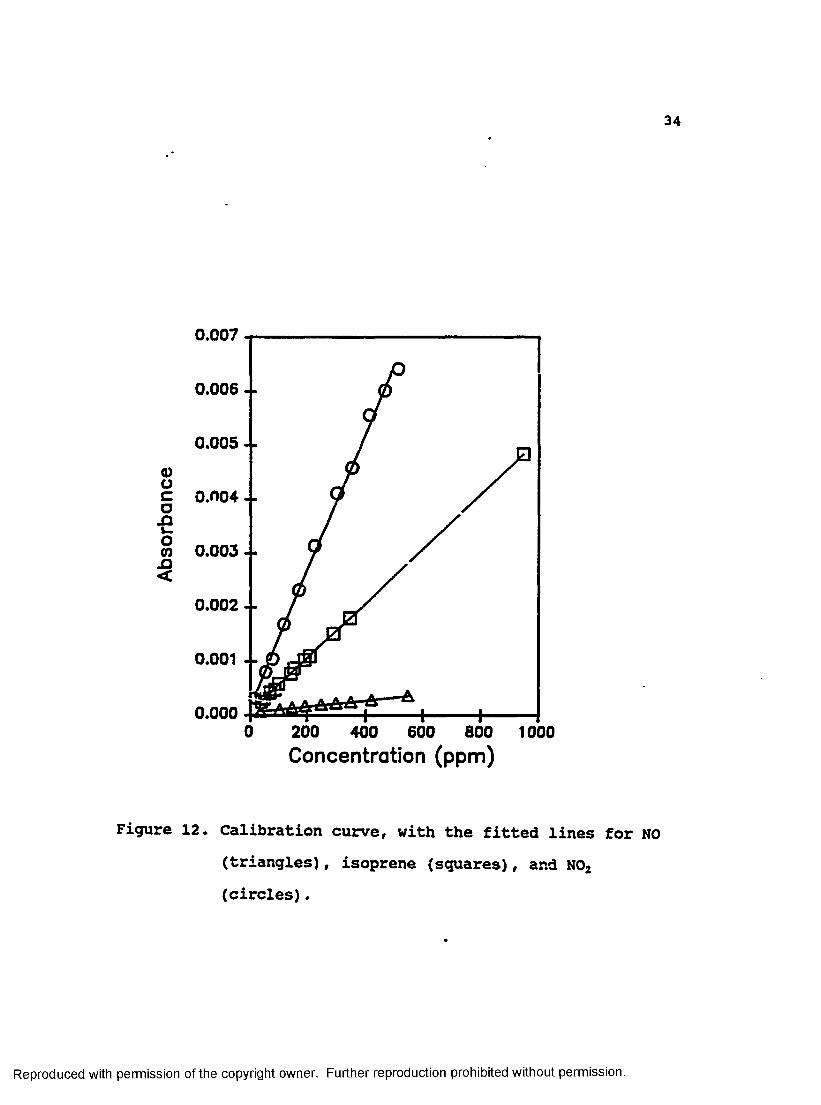
Figure 12. Calibration curve, with the fitted linesfor NO, isoprene, and N02 .............. 34
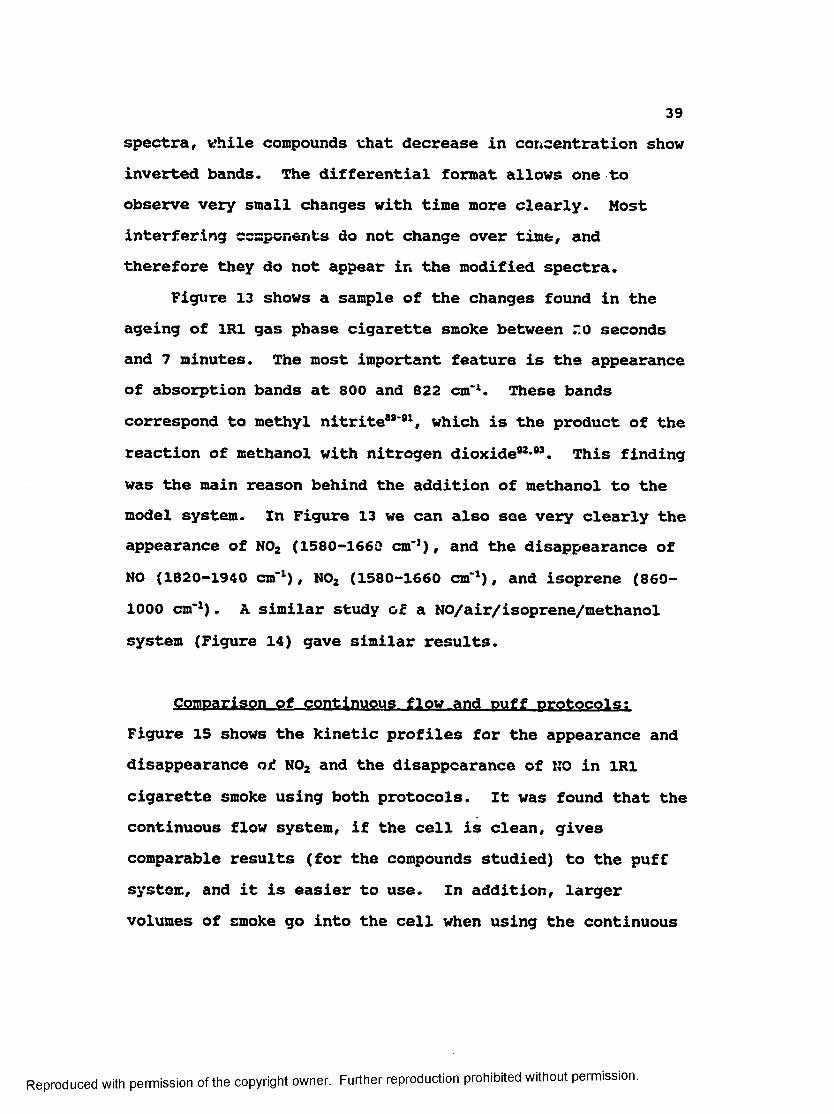
Figure 13. Differential spectral kinetic profilesof 1R1 gas phase cigarette smoke between 20 seconds and 7 minutes............... 40
ix
Reproduced with permission of the copyright owner. Further reproduction prohibited without permission.
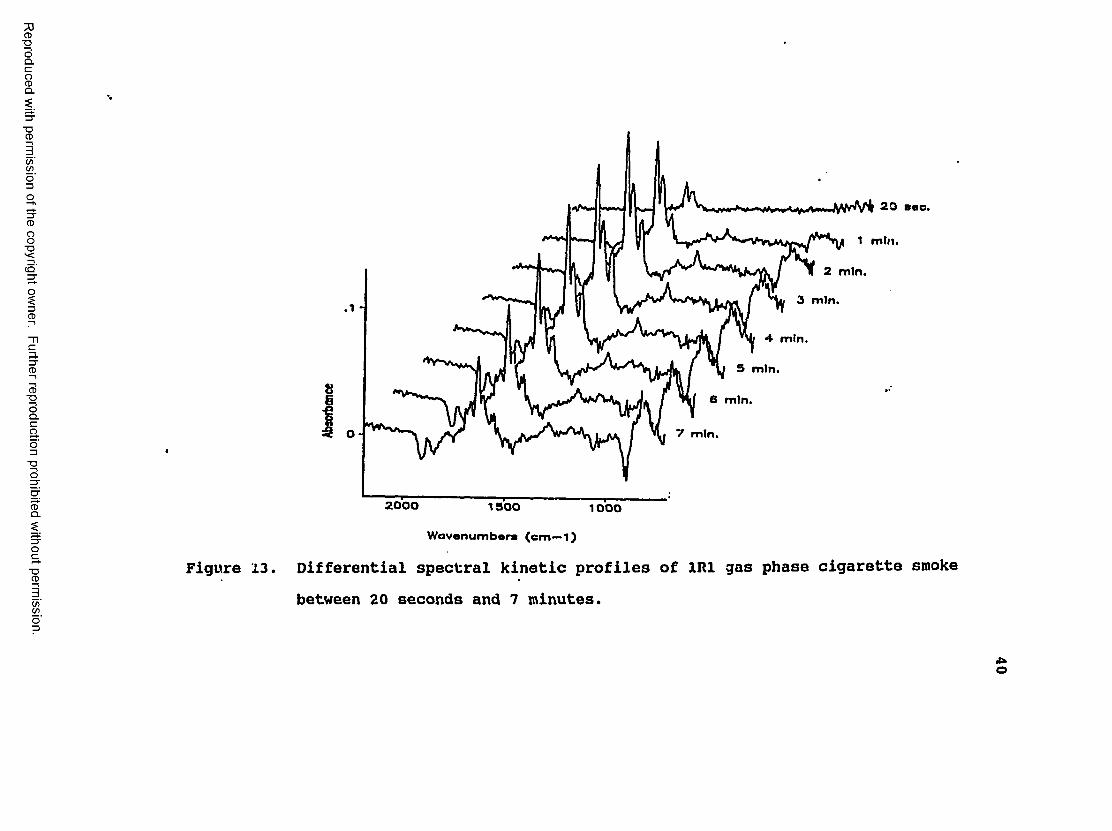
Figure 14. Differential spectral kinetic profiles of NO/air/methanol/isoprene between 20 seconds and 7 minutes.................. 41
Figure 15.
Figure 16.
Figure 17.
Figure 18.
Comnari nf t*ho nrof’ 1 «*•. for the appearance and disappearance of N02, and the disappearance of NO in 1R1 cigarette smoke using the puff protocol and the continuous flow systems................ 42
Profiled tor’ the appearance and disappearance of N02 and the disappearance of NO in 1R1 cigarette smoke. Crosses represent measurements made with a clean cell; triangles represent measurements made with a "dirty" cell............................ 44
Profiles for the appearance of N02 (open circles), and disappearance of NO (filled circles) in 1R1 gas phase cigarette smoke......................... 45
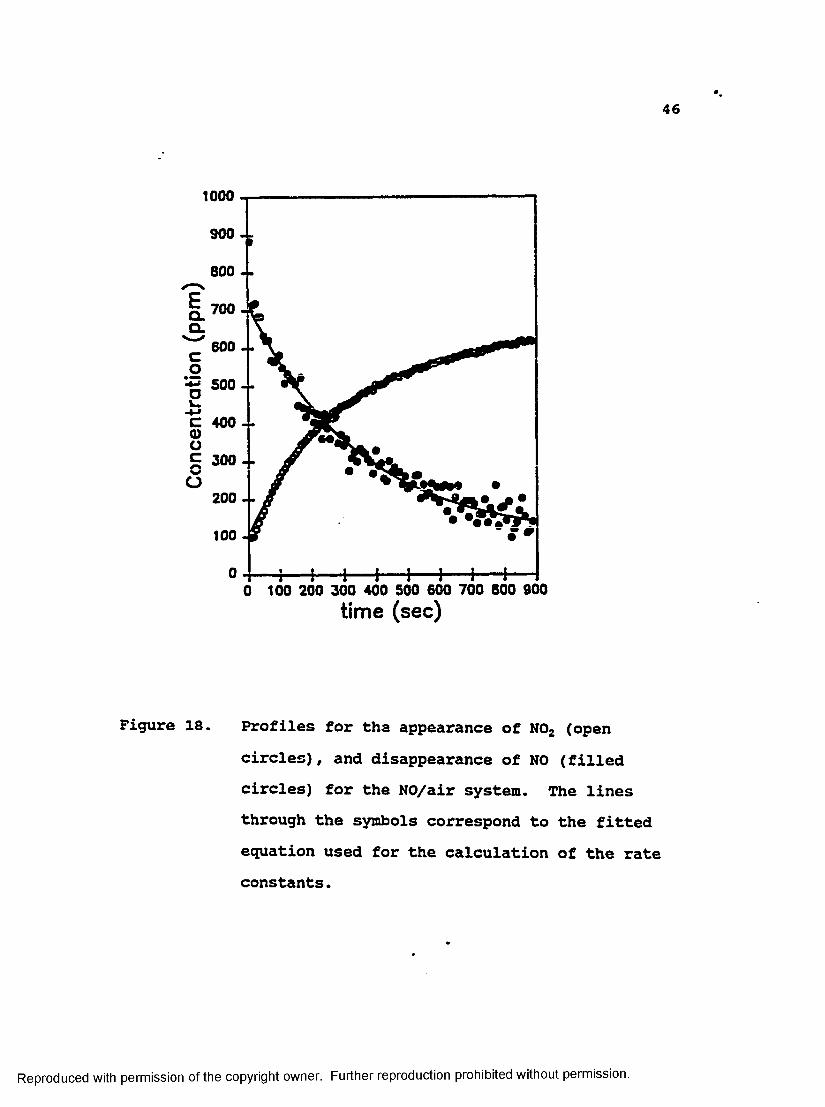
Profiles for the appearance of N02 anddisappearance of NO for the NO/airsystem.................................. 46
x
Reproduced with permission of the copyright owner. Further reproduction prohibited without permission.
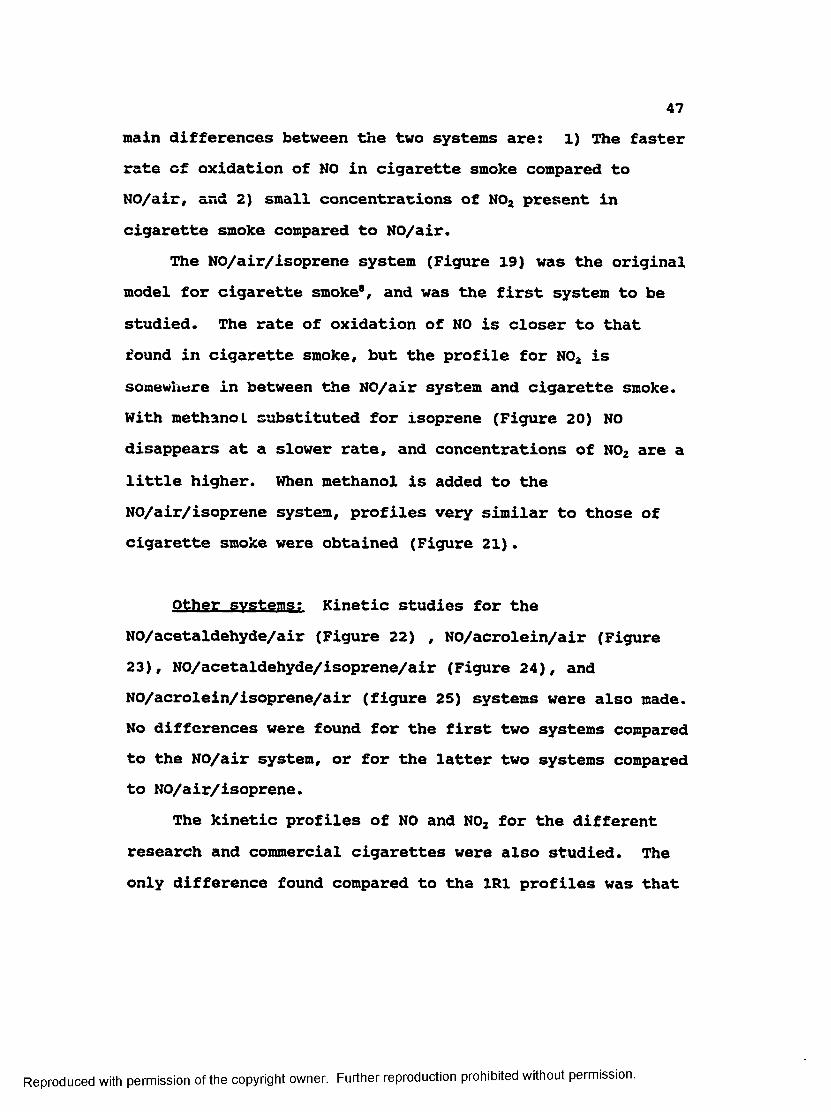
Figure 19, Profiles for the appearance and disappearance of N02 and the disappearance of NO in the NO/air/isoprene system......... 48
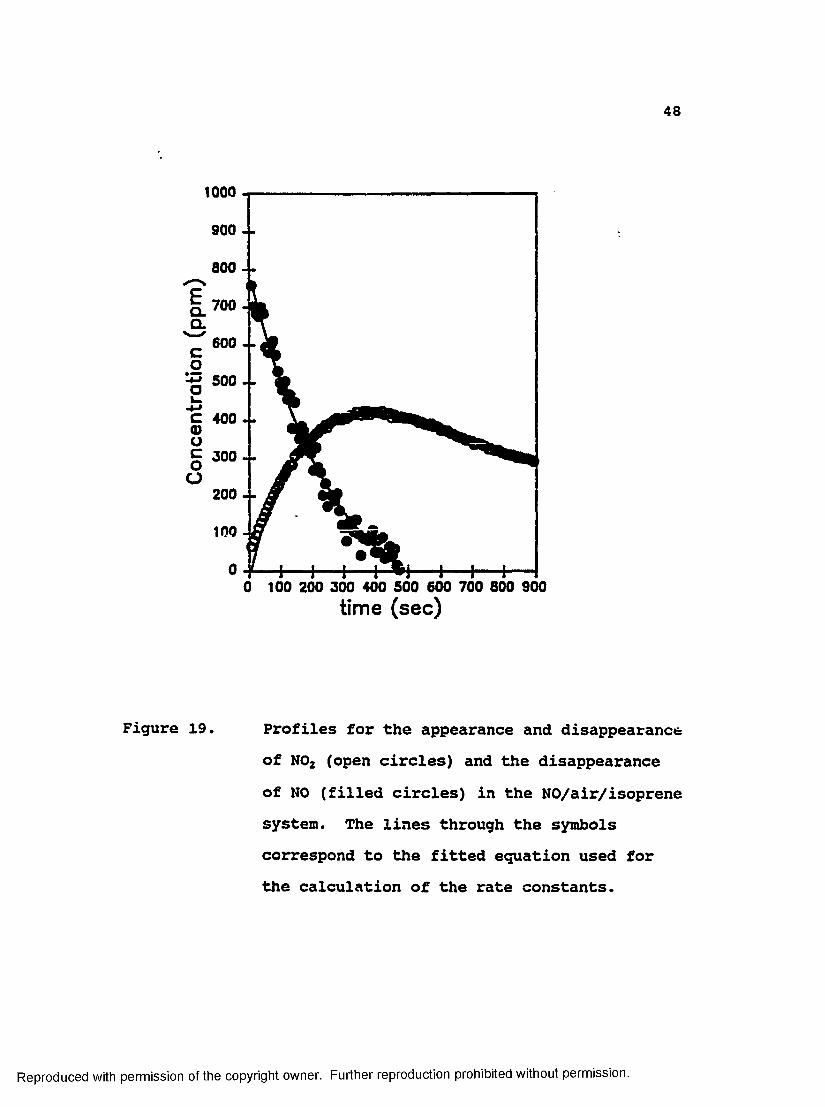
Figure 20. Profiles for the appearance and disappearance of N02 and the disappearance of NO in the NO/air/nethanol model.......... 49
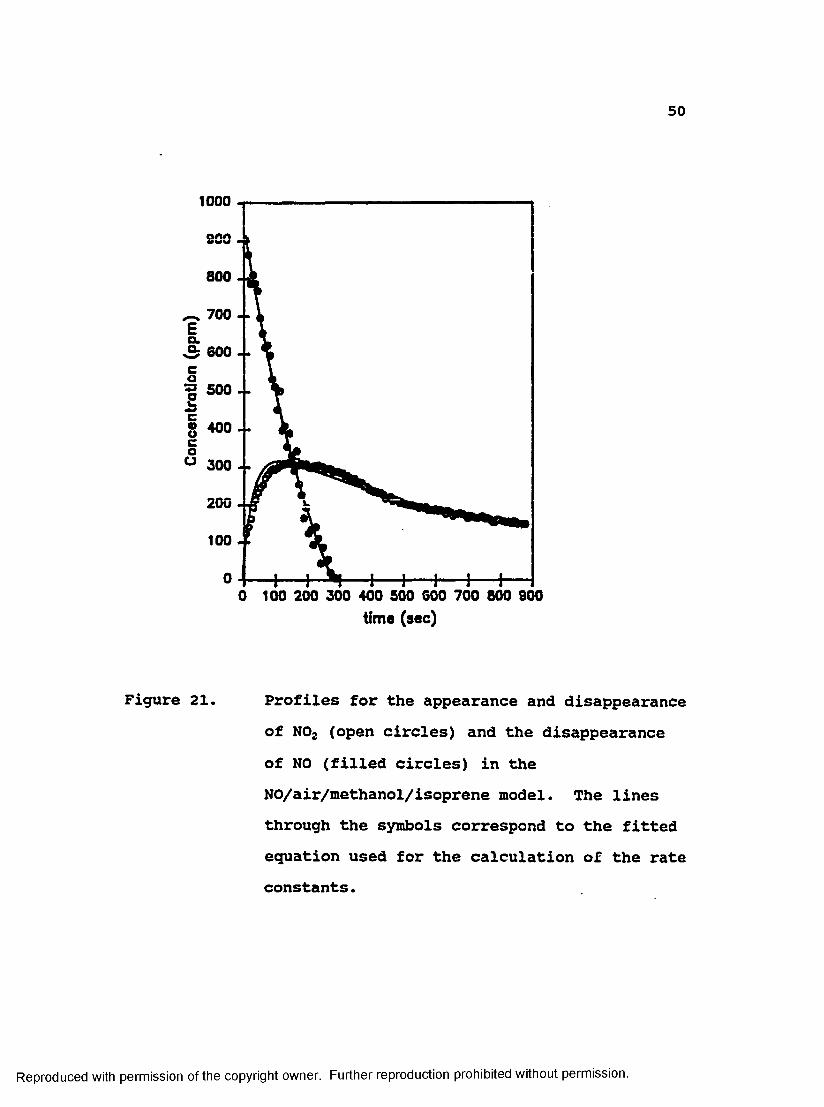
Figure 21. Profiles for the appearance and disappearance of N02 and the disappearance of NO in the NO/air/methanol/isoprene model . 50
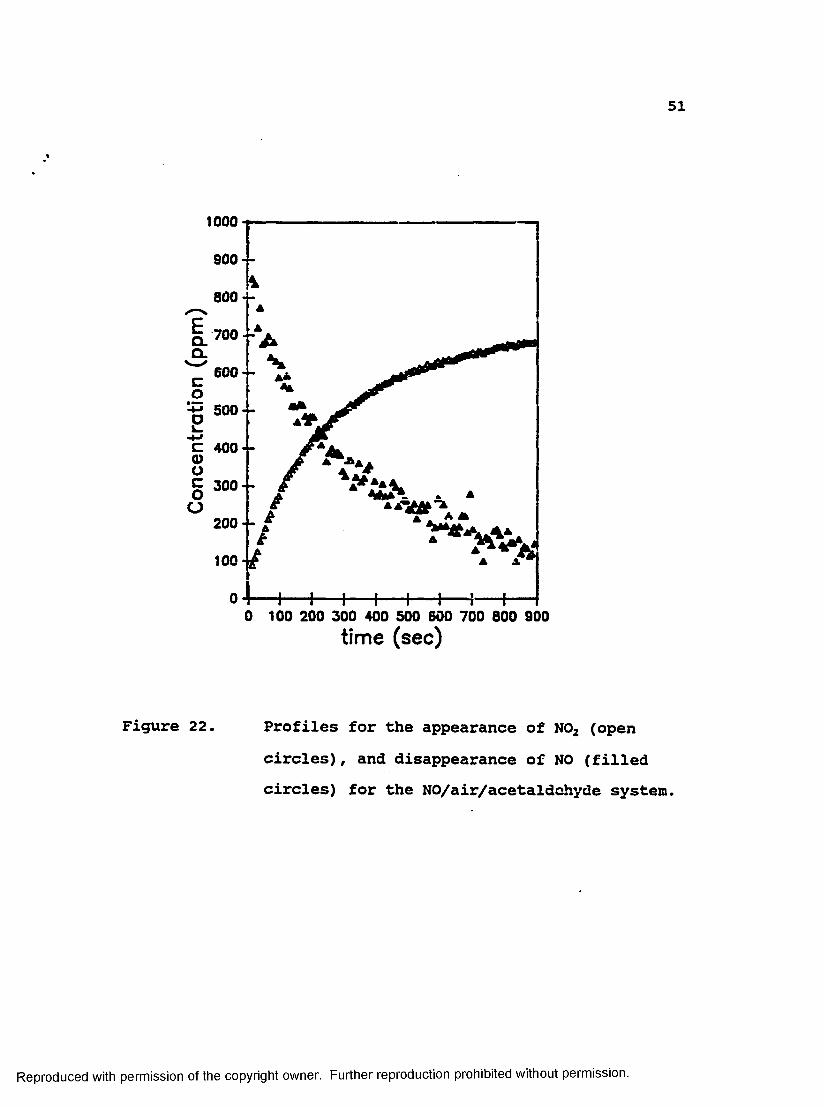
Figure 22. Profiles for the appearance of N02 and disappearance of NO for the NO/air/acetaldehyde system........... 51
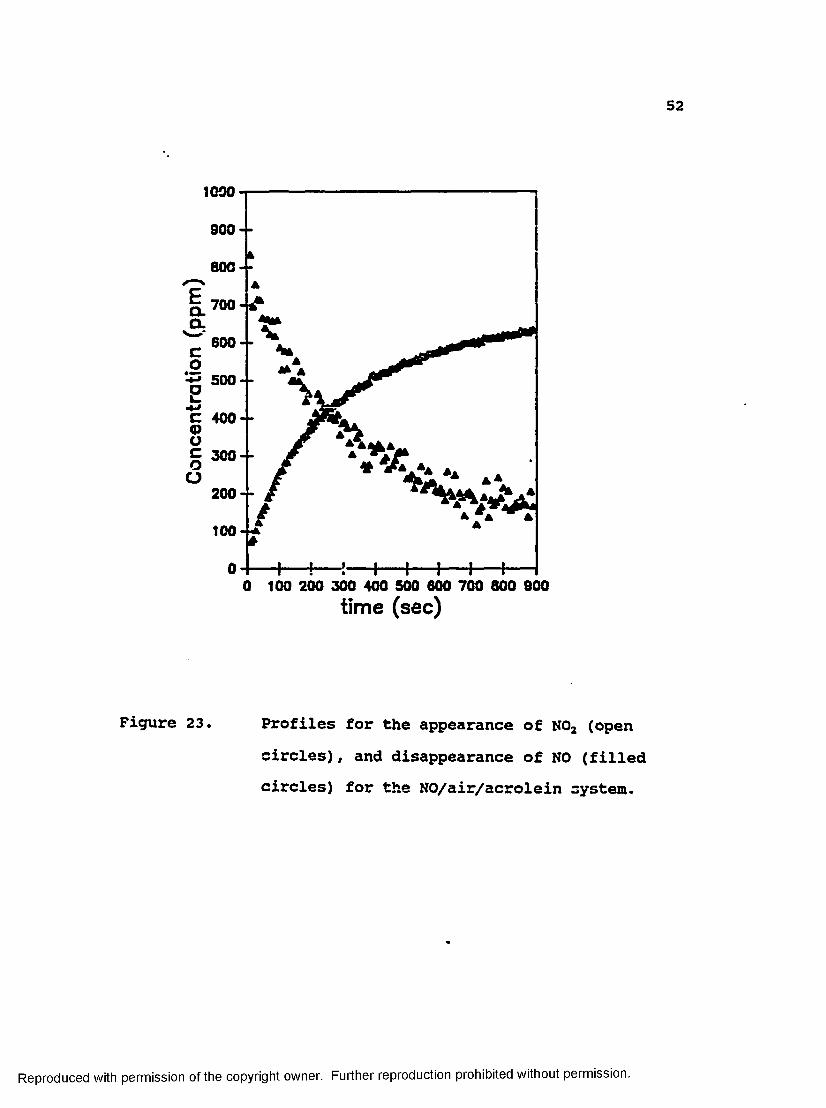
Figure 23. Profiles for the appearance of N02 and disappearance of NO for the NO/air/acrolein system............... 52
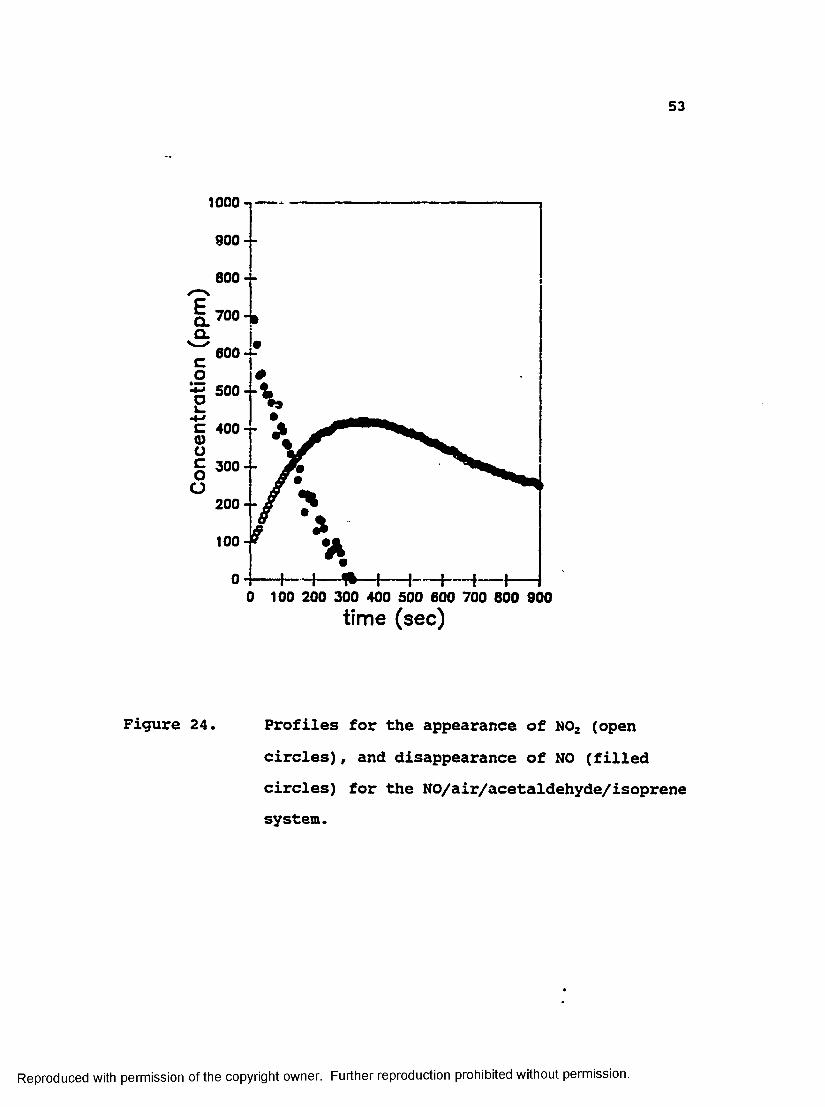
Figure 24. Profiles for the appearance of N02 and disappearance of NO for the NO/air/acetaldehyde/isoprene system. .
xi
53
Reproduced with permission of the copyright owner. Further reproduction prohibited without permission.
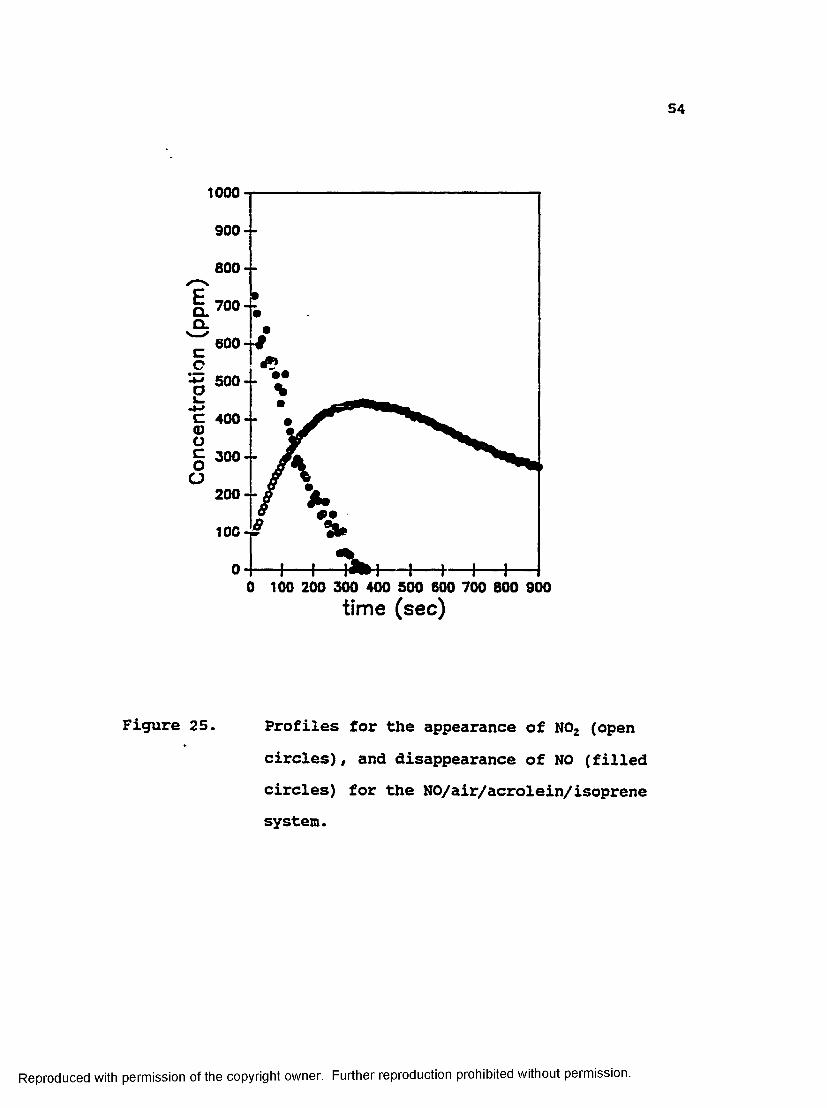
Figure 25. Profiles for the appearance of N02 and disappearance of NO for theNO/air/acrolein/isoprene system........ 54
Figure 26. FTIR spectrum of liquid products fromthe NO/air/isoprene system............. 58
xii
Reproduced with permission of the copyright owner. Further reproduction prohibited without permission.
LIST OF ABBREVIATIONS
CLS - Classical least: squares cm - centimeterDTGS - Deuterated triglycine sulfateESR - Electron spin resonanceFID - Flame ionization detectorFTIR - Fourier transform infraredGC - Gas chromatographyILS - Inverse least squaresMb - MegabyteMg - microgramml - millilitermm - millimeterNaCl - Sodium chlorideNaN03 - Sodium nitrateNO - Nitric oxideN0C1 - Nitrosyl chlorideN0X - Nitrogen oxidesN02 - Nitrogen dioxidePCR - Principal component analysisPLS - Partial least squaresppm - parts per million
xiii
Reproduced with permission of the copyright owner. Further reproduction prohibited without permission.
ABSTRACT
A new method, using Fourier transform infrared spectroscopy (FTIR), was developed for the simultaneous determination of nitrogen dioxide and nitric oxide in gas phase cigarette smoke and in model systems. The FTIR method also allows the simultaneous determination of other components.
The method uses multivariate least-squares regression analysis, that allows simultaneous quantitation of several components even in the presence of overlapping peaks, and fast data acquisition for kinetic analysis. For the preparation of the gas mixtures an apparatus that uses mass flow controllers, check-valves, and ground glass joints was constructed. This apparatus gives very exact metering, allowing the preparation of mixtures of precise concentrations, reducing the variations in the results between replications of experiments.
Using the developed method, model systems containing mixtures of nitric oxide/air with isoprene, methanol, acrolein, and acetaldehyde were studied using concentrations similar to those found in gas phase cigarette smoke. The "steady state" mechanism for the production of free radicals in gas phase cigarette smoke was substantiated, and a more realistic model for the continuous formation of free
xiv
Reproduced with permission of the copyright owner. Further reproduction prohibited without permission.
radicals in gas phase cigarette smoke was proposed. The concentrations of nitric oxide and nitrogen dioxide in the new proposed model (a mixture of nitric oxide, air, methanol, and isoprene) follow time courses that duplicate very closely those found for the same components in gas phase cigarette smoke.
Reproduced with permission of the copyright owner. Further reproduction prohibited without permission.
INTRODUCTION
GAS PHASE CIGARETTE SMOKE* CHEMISTRYIt has been known for many years that cigarette smoke
contains free radicals1. It has often been assumed that these radicals are involved in smoking-induced diseases (e.g. cancer2'*, and emphysema3,6), The radicals in gas-phase cigarette smoke are very reactive and therefore short lifetimes are expected. However, these radicals appear to survive even if smoke is aged for 5-10 minutes7,8. Even more surprisingly, the concentration of radicals actually increases in smoke as it ages, reaching a maximum after about 1-2 minutes9,10. Previous reports suggest that the radicals in cigarette smoke are continuously produced in a steady-state mechanism that depends on nitrogen oxides (NOz)**7,6. In this mechanism, nitric oxide (NO), which is relatively unreactive toward organic molecules, serves as the radical reserveir. The steady state mechanism postulates that NO slowly oxidizes to the reactive nitrogen dioxide (N02) (eg 1). N02 adds to unsaturated compoundspresent in the smoke (e.g. isoprene), producing alkyl
* Gas phase cigarette smoke is defined as the fraction of cigarette smoke that passes through a Cambridge filter, a glass fiber filter that retains 99.9% of all particulate matter with a size greater than 0.1 /*M.NO* may be either nitric oxide or nitrogen dioxide.
1
Reproduced with permission of the copyright owner. Further reproduction prohibited without permission.
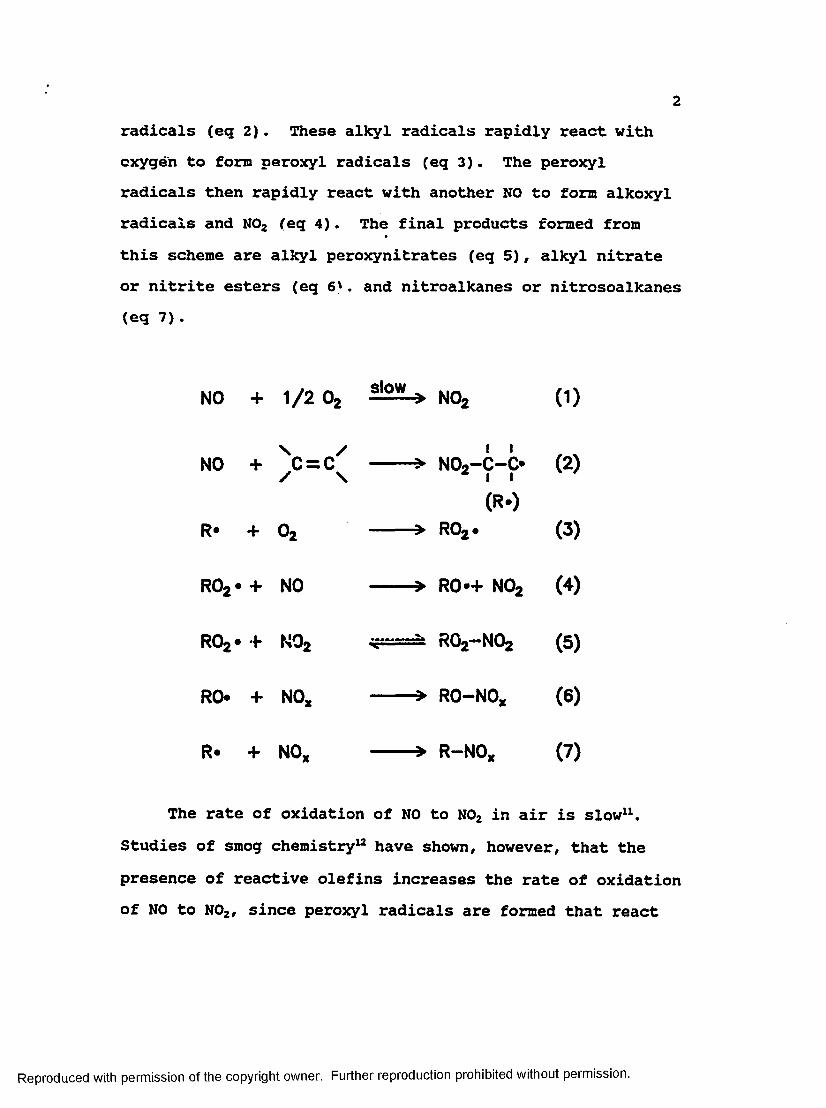
radicals (eq 2). These alkyl radicals rapidly react with oxygen to form peroxyl radicals (eq 3). The peroxyl radicals then rapidly react with another NO to form alkoxyl radicals and N02 (eq 4). The final products formed from this scheme are alkyl peroxynitrates (eq 5), alkyl nitrate or nitrite esters (eq 6'. and nitroalkanes or nitrosoalkanes (eq 7).
NO + 1 /2 Oj 8l°y > N02 (1)\ /
NO + C = C / \
R» + 0a
-> N02-C -C * (2)
(R.)-> R02- (3)
ro2 « + no ■» R0*+ N02 (4)
R02* f N02 R02—N02 (5)
R0« + NO, ■> RO—NO, (6)R. + NO, -» R-NO, (7)
The rate of oxidation of NO to N02 in air is slow11. Studies of smog chemistry12 have shown, however, that the presence of reactive olefins increases the rate of oxidation of NO to N02, since peroxyl radicals are formed that react
Reproduced with permission of the copyright owner. Further reproduction prohibited without permission.
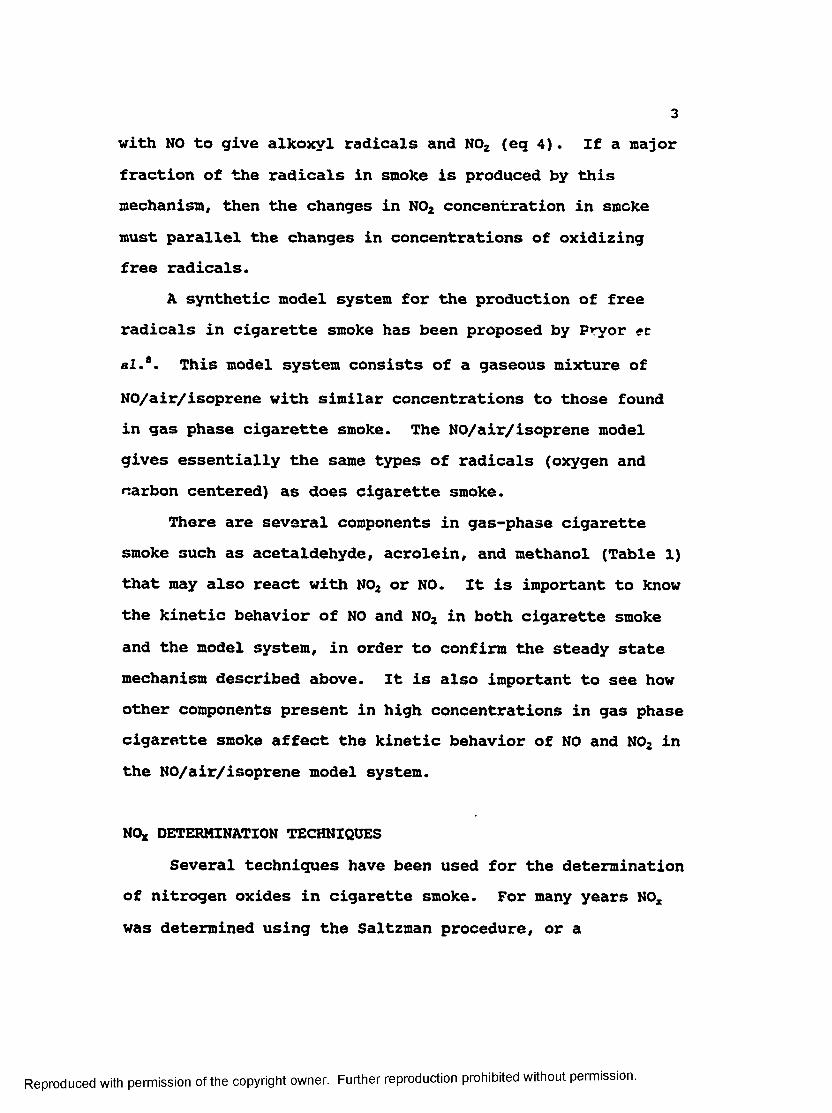
3with NO to give alkoxvl radicals and N02 (eq 4). If a major fraction of the radicals in smoke is produced by this mechanism, then the changes in N02 concentration in smoke must parallel the changes in concentrations of oxidizing free radicals.
A synthetic model system for the production of free radicals in cigarette smoke has been proposed by Pryor et al.6. This model system consists of a gaseous mixture of NO/air/isoprene with similar concentrations to those found in gas phase cigarette smoke. The NO/air/isoprene model gives essentially the same types of radicals (oxygen and carbon centered) as does cigarette smoke.
There are several components in gas-phase cigarette smoke such as acetaldehyde, acrolein, and methanol (Table 1) that may also react with N02 or NO. It is important to know the kinetic behavior of NO and N02 in both cigarette smoke and the model system, in order to confirm the steady state mechanism described above. It is also important to see how other components present in high concentrations in gas phase cigarette smoke affect the kinetic behavior of NO and N02 in the NO/air/isoprene model system.
NQx DETERMINATION TECHNIQUESSeveral techniques have been used for the determination
of nitrogen oxides in cigarette smoke. For many years NO, was determined using the Saltzman procedure, or a
Reproduced with permission of the copyright owner. Further reproduction prohibited without permission.
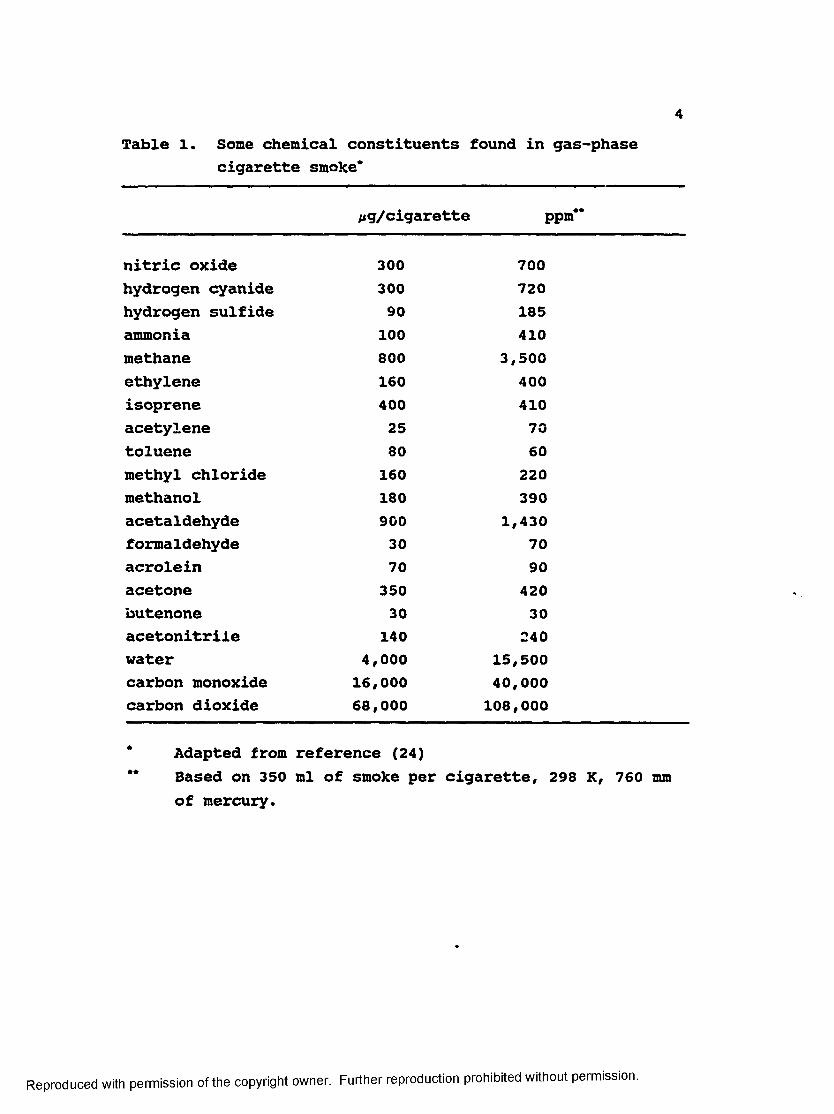
4Table 1. Some chemical constituents found in gas-phase
cigarette smoke*
/ig/cigarette ppm**
nitric oxide 300 700hydrogen cyanide 300 720hydrogen sulfide 90 185ammonia 100 410methane 800 3,500ethylene 160 400isoprene 400 410acetylene 25 70toluene 80 60methyl chloride 160 220methanol 180 390acetaldehyde 900 1,430formaldehyde 30 70acrolein 70 90acetone 350 420butenone 30 30acetonitrile 140 240water 4,000 15,500carbon monoxide 16,000 40,000carbon dioxide 68,000 108,000
Adapted from reference (24)Based on 350 ml of smoke per cigarette, 298 K, 760 mm of mercury.
Reproduced with permission of the copyright owner. Further reproduction prohibited without permission.
5modification thereof a few procedures involve othercolor forming reagents 20"23, but almost all require oxidation of NO to N02, and absorbance of the N02 in solution before measurement of the absorption of the colored solution.These procedures are time consuming and can be used only for measuring total content of N0Z. Also, many compounds interfere in the results obtained using these methods13*23, other procedures used for the measurement of NOz in cigarette smoke are electrochemistry25, gas chromatography26, non-dispersive infrared analysis27, and chemiluminescent analysis26.
Chemiluminescence has been adopted as the standard technique for the analysis of N0Z in environmental work29*33, and this method also has been used on cigarette smoke26,3*"*2, mainly to measure total content of 1J0Z. The most relevant results using chemiluminescence in cigarette smoke were published by Borland ec al.39. These researchers reported the time course for the disappearance of NO both in whole smoke and in filtered gas-phase smoke using a chemiluminescence analyzer. The chemiluminescence method does not permit continuous monitoring of concentrations, does not differentiate between NO and N02, and is subject to interferences. Borland ec al. remark on the importance of a method to monitor the change in NO and N02 concentrations continuously.
Reproduced with permission of the copyright owner. Further reproduction prohibited without permission.
6Comparison studies of some of the methods described
above have also been reported13**1*42. None of the techniques described above allow the simultaneous measurement of NO and N02 without interference from other compounds. One technique that permits simultaneous, real time determination of NO and N02 is infrared spectroscopy.
Infrared analysis of cigarette smoke was first reported in 1956 by Philippe and Hobbs43; they used dispersive infrared spectroscopy to identify new compounds in cigarette smoke, and semiquantitate some of them. In 1975, Vilcins44 used FTIR for the determination of ethylene and isoprene and Vilcins and Lephardt43*48, for the analysis of N0X, methanol and methyl nitrite in cigarette smoke. Later, (1977) Maddox and Mamantov47 used FTIR to measure CO, C02, methane, ethylene, and methanol in cigarette smoke. The work by Vilcins and Lephardt shows a preliminary analysis of NO and N02 in cigarette smoke, however, their results are of limited utility since they report only relative absorbances.
FTIR ADVANTAGESThe advantages of FTIR instruments over conventional
dispersive instruments are well documented48*30: (1) Very high signal-to-noise ratio (Fellgett's advantage, or multiplex advantage), because of short spectral acquisition times and signal averaging, (2) High light throughput to the detector
Reproduced with permission of the copyright owner. Further reproduction prohibited without permission.
7(Jaquinot advantage), and (3) high precision and accuracy in wavenumber determination (Conne's advantage).
In the last ten years several high-performance, low- cost FTIR instruments have been introduced. As a result, FTIR spectroscopy has become a very popular technique and has replaced conventional dispersive infrared spectroscopy in many laboratories. At the same time, the development of more powerful, inexpensive computers has resulted in the availability of spectral data processing techniques. Some of the biggest advances have been made in the development of new mathematical methods for multicomponent quantitative analysis. The most common chemometric methods used today for multicomponent quantitative analysis are: Beer's law K-rnatrix calculations or classical least squares (CLS)51'5*, inverse Beer's law P-matrix or inverse least squares (ILS)31*32*35*36, partial least squares (PLS)33*37"60, and principal component regression (PCR) 38*61*63. Each method has been applied to different systems, but guidelines on the applicability of each method under specific experimental conditions do not exist.
The use of FTIR spectroscopy for the determination of trace gases has become important in the analysis of air pollutants88'69 and studies of atmospheric chemistry70*71.There has also been a great interest in the kinetic study of photochemical reactions, related to the upper atmosphere,
Reproduced with permission of the copyright owner. Further reproduction prohibited without permission.
8using FTIR spectroscopy72"77. Most of these studies were made using long-path cells, and include determination of N0X.
OBJECTIVESThe main objective of this dissertation was to develop
a FTIR method that allows the simultaneous determination of NO and N02 in gas phase cigarette smoke and in model systems, in order to confirm the steady-state mechanism.
The second objective of this dissertation was to use the developed method to study the effect of components, other than isoprene (original model system), on the kinetic behavior of NO and N02 in different model systems, and if possible to suggest a better model.
Reproduced with permission of the copyright owner. Further reproduction prohibited without permission.
MATERIALS AND EQUIPMENT
GASESCommercial nitric oxide from MathesorT was first passed
through a thymol blue/KOH solution to remove nitrogen dioxide, and then through a dry ice/acetone trap to remove any remaining nitrogen dioxide and water. Matheson's certified standards of nitric oxide (554 ppm) and nitrogen dioxide (520 ppm) in helium were used for calibration. Nitrogen, compressed air., and helium from Liquid Carbonic were used for dilutions and gas phase reactions.
LIQUIDS AND SOLIDSIsoprene (Aldrich "gold label"), acrolein (Aldrich),
acetaldehyde (Aldrich), hexatriacontane (Aldrich), and absolute methanol (J.T. Baker Chemical Co.) were used without further purification.
CIGARETTESResearch cigarettes were obtained from the University
of Kentucky, Tobacco and Health Research Institute, and commercial cigarettes were purchased in a local store. Cigarettes were conditioned by storing in a desiccator over a saturated aqueous solution of ammonium nitrate (60% relative humidity) for at least 48 hours78. Several types
9
Reproduced with permission of the copyright owner. Further reproduction prohibited without permission.
10of cigarettes were analyzed, but for the modeling experiments the standard 1R179 research cigarette was used.
FOURIER TRANSFORM INFRARED SPECTROMETERInitially FTIR spectra were obtained with an IBM IR/32
FTIR spectrometer equipped with a DTGS detector and an IBM 9000 data system. Analyses were performed with the software supplied with the instrument. Later, the data system was upgraded to an IBM IR/44 which uses an 8 Mhs IBM-AT computer with a 30 MB hard disk, 4 MB of memory, and a math coprocessor. This upgrade fixed some of the problems and inconveniences experienced with the IBM 9000 system, such as slow acquisition speed, and the fact that the software did not allow the storage of interferograms. The software used by the IBM IR/44 system is supported by Nicolet.
GAS CHROMATOGRAPHYGas Chromatography analyses were performed with a
Varian Gas Chromatograph model 3700 with a 30 meter DB-5 capillary column (J&W Scientific), and a FID detector.
MASS FLOW CONTROLLERSThe mixing and control of the different gases was
accomplished using mass flow controllers model 5850 series D from Brooks (Hatfield, Pa.), connected to a controller, readout and power supply unit model 5876 also from Brooks.
Reproduced with permission of the copyright owner. Further reproduction prohibited without permission.
EXPERIMENTAL
FTIR CONDITIONSSeveral experiments were performed to determine the
optimal data collection conditions; the main parameters studied were resolution and number of scans. Most experiments were performed using 4 cm'1 resolution, 5-10 scans, gain 2, Happ-Genzel apodization, and automatic correlation. To increase the acquisition speed and the number of data points per kinetic run, interferograms were collected, then saved in memory (RAM disk). The fast Fourier transformation was executed after all interferograms were collected. Baselines of the resulting spectra were corrected, and in some cases absorption due to water was subtracted from the total absorption. Water vapor absorbs around 1600 cm'1, and may interfere with the determination of NOz. It was also found that the use of disk caching in the computer, while collecting the data, decreases the time between data points (especially during kinetic runs).
For the multiple component quantitative analysis, the QUANT software package from IBM Instruments (later NICOLET instruments), was used. This software uses multivariate least-squares regression analysis, making it possible to simultaneously quantitate several components even in the presence of overlapping peaks.
11
Reproduced with permission of the copyright owner. Further reproduction prohibited without permission.
12GAS CELL
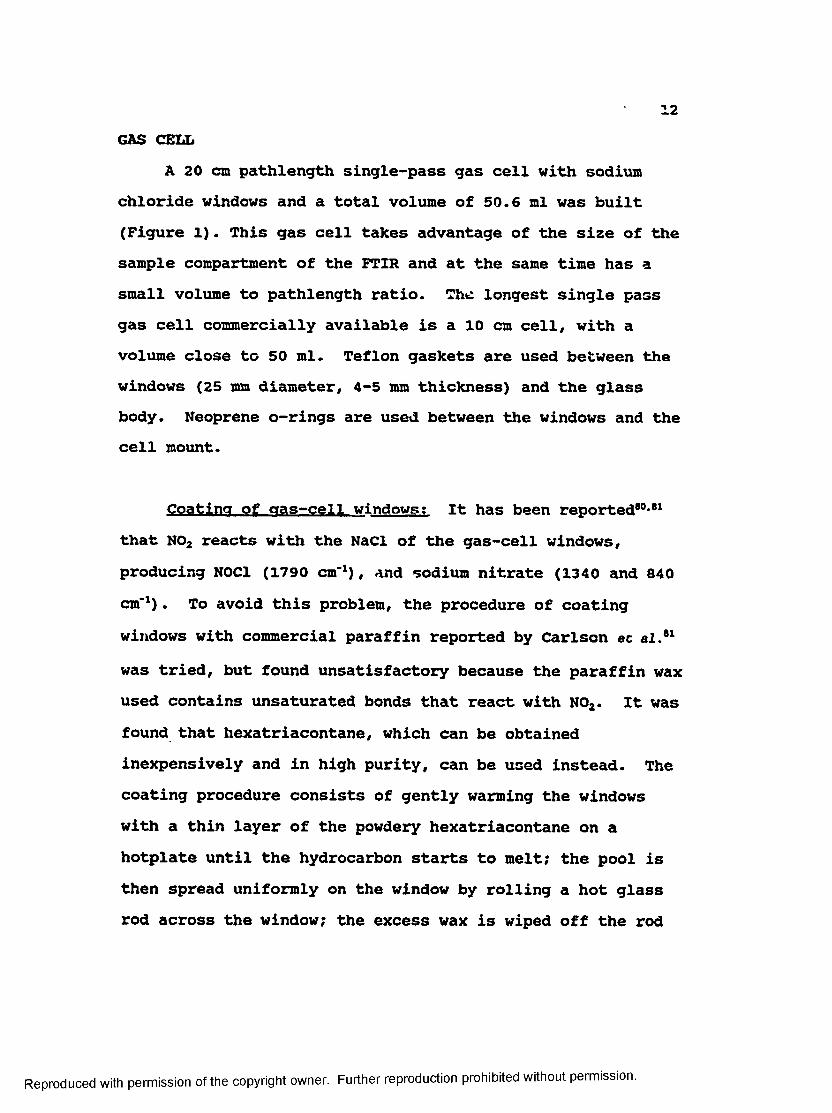
A 20 cm pathlength single-pass gas cell with sodium chloride windows and a total volume of 50.6 ml was built (Figure 1). This gas cell takes advantage of the size of the sample compartment of the FTIR and at the same time has a small volume to pathlength ratio. The longest single pass gas cell commercially available is a 10 cm cell, with a volume close to 50 ml. Teflon gaskets are used between the windows (25 mm diameter, 4-5 mm thickness) and the glass body. Neoprene o-rings are used between the windows and the cell mount.
Coating _of gas-cell windows: It has been reported80,81that N02 reacts with the NaCl of the gas-cell windows, producing N0C1 (1790 cm*1), and sodium nitrate (1340 and 840 cm*1). To avoid this problem, the procedure of coating windows with commercial paraffin reported by Carlson ec al.81 was tried, but found unsatisfactory because the paraffin wax used contains unsaturated bonds that react with N02. It was found that hexatriacontane, which can be obtained inexpensively and in high purity, can be used instead. The coating procedure consists of gently warming the windows with a thin layer of the powdery hexatriacontane on a hotplate until the hydrocarbon starts to melt? the pool is then spread uniformly on the window by rolling a hot glass rod across the window; the excess wax is wiped off the rod
Reproduced with permission of the copyright owner. Further reproduction prohibited without permission.
13
CELL SUPPORT
CLASS BODY
TEFLON CASKET—' * '
IR WINDOW ---NEOPRENE ’O’ RINC
Figure 1. Diagram of the gas cell used for the different FTIR experiments.
Reproduced with permission of the copyright owner. Further reproduction prohibited without permission.
14and the procedure is repeated until a very thin uniform film is obtained. This relatively simple method gives a uniform thin film that lasts throughout several experiments for concentrations of N02 up to 800 ppm.
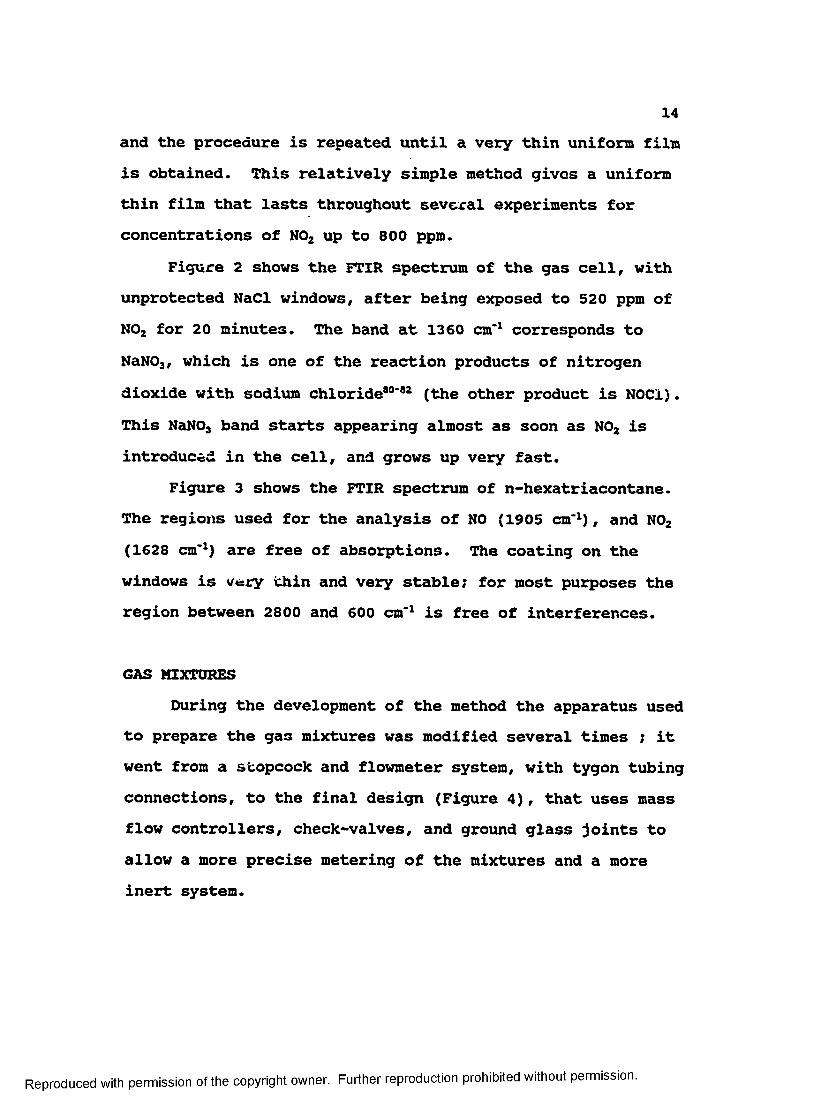
Figure 2 shows the FTIR spectrum of the gas cell, with unprotected NaCl windows, after being exposed to 520 ppm of N02 for 20 minutes. The band at 1360 cm*1 corresponds to NaNOj, which is one of the reaction products of nitrogen dioxide with sodium chloride80*82 (the other product is N0C1). This NaN03 band starts appearing almost as soon as N02 is introduced in the cell, and grows up very fast.
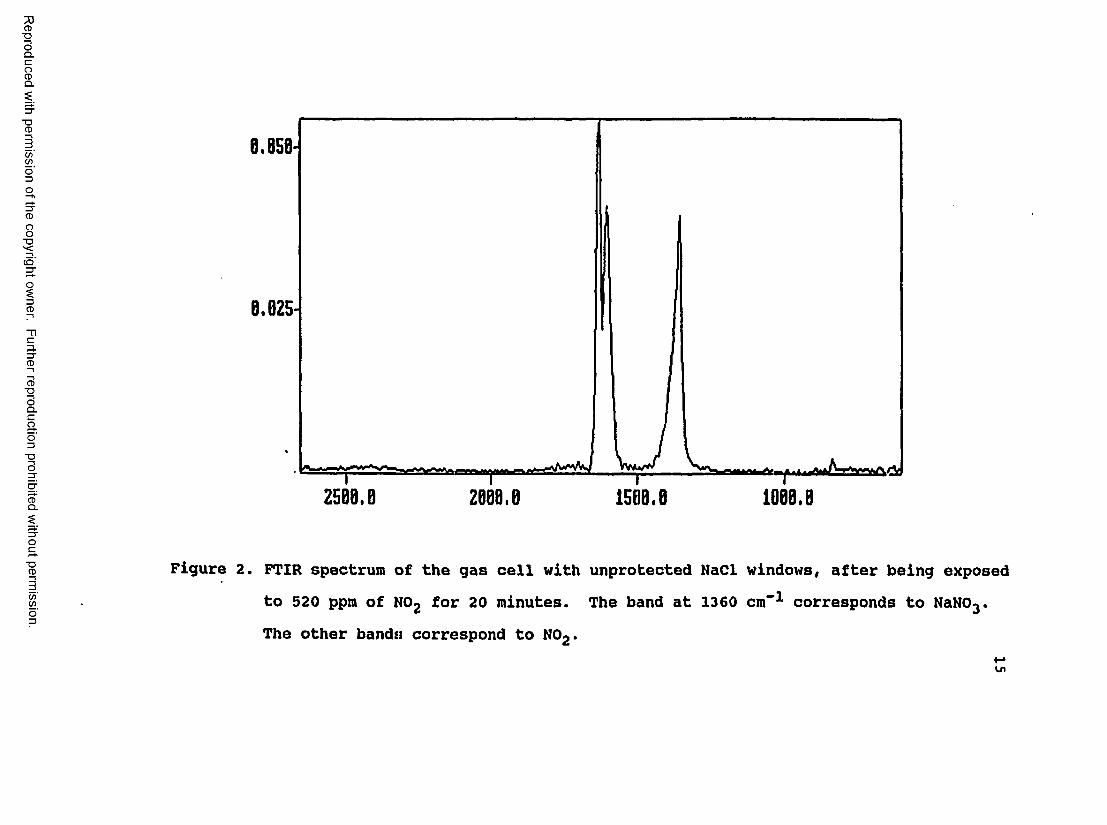
Figure 3 shows the FTIR spectrum of n-hexatriacontane. The regions used for the analysis of NO (1905 cm*1), and N02 (1628 cm*1) are free of absorptions. The coating on the windows is very thin and very stable; for most purposes the region between 2800 and 600 cm'1 is free of interferences.
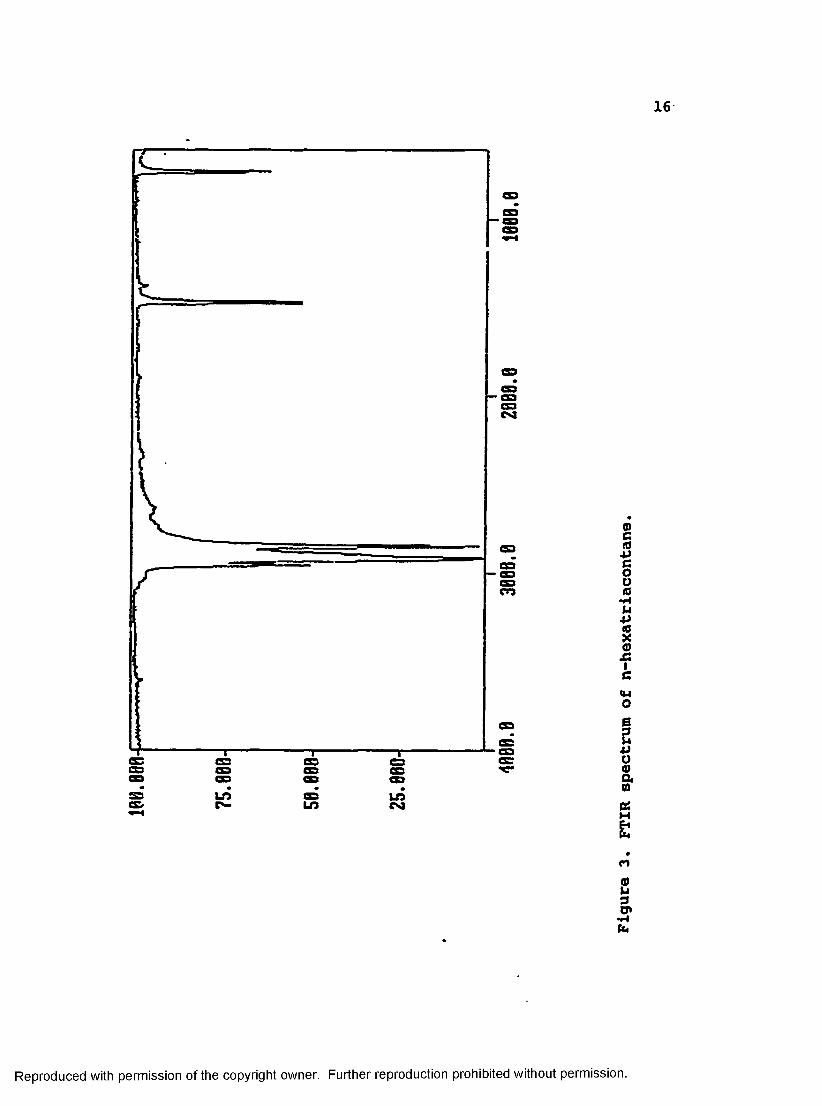
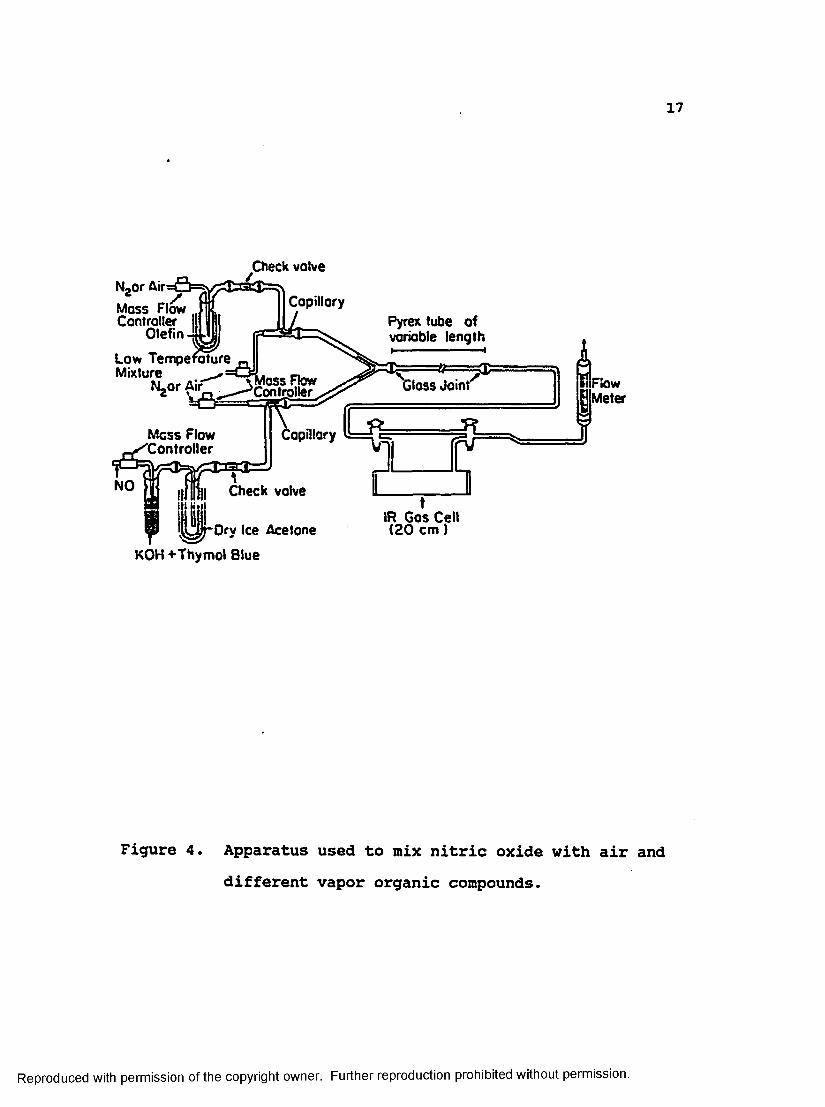
GAS MIXTURESDuring the development of the method the apparatus used
to prepare the gas mixtures was modified several times ; it went from a stopcock and flowmeter system, with tygon tubing connections, to the final design (Figure 4), that uses mass flow controllers, check-valves, and ground glass joints to allow a more precise metering of the mixtures and a more inert system.
Reproduced with permission of the copyright owner. Further reproduction prohibited without permission.
Reproduced
with perm
ission of the
copyright ow
ner. Further
reproduction prohibited
without
permission.
2500.0 1000.02000.0 1500.0
Figure 2. FTIR spectrum of the gas cell with unprotected NaCl windows, after being exposed to 520 ppm of N02 for 20 minutes. The band at 1360 cm**1 corresponds to NaN03. The other bands correspond to N02.
Reproduced with permission of the copyright owner. Further reproduction prohibited without permission.
17
Check valveN2or AirMass Flow Controller
Olefin
Low Temperature Mixture
CapillaryPyrex tube of variable length
Glass Jointhi nr Air" \MOSS FlOW*h.or r W __ ^controller
Mess Flow Controller
Capillary
Check valve
-Dry Ice Acetone
KOH -t-Thymol Blue
IR Gas Ceil (20 cm )
FlowMeter
Figure 4. Apparatus used to mix nitric oxide with air and different vapor organic compounds.
Reproduced with permission of the copyright owner. Further reproduction prohibited without permission.
18Nitric oxide: The nitric oxide, controlled by a mass
flow controller, is first passed through a 30% solution of potassium hydroxide saturated with thymol blue in order to remove any traces of nitrogen dioxide (Figure 4)< Then the NO is passed through a cold trap at -78 *C (dry ice/acetone) to remove possible traces of nitrous oxide and water. Next the NO goes through a capillary, and is diluted with either air or nitrogen. A check valve between the traps and the capillary prevents any other gases or vapors from backing into the traps.
Organic.components flsoorene. acrolein, acetaldehvde. or methanol1 r The organic components for the different mixtures can be metered in, either by controlling the temperature of the bath in which the vial containing the organic components is immersed or by adjusting the flow rates of the carrier gas (Figure 4). For different components and different concentrations, different cooling solutions were used. One or two components can be placed in the vial at the same time, or a third branch can be added to the system for more complex mixtures.
In a similar way to the nitric oxide, there is a capillary and a check valve to provide better control of the flow rate and prevent contaminations from gases backing into the system.
Reproduced with permission of the copyright owner. Further reproduction prohibited without permission.
19Mixing: The nixing of the different components occurs
at the end of the nY" shaped tube ending in two capillaries (Figure 4). The total flow rate for every experiment was set at 250 ml/minute.
Ageing: Ageing of the mixtures is accomplished by a"stop flow" system: after the gases are mixed and constant concentrations are achieved, the gas cell is closed and data collection is started. The dead volume of the system including the volume of the cell gives an initial dead time of 13 seconds.
An alternate method6 that uses variable lengths of tubing between the mixing and the gas cell was tried. This method has several disadvantages: the number of data points is limited to the number of different lengths of tubing; very long pieces of tubing are needed for long residence times; and in some instances the presence of laminar flow causes inconsistencies in the obtained data. Seme experiments were attempted with this method but the results did not compare favorably to those obtained with the "stop flow" method.
CALIBRATIONThe calibrations for NO and N02 were made using
standards from Matheson; lower concentrations were obtained
Reproduced with permission of the copyright owner. Further reproduction prohibited without permission.
20by dilution with helium. Total flow rates were 250 ml/minute. 100 scan spectra were collected for each standard.
Isoprene, acrolein, acetaldehyde and methanol were calibrated indirectly using gas chromatography (GC); 100scan FTIR spectra were measured, and then samples of 5 ml were taken from the cell with a gas-tight syringe and injected into the gas chromatograph to determine the concentration. GC standards were made following the procedure described by Cotabish ee al.83. Three determinations were made for each standard; the average value was used.
The calibration data for NO, N02, and isoprene were used to build a multicomponent calibration method, which was then used for all the calculations in the kinetic runs. The data for acetaldehyde, methanol, and acrolein were used for the calibration of the flow system to get similar concentrations of these components to those found in cigarette smoke2*.
PROCEDURE FOR SMOKING CIGARETTESCigarettes were smoked using two different protocols;i) A puff protocol78; puffs (35 cm3) of 2 sec duration
were pulled from the cigarette (using a syringe) at one minute intervals and passed through a Cambridge filter. The third puff was introduced into the evacuated gas cell.
Reproduced with permission of the copyright owner. Further reproduction prohibited without permission.
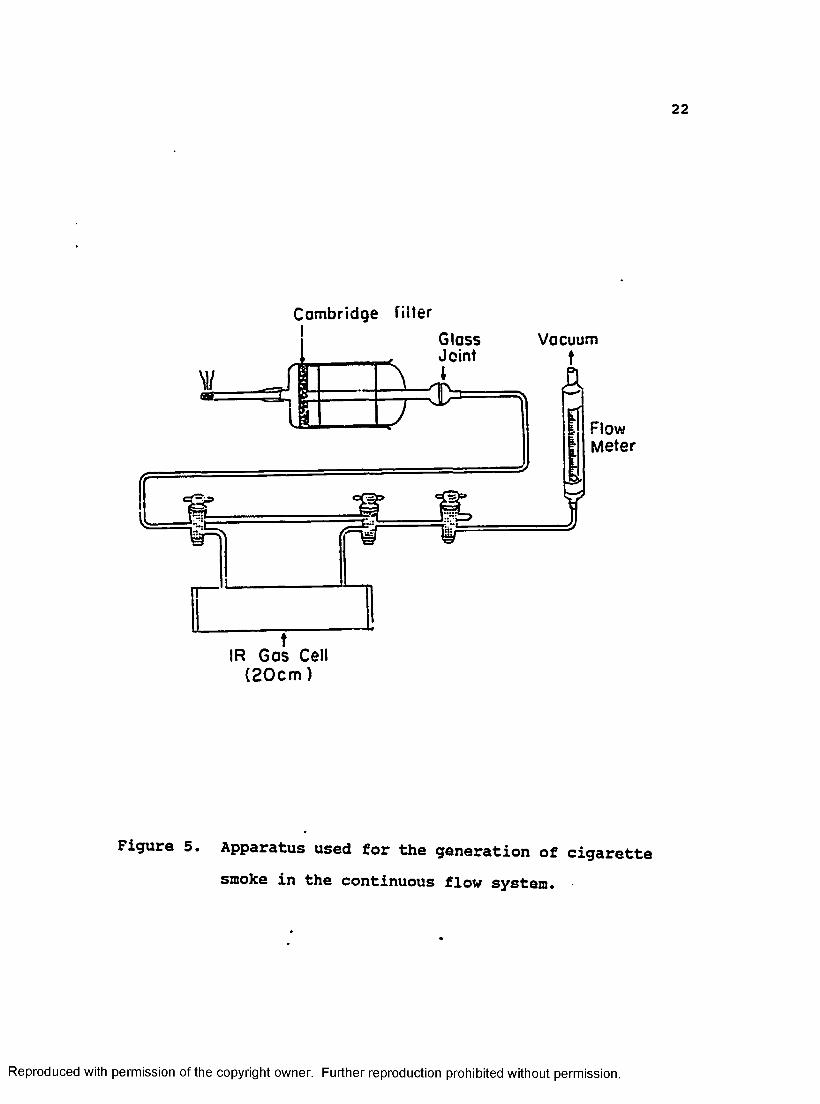
21ii) A continuous flow system (Figure 5): The smoke
stream was pulled through the cigarette, a Cambridge filter, and finally the gas cell, using a water aspirator set at a flow rate of 250 ml per minute. The cell was closed 90 sec after the cigarette was lit, and data collection was started at this time.
KINETIC RUNSPreliminary operations; Before each kinetic run using
a known gas mixture or cigarette smoke, the gas cell, glass tubing, and connections were rinsed with acetone, and the coating on the windows examined. Sometimes part of the paraffin wax coating flaked after the acetone rinse and had to be replaced. Next the gas cell was evacuated and checked for leaks; when leaks were found, the cell was tightened until the leak stopped. This has to be done very carefully, or the cell windows will crack. Next the cell was introduced in the FTIR, and both the FTIR and the gas mixing system (including the cell) were purged with dry air for several minutes. Finally a background spectrum was collected £30 scans).
Gasmixtures: The flow through the reservoirscontaining the different components was started and spectra were collected until stable readings, with the correct initial concentrations for each component (Table 1), were
Reproduced with permission of the copyright owner. Further reproduction prohibited without permission.
22
Cambridge filter
GlassJoint
Vacuum
FlowMeter
IR Gas Cell( 2 0 c m )
Figure 5. Apparatus used for the generation of cigarette smoke in the continuous flow system.
Reproduced with permission of the copyright owner. Further reproduction prohibited without permission.
23obtained. At this point the cell was closed, and data
collection started. Typical runs lasted 20 minutes. Each experiment was repeated at least five times.
Cigarette smoke: After the background spectrum wascollected, the cigarette was lit. After 90 seconds the cell was closed and data collection started; typical runs lasted 20 minutes; each experiment was repeated at least five times. Data were processed as described in the FTIR conditions section.
Kinetic calculations: For the calculations of the rateconstants the kinetic fitting routine SI-FIT from OLIS (Online instrument Systems, Inc, Jefferson GA) was used. SI- FIT uses a successive integration method that solves its kinetics cases by fitting the Y value against one or more integrations of Y with respect to time. SI-FIT differs from other non-linear fitting methods in that it obtains very good starting values which are then improved very slightly, requiring very few iterations to obtain convergence.
Reproduced with permission of the copyright owner. Further reproduction prohibited without permission.
RESULTS
SELECTION OP FTIR CONDITIONSResolution; The FTIR instrument used is capable of
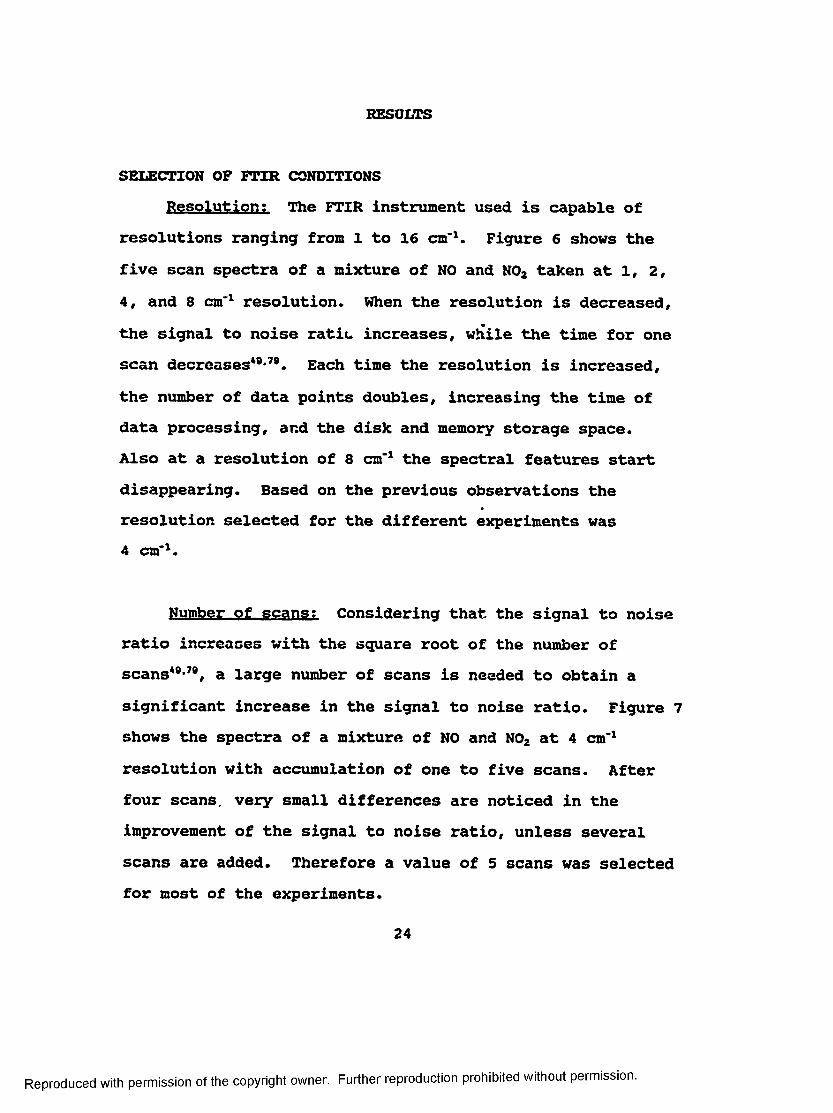
resolutions ranging from 1 to 16 cm*1. Figure 6 shows the five scan spectra of a mixture of NO and N02 taken at 1, 2,4, and 8 cm*1 resolution. When the resolution is decreased, the signal to noise ratio increases, while the time for one scan decreases*8*70. Each time the resolution is increased, the number of data points doubles, increasing the time of data processing, and the disk and memory storage space.Also at a resolution of 8 cm*1 the spectral features start disappearing. Based on the previous observations the resolution selected for the different experiments was 4 cm*1.
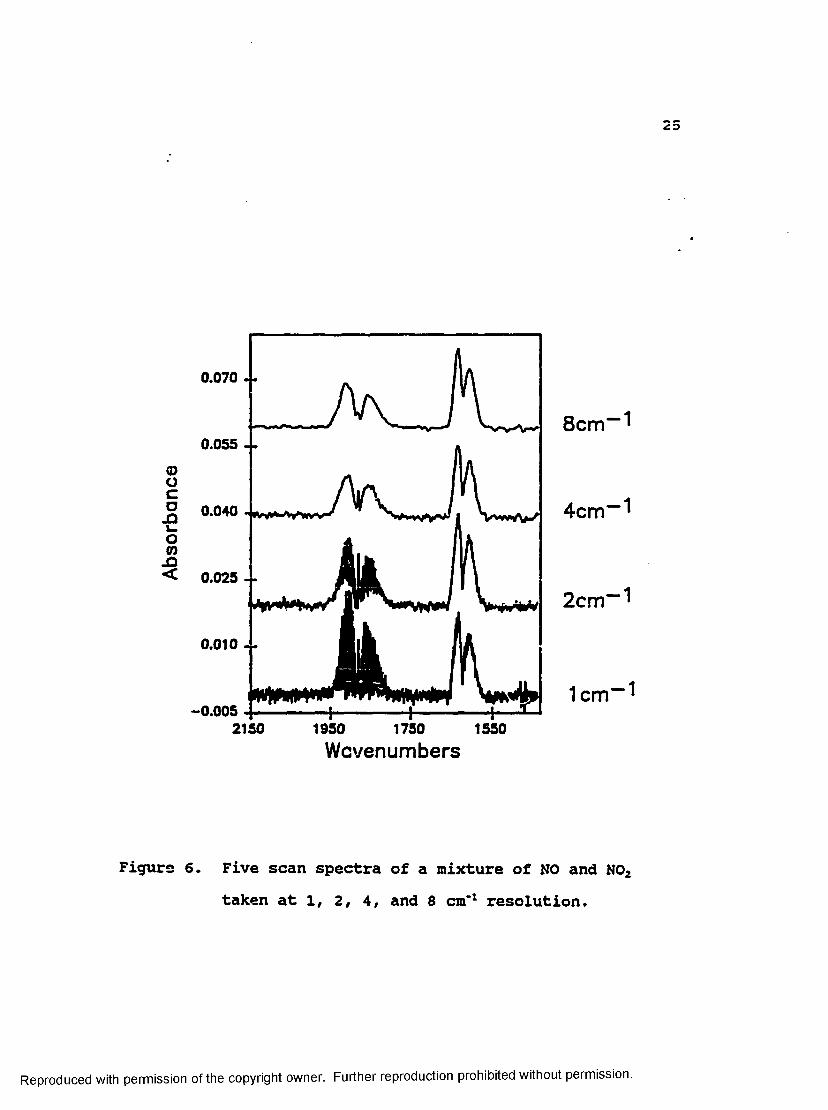
Number of scans: Considering that the signal to noiseratio increases with the square root of the number of scans*9*70, a large number of scans is needed to obtain a significant increase in the signal to noise ratio. Figure 7 shows the spectra of a mixture of NO and N02 at 4 cm*1 resolution with accumulation of one to five scans. After four scans, very small differences are noticed in the improvement of the signal to noise ratio, unless several scans are added. Therefore a value of 5 scans was selected for most of the experiments.
24
Reproduced with permission of the copyright owner. Further reproduction prohibited without permission.
0.070
0.055
©OCoJ3L.0.040 .
om
jQ< 0.025
0.010
-0.0051950 15502150 1750
8cm” ̂
4cm” 1
2cm” ̂
1 cm” ”'
Wcvenumbers
Figure 6. Five scan spectra of a mixture of NO and N02 taken at 1, 2, 4, and 8 cm*1 resolution.
Reproduced with permission of the copyright owner. Further reproduction prohibited without permission.
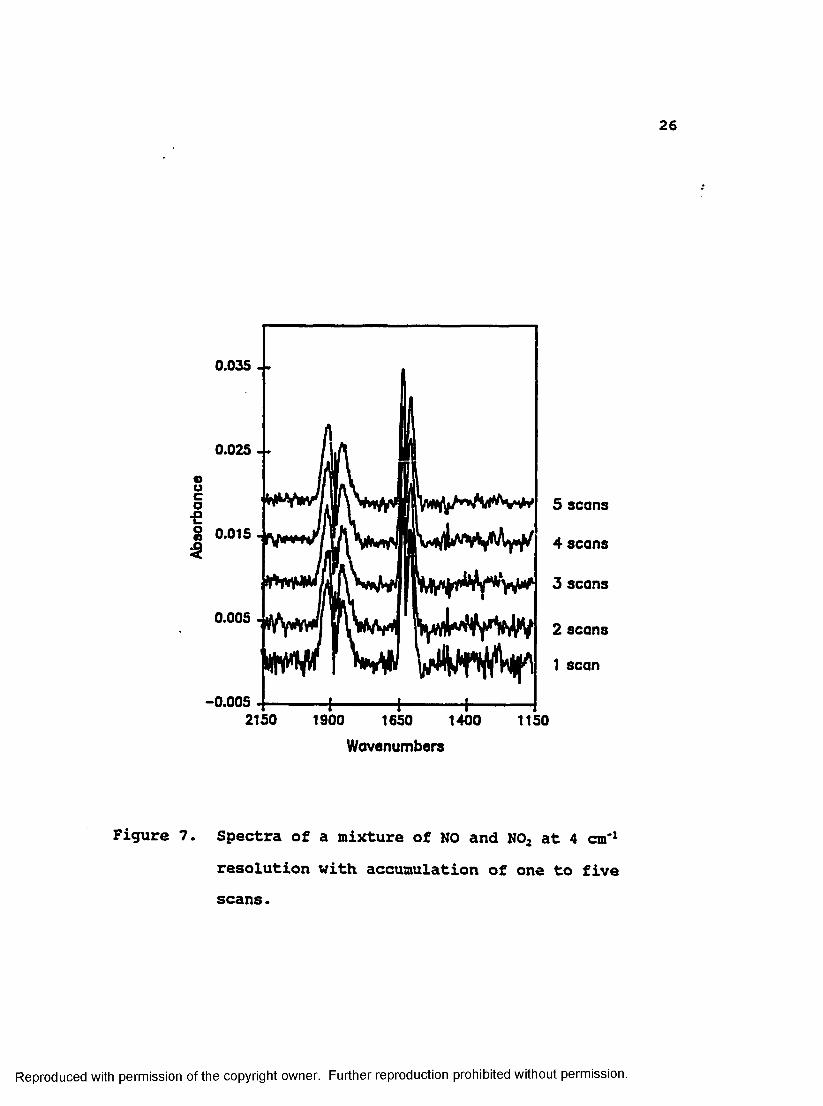
Figure 7
0.035
0.025
ooco 5 scans
g 0.015 4 scans
3 scans
0.0052 scans
1 scan
-0.0052150 1900 14001650 1150
Wavenumbers
Spectra of a mixture of NO and N02 at 4 cm'1 resolution with accumulation of one to five scans.
Reproduced with permission of the copyright owner. Further reproduction prohibited without permission.
27With S scans, a resolution ox 4 cut'*, and the conditions described in the experimental section, the average time between measurements (using the IBM-AT computer) was 7.5 seconds.
CALIBRATIONSelection of frequenciesi The two main components used
for the quantitative analysis were NO and N02, though isoprene was quantitated on some occasions. The strongest bands, and if possible the most free of overlap were chosen for the quantitative analysis.
The FTIR spectrum of NO (Figure 8) shows the strongest absorption bands at 1905, 1873, and 1850 cm-1. The band selected for quantitative analysis was the one located at 1905 cm'1.
The FTIR spectrum of NOz (Figure 9) shows the strongest bands at 1628, and 1601 cm'1. The band selected for quantitative analysis was tl.a one located at 1628 cm'1.
The FTTF. spectrum of isoprene (Figure 10) shows the strongest bands at 991, 906, and 893 cm'1. The band selected for quantitative analysis was the one located at 893 cm'1.
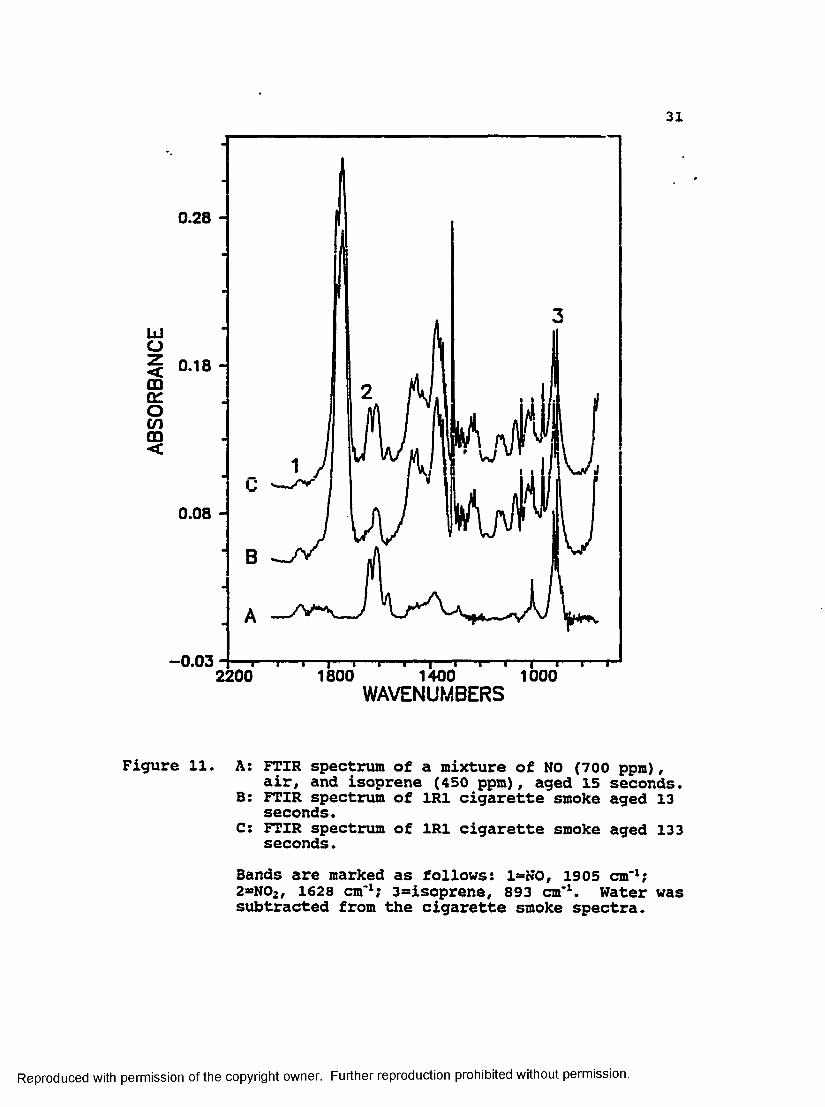
Figure 11 shows the FTIR spectrum of: a) a mixture ofNO/air/isoprene aged 15 seconds; b) 1R1 cigarette smoke aged 13 seconds, (water subtracted); c) the same smoke from (b), 120 seconds later, xt can be seen that the frequencies
Reproduced with permission of the copyright owner. Further reproduction prohibited without permission.
Abs
orba
nce
28
0.002
0.002
0.001
0.001
5.000E—4
0.000
5.GG0E-42200 19S0 1700 1450 1200 950 700
Wavenumbers
Figure 8. FTIR spectrum of nitric oxide taken with 5 scans, at 4 cm"1 resolution. The strongest absorption bands are at 1905, 1873, .and 1850 cm'1.
Reproduced with permission of the copyright owner. Further reproduction prohibited without permission.
29
0.057 - -
0.047 - -
0.037 - -
0.027 - -OonXI<
0.017 --
0.007 - .
-0.0032200 1950 1700 1450 1200 950 700
Wavenumbers
Figure 9. FTIR spectrum of nitrogen dioxide taken with 5 scans, at 4 cm'1 resolution. The strongest absorption bands are at 1628, and 1601 cml.
Reproduced with permission of the copyright owner. Further reproduction prohibited without permission.
Ab3
orba
nce
30
0.017 . .
n nio
0.007
^ v v A0.002 ..
-0.0032200 1950 1700 1450 1200 950 700
Wavenumbers
Figure 10. FTIR spectrum of isoprene taken with 5 scans, at 4 cm'1 resolution. The strongest absorption bands are at 991, 906, and 893 cm'1.
Reproduced with permission of the copyright owner. Further reproduction prohibited without permission.
ABSO
RBAN
CE
31
0.28 -
0.18 -
0.08 -
-0 .03 2200 14001800 1000WAVENUMBERS
Figure 11. A: FTIR spectrum of a mixture of NO (700 ppm),air, and isoprene (450 ppm), aged 15 seconds.
B: FTIR spectrum of 1R1 cigarette smoke aged 13 seconds.C: FTIR spectrum of 1R1 cigarette smoke aged 133
seconds.Bands are marked as follows: l=NO, 1905 cm*1;2=NOz, 1628 cm*1; 3=isoprene, 893 cm*1. Water wassubtracted from the cigarette smoke spectra.
Reproduced with permission of the copyright owner. Further reproduction prohibited without permission.
32selected for each component ( 1«N0, 2=N02, and 3=isoprene) are relatively free of overlap in the systems studied, which makes the calibration simpler, and the quantitation process faster.
Calibration method: Before using the multicomponentanalysis software, individual linear regression analyses were run for NO, N02, and isoprene. Figure 12 shows the calibration curves, with the fitted linas for NO, isoprene, and N02. In the range of concentrations used (Table 2), the absorbance is linear for all three components, with correlation coefficients of 0.999 for all three components.
For the multicomponent analysis, three methods were tested: the P-matrix method51’32'35*58, the K-matrix method31-54,and the PLS method33,3,"8°. The K-matrix method did not give very reproducible results. The P-matrix method is the most commonly used in commercial quantitative FTIR software, and it was found very adequate for the systems studied. The PLS gave similar results to those obtained using the P-matrix method but required additional data processing and used more time for each analysis. Therefore the P-matrix method using the Quant software package from Nicolet was selected for the multicomponent analysis.
A quantitative method was developed using eight mixtures ot standards of NO, N02, and isoprene. Several frequency ranges were tried for each component; Table 2
Reproduced with permission of the copyright owner. Further reproduction prohibited without permission.
33
Table 2. Concentrations and frequencies used for the calibration of NO, N02/ and isoprene
NO n o2 Isoprene
Start freq. (cm-1) 1945 1645 897
End freq. (cm-1) 1380 1615 886
Standard 1 (ppm) 138 52 0
Standard 2 (ppm) 249 130 136
Standard 3 (ppm) 360 234 220
Standard 4 (ppm) 471 338 369
Standard 5 (ppm) 526 442 641
Standard 6 (ppm) 554 520 863
Standard 7 (ppm) 0 328 220
Standard 8 (ppm) 249 0 136
Reproduced with permission of the copyright owner. Further reproduction prohibited without permission.
Abs
orba
nce
34
0.007
0.006 . .
0.005 - .
0.004 - -
0.001
0.000200 400 600 800 1000Concentration (ppm)
Figure 12. Calibration curve, with the fitted lines for NO (triangles), isoprene (squares), and N02 (circles).
Reproduced with permission of the copyright owner. Further reproduction prohibited without permission.
35shows the optimal frequency ranges found for each component, and the concentrations used for the different mixtures forthe calibration method used for all the analyses.
The calibration method was tested with the spectra ofstandard mixtures, and with the spectra of individualcomponents, of known concentrations, giving results within a 5% margin of error, the expected error range for this type of analysis83,8*.
Extinction coefficients for NO and NO,: The extinctioncoefficients (base «, ppm*1 x cm*1) for NO and N02 for the selected frequencies were calculated using the data from thecalibration curves. This resulted in the following values:
NO: c = 4.80 x 10*7 ppm*1cm'1 at 1905 cm*1N02: < = 1.23 x 10*3 ppm^cm*1 at 1628 c m 1
Infrared extinction coefficients for NO and N02 are reported infrequently; however, the reported values72,83*87 were measured at different frequencies, and in some cases under completely different experimental conditions, so it was not desirable to make a comparison.
CALCULATION OF CONCENTRATIONS IN CIGARETTE SMOKEConcentration units: The concentration units for most
of the gas phase experiments are given in parts per million
Reproduced with permission of the copyright owner. Further reproduction prohibited without permission.
36by volume (ppm, or micromoles of gas per mole of gas). For cigarette smoke the results are expressed in micrograms per cigarette. The conversion from ppm68 is made by first calculating the concentration of the component in the gas phase:
Concentration(pg/1) * C x wt. x 298 x p24.45 X T X 760
where C = concentration in ppmWt. = Molecular weight of substance P = Absolute pressure in torr of the sample stream T = Absolute temperature
Then total delivery (pg/cigarette) equals the total volume of smoke (flow rate(1/minute) multiplied by the burning time(minutes)), multiplied by the concentration (pg/1).
Concentrations of NO, in cigarette smoke: Theconcentrations of NO, N0Z, and isoprene in gas phase cigarette smoke of several commercial, and some research cigarettes were calculated. For these experiments the cigarette was lit and a minute later scanning in the FTIR was started. The data collection was stopped when the flame reached the first mark in research cigarettes, or 5 mm before the filter in commercial cigarettes. At least 10
Reproduced with permission of the copyright owner. Further reproduction prohibited without permission.
37measurements were made for each type of cigarette. Table 3 shows the concentrations measured for NO and N02, and the reported values for nitric oxide34. N02 was found in cigarette smoke, because the smoke is at least 13 seconds old by the time the FTIR measurement is started, and as a result some NO has already been converted to N02 .
The concentration values for nitrogen oxides in cigarette smoke reported in this dissertation are 2.2 times higher than the reported literature values34, because the values reported here were obtained using the continuous flow protocol, while the literature values use the puff protocol. The continuous flow protocol accounts for all the smoke generated by burning one cigarette (average burning time 3.08 minutes at 250 ml/min); the puff protocol accounts only for the volume of smoke inhaled by the smoker (350 ml)24.70
3.08 min x 250 ml/min /350 ml *» 2.2
FTIR STUDY OF CIGARETTE SMOKEDifferential spectral kinetic profiles; A detailed
study of the ageing of cigarette smoke was made using differential spectral kinetic profiles. The differential spectra exhibit only the bands of those compounds which have changed concentration over the time interval between collection of spectra. Compounds that increase in concentration show bands similar to the normal transmittance
Reproduced with permission of the copyright owner. Further reproduction prohibited without permission.
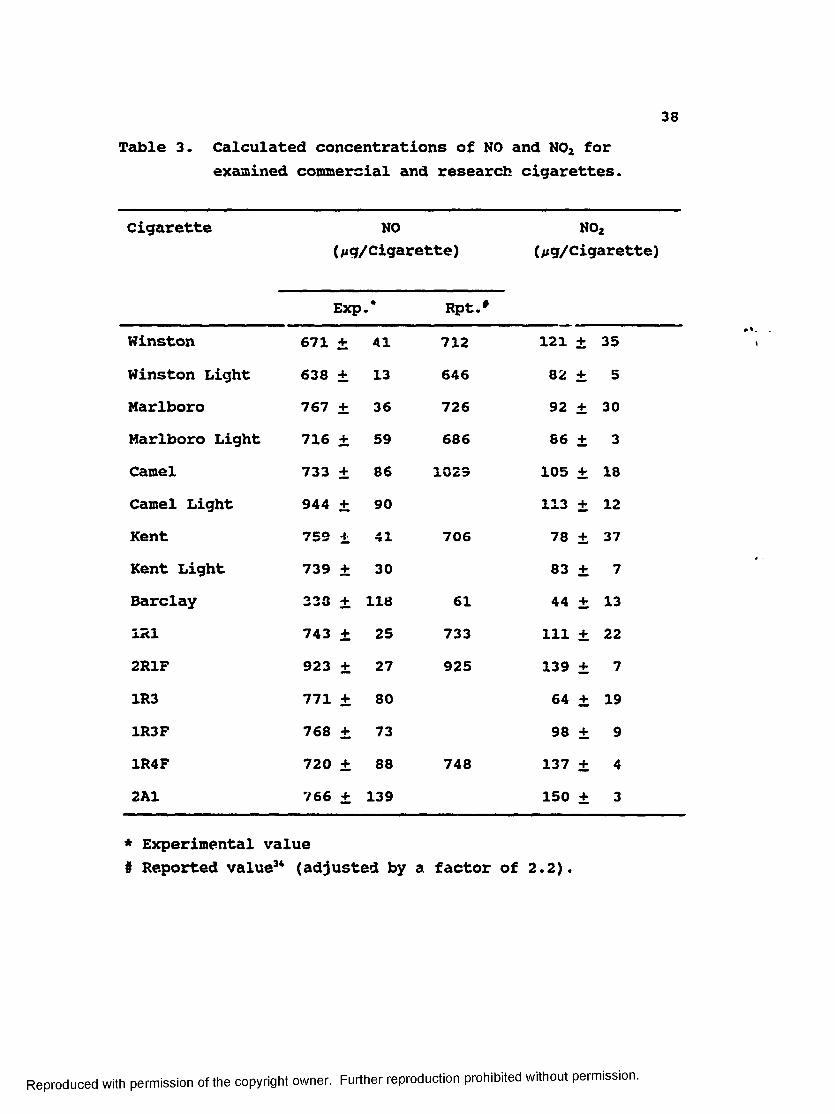
Table 3. Calculated concentrations of NO and N02 for examined commercial and research cigarettes.
38
Cigarette NO N02(pg/Cigarette) (/xg/Cigarette)
Exp •• Rpt.#
Winston 671 ± 41 712 121 + 35Winston Light 638 ± 13 646 82 + 5Marlboro 767 + 36 726 92 + 30Marlboro Light 716 ± 59 686 86 + 3Camel 733 ± 86 1023 105 + 18Camel Light 944 + 90 113 + 12Kent 759 + 41 706 78 + 37Kent Light 739 ± 30 83 + 7Barclay 333 + 118 61 44 + 131R1 743 ± 25 733 111 ± 222R1F 923 ± 27 925 139 + 71R3 771 + 80 64 + 191R3F 768 + 73 98 + 91R4F 720 ± 88 748 137 ± 42A1 766 + 139 150 + 3
* Experimental value# Reported value3* (adjusted by a factor of 2.2).
Reproduced with permission of the copyright owner. Further reproduction prohibited without permission.
39spectra, while compounds that decrease in concentration show inverted bands. The differential format allows one to observe very small changes with time more clearly. Most interfering components do not change over time, and therefore they do not appear in the modified spectra.
Figure 13 shows a sample of the changes found in the ageing of 1R1 gas phase cigarette smoke between HO seconds and 7 minutes. The most important feature is the appearance of absorption bands at 800 and 822 cm*1. These bands correspond to methyl nitrite89*81, which is the product of the reaction of methanol with nitrogen dioxide92*83. This finding was the main reason behind the addition of methanol to the model system. In Figure 13 we can also see very clearly the appearance of N02 (1580-1663 cm'1), and the disappearance of NO (1820-1940 cm*1), N02 (1580-1660 cm*1), and isoprene (860- 1000 cm*1). A similar study of a NO/air/isoprene/methanol system (Figure 14) gave similar results.
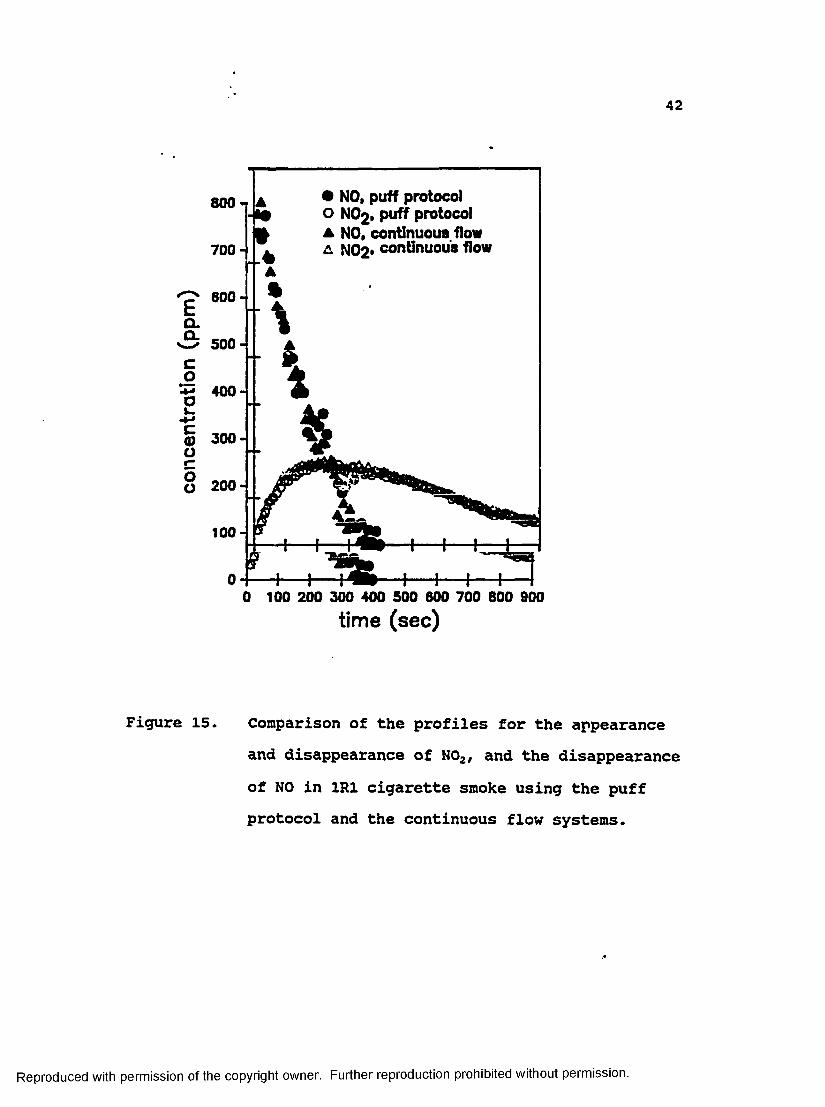
Comparisonof_continuous flow and puff protocolst Figure 15 shows the kinetic profiles for the appearance and disappearance of N02 and the disappearance of NO in 1R1 cigarette smoke using both protocols. It was found that the continuous flow system, if the cell is clean, gives comparable results (for the compounds studied) to the puff system, and it is easier to use. In addition, larger volumes of smoke go into the cell when using the continuous
Reproduced with permission of the copyright owner. Further reproduction prohibited without permission.
Reproduced
with perm
ission of the
copyright ow
ner. Further
reproduction prohibited
without
permission.
.1 -
86
20 8«o
1 mill.
2 mtn.
3 m m .
4 mln
5 mln
6 m ln.
7 mln
2 0 0 0 1 3 0 0 1OOO
W avanum bara (c m —1 )
Figure 13. Differential spectral kinetic profiles of 1R1 gas phase cigarette smoke between 20 seconds and 7 minutes.
o
Reproduced
with perm
ission of the
copyright ow
ner. Further
reproduction prohibited
without
permission.
Figure 14
S§■eO•>=9
1 mln.
2 mln.
3 mln
4 mln
S mln.
6 mln.
7 mln.• YlVr
SBC.
2 0 0 0 1300
Wavanumbers (c m —t )
1000
Differential spectral kinetic profiles of NO/air/methanol/Isoprene between 20 seconds and 7 minutes.
t
conc
entr
atio
n (p
pm
)
42
800
700
600
500
400
300
200
100
00 100 200 300 400 500 600 700 800 900
time (sec)
Figure 15. Comparison of the profiles for the appearance and disappearance of N02, and the disappearance of NO in 1R1 cigarette smoke using the puff protocol and the continuous flow systems.
Reproduced with permission of the copyright owner. Further reproduction prohibited without permission.
43flow (50.6 ml for continuous flow, 35 ml for puff method), increasing the sensitivity. Therefore, the continuous flow system was used for most of the experiments.
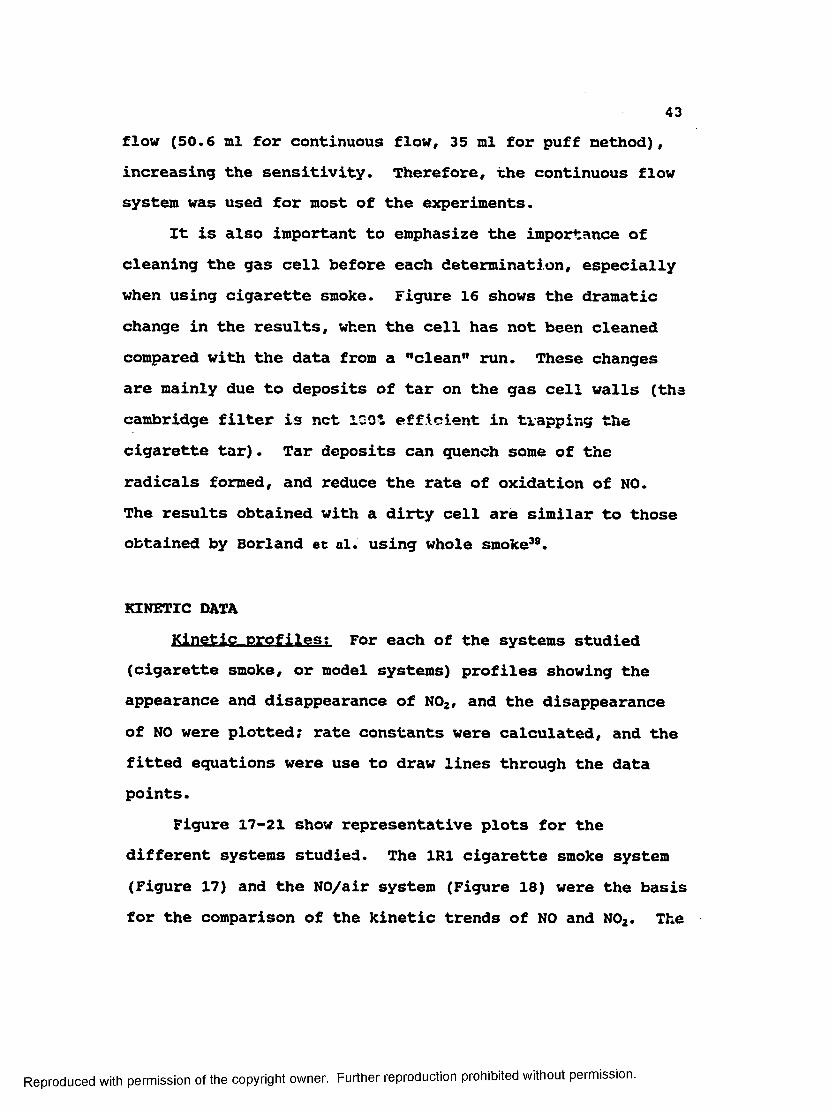
It is also important to emphasize the importance of cleaning the gas cell before each determination, especially when using cigarette smoke. Figure 16 shows the dramatic change in the results, when the cell has not been cleaned compared with the data from a "clean" run. These changes are mainly due to deposits of tar on the gas cell walls (the Cambridge filter is net ICO* efficient in trapping the cigarette tar). Tar deposits can quench some of the radicals formed, and reduce the rate of oxidation of NO.The results obtained with a dirty cell are similar to those obtained by Borland et al. using whole smoke39.
KINETIC DATAKinetic profiles: For each of the systems studied
(cigarette smoke, or model systems) profiles showing the appearance and disappearance of N02, and the disappearance of NO were plotted? rate constants were calculated, and the fitted equations were use to draw lines through the data points.
Figure 17-21 show representative plots for the different systems studied. The 1R1 cigarette smoke system (Figure 17) and the NO/air system (Figure 18) were the basis for the comparison of the kinetic trends of NO and N02. The
Reproduced with permission of the copyright owner. Further reproduction prohibited without permission.
1000
■ >800
CLCl o »
C 600
CM
200
0 800400 . .600Time (sec)
2000
Figure 16. Profiles for the appearance and disappearance of N02 (filled symbols), and the disappearance of NO (open symbols) in 1R1 cigarette smoke. Crosses represent measurements made with a clean cell; triangles represent measurements made with a "dirty" cell.
Reproduced with permission of the copyright owner. Further reproduction prohibited without permission.
Con
cent
ratio
n
45
tooo
900
800
700CL
600
500
400
300
200100
0 100 200 300 400 500 600 700 800 900time (sec)
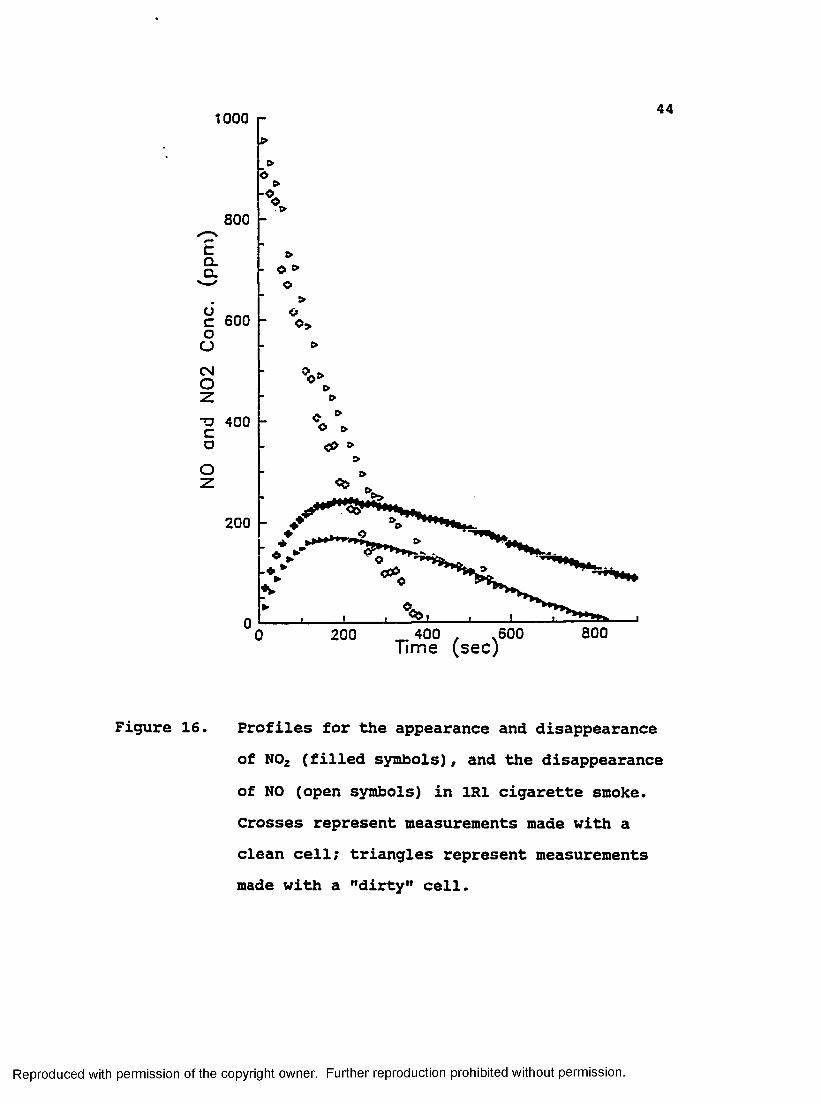
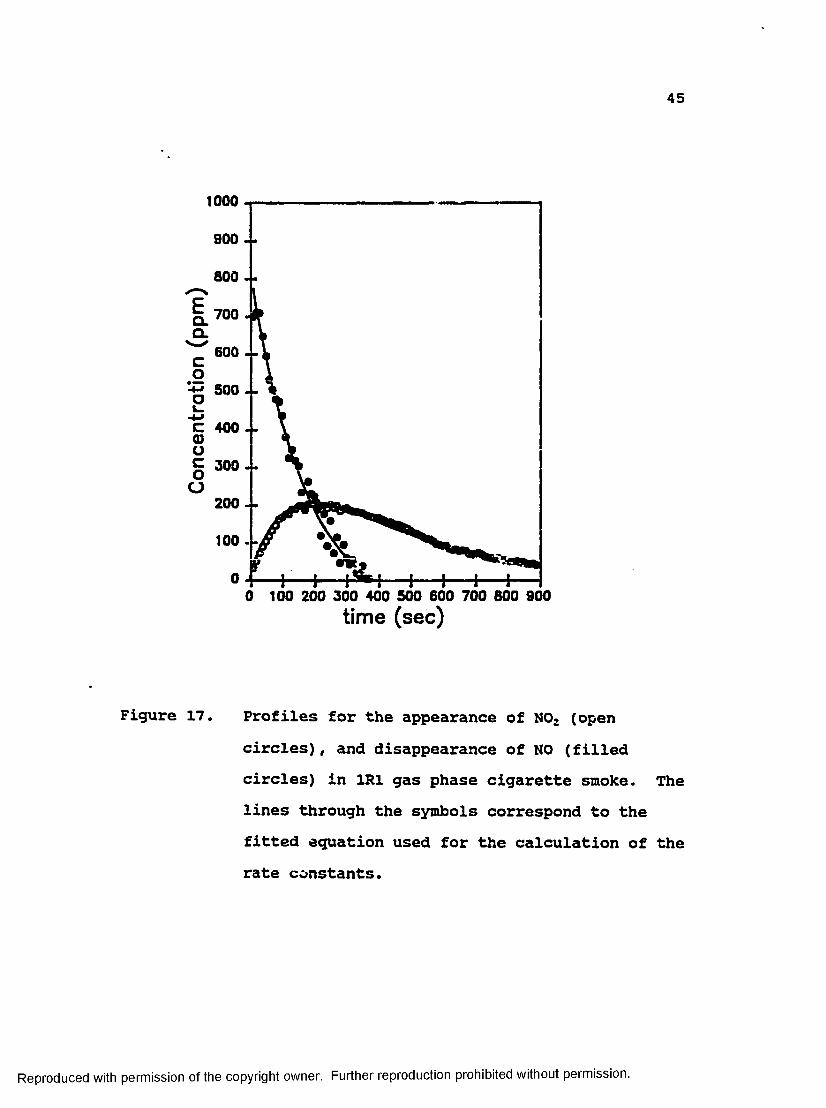
Figure 17. Profiles for the appearance of N02 (open circles), and disappearance of NO (filled circles) in 1R1 gas phase cigarette smoke. The lines through the symbols correspond to the fitted equation used for the calculation of the rate constants.
Reproduced with permission of the copyright owner. Further reproduction prohibited without permission.
46
1000900 --
800
C 400
C 300
■i----i— I— i— i— i---- i-100 200 300 400 500 600 700 800 900
time (sec)
Figure 18. Profiles for the appearance of N02 (open circles), and disappearance of NO (filled circles) for the NO/air system. The lines through the symbols correspond to the fitted equation used for the calculation of the rate constants.
Reproduced with permission of the copyright owner. Further reproduction prohibited without permission.
47main differences between the two systems are: 1) The fasterrate cf oxidation of NO in cigarette smoke compared to NO/air, and 2) small concentrations of N02 present in cigarette smoke compared to NO/air.
The NO/air/isoprene system (Figure 19) was the original model for cigarette smoke8, and was the first system to be studied. The rate of oxidation of NO is closer to that found in cigarette smoke, but the profile for N02 is somewhere in between the NO/air system and cigarette smoke. With methanol substituted for isoprene (Figure 20) NO disappears at a slower rate, and concentrations of N02 are a little higher. When methanol is added to the NO/air/isoprene system, profiles very similar to those of cigarette smoke were obtained (Figure 21).
Other systems: Kinetic studies for theNO/acetaldehyde/air (Figure 22) , NO/acrolein/air (Figure 23), NO/acetaldehyde/isoprene/air (Figure 24), and NO/acrolein/isoprene/air (figure 25) systems were also made. No differences were found for the first two systems compared to the NO/air system, or for the latter two systems compared to NO/air/isoprene.
The kinetic profiles of NO and N02 for the different research and commercial cigarettes were also studied. The only difference found compared to the 1R1 profiles was that
Reproduced with permission of the copyright owner. Further reproduction prohibited without permission.
48
1000900
800
700Q.
600
500
400
300
200100
100 200 300 400 500 600 700 800 900time (sec)
Figure 19. Profiles for the appearance and disappearance of N02 (open circles) and the disappearance of NO (filled circles) in the NO/air/isoprene system. The lines through the symbols correspond to the fitted equation used for the calculation of the rate constants.
Reproduced with permission of the copyright owner. Further reproduction prohibited without permission.
49
1000900
800
/uwQ.
600
-t; 500"c 400
E ~oo200100
0 100 200 200 400 500 600 700 600 900time (sec)
Figure 20. Profiles for the appearance and disappearance of N02 (open circles) and the disappearance of NO (filled circles) in the NO/air/methanol model. The lines through the symbols correspond to the fitted equation used for the calculation of the rate constants.
Reproduced with permission of the copyright owner. Further reproduction prohibited without permission.
50
1000SCO
800
700a.
600
500 . .
400 . .
300 . .
200
100
0 100 200 300 400 500 600 700 800 900 time (sec)
Figure 21. Profiles for the appearance and disappearance of N02 (open circles) and the disappearance of NO (filled circles) in the NO/air/methanol/isoprene model. The lines through the symbols correspond to the fitted equation used for the calculation of the rate constants.
Reproduced with permission of the copyright owner. Further reproduction prohibited without permission.
51
1000900 ■ -
800 4-
Q.600 - ;4
i f 500
C 400 •-
C 300--
200
0 100 200 300 400 500 600 700 800 900time (sec)
Figure 22. Profiles for the appearance of N02 (open circles), and disappearance of NO (filled circles) for the NO/air/acetaldchyde system.
Reproduced with permission of the copyright owner. Further reproduction prohibited without permission.
52
1000
C 400
£ 300
N v iii
0 100 200 300 400 500 600 700 600 900time (sec)
Figure 23. Profiles for the appearance of N02 (open circles), and disappearance of NO (filled circles) for the NO/air/acrolein system.
Reproduced with permission of the copyright owner. Further reproduction prohibited without permission.
53
1000 n900--
800 +
500E Vc 400 x Jk
200 - -
100
0 100 200 300 400 500 600 700 800 900time (sec)
Figure 24. Profiles for the appearance of no2 (open circles), and disappearance of NO (filled circles) for the NO/air/acetaldehyde/isoprene system.
Reproduced with permission of the copyright owner. Further reproduction prohibited without permission.
54
1000900 - -
800 --
50 0 -- VC 400--
£ 300--
200 t100
0 100 200 300 400 500 600 700 800 900time (sec)
Figure 25. Profiles for the appearance of N02 (open circles), and disappearance of NO (filled circles) for the NO/air/acrolein/isoprene system.
Reproduced with permission of the copyright owner. Further reproduction prohibited without permission.
55the initial concentrations of HO and N02 were different, but all cigarettes showed the same kinetic trends.
Rate constants: Rate constants were calculated for allthe systems studied, using the kinetic software package from OLIS. For each mixture at least five kinetic runs were collected, and the rate constants calculated.
The rate of oxidation of nitric oxide is third order, and when oxygen is greatly in excess it becomes (pseudo) second order11,19,94:
-dCKQl « 2k [02][N0]2 dtThe calculated third order rate constant for the NO air system was 4.0 x 10s l^ol'^in'1 which compares very well with the reported value (4.4 x 10⁵ l^ol’̂ in"1)11.
Since the disappearance of NO in gas phase cigarette smoke is best fitted by a logarithmic decay curve (Figure 17), first order kinetics were assumed following the guidelines given by Glasson and Tuesday39, and Borland ec al.12:
-di.NP.l = k[NO] dtThese researchers attribute the first order oxidation of nitric oxide in gas phase cigarette smoke to the rapid reaction of peroxy radicals with nitric oxide (eg. 4, in the introduction).
Reproduced with permission of the copyright owner. Further reproduction prohibited without permission.
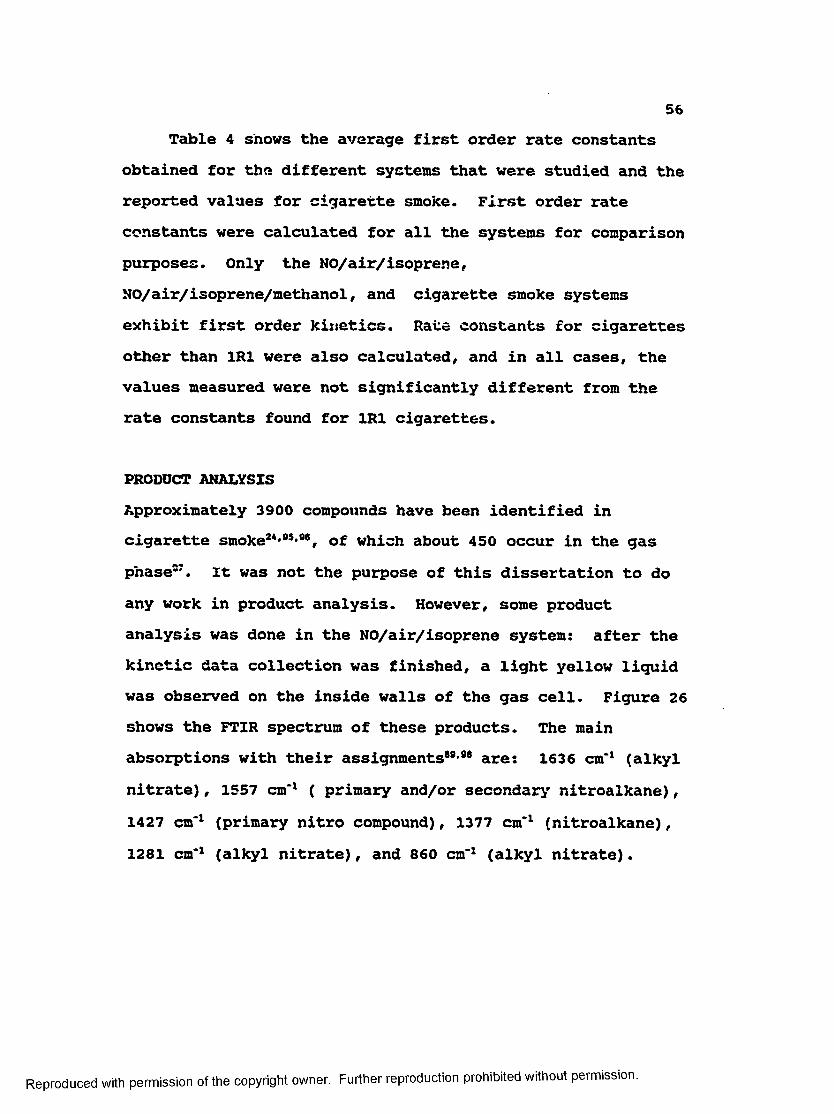
Table 4 snows the average first order rate constants obtained for the different systems that were studied and the reported values for cigarette smoke. First order rate constants were calculated for all the systems for comparison purposes. Only the NO/air/isoprene, NO/air/isoprene/methanol, and cigarette smoke systems exhibit first order kinetics. Rate constants for cigarettes other than 1R1 were also calculated, and in all cases, the values measured were not significantly different from the rate constants found for 1R1 cigarettes.
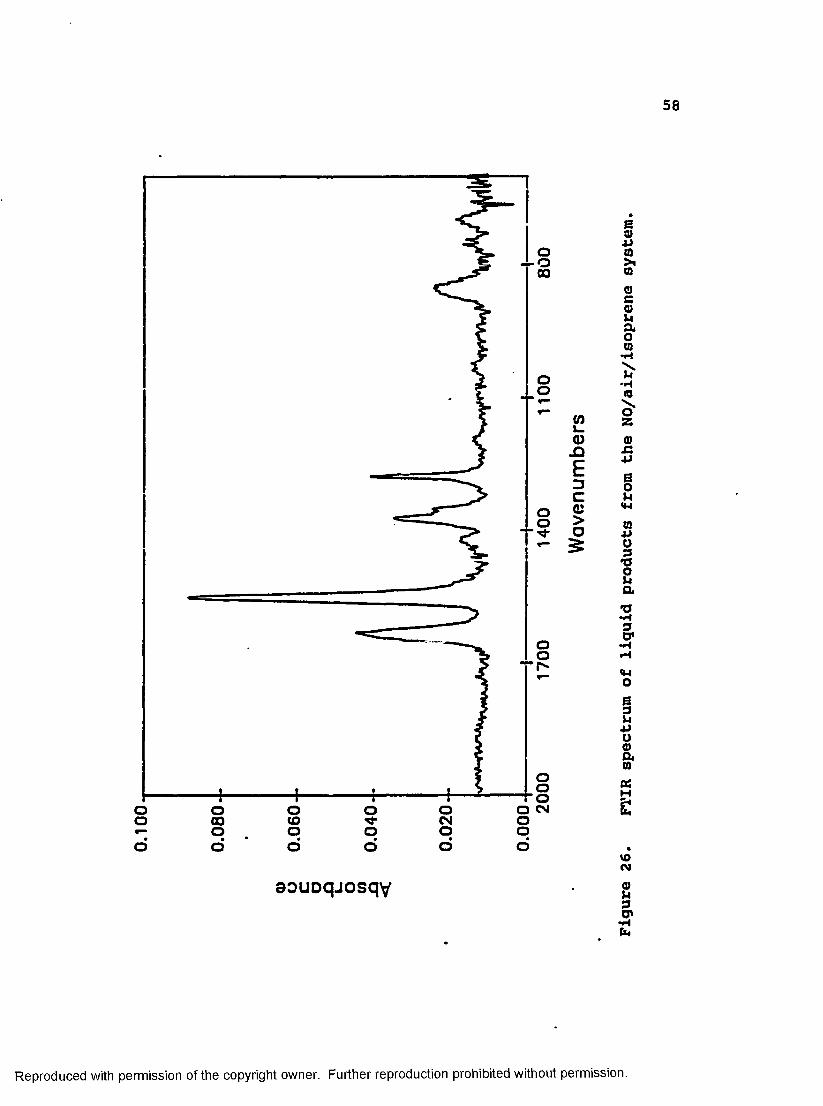
PRODUCT ANALYSISApproximately 3900 compounds have been identified in cigarette smoke24 *8S*88, of which about 450 occur in the gas phase57. It was not the purpose of this dissertation to do any work in product analysis. However, some product analysis was done in the NO/air/isoprene system: after thekinetic data collection was finished, a light yellow liquid was observed on the inside walls of the gas cell. Figure 26 shows the FTIR spectrum of these products. The main absorptions with their assignments88'8* are: 1636 cm-1 (alkylnitrate), 1557 cm-1 ( primary and/or secondary nitroalkane), 1427 cm'1 (primary nitro compound), 1377 cm'1 (nitroalkane), 1281 cm'1 (alkyl nitrate), and 860 cm'1 (alkyl nitrate).
Reproduced with permission of the copyright owner. Further reproduction prohibited without permission.
57Table 4. Rate constants for oxidation of NO, and appearance
(kx) and disappearance (k2) of U02.All rates s‘l x 103
NO N02(*i)
no2(k2)
NO in air 2.9 ± 0.6 3.2 + 0.51R1 Cig. Smoke 5.7 ± 0.7 7.3 + 1.4 3.3 ± 0.6NO/Isoprene/air 3.8 ± 0.7 5.7 + 0.8 1.1 ± 0.1NO/MeOH/air 3.0 ± 0.3 11.1 + 0.4 3.0 + 0.3NO/MeOH/Isop./air 5.1 + 0.3 14.2 + 0.8 0.8 ± 0.4NO/acrolein/air 2.9 ± 0.7 3.1 ± 0.6NO/acetaldehyde/air 2.8 ± 0.7 3.1 + 0.6NO/acrolein/isoprene/air 3.7 + 0.9 5.8 + 1.0 1.2 ± 0.3NO/acetaldehyde/isoprene/air 3.9 ± 0.8 5.8 + 1.1 1.3 ± 0.4
Borland ec al39 2.7(cigarette smoke)Vilcins & Lephardt*6* 7.0 (cigarette smoke)
* Calculated by Borland ec al30
Reproduced with permission of the copyright owner. Further reproduction prohibited without permission.
0.10
0
58
“*"0 O CM Oo<0 o■M" oCMO
(0l_0)JD
EDCe>o
aouDqjosqv
Reproduced with permission of the copyright owner. Further reproduction prohibited without permission.
Figure
26.
FTIR
spectrum
of liquid
products
from
the NO/air/isoprene
system.
59These are all predicted products from the proposed steady- state mechanism8 and confirm results reported by other research groups for the reaction of N02 with isoprene12*98*99.
Reproduced with permission of the copyright owner. Further reproduction prohibited without permission.
DISCUSSION
GAS MIXTURESThe final design of the gas nixing system (Figure 4) is
a great improvement over any of the systems used before8.The use of mass flow controllers significantly reduced the variation between replications of experiments, decreased the setup time for the experiments, and allowed the preparation of mixtures of very precise concentrations. The use of a "stop flow" system for the kinetic experiments speeded the acquisition of data and allowed for a much higher number of data points to be collected per kinetic run.
CONCENTRATION VALUES IN CIGARETTE SMOKEThe concentration values calculated for nitrogen oxides
(Table 3) are 2.2 times higher than the reported values34 because the experiments described here were done using a continuous flow system, which uses all the smoke generated by a cigarette, while previously reported values are calculated based on a puff protocol, which uses only the volume of smoke that would be inhaled by the smoker24,78. The values obtained for the concentration of NO in research cigarettes are in close agreement with those reported in the literature (after adjustment), which shows the validity of the data obtained by the FTIR method developed in this study. For a few commercial cigarettes the calculated
60
Reproduced with permission of the copyright owner. Further reproduction prohibited without permission.
61concentration values do not match the reported concentration values (Table 3). These changes may be due to changes in the composition and treatment of the tobacco in the different brands since 1981 (the year the reported values were measured).
The FTIR method developed here has several advantages over the method most frequently used in the literature (chemiluminescence)28̂ *”*2. The most distinct advantage is that the FTIR method is a real time analysis. In addition, several components can be determined simultaneously, even in the presence of overlapping bands, and the FTIR method is free of the interferences found in the chemi luminescence method. Another advantage is that use of the FTIR method can differentiate between NO and N02, and other components if desired, while the chemiluminescence method cannot.
KINETIC STUDIESStudv of profiles for NO disappearance, and NO,
appearance and disappearance: The comparison of theprofiles for the disappearance of NO and the appearance and disappearance of N02 in the different systems studied was the most important application of the method developed in this dissertation. All the systems studied were compared to gas phase cigarette smoke (Figure 17). In general the results obtained for N02 are of a better quality, because of the much higher extinction coefficients for N02 compared to
Reproduced with permission of the copyright owner. Further reproduction prohibited without permission.
62NO (at least one order of magnitude). This is especially apparent when looking at the data with concentrations of NO below 120 ppm.
NO in air: First, we may compare cigarette smoke(Figure 17) and the NO/air system (Figure 18); the disappearance of nitric oxide in cigarette smoke is faster compared to the NO/air system. There is no consumption of nitrogen dioxide in the NO/air system, which is the expected result since at concentrations below 1000 ppm the equilibrium of N02 with N20* is insignificant. The profile obtained for the oxidation of NO in air (Figure 18) is similar to the ones reported in the literature11,38,9*, and the calculated third order rate constant (4.0 x 10⁵ l^ol'^in'1) is similar to the reported value (4.4 x 10s l^ol'^in’1)11.
The differences between the NO/air system and the cigarette smoke system are in agreement with the steady state model8 that predicts a faster oxidation of NO and consumption of N02 in cigarette smoke.
NQ/air/isoprene system: The fact that reactiveolefins increase the rate of oxidation of NO in air12,99 and that the model for the continuous production of free radicals in gas phase cigarette smoke is based in NO/air/isoprene, made the NO/air/isoprene system the first one studied (Figure 19). In the NO/air/isoprene system the
Reproduced with permission of the copyright owner. Further reproduction prohibited without permission.
rate of disappearance of nitric oxide is almost as fast as in cigarette smoke, but the rates o£ formation and consumption of nitrogen dioxide still differ from those for cigarette smoke. This was expected, because such a simple model can only mimic certain features of real cigarette smoke. The rate of disappearance of nitric oxide is close to that in cigarette smoke because, as predicted in the mechanism (eg 4, in the introduction), NO in addition to being consumed in the oxidation step, reacts with the peroxyl radicals formed in the reaction of isoprene with N0Z. The rate of disappearance of N0Z in this system is slower than that for cigarette smoke, because N02 can react with several other components in cigarette smoke but not in this system.
NO/a ir/methanol: The formation of methyl nitritein cigarette smoke, as shown in Figure 13, leads us to suggest that methanol could be an important contributor to the model. It is difficult to follow the formation of methyl nitrite, because it is present in low concentrations and the infrared absorption for this type of compound is relatively weak88,90. A study of the NO/a ir/methanol system (Figure 19) shows almost the same rate of oxidation for NO as that of NO in air alone, which is the expected result (there is no formation of the reactive intermediate alkyl and peroxyl radicals). The behavior of the N02 in the
Reproduced with permission of the copyright owner. Further reproduction prohibited without permission.
64NO/air/methanol system is in between that found in the NO/air and the NO/air/isoprene systems. This also is expected, because the only reaction of N02 that can occur is with methanol to form methyl nitrite. In contrast, N02 can disappear by several reactions in the NO/air/isoprene system.
NQ/a ir/methanol/isoorene; The preceding results led to the study of the NO/air/methanol/isoprene system (Figure 20). Of the different systems studied, the NO/air/methanol/isoprene system is the one that simulates most closely the NOx concentrations in cigarette smoke, especially with regard to the rate of disappearance of nitric oxide. The model is not a perfect fit for the data from cigarette smoke, but it is very similar, especially in consideration of the large number of components found in cigarette smoke that can react either with N02, or with the intermediate radicals formed in the steady-state mechanism. This is a more realistic model for the NO* chemistry in cigarette smoke than the model proposed originally8.
It is remarkable that by using only four components (NO, oxygen, methanol, and isoprene) it is possible to get such a good model for a system as complicated as cigarette smoke.
Reproduced with permission of the copyright owner. Further reproduction prohibited without permission.
65Other models: Combinations of the systems
described above with acetaldehyde and acrolein did not give any significant change in the results. This was not very surprising, because changes were not found comparing the NO/air system with the NO/air/acetaldehyde, or the NO/air/acrolein systems. Analyzing the differential spectral kinetic profiles of gas phase cigarette smoke (Figure 13), no major changes are observed in the region corresponding to the carbonyl absorption ( 1700 cm*1), which indicates very low reactivity for ar.y carbonyl-containing component found in the gas phase cigarette smoke.
Rate constants: The rate constants calculated for thedifferent systems are difficult to analyze further (Table 4), because of the slow reaction rates and the fact that all the calculated values have the same order of magnitude.
The rates of oxidation of nitric oxide are easier to compare than those for the appearance and disappearance of nitrogen dioxide, because the reactions are very straightforward. Nitrogen dioxide, being a very reactive compound, has more routes to follow, still we can observe the same trends in the numerical values (Table 4) as found by visual comparison of the data (Figures 17 to 25).
Only two values of rate constants for the oxidation of nitric oxide in cigarette smoke were found in the literature
Reproduced with permission of the copyright owner. Further reproduction prohibited without permission.
(Table 4): The value reported by Borland et al.3®( 2.7 x 10'3 sec'1) is very small (even smaller than the rate of oxidation of NO in air), and it was obtained using cheiuiiuminescence. Cheniluminescence is a non-continuous method of analysis of NO, which the authors acknowledge as a problem. The second value is by the same group, based in tne data published by Vilcins and Lephardt*6. This value (7.0 x 10'3 sec'1) is larger than any of the values for the rate constant found in the FTIR experiments, but this value was calculated from relative absorbances estimated from a printed plot39.
Comparison of kinetic profiles with original model:One of the most important features of the original ESR studies that led to the steady state model7*8 was that maximum spin adduct yields were not observed until the smoke was at least one minute old; the proposed mechanism suggested that most of the radicals formed arose from reactions from N02. The profiles of N02 in the different systems (Figures 15-25) show the time when the concentration of N02 reaches a maximum, and this value can be compared with the time for the maximum concentration of spin adducts (about 100 seconds)®*10. Both the NO/air/isoprene and the NO/air/methanol systems (Figure 19-20) show maximum concentrations of N02 at about 400 seconds, which is more than three times the time of occurrence of the maximum
Reproduced with permission of the copyright owner. Further reproduction prohibited without permission.
concentration of spin adducts, or N02 in cigarette smoke. In contrast, both cigarette smoke (Figure 17) and the NO/air/isoprene/methanol model (Figure 21) show maximum concentrations of N0£ at about 120 seconds, closer to the time (100 see) when the spin adduct concentrations are maximum. In addition, the profile for appearance and disappearance of N02 in both systems is very similar to the profile for the spin adduct concentrations against time9. These two facts (similar time course, and similar maxima) give more evidence to support the steady state mechanism.
Reproduced with permission of the copyright owner. Further reproduction prohibited without permission.
CONCLUSIONS
A FTIR method was developed for the simultaneous analysis of NO and N02 in cigarette smoke and in model systems. The method also allows the simultaneous determination of other components.
Using the developed method, the steady-state mechanism for the production of free radicals in gas phase cigarette smoke was substantiated. In addition a more realistic model, consisting of a mixture of NO/methanol/isoprene/air, was proposed. The concentrations of nitric oxide and nitrogen dioxide in the new proposed model follow time courses that duplicate very closely the ones found for the same components in gas phase cigarette smoke.
68
Reproduced with permission of the copyright owner. Further reproduction prohibited without permission.
REFERENCES
1. Lyons, M.J.; Gibson, J.K.; Ingram, D.J.E.: Free radicals produced in cigarette smoke. Nature 181, 1003-1004 (1958).
2. Kensler, T.M.; Taffe, B.G.: Free radicals in tumor promotion. Adv. FreeRad.Biol.Med. 2, 347-388 (1986).
3. McBrien, D.C.H.; Slater, T.F.: Free radicals, lipid peroxidation and cancer Academic press. New York (1982).
4. Nagata, C.; Kodama, M.; Loki, Y.; Kimura, T.: Free radicals produced from chemical carcinogens and their significance in carcinogenesis; in; Floyd, R.A., ed. Free radicals and cancer, pp. 1-58 Dekker, New York (1982).
5. Carp, H.; Janoff, A.: Possible mechanisms for emphysema in smokers; in vitro suppression of serum elastase-inhibitory capacity by fresh cigarette smoke and DTS prevention by antioxidants. Am.Rev.Respir.Dis. 118, 617-621 (1978).
69
Reproduced with permission of the copyright owner. Further reproduction prohibited without permission.
706. Taylor, J.C.; Mittman, C.: Pulmonary emphysema and
proteolysis. Academic press, New York (1986).
7. Church, D.P.; Pryor, W.A.: Free radical chemistry of cigarette smoke and its toxicological implications.Env.Health Perso. 64, 111-126 (1985).
8. Pryor, W.A.; Tamura, M.; Church, D.F.: ESR spin trapping stuay of the radicals produced in NO^/olefin reactions: A mechan-Uin for the production of the apparently long-lived radicals in gas-phase cigarette smoke. J.Am.Chem.Soc. 106, 5073-5079 (1984).
9. Pryor, W.A.; Dooley, M.M.; Church, D.F.: Mechanisms of cigarette smoke toxicity: The inactivation of human alpha-lPI by nitric oxide/isoprene mixtures in air. Chem.-Biol. Interactions 54, 171-183 (1985).
10. Pryor, W.A.? Prier, D.G.? Church, D.F.: ESR study of mainstream and sidestream cigarette smoke: Nature of the free radicals in gas phase smoke and in cigarette tar. Env.Health Perso. 47, 345-355 (1983).
11. Baulch, D.C.; Drysdale, D.D.; Home, D.C.: Evaluated kinetic data for high temperature reactions. Vol. 2
London Butz^rworchs, London (1973).pp. 285-300.
Reproduced with permission of the copyright owner. Further reproduction prohibited without permission.
7112. Glasson, W.A.; Tuesday, C.S.: The atmospheric thermal
oxidation of nitric oxide in the presence of dienes.Envtscj,..Techt 4, 752-757 (1970).
13. Saltzman, B.E.: Colorimetric microdetermination of nitrogen dioxide in the atmosphere. Anal.Chem. 26(12), 1949-1955 (1954).
14. Saltzma?i, B.E.: Modified nitrogen dioxide reagent for recording air analyzers. Anal.Chem. 32(1), 125-136 (1960).
15. Saltzman, B.E.: Critique of measurement techniques for ambient nitrogen oxides; in: Lee, S.D., ed. Nitrogen oxides and their effects on health, pp. 31-50 Ann Arbor Sci., Michigan (1980).
16. Newsome, J.R.; Norman, V.? Keith, C.H.: Vapor phase analysis of tobacco smoke. Tob.Science 9, 102-110 (1965).
17. Norman, V.; Keith, C.H.: Nitrogen oxides in tobacco smoke. Nature 205, 915-916 (1965).
Reproduced with permission of the copyright owner. Further reproduction prohibited without permission.
7218. Fisher, G.E.; Becknell, D.E.: Saltzman method for
determination of low concentrations of oxides of nitrogen in automotive exhaust. Anal.Chem. 44(4), 863-866 (1972).
19. Sloan, C.H.; Kiefer, J.E.: Determination of NO and N02 in cigarette smoke from kinetic data. J.E.Tob.Sc.i. 13, 180-182 (1969).
20. Esch, G.J.; Nenzel, D.B.: Health effects associated with Nitrogen oxides; in: Schneider, T.; Grant, L., eds. Air pollution by nitrogen oxides, pp. 79-90 Elsevier, Amsterdam (1982).
21. Norwitz, G.: A colorimetric method for the determination of oxides of nitrogen. Analyst 9 1,553-558 (1966).
22. Scherbak, M.P.; Smith, T.A.: A colorimetric method for the determination of total oxides of nitrogen in cigarette smoke. Analyst 95, 964-968 (1970).
23. Smith, G.A.L.; Sullivan, P.J.; Irvine, W.J.: The determination of the oxidisable nitrogen oxides present in cigarette smoke. Analyst 92, 456-462 (1967).
Reproduced with permission of the copyright owner. Further reproduction prohibited without permission.
24. Guerin, M.R.: Chemical composition of cigarette smoke; in: Gori, G.B.; Bock, F.G., eds. Banbury report: 3- A safe Cigarette?, pp. 191-204 Cold Spring Harbor Laboratory, (1980).
25. Sloan, C.H.; Morie, G.P.: Determination of nitrogenoxides in cigarette smoke with a nitrate ion electrode.Tob.Sci. 19, 98-99 (1974).
26. Horton, A.D.; Stokely, J.R.; Guerin, M.R.: Gas chromatographic determination of nitric oxide in cigarette smoke. Anal.Let. 7(3), 177-185 (1974).
27. Williams, T.B.: The determination of nitric oxide ingas phase cigarette smoke by non dispersive infraredanalysis. Beitr.Tabakforsch.Int. 10(2), 91-99 (1980).
28. Jenkins, R.A.; Gill, B.E.: Determination of oxides of nitrogen (NOx) in cigarette smoke by chemiluminescent analysis. Anal.Chem. 52, 925-928 (1980).
29. Fontijn, A.; Sabadell, A.J.; Ronco, R.J.: Homogeneous chemiluminescent measurement of nitric oxide with ozone. AnSLUShSlSL. 42(6), 575-579 (1970).
Reproduced with permission of the copyright owner. Further reproduction prohibited without permission.
30. Baumgardner, R.E.; Clark, T.A.; Stevens, R.K.: Comparison of instrumental methods to measure nitrogen dioxide. Env.Sci.Tech. 9(1), 67-69 (1975).
31. Zabielski, M.F.; Seery, D.J.; Dodge, L.G.: Influence of mass transport and quenching on nitric oxide chemiluminescent analysis. Env.sci.Tech. 18, 88-92 (1984).
32. Spicer, C.W.: The fate of nitrogen oxides in the atmosphere; in: Pitts, J.N.Jr.; Metcalf, R.L.; Lloyd, A.C., eds. Advances in environmental science and technology. Vol. 7, pp. 163-262 John Wiley & Sons, New York (1977).
33. Committee on environmental improvement: Cleaning our environment. A chemical perspective American Chemical society, Washington (1978).2nd Ed. pp. 56.
34. Jenkins, R.A.; White, S.K.? Griest, W.H.; Guerin, M.R.: Chemical characterization of the smokes of selected U.S. commercial cigarettes: Tar,Nicotine,Carbon monoxide, oxides of nitrogen, hydrogen cyanide and acrolein. ORNL/TM-8749 Mav. 1-36 (1983).
Reproduced with permission of the copyright owner. Further reproduction prohibited without permission.
7535. Jenkins, R.A.; Guerin, M.R.: Analytical chemical
methods for the detection of environmental tobacco smoke constituents. European Journal of Respiratory Diseases SuPP.133.vol.65. 33-46 (1984).
36. Neurath, G.B.; Duenger, M.; Pein, F.G.: Interaction ofnitrogen oxides, oxygen and amines in gaseous mixtures.
*
IARC Sci.Publ. 14, 215-225 (1976).
37. Borland, C.D.R.; Higenbottam, T.W.: Nitric oxide yields of contemporary UK, US and French cigarettes. International Journal of Epidemology 16(1), 31-34(1987).
38. Norman, V.? Ihrig, T.K.; Larson, T.M.; Moss, B.L.: The effect of some nitrogenous blend components on NO/NO* and HCN levels in mainstream and sidestream smoke. Betty.Tabakforsch♦Int. 12(2), 55-62 (1983).
39. Borland, C.D.R.; Chamberlain, A.T.? Higenbottam, T.W.? Barber, R.W.? Thrush, B.A.: A comparison between the rate of reaction of Nitric oxide in the gas phase and in whole cigarette smoke. Beitr.Tabakforsch.Int. 13(2), 67-73 (1985).
Reproduced with permission of the copyright owner. Further reproduction prohibited without permission.
7640. Borland, C.D.R.; Higenbottam, T.W.: Do the oxides of
nitrogen in cigarette smoke cause emphysema in smokers?. Tokai J.Ex p .Clin.Med. 10(4), 371-373 (1985).
41. Joigny, c.: Report on the collaborative experiment on the determination of carbon monoxide and nitric oxide. CORESTA. Inf.Bull. 3-4, 67-76 (1978).
42. Joigny, c.: Report on the 1980 collaborative experiment on the determination of NO. CORESTA. Inf.Bull. 4, 27-31 (1981).
43. Philippe, R.; Hobbs, M.E.: Some components of the gas phase of cigarette smoke. Anal.cnem. 28(12), 21*02-2006 (1956).
44. Vilcins, G.: Determination of Ethylene and Isoprene in the gas phase of cigarette smoke by infrared spectroscopy. Beitr♦Tabakforsch.Int. 8(4), 181-185 (1975).
45. Vilcins, G.; Lephardt, J.O.: Fourier transform infrared spectroscopy applied to cigarette smoke analysis.Recent Advances in Tobacco Science 1, 123-146 (1975).
Reproduced with permission of the copyright owner. Further reproduction prohibited without permission.
7746. Vilcins, G. y Lephardt, J.O.: Ageing processes of
cigarette smoke: Formation of methyl nitrite. Chem.lnd. 974-975 (1975).
47. Maddox, W.L.; Mamantov, G.: Analysis of cigarette smoke by fourier transform infrared spectrometry. Anal.Chem. 49(2), 331-336 (1977).
48. Horlick, G.: Introduction to fourier transform spectroscopy. Ap p I . Spectrosc. 22161. 617-626 (1968).
49. Griffiths, P.R.; de Haseth, J.A.: Fourier transform infrared spectrometry John Wiley & Sons, New York (1986).
50. Perkins, W.D.: Fourier transform infrared spectroscopy Part II. Ad’.'snta^:- of FTIR. J.Chem.Ed. 64(11), A269-A271 (1987).
51. Brown, C.W.: Beer's law or inverse Beer's law:l:effects of unknown impurities. Spectroscopy 1(4), 32-37 (1986).
52. Brown, C.W. y Lynch, P.F.; Obremsky, R.J.y Lavery, D.S.: Matrix representations and criteria for selecting analytical wavelengths for multicomponent spectroscopic analysis, f tn a lt CheiHr. 54, 1472 -1479 (1 9 8 2 ) .
Reproduced with permission of the copyright owner. Further reproduction prohibited without permission.
7853. Haaland, D.M.; Easterling, R.G.: Application of new
least-squares methods for the quantitative infrared analysis of multicomponent samples. Ap p I. Spectrosc. 36(6), 665-673 (1982).
54. Kalivas, J.H.: Determination of optimal parameters for multicomponent analysis using the calibration matrix condition number. Anal.Chem. 58, 989-992 (1986).
55. Kisner, H.J.; 3rown, C.W.; Kavarnos, G.J.: Multiple analytical frecuencies and standards for the least-squares spectrometric analysis of serum lipids. Anal.Chem. 55. 1703-1707 (1983).
56. Maris, M.A.; Brown, C.W.; Lavery, D.S.: Nonlinear multicomponent analysis by infrared spectrometry. Anal.Chem. 55, 1694-1703 (1983).
57. Bingham, D.; Burton, C.H.: Analysis of multicomponent gas mixtures by correlation of Infrared spectra. Ap pI. Spectrosc. 38(5), 705-709 (1984).
Reproduced with permission of the copyright owner. Further reproduction prohibited without permission.
7958. Haaland, D.M.; Thomas, E.v.: Partial least squares
methods for spectral analysis. 1. Relation to other quantitative calibration methods and the extraction of qualitative information. Anal.Chem. 60, 1193-1202(1988). '
59. Lindberg, W.; Ohman, J.; Wold, S.: Multivariate resolution of overlapped peaks in LC using DAD. Anal.Chem. 58, 299-303 (1986).
60. Lorber, A.: Validation of hypothesis on a data matrix by target factor analysis. Anal.Chem. 56, 1004-1010 (1984).
61. Drown, C.W.; obremsky, R.J.; Anderson, P.: infrared quantitative analysis in the fourier domain:processing vector representations. Ap pI. Spectrosc. 40(6), 734-742 (1986).
62. Antoon, M.K.; D'Esposito, L.; Koenig, J.L.: Factor analysis applied to fourier transform infrared spectra. Ap pI. Spectrosc. 33(4), 351-357 (1979).
Reproduced with permission of the copyright owner. Further reproduction prohibited without permission.
63.
64.
65.
66.
67.
80Donahue, S.M.; Brown, C.W.; Obremski, R.J.: Multicomponent analysis using fourier transform infrared and UV spectra. Ap p I. Spectrosc. 42(2),353-359 (1988).
Fredericks, P.M.; Lee, J.B.; Osborn, P.R.; Swinkels, D.A.J.: Materials characterization using factor analysis of FTIR spectra .Part 1: Results. Ap p I.
Spectrosc. 39(2), 303-310 (1985).
Gillette, P.C.; Lando, J.B.; Koenig, J.L.; A survey of infrared data processing techniques; in: Ferraro, J.R.; Basile, L.J., eds. Fourier transform infrared spectroscopy applications to chemical systems, pp. 1-59 Academic Press, Crlando (1555).
Kerget, W.F.: Analysis of gaseous air pollutants using a mobile FTIR system. Am.Lab. Dec., 72-78 (1982).
Biermann, H.W.; Tuazon, E.C.; Winer, A.M.; Wallington, T.J.; Pitts, J.N.Jr.: Simultaneous absolute measurements of gaseous nitrogen species in urban ambient air by long pathlength infrared and ultraviolet-visible spectroscopy. Atm.env. 22(8), 1545-1554 (1988).
Reproduced with permission of the copyright owner. Further reproduction prohibited without permission.
8168. Gosz, J.R.; Dahm, C.N.; Risser, P.G.: Long-path FTIR
measurement of atmospheric trace gas concentrations. Ecology 69(5), 1326-1330 (1988).
69. Seasholtz, H.B.; Pence, L.E.; Moe, O.A--Tr.: Determination of carbon monoxide in automobile exhaust by FTIR spectroscopy. j.Chem.Ed. 65(9), 820-823 (1988).
70. Niki, H.; Maker, P.D.? Savage, C.M.; Breitenbach, L.P.: Fourier transform infrared spectroscopic studies of atmospheric chemistry? in: Comes, F.J.; Muller, A.; Orville, W.J., eds. Spectroscopy in chemistry and physics: modem trends, Elsevier, (1980).
71. Niki, H.; Maker. P.D.? Savage, C.M.? Breitenbach, L.P.: Fourier transform infrared spectroscopic studies of atmospheric chemistry. J.Hoi.Structure 59, 1-13 (1980).
72. Svenson, R.? Ljungstrom, E.? Lindgvist, O.: Kinetics of the reaction between nitrogen dioxide and water vapor. Atm.env. 21(7), 1529-1539 (1987).
73. Svenson, R.? Ljungstrom, E.: A kinetic study of the decomposition of HN03 and its reaction with NO.Int.J.chem.kinetics 20. 857C66 (1988).
Reproduced with permission of the copyright owner. Further reproduction prohibited without permission.
8274. Niki, H.; Maker, P.D.; Savage, C.M.; Breitenbach, L.P.;
Hurley, M.D.: An FTIR spectroscopic study of the kinetics and mechanism for the N02 initiated oxidation of tetramethyl ethylene at 298 K. Int.J .chem.kinetics 18, 1235-1247 (1986).
75. Ohta, T.; Nagura, H.; Suzuki, S.: Rate constants for the reactions of conjugated olefins with N02 in the gas phase. Int.J .chem.kinetics 1R. 1-11 (1986).
76. Atkinson, R.; Aschmann, S.M.? Carter, W.P.L.: Kinetics of the reaction of 03 and OH radicals with a series of dialkenes and trialkenes at 294 ±2 K.Int._J.chem.kinetics 16, 967-976 (1984).
77. Dodge, M.C.: Combined effects of organic reactivity and Nmhc/nox ratio on photochemical oxidant-formation.A modeling study. Atm.env. 18(8), 1657-1665 (1984).
78. Rothwell, K.; Grant, C.A.: Standard methods for analysis of tobacco smoke. IRC research paper No 11 Tobacco Research Council, London (1972).
79. Griffiths, P.R.; Foskett, C.T.; Curbelo, R.j Rapid scan infrared fourier transform spectroscopy.Ap pI.Soectrosc.Rev. 6(1), 31-78 (1972).
Reproduced with permission of the copyright owner. Further reproduction prohibited without permission.
8380. Finlayson-Pitts, B. J.: Reaction of N02 with NaCl and
atmospheric implications of N0C1 formation. Nature 306(5944), 676-677 (1983).
81. Carlson, E.H.? Lefevre, P.G.; Williams, R.C.: Infrared determination of li02 generated in a high-voltage electric arc. Anal.Chem. 56(13), 1454A-1464A (1984).
82. Finlayson-Pitts, B.J.; Johnson, S.N.: The reaction of N02 with NaBr: Possible source of BrKO in polluted marine atmospheres. Atm.env. 22(6), 1107-1112 (1988).
83. Cotabish. H.N.: McConnaughey, P.W.; Messer, K.C.:Making known concentrations for instrument calibration. American, Industrial Kvoiene Journal 22, 392-402 (1961).
84. Neff, B.A.; Weinsert, D.J.? Lam, R.B.; Leary, J.J.; Gallaher, T.N.: Studies of precision in FTIR spectroscopy. Am.Lab. 17(11), 72-79 (1985).
85. Uselman, W. ? Levine, S.Z.? Chan, W.H.? Calvert, J.C.? Shaw, J.H.: A kinetic study of the mechanism of peroxynitric acid formation in irradiated mixtures of chlorine, hydrogen, N02 and NO in air? in: Grosjean,D., ed. Nitrogenous air pollutants, pp. 17 Ann Arbor Science, Ann Arbor (1979).
Reproduced with permission of the copyright owner. Further reproduction prohibited without permission.
8486. Stockwell, W.R.; Calvert, J.G.: The mechanism of the
H0-S02 reaction. Atm.env. 17(11), 2231-2235 (1983).
87. Chan, H.H.; Nordstrom, R.J.; Calvert, J.G.; Shaw, J.H.: Kinetic study of HONO formation and decay reactions in gaseous mixtures of HONO,NO ,N02 ,H20, and N2. Env.Sci.Tech. 10(7), 674-682 (1976).
88. Intersociety Committee: Methods of air sampling and analysis American public health association, Inc., Washington (1972).pp. 469.
89. Socrates, G.: Infrared characteristic group frequencies John Wiley & Sons, New York (1980).
90. Tarte, P.: Rotational Isomerism as a general property of alkyl nitrites. J.Chem.Phvs. 20(10), 1570-1575 (1952).
91. Philippe, R.J.; Hackney, E.J.: The presence of nitrous oxide *snd methyl nitrite in cigarette smoke and tobacco pyrolysis gases. Tob.Science 3, 139-143 (1959).
92. Niki, H.; Maker, P.D.; Savage, C.M.; Breitenbach, L.P.: An FTIP. study of the reaction between nitrogen dioxide and alcohols. Int.J .chem.kinetics 14, 1199-1209 (1982).
Reproduced with permission of the copyright owner. Further reproduction prohibited without permission.
93. Yoffe, A.D.; Gray, P.: Esterification by dinitrogen tetroxide. J.Che»».Soc. 14X2-1414 (1951).
94. Daniels, F.: The oxidation of nitric oxide by oxygen; in: eds. Selected studies in chemical kinetics, 35th annual Priestley lectures, pp. 28-39 The Pensylvania State University, University Park,PA (1961).
95. ogden, M.W.: High resolution gas chromatography of tobacco smoke : The contributions of Kurt Grob. Journal of High Resolution Chromatography and Chromatography Communications 11, 428-440 (1988).
96. Dube, M.F.; Green, C.R.: Methods of collection of smoke for analytical purposes. Recent-AflYflnPeg.io.XPkflPPP Science 8, 1-102 (1982).
97. Hoffman, D.; Wynder, E.L.: Chemical constituents and bioactivity of tobacco smoke; in: Zaridze, D.G.; Peto, R., eds. Tobacco: A major international health hazard, vol 74, pp. 145-165 International Agency for Research of Cancer, IARC, Lyon (1986).
98. Altshuller, A.P.; Cohen, I.; Taft, R.A*: The gas phase reactions of nitrogen oxides with olefins. Int.J.Air and Water Poll. 4, 55-60 (1961).
with permission of the copyright owner. Further reproduction prohibited without permission.
86
99. Glasson, W.A.; Tuesday, C.S.: The atmospheric thermal oxidation of nitric oxide. J.Am.Chem.Soc. 85, 2901-2904 (1963).
Reproduced with permission of the copyright owner. Further reproduction prohibited without permission.
VITA
Rafael CuetoHe was b o m in Bogota, Colombia, on July 18, 1955. He
received high school diploma from Gimnasio Moderao, Bogota, Colombia, December 1973. He graduated with a degree in Chemistry from the Universidad Nacional de Colombia, Bogota, Colombia, in April 1981. He entered the Chemistry Department at Louisiana State University in the Fall of 1983. He is a member of the American Chemical Society, The Society for Applied Spectroscopy, and the Asociacion Colombiana de Quimicos.
87
Reproduced with permission of the copyright owner. Further reproduction prohibited without permission.
DOCTORAL EXAMINATION AND DISSERTATION REPORT
Candidate: Rafael Cueto
Major Field: Chemistry
Title of Dissertation: Quantitative FTIR Analysis of Gas Phase Cigarette Smoke
Date of Examination:
May 16, 1990
Approved:
Major Proh
Dean of the Graduate School
EXAMINING COMMITTEE:
'-V
Reproduced with permission of the copyright owner. Further reproduction prohibited without permission.