quantitative-electrogram-based methods for guiding catheter ablation in atrial fibrillation how to...
TRANSCRIPT
INV ITEDP A P E R
Quantitative-Electrogram-BasedMethods for Guiding CatheterAblation in Atrial FibrillationHow to identify points for catheter ablation to stop atrial fibrillation?
This paper summarizes challenges and recent advances in signal
processing guided ablation.
ByMathias Baumert, Senior Member IEEE, Prashanthan Sanders, and Anand Ganesan
ABSTRACT | Atrial fibrillation (AF) is the most common
cardiac arrhythmia in humans, with an estimated lifetime
prevalence of 25%. It is characterized by irregular and disor-
ganized electrical activation of the atria. In the past decade,
catheter ablation, i.e., focally burning targeted areas of car-
diac muscle, has emerged as a potentially curative therapy
for AF. Accompanying this development there has been an in-
creasing interest in quantitative intraprocedural signal analy-
sis to guide the selection of ablation targets. In this review,
we provide an overview of quantitative signal processing ap-
proaches for mapping and ablation of AF.
KEYWORDS | Atrial fibrillation (AF); catheter ablation;
electrogram
I . BACKGROUND
Atrial fibrillation (AF) is the most common cardiac ar-
rhythmia in humans, with an estimated lifetime preva-lence of 25% for adults over the age of 40 [1], [2].
Globally, AF is increasing in prevalence with more than
34 million individuals suffering from the arrhythmia [3].
AF is characterized by irregular and disorganized electri-
cal activation of the atria that results in rapid and irregu-
lar contractions of the ventricles. AF typically manifests
clinically as palpitations and chest discomfort. The
downstream consequences of AF are highly significant
and include heart failure [4], stroke [5], dementia [6],
and a doubling in mortality [3]. The burden of AF is am-
plified by health-related costs associated with hospitaliza-
tion. In the United States alone, over 400000 patients
are hospitalized for AF annually, with total costs exceed-
ing $US 3.5 billion [7]. Pharmacological control of AF is
frequently ineffective and/or poorly tolerated and may beassociated with significant side effects [1]. In the past de-
cade, there has been a growing interest in the utilization
of catheter ablation as a potentially curative therapy for
AF. Using percutaneously introduced catheters, targeted
areas of cardiac muscle are burned focally [8]. Accompa-
nying the development of AF ablation there has been a
concomitantly increasing interest in quantitative intrapro-
cedural signal analysis approaches to guide the selectionof ablation targets. The objective of the current review is
to provide an overview of the field of quantitative signal
processing approaches for mapping and ablation of AF.
II . ATRIAL FIBRILLATION:PHYSIOLOGY, MECHANISMS, ANDTREATMENT
A. Cardiac Anatomy and ElectrophysiologyThe human heart comprises four chambers, consist-
ing of paired upper left and right atria, and lower left
and right ventricles. Functionally, the primary pumping
function of the heart is carried out by the left and right
ventricles, which pump blood to the organs of the body
and the lungs, respectively. During normal cardiac con-
traction, the atria have an important role in coordinating
flow of blood through the heart in different phases of the
Manuscript received July 5, 2015; revised October 22, 2015; accepted November 27,2015. Date of current version January 19, 2016.M. Baumert is with the School of Electrical and Electronic Engineering, TheUniversity of Adelaide, Adelaide, S.A. 5000, Australia (e-mail: [email protected]).P. Sanders and A. Ganesan are with the Centre for Heart Rhythm Disorders, SouthAustralian Health and Medical Research Institute, University of Adelaide and RoyalAdelaide Hospital, Adelaide, S.A. 5000, Australia (e-mail: [email protected]).
Digital Object Identifier: 10.1109/JPROC.2015.2505318
0018-9219 Ó 2016 IEEE. Personal use is permitted, but republication/redistribution requires IEEE permission.See http://www.ieee.org/publications_standards/publications/rights/index.html for more information.
416 Proceedings of the IEEE | Vol. 104, No. 2, February 2016

cardiac cycle. During ventricular contraction, the atriaact as a functional reservoir for incoming blood to the
heart. In the late of phase of ventricular filling, atrial
contraction enhances inflow of blood into the ventricle.
Coordinated sequential contraction of the atria and ven-
tricles is regulated by specialized areas of electrically ex-
citable tissue within the heart. The sino–atrial node,
located in the upper lateral wall of the right atrium,
serves as the intrinsic cardiac pacemaker. In normalphysiologic rhythm (i.e., sinus rhythm) electrical im-
pulses arising from the sino-atrial node pass as waves of
electrical activation through the excitable atrial muscular
tissue to the atrio–ventricular node, located at the junction
between the atria and ventricles. The atrio–ventricular
node is the only physiological pathway for electrical propa-
gation to flow from the atria to ventricles, as the atria and
ventricles are otherwise electrically isolated from eachother by the fibrous rings of the atrio–ventricular valves.
Electrical activation passes through the atrio–ventricular
node to the ventricles utilizing a specialized conduction tis-
sue known as the His–Purkinje system, which spreads out
as an arborized network of fibers throughout the ventricle.
The His–Purkinje system in turn activates the ventricular
muscle and ensures an effective synchronous contraction
of the ventricular walls, maximizing the effective expulsionof blood from the heart.
During AF, this sequence of cardiac electrical activa-
tion and subsequent coordinated ventricular contraction is
disrupted and the atrial activation frequency increases dra-
matically from 1–2 Hz (i.e., 60–120 beats/min during nor-
mal sinus rhythm) to 6–10 Hz. The timing of activation in
different parts of the chamber becomes spatially asynchro-
nous, resulting in irregular and uncoordinated atrial con-tractions and the loss of the atrial contribution to late
ventricular filling. Despite the presence of the atrio–
ventricular node that acts as a low-pass filter to high-
frequency atrial impulses, ventricular rates during AF may
increase to 140–180 beats/min, typically with temporally
irregular contractions. Increased ventricular rates are
believed to be responsible for most AF-related symptoms,
such as palpitations, chest pain and can lead in somepatients to chronic weakness of the ventricular muscle
(cardiomyopathy). Stasis of blood within the atrium during
AF is thought to contribute to the increased risk of stroke
that is clinically associated with the arrhythmia.
B. Mechanisms of Atrial FibrillationDespite over a century of research there remains an on-
going debate regarding the fundamental mechanisms un-derlying atrial fibrillatory dynamics [9]. At present, a
consensus has emerged, proposing that AF is the conse-
quence of an incompletely understood interplay between
triggering mechanisms and substrate [10], [11]. Based on
clinical and experimental findings, the predominant trig-
gering mechanism for AF is believed to be an ectopic elec-
trical discharge arising from the pulmonary veins [8],
[12]–[14]. Atrial fibrillation commonly arises in the con-text of a substrate of electrophysiological and structural re-
modeling that is characterized by a combination of slowed
conduction velocity and altered electrical excitability [15].
These substrate-based physiological changes are typically
heterogeneously distributed throughout the atrium [15]. At
the histomolecular level the disease substrate is believed to
be attributable to a combination of changes in the expres-
sion of ion channels in cardiac myocytes and the develop-ment of scarring (fibrosis) that acts as a barrier to
electrical propagation in the atrial tissue [11].
A number of wave propagation mechanisms have
been proposed to explain fibrillatory dynamics in AF [9].
The multiple wavelet theory postulates that AF is main-
tained by the precession of a discrete number of electri-
cal waves. It arises as a consequence of functional
inhomogeneity in the local electrical excitability of atrialtissue [16]–[18]. The formation of multiple wavelets may
be facilitated by endo-epicardial dissociation, whereby
differences in activation times between the epicardial
and endocardial layers of atrial tissue are thought to lead
to transmyocardial breakthrough activations [19], [20].
The principal alternative hypothesis postulates that
AF is maintained by predominantly localized sources,
whereby arrhythmia maintenance occurs by a single orsmall number of drivers that sustain on-going AF [21]. A
series of studies has demonstrated that these focal
drivers are frequently rapidly spinning local-reentrant
circuits called rotors that emit curved spiral waves [22],
[23]. The rotor hypothesis of cardiac fibrillation has been
extensively tested, both experimentally [21] and in com-
putational simulations (Fig. 1) [24]. According to this
theory, the disorganization and spatio–temporal irregu-larity of electrical activity seen in AF arises as a conse-
quence of the interaction of these waves with functional
or anatomical boundaries [25], [26].
Computational models and simulations have signifi-
cantly informed mechanistic understanding of the fibril-
latory process [24]. Early works by Moe and Abildskov
were critical to the development of the multiple wavelet
hypothesis for AF [16] and involved cellular automata formodeling myocardial wave propagation in horizontal
grids of cells [24]. Models have evolved significantly over
the past few decades and feature biophysically detailed
cell electrophysiology, incorporating ionic channels and
pumps of atrial myocytes in realistic 3-D anatomical ar-
rangements. Computational models of AF have been
valuable in elucidating cellular mechanisms involved in
the pharmacological control of heart rate, for devisingpacing algorithms for AF termination and optimizing
catheter ablation strategies [24].
C. Clinical Ablation ProceduresCatheter ablation procedures are performed in spe-
cialized cardiac catheterization laboratories suited for the
aseptic introduction of catheters into the heart. The
Vol. 104, No. 2, February 2016 | Proceedings of the IEEE 417
Baumert et al. : Quantitative-Electrogram-Based Methods for Guiding Catheter Ablation in Atrial Fibrillation

catheters used in ablation procedures are typically 1.5 m
long and have platinum-alloy electrodes at the tip, de-
signed for percutaneous introduction into the body, most
commonly via the femoral vein at the upper leg. Duringcatheter ablation procedures, physicians manually ma-
neuver catheters within the heart to specific locations
under the guidance of X-ray fluoroscopy. In recent years,
however, a variety of electro-anatomic mapping technolo-
gies have evolved to enable 3-D anatomical reconstruc-
tion of the cardiac chambers, thereby reducing ionizing
radiation exposure, both for the patient undergoing the
ablation procedure and the physician performing it [27],[28]. In contemporary practice, laboratories simulta-
neously record electrical signals from intracardiac cathe-
ters, called electrogram (EGM) and from the body
surface, called electrocardiogram (ECG). The EGM and
ECG signals are displayed in real time on computer
screens, enabling the cardiac electrophysiologist to inter-
pret cardiac activity and identify ablation targets.
Historically, the mainstay of catheter-based therapy
has been to encircle the pulmonary veins via a series of
burns [pulmonary vein isolation (PVI)] to prevent ec-
topic impulses from this anatomical location from trig-gering AF episodes (Fig. 2) [8], [29]. Significant
evidence has accumulated, however, suggesting that
long-term outcomes in patients with longer lasting, per-
sistent forms of AF are modest, reflected in a long-term
failure rate of anatomically-based PVI as high as 50%
[30], [31].
In this context, quantitative EGM-guided strategies
are emerging as a tool for AF ablation. By utilizing intra-procedurally acquired EGM, meaningful information is
extracted to assists cardiac electrophysiologists in identi-
fying regions of the atrium critical to the maintenance
of AF.
There are several technical challenges in developing
and implementing quantitative EGM ablation strategies
in the electrophysiological laboratory. First, diagnostic
Fig. 1. Examples of spiral waves obtained with an electrophysiological model of chronic atrial fibrillation. (a) Simulated action
potentials in chronic atrial fibrillation conditions, where Ito and ICaL currents are reduced without IK1 upregulation (CAF1) and for the
same model, but with IK1 increased (CAF2). (b) Action potential duration (APD) versus the diastolic interval (DI) in control condition
and chronic AF. (c) Snapshots (2.4-s interval) of spiral waves and tip meander in CAF1 and CAF2. Adapted from [144] with permission.
418 Proceedings of the IEEE | Vol. 104, No. 2, February 2016
Baumert et al.: Quantitative-Electrogram-Based Methods for Guiding Catheter Ablation in Atrial Fibrillation

catheters that are introduced into the heart usually re-
cord signals from a limited number of electrodes. There-
fore, mapping of activation patterns in AF is typically
performed sequentially instead of simultaneously map-
ping the entire atrial surface. Second, the catheters allow
recording of signals only from the endocardial surfaceand not from the entire volume of the atrial muscle.
Third, the EGMs during AF exhibit complex spatial and
temporal dynamics and are vulnerable to variations in
the local myocardium (such as tissue fibrosis or local
scarring), causing difficulties in identifying appropriate
fiducial points for accurate annotation of activation tim-
ing. Fourth, the spatial accessibility of mapping proce-
dures is limited by the fact that the catheters aremaneuvered within enclosed cardiac chambers. Finally,
practical and logistical constraints restrict clinical map-
ping to discrete regions of the atrium to relatively short
periods of time.
III . SIGNAL ACQUISITION ANDPREPROCESSING
A. Intracardiac Electrogram AcquisitionCritical to the development of quantitative intrapro-
cedural EGM analysis is an understanding of the acquisi-
tion and preprocessing of intracardiac signals. The
process of EGM creation is illustrated schematically in
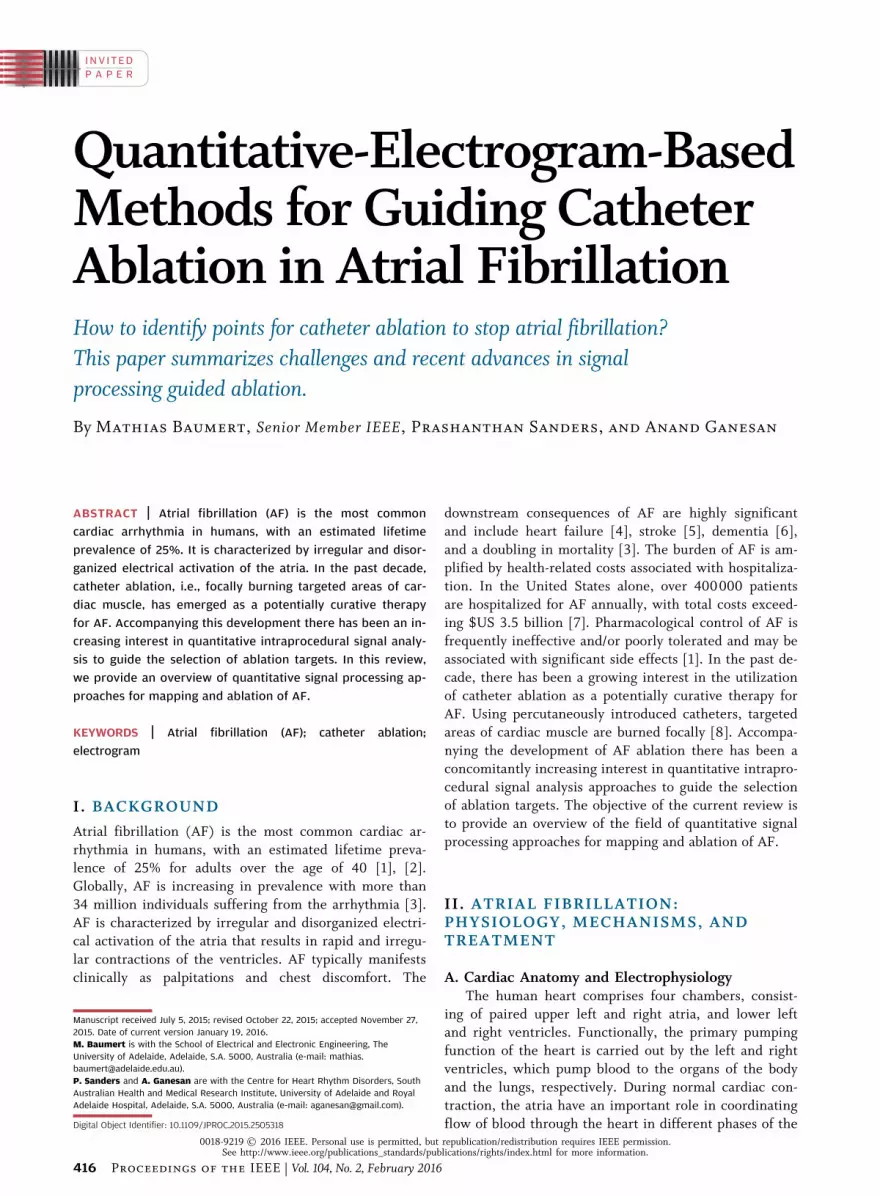
Fig. 3. Fundamentally, transmembrane currents in the
extracellular space create potential differences during de-polarization of the cardiac muscle due to differences in
the axial voltage gradient at the border zone between ac-
tivated and inactivated cells.
Cardiac EGM recordings are typically obtained by dif-
ferential amplifiers with a high input impedance and a
good common mode rejection. By convention, in the uni-
polar recording configuration, the recording electrode on
the tip of the intracardiac catheter and in physical con-tact with the cardiac muscle is connected with the an-
odal input of the amplifier. The cathodal input is
connected to an indeterminate electrode that registers
minimal cardiac signal in theory. This recording configu-
ration creates a characteristic EGM morphology as planar
wavefronts pass toward the recording electrode (Fig. 3).
Initially, a small positive deflection may be seen as the
depolarization wavefront moves toward the catheter tipelectrode. As the wavefront reaches and passes beyond
the electrode, the wavefront deflection becomes steeply
negative, creating a characteristic biphasic complex. The
timing of the maximum negative slope is concurrent
with the timing of the depolarization of cardiac tissue di-
rectly underneath the electrode. A limitation of the uni-
polar EGM is the vulnerability of the recorded electrical
signal to external electromagnetic interference (e.g.,electrical mains activity), or electrical depolarization of
other parts of the cardiac chambers, i.e., far-field activ-
ity. In the case of atrial EGM recordings, the primary is-
sue is overlap with electrical activity caused by
ventricular depolarization. To a large extent, these issues
have hindered the utilization of unipolar EGMs for clini-
cal mapping during AF, although an extensive literature
has developed around the use of unipolar recording inresearch settings [18], [32], [33].
In clinical AF mapping, most EGMs are recorded in
the bipolar mode. Bipolar EGMs are created by subtract-
ing two unipolar EGMs recorded at proximate sites, typi-
cally from adjacent poles of an intracardiac catheter.
Bipolar EGMs are usually preferred in clinical settings,
as the far-field contribution of ventricular depolarization
is largely eliminated. However, compared to unipolar re-cordings, the timing of local electrical activation is less
well defined [34].
B. Electrogram Morphology in Atrial FibrillationThe EGM morphology during sinus rhythm and AF
is an important consideration in the development of
quantitative analytical approaches. In sinus rhythm, uni-
polar endocardial EGMs display predominantly negativedeflections and a relatively uniform morphologic ap-
pearance. Similarly, bipolar atrial EGMs during sinus
rhythm have discrete complexes separated by periods of
isoelectric activity. In contrast, EGMs acquired during
AF are frequently irregular with complex morphology.
Wells et al. described three types of bipolar EGM mor-
phologies during AF [35] (Fig. 4). Type 1 AF is
Fig. 2. Example of an electroanatomic map of the left atrium
created with the NavX Fusion system. Adapted from [145] with
permission. In contemporary electrophysiological procedures, a
3-D virtual geometry of the pulmonary veins is commonly created.
Encircling ablation lesions (red dots) are used to surround the ostia
of the pulmonary veins (arrows) which are believed to be the
source of ectopic impulses known to trigger AF.
Vol. 104, No. 2, February 2016 | Proceedings of the IEEE 419
Baumert et al. : Quantitative-Electrogram-Based Methods for Guiding Catheter Ablation in Atrial Fibrillation
characterized by discrete atrial complexes, of variable
morphological appearance, but with a discrete isoelec-tric baseline. Type 2 AF is characterized by discrete
beat-to-beat atrial complexes, but differentiated from
Type 1 by the fact that the baseline is not isoelectric.
Type 3 AF is characterized by complex and highly irreg-
ular atrial EGMs that fail to exhibit either discrete com-
plexes or isoelectric intervals.
An important concept in the morphological descrip-
tions of EGMs during AF is that of fractionation. Al-though no precise consensus definition exists, the
concept of fractionation is used to describe EGMs that
may have multiple components of high frequency that
may be of relatively low amplitude and may be of pro-
longed duration compared to “organized” EGMs. A num-
ber of different physiological processes are thought to
contribute to EGM fractionation observed in human AF.
These include slow conduction through areas of scar-
ring, curved or turning wavefronts and so-called aniso-tropic conduction in areas of tissue where conduction is
more rapid longitudinally along muscle fibers, than per-
pendicularly between adjacent muscle strands [36].
Fractionation can also occur for reasons other than ab-
normal tissue properties, e.g., in regions with anatomi-
cally overlaying areas of tissue, It can be introduced
artificially by inappropriate signal high-pass filtering or
external electromagnetic interference [36]. Separatingthe features pertinent to the maintenance of AF that are
relevant as ablation targets is an ongoing challenge in
the field.
C. Electrogram FilteringAs with other bioelectrical signals, EGMs are contam-
inated with noise, originating from various internal and
Fig. 3. Schematic illustrating the formation of unipolar and bipolar electrograms in cardiac electrophysiology. Reprinted from [146]
with permission. Horizontal bars represent a sheet of myocardium with depolarization propagating from left to right. Theoretical
electrograms are shown in boxes. (a) Unipolar recording: As the wavefront propagates toward the electrode, a positive deflection, an
R wave, is inscribed. As the wavefront propagates past the recording electrode, an S wave is inscribed and thus an RS complex occurs.
Recording from the initial site of depolarization (origin at the left side of the tissue) produces a QS complex as the wavefront moves
away from the recording electrode. Recording at the right side of the tissue produces a monophasic R wave. (b) Bipolar recording:
Electrode 1 is connected to the positive input of the amplifier and electrode 2 is connected to the negative input. Compared to
the signal from electrode 1 (Uni-1), the signal from electrode 2 (Uni-2) is slightly delayed (because the wavefront reaches it later) and
is inverted because it is attached to the negative input of the recording amplifier. Adding these two signals together generates the
bipolar signal (Bi 1-2) that removes much of the far-field signal. Differentiating the signal (Uni-1 filtered) decreases the far-field
component and produces a signal quite similar to the bipolar signal but slightly shifted with respect to time. Differentiating the bipolar
signal (bipolar: filtered) produces additional deflections and further complicates the signal. Indifferent electrode configurations for
unipolar recordings are shown in (c) (RA: right arm; LA: left arm; LL: left leg; IVC: inferior vena cava).
420 Proceedings of the IEEE | Vol. 104, No. 2, February 2016
Baumert et al.: Quantitative-Electrogram-Based Methods for Guiding Catheter Ablation in Atrial Fibrillation

external sources that act across various frequency ranges.
For EGMs, the frequency band of interest is around 40–
250 Hz and zero-phase band-pass filters are commonly
applied to bipolar recordings to remove baseline shiftsand high-frequency noise. Because artefacts often show
power within the frequency band of interest, additional
strategies have been devised. Averaging procedures that
consider EGMs during ventricular activation times have
been used to generate ventricular waveform templates
that are subtracted from atrial EGMs to suppress the in-
fluence of ventricular far-field artefacts [37].
Many EGM analysis techniques require a strong sim-plification of the atrial signal, primarily aiming at the ex-
traction of the envelope of the signal. Therefore,
Botteron and Smith have proposed to rectify the band-
pass filtered signal, followed by low-pass filtering at a
cutoff frequency of 20 Hz [38]. This process results in a
time-varying waveform proportional to the amplitude of
the high-frequency components (40–250 Hz).
IV. APPROACHES TO ELECTROGRAMANALYSIS IN ATRIAL FIBRILLATION
A variety of approaches have been utilized to extract
EGM features pertinent to clinical AF ablation. In the
following section, a technical summary of available ap-
proaches is provided.
A. Analysis of Fibrillatory Rate
1) Local Activation Times: Estimation of fibrillatory rate
in the time domain, i.e., the AF cycle length (AFCL), isbased on the interval between consecutive local activation
times (LAT). The precise annotation of LAT from bipolar
EGMs, in particular during AF, is difficult and a number
of algorithms have been proposed for delineating relevant
fiducial points. Basic approaches to detect LAT include
identifying the time when the upstroke of bipolar EGM
reaches a 45� angle [39], the time of the maximum bipo-
lar EGM excursion from baseline, the time of the maxi-mum slope in either direction, or the time the sloping
segment containing the maximum slope in either direc-
tion crossed the baseline (fastest zero crossing) [40]. Ex-
amples of more complex algorithms that produce more
reliable results are outlined below.
A morphology-based algorithm has been proposed [41],
where a baseline value within the analysis window is com-
puted by averaging the EGM outside a 120-ms subwindowcentered at the extreme value in the analysis window. Ex-
trema associated with notches narrower than 4 ms are ex-
cluded. The LAT is determined from the waveform
morphology by defining primary and secondary phases.
The primary phase is obtained by finding the peak excur-
sion from the baseline and searching backward for the start
of the phase and forward for the end. The temporal limits
Fig. 4. Electrogram morphology analysis applied to bipolar electrograms of Wells’ types: type I, type II, and type III AF. Filled triangles
indicate the time of local activation waves detection using the barycenter method described in [42]. On the right, superposition of the
normalized local activation waves obtained from the signals of the left panels. Reprinted from [42] with permission.
Vol. 104, No. 2, February 2016 | Proceedings of the IEEE 421
Baumert et al. : Quantitative-Electrogram-Based Methods for Guiding Catheter Ablation in Atrial Fibrillation
of phases are defined by a change in slope sign, baselinecrossing, or a flat line. Additional phases are defined by
scanning from 55 ms before the start of the primary phase
to 55 ms after the end of the primary phase for additional
excursions from the baseline of at least 25% of the primary
peak amplitude. The LAT for monophasic, biphasic, and
triphasic responses, respectively, are equal to the time of
occurrence of the peak, zero crossing, and peak of the mid-
dle phase. If more than three phases are found, the LAT isassigned midway between the first two peaks that exceed
50% of the amplitude of the primary phase, or, if a second
phase of sufficient amplitude (in addition to the primary
phase) is not found, the LAT is assigned the time of the
peak of the primary phase.
Faes et al. proposed to estimate LAT from the barycen-
ter of LAWs in bipolar EGMs [42]. After ventricular arte-
fact rejection and application of the signal filteringprocedure proposed by Botteron and Smith [38] to the
atrial signal sðnÞ, resulting in swðnÞ, LAWs are detected by
adaptive thresholding, using the last ten detected peaks
and exponentially decreasing weights combined with a
55-ms blanking period. The barycenter of each LAW is cal-
culated as the time that divides the local area of the modu-
lus of the signal in two equal parts. A noncausal moving
average filter with 90 coefficients is applied to the modu-lus of sðnÞ: sf ðnÞ ¼
P44i¼0 jsðn� iÞj �P45
i¼1 jsðnþ iÞj. Theactivation time is set on the positive zero crossing of sf ðtÞthat is closer to the local peak of swðnÞ.
Ng et al. recently devised an iterative method for mea-
suring LAT and AFCL [43]. Following preprocessing simi-
lar to the one proposed by Botteron and Smith, the peak
with the highest magnitude is detected as the first LAT. Af-
ter excluding all neighboring peaks within a 50-ms blank-ing period, the next largest peak is detected and added to
the set and the blanking period applied again. This process
is iterated until the mean cycle length is G 275 ms and ei-
ther 1) the mean CL is less than the median CL plus 5 ms;
or 2) the magnitude of the current peak is 20% less than
that of the previously detected peak. For activation times
9 1:5� median CL, the largest peak within the interval
that is not within 50 ms of another peak is included in theset and the procedure repeated until there are no more in-
tervals 9 1:5� median CL with peaks between them.
2) Dominant Frequency Analysis: Measuring fibrillatory
rates in the frequency domain is a popular alternative to
estimating AFCL from LAT [25], [44]. It usually involves
filtering the EGM according to Botteron and Smith and
edge tapering to reduce spectral leakage before applyingthe discrete Fourier transform to decompose N samples
of swðnÞ into k frequency components [45], [46]
SwðkÞ ¼XNn¼0
swðnÞe�2�jkn
N :
Typical time frames for frequency domain analysis rangebetween 2.5 and 8 s. While shorter time frames offer in-
creased ability to track signal variations in nonstationary
conditions typical of EGM recordings, they may also
compromise frequency resolution. The EGM frequency
spectrum during AF is characterized by a more or less
well-pronounced peak, the so-called dominant frequency
(DF) that mainly reflects timing of the narrow deflec-
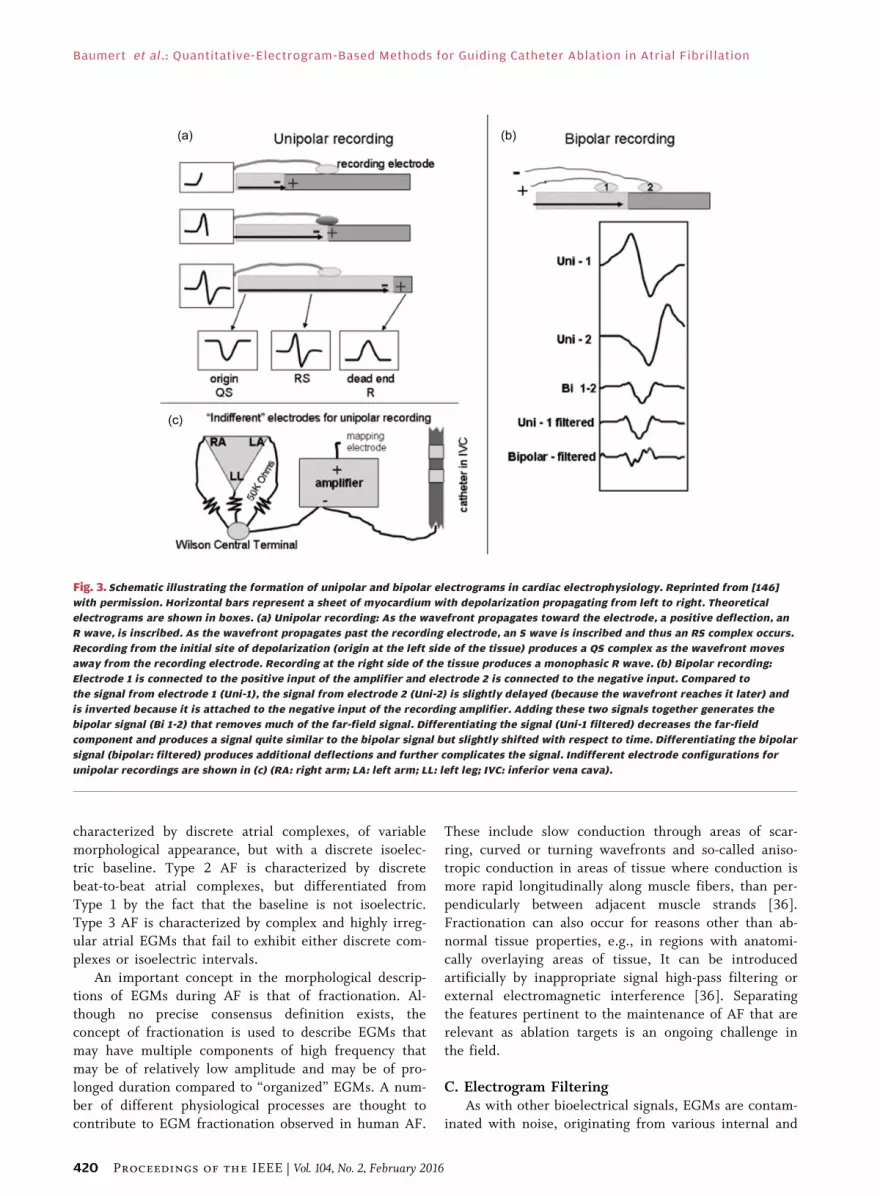
tions in bipolar EGM [47] and is considered a surrogatefor the local activation rate [23] (Fig. 5). A so-called reg-
ularity index, or organizational index, is often computed
alongside to avoid ambiguity in DF detection in regions
with low signal-to-noise ratio [48]. Although definitions
vary across studies, the underlying rationale is to relate
the EGM power at the DF to the power of background
activity or harmonics [49]–[51]. Not all investigators
have utilized this approach [46], [52], [53] and further-more, analytical treatment proves that it is biased at low
DF [47]. Sanders et al. have fixed the frequency window
of interest to 3–15 Hz, limiting it to regions of physiolog-
ical activation rates [54]. An alternative approach for
Fig. 5. Bipolar electrograms and corresponding power spectra
obtained from four atrial sites in a patient with spontaneous
paroxysmal AF. Each site shows distinct dominant frequency (DF)
and regularity index (RI) values. Reprinted from [54] with
permission.
422 Proceedings of the IEEE | Vol. 104, No. 2, February 2016
Baumert et al.: Quantitative-Electrogram-Based Methods for Guiding Catheter Ablation in Atrial Fibrillation
EGM power density spectrum estimation involves time av-eraging of EGMs for different window lengths and subse-
quent power computation of the averaged signal, where the
window length is inversely related to the frequency [55].
The nonstationary temporal dynamics of EGM signals
impose limitations on the applicability of frequency do-
main analysis for estimating DF [53] and a poor correlation
of DF with the local cycle length measured in the time do-
main has been reported [56]. In view of AF ablation map-ping, a significant concern is the spatio–temporal stability
of mapped DF locations, and the presence of a surrounding
centrifugal gradient around putative AF sources. While
some authors have observed stable DF for short periods
(two subsequent 10-s epochs) and have demonstrated cen-
trifugal gradients surrounding sites of high DF [57], others
have reported significant instability of DF during pro-
longed recordings [58], [59] and have failed to observe acentrifugal gradient around DF sites [59].
Wavelet analysis has been employed to cope with the
nonstationarity of EGM data by providing time-varying
frequency information. Using the continuous wavelet
transform
Wð�; aÞ ¼ 1ffiffiffia
pZ1�1
xðtÞ t� �
a
� �dt
where sðtÞ is the atrial signal, is the mother wavelet (a
function with compact support; typically orthonormal),
and a is the scaling factor that dilates the wavelet, unipo-
lar EGMs have been analyzed, using the first derivativeof the Gaussian function as the mother wavelet, resem-
bling activation waves seen on unipolar EGM. It has
been argued that local and far-field activation waves in
EGM are separable on low- and high-frequency scales,
using scale-dependent weights [60]. The LAWs were ex-
tracted with an algorithm that comprises template
matching, using a library of automatically generated tem-
plates, and a thresholding procedure [60]. The continu-ous wavelet transform approach combined with an
alternative set LAW detection criteria has been used to
track wavefront propagation on 2-D maps of the left atria
[61]. The discrete wavelet transform, using the Coiflet 4
mother wavelet, combined with thresholding of detail co-
efficients, has also been used for EGM denoising as well
as for classifying the degree of fractionation [62].
B. Analysis of Electrogram Complexity
1) Wave Morphology Similarity: In 2002, Faes et al. pro-posed to evaluate the complexity of EGMs by measuring
the degree of morphological repetitiveness of the LAWs
in the signal [42]. Following LAT detection using the
barycenter method, LAWs xi are extracted over a window
of �45–45 ms with respect to the fiducial point and sub-sequently normalized to their standard norm:
x̂i ¼ xi=jxij. Morphological dissimilarity between pairs of
standardized LAWs are computed as the angle of associ-
ated vectors: dðx̂i; x̂iÞ ¼ cos�1ðx̂i � x̂jÞ. The similarity in-
dex is then defined as
�ð"Þ ¼ 2
NðN � 1ÞXNi¼1
XNj¼iþ1
� �� dðx̂i; x̂iÞð Þ
where � is the Heaviside function [�ðxÞ ¼ 0 for x G 0
and �ðxÞ ¼ 1 for x � 0], " is the threshold value, empiri-
cally set to " ¼ �=3 and N is the number of LAWs (Fig. 4).
The similarity index has been usually derived from 10-s
EGMs [63], but is reliable for signal windows down to
five atrial depolarization waves and has been shown to
distinguish different degrees of similarity and trackchanges over time [42]. In patients with paroxysmal AF,
beat-to-beat analysis of similarity has been able to identify
deteriorating regularity during the first few minutes of
AF [64]. Spatial distribution maps of bipolar EGM simi-
larity have been constructed and distinct regions of high
similarity that anchored to anatomy were demonstrated
in patients with paroxysmal AF, while maps of low simi-
larity were observed in maps of patients with chronic AF[65]. Fusion of computed tomography images with simi-
larity index and AFCL maps have allowed identifying ana-
tomical locations of rapid and repetitive sources of
activity in patients with persistent AF [17]. Dichotomized
AFCL and similarity index values combined via a logic
AND operation in a single map captured points of rapid
activation and high similarity that are deemed critical to
AF [63]. Testing and application of the logical operatormaps have been recently published [66].
Recently, similarity analysis based on the cross correla-
tion of individual LAWs measured over 100-ms windows
was proposed to study the temporal repetition of LAW
morphologies, yielding so-called recurrence plots [67],
where LATs were estimated using the iterative method de-
scribed above. Periodic EGM recurrence was present at all
recording sites and highly repetitive LAW morphologieswere found to be important for maintaining AF.
2) Entropy: Shannon entropy, the classical measure of
information theory, is defined as SE¼�PMi¼1 pðiÞ log2 pðiÞ,
where M is the number of discrete values the variable can
assume and pðiÞ is the probability of assuming the ithvalue. From a finite set of N observations Shannon entropy
can be estimated as
bSE ¼ �XMi¼1
p̂ðiÞ log2 p̂ðiÞ þM� 1
2N
Vol. 104, No. 2, February 2016 | Proceedings of the IEEE 423
Baumert et al. : Quantitative-Electrogram-Based Methods for Guiding Catheter Ablation in Atrial Fibrillation

where p̂ðiÞ is the maximum-likelihood estimate and M isthe number of bins with nonzero probability. The bSE of
time delays, obtained using the barycenter method, has
been proposed to measure the synchronization of AF [68].
To relate the dispersion of the time delays with the
strength of synchronization in the activation process, a syn-
chronization index has been defined as
Sy ¼ 1�bSE
log2 N:
Higher Sy values of time delays have been related to higher
complexity of wave propagation patterns in computer sim-
ulations, and to higher EGM complexity in patients with
paroxysmal AF [68].
The SE has been used to measure AF complexity di-rectly in bipolar EGMs thereby circumventing the need
for delineating LATs and related issues [69]. Pivots of ro-
tational atrial activations have been shown to coincide
with high SE values [70]. Based on the results of com-
puter simulations, multielectrode array recordings of iso-
lated rat atria, epicardial plaque recordings of
hypertensive sheep, and high density mapping of AF pa-
tients, SE mapping has been proposed to assist in AF ro-tor identification [69]. In 2-D spiral wave simulations
obtained with different cell models, SE has been consis-
tently highest at the pivot across all investigated models
and independent of electrode spacing, electrode orienta-
tion, and EGM filtering [70]. Shannon entropy has been
further validated in a study of spiral wave EGM features
extracted from human ventricular fibrillation epicardial
recordings [71].Approximate entropy (ApEn) is a regularity metric
that measures the logarithmic likelihood that runs of pat-
terns similar to each other will remain similar in the
next incremental comparison and is defined as
ApEnðSN;m;rÞ ¼ lnCmðrÞCmþ1ðrÞ
where m is the pattern length, r is the criterion of simi-
larity, and CmðrÞ the prevalence of repetitive patterns of
length m in the sequence SN. High ApEn has been corre-
lated with EGM fractionation in a database of AF record-
ings [72], [73]. In a 3-D electro-anatomical computermodel of human atria, high ApEn values have been able
to identify the pivot of stable and meandering rotors,
providing further theoretical support for the potential of
entropy estimation for rotor mapping [73]. Sample en-
tropy (a modified version of ApEn) obtained from unipo-
lar right epicardial EGM has been shown to correlate
with DF and could be estimated from surface ECG [74].
A regularity index defined by means of conditionalentropy (CE) that represents the amount of information
carried by the most recent sample of a series s when its
past L� 1 samples are known has been defined as
CEðLÞ¼ �XMj¼1
p sJL�1
� �XNi¼1
psi
sJL�1
!log p
si
sJL�1
!
where sJL�1 represents the Jth pattern of length L� 1,
pðsJL�1Þ is its probability, and pðsi=sJL�1Þ is the conditional
probability of the sample si given the pattern sJL�1 [75].
After introducing a corrective term and normalization,
resulting in the normalized corrected conditional entropy(NCCE) an index of regularity can be defined as
Rs ¼ 1�minðNCCEðLÞÞ. Rs has been shown to discrimi-
nate different degrees of AF complexity [76].
Clinical tests of entropy informed ablation procedures
are currently pending. A recent study compared several
complexity measures that have been successfully applied
to surface ECG in AF on epicardial EGM mapping in an
animal model [77]. The measures were based on princi-pal component analysis [78], where multichannel EGM
were decomposed into their orthogonal constituents, dis-
tribution of power across the frequency spectrum as well
as sample entropy [77] and, when combined, showed
perfect classification of short-term versus long-term AF.
3) Nonlinear Dynamics: Phase-space characterization of
EGM data has been proposed to capture the nonlineardynamics of AF [79], [80]. According to Taken’s theorem
[81], the phase space of a deterministic system can be
constructed from empirical data, using the method of de-
lays, where the phase space is represented as a vector
SðnÞ¼ sðnÞ; sðn�LÞ; sðn�2LÞ; . . . ; s n�ð��1ÞLð Þ½ �T
and the embedding dimension � and reconstruction de-lay L have to be empirically determined. The noisy, non-
stationary nature of EGMs and unknown dimensionality
generally thwart faithful reconstruction of the dynamics
of the underlying system. Recurrence quantification anal-
ysis (RQA), which is based on recurrence plots for visu-
alizing system dynamics, has been utilized to measure
the complexity of EGM signals during AF [82]. The
phase space was reconstructed rather pragmatically. Amore sophisticated implementation of RQA has been
used to detect EGM fractionation [83].
4) Electrogram Fractionation: Ablation based on EGM
fractionation was introduced in 2004 [84], where a com-
plex fractionated atrial electrogram (CFAE) was defined
as an EGM composed of two or more deflections and/or
424 Proceedings of the IEEE | Vol. 104, No. 2, February 2016
Baumert et al.: Quantitative-Electrogram-Based Methods for Guiding Catheter Ablation in Atrial Fibrillation
perturbation of the baseline with continuous deflection,or an EGM with a very short AFCL (G 120 ms), averaged
over a 10-s period [84]. In the initial description, CFAEs
were identified by inspection, and thus the technique
was not strictly quantitative.
In an attempt to standardize CFAE-based selection of
ablation targets, automated methods, utilizing a variety
of quantitative approaches have been introduced, and
implemented in commercial electro-anatomic mappingsystems [85]–[87]. However, even with automated soft-
ware, commercially available algorithms require signifi-
cant end-user inputs for thresholds, and parameter
definitions, which has limited replicability of CFAE mea-
surements. Scherr et al. have analyzed CFAE EGMs using
software implemented in the CARTO (Biosense Webster,
USA) system and assessed the number of inter-deflection
intervals falling into the range of 70–120 ms, obtainedfrom sequentially acquired 2.5-s EGM maps. Verma et al.have performed a clinical analysis of automated CFAE
detection on the Ensite NavX (St Jude Medical, USA)
platform, using sequentially acquired 5-s EGMs, where
the algorithm measures the time between discrete EGM
peaks above a user-defined threshold.
A further issue is the spatio–temporal instability of
these sites. Studies using sequential mapping of AF havesuggested temporal stability of the majority of CFAE lo-
cations between sequential maps [88]–[90], but basket
catheter recordings with a stable position have demon-
strated that CFAE sites are highly temporally unstable
and sequential maps failed to identify CFAE sites in one
third of cases [58]. The issue of spatial and temporal sta-
bility of CFAE sites was examined in a recent systematic
review, which demonstrated relative stability of 81% be-tween sequentially acquired maps [91]. However, CFAE
stability was seen on average of 75% in AF recordings
with a mean duration of 1.25 min.
Although the properties of CFAEs have been exten-
sively studied, including the influence of recording time
period [92], the spatial relationship between CFAE and
DF locations [26], [50], [51], [93], and signal properties
of CFAE sites [94]–[111], no consensus has emerged re-garding the optimal definition of CFAE [112] and the
clinical application of CFAE-based ablation is currently
limited to selected laboratories.
C. Multivariate Electrogram AnalysisWhile some of the techniques described above have
been used to synthesize spatial maps from EGMs that
were sequentially obtained from different atrial sites,multivariate signal processing regimes that use multielec-
trode recordings aim at assessing the spatio–temporal re-
lationship of atrial activity.
1) Cross-Correlation and Nonparametric Coherence Esti-mation: Early attempts to measure spatial organization of
atrial activation in the time domain involved computing
the cross-correlation functions between LAWs at differ-ent recording sites [38]. The maximum cross-correlation
between brief EGM segments, preprocessed according to
Botteron and Smith, has been shown to decrease with in-
creasing spatial distance [38]. Cross correlation between
EGM from different sites was found to be higher in sinus
rhythm compared to AF and to deteriorate with in-
creased complexity of AF [76]. To deal with nonstatio-
narity and spatio–temporal instability, time-frequencyanalysis of the coherence function of two EGM has been
proposed, using a multitaper method for spectrum esti-
mation [113].
2) Multivariate Autoregressive Models: Autoregressive
(AR) models are frequently used to describe stochastic
processes. Simultaneous recordings of multiple EGMs
sðnÞ ¼ ½s1ðnÞ; . . . ; sNðnÞ�T , acquired from N differentcatheter poles can be modeled as a multivariate autore-
gressive process of order m
sðnÞ ¼Xmk¼1
Aksðn� kÞ þ wðnÞ
where each Ak is an N � N matrix comprising the AR co-
efficients aijðkÞ, i; j ¼ 1; . . . ;N and wðnÞ ¼½w1ðnÞ; . . . ;wNðnÞ�T is a multivariate white noise process
characterized by the diagonal covariance matrixP
w, in
which each diagonal element �2ii defines the variance of
wiðnÞ [114]. From this multivariate AR model, the partial
directed coherence between pairs of EMG channels can
be derived
�i;jðfÞ ¼1�iiAijðfÞffiffiffiffiffiffiffiffiffiffiffiffiffiffiffiffiffiffiffiffiffiffiffiffiffiffiffiffiffiffiPN
k¼11�2kk
AkjðfÞ2q
where Aij represents the ði; jÞ-entry of the matrix AðfÞ,being the Fourier transform of the coefficients Ak. Thepartial directed coherence indicates the coupling from
sjðnÞ to siðnÞ at frequency f , viewed in relation to the di-
rect coupling strength of sjðnÞ to all other signals
skðnÞ; k 6¼ j at that frequency. This approach has been
employed for studying spatio–temporal propagation of
atrial activation, using EGMs preprocessed according to
Botteron and Smith. Incorporation of the distance be-
tween recording sites as constraints in the model param-eter estimation has been shown to improve the
identification of propagation patterns in comparison to
conventional least square estimation [115].
3) Hilbert Phase Mapping: Obtaining the instantaneous
phase of atrial signals in multichannel EGM recording is
useful for mapping the spatial propagation of LAWs
Vol. 104, No. 2, February 2016 | Proceedings of the IEEE 425
Baumert et al. : Quantitative-Electrogram-Based Methods for Guiding Catheter Ablation in Atrial Fibrillation

across the atria. The instantaneous phase ’ðnÞ of a signalsðnÞ can be obtained from the analytic signal s�ðnÞ, given by
s�ðnÞ ¼ srðnÞ þ jsiðnÞ
where the imaginary part siðnÞ is the Hilbert transform of
the measured signal srðnÞ: ’ðnÞ ¼ arctanðsiðnÞ=sðnÞÞ. TheHilbert transform is characterized by the transfer function
Hð!Þ ¼ �j : 0 G ! �j : �� G ! G 0
�
which results in a 90� shift of the signal at its output. As
meaningful interpretation of ’ðnÞ requires the signal to beof single mode, the complicated nature of EGM waveforms
does not lend itself to Hilbert phase estimation. Empirical
mode decomposition (Hilbert–Huang transform) is a data-
driven approach that has been used decompose the EGM
signal into intrinsic mode functions, which can be individu-
ally subjected to Hilbert transform. A modified version of
empirical mode decomposition for phase-space reconstruc-
tion has been developed, where the intrinsic mode functionrelevant to AF is obtained based on the knowledge of the
DF [116].
Phase mapping techniques have provided the first de-
piction of spiral wave rotors as drivers of cardiac fibrilla-
tion [117], [118]. Spiral waves have been demonstrated
in optically mapped ventricular fibrillation and atrial fi-
brillation in experimental model systems [23], [117],
[118]. Recently, reconstruction of the EGM signal, com-prising few sinusoidal wavelets with a duration of one
AF cycle was proposed for estimating instantaneous
phase using Hilbert transform (Fig. 6). In this approach,
wavelets are generated at instants where the unipolar
EGM waveform slopes downward, reflecting passing of
the activation wave, synthesizing a simple representation
of the activation cycle [119]. The phase coherence in
EGM, estimated using this technique, has been shown todecline with increasing spatial distance [120].
Hilbert-transform-based phase mapping has been sub-
sequently adapted for the mapping of ventricular fibrilla-
tion, both in explanted hearts [121] and in vivo using
sock-electrode-based recording studies in human hearts
[122]. In each of these studies, cardiac ventricular fibril-
lation was shown to include spatio–temporally unstable
rotors as the drivers of the fibrillatory process.
4) Other Techniques: Linear prediction between pair-
wise EGM has been used to measure the degree of ran-
domness within bipolar EGMs [123]. Other approaches
utilizing the concept of linear prediction were based on
single EGMs [76], [96]. Measures of synchronization
have been exploited to quantify the relationship between
simultaneously recorded EGMs, including a conditional-
entropy-based approach [76], and a multivariate expansion
of the waveform similarity index [124]. Other techniques
involve the reconstruction of wavefronts based on the dis-
tance of LATs [125].
V. QUANTITATIVE ELECTROGRAMANALYSIS IN CLINICAL RESEARCH
A paradox in the clinical practice of quantitative EGM
guided ablation is that ablation techniques have largely
evolved in the clinical electrophysiology laboratory ahead
of mechanistic understanding, because the complexity of
AF has largely prevented detailed mapping of the arrhyth-
mia mechanism in individual patients. Contemporaryquantitative EGM-guided ablation has thus developed as a
collection of alternative approaches implemented around
the common endpoint of achieving AF termination during
a catheter ablation procedure [126], [127].
A. Clinical Results of Dominant Frequency AblationDominant frequency analysis has been adapted and
utilized prospectively in a number of studies as a quanti-tative tool to guide AF ablation. In a study utilizing real-
time DF mapping in persistent AF patients, Atienza et al.showed that ablation of sites with high DF was associated
with a reduction in the left-to-right DF gradient, a reduc-
tion in DF following ablation, and a reduced risk of atrial
arrhythmia recurrence [49]. The AF termination was
achieved in 72% of paroxysmal AF patients, but only in
Fig. 6. Schematic of the “sinusoidal recomposition” transformation.
(a) Original signal. (b) Sinusoidal wavelets are created for each
time point of the original signal (signal was downsampled for
clarity). (c) Recomposed signal is a sum of all sinusoidal wavelets.
(d) Corresponding instantaneous phase. Reprinted from [119] with
permission.
426 Proceedings of the IEEE | Vol. 104, No. 2, February 2016
Baumert et al.: Quantitative-Electrogram-Based Methods for Guiding Catheter Ablation in Atrial Fibrillation

11% of persistent AF patients. Verma and coworkers pro-spectively applied DF mapping in persistent AF patients,
where AF termination occurred in two out of 30 patients
[51]. The largest study to assess DF ablation to date, the
RADAR-AF trial, randomized 232 patients to strategies
of high DF site ablation and/or conventional PVI [128].
In persistent AF patients, freedom from atrial arrhythmia
was seen in 67% of patients who underwent PVI plus
high DF site ablation, similar to the 63% of patients whounderwent PVI alone [128]. In paroxysmal AF patients,
the role of DF ablation is an area of ongoing clinical
investigation.
B. Clinical Results of CFAE AblationWide variation in the results of CFAE guided ablation
has been noted in clinical studies. In the initial study,
ablation confined to the CFAE regions led to AF termina-tion in 95% (115/121) of patients and 91% of the patients
were free of atrial arrhythmia and symptoms one year af-
ter the ablation procedure [84]. However, replication of
these promising results has been challenging, with a
number of studies failing to demonstrate substantial in-
cremental benefit with CFAE ablation [129]–[132]. Two
systematic reviews collating results of randomized con-
trolled trials utilizing adjunctive CFAE have demon-strated positive results in nonparoxysmal AF [133], [134].
A meta-analysis of seven trials with 622 patients compar-
ing PVI plus CFAE to PVI alone showed that adjunctive
CFAE ablation yielded a small but statistically significant
increase in sinus rhythm maintenance [133]. In trials in-
cluding paroxysmal AF patients, no benefit was seen in
terms of increasing sinus rhythm maintenance [133]. In
trials reporting nonparoxysmal AF outcomes, there was asignificant benefit with adjunctive CFAE ablation [133].
The net benefit was not uniform, however, with at least
two trials showing no benefit of adjunctive CFAE abla-
tion in nonparoxysmal AF [131], [135].
The role of CFAE ablation was most recently exam-
ined in the STAR-AF 2 trial, which randomized 589 per-
sistent AF patients to PVI, PVI plus CFAE ablation, or
PVI plus linear ablation in the atrium [136]. In contrastto earlier studies, no benefit was seen with adjunctive
CFAE ablation with freedom from atrial arrhythmia of
59% in those undergoing PVI alone, compared to 49%
with PVI plus CFAE [136]. The role of CFAE ablation as
an adjunctive EGM-guided ablation strategy is an area of
ongoing investigation, with further research required to
improve the reproducibility and efficacy.
C. Clinical Results of Hilbert Phase MappingA phase mapping approach has recently been utilized
by Narayan et al. for AF ablation. In this approach, known
as focal impulse and rotor modulation (FIRM), basket
catheters are introduced into the heart for unipolar EGM
recording [137], [138]. The method involves reconstruc-
tion of phase maps based on the Hilbert transform, but
details of the signal processing have not been disclosed[138]. Utilizing FIRM-based ablation, rotors have been
identified in human AF in a number of case series [137],
[139]–[141]. In an initial case series that compared 71 pa-
tients undergoing FIRM-based ablation to 36 patients un-
dergoing conventional PVI, the acute endpoint of AF
slowing or termination was achieved in 86% of FIRM-
guided cases, compared to 20% of FIRM-blinded patients
[137]. At long-term clinical follow-up (median 890 days)patients receiving FIRM-guided ablation maintained a
higher freedom from AF than those undergoing conven-
tional PVI (78% versus 39%) [141]. In one independent
case series, FIRM-guided ablation was associated with a
one year single procedure freedom from AF of 81% [140].
However, in a second independent case series, the positive
results of the FIRM investigators were not confirmed. In
a study of 24 patients undergoing FIRM-guided ablation,AF termination/organization or slowing was achieved in
50% of patients [142]. The EGM characteristics at FIRM
suggested target sites showed neither high DF nor high
Shannon entropy, leading the authors to conclude that ad-
ditional validation of the FIRM technique is required [142].
VI. CONCLUSION AND FUTUREOUTLOOK
There is substantial evidence that AF wavefronts propa-
gate in a nonrandom manner through the atrium and
that there are critical sources that drive AF. The past
decade has seen the evolution of a wide variety of
EGM-based quantitative signal processing approaches. Al-
though significant developments have occurred, transla-tion of each of the techniques into widespread clinical
utilization has been slow, with difficulties encountered in
replication of promising results from single laboratories
in multicenter studies. A systematic comparison of signal
processing techniques and rigorous validation across lab-
oratories will be essential to advance the field. Underly-
ing the scope of the technical challenge are some of the
general limitations and constraints in the field of AFmapping, including the sparsity of mapped points within
the atria, practical constraints in terms of timing of
mapping, and the fact that the mechanisms responsible
for fibrillatory dynamics are yet to be fully elucidated.
The area will likely see significant advancements through
the development of flexible multielectrode catheters en-
abling recording of activation sequences at higher density
[143], robot-assisted systems to enable faster and moreautonomous map point acquisition, and the development
of detailed multimodal-imaging-based patient-specific
models. Together, these technological developments are
likely to lead to improvements in the volume and quality
of signal acquisition during AF, and place quantitative sig-
nal analysis at the center of innovation in AF ablation
techniques. h
Vol. 104, No. 2, February 2016 | Proceedings of the IEEE 427
Baumert et al. : Quantitative-Electrogram-Based Methods for Guiding Catheter Ablation in Atrial Fibrillation

Acknowledgment
M. Baumert holds a fellowship from the Australian
Research Council (DP110102049). P. Sanders holds aPractitioner Fellowship from the Australian National
Health and Medical Research Council. A. Ganesan holdsan Australian Early Career Health Practitioner Fellow-
ship from the Australian National Health and Medical
Research Council.
REFERENCES
[1] C. T. January et al., “2014 AHA/ACC/HRSguideline for the management of patientswith atrial fibrillation: A report of theAmerican College of Cardiology/AmericanHeart Association Task Force on PracticeGuidelines and the Heart Rhythm Society,”J. Amer. Coll. Cardiol., vol. 64, pp. e1–e76,Dec. 2, 2014.
[2] D. M. Lloyd-Jones et al., “Lifetime risk fordevelopment of atrial fibrillation: TheFramingham Heart Study,” Circulation,vol. 110, pp. 1042–1046, Aug. 31, 2004.
[3] S. S. Chugh et al., “Worldwideepidemiology of atrial fibrillation: A GlobalBurden of Disease 2010 Study,” Circulation,vol. 129, pp. 837–847, Feb. 25, 2014.
[4] T. J. Wang et al., “Temporal relations ofatrial fibrillation and congestive heartfailure and their joint influence onmortality: The Framingham Heart Study,”Circulation, vol. 107, pp. 2920–2925,Jun. 17, 2003.
[5] P. A. Wolf, R. D. Abbott, and W. B. Kannel,“Atrial fibrillation as an independent riskfactor for stroke: The Framingham Study,”Stroke, vol. 22, pp. 983–988, Aug. 1991.
[6] A. Ott et al., “Atrial fibrillation anddementia in a population-based study.The Rotterdam Study,” Stroke, vol. 28,pp. 316–321, Feb. 1997.
[7] N. J. Patel et al., “Contemporary trends ofhospitalization for atrial fibrillation in theUnited States, 2000 through 2010:Implications for healthcare planning,”Circulation, vol. 129, pp. 2371–2379,Jun. 10, 2014.
[8] M. Haissaguerre et al., “Spontaneousinitiation of atrial fibrillation by ectopicbeats originating in the pulmonary veins,”New England J. Med., vol. 339,pp. 659–666, Sep. 3, 1998.
[9] U. Schotten, S. Verheule, P. Kirchhof, andA. Goette, “Pathophysiological mechanismsof atrial fibrillation: A translationalappraisal,” Physiol. Rev., vol. 91,pp. 265–325, Jan. 2011.
[10] S. Nattel, B. Burstein, and D. Dobrev,“Atrial remodeling and atrial fibrillation:Mechanisms and implications,” Circulation:Arrhythmia Electrophysiol., vol. 1,pp. 62–73, Apr. 2008.
[11] S. Nattel and M. Harada, “Atrialremodeling and atrial fibrillation: Recentadvances and translational perspectives,”J. Amer. Coll. Cardiol., Mar. 5, 2014.
[12] M. Haissaguerre et al., “Catheter ablationof chronic atrial fibrillation targeting thereinitiating triggers,” J. Cardiovasc.Electrophysiol., vol. 11, pp. 2–10, Jan. 2000.
[13] M. Haissaguerre et al., “Electrophysiologicalbreakthroughs from the left atrium to thepulmonary veins,” Circulation, vol. 102,pp. 2463–2465, Nov. 14, 2000.
[14] M. Haissaguerre et al., “Mapping-guidedablation of pulmonary veins to cure atrialfibrillation,” Amer. J. Cardiol., vol. 86,pp. 9K–19K, Nov. 2, 2000.
[15] M. C. Wijffels, C. J. Kirchhof, R. Dorland,J. Power, and M. A. Allessie, “Electricalremodeling due to atrial fibrillation in
chronically instrumented conscious goats:Roles of neurohumoral changes, ischemia,atrial stretch, high rate of electricalactivation,” Circulation, vol. 96,pp. 3710–3720, Nov. 18, 1997.
[16] G. K. Moe, W. C. Rheinboldt, andJ. A. Abildskov, “A computer model ofatrial fibrillation,” Amer. Heart J., vol. 67,pp. 200–220, Feb. 1964.
[17] F. Ravelli et al., “Anatomic localization ofrapid repetitive sources in persistent atrialfibrillation: Fusion of biatrial CT imageswith wave similarity/cycle length maps,”J. Amer. Coll. Cardiol., Cardiovasc. Imag.,vol. 5, pp. 1211–1220, Dec. 2012.
[18] K. T. Konings et al., “High-densitymapping of electrically induced atrialfibrillation in humans,” Circulation, vol. 89,pp. 1665–1680, Apr. 1994.
[19] J. Eckstein et al., “Time course andmechanisms of endo-epicardial electricaldissociation during atrial fibrillation inthe goat,” Cardiovasc. Res., vol. 89,pp. 816–824, Mar. 1, 2011.
[20] J. Eckstein et al., “Transmural conductionis the predominant mechanism ofbreakthrough during atrial fibrillation:Evidence from simultaneousendo-epicardial high-density activationmapping,” Circulation: ArrhythmiaElectrophysiol., vol. 6, pp. 334–341,Apr. 2013.
[21] J. Jalife, “Deja vu in the theories of atrialfibrillation dynamics,” Cardiovasc. Res.,vol. 89, pp. 766–775, Mar. 1, 2011.
[22] A. C. Skanes, R. Mandapati, O. Berenfeld,J. M. Davidenko, and J. Jalife,“Spatiotemporal periodicity during atrialfibrillation in the isolated sheep heart,”Circulation, vol. 98, pp. 1236–1248,Sep. 22, 1998.
[23] R. Mandapati, A. Skanes, J. Chen,O. Berenfeld, and J. Jalife, “Stablemicroreentrant sources as a mechanism ofatrial fibrillation in the isolated sheepheart,” Circulation, vol. 101, pp. 194–199,Jan. 18, 2000.
[24] N. A. Trayanova, “Mathematical approachesto understanding and imaging atrialfibrillation: Significance for mechanismsand management,” Circ. Res., vol. 114,pp. 1516–1531, Apr. 25, 2014.
[25] O. Berenfeld, A. V. Zaitsev, S. F. Mironov,A. M. Pertsov, and J. Jalife, “Frequency-dependent breakdown of wave propagationinto fibrillatory conduction across thepectinate muscle network in the isolatedsheep right atrium,” Circ. Res., vol. 90,pp. 1173–1180, Jun. 14, 2002.
[26] J. Kalifa et al., “Mechanisms of wavefractionation at boundaries of high-frequency excitation in the posterior leftatrium of the isolated sheep heart duringatrial fibrillation,” Circulation, vol. 113,pp. 626–633, Feb. 7, 2006.
[27] L. Gepstein, G. Hayam, and S. A. Ben-Haim,“A novel method for nonfluoroscopiccatheter-based electroanatomical mapping ofthe heart. In vitro and in vivo accuracyresults,” Circulation, vol. 95, pp. 1611–1622,Mar. 18, 1997.
[28] A. Kadish, J. Hauck, B. Pederson,G. Beatty, and C. Gornick, “Mapping ofatrial activation with a noncontact,multielectrode catheter in dogs,”Circulation, vol. 99, pp. 1906–1913,Apr. 13, 1999.
[29] H. Calkins et al., “2012 HRS/EHRA/ECASexpert consensus statement on catheterand surgical ablation of atrial fibrillation,”Heart Rhythm, vol. 9, pp. 632–696,Apr. 2012.
[30] R. Weerasooriya et al., “Catheter ablationfor atrial fibrillation: Are resultsmaintained at 5 years of follow-up?”J. Amer. Coll. Cardiol., vol. 57, pp. 160–166,Jan. 11, 2011.
[31] A. N. Ganesan et al., “Long-term outcomesof catheter ablation of atrial fibrillation:A systematic review and meta-analysis,”J. Amer. Heart Assoc., vol. 2, Apr. 2013,Art. ID e004549.
[32] M. A. Allessie et al., “Electropathologicalsubstrate of long-standing persistent atrialfibrillation in patients with structural heartdisease: Longitudinal dissociation,”Circulation: Arrhythmia Electrophysiol.,vol. 3, pp. 606–615, Dec. 1, 2010.
[33] K. T. Konings, J. L. Smeets, O. C. Penn,H. J. Wellens, and M. A. Allessie,“Configuration of unipolar atrialelectrograms during electrically inducedatrial fibrillation in humans,” Circulation,vol. 95, pp. 1231–1241, Mar. 4, 1997.
[34] M. Shenasa, G. Hindricks, M. Borggrefe,and G. Breithardt, Cardiac Mapping.New York, NY, USA: Wiley, 2009.
[35] J. L. Wells, Jr. et al., “Characterization ofatrial fibrillation in man: Studies followingopen heart surgery,” Pacing Clin.Electrophysiol., vol. 1, pp. 426–438,Oct. 1978.
[36] J. M. de Bakker and F. H. Wittkampf,“The pathophysiologic basis of fractionatedand complex electrograms and the impactof recording techniques on their detectionand interpretation,” Circulation: ArrhythmiaElectrophysiol., vol. 3, pp. 204–213, 2010.
[37] S. Shkurovich, A. V. Sahakian, andS. Swiryn, “Detection of atrial activityfrom high-voltage leads of implantableventricular defibrillators using a cancellationtechnique,” IEEE Trans. Biomed. Eng.,vol. 45, pp. 229–234, Feb. 1998.
[38] G. W. Botteron and J. M. Smith,“A technique for measurement of theextent of spatial organization of atrialactivation during atrial fibrillation in theintact human heart,” IEEE Trans. Biomed.Eng., vol. 42, pp. 579–586, Jun. 1995.
[39] B. J. Scherlac, P. Samet, and R. H. Helfant,“His bundle electrogram. A critical appraisalof its uses and limitations,” Circulation,vol. 46, pp. 601–613, Sep. 1972.
[40] C. F. Pieper, R. Blue, and A. Pacifico,“Simultaneously collected monopolarand discrete bipolar electrograms:Comparison of activation time detectionalgorithms,” Pacing Clin. Electrophysiol.,vol. 16, pp. 426–433, Mar. 1993.
[41] C. F. Pieper, R. Blue, and A. Pacifico,“Simultaneously collected monopolar anddiscrete bipolar electrograms: Comparison
428 Proceedings of the IEEE | Vol. 104, No. 2, February 2016
Baumert et al.: Quantitative-Electrogram-Based Methods for Guiding Catheter Ablation in Atrial Fibrillation

of activation time detection algorithms,”Pacing Clin. Electrophysiol., vol. 16,pp. 426–433, Mar. 1993.
[42] L. Faes, G. Nollo, R. Antolini, F. Gaita,and F. Ravelli, “A method for quantifyingatrial fibrillation organization based onwave-morphology similarity,” IEEE Trans.Biomed. Eng., vol. 49, pp. 1504–1513,Dec. 2002.
[43] J. Ng, V. Sehgal, J. K. Ng, D. Gordon, andJ. J. Goldberger, “Iterative method todetect atrial activations and measure cyclelength from electrograms during atrialfibrillation,” IEEE Trans. Biomed. Eng.,vol. 61, pp. 273–278, Feb. 2014.
[44] O. Berenfeld et al., “Spatially distributeddominant excitation frequencies revealhidden organization in atrial fibrillation inthe Langendorff-perfused sheep heart,”J. Cardiovasc. Electrophysiol., vol. 11,pp. 869–879, Aug. 2000.
[45] T. H. Everett, L. C. Kok, R. H. Vaughn,J. R. Moorman, and D. E. Haines,“Frequency domain algorithm forquantifying atrial fibrillation organizationto increase defibrillation efficacy,” IEEETrans. Biomed. Eng., vol. 48, pp. 969–978,Sep. 2001.
[46] J. Ng and J. J. Goldberger, “Understandingand interpreting dominant frequencyanalysis of AF electrograms,” J. Cardiovasc.Electrophysiol., vol. 18, pp. 680–685,Jun. 2007.
[47] G. Fischer et al., “On computing dominantfrequency from bipolar intracardiacelectrograms,” IEEE Trans. Biomed. Eng.,vol. 54, pp. 165–169, Jan. 2007.
[48] T. H. Everett, J. R. Moorman, L. C. Kok,J. G. Akar, and D. E. Haines, “Assessmentof global atrial fibrillation organization tooptimize timing of atrial defibrillation,”Circulation, vol. 103, pp. 2857–2861,Jun. 12, 2001.
[49] F. Atienza et al., “Real-time dominantfrequency mapping and ablation ofdominant frequency sites in atrialfibrillation with left-to-right frequencygradients predicts long-term maintenanceof sinus rhythm,” Heart Rhythm, vol. 6,pp. 33–40, Jan. 2009.
[50] M. K. Stiles et al., “High-density mappingof atrial fibrillation in humans:Relationship between high-frequencyactivation and electrogram fractionation,”J. Cardiovasc. Electrophysiol., vol. 19,pp. 1245–1253, Dec. 2008.
[51] A. Verma et al., “Relationship betweencomplex fractionated electrograms (CFE)and dominant frequency (DF) sites andprospective assessment of addingDF-guided ablation to pulmonary veinisolation in persistent atrial fibrillation(AF),” J. Cardiovasc. Electrophysiol., vol. 22,pp. 1309–1316, Dec. 2011.
[52] J. Ng, A. H. Kadish, and J. J. Goldberger,“Technical considerations for dominantfrequency analysis,” J. Cardiovasc.Electrophysiol., vol. 18, pp. 757–764,Jul. 2007.
[53] J. Ng, A. H. Kadish, and J. J. Goldberger,“Effect of electrogram characteristics onthe relationship of dominant frequency toatrial activation rate in atrial fibrillation,”Heart Rhythm, vol. 3, pp. 1295–1305,Nov. 2006.
[54] P. Sanders et al., “Spectral analysisidentifies sites of high-frequency activitymaintaining atrial fibrillation in humans,”Circulation, vol. 112, pp. 789–797, Aug. 9,2005.
[55] E. J. Ciaccio, A. B. Biviano, and H. Garan,“Optimization of novel spectral estimatorfor fractionated electrogram analysis ishelpful to discern atrial fibrillation type,”Comput. Methods Programs Biomed.,vol. 117, pp. 343–350, Nov. 2014.
[56] A. Elvan et al., “Dominant frequency ofatrial fibrillation correlates poorly withatrial fibrillation cycle length,” Circulation:Arrhythmia Electrophysiol., vol. 2,pp. 634–644, Dec. 2009.
[57] D. E. Krummen et al., “Correlation ofelectrical rotors and focal sources withsites of centrifugal stepdown in dominantfrequency in human atrial fibrillation,”Heart Rhythm, vol. 8, p. S176, 2011.
[58] N. Habel et al., “The temporal variabilityof dominant frequency and complexfractionated atrial electrograms constrainsthe validity of sequential mapping inhuman atrial fibrillation,” Heart Rhythm,vol. 7, pp. 586–593, May 2010.
[59] J. W. Jarman et al., “Spatiotemporalbehavior of high dominant frequencyduring paroxysmal and persistent atrialfibrillation in the human left atrium,”Circulation: Arrhythmia Electrophysiol.,vol. 5, pp. 650–658, Aug. 1, 2012.
[60] R. P. Houben, N. M. de Groot, andM. A. Allessie, “Analysis of fractionatedatrial fibrillation electrograms by waveletdecomposition,” IEEE Trans. Biomed. Eng.,vol. 57, pp. 1388–1398, Jun. 2010.
[61] J. Zhao et al., “Novel methods forcharacterization of paroxysmal atrialfibrillation in human left atria,” OpenBiomed. Eng. J., vol. 7, pp. 29–40, 2013.
[62] V. Kremen et al., “A new approach toautomated assessment of fractionation ofendocardial electrograms during atrialfibrillation,” Physiol. Meas., vol. 29,pp. 1371–1381, Dec. 2008.
[63] F. Ravelli and M. Mase, “Computationalmapping in atrial fibrillation: How theintegration of signal-derived maps mayguide the localization of critical sources,”Europace, vol. 16, pp. 714–723, May 2014.
[64] F. Ravelli, M. Mase, M. Del Greco,L. Faes, and M. Disertori, “Deteriorationof organization in the first minutes ofatrial fibrillation: A beat-to-beat analysis ofcycle length and wave similarity,”J. Cardiovasc. Electrophysiol., vol. 18,pp. 60–65, Jan. 2007.
[65] F. Ravelli et al., “Wave similarity mappingshows the spatiotemporal distribution offibrillatory wave complexity in the humanright atrium during paroxysmal andchronic atrial fibrillation,” J. Cardiovasc.Electrophysiol., vol. 16, pp. 1071–1076,Oct. 2005.
[66] F. Ravelli, M. Mase, A. Cristoforetti,M. Marini, and M. Disertori, “The logicaloperator map identifies novel candidatemarkers for critical sites in patients withatrial fibrillation,” Progr. Biophys. Mol. Biol.,vol. 115, pp. 186–197, Aug. 2014.
[67] J. Ng et al., “Electrogram morphologyrecurrence patterns during atrialfibrillation,” Heart Rhythm, Aug. 5, 2014.
[68] M. Mase, L. Faes, R. Antolini, M. Scaglione,and F. Ravelli, “Quantification ofsynchronization during atrial fibrillation byShannon entropy: Validation in patients andcomputer model of atrial arrhythmias,”Physiol. Meas., vol. 26, pp. 911–923,Dec. 2005.
[69] A. N. Ganesan et al., “Bipolar electrogramshannon entropy at sites of rotationalactivation: Implications for ablation of
atrial fibrillation,” Circulation: ArrhythmiaElectrophysiol., vol. 6, pp. 48–57,Feb. 2013.
[70] A. N. Ganesan et al., “Origin andcharacteristics of high Shannon entropy atthe pivot of locally stable rotors: Insightsfrom computational simulation,” PLoS One,vol. 9, 2014, Art. ID e110662.
[71] K. Balasundaram et al., “Tracking rotorswith minimal electrodes: Modulationindex-based strategy,” Circulation:Arrhythmia Electrophysiol., vol. 8,pp. 447–455, Apr. 2015.
[72] A. Orozco-Duque, J. P. Ugarte, C. Tobon,J. Saiz, and J. Bustamante, “Approximateentropy can localize rotors, but not ectopicfoci during chronic atrial fibrillation:A simulation study,” in Proc. Comput.Cardiol. Conf., 2013, pp. 903–906.
[73] J. P. Ugarte et al., “Dynamic approximateentropy electroanatomic maps detect rotorsin a simulated atrial fibrillation model,”PLoS One, vol. 9, 2014, Art. ID e114577.
[74] R. Alcaraz, F. Hornero, and J. J. Rieta,“Assessment of non-invasive time andfrequency atrial fibrillation organizationmarkers with unipolar atrial electrograms,”Physiol. Meas., vol. 32, pp. 99–114,Jan. 2011.
[75] A. Porta et al., “Measuring regularity bymeans of a corrected conditional entropyin sympathetic outflow,” Biol. Cybern.,vol. 78, pp. 71–78, Jan. 1998.
[76] L. T. Mainardi et al., “Linear andnon-linear analysis of atrial signals andlocal activation period series duringatrial-fibrillation episodes,” Med. Biol. Eng.Comput., vol. 39, pp. 249–254, Mar. 2001.
[77] P. Bonizzi et al., “Systematic comparison ofnon-invasive measures for the assessmentof atrial fibrillation complexity: A stepforward towards standardization of atrialfibrillation electrogram analysis,” Europace,vol. 17, pp. 318–325, Feb. 2015.
[78] L. Faes et al., “Principal componentanalysis and cluster analysis for measuringthe local organisation of human atrialfibrillation,” Med. Biol. Eng. Comput.,vol. 39, pp. 656–663, Nov. 2001.
[79] B. P. Hoekstra, C. G. Diks, M. A. Allessie,and J. DeGoede, “Nonlinear analysis ofepicardial atrial electrograms of electricallyinduced atrial fibrillation in man,”J. Cardiovasc. Electrophysiol., vol. 6,pp. 419–440, Jun. 1995.
[80] V. D. A. Corino, R. Sassi, L. T. Mainardi,and S. Cerutti, “Signal processing methodsfor information enhancement in atrialfibrillation: Spectral analysis and non-linearparameters,” Biomed. Signal Process. Control,vol. 1, pp. 271–281, Oct. 2006.
[81] F. Takens, Detecting Strange Attractors inTurbulence. New York, NY, USA:Springer-Verlag, 1981.
[82] F. Censi et al., “Recurrent patterns ofatrial depolarization during atrialfibrillation assessed by recurrence plotquantification,” Ann. Biomed. Eng., vol. 28,pp. 61–70, Jan. 2000.
[83] N. Navoret, S. Jacquir, G. Laurent, andS. Binczak, “Detection of complexfractionated atrial electrograms usingrecurrence quantification analysis,”IEEE Trans. Biomed. Eng., vol. 60,pp. 1975–1982, Jul. 2013.
[84] K. Nademanee et al., “A new approach forcatheter ablation of atrial fibrillation:Mapping of the electrophysiologicsubstrate,” J. Amer. Coll. Cardiol., vol. 43,pp. 2044–2053, Jun. 2, 2004.
Vol. 104, No. 2, February 2016 | Proceedings of the IEEE 429
Baumert et al. : Quantitative-Electrogram-Based Methods for Guiding Catheter Ablation in Atrial Fibrillation

[85] A. Verma et al., “A prospective,multicenter evaluation of ablating complexfractionated electrograms (CFEs) duringatrial fibrillation (AF) identified by anautomated mapping algorithm: Acuteeffects on AF and efficacy as an adjuvantstrategy,” Heart Rhythm, vol. 5,pp. 198–205, Feb. 2008.
[86] D. Scherr et al., “Automated detection andcharacterization of complex fractionatedatrial electrograms in human left atriumduring atrial fibrillation,” Heart Rhythm,vol. 4, pp. 1013–1020, Aug. 2007.
[87] M. Porter et al., “Prospective study ofatrial fibrillation termination duringablation guided by automated detection offractionated electrograms,” J. Cardiovasc.Electrophysiol., vol. 19, pp. 613–620,Jun. 2008.
[88] J. F. Roux et al., “Complex fractionatedelectrogram distribution and temporalstability in patients undergoing atrialfibrillation ablation,” J. Cardiovasc.Electrophysiol., vol. 19, pp. 815–820,Aug. 2008.
[89] A. Verma et al., “Spatial and temporalstability of complex fractionatedelectrograms in patients with persistentatrial fibrillation over longer time periods:Relationship to local electrogramcycle length,” Heart Rhythm, vol. 5,pp. 1127–1133, Aug. 2008.
[90] D. Scherr et al., “Long- and short-termtemporal stability of complex fractionatedatrial electrograms in human left atriumduring atrial fibrillation,” J. Cardiovasc.Electrophysiol., vol. 20, pp. 13–21,Jan. 2009.
[91] D. H. Lau et al., “Stability of complexfractionated atrial electrograms: Asystematic review,” J. Cardiovasc.Electrophysiol., vol. 23, pp. 980–987,Sep. 2012.
[92] M. K. Stiles et al., “The effect ofelectrogram duration on quantification ofcomplex fractionated atrial electrogramsand dominant frequency,” J. Cardiovasc.Electrophysiol., vol. 19, pp. 252–258,Mar. 2008.
[93] F. Atienza et al., “Mechanisms offractionated electrograms formation in theposterior left atrium during paroxysmalatrial fibrillation in humans,” J. Amer. Coll.Cardiol., vol. 57, pp. 1081–1092, Mar. 1,2011.
[94] E. J. Ciaccio, A. B. Biviano, and H. Garan,“Computational method for high resolutionspectral analysis of fractionated atrialelectrograms,” Comput. Biol. Med., vol. 43,pp. 1573–1582, Oct. 2013.
[95] E. J. Ciaccio, A. B. Biviano, A. Gambhir,J. T. Jacobson, and H. Garan, “Temporalstability in the spectral representation ofcomplex fractionated atrial electrograms,”Pacing Clin. Electrophysiol., vol. 37,pp. 79–89, Jan. 2014.
[96] E. J. Ciaccio et al., “Differences inrepeating patterns of complex fractionatedleft atrial electrograms in longstandingpersistent atrial fibrillation as comparedwith paroxysmal atrial fibrillation,”Circulation: Arrhythmia Electrophysiol.,vol. 4, pp. 470–477, Aug. 2011.
[97] E. J. Ciaccio, A. B. Biviano, W. Whang,A. Gambhir, and H. Garan, “Differentcharacteristics of complex fractionatedatrial electrograms in acute paroxysmalversus long-standing persistent atrialfibrillation,” Heart Rhythm, vol. 7,pp. 1207–1215, Sep. 2010.
[98] Y. J. Lin et al., “Spatiotemporalorganization of the left atrial substrateafter circumferential pulmonary veinisolation of atrial fibrillation,” Circulation:Arrhythmia Electrophysiol., vol. 2,pp. 233–241, Jun. 2009.
[99] Y. J. Lin et al., “Novel assessment oftemporal variation in fractionatedelectrograms using histogram analysis oflocal fractionation interval in patients withpersistent atrial fibrillation,” Circulation:Arrhythmia Electrophysiol., vol. 5,pp. 949–956, Oct. 2012.
[100] Y. J. Lin et al., “Consistency of complexfractionated atrial electrograms duringatrial fibrillation,” Heart Rhythm, vol. 5,pp. 406–412, Mar. 2008.
[101] S. L. Chang et al., “Electrophysiologicalcharacteristics of complex fractionatedelectrograms and high frequency activity inatrial fibrillation,” Int. J. Cardiol., Feb. 25,2013.
[102] J. Ng et al., “Measuring the complexity ofatrial fibrillation electrograms,”J. Cardiovasc. Electrophysiol., vol. 21,pp. 649–655, Jun. 1, 2010.
[103] N. Navoret, B. Xu, S. Jacquir, andS. Binczak, “Comparison of complexfractionated atrial electrograms at cellularscale using numerical and experimentalmodels,” in Proc. Annu. Int. Conf. IEEE Eng.Med. Biol. Soc., 2010, pp. 3249–3252.
[104] K. Umapathy et al., “Electrogram fractionationin murine HL-1 atrial monolayer model,”Heart Rhythm, vol. 5, pp. 1029–1035,Jul. 2008.
[105] R. J. Hunter et al., “Characterization offractionated atrial electrograms critical formaintenance of atrial fibrillation: Arandomized, controlled trial of ablationstrategies (the CFAE AF trial),” Circulation:Arrhythmia Electrophysiol., vol. 4,pp. 622–629, Oct. 2011.
[106] K. R. Grzeda, S. F. Noujaim, O. Berenfeld,and J. Jalife, “Complex fractionated atrialelectrograms: Properties of time-domainversus frequency-domain methods,” HeartRhythm, vol. 6, pp. 1475–1482, Oct. 2009.
[107] D. Katritsis et al., “Autonomic modulationof complex fractionated atrial electrogramsin patients with paroxysmal atrialfibrillation,” J. Interventional CardiacElectrophysiol., vol. 31, pp. 217–223,Sep. 2011.
[108] D. Katritsis, E. Giazitzoglou, D. Sougiannis,E. Voridis, and S. S. Po, “Complexfractionated atrial electrograms at anatomicsites of ganglionated plexi in atrialfibrillation,” Europace, vol. 11,pp. 308–315, Mar. 2009.
[109] A. S. Jadidi et al., “Functional nature ofelectrogram fractionation demonstrated byleft atrial high-density mapping,”Circulation: Arrhythmia Electrophysiol.,vol. 5, pp. 32–42, Feb. 2012.
[110] K. Yoshida et al., “Complex electrogramswithin the coronary sinus: Time- andfrequency-domain characteristics, effects ofantral pulmonary vein isolation,relationship to clinical outcome in patientswith paroxysmal and persistent atrialfibrillation,” J. Cardiovasc. Electrophysiol.,vol. 19, pp. 1017–1023, Oct. 2008.
[111] G. Lee et al., “Relationship amongcomplex signals, short cycle length activity,dominant frequency in patients withlong-lasting persistent AF: A high-densityepicardial mapping study in humans,”Heart Rhythm, vol. 8, pp. 1714–1719,Nov. 2011.
[112] D. H. Lau et al., “Indices of bipolarcomplex fractionated atrial electrogramscorrelate poorly with each other and atrialfibrillation substrate complexity,” HeartRhythm, vol. 12, pp. 1415–1423, Jul. 2015.
[113] E. G. Lovett and K. M. Ropella,“Time-frequency coherence analysis ofatrial fibrillation termination duringprocainamide administration,” Ann.Biomed. Eng., vol. 25, pp. 975–984,Nov./Dec. 1997.
[114] U. Richter et al., “A novel approach topropagation pattern analysis in intracardiacatrial fibrillation signals,” Ann. Biomed.Eng., vol. 39, pp. 310–323, Jan. 2011.
[115] U. Richter, L. Faes, F. Ravelli, andL. Sornmo, “Propagation pattern analysisduring atrial fibrillation based on sparsemodeling,” IEEE Trans. Biomed. Eng.,vol. 59, pp. 1319–1328, May 2012.
[116] M. A. Bray and J. P. Wikswo,“Considerations in phase plane analysis fornonstationary reentrant cardiac behavior,”Phys. Rev. E, Stat. Nonlinear Soft MatterPhys., vol. 65, May 2002, Art. ID 051902.
[117] R. A. Gray, A. M. Pertsov, and J. Jalife,“Spatial and temporal organization duringcardiac fibrillation,” Nature, vol. 392,pp. 75–78, Mar. 5, 1998.
[118] A. N. Iyer and R. A. Gray, “Anexperimentalist’s approach to accuratelocalization of phase singularities duringreentry,” Ann. Biomed. Eng., vol. 29,pp. 47–59, Jan. 2001.
[119] P. Kuklik et al., “Reconstruction ofinstantaneous phase of unipolar atrialcontact electrogram using a concept ofsinusoidal recomposition and Hilberttransform,” IEEE Trans. Biomed. Eng.,vol. 62, pp. 296–302, Jan. 2015.
[120] P. Kuklik, E. Bidar, A. Gharaviri,J. Maessen, and U. Schotten, “Applicationof phase coherence in assessment of spatialalignment of electrodes duringsimultaneous endocardial-epicardial directcontact mapping of atrial fibrillation,”Europace, vol. 16, pp. iv135–iv140,Nov. 2014.
[121] M. P. Nash et al., “Evidence for multiplemechanisms in human ventricularfibrillation,” Circulation, vol. 114,pp. 536–542, Aug. 8, 2006.
[122] S. Masse, E. Downar, V. Chauhan,E. Sevaptsidis, and K. Nanthakumar,“Ventricular fibrillation in myopathichuman hearts: Mechanistic insights fromin vivo global endocardial and epicardialmapping,” Amer. J. Physiol. Heart Circ.Physiol., vol. 292, pp. H2589–H2597,Jun. 2007.
[123] H. J. Sih, D. P. Zipes, E. J. Berbari, andJ. E. Olgin, “A high-temporal resolutionalgorithm for quantifying organizationduring atrial fibrillation,” IEEE Trans.Biomed. Eng., vol. 46, pp. 440–450,Apr. 1999.
[124] L. Faes and F. Ravelli, “A morphology-basedapproach to the evaluation of atrialfibrillation organization,” IEEE Eng. Med. Biol.Mag., vol. 26, pp. 59–67, Jul./Aug. 2007.
[125] U. Richter, A. Bollmann, D. Husser, andM. Stridh, “Right atrial organization andwavefront analysis in atrial fibrillation,”Med. Biol. Eng. Comput., vol. 47,pp. 1237–1246, Dec. 2009.
[126] K. Lemola et al., “Effects of two differentcatheter ablation techniques on spectralcharacteristics of atrial fibrillation,”J. Amer. Coll. Cardiol., vol. 48, pp. 340–348,Jul. 18, 2006.
430 Proceedings of the IEEE | Vol. 104, No. 2, February 2016
Baumert et al.: Quantitative-Electrogram-Based Methods for Guiding Catheter Ablation in Atrial Fibrillation

[127] Y. Takahashi et al., “Characterization ofelectrograms associated with termination ofchronic atrial fibrillation by catheterablation,” J. Amer. Coll. Cardiol., vol. 51,pp. 1003–1010, Mar. 11, 2008.
[128] F. Atienza et al., “Comparison ofradiofrequency catheter ablation of driversand circumferential pulmonary veinisolation in atrial fibrillation: Anoninferiority randomized multicenterRADAR-AF trial,” J. Amer. Coll. Cardiol.,vol. 64, pp. 2455–2467, Dec. 16, 2014.
[129] H. Oral et al., “Radiofrequency catheterablation of chronic atrial fibrillation guidedby complex electrograms,” Circulation,vol. 115, pp. 2606–2612, May 22, 2007.
[130] H. Oral et al., “Randomized evaluation ofright atrial ablation after left atrial ablationof complex fractionated atrial electrogramsfor long-lasting persistent atrialfibrillation,” Circulation: ArrhythmiaElectrophysiol., vol. 1, pp. 6–13, Apr. 2008.
[131] H. Oral et al., “A randomized assessmentof the incremental role of ablation ofcomplex fractionated atrial electrogramsafter antral pulmonary vein isolation forlong-lasting persistent atrial fibrillation,”J. Amer. Coll. Cardiol., vol. 53, pp. 782–789,Mar. 3, 2009.
[132] A. Verma et al., “Selective complexfractionated atrial electrograms targetingfor atrial fibrillation study (SELECT AF):A multicenter, randomized trial,”Circulation: Arrhythmia Electrophysiol.,vol. 7, pp. 55–62, Feb. 1, 2014.
[133] W. J. Li et al., “Additional ablation ofcomplex fractionated atrial electrogramsafter pulmonary vein isolation in patientswith atrial fibrillation: A meta-analysis,”Circulation: Arrhythmia Electrophysiol.,vol. 4, pp. 143–148, Apr. 1, 2011.
[134] R. M. Hayward et al., “Pulmonary veinisolation with complex fractionated atrialelectrogram ablation for paroxysmal andnonparoxysmal atrial fibrillation: Ameta-analysis,” Heart Rhythm, vol. 8,pp. 994–1000, Jul. 2011.
[135] A. Verma et al., “Efficacy of adjuvantanterior left atrial ablation duringintracardiac echocardiography-guidedpulmonary vein antrum isolation for atrialfibrillation,” J. Cardiovasc. Electrophysiol.,vol. 18, pp. 151–156, Feb. 2007.
[136] A. Verma et al., “Approaches to catheterablation for persistent atrial fibrillation,”New England J. Med., vol. 372,pp. 1812–1822, May 7, 2015.
[137] S. M. Narayan et al., “Treatment of atrialfibrillation by the ablation of localizedsources: Confirm (conventional ablation foratrial fibrillation with or without focalimpulse and rotor modulation) trial,”J. Amer. Coll. Cardiol., vol. 60, pp. 628–636, Aug. 14, 2012.
[138] S. M. Narayan, D. E. Krummen,M. W. Enyeart, and W. J. Rappel,“Computational mapping identifieslocalized mechanisms for ablation of atrialfibrillation,” PloS One, vol. 7, 2012,Art. ID e46034.
[139] S. M. Narayan, D. E. Krummen,P. Clopton, K. Shivkumar, andJ. M. Miller, “Direct or coincidentalelimination of stable rotors or focal sourcesmay explain successful atrial fibrillationablation: On-treatment analysis of theconfirm (conventional ablation for AF withor without focal impulse and rotormodulation) trial,” J. Amer. Coll. Cardiol.,vol. 62, pp. 138–147, Apr. 3, 2013.
[140] J. M. Miller et al., “Initial independentoutcomes from focal impulse and rotor
modulation ablation for atrial fibrillation:Multicenter FIRM registry,” J. Cardiovasc.Electrophysiol., vol. 25, pp. 921–929,Sep. 2014.
[141] S. M. Narayan et al., “Ablation of rotorand focal sources reduces late recurrenceof atrial fibrillation compared with triggerablation alone: Extended follow-up of theCONFIRM trial (conventional ablation foratrial fibrillation with or without focalimpulse and rotor modulation),” J. Amer.Coll. Cardiol., vol. 63, pp. 1761–1768,May 6, 2014.
[142] P. Benharash et al., “Quantitative analysisof localized sources identified by focalimpulse and roter modulation mapping inatrial fibrillation,” Circulation: ArrhythmiaElectrophysiol., Apr. 14, 2015.
[143] L. Xu et al., “3D multifunctionalintegumentary membranes forspatiotemporal cardiac measurements andstimulation across the entire epicardium,”Nature Commun., vol. 5, p. 3329, 2014.
[144] S. V. Pandit et al., “Ionic determinants offunctional reentry in a 2-D model ofhuman atrial cells during simulated chronicatrial fibrillation,” Biophys. J., vol. 88,pp. 3806–3821, Jun. 2005.
[145] A. G. Brooks et al., “Image integrationusing NavX Fusion: Initial experience andvalidation,” Heart Rhythm, vol. 5,pp. 526–535, Apr. 2008.
[146] W. G. Stevenson and K. Soejima,“Recording techniques for clinicalelectrophysiology,” J. Cardiovasc.Electrophysiol., vol. 16, pp. 1017–1022,Sep. 2005.
ABOUT THE AUTHORS
Mathias Baumert (Senior Member, IEEE) re-
ceived the Ph.D. degree in biomedical engineer-
ing from the Ilmenau University of Technology,
Germany, in 2005.
Subsequently, he was awarded the Australian
Postdoctoral Fellowship and the Australian Re-
search Fellowship from the Australian Research
Council. He is currently an Associate Professor at
the School of Electrical & Electronic Engineering,
University of Adelaide, Adelaide, S.A., Australia.
His research interests include processing of electrophysiological sig-
nals, computerized electrocardiography and electroencephalography,
cardiac autonomic modulation, and sleep.
Prashanthan Sanders graduated from the Uni-
versity of Adelaide, Adelaide, S.A., Australia, with
honors and received the Ph.D. degree from the
University of Melbourne, Parkville, Vic., Australia.
He is a Professor at the University of Adelaide.
He is the Director of the Centre for Heart Rhythm
Disorders at the University of Adelaide, the Direc-
tor of Cardiac Electrophysiology and Pacing at the
Royal Adelaide Hospital, and the Group Leader for
Heart Rhythm Disorders at the South Australian
Health and Medical Research Institute. He trained as a Cardiologist at the
Royal Adelaide Hospital before subspecializing in cardiac electrophysiol-
ogy at the Royal Melbourne Hospital, Parkville, Vic., Australia. He has es-
tablished a formidable team of clinicians and researchers who span the
spectrum of research into heart rhythm disorders; ranging from computer
modeling of cardiac arrhythmias, cellular electrophysiology, small and
large animal models of disease to evaluate arrhythmia mechanisms, clini-
cal mechanistic, outcome and more recently population-based studies.
The group has an established clinical trials program and is involved in de-
velopment of novel technologies.
Anand Ganesan graduated in medicine from the
University of Sydney, Sydney, N.S.W., Australia
and received the Ph.D. degree in cardiac electro-
physiology from the Johns Hopkins University,
Baltimore, MD, USA.
He is a Senior Lecturer at the University of
Adelaide, Adelaide, S.A., Australia, and clinical
cardiac electrophysiologist currently based at
Flinders Medical Centre, Bedford Park, S.A.,
Australia. His research interest is in cardiac signal
processing in cardiac clinical electrophysiology, with a specific focus of
atrial fibrillation mapping.
Vol. 104, No. 2, February 2016 | Proceedings of the IEEE 431
Baumert et al. : Quantitative-Electrogram-Based Methods for Guiding Catheter Ablation in Atrial Fibrillation