quantitative analysis of vascular morphology from 3d mr angiograms: in vitro and in vivo results
TRANSCRIPT
Quantitative Analysis of Vascular Morphology From 3DMR Angiograms: In Vitro and In Vivo Results
Alejandro F. Frangi,* Wiro J. Niessen, Paul J. Nederkoorn, Jeannette Bakker,Willem P.Th.M. Mali, and Max A. Viergever
A 3D model-based approach for quantification of vascular mor-phology from several MRA acquisition protocols was evaluated.Accuracy, reproducibility, and influence of the image acquisi-tion techniques were studied via in vitro experiments withground truth diameters and the measurements of two expertreaders as reference. The performance of the method wassimilar to or more accurate than the manual assessments andreproducibility was also improved. The methodology was ap-plied to stenosis grading of carotid arteries from CE MRA data.In 11 patients, the approach was compared to manual scores(NASCET criterion) on CE MRA and DSA images, with the resultthat the model-based technique correlates better with DSAthan the manual scores. Spearman’s correlation coefficientwas 0.91 (P < 0.001) for the model-based technique and DSA vs.0.80 and 0.84 (P < 0.001) between the manual scores and DSA.From the results it can be concluded that the approach is apromising objective technique to assess geometrical vascularparameters, including degree of stenosis. Magn Reson Med45:311–322, 2001. © 2001 Wiley-Liss, Inc.
Key words: diameter quantification; stenosis grading; evalua-tion; model-based three-dimensional image analysis
Quantification of vessel morphology is an important pre-requisite for planning vascular surgical procedures and fortreatment selection of vascular diseases. An important ap-plication is quantification of the lumen diameter, for in-stance, to determine the proper dimensions of vascularprostheses or for accurate stenosis grading. This work, inparticular, focuses on the development of a 3D techniqueto model linear vascular segments and its application todiameter and stenosis quantification.
Treatment selection for patients with carotid artery dis-ease is an example of the need for accurate stenosis grad-ing. The North American Symptomatic Carotid Endarter-ectomy Trial (NASCET) (1) and the European Carotid Sur-gery Trial (ECST) (2), both established that carotidendarterectomy is beneficial for patients with a severesymptomatic (70–99%) carotid artery stenosis.
Two-dimensional DSA has for long time been the goldstandard for stenosis grading. Unfortunately, it is a projec-tion technique which introduces problems related to theselection of the optimal projection angle (3), especially inasymmetric stenoses, and to the correction of motion arti-facts (4), which is a 3D phenomenon. From projection
images, it is generally nontrivial to accurately assess vesseldiameter and, especially, cross-sectional area. This lastparameter is often derived from the vessel radius (5) underthe assumption of a circular cross section (thus, directlydependent on the vessel radius and not providing addi-tional information). A drawback of DSA is that it can leadto complications caused by invasive catheter manipula-tions and ionizing radiation exposure. In addition, thecontrast agents required for this technique represent a riskfactor in themselves (6).
Magnetic resonance angiography (MRA) is increasinglyused (7–15) to replace DSA in diagnostic procedures. Mis-tretta (16) analyzed the relative characteristics of MRA incomparison with other alternative vascular imaging tech-niques. The advantages of MRA are that it is noninvasive,does not involve ionizing radiation, and available contrastagents are safer and injected in smaller doses. Whereas thein-plane resolution of MRA is lower than for 2D DSA, 3D(isotropic) data can be acquired. The introduction of con-trast agents, such as gadopentetate dimeglumine (17), hasconsiderably improved the clinical applicability of MRAcompared to nonenhanced MRA techniques like time-of-flight (TOF) and phase contrast (PC) angiography. Con-trast-enhanced techniques allow for higher contrast,shorter scan times, arbitrarily positioned imaging planes,and reduced flow artifacts. Recent developments with newcontrast media such as blood pool agents may furtherimprove image quality.
In clinical practice, analysis of 3D MRA datasets ismainly performed using maximum intensity projections(MIPs) or multiplanar reformatting (MPR) of the 3D vol-ume. The first is known to introduce image artifacts (18–20), while the second requires precise delineation of acentral vessel axis. Although MRA can provide 3D infor-mation, the manual quantification of the vasculature isstill tedious and subjective. In a recent article (21), weproposed a scheme for an interactive quantitative analysisof 3D MR angiograms. The approach uses prior knowledgeof the image formation process to accurately define theboundaries of the vessels. In this article this methodologyis extended and validated in vitro to determine its accu-racy and reproducibility and its dependence on the imageacquisition protocol. Moreover, in vivo experiments werecarried out to determine its potential for clinical use.Ground truth diameters (in vitro experiments) and mea-surements by medical experts (in vitro and in vivo exper-iments) were used to validate the method.
ALGORITHM OVERVIEW
Our model-based vascular segmentation procedure con-sists of two main steps. First, the central vessel axis is
Image Sciences Institute, University Medical Center, Utrecht, The Nether-lands.Grant sponsors: Dutch Ministry of Economic Affairs (Project IOP Beeldver-werking IBV97009); EasyVision Advanced Development, Philips Medical Sys-tems BV (Best, The Netherlands).*Correspondence to: Alejandro F. Frangi, M.Sc., AZU, Room E01.334, Hei-delberglaan 100, 3584 CX Utrecht, The Netherlands. E-mail: [email protected] 25 February 2000; revised 14 September 2000; accepted14 September 2000.
Magnetic Resonance in Medicine 45:311–322 (2001)
© 2001 Wiley-Liss, Inc. 311
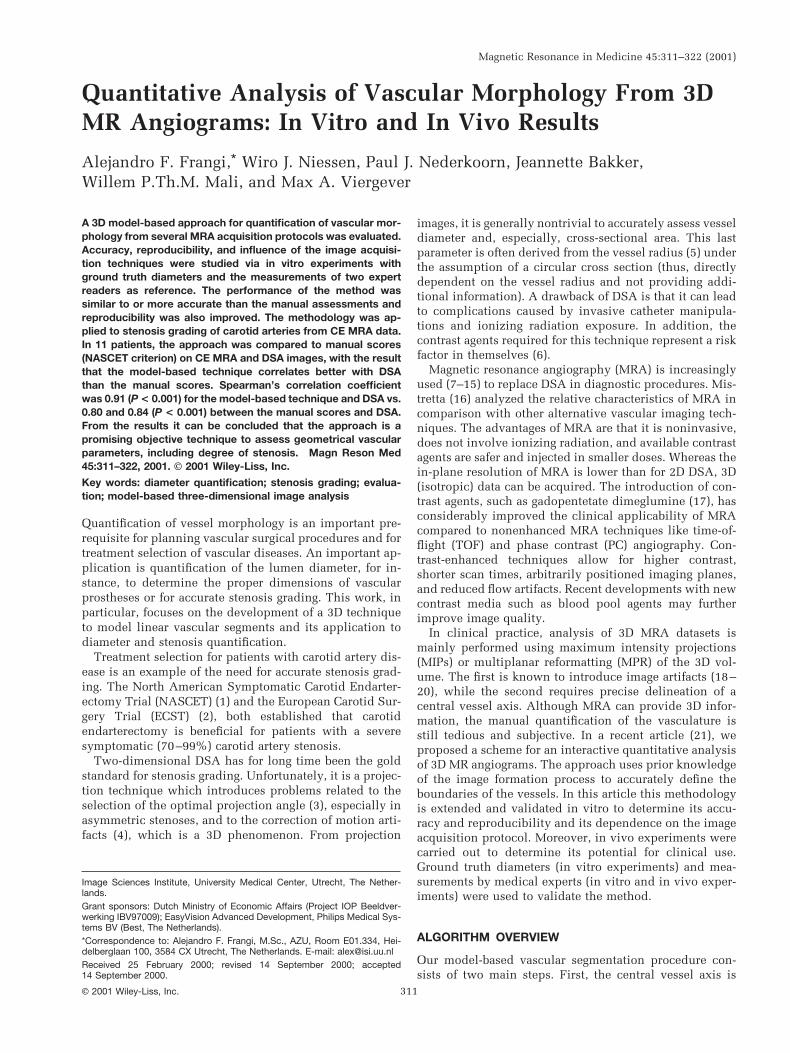
computed. Subsequently, a 3D boundary model is initial-ized and fitted to the image data using a boundary criterionderived from information on the image acquisition tech-nique. The different steps in the algorithm can be summa-rized as follows (Fig. 1):
1. Using a rough iso-surface rendering of the vessel(s) ofinterest, the user selects a couple of points indicatingthe segment to be measured (Fig. 1a). These pointsare joined with a geodesic curve that runs on theiso-surface and which forms a coarse initialization ofthe central vessel axis (Fig. 1b). This initializationonly requires a simple and intuitive interaction.
2. The central vessel axis, C(v), is approximated using aB-spline curve of degree n with s 1 1 control points.This representation enforces the lumen line to beconnected
C~v! 5 Oi50
s
Nin~v!Pi . [1]
Here Pi are the control points, Nin(v) denotes thei-th B-spline basis function of order n (22), and v [[0, 1].
3. To fit the vessel axis to the image data, we used afilter based on a local operator that analyzes the eig-envalues of the Hessian matrix computed at eachvoxel of the image. The filter has the following prop-erties:
i. de-enhances nontubular structures;ii. has maximum response at the center of the ves-
sel;iii. analyzes the image at multiple scales to be sen-
sitive to vessels of varying width;iv. incorporates directional information.
This filter, as used in this study, is an extension of thefilter proposed in Frangi et al. (21,23) and is de-scribed in the Appendix.
4. The vessel wall, W(v, u), is modeled using a tensorproduct B-spline surface (22)
W~v, u! 5 Oj50
q Ok50
r
Njl~u!Nkm~v!Pjk [2]
where Pjk are ((q 1 1) 3 (r 1 1)) control points, Njl(u)is the j-th B-spline periodic basis function of orderl and u [ [0, 2p); Nkm(v) is the k-th B-spline non-periodic basis function of order m and v [ [0, 1].The parameters u and v traverse the surface in thecircumferential and longitudinal directions, re-spectively. The model can be initialized using astandard computer-assisted design (CAD) tech-nique known as swept surfaces (22). A circularcross section with a radius equal to the distancebetween the final central vessel axis and its initial-ization on the iso-surface is swept along the centralvessel axis and orthogonal to the curve at everypoint (Fig. 1c). This results in a deformable cylin-der along the previously computed vascular axis.
5. The vessel wall model is fitted to the boundaries ofthe underlying vessel (Fig. 1d). Here, the informationon the image acquisition is introduced. In an earlierstudy (24), it was shown that the full-width half-maximum (FWHM) criterion is a reliable estimate ofvessel width in TOF and CE images. For PC, however,the full-width 10%-maximum (FWTM) is preferred.Therefore, we freely deform the vessel wall so theluminance ratio between the voxels on the wallmodel and on the centerline model fulfills the FWHMor FWTM criteria, respectively. Mathematically, themodel is deformed to minimize the function:
%W 51S E
0
1 E0
2p U tacq 2L~W~v, u!!
L~C~v!!U dv du 1 R~W!
[3]
where L(x) denotes the image gray-level at positionx, S is the total vessel wall area, and tacq is athreshold that incorporates information on the typeof MRA imaging technique. This constant equals0.5 for TOF and CE, and 0.1 for PC MR angiogra-
FIG. 1. Algorithm overview. a: The user pin-points the begin and end position of thesegment to be analyzed. From these seedpoints, a geodesic path is computed. b: Thegeodesic path is deformed until the centralvessel axis is determined. c: A circular crosssection is swept along the axis to generatean initialization of the vessel wall model. d:Vessel wall (after deformation) and centralvessel axis. In the fitting step, the vessel wallmodel is allowed to have a noncircular crosssection.
312 Frangi et al.
phy. Finally, R(W) is a regularization term thatimposes smoothness constraints on the vessel wallsurface (21).
The validity of the FWHM and FWTM criteria is depen-dent on a few assumptions about the image acquisition(21): 1) the resolution should be sufficiently high (at least3 pixels/diameter), 2) the saturation due to slow inflow atthe borders is limited (only for TOF MRA), and 3) flowartifacts can be neglected. Although it would be possible toimprove on the model of the image acquisition used here(e.g., see 25), the modeling of signal voids is a more com-plex issue, requiring prior knowledge of the geometry ofthe vessel, which is precisely what we want to estimate. Inpractice, this implies that (almost) total occlusions leadingto (almost) total signal voids should be interpreted by anexpert, whereas accurate estimates should be obtainable inthe cases of small to severe stenoses.
MATERIALS AND METHODS
Phantoms
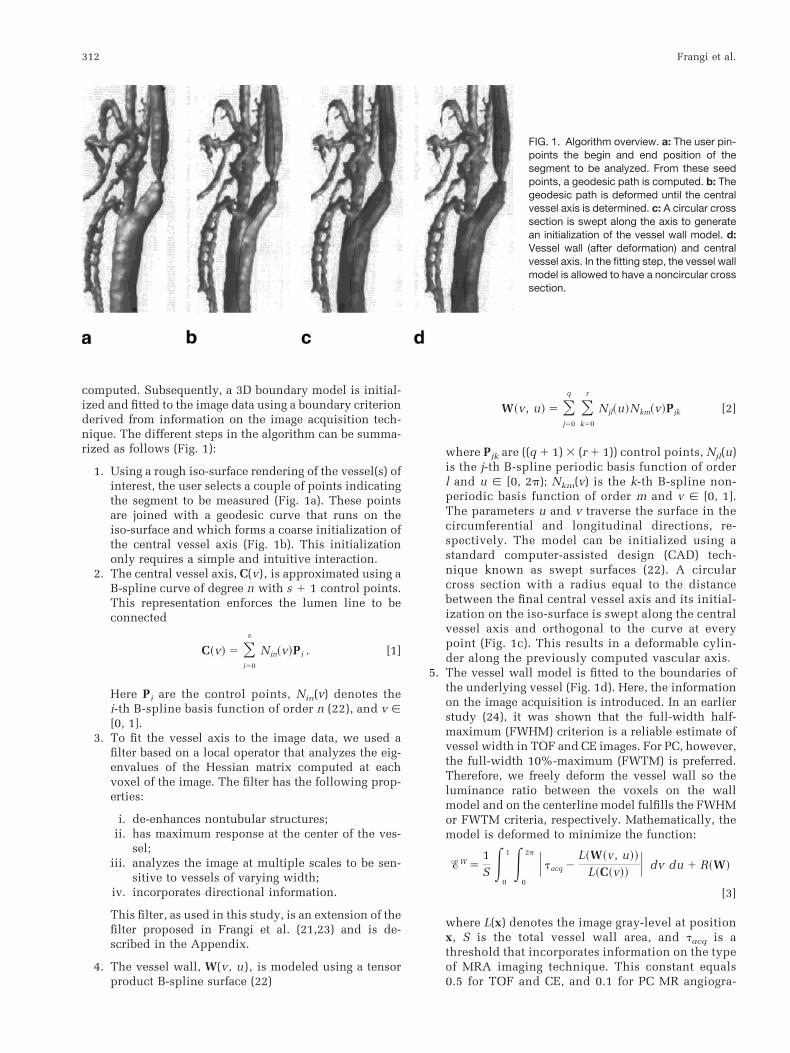
To assess the performance of the algorithm, we addressedthe problem of diameter measurements, which is a prereq-uisite for stenosis grading. Three phantoms with varyingdegrees of complexity were analyzed (see Fig. 2).
The first phantom is a synthetic tube (Elspec Kynar 3/13-X;Aalsmeer, The Netherlands) with a 4.98-mm diameter and astenosis of 1.73 mm, which simulates a stenotic linear vessel(see Fig. 2a). The tube wall thickness (0.1 mm) was smallcompared to the pixel size (0.5–1.5 mm), so the influence ofthe wall is expected to be negligible.
The second phantom simulates a carotid bifurcationwith an asymmetric stenosis (R.G. Shelley, North York,Canada). A photograph of this phantom is shown in Fig.2b. The phantom is embedded in a rigid, transparentacrylic and manufactured to reproduce normal dimen-sions in the human vasculature (26).
Third, an anthropomorphic phantom of the cerebral vas-culature (Instrumentation Department, University MedicalCenter, Utrecht, The Netherlands), embedded within arigid, transparent acrylic was used. Although it presents a
challenging and realistic geometry, no accurate referencedimensions were available from this phantom.
IMAGE ACQUISITION
Phantom Data
All images were acquired on a 1.5 T MR imaging system(Philips Gyroscan ACS-NT, PowerTrak 6000 gradients,software release 6; Philips Medical Systems, Best, TheNetherlands) with a quadrature head-neck receiver coil.
The protocols and imaging parameters used in the ex-periments with the linear (I), carotid bifurcation (Y), andcerebral vasculature (C) phantoms are summarized in Ta-ble 1. Multiple 2D TOF images were acquired at threedifferent pixel sizes (0.5 mm, 1.0 mm, and 1.5 mm) toinvestigate the effect of in-plane resolution. First-orderflow compensation was applied to all TOF experiments.The flow was regulated by a computer-controlled pump(Quest Image, London, Ontario). Water was channeledthrough the tube at a constant velocity (5 ml/s) and a longinlet length was taken to assure that laminar flow wasestablished. The tube was surrounded by the same, butstationary, water in all experiments. For CE acquisitions, a5-mM solution of gadopentetate dimeglumine (Magnevist;Schering, Berlin, Germany) was used under the same flowconditions as the TOF acquisitions.
Reference diameters for the linear and bifurcation phan-toms were measured with a Philips Integris V3000 angio-graphic unit, while the phantoms were filled with stan-dard contrast agent (Ultravist, Schering AG, Berlin, Ger-many). The pixel size was 0.23 mm, and a caliper wasavailable to perform absolute diameter measurements.
Before applying the model-based technique, all imageswere resampled to have 0.5-mm cubic voxels using sincinterpolation. This procedure does not increase the reso-lution of the acquisition, but reduces partial volume andgridding artifacts (27).
Patient Data
Eleven patients suspected of carotid artery disease werescreened with carotid duplex. All of them had a peak
FIG. 2. Phantoms used in this study. a: Lin-ear stenotic phantom. b: Carotid bifurcationphantom. c: Cerebral vasculature phantom.
Analysis of Vascular Morphology From 3D MRA 313
systolic velocity value in the internal carotid artery (ICA)larger than 150 cm/s. Subsequently, each patient under-went a standard clinical MRA protocol including 3D con-trast-enhanced (CE) MRA. BolusTrak (Philips MedicalSystems) was used to determine the arrival of the contrastbolus. Image acquisition was carried out in the same scan-ner used for the phantom experiments. The scan parame-ters were: repetition time, TR 5 4.4 ms; echo time, TE 51.5 ms; flip angle, a 5 40°; slice thickness, 1.2 mm; slicegap, 20.6 mm; a 512 3 280 image matrix, and a 256 3140-mm2 rectangular field-of-view. The contrast materialused was a 5-mM solution of gadopentetate dimeglumine(Magnevist). Before applying the model-based technique,all images were resampled to have 0.5-mm cubic voxelsusing sinc interpolation.
Each patient also underwent a DSA examination. DSAwas performed with a Philips Integris V3000 angiographicunit with an image intensifier matrix of 1024 31024. Using the Seldinger technique, the tip of a 5-F cath-eter was guided from the femoral artery to the ascendingaorta and positioned in the right and subsequently in theleft common carotid arteries. Two or three projections(posteroanterior, oblique, and possibly lateral) were ac-quired for each carotid bifurcation. For each projection6 ml of a contrast agent (Ultravist, 300 mg I/ml) was in-jected with a flow of 3 ml/s.
From the total of 22 carotid arteries, three arteries wereexcluded from the quantitative analysis because of total oc-clusion. The remaining 19 vessels ranged from normal/mildto severe stenoses. Manual measurements on MRA and DSAwere taken from printed hard copies using a digital displaycaliper (PAV Electronic, 0.01-mm resolution).
Geometric Modeling
In the B-spline representation of the vessel model a fewparameters had to be specified (cf. Eqs. [1] and [2]). In ourexperiments, third-order (cubic) B-spline curves and sur-faces were used (l 5 m 5 n 5 3). The number of controlpoints for the central vessel axis (s 1 1) and the vesselwall (r 1 1) models were determined from their length. Acontrol point was placed every 2.0–2.5 mm in the centralvessel axis. For the vessel wall model, a ring of five controlpoints was placed every 5.0 mm orthogonal to the centralvessel axis. By means of preliminary experiments with adifferent number of control points, it was observed thatthese densities yielded a good trade-off between ability to
capture the shape of the in vivo carotids and model com-plexity. Similar parameters were used in the in vitro ex-periments.
IN VITRO RESULTS
Phantom experiments of varying geometrical complexitywere used to assess the performance of the proposedmethod. First, the accuracy in diameter quantification andthe dependence on the image acquisition parameters werestudied in simple geometries where ground truth diame-ters were available (below). Finally, experiments wereconducted on more complex geometries, with the manualmeasurements as reference, to assess the robustness to userinitialization and the accuracy in diameter measurements(below).
Linear and Carotid Bifurcation Phantoms
Two experts performed diameter measurements at differ-ent points of the linear and carotid bifurcation phantoms.The measurements were taken from multiplanar reformat-ted (MPR) images which were generated by manuallydrawing a central vessel axis and subsequently computingperpendicular planes along this axis at each measurementpoint. This procedure was done using the facilities of aclinical workstation (EasyVision, Philips Medical Sys-tems, Best, The Netherlands).
To compare the measurements provided by the expertsand the results obtained with our algorithm, a measure-ment protocol was defined as indicated in Fig. 3. Thelocation of the stenosis (maximum vessel narrowing) wasused as a reference point. Distal and proximal diametermeasurements were carried out on both phantoms at20 mm and 25 mm from the stenosis center. For eachcross-sectional plane, the minimum and maximum ob-served diameters were recorded. For the carotid bifurca-tion phantom, two extra planes were analyzed and thesewere placed 5 mm at both sides of the stenosis center. Allmeasurements were done twice by the same expert withenough delay between the sessions to consider the mea-surements independent.
The semiautomated method was run twice with differ-ent initializations of the central vessel axis. For each run,we recorded the minimum and maximum diameter at thesame points where the observers performed their measure-ments.
Table 1MRA Sequences for the Three Phantom Studies: Linear (I), Carotid Bifurcation (Y), and Cerebral (C) Phantoms
Imagingprotocol
PhantomIn-plane resolution
[mm]TE
[ms]TR
[ms]a[°]
Slice thickness[mm]
FOV1
[mm]
2D-TOF I/Y 0.5 3.4 18.0 30 4.0 1282D-TOF I/Y 1.0 2.7 18.0 30 4.0 2562D-TOF I/Y 1.5 2.5 18.0 30 4.0 3843D-TOF I/Y 1.0 1.9 25.0 15 1.0 2563D-PC2 I/Y 1.0 4.0 8.9 15 1.0 2563D-CE I/Y 1.0 2.0 6.6 40 1.0 2563D-CE C 1.0 3.1 11.0 40 1.0 256
TE 5 echo time, TR 5 repetition time, a 5 flip-angle, FOV 5 field-of-view.1Matrix size 256 3 256 in all acquisitions.2venc 5 200 cm/s in all directions.
314 Frangi et al.

For each session (run) and observer (semiautomatedmethod) the absolute error in the vessel diameter was com-puted. Average error and its standard deviation (SD) werecalculated to analyze the precision and accuracy of the man-ual and semiautomated procedures. Since the images of thelinear and carotid phantoms were acquired simultaneously(same FOV), errors for both phantoms were averaged to havean overall error assessment for each modality.
Diameter Quantification: Influence of Imaging Protocol
Table 2 summarizes the statistics of the measurement errorfor a fixed resolution (1 mm) and different acquisitionprotocols. This table compares the results for the twoexpert readers (Obs. I and II) and for the model-basedtechnique (MB). In the case of multiple 2D TOF, 3D TOF,and CE MRA, the model-based method performs similarlyto or better than the observers. In all three modalities, ourmethod slightly overestimates the diameter (0.08–0.34mm) but the bias, when compared between sessions, ismore systematic than for the observers. Precision of themeasurements was 0.42–0.67 mm for the model-basedmethod and 0.29–1.13 mm for the observers.
Phase contrast angiography is the only technique thatuses a different criterion for boundary definition, namely,
the FWTM (24). In our experience, this criterion is not veryrobust when there are large variations in blood velocityalong the selected vascular segment. This occurs, for in-stance, in the presence of a severe stenosis. In this case, thevelocity encoding is tuned to the highest velocity, which isachieved near the minimum lumen diameter. Therefore, inlow velocity regions the FWTM will indicate boundarypoints with very low luminance and small SNR. As aconsequence, the model-based technique is prone to be-coming trapped in local minima during the fitting proce-dure. Finally, the bias is smaller with the model-basedtechnique and has an opposite sign. The latter indicatesthat the visually perceived “boundary” corresponds to aroll-off factor higher than 10%.
Diameter Quantification: Influence of In-Plane Resolutionfor 2D TOF MRA
Table 3 summarizes the mean error in diameter estimationfor the linear phantom (I) for the three different in-planeresolutions (0.5, 1.0, and 1.5 mm) of the multislice 2D TOFprotocol (cf. Table 1). Both accuracy (mean error) andprecision (SD) for the two observers and the model-basedtechnique are reported in millimeters. The results showthat the model-based technique performs similar to themanual assessment. However, the difference in bias be-tween sessions (or runs) is smaller for the model-basedtechnique, indicating a higher reproducibility of the re-sults.
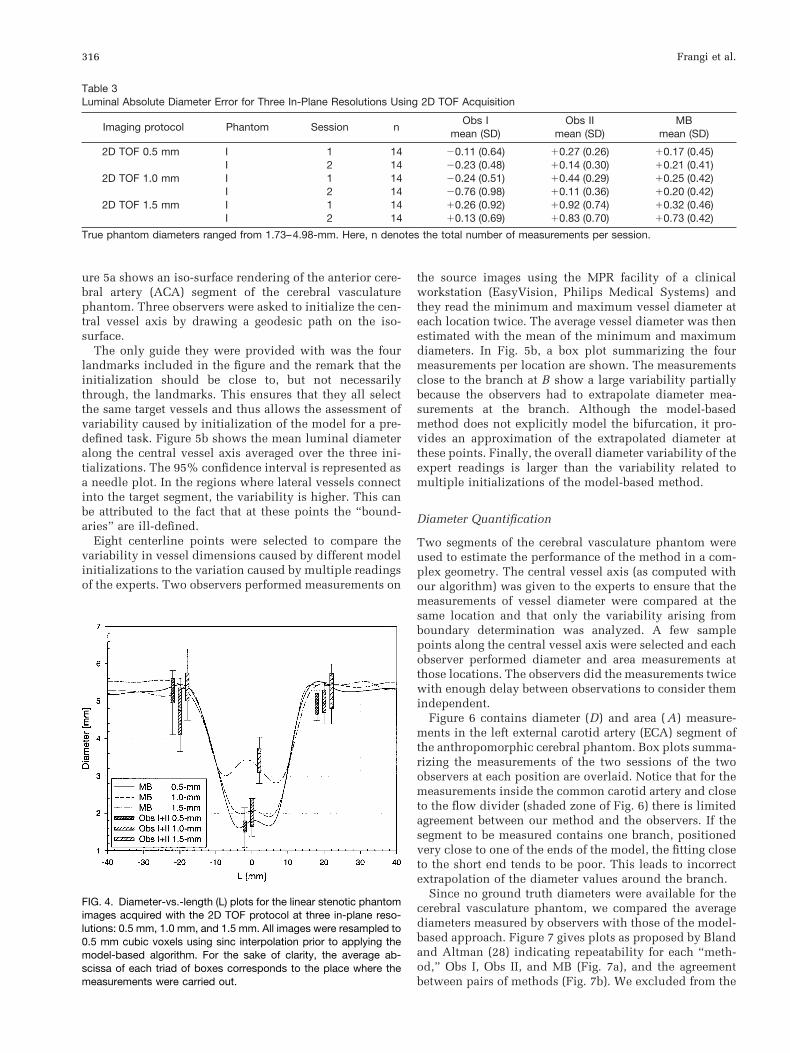
As expected, increasing voxel size tends to overestimatethe vessel width (increased positive bias). This effect ismainly observed at the place of the stenosis where thediameter becomes on the order of the voxel size. This canbe appreciated from Fig. 4 where the average diameterprofile for the three resolutions is shown. Box plots sum-marizing the measurements of all sessions and of the twoobservers in the planes that are distal and proximal to thestenosis and at the stenosis itself are overlaid for compar-ison. The degradation of the model-based measurementswith a decrease in voxel size is consistent with the mea-surements of the experts.
Cerebral Vasculature Phantom
Robustness to User Initialization
The cerebral vasculature phantom was used to analyze therobustness of the algorithm to different initializations. Fig-
FIG. 3. Manual measurement protocols: d1 5 15 mm and d2 5 5mm. a: Tube phantom. b: Carotid bifurcation phantom.
Table 2Luminal Diameter Absolute Error for Four Imaging Protocols
Imaging protocol Phantom Session nObs I
mean (SD)Obs II
mean (SD)MB
mean (SD)
2D TOF 1.0 mm I 1 14 20.24 (0.51) 10.44 (0.29) 10.25 (0.42)I 2 14 20.76 (0.98) 10.11 (0.36) 10.20 (0.42)
3D TOF 1.0 mm I/Y 1 32 10.10 (0.83) 10.58 (0.53) 10.08 (0.67)I/Y 2 32 10.00 (0.80) 10.35 (0.50) 10.09 (0.62)
3D PCA 1.0 mm I/Y 1 32 20.68 (1.08) 20.52 (1.25) 10.37 (1.32)I/Y 2 32 21.29 (1.51) 21.08 (1.40) 10.21 (1.18)
3D CEA 1.0 mm I/Y 1 32 20.30 (1.13) 10.63 (0.49) 10.34 (0.46)I/Y 2 32 20.26 (0.82) 10.70 (0.61) 10.22 (0.42)
True phantom diameters ranged from 1.18–7.37 mm. Here, n denotes the total number of measurements per session.
Analysis of Vascular Morphology From 3D MRA 315
ure 5a shows an iso-surface rendering of the anterior cere-bral artery (ACA) segment of the cerebral vasculaturephantom. Three observers were asked to initialize the cen-tral vessel axis by drawing a geodesic path on the iso-surface.
The only guide they were provided with was the fourlandmarks included in the figure and the remark that theinitialization should be close to, but not necessarilythrough, the landmarks. This ensures that they all selectthe same target vessels and thus allows the assessment ofvariability caused by initialization of the model for a pre-defined task. Figure 5b shows the mean luminal diameteralong the central vessel axis averaged over the three ini-tializations. The 95% confidence interval is represented asa needle plot. In the regions where lateral vessels connectinto the target segment, the variability is higher. This canbe attributed to the fact that at these points the “bound-aries” are ill-defined.
Eight centerline points were selected to compare thevariability in vessel dimensions caused by different modelinitializations to the variation caused by multiple readingsof the experts. Two observers performed measurements on
the source images using the MPR facility of a clinicalworkstation (EasyVision, Philips Medical Systems) andthey read the minimum and maximum vessel diameter ateach location twice. The average vessel diameter was thenestimated with the mean of the minimum and maximumdiameters. In Fig. 5b, a box plot summarizing the fourmeasurements per location are shown. The measurementsclose to the branch at B show a large variability partiallybecause the observers had to extrapolate diameter mea-surements at the branch. Although the model-basedmethod does not explicitly model the bifurcation, it pro-vides an approximation of the extrapolated diameter atthese points. Finally, the overall diameter variability of theexpert readings is larger than the variability related tomultiple initializations of the model-based method.
Diameter Quantification
Two segments of the cerebral vasculature phantom wereused to estimate the performance of the method in a com-plex geometry. The central vessel axis (as computed withour algorithm) was given to the experts to ensure that themeasurements of vessel diameter were compared at thesame location and that only the variability arising fromboundary determination was analyzed. A few samplepoints along the central vessel axis were selected and eachobserver performed diameter and area measurements atthose locations. The observers did the measurements twicewith enough delay between observations to consider themindependent.
Figure 6 contains diameter (D) and area ( A) measure-ments in the left external carotid artery (ECA) segment ofthe anthropomorphic cerebral phantom. Box plots summa-rizing the measurements of the two sessions of the twoobservers at each position are overlaid. Notice that for themeasurements inside the common carotid artery and closeto the flow divider (shaded zone of Fig. 6) there is limitedagreement between our method and the observers. If thesegment to be measured contains one branch, positionedvery close to one of the ends of the model, the fitting closeto the short end tends to be poor. This leads to incorrectextrapolation of the diameter values around the branch.
Since no ground truth diameters were available for thecerebral vasculature phantom, we compared the averagediameters measured by observers with those of the model-based approach. Figure 7 gives plots as proposed by Blandand Altman (28) indicating repeatability for each “meth-od,” Obs I, Obs II, and MB (Fig. 7a), and the agreementbetween pairs of methods (Fig. 7b). We excluded from the
Table 3Luminal Absolute Diameter Error for Three In-Plane Resolutions Using 2D TOF Acquisition
Imaging protocol Phantom Session nObs I
mean (SD)Obs II
mean (SD)MB
mean (SD)
2D TOF 0.5 mm I 1 14 20.11 (0.64) 10.27 (0.26) 10.17 (0.45)I 2 14 20.23 (0.48) 10.14 (0.30) 10.21 (0.41)
2D TOF 1.0 mm I 1 14 20.24 (0.51) 10.44 (0.29) 10.25 (0.42)I 2 14 20.76 (0.98) 10.11 (0.36) 10.20 (0.42)
2D TOF 1.5 mm I 1 14 10.26 (0.92) 10.92 (0.74) 10.32 (0.46)I 2 14 10.13 (0.69) 10.83 (0.70) 10.73 (0.42)
True phantom diameters ranged from 1.73–4.98-mm. Here, n denotes the total number of measurements per session.
FIG. 4. Diameter-vs.-length (L) plots for the linear stenotic phantomimages acquired with the 2D TOF protocol at three in-plane reso-lutions: 0.5 mm, 1.0 mm, and 1.5 mm. All images were resampled to0.5 mm cubic voxels using sinc interpolation prior to applying themodel-based algorithm. For the sake of clarity, the average ab-scissa of each triad of boxes corresponds to the place where themeasurements were carried out.
316 Frangi et al.

analysis the two measurements in the shaded zone of Fig.6, which can be regarded as outliers. In general, the modelshould be initialized such that the ROI is not close to theend points. In this case the method is accurate even if astenosis is close to a branch. The measurements of theprevious section were also included in Fig. 7.
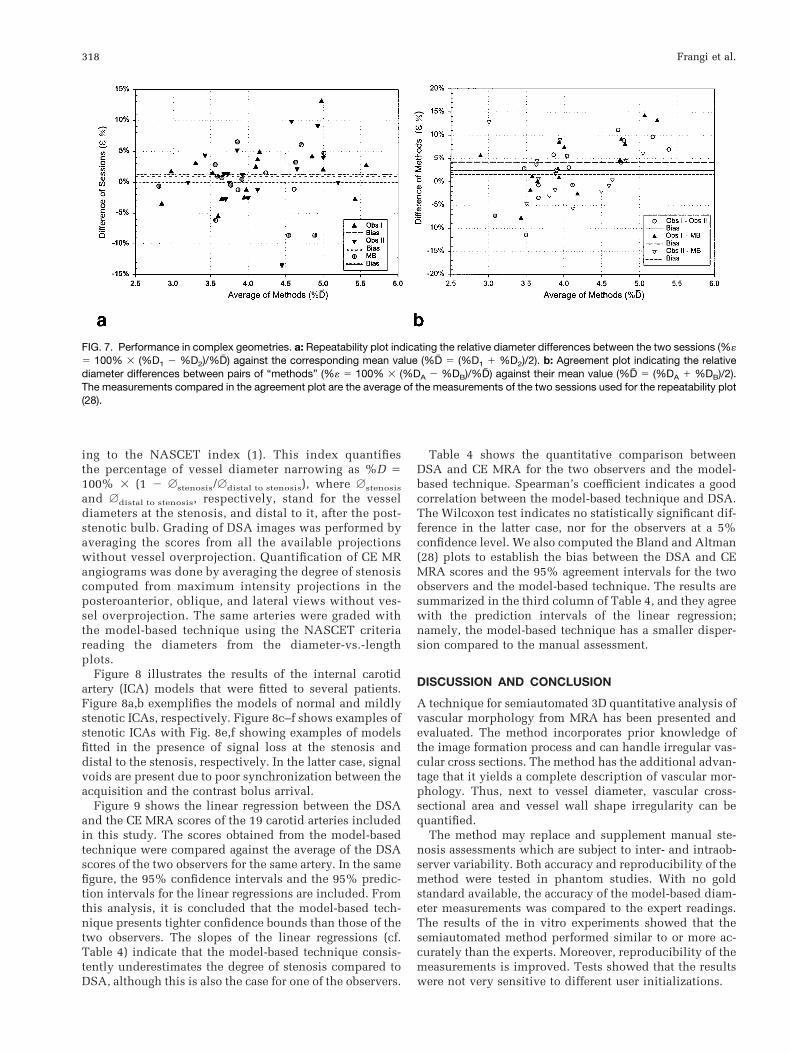
Following Bland and Altman (28), repeatability is de-fined as 61.96 z SD of the relative diameter differencebetween two sessions. This gives a measurement of theinterobserver variability, or of the variability related tomultiple initializations of the model-based technique. Therepeatability of the three methods was comparable, ObsI/ObsII/MB 5 8.6%/10.7%/8.9% with a bias (average ofrelative diameter differences between sessions) of 11.6%/10.98%/20.3%, respectively. To compare two alternativemeasurement methods, Bland and Altman define an agree-ment coefficient as 61.96 z SD of the relative diameterdifference provided by the two methods with a correction
for repeated measurements (28). The agreement coefficientwas 18.3% between the two experts, against 16.9% and17% between each observer and the model-based method.Repeatability was particularly low in the measurements ofthe ACA compared to those of the ECA segment. Theformer had a number of locations at which the diametershad to be extrapolated due to the presence of side branchesand where repeatability was poorer. If only the measure-ments at the ECA are considered, the repeatability im-proves (ObsI/ObsII/MB 5 4.5%/5.1%/1.7%) and this indi-cates that where no extrapolation is needed the repeatabil-ity is higher with our method, and that otherwise therepeatability is similar to that of the experts.
IN VIVO RESULTS
Nineteen internal carotid arteries were analyzed by twoexperts independently. Stenoses were quantified accord-
FIG. 5. Influence of user initialization. a: Iso-surface rendering of the anterior cerebral artery segment of the cerebral vasculature phantom(CE MRA protocol). b: Diameter-vs.-length (L) plot showing the average value (dots, solid line) and 95% confidence interval (needles) of themean cross-sectional diameter for three different initializations of the algorithm described in Algorithm Overview. The initializations wereperformed by three observers guided only by the four markers indicated in the rendering (a) to unambiguously specify a common portionof the vessel. Box plots indicating the overall variability of the observers for some sample points are overlaid for comparison.
FIG. 6. Cerebral vasculature phantom:left external carotid artery segment. Com-parison of average diameter and cross-sectional area along the vessel (L) as as-sessed by a human observer and with themodel-based approach. The shaded re-gion on the graph corresponds to themeasurements that are inside the bifurca-tion.
Analysis of Vascular Morphology From 3D MRA 317
ing to the NASCET index (1). This index quantifiesthe percentage of vessel diameter narrowing as %D 5100% 3 (1 2 Astenosis/Adistal to stenosis), where Astenosis
and Adistal to stenosis, respectively, stand for the vesseldiameters at the stenosis, and distal to it, after the post-stenotic bulb. Grading of DSA images was performed byaveraging the scores from all the available projectionswithout vessel overprojection. Quantification of CE MRangiograms was done by averaging the degree of stenosiscomputed from maximum intensity projections in theposteroanterior, oblique, and lateral views without ves-sel overprojection. The same arteries were graded withthe model-based technique using the NASCET criteriareading the diameters from the diameter-vs.-lengthplots.
Figure 8 illustrates the results of the internal carotidartery (ICA) models that were fitted to several patients.Figure 8a,b exemplifies the models of normal and mildlystenotic ICAs, respectively. Figure 8c–f shows examples ofstenotic ICAs with Fig. 8e,f showing examples of modelsfitted in the presence of signal loss at the stenosis anddistal to the stenosis, respectively. In the latter case, signalvoids are present due to poor synchronization between theacquisition and the contrast bolus arrival.
Figure 9 shows the linear regression between the DSAand the CE MRA scores of the 19 carotid arteries includedin this study. The scores obtained from the model-basedtechnique were compared against the average of the DSAscores of the two observers for the same artery. In the samefigure, the 95% confidence intervals and the 95% predic-tion intervals for the linear regressions are included. Fromthis analysis, it is concluded that the model-based tech-nique presents tighter confidence bounds than those of thetwo observers. The slopes of the linear regressions (cf.Table 4) indicate that the model-based technique consis-tently underestimates the degree of stenosis compared toDSA, although this is also the case for one of the observers.
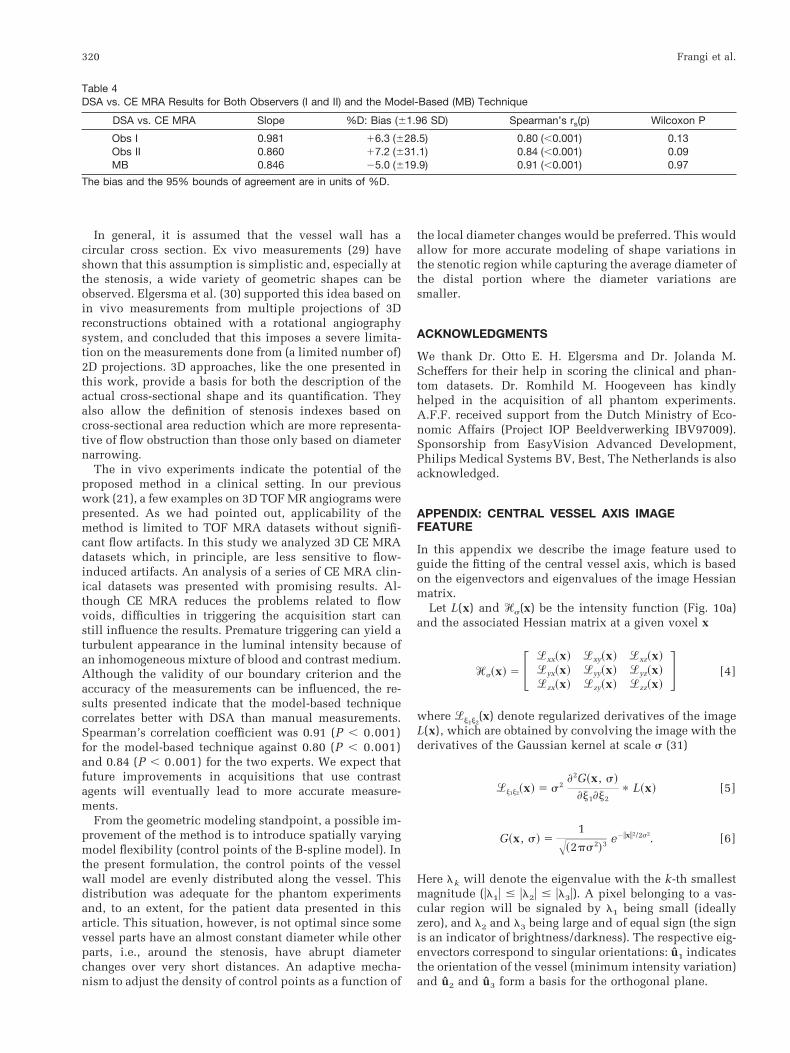
Table 4 shows the quantitative comparison betweenDSA and CE MRA for the two observers and the model-based technique. Spearman’s coefficient indicates a goodcorrelation between the model-based technique and DSA.The Wilcoxon test indicates no statistically significant dif-ference in the latter case, nor for the observers at a 5%confidence level. We also computed the Bland and Altman(28) plots to establish the bias between the DSA and CEMRA scores and the 95% agreement intervals for the twoobservers and the model-based technique. The results aresummarized in the third column of Table 4, and they agreewith the prediction intervals of the linear regression;namely, the model-based technique has a smaller disper-sion compared to the manual assessment.
DISCUSSION AND CONCLUSION
A technique for semiautomated 3D quantitative analysis ofvascular morphology from MRA has been presented andevaluated. The method incorporates prior knowledge ofthe image formation process and can handle irregular vas-cular cross sections. The method has the additional advan-tage that it yields a complete description of vascular mor-phology. Thus, next to vessel diameter, vascular cross-sectional area and vessel wall shape irregularity can bequantified.
The method may replace and supplement manual ste-nosis assessments which are subject to inter- and intraob-server variability. Both accuracy and reproducibility of themethod were tested in phantom studies. With no goldstandard available, the accuracy of the model-based diam-eter measurements was compared to the expert readings.The results of the in vitro experiments showed that thesemiautomated method performed similar to or more ac-curately than the experts. Moreover, reproducibility of themeasurements is improved. Tests showed that the resultswere not very sensitive to different user initializations.
FIG. 7. Performance in complex geometries. a: Repeatability plot indicating the relative diameter differences between the two sessions (%«5 100% 3 (%D1 2 %D2)/%D# ) against the corresponding mean value (%D# 5 (%D1 1 %D2)/2). b: Agreement plot indicating the relativediameter differences between pairs of “methods” (%« 5 100% 3 (%DA 2 %DB)/%D# ) against their mean value (%D# 5 (%DA 1 %DB)/2).The measurements compared in the agreement plot are the average of the measurements of the two sessions used for the repeatability plot(28).
318 Frangi et al.

In Linear and Carotid Bifurcation Phantoms, it wasshown that there is a small bias in the diameters obtainedwith the model-based technique. This indicates that theFWHM criteria introduce a systematic error. Hoogeveen etal. (24) demonstrated that this is indeed the case in vesselswith a resolution of less than 3 pixels/diameter. For ves-sels in the range 1–3 pixels/diameter there is a maximumsystematic underestimation of 20% and for vessels smallerthan 1 pixel/diameter the FWHM overestimates the diam-eter by a maximum of 20%. For vessels larger than3 pixels/diameter, the bias is negligible (,5%). This last
result is also in agreement with the bias obtained in theexperiments with the phantom of the cerebral vasculature,where all the measurements corresponded to diameters inthe latter range.
In the in vitro experiments, the method was comparedwith those made by the experts who measured the diam-eter in cross-sectional planes orthogonal to the vessel. Inmost clinical situations, stenoses are graded from MIPimages, as in our in vivo study. Our method uses a 3Dmodel which operates directly on the 3D data, and thus noerrors owing to projections are introduced (18–20).
FIG. 8. Examples of internal ICA models. The top row shows maximum intensity projections of 3D CE MR angiograms of the ICA. Thebottom row shows the 3D models fitted to the source images. Cases a and b are normal ICAs. Cases c and d are stenotic ICAs. Casese and f correspond to models fitted in the presence of a signal void at the stenosis and distal to the stenosis, respectively. In the latterexamples, signal voids are caused by poor synchronization between the acquisition start and the contrast bolus arrival.
FIG. 9. CE MRA vs. DSA. Degree of stenosis measured in n 5 19 carotid arteries. Linear regressions (solid line) Obs I (a), Obs II (b), andMB (c), and 95% confidence and prediction intervals (dashed and dash-dot lines, respectively). Note: Observers I and II scored the CE MRAusing MIPs. Scores from CE MRA are compared to those of DSA of the same observer. The model-based measurements were comparedagainst the average DSA scores of the two observers for the same artery. All scores were computed using the NASCET criterion (1).
Analysis of Vascular Morphology From 3D MRA 319
In general, it is assumed that the vessel wall has acircular cross section. Ex vivo measurements (29) haveshown that this assumption is simplistic and, especially atthe stenosis, a wide variety of geometric shapes can beobserved. Elgersma et al. (30) supported this idea based onin vivo measurements from multiple projections of 3Dreconstructions obtained with a rotational angiographysystem, and concluded that this imposes a severe limita-tion on the measurements done from (a limited number of)2D projections. 3D approaches, like the one presented inthis work, provide a basis for both the description of theactual cross-sectional shape and its quantification. Theyalso allow the definition of stenosis indexes based oncross-sectional area reduction which are more representa-tive of flow obstruction than those only based on diameternarrowing.
The in vivo experiments indicate the potential of theproposed method in a clinical setting. In our previouswork (21), a few examples on 3D TOF MR angiograms werepresented. As we had pointed out, applicability of themethod is limited to TOF MRA datasets without signifi-cant flow artifacts. In this study we analyzed 3D CE MRAdatasets which, in principle, are less sensitive to flow-induced artifacts. An analysis of a series of CE MRA clin-ical datasets was presented with promising results. Al-though CE MRA reduces the problems related to flowvoids, difficulties in triggering the acquisition start canstill influence the results. Premature triggering can yield aturbulent appearance in the luminal intensity because ofan inhomogeneous mixture of blood and contrast medium.Although the validity of our boundary criterion and theaccuracy of the measurements can be influenced, the re-sults presented indicate that the model-based techniquecorrelates better with DSA than manual measurements.Spearman’s correlation coefficient was 0.91 (P , 0.001)for the model-based technique against 0.80 (P , 0.001)and 0.84 (P , 0.001) for the two experts. We expect thatfuture improvements in acquisitions that use contrastagents will eventually lead to more accurate measure-ments.
From the geometric modeling standpoint, a possible im-provement of the method is to introduce spatially varyingmodel flexibility (control points of the B-spline model). Inthe present formulation, the control points of the vesselwall model are evenly distributed along the vessel. Thisdistribution was adequate for the phantom experimentsand, to an extent, for the patient data presented in thisarticle. This situation, however, is not optimal since somevessel parts have an almost constant diameter while otherparts, i.e., around the stenosis, have abrupt diameterchanges over very short distances. An adaptive mecha-nism to adjust the density of control points as a function of
the local diameter changes would be preferred. This wouldallow for more accurate modeling of shape variations inthe stenotic region while capturing the average diameter ofthe distal portion where the diameter variations aresmaller.
ACKNOWLEDGMENTS
We thank Dr. Otto E. H. Elgersma and Dr. Jolanda M.Scheffers for their help in scoring the clinical and phan-tom datasets. Dr. Romhild M. Hoogeveen has kindlyhelped in the acquisition of all phantom experiments.A.F.F. received support from the Dutch Ministry of Eco-nomic Affairs (Project IOP Beeldverwerking IBV97009).Sponsorship from EasyVision Advanced Development,Philips Medical Systems BV, Best, The Netherlands is alsoacknowledged.
APPENDIX: CENTRAL VESSEL AXIS IMAGEFEATURE
In this appendix we describe the image feature used toguide the fitting of the central vessel axis, which is basedon the eigenvectors and eigenvalues of the image Hessianmatrix.
Let L(x) and *s(x) be the intensity function (Fig. 10a)and the associated Hessian matrix at a given voxel x
*s~x! 5 F +xx~x! +xy~x! +xz~x!+yx~x! +yy~x! +yz~x!+zx~x! +zy~x! +zz~x!
G [4]
where +j1j2(x) denote regularized derivatives of the image
L(x), which are obtained by convolving the image with thederivatives of the Gaussian kernel at scale s (31)
+j1j2~x! 5 s2]2G~x, s!
]j1]j2p L~x! [5]
G~x, s! 51
Î~2ps2!3 e2ixi2/2s2. [6]
Here lk will denote the eigenvalue with the k-th smallestmagnitude (ul1u # ul2u # ul3u). A pixel belonging to a vas-cular region will be signaled by l1 being small (ideallyzero), and l2 and l3 being large and of equal sign (the signis an indicator of brightness/darkness). The respective eig-envectors correspond to singular orientations: u1 indicatesthe orientation of the vessel (minimum intensity variation)and u2 and u3 form a basis for the orthogonal plane.
Table 4DSA vs. CE MRA Results for Both Observers (I and II) and the Model-Based (MB) Technique
DSA vs. CE MRA Slope %D: Bias (61.96 SD) Spearman’s rs(p) Wilcoxon P
Obs I 0.981 16.3 (628.5) 0.80 (,0.001) 0.13Obs II 0.860 17.2 (631.1) 0.84 (,0.001) 0.09MB 0.846 25.0 (619.9) 0.91 (,0.001) 0.97
The bias and the 95% bounds of agreement are in units of %D.
320 Frangi et al.
To enhance bright vessel-like structures we have pro-posed (21,23) the following discriminant function. It per-forms a nonlinear combination of the eigenvalues of theHessian matrix in such a way that linear structures areenhanced while noise and nontubular structures aresmoothed out.
9~x, s!
5
0 if l2 . 0 or l3 . 0,
F1 2 expS25A
2
2a2DGexpS25B
2
2b2D3F1 2 expS2
62
2c2DG , otherwise [7]
5A 5ul2uul3u
, [8]
5B 5ul1u
Îul2l3u[9]
6 5 i*si 5 ÎOj
lj2 [10]
Here 5A, 5B, and 6 correspond to local measures ofcross-sectional asymmetry, local sphericity, and degree ofimage structure (23). The parameters a, b, and c tune thesensitivity of the filter to deviations in 5A, 5B, and 6relative to the ideal behavior for a line structure.
Equation [7] explicitly states that the filter response is afunction of the scale at which the Gaussian derivatives arecomputed. The filter is applied at multiple scales that span
the range of expected vessel widths according to the im-aged anatomy. To provide a unique filter output for eachpixel, the multiple scale outputs undergo a scale selectionprocedure (32). This amounts to computing the maximumfilter response across scales
V~x! 5 maxsmin#s#smax
9~x, s!. [11]
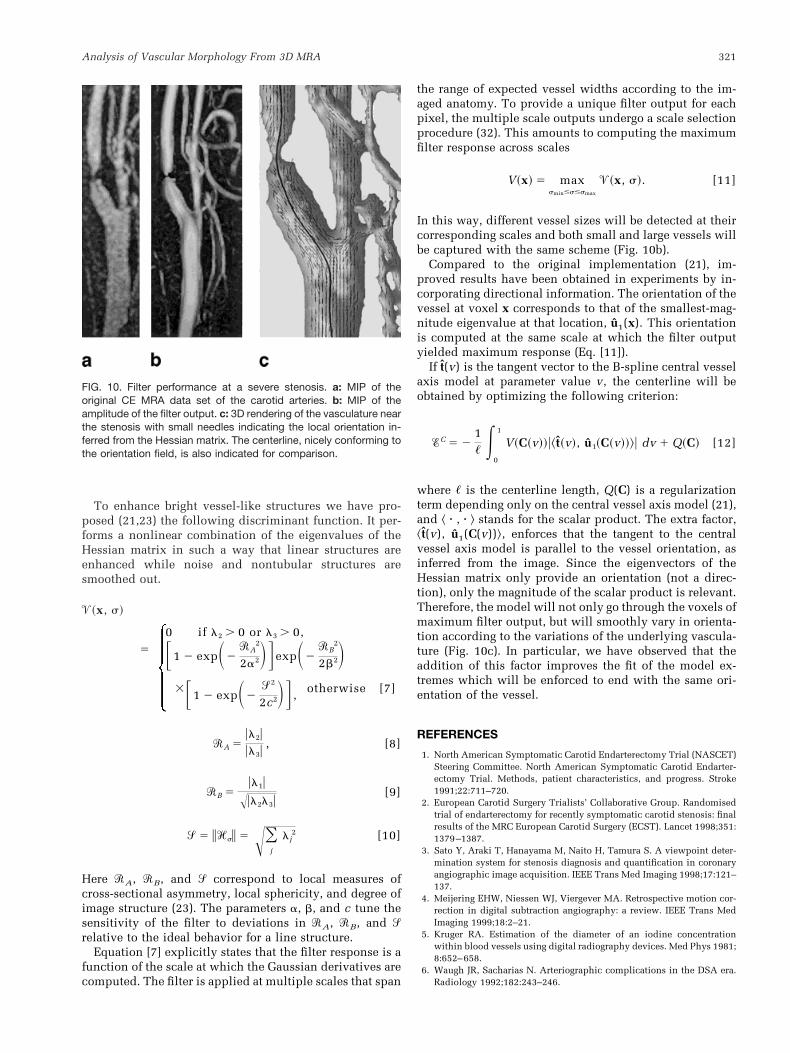
In this way, different vessel sizes will be detected at theircorresponding scales and both small and large vessels willbe captured with the same scheme (Fig. 10b).
Compared to the original implementation (21), im-proved results have been obtained in experiments by in-corporating directional information. The orientation of thevessel at voxel x corresponds to that of the smallest-mag-nitude eigenvalue at that location, u1(x). This orientationis computed at the same scale at which the filter outputyielded maximum response (Eq. [11]).
If t(v) is the tangent vector to the B-spline central vesselaxis model at parameter value v, the centerline will beobtained by optimizing the following criterion:
%C 5 21, E
0
1
V~C~v!!u^t~v!, u1~C~v!!&u dv 1 Q~C! [12]
where , is the centerline length, Q(C) is a regularizationterm depending only on the central vessel axis model (21),and ^ z , z & stands for the scalar product. The extra factor,^t(v), u1(C(v))&, enforces that the tangent to the centralvessel axis model is parallel to the vessel orientation, asinferred from the image. Since the eigenvectors of theHessian matrix only provide an orientation (not a direc-tion), only the magnitude of the scalar product is relevant.Therefore, the model will not only go through the voxels ofmaximum filter output, but will smoothly vary in orienta-tion according to the variations of the underlying vascula-ture (Fig. 10c). In particular, we have observed that theaddition of this factor improves the fit of the model ex-tremes which will be enforced to end with the same ori-entation of the vessel.
REFERENCES
1. North American Symptomatic Carotid Endarterectomy Trial (NASCET)Steering Committee. North American Symptomatic Carotid Endarter-ectomy Trial. Methods, patient characteristics, and progress. Stroke1991;22:711–720.
2. European Carotid Surgery Trialists’ Collaborative Group. Randomisedtrial of endarterectomy for recently symptomatic carotid stenosis: finalresults of the MRC European Carotid Surgery (ECST). Lancet 1998;351:1379–1387.
3. Sato Y, Araki T, Hanayama M, Naito H, Tamura S. A viewpoint deter-mination system for stenosis diagnosis and quantification in coronaryangiographic image acquisition. IEEE Trans Med Imaging 1998;17:121–137.
4. Meijering EHW, Niessen WJ, Viergever MA. Retrospective motion cor-rection in digital subtraction angiography: a review. IEEE Trans MedImaging 1999;18:2–21.
5. Kruger RA. Estimation of the diameter of an iodine concentrationwithin blood vessels using digital radiography devices. Med Phys 1981;8:652–658.
6. Waugh JR, Sacharias N. Arteriographic complications in the DSA era.Radiology 1992;182:243–246.
FIG. 10. Filter performance at a severe stenosis. a: MIP of theoriginal CE MRA data set of the carotid arteries. b: MIP of theamplitude of the filter output. c: 3D rendering of the vasculature nearthe stenosis with small needles indicating the local orientation in-ferred from the Hessian matrix. The centerline, nicely conforming tothe orientation field, is also indicated for comparison.
Analysis of Vascular Morphology From 3D MRA 321
7. Blankensteijn JD, van der Grond J, Mali WPTM, Eikelboom BC. Flowvolume changes in the major cerebral arteries before and after carotidendarterectomy: an MR angiographic study. Eur J Vasc Endovasc Surg1997;14:446–450.
8. Cronqvist M, Stahlberg F, Larsson EM, Lonntoft M, Holtas S. Evaluationof time-of-flight and phase contrast MRA sequences at 1.0-T for diag-nosis of carotid artery disease. I. A phantom and volunteer study. ActaRadiol 1996;37:267–277.
9. Ekelund L, Sjoqvist L, Thuomas KA, Asberg B. MR angiography ofabdominal and peripheral arteries. Techniques and clinical applica-tions. Acta Radiol 1996;37:3–13.
10. van Everdingen KJ, Klijn CJ, Kappelle LJ, Mali WPTM, van der GrondJ. MRA flow quantification in patients with symptomatic internal ca-rotid artery occlusion. The Dutch EC-IC Bypass Study Group. Stroke1997;28:1595–1600.
11. Korogi Y, Takahashi M, Nakagawa T, Mabuchi N, Watabe T, ShiokawaY, Shiga H, O’Uchi T, Miki H, Horikawa Y, Fujiwarea S, Furuse M.Intracranial vascular stenosis and occlusion: MR angiographic findings.Am J Neuroradiol 1997;18:135–143.
12. Li KC. MR angiography of abdominal ischemia. Semin Ultrasound CTMR 1996;17:352–359.
13. Li KC. Mesenteric occlusive disease. Magn Reson Imaging Clin N Am1998;6:331–350.
14. Manning WJ, Li W, Boyle NG, Edelman RR. Fat-suppressed breath-holdmagnetic resonance coronary angiography. Circulation 1993;87:94–104.
15. Vanninen RL, Manninen HI, Partanen PK, Tulla H, Vainio PA. Howshould we estimate carotid stenosis using magnetic resonance angiog-raphy? Neuroradiology 1996;38:299–305.
16. Mistretta CA. Relative characteristics of MR angiography and compet-ing vascular imaging modalities. J Magn Reson Imaging 1993;3:685–698.
17. Prince MR. Gadolinium-enhanced MR aortography. Radiology 1994;191:155–164.
18. Anderson CM, Saloner D, Tsuruda JS, Shapeero LG, Lee RE. Artifacts inmaximum-intensity-projection display of MR angiograms. Am J Roent-genol 1990;154:623–629.
19. Schreiner S, Paschal CB, Galloway RL. Comparison of projection algo-rithms used for the construction of maximum intensity projectionimages. J Comput Assist Tomogr 1996;20:56–67.
20. Cline HE, Dumoulin CL, Lorensen WE, Souza SP, Adams WJ. Volumerendering and connectivity algorithms for MR angiography. Magn Re-son Med 1991;18:384–394.
21. Frangi AF, Niessen WJ, Hoogeveen R, van Walsum T, Viergever MA.Model-based quantitation of 3D magnetic resonance angiographic im-ages. IEEE Trans Med Imaging 1999;18:946–956.
22. Piegl L, Tiller W. The NURBS Book. Monographs in visual communi-cation, 2nd ed. Berlin: Springer Verlag; 1996.
23. Frangi AF, Niessen WJ, Vincken KL, Viergever MA. Multiscale vesselenhancement filtering. Volume 1496 of Lect Notes Comp Science.Boston: Springer Verlag; 1998. p 130–137.
24. Hoogeveen RM, Bakker CJG, Viergever MA. Limits to the accuracy ofvessel diameter measurement in MR angiography. J Magn Reson Imag-ing 1998;8:1228–1235.
25. Hoogeveen RM, Bakker CJG, Viergever MA. MR phase-contrast flowmeasurement with limited spatial resolution in small vessels: value ofmodel-based image analysis. Magn Reson Med 1999;41:520–528.
26. Smith RF, Rutt BK, Fox AJ, Rankin RN, Holdsworth DW. Geometriccharacterization of stenoted human carotid arteries. Acad Radiol 1996;3:898–911.
27. Du YP, Parker DL, Davis WL, Cao GC. Reduction of partial volumeartifacts with zero-filled interpolation in three-dimensional MR angiog-raphy. J Magn Reson Imaging 1994;4:733–741.
28. Bland J, Altman D. Statistical methods for assessing agreement betweentwo methods of clinical measurement. Lancet 1986;1:307–310.
29. Pan XM, Saloner D, Reilly LM, Bowersox JC, Murray SP, Anderson CM,Gooding GA, Rapp JH. Assessment of carotid artery stenosis by ultra-sonography, conventional angiography, and magnetic resonanceangiography: correlation with ex vivo measurements of plaque steno-sis. J Vasc Surg 1995;21:82–89.
30. Elgersma OEH, Buijs PC, Wust AFJ, van der Graaf Y, Eikelboom BC,Mali WPTM. Assessment of maximum internal carotid artery stenosis:rotational versus conventional intra arterial digital substraction angiog-raphy. Radiology 1999;213:777–783.
31. Koenderink JJ. The structure of images. Biol Cybern 1984;50:363–370.32. Lindeberg T. Feature detection with automatic scale selection. Int
J Comput Vision 1998;30:79–116.
322 Frangi et al.