quantifying architects' and engineers' use of structural
TRANSCRIPT
1
Quantifying Architects’ and Engineers’
Use of Structural Design Software
by
Virginie B. Arnaud
Diplôme d’Ingénieur, Génie Civil Spécialité Travaux Publics (2013)
École Spéciale des Travaux Publics
Submitted to the Department of Civil and Environmental Engineering
in Partial Fulfillment of the Requirements for the Degree of
MASTER OF ENGINEERING IN CIVIL AND ENVIRONMENTAL ENGINEERING
at the
MASSACHUSETTS INSTITUTE OF TECHNOLOGY
June 2013
© 2013 Massachusetts Institute of Technology. All rights reserved.
Signature of Author:
Department of Civil and Environmental Engineering
May 10 2013
Certified by:
John A. Ochsendorf
Professor of Building Technology and Civil and Environmental Engineering
Thesis Supervisor
Accepted by:
Heidi M. Nepf
Chair, Departmental Committee for Graduate Students

2
3
Quantifying Architects’ and Engineers’
Use of Structural Design Software
by
Virginie B. Arnaud
Submitted to the Department of Civil and Environmental Engineering
on May 10, 2013 in Partial Fulfillment of the Requirements
for the Degree of Master of Engineering in Civil and Environmental Engineering
Abstract
Both architects and engineers encounter significant barriers and hurdles that compartmentalize both fields and increase the complexity of collaborative design. In addition to little interaction between both fields, software programs are limited in many aspects. That is why the current industry‟s organization and tools confront engineers and architects with significant challenges. If improvements are made, they would reduce designers‟ effort and the time spent to overcome these challenges, and would positively impact the quality of their work. Thus, it is necessary to identify problems in current tools and to study the design process to find areas for improvement in design software programs.
This paper presents a discussion on the limitations of structural design software and a study on the differences between architects and engineers during the design process through the analysis of the use of a newly developed framework: StructureFIT. This tool was recently developed at MIT and aims to create an interface between both disciplines. In this thesis, a usability study and a questionnaire were specifically designed to gather data from 38 graduate students of architecture and engineering. This material aims to assess users‟ level of satisfaction with current tools, identify the areas to be improved in current software programs, quantify the differences in designers‟ practices, and assess StructureFIT. The analysis of findings suggests that users are not fully satisfied with current tools. The reason is that most design tools do not easily foster the exploration of structural alternatives due to lack of user-friendliness, compared to StructureFIT that did meet the users‟ demands. This work also provides a better understanding of engineers‟ and architects‟ respective design approaches as discussed through the analysis of the usability study results. Lastly, StructureFIT does provide a positive design exploration for designers, since the tool enabled users to dramatically improve structural performance while providing a wide diversity of solutions. The richness of generated efficient design solutions is what makes StructureFIT an innovative and promising approach.
Key words: Usability study, structural analysis software, structural design process
Thesis supervisor: John A. Ochsendorf
Title: Professor of Building Technology and Civil and Environmental Engineering

4

5
Acknowledgements
I am incredibly grateful to so many people who enabled me to take part in great projects at MIT. First and foremost, I would like to thank Jerome J. Connor for his guidance throughout the High Performance Structures program at MIT. Thank you to John Ochsendorf for your insight in supervising my thesis and for incorporating me into great research that corresponds to my field of interest. To give me the opportunity to study both engineering and architecture and to contribute to someone else‟s work, perfectly met my ambitions and aspirations as for a research thesis. I am truly thankful to Caitlin Mueller, with whom I worked closely. I was delighted to work with you and to be able to contribute to fulfill your work on your framework. Her incredible support and invaluable advice for my thesis allowed me to conduct fascinating research. A special thank you is due to Rory Clune, Andrew Sang, and Iovana Valdez for helping me throughout my work with your valuable contributions and suggestions. Thank you to all the MIT students who participated in the usability study. Additional financial support was provided by the Fondation Ambition Travaux Publics, Fondation de France and The Rotary Club International which enabled me to study at Massachusetts Institute of Technology. Lastly, thank you to my family. For believing in my ability to succeed and for your financial support. You always encourage me to fulfill my dreams by being incredibly supportive of every decision I have made.

6
7
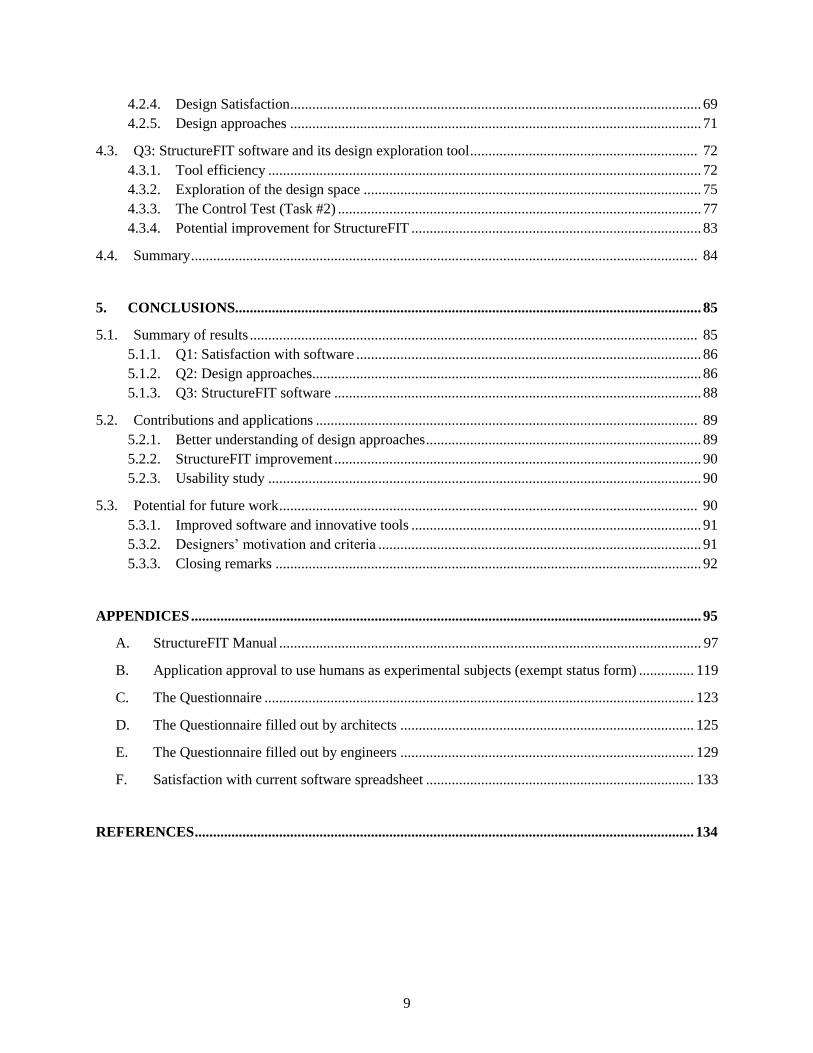
Table of Contents
Abstract ......................................................................................................................................................... 3
Acknowledgements ........................................................................................................................................ 5
Table of Contents .......................................................................................................................................... 7
List of Figures ............................................................................................................................................. 11
List of Tables ............................................................................................................................................... 13
1. PROBLEM STATEMENT .............................................................................................................. 15
1.1. Introduction ..................................................................................................................................... 15
1.1.1. Motivation ............................................................................................................................. 15
1.1.2. Contribution .......................................................................................................................... 16
1.1.3. Terminology .......................................................................................................................... 16
1.2. Current challenges ........................................................................................................................... 17
1.2.1. Difficulties of collaboration .................................................................................................. 17
1.2.2. Inconsistency of tools ............................................................................................................ 19
1.2.3. Differing criteria .................................................................................................................... 21
1.3. Research questions........................................................................................................................... 22
1.3.1. Q1: Satisfaction with current software .................................................................................. 23
1.3.2. Q2: Design approaches.......................................................................................................... 23
1.3.3. Q3: StructureFIT software .................................................................................................... 23
1.4. Organization of this thesis ............................................................................................................... 24
2. LITERATURE REVIEW ................................................................................................................ 25
2.1. Challenges and limits of current tools ............................................................................................. 25
2.1.1. Architecture software ............................................................................................................ 26
2.1.2. Repercussions on projects ..................................................................................................... 26
2.1.3. Engineering tools .................................................................................................................. 28
2.2. Improvements in tools ..................................................................................................................... 28
2.2.1. Graphic Statics method ......................................................................................................... 29
2.2.2. Real time engineering feedback in architecture tools ........................................................... 29
2.2.3. Automation design process ................................................................................................... 30
8
2.2.4. Implementation in engineering tools ..................................................................................... 31
2.3. Innovative new tool ......................................................................................................................... 32
2.3.1. Evolutionary algorithm ......................................................................................................... 33
2.3.2. Mutations in StructureFIT ..................................................................................................... 33
2.3.3. StructureFIT graphical user interface .................................................................................... 34
2.3.4. Benefits of such new tools .................................................................................................... 36
2.4. Usability study ................................................................................................................................. 36
2.4.1. The psychology of Testing .................................................................................................... 36
2.4.2. Usability study process ......................................................................................................... 37
2.4.3. Humans as experimental subjects ......................................................................................... 38
2.4.4. Number of users .................................................................................................................... 38
2.5. Summary .......................................................................................................................................... 40
3. METHODOLOGY ........................................................................................................................... 41
3.1. The usability study ........................................................................................................................... 41
3.1.1. Subject profiles ...................................................................................................................... 41
3.1.2. Preliminary test group ........................................................................................................... 42
3.1.3. The procedure ........................................................................................................................ 43
3.1.4. Test Contents ......................................................................................................................... 47
3.2. Questionnaire ................................................................................................................................... 48
3.2.1. Individual background........................................................................................................... 48
3.2.2. Current software assessment ................................................................................................. 49
3.2.3. StructureFIT assessment ....................................................................................................... 50
3.3. Data Post-Processing ....................................................................................................................... 51
3.3.1. Adjustable parameters and their efficiency ........................................................................... 51
3.3.2. Statistical values and test method .......................................................................................... 54
3.3.3. Distances between designs .................................................................................................... 55
3.3.4. Design space & evolutionary algorithm performance assessments ...................................... 56
3.4. Summary .......................................................................................................................................... 57
4. RESULTS & DISCUSSION ............................................................................................................ 59
4.1. Q1: Satisfaction with software ......................................................................................................... 59
4.1.1. Grading of software ............................................................................................................... 60
4.1.2. Tool improvements suggested by users................................................................................. 62
4.1.3. What makes software successful? ......................................................................................... 63
4.2. Q2: Design approaches .................................................................................................................... 63
4.2.1. Mutation Rate ........................................................................................................................ 63
4.2.2. Generation Size ..................................................................................................................... 66
4.2.3. Performance Score ................................................................................................................ 68
9
4.2.4. Design Satisfaction ................................................................................................................ 69
4.2.5. Design approaches ................................................................................................................ 71
4.3. Q3: StructureFIT software and its design exploration tool .............................................................. 72
4.3.1. Tool efficiency ...................................................................................................................... 72
4.3.2. Exploration of the design space ............................................................................................ 75
4.3.3. The Control Test (Task #2) ................................................................................................... 77
4.3.4. Potential improvement for StructureFIT ............................................................................... 83
4.4. Summary .......................................................................................................................................... 84
5. CONCLUSIONS............................................................................................................................... 85
5.1. Summary of results .......................................................................................................................... 85
5.1.1. Q1: Satisfaction with software .............................................................................................. 86
5.1.2. Q2: Design approaches.......................................................................................................... 86
5.1.3. Q3: StructureFIT software .................................................................................................... 88
5.2. Contributions and applications ........................................................................................................ 89
5.2.1. Better understanding of design approaches ........................................................................... 89
5.2.2. StructureFIT improvement .................................................................................................... 90
5.2.3. Usability study ...................................................................................................................... 90
5.3. Potential for future work .................................................................................................................. 90
5.3.1. Improved software and innovative tools ............................................................................... 91
5.3.2. Designers’ motivation and criteria ........................................................................................ 91
5.3.3. Closing remarks .................................................................................................................... 92
APPENDICES ........................................................................................................................................... 95
A. StructureFIT Manual ................................................................................................................... 97
B. Application approval to use humans as experimental subjects (exempt status form) ............... 119
C. The Questionnaire ..................................................................................................................... 123
D. The Questionnaire filled out by architects ................................................................................ 125
E. The Questionnaire filled out by engineers ................................................................................ 129
F. Satisfaction with current software spreadsheet ......................................................................... 133
REFERENCES ........................................................................................................................................ 134

10
V. B. ARNAUD │ MASTER’S THESIS, 2013 LIST OF FIGURES
11
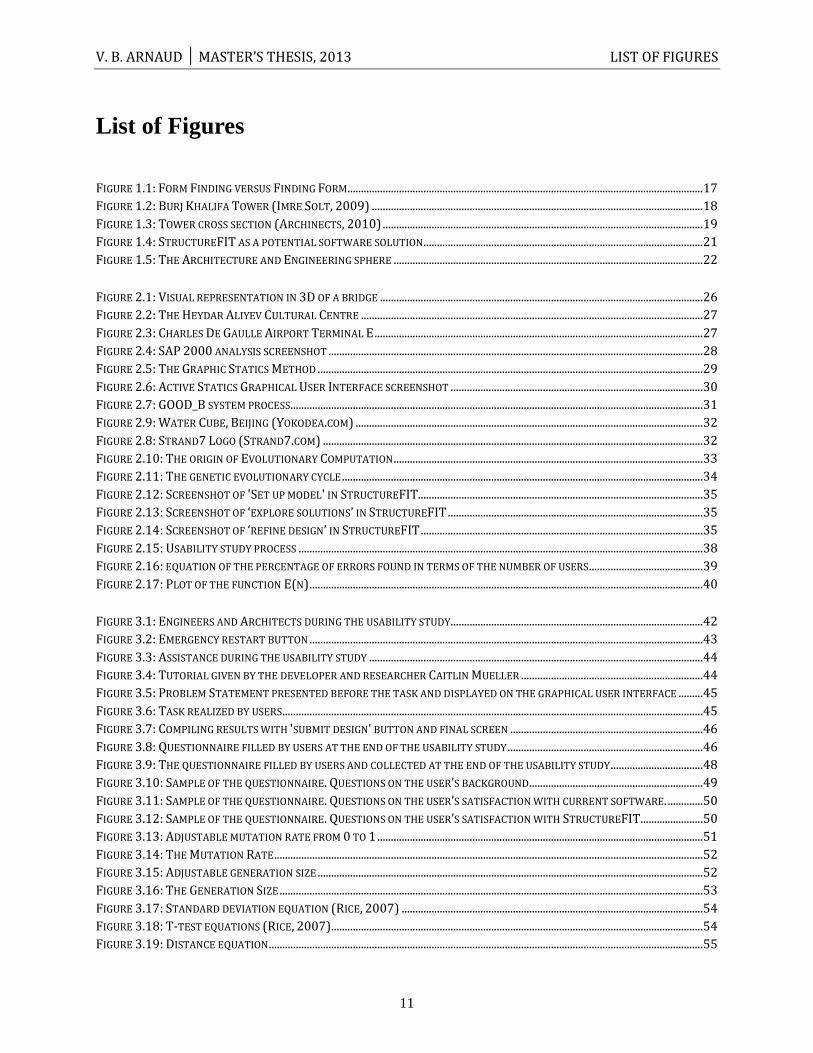
List of Figures
FIGURE 1.1: FORM FINDING VERSUS FINDING FORM ................................................................................................................................... 17 FIGURE 1.2: BURJ KHALIFA TOWER (IMRE SOLT, 2009) .......................................................................................................................... 18 FIGURE 1.3: TOWER CROSS SECTION (ARCHINECTS, 2010) ...................................................................................................................... 19 FIGURE 1.4: STRUCTUREFIT AS A POTENTIAL SOFTWARE SOLUTION ....................................................................................................... 21 FIGURE 1.5: THE ARCHITECTURE AND ENGINEERING SPHERE .................................................................................................................. 22
FIGURE 2.1: VISUAL REPRESENTATION IN 3D OF A BRIDGE ....................................................................................................................... 26 FIGURE 2.2: THE HEYDAR ALIYEV CULTURAL CENTRE .............................................................................................................................. 27 FIGURE 2.3: CHARLES DE GAULLE AIRPORT TERMINAL E ......................................................................................................................... 27 FIGURE 2.4: SAP 2000 ANALYSIS SCREENSHOT .......................................................................................................................................... 28 FIGURE 2.5: THE GRAPHIC STATICS METHOD .............................................................................................................................................. 29 FIGURE 2.6: ACTIVE STATICS GRAPHICAL USER INTERFACE SCREENSHOT ............................................................................................. 30 FIGURE 2.7: GOOD_B SYSTEM PROCESS ........................................................................................................................................................ 31 FIGURE 2.9: WATER CUBE, BEIJING (YOKODEA.COM) ................................................................................................................................ 32 FIGURE 2.8: STRAND7 LOGO (STRAND7.COM) ............................................................................................................................................ 32 FIGURE 2.10: THE ORIGIN OF EVOLUTIONARY COMPUTATION .................................................................................................................. 33 FIGURE 2.11: THE GENETIC EVOLUTIONARY CYCLE ..................................................................................................................................... 34 FIGURE 2.12: SCREENSHOT OF 'SET UP MODEL' IN STRUCTUREFIT......................................................................................................... 35 FIGURE 2.13: SCREENSHOT OF ‘EXPLORE SOLUTIONS’ IN STRUCTUREFIT .............................................................................................. 35 FIGURE 2.14: SCREENSHOT OF ‘REFINE DESIGN’ IN STRUCTUREFIT ........................................................................................................ 35 FIGURE 2.15: USABILITY STUDY PROCESS ..................................................................................................................................................... 38 FIGURE 2.16: EQUATION OF THE PERCENTAGE OF ERRORS FOUND IN TERMS OF THE NUMBER OF USERS .......................................... 39 FIGURE 2.17: PLOT OF THE FUNCTION E(N) ................................................................................................................................................. 40
FIGURE 3.1: ENGINEERS AND ARCHITECTS DURING THE USABILITY STUDY............................................................................................. 42 FIGURE 3.2: EMERGENCY RESTART BUTTON ................................................................................................................................................. 43 FIGURE 3.3: ASSISTANCE DURING THE USABILITY STUDY ........................................................................................................................... 44 FIGURE 3.4: TUTORIAL GIVEN BY THE DEVELOPER AND RESEARCHER CAITLIN MUELLER ................................................................... 44 FIGURE 3.5: PROBLEM STATEMENT PRESENTED BEFORE THE TASK AND DISPLAYED ON THE GRAPHICAL USER INTERFACE ......... 45 FIGURE 3.6: TASK REALIZED BY USERS ........................................................................................................................................................... 45 FIGURE 3.7: COMPILING RESULTS WITH 'SUBMIT DESIGN' BUTTON AND FINAL SCREEN ....................................................................... 46 FIGURE 3.8: QUESTIONNAIRE FILLED BY USERS AT THE END OF THE USABILITY STUDY ........................................................................ 46 FIGURE 3.9: THE QUESTIONNAIRE FILLED BY USERS AND COLLECTED AT THE END OF THE USABILITY STUDY .................................. 48 FIGURE 3.10: SAMPLE OF THE QUESTIONNAIRE. QUESTIONS ON THE USER’S BACKGROUND ................................................................ 49 FIGURE 3.11: SAMPLE OF THE QUESTIONNAIRE. QUESTIONS ON THE USER’S SATISFACTION WITH CURRENT SOFTWARE. ............. 50 FIGURE 3.12: SAMPLE OF THE QUESTIONNAIRE. QUESTIONS ON THE USER’S SATISFACTION WITH STRUCTUREFIT ....................... 50 FIGURE 3.13: ADJUSTABLE MUTATION RATE FROM 0 TO 1 ........................................................................................................................ 51 FIGURE 3.14: THE MUTATION RATE .............................................................................................................................................................. 52 FIGURE 3.15: ADJUSTABLE GENERATION SIZE .............................................................................................................................................. 52 FIGURE 3.16: THE GENERATION SIZE ............................................................................................................................................................ 53 FIGURE 3.17: STANDARD DEVIATION EQUATION (RICE, 2007) ............................................................................................................... 54 FIGURE 3.18: T-TEST EQUATIONS (RICE, 2007) ......................................................................................................................................... 54 FIGURE 3.19: DISTANCE EQUATION ................................................................................................................................................................ 55
V. B. ARNAUD │ MASTER’S THESIS, 2013 LIST OF FIGURES
12
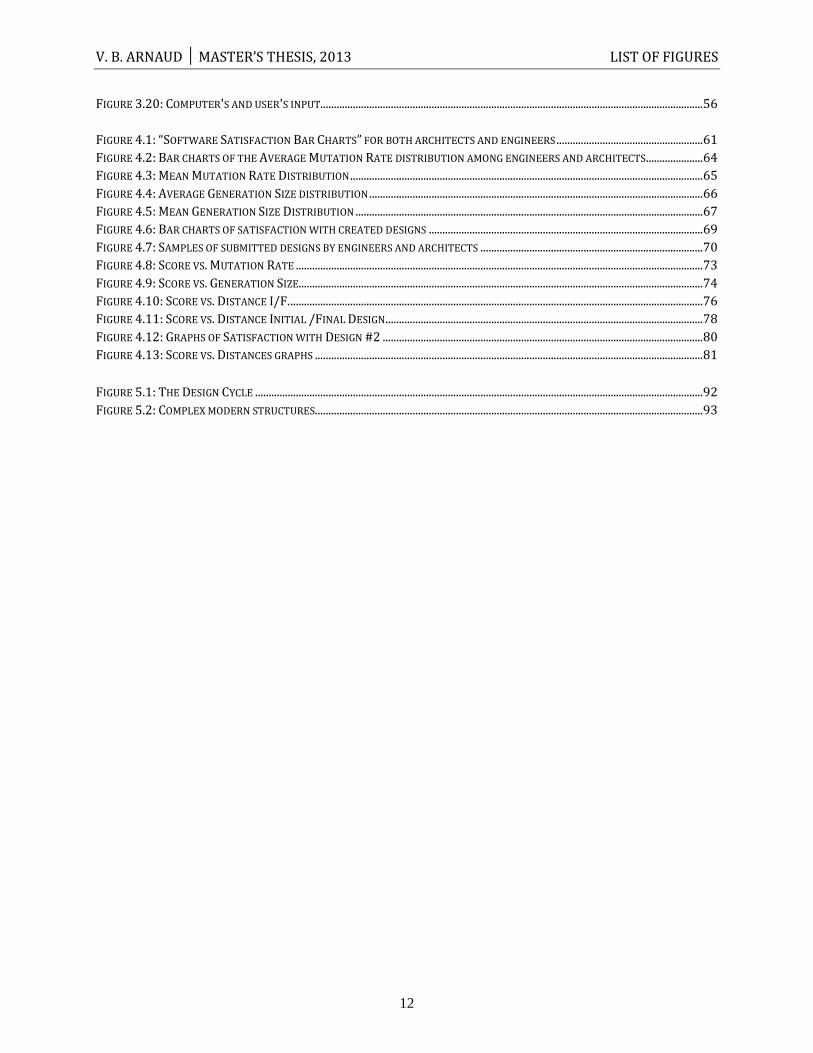
FIGURE 3.20: COMPUTER'S AND USER'S INPUT............................................................................................................................................. 56
FIGURE 4.1: “SOFTWARE SATISFACTION BAR CHARTS” FOR BOTH ARCHITECTS AND ENGINEERS ...................................................... 61 FIGURE 4.2: BAR CHARTS OF THE AVERAGE MUTATION RATE DISTRIBUTION AMONG ENGINEERS AND ARCHITECTS ..................... 64 FIGURE 4.3: MEAN MUTATION RATE DISTRIBUTION .................................................................................................................................. 65 FIGURE 4.4: AVERAGE GENERATION SIZE DISTRIBUTION ........................................................................................................................... 66 FIGURE 4.5: MEAN GENERATION SIZE DISTRIBUTION ................................................................................................................................ 67 FIGURE 4.6: BAR CHARTS OF SATISFACTION WITH CREATED DESIGNS ..................................................................................................... 69 FIGURE 4.7: SAMPLES OF SUBMITTED DESIGNS BY ENGINEERS AND ARCHITECTS .................................................................................. 70 FIGURE 4.8: SCORE VS. MUTATION RATE ...................................................................................................................................................... 73 FIGURE 4.9: SCORE VS. GENERATION SIZE..................................................................................................................................................... 74 FIGURE 4.10: SCORE VS. DISTANCE I/F. ........................................................................................................................................................ 76 FIGURE 4.11: SCORE VS. DISTANCE INITIAL /FINAL DESIGN ..................................................................................................................... 78 FIGURE 4.12: GRAPHS OF SATISFACTION WITH DESIGN #2 ...................................................................................................................... 80 FIGURE 4.13: SCORE VS. DISTANCES GRAPHS ............................................................................................................................................... 81
FIGURE 5.1: THE DESIGN CYCLE ..................................................................................................................................................................... 92 FIGURE 5.2: COMPLEX MODERN STRUCTURES............................................................................................................................................... 93
V. B. ARNAUD │ MASTER’S THESIS, 2013 LIST OF TABLES
13
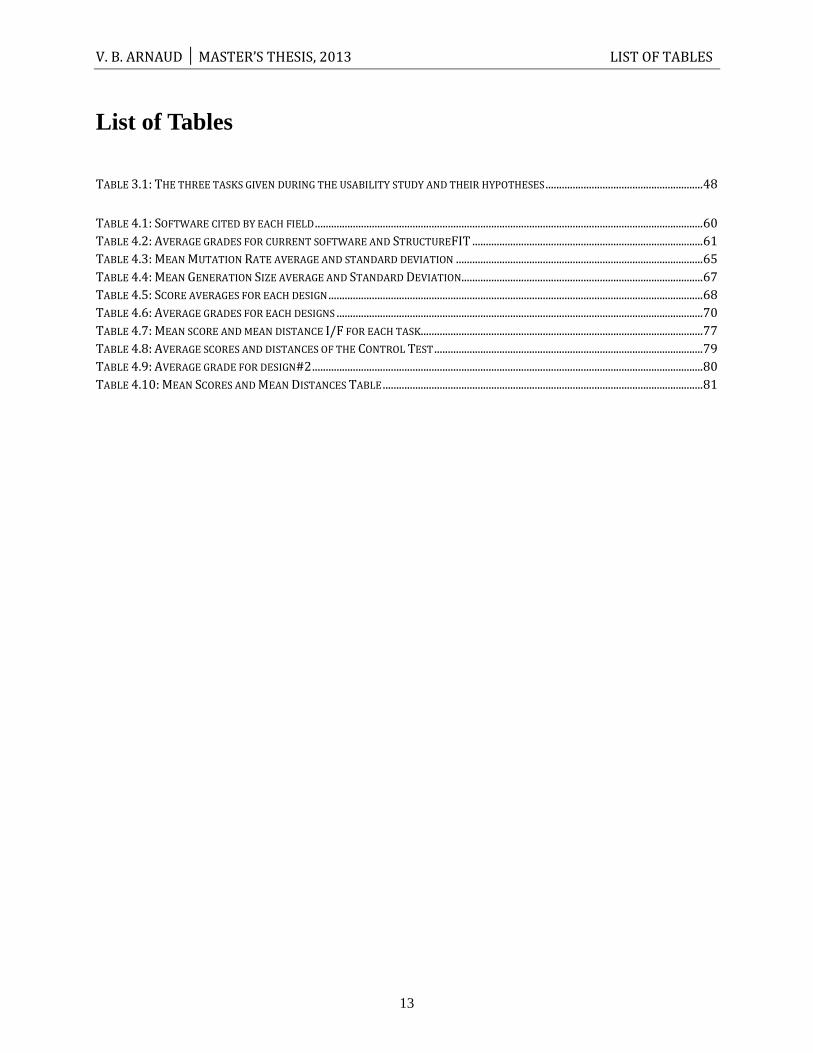
List of Tables
TABLE 3.1: THE THREE TASKS GIVEN DURING THE USABILITY STUDY AND THEIR HYPOTHESES .......................................................... 48
TABLE 4.1: SOFTWARE CITED BY EACH FIELD ............................................................................................................................................... 60 TABLE 4.2: AVERAGE GRADES FOR CURRENT SOFTWARE AND STRUCTUREFIT ..................................................................................... 61 TABLE 4.3: MEAN MUTATION RATE AVERAGE AND STANDARD DEVIATION ........................................................................................... 65 TABLE 4.4: MEAN GENERATION SIZE AVERAGE AND STANDARD DEVIATION......................................................................................... 67 TABLE 4.5: SCORE AVERAGES FOR EACH DESIGN .......................................................................................................................................... 68 TABLE 4.6: AVERAGE GRADES FOR EACH DESIGNS ....................................................................................................................................... 70 TABLE 4.7: MEAN SCORE AND MEAN DISTANCE I/F FOR EACH TASK........................................................................................................ 77 TABLE 4.8: AVERAGE SCORES AND DISTANCES OF THE CONTROL TEST ................................................................................................... 79 TABLE 4.9: AVERAGE GRADE FOR DESIGN#2 ................................................................................................................................................ 80 TABLE 4.10: MEAN SCORES AND MEAN DISTANCES TABLE ...................................................................................................................... 81

14
V. B. ARNAUD │ MASTER’S THESIS, 2013 CHAPTER 1: PROBLEM STATEMENT
15
CHAPTER 1:
1. PROBLEM STATEMENT
1.1. Introduction
Today‟s designers are constantly faced with challenges. Both architects and engineers have to
adapt to a changing world in order to meet infrastructural needs and demands while
maintaining design quality. They encounter significant barriers and hurdles that
compartmentalize both fields and increase the jobs‟ complexity.
1.1.1. Motivation
The complexity of both jobs lies in the inherent difficulty of design, but it also comes from the
current industry‟s organization. Although engineers and architects have convergent goals (i.e.,
fulfill people‟s needs and ensure safety by building structures), they are two completely separate
disciplines, which results in a linear design process. In other words, architects set requirements
at the early phase of design without consulting engineers, who then have to deal with those
requirements. Consequently, engineers have little flexibility to suggest technical alternatives
that would increase the structural performance. In addition to the lack of collaboration, the
inconsistency of current tools used in the industry makes their jobs even more challenging.
Little interaction exists between software, which is also limited in many respects. That is why
V. B. ARNAUD │ MASTER’S THESIS, 2013 CHAPTER 1: PROBLEM STATEMENT
16
the current industry‟s organization and tools confront engineers and architects with significant
challenges. If improvements are made, they would reduce designers‟ effort and the time spent to
overcome these challenges, which would positively impact on the quality of their work. Thus, it
is necessary to identify problems and areas for improvements in order to foster collaboration
between the two fields and enhance performance in their jobs by eliminating hurdles that make
designers expend excessive time and energy.
1.1.2. Contribution
To further research on how to bridge the gap between these two disciplines, this thesis presents
a study of the differences between the design processes of architects and engineers. This first
chapter introduces and explains the motivations for such research by identifying issues and
challenges in the current architecture and engineering industries and presents and assesses a
newly developed framework: StructureFIT. This tool is based on the work of Caitlin Mueller, a
PhD candidate at MIT, to foster the integration of structural and architectural design. For this
research, a questionnaire and a usability study were specifically designed to gather data from
MIT students of architecture and engineering, assess their level of satisfaction with current
tools, and quantify the differences in their practices. Finally, an analysis of findings is presented
as a way to identify the areas needing to be taken into account in the industry, requiring a better
understanding, and improvements.
1.1.3. Terminology
It is important to define terminology used in this thesis as it defines the scope of this work.
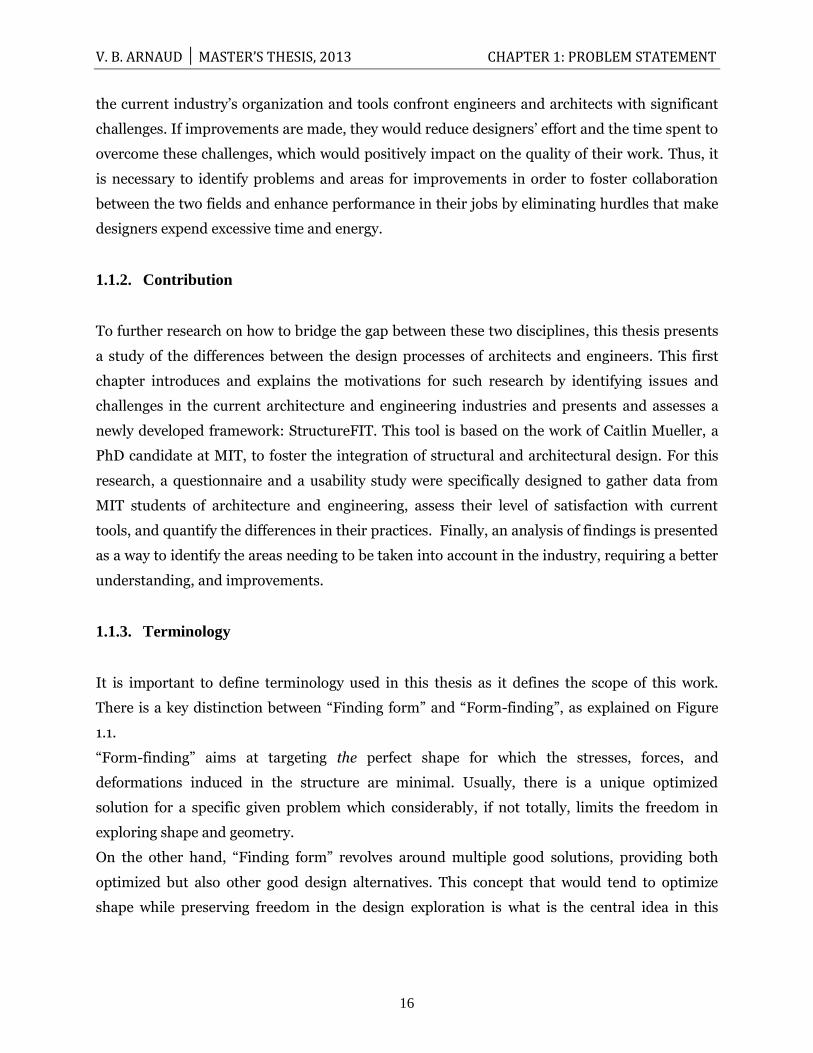
There is a key distinction between “Finding form” and “Form-finding”, as explained on Figure
1.1.
“Form-finding” aims at targeting the perfect shape for which the stresses, forces, and
deformations induced in the structure are minimal. Usually, there is a unique optimized
solution for a specific given problem which considerably, if not totally, limits the freedom in
exploring shape and geometry.
On the other hand, “Finding form” revolves around multiple good solutions, providing both
optimized but also other good design alternatives. This concept that would tend to optimize
shape while preserving freedom in the design exploration is what is the central idea in this
V. B. ARNAUD │ MASTER’S THESIS, 2013 CHAPTER 1: PROBLEM STATEMENT
17
study. Here lies the most challenging part of the problem: not only to preserve architects‟
freedom but to foster creativity by generating designs and going beyond intuitive guessing.
Figure 1.1: Form Finding versus Finding Form On the left is the screenshot of REVAULT form-finding software. Given constraints (blue arrows), they converge towards only one best solution (green dot). On the right is the “Finding Form” concept, with multiple different geometries and shapes. Starting with an initial design (green dot) and adding some
constraints, other solutions can be explored (Supermanoeuvre, 2012).
1.2. Current challenges
Designers face many challenges in the current industry. First, collaboration between engineers
and architects is difficult. Additionally, current tools do not foster interaction between both
disciplines. Furthermore, designers have different design criteria and approaches.
1.2.1. Difficulties of collaboration
Currently, architects and structural engineers try to work together closely during the entire
process of developing a building design from the conceptual phase of design through the level of
fine details and construction. However, this collaboration is not always fostered since it requires
much effort, communication and openness to alternative ideas. Reality is far different from this
idealistic partnership and sometimes the lack of interaction between both disciplines leads to a
linear design process (i.e., involving architects first, and then engineers). Therefore, many
structural aspects are neglected in the early phase of conceptual design, creating even more
V. B. ARNAUD │ MASTER’S THESIS, 2013 CHAPTER 1: PROBLEM STATEMENT
18
challenges for engineers to overcome later on. As a result, inefficient structures are built that use
large quantities of materials and present inelegant designs. Structural performance can be
significantly diminished by series of strategies that are then chosen to make a structure work
and satisfy architects‟ requirements, which can impact on the structural safety sometimes.
Case study of a successful collaboration
Because a modern structure requires extensive and varied knowledge to be designed, “one mind
cannot master it by itself” stated the structural designer Ove Arup (1895-1988). “As architects
and engineers are responsible for designs, they have to ensure safety. More applicable to
engineers, the risk is a constant challenge to surmount: from the architectural specifications to
construction methods. Because of this huge gap to bridge, structural engineers cannot work in
isolation” (Arup, 1959).
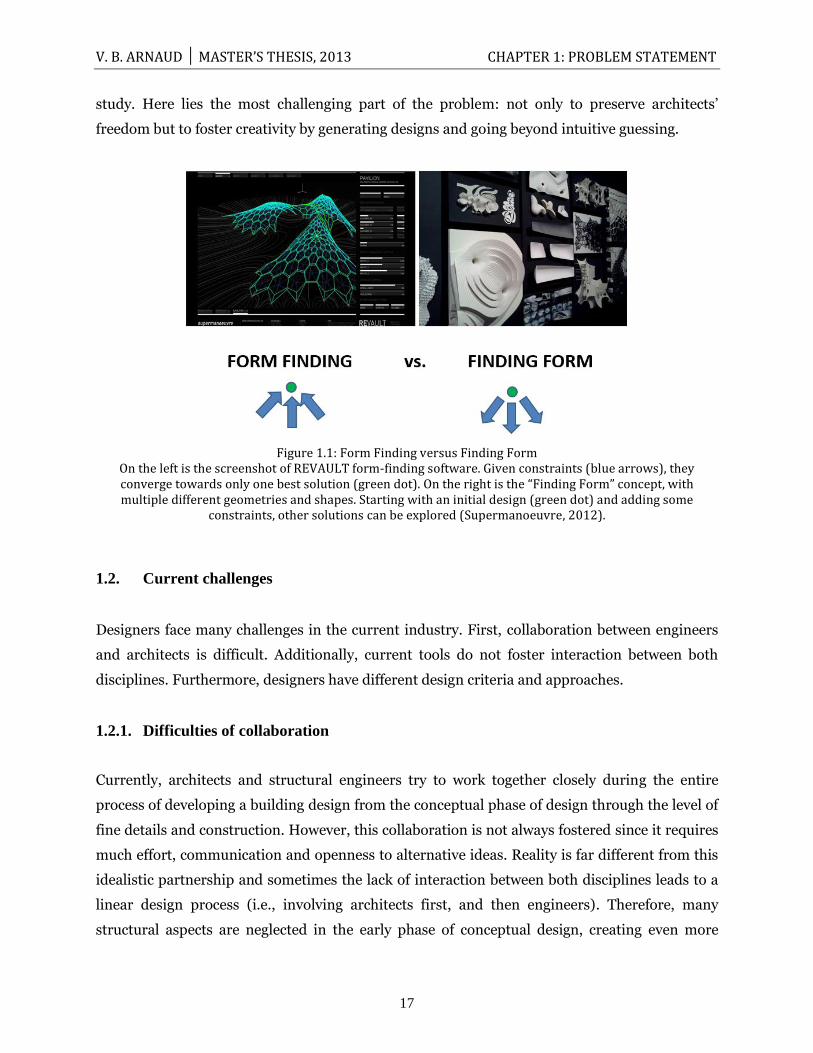
Figure 1.2: Burj Khalifa Tower (Imre Solt, 2009)
The Burj Khalifa Tower in Dubaï in Figure 1.2 perfectly illustrates the importance of interaction
between architects and engineers for a project to be built. With a total height of 828 meters, the
tower is the current tallest building in the world. But to make such a project happen, it required
an extremely qualified team with interaction between members. William Baker, the project
structural engineer, highlighted that without collaboration with architects and the
compromising between both fields of knowledge, such a high tower would not have been
feasible. According to Baker, designing consists of “picking the right solution for the scale and

V. B. ARNAUD │ MASTER’S THESIS, 2013 CHAPTER 1: PROBLEM STATEMENT
19
then make it beautiful. It is not making it work because you like it” (2012). He believes the role
of engineers starts even before the work of architects in order to lead designers on the right
tracks of the most relevant structures. In other words, it is essential that when the architect
explores solutions, considers possibilities in his mind, and starts sketching, the engineer should
guide him on high-performing structural arrangements. In this example, the Burj Khalifa Tower
was built as the natural result of the fruitful partnership between architects and engineers
working together at all phases of designs.
Determining the cross section (Figure 1.3) and overall design of the tower could not be done by
architects alone. Reaching 828 meters, wind considerations had to be taken into account and
millions of dollars were spent on testing models in a wind tunnel. Therefore, the unusual shape
was designed combining both aesthetics and engineering considerations. This is a proof of the
architect-engineer partnership importance to design a structure.
The bigger the project, the more important the collaboration. For smaller projects, it tends to be
neglected although this partnership would enable cost-effectiveness, performance, elegance,
sustainability, et cetera. Thus, this example aims at proving the necessity of collaboration and
interaction in order to build modern structures.
1.2.2. Inconsistency of tools
Not only does the lack of interaction lead to a clear division between the architectural and the
structural design phases, but available current software in the industry also increases difficulties
for both fields to overlap. Architecture tools are free of engineering considerations, while
engineering software programs require a pre-defined geometry to be run. More details are
Figure 1.3: Tower cross section (Archinects, 2010)
V. B. ARNAUD │ MASTER’S THESIS, 2013 CHAPTER 1: PROBLEM STATEMENT
20
provided in Chapter 2 about specific issues for current software, which shows that these two
disciplines with convergent goals can hardly overlap in practice due to how the current industry
operates.
That is why improvements should be made primarily on tools. There are two main features that
could be developed and improved. First, user inputs and interaction with the computer can be
developed by incorporating real time engineering feedback as the structure is modified. It would
provide the user with some guidance and control on performance. Secondly, programs that
would enable freedom in the exploration of designs and geometries could be created. This would
have a significant impact in the current industry (Mueller, 2014). If today‟s industry is not
conducive to architects and engineers collaboration, it is partially due to limited tools that
compartmentalize both fields and limit communication.
A new framework as a potential solution:
This work offers the study of a newly developed framework called StructureFIT, as a potential
software solution. Caitlin Mueller, a MIT PhD candidate focuses her work on developing this
program for several of the issues explained previously. “Tools for structural design should guide
the design process by suggesting structurally efficient options, while allowing for a diversity of
design choice. The framework proposed here implements an interactive evolutionary algorithm
to achieve this behavior” (Mueller, 2011). In other words, this emerging framework presents
many improved aspects of current software, but it also paves the way for tools of a new kind.
This innovative software program enables users to explore a wide range of solutions by self-
generating designs, while entirely preserving designers‟ freedom during the design process. It
also enables user interaction to create structural models and go beyond intuitive guessing. Based
on an approximate geometry, a model can be mutated and recombined with other structures
through an interactive evolutionary framework to generate new designs by itself. Therefore, a
wide range of geometries and unexpected shapes are suggested to the user, who also can control
structural performance based on real time engineering feedback, as shown in Figure 1.4. More
information about the program is provided in Chapter 2, Section 2.3.
V. B. ARNAUD │ MASTER’S THESIS, 2013 CHAPTER 1: PROBLEM STATEMENT
21
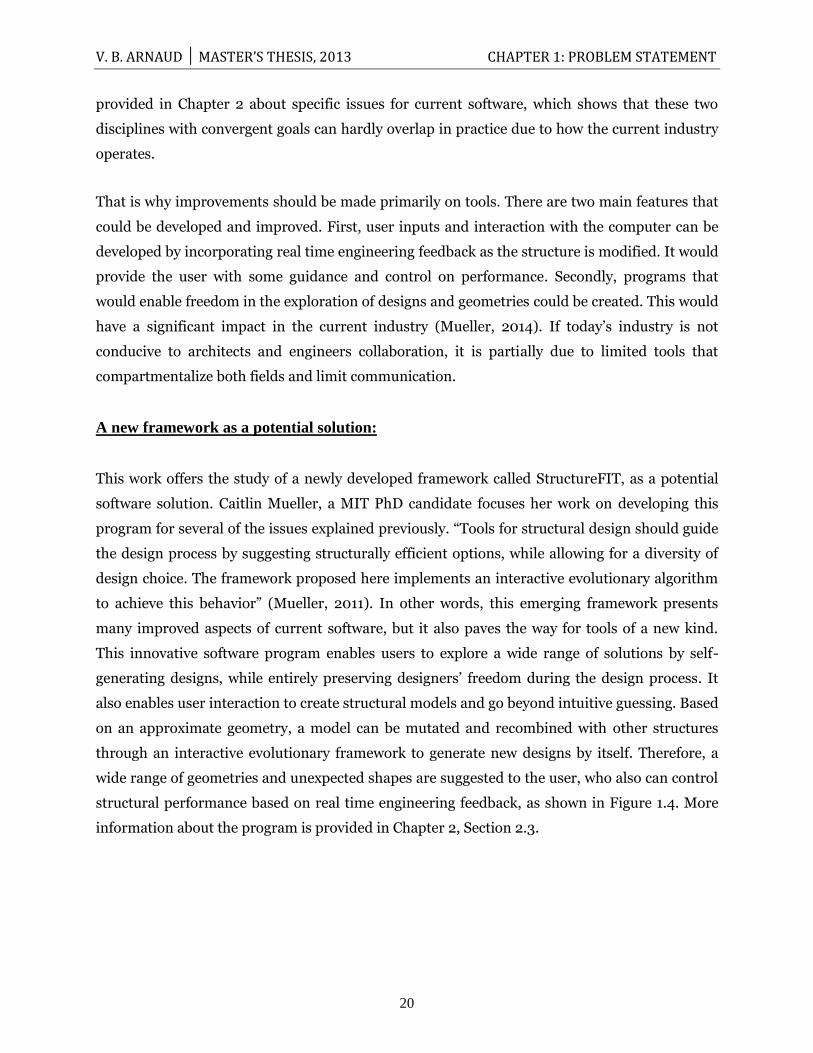
Figure 1.4: StructureFIT as a potential software solution This picture shows samples of possibilities for 6 types of structures using the Interactive Evolutionary
Framework. A performance score is displayed under each model, relative to the first model on the left and represents the required volume of material needed for that particular structure (Mueller, 2014).
1.2.3. Differing criteria
In addition to challenges related to tools, designers also face other difficulties in the design
process. While architects tend not to prioritize structurally performing systems when designing,
engineers tend to focus on structural efficiency when designing. To tackle issues between these
two approaches would mean to enhance both architects‟ skills and engineers‟ creativity, to save
time in the conceptual phase of design and to improve solutions. Given the differences in design
criteria, it seems clear that during the design process, fostering interaction between architects
and structural engineers should be a priority to avoid pitfalls. Structural feedback should be
given at the early stage of conceptual design, with engineers assisting architects.
“An engineer is a man who can do for a dollar what any fool can do for two” is a saying
illustrating reality (Shute, 1969). Once engineers are given a geometry, usually they can achieve
clear specified technological objectives for a low cost. Additionally, they can optimize the
structure within the allowable range they are granted. Therefore, optimization is limited by the
late integration of engineers in the conceptual phase of design. If both disciplines would overlap
V. B. ARNAUD │ MASTER’S THESIS, 2013 CHAPTER 1: PROBLEM STATEMENT
22
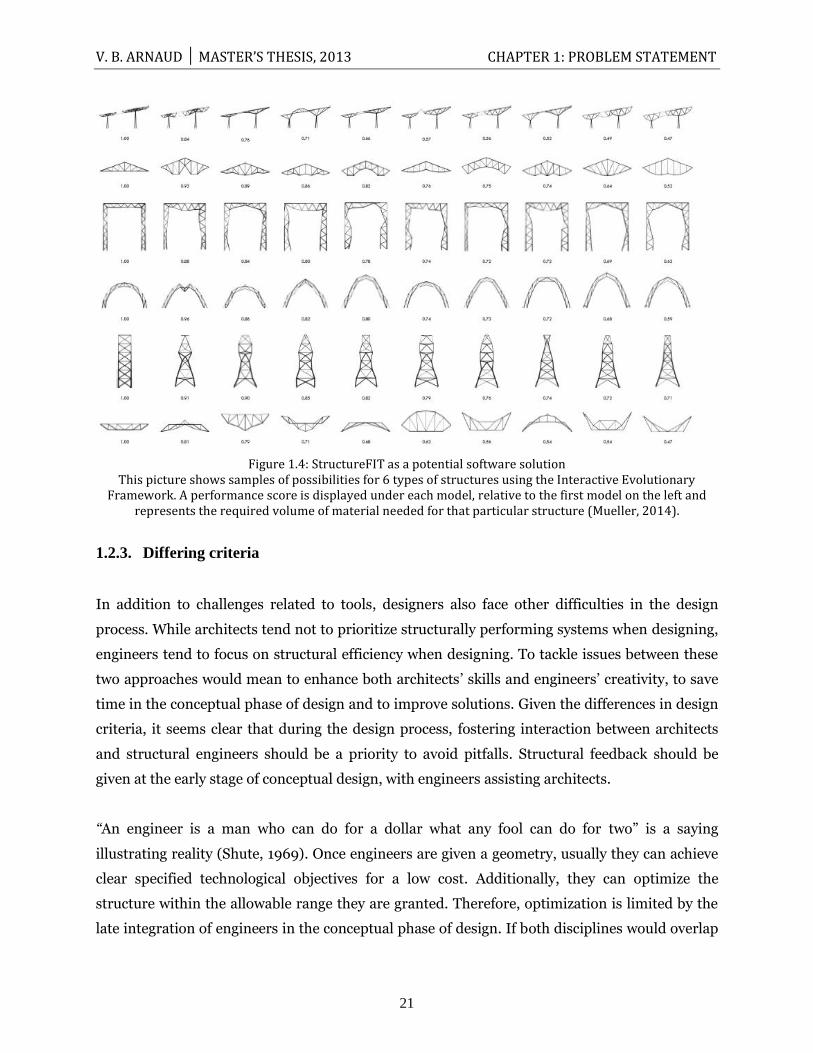
(see Figure 1.5) and share complementary knowledge for convergent goals, it would significantly
enhance structural performance and efficiency for buildings with less effort and struggles.
Figure 1.5: The Architecture and Engineering sphere This picture represents the architecture sphere overlapping the engineering sphere as a symbol for the need
of both disciplines to interact in order to enhance design quality (GoCollege.com & OrgoneDesign, 2011).
1.3. Research questions
This work aims at better understanding the differences between design processes of architects
and engineers. A newly developed software program, „StructureFIT‟ incorporates structural
analysis and performance assessments in the conceptual phase of design of a structure. This tool
aims at improving current software by offering engineering feedback at the early stage of
conceptual design and by providing a wide range of generated designs. By conducting a usability
study on software, the variety of approaches and design criteria could be revealed for both
disciplines. This study could also enable the improvement of existing tools accordingly or create
ones that facilitate compatible architectural requirements and engineering work.
This thesis strives to quantify the use of structural design software by engineers and architects.
To tackle this issue, this statement was divided into three main research questions developed in
this section. First, it is crucial to assess current tools available to architects and engineers in
order to evaluate the scope for improvement. Then, to fully understand and determine how to
improve software, an accurate study of architecture and engineering procedures has to be made.
Once these needs and demands are defined, they can be incorporated in software such as
StructureFIT. Three specific research questions are given in the following sections:
- Q1: How satisfied are architects and engineers with today‟s structural design software
V. B. ARNAUD │ MASTER’S THESIS, 2013 CHAPTER 1: PROBLEM STATEMENT
23
- Q2: Can different design approaches be identified for architects and engineers to create a
successful structural design?
- Q3: Does StructureFIT provide a positive design exploration for both architects and
engineers?
1.3.1. Q1: Satisfaction with current software
How satisfied are architects and engineers with today’s structural design
software?
To improve current software used by architects and engineers, it is essential to start with
assessing current tools. This preliminary work would enable the determination of limitations
and weaknesses of software in order to focus on the main problems to solve. Moreover,
suggestions from users could help developing software that could enable interaction between
both professions.
1.3.2. Q2: Design approaches
Can different design approaches be identified for architects and engineers to
create a successful structural design?
A quantitative understanding of both professions‟ design approaches is the key to develop
software that would bridge the gap between architecture and engineering work. That is why the
identification of designers‟ design approaches in each field can lead to a huge improvement for
tools. By incorporating them in software of the complementary field, it would enable some
pitfalls to be avoided since both disciplines work independently (i.e., inefficiently on the same
structure).
1.3.3. Q3: StructureFIT software
Does StructureFIT provide a positive design exploration for both architects and
engineers?
The developed software StructureFIT aims at providing a tool that incorporates improvement
for both professions. It does integrate engineering feedback in terms of performance at early
stage of design. Therefore, architects can adjust their models in order to enhance efficiency and
vary member sizes. This constitutes a major breakthrough as engineering analysis are made at

V. B. ARNAUD │ MASTER’S THESIS, 2013 CHAPTER 1: PROBLEM STATEMENT
24
the earliest stage of design. StructureFIT can also generate and mutate designs, providing the
user a wide range of possibilities.
1.4. Organization of this thesis
This thesis is divided into different chapters. Chapter 1, or Problem Statement, introduces the
context and motivations for this research. It also defines the three research questions that will
be tackled.
Chapter 2 examines the challenges and limitations of current software programs. Then, it
introduces a new framework, StructureFIT, as a potential software solution. Lastly, it explains
how usability studies are used to assess and improve software programs.
Chapter 3 explains the chosen methodology to answer the three research questions. First, it
presents the questionnaire and the usability study that were specifically designed to address the
three main issues. Second, it explains some mathematical tools used to process the recorded
data.
Chapter 4 presents the results and discussion of the usability study on StructureFIT.
Mathematical tools and visualizations are used to analyze the recorded data in order to
determine correlations, trends, and differences between architects and engineers during the
design process.
Chapter 5 concludes the thesis by summarizing the results of this research. Lastly, it states the
contribution of this thesis and discusses potential directions for future research.

V. B. ARNAUD │ MASTER’S THESIS, 2013 CHAPTER 2: LITERATURE REVIEW
25
CHAPTER 2:
2. LITERATURE REVIEW
This chapter presents the limitations and discusses improvements of current tools used by
architects and engineers. It then presents the newly developed framework, StructureFIT, along
with why this framework bridges the gap between the work of architects and engineers. A
discussion of usability studies is included and will evaluate whether this software has the
potential to provide original design structures with high performance capabilities.
2.1. Challenges and limits of current tools
Although designers have convergent goals, architecture and engineering are based on two
divergent processes. This paradox lies in the fact that their respective contributions are made at
different stages of design. While, at early stages of design, architects are giving shape and
geometry to an inspiration, an idea, without structural considerations, engineers are then in
charge of sizing elements preserving architects‟ specified geometry. Therefore, the two
disciplines barely overlap which negatively affects the quality of structures. Currently, two
distinct categories of tools are available for architecture and engineering practitioners
respectively.
V. B. ARNAUD │ MASTER’S THESIS, 2013 CHAPTER 2: LITERATURE REVIEW
26
2.1.1. Architecture software
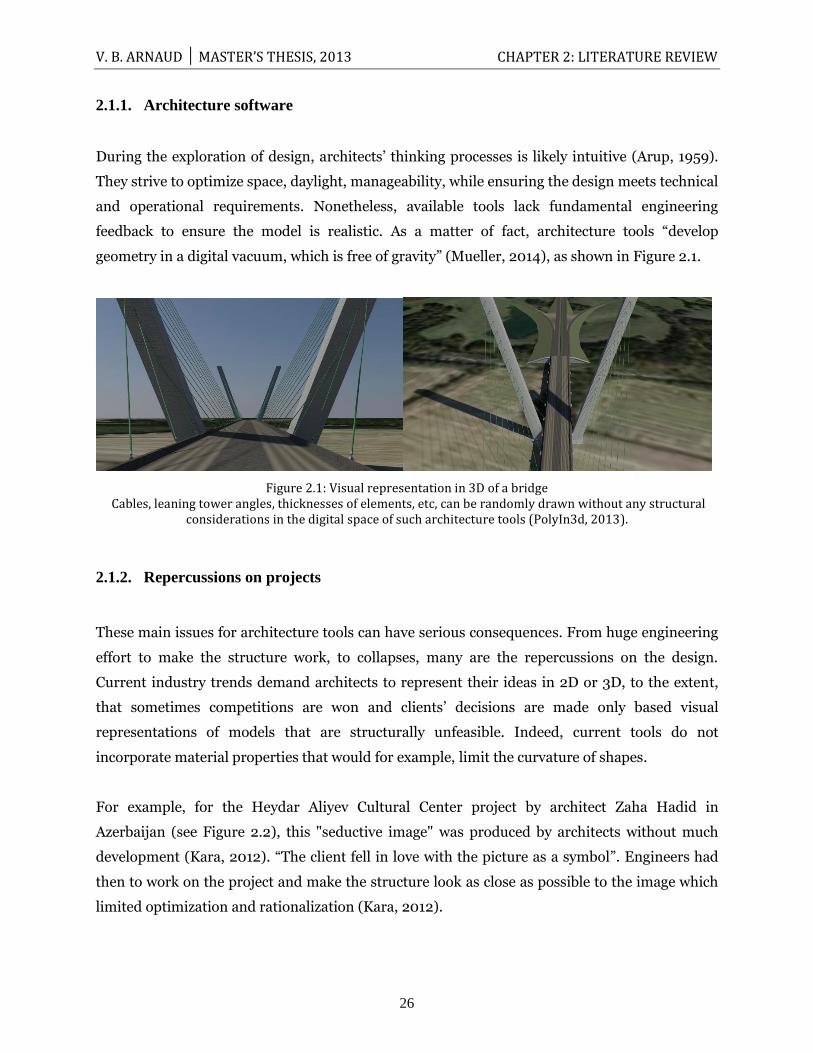
During the exploration of design, architects‟ thinking processes is likely intuitive (Arup, 1959).
They strive to optimize space, daylight, manageability, while ensuring the design meets technical
and operational requirements. Nonetheless, available tools lack fundamental engineering
feedback to ensure the model is realistic. As a matter of fact, architecture tools “develop
geometry in a digital vacuum, which is free of gravity” (Mueller, 2014), as shown in Figure 2.1.
Figure 2.1: Visual representation in 3D of a bridge Cables, leaning tower angles, thicknesses of elements, etc, can be randomly drawn without any structural
considerations in the digital space of such architecture tools (PolyIn3d, 2013).
2.1.2. Repercussions on projects
These main issues for architecture tools can have serious consequences. From huge engineering
effort to make the structure work, to collapses, many are the repercussions on the design.
Current industry trends demand architects to represent their ideas in 2D or 3D, to the extent,
that sometimes competitions are won and clients‟ decisions are made only based visual
representations of models that are structurally unfeasible. Indeed, current tools do not
incorporate material properties that would for example, limit the curvature of shapes.
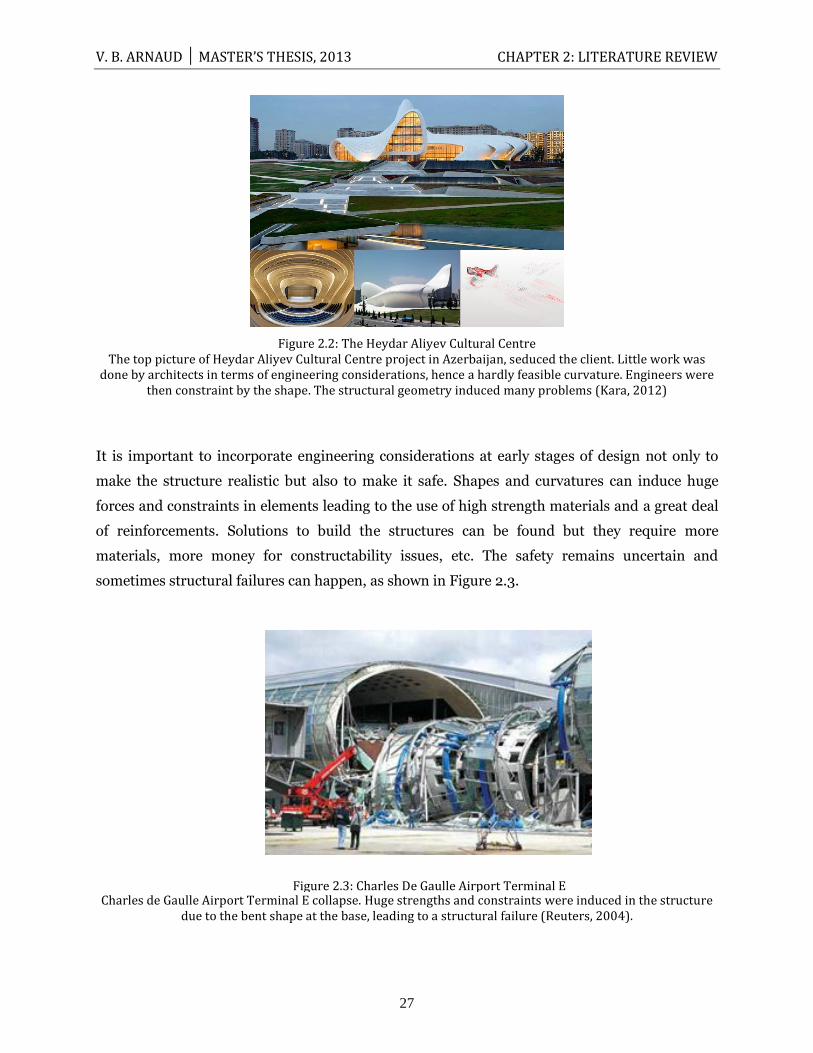
For example, for the Heydar Aliyev Cultural Center project by architect Zaha Hadid in
Azerbaijan (see Figure 2.2), this "seductive image" was produced by architects without much
development (Kara, 2012). “The client fell in love with the picture as a symbol”. Engineers had
then to work on the project and make the structure look as close as possible to the image which
limited optimization and rationalization (Kara, 2012).
V. B. ARNAUD │ MASTER’S THESIS, 2013 CHAPTER 2: LITERATURE REVIEW
27
Figure 2.2: The Heydar Aliyev Cultural Centre The top picture of Heydar Aliyev Cultural Centre project in Azerbaijan, seduced the client. Little work was
done by architects in terms of engineering considerations, hence a hardly feasible curvature. Engineers were then constraint by the shape. The structural geometry induced many problems (Kara, 2012)
It is important to incorporate engineering considerations at early stages of design not only to
make the structure realistic but also to make it safe. Shapes and curvatures can induce huge
forces and constraints in elements leading to the use of high strength materials and a great deal
of reinforcements. Solutions to build the structures can be found but they require more
materials, more money for constructability issues, etc. The safety remains uncertain and
sometimes structural failures can happen, as shown in Figure 2.3.
Charles de Gaulle Airport Terminal E collapse. Huge strengths and constraints were induced in the structure due to the bent shape at the base, leading to a structural failure (Reuters, 2004).
Figure 2.3: Charles De Gaulle Airport Terminal E
V. B. ARNAUD │ MASTER’S THESIS, 2013 CHAPTER 2: LITERATURE REVIEW
28
Therefore, the lack of structural analysis at early stages of design is likely to lead to the
construction of unsafe and structurally inefficient structures, inducing a high cost.
2.1.3. Engineering tools
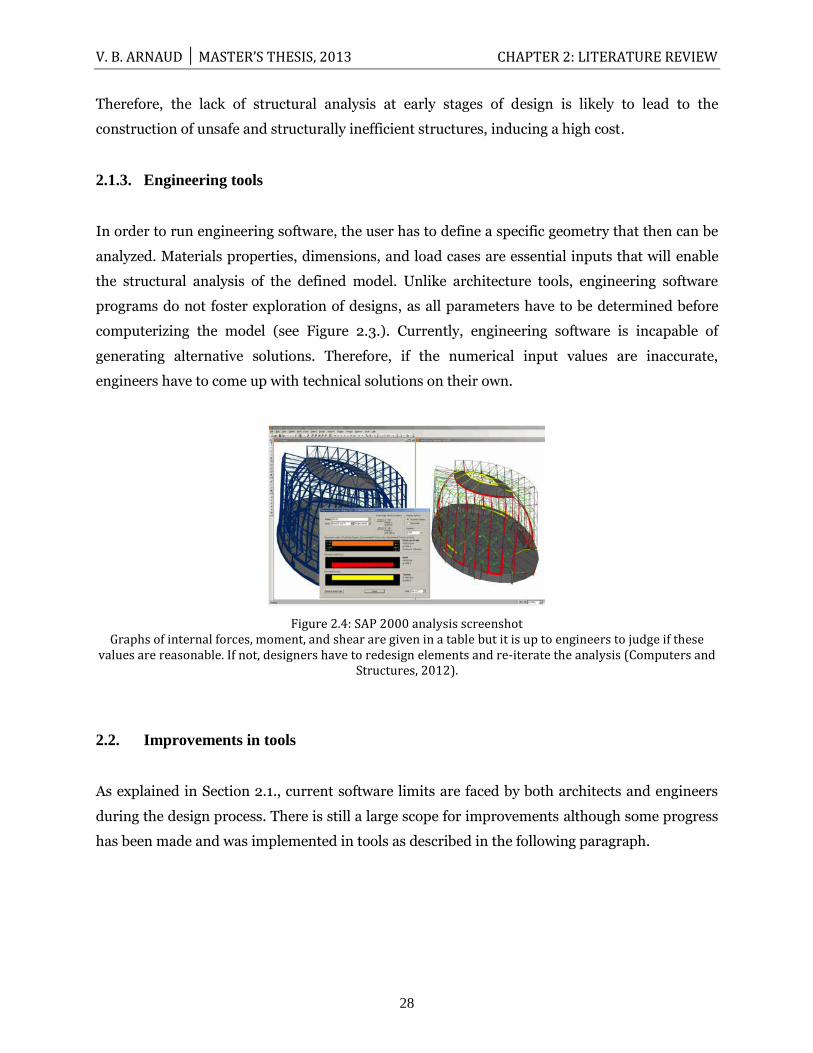
In order to run engineering software, the user has to define a specific geometry that then can be
analyzed. Materials properties, dimensions, and load cases are essential inputs that will enable
the structural analysis of the defined model. Unlike architecture tools, engineering software
programs do not foster exploration of designs, as all parameters have to be determined before
computerizing the model (see Figure 2.3.). Currently, engineering software is incapable of
generating alternative solutions. Therefore, if the numerical input values are inaccurate,
engineers have to come up with technical solutions on their own.
Figure 2.4: SAP 2000 analysis screenshot Graphs of internal forces, moment, and shear are given in a table but it is up to engineers to judge if these
values are reasonable. If not, designers have to redesign elements and re-iterate the analysis (Computers and Structures, 2012).
2.2. Improvements in tools
As explained in Section 2.1., current software limits are faced by both architects and engineers
during the design process. There is still a large scope for improvements although some progress
has been made and was implemented in tools as described in the following paragraph.
V. B. ARNAUD │ MASTER’S THESIS, 2013 CHAPTER 2: LITERATURE REVIEW
29
2.2.1. Graphic Statics method
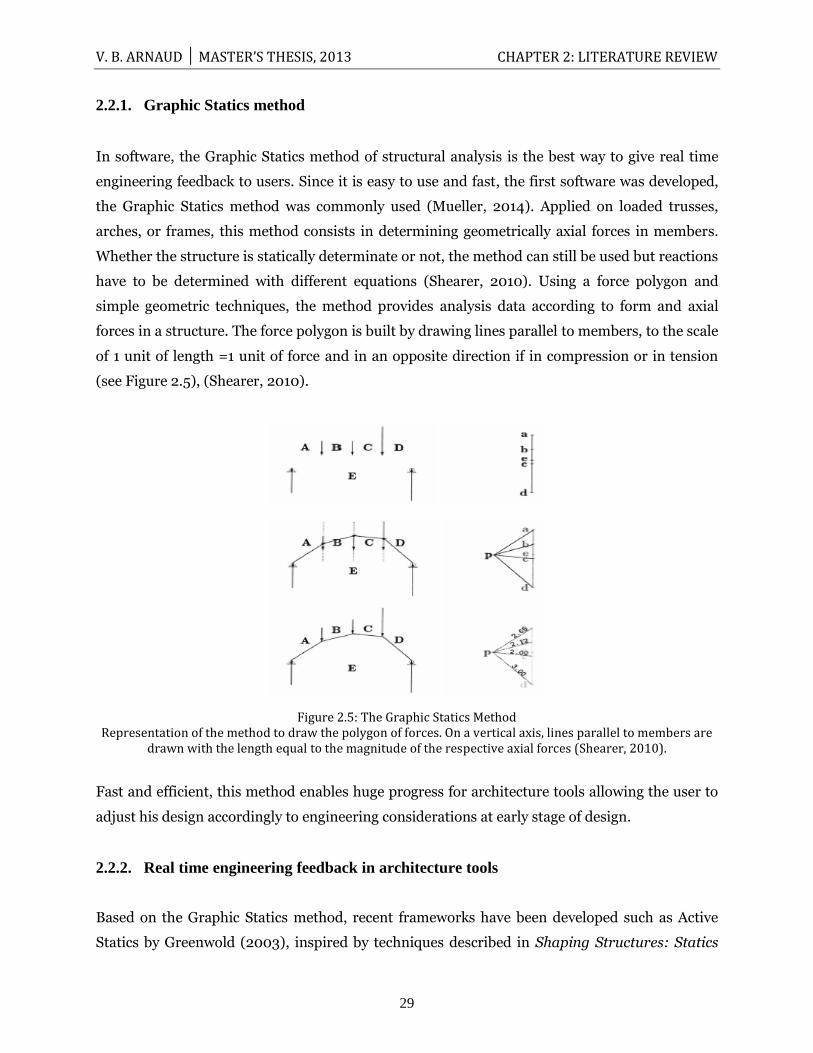
In software, the Graphic Statics method of structural analysis is the best way to give real time
engineering feedback to users. Since it is easy to use and fast, the first software was developed,
the Graphic Statics method was commonly used (Mueller, 2014). Applied on loaded trusses,
arches, or frames, this method consists in determining geometrically axial forces in members.
Whether the structure is statically determinate or not, the method can still be used but reactions
have to be determined with different equations (Shearer, 2010). Using a force polygon and
simple geometric techniques, the method provides analysis data according to form and axial
forces in a structure. The force polygon is built by drawing lines parallel to members, to the scale
of 1 unit of length =1 unit of force and in an opposite direction if in compression or in tension
(see Figure 2.5), (Shearer, 2010).
Figure 2.5: The Graphic Statics Method Representation of the method to draw the polygon of forces. On a vertical axis, lines parallel to members are
drawn with the length equal to the magnitude of the respective axial forces (Shearer, 2010).
Fast and efficient, this method enables huge progress for architecture tools allowing the user to
adjust his design accordingly to engineering considerations at early stage of design.
2.2.2. Real time engineering feedback in architecture tools
Based on the Graphic Statics method, recent frameworks have been developed such as Active
Statics by Greenwold (2003), inspired by techniques described in Shaping Structures: Statics
V. B. ARNAUD │ MASTER’S THESIS, 2013 CHAPTER 2: LITERATURE REVIEW
30
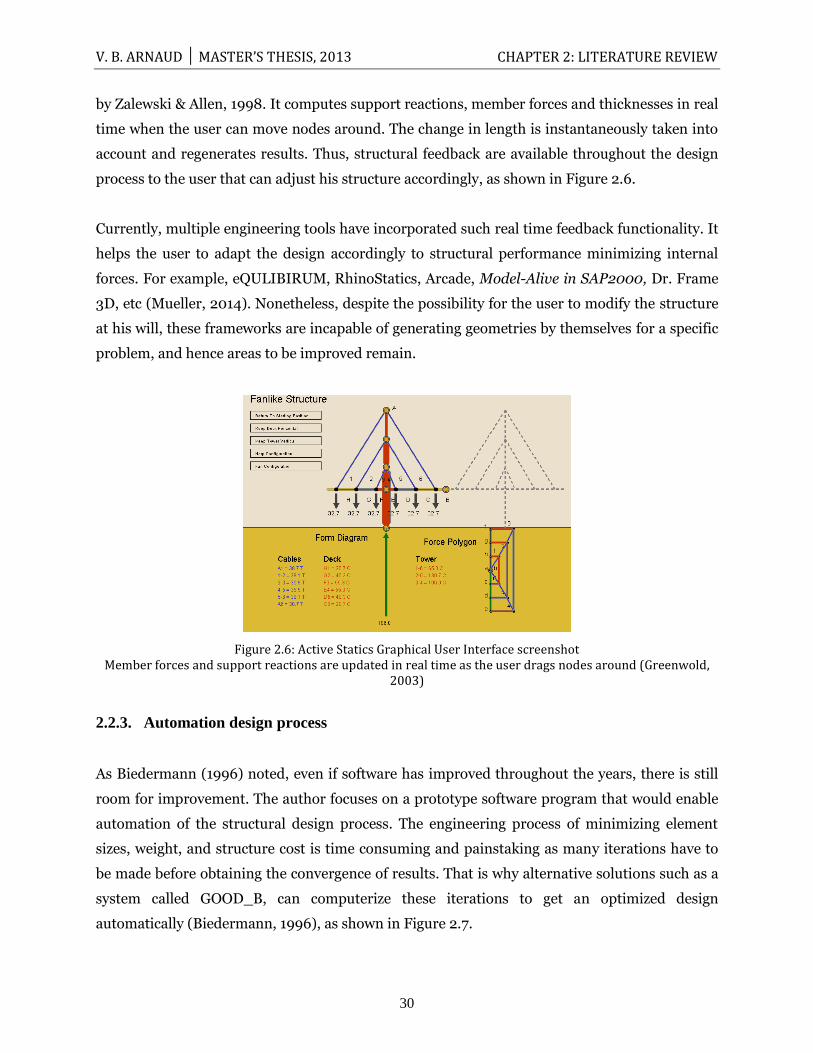
by Zalewski & Allen, 1998. It computes support reactions, member forces and thicknesses in real
time when the user can move nodes around. The change in length is instantaneously taken into
account and regenerates results. Thus, structural feedback are available throughout the design
process to the user that can adjust his structure accordingly, as shown in Figure 2.6.
Currently, multiple engineering tools have incorporated such real time feedback functionality. It
helps the user to adapt the design accordingly to structural performance minimizing internal
forces. For example, eQULIBIRUM, RhinoStatics, Arcade, Model-Alive in SAP2000, Dr. Frame
3D, etc (Mueller, 2014). Nonetheless, despite the possibility for the user to modify the structure
at his will, these frameworks are incapable of generating geometries by themselves for a specific
problem, and hence areas to be improved remain.
Figure 2.6: Active Statics Graphical User Interface screenshot Member forces and support reactions are updated in real time as the user drags nodes around (Greenwold,
2003)
2.2.3. Automation design process
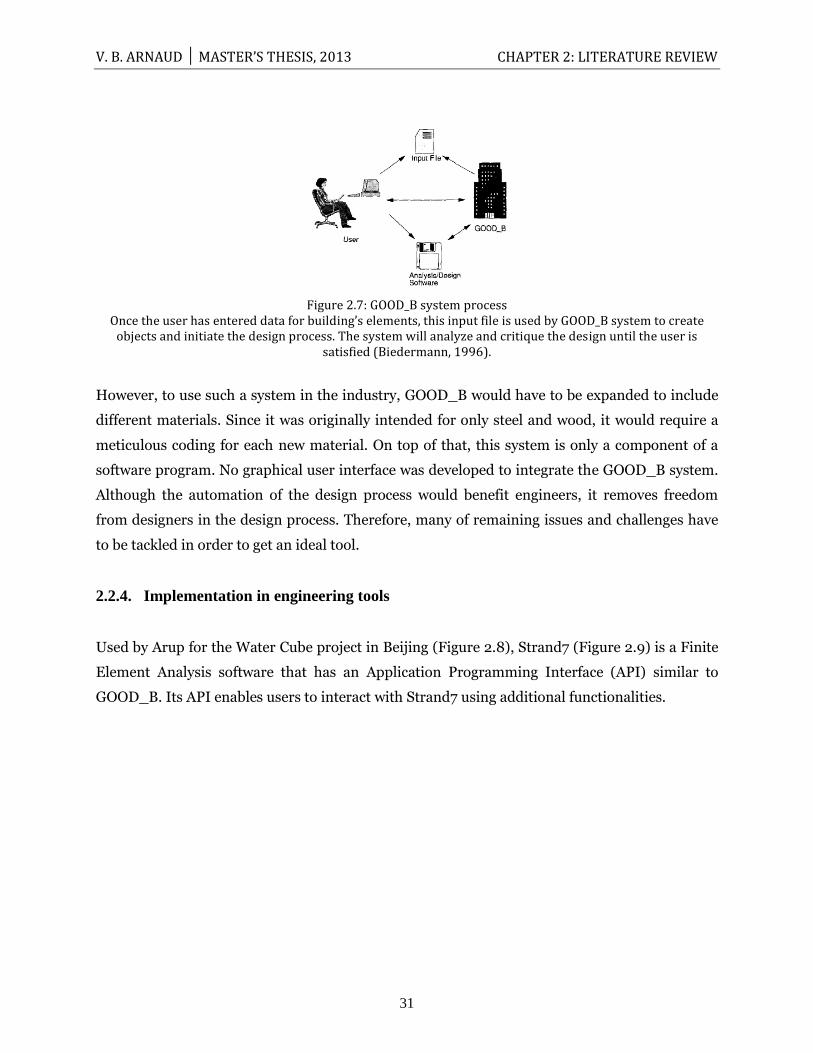
As Biedermann (1996) noted, even if software has improved throughout the years, there is still
room for improvement. The author focuses on a prototype software program that would enable
automation of the structural design process. The engineering process of minimizing element
sizes, weight, and structure cost is time consuming and painstaking as many iterations have to
be made before obtaining the convergence of results. That is why alternative solutions such as a
system called GOOD_B, can computerize these iterations to get an optimized design
automatically (Biedermann, 1996), as shown in Figure 2.7.
V. B. ARNAUD │ MASTER’S THESIS, 2013 CHAPTER 2: LITERATURE REVIEW
31
Figure 2.7: GOOD_B system process Once the user has entered data for building’s elements, this input file is used by GOOD_B system to create
objects and initiate the design process. The system will analyze and critique the design until the user is satisfied (Biedermann, 1996).
However, to use such a system in the industry, GOOD_B would have to be expanded to include
different materials. Since it was originally intended for only steel and wood, it would require a
meticulous coding for each new material. On top of that, this system is only a component of a
software program. No graphical user interface was developed to integrate the GOOD_B system.
Although the automation of the design process would benefit engineers, it removes freedom
from designers in the design process. Therefore, many of remaining issues and challenges have
to be tackled in order to get an ideal tool.
2.2.4. Implementation in engineering tools
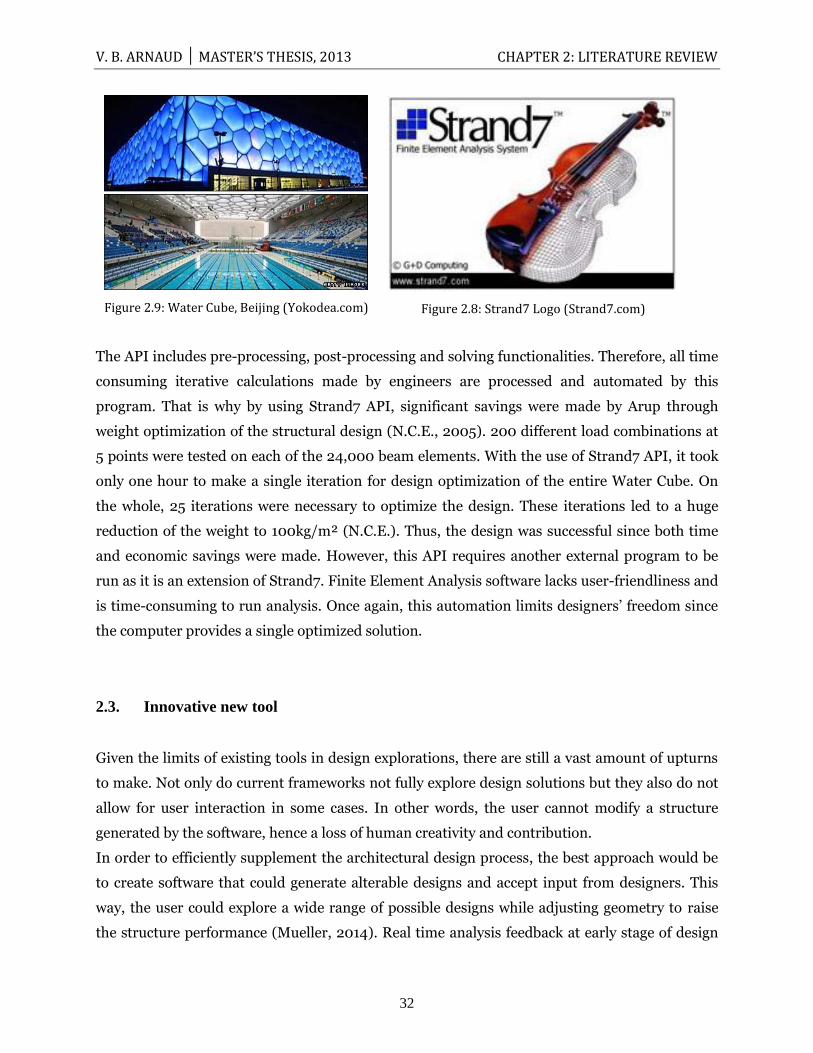
Used by Arup for the Water Cube project in Beijing (Figure 2.8), Strand7 (Figure 2.9) is a Finite
Element Analysis software that has an Application Programming Interface (API) similar to
GOOD_B. Its API enables users to interact with Strand7 using additional functionalities.
V. B. ARNAUD │ MASTER’S THESIS, 2013 CHAPTER 2: LITERATURE REVIEW
32
Figure 2.9: Water Cube, Beijing (Yokodea.com)
The API includes pre-processing, post-processing and solving functionalities. Therefore, all time
consuming iterative calculations made by engineers are processed and automated by this
program. That is why by using Strand7 API, significant savings were made by Arup through
weight optimization of the structural design (N.C.E., 2005). 200 different load combinations at
5 points were tested on each of the 24,000 beam elements. With the use of Strand7 API, it took
only one hour to make a single iteration for design optimization of the entire Water Cube. On
the whole, 25 iterations were necessary to optimize the design. These iterations led to a huge
reduction of the weight to 100kg/m² (N.C.E.). Thus, the design was successful since both time
and economic savings were made. However, this API requires another external program to be
run as it is an extension of Strand7. Finite Element Analysis software lacks user-friendliness and
is time-consuming to run analysis. Once again, this automation limits designers‟ freedom since
the computer provides a single optimized solution.
2.3. Innovative new tool
Given the limits of existing tools in design explorations, there are still a vast amount of upturns
to make. Not only do current frameworks not fully explore design solutions but they also do not
allow for user interaction in some cases. In other words, the user cannot modify a structure
generated by the software, hence a loss of human creativity and contribution.
In order to efficiently supplement the architectural design process, the best approach would be
to create software that could generate alterable designs and accept input from designers. This
way, the user could explore a wide range of possible designs while adjusting geometry to raise
the structure performance (Mueller, 2014). Real time analysis feedback at early stage of design
Figure 2.8: Strand7 Logo (Strand7.com)
V. B. ARNAUD │ MASTER’S THESIS, 2013 CHAPTER 2: LITERATURE REVIEW
33
would lead to intelligent design interaction between the user and the computer. That is what
StructureFIT strives to achieve: an overlap of engineering and architecture by incorporating
structural analysis while offering a computerized generation of designs.
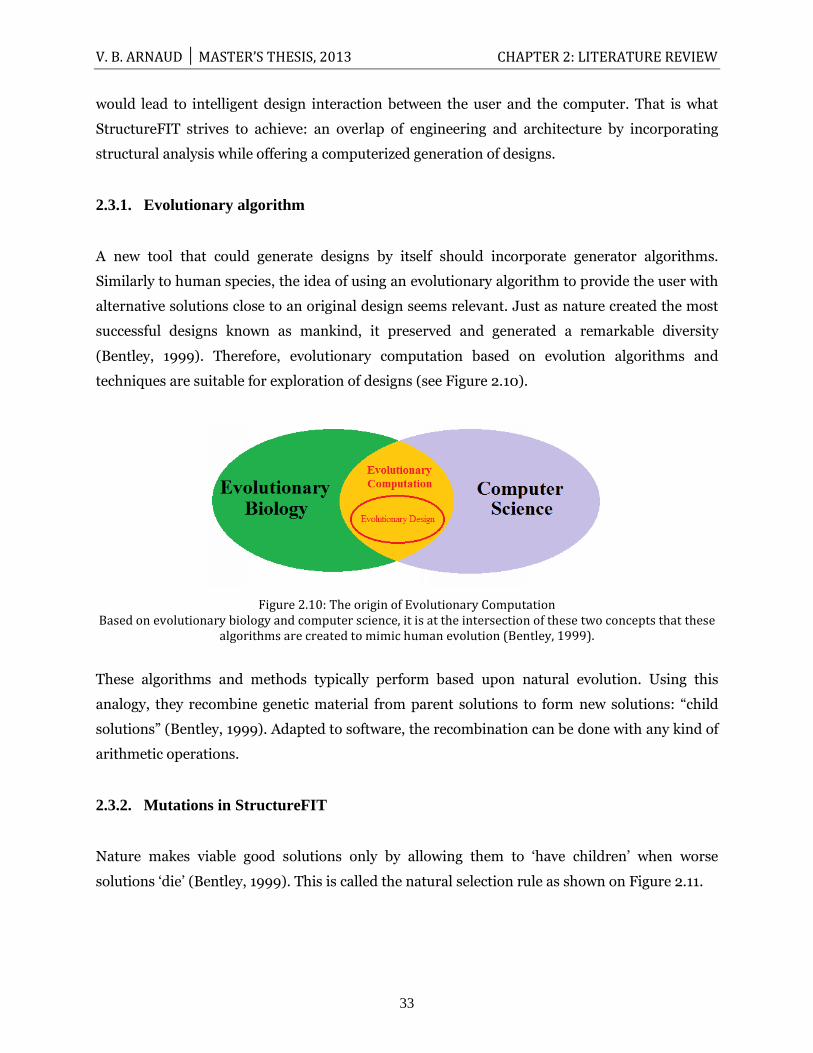
2.3.1. Evolutionary algorithm
A new tool that could generate designs by itself should incorporate generator algorithms.
Similarly to human species, the idea of using an evolutionary algorithm to provide the user with
alternative solutions close to an original design seems relevant. Just as nature created the most
successful designs known as mankind, it preserved and generated a remarkable diversity
(Bentley, 1999). Therefore, evolutionary computation based on evolution algorithms and
techniques are suitable for exploration of designs (see Figure 2.10).
Figure 2.10: The origin of Evolutionary Computation Based on evolutionary biology and computer science, it is at the intersection of these two concepts that these
algorithms are created to mimic human evolution (Bentley, 1999).
These algorithms and methods typically perform based upon natural evolution. Using this
analogy, they recombine genetic material from parent solutions to form new solutions: “child
solutions” (Bentley, 1999). Adapted to software, the recombination can be done with any kind of
arithmetic operations.
2.3.2. Mutations in StructureFIT
Nature makes viable good solutions only by allowing them to „have children‟ when worse
solutions „die‟ (Bentley, 1999). This is called the natural selection rule as shown on Figure 2.11.
V. B. ARNAUD │ MASTER’S THESIS, 2013 CHAPTER 2: LITERATURE REVIEW
34
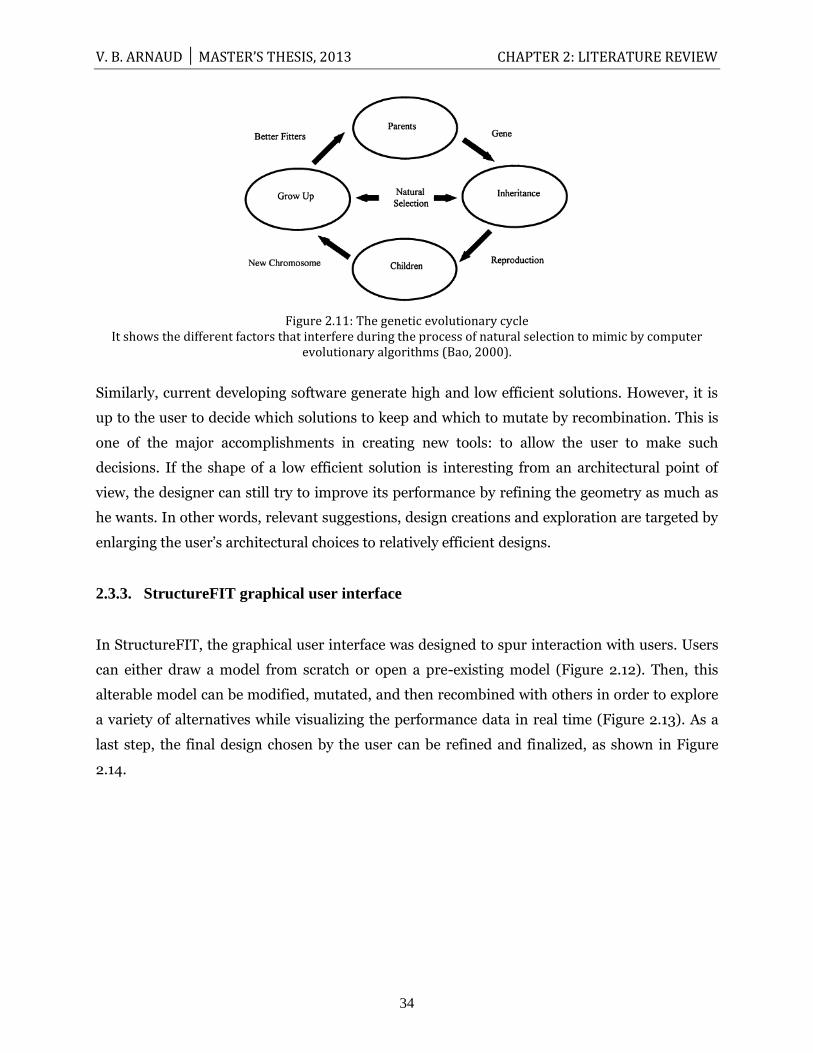
Figure 2.11: The genetic evolutionary cycle It shows the different factors that interfere during the process of natural selection to mimic by computer
evolutionary algorithms (Bao, 2000).
Similarly, current developing software generate high and low efficient solutions. However, it is
up to the user to decide which solutions to keep and which to mutate by recombination. This is
one of the major accomplishments in creating new tools: to allow the user to make such
decisions. If the shape of a low efficient solution is interesting from an architectural point of
view, the designer can still try to improve its performance by refining the geometry as much as
he wants. In other words, relevant suggestions, design creations and exploration are targeted by
enlarging the user‟s architectural choices to relatively efficient designs.
2.3.3. StructureFIT graphical user interface
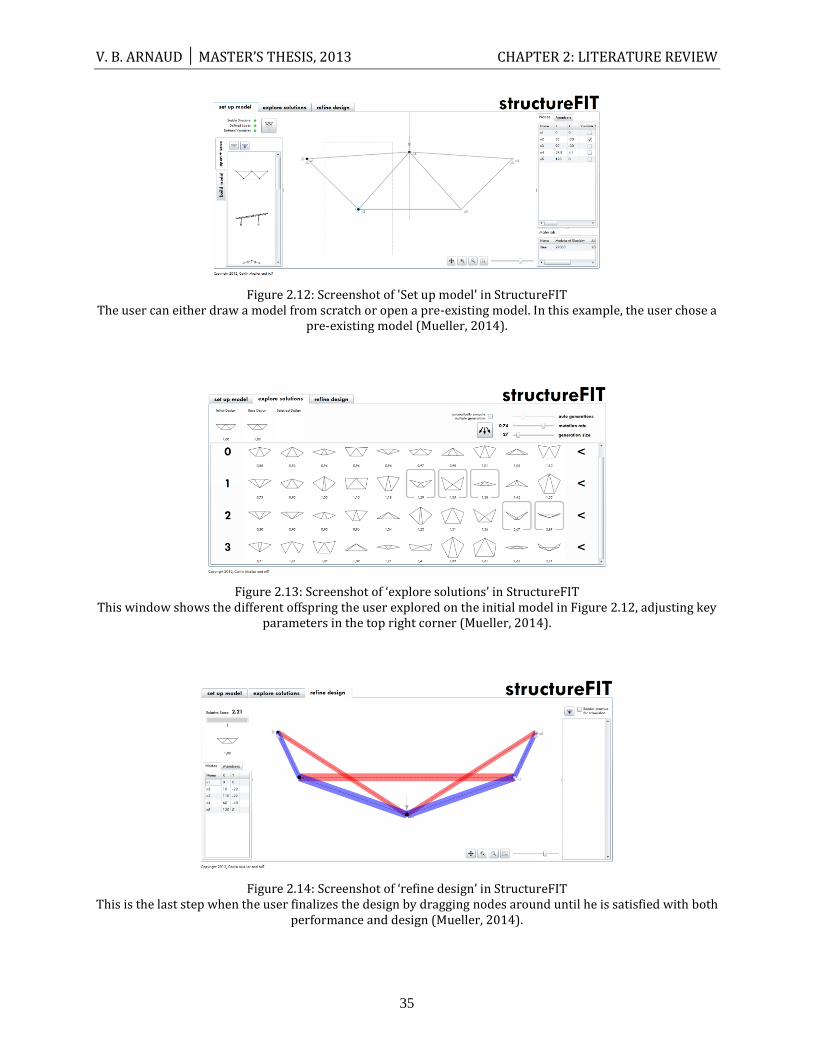
In StructureFIT, the graphical user interface was designed to spur interaction with users. Users
can either draw a model from scratch or open a pre-existing model (Figure 2.12). Then, this
alterable model can be modified, mutated, and then recombined with others in order to explore
a variety of alternatives while visualizing the performance data in real time (Figure 2.13). As a
last step, the final design chosen by the user can be refined and finalized, as shown in Figure
2.14.
V. B. ARNAUD │ MASTER’S THESIS, 2013 CHAPTER 2: LITERATURE REVIEW
35
Figure 2.12: Screenshot of 'Set up model' in StructureFIT The user can either draw a model from scratch or open a pre-existing model. In this example, the user chose a
pre-existing model (Mueller, 2014).
Figure 2.13: Screenshot of ‘explore solutions’ in StructureFIT This window shows the different offspring the user explored on the initial model in Figure 2.12, adjusting key
parameters in the top right corner (Mueller, 2014).
Figure 2.14: Screenshot of ‘refine design’ in StructureFIT This is the last step when the user finalizes the design by dragging nodes around until he is satisfied with both
performance and design (Mueller, 2014).
V. B. ARNAUD │ MASTER’S THESIS, 2013 CHAPTER 2: LITERATURE REVIEW
36
Thus, during the design search process, the instantaneously updated data with geometry
modifications allows architects to both explore and adapt shapes accordingly. This facilitates the
engineering work later on as structures are initially designed with engineering considerations.
2.3.4. Benefits of such new tools
Software capable of generating a wide variety of designs with satisfying performances, enables
the enhancement of creativity, architectural innovation and ensures feasibility. Not only will the
user be offered structurally efficient designs, but he will also be able to work on unexpected and
surprising shapes.
By definition, an efficient structure uses less material, hence a lower impact on resources and a
lower cost. Moreover, the cost can also be reduced based on structural feasibility ensuring safety
and easy construction. On top of that, the most elegant structures are usually the one that are
the symbiosis of engineering and architecture goals. There is material only where there is the
need to (i.e., material follows internal flows of forces). Thus, by incorporating structural
analysis, early stages of conceptual design enable more than just architectural innovations.
2.4. Usability study
This section introduces usability testing and develops procedures and specificities for such
process. It defines terminology in Section 2.4.1, then it explains the process of a usability study.
To finish, it describes the several issues related to the use of humans for such a study: the
requirement of authorizations and the numbers of testers needed.
2.4.1. The psychology of Testing
Usability testing is the verification that a framework meets expectations both in terms of quality
and specified requirements (Brownlee, 2011). Several methods allow to do so. If algorithms are
used to check the program code itself, it is called a „software testing‟. However, in this thesis the
focus is the testing of several functions for new developed framework, in other words, user-
based-testing. This study does not involve tests on the internal workings of software such as the
use of algorithms to test the code, hence the term „usability study‟.
V. B. ARNAUD │ MASTER’S THESIS, 2013 CHAPTER 2: LITERATURE REVIEW
37
It is important to define usability testing in order to understand the issues and prepare well-
defined tests. The aim is not to test a program to prove that it functions correctly, with no errors.
The main purpose is the intent of locating errors as many as possible and whose presence is
assumed (Glenford et al., 2012). Therefore, a successful usability study would be one that finds
errors in a program while establishing some confidence that the program functions correctly.
Thus, to do a usability study enables the identification of flaws, defects, problems, etc, in a
framework. Although such study cannot fully locate all defects in one implementation, it can be
reiterate as many times as needed and at every step of software design, which makes it a fairly
efficient method. Moreover, it provides the programmers and developers with valuable feedback
on his framework and they can adjust it accordingly. Additionally, this study aims to do more
than what was explained in this section - it tries to gain understanding of design processes.
2.4.2. Usability study process
A successful usability study requires to meticulously elaborate procedural tests in order to
ensure to accurately evaluate the intended function for example. Moreover, the goal of software
testing does not involve to test every functionality of software programs. It is usually the desire
to concentrate tests on areas of „risk, uncertainty or criticality‟ (Brownlee, 2011). That is why for
example, StructureFIT graphical user interface is not intended to be fully tested during usability
studies which are detailed in Chapter 3: Methodology. Indeed, the aim of this thesis targets the
exploration design input assessment of such new tool, and not the user interface. Parts of the
tests will however enable the assessment of it but as adjunct and accessory results.
Butler (1996) stated that “usability has become a competitive necessity for the… success of
software”. It is therefore essential to test new developed frameworks to assess the usability. As
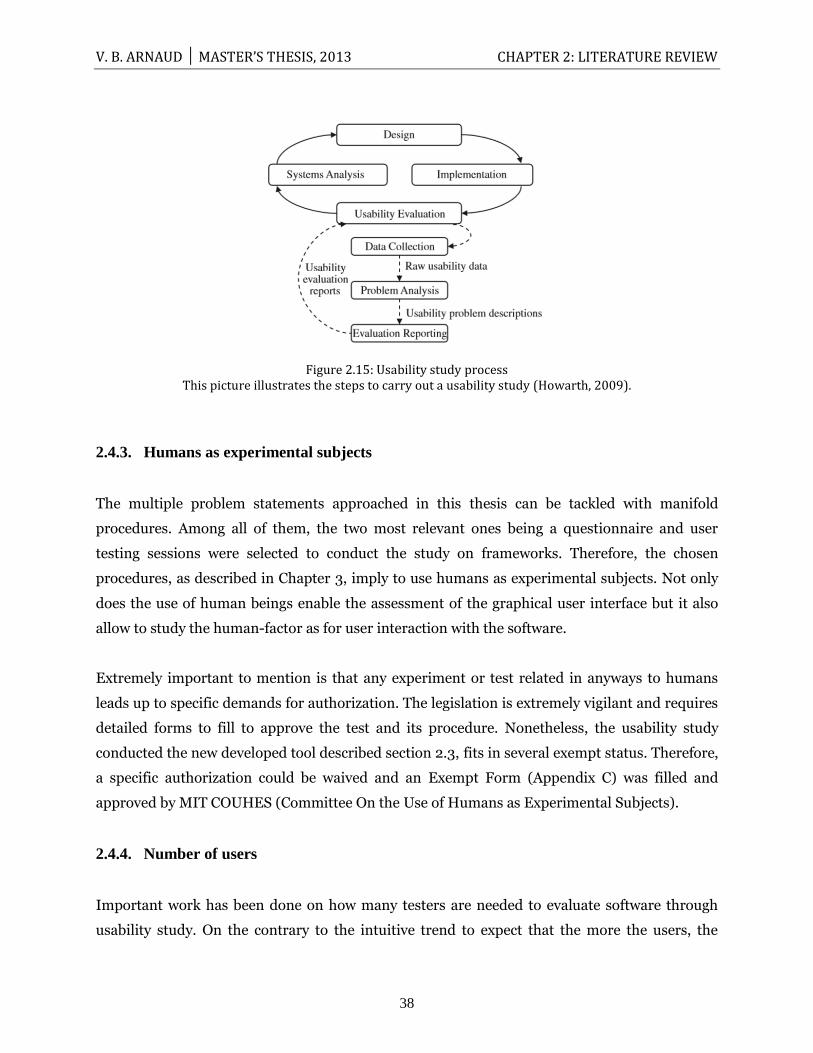
shown on Figure 2.15, a usability study is a three step process: collecting data, analyzing them
and reporting results. These enable programmers and developers to ensure software reliability
and quality as they are the keys for success in the industry. Both enable professionals to work
efficiently in the current world (Howarth, 2009), where productivity is at stake. That is why
currently, there is an incredible competition for the fastest, most performing, and most effective
tools. Thus, usability studies as a preliminary assessment are carried out to make sure these
main features are provided by new developed tools. As an example, the one on StructureFIT is
what this thesis focus on.
V. B. ARNAUD │ MASTER’S THESIS, 2013 CHAPTER 2: LITERATURE REVIEW
38
Figure 2.15: Usability study process This picture illustrates the steps to carry out a usability study (Howarth, 2009).
2.4.3. Humans as experimental subjects
The multiple problem statements approached in this thesis can be tackled with manifold
procedures. Among all of them, the two most relevant ones being a questionnaire and user
testing sessions were selected to conduct the study on frameworks. Therefore, the chosen
procedures, as described in Chapter 3, imply to use humans as experimental subjects. Not only
does the use of human beings enable the assessment of the graphical user interface but it also
allow to study the human-factor as for user interaction with the software.
Extremely important to mention is that any experiment or test related in anyways to humans
leads up to specific demands for authorization. The legislation is extremely vigilant and requires
detailed forms to fill to approve the test and its procedure. Nonetheless, the usability study
conducted the new developed tool described section 2.3, fits in several exempt status. Therefore,
a specific authorization could be waived and an Exempt Form (Appendix C) was filled and
approved by MIT COUHES (Committee On the Use of Humans as Experimental Subjects).
2.4.4. Number of users
Important work has been done on how many testers are needed to evaluate software through
usability study. On the contrary to the intuitive trend to expect that the more the users, the

V. B. ARNAUD │ MASTER’S THESIS, 2013 CHAPTER 2: LITERATURE REVIEW
39
better, the actual number of users needed is small (Glenford et al., 2012). Some reasons why
there is a limit are that it is almost impossible to detect all of inherent problems, also collecting
and analyzing data is more difficult as the number of testers increases.
The work conducted by a usability study expert, Jakob Nielsen, tried to establish a correlation
between the percentage of errors found and the number of users. With the notations explained
below, he established a correlation given by the equation in Figure 2.16.
E = percent of errors found
n = number of testers
L = percent of usability problems found by a tester
E = 100 * [ 1 - (1-L)n
]
Figure 2.16: equation of the percentage of errors found in terms of the number of users
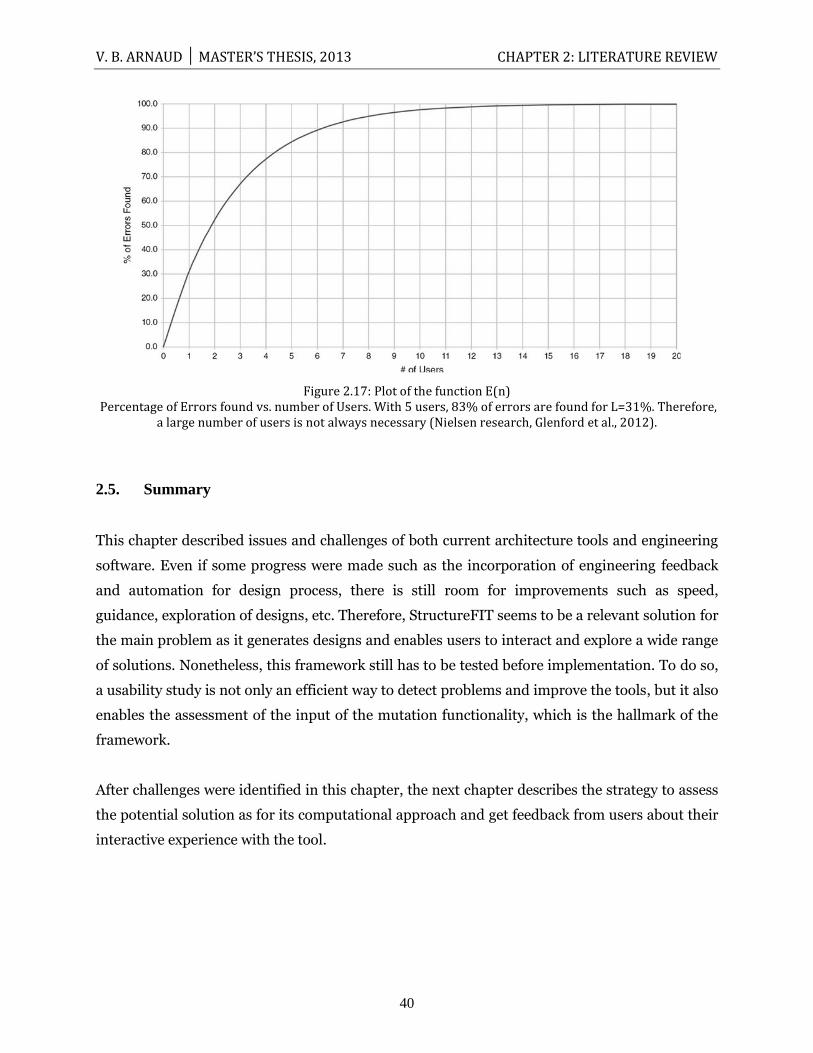
As an example, L could be chosen to be L=31% which has been demonstrated to be a reasonable
value in Nielsen research. On Figure 2.17, the asymptotic plot resulting from this value clearly
shows that most of the errors are found with a small number of users.
However, the number of users depends on the complexity of software and the choice of users in
terms of backgrounds and experiences. Sometimes, a larger number of users will be necessary in
order to reach a satisfying amount of errors found (Glenford et al., 2012). It is then up to the
developers to find the right amount of testers accordingly to his budget and time.
V. B. ARNAUD │ MASTER’S THESIS, 2013 CHAPTER 2: LITERATURE REVIEW
40
Figure 2.17: Plot of the function E(n) Percentage of Errors found vs. number of Users. With 5 users, 83% of errors are found for L=31%. Therefore,
a large number of users is not always necessary (Nielsen research, Glenford et al., 2012).
2.5. Summary
This chapter described issues and challenges of both current architecture tools and engineering
software. Even if some progress were made such as the incorporation of engineering feedback
and automation for design process, there is still room for improvements such as speed,
guidance, exploration of designs, etc. Therefore, StructureFIT seems to be a relevant solution for
the main problem as it generates designs and enables users to interact and explore a wide range
of solutions. Nonetheless, this framework still has to be tested before implementation. To do so,
a usability study is not only an efficient way to detect problems and improve the tools, but it also
enables the assessment of the input of the mutation functionality, which is the hallmark of the
framework.
After challenges were identified in this chapter, the next chapter describes the strategy to assess
the potential solution as for its computational approach and get feedback from users about their
interactive experience with the tool.
V. B. ARNAUD │ MASTER’S THESIS, 2013 CHAPTER 3: METHODOLOGY
41
CHAPTER 3:
3. METHODOLOGY
The chapter first presents the usability study and the questionnaire specifically designed for this
thesis, and then explains the mathematical tools and visualizations used to illustrate the results
of the questionnaire and study.
3.1. The usability study
The usability study on StructureFIT is the core of the testing procedure. This section will explain
and describe each of the process aspects that such a study implies. The subject profiles chosen is
depicted first, followed by the preliminary test. Then, the process of the actual usability study is
given in details. Lastly, details on the tests‟ contents are provided to fully describe the study.
3.1.1. Subject profiles
As a result of the current industry that only allows a linear design process, architecture and
engineers are segregated, with very few possible interaction, and provided with software
exclusively related to one profession. However, StructureFIT framework can be used by both
V. B. ARNAUD │ MASTER’S THESIS, 2013 CHAPTER 3: METHODOLOGY
42
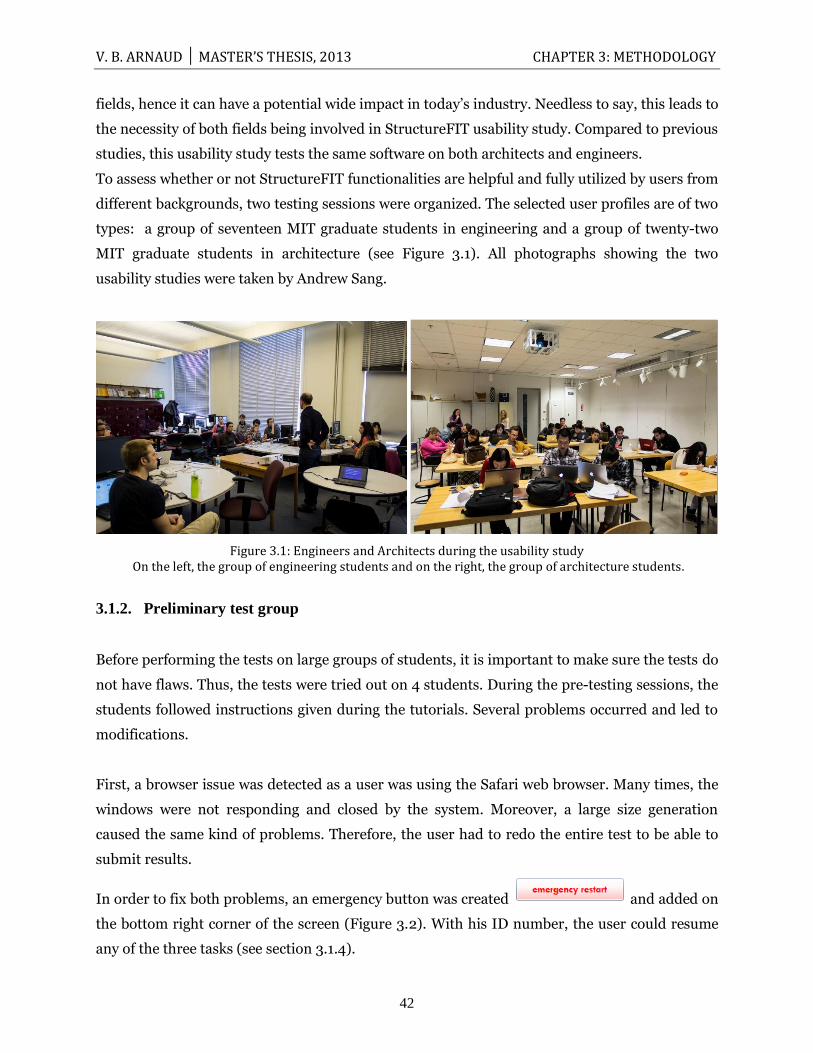
fields, hence it can have a potential wide impact in today‟s industry. Needless to say, this leads to
the necessity of both fields being involved in StructureFIT usability study. Compared to previous
studies, this usability study tests the same software on both architects and engineers.
To assess whether or not StructureFIT functionalities are helpful and fully utilized by users from
different backgrounds, two testing sessions were organized. The selected user profiles are of two
types: a group of seventeen MIT graduate students in engineering and a group of twenty-two
MIT graduate students in architecture (see Figure 3.1). All photographs showing the two
usability studies were taken by Andrew Sang.
Figure 3.1: Engineers and Architects during the usability study On the left, the group of engineering students and on the right, the group of architecture students.
3.1.2. Preliminary test group
Before performing the tests on large groups of students, it is important to make sure the tests do
not have flaws. Thus, the tests were tried out on 4 students. During the pre-testing sessions, the
students followed instructions given during the tutorials. Several problems occurred and led to
modifications.
First, a browser issue was detected as a user was using the Safari web browser. Many times, the
windows were not responding and closed by the system. Moreover, a large size generation
caused the same kind of problems. Therefore, the user had to redo the entire test to be able to
submit results.
In order to fix both problems, an emergency button was created and added on
the bottom right corner of the screen (Figure 3.2). With his ID number, the user could resume
any of the three tasks (see section 3.1.4).
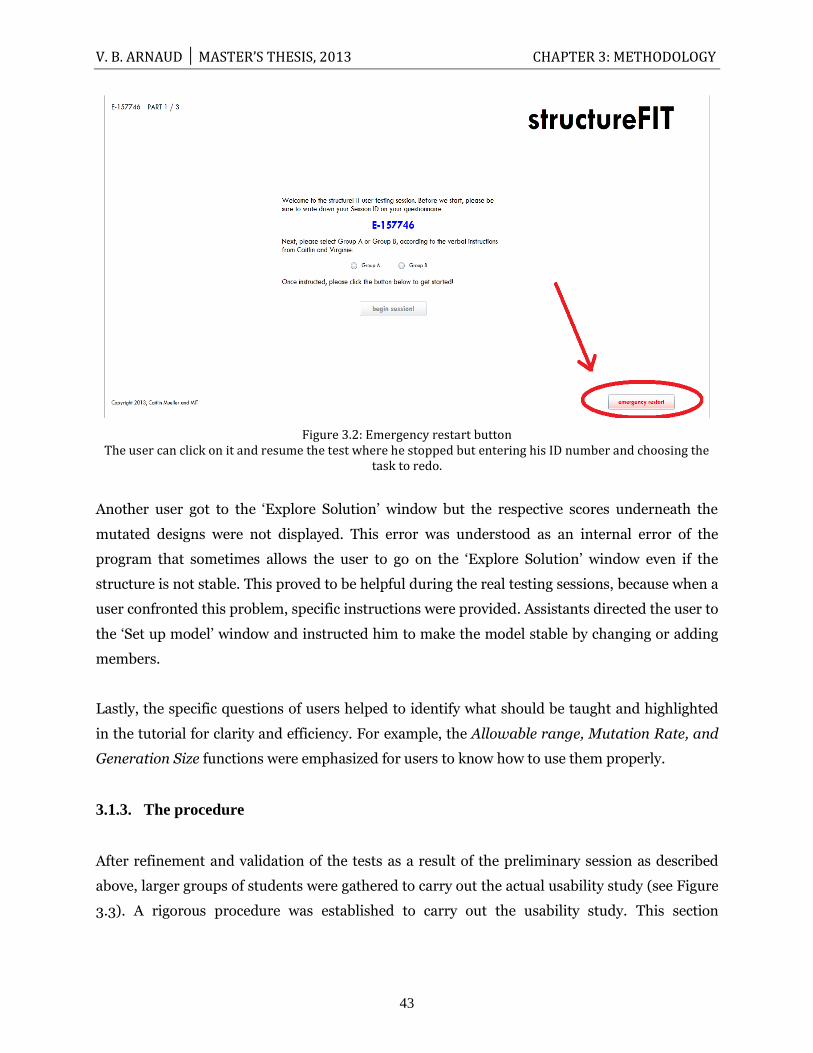
V. B. ARNAUD │ MASTER’S THESIS, 2013 CHAPTER 3: METHODOLOGY
43
Figure 3.2: Emergency restart button The user can click on it and resume the test where he stopped but entering his ID number and choosing the
task to redo.
Another user got to the „Explore Solution‟ window but the respective scores underneath the
mutated designs were not displayed. This error was understood as an internal error of the
program that sometimes allows the user to go on the „Explore Solution‟ window even if the
structure is not stable. This proved to be helpful during the real testing sessions, because when a
user confronted this problem, specific instructions were provided. Assistants directed the user to
the „Set up model‟ window and instructed him to make the model stable by changing or adding
members.
Lastly, the specific questions of users helped to identify what should be taught and highlighted
in the tutorial for clarity and efficiency. For example, the Allowable range, Mutation Rate, and
Generation Size functions were emphasized for users to know how to use them properly.
3.1.3. The procedure
After refinement and validation of the tests as a result of the preliminary session as described
above, larger groups of students were gathered to carry out the actual usability study (see Figure
3.3). A rigorous procedure was established to carry out the usability study. This section
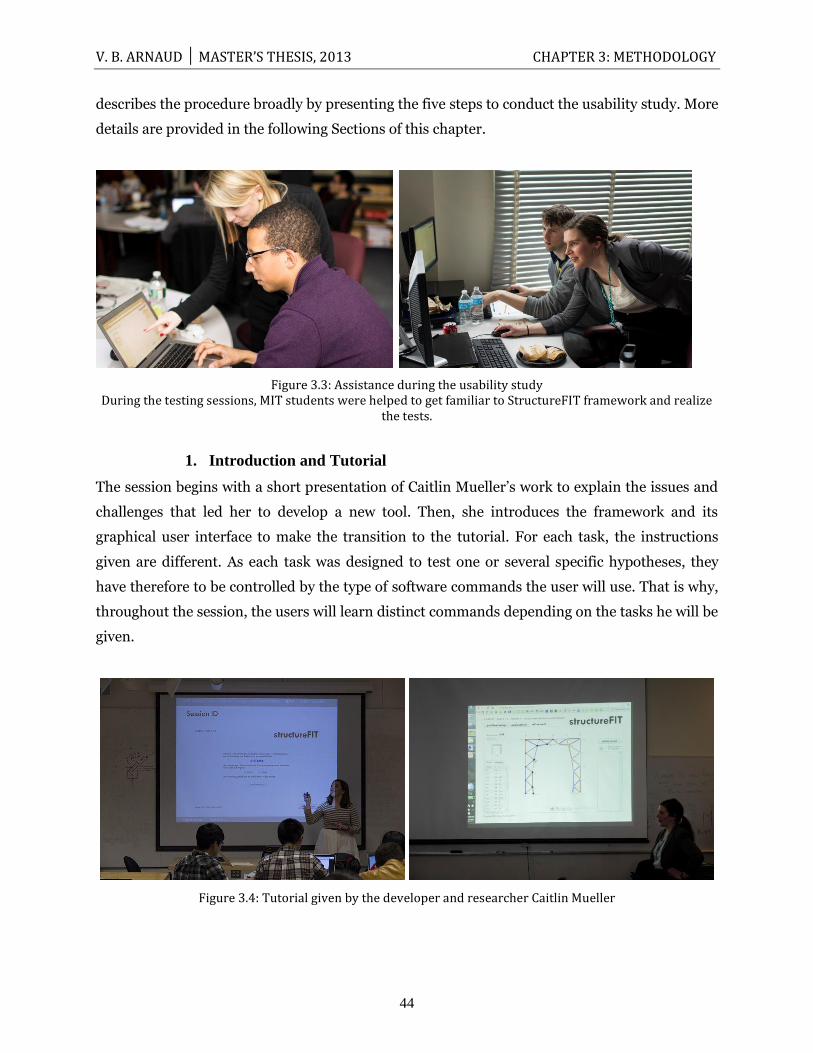
V. B. ARNAUD │ MASTER’S THESIS, 2013 CHAPTER 3: METHODOLOGY
44
describes the procedure broadly by presenting the five steps to conduct the usability study. More
details are provided in the following Sections of this chapter.
Figure 3.3: Assistance during the usability study During the testing sessions, MIT students were helped to get familiar to StructureFIT framework and realize
the tests.
1. Introduction and Tutorial
The session begins with a short presentation of Caitlin Mueller‟s work to explain the issues and
challenges that led her to develop a new tool. Then, she introduces the framework and its
graphical user interface to make the transition to the tutorial. For each task, the instructions
given are different. As each task was designed to test one or several specific hypotheses, they
have therefore to be controlled by the type of software commands the user will use. That is why,
throughout the session, the users will learn distinct commands depending on the tasks he will be
given.
Figure 3.4: Tutorial given by the developer and researcher Caitlin Mueller
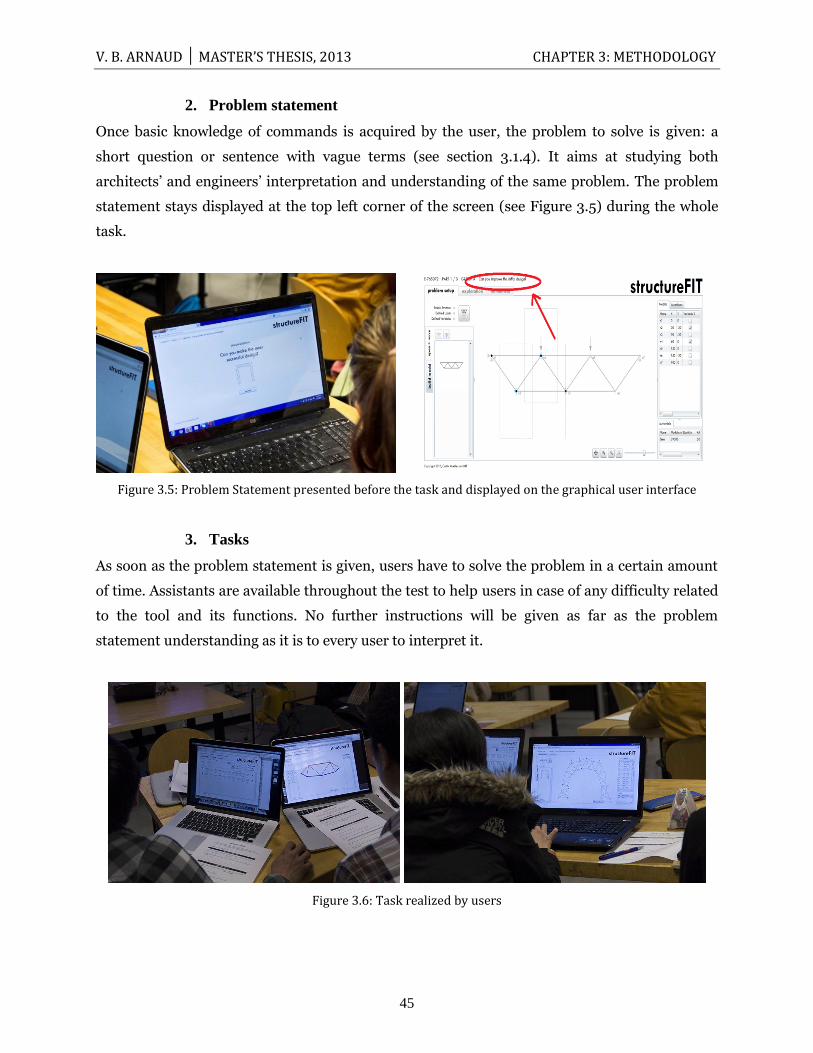
V. B. ARNAUD │ MASTER’S THESIS, 2013 CHAPTER 3: METHODOLOGY
45
2. Problem statement
Once basic knowledge of commands is acquired by the user, the problem to solve is given: a
short question or sentence with vague terms (see section 3.1.4). It aims at studying both
architects‟ and engineers‟ interpretation and understanding of the same problem. The problem
statement stays displayed at the top left corner of the screen (see Figure 3.5) during the whole
task.
Figure 3.5: Problem Statement presented before the task and displayed on the graphical user interface
3. Tasks
As soon as the problem statement is given, users have to solve the problem in a certain amount
of time. Assistants are available throughout the test to help users in case of any difficulty related
to the tool and its functions. No further instructions will be given as far as the problem
statement understanding as it is to every user to interpret it.
Figure 3.6: Task realized by users
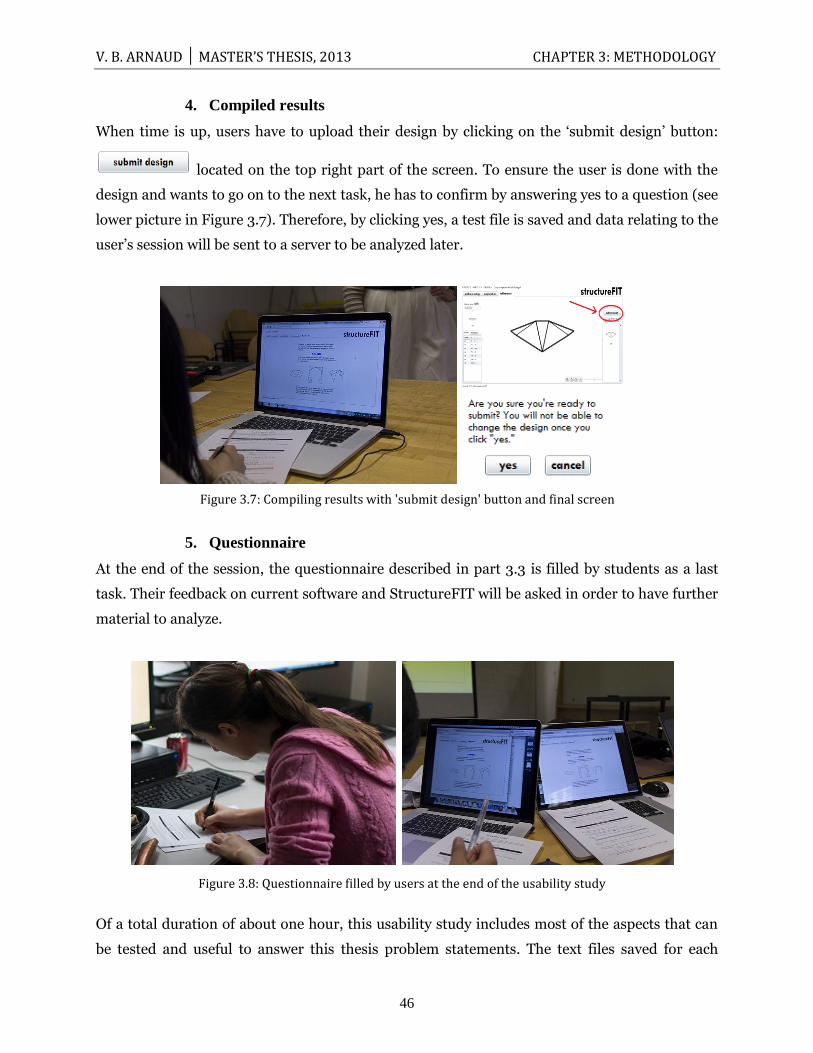
V. B. ARNAUD │ MASTER’S THESIS, 2013 CHAPTER 3: METHODOLOGY
46
4. Compiled results
When time is up, users have to upload their design by clicking on the „submit design‟ button:
located on the top right part of the screen. To ensure the user is done with the
design and wants to go on to the next task, he has to confirm by answering yes to a question (see
lower picture in Figure 3.7). Therefore, by clicking yes, a test file is saved and data relating to the
user‟s session will be sent to a server to be analyzed later.
5. Questionnaire
At the end of the session, the questionnaire described in part 3.3 is filled by students as a last
task. Their feedback on current software and StructureFIT will be asked in order to have further
material to analyze.
Of a total duration of about one hour, this usability study includes most of the aspects that can
be tested and useful to answer this thesis problem statements. The text files saved for each
Figure 3.7: Compiling results with 'submit design' button and final screen
Figure 3.8: Questionnaire filled by users at the end of the usability study
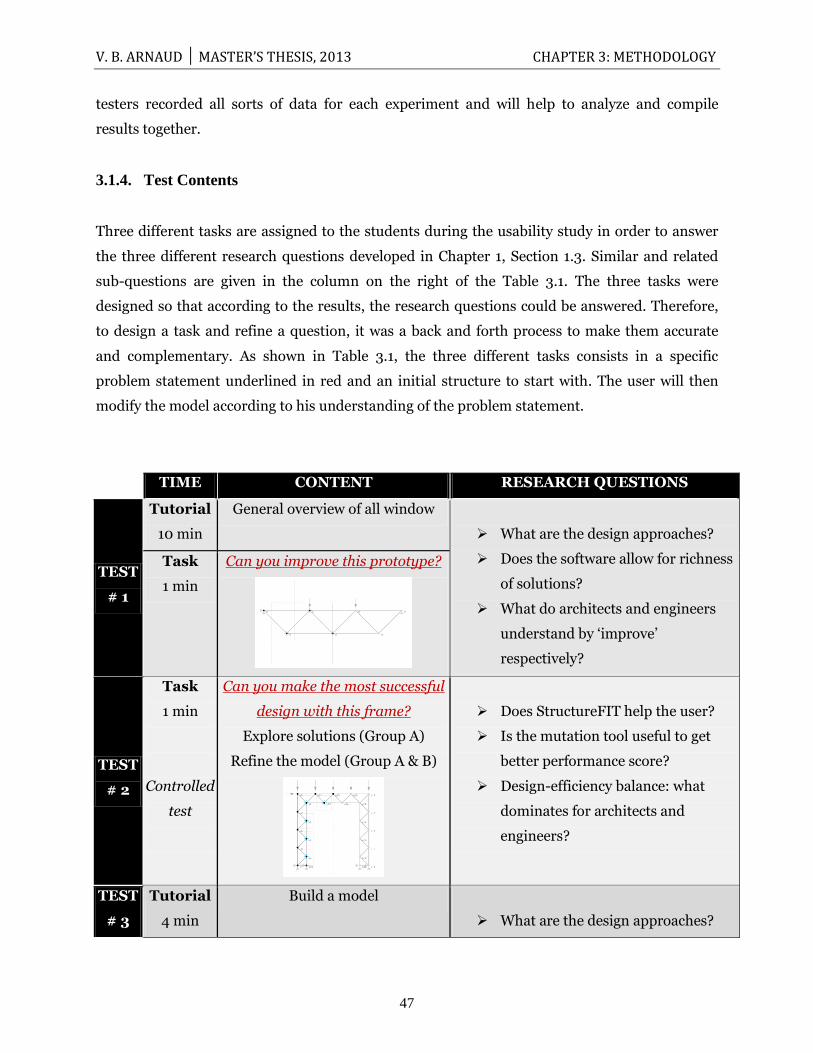
V. B. ARNAUD │ MASTER’S THESIS, 2013 CHAPTER 3: METHODOLOGY
47
testers recorded all sorts of data for each experiment and will help to analyze and compile
results together.
3.1.4. Test Contents
Three different tasks are assigned to the students during the usability study in order to answer
the three different research questions developed in Chapter 1, Section 1.3. Similar and related
sub-questions are given in the column on the right of the Table 3.1. The three tasks were
designed so that according to the results, the research questions could be answered. Therefore,
to design a task and refine a question, it was a back and forth process to make them accurate
and complementary. As shown in Table 3.1, the three different tasks consists in a specific
problem statement underlined in red and an initial structure to start with. The user will then
modify the model according to his understanding of the problem statement.
TIME CONTENT RESEARCH QUESTIONS
TEST
# 1
Tutorial
10 min
General overview of all window
What are the design approaches?
Does the software allow for richness
of solutions?
What do architects and engineers
understand by „improve‟
respectively?
Task
1 min
Can you improve this prototype?
TEST
# 2
Task
1 min
Controlled
test
Can you make the most successful
design with this frame?
Explore solutions (Group A)
Refine the model (Group A & B)
Does StructureFIT help the user?
Is the mutation tool useful to get
better performance score?
Design-efficiency balance: what
dominates for architects and
engineers?
TEST
# 3
Tutorial
4 min
Build a model
What are the design approaches?
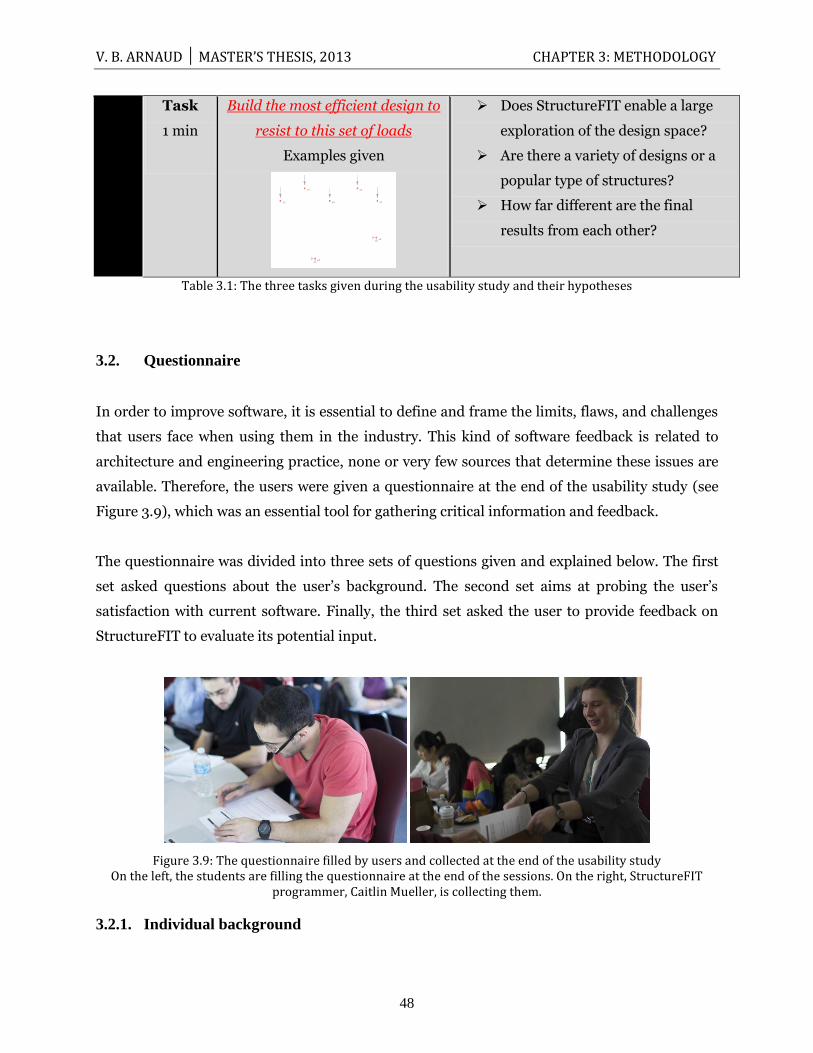
V. B. ARNAUD │ MASTER’S THESIS, 2013 CHAPTER 3: METHODOLOGY
48
Task
1 min
Build the most efficient design to
resist to this set of loads
Examples given
Does StructureFIT enable a large
exploration of the design space?
Are there a variety of designs or a
popular type of structures?
How far different are the final
results from each other?
Table 3.1: The three tasks given during the usability study and their hypotheses
3.2. Questionnaire
In order to improve software, it is essential to define and frame the limits, flaws, and challenges
that users face when using them in the industry. This kind of software feedback is related to
architecture and engineering practice, none or very few sources that determine these issues are
available. Therefore, the users were given a questionnaire at the end of the usability study (see
Figure 3.9), which was an essential tool for gathering critical information and feedback.
The questionnaire was divided into three sets of questions given and explained below. The first
set asked questions about the user‟s background. The second set aims at probing the user‟s
satisfaction with current software. Finally, the third set asked the user to provide feedback on
StructureFIT to evaluate its potential input.
Figure 3.9: The questionnaire filled by users and collected at the end of the usability study On the left, the students are filling the questionnaire at the end of the sessions. On the right, StructureFIT
programmer, Caitlin Mueller, is collecting them.
3.2.1. Individual background
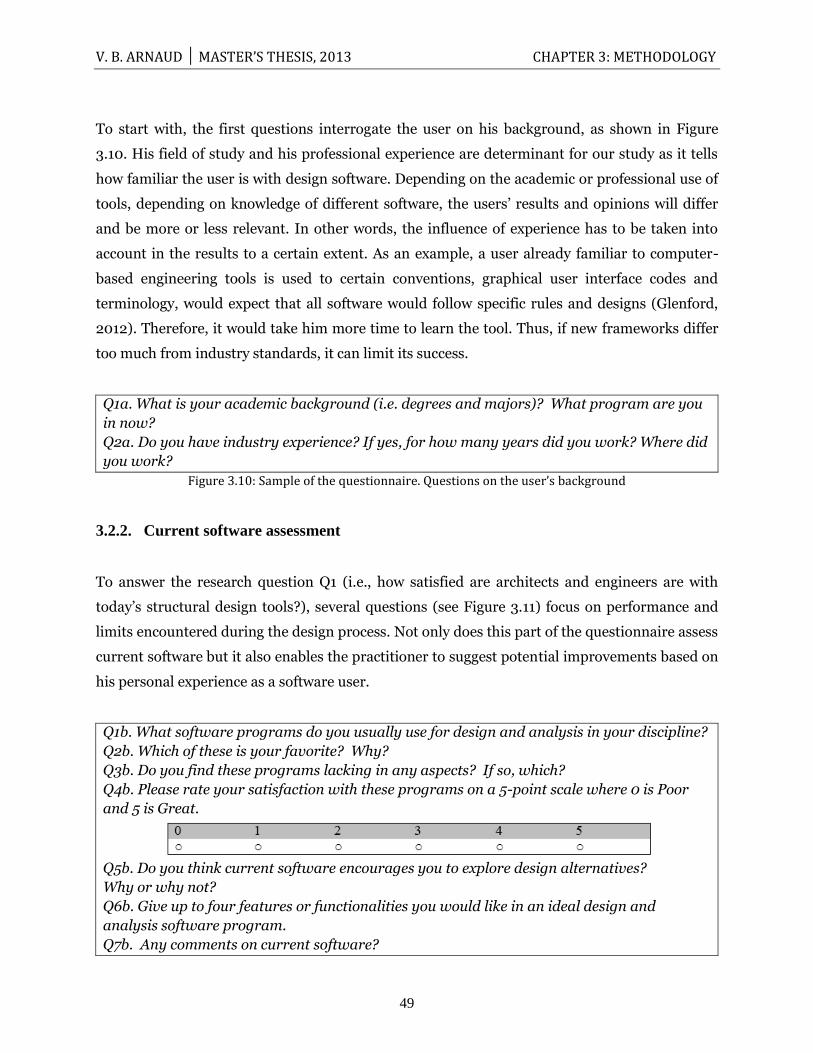
V. B. ARNAUD │ MASTER’S THESIS, 2013 CHAPTER 3: METHODOLOGY
49
To start with, the first questions interrogate the user on his background, as shown in Figure
3.10. His field of study and his professional experience are determinant for our study as it tells
how familiar the user is with design software. Depending on the academic or professional use of
tools, depending on knowledge of different software, the users‟ results and opinions will differ
and be more or less relevant. In other words, the influence of experience has to be taken into
account in the results to a certain extent. As an example, a user already familiar to computer-
based engineering tools is used to certain conventions, graphical user interface codes and
terminology, would expect that all software would follow specific rules and designs (Glenford,
2012). Therefore, it would take him more time to learn the tool. Thus, if new frameworks differ
too much from industry standards, it can limit its success.
Q1a. What is your academic background (i.e. degrees and majors)? What program are you
in now?
Q2a. Do you have industry experience? If yes, for how many years did you work? Where did
you work?
Figure 3.10: Sample of the questionnaire. Questions on the user’s background
3.2.2. Current software assessment
To answer the research question Q1 (i.e., how satisfied are architects and engineers are with
today‟s structural design tools?), several questions (see Figure 3.11) focus on performance and
limits encountered during the design process. Not only does this part of the questionnaire assess
current software but it also enables the practitioner to suggest potential improvements based on
his personal experience as a software user.
Q1b. What software programs do you usually use for design and analysis in your discipline?
Q2b. Which of these is your favorite? Why?
Q3b. Do you find these programs lacking in any aspects? If so, which?
Q4b. Please rate your satisfaction with these programs on a 5-point scale where 0 is Poor
and 5 is Great.
Q5b. Do you think current software encourages you to explore design alternatives?
Why or why not?
Q6b. Give up to four features or functionalities you would like in an ideal design and
analysis software program.
Q7b. Any comments on current software?
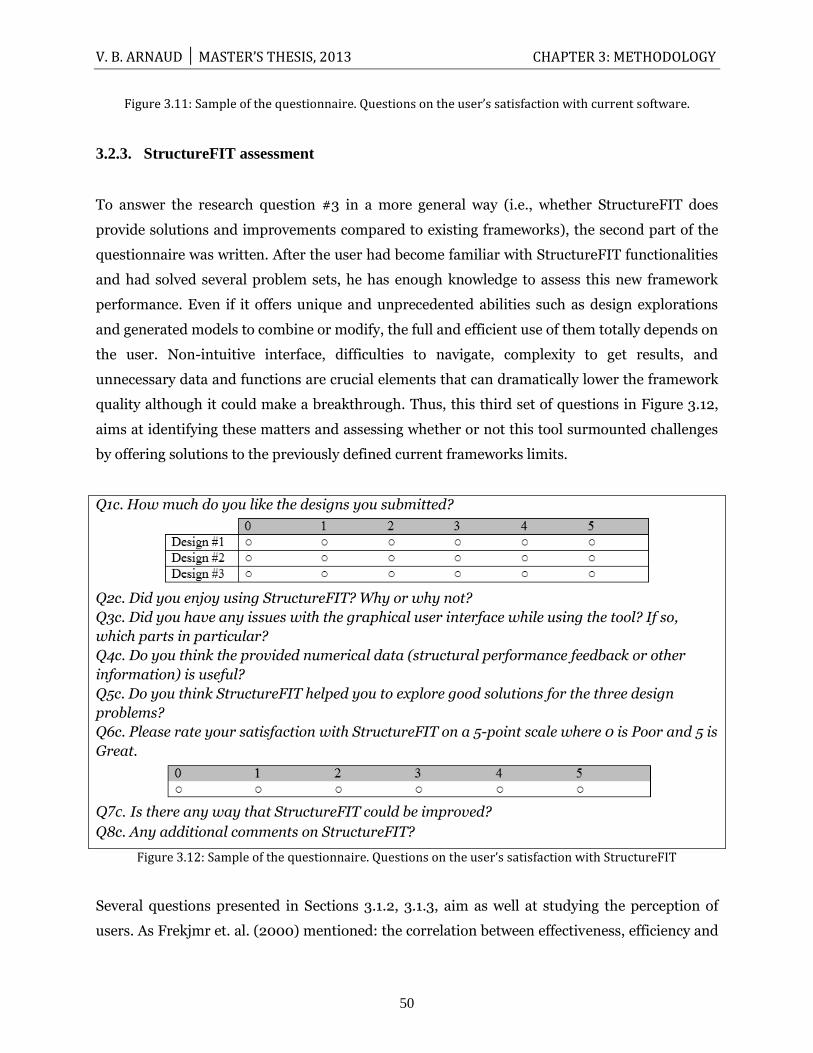
V. B. ARNAUD │ MASTER’S THESIS, 2013 CHAPTER 3: METHODOLOGY
50
Figure 3.11: Sample of the questionnaire. Questions on the user’s satisfaction with current software.
3.2.3. StructureFIT assessment
To answer the research question #3 in a more general way (i.e., whether StructureFIT does
provide solutions and improvements compared to existing frameworks), the second part of the
questionnaire was written. After the user had become familiar with StructureFIT functionalities
and had solved several problem sets, he has enough knowledge to assess this new framework
performance. Even if it offers unique and unprecedented abilities such as design explorations
and generated models to combine or modify, the full and efficient use of them totally depends on
the user. Non-intuitive interface, difficulties to navigate, complexity to get results, and
unnecessary data and functions are crucial elements that can dramatically lower the framework
quality although it could make a breakthrough. Thus, this third set of questions in Figure 3.12,
aims at identifying these matters and assessing whether or not this tool surmounted challenges
by offering solutions to the previously defined current frameworks limits.
Q1c. How much do you like the designs you submitted?
Q2c. Did you enjoy using StructureFIT? Why or why not?
Q3c. Did you have any issues with the graphical user interface while using the tool? If so,
which parts in particular?
Q4c. Do you think the provided numerical data (structural performance feedback or other
information) is useful?
Q5c. Do you think StructureFIT helped you to explore good solutions for the three design
problems?
Q6c. Please rate your satisfaction with StructureFIT on a 5-point scale where 0 is Poor and 5 is
Great.
Q7c. Is there any way that StructureFIT could be improved?
Q8c. Any additional comments on StructureFIT?
Figure 3.12: Sample of the questionnaire. Questions on the user’s satisfaction with StructureFIT
Several questions presented in Sections 3.1.2, 3.1.3, aim as well at studying the perception of
users. As Frekjmr et. al. (2000) mentioned: the correlation between effectiveness, efficiency and

V. B. ARNAUD │ MASTER’S THESIS, 2013 CHAPTER 3: METHODOLOGY
51
satisfaction is not well understood and complex. User are asked to assess their performance
based on their perception. As everyone uses different criteria, it is therefore interesting to
question about what the users think of their own experience using the software and then
compare with the actual result quality they provided during the usability study.
3.3. Data Post-Processing
In this section, the post-processing of recorded data will be explained. This part provides details
and mathematical tools used to answer each research questions explained in Chapter I, section
1.3.
3.3.1. Adjustable parameters and their efficiency
To study the differences between engineers and architects in the design process approach,
specific data were recorded during testing sessions. Specifically, the mutation rate and the
generation size are two main indicators of what the user is approaching the problem. Then, the
users were asked to grade their designs which gave information on what engineers and
architects like the most.
As described in StructureFIT Manual in Appendix A, the Mutation Rate and the Generation Size
commands are decisive in the design exploration. Through a user interface control, users can
directly manipulate the mutation rate and the generation size used in populating the next
generation of designs. This can be changed in each generation to control the type of exploration
that the algorithm produces.
The Mutation Rate:
Figure 3.13: Adjustable mutation rate from 0 to 1
The Mutation rate determines how far the designs will look like the selected design (see Figure
3.14). To use a small mutation rate will focus the design space search to the area around the
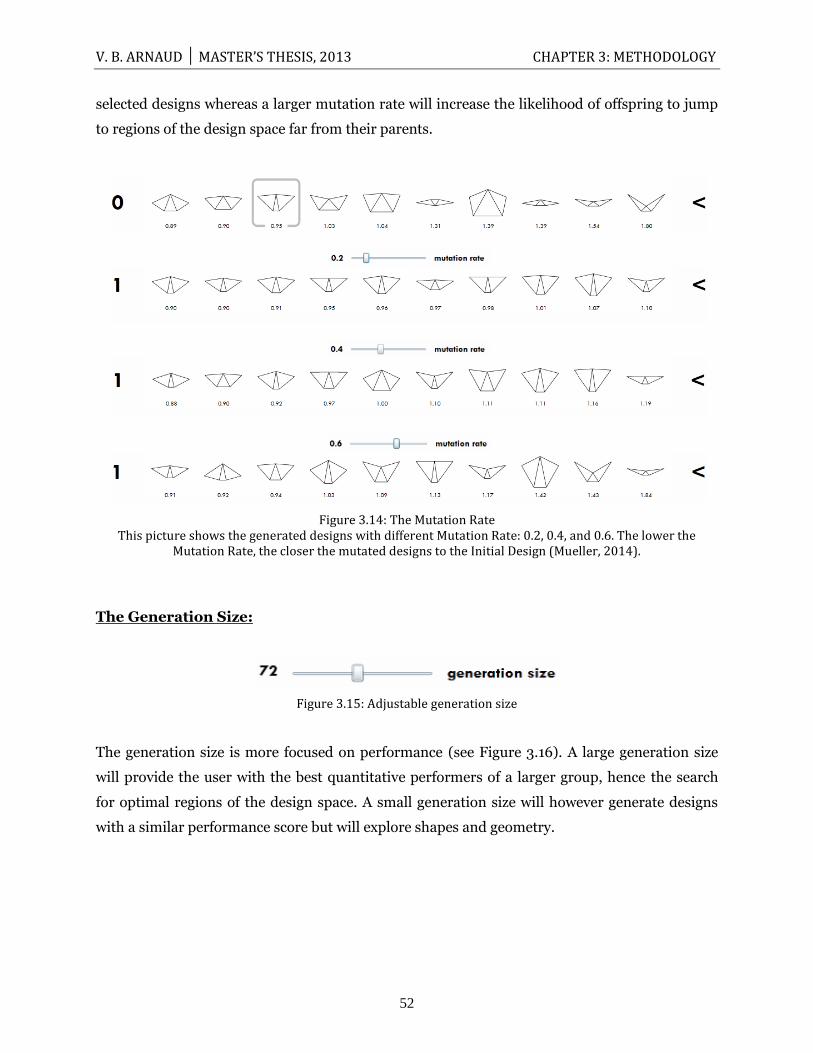
V. B. ARNAUD │ MASTER’S THESIS, 2013 CHAPTER 3: METHODOLOGY
52
selected designs whereas a larger mutation rate will increase the likelihood of offspring to jump
to regions of the design space far from their parents.
Figure 3.14: The Mutation Rate This picture shows the generated designs with different Mutation Rate: 0.2, 0.4, and 0.6. The lower the
Mutation Rate, the closer the mutated designs to the Initial Design (Mueller, 2014).
The Generation Size:
Figure 3.15: Adjustable generation size
The generation size is more focused on performance (see Figure 3.16). A large generation size
will provide the user with the best quantitative performers of a larger group, hence the search
for optimal regions of the design space. A small generation size will however generate designs
with a similar performance score but will explore shapes and geometry.
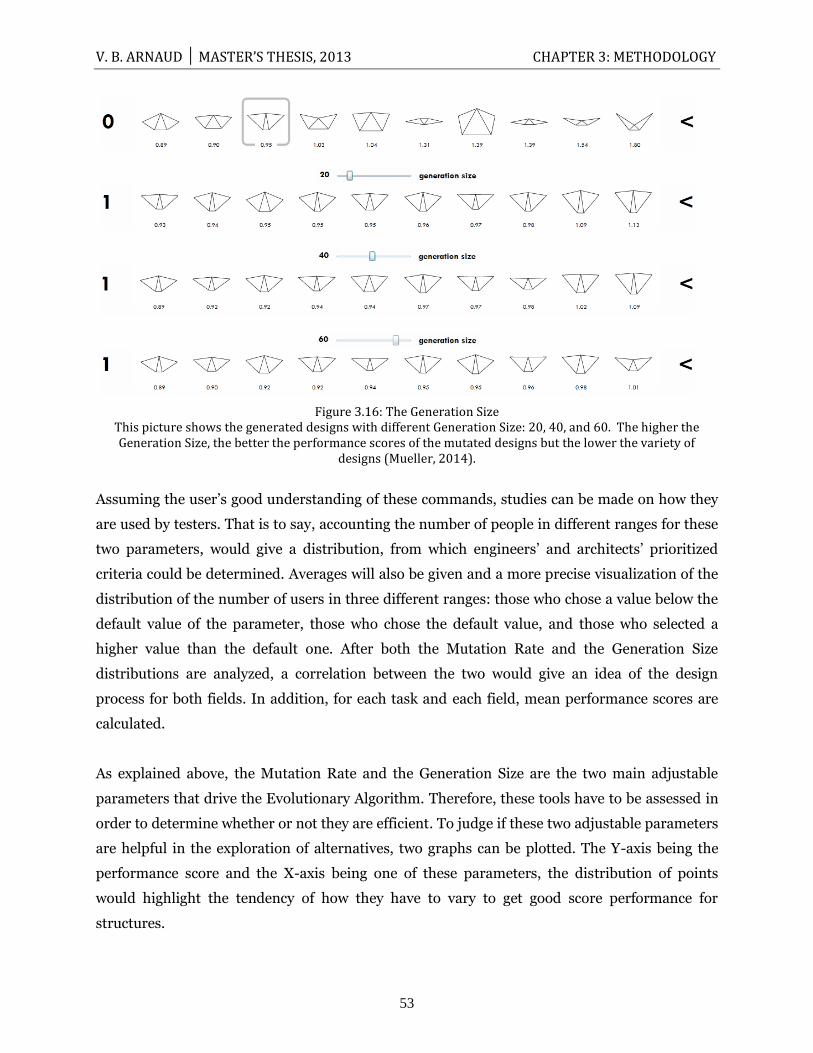
V. B. ARNAUD │ MASTER’S THESIS, 2013 CHAPTER 3: METHODOLOGY
53
Figure 3.16: The Generation Size This picture shows the generated designs with different Generation Size: 20, 40, and 60. The higher the Generation Size, the better the performance scores of the mutated designs but the lower the variety of
designs (Mueller, 2014).
Assuming the user‟s good understanding of these commands, studies can be made on how they
are used by testers. That is to say, accounting the number of people in different ranges for these
two parameters, would give a distribution, from which engineers‟ and architects‟ prioritized
criteria could be determined. Averages will also be given and a more precise visualization of the
distribution of the number of users in three different ranges: those who chose a value below the
default value of the parameter, those who chose the default value, and those who selected a
higher value than the default one. After both the Mutation Rate and the Generation Size
distributions are analyzed, a correlation between the two would give an idea of the design
process for both fields. In addition, for each task and each field, mean performance scores are
calculated.
As explained above, the Mutation Rate and the Generation Size are the two main adjustable
parameters that drive the Evolutionary Algorithm. Therefore, these tools have to be assessed in
order to determine whether or not they are efficient. To judge if these two adjustable parameters
are helpful in the exploration of alternatives, two graphs can be plotted. The Y-axis being the
performance score and the X-axis being one of these parameters, the distribution of points
would highlight the tendency of how they have to vary to get good score performance for
structures.
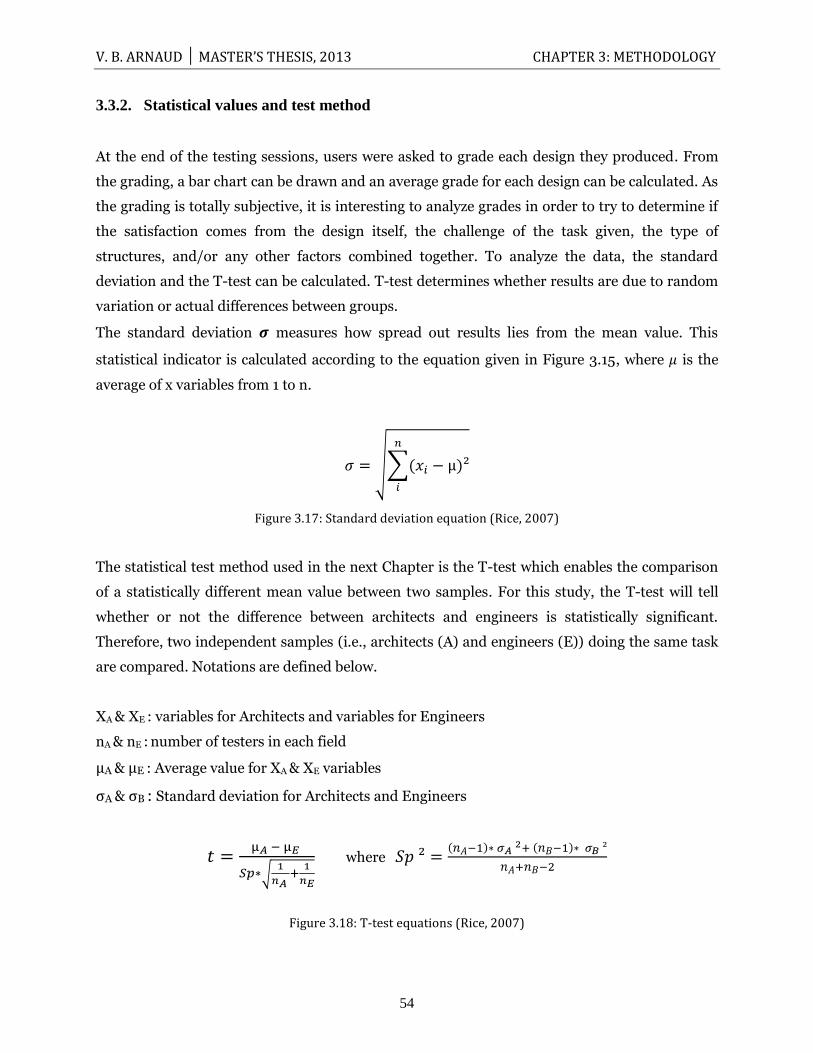
V. B. ARNAUD │ MASTER’S THESIS, 2013 CHAPTER 3: METHODOLOGY
54
3.3.2. Statistical values and test method
At the end of the testing sessions, users were asked to grade each design they produced. From
the grading, a bar chart can be drawn and an average grade for each design can be calculated. As
the grading is totally subjective, it is interesting to analyze grades in order to try to determine if
the satisfaction comes from the design itself, the challenge of the task given, the type of
structures, and/or any other factors combined together. To analyze the data, the standard
deviation and the T-test can be calculated. T-test determines whether results are due to random
variation or actual differences between groups.
The standard deviation measures how spread out results lies from the mean value. This
statistical indicator is calculated according to the equation given in Figure 3.15, where is the
average of x variables from 1 to n.
√∑
Figure 3.17: Standard deviation equation (Rice, 2007)
The statistical test method used in the next Chapter is the T-test which enables the comparison
of a statistically different mean value between two samples. For this study, the T-test will tell
whether or not the difference between architects and engineers is statistically significant.
Therefore, two independent samples (i.e., architects (A) and engineers (E)) doing the same task
are compared. Notations are defined below.
XA & XE : variables for Architects and variables for Engineers
nA & nE : number of testers in each field
A & E : Average value for XA & XE variables
A & B : Standard deviation for Architects and Engineers
√
where
Figure 3.18: T-test equations (Rice, 2007)
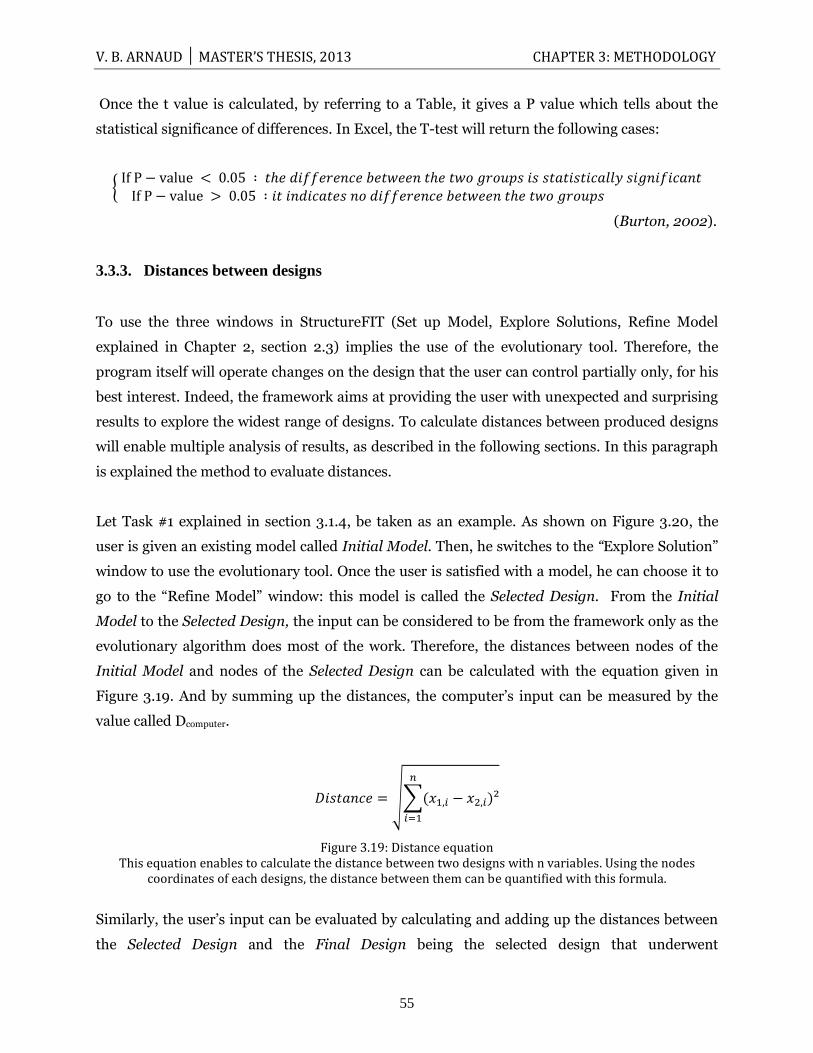
V. B. ARNAUD │ MASTER’S THESIS, 2013 CHAPTER 3: METHODOLOGY
55
Once the t value is calculated, by referring to a Table, it gives a P value which tells about the
statistical significance of differences. In Excel, the T-test will return the following cases:
{
(Burton, 2002).
3.3.3. Distances between designs
To use the three windows in StructureFIT (Set up Model, Explore Solutions, Refine Model
explained in Chapter 2, section 2.3) implies the use of the evolutionary tool. Therefore, the
program itself will operate changes on the design that the user can control partially only, for his
best interest. Indeed, the framework aims at providing the user with unexpected and surprising
results to explore the widest range of designs. To calculate distances between produced designs
will enable multiple analysis of results, as described in the following sections. In this paragraph
is explained the method to evaluate distances.
Let Task #1 explained in section 3.1.4, be taken as an example. As shown on Figure 3.20, the
user is given an existing model called Initial Model. Then, he switches to the “Explore Solution”
window to use the evolutionary tool. Once the user is satisfied with a model, he can choose it to
go to the “Refine Model” window: this model is called the Selected Design. From the Initial
Model to the Selected Design, the input can be considered to be from the framework only as the
evolutionary algorithm does most of the work. Therefore, the distances between nodes of the
Initial Model and nodes of the Selected Design can be calculated with the equation given in
Figure 3.19. And by summing up the distances, the computer‟s input can be measured by the
value called Dcomputer.
√∑
Figure 3.19: Distance equation This equation enables to calculate the distance between two designs with n variables. Using the nodes
coordinates of each designs, the distance between them can be quantified with this formula.
Similarly, the user‟s input can be evaluated by calculating and adding up the distances between
the Selected Design and the Final Design being the selected design that underwent
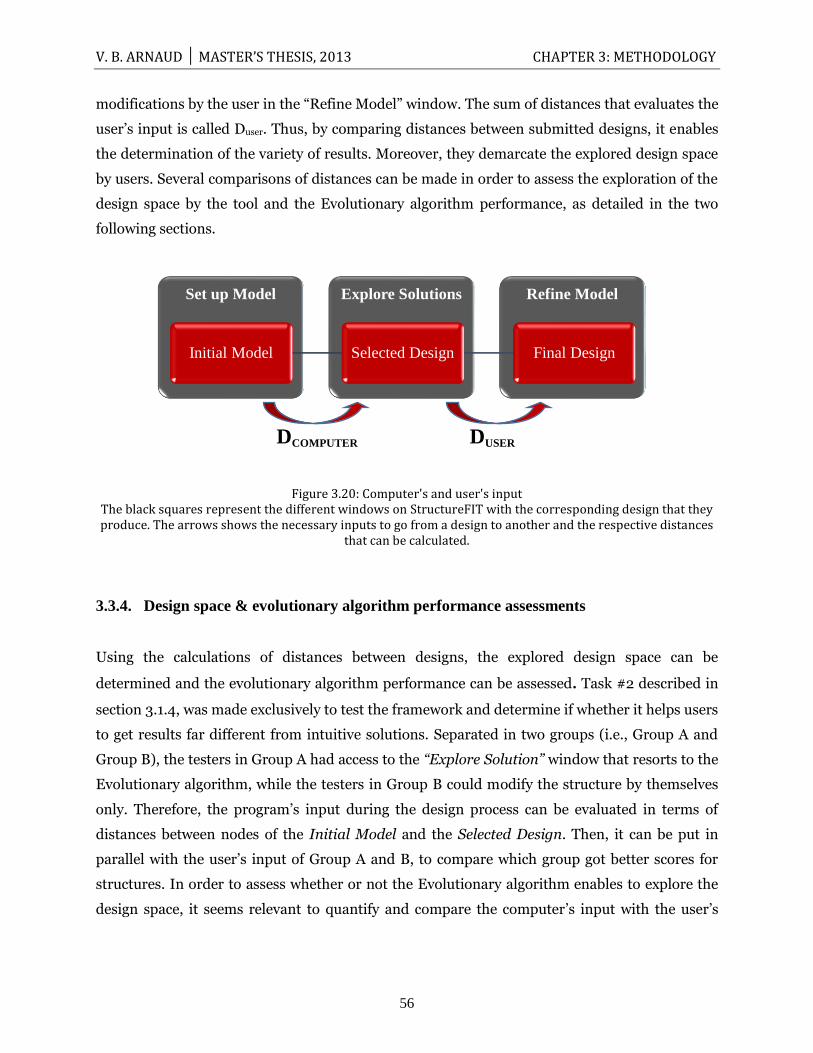
V. B. ARNAUD │ MASTER’S THESIS, 2013 CHAPTER 3: METHODOLOGY
56
modifications by the user in the “Refine Model” window. The sum of distances that evaluates the
user‟s input is called Duser. Thus, by comparing distances between submitted designs, it enables
the determination of the variety of results. Moreover, they demarcate the explored design space
by users. Several comparisons of distances can be made in order to assess the exploration of the
design space by the tool and the Evolutionary algorithm performance, as detailed in the two
following sections.
Figure 3.20: Computer's and user's input The black squares represent the different windows on StructureFIT with the corresponding design that they produce. The arrows shows the necessary inputs to go from a design to another and the respective distances
that can be calculated.
3.3.4. Design space & evolutionary algorithm performance assessments
Using the calculations of distances between designs, the explored design space can be
determined and the evolutionary algorithm performance can be assessed. Task #2 described in
section 3.1.4, was made exclusively to test the framework and determine if whether it helps users
to get results far different from intuitive solutions. Separated in two groups (i.e., Group A and
Group B), the testers in Group A had access to the “Explore Solution” window that resorts to the
Evolutionary algorithm, while the testers in Group B could modify the structure by themselves
only. Therefore, the program‟s input during the design process can be evaluated in terms of
distances between nodes of the Initial Model and the Selected Design. Then, it can be put in
parallel with the user‟s input of Group A and B, to compare which group got better scores for
structures. In order to assess whether or not the Evolutionary algorithm enables to explore the
design space, it seems relevant to quantify and compare the computer‟s input with the user‟s
Refine Model Explore Solutions Set up Model
Initial Model Selected Design Final Design
DCOMPUTER
DUSER

V. B. ARNAUD │ MASTER’S THESIS, 2013 CHAPTER 3: METHODOLOGY
57
input when a design is created. Moreover, it can be plotted against the performance score to
observe trends.
Distances between results for a same task can be compared. Indeed, while spread out, the
submitted designs show the efficiency of the framework to provide a wide range of solutions that
please the users. If closer together, submitted designs might denote a weakness in the
framework that could be of two types. It could be a limited variety of suggested alternatives or
suggestion of hardly feasible designs although appealing.
3.4. Summary
To conclude, this chapter presented the methodology applied to address the three research
questions detailed in Chapter 1, Section 1.3. The design of a specific usability study and a
questionnaire for this research was carefully elaborated to answer multiple hypotheses. Several
mathematical tools and visualizations to interpret results have been explained in this part and
will be implemented in the following chapter: Results and Discussion.

58

V. B. ARNAUD │ MASTER’S THESIS, 2013 CHAPTER 4: RESULTS AND DISCUSSION
59
CHAPTER 4:
4. RESULTS & DISCUSSION
This chapter presents results obtained following the methodology explained in Chapter 3,
Section 3.3. Divided into three sections corresponding to each research question - satisfaction
with software, design approaches and StructureFIT assessment - this part uses a variety of
mathematical tools and visual representations to analyze data recorded from the usability study
in order to answer the three main research questions.
4.1. Q1: Satisfaction with software
How satisfied are architects and engineers with today’s structural design
software?
This problem statement can be partially answered based on results provided in this section. It
analyzes the grading of software in terms of users‟ satisfaction and aims at identifying specific
needs in order to improve programs and thereby increase engineers‟ and architects‟ satisfaction.
Based on users‟ comments, inferences will be made for what makes software satisfactory and
successful.
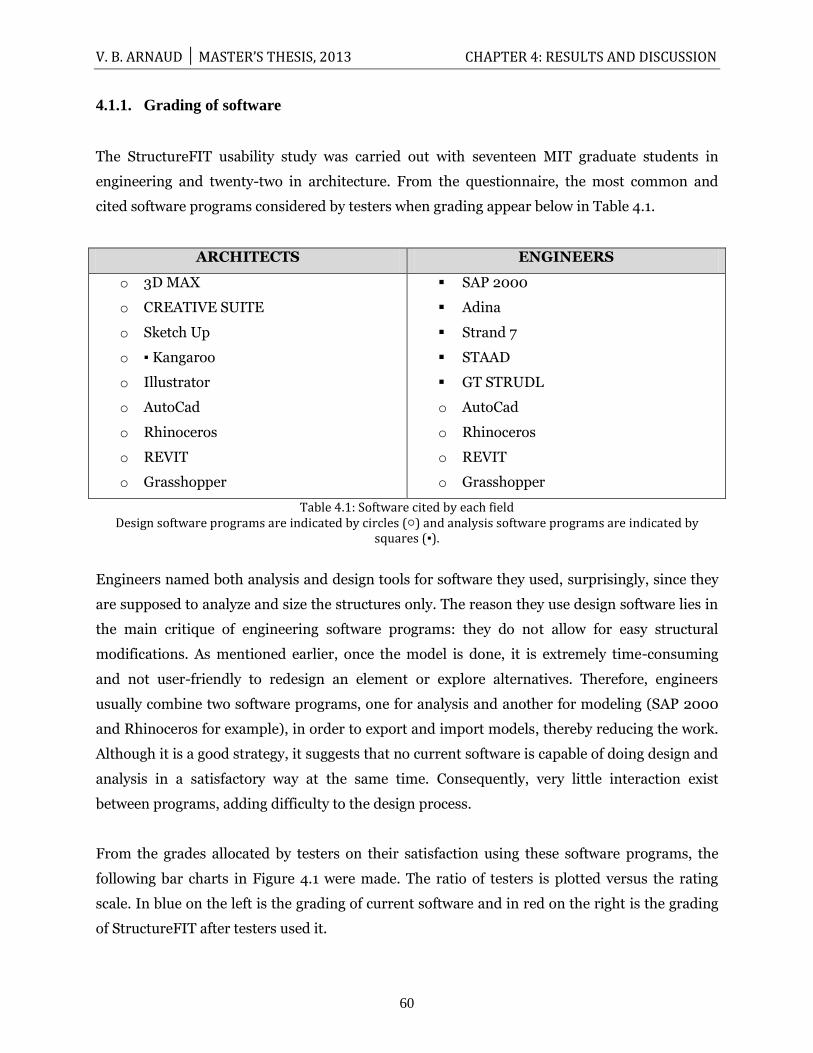
V. B. ARNAUD │ MASTER’S THESIS, 2013 CHAPTER 4: RESULTS AND DISCUSSION
60
4.1.1. Grading of software
The StructureFIT usability study was carried out with seventeen MIT graduate students in
engineering and twenty-two in architecture. From the questionnaire, the most common and
cited software programs considered by testers when grading appear below in Table 4.1.
ARCHITECTS ENGINEERS
o 3D MAX
o CREATIVE SUITE
o Sketch Up
o ▪ Kangaroo
o Illustrator
o AutoCad
o Rhinoceros
o REVIT
o Grasshopper
SAP 2000
Adina
Strand 7
STAAD
GT STRUDL
o AutoCad
o Rhinoceros
o REVIT
o Grasshopper
Table 4.1: Software cited by each field Design software programs are indicated by circles (○) and analysis software programs are indicated by
squares (▪).
Engineers named both analysis and design tools for software they used, surprisingly, since they
are supposed to analyze and size the structures only. The reason they use design software lies in
the main critique of engineering software programs: they do not allow for easy structural
modifications. As mentioned earlier, once the model is done, it is extremely time-consuming
and not user-friendly to redesign an element or explore alternatives. Therefore, engineers
usually combine two software programs, one for analysis and another for modeling (SAP 2000
and Rhinoceros for example), in order to export and import models, thereby reducing the work.
Although it is a good strategy, it suggests that no current software is capable of doing design and
analysis in a satisfactory way at the same time. Consequently, very little interaction exist
between programs, adding difficulty to the design process.
From the grades allocated by testers on their satisfaction using these software programs, the
following bar charts in Figure 4.1 were made. The ratio of testers is plotted versus the rating
scale. In blue on the left is the grading of current software and in red on the right is the grading
of StructureFIT after testers used it.

V. B. ARNAUD │ MASTER’S THESIS, 2013 CHAPTER 4: RESULTS AND DISCUSSION
61
Figure 4.1: “Software Satisfaction Bar Charts” for both architects and engineers It shows the distribution of allocated grades to current software in blue and StructureFIT in Red. Each bar
charts show a greater satisfaction using StructureFIT compared to the use of current software.
AVERAGE GRADES
Current Software StructureFIT T-test
Engineers 3.40 4.22 0.00: Statistically significant
Architects 3.95 4.32 0.06: Close to be significant
T-test 0.01
Statically significant
0.46
No difference
Table 4.2: Average grades for current software and StructureFIT The averages grades are given for current software and StructureFIT. Both architects and engineers are more
satisfied with StructureFIT compared to current tools they use.
The results in Figure 4.1 show a general tendency of both fields not to be fully satisfied with
current software and more pleased when using StructureFIT. Although averages of satisfaction
are relatively close between architects and engineers for both current software and StructureFIT
(see Table 4.2), it appears that architects are a little more satisfied with the tools they use.
Graded between a higher range: 3 and 5 by architects, current software programs were graded
only between 2 and 4 by engineers. This difference is statistically significant according to the T-
test value since it is less than 0.05. Moreover, the T-test reveals a statistical significance of
higher user satisfaction between StructureFIT and current software for both fields. Therefore, it
is interesting to analyze the reasons for such a gap in users‟ satisfaction.
0 0
0.125
0.375
0.5
0 0 0 0 0.06
0.71
0.24
0
0.2
0.4
0.6
0.8
0 1 2 3 4 5
Per
cen
tage
of
engi
nee
rs
Rating Scale
Engineers Software Satisfaction
Current Software StructureFIT
0 0 0
0.14
0.77
0.09 0 0 0
0.09
0.50 0.41
0.0
0.2
0.4
0.6
0.8
0 1 2 3 4 5
Per
cen
tage
of
arch
itec
ts
Rating scale
Architects Software Satisfaction Current Software StructureFIT
V. B. ARNAUD │ MASTER’S THESIS, 2013 CHAPTER 4: RESULTS AND DISCUSSION
62
4.1.2. Tool improvements suggested by users
The first part of the questionnaire asks users what they dislike about software and what they
expect for it to be able to do.
a) Engineering software
Engineers‟ answers show many similarities in the comments on the programs they use. First of
all, almost all of the engineers came to a general agreement that current engineering tools are
not user-friendly at all when it comes to structural modifications. Criticism was often made of
SAP 2000, the most commonly used tool in engineering. For example, this framework seems to
lack flexibility when it comes to changing geometry. Requiring the user to start from scratch or
taking a huge amount of time, this tool appears to be inefficient when the design must be
adjusted.
The data reveals about other features that engineers expect to use with software. In addition to a
more user-friendly graphical user interface that would enable easy modifications, engineers
would like self-explanatory programs with more guidance, pop-up messages, and even
suggestions from the tools. Users need both easy interaction between analysis and designs, and
parametric components and solvers that would provide accurate results in the shortest time
possible.
b) Architecture tools
Most of the architects mentioned the lack of engineering considerations in architecture tools.
They would like to have technical and structural analysis to guide their architectural choices.
Some architects show interest in the integration of a type of guidance that would go to the extent
of suggesting to the architect what type of structures would be most adapted to bear a specific
set of loads.
They also agreed on the need for software to interact and be compatible, allowing transfer of
files. Some of the tools enable easier changes, refinements and adjustments compared to others.
Therefore, they sometimes combine several software programs together, just as engineers do. As
an example, according to an architect: “Illustrator lacks in precision, AutoCad lacks in
V. B. ARNAUD │ MASTER’S THESIS, 2013 CHAPTER 4: RESULTS AND DISCUSSION
63
visualization and Rhinoceros lacks in precision for 2D drawings”. They also express the desire to
incorporate an environmental analysis tool in software programs.
4.1.3. What makes software successful?
From observations made earlier, it is possible to identify some important features that make a
software program successful. First, the program has to be user-friendly enough that the
graphical user interface is fairly intuitive and fast to learn for the user. Once the user is familiar
with most of the tools and builds a model, the ease of modification of structural elements is
much appreciated. A structure fast to redesign and to reanalyze would enable engineers to
explore alternatives and get the best performance with little effort. To do so, a unique software
that could do both design and analysis would be the ideal option since it would avoid the need to
combine several software programs.
4.2. Q2: Design approaches
Do architects and engineers have the same design approaches when they have to
create a successful structural design?
In this question lie important motivations during the design process of both architects and
engineers. In order to identify designers‟ respective design approaches, three tasks were
developed accordingly, as detailed in Chapter 3, section 3.2.4. Depending on the use of
StructureFIT and its adjustable parameters, patterns in designers‟ thinking processes can be
shown.
4.2.1. Mutation Rate
As mentioned in Chapter 3, section 3.3.2, the mutation rate is adjusted by the user to control the
type of exploration that the program produces. In order to analyze results for the mutation rate
distribution among engineers and architects, Task #1 and Task #3 only will be taken into
account; Task #2 is the controlled test which only involves half of the students and which aims
to analyze the framework itself (see Chapter 3, section 3.1.4., Table 3.1).
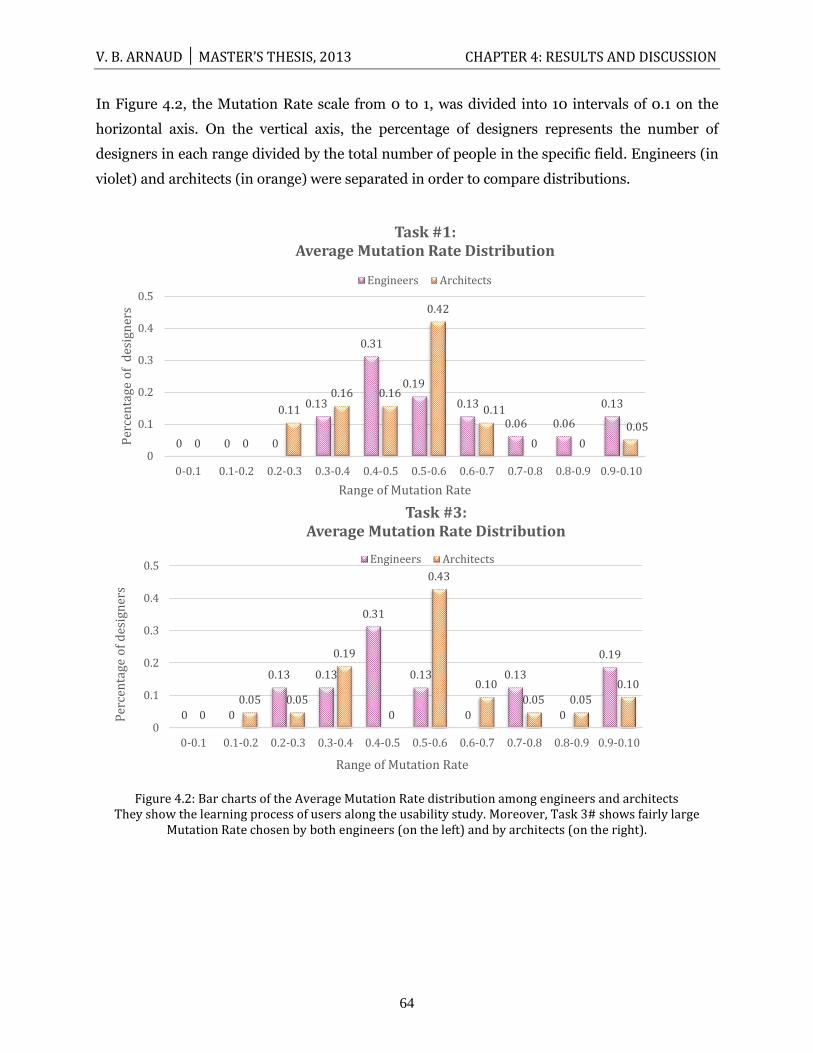
V. B. ARNAUD │ MASTER’S THESIS, 2013 CHAPTER 4: RESULTS AND DISCUSSION
64
In Figure 4.2, the Mutation Rate scale from 0 to 1, was divided into 10 intervals of 0.1 on the
horizontal axis. On the vertical axis, the percentage of designers represents the number of
designers in each range divided by the total number of people in the specific field. Engineers (in
violet) and architects (in orange) were separated in order to compare distributions.
Figure 4.2: Bar charts of the Average Mutation Rate distribution among engineers and architects They show the learning process of users along the usability study. Moreover, Task 3# shows fairly large
Mutation Rate chosen by both engineers (on the left) and by architects (on the right).
0 0 0
0.13
0.31
0.19
0.13
0.06 0.06
0.13
0 0
0.11
0.16 0.16
0.42
0.11
0 0
0.05
0
0.1
0.2
0.3
0.4
0.5
0-0.1 0.1-0.2 0.2-0.3 0.3-0.4 0.4-0.5 0.5-0.6 0.6-0.7 0.7-0.8 0.8-0.9 0.9-0.10
Per
cen
tage
of
des
ign
ers
Range of Mutation Rate
Task #1: Average Mutation Rate Distribution
Engineers Architects
0 0
0.13 0.13
0.31
0.13
0
0.13
0
0.19
0
0.05 0.05
0.19
0
0.43
0.10
0.05 0.05
0.10
0
0.1
0.2
0.3
0.4
0.5
0-0.1 0.1-0.2 0.2-0.3 0.3-0.4 0.4-0.5 0.5-0.6 0.6-0.7 0.7-0.8 0.8-0.9 0.9-0.10
Per
cen
tage
of
des
ign
ers
Range of Mutation Rate
Task #3: Average Mutation Rate Distribution
Engineers Architects
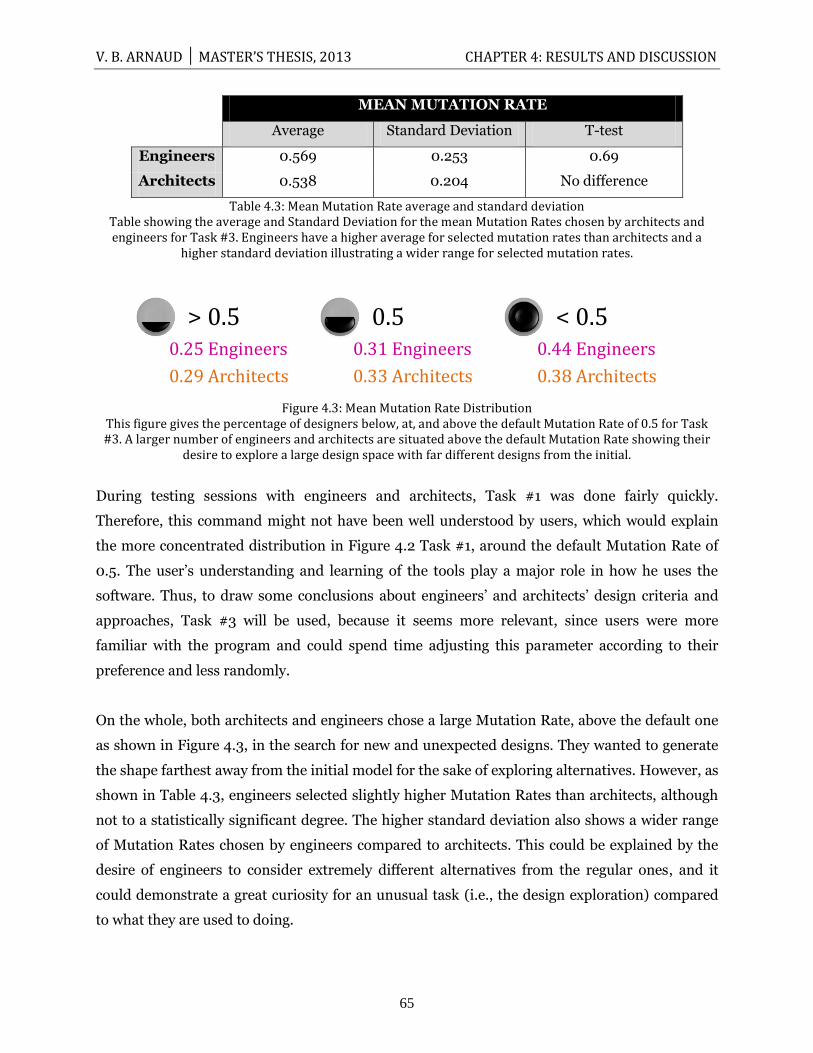
V. B. ARNAUD │ MASTER’S THESIS, 2013 CHAPTER 4: RESULTS AND DISCUSSION
65
0.25 Engineers
0.29 Architects
> 0.5 0.31 Engineers
0.33 Architects
0.5 0.44 Engineers
0.38 Architects
< 0.5
MEAN MUTATION RATE
Average Standard Deviation T-test
Engineers 0.569 0.253 0.69
No difference Architects 0.538 0.204
Table 4.3: Mean Mutation Rate average and standard deviation Table showing the average and Standard Deviation for the mean Mutation Rates chosen by architects and engineers for Task #3. Engineers have a higher average for selected mutation rates than architects and a
higher standard deviation illustrating a wider range for selected mutation rates.
Figure 4.3: Mean Mutation Rate Distribution
This figure gives the percentage of designers below, at, and above the default Mutation Rate of 0.5 for Task #3. A larger number of engineers and architects are situated above the default Mutation Rate showing their
desire to explore a large design space with far different designs from the initial.
During testing sessions with engineers and architects, Task #1 was done fairly quickly.
Therefore, this command might not have been well understood by users, which would explain
the more concentrated distribution in Figure 4.2 Task #1, around the default Mutation Rate of
0.5. The user‟s understanding and learning of the tools play a major role in how he uses the
software. Thus, to draw some conclusions about engineers‟ and architects‟ design criteria and
approaches, Task #3 will be used, because it seems more relevant, since users were more
familiar with the program and could spend time adjusting this parameter according to their
preference and less randomly.
On the whole, both architects and engineers chose a large Mutation Rate, above the default one
as shown in Figure 4.3, in the search for new and unexpected designs. They wanted to generate
the shape farthest away from the initial model for the sake of exploring alternatives. However, as
shown in Table 4.3, engineers selected slightly higher Mutation Rates than architects, although
not to a statistically significant degree. The higher standard deviation also shows a wider range
of Mutation Rates chosen by engineers compared to architects. This could be explained by the
desire of engineers to consider extremely different alternatives from the regular ones, and it
could demonstrate a great curiosity for an unusual task (i.e., the design exploration) compared
to what they are used to doing.
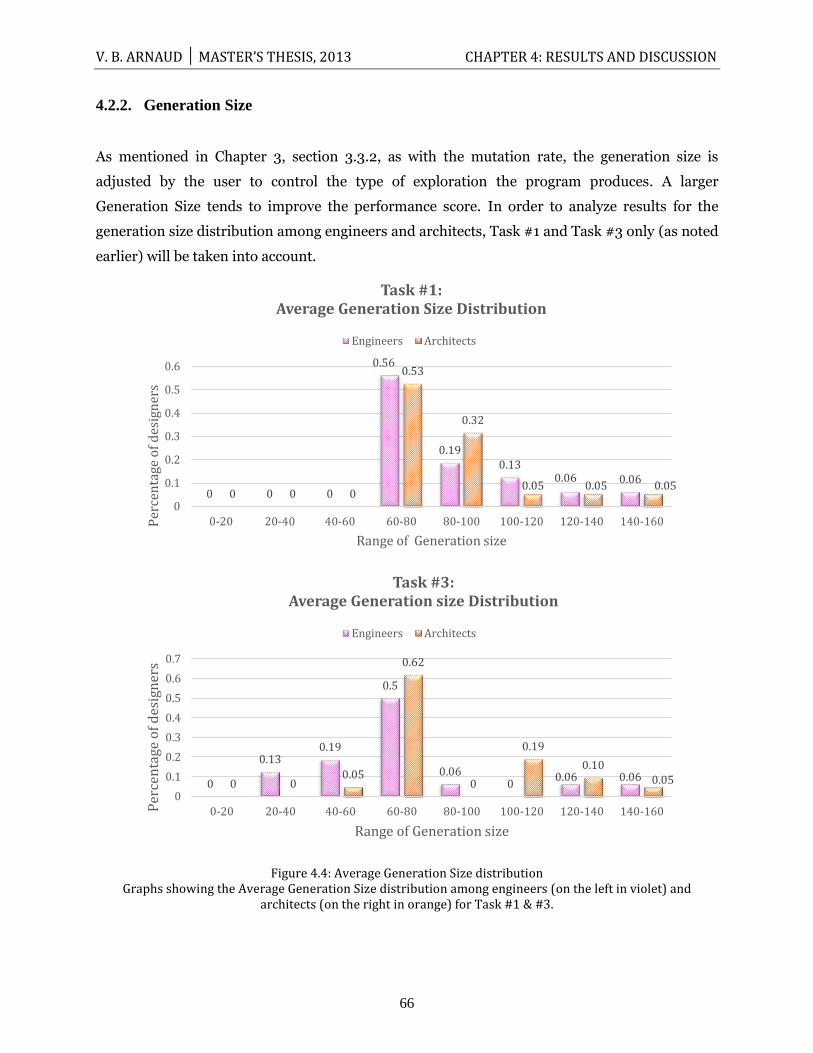
V. B. ARNAUD │ MASTER’S THESIS, 2013 CHAPTER 4: RESULTS AND DISCUSSION
66
4.2.2. Generation Size
As mentioned in Chapter 3, section 3.3.2, as with the mutation rate, the generation size is
adjusted by the user to control the type of exploration the program produces. A larger
Generation Size tends to improve the performance score. In order to analyze results for the
generation size distribution among engineers and architects, Task #1 and Task #3 only (as noted
earlier) will be taken into account.
Figure 4.4: Average Generation Size distribution Graphs showing the Average Generation Size distribution among engineers (on the left in violet) and
architects (on the right in orange) for Task #1 & #3.
0 0 0
0.56
0.19 0.13
0.06 0.06 0 0 0
0.53
0.32
0.05 0.05 0.05
0
0.1
0.2
0.3
0.4
0.5
0.6
0-20 20-40 40-60 60-80 80-100 100-120 120-140 140-160Per
cen
tage
of
des
ign
ers
Range of Generation size
Task #1: Average Generation Size Distribution
Engineers Architects
0
0.13 0.19
0.5
0.06 0
0.06 0.06 0 0
0.05
0.62
0
0.19
0.10 0.05
0
0.1
0.2
0.3
0.4
0.5
0.6
0.7
0-20 20-40 40-60 60-80 80-100 100-120 120-140 140-160Per
cen
tage
of
des
ign
ers
Range of Generation size
Task #3: Average Generation size Distribution
Engineers Architects
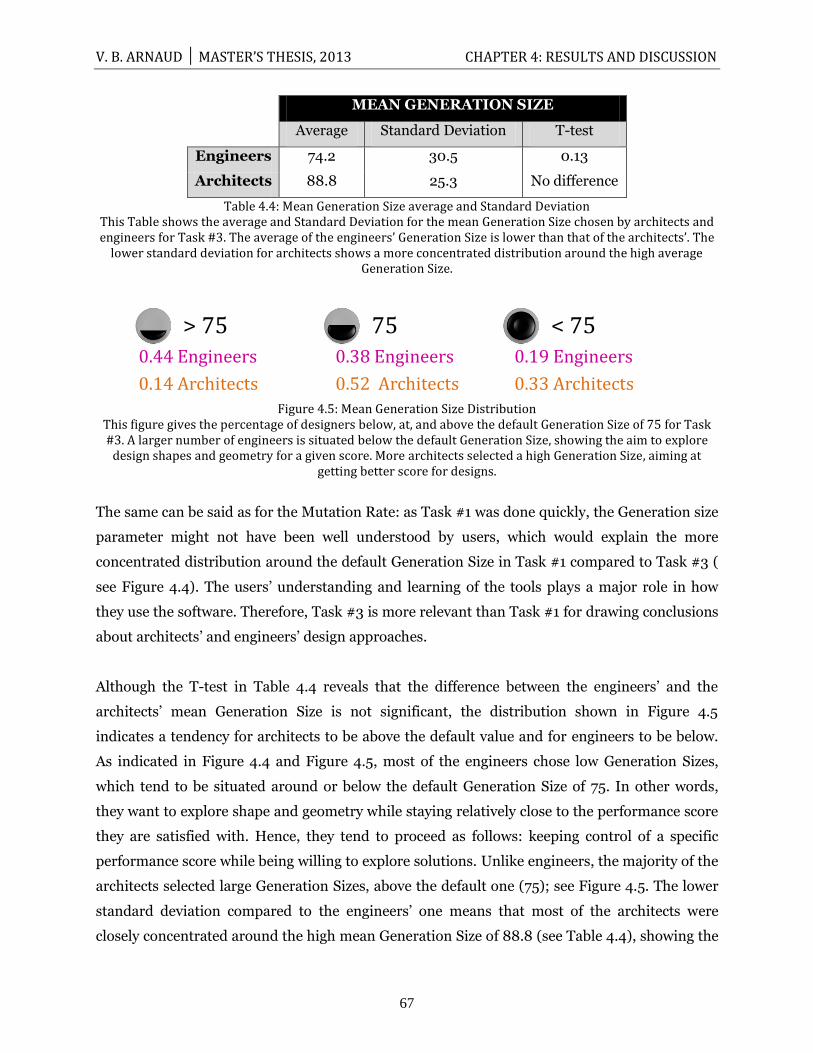
V. B. ARNAUD │ MASTER’S THESIS, 2013 CHAPTER 4: RESULTS AND DISCUSSION
67
0.44 Engineers
0.14 Architects
> 75 0.38 Engineers
0.52 Architects
75 0.19 Engineers
0.33 Architects
< 75
MEAN GENERATION SIZE
Average Standard Deviation T-test
Engineers 74.2 30.5 0.13
No difference Architects 88.8 25.3
Table 4.4: Mean Generation Size average and Standard Deviation This Table shows the average and Standard Deviation for the mean Generation Size chosen by architects and engineers for Task #3. The average of the engineers’ Generation Size is lower than that of the architects’. The
lower standard deviation for architects shows a more concentrated distribution around the high average Generation Size.
Figure 4.5: Mean Generation Size Distribution This figure gives the percentage of designers below, at, and above the default Generation Size of 75 for Task #3. A larger number of engineers is situated below the default Generation Size, showing the aim to explore
design shapes and geometry for a given score. More architects selected a high Generation Size, aiming at getting better score for designs.
The same can be said as for the Mutation Rate: as Task #1 was done quickly, the Generation size
parameter might not have been well understood by users, which would explain the more
concentrated distribution around the default Generation Size in Task #1 compared to Task #3 (
see Figure 4.4). The users‟ understanding and learning of the tools plays a major role in how
they use the software. Therefore, Task #3 is more relevant than Task #1 for drawing conclusions
about architects‟ and engineers‟ design approaches.
Although the T-test in Table 4.4 reveals that the difference between the engineers‟ and the
architects‟ mean Generation Size is not significant, the distribution shown in Figure 4.5
indicates a tendency for architects to be above the default value and for engineers to be below.
As indicated in Figure 4.4 and Figure 4.5, most of the engineers chose low Generation Sizes,
which tend to be situated around or below the default Generation Size of 75. In other words,
they want to explore shape and geometry while staying relatively close to the performance score
they are satisfied with. Hence, they tend to proceed as follows: keeping control of a specific
performance score while being willing to explore solutions. Unlike engineers, the majority of the
architects selected large Generation Sizes, above the default one (75); see Figure 4.5. The lower
standard deviation compared to the engineers‟ one means that most of the architects were
closely concentrated around the high mean Generation Size of 88.8 (see Table 4.4), showing the
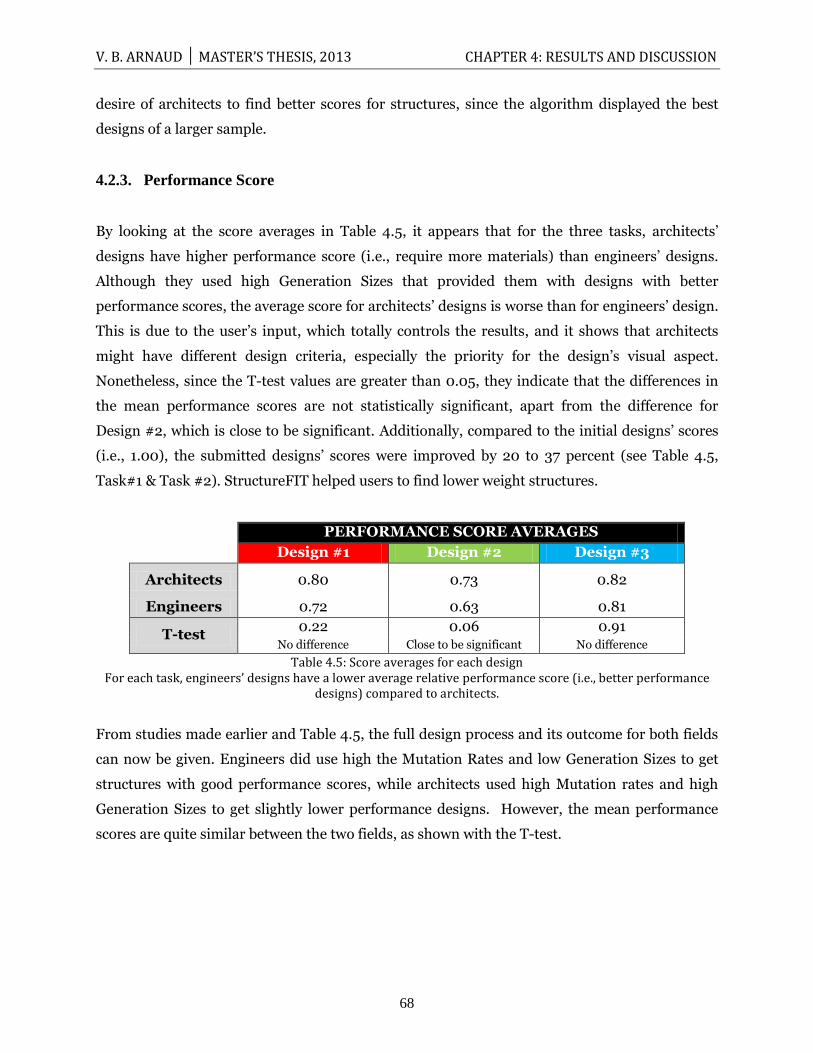
V. B. ARNAUD │ MASTER’S THESIS, 2013 CHAPTER 4: RESULTS AND DISCUSSION
68
desire of architects to find better scores for structures, since the algorithm displayed the best
designs of a larger sample.
4.2.3. Performance Score
By looking at the score averages in Table 4.5, it appears that for the three tasks, architects‟
designs have higher performance score (i.e., require more materials) than engineers‟ designs.
Although they used high Generation Sizes that provided them with designs with better
performance scores, the average score for architects‟ designs is worse than for engineers‟ design.
This is due to the user‟s input, which totally controls the results, and it shows that architects
might have different design criteria, especially the priority for the design‟s visual aspect.
Nonetheless, since the T-test values are greater than 0.05, they indicate that the differences in
the mean performance scores are not statistically significant, apart from the difference for
Design #2, which is close to be significant. Additionally, compared to the initial designs‟ scores
(i.e., 1.00), the submitted designs‟ scores were improved by 20 to 37 percent (see Table 4.5,
Task#1 & Task #2). StructureFIT helped users to find lower weight structures.
PERFORMANCE SCORE AVERAGES
Design #1 Design #2 Design #3
Architects 0.80 0.73 0.82
Engineers 0.72 0.63 0.81
T-test 0.22 0.06 0.91
No difference Close to be significant No difference
Table 4.5: Score averages for each design For each task, engineers’ designs have a lower average relative performance score (i.e., better performance
designs) compared to architects.
From studies made earlier and Table 4.5, the full design process and its outcome for both fields
can now be given. Engineers did use high the Mutation Rates and low Generation Sizes to get
structures with good performance scores, while architects used high Mutation rates and high
Generation Sizes to get slightly lower performance designs. However, the mean performance
scores are quite similar between the two fields, as shown with the T-test.
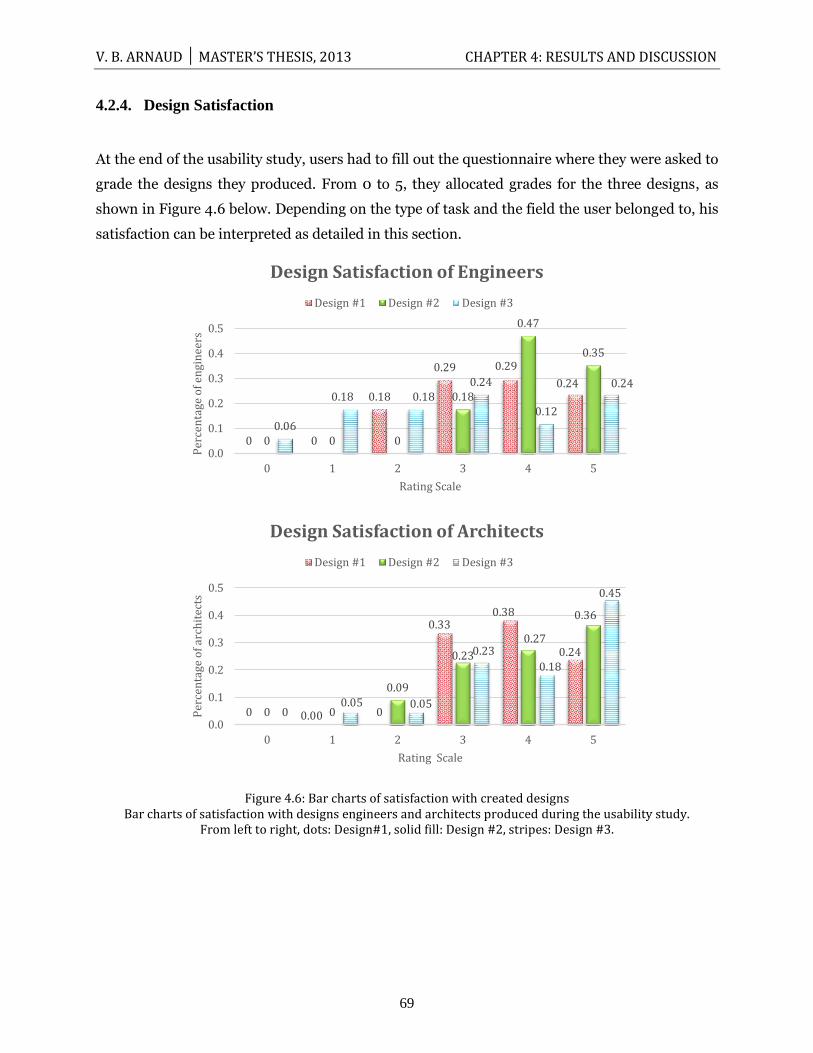
V. B. ARNAUD │ MASTER’S THESIS, 2013 CHAPTER 4: RESULTS AND DISCUSSION
69
4.2.4. Design Satisfaction
At the end of the usability study, users had to fill out the questionnaire where they were asked to
grade the designs they produced. From 0 to 5, they allocated grades for the three designs, as
shown in Figure 4.6 below. Depending on the type of task and the field the user belonged to, his
satisfaction can be interpreted as detailed in this section.
Figure 4.6: Bar charts of satisfaction with created designs Bar charts of satisfaction with designs engineers and architects produced during the usability study.
From left to right, dots: Design#1, solid fill: Design #2, stripes: Design #3.
0 0
0.18
0.29 0.29
0.24
0 0 0
0.18
0.47
0.35
0.06
0.18 0.18 0.24
0.12
0.24
0.0
0.1
0.2
0.3
0.4
0.5
0 1 2 3 4 5
Per
cen
tage
of
engi
nee
rs
Rating Scale
Design Satisfaction of Engineers
Design #1 Design #2 Design #3
0 0.00 0
0.33 0.38
0.24
0 0
0.09
0.23
0.27
0.36
0 0.05 0.05
0.23
0.18
0.45
0.0
0.1
0.2
0.3
0.4
0.5
0 1 2 3 4 5
Per
cen
tage
of
arch
itec
ts
Rating Scale
Design Satisfaction of Architects
Design #1 Design #2 Design #3
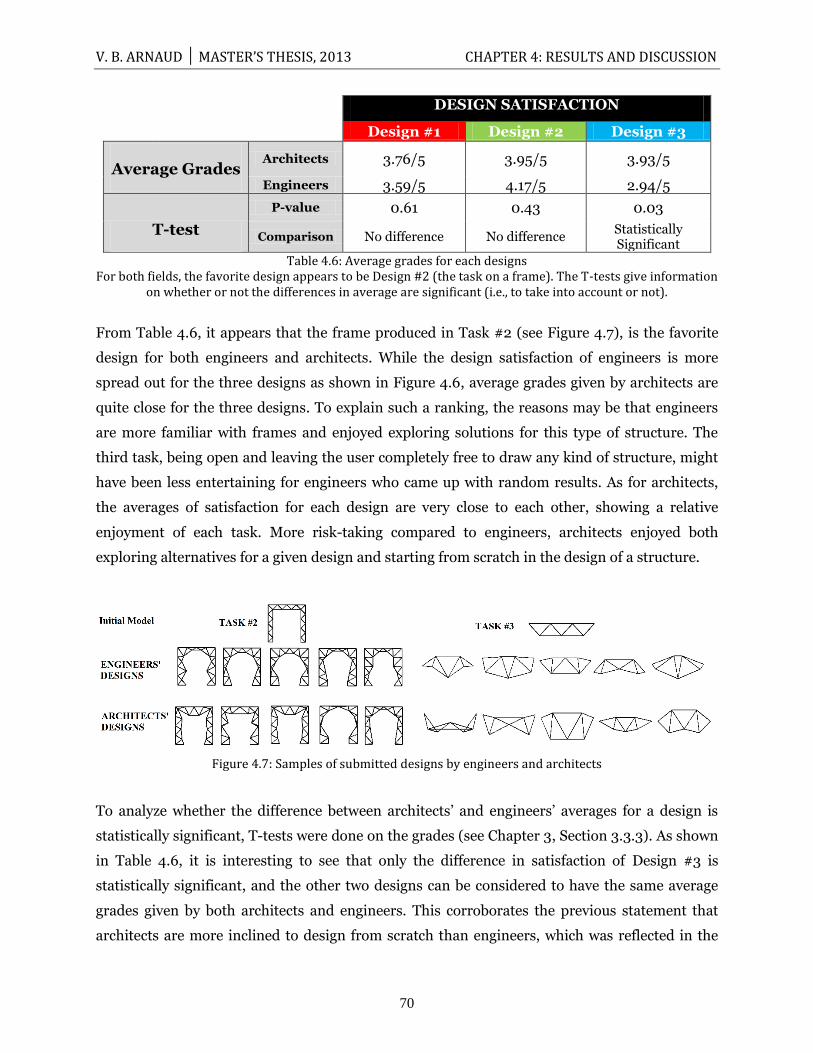
V. B. ARNAUD │ MASTER’S THESIS, 2013 CHAPTER 4: RESULTS AND DISCUSSION
70
DESIGN SATISFACTION
Design #1 Design #2 Design #3
Average Grades Architects 3.76/5 3.95/5 3.93/5
Engineers 3.59/5 4.17/5 2.94/5
T-test
P-value 0.61 0.43 0.03
Comparison No difference No difference Statistically Significant
Table 4.6: Average grades for each designs For both fields, the favorite design appears to be Design #2 (the task on a frame). The T-tests give information
on whether or not the differences in average are significant (i.e., to take into account or not).
From Table 4.6, it appears that the frame produced in Task #2 (see Figure 4.7), is the favorite
design for both engineers and architects. While the design satisfaction of engineers is more
spread out for the three designs as shown in Figure 4.6, average grades given by architects are
quite close for the three designs. To explain such a ranking, the reasons may be that engineers
are more familiar with frames and enjoyed exploring solutions for this type of structure. The
third task, being open and leaving the user completely free to draw any kind of structure, might
have been less entertaining for engineers who came up with random results. As for architects,
the averages of satisfaction for each design are very close to each other, showing a relative
enjoyment of each task. More risk-taking compared to engineers, architects enjoyed both
exploring alternatives for a given design and starting from scratch in the design of a structure.
Figure 4.7: Samples of submitted designs by engineers and architects
To analyze whether the difference between architects‟ and engineers‟ averages for a design is
statistically significant, T-tests were done on the grades (see Chapter 3, Section 3.3.3). As shown
in Table 4.6, it is interesting to see that only the difference in satisfaction of Design #3 is
statistically significant, and the other two designs can be considered to have the same average
grades given by both architects and engineers. This corroborates the previous statement that
architects are more inclined to design from scratch than engineers, which was reflected in the
V. B. ARNAUD │ MASTER’S THESIS, 2013 CHAPTER 4: RESULTS AND DISCUSSION
71
deep difference in enthusiasm between both fields when it came to creating a design from
scratch (i.e., Design #3).
4.2.5. Design approaches
Trends and tendencies in design processes can be extracted for engineers and architects based
on comments made in the sections just above which study the use of the Mutation Rate, the
Generation Size, and the Performance Score. Engineers chose fairly large Mutation Rates to
explore shapes and geometries while trying to keep control of the performance score by selecting
low generation sizes. Like engineers, architects selected high Mutation Rates, willing to explore
alternatives the farthest away from the given initial model, but they used high Generation Sizes.
This could be interpreted as the aim to obtain better scores for their designs while still exploring
other solutions.
Thus, based on the use of these adjustable parameters, two main design approaches are
identifiable for engineers and architects, respectively.
Engineers would first look at the largest variety of solutions for a specific problem and would
choose a design they like with a satisfying performance score. Then, they would try to explore
solutions around this specific score and make changes to find alternatives, keeping control of the
performance score they are satisfied with. The last step would be the optimization of the
structural performance by refining the design‟s elements.
As for architects, they would push the design exploration to its limits in order to look at the
widest range of design alternatives. They seemed to proceed in the selection of designs with
choices mainly based on their satisfaction with the design‟s visual aspect. And unlike engineers,
they would resort to a trial and guess method to improve the performance score and then pick a
design they were pleased with.
Although these design approaches are different, the T-tests show that they are equivalent when
it comes to finding both a design and a performance score that are satisfactory, since the
differences between the mean performance scores for each task and each field were not
statistically significant. Therefore, StructureFIT will provide similar results independently of the
user‟s design approach in terms of performance. However, engineers and architects seemed to
have explored the design space to a different extent, as developed in the next section answering
the third research question.
V. B. ARNAUD │ MASTER’S THESIS, 2013 CHAPTER 4: RESULTS AND DISCUSSION
72
4.3. Q3: StructureFIT software and its design exploration tool
Does StructureFIT provide a positive design exploration for both architects and
engineers?
Does StructureFIT provide a positive design exploration for architects and engineers? This third
research question tackled in this thesis is about assessing the newly developed framework
StructureFIT in order to both ensure the results‟ accuracy and contribute to the improvement of
the tool by providing some feedback.
4.3.1. Tool efficiency
As conclusions were drawn in Section 4.2 based on the use of StructureFIT functionalities, it is
important to study these parameters (i.e., the Mutation Rate and the Generation Size), in order
to verify if they provide expected results they were programmed to give. To do so, the
performance score of each submitted design was plotted versus its Mean Mutation Rate or Mean
Generation Size.
From both engineers‟ and architects‟ submitted designs, no correlation can be established
between the performance score and the Mean Mutation Rate. The trend lines in each graph
drawn in Figure 4.8 show different variation for the score when the Mean Mutation Rate
increases. This is due to the user input that significantly matters during the task and the
selection process. As it is to the user to select a design, it entirely depends on his satisfaction and
criteria which reflects the randomness of the correlation between the Score and the Mean
Mutation Rate. Furthermore, the small slopes for trend lines indicated that the choice of the
Mutation Rate does not directly influence the resulting of the score.
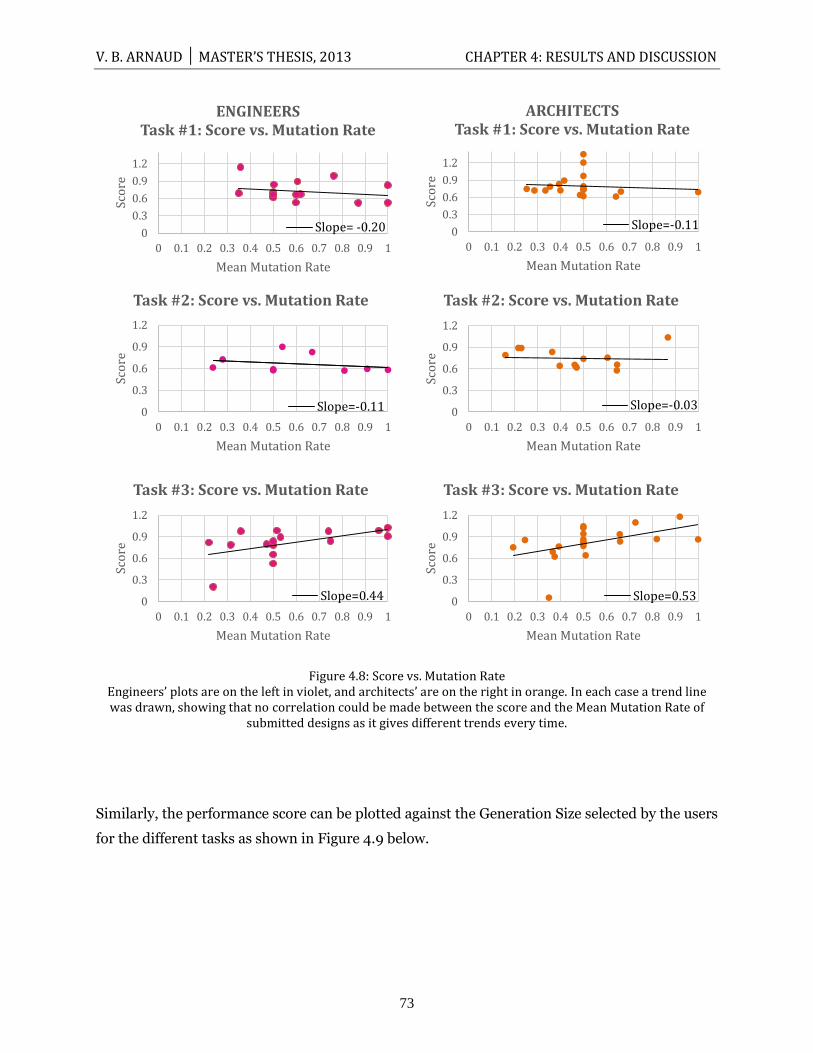
V. B. ARNAUD │ MASTER’S THESIS, 2013 CHAPTER 4: RESULTS AND DISCUSSION
73
Figure 4.8: Score vs. Mutation Rate Engineers’ plots are on the left in violet, and architects’ are on the right in orange. In each case a trend line was drawn, showing that no correlation could be made between the score and the Mean Mutation Rate of
submitted designs as it gives different trends every time.
Similarly, the performance score can be plotted against the Generation Size selected by the users
for the different tasks as shown in Figure 4.9 below.
0
0.3
0.6
0.9
1.2
0 0.1 0.2 0.3 0.4 0.5 0.6 0.7 0.8 0.9 1
Sco
re
Mean Mutation Rate
ENGINEERS Task #1: Score vs. Mutation Rate
Slope= -0.20 0
0.3
0.6
0.9
1.2
0 0.1 0.2 0.3 0.4 0.5 0.6 0.7 0.8 0.9 1
Sco
re
Mean Mutation Rate
ARCHITECTS Task #1: Score vs. Mutation Rate
Slope=-0.11
0
0.3
0.6
0.9
1.2
0 0.1 0.2 0.3 0.4 0.5 0.6 0.7 0.8 0.9 1
Sco
re
Mean Mutation Rate
Task #2: Score vs. Mutation Rate
Slope=-0.11 0
0.3
0.6
0.9
1.2
0 0.1 0.2 0.3 0.4 0.5 0.6 0.7 0.8 0.9 1Sc
ore
Mean Mutation Rate
Task #2: Score vs. Mutation Rate
Slope=-0.03
0
0.3
0.6
0.9
1.2
0 0.1 0.2 0.3 0.4 0.5 0.6 0.7 0.8 0.9 1
Sco
re
Mean Mutation Rate
Task #3: Score vs. Mutation Rate
Slope=0.44 0
0.3
0.6
0.9
1.2
0 0.1 0.2 0.3 0.4 0.5 0.6 0.7 0.8 0.9 1
Sco
re
Mean Mutation Rate
Task #3: Score vs. Mutation Rate
Slope=0.53
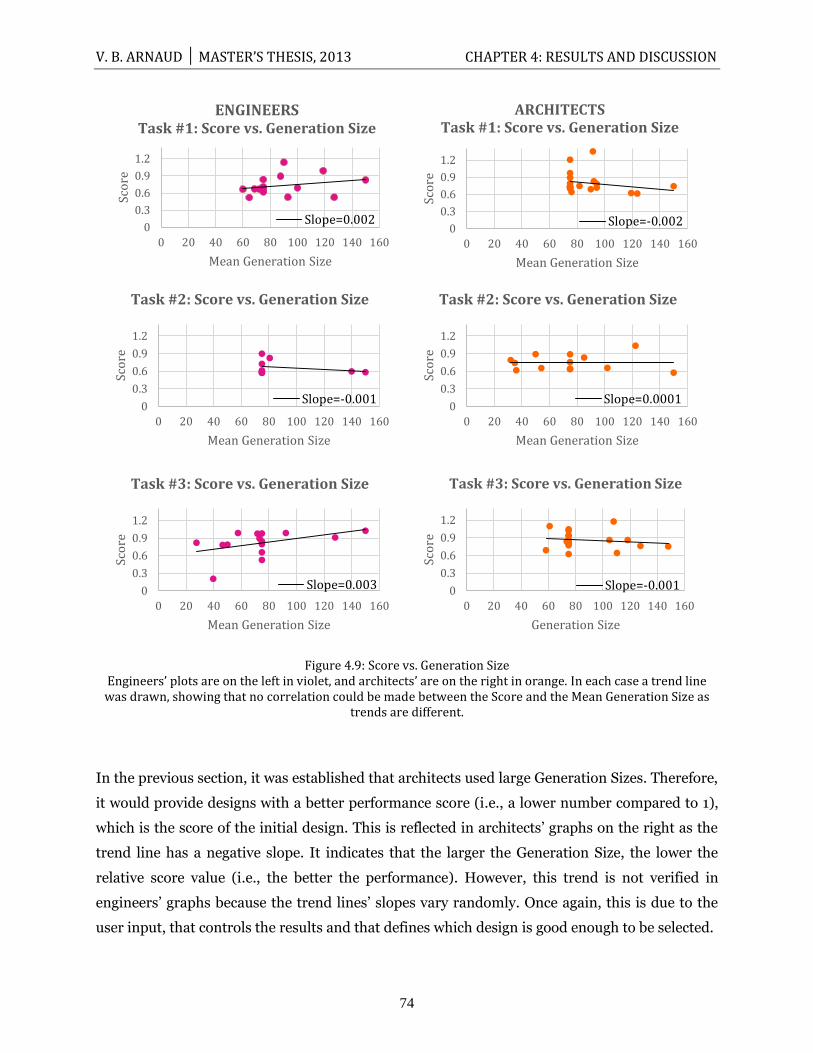
V. B. ARNAUD │ MASTER’S THESIS, 2013 CHAPTER 4: RESULTS AND DISCUSSION
74
Figure 4.9: Score vs. Generation Size Engineers’ plots are on the left in violet, and architects’ are on the right in orange. In each case a trend line was drawn, showing that no correlation could be made between the Score and the Mean Generation Size as
trends are different.
In the previous section, it was established that architects used large Generation Sizes. Therefore,
it would provide designs with a better performance score (i.e., a lower number compared to 1),
which is the score of the initial design. This is reflected in architects‟ graphs on the right as the
trend line has a negative slope. It indicates that the larger the Generation Size, the lower the
relative score value (i.e., the better the performance). However, this trend is not verified in
engineers‟ graphs because the trend lines‟ slopes vary randomly. Once again, this is due to the
user input, that controls the results and that defines which design is good enough to be selected.
0
0.3
0.6
0.9
1.2
0 20 40 60 80 100 120 140 160
Sco
re
Mean Generation Size
ENGINEERS Task #1: Score vs. Generation Size
Slope=0.0020
0.3
0.6
0.9
1.2
0 20 40 60 80 100 120 140 160
Sco
re
Mean Generation Size
ARCHITECTS Task #1: Score vs. Generation Size
Slope=-0.002
0
0.3
0.6
0.9
1.2
0 20 40 60 80 100 120 140 160
Sco
re
Mean Generation Size
Task #2: Score vs. Generation Size
Slope=-0.0010
0.3
0.6
0.9
1.2
0 20 40 60 80 100 120 140 160Sc
ore
Mean Generation Size
Task #2: Score vs. Generation Size
Slope=0.0001
0
0.3
0.6
0.9
1.2
0 20 40 60 80 100 120 140 160
Sco
re
Mean Generation Size
Task #3: Score vs. Generation Size
Slope=0.003 0
0.3
0.6
0.9
1.2
0 20 40 60 80 100 120 140 160
Sco
re
Generation Size
Task #3: Score vs. Generation Size
Slope=-0.001
V. B. ARNAUD │ MASTER’S THESIS, 2013 CHAPTER 4: RESULTS AND DISCUSSION
75
Thus, StructureFIT tools are efficient to get good results (i.e., satisfying designs and good
performance scores). However, it is to the user to make the right choices and have a good
strategy to get these kinds of results. As his input determines the outcome of the displayed
designs, he has to play carefully with the adjustable parameters (i.e., The Mutation Rate and the
Generation Size). As an example, architects‟ structures show that the use of these tools
according to what they are supposed to do, do not guarantee to get the best results in terms of
score as the user‟s input matters when it comes to choose appealing designs.
4.3.2. Exploration of the design space
To quantify the exploration of the design space, distances between designs can be calculated as
explained in Chapter III, Section 3.3.3. These distances are the sum of the differences of node
coordinates between the designs. Three distances are used in this section as described below.
Distance I/F: distance between the Initial Design and the Final Design:
This distance compares the Final Design‟ node positions with the Initial Design‟s node positions.
Distance I/S: distance between the Initial Design and the Selected Design:
This distance is entirely due to the computer input because the mutation tool recombines
designs together and let the user choose among them until the „Selected Design‟ is picked to
proceed with. Therefore, the evolutionary algorithm only generates the designs (i.e., node
positions).
Distance S/F: distance between the Selected Design and the Final Design:
This distance is entirely due to the user input because the user finished the mutation of designs
and plays now in the „Refine Design’ window. He is the only one able to modify the design and
node positions.
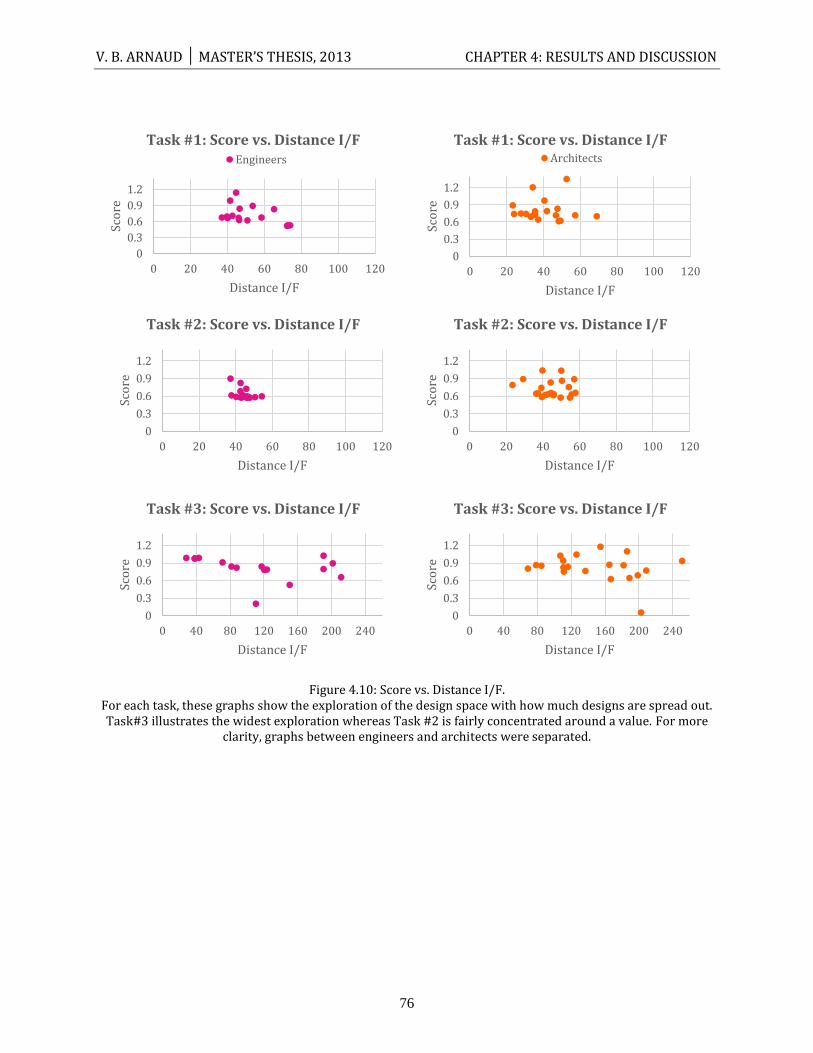
V. B. ARNAUD │ MASTER’S THESIS, 2013 CHAPTER 4: RESULTS AND DISCUSSION
76
Figure 4.10: Score vs. Distance I/F. For each task, these graphs show the exploration of the design space with how much designs are spread out. Task#3 illustrates the widest exploration whereas Task #2 is fairly concentrated around a value. For more
clarity, graphs between engineers and architects were separated.
0
0.3
0.6
0.9
1.2
0 20 40 60 80 100 120
Sco
re
Distance I/F
Task #1: Score vs. Distance I/F Engineers
0
0.3
0.6
0.9
1.2
0 20 40 60 80 100 120
Sco
re
Distance I/F
Task #1: Score vs. Distance I/F Architects
0
0.3
0.6
0.9
1.2
0 20 40 60 80 100 120
Sco
re
Distance I/F
Task #2: Score vs. Distance I/F
0
0.3
0.6
0.9
1.2
0 20 40 60 80 100 120Sc
ore
Distance I/F
Task #2: Score vs. Distance I/F
0
0.3
0.6
0.9
1.2
0 40 80 120 160 200 240
Sco
re
Distance I/F
Task #3: Score vs. Distance I/F
0
0.3
0.6
0.9
1.2
0 40 80 120 160 200 240
Sco
re
Distance I/F
Task #3: Score vs. Distance I/F
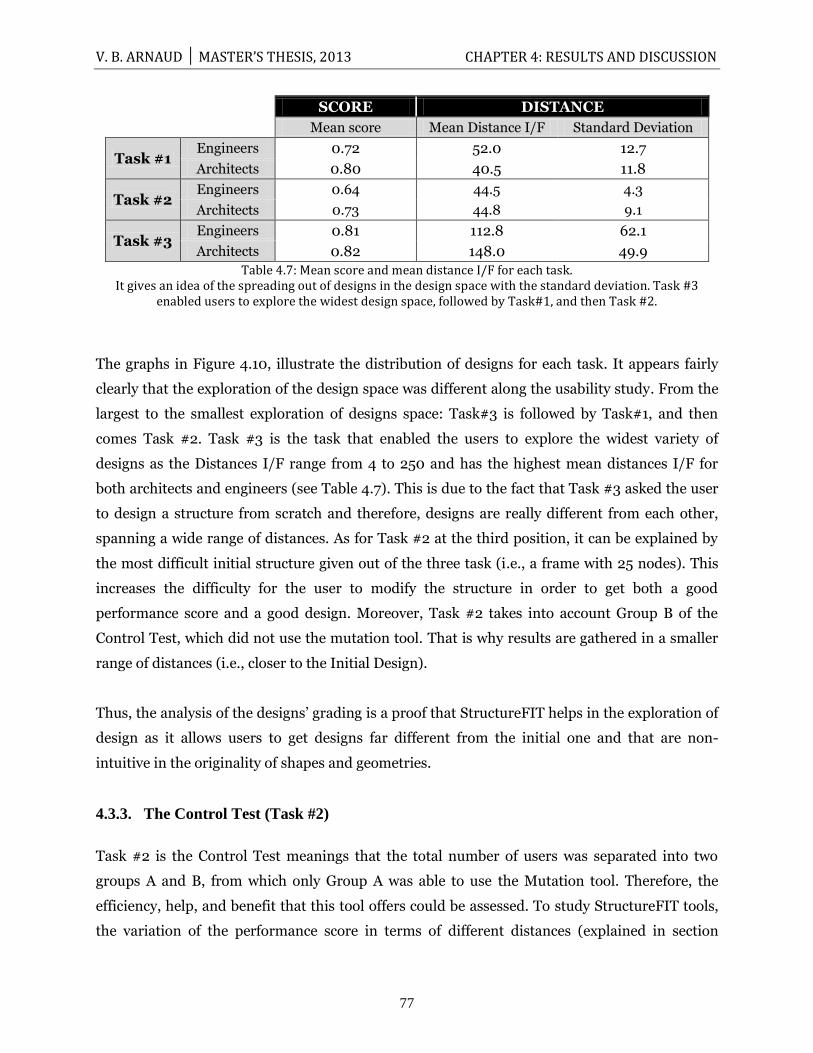
V. B. ARNAUD │ MASTER’S THESIS, 2013 CHAPTER 4: RESULTS AND DISCUSSION
77
SCORE DISTANCE
Mean score Mean Distance I/F Standard Deviation
Task #1 Engineers 0.72 52.0 12.7
Architects 0.80 40.5 11.8
Task #2 Engineers 0.64 44.5 4.3
Architects 0.73 44.8 9.1
Task #3 Engineers 0.81 112.8 62.1
Architects 0.82 148.0 49.9
Table 4.7: Mean score and mean distance I/F for each task. It gives an idea of the spreading out of designs in the design space with the standard deviation. Task #3
enabled users to explore the widest design space, followed by Task#1, and then Task #2.
The graphs in Figure 4.10, illustrate the distribution of designs for each task. It appears fairly
clearly that the exploration of the design space was different along the usability study. From the
largest to the smallest exploration of designs space: Task#3 is followed by Task#1, and then
comes Task #2. Task #3 is the task that enabled the users to explore the widest variety of
designs as the Distances I/F range from 4 to 250 and has the highest mean distances I/F for
both architects and engineers (see Table 4.7). This is due to the fact that Task #3 asked the user
to design a structure from scratch and therefore, designs are really different from each other,
spanning a wide range of distances. As for Task #2 at the third position, it can be explained by
the most difficult initial structure given out of the three task (i.e., a frame with 25 nodes). This
increases the difficulty for the user to modify the structure in order to get both a good
performance score and a good design. Moreover, Task #2 takes into account Group B of the
Control Test, which did not use the mutation tool. That is why results are gathered in a smaller
range of distances (i.e., closer to the Initial Design).
Thus, the analysis of the designs‟ grading is a proof that StructureFIT helps in the exploration of
design as it allows users to get designs far different from the initial one and that are non-
intuitive in the originality of shapes and geometries.
4.3.3. The Control Test (Task #2)
Task #2 is the Control Test meanings that the total number of users was separated into two
groups A and B, from which only Group A was able to use the Mutation tool. Therefore, the
efficiency, help, and benefit that this tool offers could be assessed. To study StructureFIT tools,
the variation of the performance score in terms of different distances (explained in section
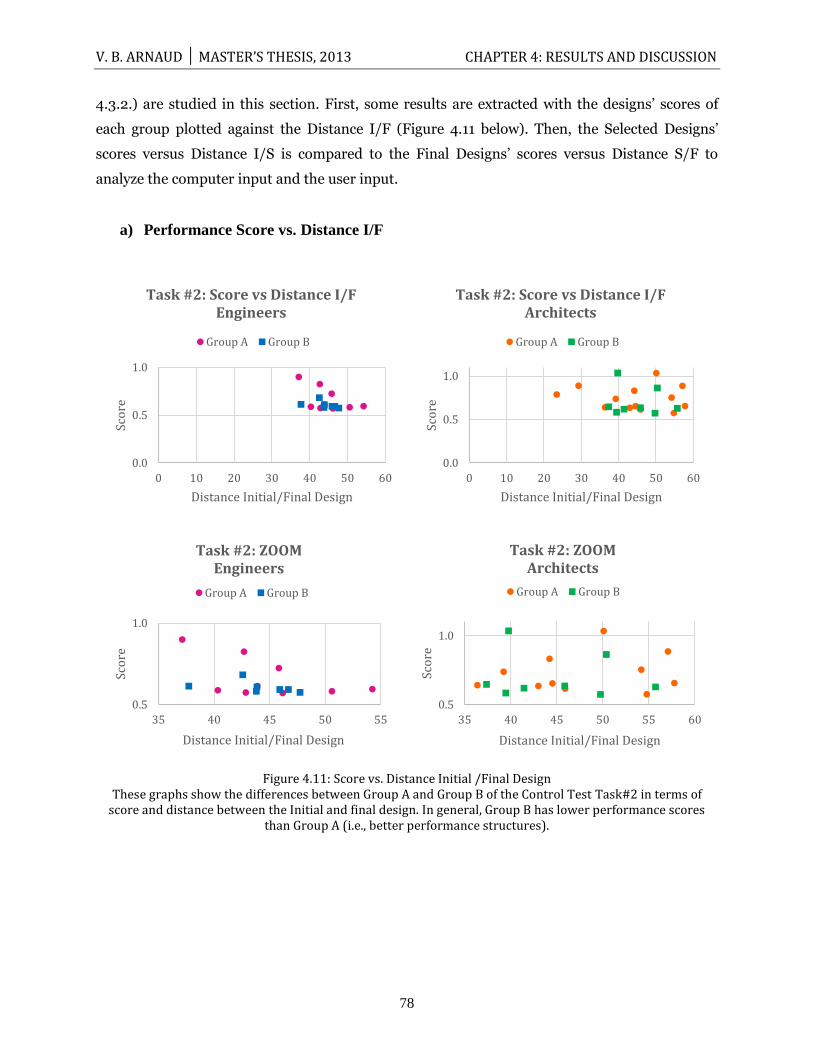
V. B. ARNAUD │ MASTER’S THESIS, 2013 CHAPTER 4: RESULTS AND DISCUSSION
78
4.3.2.) are studied in this section. First, some results are extracted with the designs‟ scores of
each group plotted against the Distance I/F (Figure 4.11 below). Then, the Selected Designs‟
scores versus Distance I/S is compared to the Final Designs‟ scores versus Distance S/F to
analyze the computer input and the user input.
a) Performance Score vs. Distance I/F
Figure 4.11: Score vs. Distance Initial /Final Design These graphs show the differences between Group A and Group B of the Control Test Task#2 in terms of
score and distance between the Initial and final design. In general, Group B has lower performance scores than Group A (i.e., better performance structures).
0.0
0.5
1.0
0 10 20 30 40 50 60
Sco
re
Distance Initial/Final Design
Task #2: Score vs Distance I/F Engineers
Group A Group B
0.0
0.5
1.0
0 10 20 30 40 50 60
Sco
re
Distance Initial/Final Design
Task #2: Score vs Distance I/F Architects
Group A Group B
0.5
1.0
35 40 45 50 55
Sco
re
Distance Initial/Final Design
Task #2: ZOOM Engineers
Group A Group B
0.5
1.0
35 40 45 50 55 60
Sco
re
Distance Initial/Final Design
Task #2: ZOOM Architects
Group A Group B
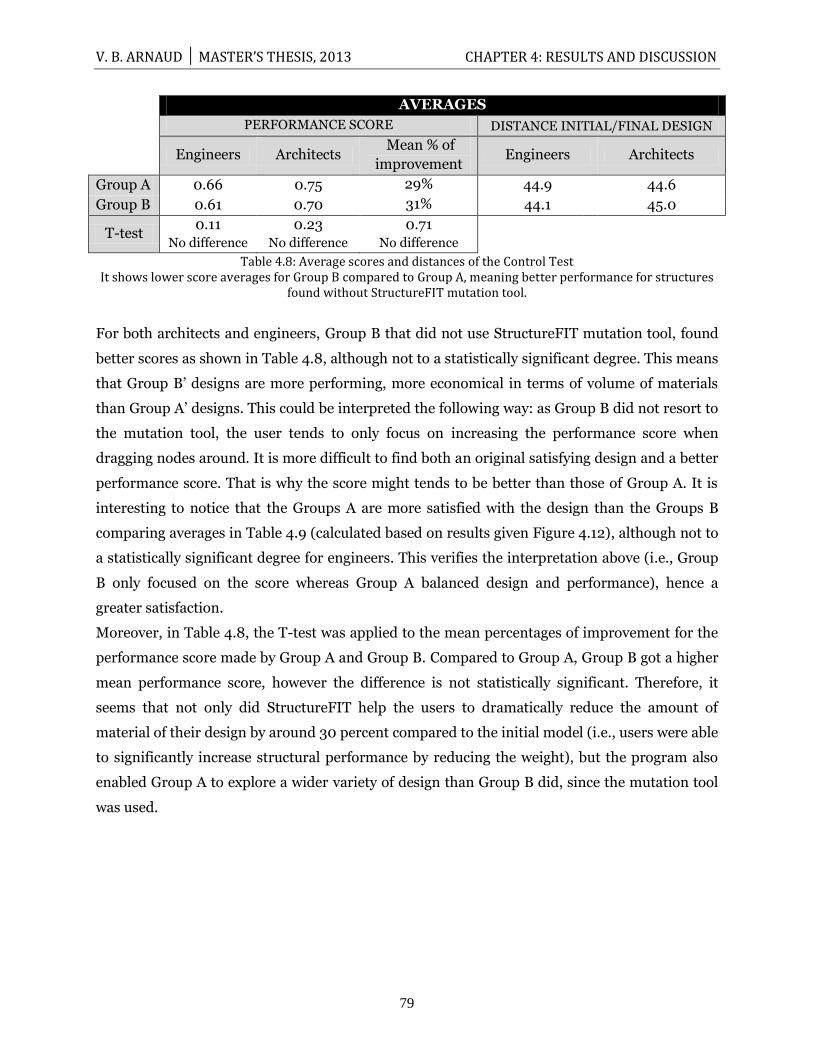
V. B. ARNAUD │ MASTER’S THESIS, 2013 CHAPTER 4: RESULTS AND DISCUSSION
79
AVERAGES
PERFORMANCE SCORE DISTANCE INITIAL/FINAL DESIGN
Engineers Architects Mean % of
improvement Engineers Architects
Group A 0.66 0.75 29% 44.9 44.6
Group B 0.61 0.70 31% 44.1 45.0
T-test 0.11
No difference
0.23
No difference
0.71
No difference
Table 4.8: Average scores and distances of the Control Test It shows lower score averages for Group B compared to Group A, meaning better performance for structures
found without StructureFIT mutation tool.
For both architects and engineers, Group B that did not use StructureFIT mutation tool, found
better scores as shown in Table 4.8, although not to a statistically significant degree. This means
that Group B‟ designs are more performing, more economical in terms of volume of materials
than Group A‟ designs. This could be interpreted the following way: as Group B did not resort to
the mutation tool, the user tends to only focus on increasing the performance score when
dragging nodes around. It is more difficult to find both an original satisfying design and a better
performance score. That is why the score might tends to be better than those of Group A. It is
interesting to notice that the Groups A are more satisfied with the design than the Groups B
comparing averages in Table 4.9 (calculated based on results given Figure 4.12), although not to
a statistically significant degree for engineers. This verifies the interpretation above (i.e., Group
B only focused on the score whereas Group A balanced design and performance), hence a
greater satisfaction.
Moreover, in Table 4.8, the T-test was applied to the mean percentages of improvement for the
performance score made by Group A and Group B. Compared to Group A, Group B got a higher
mean performance score, however the difference is not statistically significant. Therefore, it
seems that not only did StructureFIT help the users to dramatically reduce the amount of
material of their design by around 30 percent compared to the initial model (i.e., users were able
to significantly increase structural performance by reducing the weight), but the program also
enabled Group A to explore a wider variety of design than Group B did, since the mutation tool
was used.
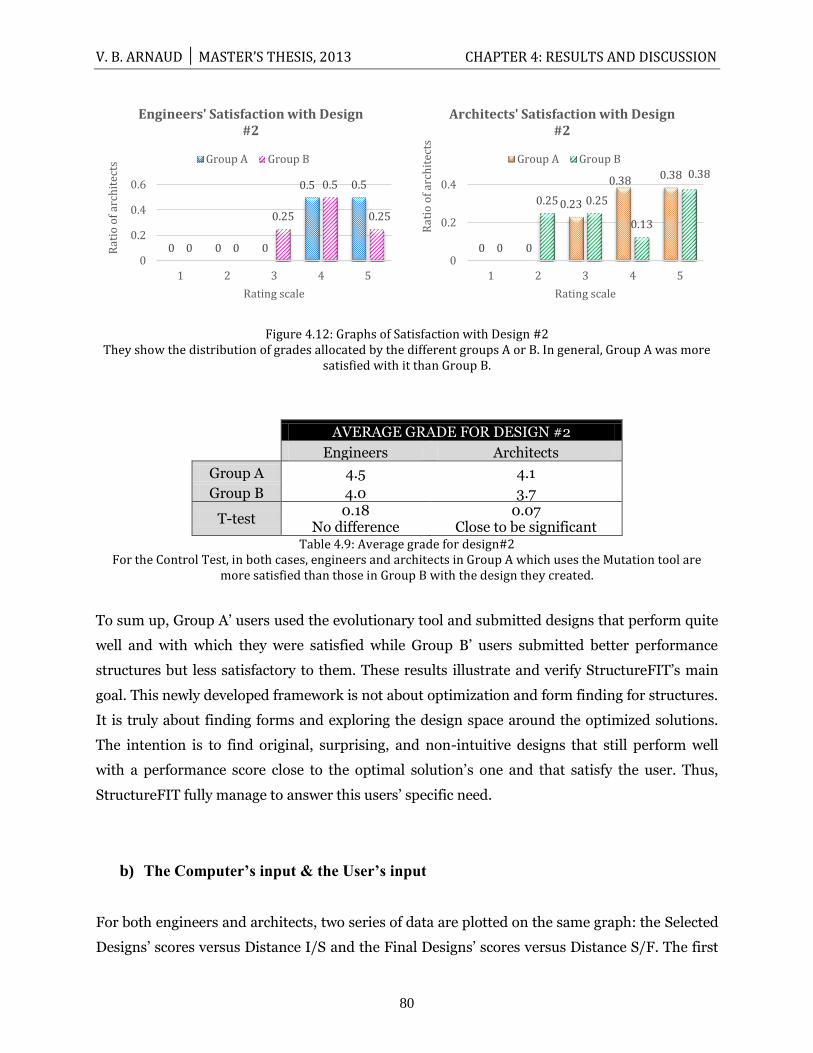
V. B. ARNAUD │ MASTER’S THESIS, 2013 CHAPTER 4: RESULTS AND DISCUSSION
80
Figure 4.12: Graphs of Satisfaction with Design #2 They show the distribution of grades allocated by the different groups A or B. In general, Group A was more
satisfied with it than Group B.
AVERAGE GRADE FOR DESIGN #2
Engineers Architects
Group A 4.5 4.1
Group B 4.0 3.7
T-test 0.18
No difference 0.07
Close to be significant Table 4.9: Average grade for design#2
For the Control Test, in both cases, engineers and architects in Group A which uses the Mutation tool are more satisfied than those in Group B with the design they created.
To sum up, Group A‟ users used the evolutionary tool and submitted designs that perform quite
well and with which they were satisfied while Group B‟ users submitted better performance
structures but less satisfactory to them. These results illustrate and verify StructureFIT‟s main
goal. This newly developed framework is not about optimization and form finding for structures.
It is truly about finding forms and exploring the design space around the optimized solutions.
The intention is to find original, surprising, and non-intuitive designs that still perform well
with a performance score close to the optimal solution‟s one and that satisfy the user. Thus,
StructureFIT fully manage to answer this users‟ specific need.
b) The Computer’s input & the User’s input
For both engineers and architects, two series of data are plotted on the same graph: the Selected
Designs‟ scores versus Distance I/S and the Final Designs‟ scores versus Distance S/F. The first
0 0 0
0.5 0.5
0 0
0.25
0.5
0.25
0
0.2
0.4
0.6
1 2 3 4 5
Rat
io o
f ar
chit
ects
Rating scale
Engineers' Satisfaction with Design #2
Group A Group B
0 0
0.23
0.38 0.38
0
0.25 0.25
0.13
0.38
0
0.2
0.4
1 2 3 4 5
Rat
io o
f ar
chit
ects
Rating scale
Architects' Satisfaction with Design #2
Group A Group B
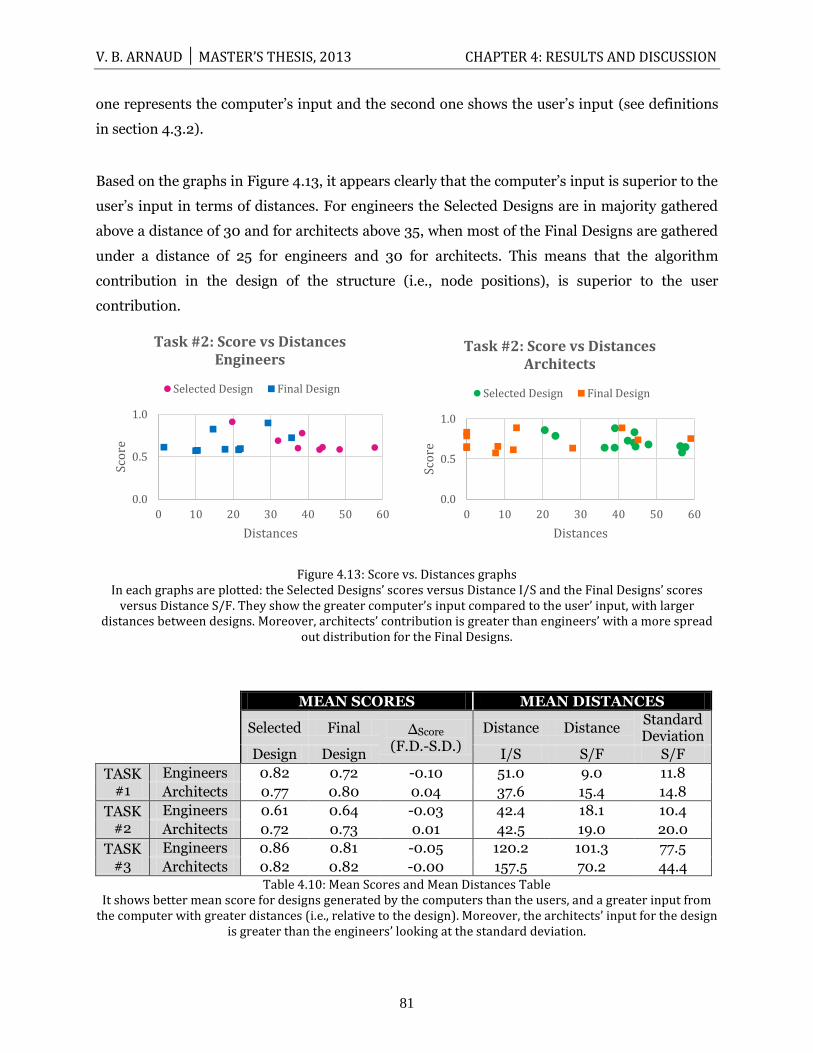
V. B. ARNAUD │ MASTER’S THESIS, 2013 CHAPTER 4: RESULTS AND DISCUSSION
81
one represents the computer‟s input and the second one shows the user‟s input (see definitions
in section 4.3.2).
Based on the graphs in Figure 4.13, it appears clearly that the computer‟s input is superior to the
user‟s input in terms of distances. For engineers the Selected Designs are in majority gathered
above a distance of 30 and for architects above 35, when most of the Final Designs are gathered
under a distance of 25 for engineers and 30 for architects. This means that the algorithm
contribution in the design of the structure (i.e., node positions), is superior to the user
contribution.
Figure 4.13: Score vs. Distances graphs In each graphs are plotted: the Selected Designs’ scores versus Distance I/S and the Final Designs’ scores
versus Distance S/F. They show the greater computer’s input compared to the user’ input, with larger distances between designs. Moreover, architects’ contribution is greater than engineers’ with a more spread
out distribution for the Final Designs.
MEAN SCORES MEAN DISTANCES
Selected Final ΔScore (F.D.-S.D.)
Distance Distance Standard Deviation
Design Design I/S S/F S/F
TASK #1
Engineers 0.82 0.72 -0.10 51.0 9.0 11.8
Architects 0.77 0.80 0.04 37.6 15.4 14.8
TASK #2
Engineers 0.61 0.64 -0.03 42.4 18.1 10.4
Architects 0.72 0.73 0.01 42.5 19.0 20.0
TASK #3
Engineers 0.86 0.81 -0.05 120.2 101.3 77.5
Architects 0.82 0.82 -0.00 157.5 70.2 44.4 Table 4.10: Mean Scores and Mean Distances Table
It shows better mean score for designs generated by the computers than the users, and a greater input from the computer with greater distances (i.e., relative to the design). Moreover, the architects’ input for the design
is greater than the engineers’ looking at the standard deviation.
0.0
0.5
1.0
0 10 20 30 40 50 60
Sco
re
Distances
Task #2: Score vs Distances Engineers
Selected Design Final Design
0.0
0.5
1.0
0 10 20 30 40 50 60
Sco
re
Distances
Task #2: Score vs Distances Architects
Selected Design Final Design
V. B. ARNAUD │ MASTER’S THESIS, 2013 CHAPTER 4: RESULTS AND DISCUSSION
82
Looking at contributions into details, Table 4.10 provides quantitative information. For
TASK#2, the computer‟s input in terms of distances is fairly the same for both fields whereas the
users‟ inputs are different. For TASK #2, although the averages for Distance S/F are similar for
engineers and architects, the architects‟ standard deviation is twice the engineers‟ one. It tells a
greater input of architects as for modifying the design by moving nodes around. Despite the
variety of designs provided by the computer, architects still want to contribute in the design and
make more modifications than engineers to get to satisfactory structures.
Thus, although architects contribution is greater than engineers‟ as show on Figure 4.13 with a
more spread out distribution for architects‟ Final Design than engineers‟; the contribution of
users is still inferior to the computer‟s input.
But does a greater contribution from the computer help in term of performance of the
structures? This can be answered with Table 4.10 looking at ΔScore (F.D.-S.D.). For engineers, the
user input helped to find better score as ΔScore (F.D.-S.D.) are negative for each task. For
architects, TASK #1 and TASK#2 shows that the mean score of selected designs provided by the
algorithm is lower (i.e., better structures relatively to the Initial Designs, than Final Designs).
Given that the architects‟ contribution is greater than the engineers‟ for these tasks, these results
could be understand the following way. When StructureFIT is used by architects, the computer
is more efficient to found better performance structures than the users. Knowing that the Final
Designs are the Selected Designs modified by the users, the computer‟s efficiency in terms of
score can be interpreted once again, as the primary users‟ focus on the design of the structure
and less on the score. This makes sense as architects are more into the design and then want to
contribute more in the production of a design compared with engineers. This was shown above
with the greater input of architects compared to engineers.
Thus, depending on the user‟s field either engineering or architecture, the user‟s input will vary.
Nonetheless, the computer‟s input is in both cases superior to the user‟s input. The algorithm
does most of the work to find a better relative performance score and then, the user can refine
the model according to his design criteria.
V. B. ARNAUD │ MASTER’S THESIS, 2013 CHAPTER 4: RESULTS AND DISCUSSION
83
4.3.4. Potential improvement for StructureFIT
From the questionnaire, users‟ comments and feedback on StructureFIT were gathered in this
section. It will help to refine the framework in order to answer users‟ needs and get some ideas
for further improvements.
Comments and suggestions can be organized under three main categories: the better display of
parameters, more explanatory messages, and other possible functionalities.
Improvement of the GUI through a better display of parameters:
- Put evidence of the score on the Graphical User Interface
- Display the total volume of materials
- Display the principal lengths of members
- Show material properties, section properties…
- Option to display a grid that would help scaling the design if needed
- Showing which parts were evolved by the mutation tool program
Explanatory messages, pop up messages may be helpful, explaining:
- Why the score of designs are changing (mass, stiffness…)
- The Mutation Rate and the Generation Size functions
- Why a structure is unstable: which nodes/members are not well connected?
- How to navigate from a window to another: when you choose a design and you
want to move forward
- Help option to give information
Other possible functionalities:
- Adapt for more complex structures and increasing robustness of metrics for
comparison
- Adapt to be able to model structures in 3D
- Analysis of curved structures
- Code for an „Undo command‟ (Ctrl+Z)
- Speed could be improved for certain types of structures (Frames, etc)
V. B. ARNAUD │ MASTER’S THESIS, 2013 CHAPTER 4: RESULTS AND DISCUSSION
84
- Function to enter the score and get a design that satisfies it. Knowing the
allowable amount of materials according to a specific budget, it would be
interesting to reverse the process by entering a score that would provide a design.
4.4. Summary
To sum up, this chapter presented results from the usability study and the questionnaire, which
helped to gather important comments and feedback on software from users, along with the
study of design approaches of engineers and architects. Through the use of StructureFIT by
designers, multiple aspects of the design processes were identified and provided a better
understanding of both fields‟ respective methodology. Lastly, suggestions for further
development of software were also given.
What was found in this chapter is summarized below:
- Designers preferred StructureFIT to standard software. Current tools lack user-
friendliness and the ease of modification of structural elements would be much
appreciated.
- Two main design approaches were identified. Engineers would try to explore solutions
keeping control of the performance score they are satisfied with, and then refine the
model to improve its performance. Architects would push the design exploration to its
limits and resort to a trial and guess method to improve the performance score.
- The Mutation Rate and the Generation size do not directly influence the resulting of the
score. This is due to the user‟s input that significantly matters during the task and the
selection process.
- StructureFIT managed to meet specific users‟ needs as this newly developed framework
is not about optimization and form finding for structures. It is truly about finding forms
and exploring the design space around the optimized solutions.
Now, it opens the discussion on the contribution of this work and what could be developed or
studied to further research on the gap between architects and engineers.

V. B. ARNAUD │ MASTER’S THESIS, 2013 CHAPTER 5: CONCLUSION
85
CHAPTER 5:
5. CONCLUSIONS
This chapter provides a summary for the thesis. First, it will give conclusions drawn from the
analysis of results developed in Chapter 4. This section will also highlight the contributions and
applications of this study as well as general knowledge of how architects and engineers work.
Finally, directions for future work will be discussed.
5.1. Summary of results
This research strives to quantify differences in the design approaches of architects and engineers
through the use of software. This goal is to quantitatively assess the differences between both
disciplines in the use of structural design software. This gives important perspective on the most
effective means to bridge dissimilar approaches for improved collaboration.
V. B. ARNAUD │ MASTER’S THESIS, 2013 CHAPTER 5: CONCLUSION
86
5.1.1. Q1: Satisfaction with software
How satisfied are architects and engineers with today’s structural design
software?
Based on users‟ comments and suggestions for the current software (see Chapter 4, section
4.1.2) and for StructureFIT (see Chapter 4, section 4.3.4), limitations and possible
improvements for software have been identified. Designers appreciate user-friendly software
programs, with a fairly intuitive and fast to learn graphical user interface. Moreover, the ease of
modification of structural elements when a model is built allows for effective design iterations.
The main challenge of current software is to enable users to redesign structural elements with
little effort in order to explore more alternatives and optimize performance, but without limiting
the designers‟ freedom of choice. While this balance is not found in current software,
StructureFIT is a positive step toward an ideal design tool. It generates alternative designs which
remain controlled by the users via adjustable parameters. This explains why users were more
satisfied with StructureFIT than with current software, as shown in Chapter 4, section 4.1.
Lastly, if a unique software program could analyze models and enable easy modifications, it
would greatly help avoid having to combine several software programs.
Thus, new developed frameworks and software programs should answer some to all of the
designers‟ needs and demands to facilitate their jobs and enhance the quality of their work with
minimum effort. Programs should foster collaboration between engineers and architects by
incorporating considerations of other fields.
5.1.2. Q2: Design approaches
Can different design approaches be identified for architects and engineers to
create a successful structural design?
Design procedures are able to be determined based on the study of the use of StructureFIT and
its key adjustable parameters as explained in Chapter 4, Section 4.2. First, the Mutation Rates
were chosen above the default value by engineers and architects. It suggests that designers were
in the search for new and unexpected designs. They wanted to generate shapes far away from
the initial model for the sake of exploring alternatives.
Second, the selections of Generation Sizes were different for architects and engineers. The
distribution indicated a tendency for architects to be above the default value and for engineers to
V. B. ARNAUD │ MASTER’S THESIS, 2013 CHAPTER 5: CONCLUSION
87
be below. By choosing lower Generation Sizes, engineers seemed to be willing to explore shape
and geometry while staying relatively close to the performance score they were satisfied with.
Hence, they tended to proceed as follows: keeping control of a specific performance score while
willing to explore solutions. Unlike engineers, the majority of the architects selected large
Generation Sizes, above the default one. It suggested a desire of architects to find better scores
for structures relying more on the software than engineers, since the algorithm displayed the
best designs of a larger sample.
However, the different use of these adjustable parameters does not seem to determine the
outcome for designs‟ performance scores. As a matter of fact, the designs‟ mean performance
scores are slightly different between engineers and architects, but not to a statistically significant
degree. That is why they can be considered to be equivalent. Nonetheless, StructureFIT helped
users to significantly improve performance scores of the designs by 20 to 37 percent compared
to the initial models. Therefore, users were able to discover lower weight structures in less than
15 minutes (i.e., average duration of one task).
Therefore, results and observations from the usability study suggest differences in the design
approaches of architects and engineers: architects tended to use a trial-and-guess process to
achieve a satisfactory design and performance, while engineers tended to proceed more
methodically in a step-by-step manner. Thus, engineers were less risk-taking than architects in
the search for designs. As a result of a less methodological process, architects seemed to have
been able to look at a wider design space and it revealed their concerns about the design‟s visual
aspects. Although these design approaches are different, in the end, both fields‟ submitted
designs that had similar mean performance scores. In other words, whatever design approach
the user adopts, StructureFIT will provide similar results in terms of performance but with a
wide variety of structures. This is shown in the next section which assesses the design
exploration with StructureFIT. It is this richness of design solutions that makes StructureFIT
such an innovative and promising tool for the industry.
Thus, the approaches taken by both fields tend to diverge in their processes, but converge to the
same goals. It appeared that for these two disciplines to be satisfied with a structure, designers
want to explore a large range of alternative designs, which are then modified until they have
found a satisfying balance between their criteria of success for a design. It leads to the idea of the
necessity of collaboration between architects and engineers since both the design and
performance are usually equally important for a client. Both fields supplement each other with
their considerations and knowledge, which opens the discussion on the current industry and
V. B. ARNAUD │ MASTER’S THESIS, 2013 CHAPTER 5: CONCLUSION
88
current software that do not foster interaction adequately, and therefore, lower the potential of a
designer‟s work.
5.1.3. Q3: StructureFIT software
Does StructureFIT provide a positive design exploration for both architects and
engineers?
Not only did StructureFIT help users to find better scores for designs but it also enabled them to
explore a wide design space. As shown previously in Chapter 4, section 4.3.2, the distances
between the initial designs and the submitted designs are significant (i.e., always greater than
20 unit length and spread until around 75 unit lengths for Task #2 and Task #3). These values
represent how far submitted designs are from the initial designs in terms of node positions.
Moreover, designs produced for Task #3 are spread between 30 and 240 unit lengths,
illustrating the wide design space explored by users. Therefore, StructureFIT seems to highly
contribute to explore a large variety of solutions due to the use of the evolutionary algorithm.
The Control Test corroborates these results since the users who did not use the mutation tool
had designs more concentrated around a certain values, compared to a more spread out design
distribution for the users that applied the mutation tool.
The Control Test also reveals the powerful efficiency of StructureFIT, this was illustrated in
section 4.3.3. Although in both fields‟ Groups B got higher mean performance scores than
Groups A, the difference is not statistically significant. In other words, users in both groups were
able to dramatically improve the initial design‟s performance score by around 30 percent using
StructureFIT. That is to say, the tool enabled users to significantly reduce the amount of
material of 30 percent, as well as the structure‟s weight, working less than 15 minutes on the
design. Therefore, it seems that not only did StructureFIT help the users to dramatically reduce
the amount of material of designs by a third, but the program also enabled Group A to explore a
wider variety of designs than Group B, since the mutation tool was used. Thus, these results
provide an answer to the third research question: StructureFIT does provide a positive design
exploration for architects and engineers, since the tool enables users to dramatically improve
structural performance by providing a wide diversity of solutions.
Additionally, the study of StructureFIT‟s contribution and user‟s contribution in the search of a
design suggests as well that the design space exploration is facilitated by StructureFIT. Although
architects seemed to have had a greater input playing more with the tool in the different tasks
than engineers, the computer‟s input was always greater than the user‟s input. The
V. B. ARNAUD │ MASTER’S THESIS, 2013 CHAPTER 5: CONCLUSION
89
modifications made on the designs were contributed to more by the tool than by the users. Thus,
the evolutionary algorithm did most of the work to find better relative performance scores for
structures that were then refined by users at a later stage.
It was confirmed that this newly developed framework called StructureFIT, is not primarily
about optimization and form finding for structures. The intention is to explore the widest design
space by finding original and non-intuitive designs that satisfies the users‟ requirements while
maintaining an acceptable performance score. StructureFIT managed to meet the users‟ specific
needs as was shown with the controlled test. The evolutionary algorithm used by StructureFIT,
is efficient to guide the user in the design process by generating high performance structural
solutions, while preserving designers‟ freedom in the diversity of design choice. Additionally,
although the user‟s contribution varies depending on the field he belongs to, the computer‟s
contribution is always superior to the user‟s contribution. This proves that the algorithm does
most of the work to find better relative performance scores and surprising designs, which the
user can refine during a final iteration. Therefore, this powerful framework allows a wide
exploration of the design space, while revolving around optimal solutions if desired.
The usability study enabled the assessment of StructureFIT, proving its potential to have a
significant impact in the current industry as it offers functionalities that meet many users‟ needs
and demands. There is still room for refinements in this framework, but it will definitely pave
the way for a new generation of design tools.
5.2. Contributions and applications
Along with the aim of quantifying differences in the design approach of architects and engineers,
this research also contributes to other research by providing input on the different approaches
to solving a design problem. This work also focuses on the improvement of StructureFIT, and
carries out an uncommon usability study involving both architects and engineers.
5.2.1. Better understanding of design approaches
The study of both disciplines‟ design approaches helps illustrate what improvements have to be
made in the current industry not only in organization, but also in terms of tools that are used.
Identifying specific needs is crucial to make progress in the future. This thesis underlined the
V. B. ARNAUD │ MASTER’S THESIS, 2013 CHAPTER 5: CONCLUSION
90
absolute necessity of collaboration between architects and engineers in the design model. The
overlap of both fields will certainly enhance productivity, performance, and structure quality,
while making both professions ever more challenging and fulfilling. To accomplish this, tools
should be adapted to foster even more collaboration to this end.
5.2.2. StructureFIT improvement
To study differences during the design process in both fields, this research used StructureFIT, a
newly developed framework. Although, the researcher, Caitlin Mueller, did most of the work,
some refinements can still be made. In particular, a Manual and a Tutorial were written to be
included in the graphical user interface and to provide the user with more guidance on available
functions and tools.
The StructureFIT Manual (in Appendix A), starts with instructions on how to open StructureFIT
and gives explanations for every window. Each icon, button, and functionality is detailed, with
examples and indications on how to use them. The StructureFIT Tutorial in Appendix B
provides a step-by-step list of instructions that the user can follow in order to gain familiarity
with the program and build a basic model.
5.2.3. Usability study
To conduct this research, a questionnaire and a usability study had to be specifically designed
for StructureFIT. Moreover, doing a usability study on StructureFIT had two benefits; it enabled
the study of differences in the design process between architects and engineers, and also helped
detect problems and improvements that can be made on the framework. Therefore, these two
advantages combined are highly profitable for this research and StructureFIT. Furthermore, this
usability study is a precursor for better understanding the design process since it involved both
architects and engineers using the same framework, which has rarely been done before.
5.3. Potential for future work
Although this thesis covered many issues, multiple problems remain and need further research.
A complete comprehension of both disciplines‟ processes seems utopian but the possibility to
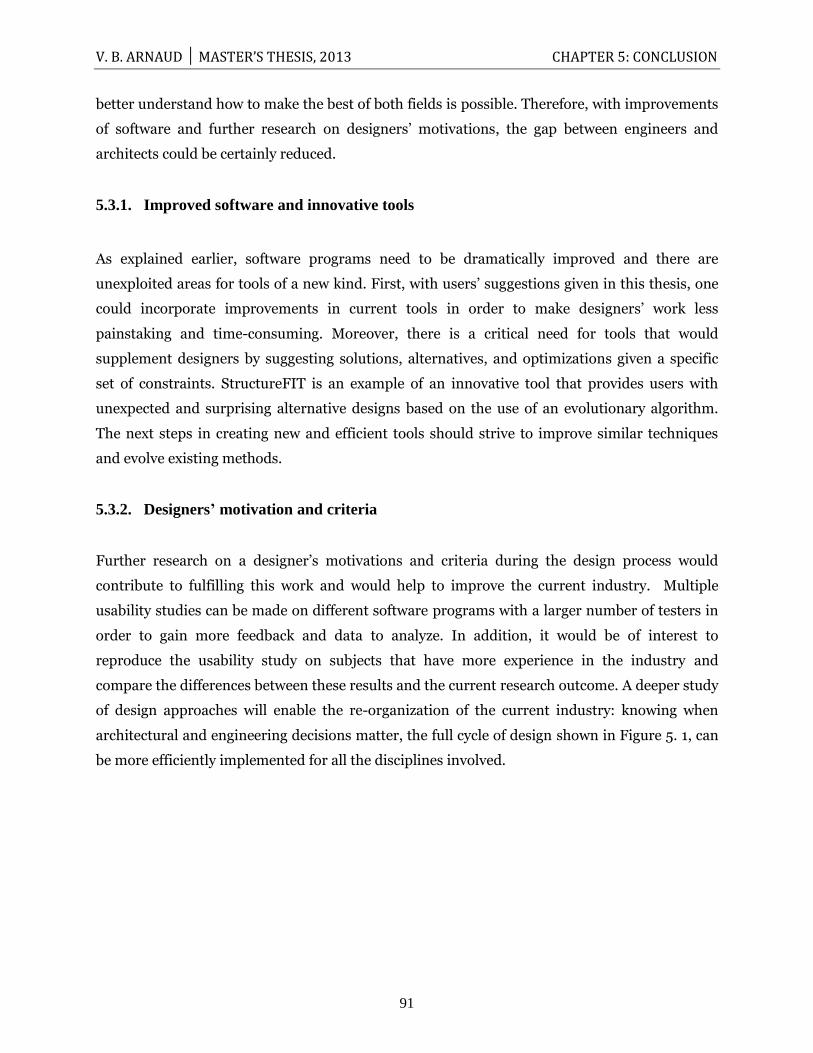
V. B. ARNAUD │ MASTER’S THESIS, 2013 CHAPTER 5: CONCLUSION
91
better understand how to make the best of both fields is possible. Therefore, with improvements
of software and further research on designers‟ motivations, the gap between engineers and
architects could be certainly reduced.
5.3.1. Improved software and innovative tools
As explained earlier, software programs need to be dramatically improved and there are
unexploited areas for tools of a new kind. First, with users‟ suggestions given in this thesis, one
could incorporate improvements in current tools in order to make designers‟ work less
painstaking and time-consuming. Moreover, there is a critical need for tools that would
supplement designers by suggesting solutions, alternatives, and optimizations given a specific
set of constraints. StructureFIT is an example of an innovative tool that provides users with
unexpected and surprising alternative designs based on the use of an evolutionary algorithm.
The next steps in creating new and efficient tools should strive to improve similar techniques
and evolve existing methods.
5.3.2. Designers’ motivation and criteria
Further research on a designer‟s motivations and criteria during the design process would
contribute to fulfilling this work and would help to improve the current industry. Multiple
usability studies can be made on different software programs with a larger number of testers in
order to gain more feedback and data to analyze. In addition, it would be of interest to
reproduce the usability study on subjects that have more experience in the industry and
compare the differences between these results and the current research outcome. A deeper study
of design approaches will enable the re-organization of the current industry: knowing when
architectural and engineering decisions matter, the full cycle of design shown in Figure 5. 1, can
be more efficiently implemented for all the disciplines involved.
V. B. ARNAUD │ MASTER’S THESIS, 2013 CHAPTER 5: CONCLUSION
92
Figure 5.1: The Design Cycle This picture shows the full design cycle that goes from the client’s needs, to the architectural requirements, to
the engineering solutions and optimization of structures. (TeachEngineering, 2003)
5.3.3. Closing remarks
“Structure is all about doing more with less”, Bill Addis, 1994
Safety, efficiency, performance, sustainability, and cost effectiveness are some of the
requirements for current and future structures. Designers strive to achieve excellence with
outstanding designs while meeting and exceeding these requirements.
Not only do they try to enhance the world‟s beauty by creating inspiring and amazing buildings,
but they also build structures that can resist nature and its great forces while ensuring people‟s
safety. Although designers have different design approaches, their convergent goals are what
unify them in their work. It has been shown that fostering collaboration and interaction between
architects and engineers can synergize both elegance and performance for complex modern
structures (see Figure 5.2). Working hand-in-hand, they can accomplish great challenges and go
beyond human expectations even as their approaches are dissimilar but complementary. When
engineering considerations are combined with early architectural inspiration, new design fronts
are challenged to create beautiful, efficient, and iconic structures.
Ask
Imagine
Plan Create
Evaluate
Improve

V. B. ARNAUD │ MASTER’S THESIS, 2013 CHAPTER 5: CONCLUSION
93
Figure 5.2: Complex modern structures
Left: the Marina Bay Sands Hotel in Singapore (three main towers supports a double-curved cantilever platform, Hunter, 2012). Center: the Burj Khalifa Tower in Dubaï (it is currently the tallest building in the
world at a height of 828 meters, ArabicGuy, 2012). Right: the Death Star Lunar Hotel in Azerbaijan (its circular shape is supported by two inner shear walls, Inhabitat, 2008).

V. B. ARNAUD │ MASTER’S THESIS, 2013 APPENDICES
94

V. B. ARNAUD │ MASTER’S THESIS, 2013 APPENDICES
95
APPENDICES

V. B. ARNAUD │ MASTER’S THESIS, 2013 APPENDICES
96
V. B. ARNAUD │ MASTER’S THESIS, 2013 APPENDICES
97
A. StructureFIT Manual
StructureFIT Manual
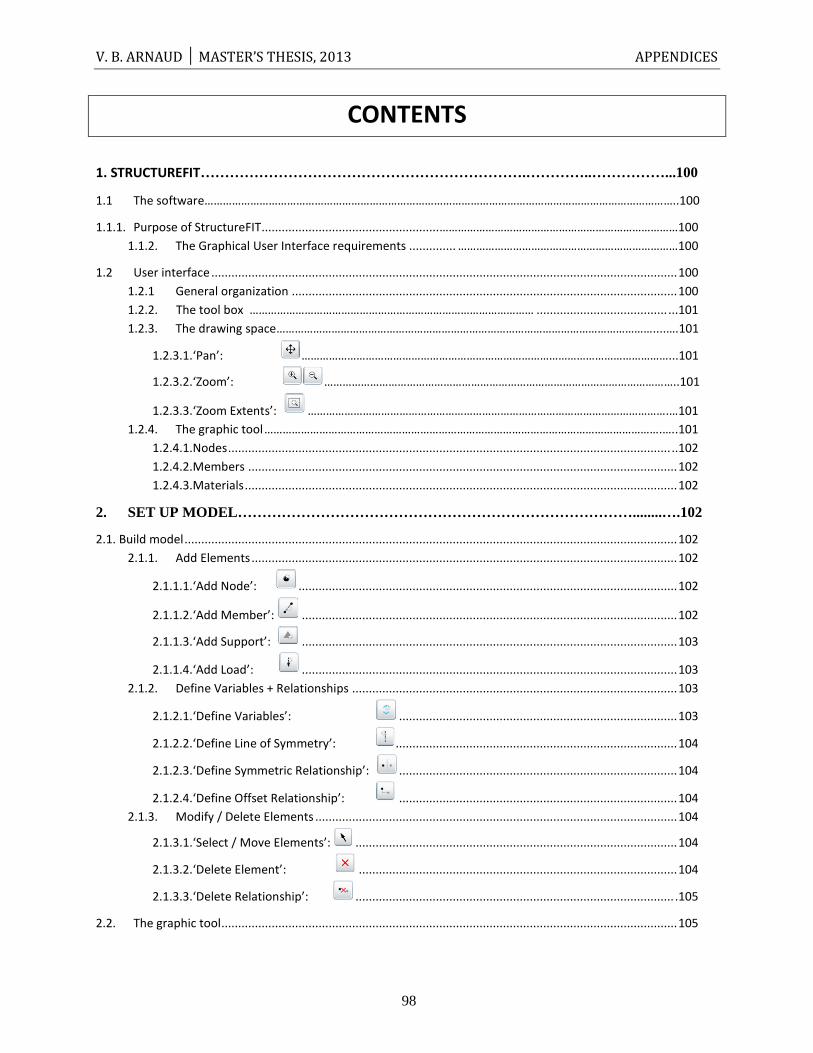
V. B. ARNAUD │ MASTER’S THESIS, 2013 APPENDICES
98
CONTENTS
1. STRUCTUREFIT………………………………………………………….…………..……………...100
1.1 The software………………………………………………………………………………………………………………………………………..100
1.1.1. Purpose of StructureFIT ..................................................... ……………………………………………………………………100
1.1.2. The Graphical User Interface requirements .............. ………………………………………………………………100
1.2 User interface ........................................................................................................................................... 100
1.2.1 General organization ................................................................................................................... 100
1.2.2. The tool box ………………………………………………………………………………… ....................................... ...101
1.2.3. The drawing space……………………………………………………………………………………………………………....….101
1.2.3.1.‘Pan’: …………………………………………………………………………………………………………...101
1.2.3.2.‘Zoom’: ……………………………………………………………………………………………………..101
1.2.3.3.‘Zoom Extents’: ……………………………………………………………………………………………………….…101
1.2.4. The graphic tool ………………………………………………………………………………………………………………….…..101
1.2.4.1.Nodes .................................................................................................................................... ..102
1.2.4.2.Members ................................................................................................................................ 102
1.2.4.3.Materials ................................................................................................................................. 102
2. SET UP MODEL………………………………………………………………………........….102
2.1. Build model ................................................................................................................................................... 102
2.1.1. Add Elements ............................................................................................................................... 102
2.1.1.1.‘Add Node’: ................................................................................................................. 102
2.1.1.2.‘Add Member’: ................................................................................................................ 102
2.1.1.3.‘Add Support’: ................................................................................................................ 103
2.1.1.4.‘Add Load’: ................................................................................................................ 103
2.1.2. Define Variables + Relationships ................................................................................................. 103
2.1.2.1.‘Define Variables’: ................................................................................... 103
2.1.2.2.‘Define Line of Symmetry’: .................................................................................... 104
2.1.2.3.‘Define Symmetric Relationship’: ................................................................................... 104
2.1.2.4.‘Define Offset Relationship’: ................................................................................... 104
2.1.3. Modify / Delete Elements ............................................................................................................ 104
2.1.3.1.‘Select / Move Elements’: ................................................................................................ 104
2.1.3.2.‘Delete Element’: ............................................................................................... 104
2.1.3.3.‘Delete Relationship’: ............................................................................................... .105
2.2. The graphic tool ........................................................................................................................................ 105
V. B. ARNAUD │ MASTER’S THESIS, 2013 APPENDICES
99
2.3. Open+ Save ............................................................................................................................................ …105
2.3.1. Selection of pre-defined models ....................................................................................................... 105
2.3.2. ‘New Design’: ............................................................................................................................ 106
2.3.3. ‘Save Design’: ............................................................................................................................. 106
2.4. Start as Initial Design in Evolutionary Exploration: ............................................................................ 106
3. EXPLORE SOLUTIONS……………….……………………………………...……………...........106
3.1.User Interface organization ........................................................................................................................... 106
3.2. The Design Overview ................................................................................................................................ 107
3.2.1. Initial Design .................................................................................................................................... 107
3.2.2. Base Design ...................................................................................................................................... 107
3.2.3. Selected Design ................................................................................................................................ 107
3.3. The Command Corner .............................................................................................................................. 107
3.3.1. Mutation Rate .................................................................................................................................. 108
3.3.2. Generation size ................................................................................................................................ 108
3.3.3. Auto generations………………………………………………….…………………..…….…………………………..…..............108
3.4. The Mutation Space ................................................................................................................................ 109
3.4.1. Left Black Arrow .............................................................................................................................. 109
3.4.2. Set as Base Design............................................................................................................................ 109
3.4.3. Select as Design to be Refined ......................................................................................................... 109
4. REFINE DESIGN……………………………………………………………….…………..……..110
4.1. User Interface organization………………………………………………………………………………………………….............….110
4.2. The Numeric Analysis ................................................................................................................................... 110
4.2.1. Relative Score .............................................................................................................................. 110
4.2.2. Nodes ........................................................................................................................................... 110
4.2.3. Members ...................................................................................................................................... 111
4.3. The Design Space ................................................................................................................................... 111
4.3.1. Caption ......................................................................................................................................... 111
4.3.1.1. Member Colors ...................................................................................................................... 111
4.3.1.2. Member Thickness ................................................................................................................. 111
4.3.2. Refine the Design ......................................................................................................................... 111
4.3.3. Tools at the bottom…………………………………………………………………………………………………………..….…112
4.4. The Saving Space……………………………………………………………………………………………………………………………......112
4.4.1. Save command ...........…………………………………………………………………………………………………………….112
4.4.2. Render structure for screenshot ......... …………………………………………………………………………………….112
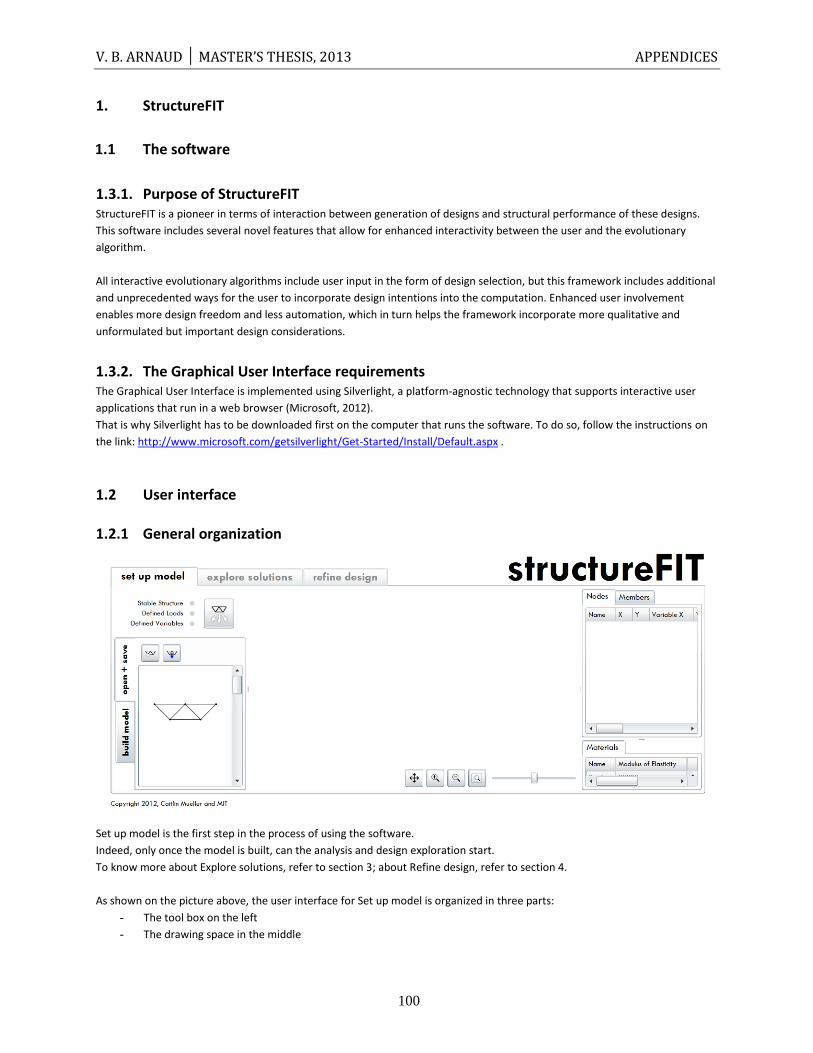
V. B. ARNAUD │ MASTER’S THESIS, 2013 APPENDICES
100
1. StructureFIT
1.1 The software
1.3.1. Purpose of StructureFIT StructureFIT is a pioneer in terms of interaction between generation of designs and structural performance of these designs.
This software includes several novel features that allow for enhanced interactivity between the user and the evolutionary
algorithm.
All interactive evolutionary algorithms include user input in the form of design selection, but this framework includes additional
and unprecedented ways for the user to incorporate design intentions into the computation. Enhanced user involvement
enables more design freedom and less automation, which in turn helps the framework incorporate more qualitative and
unformulated but important design considerations.
1.3.2. The Graphical User Interface requirements The Graphical User Interface is implemented using Silverlight, a platform-agnostic technology that supports interactive user
applications that run in a web browser (Microsoft, 2012).
That is why Silverlight has to be downloaded first on the computer that runs the software. To do so, follow the instructions on
the link: http://www.microsoft.com/getsilverlight/Get-Started/Install/Default.aspx .
1.2 User interface
1.2.1 General organization
Set up model is the first step in the process of using the software.
Indeed, only once the model is built, can the analysis and design exploration start.
To know more about Explore solutions, refer to section 3; about Refine design, refer to section 4.
As shown on the picture above, the user interface for Set up model is organized in three parts:
- The tool box on the left
- The drawing space in the middle
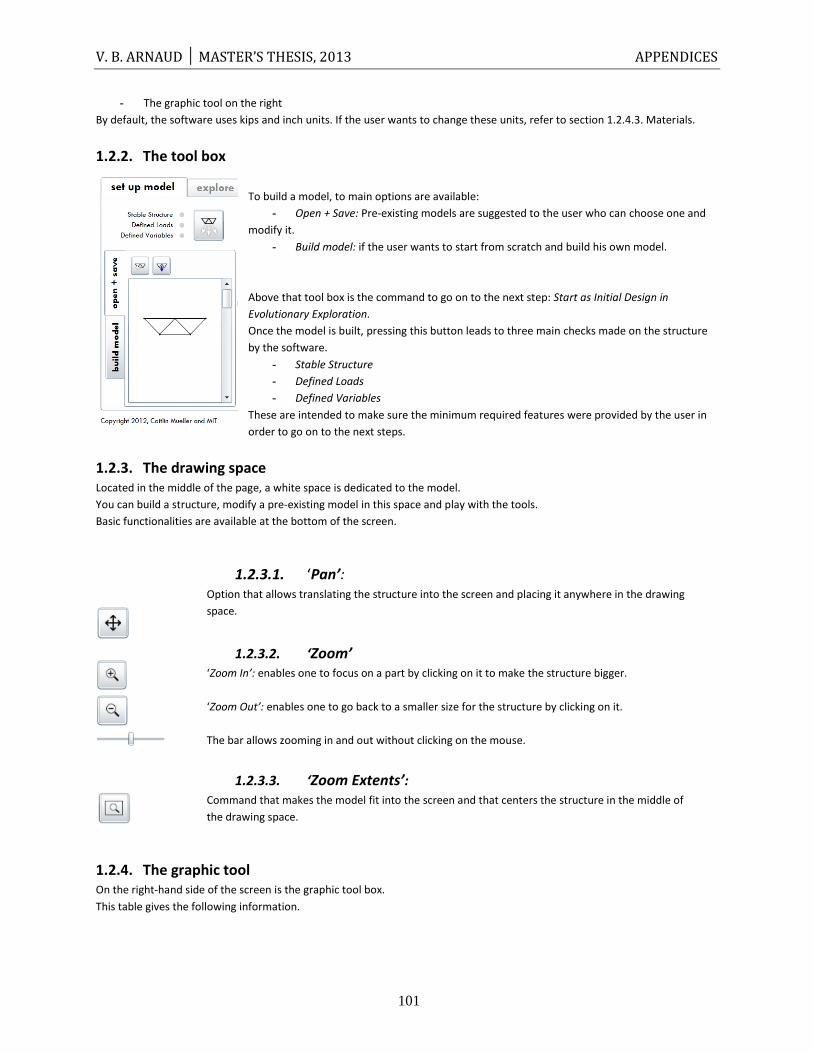
V. B. ARNAUD │ MASTER’S THESIS, 2013 APPENDICES
101
- The graphic tool on the right
By default, the software uses kips and inch units. If the user wants to change these units, refer to section 1.2.4.3. Materials.
1.2.2. The tool box
To build a model, to main options are available:
- Open + Save: Pre-existing models are suggested to the user who can choose one and
modify it.
- Build model: if the user wants to start from scratch and build his own model.
Above that tool box is the command to go on to the next step: Start as Initial Design in
Evolutionary Exploration.
Once the model is built, pressing this button leads to three main checks made on the structure
by the software.
- Stable Structure
- Defined Loads
- Defined Variables
These are intended to make sure the minimum required features were provided by the user in
order to go on to the next steps.
1.2.3. The drawing space Located in the middle of the page, a white space is dedicated to the model.
You can build a structure, modify a pre-existing model in this space and play with the tools.
Basic functionalities are available at the bottom of the screen.
1.2.3.1. ‘Pan’: Option that allows translating the structure into the screen and placing it anywhere in the drawing
space.
1.2.3.2. ‘Zoom’ ‘Zoom In’: enables one to focus on a part by clicking on it to make the structure bigger.
‘Zoom Out’: enables one to go back to a smaller size for the structure by clicking on it.
The bar allows zooming in and out without clicking on the mouse.
1.2.3.3. ‘Zoom Extents’: Command that makes the model fit into the screen and that centers the structure in the middle of
the drawing space.
1.2.4. The graphic tool On the right-hand side of the screen is the graphic tool box.
This table gives the following information.
V. B. ARNAUD │ MASTER’S THESIS, 2013 APPENDICES
102
1.2.4.1. Nodes Once the user creates a node on the drawing space, a black dot appears. At the same
time, the number and the coordinates X and Y of this node are recorded in the table titled
Nodes.
When extended, this table gathers all information on a node. Moreover, you can change
the values from the table, which is really convenient and fast.
1.2.4.2. Members By clicking on Members, next to Nodes, another table will appear. This one gives
information on members: the boundary nodes and the material: Steel by default.
1.2.4.3. Materials The table titled Materials is the one that provides material properties used by the
software. By default, it uses steel as the structural material. The Steel properties chosen
are also available:
Modulus of Elasticity= 29 000 kips
Allowable Stress= 20 kips
Density= 0.000 284 kips/in3
If the user wants to change units, these values can be modified by clicking on them.
2. SET UP MODEL
2.1. Build model This option enables you to start designing a model from scratch.
To build your own model, multiple tools are available.
2.1.1. Add Elements
2.1.1.1. ‘Add Node’: You can create nodes wherever you want by clicking on this button and then on the middle of the screen.
A numbered black dot will appear that tells you how many nodes your structure has.
If you want to link these nodes to each other, the option below enables you to do so by clicking on the nodes
you want to link with a truss member.
2.1.1.2. ‘Add Member’: By selecting this tool, you create a member with its boundary nodes by clicking twice on the blank page. If
you want to draw more than one member, you will have to click twice again to define the boundary nodes.
By checking the box ‘draw continuously’, you will click to create nodes only, as the grey line representing the
member will always appear from the previous node.
By default, the structural material is Steel.
V. B. ARNAUD │ MASTER’S THESIS, 2013 APPENDICES
103
2.1.1.3. ‘Add Support’: To define the type of support for the structure, you have to have at least one member. Then, when you select
this option, you can click on the node to be restrained. Two arrows will appear, representing the horizontal
and vertical restraints.
To remove one of the restraints, uncheck the box below the option button and click on the arrow on the
truss. It will then disappear.
To add a restraint, check the box below the option button and click on the arrow on the truss. It will then
reappear.
2.1.1.4. ‘Add Load’: To define loads on the truss, you click on the node and an arrow will appear just to indicate the node is
loaded. To fully define the load, you have to enter on the left:
- The orientation of the load with + or –
- The direction of the load: Horizontal or Vertical
- The magnitude of the load
By default, the X direction is going rightward and the Y direction upward.
Example:
No need to define the unit of the loads, but the user has to be consistent.
The load is of a magnitude 10 along X, and of a magnitude 50 going downward.
Then click on the node you want to load, two arrows will appear.
2.1.2. Define Variables + Relationships Once the basic geometry of the model is defined by nodes and members, some parameters and relationships can be defined.
2.1.2.1. ‘Define Variables’: The possible geometric modifications on a model can be restrained based on this command. When selected,
this tool makes boxes appear below, into which you can enter numerical values
- By checking a box, you allow a horizontal /vertical freedom.
- The Allowable Range is the maximum horizontal/vertical distance on which the node can vary
position.
Then by clicking on the node to restrain, small blue arrows will appear to show allowable directions, and the
rectangle framing all possible positions defines the ranges the user entered.
Example:
The user wants the n1 position to be able to be moved
horizontally within a range of 10 units length but not to
be moved up, hence the unchecked Vertical Position box.
V. B. ARNAUD │ MASTER’S THESIS, 2013 APPENDICES
104
2.1.2.2. ‘Define Line of Symmetry’: If you want to define a Symmetric Relationship somewhere in the structure, the first step is to locate the axis of
symmetry with this command.
When selected, the user has to choose between a horizontal or vertical axis by checking one of the boxes
below.
Then click on the node intersecting the axis of symmetry; a light grey dashed line will appear. Then go to
section 2.2.3.3.
Example:
2.1.2.3. ‘Define Symmetric Relationship’: (See Section 2.2.3.2)
This tool creates a vertical or horizontal symmetry relationship after step 2.2.3.2. is completed.
When this command is selected, the user has to define the two symmetrical nodes on each side of the axis of
symmetry. On one side, click on the specific node. Then, click on the node on the other side of the axis of
symmetry. The node will be translated to be symmetrical to the first selected one and it will become light grey,
showing that a relationship has been defined.
2.1.2.4. ‘Define Offset Relationship’: This option is able to set a specific distance between two nodes that remains the same. When this option is
selected, the offset can be defined as:
- The existing one when the nodes were drawn : Use Existing Offset
- A new value can be defined by entering a number in the boxes for Horizontal Offset and Vertical
Offset.
First, click on the “leading node” and then on the “following node” that will become light grey.
2.1.3. Modify / Delete Elements
2.1.3.1. ‘Select / Move Elements’: Select this tool and then select an element or group of elements you want to move by clicking on it or by
framing them in a square holding your click.
The selection will be highlighted in orange. Hold your click and move the mouse around to move your
selection and modify the structure.
If Escape is pressed, the user automatically uses this option.
2.1.3.2. ‘Delete Element’: Select this option first. Then click on each element to delete: members or nodes.
The user can also draw a square with the mouse to select a group of elements and then press delete on the
keyboard.
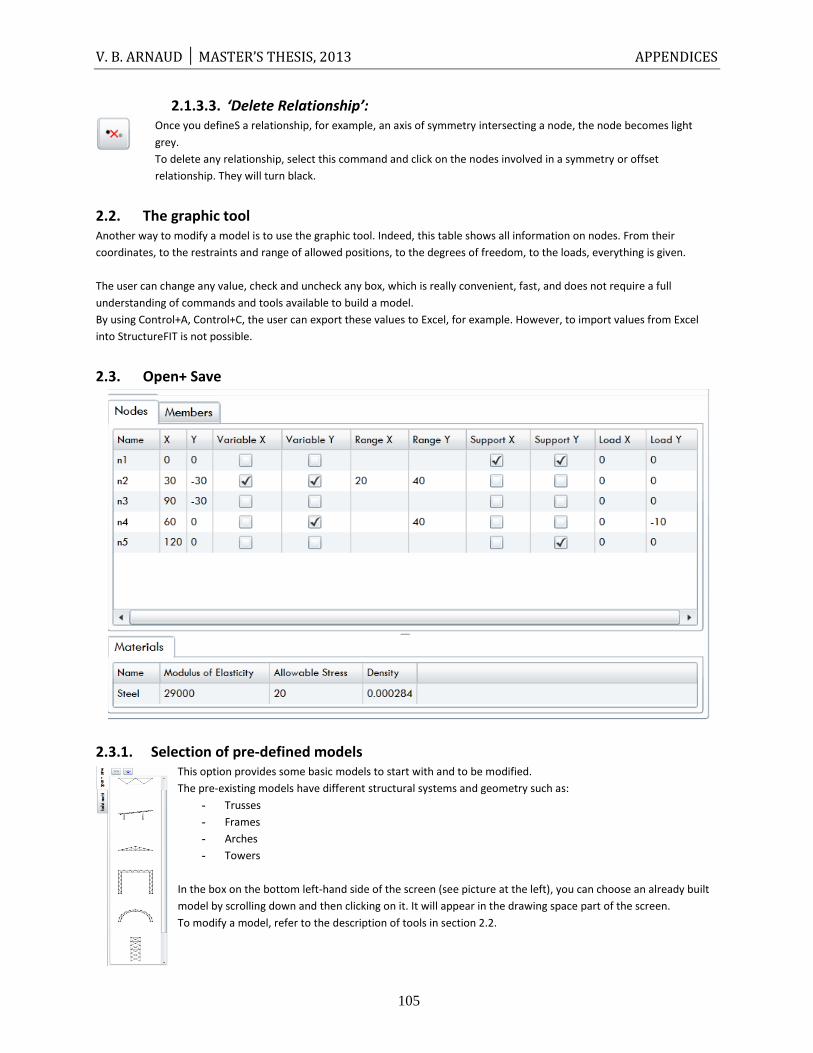
V. B. ARNAUD │ MASTER’S THESIS, 2013 APPENDICES
105
2.1.3.3. ‘Delete Relationship’: Once you defineS a relationship, for example, an axis of symmetry intersecting a node, the node becomes light
grey.
To delete any relationship, select this command and click on the nodes involved in a symmetry or offset
relationship. They will turn black.
2.2. The graphic tool Another way to modify a model is to use the graphic tool. Indeed, this table shows all information on nodes. From their
coordinates, to the restraints and range of allowed positions, to the degrees of freedom, to the loads, everything is given.
The user can change any value, check and uncheck any box, which is really convenient, fast, and does not require a full
understanding of commands and tools available to build a model.
By using Control+A, Control+C, the user can export these values to Excel, for example. However, to import values from Excel
into StructureFIT is not possible.
2.3. Open+ Save
2.3.1. Selection of pre-defined models This option provides some basic models to start with and to be modified.
The pre-existing models have different structural systems and geometry such as:
- Trusses
- Frames
- Arches
- Towers
In the box on the bottom left-hand side of the screen (see picture at the left), you can choose an already built
model by scrolling down and then clicking on it. It will appear in the drawing space part of the screen.
To modify a model, refer to the description of tools in section 2.2.
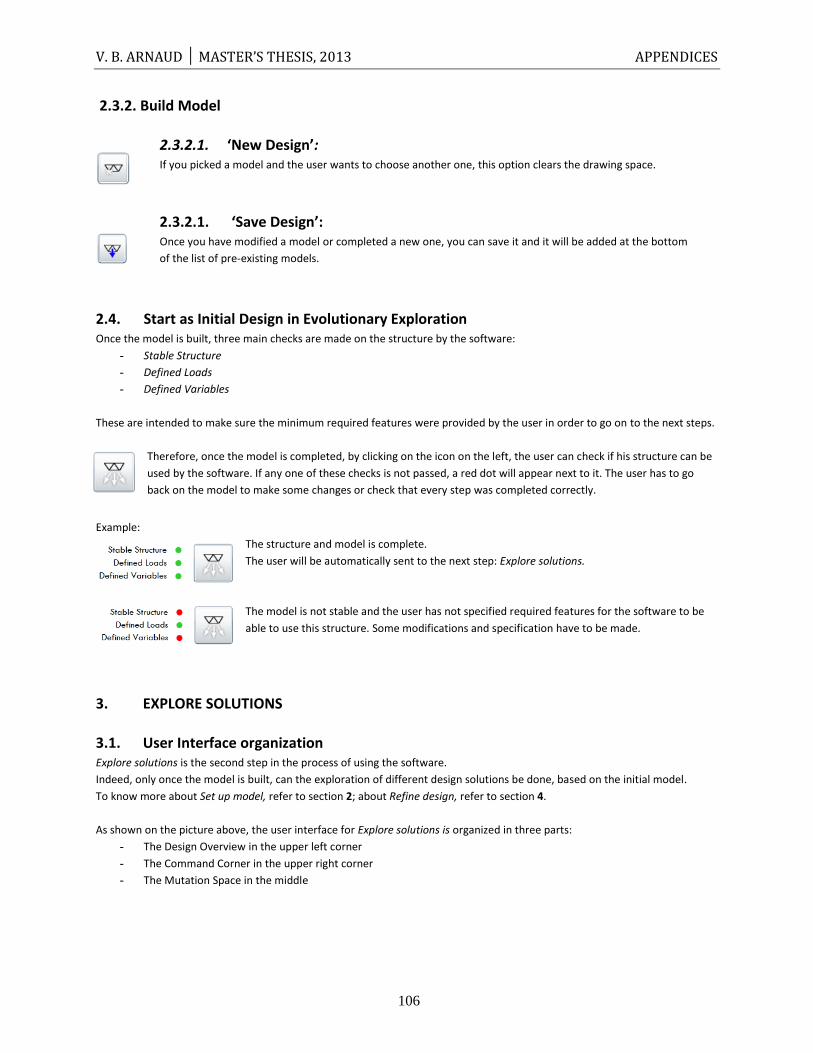
V. B. ARNAUD │ MASTER’S THESIS, 2013 APPENDICES
106
2.3.2. Build Model
2.3.2.1. ‘New Design’: If you picked a model and the user wants to choose another one, this option clears the drawing space.
2.3.2.1. ‘Save Design’: Once you have modified a model or completed a new one, you can save it and it will be added at the bottom
of the list of pre-existing models.
2.4. Start as Initial Design in Evolutionary Exploration Once the model is built, three main checks are made on the structure by the software:
- Stable Structure
- Defined Loads
- Defined Variables
These are intended to make sure the minimum required features were provided by the user in order to go on to the next steps.
Therefore, once the model is completed, by clicking on the icon on the left, the user can check if his structure can be
used by the software. If any one of these checks is not passed, a red dot will appear next to it. The user has to go
back on the model to make some changes or check that every step was completed correctly.
Example:
The structure and model is complete.
The user will be automatically sent to the next step: Explore solutions.
The model is not stable and the user has not specified required features for the software to be
able to use this structure. Some modifications and specification have to be made.
3. EXPLORE SOLUTIONS
3.1. User Interface organization Explore solutions is the second step in the process of using the software.
Indeed, only once the model is built, can the exploration of different design solutions be done, based on the initial model.
To know more about Set up model, refer to section 2; about Refine design, refer to section 4.
As shown on the picture above, the user interface for Explore solutions is organized in three parts:
- The Design Overview in the upper left corner
- The Command Corner in the upper right corner
- The Mutation Space in the middle
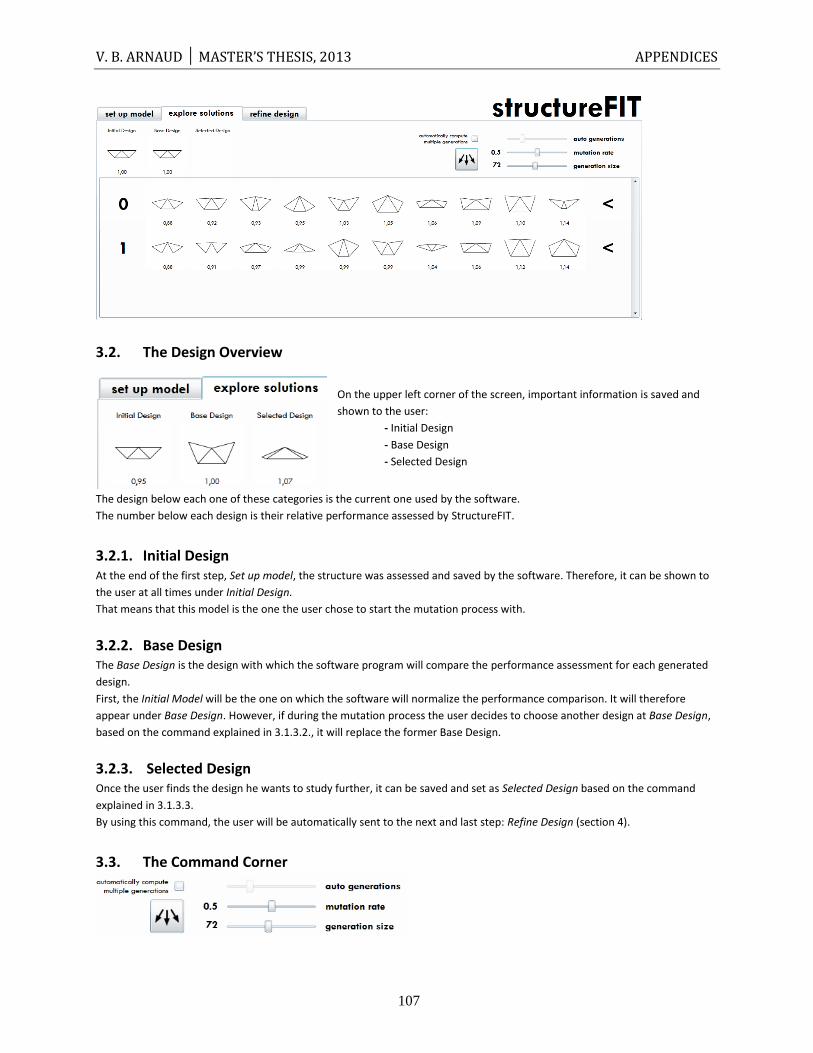
V. B. ARNAUD │ MASTER’S THESIS, 2013 APPENDICES
107
3.2. The Design Overview
On the upper left corner of the screen, important information is saved and
shown to the user:
- Initial Design
- Base Design
- Selected Design
The design below each one of these categories is the current one used by the software.
The number below each design is their relative performance assessed by StructureFIT.
3.2.1. Initial Design At the end of the first step, Set up model, the structure was assessed and saved by the software. Therefore, it can be shown to
the user at all times under Initial Design.
That means that this model is the one the user chose to start the mutation process with.
3.2.2. Base Design The Base Design is the design with which the software program will compare the performance assessment for each generated
design.
First, the Initial Model will be the one on which the software will normalize the performance comparison. It will therefore
appear under Base Design. However, if during the mutation process the user decides to choose another design at Base Design,
based on the command explained in 3.1.3.2., it will replace the former Base Design.
3.2.3. Selected Design Once the user finds the design he wants to study further, it can be saved and set as Selected Design based on the command
explained in 3.1.3.3.
By using this command, the user will be automatically sent to the next and last step: Refine Design (section 4).
3.3. The Command Corner
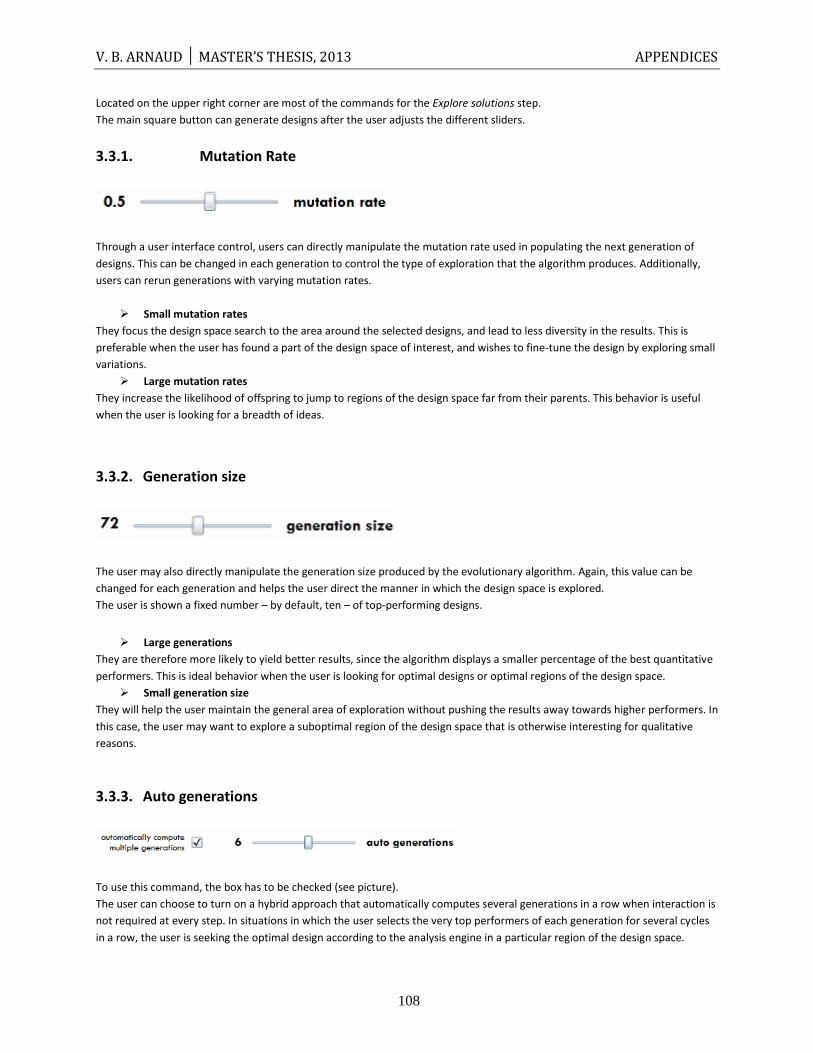
V. B. ARNAUD │ MASTER’S THESIS, 2013 APPENDICES
108
Located on the upper right corner are most of the commands for the Explore solutions step.
The main square button can generate designs after the user adjusts the different sliders.
3.3.1. Mutation Rate
Through a user interface control, users can directly manipulate the mutation rate used in populating the next generation of
designs. This can be changed in each generation to control the type of exploration that the algorithm produces. Additionally,
users can rerun generations with varying mutation rates.
Small mutation rates
They focus the design space search to the area around the selected designs, and lead to less diversity in the results. This is
preferable when the user has found a part of the design space of interest, and wishes to fine-tune the design by exploring small
variations.
Large mutation rates
They increase the likelihood of offspring to jump to regions of the design space far from their parents. This behavior is useful
when the user is looking for a breadth of ideas.
3.3.2. Generation size
The user may also directly manipulate the generation size produced by the evolutionary algorithm. Again, this value can be
changed for each generation and helps the user direct the manner in which the design space is explored.
The user is shown a fixed number – by default, ten – of top-performing designs.
Large generations
They are therefore more likely to yield better results, since the algorithm displays a smaller percentage of the best quantitative
performers. This is ideal behavior when the user is looking for optimal designs or optimal regions of the design space.
Small generation size
They will help the user maintain the general area of exploration without pushing the results away towards higher performers. In
this case, the user may want to explore a suboptimal region of the design space that is otherwise interesting for qualitative
reasons.
3.3.3. Auto generations
To use this command, the box has to be checked (see picture).
The user can choose to turn on a hybrid approach that automatically computes several generations in a row when interaction is
not required at every step. In situations in which the user selects the very top performers of each generation for several cycles
in a row, the user is seeking the optimal design according to the analysis engine in a particular region of the design space.
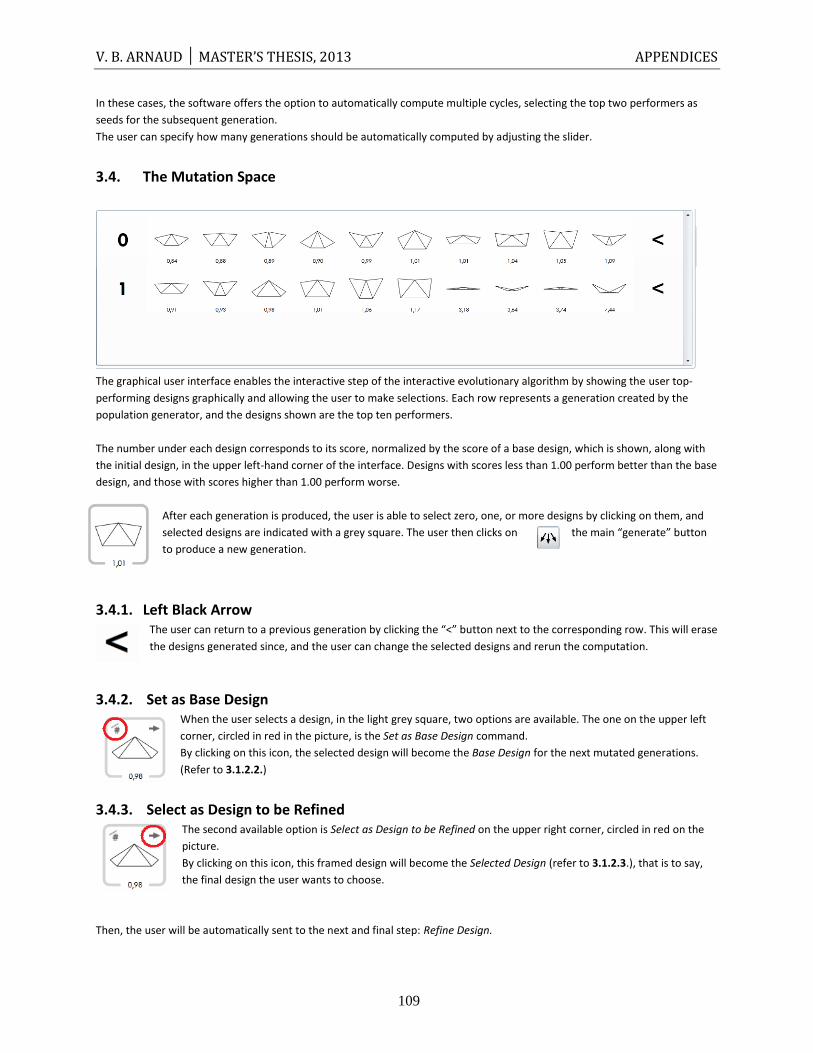
V. B. ARNAUD │ MASTER’S THESIS, 2013 APPENDICES
109
In these cases, the software offers the option to automatically compute multiple cycles, selecting the top two performers as
seeds for the subsequent generation.
The user can specify how many generations should be automatically computed by adjusting the slider.
3.4. The Mutation Space
The graphical user interface enables the interactive step of the interactive evolutionary algorithm by showing the user top-
performing designs graphically and allowing the user to make selections. Each row represents a generation created by the
population generator, and the designs shown are the top ten performers.
The number under each design corresponds to its score, normalized by the score of a base design, which is shown, along with
the initial design, in the upper left-hand corner of the interface. Designs with scores less than 1.00 perform better than the base
design, and those with scores higher than 1.00 perform worse.
After each generation is produced, the user is able to select zero, one, or more designs by clicking on them, and
selected designs are indicated with a grey square. The user then clicks on the main “generate” button
to produce a new generation.
3.4.1. Left Black Arrow The user can return to a previous generation by clicking the “<” button next to the corresponding row. This will erase
the designs generated since, and the user can change the selected designs and rerun the computation.
3.4.2. Set as Base Design When the user selects a design, in the light grey square, two options are available. The one on the upper left
corner, circled in red in the picture, is the Set as Base Design command.
By clicking on this icon, the selected design will become the Base Design for the next mutated generations.
(Refer to 3.1.2.2.)
3.4.3. Select as Design to be Refined The second available option is Select as Design to be Refined on the upper right corner, circled in red on the
picture.
By clicking on this icon, this framed design will become the Selected Design (refer to 3.1.2.3.), that is to say,
the final design the user wants to choose.
Then, the user will be automatically sent to the next and final step: Refine Design.
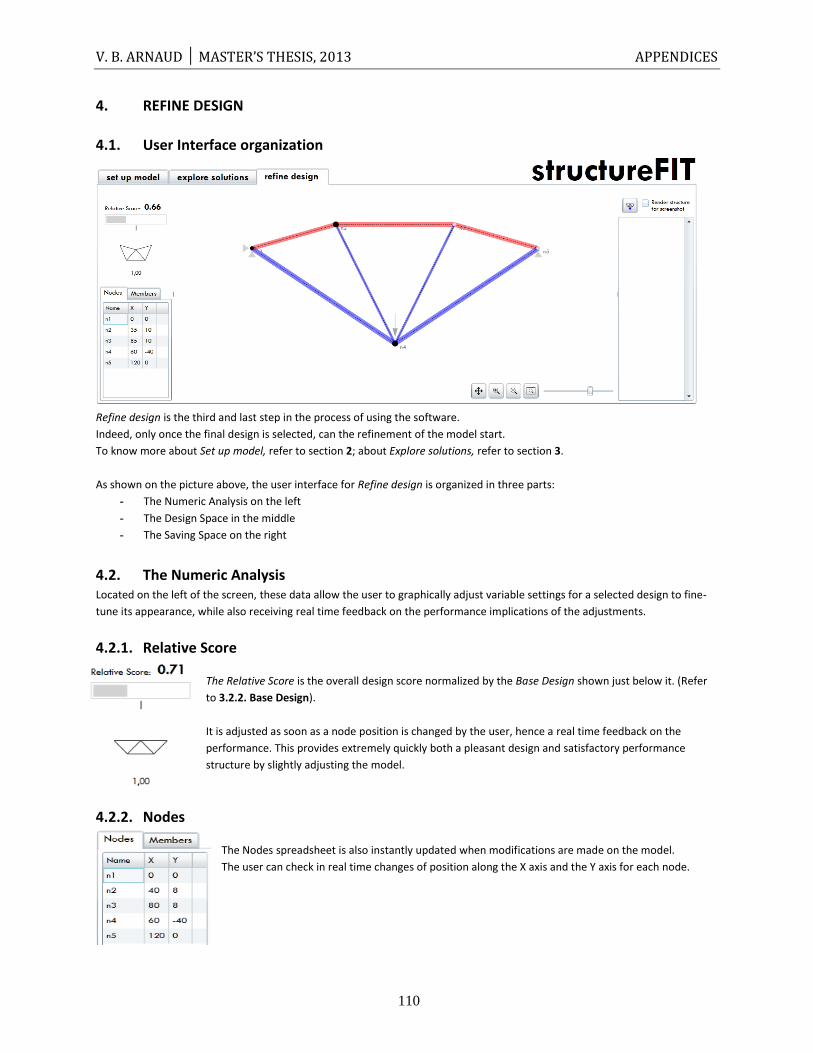
V. B. ARNAUD │ MASTER’S THESIS, 2013 APPENDICES
110
4. REFINE DESIGN
4.1. User Interface organization
Refine design is the third and last step in the process of using the software.
Indeed, only once the final design is selected, can the refinement of the model start.
To know more about Set up model, refer to section 2; about Explore solutions, refer to section 3.
As shown on the picture above, the user interface for Refine design is organized in three parts:
- The Numeric Analysis on the left
- The Design Space in the middle
- The Saving Space on the right
4.2. The Numeric Analysis Located on the left of the screen, these data allow the user to graphically adjust variable settings for a selected design to fine-
tune its appearance, while also receiving real time feedback on the performance implications of the adjustments.
4.2.1. Relative Score
The Relative Score is the overall design score normalized by the Base Design shown just below it. (Refer
to 3.2.2. Base Design).
It is adjusted as soon as a node position is changed by the user, hence a real time feedback on the
performance. This provides extremely quickly both a pleasant design and satisfactory performance
structure by slightly adjusting the model.
4.2.2. Nodes
The Nodes spreadsheet is also instantly updated when modifications are made on the model.
The user can check in real time changes of position along the X axis and the Y axis for each node.
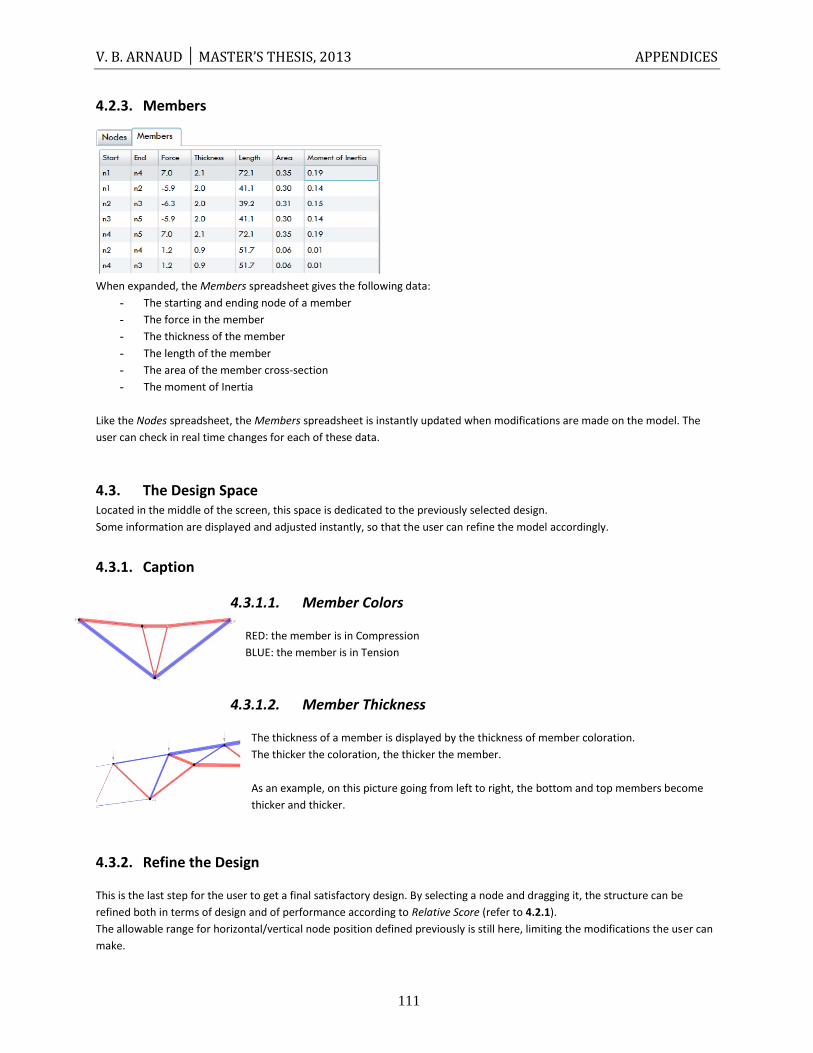
V. B. ARNAUD │ MASTER’S THESIS, 2013 APPENDICES
111
4.2.3. Members
When expanded, the Members spreadsheet gives the following data:
- The starting and ending node of a member
- The force in the member
- The thickness of the member
- The length of the member
- The area of the member cross-section
- The moment of Inertia
Like the Nodes spreadsheet, the Members spreadsheet is instantly updated when modifications are made on the model. The
user can check in real time changes for each of these data.
4.3. The Design Space Located in the middle of the screen, this space is dedicated to the previously selected design.
Some information are displayed and adjusted instantly, so that the user can refine the model accordingly.
4.3.1. Caption
4.3.1.1. Member Colors
RED: the member is in Compression
BLUE: the member is in Tension
4.3.1.2. Member Thickness
The thickness of a member is displayed by the thickness of member coloration.
The thicker the coloration, the thicker the member.
As an example, on this picture going from left to right, the bottom and top members become
thicker and thicker.
4.3.2. Refine the Design
This is the last step for the user to get a final satisfactory design. By selecting a node and dragging it, the structure can be
refined both in terms of design and of performance according to Relative Score (refer to 4.2.1).
The allowable range for horizontal/vertical node position defined previously is still here, limiting the modifications the user can
make.
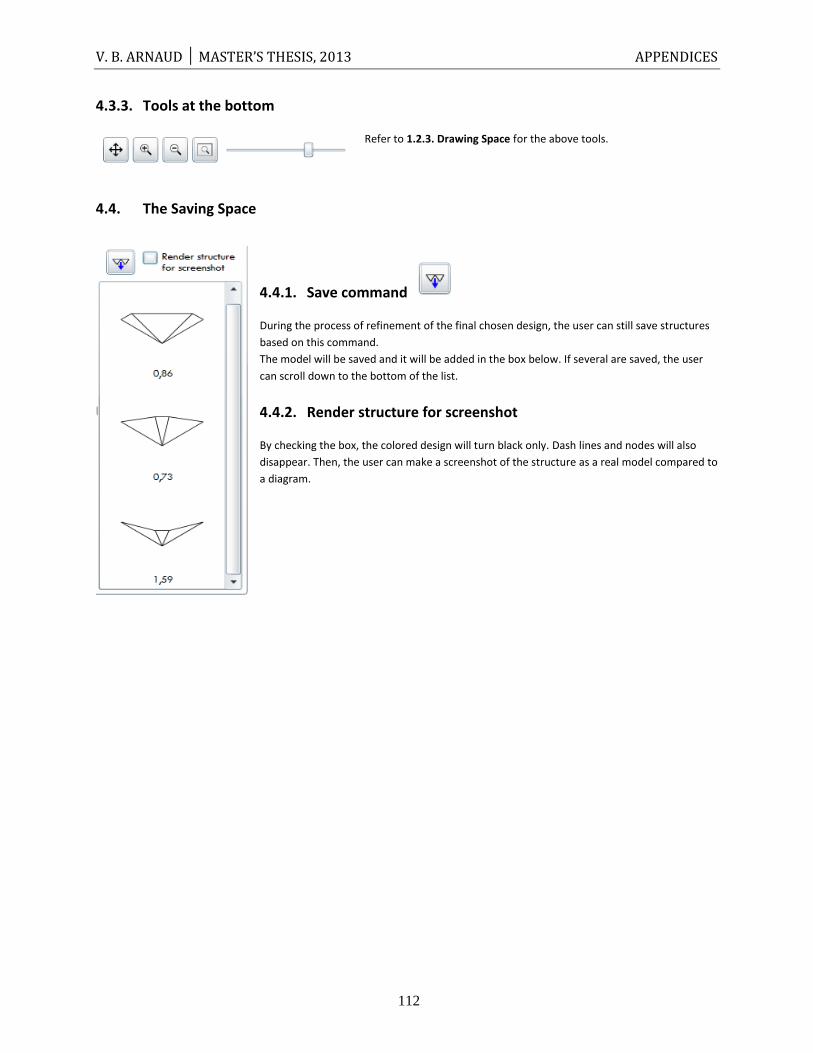
V. B. ARNAUD │ MASTER’S THESIS, 2013 APPENDICES
112
4.3.3. Tools at the bottom
Refer to 1.2.3. Drawing Space for the above tools.
4.4. The Saving Space
4.4.1. Save command
During the process of refinement of the final chosen design, the user can still save structures
based on this command.
The model will be saved and it will be added in the box below. If several are saved, the user
can scroll down to the bottom of the list.
4.4.2. Render structure for screenshot
By checking the box, the colored design will turn black only. Dash lines and nodes will also
disappear. Then, the user can make a screenshot of the structure as a real model compared to
a diagram.
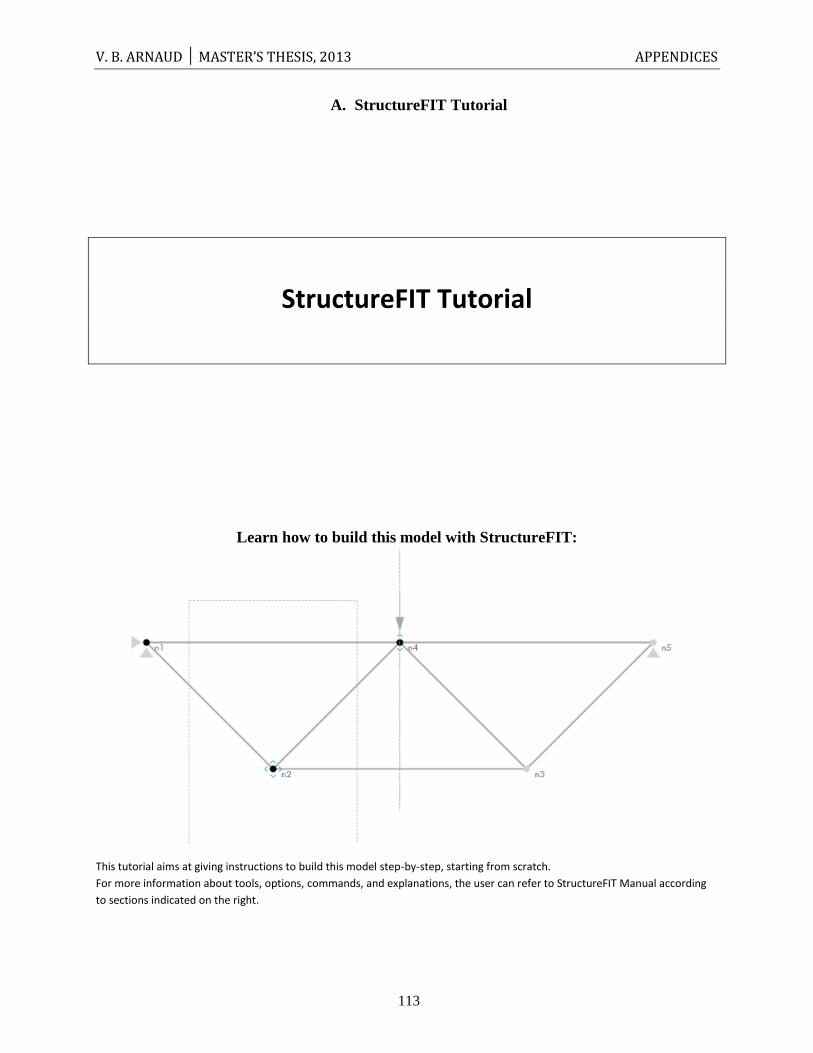
V. B. ARNAUD │ MASTER’S THESIS, 2013 APPENDICES
113
A. StructureFIT Tutorial
StructureFIT Tutorial
Learn how to build this model with StructureFIT:
This tutorial aims at giving instructions to build this model step-by-step, starting from scratch.
For more information about tools, options, commands, and explanations, the user can refer to StructureFIT Manual according
to sections indicated on the right.
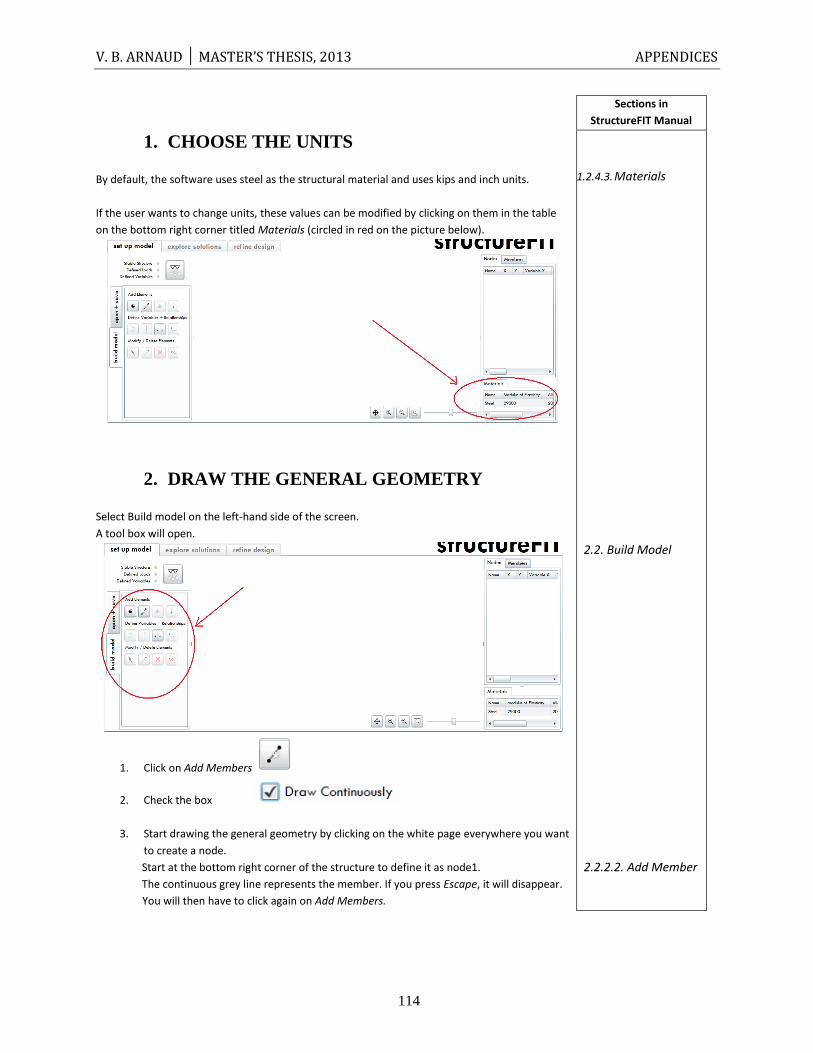
V. B. ARNAUD │ MASTER’S THESIS, 2013 APPENDICES
114
Sections in
StructureFIT Manual
1. CHOOSE THE UNITS
By default, the software uses steel as the structural material and uses kips and inch units.
If the user wants to change units, these values can be modified by clicking on them in the table
on the bottom right corner titled Materials (circled in red on the picture below).
2. DRAW THE GENERAL GEOMETRY
Select Build model on the left-hand side of the screen.
A tool box will open.
1. Click on Add Members
2. Check the box
3. Start drawing the general geometry by clicking on the white page everywhere you want
to create a node.
Start at the bottom right corner of the structure to define it as node1.
The continuous grey line represents the member. If you press Escape, it will disappear.
. You will then have to click again on Add Members.
1.2.4.3. Materials
2.2. Build Model
2.2.2.2. Add Member
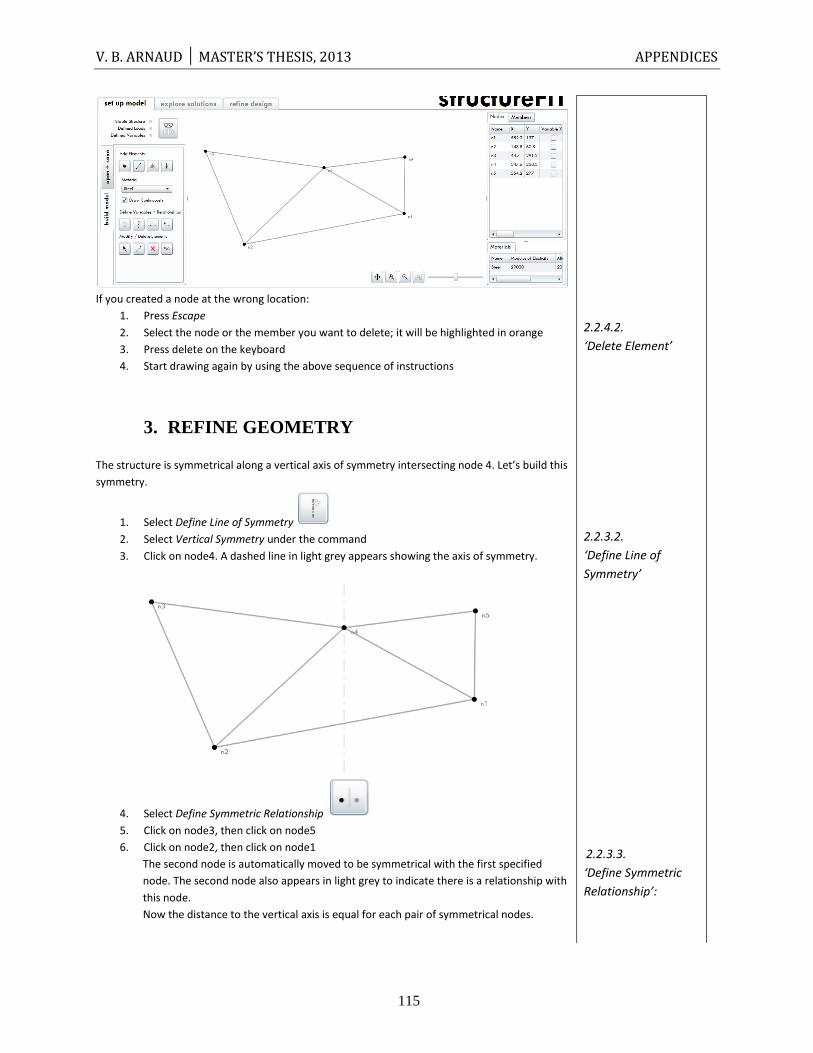
V. B. ARNAUD │ MASTER’S THESIS, 2013 APPENDICES
115
If you created a node at the wrong location:
1. Press Escape
2. Select the node or the member you want to delete; it will be highlighted in orange
3. Press delete on the keyboard
4. Start drawing again by using the above sequence of instructions
2.2.4.2.
‘Delete Element’
3. REFINE GEOMETRY
The structure is symmetrical along a vertical axis of symmetry intersecting node 4. Let’s build this
symmetry.
1. Select Define Line of Symmetry 2. Select Vertical Symmetry under the command 3. Click on node4. A dashed line in light grey appears showing the axis of symmetry.
4. Select Define Symmetric Relationship
5. Click on node3, then click on node5
6. Click on node2, then click on node1
The second node is automatically moved to be symmetrical with the first specified
node. The second node also appears in light grey to indicate there is a relationship with
this node.
Now the distance to the vertical axis is equal for each pair of symmetrical nodes.
2.2.3.2.
‘Define Line of
Symmetry’
2.2.3.3.
‘Define Symmetric
Relationship’:
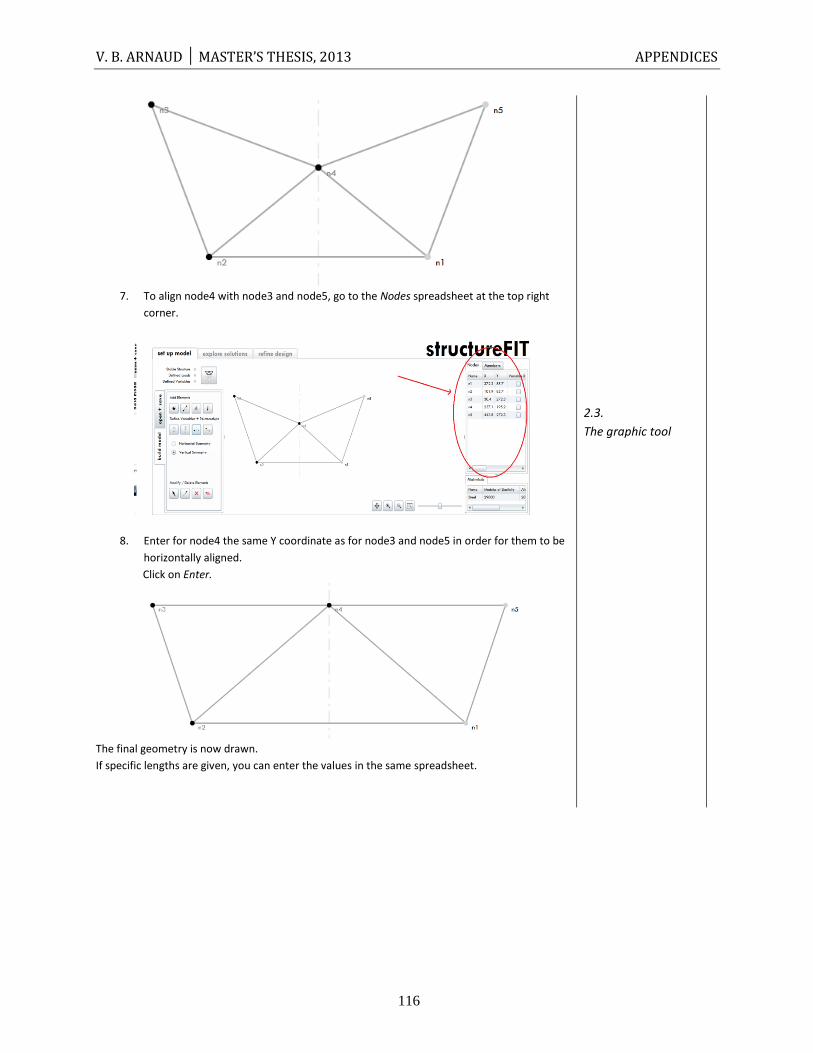
V. B. ARNAUD │ MASTER’S THESIS, 2013 APPENDICES
116
7. To align node4 with node3 and node5, go to the Nodes spreadsheet at the top right
corner.
8. Enter for node4 the same Y coordinate as for node3 and node5 in order for them to be
horizontally aligned.
Click on Enter.
The final geometry is now drawn.
If specific lengths are given, you can enter the values in the same spreadsheet.
2.3.
The graphic tool
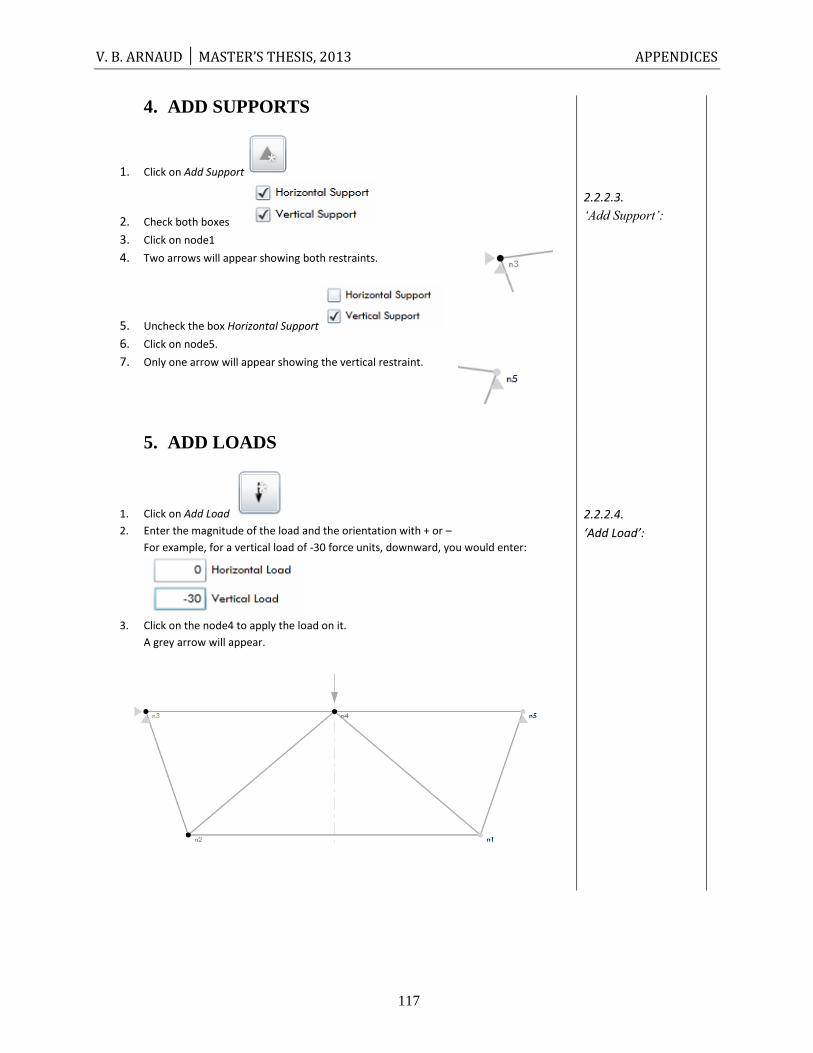
V. B. ARNAUD │ MASTER’S THESIS, 2013 APPENDICES
117
4. ADD SUPPORTS
1. Click on Add Support
2. Check both boxes
3. Click on node1
4. Two arrows will appear showing both restraints.
5. Uncheck the box Horizontal Support 6. Click on node5. 7. Only one arrow will appear showing the vertical restraint.
2.2.2.3.
‘Add Support’:
5. ADD LOADS
1. Click on Add Load
2. Enter the magnitude of the load and the orientation with + or –
For example, for a vertical load of -30 force units, downward, you would enter:
3. Click on the node4 to apply the load on it.
A grey arrow will appear.
2.2.2.4.
‘Add Load’:
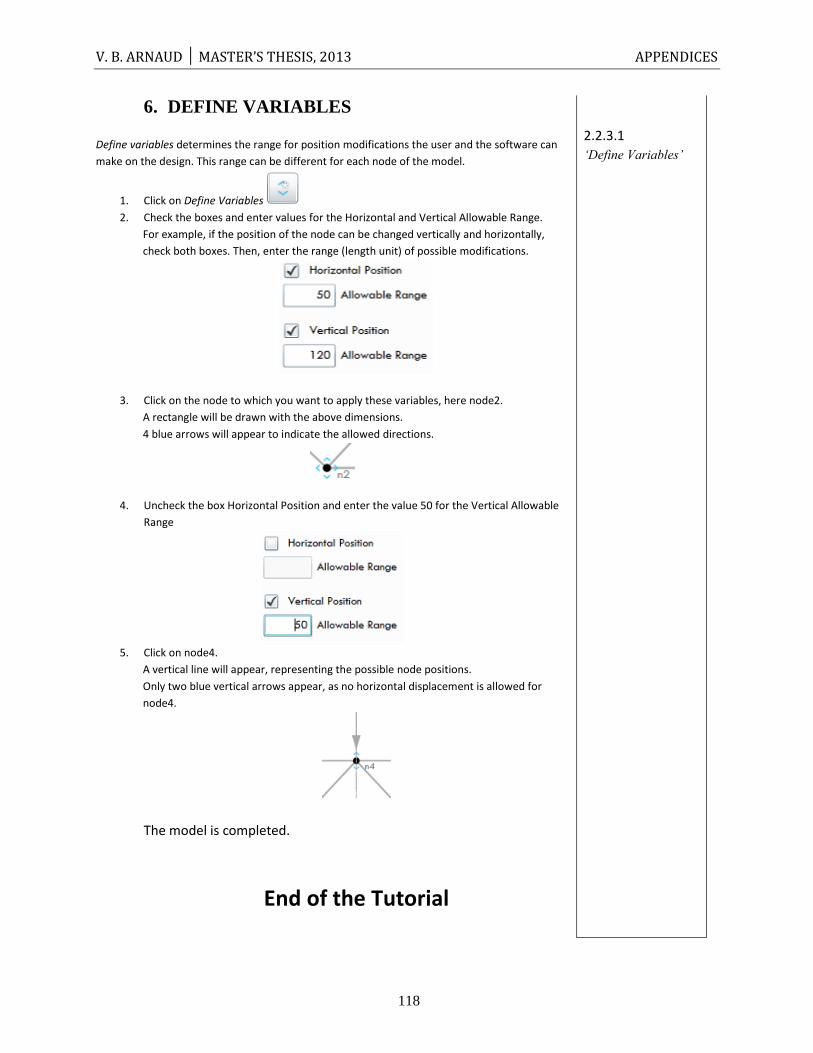
V. B. ARNAUD │ MASTER’S THESIS, 2013 APPENDICES
118
6. DEFINE VARIABLES
Define variables determines the range for position modifications the user and the software can
make on the design. This range can be different for each node of the model.
1. Click on Define Variables 2. Check the boxes and enter values for the Horizontal and Vertical Allowable Range.
For example, if the position of the node can be changed vertically and horizontally,
check both boxes. Then, enter the range (length unit) of possible modifications.
3. Click on the node to which you want to apply these variables, here node2.
A rectangle will be drawn with the above dimensions.
4 blue arrows will appear to indicate the allowed directions.
4. Uncheck the box Horizontal Position and enter the value 50 for the Vertical Allowable
Range
5. Click on node4.
A vertical line will appear, representing the possible node positions.
Only two blue vertical arrows appear, as no horizontal displacement is allowed for
node4.
The model is completed.
End of the Tutorial
2.2.3.1
‘Define Variables’

V. B. ARNAUD │ MASTER’S THESIS, 2013 APPENDICES
119
B. Application approval to use humans as experimental subjects (exempt status form)

V. B. ARNAUD │ MASTER’S THESIS, 2013 APPENDICES
120

V. B. ARNAUD │ MASTER’S THESIS, 2013 APPENDICES
121

V. B. ARNAUD │ MASTER’S THESIS, 2013 APPENDICES
122

V. B. ARNAUD │ MASTER’S THESIS, 2013 APPENDICES
123
C. The Questionnaire Participation is voluntary; subjects may decline to answer any and all questions and withdraw their participation at any time; and
confidentiality and/or anonymity are assured. Your feedback is greatly appreciated!
SESSION ID: _____________
GENERAL INFORMATION
Q1a. What is your academic background (i.e. degrees and majors)? What program are you in now?
……………………………………………………………………………………………………………………………………………………………………………………………………………
Q2a. Do you have industry experience? If yes, for how many years did you work? Where did you work?
……………………………………………………………………………………………………………………………………………………………………………………………………………
CURRENT SOFTWARE
Q1b. What software programs do you usually use for design and analysis in your discipline?
-…………………………. -………………………….
-…………………………. -………………………….
-………………………..... -………………………….
Q2b. Which of these is your favorite? Why?
……………………………………………………………………………………………………………………………………………………………………………………………………………
Q3b. Do you find these programs lacking in any aspects? If so, which?
……………………………………………………………………………………………………………………………………………………………………………………………………………
Q4b. Please rate your satisfaction with these programs on a 5-point scale where 0 is Poor and 5 is Great.
0 1 2 3 4 5
○ ○ ○ ○ ○ ○
Q5b. Do you think current software encourages you to explore design alternatives? Why or why not?
……………………………………………………………………………………………………………………………………………………………………………………………………………
Q6b. Give up to four features or functionalities you would like in an ideal design and analysis software program:
#1-………………………….
#2-………………………….
#3-………………………….
#4-………………………….
Q7b. Any comments on current software?
……………………………………………………………………………………………………………………………………………………………………………………………………………
STRUCTUREFIT
Q1c. How much do you like the designs you submitted?
0 1 2 3 4 5
Design #1 ○ ○ ○ ○ ○ ○
Design #2 ○ ○ ○ ○ ○ ○
Design #3 ○ ○ ○ ○ ○ ○
Q2c. Did you enjoy using StructureFIT? Why or why not?
………………………………………………………………………………………………………………………………………………………………………………………………………….
Q3c. Did you have any issues with the graphical user interface while using the tool? If so, which parts in particular?
……………………………………………………………………………………………………………………………………………………………………………………………………………
Q4c. Do you think the provided numerical data (structural performance feedback or other information) is useful?
……………………………………………………………………………………………………………………………………………………………………………………………………………
Q5c. Do you think StructureFIT helped you to explore good solutions for the three design problems?
……………………………………………………………………………………………………………………………………………………………………………………………………………
Q6c. Please rate your satisfaction with StructureFIT on a 5-point scale where 0 is Poor and 5 is Great.
0 1 2 3 4 5
○ ○ ○ ○ ○ ○
Q7c. Is there any way that StructureFIT could be improved?
……………………………………………………………………………………………………………………………………………………………………………………………………………
Q8c. Any additional comments on StructureFIT?
……………………………………………………………………………………………………………………………………………………………………………………………………………

V. B. ARNAUD │ MASTER’S THESIS, 2013 APPENDICES
124
V. B. ARNAUD │ MASTER’S THESIS, 2013 APPENDICES
125
D. The Questionnaire filled out by architects Session ID: A-145893
Q1a. Architecture
Q2a. Yes, 1 year, architecture firm (Beirut, Lebanon)
Q1b. Rhino, 3D MAX, Creative Suite
Q2b. Rhino, interface
Q3b. 3D MAX, ease of interface
Q5b. Yes only Rhino
Q6b. Interface must be clean, less buttons, explanation of each
button, multi-platform (export to diff. stuff) 3D stuff
Q7b. 3D-perspectives
Q2c. Yes, very clean and simple
Q3c. How to move forward once design is chosen
Q4c. Not really
Q5c. Yes
Q7c. Yes, export features
Q8c. No
Session ID: A-166151
Group: B
Q1a. B.A. Columbia University (major in architecture) 2004-
2008, MIT M. Arch First Year (Fall 2012)
Q2a. I worked for 4 years at a small architecture practice in NYC
called Common Room
Q1b. AutoCAD, Rhino, Grasshopper
Q2b. Rhino because it is the easiest to use
Q3b. Yes, they are very limiting in terms of methods of designing.
The interfaces are abstract but also specific
Q5b. I think this tool is great for solving specific structural design
problems but I‟m not sure how I would integrate it into my
design process at an early stage
Q6b. 3D Solutions, integration with programs, visualization that
are more realistic
Q7b. It can be confusing to understand what the numbers mean
Q2c. Very much. It is fun way to understand structure and the
results are surprising
Q3c. No
Q4c. Yes
Q5c. Yes, Definitely
Q7c. I enjoyed it a lot but I‟m not sure how easy it would be to
use in real life
Q8c.
Session ID: A-725985
Q1a. Background: B of Design in Arch, Masters in Bld. Const.
Management. Now: MArch year 1
Q2a. N/A
Q1b. Rhino, Revit
Q2b. Rhino-easier to manipulate form
Q3b. Rhino has no real world restrictions unless you have the
right plug in
Q5b. Yes, it shows design possibilities that I would think would
have more material
Q6b. Moving Variables, Controlling Mutations, Variables in 3rd
Dimension, Curve Elements
Q7b.
Q2c. Yes, if was very simple and clear to navigate
Q3c. No
Q4c. Yes
Q5c. Yes
Q7c.
Q8c.
Session ID: A-410050
Q1a. M. Arch 1st year
Q2a. No
Q1b. Rhino, (Grasshopper), CAD
Q2b. Rhino, Moving Plug-in that I can use
Q3b. Analysis
Q5b. Partially Yes
Q6b. Structure analysis tool, Environmental analysis tool
Q7b.
Q2c. Idea of evolving is interesting
Q3c. Can I know basic environmental conditions of that structure
where is ground or something like that.
Q4c. Formal change is more interesting, so I didn‟t look much
the provided numerical data
Q5c. Sure
Q7c. When it is evolved, can I know evolved part in next
generation?
Q8c.
Session ID: A-470650
Group: A
Q1a. Architecture, M. Arch 1
Q2a. Worked in Hong Kong for 1 year
Q1b. Rhino, Sketchup , AutoCAD
Q2b. Rhino Intuitive Hybrid user interface
Q3b. Design in vacuum
Q5b. No, hard to integrate evolutionary iterations
Q6b. Intuitive interface and controls, control cases materlality,
change the degree of control the user has/computer has, strong
graphics
Q7b.
Q2c. Intuitive informative feedback
Q3c. Maybe add loading so you know that the data is being
processed.
Q4c. put it as a graph, compare with previous iteration
Q5c. yes, maybe add what type of structure categories you are
designing for (is it a beam, column, truss, space truss, dingrod?)
maybe castins tools for each.
Q7c.
Q8c. Great job!
Session ID: A-607586
Group: B
Q1a. BA in Economics, currently in March 1
Q2a. No
Q1b. Rhino, Grasshopper
Q2b. we only ever use one, so I‟m not sure I can say
Q3b. Yes, there‟s no good physics structure that‟s easy to use
Q5b. I think there are contrants to any type of desgn program.
Grasshopper inodlbe a potential tool for alternatives of iter. Level
in some of plugins.
Q6b Good physics simulator, materials simulator
Q7b.
Q2c. Yes, I think it‟s sometimes very gratifying to be given
variations as a design since design is often work iteratively
Q3c. Yes, I would love liked to see all the design iterations of the
generator
Q4c. yes
Q5c. yes! I think it‟s helpful bid also educational for students like
us who are learning about structure
Q7c.
Q8c.
Session ID: A-287993
Group: B
Q1a. B. Arch M. Arch now
V. B. ARNAUD │ MASTER’S THESIS, 2013 APPENDICES
126
Q2a. no
Q1b. Rhino Sketchup, Grasshopper
Q2b. Rhino, G.H. Easy to develop models
Q3b. Sometimes the next generations are „worse‟ than their
parents
Q5b. Yes, get more sense of structural design
Q6b. 3D, different types of joints, curve structure
Q7b. Analysis of curve structure
Q2c. Yes, more options
Q3c. no, It is aswesome
Q4c. Data could be not just doing with materials
Q5c. Yes
Q7c. 2d->3D
Q8c.
Session ID: A-677606
Group: B
Q1a. MArch
Q2a. 2 years, OMA Hong Kong
Q1b. Rhino
Q2b. Rhino easy to use plugin helps
Q3b. Animation function is not very convenient
Q5b. Yes!
Q6b. 3D not 2D, Assign material
Q7b. Will be good to quantitatively input
Q2c. Yes
Q3c. It‟s good interface very handy
Q4c. Yes, better is there‟s‟ another panel showing the load
Q5c. not really in Design 2
Q7c. N/A
Q8c. N/A
Session ID: A-648049
Group: B
Q1a. Master of Architecture March I
Q2a. No
Q1b. Rhino, Grasshopper, kangaroo
Q2b.
Q3b. kangaroo has some bugs
Q5b. Yes
Q6b. Works together with Adobe, computes quickly, beautiful
interface, easy to learn
Q7b.
Q2c. Yes, generally I feel that I was using a different logic to
design
Q3c. no
Q4c. The one that I always look at was the percentage (0-1)
Q5c. Yes to different degree
Q7c. 3Dimensional Together with Rhino
Q8c. Explain more the concept of StructureFIT
Session ID: A-114234
Q1a. Environmental Design-Undergraduate March-Grad
Q2a. Yes, 2 years Puerto Rico
Q1b. Rhinoceros, Sketchup, Grasshopper, 3D Max
Q2b. Rhino friendly
Q3b. Architectural related
Q5b. yes the interface
Q6b. 3D, materiality, an undo button
Q7b.
Q2c. Yes is very FUN, user friendly
Q3c. Not I liked
Q4c. Yes
Q5c. Definitely
Q7c. Make it a plug-in completely integrated to a 3D modeling
software
Q8c. Great! Keep it up and become famous!
Session ID: A-809984
Group: B
Q1a. Structural Engineer, Special Student
Q2a. Yes, 10+ years, Weidlinger Assoc. Inc.
Q1b. SAP 2000, Ramsteel, Staad, Ramsbeam, Tedfs
Q2b. Depends on what type of model I am running
Q3b. Quickly evaluating as preliminary design tool vs. what
structure jot” is doing
Q5b. Simple models can do that, but complicated model will take
lots of time
Q6b. simple, user friendly, quick
Q7b.
Q2c. Yes, lots of variables to play with and gets the weight
quickly
Q3c. No
Q4c. Very useful
Q5c. yes
Q7c.
Q8c.
Session ID: A-278078
Q1a. Master of Architecture
Q2a. no
Q1b. Illustrator, P.S. Rhino, AutoCAD
Q2b. Rhino, more freedom
Q3b. No, technical analysis
Q5b. Not very well. It doesn‟t offer options based on any criteria.
Q6b
Q7b.
Q2c. Very Much, It gives me a clue of how to improve structure
Q3c. No, It‟s well designed
Q4c. Yes
Q5c. Yes
Q7c. Offer options that will increase structural strength
Q8c.
Session ID: A-185587
Group: A
Q1a. March
Q2a.
Q1b. Rhino
Q2b. Rhino-design capabilities + ease of use+ user interface
Q3b. lack of structural implications
Q5b. Yes, form is very malleable in Rhino
Q6b. Intuitive interface, tool icons, scroll-over explanations, help
option
Q7b.
Q2c. Yes, seeing the correlation between form + structure was
very interesting
Q3c. it took me a while to figure out how to go back and choose
diff. design alternatives in the generations.
Q4c. yes
Q5c. yes
Q7c. selection + deletion of nodes
Q8c.
Session ID: A-218040
Q1a. 3rd yr Bachelor of Arts in Architecture Studios, now in
Master of Architecture
Q2a. Yes, 2 yrs working experience in Hong Kong
Q1b. AutoCAD, Rhinoceros
Q2b. Rhinoceros, which can deal with complex geometries with
various plug-ins
Q3b. Interface tween the different plugins maybe confusing
Q5b. Yes, Grasshopper plugins makes that possible
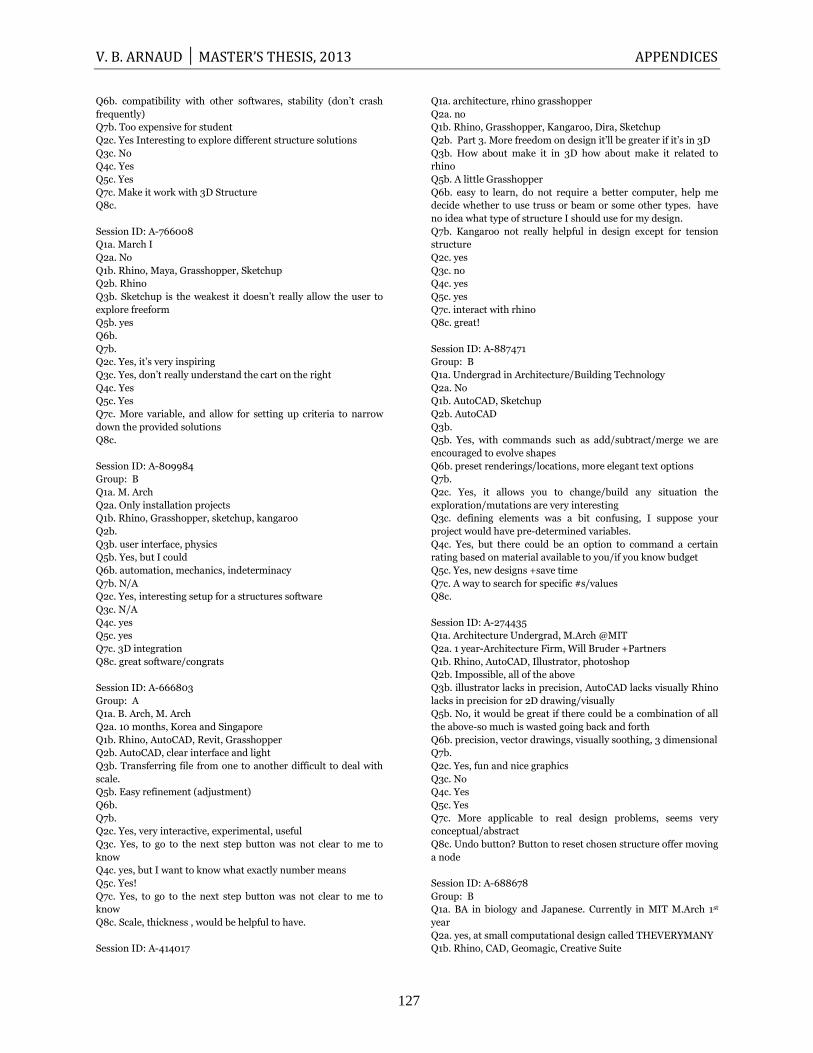
V. B. ARNAUD │ MASTER’S THESIS, 2013 APPENDICES
127
Q6b. compatibility with other softwares, stability (don‟t crash
frequently)
Q7b. Too expensive for student
Q2c. Yes Interesting to explore different structure solutions
Q3c. No
Q4c. Yes
Q5c. Yes
Q7c. Make it work with 3D Structure
Q8c.
Session ID: A-766008
Q1a. March I
Q2a. No
Q1b. Rhino, Maya, Grasshopper, Sketchup
Q2b. Rhino
Q3b. Sketchup is the weakest it doesn‟t really allow the user to
explore freeform
Q5b. yes
Q6b.
Q7b.
Q2c. Yes, it‟s very inspiring
Q3c. Yes, don‟t really understand the cart on the right
Q4c. Yes
Q5c. Yes
Q7c. More variable, and allow for setting up criteria to narrow
down the provided solutions
Q8c.
Session ID: A-809984
Group: B
Q1a. M. Arch
Q2a. Only installation projects
Q1b. Rhino, Grasshopper, sketchup, kangaroo
Q2b.
Q3b. user interface, physics
Q5b. Yes, but I could
Q6b. automation, mechanics, indeterminacy
Q7b. N/A
Q2c. Yes, interesting setup for a structures software
Q3c. N/A
Q4c. yes
Q5c. yes
Q7c. 3D integration
Q8c. great software/congrats
Session ID: A-666803
Group: A
Q1a. B. Arch, M. Arch
Q2a. 10 months, Korea and Singapore
Q1b. Rhino, AutoCAD, Revit, Grasshopper
Q2b. AutoCAD, clear interface and light
Q3b. Transferring file from one to another difficult to deal with
scale.
Q5b. Easy refinement (adjustment)
Q6b.
Q7b.
Q2c. Yes, very interactive, experimental, useful
Q3c. Yes, to go to the next step button was not clear to me to
know
Q4c. yes, but I want to know what exactly number means
Q5c. Yes!
Q7c. Yes, to go to the next step button was not clear to me to
know
Q8c. Scale, thickness , would be helpful to have.
Session ID: A-414017
Q1a. architecture, rhino grasshopper
Q2a. no
Q1b. Rhino, Grasshopper, Kangaroo, Dira, Sketchup
Q2b. Part 3. More freedom on design it‟ll be greater if it‟s in 3D
Q3b. How about make it in 3D how about make it related to
rhino
Q5b. A little Grasshopper
Q6b. easy to learn, do not require a better computer, help me
decide whether to use truss or beam or some other types. have
no idea what type of structure I should use for my design.
Q7b. Kangaroo not really helpful in design except for tension
structure
Q2c. yes
Q3c. no
Q4c. yes
Q5c. yes
Q7c. interact with rhino
Q8c. great!
Session ID: A-887471
Group: B
Q1a. Undergrad in Architecture/Building Technology
Q2a. No
Q1b. AutoCAD, Sketchup
Q2b. AutoCAD
Q3b.
Q5b. Yes, with commands such as add/subtract/merge we are
encouraged to evolve shapes
Q6b. preset renderings/locations, more elegant text options
Q7b.
Q2c. Yes, it allows you to change/build any situation the
exploration/mutations are very interesting
Q3c. defining elements was a bit confusing, I suppose your
project would have pre-determined variables.
Q4c. Yes, but there could be an option to command a certain
rating based on material available to you/if you know budget
Q5c. Yes, new designs +save time
Q7c. A way to search for specific #s/values
Q8c.
Session ID: A-274435
Q1a. Architecture Undergrad, M.Arch @MIT
Q2a. 1 year-Architecture Firm, Will Bruder +Partners
Q1b. Rhino, AutoCAD, Illustrator, photoshop
Q2b. Impossible, all of the above
Q3b. illustrator lacks in precision, AutoCAD lacks visually Rhino
lacks in precision for 2D drawing/visually
Q5b. No, it would be great if there could be a combination of all
the above-so much is wasted going back and forth
Q6b. precision, vector drawings, visually soothing, 3 dimensional
Q7b.
Q2c. Yes, fun and nice graphics
Q3c. No
Q4c. Yes
Q5c. Yes
Q7c. More applicable to real design problems, seems very
conceptual/abstract
Q8c. Undo button? Button to reset chosen structure offer moving
a node
Session ID: A-688678
Group: B
Q1a. BA in biology and Japanese. Currently in MIT M.Arch 1st
year
Q2a. yes, at small computational design called THEVERYMANY
Q1b. Rhino, CAD, Geomagic, Creative Suite
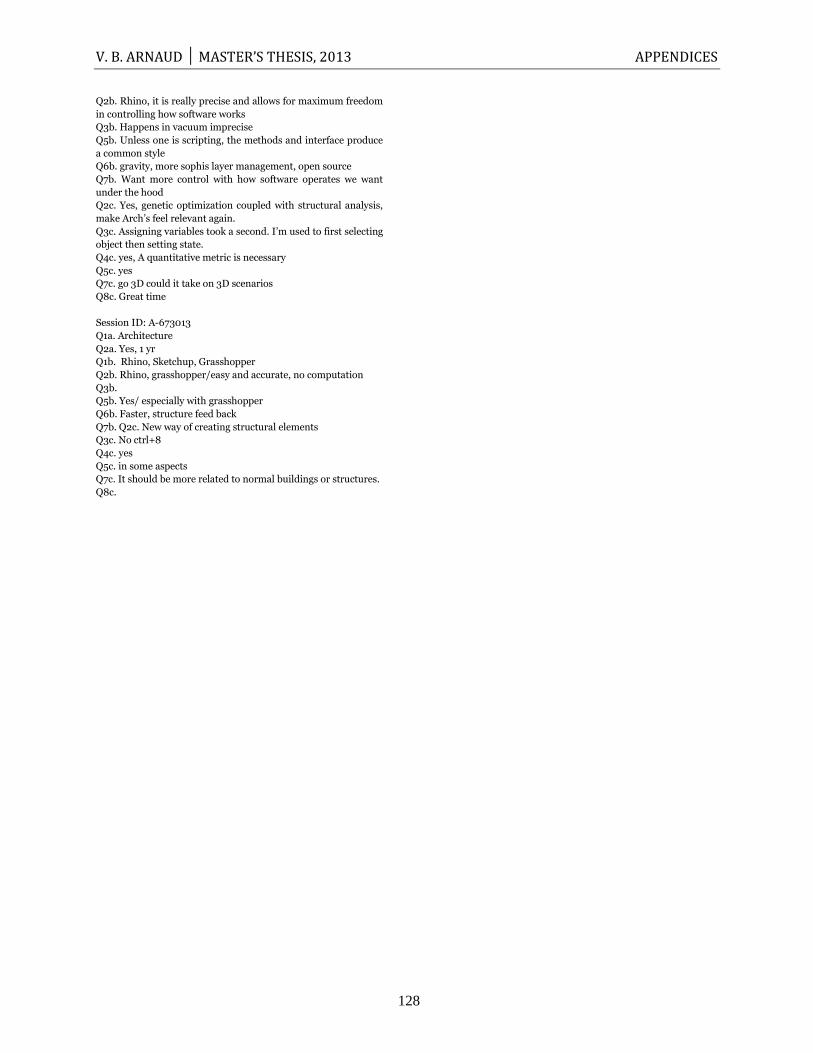
V. B. ARNAUD │ MASTER’S THESIS, 2013 APPENDICES
128
Q2b. Rhino, it is really precise and allows for maximum freedom
in controlling how software works
Q3b. Happens in vacuum imprecise
Q5b. Unless one is scripting, the methods and interface produce
a common style
Q6b. gravity, more sophis layer management, open source
Q7b. Want more control with how software operates we want
under the hood
Q2c. Yes, genetic optimization coupled with structural analysis,
make Arch‟s feel relevant again.
Q3c. Assigning variables took a second. I‟m used to first selecting
object then setting state.
Q4c. yes, A quantitative metric is necessary
Q5c. yes
Q7c. go 3D could it take on 3D scenarios
Q8c. Great time
Session ID: A-673013
Q1a. Architecture
Q2a. Yes, 1 yr
Q1b. Rhino, Sketchup, Grasshopper
Q2b. Rhino, grasshopper/easy and accurate, no computation
Q3b.
Q5b. Yes/ especially with grasshopper
Q6b. Faster, structure feed back
Q7b. Q2c. New way of creating structural elements
Q3c. No ctrl+8
Q4c. yes
Q5c. in some aspects
Q7c. It should be more related to normal buildings or structures.
Q8c.
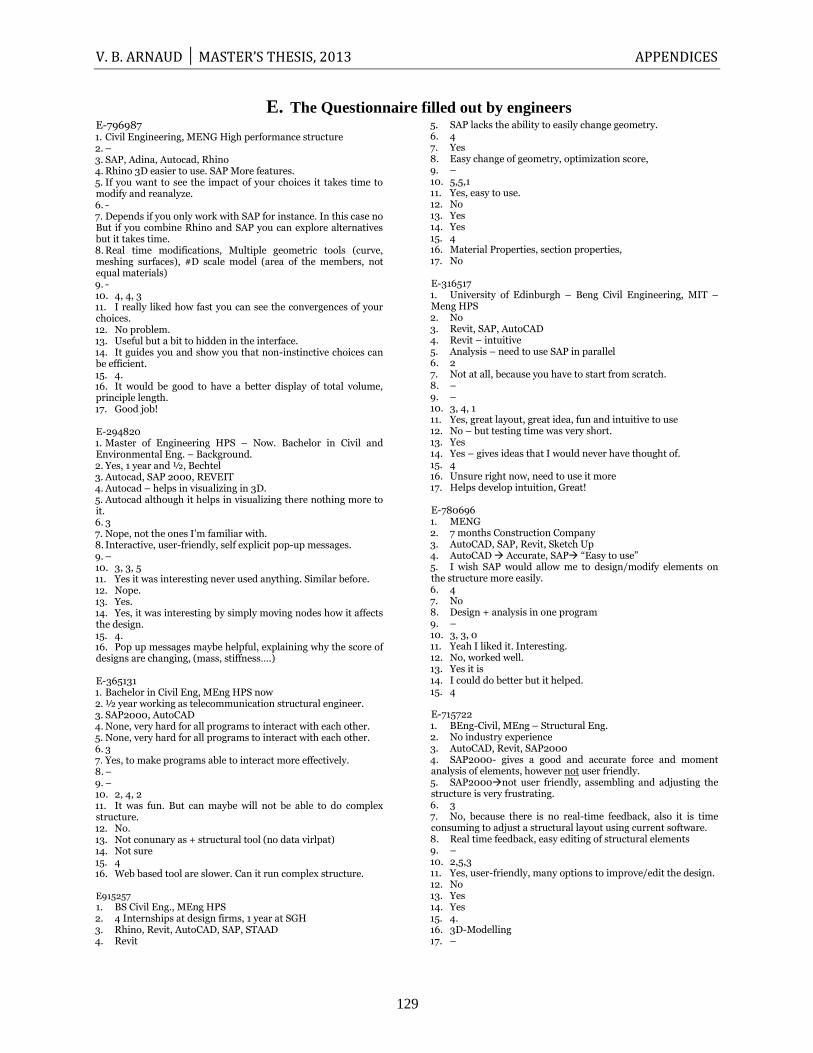
V. B. ARNAUD │ MASTER’S THESIS, 2013 APPENDICES
129
E. The Questionnaire filled out by engineers E-796987 1. Civil Engineering, MENG High performance structure 2. – 3. SAP, Adina, Autocad, Rhino 4. Rhino 3D easier to use. SAP More features. 5. If you want to see the impact of your choices it takes time to modify and reanalyze. 6. - 7. Depends if you only work with SAP for instance. In this case no But if you combine Rhino and SAP you can explore alternatives but it takes time. 8. Real time modifications, Multiple geometric tools (curve, meshing surfaces), #D scale model (area of the members, not equal materials) 9. - 10. 4, 4, 3 11. I really liked how fast you can see the convergences of your choices. 12. No problem. 13. Useful but a bit to hidden in the interface. 14. It guides you and show you that non-instinctive choices can be efficient. 15. 4. 16. It would be good to have a better display of total volume, principle length. 17. Good job! E-294820 1. Master of Engineering HPS – Now. Bachelor in Civil and Environmental Eng. – Background. 2. Yes, 1 year and ½, Bechtel 3. Autocad, SAP 2000, REVEIT 4. Autocad – helps in visualizing in 3D. 5. Autocad although it helps in visualizing there nothing more to it. 6. 3 7. Nope, not the ones I‟m familiar with. 8. Interactive, user-friendly, self explicit pop-up messages. 9. – 10. 3, 3, 5 11. Yes it was interesting never used anything. Similar before. 12. Nope. 13. Yes. 14. Yes, it was interesting by simply moving nodes how it affects the design. 15. 4. 16. Pop up messages maybe helpful, explaining why the score of designs are changing, (mass, stiffness….) E-365131 1. Bachelor in Civil Eng, MEng HPS now 2. ½ year working as telecommunication structural engineer. 3. SAP2000, AutoCAD 4. None, very hard for all programs to interact with each other. 5. None, very hard for all programs to interact with each other. 6. 3 7. Yes, to make programs able to interact more effectively. 8. – 9. – 10. 2, 4, 2 11. It was fun. But can maybe will not be able to do complex structure. 12. No. 13. Not conunary as + structural tool (no data virlpat) 14. Not sure 15. 4 16. Web based tool are slower. Can it run complex structure. E915257 1. BS Civil Eng., MEng HPS 2. 4 Internships at design firms, 1 year at SGH 3. Rhino, Revit, AutoCAD, SAP, STAAD 4. Revit
5. SAP lacks the ability to easily change geometry. 6. 4 7. Yes 8. Easy change of geometry, optimization score, 9. – 10. 5,5,1 11. Yes, easy to use. 12. No 13. Yes 14. Yes 15. 4 16. Material Properties, section properties, 17. No E-316517 1. University of Edinburgh – Beng Civil Engineering, MIT – Meng HPS 2. No 3. Revit, SAP, AutoCAD 4. Revit – intuitive 5. Analysis – need to use SAP in parallel 6. 2 7. Not at all, because you have to start from scratch. 8. – 9. – 10. 3, 4, 1 11. Yes, great layout, great idea, fun and intuitive to use 12. No – but testing time was very short. 13. Yes 14. Yes – gives ideas that I would never have thought of. 15. 4 16. Unsure right now, need to use it more 17. Helps develop intuition, Great! E-780696 1. MENG 2. 7 months Construction Company 3. AutoCAD, SAP, Revit, Sketch Up 4. AutoCAD Accurate, SAP “Easy to use” 5. I wish SAP would allow me to design/modify elements on the structure more easily. 6. 4 7. No 8. Design + analysis in one program 9. – 10. 3, 3, 0 11. Yeah I liked it. Interesting. 12. No, worked well. 13. Yes it is 14. I could do better but it helped. 15. 4 E-715722 1. BEng-Civil, MEng – Structural Eng. 2. No industry experience 3. AutoCAD, Revit, SAP2000 4. SAP2000- gives a good and accurate force and moment analysis of elements, however not user friendly. 5. SAP2000not user friendly, assembling and adjusting the structure is very frustrating. 6. 3 7. No, because there is no real-time feedback, also it is time consuming to adjust a structural layout using current software. 8. Real time feedback, easy editing of structural elements 9. – 10. 2,5,3 11. Yes, user-friendly, many options to improve/edit the design. 12. No 13. Yes 14. Yes 15. 4. 16. 3D-Modelling 17. –
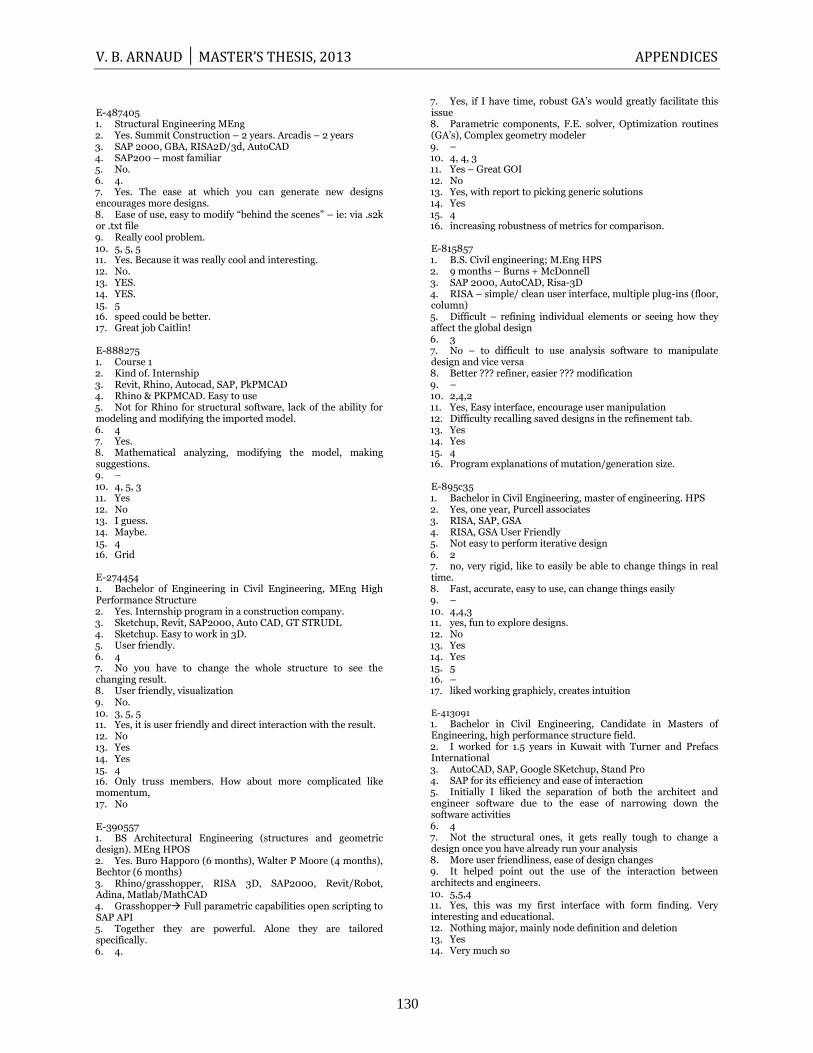
V. B. ARNAUD │ MASTER’S THESIS, 2013 APPENDICES
130
E-487405 1. Structural Engineering MEng 2. Yes. Summit Construction – 2 years. Arcadis – 2 years 3. SAP 2000, GBA, RISA2D/3d, AutoCAD 4. SAP200 – most familiar 5. No. 6. 4. 7. Yes. The ease at which you can generate new designs encourages more designs. 8. Ease of use, easy to modify “behind the scenes” – ie: via .s2k or .txt file 9. Really cool problem. 10. 5, 5, 5 11. Yes. Because it was really cool and interesting. 12. No. 13. YES. 14. YES. 15. 5 16. speed could be better. 17. Great job Caitlin! E-888275 1. Course 1 2. Kind of. Internship 3. Revit, Rhino, Autocad, SAP, PkPMCAD 4. Rhino & PKPMCAD. Easy to use 5. Not for Rhino for structural software, lack of the ability for modeling and modifying the imported model. 6. 4 7. Yes. 8. Mathematical analyzing, modifying the model, making suggestions. 9. – 10. 4, 5, 3 11. Yes 12. No 13. I guess. 14. Maybe. 15. 4 16. Grid E-274454 1. Bachelor of Engineering in Civil Engineering, MEng High Performance Structure 2. Yes. Internship program in a construction company. 3. Sketchup, Revit, SAP2000, Auto CAD, GT STRUDL 4. Sketchup. Easy to work in 3D. 5. User friendly. 6. 4 7. No you have to change the whole structure to see the changing result. 8. User friendly, visualization 9. No. 10. 3, 5, 5 11. Yes, it is user friendly and direct interaction with the result. 12. No 13. Yes 14. Yes 15. 4 16. Only truss members. How about more complicated like momentum, 17. No E-390557 1. BS Architectural Engineering (structures and geometric design). MEng HPOS 2. Yes. Buro Happoro (6 months), Walter P Moore (4 months), Bechtor (6 months) 3. Rhino/grasshopper, RISA 3D, SAP2000, Revit/Robot, Adina, Matlab/MathCAD 4. Grasshopper Full parametric capabilities open scripting to SAP API 5. Together they are powerful. Alone they are tailored specifically. 6. 4.
7. Yes, if I have time, robust GA‟s would greatly facilitate this issue 8. Parametric components, F.E. solver, Optimization routines (GA‟s), Complex geometry modeler 9. – 10. 4, 4, 3 11. Yes – Great GOI 12. No 13. Yes, with report to picking generic solutions 14. Yes 15. 4 16. increasing robustness of metrics for comparison. E-815857 1. B.S. Civil engineering; M.Eng HPS 2. 9 months – Burns + McDonnell 3. SAP 2000, AutoCAD, Risa-3D 4. RISA – simple/ clean user interface, multiple plug-ins (floor, column) 5. Difficult – refining individual elements or seeing how they affect the global design 6. 3 7. No – to difficult to use analysis software to manipulate design and vice versa 8. Better ??? refiner, easier ??? modification 9. – 10. 2,4,2 11. Yes, Easy interface, encourage user manipulation 12. Difficulty recalling saved designs in the refinement tab. 13. Yes 14. Yes 15. 4 16. Program explanations of mutation/generation size. E-895c35 1. Bachelor in Civil Engineering, master of engineering. HPS 2. Yes, one year, Purcell associates 3. RISA, SAP, GSA 4. RISA, GSA User Friendly 5. Not easy to perform iterative design 6. 2 7. no, very rigid, like to easily be able to change things in real time. 8. Fast, accurate, easy to use, can change things easily 9. – 10. 4,4,3 11. yes, fun to explore designs. 12. No 13. Yes 14. Yes 15. 5 16. – 17. liked working graphicly, creates intuition E-413091 1. Bachelor in Civil Engineering, Candidate in Masters of Engineering, high performance structure field. 2. I worked for 1.5 years in Kuwait with Turner and Prefacs International 3. AutoCAD, SAP, Google SKetchup, Stand Pro 4. SAP for its efficiency and ease of interaction 5. Initially I liked the separation of both the architect and engineer software due to the ease of narrowing down the software activities 6. 4 7. Not the structural ones, it gets really tough to change a design once you have already run your analysis 8. More user friendliness, ease of design changes 9. It helped point out the use of the interaction between architects and engineers. 10. 5,5,4 11. Yes, this was my first interface with form finding. Very interesting and educational. 12. Nothing major, mainly node definition and deletion 13. Yes 14. Very much so
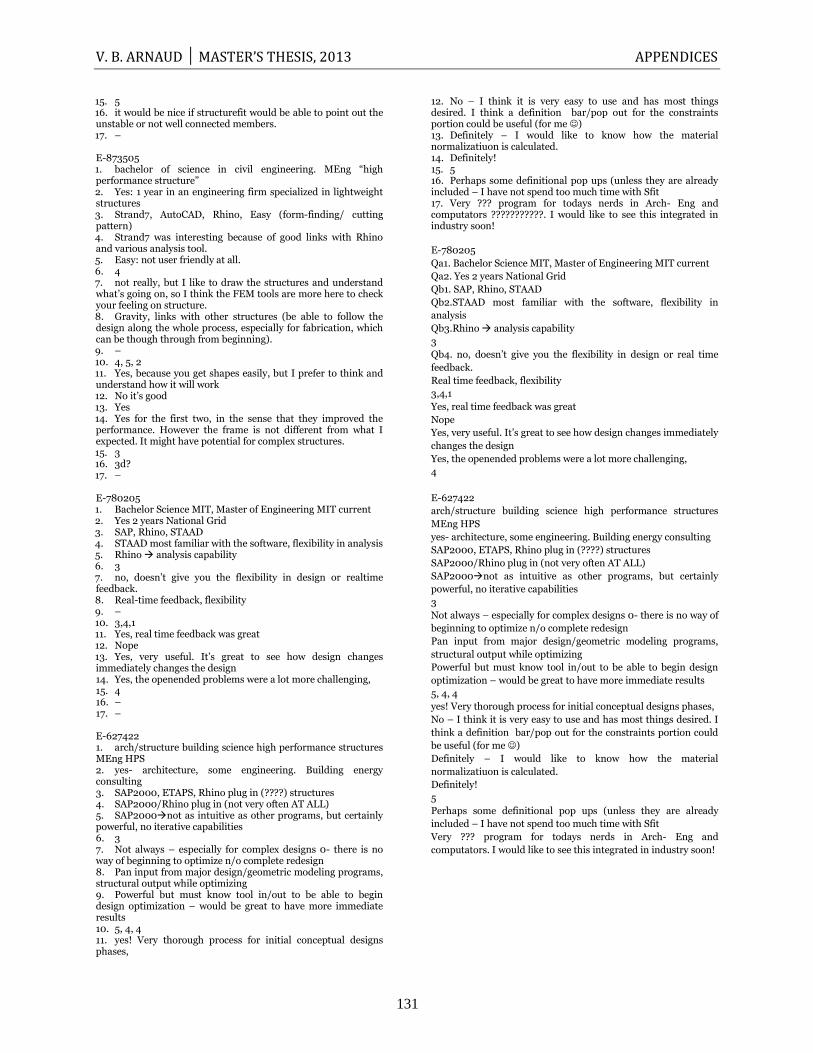
V. B. ARNAUD │ MASTER’S THESIS, 2013 APPENDICES
131
15. 5 16. it would be nice if structurefit would be able to point out the unstable or not well connected members. 17. – E-873505 1. bachelor of science in civil engineering. MEng “high performance structure” 2. Yes: 1 year in an engineering firm specialized in lightweight structures 3. Strand7, AutoCAD, Rhino, Easy (form-finding/ cutting pattern) 4. Strand7 was interesting because of good links with Rhino and various analysis tool. 5. Easy: not user friendly at all. 6. 4 7. not really, but I like to draw the structures and understand what‟s going on, so I think the FEM tools are more here to check your feeling on structure. 8. Gravity, links with other structures (be able to follow the design along the whole process, especially for fabrication, which can be though through from beginning). 9. – 10. 4, 5, 2 11. Yes, because you get shapes easily, but I prefer to think and understand how it will work 12. No it‟s good 13. Yes 14. Yes for the first two, in the sense that they improved the performance. However the frame is not different from what I expected. It might have potential for complex structures. 15. 3 16. 3d? 17. – E-780205 1. Bachelor Science MIT, Master of Engineering MIT current 2. Yes 2 years National Grid 3. SAP, Rhino, STAAD 4. STAAD most familiar with the software, flexibility in analysis 5. Rhino analysis capability 6. 3 7. no, doesn‟t give you the flexibility in design or realtime feedback. 8. Real-time feedback, flexibility 9. – 10. 3,4,1 11. Yes, real time feedback was great 12. Nope 13. Yes, very useful. It‟s great to see how design changes immediately changes the design 14. Yes, the openended problems were a lot more challenging, 15. 4 16. – 17. – E-627422 1. arch/structure building science high performance structures MEng HPS 2. yes- architecture, some engineering. Building energy consulting 3. SAP2000, ETAPS, Rhino plug in (????) structures 4. SAP2000/Rhino plug in (not very often AT ALL) 5. SAP2000not as intuitive as other programs, but certainly powerful, no iterative capabilities 6. 3 7. Not always – especially for complex designs 0- there is no way of beginning to optimize n/o complete redesign 8. Pan input from major design/geometric modeling programs, structural output while optimizing 9. Powerful but must know tool in/out to be able to begin design optimization – would be great to have more immediate results 10. 5, 4, 4 11. yes! Very thorough process for initial conceptual designs phases,
12. No – I think it is very easy to use and has most things desired. I think a definition bar/pop out for the constraints portion could be useful (for me ) 13. Definitely – I would like to know how the material normalizatiuon is calculated. 14. Definitely! 15. 5 16. Perhaps some definitional pop ups (unless they are already included – I have not spend too much time with Sfit 17. Very ??? program for todays nerds in Arch- Eng and computators ???????????. I would like to see this integrated in industry soon!
E-780205
Qa1. Bachelor Science MIT, Master of Engineering MIT current
Qa2. Yes 2 years National Grid
Qb1. SAP, Rhino, STAAD
Qb2.STAAD most familiar with the software, flexibility in
analysis
Qb3.Rhino analysis capability
3
Qb4. no, doesn‟t give you the flexibility in design or real time
feedback.
Real time feedback, flexibility
3,4,1
Yes, real time feedback was great
Nope
Yes, very useful. It‟s great to see how design changes immediately
changes the design
Yes, the openended problems were a lot more challenging,
4
E-627422
arch/structure building science high performance structures
MEng HPS
yes- architecture, some engineering. Building energy consulting
SAP2000, ETAPS, Rhino plug in (????) structures
SAP2000/Rhino plug in (not very often AT ALL)
SAP2000not as intuitive as other programs, but certainly
powerful, no iterative capabilities
3
Not always – especially for complex designs 0- there is no way of
beginning to optimize n/o complete redesign
Pan input from major design/geometric modeling programs,
structural output while optimizing
Powerful but must know tool in/out to be able to begin design
optimization – would be great to have more immediate results
5, 4, 4
yes! Very thorough process for initial conceptual designs phases,
No – I think it is very easy to use and has most things desired. I
think a definition bar/pop out for the constraints portion could
be useful (for me )
Definitely – I would like to know how the material
normalizatiuon is calculated.
Definitely!
5
Perhaps some definitional pop ups (unless they are already
included – I have not spend too much time with Sfit
Very ??? program for todays nerds in Arch- Eng and
computators. I would like to see this integrated in industry soon!

V. B. ARNAUD │ MASTER’S THESIS, 2013 APPENDICES
132
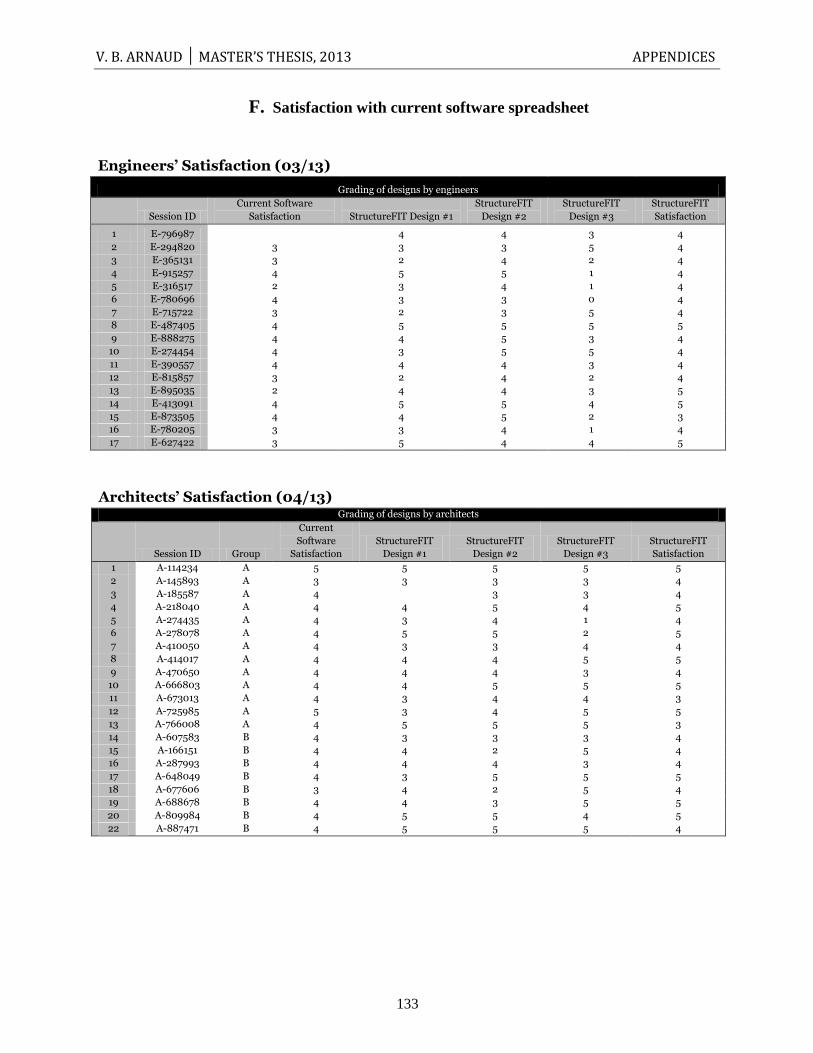
V. B. ARNAUD │ MASTER’S THESIS, 2013 APPENDICES
133
F. Satisfaction with current software spreadsheet
Engineers’ Satisfaction (03/13)
Grading of designs by engineers
Session ID
Current Software
Satisfaction StructureFIT Design #1
StructureFIT
Design #2
StructureFIT
Design #3
StructureFIT
Satisfaction
1 E-796987
4 4 3 4
2 E-294820 3 3 3 5 4
3 E-365131 3 2 4 2 4
4 E-915257 4 5 5 1 4
5 E-316517 2 3 4 1 4
6 E-780696 4 3 3 0 4
7 E-715722 3 2 3 5 4
8 E-487405 4 5 5 5 5
9 E-888275 4 4 5 3 4
10 E-274454 4 3 5 5 4
11 E-390557 4 4 4 3 4
12 E-815857 3 2 4 2 4
13 E-895035 2 4 4 3 5
14 E-413091 4 5 5 4 5
15 E-873505 4 4 5 2 3
16 E-780205 3 3 4 1 4
17 E-627422 3 5 4 4 5
Architects’ Satisfaction (04/13)
Grading of designs by architects
Session ID Group
Current
Software
Satisfaction
StructureFIT
Design #1
StructureFIT
Design #2
StructureFIT
Design #3
StructureFIT
Satisfaction
1 A-114234 A 5 5 5 5 5
2 A-145893 A 3 3 3 3 4
3 A-185587 A 4
3 3 4
4 A-218040 A 4 4 5 4 5
5 A-274435 A 4 3 4 1 4
6 A-278078 A 4 5 5 2 5
7 A-410050 A 4 3 3 4 4
8 A-414017 A 4 4 4 5 5
9 A-470650 A 4 4 4 3 4
10 A-666803 A 4 4 5 5 5
11 A-673013 A 4 3 4 4 3
12 A-725985 A 5 3 4 5 5
13 A-766008 A 4 5 5 5 3
14 A-607583 B 4 3 3 3 4
15 A-166151 B 4 4 2 5 4
16 A-287993 B 4 4 4 3 4
17 A-648049 B 4 3 5 5 5
18 A-677606 B 3 4 2 5 4
19 A-688678 B 4 4 3 5 5
20 A-809984 B 4 5 5 4 5
22 A-887471 B 4 5 5 5 4

134
V. B. ARNAUD │ MASTER’S THESIS, 2013 REFERENCES
135
REFERENCES
1. ADDIS, Bill, The Art of the Structural Engineer, Artemis, London, 1994
2. ARUP, Ove Nyquist, The Engineer and the Architect, Thesis No. 6368, 21 October, 1958.
3. ARUP, Ove Nyquist, Art and Architecture: the Architect-Engineer Relationship, p 350-359, August
1966.
4. BAKER, William, The Engineer’s Role in Creating New Architecture, Studies in Scale and Topology,
Harvard School of Architecture and Design, November, 2012
5. BAO, W. Y, Modeling Micro-end-milling Operations. Part III: Influence of Tool Wear,
6. BENTLEY, P., Evolutionary Design by Computers, Morgan Kaufmann, San Francisco, 1999.
7. BIEDERMANN, Julia, Addressing Current Issues in Structural Design Software, Journal of
computing in civil engineering, October 1996.
8. BLOCK Research Group, ETH Zurich, 2009-2012, Switzerland,http://block.arch.ethz.ch/equilibrium/
9. BURTON, Rebecca, Dept. of Biology, Alverno College, 2002,http://depts.alverno.edu/nsmt/stats.htm
10. BROWNLEE, Jason, Clever Algorithms: Nature-Inspired Programming Recipes
PhD. First Edition, Lulu Enterprises, January 2011
11. BOSCH, Jan and Molin, Peter, Software Architecture Design: Evaluation and Transformation,
Research Report, University of Karlskrona/Ronneby, Sweden, Department of Computer Science and
Business Administration, 1997.
12. CLUNE, Rory P., Explorative Structural Design, unpublished SM thesis, (Dept. of Civil and
Environmental Engineering, MIT, 2010)
13. FREKJMR Erik, Hertzum Morten, Hornbmk Kasper, Measuring Usability: Are Effectiveness,
Efficiency, and Satisfaction Really Correlated? CHI Letters, volume 2, p345-352, 2000.
14. GAGNE, Jaime M. L., An Interactive Performance-based Expert System for Daylighting in
Architectural Design, unpublished thesis, (Dept. of Civil and Environmental Engineering, MIT, 2011)
15. GLENFORD Myers J., BADGETT Tom, SANDLER Corey, The Art of Software Testing, third
edition, Hoboken, N.J., John Wiley & Sons, c2012
16. GREENWOLD S., Allen. E., Active Static, 2003,
http://ocw.mit.edu/ans7870/4/4.461/f04/module/Start.html
17. HARRIS, Alan, Architectural Misconceptions of Engineering, p 130-136, February 1961.
18. KARA Hanif, HAS.6328: In Search Of Design through Engineers, Introduction class 02/04/2013,
Harvard Graduate School of Design.
V. B. ARNAUD │ MASTER’S THESIS, 2013 REFERENCES
136
19. HOLGATE, Alan, The Art in Structural Design: An Introduction and Sourcebook, Clarendon Press,
Oxford; Oxford University Press, New York, 1986.
20. HOWARTH Jonathan, Smith-Jackson Tonya, Hartson Rex, Supporting Novice Usability
Practitioners with Usability Engineering Tools, International Journal of Human-Computer Studies 67
p533-549, 2009.
21. International Journal of Machine Tools and Manufacture, volume 40, Issue 15, December 2000,
Pages 2193–2211
22. MUELLER, Caitlin, A novel computational approach for conceptual structural design, unpublished
thesis (Department of Architecture, MIT, 2014)
23. MUELLER, Caitlin and Ochsendorf, John, An Interactive Evolutionary Framework for Structural
Design, IASS Workshop, London, 2011.
24. New Civil Engineer, Bubbling up: 3-D modelling has been put to good use in designing Beijing's
National Swimming Centre, 8 September 2005.
25. New Civil Engineer, Bubbling up: 3-D modelling has been put to good use in designing Beijing's
National Swimming Centre, 8 September 2005.
26. PARMEE, I., Evolutionary and Adaptive Computing in Engineering Design, Springer, London,
2001.
27. RICE, John A., Mathematical Statistics and Data Analysis, Third Edition, Duxbury Press, 2006
28. RICE, Peter, An Engineer Imagines, Artemis-Aidc, 1999
29. SHEARER, Michael S., Analyzing and Creating Forms: Rapid Generation of Graphic Statics
Solutions through RhinoScript, unpublished thesis, (Dept. of Civil and Environmental Engineering, MIT,
2010)
30. SHUTE, Nevil, Slide Rule, 2nd ed., London: Pan, 1969, p.63
31. STRAND7 Software, http://www.strand7.com/Master.htm © Copyright Strand7 Pty Ltd, April 2013
32. SURVEY GIZMO, http://www.surveygizmo.com/survey-examples © 2005-2013 Widgix
33. TEACH ENGINEERING, http://www.teachengineering.org/engrdesignprocess.php, April 2013
34. The Structural Engineer, The Role of the Consulting Structural Engineer in the ‘70s, N°12, Volume
47, December 1969.
35. VAUGHAN, Terry Wilson, Common Ground: Towards an Architecture of Continuity, Journal of
Architectural Education (1984-), Vol. 40, No. 2, Jubilee Issue.
36. VINCE Sheehan, Civil 3D & Civil View with AutoCAD Solids,
http://polyin3d.blogspot.com/2013/03/civil-3d-civil-view-with-autocad-solids.htm, March 2013,

V. B. ARNAUD │ MASTER’S THESIS, 2013 REFERENCES
137