quality of retail beef from two grass-based production systems in comparison with conventional beef
TRANSCRIPT
Meat Science 73 (2006) 351–361www.elsevier.com/locate/meatsci
Quality of retail beef from two grass-based production systemsin comparison with conventional beef
R.H. Razminowicz, M. Kreuzer, M.R.L. Scheeder ¤
Institute of Animal Science, Animal Nutrition, ETH Zurich, CH-8092 Zurich, Switzerland
Received 22 August 2005; received in revised form 12 December 2005; accepted 12 December 2005
Abstract
Seventy beef strip loins (Longissimus dorsi) were sampled, originating from labels prescribing pasturing (PS, suckler beef; PF, Wnishedsteers or heifers), from conventional production (CH, heifers; CB, young bulls), and from a label producing intensively fattened youngbulls (LB) and prescribing speciWc husbandry conditions but not grazing. Samples were purchased in autumn and spring (1:1) from 33retail stores in northeastern Switzerland. Colour was lightest in LB beef, while PS displayed the least intensive red. Shear force was low inpasture beef, with PF showing the lowest variability. Pasture beef was richer in n¡3 fatty acids than beef of all other origins. The n¡6/n¡3ratio was consistently below 2 in pasture beef, while it ranged above 5 in LB, and also in CH and CB when purchased in spring. Prescrib-ing year-round feeding of grass products and the use of steers or heifers therefore guarantees n¡3 enriched beef, which can be at least astender as conventional beef.© 2006 Elsevier Ltd. All rights reserved.
Keywords: Omega¡3 fatty acids; Pasture; Meat colour; Tenderness; Beef
1. Introduction
Grass-based beef production systems are low-input sys-tems that are particularly suitable to meet the demand ofmeat retailers and consumers for naturally and animal-friendly produced beef. Beside such idealistic aspects, theperceived healthiness of food is becoming a key qualityissue for consumers. In the case of meat, this is largelyrelated to its fat content and its fatty acid composition(Fisher et al., 2000). Concerning the health aspect of beef,there might be an advantage of grass-based systems sincelipids of green forage are known to contain high propor-tions of �-linolenic acid (ALA). This basic n¡3 (omega¡3)fatty acid can be endogenously desaturated and elongatedto long-chain n¡3 fatty acids (n¡3 LC-PUFA) (Sprecher,2000), i.e., eicosapentaenoic acid (EPA), docosapentaenoicacid (DPA), and docosahexaenoic acid (DHA). n¡3 Fatty
* Corresponding author. Tel.: +41 44 632 3278; fax: +41 44 632 1128.E-mail address: [email protected] (M.R.L. Scheeder).
0309-1740/$ - see front matter © 2006 Elsevier Ltd. All rights reserved.doi:10.1016/j.meatsci.2005.12.013
acids, particularly the n¡3 LC-PUFA, were shown to exertvarious beneWcial health eVects (Simopoulos, Leaf, &Salem, 1999). While nearly all lipid containing foods inWestern diets contribute to the intakes of n¡6 PUFA andALA, according to Meyer et al. (2003) only three maingroups of foods contribute to the supply with n¡3 LC-PUFA, namely seafood, meat, and eggs.
Conjugated linoleic acids (CLA) are another group offatty acids, which naturally occur in ruminant-derived foodand to which various beneWcial health eVects are ascribed(Belury, 2002). There is clear evidence for an enhanced pro-portion of n¡3 fatty acids and CLA in beef from grass(and linseed) fed bulls compared with beef from bulls fedmaize silage and concentrate (Dannenberger et al., 2004;Nürnberg et al., 2002). However, it is still unclear whetherbeef from pasture-based production systems compared tointensive production may provide a measurable and rele-vant dietetic advantage to consumers, when produced undercommercial and not experimental conditions. In Switzerlandand regions with similar climatic conditions it is especiallyunknown whether or not such an advantage is still found at
352 R.H. Razminowicz et al. / Meat Science 73 (2006) 351–361
the end of the winter period when typically several monthswithout consumption of fresh grass have passed. Providedbeef from grass-based fattening systems could be reliablydistinguished from conventional beef at the point of sale byits fatty acid proWle, this would facilitate authentication ofmeat (Franke, Gremaud, Hadorn, & Kreuzer, 2005),although other plant biomarkers would also be available(Prache, Cornu, Berdagué, & Priolo, 2005). Additionally,from the consumer’s point of view, visual appearance andtenderness of beef are still very important traits inXuencingpurchase decisions (Maltin, Balcerzak, Tilley, & Delay,2003). As grass-based fattening is typically less intensive,animals are often older at slaughter, which could result inless tender meat (Mitchell, Reed, & Rogers, 1991) anddarker meat colour (Priolo, Micol, & Agabriel, 2001).
The objective of the present investigation was, therefore,to purchase and analyse retail beef with stated origin frompasture-based systems both at the end of the vegetative sea-son and at the end of the winter period, and to compare itscomposition, colour and texture with beef from conven-tional production or a label with other provisions thangrazing.
2. Material and methods
2.1. Sample origin
This investigation was conducted with 70 strip loins(Longissimus dorsi, LD) obtained from Wve diVerent origins,and purchased in 33 diVerent retail stores in north-easternSwitzerland. Two of these origins were beef labels, whichprescribe grazing during the vegetative season: one pro-vides suckler beef, i.e., calves staying with their mother frombirth until being slaughtered at an age of approximately 10months (PS, nD 10). At that age, carcass weights rangefrom 150 to 220 kg. The other pasture-based label (PF,nD 20) represents a recently launched organic productionsystem, additionally prescribing a diet consisting of hay andgrass silage in winter time. Feeding low amounts of organi-cally produced concentrate is allowed in the Wnishing phase.The animals have to be steers or heifers, slaughtered at agesof 18–24 months and providing carcasses weighing from250–320 kg. The compliance of the producers with the rulesis regularly controlled in both labels. The other three ori-gins were based on intensive fattening regimes and com-prised: young bulls also kept under label conditions whichprescribe, among others, animal-friendly husbandry sys-tems (i.e., access to an outdoor area, unrestricted movementand social contact, fresh air and suYcient daylight in thebarn), and recommend the feeding of grass, hay, maize,silage, cereals, beet and milk products (LB, nD20), conven-tionally fattened heifers (CH, nD 10) and conventionallyfattened young bulls (CB, nD10). In Switzerland, youngbulls (as fattened in LB and CB) are commonly slaughteredat about 13 months of age, providing carcasses weighingbetween 270 and 310 kg. Heifers are typically fattened lessintensively than bulls in order to avoid excessive fat accre-
tion. They are commonly slaughtered at an age of 18–20months, with carcasses of about 250 kg. The CH sampleswere purchased from butcher shops, the ones from PS, PF,LB and CB in supermarkets. Beef from PF and LB hadbeen processed in the same slaughter and cutting plant andwas sold by the same supermarket chain (although in diVer-ent shops). From these two origins 20 samples each (insteadof ten as for the other origins) were purchased to morethoroughly validate the potential diVerences between exten-sive, grass-based and intensive beef production as well asthe potential interactions with season.
Half of the samples were purchased in October andNovember, following several months of grazing in the caseof PS and PF, the other half in February and March, i.e.,just before the next grazing season started. In all cases, theretailers had assured that the beef had been aged and wasready for consumption.
2.2. Sample analysis
The samples were transported in a refrigerated box tothe laboratory. Directly after transport, pH was measuredusing an IP67 electrode (model SenTix 21) attached to aWTW-340 pH meter (Wissenschaftliche Technische Wer-kstätten, Weilheim, Germany). Subsequently, the sampleswere stored at 4 °C over night and then cut to obtain 2.5 cmthick slices for further analyses. Colour traits were deter-mined at three deWned areas of the fresh cut surface,bloomed for 1 h at 4 °C and using a Chroma Meter (model300-CR, Minolta, Dietikon, Switzerland), applying theL¤a¤b¤ system with D65 as light source.
For texture measurements the beef slices were grilled to aWnal core temperature of 72 °C in an electrical double con-tact grill (model TURMIX 246, Beer Grill, Zurich, Switzer-land) heated to 240 °C. The core temperatures werecontrolled by two thermocouples (Thermo ZA9020-FS,NiCr-Ni Type K) inserted into the centre of the slices andattached to a datalogger (ALMEMO model 3290-8, Ahl-born, Holzkirchen, Germany). Cooking loss was determinedafter cooling the grilled slices on a grid for 30 min at roomtemperature. Subsequently, six cores (cylinders of 1.27 cmdiameter) and six stripes (1£1 cm cross-section) were pre-pared from each grilled slice by drilling/cutting parallel tothe muscle Wbre direction. The cores were sheared by a mod-iWed Warner–Bratzler–Shear blade and the stripes by a Vol-odkevich bite tendrometer, both mounted on a TA-XT2Textur Analyser (Stable Micro System, Surrey, UK).
Adhering connective and adipose tissue was carefullyremoved from one slice which then was homogenized in aMoulinette (Moulinex, type 643, Ecully Cedex, France) forsubsequent chemical analyses. For lipid analysis, 1.8 g ofthe homogenate was subjected to extraction with 20 ml hex-ane-isopropanol (3:2), containing tritridecanoin and phos-phatidylcholin 11:0 (Fluka Chemie, Buchs, Switzerland) asinternal standard. The fatty acids in the extracted lipidswere then converted to methyl esters according to IUPAC(1987) with slight modiWcations. Apart from analysing the
R.H. Razminowicz et al. / Meat Science 73 (2006) 351–361 353
fatty acid composition of total lipids, fatty acids were alsodetermined after separation into phospholipids and neutrallipids being accomplished by solid phase extraction(Kaluzny, Duncan, Merritt, & Epps, 1985) using NH2 Col-umns (Separtis AG, Grellingen, Schweiz). The fatty acidanalyses were done with a gas chromatograph (HP 6890,Hewlett-Packard, Wilmington, DE, USA) equipped with asplit injector, an FID detector and a 100 m CP-Sil88 col-umn. Analysis was performed using an initial isothermicperiod (175 °C, 20 min). Thereafter the temperature wasincreased at a rate of 2 °C/min to 225 °C. Finally, an iso-thermic period of 235 °C followed. Chromatograms wererecorded and integrated with a ChemStation (Hewlett-Packard, USA). IdentiWcation of diVerent fatty acid methylesters was performed by comparing the retention times withthose of known standards. Response factors were deter-mined by injecting samples containing a known amount ofFAME in order to calculate the fatty acid content in thebeef. The proportion of fatty acids were expressed as per-centages of the total area of injected methyl esters. Theintramuscular fat content (IMF) was determined accordingto AOAC Method 954.02 (1977) with slight modiWcationand using the extraction system B-811 (Büchi LabortechnikAG, Flawil, Switzerland).
2.3. Statistical analyses
Data were statistically analysed with the SAS program(version 8.0, SAS Institute Inc., Cary, NC). The model foranalyses of variance included origin and season as well astheir interaction as Wxed eVects. The ScheVé test wasapplied for the multiple comparisons among means, consid-ering P < 0.05 as signiWcant. Where appropriate for furtherinterpretation, LS-means of the diVerent origins or seasonal
eVects within beef origins were compared using a t-test. Forcolour, pH, texture and cooking loss analyses, samples withpH 7 5.8 (nD3) were excluded since an undesirably highpH is rather the result of inappropriate handling and treat-ment of the animals right before slaughter than a potentialcharacteristic of the underlying production systems. Thetables give the least square means of beef origin (seasonscombined) and season (origins combined), the maximumstandard error of the mean and the levels of signiWcance forthe main eVects and the interaction.
3. Results
3.1. Physico-chemical meat quality traits
Beef from the young bulls intensively fattened underlabel conditions (LB) was lightest in colour (signiWcantlydiVerent from PF, CH, and CB in a direct comparison, t-test P < 0.05), followed by pasture beef from sucklers (PS,Table 1). Conventionally fattened heifers (CH) providedthe numerically darkest beef (signiWcantly diVerent fromLB, t-test P < 0.01 and borderline signiWcant from PS, t-testPD0.06). Pasture beef from steers or heifers (PF) presentedthe most intensive red colour (versus CB and PS P < 0.05, t-test), while PS was least intensively red (t-test versus PF andLB P < 0.05, versus CH PD0.08), followed by convention-ally fattened young bulls (CB). No signiWcant diVerencesbetween origins were recorded for yellowness (b¤ value) inthe multiple comparison of means.
Three samples from diVerent origin groups showed apH 7 5.8, indicating a tendency to dark-Wrm-dry meat. Theultimate pH of all other beef samples ranged around 5.5and did not diVer signiWcantly between groups. Cookingloss accounted for 30% on average and was not inXuenced
Table 1Physico-chemical traits of retail beef from diVerent categories and production systems (LS-means)
a and b, LS-means of beef origins lacking a common letter are signiWcantly diVerent (ScheVé test; P < 0.05); CV, coeYcients of variation (standard devia-tion/mean) within each slice; SEM, standard error of the mean.
Origin Season SEM P level
Pasture-derived label beef Other label beef Conventional beef Autumn Spring Origin (O) Season (S) O £ S
Category Suckler beef Steers/heifers Young bulls Heifers Young bulls
Acronym PS PF LB CH CB
n 10 19 20 9 9 34 33
ColourL¤ (lightness) 39.8ab 38.8ab 41.0b 37.5a 38.7ab 39.0 38.9 0.88 0.012 0.90 0.38a¤ (redness) 20.3b 23.6a 22.6ab 22.2ab 21.4ab 22.0 21.5 0.78 0.009 0.78 0.74b¤ (yellowness) 10.7 11.8 11.7 10.8 10.8 11.3 10.7 0.35 0.011 0.16 0.92
pHultimate 5.55 5.52 5.53 5.54 5.50 5.53 5.55 0.026 0.71 0.72 0.85Cooking loss (%) 30.9 30.4 31.4 30.6 29.4 30.1 30.8 0.66 0.16 0.35 0.023
TextureMaximal shear force (Warner–Bratzler)
Force (N) 40.3ab 34.7a 39.7ab 51.0b 52.5b 42.7 45.0 4.02 0.002 0.41 0.54CV (%) 24.9 16.2 24.7 23.5 24.0 24.1 21.3 3.19 0.028 0.24 0.85
Total shear energy (Volodkevich)Energy (J) 1101ab 1038a 1222ab 1571b 1469b 1316 1262 107.8 0.001 0.51 0.54CV (%) 23.2 17.3 23.9 16.8 20.4 20.2 20.5 3.37 0.31 0.64 0.21
354 R.H. Razminowicz et al. / Meat Science 73 (2006) 351–361
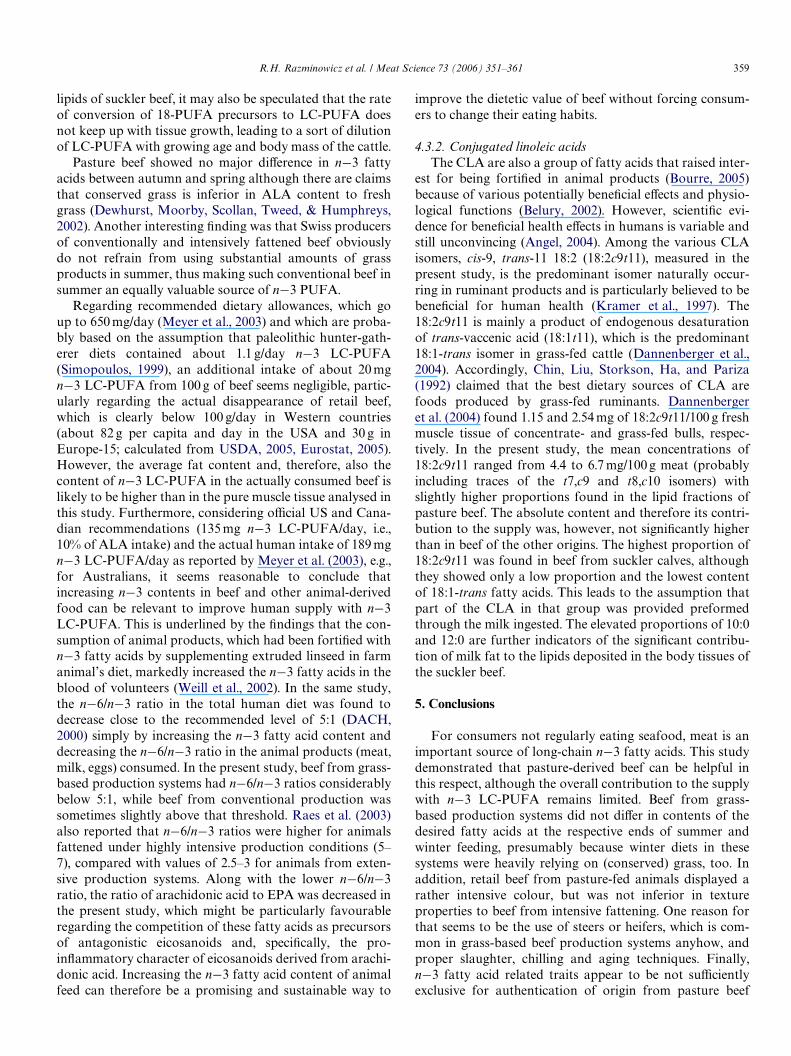
by origin. The intramuscular fat content did not diVer sig-niWcantly between the groups, but varied overall from <1%to about 3.5% (Fig. 1).
Both mechanical methods used to measure meat texturetraits, the Warner–Bratzler and the Volodkevich device,
Fig. 1. Intramuscular fat content plotted against the correspondingWarner–Bratzler shear force in beef of diVerent origin grilled to a coretemperature of 72 °C. PS, pasture beef from sucklers (£, spring; ,autumn); PF, pasture beef from Wnished steers/heifers (�, spring; �,autumn); LB, other label beef from intensively fattened young bulls (�,spring; �, autumn); CH, conventional beef from heifers (�, spring; �,autumn); CB, conventional beef from young bulls (�, spring, , autumn).
0
40
80
120
10 432
Intramuscular fat (g/100 g meat)
WB
-she
ar f
orce
(N
)
indicated a superior tenderness for the mature pasture beef,while both conventional origins showed signiWcantly highershear force and energy values. Furthermore, the variationof texture within the same slice, here given as coeYcient ofvariance (CV), was lowest for PF, being signiWcantly diVer-ent from PS, LB, and CB in preplaned comparisons (t-test).The variation among samples of the same origin was alsohighest in both conventional origins with standard devia-tions in WB-shear force of 18.3 and 18.1 N for CH and CB,respectively, while the variation within PF and LB was con-siderably lower (both 7.2 N) and intermediate for PS (11.7).This indicates a more consistent texture and uniform ten-derness in the beef from label origin.
Season had no eVects on the physico-chemical traits withthe exception of intramuscular fat content, which washigher in spring than in autumn. Interactions of origin andseason only occurred with cooking loss but were not sys-tematic concerning pasture beef versus non-pasture beef inthat respect and were likely to have been a statistical arte-fact.
3.2. Fatty acid composition
Beef from both grass-based systems was richer in totaln¡3 and lower in total n¡6 fatty acids than beef from theintensive production systems (Table 2). In detail, pasturebeef expressed the highest concentration of all investigatedn¡3 fatty acids, i.e., ALA, EPA and DHA, compared to the
Table 2Concentration of fat and selected fatty acids as well as fatty acid ratios in retail beef of diVerent categories and production systems (LS-means)
a–c, LS-means of beef origins lacking a common letter are signiWcantly diVerent (ScheVé test; P < 0.05); AA, arachidonic acid; ALA, �-linolenic acid; CLA,conjugated linoleic acid; DHA, docosahexaenoic acid; DPA, docosapentaenoic acid; EPA, eicosapentaenoic acid; LA, linoleic acid; MUFA, monounsatu-rated fatty acids; PUFA, polyunsaturated fatty acids; SEM, standard error of the mean; SFA, saturated fatty acids.
Origin Season SEM P level
Pasture-derived label beef Other label beef Conventional beef Autumn Spring Origin (O) Season (S) O £ S
Category Suckler beef Steers/heifers Young bulls Heifers Young bulls
n 10 20 20 10 10 35 35
Fat (g/100 g beef) 1.22 1.57 1.61 1.73 1.31 1.28 1.68 0.221 0.37 0.029 0.89
Fatty acid content (mg/100 g beef)18:1trans 25.4 42.0 47.6 53.5 37.1 32.8 49.5 7.48 0.079 0.007 0.1618:2c9t11 (CLA) 6.6 6.7 5.8 5.6 4.3 5.2 6.4 1.36 0.68 0.29 0.5418:2n¡6 (LA) 52.9a 53.9a 84.3b 66.6ab 81.3ab 56.5 79.1 7.32 <0.001 <0.001 0.0918:3n¡3 (ALA) 19.7ab 22.9a 12.5b 16.1ab 12.2ab 14.6 18.7 2.86 0.004 0.08 0.6220:4n¡6 (AA) 22ab 18a 26b 19ab 25ab 19.2 24.4 1.71 0.001 <0.001 0.06620:5n¡3 (EPA) 12.3c 9.6ac 4.3b 7.1ab 4.2b 7.3 7.6 1.11 <0.001 0.69 0.6422:5n¡3 (DPA) 12.6ab 14.3a 9.3b 11.4ab 8.8b 10.4 12.1 1.31 0.002 0.101 0.19822:6n¡3 (DHA) 1.8a 1.7a 1.1b 1.5ab 1.1ab 1.3 1.6 0.20 0.008 0.17 0.076SFA 448 581 768 621 549 481 706 93.1 0.064 0.004 0.31MUFA 380 549 716 585 510 442 655 92.4 0.056 0.006 0.35PUFA 147 151 170 149 159 134 177 13.5 0.54 <0.001 0.17n¡3 47ab 49a 28b 37ab 27b 34 41 5.2 <0.001 0.12 0.50n¡6 82ab 80b 121b 94 ab 116b 84 114 9.3 <0.001 <0.001 0.061
Fatty acid ratiosPUFA/SFA 0.45b 0.28a 0.26a 0.26a 0.32ab 0.35 0.28 0.032 <0.001 0.011 0.002LA/ALA 2.5a 2.5a 9.2b 8.1ab 7.7ab 4.8 7.4 1.47 <0.001 0.036 0.054n¡6/n¡3 1.9a 1.7a 5.6b 3.5ab 5.0b 3.0 4.1 0.61 <0.001 0.026 0.11AA/EPA 2.0a 2.0a 8.4b 3.5a 7.6b 3.8 5.6 0.84 <0.001 0.008 0.056
R.H. Razminowicz et al. / Meat Science 73 (2006) 351–361 355
origins from intensive fattening (CB and LB), while CHmostly showed intermediate values (Table 2). A low contentof arachidonic acid was observed for PF and CH beef whileLB and CB beef showed higher values and PS beef interme-diate concentrations. The overriding eVect, though, wasthat on the ratios of AA to EPA, LA to ALA and, gener-ally, n¡6 to n¡3. The PUFA/SFA ratio was highest for PS(signiWcant against PF, LB and CH), mainly due to therather low content of SFA. Contents of cis-9, trans-11 CLAwere not signiWcantly diVerent between origins, althoughvalues were numerically higher in pasture beef.
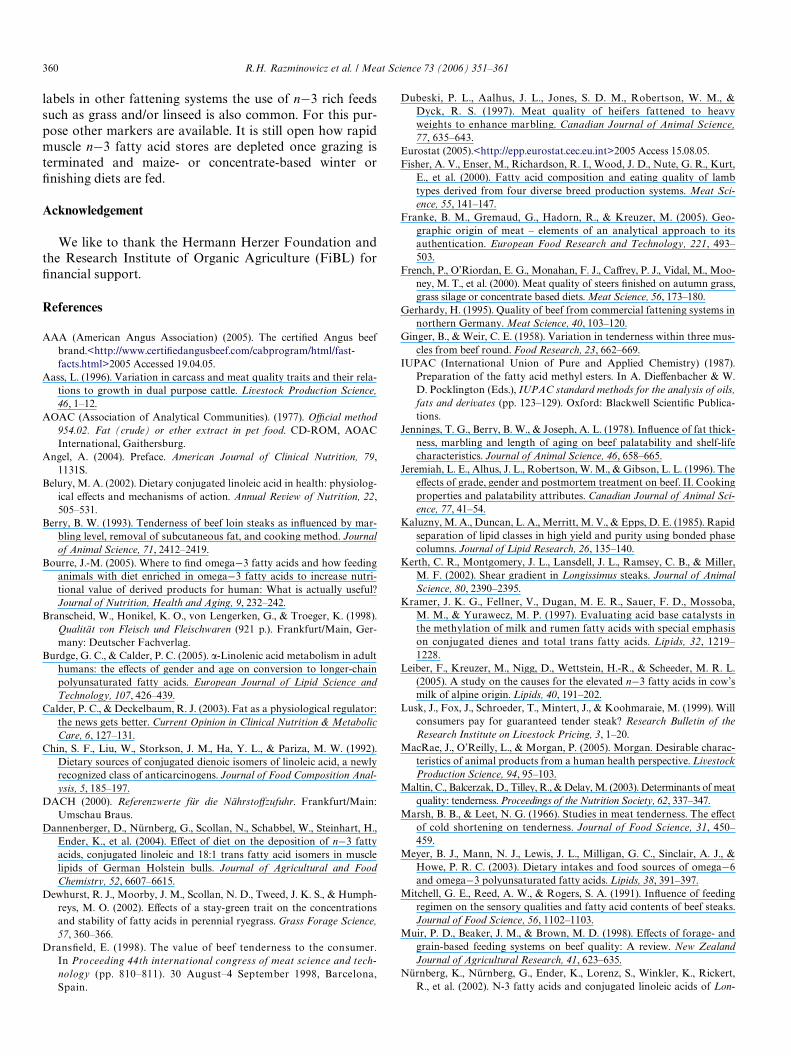
Beef purchased in spring was lower in n¡3 and higher inn¡6 fatty acid contents on average which, however, wasmainly the result of seasonal diVerences in conventionalbeef, while ratios were consistently low in pasture beef andhigh in LB (Fig. 2), indicating a season£origin interaction.In detail, n¡6/n¡3 ratios in autumn and spring for PS, PF,LB, CH and CB, respectively, were: 1.9 and 1.8, 1.8 and 1.5,5.4 and 5.8, 2.2 and 4.9, and 3.5 and 6.4.
In Tables 3 and 4, presenting the fatty acid proWles ofphospholipids and neutral lipids, only those fatty acids are
displayed which made up >0.1% of total fatty acid methylesters. Total n¡3 and n¡6 fatty acids and their ratiodiVered similarly between the origin of beef in both frac-tions, phospholipids and neutral lipids, although the PUFAconcentrations were much lower in neutral lipids than inphospholipids. The elevated n¡3 proportion in phospholip-ids and neutral lipids of pasture-derived beef comprised allmajor n¡3 fatty acids (ALA, EPA, DPA and DHA), withsuckler beef being superior in total n¡3 LC-PUFA. Inphospholipids of pasture beef, the high n¡3 proportionswere compensated by lower proportions of 18:1cis and18:2n¡6, while this was not obvious for 20:4n¡6 (arachi-donic acid; AA). The proportion of CLA was signiWcantlyhigher in beef from sucklers than in LB and conventionalbeef, with pasture beef from mature cattle showing interme-diate proportions in both lipid fractions. The proportion of18:1trans was similar across groups, except for the conven-tionally fattened heifers where proportions were higher.Generally, the proportion of trans fatty acids, includingCLA, were smaller in phospholipids than in neutral lipids.There were some origin diVerences in uneven-chain fatty
Table 3Fatty acid proWle of phospholipids in retail beef samples from diVerent categories and production systems (LS-means)
a–d, LS-means of beef origins lacking a common letter are signiWcantly diVerent (ScheVé test; P < 0.05); AA, arachidonic acid; ALA, �-linolenic acid;CLA, conjugated linoleic acid; DHA, docosahexaenoic acid; DPA, docosapentaenoic acid; EPA, eicosapentaenoic acid; LA, linoleic acid; MUFA, mono-unsaturated fatty acids; PUFA, polyunsaturated fatty acids; SEM, standard error of the mean; SFA, saturated fatty acids.
Origin Season SEM P level
Pasture-derived label beef Other label beef Conventional beef Autumn Spring Origin (O) Season (S) O £ S
Category Suckler beef Steers/heifers Young bulls Heifers Young bulls
Fatty acid (g/100 g total fatty acids methyl esters)10:0 0.15 0.13 0.12 0.16 0.14 0.16 0.11 0.028 0.80 0.009 0.2112:0 0.14 0.17 0.13 0.18 0.15 0.15 0.15 0.022 0.36 0.84 0.03416:0 20.5 20.2 20.0 18.6 18.8 19.4 19.8 0.43 0.003 0.32 0.2417:0 0.47ab 0.65a 0.38b 0.63a 0.38b 0.49 0.51 0.051 <0.001 0.63 0.00618:0 8.71a 8.80a 9.10ab 9.32ab 9.88b 8.98 9.34 0.229 0.002 0.051 0.8419:0 0.11 0.09 0.11 0.12 0.09 0.30 0.10 0.008 0.026 0.27 0.03316:1 1.03 1.04 1.17 1.17 0.86 1.03 0.86 0.092 0.065 0.73 0.04817:1 0.95 1.32 1.21 0.99 1.47 1.07 1.29 0.212 0.33 0.18 0.9818:1cis 18.4a 21.2a 25.5b 23.5ab 21.7ab 22.2 21.9 1.28 <0.001 0.73 0.03018:1trans 1.61ab 1.73ab 1.60b 2.25a 1.43b 1.61 1.84 0.151 0.003 0.059 0.1818:2c9t11 (CLA) 0.30a 0.21ab 0.17b 0.19ab 0.14b 0.24 0.15 0.025 <0.001 <0.001 0.00918:2n¡6 (LA) 15.8ab 14.8a 18.2ab 16.7ab 21.1b 17.6 17.0 1.36 0.005 0.55 0.05418:3n¡6 0.14 0.19 0.17 0.20 0.19 0.20 0.15 0.025 0.42 0.033 0.4520:2n¡6 0.15 0.16 0.14 0.15 0.15 0.17 0.15 0.014 0.77 0.89 0.2920:3n¡6 1.88 1.82 1.65 1.79 1.75 1.85 1.69 0.103 0.35 0.053 0.2420:4n¡6 (AA) 8.58b 6.85a 7.69ab 6.72a 8.00ab 7.73 7.41 0.375 <0.001 0.29 0.01722:4n¡6 0.28a 0.36a 0.84b 0.52a 0.82b 0.50 0.62 0.062 <0.001 0.021 0.05722:5n¡6 0.08c 0.13ac 0.21b 0.14abc 0.18ab 0.09 0.20 0.017 <0.001 <0.001 0.4518:3n¡3 (ALA) 4.99a 5.15a 1.95c 3.97ab 2.62bc 4.06 3.40 0.418 <0.001 0.054 0.3220:5n¡3 (EPA) 4.99d 3.82ad 1.36c 2.76ab 1.57bc 3.09 2.69 0.334 <0.001 0.14 0.4922:5n¡3 (DPA) 4.33a 4.86a 2.53c 3.90ab 2.83bc 3.89 3.48 0.286 <0.001 0.082 0.1422:6n¡3 (DHA) 0.64a 0.58a 0.28c 0.53ab 0.35bc 0.50 0.44 0.049 <0.001 0.15 0.085SFA 32.1 32.3 31.7 31.2 31.4 30.8 32.7 0.44 0.19 <0.001 0.71MUFA 24.7b 27.7ab 31.9a 30.3ab 27.8ab 28.3 28.7 1.34 <0.001 0.69 0.042PUFA 43.1b 39.9ab 36.4a 38.5ab 40.9ab 40.9 38.6 1.38 0.002 0.040 0.022n¡3 14.9a 14.4a 6.1c 11.1ab 7.4bc 11.6 10.0 0.93 <0.001 0.047 0.25n¡6 26.9ab 24.3a 28.9ab 26.2ab 32.2b 28.2 27.2 1.54 0.001 0.44 0.018
Fatty acid ratiosn¡6/n¡3 1.9a 1.7a 5.6b 3.3ab 5.3b 3.0 4.1 0.60 <0.001 0.025 0.044AA/EPA 1.9a 1.9a 7.7c 3.4ab 6.7bc 3.6 5.0 0.76 <0.001 0.025 0.028
356 R.H. Razminowicz et al. / Meat Science 73 (2006) 351–361
acids (particularly C17), indicative of rumen microbial pro-cesses, but these were not systematic with respect to pasturebeef and non-pasture beef. In the neutral lipids, but not in
Fig. 2. Seasonal eVects on the n¡6/n¡3 ratio in the phospholipids of beefof diVerent origin. The horizontal line illustrates the recommended upperlevel of 5 for n¡6/n¡3 in human diets (DACH, 2000). PS, pasture beeffrom sucklers; PF, pasture beef from Wnished steers/heifers; LB, label beeffrom intensively fattened young bulls; CH, conventional beef from heifers;CB, conventional beef from young bulls. Error bars are standard devia-tions. Bars annotated without a common superscript are signiWcantlydiVerent in multiple comparisons (ScheVé test; P < 0.05). Comparisonsbetween seasons within the same origins were done with the t-test and P-values are given (n.s., not signiWcant).
uA tumn
pS ring
0
5
01
SP FP LB CH CB
Production origin
n-6/
n-3
ratio
P 200.0 <
P 90.0 < .s.n
.s.n .s.n
d
da
da
da
dc db
aba cba cba
the phospholipids, there was a clear diVerence in the pro-portion of medium-chain fatty acids (10:0, 12:0).
The proportions of several fatty acids were aVected byseason in both phospholipids and neutral lipids. Notewor-thy is the decline in CLA from autumn to spring found inall groups, but particularly in PS and CH, which led to sig-niWcant interactions (data not shown in table). Theincreased n¡6/n¡3 ratios in spring were exclusively due tochanges in the conventional beef, which presented lowratios in autumn and high ratios in spring. Fig. 2 gives anexample of the change with season in the n¡6/n¡3 ratio inthe phospholipids where it is obvious that only CH and CBshowed a season eVect, resulting in season £ origin interac-tions. In both pasture beef origins and in beef from labelbulls the n¡6/n¡3 ratio was remarkably constant, althoughon a diVerent level (Fig. 2).
4. Discussion
In the present study, the quality of retail beef from pas-ture-based systems was compared with beef from intensivefattening systems not prescribing grazing. DiVerencesbetween the underlying production systems also includefattening intensity, slaughter age, sex and the use of diVer-ent feeding stuVs apart from grass versus no grass. Exten-sive beef production, for example, is typically carried outwith steers and heifers rather than with young bulls, and atthe same time less concentrate is used. It was not the aim of
Table 4Fatty acid proWle of neutral lipids in retail beef samples from diVerent categories and production systems (LS-means)
a–c, LS-means of beef origins lacking a common letter are signiWcantly diVerent (ScheVé test; P < 0.05); AA, arachidonic acid; ALA, �-linolenic acid; CLA,conjugated linoleic acid; LA, linoleic acid; MUFA, monounsaturated fatty acids; PUFA, polyunsaturated fatty acids; SEM, standard error of the mean;SFA, saturated fatty acids.
Origin Season SEM P level
Pasture-derived label beef Other label beef Conventional beef Autumn Spring Origin (O) Season (S) O £ S
Category Suckler beef Steers/heifers Young bulls Heifers Young bulls
Fatty acid (g/100 g total fatty acid methyl esters)10:0 0.34b 0.11a 0.12a 0.13a 0.14a 0.22 0.11 0.046 0.002 0.002 0.00112:0 0.23b 0.07a 0.09a 0.09a 0.08a 0.12 0.11 0.016 <0.001 0.68 0.05716:0 26.2ab 25.0a 26.7b 25.8ab 25.0a 25.7 25.6 0.59 0.031 0.99 0.1917:0 1.24a 1.27a 0.99c 1.16ab 1.01bc 1.15 1.10 0.055 <0.001 0.18 0.3018:0 13.7c 16.2a 17.6b 17.0ab 18.4b 16.5 16.6 0.71 <0.001 0.91 0.9319:0 0.23 0.22 0.22 0.19 0.20 0.19 0.23 0.015 0.30 0.001 0.8816:1 3.81b 3.06a 2.95a 2.71a 2.57a 3.00 3.01 0.186 <0.001 0.92 0.5517:1 0.73a 0.71a 0.51b 0.58ab 0.48b 0.61 0.59 0.035 <0.001 0.60 0.6118:1cis 33.4b 36.8a 35.2ab 35.9ab 36.0ab 35.4 35.3 0.85 0.032 0.86 0.8218:1trans 3.47 3.44 3.24 4.05 3.40 3.53 3.50 0.329 0.40 0.93 0.6418:2c9t11 (CLA) 0.94c 0.65a 0.40b 0.53ab 0.41ab 0.67 0.47 0.066 <0.001 <0.001 0.00318:2n¡6 (LA) 1.66ab 1.44a 1.93ab 1.53ab 2.24b 1.69 1.86 0.158 0.001 0.34 0.2318:3n¡3 (ALA) 0.90ac 0.95a 0.42b 0.64ab 0.54bc 0.73 0.85 0.089 <0.001 0.28 0.098SFA 49.3 48.1 51.0 49.6 49.5 49.6 49.3 0.65 0.056 0.72 0.57MUFA 45.3 47.2 45.1 46.3 45.8 45.7 46.18 0.89 0.20 0.53 0.97PUFA 5.35a 4.75a 3.93b 4.10bc 4.73ac 4.66 4.48 0.262 <0.001 0.36 0.003n¡3 1.15a 1.15a 0.53c 0.85b 0.72bc 0.93 0.82 0.099 <0.001 0.18 0.045n¡6 2.00ab 1.73a 2.11ab 1.78ab 2.56b 1.95 2.12 0.175 0.004 0.23 0.064
Fatty acid ratiosn¡6/n¡3 2.5ac 1.6a 4.5b 3.5bc 3.9bc 2.5 3.8 0.66 <0.001 0.015 0.22AA/EPA 1.8 2.9 1.9 1.7 1.9 2.0 2.1 0.97 0.81 0.83 0.71
R.H. Razminowicz et al. / Meat Science 73 (2006) 351–361 357
the present study to evaluate eVects of these single factors,which have been subject of extensive research before, but tofocus on the eVects of entire production systems on meatquality as displayed under the conditions of commercialproduction and marketing. The main focus was put onwhether grass-based, extensive production systems result ina markedly diVerent beef quality and whether this is of rele-vance for the consumer in terms of appearance, texture andnutritional value or even health beneWts.
4.1. Visual appearance, pH and cooking loss
Meat colour is one important determinant of the visualappearance of meat (Sapp, Williams, & Mc Cann, 1999),where light beef is often preferred, although some consum-ers may favour intensively red beef by associating thisappearance with a more natural production method. Witha growing market share for pink veal, a more intense redcolour of ‘mature’ beef can meanwhile even be desired byretailers allowing a better diVerentiation of beef from veal.In our study, beef from intensively fattened young bulls waslightest and suckler beef had the least red colour asopposed to pasture beef from Wnished steers and heifers.This is in accordance with the age of the animals (Aass,1996). Moreover, when also regarding the rather high L¤-values of the probably older LB compared with PS, itshows again the known (Priolo et al., 2001) darker colourof beef from animals Wnished on pasture and not on con-centrate. Muir, Beaker, and Brown (1998) explained this bythe higher ultimate pH values found in beef from grass-fedcompared to grain-fed steers. They hypothesised that grass-fed steers are more susceptible to pre-slaughter stress andassociated pre-slaughter glycogen depletion than grain-fedsteers as the latter would be better accustomed to penningand handling. However, in our study no such diVerence inultimate pH was obvious, which is in agreement withFrench et al. (2000). Also water-holding capacity, as deter-mined by cooking loss, was not diVerent between origins,which is in line with the lack of diVerences in ultimate pH.It has to be mentioned that in the present study ultimatepH was recorded after presumable ageing of the meat andnot at a deWned time post mortem as is common in most ofthe published studies. The reported slight increase of pHduring ageing (Penney, Bell, & Moorhead, 1998) mayexplain why values in this study were comparatively high.
Another visual trait potentially aVecting purchase deci-sion is the degree of marbling, i.e., the visibility and distri-bution of intramuscular fat (IMF; AAA, 2005). In the USthis is the primary criterion for quality grading of beef car-casses (Dubeski, Aalhus, Jones, Robertson, & Dyck, 1997),while consideration of this criterion is uncommon inEurope. Marbling is often assumed to be linked to beef pal-atability, but its quantitative importance is seen controver-sially (Lusk, Fox, Schroeder, Mintert, & Koohmaraie,1999). Jeremiah, Alhus, Robertson, and Gibson (1996)reported higher panel scores for juiciness and Xavour inten-sity of LD steaks with higher IMF contents, while a con-
sumer study suggested that marbling is obviously notrelevant for beef palatability for the majority of consumers(Savell et al., 1987). When compared at similar IMF con-tents, the eating quality obviously does not diVer betweenbeef from grass fed-cattle and grain-fed cattle (French et al.,2000). In the present survey, the IMF content was not sig-niWcantly diVerent between origins, although suckler beefdisplayed the numerically lowest contents. The higher IMFcontent found in spring beef compared to autumn beefmight have resulted from a higher feeding intensity in win-ter. One reason might have been that even in conventionalfattening in summer-time grass-products seem to have beenused. This can be assumed from the corresponding fattyacid proWles.
4.2. Tenderness
The texture of meat is of utmost importance to con-sumer acceptance (DransWeld, 1998). Pasture beef, as pur-chased in the present study, turned out be lower in shearforce and energy than conventional beef and, whendirectly comparing the meat processed in the sameslaughter plant, even to beef from the non-pasture relatedlabel (PF versus LB; P < 0.05, t-test). The averageWarner–Bratzler peak shear forces of pasture beef frommature animals was clearly below the threshold of 40 N,suggested by Branscheid, Honikel, von Lengerken, andTroeger (1998) for tender meat, while it was at this bor-derline for the pasture beef from sucklers and was clearlyexceeded by conventional beef. Results obtained with theVolodkevich device conWrmed the diVerences found withthe Warner–Bratzler device. French et al. (2000) found nodiVerence in Warner–Bratzler shear force between beefproduced on grass-based and concentrate-based diets. Itis, therefore, likely that the diVerences found in the pres-ent study are mainly the result of a diVerent mode of pro-ducing the meat, including transport, slaughter, chilling,and aging (Rogov, Kuznetsova, Snezhko, Borisova, &Rozantsev, 2002). Previously (Gerhardy, 1995), tender-ness of beef from steers and heifers produced under com-mercial conditions had been found to be similar to beeffrom young bulls, although the latter had been clearlyyounger. Adverse eVects of animal age on tenderness arelikely to predominantly aVect muscles with higher colla-gen content (Shorthose & Harris, 1990). Nevertheless, thestudy of Shorthose and Harris (1990) showed that even inthe LD tenderness markedly declines between about 10and 18 month of age. However, under commercial condi-tions, eVects of slaughter, chilling, and aging may bemuch more decisive (Gerhardy, 1995). This could partlyexplain why the beef from the young sucklers was notlower in shear force than mature pasture beef and to thatfrom young bulls from label production. On the otherhand, the degree of tenderness achieved in the LD of PFwas already very high and probably could have beenhardly further improved. It has to be mentioned at thispoint that aging of the striploins for at least 4 weeks was
358 R.H. Razminowicz et al. / Meat Science 73 (2006) 351–361
a declared provision within the quality assurance systemof this organic pasture beef label.
Beside the mean level of tenderness, its variation withinsteak and among individual steaks within origin is relevantfor consumer satisfaction and, consequently, loyalty.Within-muscle variation has been described already quitesome time ago (Ginger & Weir, 1958). More recently,Kerth, Montgomery, Lansdell, Ramsey, and Miller (2002)reported that the lateral region of LD steaks consistentlyshowed the highest Warner–Bratzler shear forces comparedto any other region, while Berry (1993) did not detect suchdiVerences in the entire cross-section of the LD. In a previ-ous own study (Scheeder, 1998), a systematic variation oftexture within the LD of young bulls also occurred, withthe highest shear force values at the ventral location, wherethe muscle touches the ribs, and the lowest shear force val-ues at the dorso-medial and dorso-lateral locations. At thesame time short sarcomere lengths corresponded well withshear force data. This indicates that shortening of the mus-cle Wbers occurring in one zone of the muscle may be com-pensated by stretching of the Wbers elsewhere, when theskeleton–muscle arrangement is intact (Marsh & Leet,1966). Within-muscle variation of texture therefore pro-vides evidence for partial sarcomere shortening and indi-cates suboptimal chilling conditions. This was probably thecase for beef from the conventionally fattened young bulls.The still rather high within-slice variation found in PS andLB beef may also be a sign of a chilling intensity reachingthe borderline to cold-shortening conditions. Since the pro-ducers of the PF label were encouraged to deliver animalswith fatness scores of at least 3 according to the Wve-scoreEuropean carcass grading system, those carcasses mighthave been less susceptible to improper chilling conditions(Jennings, Berry, & Joseph, 1978) than the younger, slightlylighter and supposedly less fat carcasses of LB, slaughteredunder the same conditions.
The variation among samples of the same origin waslowest for PF and LB and only slightly higher for PS, eachof these being beef produced under label conditions. Thisindeed underlines an advantage of an eVective label pro-gram. On the other hand, it was quite surprising that also inbutcher shops tough steaks were sold (Fig. 1), althoughheifers were used and a supply of high quality productswould have been expected from butchers.
In the present study, we did not detect a clear relation-ship between Warner–Bratzler shear force and intramus-cular fat (IMF) content, but it was observed that reallyhigh shear force values only occurred in steaks with lessthan 1.5 g IMF/100 g beef (Fig. 1). Improper chilling con-ditions could be one underlying cause of the often claimedrelationship between tenderness and IMF content. A highIMF content, when associated with a pronounced fatcover of the carcass, therefore, could indicate some pro-tection against cold-shortening (Jennings et al., 1978).However, this does not exclude that lean beef can be ten-der, provided animals and beef are treated and processedproperly.
4.3. Relevance for human nutrition of changes in the fatty acid proWle of beef
While the IMF seems less decisive for beef tenderness, itscomposition is an important determinant of the dieteticvalue of beef. Animal-derived lipids have often beenblamed as health-risk factors although it has become evi-dent now that they provide a couple of physiologicallyfunctional and potentially health-beneWcial fatty acids. Thissupports strategies aiming to enhance health-promotingcompounds in animal products (MacRae, O’Reilly, & Mor-gan, 2005).
4.3.1. Omega¡3 (n¡3) fatty acidsIncreasing public awareness of the health beneWts attrib-
utable to n¡3 PUFA has stimulated interest in sources ofthese fatty acids for human consumption (Bourre, 2005;Calder & Deckelbaum, 2003). In vertebrates, includingman, the essential and basic n¡3 fatty acid (ALA; 18:3n¡3)can be converted to longer and more unsaturated n¡3 fattyacid such as EPA and DHA through desaturation, elonga-tion and, in the case of DHA, chain-shortening steps (Spre-cher, 2000). The extent of conversion is, however, ratherlimited (Burdge & Calder, 2005), making farm animals asadditional converters of ALA to n¡3 LC-PUFA and, thus,animal-derived food as a potential source of preformedEPA and DHA even more interesting. In fact, it has beenshown that meat contributes to about 20% of the intake ofn¡3 LC-PUFA in an average Australian diet (Meyer et al.,2003), representing a western type of diet. The share ofland-animal derived food of total n¡3 LC-PUFA supplycan be further increased when the ALA content in the ani-mal’s diets is increased, e.g., by switching to grass-baseddiets or by supplementing linseed. The experiment of Nürn-berg et al. (2002) showed that 100 g beef from grass-fedbulls can supply on average about 40–47 mg n¡3 LC-PUFA while only 16–19 mg were found in 100 g beef frombulls fattened on concentrates. Similarly, Raes et al. (2003)found in retail beef derived from extensive, grass-basedproduction (Irish beef) about twice as much n¡3 LC-PUFA (38 mg/100 g beef) than in beef from intensive pro-duction systems (18 mg/100 g). In the present study, the n¡3LC-PUFA content of pasture beef was also nearly twicethat of LB and CB beef (26.7 and 25.7 versus 14.7 and14.1 mg/100 g), although the absolute level was slightlylower than reported in the above mentioned studies.
There was also a diVerence in individual n¡3 PUFAbetween the two pasture beef types investigated, with suc-kler beef having higher contents of n¡3 LC-PUFA. It hasbeen shown that milk from grass-fed cows is not onlyhigher in ALA content but concomitantly also in n¡3 LC-PUFA (Leiber, Kreuzer, Nigg, Wettstein, & Scheeder,2005). Therefore, milk in the suckler beef diet may havespeciWcally contributed to the high LC-PUFA concentra-tion in its beef, while ALA was not elevated relative tomature pasture beef. However, since not only n¡3 LC-PUFA but also arachidonic acid were highest in phospho-
R.H. Razminowicz et al. / Meat Science 73 (2006) 351–361 359
lipids of suckler beef, it may also be speculated that the rateof conversion of 18-PUFA precursors to LC-PUFA doesnot keep up with tissue growth, leading to a sort of dilutionof LC-PUFA with growing age and body mass of the cattle.
Pasture beef showed no major diVerence in n¡3 fattyacids between autumn and spring although there are claimsthat conserved grass is inferior in ALA content to freshgrass (Dewhurst, Moorby, Scollan, Tweed, & Humphreys,2002). Another interesting Wnding was that Swiss producersof conventionally and intensively fattened beef obviouslydo not refrain from using substantial amounts of grassproducts in summer, thus making such conventional beef insummer an equally valuable source of n¡3 PUFA.
Regarding recommended dietary allowances, which goup to 650 mg/day (Meyer et al., 2003) and which are proba-bly based on the assumption that paleolithic hunter-gath-erer diets contained about 1.1 g/day n¡3 LC-PUFA(Simopoulos, 1999), an additional intake of about 20 mgn¡3 LC-PUFA from 100 g of beef seems negligible, partic-ularly regarding the actual disappearance of retail beef,which is clearly below 100 g/day in Western countries(about 82 g per capita and day in the USA and 30 g inEurope-15; calculated from USDA, 2005, Eurostat, 2005).However, the average fat content and, therefore, also thecontent of n¡3 LC-PUFA in the actually consumed beef islikely to be higher than in the pure muscle tissue analysed inthis study. Furthermore, considering oYcial US and Cana-dian recommendations (135 mg n¡3 LC-PUFA/day, i.e.,10% of ALA intake) and the actual human intake of 189 mgn¡3 LC-PUFA/day as reported by Meyer et al. (2003), e.g.,for Australians, it seems reasonable to conclude thatincreasing n¡3 contents in beef and other animal-derivedfood can be relevant to improve human supply with n¡3LC-PUFA. This is underlined by the Wndings that the con-sumption of animal products, which had been fortiWed withn¡3 fatty acids by supplementing extruded linseed in farmanimal’s diet, markedly increased the n¡3 fatty acids in theblood of volunteers (Weill et al., 2002). In the same study,the n¡6/n¡3 ratio in the total human diet was found todecrease close to the recommended level of 5:1 (DACH,2000) simply by increasing the n¡3 fatty acid content anddecreasing the n¡6/n¡3 ratio in the animal products (meat,milk, eggs) consumed. In the present study, beef from grass-based production systems had n¡6/n¡3 ratios considerablybelow 5:1, while beef from conventional production wassometimes slightly above that threshold. Raes et al. (2003)also reported that n¡6/n¡3 ratios were higher for animalsfattened under highly intensive production conditions (5–7), compared with values of 2.5–3 for animals from exten-sive production systems. Along with the lower n¡6/n¡3ratio, the ratio of arachidonic acid to EPA was decreased inthe present study, which might be particularly favourableregarding the competition of these fatty acids as precursorsof antagonistic eicosanoids and, speciWcally, the pro-inXammatory character of eicosanoids derived from arachi-donic acid. Increasing the n¡3 fatty acid content of animalfeed can therefore be a promising and sustainable way to
improve the dietetic value of beef without forcing consum-ers to change their eating habits.
4.3.2. Conjugated linoleic acidsThe CLA are also a group of fatty acids that raised inter-
est for being fortiWed in animal products (Bourre, 2005)because of various potentially beneWcial eVects and physio-logical functions (Belury, 2002). However, scientiWc evi-dence for beneWcial health eVects in humans is variable andstill unconvincing (Angel, 2004). Among the various CLAisomers, cis-9, trans-11 18:2 (18:2c9t11), measured in thepresent study, is the predominant isomer naturally occur-ring in ruminant products and is particularly believed to bebeneWcial for human health (Kramer et al., 1997). The18:2c9t11 is mainly a product of endogenous desaturationof trans-vaccenic acid (18:1t11), which is the predominant18:1-trans isomer in grass-fed cattle (Dannenberger et al.,2004). Accordingly, Chin, Liu, Storkson, Ha, and Pariza(1992) claimed that the best dietary sources of CLA arefoods produced by grass-fed ruminants. Dannenbergeret al. (2004) found 1.15 and 2.54 mg of 18:2c9t11/100 g freshmuscle tissue of concentrate- and grass-fed bulls, respec-tively. In the present study, the mean concentrations of18:2c9t11 ranged from 4.4 to 6.7 mg/100 g meat (probablyincluding traces of the t7,c9 and t8,c10 isomers) withslightly higher proportions found in the lipid fractions ofpasture beef. The absolute content and therefore its contri-bution to the supply was, however, not signiWcantly higherthan in beef of the other origins. The highest proportion of18:2c9t11 was found in beef from suckler calves, althoughthey showed only a low proportion and the lowest contentof 18:1-trans fatty acids. This leads to the assumption thatpart of the CLA in that group was provided preformedthrough the milk ingested. The elevated proportions of 10:0and 12:0 are further indicators of the signiWcant contribu-tion of milk fat to the lipids deposited in the body tissues ofthe suckler beef.
5. Conclusions
For consumers not regularly eating seafood, meat is animportant source of long-chain n¡3 fatty acids. This studydemonstrated that pasture-derived beef can be helpful inthis respect, although the overall contribution to the supplywith n¡3 LC-PUFA remains limited. Beef from grass-based production systems did not diVer in contents of thedesired fatty acids at the respective ends of summer andwinter feeding, presumably because winter diets in thesesystems were heavily relying on (conserved) grass, too. Inaddition, retail beef from pasture-fed animals displayed arather intensive colour, but was not inferior in textureproperties to beef from intensive fattening. One reason forthat seems to be the use of steers or heifers, which is com-mon in grass-based beef production systems anyhow, andproper slaughter, chilling and aging techniques. Finally,n¡3 fatty acid related traits appear to be not suYcientlyexclusive for authentication of origin from pasture beef
360 R.H. Razminowicz et al. / Meat Science 73 (2006) 351–361
labels in other fattening systems the use of n¡3 rich feedssuch as grass and/or linseed is also common. For this pur-pose other markers are available. It is still open how rapidmuscle n¡3 fatty acid stores are depleted once grazing isterminated and maize- or concentrate-based winter orWnishing diets are fed.
Acknowledgement
We like to thank the Hermann Herzer Foundation andthe Research Institute of Organic Agriculture (FiBL) forWnancial support.
References
AAA (American Angus Association) (2005). The certiWed Angus beefbrand.<http://www.certiWedangusbeef.com/cabprogram/html/fast-facts.html>2005 Accessed 19.04.05.
Aass, L. (1996). Variation in carcass and meat quality traits and their rela-tions to growth in dual purpose cattle. Livestock Production Science,46, 1–12.
AOAC (Association of Analytical Communities). (1977). OYcial method954.02. Fat (crude) or ether extract in pet food. CD-ROM, AOACInternational, Gaithersburg.
Angel, A. (2004). Preface. American Journal of Clinical Nutrition, 79,1131S.
Belury, M. A. (2002). Dietary conjugated linoleic acid in health: physiolog-ical eVects and mechanisms of action. Annual Review of Nutrition, 22,505–531.
Berry, B. W. (1993). Tenderness of beef loin steaks as inXuenced by mar-bling level, removal of subcutaneous fat, and cooking method. Journalof Animal Science, 71, 2412–2419.
Bourre, J.-M. (2005). Where to Wnd omega¡3 fatty acids and how feedinganimals with diet enriched in omega¡3 fatty acids to increase nutri-tional value of derived products for human: What is actually useful?Journal of Nutrition, Health and Aging, 9, 232–242.
Branscheid, W., Honikel, K. O., von Lengerken, G., & Troeger, K. (1998).Qualität von Fleisch und Fleischwaren (921 p.). Frankfurt/Main, Ger-many: Deutscher Fachverlag.
Burdge, G. C., & Calder, P. C. (2005). �-Linolenic acid metabolism in adulthumans: the eVects of gender and age on conversion to longer-chainpolyunsaturated fatty acids. European Journal of Lipid Science andTechnology, 107, 426–439.
Calder, P. C., & Deckelbaum, R. J. (2003). Fat as a physiological regulator:the news gets better. Current Opinion in Clinical Nutrition & MetabolicCare, 6, 127–131.
Chin, S. F., Liu, W., Storkson, J. M., Ha, Y. L., & Pariza, M. W. (1992).Dietary sources of conjugated dienoic isomers of linoleic acid, a newlyrecognized class of anticarcinogens. Journal of Food Composition Anal-ysis, 5, 185–197.
DACH (2000). Referenzwerte für die NährstoVzufuhr. Frankfurt/Main:Umschau Braus.
Dannenberger, D., Nürnberg, G., Scollan, N., Schabbel, W., Steinhart, H.,Ender, K., et al. (2004). EVect of diet on the deposition of n¡3 fattyacids, conjugated linoleic and 18:1 trans fatty acid isomers in musclelipids of German Holstein bulls. Journal of Agricultural and FoodChemistry, 52, 6607–6615.
Dewhurst, R. J., Moorby, J. M., Scollan, N. D., Tweed, J. K. S., & Humph-reys, M. O. (2002). EVects of a stay-green trait on the concentrationsand stability of fatty acids in perennial ryegrass. Grass Forage Science,57, 360–366.
DransWeld, E. (1998). The value of beef tenderness to the consumer.In Proceeding 44th international congress of meat science and tech-nology (pp. 810–811). 30 August–4 September 1998, Barcelona,Spain.
Dubeski, P. L., Aalhus, J. L., Jones, S. D. M., Robertson, W. M., &Dyck, R. S. (1997). Meat quality of heifers fattened to heavyweights to enhance marbling. Canadian Journal of Animal Science,77, 635–643.
Eurostat (2005).<http://epp.eurostat.cec.eu.int>2005 Access 15.08.05.Fisher, A. V., Enser, M., Richardson, R. I., Wood, J. D., Nute, G. R., Kurt,
E., et al. (2000). Fatty acid composition and eating quality of lambtypes derived from four diverse breed production systems. Meat Sci-ence, 55, 141–147.
Franke, B. M., Gremaud, G., Hadorn, R., & Kreuzer, M. (2005). Geo-graphic origin of meat – elements of an analytical approach to itsauthentication. European Food Research and Technology, 221, 493–503.
French, P., O’Riordan, E. G., Monahan, F. J., CaVrey, P. J., Vidal, M., Moo-ney, M. T., et al. (2000). Meat quality of steers Wnished on autumn grass,grass silage or concentrate based diets. Meat Science, 56, 173–180.
Gerhardy, H. (1995). Quality of beef from commercial fattening systems innorthern Germany. Meat Science, 40, 103–120.
Ginger, B., & Weir, C. E. (1958). Variation in tenderness within three mus-cles from beef round. Food Research, 23, 662–669.
IUPAC (International Union of Pure and Applied Chemistry) (1987).Preparation of the fatty acid methyl esters. In A. DieVenbacher & W.D. Pocklington (Eds.), IUPAC standard methods for the analysis of oils,fats and derivates (pp. 123–129). Oxford: Blackwell ScientiWc Publica-tions.
Jennings, T. G., Berry, B. W., & Joseph, A. L. (1978). InXuence of fat thick-ness, marbling and length of aging on beef palatability and shelf-lifecharacteristics. Journal of Animal Science, 46, 658–665.
Jeremiah, L. E., Alhus, J. L., Robertson, W. M., & Gibson, L. L. (1996). TheeVects of grade, gender and postmortem treatment on beef. II. Cookingproperties and palatability attributes. Canadian Journal of Animal Sci-ence, 77, 41–54.
Kaluzny, M. A., Duncan, L. A., Merritt, M. V., & Epps, D. E. (1985). Rapidseparation of lipid classes in high yield and purity using bonded phasecolumns. Journal of Lipid Research, 26, 135–140.
Kerth, C. R., Montgomery, J. L., Lansdell, J. L., Ramsey, C. B., & Miller,M. F. (2002). Shear gradient in Longissimus steaks. Journal of AnimalScience, 80, 2390–2395.
Kramer, J. K. G., Fellner, V., Dugan, M. E. R., Sauer, F. D., Mossoba,M. M., & Yurawecz, M. P. (1997). Evaluating acid base catalysts inthe methylation of milk and rumen fatty acids with special emphasison conjugated dienes and total trans fatty acids. Lipids, 32, 1219–1228.
Leiber, F., Kreuzer, M., Nigg, D., Wettstein, H.-R., & Scheeder, M. R. L.(2005). A study on the causes for the elevated n¡3 fatty acids in cow’smilk of alpine origin. Lipids, 40, 191–202.
Lusk, J., Fox, J., Schroeder, T., Mintert, J., & Koohmaraie, M. (1999). Willconsumers pay for guaranteed tender steak? Research Bulletin of theResearch Institute on Livestock Pricing, 3, 1–20.
MacRae, J., O’Reilly, L., & Morgan, P. (2005). Morgan. Desirable charac-teristics of animal products from a human health perspective. LivestockProduction Science, 94, 95–103.
Maltin, C., Balcerzak, D., Tilley, R., & Delay, M. (2003). Determinants of meatquality: tenderness. Proceedings of the Nutrition Society, 62, 337–347.
Marsh, B. B., & Leet, N. G. (1966). Studies in meat tenderness. The eVectof cold shortening on tenderness. Journal of Food Science, 31, 450–459.
Meyer, B. J., Mann, N. J., Lewis, J. L., Milligan, G. C., Sinclair, A. J., &Howe, P. R. C. (2003). Dietary intakes and food sources of omega¡6and omega¡3 polyunsaturated fatty acids. Lipids, 38, 391–397.
Mitchell, G. E., Reed, A. W., & Rogers, S. A. (1991). InXuence of feedingregimen on the sensory qualities and fatty acid contents of beef steaks.Journal of Food Science, 56, 1102–1103.
Muir, P. D., Beaker, J. M., & Brown, M. D. (1998). EVects of forage- andgrain-based feeding systems on beef quality: A review. New ZealandJournal of Agricultural Research, 41, 623–635.
Nürnberg, K., Nürnberg, G., Ender, K., Lorenz, S., Winkler, K., Rickert,R., et al. (2002). N-3 fatty acids and conjugated linoleic acids of Lon-
R.H. Razminowicz et al. / Meat Science 73 (2006) 351–361 361
gissimus muscle in beef cattle. European Journal of Lipid Science andTechnology, 104, 463–471.
Penney, N., Bell, R. G., & Moorhead, S. M. (1998). Performance duringretail display of hot and cold boned beef striploins after chilled storagein vacuum or carbon dioxide packaging. Food Research International,31, 521–527.
Prache, S., Cornu, A., Berdagué, J. L., & Priolo, A. (2005). Traceability ofanimal feeding diets in the meat and milk of small ruminants. SmallRuminant Research, 59, 157–168.
Priolo, A., Micol, D., & Agabriel, J. (2001). EVects of grass feeding systemson ruminant meat colour and Xavour. A review. Animal Research, 50,185–200.
Raes, K., Balcean, A., Dirink, P., De Winne, A., Claeys, E., Demeyer, D., etal. (2003). Meat quality, fatty acid composition and Xavour analysis inBelgian retail beef. Meat Science, 65, 1237–1246.
Rogov, I. A., Kuznetsova, L. S., Snezhko, A. G., Borisova, Z. S., & Rozant-sev, E. G. (2002). Complex of technologies for antimicrobial protectionof meat products surface. In Proceedings of 48th international congressof meat science (pp. 198–199). Italy.
Sapp, P. H., Williams, S. E., & Mc Cann, M. A. (1999). Sensory attri-butes and retail display characteristics of pasture- and/or grain-fed beef aged 7, 14 or 21 days. Journal of Food Quality, 22, 257–274.
Savell, J. W., Branson, R. E., Cross, H. R., StiZer, D. M., Wise, J. W.,GriYn, D. B., et al. (1987). National consumer retail beef study: palat-ability evaluations of beef loin steaks that diVered in marbling. Journalof Food Science, 52, 517–519.
Scheeder, M.R.L. (1998). Age-related changes in meat quality of growingcattle. In Proceedings of the symposium on growth in ruminants: basicaspects, theory and practice for the future (pp. 265–275). 20–22 August1998, Berne, Switzerland.
Shorthose, W. R., & Harris, P. V. (1990). EVect of animal age on the ten-derness of selected beef muscles. Journal of Food Science, 55, 1–8.
Simopoulos, A. P. (1999). Essential fatty acids in health and chronic dis-ease. American Journal of Clinical Nutrition, 70, 560–569.
Simopoulos, A. P., Leaf, A., & Salem, N. (1999). Essentiality of fatty acidsand recommended dietary intakes for omega¡6 and omega¡3 fattyacids. Annals of Nutrition and Metabolism, 43, 127–130.
Sprecher, H. (2000). Metabolism of highly unsaturated n¡3 and n¡6 fattyacids. Biochimica et Biophysica Acta, 1486, 219–231.
USDA (2005).<http://www.ers.usda.gov/data/foodconsumption/Food-AvailIndex.htm>2005 Access 15.08.05.
Weill, P., Schmitt, B., Chesneau, G., Daniel, N., Safraou, F., & Legrand, F.(2002). EVects of introducing linseed in livestock diet on blood fattyacid composition of consumers of animal products. Annals of Nutritionand Metabolism, 46, 182–191.