quality assessment of various local bottled waters in different iraqi markets
TRANSCRIPT
Eng. & Tech. Journal .Vol31,Part (B), No. 5 , 2013
660
Quality Assessment of Various Local Bottled Waters
in Different Iraqi Markets
Alhassan H. Ismail Foundation of Technical Education, Institute of Technology, Department of water resources techniques/Baghdad Email: [email protected] Dr.Adnan Zowain Foundation of Technical Education, Institute of Technology, Department of water resources techniques/Baghda Enas KH. Sufar Foundation of Technical Education, Institute of Technology, Department of water resources techniques/Baghdad
Received on: 8/11/2012 & Accepted on: 4/4/2013 ABSTRACT
Fifteen local bottled waters brands (Best-selling brands) purchased randomly covering nine Iraqi governorates were analyzed for various physico-chemical as well as bacterial water quality parameters. The obtained results were compared to national and international water standard for drinking water as well as to the reported label values of the bottled water. Results showed that the majority of bottled water met the different drinking water quality standards for physico-chemical parameters except for calcium (one brand at Baghdad), magnesium (Ten brands at all studied governorates except Basrah) and total alkalinity (Two brands at Baghdad and Duhok). All bottled water brands showed negative growth for fecal coliforms, total coliforms and heterotrophic plate count at 37◦C. Generated Piper diagrams revealed that the majority of bottled waters samples are of calcium–magnesium chloride and some sulfate type (Ten brands) and the other water type are of calcium–magnesium bicarbonates (Five brands). Hierarchical cluster analysis was used to classify bottled water brands with similar properties and results distinguished five groups of brands. Comparison of the study results with reported label values indicated considerable variation for pH, Ca, Mg, Na, K, Cl, TH, TA, TDS, EC and SO4.
Keywords: Bottled Water, Quality Assessment, Iraqi Governorates, Drinking Water Standard, WHO, Cluster Analysis.
PDF created with pdfFactory Pro trial version www.pdffactory.com
Eng. & Tech. Journal .Vol31, Part (B), No. 5, 2013 Quality Assessment of Various Local Bottled Waters in Different Iraqi Markets
661
العراقیة األسواق مختلف في محلیا المعبأة الشرب لمیاه النوعي التقییم
الخالصةم ن تس ع محافظ ات عراقی ة ) الماركات األكثر مبیعا(تم سحب خمسة عشر عینة عشوائیة من المیاه المعبأة محلیا
وتمت مقارن ة نت ائج الدراس ة . لوجیةوتم تحلیلھا مختبریا لمختلف المتغیرات الفیزیائیة والكیمیائیة باألضافة الى البكتریو. م ع المع اییر المحلی ة والعالمی ة لمی اه الش رب باالض افة ال ى مقارنتھ ا م ع الق یم ال واردة عل ى الملص ق لك ل زجاج ة
رب بالنس بة وأظھرت النتائج أن غالبیة عینات المیاه المعبأة محلیا كانت ض من المواص فات المحلی ة والعالمی ة لمی اه الش عش رة مارك ات ف ي جمی ع (والمغنیس یوم ) مارك ة واح دة ف ي بغ داد(لفیزیائیة والكیمیائیة باستثناء الكالس یوم للمتغیرات ا
فیم ا أظھ رت ) اثن ین م ن العالم ات التجاری ة ف ي بغ داد و دھ وك(والقاعدیة الكلی ة ) المحافظات ما عدا محافظة البصرةلبرازی ة، الع دد الكل ي لبكتری ا القول ون، وأع داد البكتری ا المختلف ة جمیع عینات المیاه المعبأة نموا سلبیا لبكتری ا القول ون ا
-كم ا كش ف مخط ط ب ایبر أن غالبی ة عین ات المی اه المعب اة ھ ي م ن ن وع كالس یوم. مئوي 37التغذیة عند درجة حرارة وم مغنیس ی-أم ا العین ات االخ رى فكان ت م ن ن وع كالس یوم) مارك ات 10(مغنیس یوم كلوری دات م ع بع ض الكبریت ات
لتص نیف الخمس ة عش ر عین ة م ع خصائص ھا المماثل ة أس تخدم التحلی ل العنق ودي الھرم ي ). مارك ات 5(بیكاربون ات م ع ق یم الملص ق الحالی ة وأش ارت المقارن ة ب ین نت ائج الدراس ة . وأظھرت النتائج خمسة مجامیع من العالمات التجاریة
ر ف ي األس الھی دروجیني، الكالس یو م، المغنیس یوم، الص ودیوم، البوتاس یوم، الكل ور، العس رة لك ل زجاج ة اخ تالف كبی .الكلیة، القاعدیة، المواد الصلبة الذائبة، التوصیلیة الكھربائیة والكبریتات
INTRODUCTION
rinking water is considered the most basic needs for ongoing daily consumption to human. (Semerjian, 2011) has defined bottled water as “water that is intended for human consumption and that is sealed in bottles or other
containers with no added ingredients except that it may optionally contain safe and suitable antimicrobial agents” [1]. The estimated individual needs of drinking water about 2 liters per day for people weighed 60 kg and one liter per day for children weighed 10 kg, depending on the nature of the climate and physical activity and the culture of the community [2]. Bottled water consumption has been growing steadily worldwide during the past three decades [1]. It is considered as one of the fastest growing and most vital of all the food and beverage factories.
Bottled waters should be disinfected and fit for human consumption and compliant to national/international drinking water specifications such as WHO guideline [3] and Iraqi drinking standard [4]. Even though bottled water is disinfected, the microbes and solvents that have been detected throughout groundwater supplies can still be found in bottled water. Campylobacter infection could have wide public health implications and natural mineral water is a risk factor for this [5].
In Iraq, bottled water factories that licensed and approved by General Directorate for Industrial Development estimated as 10 factories with total capacity of 175000 tons/year till the end of 2006 facing 234 factories under-establishing distributed in all Iraqi governorates [6, 7]. The manufacturing bottled water becomes very popular especially after the last war of Iraq in 2003, in which the number of factories represents 54.5% of the overall food and beverage factories that are officially approved by the General Directorate for Industrial Development, according to this, the bottled water industries becomes the widely spreading industry in the country. The growing demand for bottled water in Iraq could be restricted to different reasons such as water scarcity, change in the
D
PDF created with pdfFactory Pro trial version www.pdffactory.com
Eng. & Tech. Journal .Vol31, Part (B), No. 5, 2013 Quality Assessment of Various Local Bottled Waters in Different Iraqi Markets
662
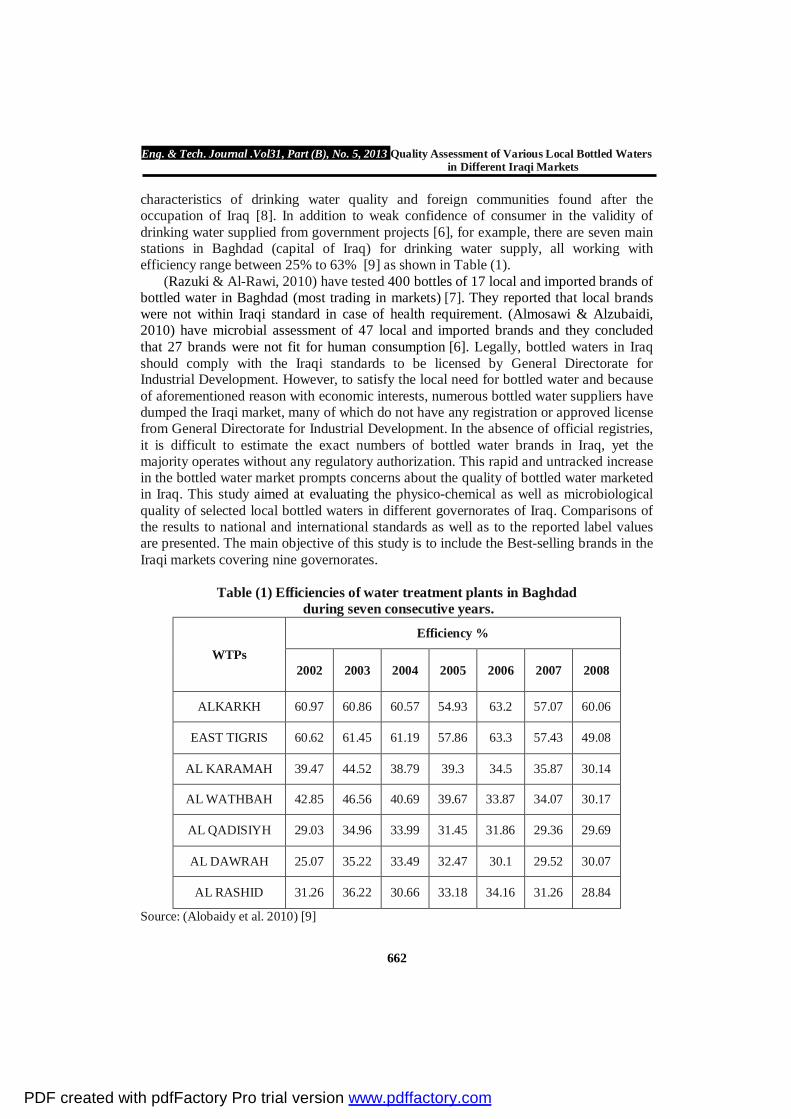
characteristics of drinking water quality and foreign communities found after the occupation of Iraq [8]. In addition to weak confidence of consumer in the validity of drinking water supplied from government projects [6], for example, there are seven main stations in Baghdad (capital of Iraq) for drinking water supply, all working with efficiency range between 25% to 63% [9] as shown in Table (1).
(Razuki & Al-Rawi, 2010) have tested 400 bottles of 17 local and imported brands of bottled water in Baghdad (most trading in markets) [7]. They reported that local brands were not within Iraqi standard in case of health requirement. (Almosawi & Alzubaidi, 2010) have microbial assessment of 47 local and imported brands and they concluded that 27 brands were not fit for human consumption [6]. Legally, bottled waters in Iraq should comply with the Iraqi standards to be licensed by General Directorate for Industrial Development. However, to satisfy the local need for bottled water and because of aforementioned reason with economic interests, numerous bottled water suppliers have dumped the Iraqi market, many of which do not have any registration or approved license from General Directorate for Industrial Development. In the absence of official registries, it is difficult to estimate the exact numbers of bottled water brands in Iraq, yet the majority operates without any regulatory authorization. This rapid and untracked increase in the bottled water market prompts concerns about the quality of bottled water marketed in Iraq. This study aimed at evaluating the physico-chemical as well as microbiological quality of selected local bottled waters in different governorates of Iraq. Comparisons of the results to national and international standards as well as to the reported label values are presented. The main objective of this study is to include the Best-selling brands in the Iraqi markets covering nine governorates.
Table (1) Efficiencies of water treatment plants in Baghdad during seven consecutive years.
WTPs Efficiency %
2002 2003 2004 2005 2006 2007 2008
ALKARKH 60.97 60.86 60.57 54.93 63.2 57.07 60.06
EAST TIGRIS 60.62 61.45 61.19 57.86 63.3 57.43 49.08
AL KARAMAH 39.47 44.52 38.79 39.3 34.5 35.87 30.14
AL WATHBAH 42.85 46.56 40.69 39.67 33.87 34.07 30.17
AL QADISIYH 29.03 34.96 33.99 31.45 31.86 29.36 29.69
AL DAWRAH 25.07 35.22 33.49 32.47 30.1 29.52 30.07
AL RASHID 31.26 36.22 30.66 33.18 34.16 31.26 28.84
Source: (Alobaidy et al. 2010) [9]
PDF created with pdfFactory Pro trial version www.pdffactory.com
Eng. & Tech. Journal .Vol31, Part (B), No. 5, 2013 Quality Assessment of Various Local Bottled Waters in Different Iraqi Markets
663
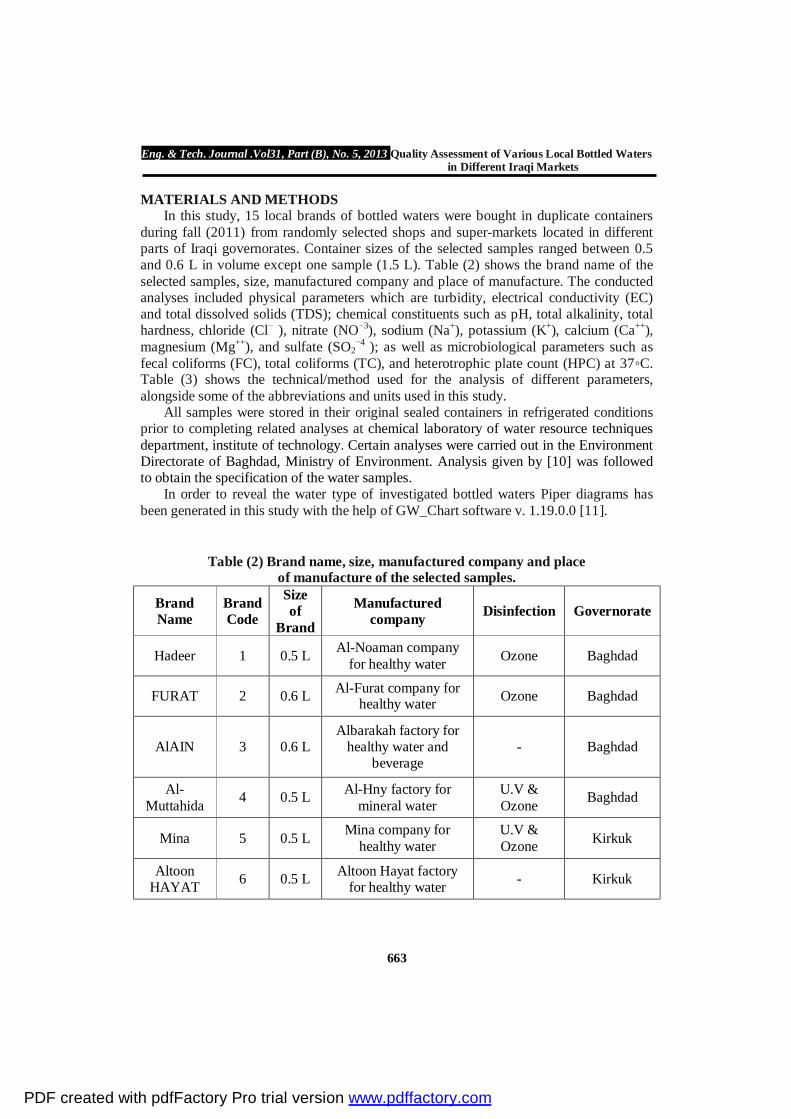
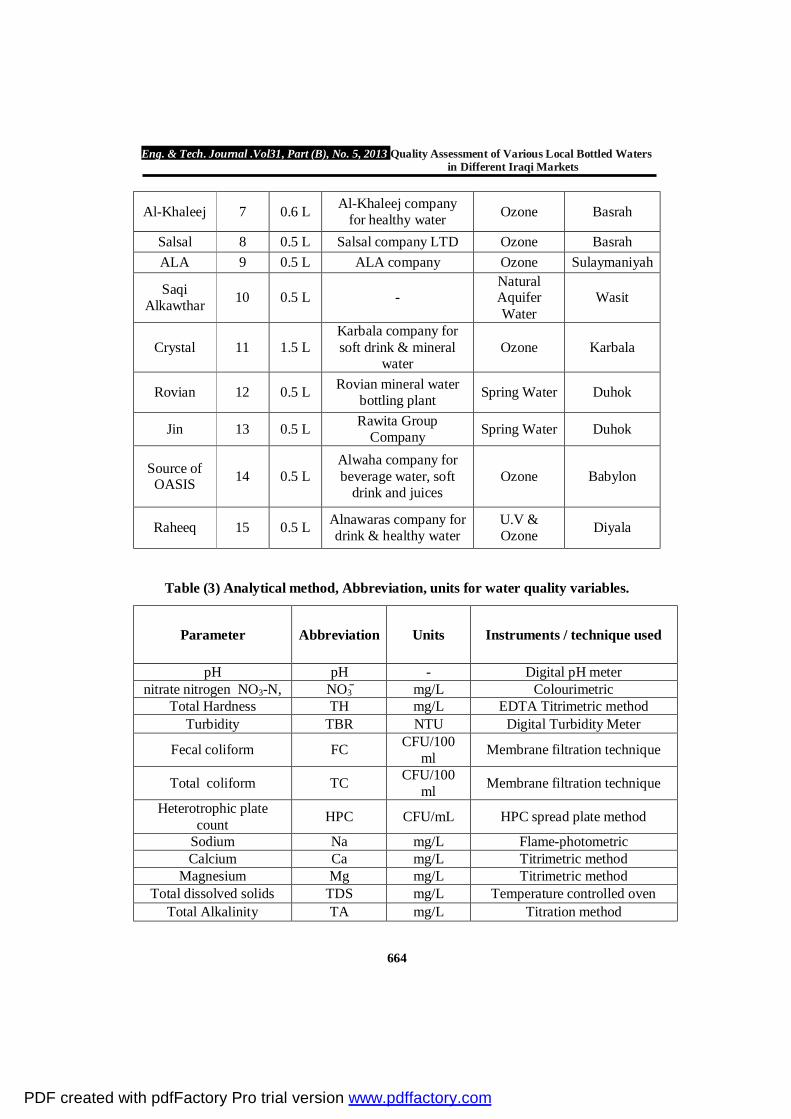
MATERIALS AND METHODS In this study, 15 local brands of bottled waters were bought in duplicate containers
during fall (2011) from randomly selected shops and super-markets located in different parts of Iraqi governorates. Container sizes of the selected samples ranged between 0.5 and 0.6 L in volume except one sample (1.5 L). Table (2) shows the brand name of the selected samples, size, manufactured company and place of manufacture. The conducted analyses included physical parameters which are turbidity, electrical conductivity (EC) and total dissolved solids (TDS); chemical constituents such as pH, total alkalinity, total hardness, chloride (Cl− ), nitrate (NO−3), sodium (Na+), potassium (K+), calcium (Ca++), magnesium (Mg++), and sulfate (SO2
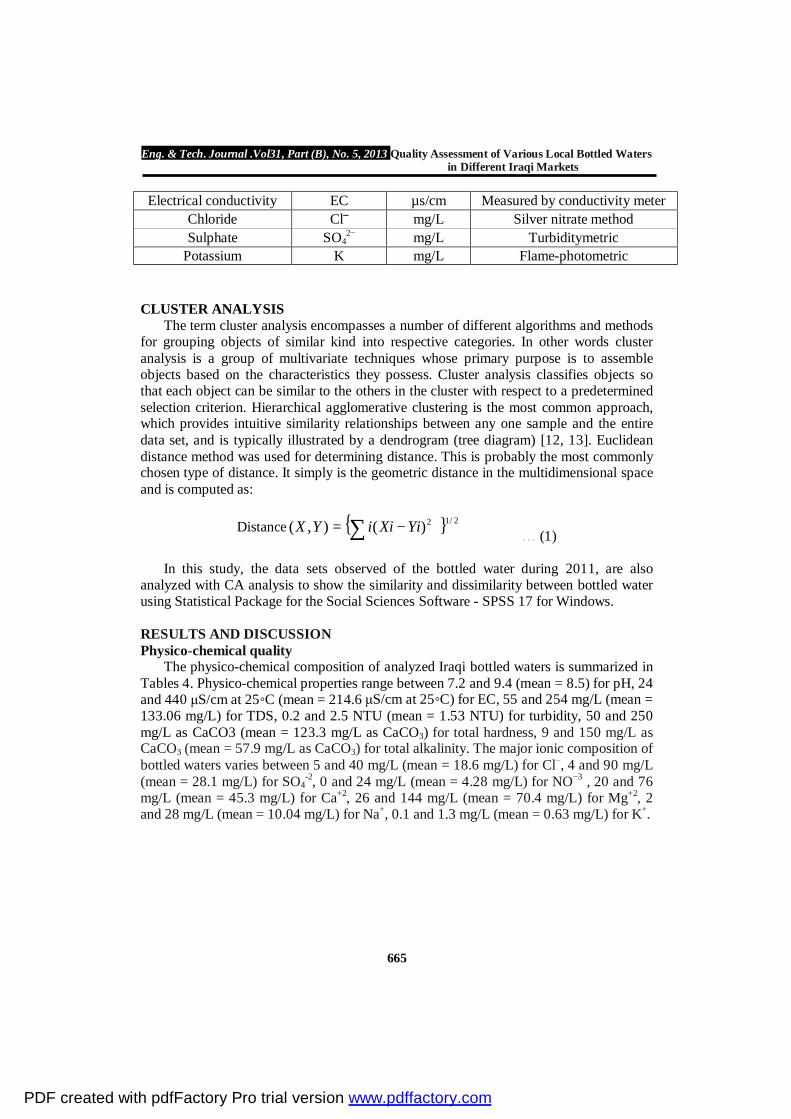
−4 ); as well as microbiological parameters such as fecal coliforms (FC), total coliforms (TC), and heterotrophic plate count (HPC) at 37◦C. Table (3) shows the technical/method used for the analysis of different parameters, alongside some of the abbreviations and units used in this study.
All samples were stored in their original sealed containers in refrigerated conditions prior to completing related analyses at chemical laboratory of water resource techniques department, institute of technology. Certain analyses were carried out in the Environment Directorate of Baghdad, Ministry of Environment. Analysis given by [10] was followed to obtain the specification of the water samples.
In order to reveal the water type of investigated bottled waters Piper diagrams has been generated in this study with the help of GW_Chart software v. 1.19.0.0 [11].
Table (2) Brand name, size, manufactured company and place of manufacture of the selected samples.
Brand Name
Brand Code
Size of
Brand
Manufactured company Disinfection Governorate
Hadeer 1 0.5 L Al-Noaman company for healthy water Ozone Baghdad
FURAT 2 0.6 L Al-Furat company for healthy water Ozone Baghdad
AlAIN 3 0.6 L Albarakah factory for
healthy water and beverage
- Baghdad
Al-Muttahida 4 0.5 L Al-Hny factory for
mineral water U.V & Ozone Baghdad
Mina 5 0.5 L Mina company for healthy water
U.V & Ozone Kirkuk
Altoon HAYAT 6 0.5 L Altoon Hayat factory
for healthy water - Kirkuk
PDF created with pdfFactory Pro trial version www.pdffactory.com
Eng. & Tech. Journal .Vol31, Part (B), No. 5, 2013 Quality Assessment of Various Local Bottled Waters in Different Iraqi Markets
664
Al-Khaleej 7 0.6 L Al-Khaleej company for healthy water Ozone Basrah
Salsal 8 0.5 L Salsal company LTD Ozone Basrah ALA 9 0.5 L ALA company Ozone Sulaymaniyah
Saqi Alkawthar 10 0.5 L -
Natural Aquifer Water
Wasit
Crystal 11 1.5 L Karbala company for soft drink & mineral
water Ozone Karbala
Rovian 12 0.5 L Rovian mineral water bottling plant Spring Water Duhok
Jin 13 0.5 L Rawita Group Company Spring Water Duhok
Source of OASIS 14 0.5 L
Alwaha company for beverage water, soft
drink and juices Ozone Babylon
Raheeq 15 0.5 L Alnawaras company for drink & healthy water
U.V & Ozone Diyala
Table (3) Analytical method, Abbreviation, units for water quality variables.
Parameter Abbreviation Units Instruments / technique used
pH pH - Digital pH meter nitrate nitrogen NO3-N, NO3 ̄ mg/L Colourimetric
Total Hardness TH mg/L EDTA Titrimetric method Turbidity TBR NTU Digital Turbidity Meter
Fecal coliform FC CFU/100 ml Membrane filtration technique
Total coliform TC CFU/100 ml Membrane filtration technique
Heterotrophic plate count HPC CFU/mL HPC spread plate method
Sodium Na mg/L Flame-photometric Calcium Ca mg/L Titrimetric method
Magnesium Mg mg/L Titrimetric method Total dissolved solids TDS mg/L Temperature controlled oven
Total Alkalinity TA mg/L Titration method
PDF created with pdfFactory Pro trial version www.pdffactory.com
Eng. & Tech. Journal .Vol31, Part (B), No. 5, 2013 Quality Assessment of Various Local Bottled Waters in Different Iraqi Markets
665
CLUSTER ANALYSIS
The term cluster analysis encompasses a number of different algorithms and methods for grouping objects of similar kind into respective categories. In other words cluster analysis is a group of multivariate techniques whose primary purpose is to assemble objects based on the characteristics they possess. Cluster analysis classifies objects so that each object can be similar to the others in the cluster with respect to a predetermined selection criterion. Hierarchical agglomerative clustering is the most common approach, which provides intuitive similarity relationships between any one sample and the entire data set, and is typically illustrated by a dendrogram (tree diagram) [12, 13]. Euclidean distance method was used for determining distance. This is probably the most commonly chosen type of distance. It simply is the geometric distance in the multidimensional space and is computed as:
Distance { } 2/12)(),( YiXiiYX −= ∑ … (1)
In this study, the data sets observed of the bottled water during 2011, are also
analyzed with CA analysis to show the similarity and dissimilarity between bottled water using Statistical Package for the Social Sciences Software - SPSS 17 for Windows. RESULTS AND DISCUSSION Physico-chemical quality
The physico-chemical composition of analyzed Iraqi bottled waters is summarized in Tables 4. Physico-chemical properties range between 7.2 and 9.4 (mean = 8.5) for pH, 24 and 440 μS/cm at 25◦C (mean = 214.6 μS/cm at 25◦C) for EC, 55 and 254 mg/L (mean = 133.06 mg/L) for TDS, 0.2 and 2.5 NTU (mean = 1.53 NTU) for turbidity, 50 and 250 mg/L as CaCO3 (mean = 123.3 mg/L as CaCO3) for total hardness, 9 and 150 mg/L as CaCO3 (mean = 57.9 mg/L as CaCO3) for total alkalinity. The major ionic composition of bottled waters varies between 5 and 40 mg/L (mean = 18.6 mg/L) for Cl−, 4 and 90 mg/L (mean = 28.1 mg/L) for SO4
-2, 0 and 24 mg/L (mean = 4.28 mg/L) for NO−3 , 20 and 76 mg/L (mean = 45.3 mg/L) for Ca+2, 26 and 144 mg/L (mean = 70.4 mg/L) for Mg+2, 2 and 28 mg/L (mean = 10.04 mg/L) for Na+, 0.1 and 1.3 mg/L (mean = 0.63 mg/L) for K+.
Electrical conductivity EC µs/cm Measured by conductivity meter Chloride Cl‾ mg/L Silver nitrate method Sulphate SO4
2− mg/L Turbiditymetric Potassium K mg/L Flame-photometric
PDF created with pdfFactory Pro trial version www.pdffactory.com
Eng. & Tech. Journal .Vol31, Part (B), No. 5, 2013 Quality Assessment of Various Local Bottled Waters in Different Iraqi Markets
666
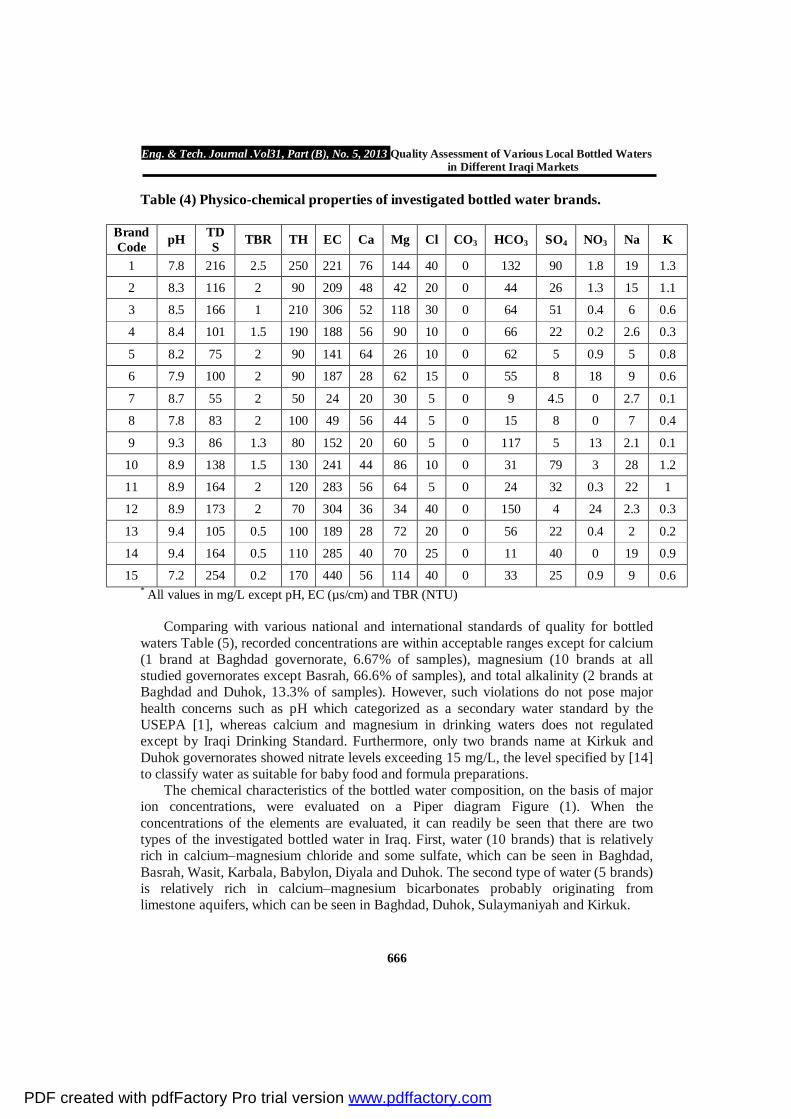
Table (4) Physico-chemical properties of investigated bottled water brands.
Brand Code pH TD
S TBR TH EC Ca Mg Cl CO3 HCO3 SO4 NO3 Na K
1 7.8 216 2.5 250 221 76 144 40 0 132 90 1.8 19 1.3
2 8.3 116 2 90 209 48 42 20 0 44 26 1.3 15 1.1
3 8.5 166 1 210 306 52 118 30 0 64 51 0.4 6 0.6
4 8.4 101 1.5 190 188 56 90 10 0 66 22 0.2 2.6 0.3
5 8.2 75 2 90 141 64 26 10 0 62 5 0.9 5 0.8
6 7.9 100 2 90 187 28 62 15 0 55 8 18 9 0.6
7 8.7 55 2 50 24 20 30 5 0 9 4.5 0 2.7 0.1
8 7.8 83 2 100 49 56 44 5 0 15 8 0 7 0.4
9 9.3 86 1.3 80 152 20 60 5 0 117 5 13 2.1 0.1
10 8.9 138 1.5 130 241 44 86 10 0 31 79 3 28 1.2
11 8.9 164 2 120 283 56 64 5 0 24 32 0.3 22 1
12 8.9 173 2 70 304 36 34 40 0 150 4 24 2.3 0.3
13 9.4 105 0.5 100 189 28 72 20 0 56 22 0.4 2 0.2
14 9.4 164 0.5 110 285 40 70 25 0 11 40 0 19 0.9
15 7.2 254 0.2 170 440 56 114 40 0 33 25 0.9 9 0.6 * All values in mg/L except pH, EC (µs/cm) and TBR (NTU)
Comparing with various national and international standards of quality for bottled waters Table (5), recorded concentrations are within acceptable ranges except for calcium (1 brand at Baghdad governorate, 6.67% of samples), magnesium (10 brands at all studied governorates except Basrah, 66.6% of samples), and total alkalinity (2 brands at Baghdad and Duhok, 13.3% of samples). However, such violations do not pose major health concerns such as pH which categorized as a secondary water standard by the USEPA [1], whereas calcium and magnesium in drinking waters does not regulated except by Iraqi Drinking Standard. Furthermore, only two brands name at Kirkuk and Duhok governorates showed nitrate levels exceeding 15 mg/L, the level specified by [14] to classify water as suitable for baby food and formula preparations.
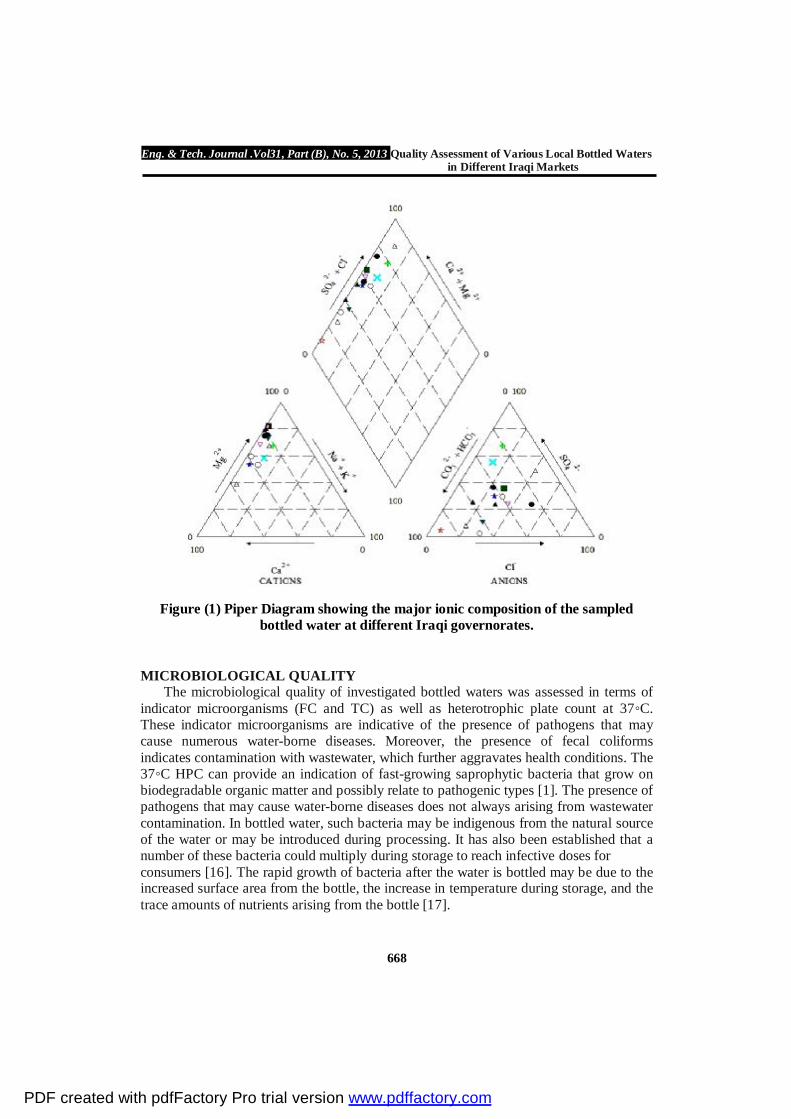
The chemical characteristics of the bottled water composition, on the basis of major ion concentrations, were evaluated on a Piper diagram Figure (1). When the concentrations of the elements are evaluated, it can readily be seen that there are two types of the investigated bottled water in Iraq. First, water (10 brands) that is relatively rich in calcium–magnesium chloride and some sulfate, which can be seen in Baghdad, Basrah, Wasit, Karbala, Babylon, Diyala and Duhok. The second type of water (5 brands) is relatively rich in calcium–magnesium bicarbonates probably originating from limestone aquifers, which can be seen in Baghdad, Duhok, Sulaymaniyah and Kirkuk.
PDF created with pdfFactory Pro trial version www.pdffactory.com
Eng. & Tech. Journal .Vol31, Part (B), No. 5, 2013 Quality Assessment of Various Local Bottled Waters in Different Iraqi Markets
667
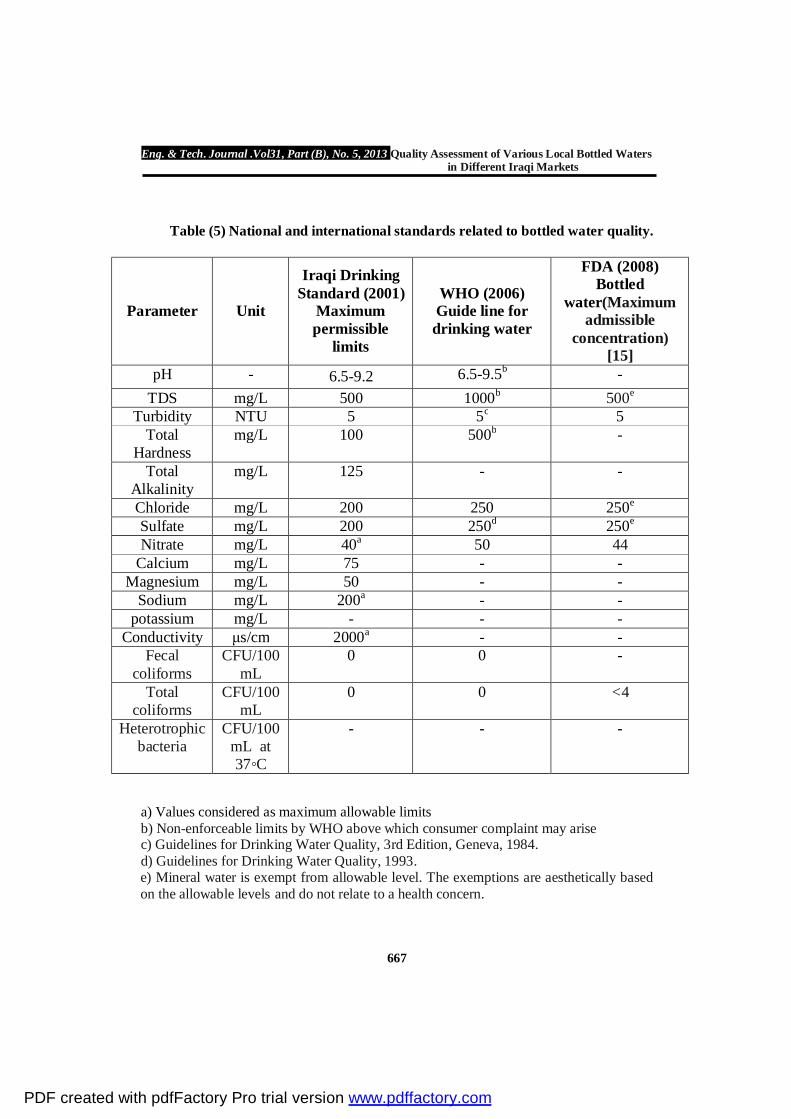
Table (5) National and international standards related to bottled water quality.
a) Values considered as maximum allowable limits b) Non-enforceable limits by WHO above which consumer complaint may arise c) Guidelines for Drinking Water Quality, 3rd Edition, Geneva, 1984. d) Guidelines for Drinking Water Quality, 1993. e) Mineral water is exempt from allowable level. The exemptions are aesthetically based on the allowable levels and do not relate to a health concern.
FDA (2008) Bottled
water(Maximum admissible
concentration) [15]
WHO (2006) Guide line for drinking water
Iraqi Drinking Standard (2001)
Maximum permissible
limits
Unit Parameter
- 6.5-9.5b 6.5-9.2 - pH 500e 1000b 500 mg/L TDS
5 5c 5 NTU Turbidity - 500b 100 mg/L Total
Hardness - - 125 mg/L Total
Alkalinity 250e 250 200 mg/L Chloride 250e 250d 200 mg/L Sulfate 44 50 40a mg/L Nitrate - - 75 mg/L Calcium - - 50 mg/L Magnesium - - 200a mg/L Sodium - - - mg/L potassium - - 2000a μs/cm Conductivity - 0 0 CFU/100
mL Fecal
coliforms <4 0 0 CFU/100
mL Total
coliforms - - - CFU/100
mL at 37◦C
Heterotrophic bacteria
PDF created with pdfFactory Pro trial version www.pdffactory.com
Eng. & Tech. Journal .Vol31, Part (B), No. 5, 2013 Quality Assessment of Various Local Bottled Waters in Different Iraqi Markets
668
Figure (1) Piper Diagram showing the major ionic composition of the sampled
bottled water at different Iraqi governorates. MICROBIOLOGICAL QUALITY
The microbiological quality of investigated bottled waters was assessed in terms of indicator microorganisms (FC and TC) as well as heterotrophic plate count at 37◦C. These indicator microorganisms are indicative of the presence of pathogens that may cause numerous water-borne diseases. Moreover, the presence of fecal coliforms indicates contamination with wastewater, which further aggravates health conditions. The 37◦C HPC can provide an indication of fast-growing saprophytic bacteria that grow on biodegradable organic matter and possibly relate to pathogenic types [1]. The presence of pathogens that may cause water-borne diseases does not always arising from wastewater contamination. In bottled water, such bacteria may be indigenous from the natural source of the water or may be introduced during processing. It has also been established that a number of these bacteria could multiply during storage to reach infective doses for consumers [16]. The rapid growth of bacteria after the water is bottled may be due to the increased surface area from the bottle, the increase in temperature during storage, and the trace amounts of nutrients arising from the bottle [17].
PDF created with pdfFactory Pro trial version www.pdffactory.com
Eng. & Tech. Journal .Vol31, Part (B), No. 5, 2013 Quality Assessment of Various Local Bottled Waters in Different Iraqi Markets
669
Analyzed bottled waters revealed that all the samples showed negative growth for fecal coliforms, total coliforms and HPC at 37.C. COMPARISON OF THE STUDY RESULTS WITH THE REPORTED LABEL VALUES
The variation of recorded results from the reported label values for pH, Ca++, Mg++, Na+, K+, Cl-, TH, TA, TDS, EC and SO4
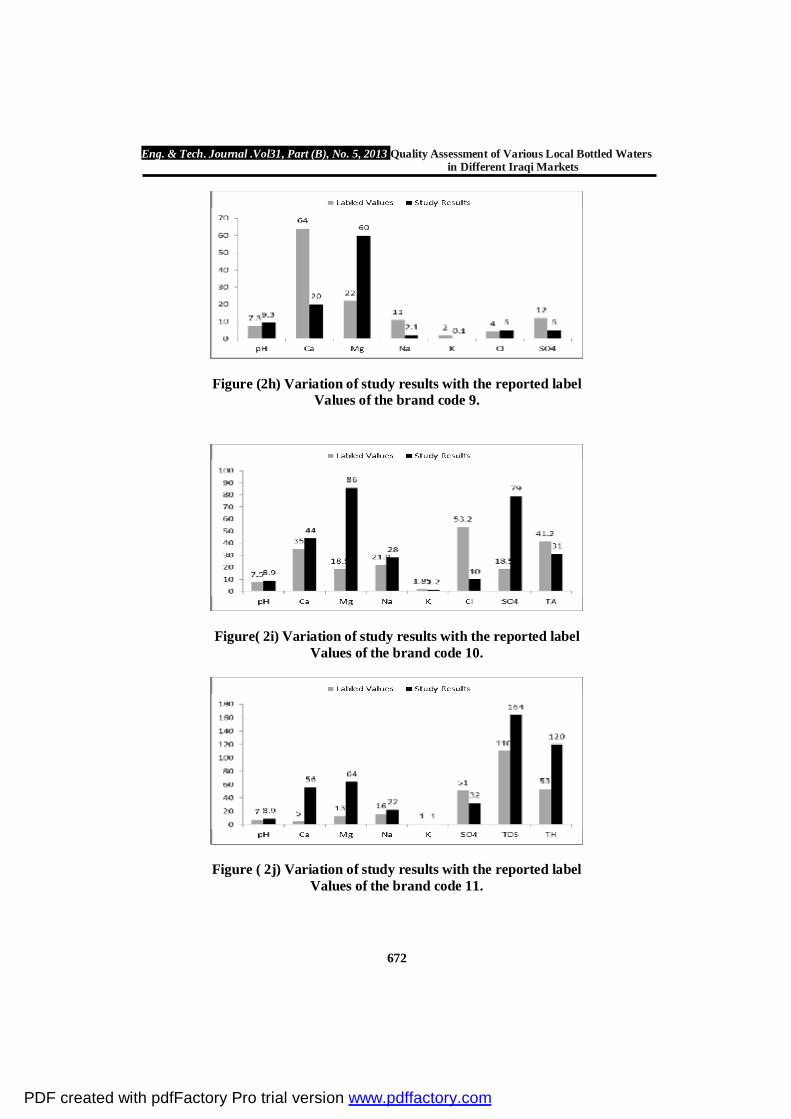
-2 were assessed and presented in Figures 2a to 2n. The label values of the brand coded 5 is missing due to unclear values reported on the label. The Figures 2a - 2n were made based on the availability of the reported values in each of bottled water label. From the Figures 2a – 2n, it can be seen that there is a large variation between the obtained results and the reported values in most parameters. In some cases, the label values were higher than the recorded values and vice versa, the label values were lower than the recorded values. Among the observed variation for the assessed parameters, pH levels showed the lowest variation. The observed pH values of all bottled water brands were alkaline, and highest values recorded in the brands 7, 9, 10, 11, 12, 13, 14, which can be seen in Basrah, Sulaymaniyah, Wasit, Karbala, Duhok and Babylon.
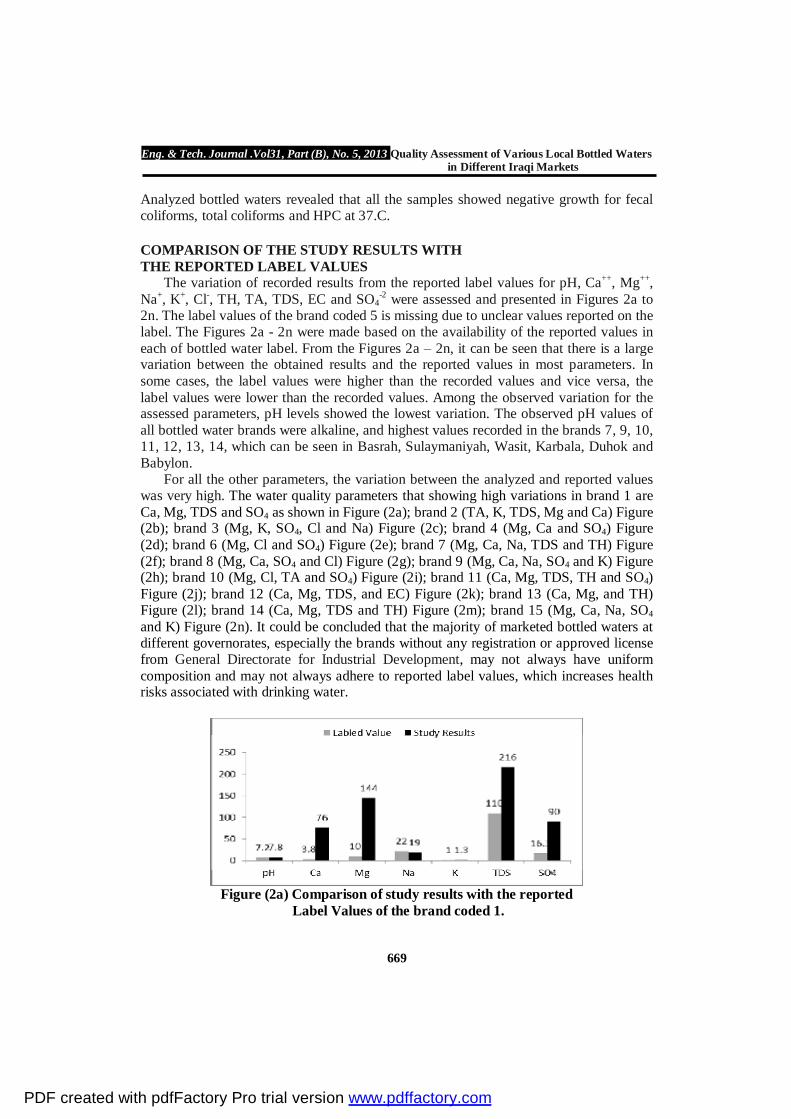
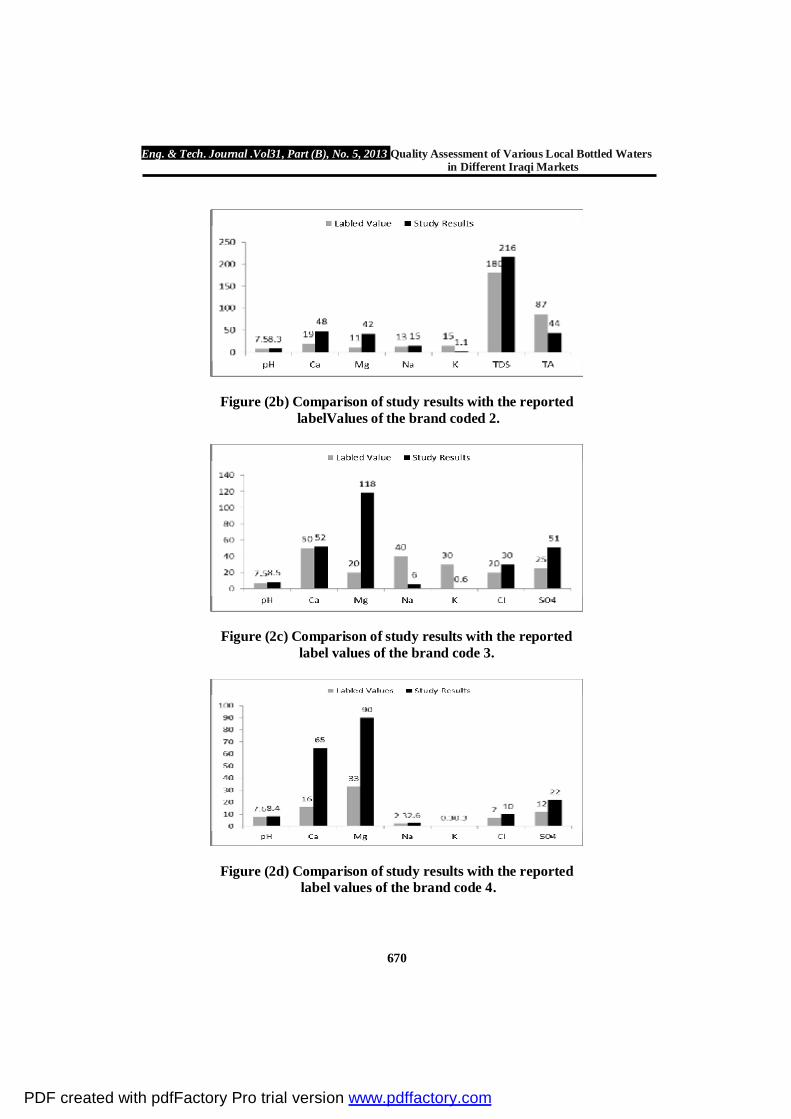
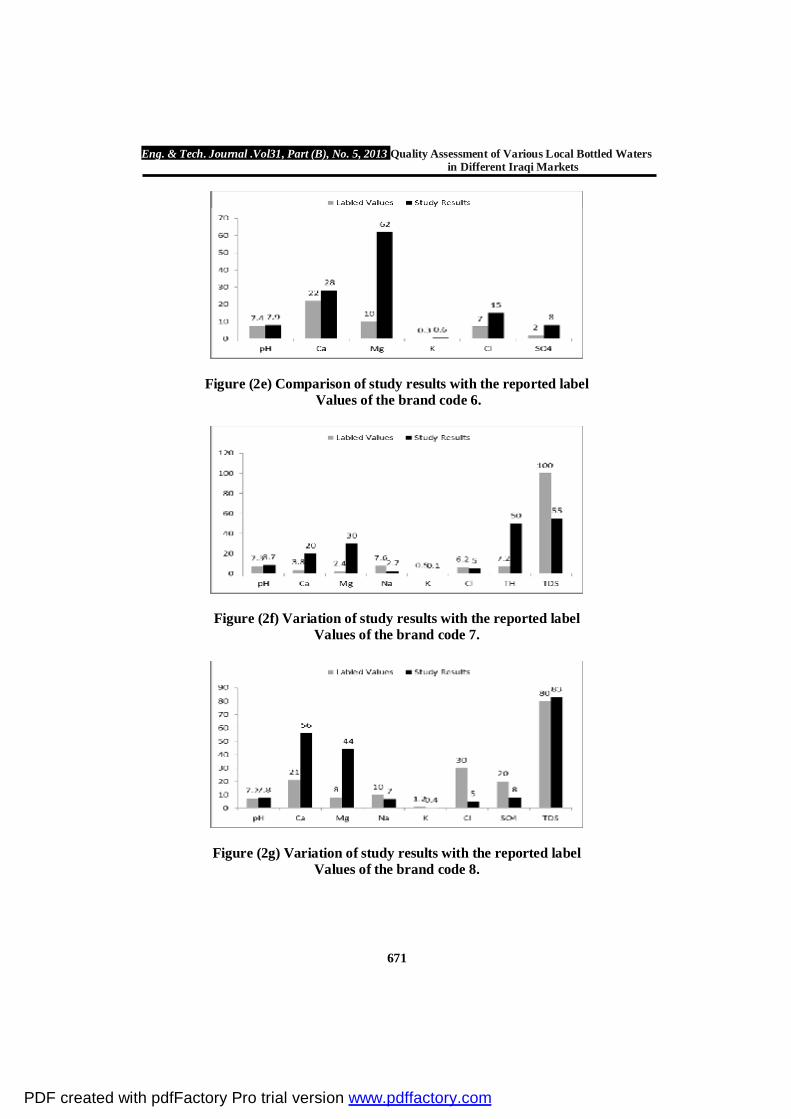
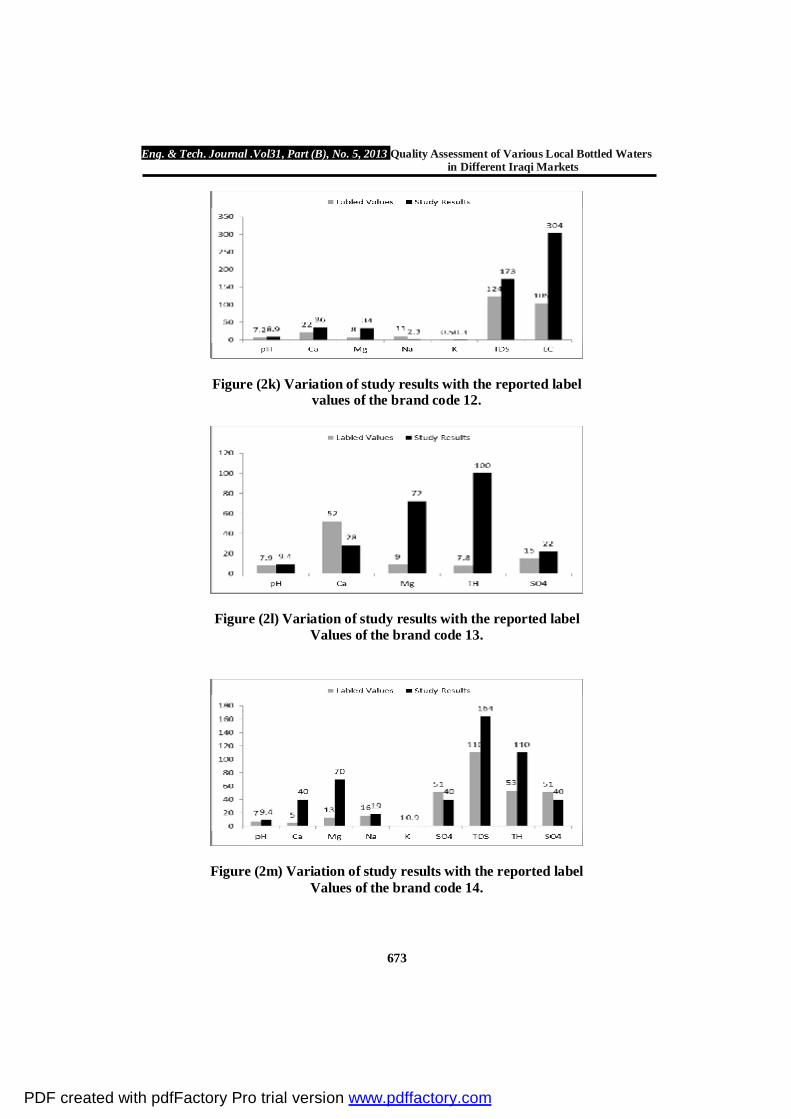
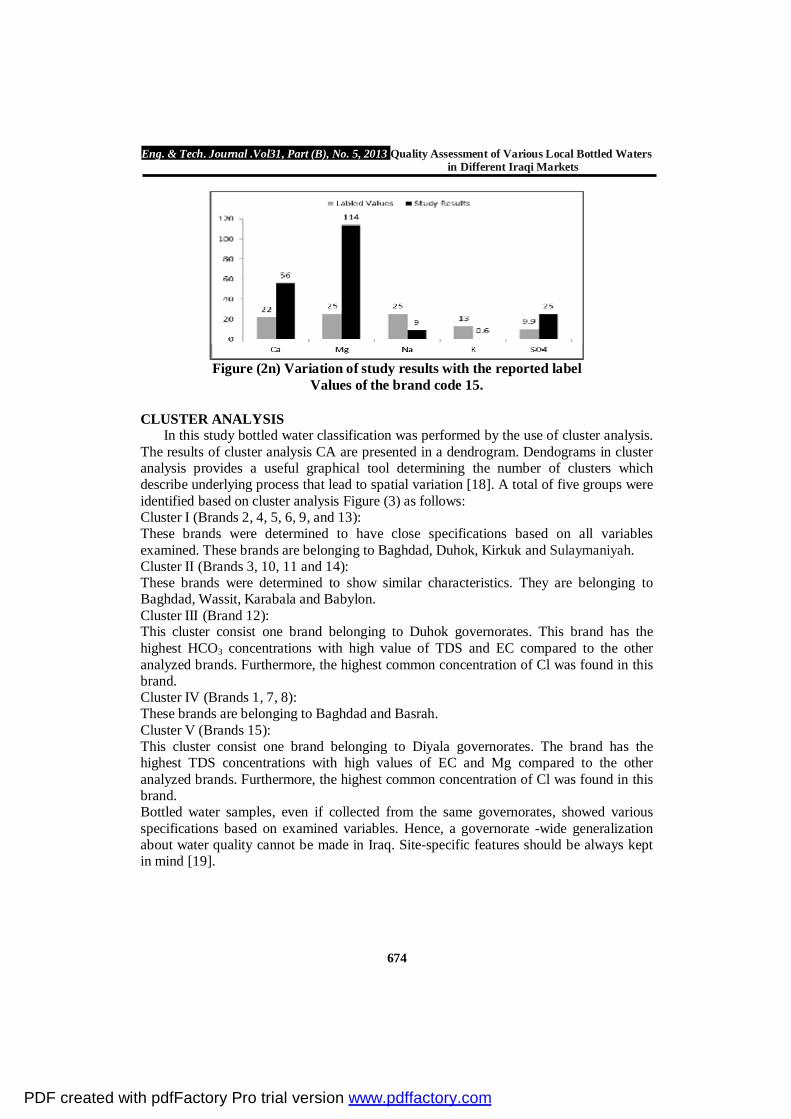
For all the other parameters, the variation between the analyzed and reported values was very high. The water quality parameters that showing high variations in brand 1 are Ca, Mg, TDS and SO4 as shown in Figure (2a); brand 2 (TA, K, TDS, Mg and Ca) Figure (2b); brand 3 (Mg, K, SO4, Cl and Na) Figure (2c); brand 4 (Mg, Ca and SO4) Figure (2d); brand 6 (Mg, Cl and SO4) Figure (2e); brand 7 (Mg, Ca, Na, TDS and TH) Figure (2f); brand 8 (Mg, Ca, SO4 and Cl) Figure (2g); brand 9 (Mg, Ca, Na, SO4 and K) Figure (2h); brand 10 (Mg, Cl, TA and SO4) Figure (2i); brand 11 (Ca, Mg, TDS, TH and SO4) Figure (2j); brand 12 (Ca, Mg, TDS, and EC) Figure (2k); brand 13 (Ca, Mg, and TH) Figure (2l); brand 14 (Ca, Mg, TDS and TH) Figure (2m); brand 15 (Mg, Ca, Na, SO4 and K) Figure (2n). It could be concluded that the majority of marketed bottled waters at different governorates, especially the brands without any registration or approved license from General Directorate for Industrial Development, may not always have uniform composition and may not always adhere to reported label values, which increases health risks associated with drinking water.
Figure (2a) Comparison of study results with the reported
Label Values of the brand coded 1.
PDF created with pdfFactory Pro trial version www.pdffactory.com
Eng. & Tech. Journal .Vol31, Part (B), No. 5, 2013 Quality Assessment of Various Local Bottled Waters in Different Iraqi Markets
670
Figure (2b) Comparison of study results with the reported labelValues of the brand coded 2.
Figure (2c) Comparison of study results with the reported label values of the brand code 3.
Figure (2d) Comparison of study results with the reported label values of the brand code 4.
PDF created with pdfFactory Pro trial version www.pdffactory.com
Eng. & Tech. Journal .Vol31, Part (B), No. 5, 2013 Quality Assessment of Various Local Bottled Waters in Different Iraqi Markets
671
Figure (2e) Comparison of study results with the reported label Values of the brand code 6.
Figure (2f) Variation of study results with the reported label Values of the brand code 7.
Figure (2g) Variation of study results with the reported label Values of the brand code 8.
PDF created with pdfFactory Pro trial version www.pdffactory.com
Eng. & Tech. Journal .Vol31, Part (B), No. 5, 2013 Quality Assessment of Various Local Bottled Waters in Different Iraqi Markets
672
Figure (2h) Variation of study results with the reported label Values of the brand code 9.
Figure( 2i) Variation of study results with the reported label Values of the brand code 10.
Figure ( 2j) Variation of study results with the reported label Values of the brand code 11.
PDF created with pdfFactory Pro trial version www.pdffactory.com
Eng. & Tech. Journal .Vol31, Part (B), No. 5, 2013 Quality Assessment of Various Local Bottled Waters in Different Iraqi Markets
673
Figure (2k) Variation of study results with the reported label values of the brand code 12.
Figure (2l) Variation of study results with the reported label Values of the brand code 13.
Figure (2m) Variation of study results with the reported label Values of the brand code 14.
PDF created with pdfFactory Pro trial version www.pdffactory.com
Eng. & Tech. Journal .Vol31, Part (B), No. 5, 2013 Quality Assessment of Various Local Bottled Waters in Different Iraqi Markets
674
Figure (2n) Variation of study results with the reported label
Values of the brand code 15.
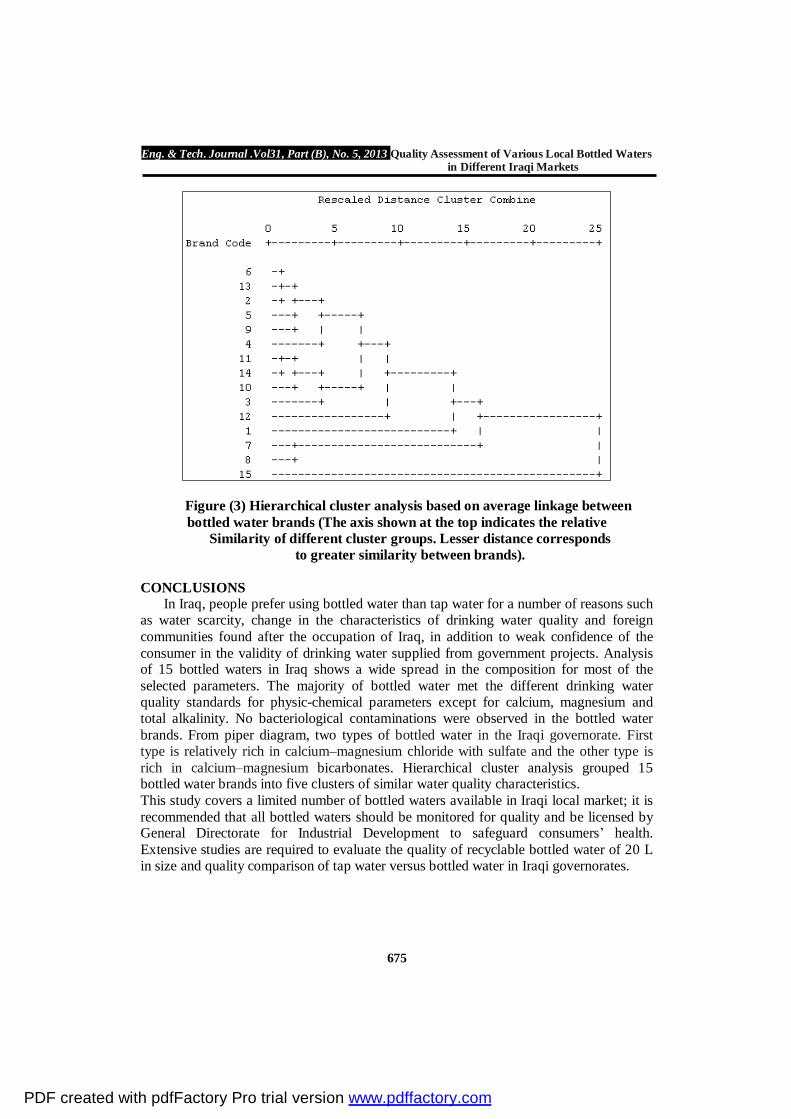
CLUSTER ANALYSIS In this study bottled water classification was performed by the use of cluster analysis.
The results of cluster analysis CA are presented in a dendrogram. Dendograms in cluster analysis provides a useful graphical tool determining the number of clusters which describe underlying process that lead to spatial variation [18]. A total of five groups were identified based on cluster analysis Figure (3) as follows: Cluster I (Brands 2, 4, 5, 6, 9, and 13): These brands were determined to have close specifications based on all variables examined. These brands are belonging to Baghdad, Duhok, Kirkuk and Sulaymaniyah. Cluster II (Brands 3, 10, 11 and 14): These brands were determined to show similar characteristics. They are belonging to Baghdad, Wassit, Karabala and Babylon. Cluster III (Brand 12): This cluster consist one brand belonging to Duhok governorates. This brand has the highest HCO3 concentrations with high value of TDS and EC compared to the other analyzed brands. Furthermore, the highest common concentration of Cl was found in this brand. Cluster IV (Brands 1, 7, 8): These brands are belonging to Baghdad and Basrah. Cluster V (Brands 15): This cluster consist one brand belonging to Diyala governorates. The brand has the highest TDS concentrations with high values of EC and Mg compared to the other analyzed brands. Furthermore, the highest common concentration of Cl was found in this brand. Bottled water samples, even if collected from the same governorates, showed various specifications based on examined variables. Hence, a governorate -wide generalization about water quality cannot be made in Iraq. Site-specific features should be always kept in mind [19].
PDF created with pdfFactory Pro trial version www.pdffactory.com
Eng. & Tech. Journal .Vol31, Part (B), No. 5, 2013 Quality Assessment of Various Local Bottled Waters in Different Iraqi Markets
675
Figure (3) Hierarchical cluster analysis based on average linkage between bottled water brands (The axis shown at the top indicates the relative
Similarity of different cluster groups. Lesser distance corresponds to greater similarity between brands).
CONCLUSIONS
In Iraq, people prefer using bottled water than tap water for a number of reasons such as water scarcity, change in the characteristics of drinking water quality and foreign communities found after the occupation of Iraq, in addition to weak confidence of the consumer in the validity of drinking water supplied from government projects. Analysis of 15 bottled waters in Iraq shows a wide spread in the composition for most of the selected parameters. The majority of bottled water met the different drinking water quality standards for physic-chemical parameters except for calcium, magnesium and total alkalinity. No bacteriological contaminations were observed in the bottled water brands. From piper diagram, two types of bottled water in the Iraqi governorate. First type is relatively rich in calcium–magnesium chloride with sulfate and the other type is rich in calcium–magnesium bicarbonates. Hierarchical cluster analysis grouped 15 bottled water brands into five clusters of similar water quality characteristics. This study covers a limited number of bottled waters available in Iraqi local market; it is recommended that all bottled waters should be monitored for quality and be licensed by General Directorate for Industrial Development to safeguard consumers’ health. Extensive studies are required to evaluate the quality of recyclable bottled water of 20 L in size and quality comparison of tap water versus bottled water in Iraqi governorates.
PDF created with pdfFactory Pro trial version www.pdffactory.com
Eng. & Tech. Journal .Vol31, Part (B), No. 5, 2013 Quality Assessment of Various Local Bottled Waters in Different Iraqi Markets
676
REFERENCE [1]. Semerjian, L.A (2011). Quality assessment of various bottled waters marketed in
Lebanon, Environ Monit Assess, 172:275–285, doi: 10.1007/s10661-010-1333-7. [2]. Fewtrell, L. and Bartram, J. (2001). Water Quality Standards and Health. Assessment
of Risk and Risk Management for Water Related Infectious Disease. IWA Publishing, London, UK.
[3]. World Health Organization (WHO) (2006). Guidelines for drinking water quality (3rd ed.). Geneva, Switzerland. http://www.who.int/water_sanitation_health.
[4]. Drinking-Water Standard IQS: 417, Central Organization for Quality Control and Standardization, Council of Ministers, Republic of Iraq, 2001.
[5]. Ahmad, M. & Bajahlan, A.S (2009). Quality comparison of tap water vs. bottled water in the industrial city of Yanbu (Saudi Arabia), Environ Monit Assess, 159:1–14, doi: 10.1007/s10661-008-0608-8.
[6]. Almosawi, B.N.E & Alzubaidi, I.S.H (2010). Detection of Microbial and chemical contaminants of the plastic bottled drinking waters, Iraqi Journal of Market Research and Consumer Protection Vol. 2, NO. 3, 168.
-184. [7]. Razuki, S.M.M & AL-Rawi, M.A (2010). Study of Some Physiochemical and
Microbial Properties of Local and Imported bottled Water in Baghdad City, Iraqi Journal of Market Research and Consumer Protection Vol. 2, NO. 3, 75-103.
[8]. USAID-Iraq (2007). The Bottled Water Market in Iraq, Iraq private sector growth and employment generation, The Louis Berger Group.
[9]. Alobaidy, A.M..J, Maulood, B.K, Kadhem , A.J. (2010). Evaluating Raw and Treated Water Quality of Tigris River within Baghdad by Index Analysis, J. Water Resource and Protection, 2, 629-635.
[10]. APHA. (1998). Standard methods for the examination of water and waste water, 19th. Ed, American Public Health Association, American Water Works Association & Water Environment Federation, Washington, DC.
[11]. Winston, R. (2000). Graphical user interface for MODFLOW, version 4: U.S. Geological Survey open-f ile report 00-315, 2000. http://water.usgs.gov/nrp/gwsoftware/GW_Chart/GW_Chart.html.
[12]. Singh, K. P., Malik, A., Mohan, D., & Sinha, S. (2004). Multivariate statistical techniques for the evaluation of spatial and temporal variations in water quality of Gomti River (India):Acase study. Water Research, 38, 3980–3992. doi:10.1016/j.watres.2004.06.011.
[13]. Shrestha, S., & Kazama, F. (2007). Assessment of surface water quality using multivariate statistical techniques: A case study of the Fuji river basin, Japan. EnvironmentalModelling & Software, 22, 464–475. doi:10.1016/j.envsoft.2006.02.001.
[14]. Lebanese Standards Institution (LIBNOR) (1999). Lebanese standard no 162:1999: Bottled drinking water. Beirut, Lebanon: LIBNOR.
[15]. Food and Drug Administration (FDA) (2008). 21 CFR part 165: Beverages: Bottled water. FDA. http://www.cfsan.fda.gov/∼lrd/fr050609.html.
PDF created with pdfFactory Pro trial version www.pdffactory.com
Eng. & Tech. Journal .Vol31, Part (B), No. 5, 2013 Quality Assessment of Various Local Bottled Waters in Different Iraqi Markets
677
[16]. Bharath, J., Mosodeen, M., Motilal, S., Sandy, S., Sharma, S., & Tessaro, T. (2003). Microbial quality of domestic and imported brands of bottled water in Trinidad. International Journal of Food Microbiology, 81, 53–62.
[17]. Venieri, D., Vantarakis, A., Komninou, G., & Papapetropoulou, M. (2006). Microbiological evaluation of bottled non-carbonated water from domestic brands in Greece. International Journal of Food Microbiology, 107, 68–72.
[18]. Boyacioglu, H. & Boyacioglu, H. (2007), “Surface Water Quality Assessment by Environmetric Methods” Environ Monit Assess 131:371–376. doi: 10.1007/s10661-006-9482-4.
[19]. Baba, A., Ereeş, F. S., Hıçsönmez, Ü., Çam, S., Özdılek, H. G. (2008). An assessment of the quality of various bottled mineral water marketed in Turkey, Environ Monit Assess 139:277–285, doi: 10.1007/s10661-007-9833-9.
PDF created with pdfFactory Pro trial version www.pdffactory.com