qualification of new technology for capture of co2 in coal-fired power plants
TRANSCRIPT
i | P a g e
MSC THESIS BJØRN UTGÅRD:
QUALIFICATION OF NEW TECHNOLOGY
FOR CAPTURE OF CO2 IN COAL-FIRED
POWER PLANTS
FOREWORD
This article is a result of a cooperative project between DNV Research and Innovation and
The Norwegian University of Science and Technology (NTNU) undertaken from September 2006
to September 2007. In agreement with the supervisors of the project, the scope of work has been
changed since the outset. The scope of the article therefore does not overlap fully with the scope
defined in the thesis assignment. For one, the report is written in the article format, with the
consequences that implies for formulation and structure. The tables of content and lists of
figures and tables are therefore given before the start of the actual article. Furthermore, the
intended application of the membrane was changed from gas-fired to coal-fired power plants. It
was also felt that the knowledge basis for technology qualification of the membrane needed to
be explored and synthesized, meaning that actually carrying out the qualification work would be
outside scope. Rather, the objective was changed to provide recommendations for the upcoming
qualification process. Negotiating access to business-sensitive information sufficient to actually
carry out qualification work was further a restraint. Finally, the desire to make sure that the
findings could be published openly in academic fora was an important consideration.
The work has been made possible due to three important instances. First of all, Dr. Håvard
Thevik and Dr. Tore Myrvold at DNV Research and Innovation had the original idea for the work.
They are gratefully thanked for their encouragement and direction. Secondly, Professor May-
Britt Hägg and Dr. David Grainger at the MEMFO research group at NTNU deserve gratitude for
their open and helpful attitude in the venture into new and unknown territory. And, most
importantly, this work would not have been possible without the insight, patience, support and
encouragement of Professor Marvin Rausand at the department of Production and Quality
Engineering of NTNU, who has been the mentor and academical anchor of the work. The author
is grateful for his generous attitude, flexibility and openness, the valuable personal and
professional advice, as well as the friendship.
MSc Thesis: Qualification of new technology for capture of CO2 in coal-fired power plants Bjørn Utgård, Norwegian University of Science and Technology, September 2007
ii | P a g e
CONTENTS
1 Introduction ...................................................................................................................................................... 1
2 Qualification of new technology ............................................................................................................... 3
2.1 Classification of technology .............................................................................................................. 5
2.2 Reliability engineering ........................................................................................................................ 6
2.2.1 Systems and their interfaces ....................................................................................................... 6
2.2.2 Approach .............................................................................................................................................. 7
2.2.3 Reliability specification .............................................................................................................. 10
2.2.4 Reliability characteristics .......................................................................................................... 11
2.2.5 Operational regime and conditions ....................................................................................... 13
2.3 Reliability assurance ......................................................................................................................... 13
2.3.1 Functional analysis ....................................................................................................................... 15
2.3.2 Failure analysis .............................................................................................................................. 18
2.3.3 Reliability prediction ................................................................................................................... 25
2.3.4 Risk classification and ranking ................................................................................................ 32
2.4 Technology Qualification in practice ......................................................................................... 34
3 IGCC coal fired power plants and carbon capture .......................................................................... 35
3.1.1 IGCC power plants......................................................................................................................... 35
3.2 Carbon capture .................................................................................................................................... 36
3.2.1 Carbon capture concepts............................................................................................................ 37
3.2.2 Gas separation methods ............................................................................................................. 38
3.2.3 Bench-marking of carbon capture systems ........................................................................ 39
3.3 Carbon capture in IGCC power plants ....................................................................................... 40
3.3.1 System performance bench-mark .......................................................................................... 41
3.3.2 Process adaption for CO2 capture ........................................................................................... 41
4 Gas separation membranes ..................................................................................................................... 42
4.1 Membrane performance and economics .................................................................................. 42
4.1.1 Performance targets..................................................................................................................... 42
4.1.2 Performance determinants ....................................................................................................... 43
4.2 Membrane types ................................................................................................................................. 44
4.2.1 Separation driving forces ........................................................................................................... 44
4.2.2 Membrane materials .................................................................................................................... 45
4.2.3 Physical structure ......................................................................................................................... 46
4.3 Composite polymeric facilitated transport membranes .................................................... 47
4.3.1 Facilitated transport .................................................................................................................... 47
4.3.2 Membrane design and configurations .................................................................................. 49
MSc Thesis: Qualification of new technology for capture of CO2 in coal-fired power plants Bjørn Utgård, Norwegian University of Science and Technology, September 2007
iii | P a g e
4.4 Module and process design ............................................................................................................ 51
4.4.1 Membrane modules ...................................................................................................................... 51
4.4.2 Flow patterns .................................................................................................................................. 53
4.4.3 Process design ................................................................................................................................ 54
4.5 Physics-of-failure of polymeric membranes ........................................................................... 55
4.5.1 Corrosion (chemical degradation) ......................................................................................... 56
4.5.2 Physical aging (structural degradation) .............................................................................. 57
4.5.3 Plasticization (swelling) ............................................................................................................. 58
4.5.4 Compaction ...................................................................................................................................... 59
4.5.5 Fouling ............................................................................................................................................... 59
4.5.6 Dehydration ..................................................................................................................................... 60
4.5.7 Concentration polarization ....................................................................................................... 60
4.5.8 Assembly issues ............................................................................................................................. 61
4.6 Membrane performance evaluation and testing ................................................................... 62
4.6.1 Performance simulation ............................................................................................................. 62
4.6.2 Membrane testing ......................................................................................................................... 62
5 Recommendations for qualification of a fixed site carrier PVAm membrane .................... 63
5.1 Background ........................................................................................................................................... 64
5.2 Qualification approach and methodology ................................................................................ 64
5.3 Qualification Basis ............................................................................................................................. 65
5.3.1 System description and boundaries ...................................................................................... 65
5.3.2 Operational regime and interface conditions .................................................................... 68
5.3.3 Performance and reliability requirements ......................................................................... 69
5.4 Technology Assessment .................................................................................................................. 70
5.5 Failure Mode Identification and Risk Ranking ....................................................................... 71
5.6 Selection of qualification methods .............................................................................................. 72
6 Concluding remarks .................................................................................................................................... 73
7 Bibliography................................................................................................................................................... 75
MSc Thesis: Qualification of new technology for capture of CO2 in coal-fired power plants Bjørn Utgård, Norwegian University of Science and Technology, September 2007
iv | P a g e
LIST OF FIGURES
Figure 1 : The commercial rationale for developing and qualifying new technology ................... 4 Figure 2 : A technical system and its interfaces ............................................................................................ 7 Figure 3 : Design flexibility decreases throughout the technology development process. ......... 8 Figure 4: Uncertainties in qualification of new technology. .................................................................. 14 Figure 5 : Examples of Function tree, FAST and SADT diagrams. ....................................................... 16 Figure 6 : Failure mechanisms, modes and effects. ................................................................................... 18 Figure 7 : Failure process flow .......................................................................................................................... 19 Figure 8 : HAZOP process. ................................................................................................................................... 24 Figure 9 : Time and cost-efficient process for acquisition of adequate qualification and
reliability data. ................................................................................................................................................................. 25 Figure 10 : Structural similarity analysis process ..................................................................................... 27 Figure 11 : The physics-of-Failure process .................................................................................................. 28 Figure 12 : Risk ranking process....................................................................................................................... 32 Figure 13 : Technology qualification stages ................................................................................................. 35 Figure 14 : CO2 capture concepts for coal-fired power plants. ............................................................. 37 Figure 15 : General schemes of the main separation processes relevant for CO2 capture ...... 38 Figure 16 : IGCC power plant process blocks .............................................................................................. 41 Figure 17 : Membrane performance parameters. ...................................................................................... 43 Figure 18 : Total flux versus driving force in facilitated transport membranes ........................... 49 Figure 19 : A proposed mechanism for facilitated transport of CO2 in a fixed-site carrier
membrane. ......................................................................................................................................................................... 50 Figure 20 : Hollow fiber asymmetric polymer membrane .................................................................... 52 Figure 21 : Schematic of a typical hollow fiber membrane module and the case (pressure
vessel) that holds it ........................................................................................................................................................ 53 Figure 22 : Idealized flow patterns in membrane separation. ............................................................. 54 Figure 23 : Membrane modules set up in parallel in a series of stages. ........................................... 55 Figure 24 : Molar fraction profiles of the more (left) and less (right) permeable gases on the
feed side under steady separation condition ...................................................................................................... 61 Figure 25 : IGCC power plant with CO2 capture integrated in the process. .................................... 66 Figure 26 : Process diagram for an IGCC process with sour water-gas shift and membrane
CO2 capture ........................................................................................................................................................................ 66 Figure 27 : Physical system breakdown. ....................................................................................................... 68
LIST OF TABLES
Table 1: Technology classification (DNV 2001). ........................................................................................... 6 Table 2 : Reliability clauses in a specification (BS 5670). ...................................................................... 11 Table 3 : Operational regime and conditions (BS 5670). ........................................................................ 13 Table 4 : Function types. ...................................................................................................................................... 17 Table 5 : Failure causes (Rausand and Høyland 2004). .......................................................................... 19 Table 6 : FMECA table. ........................................................................................................................................... 21 Table 7 : Failure probability classification. .................................................................................................. 33 Table 8 : Consequence severity classification. ............................................................................................ 33 Table 9 : Risk ranking matrix. ............................................................................................................................ 34 Table 10 : Selected technology demonstration projects of IGCC with CCS ..................................... 36 Table 11 : Interface conditions and requirements. ................................................................................... 69 Table 12 : Newness classification of main elements of a membrane module. ............................... 70 Table 13 : Evaluation of the relevance of known polymer membrane failure mechanisms. ... 73
1 | P a g e
QUALIFICATION OF NEW TECHNOLOGY FOR
CAPTURE OF CO2 IN COAL-FIRED POWER PLANTS
Bjørn Olsrud Utgård
Department of Production and Quality Engineering
Norwegian University of Science and Technology, 7491 Trondheim, Norway
Phone: +47 92088057, e-mail: [email protected]
ABSTRACT
New technology is needed to overcome the challenge of mitigating climate change in a world
heavily dependent on the utilization of fossil fuels for energy supply. To meet this need a CO2 –
selective polymeric gas separation membrane that enables capture of CO2 from fossil-fuelled power
plants is under development. Key to successful development and commercialization of this
technology is that it can be demonstrated that it will work in the intended application for the
intended time. In other words, it must be qualified. To do this, both the process of technology
qualification and the science of the membrane and the process of which it will be part must be
understood. Based on thorough surveys of these area s of knowledge, the current article provides
recommendations for the forthcoming qualification process.
1 INTRODUCTION
The Fourth Assessment Report of the International Panel on Climate Change (IPCC) leaves
little doubt; global warming is indeed taking place and its consequences - both those observed
and those anticipated – are very likely (probability of occurrence higher than 90%) to pose
serious threats to both human society and the ecosystems it relies on. And, “most of the
observed increase in globally averaged temperatures since the mid-20th century is very likely
due to the observed increase in anthropogenic greenhouse gas concentrations.” (IPCC 2007) It is
therefore necessary to stabilize and reduce anthropogenic emission of greenhouse gases.
MSc Thesis: Qualification of new technology for capture of CO2 in coal-fired power plants Bjørn Utgård, Norwegian University of Science and Technology, September 2007
2 | P a g e
An effective strategy for reducing anthropogenic emission of greenhouse gases must address
both socioeconomic and technological aspects. While large reductions in greenhouse gas
emissions certainly is within reach through increased energy efficiency throughout the value
chain, economic development has historically been closely coupled with increased energy
consumption. Access to sufficient supply of energy without sacrificing national independence
and security is therefore a key national policy objective. An abundant and relatively cheap
source of energy, coal currently fuels some 40% of global electricity generation (IEA 2005). Until
an alternative that is both sufficiently cheap and abundant is found, large reductions in
consumption of coal and other fossil fuels seems unlikely. A way to allow continued exploitation
of fossil energy resources for power generation while strongly reducing its emission of
greenhouse gases is therefore needed.
A promising solution to this challenge is to capture CO2 from power plants and store it safely
in reservoirs in the earth’s crust (IEA 2006). The concept studied in this paper captures CO2
prior to the combustion in an Integrated Gasification Combined Cycle (IGCC) power plant by
means of a Fixed Site Carrier (FSC) cross-linked polyvinyl-amine membrane (PVAm) supported
on polysulfone (these terms are further described in Section 4.) The membrane acts as a semi-
permeable barrier between two phases, which in this case are both gases. Driven by a partial
pressure difference (solution-diffusion mechanism) and facilitated by a reversible chemical
reaction (absorption) with the membrane itself, the permeate is transported through the
membrane and separated from the remaining feed mixture, the retentate (Noble and Koval
2006).
Large-scale CO2 capture by means of polymer membranes in power plants is not yet a proven
concept. Even though computer simulations and laboratory experiments show that the concept
does have a large potential (Grainger and Hägg 2007; Favre 2007), what quality, reliability and
availability that can be expected in the field still remains uncertain. Qualification of the concept
MSc Thesis: Qualification of new technology for capture of CO2 in coal-fired power plants Bjørn Utgård, Norwegian University of Science and Technology, September 2007
3 | P a g e
is therefore necessary to reduce uncertainty, mitigate risks, and ensure feasibility. The objective
of the current work is to establish a solid basis for cost- and time-efficient qualification of the
technology, and provide recommendations for the choice of technology qualification approach
and methods. The provision of precise cost and performance predictions for the proposed
membrane is a substantive exercise on its own, and is beyond scope of the current work.
Broadly speaking, qualification of new technology rests on two fundamental pillars of
knowledge: For one, qualification makes use of knowledge and analytical methods developed in
various academic fields, such as reliability engineering, risk management and project
management. An outline of the most relevant concepts and methods from these fields is given in
Section 2. Secondly, a thorough understanding of the technology at hand is necessary.
Developing membrane technology requires an understanding of polymer chemistry to develop
new membrane structures, physical chemistry and mathematics to model transport properties
and predict membrane separation performance, and chemical process engineering to design
separation processes for large scale industrial utilization (Strathmann 1990). Qualifying a new
polymeric membrane for capture of CO2 in power plants requires that these fields are
understood, and an outline is given in Sections 3 and 4. Recommendations for qualifying the
membrane are given in Section 5.
2 QUALIFICATION OF NEW TECHNOLOGY
Successful new products must be better (superior performance), faster (get to market
faster), and cheaper (lower factory cost, prices, and operating costs). “The problem is that these
three requirements seem to be mutually exclusive, particularly ‘better’ and ‘faster’ – it is very
difficult to achieve high reliability at low cost with shortened design and life cycles that leave no
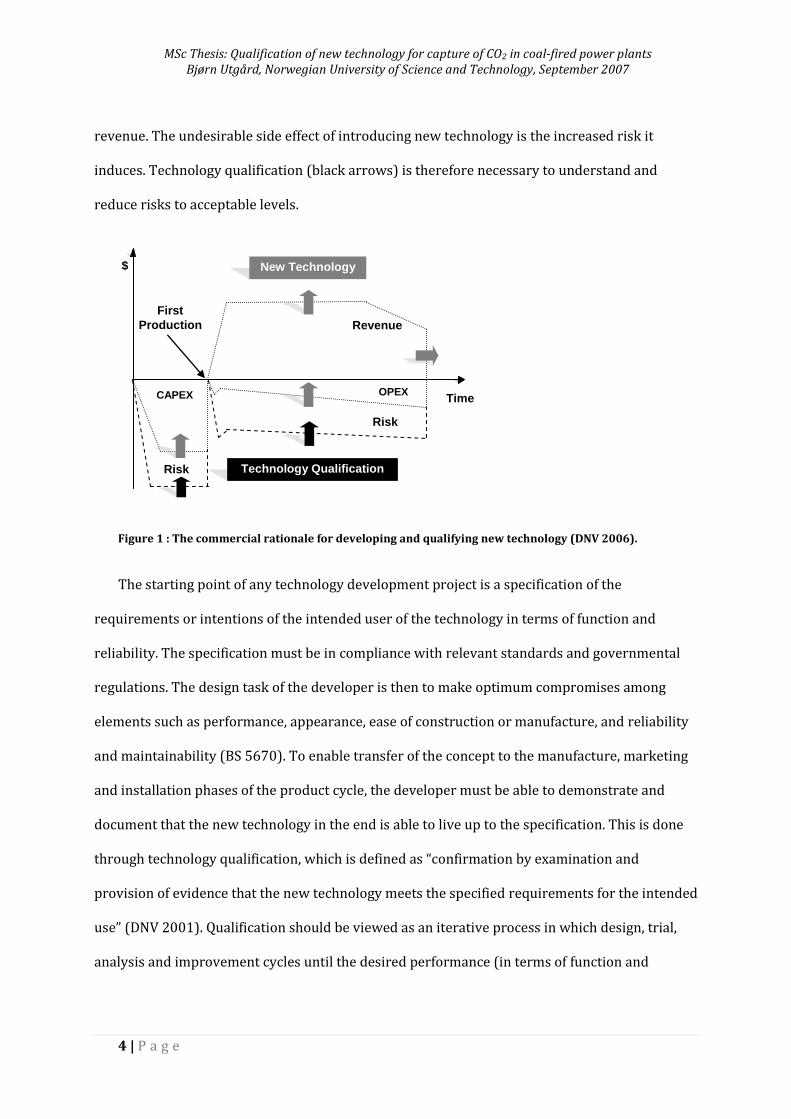
time for testing and refinements” (Moss 1996). The desired effect of new technology (grey
arrows in Figure 1) is to increase the performance (quality, reliability, service life) of products
and reduce capital (CAPEX) and operating (OPEX) expenditure, and in so doing increase
MSc Thesis: Qualification of new technology for capture of CO2 in coal-fired power plants Bjørn Utgård, Norwegian University of Science and Technology, September 2007
4 | P a g e
revenue. The undesirable side effect of introducing new technology is the increased risk it
induces. Technology qualification (black arrows) is therefore necessary to understand and
reduce risks to acceptable levels.
Figure 1 : The commercial rationale for developing and qualifying new technology (DNV 2006).
The starting point of any technology development project is a specification of the
requirements or intentions of the intended user of the technology in terms of function and
reliability. The specification must be in compliance with relevant standards and governmental
regulations. The design task of the developer is then to make optimum compromises among
elements such as performance, appearance, ease of construction or manufacture, and reliability
and maintainability (BS 5670). To enable transfer of the concept to the manufacture, marketing
and installation phases of the product cycle, the developer must be able to demonstrate and
document that the new technology in the end is able to live up to the specification. This is done
through technology qualification, which is defined as “confirmation by examination and
provision of evidence that the new technology meets the specified requirements for the intended
use” (DNV 2001). Qualification should be viewed as an iterative process in which design, trial,
analysis and improvement cycles until the desired performance (in terms of function and
Time
$
Technology Qualification
First
Production
CAPEX
Revenue
OPEX
Risk Exp.
Risk Exp.
New Technology
MSc Thesis: Qualification of new technology for capture of CO2 in coal-fired power plants Bjørn Utgård, Norwegian University of Science and Technology, September 2007
5 | P a g e
reliability) is demonstrated and documented. The sooner in the development cycle attention is
given to technology qualification, the better.
Hence, the overall objective of technology qualification is twofold:
a. Identify all ways in which the new technology can conceivably fail; evaluate risks,
that is, the combination of likelihood and consequence of failure; suggest concept
improvements to tackle risks; and document compliance with specifications and
standards.
b. Minimize the time and capital penalty on the development project due to
qualification.
Note that economical investment analysis usually lies beyond the scope of technology
qualification.
2.1 CLASSIFICATION OF TECHNOLOGY
The choice of qualification methods depends on the level of newness of the technology. If
field experience shows that a technology is able to meet the specified requirements in a defined
environment, qualification rather simple; it merely requires documentation of this experience.
In this case the technology is proven (class 1 in Table 1). At the other end of this scale is new
technology (class 4 in Table 1), that is, “technology that is not proven” (DNV 2001). This is in line
with the technology development guideline of a major supplier of technology to the energy
industry, in which new technologies comprise “technologies and processes outside the current
capability range (often shown by wide risks or high uncertainty of success), technology used
outside its verified range or domain of performance, safety or reliability; and capabilities that
need to be acquired to feed into the development of one or more products.”
New products are rarely completely new; some elements (parts, processes) are usually
known. To keep the time and cost penalty of qualification to a minimum, it is important that
attention is focused on the truly new elements of the technology and not on elements that
MSc Thesis: Qualification of new technology for capture of CO2 in coal-fired power plants Bjørn Utgård, Norwegian University of Science and Technology, September 2007
6 | P a g e
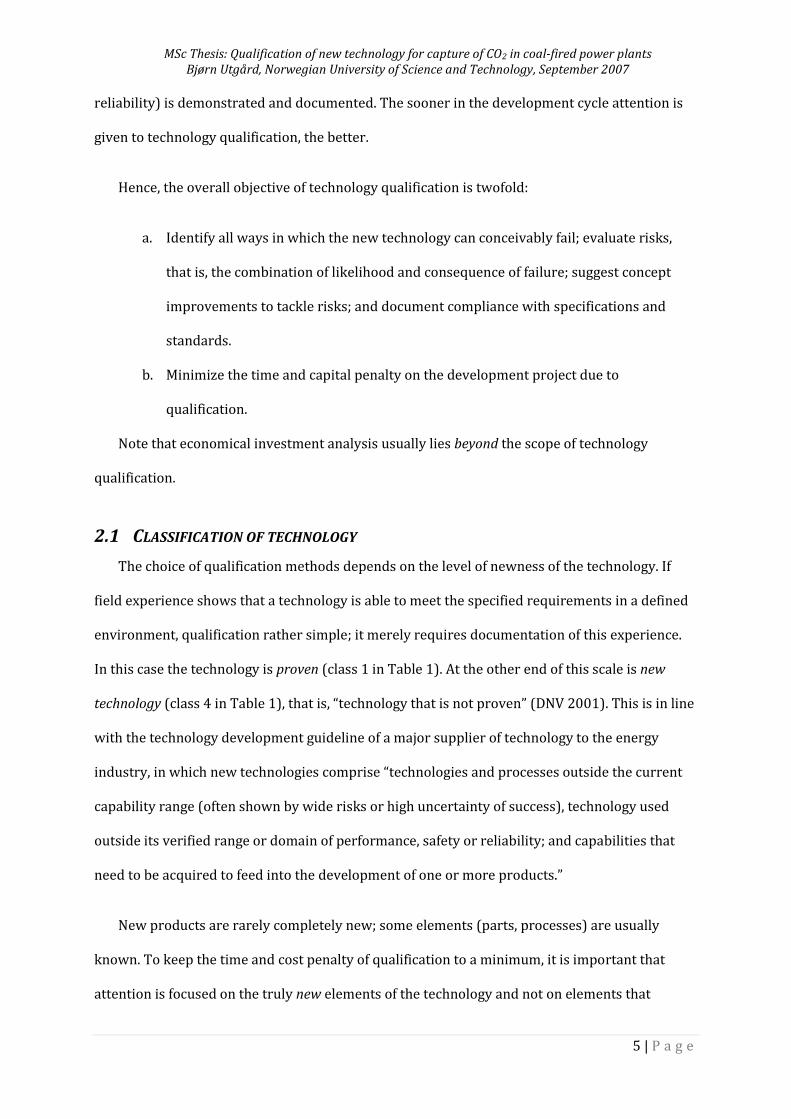
already have been qualified and proved to work in the field. To do this, the technology should be
divided into manageable elements that can be subject to further analysis, see Sections 2.3.1 and
2.3.2.
Table 1: Technology classification (DNV 2001).
Tech. status Application
Proven Limited field
history
New or unproven
The classes indicate:
1. No new technical uncertainties
2. New technical uncertainties
3. New technical challenges
4. Demanding new challenges
Known 1 2 3
New 2 3 4
2.2 RELIABILITY ENGINEERING
To be acceptable, a product must be able to operate satisfactorily for a specified period of
time in the actual application for which it is intended. Reliability assurance is therefore an
important part of technology qualification. Reliability is defined as “the ability of an item to
perform a required function, under given environmental and operational conditions and for a
stated period of time” (ISO 8402). From this, it is clear that function and failure are core concepts
of reliability engineering; the goal is to understand the mechanisms and impact of failure and
make informed choices throughout the life cycle to maximize performance.
2.2.1 SYSTEMS AND THEIR INTERFACES
Reliability engineering is based on the study of technical systems and their interfaces. For
example, a gas separation membrane constitutes a technical system in itself. One level up, it can
be regarded as a subsystem of a larger CO2 capture system, which again is a subsystem of the
power plant it is applied in. For the sake of analysis, a frame of reference is established to define
the boundary of the system of interest, that is, what lies within the system subject to study and
what lies beyond. The system will usually comprise several subsystems and components
interconnected in such a way that the system is able to perform the required functions in line
MSc Thesis: Qualification of new technology for capture of CO2 in coal-fired power plants Bjørn Utgård, Norwegian University of Science and Technology, September 2007
7 | P a g e
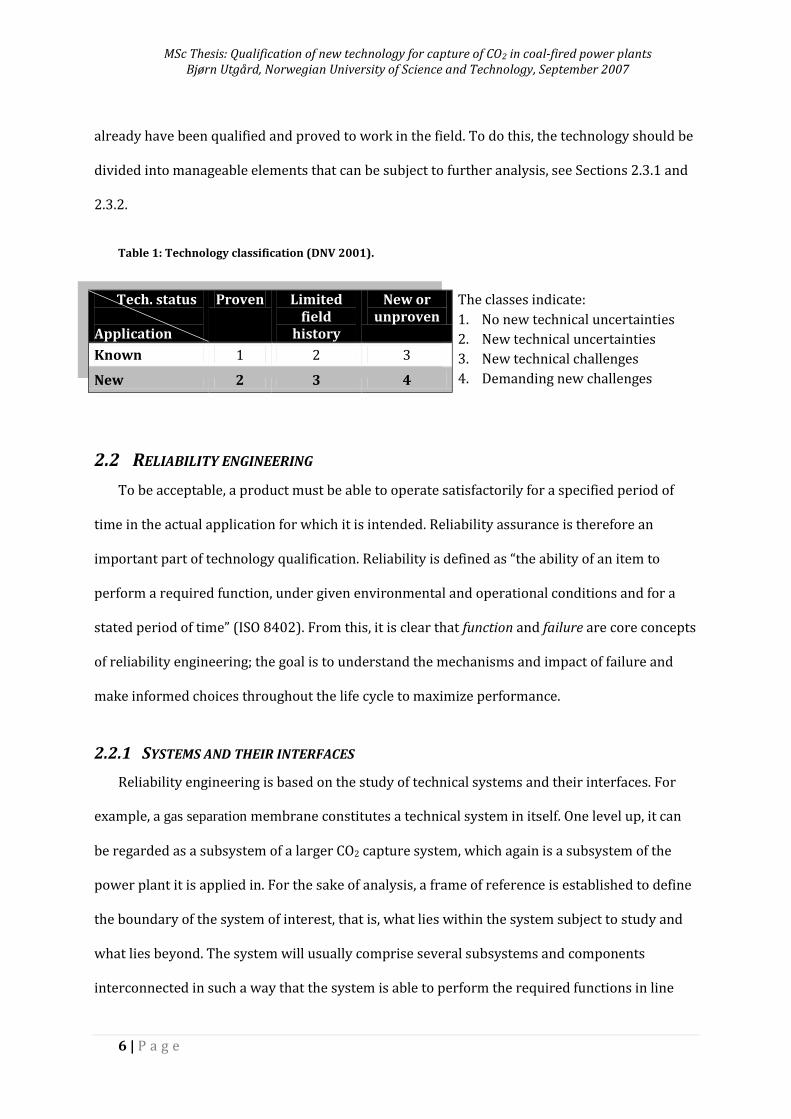
with the specification. Elements of the system are termed functional blocks (Rausand and
Høyland 2004).
Sub-
system 1
Sub-
system 3
Sub-
system 2Wanted
outputs
Unwanted
outputs
Wanted
inputs
Unwanted
inputs
Boundary
conditions
External
threats
Support
System
Figure 2 : A technical system and its interfaces (Rausand and Høyland 2004).
The reliability of a technical system depends on its interfaces with the rest of the world. The
system is intended to perform a specific function to create a desired output from a specific input
(artifacts, material, energy, information). Beyond this wanted output, the system unfortunately
will most often produce outputs that are not wanted and can impact the surroundings adversely.
Unwanted inputs, for example particulate matter in a gas feed, further complicate the operation
of the system. Also influencing the system at its interface are certain boundary conditions, such
as environmental regulations, standards and risk acceptance criteria. The system may also need
some support, such as maintenance, cleaning or repair. External threats include the impact of
natural environmental catastrophes (earth quakes, floods and the similar), infrastructure
deficiencies and breakdowns, social events (sabotage etc), and other surrounding systems.
While the distinction between external threats and unwanted inputs is not always clear, the
essence is that the interaction across the system interface induces risks that must be managed.
Figure 2 illustrates a technical system and its interfaces (Rausand and Høyland 2004).
2.2.2 APPROACH
Reliability engineering and technology qualification can be done reactively, proactively,
qualitatively, or quantitatively. In practice a combination is usually necessary.
MSc Thesis: Qualification of new technology for capture of CO2 in coal-fired power plants Bjørn Utgård, Norwegian University of Science and Technology, September 2007
8 | P a g e
Reactive vs. proactive
With a reactive approach, one examines the final product as a ‘black box’ by evaluating its
properties compared to the specification as a ‘final’ or ‘incoming inspection’ after product
development. This approach is reactive in the sense that it adds an additional step at the end of
the development phase, “and hardly differentiates in giving focus on those issues which really
need to be qualified.” The core method here is to test for the existence of known failure modes
which have been observed in products of matured technologies, usually by means of stress tests
of the product at elevated conditions. The necessity of field data makes “the meaningfulness of
the results questionable in the case of new or changed materials or technologies” (Gerling,
Preussger and Wulfert 2002). Another limitation to this approach is that identification of the
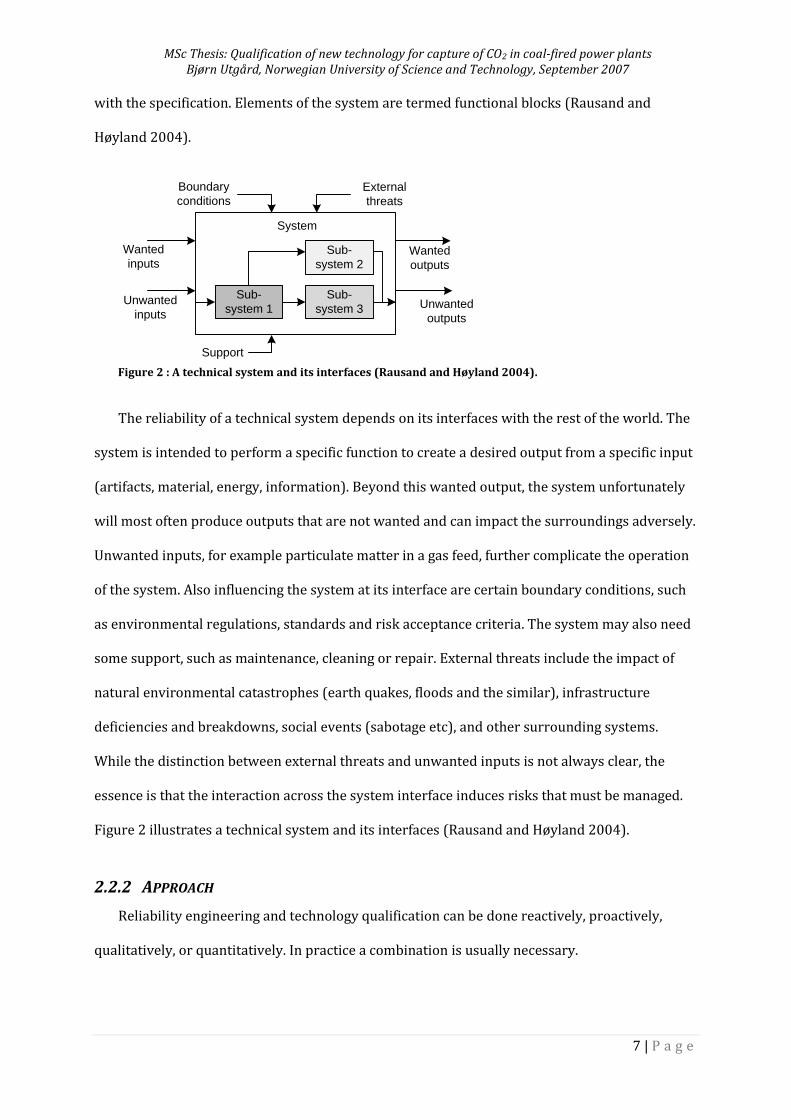
mechanisms by which failure occurs is difficult. This, combined with low design flexibility at the
time of qualification (see Figure 3), makes identifying and implementing potential design
improvements difficult.
Figure 3 : Design flexibility decreases throughout the technology development process. In the reactive
approach, qualification is done at the end of the design phase.
A supposedly more efficient approach is to make better use of existing knowledge and
integrate qualification into the innovation process instead of carrying out qualification as a
separate activity (Pecht 1993). In this proactive approach, qualification measures are carried out
Quality determined & costs committed
Life Cycle Phase
100%
50%
Pro
ble
m
Defin
itio
n
Concept
Desig
n
Deta
il D
esig
n
Ma
nufa
ctu
re
Use
Design Flexibility
Perc
enta
ge o
f to
tal
MSc Thesis: Qualification of new technology for capture of CO2 in coal-fired power plants Bjørn Utgård, Norwegian University of Science and Technology, September 2007
9 | P a g e
throughout the development cycle, making proactive use of Physics-of-Failure (PoF) based
testing with respect to the product construction and the operational conditions (Gerling,
Preussger and Wulfert 2002). PoF is discussed further in Section 2.3.2.
Qualitative vs. Quantitative
A qualitative approach, in which reliability is thought of as a subjective characteristic, is the
traditional approach to reliability specification. Here, reliability has been achieved by use of
suitable codes of practice or methods of working established over decades of observing
experience. A qualitative specification of reliability requirements should clearly describe the
methods used to qualify the technology and the criteria against which reliability is to be judged.
Essential here is that relevant operating and maintenance conditions in particular are met (BS
5670).
The qualitative approach does however fall short when the importance of in-service
availability and cost of maintenance is significant. In this case, a quantitative approach is
necessary. Here, reliability specification includes defining the task (time or other measure of
usage) against which a reliability measure can be expressed, the conditions under which the
item is to function, and the performance at which the item’s function ceases to be satisfactory
(failure criterion). The requisite for this approach is that the ultimate conditions of use and
maintenance and the failure criteria that will be applied can be controlled, or that they can be
predicted adequately. Without this step, a quantitative assessment is not likely to be
trustworthy. Another prerequisite complicating the quantitative approach is that adequate
failure data must be available. These data can only be obtained from reliability testing, from field
data (statistics), or from physics-of-failure knowledge (physical processes leading to failure); the
greater the volume of data the greater the confidence (BS 5670). For new technology, field data
is by definition non-existent. Physics-of-failure knowledge may to some extent be available if the
materials used already have been thoroughly characterized and stresses and loads are known.
Designing realistic reliability tests is anything but straight forward, since it usually requires
MSc Thesis: Qualification of new technology for capture of CO2 in coal-fired power plants Bjørn Utgård, Norwegian University of Science and Technology, September 2007
10 | P a g e
some sort of acceleration of usage (time, number of cycles, load). From this it is clear that while
quantitative analysis is preferable, qualification of new technology will have to rely on
considerable amounts of qualitative engineering judgment.
2.2.3 RELIABILITY SPECIFICATION
A technology is qualified when it is documented that the specified performance criteria are
met. A prerequisite for technology qualification is therefore that the requirements are clearly
communicated in writing, which is done in a specification. A specification may define general
characteristics or it may be specific to the reliability and maintainability features of a product,
such as service life at various performance levels, conditions of use, installation,
acceptance/rejection criteria and definitions of failure. The function of a specification is to
provide a basis of understanding between two parties so that both agree on the criteria to be
met (BS 5670).
A specification should be formulated in a way that makes it possible to demonstrate
compliance with the defined characteristics, which means that it should have the following
properties:
concise and precise;
adequate or complete;
unambiguous, particularly with regard to acceptance/rejection criteria
corresponding to the desired functions and reliability of the product in question;
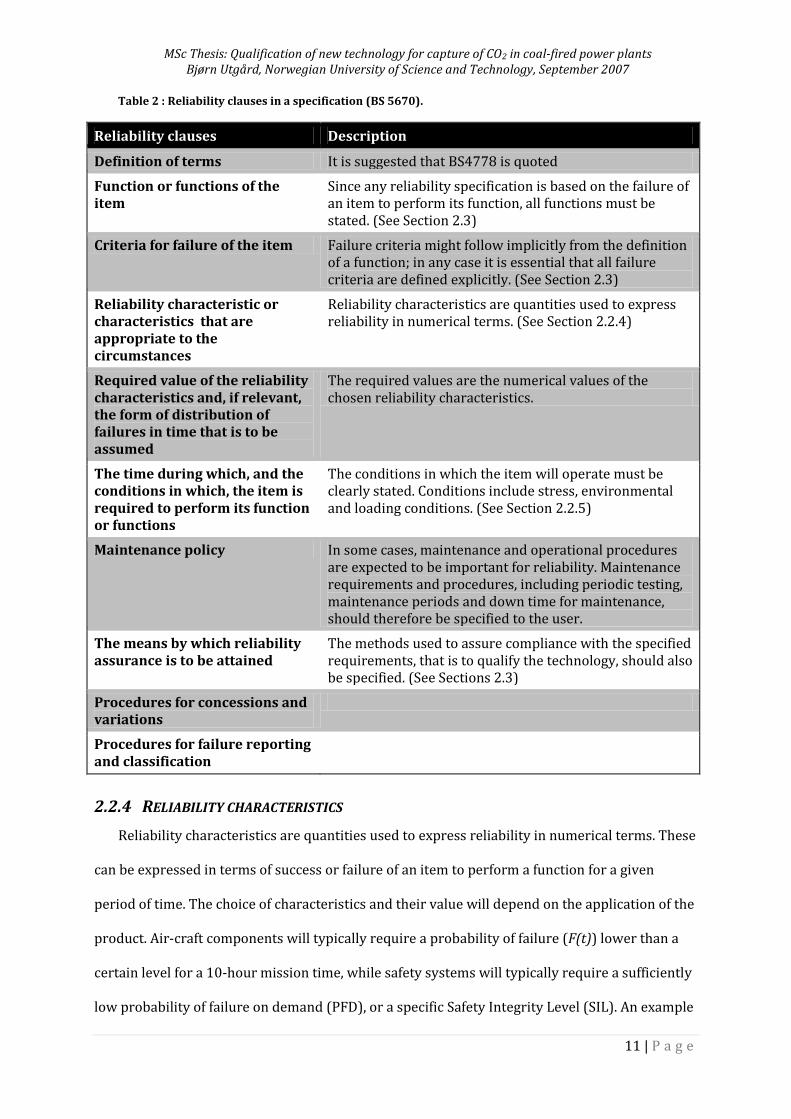
BS 5670 gives direction for the formulation of reliability specifications. The clauses that
should be covered in a specification are shown in Table 2.
MSc Thesis: Qualification of new technology for capture of CO2 in coal-fired power plants Bjørn Utgård, Norwegian University of Science and Technology, September 2007
11 | P a g e
Table 2 : Reliability clauses in a specification (BS 5670).
Reliability clauses Description
Definition of terms It is suggested that BS4778 is quoted
Function or functions of the item
Since any reliability specification is based on the failure of an item to perform its function, all functions must be stated. (See Section 2.3)
Criteria for failure of the item Failure criteria might follow implicitly from the definition of a function; in any case it is essential that all failure criteria are defined explicitly. (See Section 2.3)
Reliability characteristic or characteristics that are appropriate to the circumstances
Reliability characteristics are quantities used to express reliability in numerical terms. (See Section 2.2.4)
Required value of the reliability characteristics and, if relevant, the form of distribution of failures in time that is to be assumed
The required values are the numerical values of the chosen reliability characteristics.
The time during which, and the conditions in which, the item is required to perform its function or functions
The conditions in which the item will operate must be clearly stated. Conditions include stress, environmental and loading conditions. (See Section 2.2.5)
Maintenance policy In some cases, maintenance and operational procedures are expected to be important for reliability. Maintenance requirements and procedures, including periodic testing, maintenance periods and down time for maintenance, should therefore be specified to the user.
The means by which reliability assurance is to be attained
The methods used to assure compliance with the specified requirements, that is to qualify the technology, should also be specified. (See Sections 2.3)
Procedures for concessions and variations
Procedures for failure reporting and classification
2.2.4 RELIABILITY CHARACTERISTICS
Reliability characteristics are quantities used to express reliability in numerical terms. These
can be expressed in terms of success or failure of an item to perform a function for a given
period of time. The choice of characteristics and their value will depend on the application of the
product. Air-craft components will typically require a probability of failure (F(t)) lower than a
certain level for a 10-hour mission time, while safety systems will typically require a sufficiently
low probability of failure on demand (PFD), or a specific Safety Integrity Level (SIL). An example
MSc Thesis: Qualification of new technology for capture of CO2 in coal-fired power plants Bjørn Utgård, Norwegian University of Science and Technology, September 2007
12 | P a g e
of the latter case is subsea technologies in the oil and gas industry. Measures such as mean time
to failure (MTTF), mean time between failures (MTBF), or availability are also common, and
time can be replaced by distance, cycles, throughput or other usage-related parameters
(Rausand and Høyland 2004).
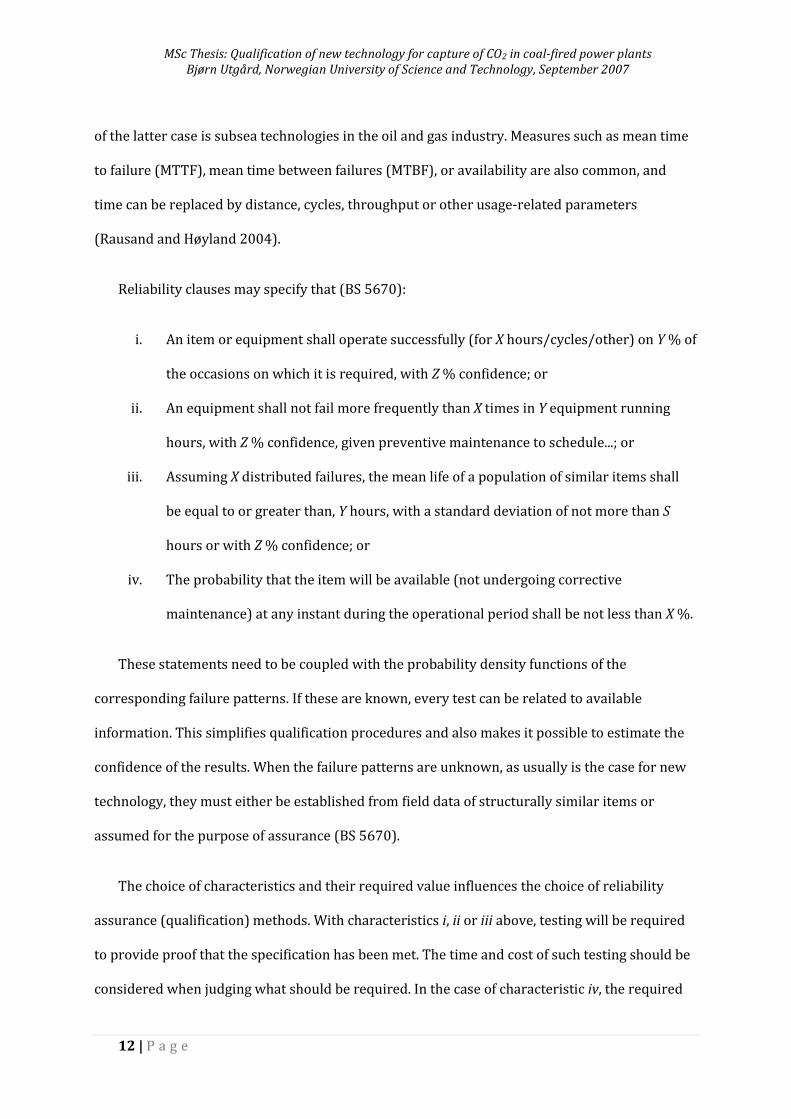
Reliability clauses may specify that (BS 5670):
i. An item or equipment shall operate successfully (for X hours/cycles/other) on Y % of
the occasions on which it is required, with Z % confidence; or
ii. An equipment shall not fail more frequently than X times in Y equipment running
hours, with Z % confidence, given preventive maintenance to schedule...; or
iii. Assuming X distributed failures, the mean life of a population of similar items shall
be equal to or greater than, Y hours, with a standard deviation of not more than S
hours or with Z % confidence; or
iv. The probability that the item will be available (not undergoing corrective
maintenance) at any instant during the operational period shall be not less than X %.
These statements need to be coupled with the probability density functions of the
corresponding failure patterns. If these are known, every test can be related to available
information. This simplifies qualification procedures and also makes it possible to estimate the
confidence of the results. When the failure patterns are unknown, as usually is the case for new
technology, they must either be established from field data of structurally similar items or
assumed for the purpose of assurance (BS 5670).
The choice of characteristics and their required value influences the choice of reliability
assurance (qualification) methods. With characteristics i, ii or iii above, testing will be required
to provide proof that the specification has been met. The time and cost of such testing should be
considered when judging what should be required. In the case of characteristic iv, the required
MSc Thesis: Qualification of new technology for capture of CO2 in coal-fired power plants Bjørn Utgård, Norwegian University of Science and Technology, September 2007
13 | P a g e
value will be assessed from some source(s) agreed upon between the supplier and purchaser
(BS 5670). With very stringent reliability requirements, as the case is in for instance the subsea,
aircraft and space industries, “box level testing is infeasible” (Pecht 1993), making alternative
approaches and methods necessary. And when only a small number of units will be made,
“testing to the extent required for statistical proof of the required reliability frequently becomes
inappropriate and assessments have to be made.” (BS 5670) Testing is further discussed in
Section 2.3.3.
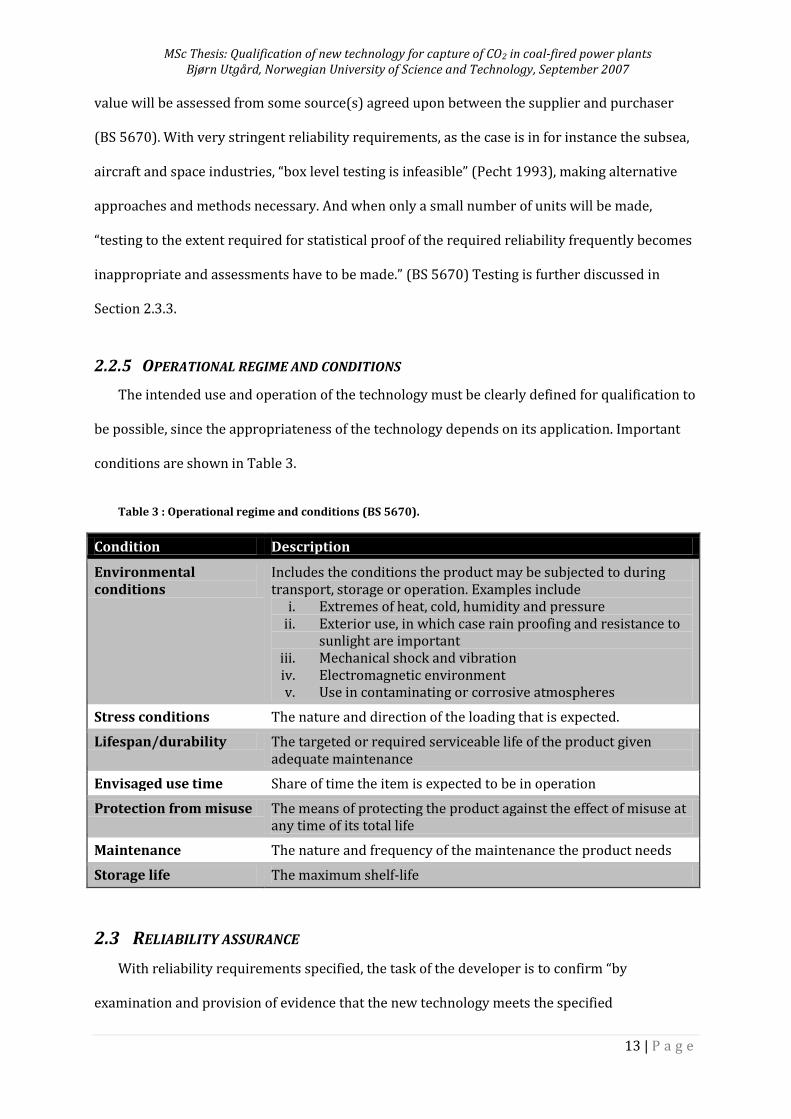
2.2.5 OPERATIONAL REGIME AND CONDITIONS
The intended use and operation of the technology must be clearly defined for qualification to
be possible, since the appropriateness of the technology depends on its application. Important
conditions are shown in Table 3.
Table 3 : Operational regime and conditions (BS 5670).
Condition Description
Environmental conditions
Includes the conditions the product may be subjected to during transport, storage or operation. Examples include
i. Extremes of heat, cold, humidity and pressure ii. Exterior use, in which case rain proofing and resistance to
sunlight are important iii. Mechanical shock and vibration iv. Electromagnetic environment v. Use in contaminating or corrosive atmospheres
Stress conditions The nature and direction of the loading that is expected.
Lifespan/durability The targeted or required serviceable life of the product given adequate maintenance
Envisaged use time Share of time the item is expected to be in operation
Protection from misuse The means of protecting the product against the effect of misuse at any time of its total life
Maintenance The nature and frequency of the maintenance the product needs
Storage life The maximum shelf-life
2.3 RELIABILITY ASSURANCE
With reliability requirements specified, the task of the developer is to confirm “by
examination and provision of evidence that the new technology meets the specified
MSc Thesis: Qualification of new technology for capture of CO2 in coal-fired power plants Bjørn Utgård, Norwegian University of Science and Technology, September 2007
14 | P a g e
requirements for the intended use” (DNV 2001). In the case of new technology, the volume of
data available is small, which means that the confidence of the evidence provided is reduced.
Confidence is further reduced due to possible discrepancies between specification, design,
manufacture, installation, commissioning and use. This means that the predicted performance
demonstrated through the qualification process may be different from the actual performance
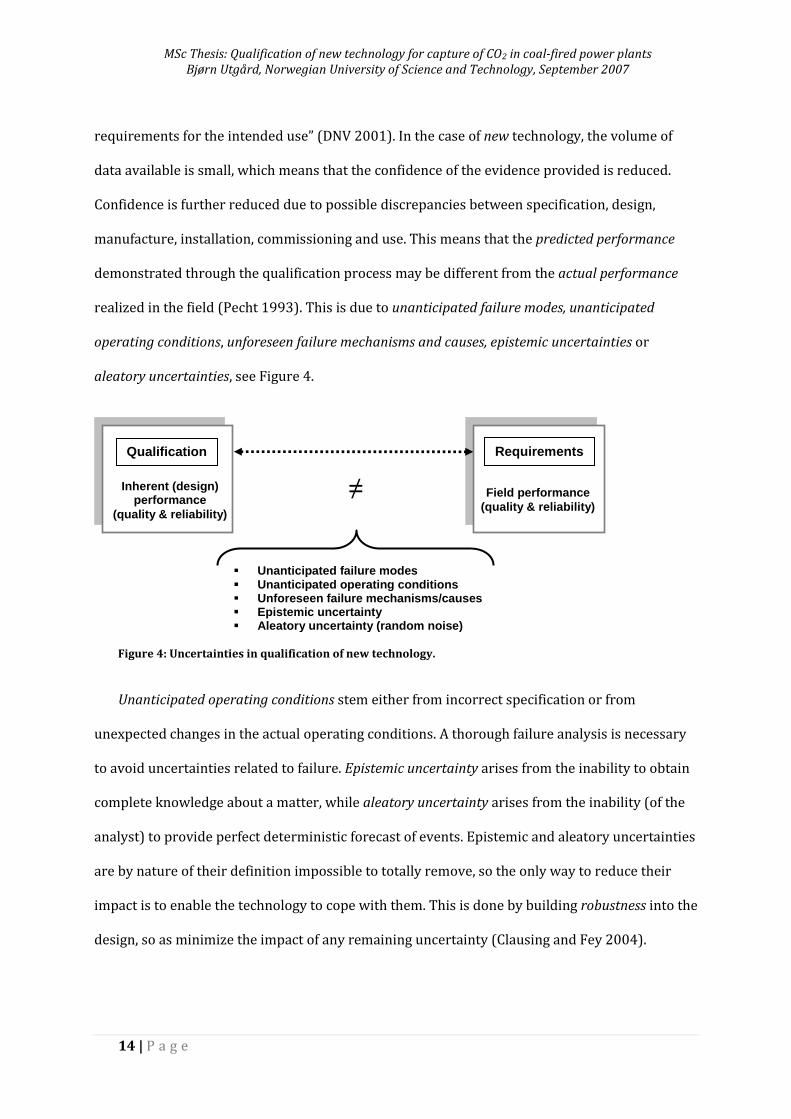
realized in the field (Pecht 1993). This is due to unanticipated failure modes, unanticipated
operating conditions, unforeseen failure mechanisms and causes, epistemic uncertainties or
aleatory uncertainties, see Figure 4.
Figure 4: Uncertainties in qualification of new technology.
Unanticipated operating conditions stem either from incorrect specification or from
unexpected changes in the actual operating conditions. A thorough failure analysis is necessary
to avoid uncertainties related to failure. Epistemic uncertainty arises from the inability to obtain
complete knowledge about a matter, while aleatory uncertainty arises from the inability (of the
analyst) to provide perfect deterministic forecast of events. Epistemic and aleatory uncertainties
are by nature of their definition impossible to totally remove, so the only way to reduce their
impact is to enable the technology to cope with them. This is done by building robustness into the
design, so as minimize the impact of any remaining uncertainty (Clausing and Fey 2004).
≠
Unanticipated failure modes Unanticipated operating conditions Unforeseen failure mechanisms/causes Epistemic uncertainty Aleatory uncertainty (random noise)
Requirements
Field performance
(quality & reliability)
Inherent (design) performance
(quality & reliability)
Qualification
MSc Thesis: Qualification of new technology for capture of CO2 in coal-fired power plants Bjørn Utgård, Norwegian University of Science and Technology, September 2007
15 | P a g e
‘Examination and provision of evidence’ is done through functional and failure analysis, and
reliability testing, and can be supplemented with experience from proven, structurally similar
technologies.
2.3.1 FUNCTIONAL ANALYSIS
Failure can be defined as termination of the ability of an item to perform the required
(specified) function (BS4778). Hence, an analysis of the ways in which a technology can fail
requires that all of its functions and the performance criteria related to them are thoroughly
defined and understood. This is done through a functional analysis, which aims to (Rausand and
Høyland 2004):
1. Identify all the functions of the system
2. Identify the functions required in the various operational modes of the
system
3. Provide a hierarchical decomposition of the system functions
4. Describe how each function is realized
5. Identify the interrelationships between the functions
6. Identify interfaces with other systems and with the environment
The functions of a system are performed jointly by the physical components (subsystems) of
the system. An analysis of the system’s reliability may therefore take a structural or a functional
focus. With a structural focus, the system is broken down according to its physical structure
(subsystems and components). With a functional focus, the various functions of the system and
how these are fulfilled is of interest. Which focus is preferable depends on the use of the
analysis; while a structural focus often is more practical for existing systems, the functional
approach is useful in the early design process of a new system (Rausand and Høyland 2004).
MSc Thesis: Qualification of new technology for capture of CO2 in coal-fired power plants Bjørn Utgård, Norwegian University of Science and Technology, September 2007
16 | P a g e
System
function
System
function 3
System
function 2
System
function 1
Function 1.1
Function 1.1
Function 1.1
Function 1.1
Function 1.1
Function 1.1
Function 1.1
Limit of fuctional analysis
Why?How?
OR
AND
Function
(verb + noun)How?
When?
When?
Why?
More level 3 functions
More level 2 functions
More level 1 functions
System functions
Function 1 Function 2
Function
1.1
Function
1.2
Function
2.1
Function
2.2
Function
1.1.1
Function
1.1.2
Function
2.1.1
Function
2.1.2
Function
2.3
a) Function tree
b) FAST diagram
Control valves
Mechanism
Unstimulated
oil flowFunction Control
Mechanism
Input
Sensor
information
Function
Function
Control
Output
Mechanism
Input
Function
b) SADT diagram
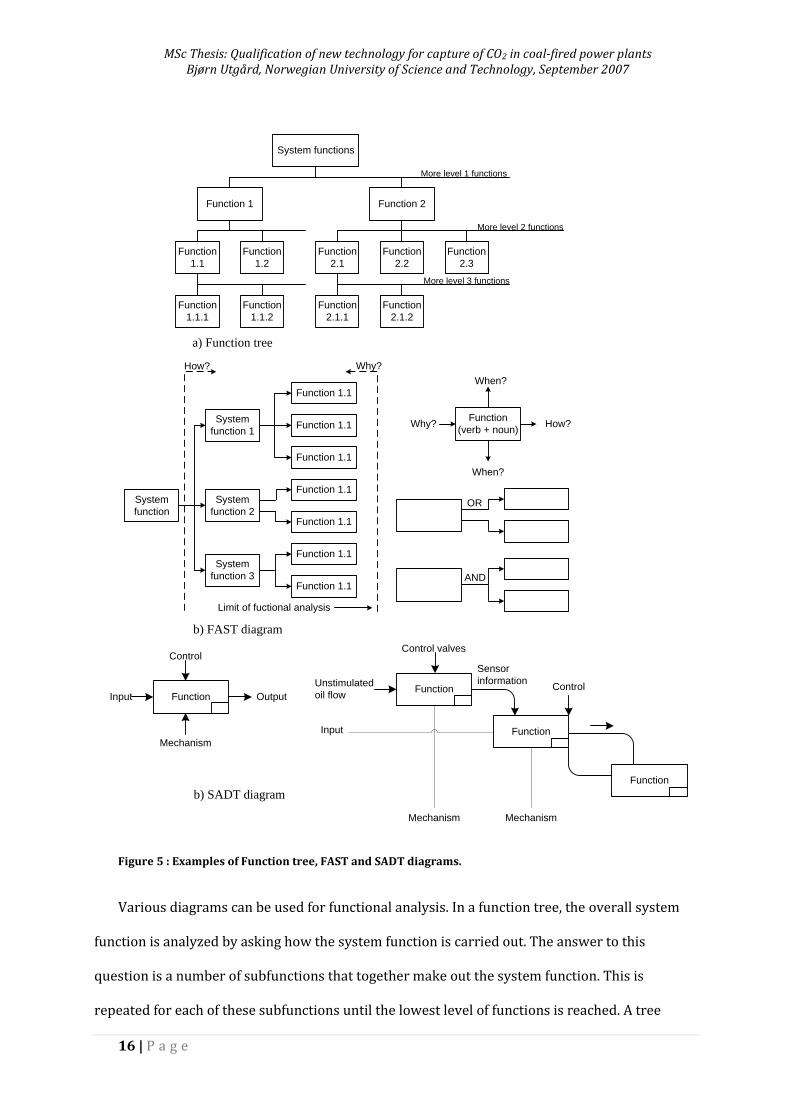
Figure 5 : Examples of Function tree, FAST and SADT diagrams.
Various diagrams can be used for functional analysis. In a function tree, the overall system
function is analyzed by asking how the system function is carried out. The answer to this
question is a number of subfunctions that together make out the system function. This is
repeated for each of these subfunctions until the lowest level of functions is reached. A tree
MSc Thesis: Qualification of new technology for capture of CO2 in coal-fired power plants Bjørn Utgård, Norwegian University of Science and Technology, September 2007
17 | P a g e
diagram can also be used for a physical system breakdown in the case of a structurally focused
analysis. Other diagrams include functional block diagrams (SADT diagrams) and FAST
diagrams. Figure 5 shows examples of such diagrams.
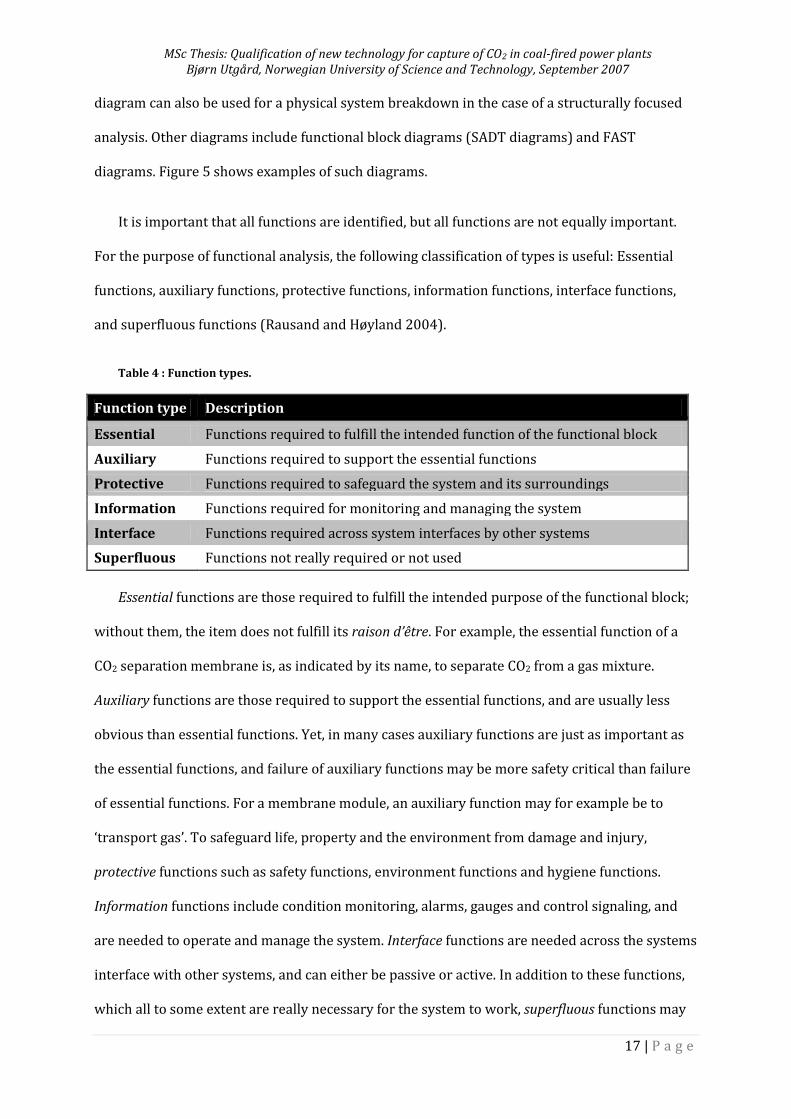
It is important that all functions are identified, but all functions are not equally important.
For the purpose of functional analysis, the following classification of types is useful: Essential
functions, auxiliary functions, protective functions, information functions, interface functions,
and superfluous functions (Rausand and Høyland 2004).
Table 4 : Function types.
Function type Description
Essential Functions required to fulfill the intended function of the functional block
Auxiliary Functions required to support the essential functions
Protective Functions required to safeguard the system and its surroundings
Information Functions required for monitoring and managing the system
Interface Functions required across system interfaces by other systems
Superfluous Functions not really required or not used
Essential functions are those required to fulfill the intended purpose of the functional block;
without them, the item does not fulfill its raison d’être. For example, the essential function of a
CO2 separation membrane is, as indicated by its name, to separate CO2 from a gas mixture.
Auxiliary functions are those required to support the essential functions, and are usually less
obvious than essential functions. Yet, in many cases auxiliary functions are just as important as
the essential functions, and failure of auxiliary functions may be more safety critical than failure
of essential functions. For a membrane module, an auxiliary function may for example be to
‘transport gas’. To safeguard life, property and the environment from damage and injury,
protective functions such as safety functions, environment functions and hygiene functions.
Information functions include condition monitoring, alarms, gauges and control signaling, and
are needed to operate and manage the system. Interface functions are needed across the systems
interface with other systems, and can either be passive or active. In addition to these functions,
which all to some extent are really necessary for the system to work, superfluous functions may
MSc Thesis: Qualification of new technology for capture of CO2 in coal-fired power plants Bjørn Utgård, Norwegian University of Science and Technology, September 2007
18 | P a g e
be included in the functional block. These functions are ‘nice-to-have’ functions that are not
really necessary or never used (Rausand and Høyland 2004).
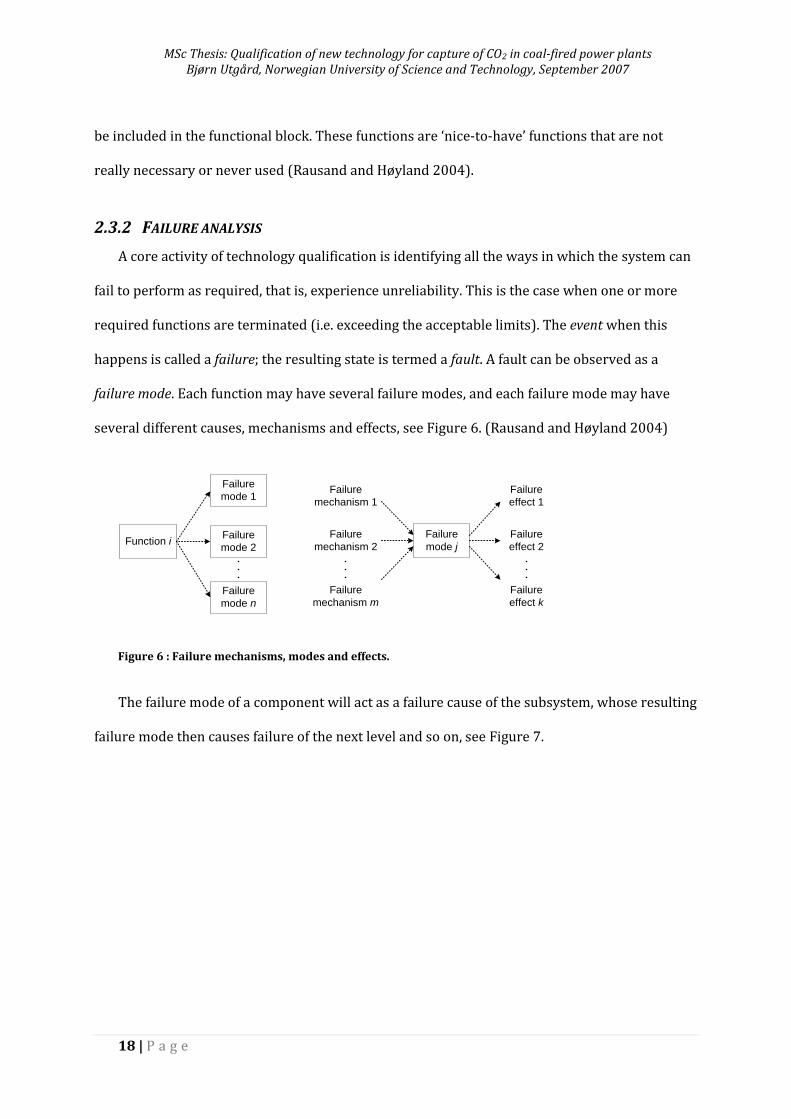
2.3.2 FAILURE ANALYSIS
A core activity of technology qualification is identifying all the ways in which the system can
fail to perform as required, that is, experience unreliability. This is the case when one or more
required functions are terminated (i.e. exceeding the acceptable limits). The event when this
happens is called a failure; the resulting state is termed a fault. A fault can be observed as a
failure mode. Each function may have several failure modes, and each failure mode may have
several different causes, mechanisms and effects, see Figure 6. (Rausand and Høyland 2004)
Function i
Failure
mode 1
Failure
mode 2
Failure
mode n
Failure
mode j
Failure
mechanism 1
Failure
mechanism 2
Failure
mechanism m
Failure
effect 1
Failure
effect 2
Failure
effect k
Figure 6 : Failure mechanisms, modes and effects.
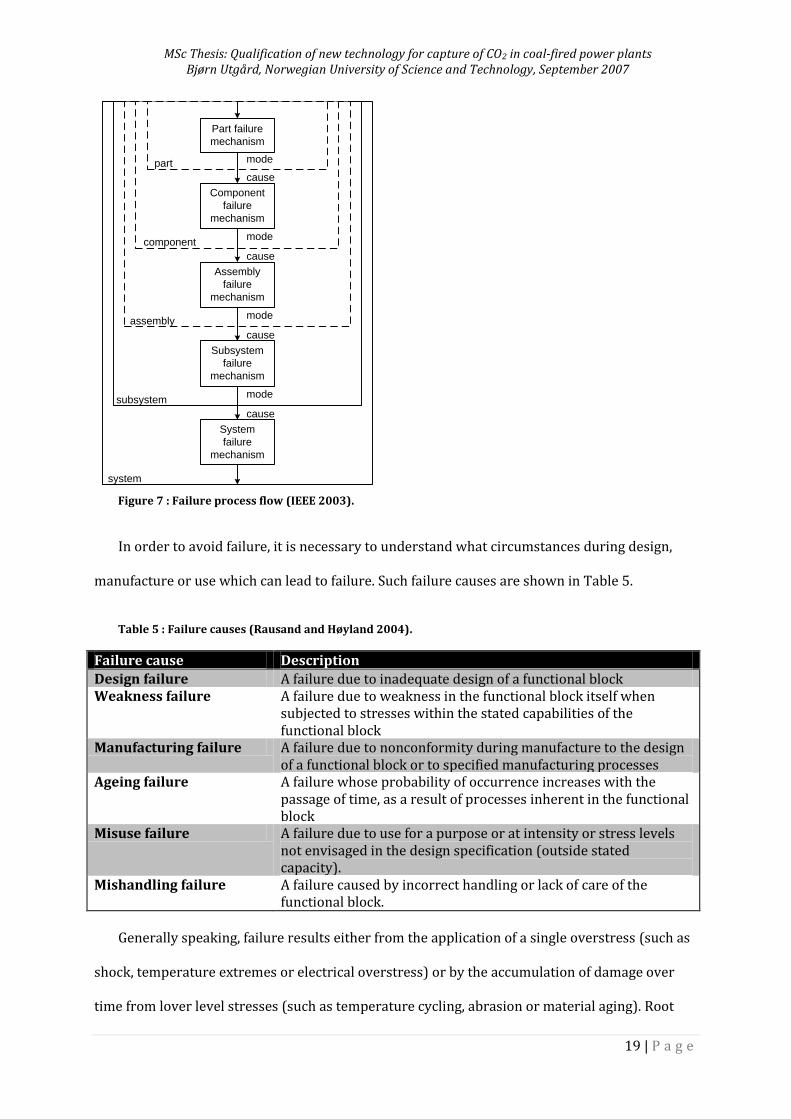
The failure mode of a component will act as a failure cause of the subsystem, whose resulting
failure mode then causes failure of the next level and so on, see Figure 7.
MSc Thesis: Qualification of new technology for capture of CO2 in coal-fired power plants Bjørn Utgård, Norwegian University of Science and Technology, September 2007
19 | P a g e
Part failure
mechanism
Component
failure
mechanism
Assembly
failure
mechanism
Subsystem
failure
mechanism
System
failure
mechanism
part
component
assembly
subsystem
system
mode
cause
mode
cause
mode
cause
mode
cause
Figure 7 : Failure process flow (IEEE 2003).
In order to avoid failure, it is necessary to understand what circumstances during design,
manufacture or use which can lead to failure. Such failure causes are shown in Table 5.
Table 5 : Failure causes (Rausand and Høyland 2004).
Failure cause Description
Design failure A failure due to inadequate design of a functional block Weakness failure A failure due to weakness in the functional block itself when
subjected to stresses within the stated capabilities of the functional block
Manufacturing failure A failure due to nonconformity during manufacture to the design of a functional block or to specified manufacturing processes
Ageing failure A failure whose probability of occurrence increases with the passage of time, as a result of processes inherent in the functional block
Misuse failure A failure due to use for a purpose or at intensity or stress levels not envisaged in the design specification (outside stated capacity).
Mishandling failure A failure caused by incorrect handling or lack of care of the functional block.
Generally speaking, failure results either from the application of a single overstress (such as
shock, temperature extremes or electrical overstress) or by the accumulation of damage over
time from lover level stresses (such as temperature cycling, abrasion or material aging). Root
MSc Thesis: Qualification of new technology for capture of CO2 in coal-fired power plants Bjørn Utgård, Norwegian University of Science and Technology, September 2007
20 | P a g e
causes are the most fundamental factor or factors that, if corrected or removed, will prevent the
recurrence of the failure. (IEEE 2003) Failure mechanisms are “physical, chemical or other
processes that have lead to failure” (IEC n.d.). One of the reasons for identifying these root
causes and failure mechanisms in the design phase is to fix the problem at its most fundamental
source rather than merely fixing failure symptoms is that recurrence can be avoided (IEEE
2003). Another purpose of root cause and failure mode identification is to predict to predict the
probability of occurrence of the failure in real life (IEEE 2003).
Failure Modes, Effects, and Criticality Analysis
The systematic technique most commonly used to make sure the failure analysis captures all
conceivable failure modes and their effects is the Failure Modes, Effects, and Criticality Analysis
(FMECA). Usually carried out in the design phase of a system, the objective of an FMECA is to
reveal weaknesses and potential failures at an early stage, and based on their criticality rank
suggest corrective and mitigative modifications to the design. The level of detail and focus of
analysis depends on when the FMECA is carried out. In the early design phase, when no or very
few hardware solutions are known, a functional FMECA is done by identifying potential failures
for each function according to the hierarchy established in the function tree. In the embodiment
design phase, an interface FMECA is useful to verify compliance with requirements across the
interfaces between components and subsystems. When hardware and software solutions are
decided for the various functions in the detailed design phase, a System Breakdown Structure
showing the hierarchy of components and subsystems, much in the same way as for Function
Trees as shown in Figure 5. With the breakdown structure as input, a detailed FMECA identifies
system failures by starting with the failure modes at the lowest level of indenture and then
proceeding upwards in the hierarchy until the system level is reached.
The FMECA is done by answering a set of questions:
1. How can each part conceivably fail?
MSc Thesis: Qualification of new technology for capture of CO2 in coal-fired power plants Bjørn Utgård, Norwegian University of Science and Technology, September 2007
21 | P a g e
2. What mechanisms might produce these modes of failure?
3. What could the effects be if the failures did occur?
4. Is the failure in the safe or unsafe direction?
5. How is the failure detected?
6. What inherent provisions are provided in the design to compensate for the failure?
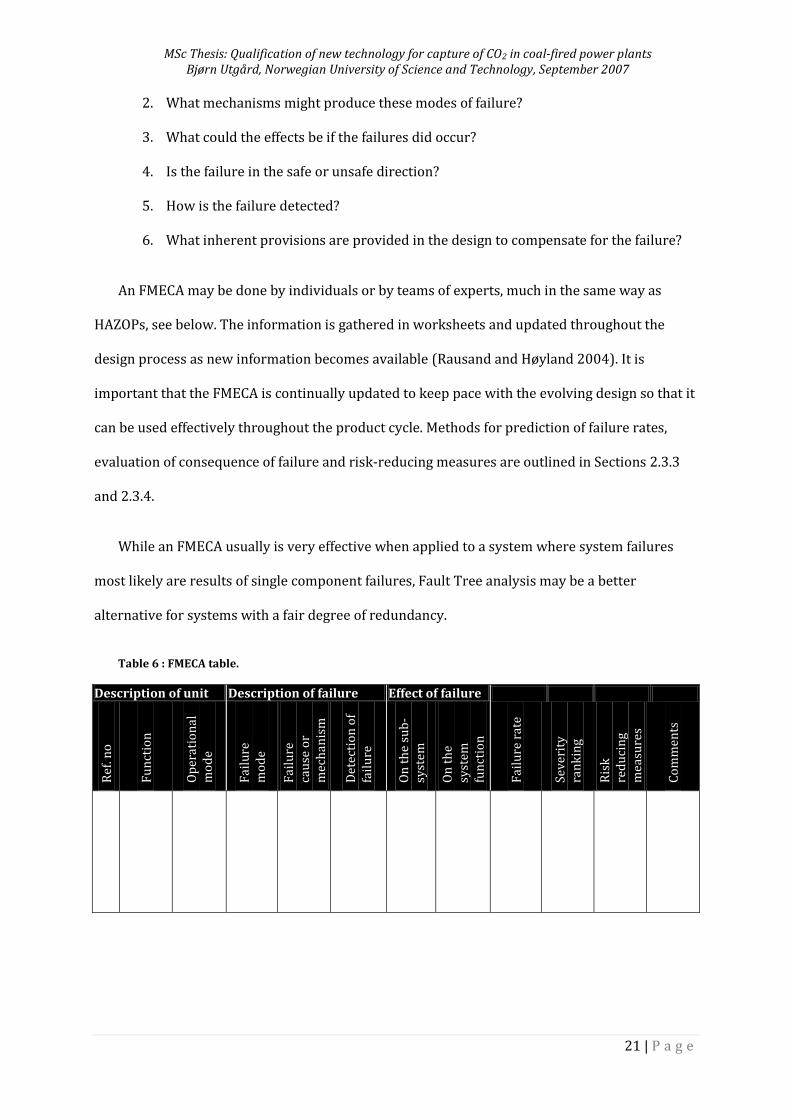
An FMECA may be done by individuals or by teams of experts, much in the same way as
HAZOPs, see below. The information is gathered in worksheets and updated throughout the
design process as new information becomes available (Rausand and Høyland 2004). It is
important that the FMECA is continually updated to keep pace with the evolving design so that it
can be used effectively throughout the product cycle. Methods for prediction of failure rates,
evaluation of consequence of failure and risk-reducing measures are outlined in Sections 2.3.3
and 2.3.4.
While an FMECA usually is very effective when applied to a system where system failures
most likely are results of single component failures, Fault Tree analysis may be a better
alternative for systems with a fair degree of redundancy.
Table 6 : FMECA table.
Description of unit Description of failure Effect of failure
Ref
. no
Fu
nct
ion
Op
erat
ion
al
mo
de
Fai
lure
m
od
e
Fai
lure
ca
use
or
mec
han
ism
Det
ecti
on
of
fail
ure
On
th
e su
b-
syst
em
On
th
e sy
stem
fu
nct
ion
Fai
lure
rat
e
Sev
erit
y
ran
kin
g
Ris
k
red
uci
ng
mea
sure
s
Co
mm
ents

MSc Thesis: Qualification of new technology for capture of CO2 in coal-fired power plants Bjørn Utgård, Norwegian University of Science and Technology, September 2007
22 | P a g e
Fault tree analysis
A Fault Tree is constructed by means of logic operators to display the interrelationships
between a potential critical event in a system and the causes of the event. Depending on the use
of the fault tree, it may be quantitative or qualitative in approach. The output may for example
be the probability of a critical event occurring during a specified time interval or a list of possible
combinations of environmental factors, human errors, normal events and component failures
that may result in a critical event in the system.
Fault tree analysis is a deductive technique in the sense that a system failure is the starting
point, and the causes for it are identified backwards in the causal chain until the root causes of
the failure are identified. The steps of constructing a fault tree are:
1. Define boundary conditions for the analysis
a. Physical boundaries of the system
b. Initial conditions (mode of operation)
c. Boundary conditions with respect to external stresses
d. Level of resolution (how far down in detail should the analysis go?)
2. Identify all critical/fault events and for each describe
a. What type of critical event it is
b. Where the event occurs (in the system)
c. When the event occurs (mode of operation)
3. Evaluate fault events (primary failures, secondary failures or command faults?)
4. Complete the gates before moving down the tree to the next gate
The gathered information is logically arranged in a tree shape, with logic operators
connecting the lower level causes to the TOP event. The finished fault tree is then qualitatively
and/or quantitatively analyzed to identify the various combinations of events that may lead to
MSc Thesis: Qualification of new technology for capture of CO2 in coal-fired power plants Bjørn Utgård, Norwegian University of Science and Technology, September 2007
23 | P a g e
the TOP failure, and weigh the importance/criticality of the possible events (Rausand and
Høyland 2004).
HAZard and OPerability study (HAZOP)
The limited amount of experience data that is available for qualifying new technology means
that it is particularly important to gather as much qualitative expert judgment on the potential
ways in which a system may fail as possible. A technique for systematically doing this is the
HAZOP technique. Commonly applied in the concept design phase of process plants to analyze
the risks involved in the system, its primary objective is to identify potential problems that can
arise during operation and maintenance of the system.
The main activity of a HAZOP is a managed creative process carried out through a series of
sessions by a team usually built up by 4-6 experts of relevant disciplines, a secretary and a
HAZOP facilitator charged with managing the process. By conducting the sessions as brainstorm
sessions, the creative potential of the team members can be utilized to identify all possible ways
the system can conceivably fail (Rausand 1991).
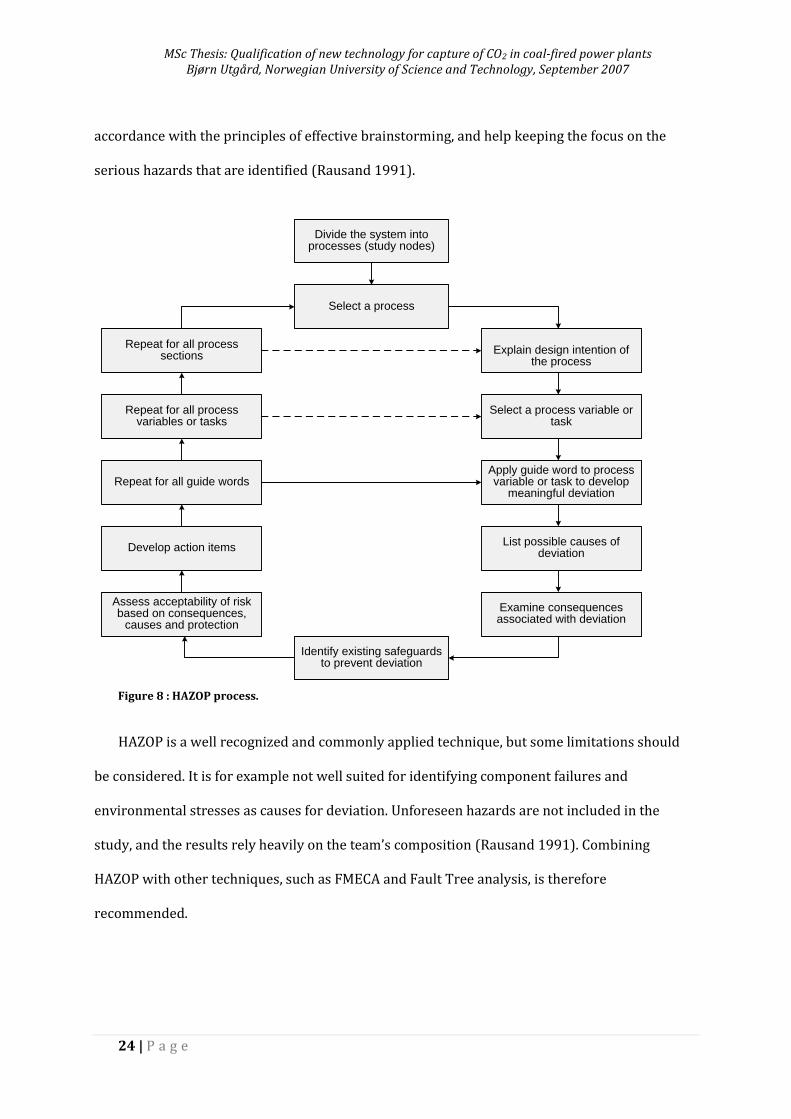
The HAZOP process is shown in Figure 8. After the process system has been divided into
individual processes (study nodes), each process can be studied in turn. Guide words are
selected and combined with process parameters to guide or stimulate the brainstorming
process. For example, the guide word less combined with the process parameter pressure helps
the team identify the consequences of this particular deviation. If the consequences are thought
to cause safety or operability problems beyond the limits of the design robustness, this is noted
as a potential hazard. Recommendations for mitigative measures may also be given.
A HAZOP analysis requires that the information (drawings, figures, other) used as basis for
the analysis is complete and accurate, and that the technical skill and insight of the team
members is adequate. The role of the facilitator is then to manage the team working process in
MSc Thesis: Qualification of new technology for capture of CO2 in coal-fired power plants Bjørn Utgård, Norwegian University of Science and Technology, September 2007
24 | P a g e
accordance with the principles of effective brainstorming, and help keeping the focus on the
serious hazards that are identified (Rausand 1991).
Select a process
Explain design intention of the process
Select a process variable or task
Repeat for all process sections
Repeat for all process variables or tasks
Repeat for all guide words
Develop action items
Apply guide word to process variable or task to develop
meaningful deviation
List possible causes of deviation
Assess acceptability of risk based on consequences,
causes and protection
Examine consequences associated with deviation
Identify existing safeguards to prevent deviation
Divide the system into processes (study nodes)
Figure 8 : HAZOP process.
HAZOP is a well recognized and commonly applied technique, but some limitations should
be considered. It is for example not well suited for identifying component failures and
environmental stresses as causes for deviation. Unforeseen hazards are not included in the
study, and the results rely heavily on the team’s composition (Rausand 1991). Combining
HAZOP with other techniques, such as FMECA and Fault Tree analysis, is therefore
recommended.
MSc Thesis: Qualification of new technology for capture of CO2 in coal-fired power plants Bjørn Utgård, Norwegian University of Science and Technology, September 2007
25 | P a g e
2.3.3 RELIABILITY PREDICTION
With all failure modes, mechanisms and causes identified, information must be gathered to
predict the probability and consequence of failure. This can be already existing knowledge about
failure mechanisms of structurally similar technologies or new information in the form of results
from tests and analysis of the technology at hand.
Structural similarity analysis
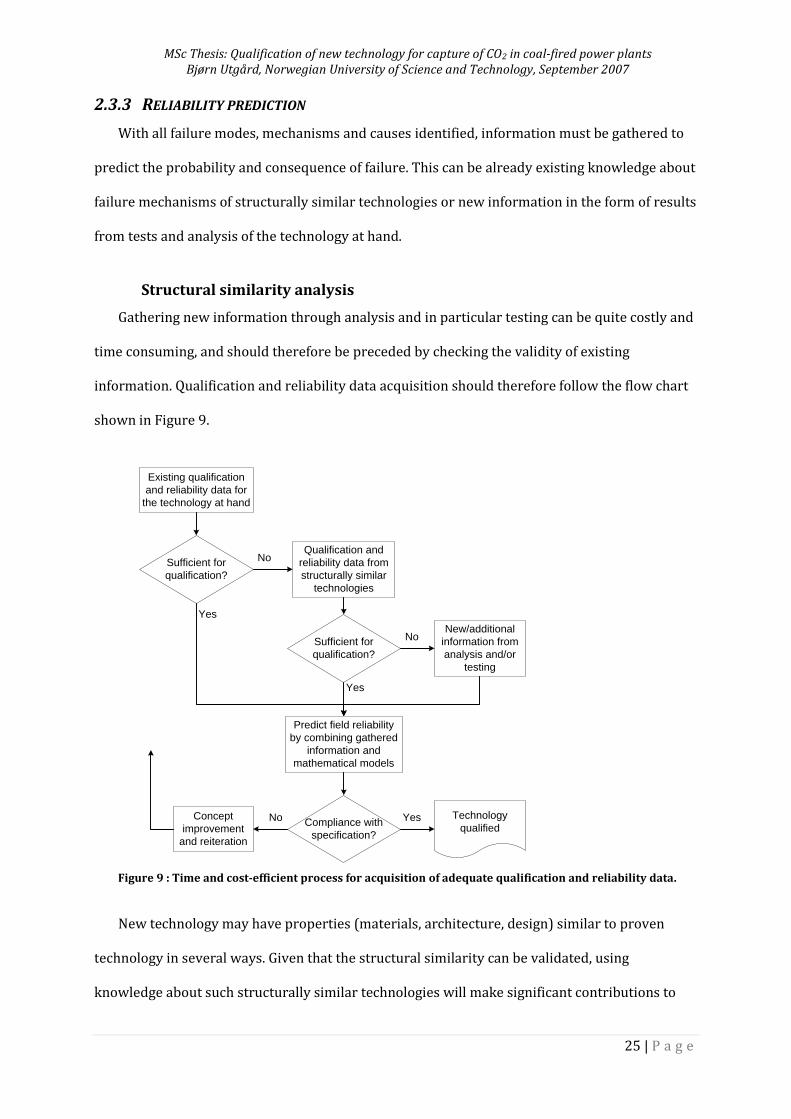
Gathering new information through analysis and in particular testing can be quite costly and
time consuming, and should therefore be preceded by checking the validity of existing
information. Qualification and reliability data acquisition should therefore follow the flow chart
shown in Figure 9.
Existing qualification
and reliability data for
the technology at hand
Sufficient for
qualification?
Qualification and
reliability data from
structurally similar
technologies
No
Sufficient for
qualification?
Concept
improvement
and reiteration
Yes
Yes
New/additional
information from
analysis and/or
testing
No
Compliance with
specification?
Technology
qualifiedYesNo
Predict field reliability
by combining gathered
information and
mathematical models
Figure 9 : Time and cost-efficient process for acquisition of adequate qualification and reliability data.
New technology may have properties (materials, architecture, design) similar to proven
technology in several ways. Given that the structural similarity can be validated, using
knowledge about such structurally similar technologies will make significant contributions to
MSc Thesis: Qualification of new technology for capture of CO2 in coal-fired power plants Bjørn Utgård, Norwegian University of Science and Technology, September 2007
26 | P a g e
simplifying qualification of the new technology. Structural similarity analysis is widely used in
the highly competitive semiconductor industry to define effective qualification and reliability
monitoring programs (van Driel, Zhang og Ernst 2005). The technique is also widely used in the
energy industry (Sunde and Bjeglerud 2006).
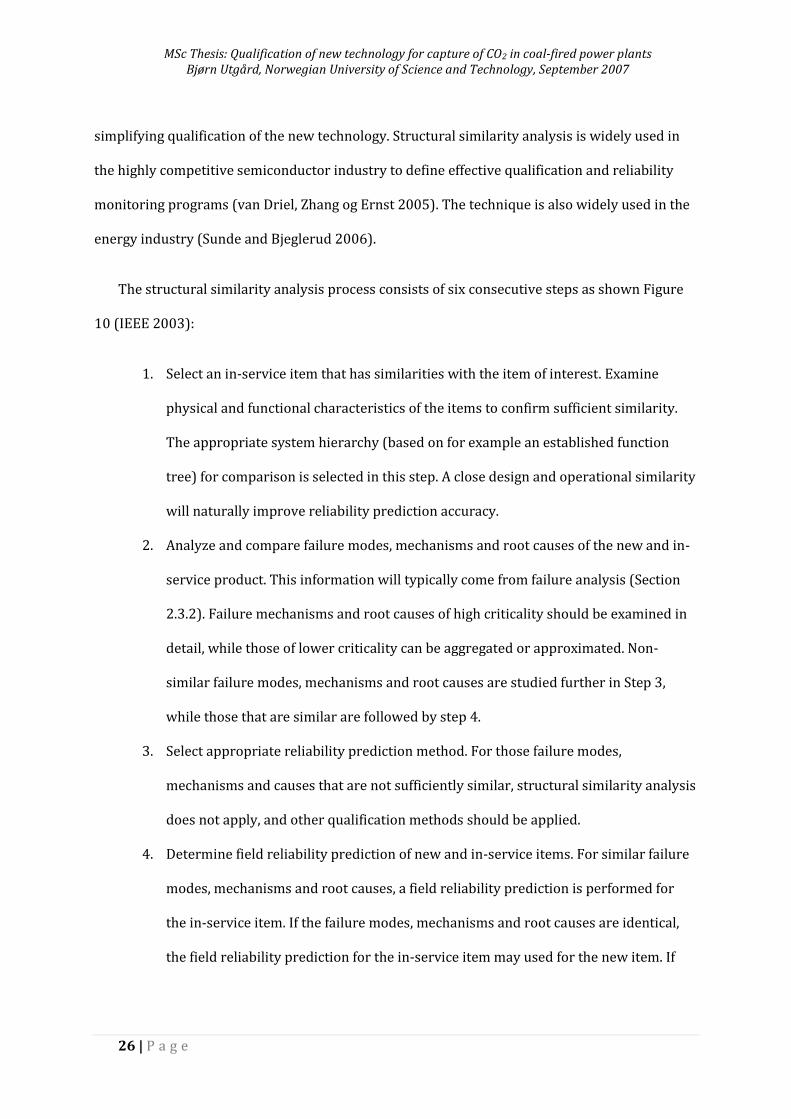
The structural similarity analysis process consists of six consecutive steps as shown Figure
10 (IEEE 2003):
1. Select an in-service item that has similarities with the item of interest. Examine
physical and functional characteristics of the items to confirm sufficient similarity.
The appropriate system hierarchy (based on for example an established function
tree) for comparison is selected in this step. A close design and operational similarity
will naturally improve reliability prediction accuracy.
2. Analyze and compare failure modes, mechanisms and root causes of the new and in-
service product. This information will typically come from failure analysis (Section
2.3.2). Failure mechanisms and root causes of high criticality should be examined in
detail, while those of lower criticality can be aggregated or approximated. Non-
similar failure modes, mechanisms and root causes are studied further in Step 3,
while those that are similar are followed by step 4.
3. Select appropriate reliability prediction method. For those failure modes,
mechanisms and causes that are not sufficiently similar, structural similarity analysis
does not apply, and other qualification methods should be applied.
4. Determine field reliability prediction of new and in-service items. For similar failure
modes, mechanisms and root causes, a field reliability prediction is performed for
the in-service item. If the failure modes, mechanisms and root causes are identical,
the field reliability prediction for the in-service item may used for the new item. If
MSc Thesis: Qualification of new technology for capture of CO2 in coal-fired power plants Bjørn Utgård, Norwegian University of Science and Technology, September 2007
27 | P a g e
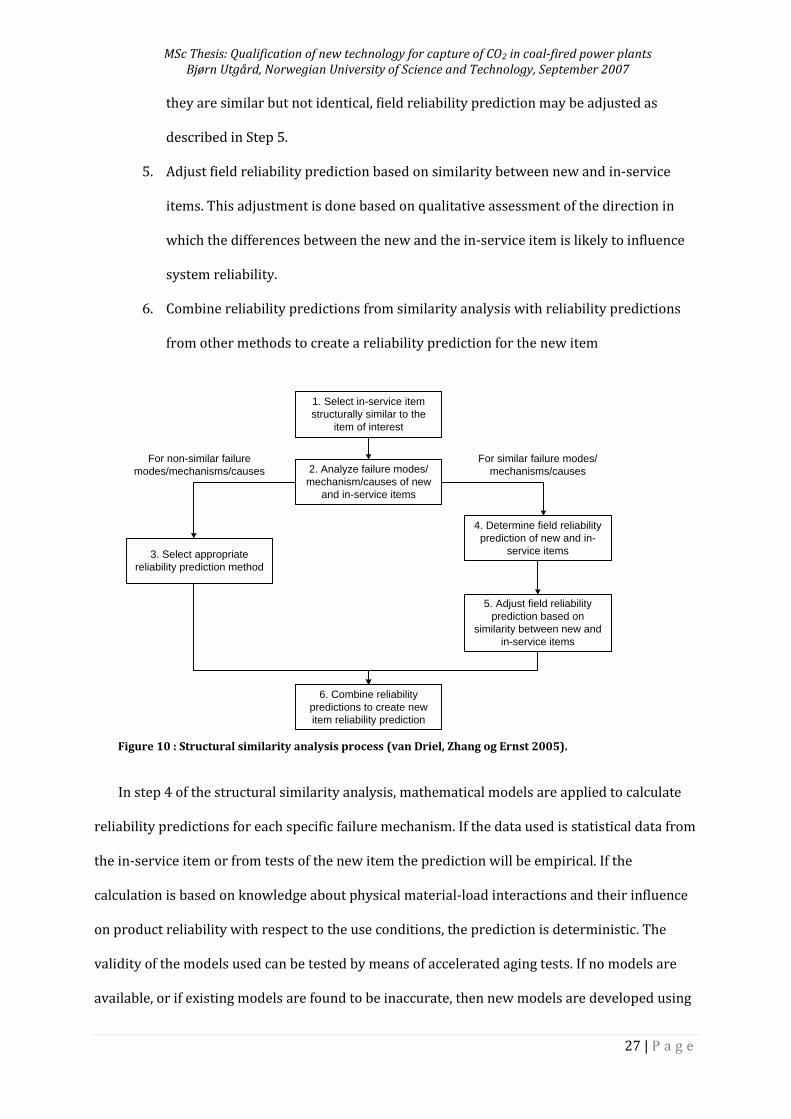
they are similar but not identical, field reliability prediction may be adjusted as
described in Step 5.
5. Adjust field reliability prediction based on similarity between new and in-service
items. This adjustment is done based on qualitative assessment of the direction in
which the differences between the new and the in-service item is likely to influence
system reliability.
6. Combine reliability predictions from similarity analysis with reliability predictions
from other methods to create a reliability prediction for the new item
1. Select in-service item
structurally similar to the
item of interest
2. Analyze failure modes/
mechanism/causes of new
and in-service items
For similar failure modes/
mechanisms/causes
4. Determine field reliability
prediction of new and in-
service items
5. Adjust field reliability
prediction based on
similarity between new and
in-service items
3. Select appropriate
reliability prediction method
For non-similar failure
modes/mechanisms/causes
6. Combine reliability
predictions to create new
item reliability prediction
Figure 10 : Structural similarity analysis process (van Driel, Zhang og Ernst 2005).
In step 4 of the structural similarity analysis, mathematical models are applied to calculate
reliability predictions for each specific failure mechanism. If the data used is statistical data from
the in-service item or from tests of the new item the prediction will be empirical. If the
calculation is based on knowledge about physical material-load interactions and their influence
on product reliability with respect to the use conditions, the prediction is deterministic. The
validity of the models used can be tested by means of accelerated aging tests. If no models are
available, or if existing models are found to be inaccurate, then new models are developed using
MSc Thesis: Qualification of new technology for capture of CO2 in coal-fired power plants Bjørn Utgård, Norwegian University of Science and Technology, September 2007
28 | P a g e
a series of experiments, statistically designed to identify the most important design and
environmental factors governing failure and the mathematical relationship linking those factors
to the time to failure. Reliability prediction by means of testing is described below.
Physics-of-Failure
Physics-of-Failure (PoF) is a proactive, deterministic approach to reliability prediction. This
approach has along with structural similarity analysis been successfully applied in the
semiconductor industry, see Pecht and Dasgupta (1995) and Gerling, Preussger and Wulfert
(2002). The use of the PoF concept for qualification is based on the understanding that reliability
depends on the stability of product elements properties, their materials and the interaction
between them, and that these change in response to (external or internal) stresses applied in
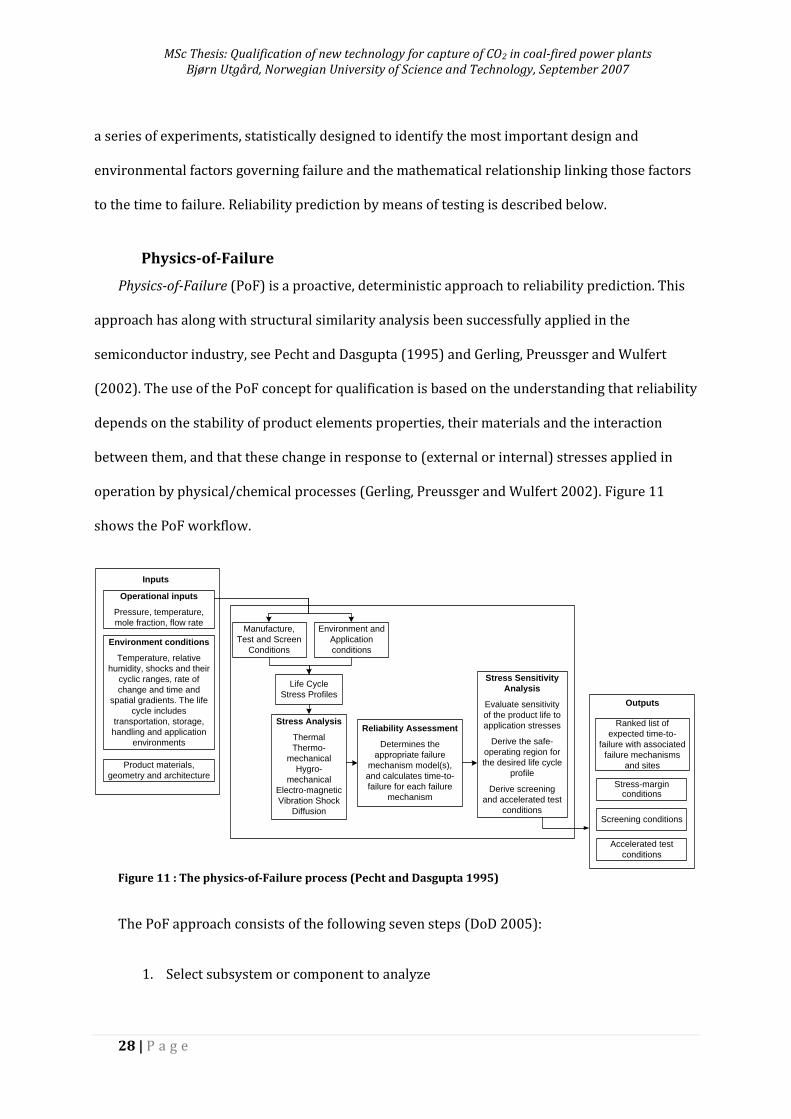
operation by physical/chemical processes (Gerling, Preussger and Wulfert 2002). Figure 11
shows the PoF workflow.
Operational inputs
Pressure, temperature,
mole fraction, flow rate
Environment conditions
Temperature, relative
humidity, shocks and their
cyclic ranges, rate of
change and time and
spatial gradients. The life
cycle includes
transportation, storage,
handling and application
environments
Product materials,
geometry and architecture
Inputs
Manufacture,
Test and Screen
Conditions
Environment and
Application
conditions
Life Cycle
Stress Profiles
Stress Analysis
Thermal
Thermo-
mechanical
Hygro-
mechanical
Electro-magnetic
Vibration Shock
Diffusion
Reliability Assessment
Determines the
appropriate failure
mechanism model(s),
and calculates time-to-
failure for each failure
mechanism
Stress Sensitivity
Analysis
Evaluate sensitivity
of the product life to
application stresses
Derive the safe-
operating region for
the desired life cycle
profile
Derive screening
and accelerated test
conditions
Ranked list of
expected time-to-
failure with associated
failure mechanisms
and sites
Stress-margin conditions
Accelerated test
conditions
Outputs
Screening conditions
Figure 11 : The physics-of-Failure process (Pecht and Dasgupta 1995)
The PoF approach consists of the following seven steps (DoD 2005):
1. Select subsystem or component to analyze
MSc Thesis: Qualification of new technology for capture of CO2 in coal-fired power plants Bjørn Utgård, Norwegian University of Science and Technology, September 2007
29 | P a g e
a. Determine which subsystem or components are most functionally critical to
the operation of the system
b. Identify which subsystem or component has the highest likelihood of failure.
2. Examine operational and environmental loads and the preliminary design to identify
potential failure sites and failure modes. This is similar to the failure analysis
methods discussed in Section 2.3.2.
3. Analyze the stresses (including thermal stresses, thermal cycling, vibration,
mechanical shock, humidity, humidity cycling, voltage and current) that affect the
potential failure mechanisms.
4. Identify appropriate failure models (stress-life relationships) and their input
parameters (material characteristics, damage properties, relevant geometry at
failure sites, manufacturing flaws and defects, environmental and operating loads).
When possible, the variability for each design parameter is identified here.
5. After the model is developed, predict reliability characteristics (time-to-failure or
lifetime) of the potential failure mechanisms in the test, operational or usage
environment. Probabilistic time-to-failure estimates should preferably be calculated
for the variability of input parameters and process characteristics.
6. Perform physical testing (life testing, accelerated-life testing, instrumented terrain
tests, instrumented drop tests or other tests) to validate the modeling process. The
objective here is to validate the stress analysis, verify that the identified failure
mechanisms will occur, and to determine if there are unexpected failure
mechanisms.
7. Redesign to eliminate failure mechanisms, or if this is not feasible, plan a preventive
maintenance program to replace the affected items before they cause a system
failure.
MSc Thesis: Qualification of new technology for capture of CO2 in coal-fired power plants Bjørn Utgård, Norwegian University of Science and Technology, September 2007
30 | P a g e
Performance and reliability testing
Usually used in combination with other methods, or as a validation of these (see for example
stage 6 of the PoF process), the benefit of tests is that they include actual equipment operational
experience. This makes possible the discovery of unexpected failure modes and experimentation
for robustness development (Clausing and Fey 2004). The main disadvantage of testing is its
time and cost penalty on the development cycle.
One of the most critical aspects of reliability or qualification testing is planning. Some
general test considerations in this respect are given below (DoD 2005):
1. A structured system for collecting and storing gathered data is highly desirable. The
database should include test start and stop times and dates, environmental
conditions, transients, transient durations, unit responses, etc. If the event of failure
the results of the subsequent root cause analysis along with identified corrective
actions and design modifications should also be stored in the database. This
information is useful to understand the circumstances leading to failure.
2. Tests can be performed at material, component, subsystem or fully integrated system
level. Testing of the integrated system at full scale in actual environmental conditions
is usually prohibitively expensive. Tests are therefore often conducted at lower
levels of the system. If failure due to interaction of various components is negligible,
reliability data at lower levels can be combined to infer reliability at the next higher
level of the system hierarchy.
3. Some failures can be excluded from the results if it after rigorous failure analysis is
proved that they can be ascribed to conditions related to circumstances of the test
(test fixture, test software or environmental conditions that will not be present in the
actual use environment).
MSc Thesis: Qualification of new technology for capture of CO2 in coal-fired power plants Bjørn Utgård, Norwegian University of Science and Technology, September 2007
31 | P a g e
4. Multiple failures due to the same cause or exhibiting the same failure mode should
not be aggregated and should instead be counted as individual events.
Testing can be done at the specified loading levels and environmental conditions, which is
the case for reliability demonstration tests and various kinds of manufacturing tests. Common
for this kind of tests is that they are performed at the later stages in development cycle, typical
to the reactive approach discussed in Section 2.2.2.
To verify within a short time the life-cycle reliability of items that are expected to last for a
long period of time (order of several years), some sort of acceleration (elevation) of test
conditions (number of cycles, loads and stresses, temperature, pressure) is necessary. The goal
of accelerated testing is to accelerate the damage accumulation rate for the relevant wear-out
failure mechanisms. The level of acceleration is indicated by an acceleration factor which is
defined as the ratio of the life under real life-cycle conditions to the life under accelerated test
conditions. The data obtained must be quantitatively extrapolated from the test results to
provide a prediction of reliability in use conditions. In this case, uncertainty is added to the
qualification since it is not necessarily given that the up-scaled data accurately indicates the
performance that will be delivered by the integrated product in the actual conditions. Hence,
confidence in results from tests performed with accelerated conditions is expectedly lower than
if the tests were performed in realistic conditions, but may still be acceptable (DoD 2005).
A comprehensive account and evaluation of the appropriateness of the various types of tests
available for testing performance and reliability is beyond the scope of the current work. It is
however appropriate to emphasize the fact that testing is both time-consuming and costly. It is
therefore commendable to put effort into optimizing the utility of their results and evaluate
precisely the extent to which testing is strictly necessary, that is, identify the parts of the
technology that actually are new (see Section 2.1).
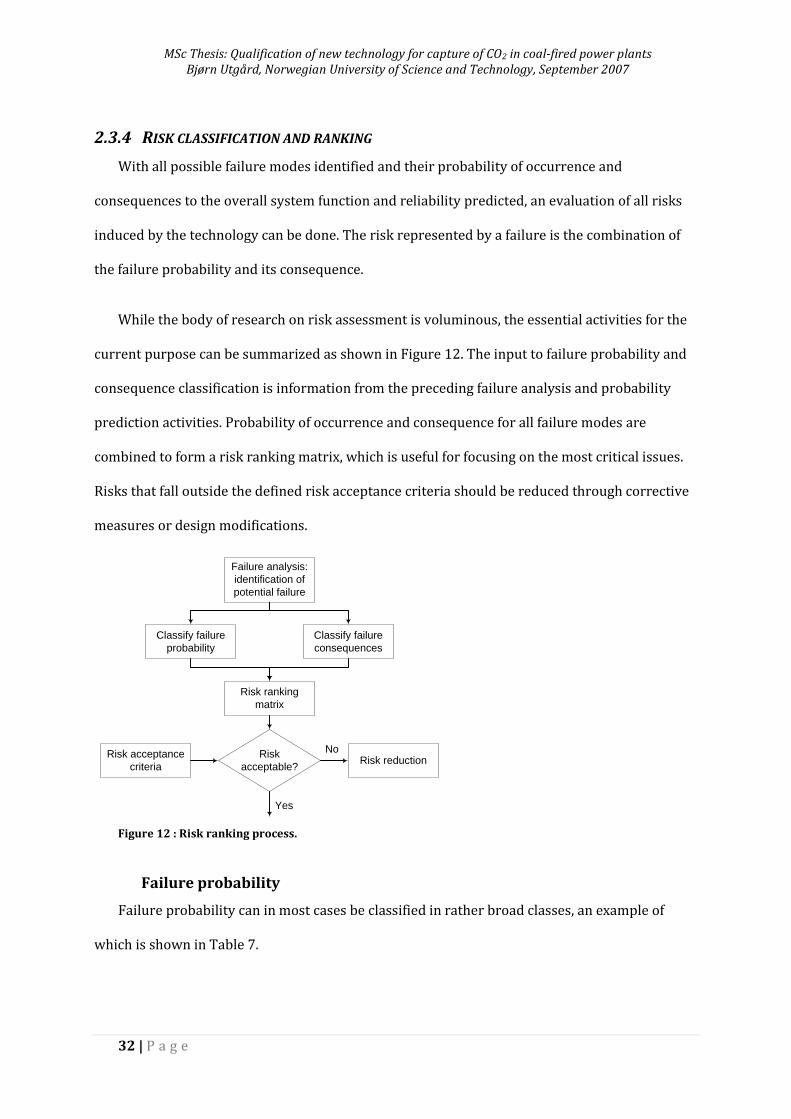
MSc Thesis: Qualification of new technology for capture of CO2 in coal-fired power plants Bjørn Utgård, Norwegian University of Science and Technology, September 2007
32 | P a g e
2.3.4 RISK CLASSIFICATION AND RANKING
With all possible failure modes identified and their probability of occurrence and
consequences to the overall system function and reliability predicted, an evaluation of all risks
induced by the technology can be done. The risk represented by a failure is the combination of
the failure probability and its consequence.
While the body of research on risk assessment is voluminous, the essential activities for the
current purpose can be summarized as shown in Figure 12. The input to failure probability and
consequence classification is information from the preceding failure analysis and probability
prediction activities. Probability of occurrence and consequence for all failure modes are
combined to form a risk ranking matrix, which is useful for focusing on the most critical issues.
Risks that fall outside the defined risk acceptance criteria should be reduced through corrective
measures or design modifications.
Classify failure
probability
Classify failure
consequences
Failure analysis:
identification of
potential failure
Risk ranking
matrix
Risk acceptance
criteria
Risk
acceptable?Risk reduction
No
Yes
Figure 12 : Risk ranking process.
Failure probability
Failure probability can in most cases be classified in rather broad classes, an example of
which is shown in Table 7.
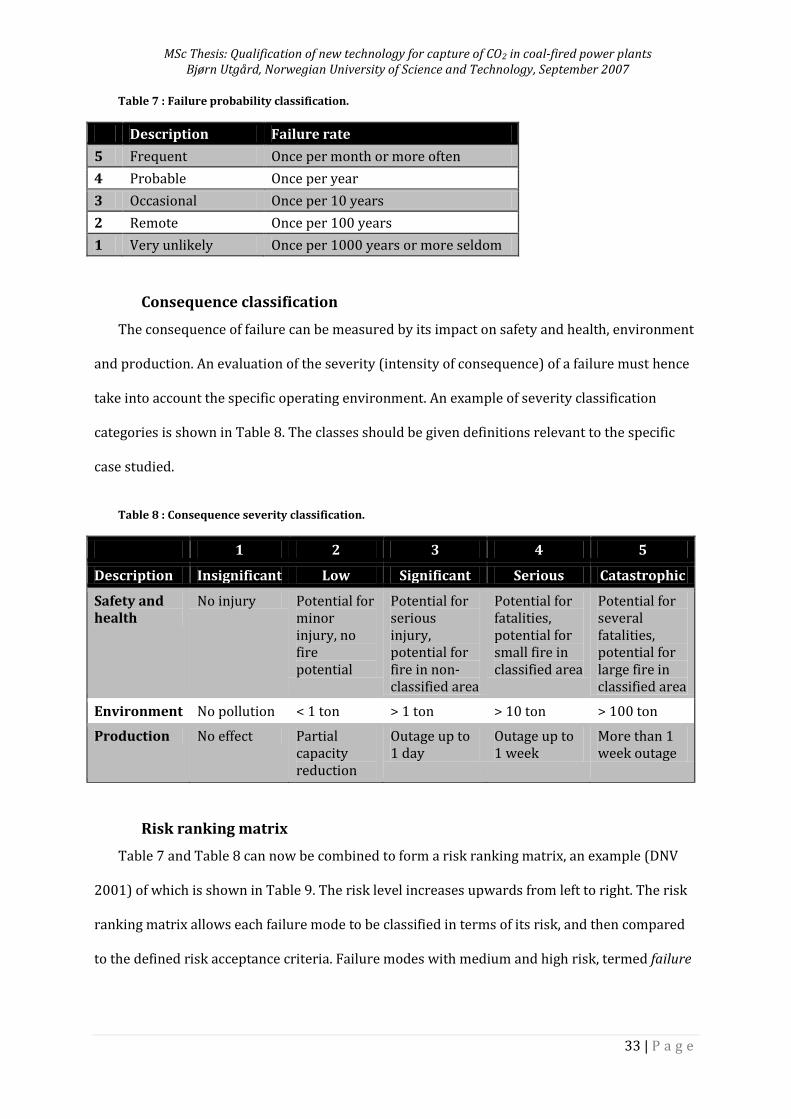
MSc Thesis: Qualification of new technology for capture of CO2 in coal-fired power plants Bjørn Utgård, Norwegian University of Science and Technology, September 2007
33 | P a g e
Table 7 : Failure probability classification.
Description Failure rate
5 Frequent Once per month or more often
4 Probable Once per year
3 Occasional Once per 10 years
2 Remote Once per 100 years
1 Very unlikely Once per 1000 years or more seldom
Consequence classification
The consequence of failure can be measured by its impact on safety and health, environment
and production. An evaluation of the severity (intensity of consequence) of a failure must hence
take into account the specific operating environment. An example of severity classification
categories is shown in Table 8. The classes should be given definitions relevant to the specific
case studied.
Table 8 : Consequence severity classification.
1 2 3 4 5
Description Insignificant Low Significant Serious Catastrophic
Safety and health
No injury Potential for minor injury, no fire potential
Potential for serious injury, potential for fire in non-classified area
Potential for fatalities, potential for small fire in classified area
Potential for several fatalities, potential for large fire in classified area
Environment No pollution < 1 ton > 1 ton > 10 ton > 100 ton
Production No effect Partial capacity reduction
Outage up to 1 day
Outage up to 1 week
More than 1 week outage
Risk ranking matrix
Table 7 and Table 8 can now be combined to form a risk ranking matrix, an example (DNV
2001) of which is shown in Table 9. The risk level increases upwards from left to right. The risk
ranking matrix allows each failure mode to be classified in terms of its risk, and then compared
to the defined risk acceptance criteria. Failure modes with medium and high risk, termed failure
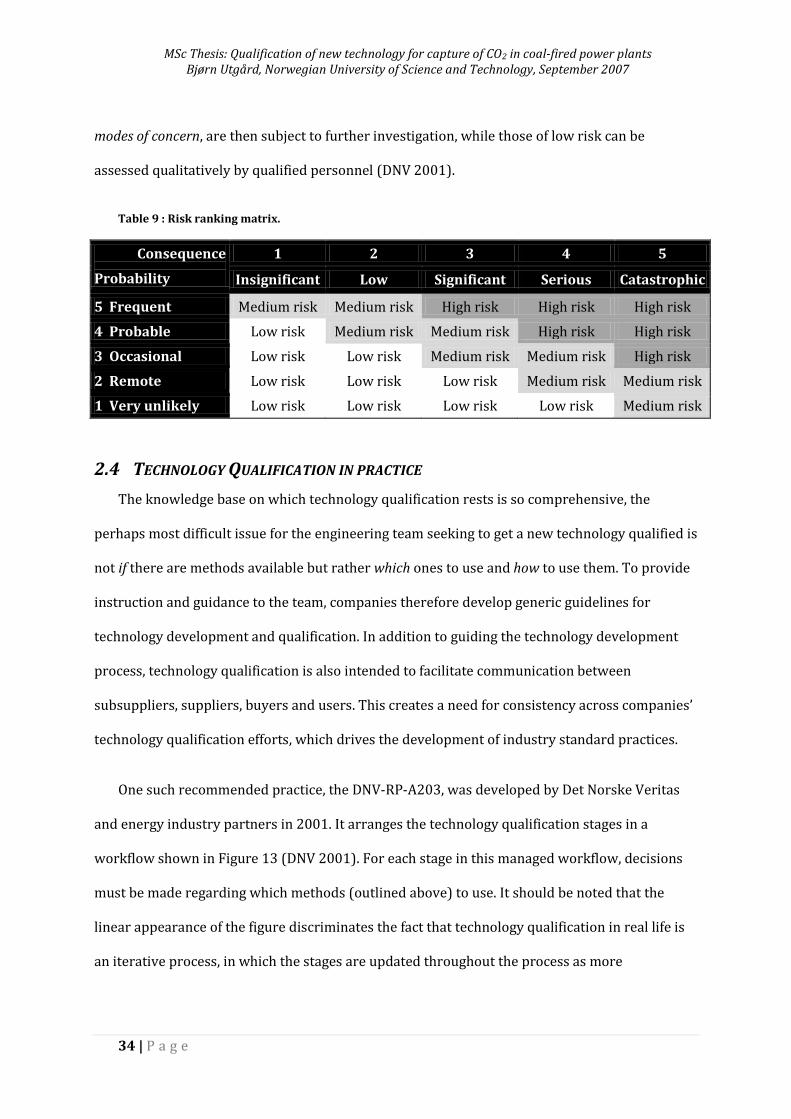
MSc Thesis: Qualification of new technology for capture of CO2 in coal-fired power plants Bjørn Utgård, Norwegian University of Science and Technology, September 2007
34 | P a g e
modes of concern, are then subject to further investigation, while those of low risk can be
assessed qualitatively by qualified personnel (DNV 2001).
Table 9 : Risk ranking matrix.
Consequence
Probability
1 2 3 4 5
Insignificant Low Significant Serious Catastrophic
5 Frequent Medium risk Medium risk High risk High risk High risk
4 Probable Low risk Medium risk Medium risk High risk High risk
3 Occasional Low risk Low risk Medium risk Medium risk High risk
2 Remote Low risk Low risk Low risk Medium risk Medium risk
1 Very unlikely Low risk Low risk Low risk Low risk Medium risk
2.4 TECHNOLOGY QUALIFICATION IN PRACTICE
The knowledge base on which technology qualification rests is so comprehensive, the
perhaps most difficult issue for the engineering team seeking to get a new technology qualified is
not if there are methods available but rather which ones to use and how to use them. To provide
instruction and guidance to the team, companies therefore develop generic guidelines for
technology development and qualification. In addition to guiding the technology development
process, technology qualification is also intended to facilitate communication between
subsuppliers, suppliers, buyers and users. This creates a need for consistency across companies’
technology qualification efforts, which drives the development of industry standard practices.
One such recommended practice, the DNV-RP-A203, was developed by Det Norske Veritas
and energy industry partners in 2001. It arranges the technology qualification stages in a
workflow shown in Figure 13 (DNV 2001). For each stage in this managed workflow, decisions
must be made regarding which methods (outlined above) to use. It should be noted that the
linear appearance of the figure discriminates the fact that technology qualification in real life is
an iterative process, in which the stages are updated throughout the process as more
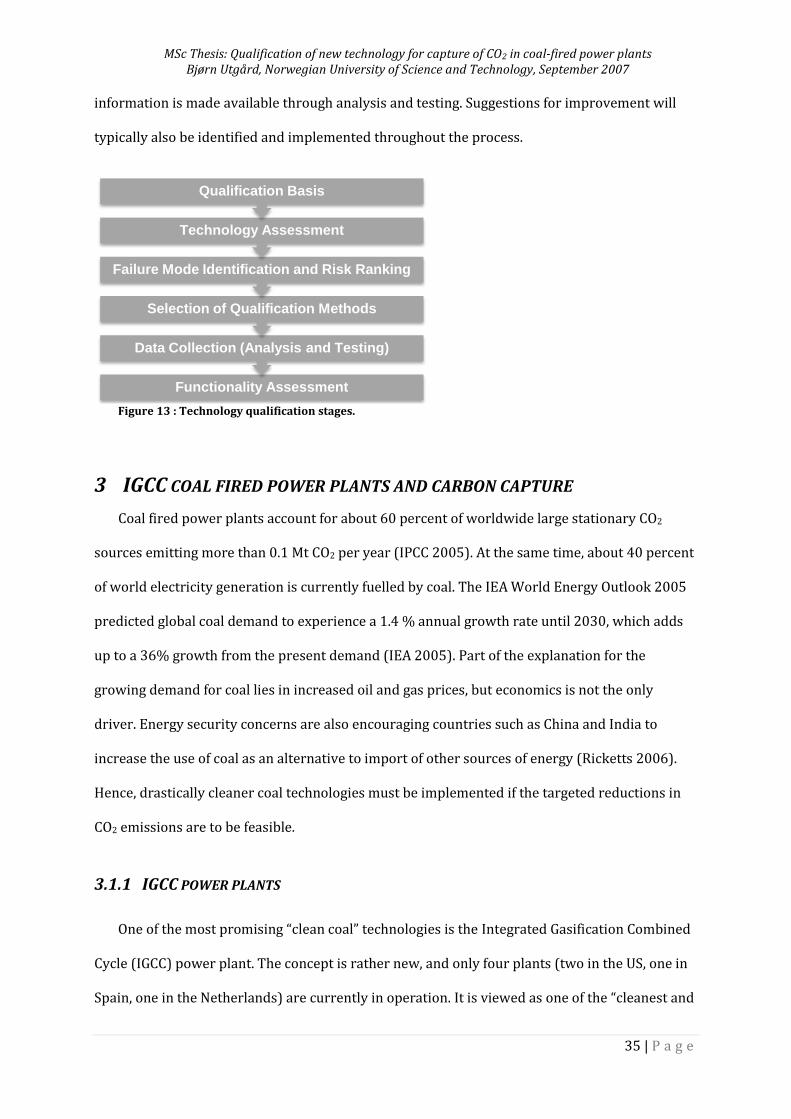
MSc Thesis: Qualification of new technology for capture of CO2 in coal-fired power plants Bjørn Utgård, Norwegian University of Science and Technology, September 2007
35 | P a g e
information is made available through analysis and testing. Suggestions for improvement will
typically also be identified and implemented throughout the process.
Figure 13 : Technology qualification stages.
3 IGCC COAL FIRED POWER PLANTS AND CARBON CAPTURE
Coal fired power plants account for about 60 percent of worldwide large stationary CO2
sources emitting more than 0.1 Mt CO2 per year (IPCC 2005). At the same time, about 40 percent
of world electricity generation is currently fuelled by coal. The IEA World Energy Outlook 2005
predicted global coal demand to experience a 1.4 % annual growth rate until 2030, which adds
up to a 36% growth from the present demand (IEA 2005). Part of the explanation for the
growing demand for coal lies in increased oil and gas prices, but economics is not the only
driver. Energy security concerns are also encouraging countries such as China and India to
increase the use of coal as an alternative to import of other sources of energy (Ricketts 2006).
Hence, drastically cleaner coal technologies must be implemented if the targeted reductions in
CO2 emissions are to be feasible.
3.1.1 IGCC POWER PLANTS
One of the most promising “clean coal” technologies is the Integrated Gasification Combined
Cycle (IGCC) power plant. The concept is rather new, and only four plants (two in the US, one in
Spain, one in the Netherlands) are currently in operation. It is viewed as one of the “cleanest and
Functionality Assessment
Data Collection (Analysis and Testing)
Selection of Qualification Methods
Failure Mode Identification and Risk Ranking
Technology Assessment
Qualification Basis
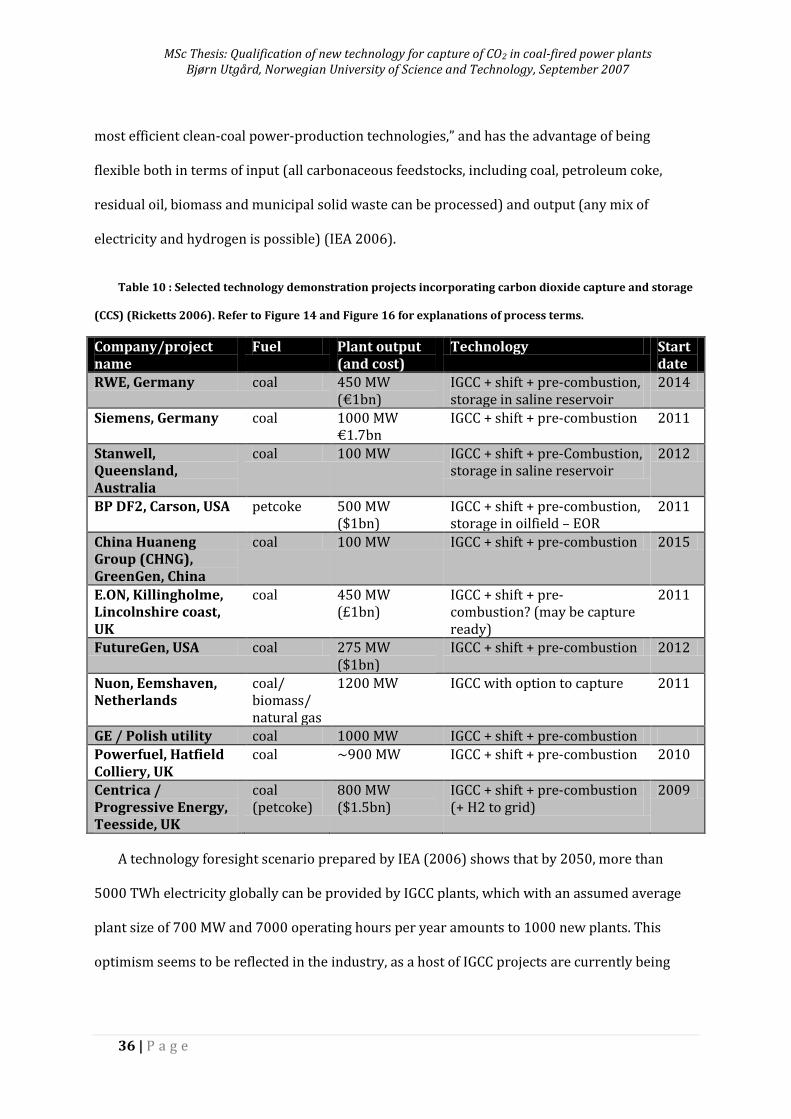
MSc Thesis: Qualification of new technology for capture of CO2 in coal-fired power plants Bjørn Utgård, Norwegian University of Science and Technology, September 2007
36 | P a g e
most efficient clean-coal power-production technologies,” and has the advantage of being
flexible both in terms of input (all carbonaceous feedstocks, including coal, petroleum coke,
residual oil, biomass and municipal solid waste can be processed) and output (any mix of
electricity and hydrogen is possible) (IEA 2006).
Table 10 : Selected technology demonstration projects incorporating carbon dioxide capture and storage
(CCS) (Ricketts 2006). Refer to Figure 14 and Figure 16 for explanations of process terms.
Company/project name
Fuel Plant output (and cost)
Technology Start date
RWE, Germany coal 450 MW (€1bn)
IGCC + shift + pre-combustion, storage in saline reservoir
2014
Siemens, Germany coal 1000 MW €1.7bn
IGCC + shift + pre-combustion 2011
Stanwell, Queensland, Australia
coal 100 MW IGCC + shift + pre-Combustion, storage in saline reservoir
2012
BP DF2, Carson, USA petcoke 500 MW ($1bn)
IGCC + shift + pre-combustion, storage in oilfield – EOR
2011
China Huaneng Group (CHNG), GreenGen, China
coal 100 MW IGCC + shift + pre-combustion 2015
E.ON, Killingholme, Lincolnshire coast, UK
coal 450 MW (£1bn)
IGCC + shift + pre-combustion? (may be capture ready)
2011
FutureGen, USA coal 275 MW ($1bn)
IGCC + shift + pre-combustion 2012
Nuon, Eemshaven, Netherlands
coal/ biomass/ natural gas
1200 MW IGCC with option to capture 2011
GE / Polish utility coal 1000 MW IGCC + shift + pre-combustion
Powerfuel, Hatfield Colliery, UK
coal ~900 MW IGCC + shift + pre-combustion 2010
Centrica / Progressive Energy, Teesside, UK
coal (petcoke)
800 MW ($1.5bn)
IGCC + shift + pre-combustion (+ H2 to grid)
2009
A technology foresight scenario prepared by IEA (2006) shows that by 2050, more than
5000 TWh electricity globally can be provided by IGCC plants, which with an assumed average
plant size of 700 MW and 7000 operating hours per year amounts to 1000 new plants. This
optimism seems to be reflected in the industry, as a host of IGCC projects are currently being
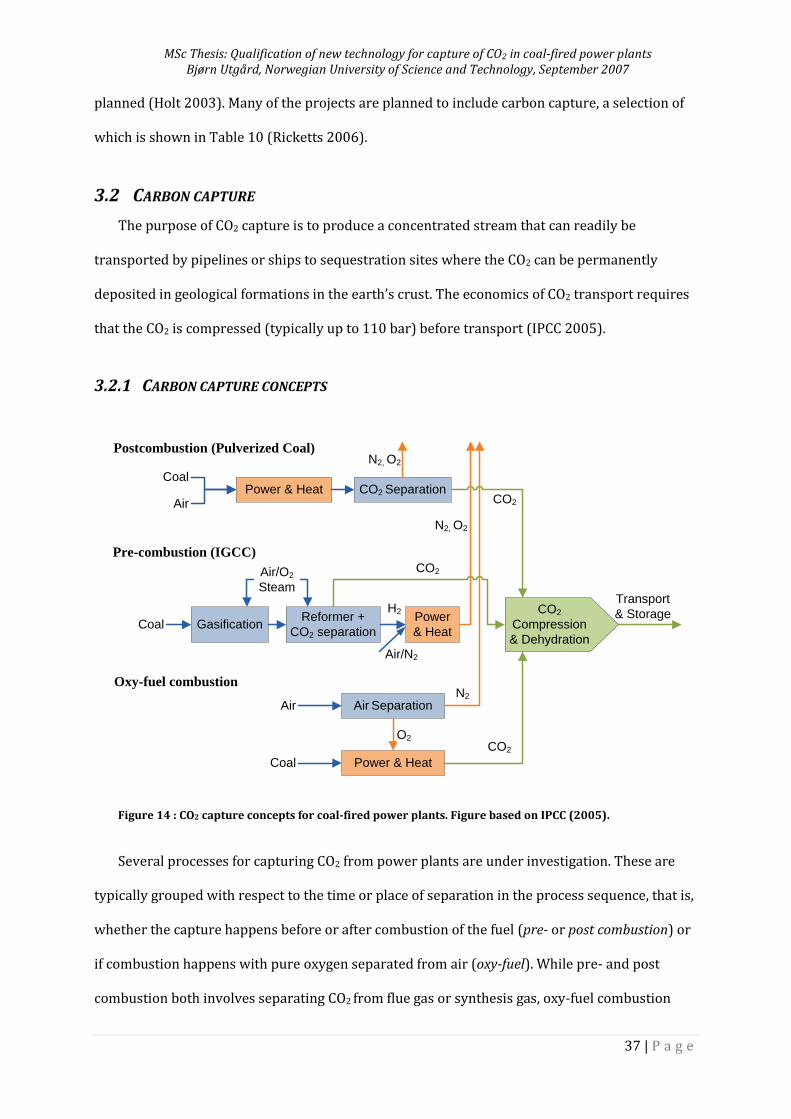
MSc Thesis: Qualification of new technology for capture of CO2 in coal-fired power plants Bjørn Utgård, Norwegian University of Science and Technology, September 2007
37 | P a g e
planned (Holt 2003). Many of the projects are planned to include carbon capture, a selection of
which is shown in Table 10 (Ricketts 2006).
3.2 CARBON CAPTURE
The purpose of CO2 capture is to produce a concentrated stream that can readily be
transported by pipelines or ships to sequestration sites where the CO2 can be permanently
deposited in geological formations in the earth’s crust. The economics of CO2 transport requires
that the CO2 is compressed (typically up to 110 bar) before transport (IPCC 2005).
3.2.1 CARBON CAPTURE CONCEPTS
Power & Heat CO2 Separation
GasificationReformer +
CO2 separation
Power
& Heat
H2
Coal
Coal
Air
Air/O2
Steam
CO2
CO2
Air/N2
N2, O2
Coal
Air Separation
Power & Heat
O2
N2, O2
AirN2
CO2
Transport
& Storage
Postcombustion (Pulverized Coal)
Pre-combustion (IGCC)
Oxy-fuel combustion
CO2
Compression
& Dehydration
Figure 14 : CO2 capture concepts for coal-fired power plants. Figure based on IPCC (2005).
Several processes for capturing CO2 from power plants are under investigation. These are
typically grouped with respect to the time or place of separation in the process sequence, that is,
whether the capture happens before or after combustion of the fuel (pre- or post combustion) or
if combustion happens with pure oxygen separated from air (oxy-fuel). While pre- and post
combustion both involves separating CO2 from flue gas or synthesis gas, oxy-fuel combustion
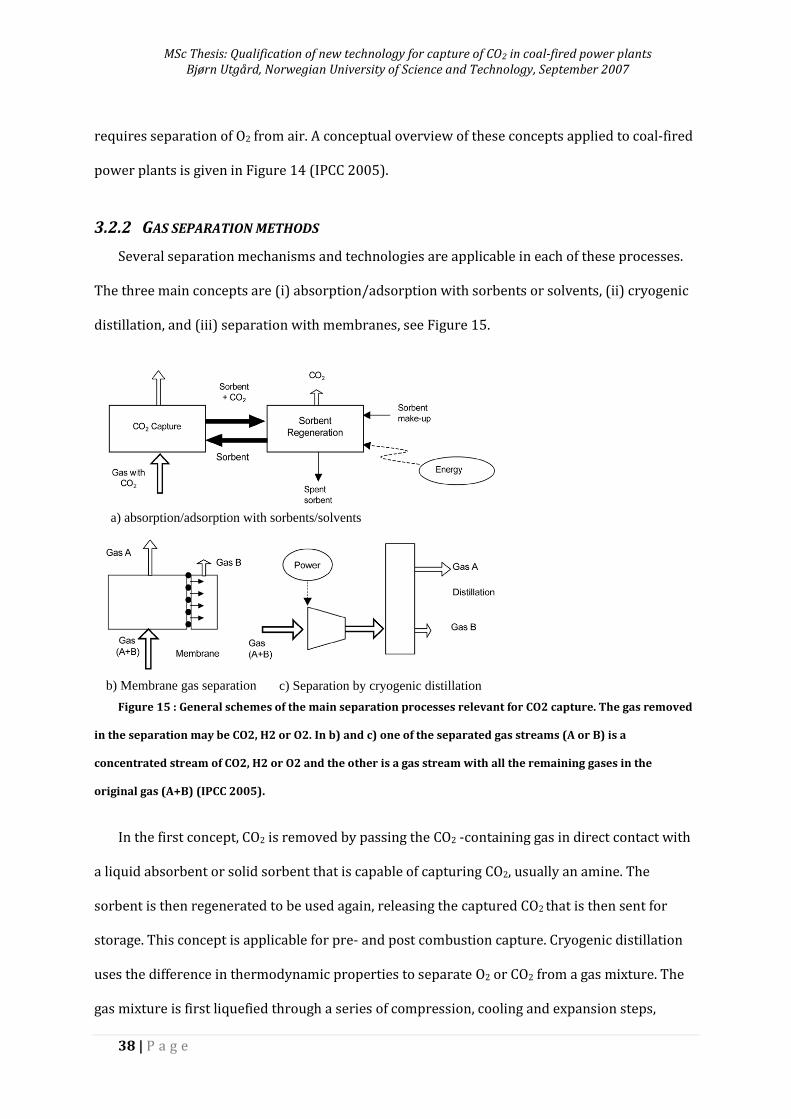
MSc Thesis: Qualification of new technology for capture of CO2 in coal-fired power plants Bjørn Utgård, Norwegian University of Science and Technology, September 2007
38 | P a g e
requires separation of O2 from air. A conceptual overview of these concepts applied to coal-fired
power plants is given in Figure 14 (IPCC 2005).
3.2.2 GAS SEPARATION METHODS
Several separation mechanisms and technologies are applicable in each of these processes.
The three main concepts are (i) absorption/adsorption with sorbents or solvents, (ii) cryogenic
distillation, and (iii) separation with membranes, see Figure 15.
a) absorption/adsorption with sorbents/solvents
c) Separation by cryogenic distillationb) Membrane gas separation
Figure 15 : General schemes of the main separation processes relevant for CO2 capture. The gas removed
in the separation may be CO2, H2 or O2. In b) and c) one of the separated gas streams (A or B) is a
concentrated stream of CO2, H2 or O2 and the other is a gas stream with all the remaining gases in the
original gas (A+B) (IPCC 2005).
In the first concept, CO2 is removed by passing the CO2 -containing gas in direct contact with
a liquid absorbent or solid sorbent that is capable of capturing CO2, usually an amine. The
sorbent is then regenerated to be used again, releasing the captured CO2 that is then sent for
storage. This concept is applicable for pre- and post combustion capture. Cryogenic distillation
uses the difference in thermodynamic properties to separate O2 or CO2 from a gas mixture. The
gas mixture is first liquefied through a series of compression, cooling and expansion steps,
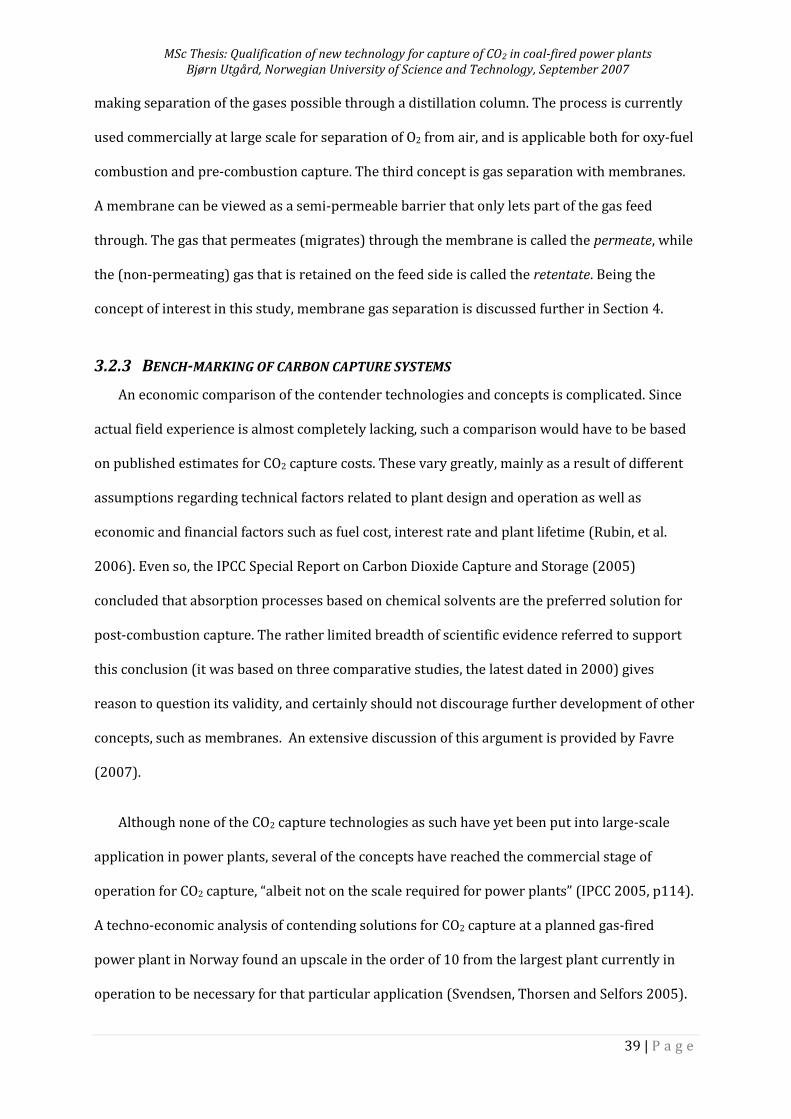
MSc Thesis: Qualification of new technology for capture of CO2 in coal-fired power plants Bjørn Utgård, Norwegian University of Science and Technology, September 2007
39 | P a g e
making separation of the gases possible through a distillation column. The process is currently
used commercially at large scale for separation of O2 from air, and is applicable both for oxy-fuel
combustion and pre-combustion capture. The third concept is gas separation with membranes.
A membrane can be viewed as a semi-permeable barrier that only lets part of the gas feed
through. The gas that permeates (migrates) through the membrane is called the permeate, while
the (non-permeating) gas that is retained on the feed side is called the retentate. Being the
concept of interest in this study, membrane gas separation is discussed further in Section 4.
3.2.3 BENCH-MARKING OF CARBON CAPTURE SYSTEMS
An economic comparison of the contender technologies and concepts is complicated. Since
actual field experience is almost completely lacking, such a comparison would have to be based
on published estimates for CO2 capture costs. These vary greatly, mainly as a result of different
assumptions regarding technical factors related to plant design and operation as well as
economic and financial factors such as fuel cost, interest rate and plant lifetime (Rubin, et al.
2006). Even so, the IPCC Special Report on Carbon Dioxide Capture and Storage (2005)
concluded that absorption processes based on chemical solvents are the preferred solution for
post-combustion capture. The rather limited breadth of scientific evidence referred to support
this conclusion (it was based on three comparative studies, the latest dated in 2000) gives
reason to question its validity, and certainly should not discourage further development of other
concepts, such as membranes. An extensive discussion of this argument is provided by Favre
(2007).
Although none of the CO2 capture technologies as such have yet been put into large-scale
application in power plants, several of the concepts have reached the commercial stage of
operation for CO2 capture, “albeit not on the scale required for power plants” (IPCC 2005, p114).
A techno-economic analysis of contending solutions for CO2 capture at a planned gas-fired
power plant in Norway found an upscale in the order of 10 from the largest plant currently in
operation to be necessary for that particular application (Svendsen, Thorsen and Selfors 2005).
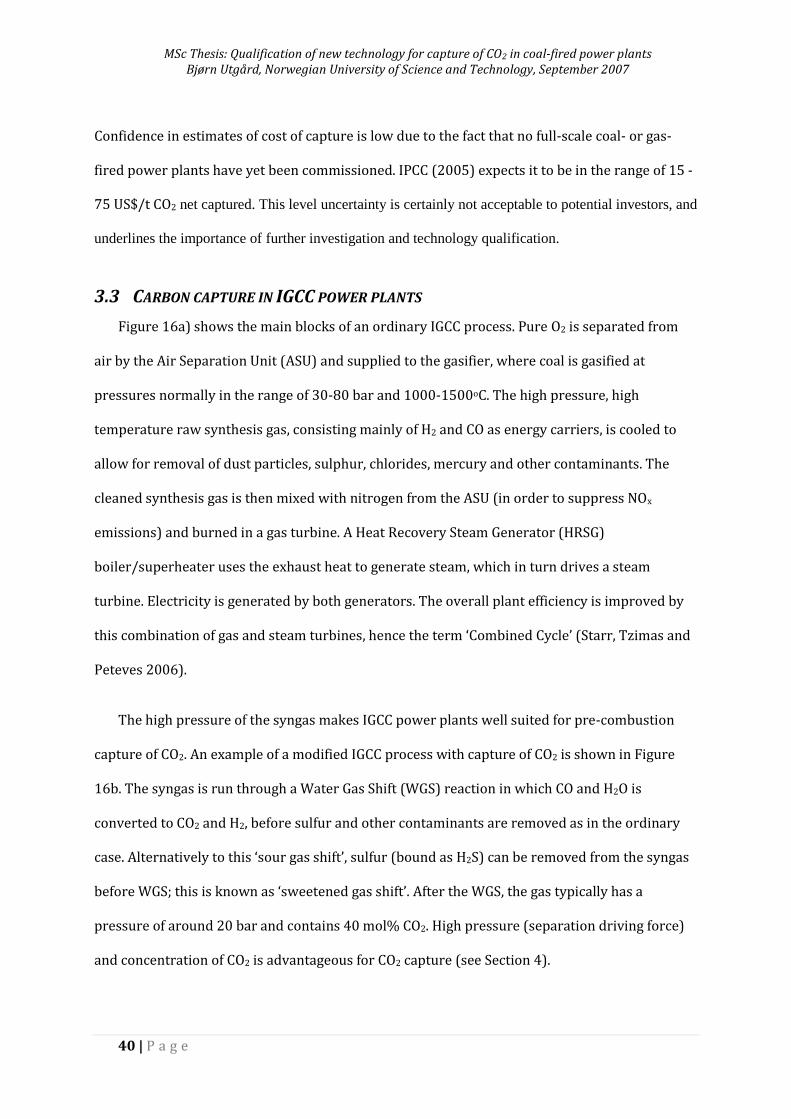
MSc Thesis: Qualification of new technology for capture of CO2 in coal-fired power plants Bjørn Utgård, Norwegian University of Science and Technology, September 2007
40 | P a g e
Confidence in estimates of cost of capture is low due to the fact that no full-scale coal- or gas-
fired power plants have yet been commissioned. IPCC (2005) expects it to be in the range of 15 -
75 US$/t CO2 net captured. This level uncertainty is certainly not acceptable to potential investors, and
underlines the importance of further investigation and technology qualification.
3.3 CARBON CAPTURE IN IGCC POWER PLANTS
Figure 16a) shows the main blocks of an ordinary IGCC process. Pure O2 is separated from
air by the Air Separation Unit (ASU) and supplied to the gasifier, where coal is gasified at
pressures normally in the range of 30-80 bar and 1000-1500oC. The high pressure, high
temperature raw synthesis gas, consisting mainly of H2 and CO as energy carriers, is cooled to
allow for removal of dust particles, sulphur, chlorides, mercury and other contaminants. The
cleaned synthesis gas is then mixed with nitrogen from the ASU (in order to suppress NOx
emissions) and burned in a gas turbine. A Heat Recovery Steam Generator (HRSG)
boiler/superheater uses the exhaust heat to generate steam, which in turn drives a steam
turbine. Electricity is generated by both generators. The overall plant efficiency is improved by
this combination of gas and steam turbines, hence the term ‘Combined Cycle’ (Starr, Tzimas and
Peteves 2006).
The high pressure of the syngas makes IGCC power plants well suited for pre-combustion
capture of CO2. An example of a modified IGCC process with capture of CO2 is shown in Figure
16b. The syngas is run through a Water Gas Shift (WGS) reaction in which CO and H2O is
converted to CO2 and H2, before sulfur and other contaminants are removed as in the ordinary
case. Alternatively to this ‘sour gas shift’, sulfur (bound as H2S) can be removed from the syngas
before WGS; this is known as ‘sweetened gas shift’. After the WGS, the gas typically has a
pressure of around 20 bar and contains 40 mol% CO2. High pressure (separation driving force)
and concentration of CO2 is advantageous for CO2 capture (see Section 4).
MSc Thesis: Qualification of new technology for capture of CO2 in coal-fired power plants Bjørn Utgård, Norwegian University of Science and Technology, September 2007
41 | P a g e
GasifierCombined Cycle
Power BlockPowerO2 Syngas
Air
Separation
Unit (ASU)
GasifierO2
Air
Air
Coal
Slag
Coal
Slag
Gas Clean
Up
Combined
Cycle Power
Block
PowerWater Gas
Shift
CO2 H2
N2
N2
Sulfur, other H2
Gas Clean
Up
a) ordinary IGCC process
b) IGCC process with CO2 capture
Syn-
gas
Sulfur, other
Air Separation
Unit (ASU)
CO2 capture
Figure 16 : IGCC power plant process blocks. Concept a) is the ordinary concept, b) includes CO2 capture.
3.3.1 SYSTEM PERFORMANCE BENCH-MARK
IGCC plants (without CO2) capture currently in operation have efficiencies of about 43%, a
figure that is expected to increase up to 55% due to further technology development in the
coming decades (IEA 2006). Most of the first generation IGCC plants have experienced
availabilities of less than 80% after a number of years in operation, about 5-7% less than
contending coal technologies (e.g. Pulverized Coal plants) (Dalton 2005). This relatively low
figure is attributable to the newness of the technology and can be expected to increase as
experience from the first generation plants is implemented in future installations (Elcogas n.d.).
3.3.2 PROCESS ADAPTION FOR CO2 CAPTURE
While IGCC plants are well suited for carbon capture, several process adaptations must be
made to accommodate carbon capture in IGCC plants. The most notable adaptations are (Dalton
2005):
Gasifiers and ASU need to be oversized to match later CO2 removal (more syngas is
needed)
MSc Thesis: Qualification of new technology for capture of CO2 in coal-fired power plants Bjørn Utgård, Norwegian University of Science and Technology, September 2007
42 | P a g e
More moisture is needed for WGS CO in syngas to CO2, favoring different gasifier
designs
Turbines must be able to handle the modified synthesis gas feed
New burners may be needed as lean pre-mixed low-NOx burners are not suitable for
H2 meaning N2 (from the ASU) would need to be injected
4 GAS SEPARATION MEMBRANES
The fact that gas can permeate through a dense, non-porous material was first scientifically
observed in the mid 19th century (Pandey and Chauhan 2001). Since then, the growing
understanding of the mechanisms by which gas permeates through membranes has made
possible the development of membranes for a host of industrial applications. However,
widespread use was limited by the generally unreliable, non-selective and low-flux performance
of the membranes available. It was not until the late 1970s that separation of gas mixtures of
industrial interest with membranes became economically competitive for certain applications.
Core to this was the invention of new production processes that enabled asymmetric
membranes, which combined the properties of different materials to drastically improve the flux
of the membranes. The further development of gas separation membranes was accelerated in
the 1980s with the application of membranes for large-scale separation of hydrogen from
hydrocarbons and CO2 from air (Fritzsche and Kurz 1990).
4.1 MEMBRANE PERFORMANCE AND ECONOMICS
4.1.1 PERFORMANCE TARGETS
For CO2-capture, target separation performance is typically expressed through the CO2
recovery ratio 𝑅 =𝑄𝑝 ∙𝑦
𝑄𝑖𝑛 ∙𝑥𝑖𝑛 (the fraction of CO2 in the feed that is recovered) and the CO2 mole
fraction y in the permeate (the purity of the CO2 recovered), see Figure 17. The specification of
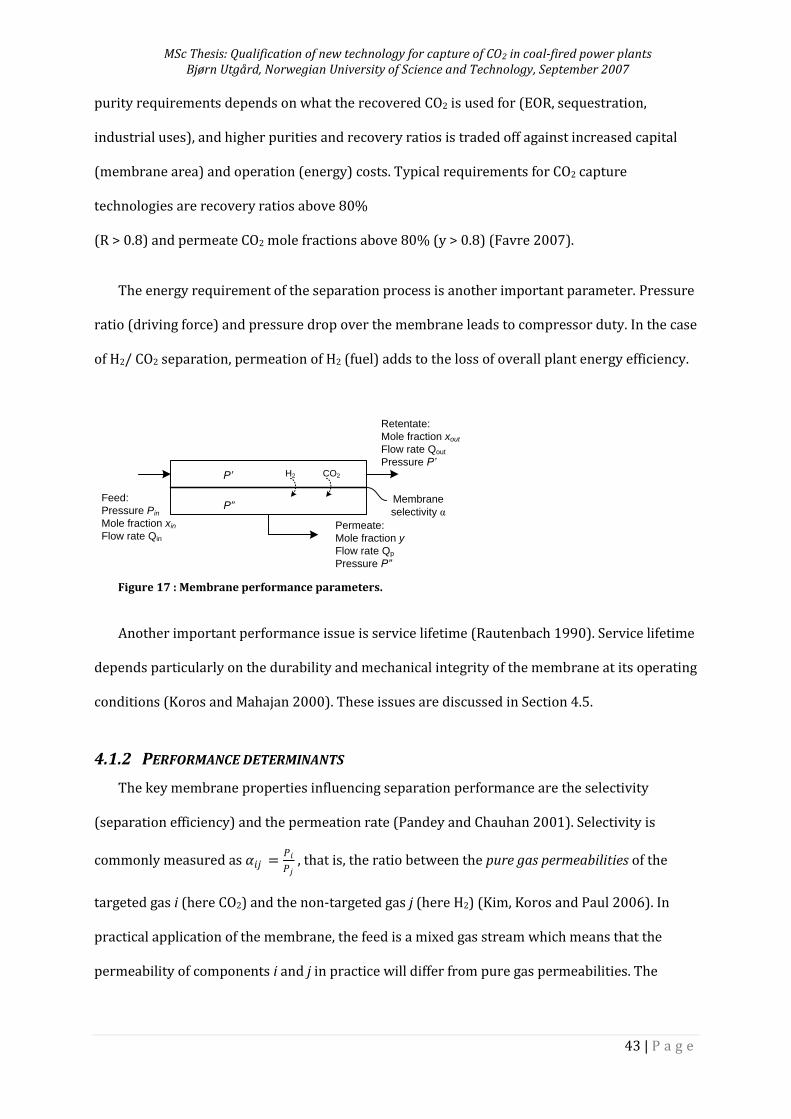
MSc Thesis: Qualification of new technology for capture of CO2 in coal-fired power plants Bjørn Utgård, Norwegian University of Science and Technology, September 2007
43 | P a g e
purity requirements depends on what the recovered CO2 is used for (EOR, sequestration,
industrial uses), and higher purities and recovery ratios is traded off against increased capital
(membrane area) and operation (energy) costs. Typical requirements for CO2 capture
technologies are recovery ratios above 80%
(R > 0.8) and permeate CO2 mole fractions above 80% (y > 0.8) (Favre 2007).
The energy requirement of the separation process is another important parameter. Pressure
ratio (driving force) and pressure drop over the membrane leads to compressor duty. In the case
of H2/ CO2 separation, permeation of H2 (fuel) adds to the loss of overall plant energy efficiency.
Retentate:
Mole fraction xout
Flow rate Qout
Pressure P’
Permeate:
Mole fraction y
Flow rate Qp
Pressure P”
Feed:
Pressure Pin
Mole fraction xin
Flow rate Qin
CO2H2
P”
P’
Membrane
selectivity α
Figure 17 : Membrane performance parameters.
Another important performance issue is service lifetime (Rautenbach 1990). Service lifetime
depends particularly on the durability and mechanical integrity of the membrane at its operating
conditions (Koros and Mahajan 2000). These issues are discussed in Section 4.5.
4.1.2 PERFORMANCE DETERMINANTS
The key membrane properties influencing separation performance are the selectivity
(separation efficiency) and the permeation rate (Pandey and Chauhan 2001). Selectivity is
commonly measured as 𝛼𝑖𝑗 =𝑃𝑖
𝑃𝑗 , that is, the ratio between the pure gas permeabilities of the
targeted gas i (here CO2) and the non-targeted gas j (here H2) (Kim, Koros and Paul 2006). In
practical application of the membrane, the feed is a mixed gas stream which means that the
permeability of components i and j in practice will differ from pure gas permeabilities. The
MSc Thesis: Qualification of new technology for capture of CO2 in coal-fired power plants Bjørn Utgård, Norwegian University of Science and Technology, September 2007
44 | P a g e
definition 𝛼𝑖𝑗 =𝑦𝑖 𝑦𝑗
𝑥𝑖 𝑥𝑗 , where y and x are the compositions of i and j on the permeate and feed
sides respectively, is therefore more correct.
Selectivity depends on material properties and operating factors, such as temperature,
concentration of CO2 in the feed (xin) and pressure ratio (permeate side pressure over retentate
pressure) across the membrane (𝜓 = 𝑃"/𝑃′). The higher the CO2 concentration, the lower the
necessary selectivity to achieve targeted separation performance (Favre 2007). High selectivity
is desirable because it improves process efficiency, lowers the driving force required to achieve
a given separation, and hence reduces operating costs (Koros and Mahajan 2000).
The rate of permeation (migration) of the permeate through the membrane is decided by the
permeability, which depends on the material properties and the thickness of the membrane. The
lower the thickness, the higher the permeation rate, the smaller the required membrane area,
and the lower the capital cost of the membrane system (Koros and Mahajan 2000). High
selectivity and high permeability are thus key objectives when developing membranes for gas
separation. Target values for selectivity and permeance are typically set by use of so-called
tradeoff curves, which enable balancing ideal selectivity versus fast component permeance
(Favre 2007).
4.2 MEMBRANE TYPES
Several distinctions can be made when describing gas separation membranes, such as
transport mechanisms, driving forces, membrane materials, and physical structure. Transport
mechanisms are discussed in line with the outline of facilitated transport in Section 4.3.1; the
latter three are outlined below:
4.2.1 SEPARATION DRIVING FORCES
Three different mechanisms lead to transport of a species through a membrane (Strathmann
1990):
MSc Thesis: Qualification of new technology for capture of CO2 in coal-fired power plants Bjørn Utgård, Norwegian University of Science and Technology, September 2007
45 | P a g e
a) A hydrostatic pressure difference between two phases separated by a membrane leads to
a separation of chemical species when the hydrodynamic permeability of the membrane is
different for different components.
b) A concentration difference between two phases separated by a membrane leads to a
separation of various chemical species when the diffusivity and the concentration of the
various chemical species in the membrane are different for different components.
c) A difference in the electrical potential between two phases separated by a membrane
leads to a separation of various chemical species when the differently charged particles
show different mobilities and concentrations in the membrane.
4.2.2 MEMBRANE MATERIALS
Gas separation membranes can be made from organic materials (typically polymers), non-
organic materials (ceramic, alloy, glass, carbon, zeolite), or hybrids (combinations) of the two.
Polymeric membranes tend to be more economical than other materials and thus dominate
traditional gas separation processes. The economical advantage stems from the ease at which
polymeric materials can be spun into hollow asymmetric fibers or spiral wound modules (Koros
and Mahajan 2000). A disadvantage with polymer materials is that their efficiency tends to
decrease with time due to fouling, compaction, chemical degradation, and thermal instability
(see Section 4.5). This limits their applicability in separation processes where hot reactive gases
are encountered, and has for these processes led to a shift of interest toward ceramic and alloy
materials (Pandey and Chauhan 2001). While these membranes have shown promising
performance, manufacture is more complex. Even with improvements in manufacturing
efficiency, “it is reasonable to expect ceramic, glass, carbon, zeolitic and other inorganic
membranes to cost between one- and three-orders of magnitude more per unit of membrane
area compared to polymeric membranes” (Koros and Mahajan 2000).
The membrane of interest in this study is made from the polymeric materials
polyvinylamine and polysulfone. These polymers are thermoplasts, that is, they have long-chain
MSc Thesis: Qualification of new technology for capture of CO2 in coal-fired power plants Bjørn Utgård, Norwegian University of Science and Technology, September 2007
46 | P a g e
linear molecules that can be easily formed by heat and pressures at temperatures above a
critical temperature referred to as the glass temperature, Tg (Schweitzer 2007). The glass
temperature is marked by a step change in thermodynamic and mechanic properties of the
polymer when it is cooled at a finite rate. Above Tg, the polymer is said to be in the rubbery state;
below Tg, the polymer is in the glassy state (Pfromm 2006).
Polymers are built up by many units (monomers) chemically bound into long molecule
chains (thereof the name polymer – ‘many parts’ [gr.]). Polymerization, the process of chemically
binding monomers together to polymers, can take place through various methods. Important in
deciding the physical and chemical properties of polymers is the chosen formation method
(Schweitzer 2007). This underlines the importance of careful control of the membrane
manufacture process to ensure the desired gas separation performance.
4.2.3 PHYSICAL STRUCTURE
The physical structure of membranes is either porous or non-porous, or a combination
(asymmetric). Porous membranes are rigid, highly voided structures with randomly distributed
interconnected pores. In structure and function, porous membranes are similar to conventional
filters; they rely on and utilize differences in molecular size to separate gases (Fritzsche and
Kurz 1990). Permeation happens through molecular migration through microvoids in the
material. While their high permeability (which gives a high permeate flux through the
membrane) gives porous membranes an advantage, their selectivity or separation efficiency is
low (Pandey and Chauhan 2001).
The characteristics of non-porous (dense) membranes are generally opposite to porous
membranes; selectivity is usually high while the flux is low. Dense membranes uses differences
in solubility in the membrane to separate gases and are therefore capable of separating gases of
similar molecular sizes (Fritzsche and Kurz 1990). Since the permeability of dense membranes
MSc Thesis: Qualification of new technology for capture of CO2 in coal-fired power plants Bjørn Utgård, Norwegian University of Science and Technology, September 2007
47 | P a g e
is inversely related to the thickness of the membrane, it is a design objective to make the dense
membrane as thin as possible while maintaining its mechanical integrity.
An asymmetric membrane is designed to combine the strengths of porous and non-porous
membranes; one way to do this is to combine two different polymers. In such a composite
membrane, a thin, dense and selective skin (barrier) layer, termed the permselective layer,
provides high separation efficiency. This skin layer can be made very thin and hence relatively
permeable since it is physically supported by a much thicker, porous and highly permeable
substrate layer (Strathmann 1990). The permselective layer may be supported on one or both
sides by a substrate layer; support on both sides is advantageous if the membrane needs to be
reversed for cleaning purposes (Smith 2005). This enables design of membranes that are at the
same time highly permeable and highly selective.
4.3 COMPOSITE POLYMERIC FACILITATED TRANSPORT MEMBRANES
The membrane which is the subject of the current study is a Fixed Site Carrier (FSC) cross-
linked polyvinyl-amine membrane (PVAm) supported on polysulfone. As the term indicates, the
membrane is an asymmetric composite membrane, with a permselective layer made from a
dense polyvinyl-amine providing selectivity, and a substrate layer made from polysulfone
providing structural support. Polyvinylamine and polysulfone are polymeric materials. The
concepts facilitated transport, Fixed Site Carrier and cross-linking are explained below.
4.3.1 FACILITATED TRANSPORT
Transportation of a permeant through a dense, polymeric membrane is commonly described
as happening by sequential gas dissolution and diffusion through the polymeric material
(Matteucci, et al. 2006). According to this ‘solution-diffusion’ model (the term ‘sorption-
diffusion’ is also common), transport through the membrane happens in three steps. The
MSc Thesis: Qualification of new technology for capture of CO2 in coal-fired power plants Bjørn Utgård, Norwegian University of Science and Technology, September 2007
48 | P a g e
permeate is first dissolved into the membrane. It then diffuses1 across the membrane due to a
concentration gradient, and desorbs (disassociates) from the membrane at the permeate side
(Koros and Mahajan 2000). While a range of other models have been proposed as well, this
model is popular because the same model and the same set of assumptions can be used to
describe permeation in a variety of seemingly different processes. The mathematics of the model
is straight forward to apply, and the resulting transport equations are easy to use because the
contributions of diffusion and sorption are conveniently combined into one permeability
coefficient (Wijmans and Baker 2006).
In addition to the solution-diffusion mechanism, which suffices to explain gas permeation in
dense polymeric membranes of the simplest kind, transport in facilitated transport membranes
is enhanced by a reversible complexing reaction between the permeant and the membrane. This
additional reaction is analogous to a chemical absorption process (Section 0) on the feed side
and a stripping process on the permeate side of the membrane. After the solute is dissolved
(sorbed) in the membrane, it will either diffuse down its own concentration gradient, or react
chemically with the complexing (carrier) agent and diffuse down the concentration gradient of
the carrier-solute complex concentration gradient. Provided that the complexing agent is not
reactive with any other gas component in the feed, this additional mechanism makes facilitated
transport membrane highly selective (Koros and Mahajan 2000).
The total flux of a permeant A (here CO2) through a facilitated transport membrane is
calculated as the sum of the flux of the carrier-solute complex and the uncomplexed solute
according to the following equation: 𝐽𝐴 =𝐷𝐴
𝑙 𝑐𝐴,0 − 𝑐𝐴,𝑙 +
𝐷𝐴𝐶
𝑙(𝑐𝐴𝐶 ,0 − 𝑐𝐴𝐶 ,𝑙)
where the first term on the right hand side represents the contribution of the solution-diffusion
1 Diffusion: “gradual dispersal of one substance through another substance” (Atkins and Jones 2002)
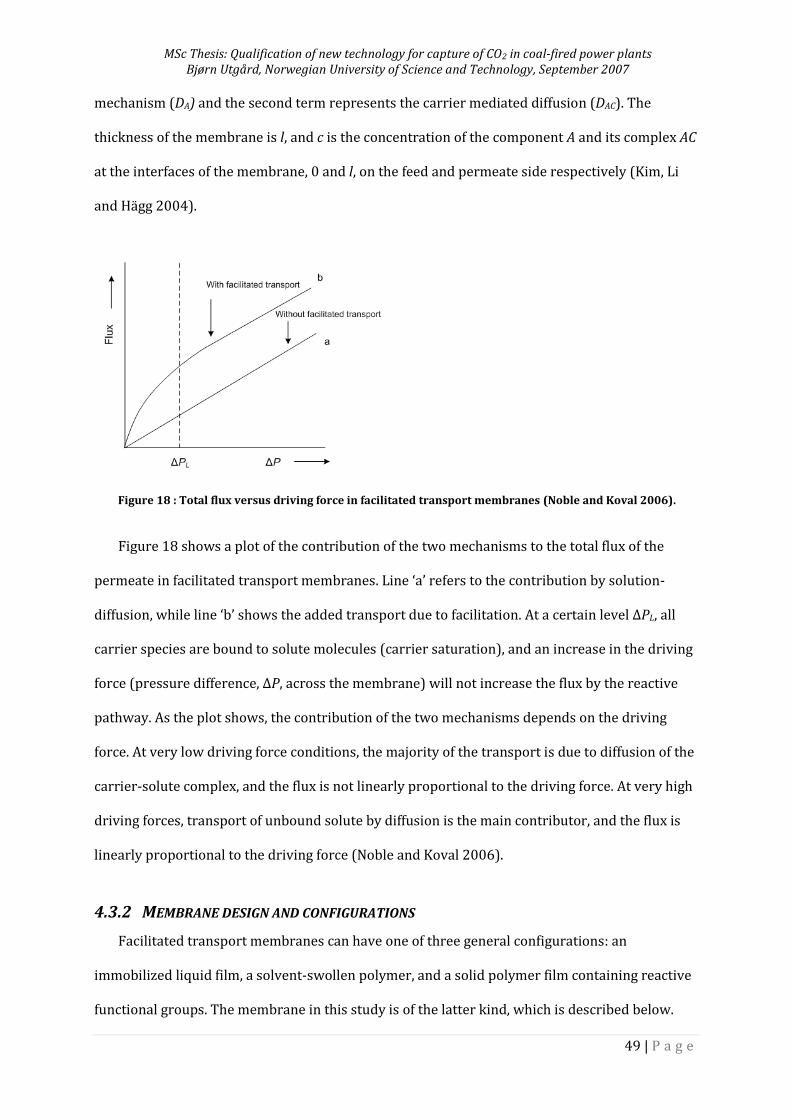
MSc Thesis: Qualification of new technology for capture of CO2 in coal-fired power plants Bjørn Utgård, Norwegian University of Science and Technology, September 2007
49 | P a g e
mechanism (DA) and the second term represents the carrier mediated diffusion (DAC). The
thickness of the membrane is l, and c is the concentration of the component A and its complex AC
at the interfaces of the membrane, 0 and l, on the feed and permeate side respectively (Kim, Li
and Hägg 2004).
Figure 18 : Total flux versus driving force in facilitated transport membranes (Noble and Koval 2006).
Figure 18 shows a plot of the contribution of the two mechanisms to the total flux of the
permeate in facilitated transport membranes. Line ‘a’ refers to the contribution by solution-
diffusion, while line ‘b’ shows the added transport due to facilitation. At a certain level ΔPL, all
carrier species are bound to solute molecules (carrier saturation), and an increase in the driving
force (pressure difference, ΔP, across the membrane) will not increase the flux by the reactive
pathway. As the plot shows, the contribution of the two mechanisms depends on the driving
force. At very low driving force conditions, the majority of the transport is due to diffusion of the
carrier-solute complex, and the flux is not linearly proportional to the driving force. At very high
driving forces, transport of unbound solute by diffusion is the main contributor, and the flux is
linearly proportional to the driving force (Noble and Koval 2006).
4.3.2 MEMBRANE DESIGN AND CONFIGURATIONS
Facilitated transport membranes can have one of three general configurations: an
immobilized liquid film, a solvent-swollen polymer, and a solid polymer film containing reactive
functional groups. The membrane in this study is of the latter kind, which is described below.
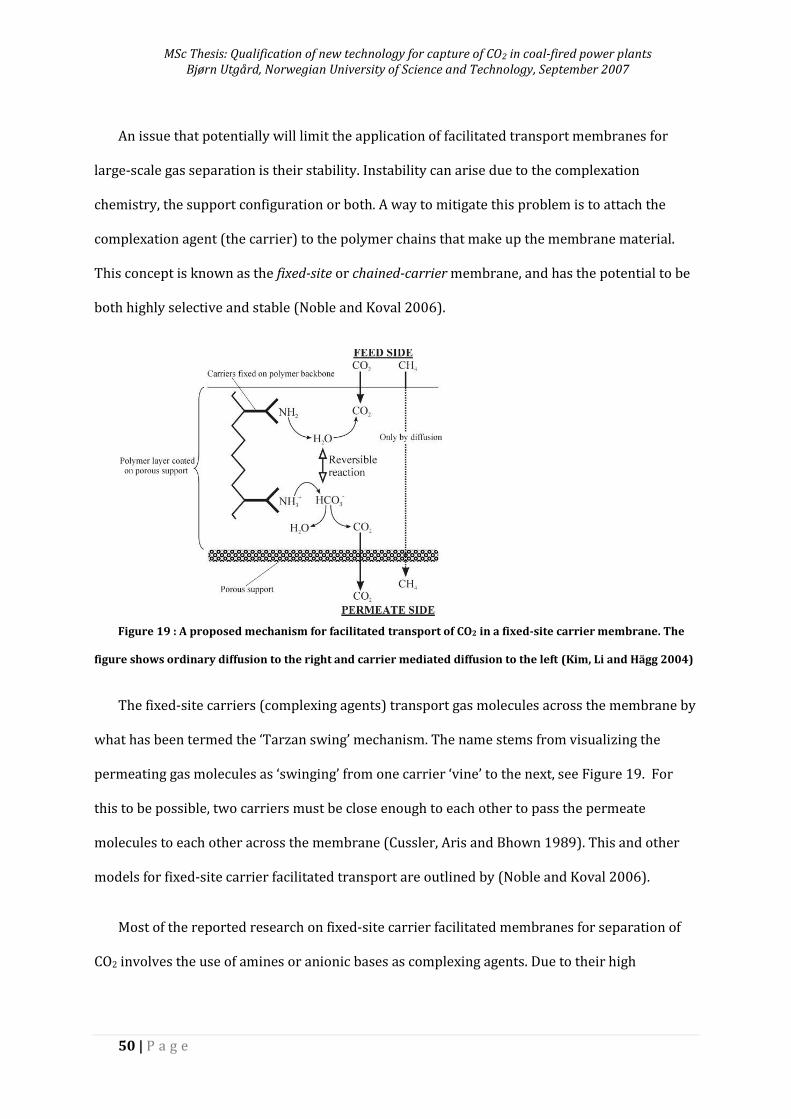
MSc Thesis: Qualification of new technology for capture of CO2 in coal-fired power plants Bjørn Utgård, Norwegian University of Science and Technology, September 2007
50 | P a g e
An issue that potentially will limit the application of facilitated transport membranes for
large-scale gas separation is their stability. Instability can arise due to the complexation
chemistry, the support configuration or both. A way to mitigate this problem is to attach the
complexation agent (the carrier) to the polymer chains that make up the membrane material.
This concept is known as the fixed-site or chained-carrier membrane, and has the potential to be
both highly selective and stable (Noble and Koval 2006).
Figure 19 : A proposed mechanism for facilitated transport of CO2 in a fixed-site carrier membrane. The
figure shows ordinary diffusion to the right and carrier mediated diffusion to the left (Kim, Li and Hägg 2004)
The fixed-site carriers (complexing agents) transport gas molecules across the membrane by
what has been termed the ‘Tarzan swing’ mechanism. The name stems from visualizing the
permeating gas molecules as ‘swinging’ from one carrier ‘vine’ to the next, see Figure 19. For
this to be possible, two carriers must be close enough to each other to pass the permeate
molecules to each other across the membrane (Cussler, Aris and Bhown 1989). This and other
models for fixed-site carrier facilitated transport are outlined by (Noble and Koval 2006).
Most of the reported research on fixed-site carrier facilitated membranes for separation of
CO2 involves the use of amines or anionic bases as complexing agents. Due to their high
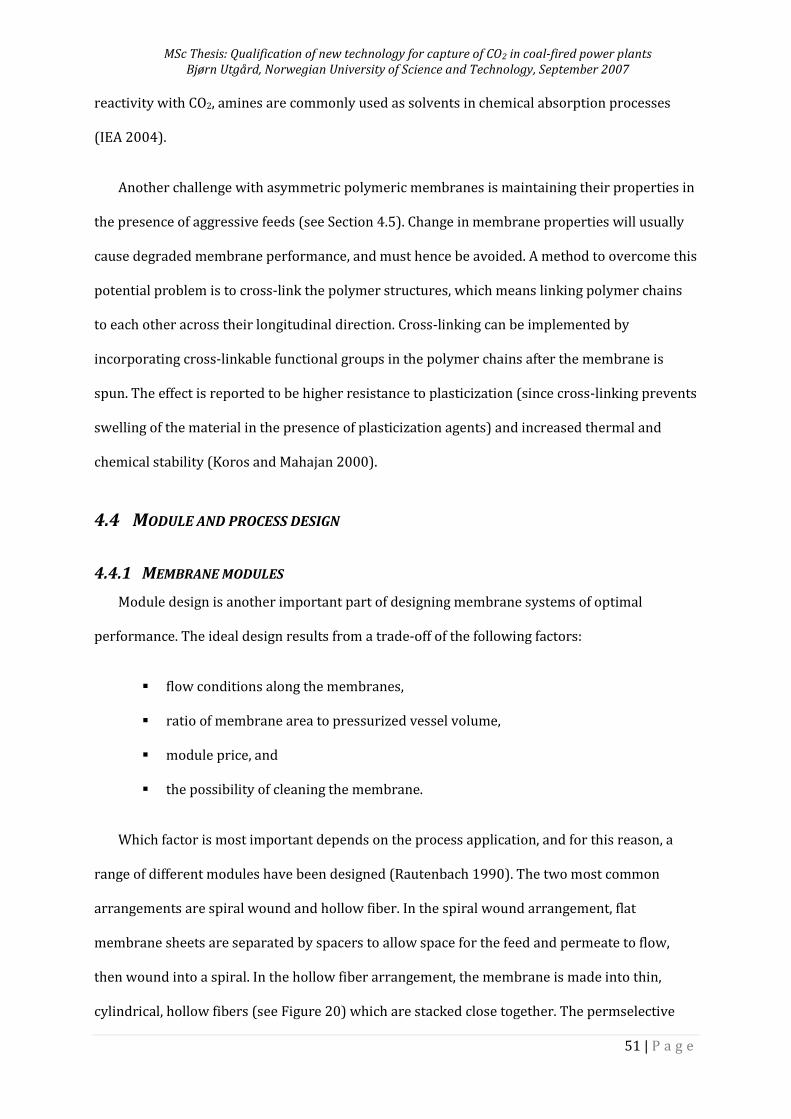
MSc Thesis: Qualification of new technology for capture of CO2 in coal-fired power plants Bjørn Utgård, Norwegian University of Science and Technology, September 2007
51 | P a g e
reactivity with CO2, amines are commonly used as solvents in chemical absorption processes
(IEA 2004).
Another challenge with asymmetric polymeric membranes is maintaining their properties in
the presence of aggressive feeds (see Section 4.5). Change in membrane properties will usually
cause degraded membrane performance, and must hence be avoided. A method to overcome this
potential problem is to cross-link the polymer structures, which means linking polymer chains
to each other across their longitudinal direction. Cross-linking can be implemented by
incorporating cross-linkable functional groups in the polymer chains after the membrane is
spun. The effect is reported to be higher resistance to plasticization (since cross-linking prevents
swelling of the material in the presence of plasticization agents) and increased thermal and
chemical stability (Koros and Mahajan 2000).
4.4 MODULE AND PROCESS DESIGN
4.4.1 MEMBRANE MODULES
Module design is another important part of designing membrane systems of optimal
performance. The ideal design results from a trade-off of the following factors:
flow conditions along the membranes,
ratio of membrane area to pressurized vessel volume,
module price, and
the possibility of cleaning the membrane.
Which factor is most important depends on the process application, and for this reason, a
range of different modules have been designed (Rautenbach 1990). The two most common
arrangements are spiral wound and hollow fiber. In the spiral wound arrangement, flat
membrane sheets are separated by spacers to allow space for the feed and permeate to flow,
then wound into a spiral. In the hollow fiber arrangement, the membrane is made into thin,
cylindrical, hollow fibers (see Figure 20) which are stacked close together. The permselective
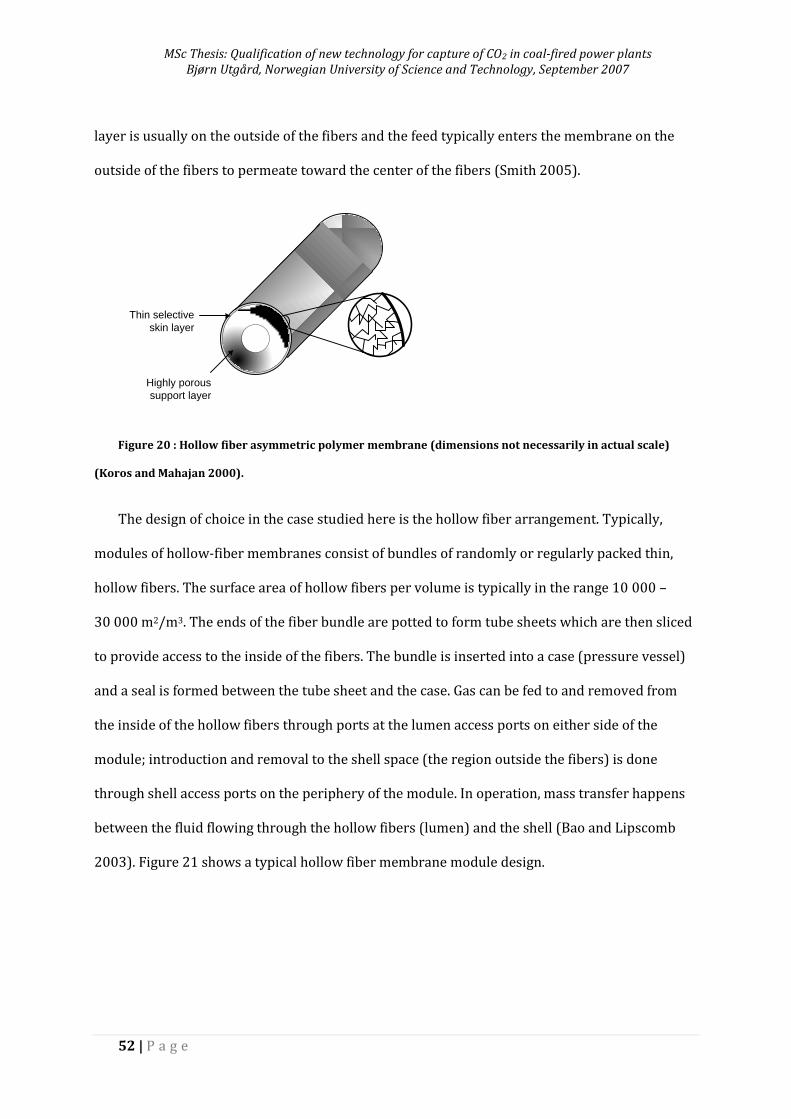
MSc Thesis: Qualification of new technology for capture of CO2 in coal-fired power plants Bjørn Utgård, Norwegian University of Science and Technology, September 2007
52 | P a g e
layer is usually on the outside of the fibers and the feed typically enters the membrane on the
outside of the fibers to permeate toward the center of the fibers (Smith 2005).
Highly porous
support layer
Thin selective
skin layer
Figure 20 : Hollow fiber asymmetric polymer membrane (dimensions not necessarily in actual scale)
(Koros and Mahajan 2000).
The design of choice in the case studied here is the hollow fiber arrangement. Typically,
modules of hollow-fiber membranes consist of bundles of randomly or regularly packed thin,
hollow fibers. The surface area of hollow fibers per volume is typically in the range 10 000 –
30 000 m2/m3. The ends of the fiber bundle are potted to form tube sheets which are then sliced
to provide access to the inside of the fibers. The bundle is inserted into a case (pressure vessel)
and a seal is formed between the tube sheet and the case. Gas can be fed to and removed from
the inside of the hollow fibers through ports at the lumen access ports on either side of the
module; introduction and removal to the shell space (the region outside the fibers) is done
through shell access ports on the periphery of the module. In operation, mass transfer happens
between the fluid flowing through the hollow fibers (lumen) and the shell (Bao and Lipscomb
2003). Figure 21 shows a typical hollow fiber membrane module design.
MSc Thesis: Qualification of new technology for capture of CO2 in coal-fired power plants Bjørn Utgård, Norwegian University of Science and Technology, September 2007
53 | P a g e
TubesheetFiber Bundle
Case
Lumen
header
Bolts to attach
header to case
Lumen
access port
Distribution collar
for shell fluid
Shell access port
Fiber Bundle
Tubesheet
Fiber ends
open along
tubesheet
face
Figure 21 : Schematic of a typical hollow fiber membrane module and the case (pressure vessel) that
holds it (Bao and Lipscomb 2003).
Predicting and measuring the separation efficiency and throughput of the membrane is
complicated. Membrane material properties and transport mechanisms are still not completely
understood. “Therefore, almost all transport models proposed in the literature are
phenomenological in nature and contain one or more adjustable parameters which must be
determined experimentally” (Pandey and Chauhan 2001). Concentration boundary layers in the
lumen and shell spaces further complicates the analysis, as does the complex geometry of the
shell and the flows within it (Bao and Lipscomb 2003). This implies that the sensitivity to
random variations in the shell and lumen flow must be considered especially when selecting
qualification methods (tests, analysis) for the module.
4.4.2 FLOW PATTERNS
The performance of a membrane is also influenced by the way in which the permeate and
retentate flow in the membrane. Three common flow patterns for gas separation are shown in
Figure 22. Parametric studies of these flow patterns have shown that given equal operating
conditions, the countercurrent flow pattern is most efficient (meaning less membrane area is
needed), followed by the cross flow pattern. Which of these idealized flow patterns is assumed in
practice is not always clear, since the flow pattern depends on both the geometry of the
membrane module design and the permeation rate (Smith 2005).
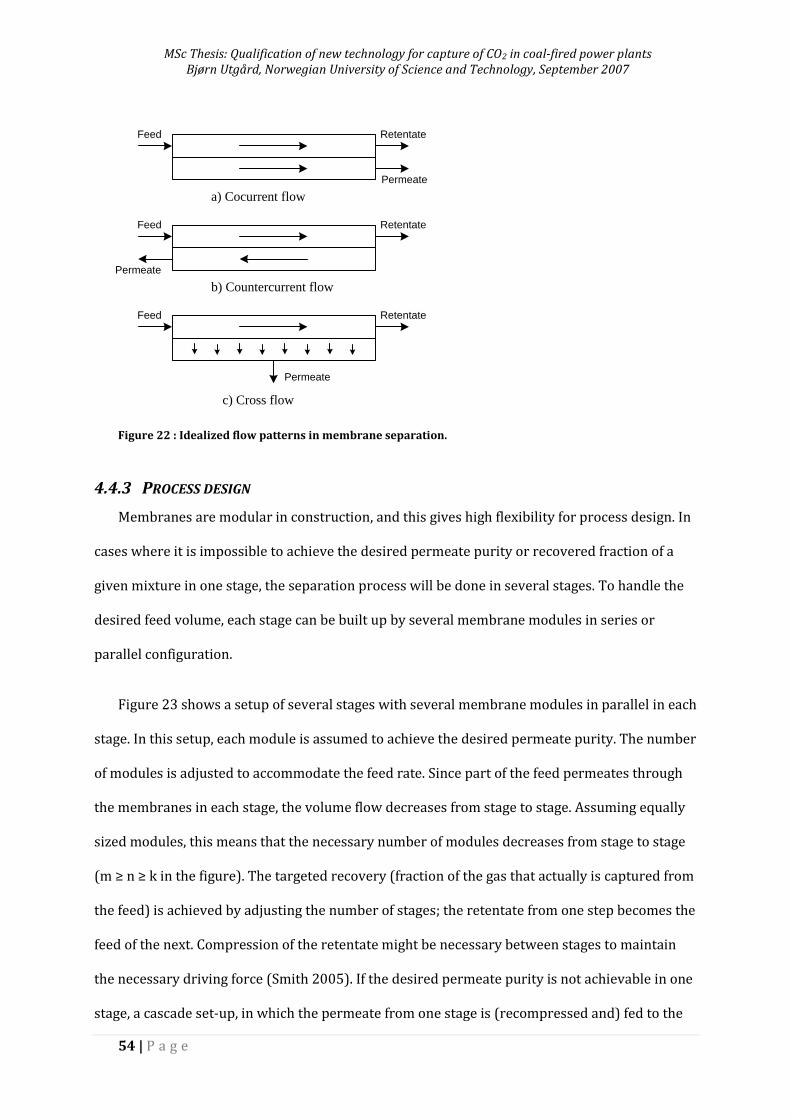
MSc Thesis: Qualification of new technology for capture of CO2 in coal-fired power plants Bjørn Utgård, Norwegian University of Science and Technology, September 2007
54 | P a g e
Retentate
Permeate
Feed
b) Countercurrent flow
Retentate
Permeate
Feed
c) Cross flow
Retentate
Permeate
Feed
a) Cocurrent flow
Figure 22 : Idealized flow patterns in membrane separation.
4.4.3 PROCESS DESIGN
Membranes are modular in construction, and this gives high flexibility for process design. In
cases where it is impossible to achieve the desired permeate purity or recovered fraction of a
given mixture in one stage, the separation process will be done in several stages. To handle the
desired feed volume, each stage can be built up by several membrane modules in series or
parallel configuration.
Figure 23 shows a setup of several stages with several membrane modules in parallel in each
stage. In this setup, each module is assumed to achieve the desired permeate purity. The number
of modules is adjusted to accommodate the feed rate. Since part of the feed permeates through
the membranes in each stage, the volume flow decreases from stage to stage. Assuming equally
sized modules, this means that the necessary number of modules decreases from stage to stage
(m ≥ n ≥ k in the figure). The targeted recovery (fraction of the gas that actually is captured from
the feed) is achieved by adjusting the number of stages; the retentate from one step becomes the
feed of the next. Compression of the retentate might be necessary between stages to maintain
the necessary driving force (Smith 2005). If the desired permeate purity is not achievable in one
stage, a cascade set-up, in which the permeate from one stage is (recompressed and) fed to the
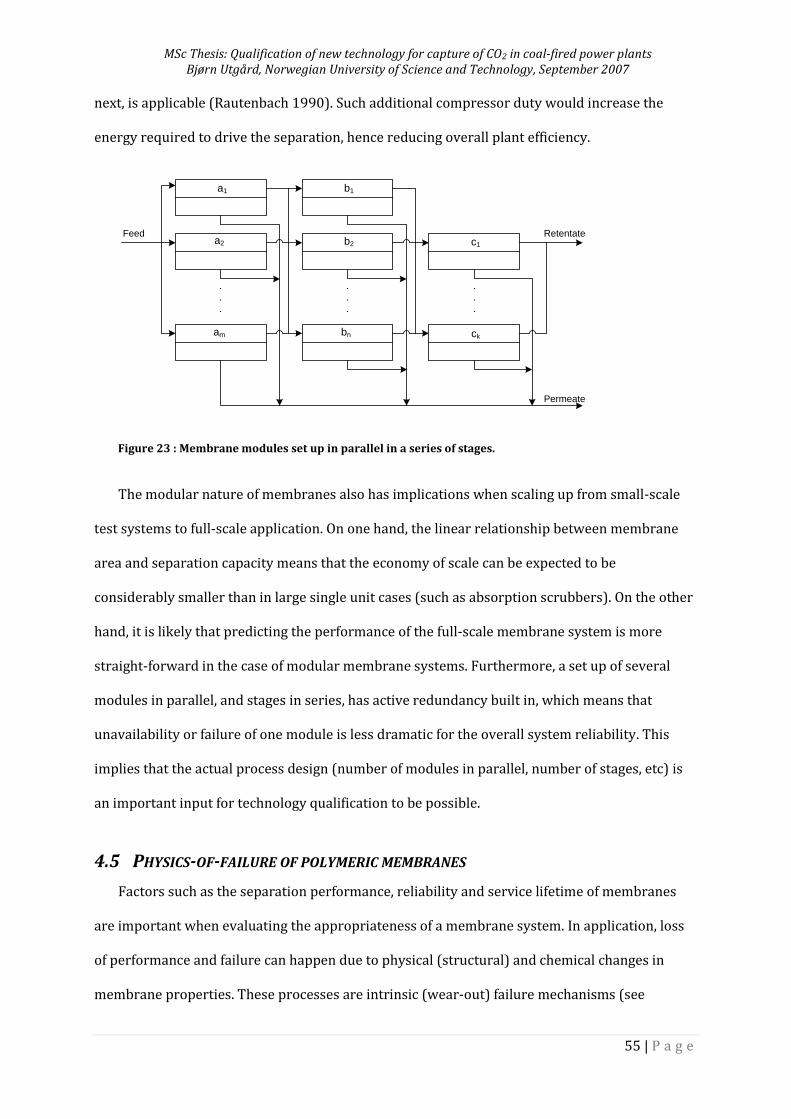
MSc Thesis: Qualification of new technology for capture of CO2 in coal-fired power plants Bjørn Utgård, Norwegian University of Science and Technology, September 2007
55 | P a g e
next, is applicable (Rautenbach 1990). Such additional compressor duty would increase the
energy required to drive the separation, hence reducing overall plant efficiency.
Feed
a1
a2
am
b1
bn ck
b2 c1
Retentate
Permeate
Figure 23 : Membrane modules set up in parallel in a series of stages.
The modular nature of membranes also has implications when scaling up from small-scale
test systems to full-scale application. On one hand, the linear relationship between membrane
area and separation capacity means that the economy of scale can be expected to be
considerably smaller than in large single unit cases (such as absorption scrubbers). On the other
hand, it is likely that predicting the performance of the full-scale membrane system is more
straight-forward in the case of modular membrane systems. Furthermore, a set up of several
modules in parallel, and stages in series, has active redundancy built in, which means that
unavailability or failure of one module is less dramatic for the overall system reliability. This
implies that the actual process design (number of modules in parallel, number of stages, etc) is
an important input for technology qualification to be possible.
4.5 PHYSICS-OF-FAILURE OF POLYMERIC MEMBRANES
Factors such as the separation performance, reliability and service lifetime of membranes
are important when evaluating the appropriateness of a membrane system. In application, loss
of performance and failure can happen due to physical (structural) and chemical changes in
membrane properties. These processes are intrinsic (wear-out) failure mechanisms (see
MSc Thesis: Qualification of new technology for capture of CO2 in coal-fired power plants Bjørn Utgård, Norwegian University of Science and Technology, September 2007
56 | P a g e
sections 2.3.2 and 2.3.3) which ultimately may cause failure of the product if limits required for
the product function are exceeded.
Published studies of polymer membranes tend to focus on performance assurance, giving
little or no attention to assurance of long-term reliability. Furthermore, an all-inclusive account
of failure mechanisms relevant in polymer gas separation membranes has not been found in the
literature, and terms tend to be used without proper definitions. While this may be because they
are widely understood within certain academic disciplines, it does not promote cross-
disciplinary understanding and analysis. The following listing therefore aims to briefly describe
failure mechanisms reported at various places in the literature. Note that the effect of the
mechanisms depends largely on membrane properties; some mechanisms may actually have a
positive effect on membrane performance. The relevance of each mechanism to the particular
membrane of interest is addressed in Section 5.5.
4.5.1 CORROSION (CHEMICAL DEGRADATION)
Unlike the case with metallic materials, polymers do not experience specific corrosion rates
in a particular corrosive environment. This makes prediction of performance degradation with
time due to corrosion less straight-forward for polymers than for metals. Within specific
temperature ranges, polymers are usually completely resistant to a specific corrodent or they
deteriorate rapidly. Corrosion failure mechanisms can be classified as follows (Schweitzer
2007):
1. Disintegration or degradation of a physical nature because of absorption, solvent
action, or other factors
2. Oxidation, where chemical bonds are attacked
3. Hydrolysis, where ester linkages are attacked
4. Radiation (may also lead to cross-linking and hence have a positive effect on
performance)
MSc Thesis: Qualification of new technology for capture of CO2 in coal-fired power plants Bjørn Utgård, Norwegian University of Science and Technology, September 2007
57 | P a g e
5. Thermal degradation involving depolymerization and possibly repolymerization
6. Dehydration (rather uncommon)
7. Any combination of the above
The results of these corrosive attacks on the polymer material can be observed as softening,
charring, crazing, delamination, embrittlement, dissolving or swelling (Schweitzer 2007).
For well-known polymeric materials, information about the resistance to a whole range of
corrodents is readily available; see for example Schweitzer (2007). In the case of novel
polymeric materials or combinations of well-known materials, testing is necessary to acquire
this information.
4.5.2 PHYSICAL AGING (STRUCTURAL DEGRADATION)
Physical aging (or structural relaxation) has been defined as the change of a chosen property
with time in the absence of chemical changes of the polymer, and in the absence of highly
sorbing components such as CO2 and hydrocarbons (which can cause plasticization). Physical
aging happens in glassy polymers due to their non-equilibrium state and is observed as a
gradual approach to thermodynamic equilibrium. Physical aging at constant temperature leads
to increased stiffness, brittleness and volume contraction with time, and hence influences the
separation performance of the membrane. Describing the impact of aging of polymeric materials
is complicated by the observation that the thickness of the tested sample is of high importance
for aging; aging in the glassy state of polymers proceeds very rapidly in thin films compared to
thick films (Pfromm 2006). Aging rate has also been found to correlate with the level of free
volume of the polymer; the higher the free volume, the faster the aging. The aging rate is also
dependent on aging temperature (Kim, Koros and Paul 2006).
The implication of thickness-dependent aging for practical membrane gas separations is that
performance of practical gas separation membranes with selective layers made from glassy
polymers is time-dependent. It should hence not be surprising if a gas separation module looses
MSc Thesis: Qualification of new technology for capture of CO2 in coal-fired power plants Bjørn Utgård, Norwegian University of Science and Technology, September 2007
58 | P a g e
a significant amount of productivity while gaining some selectivity during the first months of
operation. This is the case even in the complete absence of fouling or presence of contaminants
in the feed, simply by physical aging. Another implication is that the (thermal) history of samples
used for testing should be carefully considered, as re-testing after some time is likely to show
different results for thin films, while thick films may remain unchanged. Data for design of
membrane gas separation systems should therefore be obtained with membranes that have
aged sufficiently (in the order of weeks) if glassy polymers are used (Pfromm 2006).
4.5.3 PLASTICIZATION (SWELLING)
Loss of selectivity due to plasticization is mentioned as one of the challenges for polymeric
gas separation (Wallace, et al. 2006). Plasticization happens when the polymer matrix is swollen
with highly sorbing penetrants (such as CO2 and hydrocarbons), forcing the polymer chains
apart to accommodate the penetrant molecules. This can be thought of as partially pushing the
polymer toward its liquid state. Penetrant molecules can also ‘lubricate’ the polymer matrix,
hence facilitating chain motion. The effect of this tends to be increased permeability but reduced
selectivity, making long-term performance somewhat unpredictable since the effects may be
time-dependent (Kim, Koros and Paul 2006). For polyimide membranes, for example,
plasticization has been observed to greatly reduce (to the order of 6-8) selectivity in industrial
application with gas mixtures at high, near saturation, pressures compared to that measured in
pure gas tests in idealistic conditions (Merkel, et al. 2006).
Plasticization influences membrane performance; in some cases, a certain level of swelling is
necessary to achieve the desired separation performance. Treatment of the membrane to control
plasticization is therefore necessary. Several strategies, such as heat treatment, blending,
reactively formed interpenetrating networks and crosslinking, have been tried to developed
plasticization resistant polymeric membranes. Of these, crosslinking has been found to be an
attractive option, since it combines relatively easy implementation within acceptable processing
MSc Thesis: Qualification of new technology for capture of CO2 in coal-fired power plants Bjørn Utgård, Norwegian University of Science and Technology, September 2007
59 | P a g e
conditions and produces significantly improved plasticization resistance (measured by
improved selectivity under demanding feed conditions (Wallace, et al. 2006).
4.5.4 COMPACTION
In the presence of high trans-membrane pressures, membrane performance can be reduced
due to compaction of the porous asymmetric hollow fiber membrane substructure. Compaction
is defined as a compression of the membrane structure under a trans-membrane pressure
difference causing a decrease in membrane permeability. The reduced permeability is believed
to be mostly attributable to densification of the substrate support layer (observed as lower
porosity), but thickening of the permselective layer also contributes (Reinsch, et al. 2000).
It has also been hypothesized that compaction can happen when the membrane is exposed
to large concentrations of highly sorbing feed stream contaminants that sorb into the glassy
polymer matrix. Compaction here is believed to be caused by reduced fiber substructure
modulus, which is a measure of the physical stiffness of the material, equaling the ratio applied
load (stress) to resultant deformation of the material (high modulus indicates a stiff material). In
other words, the ability of the membrane to resist stress (transmembrane pressure difference)
is reduced (Madden 2005).
4.5.5 FOULING
Fouling happens when particulate matter in the feed deposits on or within the membrane
pore structure in a wetted environment. The particulate matter is contaminants stemming from
some stage earlier in the process upstream from the membrane, and process considerations are
hence necessary to avoid fouling. The effect of fouling is increased hydraulic resistance to flow.
Fouling is reported to be a major problem with microfiltration polymer membranes (Zydney, Ho
and Yuan 2003). In gas separation applications, fouling can be avoided by removing fouling
matter (particles) in the feed gas prior to entering the membrane. Such pretreatment may either
be done by a designated functional block (such as a feed gas filtration unit), or as a side effect of
other processes that the gas passes through upstream from the membrane.
MSc Thesis: Qualification of new technology for capture of CO2 in coal-fired power plants Bjørn Utgård, Norwegian University of Science and Technology, September 2007
60 | P a g e
4.5.6 DEHYDRATION
For some membranes and gas separations, water is required as a mobile medium for the
permeate. Such hydrophilic membranes must be swollen to work optimally, which means that
the gas feed at all times should be saturated with water vapor to keep the membrane from
drying out (Kim, Li and Hägg 2004). As Figure 19 shows, the facilitated transport concept
designed for the membrane of interest in the current work will not work if the membrane is not
sufficiently swollen with water. Dehydration should therefore be regarded as a potential failure
mechanism for failure analysis. As with fouling, careful control of the feed (i.e. ensuring a certain
level of humidity of the feed) is a possible preventive measure.
4.5.7 CONCENTRATION POLARIZATION
As the most permeable species (CO2 in a CO2-selective membrane) in the feed gas migrates
through the membrane, there is an accumulation of the less permeable species and a depletion
of the more permeable species in the boundary layer adjacent to the feed side of the membrane,
see Figure 24. The effect of this concentration polarization is a decrease in the available cross-
membrane driving force for the more permeable gas and an increase in the available driving
force for the less permeable species. This means that the permeation rate of the most permeable
gas (here: CO2) decreases while the permeation rate of the less permeable gas increases, and
hence that the overall separation efficiency is reduced (Bhattacharya and Hwang 1997).
Concentration polarization will in theory take place in all membrane separation processes.
Due to the high diffusivity of gases, however, concentration polarization has until recently
(justifiably or not) been thought not to be a concern for gas separation membranes. In a
parametric study of the factors influencing concentration polarization in gas separation
membranes, He, Yongli, Yue and Chen (1999) showed that this assumption no longer safely can
be made. Having established a mathematical model to analyze the effects of concentration
polarization on membrane performance, they found permeation rate to be a dominating factor
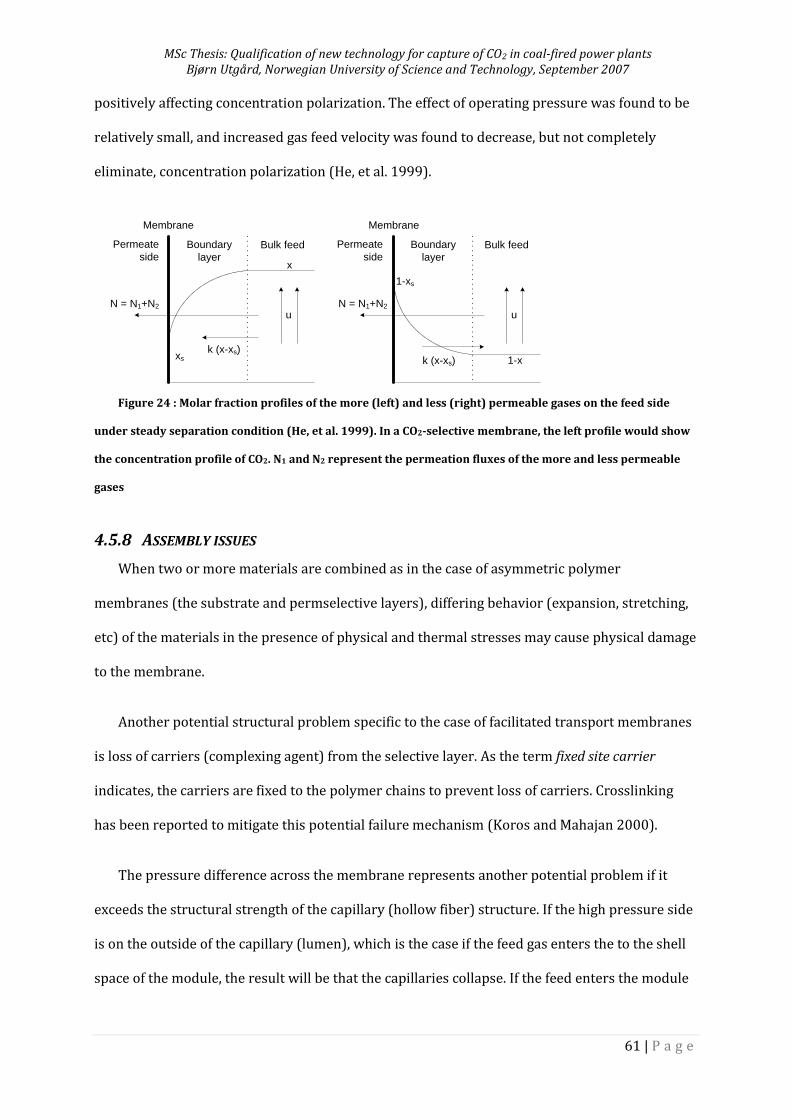
MSc Thesis: Qualification of new technology for capture of CO2 in coal-fired power plants Bjørn Utgård, Norwegian University of Science and Technology, September 2007
61 | P a g e
positively affecting concentration polarization. The effect of operating pressure was found to be
relatively small, and increased gas feed velocity was found to decrease, but not completely
eliminate, concentration polarization (He, et al. 1999).
Membrane
x
u
k (x-xs)
N = N1+N2
xs
Permeate
side
Membrane
Bulk feed
1-x
u
k (x-xs)
N = N1+N2
1-xs
Boundary
layer
Permeate
sideBulk feedBoundary
layer
Figure 24 : Molar fraction profiles of the more (left) and less (right) permeable gases on the feed side
under steady separation condition (He, et al. 1999). In a CO2-selective membrane, the left profile would show
the concentration profile of CO2. N1 and N2 represent the permeation fluxes of the more and less permeable
gases
4.5.8 ASSEMBLY ISSUES
When two or more materials are combined as in the case of asymmetric polymer
membranes (the substrate and permselective layers), differing behavior (expansion, stretching,
etc) of the materials in the presence of physical and thermal stresses may cause physical damage
to the membrane.
Another potential structural problem specific to the case of facilitated transport membranes
is loss of carriers (complexing agent) from the selective layer. As the term fixed site carrier
indicates, the carriers are fixed to the polymer chains to prevent loss of carriers. Crosslinking
has been reported to mitigate this potential failure mechanism (Koros and Mahajan 2000).
The pressure difference across the membrane represents another potential problem if it
exceeds the structural strength of the capillary (hollow fiber) structure. If the high pressure side
is on the outside of the capillary (lumen), which is the case if the feed gas enters the to the shell
space of the module, the result will be that the capillaries collapse. If the feed enters the module
MSc Thesis: Qualification of new technology for capture of CO2 in coal-fired power plants Bjørn Utgård, Norwegian University of Science and Technology, September 2007
62 | P a g e
on the lumen side, failure can occur by puncture of the capillary. These potential failures can
possibly be mitigated by means of safety over-pressure valves.
4.6 MEMBRANE PERFORMANCE EVALUATION AND TESTING
4.6.1 PERFORMANCE SIMULATION
In order to evaluate what system performance can be expected from the membrane and the
various possible process designs it can be integrated into, a computer simulation program has
been developed and integrated into the well-known process simulation program Aspen HySys®
(Hägg and Lindbråthen 2005). The model offers flexibility in terms of flow directions, modular
architecture and feed compositions useful for process design and techno-economic performance
evaluations, but does not include information about degradation rates or failure mechanisms. Its
utility on its own for reliability assurance is therefore limited.
The transport mechanisms in polymer membranes are however still not completely
understood. “Therefore, almost all transport models proposed in the literature are
phenomenological in nature and contain one or more adjustable parameters which must be
determined experimentally” (Pandey and Chauhan 2001). Deterministic modeling of membrane
performance is therefore difficult, and should commendably be supplemented with
experimental models such as performance and reliability tests.
4.6.2 MEMBRANE TESTING
Published permeability values for a specific polymer have been found to be varying “very
significantly”. This scatter of permeability values is attributable to two major causes: the
variation in physical properties of a polymer (due to different manufacture processes and its
history-dependent properties), and the differences in permeability measurement techniques
(Kruczek and Matsuura 2000). For qualification of polymer membranes, this implies that it is
important that the manufacture method of tested components (prototypes) should be equivalent
MSc Thesis: Qualification of new technology for capture of CO2 in coal-fired power plants Bjørn Utgård, Norwegian University of Science and Technology, September 2007
63 | P a g e
to the method used for serial manufacture. It further implies that the testing method used for
qualifying the membrane’s performance should be chosen with caution.
The most elementary method for evaluating gas separation performance of a membrane
material is to measure the permeability of various gases through it. In its simplest form, this
method tests the permeability of pure gases. As the discussion of concentration polarization
(Section 4.5.7) showed, the permeation rate of one gas is however influenced by other gases in
the mixture. The real-life permeance and selectivity of a gas will usually be lower than shown in
pure gas tests. Membrane performance is also strongly influenced by testing conditions
(pressure and temperature), so testing should be performed at conditions as close as possible to
actual operating conditions (Fritzsche and Kurz 1990).
In general, three types of measurement techniques are available: constant pressure, constant
pressure with sweep gas, and constant volume techniques. Variations in testing schemes also
exist in terms of the order and duration of tests. Considerations regarding the limitations of the
various test protocols are discussed by Kruczek and Matsuura (2000). A method for
simultaneous, real-time measurement of membrane compaction and performance during
exposure to high-pressure gas was suggested by Reinsch et al. (2000).
5 RECOMMENDATIONS FOR QUALIFICATION OF A FIXED SITE CARRIER
PVAM MEMBRANE
A foundation for qualification of the proposed fixed site carrier polyvinylamine CO2-selective
membrane applied for pre-combustion capture of CO2 in IGCC power plants has been established
in Sections 2, 3 and 4. Based on this foundation, the objective of the current section is to provide
recommendations for the forthcoming qualification process. Main sources of information are
journal articles and documentation (published and non-published) provided by the research and
development (R&D) team. Supplemental information has further been acquired through
interviews and conversations with the research team. Beyond scope has been to carry out
MSc Thesis: Qualification of new technology for capture of CO2 in coal-fired power plants Bjørn Utgård, Norwegian University of Science and Technology, September 2007
64 | P a g e
interviews and workshops involving external resources (such as polymer membrane
manufacturers and potential customers) to gather the information necessary for carrying out the
actual qualification work.
5.1 BACKGROUND
The proposed membrane is a CO2-selective membrane intended for capturing CO2 generated
from combustion of fossil fuels at power plants. The membrane is under development by the
Membrane Research Group (MEMFO) at the department of Chemical Engineering of the
Norwegian University of Science and Technology. R&D has been going on for several years, and
an international patent for the membrane and its production process was granted in 2005
(Hägg, Kim and Li 2005). The membrane itself is described by Kim, Li and Hägg (2004), and
industrial applications of the membrane are proposed and analyzed by Hägg and Lindbråthen
(2005), Grainger, Lindbråthen and Hägg (2006), and Grainger and Hägg (2007). Industrial
demand for cost-efficient technologies for CO2-capture technology is a strong driver in the
development, and a lab-scale pilot plant is being planned in close cooperation with leading
industrial actors, both within membrane manufacture and process integration and application.
The membrane can be adapted for a range of carbon capture applications, including pre- or
post combustion at coal- or natural gas-fired power plants, as well as various industrial
processes. The application studied here is pre-combustion capture integrated in an IGCC power
plant as described by Grainger and Hägg (2007). Even so, the following discussion is intended to
be relevant also when qualifying the membrane for other process concepts, such as integrated
CO2 capture in a Natural Gas Combined Cycle (NGCC) plant.
5.2 QUALIFICATION APPROACH AND METHODOLOGY
Following the discussion in Section 2.2.2, a proactive approach in which attention is given to
technology qualification early on is advisable. Quantitative analysis is furthermore
recommended, supplemented with qualitative engineering judgment from relevant scientific and
MSc Thesis: Qualification of new technology for capture of CO2 in coal-fired power plants Bjørn Utgård, Norwegian University of Science and Technology, September 2007
65 | P a g e
engineering disciplines. Existing knowledge from technologies similar in structure and materials
(Physics-of-Failure) should be identified and utilized in order to minimize the cost of
development and testing (see Figure 9). This will also help directing attention to the aspects of
the membrane which are truly unknown.
Technology suppliers are increasingly being required by major energy companies prove that
technology qualification has been carried out in compliance with the DNV RP-A203, see Section
2.4 and DNV (2001). The following discussion of the forthcoming qualification process will
therefore follow the main steps of the guideline, as shown in Figure 13.
5.3 QUALIFICATION BASIS
Setting the Qualification Basis (QB) is the first step of the qualification process, and includes
Reliability specification (Sections 2.2.3). Here, the goal is to understand and document the needs
for the given system capability so that the technology development process can fulfill those
needs. For this, the QB should describe the technology and its interfaces with other system
components (Section 2.2.1), describe the operational regime and conditions (Section 2.2.5), and
set required values for key operational parameters (Section 2.2.4).
5.3.1 SYSTEM DESCRIPTION AND BOUNDARIES
A conceptual sketch of an Integrated Gasification Combined Cycle power plant with CO2
capture integrated in the process is shown in Figure 25 (refer back to Figure 16 for the ordinary
IGCC process), and Figure 26 shows the main components of each functional block. Coal and
pure oxygen (from an Air Separation Unit) enters the gasifier to produce syngas. The syngas is
then run through a Water Gas Shift (WGS) reaction in which CO and H2O is converted to CO2 and
H2. After the WGS, the gas typically has a pressure of around 20 bar and contains 40 mol% CO2.
The shifted syngas is then cooled by means of heat exchangers to about 35oC to remove sulfur
and other contaminants in Venturi scrubber, Selexol and Claus units. The membrane section
then splits the syngas stream in two by separating CO2 from H2. Some electric power is needed
here for recompression of the feed gas between stages of the membrane cascade. The CO2 is then
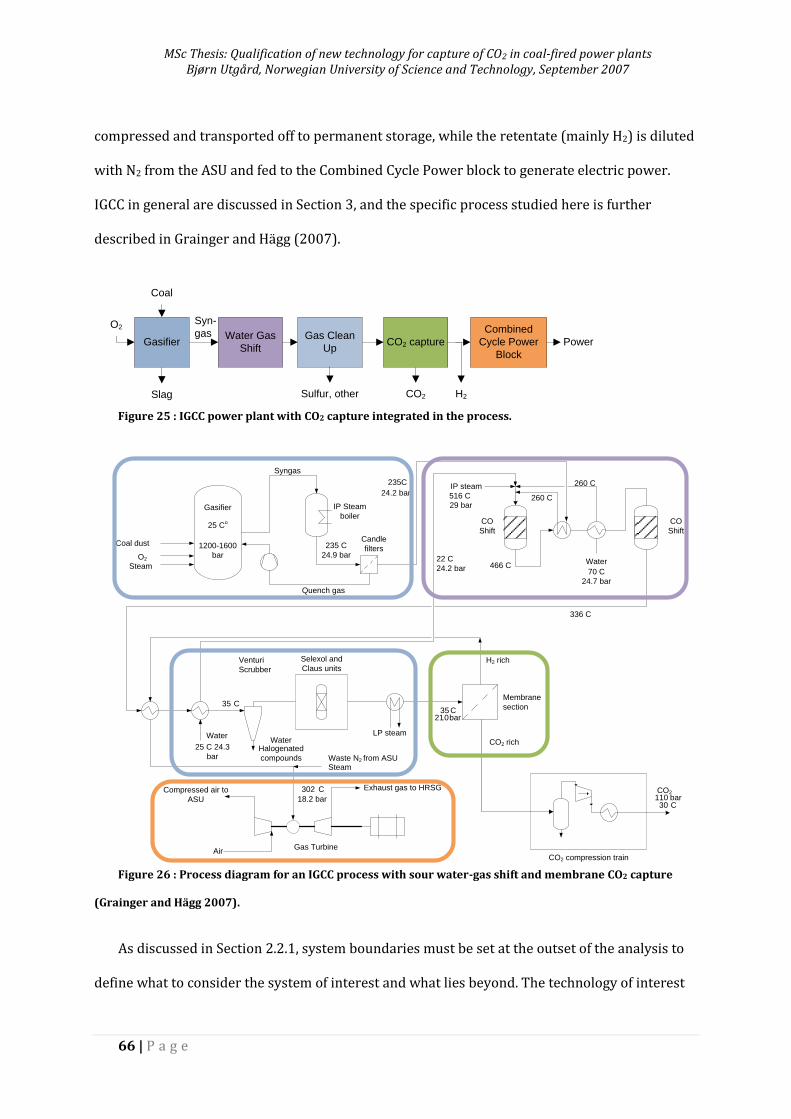
MSc Thesis: Qualification of new technology for capture of CO2 in coal-fired power plants Bjørn Utgård, Norwegian University of Science and Technology, September 2007
66 | P a g e
compressed and transported off to permanent storage, while the retentate (mainly H2) is diluted
with N2 from the ASU and fed to the Combined Cycle Power block to generate electric power.
IGCC in general are discussed in Section 3, and the specific process studied here is further
described in Grainger and Hägg (2007).
Gasifier
Coal
Slag
Gas Clean
Up
Combined
Cycle Power
Block
PowerWater Gas
Shift
CO2 H2
Syn-
gas
Sulfur, other
CO2 capture
O2
Figure 25 : IGCC power plant with CO2 capture integrated in the process.
Coal dust
O2
Steam
Syngas
Gasifier
25 Co
1200-1600
bar
Quench gas
IP Steam
boiler
235 C
24.9 bar
Candle
filters
336 C
35 C21.0 bar
Waste N2 from ASUSteam
Compressed air to
ASU
Air
Exhaust gas to HRSG
CO2 compression train
CO2
110 bar30 C
Gas Turbine
Membrane
section
Selexol and
Claus units
Water
25 C 24.3
bar
302 C
Venturi
Scrubber
LP steam
260 C
CO
Shift
Water
260 C
WaterHalogenated
compounds
CO
Shift
IP steam
516 C
29 bar
466 C
235C
24.2 bar
35 C
H2 rich
CO2 rich
70 C
24.7 bar
22 C
24.2 bar
18.2 bar
Figure 26 : Process diagram for an IGCC process with sour water-gas shift and membrane CO2 capture
(Grainger and Hägg 2007).
As discussed in Section 2.2.1, system boundaries must be set at the outset of the analysis to
define what to consider the system of interest and what lies beyond. The technology of interest
MSc Thesis: Qualification of new technology for capture of CO2 in coal-fired power plants Bjørn Utgård, Norwegian University of Science and Technology, September 2007
67 | P a g e
here is the CO2 capture unit in general, and the membrane modules in particular. Therefore,
system boundaries should either be set around the whole membrane section, or around a single
membrane module in the membrane section, see Figure 26. For the following discussion, system
boundaries will be assumed to be set around a single membrane module as illustrated in Figure
21. Once this has been done, the physical structure and functions of the system should be
described.
Functional description
A thorough description of all the various functions expected from the system is necessary in
order to qualify the technology. As discussed in Section 2.3.1, various methods are available for
such a functional analysis. The list of function types given in Table 4 can be used to make sure all
expected functions are identified, and some sort of function diagram would be used to visualize
the hierarchy of functions and their interconnection, see Figure 5. As an example, the essential
function of a membrane module can be described as to “separate 85% of the CO2 from the feed
gas”. Several functions are necessary for the membrane to perform this level 1 function, such as
“lead feed gas into the module,” “maintain gas pressure,” “keep the permeated gas separate from
the feed stream,” and “lead separated CO2 away from the module.”
Physical system breakdown
The detailed design of the membrane CO2 capture section has not yet been carried out, and
decisions regarding module dimensions, structure and materials, and process design (such as
number of units and stages, and operating conditions and requirements) are still to be made.
The physical system breakdown shown in Figure 27 is therefore assumed on the basis of the
outlines given in Sections 3.3, and 4.4, and must be updated as decisions on module and process
design are made.
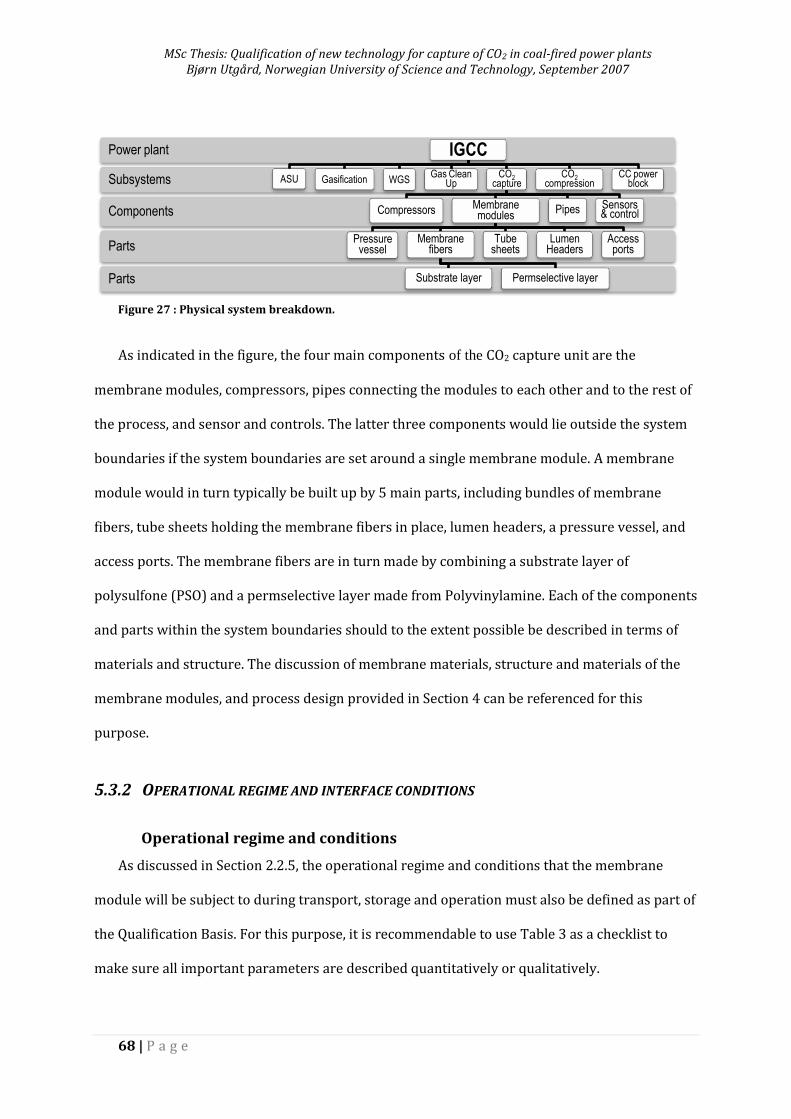
MSc Thesis: Qualification of new technology for capture of CO2 in coal-fired power plants Bjørn Utgård, Norwegian University of Science and Technology, September 2007
68 | P a g e
Figure 27 : Physical system breakdown.
As indicated in the figure, the four main components of the CO2 capture unit are the
membrane modules, compressors, pipes connecting the modules to each other and to the rest of
the process, and sensor and controls. The latter three components would lie outside the system
boundaries if the system boundaries are set around a single membrane module. A membrane
module would in turn typically be built up by 5 main parts, including bundles of membrane
fibers, tube sheets holding the membrane fibers in place, lumen headers, a pressure vessel, and
access ports. The membrane fibers are in turn made by combining a substrate layer of
polysulfone (PSO) and a permselective layer made from Polyvinylamine. Each of the components
and parts within the system boundaries should to the extent possible be described in terms of
materials and structure. The discussion of membrane materials, structure and materials of the
membrane modules, and process design provided in Section 4 can be referenced for this
purpose.
5.3.2 OPERATIONAL REGIME AND INTERFACE CONDITIONS
Operational regime and conditions
As discussed in Section 2.2.5, the operational regime and conditions that the membrane
module will be subject to during transport, storage and operation must also be defined as part of
the Qualification Basis. For this purpose, it is recommendable to use Table 3 as a checklist to
make sure all important parameters are described quantitatively or qualitatively.
Parts
Parts
Components
Subsystems
Power plant IGCC
ASU Gasification WGSGas Clean
UpCO2
capture
Compressors Membrane modules
Pressure vessel
Membrane fibers
Substrate layer Permselective layer
Tube sheets
Lumen Headers
Access ports
Pipes Sensors & control
CO2compression
CC power block
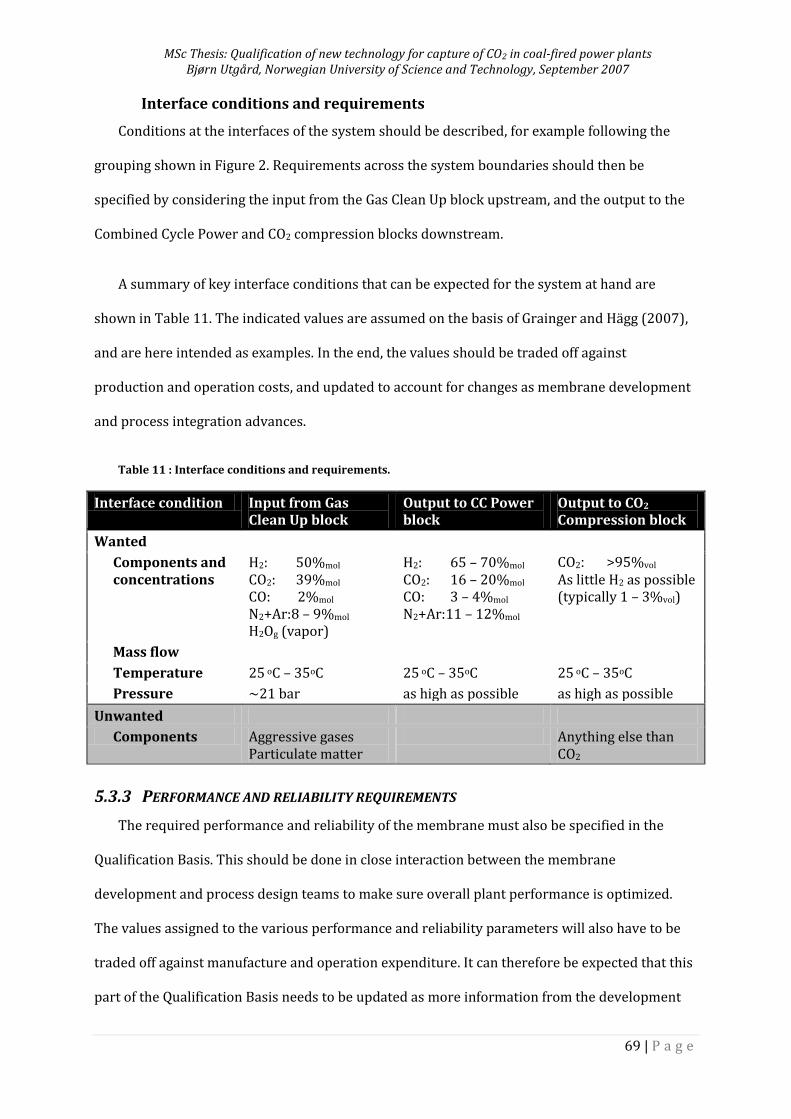
MSc Thesis: Qualification of new technology for capture of CO2 in coal-fired power plants Bjørn Utgård, Norwegian University of Science and Technology, September 2007
69 | P a g e
Interface conditions and requirements
Conditions at the interfaces of the system should be described, for example following the
grouping shown in Figure 2. Requirements across the system boundaries should then be
specified by considering the input from the Gas Clean Up block upstream, and the output to the
Combined Cycle Power and CO2 compression blocks downstream.
A summary of key interface conditions that can be expected for the system at hand are
shown in Table 11. The indicated values are assumed on the basis of Grainger and Hägg (2007),
and are here intended as examples. In the end, the values should be traded off against
production and operation costs, and updated to account for changes as membrane development
and process integration advances.
Table 11 : Interface conditions and requirements.
Interface condition Input from Gas Clean Up block
Output to CC Power block
Output to CO2 Compression block
Wanted
Components and concentrations
H2: 50%mol
CO2: 39%mol CO: 2%mol N2+Ar: 8 – 9%mol H2Og (vapor)
H2: 65 – 70%mol CO2: 16 – 20%mol CO: 3 – 4%mol N2+Ar: 11 – 12%mol
CO2: >95%vol As little H2 as possible (typically 1 – 3%vol)
Mass flow
Temperature 25 oC – 35oC 25 oC – 35oC 25 oC – 35oC
Pressure ~21 bar as high as possible as high as possible
Unwanted
Components Aggressive gases Particulate matter
Anything else than CO2
5.3.3 PERFORMANCE AND RELIABILITY REQUIREMENTS
The required performance and reliability of the membrane must also be specified in the
Qualification Basis. This should be done in close interaction between the membrane
development and process design teams to make sure overall plant performance is optimized.
The values assigned to the various performance and reliability parameters will also have to be
traded off against manufacture and operation expenditure. It can therefore be expected that this
part of the Qualification Basis needs to be updated as more information from the development
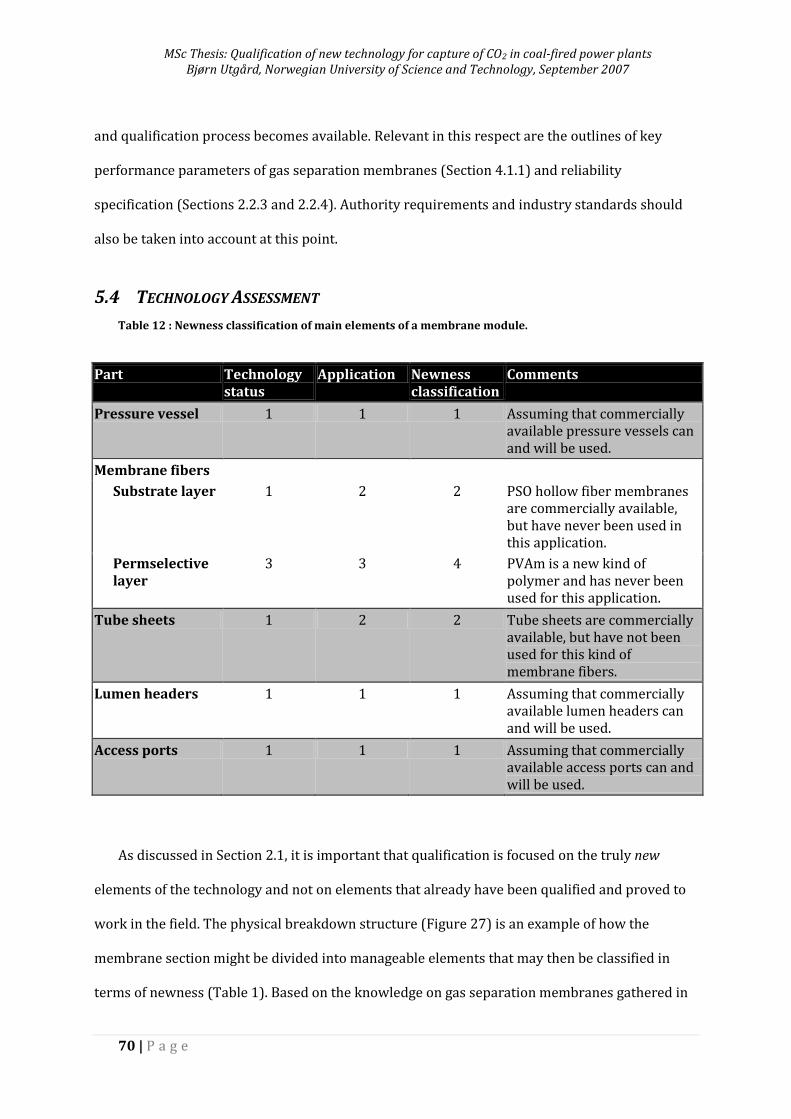
MSc Thesis: Qualification of new technology for capture of CO2 in coal-fired power plants Bjørn Utgård, Norwegian University of Science and Technology, September 2007
70 | P a g e
and qualification process becomes available. Relevant in this respect are the outlines of key
performance parameters of gas separation membranes (Section 4.1.1) and reliability
specification (Sections 2.2.3 and 2.2.4). Authority requirements and industry standards should
also be taken into account at this point.
5.4 TECHNOLOGY ASSESSMENT
Table 12 : Newness classification of main elements of a membrane module.
Part Technology status
Application Newness classification
Comments
Pressure vessel 1 1 1 Assuming that commercially available pressure vessels can and will be used.
Membrane fibers
Substrate layer 1 2 2 PSO hollow fiber membranes are commercially available, but have never been used in this application.
Permselective layer
3 3 4 PVAm is a new kind of polymer and has never been used for this application.
Tube sheets 1 2 2 Tube sheets are commercially available, but have not been used for this kind of membrane fibers.
Lumen headers 1 1 1 Assuming that commercially available lumen headers can and will be used.
Access ports 1 1 1 Assuming that commercially available access ports can and will be used.
As discussed in Section 2.1, it is important that qualification is focused on the truly new
elements of the technology and not on elements that already have been qualified and proved to
work in the field. The physical breakdown structure (Figure 27) is an example of how the
membrane section might be divided into manageable elements that may then be classified in
terms of newness (Table 1). Based on the knowledge on gas separation membranes gathered in
MSc Thesis: Qualification of new technology for capture of CO2 in coal-fired power plants Bjørn Utgård, Norwegian University of Science and Technology, September 2007
71 | P a g e
Section 4, the main elements of a fixed site carrier polyvinylamine CO2-selective membrane
module might be classified as shown in Table 12.
The assumptions made to classify the pressure vessel, tube sheets, lumen headers, and
access ports need to be validated, that is, it has to be shown that the operational regime these
parts will be exposed to lies within their proven capability range. Even so, it is clear that the
membrane fibers in general and the permselective polyvinylamine layer in particular pose
demanding new challenges, and hence should be considered a main concern for the qualification
process.
5.5 FAILURE MODE IDENTIFICATION AND RISK RANKING
As pointed out in the discussion on Reliability assurance (Section 2.3), an inquiry into how
an item might conceivably fail requires that all of its functions and the performance criteria
related to them are thoroughly defined and understood. Such a functional analysis should by
now have been carried out as part of the Qualification Basis. The aim of the failure mode
identification and risk ranking stage of the qualification process is then to identify both the
failure mechanisms (physical, chemical or other process) leading to failure and the resulting
failure modes (the manner in which failure is observed). Combining this information with an
assessment of the probability of the individual failure modes occurring and their consequence,
the technical risks of the technology can be evaluated and ranked.
A sensible starting point for doing this is to prepare and carry out a HAZOP and/or FMECA
session. Apart from a trained facilitator, such a session should involve experts of polymer
membrane manufacture, polymer chemistry, chemical process engineering, and mechanical
engineering. In addition to the membrane R&D team, such expertise could be found within
potential manufacturing companies and companies interested in using the membrane. The
objective of the sessions would be to make sure that all functions the membrane is expected to
perform have been identified, and identify all conceivable failure modes and mechanisms and
their consequence for membrane performance and reliability. Elements of failure tree analysis
MSc Thesis: Qualification of new technology for capture of CO2 in coal-fired power plants Bjørn Utgård, Norwegian University of Science and Technology, September 2007
72 | P a g e
are expected to be useful at this point in order to understand the logic of each failure, see Section
2.3.2. The likelihood of each failure occurring and their consequence should at this point be
assessed qualitatively based on the experience of the gathered expertise. The findings of the
analysis should then be fed into a risk ranking matrix, see Section 2.3.4. Later in the qualification
process, the findings should be sought verified through further analysis and testing, see Section
2.3.3.
For the system components that were found to be proven technology (classed 1 in Table 12),
qualification documentation and statistical information on failures and performance should be
gathered. For those items that pose new technical uncertainties, new technical challenges, or
demanding new challenges (classed 2-4 in Table 12), the Structural similarity and Physics-of-
Failure techniques should be used see Section 2.3.3. To aid this analysis, the knowledge on
physics of failure of polymeric hollow fiber membranes gathered in Section 4.5 is discussed in
relation to qualifying the fixed site carrier PVAm membrane in Section 5.6 below.
5.6 SELECTION OF QUALIFICATION METHODS
Using the input of the previous steps in the qualification process, the aim of this step is to
select qualification methods that will address each of the identified failure mechanisms and
modes. As discussed in Section 4.6, a combination of deterministic and experimental methods is
necessary. Table 13 indicates the extent to which each of the physics of failure issues identified
in Section 4.5 is expected to be an issue for the given membrane, and suggests strategies for
addressing each of them.
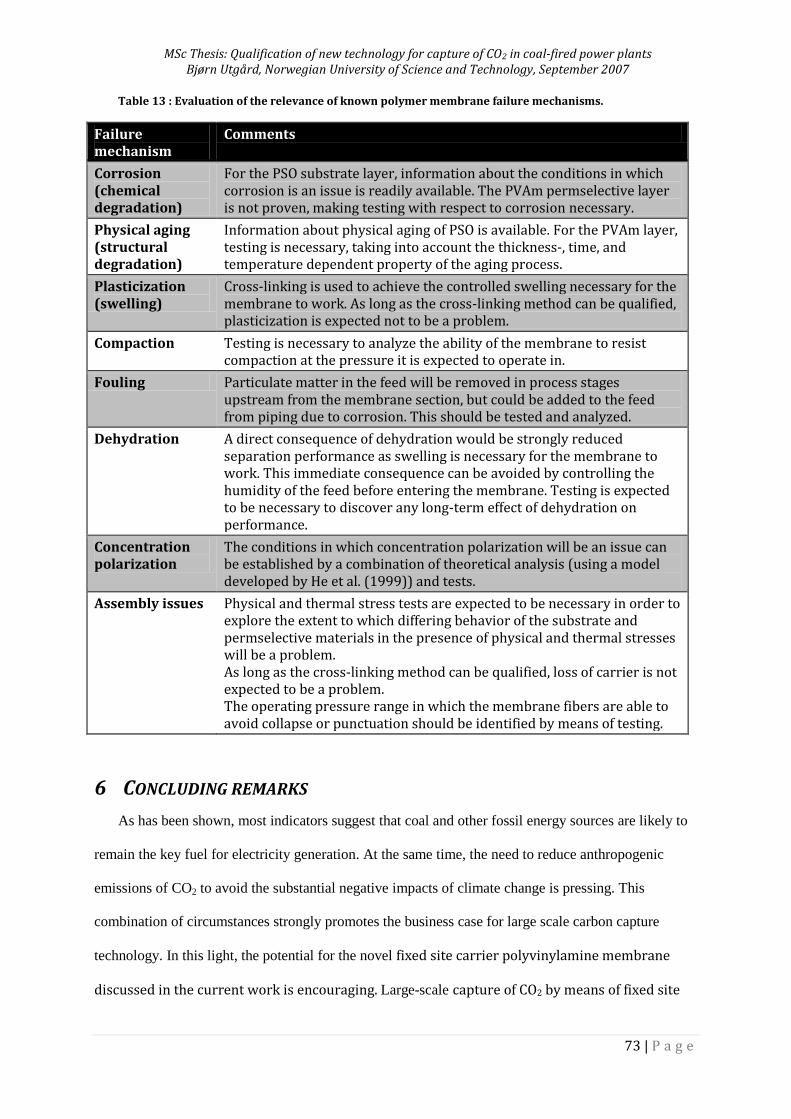
MSc Thesis: Qualification of new technology for capture of CO2 in coal-fired power plants Bjørn Utgård, Norwegian University of Science and Technology, September 2007
73 | P a g e
Table 13 : Evaluation of the relevance of known polymer membrane failure mechanisms.
Failure mechanism
Comments
Corrosion (chemical degradation)
For the PSO substrate layer, information about the conditions in which corrosion is an issue is readily available. The PVAm permselective layer is not proven, making testing with respect to corrosion necessary.
Physical aging (structural degradation)
Information about physical aging of PSO is available. For the PVAm layer, testing is necessary, taking into account the thickness-, time, and temperature dependent property of the aging process.
Plasticization (swelling)
Cross-linking is used to achieve the controlled swelling necessary for the membrane to work. As long as the cross-linking method can be qualified, plasticization is expected not to be a problem.
Compaction Testing is necessary to analyze the ability of the membrane to resist compaction at the pressure it is expected to operate in.
Fouling Particulate matter in the feed will be removed in process stages upstream from the membrane section, but could be added to the feed from piping due to corrosion. This should be tested and analyzed.
Dehydration A direct consequence of dehydration would be strongly reduced separation performance as swelling is necessary for the membrane to work. This immediate consequence can be avoided by controlling the humidity of the feed before entering the membrane. Testing is expected to be necessary to discover any long-term effect of dehydration on performance.
Concentration polarization
The conditions in which concentration polarization will be an issue can be established by a combination of theoretical analysis (using a model developed by He et al. (1999)) and tests.
Assembly issues Physical and thermal stress tests are expected to be necessary in order to explore the extent to which differing behavior of the substrate and permselective materials in the presence of physical and thermal stresses will be a problem. As long as the cross-linking method can be qualified, loss of carrier is not expected to be a problem. The operating pressure range in which the membrane fibers are able to avoid collapse or punctuation should be identified by means of testing.
6 CONCLUDING REMARKS
As has been shown, most indicators suggest that coal and other fossil energy sources are likely to
remain the key fuel for electricity generation. At the same time, the need to reduce anthropogenic
emissions of CO2 to avoid the substantial negative impacts of climate change is pressing. This
combination of circumstances strongly promotes the business case for large scale carbon capture
technology. In this light, the potential for the novel fixed site carrier polyvinylamine membrane
discussed in the current work is encouraging. Large-scale capture of CO2 by means of fixed site

MSc Thesis: Qualification of new technology for capture of CO2 in coal-fired power plants Bjørn Utgård, Norwegian University of Science and Technology, September 2007
74 | P a g e
carrier polyvinylamine membranes in power plants is however not yet a proven concept. While
the concept is likely to have a large potential, it remains to be proven that it in application will
work within acceptable ranges of quality, reliability and cost. In other words, the technology
must be qualified.
The survey of relevant scientific knowledge in Sections 2 through 4 provides a sound basis
for qualifying the technology. Guided by the recommendations provided in Section 5, the next
step is then to plan a qualification process that takes into account the issues raised. A proactive
approach that addresses qualification from the very start of the upcoming pilot plant project is
strongly recommended. This will ensure that the qualification process is as efficient as possible,
and that the cost and time penalty on the development and commercialization process is
minimized.
MSc Thesis: Qualification of new technology for capture of CO2 in coal-fired power plants Bjørn Utgård, Norwegian University of Science and Technology, September 2007
75 | P a g e
7 BIBLIOGRAPHY
Atkins, Peter, and Loretta Jones. Chemical Principles: The Quest for Insight. New York: W. H.
Freeman and Company, 2002.
Bao, L, and G.G Lipscomb. "Mass Transfer in Axial Flows Through Randomly Packed Fiber
Bundles." In New Insights Into Membrane Science and Technology: Polymeric and Biofunctional
Membranes, by D. Bhattacharyya and D.A. Butterfield, 3-26. Amsterdam: Elsevier Science B.V.,
2003.
Bhattacharya, Sudipta, and Sun-Tak Hwang. "Concentration polarization, separation factor,
and Peclet number in membrane processes." Journal of Membrane Science, 1997: 73-90.
Birolini, A. Reliability Engineering : Theory and Practice. Berlin: Springer-Verlag, 2004.
BS 5670. Reliability of systems, equipment and components Part 4: Guide to the specification of
dependability requirements. British Standard Institution, 1986.
BS4778. Glossary of Terms Used in Quality Assurance (Including Reliability and Maintainability
Terms). British Standard Institution.
Clausing, D., and Victor Fey. Effective Innovation, . New York: ASME Press, 2004.
Cussler, E.L., Rutherford Aris, and Abhoyjit Bhown. "On the Limits of Facilitated Diffusion."
Journal of Membrane Science, 1989: 149-164.
Dalton, Stu. "Clean Coal Technology: Options and Tradeoffs." Presentation. Electric Power
Research Institute, December 2 , 2005.
DNV. "Qualification Procedures for New Technology – Workshop (2612)." Høvik: Det Norske
Veritas, October 18, 2006.
MSc Thesis: Qualification of new technology for capture of CO2 in coal-fired power plants Bjørn Utgård, Norwegian University of Science and Technology, September 2007
76 | P a g e
DNV. Recommended Practice DNV-RP-A203 Qualification procedures for new technology.
Guideline, Høvik: Det Norske Veritas (DNV), 2001.
DoD. DoD Guide for Achieving Reliability, Availability, and Maintainability. US Department of
Defence, 2005.
Elcogas. IGCC Puertollano: A Clean Coal Gasification Power Plant. Elcogas.
Favre, Eric. "Carbon dioxide recovery from post-combustion processes: Can gas permeation
membranes compete with absorption?" Journal of Membrane Science, 2007: 50-59.
Fritzsche, Keith A., and James E. Kurz. "The Separation of Gases by Membranes." In Handbook
of industrial membrane technology, by Mark C. Porter, 559-593. Park Ridge, NJ: Noyes
Publications, 1990.
Gerling, W. H., A. Preussger, and F. W. Wulfert. "Reliability Qualification of Semiconductor
Devices Based on Physics-of-Failure and Risk and Opportunity Assessment." Quality and
Reliability Engineering International, 2002: 81-98.
Grainger, David, and May-Britt Hägg. "Techno-economic evaluation of a PVAm CO2-selective
membrane in an IGCC power plant with CO2 capture." 2007.
Grainger, David, Arne Lindbråthen, and May-Britt Hägg. "CO2 capture from fossi-fuelled
power plants using facilitated transport membrane technology." 8th International Conference on
Greenhouse Gas Control Technologies. Trondheim, 2006.
He, Gaohong, Yongli Mi, Po Lock Yue Yue, and Chen Guohua. "Theoretical study on
concentration polarization in gas separation membrane processes." Journal of Membrane
Science, 1999: 243-258.
MSc Thesis: Qualification of new technology for capture of CO2 in coal-fired power plants Bjørn Utgård, Norwegian University of Science and Technology, September 2007
77 | P a g e
Holt, Neville. "A Summary of Recent IGCC Studies of CO2 Capture for Sequestration." The
Gasification Technologies Conference San Francisco. San Francisco: Gasification Technologies
Council, 2003.
Hägg, May-Britt, and Arne Lindbråthen. "CO2 Capture from Natural Gas Fired Power Plants
by Using Membrane Technology." Journal of Industrial & Engineering Chemistry Research , 2005:
7668-7675.
Hägg, May-Britt, Taek-Joong Kim, and Baoan Li. Membrane for Separating CO2 and Process
for the Production thereof. World Patent WO/2005/089907. September 29, 2005.
IEA. Energy Technology Perspectives 2006. Paris: OECD/IEA, 2006.
—. Prospects for CO2 Capture and Storage. Paris: OECD/IEA, 2004.
IEA. World Energy Outlook 2005. Paris: OECD/ IEA, 2005.
IEC. Glossary. http://std.iec.ch/ (accessed June 10, 2007).
IEEE. IEEE Guide for Selecting and Using Reliability Predictions Based on IEEE 1413™. New
York: The Institute of Electrical and Electronics Engineers, Inc, 2003.
IPCC. Climate Change 2007: The Physical Science Basis - Summary for Policymakers -
Contribution of Working Group I to the Fourth Assessment Report of the. Geneve:
INTERGOVERNMENTAL PANEL ON CLIMATE CHANGE, 2007.
—. IPCC Special Report on Carbon Dioxide Capture and Storage. Prepared by Working Group
III of the Intergovernmental Panel on Climate Change [Metz, B., O. Davidson, H. C. de Coninck, M.
Loos, and L. A. Meyer (eds.)]. Cambridge, United Kingdom and New York, NY, USA: Cambridge
University Press/Intergovernmental Panel on Climate Change, 2005.
MSc Thesis: Qualification of new technology for capture of CO2 in coal-fired power plants Bjørn Utgård, Norwegian University of Science and Technology, September 2007
78 | P a g e
Kim, J.H., W.J. Koros, and D.R. Paul. "Effects of CO2 Exposure and Physical Aging on the Gas
Permeability of Thin 6FDA-based Polyimide Membranes. Part 1. Without Crosslinking." Journal
of Membrane Science, 2006: 21-31.
Kim, J.H., W.J. Koros, and D.R. Paul. "Physical Aging of Thin 6FDA Polyimide Membranes
Containing Carboxyl Acid Groups. Part I. Transport Properties." Polymer, 2006: 3094-3103.
Kim, Taek-Joong, Baoan Li, and May-Britt Hägg. "Novel Fixed-Site–Carrier Polyvinylamine
Membrane for Carbon Dioxide Capture." Journal of Polymer Science, 2004: 4326-4336.
Koros, William J., and Rajiv Mahajan. "Pushing the Limits on Possibilities for Large Scale Gas
Separation: Which Strategies?" Journal of Membrane Science, 2000: 181-196.
Kruczek, Boguslaw, and Takeshi Matsuura. "Limitations of a constant pressure-type testing
system in determination of gas transport properties of hydrophilic films." Journal of Membrane
Science, 2000: 129-142 .
Madden, William Clark. The Performance of Hollow Fiber Gas Seaparation Membranes in the
Presence of an Aggressive Feed Stream. PhD Thesis (Dissertation), Georgia Institute of
Technology, 2005.
Matteucci, Scott, Yuri Yampolskii, Benny D. Freeman, and Ingo Pinnau. "Transport of Gases
and Vapors in Glassy and Rubbery Polymers." In Materials Science of Membranes for Gas and
Vapor Separation, by Yuri Yampolskii, Ingo Pinnau and Benny D. Freeman, 1-47. West Sussex:
John Wiley & Sons Ltd., 2006.
Merkel, Tim C., Ingo Pinnau, Rajeev Prabhakar, and Benny Freeman. "Perfluoropolymers, Gas
and Vapor Transport Properties of ." In Materials Science of Membranes for Gas and Vapor
Separation, by Yuri Yampolskii, Ingo Pinnau and Benny Freeman, 251-270. West Sussex: John
Wiley & Sons Ltd, 2006.
MSc Thesis: Qualification of new technology for capture of CO2 in coal-fired power plants Bjørn Utgård, Norwegian University of Science and Technology, September 2007
79 | P a g e
Moss, Richard Y. "Design for Reliability." In Handbook of Reliability Engineering and
Management, by W. G. Ireson, Clyde F. Coombs and Moss Richard Y., 73-89. New York: McGraw-
Hill, 1996.
Noble, Richard D. "Analysis of Facilitated Transport with Fixed Site Carrier Membranes."
Journal of Membrane Science, 1990: 207-214.
Noble, Richard D., and Carl A. Koval. "Review of Facilitated Transport Membranes." In
Materials Science of Membranes for Gas and Vapor Separation, by Yuri Yampolskii, Ingo Pinnau
and Benny Freeman, 411-435. West Sussex: John Wiley & Sons Ltd, 2006.
Pandey, Pratibha, and R.S. Chauhan. "Membranes for gas separation." Progress in Polymer
Science (Elsevier Science Ltd.), 2001: 853-893.
Pecht, Michael. "Design for Qualification." Proceedings Annual Reliability and Maintainability
Symposium. Atlanta: IEEE, 1993.
Pecht, Michael, and Abhijit Dasgupta. "Physics-of-Failure: an Approach to ReliableProduct
Development." Journal of the Institute of Environmental Science, 1995: 30-34.
Peeters, Ad, André Faaij, and Wim Turkenburg. "Technological and economic comparison of
CO2 capture technologies including development potential evaluations." 8th International
Conference on Greenhouse Gas Control Technologies GHGT-8. Trondheim: NTNU, SINTEF, IEA
Greenhouse Gas R&D Programme , 2006.
Pfromm, Peter H. "The Impact of Physical Aging of Amorphous Glassy Polymers on Gas
Separation Membranes." In Materials Science of Membranes for Gas and Vapor Separation, by Yuri
Yampolskii, Ingo Pinnau and Benny Freeman, 293-306. West Sussex: John Wiley & Sons Ltd,
2006.
MSc Thesis: Qualification of new technology for capture of CO2 in coal-fired power plants Bjørn Utgård, Norwegian University of Science and Technology, September 2007
80 | P a g e
Rausand, Marvin. Risikoanalyse : Veiledning til NS 5814 (in Norwegian). Trondheim: Tapir
Forlag, 1991.
Rausand, Marvin, and Arnljot Høyland. System reliability theory : models, statistical methods,
and applications, 2nd ed. Hoboken, New Jersey: John Wiley & Sons, Inc, 2004.
Rautenbach, Robert. "Process Design and Optimization." In Handbook of Industrial Membrane
Technology, by Mark C. Porter, 349-400. Noyes, 1990.
Reinsch, Veronika E., Alan R. Greenberga, Stephen S. Kelley, and Rorik Peterson. "A New
Technique for the Simultaneous, Real-Time Measurement of Membrane Compaction and
Performance During Exposure to High-Pressure Gas." Journal of Membrane Science, 2000: 217-
228.
Ricketts, Brian. Focus on Clean Coal. Working Paper, Paris: OECD/IEA, 2006.
Rubin, Edward S., Sonia Yeh, Matt Antes, Michael Berkenpas, and John Davison. "Estimating
Future Costs of CO2 Capture Systems Using Historical Experience Curves." 8th International
Conference on Greenhouse Gas Control Technologies. Trondheim: IEA/NTNU/SINTEF, 2006.
Schweitzer, Philip A. Corrosion Engineering Handbook : Corrosion of Polymers and Elastomers.
Boca Raton: CRC Press, Taylor & Francis Group, 2007.
Smith, Robin. Chemical Process Design and Integration. Chichester, West Sussex: John Wiley &
Sons Ltd, 2005.
Starr, F., E. Tzimas, and S.D. Peteves. Near-Term IGCC and Steam Reforming Processes for the
Hydrogen Economy: The Development Issues. EUR 22340, Petten: Director General Joint Research
Cenctre Institute for Energy, 2006.
MSc Thesis: Qualification of new technology for capture of CO2 in coal-fired power plants Bjørn Utgård, Norwegian University of Science and Technology, September 2007
81 | P a g e
Strathmann, Heiner. "Synthetic Membranes and Their Preparation." In Handbook of
Industrial Membrane Technology, by Mark C Porter, 1-60. Park Ridge, NJ: Noyes Publications,
1990.
Sunde, Leif, and Jarle Bjeglerud, interview by Bjørn Utgård. Methods for Qualification of New
Technology (October 2006).
Svendsen, Pål Tore, Kjell Thorsen, and Asle Selfors. Gasskraft med CO2-håndtering:
Verdikjedevurderinger (in Norwegian). Report, Oslo: Norges Vassdrags- og Energidirektorat
(Norwegian Water- and Energy Authority), 2005.
van Driel, W.D., G.Q. Zhang, and L.J. Ernst. "Structural Similarity as a Method to Reduce
Qualification Tests." 6th International Conference on Electronic Packaging Technology
Proceedings. Shenzhen: IEEE, 2005.
Wallace, David W., Jason Williams, Staudt-Bickel Claudia, and William J. Koros.
"Characterization of Crosslinked Hollow Fiber Membranes." Polymer, 2006: 1207-1216.
Wijmans, Johannes G., and Richard W. Baker. "The Solution-Diffusion Model: A Unified
Approach to Membrane Permeation." In Materials Science of Membranes for Gas and Vapor
Separation, by Yuri Yampolskii, Ingo Pinnau and Benny Freeman, 159-190. West Sussex: John
Wiley & Sons Ltd, 2006.
Zydney, Andrew L., Chia-Chi Ho, and Wei Yuan. "Fouling phenomena during microfiltration:
effectso of pore blockage, cake filtration, and membrane morphology." In New Insights Into
Membrane Science and Technology: Polymeric and Biofunctional Membranes, by D. Bhattacharyya
and D.A. Butterfield, 27-44. Amsterdam: Elsevier Science B.V., 2003.