q4 2021 us industrial market overview - transwestern
TRANSCRIPT
Fourth Quarter 2021
COMMERCIAL REAL ESTATE
U.S. MARKET | INDUSTRIAL
U . S . M A R K E T | I N D U S T R I A L | Q 4 2 0 2 1
-50
0
50
100
150
200
250
2012 2013 2014 2015 2016 2017 2018 2019 2020 2021
0100200300400500600700800
2012 2013 2014 2015 2016 2017 2018 2019 2020 2021
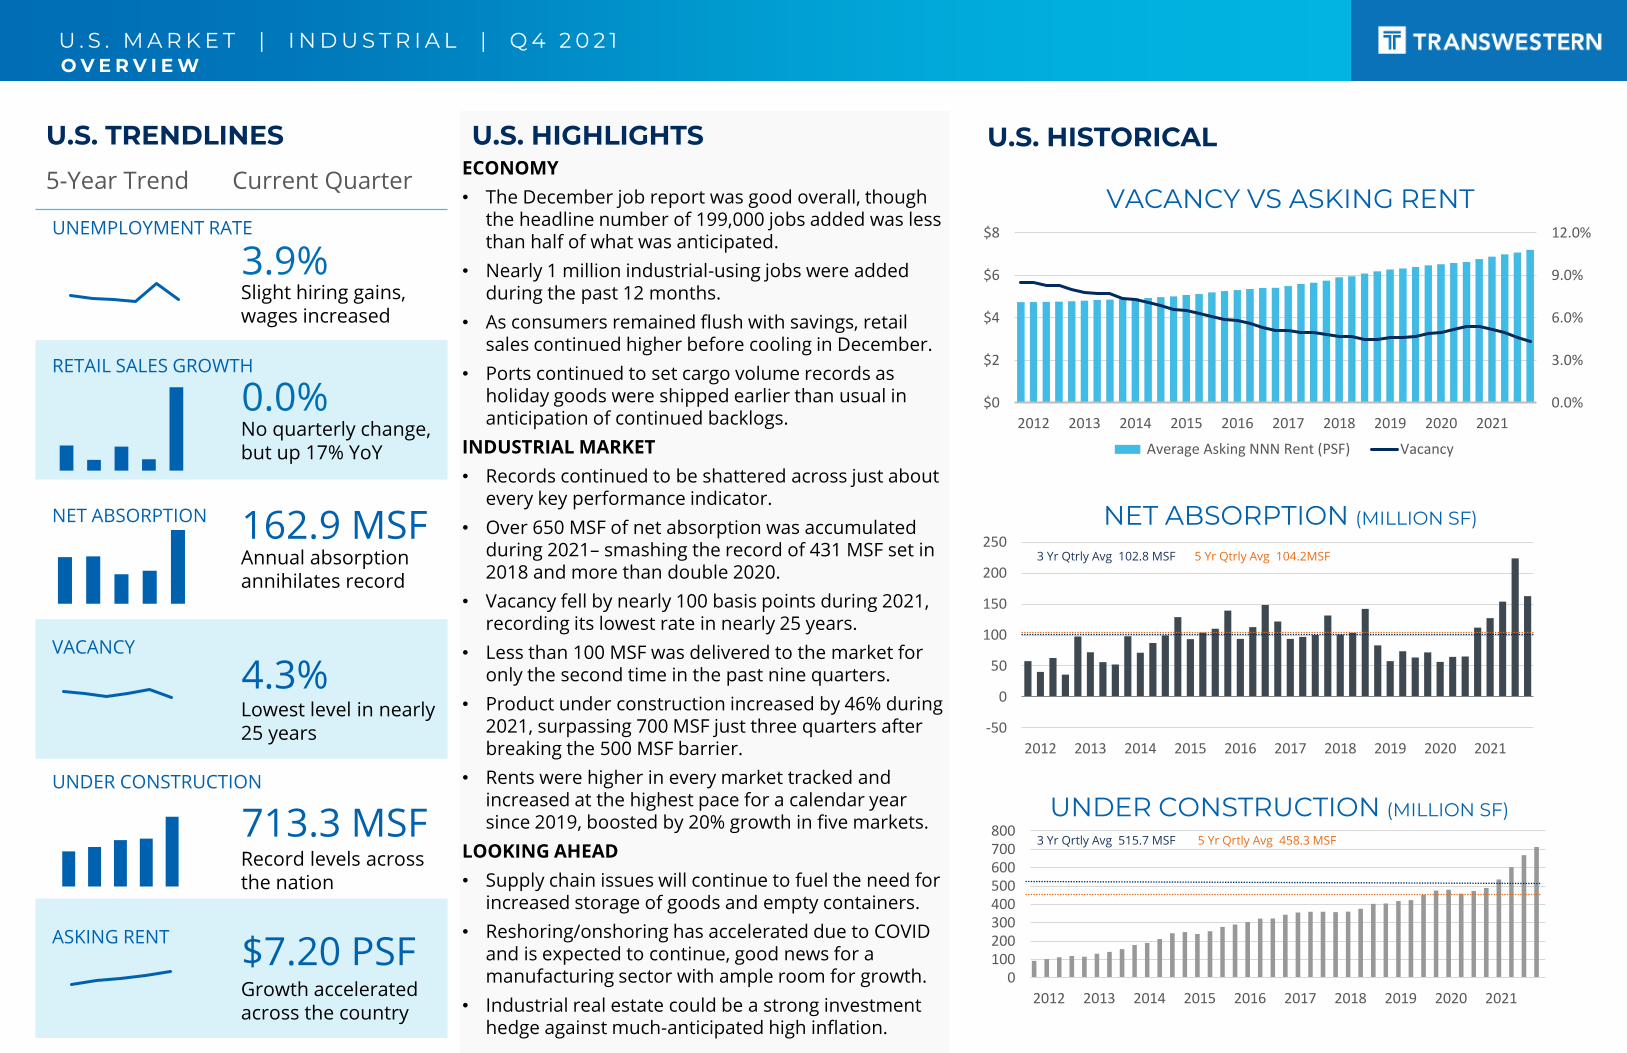
U.S. TRENDLINES
5-Year Trend Current Quarter
VACANCY
U.S. HIGHLIGHTS
4.3%Lowest level in nearly 25 years
ECONOMY
• The December job report was good overall, though the headline number of 199,000 jobs added was less than half of what was anticipated.
• Nearly 1 million industrial-using jobs were added during the past 12 months.
• As consumers remained flush with savings, retail sales continued higher before cooling in December.
• Ports continued to set cargo volume records as holiday goods were shipped earlier than usual in anticipation of continued backlogs.
INDUSTRIAL MARKET
• Records continued to be shattered across just about every key performance indicator.
• Over 650 MSF of net absorption was accumulated during 2021– smashing the record of 431 MSF set in 2018 and more than double 2020.
• Vacancy fell by nearly 100 basis points during 2021, recording its lowest rate in nearly 25 years.
• Less than 100 MSF was delivered to the market for only the second time in the past nine quarters.
• Product under construction increased by 46% during 2021, surpassing 700 MSF just three quarters after breaking the 500 MSF barrier.
• Rents were higher in every market tracked and increased at the highest pace for a calendar year since 2019, boosted by 20% growth in five markets.
LOOKING AHEAD
• Supply chain issues will continue to fuel the need for increased storage of goods and empty containers.
• Reshoring/onshoring has accelerated due to COVIDand is expected to continue, good news for a manufacturing sector with ample room for growth.
• Industrial real estate could be a strong investment hedge against much-anticipated high inflation.
VACANCY VS ASKING RENT
0.0%
3.0%
6.0%
9.0%
12.0%
$0
$2
$4
$6
$8
2012 2013 2014 2015 2016 2017 2018 2019 2020 2021
Average Asking NNN Rent (PSF) Vacancy
NET ABSORPTION (MILLION SF)
UNDER CONSTRUCTION (MILLION SF)3 Yr Qrtly Avg 515.7 MSF 5 Yr Qrtly Avg 458.3 MSF
3 Yr Qtrly Avg 102.8 MSF 5 Yr Qtrly Avg 104.2MSF
NET ABSORPTION 162.9 MSFAnnual absorption annihilates record
ASKING RENT$7.20 PSFGrowth accelerated across the country
UNDER CONSTRUCTION
713.3 MSFRecord levels across the nation
YTD
UNEMPLOYMENT RATE
3.9%Slight hiring gains, wages increased
RETAIL SALES GROWTH
0.0%No quarterly change, but up 17% YoY
U.S. HISTORICAL
O V E R V I E W
U . S . M A R K E T | I N D U S T R I A L | Q 4 2 0 2 1
05
10152025303540455055
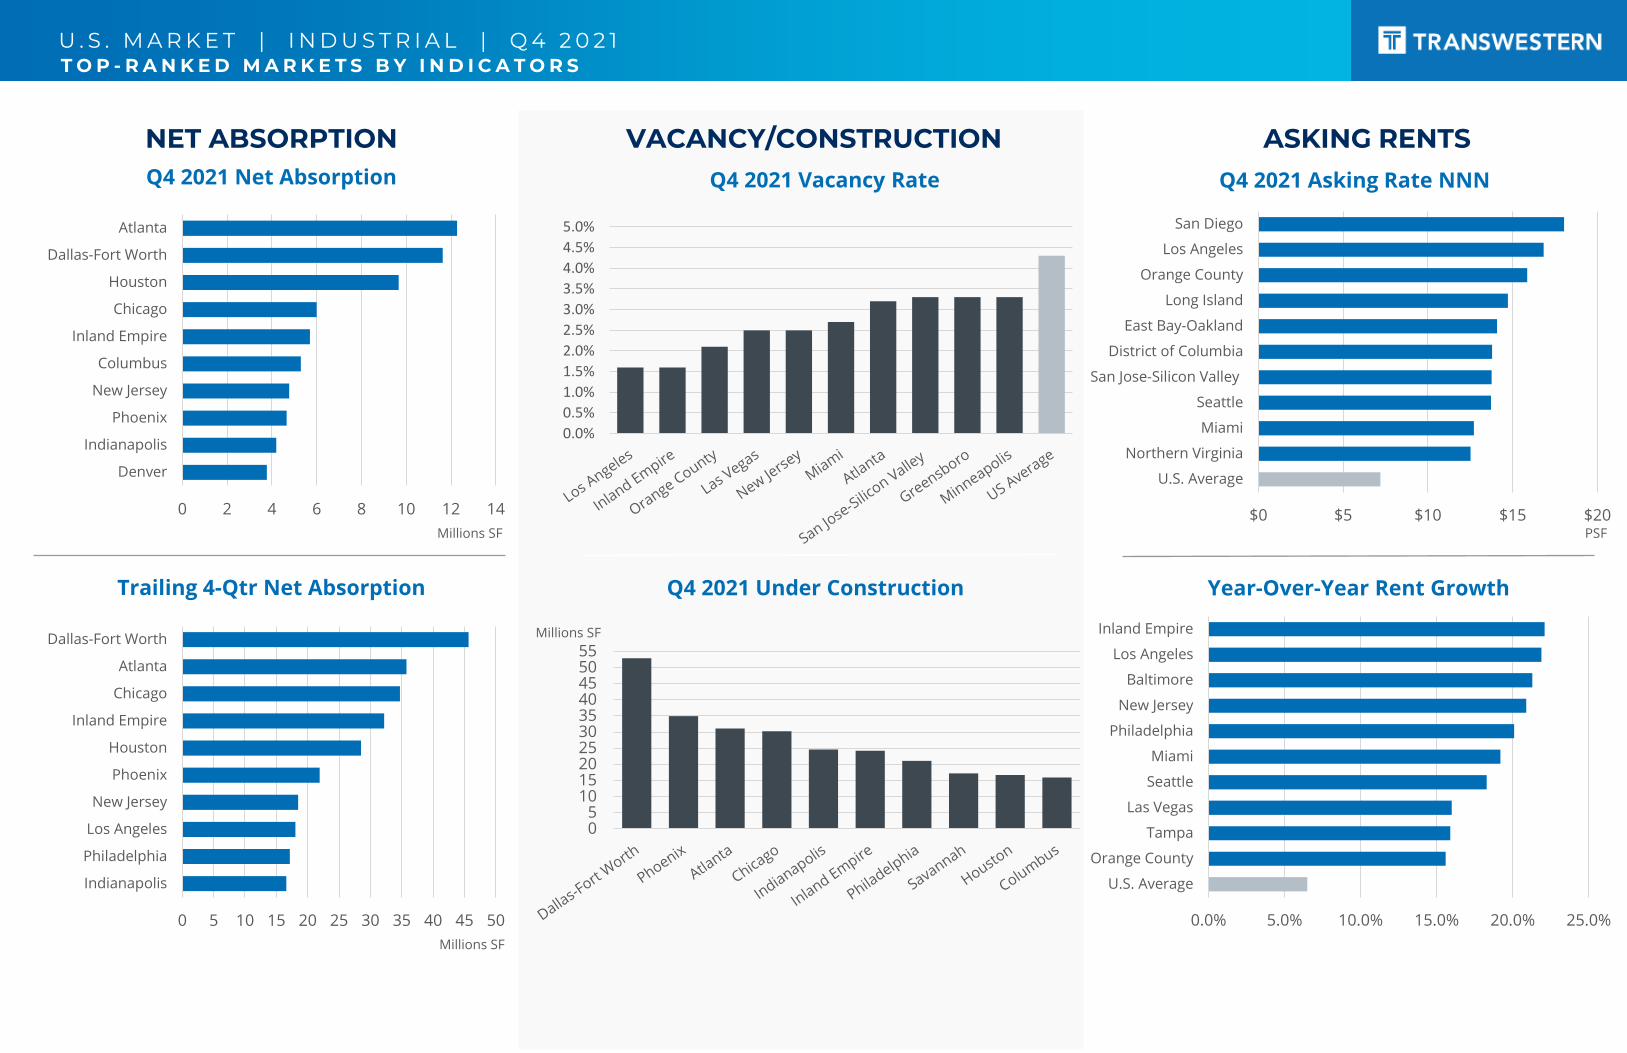
NET ABSORPTIONQ4 2021 Net Absorption
VACANCY/CONSTRUCTION ASKING RENTS
Trailing 4-Qtr Net Absorption Q4 2021 Under Construction
Q4 2021 Vacancy Rate
Year-Over-Year Rent Growth
Q4 2021 Asking Rate NNN
0 2 4 6 8 10 12 14
Denver
Indianapolis
Phoenix
New Jersey
Columbus
Inland Empire
Chicago
Houston
Dallas-Fort Worth
Atlanta
0 5 10 15 20 25 30 35 40 45 50
Indianapolis
Philadelphia
Los Angeles
New Jersey
Phoenix
Houston
Inland Empire
Chicago
Atlanta
Dallas-Fort Worth
$0 $5 $10 $15 $20
U.S. Average
Northern Virginia
Miami
Seattle
San Jose-Silicon Valley
District of Columbia
East Bay-Oakland
Long Island
Orange County
Los Angeles
San Diego
0.0%
0.5%
1.0%
1.5%
2.0%
2.5%
3.0%
3.5%
4.0%
4.5%
5.0%
0.0% 5.0% 10.0% 15.0% 20.0% 25.0%
U.S. Average
Orange County
Tampa
Las Vegas
Seattle
Miami
Philadelphia
New Jersey
Baltimore
Los Angeles
Inland Empire
Millions SF
Millions SF PSF
Millions SF
T O P - R A N K E D M A R K E T S B Y I N D I C A T O R S
U . S . M A R K E T | I N D U S T R I A L | Q 4 2 0 2 1
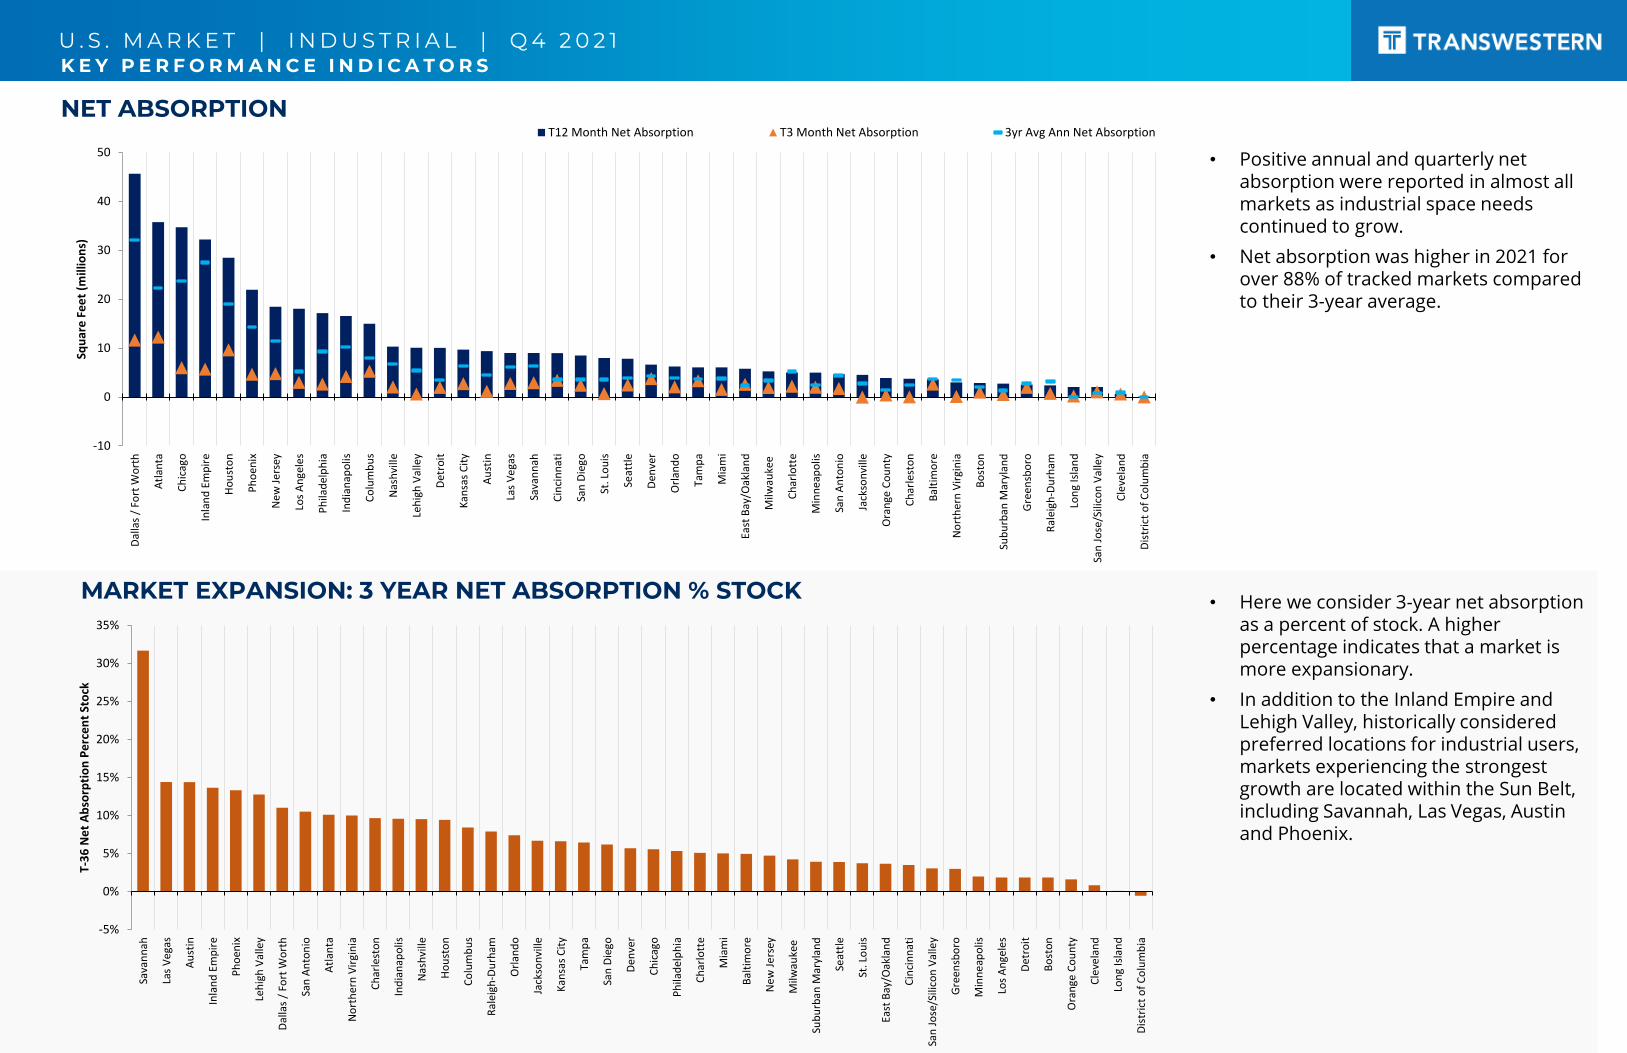
NET ABSORPTION
MARKET EXPANSION: 3 YEAR NET ABSORPTION % STOCK
K E Y P E R F O R M A N C E I N D I C A T O R S
• Positive annual and quarterly net absorption were reported in almost all markets as industrial space needs continued to grow.
• Net absorption was higher in 2021 for over 88% of tracked markets compared to their 3-year average.
• Here we consider 3-year net absorption as a percent of stock. A higher percentage indicates that a market is more expansionary.
• In addition to the Inland Empire and Lehigh Valley, historically considered preferred locations for industrial users, markets experiencing the strongest growth are located within the Sun Belt, including Savannah, Las Vegas, Austinand Phoenix.
-5%
0%
5%
10%
15%
20%
25%
30%
35%
Sava
nn
ah
Las
Ve
gas
Au
stin
Inla
nd
Em
pir
e
Ph
oen
ix
Leh
igh
Val
ley
Dal
las
/ Fo
rt W
ort
h
San
An
ton
io
Atl
anta
No
rth
ern
Vir
gin
ia
Ch
arle
sto
n
Ind
ian
apo
lis
Nas
hvi
lle
Ho
ust
on
Co
lum
bu
s
Ral
eigh
-Du
rham
Orl
and
o
Jack
son
ville
Kan
sas
Cit
y
Tam
pa
San
Die
go
Den
ver
Ch
icag
o
Ph
ilad
elp
hia
Ch
arlo
tte
Mia
mi
Bal
tim
ore
Ne
w J
ers
ey
Milw
auke
e
Sub
urb
an M
aryl
and
Seat
tle
St. L
ou
is
East
Bay
/Oak
lan
d
Cin
cin
nat
i
San
Jo
se/S
ilico
n V
alle
y
Gre
ensb
oro
Min
ne
apo
lis
Los
An
gele
s
Det
roit
Bo
sto
n
Ora
nge
Co
un
ty
Cle
vela
nd
Lon
g Is
lan
d
Dis
tric
t o
f C
olu
mb
ia
T-3
6 N
et
Ab
sorp
tio
n P
erc
en
t St
ock
-10
0
10
20
30
40
50
Dal
las
/ Fo
rt W
ort
h
Atl
anta
Ch
icag
o
Inla
nd
Em
pir
e
Ho
ust
on
Ph
oen
ix
Ne
w J
ers
ey
Los
An
gele
s
Ph
ilad
elp
hia
Ind
ian
apo
lis
Co
lum
bu
s
Nas
hvi
lle
Leh
igh
Val
ley
Det
roit
Kan
sas
Cit
y
Au
stin
Las
Ve
gas
Sava
nn
ah
Cin
cin
nat
i
San
Die
go
St. L
ou
is
Seat
tle
Den
ver
Orl
and
o
Tam
pa
Mia
mi
East
Bay
/Oak
lan
d
Milw
auke
e
Ch
arlo
tte
Min
ne
apo
lis
San
An
ton
io
Jack
son
ville
Ora
nge
Co
un
ty
Ch
arle
sto
n
Bal
tim
ore
No
rth
ern
Vir
gin
ia
Bo
sto
n
Sub
urb
an M
aryl
and
Gre
ensb
oro
Ral
eigh
-Du
rham
Lon
g Is
lan
d
San
Jo
se/S
ilico
n V
alle
y
Cle
vela
nd
Dis
tric
t o
f C
olu
mb
ia
Squ
are
Fe
et
(mill
ion
s)
T12 Month Net Absorption T3 Month Net Absorption 3yr Avg Ann Net Absorption
U . S . M A R K E T | I N D U S T R I A L | Q 4 2 0 2 1
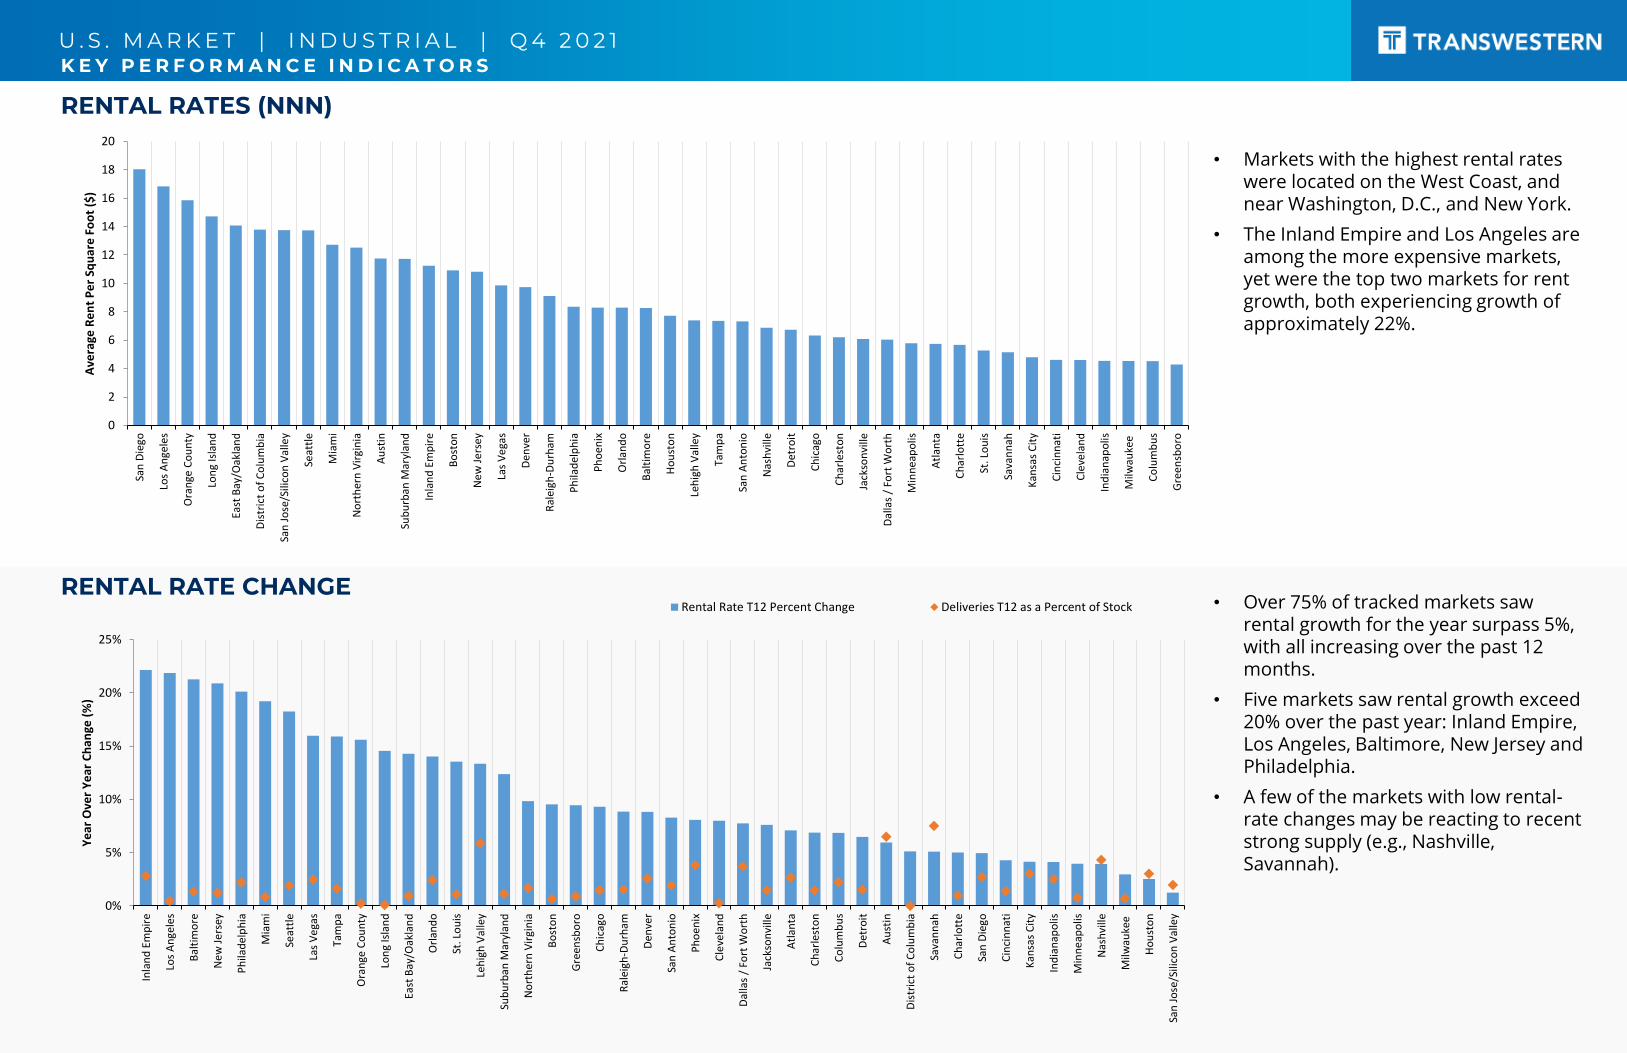
RENTAL RATES (NNN)
RENTAL RATE CHANGE
K E Y P E R F O R M A N C E I N D I C A T O R S
• Markets with the highest rental rates were located on the West Coast, and near Washington, D.C., and New York.
• The Inland Empire and Los Angeles are among the more expensive markets, yet were the top two markets for rent growth, both experiencing growth of approximately 22%.
• Over 75% of tracked markets saw rental growth for the year surpass 5%, with all increasing over the past 12 months.
• Five markets saw rental growth exceed 20% over the past year: Inland Empire, Los Angeles, Baltimore, New Jersey and Philadelphia.
• A few of the markets with low rental-rate changes may be reacting to recent strong supply (e.g., Nashville, Savannah).
0
2
4
6
8
10
12
14
16
18
20Sa
n D
iego
Los
An
gele
s
Ora
nge
Co
un
ty
Lon
g Is
lan
d
East
Bay
/Oak
lan
d
Dis
tric
t o
f C
olu
mb
ia
San
Jo
se/S
ilico
n V
alle
y
Seat
tle
Mia
mi
No
rth
ern
Vir
gin
ia
Au
stin
Sub
urb
an M
aryl
and
Inla
nd
Em
pir
e
Bo
sto
n
Ne
w J
ers
ey
Las
Ve
gas
Den
ver
Ral
eigh
-Du
rham
Ph
ilad
elp
hia
Ph
oen
ix
Orl
and
o
Bal
tim
ore
Ho
ust
on
Leh
igh
Val
ley
Tam
pa
San
An
ton
io
Nas
hvi
lle
Det
roit
Ch
icag
o
Ch
arle
sto
n
Jack
son
ville
Dal
las
/ Fo
rt W
ort
h
Min
ne
apo
lis
Atl
anta
Ch
arlo
tte
St. L
ou
is
Sava
nn
ah
Kan
sas
Cit
y
Cin
cin
nat
i
Cle
vela
nd
Ind
ian
apo
lis
Milw
auke
e
Co
lum
bu
s
Gre
ensb
oro
Ave
rage
Re
nt
Pe
r Sq
uar
e F
oo
t ($
)
0%
5%
10%
15%
20%
25%
Inla
nd
Em
pir
e
Los
An
gele
s
Bal
tim
ore
Ne
w J
ers
ey
Ph
ilad
elp
hia
Mia
mi
Seat
tle
Las
Ve
gas
Tam
pa
Ora
nge
Co
un
ty
Lon
g Is
lan
d
East
Bay
/Oak
lan
d
Orl
and
o
St. L
ou
is
Leh
igh
Val
ley
Sub
urb
an M
aryl
and
No
rth
ern
Vir
gin
ia
Bo
sto
n
Gre
ensb
oro
Ch
icag
o
Ral
eigh
-Du
rham
Den
ver
San
An
ton
io
Ph
oen
ix
Cle
vela
nd
Dal
las
/ Fo
rt W
ort
h
Jack
son
ville
Atl
anta
Ch
arle
sto
n
Co
lum
bu
s
Det
roit
Au
stin
Dis
tric
t o
f C
olu
mb
ia
Sava
nn
ah
Ch
arlo
tte
San
Die
go
Cin
cin
nat
i
Kan
sas
Cit
y
Ind
ian
apo
lis
Min
ne
apo
lis
Nas
hvi
lle
Milw
auke
e
Ho
ust
on
San
Jo
se/S
ilico
n V
alle
y
Ye
ar O
ver
Ye
ar C
han
ge (
%)
Rental Rate T12 Percent Change Deliveries T12 as a Percent of Stock
U . S . M A R K E T | I N D U S T R I A L | Q 4 2 0 2 1
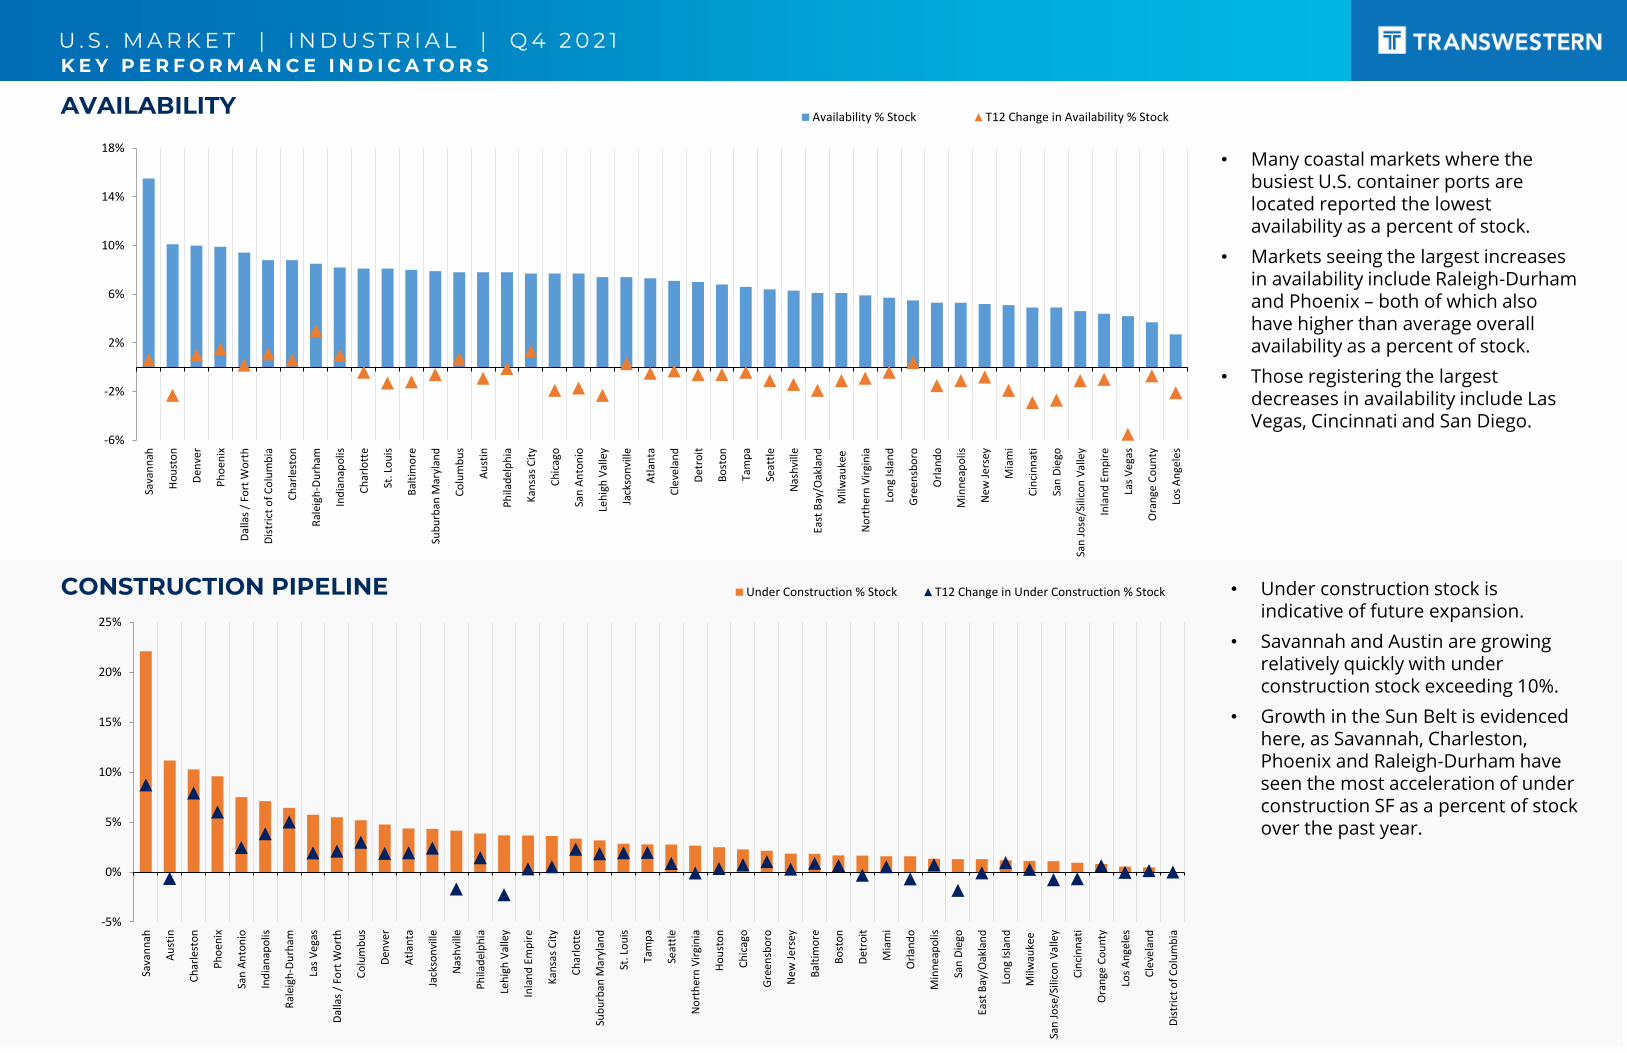
CONSTRUCTION PIPELINE
AVAILABILITY
K E Y P E R F O R M A N C E I N D I C A T O R S
• Many coastal markets where the busiest U.S. container ports are located reported the lowest availability as a percent of stock.
• Markets seeing the largest increases in availability include Raleigh-Durham and Phoenix – both of which also have higher than average overall availability as a percent of stock.
• Those registering the largest decreases in availability include Las Vegas, Cincinnati and San Diego.
• Under construction stock is indicative of future expansion.
• Savannah and Austin are growing relatively quickly with under construction stock exceeding 10%.
• Growth in the Sun Belt is evidenced here, as Savannah, Charleston, Phoenix and Raleigh-Durham have seen the most acceleration of under construction SF as a percent of stock over the past year.
-6%
-2%
2%
6%
10%
14%
18%Sa
van
nah
Ho
ust
on
Den
ver
Ph
oen
ix
Dal
las
/ Fo
rt W
ort
h
Dis
tric
t o
f C
olu
mb
ia
Ch
arle
sto
n
Ral
eigh
-Du
rham
Ind
ian
apo
lis
Ch
arlo
tte
St. L
ou
is
Bal
tim
ore
Sub
urb
an M
aryl
and
Co
lum
bu
s
Au
stin
Ph
ilad
elp
hia
Kan
sas
Cit
y
Ch
icag
o
San
An
ton
io
Leh
igh
Val
ley
Jack
son
ville
Atl
anta
Cle
vela
nd
Det
roit
Bo
sto
n
Tam
pa
Seat
tle
Nas
hvi
lle
East
Bay
/Oak
lan
d
Milw
auke
e
No
rth
ern
Vir
gin
ia
Lon
g Is
lan
d
Gre
ensb
oro
Orl
and
o
Min
ne
apo
lis
Ne
w J
ers
ey
Mia
mi
Cin
cin
nat
i
San
Die
go
San
Jo
se/S
ilico
n V
alle
y
Inla
nd
Em
pir
e
Las
Ve
gas
Ora
nge
Co
un
ty
Los
An
gele
s
Availability % Stock T12 Change in Availability % Stock
-5%
0%
5%
10%
15%
20%
25%
Sava
nn
ah
Au
stin
Ch
arle
sto
n
Ph
oen
ix
San
An
ton
io
Ind
ian
apo
lis
Ral
eigh
-Du
rham
Las
Ve
gas
Dal
las
/ Fo
rt W
ort
h
Co
lum
bu
s
Den
ver
Atl
anta
Jack
son
ville
Nas
hvi
lle
Ph
ilad
elp
hia
Leh
igh
Val
ley
Inla
nd
Em
pir
e
Kan
sas
Cit
y
Ch
arlo
tte
Sub
urb
an M
aryl
and
St. L
ou
is
Tam
pa
Seat
tle
No
rth
ern
Vir
gin
ia
Ho
ust
on
Ch
icag
o
Gre
ensb
oro
Ne
w J
ers
ey
Bal
tim
ore
Bo
sto
n
Det
roit
Mia
mi
Orl
and
o
Min
ne
apo
lis
San
Die
go
East
Bay
/Oak
lan
d
Lon
g Is
lan
d
Milw
auke
e
San
Jo
se/S
ilico
n V
alle
y
Cin
cin
nat
i
Ora
nge
Co
un
ty
Los
An
gele
s
Cle
vela
nd
Dis
tric
t o
f C
olu
mb
ia
Under Construction % Stock T12 Change in Under Construction % Stock
U . S . M A R K E T | I N D U S T R I A L | Q 4 2 0 2 1
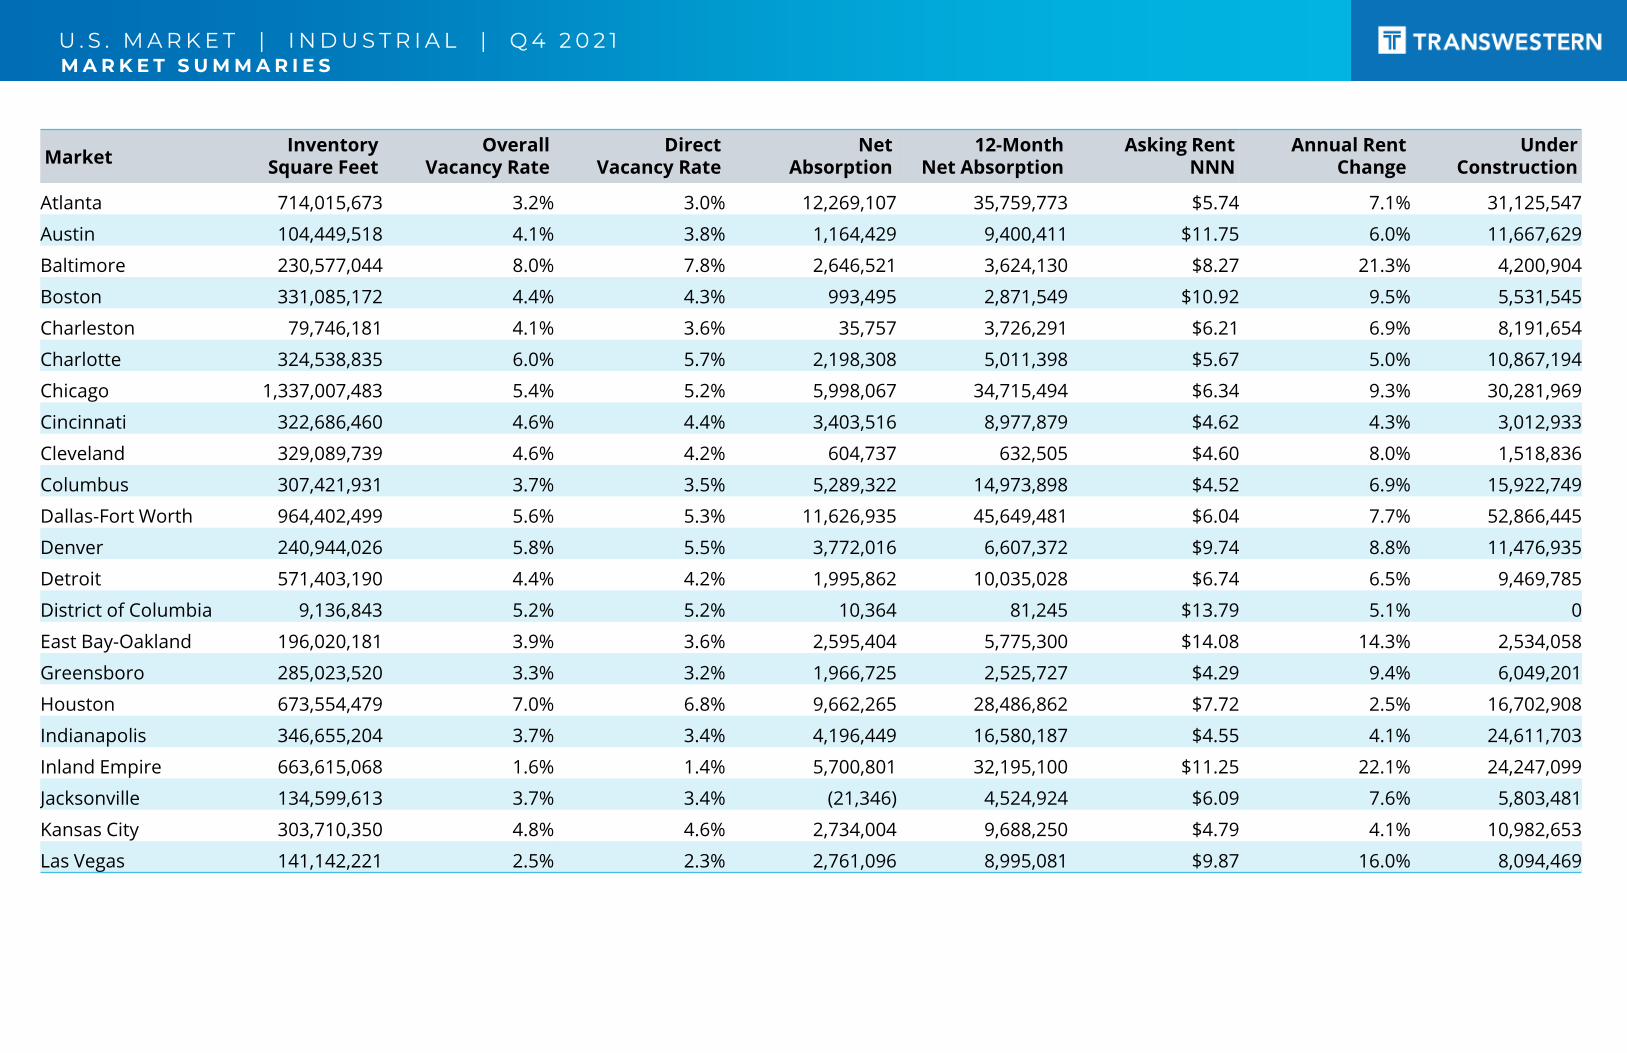
MarketInventory
Square FeetOverall
Vacancy Rate Direct
Vacancy RateNet
Absorption12-Month
Net AbsorptionAsking Rent
NNNAnnual Rent
ChangeUnder
Construction
Atlanta 714,015,673 3.2% 3.0% 12,269,107 35,759,773 $5.74 7.1% 31,125,547
Austin 104,449,518 4.1% 3.8% 1,164,429 9,400,411 $11.75 6.0% 11,667,629
Baltimore 230,577,044 8.0% 7.8% 2,646,521 3,624,130 $8.27 21.3% 4,200,904
Boston 331,085,172 4.4% 4.3% 993,495 2,871,549 $10.92 9.5% 5,531,545
Charleston 79,746,181 4.1% 3.6% 35,757 3,726,291 $6.21 6.9% 8,191,654
Charlotte 324,538,835 6.0% 5.7% 2,198,308 5,011,398 $5.67 5.0% 10,867,194
Chicago 1,337,007,483 5.4% 5.2% 5,998,067 34,715,494 $6.34 9.3% 30,281,969
Cincinnati 322,686,460 4.6% 4.4% 3,403,516 8,977,879 $4.62 4.3% 3,012,933
Cleveland 329,089,739 4.6% 4.2% 604,737 632,505 $4.60 8.0% 1,518,836
Columbus 307,421,931 3.7% 3.5% 5,289,322 14,973,898 $4.52 6.9% 15,922,749
Dallas-Fort Worth 964,402,499 5.6% 5.3% 11,626,935 45,649,481 $6.04 7.7% 52,866,445
Denver 240,944,026 5.8% 5.5% 3,772,016 6,607,372 $9.74 8.8% 11,476,935
Detroit 571,403,190 4.4% 4.2% 1,995,862 10,035,028 $6.74 6.5% 9,469,785
District of Columbia 9,136,843 5.2% 5.2% 10,364 81,245 $13.79 5.1% 0
East Bay-Oakland 196,020,181 3.9% 3.6% 2,595,404 5,775,300 $14.08 14.3% 2,534,058
Greensboro 285,023,520 3.3% 3.2% 1,966,725 2,525,727 $4.29 9.4% 6,049,201
Houston 673,554,479 7.0% 6.8% 9,662,265 28,486,862 $7.72 2.5% 16,702,908
Indianapolis 346,655,204 3.7% 3.4% 4,196,449 16,580,187 $4.55 4.1% 24,611,703
Inland Empire 663,615,068 1.6% 1.4% 5,700,801 32,195,100 $11.25 22.1% 24,247,099
Jacksonville 134,599,613 3.7% 3.4% (21,346) 4,524,924 $6.09 7.6% 5,803,481
Kansas City 303,710,350 4.8% 4.6% 2,734,004 9,688,250 $4.79 4.1% 10,982,653
Las Vegas 141,142,221 2.5% 2.3% 2,761,096 8,995,081 $9.87 16.0% 8,094,469
M A R K E T S U M M A R I E S
U . S . M A R K E T | I N D U S T R I A L | Q 4 2 0 2 1M A R K E T S U M M A R I E S
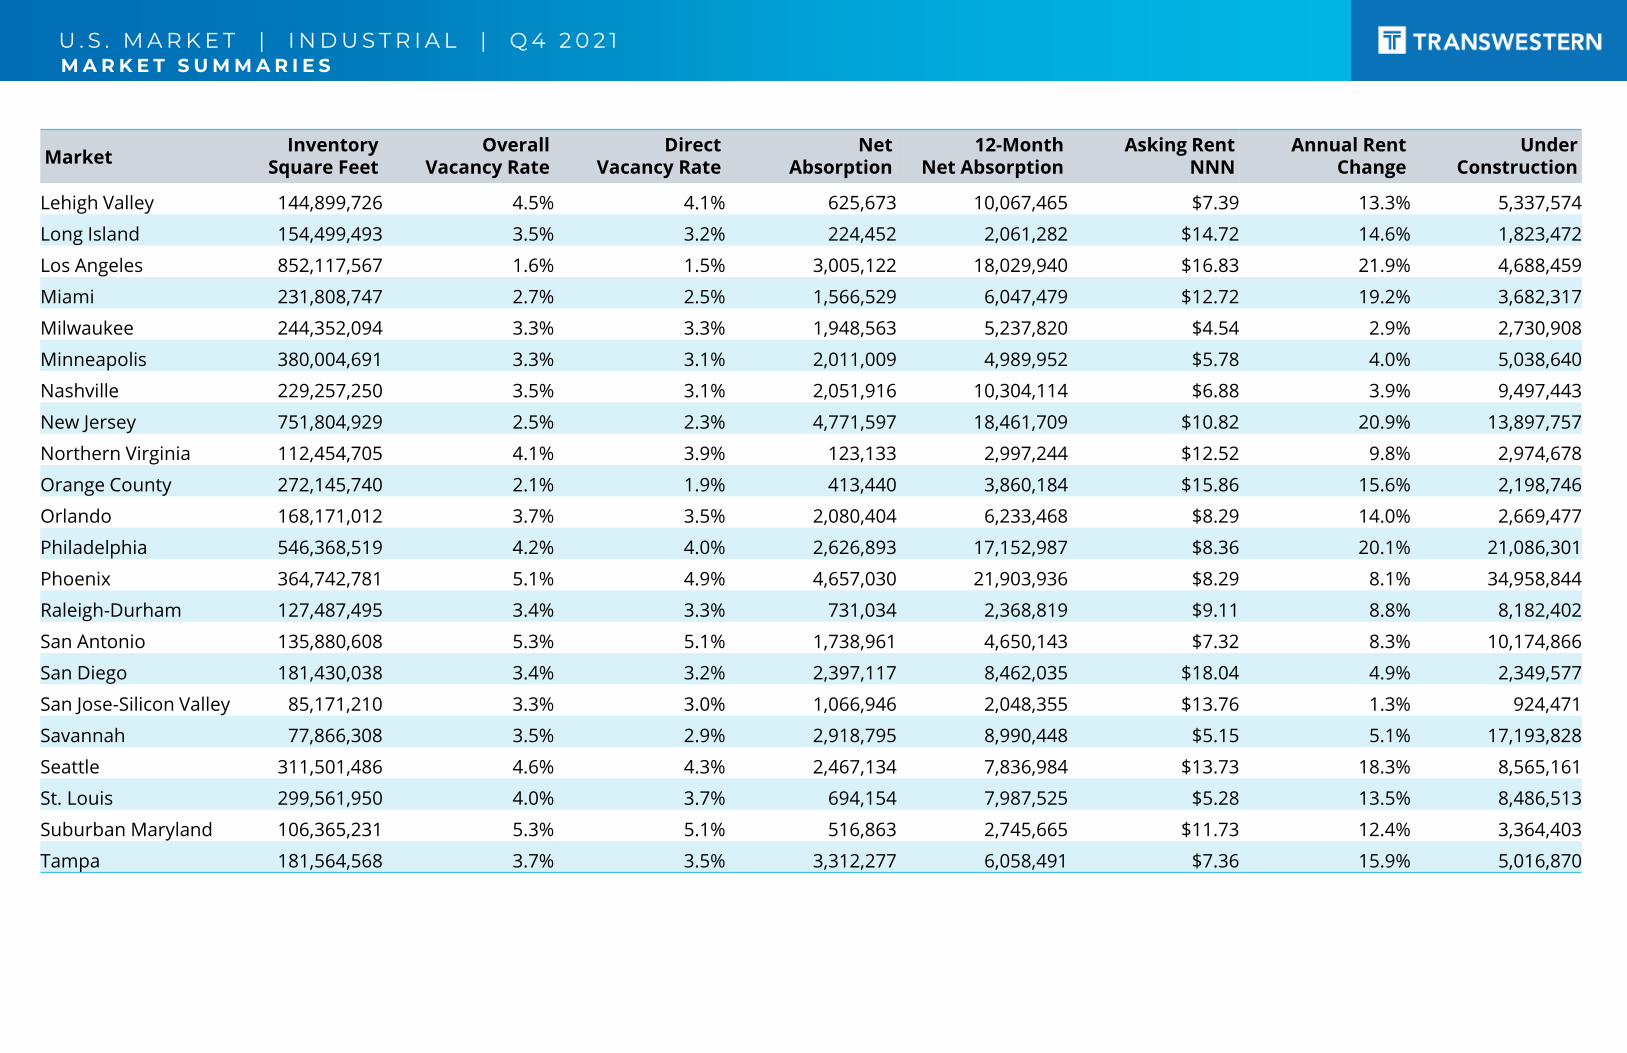
MarketInventory
Square FeetOverall
Vacancy Rate Direct
Vacancy RateNet
Absorption12-Month
Net AbsorptionAsking Rent
NNNAnnual Rent
ChangeUnder
Construction
Lehigh Valley 144,899,726 4.5% 4.1% 625,673 10,067,465 $7.39 13.3% 5,337,574
Long Island 154,499,493 3.5% 3.2% 224,452 2,061,282 $14.72 14.6% 1,823,472
Los Angeles 852,117,567 1.6% 1.5% 3,005,122 18,029,940 $16.83 21.9% 4,688,459
Miami 231,808,747 2.7% 2.5% 1,566,529 6,047,479 $12.72 19.2% 3,682,317
Milwaukee 244,352,094 3.3% 3.3% 1,948,563 5,237,820 $4.54 2.9% 2,730,908
Minneapolis 380,004,691 3.3% 3.1% 2,011,009 4,989,952 $5.78 4.0% 5,038,640
Nashville 229,257,250 3.5% 3.1% 2,051,916 10,304,114 $6.88 3.9% 9,497,443
New Jersey 751,804,929 2.5% 2.3% 4,771,597 18,461,709 $10.82 20.9% 13,897,757
Northern Virginia 112,454,705 4.1% 3.9% 123,133 2,997,244 $12.52 9.8% 2,974,678
Orange County 272,145,740 2.1% 1.9% 413,440 3,860,184 $15.86 15.6% 2,198,746
Orlando 168,171,012 3.7% 3.5% 2,080,404 6,233,468 $8.29 14.0% 2,669,477
Philadelphia 546,368,519 4.2% 4.0% 2,626,893 17,152,987 $8.36 20.1% 21,086,301
Phoenix 364,742,781 5.1% 4.9% 4,657,030 21,903,936 $8.29 8.1% 34,958,844
Raleigh-Durham 127,487,495 3.4% 3.3% 731,034 2,368,819 $9.11 8.8% 8,182,402
San Antonio 135,880,608 5.3% 5.1% 1,738,961 4,650,143 $7.32 8.3% 10,174,866
San Diego 181,430,038 3.4% 3.2% 2,397,117 8,462,035 $18.04 4.9% 2,349,577
San Jose-Silicon Valley 85,171,210 3.3% 3.0% 1,066,946 2,048,355 $13.76 1.3% 924,471
Savannah 77,866,308 3.5% 2.9% 2,918,795 8,990,448 $5.15 5.1% 17,193,828
Seattle 311,501,486 4.6% 4.3% 2,467,134 7,836,984 $13.73 18.3% 8,565,161
St. Louis 299,561,950 4.0% 3.7% 694,154 7,987,525 $5.28 13.5% 8,486,513
Suburban Maryland 106,365,231 5.3% 5.1% 516,863 2,745,665 $11.73 12.4% 3,364,403
Tampa 181,564,568 3.7% 3.5% 3,312,277 6,058,491 $7.36 15.9% 5,016,870
U . S . M A R K E T | I N D U S T R I A L | Q 4 2 0 2 1
RESEARCH METHODOLOGYThe information in this report is a compilation of single and multi-
tenant industrial and flex properties located in select U.S.
metropolitan areas. Government-owned buildings are excluded
from analysis. All rents are reported as triple net.
Copyright © 2022 Transwestern. All rights reserved. No part of this work may be reproduced or distributed to third parties without written permission of the copyright owner. The information contained in this report was gathered by Transwestern from CoStar and other primary and secondary sources believed to be reliable. Transwestern, however, makes no representation concerning the accuracy or completeness of such information and expressly disclaims any responsibility for any inaccuracy contained herein.
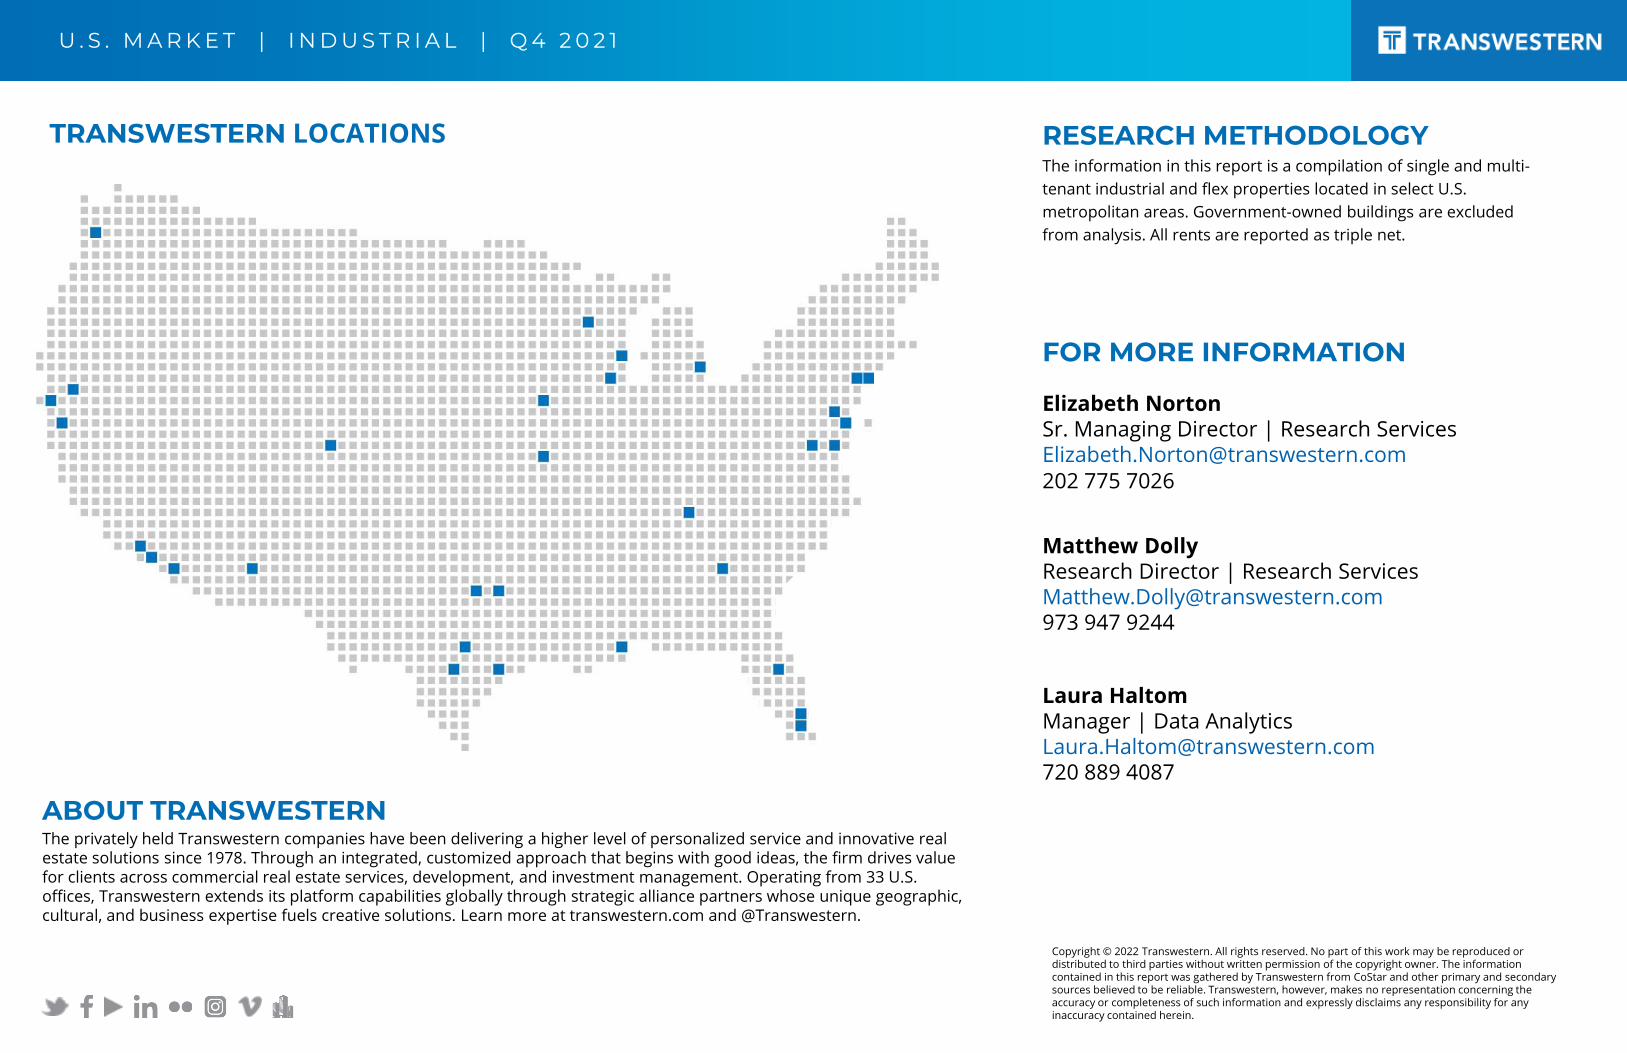
TRANSWESTERN LOCATIONS
ABOUT TRANSWESTERNThe privately held Transwestern companies have been delivering a higher level of personalized service and innovative real estate solutions since 1978. Through an integrated, customized approach that begins with good ideas, the firm drives value for clients across commercial real estate services, development, and investment management. Operating from 33 U.S. offices, Transwestern extends its platform capabilities globally through strategic alliance partners whose unique geographic,cultural, and business expertise fuels creative solutions. Learn more at transwestern.com and @Transwestern.
FOR MORE INFORMATION
Matthew DollyResearch Director | Research [email protected] 947 9244
Elizabeth NortonSr. Managing Director | Research [email protected] 775 7026
Laura HaltomManager | Data [email protected] 889 4087