putting an academic factor into practice: the case of ... - aws
TRANSCRIPT
0
Putting an Academic Factor into Practice: The Case of Momentum
RONEN ISRAEL, TOBIAS J. MOSKOWITZ, ADRIENNE ROSS, LAURA SERBAN∗
Current draft: June 25, 2021
Abstract
Academic research identifies a host of asset pricing factors that describe and predict returns. However, little is known about how these factors are brought into practice. In July 2009, AQR Capital launched a suite of mutual funds designed to capture the well-known momentum factor. Momentum, because of its high turnover, has often been challenged as being too difficult and costly to implement. Using AQR’s live experience, we examine real-world implementation costs and frictions. Through portfolio design choices and trading aimed at reducing costs, we show that live momentum portfolios are capable of capturing the academic momentum premium in practice, even after accounting for expenses, trading costs, taxes, and other frictions. We highlight the real-world challenges, and potential remedies, to bringing an academic factor into practice.
∗Israel, Moskowitz, Ross, and Serban are at AQR Capital, and Moskowitz is also at Yale University and NBER. Corresponding email: [email protected]. We thank Gregor Andrade, Cliff Asness, Andrea Frazzini, William Goetzmann, Antti Ilmanen, Stanley Krasner, and Lukasz Pomorski for helpful comments and suggestions. Moskowitz thanks the International Finance Center at Yale University for financial support. AQR Capital Management is a global investment management firm, which may or may not apply similar investment techniques or methods of analysis as described herein. The views expressed here are those of the authors and not necessarily those of AQR.
1
Academic research in asset pricing identifies a host of factors that describe and predict returns. Much
debate exists on the interpretation of these factors, which have become the focal point for discussions of
market efficiency. Part of this debate centers on the feasibility of implementing these factors in practice.
Yet, little is known about how factors are brought into practice and what real-world frictions they face.
We examine the real-world challenges, and their potential remedies, of bringing an asset pricing factor
into practice using as a case study the well-known momentum factor – a factor with overwhelming
academic evidence supporting its efficacy, but whose implementation feasibility has been questioned due
to its high turnover and volatility.
Momentum is the phenomenon that securities that have performed well relative to their peers
(“winners”) over the recent period tend to continue to outperform, and securities that have performed
relatively poorly (“losers”) tend to continue to underperform. The existence of a momentum premium, first
established by Jegadeesh and Titman (1993) and Asness (1994), is a well-established empirical result.
While the original momentum studies covered the period 1963 to 1990 in U.S. equities, subsequent studies
have found a momentum premium as far back as 1801 in U.S. markets (Geczy and Samonov (2016)), in
the U.K. going back to the Victorian age (Chabot, Ghysels, and Jagannathan (2009)), and in Imperial
Russia (Goetzmann and Huang (2018)). In addition, the literature finds a robust momentum premium
in 30 years of out-of-sample data from its original sample period (Ilmanen, Israel, Lee, Moskowitz,
and Thapar (2021)), in 40 other countries (Rouwenhorst (1998), Griffin and Martin (2003)), and in
more than a dozen other asset classes (Asness, Moskowitz, and Pedersen (2013)).
While a wealth of academic evidence and theory exists on the efficacy and intuition behind
momentum investing, a limited number of studies discuss the feasibility of running momentum portfolios
in practice. 1 These studies focus exclusively on trading costs, and assess the costs of trading strategies
using estimates of those costs. Rather than estimate costs from a model, we use the live returns and costs of
live momentum funds directly. Specifically, we use data from AQR Capital, who in July of 2009 launched
a suite of momentum mutual funds designed to capture the academic momentum factor, in a long-only
context. The idea behind the funds was to offer a passive vehicle for investors to access the momentum
1 Korajczyk and Sadka (2004) argue that trading costs eliminate the profits to momentum at fairly low asset size, suggesting that momentum is difficult to implement at large fund sizes. Frazzini, Israel, and Moskowitz (2020) provide detailed insight on real-world trading costs of academic-style portfolios, and argue that momentum is profitable at much larger fund sizes. Gray and Vogel (2017) survey the literature on factors surviving trading costs and show that the results, not surprisingly, depend on the data and assumptions used.
2
premium found and used in academia. AQR launched U.S. large cap, U.S. small cap, and international
momentum funds based off of momentum indices they created with Standard and Poor’s to capture the
academic momentum premium. The indices are designed to mimic the academic research and are based on
non-proprietary measures commonly used and publicly available in academic research. We use their live
experience and trading data to decompose the costs and frictions associated with implementing momentum
strategies. We examine deviations in design choices and trading of the funds from their underlying indices
to highlight the implementation choices made to address real-world frictions. Those frictions include not
only trading costs, which we examine directly, but also risk management, rebalancing due to reconstitution
and flows, tax implications, and other real-world frictions.
In 2012, AQR also launched a suite of complementary momentum funds designed to address the
impact of taxes. We use the live experience of these “tax-aware” momentum mutual funds to assess how
portfolios can be designed to mitigate tax costs, by comparing the tax-aware momentum funds to their
“regular” tax-agnostic counterparts.
We use the live data from these standalone momentum strategies implemented in practice to answer
several key questions. First, what are the real-world frictions facing a portfolio? Second, can those frictions
be overcome or mitigated, and how? And finally, can the momentum factor, specifically, survive the
frictions associated with implementing real-life portfolios? We document the real-world frictions facing
live portfolios, and show how portfolio design and smart trading can mitigate their impact, decomposing
various design and trading choices and how they help ameliorate net of cost returns. We show that through
these choices, momentum investing in practice does not have to produce excessive turnover, large trading
costs, or significant tax burdens that prohibit capturing the momentum premium. We show that the
momentum factor can be captured in practice as a viable implementable strategy and what investment and
trading choices help achieve this goal.2
The rest of the paper is organized as follows. Section 1 begins by describing the genesis of AQR’s
momentum portfolios and indices, discusses their construction, and assesses how well they capture the
standard academic factors. Section 2 describes how the implementation of the momentum funds has fared
during the live period and decomposes its implementation costs into various components. Section 3
2 While we focus on standalone long-only momentum implementation, the main takeaways apply to momentum implemented in a multi-style portfolio and long/short portfolios, too. In fact, the conclusions are likely stronger for an integrated multi-factor portfolio given the benefits of turnover netting across lowly correlated styles (Fitzgibbons et al., (2016)).
3
focuses on trading costs of the live strategies and Section 4 examines the impact of taxes, where in both
cases we highlight the portfolio construction choices that improve the ability to capture momentum in the
face of these real-world frictions. Section 5 examines how these choices fare during extreme drawdowns or
“momentum crashes.” Section 6 concludes.
1. The Genesis of AQR’s Momentum Strategies
AQR launched its first standalone momentum style strategy (“MOM”) in July 2009 to provide
investors with an opportunity to harvest the momentum premium and to diversify value exposure in their
portfolios. The long-run evidence for a hypothetical standalone long-only momentum strategy is
compelling, as the academic literature shows (Jegadeesh and Titman (1993)), and we show below: a gross
information ratio of around 0.3 (relative to the market factor) and gross average return of around 2% to 3%
per year over the market, size, and value benchmarks. Academic evidence also shows that momentum is
negatively correlated to the value premium – another factor that outperforms the market – providing
diversification benefits from combining both factors.3 Based on this evidence, three funds were launched
in three regions: U.S. Large Cap, U.S. Small Cap, and International.4
A. Momentum Indices
At the same time that AQR launched the suite of momentum strategies, they also created a set of
momentum indices. The indices were created to provide a passive and replicable benchmark for
momentum that could serve several purposes, including identifying a fund’s exposure to the momentum
factor, tracking a momentum factor’s performance through time, and, for our purposes here, helping to
evaluate the implementation of live momentum portfolios. Given that no real momentum benchmark or
index existed at the time, the thought was that such indices would give widespread access to this important
investment style that investors could follow.
The indices are maintained by Standard and Poors (S&P) and provide access to daily returns as well
as daily holdings. They are constructed in a similar way to an academic-style portfolio, such as Fama-
3 Asness, Moskowitz, and Pedersen (2013) study value and momentum across eight diverse markets and asset classes over the period 1972-2011 and find that value and momentum are consistently negatively correlated within and across asset classes. They also show that value and momentum deliver positive expected abnormal returns in a variety of markets and asset classes, and that their combination performs even better than either alone. 4 An emerging markets momentum strategy also launched later in 2012.
4
French’s “Up-Minus-Down” (UMD) long/short momentum factor, which ranks stocks on total returns
over the past year skipping the most recent month. Specifically, the momentum index selects the top third
of stocks based on this ranking, weights them in proportion to market capitalization, and then rebalances
on a quarterly basis. For the U.S. Large Cap (U.S. Small Cap, International) momentum index, stocks
within the Russell 1000 (Russell 2000, MSCI Developed Index) are ranked based on their past 12-month
return, skipping the most recent month (return from t-12 to t-2, as commonly used in academic studies,
Asness (1994), Fama and French (1996), and Asness, Moskowitz, and Pedersen (2013)) and the index
goes long the top one third of stocks based on momentum, weighting stocks by their beginning of month
market capitalization (placing no weight on the bottom two thirds). The index is reconstituted quarterly.
To show that these long-only indices can faithfully capture the momentum premium documented in
the academic literature, Table 1 reports the excess returns (in excess of the Treasury bill rate) of the
momentum indices and compares them to the excess returns of Fama and French’s UMD factor obtained
from Ken French’s website. The first column reports the returns to Fama and French’s long-short UMD
factor applied to the entire universe of stocks covered on the Center for Research in Security Prices
(CRSP). The sample period is January 1990 to December 2016. The average return to UMD is 6.2% per
year with an annual Sharpe ratio of 0.37. Regressing UMD’s returns on the Fama and French (1993) three
factor model, consisting of the market (RMRF), the size factor SMB, and the value factor HML, Table 1
reports a 9.7% alpha (t-statistic of 3.13) over the sample period, indicating that the momentum factor is
unexplained by the other Fama and French factors and therefore adds to the efficient frontier of risky assets
when included with those factors. The second column of Table 1 repeats the analysis, but forms all factors
using only the Russell 1000 universe of stocks, in order to correspond with the U.S. large cap momentum
index. The average returns to UMD are lower among the larger cap stocks at 4.21% (Sharpe ratio of 0.26),
but its alpha to the Fama and French (1993) three factor model is still a robust 7.2% (t-statistic of 2.96),
indicating that a healthy momentum premium still exists even among the largest stocks. This result
contradicts the claim that the momentum premium is primarily a small stock phenomenon (Fama and
French (2015)). Moreover, it shows that the momentum premium exists among the universe of stocks that
comprise the index. The third column of Table 1 repeats the analysis one more time using only the long
portion, U, of the UMD portfolio (among the Russell 1000 stocks). The average return in excess of the T-
bill rate to the long-only portion of the momentum factor among the largest U.S. stocks is 6.82% per year.
Of course, part of that return is the return to the market since this is a long-only portfolio. Regressing the
5
excess returns of U on the Fama and French three factor model produces an alpha of 2.5% per year (t-
statistic of 2.14), indicating a significant positive premium for a long-only momentum factor among U.S.
large cap stocks. Finally, the fourth column of Table 1 reports the same statistics for the AQR U.S. Large
Cap Momentum Index, which is designed to emulate the long-only academic momentum factor. The
average excess return to the index is 8.59% (Sharpe ratio of 0.51) and it has a marginally significant alpha
of 2.3% to the Fama and French three factor model.
The remaining columns of Table 1 perform the same analysis for the AQR U.S. Small Cap
Momentum Index and the International Momentum Index. As the table shows, there is a healthy
momentum premium among the Russell 2000 stocks and the momentum index seems to capture it –
producing 10.28% returns per year (Sharpe ratio of 0.48) and a 3.8% alpha (t-statistic of 3.80) relative to
the Fama and French three factor model. Internationally, the academic momentum factor generates a
positive premium of roughly the same or larger magnitude as in the U.S. Restricting the universe to MSCI
index stocks only, the momentum premium is halved, but still significantly positive. Looking at the long-
only momentum factor internationally, the momentum premium is 4.95% with a three-factor alpha of 3.1%
The international momentum index captures the bulk of this premium, though generates only a 3.5%
average return over the sample period and a 1.9% alpha with respect to the Fama and French three factor
model, with the latter being statistically insignificant. Nevertheless, there is a positive momentum premium
internationally over this period that the AQR momentum index seems to largely capture.
B. Capturing the Academic Factor
Table 2 takes a deeper dive into how well the momentum indices capture the academic momentum
factors. We regress the monthly excess returns of the AQR momentum indices on the Fama and French
three factor model augmented with the momentum factor UMD. For the U.S., we report results for the
Fama-French factors constructed over the entire CRSP universe of stocks, as well as only among the
Russell 1000 and 2000 stocks for comparison to the AQR U.S. large cap and small cap Momentum
indices. We also look at long-only versions of the Fama-French factors as independent variables to match
the indices. For international stocks, we construct the factors among the full MSCI and Bloomberg
universe from Ken French’s website, and also report results for the universe of MSCI index constituents
only, and for long-only versions of the factors among the MSCI constituent universe.
6
As the first column of Table 2 shows, the U.S. Large cap AQR Momentum Index, despite being a
long-only portfolio constructed from a smaller number of stocks that are much larger and more liquid than
the full universe of CRSP stocks, have a strong and significant exposure to the long/short momentum
factor, UMD, commonly used in academic models.5 The coefficient on UMD is 0.35 with a t-statistic of
24. This result indicates that the large cap momentum index has both economically and statistically
significant exposure to UMD, and therefore provides a good ‘proxy’ to capture the momentum factor. In
the second column, we restrict the factors to be formed only among the Russell 1000 stocks to match the
universe of stocks in the index as a better comparison. Here, the loading on UMD goes up to 0.42 (t-
statistic of 28.22), indicating an even tighter connection between the index and the academic momentum
factor. Since UMD is long/short, a coefficient of about 0.5 is expected if the long and short sides
contribute equally to UMD’s returns (which is an empirically reasonable estimate according to Israel
and Moskowitz (2013)). Thus, the 0.42 coefficient is pretty close to expectations if the long-only
index is able to capture the momentum factor. Finally, in the third column we examine long-only
versions of the Fama-French factors and find that the coefficient on U (the long-side of UMD) is 0.92 (t-
statistic of 32), which indicates the momentum index is tracking the momentum factor very closely. The
R-squares from these regressions are all above 94%, with the long-only regression having a 97% R-square,
indicating that the index is well-spanned by the academic Fama-French factors.
The alphas from the regression are somewhat less interesting here, because the goal of the index is to
capture the momentum factor and not necessarily outperform it. Nevertheless, it is still informative to
examine the alphas. As the first column shows, the alpha of the large cap momentum index relative to the
Fama-French long/short factors over the entire CRSP universe is -1.7% (t-statistic of -2.09). The slight
underperformance of the index is expected since the factors use the entire universe of stocks and are
long/short. Moving to the Russell 1000 universe, the alpha is -1.8% (t-statistic of -2.75), indicating it is the
missing shorting component and not the universe of stocks that drives the underperformance of the index
relative to the Fama-French factors. Consistent with this conclusion, the third column, which examines
long-only versions of the Fama-French factors, generates a positive, but statistically insignificant, alpha of
0.7%. This last result indicates that the U.S. large cap momentum index captures the returns to the
5 There are other small differences between the long-only AQR Momentum Indices and the UMD long/short factor, including the indices being rebalanced quarterly as opposed to monthly.

7
momentum factor found in academia, providing a large exposure to that factor, with very high R-square,
and average returns slightly higher, but statistically no different from that factor.
The remaining columns of Table 2 repeat the analysis for the U.S. Small Cap Momentum Index and
International Momentum Index. In both cases, the indices are able to capture significant exposure to the
academic momentum factor, with high R-squares and alphas that are not significantly different from zero,
or in the case of small cap, a significant positive alpha with respect to the Fama-French long-only factors.
Of course, the Momentum indices are not investable vehicles, but merely benchmarks designed to
capture the academic momentum factor. Live funds designed to track these indices need to be created. In
July 2009, AQR launched three mutual funds to track these indices. The indices incur no actual trading (or
trading costs) and have no expenses, flows, or other frictions, while the live portfolios must deal with these
and other market impediments. As a result, the performance of the live funds will differ from the
hypothetical returns of the index. Moreover, in anticipation of these frictions, the live funds may be
designed slightly differently from the benchmarks in order to mitigate the impact of these frictions on
performance. In the next section, we examine these design choices and breakdown the performance
differences between the live funds and their indices into portfolio construction, expenses, trading costs, and
other real-world frictions.
2. How has Implementation Been?
We examine how live implementation of the AQR momentum funds, designed to track the
momentum indices, have fared during the live period from July 2009 to December.
A. Portfolio Design
We start by describing some of the portfolio design differences between the AQR Momentum funds
and their indices. Compared to the indices, the live strategies utilize a number of more sophisticated
portfolio construction choices. First, the live strategies use several signals for momentum in addition to the
past t-12 to t-2 return, that include earnings announcement momentum, which ranks stocks based on
average abnormal earnings announcement returns over the past year, following Chan, Jegadeesh, and
Lakonishok (1996) and Novy-Marx (2015), and residual momentum, which ranks stocks based on
volatility-adjusted cumulative idiosyncratic returns (relative to the market) over the same period, following
Blitz, Huji, and Martens (2011). Stocks are ranked by the sum of their momentum scores across the three
8
measures, where each momentum signal is first normalized to mean zero and unit variance cross-
sectionally, and the top third of stocks are selected based on their total momentum score (assigning
majority of the weight to past total return (60%), and the remaining weight split evenly between earnings
surprise (20%) and past residual return (20%)).
Second, the live funds tilt their weight towards higher momentum scoring names among the top third
of stocks, instead of weighting purely by market cap as the indices do. The funds weight the top third of
stocks based on an equal combination of their market capitalization and their signal strength (or
momentum characteristic).6 Specifically, the weight on security k in month t is as follows:
𝑤𝑤𝑘𝑘,𝑡𝑡 = �[0.5 × (𝑝𝑝𝑝𝑝𝑝𝑝𝑝𝑝𝑒𝑒𝑘𝑘,𝑡𝑡−1 × 𝑠𝑠ℎ𝑎𝑎𝑝𝑝𝑒𝑒𝑠𝑠𝑎𝑎𝑎𝑎𝑡𝑡𝑘𝑘,𝑡𝑡−1
∑ 𝑝𝑝𝑝𝑝𝑝𝑝𝑝𝑝𝑒𝑒𝑘𝑘,𝑡𝑡−1 × 𝑠𝑠ℎ𝑎𝑎𝑝𝑝𝑒𝑒𝑠𝑠𝑎𝑎𝑎𝑎𝑡𝑡𝑘𝑘,𝑡𝑡−1𝑁𝑁𝑘𝑘=1
) + 0.5 × 𝑝𝑝(𝑚𝑚𝑎𝑎𝑚𝑚𝑠𝑠𝑝𝑝𝑎𝑎𝑝𝑝𝑒𝑒𝑘𝑘,𝑡𝑡 − 𝑚𝑚𝑒𝑒𝑚𝑚𝑝𝑝𝑎𝑎𝑚𝑚(𝑚𝑚𝑎𝑎𝑚𝑚𝑠𝑠𝑝𝑝𝑎𝑎𝑝𝑝𝑒𝑒𝑡𝑡))]𝑁𝑁
𝑘𝑘=1
where momscore is the total momentum score described above and c is a constant that ensures the weights
from the momscore sum to one. A stock’s momentum score and its market capitalization are computed
monthly and the time t-1 values are used to compute weights at time t.
Third, the strategies rebalance more frequently than the indices (monthly rather than quarterly) to
more effectively capture the momentum premium. Finally, the live strategies include additional controls to
manage liquidity, turnover, transaction costs, as well as risk management constraints. Constraints are
applied to sector and country (where relevant) weights to ensure no exposure is too large. While country
and industry momentum deliver positive excess returns (Moskowitz and Grinblatt (1999), Asness,
Moskowitz, and Pedersen (2013)), they can also increase industry and country-specific risk. The strategies
limit sector and country deviations relative to market capitalization weights to +/-15% (and also place a
maximum on total stock level exposure). These risk management controls should have zero expected
return consequences, but can deliver lower levels of active risk and lower relative drawdowns. Of course,
over short sample periods these deviations can have significant realized return consequences. We show
below what the average contribution to returns is from these additions over the live sample period.
B. Implementation Costs
Since we have access to holdings for both the live strategies and theoretical indices, we can
decompose the performance differences to provide a careful evaluation of implementation costs. As Tables
6 For more on the benefits of different ways to select and weight securities within a factor portfolio, see Israel, Jiang, and Ross (2017).
9
1 and 2 show, the indices provide a very good proxy for the long-only academic returns to momentum
investing. Hence, this decomposition provides a good description of the implementation costs of the
academic momentum factor.
How much did implementation costs impact the returns from momentum investing over the live
period? The live experience allows us to address some of the misconceptions of momentum
investing. In particular, one of the most common myths about momentum is that it does not survive
trading costs because it turns over too quickly. A related claim is that its higher turnover also
generates a large tax bill, making it less attractive on a post-tax basis. In addition, by comparing the
large cap and small cap momentum funds, we can address whether momentum resides mostly in
small stocks and whether it is implementable among small stocks, who face larger frictions and
trading costs?7 We also examine attempts to manage transaction costs and taxes through portfolio
design that may introduce distortions that reduce the ability to capture momentum, potentially
decreasing gross returns. We investigate these issues as well by comparing tax managed funds, which
attempt to minimize tax exposure subject to a tracking error constraint to the index, versus the regular
or “tax agnostic” momentum funds.
Table 3 drills down into the real-world frictions mentioned above by decomposing the performance
differences between the live momentum strategies and the theoretical AQR Momentum Indices based on
expenses, trading and rebalancing costs, and other portfolio construction differences. Trading costs and
expenses will be a drag on performance. On the other hand, more sophisticated portfolio construction
decisions may offset some of these detractions.8
7 Hong, Lim, and Stein (2000) and Fama and French (2015) argue that momentum is much stronger among small stocks that may be difficult to trade. However, Israel and Moskowitz (2013) show that momentum does not work much better among small stocks and Asness, Frazzini, Israel, and Moskowitz (2015) show further evidence that a robust momentum premium resides among large stocks and is not concentrated among small stocks. 8 Readers may note that the seven years of live performance were not a particularly good period for momentum in general, which is not the point of this paper. More importantly, we study whether the performance was due to high implementation costs or a more general inability to capture momentum. If either are true, it could be problematic for the momentum strategy in real life implementation. Even a good strategy (one with a 0.2-0.3 information ratio) can go through a bad period over a relatively short horizon (e.g., seven years). The probability that a 0.3 information ratio strategy underperforms (delivers active returns less than zero) over a 7-year period is 21%. Our focus, however, is whether implementation costs are severe and whether momentum can be captured in real time, even if it was a lackluster period for the academic momentum factor. In Section 5, we also examine implementation costs during extreme momentum drawdowns or “crashes” to assess whether these costs vary significantly depending on the environment.
10
How well do the live momentum strategies perform relative to the theoretical AQR Momentum
Indices? Table 3 compares the annualized return of the live strategies relative to the corresponding
momentum index in the U.S. Large Cap, U.S. Small Cap, and International universes over the live period.
As the first column of Table 3 shows, the U.S. large cap momentum fund generated an average 14.32% net
return per year, which outperformed the momentum index in U.S. large caps by an average of 0.87% per
year over the live period. We decompose that positive 87 basis point difference into fund expenses, which
subtract 44 bps, trading costs (including both fixed costs and market impact), which subtract a further 12
bps annually, and portfolio construction differences, which add a positive 1.42% average return per year.
The second and third columns of Table 3 report the performances of the U.S. Small Cap and
International Momentum funds. The U.S. Small Cap fund underperformed the index by -1.2% on average
and the International Momentum fund lagged its index by 1.1% on average. Expenses explain half of the
performance difference, with the U.S. Small Cap fund having 60 bps in expenses and the International
fund 58 basis points. Trading costs subtracted another 32 bps from the Small Cap fund and another 25 bps
from the International Momentum fund. Consistent with other work (Frazzini, Israel, and Moskowitz
(2020a, b)), trading costs are larger for smaller stocks and for international stocks. Finally, portfolio
construction differences subtracted 28 and 24 bps, respectively, from performance relative to the index for
the U.S. Small Cap and International Momentum funds.
The last column summarizes the decomposition of the performance differences between the funds and
their respective indices. Expenses account for an average -54 bps and trading costs another -23 bps, but
portfolio construction and other frictions on average provide +30 bps to the funds versus their indices. We
next look in more detail at the portfolio construction differences between the funds and their indices and
how they affect performance.
C. The Impact of Portfolio Construction
The remaining rows of Table 3 decompose the portfolio construction costs by providing detail
on the performance differences between each fund and its index. Starting with the U.S. Large Cap
Momentum fund, which has a 1.42% added return from portfolio construction relative to the index,
the table shows that 62 bps comes from rebalancing effects (item (3.1)). The fund rebalances more
frequently than the index (which reconstitutes quarterly) by both design – AQR chose to rebalance
the fund monthly rather than quarterly – as well as due to flows into and out of the fund. We
11
decompose the 62 bps in added performance into 24 bps coming from the choice to rebalance
monthly and 38 bps coming from rebalancing due to flows. We might expect the former to provide
positive expected returns (based on the evidence from the momentum literature, Jegadeesh and
Titman (1993), that higher frequency rebalancing captures the momentum premium better), but the
latter is unclear since flow-induced rebalancing may or may not be advantageous since it is less at the
discretion of the portfolio manager. For the small cap fund, rebalancing due to flows subtracted 19
bps of returns (and monthly rebalancing subtracted 5 bps), while for the international fund flow-
rebalancing added 29 bps and monthly portfolio rebalancing added another 10 bps.
The next rows decompose the performance differences into portfolio construction deviations
coming from risk management and trading cost considerations. As mentioned above, the portfolios
place restrictions on country and -sector bets and individual stock names, by constraining portfolio
weights. There are also restrictions on the liquidity of the stock and the amount of daily trading
volume AQR expects to trade in that stock. These constraints create deviations from the index
weights and their impact on performance is highlighted in row (3.2). For large cap momentum, these
choices added 80 bps of performance and for small cap momentum they added 81 bps, but for
international momentum they subtracted 24 bps of performance.9 We expect these choices to have
zero expected return consequences long-term, but obviously they can have substantial impact in a
short sample period.
On the other hand, looking at the next row (3.3), we expect additional momentum signals (e.g.,
earnings momentum and residual return momentum) and weighting stronger momentum stocks more
heavily (signal-weighting as discussed above) to have a positive impact on performance over the
long run. However, in any short sample period these deviations may not deliver positive returns. For
large cap momentum, the additional momentum signals added 8 bps of performance, and for small
cap momentum they subtracted 116 bps of returns, while for international momentum they
contributed +26 bps.
While some of the deviations of the funds from their indices are by design, other deviations
between the fund and index will occur simply from market and operating frictions. For instance, row
(3.4) shows the impact from differences in execution prices of the fund, which occur intra-day, and
9 For the curious reader, the negative impact on the international momentum fund was driven by a constraint on overweighting Japan.
12
those of the hypothetical index which occur at the close of the trading day. This “trading P&L”
difference amounts to +25, +40, and -68 bps for the U.S. large cap, U.S. small, cap, and international
funds, respectively. We expect this trading friction to have zero return on average and across all three
momentum funds its contribution averages -1 basis point per year. Nevertheless, this friction can
create sizeable distortions between the fund and index in any small sample.
In terms of managing the flows into and out of the fund on a daily basis, the fund manager has to
convert the flows from cash to equity markets. That process does not happen instantaneously and the
lag in converting cash to equity can prevent the flows from being fully equitized. In some cases, the
manager may use futures contracts on the equity market (R1000, R2000, or MSCI) to equitize the
flows as quickly as possible and then shift them to momentum stocks. This process is done to avoid
tracking error from large market movements, since these are long-only funds with a market beta
close to one. Row (3.5) shows the impact on performance from these frictions driven by flow
handling. On average, not being 100% equitized caused an 18 bps opportunity cost for investors
across the momentum funds. Using futures contracts to equitize the flows offset 7 bps of that cost.
Finally, other frictions due to compounding, rounding, and accounting discrepancies (line (3.6))
can also impact performance. On average across the funds, these amount to only -2 bps of
performance, but can have sizeable impact over any short time period for a given fund.
We next examine in more detail the implementation costs that we expect to detract from
performance. We start with trading costs (which affects all investors) and then focus on taxes (which
affect taxable investors only).
3. Trading Costs
Trading costs, shown in line item (2) in Table 3, are uniformly negative, but for those who believe the
turnover of momentum is prohibitively costly, these realized costs appear rather meager (on average, 23
basis points per year). In this section, we examine the realized trading costs of the funds in more detail.
There are a number of techniques that can be used to manage trading costs for any live strategy. When
trading momentum, AQR uses a simple optimization framework and employs a transaction cost model to
minimize transaction costs per dollar traded. For example, allowing trade substitutions across stocks with
similar momentum characteristics and replacing securities that are expensive to trade for those that are
cheaper to trade. This substitution is based on expected trading costs that are in turn a function of expected
13
participation rate (i.e., trade size as a fraction of daily volume traded) and information about stock
characteristics and market conditions (see Frazzini, Israel, and Moskowitz (2020a) for details on a model
of expected trading costs). AQR has developed and calibrated a trading cost model using data based on
their own trading experience in global equities since 1998 from all of their hedge fund and institutional
portfolios. Importantly, the model depends on the size of trades, which is a key input in determining price
impact. Frazzini, Israel, and Moskowitz (2020a,b) use the AQR live trading data to build a simple trading
cost model that illustrates how this is done and apply the model to various factor portfolios, including
momentum. The live strategies also employ a number of techniques to explicitly manage trading costs,
such as managing participation rate, trading patiently using limit orders that seek to provide rather than
demand liquidity, and utilizing smart algorithmic trading techniques that try to minimize the price impact
of trades, including breaking up trades into smaller orders, randomizing order size and timing around those
trades, and avoiding as best as possible large news events in a stock.
How have these decisions affected the live performance of the portfolios? Table 3 (line (3.2)) showed
that trading cost and risk management portfolio decisions added 46 bps to the returns of the funds on
average, while trading costs themselves (line (2)) averaged -23 bps per year. To better understand the
trading costs of the Momentum strategies over the live period, Table 4 breaks trading costs down further
into the average realized cost per dollar traded, annualized turnover, and their impact on gross returns.
As Table 4 shows, the Momentum strategies experienced on average 83.7% one-sided net
turnover per year over the live period, implying the funds traded nearly 84 cents per dollar of Net
Asset Value (NAV) on average per year. There is a wide range of turnover from year-to-year,
however, ranging from 70% to 150%, which we investigate further below. The realized average
transaction costs per dollar traded from that turnover is 12.61 bps per year per dollar traded on
average across the funds.10 Of that 12.61 total cost, only 1.82 bps comes from fixed costs due to
commissions, fees, and taxes, while 10.79 bps comes from market impact, which is the largest cost
facing any large institutional investor (see Frazzini, Israel, and Moskowitz (2020a,b)). These figures
can also be expressed as a fraction of NAV, which amounts to 0.228% for total trading costs, of
which 0.034% is from fixed costs and 0.193% from market impact.
10 Using an implementation shortfall method (i.e., including slippage, market impact, commissions, etc.). See Frazzini, Israel, and Moskowitz (2020a) for a discussion of this method.
14
Looking at the funds separately, the average turnover of the U.S. Large Cap, U.S. Small Cap,
and International Momentum funds is similar, but not surprisingly market impact per dollar traded is
highest for small cap stocks and higher for international stocks relative to U.S. large cap stocks. The
main difference in trading costs between small and large cap stocks is market impact, which is 2.5
times larger per dollar traded for small stocks versus large stocks. This finding is consistent with the
literature on trading costs (Keim (1999), Korajczyk and Sadka (2004), Frazzini, Israel, and
Moskowitz (2020a)). For international stocks, the larger costs are partly due to greater market impact
per dollar traded (8.28 versus 6.19 for U.S. large cap stocks), but also a much higher fixed cost due to
higher commissions, fees, and taxes that must be paid to trade in many international markets,
amounting to 4.89 bps per year, which is an order of magnitude larger than the fixed costs paid in the
U.S. market (0.21 bps for large cap and 0.35 bps for small cap).
From this analysis, we can address one of the most common myths or misconceptions of
momentum investing: that momentum’s returns do not survive trading costs. The drag from trading
costs can be considerably smaller than the expected gross return to momentum. Recall, the gross
average historical excess return of momentum is around 1.0% to 1.5% per year. This means that even
if transaction costs were twice as high as what the live funds realized, they still only put a small dent
in the expected performance of momentum strategies. Trading costs would need to be more than five
times higher than what was experienced with the live trades to fully wipe out the expected returns to
momentum strategies. These results are consistent with those in Frazzini, Israel, and Moskowitz
(2020b).11 These results are in stark contrast to much of the literature that estimates trading costs
based on liquidity-demanding orders for immediate execution or theoretical models (Korajczyk and
Sadka (2004), Novy-Marx and Velikov (2016)), which can result in many times larger trading costs
than those based on actual, live trading costs, as we do here.
A. Realized Versus Predicted Trading Costs
However, it is interesting to compare how realized trading costs from the live portfolios compare
to the estimated trading costs of those portfolios. This analysis serves to validate how well trading
cost estimates work in practice and therefore may be useful to evaluate trading costs in research.
11 Though it is important to note that less efficient trading may result in higher transaction costs.
15
Figure 1 plots the average realized trading costs of the live AQR momentum strategies versus
the predicted or expected trading costs for each fund, using AQR’s trading cost model, which is
similar to Frazzini, Israel, and Moskowitz (2020a). These models focus on the market impact
component of costs, which is what we focus on here. On average, realized market impact costs line
up very well with predicted market impact costs for each fund, with realized costs slightly exceeding
predicted costs for U.S. large cap, slightly lagging predicted costs for U.S. small cap, and being spot
on for International momentum. On average across the funds, there is no detectable difference
between average realized and predicted market impact costs. These results highlight that the trading
cost models that predict expected costs are good at capturing average realized costs from live
implementation of the funds.
The second graph in Figure 1 plots the year-by-year comparisons of realized versus predicted
trading costs averaged across all funds. In any given year, of course, there can be larger differences
between realized and expected costs. However, these differences tend to average out (e.g., in 2010
realized costs fell far below what was expected of the funds, but in 2013 the reverse happened). A
natural question to ask, however, is whether variation over time in how well realized costs line up
with predicted costs affects the performance of the funds. For example, does the gross return or alpha
of the momentum fund vary with the realized cost of implementing the fund? In years when
momentum is particularly profitable, is it also more costly to capture, due to it becoming a crowded
trade for instance, that might drive up the price impact of trading momentum? Or, when it is
particularly costly to trade, is the momentum premium larger due to more arbitrageurs staying on the
side lines? Or, perhaps larger momentum premia require greater turnover, which incurs larger
transactions costs, so in years where there is greater spread in momentum characteristics (and
therefore perhaps greater profits to momentum trading) more trading (and more cost) is required? To
address these questions, we investigate the variation in momentum returns, turnover, and realized
trading costs in the next section.
B. Variation in Returns, Turnover, and Trading Costs
Figure 2 examines the relation between returns of the momentum funds and trading costs over
time. The first graph plots the realized returns per year of each fund against the realized annual
trading costs of all AQR momentum strategies (U.S. large cap, U.S. small cap, and international),
16
using fund-year observations. The graph shows no relation between realized returns of the funds each
year and their average realized trading costs. A linear regression line is estimated and reported in the
figure which indicates no statistically reliable relation between realized returns and trading costs for
momentum. This evidence suggests that realized trading costs and realized returns to momentum
strategies vary independently over time. Thus, it does not appear that when momentum is particularly
profitable, trading costs are higher (or lower), and vice versa.
The second graph in Figure 2 plots the difference in returns (in bps) between the realized live
fund return and the return to the momentum index for each fund against the unexpected realized
trading cost incurred for each fund (realized trading cost minus predicted trading cost). By looking at
the excess returns of the funds in comparison to unexpected trading costs, we control for changes in
turnover, stock characteristics, and market conditions associated with the funds each year.
As Figure 2 shows, there is a negative relation between the return of the fund in excess of the
benchmark and the unanticipated realized trading cost. This result is intuitive. One of the main
differences between the fund and the index is that the index does not have to actually trade and incurs
no trading costs. Hence, in years where costs are lower than expected, the fund will do relatively
better than the index compared to years when costs were higher than expected.
Variation in market impact depends on both the amount of trading and the impact that trading
has on market prices. Variation in turnover of the funds will contribute to the amount of trading, but
so will the size of the funds in terms of the dollars traded (as well as the size of inflows and outflows
of the fund). The dollar size of trading will also have a direct effect on market impact, since larger
trades create greater market participation, resulting in the funds having to trade a larger fraction of
the outstanding trading volume available for a stock in a given day. Larger participation translates
into potential for moving market prices more and incurring more price impact costs.
Figure 3 plots trading costs per dollar traded and asset growth by year, along with annual
turnover numbers at the bottom of the graph. We aggregate across the three funds, weighted by the
dollar value of trades. The patterns are similar for each fund separately and are provided in Appendix
A. The live strategies realize variability in net turnover over time: from a low of 70% in 2013 to a
high of 151% in 2010. This variability occurs naturally since the live strategies do not explicitly
constrain turnover, which is dictated by the underlying momentum characteristics of the portfolio and
17
how frequently they change. Flows will also cause some variability in net turnover, so we remove
those here to focus just on the changing characteristics of the funds.
The market impact varies between 0.7 bps in 2010 to 16.6 bps in 2013, with smaller variability
in commissions, which range from 0.8 bps in 2011 to 1.8 bps in 2016. As is apparent from the figure,
higher turnover does not necessarily mean higher trading costs – 2010 had the highest turnover and
yet the lowest trading costs, while 2013 had the opposite. Trading costs are a function of not only the
frequency of trading, but also the size of trades, and the price impact of those trades, which is a
function of the size of trades relative to the amount of trading from other traders at the same time.
Although 2010 incurred a lot of turnover in the funds, the relative size of the funds was small (having
just been launched in 2009), resulting in small market impact. In 2013, however, the funds had
grown substantially in size and hence the average size of trades and their price impact per dollar
traded was larger. Finally, not shown in the figure are the underlying market conditions in each year
that can also affect market impact, such as market liquidity and market volatility as measured by
VIX. Frazzini, Israel, and Moskowitz (2020a) show that market conditions such as the VIX and the
idiosyncratic volatility and dollar volume traded of the stock are important drivers of market impact.
More to the point, even if transaction costs are at the highest realized level (in 2013 they were
close to 17 bps) and taking into account the range of turnover in the funds, momentum would still
survive trading costs and deliver a sizeable positive net return premium based on its implied
historical average return. In addition, and to make the point differently, although the live momentum
returns underperformed their long-run historical average over the seven years ending in 2016,
transaction costs were not the culprit, and were actually even a little lower than expected. Trading
costs for momentum are relatively low despite the high turnover associated with momentum
strategies, and do not appear to have a substantial impact on momentum’s achievable returns in
practice.
4. Taxes and Tax Considerations
One potential cost we have not discussed with live portfolios comes from taxes. For taxable
investors, this cost can be sizeable and can potentially reduce the returns to an investment strategy
significantly. Due to momentum’s high turnover, some argue that momentum strategies will face a
high tax cost burden and that momentum is tax inefficient. In this section, we investigate the tax

18
consequences of the three live momentum funds. In addition, in January 2012, AQR launched tax-
aware versions of the three momentum strategies, which seek to minimize capital gain taxes subject
to a tracking error constraint to the momentum indices. We discuss the portfolio design choices that
seek to reduce taxes and compare the tax-aware funds to their tax-agnostic counterparts in real time
to assess the impact of those choices on before and after-tax returns.
This analysis serves several purposes. First, it highlights another real-world cost associated with
live portfolios that academic factors typically ignore – taxes. Second, it identifies tax management
strategies a real-world portfolio manager can pursue in order to reduce the fund’s tax burden, and
assesses the pre-tax and after-tax return consequences of those choices. Third, by examining the live
performance of the funds, it identifies how well those choices work in practice to mitigate the tax
burden in real time and what ancillary consequences those portfolio design choices have on pre-tax
returns, tracking error, and trading costs.
Finally, this analysis also serves to address another misconception about momentum that it is tax
inefficient due to its higher turnover, relative to other factors such as value or defensive factors.
Israel and Moskowitz (2020) show that higher turnover does not necessarily equal higher taxes,
especially if it generates relatively more short-term losses and long-term gains, which are beneficial
from a tax perspective. They show that momentum strategies tend to hold winners longer and sell
losers more quickly, realizing short-term losses and more long-term capital gains, both of which are
tax advantageous. In addition, momentum stocks tend to have relatively lower dividend yield than
value or defensive stocks, and hence generate lower income tax. Finally, Israel and Moskowitz
(2020) show that momentum is more amenable to tax optimization compared to other factors, such as
value and defensive, because it is more efficient to make trade-offs across long-term versus short-
term capital gains and losses without incurring meaningful tracking error or style drift.12 Put
differently, momentum is a more substitutable characteristic than say value from a tax optimization
perspective, in the sense that it is easier to find similar momentum stocks with different tax liabilities
than it is to find a similar value stock with very different tax consequences. Accelerating the
realization of short-term losses or deferring the realization of gains from short-term to long-term
status (which often requires only delaying a trade by a month) has a small effect on the momentum
12 In the case of value, avoiding high dividend paying stocks or reducing the income of the portfolio simultaneously reduces value exposure; as such, tax-aware optimization for a value portfolio coincides with value reduction.
19
exposure of the portfolio, but a large tax effect given the difference in tax rates between short- and
long-term capital net gains. While Israel and Moskowitz (2020) show these results with hypothetical
factor portfolios, we test these findings below with the live momentum funds that directly compare
tax-aware versions of the momentum funds to their “regular” tax-agnostic counterparts in real time.
A. Tax-Aware Funds
AQR launched tax-aware versions of the momentum funds on January 30, 2012. These
strategies follow identical processes as the original momentum funds, but apply tax optimization that
aims to minimize capital gains tax liabilities, while maintaining meaningful exposure to momentum
via a tracking error constraint. The tax optimization induces portfolio management techniques that
defer realizations of capital gains and attempt to generate long-term capital gains where feasible. It
also accelerates the realization of short-term losses to offset realized gains, and limits portfolio
turnover that may result in taxable gains. It is similar in spirit to the kinds of trade-offs that can be
made to reduce transaction costs, where tax optimization makes substitutions between stocks with
similar momentum characteristics but different tax consequences. With the added objective of
minimizing taxes, we expect the tax-aware process to incur a reduction in pre-tax momentum return
on average. Israel and Moskowitz (2020) show a small pre-tax reduction in momentum returns from
tax optimization, but a large after-tax gain in the returns to momentum from tax optimization. We
now test whether the live portfolios experience similar effects in real time.
As a result of the techniques described above, the tax-aware versions are designed explicitly for
tax sensitive investors, who want to reduce taxes and are more concerned with after-tax returns.
Conversely, the tax-agnostic strategies are better suited for tax exempt investors, who are more
concerned about pre-tax returns. The two types of strategies also allow us to evaluate the tax-
efficiency of momentum, and the efficacy of tax optimization techniques applied to momentum.
B. Comparing Tax Agnostic Versus Tax Managed Momentum Funds
Table 5 compares the tax costs and returns of the regular momentum strategies versus the tax-
managed versions over their common overlapping period (January 2012 to December 2016). The
table reports for each momentum fund, the average pre-tax return of the fund, potential Federal taxes
(based on the highest marginal tax bracket), post-tax return of the fund, effective tax rate (calculated
20
as (pre-tax return – after-tax return)/pre-tax return), and turnover of the fund. Turnover numbers are
annualized one-sided and net of flows. For reference, we also report pre- and post-tax returns and tax
exposure for the market index for each momentum fund: Russell 1000 (U.S. large cap), Russell 2000
(U.S. small cap), and MSCI ex US (International) indices.13 Calculation methodology is the
Morningstar methodology for computing pre-tax and after tax returns, and accounts for federal taxes
only. Tax rates are as follows: 43.4% for ordinary dividends, 23.8% for qualified dividends and
23.8% for capital gains.
Starting with the U.S. Large Cap funds, both the regular and tax-managed momentum strategies
delivered the exact same average return, 12.9% per year over the live period. However, the second
row of the table indicates that the two funds paid different tax amounts, with the regular fund
imposing a -1.8% tax hit to returns and the tax-aware fund only generating a -0.5% drag on returns
from taxes. The positive difference of 1.3% per year is how much more the tax-aware fund
outperforms the regular tax-agnostic fund on an after-tax basis over the live period. The effective tax
rate of the regular momentum fund is 14% and of the tax-managed fund is only 3.8%. These are
relatively small tax exposures, indicating that even the regular momentum fund is not overburdened
with tax costs, and if one adds smart portfolio construction to minimize taxes, that burden declines
even further, reducing the effective tax rate by 73%.
How does the tax optimization achieve these lower tax rates? As mentioned above, the optimizer
instructs the portfolio to realize more short-term losses and defer gains to long-term status. The latter
results in lower turnover of the funds, as evidenced by the last row in Table 5, where the tax aware
U.S. Large Cap momentum fund realizes 47.2% annual turnover compared to the regular, tax-
agnostic momentum fund that has 78.1% annual turnover. Avoiding dividend income, which is very
tax inefficient (Israel and Moskowitz (2020)), is also something the tax optimizer seeks to achieve,
but in the case of momentum, which has very little dividend income exposure to begin with, this
aspect of tax management is inconsequential.
Momentum strategies are amenable to tax management since the bulk of the after-tax gains
come from deferring capital gains to long-term status, which does not introduce a lot of tracking
13 Benchmark taxes are computed based on the assumption that passive exposure is taken with corresponding ETFs: IWB for U.S. Large Cap, IWM for U.S. Small Cap and a weighted combination of the EFA and EWC for International. Benchmark turnover is based on the turnover of the corresponding tracking ETF. Both the pre-tax and after-tax return on the benchmark are gross of transaction costs and fees, while the corresponding numbers for the strategies are net of both transaction costs and fees.
21
error. Intuitively, deferring the sale of a winning stock by a month or a few months to push it from
short-term realization status to long-term status is unlikely to have a big impact on the gross return of
the portfolio. This intuition is confirmed with historical backtested data from Israel and Moskowitz
(2020) on hypothetical momentum factor portfolios, but we show in Table 5 evidence of the same for
the live funds in practice. The bottom row of the table shows the correlation and tracking error of the
tax-aware fund to the original (tax-agnostic) momentum fund. For U.S. Large Cap, the correlation
between the two funds is 0.98 and the tracking error is only 0.80% per year. Hence, despite the
significant reduction in taxes and improvement in after-tax returns coming from reducing turnover by
deferring gains to long-term status, the tax-aware momentum fund maintains a tight exposure to the
original momentum fund. Thus, despite claims to the contrary, momentum does not appear to be tax
inefficient, especially when tax optimization techniques are applied to its portfolio construction. On
the contrary, momentum’s tax burden can be minimized effectively without incurring substantial
tracking error or style drift.
From these live numbers, momentum is not heavily exposed to capital gains (or dividend) taxes,
consistent with the theoretical and backtested evidence in Israel and Moskowitz (2020). To give a
sense of the magnitudes, the tax cost of the U.S. Large Cap Momentum fund is the same as the
Russell 1000 index, which is a buy-and-hold cap-weighted portfolio. The effective tax rate of the
Russell 1000 is 3.7% and the drag on returns per year from taxes is -0.5%, which is exactly the same
as that for the tax-aware Large Cap Momentum fund. This may seem like a surprising result given
that the turnover of the momentum fund is an order of magnitude larger than that of the Russell 1000
(47.2% versus 4.0%). As Israel and Moskowitz (2020) show, and as alluded to above, turnover does
not translate into higher taxes. In particular, momentum’s turnover naturally realizes short-term
losses and long-term gains, making it more tax efficient. By also optimizing this process through the
tax-aware funds, the portfolio takes full advantage of these differences in tax rates and uses turnover
to reduce taxes. Hence, the additional turnover associated with momentum relative to the Russell
1000 does not incur any additional tax costs. One other key difference, too, is that much of the
Russell 1000’s tax cost comes from dividends, while very little of the Momentum fund’s comes from
dividend exposure, which also contribute to the tax rates, and is largely unrelated to turnover.
The results for the U.S. Small Cap Momentum and International Momentum funds are similar.
For U.S. Small Cap, the gross returns to the regular momentum fund are the same as the tax-aware
22
momentum fund (13.0% versus 13.1%), but the after-tax returns are much better for the tax-aware
fund, yielding 12.6% over the sample period versus only 11.7% for the regular momentum fund. The
tax-aware fund generates an extra 80 basis points of tax savings per year by reducing the effective tax
rate from 9.8% to 3.9% by deferring gains to long-term status and reducing turnover from 80.2% to
41.3%. The tax-aware fund is able to achieve these savings without incurring large deviations from
the original momentum fund, as the two portfolios are 0.95 correlated and the tracking error of the
fund is only 1% per year.
The international momentum fund exhibits smaller tax gains, but the same results hold up
internationally. The tax-aware momentum fund is able to reduce the effective tax rate and improve
after-tax returns without sacrificing pre-tax returns or incurring large tracking error. The correlation
between the International Momentum fund and the tax-managed International Momentum fund is
0.99, with the latter having only a 0.73% tracking error to the original fund.
While the tax-aware strategies have generated higher after-tax returns than their tax-agnostic
counterparts in U.S. small cap and International markets over this time period, we can also compare
how they have fared relative to their passive market indices. In both cases, the tax-aware momentum
funds have similar or lower taxes than their corresponding passive market indices – on average
across the three funds, the passive market index paid roughly 0.6% in taxes per year, while the tax-
managed momentum strategies paid only 0.5% per year over the live period. These outcomes are
realized despite the passive strategies experiencing considerably lower turnover over this period.14
C. Summary
The results in Table 5 address one of the most prominent myths about momentum and show that
its higher turnover does not appear to result in prohibitively larger tax costs. Based on the evidence
from live data, it does not appear that momentum strategies carry a heavy tax burden. Most
importantly, simple tax optimizations may significantly reduce taxes – over this period, the tax-
14 Our tax liability estimates for the benchmarks are conservative estimates of taxes paid by a passive strategy due to the fact that they are based on tracking ETFs, which generate minimal capital gains owing to the favorable tax regulation on AP intermediates. The majority of the benchmark tax liability is due to dividend payments, which are largely qualified. If, however, the benchmark exposure were obtained through a different vehicle – such as a mutual fund or L.P. structure - we would expect the capital gains tax burden of the benchmark to be considerably higher. Furthermore, both the pre-tax and after-tax return on the benchmark are gross of transaction costs and fees, while the corresponding numbers for the live strategies are net of transaction costs and fees.
23
managed momentum strategies incur a tax liability in line or better than the passive benchmark,
without altering the nature of the portfolio and maintaining its momentum exposure.
Focusing on transaction costs and taxes, the live momentum funds are able to capture the
momentum premium, with a high correlation to academic factors, without incurring a substantial
drag on that premium from those costs. Compared to the gross excess return expectation of 1.0 to
1.5% per year over the market index, transaction costs detracted 0.23% on average. For tax-aware
investors, the tax-aware momentum strategies actually had a tax benefit relative to the cap-weighted
market benchmarks of 0.10% on average across universes over this period.15 As such, the expected
gross excess return to momentum survives the major implementation costs associated with running a
live strategy for both tax-exempt investors (who invest in the tax-agnostic strategy and care only
about transaction costs) as well as for taxable investors (who invest in the tax-aware strategy and care
about both transaction costs and taxes).
The implementation techniques to control transaction costs and taxes (and manage risk) can
distort the portfolio from its intended momentum exposure. However, the live performance of these
funds shows that these deviations have small costs and tiny tracking error consequences.16 Such
portfolio construction choices can also add value and capture momentum more efficiently that offsets
some of the costs associated with slowing down turnover and making substitutions towards cheaper-
to-trade stocks.
5. Momentum Crashes
All of our results thus far have been about average returns and costs to implementation.
However, it is worth considering whether these costs and frictions are particularly different during
extreme times. The Momentum factor famously suffers from crashes or extreme drawdowns, as
documented by Daniel and Moskowitz (2016). We examine how implementation costs vary during
these extreme episodes.
15 The cap-weighted benchmarks paid roughly 0.6% on average across universes, while the tax-agnostic momentum strategies paid 1.2% and tax-aware momentum strategies paid 0.5%. As a result, the taxes paid relative to the cap-weighted benchmark were -0.60% for tax-agnostic momentum and + 0.10% for tax-aware momentum (e.g., a tax benefit relative to the cap-weighted benchmark). 16 For an overview of the various “craftsmanship” choices that can be made when constructing factor portfolios, see Israel, Jiang, and Ross (2017).
24
Table 6 reports the returns of the funds relative to their indices, realized trading costs relative to
expectations, and the return differences of the regular versus tax aware funds during crash and non-
crash periods for the momentum factor. Specifically, we define a “momentum crash” as one where
the Fama and French UMD factor suffered a monthly return of less than -2%. We then compute the
returns and trading costs of the funds in months experiencing a crash versus months outside of those
crashes and report the results in Table 6.
Panel A of Table 6 reports the results for the U.S. Large Cap Momentum funds. The first three
columns highlight the difference in returns between the fund and the Large Cap Momentum Index
which it tracks. Obviously, during crash periods both the momentum fund and the momentum index
fare poorly – delivering only 4.05% and -0.37% (annualized) returns. These numbers, however, are
much greater than the average long-short momentum factor return during these times, which
averages -52.40% annualized during crashes! These results are consistent with Daniel and
Moskowitz (2016) who show that the bulk of the momentum crashes are driven by the short leg of
the momentum strategy. Since the funds we examine are long-only they are less prone to these
crashes, though they still significantly underperform the general stock market during these times.
Also, compared to non-crash periods, the fund and index lag deliver 17.5 and 17.9% annual returns,
respectively, which are 13.4% and 18.2% better than their performance during crashes. Looking at
the difference between the fund and index during crash versus non-crash times, it is apparent that the
fund suffers less during these extreme drawdowns. The fund outperforms its index by 4.4% during
crashes and performs about the same, though slightly worse (-0.39%) during non-crash periods.
The better performance of the fund versus the index during crash times is driven primarily by
the portfolio construction choices of the fund that deviate from the index. Specifically, the fund uses
residual momentum as one of its signal and imposes sector and stock weighting constraints to
mitigate excessive risk exposure. These additions help insulate the fund from momentum crashes,
which Daniel and Moskowitz (2016) show are primarily caused by dynamic market beta exposure of
the momentum factor. Using residual momentum (that takes out market beta) and imposing
weighting constraints helps reduce the conditional beta exposure of the momentum fund that causes
it to suffer less during crashes than the index, which does not have these additional features.
The next three columns of Panel A of Table 6 report differences in trading costs (price impact)
of the fund during crash and non-crash periods. We report both the actual market impact and the

25
expected or predicted market impact. The results show that trading costs are slightly larger than
expected during crashes and slightly smaller than expected during non-crash periods, but are
essentially very stable during crashes and non-crashes. The evidence does not suggest that
momentum is particularly costly to trade during crash periods.
The last three columns of Panel A of Table 6 report the gross returns, and their difference,
between the tax agnostic and tax-aware momentum funds during crash and non-crash periods. The
tax-managed fund imposes additional constraints on the portfolio that cause it to underperform on a
before-tax basis in both crash and non-crash periods, with little difference in that underperformance
across the two periods. These results indicate that tax management is not more costly on a gross
return basis during crash periods and appears relatively immune to these extreme episodes.
Panels B and C repeat the analysis of Panel A for the U.S. Small Cap Momentum and
International Momentum funds, respectively. The results for U.S. Small Cap are consistent with
those from Panel A: the fund outperforms its index substantially during crash periods, and does not
have very different trading cost or tax distortions in crash versus non-crash periods, although the tax-
aware fund imposes a bigger opportunity cost during crashes. For International Momentum, the fund
consistently underperforms the index in both crash and non-crash periods, and trading costs due to
market impact appear to be higher during crash periods. The imposition of tax management on the
portfolio is no different during crash and non-crash periods, however.
In summary, compared to the theoretical AQR Momentum Indices, the live portfolios get hurt a
bit by having to trade more optimally, and helped by better portfolio construction and more robust
measurement of momentum. On net, these decisions have added about 30 bps on average per year
across the three funds we study over their live period. A large part of the benefits of portfolio
construction accrue during extreme momentum crash periods, which mitigates losses. Even though
this may not be the case in every period, we expect and find that the costs of implementation are
modest, while the benefits of portfolio construction are significant, so that the net effect is a live
strategy that captures the theoretical momentum premium without incurring substantial real-world
costs. In other words, putting an academic factor into practice – even one as seemingly challenging
as momentum – is achievable with some simple and thoughtful portfolio construction and trading
techniques. The academic momentum factor is implementable in practice and resembles the factor
used in academic research.
26
6. Conclusion
While seven years of live experience is still too short to evaluate the efficacy of a factor or style
portfolio such as momentum (i.e., what is the true gross momentum premium?), it is sufficient to
learn something about its implementability in practice. Through an examination of the live track
record and trades of AQR’s momentum strategies in three regions, U.S. Large Cap, U.S. Small Cap,
and International, we find that many implementation concerns about momentum may be overstated.
Over the live sample period, through efficient portfolio construction and trading techniques, we show
that the momentum style has been captured in an efficient, low cost manner. Comparing tax-aware
and tax-agnostic versions of the same strategy that have been run concurrently over the live period,
we also find significant tax improvements from the tax-optimized portfolios that are consistent with –
or actually better than – historical estimates from academic studies.
The results show that momentum is an implementable strategy and that the live experience of
trading has not necessarily produced excessive turnover, large trading costs, or significant tax
burdens. These results contradict common myths about momentum investing, but are in line with
recent academic studies that attempt to address these issues (Frazzini, Israel, and Moskowitz (2020b),
Israel and Moskowitz (2020), and Sialm and Sosner (2017)). The live experience running momentum
portfolios matches the conclusions of the academic studies.
We show the portfolio construction choices and trading techniques used to achieve putting the
momentum factor into practice. While these choices deviate from the academic factor, those
deviations are small on average and have both positive and negative performance consequences that
add up to similar performance overall to the academic factor. Net of costs and fees, the live
momentum strategies are able to capture a sizeable momentum premium that survives these real-
world frictions and highlights that an academic factor can be put into practice and made available to
the investment public in an efficient and accessible way.
27
REFERENCES
Asness, C., 1997. “The Interaction of Value and Momentum Strategies.” Financial Analysts Journal. Asness, C., A. Ilmanen, R. Israel, and T. Moskowitz, 2015. “Investing with Style.” Journal of
Investment Management, Vol. 13, No. 1, 27-63. Asness, C., A. Frazzini, R. Israel, and T. Moskowitz, 2014. “Fact, Fiction, and Momentum Investing.”
Journal of Portfolio Management, Fortieth Year Special Anniversary Issue. Asness, C., A. Ilmanen, R. Israel, and T. Moskowitz, 2015. “Investing with Style.” Journal of
Investment Management, Vol. 13, No. 1, pp 27-63. Asness, C., T. Moskowitz, and L. Pedersen, 2013. “Value and Momentum Everywhere.” Journal of
Finance, Vol. 68, No. 3, 929-985. Blitz, D. Huji, J., and Martens, M., 2011. Residual Momentum, J. of Empirical Finance, Vol. 18 (3),
506-521. Chabot, B., Ghysels, E., Jagannathan, R., 2009. Momentum cycles and limits to arbitrage: evidence from Victorian England and post-depression US stocks markets. Unpublished working paper. National Bureau of Economic Research. Chui, A.C., Titman, S., Wei, K.J., 2010. Individualism and momentum around the world. J. Finance 65, 361–392. Daniel, K., Moskowitz, T.J., 2016. Momentum crashes. J. Financ. Econ. 122, 221–247. De Long, J.B., Shleifer, A., Summers, L.H., Waldmann, R.J., 1990. Positive feedback investment strategies and destabilizing rational speculation. J. Finance 45 (2), 379–395. Fama, E.F., French, K.R., 1993. Common risk factors in the returns on stocks and bonds. J. Financ. Econ. 33, 3–56. Fitzgibbons, S., J. Friedman, L. Pomorski., and L. Serban, 2016. “Long-Only Style Investing: Don’t
Just Mix, Integrate.” AQR Whitepaper. Frazzini, A., R. Israel, and T. Moskowitz, 2015. “Trading Costs of Asset Pricing Anomalies.” SSRN
Working Paper. Geczy, C.C., Samonov, M., 2016. Two centuries of price-return momentum. Financial Analysts Journal 72, 32–56. Goetzmann, W. N. and Huang, S., 2018. Momentum in Imperial Russia Journal of Financial Economics, Volume 130, Issue 3, pp 579-591 Gray, W., and J. Vogel, 2017. “Factor Investing and Trading Costs.” Alpha Architect. Griffin, J.M., Ji, X., Martin, J.S., 2003. Momentum investing and business cycle risk: evidence from pole to pole. J. Finance 58, 2515–2547.

28
Grinblatt, M., Moskowitz, T.J., 2004. Predicting stock price movements from past returns: the role of consistency and tax-loss selling. J. Financ. Econ. 71, 541–579. doi:10.1016/S0304-405X(03)00176-4. Israel, R., and T. Moskowitz, 2013. “The Role of Shorting, Firm Size, and Time on Market
Anomalies.” Journal of Financial Economics, Vol. 108, No. 2, 275-301. Israel, R., and T. Moskowitz, 2012. “How Tax Efficient are Equity Styles?” SSRN Working paper. Israel, R., Jiang, S., and A. Ross, 2017. “Craftsmanship Alpha.” Forthcoming Journal of Portfolio
Management. Israel, R., and A. Ross, 2017. “Measuring Factor Exposures: Uses and Abuses.” Journal of Alternative
Investments, Vol. 20, No. 1. Jegadeesh, N., and S. Titman, 1993. “Returns to Buying Winners and Selling Losers: Implications for
Stock Market Efficiency,” Journal of Finance, Vol. 48, 65-91 Jegadeesh, N., Titman, S., 2001. Profitability of momentum strategies: an evaluation of alternative explanations. J. Finance 56, 699–720. Korajczyk, R. A., Sadka, R. 2004. Are momentum profits robust to trading costs? Journal of Finance,
59, 1039–1082. Moskowitz, T., and M. Grinblatt, 1999. “Do Industries Explain Momentum?” Journal of Finance, Vol.
54, No. 4, 1249-1290. Novy-Marx, R. and Velikov, M., 2016. “A Taxonomy of Anomalies and their Trading Costs,” Review
of Financial Studies 29(1), 2016, 104-147. Rouwenhorst, K.G., 1998. International momentum strategies. J. Finance 53, 267–284.
Sialm, C., and N. Sosner, 2017. “Taxes, Shorting, and Active Management.” SSRN Working Paper.
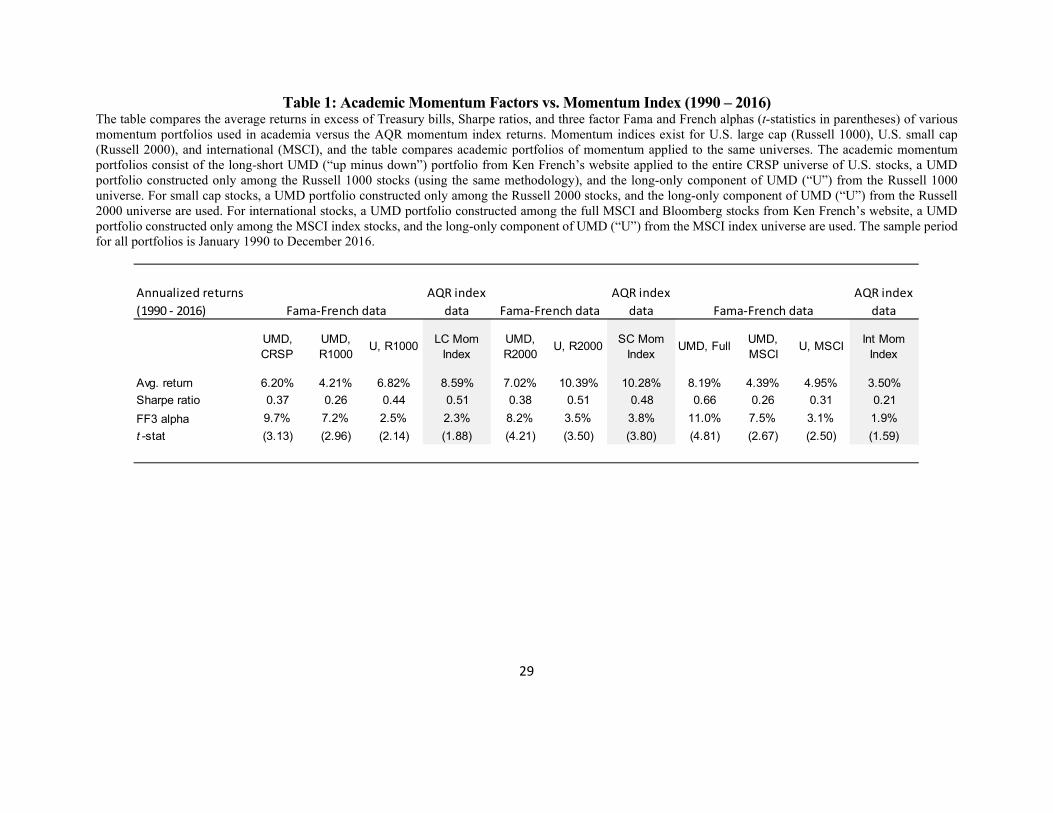
29
Table 1: Academic Momentum Factors vs. Momentum Index (1990 – 2016) The table compares the average returns in excess of Treasury bills, Sharpe ratios, and three factor Fama and French alphas (t-statistics in parentheses) of various momentum portfolios used in academia versus the AQR momentum index returns. Momentum indices exist for U.S. large cap (Russell 1000), U.S. small cap (Russell 2000), and international (MSCI), and the table compares academic portfolios of momentum applied to the same universes. The academic momentum portfolios consist of the long-short UMD (“up minus down”) portfolio from Ken French’s website applied to the entire CRSP universe of U.S. stocks, a UMD portfolio constructed only among the Russell 1000 stocks (using the same methodology), and the long-only component of UMD (“U”) from the Russell 1000 universe. For small cap stocks, a UMD portfolio constructed only among the Russell 2000 stocks, and the long-only component of UMD (“U”) from the Russell 2000 universe are used. For international stocks, a UMD portfolio constructed among the full MSCI and Bloomberg stocks from Ken French’s website, a UMD portfolio constructed only among the MSCI index stocks, and the long-only component of UMD (“U”) from the MSCI index universe are used. The sample period for all portfolios is January 1990 to December 2016.
Annualized returns (1990 - 2016)
AQR index data
AQR index data
AQR index data
UMD, CRSP
UMD, R1000
U, R1000 LC Mom Index
UMD, R2000
U, R2000 SC Mom Index
UMD, Full UMD, MSCI
U, MSCI Int Mom Index
Avg. return 6.20% 4.21% 6.82% 8.59% 7.02% 10.39% 10.28% 8.19% 4.39% 4.95% 3.50%Sharpe ratio 0.37 0.26 0.44 0.51 0.38 0.51 0.48 0.66 0.26 0.31 0.21FF3 alpha 9.7% 7.2% 2.5% 2.3% 8.2% 3.5% 3.8% 11.0% 7.5% 3.1% 1.9%t -stat (3.13) (2.96) (2.14) (1.88) (4.21) (3.50) (3.80) (4.81) (2.67) (2.50) (1.59)
Fama-French data Fama-French dataFama-French data
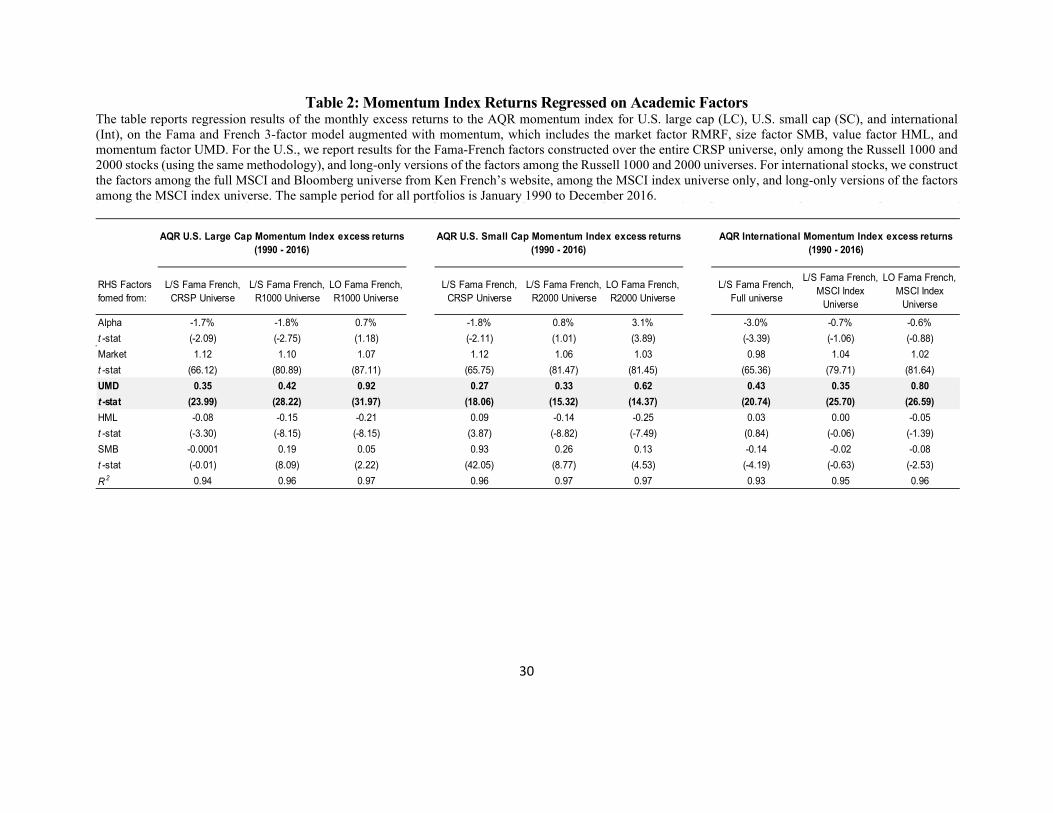
30
Table 2: Momentum Index Returns Regressed on Academic Factors The table reports regression results of the monthly excess returns to the AQR momentum index for U.S. large cap (LC), U.S. small cap (SC), and international (Int), on the Fama and French 3-factor model augmented with momentum, which includes the market factor RMRF, size factor SMB, value factor HML, and momentum factor UMD. For the U.S., we report results for the Fama-French factors constructed over the entire CRSP universe, only among the Russell 1000 and 2000 stocks (using the same methodology), and long-only versions of the factors among the Russell 1000 and 2000 universes. For international stocks, we construct the factors among the full MSCI and Bloomberg universe from Ken French’s website, among the MSCI index universe only, and long-only versions of the factors among the MSCI index universe. The sample period for all portfolios is January 1990 to December 2016.
RHS Factors fomed from:
L/S Fama French, CRSP Universe
L/S Fama French, R1000 Universe
LO Fama French, R1000 Universe
L/S Fama French, CRSP Universe
L/S Fama French, R2000 Universe
LO Fama French, R2000 Universe
L/S Fama French, Full universe
L/S Fama French, MSCI Index
Universe
LO Fama French, MSCI Index
Universe
Alpha -1.7% -1.8% 0.7% -1.8% 0.8% 3.1% -3.0% -0.7% -0.6%t -stat (-2.09) (-2.75) (1.18) (-2.11) (1.01) (3.89) (-3.39) (-1.06) (-0.88)Market 1.12 1.10 1.07 1.12 1.06 1.03 0.98 1.04 1.02t -stat (66.12) (80.89) (87.11) (65.75) (81.47) (81.45) (65.36) (79.71) (81.64)UMD 0.35 0.42 0.92 0.27 0.33 0.62 0.43 0.35 0.80t -stat (23.99) (28.22) (31.97) (18.06) (15.32) (14.37) (20.74) (25.70) (26.59)HML -0.08 -0.15 -0.21 0.09 -0.14 -0.25 0.03 0.00 -0.05t -stat (-3.30) (-8.15) (-8.15) (3.87) (-8.82) (-7.49) (0.84) (-0.06) (-1.39)SMB -0.0001 0.19 0.05 0.93 0.26 0.13 -0.14 -0.02 -0.08t -stat (-0.01) (8.09) (2.22) (42.05) (8.77) (4.53) (-4.19) (-0.63) (-2.53)R 2 0.94 0.96 0.97 0.96 0.97 0.97 0.93 0.95 0.96
AQR U.S. Large Cap Momentum Index excess returns (1990 - 2016)
AQR U.S. Small Cap Momentum Index excess returns (1990 - 2016)
AQR International Momentum Index excess returns (1990 - 2016)
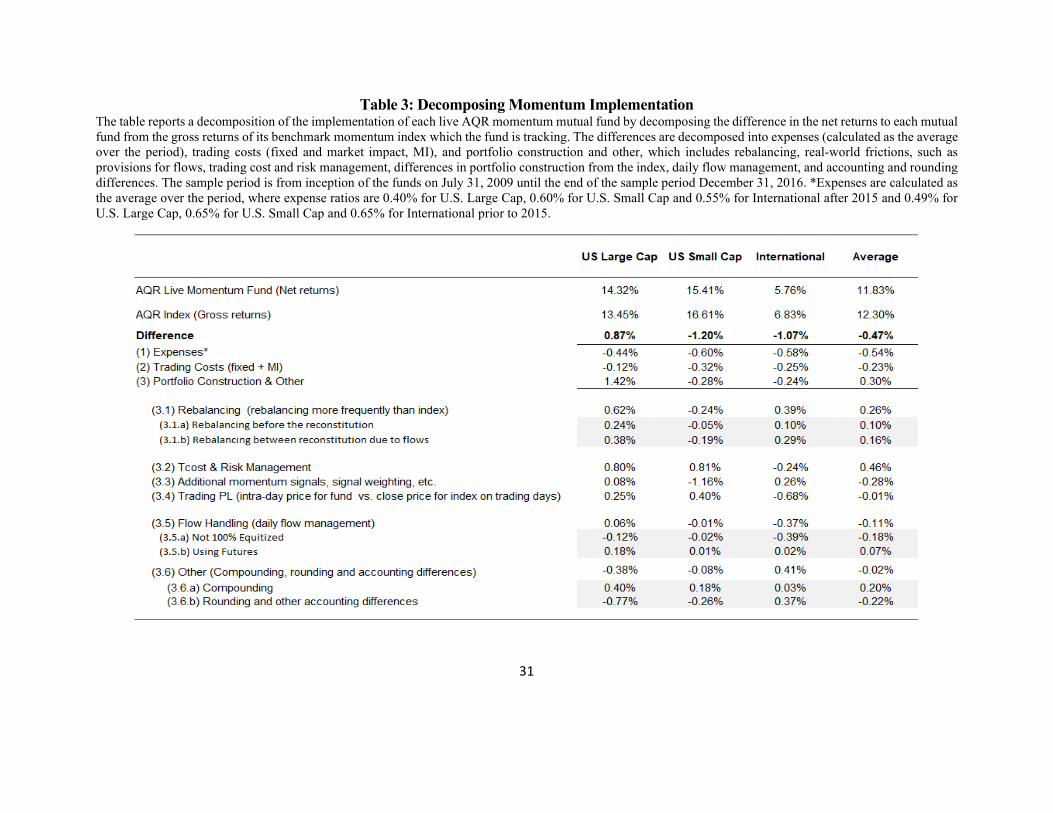
31
Table 3: Decomposing Momentum Implementation The table reports a decomposition of the implementation of each live AQR momentum mutual fund by decomposing the difference in the net returns to each mutual fund from the gross returns of its benchmark momentum index which the fund is tracking. The differences are decomposed into expenses (calculated as the average over the period), trading costs (fixed and market impact, MI), and portfolio construction and other, which includes rebalancing, real-world frictions, such as provisions for flows, trading cost and risk management, differences in portfolio construction from the index, daily flow management, and accounting and rounding differences. The sample period is from inception of the funds on July 31, 2009 until the end of the sample period December 31, 2016. *Expenses are calculated as the average over the period, where expense ratios are 0.40% for U.S. Large Cap, 0.60% for U.S. Small Cap and 0.55% for International after 2015 and 0.49% for U.S. Large Cap, 0.65% for U.S. Small Cap and 0.65% for International prior to 2015.
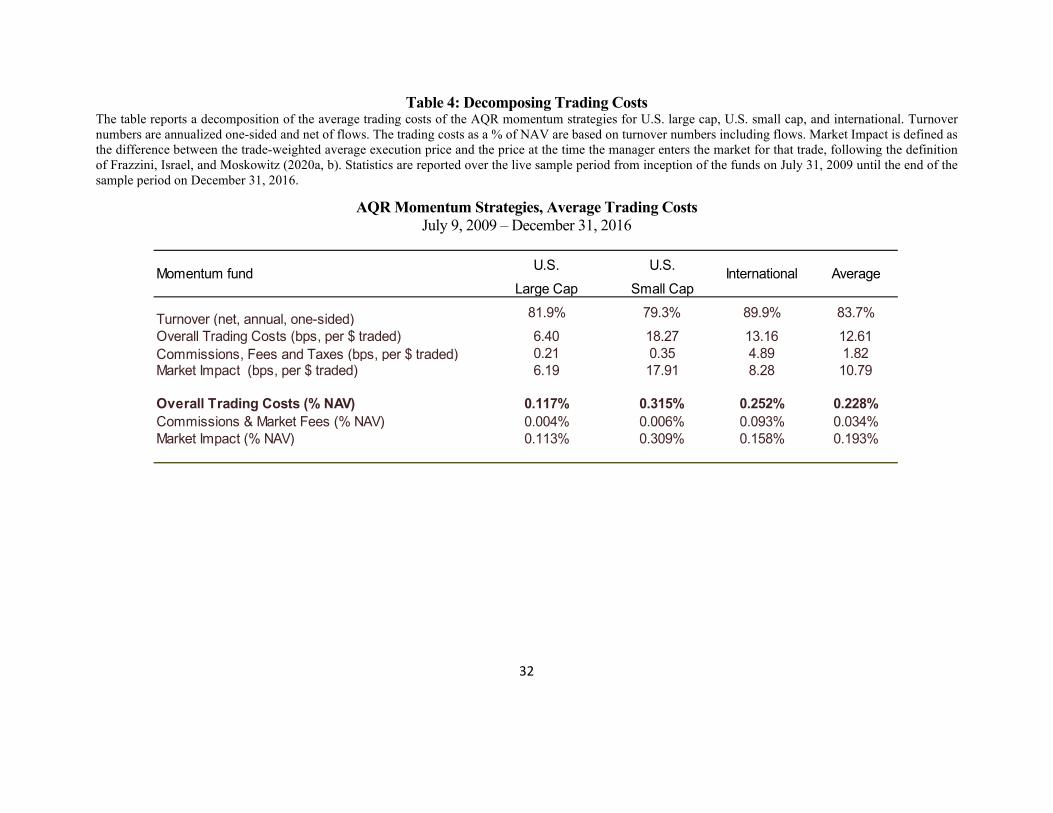
32
Table 4: Decomposing Trading Costs The table reports a decomposition of the average trading costs of the AQR momentum strategies for U.S. large cap, U.S. small cap, and international. Turnover numbers are annualized one-sided and net of flows. The trading costs as a % of NAV are based on turnover numbers including flows. Market Impact is defined as the difference between the trade-weighted average execution price and the price at the time the manager enters the market for that trade, following the definition of Frazzini, Israel, and Moskowitz (2020a, b). Statistics are reported over the live sample period from inception of the funds on July 31, 2009 until the end of the sample period on December 31, 2016.
AQR Momentum Strategies, Average Trading Costs July 9, 2009 – December 31, 2016
U.S. U.S. Large Cap Small Cap
Turnover (net, annual, one-sided) 81.9% 79.3% 89.9% 83.7%Overall Trading Costs (bps, per $ traded) 6.40 18.27 13.16 12.61Commissions, Fees and Taxes (bps, per $ traded) 0.21 0.35 4.89 1.82Market Impact (bps, per $ traded) 6.19 17.91 8.28 10.79
Overall Trading Costs (% NAV) 0.117% 0.315% 0.252% 0.228%Commissions & Market Fees (% NAV) 0.004% 0.006% 0.093% 0.034%Market Impact (% NAV) 0.113% 0.309% 0.158% 0.193%
Momentum fund International Average
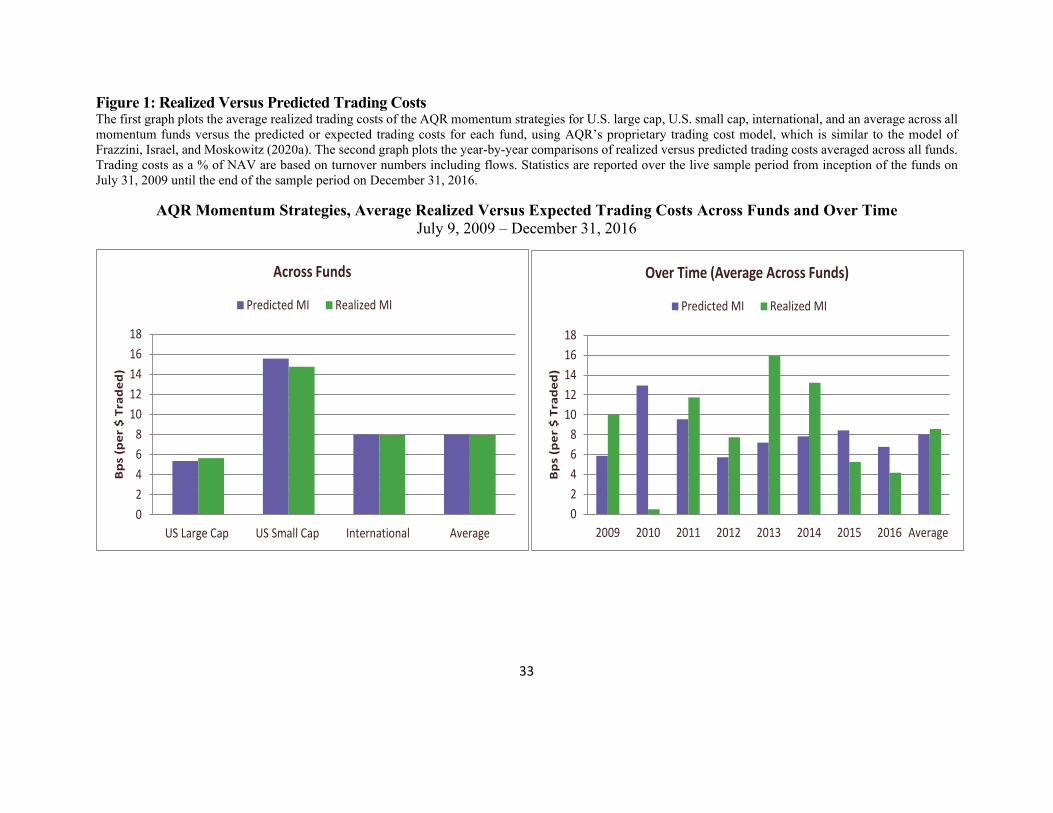
33
Figure 1: Realized Versus Predicted Trading Costs The first graph plots the average realized trading costs of the AQR momentum strategies for U.S. large cap, U.S. small cap, international, and an average across all momentum funds versus the predicted or expected trading costs for each fund, using AQR’s proprietary trading cost model, which is similar to the model of Frazzini, Israel, and Moskowitz (2020a). The second graph plots the year-by-year comparisons of realized versus predicted trading costs averaged across all funds. Trading costs as a % of NAV are based on turnover numbers including flows. Statistics are reported over the live sample period from inception of the funds on July 31, 2009 until the end of the sample period on December 31, 2016.
AQR Momentum Strategies, Average Realized Versus Expected Trading Costs Across Funds and Over Time July 9, 2009 – December 31, 2016
02468
1012141618
US Large Cap US Small Cap International Average
Bp
s (p
er $
Tra
ded
)
Across Funds
Predicted MI Realized MI
02468
1012141618
2009 2010 2011 2012 2013 2014 2015 2016 AverageB
ps
(per
$ T
rad
ed)
Over Time (Average Across Funds)
Predicted MI Realized MI
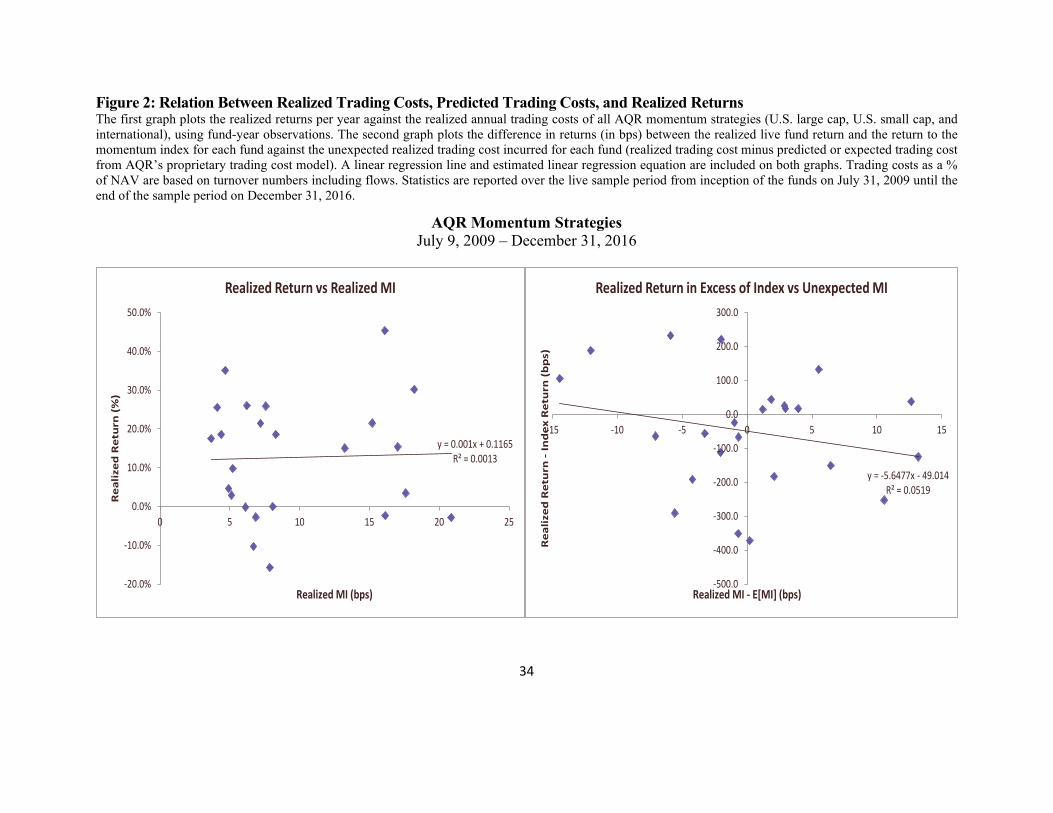
34
Figure 2: Relation Between Realized Trading Costs, Predicted Trading Costs, and Realized Returns The first graph plots the realized returns per year against the realized annual trading costs of all AQR momentum strategies (U.S. large cap, U.S. small cap, and international), using fund-year observations. The second graph plots the difference in returns (in bps) between the realized live fund return and the return to the momentum index for each fund against the unexpected realized trading cost incurred for each fund (realized trading cost minus predicted or expected trading cost from AQR’s proprietary trading cost model). A linear regression line and estimated linear regression equation are included on both graphs. Trading costs as a % of NAV are based on turnover numbers including flows. Statistics are reported over the live sample period from inception of the funds on July 31, 2009 until the end of the sample period on December 31, 2016.
AQR Momentum Strategies July 9, 2009 – December 31, 2016
y = 0.001x + 0.1165R² = 0.0013
-20.0%
-10.0%
0.0%
10.0%
20.0%
30.0%
40.0%
50.0%
0 5 10 15 20 25
Rea
lized
Ret
urn
(%
)
Realized MI (bps)
Realized Return vs Realized MI
y = -5.6477x - 49.014R² = 0.0519
-500.0
-400.0
-300.0
-200.0
-100.0
0.0
100.0
200.0
300.0
-15 -10 -5 0 5 10 15
Rea
lized
Ret
urn
-In
dex
Ret
urn
(b
ps)
Realized MI - E[MI] (bps)
Realized Return in Excess of Index vs Unexpected MI
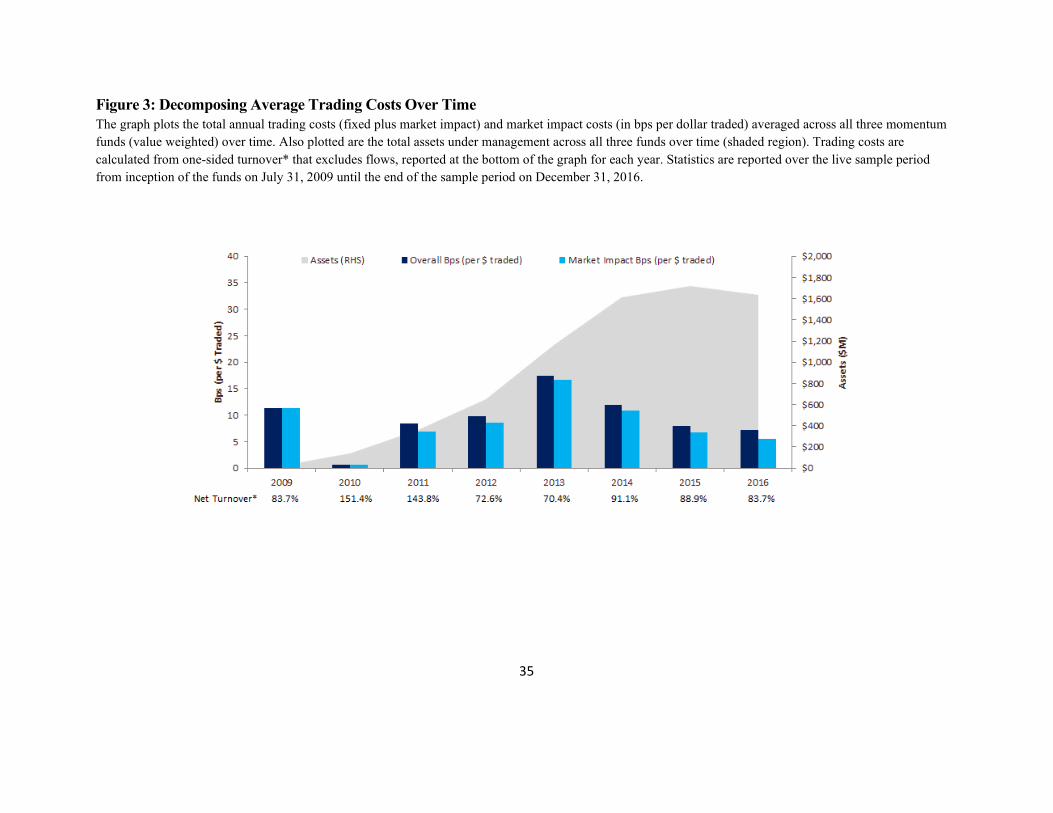
35
Figure 3: Decomposing Average Trading Costs Over Time The graph plots the total annual trading costs (fixed plus market impact) and market impact costs (in bps per dollar traded) averaged across all three momentum funds (value weighted) over time. Also plotted are the total assets under management across all three funds over time (shaded region). Trading costs are calculated from one-sided turnover* that excludes flows, reported at the bottom of the graph for each year. Statistics are reported over the live sample period from inception of the funds on July 31, 2009 until the end of the sample period on December 31, 2016.
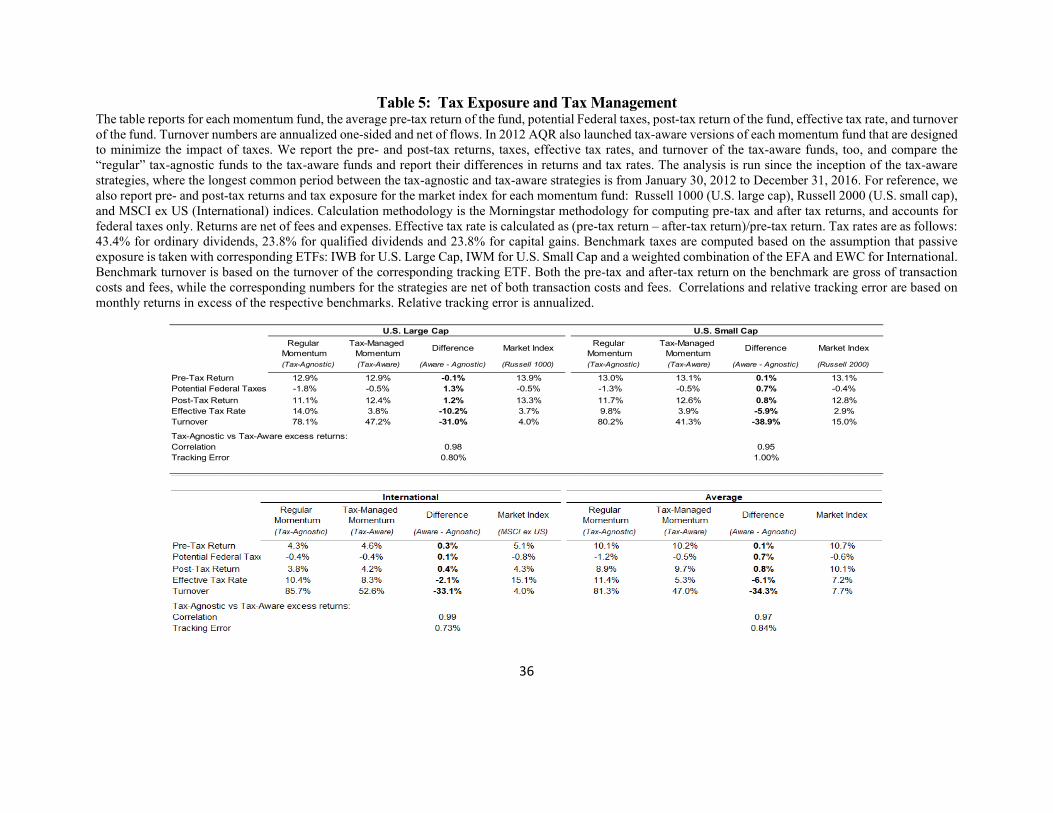
36
Table 5: Tax Exposure and Tax Management The table reports for each momentum fund, the average pre-tax return of the fund, potential Federal taxes, post-tax return of the fund, effective tax rate, and turnover of the fund. Turnover numbers are annualized one-sided and net of flows. In 2012 AQR also launched tax-aware versions of each momentum fund that are designed to minimize the impact of taxes. We report the pre- and post-tax returns, taxes, effective tax rates, and turnover of the tax-aware funds, too, and compare the “regular” tax-agnostic funds to the tax-aware funds and report their differences in returns and tax rates. The analysis is run since the inception of the tax-aware strategies, where the longest common period between the tax-agnostic and tax-aware strategies is from January 30, 2012 to December 31, 2016. For reference, we also report pre- and post-tax returns and tax exposure for the market index for each momentum fund: Russell 1000 (U.S. large cap), Russell 2000 (U.S. small cap), and MSCI ex US (International) indices. Calculation methodology is the Morningstar methodology for computing pre-tax and after tax returns, and accounts for federal taxes only. Returns are net of fees and expenses. Effective tax rate is calculated as (pre-tax return – after-tax return)/pre-tax return. Tax rates are as follows: 43.4% for ordinary dividends, 23.8% for qualified dividends and 23.8% for capital gains. Benchmark taxes are computed based on the assumption that passive exposure is taken with corresponding ETFs: IWB for U.S. Large Cap, IWM for U.S. Small Cap and a weighted combination of the EFA and EWC for International. Benchmark turnover is based on the turnover of the corresponding tracking ETF. Both the pre-tax and after-tax return on the benchmark are gross of transaction costs and fees, while the corresponding numbers for the strategies are net of both transaction costs and fees. Correlations and relative tracking error are based on monthly returns in excess of the respective benchmarks. Relative tracking error is annualized.
Regular Momentum
Tax-Managed Momentum Difference Market Index Regular
MomentumTax-Managed
Momentum Difference Market Index
(Tax-Agnostic) (Tax-Aware) (Aware - Agnostic) (Russell 1000) (Tax-Agnostic) (Tax-Aware) (Aware - Agnostic) (Russell 2000)
Pre-Tax Return 12.9% 12.9% -0.1% 13.9% 13.0% 13.1% 0.1% 13.1%Potential Federal Taxes -1.8% -0.5% 1.3% -0.5% -1.3% -0.5% 0.7% -0.4%Post-Tax Return 11.1% 12.4% 1.2% 13.3% 11.7% 12.6% 0.8% 12.8%Effective Tax Rate 14.0% 3.8% -10.2% 3.7% 9.8% 3.9% -5.9% 2.9%Turnover 78.1% 47.2% -31.0% 4.0% 80.2% 41.3% -38.9% 15.0%
Tax-Agnostic vs Tax-Aware excess returns:Correlation 0.98 0.95Tracking Error 0.80% 1.00%
U.S. Large Cap U.S. Small Cap
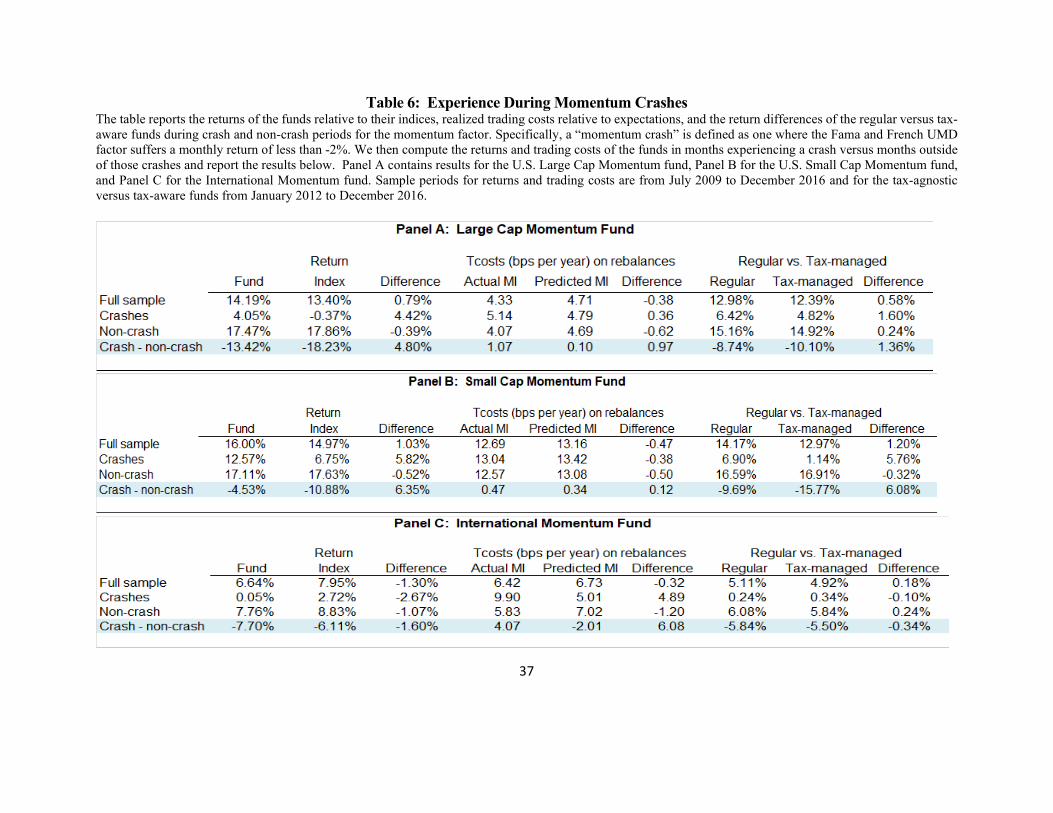
37
Table 6: Experience During Momentum Crashes The table reports the returns of the funds relative to their indices, realized trading costs relative to expectations, and the return differences of the regular versus tax-aware funds during crash and non-crash periods for the momentum factor. Specifically, a “momentum crash” is defined as one where the Fama and French UMD factor suffers a monthly return of less than -2%. We then compute the returns and trading costs of the funds in months experiencing a crash versus months outside of those crashes and report the results below. Panel A contains results for the U.S. Large Cap Momentum fund, Panel B for the U.S. Small Cap Momentum fund, and Panel C for the International Momentum fund. Sample periods for returns and trading costs are from July 2009 to December 2016 and for the tax-agnostic versus tax-aware funds from January 2012 to December 2016.
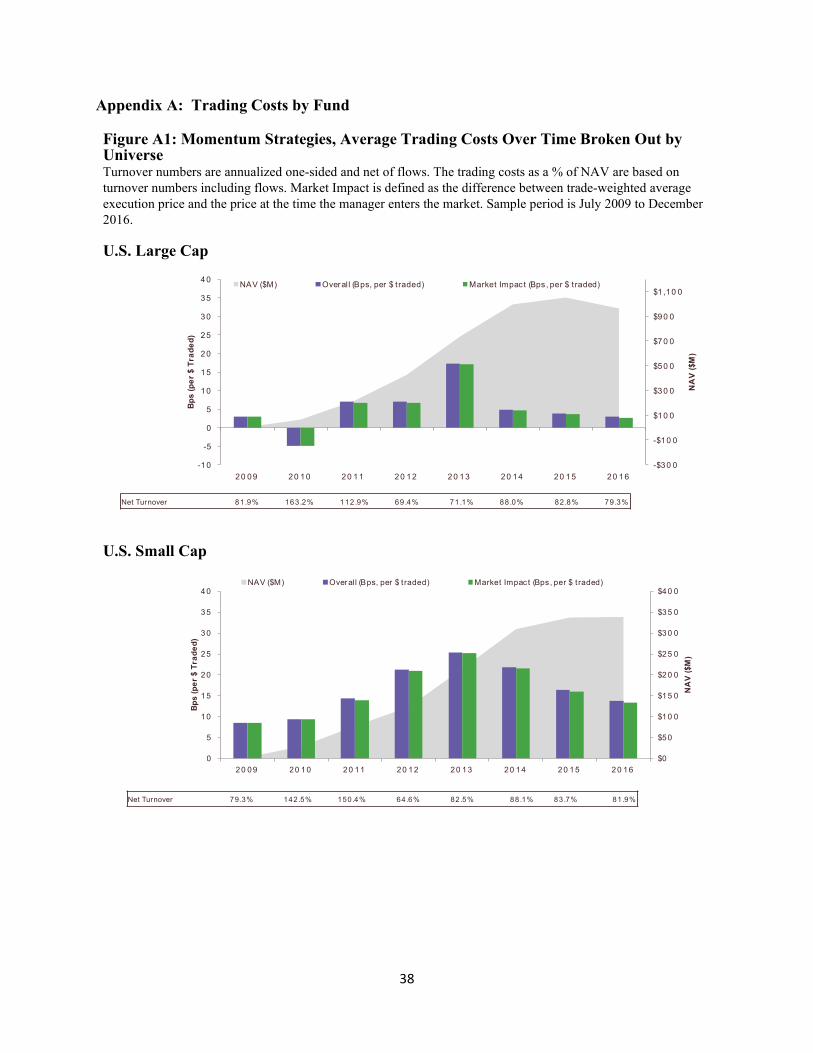
38
Appendix A: Trading Costs by Fund Figure A1: Momentum Strategies, Average Trading Costs Over Time Broken Out by Universe Turnover numbers are annualized one-sided and net of flows. The trading costs as a % of NAV are based on turnover numbers including flows. Market Impact is defined as the difference between trade-weighted average execution price and the price at the time the manager enters the market. Sample period is July 2009 to December 2016. U.S. Large Cap
U.S. Small Cap
Net Turnover 79.3% 142.5% 150.4% 64.6% 82.5% 88.1% 83.7% 81.9%
$0
$50
$10 0
$15 0
$20 0
$25 0
$30 0
$35 0
$40 0
0
5
10
15
20
25
30
35
40
20 09 20 10 20 11 20 12 20 13 20 14 20 15 20 16
NA
V ($
M)
Bps
(per
$ T
rade
d)
NAV ($M) Overall (Bps, per $ t raded) Market Impact (Bps, per $ t raded)
-$30 0
-$10 0
$10 0
$30 0
$50 0
$70 0
$90 0
$1 ,10 0
-10
-5
0
5
10
15
20
25
30
35
40
20 09 20 10 20 11 20 12 20 13 20 14 20 15 20 16
NA
V ($
M)
Bps
(per
$ T
rade
d)
NAV ($M) Overall (Bps, per $ t raded) Market Impact (Bps, per $ t raded)
Net Turnover 81.9% 163.2% 112.9% 69.4% 71.1% 88.0% 82.8% 79.3%
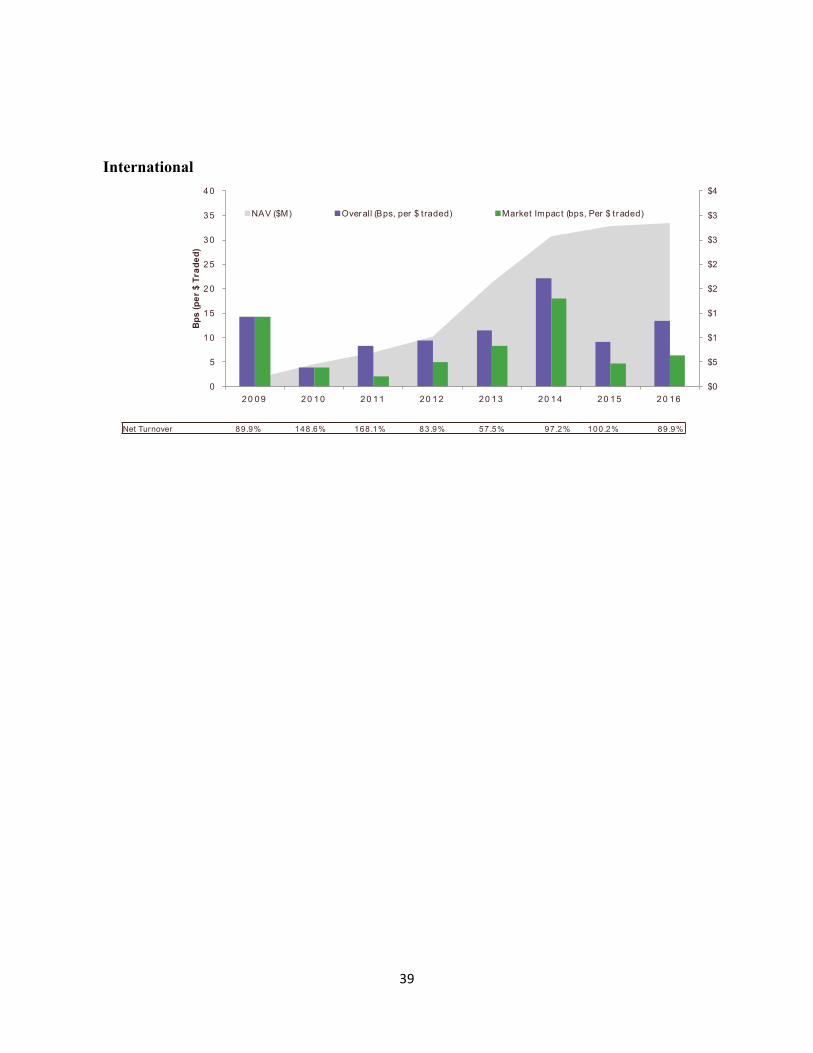
39
International
Net Turnover 89.9% 148.6% 168.1% 83.9% 57.5% 97.2% 100.2% 89.9%
$0
$5
$1
$1
$2
$2
$3
$3
$4
0
5
10
15
20
25
30
35
40
20 09 20 10 20 11 20 12 20 13 20 14 20 15 20 16
Bps
(per
$ T
rade
d)
NAV ($M) Overall (Bps, per $ t raded) Market Impact (bps, Per $ t raded)