pulsed signal properties of free-ranging bottlenose dolphins ( tursiops truncatus ) in the central...
TRANSCRIPT

MARINE MAMMAL SCIENCE, **(*): ***–*** (*** 2014)© 2014 Society for Marine MammalogyDOI: 10.1111/mms.12194
Pulsed signal properties of free-ranging bottlenosedolphins (Tursiops truncatus) in the central
Mediterranean Sea
GIUSEPPA BUSCAINO,1 GASPARE BUFFA, FRANCESCO FILICIOTTO, VINCENZO MACCAR-
RONE, VINCENZO DI STEFANO, MARIA CERAULO, and SALVATORE MAZZOLA, CNR,
Istituto per l’Ambiente Marino Costiero UOS Capo Granitola, BioacousticsLab, Via del Faro
No. 3, 91021–Torretta Granitola (TP), Italy; GIUSEPPE ALONGE, ENEA, UTMEATER,Via Catania No. 2, Palermo, Italy.
Abstract
This study describes pulsed signals from bottlenose dolphins of the central Medi-terranean Sea. Data were collected during 2011 and 2012 in 27 surveys in the Sicil-ian Channel, during which 163 animals were sighted. Based mainly on the pulserepetition rate, the signals were classified as Low-frequency click (LF; single clickswithout a regular pulse rate), Train click (TC; with a interclick interval of80 � 2 ms), Burst (with a interclick interval of 3.4 � 0.2 ms), or Packed click(with a lower number of clicks per train and median interclick interval of3.2 � 0.0 ms). The measured parameters were peak sound pressure level (SPLpk);signal duration; the 1st, 2nd, and 3rd peak of frequency; number of peaks frequency;bandwidth; centroid frequency; and the 10th, 25th, 75th, and 90th percentiles ofthe power spectrum distribution. Most of the parameters were significantly differentamong the groups, reflecting the different functions of these signals. LF clicksshowed a lower peak frequency and percentiles and a longer duration and couldbe used to explore a wide area without a specific target focalization and with lessresolution. The TC showed a higher SPLpk, higher peak frequency, lower duration,and lower number of secondary peaks frequency, showing a better resolution toinvestigate a specific target.
Key words: bottlenose dolphin, Tursiops truncatus, pulsed signals, MediterraneanSea.
Bottlenose dolphins, like other dolphins, produce pulsed acoustic emissionsthat vary widely in duration, interpulse interval, and spectral composition (Au1993, Houser et al. 1999). These pulsed signals are usually categorized as echolo-cation clicks and burst clicks. Echolocation clicks are used for detection, ranging,and discrimination of objects by trained dolphins (Au 1993) and likely in free-ranging animals (Simard et al. 2010). Burst clicks, similar to echolocation clicksbut with a higher pulse rate, are used in association with social interaction forshort-distance communicative purposes (Caldwell and Caldwell 1967, Lammerset al. 2003).
1Corresponding author (e-mail: [email protected]).
1

Although pulsed signals of bottlenose dolphins (Tursiops truncatus) are well studiedin captive animals, especially in confined spaces (Branstetter et al. 2012, Finneran2013), studies of the acoustics of free-ranging bottlenose dolphins are not as common(Wahlberg et al. 2011, Simard et al. 2010). In the Mediterranean Sea, studies of theacoustic production of bottlenose dolphins are scarce and consider whistles (D�ıazL�opez 2011) or clicks using only a 32 kHz sampling rate (Greco et al. 2003) withusable band of 0.1–16 kHz (this band is very narrow to feature the dolphins clicks ifwe consider that their centroid frequency is much higher than 16 kHz; Au 1993).Like whistles (Steiner 1981, Wang et al. 1995, Rendell et al. 1999), pulsed signals
can be used to identify some dolphin species (Roch et al. 2007, Soldevilla et al. 2008,Baumann-Pickering et al. 2010). Further studies should be focused on this directionbecause the new advances in field and autonomous long-term recordings with highsampling frequencies allow the use of clicks to identify dolphins to the species level(Roch et al. 2011). Moreover, in many cases echolocation clicks far outnumber thenumber of whistles (GB, unpublished data). The identification of dolphin species pre-supposes that we know the mean acoustic parameters of clicks for each species, butsometimes this method is not completely robust (Baumann-Pickering et al. 2010),and more information is necessary. We must consider that for each species, we canfind different click types that could have different temporal and frequency parame-ters. The recording of clicks can be influenced both by environmental factors, e.g., thepresence of a reflecting surface (i.e., sea surface, sea bottom), the greater attenuation ofhigher frequencies with the distance, and the orientation of the dolphins with respectto the hydrophone, and by the fact that dolphins can produce different click typesthat can interact in a different way with the internal tissues of the head (Branstetteret al. 2012). Although different studies demonstrated significant distortion in thewave shape and spectral content of clicks as a function of beam angle (Au 1993,Branstettera et al. 2012), on-axis clicks may not accurately represent the full ensem-ble of clicks that will be acquired during passive acoustic monitoring of free-rangeodontocetes. Both on- and off-axis clicks could be useful to classify dolphin species(Soldevilla et al. 2008). All these aspects should be considered when comparing theclicks from different species.For echolocation, the temporal and spectral proprieties of clicks determine the
information that can be derived from the returning echoes and how well the echoescan be distinguished from background noise (Madsen and Wahlberg 2007). A broadbandwidth of the source improves the ability to resolve the location of a target intime and space as well as its size, shape, and material (Au 1993). If we consider thathigher frequencies are more attenuated over long distances than lower frequencies(Urick 1983) and that bottlenose dolphins wait for the return of the echo beforeemitting successive clicks (Au 1993, Au and Hastings 2008), we could consider theinter-click interval as a way to classify the click types because the echoes from theseclick types contain different useful information for dolphins. Therefore, if the focaltarget of a dolphin is at a greater distance, the interclick interval increases and thehigher-frequency component of the echo decreases, and if the distance increases muchmore or no close targets are present, dolphins could expend less energy emitting anarrow low-frequency band click to have a wider and lower-resolution view of theenvironment.In this study, we present the results of measurements of temporal and spectral
parameters of wild Mediterranean bottlenose dolphin pulsed signals (burst clicks andecholocation clicks), considering the interclick interval and the number of clicks pertrain as classification factors.
2 MARINE MAMMAL SCIENCE, VOL. **, NO. **, 2014

Materials and Methods
Field Acoustic Sampling
The bottlenose dolphin signals were recorded during 27 surveys in the summers of2011 and 2012 (see Table 1) using a rubber boat (BWA, 740 cm length, with alow-noise 4-stroke Honda 200 hp). The sampling area comprised the region fromCapo Feto (37�39.57’N, 12�31.06’E) to Capo San Marco (37�29.25’N, 13�0.9’E) andaround Lampedusa Island (35�30.93’N, 12°35.03’E). Sightings of bottlenose dolphinoccurred from 1 to 50 km from the coast and in depth from 30 to 200 m. When wedetected animals, we approached them for species identification, school-size estima-tion, and acoustic recording.The acoustic signals were recorded using a calibrated hydrophone (model
8104, Bruel and Kjer, Nærum, Denmark) with a sensitivity of –205.6 dB re1V/l lPa � 4.0 dB in the 0.1 Hz to 80 kHz frequency band (+4 dB and–12 dB in the frequency range of 0.1 Hz to 120 kHz). The hydrophone wasconnected to a digital acquisition card set at 40 dB gain (USGH416HB, AvisoftBioacoustics, Berlin, Germany) managed by dedicated Avisoft Recorder USGHsoftware (Avisoft Bioacoustics). The signals were acquired at 300 kHz samplingrate at 16 bits. The hydrophone was lowered into the water from the middle ofone side of boat (7.4 m length) and positioned at 5 m depth. The acoustic mon-itoring was performed if the dolphins (surface sightings) were close less thanabout 50 m from the hydrophone (this distance was assessed by expert observersthat taken the photos of dorsal fins). The mean number or animals per sightingis 5.6 � 3.0 (� SD).
Click Selection
In total, we considered 1,658 files with a total of 13.4 h of recording. Each file wasvisualized both in the time and in the frequency domain (Avisoft-SASLab Pro soft-ware, Avisoft Bioacoustics). Files were considered for further analysis (1) if there wasno noise from another source (e.g., sonar or boat engines) or from electromagneticinterference (e.g., mobile or VHF) and (2) if the pulsed signals were well distinguish-able (e.g., without an echo from any surface or with the echo clearly separable fromthe original click).To consider the maximum variability of the signals and to balance the weight of
each group to the analysis, for each survey/dolphin group, we extracted approximatelythe same number of files for each click type. The selected files were reanalyzed todelete, without changing the pulse rate, all the signals (other click trains or echoes)that did not belong to the selected click train.
Table 1. Information about the sampling area and total no. of Tursiops truncatus sightedduring the acoustic sampling.
Area Year No. of surveys No. of individuals
Capo Granitola 2011 9 75Capo Granitola 2012 13 68Lampedusa 2012 5 20Total 27 163
BUSCAINO ET AL.: BOTTLENOSE DOLPHIN PULSED SIGNALS 3

Because amplitude of clicks was not considered a preferential factor to select clicks,both on-axis (clicks with higher amplitude) and off-axis clicks should be representedin the samples analyzed.
Click-parameter Measurements
To extract the acoustic data parameters, we used a modified MATLAB code devel-oped to automatically identify and characterize the high-frequency pulsed signals ofthe aquatic crustacean decapod, Procambarus clarkii (Buscaino et al. 2012). This codeoperated using the following four steps: (1) the signal condition (deconvolution filter,3 kHz high-pass filter, Tiger Kaiser filter); (2) identifying signals that surpassed agiven level threshold; (3) oversampling eight times; and (4) measuring the principalacoustic features of the identified signals.Signal condition—Because the hydrophone introduced an undesired convolution, a
deconvolution filter is necessary to recreate the click signal, as it existed before the hy-drophone convolution took place. In particular, the hydrophone modified the powerspectrum of the original click according to its sensitivity curve; through the deconvo-lution we adjusted the power spectrum of the click amplifying the attenuated fre-quencies and vice versa (compensation of undesired convolution). In this way weobtained a flat frequency response of the system hydrophone-deconvolution filter witha cut-off frequency of 120 kHz.After the deconvolution filter, all the data were first filtered with a 3 kHz high-
pass filter (4th order) and then with the Teager Kaiser operator (Kaiser 1990). Thisoperator is defined as following:
En ¼ x2n � xnþ1xn�1
where En is the output of the algorithm and is a sample of the waveform at time n. Enis large only when the signal is both high in power (i.e., x2n is large) and high infrequency (i.e., is xn large while xn+1 and xn–1 are small). Because the dolphins’ click sig-nals are characterized by high frequency and an increase in instantaneous energy, thisoperator has an advantage over others methods that well identifies dolphin clicks.Signal identification and oversampling—After the application of the Teager Kaiser
operator, the click signals were identified in the time domain by comparison with anenergy threshold. Then, we obtained two signals (a 3 kHz high-pass wave and theTaiger Kaiser wave). From these two waves, we extracted two 128-sample windows(427 ls) containing the identified click. These two windows were resampled eighttimes.Measuring the acoustic features—In these resampled windows, the acoustic features of
the signal were defined as follows:
(1) Pulse duration was determined from the envelope of the Teager Kaiser operator,identifying the pulse peak. The onset and termination of the click signal weredefined as the points at which 5% of the peak value was reached.
(2) Peak sound pressure level (SPLpk, expressed in dB re 1 lPa) is 20 times the loga-rithm (base ten) of the ratio of the pressure received to the hydrophone to the ref-erence pressure (1 lPa). Here, SPL refers to the peak of the pressure. The SPL iscalculated in the time window of the pulse duration.
(3) Centroid frequency is the frequency value that divides the spectrum in halves ofequal energy (Madsen and Wahlberg 2007).
4 MARINE MAMMAL SCIENCE, VOL. **, NO. **, 2014

(4) Bandwidth rms (root mean square) is a measure of the spectral standard deviationaround the centroid frequency of the spectrum (Madsen and Wahlberg 2007).
(5) Bandwidth 3 dB is the frequency range within which the power spectrum den-sity is above half its maximum value, that is, above –3 dB relative to the peak.
(6) 1st, 2nd, and 3rd peak frequencies are the frequencies corresponding to the high-est, second, and third amplitude, respectively, determined for the power spectraldensity.
(7) Number of peaks frequency.(8) 10th, 25th, 75th, and 90th percentile of the power spectrum density distribution
(Volt2 Hz–1).(9) Number of oscillations of the waveform.
We verified the accuracy of the measurements in 1% of all the clicks measured toestablish a post-analysis filter to eliminate errors. This filter consists of consideringonly the click measurements that have a number of power-spectrum peaks rangingfrom one to six and a number of oscillations ranging from 3 to 10.
Statistical Analysis
Descriptive statistics were calculated for all the acoustic parameters for each signaltype. Because the data were not normally distributed and most of the parameters werecorrelated with the click received intensity (see Table 2), a covariance analysis (sepa-rate-slopes model) was performed to look for significant differences between the clickparameters of the pulse types.
Results
Based on the interclick interval and on the total number of clicks per train, wegrouped click signals into the following four categories: (1) Low-frequency click (LF):single clicks without a regular pulse rate; (2) Train click (TC): clicks with an inter-click interval of 34.5–142.8 ms (10–90 percentile range); (3) Packed clicks (PC):clicks with an interclick interval of 2.0–5.5 ms (10–90 percentile range) and a signif-icantly lower number of clicks per train with respect to the burst category (median,10–90 percentile: 11.5, 6–30); Burst: clicks with an interclick interval of 1.7–4.9 ms(10–90 percentile range) and an higher number of click than Packed clicks (median,10–90 percentile: 11.5, 39–244).Table 3 contains the descriptive statistics for the different click types, and Table 2
contains the correlation coefficients between the SPLpk and the other acoustic parame-ters. Above all, for the TC, the peak frequency, centroid frequency, and the 25th and75th percentiles of the power spectrum distribution show a positive linear correlationwith the SPLpk (r
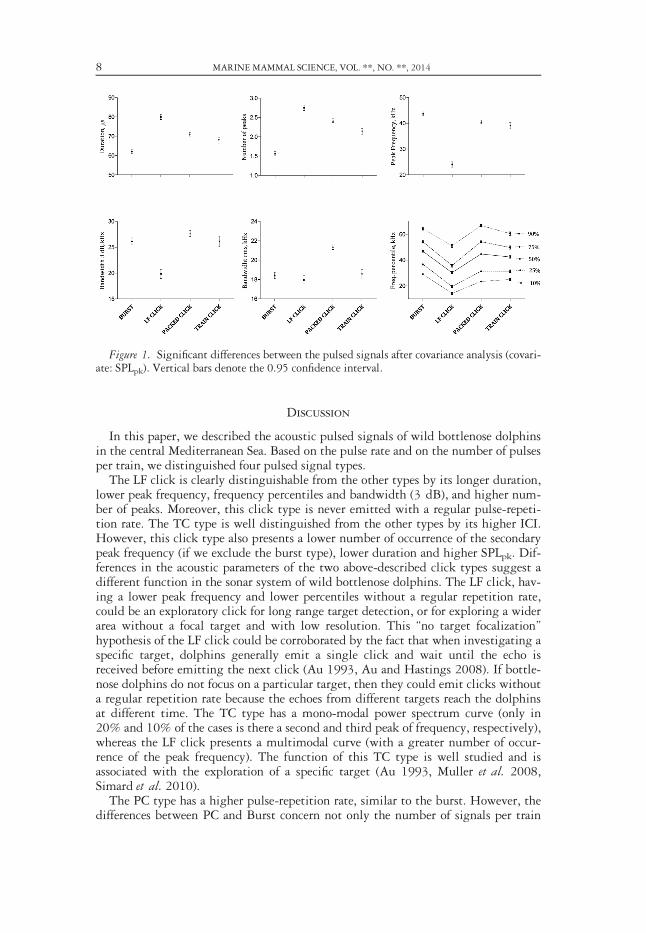
2 > 0.25). For the other click types, LF, PC, and Burst, values ofcorrelation coefficient are lowest (r2 < 0.15) for all acoustics parameters.Figure 1 compares the acoustic parameters between the signal types after the
covariance analysis (covariate SPLpk). Almost all the parameters presented significantdifferences among the click types. The LF click presents the greatest differences(P < 0.00001) from the others, especially for the duration, peak frequency, centroidfrequency, frequency percentiles and 3 dB bandwidth, and had the greater number ofpeaks. Figure 2 shows examples of the different pulsed signal-types waveforms andpower spectra.
BUSCAINO ET AL.: BOTTLENOSE DOLPHIN PULSED SIGNALS 5

Table2.
Correlation
betweentheSPL p
kandalltheothermeasuredparameters.r=
correlationcoefficient
(r2>0.25
inbold).
Param
eter
Unit
Low-frequency
click
(n=1,110)
Click
train
(n=1,728)
Packedclick
(n=1,175)
Burst
(n=2,433)
rr2
Pr
r2P
rr2
Pr
r2P
Duration
ls0.08
0.01
<0.01
.0.17
<0.001
0.07
0.01
<0.05
–0.07
0.01
<0.001
Peakfrequency
kHz
–0.29
0.09
<0.001
0.53
0.29
<0.001
0.06
0.00
<0.05
0.16
0.03
<0.001
Second
peak
frequency
kHz
–0.18
0.03
<0.001
0.31
0.10
<0.001
–0.12
0.02
<0.001
–0.10
0.01
<0.001
Third
peak
frequency
kHz
–0.21
0.05
<0.001
0.11
0.01
0.15
0.09
0.01
<0.05
–0.22
0.05
<0.001
Centroidfrequency
kHz
–0.21
0.05
<0.001
0.62
0.39
<0.001
0.11
0.01
<0.001
0.22
0.05
<0.001
Bandw
idth
rms
kHz
–0.02
0.00
0.58
–0.01
0.00
0.54
0.01
0.01
<0.01
–0.17
0.03
<0.001
Bandw
idth
3dB
kHz
–0.22
0.05
<0.001
0.38
0.14
<0.001
0.02
0.00
0.44
–0.12
0.01
<0.001
Firstquartileofpowerspectrum
(25%
)distribution
kHz
–0.22
0.05
<0.001
0.62
0.38
<0.001
0.11
0.01
<0.001
0.28
0.08
<0.001
Third
quartileofpowerspectrum
distribution
(75%
)kH
z–0.15
0.02
<0.001
0.59
0.35
<0.001
0.10
0.01
<0.01
0.16
0.02
<0.001
6 MARINE MAMMAL SCIENCE, VOL. **, NO. **, 2014

Table3.
Descriptive
statisticsoftheacousticparametersforthefour
clicktypes.
Param
eter
Unit
Low-frequency
click
(n=1,026)
Train
click
(n=1,527)
Packedclick
(n=1,084)
Burst
(n=1,800)
Median
10%–90%
Median
10%–90%
Median
10%–90%
Median
10%–90%
Interclick
intervala
ms
––
6035–143
2.7
2.0–5.5
2.2
1.7–4.9
SPL p
kdB
re1l
Pa
134.8
129.3–142.6
156.9
147.1–164.3
140.0
130.3–163.8
133.7
127.8–140.7
Duration
ls77.9
62.9–95.4
57.6
45.8–67.9
69.6
48.8–105.4
60.0
47.7–79.6
Peakfrequency
kHz
26.8
18.8–35.2
44.5
34.0–63.3
32.8
21.1–60.9
38.7
25.8–50.4
Second
peak
frequency
kHz
(97%
)57.4
41.0–77.3
(51%
)84.4
45.7–123.0
(89%
)62.1
24.6–99.6
(65%
)67.7
14.1–100.1
Third
peak
frequency
kHz
(65%
)77.3
56.3–98.4
(18%
)103.1
4.7–112.5
(58%
)76.2
39.7–109.0
(20%
)81.1
10.5–116.1
Num
berofpeak
frequency
no.
3.0
2.0–4.0
2.0
1.0–3.0
31–5
2.0
1.0–3.0
Centroidfrequency
kHz
29.7
23.7–38.1
56.3
39.4–69.6
45.6
27.1–62.6
44.1
32.0–57.5
Bandw
idth
rms
kHz
15.8
12.4–23.5
23.2
16.4–29.0
24.5
14.2–33.9
21.6
14.8–28.7
Bandw
idth
3dB
kHz
18.8
14.1–27.0
34.0
19.9–66.8
23.4
14.1–46.9
27.6
16.4–41.0
Firstquartileofpower
spectrum
distribution
(25%
)
kHz
21.1
15.2–27.0
41.0
29.3–50.3
28.1
18.8–43.4
32.0
22.3–42.2
Third
quartileofpower
spectrum
distribution
(75%
)
kHz
32.8
25.8–43.4
66.8
44.5–86.7
56.3
28.1–84.4
51.8
34.0–70.3
No.ofoscillations
no.
5.0
3.0–7.0
5.0
4.0–7.0
5.0
3.0–9.0
5.0
3.0–7.0
a The
Low-frequency
clicks
donothave
aregularinterclick
interval.
BUSCAINO ET AL.: BOTTLENOSE DOLPHIN PULSED SIGNALS 7
Discussion
In this paper, we described the acoustic pulsed signals of wild bottlenose dolphinsin the central Mediterranean Sea. Based on the pulse rate and on the number of pulsesper train, we distinguished four pulsed signal types.The LF click is clearly distinguishable from the other types by its longer duration,
lower peak frequency, frequency percentiles and bandwidth (3 dB), and higher num-ber of peaks. Moreover, this click type is never emitted with a regular pulse-repeti-tion rate. The TC type is well distinguished from the other types by its higher ICI.However, this click type also presents a lower number of occurrence of the secondarypeak frequency (if we exclude the burst type), lower duration and higher SPLpk. Dif-ferences in the acoustic parameters of the two above-described click types suggest adifferent function in the sonar system of wild bottlenose dolphins. The LF click, hav-ing a lower peak frequency and lower percentiles without a regular repetition rate,could be an exploratory click for long range target detection, or for exploring a widerarea without a focal target and with low resolution. This “no target focalization”hypothesis of the LF click could be corroborated by the fact that when investigating aspecific target, dolphins generally emit a single click and wait until the echo isreceived before emitting the next click (Au 1993, Au and Hastings 2008). If bottle-nose dolphins do not focus on a particular target, then they could emit clicks withouta regular repetition rate because the echoes from different targets reach the dolphinsat different time. The TC type has a mono-modal power spectrum curve (only in20% and 10% of the cases is there a second and third peak of frequency, respectively),whereas the LF click presents a multimodal curve (with a greater number of occur-rence of the peak frequency). The function of this TC type is well studied and isassociated with the exploration of a specific target (Au 1993, Muller et al. 2008,Simard et al. 2010).The PC type has a higher pulse-repetition rate, similar to the burst. However, the
differences between PC and Burst concern not only the number of signals per train
Figure 1. Significant differences between the pulsed signals after covariance analysis (covari-ate: SPLpk). Vertical bars denote the 0.95 confidence interval.
8 MARINE MAMMAL SCIENCE, VOL. **, NO. **, 2014

(significantly lower for PC) but also the longer duration, greater number of peaks,and lower peak frequency in PC. PC is most similar to the TC type and could have asimilar function. A recent study with trained bottlenose dolphins (Finneran 2013)demonstrated that when the target range increased to more than 75 m, the dolphinsstarted to use packed clicks. In this case, dolphins changed their sonar strategy; didnot wait for the echo from a single click before emitting the next, but they wait forthe echo of a whole packet before emitting the next packet (Finneran 2013).The Burst signal has a shorter duration, lower number of peaks and higher peak
frequency. In dolphin species, these pulse types are associated with social interactionand for short communicative purposes (Caldwell and Caldwell 1967, Dawson 1991,Norris et al. 1994, Lammers et al. 2003, Blomqvist and Amundin 2004).Given the sampling frequency (300 kHz) and our hydrophone sensitivity, in this
study, we consider a useful band of 3-120 kHz and pulsed signals of bottlenose dol-phins with no specific distance and orientation respect to the hydrophone. In otherstudies conducted in a controlled environment with a few trained bottlenose dolphinsclose to hydrophones (Houser et al. 1999, Muller et al. 2008, Au et al. 2012,
-1
0
1
0.0 0.4
Rel
ave
am
plit
ud
e
Train Click
-1
0
1
0.0 0.4
Rel
ave
am
plit
ud
e
Packed Click
40
50
60
70
80
90
100
110
120
0 20 40 60 80 100 120 140
Rela
ve d
B
Packed Click
-1
0
1
0.0 0.4
Rela
ve a
mpl
itud
e
Time, ms
Burst
40
50
60
70
80
90
100
110
120
0 20 40 60 80 100 120 140
Rela
ve d
B
Frequency, kHz
Burst
40
50
60
70
80
90
100
110
120
0 20 40 60 80 100 120 140
Rela
ve d
B
Train Click
-1
0
1
0.0 0.4
Rel
ave
am
plit
ud
e
LF Click
40
50
60
70
80
90
100
110
120
0 20 40 60 80 100 120 140
Rela
ve d
B
LF Click
Figure 2. An example of the waveform (on the left) and power spectrum (on the right,black line) of the four pulsed signal types from T. truncatus. In the power spectrum, the grayline represents the background sea noise.
BUSCAINO ET AL.: BOTTLENOSE DOLPHIN PULSED SIGNALS 9

Branstetter et al. 2012), where the useful band was wider, the first and second peakfrequencies reached values higher than 120 kHz, and the shape of power spectrumchanged as a function of the orientation of the animal. However, in long-term passiveacoustic monitoring of wild dolphins, generally both the bandwidth and samplingtime window are reduced, and recorded signals come from uncontrolled dolphins thatare an unknown distance from the hydrophone and that emit clicks both along andnot along the axes of the sensor (Soldevilla et al. 2008). In this context, the distinc-tion of the pulsed signal types based on the interpulse time could be useful to under-stand the percentage of time spent by dolphins in different activities (e.g., by relatingexploring with LF clicks, foraging with TC, and social behavior with Burst signals)and also for species identification, for which pulsed signals of the same type (in- andoff-axis) should be compared, reducing the variability of acoustic parameters.
Acknowledgments
We thank dr Fabio Giardina, Giovanni Raptis, Salvatore Taranto, Pietro De Rubeis and theMarine Protected Area of Pelagie Island for their support in the sea surveys around Lampedusa.A special thanks to dr Giorgio Tranchida and SeaMED ltd for the support in sea surveysaround Capo Granitola.
Literature Cited
Au, W.W. L. 1993. Page 277. The sonar of dolphins. Springer-Verlag, New York, NY.Au, W. W. L., and M. C. Hastings. 2008. Page 679. Principles of marine bioacoustics.
Springer-Verlag, New York, NY.Au, W. W. L., B. Branstetter, P. W. Moore and J. J. Finneran. 2012. The biosonar field
around an Atlantic bottlenose dolphin (Tursiops truncatus). Journal of the AcousticalSociety of America 131:569–576.
Baumann-Pickering, S., S. M. Wiggins, J. A. Hildebrand, M. A. Roch and H. U. Schnitz.2010. Discriminating features of echolocation clicks of melon-headed whales(Peponocephala electra), bottlenose dolphins (Tursiops truncatus), and Gray’s spinnerdolphins (Stenella longirostris longirostris). Journal of the Acoustical Society of America128:2212–2224.
Blomqvist, C. and M. Amundin. 2004. High-frequency burst-pulse sounds in agonistic/aggressive Interactions in bottlenose dolphins, Tursiops truncatus. Pages 425–431 in J. A.Thomas, C. F. Mossand and M. Vater, eds. Echolocation in bats and dolphins. TheUniversity of Chicago Press, Chicago, IL.
Branstetter, B. K., P. W. Moore, J. J. Finneran, M. N. Tormey and H. J. Aihara. 2012.Directional properties of bottlenose dolphin (Tursiops truncatus) clicks, burst-pulse, andwhistle sounds. Journal of the Acoustical Society of America 131:1613–1621.
Buscaino, G., F. Filiciotto, G. Buffa, et al. 2012. The underwater acoustic activities of the redswamp crayfish Procambarus clarkii. Journal of the Acoustical Society of America132:1792–1798.
Caldwell, M. C., and D. K. Caldwell. 1967. Dolphin community life. Los Angeles CountyMuseum of Natural History Quarterly 5(4):12–15.
Dawson, S. M. 1991. Click and communication: The behavioural and social contexts ofHector’s dolphin vocalizations. Ethology 88:265–276.
D�ıaz L�opez, B. 2011. Whistle characteristics in free-ranging bottlenose dolphins (Tursiopstruncatus) in the Mediterranean Sea: Influence of behaviour. Mammalian Biology76:180–189.
10 MARINE MAMMAL SCIENCE, VOL. **, NO. **, 2014

Finneran, J. J. 2013. Dolphin “packed” use during long-rande echolocation tasks. Journal ofthe Acoustical Society of America 133:1796–1810.
Greco, M., F. Gini and L. Verrazzani. 2003. Analysis and modelling of acoustic signalsemitted by Mediterranean bottlenose dolphins. Proceedings of the IEEE InternationalSymposium on Signal Processing and Information Technology (ISSPIT), Darmstadt,Germany. Pp. 122–125.
Houser, D. S., D. A. Helweg and P. W. Moore. 1999. Classification of dolphin echolocationclicks by energy and frequency distributions. Journal of the Acoustical Society ofAmerica 106:1579–1585.
Kaiser, J. F. 1990. On a simple algorithm to calculate the energy of a signal. Proceedings ofthe IEEE International Conference on Acoustics, Speech, and Signal Processing(ICASSP), Albuquerque, NM. Pp. 381–384.
Lammers, M. O., W. W. L. Au and D. L. Herzing. 2003. The broad band social acousticsignaling behavior of spinner and spotted dolphins. Journal of the Acoustical Society ofAmerica 105:2493–2498.
Madsen, P. T., and M. Wahlberg. 2007. Recording and quantification of ultrasonicecholocation clicks from free-ranging toothed whales. Deep-Sea Research Part I54:1421–1444.
Muller, M. W., J. S. Allen, W. W. L. Au and P. E. Nachtigall. 2008. Time-frequency analysisand modeling of the backscatter of categorization dolphin echolocation clicks for targetdiscrimination. Journal of the Acoustical Society of America 124:657–666.
Norris, K. S., B. W€ursig, R. S. Wells and M. W€ursig. 1994. The Hawaiian spinner dolphin.University of California Press, Berkeley, CA.
Rendell, L. E., J. N. Matthews, A. Gill, J. C. D. Gordon and D. W. Macdonald. 1999.Quantitative analysis of tonal calls from five odontocete species, examining interspecificand intraspecific variation. Journal of Zoology 249:403–410.
Roch, M. A., M. S. Soldevilla, J. C. Burtenshaw, E. E. Henderson and J. A. Hildebrand. 2007.Gaussian mixture model classification of odontocetes in the Southern California Bightand the Gulf of California. Journal of the Acoustical Society of America 121:1737–1748.
Roch, M. A., H. Klinck, S. Baumann-Pickering, D. K. Mellinger, M. S. Soldevilla and J. A.Hildebrand. 2011. Classification of echolocation clicks from odontocetes in the SouthernCalifornia Bight. Journal of the Acoustical Society of America 129:467–475.
Simard, P., A. L. Hibbard, K. A. McCallister, et al. 2010. Depth dependent variation of theecholocation pulse rate of bottlenose dolphins (Tursiops truncatus). Journal of theAcoustical Society of America 127:568–578.
Soldevilla, M. S., E. E. Henderson, G. S. Campbell, S. M. Wiggins, J. A. Hildebrand and M.A. Roch. 2008. Classification of Risso’s and Pacific white-sided dolphins using spectralproperties of echolocation clicks. Journal of the Acoustical Society of America 124:609–624.
Steiner, W. W. 1981. Species-specific differences in pure tonal whistle vocalizations of fivewestern North Atlantic dolphin species. Behavioral Ecology and Sociobiology 9:241–246.
Urick, R. J. 1983. Principles of underwater sound. Peninsula, Los Altos, CA.Wahlberg, M., H. F. Jensen, N. Aguilar, et al. 2011. Source parameters of echolocation clicks
from wild bottlenose dolphins (Tursiops aduncus and Tursiops truncatus). Journal of theAcoustical Society of America 130:2263–2274.
Wang, D., B. W€ursig and W. Evans. 1995. Comparisons of whistles among seven odontocetespecies. Pages 299–323 in R. A. Kastelein, J. A. Thomas and P. E. Natchigall, eds.Sensory systems of aquatic mammals. De Spil, Woerden, The Netherlands.
Received: 5 March 2014Accepted: 5 November 2014
BUSCAINO ET AL.: BOTTLENOSE DOLPHIN PULSED SIGNALS 11