propagation of a stress wave through a virtual functionally graded foam
TRANSCRIPT
www.elsevier.com/locate/nlm
Author’s Accepted Manuscript
Propagation of a stress wave through a virtualfunctionally graded foam
Stephen Kiernan, Liang Cui, Michael D. Gilchrist
PII: S0020-7462(09)00031-6DOI: doi:10.1016/j.ijnonlinmec.2009.02.006Reference: NLM1587
To appear in: International Journal of Non-Linear Mechanics
Received date: 9 September 2008Revised date: 31 January 2009Accepted date: 9 February 2009
Cite this article as: Stephen Kiernan, Liang Cui and Michael D. Gilchrist, Propagation ofa stress wave through a virtual functionally graded foam, International Journal of Non-Linear Mechanics (2009), doi:10.1016/j.ijnonlinmec.2009.02.006
This is a PDF file of an unedited manuscript that has been accepted for publication. Asa service to our customers we are providing this early version of the manuscript. Themanuscript will undergo copyediting, typesetting, and review of the resulting galley proofbefore it is published in its final citable form. Please note that during the production processerrorsmay be discoveredwhich could affect the content, and all legal disclaimers that applyto the journal pertain.
peer
-005
3185
8, v
ersi
on 1
- 4
Nov
201
0Author manuscript, published in "International Journal of Non-Linear Mechanics 44, 5 (2009) 456"
DOI : 10.1016/j.ijnonlinmec.2009.02.006
Accep
ted m
anusc
ript
Propagation of a stress wave through a virtual
functionally graded foam
Stephen Kiernan a Liang Cui a Michael D. Gilchrist a,∗
aSchool of Electrical, Electronic & Mechanical Engineering, University College
Dublin, Ireland
Dedicated to Professor Philippe Boulanger on the occasion of his 60th birthday.
Abstract
Stress wave propagation through a Functionally Graded Foam Material (FGFM) isanalysed in this paper using the finite element method. A finite element model ofthe Split Hopkinson Pressure Bar (SHPB) is developed to apply realistic bound-ary conditions to a uniform density foam and is validated against laboratory SHPBtests. Wave propagation through virtual FGFMs with various gradient functions arethen considered. The amplitude of the stress wave is found to be shaped by the gra-dient functions, i.e., the stress can be amplified or diminished following propagationthrough the FGFMs. The plastic dissipation energy in the specimens is also shapedby the gradient functions. This property of FGFMs provides significant potentialfor such materials to be used for cushioning structures.
Key words:
Stress wave propagation, Functionally Graded Material, Split Hopkinson PressureBar
1 Introduction
Cellular foams are widely used in energy absorbing applications where it isimportant to minimise the peak acceleration of the impacting body [1], e.gpackaging of fragile goods, protective headgear [2,3] and body garments. Thisis due to their low volume fraction of solid material and their complex mi-crostructure which allows large degrees of plastic crushing to occur at a fairlyconstant stress value. This plastic crushing at a constant stress will continue
∗ Corresponding author.
Preprint submitted to Elsevier 28 January 2009
peer
-005
3185
8, v
ersi
on 1
- 4
Nov
201
0

Accep
ted m
anusc
ript
until, depending on their initial density, a densification strain is reached whencell walls and struts impinge on one another and further crushing is of the ma-terial matrix itself rather than the foam cells. Understanding their dynamicstress-strain behaviour at finite deformations is therefore essential in order topredict their performance as cushioning materials.
Much research has been performed, both experimentally and numerically, onthe finite deformation of both polymeric and metallic foams under quasi-staticto moderate strain-rate conditions. However, there does not appear to be anobvious consensus in the literature as to the dynamic behaviour of metallicfoams w.r.t. strain rate sensitivity. Deshpande and Fleck [4] reported that theplateau stress in closed cell Alulight and open cell Duocel metallic foams arealmost strain rate insensitive, up to rates of 5000/s. An open celled AA6101-T6 AL foam was investigated by Lankford and Dannemann [5], who reportedalmost no change in mechanical strength in response to varying strain rates.Peroni et al., [6] also reported strain rate insensitivity for aluminium foam.However, Kanahashi et al., [7] have investigated the dynamic strain rate re-sponse of open celled SG91A aluminium foam at a rate of 1400/s and reporteda strain rate dependence. Dannemann and Lankford [8] reported a strain rateeffect in closed cell ALPORAS foam at strain rates between 400 and 2500/s.They noted that strain rate effects were higher for a higher density and at-tribute this to the kinetics of internal gas flow. Elnasri et al [9] reported alimited rate sensitivity for ALPORAS foam at strain rates up to 1300 m/s.Zhao and Abdennadher [10] stated that the rate sensitivity of metallic foamis due to inertia effects in dynamic buckling of cell walls, even though theirfoam was made of strain rate insensitive material. Klintworth [11] and Reidand Peng [12] discussed the possibility for the strength increase in cellularstructures whereby, under dynamic conditions, the collapse mechanism of thefoam changes from a quasi-static mode to a dynamic mode involving addi-tional stretching of the cell wall that dissipates more energy. Therefore, theadditional micro-inertial contribution from the additional stretching of all cellwalls can lead to the observed strain-rate response.
The recently emerging field of Functionally Graded Materials(FGMs) was ini-tially limited to metal-ceramic composites to combat high thermal gradientsin the aerospace industry, but can also be applied to cellular structures. It hasalready been shown numerically [13] that Functionally Graded Foam Materi-als (FGFMs) are suitable candidates for providing improved energy absorbingproperties over those provided by conventional foams of uniform densities.Bruck [14] has studied FGMs to analyse the effect of a gradient architectureon the mitigation of stress waves reflected from the graded interface. Bere-zovski [15] extended the study of stress wave propagation from one dimen-sion to two dimensions for metal-ceramic FGMs. The current study examineswave propagation through a virtual FGFM, using a traditional Split Hop-kinson Pressure Bar setup to apply meaningful boundary conditions, and to
2
peer
-005
3185
8, v
ersi
on 1
- 4
Nov
201
0
Accep
ted m
anusc
ript
elucidate the general energy absorbing mechanisms of this type of material.Metallic foam, rather than polymeric foam, was used in the current study asthe former has higher impedance.
Manufacturing a FGFM is inherently more complex than a uniform foam dueto the varying material properties, however, some authors have reported ontechnologies to produce such materials. Brother and Dunand [16], for example,created density graded aluminium foams from polyurethane foam precursorsusing an investment casting method. This was in an effort to improve mass-efficiency in load bearing metallic foams. Matsumoto et al [17] have proposedan alternate and interesting method to produce density graded foams: ratherthan introducing the gradient at the time of foaming, their method is basedon chemical dissolution of a uniform foam. By immersing the uniform foamwithin a NaOH bath of controlled pH and then draining the NaOH by gravityat a constant rate, they introduced a continuous gradient in exposure timeof the solution to the uniform foam, thereby creating a continuous densitygradient. Kieback et al [18] also developed a metallurgical process for FGMswhich were formed through graded metal powder compacts and followed bymelt processing. As described by Kieback et al, manufacturing FGMs on alaboratory scale has reached a considerable level of maturity, however, therewill be new challenges including manufacturing processes to mass productionand up-scaling, and cost-effectiveness of production processes. The technologyto manufacture the functionally graded polymeric foam material is presentlybeing developed in our laboratory and will form the basis of a future publica-tion.
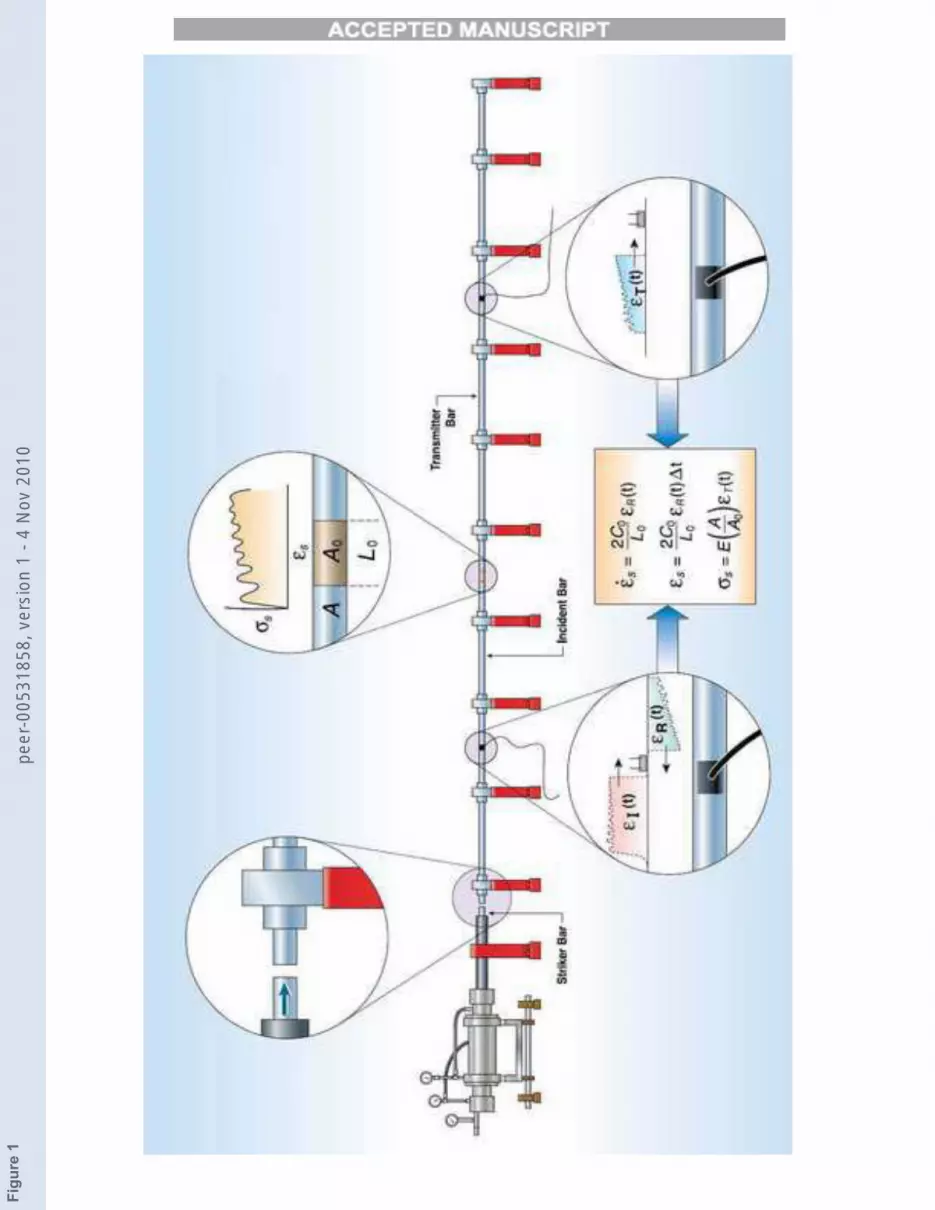
The Split Hopkinson Pressure Bar was designed to capture the dynamic stress-strain response of materials at very high strain rates. A typical arrangementof the SHPB is shown in Fig. 1. A stress pulse, generated by the impactof the striker bar onto the incident bar, travels down the incident bar andinteracts with the specimen. Some of this stress pulse is transmitted throughthe specimen to the transmitter bar, and some of the pulse is reflected back tothe incident bar. Strain gauges, mounted on the incident and transmitter bars,record the incident strain, εI(t), the transmitted strain, εT (t), and the reflectedstrain, εR(t) of these two bars. The stress-strain response, σs(t) and εs(t), (andthe strain rate of the response, εs(t)) of the specimen can be reconstructedfrom these strain-time records by applying the well known equations:
εs(t) =−2C0
Ls
εR(t) (1)
εs(t) =−2C0
Ls
t∫
0
εR(t)dt (2)
σs(t) = Eb
Ab
As
εT (t) (3)
3
peer
-005
3185
8, v
ersi
on 1
- 4
Nov
201
0

Accep
ted m
anusc
ript
where C0 is the wave speed within the bar, Ls is the length/thickness of thespecimen, As and Ab are the cross-sectional area of the specimen and the bar,respectively, and Eb is Young’s modulus of the bar.
Fig. 1. Schematic illustration of the Split Hopkinson Pressure Bar (SHPB). [19]
The SHPB technique has proved to be extremely versatile and has grownfrom its original configuration for compression testing to include tension, tor-sion and fracture testing [20]. It has been used to characterise the dynamicresponse of a multitude of materials such as soils [21], composites [22], com-pliant materials [23] and metals [24]. Foams have also been studied using theSHPB technique [25].
Al-Mousawi et al [20] provided a good summary of the limitations of usingthe Split Hopkinson technique in dynamic testing, including uniaxial stressdistribution through the specimen, bar-specimen frictional forces that cancause radial tractions, and the influence of radial dispersion of the pulse wavethrough the elastic bars. Sawas [26] acknowledged the limitations on highnoise-to-signal ratio and low achievable strain when using metal incident andtransmitter bars with complaint specimens like rubbers and foams due to thevery high impedance mismatch and short rise time of the pulse wave. Theyintroduced an all-polymeric Split Hopkinson Bar system to overcome theselimitations. Chen et al [27] noticed the non-homogeneous deformation of theSHPB when using low-impedance specimens, due to the attenuation and slowspeed of the wave across the soft material (� 500 m/s compared to � 5000 m/sfor metals). In order to achieve near identical force-time histories on both facesof the soft specimen, a thin sample should be used and pulse shaping tech-niques should be employed. Although these techniques were applied to solidelastomeric materials, the authors point out that they are applicable also tocellular foams.
In this paper, laboratory SHPB tests are first performed to validate a vir-tual SHPB setup. Complementary simulations are then carried out using theexperimental input parameters. The FE predictions of the incident and re-flected waves are quantitatively validated by comparing the laboratory testswith the simulations. Discrepancies between the simulated and experimentaltransmitted waves are explained by the strain rate sensitivity of the physicalfoam. In the second half of the paper, a stress wave is propagated through avirtual FGFM to illustrate and analyse the wave propagation characteristicsthrough the FGFM, and compare its response with a uniform foam of equalaverage density. Much thicker specimens (≈ 300 mm) than is traditional forSHPB testing are required during these simulations to illustrate the differingresponse between a uniform and a functionally graded foam. Although usingsuch large thicknesses would immediately invalidate Equations (1) to (3) un-der experimental conditions, these equations are not required to determine the
4
peer
-005
3185
8, v
ersi
on 1
- 4
Nov
201
0
Accep
ted m
anusc
ript
stress-strain response of the virtual FGFM; stress, strain, and any other val-ues can be determined directly from requested element outputs from the finiteelement simulations. In this respect the virtual incident and transmission barsserve only to apply realistic boundary conditions to the FGFM, since they arecompared against those from the laboratory tests, and ensure that a realisticstress wave is used in the model.
2 Laboratory Tests
2.1 Experimental Setup
In order to achieve comparable impedances between a specimen and the pres-sure bars, and to ensure a transmitted wave with a high signal-to-noise ratio,the incident and transmitter bars used were made from 30% glass filled nylon66 with a diameter of 50 mm and a length of 1000 mm. The bars have a quotedYoung’s Modulus of 7.5 GPa and density of 1350 kg/m3, giving a theoreticalwave speed of 2357 m/s. From experiment, the wave speed was calculatedas 2296 m/s. The positive z-direction was taken to coincide with the bars’longitudinal axes in the direction of the propagating wave. Two projectilesof length 150 mm and 250 mm were used during the tests. Each projectilewas accelerated using a pneumatic ram powered by pressurised nitrogen. Inthe current study, a velocity of about 19 m/s and 13 m/s for the 150 mm and250 mm projectiles, respectively, was achieved using a pressure head of 10 bar.A low velocity was chosen for two reasons: a) to minimise the amount of strainand hence dispersion of the stress wave due to the visco-elastic behaviour ofthe nylon bars, b) the laboratory tests serve to validate the numerical model,and so do not require high projectile velocities. A limited gas pressure wasavailable during the current experiments and so a short projectile length wasused out of necessity. A longer projectile would give a longer incident wave butwould have been of too low amplitude to cause specimen yielding. As no pulseshaping techniques were used in this work, stress uniformity cannot be fullyensured and so the reported laboratory results should only be interpreted asan average stress-strain reading, used to compare against simulation results.
2.2 Materials
A single material, ALPORAS� aluminium foam (GLEICH GmbH Metallplatten-Service, Kaltenkirchen, Germany), was used for all tests and a PTFE spraywas used on both incident and transmitter bars to minimise any radial traction
of the foam during compression. ALPORAS� foam has a quoted mass density
5
peer
-005
3185
8, v
ersi
on 1
- 4
Nov
201
0
Accep
ted m
anusc
ript
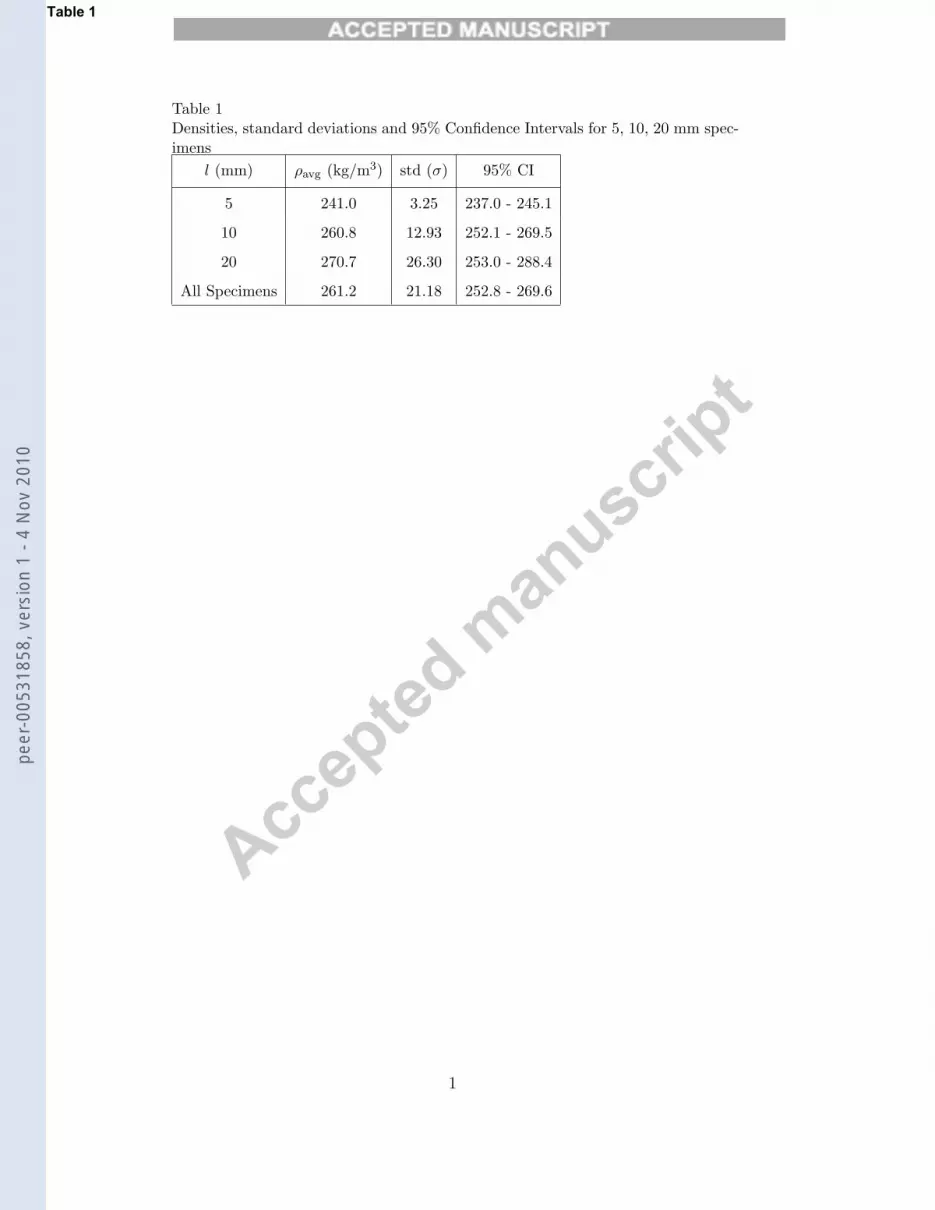
of 250 kg/m3. The standard deviations (std), and 95% confidence intervals,(CI) for each specimen length are shown in Table 1. It shows that there is infact a wide spread in density between samples, which is likely due to random,unfoamed regions, and aluminium agglomerates that will decrease or increase
the average density respectively. Young’s Modulus of ALPORAS� foam wasobtained from quasi-static uniaxial compression to be about 75 MPa.
The specimens are 45 mm in diameter to give an adequate radial representa-tive volume element (RVE), and are of various lengths l, as listed in Table 1.Achieving stress uniformity in cellular materials under SHPB conditions isdifficult because there is a trade-off between how thin a sample must be toensure that Equation (3) is valid, and how thick it must be to give enoughcells through the thickness for the RVE. Chen et al [28] performed SHPBexperiments on polyurethane foams of thickness 1.7 mm, with a cell size of0.3 mm, giving about 5.5 cells through the thickness. Despande and Fleck [4]carried out similar experiments on Alulight and Duocel foams. They reportedspecimens having 6 - 8 cells in all specimen dimensions. During our experi-ments a specimen thickness of 5 mm was found to be too small to give anaccurate RVE of the bulk foam. Indeed, the resulting stress-strain curves werebelieved to represent the response of the individual cells themselves. Speci-mens of thickness 10 mm, however, contained between 5 and 7 cells throughthe thickness and were found to be sufficient.
Table 1
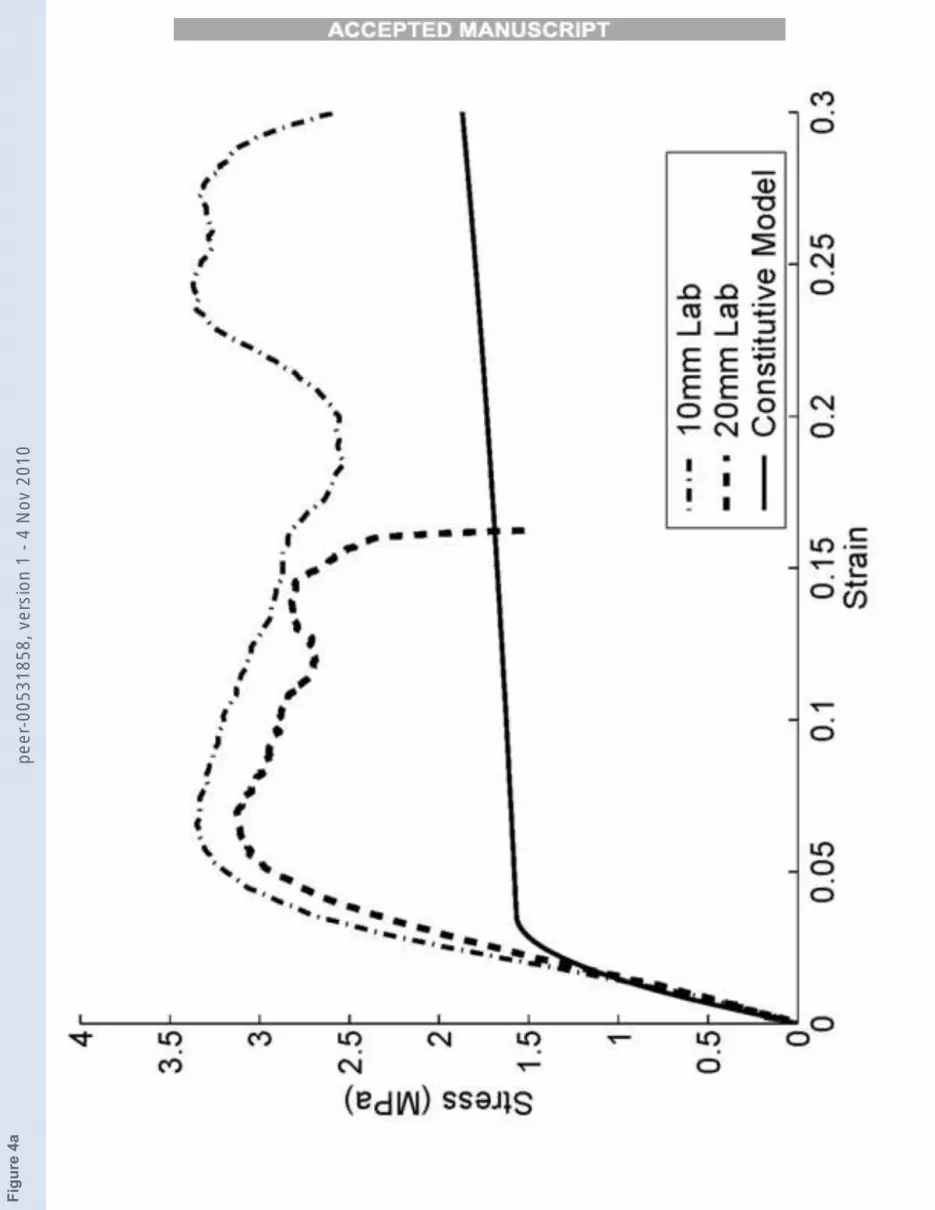
Fig. 2 shows the representative incident strain and the reflected strain gen-erated by the projectile of length 150 mm with velocity of 19 m/s, and thetransmitted strain through a specimen of thickness 10 mm, as obtained fromthe strain gauges. The deduced strain and stress curves of the same specimenusing Equations (2) and (3) are illustrated in Fig. 3, and the stress-strain rela-tionships for the 10 mm (ε ≈ 2000/s) and 20 mm (ε ≈ 1000/s) specimens areshown and compared to the quasi-static compression curve in Fig. 4. The cal-culated stress-strain curve exhibits a higher yield stress than the quasi-staticcompression curve, indicating a strain rate sensitivity of the foam; the elasticmodulus does not appear to be strain rate sensitive. In this study, however,our model assumes rate independent plasticity. As strain rate effects are ab-sent from both the uniform and graded foam models and as the same strainrate was used for comparison between the uniform and graded foam models,the influence of introducing material gradients into cushioning structures canclearly be quantified. It is intended to implement strain rate sensitivity intothe constitutive model in subsequent research.
Fig. 2. Representative incident, reflected and transmitted strains as measured fromlaboratory tests using a 150 mm projectile.
6
peer
-005
3185
8, v
ersi
on 1
- 4
Nov
201
0

Accep
ted m
anusc
ript
Fig. 3. The deduced strain curves and stress curves from the strain gauges as ob-tained from the 10mm and 20mm laboratory specimens (150 mm projectile). (a)Strain curves, (b) Stress curves
Fig. 4. The stress-strain curves obtained from the SHPB tests. (a) 150 mm projectile(b) 250 mm projectile
2.3 Wave Dispersion
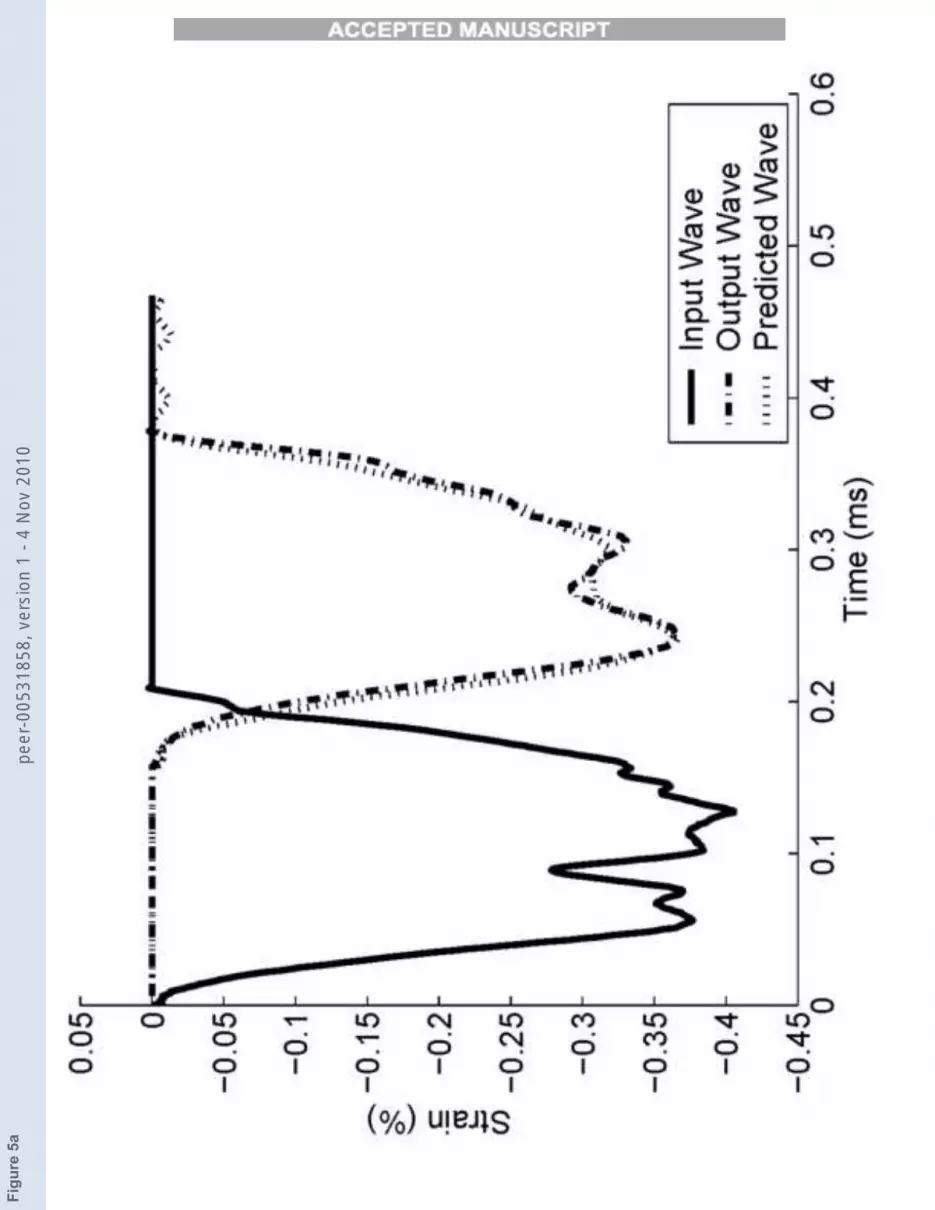
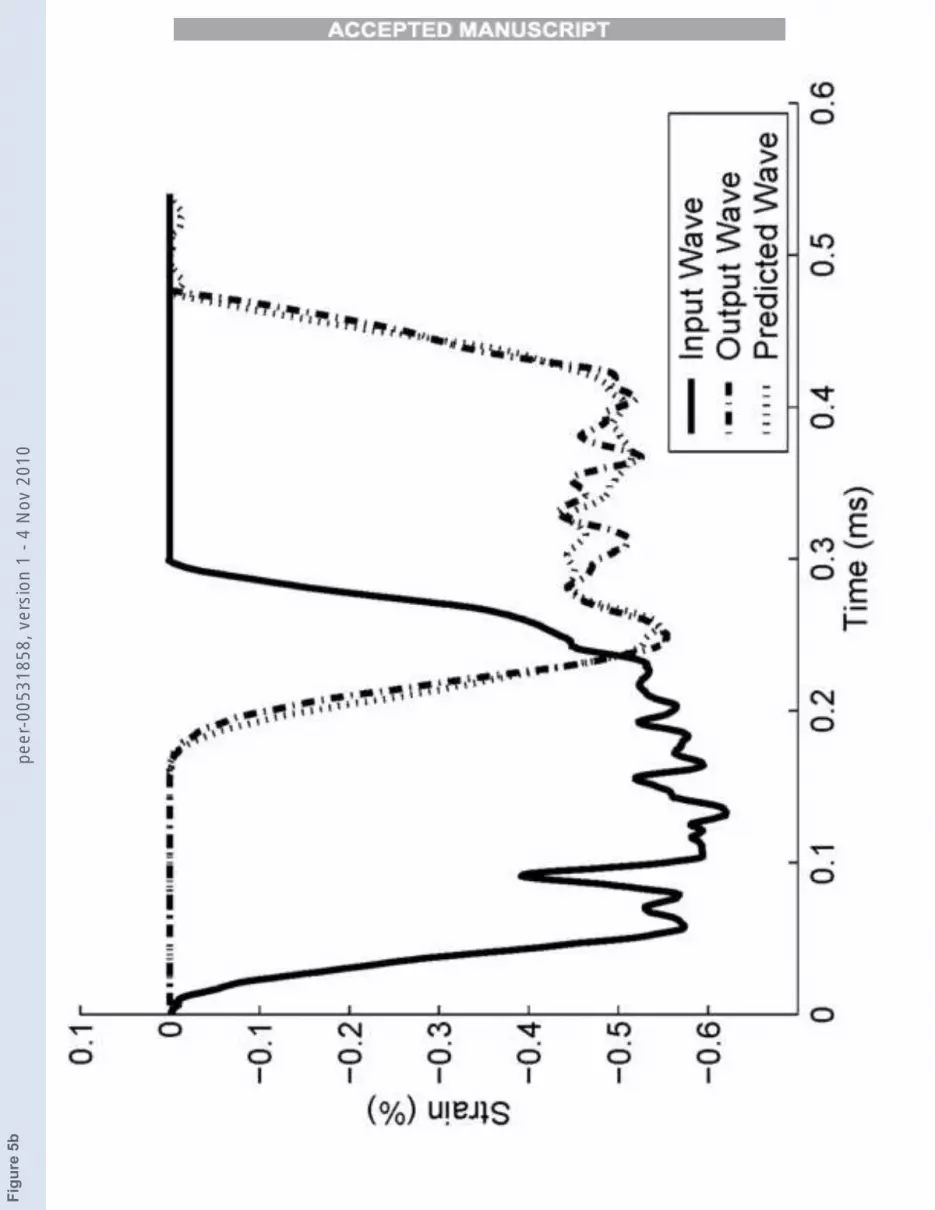
Although a low projectile velocity was selected during the experiments, wavedispersion was seen to take place as the wave propagated longitudinally downthe bar. The testing of low impedance materials such as cellular solids re-quires that low impedance incident and transmission bars be used to ensurea significant transmission wave is recorded and can be easily discerned fromany obvious noise in the system. For such cases viscoelastic bars made fromnylon or PMMA are suitable options as there are currently few known lowimpedance pure elastic materials [29]. However due to the viscoelastic natureof these materials, different frequency components of the incident, reflected,and transmission waves will behave differently to each other, i.e. higher fre-quencies will have a higher phase velocity and will be attenuated quicker thanlower frequency components of the waves. This will lead to a change in thewave shape and amplitude as it propagates from one point in the bar to an-other. Therefore, it is necessary to shift each wave from the point at which itis measured to the specimen-bar interfaces. This was done by transferring thesignal (recorded at a position z1) into the frequency domain using a discreteFourier transform, processing it according to the work of [30] and [31], and re-constructing the signal back into the time domain at a new position z2. Figure5 shows the same wave (input/output) measured at two strain gauges 0.373 mapart along with the predicted wave at the second strain gauge when 150 mmand 250 mm projectiles are used. From the simulations, very little change inthe wave shape took place in the elastic pressure bars, indicating that wavedispersion was only due to material effects rather than the bar’s geometry.
Fig. 5. Change in wave shape over 0.373 m and predicted wave shape for 150 mmand 250 mm projectiles. (a) 150 mm (b) 250 mm
7
peer
-005
3185
8, v
ersi
on 1
- 4
Nov
201
0

Accep
ted m
anusc
ript
3 FEM simulations
3.1 Constitutive model for FGFM
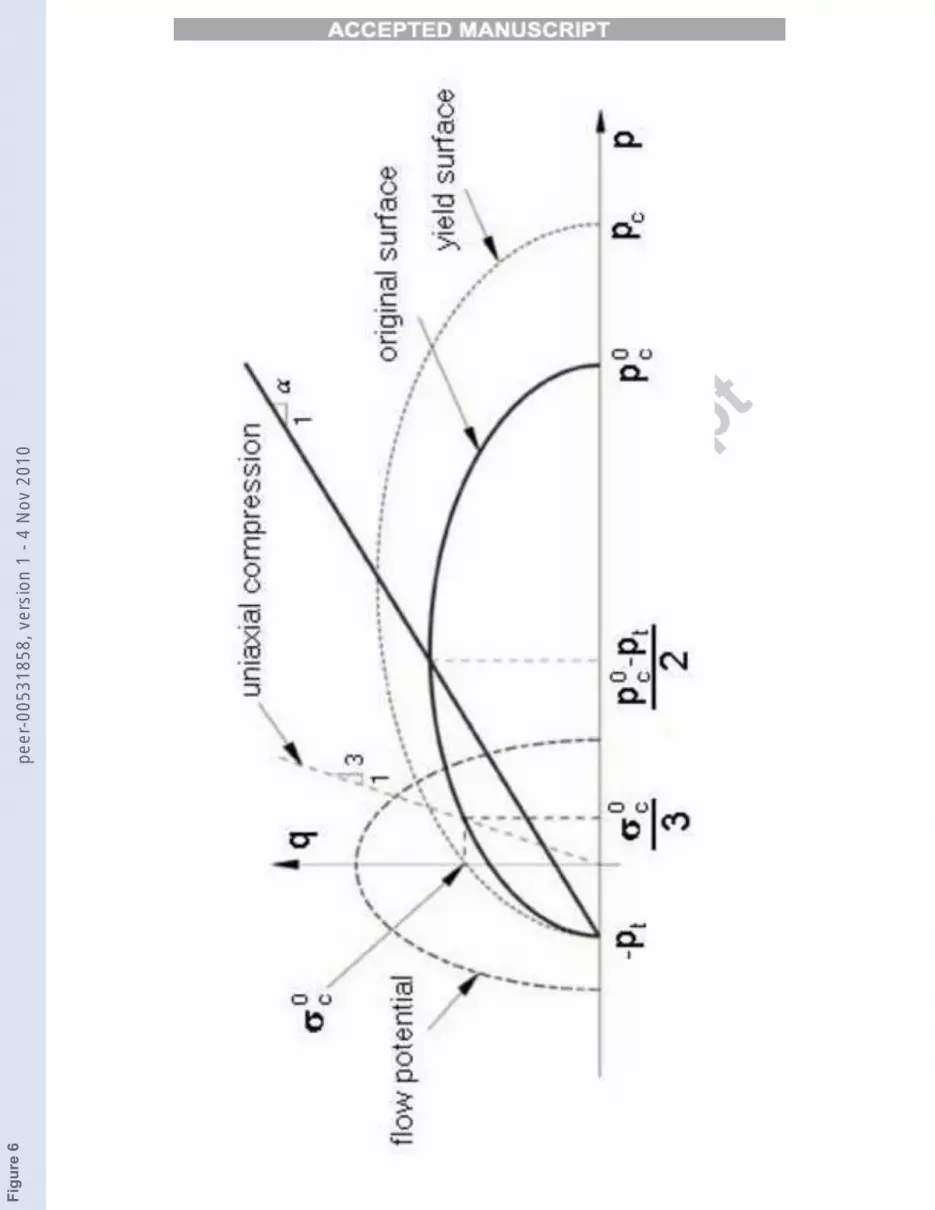
In modelling the uniform foam (and FGFM), the actual topology of the foam(cell, struts, etc) was not modelled and so, from a finite element perspective,the virtual foam cells could be assumed to be infinitely small. The FE packageABAQUS allows one to describe the dynamic response of a crushable foamplasticity model by inputting a uniaxial σ − ε curve to calibrate the modelprovided. The yield surface of the crushable foam is an ellipse in the meridional(p−q) stress plane, as shown in Fig. 6. The evolution of the yield surface followsthe volumetric hardening rule, for which the point on the yield ellipse thatrepresents hydrostatic tension loading is fixed and the evolution of the yieldsurface is driven by the volumetric compacting plastic strain. The shape of theyield surface is determined by the initial yield stress in uniaxial compression,σ0
c , the initial yield stress in hydrostatic compression, p0c (the initial value
of pc), and the yield strength in hydrostatic tension, pt. The values of theyield stress in uniaxial compression as a function of the plastic strain can becalculated from the uni-axial compression stress-strain curve obtained fromthe constitutive stress-strain relationship.
Fig. 6. Crushable foam model with volumetric hardening: yield surface and flowpotential in the p− q stress plane [32]
Modelling of the FGFM is achieved by approximating a specimen with a con-tinuous variation in material properties as many discrete, finely meshed ele-ment layers though the thickness, with a unique σ − ε curve associated witheach layer. As described in the following constitutive model, the foam relativedensity is the controlling parameter in describing the shape of each σ−ε curve.By varying this parameter in an incremental manner, it is possible to generatemultiple σ − ε curves and calibrate the ABAQUS crushable foam model fora range of foam densities. Each calibrated crushable foam model for a givendensity may then be assigned to a given element layer through the specimenthickness, creating a quasi-graded cellular constitutive response.
The constitutive model describing σ(ε) for each curve follows Schraad and Har-low [33], describing disordered cellular materials under uni-axial compressionaccording to various stochastic material representations. This model was firstapplied to the crushable model by Cui et al [13]. The stress-strain relation ofthe foam was represented by a tri-linear function. With the assumption thatthe Poisson’s ratio for low-density foam is approximately zero, the tangentstiffness E of the foam under uni-axial compression is found to be a function
8
peer
-005
3185
8, v
ersi
on 1
- 4
Nov
201
0
Accep
ted m
anusc
ript
of its solid-volume fraction and the axial strain. That is
E(εn) = A(εn)Es[φ(εn)]2 (4)
where εn is the nominal axial strain (length change per unit undeformedlength) and in the range of (-1, 0), A(εn) is a stiffness related parametervaried with the axial strain, Es is the tangent stiffness of the parent solid ma-terial used to make the cellular material, and φ(εn) is the relative density, orthe solid-volume fraction. As εn = 0, A(0) = A0, φ(0) = φ0, and E(0) = E0.During the compression, φ(εn) can be expressed as (with zero Poisson’s ratio)
φ(εn) =(φ0)
1 + εn=
ρ0
ρs
1
1 + εn(5)
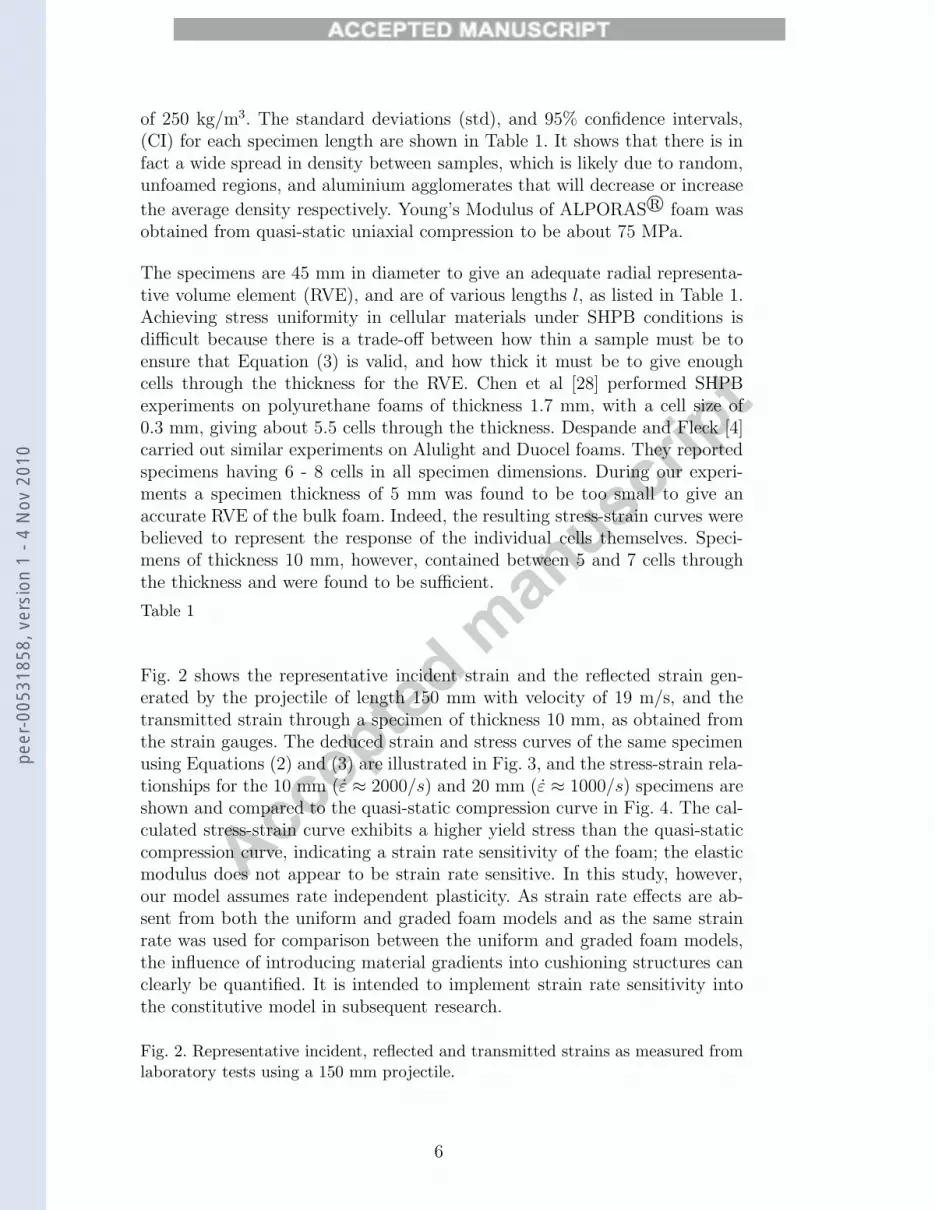
where ρ0 is the initial density before compression and ρs is the density of theparent solid material. The parameter A(εn) defines the geometry of the stress-strain curve. For axial strains lower than the yield value, ε1, it shows a linearelastic response with a tangent stiffness equal to E0. As the axial strain isincreased over the yield value, the plateau stress only increases slightly withthe steadily increasing axial strain, yielding a smaller tangent stiffness, E1. Asthe axial strain increases further to higher than a densification strain, ε2, thecells are crushed entirely and the cell walls start to contact each other. Thestiffness in this stage increases sharply and finally approaches the stiffness ofthe parent solid material as the axial strain approaches 100%.
As described by Schraad and Harlow [33], the transition between the threestages is over a small range of strain rather than instantaneously, due to theimperfectly homogeneous or identical cellular structure of the foam. Assum-ing that the imperfection of the cellular structure is distributed randomly,the transition between the linear elastic stage and the plateau stage occursover a small range of 2Δε1, while the transition between the plateau stageand the densification stage occurs over a small range of 2Δε2. The geometricparameter, A(εn), for the foam can then be expressed as
A(εn) =
⎧⎪⎪⎪⎪⎪⎪⎪⎪⎪⎪⎪⎪⎨⎪⎪⎪⎪⎪⎪⎪⎪⎪⎪⎪⎪⎩
A0, ε1 + Δε1 ≤ εn ≤ 0
(A0−A1)εn−A0(ε1−Δε1)+A1(ε1+Δε1)
2Δε1
, ε1 −Δε1 ≤ εn ≤ ε1 + Δε1
A1, ε2 + Δε2 ≤ εn ≤ ε1 −Δε1
(A1−1)εn−A1(ε2−Δε2)+(ε2+Δε2)
2Δε2
, ε2 −Δε2 ≤ εn ≤ ε2 + Δε2
1, −1 ≤ εn ≤ ε2 + Δε2
(6)
9
peer
-005
3185
8, v
ersi
on 1
- 4
Nov
201
0
Accep
ted m
anusc
ript
where A0 and A1 can be obtained from Equations (4) and (5) as
A0 =E0
Esφ20
=E0ρ
2s
Esρ20
(7)
A1 =E1
Esφ(ε1)2=
E1ρ2s
Esρ20
(1 + ε1)2 (8)
To determine the parameters in the functions of the constitutive model for aspecified type of foam, a series of quasi-static uni-axial compression tests were
performed on the ALPORAS� foam. The assumption of a vanishing Pois-
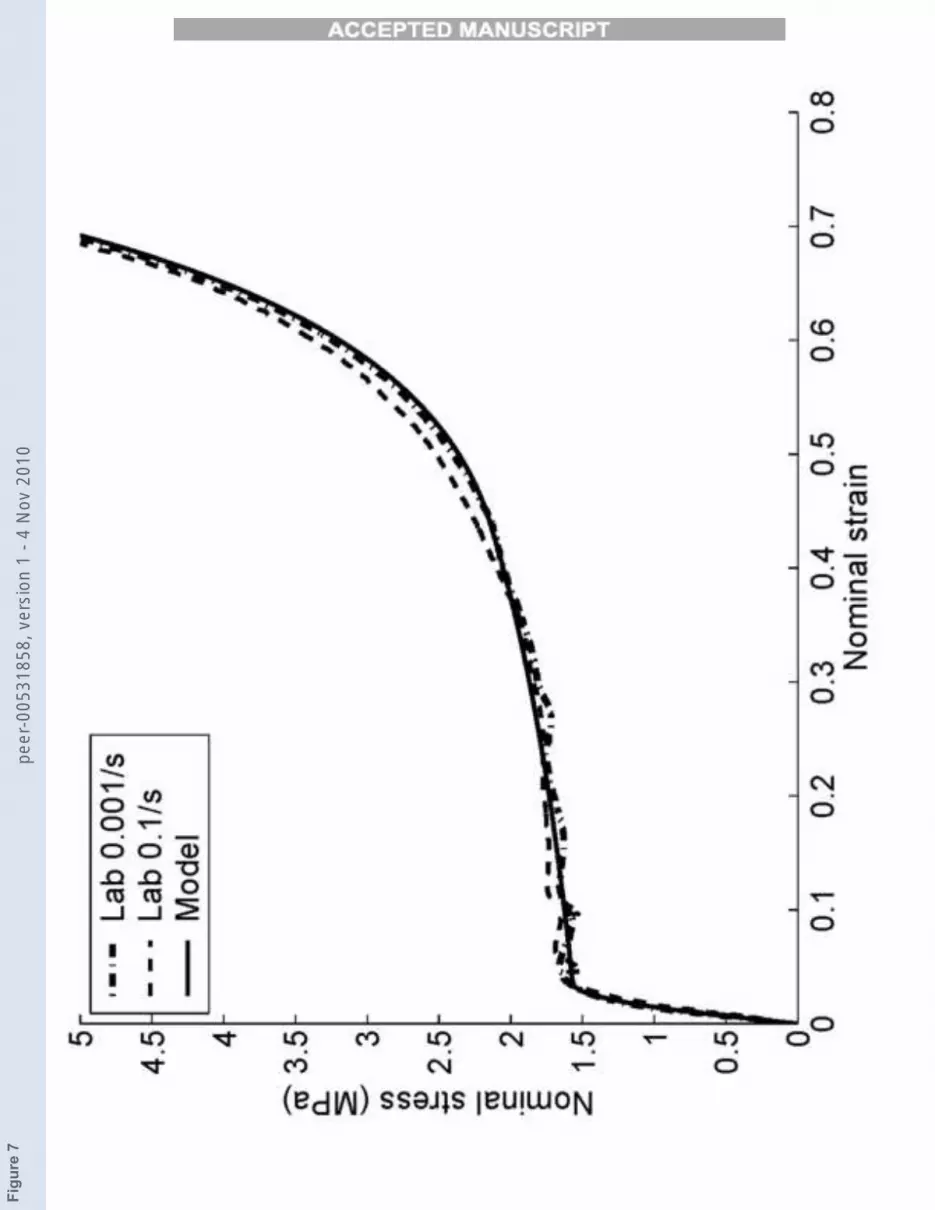
son’s ratio for ALPORAS� foam is not strictly correct although uni-axialcompression testing up to 80% strain revealed lateral straining to be only 4-5%. Experimental SHPB testing resulted in maximum strains of about 30%.A summary of the static test results is shown in Fig. 7. For solid aluminium,ρs = 2700 kg/m3 and Es = 70 GPa. Based on the results of the experimen-tal compression tests, the parameters in the model can be determined. Thestress-strain curves obtained from the constitutive formula with the deter-mined parameters are also illustrated in Fig. 7. The constitutive model wasfound to quantitatively match the results of the experimental tests. From this,stress-strain curves for virtual specimens of higher arbitrary densities were ex-trapolated and used during the numerical simulations in order to analyse asuitably wide range of densities, as shown in Fig. 8.
Fig. 7. Quasi-static compression stress-strain curves of the aluminium ALPORAS�
foam.
Fig. 8. Virtual stress-strain curves for various aluminium foam densities.
In order to describe the hypothetical constitutive response of the function-ally graded foam proposed in this paper, the model specimen is meshed finelythrough the thickness direction, as shown in Fig. 9. A unique σ − ε curve isassociated with each element layer. By varying σ(ε) incrementally, and accord-ing to a chosen monotonic gradient function, from one element layer to thenext, a quasi-gradient FGFM constitutive response could be described. In thecurrent study, gradient functions of logarithmic, square root, linear, quadratic,and cubic, as shown in Fig. 10, are used. To perform a parallel comparison,the average density of each specimen is targeted to be the same as that of theuniform foam specimen, 250 kg/m3. To achieve the same average density theupper and lower limits for the graded density range increases as the gradientchanges from convex (logarithmic, square root) to concave (quadratic, andcubic). The density parameters for the FGFM specimens are listed in Table 2.
10
peer
-005
3185
8, v
ersi
on 1
- 4
Nov
201
0

Accep
ted m
anusc
ript
Fig. 9. Mesh configuration of foam specimen (thickness=20 mm)
Fig. 10. Variation in density versus normalised distance away from the incidentsurface (Δρ = 100 kg/m3). (a) Increasing density (b) Decreasing density
Table 2
3.2 FE model
The FE simulations of the Split-Hopkinson Pressure Bar were performed us-ing the software package ABAQUS [32]. Material parameters measured fromthe laboratory tests define the constitutive response of the model. Materialdescriptions of the bars and projectiles are defined as elastic media with thesame dimension, density and stiffness as those in the laboratory tests. Thefoam specimen is modelled as a crushable foam as described in Section 3.1.
All assembly parts are modelled as three-dimensional 8-node linear brick el-ements using reduced integration with hourglass control (C3D8R). The barsand projectiles have 214 elements in its cross-sectional area. The bars have 180elements through its thickness. A mesh sensitivity analysis of the incident andtransmitter bars using 75, 100 and 150 elements along their lengths showedno significant change in the strain wave profiles. The 150 mm projectile and250 mm projectile have 25 and 50 elements through its thickness, respectively.The foam specimen has 20 elements through its thickness and 214 elementsin its cross-sectional area. An explicit central-difference time integration ruleis used to simulate the dynamic impact behaviour [34]. The maximum stabletime increment is given by
Δt =Lmin
Cd
(9)
where Lmin is the smallest element dimension in the mesh, Cd is the wavepropagation speed. The stable time step is chosen and updated automaticallyby ABAQUS throughout the solution.
The incident velocity of the 150 mm projectile is 20 m/s and the incident ve-locity of the 250 mm projectile is 10 m/s in the simulations. All the contactingsurfaces are defined as frictionless. No gravitational force is included for anypart and initial boundary conditions are applied to the projectile, specimenand bars such that only movement in the z-direction is allowed, i.e., x = y =0 throughout the simulations. An initial velocity boundary condition is alsoapplied to the projectile. Strain gauges are defined on the virtual incidentand transmitter bars to compare with the laboratory test strain curves and to
11
peer
-005
3185
8, v
ersi
on 1
- 4
Nov
201
0
Accep
ted m
anusc
ript
validate the FE models.
3.3 Simulation results - Uniform specimen
Comparisons of the incident and reflected strains between the laboratory testsand the FE simulations are illustrated in Fig. 11(a) and match each otherclosely. Comparison of the transmitted strains between the laboratory testsand the FE simulations is also illustrated in Fig. 11(b), however the transmit-ted strains are lower in the FE simulations than those in the laboratory testsdue to the aforementioned strain rate sensitivity of the physical foam.
Fig. 11. Comparison of the strain gauge readings between the laboratory tests andthe FE simulations. (a) Incident and reflected strains (b) Transmitted strains
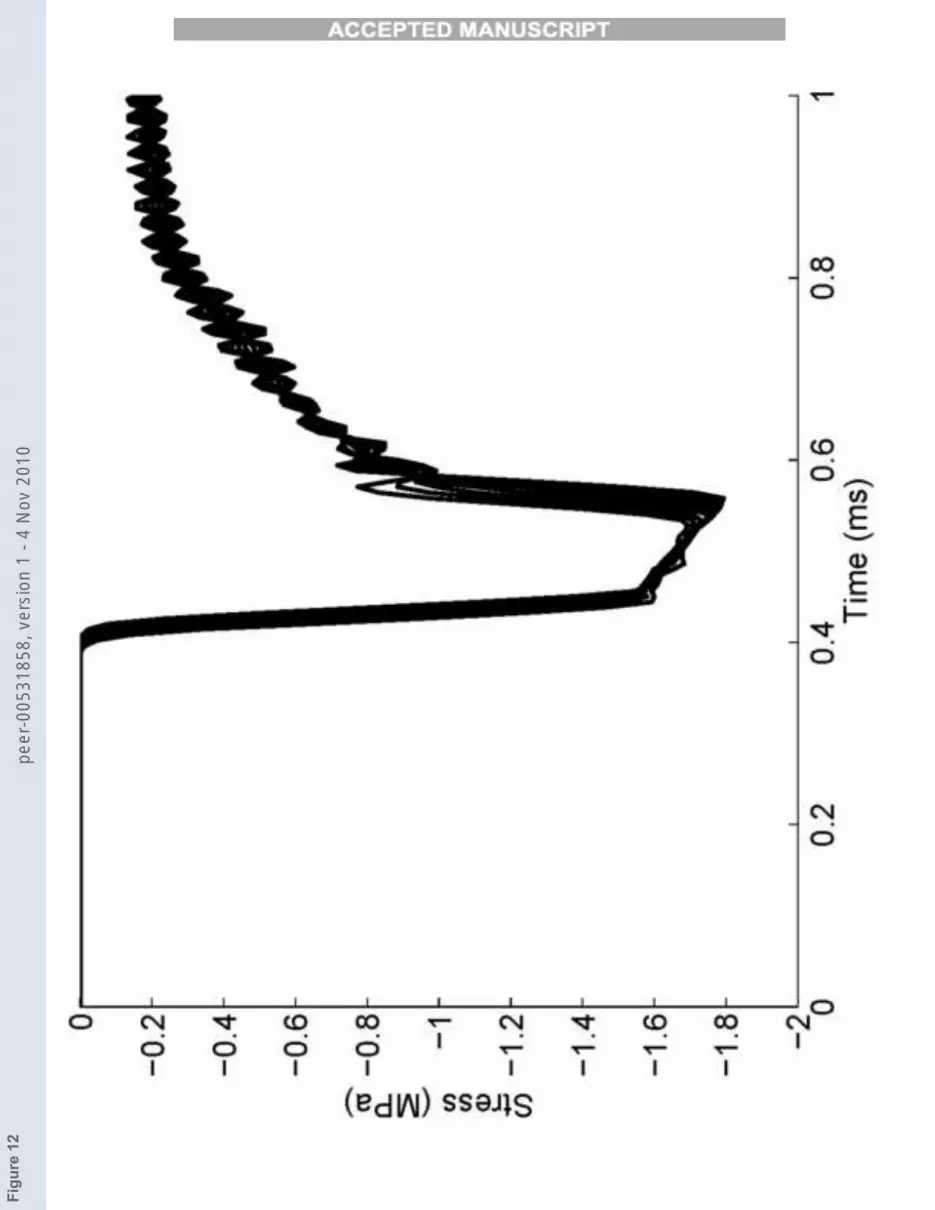
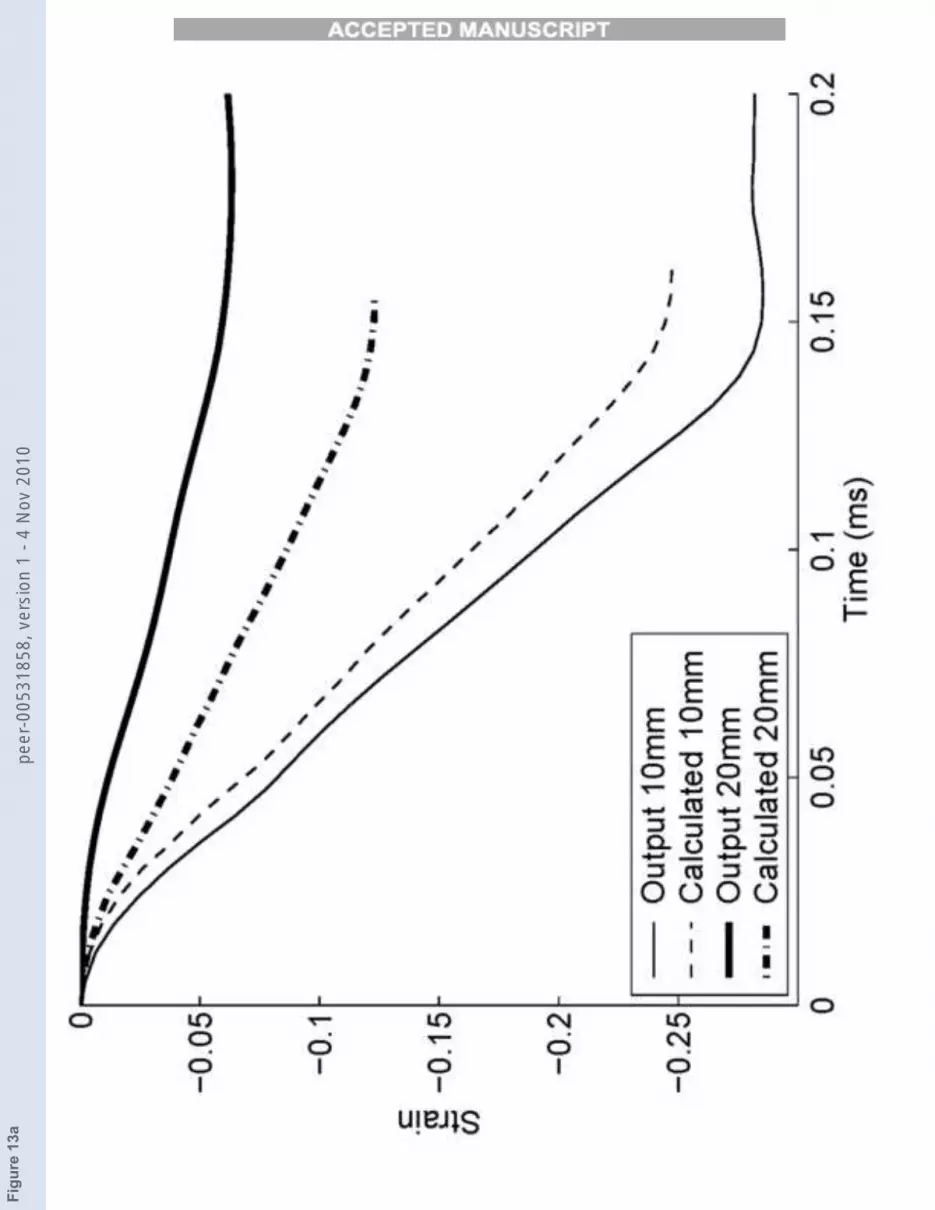
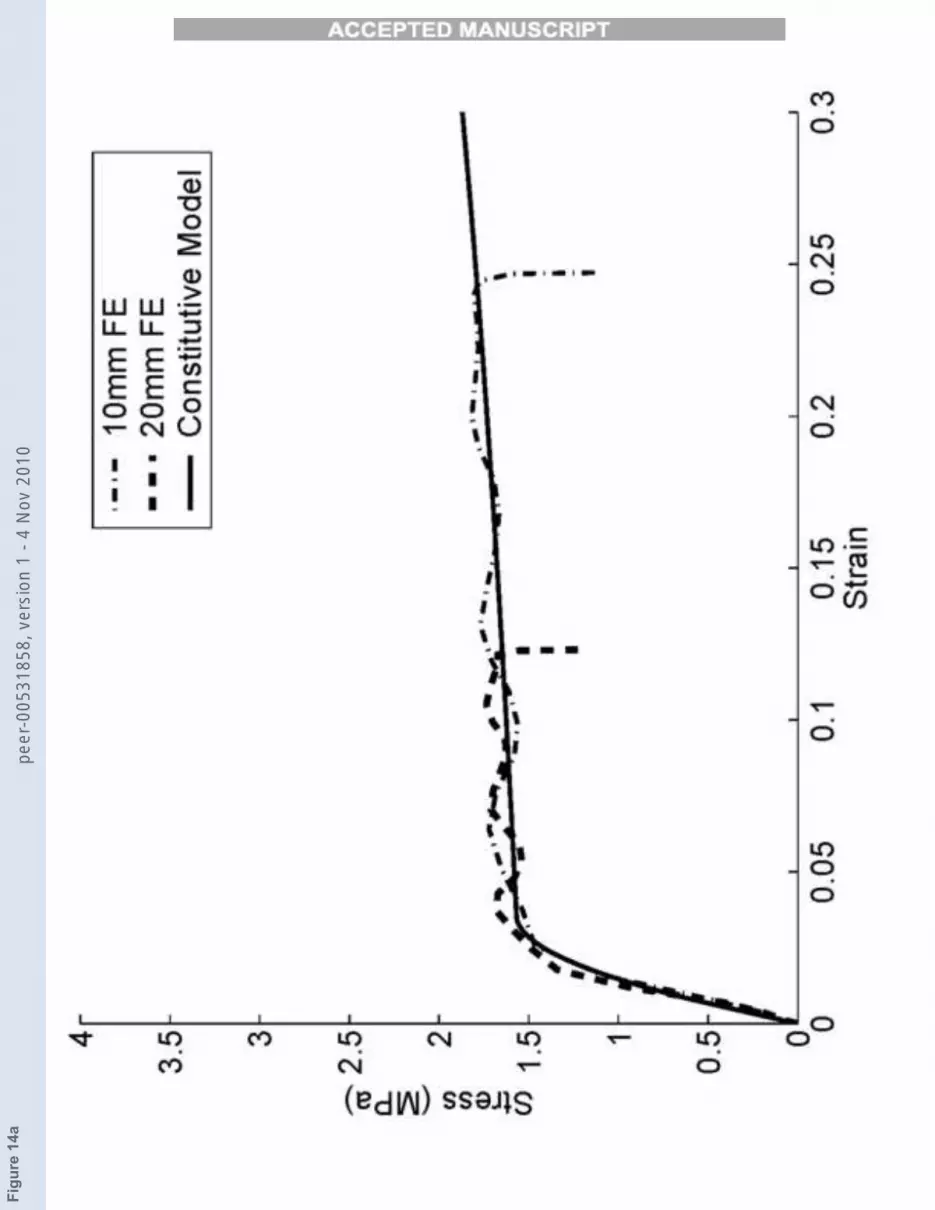
The evolution of stress in 10 selected layers from the incident surface to thedistal surface of the uniform specimens (thickness=10 mm) is illustrated inFig. 12. The stress curves for different layers almost coincide except for thepeak values, indicating that a state of dynamic stress equilibrium exists in the10 mm virtual specimens. The stress and strain responses of the specimen canbe calculated from the strain curves from the strain gauges. The average stressand strain response of the whole specimen can also be output directly fromthe FE simulations. These two sets of curves are compared in Fig. 13. Stressand strain measurements from the virtual strain gauges and those computeddirectly from the 10 mm thick virtual foam are similar but deviate more asthe thickness increases to 20 mm. This should be expected, as Equations (2)and (3) become less valid for increasing thickness. The calculated stress-straincurves from this data coincide with the input stress-strain model curve exceptfor some minor fluctuations, as shown in Fig. 14.
Fig. 12. Evolution of stress in 10 selected layers in the uniform specimen of thickness10 mm.
Fig. 13. Comparison of the strain curves and stress curves obtained directly fromthe strain gauge and from the specimen directly (150 mm projectile). (a) Straincurves (b) Stress curves
Fig. 14. The stress-strain curve obtained from the simulations and compared withthe model curve of Fig. 7 (a) 150 mm projectile (b) 250 mm projectile
By comparing the stress and strain response of the specimen in the FE model(Figs. 13(a) and 13(b)) and in the laboratory tests (Figs. 3(a) and 3(b)) withvarious specimen thicknesses, and noting the lack of a strain rate definition inthe model of Schraad and Harlow [33], the FE model is judged to be qualita-tively validated. The SHPB model can now be applied more generally to the
12
peer
-005
3185
8, v
ersi
on 1
- 4
Nov
201
0

Accep
ted m
anusc
ript
functionally graded foam by providing appropriate boundary conditions to setup an initial stress wave without the need to rely on Equations (1) to (3) tocalculate the constitutive response.
3.4 Simulation Results - FGFM specimen
Once the FE model is quantitatively validated, it is possible to consider thewave propagation through a virtual FGFM. To illustrate the expected vari-ation in stress/strain through the thickness due to the graded mechanicalproperties in this section, specimens of thickness 300 mm were adopted. Thislarge thickness is still valid in the FEM simulations as the stress and strainare obtained directly from the simulation results, rather than calculated fromthe strain gauges.
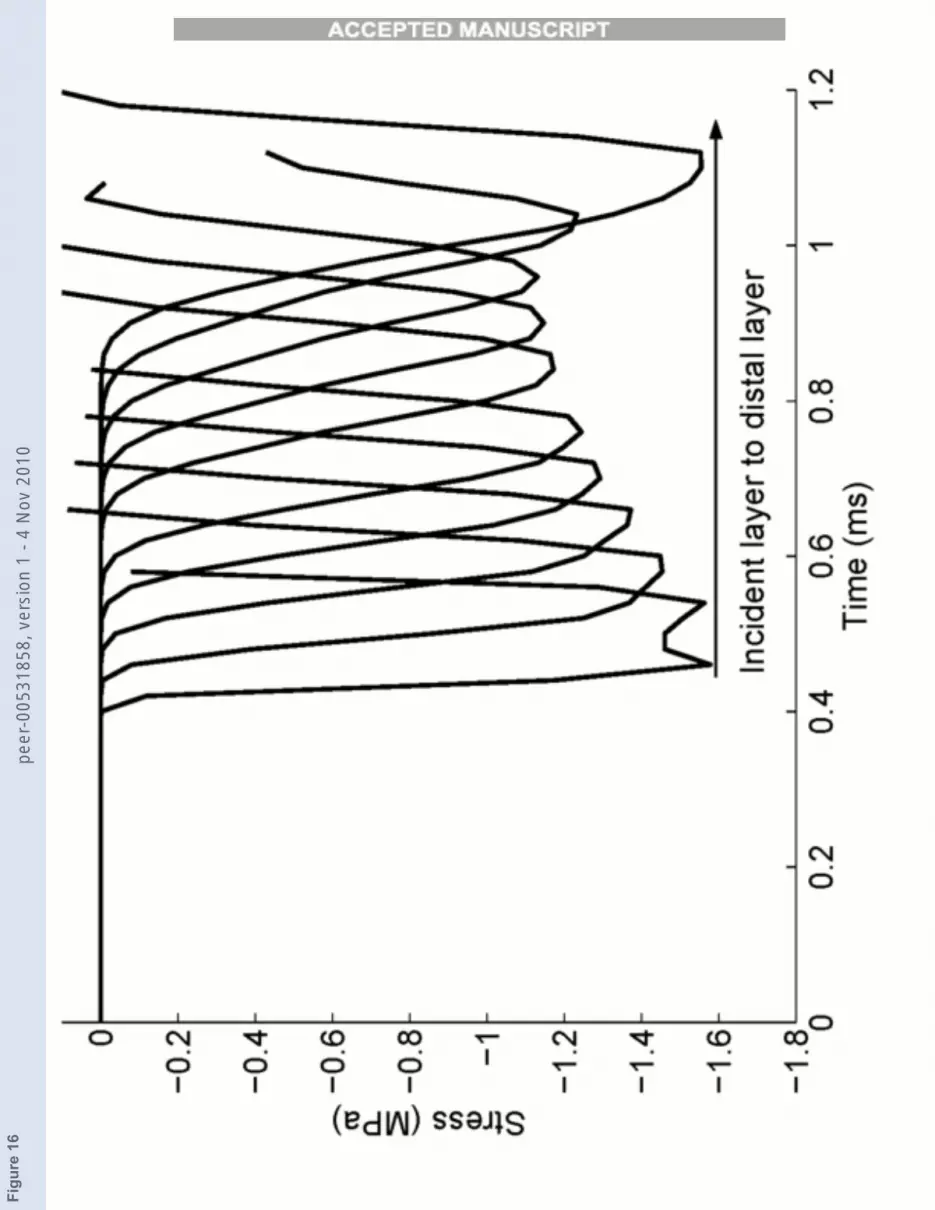
The sensitivity of peak stress in each layer to the specimen thickness is shownin Fig. 15. The difference in peak values of stresses in different layers becomesmore pronounced as the thickness increases. The magnitude of peak stressdecreases with the increasing thickness as the stress wave is diminished morethrough a thicker specimen. The evolution of stress in 10 selected layers in theuniform specimens of thickness 300 mm is illustrated in Fig. 16.
Fig. 15. Sensitivity of peak stress in layers to the specimen thickness.
Fig. 16. Evolution of stress in 10 selected layers in the uniform specimen of thickness300 mm.
The transmitted waves, as measured from the strain gauge on the transmitterbar for the uniform specimen and the FGFM specimens (Δρ=100 kg/m3)are illustrated in Fig. 17. The transmitted wave is obviously diminished morethrough the FGFM specimens with decreasing density. The graded specimens,with their density increasing according to the logarithmic and square rootgradient functions, attenuate the wave more than the uniform specimen, whilethe graded specimens with their density increasing according to the other typesof gradient functions (linear, quadratic, cubic) transmit more of the wave.
Fig. 17. Comparison of transmitted wave as measured from the strain gauge forthe uniform specimen and the FGFM specimens (Δρ=100 kg/m3). (a) Increasingdensity (b) Decreasing density
Following from the theory of elastic wave propagation, as a wave propagatesfrom material 1 to material 2, the displacement amplitudes of the incident(Ai), reflected (Ar), and transmitted wave (At) can be related by:
13
peer
-005
3185
8, v
ersi
on 1
- 4
Nov
201
0

Accep
ted m
anusc
ript
Ar =1− α
1 + αAi (10)
At =2
1 + αAi (11)
where α is the impedance ratio defined as√
ρ2E2
ρ1E1
, E is Young’s modulus, and
ρ is the density. The stress amplitudes of the incident (σi), reflected (σr), andtransmitted wave (σt) can be related as:
σr =α− 1
1 + ασi (12)
σt =2α
1 + ασi (13)
Equation (13) illustrates that, when an incident wave approaches a more com-pliant material (the impedance ratio is less than 1), the stress amplitude ofthe transmitted wave will be smaller than that of the incident wave; whenan incident wave approaches a stiffer material (the impedance ratio is greaterthan 1), the stress amplitude of the transmitted wave will be greater than thatof the incident wave.
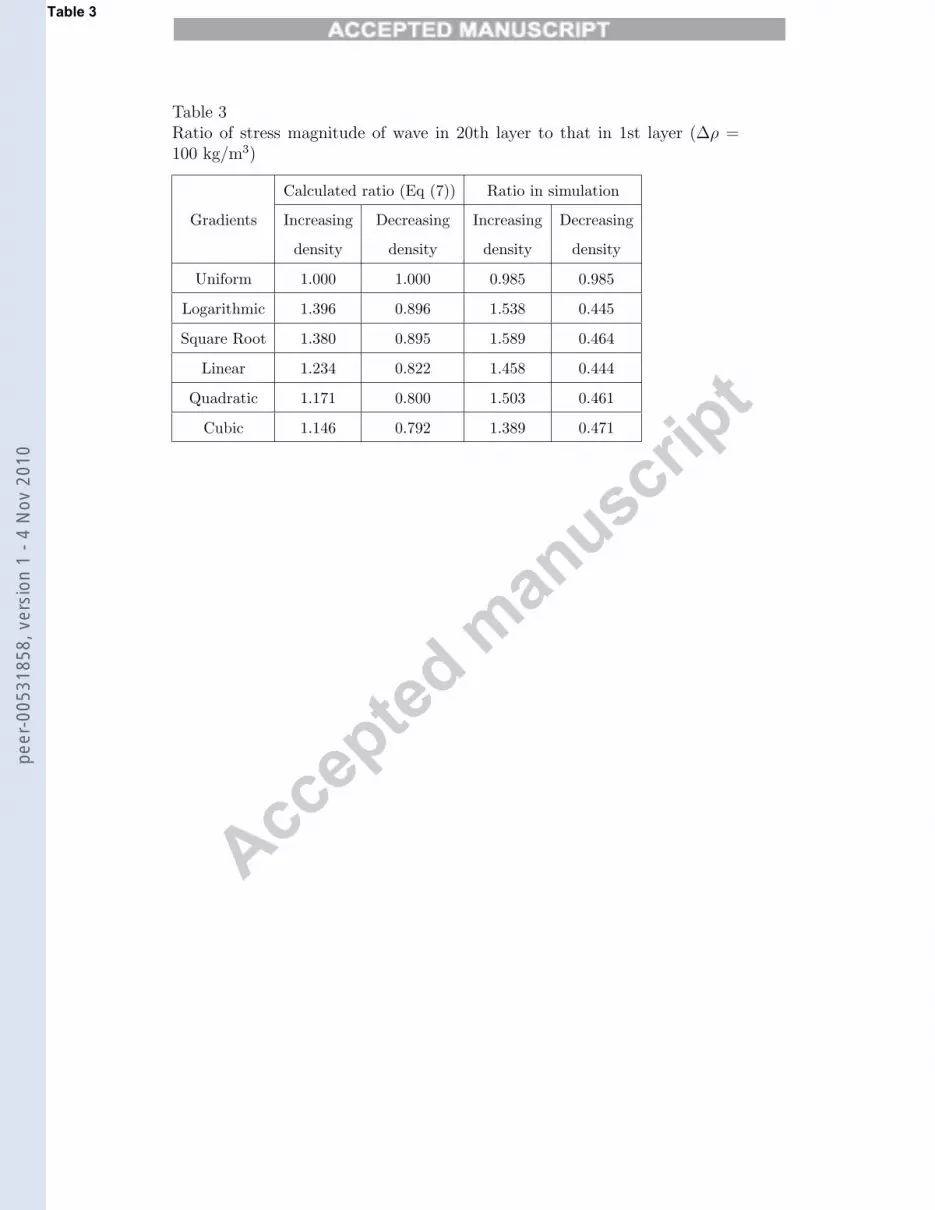
As described above, the FGFM specimen is divided into 20 layers and so thereare 19 graded interfaces where wave incidence and wave reflection occur. Al-though the FGFM specimens deform both elastically and plastically as thestress wave propagates, the ratio of transmitted stress in layer twenty to inci-dent stress in layer one, accounting for just the FGFM’s elastic properties, iscalculated using Equation (13) simply for reference. Although there are mul-tiple reflections and incidences at each interface, only the first transmission ineach layer is considered for calculation as the subsequent transmissions havetime delays. These ratios, calculated from elastic wave theory, and the actualratios predicted by simulation, which include plastic wave propagation, arecompared in Table 3. It can be seen from Table 3 that, for the elastic wave,the ratio of stress magnitude for increasing density is highest in a logarithmicgradient, while it is lowest in a cubic gradient. As there is energy dissipationdue to plastic deformation, the stress ratios are not the same as those fromcalculations. However, the trend in both cases agrees with what is expected,namely an increasing density gradient will amplify the resultant transmittedelastic stress, while a decreasing gradient will attenuate the transmitted elasticstress.
Table 3
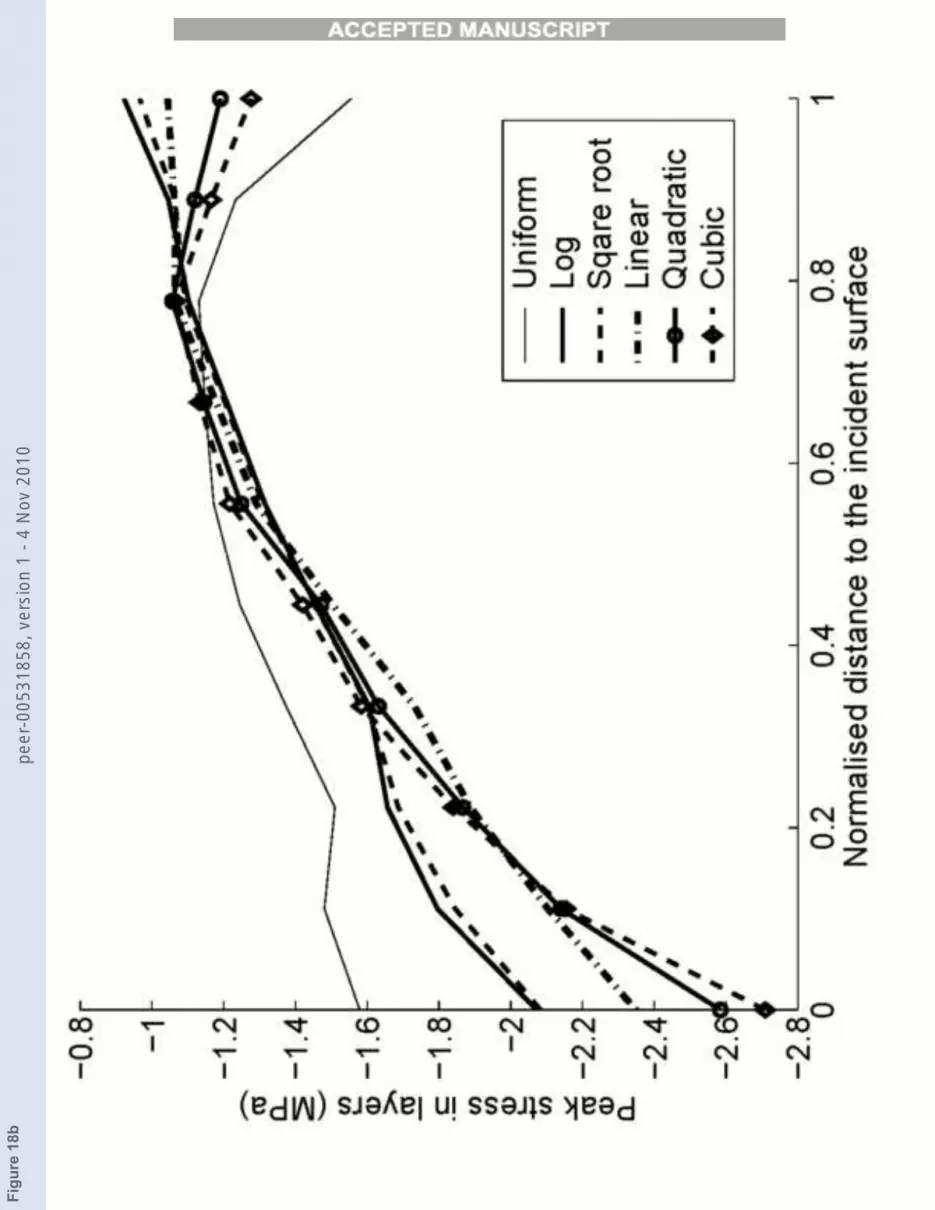
The peak stresses in layers in the specimen with various gradient functions(Δρ = 100 kg/m3) are illustrated in Fig. 18. The stress is seen to be shaped
14
peer
-005
3185
8, v
ersi
on 1
- 4
Nov
201
0

Accep
ted m
anusc
ript
by the functionally graded densities. By comparing Fig. 18 and Fig. 10, itcan be seen that the relative levels of stress for each gradient at the incidentand distal faces are similarly ordered to the density of each gradient at theincident and distal faces. It is expected that the magnitude of stress increasesas the wave propagates to layers of higher density and decreases as the wavepropagates to layers of lower density. However, this trend is not always true inthe intermediate layers for the increasing densities. The global trend at the twofree surfaces is true (confirmed from Table 3). This trend is more obvious in thespecimens with decreasing densities. The magnitudes of stresses monotonicallydecrease for the logarithmic, square root, and linear gradient functions.
Fig. 18. Comparison of peak stresses in layers between various gradient functions(Δρ = 100 kg/m3). (a) Increasing density (b) Decreasing density
As listed in Table 2, for the specimens with increasing densities, the densitiesat the incident surface increase as the gradient function changes from loga-rithmic to cubic: this is consistent with the magnitudes of stresses as shownin Fig. 18(a). As the wave propagates to the distal surface, the densities allincrease to values higher than the uniform specimen. However, the magni-tudes of stresses in the specimens with logarithmic and square root gradientfunctions are still lower than that in the uniform specimen. The relative mag-nitudes of stresses at the distal face for each gradient (Fig. 18(a)) agree withthe relative peak strains induced by the transmitted wave as measured fromthe strain gauge on the transmitter bar (Fig. 17(a)). For the specimens withdecreasing densities, the densities at the incident surface increase as the gra-dient function changes from logarithmic to cubic, which are consistent withthe magnitudes of stresses as shown in Fig. 18(b). As the wave propagates tothe distal surface, the densities all decrease to values lower than that of theuniform specimen and the magnitudes of stresses also decrease to values lowerthan that of the uniform specimen. The magnitudes of stresses at the distalsurface also agree with the transmitted wave measured from the transmitterbar (Fig. 18(b)).
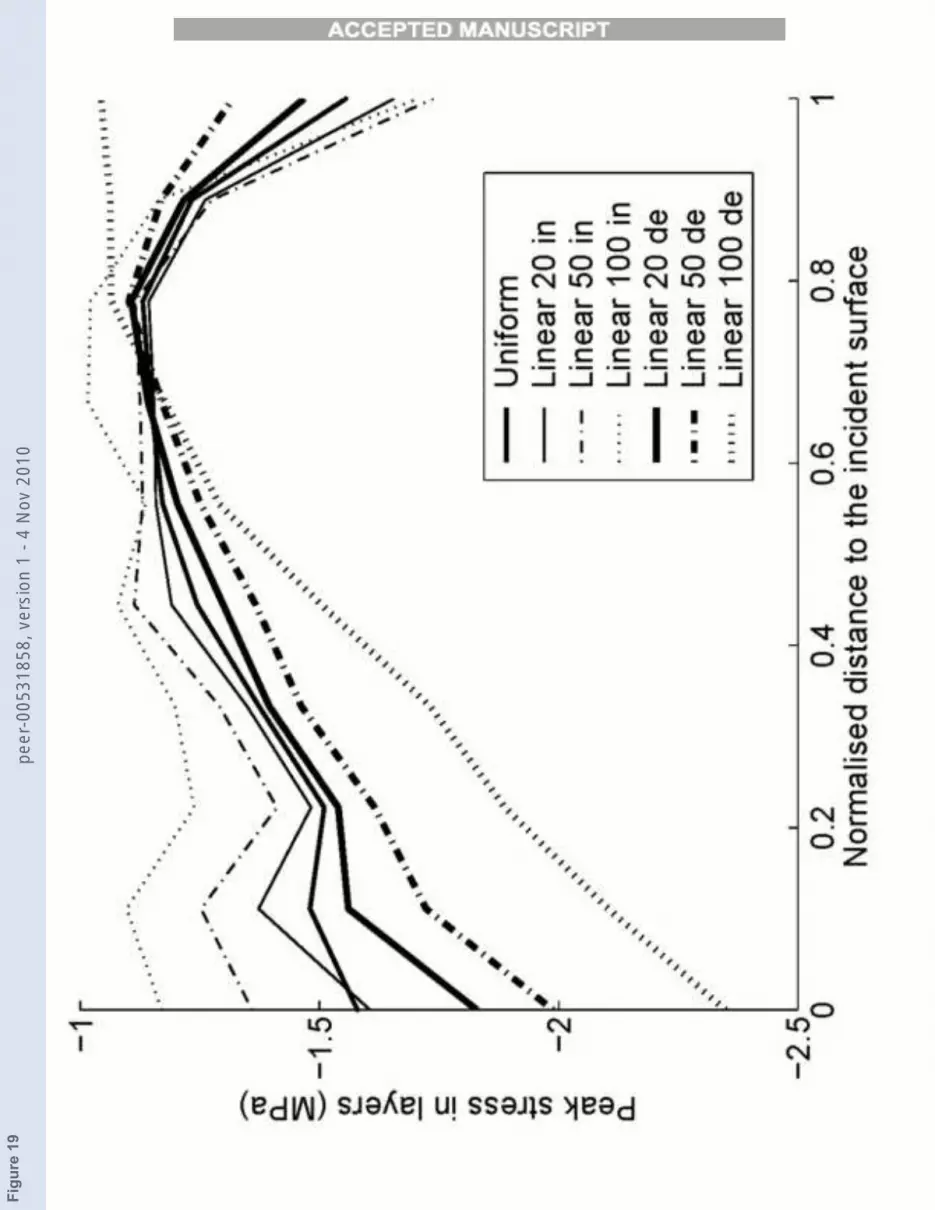
The sensitivity of the peak stress in layers to the density range (Δρ) is shownin Fig. 19 for the linear gradient. The difference in peak stress between theincident and the distal surfaces is amplified by increasing the density range.The lower or higher magnitudes of peak stresses at both free surfaces are allconsistent with the lower or higher values of densities at those surfaces.
Fig. 19. Comparison of peak stresses in layers between various density ranges (lineargradient; in-increasing density; de-decreasing density.)
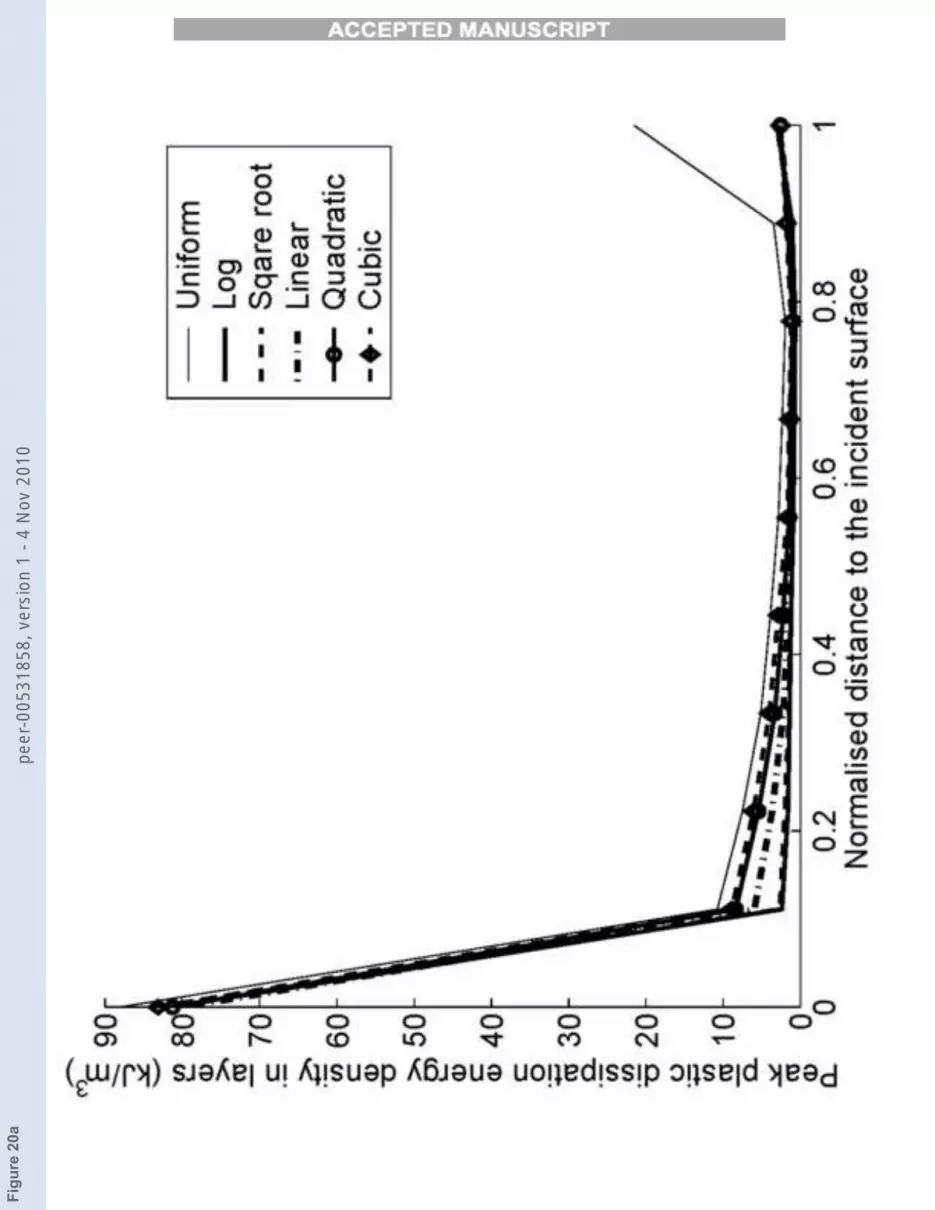
The peak plastic dissipation energy density in layers in the specimen withvarious gradient functions (Δρ=100 kg/m3) are illustrated in Fig. 20. Theplastic dissipation energy density is the total energy dissipated per unit volume
15
peer
-005
3185
8, v
ersi
on 1
- 4
Nov
201
0

Accep
ted m
anusc
ript
in the element by plastic deformation. It is clearly shown that most of theenergy dissipates in the first layer at the incident surface. The layer at thedistal surface also dissipates a large proportion of energy.
Fig. 20. Comparison of peak plastic dissipation energy density in layers betweenvarious gradient functions (Δρ=100 kg/m3). (a) Increasing density (b) Decreasingdensity
In the first layer at the incident surface for the increasing density, the density(Fig. 10(a)) and also the peak stress (Fig. 18(a)) increase from logarithmic tocubic gradient functions and to uniform, while the plastic dissipation energydensity (Fig. 20(a)) decreases from logarithmic to cubic gradient functions andfinally to the uniform. This is because the yield stress also increases as thedensity increases (Fig. 8), and fewer plastic strains occur in the higher densitylayers even though the peak stresses occur. From the second layer, this trendreverses.
In the first layer at the incident surface for the decreasing density, the den-sity (Fig. 10(b)), and also the peak stress, (Fig. 18(a)) decrease from cubic tologarithmic gradient functions and finally to uniform, while the plastic dissi-pation energy density (Fig. 20(b)) increases from cubic to logarithmic gradientfunctions and to the uniform. From the second layer, this trend also reverses.At the last layer at the distal surface, the trend alters again, i.e. the energydensity in the uniform density exhibits the lowest value, and it increases fromthe cubic to logarithmic gradient functions.
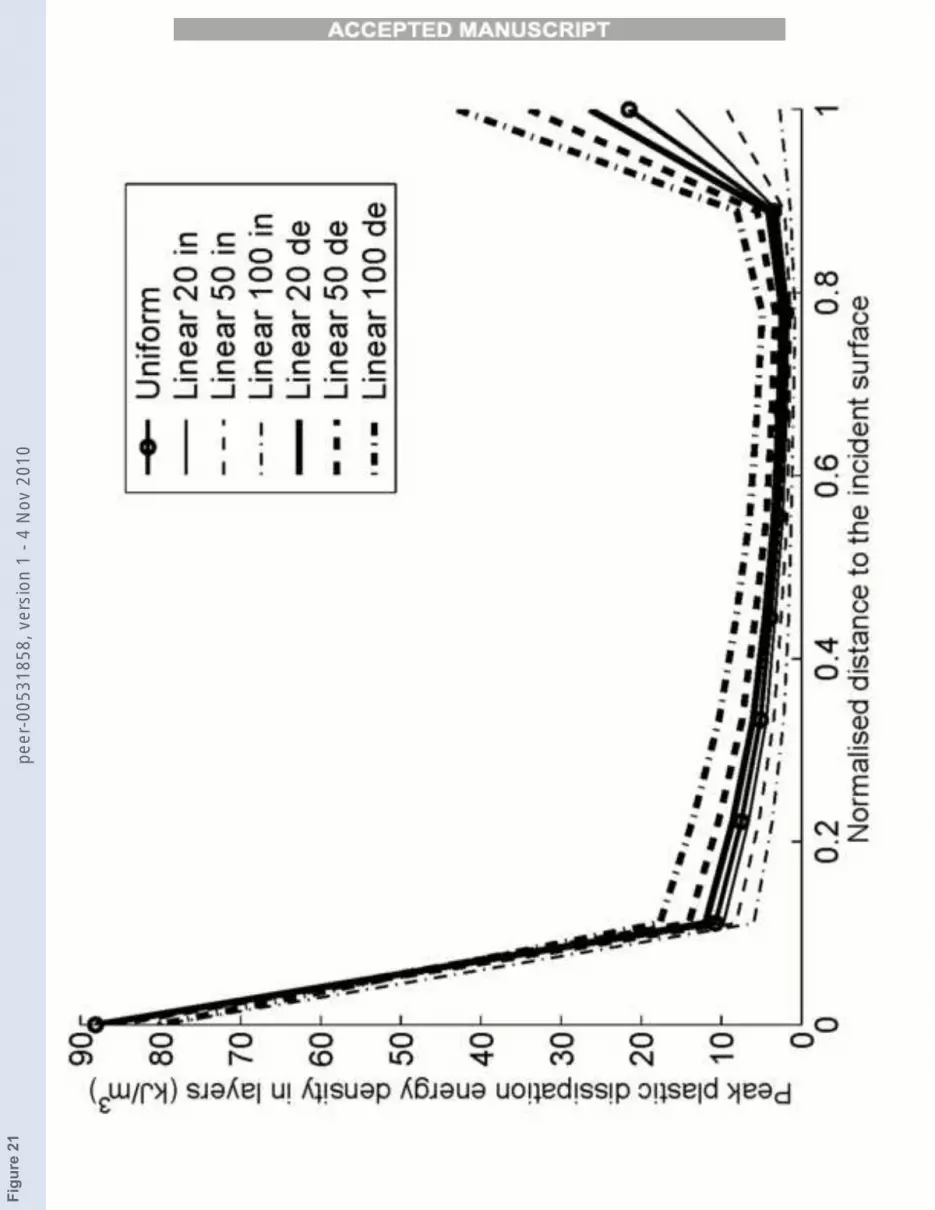
The sensitivity of the peak plastic dissipation energy density in each layerto the density range (Δρ) is shown in Fig. 21 for the linear gradient. Theplastic dissipation energy density is highest for the widest density range withdecreasing density range (100 de) and lowest for the widest density rangewith increasing density range (100 in). However, the density value and themagnitude of peak stress at the distal surface for the widest density rangewith decreasing density range (100 de) is the lowest. The reason for this isthat the lowest yield stress is associated with this density.
Fig. 21. Comparison of peak plastic dissipation energy density in layers betweenvarious density ranges (linear gradient; in-increasing density; de-decreasing density.)
The plastic mechanism associated with the fact that the FGFMs absorb moreenergy than the uniform foam can be explained as follows:
The main mechanism by which a foam absorbs energy or attenuates stress isthrough plastic deformation. As a stress wave propagates along the z-directionthrough a uniform foam, it will plastically deform the foam until its magnitude,σw, becomes lower than the foam’s yield stress, σy. Once this occurs, the
16
peer
-005
3185
8, v
ersi
on 1
- 4
Nov
201
0
Accep
ted m
anusc
ript
remainder of the wave will propagate elastically with little additional energydissipation since no more plastic deformation will occur. It can be deduced thatif σy were to decrease, or σw were to increase in the z-direction there would bea time delay in σw attenuating to the value of σy, allowing greater amounts ofenergy to be absorbed plastically. This is exactly what an FGFM is designedto achieve: the yield stress σy of a graded foam diminishes in the z-direction asthe density decreases, or the wave stress σw of a graded foam amplifies in thez-direction as the density increases. Ideally, in order to maximise the amountof plastic deformation in a graded foam, the yield stress σy at any point zshould be equal to the stress wave magnitude σw at z, while the change inyield stress between any two points z and z + δz should be greater than δσw
over the distance δz. Symbolically:
σy |z = σw |z, ∀z (14)
∂σy
∂z≥
∂σw
∂z(15)
In essence, the plastic dissipation energy density is a combined result of theachieved stress level and yield stress. A comprehensive study of this can leadto an optimised density range and gradient function for each amplitude ofincident wave. The work of Cui et al [13] provides a series of such results.
4 Conclusions
The current study established an FE model of the SHPB test and validatedit against a complementary set of laboratory SHPB tests. Wave propagationthrough the FGFMs were analysed using this FE model. The principle findingsof this study are outlined as follows:
• The plateau stress of ALPORAS� foam is shown to be strain rate sensitivewhen moving from quasi-static (�1/s) to strain rates on the order of 1000/s.However, higher strain rates (≈ 2000/s) appeared to influence the plateaustress only slightly. This indicates that once dynamic conditions are reached,
ALPORAS� foam becomes relatively strain rate insensitive. Sensitivityfrom static to dynamic conditions will be implemented into the presentFEM model in due course.
• Corrections for wave dispersion should be accounted for when using lowimpedance pressure bars, i.e. a purely elastic behaviour cannot be assumed.This can be achieved using Fourier theory and knowledge of the material’sviscoelastic behaviour.
• The variation in a cellular FGFM would make it extremely difficult to dy-namically test and obtain valid results using a traditional SHPB apparatus,
17
peer
-005
3185
8, v
ersi
on 1
- 4
Nov
201
0
Accep
ted m
anusc
ript
due to the limiting assumptions that are made for Equations (1) to (3). Vari-ables that a FGM would introduce, such as a spatially varying yield stress,varying density and/or varying strain rate sensitivities, would almost cer-tainly invalidate any efforts in assuring stress-strain uniformity, in whichcase only an average stress-strain result could be obtained. This problemcan be overcome by virtually testing such materials since Equations (1) to(3) are not necessary to calculate the constitutive outputs.
• The amplitude of a stress wave propagating through a FGFM can be shapedby the gradient functions according to which the foam density varies throughthe direction of wave propagation.
• The local plastic dissipation energy density is a combined result of theachieved local stress level and the local yield stress. Optimum gradient func-tions and density ranges can be achieved by the optimisation design usingthis FE model.
The current study considered an FGFM graded in one dimension and hasshown that improved energy management can be obtained under uni-axialloading conditions. However, it would be unreasonable to assume that such agradient would provide an advantage in impact management in any scenarioother than if the direction of the impact coincides very closely to the directionof the gradient. Hypothetically speaking, an FGFM graded in three mutu-ally orthogonal dimensions may be more suitable for general triaxial loadingconditions. However, the influence and interdependency that would inevitablyarise from three mutually orthogonal gradients would complicate the problemdescription and hence the solving procedure many times over. It is likely thatan FGFM would be most advantageous for applications in which the directionof a likely impact can be predicted with reasonable accuracy [35][36][37]. Forexample, the force to a helmet during an impact can, in the majority of cases,be assumed to act approximately normal to the point of impact (assuming thehorizontal component of the fall is small compared to the vertical component),i.e., through the thickness of a helmet liner, for which the principle directionof an impact is typically also through the thickness.
Acknowledgements
This study is funded by Enterprise Ireland (PC/2005/071) and the Turf Clubof Ireland.
18
peer
-005
3185
8, v
ersi
on 1
- 4
Nov
201
0

Accep
ted m
anusc
ript
References
[1] N. Hilyard, L. Djiauw, Observations on the impact behaviour of polyurethanefoams; I. the polymer matrix, Journal of Cellular Plastics 7 (1971) 33 – 42.
[2] N. Mills, A. Gilchrist, The effectiveness of foams in bicycle and motorcyclehelmets, Accident Analysis and Prevention 23 (1991) 153 – 163.
[3] L. D. Landro, G. Sala, D. Olivieri, Deformation mechanisms and energyabsorption of polystyrene foams for protective helmets, Polymer Testing 21(2002) 217 – 228.
[4] V. Deshpande, N. Fleck, High strain rate compressive behaviour of aluminiumalloy foams, International Journal of Impact Engineering 44 (2000) 277–298.
[5] J. L. Jr, K. A. Dannemann, Strain rate effects in porous materials, porousand cellular materials for structural applications, Materials Research SocietySymposium Proceedings 521 (1998) 103–108.
[6] M. Peroni, L. Peroni, M. Avalle, High strain-rate compression test on metallicfoam using a multiple pulse SHPB apparatus, Journal de Physique IV France134 (2006) 609–616.
[7] H. Kanahashi, T. Mukai, Y. Yamada, K. Shimojima, M. Mabuchi, T. Nieh,K. Higashi, Dynamic compression of an ultra-low density aluminium foam,Material Science and Engineering A 280 (2000) 349–353.
[8] K. Dannemann, J. L. Jr, High strain rate compression of closed-cell aluminiumfoams, Material Science and Engineering A 293 (2000) 157–164.
[9] I. Elnasri, S. Pattofatto, H. Zhao, H. Tsitsiris, F. Hild, Y. Girard, Shockenhancement of cellular structures under impact loading: Part i experiments,Journal of the Mechanics and Physics of Solids 55 (2007) 2652 – 2671.
[10] H. Zhao, S. Abdennadher, On the strength enhancement under impact loadingof square tubes made from rate insensitive metals, International Journal ofSolids and Structures 41 (2004) 6677–6697.
[11] J. W. Klintworth, Dynamic crushing of cellular solids, Ph.D. thesis, Universityof Cambridge (1989).
[12] S. Reid, C. Peng, Dynamic uniaxial crushing of wood, International Journal ofImpact Engineering 19 (1997) 531–570.
[13] L. Cui, S. Kiernan, M. D. Gilchrist, Designing the energy absorption capacityof functionally graded foam materials, Materials Science and Engineering A Inpress, DOI: 10.1016/j.msea.2008.12.011.
[14] H. A. Bruck, A one-dimensional model for designing functionally gradedmaterials to manage stress waves, International Journal of Solids and Structures37 (2000) 6383 – 6395.
19
peer
-005
3185
8, v
ersi
on 1
- 4
Nov
201
0

Accep
ted m
anusc
ript
[15] A. Berezovski, J. Engelbrecht, G. A. Maugin, Numerical simulation of two-dimensional wave propagation in functionally graded materials, EuropeanJournal of Mechanics A/Solids 22 (2003) 257–256.
[16] A. H. Brothers, D. C. Dunand, Mechanical properties of a density-gradedreplicated aluminium foam, Material Science and Engineering A 489 (2008)439 – 443.
[17] Y. Matsumoto, A. Brothers, S. Stock, D. Dunand, Uniform and graded chemicalmilling of aluminum foams, Materials Science and Engineering A 447 (2007) 150– 157.
[18] B. Kieback, A. Neubrand, H. Riedel, Processing techniques for functionallygraded materials, Materials Science and Engineering A 362 (2003) 81 – 105.
[19] AMSE, Split-hopkinson pressure bar apparatus. An historic mechanicalengineering landmark, Designation Ceremony, Southwest Research Institute.
[20] M. M. Al-Mousawi, S. R. Reid, W. F. Deans, The use of the split hopkinsonpressure bar techniques in high strain rate materials testing, Proceedings of theI MECH E Part C Journal of Mechanical Engineering Science 211 (1997) 273– 292.
[21] A. Bragov, A. Lomunov, I. Sergeichev, K. Tsembelis, W. Proud, Determinationof physicomechanical properties of soft soils from medium to high strain rates,International Journal of Impact Engineering 35 (2008) 967 – 976.
[22] L. Ninan, J. Tsai, C. Sun, Use of split hopkinson pressure bar for testing off-axiscomposites, International Journal of Impact Engineering 25 (2001) 291 – 313.
[23] A. Sharma, A. Shukla, R. A. Prosser, Mechanical characterization of softmaterials using high speed photography and split hopkinson pressure bartechnique, Journal of Materials Science 37 (2002) 1005 – 1017.
[24] O. Lee, M. Kim, Dynamic material property characterization by using splithopkinson pressure bar (SHPB) technique, Nuclear Engineering and Design226 (2004) 119 – 125.
[25] W. Chen, B. Song, D. J. Frew, M. J. Forrestal, Dynamic small strainmeasurements of a metal specimen with a split hopkinson pressure bar, Societyfor Experimental Mechanics 43 (2003) 20 – 23.
[26] O. Sawas, N. S. Brar, R. A. Brockman, Dynamic characterization of compliantmaterials using an all-polymeric split hopkinson bar, ExperimentaI Mechanics38 (1998) 204 – 210.
[27] W. Chen, F. Lu, D. J. Frew, M. J. Forrestal, Dynamic compression testing ofsoft materials, Journal of Applied Mechanics 69 (2002) 214 – 223.
[28] W. Chen, F. Lu, N. Winfree, High-strain-rate compressive behavior of a rigidpolyurethane foam with various densities, Experimental Mechanics 42 (2002)65 – 73.
20
peer
-005
3185
8, v
ersi
on 1
- 4
Nov
201
0
Accep
ted m
anusc
ript
[29] H. Zhao, G. Gary, On the use of shpb techniques to determine the dynamicbehaviour of materials in the range of small strains., International Journal ofSolids and Structures (1996) 3363 – 3375.
[30] R. H. Blanc, Transient wave propagation methods for determining theviscoelastic properties of solids, Journal of Applied Mechanics 60 (1993) 763– 768.
[31] H. Zhao, G. Gary, A three dimensional analytical solution of the longitudinalwave propagation in an infinite linear viscoelastic cylindrical bar. applicationto experimental techniques, Journal of The Mechanics and Physics of Solids 43(1995) 1335 – 1348.
[32] ABAQUS, ABAQUS Analysis User’s Manual, Version 6.7, c©ABAQUS, Inc.(2007).
[33] M. Schraad, F. Harlow, A stochastic constitutive model for disordered cellularmaterials: Finite-strain uni-axial compression, International Journal of Solidsand Structures 43 (2006) 3542 – 3568.
[34] T. J. Horgan, M. D. Gilchrist, Influence of FE model variability in predictingbrain motion and intracranial pressure changes in head impact simulations,International Journal of Crashworthiness 9(4) (2004) 401 – 418.
[35] K. O’Riordain, P. Thomas, J. Phillips, M. Gilchrist, Reconstruction of real worldhead injury accidents resulting from falls using multibody dynamics, ClinicalBiomechanics 18 (2003) 590 – 600.
[36] M. D. Gilchrist, D. O’Donoghue, Simulation of the development of frontal headimpact injury., Computational Mechanics 26(3) (2000) 229 – 235.
[37] M. D. Gilchrist, D. O’Donoghue, T. Horgan, A two dimensional analysis ofthe biomechanics of frontal and occipital head impact injuries, InternationalJournal of Crashworthiness 6(2) (2001) 253 – 262.
21
peer
-005
3185
8, v
ersi
on 1
- 4
Nov
201
0
Accep
ted m
anusc
ript
Figu
re 1
peer
-005
3185
8, v
ersi
on 1
- 4
Nov
201
0

Accep
ted m
anusc
ript
Figu
re 2
peer
-005
3185
8, v
ersi
on 1
- 4
Nov
201
0

Accep
ted m
anusc
ript
Figu
re 3
ape
er-0
0531
858,
ver
sion
1 -
4 N
ov 2
010

Accep
ted m
anusc
ript
Figu
re 3
bpe
er-0
0531
858,
ver
sion
1 -
4 N
ov 2
010
Accep
ted m
anusc
ript
Figu
re 4
ape
er-0
0531
858,
ver
sion
1 -
4 N
ov 2
010

Accep
ted m
anusc
ript
Figu
re 4
bpe
er-0
0531
858,
ver
sion
1 -
4 N
ov 2
010
Accep
ted m
anusc
ript
Figu
re 5
ape
er-0
0531
858,
ver
sion
1 -
4 N
ov 2
010
Accep
ted m
anusc
ript
Figu
re 5
bpe
er-0
0531
858,
ver
sion
1 -
4 N
ov 2
010
Accep
ted m
anusc
ript
Figu
re 6
peer
-005
3185
8, v
ersi
on 1
- 4
Nov
201
0
Accep
ted m
anusc
ript
Figu
re 7
peer
-005
3185
8, v
ersi
on 1
- 4
Nov
201
0

Accep
ted m
anusc
ript
Figu
re 8
peer
-005
3185
8, v
ersi
on 1
- 4
Nov
201
0

Accep
ted m
anusc
ript
Figu
re 9
peer
-005
3185
8, v
ersi
on 1
- 4
Nov
201
0

Accep
ted m
anusc
ript
Figu
re 1
0ape
er-0
0531
858,
ver
sion
1 -
4 N
ov 2
010

Accep
ted m
anusc
ript
Figu
re 1
0bpe
er-0
0531
858,
ver
sion
1 -
4 N
ov 2
010

Accep
ted m
anusc
ript
Figu
re 1
1ape
er-0
0531
858,
ver
sion
1 -
4 N
ov 2
010

Accep
ted m
anusc
ript
Figu
re 1
1bpe
er-0
0531
858,
ver
sion
1 -
4 N
ov 2
010
Accep
ted m
anusc
ript
Figu
re 1
2pe
er-0
0531
858,
ver
sion
1 -
4 N
ov 2
010
Accep
ted m
anusc
ript
Figu
re 1
3ape
er-0
0531
858,
ver
sion
1 -
4 N
ov 2
010

Accep
ted m
anusc
ript
Figu
re 1
3bpe
er-0
0531
858,
ver
sion
1 -
4 N
ov 2
010
Accep
ted m
anusc
ript
Figu
re 1
4ape
er-0
0531
858,
ver
sion
1 -
4 N
ov 2
010

Accep
ted m
anusc
ript
Figu
re 1
4bpe
er-0
0531
858,
ver
sion
1 -
4 N
ov 2
010

Accep
ted m
anusc
ript
Figu
re 1
5pe
er-0
0531
858,
ver
sion
1 -
4 N
ov 2
010
Accep
ted m
anusc
ript
Figu
re 1
6pe
er-0
0531
858,
ver
sion
1 -
4 N
ov 2
010

Accep
ted m
anusc
ript
Figu
re 1
7ape
er-0
0531
858,
ver
sion
1 -
4 N
ov 2
010

Accep
ted m
anusc
ript
Figu
re 1
7bpe
er-0
0531
858,
ver
sion
1 -
4 N
ov 2
010

Accep
ted m
anusc
ript
Figu
re 1
8ape
er-0
0531
858,
ver
sion
1 -
4 N
ov 2
010
Accep
ted m
anusc
ript
Figu
re 1
8bpe
er-0
0531
858,
ver
sion
1 -
4 N
ov 2
010
Accep
ted m
anusc
ript
Figu
re 1
9pe
er-0
0531
858,
ver
sion
1 -
4 N
ov 2
010
Accep
ted m
anusc
ript
Figu
re 2
0ape
er-0
0531
858,
ver
sion
1 -
4 N
ov 2
010

Accep
ted m
anusc
ript
Figu
re 2
0bpe
er-0
0531
858,
ver
sion
1 -
4 N
ov 2
010
Accep
ted m
anusc
ript
Figu
re 2
1pe
er-0
0531
858,
ver
sion
1 -
4 N
ov 2
010
Accep
ted m
anusc
ript
Table 1Densities, standard deviations and 95% Confidence Intervals for 5, 10, 20 mm spec-imens
l (mm) ρavg (kg/m3) std (σ) 95% CI
5 241.0 3.25 237.0 - 245.1
10 260.8 12.93 252.1 - 269.5
20 270.7 26.30 253.0 - 288.4
All Specimens 261.2 21.18 252.8 - 269.6
1
Table 1pe
er-0
0531
858,
ver
sion
1 -
4 N
ov 2
010

Accep
ted m
anusc
ript
Table 2Density parameters for the FGFM specimens
Gradients Density Range (kg/m3)
Δρ = 100 Δρ = 50 Δρ= 20
Uniform 250 250 250
Logarithmic 179.34-279.34
Square Root 184.39-284.39
Linear 200-300 225-275 240-260
Quadratic 215.79-315.79
Cubic 223.68-323.68
Table 2pe
er-0
0531
858,
ver
sion
1 -
4 N
ov 2
010
Accep
ted m
anusc
ript
Table 3Ratio of stress magnitude of wave in 20th layer to that in 1st layer (Δρ =100 kg/m3)
Calculated ratio (Eq (7)) Ratio in simulation
Gradients Increasing Decreasing Increasing Decreasing
density density density density
Uniform 1.000 1.000 0.985 0.985
Logarithmic 1.396 0.896 1.538 0.445
Square Root 1.380 0.895 1.589 0.464
Linear 1.234 0.822 1.458 0.444
Quadratic 1.171 0.800 1.503 0.461
Cubic 1.146 0.792 1.389 0.471
Table 3pe
er-0
0531
858,
ver
sion
1 -
4 N
ov 2
010