promoting multiple representations in algebra
TRANSCRIPT
1
PROMOTING MULTIPLE REPRESENTATIONS IN ALGEBRA
Alex Friedlander Michal Tabach
Department of Science Teaching
Weizmann Institute of Science
Rehovot 76100
ISRAEL
E-mail: [email protected]
Phone: 972–8–934-2817
A. A. Cuoco (Ed.), 2001 Yearbook of the National Council of the Teachers of Mathematics: The Roles of Representation in School Mathematics (pp.173-185). Reston, Virginia: The Council.
2
Background
Many teachers and researchers know, that the presentation of algebra almost
exclusively as the study of expressions and equations, can pose serious obstacles in
the process of effective and meaningful learning (Kieran 1992). As a result, from the
very beginning of learning algebra, the use of various representations is recommended
(NCTM 1989).
The use of verbal, numerical, graphical, and algebraic representations has the
potential of making the process of learning algebra meaningful and effective. In order
that this potential be realized in practice, we must be aware of both the advantages
and disadvantages of each representation. The following are some of the strengths
and weaknesses of each representation.
a) The verbal representation is usually used in posing a problem, and is also needed
in the final interpretation of the results obtained in the solution process. The verbal
presentation of a problem creates a natural environment for understanding its
context and for communicating its solution. Verbal reasoning can also be a
powerful tool for solving problems and can facilitate the presentation and
application of general patterns. It also emphasizes the connection between
mathematics and other domains of academic and everyday life. On the other hand,
the use of verbal language can be ambiguous and elicit irrelevant or misleading
associations; it is less universal and its dependence on personal style can be an
obstacle in mathematical communication. Moreover, if symbols are avoided,
verbal communication or reasoning may be a less powerful mathematical tool than
more formal approaches.
b) The numerical representation is familiar to students at the beginning algebra stage.
Numerical approaches provide a convenient and effective bridge to algebra, and
frequently precede the use of any other representation. The use of numbers is
important in acquiring a first understanding of a problem, and in the investigation
of particular cases. However, its lack of generality can be a disadvantage. A
numerical approach may not be very effective in providing a general picture and as
a result, some important aspects or solutions of a problem may be missed. Thus,
its potential as a tool for solving problems may be sometimes quite limited.
3
c) The graphical representation is effective in providing a clear picture of a real
valued function of a real variable. Graphs are intuitive and particularly appealing
to students who like a visual approach. On the other hand, graphical representation
may lack the required accuracy, is influenced by external factors (such as scaling)
and frequently presents only a section of the problem’s domain or range. Its power
as a mathematical tool varies, according to the task at hand.
d) The algebraic representation is concise, general, and effective in the presentation
of patterns and mathematical models and hence, it is a powerful tool. The
manipulation of algebraic objects is sometimes the only method of justifying or
proving general statements. However, an exclusive use of algebraic symbols (at
any stage of learning) may blur or obstruct the mathematical meaning or nature of
the represented objects, and cause difficulties in some students’ interpretation of
their results.
The importance of working with various representations is a result of these and other
advantages and disadvantages of each representation, and the need to cater to
students’ individual styles of thinking. Thus, both curriculum developers and teachers
should be aware of the need to work in an environment of multiple representations –
i.e., an environment that allows the representation of a problem and its solution in
several ways (usually some, or all of the four representations mentioned above).
Although each representation has its disadvantages, their combined use can cancel
them out and proves to be an effective tool (Kaput 1992). The Standards (NCTM
1989) relate to this issue as following:
Different representations of problems serve as different lenses through
which students interpret the problems and the solutions. If students are
to become mathematically powerful, they must be flexible enough to
approach situations in a variety of ways and recognize the relationships
among different points of view. (p. 84)
More specifically, Ainsworth and colleagues (1998) mention three reasons why
multiple representations may promote learning: (a) it is highly probable that different
representations express different aspects more clearly and that, hence, the information
gained from combining representations will be greater than can be gained from a
single representation; (b) multiple representations constrain each other, so that the
4
space of permissible operators becomes smaller; (c) when required to relate multiple
representations to each other, the learner has to engage in activities which promote
understanding, in contrast to rote learning.
In the case of algebra learning, the use of computers contributes considerably to the
promotion of multiple representations (Heid 1995). While working with spreadsheets
and graph plotters, algebraic expressions become a natural requirement and provide
an effective means for obtaining a numerical and graphical representation of the
relevant data. In a learning environment that lacks computers, the drawing of graphs
or the production of extended lists of numbers tends to be tedious and unrewarding.
In the process of solving a problem it is difficult to isolate representations. Thus in
most cases, any approach is accompanied by verbal explanations or by numerical
computations. In this paper we restrict ourselves to the use of representations as
mathematical tools (and less as means of communication) in the context of beginning
algebra. Thus the use of a sequence or table to answer a question will be an example
of a numerical approach, whereas the use of verbal reasoning (possibly including
some computations and numbers) will be considered a verbal approach. The use of
graphs or algebraic expressions is easier to define and detect.
The ability to work with a variety of representations cannot be expected to develop
spontaneously. Therefore, when learning algebra in either a technologically based or
in a more conventional environment, student awareness and ability to use various
representations must be promoted actively and systematically. We describe some
ways in which tasks can be designed to promote the use of multiple representations.
The following section presents, as an example, an activity taken from a beginning
algebra course for seventh grade students, and discusses its potential to achieve this
goal. We also report some findings about students’ use of representations in an
assessment task given at the end of one week of work on the activity.
Designing Tasks
In our attempts to promote student thinking and actions in a variety of representations,
we found some effective types of tasks and questioning. We will analyze the
structure of an activity called Savings, to illustrate the claim that tasks can be
designed to encourage simultaneous use of several representations.
5
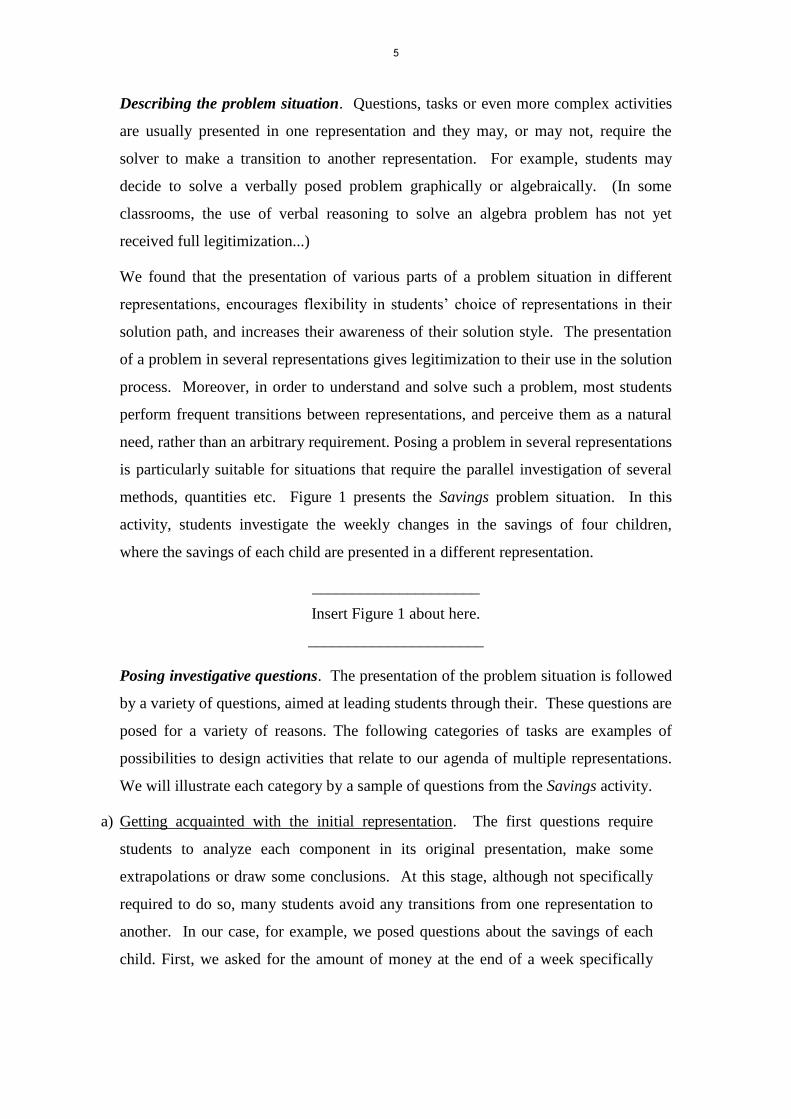
Describing the problem situation. Questions, tasks or even more complex activities
are usually presented in one representation and they may, or may not, require the
solver to make a transition to another representation. For example, students may
decide to solve a verbally posed problem graphically or algebraically. (In some
classrooms, the use of verbal reasoning to solve an algebra problem has not yet
received full legitimization...)
We found that the presentation of various parts of a problem situation in different
representations, encourages flexibility in students’ choice of representations in their
solution path, and increases their awareness of their solution style. The presentation
of a problem in several representations gives legitimization to their use in the solution
process. Moreover, in order to understand and solve such a problem, most students
perform frequent transitions between representations, and perceive them as a natural
need, rather than an arbitrary requirement. Posing a problem in several representations
is particularly suitable for situations that require the parallel investigation of several
methods, quantities etc. Figure 1 presents the Savings problem situation. In this
activity, students investigate the weekly changes in the savings of four children,
where the savings of each child are presented in a different representation.
_____________________
Insert Figure 1 about here.
______________________
Posing investigative questions. The presentation of the problem situation is followed
by a variety of questions, aimed at leading students through their. These questions are
posed for a variety of reasons. The following categories of tasks are examples of
possibilities to design activities that relate to our agenda of multiple representations.
We will illustrate each category by a sample of questions from the Savings activity.
a) Getting acquainted with the initial representation. The first questions require
students to analyze each component in its original presentation, make some
extrapolations or draw some conclusions. At this stage, although not specifically
required to do so, many students avoid any transitions from one representation to
another. In our case, for example, we posed questions about the savings of each
child. First, we asked for the amount of money at the end of a week specifically
6
included in the data, then to extrapolate to a more advanced week, and finally, we
asked for the week corresponding to a given amount of money.
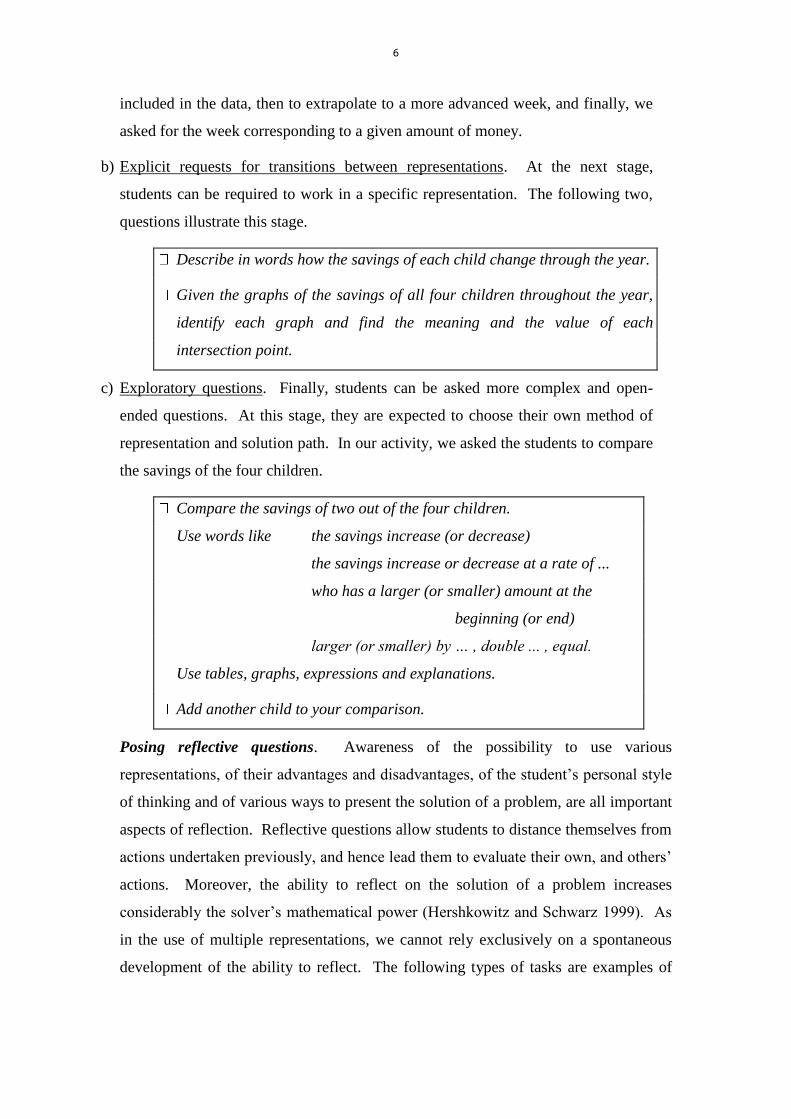
b) Explicit requests for transitions between representations. At the next stage,
students can be required to work in a specific representation. The following two,
questions illustrate this stage.
Describe in words how the savings of each child change through the year.
Given the graphs of the savings of all four children throughout the year,
identify each graph and find the meaning and the value of each
intersection point.
c) Exploratory questions. Finally, students can be asked more complex and open-
ended questions. At this stage, they are expected to choose their own method of
representation and solution path. In our activity, we asked the students to compare
the savings of the four children.
Compare the savings of two out of the four children.
Use words like the savings increase (or decrease)
the savings increase or decrease at a rate of ...
who has a larger (or smaller) amount at the
beginning (or end)
larger (or smaller) by … , double ... , equal.
Use tables, graphs, expressions and explanations.
Add another child to your comparison.
Posing reflective questions. Awareness of the possibility to use various
representations, of their advantages and disadvantages, of the student’s personal style
of thinking and of various ways to present the solution of a problem, are all important
aspects of reflection. Reflective questions allow students to distance themselves from
actions undertaken previously, and hence lead them to evaluate their own, and others’
actions. Moreover, the ability to reflect on the solution of a problem increases
considerably the solver’s mathematical power (Hershkowitz and Schwarz 1999). As
in the use of multiple representations, we cannot rely exclusively on a spontaneous
development of the ability to reflect. The following types of tasks are examples of
7
possibilities to design activities that make reflection an integral part of the solution
process.
a) Description of work. The requirement to describe one’s work is attached to many
questions. This “habit” is more than routine, and its importance is beyond the need
to document the solution. It allows students to reevaluate their solution strategies
and eventually consider other possibilities. Sometimes, the task can be more
specific. Thus, we can attach to the text of a problem a blank page called Work
Area, with the words Tables, Graphs, Expressions and Descriptions on various
parts of the page. In this case, the use of any particular representation is
recommended, but optional. At other times, we can ask students directly to
mention the representation they used on each occasion.
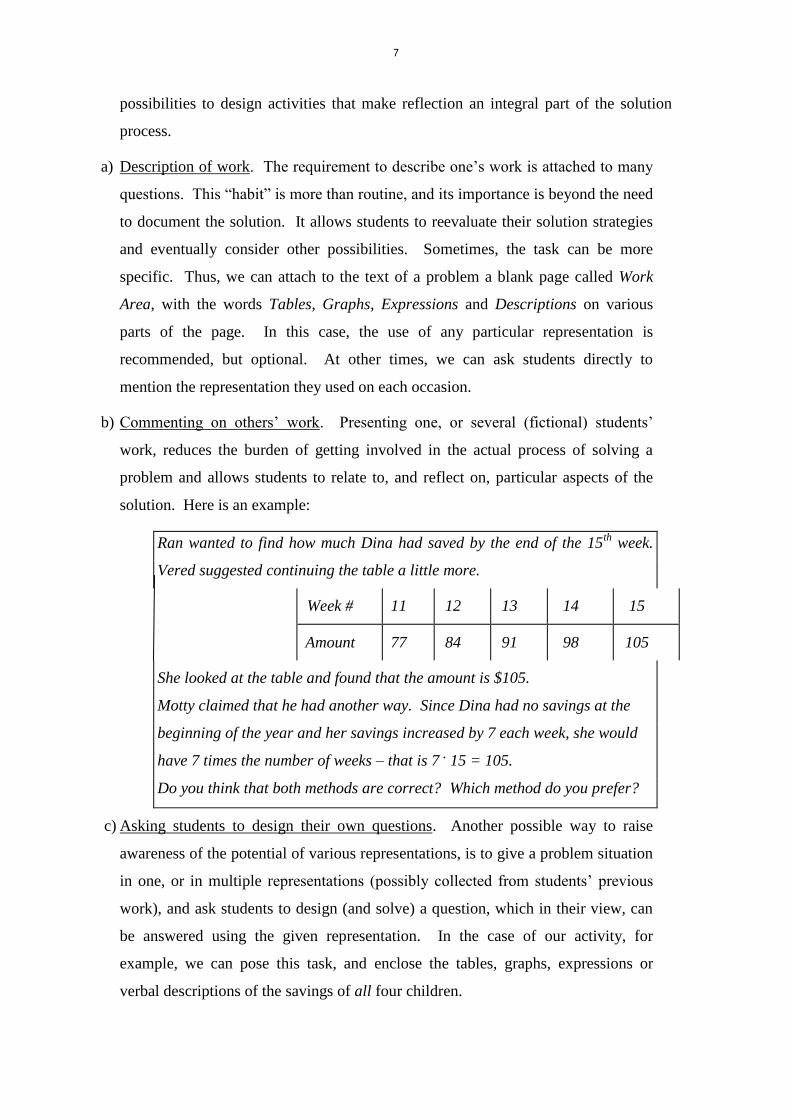
b) Commenting on others’ work. Presenting one, or several (fictional) students’
work, reduces the burden of getting involved in the actual process of solving a
problem and allows students to relate to, and reflect on, particular aspects of the
solution. Here is an example:
Ran wanted to find how much Dina had saved by the end of the 15th
week.
Vered suggested continuing the table a little more.
Week # 11 12 13 14 15
Amount 77 84 91 98 105
She looked at the table and found that the amount is $105.
Motty claimed that he had another way. Since Dina had no savings at the
beginning of the year and her savings increased by 7 each week, she would
have 7 times the number of weeks – that is 7 . 15 = 105.
Do you think that both methods are correct? Which method do you prefer?
c) Asking students to design their own questions. Another possible way to raise
awareness of the potential of various representations, is to give a problem situation
in one, or in multiple representations (possibly collected from students’ previous
work), and ask students to design (and solve) a question, which in their view, can
be answered using the given representation. In the case of our activity, for
example, we can pose this task, and enclose the tables, graphs, expressions or
verbal descriptions of the savings of all four children.
8
d) Asking for reflection on mathematical concept. Journal items are particularly
appropriate for asking students to reflect on possible ways to answer the
posed questions, and of describing their solution. Thus, towards the end of
our activity, the students were required to construct a concept map on means
of representing data and solutions. They were also encouraged to discuss the
advantages and disadvantages of using a particular representation.
Five)Allowing time for reflection. The solution of complex problems over a longer
period of time (in our case, five lessons spread through one week) creates, of itself,
further opportunities for spontaneous or induced reflection.
In the next section, we consider the use of various representations in the solution of a
task by two classes of beginning algebra students, who worked on Savings and other
similar activities.
Assessing Students’ Use of Representations.
After a week of investigating the Savings activity (including one lesson of work with
Excel), the teachers of two seventh grade beginning algebra classes gave an
assessment task related to the same context. The task was given, about two months
after the beginning of the course, to seventy students (M. T. was one of the teachers)
who worked in (thirty five) pairs and without computers. Although the assessment of
the students’ work had a wider scope, we will present here only some findings that
relate to their use of representations. At the initial stage of the task, the savings of
two children during a year were described in a table and a graph. Then, the students
`were required to answer a sequence of questions and were specifically instructed,
both orally and in writing, to show their work and to mention the representation they
used in each answer. Figure 2 presents the first seven (of ten) questions in this task.
_____________________
Insert Figure 2 about here.
______________________
Algebraic expressions were mentioned at the beginning of the task as one of the four
possible representations, but were not actually given. Our impression from the
students’ classroom work indicated that at this stage of the course, they preferred
numerical or verbal solutions, and made a more limited use of graphs, and even less
9
of algebraic expressions. We wanted, however, to have a more detailed picture of
students’ preferences and flexibility in their choice of representations. According to
our (expert) view, different questions in the task favor different representations.
Thus, the first two questions clearly favor the use of the given table of numbers,
whereas in order to find the largest difference between their savings (Question 4), the
use of graphs is more advantageous. In our opinion, the other questions could be
answered with a reasonable investment of effort by choosing from several possible
representations.
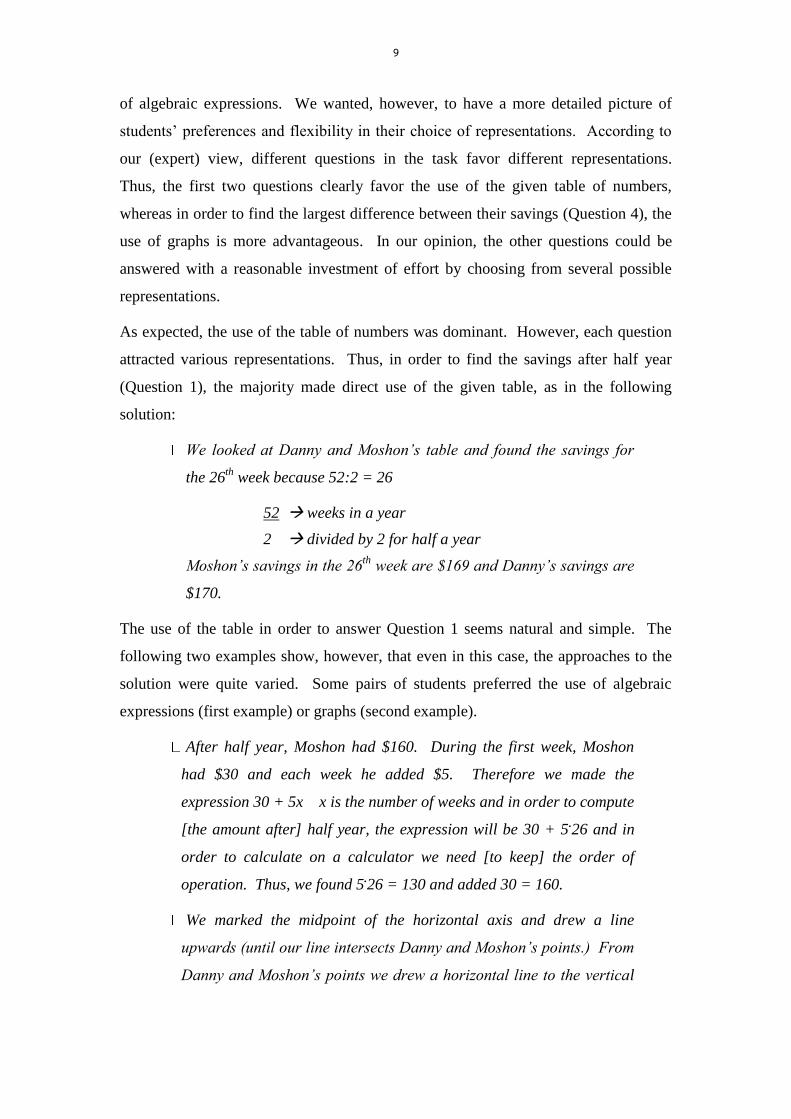
As expected, the use of the table of numbers was dominant. However, each question
attracted various representations. Thus, in order to find the savings after half year
(Question 1), the majority made direct use of the given table, as in the following
solution:
We looked at Danny and Moshon’s table and found the savings for
the 26th
week because 52:2 = 26
52 weeks in a year
2 divided by 2 for half a year
Moshon’s savings in the 26th
week are $169 and Danny’s savings are
$170.
The use of the table in order to answer Question 1 seems natural and simple. The
following two examples show, however, that even in this case, the approaches to the
solution were quite varied. Some pairs of students preferred the use of algebraic
expressions (first example) or graphs (second example).
After half year, Moshon had $160. During the first week, Moshon
had $30 and each week he added $5. Therefore we made the
expression 30 + 5x x is the number of weeks and in order to compute
[the amount after] half year, the expression will be 30 + 5.26 and in
order to calculate on a calculator we need [to keep] the order of
operation. Thus, we found 5.26 = 130 and added 30 = 160.
We marked the midpoint of the horizontal axis and drew a line
upwards (until our line intersects Danny and Moshon’s points.) From
Danny and Moshon’s points we drew a horizontal line to the vertical
11
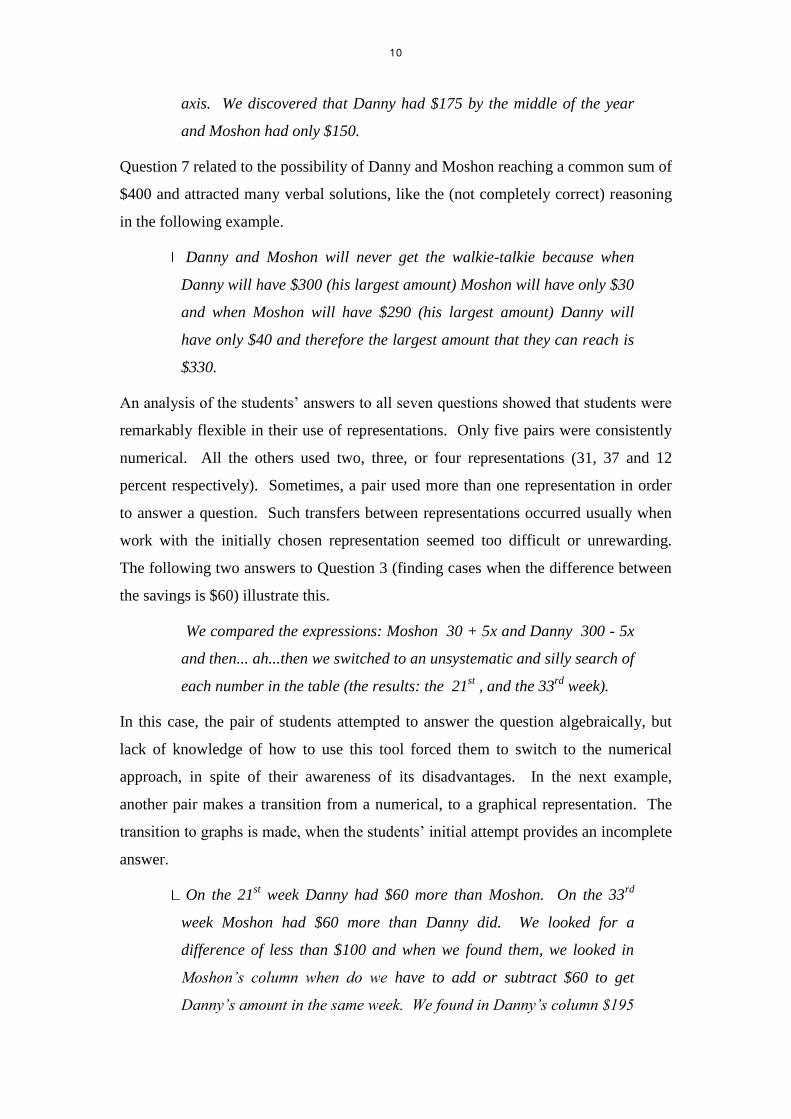
axis. We discovered that Danny had $175 by the middle of the year
and Moshon had only $150.
Question 7 related to the possibility of Danny and Moshon reaching a common sum of
$400 and attracted many verbal solutions, like the (not completely correct) reasoning
in the following example.
Danny and Moshon will never get the walkie-talkie because when
Danny will have $300 (his largest amount) Moshon will have only $30
and when Moshon will have $290 (his largest amount) Danny will
have only $40 and therefore the largest amount that they can reach is
$330.
An analysis of the students’ answers to all seven questions showed that students were
remarkably flexible in their use of representations. Only five pairs were consistently
numerical. All the others used two, three, or four representations (31, 37 and 12
percent respectively). Sometimes, a pair used more than one representation in order
to answer a question. Such transfers between representations occurred usually when
work with the initially chosen representation seemed too difficult or unrewarding.
The following two answers to Question 3 (finding cases when the difference between
the savings is $60) illustrate this.
We compared the expressions: Moshon 30 + 5x and Danny 300 - 5x
and then... ah...then we switched to an unsystematic and silly search of
each number in the table (the results: the 21st , and the 33
rd week).
In this case, the pair of students attempted to answer the question algebraically, but
lack of knowledge of how to use this tool forced them to switch to the numerical
approach, in spite of their awareness of its disadvantages. In the next example,
another pair makes a transition from a numerical, to a graphical representation. The
transition to graphs is made, when the students’ initial attempt provides an incomplete
answer.
On the 21st week Danny had $60 more than Moshon. On the 33
rd
week Moshon had $60 more than Danny did. We looked for a
difference of less than $100 and when we found them, we looked in
Moshon’s column when do we have to add or subtract $60 to get
Danny’s amount in the same week. We found in Danny’s column $195
11
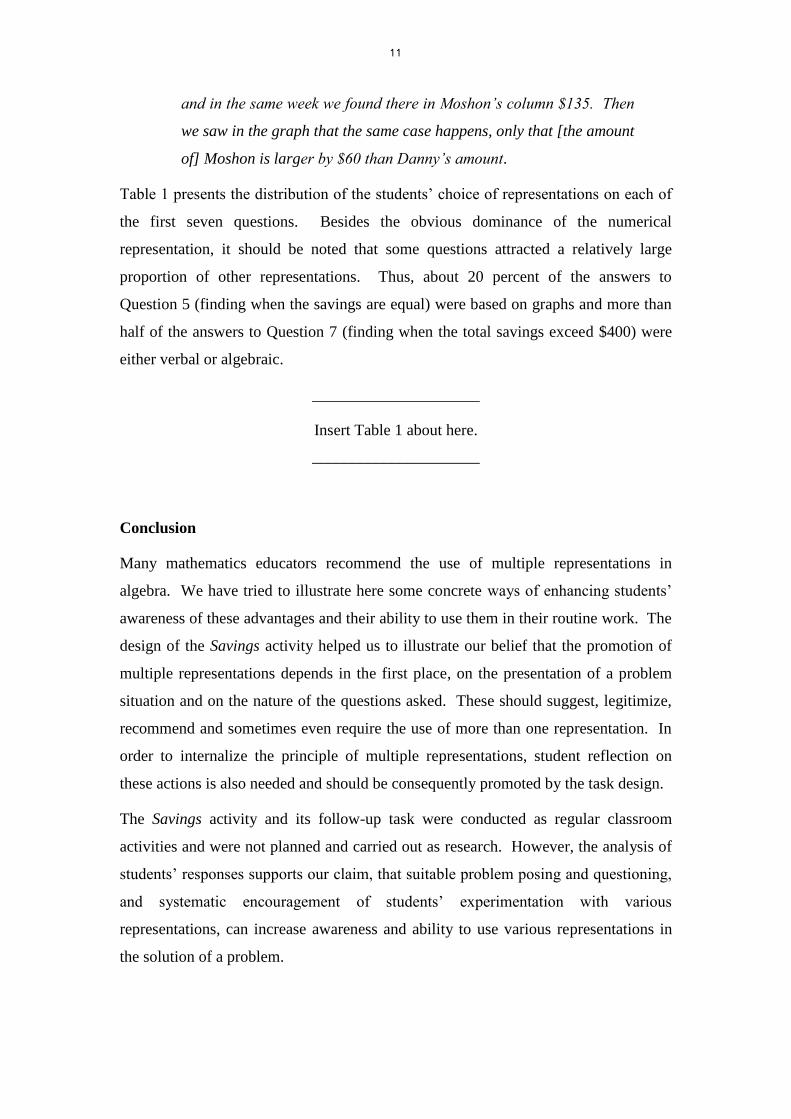
and in the same week we found there in Moshon’s column $135. Then
we saw in the graph that the same case happens, only that [the amount
of] Moshon is larger by $60 than Danny’s amount.
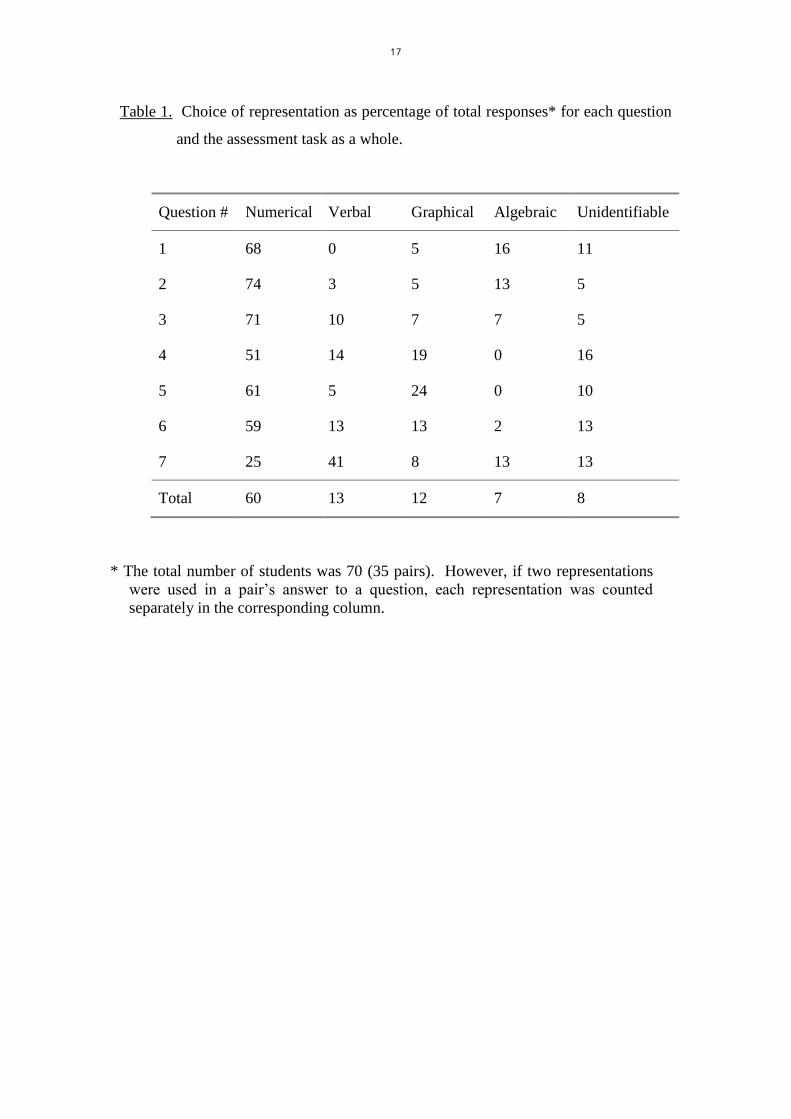
Table 1 presents the distribution of the students’ choice of representations on each of
the first seven questions. Besides the obvious dominance of the numerical
representation, it should be noted that some questions attracted a relatively large
proportion of other representations. Thus, about 20 percent of the answers to
Question 5 (finding when the savings are equal) were based on graphs and more than
half of the answers to Question 7 (finding when the total savings exceed $400) were
either verbal or algebraic.
_____________________
Insert Table 1 about here.
_____________________
Conclusion
Many mathematics educators recommend the use of multiple representations in
algebra. We have tried to illustrate here some concrete ways of enhancing students’
awareness of these advantages and their ability to use them in their routine work. The
design of the Savings activity helped us to illustrate our belief that the promotion of
multiple representations depends in the first place, on the presentation of a problem
situation and on the nature of the questions asked. These should suggest, legitimize,
recommend and sometimes even require the use of more than one representation. In
order to internalize the principle of multiple representations, student reflection on
these actions is also needed and should be consequently promoted by the task design.
The Savings activity and its follow-up task were conducted as regular classroom
activities and were not planned and carried out as research. However, the analysis of
students’ responses supports our claim, that suitable problem posing and questioning,
and systematic encouragement of students’ experimentation with various
representations, can increase awareness and ability to use various representations in
the solution of a problem.
12
The predominant use of the numerical representation was expected. We relate this
preference to the students’ early stage in their learning of algebra and to the fact that
in many cases, the nature of a task makes the use of a numerical approach
mathematically sound.
“The good news”, however, is that if students are provided with an appropriate
learning environment, they will be able and willing to employ a wide variety of
solution tools and paths. In our analysis of students’ work, we found that the choice
of a representation can be the result of the task’s nature, personal preference, the
problem solver’s thinking style or attempts to overcome difficulties encountered
during the use of another representation. Frequently, the choice of representation is
influenced by a combination of several factors. Thus, in order to answer a question,
students may choose a representation, based on their analysis of the problem and on
personal preference, and switch to another representation at a later stage, as a result of
difficulties in the solution process.
References
Ainsworth, Shaaron E., Peter A. Bibby, and David J. Wood. “Analysing the Costs
and Benefits of Multi-Representational Learning Environments.” In Learning
with Multiple Representations, edited by Maarten W. van Someren, Peter
Reimann, Henry P. A.. Boshuizen and Ton de Jong, pp. 120-134. Oxford, UK:
Elsevier Science, 1998.
Heid, Kathleen M. Algebra in a Technological World. Curriculum and Evaluation
Standards for School Mathematics. Addenda Series, Grades 9-12. Reston, Va.:
NCTM, 1995.
Hershkowitz, Rina & Schwarz, Baruch. “Reflective Processes in a Mathematics
Classroom With a Rich Learning Environment.” Cognition and Instruction 17
(1999): 65-91.
Kaput, James J. “Technology and Mathematics Education”. In Handbook of
Research on Mathematics Teaching and Learning, edited by Douglas A. Grouws,
pp.515-556. New York: Macmillan Publishing Company, 1992.

13
Kieran, Carolyn. “The Learning and Teaching of School Algebra.” In Handbook of
Research on Mathematics Teaching and Learning, edited by Douglas A. Grouws,
pp.390-419. New York: Macmillan Publishing Company, 1992.
National Council of Teachers of Mathematics. Curriculum and Evaluation Standards
for School Mathematics. Reston, Va.: The Council, 1989.
14
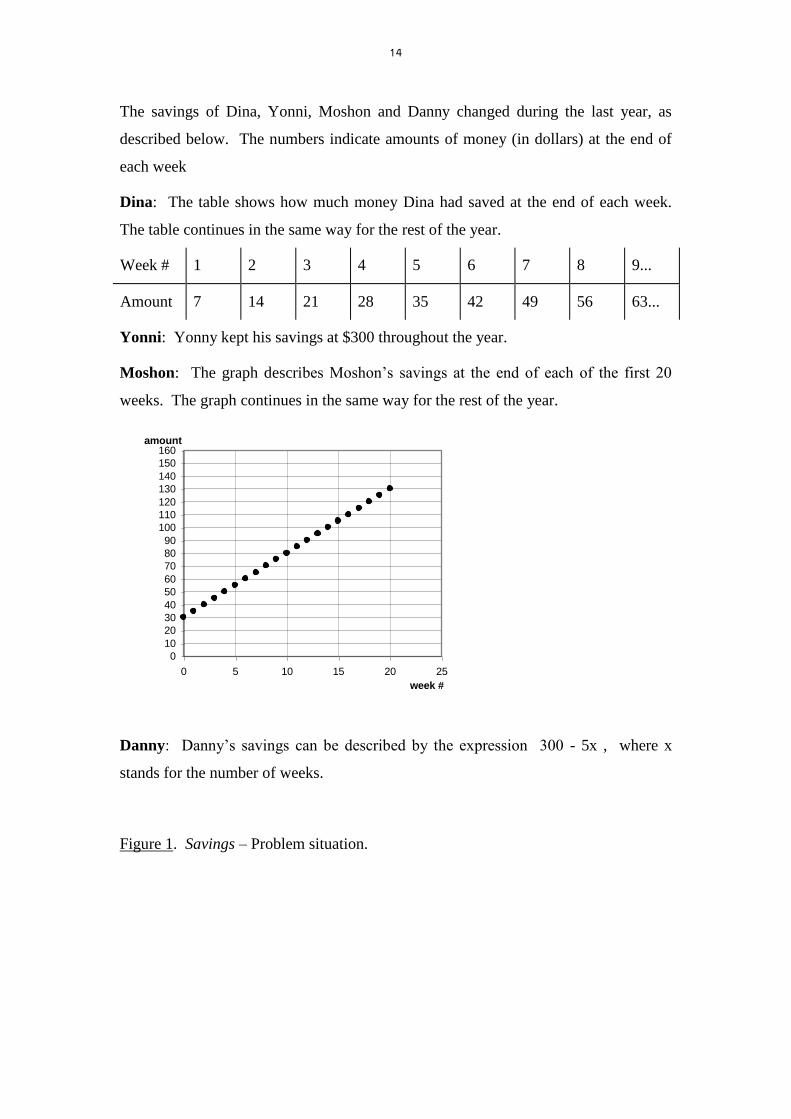
The savings of Dina, Yonni, Moshon and Danny changed during the last year, as
described below. The numbers indicate amounts of money (in dollars) at the end of
each week
Dina: The table shows how much money Dina had saved at the end of each week.
The table continues in the same way for the rest of the year.
Week # 1 2 3 4 5 6 7 8 9...
Amount 7 14 21 28 35 42 49 56 63...
Yonni: Yonny kept his savings at $300 throughout the year.
Moshon: The graph describes Moshon’s savings at the end of each of the first 20
weeks. The graph continues in the same way for the rest of the year.
0
10
20
30
40
50
60
70
80
90
100
110
120
130
140
150
160
0 5 10 15 20 25
week #
amount
Danny: Danny’s savings can be described by the expression 300 - 5x , where x
stands for the number of weeks.
Figure 1. Savings – Problem situation.
15
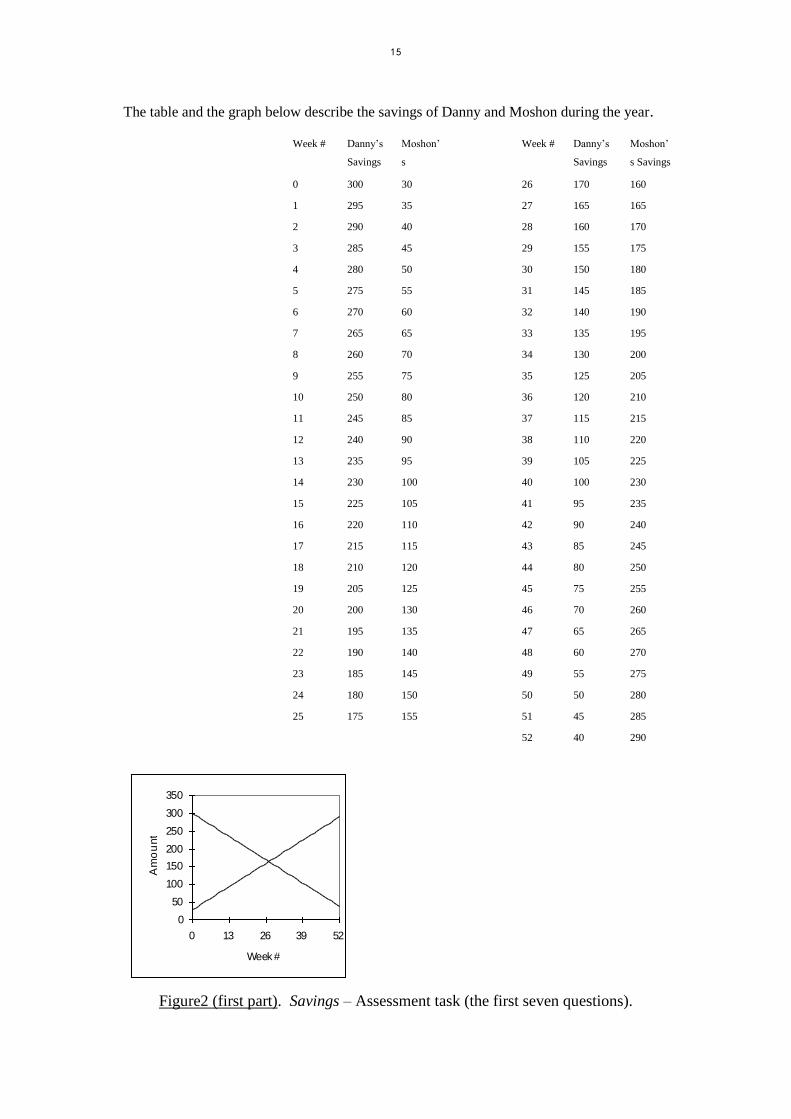
The table and the graph below describe the savings of Danny and Moshon during the year.
Week # Danny’s
Savings
Moshon’
s
Savings
Week # Danny’s
Savings
Moshon’
s Savings
0 300 30 26 170 160
1 295 35 27 165 165
2 290 40 28 160 170
3 285 45 29 155 175
4 280 50 30 150 180
5 275 55 31 145 185
6 270 60 32 140 190
7 265 65 33 135 195
8 260 70 34 130 200
9 255 75 35 125 205
10 250 80 36 120 210
11 245 85 37 115 215
12 240 90 38 110 220
13 235 95 39 105 225
14 230 100 40 100 230
15 225 105 41 95 235
16 220 110 42 90 240
17 215 115 43 85 245
18 210 120 44 80 250
19 205 125 45 75 255
20 200 130 46 70 260
21 195 135 47 65 265
22 190 140 48 60 270
23 185 145 49 55 275
24 180 150 50 50 280
25 175 155 51 45 285
52 40 290
Figure2 (first part). Savings – Assessment task (the first seven questions).
0
50
100
150
200
250
300
350
0 13 26 39 52
Week #
Am
ou
nt
16
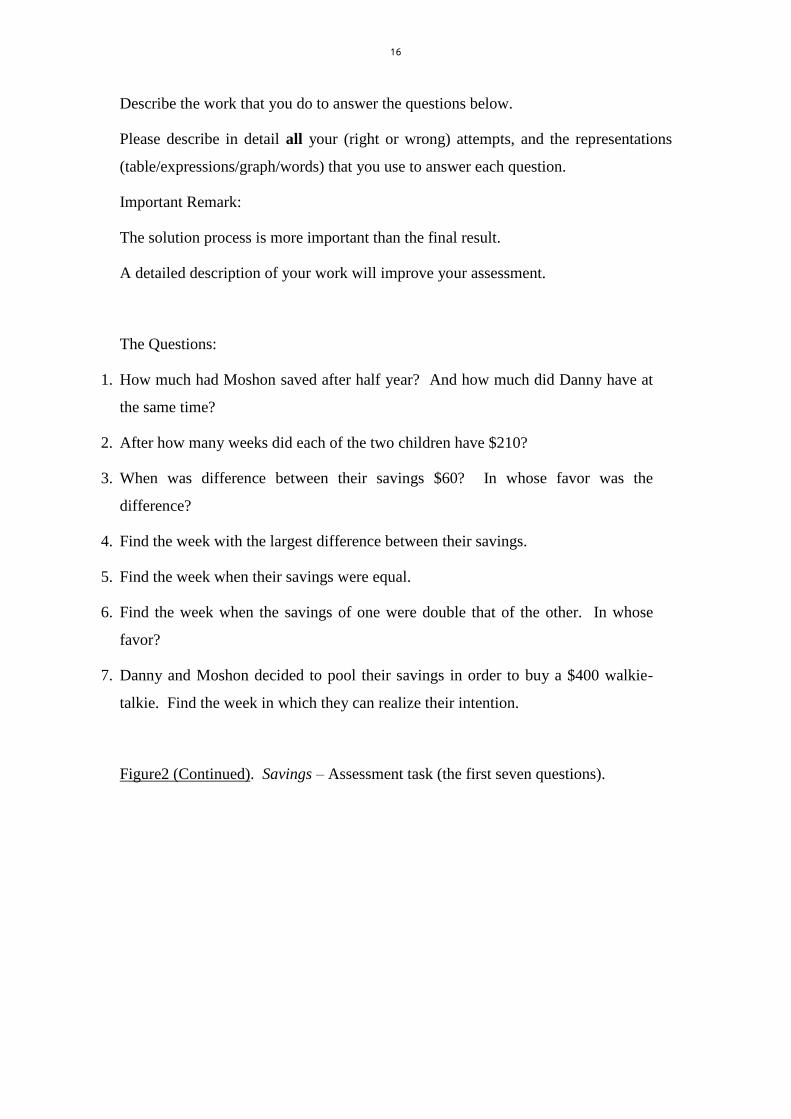
Describe the work that you do to answer the questions below.
Please describe in detail all your (right or wrong) attempts, and the representations
(table/expressions/graph/words) that you use to answer each question.
Important Remark:
The solution process is more important than the final result.
A detailed description of your work will improve your assessment.
The Questions:
1. How much had Moshon saved after half year? And how much did Danny have at
the same time?
2. After how many weeks did each of the two children have $210?
3. When was difference between their savings $60? In whose favor was the
difference?
4. Find the week with the largest difference between their savings.
5. Find the week when their savings were equal.
6. Find the week when the savings of one were double that of the other. In whose
favor?
7. Danny and Moshon decided to pool their savings in order to buy a $400 walkie-
talkie. Find the week in which they can realize their intention.
Figure2 (Continued). Savings – Assessment task (the first seven questions).
17
Table 1. Choice of representation as percentage of total responses* for each question
and the assessment task as a whole.
Question # Numerical Verbal Graphical Algebraic Unidentifiable
1 68 0 5 16 11
2 74 3 5 13 5
3 71 10 7 7 5
4 51 14 19 0 16
5 61 5 24 0 10
6 59 13 13 2 13
7 25 41 8 13 13
Total 60 13 12 7 8
* The total number of students was 70 (35 pairs). However, if two representations
were used in a pair’s answer to a question, each representation was counted
separately in the corresponding column.