project sun - assets.kpmg
TRANSCRIPT
Project SUNA study of the illicit cigarette market in the European Union, Norway and Switzerland
2015 Results
kpmg.com/uk/
2
Proj
ect
SU
N
Important Notice
• This presentation of Project SUN key findings (the ‘Report’) has been prepared by KPMG LLP in the UK (“KPMG UK”) for British American Tobacco (Investments Limited), Imperial Tobacco Limited, JT International SA and Philip Morris International Management SA, described together in this Important Notice and in this Report as ‘the Beneficiaries’, on the basis set out in a private contract dated 3 February 2016 agreed separately by KPMG UK with the Beneficiaries (the ‘Contract’).
• Nothing in this Report constitutes legal advice. Information sources, the scope of our work, and scope and source limitations, are set out in the Appendices to this Report. The scope of our review of the contraband and counterfeit segments of the cigarette market within the 28 EU Member States, Switzerland and Norway was fixed by agreement with the Beneficiaries and is set out in the Appendices.
• We have satisfied ourselves, so far as possible, that the information presented in this Report is consistent with our information sources but we have not sought to establish the reliability of the information sources by reference to other evidence.
• This Report has not been designed to benefit anyone except the Beneficiaries. In preparing this Report we have not taken into account the interests, needs or circumstances of anyone apart from the Beneficiaries, even though we have been aware that others might read this Report.
• This Report is not suitable to be relied on by any party wishing to acquire rights or assert any claims against KPMG LLP (other than the Beneficiaries) for any purpose or in any context.
• At the request of the Beneficiaries and as a matter of practical convenience we have agreed to publish this Report on the KPMG UK website, in order to facilitate demonstration by the Beneficiaries that a study into the matters reported has been performed by KPMG UK for the Beneficiaries.
• Publication of this Report does not in any way or on any basis affect or add to or extend KPMG UK’s duties and responsibilities to the Beneficiaries or give rise to any duty or responsibility being accepted or assumed by or imposed on KPMG UK to any party except the Beneficiaries. To the fullest extent permitted by law, KPMG UK does not assume any responsibility and will not accept any liability in respect of this Report to anyone except the Beneficiaries.
• In particular, and without limiting the general statement above, since we have prepared this Report for the Beneficiaries alone, this Report has not been prepared for the benefit of any other manufacturer of tobacco products nor for any other person or organisation who might have an interest in the matters discussed in this Report, including for example those who work in or monitor the tobacco or public health sectors or those who provide goods or services to those who operate in those sectors.
Impo
rtan
t N
otic
e
© 2016 KPMG LLP, a UK limited liability partnership, and a member firm of the KPMG network of independent member firms affiliated with KPMG International Cooperative, a Swiss entity.
3
Proj
ect
SU
N
Glossary
Glo
ssar
y
GLOSSARY
Average Daily Consumption
Daily average consumption by the population of the legal smoking age
BAT British American Tobacco plc
Bn Billion
C&C Counterfeit and Contraband, including Illicit Whites
CAGR Compound Annual Growth Rate
Cigarette Any factory-made product that contains tobacco and is intended to be burned under ordinary conditions of use
Cigarillos A short, narrow cigar, which, like cigarettes, is often machine-made and sold in packs
Consumption Actual total consumption of cigarettes in a market, including Legal Domestic Consumption (LDC) and illicit products as well as those legally purchased overseas
Contraband (CB)Genuine products that have been either bought in a low-tax country and which exceed legal border limits or acquired without taxes for export purposes to be illegally re-sold (for financial profit) in a higher priced market
Counterfeit (CF)Cigarettes that are illegally manufactured and sold by a party other than the original trademark owner. In this report, counterfeit volumes are reported from the participating manufacturers of BAT, ITL, JTI and PMI. No other counterfeit is included in the volumes reported due to lack of information
Country of originCountry from which the packs collected are deemed to have originated. This is determined by either the tax stamp on the pack or in cases where the tax stamp is not shown, on the health warning and packaging characteristics
Domestic WhitesDomestic Whites are packs of domestic market variant, but those that are priced below the minimum tax yield. These products are treated as having not been legally sold in the country in question, and have therefore been reclassified as non-domestic
Duty FreeCigarettes bought without payment of customs or excise duties. Consumers may buy Duty Free Cigarettes when travelling into or out of the EU (including Switzerland and Norway) by land, air or sea at legal Duty Free shops
EC European Commission
EPS Empty Pack Survey
EU European Union
EU Flows ModelThe primary methodology for measuring consumption in a market. The model has been developed by KPMG on a bespoke basis for the specific purpose of measuring inflows and outflows of cigarettes in the scope of this project
FYROM Former Yugoslav Rebublic of Macedonia
Green Leaf Uncut dried tobacco leaf, which smokers cut themselves
Illicit Whites (IW)Cigarettes that are usually manufactured legally in one country/market but which the evidence suggests have been smuggled across borders during their transit to the destination market under review where they have limited or no legal distribution and are sold without payment of tax
Illicit Whites with no country specific labelling Packs of Illicit White Cigarettes which have “duty free” or no identifiable labelling on the packs
IMS In Market Sales (the primary source of legal domestic sales volumes)
Inflows/Outflows Inflows of non-domestic product into a market / outflows of product from a market
ITL Imperial Tobacco Limited
JTI JT International SA
LDC Legal Domestic Consumption is defined as Legal Domestic Sales (LDS) net of outflows
© 2016 KPMG LLP, a UK limited liability partnership, and a member firm of the KPMG network of independent member firms affiliated with KPMG International Cooperative, a Swiss entity.
4
Proj
ect
SU
N
Glossary
GLOSSARY
LDSLegal Domestic Sales of genuine domestic product through legitimate, domestic channels based on In Market Sales (IMS) data
Mn Million
MPPC Most Popular Price Category
MYO Make Your Own tobacco products
NDNon-Domestic product – product that originates from a different market than the one in which it is consumed
ND(L)Non-Domestic (Legal) – product that is brought into the market legally by consumers, such as during a cross-border trip
NMA / TMA National Manufacturers’ Association / Tobacco Manufacturers’ Association
OLAF Office Européen de Lutte Antifraude also known as the European Anti-Fraud Office
OTP Other Tobacco Products (RYO/MYO, cigarillos, portions, rolls and cigars; excluding smokeless tobacco and water-pipe tobacco)
PMI Philip Morris International Management SA
RYO Roll Your Own tobacco products
Smoking prevalence The percentage of smokers in the total population of the legal smoking age
Tobacco taxes
The sum of all types of taxes levied on tobacco products, including VAT. There are two basic methods of tobacco taxation: Normal or specific taxes are based on a set amount of tax per unit (e.g. cigarette); these taxes are differentiated according to the type of tobacco. Ad valorem taxes are assessed as a percentage mark up on a determined value, usually the retail selling price or a wholesale price and includes any value added tax
Unspecified Unspecified market variant refers to cigarette packs which do not bear specific market labelling or Duty Free labelling
UNWTO World Tourism Organisation
WAP
The weighted average price for cigarettes calculated by reference to the total value of all cigarettes released for consumption, based on the retail selling price including all taxes, divided by the total quantity of cigarettes released for consumption. The WAP is provided by the European Commission Excise Duty Tables
Glo
ssar
y
© 2016 KPMG LLP, a UK limited liability partnership, and a member firm of the KPMG network of independent member firms affiliated with KPMG International Cooperative, a Swiss entity.

5
Proj
ect
SU
N
Contents
Chapter page
EXECUTIVE SUMMARY
Introduction 6
Key Findings 7
European Market Overview 8
Illicit Whites 16
COUNTRY REPORTS
Austria 20
Belgium 24
Bulgaria 28
Croatia 32
Cyprus 36
Czech Republic 40
Denmark 44
Estonia 48
Finland 52
France 56
Germany 60
Greece 64
Hungary 68
Ireland 72
Italy 76
Latvia 82
Lithuania 86
Luxembourg 90
Malta 94
Netherlands 98
Norway 102
Poland 106
Portugal 110
Romania 114
Slovakia 118
Slovenia 122
Spain 126
Sweden 130
Switzerland 134
UK 138
Chapter page
METHODOLOGY
Overview 146
KPMG EU flows model 150
LDS 152
EPS 154
Non domestic legal analysis 165
Illicit Whites analysis 178
EU tax loss calculation 180
APPENDICES
1. Limitation of results 182
2. EPS results by country 186
3. Sources 204
4. Scope of work 206
Con
tent
s
© 2016 KPMG LLP, a UK limited liability partnership, and a member firm of the KPMG network of independent member firms affiliated with KPMG International Cooperative, a Swiss entity.
6
Proj
ect
SU
N
6
Exe
cutiv
e S
umm
ary
© 2016 KPMG LLP, a UK limited liability partnership, and a member firm of the KPMG network of independent member firms affiliated with KPMG International Cooperative, a Swiss entity.
7
Proj
ect
SU
N
7
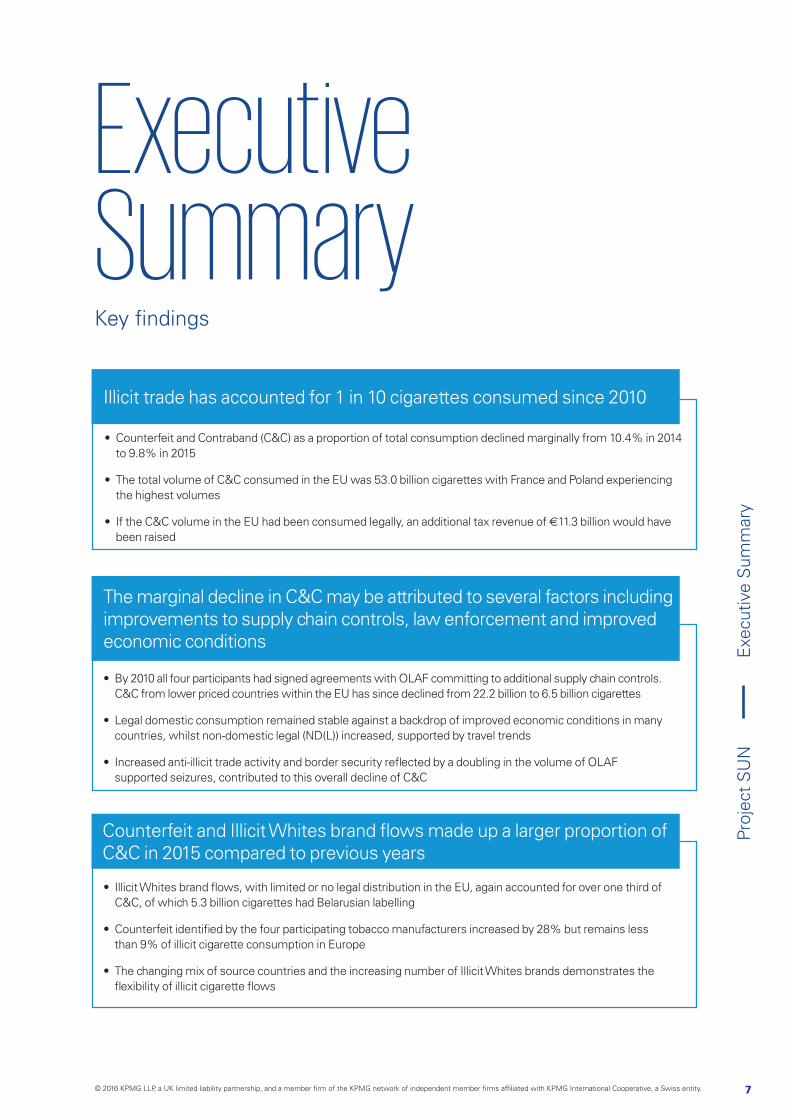
Key findings
• Counterfeit and Contraband (C&C) as a proportion of total consumption declined marginally from 10.4% in 2014 to 9.8% in 2015
• The total volume of C&C consumed in the EU was 53.0 billion cigarettes with France and Poland experiencing the highest volumes
• If the C&C volume in the EU had been consumed legally, an additional tax revenue of €11.3 billion would have been raised
• By 2010 all four participants had signed agreements with OLAF committing to additional supply chain controls. C&C from lower priced countries within the EU has since declined from 22.2 billion to 6.5 billion cigarettes
• Legal domestic consumption remained stable against a backdrop of improved economic conditions in many countries, whilst non-domestic legal (ND(L)) increased, supported by travel trends
• Increased anti-illicit trade activity and border security reflected by a doubling in the volume of OLAF supported seizures, contributed to this overall decline of C&C
• Illicit Whites brand flows, with limited or no legal distribution in the EU, again accounted for over one third of C&C, of which 5.3 billion cigarettes had Belarusian labelling
• Counterfeit identified by the four participating tobacco manufacturers increased by 28% but remains less than 9% of illicit cigarette consumption in Europe
• The changing mix of source countries and the increasing number of Illicit Whites brands demonstrates the flexibility of illicit cigarette flows
Illicit trade has accounted for 1 in 10 cigarettes consumed since 2010
The marginal decline in C&C may be attributed to several factors including improvements to supply chain controls, law enforcement and improved economic conditions
Counterfeit and Illicit Whites brand flows made up a larger proportion of C&C in 2015 compared to previous years
Executive Summary
Exe
cutiv
e S
umm
ary
© 2016 KPMG LLP, a UK limited liability partnership, and a member firm of the KPMG network of independent member firms affiliated with KPMG International Cooperative, a Swiss entity.
8
Proj
ect
SU
N
8
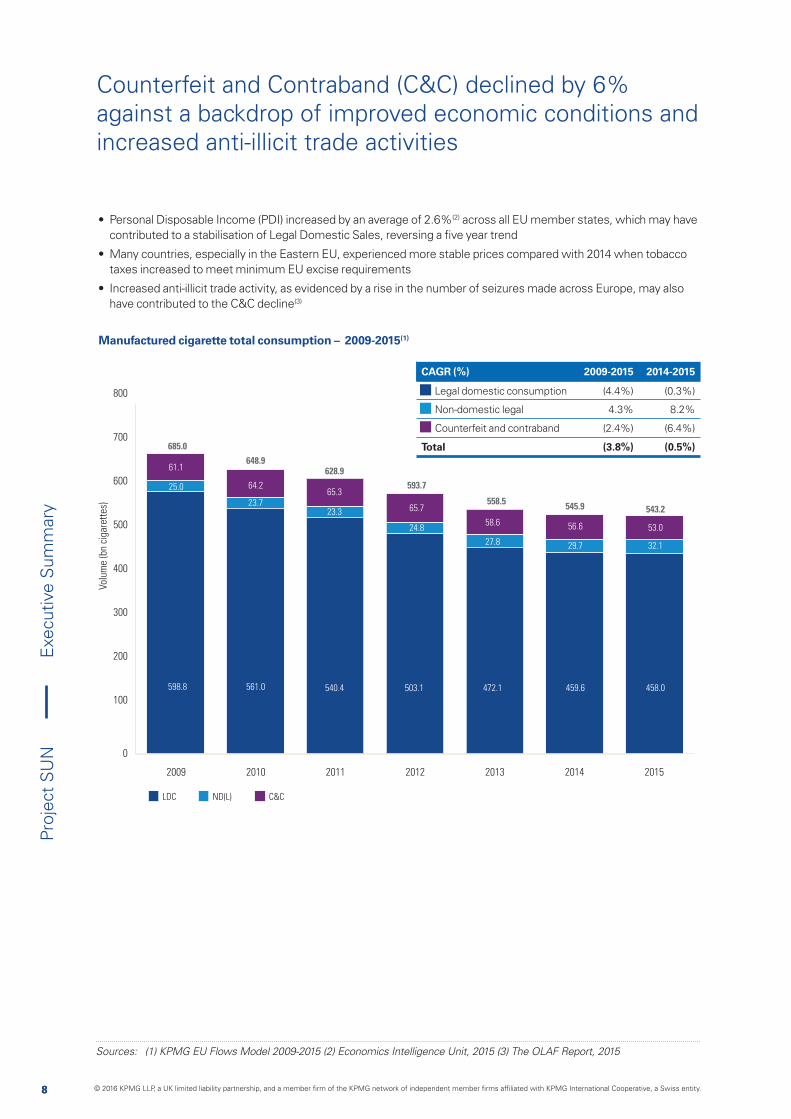
Counterfeit and Contraband (C&C) declined by 6% against a backdrop of improved economic conditions and increased anti-illicit trade activities
• Personal Disposable Income (PDI) increased by an average of 2.6%(2) across all EU member states, which may have contributed to a stabilisation of Legal Domestic Sales, reversing a five year trend
• Many countries, especially in the Eastern EU, experienced more stable prices compared with 2014 when tobacco taxes increased to meet minimum EU excise requirements
• Increased anti-illicit trade activity, as evidenced by a rise in the number of seizures made across Europe, may also have contributed to the C&C decline(3)
Sources: (1) KPMG EU Flows Model 2009-2015 (2) Economics Intelligence Unit, 2015 (3) The OLAF Report, 2015
Volu
me
(bn
ciga
rett
es)
0
100
200
300
400
500
600
700
800
2009 2010 2011 2012 2013 2014 2015
64.2
23.7 65.3
23.3
61.1
25.0
598.8 561.0
65.7
24.8
5.0%
540.4
5.4%
685.0
628.9648.9
593.7
558.5 545.9
503.1 472.1
58.6
27.8
459.6
56.6
29.7
6.0%543.2
458.0
53.0
32.1
ND(L)LDC C&C
Manufactured cigarette total consumption – 2009-2015(1)
CAGR (%) 2009-2015 2014-2015
Legal domestic consumption (4.4%) (0.3%)
Non-domestic legal 4.3% 8.2%
Counterfeit and contraband (2.4%) (6.4%)
Total (3.8%) (0.5%)
Exe
cutiv
e S
umm
ary
© 2016 KPMG LLP, a UK limited liability partnership, and a member firm of the KPMG network of independent member firms affiliated with KPMG International Cooperative, a Swiss entity.
9
Proj
ect
SU
N
9
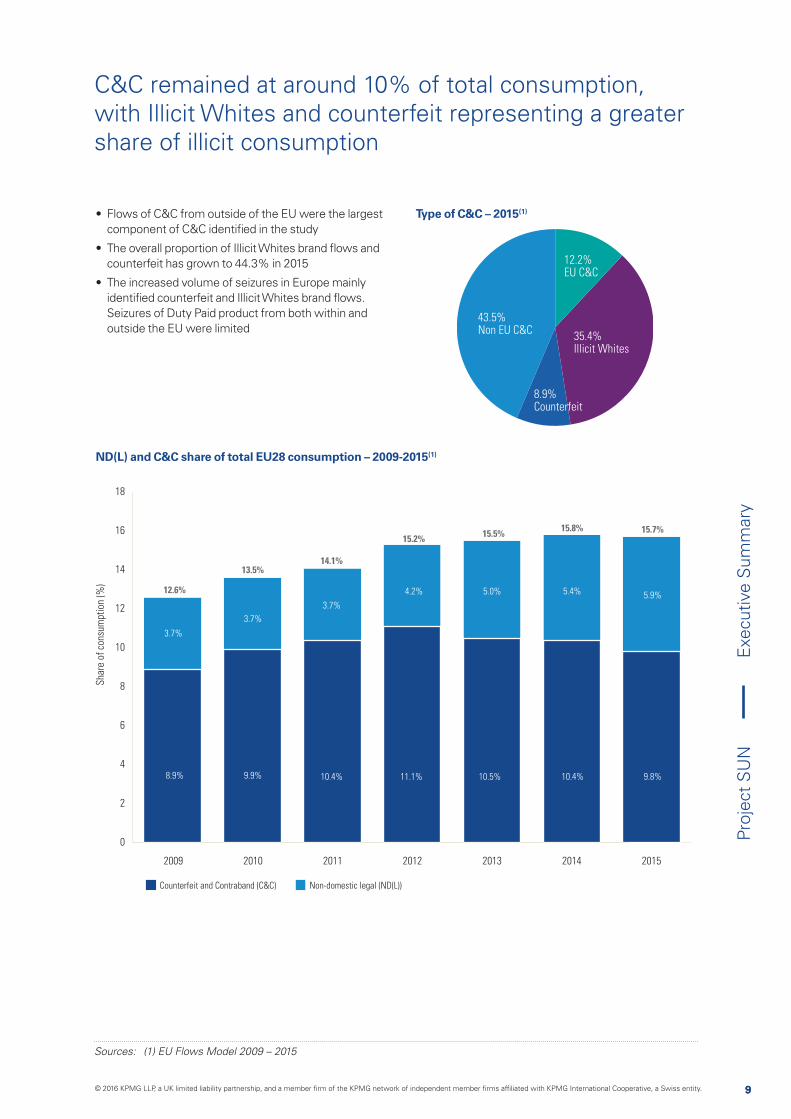
12.2%EU C&C
8.9%Counterfeit
35.4%Illicit Whites
43.5%Non EU C&C
C&C remained at around 10% of total consumption, with Illicit Whites and counterfeit representing a greater share of illicit consumption
Sources: (1) EU Flows Model 2009 – 2015
Sha
re o
f co
nsum
ptio
n (%
)
0
2
4
6
8
10
12
14
16
18
2009 2010 2011 2012 2013 2014 2015
3.7%
3.7%
3.7%
8.9% 9.9%
4.2% 5.0%
10.4%
5.4%12.6%
14.1%13.5%
15.2% 15.5% 15.8%
11.1% 10.5% 10.4%
5.9%
15.7%
9.8%
Non-domestic legal (ND(L))Counterfeit and Contraband (C&C)
• Flows of C&C from outside of the EU were the largest component of C&C identified in the study
• The overall proportion of Illicit Whites brand flows and counterfeit has grown to 44.3% in 2015
• The increased volume of seizures in Europe mainly identified counterfeit and Illicit Whites brand flows. Seizures of Duty Paid product from both within and outside the EU were limited
ND(L) and C&C share of total EU28 consumption – 2009-2015(1)
Type of C&C – 2015(1)
Exe
cutiv
e S
umm
ary
© 2016 KPMG LLP, a UK limited liability partnership, and a member firm of the KPMG network of independent member firms affiliated with KPMG International Cooperative, a Swiss entity.
10
Proj
ect
SU
N
10
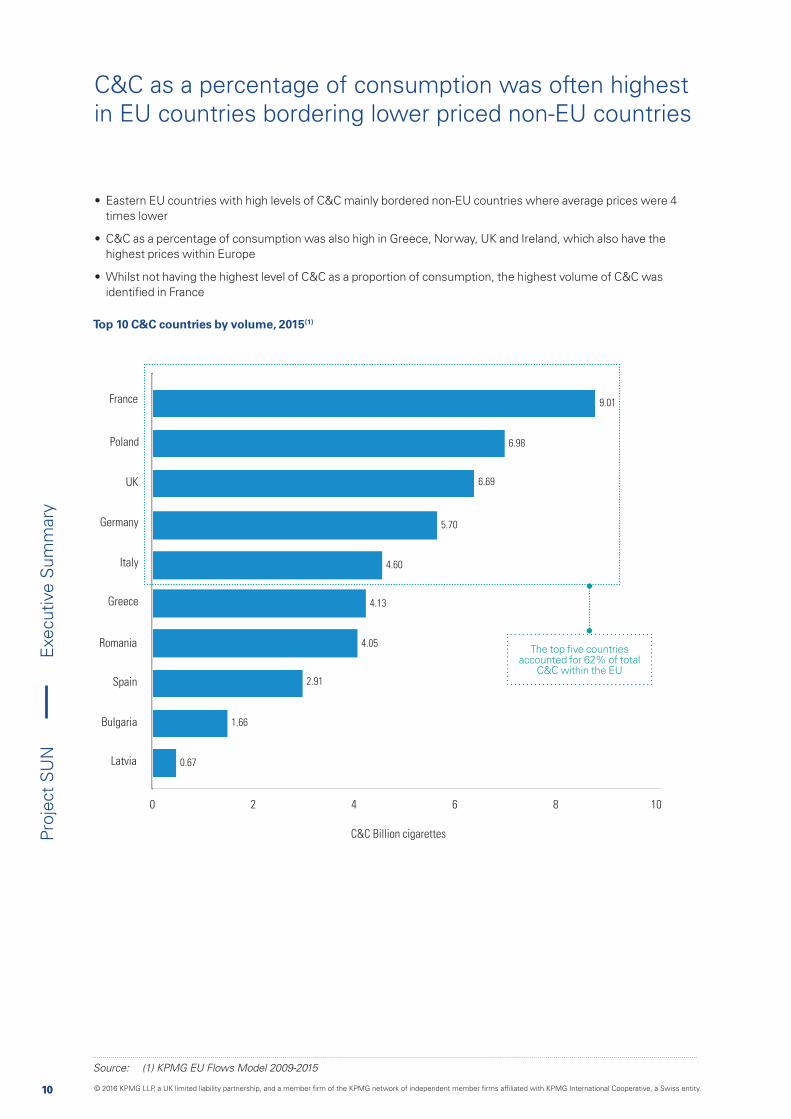
C&C as a percentage of consumption was often highest in EU countries bordering lower priced non-EU countries
• Eastern EU countries with high levels of C&C mainly bordered non-EU countries where average prices were 4 times lower
• C&C as a percentage of consumption was also high in Greece, Norway, UK and Ireland, which also have the highest prices within Europe
• Whilst not having the highest level of C&C as a proportion of consumption, the highest volume of C&C was identified in France
Source: (1) KPMG EU Flows Model 2009-2015
Top 10 C&C countries by volume, 2015(1)
0 642 8 10
Latvia
Bulgaria
Spain
Romania
UK
Poland
France 9.01
6.98
6.69
5.70
4.60
4.13
4.05
2.91
1.66
0.67
C&C Billion cigarettes
Italy
Germany
Greece
The top five countries accounted for 62% of total
C&C within the EU
Exe
cutiv
e S
umm
ary
© 2016 KPMG LLP, a UK limited liability partnership, and a member firm of the KPMG network of independent member firms affiliated with KPMG International Cooperative, a Swiss entity.
11
Proj
ect
SU
N
11
Source: (1) KPMG EU Flows Model 2015
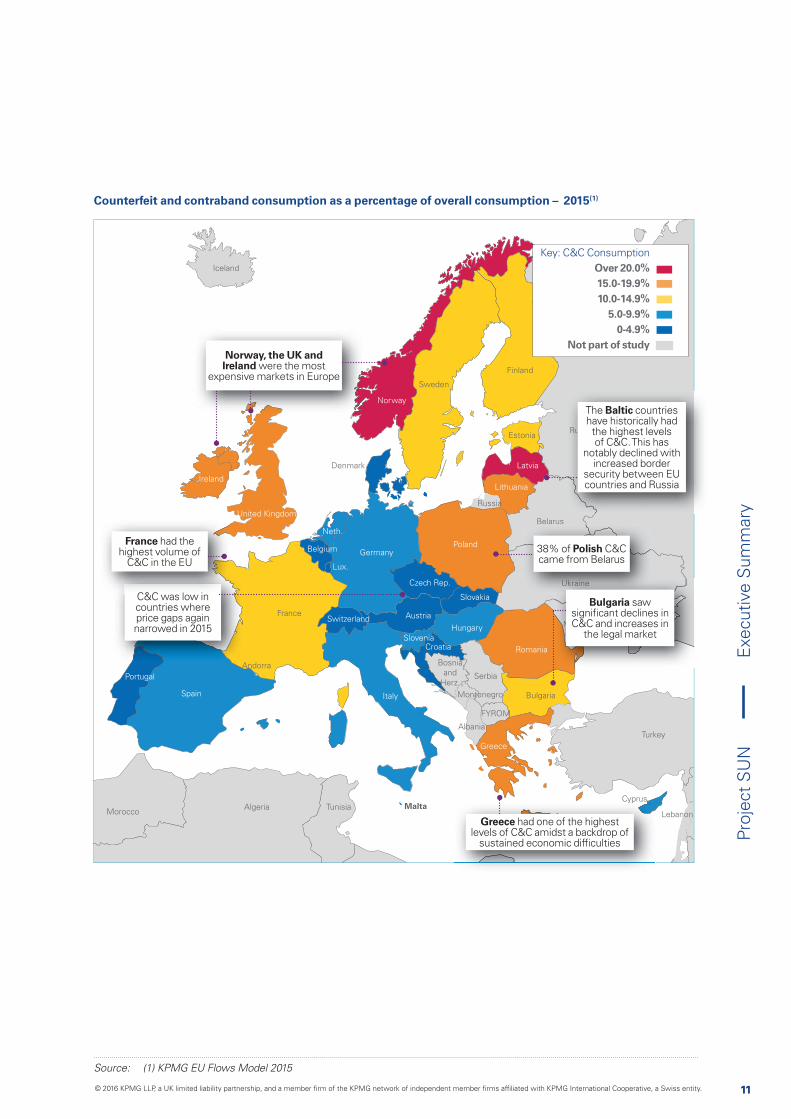
Counterfeit and contraband consumption as a percentage of overall consumption – 2015(1)
Andorra
France
Belgium
Lux.
Neth.
Spain
Portugal
United Kingdom
Ireland
Denmark
Switzerland
Germany
Austria
Czech Rep.
Poland
Slovakia
HungarySlovenia
Croatia
Bosniaand
Herz.
Romania
Ukraine
Moldova
Bulgaria
Albania
Montenegro
Turkey
Cyprus
Italy
Norway
Sweden
Finland
Estonia
Latvia
Lithuania
Russia
Belarus
Russia
Iceland
Lebanon
I lJ
TunisiaAlgeriaMorocco
Serbia
FYROM
Greece
Malta
RRRuuuusssssssiaa
The Baltic countries have historically had the highest levels of C&C. This has
notably declined with increased border
security between EU countries and Russia
38% of Polish C&C came from Belarus
aovaaMMMMMMMooollddoodo
UkUkrUkrUkrUkU iiainainee
Bulgaria saw significant declines in C&C and increases in
the legal market
Norway, the UK and Ireland were the most
expensive markets in Europe
A
C&C was low in countries where price gaps again narrowed in 2015
C&C l i
France had the highest volume of
C&C in the EU
yp
Greece had one of the highest levels of C&C amidst a backdrop of
sustained economic difficulties
Key: C&C Consumption Over 20.0%15.0-19.9%10.0-14.9%
5.0-9.9%0-4.9%
Not part of study
Exe
cutiv
e S
umm
ary
© 2016 KPMG LLP, a UK limited liability partnership, and a member firm of the KPMG network of independent member firms affiliated with KPMG International Cooperative, a Swiss entity.
12
Proj
ect
SU
N
12
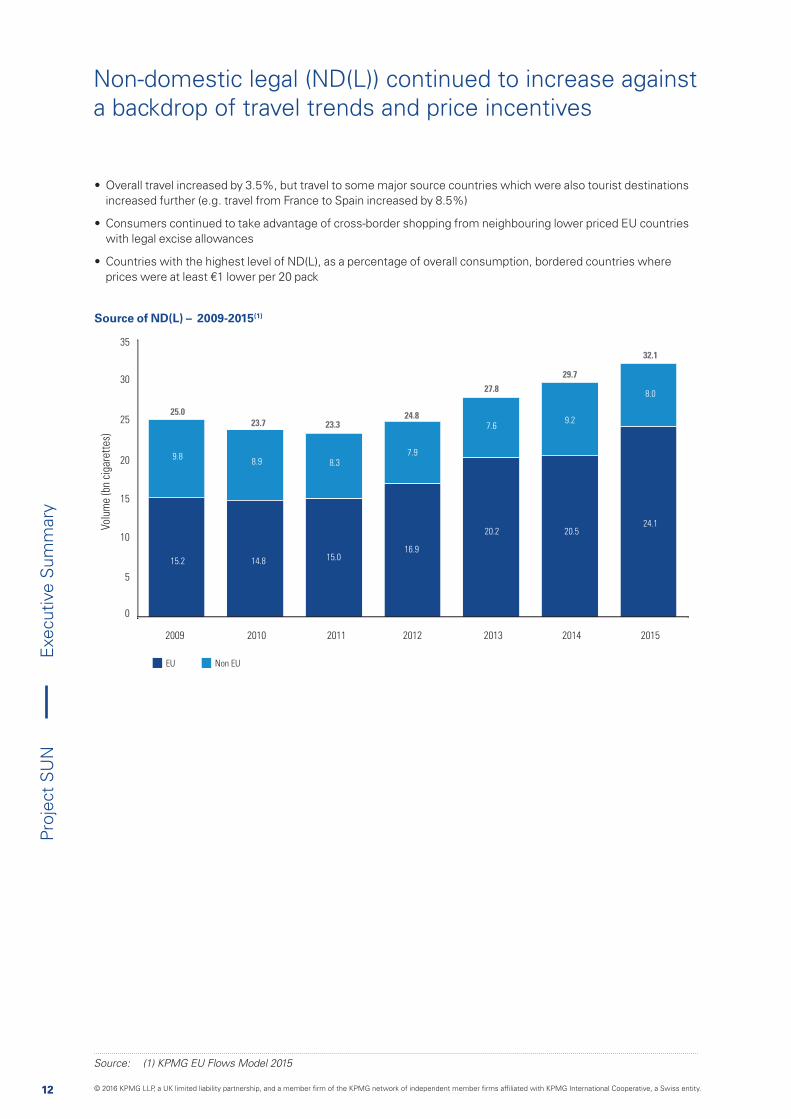
• Overall travel increased by 3.5%, but travel to some major source countries which were also tourist destinations increased further (e.g. travel from France to Spain increased by 8.5%)
• Consumers continued to take advantage of cross-border shopping from neighbouring lower priced EU countries with legal excise allowances
• Countries with the highest level of ND(L), as a percentage of overall consumption, bordered countries where prices were at least €1 lower per 20 pack
Source of ND(L) – 2009-2015(1)
Source: (1) KPMG EU Flows Model 2015
0
5
10
15
20
25
30
35
2009 2010 2011 2012 2013
8.99.8
8.37.9
15.2
7.6
25.023.7 23.3
24.8
27.8
15.014.8
16.9
20.2
2014 2015
9.2
29.7
32.1
20.5 24.1
8.0
Volu
me
(bn
ciga
rett
es)
Non EUEU
Non-domestic legal (ND(L)) continued to increase against a backdrop of travel trends and price incentives
Exe
cutiv
e S
umm
ary
© 2016 KPMG LLP, a UK limited liability partnership, and a member firm of the KPMG network of independent member firms affiliated with KPMG International Cooperative, a Swiss entity.

13
Proj
ect
SU
N
13
Andorra
France
Belgium
Lux.
Neth.
Spain
Portugal
United Kingdom
Ireland
Denmark
Switzerland
Germany
Austria
Czech Rep.
Poland
Slovakia
Hungary
SloveniaCroatia
Bosnia
and
Herz.
Romania
Ukraine
Moldova
Bulgaria
Albania
Montenegro
Turkey
Cyprus
Italy
Iceland
Norway SwedenFinland
Estonia
Latvia
Lithuania
Russia
Belarus
Russia
Syria
Israel Jordan
Saudi ArabiEgyptLibya
Tunisia
Algeria
Morocco
Serbia
FYROM
Greece
Malta
mmm
Over 1 billion0.5-1 billion
Under 0.5 billionNot part of study
0.1bn 0.2bn
0.1bn
0.1bn
0.3bn
0.1bn
0.05bn
3.4bn
0.5bn
0.1bn
0.3bn
0.4bn
0.03bn
0.5bn
0.8bn
0.9bn
0.3bn
0.0.1bn
4.6bn
1.5bn
0.1bn
0.3bn
0.4bn
2.1bn
5.1bn
0.1bn
0.4bn
0.5bn0.8bn
0.4bn
30 million tourists from the higher
priced countries of Germany, France and the UK visited
Spain in 2015
reland
DDDeDeDenDenDenDenmenmnmnmmaarkrk
000.00 10.10.1bbnbn
Belgium and Luxembourg flows
relate to the sizeable population close to the border in neighbouring France and Germany
Total volume of ND(L) by source country – 2015(1)
Source: (1) KPMG EU Flows Model 2015
Key: ND(L) source country
Poland had both cheaper prices and a high volume of Polish nationals in Western
EU countries
ne
ovvaaaaooo
87% of Czech flows were to Germany, with
Germans shopping cross-border for a range of goods
Exe
cutiv
e S
umm
ary
© 2016 KPMG LLP, a UK limited liability partnership, and a member firm of the KPMG network of independent member firms affiliated with KPMG International Cooperative, a Swiss entity.
14
Proj
ect
SU
N
14
Volu
me
(bn
ciga
rett
es)
0
10
20
30
40
50
60
70
2009 2010 2011 2012 2013 2014 2015
41.9 43.737.3
23.9 22.2
45.4
3.4
21.6
3.7
61.1
65.364.2
65.7
58.656.6
20.3
14.6
40.6
8.3
44.6
4.7
53.0
6.5
41.8
Non-EUEU Counterfeit
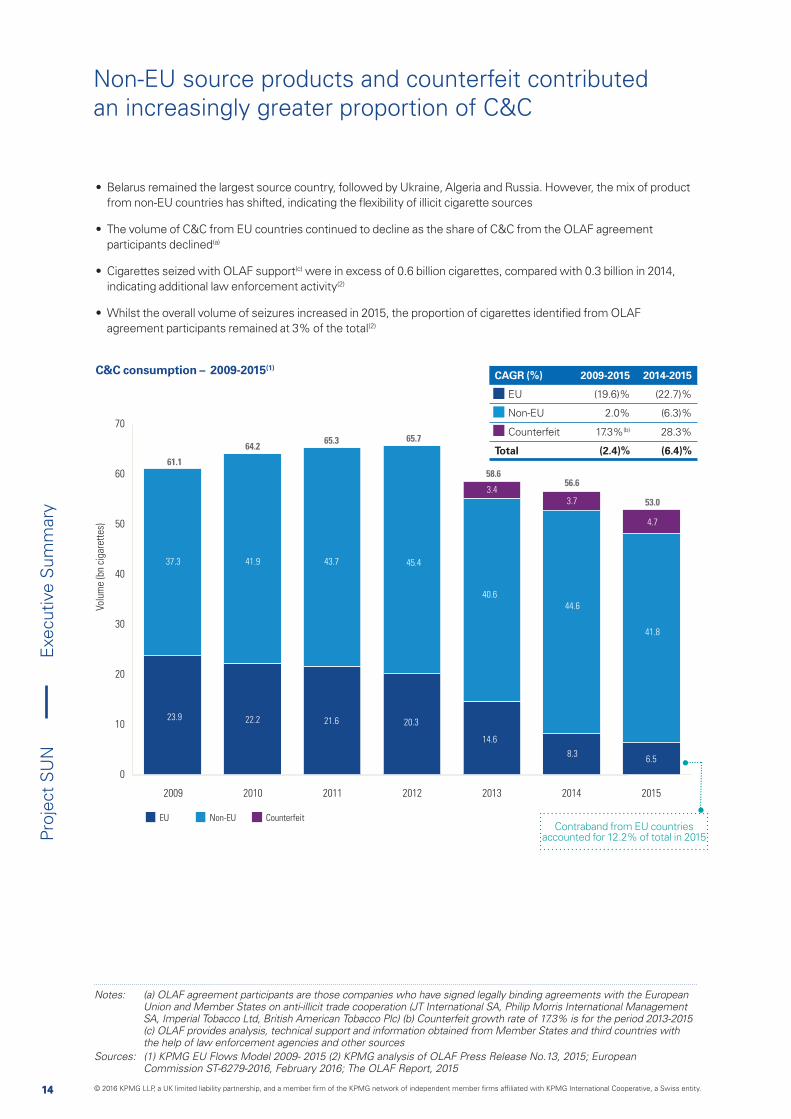
• Belarus remained the largest source country, followed by Ukraine, Algeria and Russia. However, the mix of product from non-EU countries has shifted, indicating the flexibility of illicit cigarette sources
• The volume of C&C from EU countries continued to decline as the share of C&C from the OLAF agreement participants declined(a)
• Cigarettes seized with OLAF support(c) were in excess of 0.6 billion cigarettes, compared with 0.3 billion in 2014, indicating additional law enforcement activity(2)
• Whilst the overall volume of seizures increased in 2015, the proportion of cigarettes identified from OLAF agreement participants remained at 3% of the total(2)
C&C consumption – 2009-2015(1)CAGR (%) 2009-2015 2014-2015
EU (19.6)% (22.7)%
Non-EU 2.0% (6.3)%
Counterfeit 17.3%(b) 28.3%
Total (2.4)% (6.4)%
Contraband from EU countries accounted for 12.2% of total in 2015
Notes: (a) OLAF agreement participants are those companies who have signed legally binding agreements with the European Union and Member States on anti-illicit trade cooperation (JT International SA, Philip Morris International Management SA, Imperial Tobacco Ltd, British American Tobacco Plc) (b) Counterfeit growth rate of 17.3% is for the period 2013-2015 (c) OLAF provides analysis, technical support and information obtained from Member States and third countries with the help of law enforcement agencies and other sources
Sources: (1) KPMG EU Flows Model 2009- 2015 (2) KPMG analysis of OLAF Press Release No.13, 2015; European Commission ST-6279-2016, February 2016; The OLAF Report, 2015
Non-EU source products and counterfeit contributed an increasingly greater proportion of C&C
Exe
cutiv
e S
umm
ary
© 2016 KPMG LLP, a UK limited liability partnership, and a member firm of the KPMG network of independent member firms affiliated with KPMG International Cooperative, a Swiss entity.

15
Proj
ect
SU
N
15
Note: (a) Manufacturer estimates based on the price of the most sold brand used for countries not included in the EU Tax Tables
Sources: (1) EU Tax Tables and pricing information on most sold brands outside of EU (2) Data provided by manufacturers for Canary Islands, Norway, Switzerland, Belarus, Ukraine, Russia and Albania
• Prices stabilised in 2015 in many EU countries, especially those in the Eastern EU, as member states met minimum EU excise requirements in 2014
• Prices increased by 3 percentage points less in 2015 than in 2014 and legal domestic consumption stabilised
Map denotes weighted average prices for a pack of 20 cigarettes - January 2016(1)(2)(a)
Andorra
France
Belgium
Lux.
Neth.
Spain
Portugal
United Kingdom
Denmark
Switzerland
Germany
Austria
Czech Rep.
Poland
Slovakia
Hungary
SloveniaCroatia
Bosnia andHerz.
Romania
Ukraine
Moldova
Bulgaria
Albania
Montenegro
Turkey
Cyprus
Italy
Iceland
NorwaySweden
Finland
Estonia
Latvia
Lithuania
RussiaBelarus
Russia
Lebanon
Tunisia
AlgeriaMorocco
Serbia
FYROM
Greece
Malta
Canary
Islands
Ireland
Key:EU countries
Non-EU countries
0.83
5.47
5.59 10.75
0.58
0.58
3.07
2.86
2.60
3.13
10.10
9.285.49
4.44
2.79 4.15
1.97
3.15
2.42
4.21
3.71
6.75
4.92
4.66
5.34
0.66
1.79
2.40
5.94
7.12
2.954.50
3.12
3.38
5.51
4.48
1.79
1.63
1.09
3.00
1.95
3.51
The largest C&C source countries were those with the lowest prices on the Eastern EU border
Exe
cutiv
e S
umm
ary
© 2016 KPMG LLP, a UK limited liability partnership, and a member firm of the KPMG network of independent member firms affiliated with KPMG International Cooperative, a Swiss entity.
16
Proj
ect
SU
N
16
42%Country Specific
28%Duty Free Labelled
29%Unspecified
Labelling
Illicit Whites labelling – 2015(1)(a) Illicit Whites as a percentage of total C&C(1)(c)
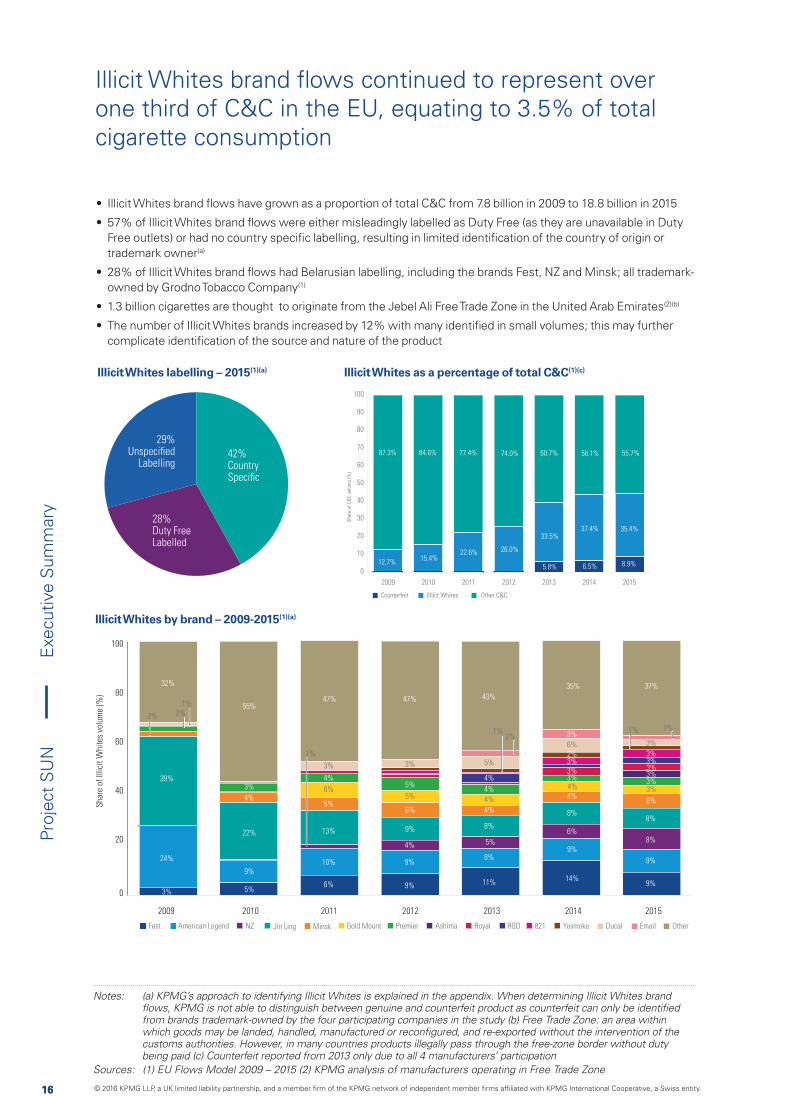
• Illicit Whites brand flows have grown as a proportion of total C&C from 7.8 billion in 2009 to 18.8 billion in 2015
• 57% of Illicit Whites brand flows were either misleadingly labelled as Duty Free (as they are unavailable in Duty Free outlets) or had no country specific labelling, resulting in limited identification of the country of origin or trademark owner(a)
• 28% of Illicit Whites brand flows had Belarusian labelling, including the brands Fest, NZ and Minsk; all trademark-owned by Grodno Tobacco Company(1)
• 1.3 billion cigarettes are thought to originate from the Jebel Ali Free Trade Zone in the United Arab Emirates(2)(b)
• The number of Illicit Whites brands increased by 12% with many identified in small volumes; this may further complicate identification of the source and nature of the product
Illicit Whites by brand – 2009-2015(1)(a)
Notes: (a) KPMG’s approach to identifying Illicit Whites is explained in the appendix. When determining Illicit Whites brand
from brands trademark-owned by the four participating companies in the study (b) Free Trade Zone: an area within
customs authorities. However, in many countries products illegally pass through the free-zone border without duty being paid (c) Counterfeit reported from 2013 only due to all 4 manufacturers’ participation
Sources: (1) EU Flows Model 2009 – 2015 (2) KPMG analysis of manufacturers operating in Free Trade Zone
2009 2010 2011 2012 2013 2014 2015
47%
3%
24%
39%
22%
4%
3%
55%
32%
4%
9%
9%
8%
4%
4%
4%
4%
5%
5%
8%
11%
35%
6%
5%
3%
13%
4%
10%
6%
9%
5%
9%
14%
8%
6%
4%
3%3%3%2%6%
3%
4%
9%
9%
8%
6%
3%
3%3%
3%3%3%
8%
3%
37%
9%
6%
5%
5%
3%
2% 2%1%
1%
47% 43%
1%2%
1% 1%
American Legend Jin LingNZFest Gold Mount AshimaPremierMinsk RGD Yesmoke821Royal Email OtherDucal
Sha
re o
f Ill
icit
Whi
tes
volu
me
(%)
0
40
20
60
80
100
Illicit Whites brand flows continued to represent over one third of C&C in the EU, equating to 3.5% of total cigarette consumption
0
10
20
30
40
50
60
70
80
90
100
2009 2010 2011 2012 2013 2014 2015
84.6%87.3% 77.4% 74.0% 60.7%
22.6%
56.1%
26.0%
33.5%
5.8%
37.4%
6.5%
55.7%
35.4%
8.9%
IIllict Whites Other C&CCounterfeit
12.7%15.4%
Sha
re o
f C
&C
vol
ume
(%)
Exe
cutiv
e S
umm
ary
© 2016 KPMG LLP, a UK limited liability partnership, and a member firm of the KPMG network of independent member firms affiliated with KPMG International Cooperative, a Swiss entity.
17
Proj
ect
SU
N
17
Andorra
France
Belgium
Lux.
Neth.
Spain
Portugal
United Kingdom
Ireland
Denmark
Switzerland
Germany
Austria
Czech Rep.
Poland
Slovakia
Hungary
SloveniaCroatia
Bosnia
and
Herz.
Romania
Ukraine
Moldova
Bulgaria
Albania
Montenegro
Turkey
Cyprus
Italy
Iceland
Norway SwedenFinland
Estonia
Latvia
Lithuania
Russia
Belarus
Russia
Syria
Israel Jordan
Saudi Arabia EgyptLibya
Tunisia
Algeria
Morocco
Serbia
FYROM
Greece
Malta
Over 1.5 billion1-1.5 billion0.5-1 billion
Under 0.5 billionNot part of study
0.03bn 0.29bn
0.15bn
0.45bn
1.15bn
0.18bn
0.04bn
1.33bn
0.09bn
0.03bn
2.48bn
0.88bn
0.05bn
1.25bn
2.29bn
1.04bn
0.02bn
0.0.01bn
4.16bn
0.00bn
0.54bn
0.03bn
0.04bn
0.03bn
0.15bn
0.08bn
1.71bn
0.35bn0.04bn
0.04bn
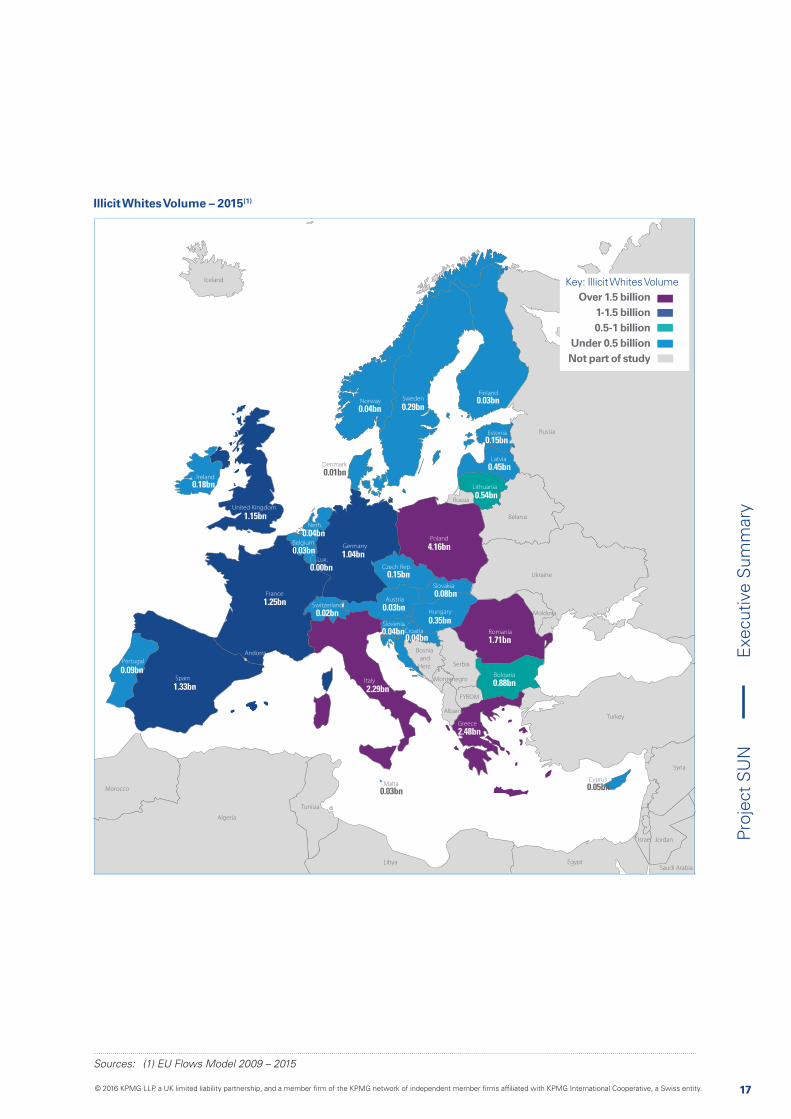
Illicit Whites Volume – 2015(1)
Key: Illicit Whites Volume
Sources: (1) EU Flows Model 2009 – 2015
Exe
cutiv
e S
umm
ary
© 2016 KPMG LLP, a UK limited liability partnership, and a member firm of the KPMG network of independent member firms affiliated with KPMG International Cooperative, a Swiss entity.
18
Proj
ect
SU
N
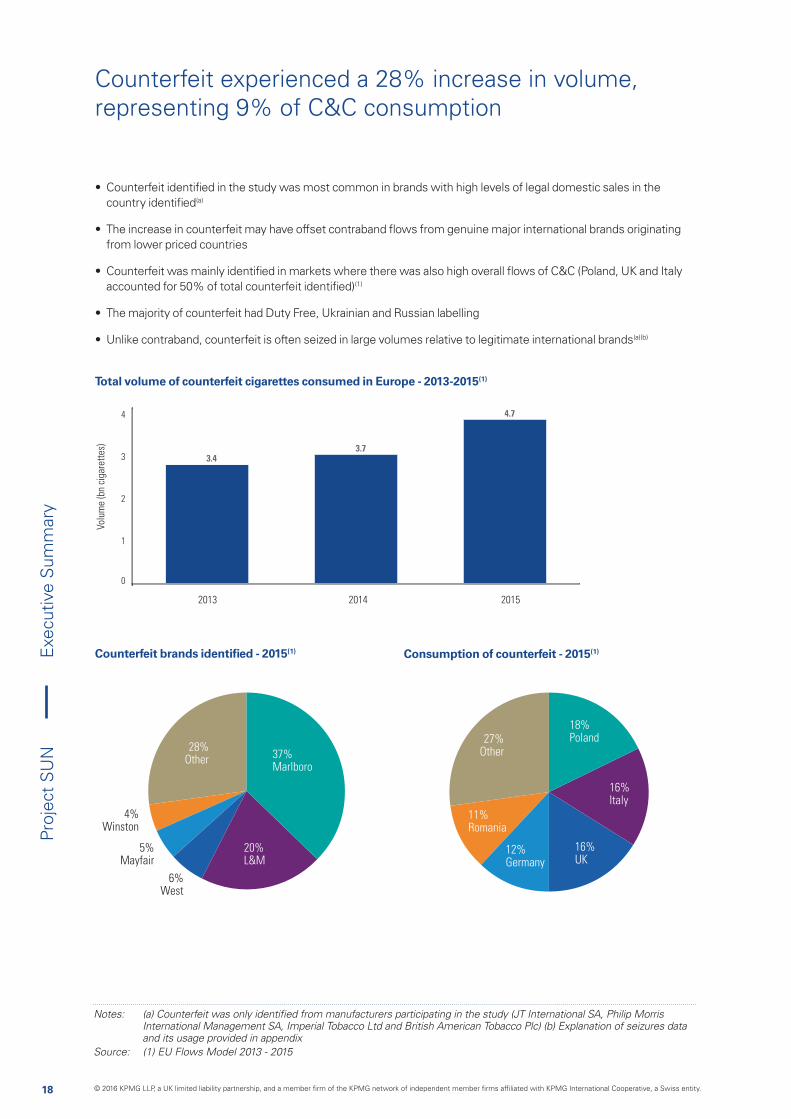
• Counterfeit identified in the study was most common in brands with high levels of legal domestic sales in the country identified(a)
• The increase in counterfeit may have offset contraband flows from genuine major international brands originating from lower priced countries
• Counterfeit was mainly identified in markets where there was also high overall flows of C&C (Poland, UK and Italy accounted for 50% of total counterfeit identified)(1)
• The majority of counterfeit had Duty Free, Ukrainian and Russian labelling
• Unlike contraband, counterfeit is often seized in large volumes relative to legitimate international brands(a)(b)
Total volume of counterfeit cigarettes consumed in Europe - 2013-2015(1)
Consumption of counterfeit - 2015(1)Counterfeit brands identified - 2015(1)
International Management SA, Imperial Tobacco Ltd and British American Tobacco Plc) (b) Explanation of seizures data and its usage provided in appendix
Source: (1) EU Flows Model 2013 - 2015
0
1
2
3
4
2013 2014 2015
3.43.7
4.7
Volu
me
(bn
ciga
rett
es)
37%Marlboro
20%L&M
28%Other
4%Winston
5%Mayfair
6%West
18%Poland
16%UK
16%Italy
12%Germany
11%Romania
27%Other
Counterfeit experienced a 28% increase in volume, representing 9% of C&C consumption
Exe
cutiv
e S
umm
ary
© 2016 KPMG LLP, a UK limited liability partnership, and a member firm of the KPMG network of independent member firms affiliated with KPMG International Cooperative, a Swiss entity.

19
Proj
ect
SU
NE
xecu
tive
Sum
mar
y
© 2016 KPMG LLP, a UK limited liability partnership, and a member firm of the KPMG network of independent member firms affiliated with KPMG International Cooperative, a Swiss entity.
20
Proj
ect
SU
NA
ustr
ia
Austria
Manufactured cigarette consumption - 2009-2015
Manufactured cigarette C&C volumes and share of overall cigarette consumption - 2009-2015
0
1
2
3
Volu
me
(bn
ciga
rett
es)
% o
f co
nsum
ptio
n
Counterfeit and contraband (C&C)
C&C as a % of consumption
2009 2010 2011 2012 2013 2014 2015
0
2
4
6
8
10
12
14
8.5%9.0%
11.6%
9.7%
6.4%
2.3% 3.9%
1.34 1.41
1.85
1.50
0.95
0.35
0.56
Volu
me
(bn
ciga
rett
es)
2009 2010 2011 2012 2013 2014 2015
14.87 15.71 15.65 16.00
15.4114.92
14.3414.97
0
5
10
15
20
4
19.2%Counterfeit
75.1%Other C&C
5.7%Illicit Whites
9.9%ND(L)
3.9%C&C
86.3%LDC
Overview
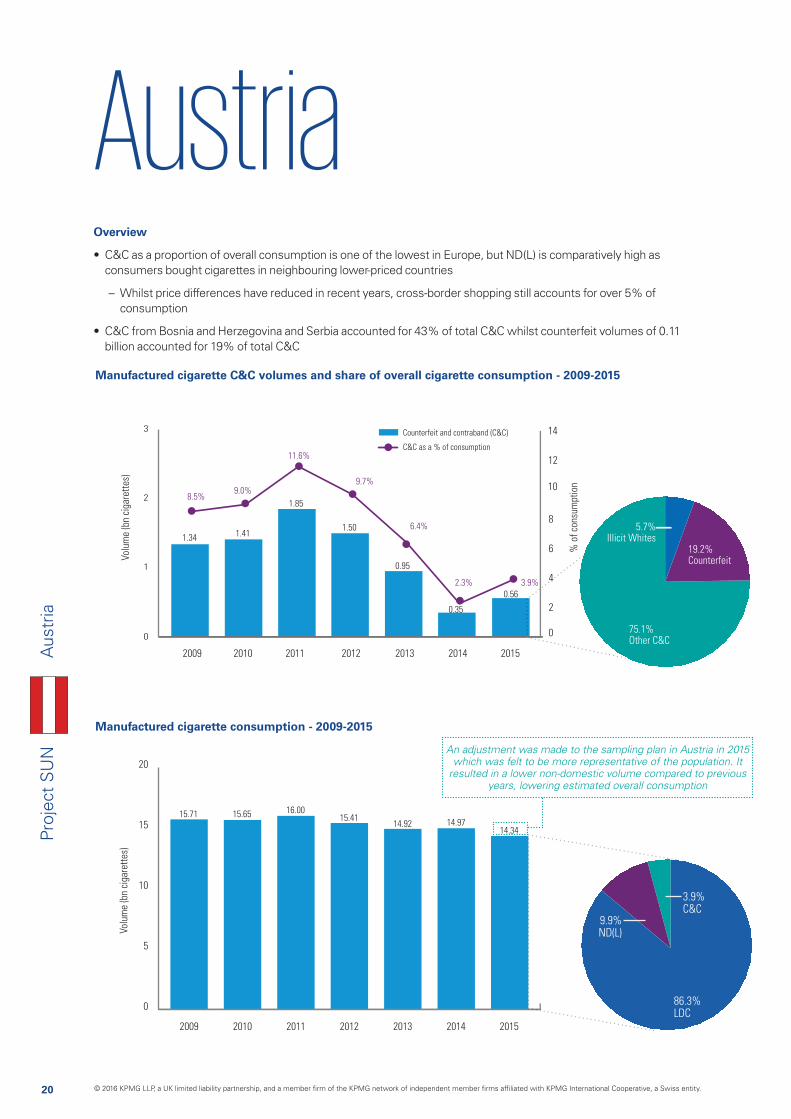
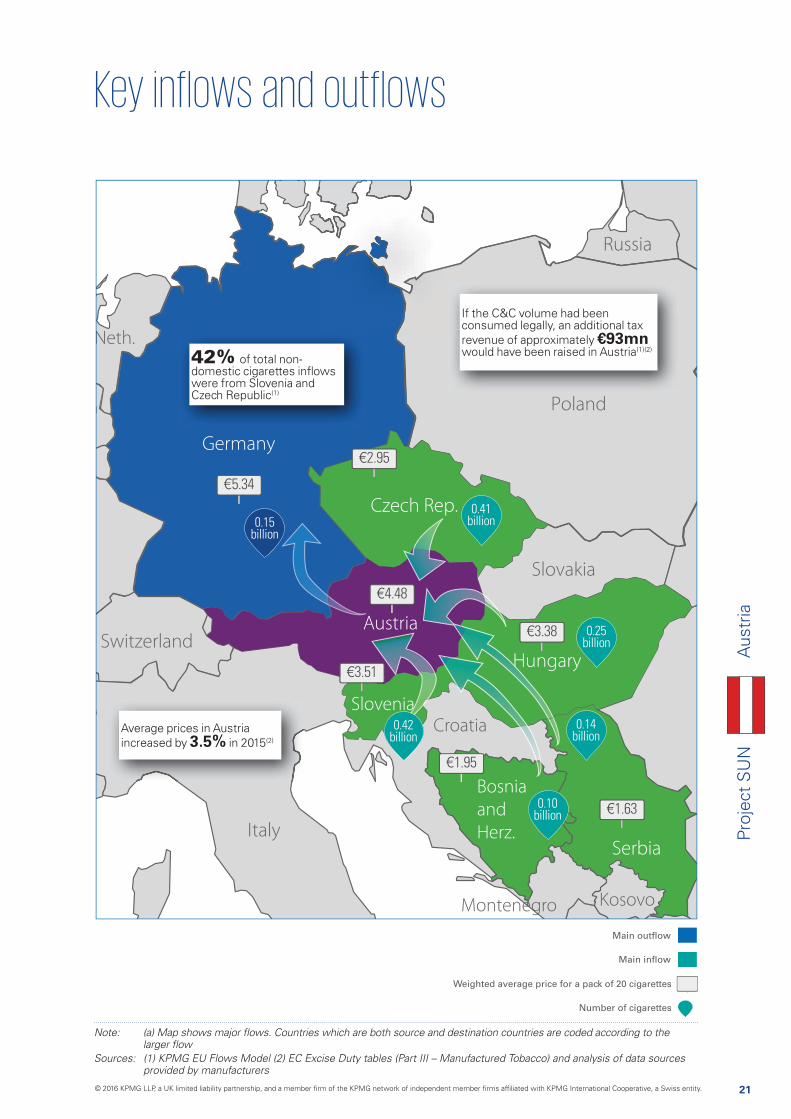
• C&C as a proportion of overall consumption is one of the lowest in Europe, but ND(L) is comparatively high as consumers bought cigarettes in neighbouring lower-priced countries
– Whilst price differences have reduced in recent years, cross-border shopping still accounts for over 5% of consumption
• C&C from Bosnia and Herzegovina and Serbia accounted for 43% of total C&C whilst counterfeit volumes of 0.11 billion accounted for 19% of total C&C
An adjustment was made to the sampling plan in Austria in 2015 which was felt to be more representative of the population. It
resulted in a lower non-domestic volume compared to previous years, lowering estimated overall consumption
© 2016 KPMG LLP, a UK limited liability partnership, and a member firm of the KPMG network of independent member firms affiliated with KPMG International Cooperative, a Swiss entity.
21
Proj
ect
SU
NA
ustr
ia
Main outflow
Main inflow
Weighted average price for a pack of 20 cigarettes
Number of cigarettes
Croatia
Bosnia
and
Herz.
Montenegro
Neth.
m
Kosovo
Sloveniaaa
0.41 billion
0.42 billion
0.15 billion
Sources: (1) KPMG EU Flows Model (2) EC Excise Duty tables (Part III – Manufactured Tobacco) and analysis of data sources provided by manufacturers
€5.34
€2.95
€4.48
€3.38
€1.63
€1.95
0.25 billion
0.14 billion
0.10 billion
€3.51
42% of total non-domestic cigarettes inflows were from Slovenia and Czech Republic(1)
Average prices in Austria increased by 3.5% in 2015(2)
If the C&C volume had been consumed legally, an additional tax revenue of approximately €93mn would have been raised in Austria(1)(2)
© 2016 KPMG LLP, a UK limited liability partnership, and a member firm of the KPMG network of independent member firms affiliated with KPMG International Cooperative, a Swiss entity.
22
Proj
ect
SU
N
ND INFLOWS TO AUSTRIA
Billion cigarettes 2009 2010 2011 2012 2013 2014 2015
Slovenia 0.79 0.85 1.04 0.83 0.68 0.74 0.42
Czech Republic 0.23 0.25 0.47 0.41 0.61 0.47 0.41
Hungary 0.48 0.48 0.99 0.86 0.71 0.56 0.25
Serbia 0.08 0.10 0.08 0.14 0.10 0.03 0.14
Bosnia and Herzegovina 0.11 0.08 0.08 0.07 0.05 0.08 0.10
Duty Free labelled 0.22 0.11 0.11 0.07 0.12 0.13 0.10
Other 0.68 0.69 0.50 0.37 0.37 0.44 0.55
Total inflows 2.59 2.56 3.28 2.76 2.64 2.46 1.97
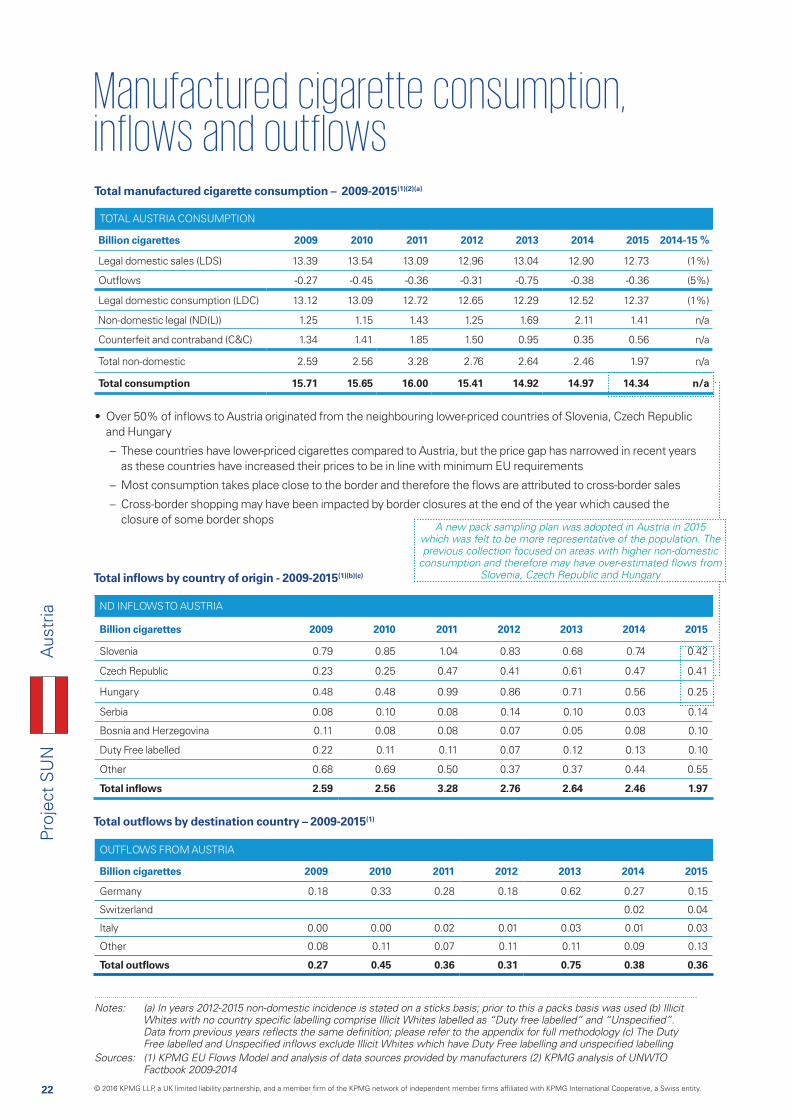
Total manufactured cigarette consumption – 2009-2015(1)(2)(a)
Total inflows by country of origin - 2009-2015(1)(b)(c)
TOTAL AUSTRIA CONSUMPTION
Billion cigarettes 2009 2010 2011 2012 2013 2014 2015 2014-15 %
Legal domestic sales (LDS) 13.39 13.54 13.09 12.96 13.04 12.90 12.73 (1%)
Outflows -0.27 -0.45 -0.36 -0.31 -0.75 -0.38 -0.36 (5%)
Legal domestic consumption (LDC) 13.12 13.09 12.72 12.65 12.29 12.52 12.37 (1%)
Non-domestic legal (ND(L)) 1.25 1.15 1.43 1.25 1.69 2.11 1.41 n/a
Counterfeit and contraband (C&C) 1.34 1.41 1.85 1.50 0.95 0.35 0.56 n/a
Total non-domestic 2.59 2.56 3.28 2.76 2.64 2.46 1.97 n/a
Total consumption 15.71 15.65 16.00 15.41 14.92 14.97 14.34 n/a
Total outflows by destination country – 2009-2015(1)
OUTFLOWS FROM AUSTRIA
Billion cigarettes 2009 2010 2011 2012 2013 2014 2015
Germany 0.18 0.33 0.28 0.18 0.62 0.27 0.15
Switzerland 0.02 0.04
Italy 0.00 0.00 0.02 0.01 0.03 0.01 0.03
Other 0.08 0.11 0.07 0.11 0.11 0.09 0.13
Total outflows 0.27 0.45 0.36 0.31 0.75 0.38 0.36
Notes: (a) In years 2012-2015 non-domestic incidence is stated on a sticks basis; prior to this a packs basis was used (b) Illicit
Sources: (1) KPMG EU Flows Model and analysis of data sources provided by manufacturers (2) KPMG analysis of UNWTO Factbook 2009-2014
• Over 50% of inflows to Austria originated from the neighbouring lower-priced countries of Slovenia, Czech Republic and Hungary
– These countries have lower-priced cigarettes compared to Austria, but the price gap has narrowed in recent years as these countries have increased their prices to be in line with minimum EU requirements
– Most consumption takes place close to the border and therefore the flows are attributed to cross-border sales
– Cross-border shopping may have been impacted by border closures at the end of the year which caused the closure of some border shops
A new pack sampling plan was adopted in Austria in 2015 which was felt to be more representative of the population. The previous collection focused on areas with higher non-domestic
Slovenia, Czech Republic and Hungary
Aus
tria
© 2016 KPMG LLP, a UK limited liability partnership, and a member firm of the KPMG network of independent member firms affiliated with KPMG International Cooperative, a Swiss entity.
23
Proj
ect
SU
N
Notes: (a) KPMG calculates the split between C&C and ND(L) by calculating the ND(L) volumes and subtracting from the total
by manufacturers; detail surrounding methodology changes is provided in the appendix
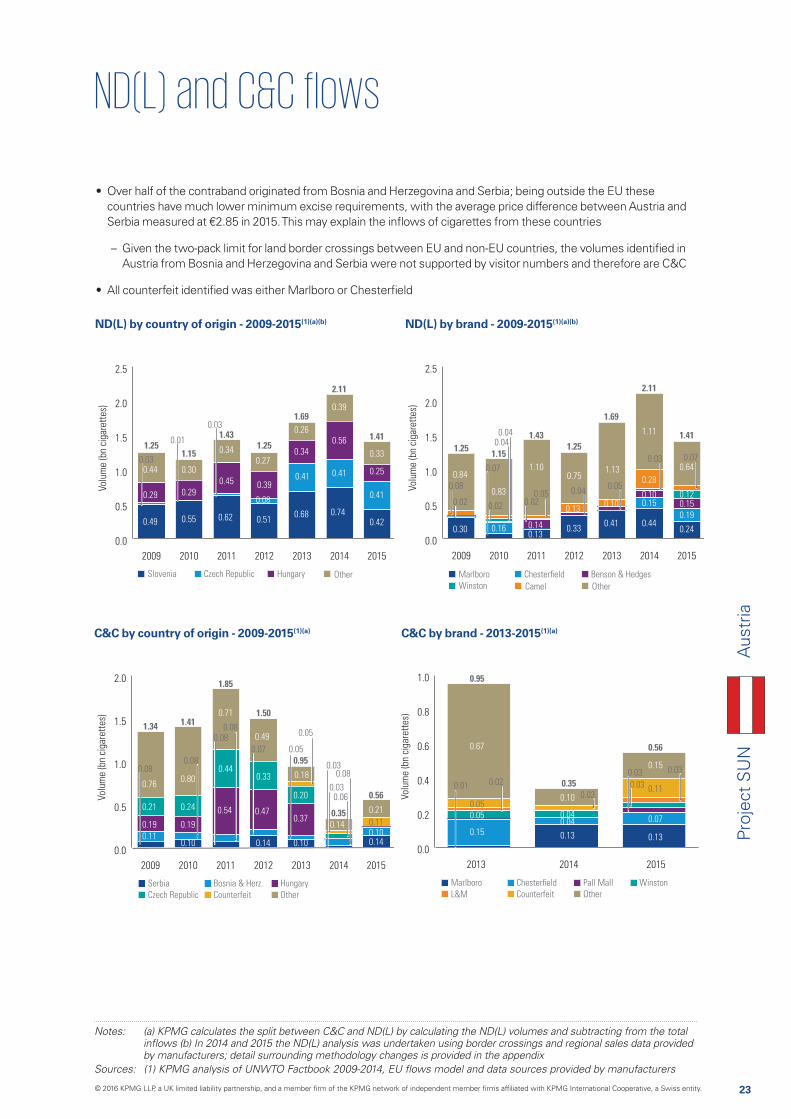
ND(L) by country of origin - 2009-2015(1)(a)(b)
C&C by country of origin - 2009-2015(1)(a)
0.0
0.5
1.0
1.5
2.0
2.5
2009 2010 2011 2012 2013 2014 2015
0.34
0.49
0.290.29
0.44 0.30
0.510.68
0.561.251.15
1.431.25
1.69
2.11
1.41
0.450.41
0.39
0.41
0.620.550.74
0.42
0.41
0.25
0.33
0.01
0.27
0.08
0.39
0.26
0.340.03
0.03
Czech Republic OtherHungarySlovenia
Volu
me
(bn
ciga
rett
es)
0.0
0.5
1.0
1.5
2.0
2.5
2009 2010 2011 2012 2013 2014 2015
0.30
0.83
0.84
0.330.41
1.25 1.15
1.431.25
1.69
2.11
1.41
1.10 1.13
0.130.140.16
0.44
0.150.10
0.28
1.11
0.15
0.19
0.12
0.24
0.640.07
0.13
0.75
0.10
0.08
0.020.05
0.03
0.040.04
0.020.02
0.050.04
0.07
Chesterfield
CamelWinston
Marlboro Benson & Hedges
Other
Volu
me
(bn
ciga
rett
es)
0.0
0.5
1.0
1.5
2.0
2009 2010 2011 2012 2013 2014 2015
0.71
0.19
0.11
0.240.21
0.760.80
0.140.10 0.10
0.37
1.34 1.41
1.85
1.50
0.95
0.35
0.56
0.440.18
0.54
0.19 0.140.100.11
0.14
0.21
0.49
0.47
0.33
0.20
0.08
0.080.08
0.07
0.03
0.05
0.05
0.030.06
0.08
0.08
Bosnia & Herz.
CounterfeitCzech Republic
Serbia Hungary
Other
Volu
me
(bn
ciga
rett
es)
0.0
0.2
0.4
0.6
0.8
1.0
2013 2014 2015
0.15
0.95
0.35
0.56
0.13
0.040.04
0.10
0.15
0.11
0.07
0.13
0.67
0.050.05
0.03
0.020.01
0.030.03
0.03
Chesterfield
CounterfeitL&M
Marlboro Pall Mall
Other
Winston
Volu
me
(bn
ciga
rett
es)
ND(L) by brand - 2009-2015(1)(a)(b)
C&C by brand - 2013-2015(1)(a)
• Over half of the contraband originated from Bosnia and Herzegovina and Serbia; being outside the EU these countries have much lower minimum excise requirements, with the average price difference between Austria and Serbia measured at €2.85 in 2015. This may explain the inflows of cigarettes from these countries
– Given the two-pack limit for land border crossings between EU and non-EU countries, the volumes identified in Austria from Bosnia and Herzegovina and Serbia were not supported by visitor numbers and therefore are C&C
• All counterfeit identified was either Marlboro or Chesterfield
Aus
tria
© 2016 KPMG LLP, a UK limited liability partnership, and a member firm of the KPMG network of independent member firms affiliated with KPMG International Cooperative, a Swiss entity.
24
Proj
ect
SU
NB
elgi
um
Manufactured cigarette consumption - 2009-2015
Manufactured cigarette C&C volumes and share of overall cigarette consumption - 2009-2015
0.0
0.3
0.6
0.9
1.2
1.5
Volu
me
(bn
ciga
rett
es)
% o
f co
nsum
ptio
n
2009 2010 2011 2012 2013 2014 2015
Counterfeit and contraband (C&C)
C&C as a % of consumption
0
2
4
6
8
10
12
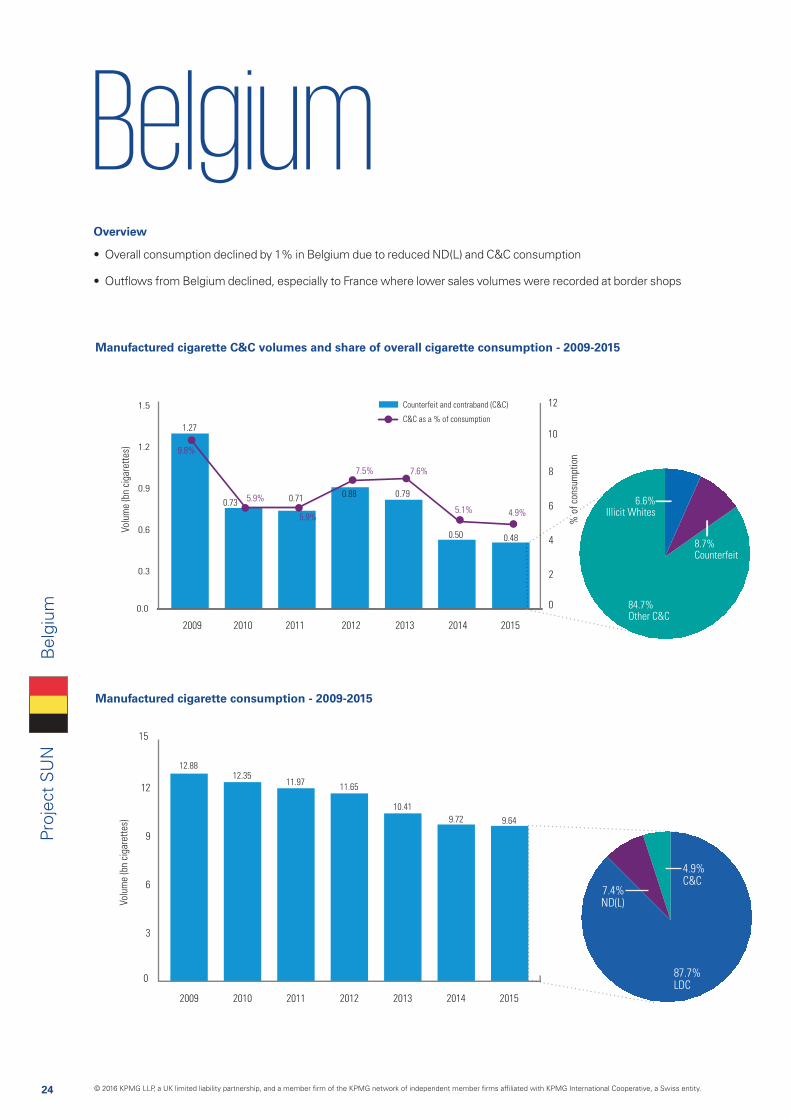
9.8%
5.9%
5.9%
7.5% 7.6%
5.1% 4.9%
1.27
0.73 0.71 0.88 0.79
0.50 0.48
Volu
me
(bn
ciga
rett
es)
2009 2010 2011 2012 2013 2014 2015
12.8812.35
11.9711.65
10.41
9.649.72
0
3
6
9
12
15
o
7.4%ND(L)
4.9%C&C
87.7%LDC
Overview
• Overall consumption declined by 1% in Belgium due to reduced ND(L) and C&C consumption
• Outflows from Belgium declined, especially to France where lower sales volumes were recorded at border shops
8.7%Counterfeit
84.7%Other C&C
6.6%Illicit Whites
© 2016 KPMG LLP, a UK limited liability partnership, and a member firm of the KPMG network of independent member firms affiliated with KPMG International Cooperative, a Swiss entity.

25
Proj
ect
SU
NB
elgi
um
Main outflow
Main inflow
Weighted average price for a pack of 20 cigarettes
Number of cigarettes
Belgiumgggg0.17
billion
0.29 billion
1.69 billion
Sources: (1) KPMG EU Flows Model (2) EC Excise Duty tables (Part III – Manufactured Tobacco)
€6.75
€5.94
€4.50
€5.51
16% of legal domestic sales in Belgium were consumed in France(1)
Average price of a pack of cigarettes in Belgium increased by approximately 4% in 2015(2)
If the C&C volume had been consumed legally, an additional tax revenue of approximately €100mn would have been raised in Belgium(1)(2)
Duty Free
labelled
0.20 billion
© 2016 KPMG LLP, a UK limited liability partnership, and a member firm of the KPMG network of independent member firms affiliated with KPMG International Cooperative, a Swiss entity.
26
Proj
ect
SU
N
ND INFLOWS TO BELGIUM
Billion cigarettes 2009 2010 2011 2012 2013 2014 2015
Duty Free labelled 0.37 0.27 0.18 0.20 0.22 0.20 0.20
Luxembourg 0.12 0.23 0.47 0.51 0.42 0.25 0.17
France 0.16 0.07 0.06 0.09 0.29 0.07 0.10
Netherlands 0.11 0.13 0.06 0.04 0.17 0.08 0.10
Russia 0.08 0.09 0.17 0.12 0.08 0.05 0.07
Bulgaria 0.13 0.05 0.01 0.04 0.04 0.02 0.06
Other 0.97 0.62 0.52 0.69 0.67 0.61 0.48
Total inflows 1.95 1.46 1.46 1.69 1.89 1.27 1.18
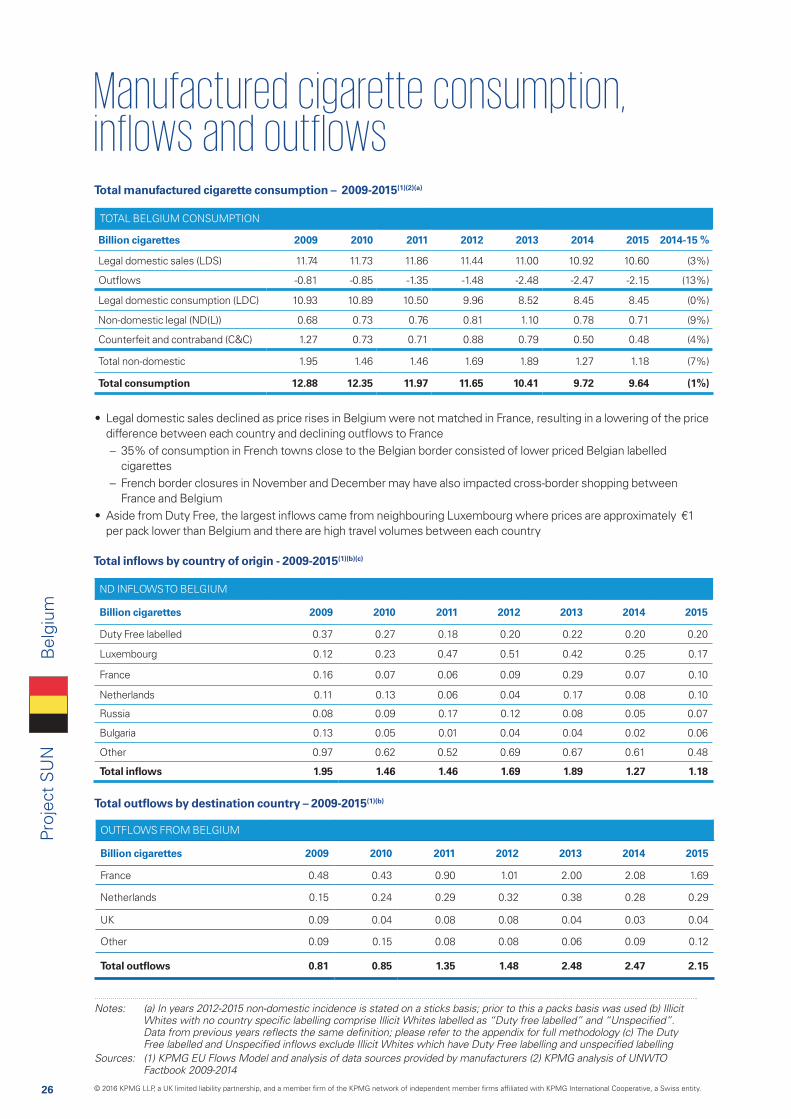
Total manufactured cigarette consumption – 2009-2015(1)(2)(a)
Total inflows by country of origin - 2009-2015(1)(b)(c)
TOTAL BELGIUM CONSUMPTION
Billion cigarettes 2009 2010 2011 2012 2013 2014 2015 2014-15 %
Legal domestic sales (LDS) 11.74 11.73 11.86 11.44 11.00 10.92 10.60 (3%)
Outflows -0.81 -0.85 -1.35 -1.48 -2.48 -2.47 -2.15 (13%)
Legal domestic consumption (LDC) 10.93 10.89 10.50 9.96 8.52 8.45 8.45 (0%)
Non-domestic legal (ND(L)) 0.68 0.73 0.76 0.81 1.10 0.78 0.71 (9%)
Counterfeit and contraband (C&C) 1.27 0.73 0.71 0.88 0.79 0.50 0.48 (4%)
Total non-domestic 1.95 1.46 1.46 1.69 1.89 1.27 1.18 (7%)
Total consumption 12.88 12.35 11.97 11.65 10.41 9.72 9.64 (1%)
Total outflows by destination country – 2009-2015(1)(b)
OUTFLOWS FROM BELGIUM
Billion cigarettes 2009 2010 2011 2012 2013 2014 2015
France 0.48 0.43 0.90 1.01 2.00 2.08 1.69
Netherlands 0.15 0.24 0.29 0.32 0.38 0.28 0.29
UK 0.09 0.04 0.08 0.08 0.04 0.03 0.04
Other 0.09 0.15 0.08 0.08 0.06 0.09 0.12
Total outflows 0.81 0.85 1.35 1.48 2.48 2.47 2.15
Notes: (a) In years 2012-2015 non-domestic incidence is stated on a sticks basis; prior to this a packs basis was used (b) Illicit
Sources: (1) KPMG EU Flows Model and analysis of data sources provided by manufacturers (2) KPMG analysis of UNWTO Factbook 2009-2014
• Legal domestic sales declined as price rises in Belgium were not matched in France, resulting in a lowering of the price difference between each country and declining outflows to France
– 35% of consumption in French towns close to the Belgian border consisted of lower priced Belgian labelled cigarettes
– French border closures in November and December may have also impacted cross-border shopping between France and Belgium
• Aside from Duty Free, the largest inflows came from neighbouring Luxembourg where prices are approximately €1 per pack lower than Belgium and there are high travel volumes between each country
Bel
gium
© 2016 KPMG LLP, a UK limited liability partnership, and a member firm of the KPMG network of independent member firms affiliated with KPMG International Cooperative, a Swiss entity.
27
Proj
ect
SU
N
Notes: (a) KPMG calculates the split between C&C and ND(L) by calculating the ND(L) volumes and subtracting from the total
by manufacturers; detail surrounding methodology changes is provided in the appendix
ND(L) by country of origin - 2009-2015(1)(a)(b)
C&C by country of origin - 2009-2015(1)(a)
0.0
0.2
0.4
0.6
0.8
1.0
1.2
1.4
2009 2010 2011 2012 2013 2014 2015
0.17
0.12
0.13
0.070.16
0.11
0.300.28
0.510.42
0.37
0.680.73 0.76 0.81
1.10
0.780.71
0.060.06
0.29
0.080.07
0.470.23 0.25
0.17
0.10
0.10
0.29
0.05
0.01
0.16
0.09
0.21
0.17
0.01
0.010.040.01
France
OtherPoland
Luxembourg Netherlands
Volu
me
(bn
ciga
rett
es)
0.0
0.2
0.4
0.6
0.8
1.0
1.2
2009 2010 2011 2012 2013 2014 2015
0.26
0.090.05
0.31
0.07
0.30
0.22 0.21
0.680.73 0.76
0.81
1.10
0.780.71
0.43
0.070.05
0.72
0.200.28 0.30
0.05
0.34
0.050.06
0.19
0.33
0.070.05
0.47
0.10
0.05
0.02
0.02 0.01
0.040.01 0.01 0.02
0.02
0.04
0.030.04
L&M
WinstonLucky Strike
Marlboro Camel
Other
Volu
me
(bn
ciga
rett
es)
0.0
0.4
0.8
1.2
1.6
2009 2010 2011 2012 2013 2014 2015
0.71
0.130.08
0.10
0.96
0.53
0.12 0.08
1.27
0.73 0.71
0.880.79
0.50 0.480.460.49
0.170.09
0.33
0.06
0.23
0.06
0.04
0.55
0.110.06 0.09
0.01
0.01
0.04
0.03
0.04
0.05
0.03
0.04
0.05
0.02
0.02
0.01
0.030.03
0.05
0.050.04
0.04
Bulgaria
CounterfeitBelarus
Russia Romania
Other
Volu
me
(bn
ciga
rett
es)
0.0
0.2
0.4
0.6
0.8
1.0
2013 2014 2015
0.09
0.22
0.08
0.040.05
0.31
0.07
0.79
0.500.48
0.10
0.08
0.200.07
0.320.02
0.030.02
0.04
0.02
L&M
CounterfeitDavidoff
Marlboro Pall Mall
Other
Volu
me
(bn
ciga
rett
es)
ND(L) by brand - 2009-2015(1)(a)(b)
C&C by brand - 2013-2015(1)(a)
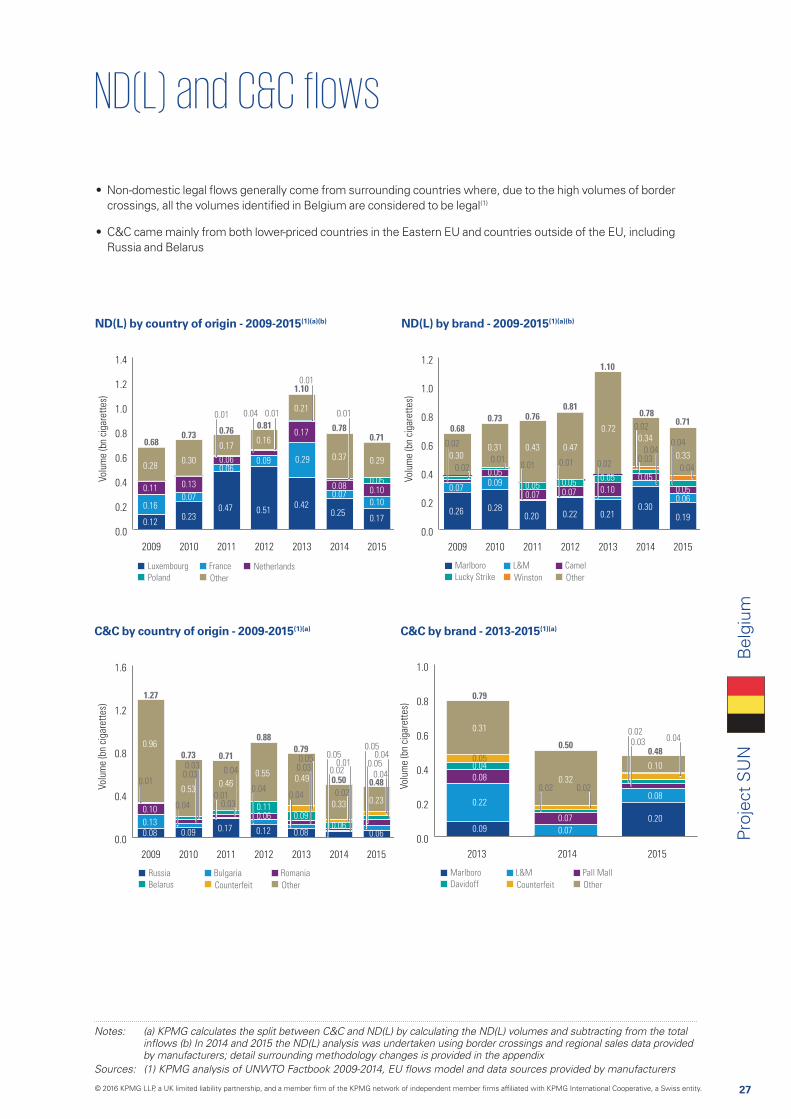
• Non-domestic legal flows generally come from surrounding countries where, due to the high volumes of border crossings, all the volumes identified in Belgium are considered to be legal(1)
• C&C came mainly from both lower-priced countries in the Eastern EU and countries outside of the EU, including Russia and Belarus
Bel
gium
© 2016 KPMG LLP, a UK limited liability partnership, and a member firm of the KPMG network of independent member firms affiliated with KPMG International Cooperative, a Swiss entity.

28
Proj
ect
SU
NB
ulga
ria
Manufactured cigarette consumption - 2009-2015
Manufactured cigarette C&C volumes and share of overall cigarette consumption - 2009-2015
0
1
2
3
4
5
6
Volu
me
(bn
ciga
rett
es)
% o
f co
nsum
ptio
n
2009 2010 2011 2012 2013 2014 2015
Counterfeit and contraband (C&C)
C&C as a % of consumption
0
5
10
15
20
25
30
35
16.5%
30.7%
20.2%
15.5%
18.2% 18.5%
11.6%
3.26
4.78
2.69
2.08
2.51 2.50
1.66
Volu
me
(bn
ciga
rett
es)
2009 2010 2011 2012 2013 2014 2015
19.83
15.57
13.36 13.42 13.7914.27
13.50
0
5
10
15
20
0.4%ND(L)
11.6%C&C
88.0%LDC
4.5%Counterfeit
42.3%Other C&C
53.2%Illicit Whites
Overview
• C&C volumes declined by 0.8 billion cigarettes in 2015
• A 0.9 billion cigarette decline in inflows was offset by growth in legal domestic consumption
• Historically prevalent C&C brands Don, Turquoise, Diva and Palladium, declined from 39% to 11% of total C&C volume between 2014 and 2015
Overall manufactured cigarette consumption may be overestimated due to possible stock build up towards the
end of 2015 in advance of an excise tax increase
© 2016 KPMG LLP, a UK limited liability partnership, and a member firm of the KPMG network of independent member firms affiliated with KPMG International Cooperative, a Swiss entity.
29
Proj
ect
SU
NB
ulga
ria
Main outflow
Main inflow
Weighted average price for a pack of 20 cigarettes
Number of cigarettes
FYROM
Bosnia
and
Herz.
Croatia
Slovenia
Montenegro
Albania
Moldova
Turkey
Ukraine
Poland
Belgium
Neth.
Belarus
Kosovo
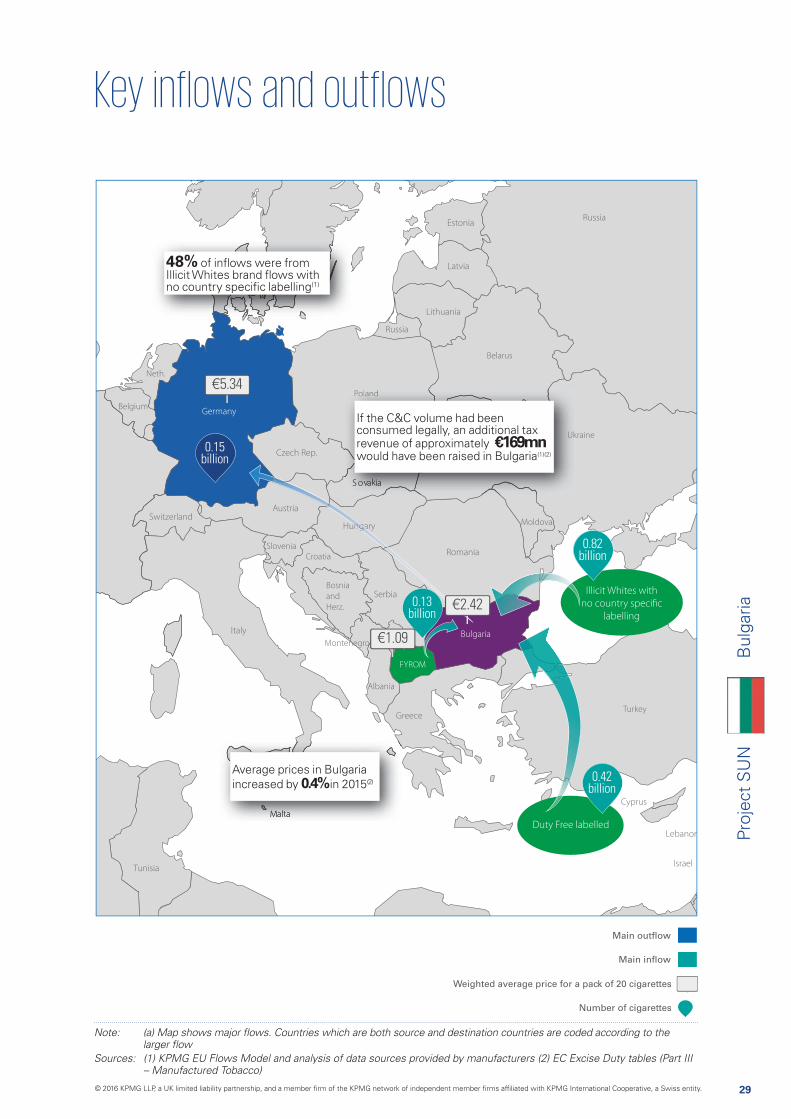
0.13 billion
0.82 billion
0.42 billion
0.15 billion
Sources: (1) KPMG EU Flows Model and analysis of data sources provided by manufacturers (2) EC Excise Duty tables (Part III – Manufactured Tobacco)
€1.09
€2.42
€5.34
48% of inflows were from Illicit Whites brand flows with no country specific labelling(1)
Average prices in Bulgaria increased by 0.4% in 2015(2)
UUkk
PolPolol dandand
If the C&C volume had been consumed legally, an additional tax revenue of approximately €169mn would have been raised in Bulgaria(1)(2)
Duty Free labelled
Illicit Whites with
no country specific
labelling
© 2016 KPMG LLP, a UK limited liability partnership, and a member firm of the KPMG network of independent member firms affiliated with KPMG International Cooperative, a Swiss entity.

30
Proj
ect
SU
N
ND INFLOWS TO BULGARIA
Billion cigarettes 2009 2010 2011 2012 2013 2014 2015
IWs with no country-specific labelling 0.32 1.21 0.92 0.45 0.37 1.28 0.82
Duty free labelled 2.03 2.08 1.14 1.24 1.87 0.90 0.42
FYROM 0.00 0.02 0.04 0.07 0.04 0.03 0.13
United Arab Emirates 0.00 0.10 0.00 0.00 0.00 0.08 0.13
Georgia 0.00 0.00 0.00 0.01 0.02 0.02 0.03
Counterfeit 0.00 0.01 0.07
Other 1.15 1.51 0.75 0.46 0.37 0.25 0.12
Total inflows 3.50 4.93 2.84 2.23 2.66 2.57 1.72
Total manufactured cigarette consumption – 2009-2015(1)(2)(a)
Total inflows by country of origin - 2009-2015(1)(b)(c)
TOTAL BULGARIA CONSUMPTION
Billion cigarettes 2009 2010 2011 2012 2013 2014 2015 2014-15 %
Legal domestic sales (LDS) 16.80 10.91 10.80 11.57 11.50 11.34 13.16 16%
Outflows -0.47 -0.27 -0.29 -0.38 -0.36 -0.41 -0.61 48%
Legal domestic consumption (LDC) 16.33 10.64 10.51 11.19 11.14 10.93 12.55 15%
Non-domestic legal (ND(L)) 0.23 0.15 0.15 0.15 0.15 0.07 0.06 (15%)
Counterfeit and contraband (C&C) 3.26 4.78 2.69 2.08 2.51 2.50 1.66 (34%)
Total non-domestic 3.50 4.93 2.84 2.23 2.66 2.57 1.72 (33%)
Total consumption 19.83 15.57 13.36 13.42 13.79 13.50 14.27 6%
Total outflows by destination country – 2009-2015(1)
OUTFLOWS FROM BULGARIA
Billion cigarettes 2009 2010 2011 2012 2013 2014 2015
Germany 0.04 0.03 0.07 0.06 0.08 0.11 0.15
France 0.04 0.02 0.03 0.05 0.09 0.07 0.13
UK 0.09 0.03 0.06 0.08 0.03 0.05 0.08
Other 0.30 0.18 0.13 0.19 0.17 0.19 0.25
Total outflows 0.47 0.27 0.29 0.38 0.36 0.41 0.61
Notes: (a) In years 2012-2015 non-domestic incidence is stated on a sticks basis; prior to this a packs basis was used (b) Illicit
Sources: (1) KPMG EU Flows Model and analysis of data sources provided by manufacturers (2) KPMG analysis of UNWTO Factbook 2009-2014 (3) Euromonitor, 2015 (4) Deutsche Welle, January 2014 and European Commission memo 14-1, January 2014
• Adult smoking prevalence remained stable at 38%(3), whilst C&C fell and legal domestic sales grew by 16% • Lower volumes of Illicit Whites brand flows and Duty Free labelled cigarettes in 2015 caused inflows to decline by one
third• Outflows increased by 0.2 billion, which may have been associated with the lifting of EU restrictions on the free
movement of Bulgarian workers in 2014(4)
Overall manufactured cigarette consumption may be overestimated due to possible stock build up towards the end of 2015 in advance of an excise tax increase
98% of counterfeit had Ukrainian labelling
Bul
garia
© 2016 KPMG LLP, a UK limited liability partnership, and a member firm of the KPMG network of independent member firms affiliated with KPMG International Cooperative, a Swiss entity.
31
Proj
ect
SU
N
Notes: (a) KPMG calculates the split between C&C and ND(L) by calculating the ND(L) volumes and subtracting from the total
by manufacturers; detail surrounding methodology changes is provided in the appendix
ND(L) by country of origin - 2009-2015(1)(a)(b)
C&C by country of origin - 2009-2015(1)(a)
0.00
0.05
0.10
0.15
0.20
0.25
2009 2010 2011 2012 2013 2014 2015
0.13
0.02
0.130.21
0.02 0.02
0.23
0.15 0.15 0.15 0.15
0.070.06
0.13
0.06
0.020.020.010.01
0.04
0.13
GermanyTurkey Other
Volu
me
(bn
ciga
rett
es)
0.00
0.05
0.10
0.15
0.20
0.25
2009 2010 2011 2012 2013 2014 2015
0.10 0.02
0.090.03
0.10
0.04 0.04
0.23
0.15 0.15 0.150.15
0.070.06
0.10
0.01
0.10
0.040.04
0.05
0.010.01 0.01
0.050.01
0.10
0.02
KareliaMarlboro Other
Volu
me
(bn
ciga
rett
es)
0
1
2
3
4
5
2009 2010 2011 2012 2013 2014 2015
0.49
0.32
2.46
0.57
2.97
0.45 0.37
3.26
4.78
2.69
2.08
2.51 2.50
1.661.51
0.23
2.03
0.921.21
1.17
1.28
0.61
0.82
1.490.04
0.06
0.07
0.01
0.07
0.04
0.030.020.02
0.03
0.070.13
Unspecified
Counterfeit
IWs with no country-specific labelling
FYROM Other
Volu
me
(bn
ciga
rett
es)
0.0
0.5
1.0
1.5
2.0
2.5
3.0
2013 2014 2015
0.28
0.17
1.79
0.22
2.51 2.50
1.66
0.92
0.170.13
0.19
0.29
0.26
0.24
0.20
1.23
0.01
0.01
0.040.06
0.06
0.07
0.03
0.060.04
0.020.03 0.07
0.10
President
Diva
TurquoiseKarelia MM
Palladium
Don
Counterfeit Other
Volu
me
(bn
ciga
rett
es)
ND(L) by brand - 2009-2015(1)(a)(b)
C&C by brand - 2013-2015(1)(a)
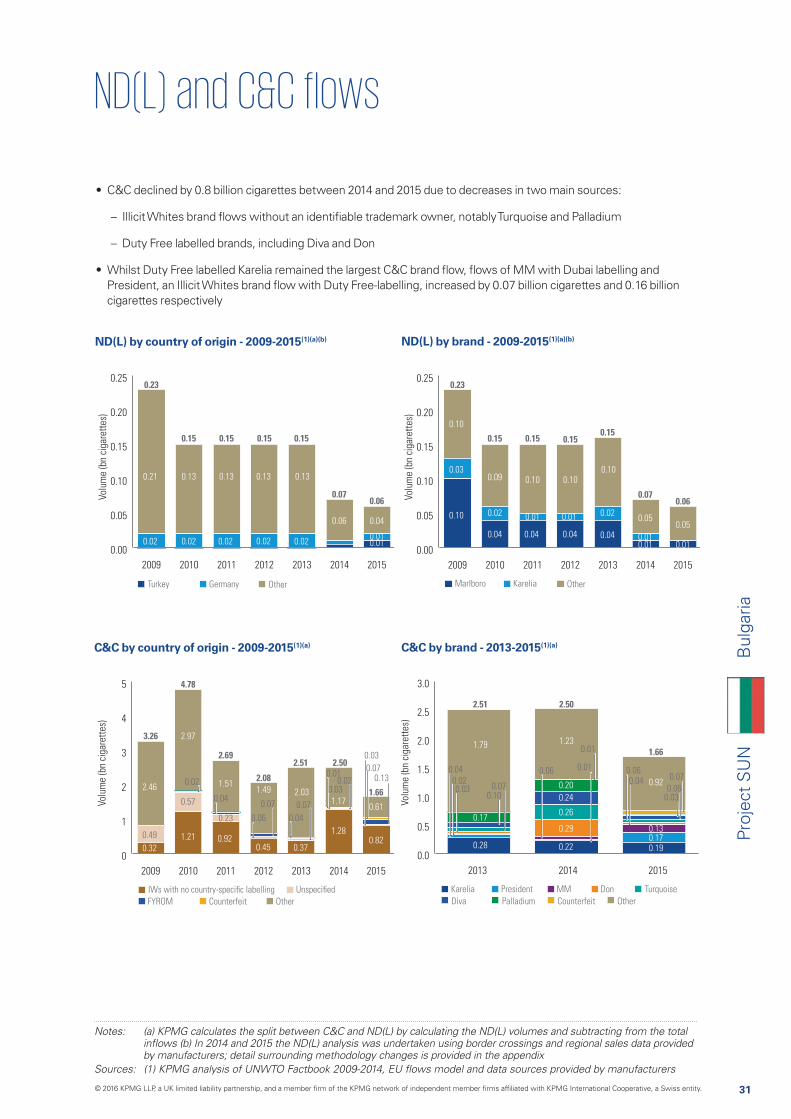
• C&C declined by 0.8 billion cigarettes between 2014 and 2015 due to decreases in two main sources:
– Illicit Whites brand flows without an identifiable trademark owner, notably Turquoise and Palladium
– Duty Free labelled brands, including Diva and Don
• Whilst Duty Free labelled Karelia remained the largest C&C brand flow, flows of MM with Dubai labelling and President, an Illicit Whites brand flow with Duty Free-labelling, increased by 0.07 billion cigarettes and 0.16 billion cigarettes respectively
Bul
garia
© 2016 KPMG LLP, a UK limited liability partnership, and a member firm of the KPMG network of independent member firms affiliated with KPMG International Cooperative, a Swiss entity.
32
Proj
ect
SU
N
CroatiaC
roat
ia
Manufactured cigarette consumption - 2013-2015
Manufactured cigarette C&C volumes and share of overall cigarette consumption - 2013-2015
0.0
0.1
0.2
0.3
0.4
0.5
0.6
Volu
me
(bn
ciga
rett
es)
% o
f co
nsum
ptio
n
2013 2014 2015
Counterfeit and contraband (C&C)
C&C as a % of consumption
3
4
5
6
7
8
3.8%
8.1%
4.3%
0.25
0.50
0.25
Volu
me
(bn
ciga
rett
es)
2013 2014 2015
6.83
5.74
6.44
0
1
2
3
4
5
6
7
8
c
0.8%ND(L)
4.3%C&C
94.9%LDC
3.8%Counterfeit
78.7%Other C&C
17.4%Illicit Whites
Overview
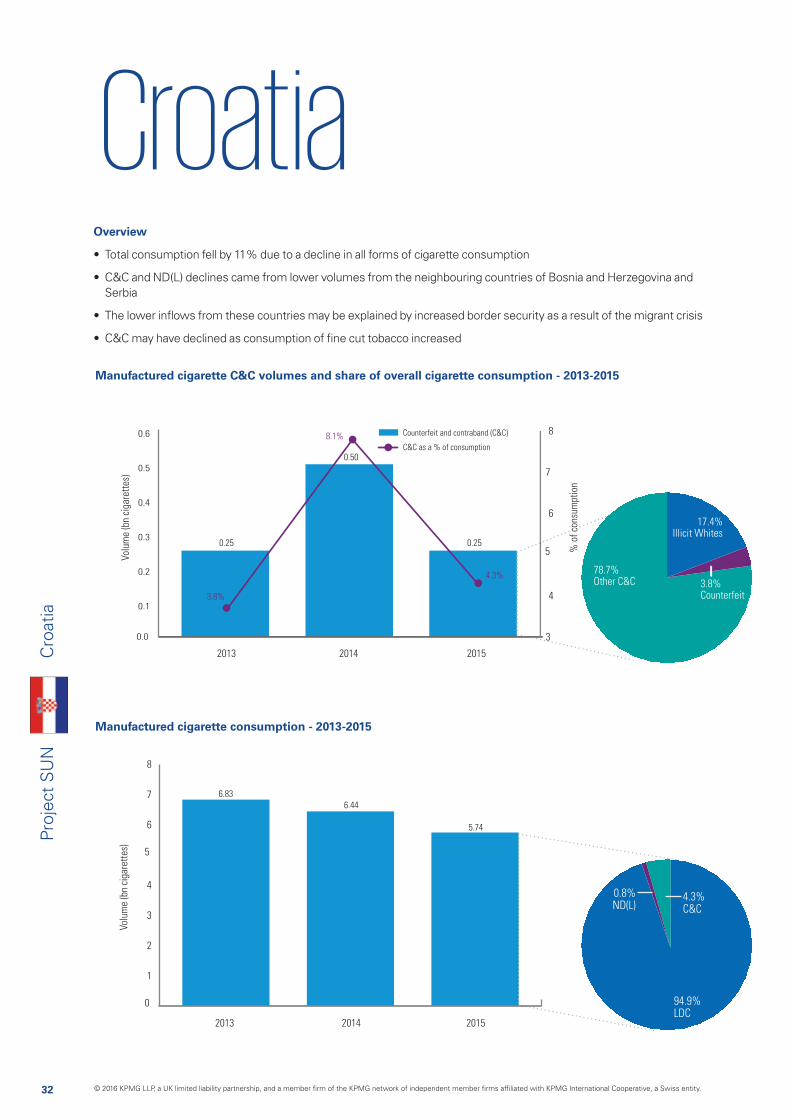
• Total consumption fell by 11% due to a decline in all forms of cigarette consumption
• C&C and ND(L) declines came from lower volumes from the neighbouring countries of Bosnia and Herzegovina and Serbia
• The lower inflows from these countries may be explained by increased border security as a result of the migrant crisis
• C&C may have declined as consumption of fine cut tobacco increased
© 2016 KPMG LLP, a UK limited liability partnership, and a member firm of the KPMG network of independent member firms affiliated with KPMG International Cooperative, a Swiss entity.
33
Proj
ect
SU
NC
roat
ia
Main outflow
Main inflow
Weighted average price for a pack of 20 cigarettes
Number of cigarettes
FYROM
Bosnia
and
Herz.
Croatia
Slovenia
Montenegro
Albania
Mo
Belgium
Neth.
Belarus
Kosovo
0.02 billion
0.16 billion
0.03 billion
0.27 billion
Sources: (1) KPMG EU Flows Model (2) EC Excise Duty tables (Part III – Manufactured Tobacco) and analysis of data sources provided by manufacturers
€3.00
€1.95
€1.63
€5.34
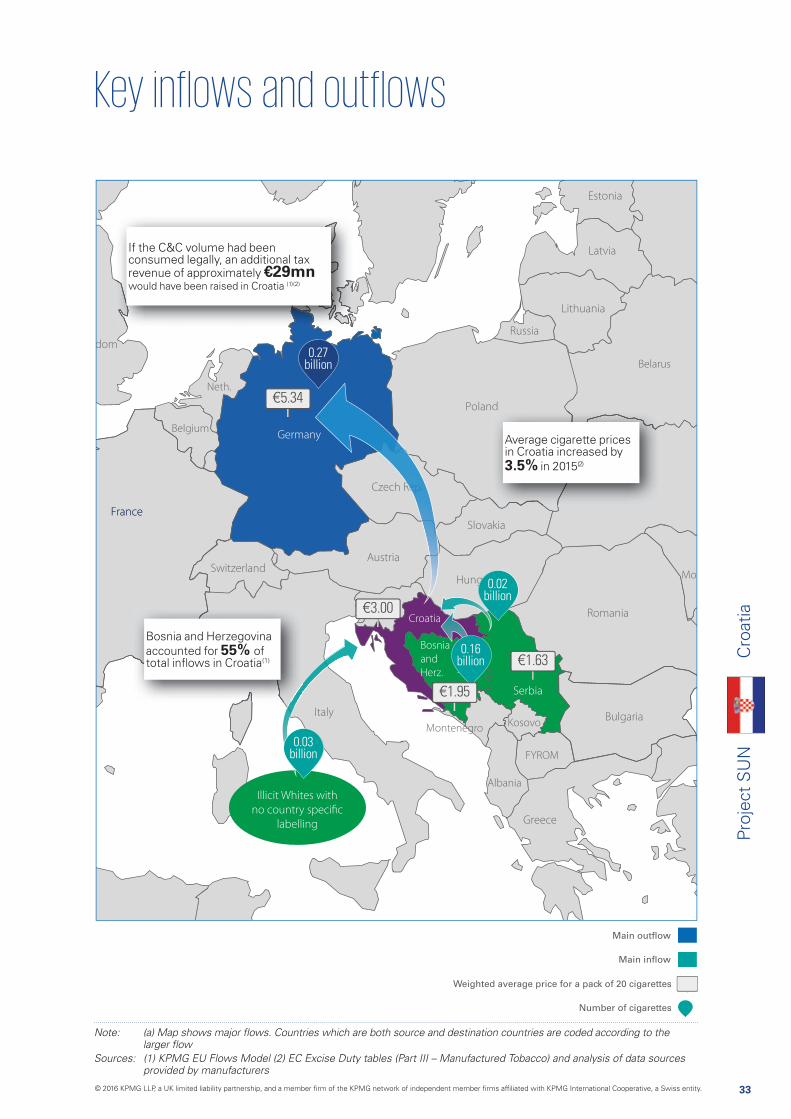
Average cigarette prices in Croatia increased by 3.5% in 2015(2)
Bosnia and Herzegovina accounted for 55% of total inflows in Croatia(1)
If the C&C volume had been consumed legally, an additional tax revenue of approximately €29mn
would have been raised in Croatia (1) (2)
Illicit Whites with
no country specific
labelling
© 2016 KPMG LLP, a UK limited liability partnership, and a member firm of the KPMG network of independent member firms affiliated with KPMG International Cooperative, a Swiss entity.
34
Proj
ect
SU
N
ND INFLOWS TO CROATIA
Billion cigarettes 2012 2013 2014 2015
Bosnia And Herzegovina 0.46 0.20 0.38 0.16
IWs with no country-specific labelling n/a 0.00 0.04 0.03
Serbia 0.07 0.05 0.09 0.02
Slovenia n/a 0.00 0.01 0.01
Duty Free labelled n/a 0.00 0.00 0.00
Other 0.18 0.10 0.11 0.07
Total inflows 0.71 0.35 0.64 0.29
Total manufactured cigarette consumption – 2012-2015(1)(2)(a)(b)(c)
Total inflows by country of origin - 2012-2015(1)(d)(e)
TOTAL CROATIA CONSUMPTION
Billion cigarettes 2012 2013 2014 2015 2014-15 %
Legal domestic sales (LDS) 7.22 6.71 6.07 5.86 (3%)
Outflows -0.18 -0.23 -0.26 -0.42 59%
Legal domestic consumption (LDC) 7.04 6.47 5.81 5.44 (6%)
Non-domestic legal (ND(L)) n/a 0.10 0.13 0.04 (67%)
Counterfeit and contraband (C&C) n/a 0.25 0.50 0.25 (50%)
Total non-domestic 0.71 0.35 0.64 0.29 (54%)
Total consumption 7.76 6.83 6.44 5.74 (11%)
Total outflows by destination country – 2012-2015(1)
OUTFLOWS FROM CROATIA
Billion cigarettes 2012 2013 2014 2015
Germany 0.07 0.09 0.14 0.27
Slovenia 0.01 0.03 0.02 0.04
Austria 0.03 0.03 0.03 0.03
Other 0.07 0.09 0.07 0.08
Total outflows 0.18 0.23 0.26 0.42
Notes: (a) In years 2012-2015 non-domestic incidence is stated on a sticks basis; prior to this a packs basis was used (b) As Croatia was not in the EU in 2012 KPMG has used historic legal domestic sales data but did not report on 2012 volumes.
model (c) Non-domestic incidence for 2012 is not given as no consumer research was undertaken for Croatia
Sources: (1) KPMG EU Flows Model and analysis of data sources provided by manufacturers (2) KPMG analysis of UNWTO Factbook 2009-2014 (3) 2015 Euromonitor
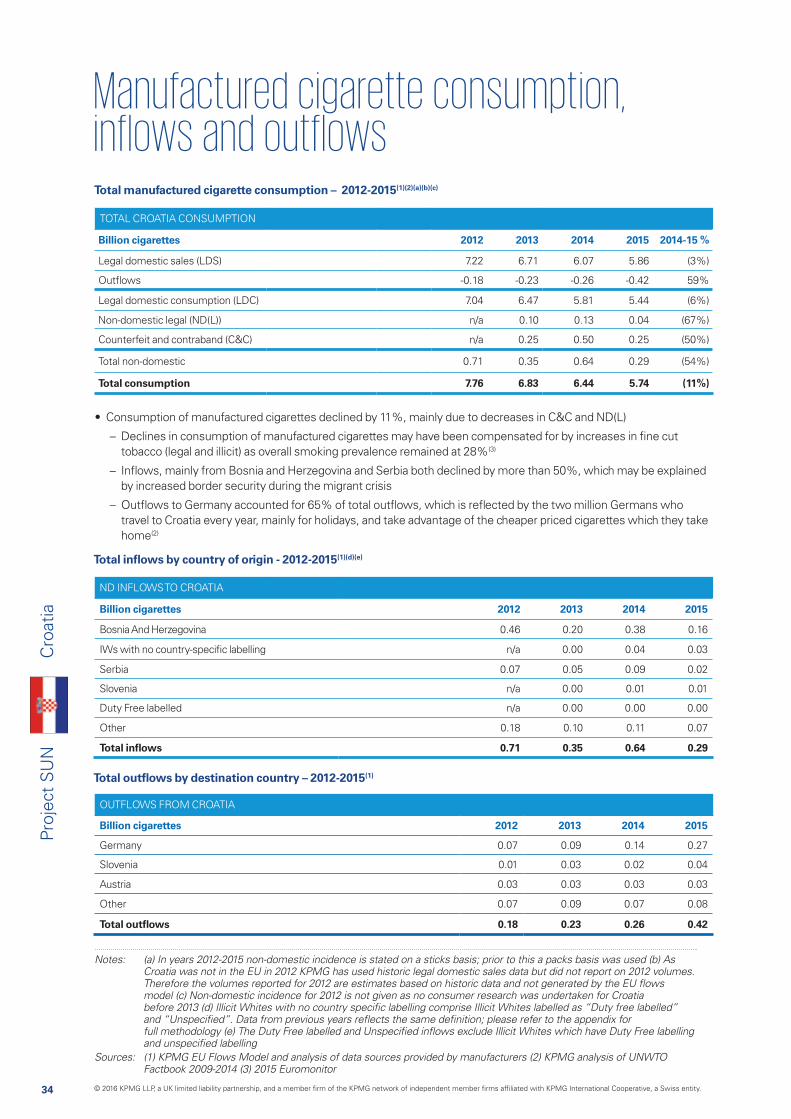
• Consumption of manufactured cigarettes declined by 11%, mainly due to decreases in C&C and ND(L)
– Declines in consumption of manufactured cigarettes may have been compensated for by increases in fine cut tobacco (legal and illicit) as overall smoking prevalence remained at 28%(3)
– Inflows, mainly from Bosnia and Herzegovina and Serbia both declined by more than 50%, which may be explained by increased border security during the migrant crisis
– Outflows to Germany accounted for 65% of total outflows, which is reflected by the two million Germans who travel to Croatia every year, mainly for holidays, and take advantage of the cheaper priced cigarettes which they take home(2)
Cro
atia
© 2016 KPMG LLP, a UK limited liability partnership, and a member firm of the KPMG network of independent member firms affiliated with KPMG International Cooperative, a Swiss entity.

35
Proj
ect
SU
N
Notes: (a) KPMG calculates the split between C&C and ND(L) by calculating the ND(L) volumes and subtracting from the total
by manufacturers; detail surrounding methodology changes is provided in the appendix
ND(L) by country of origin - 2013-2015(1)(a)(b)
C&C by country of origin - 2013-2015(1)(a)
0.00
0.03
0.06
0.09
0.12
0.15
2013 2014 2015
0.01
0.10
0.13
0.04
0.04
0.08
0.06
0.04
0.01
0.01
0.03
Bosnia and HerzegovinaSlovenia Other
Volu
me
(bn
ciga
rett
es)
0.00
0.03
0.06
0.09
0.12
0.15
2013 2014 2015
0.01
0.10
0.13
0.04
0.12
0.10
0.01
0.01
0.02
0.01
RonhillMarlboro Lucky Strike Other
Volu
me
(bn
ciga
rett
es)
0.0
0.1
0.2
0.3
0.4
0.5
0.6
2013 2014 2015
0.30
0.09
0.04
0.25
0.50
0.25
0.05
0.07
0.04
0.14 0.15
0.03
0.03
SerbiaBosnia and Herzegovina Kosovo
IWs with no country-specific labelling Counterfeit Other
Volu
me
(bn
ciga
rett
es)
0.02
0.010.010.02
0.0
0.1
0.2
0.3
0.4
0.5
0.6
2013 2014 2015
0.08
0.11
0.06
0.08
0.25
0.50
0.25
0.08
0.040.03
0.07
0.07
0.09
0.260.02
0.01
RonhillMarlboro York Neo Walter Wolf
Counterfeit Other
Volu
me
(bn
ciga
rett
es)
ND(L) by brand - 2013-2015(1)(a)(b)
C&C by brand - 2013-2015(1)(a)
• ND(L) from Bosnia and Herzegovina declined. This may have been due to a closer observation of the 40-cigarette legal allowance between countries as additional border checks were implemented during the migrant crisis
Cro
atia
© 2016 KPMG LLP, a UK limited liability partnership, and a member firm of the KPMG network of independent member firms affiliated with KPMG International Cooperative, a Swiss entity.
36
Proj
ect
SU
N
CyprusC
ypru
s
Manufactured cigarette consumption - 2009-2015
Manufactured cigarette C&C volumes and share of overall cigarette consumption - 2009-2015
0.00
0.02
0.04
0.06
0.08
0.10
Volu
me
(bn
ciga
rett
es)
% o
f co
nsum
ptio
n
Counterfeit and contraband (C&C)
C&C as a % of consumption
2009 2010 2011 2012 2013 2014 2015
0
1
2
3
4
5
6
1.7%
0.6%
1.1%
2.1%
4.5% 4.4%
5.7%
0.03
0.01 0.01
0.03
0.07
0.06
0.08
Volu
me
(bn
ciga
rett
es)
2009 2010 2011 2012 2013 2014 2015
14.87
1.58 1.56
1.29
1.45 1.48
1.371.34
0.0
0.5
1.0
1.5
2.0
1.1%ND(L)
5.7%C&C
93.2%LDC
38.6%Other C&C
61.4%Illicit Whites
Overview
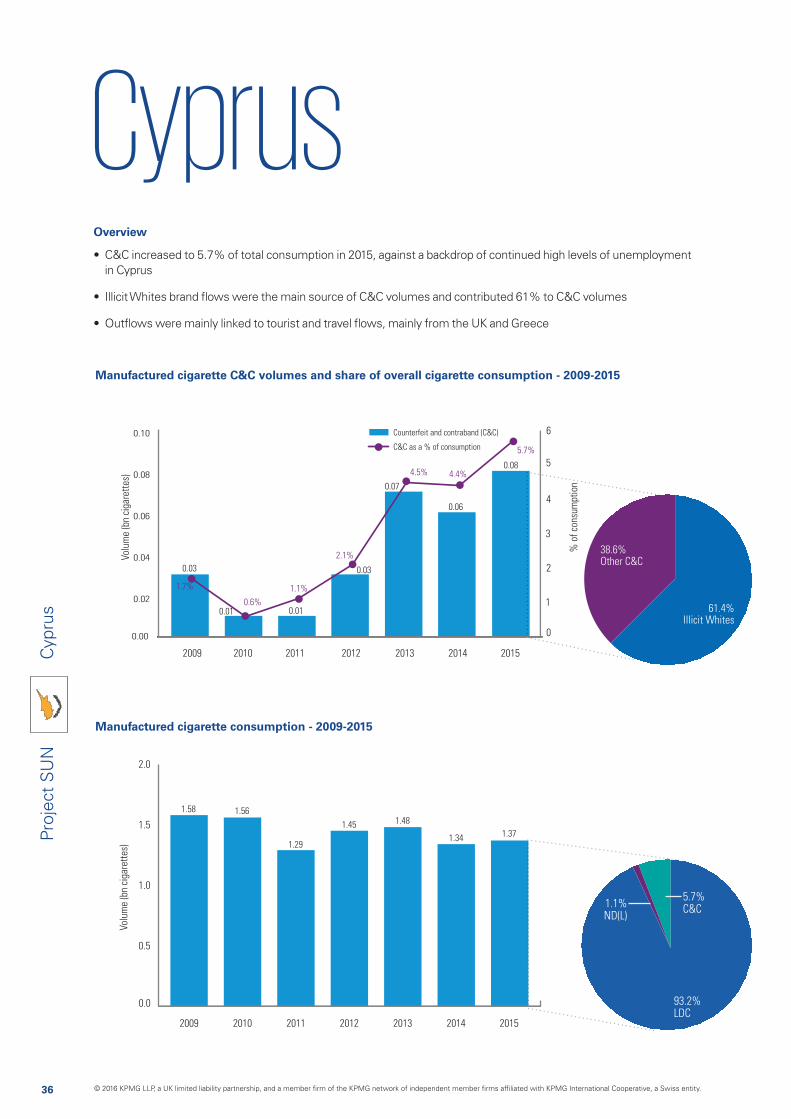
• C&C increased to 5.7% of total consumption in 2015, against a backdrop of continued high levels of unemployment in Cyprus
• Illicit Whites brand flows were the main source of C&C volumes and contributed 61% to C&C volumes
• Outflows were mainly linked to tourist and travel flows, mainly from the UK and Greece
© 2016 KPMG LLP, a UK limited liability partnership, and a member firm of the KPMG network of independent member firms affiliated with KPMG International Cooperative, a Swiss entity.
37
Proj
ect
SU
NC
ypru
s
Slovenia
Moldova
Belgium
Montenegro
FYROM
Croatia
Turkey
Ukraine
Belarus
Kosovo
Main outflow
Main inflow
Weighted average price for a pack of 20 cigarettes
Number of cigarettes
0.021 billion
Sources: (1) KPMG EU Flows Model (2) EC Excise Duty tables (Part III – Manufactured Tobacco) and analysis of data sources provided by manufacturers
€10.10 €0.83
€4.21
0.003 billion
0.016 billion
0.049 billion
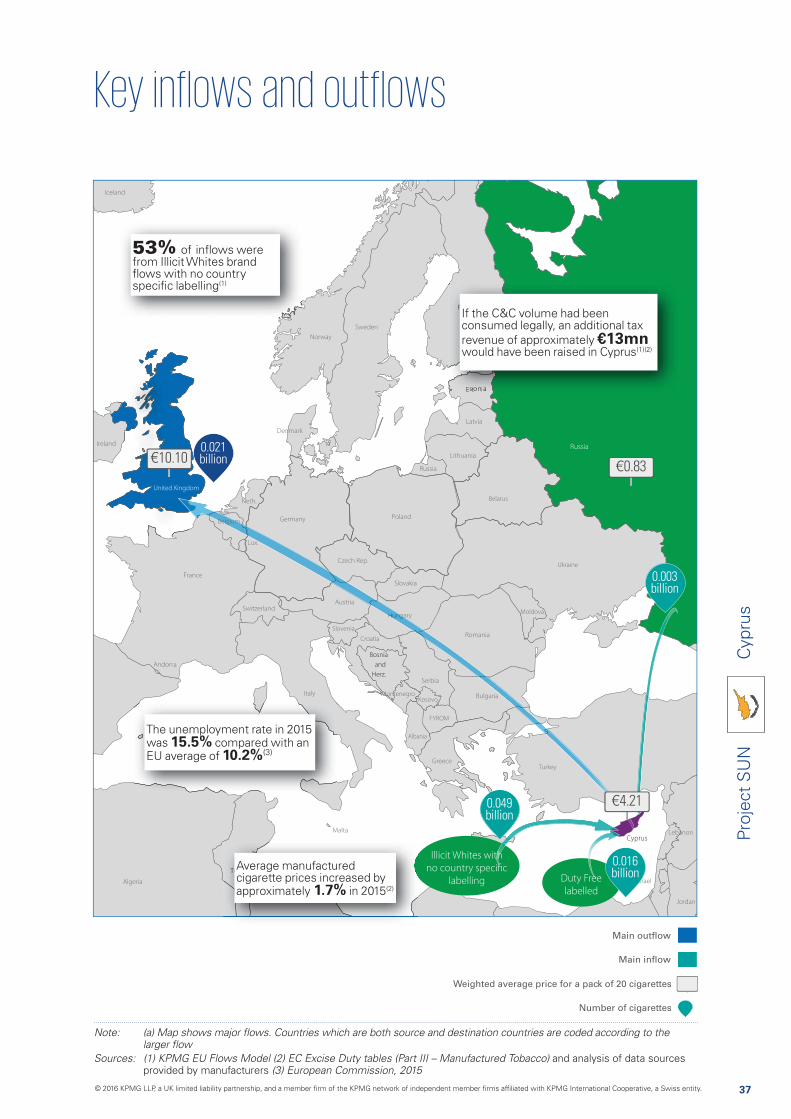
53% of inflows were from Illicit Whites brand flows with no country specific labelling(1)
The unemployment rate in 2015 was 15.5% compared with an EU average of 10.2%(3)
Average manufactured cigarette prices increased by approximately 1.7% in 2015(2)
If the C&C volume had been consumed legally, an additional tax revenue of approximately €13mn would have been raised in Cyprus(1)(2)
Duty Free
labelled
Illicit Whites with
no country specific
labelling
© 2016 KPMG LLP, a UK limited liability partnership, and a member firm of the KPMG network of independent member firms affiliated with KPMG International Cooperative, a Swiss entity.
38
Proj
ect
SU
N
ND INFLOWS TO CYPRUS
Billion cigarettes 2009 2010 2011 2012 2013 2014 2015
IWs with no country-specific labelling 0.000 0.000 0.000 0.001 0.002 0.022 0.049
Duty Free labelled 0.060 0.009 0.014 0.022 0.040 0.021 0.016
Russia 0.008 0.005 0.000 0.004 0.002 0.003 0.003
Bulgaria 0.000 0.003 0.000 0.000 0.005 0.001 0.003
Unspecified 0.000 0.000 0.002 0.004 0.024 0.004 0.000
Other 0.063 0.009 0.012 0.013 0.015 0.017 0.022
Total inflows 0.131 0.027 0.028 0.043 0.087 0.070 0.093
Total manufactured cigarette consumption – 2009-2015(1)(2)(a)
Total inflows by country of origin - 2009-2015(1)(b)(c)
TOTAL CYPRUS CONSUMPTION
Billion cigarettes 2009 2010 2011 2012 2013 2014 2015 2014-15 %
Legal domestic sales (LDS) 1.705 1.752 1.505 1.630 1.445 1.305 1.306 0%
Outflows -0.252 -0.218 -0.239 -0.211 -0.048 -0.032 -0.034 6%
Legal domestic consumption (LDC) 1.453 1.534 1.266 1.420 1.397 1.272 1.272 (0%)
Non-domestic legal (ND(L)) 0.105 0.018 0.014 0.013 0.020 0.010 0.015 46%
Counterfeit and contraband (C&C) 0.027 0.009 0.014 0.030 0.066 0.060 0.078 31%
Total non-domestic 0.131 0.027 0.028 0.043 0.087 0.070 0.093 33%
Total consumption 1.584 1.561 1.295 1.450 1.484 1.342 1.365 2%
Total outflows by destination country – 2009-2015(1)
OUTFLOWS FROM CYPRUS
Billion cigarettes 2009 2010 2011 2012 2013 2014 2015
UK 0.214 0.200 0.205 0.193 0.034 0.016 0.021
Greece 0.000 0.003 0.005 0.002 0.004 0.002 0.007
Netherlands 0.000 0.000 0.006 0.004 0.003 0.002 0.002
Other 0.038 0.015 0.024 0.012 0.007 0.012 0.004
Total outflows 0.252 0.218 0.239 0.211 0.048 0.032 0.034
Notes: (a) In years 2012-2015 non-domestic incidence is stated on a sticks basis; prior to this a packs basis was used (b) Illicit
Sources: (1) KPMG EU Flows Model and analysis of data sources provided by manufacturers (2) KPMG analysis of UNWTO Factbook 2009-2014
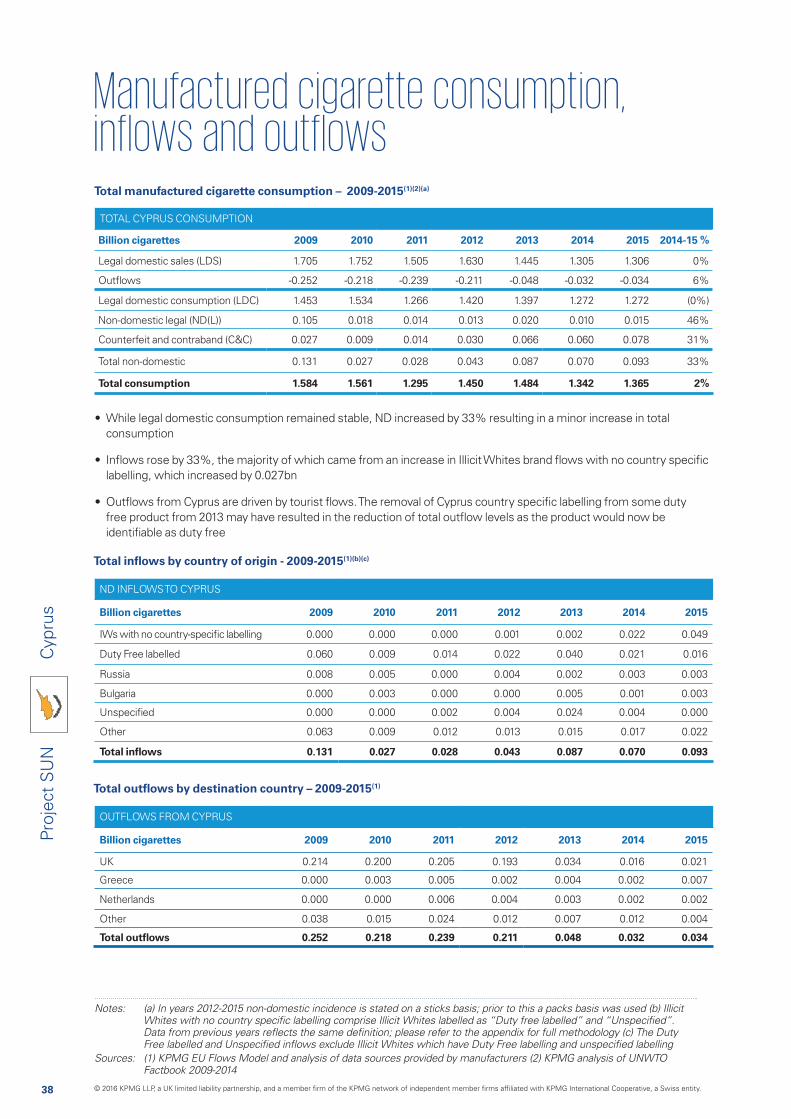
• While legal domestic consumption remained stable, ND increased by 33% resulting in a minor increase in total consumption
• Inflows rose by 33%, the majority of which came from an increase in Illicit Whites brand flows with no country specific labelling, which increased by 0.027bn
• Outflows from Cyprus are driven by tourist flows. The removal of Cyprus country specific labelling from some duty free product from 2013 may have resulted in the reduction of total outflow levels as the product would now be identifiable as duty free
Cyp
rus
© 2016 KPMG LLP, a UK limited liability partnership, and a member firm of the KPMG network of independent member firms affiliated with KPMG International Cooperative, a Swiss entity.
39
Proj
ect
SU
N
Notes: (a) KPMG calculates the split between C&C and ND(L) by calculating the ND(L) volumes and subtracting from the total
by manufacturers; detail surrounding methodology changes is provided in the appendix
ND(L) by country of origin - 2009-2015(1)(a)(b)
C&C by country of origin - 2009-2015(1)(a)
0.00
0.02
0.04
0.06
0.08
0.10
0.12
2009 2010 2011 2012 2013 2014 2015
0.013
0.088
0.011
0.010
0.007
0.105
0.0180.014 0.013
0.020
0.0100.015
0.0120.0090.005 0.008
0.007
0.003
0.003
0.001
0.0010.002
0.001
0.003
0.0020.001 0.001 0.003
Malta
Other
RomaniaBulgaria
GreeceBelgium
Volu
me
(bn
ciga
rett
es)
0.00
0.02
0.04
0.06
0.08
0.10
0.12
2009 2010 2011 2012 2013 2014 2015
0.035
0.063
0.0100.016
0.105
0.018 0.014 0.0130.020
0.0100.015
0.0120.0140.008
0.003
0.002
0.002
0.005
0.0020.002
0.002 0.0040.004
0.0030.001
0.004
Dunhill
L&M
Marlboro Victory
Other
Volu
me
(bn
ciga
rett
es)
0.00
0.02
0.04
0.06
0.08
0.10
2009 2010 2011 2012 2013 2014 2015
0.008
0.019
0.0040.004
0.76
0.004 0.004
0.024
0.027
0.0090.014
0.030
0.0660.060
0.078
0.040
0.012
0.022
0.030
0.049
0.027
0.022
0.002
0.0030.001
0.002
0.0030.001
0.003
Russia
Other
Volu
me
(bn
ciga
rett
es)
Unspecified IWs with no country-specific labelling
0.00
0.02
0.04
0.06
0.08
0.10
2013 2014 2015
0.029
0.036
0.017
0.0660.060
0.078
0.011
0.0050.005
0.013
0.020
0.024
0.010
0.004
0.0280.001
Marlboro
Raquel
Gaulwaz Double V One American Legend
Other
Volu
me
(bn
ciga
rett
es)
ND(L) by brand - 2009-2015(1)(a)(b)
C&C by brand - 2013-2015(1)(a)
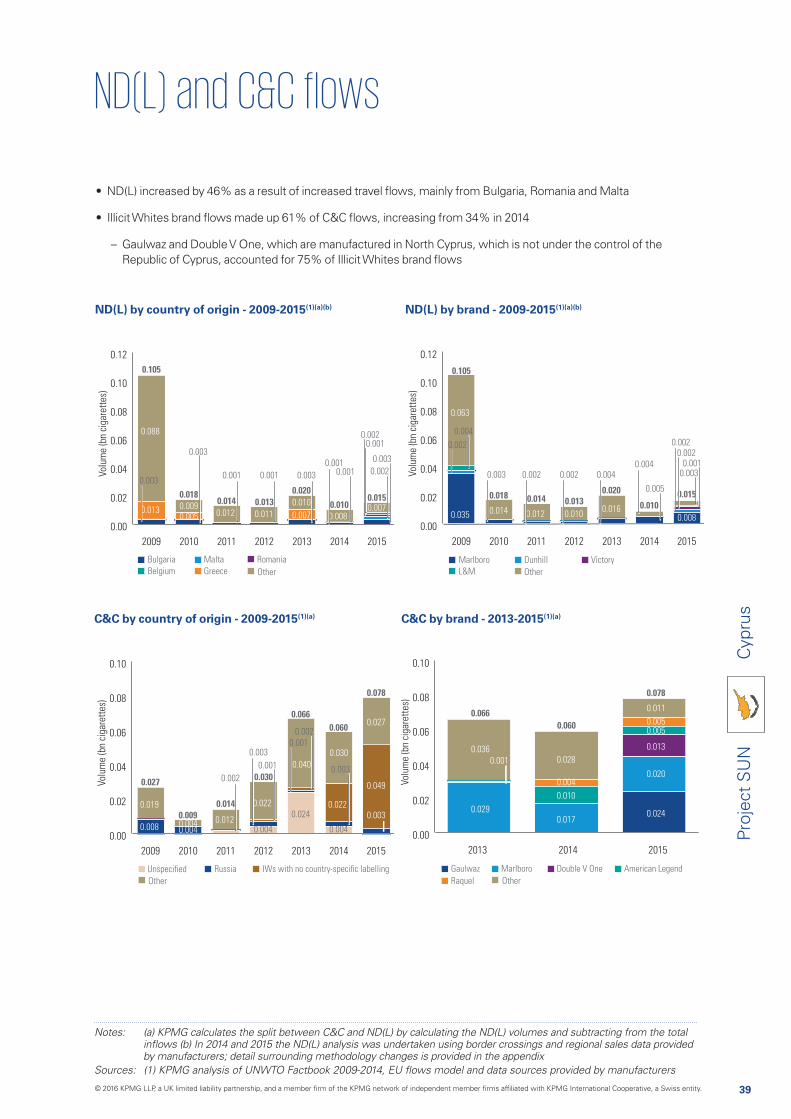
• ND(L) increased by 46% as a result of increased travel flows, mainly from Bulgaria, Romania and Malta
• Illicit Whites brand flows made up 61% of C&C flows, increasing from 34% in 2014
– Gaulwaz and Double V One, which are manufactured in North Cyprus, which is not under the control of the Republic of Cyprus, accounted for 75% of Illicit Whites brand flows
Cyp
rus
© 2016 KPMG LLP, a UK limited liability partnership, and a member firm of the KPMG network of independent member firms affiliated with KPMG International Cooperative, a Swiss entity.
40
Proj
ect
SU
N
Czech RepublicC
zech
Rep
ublic
Manufactured cigarette consumption - 2009-2015
Manufactured cigarette C&C volumes and share of overall cigarette consumption - 2009-2015
0.0
0.2
0.4
0.6
0.8
1.0
1.2
Volu
me
(bn
ciga
rett
es)
% o
f co
nsum
ptio
n
2009 2010 2011 2012 2013 2014 2015
Counterfeit and contraband (C&C)
C&C as a % of consumption
2
3
4
5
65.8%
5.5%
3.6%
2.2%
3.1% 3.1%
3.2%
1.09
0.94
0.56
0.34
0.42 0.440.47
Volu
me
(bn
ciga
rett
es)
2009 2010 2011 2012 2013 2014 2015
18.97
17.01
15.51 15.28
13.34
14.7214.29
0
5
10
15
20
f
1.3%ND(L)
3.2%C&C
95.6%LDC
7.8%Counterfeit
59.6%Other C&C
32.6%Illicit Whites
Overview
• C&C volumes in the Czech Republic remained stable at 3.2% of total consumption; one of the lowest levels in the EU
• Consumption increased in the Czech Republic as C&C remained stable and legal domestic sales increased by 1%
• The majority of C&C came from non-EU Eastern European countries where prices are lower compared with the EU
© 2016 KPMG LLP, a UK limited liability partnership, and a member firm of the KPMG network of independent member firms affiliated with KPMG International Cooperative, a Swiss entity.

41
Proj
ect
SU
NC
zech
Rep
ublic
Main outflow
Main inflow
Weighted average price for a pack of 20 cigarettes
Number of cigarettes
FYROM
Bosnia
and
Herz.
Croatia
Slovenia
Montenegro
Albania
Moldova
Turkey
Ukraine
Belgium
Neth.
Belarus
Kosovo
0.13 billion
0.09 billion
0.08 billion
5.24 billion
0.41 billion
Sources: (1) KPMG EU Flows Model (2) EC Excise Duty tables (Part III – Manufactured Tobacco) and analysis of data sources provided by manufacturers
€2.95
€4.48
€0.58
€0.58
€5.34
Over 25% of legal domestic sales in the Czech Republic are consumed in Germany(1)
Average price of a pack of cigarettes in Czech Republic has increased by approximately 6.2% when compared with 2014(2)
If the C&C volume had been consumed legally, an additional tax revenue of approximately €54mn would have been raised in the Czech Republic(1)(2)
Duty Free labelled
© 2016 KPMG LLP, a UK limited liability partnership, and a member firm of the KPMG network of independent member firms affiliated with KPMG International Cooperative, a Swiss entity.
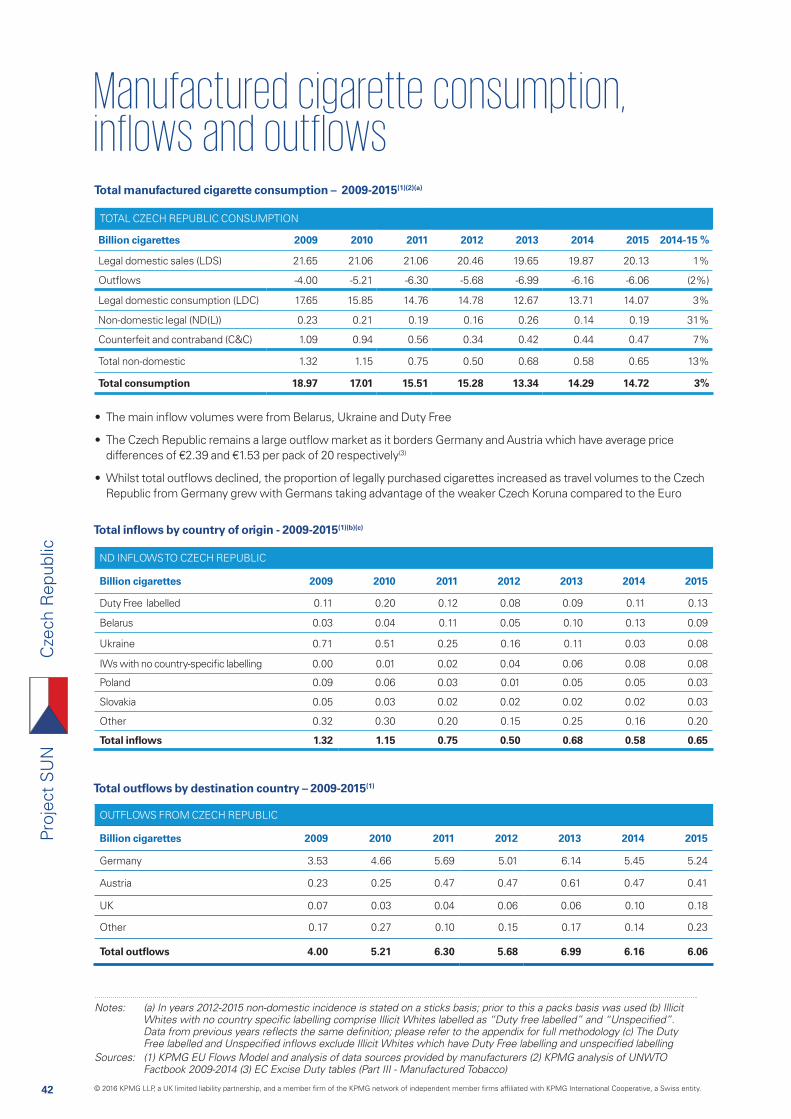
42
Proj
ect
SU
N
ND INFLOWS TO CZECH REPUBLIC
Billion cigarettes 2009 2010 2011 2012 2013 2014 2015
Duty Free labelled 0.11 0.20 0.12 0.08 0.09 0.11 0.13
Belarus 0.03 0.04 0.11 0.05 0.10 0.13 0.09
Ukraine 0.71 0.51 0.25 0.16 0.11 0.03 0.08
IWs with no country-specific labelling 0.00 0.01 0.02 0.04 0.06 0.08 0.08
Poland 0.09 0.06 0.03 0.01 0.05 0.05 0.03
Slovakia 0.05 0.03 0.02 0.02 0.02 0.02 0.03
Other 0.32 0.30 0.20 0.15 0.25 0.16 0.20
Total inflows 1.32 1.15 0.75 0.50 0.68 0.58 0.65
Total manufactured cigarette consumption – 2009-2015(1)(2)(a)
Total inflows by country of origin - 2009-2015(1)(b)(c)
TOTAL CZECH REPUBLIC CONSUMPTION
Billion cigarettes 2009 2010 2011 2012 2013 2014 2015 2014-15 %
Legal domestic sales (LDS) 21.65 21.06 21.06 20.46 19.65 19.87 20.13 1%
Outflows -4.00 -5.21 -6.30 -5.68 -6.99 -6.16 -6.06 (2%)
Legal domestic consumption (LDC) 17.65 15.85 14.76 14.78 12.67 13.71 14.07 3%
Non-domestic legal (ND(L)) 0.23 0.21 0.19 0.16 0.26 0.14 0.19 31%
Counterfeit and contraband (C&C) 1.09 0.94 0.56 0.34 0.42 0.44 0.47 7%
Total non-domestic 1.32 1.15 0.75 0.50 0.68 0.58 0.65 13%
Total consumption 18.97 17.01 15.51 15.28 13.34 14.29 14.72 3%
Total outflows by destination country – 2009-2015(1)
OUTFLOWS FROM CZECH REPUBLIC
Billion cigarettes 2009 2010 2011 2012 2013 2014 2015
Germany 3.53 4.66 5.69 5.01 6.14 5.45 5.24
Austria 0.23 0.25 0.47 0.47 0.61 0.47 0.41
UK 0.07 0.03 0.04 0.06 0.06 0.10 0.18
Other 0.17 0.27 0.10 0.15 0.17 0.14 0.23
Total outflows 4.00 5.21 6.30 5.68 6.99 6.16 6.06
Notes: (a) In years 2012-2015 non-domestic incidence is stated on a sticks basis; prior to this a packs basis was used (b) Illicit
Sources: (1) KPMG EU Flows Model and analysis of data sources provided by manufacturers (2) KPMG analysis of UNWTO Factbook 2009-2014 (3) EC Excise Duty tables (Part III - Manufactured Tobacco)
• The main inflow volumes were from Belarus, Ukraine and Duty Free
• The Czech Republic remains a large outflow market as it borders Germany and Austria which have average price differences of €2.39 and €1.53 per pack of 20 respectively(3)
• Whilst total outflows declined, the proportion of legally purchased cigarettes increased as travel volumes to the Czech Republic from Germany grew with Germans taking advantage of the weaker Czech Koruna compared to the Euro
Cze
ch R
epub
lic
© 2016 KPMG LLP, a UK limited liability partnership, and a member firm of the KPMG network of independent member firms affiliated with KPMG International Cooperative, a Swiss entity.
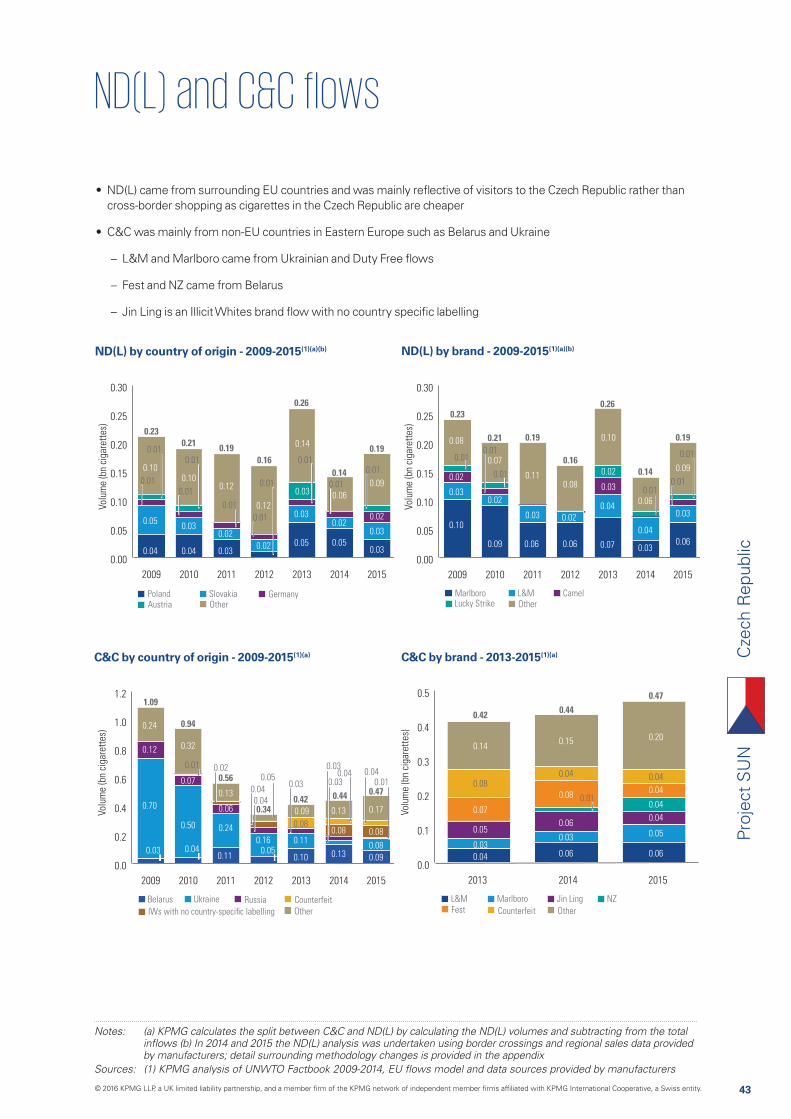
43
Proj
ect
SU
N
Notes: (a) KPMG calculates the split between C&C and ND(L) by calculating the ND(L) volumes and subtracting from the total
by manufacturers; detail surrounding methodology changes is provided in the appendix
ND(L) by country of origin - 2009-2015(1)(a)(b)
C&C by country of origin - 2009-2015(1)(a)
0.00
0.05
0.10
0.15
0.20
0.25
0.30
2009 2010 2011 2012 2013 2014 2015
0.12
0.04
0.05
0.100.10
0.02 0.05
0.03
0.230.21 0.19
0.16
0.26
0.14
0.19
0.03 0.06
0.14
0.05
0.02
0.03
0.02
0.04
0.030.03
0.03
0.02
0.09
0.12
SlovakiaPoland GermanyOtherAustria
Volu
me
(bn
ciga
rett
es)
0.010.01
0.01
0.01
0.01
0.01
0.01
0.01
0.01
0.01
0.00
0.05
0.10
0.15
0.20
0.25
0.30
2009 2010 2011 2012 2013 2014 2015
0.10
0.02
0.07
0.03
0.08
0.02
0.06 0.07
0.23
0.21 0.19
0.16
0.26
0.14
0.19
0.11
0.03
0.03
0.02
0.10
0.060.09
0.04
0.06
0.030.06
0.03
0.09
0.02
0.08
0.04
L&MMarlboro CamelOtherLucky Strike
Volu
me
(bn
ciga
rett
es)
0.01
0.01
0.01
0.01
0.01
0.01
0.0
0.2
0.4
0.6
0.8
1.0
1.2
2009 2010 2011 2012 2013 2014 2015
0.12
0.70
0.24
0.07
0.32
0.16
0.10
0.11
0.08
1.09
0.94
0.56
0.340.42 0.44 0.470.13
0.24
0.06 0.09
0.11
0.50
0.13
0.13
0.08
0.17
0.09
0.08
0.08
0.02
0.04
0.04
0.050.03
0.03 0.030.04
0.010.04
0.01
0.04 0.050.03
Ukraine Russia
IWs with no country-specific labelling
CounterfeitBelarus
Other
Volu
me
(bn
ciga
rett
es)
0.0
0.1
0.2
0.3
0.4
0.5
2013 2014 2015
0.08
0.07
0.05
0.03
0.04
0.14
0.42 0.44
0.47
0.20
0.05
0.04
0.04
0.06
0.04
0.04
0.06
0.03
0.06
0.08
0.04
0.15
MarlboroL&MFest
Jin Ling NZ
Counterfeit Other
Volu
me
(bn
ciga
rett
es)
0.01
ND(L) by brand - 2009-2015(1)(a)(b)
C&C by brand - 2013-2015(1)(a)
• ND(L) came from surrounding EU countries and was mainly reflective of visitors to the Czech Republic rather than cross-border shopping as cigarettes in the Czech Republic are cheaper
• C&C was mainly from non-EU countries in Eastern Europe such as Belarus and Ukraine
– L&M and Marlboro came from Ukrainian and Duty Free flows
– Fest and NZ came from Belarus
– Jin Ling is an Illicit Whites brand flow with no country specific labelling
Cze
ch R
epub
lic
© 2016 KPMG LLP, a UK limited liability partnership, and a member firm of the KPMG network of independent member firms affiliated with KPMG International Cooperative, a Swiss entity.

44
Proj
ect
SU
N
DenmarkD
enm
ark
Manufactured cigarette consumption - 2009-2015
Manufactured cigarette C&C volumes and share of overall cigarette consumption - 2009-2015
0.00
0.05
0.10
0.15
0.20
0.25
0.30
0.35
0.40
Volu
me
(bn
ciga
rett
es)
% o
f co
nsum
ptio
n
Counterfeit and contraband (C&C)
C&C as a % of consumption
2009 2010 2011 2012 2013 2014 2015
1
2
3
4
5
3.5%
4.3%
3.0%
2.4%
3.7%
1.8%
2.5%
0.28
0.34
0.23
0.17
0.23
0.10
0.15
Volu
me
(bn
ciga
rett
es)
2009 2010 2011 2012 2013 2014 2015
14.87
8.087.87
7.56
6.88
6.22 6.16
5.30
0
2
4
6
8
10
1
f c
17.7%Counterfeit
78.6%Other C&C
3.7%Illicit Whites
3.2%ND(L)
2.5%C&C
94.4%LDC
Overview
• C&C volumes remained amoung the lowest in the European Union at 2.5% of total consumption and compared favourably to surrounding countries (over 20% in Norway, 10% in Sweden and 6% in Germany)
• Both C&C and ND(L) grew by 0.05 billion and 0.04 billion cigarettes respectively in 2015 while prices remained stable throughout the year
Drop in 2014 consumption was due to changes in reported LDS as a result of de-stocking (estimated at 1 billion
cigarettes). When the 2015 results are compared to 2013, the decline in consumption is in line with estimated overall
consumer trends in cigarette consumption
© 2016 KPMG LLP, a UK limited liability partnership, and a member firm of the KPMG network of independent member firms affiliated with KPMG International Cooperative, a Swiss entity.

45
Proj
ect
SU
ND
enm
ark
Main outflow
Main inflow
Weighted average price for a pack of 20 cigarettes
Number of cigarettes
Neth.
Belgium
Sl i
0.13 billion
0.02 billion
0.02 billion
0.06 billion
Sources: (1) KPMG EU Flows Model (2) EC Excise Duty tables (Part III – Manufactured Tobacco) and data sources provided
€10.75
€5.49
€5.59
€3.13
0.02 billion
€5.34
Approximately 1 in every 3 non-domestic cigarettes in Denmark was Duty Free labelled(1)
Sweden is also the 2nd largest country with respect to inflows – with 0.05 billion flowing into Denmark(1)
If the C&C volume had been consumed legally, an additional tax revenue of approximately DKK245m (€33mn) would have been raised in Denmark(1)(2)
Average prices in Denmark increased by 0.04% in 2015(2)
Duty Free labelled
© 2016 KPMG LLP, a UK limited liability partnership, and a member firm of the KPMG network of independent member firms affiliated with KPMG International Cooperative, a Swiss entity.
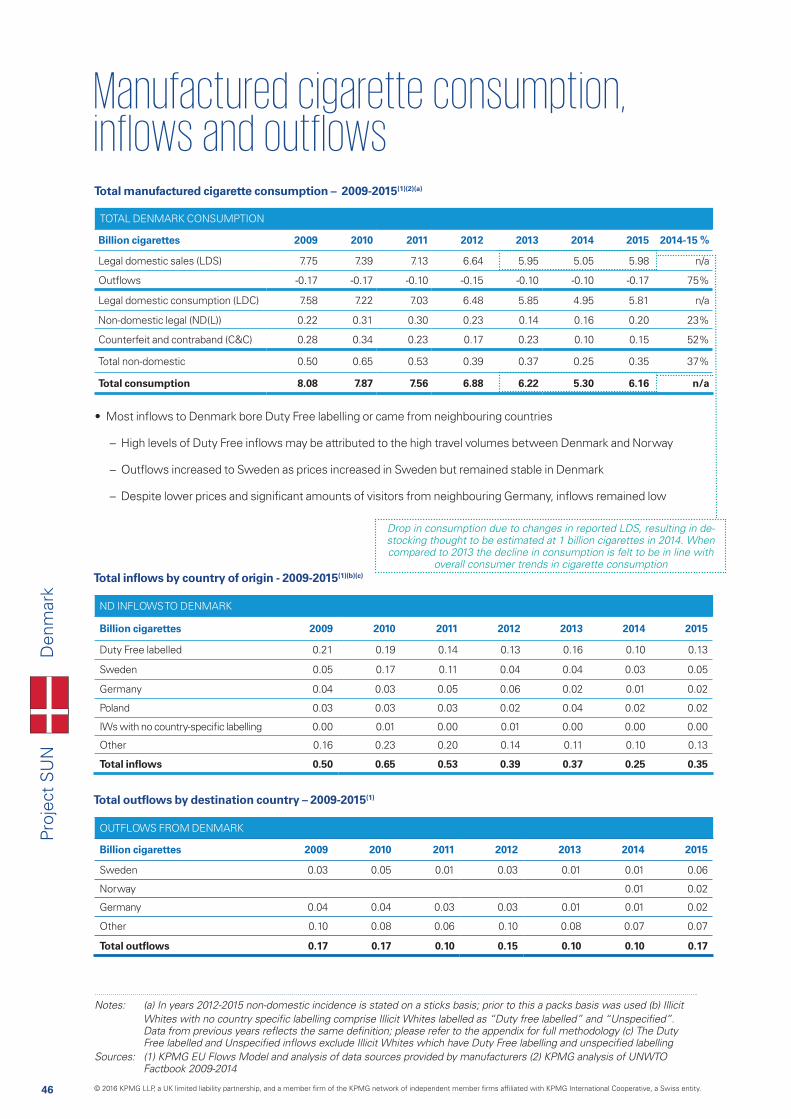
46
Proj
ect
SU
N
ND INFLOWS TO DENMARK
Billion cigarettes 2009 2010 2011 2012 2013 2014 2015
Duty Free labelled 0.21 0.19 0.14 0.13 0.16 0.10 0.13
Sweden 0.05 0.17 0.11 0.04 0.04 0.03 0.05
Germany 0.04 0.03 0.05 0.06 0.02 0.01 0.02
Poland 0.03 0.03 0.03 0.02 0.04 0.02 0.02
IWs with no country-specific labelling 0.00 0.01 0.00 0.01 0.00 0.00 0.00
Other 0.16 0.23 0.20 0.14 0.11 0.10 0.13
Total inflows 0.50 0.65 0.53 0.39 0.37 0.25 0.35
Total manufactured cigarette consumption – 2009-2015(1)(2)(a)
Total inflows by country of origin - 2009-2015(1)(b)(c)
TOTAL DENMARK CONSUMPTION
Billion cigarettes 2009 2010 2011 2012 2013 2014 2015 2014-15 %
Legal domestic sales (LDS) 7.75 7.39 7.13 6.64 5.95 5.05 5.98 n/a
Outflows -0.17 -0.17 -0.10 -0.15 -0.10 -0.10 -0.17 75%
Legal domestic consumption (LDC) 7.58 7.22 7.03 6.48 5.85 4.95 5.81 n/a
Non-domestic legal (ND(L)) 0.22 0.31 0.30 0.23 0.14 0.16 0.20 23%
Counterfeit and contraband (C&C) 0.28 0.34 0.23 0.17 0.23 0.10 0.15 52%
Total non-domestic 0.50 0.65 0.53 0.39 0.37 0.25 0.35 37%
Total consumption 8.08 7.87 7.56 6.88 6.22 5.30 6.16 n/a
Total outflows by destination country – 2009-2015(1)
OUTFLOWS FROM DENMARK
Billion cigarettes 2009 2010 2011 2012 2013 2014 2015
Sweden 0.03 0.05 0.01 0.03 0.01 0.01 0.06
Norway 0.01 0.02
Germany 0.04 0.04 0.03 0.03 0.01 0.01 0.02
Other 0.10 0.08 0.06 0.10 0.08 0.07 0.07
Total outflows 0.17 0.17 0.10 0.15 0.10 0.10 0.17
Notes: (a) In years 2012-2015 non-domestic incidence is stated on a sticks basis; prior to this a packs basis was used (b) Illicit
Sources: (1) KPMG EU Flows Model and analysis of data sources provided by manufacturers (2) KPMG analysis of UNWTO Factbook 2009-2014
• Most inflows to Denmark bore Duty Free labelling or came from neighbouring countries
– High levels of Duty Free inflows may be attributed to the high travel volumes between Denmark and Norway
– Outflows increased to Sweden as prices increased in Sweden but remained stable in Denmark
– Despite lower prices and significant amounts of visitors from neighbouring Germany, inflows remained low
Drop in consumption due to changes in reported LDS, resulting in de-stocking thought to be estimated at 1 billion cigarettes in 2014. When compared to 2013 the decline in consumption is felt to be in line with
overall consumer trends in cigarette consumption
Den
mar
k
© 2016 KPMG LLP, a UK limited liability partnership, and a member firm of the KPMG network of independent member firms affiliated with KPMG International Cooperative, a Swiss entity.

47
Proj
ect
SU
N
Notes: (a) KPMG calculates the split between C&C and ND(L) by calculating the ND(L) volumes and subtracting from the total
by manufacturers; detail surrounding methodology changes is provided in the appendix
ND(L) by country of origin - 2009-2015(1)(a)(b)
C&C by country of origin - 2009-2015(1)(a)
0.00
0.05
0.10
0.15
0.20
0.25
0.30
0.35
2009 2010 2011 2012 2013 2014 2015
0.13
0.05
0.03
0.04
0.11
0.10
0.04 0.04
0.22
0.31 0.30
0.23
0.140.16
0.20
0.05
0.08
0.02
0.11
0.11
0.17
0.03 0.05
0.020.02
0.100.12
0.06
0.01
0.01
0.01
0.01
0.010.01
0.01
Germany PolandSweden
Czech Republic Other
Volu
me
(bn
ciga
rett
es)
0.00
0.05
0.10
0.15
0.20
0.25
0.30
0.35
2009 2010 2011 2012 2013 2014 2015
0.15
0.12
0.030.03
0.06
0.16
0.09 0.06
0.22
0.310.30
0.23
0.14 0.16
0.20
0.04 0.05
0.02
0.07
0.110.11
0.04
0.04
0.05
0.04
0.080.09
0.03
0.01
0.010.01
0.01
0.01
0.01
0.010.010.01
0.01
Marlboro Pall MallPrince
L&M Chesterfield Other
Volu
me
(bn
ciga
rett
es)
0.00
0.05
0.10
0.15
0.20
0.25
0.30
0.35
2009 2010 2011 2012 2013 2014 2015
0.02
0.25
0.30
0.020.020.04
0.28
0.34
0.23
0.17
0.23
0.10
0.150.200.17
0.02
0.06
0.02 0.03
0.10
0.13
0.01 0.01
0.01
0.01
0.01
0.01
0.010.01
0.010.01
0.01
Canary Islands
CounterfeitIWs with no country-specific labelling
Bulgaria PolandRomania
Other
Volu
me
(bn
ciga
rett
es)
0.00
0.05
0.10
0.15
0.20
0.25
2013 2014 2015
0.07
0.23
0.10
0.15
0.06
0.010.010.01
0.07
0.02
0.020.01
0.01
0.04 0.05
0.04
0.010.01
0.03
0.02
Prince
Counterfeit
Marlboro WinstonL&M
Other
Volu
me
(bn
ciga
rett
es)
ND(L) by brand - 2009-2015(1)(a)(b)
C&C by brand - 2013-2015(1)(a)
• Most ND(L) and C&C brands were similar to those sold within Denmark
– ND(L) continued to increase, supported by travel trends and an increase in cigarettes coming from Sweden to Denmark despite higher prices in Sweden by the end of the year
– Higher volumes of counterfeit, all Prince and Marlboro, were identified in 2015
Den
mar
k
© 2016 KPMG LLP, a UK limited liability partnership, and a member firm of the KPMG network of independent member firms affiliated with KPMG International Cooperative, a Swiss entity.
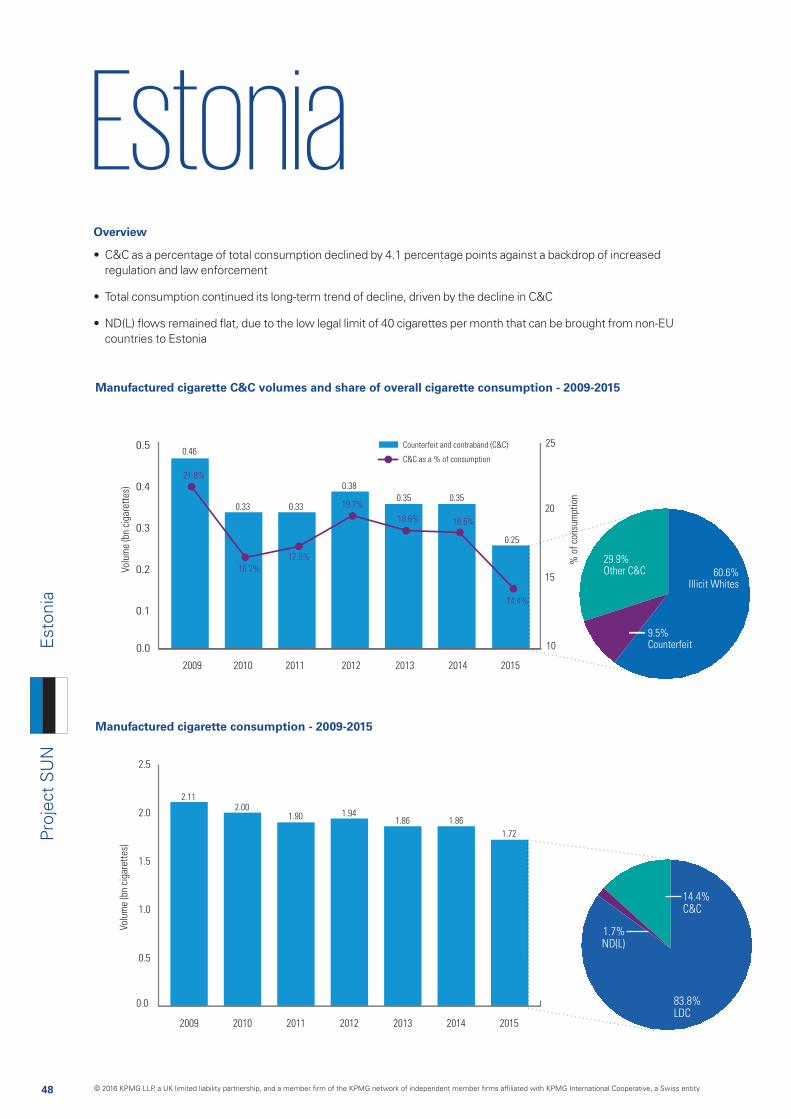
48
Proj
ect
SU
N
EstoniaE
ston
ia
Manufactured cigarette consumption - 2009-2015
Manufactured cigarette C&C volumes and share of overall cigarette consumption - 2009-2015
0.0
0.1
0.2
0.3
0.4
0.5
Volu
me
(bn
ciga
rett
es)
% o
f co
nsum
ptio
n
Counterfeit and contraband (C&C)
C&C as a % of consumption
2009 2010 2011 2012 2013 2014 2015
10
15
20
25
21.8%
16.7%
17.5%
19.7%
18.6% 18.5%
14.4%
0.46
0.33 0.33
0.38
0.35 0.35
0.25
Volu
me
(bn
ciga
rett
es)
2009 2010 2011 2012 2013 2014 2015
2.112.00
1.90 1.941.86
1.72
1.86
0.0
0.5
1.0
1.5
2.0
2.5
n
9.5%Counterfeit
29.9%Other C&C 60.6%
Illicit Whites
1.7%ND(L)
14.4%C&C
83.8%LDC
Overview
• C&C as a percentage of total consumption declined by 4.1 percentage points against a backdrop of increased regulation and law enforcement
• Total consumption continued its long-term trend of decline, driven by the decline in C&C
• ND(L) flows remained flat, due to the low legal limit of 40 cigarettes per month that can be brought from non-EU countries to Estonia
© 2016 KPMG LLP, a UK limited liability partnership, and a member firm of the KPMG network of independent member firms affiliated with KPMG International Cooperative, a Swiss entity.
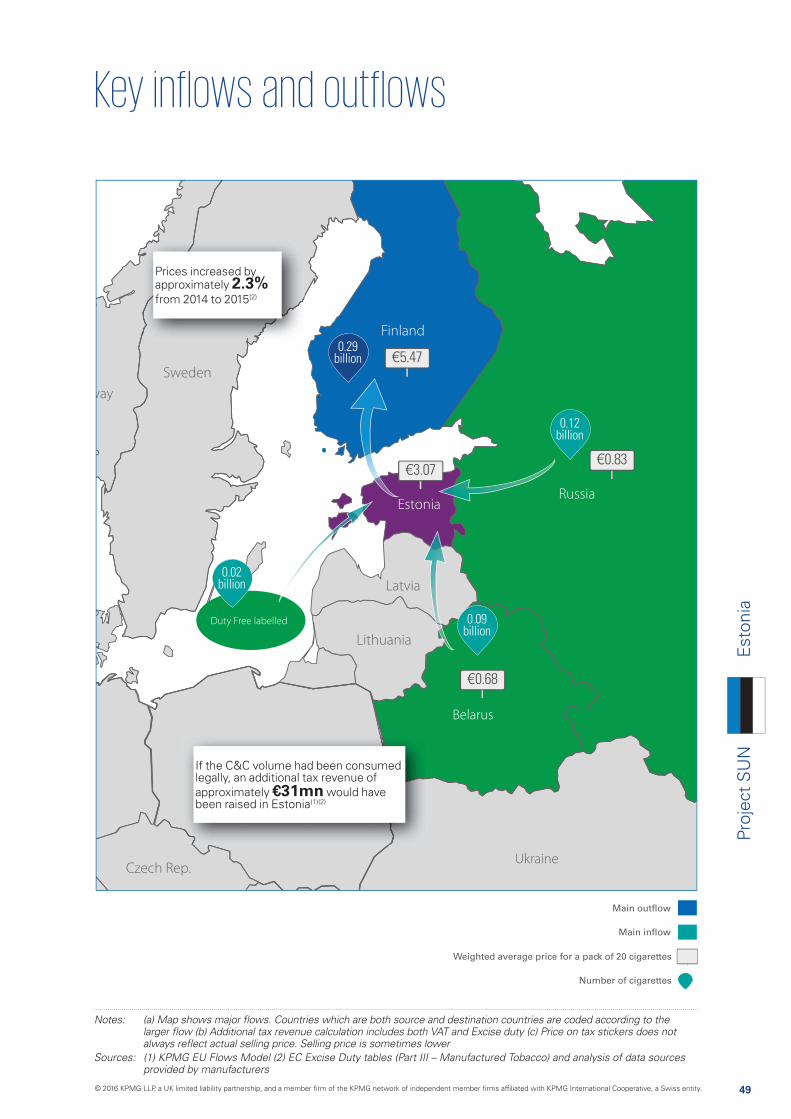
49
Proj
ect
SU
NE
ston
ia
Main outflow
Main inflow
Weighted average price for a pack of 20 cigarettes
Number of cigarettes
Ukraine
Belarus
0.02 billion
0.29 billion
Sources: (1) KPMG EU Flows Model (2) EC Excise Duty tables (Part III – Manufactured Tobacco) and analysis of data sources provided by manufacturers
€3.07
€5.47
€0.68
€0.83
0.09 billion
0.12 billion
Prices increased by approximately 2.3% from 2014 to 2015(2)
If the C&C volume had been consumed legally, an additional tax revenue of approximately €31mn would have been raised in Estonia(1)(2)
Duty Free labelled
© 2016 KPMG LLP, a UK limited liability partnership, and a member firm of the KPMG network of independent member firms affiliated with KPMG International Cooperative, a Swiss entity.
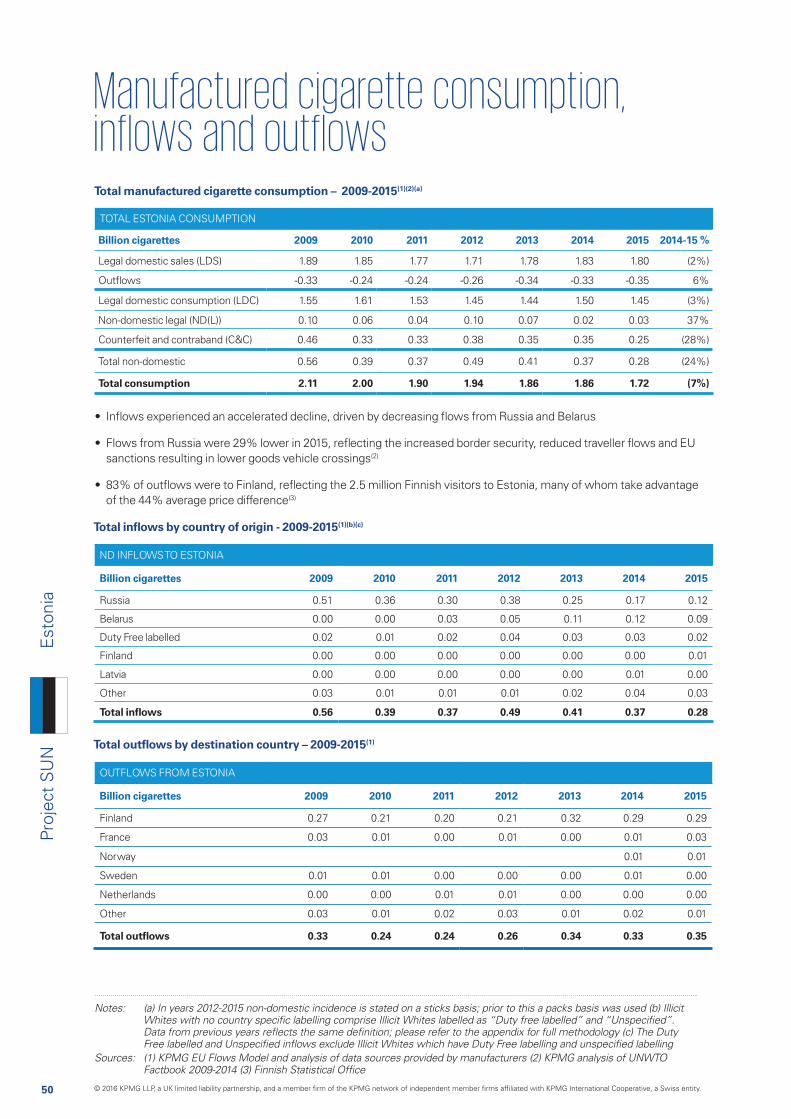
50
Proj
ect
SU
N
ND INFLOWS TO ESTONIA
Billion cigarettes 2009 2010 2011 2012 2013 2014 2015
Russia 0.51 0.36 0.30 0.38 0.25 0.17 0.12
Belarus 0.00 0.00 0.03 0.05 0.11 0.12 0.09
Duty Free labelled 0.02 0.01 0.02 0.04 0.03 0.03 0.02
Finland 0.00 0.00 0.00 0.00 0.00 0.00 0.01
Latvia 0.00 0.00 0.00 0.00 0.00 0.01 0.00
Other 0.03 0.01 0.01 0.01 0.02 0.04 0.03
Total inflows 0.56 0.39 0.37 0.49 0.41 0.37 0.28
Total manufactured cigarette consumption – 2009-2015(1)(2)(a)
Total inflows by country of origin - 2009-2015(1)(b)(c)
TOTAL ESTONIA CONSUMPTION
Billion cigarettes 2009 2010 2011 2012 2013 2014 2015 2014-15 %
Legal domestic sales (LDS) 1.89 1.85 1.77 1.71 1.78 1.83 1.80 (2%)
Outflows -0.33 -0.24 -0.24 -0.26 -0.34 -0.33 -0.35 6%
Legal domestic consumption (LDC) 1.55 1.61 1.53 1.45 1.44 1.50 1.45 (3%)
Non-domestic legal (ND(L)) 0.10 0.06 0.04 0.10 0.07 0.02 0.03 37%
Counterfeit and contraband (C&C) 0.46 0.33 0.33 0.38 0.35 0.35 0.25 (28%)
Total non-domestic 0.56 0.39 0.37 0.49 0.41 0.37 0.28 (24%)
Total consumption 2.11 2.00 1.90 1.94 1.86 1.86 1.72 (7%)
Total outflows by destination country – 2009-2015(1)
OUTFLOWS FROM ESTONIA
Billion cigarettes 2009 2010 2011 2012 2013 2014 2015
Finland 0.27 0.21 0.20 0.21 0.32 0.29 0.29
France 0.03 0.01 0.00 0.01 0.00 0.01 0.03
Norway 0.01 0.01
Sweden 0.01 0.01 0.00 0.00 0.00 0.01 0.00
Netherlands 0.00 0.00 0.01 0.01 0.00 0.00 0.00
Other 0.03 0.01 0.02 0.03 0.01 0.02 0.01
Total outflows 0.33 0.24 0.24 0.26 0.34 0.33 0.35
Notes: (a) In years 2012-2015 non-domestic incidence is stated on a sticks basis; prior to this a packs basis was used (b) Illicit
Sources: (1) KPMG EU Flows Model and analysis of data sources provided by manufacturers (2) KPMG analysis of UNWTO
• Inflows experienced an accelerated decline, driven by decreasing flows from Russia and Belarus
• Flows from Russia were 29% lower in 2015, reflecting the increased border security, reduced traveller flows and EU sanctions resulting in lower goods vehicle crossings(2)
• 83% of outflows were to Finland, reflecting the 2.5 million Finnish visitors to Estonia, many of whom take advantage of the 44% average price difference(3)
Est
onia
© 2016 KPMG LLP, a UK limited liability partnership, and a member firm of the KPMG network of independent member firms affiliated with KPMG International Cooperative, a Swiss entity.
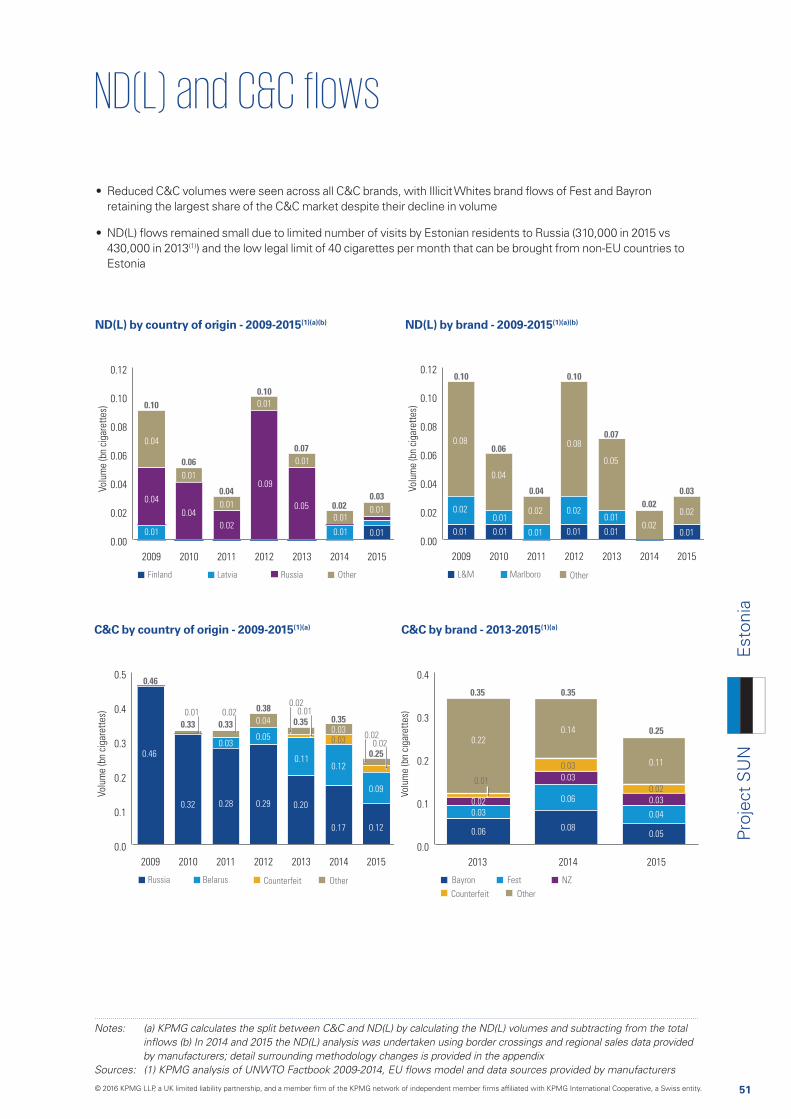
51
Proj
ect
SU
N
Notes: (a) KPMG calculates the split between C&C and ND(L) by calculating the ND(L) volumes and subtracting from the total
by manufacturers; detail surrounding methodology changes is provided in the appendix
ND(L) by country of origin - 2009-2015(1)(a)(b)
C&C by country of origin - 2009-2015(1)(a)
0.00
0.02
0.04
0.06
0.08
0.10
0.12
2009 2010 2011 2012 2013 2014 2015
0.01
0.01
0.04
0.04
0.09
0.05
0.10
0.06
0.04
0.10
0.07
0.020.03
0.01
0.02
0.010.04
0.01
0.01
0.01
0.01
0.01
Latvia RussiaFinland Other
Volu
me
(bn
ciga
rett
es)
0.00
0.02
0.04
0.06
0.08
0.10
0.12
2009 2010 2011 2012 2013 2014 2015
0.01
0.04
0.02
0.08
0.02
0.01
0.01
0.01
0.10
0.06
0.04
0.10
0.07
0.020.03
0.05
0.01
0.020.01
0.010.02
0.01
0.02
0.08
MarlboroL&M Other
Volu
me
(bn
ciga
rett
es)
0.0
0.1
0.2
0.3
0.4
0.5
2009 2010 2011 2012 2013 2014 2015
0.46
0.32 0.20
0.46
0.33 0.33
0.380.35 0.35
0.25
0.28
0.03
0.110.12
0.030.03
0.17 0.12
0.09
0.29
0.05
0.04
Belarus CounterfeitRussia Other
Volu
me
(bn
ciga
rett
es) 0.01 0.02 0.01
0.02
0.020.02
0.0
0.1
0.2
0.3
0.4
2013 2014 2015
0.03
0.35 0.35
0.25
0.06
0.02
0.22
0.08
0.03
0.14
0.03
0.060.02
0.03
0.04
0.05
0.11
Bayron
Counterfeit
Fest NZ
Other
Volu
me
(bn
ciga
rett
es)
0.01
ND(L) by brand - 2009-2015(1)(a)(b)
C&C by brand - 2013-2015(1)(a)
• Reduced C&C volumes were seen across all C&C brands, with Illicit Whites brand flows of Fest and Bayron retaining the largest share of the C&C market despite their decline in volume
• ND(L) flows remained small due to limited number of visits by Estonian residents to Russia (310,000 in 2015 vs 430,000 in 2013(1)) and the low legal limit of 40 cigarettes per month that can be brought from non-EU countries to Estonia
Est
onia
© 2016 KPMG LLP, a UK limited liability partnership, and a member firm of the KPMG network of independent member firms affiliated with KPMG International Cooperative, a Swiss entity.
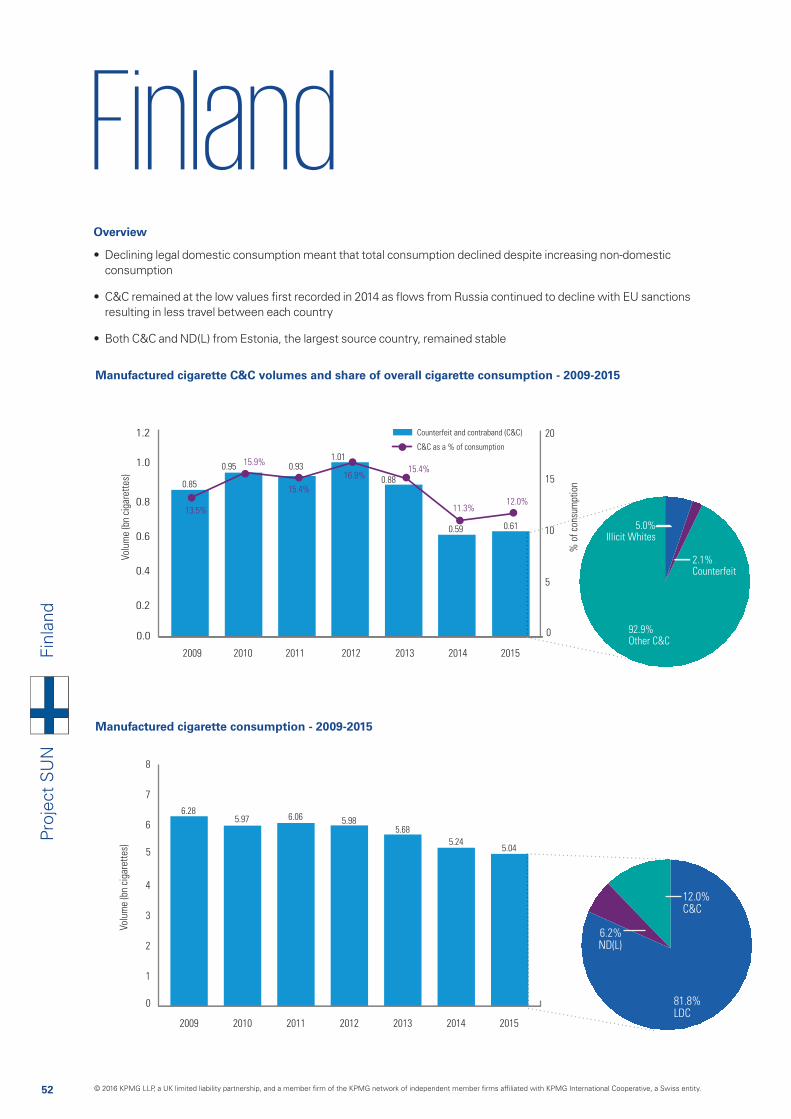
52
Proj
ect
SU
NFi
nlan
d
Manufactured cigarette consumption - 2009-2015
Manufactured cigarette C&C volumes and share of overall cigarette consumption - 2009-2015
0.0
0.2
0.4
0.6
0.8
1.0
1.2
Volu
me
(bn
ciga
rett
es)
% o
f co
nsum
ptio
n
Counterfeit and contraband (C&C)
C&C as a % of consumption
2009 2010 2011 2012 2013 2014 2015
0
5
10
15
20
13.5%
15.9%
15.4%
16.9%15.4%
11.3%12.0%
0.85
0.95 0.931.01
0.88
0.59 0.61
Volu
me
(bn
ciga
rett
es)
2009 2010 2011 2012 2013 2014 2015
14.87 6.28
5.97 6.06 5.985.68
5.045.24
0
1
2
3
4
5
6
7
8
10
n
2.1%Counterfeit
92.9%Other C&C
5.0%Illicit Whites
6.2%ND(L)
12.0%C&C
81.8%LDC
Overview
• Declining legal domestic consumption meant that total consumption declined despite increasing non-domestic consumption
• C&C remained at the low values first recorded in 2014 as flows from Russia continued to decline with EU sanctions resulting in less travel between each country
• Both C&C and ND(L) from Estonia, the largest source country, remained stable
© 2016 KPMG LLP, a UK limited liability partnership, and a member firm of the KPMG network of independent member firms affiliated with KPMG International Cooperative, a Swiss entity.
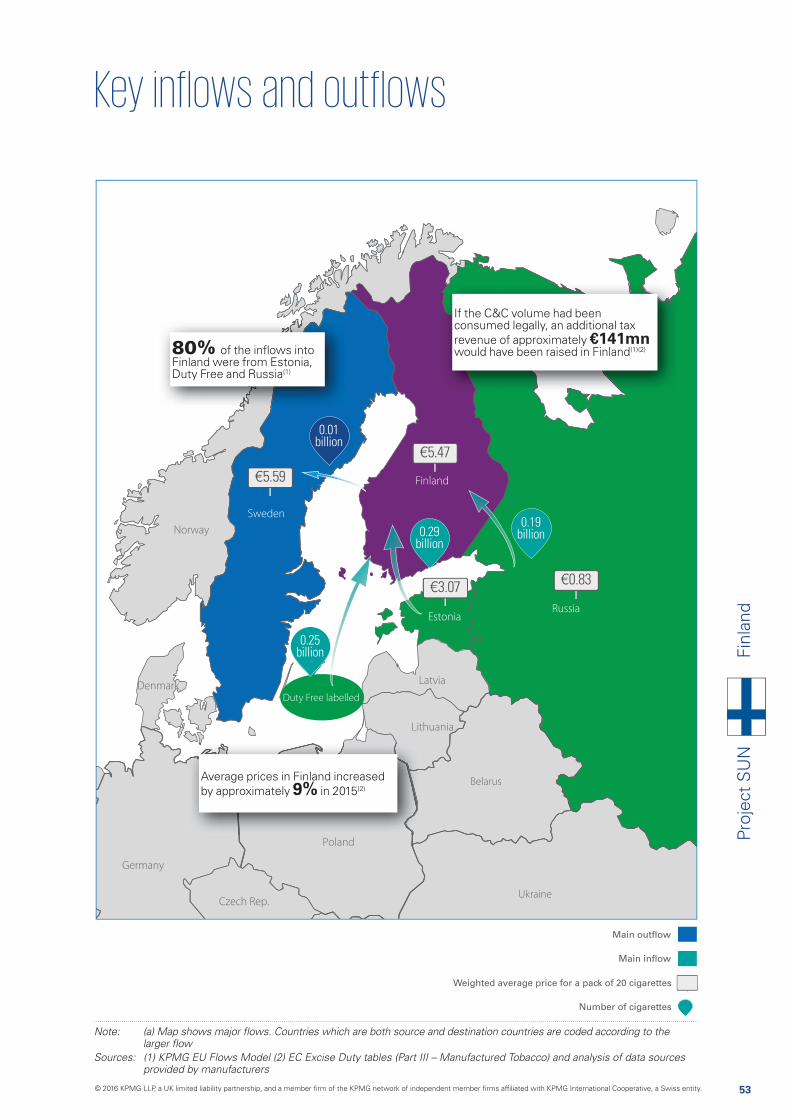
53
Proj
ect
SU
NFi
nlan
d
Main outflow
Main inflow
Weighted average price for a pack of 20 cigarettes
Number of cigarettes
Ukraine
Belarus
0.19 billion
0.01 billion
Sources: (1) KPMG EU Flows Model (2) EC Excise Duty tables (Part III – Manufactured Tobacco) and analysis of data sources provided by manufacturers
€5.59
€5.47
€3.07€0.83
0.29 billion
0.25 billion
80% of the inflows into Finland were from Estonia, Duty Free and Russia(1)
Average prices in Finland increased by approximately 9% in 2015(2)
If the C&C volume had been consumed legally, an additional tax revenue of approximately €141mn would have been raised in Finland(1)(2)
Duty Free labelled
© 2016 KPMG LLP, a UK limited liability partnership, and a member firm of the KPMG network of independent member firms affiliated with KPMG International Cooperative, a Swiss entity.
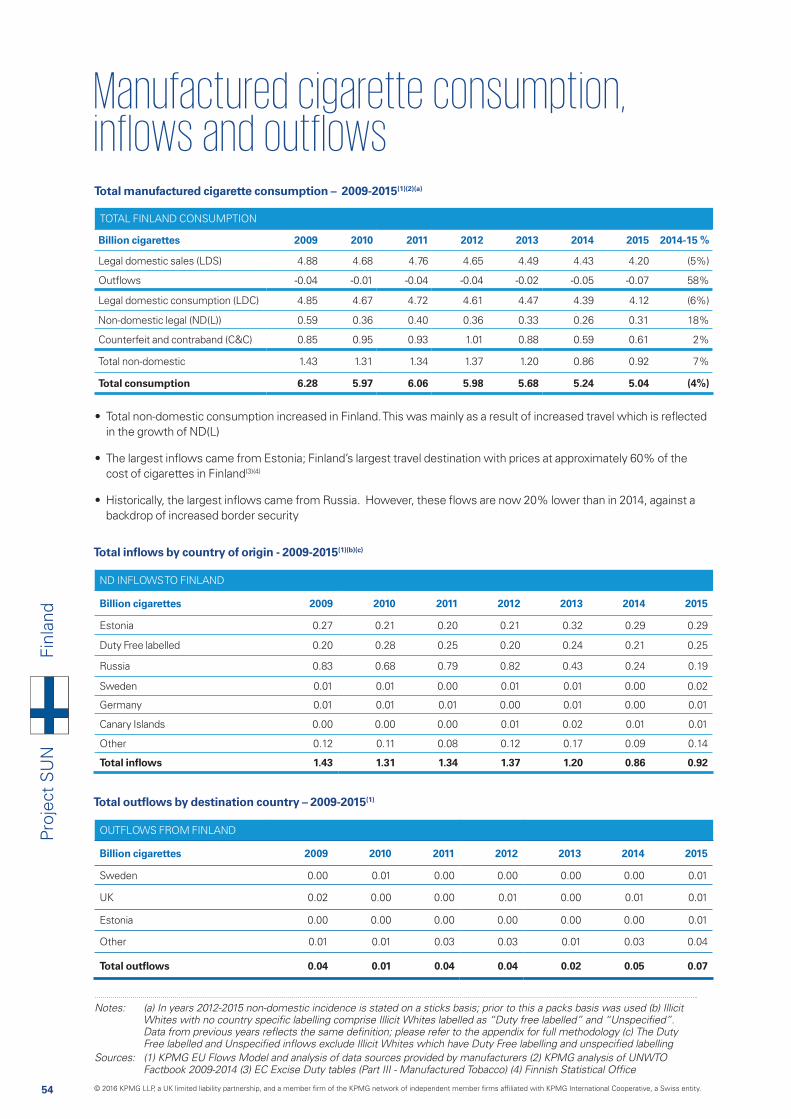
54
Proj
ect
SU
N
ND INFLOWS TO FINLAND
Billion cigarettes 2009 2010 2011 2012 2013 2014 2015
Estonia 0.27 0.21 0.20 0.21 0.32 0.29 0.29
Duty Free labelled 0.20 0.28 0.25 0.20 0.24 0.21 0.25
Russia 0.83 0.68 0.79 0.82 0.43 0.24 0.19
Sweden 0.01 0.01 0.00 0.01 0.01 0.00 0.02
Germany 0.01 0.01 0.01 0.00 0.01 0.00 0.01
Canary Islands 0.00 0.00 0.00 0.01 0.02 0.01 0.01
Other 0.12 0.11 0.08 0.12 0.17 0.09 0.14
Total inflows 1.43 1.31 1.34 1.37 1.20 0.86 0.92
Total manufactured cigarette consumption – 2009-2015(1)(2)(a)
Total inflows by country of origin - 2009-2015(1)(b)(c)
TOTAL FINLAND CONSUMPTION
Billion cigarettes 2009 2010 2011 2012 2013 2014 2015 2014-15 %
Legal domestic sales (LDS) 4.88 4.68 4.76 4.65 4.49 4.43 4.20 (5%)
Outflows -0.04 -0.01 -0.04 -0.04 -0.02 -0.05 -0.07 58%
Legal domestic consumption (LDC) 4.85 4.67 4.72 4.61 4.47 4.39 4.12 (6%)
Non-domestic legal (ND(L)) 0.59 0.36 0.40 0.36 0.33 0.26 0.31 18%
Counterfeit and contraband (C&C) 0.85 0.95 0.93 1.01 0.88 0.59 0.61 2%
Total non-domestic 1.43 1.31 1.34 1.37 1.20 0.86 0.92 7%
Total consumption 6.28 5.97 6.06 5.98 5.68 5.24 5.04 (4%)
Total outflows by destination country – 2009-2015(1)
OUTFLOWS FROM FINLAND
Billion cigarettes 2009 2010 2011 2012 2013 2014 2015
Sweden 0.00 0.01 0.00 0.00 0.00 0.00 0.01
UK 0.02 0.00 0.00 0.01 0.00 0.01 0.01
Estonia 0.00 0.00 0.00 0.00 0.00 0.00 0.01
Other 0.01 0.01 0.03 0.03 0.01 0.03 0.04
Total outflows 0.04 0.01 0.04 0.04 0.02 0.05 0.07
Notes: (a) In years 2012-2015 non-domestic incidence is stated on a sticks basis; prior to this a packs basis was used (b) Illicit
Sources: (1) KPMG EU Flows Model and analysis of data sources provided by manufacturers (2) KPMG analysis of UNWTO
• Total non-domestic consumption increased in Finland. This was mainly as a result of increased travel which is reflected in the growth of ND(L)
• The largest inflows came from Estonia; Finland’s largest travel destination with prices at approximately 60% of the cost of cigarettes in Finland(3)(4)
• Historically, the largest inflows came from Russia. However, these flows are now 20% lower than in 2014, against a backdrop of increased border security
Finl
and
© 2016 KPMG LLP, a UK limited liability partnership, and a member firm of the KPMG network of independent member firms affiliated with KPMG International Cooperative, a Swiss entity.
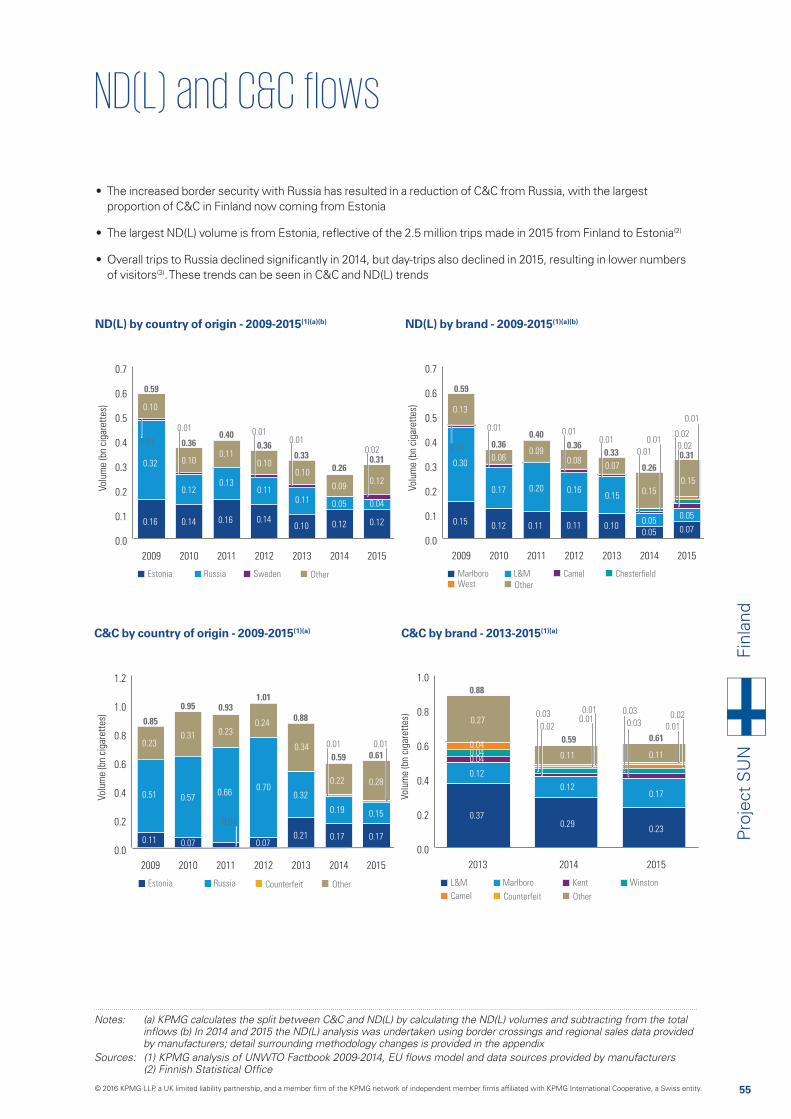
55
Proj
ect
SU
N
Notes: (a) KPMG calculates the split between C&C and ND(L) by calculating the ND(L) volumes and subtracting from the total
by manufacturers; detail surrounding methodology changes is provided in the appendix
ND(L) by country of origin - 2009-2015(1)(a)(b)
C&C by country of origin - 2009-2015(1)(a)
0.0
0.1
0.2
0.3
0.4
0.5
0.6
0.7
2009 2010 2011 2012 2013 2014 2015
0.11
0.16
0.12
0.32
0.10
0.10
0.140.10
0.59
0.360.40
0.360.33
0.260.31
0.130.10
0.11
0.160.14
0.09
0.05
0.12 0.12
0.04
0.12
0.01
0.10
0.11
0.01 0.010.01
0.02
Russia OtherSwedenEstonia
Volu
me
(bn
ciga
rett
es)
0.0
0.1
0.2
0.3
0.4
0.5
0.6
0.7
2009 2010 2011 2012 2013 2014 2015
0.09
0.15
0.17
0.30
0.13
0.06
0.11 0.10
0.59
0.360.40
0.360.33
0.260.31
0.20
0.07
0.15
0.110.12
0.15
0.05
0.05 0.07
0.05
0.15
0.01
0.08
0.16
0.010.01
0.01
0.02
0.02
0.01
0.01
0.01
L&M
Other
CamelMarlboro ChesterfieldWest
Volu
me
(bn
ciga
rett
es)
0.0
0.2
0.4
0.6
0.8
1.0
1.2
2009 2010 2011 2012 2013 2014 2015
0.51
0.11
0.23
0.57
0.31
0.070.070.21
0.85
0.95 0.931.01
0.88
0.59 0.61
0.23
0.34
0.66
0.17
0.19
0.22
0.15
0.17
0.28
0.24
0.700.32
0.04
0.01 0.01
Russia CounterfeitEstonia Other
Volu
me
(bn
ciga
rett
es)
0.0
0.2
0.4
0.6
0.8
1.0
2013 2014 2015
0.37
0.88
0.59 0.61
0.27
0.29
0.12
0.11
0.17
0.23
0.11
0.12
0.04
0.040.04
0.020.01
0.03 0.01
0.030.02
0.01
0.03
Marlboro
Counterfeit
L&M
Camel
WinstonKent
Other
Volu
me
(bn
ciga
rett
es)
ND(L) by brand - 2009-2015(1)(a)(b)
C&C by brand - 2013-2015(1)(a)
• The increased border security with Russia has resulted in a reduction of C&C from Russia, with the largest proportion of C&C in Finland now coming from Estonia
• The largest ND(L) volume is from Estonia, reflective of the 2.5 million trips made in 2015 from Finland to Estonia(2)
• Overall trips to Russia declined significantly in 2014, but day-trips also declined in 2015, resulting in lower numbers of visitors(3). These trends can be seen in C&C and ND(L) trends
Finl
and
© 2016 KPMG LLP, a UK limited liability partnership, and a member firm of the KPMG network of independent member firms affiliated with KPMG International Cooperative, a Swiss entity.
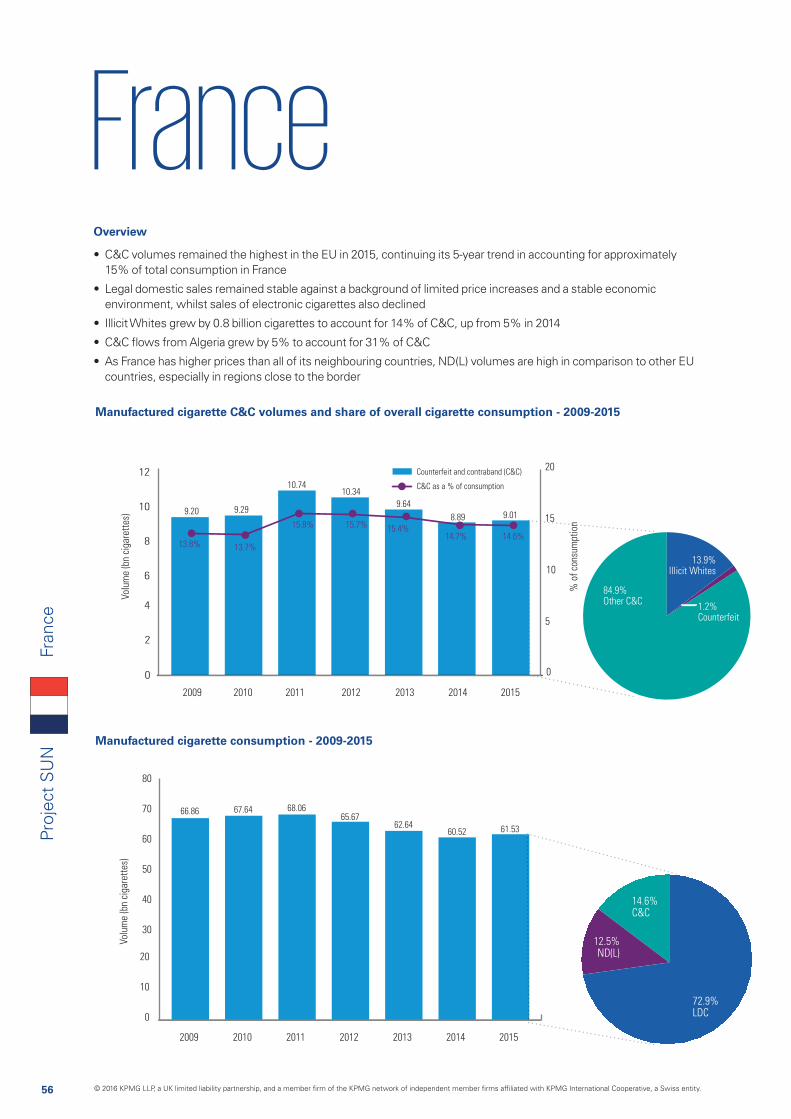
56
Proj
ect
SU
N
FranceFr
ance
Manufactured cigarette consumption - 2009-2015
Manufactured cigarette C&C volumes and share of overall cigarette consumption - 2009-2015
0
2
4
6
8
10
12
Volu
me
(bn
ciga
rett
es)
% o
f co
nsum
ptio
n
2009 2010 2011 2012 2013 2014 2015
Counterfeit and contraband (C&C)
C&C as a % of consumption
0
5
10
15
20
13.8% 13.7%
15.8% 15.7% 15.4%14.7% 14.6%
9.20 9.29
10.7410.34
9.64
8.89 9.01
Volu
me
(bn
ciga
rett
es)
2009 2010 2011 2012 2013 2014 2015
66.86 67.64 68.0665.67
62.64 61.5360.52
0
10
20
30
40
50
60
70
80
12.5%ND(L)
14.6%C&C
72.9%LDC
1.2%Counterfeit
84.9%Other C&C
13.9%Illicit Whites
Overview
• C&C volumes remained the highest in the EU in 2015, continuing its 5-year trend in accounting for approximately 15% of total consumption in France
• Legal domestic sales remained stable against a background of limited price increases and a stable economic environment, whilst sales of electronic cigarettes also declined
• Illicit Whites grew by 0.8 billion cigarettes to account for 14% of C&C, up from 5% in 2014
• C&C flows from Algeria grew by 5% to account for 31% of C&C
• As France has higher prices than all of its neighbouring countries, ND(L) volumes are high in comparison to other EU countries, especially in regions close to the border
© 2016 KPMG LLP, a UK limited liability partnership, and a member firm of the KPMG network of independent member firms affiliated with KPMG International Cooperative, a Swiss entity.
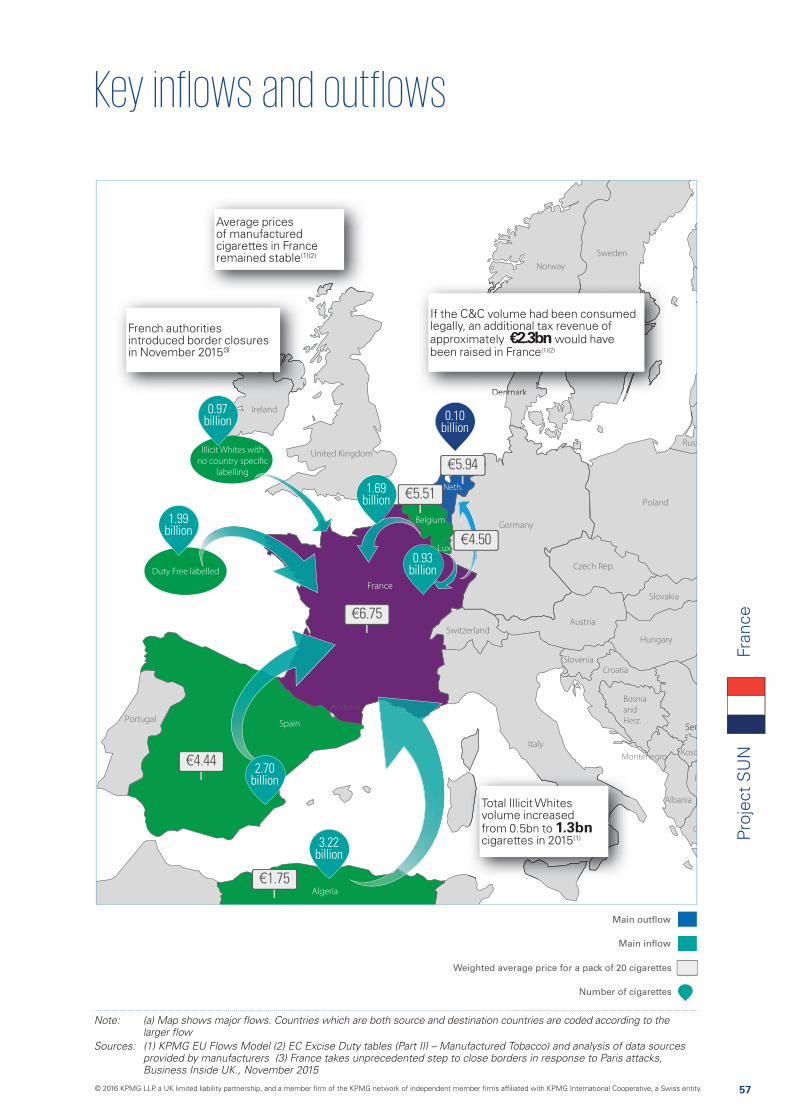
57
Proj
ect
SU
NFr
ance
Main outflow
Main inflow
Weighted average price for a pack of 20 cigarettes
Number of cigarettes
F
Bosnia
and
Herz.
Croatia
Slovenia
Montenegro
Albania
Andorra
Belgium
Neth.
Koso
3.22 billion
2.70 billion
1.99 billion
1.69 billion
0.93 billion
0.97 billion 0.10
billion
Sources: (1) KPMG EU Flows Model (2) EC Excise Duty tables (Part III – Manufactured Tobacco) and analysis of data sources provided by manufacturers (3) France takes unprecedented step to close borders in response to Paris attacks, Business Inside UK., November 2015
€1.75
€6.75
€5.94
€5.51
€4.50
€4.44
Average prices of manufactured cigarettes in France remained stable(1)(2)
French authorities introduced border closures in November 2015(3)
Total Illicit Whites volume increased from 0.5bn to 1.3bn cigarettes in 2015(1)
If the C&C volume had been consumed legally, an additional tax revenue of approximately €2.3bn would have been raised in France(1)(2)
Duty Free labelled
Illicit Whites with
no country specific
labelling
© 2016 KPMG LLP, a UK limited liability partnership, and a member firm of the KPMG network of independent member firms affiliated with KPMG International Cooperative, a Swiss entity.
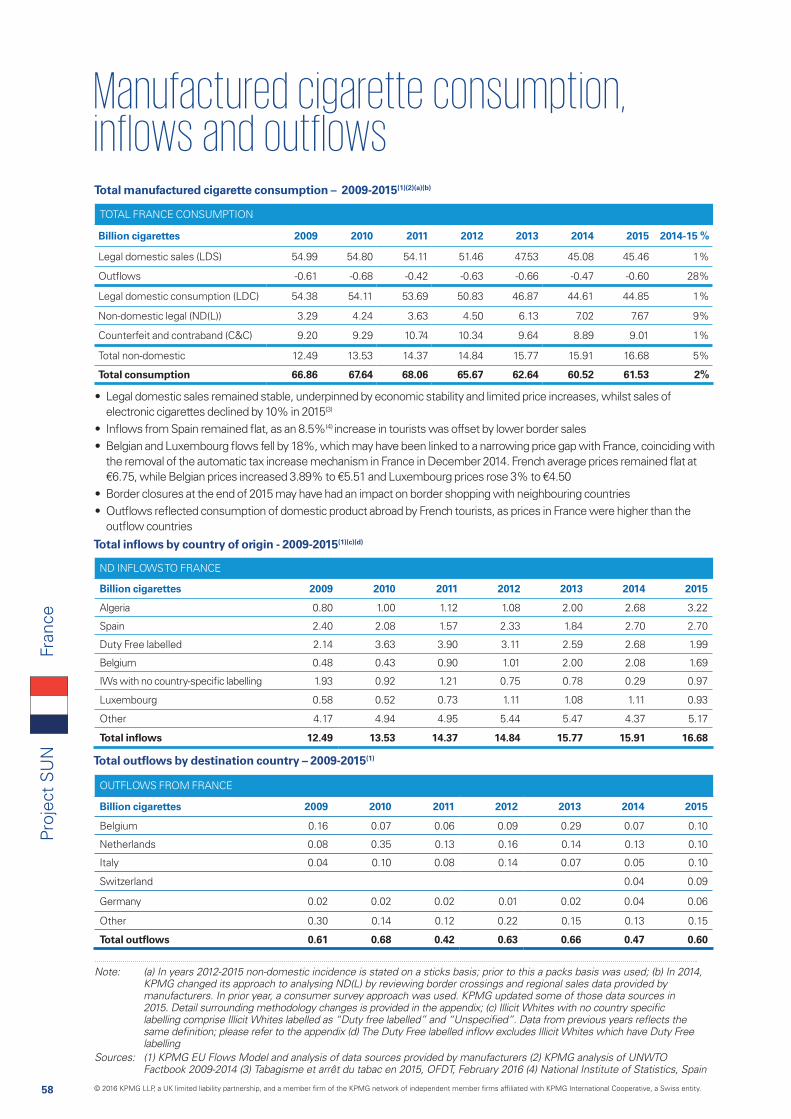
58
Proj
ect
SU
N
ND INFLOWS TO FRANCE
Billion cigarettes 2009 2010 2011 2012 2013 2014 2015
Algeria 0.80 1.00 1.12 1.08 2.00 2.68 3.22
Spain 2.40 2.08 1.57 2.33 1.84 2.70 2.70
Duty Free labelled 2.14 3.63 3.90 3.11 2.59 2.68 1.99
Belgium 0.48 0.43 0.90 1.01 2.00 2.08 1.69
IWs with no country-specific labelling 1.93 0.92 1.21 0.75 0.78 0.29 0.97
Luxembourg 0.58 0.52 0.73 1.11 1.08 1.11 0.93
Other 4.17 4.94 4.95 5.44 5.47 4.37 5.17
Total inflows 12.49 13.53 14.37 14.84 15.77 15.91 16.68
Total manufactured cigarette consumption – 2009-2015(1)(2)(a)(b)
Total inflows by country of origin - 2009-2015(1)(c)(d)
TOTAL FRANCE CONSUMPTION
Billion cigarettes 2009 2010 2011 2012 2013 2014 2015 2014-15 %
Legal domestic sales (LDS) 54.99 54.80 54.11 51.46 47.53 45.08 45.46 1%
Outflows -0.61 -0.68 -0.42 -0.63 -0.66 -0.47 -0.60 28%
Legal domestic consumption (LDC) 54.38 54.11 53.69 50.83 46.87 44.61 44.85 1%
Non-domestic legal (ND(L)) 3.29 4.24 3.63 4.50 6.13 7.02 7.67 9%
Counterfeit and contraband (C&C) 9.20 9.29 10.74 10.34 9.64 8.89 9.01 1%
Total non-domestic 12.49 13.53 14.37 14.84 15.77 15.91 16.68 5%
Total consumption 66.86 67.64 68.06 65.67 62.64 60.52 61.53 2%
Total outflows by destination country – 2009-2015(1)
OUTFLOWS FROM FRANCE
Billion cigarettes 2009 2010 2011 2012 2013 2014 2015
Belgium 0.16 0.07 0.06 0.09 0.29 0.07 0.10
Netherlands 0.08 0.35 0.13 0.16 0.14 0.13 0.10
Italy 0.04 0.10 0.08 0.14 0.07 0.05 0.10
Switzerland 0.04 0.09
Germany 0.02 0.02 0.02 0.01 0.02 0.04 0.06
Other 0.30 0.14 0.12 0.22 0.15 0.13 0.15
Total outflows 0.61 0.68 0.42 0.63 0.66 0.47 0.60
Note: (a) In years 2012-2015 non-domestic incidence is stated on a sticks basis; prior to this a packs basis was used; (b) In 2014, KPMG changed its approach to analysing ND(L) by reviewing border crossings and regional sales data provided by manufacturers. In prior year, a consumer survey approach was used. KPMG updated some of those data sources in
labelling Sources: (1) KPMG EU Flows Model and analysis of data sources provided by manufacturers (2) KPMG analysis of UNWTO Factbook 2009-2014 (3) Tabagisme et arrêt du tabac en 2015, OFDT, February 2016 (4) National Institute of Statistics, Spain
• Legal domestic sales remained stable, underpinned by economic stability and limited price increases, whilst sales of electronic cigarettes declined by 10% in 2015(3)
• Inflows from Spain remained flat, as an 8.5%(4) increase in tourists was offset by lower border sales• Belgian and Luxembourg flows fell by 18%, which may have been linked to a narrowing price gap with France, coinciding with
the removal of the automatic tax increase mechanism in France in December 2014. French average prices remained flat at €6.75, while Belgian prices increased 3.89% to €5.51 and Luxembourg prices rose 3% to €4.50
• Border closures at the end of 2015 may have had an impact on border shopping with neighbouring countries• Outflows reflected consumption of domestic product abroad by French tourists, as prices in France were higher than the
outflow countries
Fran
ce
© 2016 KPMG LLP, a UK limited liability partnership, and a member firm of the KPMG network of independent member firms affiliated with KPMG International Cooperative, a Swiss entity.
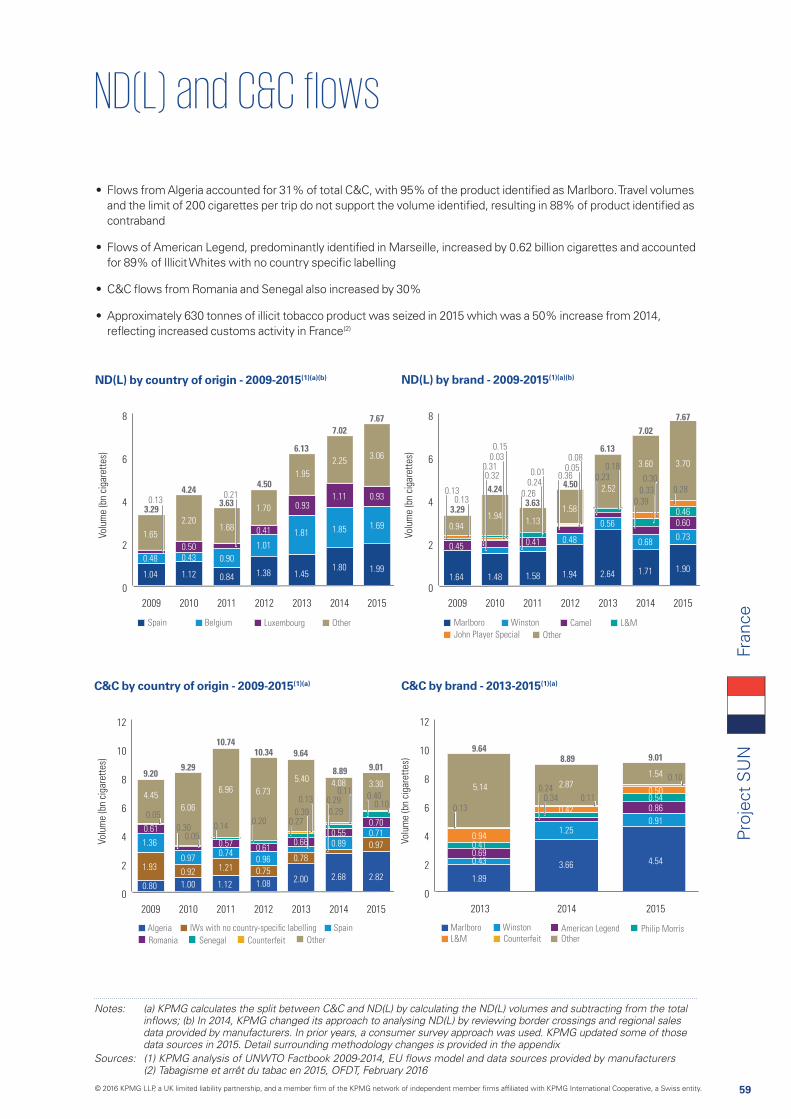
59
Proj
ect
SU
N
Notes: (a) KPMG calculates the split between C&C and ND(L) by calculating the ND(L) volumes and subtracting from the total
data provided by manufacturers. In prior years, a consumer survey approach was used. KPMG updated some of those data sources in 2015. Detail surrounding methodology changes is provided in the appendix
(2) Tabagisme et arrêt du tabac en 2015, OFDT, February 2016
ND(L) by country of origin - 2009-2015(1)(a)(b)
C&C by country of origin - 2009-2015(1)(a)
0
2
4
6
8
2009 2010 2011 2012 2013 2014 2015
1.04
0.48
1.65
0.10
1.38
1.01
1.45
1.81
3.29
4.243.63
4.50
6.13
7.027.67
0.93
1.95
2.25
1.80
1.85
1.11
0.84
0.90
1.68
1.12
0.50
2.20
0.43
1.69
1.99
0.93
3.06
1.70
0.41
BelgiumSpain Luxembourg Other
Volu
me
(bn
ciga
rett
es)
0.130.21
0
2
4
6
8
2009 2010 2011 2012 2013 2014 2015
1.64
0.45
0.94
1.94
0.48
2.64
0.56
3.29
4.243.63
4.50
6.13
7.027.67
2.52
3.60
1.71
0.68
1.58
0.41
1.13
1.48
1.94
0.73
1.90
0.600.46
3.70
1.58
WinstonMarlboro Camel L&M
Volu
me
(bn
ciga
rett
es)
John Player Special Other
0.130.13
0.150.03
0.320.31
0.010.24
0.080.05 0.18
0.23
0.39
0.33
0.300.280.26
0.36
0
2
4
6
8
10
12
2009 2010 2011 2012 2013 2014 2015
4.45
1.36
0.61
1.93
0.80
0.24
0.92
0.97
6.06
1.08
0.75
0.61
0.96
6.73
2.00
0.78
0.66
9.209.29
10.7410.34 9.64
8.89 9.01
6.96
1.21
0.570.74
5.40
1.121.00
0.89
4.08
2.68
0.55 0.710.70
3.30
2.82
0.97
0.140.20
0.29
0.270.29
0.110.40
0.10
0.050.30
0.39
0.13
0.05
Spain
Romania
IWs with no country-specific labelling
Senegal Counterfeit
Algeria
Other
Volu
me
(bn
ciga
rett
es)
0
2
4
6
8
10
12
2013 2014 2015
1.89
0.410.690.43
0.94
9.648.89 9.01
5.14
0.42
2.87
3.66
1.25
0.50
1.54
0.86
0.91
4.54
0.540.24
0.130.34
0.10
0.11
Winston American Legend Philip MorrisCounterfeit
Marlboro
OtherL&M
Volu
me
(bn
ciga
rett
es)
ND(L) by brand - 2009-2015(1)(a)(b)
C&C by brand - 2013-2015(1)(a)
• Flows from Algeria accounted for 31% of total C&C, with 95% of the product identified as Marlboro. Travel volumes and the limit of 200 cigarettes per trip do not support the volume identified, resulting in 88% of product identified as contraband
• Flows of American Legend, predominantly identified in Marseille, increased by 0.62 billion cigarettes and accounted for 89% of Illicit Whites with no country specific labelling
• C&C flows from Romania and Senegal also increased by 30%
• Approximately 630 tonnes of illicit tobacco product was seized in 2015 which was a 50% increase from 2014, reflecting increased customs activity in France(2)
Fran
ce
© 2016 KPMG LLP, a UK limited liability partnership, and a member firm of the KPMG network of independent member firms affiliated with KPMG International Cooperative, a Swiss entity.
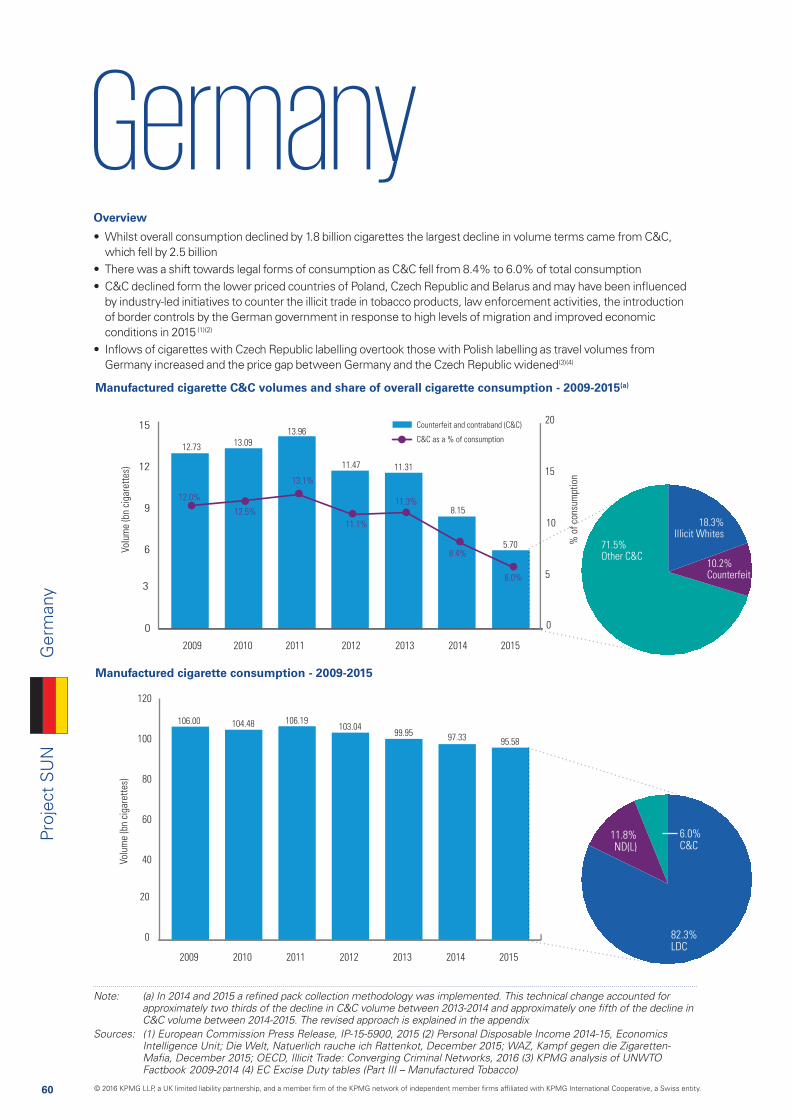
60
Proj
ect
SU
N
GermanyG
erm
any
Manufactured cigarette consumption - 2009-2015
Manufactured cigarette C&C volumes and share of overall cigarette consumption - 2009-2015(a)
0
3
6
9
12
15
Volu
me
(bn
ciga
rett
es)
% o
f co
nsum
ptio
n
2009 2010 2011 2012 2013 2014 2015
Counterfeit and contraband (C&C)
C&C as a % of consumption
0
5
10
15
20
12.0%
12.5%
13.1%
11.1%
11.3%
8.4%
6.0%
12.73 13.0913.96
11.47 11.31
8.15
5.70
Volu
me
(bn
ciga
rett
es)
2009 2010 2011 2012 2013 2014 2015
106.00 104.48 106.19103.04
99.9595.5897.33
0
20
40
60
80
100
120
f c
11.8%ND(L)
6.0%C&C
82.3%LDC
10.2%Counterfeit
71.5%Other C&C
18.3%Illicit Whites
C&C volume between 2014-2015. The revised approach is explained in the appendixSources: (1) European Commission Press Release, IP-15-5900, 2015 (2) Personal Disposable Income 2014-15, Economics Intelligence Unit; Die Welt, Natuerlich rauche ich Rattenkot, December 2015; WAZ, Kampf gegen die Zigaretten-
Overview
• Whilst overall consumption declined by 1.8 billion cigarettes the largest decline in volume terms came from C&C, which fell by 2.5 billion
• There was a shift towards legal forms of consumption as C&C fell from 8.4% to 6.0% of total consumption• C&C declined form the lower priced countries of Poland, Czech Republic and Belarus and may have been influenced
by industry-led initiatives to counter the illicit trade in tobacco products, law enforcement activities, the introduction of border controls by the German government in response to high levels of migration and improved economic conditions in 2015 (1)(2)
• Inflows of cigarettes with Czech Republic labelling overtook those with Polish labelling as travel volumes from Germany increased and the price gap between Germany and the Czech Republic widened(3)(4)
© 2016 KPMG LLP, a UK limited liability partnership, and a member firm of the KPMG network of independent member firms affiliated with KPMG International Cooperative, a Swiss entity.
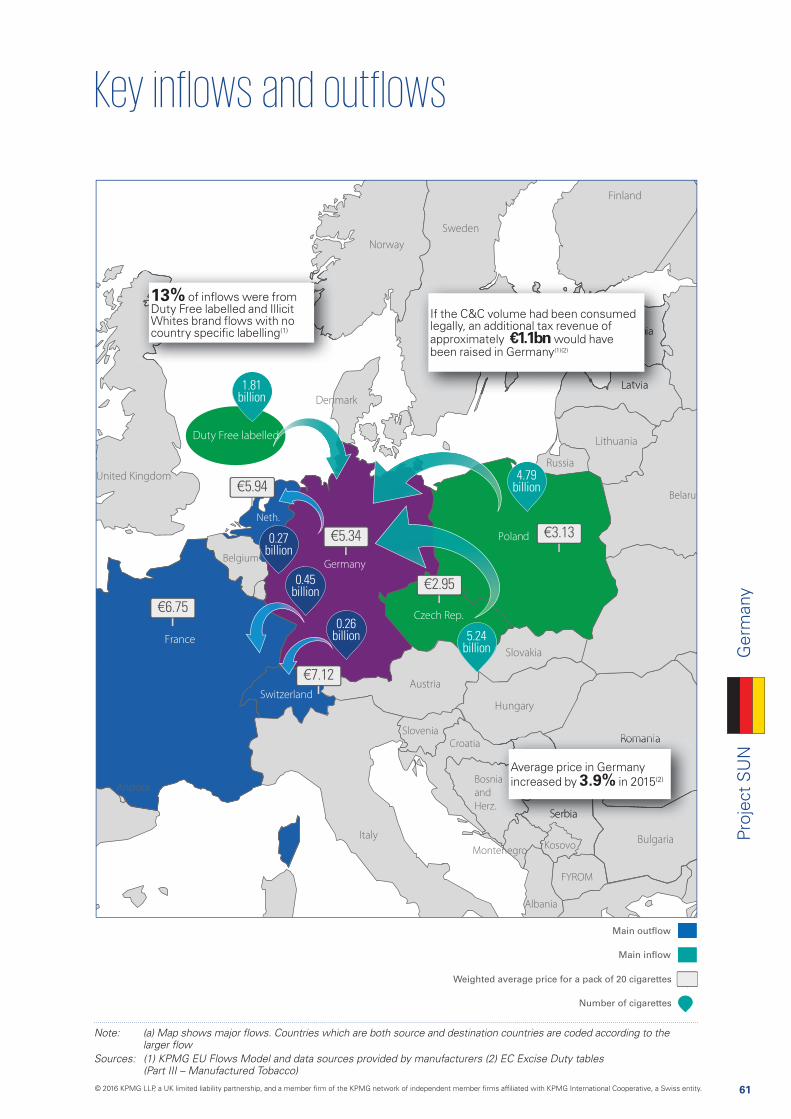
61
Proj
ect
SU
NG
erm
any
Main outflow
Main inflow
Weighted average price for a pack of 20 cigarettes
Number of cigarettes
FYROM
Bosnia
and
Herz.
Croatia
Slovenia
Montenegro
Albania
Belgium
Neth.
Belarus
Kosovo
5.24 billion
1.81 billion
4.79 billion
0.26 billion
0.45 billion
0.27 billion
Sources: (1) KPMG EU Flows Model and data sources provided by manufacturers (2) EC Excise Duty tables (Part III – Manufactured Tobacco)
€5.34
€5.94
€2.95
€3.13
€7.12
€6.75
13% of inflows were from Duty Free labelled and Illicit Whites brand flows with no country specific labelling(1)
aaAverage price in Germany increased by 3.9% in 2015(2)
If the C&C volume had been consumed legally, an additional tax revenue of approximately €1.1bn would have been raised in Germany(1)(2)
Duty Free labelled
© 2016 KPMG LLP, a UK limited liability partnership, and a member firm of the KPMG network of independent member firms affiliated with KPMG International Cooperative, a Swiss entity.

62
Proj
ect
SU
N
ND INFLOWS TO GERMANY
Billion cigarettes 2009 2010 2011 2012 2013 2014 2015
Czech Republic 3.53 4.66 5.69 5.01 6.14 5.45 5.24
Poland 7.54 7.49 8.64 8.54 7.54 5.67 4.79
Duty Free labelled 1.60 1.68 1.53 1.67 1.92 1.84 1.81
Belarus 0.18 0.43 0.61 0.64 0.96 0.98 0.72
IWs with no country-specific labelling 0.12 0.02 0.05 0.03 0.08 0.27 0.36
Luxembourg 0.80 0.38 0.41 0.46 0.45 0.48 0.31
Other 7.58 6.86 5.66 4.63 4.64 3.79 3.72
Total inflows 21.35 21.52 22.58 20.98 21.73 18.47 16.96
Total manufactured cigarette consumption – 2009-2015(1)(2)(a)(b)
Total inflows by country of origin - 2009-2015(1)(b)(c)(d)
TOTAL GERMANY CONSUMPTION
Billion cigarettes 2009 2010 2011 2012 2013 2014 2015 2014-15 %
Legal domestic sales (LDS) 85.49 83.91 84.47 83.44 79.63 80.35 80.04 (0%)
Outflows -0.84 -0.95 -0.86 -1.37 -1.42 -1.49 -1.42 (5%)
Legal domestic consumption (LDC) 84.65 82.96 83.60 82.07 78.21 78.86 78.62 (0%)
Non-domestic legal (ND(L)) 8.62 8.43 8.62 9.50 10.43 10.32 11.26 9%
Counterfeit and contraband (C&C) 12.73 13.09 13.96 11.47 11.31 8.15 5.70 (30%)
Total non-domestic 21.35 21.52 22.58 20.98 21.73 18.47 16.96 (8%)
Total consumption 106.00 104.48 106.19 103.04 99.95 97.33 95.58 (2%)
Total outflows by destination country – 2009-2015(1)
OUTFLOWS FROM GERMANY
Billion cigarettes 2009 2010 2011 2012 2013 2014 2015
France 0.24 0.22 0.21 0.52 0.62 0.47 0.45
Netherlands 0.13 0.35 0.25 0.33 0.33 0.36 0.27
Switzerland 0.17 0.26
Other 0.47 0.37 0.41 0.52 0.46 0.50 0.44
Total outflows 0.84 0.95 0.86 1.37 1.42 1.49 1.42
Notes: (a) In years 2012-2015 non-domestic incidence is stated on a sticks basis; prior to this a packs basis was used (b) In 2014
Sources: (1) KPMG EU Flows Model and analysis of data sources provided by manufacturers; Switzerland was included in the
Release, IP-15-5900, 2015; Die Welt, Natuerlich rauche ich Rattenkot, December 2015; WAZ, Kampf gegen die Zigaretten-
Manufactured Tobacco), January 2016 and January 2013
• Whilst legal domestic consumption remained stable total consumption fell by 1.8 billion; the largest decline in volume terms came from the 2.5 billion reduction in C&C, whilst ND(L) increased by 0.9 billion
– Inflows may have been influenced by industry-led initiatives to counter the illicit trade in tobacco products, law enforcement activities and the introduction of German border controls in response to the high levels of migration during 2015 (3)
• The Czech Republic overtook Poland to become the highest inflow country, possibly reflecting the fact that prices increased more quickly in Poland over the past 3 years, relative to the Czech Republic
– Czech Republic average price increased by 9% over 3 years to €2.95, whereas the Polish average price increased 18% over 3 years to €3.13(4)
Czech Republic overtook Poland in 2015 to
Ger
man
y
© 2016 KPMG LLP, a UK limited liability partnership, and a member firm of the KPMG network of independent member firms affiliated with KPMG International Cooperative, a Swiss entity.

63
Proj
ect
SU
N
Notes: (a) KPMG calculates the split between C&C and ND(L) by calculating the ND(L) volumes and subtracting from the total
by manufacturers; detail surrounding methodology changes is provided in the appendix
ND(L) by country of origin - 2009-2015(1)(a)(b)
C&C by country of origin - 2009-2015(1)(a)
0
2
4
6
8
10
12
2009 2010 2011 2012 2013 2014 2015
2.35
1.39
4.454.61
1.90
2.50
0.46
3.92
3.41
8.62 8.43 8.629.50
10.43 10.3211.26
0.45
2.65 2.47
3.80
3.56
0.48
2.00
2.25
4.05
2.13
1.684.42
3.54
2.98
4.64
PolandCzech Republic Luxembourg Other
Volu
me
(bn
ciga
rett
es)
0.28 0.170.33
0.31
0
2
4
6
8
10
12
2009 2010 2011 2012 2013 2014 2015
1.41
2.27
5.30
4.18
2.19
1.12
0.840.64
1.20
1.15
1.28
0.88
8.62 8.43 8.629.50
10.43 10.3211.26
1.46
4.45 4.82
0.86
1.29
1.31
1.15
0.88
1.39
0.92
5.76
1.07
1.20
0.521.33
1.22
1.42
1.11
1.00
5.18
4.64
WestMarlboro Pall Mall
Other
Volu
me
(bn
ciga
rett
es)
L&MRoute 66
0.010.34
0.190.08
0.290.04
0.350.05
0.37
0
3
6
9
12
15
2009 2010 2011 2012 2013 2014 2015
1.18
6.15
5.10
5.81
2.53
4.30
6.05
3.11
0.64
1.65
4.13
2.23
0.660.96
12.73 13.0913.96
11.47 11.31
8.15
5.70
3.21
3.69
3.25
6.39
2.57
2.10
1.64
0.98
0.591.96
1.25
0.820.72
0.58
0.05
0.03
0.36
0.02
0.43
0.08
0.61
0.27
0.120.18
Czech Republic BelarusIWs with no country-specific labelling Counterfeit
Poland
Other
Volu
me
(bn
ciga
rett
es)
0
2
4
6
8
10
12
2013 2014 2015
1.38
1.69
0.530.570.66
1.56
11.31
8.15
5.70
4.91
0.59
3.00
0.71
1.08
1.08
1.210.48
2.58
0.660.600.45
0.58
0.420.41
Route 66 West L&M
Counterfeit
Pall Mall
OtherMarlboro
Volu
me
(bn
ciga
rett
es)
ND(L) by brand - 2009-2015(1)(a)(b)
C&C by brand - 2013-2015(1)(a)
• ND(L) increased by 0.9 billion cigarettes, due largely to increased ND(L) from the Czech Republic
– An estimated 6.9% increase in border crossings and a widening price gap between the Czech Republic and Germany between 2014 and 2015 support the increase in ND(L)(1)
• Flows from Luxembourg to Germany are assumed to be 100% legal as the number of border crossings between these countries supported the overall volume identified
• C&C declined by 2.5 billion cigarettes largely as a result of reduced flows of cigarettes from lower priced countries Czech Republic, Poland and Belarus
Ger
man
y
© 2016 KPMG LLP, a UK limited liability partnership, and a member firm of the KPMG network of independent member firms affiliated with KPMG International Cooperative, a Swiss entity.
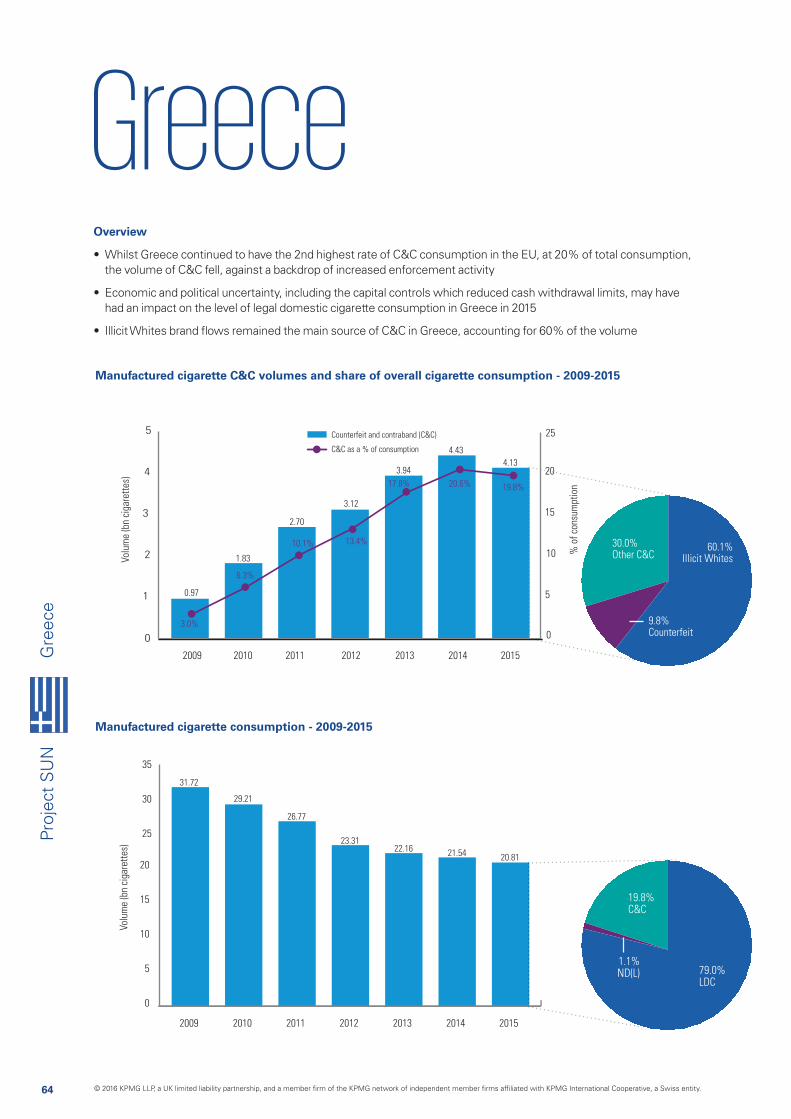
64
Proj
ect
SU
N
GreeceG
reec
e
Manufactured cigarette consumption - 2009-2015
Manufactured cigarette C&C volumes and share of overall cigarette consumption - 2009-2015
0
1
2
3
4
5
Volu
me
(bn
ciga
rett
es)
% o
f co
nsum
ptio
n
2009 2010 2011 2012 2013 2014 2015
Counterfeit and contraband (C&C)
C&C as a % of consumption
0
5
10
15
20
25
3.0%
6.3%
10.1% 13.4%
17.8% 20.6% 19.8%
0.97
1.83
2.70
3.12
3.94
4.43
4.13
Volu
me
(bn
ciga
rett
es)
2009 2010 2011 2012 2013 2014 2015
31.72
29.21
26.77
23.3122.16
20.8121.54
0
5
10
15
20
25
30
35
1.1%ND(L)
19.8%C&C
79.0%LDC
9.8%Counterfeit
30.0%Other C&C
60.1%Illicit Whites
Overview
• Whilst Greece continued to have the 2nd highest rate of C&C consumption in the EU, at 20% of total consumption, the volume of C&C fell, against a backdrop of increased enforcement activity
• Economic and political uncertainty, including the capital controls which reduced cash withdrawal limits, may have had an impact on the level of legal domestic cigarette consumption in Greece in 2015
• Illicit Whites brand flows remained the main source of C&C in Greece, accounting for 60% of the volume
© 2016 KPMG LLP, a UK limited liability partnership, and a member firm of the KPMG network of independent member firms affiliated with KPMG International Cooperative, a Swiss entity.
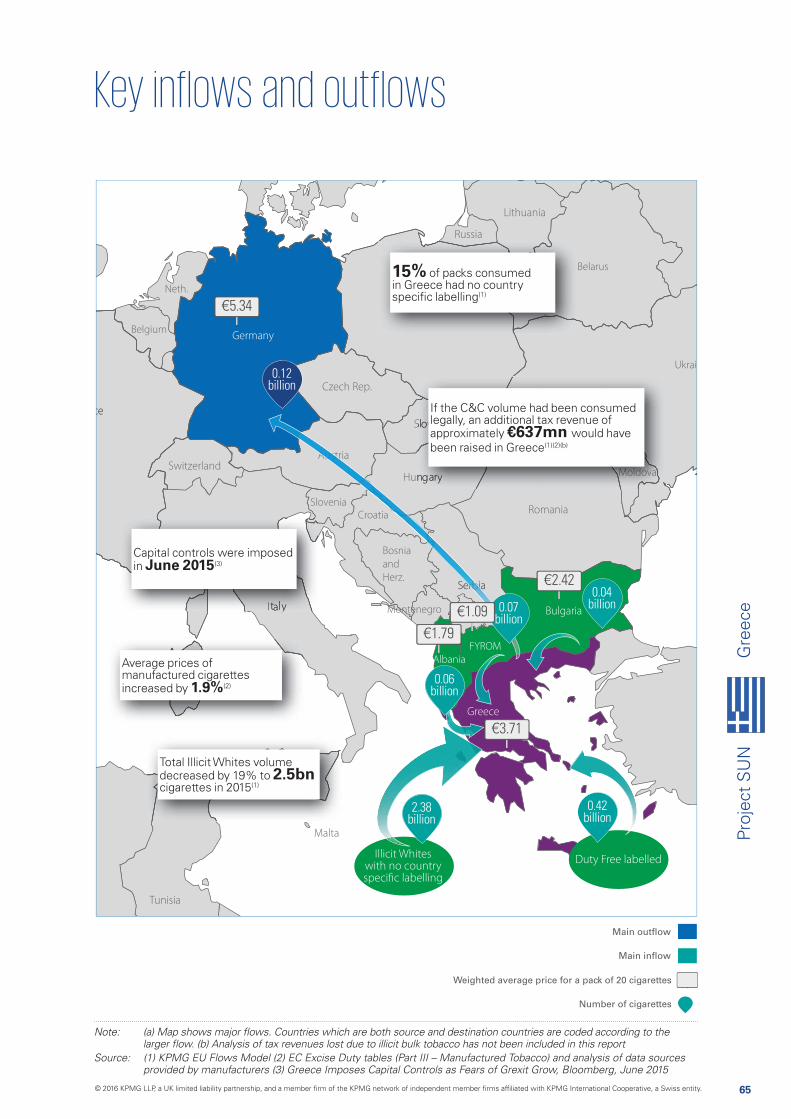
65
Proj
ect
SU
NG
reec
e
Main outflow
Main inflow
Weighted average price for a pack of 20 cigarettes
Number of cigarettes
FYROM
Bosnia
and
Herz.
Croatia
Slovenia
Montenegro
Albania
Moldova
Ukrai
Belgium
Neth.
Belarus
Kosovo
0.06 billion
0.07 billion
0.42 billion
2.38 billion
0.04 billion
0.12 billion
Source: (1) KPMG EU Flows Model (2) EC Excise Duty tables (Part III – Manufactured Tobacco) and analysis of data sources provided by manufacturers (3) Greece Imposes Capital Controls as Fears of Grexit Grow, Bloomberg, June 2015
€5.34
€1.79
€1.09
€2.42
€3.71
15% of packs consumed in Greece had no country specific labelling(1)
Capital controls were imposed in June 2015(3)
Average prices of manufactured cigarettes increased by 1.9%(2)
Total Illicit Whites volume decreased by 19% to 2.5bn cigarettes in 2015(1)
MMMoMoMoMoMoMooldldlddlddldldldlddoovovovovovvvaaaaa
If the C&C volume had been consumed legally, an additional tax revenue of approximately €637mn would have been raised in Greece(1)(2)(b)
Duty Free labelledIllicit Whites
with no country specific labelling
© 2016 KPMG LLP, a UK limited liability partnership, and a member firm of the KPMG network of independent member firms affiliated with KPMG International Cooperative, a Swiss entity.

66
Proj
ect
SU
N
ND INFLOWS TO GREECE
Billion cigarettes 2009 2010 2011 2012 2013 2014 2015
IWs with no country-specific labelling 0.22 0.39 1.01 2.50 2.72 2.65 2.38
Unspecified 0.27 0.32 0.40 0.05 0.64 1.00 0.74
Duty Free labelled 0.66 0.81 0.92 0.33 0.48 0.59 0.42
FYROM 0.00 0.01 0.01 0.02 0.02 0.05 0.07
Albania 0.03 0.07 0.06 0.08 0.08 0.08 0.06
Other 0.43 0.50 0.63 0.38 0.22 0.24 0.69
Total inflows 1.61 2.09 3.02 3.37 4.17 4.61 4.36
Total manufactured cigarette consumption – 2009-2015(1)(2)(3)(a)
Total inflows by country of origin - 2009-2015(1)(b)(c)
TOTAL GREECE CONSUMPTION
Billion cigarettes 2009 2010 2011 2012 2013 2014 2015 2014-15 %
Legal domestic sales (LDS) 30.97 27.78 24.24 20.45 18.46 17.27 16.79 (3%)
Outflows -0.85 -0.66 -0.50 -0.50 -0.47 -0.33 -0.34 2%
Legal domestic consumption (LDC) 30.11 27.12 23.75 19.94 17.99 16.93 16.45 (3%)
Non-domestic legal (ND(L)) 0.64 0.26 0.32 0.25 0.23 0.18 0.24 32%
Counterfeit and contraband (C&C) 0.97 1.83 2.70 3.12 3.94 4.43 4.13 (7%)
Total non-domestic 1.61 2.09 3.02 3.37 4.17 4.61 4.37 (5%)
Total consumption 31.72 29.21 26.77 23.31 22.16 21.54 20.81 (3%)
Total outflows by destination country – 2009-2015(1)
OUTFLOWS FROM GREECE
Billion cigarettes 2009 2010 2011 2012 2013 2014 2015
Germany 0.26 0.19 0.17 0.18 0.15 0.11 0.12
UK 0.28 0.16 0.12 0.16 0.11 0.08 0.05
France 0.09 0.12 0.04 0.07 0.12 0.02 0.03
Belgium 0.01 0.00 0.00 0.01 0.00 0.03 0.03
Italy 0.08 0.08 0.05 0.02 0.02 0.03 0.02
Other 0.13 0.10 0.10 0.07 0.06 0.07 0.09
Total outflows 0.85 0.66 0.50 0.50 0.47 0.33 0.34
Note: (a) In years 2012-2015 non-domestic incidence is stated on a sticks basis; prior to this a packs basis was used; (b) Illicit
Sources: (1) KPMG EU Flows Model and analysis of data sources provided by manufacturers (2) KPMG analysis of UNWTO Factbook
• Legal domestic sales continued their long term decline, falling 3% against a backdrop of political and economic uncertainty in 2015, with capital controls in the second half of the year potentially impacting consumer spending
• Whilst flows of cigarettes with no country specific labelling decreased by 0.53 billion, they accounted for 72% of total inflows
• Seizures increased by 48% in 2015, which is reflective of the increased monitoring by Greek authorities(3)
• Outflows from Greece were mainly driven by the 26 million tourists visiting in 2015
Gre
ece
© 2016 KPMG LLP, a UK limited liability partnership, and a member firm of the KPMG network of independent member firms affiliated with KPMG International Cooperative, a Swiss entity.

67
Proj
ect
SU
N
Notes: (a) KPMG calculates the split between C&C and ND(L) by calculating the ND(L) volumes and subtracting from the total
by manufacturers; detail surrounding methodology changes is provided in the appendix
(2) KPMG analysis of manufacturers operating in Free Trade Zone
ND(L) by country of origin - 2009-2015(1)(a)(b)
C&C by country of origin - 2009-2015(1)(a)
0.0
0.1
0.2
0.3
0.4
0.5
0.6
0.7
2009 2010 2011 2012 2013 2014 2015
0.03
0.59
0.03 0.04 0.040.03
0.03
0.20
0.46
0.17
0.64
0.26
0.32
0.25 0.230.18
0.24
0.11
0.03
0.270.23
0.14
AlbaniaBulgaria Romania Turkey
Other
Volu
me
(bn
ciga
rett
es)
0.020.02
0.02 0.02 0.020.01
0.010.02
0.020.01
0.0
0.1
0.2
0.3
0.4
0.5
0.6
0.7
2009 2010 2011 2012 2013 2014 2015
0.16
0.46
0.11 0.080.04
0.11
0.46
0.10
0.64
0.26
0.32
0.250.23
0.18
0.24
0.12
0.14
0.12
0.030.11
0.11
0.17
KareilaMarlboro Davidoff Parliament
Kent Other
Volu
me
(bn
ciga
rett
es)
0.010.01
0.01
0.020.02
0.010.01
0.010.02
0.010.01
0.010.02
0.010.01
0.01
0.01
0.01
0.020.02
0
1
2
3
4
5
2009 2010 2011 2012 2013 2014 2015
0.280.22
0.47
1.13
0.39
0.32
2.50
0.57
2.71
0.64
0.97
1.83
2.70
3.12
3.94
4.434.13
0.57
0.40
1.29
1.01
1.00
0.75
2.65
0.74
0.41
0.60
2.38
0.06
0.030.02
UnspecifiedIWs with no country-specific labelling
Counterfeit Other
Volu
me
(bn
ciga
rett
es)
0
1
2
3
4
5
2013 2014 2015
0.72
0.68
0.26
3.944.43
4.13
1.942.17
0.65
0.57
0.250.36
0.38
1.65
0.33
0.37
0.49
0.330.30
0.410.03
0.03 0.13 0.130.02
0.15
0.17
Gold MountRoyal
GR President
RGDCooper
777 Counterfeit Other
Volu
me
(bn
ciga
rett
es)
ND(L) by brand - 2009-2015(1)(a)(b)
C&C by brand - 2013-2015(1)(a)
• Illicit White brand flows with no country specific labelling declined by 0.27 billion cigarettes, driven by declines in 777, Gold Mount and Royal brands
– Flows of Gold Mount and 777 originated from UAE based Free Trade Zones(2)
• The Cooper and GR C&C identified had no country specific labelling
• Counterfeit product increased from 0.03 to 0.41, consisting mainly of Assos and Marlboro with duty free labelling
Gre
ece
© 2016 KPMG LLP, a UK limited liability partnership, and a member firm of the KPMG network of independent member firms affiliated with KPMG International Cooperative, a Swiss entity.
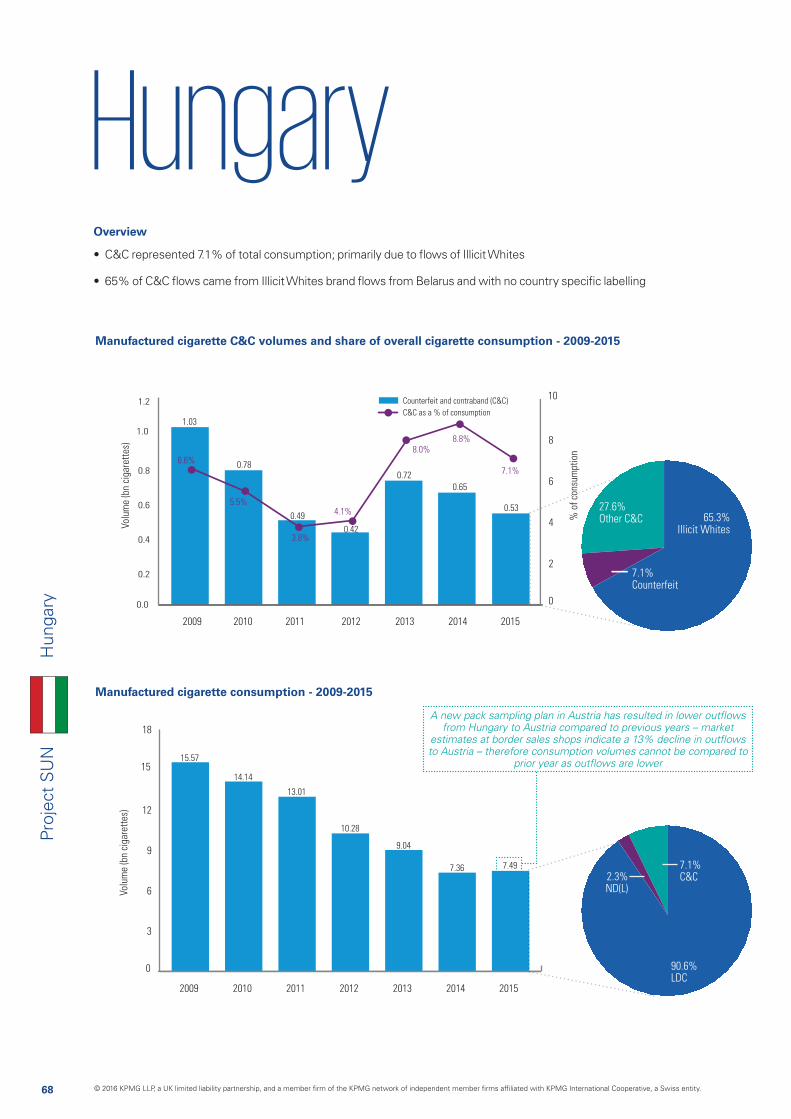
68
Proj
ect
SU
NH
unga
ry
Manufactured cigarette consumption - 2009-2015
Manufactured cigarette C&C volumes and share of overall cigarette consumption - 2009-2015
0.0
0.2
0.4
0.6
0.8
1.0
1.2
Volu
me
(bn
ciga
rett
es)
% o
f co
nsum
ptio
n
2009 2010 2011 2012 2013 2014 2015
Counterfeit and contraband (C&C)
C&C as a % of consumption
0
2
4
6
8
10
6.6%
5.5%
3.8%
4.1%
8.0%8.8%
7.1%
1.03
0.78
0.49
0.42
0.72
0.65
0.53
Volu
me
(bn
ciga
rett
es)
2009 2010 2011 2012 2013 2014 2015
15.57
14.14
13.01
10.28
9.04
7.497.36
0
3
6
9
12
15
18
co
2.3%ND(L)
7.1%C&C
90.6%LDC
7.1%Counterfeit
27.6%Other C&C 65.3%
Illicit Whites
Overview
• C&C represented 7.1% of total consumption; primarily due to flows of Illicit Whites
• 65% of C&C flows came from Illicit Whites brand flows from Belarus and with no country specific labelling
from Hungary to Austria compared to previous years – market
to Austria – therefore consumption volumes cannot be compared to
© 2016 KPMG LLP, a UK limited liability partnership, and a member firm of the KPMG network of independent member firms affiliated with KPMG International Cooperative, a Swiss entity.
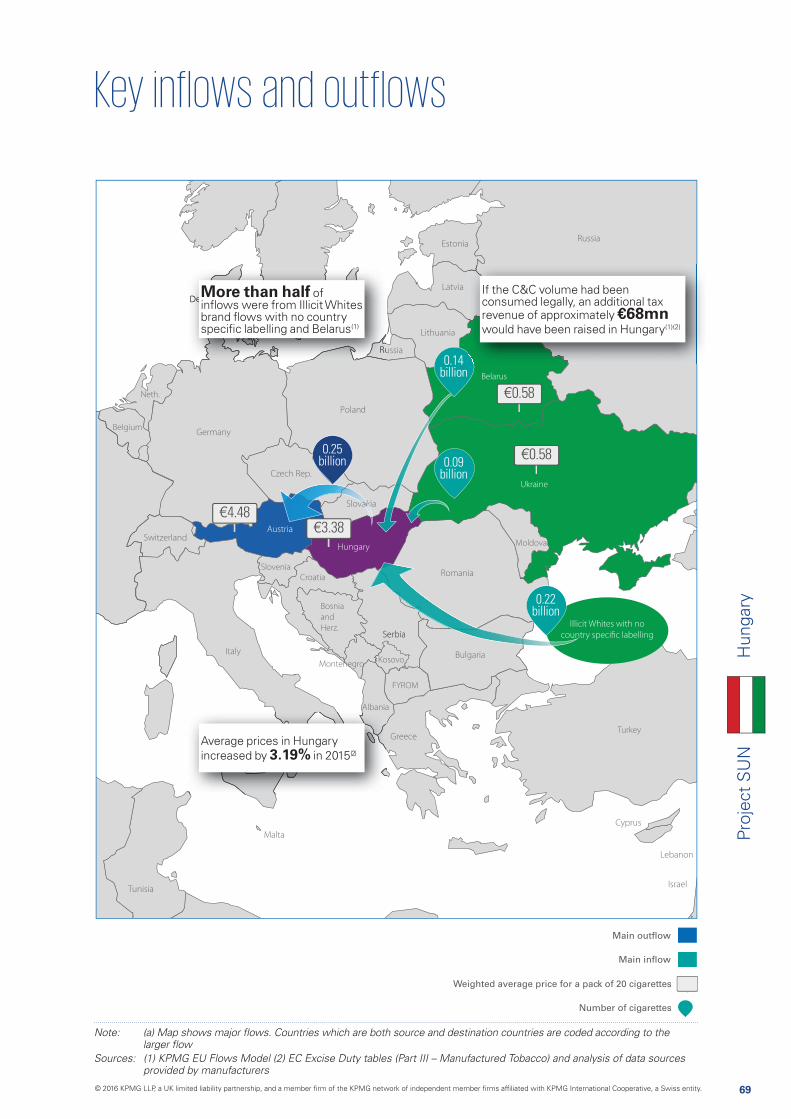
69
Proj
ect
SU
NH
unga
ry
Main outflow
Main inflow
Weighted average price for a pack of 20 cigarettes
Number of cigarettes
FYROM
Bosnia
and
Herz.
Croatia
Slovenia
Montenegro
Albania
Moldova
Turkey
Ukraine
Belgium
Neth.
Belarus
Kosovo
0.09 billion
0.22 billion
0.14 billion
0.25 billion
Sources: (1) KPMG EU Flows Model (2) EC Excise Duty tables (Part III – Manufactured Tobacco) and analysis of data sources provided by manufacturers
€3.38
€0.58
€0.58
€4.48
More than half of inflows were from Illicit Whites brand flows with no country specific labelling and Belarus(1)
Average prices in Hungary increased by 3.19% in 2015(2)
If the C&C volume had been consumed legally, an additional tax revenue of approximately €68mn would have been raised in Hungary(1)(2)
Illicit Whites with no
country specific labelling
© 2016 KPMG LLP, a UK limited liability partnership, and a member firm of the KPMG network of independent member firms affiliated with KPMG International Cooperative, a Swiss entity.

70
Proj
ect
SU
N
ND INFLOWS TO HUNGARY
Billion cigarettes 2009 2010 2011 2012 2013 2014 2015
IWs with no country-specific labelling 0.04 0.02 0.00 0.01 0.15 0.23 0.22
Belarus 0.00 0.00 0.00 0.07 0.35 0.31 0.14
Ukraine 0.81 0.46 0.25 0.13 0.07 0.04 0.09
Duty Free labelled 0.11 0.01 0.01 0.02 0.02 0.03 0.03
Austria 0.00 0.00 0.00 0.01 0.02 0.02 0.02
Other 0.25 0.33 0.30 0.23 0.20 0.13 0.20
Total inflows 1.21 0.83 0.57 0.48 0.80 0.76 0.70
Total manufactured cigarette consumption – 2009-2015(1)(2)(a)
Total inflows by country of origin - 2009-2015(1)(b)(c)
TOTAL HUNGARY CONSUMPTION
Billion cigarettes 2009 2010 2011 2012 2013 2014 2015 2014-15 %
Legal domestic sales (LDS) 15.30 14.18 13.94 11.21 9.36 7.47 7.34 (2%)
Outflows -0.93 -0.87 -1.50 -1.41 -1.13 -0.87 -0.56 n/a
Legal domestic consumption (LDC) 14.36 13.31 12.44 9.80 8.24 6.60 6.78 3%
Non-domestic legal (ND(L)) 0.18 0.05 0.08 0.06 0.08 0.11 0.17 51%
Counterfeit and contraband (C&C) 1.03 0.78 0.49 0.42 0.72 0.65 0.53 (18%)
Total non-domestic 1.21 0.83 0.57 0.48 0.80 0.76 0.71 (8%)
Total consumption 15.57 14.14 13.01 10.28 9.04 7.36 7.49 n/a
Total outflows by destination country – 2009-2015(1)
OUTFLOWS FROM HUNGARY
Billion cigarettes 2009 2010 2011 2012 2013 2014 2015
Austria 0.48 0.48 0.99 0.99 0.71 0.56 0.25
Germany 0.16 0.17 0.21 0.20 0.22 0.11 0.12
UK 0.10 0.02 0.09 0.12 0.03 0.08 0.08
Other 0.19 0.20 0.21 0.10 0.16 0.12 0.11
Total outflows 0.93 0.87 1.50 1.41 1.13 0.87 0.56
Notes: (a) In years 2012-2015 non-domestic incidence is stated on a sticks basis; prior to this a packs basis was used (b) Illicit
Sources: (1) KPMG EU Flows Model and analysis of data sources provided by manufacturers (2) KPMG analysis of UNWTO Factbook 2009-2014
• Consumption of manufactured cigarettes stabilised after a decline of 15% (CAGR) between 2009 and 2015
• Over 50% of inflows came from Belarus and brands with no country specific labelling
• Inflows may have reduced further given the border closures during the migrant crisis towards the end of 2015(b)
• An 18% decline in C&C was partially offset by a 51% increase in ND(L) flows
from Hungary to Austria compared to previous years – market
Austria – therefore it cannot be compared to prior year
Hun
gary
© 2016 KPMG LLP, a UK limited liability partnership, and a member firm of the KPMG network of independent member firms affiliated with KPMG International Cooperative, a Swiss entity.

71
Proj
ect
SU
N
Notes: (a) KPMG calculates the split between C&C and ND(L) by calculating the ND(L) volumes and subtracting from the total
ND(L) by country of origin - 2009-2015(1)(a)(b)
C&C by country of origin - 2009-2015(1)(a)(c)
0.00
0.05
0.10
0.15
0.20
2009 2010 2011 2012 2013 2014 2015
0.04
0.04
0.01
0.04
0.13
0.09
0.010.01
0.03
0.02
0.01
0.04
0.18
0.05
0.08
0.06
0.08
0.11
0.17
0.07
0.010.01
0.020.01
0.03
0.010.01
0.03
0.02
0.02
0.02
0.11
0.13
RomaniaAustria Slovakia Other
Volu
me
(bn
ciga
rett
es)
0.00
0.05
0.10
0.15
0.20
2009 2010 2011 2012 2013 2014 2015
0.05
0.04
0.01
0.13
0.12
0.02
0.03
0.02
0.01
0.05
0.18
0.05
0.08
0.06
0.08
0.11
0.17
0.06
0.010.01
0.040.02
0.01
0.01
0.03
0.01
0.010.01
0.04
0.01
0.09
0.13
L&MMarlboro Winston Camel
Pall Mall Other
Volu
me
(bn
ciga
rett
es)
0.0
0.2
0.4
0.6
0.8
1.0
1.2
2009 2010 2011 2012 2013 2014 2015
0.80
0.060.12
0.19
0.052.97
0.07
0.13
0.14
0.070.35
1.03
0.78
0.490.42
0.720.65
0.53
0.14
0.10
0.15
0.06
0.060.07
0.25
0.46
0.05
0.31
0.23 0.22
0.08
0.14
0.01
0.020.03
0.02
0.03
0.040.02
0.04
0.04
0.01
0.040.03
Unspecified CounterfeitIWs with no country-specific labelling Belarus
Other
Ukraine
Serbia
Volu
me
(bn
ciga
rett
es)
0.0
0.1
0.2
0.3
0.4
0.5
0.6
0.7
0.8
2013 2014 2015
0.31
0.72
0.65
0.53
0.030.03
0.030.05
0.26
0.26
0.10
0.08
0.040.04
0.11
0.14
0.04
0.12
0.12
0.050.040.03
0.020.01
Counterfeit
Fest
Other NZ
Compliment Lifa Marlboro
Volu
me
(bn
ciga
rett
es)
ND(L) by brand - 2009-2015(1)(a)(b)
C&C by brand - 2013-2015(1)(a)
• ND(L) is reflective of increasing travel flows between neighbouring EU countries
• Over 40% of C&C identified had no country specific labelling and therefore was not produced for legal distribution
• The largest C&C brand, Fest, had Belarusian labelling and Compliment had Duty Free labelling without any legal distribution channels in Hungary
Hun
gary
© 2016 KPMG LLP, a UK limited liability partnership, and a member firm of the KPMG network of independent member firms affiliated with KPMG International Cooperative, a Swiss entity.
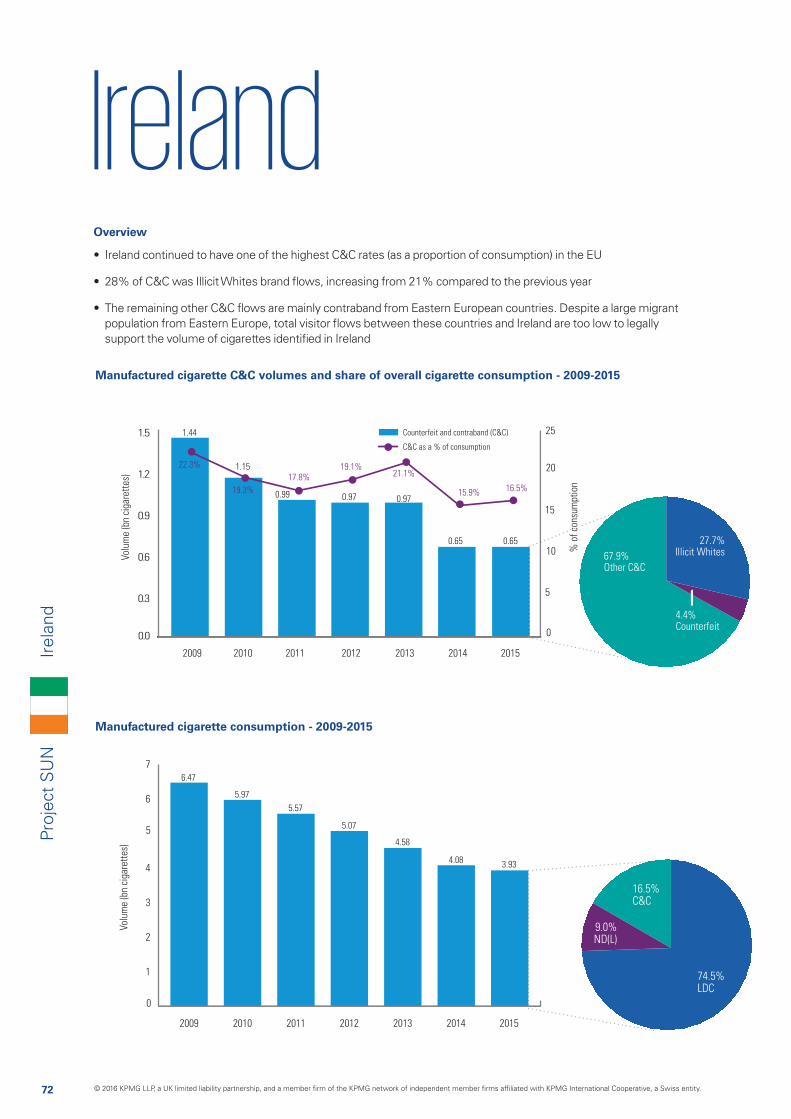
72
Proj
ect
SU
NIr
elan
d
Manufactured cigarette consumption - 2009-2015
Manufactured cigarette C&C volumes and share of overall cigarette consumption - 2009-2015
0.0
0.3
0.6
0.9
1.2
1.5
Volu
me
(bn
ciga
rett
es)
% o
f co
nsum
ptio
n
Counterfeit and contraband (C&C)
C&C as a % of consumption
2009 2010 2011 2012 2013 2014 2015
0
5
10
15
20
25
22.3%
19.3%
17.8%19.1%
21.1%
15.9% 16.5%
1.44
1.15
0.99 0.97 0.97
0.65 0.65
Volu
me
(bn
ciga
rett
es)
2009 2010 2011 2012 2013 2014 2015
6.47
5.97
5.57
5.07
4.58
3.934.08
0
1
2
3
4
5
6
7
co
4.4%Counterfeit
67.9%Other C&C
27.7%Illicit Whites
9.0%ND(L)
16.5%C&C
74.5%LDC
Overview
• Ireland continued to have one of the highest C&C rates (as a proportion of consumption) in the EU
• 28% of C&C was Illicit Whites brand flows, increasing from 21% compared to the previous year
• The remaining other C&C flows are mainly contraband from Eastern European countries. Despite a large migrant population from Eastern Europe, total visitor flows between these countries and Ireland are too low to legally support the volume of cigarettes identified in Ireland
© 2016 KPMG LLP, a UK limited liability partnership, and a member firm of the KPMG network of independent member firms affiliated with KPMG International Cooperative, a Swiss entity.
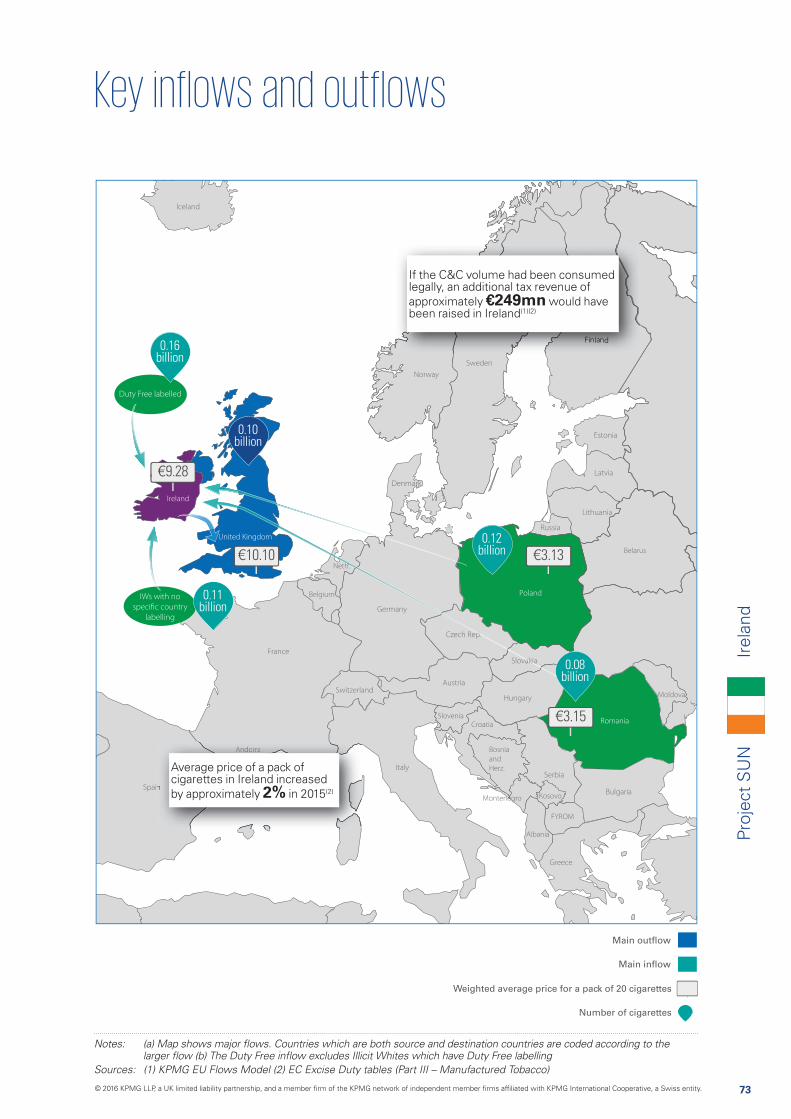
73
Proj
ect
SU
NIr
elan
d
Main outflow
Main inflow
Weighted average price for a pack of 20 cigarettes
Number of cigarettes
Croatia
Bosnia
and
Herz.
Andorra
Montenegro
FYROM
Albania
Neth.
Belgium
Moldova
Belarus
Kosovo
Slovenia
hh
0.16 billion
0.11 billion
0.10 billion
Sources: (1) KPMG EU Flows Model (2) EC Excise Duty tables (Part III – Manufactured Tobacco)
€9.28
€10.10 €3.13
€3.15
0.12 billion
0.08 billion
If the C&C volume had been consumed legally, an additional tax revenue of approximately €249mn would have been raised in Ireland(1)(2)
A dAndoAndoAndoAndorrarrarrarra
Average price of a pack of cigarettes in Ireland increased by approximately 2% in 2015(2)
Duty Free labelled
IWs with no
specific country
labelling
© 2016 KPMG LLP, a UK limited liability partnership, and a member firm of the KPMG network of independent member firms affiliated with KPMG International Cooperative, a Swiss entity.
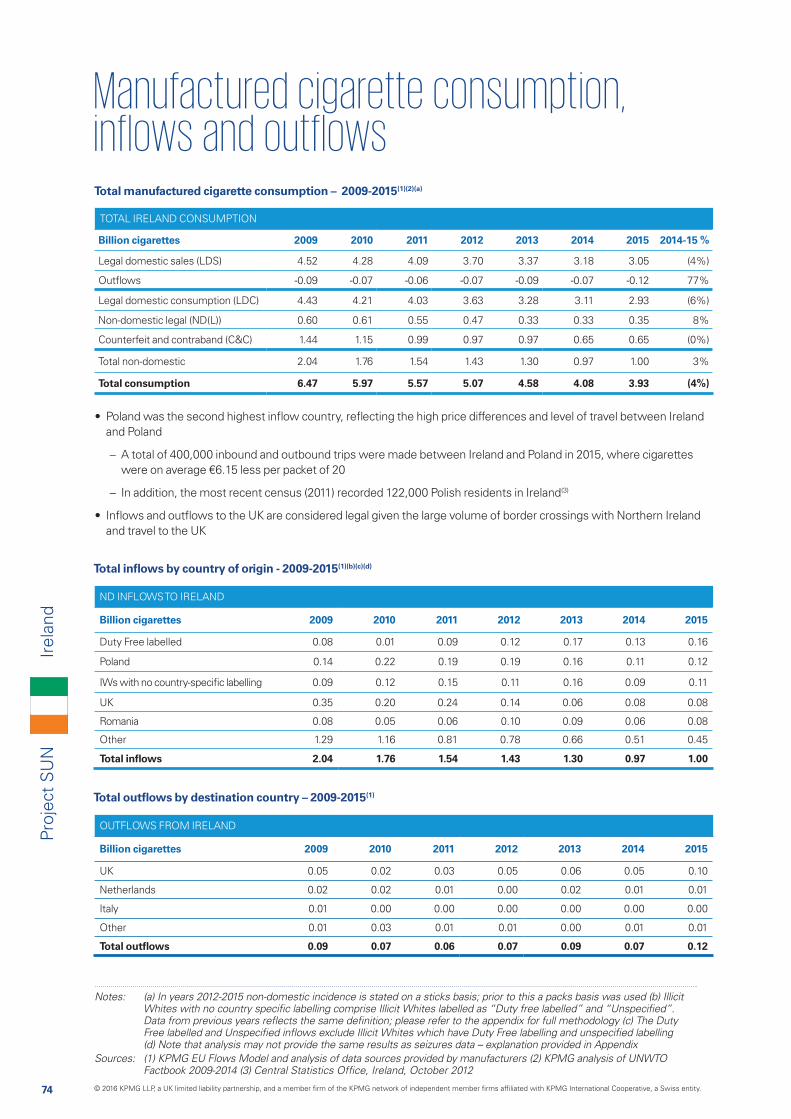
74
Proj
ect
SU
N
ND INFLOWS TO IRELAND
Billion cigarettes 2009 2010 2011 2012 2013 2014 2015
Duty Free labelled 0.08 0.01 0.09 0.12 0.17 0.13 0.16
Poland 0.14 0.22 0.19 0.19 0.16 0.11 0.12
IWs with no country-specific labelling 0.09 0.12 0.15 0.11 0.16 0.09 0.11
UK 0.35 0.20 0.24 0.14 0.06 0.08 0.08
Romania 0.08 0.05 0.06 0.10 0.09 0.06 0.08
Other 1.29 1.16 0.81 0.78 0.66 0.51 0.45
Total inflows 2.04 1.76 1.54 1.43 1.30 0.97 1.00
Total manufactured cigarette consumption – 2009-2015(1)(2)(a)
Total inflows by country of origin - 2009-2015(1)(b)(c)(d)
TOTAL IRELAND CONSUMPTION
Billion cigarettes 2009 2010 2011 2012 2013 2014 2015 2014-15 %
Legal domestic sales (LDS) 4.52 4.28 4.09 3.70 3.37 3.18 3.05 (4%)
Outflows -0.09 -0.07 -0.06 -0.07 -0.09 -0.07 -0.12 77%
Legal domestic consumption (LDC) 4.43 4.21 4.03 3.63 3.28 3.11 2.93 (6%)
Non-domestic legal (ND(L)) 0.60 0.61 0.55 0.47 0.33 0.33 0.35 8%
Counterfeit and contraband (C&C) 1.44 1.15 0.99 0.97 0.97 0.65 0.65 (0%)
Total non-domestic 2.04 1.76 1.54 1.43 1.30 0.97 1.00 3%
Total consumption 6.47 5.97 5.57 5.07 4.58 4.08 3.93 (4%)
Total outflows by destination country – 2009-2015(1)
OUTFLOWS FROM IRELAND
Billion cigarettes 2009 2010 2011 2012 2013 2014 2015
UK 0.05 0.02 0.03 0.05 0.06 0.05 0.10
Netherlands 0.02 0.02 0.01 0.00 0.02 0.01 0.01
Italy 0.01 0.00 0.00 0.00 0.00 0.00 0.00
Other 0.01 0.03 0.01 0.01 0.00 0.01 0.01
Total outflows 0.09 0.07 0.06 0.07 0.09 0.07 0.12
Notes: (a) In years 2012-2015 non-domestic incidence is stated on a sticks basis; prior to this a packs basis was used (b) Illicit
(d) Note that analysis may not provide the same results as seizures data – explanation provided in AppendixSources: (1) KPMG EU Flows Model and analysis of data sources provided by manufacturers (2) KPMG analysis of UNWTO
• Poland was the second highest inflow country, reflecting the high price differences and level of travel between Ireland and Poland
– A total of 400,000 inbound and outbound trips were made between Ireland and Poland in 2015, where cigarettes were on average €6.15 less per packet of 20
– In addition, the most recent census (2011) recorded 122,000 Polish residents in Ireland(3)
• Inflows and outflows to the UK are considered legal given the large volume of border crossings with Northern Ireland and travel to the UK
Irel
and
© 2016 KPMG LLP, a UK limited liability partnership, and a member firm of the KPMG network of independent member firms affiliated with KPMG International Cooperative, a Swiss entity.
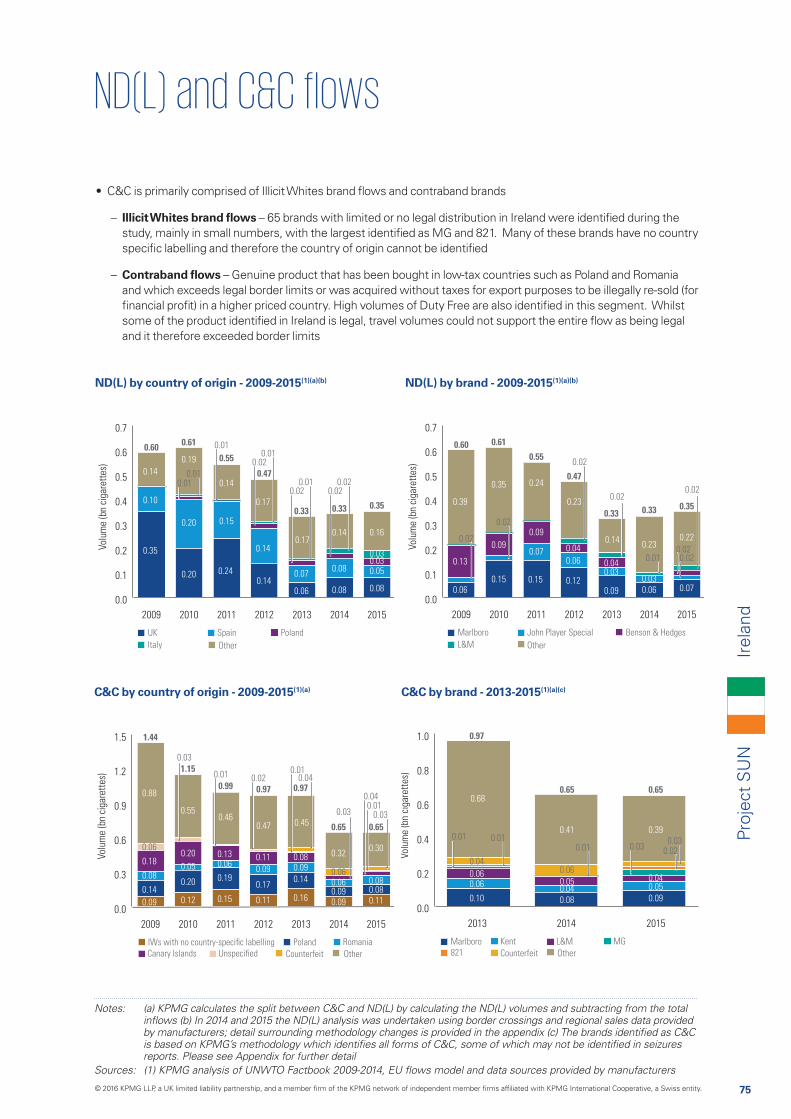
75
Proj
ect
SU
N
Notes: (a) KPMG calculates the split between C&C and ND(L) by calculating the ND(L) volumes and subtracting from the total
reports. Please see Appendix for further detail
ND(L) by country of origin - 2009-2015(1)(a)(b)
C&C by country of origin - 2009-2015(1)(a)
0.0
0.1
0.2
0.3
0.4
0.5
0.6
0.7
2009 2010 2011 2012 2013 2014 2015
0.14
0.35
0.20
0.10
0.14
0.19
0.140.06
0.60 0.61
0.55
0.47
0.33 0.33 0.35
0.15
0.17
0.07
0.14
0.240.20
0.08
0.08
0.08
0.050.030.03
0.16
0.17
0.14
0.010.01
0.020.02
0.020.01
0.020.01
0.01
Spain PolandUK
Italy Other
Volu
me
(bn
ciga
rett
es)
0.0
0.1
0.2
0.3
0.4
0.5
0.6
0.7
2009 2010 2011 2012 2013 2014 2015
0.24
0.06
0.09
0.13
0.39
0.35
0.120.09
0.60 0.61
0.55
0.47
0.33 0.33 0.35
0.07
0.090.14
0.030.04
0.23
0.150.150.060.03
0.07
0.22
0.23
0.04
0.06
0.02
0.02
0.01 0.020.02
0.020.02
0.02
John Player Special Benson & HedgesMarlboro
L&M Other
Volu
me
(bn
ciga
rett
es)
0.0
0.3
0.6
0.9
1.2
1.5
2009 2010 2011 2012 2013 2014 2015
0.09
0.14
0.08
0.18
0.06
0.88
0.55
0.11
0.17
0.09
0.11
0.12
0.20
0.05
0.20
0.16
0.14
0.090.08
1.44
1.15
0.99 0.97 0.97
0.65 0.650.46
0.45
0.15
0.19
0.060.13
0.060.06
0.32
0.090.09
0.110.080.08
0.30
0.47
0.02
0.03
0.01
0.03
0.040.01
0.03
0.010.04
Romania
Counterfeit
IWs with no country-specific labelling Poland
Canary Islands Other Unspecified
Volu
me
(bn
ciga
rett
es)
0.0
0.2
0.4
0.6
0.8
1.0
2013 2014 2015
0.10
0.060.06
0.04
0.97
0.65 0.650.68
0.06
0.05
0.41
0.080.04
0.09
0.050.04
0.39
0.01 0.030.03
0.02
0.01 0.01
Kent
Counterfeit
Marlboro821
L&M
Other
MG
Volu
me
(bn
ciga
rett
es)
ND(L) by brand - 2009-2015(1)(a)(b)
C&C by brand - 2013-2015(1)(a)(c)
• C&C is primarily comprised of Illicit Whites brand flows and contraband brands
– Illicit Whites brand flows – 65 brands with limited or no legal distribution in Ireland were identified during the study, mainly in small numbers, with the largest identified as MG and 821. Many of these brands have no country specific labelling and therefore the country of origin cannot be identified
– Contraband flows – Genuine product that has been bought in low-tax countries such as Poland and Romania and which exceeds legal border limits or was acquired without taxes for export purposes to be illegally re-sold (for financial profit) in a higher priced country. High volumes of Duty Free are also identified in this segment. Whilst some of the product identified in Ireland is legal, travel volumes could not support the entire flow as being legal and it therefore exceeded border limits
Irel
and
© 2016 KPMG LLP, a UK limited liability partnership, and a member firm of the KPMG network of independent member firms affiliated with KPMG International Cooperative, a Swiss entity.

76
Proj
ect
SU
N
ItalyIt
aly
Manufactured cigarette consumption - 2009-2015
Manufactured cigarette C&C volumes and share of overall cigarette consumption - 2009-2015
0
1
2
3
4
5
6
7
8
Volu
me
(bn
ciga
rett
es)
% o
f co
nsum
ptio
n
Counterfeit and contraband (C&C)
C&C as a % of consumption
2009 2010 2011 2012 2013 2014 2015
0
2
4
6
8
10
3.3%
5.0%5.3%
8.5%
4.7%
5.6% 5.8%
3.04
4.554.81
7.29
3.68
4.424.60
Volu
me
(bn
ciga
rett
es)
2009 2010 2011 2012 2013 2014 2015
92.74 91.76 90.3985.94
77.77 78.6078.76
0
20
40
60
80
100
s
16.5%Counterfeit
33.6%Other C&C
49.9%Illicit Whites
1.5%ND(L)
5.8%C&C
92.7%LDC
Overview
• C&C remained stable at 5.8% of total consumption in 2015
• Illicit Whites brand flows decreased by 9%, but still accounted for the largest proportion of non-domestic consumption, representing 2.3 billion cigarettes
• The decline in Illicit Whites brand flows was offset by a doubling of counterfeit product, demonstrating the flexibility of illicit cigarette flows
• Although overall consumption remained stable, ND(L) grew by 17% as more tourists visited Italy in 2015
© 2016 KPMG LLP, a UK limited liability partnership, and a member firm of the KPMG network of independent member firms affiliated with KPMG International Cooperative, a Swiss entity.
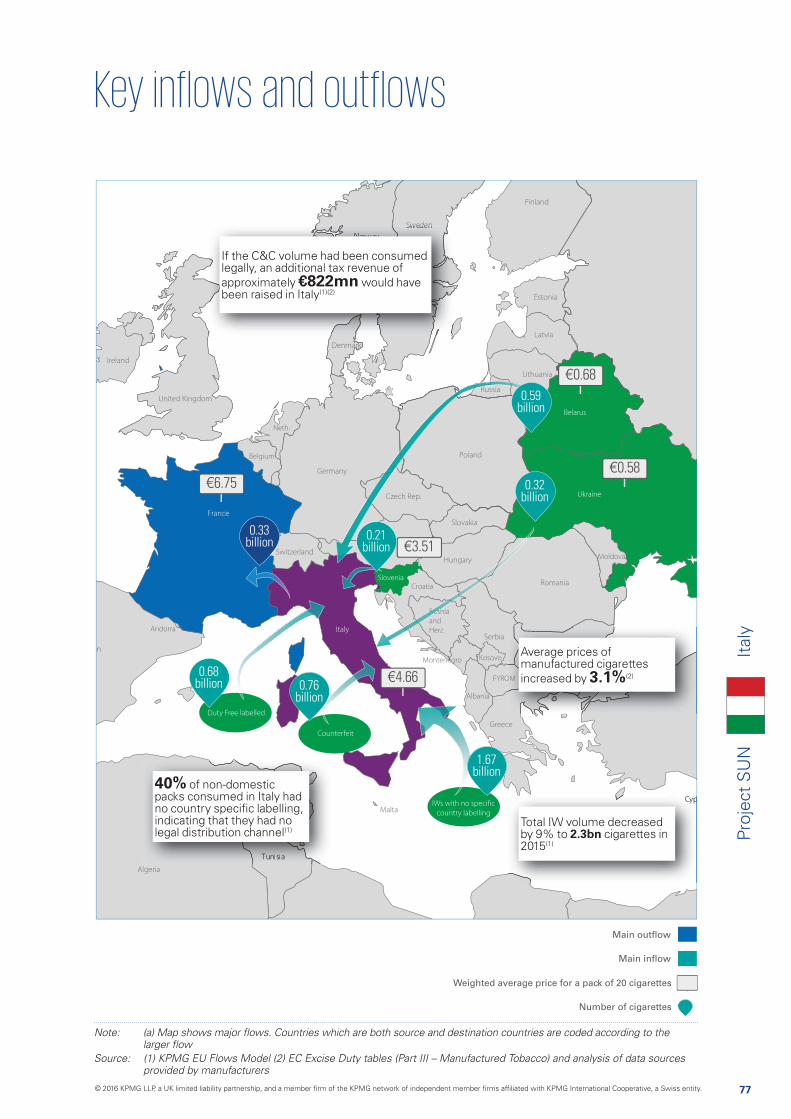
77
Proj
ect
SU
NIt
aly
Main outflow
Main inflow
Weighted average price for a pack of 20 cigarettes
Number of cigarettes
Croatia
Bosnia
and
Herz.Andorra
Ukraine
Montenegro
FYROM
Albania
Neth.
Belgium
Moldova
Belarus
Kosovo
Slovenia
BosnBosn
0.32 billion
0.68 billion 0.76
billion
0.33 billion
Source: (1) KPMG EU Flows Model (2) EC Excise Duty tables (Part III – Manufactured Tobacco) and analysis of data sources provided by manufacturers
€6.75
€4.66
€3.51
€0.68
€0.58
0.59 billion
1.67 billion
0.21 billion
If the C&C volume had been consumed legally, an additional tax revenue of approximately €822mn would have been raised in Italy(1)(2)
OOMM
Average prices of manufactured cigarettes increased by 3.1%(2)
Total IW volume decreased by 9% to 2.3bn cigarettes in 2015(1)
40% of non-domestic packs consumed in Italy had no country specific labelling, indicating that they had no legal distribution channel(1)
Duty Free labelled
Counterfeit
IWs with no specific
country labelling
© 2016 KPMG LLP, a UK limited liability partnership, and a member firm of the KPMG network of independent member firms affiliated with KPMG International Cooperative, a Swiss entity.
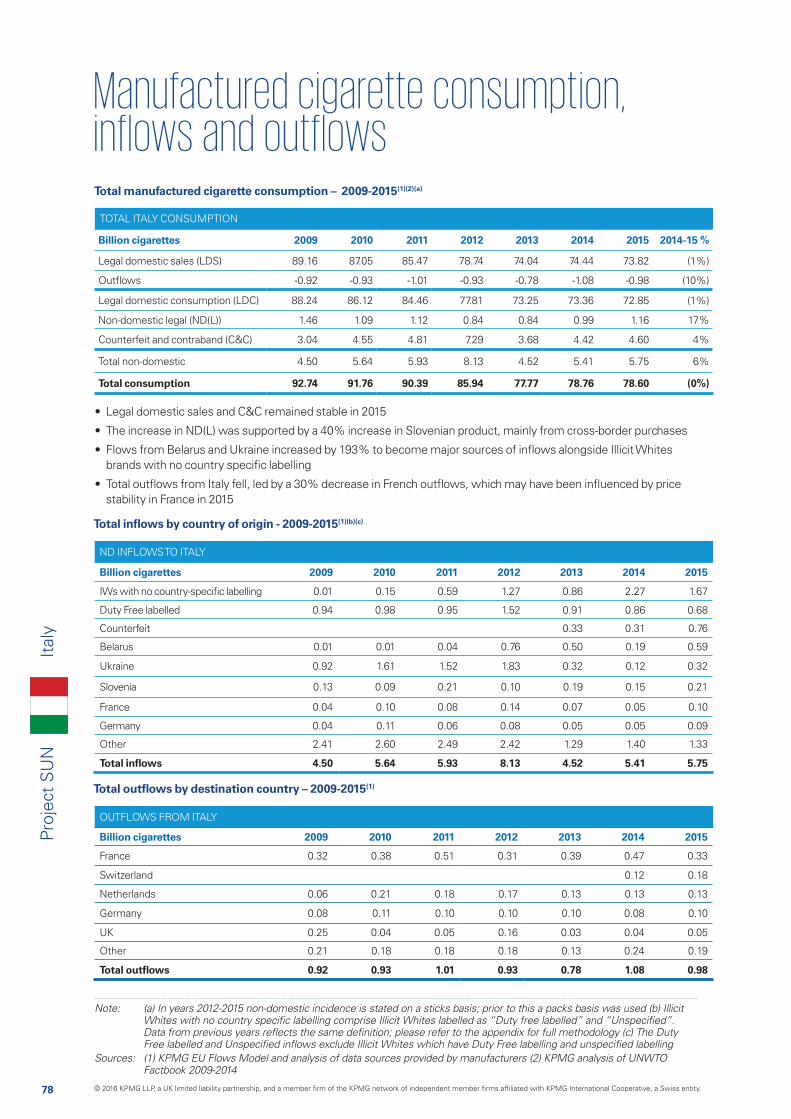
78
Proj
ect
SU
N
ND INFLOWS TO ITALY
Billion cigarettes 2009 2010 2011 2012 2013 2014 2015
IWs with no country-specific labelling 0.01 0.15 0.59 1.27 0.86 2.27 1.67
Duty Free labelled 0.94 0.98 0.95 1.52 0.91 0.86 0.68
Counterfeit 0.33 0.31 0.76
Belarus 0.01 0.01 0.04 0.76 0.50 0.19 0.59
Ukraine 0.92 1.61 1.52 1.83 0.32 0.12 0.32
Slovenia 0.13 0.09 0.21 0.10 0.19 0.15 0.21
France 0.04 0.10 0.08 0.14 0.07 0.05 0.10
Germany 0.04 0.11 0.06 0.08 0.05 0.05 0.09
Other 2.41 2.60 2.49 2.42 1.29 1.40 1.33
Total inflows 4.50 5.64 5.93 8.13 4.52 5.41 5.75
Total manufactured cigarette consumption – 2009-2015(1)(2)(a)
Total inflows by country of origin - 2009-2015(1)(b)(c)
TOTAL ITALY CONSUMPTION
Billion cigarettes 2009 2010 2011 2012 2013 2014 2015 2014-15 %
Legal domestic sales (LDS) 89.16 87.05 85.47 78.74 74.04 74.44 73.82 (1%)
Outflows -0.92 -0.93 -1.01 -0.93 -0.78 -1.08 -0.98 (10%)
Legal domestic consumption (LDC) 88.24 86.12 84.46 77.81 73.25 73.36 72.85 (1%)
Non-domestic legal (ND(L)) 1.46 1.09 1.12 0.84 0.84 0.99 1.16 17%
Counterfeit and contraband (C&C) 3.04 4.55 4.81 7.29 3.68 4.42 4.60 4%
Total non-domestic 4.50 5.64 5.93 8.13 4.52 5.41 5.75 6%
Total consumption 92.74 91.76 90.39 85.94 77.77 78.76 78.60 (0%)
Total outflows by destination country – 2009-2015(1)
OUTFLOWS FROM ITALY
Billion cigarettes 2009 2010 2011 2012 2013 2014 2015
France 0.32 0.38 0.51 0.31 0.39 0.47 0.33
Switzerland 0.12 0.18
Netherlands 0.06 0.21 0.18 0.17 0.13 0.13 0.13
Germany 0.08 0.11 0.10 0.10 0.10 0.08 0.10
UK 0.25 0.04 0.05 0.16 0.03 0.04 0.05
Other 0.21 0.18 0.18 0.18 0.13 0.24 0.19
Total outflows 0.92 0.93 1.01 0.93 0.78 1.08 0.98
Note: (a) In years 2012-2015 non-domestic incidence is stated on a sticks basis; prior to this a packs basis was used (b) Illicit
Sources: (1) KPMG EU Flows Model and analysis of data sources provided by manufacturers (2) KPMG analysis of UNWTO Factbook 2009-2014
• Legal domestic sales and C&C remained stable in 2015
• The increase in ND(L) was supported by a 40% increase in Slovenian product, mainly from cross-border purchases
• Flows from Belarus and Ukraine increased by 193% to become major sources of inflows alongside Illicit Whites brands with no country specific labelling
• Total outflows from Italy fell, led by a 30% decrease in French outflows, which may have been influenced by price stability in France in 2015
Ital
y
© 2016 KPMG LLP, a UK limited liability partnership, and a member firm of the KPMG network of independent member firms affiliated with KPMG International Cooperative, a Swiss entity.

79
Proj
ect
SU
N
Notes: (a) KPMG calculates the split between C&C and ND(L) by calculating the ND(L) volumes and subtracting from the total
by manufacturers; detail surrounding methodology changes is provided in the appendix
ND(L) by country of origin - 2009-2015(1)(a)(b)
C&C by country of origin - 2009-2015(1)(a)
0.0
0.2
0.4
0.6
0.8
1.0
1.2
1.4
1.6
2009 2010 2011 2012 2013 2014 2015
0.200.11
0.14
0.73
1.12
0.14
0.080.13
0.19
1.46
1.09 1.12
0.84 0.84
0.99
1.16
0.90 0.47
0.07
0.06
0.65
0.080.060.06
0.10 0.15
0.08
0.21
0.100.090.09
0.68
0.47
0.050.050.05
0.020.020.04
0.06
0.040.01
France GermanySlovenia
Spain Other
Volu
me
(bn
ciga
rett
es)
0.0
0.2
0.4
0.6
0.8
1.0
1.2
1.4
1.6
2009 2010 2011 2012 2013 2014 2015
0.70
0.40
0.13
0.45
0.06
0.19
0.48
0.09
0.27
1.46
1.09 1.12
0.84 0.84
0.99
1.16
0.32
0.40
0.09
0.48
0.59
0.16
0.51 0.33
0.06
0.30
0.090.080.060.05
0.58
0.180.05
0.04
0.02
0.020.04
0.030.010.03
0.02
0.01
0.03
0.010.020.05
0.030.03
Camel WinstonMarlboro
Chesterfield Pall Mall Other
Volu
me
(bn
ciga
rett
es)
0
1
2
3
4
5
6
7
8
2009 2010 2011 2012 2013 2014 2015
0.92
2.11
1.29
0.76
1.83
1.61
2.78
0.86
0.310.50
0.33
1.493.04
4.55 4.81
7.29
3.68
4.42 4.60
2.67
0.59
1.51
0.31
1.49
2.31 1.67
0.590.32
0.76
1.26
3.41
0.04
0.010.01
0.19
0.12
0.15
0.01
Ukraine
Counterfeit
IWs with no country-specific labelling Belarus
Other
Volu
me
(bn
ciga
rett
es)
0
1
2
3
4
5
2013 2014 2015
0.66
0.38
0.33
2.14
3.68
4.424.60
0.42
0.31
2.77
0.66 0.61
0.310.220.200.22
0.76
2.28
0.04
0.030.10
0.060.18
0.02
Minsk
Counterfeit
Marlboro NZYesmoke
Other Winston
Volu
me
(bn
ciga
rett
es)
ND(L) by brand - 2009-2015(1)(a)(b)
C&C by brand - 2013-2015(1)(a)
• ND(L) reflects travel flows in 2015 along with cross-border purchases from Slovenia
– Flows from France and Germany are both considered 100% ND(L) due to higher prices compared with Italy. Average French prices were €6.75 while German prices were €5.34 per pack in 2015
• Despite remaining stable, the composition of C&C changed in 2015, as brands from Belarus and Ukraine replaced Illicit Whites brand flows with no country specific labelling
– Incidence of flows of Yesmoke dropped by 80% between the first and fourth quarters of 2015, while 821 was not identified after Q1.
– Flows of Belarusian Minsk and NZ increased from 0.08 billion cigarettes in 2014 to 0.51 billion cigarettes in 2015
• Counterfeit flows more than doubled from 0.31 to 0.76 billion cigarettes to account for 16.5% of C&C in 2015
– 65% of counterfeit identified was Marlboro, primarily with Russian labelling
– The remaining counterfeit brands included Bond Street with Ukrainian labelling and L&M and Winston with Moldovan labelling
Ital
y
© 2016 KPMG LLP, a UK limited liability partnership, and a member firm of the KPMG network of independent member firms affiliated with KPMG International Cooperative, a Swiss entity.
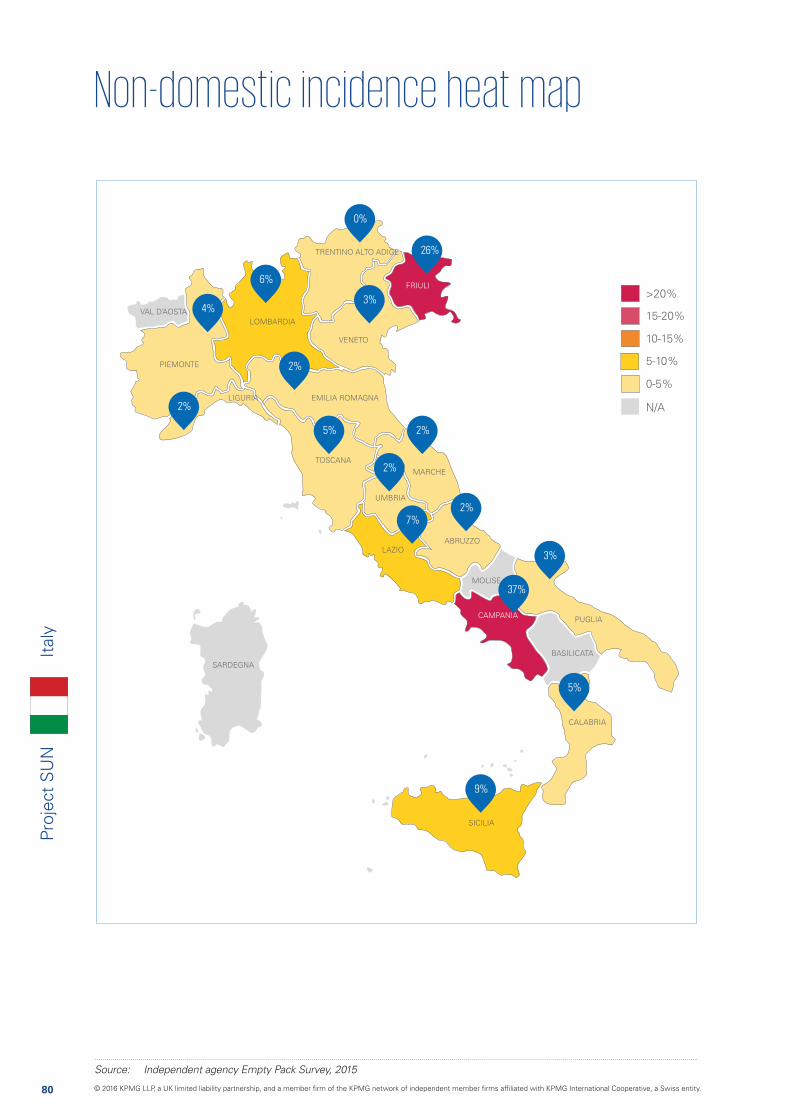
80
Proj
ect
SU
N
EMILIA ROMAGNA
VENETO
LIGURIA
VAL D’AOSTA
FRIULI
UMBRIA
MOLISE
LAZIO
CAMPANIA
BASILICATA
CALABRIA
SICILIA
SARDEGNA
PUGLIA
ABRUZZO
MARCHETOSCANA
PIEMONTE
LOMBARDIA
TRENTINO ALTO ADIGE
N/A
0-5%
5-10%
10-15%
15-20%
>20%
26%
0%
3%
6%
4%
2%
2%
5% 2%
3%
2%
7%
5%
9%
2%
37%
Ital
y
Source: Independent agency Empty Pack Survey, 2015
© 2016 KPMG LLP, a UK limited liability partnership, and a member firm of the KPMG network of independent member firms affiliated with KPMG International Cooperative, a Swiss entity.
81
Proj
ect
SU
NIt
aly
© 2016 KPMG LLP, a UK limited liability partnership, and a member firm of the KPMG network of independent member firms affiliated with KPMG International Cooperative, a Swiss entity.

82
Proj
ect
SU
N
LatviaLa
tvia
Manufactured cigarette consumption - 2009-2015
Manufactured cigarette C&C volumes and share of overall cigarette consumption - 2009-2015
0.0
0.2
0.4
0.6
0.8
1.0
1.2
Volu
me
(bn
ciga
rett
es)
% o
f co
nsum
ptio
n
Counterfeit and contraband (C&C)
C&C as a % of consumption
2009 2010 2011 2012 2013 2014 2015
0
10
20
30
40
25.8%
37.0%
31.6%
30.7%
28.8% 29.3%
26.7%
0.75
1.02
0.83
0.730.68
0.75
0.67
Volu
me
(bn
ciga
rett
es)
2009 2010 2011 2012 2013 2014 2015
2.92
2.752.63
2.38 2.36
2.522.56
0.0
0.5
1.0
1.5
2.0
2.5
3.0
s
9.6%Counterfeit
23.2%Other C&C
67.2%Illicit Whites
0.8%ND(L)
26.7%C&C
72.5%LDC
Overview
• C&C declined by 2.6 percentage points due to reduced flows from Russia but, as a percentage of total consumption, it remained the highest in Europe
• Total consumption declined by only 1.6% as an increase in legal domestic consumption partly offset the reduced C&C flows
• Almost 90% of C&C flows were from Russia and Belarus, with approximately two thirds being Illicit Whites brand flows from Belarus
© 2016 KPMG LLP, a UK limited liability partnership, and a member firm of the KPMG network of independent member firms affiliated with KPMG International Cooperative, a Swiss entity.
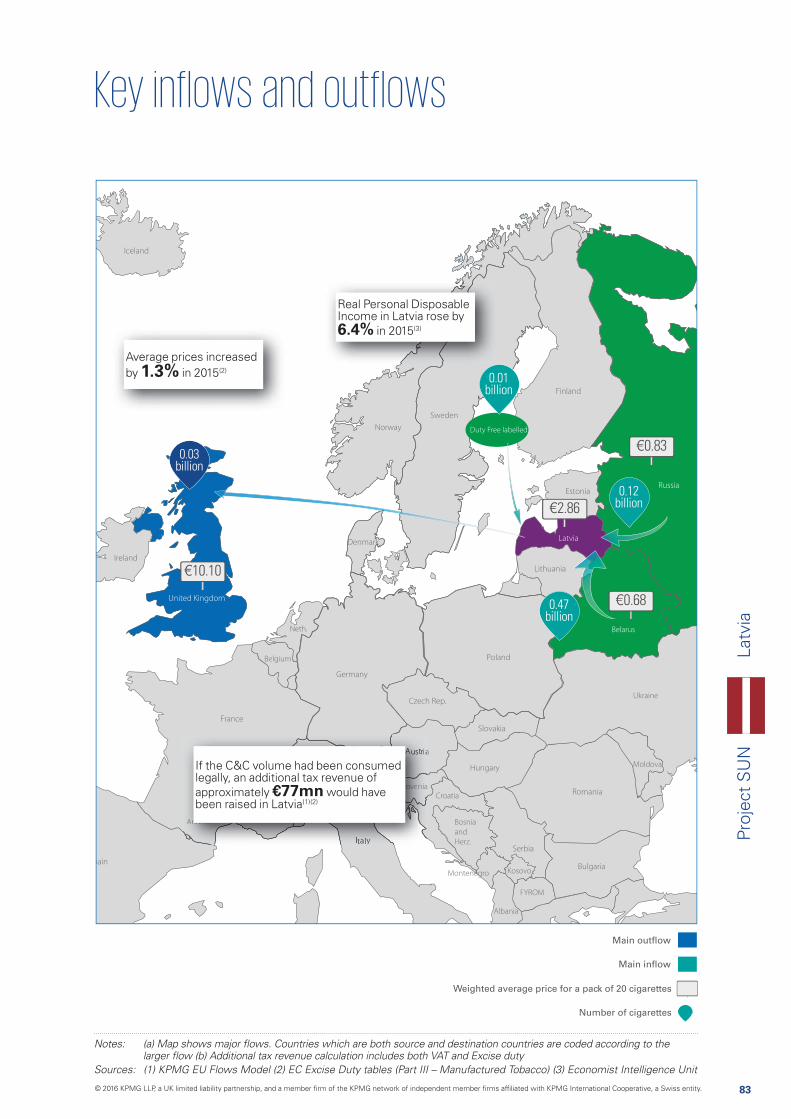
83
Proj
ect
SU
NLa
tvia
Main outflow
Main inflow
Weighted average price for a pack of 20 cigarettes
Number of cigarettes
Croatia
Bosnia
and
Herz.
Andorra
Ukraine
Montenegro
FYROM
Albania
Neth.
Belgium
Moldova
Belarus
Kosovo
Slovenia
0.03 billion
Sources: (1) KPMG EU Flows Model (2) EC Excise Duty tables (Part III – Manufactured Tobacco) (3) Economist Intelligence Unit
€10.10
€2.86
€0.83
€0.680.47 billion
0.12 billion
0.01 billion
Average prices increased by 1.3% in 2015(2)
Real Personal Disposable Income in Latvia rose by 6.4% in 2015(3)
AAAnnndndddddooorrorrrrrrroo aaaaaa
SSloooovvvvveeenniaa
If the C&C volume had been consumed legally, an additional tax revenue of approximately €77mn would have been raised in Latvia(1)(2)
Duty Free labelled
© 2016 KPMG LLP, a UK limited liability partnership, and a member firm of the KPMG network of independent member firms affiliated with KPMG International Cooperative, a Swiss entity.
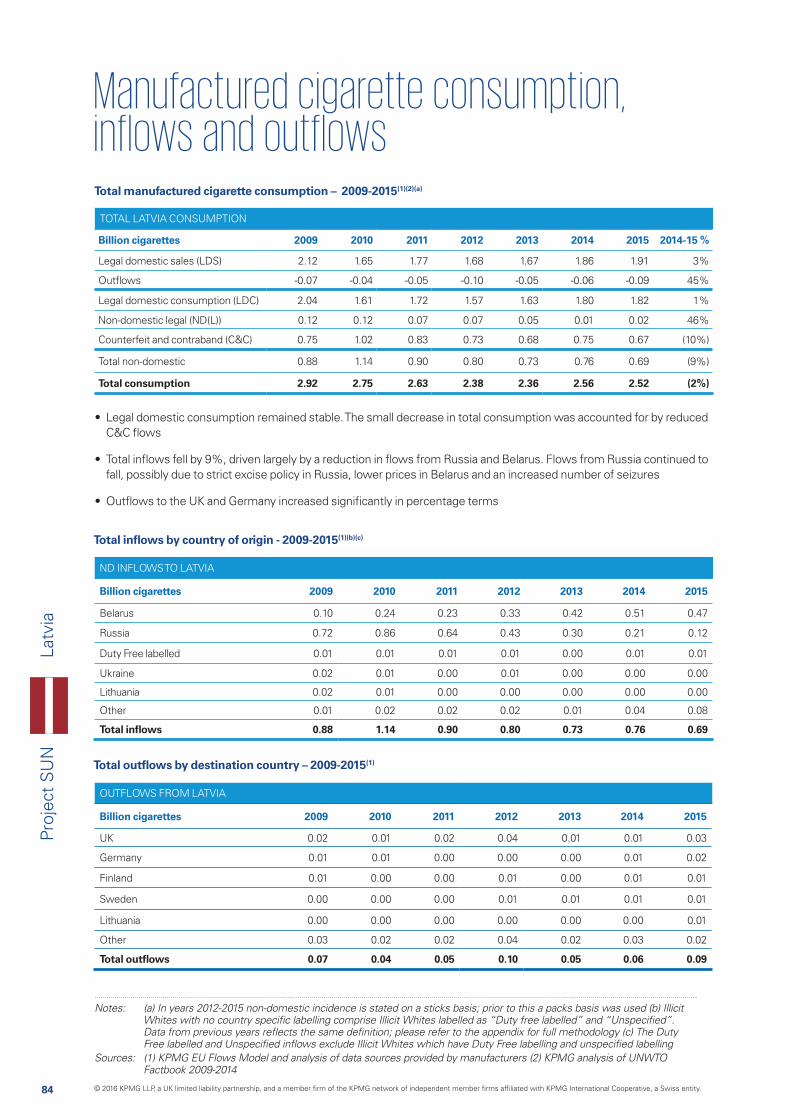
84
Proj
ect
SU
N
ND INFLOWS TO LATVIA
Billion cigarettes 2009 2010 2011 2012 2013 2014 2015
Belarus 0.10 0.24 0.23 0.33 0.42 0.51 0.47
Russia 0.72 0.86 0.64 0.43 0.30 0.21 0.12
Duty Free labelled 0.01 0.01 0.01 0.01 0.00 0.01 0.01
Ukraine 0.02 0.01 0.00 0.01 0.00 0.00 0.00
Lithuania 0.02 0.01 0.00 0.00 0.00 0.00 0.00
Other 0.01 0.02 0.02 0.02 0.01 0.04 0.08
Total inflows 0.88 1.14 0.90 0.80 0.73 0.76 0.69
Total manufactured cigarette consumption – 2009-2015(1)(2)(a)
Total inflows by country of origin - 2009-2015(1)(b)(c)
TOTAL LATVIA CONSUMPTION
Billion cigarettes 2009 2010 2011 2012 2013 2014 2015 2014-15 %
Legal domestic sales (LDS) 2.12 1.65 1.77 1.68 1.67 1.86 1.91 3%
Outflows -0.07 -0.04 -0.05 -0.10 -0.05 -0.06 -0.09 45%
Legal domestic consumption (LDC) 2.04 1.61 1.72 1.57 1.63 1.80 1.82 1%
Non-domestic legal (ND(L)) 0.12 0.12 0.07 0.07 0.05 0.01 0.02 46%
Counterfeit and contraband (C&C) 0.75 1.02 0.83 0.73 0.68 0.75 0.67 (10%)
Total non-domestic 0.88 1.14 0.90 0.80 0.73 0.76 0.69 (9%)
Total consumption 2.92 2.75 2.63 2.38 2.36 2.56 2.52 (2%)
Total outflows by destination country – 2009-2015(1)
OUTFLOWS FROM LATVIA
Billion cigarettes 2009 2010 2011 2012 2013 2014 2015
UK 0.02 0.01 0.02 0.04 0.01 0.01 0.03
Germany 0.01 0.01 0.00 0.00 0.00 0.01 0.02
Finland 0.01 0.00 0.00 0.01 0.00 0.01 0.01
Sweden 0.00 0.00 0.00 0.01 0.01 0.01 0.01
Lithuania 0.00 0.00 0.00 0.00 0.00 0.00 0.01
Other 0.03 0.02 0.02 0.04 0.02 0.03 0.02
Total outflows 0.07 0.04 0.05 0.10 0.05 0.06 0.09
Notes: (a) In years 2012-2015 non-domestic incidence is stated on a sticks basis; prior to this a packs basis was used (b) Illicit
Sources: (1) KPMG EU Flows Model and analysis of data sources provided by manufacturers (2) KPMG analysis of UNWTO Factbook 2009-2014
• Legal domestic consumption remained stable. The small decrease in total consumption was accounted for by reduced C&C flows
• Total inflows fell by 9%, driven largely by a reduction in flows from Russia and Belarus. Flows from Russia continued to fall, possibly due to strict excise policy in Russia, lower prices in Belarus and an increased number of seizures
• Outflows to the UK and Germany increased significantly in percentage terms
Latv
ia
© 2016 KPMG LLP, a UK limited liability partnership, and a member firm of the KPMG network of independent member firms affiliated with KPMG International Cooperative, a Swiss entity.
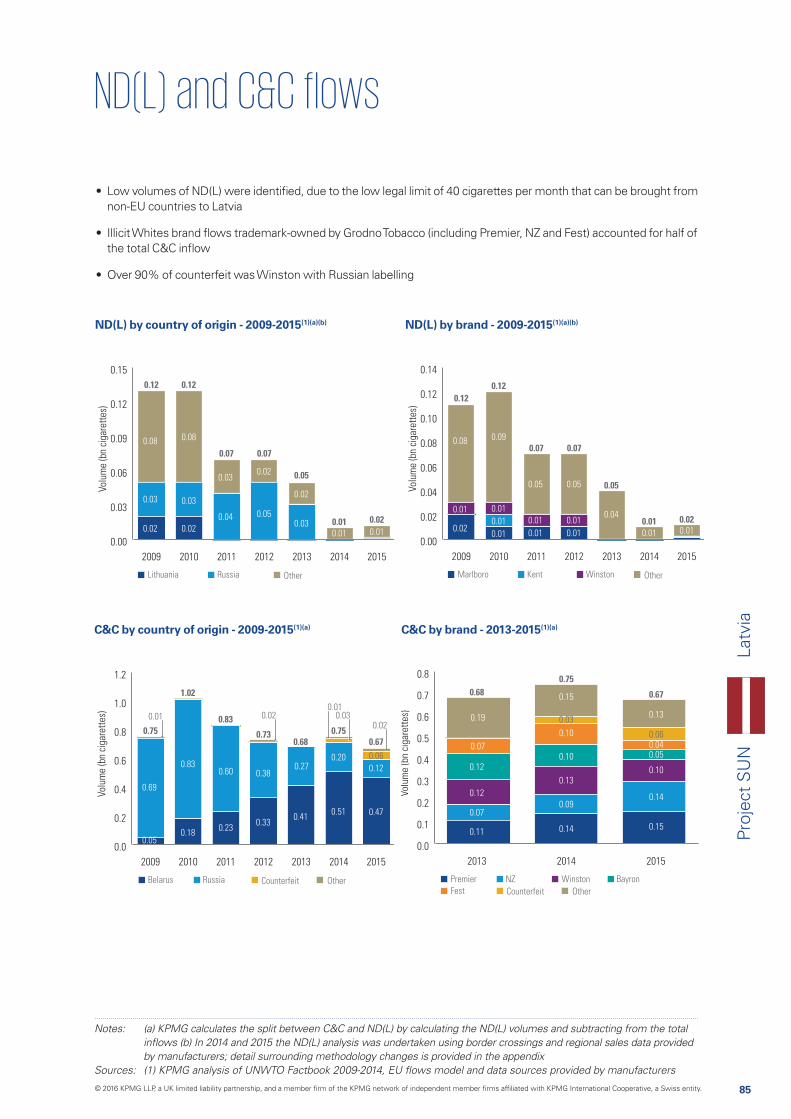
85
Proj
ect
SU
N
Notes: (a) KPMG calculates the split between C&C and ND(L) by calculating the ND(L) volumes and subtracting from the total
by manufacturers; detail surrounding methodology changes is provided in the appendix
ND(L) by country of origin - 2009-2015(1)(a)(b)
C&C by country of origin - 2009-2015(1)(a)
0.00
0.03
0.06
0.09
0.12
0.15
2009 2010 2011 2012 2013 2014 2015
0.02
0.08
0.03
0.08
0.02
0.05
0.02
0.03
0.12 0.12
0.07 0.07
0.05
0.01 0.020.04
0.03
0.03
0.020.01 0.01
RussiaLithuania Other
Volu
me
(bn
ciga
rett
es)
0.00
0.02
0.04
0.06
0.08
0.10
0.12
0.14
2009 2010 2011 2012 2013 2014 2015
0.02
0.09
0.01
0.08
0.05
0.01
0.010.04
0.120.12
0.07 0.07
0.05
0.01 0.020.01
0.01
0.05
0.01
0.01
0.01 0.01 0.01
KentMarlboro Winston Other
Volu
me
(bn
ciga
rett
es)
0.0
0.2
0.4
0.6
0.8
1.0
1.2
2009 2010 2011 2012 2013 2014 2015
0.69
0.050.18
0.83
0.41
0.75
1.02
0.83
0.730.68
0.750.67
0.23
0.600.27
0.20
0.51 0.47
0.12
0.06
0.33
0.38
Russia CounterfeitBelarus Other
Volu
me
(bn
ciga
rett
es)
0.01 0.02 0.030.01
0.02
0.0
0.1
0.2
0.3
0.4
0.5
0.6
0.7
0.8
2013 2014 2015
0.12
0.12
0.07
0.11
0.680.75
0.67
0.19
0.070.10
0.10
0.03
0.15
0.14
0.09
0.13
0.15
0.14
0.10
0.050.040.06
0.13
NZ
Counterfeit
Premier
Fest
BayronWinston
Other
Volu
me
(bn
ciga
rett
es)
ND(L) by brand - 2009-2015(1)(a)(b)
C&C by brand - 2013-2015(1)(a)
• Low volumes of ND(L) were identified, due to the low legal limit of 40 cigarettes per month that can be brought from non-EU countries to Latvia
• Illicit Whites brand flows trademark-owned by Grodno Tobacco (including Premier, NZ and Fest) accounted for half of the total C&C inflow
• Over 90% of counterfeit was Winston with Russian labelling
Latv
ia
© 2016 KPMG LLP, a UK limited liability partnership, and a member firm of the KPMG network of independent member firms affiliated with KPMG International Cooperative, a Swiss entity.
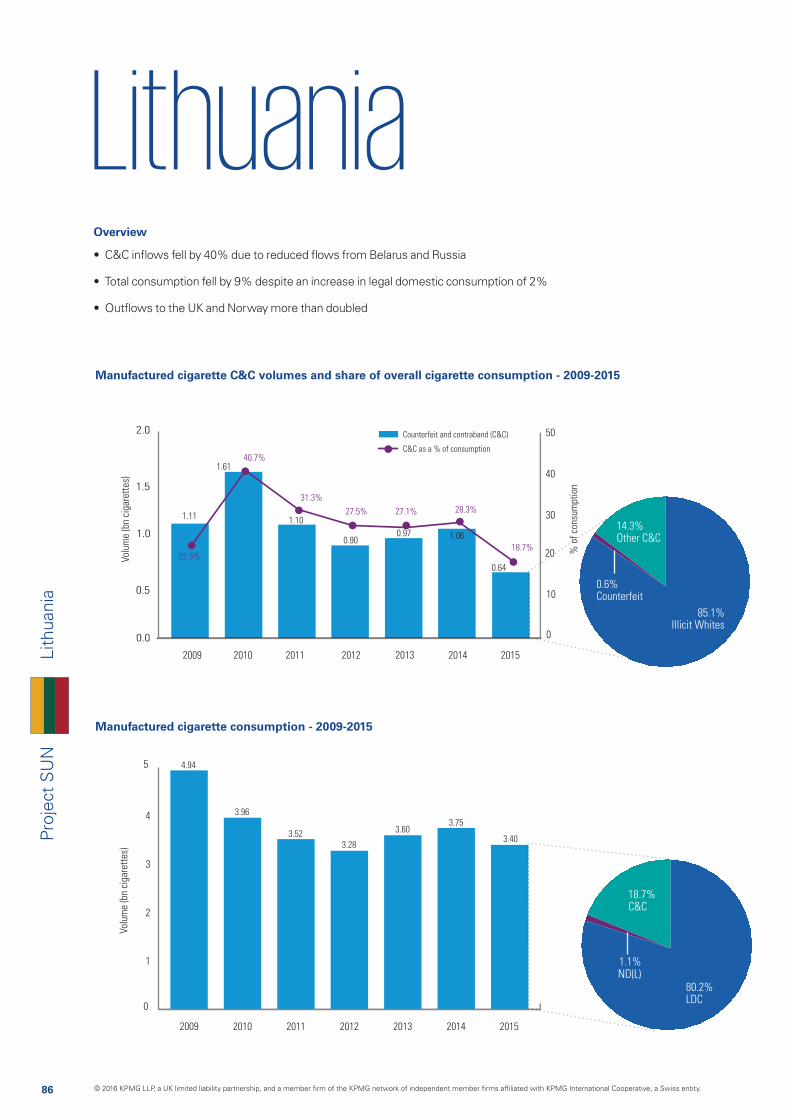
86
Proj
ect
SU
N
LithuaniaLi
thua
nia
Manufactured cigarette consumption - 2009-2015
Manufactured cigarette C&C volumes and share of overall cigarette consumption - 2009-2015
0.0
0.5
1.0
1.5
2.0
Volu
me
(bn
ciga
rett
es)
% o
f co
nsum
ptio
n
Counterfeit and contraband (C&C)
C&C as a % of consumption
2009 2010 2011 2012 2013 2014 2015
0
10
20
30
40
50
22.5%
40.7%
31.3%
27.5% 27.1% 28.3%
18.7%
1.11
1.61
1.10
0.900.97 1.06
0.64
Volu
me
(bn
ciga
rett
es)
2009 2010 2011 2012 2013 2014 2015
4.94
3.96
3.523.28
3.603.40
3.75
0
1
2
3
4
5
0
o0.6%Counterfeit
14.3%Other C&C
85.1%Illicit Whites
1.1%ND(L)
18.7%C&C
80.2%LDC
Overview
• C&C inflows fell by 40% due to reduced flows from Belarus and Russia
• Total consumption fell by 9% despite an increase in legal domestic consumption of 2%
• Outflows to the UK and Norway more than doubled
© 2016 KPMG LLP, a UK limited liability partnership, and a member firm of the KPMG network of independent member firms affiliated with KPMG International Cooperative, a Swiss entity.
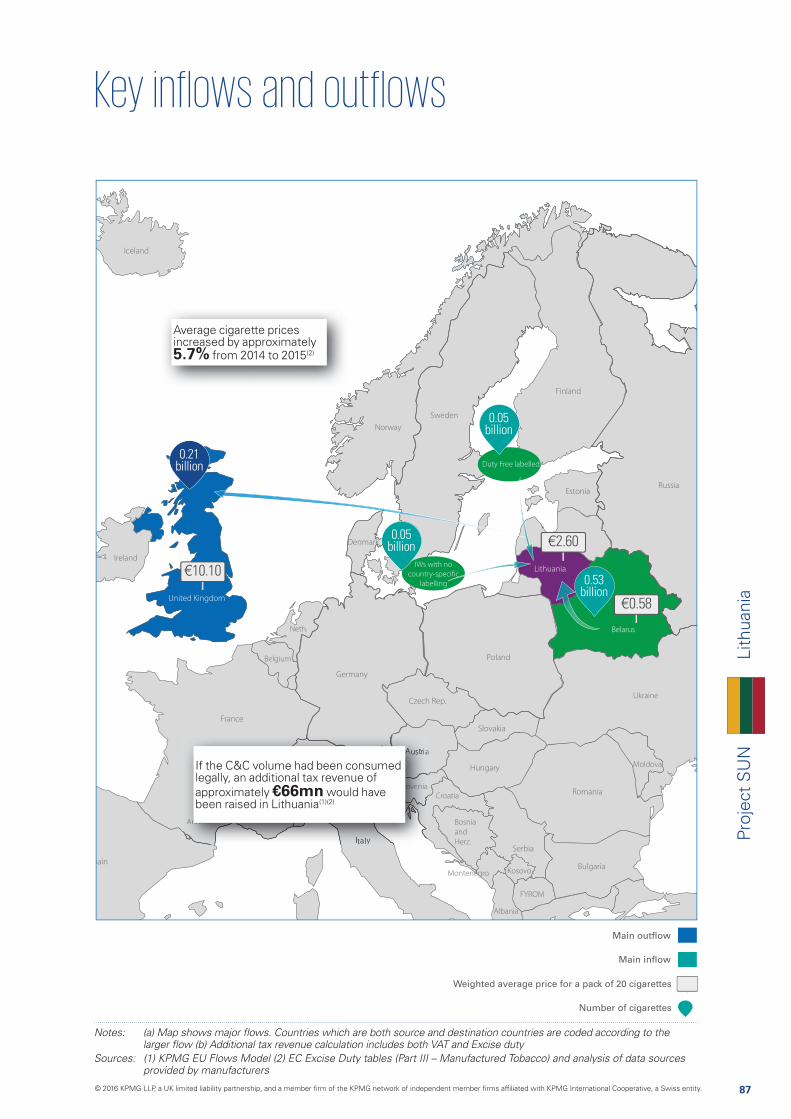
87
Proj
ect
SU
NLi
thua
nia
Main outflow
Main inflow
Weighted average price for a pack of 20 cigarettes
Number of cigarettes
Croatia
Bosnia
and
Herz.
Andorra
Ukraine
Montenegro
FYROM
Albania
Neth.
Belgium
Moldova
Belarus
Kosovo
Slovenia
0.21 billion
Sources: (1) KPMG EU Flows Model (2) EC Excise Duty tables (Part III – Manufactured Tobacco) and analysis of data sources provided by manufacturers
€10.10
€2.60
€0.58
0.53 billion
0.05 billion
0.05 billion
Average cigarette prices increased by approximately 5.7% from 2014 to 2015(2)
AAAnnndndddddooorrorrrrrrroo aaaaaa
SSloooovvvvveeenniaa
If the C&C volume had been consumed legally, an additional tax revenue of approximately €66mn would have been raised in Lithuania(1)(2)
Duty Free labelled
IWs with no
country-specific
labelling
© 2016 KPMG LLP, a UK limited liability partnership, and a member firm of the KPMG network of independent member firms affiliated with KPMG International Cooperative, a Swiss entity.
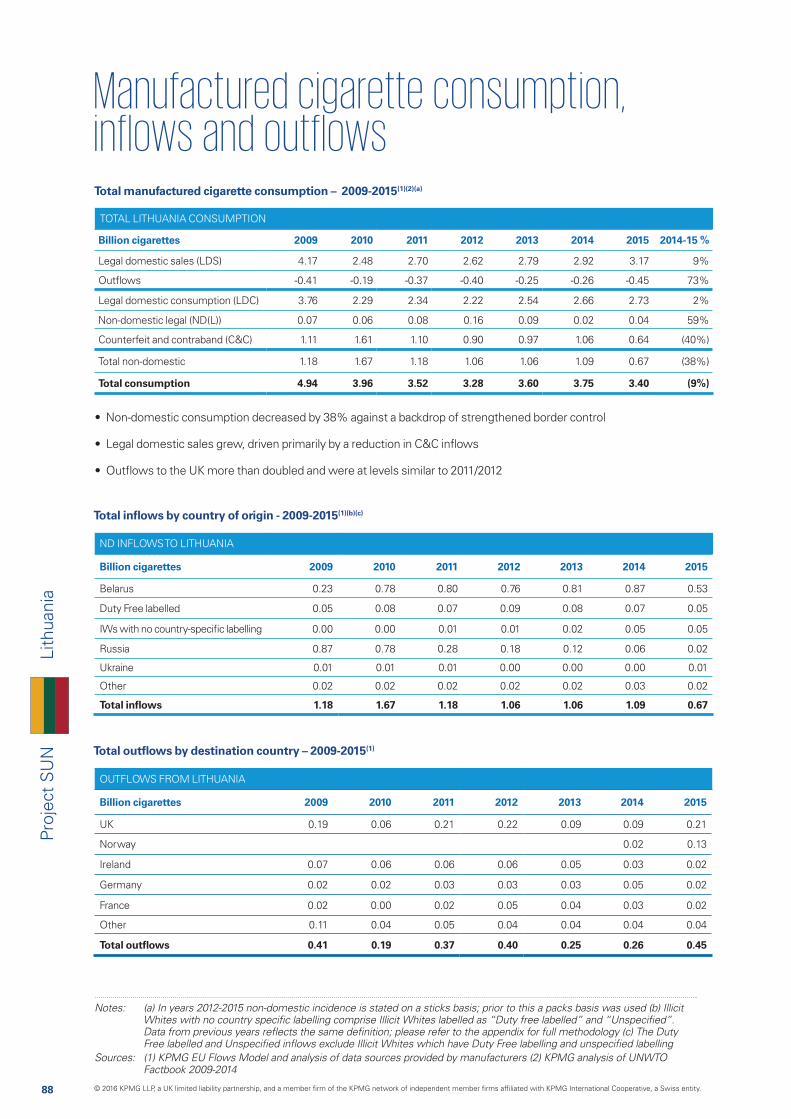
88
Proj
ect
SU
N
ND INFLOWS TO LITHUANIA
Billion cigarettes 2009 2010 2011 2012 2013 2014 2015
Belarus 0.23 0.78 0.80 0.76 0.81 0.87 0.53
Duty Free labelled 0.05 0.08 0.07 0.09 0.08 0.07 0.05
IWs with no country-specific labelling 0.00 0.00 0.01 0.01 0.02 0.05 0.05
Russia 0.87 0.78 0.28 0.18 0.12 0.06 0.02
Ukraine 0.01 0.01 0.01 0.00 0.00 0.00 0.01
Other 0.02 0.02 0.02 0.02 0.02 0.03 0.02
Total inflows 1.18 1.67 1.18 1.06 1.06 1.09 0.67
Total manufactured cigarette consumption – 2009-2015(1)(2)(a)
Total inflows by country of origin - 2009-2015(1)(b)(c)
TOTAL LITHUANIA CONSUMPTION
Billion cigarettes 2009 2010 2011 2012 2013 2014 2015 2014-15 %
Legal domestic sales (LDS) 4.17 2.48 2.70 2.62 2.79 2.92 3.17 9%
Outflows -0.41 -0.19 -0.37 -0.40 -0.25 -0.26 -0.45 73%
Legal domestic consumption (LDC) 3.76 2.29 2.34 2.22 2.54 2.66 2.73 2%
Non-domestic legal (ND(L)) 0.07 0.06 0.08 0.16 0.09 0.02 0.04 59%
Counterfeit and contraband (C&C) 1.11 1.61 1.10 0.90 0.97 1.06 0.64 (40%)
Total non-domestic 1.18 1.67 1.18 1.06 1.06 1.09 0.67 (38%)
Total consumption 4.94 3.96 3.52 3.28 3.60 3.75 3.40 (9%)
Total outflows by destination country – 2009-2015(1)
OUTFLOWS FROM LITHUANIA
Billion cigarettes 2009 2010 2011 2012 2013 2014 2015
UK 0.19 0.06 0.21 0.22 0.09 0.09 0.21
Norway 0.02 0.13
Ireland 0.07 0.06 0.06 0.06 0.05 0.03 0.02
Germany 0.02 0.02 0.03 0.03 0.03 0.05 0.02
France 0.02 0.00 0.02 0.05 0.04 0.03 0.02
Other 0.11 0.04 0.05 0.04 0.04 0.04 0.04
Total outflows 0.41 0.19 0.37 0.40 0.25 0.26 0.45
Notes: (a) In years 2012-2015 non-domestic incidence is stated on a sticks basis; prior to this a packs basis was used (b) Illicit
Sources: (1) KPMG EU Flows Model and analysis of data sources provided by manufacturers (2) KPMG analysis of UNWTO Factbook 2009-2014
• Non-domestic consumption decreased by 38% against a backdrop of strengthened border control
• Legal domestic sales grew, driven primarily by a reduction in C&C inflows
• Outflows to the UK more than doubled and were at levels similar to 2011/2012
Lith
uani
a
© 2016 KPMG LLP, a UK limited liability partnership, and a member firm of the KPMG network of independent member firms affiliated with KPMG International Cooperative, a Swiss entity.

89
Proj
ect
SU
N
Notes: (a) KPMG calculates the split between C&C and ND(L) by calculating the ND(L) volumes and subtracting from the total
by manufacturers; detail surrounding methodology changes is provided in the appendix
ND(L) by country of origin - 2009-2015(1)(a)(b)
C&C by country of origin - 2009-2015(1)(a)
0.00
0.03
0.06
0.09
0.12
0.15
0.18
2009 2010 2011 2012 2013 2014 2015
0.01
0.08
0.06
0.08
0.13
0.02
0.06
0.02
0.070.06
0.08
0.16
0.09
0.02
0.04
0.02
0.07
0.05
0.01 0.02 0.01
0.03
RussiaLatvia Other
Volu
me
(bn
ciga
rett
es)
0.00
0.03
0.06
0.09
0.12
0.15
0.18
2009 2010 2011 2012 2013 2014 2015
0.01
0.02
0.01
0.08
0.03
0.08
0.09
0.06
0.010.01 0.06
0.010.010.01
0.070.06
0.08
0.16
0.09
0.02
0.04
0.02
0.010.01
0.04
0.03
0.01
0.010.01
0.02 0.01
0.03
MarlboroWinston L&M Other
Volu
me
(bn
ciga
rett
es)
0.0
0.2
0.4
0.6
0.8
1.0
1.2
1.4
1.6
1.8
2009 2010 2011 2012 2013 2014 2015
0.86
0.22
0.78
0.77
0.81
1.11
1.61
1.10
0.90 0.971.06
0.64
0.80
0.270.10
0.08
0.860.53
0.12
0.06
0.74
0.15
Russia Counterfeit
Belarus
Other
Volu
me
(bn
ciga
rett
es)
0.03 0.020.01
0.01
0.020.03
0.01
0.06
0.05
0.06
0.05
0.010.04
IWs with no country-specific labelling
0.0
0.2
0.4
0.6
0.8
1.0
1.2
2013 2014 2015
0.25
0.971.06
0.64
0.24
0.09
0.10
0.29
0.16
0.08
0.21
0.330.19
0.14
0.050.040.07
New Line Counterfeit
Fest Minsk NZ Winston
Other
Volu
me
(bn
ciga
rett
es) 0.02
0.01
0.26
0.14
ND(L) by brand - 2009-2015(1)(a)(b)
C&C by brand - 2013-2015(1)(a)
• Belarus remained the major source of C&C flows, while the trend in declining C&C flows from Russia continued
• Reduced C&C volumes were seen across almost all C&C brands, with Illicit Whites brands Fest, Minsk and NZ retaining the largest share of the C&C market flows
• ND(L) flows remained low due to the low legal limit of 40 cigarettes per month that can be brought from non-EU countries to Lithuania
Lith
uani
a
© 2016 KPMG LLP, a UK limited liability partnership, and a member firm of the KPMG network of independent member firms affiliated with KPMG International Cooperative, a Swiss entity.
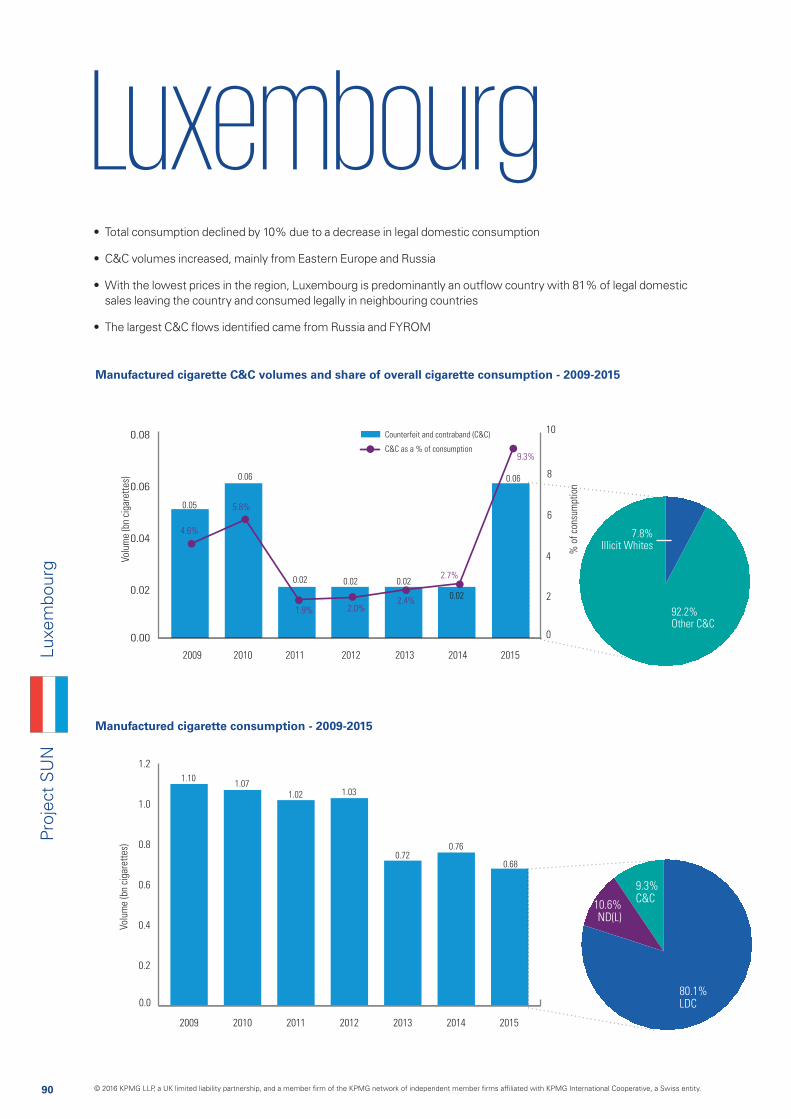
90
Proj
ect
SU
NLu
xem
bour
g
Manufactured cigarette consumption - 2009-2015
Manufactured cigarette C&C volumes and share of overall cigarette consumption - 2009-2015
0.00
0.02
0.04
0.06
0.08
Volu
me
(bn
ciga
rett
es)
% o
f co
nsum
ptio
n
Counterfeit and contraband (C&C)
C&C as a % of consumption
2009 2010 2011 2012 2013 2014 2015
0
2
4
6
8
10
4.6%
5.8%
1.9% 2.0%2.4%
2.7%
9.3%
0.05
0.06
0.02 0.02 0.02
0.02
0.06
Volu
me
(bn
ciga
rett
es)
2009 2010 2011 2012 2013 2014 2015
1.101.07
1.02 1.03
0.720.68
0.76
0.0
0.2
0.4
0.6
0.8
1.0
1.2
92.2%Other C&C
7.8%Illicit Whites
10.6%ND(L)
9.3%C&C
80.1%LDC
• Total consumption declined by 10% due to a decrease in legal domestic consumption
• C&C volumes increased, mainly from Eastern Europe and Russia
• With the lowest prices in the region, Luxembourg is predominantly an outflow country with 81% of legal domestic sales leaving the country and consumed legally in neighbouring countries
• The largest C&C flows identified came from Russia and FYROM
© 2016 KPMG LLP, a UK limited liability partnership, and a member firm of the KPMG network of independent member firms affiliated with KPMG International Cooperative, a Swiss entity.
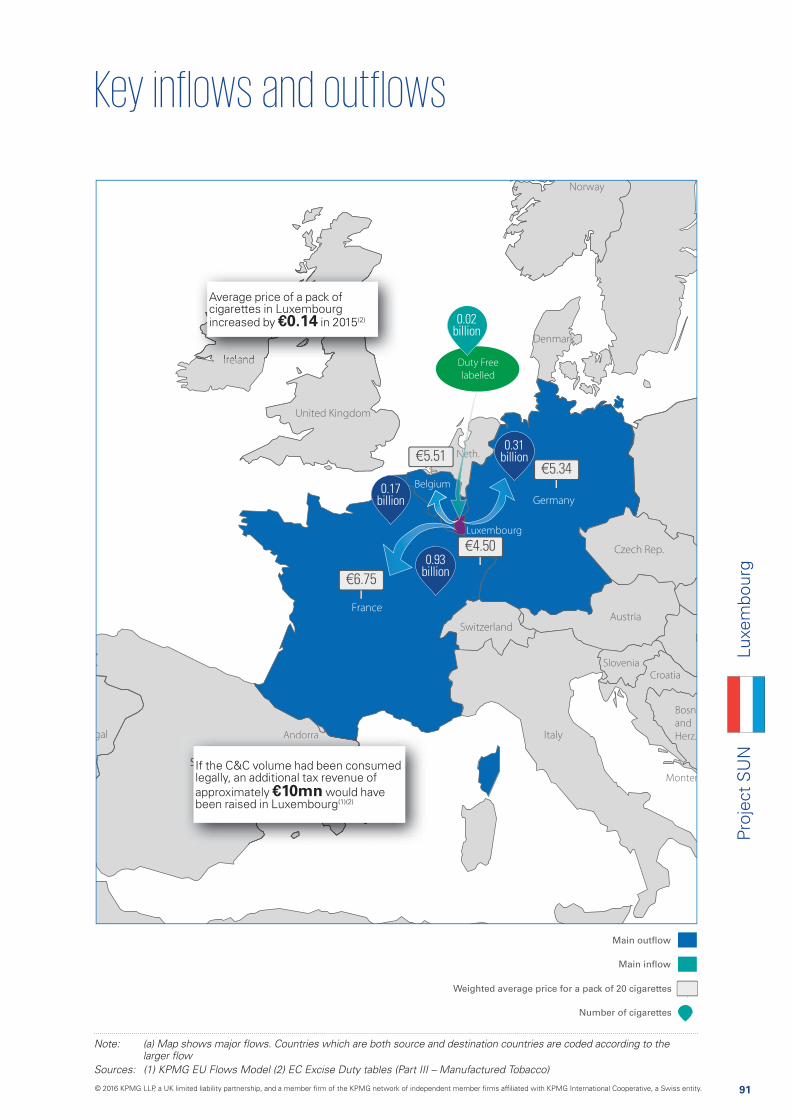
91
Proj
ect
SU
NLu
xem
bour
g
Main outflow
Main inflow
Weighted average price for a pack of 20 cigarettes
Number of cigarettes
Croatia
Bosn
and
Herz.Andorra
Monten
Neth.
Belgium
Slovenia
Luxembourg
NeNe
0.93 billion
0.31 billion
0.17 billion
Sources: (1) KPMG EU Flows Model (2) EC Excise Duty tables (Part III – Manufactured Tobacco)
€4.50
€5.34
€6.75
€5.51
0.02 billion
Average price of a pack of cigarettes in Luxembourg increased by €0.14 in 2015(2)
AnAndodorrrraa
If the C&C volume had been consumed legally, an additional tax revenue of approximately €10mn would have been raised in Luxembourg(1)(2)
Duty Free
labelled
© 2016 KPMG LLP, a UK limited liability partnership, and a member firm of the KPMG network of independent member firms affiliated with KPMG International Cooperative, a Swiss entity.

92
Proj
ect
SU
N
ND INFLOWS TO LUXEMBOURG
Billion cigarettes 2009 2010 2011 2012 2013 2014 2015
France 0.02 0.01 0.01 0.02 0.01 0.03 0.02
Duty Free labelled 0.01 0.01 0.01 0.01 0.00 0.01 0.02
Belgium 0.04 0.06 0.01 0.00 0.01 0.02 0.02
Portugal 0.00 0.03 0.00 0.00 0.00 0.00 0.01
FYROM 0.00 0.00 0.00 0.00 0.00 0.00 0.01
Other 0.05 0.03 0.03 0.03 0.03 0.05 0.05
Total inflows 0.12 0.13 0.06 0.07 0.06 0.11 0.14
Total manufactured cigarette consumption – 2009-2015(1)(2)(a)
Total inflows by country of origin - 2009-2015(1)(b)(c)(d)
TOTAL LUXEMBOURG CONSUMPTION
Billion cigarettes 2009 2010 2011 2012 2013 2014 2015 2014-15 %
Legal domestic sales (LDS) 4.15 3.93 3.94 3.68 3.42 3.39 2.84 (16%)
Outflows -3.18 -3.00 -2.98 -2.72 -2.77 -2.74 -2.30 (16%)
Legal domestic consumption (LDC) 0.97 0.93 0.96 0.96 0.66 0.65 0.54 (16%)
Non-domestic legal (ND(L)) 0.07 0.07 0.04 0.05 0.04 0.09 0.07 (16%)
Counterfeit and contraband (C&C) 0.05 0.06 0.02 0.02 0.02 0.02 0.06 213%
Total non-domestic 0.12 0.13 0.06 0.07 0.06 0.11 0.14 28%
Total consumption 1.10 1.07 1.02 1.03 0.72 0.76 0.68 (10%)
Total outflows by destination country – 2009-2015(1)
OUTFLOWS FROM LUXEMBOURG
Billion cigarettes 2009 2010 2011 2012 2013 2014 2015
France 0.58 0.52 0.73 1.11 1.08 1.11 0.93
Germany 0.80 0.38 0.41 0.46 0.45 0.48 0.31
Belgium 0.12 0.23 0.47 0.51 0.42 0.25 0.17
Other 1.68 1.87 1.37 0.63 0.82 0.91 0.89
Total outflows 3.18 3.00 2.98 2.72 2.77 2.74 2.30
Notes: (a) In years 2012-2015 non-domestic incidence is stated on a sticks basis; prior to this a packs basis was used (b) Illicit
Fieldwork was undertaken during the public holiday celebrating All Saints Day which may have impacted the level of non-domestic product Sources: (1) KPMG EU Flows Model and analysis of data sources provided by manufacturers (2) KPMG analysis of UNWTO Factbook 2009-2014
• Over half of the inflows to Luxembourg are considered legal as the largest inflow countries, France and Belgium, have higher prices; therefore inflows are generally reflective of tourist flows
• Over 60% of outflows went to neighbouring France, Germany and Belgium. As Luxembourg is one of the cheapest markets in Western Europe, flows also go to many other EU countries in smaller volumes
Luxe
mbo
urg
© 2016 KPMG LLP, a UK limited liability partnership, and a member firm of the KPMG network of independent member firms affiliated with KPMG International Cooperative, a Swiss entity.
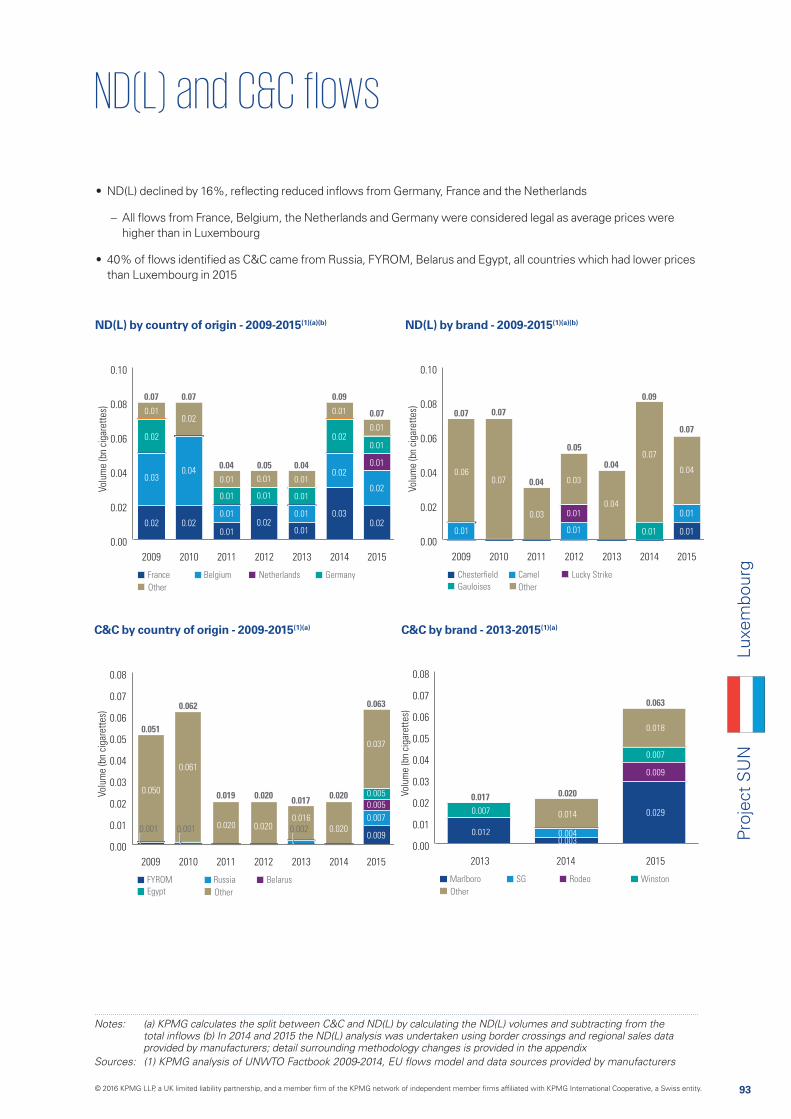
93
Proj
ect
SU
N
Notes: (a) KPMG calculates the split between C&C and ND(L) by calculating the ND(L) volumes and subtracting from the
provided by manufacturers; detail surrounding methodology changes is provided in the appendix
ND(L) by country of origin - 2009-2015(1)(a)(b)
C&C by country of origin - 2009-2015(1)(a)
0.00
0.02
0.04
0.06
0.08
0.10
2009 2010 2011 2012 2013 2014 2015
0.03
0.02
0.02
0.01
0.02
0.01
0.01 0.01
0.01
0.01
0.01
0.07 0.07
0.04 0.05 0.04
0.09
0.07
0.01
0.01
0.01
0.01
0.02
0.04
0.02
0.02
0.03
0.02
0.01
0.01
0.02
0.02
0.01
0.01
0.01
Belgium
Other
NetherlandsFrance Germany
Volu
me
(bn
ciga
rett
es)
0.00
0.02
0.04
0.06
0.08
0.10
2009 2010 2011 2012 2013 2014 2015
0.01
0.06
0.01
0.01
0.03
0.04
0.07 0.07
0.04
0.05
0.04
0.09
0.07
0.03
0.07
0.07
0.01 0.01
0.01
0.04
0.06
Camel
Other
Chesterfield
Gauloises
Lucky Strike
Volu
me
(bn
ciga
rett
es)
0.00
0.01
0.02
0.03
0.04
0.05
0.06
0.07
0.08
2009 2010 2011 2012 2013 2014 2015
0.001
0.050
0.0200.016
0.051
0.062
0.019 0.020 0.017 0.020
0.063
0.020
0.061
0.0200.009
0.007
0.005
0.005
0.037
Russia
Other
BelarusFYROM
Egypt
Volu
me
(bn
ciga
rett
es)
0.001 0.002
0.00
0.01
0.02
0.03
0.04
0.05
0.06
0.07
0.08
2013 2014 2015
0.007
0.012
0.017 0.020
0.063
0.014
0.0040.003
0.029
0.007
0.009
0.018
SG
Other
Marlboro WinstonRodeo
Volu
me
(bn
ciga
rett
es)
ND(L) by brand - 2009-2015(1)(a)(b)
C&C by brand - 2013-2015(1)(a)
• ND(L) declined by 16%, reflecting reduced inflows from Germany, France and the Netherlands
– All flows from France, Belgium, the Netherlands and Germany were considered legal as average prices were higher than in Luxembourg
• 40% of flows identified as C&C came from Russia, FYROM, Belarus and Egypt, all countries which had lower prices than Luxembourg in 2015
Luxe
mbo
urg
© 2016 KPMG LLP, a UK limited liability partnership, and a member firm of the KPMG network of independent member firms affiliated with KPMG International Cooperative, a Swiss entity.
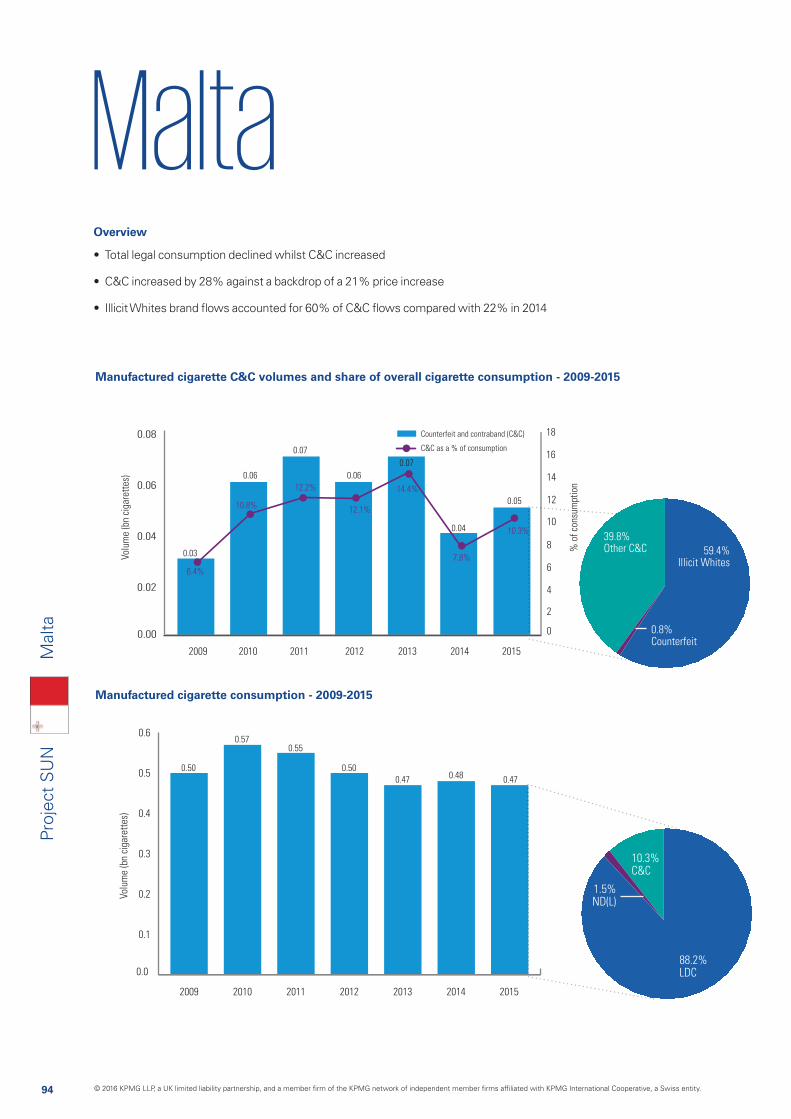
94
Proj
ect
SU
N
MaltaM
alta
Manufactured cigarette consumption - 2009-2015
Manufactured cigarette C&C volumes and share of overall cigarette consumption - 2009-2015
0.00
0.02
0.04
0.06
0.08
Volu
me
(bn
ciga
rett
es)
% o
f co
nsum
ptio
n
Counterfeit and contraband (C&C)
C&C as a % of consumption
2009 2010 2011 2012 2013 2014 2015
0
2
4
6
8
10
12
14
16
18
6.4%
10.8%
12.2%
12.1%
14.4%
7.8%
10.3%
0.03
0.06
0.07
0.06
0.07
0.04
0.05
Volu
me
(bn
ciga
rett
es)
2009 2010 2011 2012 2013 2014 2015
0.50
0.570.55
0.50
0.47 0.470.48
0.0
0.1
0.2
0.3
0.4
0.5
0.6
%%
u
39.8%Other C&C
0.8%Counterfeit
59.4%Illicit Whites
1.5%ND(L)
10.3%C&C
88.2%LDC
Overview
• Total legal consumption declined whilst C&C increased
• C&C increased by 28% against a backdrop of a 21% price increase
• Illicit Whites brand flows accounted for 60% of C&C flows compared with 22% in 2014
© 2016 KPMG LLP, a UK limited liability partnership, and a member firm of the KPMG network of independent member firms affiliated with KPMG International Cooperative, a Swiss entity.
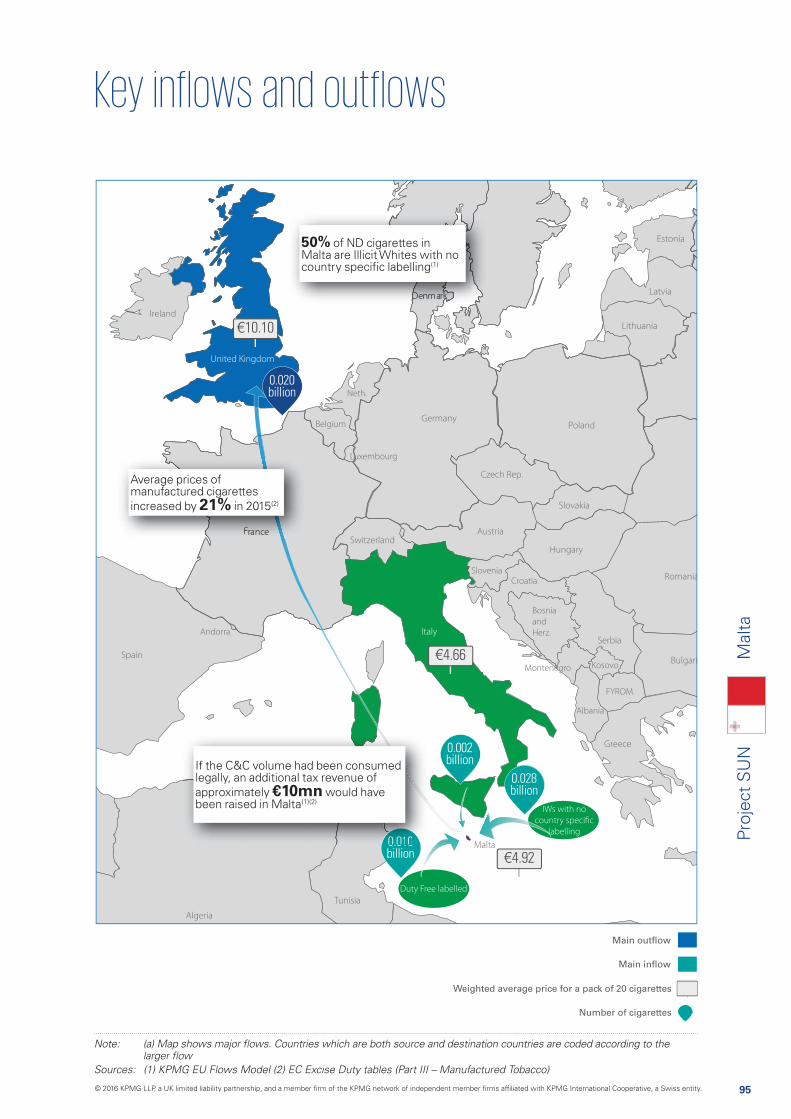
95
Proj
ect
SU
NM
alta
Main outflow
Main inflow
Weighted average price for a pack of 20 cigarettes
Number of cigarettes
Croatia
Bosnia
and
Herz.Andorra
Montenegro
FYROM
Albania
Neth.
Belgium
Kosovo
Slovenia
Luxembourg
0.020 billion
Sources: (1) KPMG EU Flows Model (2) EC Excise Duty tables (Part III – Manufactured Tobacco)
€4.66
€4.92
€10.10
0.028 billion
0.002 billion
0.010 billion
Average prices of manufactured cigarettes increased by 21% in 2015(2)
50% of ND cigarettes in Malta are Illicit Whites with no country specific labelling(1)
000 0010100
If the C&C volume had been consumed legally, an additional tax revenue of approximately €10mn would have been raised in Malta(1)(2)
Duty Free labelled
IWs with no
country specific
labelling
© 2016 KPMG LLP, a UK limited liability partnership, and a member firm of the KPMG network of independent member firms affiliated with KPMG International Cooperative, a Swiss entity.
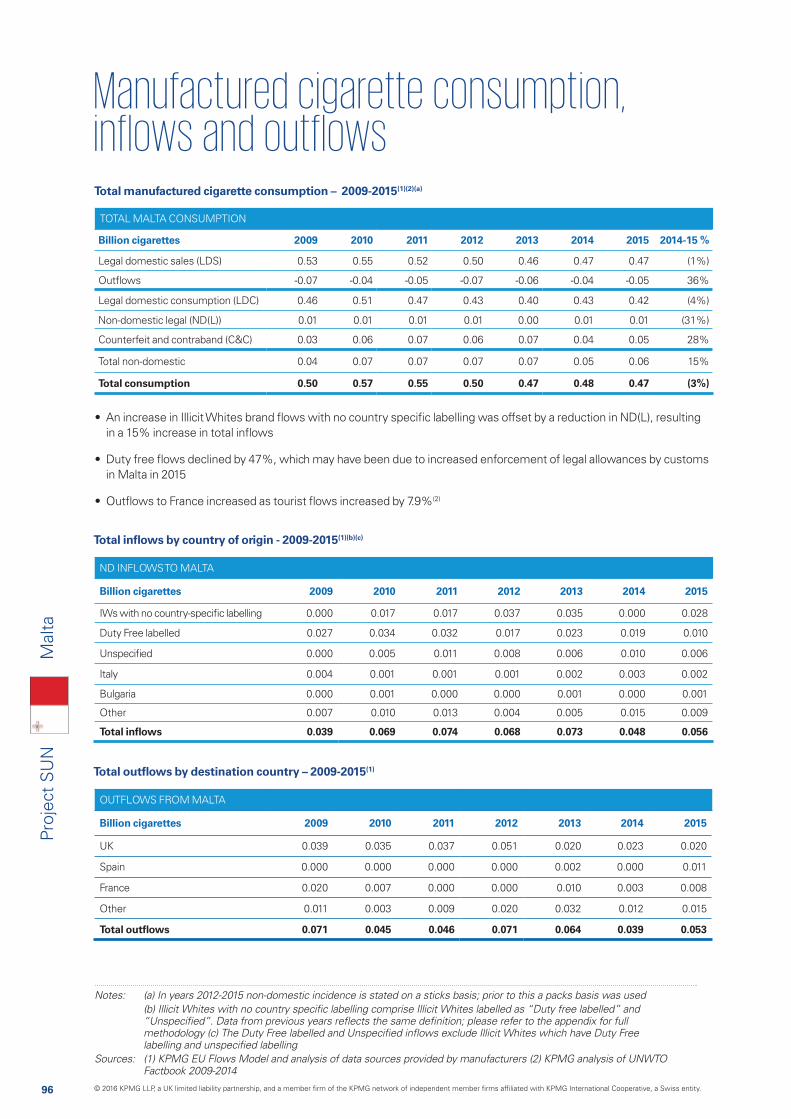
96
Proj
ect
SU
N
ND INFLOWS TO MALTA
Billion cigarettes 2009 2010 2011 2012 2013 2014 2015
IWs with no country-specific labelling 0.000 0.017 0.017 0.037 0.035 0.000 0.028
Duty Free labelled 0.027 0.034 0.032 0.017 0.023 0.019 0.010
Unspecified 0.000 0.005 0.011 0.008 0.006 0.010 0.006
Italy 0.004 0.001 0.001 0.001 0.002 0.003 0.002
Bulgaria 0.000 0.001 0.000 0.000 0.001 0.000 0.001
Other 0.007 0.010 0.013 0.004 0.005 0.015 0.009
Total inflows 0.039 0.069 0.074 0.068 0.073 0.048 0.056
Total manufactured cigarette consumption – 2009-2015(1)(2)(a)
Total inflows by country of origin - 2009-2015(1)(b)(c)
TOTAL MALTA CONSUMPTION
Billion cigarettes 2009 2010 2011 2012 2013 2014 2015 2014-15 %
Legal domestic sales (LDS) 0.53 0.55 0.52 0.50 0.46 0.47 0.47 (1%)
Outflows -0.07 -0.04 -0.05 -0.07 -0.06 -0.04 -0.05 36%
Legal domestic consumption (LDC) 0.46 0.51 0.47 0.43 0.40 0.43 0.42 (4%)
Non-domestic legal (ND(L)) 0.01 0.01 0.01 0.01 0.00 0.01 0.01 (31%)
Counterfeit and contraband (C&C) 0.03 0.06 0.07 0.06 0.07 0.04 0.05 28%
Total non-domestic 0.04 0.07 0.07 0.07 0.07 0.05 0.06 15%
Total consumption 0.50 0.57 0.55 0.50 0.47 0.48 0.47 (3%)
Total outflows by destination country – 2009-2015(1)
OUTFLOWS FROM MALTA
Billion cigarettes 2009 2010 2011 2012 2013 2014 2015
UK 0.039 0.035 0.037 0.051 0.020 0.023 0.020
Spain 0.000 0.000 0.000 0.000 0.002 0.000 0.011
France 0.020 0.007 0.000 0.000 0.010 0.003 0.008
Other 0.011 0.003 0.009 0.020 0.032 0.012 0.015
Total outflows 0.071 0.045 0.046 0.071 0.064 0.039 0.053
Notes: (a) In years 2012-2015 non-domestic incidence is stated on a sticks basis; prior to this a packs basis was used
Sources: (1) KPMG EU Flows Model and analysis of data sources provided by manufacturers (2) KPMG analysis of UNWTO Factbook 2009-2014
• An increase in Illicit Whites brand flows with no country specific labelling was offset by a reduction in ND(L), resulting in a 15% increase in total inflows
• Duty free flows declined by 47%, which may have been due to increased enforcement of legal allowances by customs in Malta in 2015
• Outflows to France increased as tourist flows increased by 7.9%(2)
Mal
ta
© 2016 KPMG LLP, a UK limited liability partnership, and a member firm of the KPMG network of independent member firms affiliated with KPMG International Cooperative, a Swiss entity.
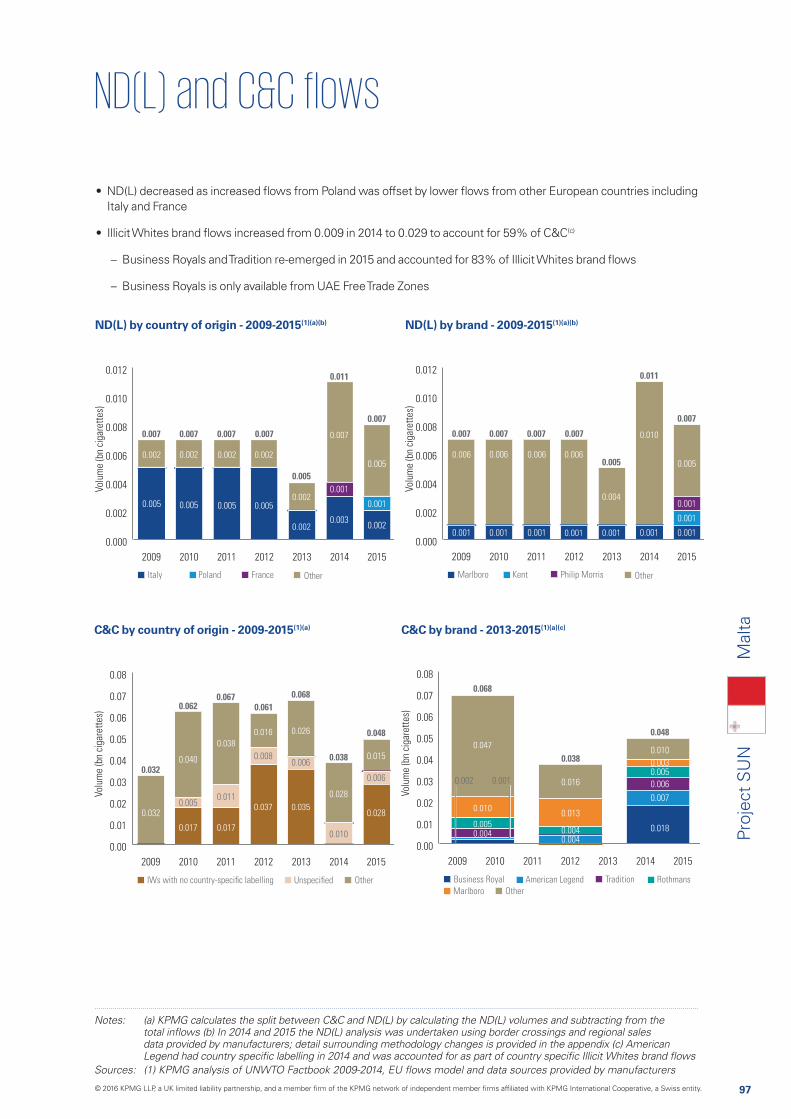
97
Proj
ect
SU
N
Notes: (a) KPMG calculates the split between C&C and ND(L) by calculating the ND(L) volumes and subtracting from the
data provided by manufacturers; detail surrounding methodology changes is provided in the appendix (c) American
ND(L) by country of origin - 2009-2015(1)(a)(b)
C&C by country of origin - 2009-2015(1)(a)
0.000
0.002
0.004
0.006
0.008
0.010
0.012
2009 2010 2011 2012 2013 2014 2015
0.005
0.002
0.005
0.002
0.002
0.002
0.007 0.007 0.007 0.007
0.005
0.011
0.007
0.005
0.0020.002
0.005
0.003
0.001
0.007
0.002
0.001
0.005
Poland OtherFranceItaly
Volu
me
(bn
ciga
rett
es)
0.000
0.002
0.004
0.006
0.008
0.010
0.012
2009 2010 2011 2012 2013 2014 2015
0.001
0.006
0.001
0.006
0.004
0.001
0.007 0.007 0.007 0.007
0.005
0.011
0.007
0.001
0.0060.006
0.001 0.001
0.010
0.001
0.001
0.001
0.005
Kent OtherPhilip MorrisMarlboro
Volu
me
(bn
ciga
rett
es)
0.00
0.01
0.02
0.03
0.04
0.05
0.06
0.07
0.08
2009 2010 2011 2012 2013 2014 2015
0.0320.037
0.008
0.016
0.006
0.026
0.035
0.032
0.0620.067
0.0610.068
0.038
0.048
0.017
0.038
0.011
0.040
0.005
0.0170.010
0.028
0.028
0.006
0.015
Volu
me
(bn
ciga
rett
es)
IWs with no country-specific labelling Unspecified Other
0.00
0.01
0.02
0.03
0.04
0.05
0.06
0.07
0.08
2009 2010 2011 2012 2013 2014 2015
0.005
0.010
0.047
0.004
0.068
0.038
0.048
0.013
0.0040.004
0.016
0.018
0.007
0.006
0.0050.003
0.010
Volu
me
(bn
ciga
rett
es)
Business Royal American Legend Tradition Rothmans
OtherMarlboro
0.0010.002
ND(L) by brand - 2009-2015(1)(a)(b)
C&C by brand - 2013-2015(1)(a)(c)
• ND(L) decreased as increased flows from Poland was offset by lower flows from other European countries including Italy and France
• Illicit Whites brand flows increased from 0.009 in 2014 to 0.029 to account for 59% of C&C(c)
– Business Royals and Tradition re-emerged in 2015 and accounted for 83% of Illicit Whites brand flows
– Business Royals is only available from UAE Free Trade Zones
Mal
ta
© 2016 KPMG LLP, a UK limited liability partnership, and a member firm of the KPMG network of independent member firms affiliated with KPMG International Cooperative, a Swiss entity.
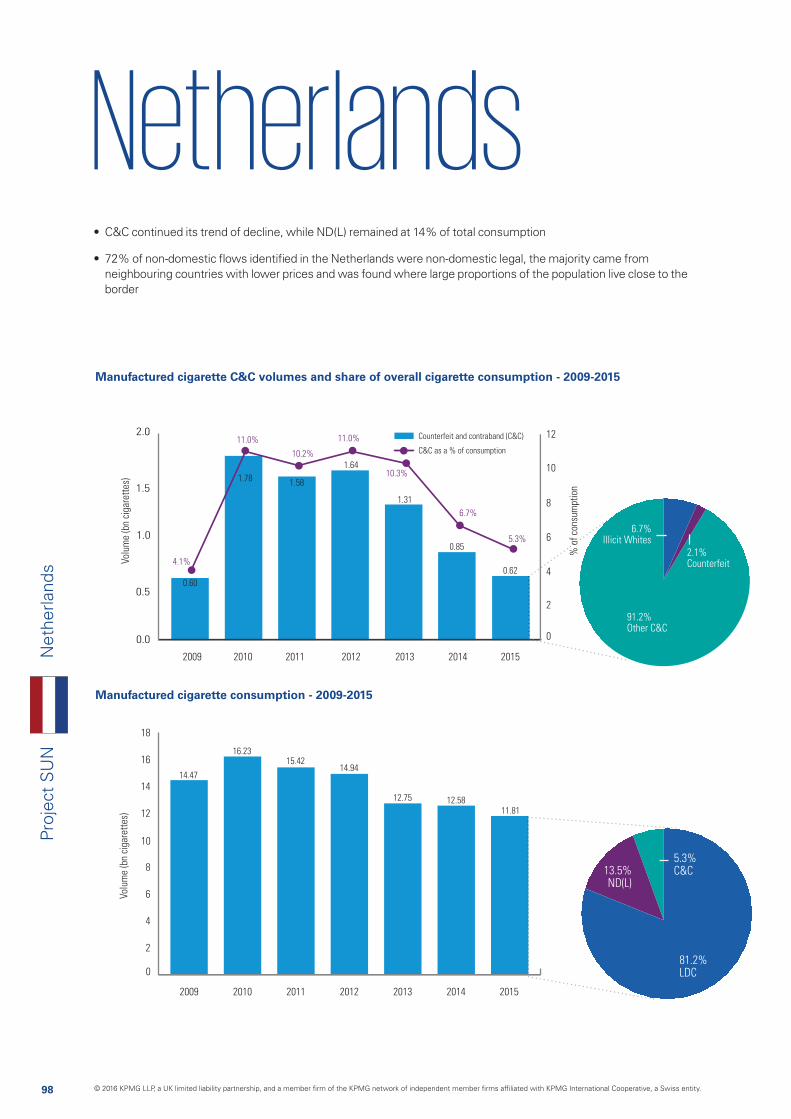
98
Proj
ect
SU
NN
ethe
rland
s
Manufactured cigarette consumption - 2009-2015
Manufactured cigarette C&C volumes and share of overall cigarette consumption - 2009-2015
0.0
0.5
1.0
1.5
2.0
Volu
me
(bn
ciga
rett
es)
% o
f co
nsum
ptio
n
Counterfeit and contraband (C&C)
C&C as a % of consumption
2009 2010 2011 2012 2013 2014 2015
0
2
4
6
8
10
12
4.1%
11.0%
10.2%
11.0%
10.3%
6.7%
5.3%
0.60
1.78 1.58
1.64
1.31
0.85
0.62
Volu
me
(bn
ciga
rett
es)
2009 2010 2011 2012 2013 2014 2015
14.47
16.2315.42
14.94
12.75
11.8112.58
0
2
4
6
8
10
12
14
16
18
o
91.2%Other C&C
2.1%Counterfeit
6.7%Illicit Whites
13.5%ND(L)
5.3%C&C
81.2%LDC
• C&C continued its trend of decline, while ND(L) remained at 14% of total consumption
• 72% of non-domestic flows identified in the Netherlands were non-domestic legal, the majority came from neighbouring countries with lower prices and was found where large proportions of the population live close to the border
© 2016 KPMG LLP, a UK limited liability partnership, and a member firm of the KPMG network of independent member firms affiliated with KPMG International Cooperative, a Swiss entity.

99
Proj
ect
SU
NN
ethe
rland
s
Main outflow
Main inflow
Weighted average price for a pack of 20 cigarettes
Number of cigarettes
Croatia
Bosnia
and
Herz.Andorra
Neth.
Belgium
Slovenia
Luxembourg
B
Sources: (1) KPMG EU Flows Model (2) EC Excise Duty tables (Part III – Manufactured Tobacco)
€5.94
€5.51
€5.34
€10.10
0.43 billion
0.27 billion
0.10 billion
0.16 billion
0.29 billion
Highest inflows to Netherlands were from Duty free which accounts for approximately 20% of total inflows(1)
Inflows from the UK are considered to be legal and are due to UK residents taking one or two packs with them as they travelled to the Netherlands
Average prices of manufactured cigarettes increased by 1.7%(2)
If the C&C volume had been consumed legally, an additional tax revenue of approximately €145mn would have been raised in Netherlands(1)(2)
Duty Free labelled
© 2016 KPMG LLP, a UK limited liability partnership, and a member firm of the KPMG network of independent member firms affiliated with KPMG International Cooperative, a Swiss entity.

100
Proj
ect
SU
N
ND INFLOWS TO NETHERLANDS
Billion cigarettes 2009 2010 2011 2012 2013 2014 2015
Duty Free labelled 0.38 0.54 0.58 0.65 0.55 0.52 0.43
Belgium 0.15 0.24 0.29 0.32 0.38 0.28 0.29
Germany 0.13 0.35 0.25 0.33 0.33 0.36 0.27
UK 0.11 0.20 0.14 0.15 0.14 0.16 0.16
Italy 0.06 0.21 0.18 0.17 0.13 0.13 0.13
Other 0.73 2.01 1.55 1.57 1.32 1.21 0.95
Total inflows 1.56 3.55 2.98 3.19 2.85 2.66 2.22
Total manufactured cigarette consumption – 2009-2015(1)(2)(a)
Total inflows by country of origin - 2009-2015(1)(b)(c)
TOTAL NETHERLANDS CONSUMPTION
Billion cigarettes 2009 2010 2011 2012 2013 2014 2015 2014-15 %
Legal domestic sales (LDS) 13.39 13.16 12.71 12.05 10.25 10.24 9.97 (3%)
Outflows -0.48 -0.49 -0.27 -0.29 -0.36 -0.32 -0.38 18%
Legal domestic consumption (LDC) 12.91 12.67 12.44 11.75 9.89 9.92 9.59 (3%)
Non-domestic legal (ND(L)) 0.97 1.77 1.41 1.55 1.54 1.81 1.60 (12%)
Counterfeit and contraband (C&C) 0.60 1.78 1.58 1.64 1.31 0.85 0.62 (27%)
Total non-domestic 1.56 3.55 2.98 3.19 2.85 2.66 2.22 (16%)
Total consumption 14.47 16.23 15.42 14.94 12.75 12.58 11.81 (6%)
Total outflows by destination country – 2009-2015(1)
OUTFLOWS FROM NETHERLANDS
Billion cigarettes 2009 2010 2011 2012 2013 2014 2015
Belgium 0.11 0.13 0.06 0.04 0.17 0.08 0.10
France 0.14 0.09 0.08 0.07 0.07 0.05 0.08
Germany 0.13 0.14 0.07 0.06 0.03 0.11 0.08
Other 0.10 0.13 0.06 0.12 0.08 0.08 0.12
Total outflows 0.48 0.49 0.27 0.29 0.36 0.32 0.38
Notes: (a) In years 2012-2015 non-domestic incidence is stated on a sticks basis; prior to this a packs basis was used (b) Illicit
Sources: (1) KPMG EU Flows Model and analysis of data sources provided by manufacturers (2) KPMG analysis of UNWTO Factbook 2009-2014
• Consumption fell by 6% as both non-domestic and legal domestic consumption fell
• The relatively high volume of non-domestic consumption in the Netherlands (19% of total consumption) is reflective of its ease of access to other lower-priced countries and a relatively high volume of visitors
• Inflows from the UK, which is a higher priced country, are all considered to be legal and reflect tourist and business trips made by British people to the Netherlands
• Outflows from the Netherlands were mainly to surrounding countries, and were consistent with tourist flows
Net
herla
nds
© 2016 KPMG LLP, a UK limited liability partnership, and a member firm of the KPMG network of independent member firms affiliated with KPMG International Cooperative, a Swiss entity.
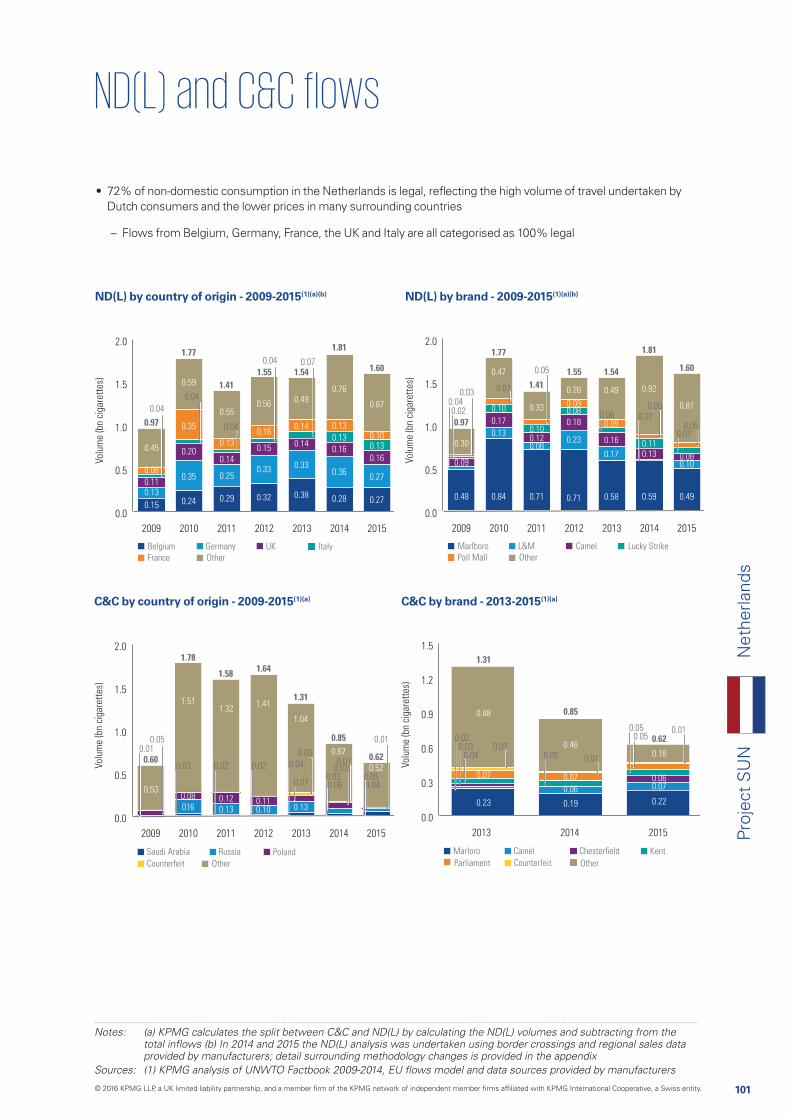
101
Proj
ect
SU
N
Notes: (a) KPMG calculates the split between C&C and ND(L) by calculating the ND(L) volumes and subtracting from the
provided by manufacturers; detail surrounding methodology changes is provided in the appendix
ND(L) by country of origin - 2009-2015(1)(a)(b)
C&C by country of origin - 2009-2015(1)(a)
0.0
0.5
1.0
1.5
2.0
2009 2010 2011 2012 2013 2014 2015
0.15
0.130.11
0.08
0.45
0.33
0.56
0.16
0.15
0.32
0.33
0.14
0.14
0.49
0.38
0.97
1.77
1.411.55 1.54
1.81
1.60
0.25
0.14
0.29
0.55
0.13
0.35
0.20
0.59
0.35
0.24 0.28
0.36
0.16
0.13
0.13
0.76
0.27
0.27
0.100.13
0.16
0.67
Germany ItalyUKBelgium
OtherFrance
Volu
me
(bn
ciga
rett
es)
0.04 0.07
0.04
0.04
0.04
0.0
0.5
1.0
1.5
2.0
2009 2010 2011 2012 2013 2014 2015
0.48
0.09
0.30
0.26
0.080.09
0.090.18
0.23
0.71
0.17
0.16
0.49
0.58
0.97
1.77
1.411.55 1.54
1.81
1.60
0.080.12
0.71
0.33
0.100.17
0.10
0.13
0.47
0.84 0.59
0.130.11
0.92
0.49
0.100.08
0.81
L&M Lucky StrikeCamelMarlboro
OtherPall Mall
Volu
me
(bn
ciga
rett
es)
0.060.05
0.01
0.030.040.02
0.07
0.050.07
0.05
0.0
0.5
1.0
1.5
2.0
2009 2010 2011 2012 2013 2014 2015
0.53
0.100.11
1.41
1.04
0.13
0.60
1.78
1.58 1.64
1.31
0.85
0.62
0.13
1.32
0.12
1.51
0.08016
0.67
0.52Volu
me
(bn
ciga
rett
es)
Saudi Arabia Russia Poland
OtherCounterfeit
0.050.01
0.03 0.02 0.04
0.03
0.070.03
0.07
0.06
0.01
0.050.04
0.01
0.02
0.0
0.3
0.6
0.9
1.2
1.5
2013 2014 2015
0.88
0.23
0.07
1.31
0.85
0.620.46
0.19
0.06
0.07
0.22
0.070.06
0.16
Volu
me
(bn
ciga
rett
es)
Marloro Camel Chesterfield
Parliament
Kent
OtherCounterfeit
0.020.03
0.040.03
0.05
0.01
0.01
0.050.05
ND(L) by brand - 2009-2015(1)(a)(b)
C&C by brand - 2013-2015(1)(a)
• 72% of non-domestic consumption in the Netherlands is legal, reflecting the high volume of travel undertaken by Dutch consumers and the lower prices in many surrounding countries
– Flows from Belgium, Germany, France, the UK and Italy are all categorised as 100% legal
Net
herla
nds
© 2016 KPMG LLP, a UK limited liability partnership, and a member firm of the KPMG network of independent member firms affiliated with KPMG International Cooperative, a Swiss entity.
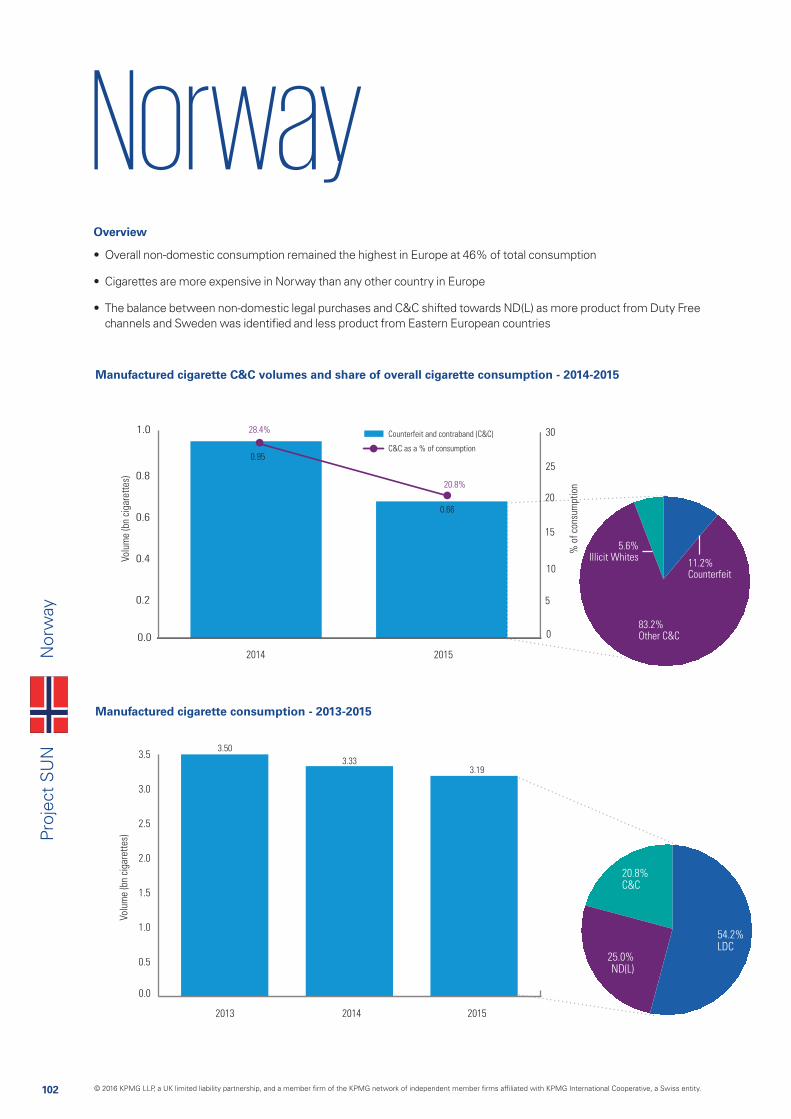
102
Proj
ect
SU
NN
orw
ay
Manufactured cigarette consumption - 2013-2015
Manufactured cigarette C&C volumes and share of overall cigarette consumption - 2014-2015
0.0
0.2
0.4
0.6
0.8
1.0
Volu
me
(bn
ciga
rett
es)
% o
f co
nsum
ptio
n
Counterfeit and contraband (C&C)
C&C as a % of consumption
2014 2015
0
5
10
15
20
25
3028.4%
20.8%
0.95
0.66
Volu
me
(bn
ciga
rett
es)
20142013 2015
3.193.33
3.50
0.0
0.5
1.0
1.5
2.0
2.5
3.0
3.5
20 p
83.2%Other C&C
11.2%Counterfeit
5.6%Illicit Whites
25.0%ND(L)
20.8%C&C
54.2%LDC
Overview
• Overall non-domestic consumption remained the highest in Europe at 46% of total consumption
• Cigarettes are more expensive in Norway than any other country in Europe
• The balance between non-domestic legal purchases and C&C shifted towards ND(L) as more product from Duty Free channels and Sweden was identified and less product from Eastern European countries
© 2016 KPMG LLP, a UK limited liability partnership, and a member firm of the KPMG network of independent member firms affiliated with KPMG International Cooperative, a Swiss entity.
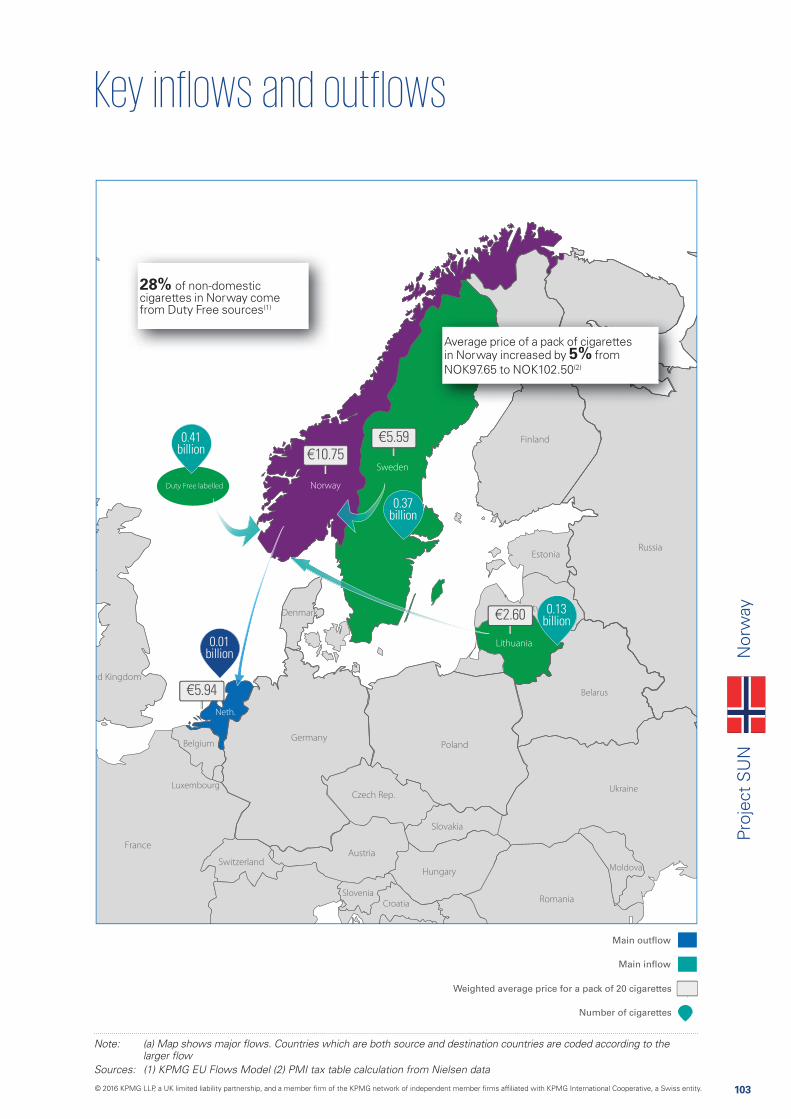
103
Proj
ect
SU
NN
orw
ay
Main outflow
Main inflow
Weighted average price for a pack of 20 cigarettes
Number of cigarettes
Croatia
Neth.
Belgium
Moldova
Belarus
Ukraine
Slovenia
Luxembourg
Sources: (1) KPMG EU Flows Model (2) PMI tax table calculation from Nielsen data
€2.60
€10.75€5.59
€5.94
0.37 billion
0.01 billion
0.13 billion
0.41 billion
28% of non-domestic cigarettes in Norway come from Duty Free sources(1)
Average price of a pack of cigarettes in Norway increased by 5% from NOK97.65 to NOK102.50(2)
Duty Free labelled
© 2016 KPMG LLP, a UK limited liability partnership, and a member firm of the KPMG network of independent member firms affiliated with KPMG International Cooperative, a Swiss entity.
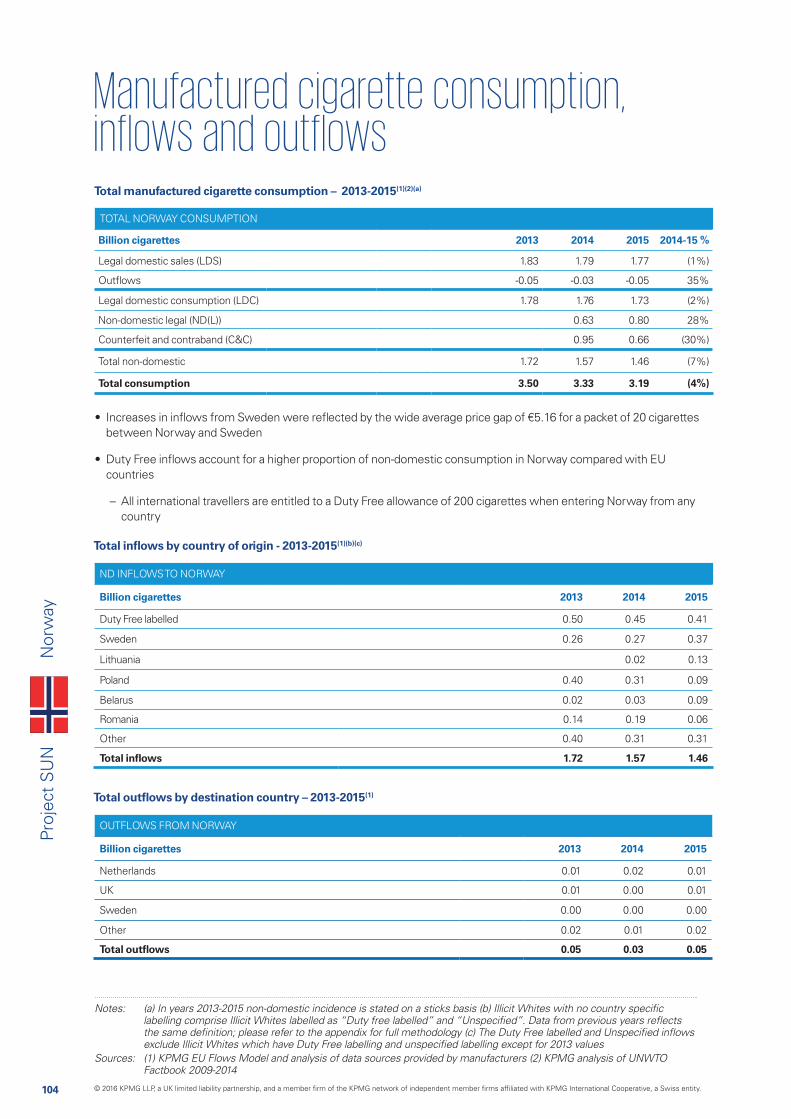
104
Proj
ect
SU
N
ND INFLOWS TO NORWAY
Billion cigarettes 2013 2014 2015
Duty Free labelled 0.50 0.45 0.41
Sweden 0.26 0.27 0.37
Lithuania 0.02 0.13
Poland 0.40 0.31 0.09
Belarus 0.02 0.03 0.09
Romania 0.14 0.19 0.06
Other 0.40 0.31 0.31
Total inflows 1.72 1.57 1.46
Total manufactured cigarette consumption – 2013-2015(1)(2)(a)
Total inflows by country of origin - 2013-2015(1)(b)(c)
TOTAL NORWAY CONSUMPTION
Billion cigarettes 2013 2014 2015 2014-15 %
Legal domestic sales (LDS) 1.83 1.79 1.77 (1%)
Outflows -0.05 -0.03 -0.05 35%
Legal domestic consumption (LDC) 1.78 1.76 1.73 (2%)
Non-domestic legal (ND(L)) 0.63 0.80 28%
Counterfeit and contraband (C&C) 0.95 0.66 (30%)
Total non-domestic 1.72 1.57 1.46 (7%)
Total consumption 3.50 3.33 3.19 (4%)
Total outflows by destination country – 2013-2015(1)
OUTFLOWS FROM NORWAY
Billion cigarettes 2013 2014 2015
Netherlands 0.01 0.02 0.01
UK 0.01 0.00 0.01
Sweden 0.00 0.00 0.00
Other 0.02 0.01 0.02
Total outflows 0.05 0.03 0.05
Sources: (1) KPMG EU Flows Model and analysis of data sources provided by manufacturers (2) KPMG analysis of UNWTO Factbook 2009-2014
• Increases in inflows from Sweden were reflected by the wide average price gap of €5.16 for a packet of 20 cigarettes between Norway and Sweden
• Duty Free inflows account for a higher proportion of non-domestic consumption in Norway compared with EU countries
– All international travellers are entitled to a Duty Free allowance of 200 cigarettes when entering Norway from any country
Nor
way
© 2016 KPMG LLP, a UK limited liability partnership, and a member firm of the KPMG network of independent member firms affiliated with KPMG International Cooperative, a Swiss entity.

105
Proj
ect
SU
N
Notes: (a) KPMG calculates the split between C&C and ND(L) by calculating the ND(L) volumes and subtracting from the
provided by manufacturers; detail surrounding methodology changes is provided in the appendix (c) As Norway has
ND(L) by country of origin - 2014-2015(1)(a)(b)(c)
C&C by country of origin - 2014-2015(1)(a)(c)
0.0
0.2
0.4
0.6
0.8
1.0
2014 2015
0.63
0.80
0.27
0.33
0.37
0.38
Denmark GermanyPolandSweden
Other
Volu
me
(bn
ciga
rett
es)
0.020.010.01
0.010.020.02
0.0
0.2
0.4
0.6
0.8
1.0
2014 2015
0.63
0.80
0.25
0.18
0.13
0.32
0.16
0.040.040.04
0.20
Prince Lucky StrikeCamelMarlboro
L&M Other
Volu
me
(bn
ciga
rett
es)
0.010.020.03
0.0
0.2
0.4
0.6
0.8
1.0
2014 2015
0.95
0.66
0.30
0.31
0.19
0.09
0.13
0.09
0.08
0.23
0.070.06
Belarus RomaniaPolandLithuania
Counterfeit Other
Volu
me
(bn
ciga
rett
es)
0.030.01
0.0
0.2
0.4
0.6
0.8
1.0
2014 2015
0.95
0.66
0.64
0.07
0.09
0.060.04
0.35
0.07
0.07
0.10
Winston L&MKentMarlboro
Camel Counterfeit Other
Volu
me
(bn
ciga
rett
es)
0.020.030.03
0.02 0.02
ND(L) by brand - 2014-2015(1)(a)(b)(c)
C&C by brand - 2014-2015(1)(a)(c)
• While the total level of non-domestic consumption remained at the highest level in Europe, 46% compared to 47% in 2014, the split between non-domestic legal and C&C changed. An increase in Swedish flows was offset by declines in volumes from Eastern Europe, especially Romania and Poland
– While Norway has an immigrant population of over 97,000 Polish-born and 37,000 Lithuanian-born residents(2), the flows of cigarettes identified from these countries in 2014 was not supported by the travel movements between each country. As a result, the majority of the product was C&C
• High numbers of Norwegians travel to Sweden take advantage of cheaper goods, including cigarettes, resulting in 12% of total consumption in Norway being Swedish ND(L)
Nor
way
© 2016 KPMG LLP, a UK limited liability partnership, and a member firm of the KPMG network of independent member firms affiliated with KPMG International Cooperative, a Swiss entity.
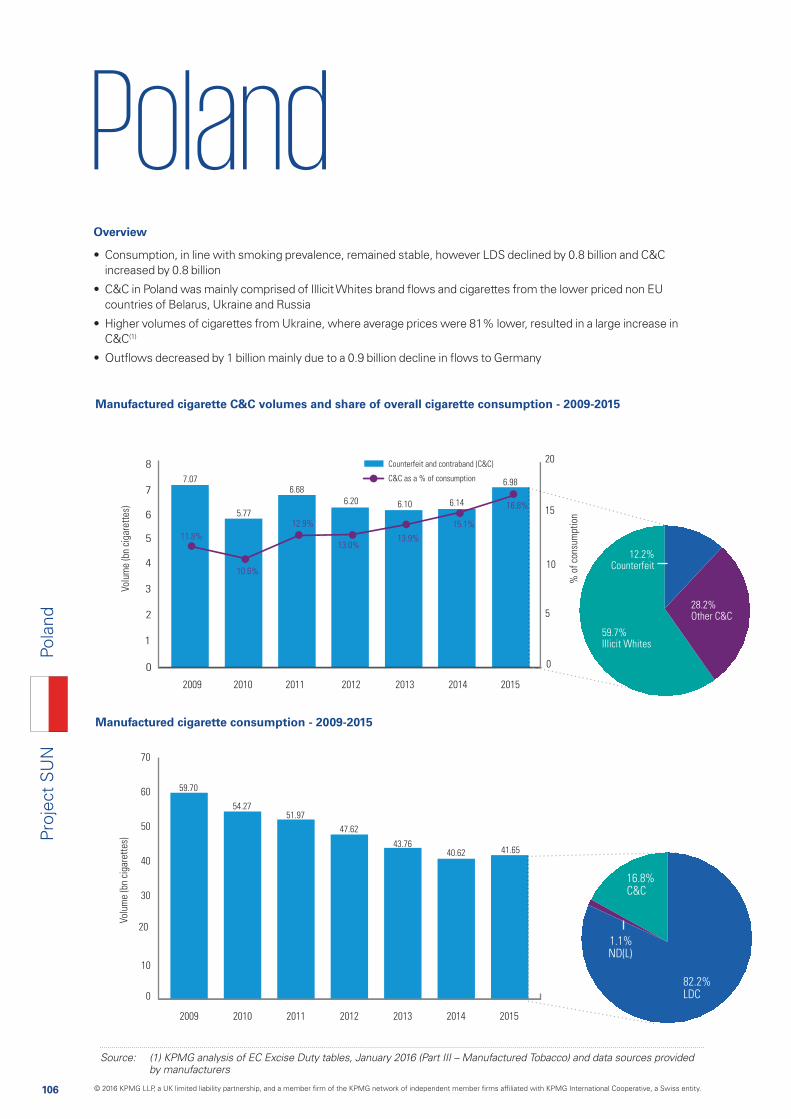
106
Proj
ect
SU
NPo
land
Manufactured cigarette consumption - 2009-2015
Manufactured cigarette C&C volumes and share of overall cigarette consumption - 2009-2015
0
1
2
3
4
5
6
7
8
Volu
me
(bn
ciga
rett
es)
% o
f co
nsum
ptio
n
Counterfeit and contraband (C&C)
C&C as a % of consumption
2009 2010 2011 2012 2013 2014 2015
0
5
10
15
20
11.8%
10.6%
12.9%
13.0%13.9%
15.1%
16.8%
7.07
5.77
6.68
6.20 6.10 6.14
6.98
Volu
me
(bn
ciga
rett
es)
2009 2010 2011 2012 2013 2014 2015
59.70
54.2751.97
47.62
43.7641.6540.62
0
10
20
30
40
50
60
70
28.2%Other C&C
12.2%Counterfeit
59.7%Illicit Whites
1.1%ND(L)
16.8%C&C
82.2%LDC
Source: (1) KPMG analysis of EC Excise Duty tables, January 2016 (Part III – Manufactured Tobacco) and data sources provided by manufacturers
Overview
• Consumption, in line with smoking prevalence, remained stable, however LDS declined by 0.8 billion and C&C increased by 0.8 billion
• C&C in Poland was mainly comprised of Illicit Whites brand flows and cigarettes from the lower priced non EU countries of Belarus, Ukraine and Russia
• Higher volumes of cigarettes from Ukraine, where average prices were 81% lower, resulted in a large increase in C&C(1)
• Outflows decreased by 1 billion mainly due to a 0.9 billion decline in flows to Germany
© 2016 KPMG LLP, a UK limited liability partnership, and a member firm of the KPMG network of independent member firms affiliated with KPMG International Cooperative, a Swiss entity.
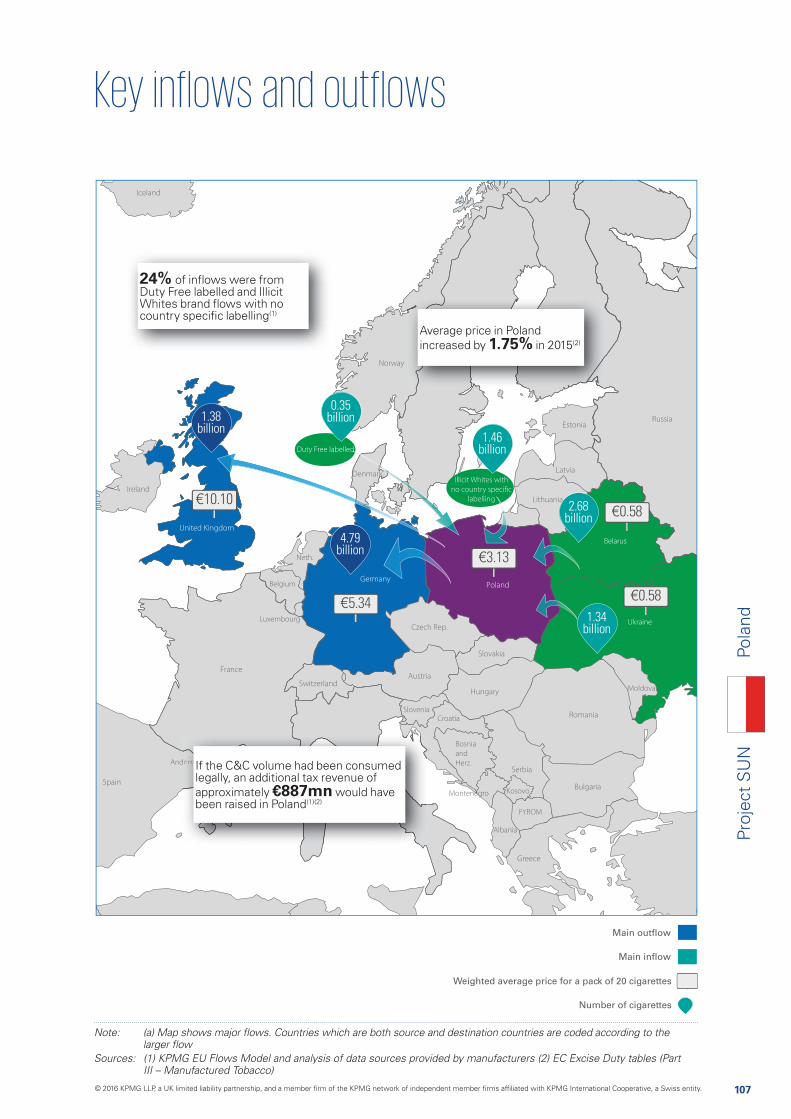
107
Proj
ect
SU
NPo
land
Main outflow
Main inflow
Weighted average price for a pack of 20 cigarettes
Number of cigarettes
Croatia
Bosnia
and
Herz.Andorra
Montenegro
FYROM
Albania
Neth.
Belgium
Moldova
Belarus
Kosovo
Ukraine
Slovenia
Luxembourg
Sources: (1) KPMG EU Flows Model and analysis of data sources provided by manufacturers (2) EC Excise Duty tables (Part III – Manufactured Tobacco)
€3.13
€5.34€0.58
€0.58€10.10
1.46 billion
1.38 billion
4.79 billion
1.34 billion
0.35 billion
2.68 billion
24% of inflows were from Duty Free labelled and Illicit Whites brand flows with no country specific labelling(1)
Average price in Poland increased by 1.75% in 2015(2)
dorrrrraaaIf the C&C volume had been consumed legally, an additional tax revenue of approximately €887mn would have been raised in Poland(1)(2)
Duty Free labelled
Illicit Whites with
no country specific
labelling
© 2016 KPMG LLP, a UK limited liability partnership, and a member firm of the KPMG network of independent member firms affiliated with KPMG International Cooperative, a Swiss entity.
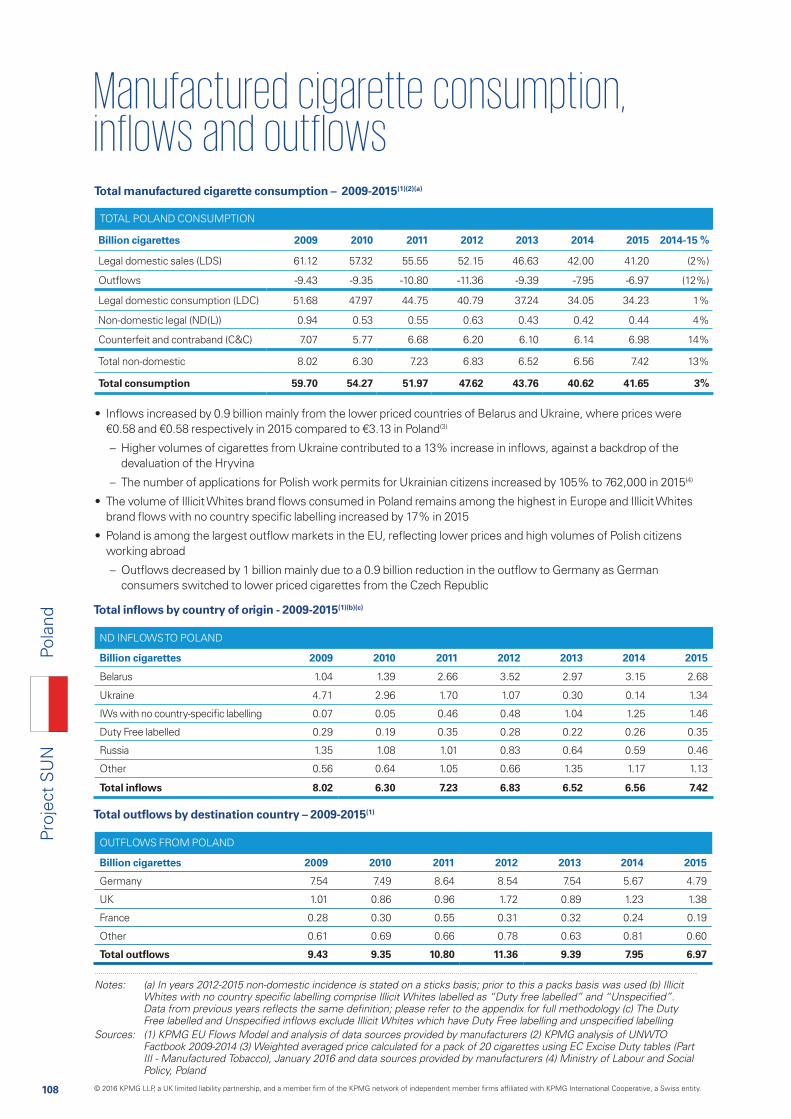
108
Proj
ect
SU
N
ND INFLOWS TO POLAND
Billion cigarettes 2009 2010 2011 2012 2013 2014 2015
Belarus 1.04 1.39 2.66 3.52 2.97 3.15 2.68
Ukraine 4.71 2.96 1.70 1.07 0.30 0.14 1.34
IWs with no country-specific labelling 0.07 0.05 0.46 0.48 1.04 1.25 1.46
Duty Free labelled 0.29 0.19 0.35 0.28 0.22 0.26 0.35
Russia 1.35 1.08 1.01 0.83 0.64 0.59 0.46
Other 0.56 0.64 1.05 0.66 1.35 1.17 1.13
Total inflows 8.02 6.30 7.23 6.83 6.52 6.56 7.42
Total manufactured cigarette consumption – 2009-2015(1)(2)(a)
Total inflows by country of origin - 2009-2015(1)(b)(c)
TOTAL POLAND CONSUMPTION
Billion cigarettes 2009 2010 2011 2012 2013 2014 2015 2014-15 %
Legal domestic sales (LDS) 61.12 57.32 55.55 52.15 46.63 42.00 41.20 (2%)
Outflows -9.43 -9.35 -10.80 -11.36 -9.39 -7.95 -6.97 (12%)
Legal domestic consumption (LDC) 51.68 47.97 44.75 40.79 37.24 34.05 34.23 1%
Non-domestic legal (ND(L)) 0.94 0.53 0.55 0.63 0.43 0.42 0.44 4%
Counterfeit and contraband (C&C) 7.07 5.77 6.68 6.20 6.10 6.14 6.98 14%
Total non-domestic 8.02 6.30 7.23 6.83 6.52 6.56 7.42 13%
Total consumption 59.70 54.27 51.97 47.62 43.76 40.62 41.65 3%
Total outflows by destination country – 2009-2015(1)
OUTFLOWS FROM POLAND
Billion cigarettes 2009 2010 2011 2012 2013 2014 2015
Germany 7.54 7.49 8.64 8.54 7.54 5.67 4.79
UK 1.01 0.86 0.96 1.72 0.89 1.23 1.38
France 0.28 0.30 0.55 0.31 0.32 0.24 0.19
Other 0.61 0.69 0.66 0.78 0.63 0.81 0.60
Total outflows 9.43 9.35 10.80 11.36 9.39 7.95 6.97
Notes: (a) In years 2012-2015 non-domestic incidence is stated on a sticks basis; prior to this a packs basis was used (b) Illicit
Sources: (1) KPMG EU Flows Model and analysis of data sources provided by manufacturers (2) KPMG analysis of UNWTO Factbook 2009-2014 (3) Weighted averaged price calculated for a pack of 20 cigarettes using EC Excise Duty tables (Part III - Manufactured Tobacco), January 2016 and data sources provided by manufacturers (4) Ministry of Labour and Social Policy, Poland
• Inflows increased by 0.9 billion mainly from the lower priced countries of Belarus and Ukraine, where prices were €0.58 and €0.58 respectively in 2015 compared to €3.13 in Poland(3)
– Higher volumes of cigarettes from Ukraine contributed to a 13% increase in inflows, against a backdrop of the devaluation of the Hryvina
– The number of applications for Polish work permits for Ukrainian citizens increased by 105% to 762,000 in 2015(4)
• The volume of Illicit Whites brand flows consumed in Poland remains among the highest in Europe and Illicit Whites brand flows with no country specific labelling increased by 17% in 2015
• Poland is among the largest outflow markets in the EU, reflecting lower prices and high volumes of Polish citizens working abroad
– Outflows decreased by 1 billion mainly due to a 0.9 billion reduction in the outflow to Germany as German consumers switched to lower priced cigarettes from the Czech Republic
Pola
nd
© 2016 KPMG LLP, a UK limited liability partnership, and a member firm of the KPMG network of independent member firms affiliated with KPMG International Cooperative, a Swiss entity.
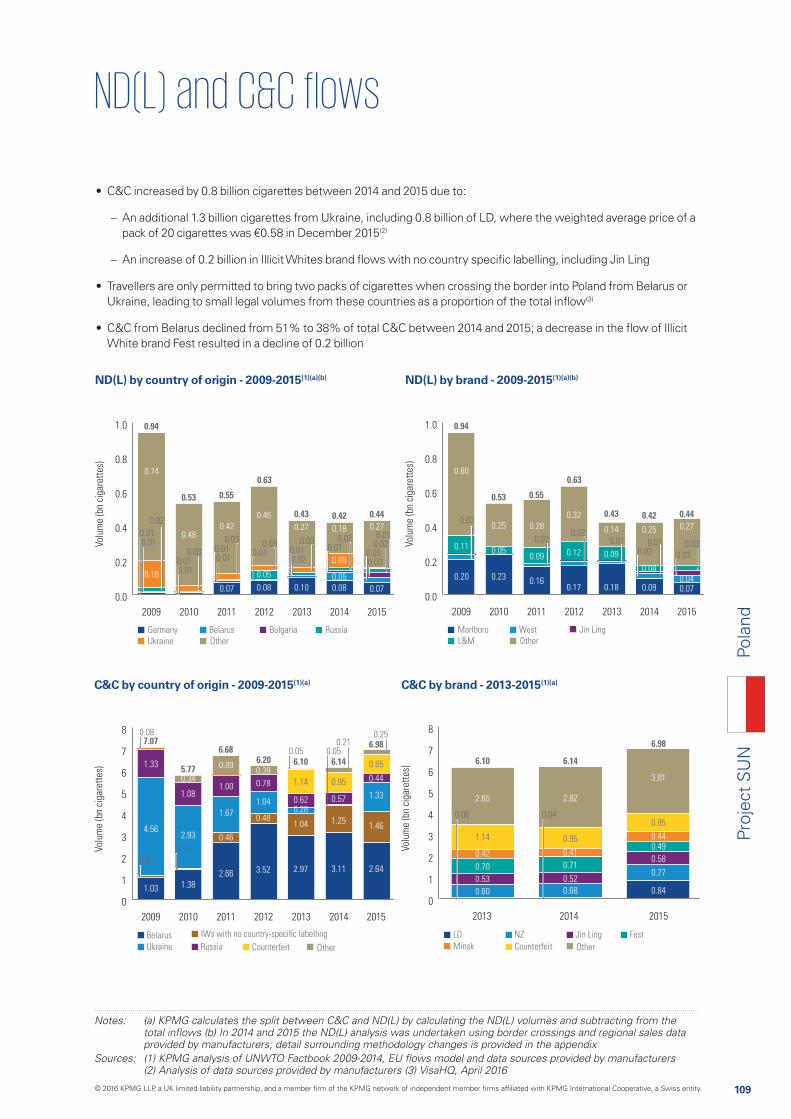
109
Proj
ect
SU
N
Notes: (a) KPMG calculates the split between C&C and ND(L) by calculating the ND(L) volumes and subtracting from the
provided by manufacturers; detail surrounding methodology changes is provided in the appendix
ND(L) by country of origin - 2009-2015(1)(a)(b)
C&C by country of origin - 2009-2015(1)(a)
0.0
0.2
0.4
0.6
0.8
1.0
2009 2010 2011 2012 2013 2014 2015
0.16
0.74
0.05
0.46
0.08
0.27
0.14
0.10
0.94
0.53 0.55
0.63
0.43 0.42 0.44
0.07
0.420.48
0.080.05
0.08
0.18
0.07
0.27
Belarus RussiaBulgariaGermany
OtherUkraine
Volu
me
(bn
ciga
rett
es)
0.02
0.010.01
0.030.010.01
0.030.010.01
0.030.010.02
0.020.010.03
0.01
0.01
0.030.03
0.02
0.0
0.2
0.4
0.6
0.8
1.0
2009 2010 2011 2012 2013 2014 2015
0.20
0.11
0.60
0.12
0.32
0.17
0.14
0.14
0.18
0.09
0.94
0.53 0.55
0.63
0.43 0.42 0.44
0.16
0.09
0.280.25
0.05
0.230.09
0.04
0.25
0.070.04
0.27
West
L&M
Jin LingMarlboro
Other
Volu
me
(bn
ciga
rett
es)
0.03
0.02 0.01 0.010.03
0.02
0.03
0.03
0
1
2
3
4
5
6
7
8
2009 2010 2011 2012 2013 2014 2015
1.03
1.33
4.56
3.52
0.78
0.39
1.04
0.48
0.62
1.04
0.28
1.14
2.97
7.07
5.77
6.686.20 6.10 6.14
6.98
2.66
1.00
0.89
1.67
0.46
1.08
0.34
2.93
1.38
0.95
0.57
1.25
3.11
0.85
0.44
1.33
1.46
2.64
Volu
me
(bn
ciga
rett
es)
IWs with no country-specific labellingBelarus
Ukraine Russia OtherCounterfeit
0.07
0.08
0.05
0.05 0.050.21
0.25
0
1
2
3
4
5
6
7
8
2013 2014 2015
0.42
0.53
0.70
1.14
2.65
0.60
6.10 6.14
6.98
2.82
0.41
0.95
0.71
0.52
0.68
3.01
0.490.44
0.85
0.58
0.77
0.84
Volu
me
(bn
ciga
rett
es)
LD
Minsk
NZ Jin Ling Fest
OtherCounterfeit
0.06 0.04
ND(L) by brand - 2009-2015(1)(a)(b)
C&C by brand - 2013-2015(1)(a)
• C&C increased by 0.8 billion cigarettes between 2014 and 2015 due to:
– An additional 1.3 billion cigarettes from Ukraine, including 0.8 billion of LD, where the weighted average price of a pack of 20 cigarettes was €0.58 in December 2015(2)
– An increase of 0.2 billion in Illicit Whites brand flows with no country specific labelling, including Jin Ling
• Travellers are only permitted to bring two packs of cigarettes when crossing the border into Poland from Belarus or Ukraine, leading to small legal volumes from these countries as a proportion of the total inflow(3)
• C&C from Belarus declined from 51% to 38% of total C&C between 2014 and 2015; a decrease in the flow of Illicit White brand Fest resulted in a decline of 0.2 billion
Pola
nd
© 2016 KPMG LLP, a UK limited liability partnership, and a member firm of the KPMG network of independent member firms affiliated with KPMG International Cooperative, a Swiss entity.
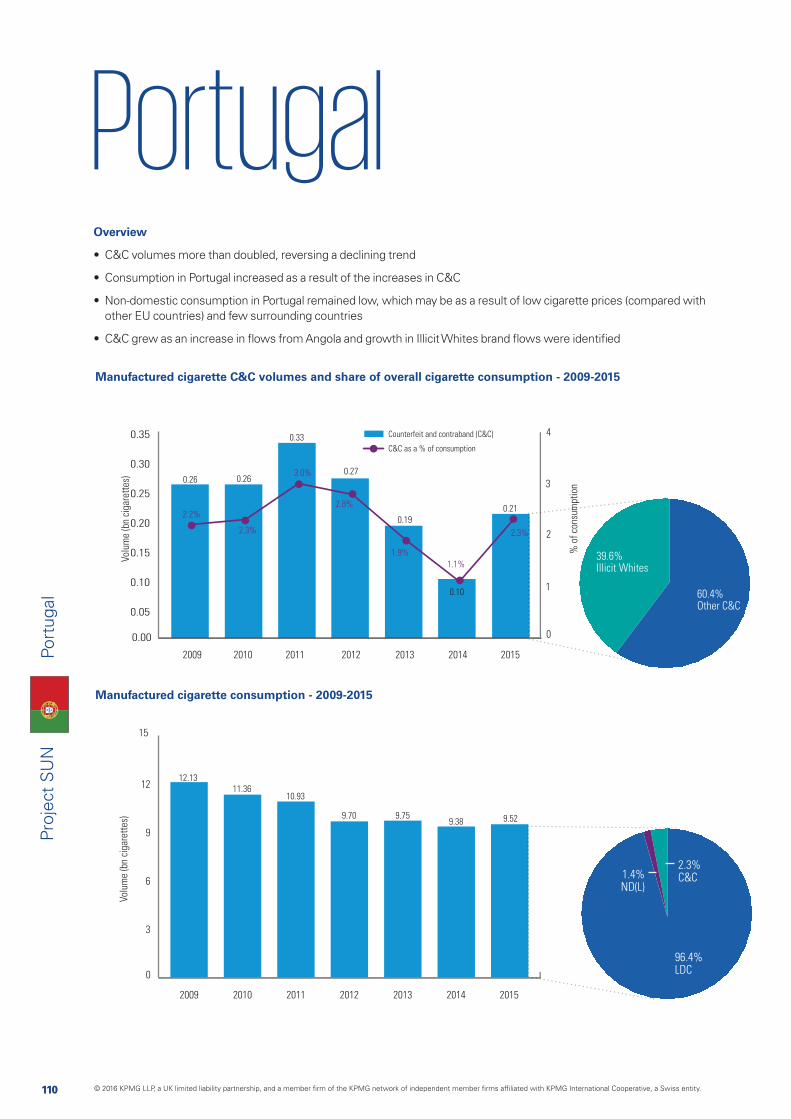
110
Proj
ect
SU
N
110
Port
ugal
Manufactured cigarette consumption - 2009-2015
Manufactured cigarette C&C volumes and share of overall cigarette consumption - 2009-2015
0.00
0.05
0.10
0.15
0.20
0.25
0.30
0.35
Volu
me
(bn
ciga
rett
es)
% o
f co
nsum
ptio
n
Counterfeit and contraband (C&C)
C&C as a % of consumption
2009 2010 2011 2012 2013 2014 2015
0
1
2
3
4
2.2%
2.3%
3.0%
2.8%
1.9%
1.1%
2.3%
0.26 0.26
0.33
0.27
0.19
0.10
0.21
Volu
me
(bn
ciga
rett
es)
2009 2010 2011 2012 2013 2014 2015
12.1311.36
10.93
9.70 9.75 9.529.38
0
3
6
9
12
15
m
60.4%Other C&C
39.6%Illicit Whites
1.4%ND(L)
2.3%C&C
96.4%LDC
Overview
• C&C volumes more than doubled, reversing a declining trend
• Consumption in Portugal increased as a result of the increases in C&C
• Non-domestic consumption in Portugal remained low, which may be as a result of low cigarette prices (compared with other EU countries) and few surrounding countries
• C&C grew as an increase in flows from Angola and growth in Illicit Whites brand flows were identified
© 2016 KPMG LLP, a UK limited liability partnership, and a member firm of the KPMG network of independent member firms affiliated with KPMG International Cooperative, a Swiss entity.
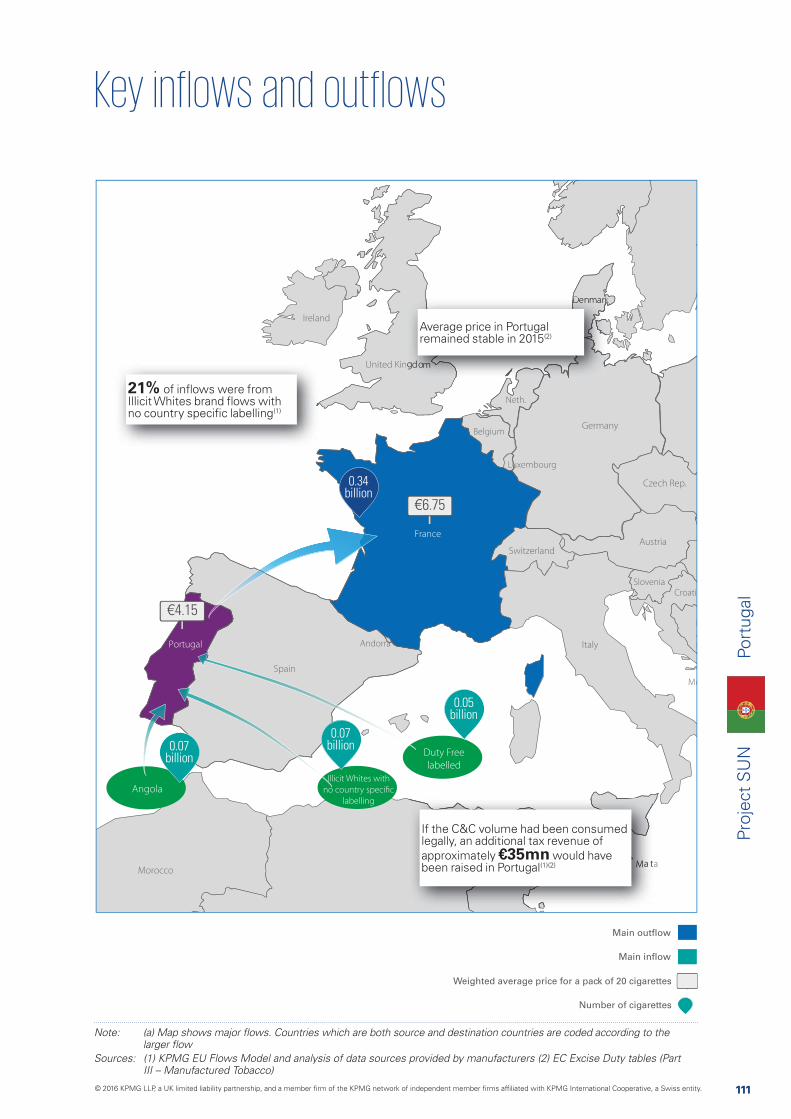
111
Proj
ect
SU
N
111
Port
ugal
Main outflow
Main inflow
Weighted average price for a pack of 20 cigarettes
Number of cigarettes
Croati
B
a
HAndorra
Mo
Neth.
Belgium
Slovenia
Luxembourg
Sources: (1) KPMG EU Flows Model and analysis of data sources provided by manufacturers (2) EC Excise Duty tables (Part III – Manufactured Tobacco)
€6.75
€4.15
0.34 billion
0.05 billion
0.07 billion 0.07
billion
21% of inflows were from Illicit Whites brand flows with no country specific labelling(1)
Average price in Portugal remained stable in 2015(2)
If the C&C volume had been consumed legally, an additional tax revenue of approximately €35mn would have been raised in Portugal(1)(2)
Duty Free
labelled
AngolaIllicit Whites with
no country specific
labelling
© 2016 KPMG LLP, a UK limited liability partnership, and a member firm of the KPMG network of independent member firms affiliated with KPMG International Cooperative, a Swiss entity.
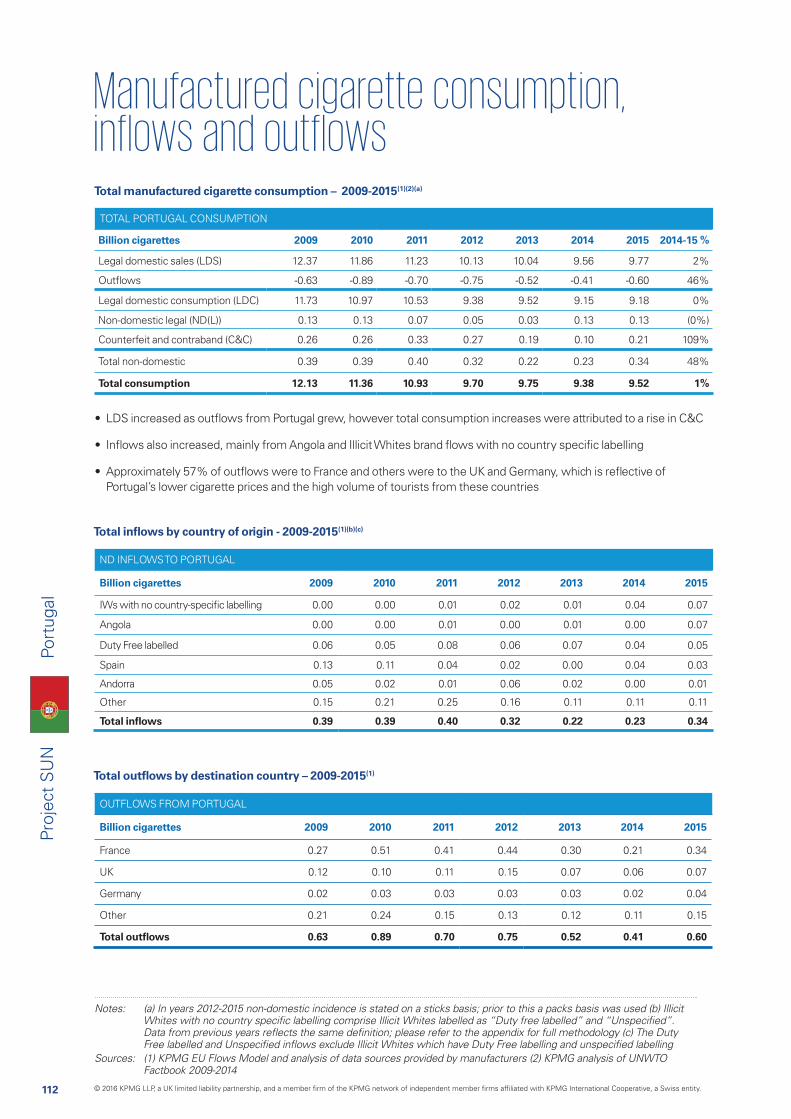
112
Proj
ect
SU
N
ND INFLOWS TO PORTUGAL
Billion cigarettes 2009 2010 2011 2012 2013 2014 2015
IWs with no country-specific labelling 0.00 0.00 0.01 0.02 0.01 0.04 0.07
Angola 0.00 0.00 0.01 0.00 0.01 0.00 0.07
Duty Free labelled 0.06 0.05 0.08 0.06 0.07 0.04 0.05
Spain 0.13 0.11 0.04 0.02 0.00 0.04 0.03
Andorra 0.05 0.02 0.01 0.06 0.02 0.00 0.01
Other 0.15 0.21 0.25 0.16 0.11 0.11 0.11
Total inflows 0.39 0.39 0.40 0.32 0.22 0.23 0.34
Total manufactured cigarette consumption – 2009-2015(1)(2)(a)
Total inflows by country of origin - 2009-2015(1)(b)(c)
TOTAL PORTUGAL CONSUMPTION
Billion cigarettes 2009 2010 2011 2012 2013 2014 2015 2014-15 %
Legal domestic sales (LDS) 12.37 11.86 11.23 10.13 10.04 9.56 9.77 2%
Outflows -0.63 -0.89 -0.70 -0.75 -0.52 -0.41 -0.60 46%
Legal domestic consumption (LDC) 11.73 10.97 10.53 9.38 9.52 9.15 9.18 0%
Non-domestic legal (ND(L)) 0.13 0.13 0.07 0.05 0.03 0.13 0.13 (0%)
Counterfeit and contraband (C&C) 0.26 0.26 0.33 0.27 0.19 0.10 0.21 109%
Total non-domestic 0.39 0.39 0.40 0.32 0.22 0.23 0.34 48%
Total consumption 12.13 11.36 10.93 9.70 9.75 9.38 9.52 1%
Total outflows by destination country – 2009-2015(1)
OUTFLOWS FROM PORTUGAL
Billion cigarettes 2009 2010 2011 2012 2013 2014 2015
France 0.27 0.51 0.41 0.44 0.30 0.21 0.34
UK 0.12 0.10 0.11 0.15 0.07 0.06 0.07
Germany 0.02 0.03 0.03 0.03 0.03 0.02 0.04
Other 0.21 0.24 0.15 0.13 0.12 0.11 0.15
Total outflows 0.63 0.89 0.70 0.75 0.52 0.41 0.60
Notes: (a) In years 2012-2015 non-domestic incidence is stated on a sticks basis; prior to this a packs basis was used (b) Illicit
Sources: (1) KPMG EU Flows Model and analysis of data sources provided by manufacturers (2) KPMG analysis of UNWTO Factbook 2009-2014
• LDS increased as outflows from Portugal grew, however total consumption increases were attributed to a rise in C&C
• Inflows also increased, mainly from Angola and Illicit Whites brand flows with no country specific labelling
• Approximately 57% of outflows were to France and others were to the UK and Germany, which is reflective of Portugal’s lower cigarette prices and the high volume of tourists from these countries
Port
ugal
© 2016 KPMG LLP, a UK limited liability partnership, and a member firm of the KPMG network of independent member firms affiliated with KPMG International Cooperative, a Swiss entity.
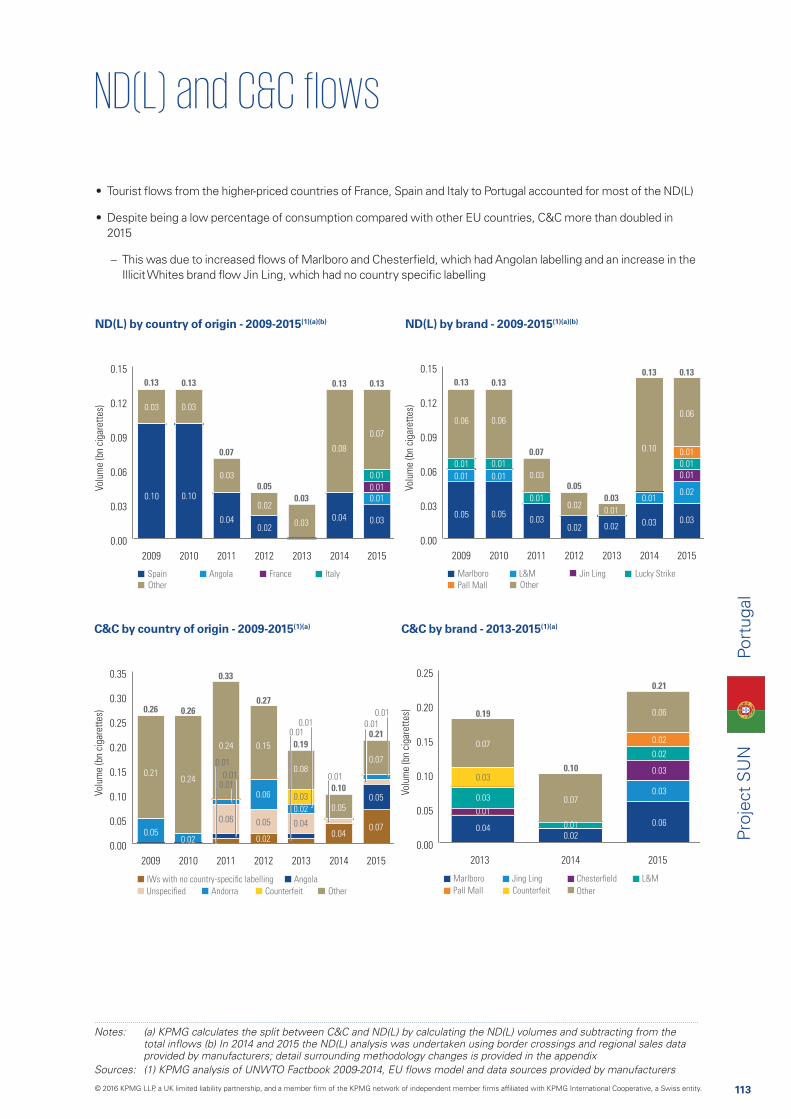
113
Proj
ect
SU
N
Notes: (a) KPMG calculates the split between C&C and ND(L) by calculating the ND(L) volumes and subtracting from the
provided by manufacturers; detail surrounding methodology changes is provided in the appendix
ND(L) by country of origin - 2009-2015(1)(a)(b)
C&C by country of origin - 2009-2015(1)(a)
0.00
0.03
0.06
0.09
0.12
0.15
2009 2010 2011 2012 2013 2014 2015
0.02
0.02
0.10
0.03
0.03
0.13 0.13
0.07
0.050.03
0.13 0.13
0.04
0.03
0.03
0.10
0.04
0.08
0.07
0.01
0.010.01
0.03
Angola ItalyFranceSpain
Other
Volu
me
(bn
ciga
rett
es)
0.00
0.03
0.06
0.09
0.12
0.15
2009 2010 2011 2012 2013 2014 2015
0.02
0.02
0.05
0.06
0.02
0.01
0.13 0.13
0.07
0.050.03
0.13 0.13
0.03
0.01
0.03
0.06
0.05
0.01 0.01
0.01 0.01
0.03
0.01
0.10
0.06
0.01
0.01
0.02
0.01
0.03
L&M Lucky StrikeJin LingMarlboro
Pall Mall Other
Volu
me
(bn
ciga
rett
es)
0.00
0.05
0.10
0.15
0.20
0.25
0.30
0.35
2009 2010 2011 2012 2013 2014 2015
0.05
1.33
0.21
0.06
0.05
0.15
0.02
0.03
0.08
0.02
0.04
0.26 0.26
0.33
0.27
0.19
0.10
0.21
0.06
0.24
0.24
0.02
0.95
0.57
1.25
0.05
0.04
0.85
0.44
0.07
0.07
0.05
Volu
me
(bn
ciga
rett
es)
IWs with no country-specific labelling Angola
Andorra OtherCounterfeit
0.010.01
0.01
0.01
0.010.01
0.01
0.01
Unspecified
0.00
0.05
0.10
0.15
0.20
0.25
2013 2014 2015
0.07
0.03
0.03
0.01
0.04
0.19
0.10
0.21
0.07
0.010.02
0.06
0.02
0.02
0.03
0.03
0.06
Volu
me
(bn
ciga
rett
es)
Marlboro Chesterfield L&M
OtherCounterfeit
Jing Ling
Pall Mall
ND(L) by brand - 2009-2015(1)(a)(b)
C&C by brand - 2013-2015(1)(a)
• Tourist flows from the higher-priced countries of France, Spain and Italy to Portugal accounted for most of the ND(L)
• Despite being a low percentage of consumption compared with other EU countries, C&C more than doubled in 2015
– This was due to increased flows of Marlboro and Chesterfield, which had Angolan labelling and an increase in the Illicit Whites brand flow Jin Ling, which had no country specific labelling
Port
ugal
© 2016 KPMG LLP, a UK limited liability partnership, and a member firm of the KPMG network of independent member firms affiliated with KPMG International Cooperative, a Swiss entity.
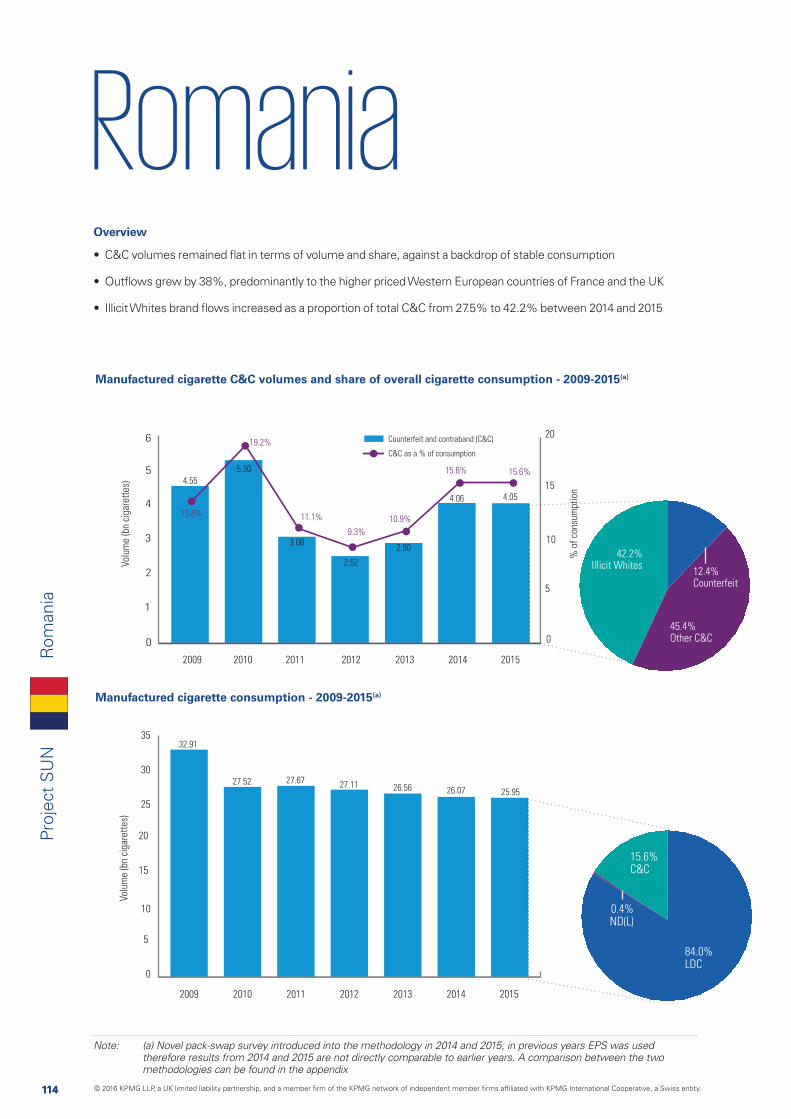
114
Proj
ect
SU
N
Romania
114
Rom
ania
Manufactured cigarette consumption - 2009-2015(a)
Manufactured cigarette C&C volumes and share of overall cigarette consumption - 2009-2015(a)
0
1
2
3
4
5
6
Volu
me
(bn
ciga
rett
es)
% o
f co
nsum
ptio
n
Counterfeit and contraband (C&C)
C&C as a % of consumption
2009 2010 2011 2012 2013 2014 2015
0
5
10
15
20
13.8%
19.2%
11.1%
9.3%
10.9%
15.6% 15.6%4.55
5.30
3.08
2.52
2.90
4.06 4.05
Volu
me
(bn
ciga
rett
es)
2009 2010 2011 2012 2013 2014 2015
32.91
27.52 27.67 27.11 26.56 25.9526.07
0
5
10
15
20
25
30
35
pt
45.4%Other C&C
12.4%Counterfeit
42.2%Illicit Whites
0.4%ND(L)
15.6%C&C
84.0%LDC
Note: (a) Novel pack-swap survey introduced into the methodology in 2014 and 2015; in previous years EPS was used therefore results from 2014 and 2015 are not directly comparable to earlier years. A comparison between the two methodologies can be found in the appendix
Overview
• C&C volumes remained flat in terms of volume and share, against a backdrop of stable consumption
• Outflows grew by 38%, predominantly to the higher priced Western European countries of France and the UK
• Illicit Whites brand flows increased as a proportion of total C&C from 27.5% to 42.2% between 2014 and 2015
© 2016 KPMG LLP, a UK limited liability partnership, and a member firm of the KPMG network of independent member firms affiliated with KPMG International Cooperative, a Swiss entity.
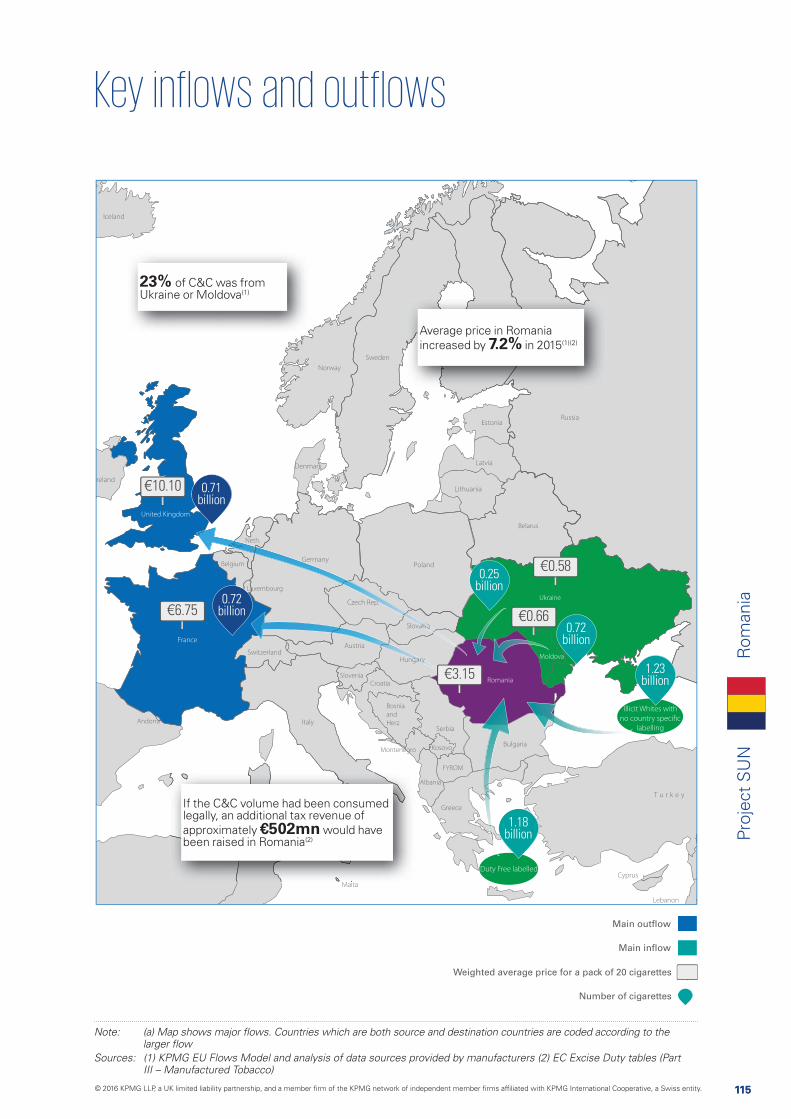
115
Proj
ect
SU
N
115
Rom
ania
Main outflow
Main inflow
Weighted average price for a pack of 20 cigarettes
Number of cigarettes
Croatia
Bosnia
and
Herz.Andorra
Montenegro
FYROM
Albania
Neth.
Belgium
Moldova
Belarus
Kosovo
Ukraine
Slovenia
Luxembourg
Sources: (1) KPMG EU Flows Model and analysis of data sources provided by manufacturers (2) EC Excise Duty tables (Part III – Manufactured Tobacco)
€0.58
€0.66
€3.15
€6.75
€10.10 0.71 billion
0.72 billion
1.18 billion
1.23 billion
0.25 billion
0.72 billion
23% of C&C was from Ukraine or Moldova(1)
Average price in Romania increased by 7.2% in 2015(1)(2)
If the C&C volume had been consumed legally, an additional tax revenue of approximately €502mn would have been raised in Romania(2)
Duty Free labelled
Illicit Whites with
no country specific
labelling
© 2016 KPMG LLP, a UK limited liability partnership, and a member firm of the KPMG network of independent member firms affiliated with KPMG International Cooperative, a Swiss entity.
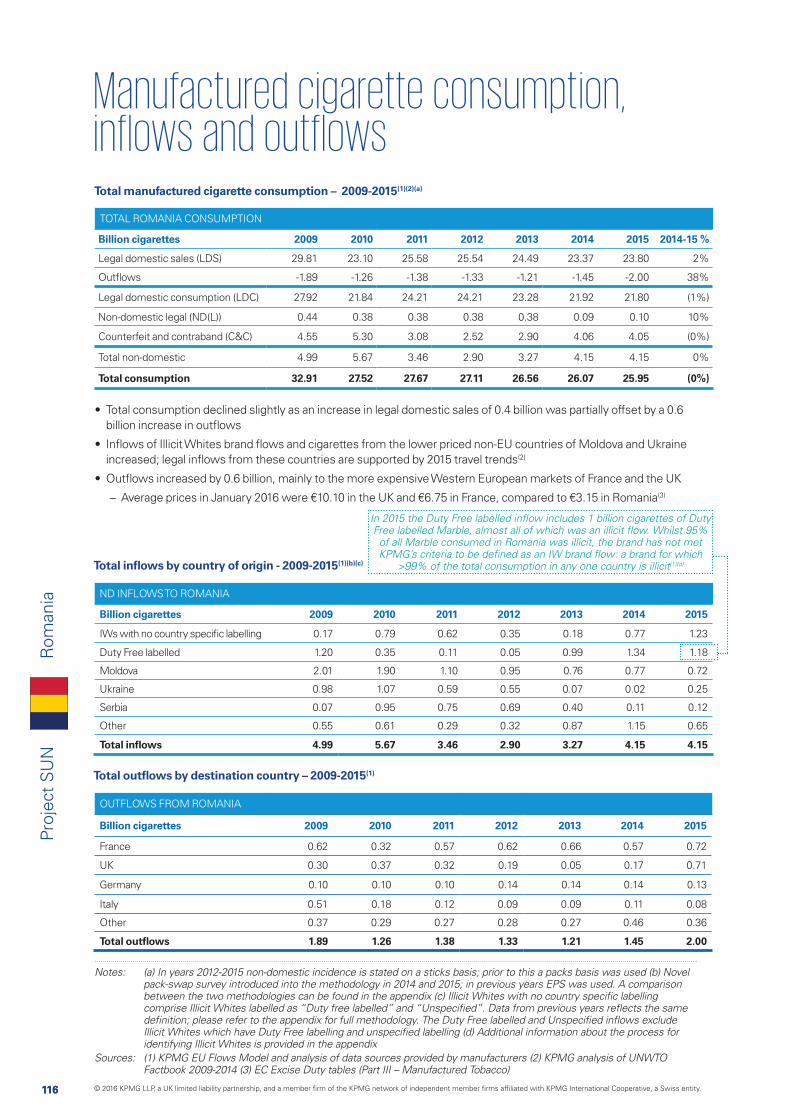
116
Proj
ect
SU
N
116
ND INFLOWS TO ROMANIA
Billion cigarettes 2009 2010 2011 2012 2013 2014 2015
IWs with no country specific labelling 0.17 0.79 0.62 0.35 0.18 0.77 1.23
Duty Free labelled 1.20 0.35 0.11 0.05 0.99 1.34 1.18
Moldova 2.01 1.90 1.10 0.95 0.76 0.77 0.72
Ukraine 0.98 1.07 0.59 0.55 0.07 0.02 0.25
Serbia 0.07 0.95 0.75 0.69 0.40 0.11 0.12
Other 0.55 0.61 0.29 0.32 0.87 1.15 0.65
Total inflows 4.99 5.67 3.46 2.90 3.27 4.15 4.15
Total manufactured cigarette consumption – 2009-2015(1)(2)(a)
Total inflows by country of origin - 2009-2015(1)(b)(c)
TOTAL ROMANIA CONSUMPTION
Billion cigarettes 2009 2010 2011 2012 2013 2014 2015 2014-15 %
Legal domestic sales (LDS) 29.81 23.10 25.58 25.54 24.49 23.37 23.80 2%
Outflows -1.89 -1.26 -1.38 -1.33 -1.21 -1.45 -2.00 38%
Legal domestic consumption (LDC) 27.92 21.84 24.21 24.21 23.28 21.92 21.80 (1%)
Non-domestic legal (ND(L)) 0.44 0.38 0.38 0.38 0.38 0.09 0.10 10%
Counterfeit and contraband (C&C) 4.55 5.30 3.08 2.52 2.90 4.06 4.05 (0%)
Total non-domestic 4.99 5.67 3.46 2.90 3.27 4.15 4.15 0%
Total consumption 32.91 27.52 27.67 27.11 26.56 26.07 25.95 (0%)
Total outflows by destination country – 2009-2015(1)
OUTFLOWS FROM ROMANIA
Billion cigarettes 2009 2010 2011 2012 2013 2014 2015
France 0.62 0.32 0.57 0.62 0.66 0.57 0.72
UK 0.30 0.37 0.32 0.19 0.05 0.17 0.71
Germany 0.10 0.10 0.10 0.14 0.14 0.14 0.13
Italy 0.51 0.18 0.12 0.09 0.09 0.11 0.08
Other 0.37 0.29 0.27 0.28 0.27 0.46 0.36
Total outflows 1.89 1.26 1.38 1.33 1.21 1.45 2.00
Notes: (a) In years 2012-2015 non-domestic incidence is stated on a sticks basis; prior to this a packs basis was used (b) Novel pack-swap survey introduced into the methodology in 2014 and 2015; in previous years EPS was used. A comparison
identifying Illicit Whites is provided in the appendixSources: (1) KPMG EU Flows Model and analysis of data sources provided by manufacturers (2) KPMG analysis of UNWTO Factbook 2009-2014 (3) EC Excise Duty tables (Part III – Manufactured Tobacco)
• Total consumption declined slightly as an increase in legal domestic sales of 0.4 billion was partially offset by a 0.6 billion increase in outflows
• Inflows of Illicit Whites brand flows and cigarettes from the lower priced non-EU countries of Moldova and Ukraine increased; legal inflows from these countries are supported by 2015 travel trends(2)
• Outflows increased by 0.6 billion, mainly to the more expensive Western European markets of France and the UK
– Average prices in January 2016 were €10.10 in the UK and €6.75 in France, compared to €3.15 in Romania(3)
of all Marble consumed in Romania was illicit, the brand has not met
>99% of the total consumption in any one country is illicit(1)(d)
Rom
ania
© 2016 KPMG LLP, a UK limited liability partnership, and a member firm of the KPMG network of independent member firms affiliated with KPMG International Cooperative, a Swiss entity.
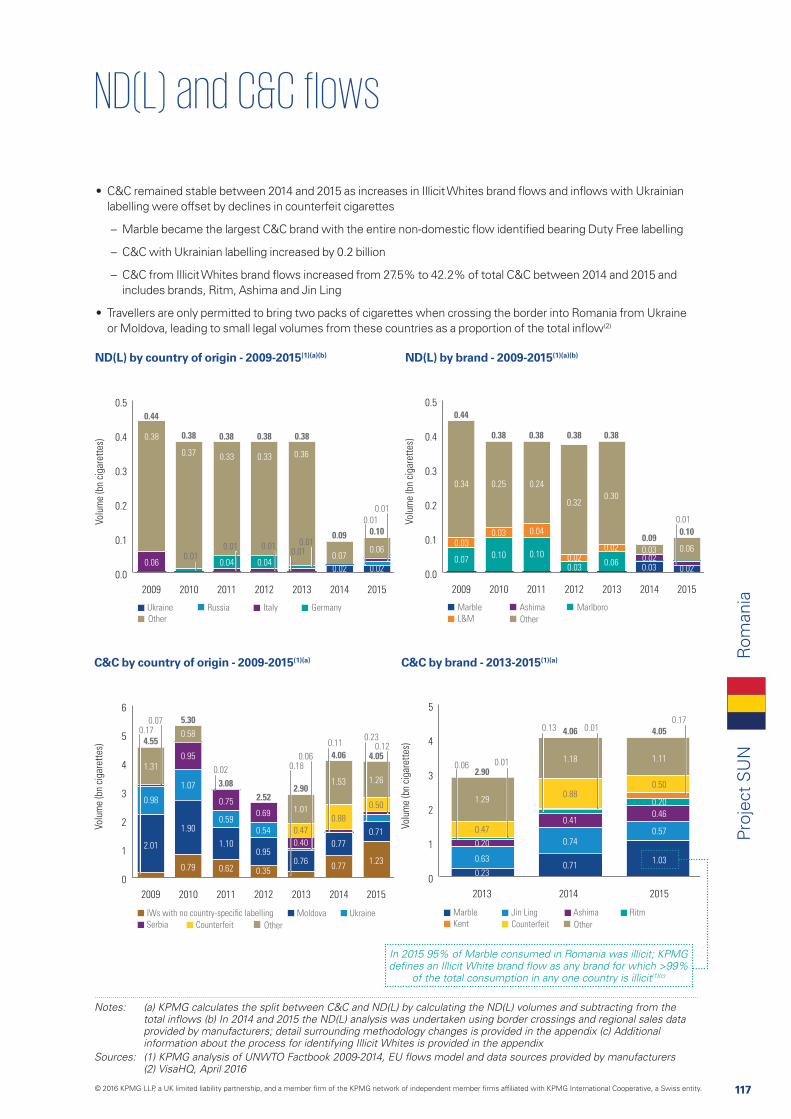
117
Proj
ect
SU
N
117
Notes: (a) KPMG calculates the split between C&C and ND(L) by calculating the ND(L) volumes and subtracting from the
provided by manufacturers; detail surrounding methodology changes is provided in the appendix (c) Additional information about the process for identifying Illicit Whites is provided in the appendix
ND(L) by country of origin - 2009-2015(1)(a)(b)
C&C by country of origin - 2009-2015(1)(a)
0.0
0.1
0.2
0.3
0.4
0.5
2009 2010 2011 2012 2013 2014 2015
0.33
0.040.06
0.38
0.36
0.44
0.38 0.38 0.38 0.38
0.09 0.10
0.04
0.330.37
0.07
0.02
0.08
0.06
0.02
Ukraine ItalyRussia Germany
Other
Volu
me
(bn
ciga
rett
es)
0.010.01 0.01 0.01
0.01
0.01
0.01
0.0
0.1
0.2
0.3
0.4
0.5
2009 2010 2011 2012 2013 2014 2015
0.32
0.030.02
0.34
0.03
0.07
0.30
0.06
0.02
0.44
0.38 0.38 0.38 0.38
0.090.10
0.24
0.04
0.10
0.25
0.03
0.100.03
0.03 0.020.02
0.06
AshimaMarble
L&M
Marlboro
Other
Volu
me
(bn
ciga
rett
es)
0.01
0
1
2
3
4
5
6
2009 2010 2011 2012 2013 2014 2015
2.01
0.98
1.33
1.31
0.95
0.54
0.35
0.69
0.47
1.01
0.40
0.76
4.55
5.30
3.082.52
2.90
4.06 4.05
0.62
1.10
0.59
0.75
0.58
0.79
1.90
1.07
0.95
1.53
0.88
0.77
0.77
1.26
0.50
1.23
0.71
Volu
me
(bn
ciga
rett
es)
IWs with no country-specific labelling Moldova Ukraine
Serbia OtherCounterfeit
0.180.06
0.170.07
0.11 0.120.23
0.02
0
1
2
3
4
5
2013 2014 2015
0.47
1.29
0.20
0.63
0.23
2.90
4.06 4.05
1.18
0.88
0.74
0.41
0.71
1.11
0.50
1.03
0.57
0.46
0.20
Volu
me
(bn
ciga
rett
es)
Marble
Kent
Jin Ling Ashima Ritm
OtherCounterfeit
0.06 0.01
0.13 0.010.17
ND(L) by brand - 2009-2015(1)(a)(b)
C&C by brand - 2013-2015(1)(a)
• C&C remained stable between 2014 and 2015 as increases in Illicit Whites brand flows and inflows with Ukrainian labelling were offset by declines in counterfeit cigarettes
– Marble became the largest C&C brand with the entire non-domestic flow identified bearing Duty Free labelling
– C&C with Ukrainian labelling increased by 0.2 billion
– C&C from Illicit Whites brand flows increased from 27.5% to 42.2% of total C&C between 2014 and 2015 and includes brands, Ritm, Ashima and Jin Ling
• Travellers are only permitted to bring two packs of cigarettes when crossing the border into Romania from Ukraine or Moldova, leading to small legal volumes from these countries as a proportion of the total inflow(2)
In 2015 95% of Marble consumed in Romania was illicit; KPMG
of the total consumption in any one country is illicit(1)(c)
Rom
ania
© 2016 KPMG LLP, a UK limited liability partnership, and a member firm of the KPMG network of independent member firms affiliated with KPMG International Cooperative, a Swiss entity.
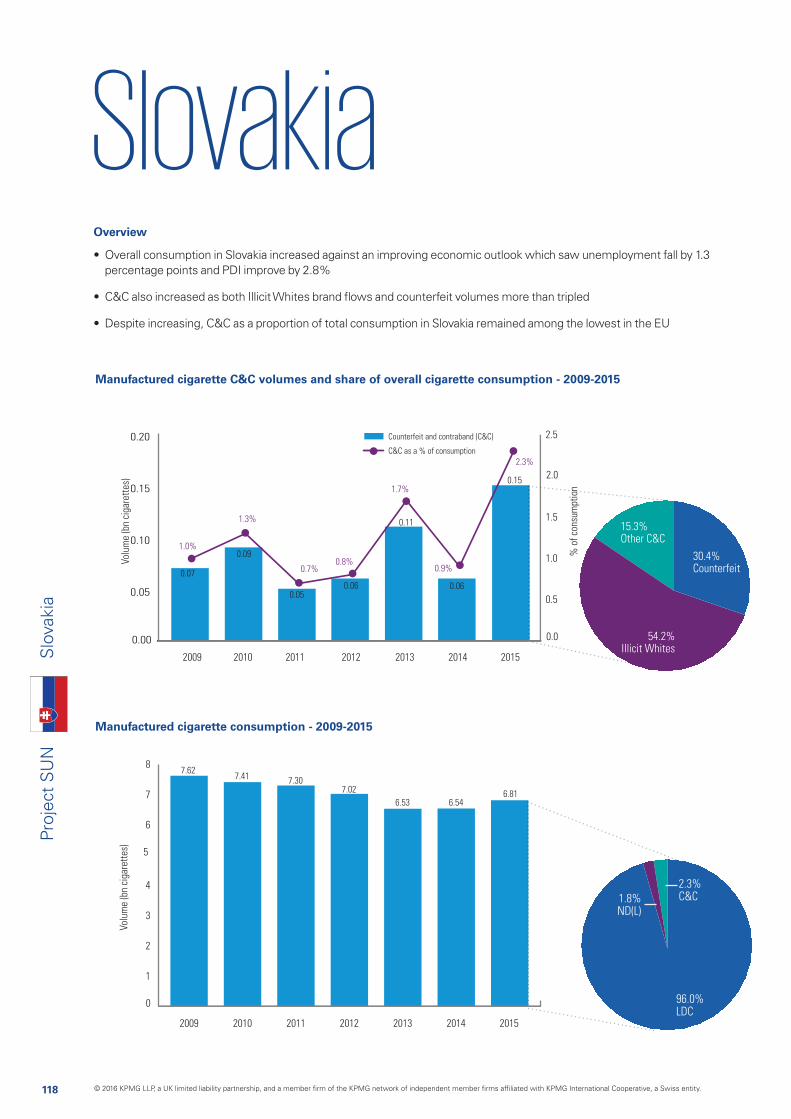
118
Proj
ect
SU
N
SlovakiaS
lova
kia
Manufactured cigarette consumption - 2009-2015
Manufactured cigarette C&C volumes and share of overall cigarette consumption - 2009-2015
0.00
0.05
0.10
0.15
0.20
Volu
me
(bn
ciga
rett
es)
% o
f co
nsum
ptio
n
Counterfeit and contraband (C&C)
C&C as a % of consumption
2009 2010 2011 2012 2013 2014 2015
0.0
0.5
1.0
1.5
2.0
2.5
1.0%
1.3%
0.7%0.8%
1.7%
0.9%
2.3%
0.07
0.09
0.050.06
0.11
0.06
0.15
Volu
me
(bn
ciga
rett
es)
2009 2010 2011 2012 2013 2014 2015
7.627.41 7.30
7.02
6.536.81
6.54
0
1
2
3
4
5
6
7
8
on
15.3%Other C&C
30.4%Counterfeit
54.2%Illicit Whites
1.8%ND(L)
2.3%C&C
96.0%LDC
Overview
• Overall consumption in Slovakia increased against an improving economic outlook which saw unemployment fall by 1.3 percentage points and PDI improve by 2.8%
• C&C also increased as both Illicit Whites brand flows and counterfeit volumes more than tripled
• Despite increasing, C&C as a proportion of total consumption in Slovakia remained among the lowest in the EU
© 2016 KPMG LLP, a UK limited liability partnership, and a member firm of the KPMG network of independent member firms affiliated with KPMG International Cooperative, a Swiss entity.
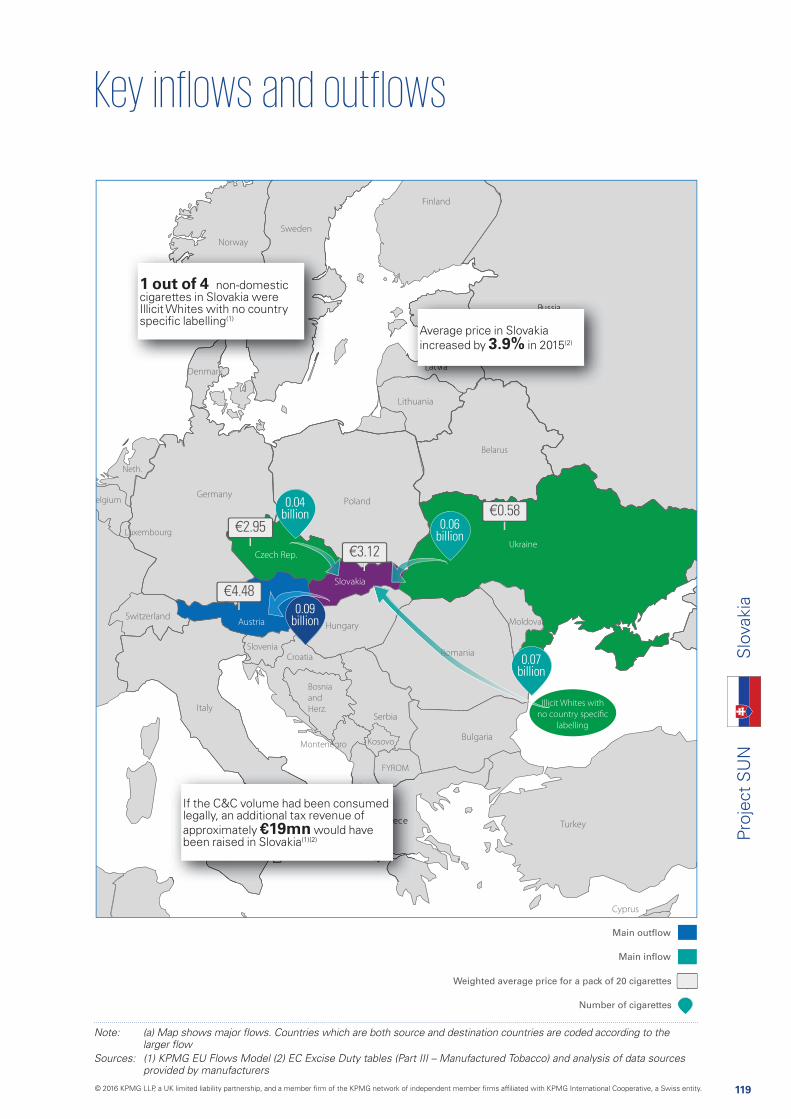
119
Proj
ect
SU
NS
lova
kia
Main outflow
Main inflow
Weighted average price for a pack of 20 cigarettes
Number of cigarettes
Croatia
Bosnia
and
Herz.
Montenegro
FYROM
Albania
Neth.
elgium
Moldova
Belarus
Kosovo
Ukraine
Slovenia
Luxembourg
Turkey
Sources: (1) KPMG EU Flows Model (2) EC Excise Duty tables (Part III – Manufactured Tobacco) and analysis of data sources provided by manufacturers
€0.58
€3.12
€4.48
€2.95
0.09 billion
0.04 billion
0.06 billion
0.07 billion
1 out of 4 non-domestic cigarettes in Slovakia were Illicit Whites with no country specific labelling(1)
Average price in Slovakia increased by 3.9% in 2015(2)
AlbAlbAlbAlbAlbAlb ianianianianianiaaaaa
If the C&C volume had been consumed legally, an additional tax revenue of approximately €19mn would have been raised in Slovakia(1)(2)
Illicit Whites with
no country specific
labelling
© 2016 KPMG LLP, a UK limited liability partnership, and a member firm of the KPMG network of independent member firms affiliated with KPMG International Cooperative, a Swiss entity.

120
Proj
ect
SU
N
ND INFLOWS TO SLOVAKIA
Billion cigarettes 2009 2010 2011 2012 2013 2014 2015
IWs with no country-specific labelling 0.00 0.01 0.00 0.04 0.09 0.03 0.07
Ukraine 0.08 0.05 0.05 0.01 0.02 0.00 0.06
Czech Republic 0.04 0.02 0.02 0.01 0.02 0.01 0.04
Belarus 0.00 0.00 0.00 0.00 0.01 0.01 0.02
Hungary 0.06 0.03 0.04 0.03 0.01 0.01 0.01
Other 0.04 0.07 0.04 0.04 0.04 0.02 0.09
Total inflows 0.21 0.18 0.15 0.13 0.18 0.08 0.28
Total manufactured cigarette consumption – 2009-2015(1)(2)(a)
Total inflows by country of origin - 2009-2015(1)(b)(c)
TOTAL SLOVAKIA CONSUMPTION
Billion cigarettes 2009 2010 2011 2012 2013 2014 2015 2014-15 %
Legal domestic sales (LDS) 7.69 7.48 7.36 7.19 6.64 6.63 6.82 3%
Outflows -0.29 -0.25 -0.22 -0.29 -0.29 -0.18 -0.29 65%
Legal domestic consumption (LDC) 7.40 7.23 7.15 6.89 6.35 6.45 6.53 1%
Non-domestic legal (ND(L)) 0.14 0.09 0.10 0.07 0.07 0.03 0.12 356%
Counterfeit and contraband (C&C) 0.07 0.09 0.05 0.06 0.11 0.06 0.15 166%
Total non-domestic 0.21 0.18 0.15 0.13 0.18 0.08 0.28 225%
Total consumption 7.62 7.41 7.30 7.02 6.53 6.54 6.81 4%
Total outflows by destination country – 2009-2015(1)
OUTFLOWS FROM SLOVAKIA
Billion cigarettes 2009 2010 2011 2012 2013 2014 2015
Austria 0.04 0.03 0.04 0.04 0.04 0.06 0.09
Germany 0.04 0.04 0.04 0.07 0.09 0.05 0.05
UK 0.08 0.05 0.02 0.03 0.02 0.01 0.03
Other 0.12 0.13 0.12 0.16 0.14 0.06 0.12
Total outflows 0.29 0.25 0.22 0.29 0.29 0.18 0.29
Notes: (a) In years 2012-2015 non-domestic incidence is stated on a sticks basis; prior to this a packs basis was used (b) Illicit
Sources: (1) KPMG EU Flows Model and analysis of data sources provided by manufacturers (2) KPMG analysis of UNWTO Factbook 2009-2014 (3) Slovakian Department for Labour, Social Affairs and Family
• Illicit Whites inflows with no country specific labelling increased from 0.03 billion to 0.07 billion cigarettes
• Inflows from Ukraine also increased as the currency devaluation and a cigarette price drop made cigarettes far cheaper, along with increases in Ukrainian nationals acquiring visas to work in Slovakia(3)
• Inflows from the Czech Republic were reflective of tourists and a high number of border crossings
Slo
vaki
a
© 2016 KPMG LLP, a UK limited liability partnership, and a member firm of the KPMG network of independent member firms affiliated with KPMG International Cooperative, a Swiss entity.
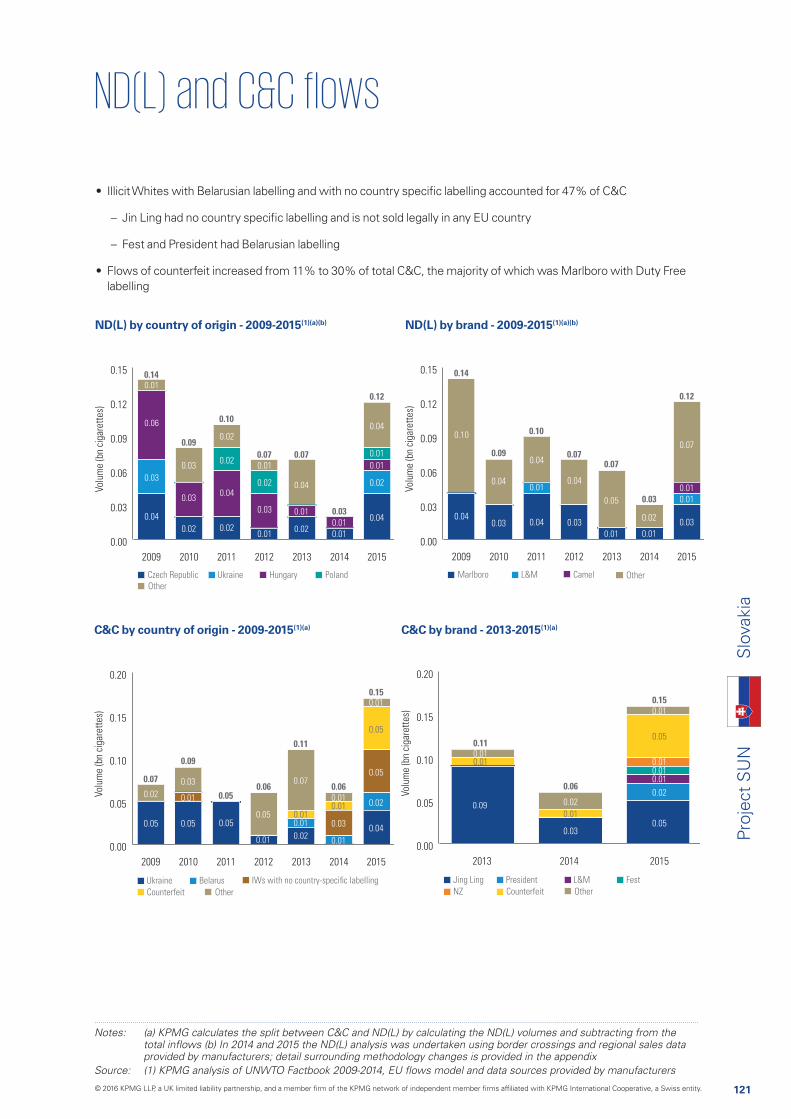
121
Proj
ect
SU
N
Notes: (a) KPMG calculates the split between C&C and ND(L) by calculating the ND(L) volumes and subtracting from the
provided by manufacturers; detail surrounding methodology changes is provided in the appendix
ND(L) by country of origin - 2009-2015(1)(a)(b)
C&C by country of origin - 2009-2015(1)(a)
0.00
0.03
0.06
0.09
0.12
0.15
2009 2010 2011 2012 2013 2014 2015
0.12
0.01
0.02
0.03
0.01
0.04
0.06
0.01
0.030.04
0.01
0.02
0.14
0.09
0.10
0.07 0.07
0.03
0.12
0.02
0.02
0.02
0.040.03
0.02
0.03
0.01
0.01
0.04
0.02
0.01
0.01
0.04
Ukraine PolandHungaryCzech Republic
Other
Volu
me
(bn
ciga
rett
es)
0.00
0.03
0.06
0.09
0.12
0.15
2009 2010 2011 2012 2013 2014 2015
0.04
0.030.04
0.10
0.05
0.01
0.14
0.09
0.10
0.070.07
0.03
0.12
0.04
0.04
0.01
0.03
0.04
0.02
0.01
0.03
0.01
0.01
0.07
L&M CamelMarlboro Other
Volu
me
(bn
ciga
rett
es)
0.00
0.05
0.10
0.15
0.20
2009 2010 2011 2012 2013 2014 2015
0.05
0.02
0.05
0.01
0.01
0.07
0.01
0.02
0.07
0.09
0.050.06
0.11
0.06
0.15
0.050.05
0.03
0.010.010.01
0.03
0.01
0.05
0.01
0.05
0.04
0.02
Volu
me
(bn
ciga
rett
es)
IWs with no country-specific labellingUkraine Belarus
OtherCounterfeit
0.00
0.05
0.10
0.15
0.20
2013 2014 2015
0.010.01
0.09
0.11
0.06
0.15
0.02
0.01
0.03
0.01
0.01
0.05
0.010.01
0.05
0.02Volu
me
(bn
ciga
rett
es)
Jing Ling
NZ
President L&M Fest
OtherCounterfeit
ND(L) by brand - 2009-2015(1)(a)(b)
C&C by brand - 2013-2015(1)(a)
• Illicit Whites with Belarusian labelling and with no country specific labelling accounted for 47% of C&C
– Jin Ling had no country specific labelling and is not sold legally in any EU country
– Fest and President had Belarusian labelling
• Flows of counterfeit increased from 11% to 30% of total C&C, the majority of which was Marlboro with Duty Free labelling
Slo
vaki
a
© 2016 KPMG LLP, a UK limited liability partnership, and a member firm of the KPMG network of independent member firms affiliated with KPMG International Cooperative, a Swiss entity.

122
Proj
ect
SU
N
SloveniaS
love
nia
Manufactured cigarette consumption - 2009-2015
Manufactured cigarette C&C volumes and share of overall cigarette consumption - 2009-2015
0.00
0.05
0.10
0.15
0.20
0.25
0.30
Volu
me
(bn
ciga
rett
es)
% o
f co
nsum
ptio
n
Counterfeit and contraband (C&C)
C&C as a % of consumption
2009 2010 2011 2012 2013 2014 2015
0
2
4
6
8
10
6.6%
5.4%
6.3%
6.7%7.1%
7.7%
7.8%
0.28
0.21
0.23
0.25
0.22
0.22
0.25
Volu
me
(bn
ciga
rett
es)
2009 2010 2011 2012 2013 2014 2015
4.23
3.96
3.67 3.74
3.07 3.202.94
0
1
2
3
4
5
8
84.6%Other C&C
1.3%Counterfeit
14.1%Illicit Whites
2.2%ND(L)
7.8%C&C
90.0%LDC
Overview
• C&C continued to account for approximately 8% of total consumption in 2015, with Bosnia and Herzegovina as the main source country
• Outflows from Slovenia to higher-priced countries, such as Austria, may have fallen due to increased border controls during the migrant crisis
– The change in the Austrian pack sampling plan may have reduced the reported outflows from Slovenia to Austria
A new pack sampling plan was adopted in Austria in 2015 which was felt to be more representative of the population.
It resulted in a lower non-domestic volume compared to
consumption volumes are not comparable
© 2016 KPMG LLP, a UK limited liability partnership, and a member firm of the KPMG network of independent member firms affiliated with KPMG International Cooperative, a Swiss entity.
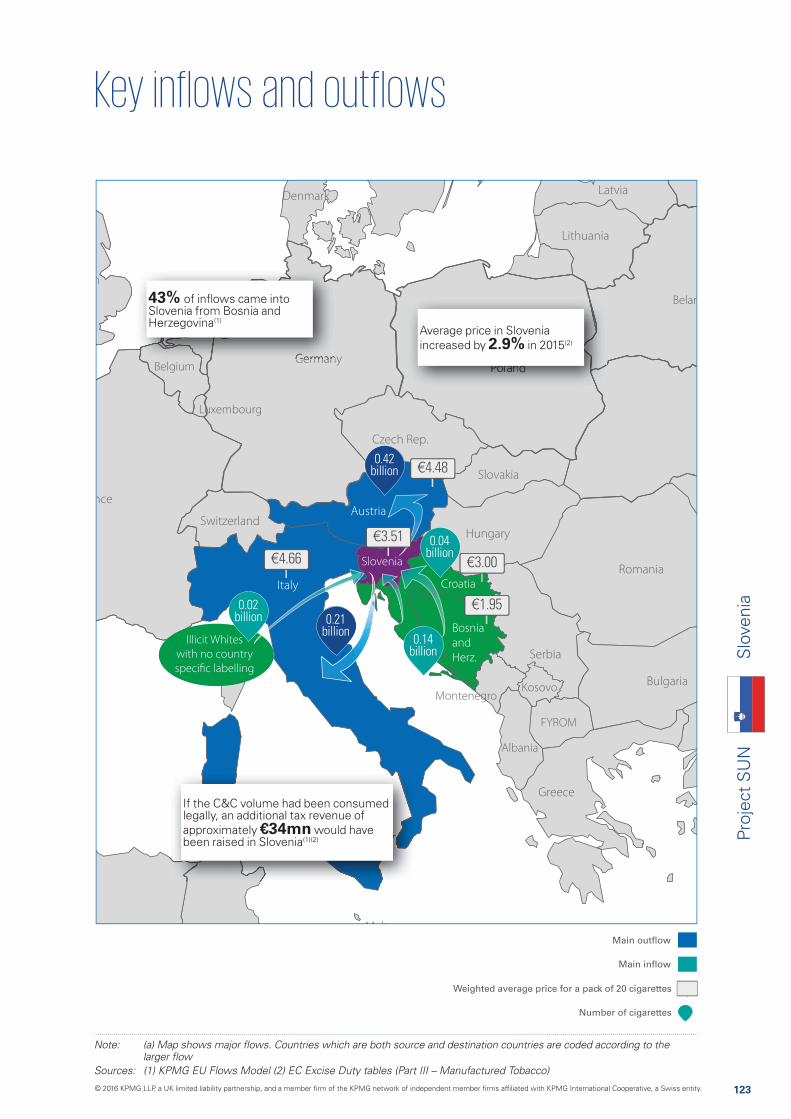
123
Proj
ect
SU
NS
love
nia
Main outflow
Main inflow
Weighted average price for a pack of 20 cigarettes
Number of cigarettes
Croatia
Bosnia
and
Herz.
Montenegro
FYROM
Albania
Neth.
Belgium
Belar
Kosovo
Slovenia
Luxembourg
Sources: (1) KPMG EU Flows Model (2) EC Excise Duty tables (Part III – Manufactured Tobacco)
€3.00
€1.95
€3.51
€4.66
€4.480.42
billion
0.21 billion
0.02 billion
0.04 billion
0.14 billion
Neth.
43% of inflows came into Slovenia from Bosnia and Herzegovina(1)
Average price in Slovenia increased by 2.9% in 2015(2)
If the C&C volume had been consumed legally, an additional tax revenue of approximately €34mn would have been raised in Slovenia(1)(2)
Illicit Whites
with no country
specific labelling
© 2016 KPMG LLP, a UK limited liability partnership, and a member firm of the KPMG network of independent member firms affiliated with KPMG International Cooperative, a Swiss entity.
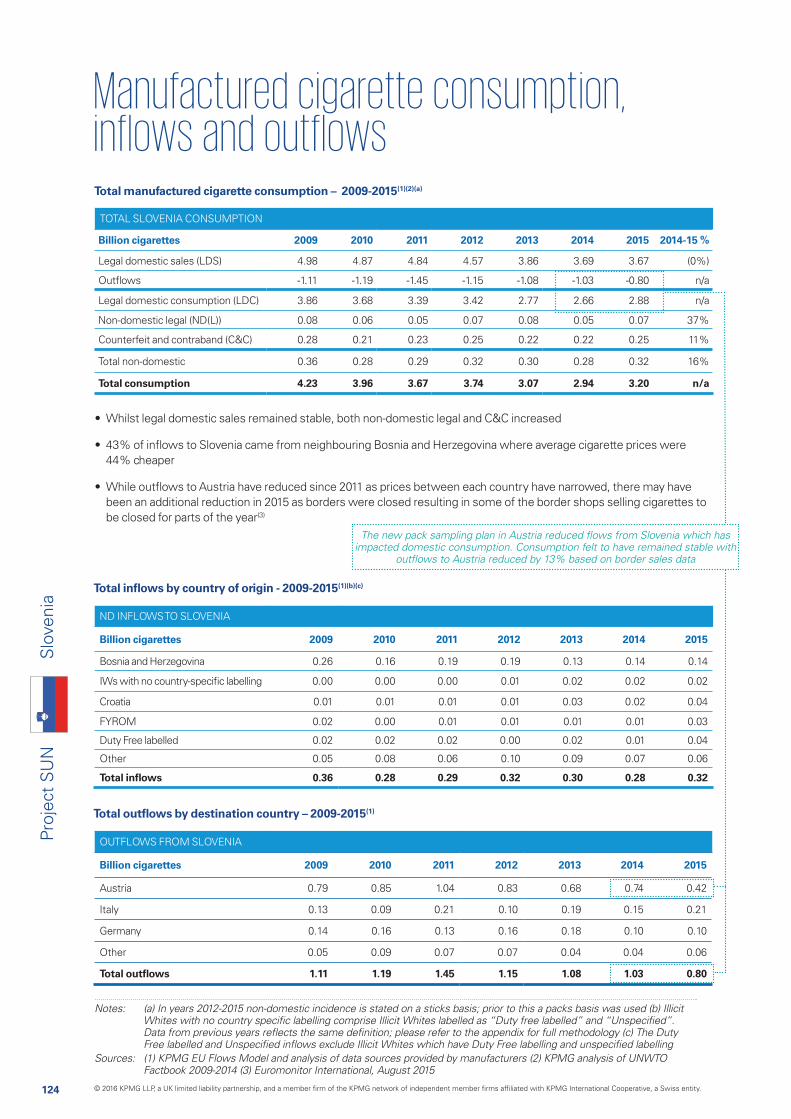
124
Proj
ect
SU
N
ND INFLOWS TO SLOVENIA
Billion cigarettes 2009 2010 2011 2012 2013 2014 2015
Bosnia and Herzegovina 0.26 0.16 0.19 0.19 0.13 0.14 0.14
IWs with no country-specific labelling 0.00 0.00 0.00 0.01 0.02 0.02 0.02
Croatia 0.01 0.01 0.01 0.01 0.03 0.02 0.04
FYROM 0.02 0.00 0.01 0.01 0.01 0.01 0.03
Duty Free labelled 0.02 0.02 0.02 0.00 0.02 0.01 0.04
Other 0.05 0.08 0.06 0.10 0.09 0.07 0.06
Total inflows 0.36 0.28 0.29 0.32 0.30 0.28 0.32
Total manufactured cigarette consumption – 2009-2015(1)(2)(a)
Total inflows by country of origin - 2009-2015(1)(b)(c)
TOTAL SLOVENIA CONSUMPTION
Billion cigarettes 2009 2010 2011 2012 2013 2014 2015 2014-15 %
Legal domestic sales (LDS) 4.98 4.87 4.84 4.57 3.86 3.69 3.67 (0%)
Outflows -1.11 -1.19 -1.45 -1.15 -1.08 -1.03 -0.80 n/a
Legal domestic consumption (LDC) 3.86 3.68 3.39 3.42 2.77 2.66 2.88 n/a
Non-domestic legal (ND(L)) 0.08 0.06 0.05 0.07 0.08 0.05 0.07 37%
Counterfeit and contraband (C&C) 0.28 0.21 0.23 0.25 0.22 0.22 0.25 11%
Total non-domestic 0.36 0.28 0.29 0.32 0.30 0.28 0.32 16%
Total consumption 4.23 3.96 3.67 3.74 3.07 2.94 3.20 n/a
Total outflows by destination country – 2009-2015(1)
OUTFLOWS FROM SLOVENIA
Billion cigarettes 2009 2010 2011 2012 2013 2014 2015
Austria 0.79 0.85 1.04 0.83 0.68 0.74 0.42
Italy 0.13 0.09 0.21 0.10 0.19 0.15 0.21
Germany 0.14 0.16 0.13 0.16 0.18 0.10 0.10
Other 0.05 0.09 0.07 0.07 0.04 0.04 0.06
Total outflows 1.11 1.19 1.45 1.15 1.08 1.03 0.80
Notes: (a) In years 2012-2015 non-domestic incidence is stated on a sticks basis; prior to this a packs basis was used (b) Illicit
Sources: (1) KPMG EU Flows Model and analysis of data sources provided by manufacturers (2) KPMG analysis of UNWTO Factbook 2009-2014 (3) Euromonitor International, August 2015
• Whilst legal domestic sales remained stable, both non-domestic legal and C&C increased
• 43% of inflows to Slovenia came from neighbouring Bosnia and Herzegovina where average cigarette prices were 44% cheaper
• While outflows to Austria have reduced since 2011 as prices between each country have narrowed, there may have been an additional reduction in 2015 as borders were closed resulting in some of the border shops selling cigarettes to be closed for parts of the year(3)
impacted domestic consumption. Consumption felt to have remained stable with
Slo
veni
a
© 2016 KPMG LLP, a UK limited liability partnership, and a member firm of the KPMG network of independent member firms affiliated with KPMG International Cooperative, a Swiss entity.

125
Proj
ect
SU
N
Notes: (a) KPMG calculates the split between C&C and ND(L) by calculating the ND(L) volumes and subtracting from the
provided by manufacturers; detail surrounding methodology changes is provided in the appendix
ND(L) by country of origin - 2009-2015(1)(a)(b)
C&C by country of origin - 2009-2015(1)(a)
0.00
0.02
0.04
0.06
0.08
0.10
2009 2010 2011 2012 2013 2014 2015
0.04
0.01
0.01
0.010.01
0.01
0.05
0.02
0.03
0.01
0.03
0.08
0.06
0.05
0.07 0.08
0.05
0.07
0.01
0.03
0.01
0.050.02
0.02
0.04
0.01
0.01
0.02
Italy SerbiaAustriaCroatia
Other
Volu
me
(bn
ciga
rett
es)
0.00
0.02
0.04
0.06
0.08
0.10
2009 2010 2011 2012 2013 2014 2015
0.03
0.01
0.03
0.01
0.03
0.05
0.03
0.01
0.04
0.08
0.06 0.05
0.07
0.08
0.05
0.07
0.03
0.01
0.02
0.03
0.01
0.02
0.03
0.02
0.01
0.02
0.03
York RonhillMarlboro Other
Volu
me
(bn
ciga
rett
es)
0.0
0.1
0.2
0.3
0.4
2009 2010 2011 2012 2013 2014 2015
0.26
0.02
0.03
0.18
0.02
0.02
0.03
0.13
0.28
0.210.23 0.25
0.22 0.22
0.25
0.030.02
0.180.16
0.04 0.020.03
0.03
0.13
0.04
0.020.02
0.03
0.14
Volu
me
(bn
ciga
rett
es)
IWs with no country-specific labelling
Bosnia and Herzegovina FYROM Serbia
OtherCounterfeit
0.01
0.01
0.010.01
0.01 0.01
0.01
0.01
0.00
0.05
0.10
0.15
0.20
0.25
0.30
2013 2014 2015
0.10
0.05
0.02
0.03
0.22 0.220.25
0.08
0.03
0.07
0.02
0.02
0.09
0.02
0.03
0.03
0.05
Volu
me
(bn
ciga
rett
es)
Marlboro
Rodeo
Boss Ronhill West
OtherCounterfeit
0.01 0.01
0.01 0.01
ND(L) by brand - 2009-2015(1)(a)(b)
C&C by brand - 2013-2015(1)(a)
• Most ND(L) is from surrounding countries and reflects tourist flows from Italy and Austria and cross-border shopping in areas near to Croatia where cigarettes are 15% cheaper
• Over 50% of C&C originated from Bosnia and Herzegovina; whilst there were 1.85 million trips made from Croatia to Bosnia and similar volumes the other way, the customs rules stipulate that 40 cigarettes can be brought per trip, resulting in less than 10% of the total flow identified as ND(L)(1)
• Most ND(L) and C&C brands reflected domestic consumption and brands available in Bosnia and Herzegovina. However, Rodeo originated exclusively from FYROM
Slo
veni
a
© 2016 KPMG LLP, a UK limited liability partnership, and a member firm of the KPMG network of independent member firms affiliated with KPMG International Cooperative, a Swiss entity.
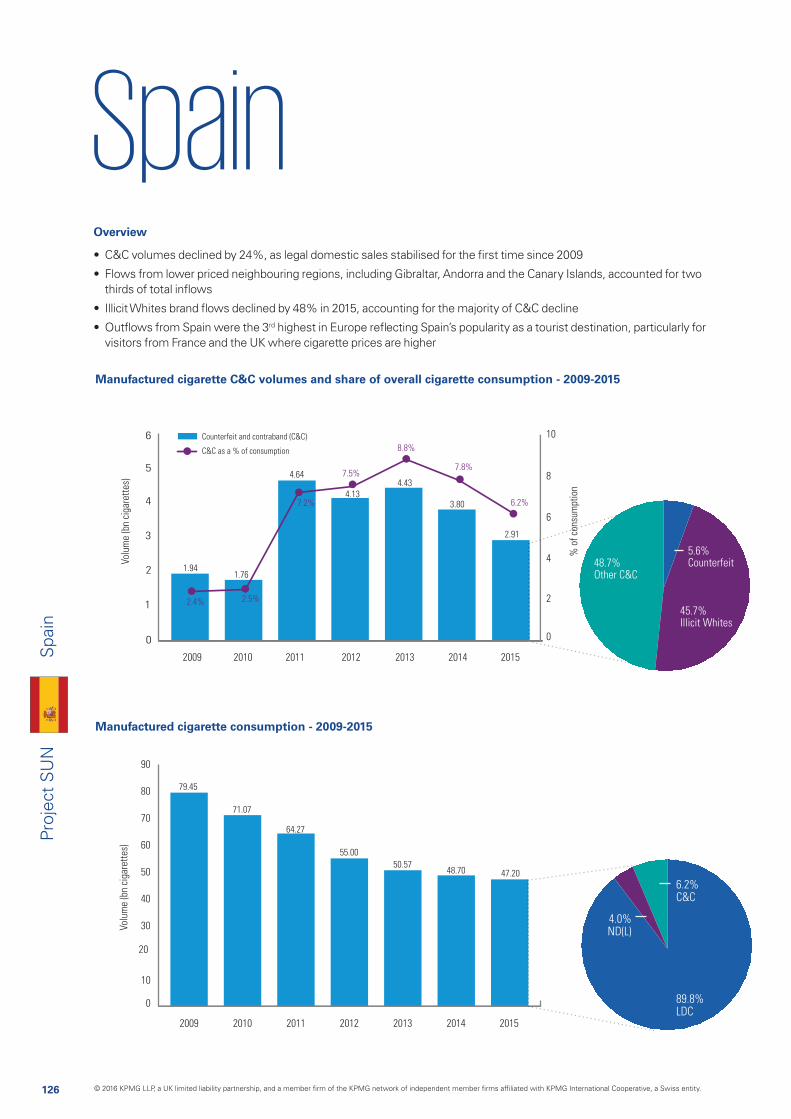
126
Proj
ect
SU
N
SpainS
pain
Manufactured cigarette consumption - 2009-2015
Manufactured cigarette C&C volumes and share of overall cigarette consumption - 2009-2015
0
1
2
3
4
5
6
Volu
me
(bn
ciga
rett
es)
% o
f co
nsum
ptio
n
Counterfeit and contraband (C&C)
C&C as a % of consumption
2009 2010 2011 2012 2013 2014 2015
0
2
4
6
8
10
2.4% 2.5%
7.2%
7.5%
8.8%
7.8%
6.2%
1.941.76
4.64
4.13
4.43
3.80
2.91
Volu
me
(bn
ciga
rett
es)
2009 2010 2011 2012 2013 2014 2015
79.45
71.07
64.27
55.00
50.5747.2048.70
0
10
20
30
40
50
60
70
80
90
o48.7%Other C&C
5.6%Counterfeit
45.7%Illicit Whites
4.0%ND(L)
6.2%C&C
89.8%LDC
Overview
• C&C volumes declined by 24%, as legal domestic sales stabilised for the first time since 2009
• Flows from lower priced neighbouring regions, including Gibraltar, Andorra and the Canary Islands, accounted for two thirds of total inflows
• Illicit Whites brand flows declined by 48% in 2015, accounting for the majority of C&C decline
• Outflows from Spain were the 3rd highest in Europe reflecting Spain’s popularity as a tourist destination, particularly for visitors from France and the UK where cigarette prices are higher
© 2016 KPMG LLP, a UK limited liability partnership, and a member firm of the KPMG network of independent member firms affiliated with KPMG International Cooperative, a Swiss entity.
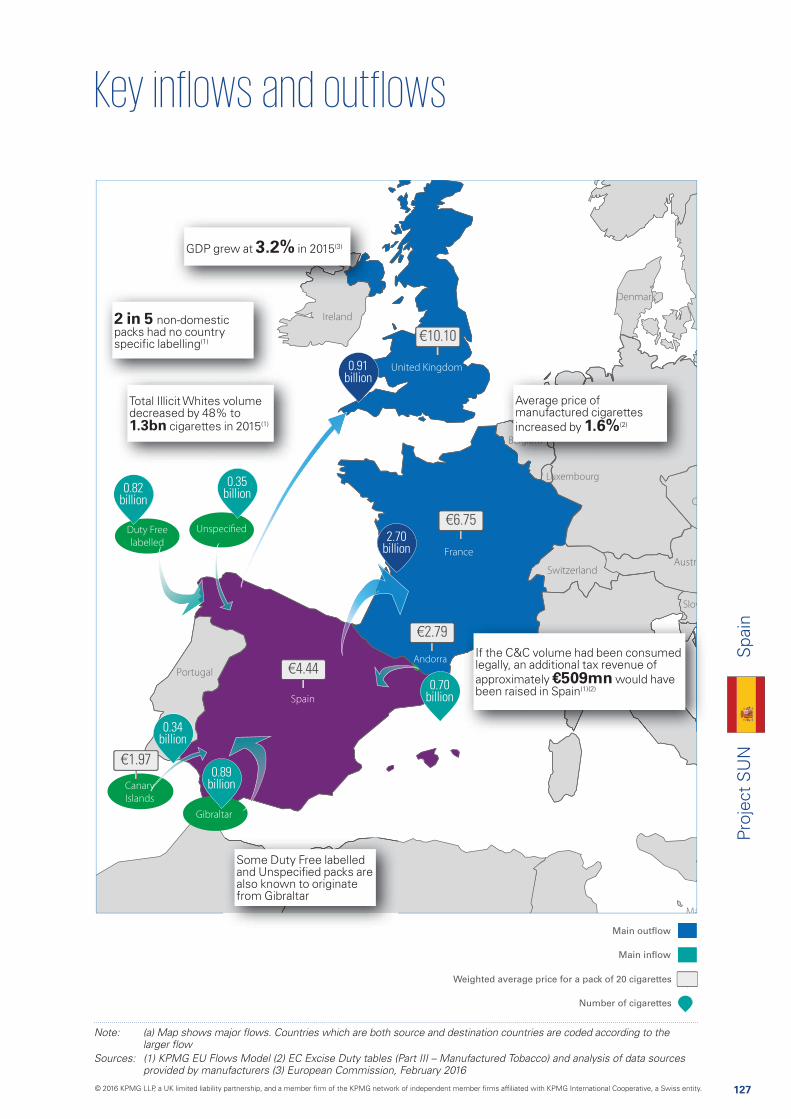
127
Proj
ect
SU
NS
pain
Main outflow
Main inflow
Weighted average price for a pack of 20 cigarettes
Number of cigarettes
Andorra
Neth.
Belgium
Slov
Luxembourg
Sources: (1) KPMG EU Flows Model (2) EC Excise Duty tables (Part III – Manufactured Tobacco) and analysis of data sources provided by manufacturers (3) European Commission, February 2016
€6.75
€4.44
€1.97
€2.79
€10.10
0.91 billion
2.70 billion
0.70 billion
0.35 billion
0.82 billion
0.34 billion
0.89 billion
GDP grew at 3.2% in 2015(3)
2 in 5 non-domestic packs had no country specific labelling(1)
Total Illicit Whites volume decreased by 48% to 1.3bn cigarettes in 2015(1)
Some Duty Free labelled and Unspecified packs are also known to originate from Gibraltar
Nethh.
BBeBeeelellllBeelgigiugiugiugiuiuiuuiugigggg mmmmmmm
Average price of manufactured cigarettes increased by 1.6%(2)
If the C&C volume had been consumed legally, an additional tax revenue of approximately €509mn would have been raised in Spain(1)(2)
Canary
Islands
Gibraltar
Duty Free
labelled
Unspecified
© 2016 KPMG LLP, a UK limited liability partnership, and a member firm of the KPMG network of independent member firms affiliated with KPMG International Cooperative, a Swiss entity.
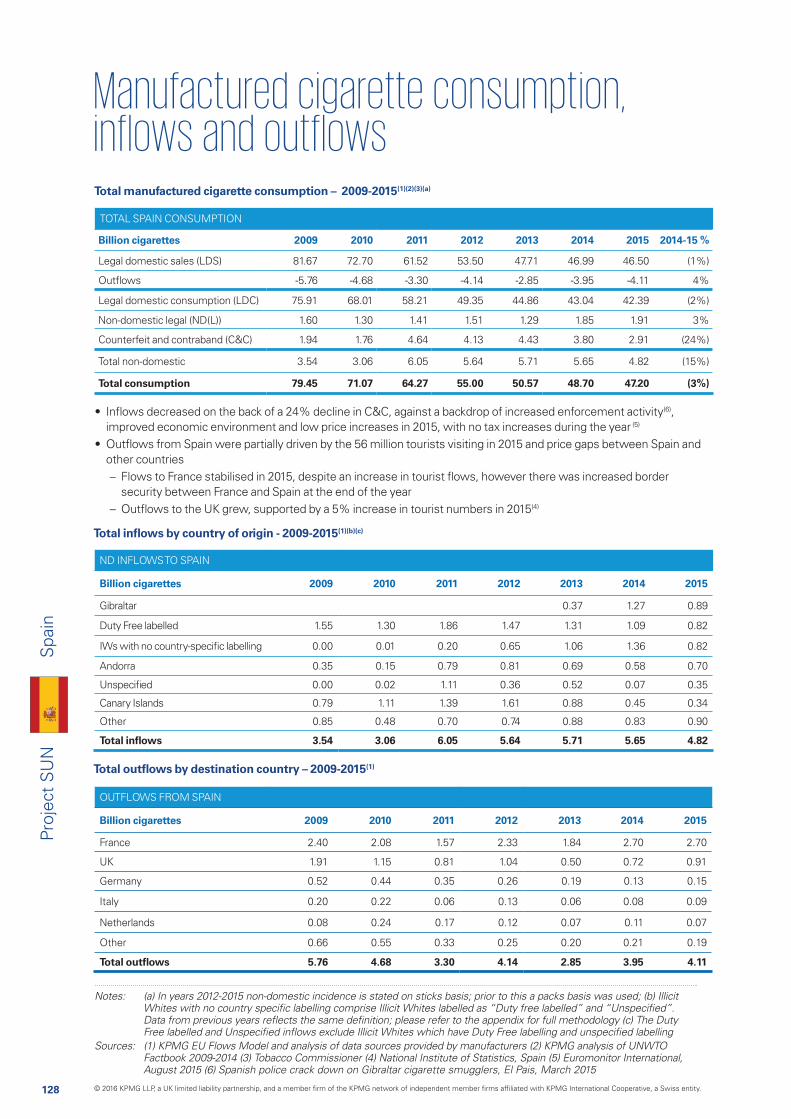
128
Proj
ect
SU
N
ND INFLOWS TO SPAIN
Billion cigarettes 2009 2010 2011 2012 2013 2014 2015
Gibraltar 0.37 1.27 0.89
Duty Free labelled 1.55 1.30 1.86 1.47 1.31 1.09 0.82
IWs with no country-specific labelling 0.00 0.01 0.20 0.65 1.06 1.36 0.82
Andorra 0.35 0.15 0.79 0.81 0.69 0.58 0.70
Unspecified 0.00 0.02 1.11 0.36 0.52 0.07 0.35
Canary Islands 0.79 1.11 1.39 1.61 0.88 0.45 0.34
Other 0.85 0.48 0.70 0.74 0.88 0.83 0.90
Total inflows 3.54 3.06 6.05 5.64 5.71 5.65 4.82
Total manufactured cigarette consumption – 2009-2015(1)(2)(3)(a)
Total inflows by country of origin - 2009-2015(1)(b)(c)
TOTAL SPAIN CONSUMPTION
Billion cigarettes 2009 2010 2011 2012 2013 2014 2015 2014-15 %
Legal domestic sales (LDS) 81.67 72.70 61.52 53.50 47.71 46.99 46.50 (1%)
Outflows -5.76 -4.68 -3.30 -4.14 -2.85 -3.95 -4.11 4%
Legal domestic consumption (LDC) 75.91 68.01 58.21 49.35 44.86 43.04 42.39 (2%)
Non-domestic legal (ND(L)) 1.60 1.30 1.41 1.51 1.29 1.85 1.91 3%
Counterfeit and contraband (C&C) 1.94 1.76 4.64 4.13 4.43 3.80 2.91 (24%)
Total non-domestic 3.54 3.06 6.05 5.64 5.71 5.65 4.82 (15%)
Total consumption 79.45 71.07 64.27 55.00 50.57 48.70 47.20 (3%)
Total outflows by destination country – 2009-2015(1)
OUTFLOWS FROM SPAIN
Billion cigarettes 2009 2010 2011 2012 2013 2014 2015
France 2.40 2.08 1.57 2.33 1.84 2.70 2.70
UK 1.91 1.15 0.81 1.04 0.50 0.72 0.91
Germany 0.52 0.44 0.35 0.26 0.19 0.13 0.15
Italy 0.20 0.22 0.06 0.13 0.06 0.08 0.09
Netherlands 0.08 0.24 0.17 0.12 0.07 0.11 0.07
Other 0.66 0.55 0.33 0.25 0.20 0.21 0.19
Total outflows 5.76 4.68 3.30 4.14 2.85 3.95 4.11
Notes: (a) In years 2012-2015 non-domestic incidence is stated on sticks basis; prior to this a packs basis was used; (b) Illicit
Sources: (1) KPMG EU Flows Model and analysis of data sources provided by manufacturers (2) KPMG analysis of UNWTO Factbook 2009-2014 (3) Tobacco Commissioner (4) National Institute of Statistics, Spain (5) Euromonitor International, August 2015 (6) Spanish police crack down on Gibraltar cigarette smugglers, El Pais, March 2015
• Inflows decreased on the back of a 24% decline in C&C, against a backdrop of increased enforcement activity(6), improved economic environment and low price increases in 2015, with no tax increases during the year (5)
• Outflows from Spain were partially driven by the 56 million tourists visiting in 2015 and price gaps between Spain and other countries
– Flows to France stabilised in 2015, despite an increase in tourist flows, however there was increased border security between France and Spain at the end of the year
– Outflows to the UK grew, supported by a 5% increase in tourist numbers in 2015(4)
Spa
in
© 2016 KPMG LLP, a UK limited liability partnership, and a member firm of the KPMG network of independent member firms affiliated with KPMG International Cooperative, a Swiss entity.

129
Proj
ect
SU
N
Notes: (a) KPMG calculates the split between C&C and ND(L) by calculating the ND(L) volumes and subtracting from the
data provided by manufacturers; detail surrounding methodology changes is provided in the appendix (c) KPMG uses data on propensity to travel and purchases cigarettes in Andorra, Gibraltar and the Canary Islands instead of smoking prevalence data. Please refer to the methodology for more information
(2) KPMG analysis of data sources provided by manufacturers (3) Government of Gibraltar, Statistics (4) Government of Andorra Statistics (5) Istec, Canary Island visitor numbers (6) Spanish police crack down on Gibraltar cigarette smugglers, El Pais, March 2015
ND(L) by country of origin - 2009-2015(1)(2)(3)(4)(5)(a)(b)(c)
C&C by country of origin - 2009-2015(1)(2)(a)
0.0
0.5
1.0
1.5
2.0
2009 2010 2011 2012 2013 2014 2015
0.45
0.66
0.360.35
0.14
0.31
0.79
0.37
0.29
0.120.08
0.42
1.60
1.301.41
1.51
1.29
1.85 1.91
0.45
0.75
0.18
0.15
0.79
0.08
0.27
0.33
0.58
0.18
0.74 0.74
0.59
0.22
0.33
Andorra PortugalCanary IslandsGibralter
Other
Volu
me
(bn
ciga
rett
es)
0.030.04
0.020.03
0.0
0.5
1.0
1.5
2.0
2009 2010 2011 2012 2013 2014 2015
0.66
0.18
0.09
0.16
0.410.34
0.93
0.280.21
0.14
0.56
0.34
1.60
1.301.41
1.51
1.29
1.85 1.91
0.27
0.26
0.10
0.72
0.24
0.15
0.80
0.85
0.23
0.12
0.35
0.25 0.35
0.31
0.22
0.18
0.10
0.75
Ducal ChesterfieldWinstonMarlboro
Fortuna Other
Volu
me
(bn
ciga
rett
es)
0.05
0.040.07
0.050.06
0.05
0
1
2
3
4
5
2009 2010 2011 2012 2013 2014 2015
3.07
0.36
0.65
1.94 0.52
2.75
1.06
1.94 1.76
4.64
4.134.43
3.80
2.91
0.20
1.11
3.25
1.73
0.80
1.69
0.53
1.360.80
0.35
1.31
AndorraGibralter Other
Volu
me
(bn
ciga
rett
es)
0.110.05
0.07 0.160.14
0.15
0.070.03
0.080.05
0.010.02
0.010.01
IWs with no country-specific labelling UnspecifiedCounterfeit
0
1
2
3
4
5
2013 2014 2015
0.90
0.35
0.73
0.44
1.36
0.59
4.43
3.80
2.910.60
0.80
0.39
0.44
0.37
1.110.59
0.260.310.31
0.46
0.82
DucalAmerican LegendChesterfield
WinstonMarlboroOther
Volu
me
(bn
ciga
rett
es)
0.16
0.070.11
Counterfeit
ND(L) by brand - 2009-2015(1)(2)(a)
C&C by brand - 2013-2015(1)(2)(a)
• More than 80% of ND(L) flows came from neighbouring lower priced regions, with volumes supported by travel flows and frontier workers
• Illicit Whites brand flows with no country specific labelling and C&C Gibraltar-labelled product declined by 51% amidst an increase in the number of law enforcement operations undertaken by Spanish police(6)
– Flows of American legend, which has no country specific labelling declined by 47%
– C&C flows of Gibraltar-labelled Ducal declined by 43%
Spa
in
© 2016 KPMG LLP, a UK limited liability partnership, and a member firm of the KPMG network of independent member firms affiliated with KPMG International Cooperative, a Swiss entity.
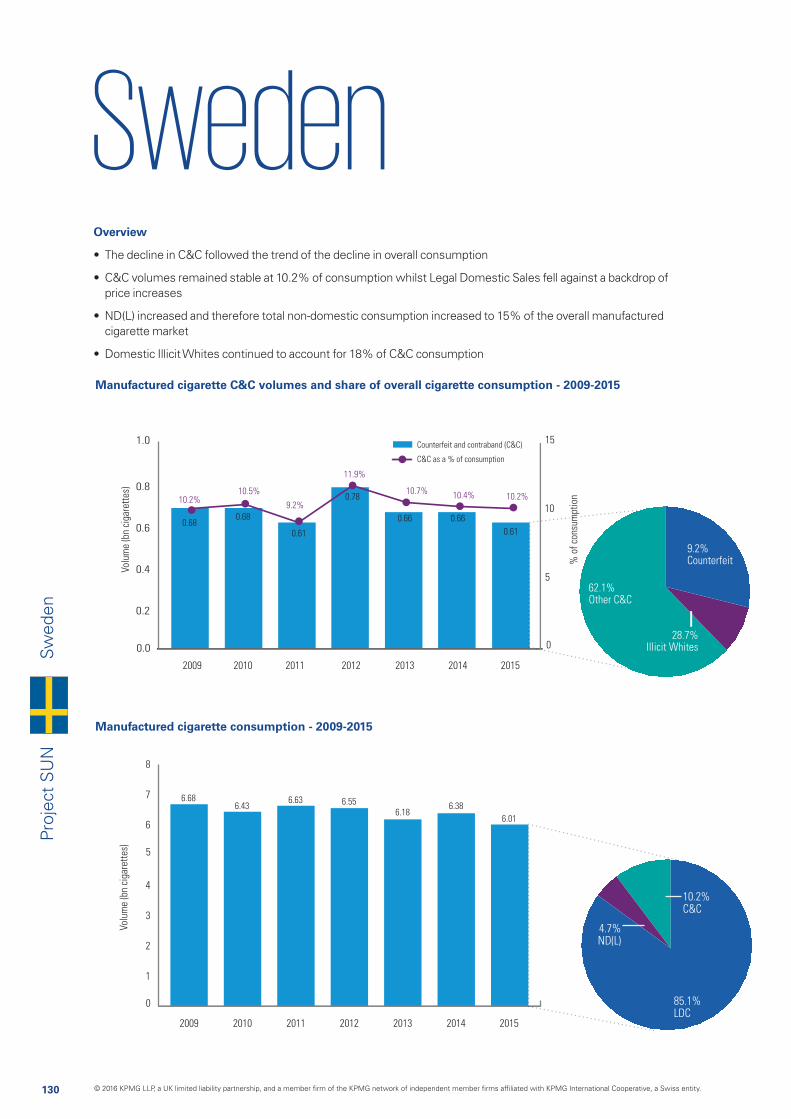
130
Proj
ect
SU
NSw
eden
Manufactured cigarette consumption - 2009-2015
Manufactured cigarette C&C volumes and share of overall cigarette consumption - 2009-2015
0.0
0.2
0.4
0.6
0.8
1.0
Volu
me
(bn
ciga
rett
es)
% o
f co
nsum
ptio
n
Counterfeit and contraband (C&C)
C&C as a % of consumption
2009 2010 2011 2012 2013 2014 2015
0
5
10
15
10.2%10.5%
9.2%
11.9%
10.7% 10.4% 10.2%
0.680.68
0.61
0.78
0.66 0.66
0.61
Volu
me
(bn
ciga
rett
es)
2009 2010 2011 2012 2013 2014 2015
6.686.43
6.63 6.556.18
6.01
6.38
0
1
2
3
4
5
6
7
8
m
9.2%Counterfeit
62.1%Other C&C
28.7%Illicit Whites
4.7%ND(L)
10.2%C&C
85.1%LDC
Overview
• The decline in C&C followed the trend of the decline in overall consumption
• C&C volumes remained stable at 10.2% of consumption whilst Legal Domestic Sales fell against a backdrop of price increases
• ND(L) increased and therefore total non-domestic consumption increased to 15% of the overall manufactured cigarette market
• Domestic Illicit Whites continued to account for 18% of C&C consumption
© 2016 KPMG LLP, a UK limited liability partnership, and a member firm of the KPMG network of independent member firms affiliated with KPMG International Cooperative, a Swiss entity.
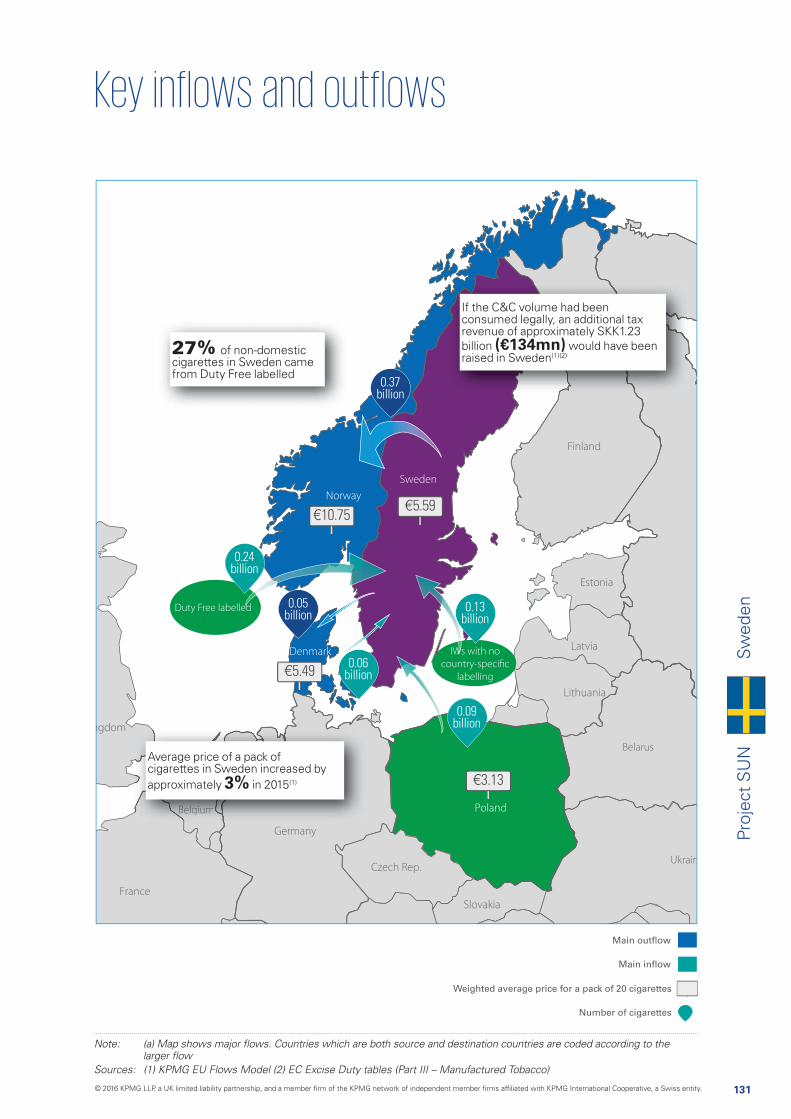
131
Proj
ect
SU
NSw
eden
Main outflow
Main inflow
Weighted average price for a pack of 20 cigarettes
Number of cigarettes
Ukrain
Neth.
Belgium
Belarus
0.13 billion
0.37 billion
0.05 billion
Sources: (1) KPMG EU Flows Model (2) EC Excise Duty tables (Part III – Manufactured Tobacco)
€10.75€5.59
€3.13
€5.49
0.24 billion
0.06 billion
0.09 billion
27% of non-domestic cigarettes in Sweden came from Duty Free labelled
Neth.
BBeBeBeBeBeBeBellglglglglglglgiiiuiuiuiuiuiummmmmm
Average price of a pack of cigarettes in Sweden increased by approximately 3% in 2015(1)
If the C&C volume had been consumed legally, an additional tax revenue of approximately SKK1.23 billion (€134mn) would have been raised in Sweden(1)(2)
Duty Free labelled
IWs with no
country-specific
labelling
© 2016 KPMG LLP, a UK limited liability partnership, and a member firm of the KPMG network of independent member firms affiliated with KPMG International Cooperative, a Swiss entity.
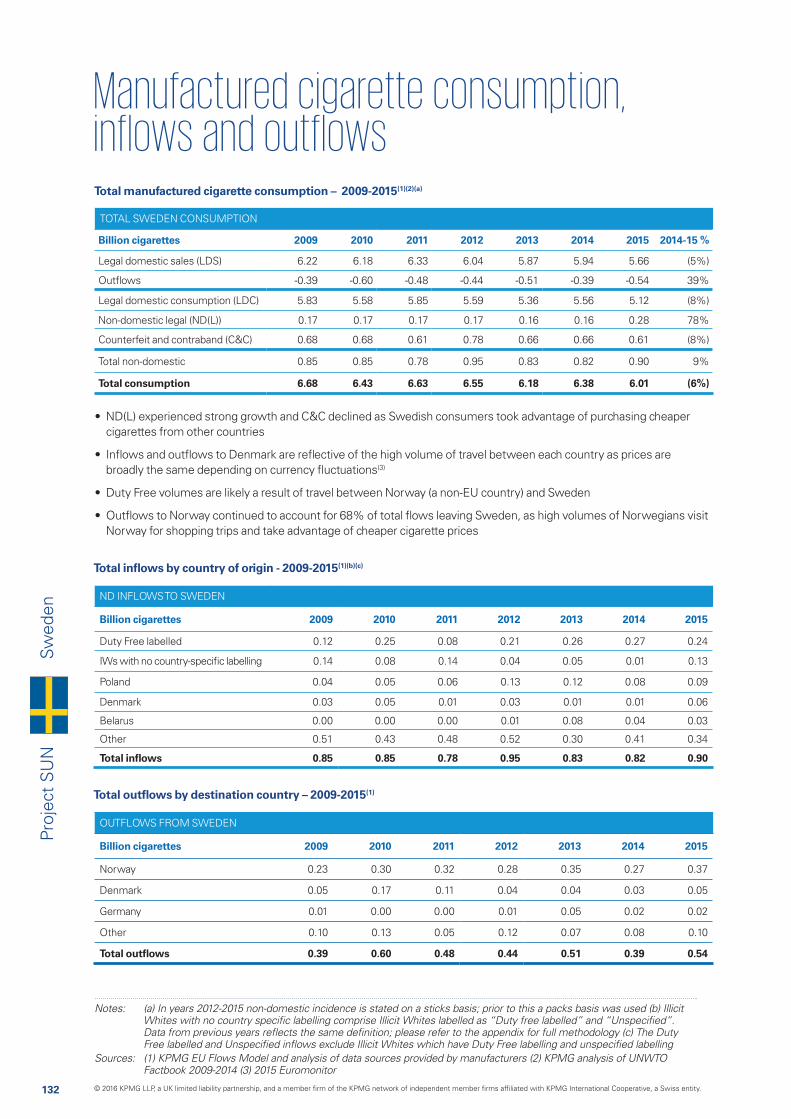
132
Proj
ect
SU
N
ND INFLOWS TO SWEDEN
Billion cigarettes 2009 2010 2011 2012 2013 2014 2015
Duty Free labelled 0.12 0.25 0.08 0.21 0.26 0.27 0.24
IWs with no country-specific labelling 0.14 0.08 0.14 0.04 0.05 0.01 0.13
Poland 0.04 0.05 0.06 0.13 0.12 0.08 0.09
Denmark 0.03 0.05 0.01 0.03 0.01 0.01 0.06
Belarus 0.00 0.00 0.00 0.01 0.08 0.04 0.03
Other 0.51 0.43 0.48 0.52 0.30 0.41 0.34
Total inflows 0.85 0.85 0.78 0.95 0.83 0.82 0.90
Total manufactured cigarette consumption – 2009-2015(1)(2)(a)
Total inflows by country of origin - 2009-2015(1)(b)(c)
TOTAL SWEDEN CONSUMPTION
Billion cigarettes 2009 2010 2011 2012 2013 2014 2015 2014-15 %
Legal domestic sales (LDS) 6.22 6.18 6.33 6.04 5.87 5.94 5.66 (5%)
Outflows -0.39 -0.60 -0.48 -0.44 -0.51 -0.39 -0.54 39%
Legal domestic consumption (LDC) 5.83 5.58 5.85 5.59 5.36 5.56 5.12 (8%)
Non-domestic legal (ND(L)) 0.17 0.17 0.17 0.17 0.16 0.16 0.28 78%
Counterfeit and contraband (C&C) 0.68 0.68 0.61 0.78 0.66 0.66 0.61 (8%)
Total non-domestic 0.85 0.85 0.78 0.95 0.83 0.82 0.90 9%
Total consumption 6.68 6.43 6.63 6.55 6.18 6.38 6.01 (6%)
Total outflows by destination country – 2009-2015(1)
OUTFLOWS FROM SWEDEN
Billion cigarettes 2009 2010 2011 2012 2013 2014 2015
Norway 0.23 0.30 0.32 0.28 0.35 0.27 0.37
Denmark 0.05 0.17 0.11 0.04 0.04 0.03 0.05
Germany 0.01 0.00 0.00 0.01 0.05 0.02 0.02
Other 0.10 0.13 0.05 0.12 0.07 0.08 0.10
Total outflows 0.39 0.60 0.48 0.44 0.51 0.39 0.54
Notes: (a) In years 2012-2015 non-domestic incidence is stated on a sticks basis; prior to this a packs basis was used (b) Illicit
Sources: (1) KPMG EU Flows Model and analysis of data sources provided by manufacturers (2) KPMG analysis of UNWTO Factbook 2009-2014 (3) 2015 Euromonitor
• ND(L) experienced strong growth and C&C declined as Swedish consumers took advantage of purchasing cheaper cigarettes from other countries
• Inflows and outflows to Denmark are reflective of the high volume of travel between each country as prices are broadly the same depending on currency fluctuations(3)
• Duty Free volumes are likely a result of travel between Norway (a non-EU country) and Sweden
• Outflows to Norway continued to account for 68% of total flows leaving Sweden, as high volumes of Norwegians visit Norway for shopping trips and take advantage of cheaper cigarette prices
Swed
en
© 2016 KPMG LLP, a UK limited liability partnership, and a member firm of the KPMG network of independent member firms affiliated with KPMG International Cooperative, a Swiss entity.

133
Proj
ect
SU
N
Notes: (a) KPMG calculates the split between C&C and ND(L) by calculating the ND(L) volumes and subtracting from the total
by manufacturers; detail surrounding methodology changes is provided in the appendix (c) The Domestic Illicit Whites volumes were derived from a study undertaken by KPMG and the local NMA which reported Illicit White consumption as 1.9% of total consumption which, when applied to Project SUN derives a volume of 0.11 billion cigarettes
(2) KPMG analysis of data sources provided by manufacturers (3) Obeskattade cigaretter 2015
ND(L) by country of origin - 2009-2015(1)(2)(a)(b)
C&C by country of origin - 2009-2015(1)(2)(a)
0.00
0.05
0.10
0.15
0.20
0.25
0.30
2009 2010 2011 2012 2013 2014 2015
0.11
0.03
0.02 0.02
0.11
0.13
0.020.02
0.17 0.17 0.17 0.170.16 0.16
0.28
0.020.01
0.11
0.020.02
0.13
0.06
0.03
0.02
0.16
0.12
0.02
0.01
0.01
0.010.01
0.010.010.01
0.01
0.01
0.010.01
0.010.010.01
0.01
Poland FinlandGermanyDenmarkOtherSpain
Volu
me
(bn
ciga
rett
es)
0.00
0.05
0.10
0.15
0.20
0.25
0.30
2009 2010 2011 2012 2013 2014 2015
0.06
0.07
0.05 0.03
0.01
0.04 0.05
0.06 0.05
0.02
0.17 0.17 0.17 0.170.16 0.16
0.28
0.03
0.07
0.060.07
0.08
0.040.07
0.03
0.03
0.13
0.06
0.02
0.010.01
0.010.01
0.010.01
0.01
0.010.010.01
0.01
0.010.01
0.01
L&M CamelPrinceMarlboroOtherPall Mall
Volu
me
(bn
ciga
rett
es)
0.0
0.1
0.2
0.3
0.4
0.5
0.6
0.7
0.8
2009 2010 2011 2012 2013 2014 2015
0.18
0.14
0.040.04
0.28
0.07
0.41
0.04
0.12
0.08
0.07
0.04
0.05
0.11
0.68 0.680.61
0.78
0.66 0.660.61
0.12
0.06 0.31
0.24
0.14
0.05
0.07
0.12
0.09
0.03
0.04
0.30
0.06
0.13
0.06
0.31
0.03
0.48
0.08
0.05 0.08
0.040.040.03
0.01
0.010.02
Belarus
Counterfeit
Poland
OtherRussia
Volu
me
(bn
ciga
rett
es)
Unspecified
IWs with no country-specific labelling
0.0
0.1
0.2
0.3
0.4
0.5
0.6
0.7
0.8
2013 2014 2015
0.23
0.05
0.66 0.660.61
0.19
0.15
0.09
0.07
0.04
0.11
0.18
0.11
0.12
0.040.03
0.20
0.06
0.08
0.03
0.06 0.06
0.02 0.02
Unknown
Counterfeit
Marlboro
Camel
WinstonL&M
Other
Volu
me
(bn
ciga
rett
es)
ND(L) by brand - 2009-2015(1)(2)(a)(b)
C&C by brand - 2013-2015(1)(2)(3)(a)
• ND(L) increased driven partially by cross-border purchases from Denmark, which increased as prices became more expensive in Sweden compared to Denmark in 2015
• Source countries and brand flows of C&C remained similar to 2014
• Domestic Illicit Whites continued to make up almost 18% of C&C(c)
– Domestic Illicit Whites have Swedish labelling but have no tax paid on them and no legal Swedish distribution
Swed
en
© 2016 KPMG LLP, a UK limited liability partnership, and a member firm of the KPMG network of independent member firms affiliated with KPMG International Cooperative, a Swiss entity.
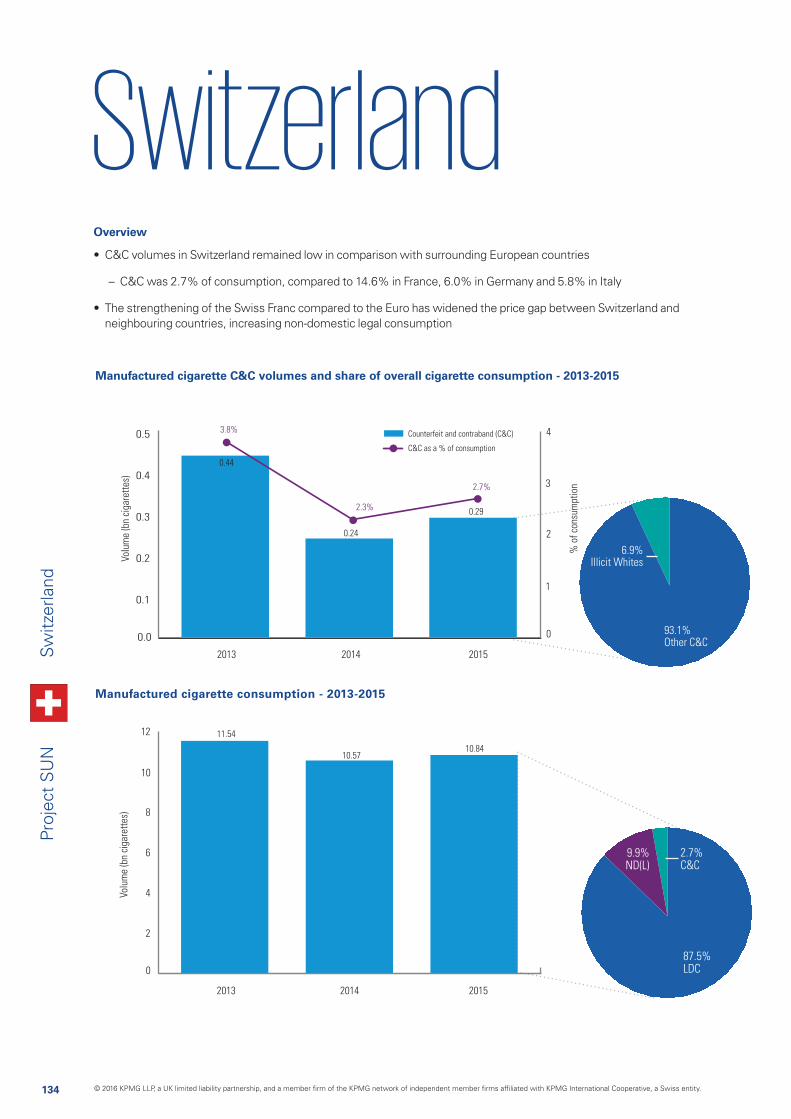
134
Proj
ect
SU
NSw
itzer
land
Manufactured cigarette consumption - 2013-2015
Manufactured cigarette C&C volumes and share of overall cigarette consumption - 2013-2015
0.0
0.1
0.2
0.3
0.4
0.5
Volu
me
(bn
ciga
rett
es)
% o
f co
nsum
ptio
n
Counterfeit and contraband (C&C)
C&C as a % of consumption
20142013 2015
0
1
2
3
43.8%
2.7%
2.3%
0.44
0.29
0.24
Volu
me
(bn
ciga
rett
es)
20142013 2015
10.8410.57
11.54
0
2
4
6
8
10
12
93.1%Other C&C
6.9%Illicit Whites
9.9%ND(L)
2.7%C&C
87.5%LDC
Overview
• C&C volumes in Switzerland remained low in comparison with surrounding European countries
– C&C was 2.7% of consumption, compared to 14.6% in France, 6.0% in Germany and 5.8% in Italy
• The strengthening of the Swiss Franc compared to the Euro has widened the price gap between Switzerland and neighbouring countries, increasing non-domestic legal consumption
© 2016 KPMG LLP, a UK limited liability partnership, and a member firm of the KPMG network of independent member firms affiliated with KPMG International Cooperative, a Swiss entity.
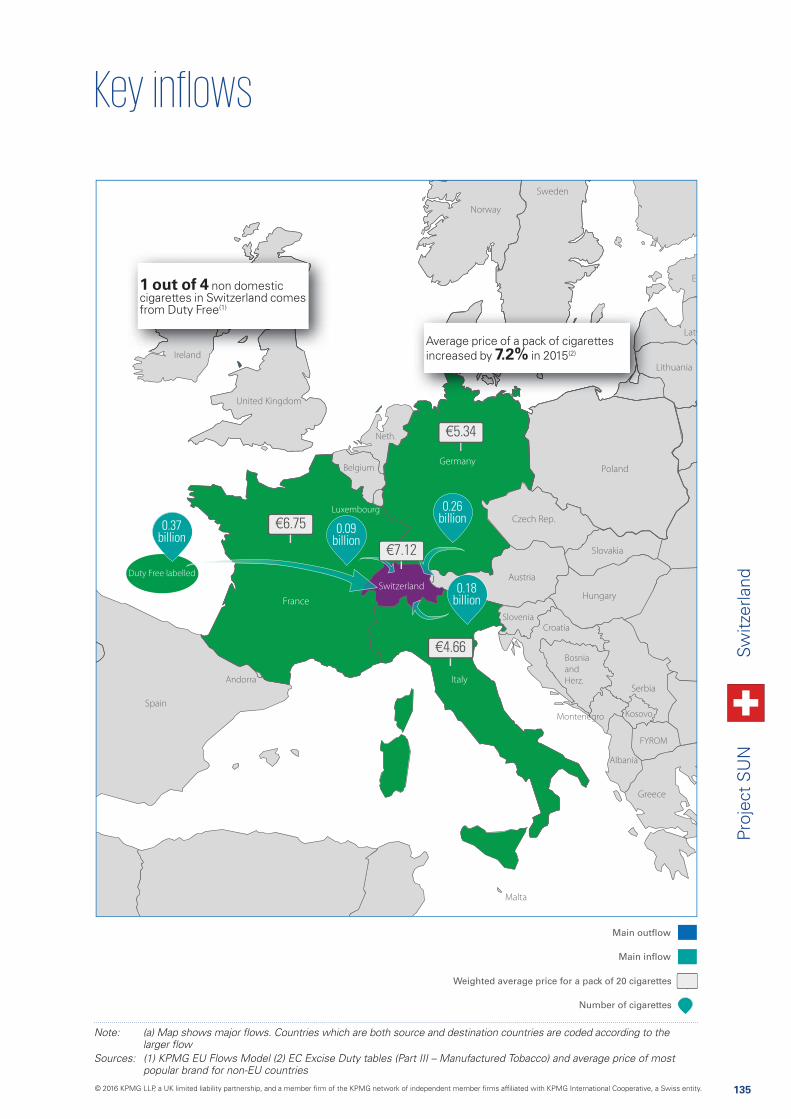
135
Proj
ect
SU
NSw
itzer
land
Main outflow
Main inflow
Weighted average price for a pack of 20 cigarettes
Number of cigarettes
Croatia
Bosnia
and
Herz.Andorra
Montenegro
FYROM
Albania
Neth.
Belgium
Kosovo
Slovenia
Luxembourg
Sources: (1) KPMG EU Flows Model (2) EC Excise Duty tables (Part III – Manufactured Tobacco) and average price of most popular brand for non-EU countries
€4.66
€6.75
€5.34
€7.12
0.26 billion
0.18 billion
0.09 billion
0.37 billion
1 out of 4 non domestic cigarettes in Switzerland comes from Duty Free(1)
Average price of a pack of cigarettes increased by 7.2% in 2015(2)
Duty Free labelled
© 2016 KPMG LLP, a UK limited liability partnership, and a member firm of the KPMG network of independent member firms affiliated with KPMG International Cooperative, a Swiss entity.
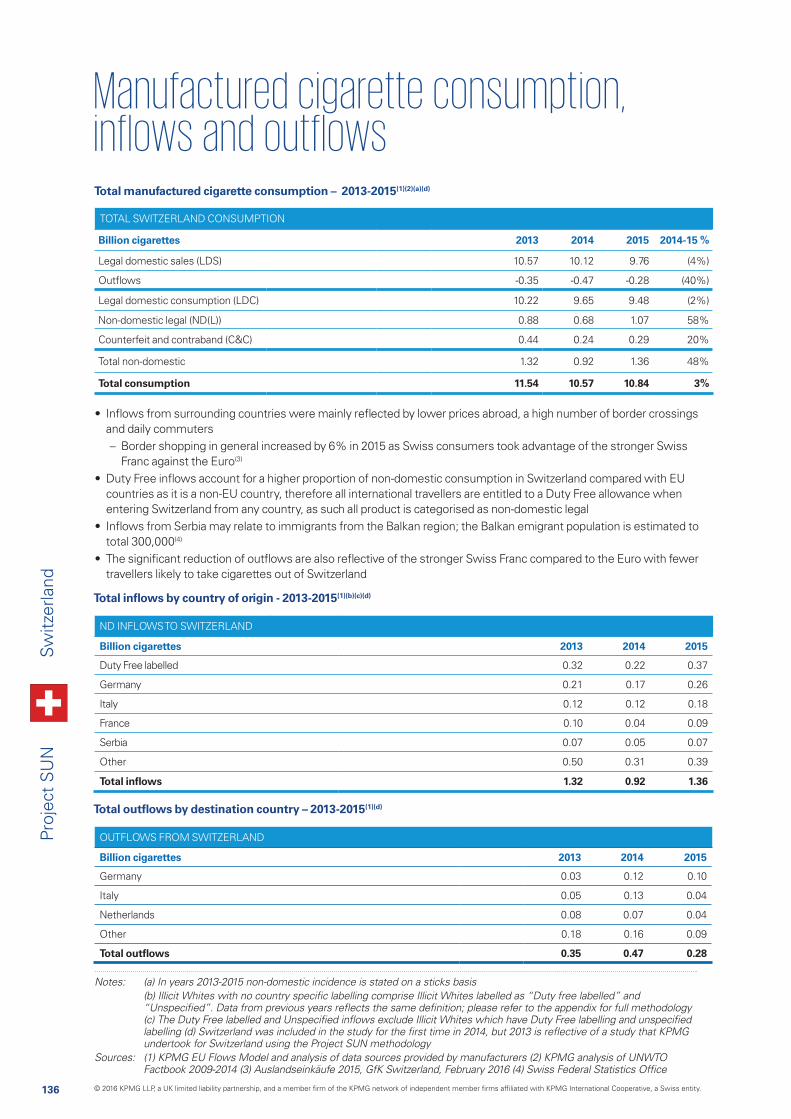
136
Proj
ect
SU
N
ND INFLOWS TO SWITZERLAND
Billion cigarettes 2013 2014 2015
Duty Free labelled 0.32 0.22 0.37
Germany 0.21 0.17 0.26
Italy 0.12 0.12 0.18
France 0.10 0.04 0.09
Serbia 0.07 0.05 0.07
Other 0.50 0.31 0.39
Total inflows 1.32 0.92 1.36
Total manufactured cigarette consumption – 2013-2015(1)(2)(a)(d)
Total inflows by country of origin - 2013-2015(1)(b)(c)(d)
TOTAL SWITZERLAND CONSUMPTION
Billion cigarettes 2013 2014 2015 2014-15 %
Legal domestic sales (LDS) 10.57 10.12 9.76 (4%)
Outflows -0.35 -0.47 -0.28 (40%)
Legal domestic consumption (LDC) 10.22 9.65 9.48 (2%)
Non-domestic legal (ND(L)) 0.88 0.68 1.07 58%
Counterfeit and contraband (C&C) 0.44 0.24 0.29 20%
Total non-domestic 1.32 0.92 1.36 48%
Total consumption 11.54 10.57 10.84 3%
Total outflows by destination country – 2013-2015(1)(d)
OUTFLOWS FROM SWITZERLAND
Billion cigarettes 2013 2014 2015
Germany 0.03 0.12 0.10
Italy 0.05 0.13 0.04
Netherlands 0.08 0.07 0.04
Other 0.18 0.16 0.09
Total outflows 0.35 0.47 0.28
Notes: (a) In years 2013-2015 non-domestic incidence is stated on a sticks basis
undertook for Switzerland using the Project SUN methodologySources: (1) KPMG EU Flows Model and analysis of data sources provided by manufacturers (2) KPMG analysis of UNWTO
• Inflows from surrounding countries were mainly reflected by lower prices abroad, a high number of border crossings and daily commuters
– Border shopping in general increased by 6% in 2015 as Swiss consumers took advantage of the stronger Swiss Franc against the Euro(3)
• Duty Free inflows account for a higher proportion of non-domestic consumption in Switzerland compared with EU countries as it is a non-EU country, therefore all international travellers are entitled to a Duty Free allowance when entering Switzerland from any country, as such all product is categorised as non-domestic legal
• Inflows from Serbia may relate to immigrants from the Balkan region; the Balkan emigrant population is estimated to total 300,000(4)
• The significant reduction of outflows are also reflective of the stronger Swiss Franc compared to the Euro with fewer travellers likely to take cigarettes out of Switzerland
Switz
erla
nd
© 2016 KPMG LLP, a UK limited liability partnership, and a member firm of the KPMG network of independent member firms affiliated with KPMG International Cooperative, a Swiss entity.
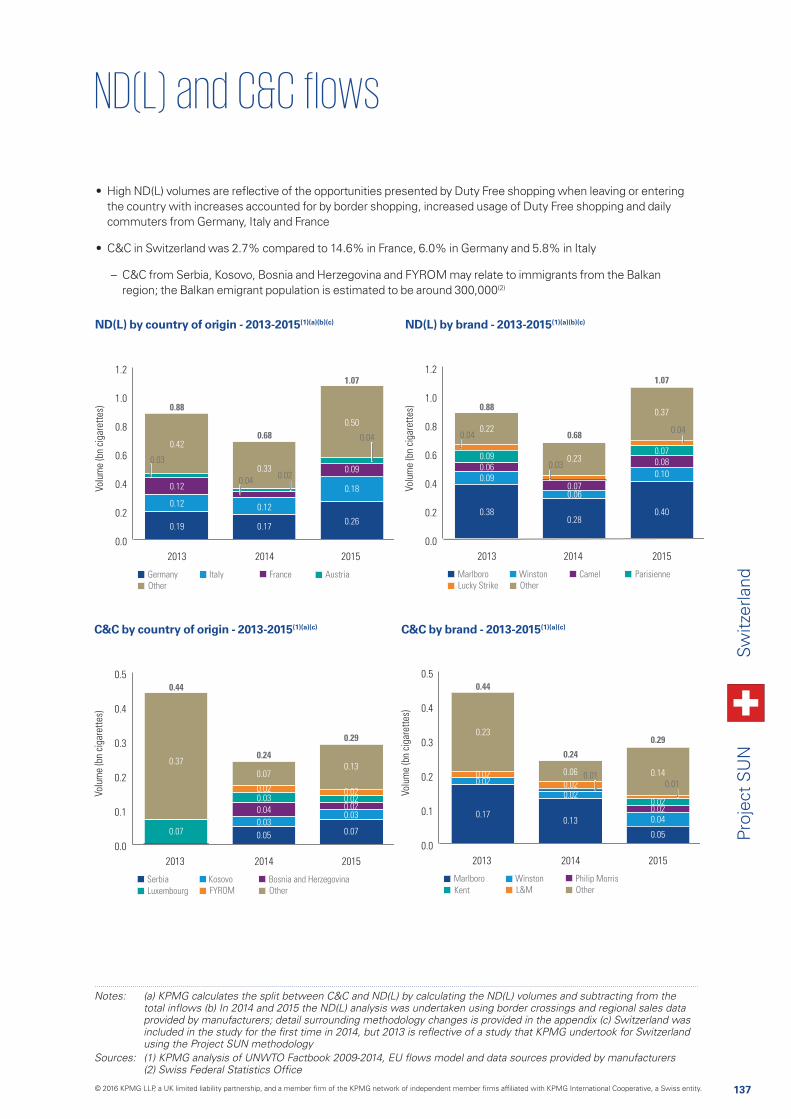
137
Proj
ect
SU
N
Notes: (a) KPMG calculates the split between C&C and ND(L) by calculating the ND(L) volumes and subtracting from the
provided by manufacturers; detail surrounding methodology changes is provided in the appendix (c) Switzerland was
using the Project SUN methodology
ND(L) by country of origin - 2013-2015(1)(a)(b)(c)
C&C by country of origin - 2013-2015(1)(a)(c)
0.0
0.2
0.4
0.6
0.8
1.0
1.2
20142013 2015
0.88
1.07
0.68
0.19
0.12
0.12
0.42
0.260.17
0.12
0.33
0.18
0.09
0.50
Italy AustriaFranceGermany
Other
Volu
me
(bn
ciga
rett
es)
0.03
0.04
0.020.04
0.0
0.2
0.4
0.6
0.8
1.0
1.2
20142013 2015
0.88
1.07
0.68
0.38
0.090.060.09
0.22
0.40
0.10
0.28
0.070.06
0.23 0.080.07
0.37
Winston ParisienneCamelMarlboro
Lucky Strike Other
Volu
me
(bn
ciga
rett
es)
0.040.04
0.03
0.0
0.1
0.2
0.3
0.4
0.5
20142013 2015
0.44
0.29
0.24
0.07
0.37
0.07
0.03
0.05
0.04
0.030.02
0.03
0.07
0.020.020.02
0.13
0.37
Kosovo
Luxembourg
Bosnia and HerzegovinaSerbia
FYROM Other
Volu
me
(bn
ciga
rett
es)
0.0
0.1
0.2
0.3
0.4
0.5
20142013 2015
0.44
0.29
0.24
0.17
0.020.02
0.23
0.05
0.040.13
0.020.02
0.06
0.020.02
0.14
0.37
Winston
Kent
Philip MorrisMarlboro
L&M Other
Volu
me
(bn
ciga
rett
es)
0.010.01
ND(L) by brand - 2013-2015(1)(a)(b)(c)
C&C by brand - 2013-2015(1)(a)(c)
• High ND(L) volumes are reflective of the opportunities presented by Duty Free shopping when leaving or entering the country with increases accounted for by border shopping, increased usage of Duty Free shopping and daily commuters from Germany, Italy and France
• C&C in Switzerland was 2.7% compared to 14.6% in France, 6.0% in Germany and 5.8% in Italy
– C&C from Serbia, Kosovo, Bosnia and Herzegovina and FYROM may relate to immigrants from the Balkan region; the Balkan emigrant population is estimated to be around 300,000(2)
Switz
erla
nd
© 2016 KPMG LLP, a UK limited liability partnership, and a member firm of the KPMG network of independent member firms affiliated with KPMG International Cooperative, a Swiss entity.
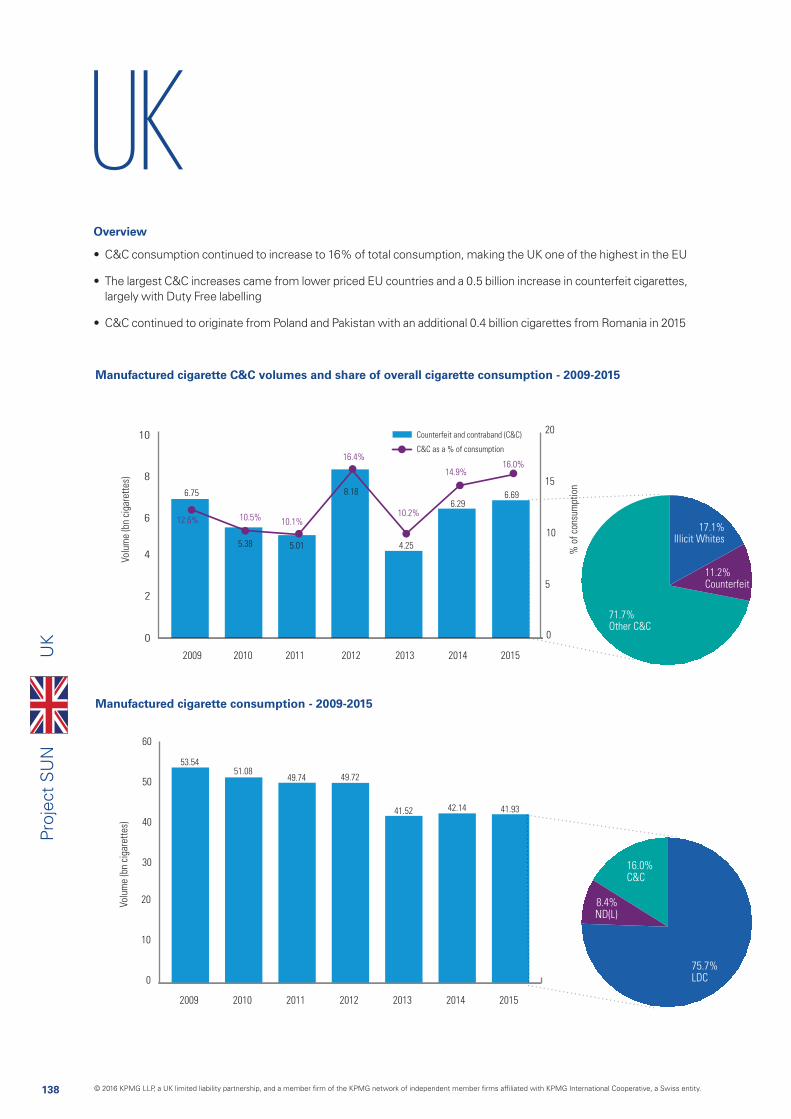
138
Proj
ect
SU
N
UKU
K
Manufactured cigarette consumption - 2009-2015
Manufactured cigarette C&C volumes and share of overall cigarette consumption - 2009-2015
0
2
4
6
8
10
Volu
me
(bn
ciga
rett
es)
% o
f co
nsum
ptio
n
2009 2010 2011 2012 2013 2014 2015
Counterfeit and contraband (C&C)
C&C as a % of consumption
0
5
10
15
20
12.6% 10.5% 10.1%
16.4%
10.2%
14.9%16.0%
6.75
5.38 5.01
8.18
4.25
6.296.69
Volu
me
(bn
ciga
rett
es)
2009 2010 2011 2012 2013 2014 2015
53.5451.08
49.74 49.72
41.52 41.9342.14
0
10
20
30
40
50
60
8.4%ND(L)
16.0%C&C
75.7%LDC
11.2%Counterfeit
71.7%Other C&C
17.1%Illicit Whites
Overview
• C&C consumption continued to increase to 16% of total consumption, making the UK one of the highest in the EU
• The largest C&C increases came from lower priced EU countries and a 0.5 billion increase in counterfeit cigarettes, largely with Duty Free labelling
• C&C continued to originate from Poland and Pakistan with an additional 0.4 billion cigarettes from Romania in 2015
© 2016 KPMG LLP, a UK limited liability partnership, and a member firm of the KPMG network of independent member firms affiliated with KPMG International Cooperative, a Swiss entity.
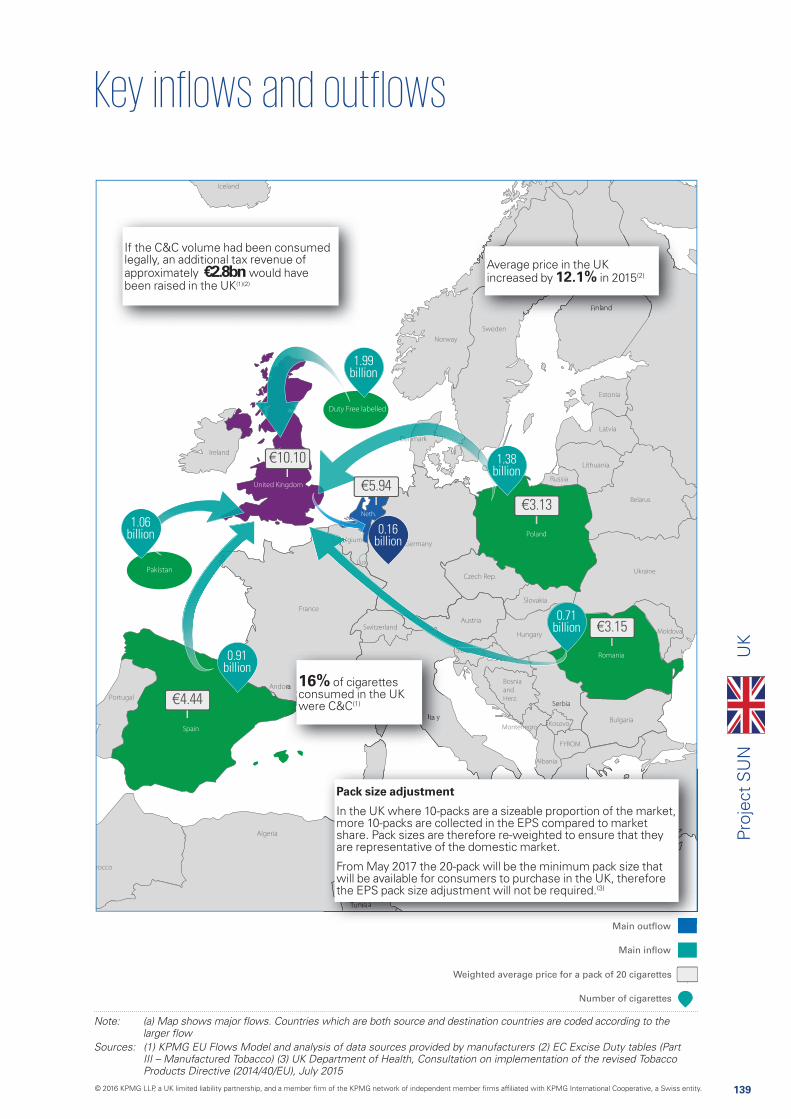
139
Proj
ect
SU
NU
K
Main outflow
Main inflow
Weighted average price for a pack of 20 cigarettes
Number of cigarettes
FYROM
Bosnia
and
Herz.
Croatia
Slovenia
Montenegro
Albania
Moldova
Ukraine
Belgium
Neth.
Belarus
Croatiaa
Slovoveniae
Bel
Croati
Slove
Bel
Kosovo
0.91 billion
1.06 billion
1.38 billion
0.71 billion
1.99 billion
0.16 billion
Sources: (1) KPMG EU Flows Model and analysis of data sources provided by manufacturers (2) EC Excise Duty tables (Part III – Manufactured Tobacco) (3) UK Department of Health, Consultation on implementation of the revised Tobacco Products Directive (2014/40/EU), July 2015
€5.94
€3.13
€10.10
€3.15
€4.44
M i tfl
Pack size adjustment
In the UK where 10-packs are a sizeable proportion of the market, more 10-packs are collected in the EPS compared to market share. Pack sizes are therefore re-weighted to ensure that they are representative of the domestic market.
From May 2017 the 20-pack will be the minimum pack size that will be available for consumers to purchase in the UK, therefore the EPS pack size adjustment will not be required.(3)
16% of cigarettes consumed in the UK were C&C(1)
Average price in the UK increased by 12.1% in 2015(2)
If the C&C volume had been consumed legally, an additional tax revenue of approximately €2.8bn would have been raised in the UK(1)(2)
Pakistan
Duty Free labelled
© 2016 KPMG LLP, a UK limited liability partnership, and a member firm of the KPMG network of independent member firms affiliated with KPMG International Cooperative, a Swiss entity.
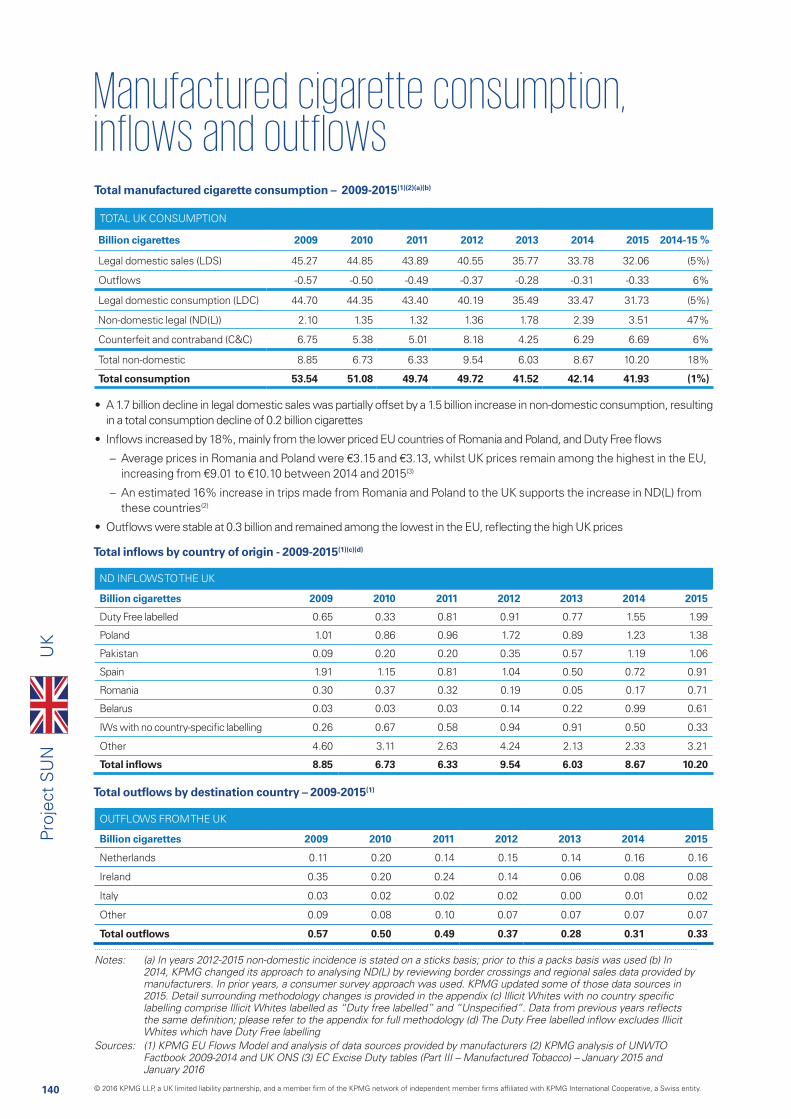
140
Proj
ect
SU
N
ND INFLOWS TO THE UK
Billion cigarettes 2009 2010 2011 2012 2013 2014 2015
Duty Free labelled 0.65 0.33 0.81 0.91 0.77 1.55 1.99
Poland 1.01 0.86 0.96 1.72 0.89 1.23 1.38
Pakistan 0.09 0.20 0.20 0.35 0.57 1.19 1.06
Spain 1.91 1.15 0.81 1.04 0.50 0.72 0.91
Romania 0.30 0.37 0.32 0.19 0.05 0.17 0.71
Belarus 0.03 0.03 0.03 0.14 0.22 0.99 0.61
IWs with no country-specific labelling 0.26 0.67 0.58 0.94 0.91 0.50 0.33
Other 4.60 3.11 2.63 4.24 2.13 2.33 3.21
Total inflows 8.85 6.73 6.33 9.54 6.03 8.67 10.20
Total manufactured cigarette consumption – 2009-2015(1)(2)(a)(b)
Total inflows by country of origin - 2009-2015(1)(c)(d)
TOTAL UK CONSUMPTION
Billion cigarettes 2009 2010 2011 2012 2013 2014 2015 2014-15 %
Legal domestic sales (LDS) 45.27 44.85 43.89 40.55 35.77 33.78 32.06 (5%)
Outflows -0.57 -0.50 -0.49 -0.37 -0.28 -0.31 -0.33 6%
Legal domestic consumption (LDC) 44.70 44.35 43.40 40.19 35.49 33.47 31.73 (5%)
Non-domestic legal (ND(L)) 2.10 1.35 1.32 1.36 1.78 2.39 3.51 47%
Counterfeit and contraband (C&C) 6.75 5.38 5.01 8.18 4.25 6.29 6.69 6%
Total non-domestic 8.85 6.73 6.33 9.54 6.03 8.67 10.20 18%
Total consumption 53.54 51.08 49.74 49.72 41.52 42.14 41.93 (1%)
Total outflows by destination country – 2009-2015(1)
OUTFLOWS FROM THE UK
Billion cigarettes 2009 2010 2011 2012 2013 2014 2015
Netherlands 0.11 0.20 0.14 0.15 0.14 0.16 0.16
Ireland 0.35 0.20 0.24 0.14 0.06 0.08 0.08
Italy 0.03 0.02 0.02 0.02 0.00 0.01 0.02
Other 0.09 0.08 0.10 0.07 0.07 0.07 0.07
Total outflows 0.57 0.50 0.49 0.37 0.28 0.31 0.33
Notes: (a) In years 2012-2015 non-domestic incidence is stated on a sticks basis; prior to this a packs basis was used (b) In 2014, KPMG changed its approach to analysing ND(L) by reviewing border crossings and regional sales data provided by manufacturers. In prior years, a consumer survey approach was used. KPMG updated some of those data sources in
Sources: (1) KPMG EU Flows Model and analysis of data sources provided by manufacturers (2) KPMG analysis of UNWTO Factbook 2009-2014 and UK ONS (3) EC Excise Duty tables (Part III – Manufactured Tobacco) – January 2015 and January 2016
• A 1.7 billion decline in legal domestic sales was partially offset by a 1.5 billion increase in non-domestic consumption, resulting in a total consumption decline of 0.2 billion cigarettes
• Inflows increased by 18%, mainly from the lower priced EU countries of Romania and Poland, and Duty Free flows
– Average prices in Romania and Poland were €3.15 and €3.13, whilst UK prices remain among the highest in the EU, increasing from €9.01 to €10.10 between 2014 and 2015(3)
– An estimated 16% increase in trips made from Romania and Poland to the UK supports the increase in ND(L) from these countries(2)
• Outflows were stable at 0.3 billion and remained among the lowest in the EU, reflecting the high UK prices
UK
© 2016 KPMG LLP, a UK limited liability partnership, and a member firm of the KPMG network of independent member firms affiliated with KPMG International Cooperative, a Swiss entity.
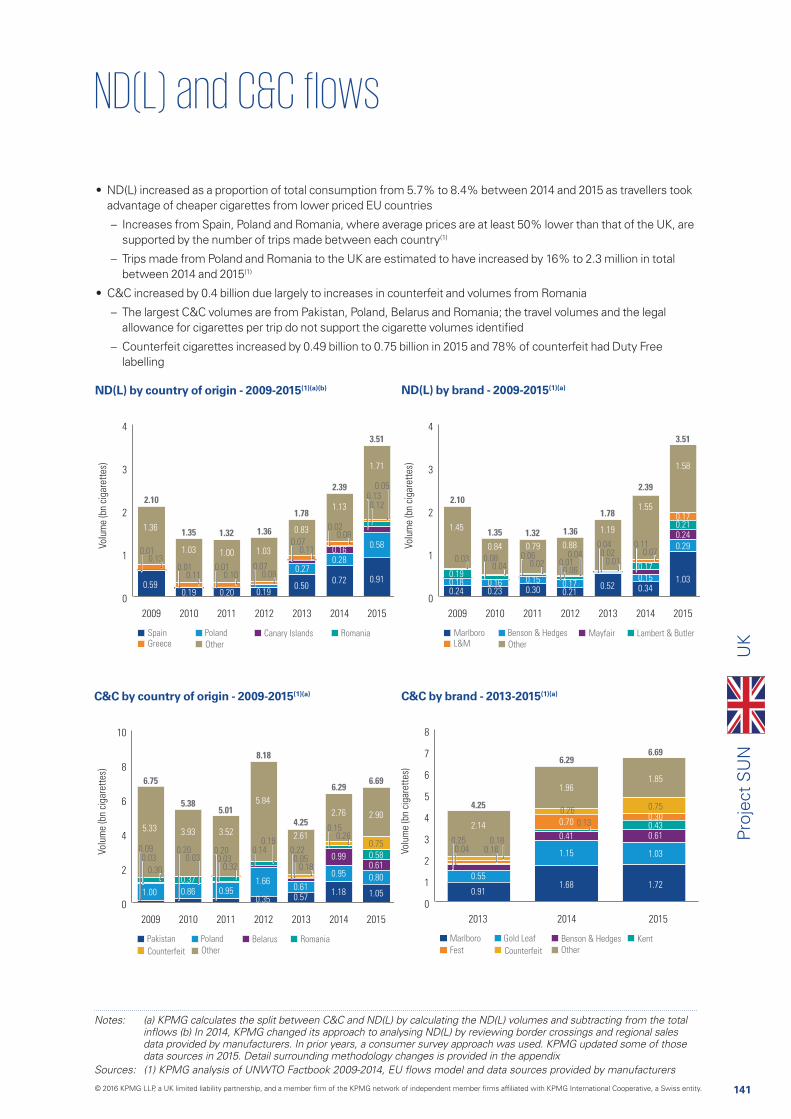
141
Proj
ect
SU
N
Notes: (a) KPMG calculates the split between C&C and ND(L) by calculating the ND(L) volumes and subtracting from the total
data provided by manufacturers. In prior years, a consumer survey approach was used. KPMG updated some of those data sources in 2015. Detail surrounding methodology changes is provided in the appendix
ND(L) by country of origin - 2009-2015(1)(a)(b)
C&C by country of origin - 2009-2015(1)(a)
0
1
2
3
4
2009 2010 2011 2012 2013 2014 2015
0.59
1.36
0.19
1.03
0.50
0.83
2.10
1.35 1.32 1.36
1.78
2.39
3.51
0.27
1.95
2.25
0.72
0.280.16
1.13
0.20
1.00
0.19
1.030.58
0.91
1.71
PolandSpain Canary Islands Romania
OtherGreece
Volu
me
(bn
ciga
rett
es)
0.050.130.12
0.020.08
0.070.11
0.070.08
0.010.10
0.010.11
0.010.13
0
1
2
3
4
2009 2010 2011 2012 2013 2014 2015
0.240.180.19
1.45
0.21
0.88
0.17 0.52
1.19
2.10
1.35 1.32 1.36
1.78
2.39
3.51
1.95
2.25
0.34
0.17
0.15
1.55
0.300.15
0.79
0.230.16
0.84 0.29
0.240.210.17
1.03
1.58
Benson & HedgesMarlboro Mayfair Lambert & Butler
OtherL&M
Volu
me
(bn
ciga
rett
es)
0.110.07
0.040.02
0.010.010.06
0.040.060.02
0.080.04
0.03
0
2
4
6
8
10
2009 2010 2011 2012 2013 2014 2015
1.00
5.33
0.35
5.84
1.66
0.570.61
2.61
6.75
5.385.01
8.18
4.25
6.296.69
1.18
0.99
0.95
2.76
0.95
3.52
0.86
0.37
3.93
0.80
0.610.58
0.75
2.90
1.05
PolandPakistan Belarus Romania
Other
Volu
me
(bn
ciga
rett
es)
0.150.26
0.220.05
0.18
0.140.19
0.200.03
0.32
0.200.03
0.090.03
0.30
Counterfeit
0
1
2
3
4
5
6
7
8
2013 2014 2015
0.91
0.55
2.14
4.25
6.296.69
1.68
1.15
0.70
0.41
1.96
1.03
0.300.430.61
0.75
1.85
1.72
Gold LeafMarlboro Benson & Hedges Kent
OtherFest
Volu
me
(bn
ciga
rett
es)
0.26
0.13
0.250.04 0.16
0.18
Counterfeit
ND(L) by brand - 2009-2015(1)(a)
C&C by brand - 2013-2015(1)(a)
• ND(L) increased as a proportion of total consumption from 5.7% to 8.4% between 2014 and 2015 as travellers took advantage of cheaper cigarettes from lower priced EU countries
– Increases from Spain, Poland and Romania, where average prices are at least 50% lower than that of the UK, are supported by the number of trips made between each country(1)
– Trips made from Poland and Romania to the UK are estimated to have increased by 16% to 2.3 million in total between 2014 and 2015(1)
• C&C increased by 0.4 billion due largely to increases in counterfeit and volumes from Romania
– The largest C&C volumes are from Pakistan, Poland, Belarus and Romania; the travel volumes and the legal allowance for cigarettes per trip do not support the cigarette volumes identified
– Counterfeit cigarettes increased by 0.49 billion to 0.75 billion in 2015 and 78% of counterfeit had Duty Free labelling
UK
© 2016 KPMG LLP, a UK limited liability partnership, and a member firm of the KPMG network of independent member firms affiliated with KPMG International Cooperative, a Swiss entity.
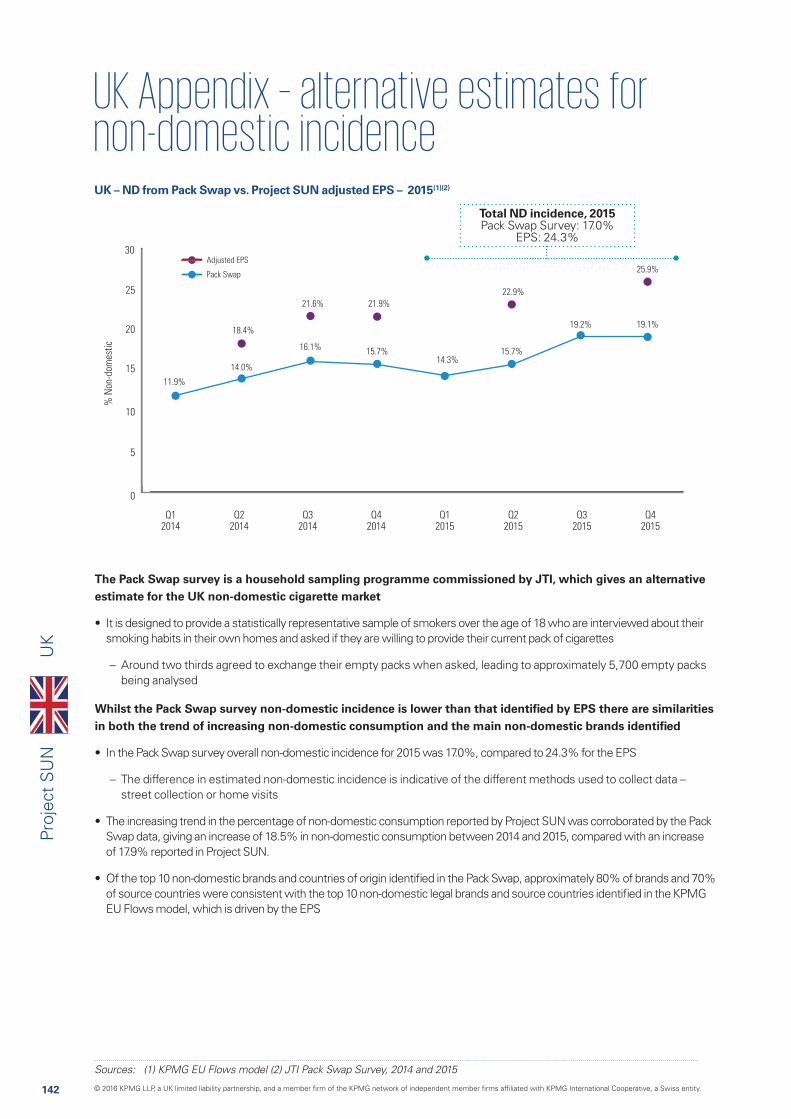
142
Proj
ect
SU
N
UK – ND from Pack Swap vs. Project SUN adjusted EPS – 2015(1)(2)
Sources: (1) KPMG EU Flows model (2) JTI Pack Swap Survey, 2014 and 2015
The Pack Swap survey is a household sampling programme commissioned by JTI, which gives an alternative estimate for the UK non-domestic cigarette market
• It is designed to provide a statistically representative sample of smokers over the age of 18 who are interviewed about their smoking habits in their own homes and asked if they are willing to provide their current pack of cigarettes
– Around two thirds agreed to exchange their empty packs when asked, leading to approximately 5,700 empty packs being analysed
Whilst the Pack Swap survey non-domestic incidence is lower than that identified by EPS there are similarities in both the trend of increasing non-domestic consumption and the main non-domestic brands identified
• In the Pack Swap survey overall non-domestic incidence for 2015 was 17.0%, compared to 24.3% for the EPS
– The difference in estimated non-domestic incidence is indicative of the different methods used to collect data – street collection or home visits
• The increasing trend in the percentage of non-domestic consumption reported by Project SUN was corroborated by the Pack Swap data, giving an increase of 18.5% in non-domestic consumption between 2014 and 2015, compared with an increase of 17.9% reported in Project SUN.
• Of the top 10 non-domestic brands and countries of origin identified in the Pack Swap, approximately 80% of brands and 70% of source countries were consistent with the top 10 non-domestic legal brands and source countries identified in the KPMG EU Flows model, which is driven by the EPS
0
5
10
15
20
25
30
Q12014
Q22014
Q32014
Q42014
Q12015
Q22015
Q32015
Q42015
% N
on-d
omes
tic
Adjusted EPS
Pack Swap
11.9%
14.0%
16.1% 15.7%14.3%
15.7%
18.4%
21.6% 21.9%
22.9%
25.9%
19.2% 19.1%
Total ND incidence, 2015 Pack Swap Survey: 17.0%
EPS: 24.3%
UK
© 2016 KPMG LLP, a UK limited liability partnership, and a member firm of the KPMG network of independent member firms affiliated with KPMG International Cooperative, a Swiss entity.

143
Proj
ect
SU
NU
K
© 2016 KPMG LLP, a UK limited liability partnership, and a member firm of the KPMG network of independent member firms affiliated with KPMG International Cooperative, a Swiss entity.
144
Proj
ect
SU
NM
etho
dolo
gy a
nd A
ppen
dice
s
© 2016 KPMG LLP, a UK limited liability partnership, and a member firm of the KPMG network of independent member firms affiliated with KPMG International Cooperative, a Swiss entity.
145
Proj
ect
SU
NM
etho
dolo
gy a
nd A
ppen
dice
s
Chapter page
METHODOLOGY
Overview 146
KPMG EU flows model 150
LDS 152
EPS 154
Non-domestic legal analysis 165
Illicit Whites analysis 178
EU tax loss calculation 180
APPENDICES
1. Limitation of results 182
2. EPS results by country 186
3. Sources 204
4. Scope of work 206
Contents
© 2016 KPMG LLP, a UK limited liability partnership, and a member firm of the KPMG network of independent member firms affiliated with KPMG International Cooperative, a Swiss entity.
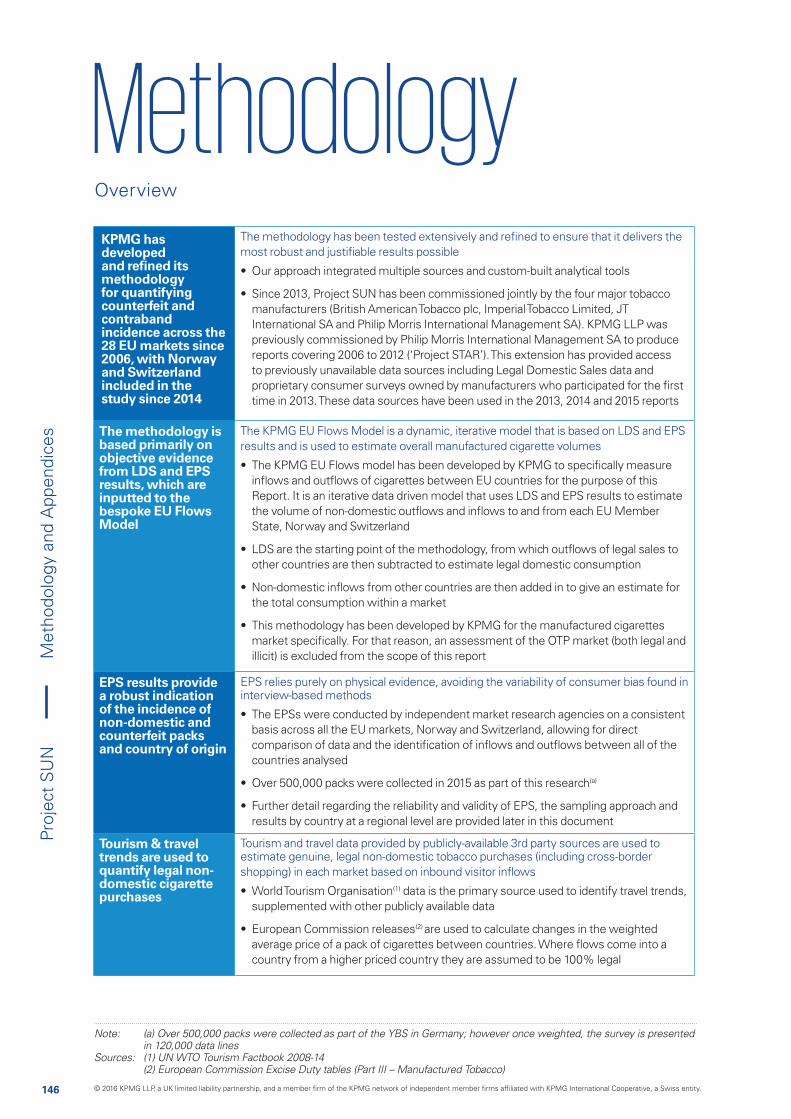
146
Proj
ect
SU
N
KPMG has developed and refined its methodology for quantifying counterfeit and contraband incidence across the 28 EU markets since 2006, with Norway and Switzerland included in the study since 2014
The methodology has been tested extensively and refined to ensure that it delivers the most robust and justifiable results possible
• Our approach integrated multiple sources and custom-built analytical tools
• Since 2013, Project SUN has been commissioned jointly by the four major tobacco manufacturers (British American Tobacco plc, Imperial Tobacco Limited, JT International SA and Philip Morris International Management SA). KPMG LLP was previously commissioned by Philip Morris International Management SA to produce reports covering 2006 to 2012 (‘Project STAR’). This extension has provided access to previously unavailable data sources including Legal Domestic Sales data and proprietary consumer surveys owned by manufacturers who participated for the first time in 2013. These data sources have been used in the 2013, 2014 and 2015 reports
The methodology is based primarily on objective evidence from LDS and EPS results, which are inputted to the bespoke EU Flows Model
The KPMG EU Flows Model is a dynamic, iterative model that is based on LDS and EPS results and is used to estimate overall manufactured cigarette volumes
• The KPMG EU Flows model has been developed by KPMG to specifically measure inflows and outflows of cigarettes between EU countries for the purpose of this Report. It is an iterative data driven model that uses LDS and EPS results to estimate the volume of non-domestic outflows and inflows to and from each EU Member State, Norway and Switzerland
• LDS are the starting point of the methodology, from which outflows of legal sales to other countries are then subtracted to estimate legal domestic consumption
• Non-domestic inflows from other countries are then added in to give an estimate for the total consumption within a market
• This methodology has been developed by KPMG for the manufactured cigarettes market specifically. For that reason, an assessment of the OTP market (both legal and illicit) is excluded from the scope of this report
EPS results provide a robust indication of the incidence of non-domestic and counterfeit packs and country of origin
EPS relies purely on physical evidence, avoiding the variability of consumer bias found in interview-based methods
• The EPSs were conducted by independent market research agencies on a consistent basis across all the EU markets, Norway and Switzerland, allowing for direct comparison of data and the identification of inflows and outflows between all of the countries analysed
• Over 500,000 packs were collected in 2015 as part of this research(a)
• Further detail regarding the reliability and validity of EPS, the sampling approach and results by country at a regional level are provided later in this document
Tourism & travel trends are used to quantify legal non-domestic cigarette purchases
Tourism and travel data provided by publicly-available 3rd party sources are used to estimate genuine, legal non-domestic tobacco purchases (including cross-border shopping) in each market based on inbound visitor inflows
• World Tourism Organisation(1) data is the primary source used to identify travel trends, supplemented with other publicly available data
• European Commission releases(2) are used to calculate changes in the weighted average price of a pack of cigarettes between countries. Where flows come into a country from a higher priced country they are assumed to be 100% legal
Note: (a) Over 500,000 packs were collected as part of the YBS in Germany; however once weighted, the survey is presented in 120,000 data lines Sources: (1) UN WTO Tourism Factbook 2008-14
(2) European Commission Excise Duty tables (Part III – Manufactured Tobacco)
Overview
Met
hodo
logy
and
App
endi
ces
© 2016 KPMG LLP, a UK limited liability partnership, and a member firm of the KPMG network of independent member firms affiliated with KPMG International Cooperative, a Swiss entity.

147
Proj
ect
SU
N
The Project SUN methodology was developed by KPMG. It has been deployed on a consistent basis since 2006, enabling comparisons to be made between counterfeit and contraband volumes from year to year.
Legal Domestic
Sales
Legal Domestic
consumption
DOMESTIC CONSUMPTION
Outflows
Non- domestic
*
Based on EPS results
*
*
Obtained by subtracting legal cross-border purchases from the total non-domestic volume
Based on consumer survey results regarding cross-border purchases
Non-domestic (legal)
Counterfeit and contraband
There are some specific limitations in the Project SUN methodology
Given the complexity of measuring C&C, we recognise there are some limitations within the methodology
• There are broadly two types of limitations: scope exclusions and source limitations
- scope exclusions include areas which cannot or have not been accounted for in our scope of work and approach, such as geographic, brand (non-participating manufacturer counterfeit), category exclusions (OTP) and legal domestic product flows out of the EU
- source limitations include the availability of information and the potential errors inherent with any data sources such as sampling criteria, coverage issues and seasonality factors
To help improve the accuracy of results, some minor refinements were necessary at a country level
Comparison of results from alternative sources identified a few markets where country-to-country flows required minor adjustment
• In nearly all instances, overall country results and flows from the KPMG EU Flows Model appeared reasonable. However, in a limited number of instances, specific adjustments were made to country-to-country flows where additional data provided by manufacturers allowed for further refinement of the analysis
Cig
aret
te c
onsu
mpt
ion
(cig
aret
tes)
Project SUN uses LDS, EPS results and other consumer research to estimate the volume of C&C cigarettes consumed in the EU
Met
hodo
logy
and
App
endi
ces
© 2016 KPMG LLP, a UK limited liability partnership, and a member firm of the KPMG network of independent member firms affiliated with KPMG International Cooperative, a Swiss entity.
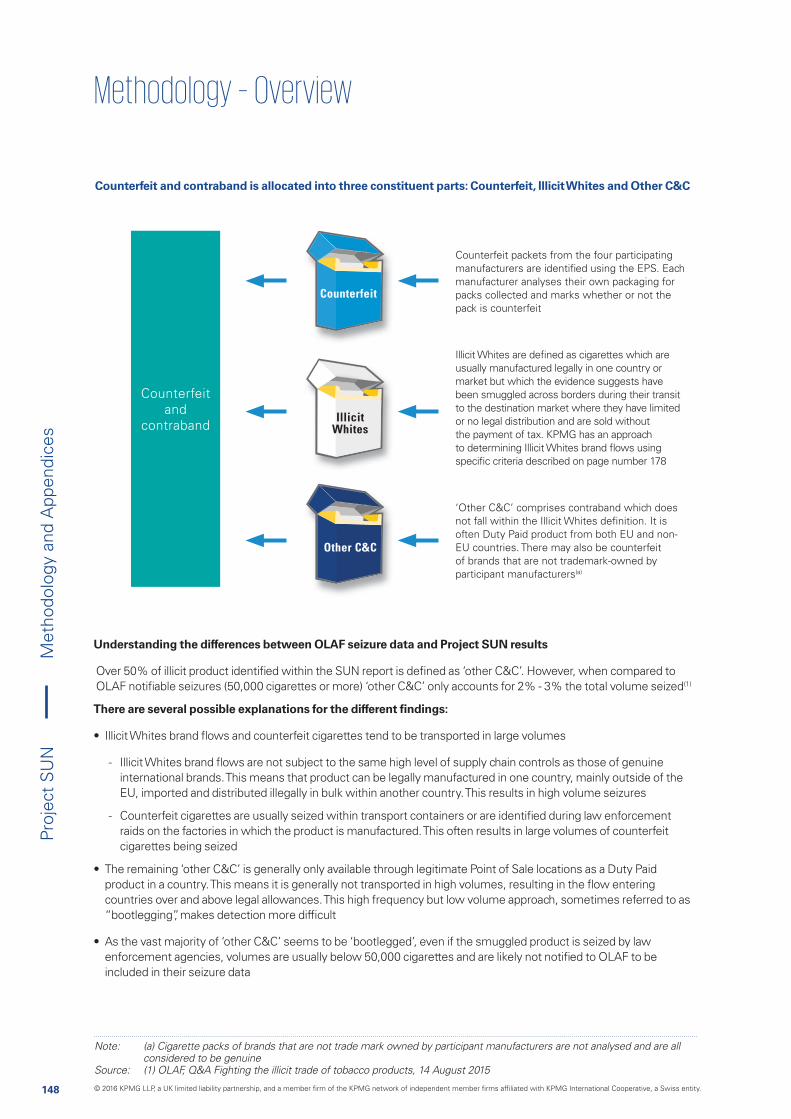
148
Proj
ect
SU
N
Counterfeit and
contraband
Counterfeit packets from the four participating manufacturers are identified using the EPS. Each manufacturer analyses their own packaging for packs collected and marks whether or not the pack is counterfeit
Illicit Whites are defined as cigarettes which are usually manufactured legally in one country or market but which the evidence suggests have been smuggled across borders during their transit to the destination market where they have limited or no legal distribution and are sold without the payment of tax. KPMG has an approach to determining Illicit Whites brand flows using specific criteria described on page number 178
‘Other C&C’ comprises contraband which does not fall within the Illicit Whites definition. It is often Duty Paid product from both EU and non-EU countries. There may also be counterfeit of brands that are not trademark-owned by participant manufacturers(a)
Note: (a) Cigarette packs of brands that are not trade mark owned by participant manufacturers are not analysed and are all considered to be genuine
Counterfeit and contraband is allocated into three constituent parts: Counterfeit, Illicit Whites and Other C&C
Understanding the differences between OLAF seizure data and Project SUN results
Over 50% of illicit product identified within the SUN report is defined as ‘other C&C’. However, when compared to OLAF notifiable seizures (50,000 cigarettes or more) ‘other C&C’ only accounts for 2% - 3% the total volume seized(1)
There are several possible explanations for the different findings:
• Illicit Whites brand flows and counterfeit cigarettes tend to be transported in large volumes
- Illicit Whites brand flows are not subject to the same high level of supply chain controls as those of genuine international brands. This means that product can be legally manufactured in one country, mainly outside of the EU, imported and distributed illegally in bulk within another country. This results in high volume seizures
- Counterfeit cigarettes are usually seized within transport containers or are identified during law enforcement raids on the factories in which the product is manufactured. This often results in large volumes of counterfeit cigarettes being seized
• The remaining ‘other C&C’ is generally only available through legitimate Point of Sale locations as a Duty Paid product in a country. This means it is generally not transported in high volumes, resulting in the flow entering countries over and above legal allowances. This high frequency but low volume approach, sometimes referred to as “bootlegging”, makes detection more difficult
• As the vast majority of ‘other C&C’ seems to be ‘bootlegged’, even if the smuggled product is seized by law enforcement agencies, volumes are usually below 50,000 cigarettes and are likely not notified to OLAF to be included in their seizure data
Counterfeit
Other C&C
Illicit Whites
Met
hodo
logy
and
App
endi
ces
© 2016 KPMG LLP, a UK limited liability partnership, and a member firm of the KPMG network of independent member firms affiliated with KPMG International Cooperative, a Swiss entity.
149
Proj
ect
SU
N
Chapter page
METHODOLOGY
Overview 146
KPMG EU flows model 150
LDS 152
EPS 154
Non-domestic legal analysis 165
Illicit Whites analysis 178
EU tax loss calculation 180
APPENDICES
1. Limitation of results 182
2. EPS results by country 186
3. Sources 204
4. Scope of work 206
Met
hodo
logy
and
App
endi
ces
© 2016 KPMG LLP, a UK limited liability partnership, and a member firm of the KPMG network of independent member firms affiliated with KPMG International Cooperative, a Swiss entity.
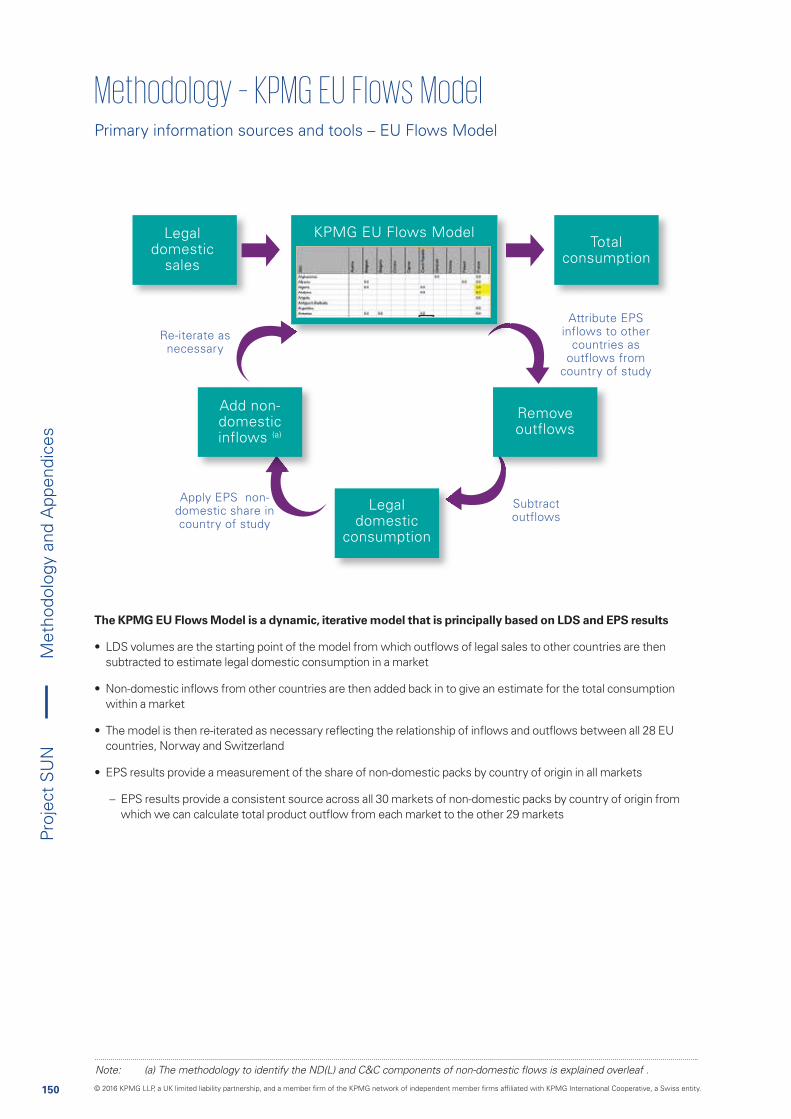
150
Proj
ect
SU
N
Legal domestic
sales
Total consumption
KPMG EU Flows Model
Add non-domestic inflows (a)
Remove outflows
Legal domestic
consumption
Apply EPS non-domestic share in country of study
Subtract outflows
Attribute EPS inflows to other
countries as outflows from
country of study
Re-iterate as necessary
Primary information sources and tools – EU Flows Model
The KPMG EU Flows Model is a dynamic, iterative model that is principally based on LDS and EPS results
• LDS volumes are the starting point of the model from which outflows of legal sales to other countries are then subtracted to estimate legal domestic consumption in a market
• Non-domestic inflows from other countries are then added back in to give an estimate for the total consumption within a market
• The model is then re-iterated as necessary reflecting the relationship of inflows and outflows between all 28 EU countries, Norway and Switzerland
• EPS results provide a measurement of the share of non-domestic packs by country of origin in all markets
– EPS results provide a consistent source across all 30 markets of non-domestic packs by country of origin from which we can calculate total product outflow from each market to the other 29 markets
Met
hodo
logy
and
App
endi
ces
© 2016 KPMG LLP, a UK limited liability partnership, and a member firm of the KPMG network of independent member firms affiliated with KPMG International Cooperative, a Swiss entity.

151
Proj
ect
SU
N
Chapter page
METHODOLOGY
Overview 146
KPMG EU flows model 150
LDS 152
EPS 154
Non-domestic legal analysis 165
Illicit Whites analysis 178
EU tax loss calculation 180
APPENDICES
1. Limitation of results 182
2. EPS results by country 186
3. Sources 204
4. Scope of work 206
Met
hodo
logy
and
App
endi
ces
© 2016 KPMG LLP, a UK limited liability partnership, and a member firm of the KPMG network of independent member firms affiliated with KPMG International Cooperative, a Swiss entity.
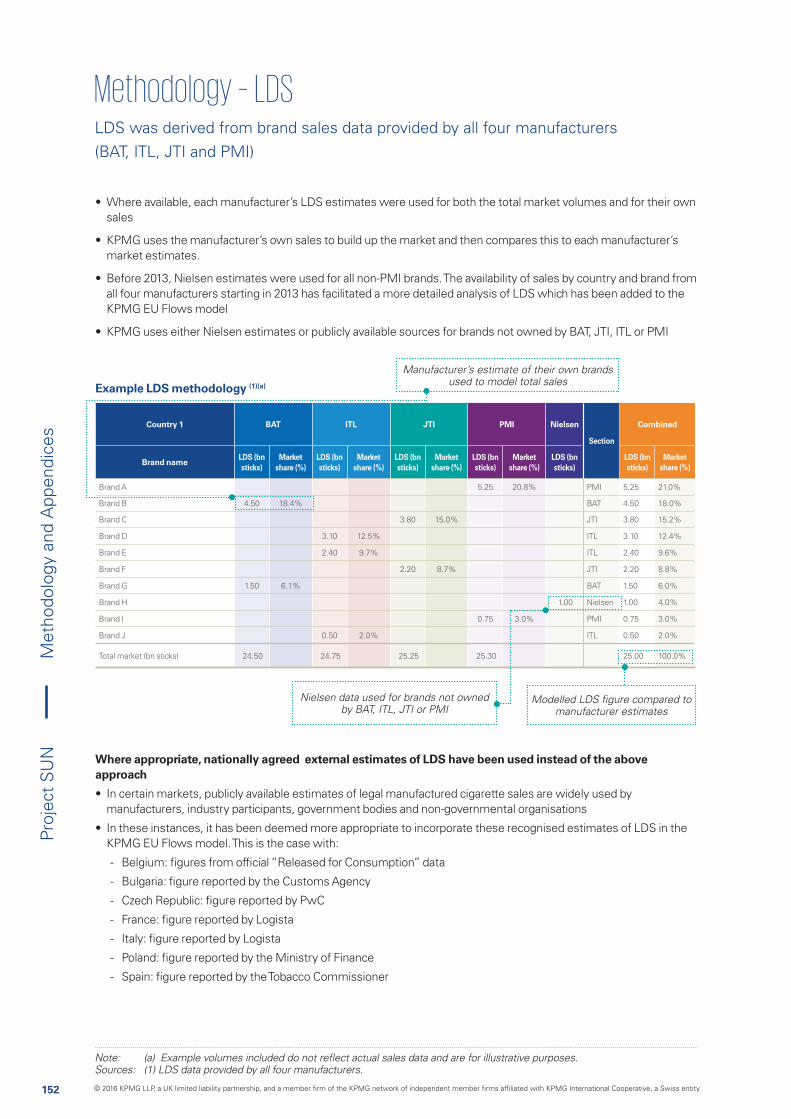
152
Proj
ect
SU
N
Country 1 BAT ITL JTI PMI Nielsen
Section
Combined
Brand nameLDS (bn sticks)
Market share (%)
LDS (bn sticks)
Market share (%)
LDS (bn sticks)
Market share (%)
LDS (bn sticks)
Market share (%)
LDS (bn sticks)
LDS (bn sticks)
Market share (%)
Brand A 5.25 20.8% PMI 5.25 21.0%
Brand B 4.50 18.4% BAT 4.50 18.0%
Brand C 3.80 15.0% JTI 3.80 15.2%
Brand D 3.10 12.5% ITL 3.10 12.4%
Brand E 2.40 9.7% ITL 2.40 9.6%
Brand F 2.20 8.7% JTI 2.20 8.8%
Brand G 1.50 6.1% BAT 1.50 6.0%
Brand H 1.00 Nielsen 1.00 4.0%
Brand I 0.75 3.0% PMI 0.75 3.0%
Brand J 0.50 2.0% ITL 0.50 2.0%
Total market (bn sticks) 24.50 24.75 25.25 25.30 25.00 100.0%
• Where available, each manufacturer’s LDS estimates were used for both the total market volumes and for their own sales
• KPMG uses the manufacturer’s own sales to build up the market and then compares this to each manufacturer’s market estimates.
• Before 2013, Nielsen estimates were used for all non-PMI brands. The availability of sales by country and brand from all four manufacturers starting in 2013 has facilitated a more detailed analysis of LDS which has been added to the KPMG EU Flows model
• KPMG uses either Nielsen estimates or publicly available sources for brands not owned by BAT, JTI, ITL or PMI
Example LDS methodology (1)(a)
manufacturer estimatesNielsen data used for brands not owned
by BAT, ITL, JTI or PMI
Where appropriate, nationally agreed external estimates of LDS have been used instead of the above approach
• In certain markets, publicly available estimates of legal manufactured cigarette sales are widely used by manufacturers, industry participants, government bodies and non-governmental organisations
• In these instances, it has been deemed more appropriate to incorporate these recognised estimates of LDS in the KPMG EU Flows model. This is the case with:
- Belgium: figures from official “Released for Consumption” data
- Bulgaria: figure reported by the Customs Agency
- Czech Republic: figure reported by PwC
- France: figure reported by Logista
- Italy: figure reported by Logista
- Poland: figure reported by the Ministry of Finance
- Spain: figure reported by the Tobacco Commissioner
Sources: (1) LDS data provided by all four manufacturers.
Manufacturer’s estimate of their own brands used to model total sales
LDS was derived from brand sales data provided by all four manufacturers (BAT, ITL, JTI and PMI)
Met
hodo
logy
and
App
endi
ces
© 2016 KPMG LLP, a UK limited liability partnership, and a member firm of the KPMG network of independent member firms affiliated with KPMG International Cooperative, a Swiss entity.

153
Proj
ect
SU
N
Chapter page
METHODOLOGY
Overview 146
KPMG EU flows model 150
LDS 152
EPS 154
Non-domestic legal analysis 165
Illicit Whites analysis 178
EU tax loss calculation 180
APPENDICES
1. Limitation of results 182
2. EPS results by country 186
3. Sources 204
4. Scope of work 206
Met
hodo
logy
and
App
endi
ces
© 2016 KPMG LLP, a UK limited liability partnership, and a member firm of the KPMG network of independent member firms affiliated with KPMG International Cooperative, a Swiss entity.
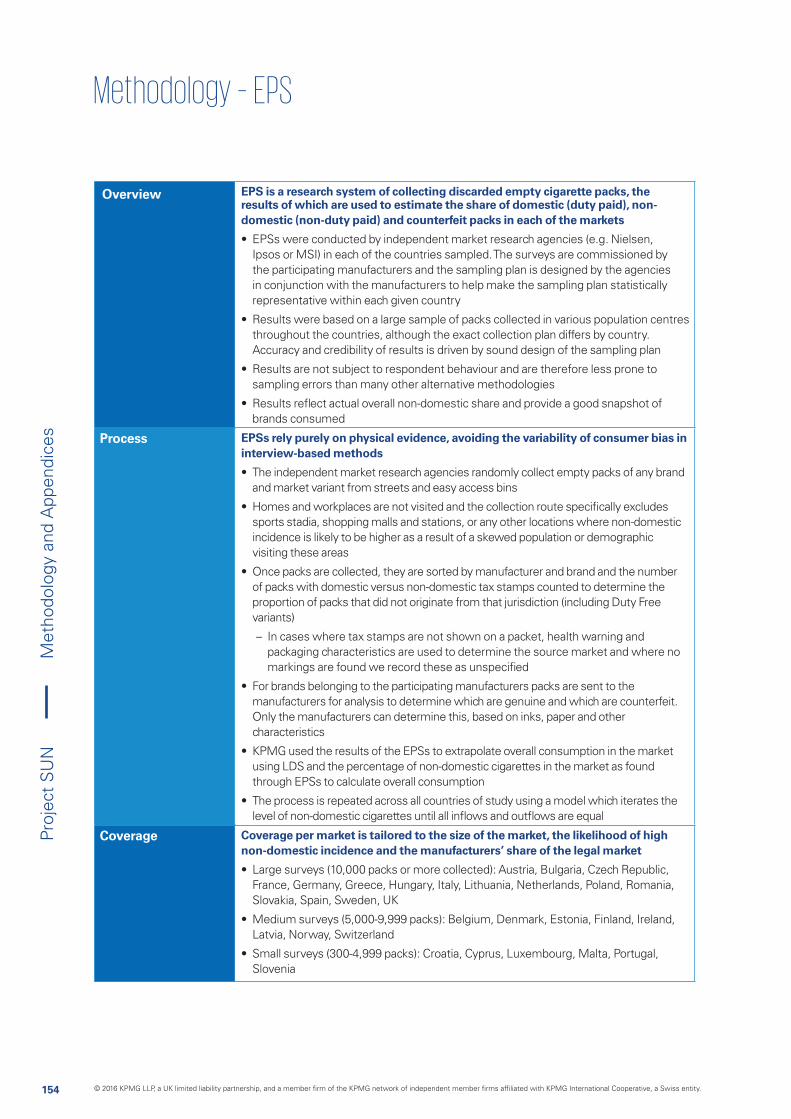
154
Proj
ect
SU
N
Overview EPS is a research system of collecting discarded empty cigarette packs, the results of which are used to estimate the share of domestic (duty paid), non-domestic (non-duty paid) and counterfeit packs in each of the markets
• EPSs were conducted by independent market research agencies (e.g. Nielsen, Ipsos or MSI) in each of the countries sampled. The surveys are commissioned by the participating manufacturers and the sampling plan is designed by the agencies in conjunction with the manufacturers to help make the sampling plan statistically representative within each given country
• Results were based on a large sample of packs collected in various population centres throughout the countries, although the exact collection plan differs by country. Accuracy and credibility of results is driven by sound design of the sampling plan
• Results are not subject to respondent behaviour and are therefore less prone to sampling errors than many other alternative methodologies
• Results reflect actual overall non-domestic share and provide a good snapshot of brands consumed
Process EPSs rely purely on physical evidence, avoiding the variability of consumer bias in interview-based methods
• The independent market research agencies randomly collect empty packs of any brand and market variant from streets and easy access bins
• Homes and workplaces are not visited and the collection route specifically excludes sports stadia, shopping malls and stations, or any other locations where non-domestic incidence is likely to be higher as a result of a skewed population or demographic visiting these areas
• Once packs are collected, they are sorted by manufacturer and brand and the number of packs with domestic versus non-domestic tax stamps counted to determine the proportion of packs that did not originate from that jurisdiction (including Duty Free variants)
– In cases where tax stamps are not shown on a packet, health warning and packaging characteristics are used to determine the source market and where no markings are found we record these as unspecified
• For brands belonging to the participating manufacturers packs are sent to the manufacturers for analysis to determine which are genuine and which are counterfeit. Only the manufacturers can determine this, based on inks, paper and other characteristics
• KPMG used the results of the EPSs to extrapolate overall consumption in the market using LDS and the percentage of non-domestic cigarettes in the market as found through EPSs to calculate overall consumption
• The process is repeated across all countries of study using a model which iterates the level of non-domestic cigarettes until all inflows and outflows are equal
Coverage Coverage per market is tailored to the size of the market, the likelihood of high non-domestic incidence and the manufacturers’ share of the legal market
• Large surveys (10,000 packs or more collected): Austria, Bulgaria, Czech Republic, France, Germany, Greece, Hungary, Italy, Lithuania, Netherlands, Poland, Romania, Slovakia, Spain, Sweden, UK
• Medium surveys (5,000-9,999 packs): Belgium, Denmark, Estonia, Finland, Ireland, Latvia, Norway, Switzerland
• Small surveys (300-4,999 packs): Croatia, Cyprus, Luxembourg, Malta, Portugal, Slovenia
Met
hodo
logy
and
App
endi
ces
© 2016 KPMG LLP, a UK limited liability partnership, and a member firm of the KPMG network of independent member firms affiliated with KPMG International Cooperative, a Swiss entity.
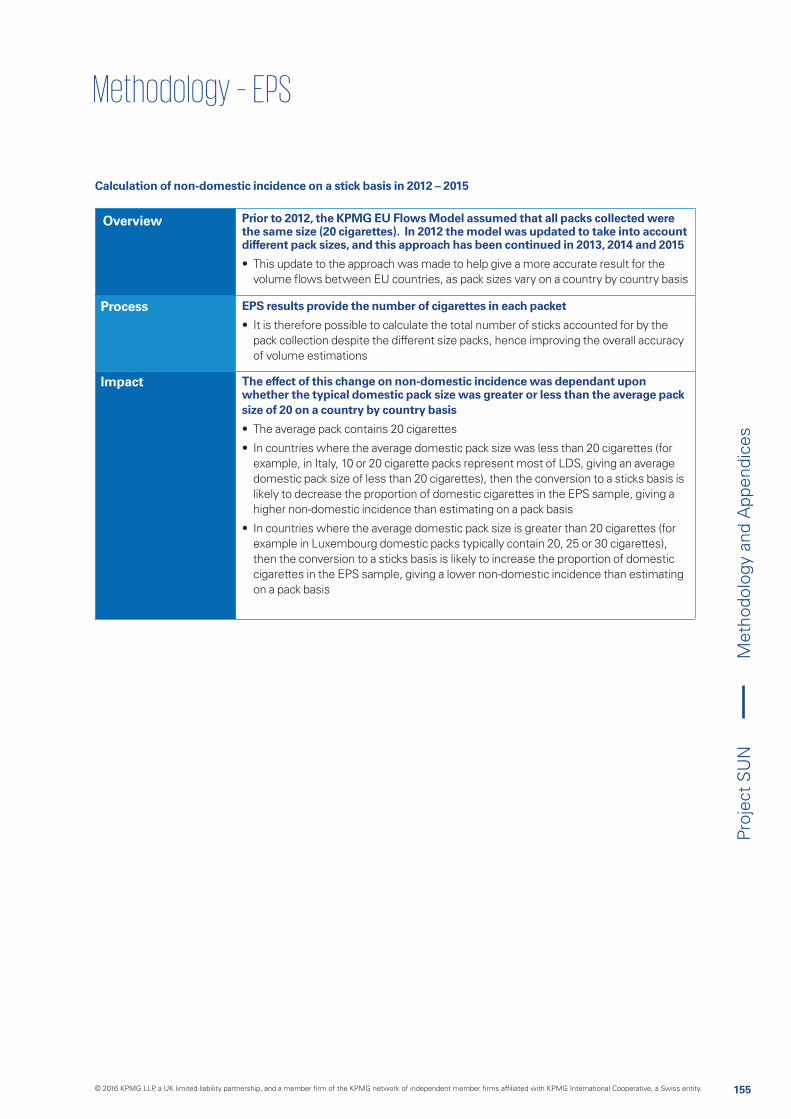
155
Proj
ect
SU
N
Overview Prior to 2012, the KPMG EU Flows Model assumed that all packs collected were the same size (20 cigarettes). In 2012 the model was updated to take into account different pack sizes, and this approach has been continued in 2013, 2014 and 2015
• This update to the approach was made to help give a more accurate result for the volume flows between EU countries, as pack sizes vary on a country by country basis
Process EPS results provide the number of cigarettes in each packet
• It is therefore possible to calculate the total number of sticks accounted for by the pack collection despite the different size packs, hence improving the overall accuracy of volume estimations
Impact The effect of this change on non-domestic incidence was dependant upon whether the typical domestic pack size was greater or less than the average pack size of 20 on a country by country basis
• The average pack contains 20 cigarettes
• In countries where the average domestic pack size was less than 20 cigarettes (for example, in Italy, 10 or 20 cigarette packs represent most of LDS, giving an average domestic pack size of less than 20 cigarettes), then the conversion to a sticks basis is likely to decrease the proportion of domestic cigarettes in the EPS sample, giving a higher non-domestic incidence than estimating on a pack basis
• In countries where the average domestic pack size is greater than 20 cigarettes (for example in Luxembourg domestic packs typically contain 20, 25 or 30 cigarettes), then the conversion to a sticks basis is likely to increase the proportion of domestic cigarettes in the EPS sample, giving a lower non-domestic incidence than estimating on a pack basis
Calculation of non-domestic incidence on a stick basis in 2012 – 2015
Met
hodo
logy
and
App
endi
ces
© 2016 KPMG LLP, a UK limited liability partnership, and a member firm of the KPMG network of independent member firms affiliated with KPMG International Cooperative, a Swiss entity.
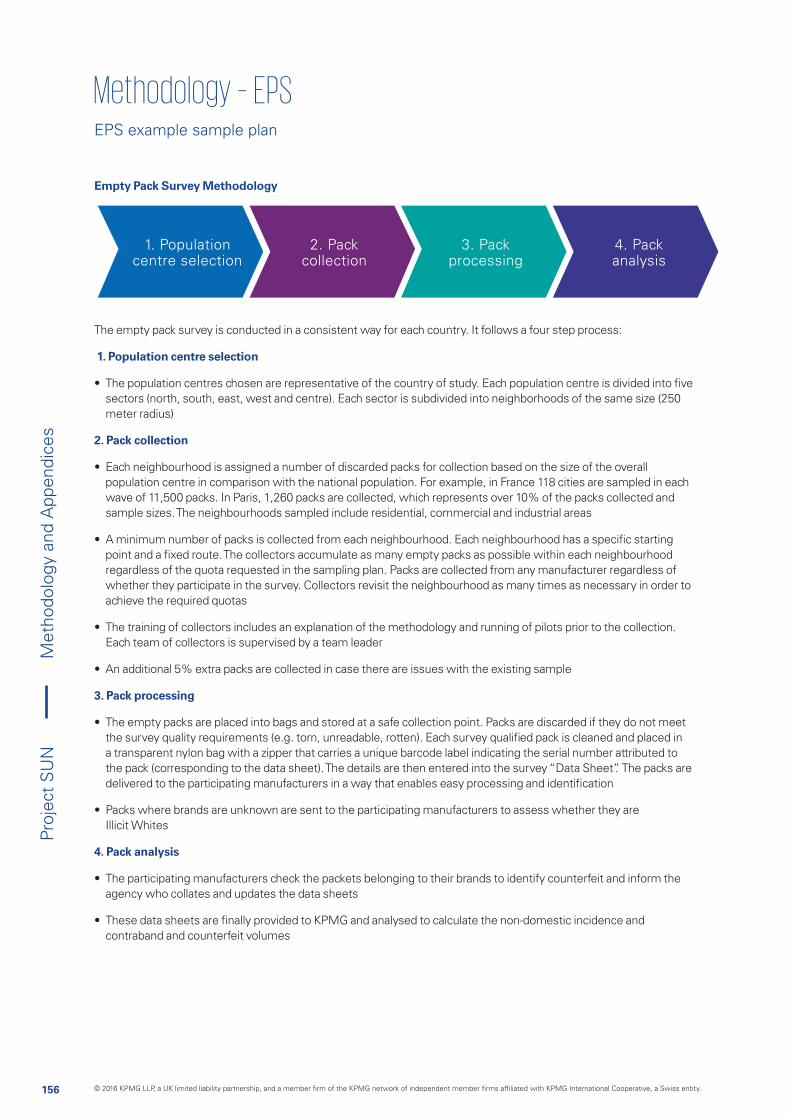
156
Proj
ect
SU
N
Empty Pack Survey Methodology
1. Population centre selection
2. Pack collection
3. Pack processing
4. Pack analysis
The empty pack survey is conducted in a consistent way for each country. It follows a four step process:
1. Population centre selection
• The population centres chosen are representative of the country of study. Each population centre is divided into five sectors (north, south, east, west and centre). Each sector is subdivided into neighborhoods of the same size (250 meter radius)
2. Pack collection
• Each neighbourhood is assigned a number of discarded packs for collection based on the size of the overall population centre in comparison with the national population. For example, in France 118 cities are sampled in each wave of 11,500 packs. In Paris, 1,260 packs are collected, which represents over 10% of the packs collected and sample sizes. The neighbourhoods sampled include residential, commercial and industrial areas
• A minimum number of packs is collected from each neighbourhood. Each neighbourhood has a specific starting point and a fixed route. The collectors accumulate as many empty packs as possible within each neighbourhood regardless of the quota requested in the sampling plan. Packs are collected from any manufacturer regardless of whether they participate in the survey. Collectors revisit the neighbourhood as many times as necessary in order to achieve the required quotas
• The training of collectors includes an explanation of the methodology and running of pilots prior to the collection. Each team of collectors is supervised by a team leader
• An additional 5% extra packs are collected in case there are issues with the existing sample
3. Pack processing
• The empty packs are placed into bags and stored at a safe collection point. Packs are discarded if they do not meet the survey quality requirements (e.g. torn, unreadable, rotten). Each survey qualified pack is cleaned and placed in a transparent nylon bag with a zipper that carries a unique barcode label indicating the serial number attributed to the pack (corresponding to the data sheet). The details are then entered into the survey “Data Sheet”. The packs are delivered to the participating manufacturers in a way that enables easy processing and identification
• Packs where brands are unknown are sent to the participating manufacturers to assess whether they are Illicit Whites
4. Pack analysis
• The participating manufacturers check the packets belonging to their brands to identify counterfeit and inform the agency who collates and updates the data sheets
• These data sheets are finally provided to KPMG and analysed to calculate the non-domestic incidence and contraband and counterfeit volumes
EPS example sample plan
Met
hodo
logy
and
App
endi
ces
© 2016 KPMG LLP, a UK limited liability partnership, and a member firm of the KPMG network of independent member firms affiliated with KPMG International Cooperative, a Swiss entity.
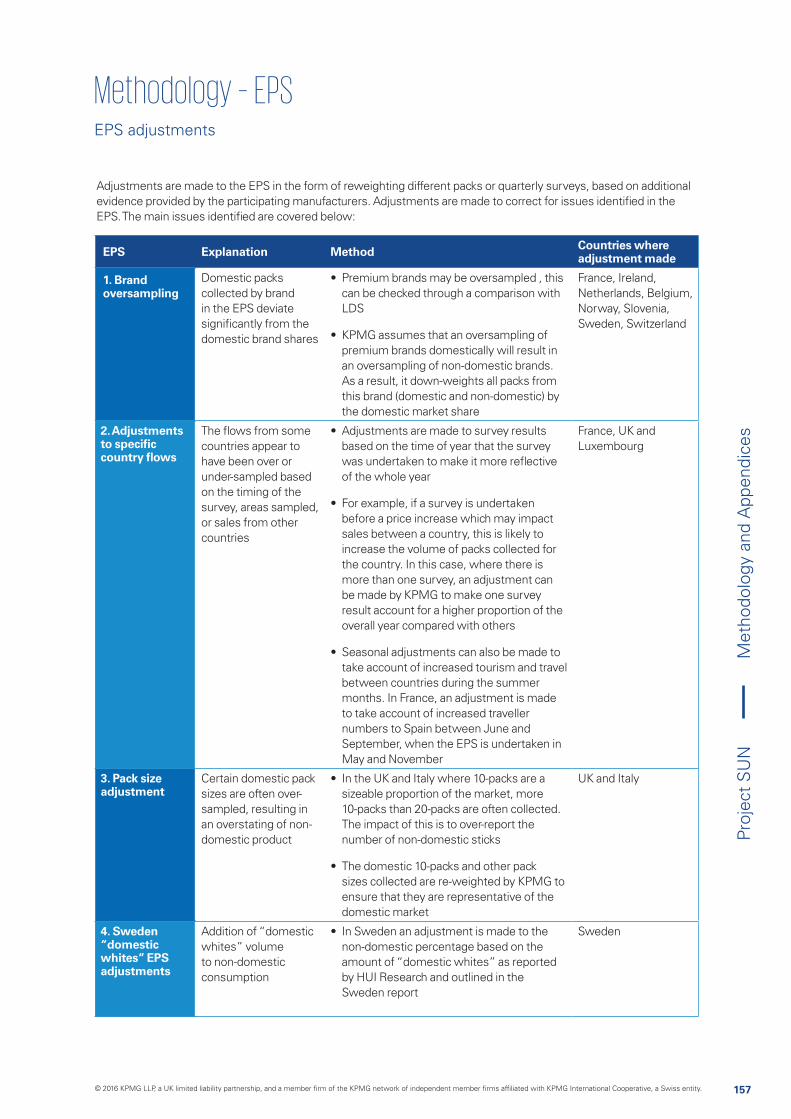
157
Proj
ect
SU
N
Adjustments are made to the EPS in the form of reweighting different packs or quarterly surveys, based on additional evidence provided by the participating manufacturers. Adjustments are made to correct for issues identified in the EPS. The main issues identified are covered below:
EPS Explanation Method Countries where adjustment made
1. Brand oversampling
Domestic packs collected by brand in the EPS deviate significantly from the domestic brand shares
• Premium brands may be oversampled , this can be checked through a comparison with LDS
• KPMG assumes that an oversampling of premium brands domestically will result in an oversampling of non-domestic brands. As a result, it down-weights all packs from this brand (domestic and non-domestic) by the domestic market share
France, Ireland, Netherlands, Belgium, Norway, Slovenia, Sweden, Switzerland
2. Adjustments to specific country flows
The flows from some countries appear to have been over or under-sampled based on the timing of the survey, areas sampled, or sales from other countries
• Adjustments are made to survey results based on the time of year that the survey was undertaken to make it more reflective of the whole year
• For example, if a survey is undertaken before a price increase which may impact sales between a country, this is likely to increase the volume of packs collected for the country. In this case, where there is more than one survey, an adjustment can be made by KPMG to make one survey result account for a higher proportion of the overall year compared with others
• Seasonal adjustments can also be made to take account of increased tourism and travel between countries during the summer months. In France, an adjustment is made to take account of increased traveller numbers to Spain between June and September, when the EPS is undertaken in May and November
France, UK and Luxembourg
3. Pack size adjustment
Certain domestic pack sizes are often over-sampled, resulting in an overstating of non-domestic product
• In the UK and Italy where 10-packs are a sizeable proportion of the market, more 10-packs than 20-packs are often collected. The impact of this is to over-report the number of non-domestic sticks
• The domestic 10-packs and other pack sizes collected are re-weighted by KPMG to ensure that they are representative of the domestic market
UK and Italy
4. Sweden “domestic whites” EPS adjustments
Addition of “domestic whites” volume to non-domestic consumption
• In Sweden an adjustment is made to the non-domestic percentage based on the amount of “domestic whites” as reported by HUI Research and outlined in the Sweden report
Sweden
EPS adjustments
Met
hodo
logy
and
App
endi
ces
© 2016 KPMG LLP, a UK limited liability partnership, and a member firm of the KPMG network of independent member firms affiliated with KPMG International Cooperative, a Swiss entity.
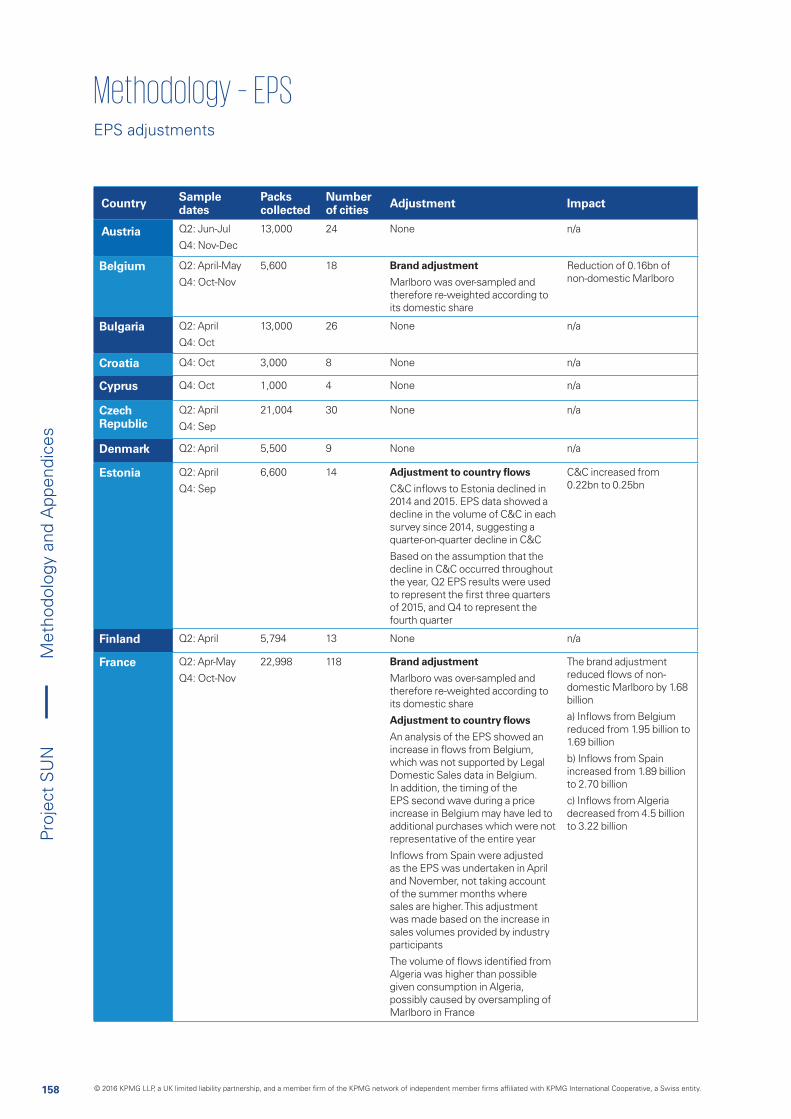
158
Proj
ect
SU
N
Country Sample dates
Packs collected
Number of cities Adjustment Impact
Austria Q2: Jun-Jul
Q4: Nov-Dec
13,000 24 None n/a
Belgium Q2: April-May
Q4: Oct-Nov
5,600 18 Brand adjustment
Marlboro was over-sampled and therefore re-weighted according to its domestic share
Reduction of 0.16bn of non-domestic Marlboro
Bulgaria Q2: April
Q4: Oct
13,000 26 None n/a
Croatia Q4: Oct 3,000 8 None n/a
Cyprus Q4: Oct 1,000 4 None n/a
Czech Republic
Q2: April
Q4: Sep
21,004 30 None n/a
Denmark Q2: April 5,500 9 None n/a
Estonia Q2: April
Q4: Sep
6,600 14 Adjustment to country flows
C&C inflows to Estonia declined in 2014 and 2015. EPS data showed a decline in the volume of C&C in each survey since 2014, suggesting a quarter-on-quarter decline in C&C
Based on the assumption that the decline in C&C occurred throughout the year, Q2 EPS results were used to represent the first three quarters of 2015, and Q4 to represent the fourth quarter
C&C increased from 0.22bn to 0.25bn
Finland Q2: April 5,794 13 None n/a
France Q2: Apr-May
Q4: Oct-Nov
22,998 118 Brand adjustment
Marlboro was over-sampled and therefore re-weighted according to its domestic share
Adjustment to country flows
An analysis of the EPS showed an increase in flows from Belgium, which was not supported by Legal Domestic Sales data in Belgium. In addition, the timing of the EPS second wave during a price increase in Belgium may have led to additional purchases which were not representative of the entire year
Inflows from Spain were adjusted as the EPS was undertaken in April and November, not taking account of the summer months where sales are higher. This adjustment was made based on the increase in sales volumes provided by industry participants
The volume of flows identified from Algeria was higher than possible given consumption in Algeria, possibly caused by oversampling of Marlboro in France
The brand adjustment reduced flows of non-domestic Marlboro by 1.68 billion
a) Inflows from Belgium reduced from 1.95 billion to 1.69 billion
b) Inflows from Spain increased from 1.89 billion to 2.70 billion
c) Inflows from Algeria decreased from 4.5 billion to 3.22 billion
EPS adjustments
Met
hodo
logy
and
App
endi
ces
© 2016 KPMG LLP, a UK limited liability partnership, and a member firm of the KPMG network of independent member firms affiliated with KPMG International Cooperative, a Swiss entity.
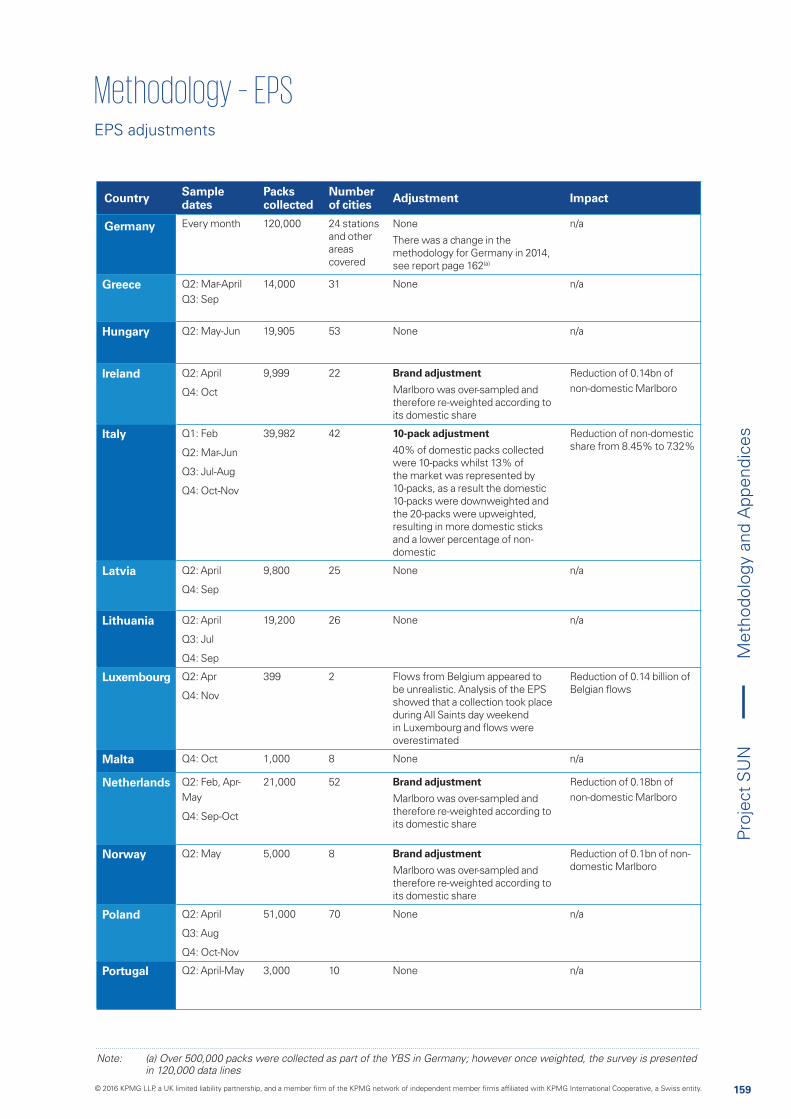
159
Proj
ect
SU
N
Country Sample dates
Packs collected
Number of cities Adjustment Impact
Germany Every month 120,000 24 stations and other areas covered
None
There was a change in the methodology for Germany in 2014, see report page 162(a)
n/a
Greece Q2: Mar-April Q3: Sep
14,000 31 None n/a
Hungary Q2: May-Jun 19,905 53 None n/a
Ireland Q2: April
Q4: Oct
9,999 22 Brand adjustment
Marlboro was over-sampled and therefore re-weighted according to its domestic share
Reduction of 0.14bn of non-domestic Marlboro
Italy Q1: Feb
Q2: Mar-Jun
Q3: Jul-Aug
Q4: Oct-Nov
39,982 42 10-pack adjustment
40% of domestic packs collected were 10-packs whilst 13% of the market was represented by 10-packs, as a result the domestic 10-packs were downweighted and the 20-packs were upweighted, resulting in more domestic sticks and a lower percentage of non-domestic
Reduction of non-domestic share from 8.45% to 7.32%
Latvia Q2: April
Q4: Sep
9,800 25 None n/a
Lithuania Q2: April
Q3: Jul
Q4: Sep
19,200 26 None n/a
Luxembourg Q2: Apr
Q4: Nov
399 2 Flows from Belgium appeared to be unrealistic. Analysis of the EPS showed that a collection took place during All Saints day weekend in Luxembourg and flows were overestimated
Reduction of 0.14 billion of Belgian flows
Malta Q4: Oct 1,000 8 None n/a
Netherlands Q2: Feb, Apr-May
Q4: Sep-Oct
21,000 52 Brand adjustment
Marlboro was over-sampled and therefore re-weighted according to its domestic share
Reduction of 0.18bn of non-domestic Marlboro
Norway Q2: May 5,000 8 Brand adjustment
Marlboro was over-sampled and therefore re-weighted according to its domestic share
Reduction of 0.1bn of non-domestic Marlboro
Poland Q2: April
Q3: Aug
Q4: Oct-Nov
51,000 70 None n/a
Portugal Q2: April-May 3,000 10 None n/a
Note: (a) Over 500,000 packs were collected as part of the YBS in Germany; however once weighted, the survey is presented in 120,000 data lines
EPS adjustments
Met
hodo
logy
and
App
endi
ces
© 2016 KPMG LLP, a UK limited liability partnership, and a member firm of the KPMG network of independent member firms affiliated with KPMG International Cooperative, a Swiss entity.
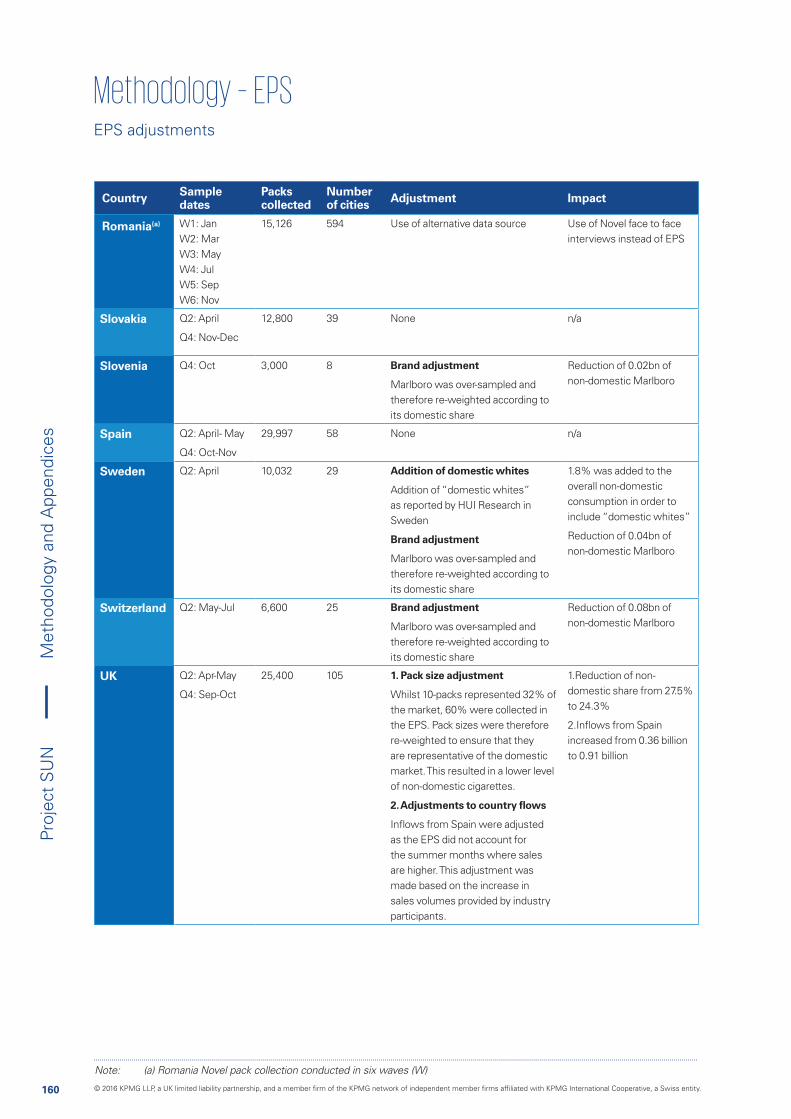
160
Proj
ect
SU
N
Country Sample dates
Packs collected
Number of cities Adjustment Impact
Romania(a) W1: Jan W2: Mar W3: May W4: Jul W5: Sep W6: Nov
15,126 594 Use of alternative data source Use of Novel face to face interviews instead of EPS
Slovakia Q2: April
Q4: Nov-Dec
12,800 39 None n/a
Slovenia Q4: Oct 3,000 8 Brand adjustment
Marlboro was over-sampled and therefore re-weighted according to its domestic share
Reduction of 0.02bn of non-domestic Marlboro
Spain Q2: April- May
Q4: Oct-Nov
29,997 58 None n/a
Sweden Q2: April 10,032 29 Addition of domestic whites
Addition of “domestic whites” as reported by HUI Research in Sweden
Brand adjustment
Marlboro was over-sampled and therefore re-weighted according to its domestic share
1.8% was added to the overall non-domestic consumption in order to include “domestic whites”
Reduction of 0.04bn of non-domestic Marlboro
Switzerland Q2: May-Jul 6,600 25 Brand adjustment
Marlboro was over-sampled and therefore re-weighted according to its domestic share
Reduction of 0.08bn of non-domestic Marlboro
UK Q2: Apr-May
Q4: Sep-Oct
25,400 105 1. Pack size adjustment
Whilst 10-packs represented 32% of the market, 60% were collected in the EPS. Pack sizes were therefore re-weighted to ensure that they are representative of the domestic market. This resulted in a lower level of non-domestic cigarettes.
2. Adjustments to country flows
Inflows from Spain were adjusted as the EPS did not account for the summer months where sales are higher. This adjustment was made based on the increase in sales volumes provided by industry participants.
1.Reduction of non-domestic share from 27.5% to 24.3%
2.Inflows from Spain increased from 0.36 billion to 0.91 billion
Note: (a) Romania Novel pack collection conducted in six waves (W)
EPS adjustments
Met
hodo
logy
and
App
endi
ces
© 2016 KPMG LLP, a UK limited liability partnership, and a member firm of the KPMG network of independent member firms affiliated with KPMG International Cooperative, a Swiss entity.
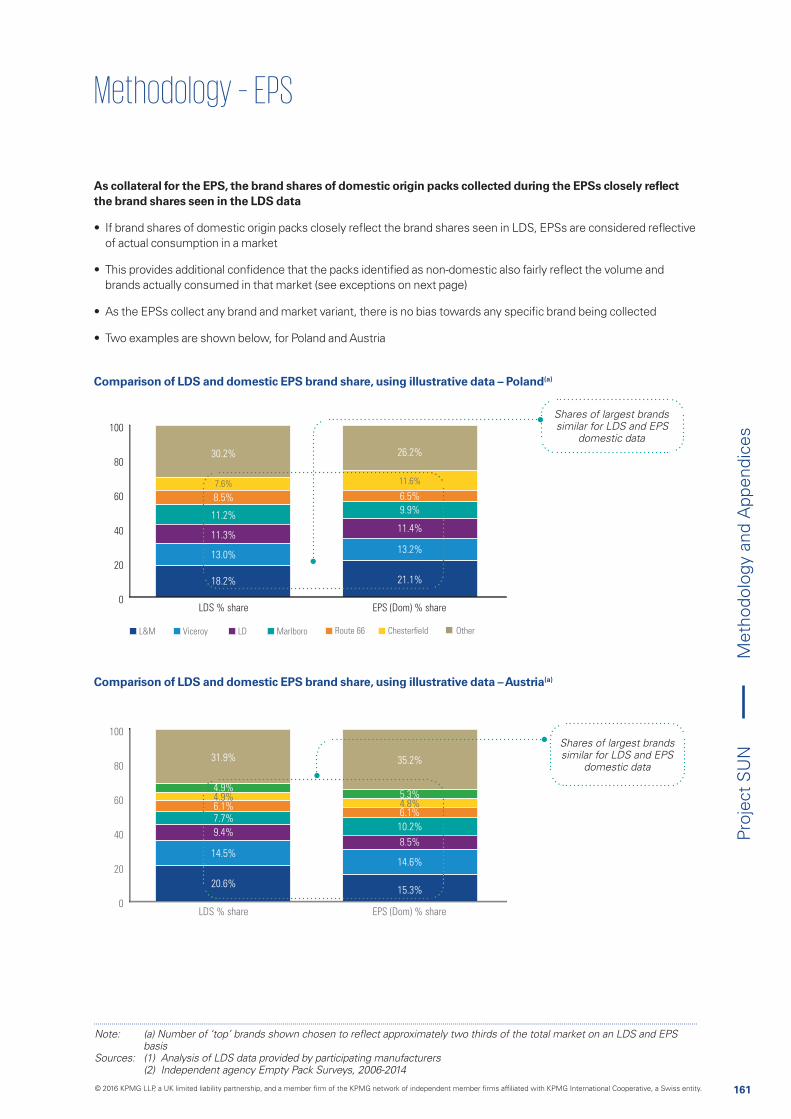
161
Proj
ect
SU
N
As collateral for the EPS, the brand shares of domestic origin packs collected during the EPSs closely reflect the brand shares seen in the LDS data
• If brand shares of domestic origin packs closely reflect the brand shares seen in LDS, EPSs are considered reflective of actual consumption in a market
• This provides additional confidence that the packs identified as non-domestic also fairly reflect the volume and brands actually consumed in that market (see exceptions on next page)
• As the EPSs collect any brand and market variant, there is no bias towards any specific brand being collected
• Two examples are shown below, for Poland and Austria
Comparison of LDS and domestic EPS brand share, using illustrative data – Poland(a)
Comparison of LDS and domestic EPS brand share, using illustrative data – Austria(a)
Shares of largest brands similar for LDS and EPS
domestic data
Shares of largest brands similar for LDS and EPS
domestic data
0
20
40
60
80
100
LDS % share
EPS (Dom) % share
18.2%
13.0%
11.3%
11.2%
8.5%
7.6%
30.2%
21.1%
13.2%
11.4%
9.9%
6.5%
11.6%
26.2%
L&M Route 66Viceroy LD Marlboro OtherChesterfield
0
20
40
60
80
100
LDS % share
EPS (Dom) % share
20.6%
14.5%
9.4%
7.7%6.1%4.9%
31.9%
15.3%
8.5%
10.2%
6.1%4.8%5.3%
35.2%
4.9%
14.6%
basis Sources: (1) Analysis of LDS data provided by participating manufacturers (2) Independent agency Empty Pack Surveys, 2006-2014
Met
hodo
logy
and
App
endi
ces
© 2016 KPMG LLP, a UK limited liability partnership, and a member firm of the KPMG network of independent member firms affiliated with KPMG International Cooperative, a Swiss entity.
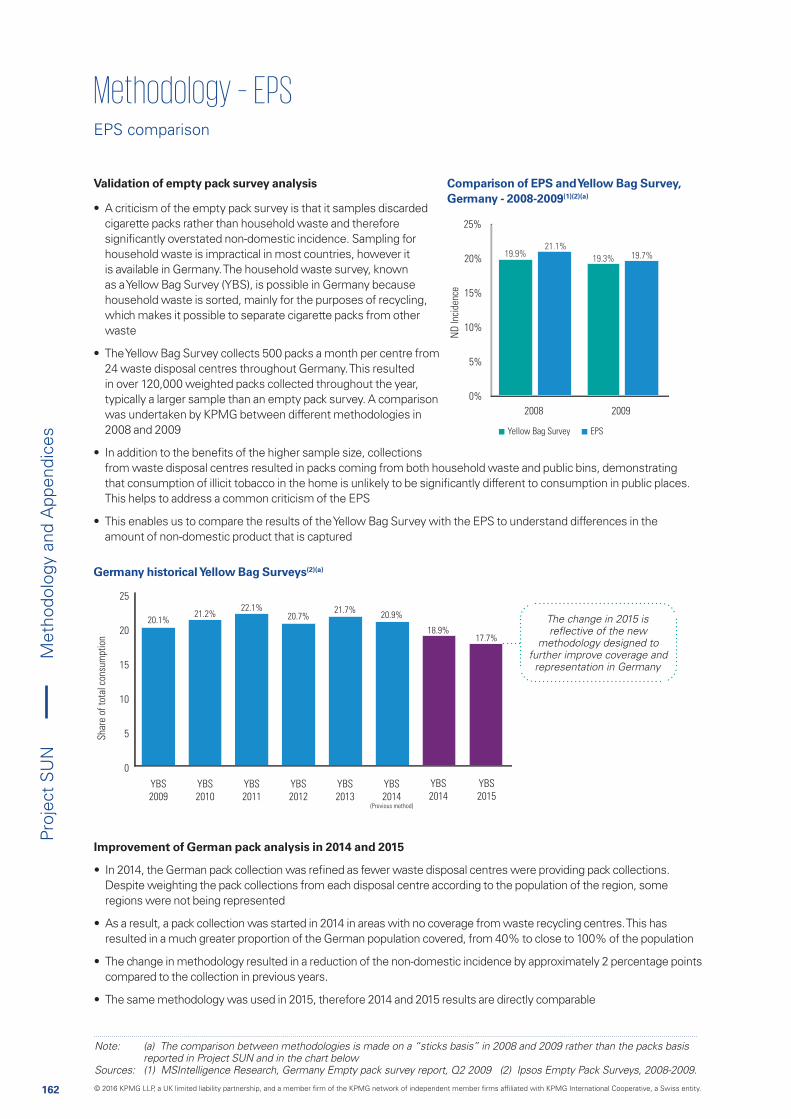
162
Proj
ect
SU
N
reported in Project SUN and in the chart below
• A criticism of the empty pack survey is that it samples discarded cigarette packs rather than household waste and therefore significantly overstated non-domestic incidence. Sampling for household waste is impractical in most countries, however it is available in Germany. The household waste survey, known as a Yellow Bag Survey (YBS), is possible in Germany because household waste is sorted, mainly for the purposes of recycling, which makes it possible to separate cigarette packs from other waste
• The Yellow Bag Survey collects 500 packs a month per centre from 24 waste disposal centres throughout Germany. This resulted in over 120,000 weighted packs collected throughout the year, typically a larger sample than an empty pack survey. A comparison was undertaken by KPMG between different methodologies in 2008 and 2009
• In addition to the benefits of the higher sample size, collections from waste disposal centres resulted in packs coming from both household waste and public bins, demonstrating that consumption of illicit tobacco in the home is unlikely to be significantly different to consumption in public places. This helps to address a common criticism of the EPS
• This enables us to compare the results of the Yellow Bag Survey with the EPS to understand differences in the amount of non-domestic product that is captured
0%
5%
10%
15%
20%
25%
2008 2009
Yellow Bag Survey EPS
19.9%21.1%
19.3% 19.7%
ND
Inci
denc
e
Comparison of EPS and Yellow Bag Survey, Germany - 2008-2009(1)(2)(a)
Improvement of German pack analysis in 2014 and 2015
• In 2014, the German pack collection was refined as fewer waste disposal centres were providing pack collections. Despite weighting the pack collections from each disposal centre according to the population of the region, some regions were not being represented
• As a result, a pack collection was started in 2014 in areas with no coverage from waste recycling centres. This has resulted in a much greater proportion of the German population covered, from 40% to close to 100% of the population
• The change in methodology resulted in a reduction of the non-domestic incidence by approximately 2 percentage points compared to the collection in previous years.
• The same methodology was used in 2015, therefore 2014 and 2015 results are directly comparable
0
5
10
15
20
25
YBS
2009
YBS
2010
YBS
2011
YBS
2012
YBS
2013
YBS
2014(Previous method)
YBS
2014
YBS
2015
20.1%21.2%
22.1%20.7%
21.7%20.9%
18.9%17.7%
Sha
re o
f to
tal c
onsu
mpt
ion
Germany historical Yellow Bag Surveys(2)(a)
The change in 2015 is
methodology designed to further improve coverage and representation in Germany
Validation of empty pack survey analysis
EPS comparison
Met
hodo
logy
and
App
endi
ces
© 2016 KPMG LLP, a UK limited liability partnership, and a member firm of the KPMG network of independent member firms affiliated with KPMG International Cooperative, a Swiss entity.
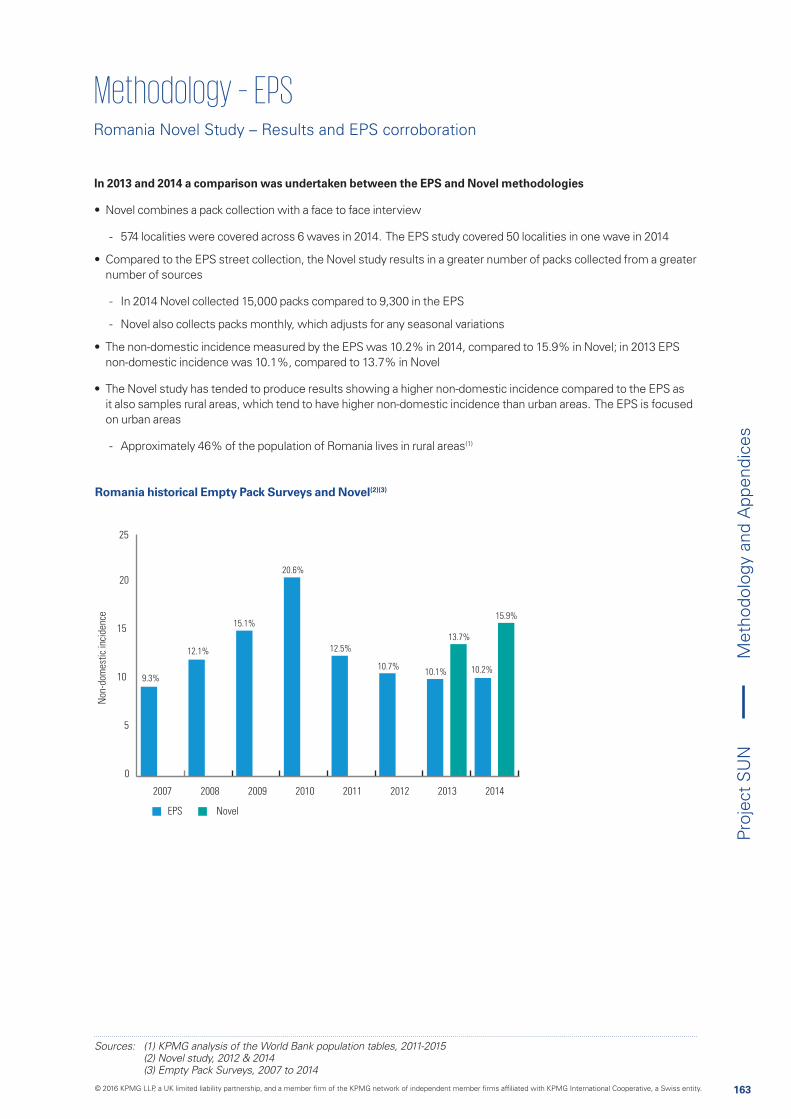
163
Proj
ect
SU
N
Romania Novel Study – Results and EPS corroboration
In 2013 and 2014 a comparison was undertaken between the EPS and Novel methodologies
• Novel combines a pack collection with a face to face interview
- 574 localities were covered across 6 waves in 2014. The EPS study covered 50 localities in one wave in 2014
• Compared to the EPS street collection, the Novel study results in a greater number of packs collected from a greater number of sources
- In 2014 Novel collected 15,000 packs compared to 9,300 in the EPS
- Novel also collects packs monthly, which adjusts for any seasonal variations
• The non-domestic incidence measured by the EPS was 10.2% in 2014, compared to 15.9% in Novel; in 2013 EPS non-domestic incidence was 10.1%, compared to 13.7% in Novel
• The Novel study has tended to produce results showing a higher non-domestic incidence compared to the EPS as it also samples rural areas, which tend to have higher non-domestic incidence than urban areas. The EPS is focused on urban areas
- Approximately 46% of the population of Romania lives in rural areas(1)
Sources: (1) KPMG analysis of the World Bank population tables, 2011-2015 (2) Novel study, 2012 & 2014 (3) Empty Pack Surveys, 2007 to 2014
Non
-dom
esti
c in
cide
nce
200920082007 2010 2011 2012 2013 2014
0
5
10
15
20
25
9.3%
12.1%
15.1%
20.6%
12.5%
10.7%10.1% 10.2%
13.7%
15.9%
EPS Novel
Romania historical Empty Pack Surveys and Novel(2)(3)
Met
hodo
logy
and
App
endi
ces
© 2016 KPMG LLP, a UK limited liability partnership, and a member firm of the KPMG network of independent member firms affiliated with KPMG International Cooperative, a Swiss entity.
164
Proj
ect
SU
N
Chapter page
METHODOLOGY
Overview 146
KPMG EU flows model 150
LDS 152
EPS 154
Non-domestic legal analysis 165
Illicit Whites analysis 178
EU tax loss calculation 180
APPENDICES
1. Limitation of results 182
2. EPS results by country 186
3. Sources 204
4. Scope of work 206
Met
hodo
logy
and
App
endi
ces
© 2016 KPMG LLP, a UK limited liability partnership, and a member firm of the KPMG network of independent member firms affiliated with KPMG International Cooperative, a Swiss entity.

165
Proj
ect
SU
N
COUNTRIES WHERE ND(L) IS 100% OF TOTAL
Country ND 2015 (bn sticks) (1) 2015 ND(L) (bn sticks % of
ND
Belgium 0.62 0.62 100%
USE OF CONSUMER RESEARCH AND ANY ADJUSTMENTS FOR 2015 DATA
Country ND 2015 (bn sticks) (1)
Number of border crossings (m)(2)(3)
Population 18+ (2)
Smoking prevalence
Trips where cigarettes purchased
Cigarettes per trip
2015 ND(L) (bn sticks
% of ND
Belgium 0.62 8.63 (b) 10 90.40 1.81 0.62 90%
ND(L) was determined by analysis of travel trends, border crossings and cigarette pricing dataC&C volumes formed the remaining ND balance after subtracting ND(L) from total non-domestic• ND(L) was calculated using 2 methods:
1) Use of travel flows analysis
- Business and tourism travel data from the World Tourism Organization (UNWTO), national statistics offices and other publically available sources were used to calculate the number of trips made by travellers over the age of 18
- This total number of trips was then multiplied by the average smoking prevalence of the country of origin to calculate the total number of trips where cigarettes are purchased. Smoking prevalence data was provided by Euromonitor
- It was assumed that the number of packs purchased per trip is equal to the Duty Free allowance, or the indicative legal limit for intra-EU travel
- The EPS and EU Flows model form the basis of all non-domestic analysis. As a result, where the ND(L) calculation was greater than 100% of the flow calculated by the EU Flows model it is capped at the volume generated by the EU flows model
- In certain cases travel data may not capture the extent of cross-border travel where such travel does not entail an overnight stay. Where this is a material source of cross-border flows, it is estimated based on regional border populations and travel retail sales data
2) Countries where ND(L) is 100% of total ND
- Non-domestic product found in Empty Pack Surveys from higher priced inbound tourist/visitor countries was categorised as legal
Counterfeit and
contraband (C&C)
Non-domestic legal (ND(L))
Non-domestic inflows
(ND)
Volume estimated by consumer research and additional analysis as
discussed below
ND – ND(L) = C&C
ND(L) is 100% of
total non-domestic
ND from EU Flows
model
Total ND(L)
(sticks) ==>
Countries where ND(L) is 100% of total Travel flows analysis
Total trips where
cigarettes purchased
Cigarettes per trip
Total ND(L)
(sticks)=X
Notes: (a) KPMG calculates the split between C&C and ND(L) by calculating the ND(L) volume and subtracting from the total
Sources: (1) KPMG EU Flows Model (2) UN WTO Tourism Factbook 2008-14 (3) Euromonitor
2
2
1
1
Primary information sources and tools – Non-domestic Legal analysis and assumptions
Example using Illustrative data
Met
hodo
logy
and
App
endi
ces
© 2016 KPMG LLP, a UK limited liability partnership, and a member firm of the KPMG network of independent member firms affiliated with KPMG International Cooperative, a Swiss entity.

166
Proj
ect
SU
N
Percentage split of border sales by brand
Total volume of cigarettes purchased
ND(L) brand split
Having determined the volume of ND(L) using travel statistics, the brand share of each ND(L) inflow was determined by an analysis of brands sold at border shops
• Border sales data was provided to KPMG by participating manufacturers in a range of formats:
- Sales data from participating manufacturers from shops on the border – which can be either the total market, or restricted to the brands that each participant sells
- Sales data by region bordering the destination country which is often collated by Nielsen for some of the larger countries
- Any other individual studies that participants have made which can help the overall border sales
• KPMG used all data sources available to come up with a fair representation of the overall brand split, prioritising independent border sales data provided by a third party for all brands where possible
• This border sales data is used to calculate the percentage split of brand sales. It is not used in order to calculate volumes
• Where the ND(L) flow was considered 100% of the total flow, all brands from that country were allocated to ND(L) and border sales data was not analysed
France(country of study)
(country of origin)
Spain
X
Illustrative example of ND(L) by brand approach
Border sales data is derived from sales of cigarettes in retail
outlets in bordering regions
Non-domestic Legal brand split analysis and assumptions
Met
hodo
logy
and
App
endi
ces
© 2016 KPMG LLP, a UK limited liability partnership, and a member firm of the KPMG network of independent member firms affiliated with KPMG International Cooperative, a Swiss entity.

167
Proj
ect
SU
N
AUSTRIA
Country # of border crossings
Population 18+
Smoking prevalence
Smoker trips
Packs per trip
# of cigarettes
ND(L) volume
Total ND(L)
Slovenia OutboundAll flows considered legal
0.42bn
Inbound
Czech Republic OutboundAll flows considered legal
0.41bn
Inbound
Hungary OutboundAll flows considered legal
0.25bn
Inbound
Germany OutboundAll flows considered legal
0.06bn
Inbound
Others 0.28bn
Total 1.41bn
BULGARIA
Country # of border crossings
Population 18+
Smoking prevalence
Smoker trips
Packs per trip
# of cigarettes
ND(L) volume
Total ND(L)
Turkey Outbound All flows considered legal
0.01bn
Inbound
Germany Outbound All flows considered legal
0.01bn
Inbound
Serbia Outbound All flows considered legal
0.00bn
Inbound
Greece Outbound 0.06mn 84% 38% 0.02mn 10 200 0.00bn 0.00bn
Inbound 0.49mn 83% 30% 0.12mn 2 40 0.00bn
Others 0.03bn
Total 0.06bn
BELGIUM
Country # of border crossings
Population 18+
Smoking prevalence
Smoker trips
Packs per trip
# of cigarettes
ND(L) volume
Total ND(L)
Luxembourg Outbound All flows considered legal
0.17bn
Inbound
France Outbound All flows considered legal
0.10bn
Inbound
Netherlands Outbound All flows considered legal
0.10bn
Inbound
Poland Outbound 0.37mn 80% 20% 0.06mn 40 800 0.05bn 0.05bn
Inbound 0.09mn 82% 28% 0.06mn 2 40 0.00bn
Others 0.29bn
Total 0.71bn
Primary information sources and tools – Non-domestic Legal major flow calculations
Met
hodo
logy
and
App
endi
ces
© 2016 KPMG LLP, a UK limited liability partnership, and a member firm of the KPMG network of independent member firms affiliated with KPMG International Cooperative, a Swiss entity.
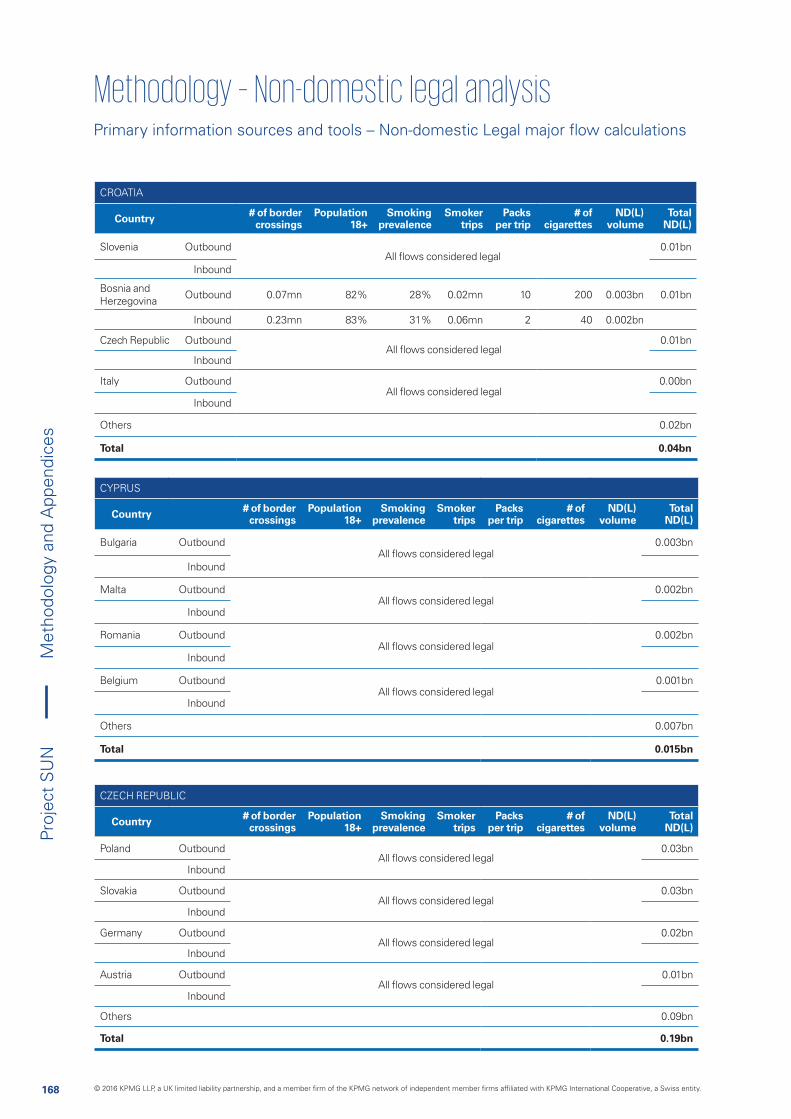
168
Proj
ect
SU
N
CZECH REPUBLIC
Country # of border crossings
Population 18+
Smoking prevalence
Smoker trips
Packs per trip
# of cigarettes
ND(L) volume
Total ND(L)
Poland OutboundAll flows considered legal
0.03bn
Inbound
Slovakia OutboundAll flows considered legal
0.03bn
Inbound
Germany OutboundAll flows considered legal
0.02bn
Inbound
Austria OutboundAll flows considered legal
0.01bn
Inbound
Others 0.09bn
Total 0.19bn
CYPRUS
Country # of border crossings
Population 18+
Smoking prevalence
Smoker trips
Packs per trip
# of cigarettes
ND(L) volume
Total ND(L)
Bulgaria OutboundAll flows considered legal
0.003bn
Inbound
Malta OutboundAll flows considered legal
0.002bn
Inbound
Romania OutboundAll flows considered legal
0.002bn
Inbound
Belgium OutboundAll flows considered legal
0.001bn
Inbound
Others 0.007bn
Total 0.015bn
CROATIA
Country # of border crossings
Population 18+
Smoking prevalence
Smoker trips
Packs per trip
# of cigarettes
ND(L) volume
Total ND(L)
Slovenia OutboundAll flows considered legal
0.01bn
Inbound
Bosnia and Herzegovina Outbound 0.07mn 82% 28% 0.02mn 10 200 0.003bn 0.01bn
Inbound 0.23mn 83% 31% 0.06mn 2 40 0.002bn
Czech Republic Outbound All flows considered legal
0.01bn
Inbound
Italy Outbound All flows considered legal
0.00bn
Inbound
Others 0.02bn
Total 0.04bn
Primary information sources and tools – Non-domestic Legal major flow calculations
Met
hodo
logy
and
App
endi
ces
© 2016 KPMG LLP, a UK limited liability partnership, and a member firm of the KPMG network of independent member firms affiliated with KPMG International Cooperative, a Swiss entity.
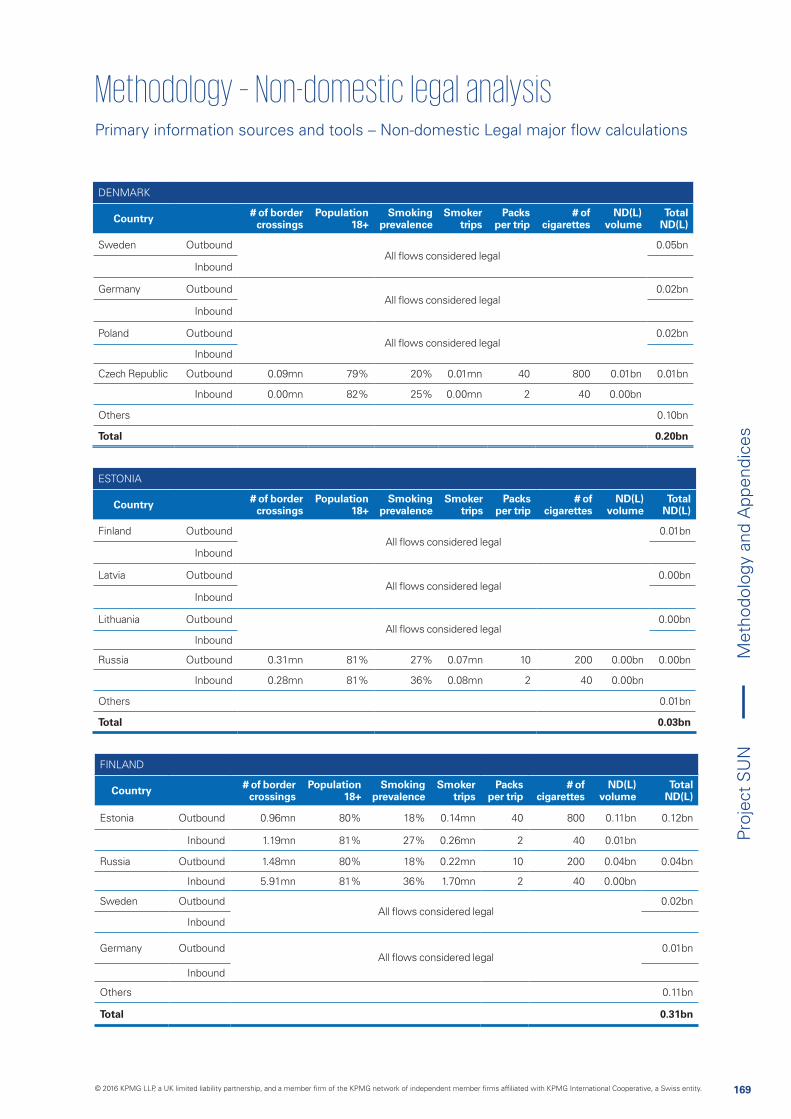
169
Proj
ect
SU
N
DENMARK
Country # of border crossings
Population 18+
Smoking prevalence
Smoker trips
Packs per trip
# of cigarettes
ND(L) volume
Total ND(L)
Sweden OutboundAll flows considered legal
0.05bn
Inbound
Germany OutboundAll flows considered legal
0.02bn
Inbound
Poland OutboundAll flows considered legal
0.02bn
Inbound
Czech Republic Outbound 0.09mn 79% 20% 0.01mn 40 800 0.01bn 0.01bn
Inbound 0.00mn 82% 25% 0.00mn 2 40 0.00bn
Others 0.10bn
Total 0.20bn
ESTONIA
Country # of border crossings
Population 18+
Smoking prevalence
Smoker trips
Packs per trip
# of cigarettes
ND(L) volume
Total ND(L)
Finland OutboundAll flows considered legal
0.01bn
Inbound
Latvia OutboundAll flows considered legal
0.00bn
Inbound
Lithuania OutboundAll flows considered legal
0.00bn
Inbound
Russia Outbound 0.31mn 81% 27% 0.07mn 10 200 0.00bn 0.00bn
Inbound 0.28mn 81% 36% 0.08mn 2 40 0.00bn
Others 0.01bn
Total 0.03bn
FINLAND
Country # of border crossings
Population 18+
Smoking prevalence
Smoker trips
Packs per trip
# of cigarettes
ND(L) volume
Total ND(L)
Estonia Outbound 0.96mn 80% 18% 0.14mn 40 800 0.11bn 0.12bn
Inbound 1.19mn 81% 27% 0.26mn 2 40 0.01bn
Russia Outbound 1.48mn 80% 18% 0.22mn 10 200 0.04bn 0.04bn
Inbound 5.91mn 81% 36% 1.70mn 2 40 0.00bn
Sweden OutboundAll flows considered legal
0.02bn
Inbound
Germany OutboundAll flows considered legal
0.01bn
Inbound
Others 0.11bn
Total 0.31bn
Primary information sources and tools – Non-domestic Legal major flow calculations
Met
hodo
logy
and
App
endi
ces
© 2016 KPMG LLP, a UK limited liability partnership, and a member firm of the KPMG network of independent member firms affiliated with KPMG International Cooperative, a Swiss entity.
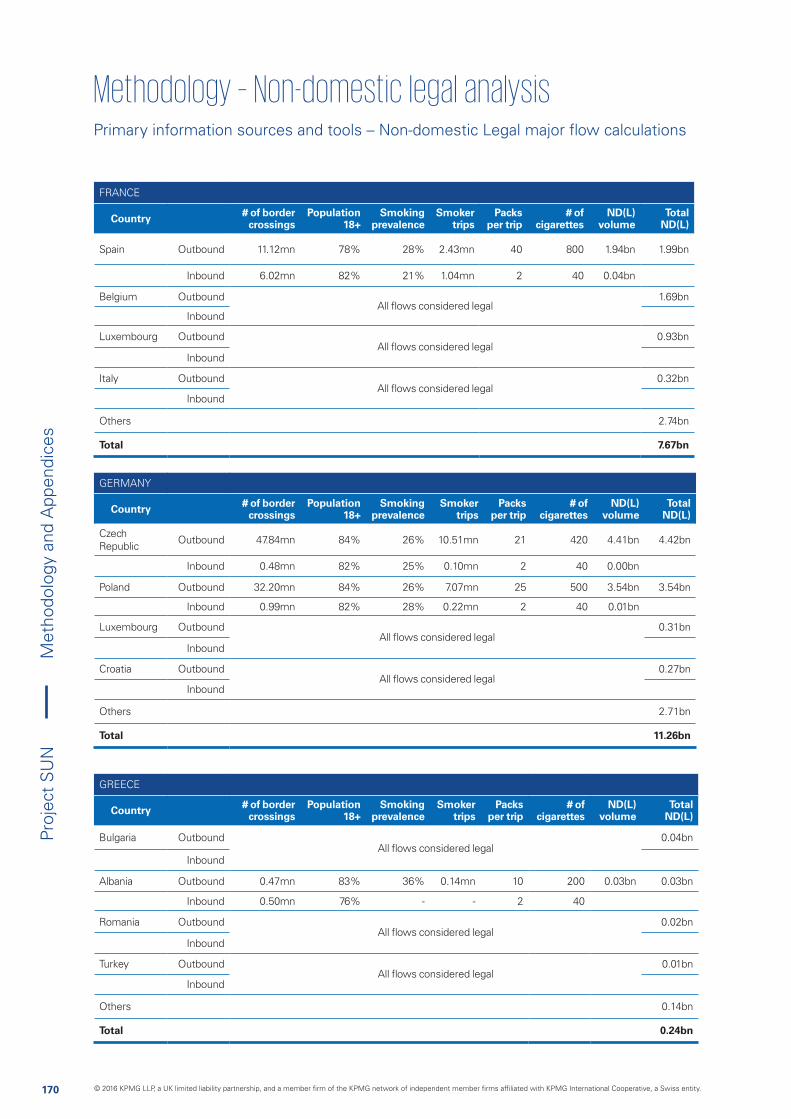
170
Proj
ect
SU
N
GERMANY
Country # of border crossings
Population 18+
Smoking prevalence
Smoker trips
Packs per trip
# of cigarettes
ND(L) volume
Total ND(L)
Czech Republic Outbound 47.84mn 84% 26% 10.51mn 21 420 4.41bn 4.42bn
Inbound 0.48mn 82% 25% 0.10mn 2 40 0.00bn
Poland Outbound 32.20mn 84% 26% 7.07mn 25 500 3.54bn 3.54bn
Inbound 0.99mn 82% 28% 0.22mn 2 40 0.01bn
Luxembourg OutboundAll flows considered legal
0.31bn
Inbound
Croatia OutboundAll flows considered legal
0.27bn
Inbound
Others 2.71bn
Total 11.26bn
GREECE
Country # of border crossings
Population 18+
Smoking prevalence
Smoker trips
Packs per trip
# of cigarettes
ND(L) volume
Total ND(L)
Bulgaria OutboundAll flows considered legal
0.04bn
Inbound
Albania Outbound 0.47mn 83% 36% 0.14mn 10 200 0.03bn 0.03bn
Inbound 0.50mn 76% - - 2 40
Romania OutboundAll flows considered legal
0.02bn
Inbound
Turkey OutboundAll flows considered legal
0.01bn
Inbound
Others 0.14bn
Total 0.24bn
FRANCE
Country # of border crossings
Population 18+
Smoking prevalence
Smoker trips
Packs per trip
# of cigarettes
ND(L) volume
Total ND(L)
Spain Outbound 11.12mn 78% 28% 2.43mn 40 800 1.94bn 1.99bn
Inbound 6.02mn 82% 21% 1.04mn 2 40 0.04bn
Belgium OutboundAll flows considered legal
1.69bn
Inbound
Luxembourg OutboundAll flows considered legal
0.93bn
Inbound
Italy OutboundAll flows considered legal
0.32bn
Inbound
Others 2.74bn
Total 7.67bn
Primary information sources and tools – Non-domestic Legal major flow calculations
Met
hodo
logy
and
App
endi
ces
© 2016 KPMG LLP, a UK limited liability partnership, and a member firm of the KPMG network of independent member firms affiliated with KPMG International Cooperative, a Swiss entity.
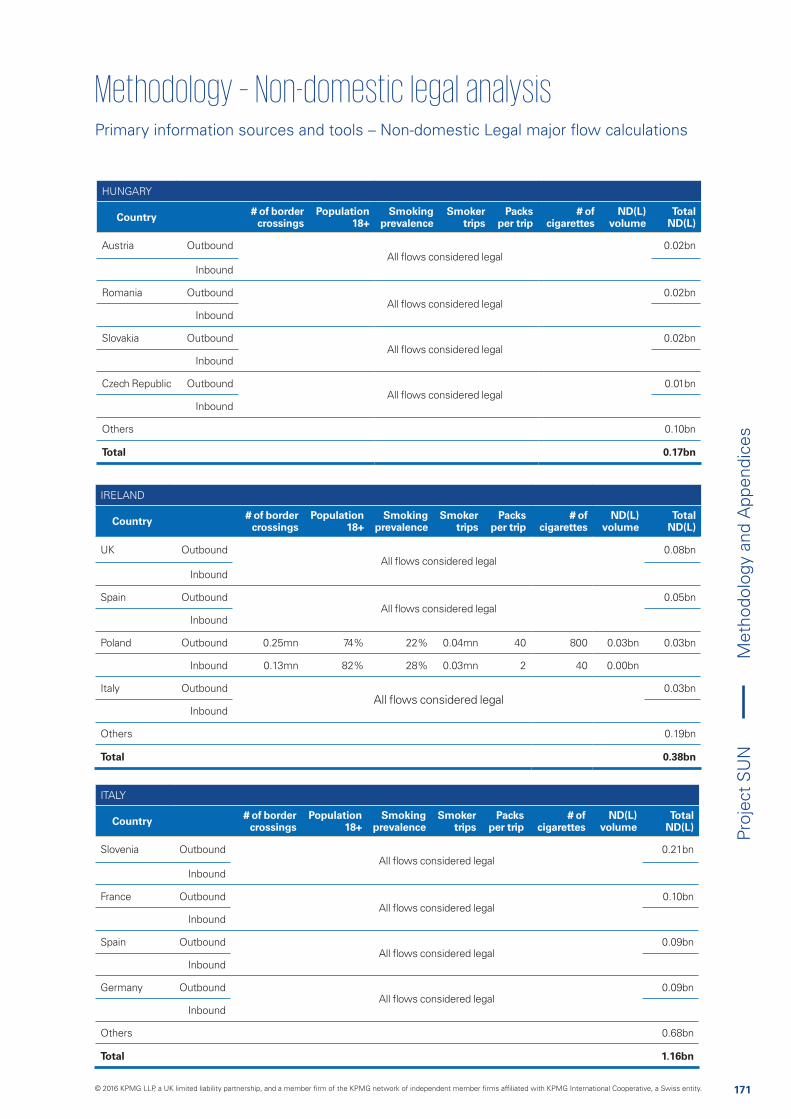
171
Proj
ect
SU
N
ITALY
Country # of border crossings
Population 18+
Smoking prevalence
Smoker trips
Packs per trip
# of cigarettes
ND(L) volume
Total ND(L)
Slovenia OutboundAll flows considered legal
0.21bn
Inbound
France OutboundAll flows considered legal
0.10bn
Inbound
Spain OutboundAll flows considered legal
0.09bn
Inbound
Germany OutboundAll flows considered legal
0.09bn
Inbound
Others 0.68bn
Total 1.16bn
IRELAND
Country # of border crossings
Population 18+
Smoking prevalence
Smoker trips
Packs per trip
# of cigarettes
ND(L) volume
Total ND(L)
UK OutboundAll flows considered legal
0.08bn
Inbound
Spain OutboundAll flows considered legal
0.05bn
Inbound
Poland Outbound 0.25mn 74% 22% 0.04mn 40 800 0.03bn 0.03bn
Inbound 0.13mn 82% 28% 0.03mn 2 40 0.00bn
Italy OutboundAll flows considered legal
0.03bn
Inbound
Others 0.19bn
Total 0.38bn
HUNGARY
Country # of border crossings
Population 18+
Smoking prevalence
Smoker trips
Packs per trip
# of cigarettes
ND(L) volume
Total ND(L)
Austria OutboundAll flows considered legal
0.02bn
Inbound
Romania OutboundAll flows considered legal
0.02bn
Inbound
Slovakia OutboundAll flows considered legal
0.02bn
Inbound
Czech Republic OutboundAll flows considered legal
0.01bn
Inbound
Others 0.10bn
Total 0.17bn
Primary information sources and tools – Non-domestic Legal major flow calculations
Met
hodo
logy
and
App
endi
ces
© 2016 KPMG LLP, a UK limited liability partnership, and a member firm of the KPMG network of independent member firms affiliated with KPMG International Cooperative, a Swiss entity.
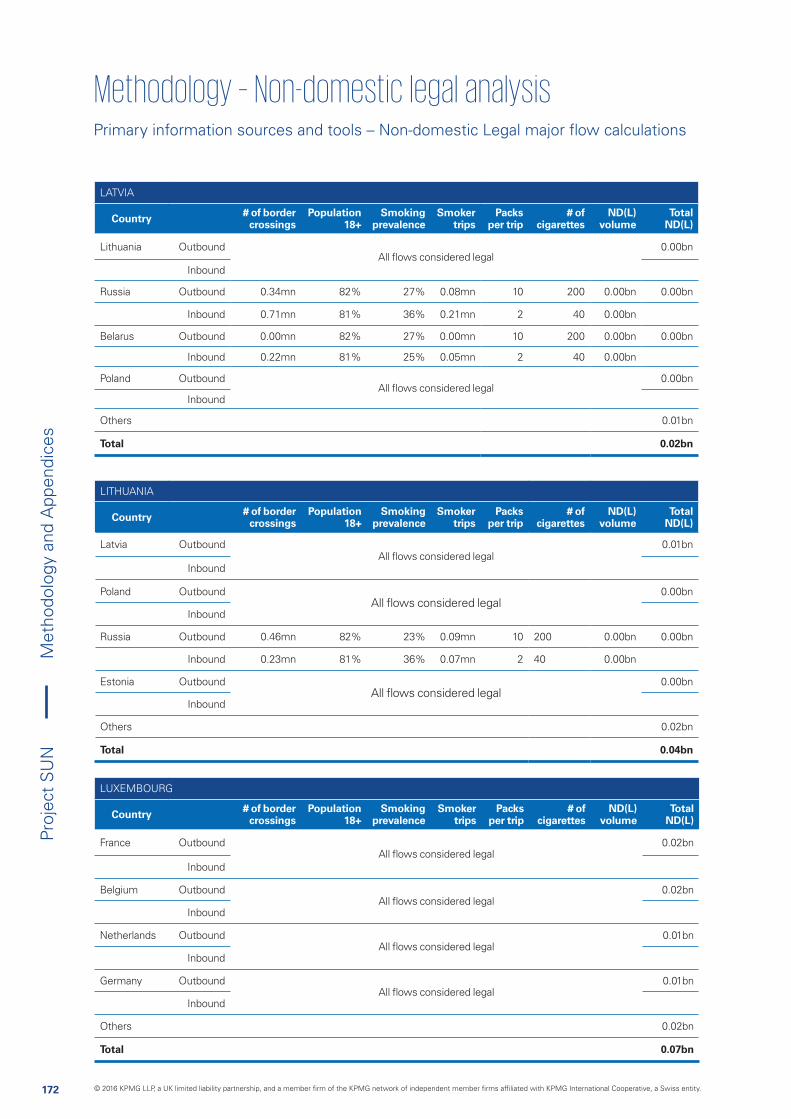
172
Proj
ect
SU
N
LUXEMBOURG
Country # of border crossings
Population 18+
Smoking prevalence
Smoker trips
Packs per trip
# of cigarettes
ND(L) volume
Total ND(L)
France OutboundAll flows considered legal
0.02bn
Inbound
Belgium OutboundAll flows considered legal
0.02bn
Inbound
Netherlands OutboundAll flows considered legal
0.01bn
Inbound
Germany OutboundAll flows considered legal
0.01bn
Inbound
Others 0.02bn
Total 0.07bn
LITHUANIA
Country # of border crossings
Population 18+
Smoking prevalence
Smoker trips
Packs per trip
# of cigarettes
ND(L) volume
Total ND(L)
Latvia OutboundAll flows considered legal
0.01bn
Inbound
Poland OutboundAll flows considered legal
0.00bn
Inbound
Russia Outbound 0.46mn 82% 23% 0.09mn 10 200 0.00bn 0.00bn
Inbound 0.23mn 81% 36% 0.07mn 2 40 0.00bn
Estonia OutboundAll flows considered legal
0.00bn
Inbound
Others 0.02bn
Total 0.04bn
LATVIA
Country # of border crossings
Population 18+
Smoking prevalence
Smoker trips
Packs per trip
# of cigarettes
ND(L) volume
Total ND(L)
Lithuania OutboundAll flows considered legal
0.00bn
Inbound
Russia Outbound 0.34mn 82% 27% 0.08mn 10 200 0.00bn 0.00bn
Inbound 0.71mn 81% 36% 0.21mn 2 40 0.00bn
Belarus Outbound 0.00mn 82% 27% 0.00mn 10 200 0.00bn 0.00bn
Inbound 0.22mn 81% 25% 0.05mn 2 40 0.00bn
Poland OutboundAll flows considered legal
0.00bn
Inbound
Others 0.01bn
Total 0.02bn
Primary information sources and tools – Non-domestic Legal major flow calculations
Met
hodo
logy
and
App
endi
ces
© 2016 KPMG LLP, a UK limited liability partnership, and a member firm of the KPMG network of independent member firms affiliated with KPMG International Cooperative, a Swiss entity.
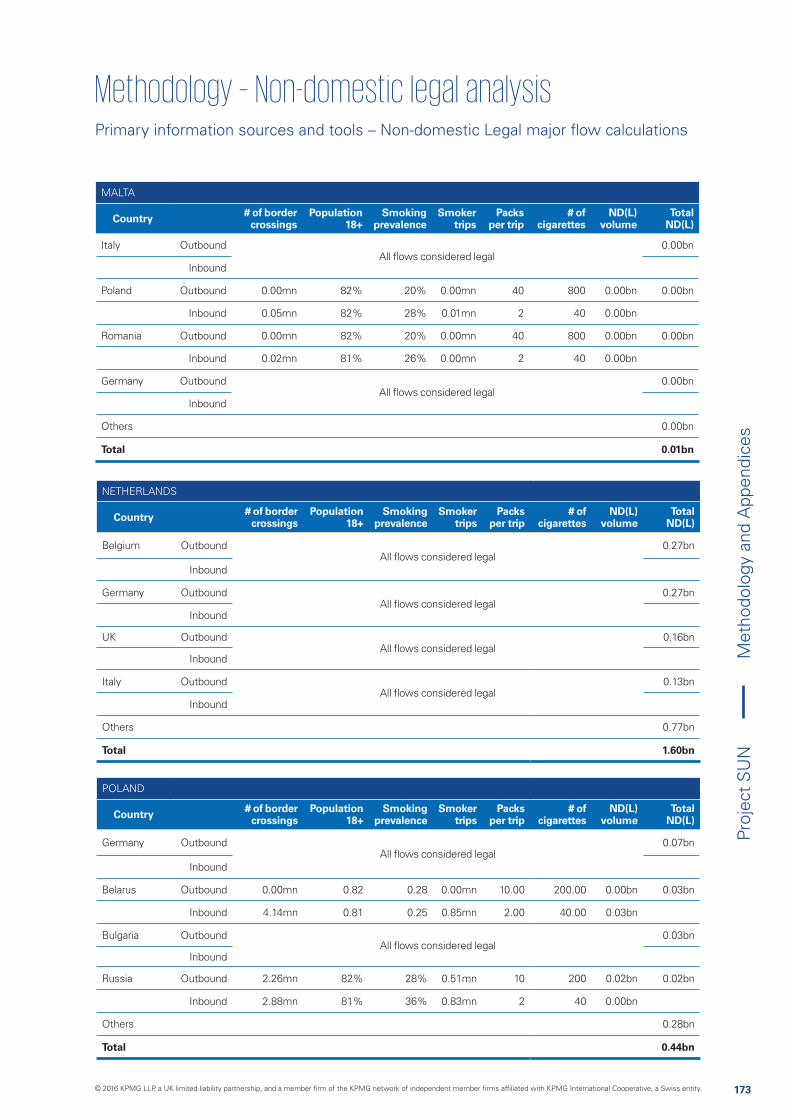
173
Proj
ect
SU
N
POLAND
Country # of border crossings
Population 18+
Smoking prevalence
Smoker trips
Packs per trip
# of cigarettes
ND(L) volume
Total ND(L)
Germany OutboundAll flows considered legal
0.07bn
Inbound
Belarus Outbound 0.00mn 0.82 0.28 0.00mn 10.00 200.00 0.00bn 0.03bn
Inbound 4.14mn 0.81 0.25 0.85mn 2.00 40.00 0.03bn
Bulgaria OutboundAll flows considered legal
0.03bn
Inbound
Russia Outbound 2.26mn 82% 28% 0.51mn 10 200 0.02bn 0.02bn
Inbound 2.88mn 81% 36% 0.83mn 2 40 0.00bn
Others 0.28bn
Total 0.44bn
NETHERLANDS
Country # of border crossings
Population 18+
Smoking prevalence
Smoker trips
Packs per trip
# of cigarettes
ND(L) volume
Total ND(L)
Belgium OutboundAll flows considered legal
0.27bn
Inbound
Germany OutboundAll flows considered legal
0.27bn
Inbound
UK OutboundAll flows considered legal
0.16bn
Inbound
Italy OutboundAll flows considered legal
0.13bn
Inbound
Others 0.77bn
Total 1.60bn
MALTA
Country # of border crossings
Population 18+
Smoking prevalence
Smoker trips
Packs per trip
# of cigarettes
ND(L) volume
Total ND(L)
Italy OutboundAll flows considered legal
0.00bn
Inbound
Poland Outbound 0.00mn 82% 20% 0.00mn 40 800 0.00bn 0.00bn
Inbound 0.05mn 82% 28% 0.01mn 2 40 0.00bn
Romania Outbound 0.00mn 82% 20% 0.00mn 40 800 0.00bn 0.00bn
Inbound 0.02mn 81% 26% 0.00mn 2 40 0.00bn
Germany OutboundAll flows considered legal
0.00bn
Inbound
Others 0.00bn
Total 0.01bn
Primary information sources and tools – Non-domestic Legal major flow calculations
Met
hodo
logy
and
App
endi
ces
© 2016 KPMG LLP, a UK limited liability partnership, and a member firm of the KPMG network of independent member firms affiliated with KPMG International Cooperative, a Swiss entity.
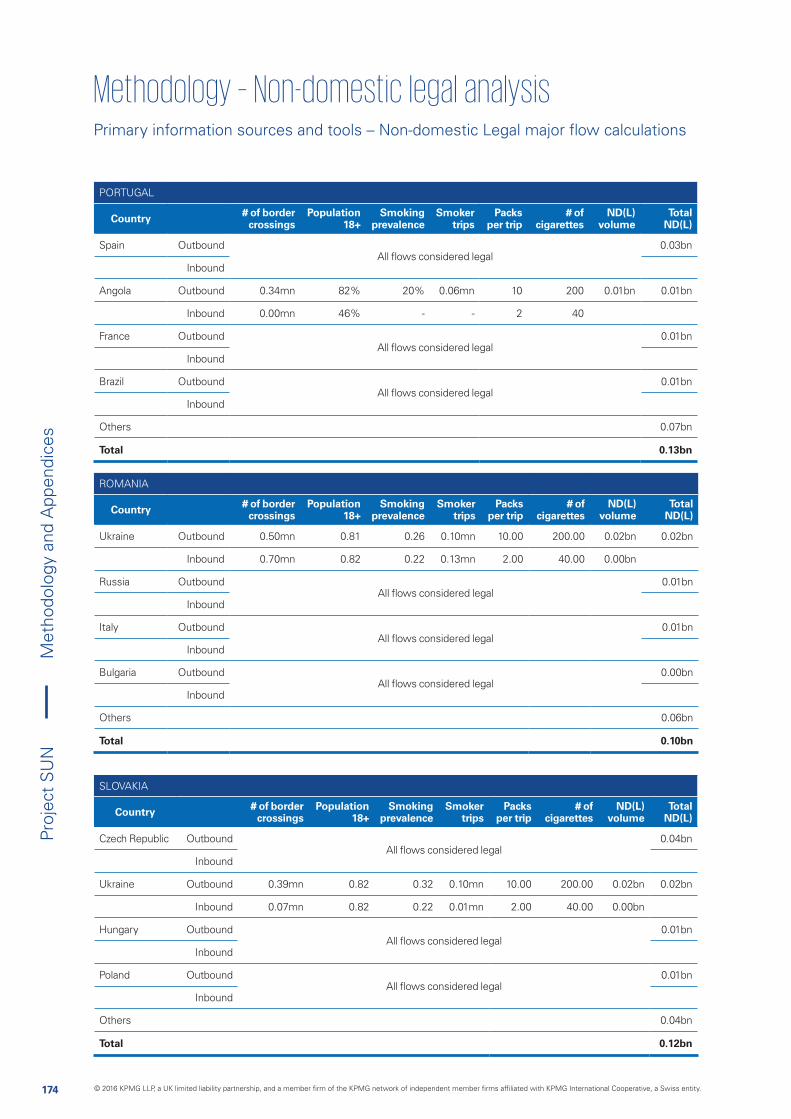
174
Proj
ect
SU
N
PORTUGAL
Country # of border crossings
Population 18+
Smoking prevalence
Smoker trips
Packs per trip
# of cigarettes
ND(L) volume
Total ND(L)
Spain OutboundAll flows considered legal
0.03bn
Inbound
Angola Outbound 0.34mn 82% 20% 0.06mn 10 200 0.01bn 0.01bn
Inbound 0.00mn 46% - - 2 40
France OutboundAll flows considered legal
0.01bn
Inbound
Brazil OutboundAll flows considered legal
0.01bn
Inbound
Others 0.07bn
Total 0.13bn
SLOVAKIA
Country # of border crossings
Population 18+
Smoking prevalence
Smoker trips
Packs per trip
# of cigarettes
ND(L) volume
Total ND(L)
Czech Republic OutboundAll flows considered legal
0.04bn
Inbound
Ukraine Outbound 0.39mn 0.82 0.32 0.10mn 10.00 200.00 0.02bn 0.02bn
Inbound 0.07mn 0.82 0.22 0.01mn 2.00 40.00 0.00bn
Hungary OutboundAll flows considered legal
0.01bn
Inbound
Poland OutboundAll flows considered legal
0.01bn
Inbound
Others 0.04bn
Total 0.12bn
ROMANIA
Country # of border crossings
Population 18+
Smoking prevalence
Smoker trips
Packs per trip
# of cigarettes
ND(L) volume
Total ND(L)
Ukraine Outbound 0.50mn 0.81 0.26 0.10mn 10.00 200.00 0.02bn 0.02bn
Inbound 0.70mn 0.82 0.22 0.13mn 2.00 40.00 0.00bn
Russia OutboundAll flows considered legal
0.01bn
Inbound
Italy OutboundAll flows considered legal
0.01bn
Inbound
Bulgaria OutboundAll flows considered legal
0.00bn
Inbound
Others 0.06bn
Total 0.10bn
Primary information sources and tools – Non-domestic Legal major flow calculations
Met
hodo
logy
and
App
endi
ces
© 2016 KPMG LLP, a UK limited liability partnership, and a member firm of the KPMG network of independent member firms affiliated with KPMG International Cooperative, a Swiss entity.
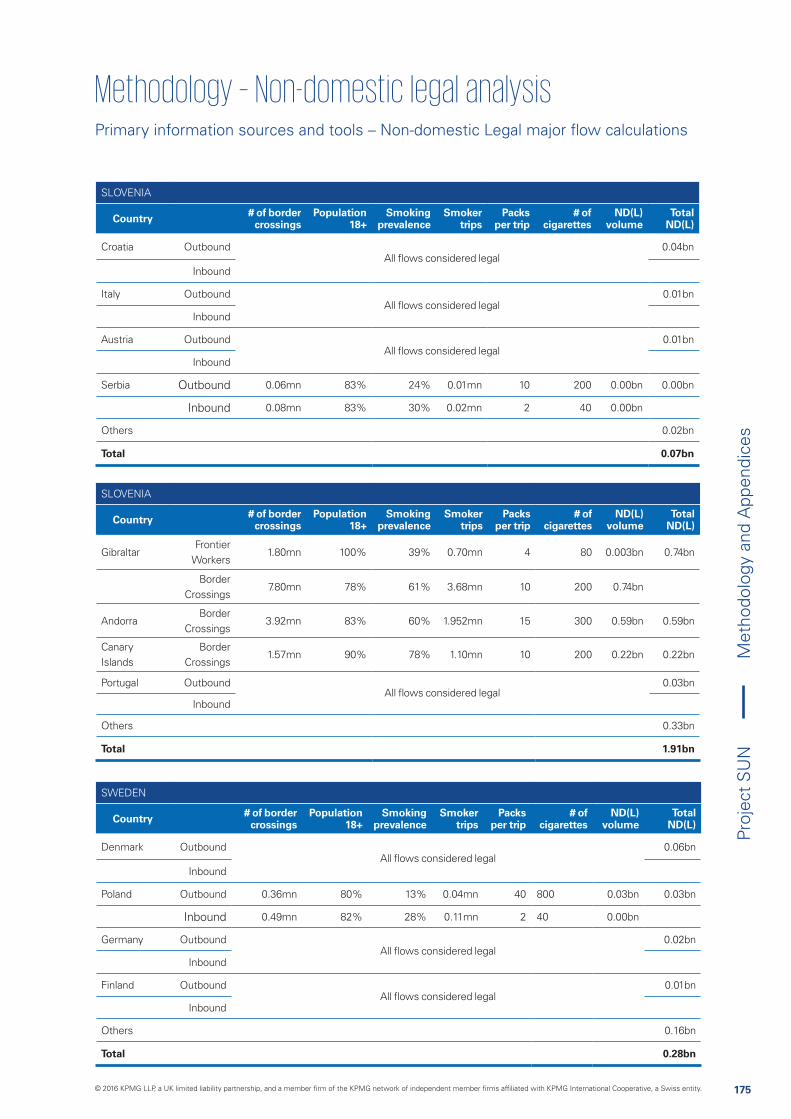
175
Proj
ect
SU
N
SLOVENIA
Country # of border crossings
Population 18+
Smoking prevalence
Smoker trips
Packs per trip
# of cigarettes
ND(L) volume
Total ND(L)
Croatia OutboundAll flows considered legal
0.04bn
Inbound
Italy OutboundAll flows considered legal
0.01bn
Inbound
Austria OutboundAll flows considered legal
0.01bn
Inbound
Serbia Outbound 0.06mn 83% 24% 0.01mn 10 200 0.00bn 0.00bn
Inbound 0.08mn 83% 30% 0.02mn 2 40 0.00bn
Others 0.02bn
Total 0.07bn
SLOVENIA
Country # of border crossings
Population 18+
Smoking prevalence
Smoker trips
Packs per trip
# of cigarettes
ND(L) volume
Total ND(L)
GibraltarFrontier
Workers1.80mn 100% 39% 0.70mn 4 80 0.003bn 0.74bn
Border Crossings
7.80mn 78% 61% 3.68mn 10 200 0.74bn
AndorraBorder
Crossings3.92mn 83% 60% 1.952mn 15 300 0.59bn 0.59bn
Canary Islands
Border Crossings
1.57mn 90% 78% 1.10mn 10 200 0.22bn 0.22bn
Portugal OutboundAll flows considered legal
0.03bn
Inbound
Others 0.33bn
Total 1.91bn
SWEDEN
Country # of border crossings
Population 18+
Smoking prevalence
Smoker trips
Packs per trip
# of cigarettes
ND(L) volume
Total ND(L)
Denmark OutboundAll flows considered legal
0.06bn
Inbound
Poland Outbound 0.36mn 80% 13% 0.04mn 40 800 0.03bn 0.03bn
Inbound 0.49mn 82% 28% 0.11mn 2 40 0.00bn
Germany OutboundAll flows considered legal
0.02bn
Inbound
Finland OutboundAll flows considered legal
0.01bn
Inbound
Others 0.16bn
Total 0.28bn
Primary information sources and tools – Non-domestic Legal major flow calculations
Met
hodo
logy
and
App
endi
ces
© 2016 KPMG LLP, a UK limited liability partnership, and a member firm of the KPMG network of independent member firms affiliated with KPMG International Cooperative, a Swiss entity.

176
Proj
ect
SU
N
NORWAY
Country # of border crossings
Population 18+
Smoking prevalence
Smoker trips
Packs per trip
# of cigarettes
ND(L) volume
Total ND(L)
Sweden OutboundAll flows considered legal
0.37bn
Inbound
Denmark OutboundAll flows considered legal
0.02bn
Inbound
Poland Outbound 0.89mn 78% 13% 0.09mn 10 200 0.02bn 0.02bn
Inbound 0.01mn 82% 28% 0.00mn 2 40 0.00bn
Germany Outbound 0.43mn 78% 13% 0.04mn 10 200 0.01bn 0.01bn
Inbound 0.15mn 84% 26% 0.03mn 2 40 0.00bn
Others 0.38bn
Total 0.80bn
UK(a)
Country # of border crossings
Population 18+
Smoking prevalence
Smoker trips
Packs per trip
# of cigarettes
ND(L) volume
Total ND(L)
Spain OutboundAll flows considered legal
0.91bn
Inbound
Poland Outbound 1.76mn 79% 26% 0.36mn 40 800 0.28bn 0.58bn
Inbound 1.65mn 82% 30% 0.40mn 37 740 0.30bn
Canary Islands OutboundAll flows considered legal
0.13bn
Inbound
Romania Outbound 0.16mn 79% 19% 0.02mn 40 800 0.02bn 0.12bn
Inbound 0.63mn 81% 26% 0.13mn 40 800 0.10bn
Others 1.76bn
Total 3.51bn
SWITZERLAND
Country # of border crossings
Population 18+
Smoking prevalence
Smoker trips
Packs per trip
# of cigarettes
ND(L) volume
Total ND(L)
Germany OutboundAll flows considered legal
0.26bn
Inbound
Italy OutboundAll flows considered legal
0.18bn
Inbound
France OutboundAll flows considered legal
0.09bn
Inbound
Austria OutboundAll flows considered legal
0.04bn
Inbound
Others 0.50bn
Total 1.07bn
Note: (a) Smoking prevalence has been weighted to take account of the nationality and gender of the travellers between Poland and the UK
Primary information sources and tools – Non-domestic Legal major flow calculations
Met
hodo
logy
and
App
endi
ces
© 2016 KPMG LLP, a UK limited liability partnership, and a member firm of the KPMG network of independent member firms affiliated with KPMG International Cooperative, a Swiss entity.

177
Proj
ect
SU
N
Chapter page
METHODOLOGY
Overview 148
KPMG EU flows model 152
LDS 154
EPS 156
Non-domestic legal analysis 167
Illicit Whites analysis 180
EU tax loss calculation 182
APPENDICES
1. Limitation of results 184
2. EPS results by country 188
3. Sources 206
4. Scope of work 208
Met
hodo
logy
and
App
endi
ces
© 2016 KPMG LLP, a UK limited liability partnership, and a member firm of the KPMG network of independent member firms affiliated with KPMG International Cooperative, a Swiss entity.

178
Proj
ect
SU
N
178
PROJECT SUN - NON-DOMESTIC VOLUMES BY BRAND AND DESTINATION COUNTRY
Brand Country 1 Country 2 Country 3 Country 4
Brand A 0.01 0.24 0.01 0.01
PROJECT SUN - LDS BY BRAND AND BY COUNTRY
Brand Country 1 Country 2 Country 3 Country 4
Brand A - 0.00 - 0.01
PROJECT SUN - NON-DOMESTIC VOLUMES AS SHARE OF TOTAL CONSUMPTION
Brand Country 1 Country 2 Country 3 Country 4
Brand A 100% 100% 100% 38%
PROJECT SUN - ILLICIT WHITE VOLUMES BY BRAND AND BY DESTINATION COUNTRY
Brand Country 1 Country 2 Country 3 Country 4
Brand A 0.01 0.24 0.01 -
Illicit Whites brand flows have grown at a CAGR of 16% between 2009 and 2015 and now account for 35% of total C&C volumes in the EU
• Illicit Whites are defined as
- Cigarettes that are usually manufactured legally in one country/market, but which the evidence suggests have been smuggled across borders during their transit to their destination market under review where they have limited or no legal distribution and are sold without payment of tax
• KPMG undertook the following analysis to determine which brands made up Illicit Whites brand flows:
- Illicit volumes were compared to LDS on a country by country basis to determine a share of total consumption
- KPMG conservatively assumed that where illicit volumes represented >99% of total consumption, the brand is an Illicit White
- Once identified, the brand’s overall volume is determined only in countries where the brand flow meets the 99% criteria
• Many of the Illicit Whites Brand flows are identified in high volumes in the EPS. However, given our identification of counterfeit product is limited to the four industry participants, we cannot assess whether these flows are genuine or counterfeit
there is no evidence of legal distribution and all in country 4 where non-domestic volumes are 38% of consumption
Illicit Whites identification process, Project SUN – worked example
Met
hodo
logy
and
App
endi
ces
© 2016 KPMG LLP, a UK limited liability partnership, and a member firm of the KPMG network of independent member firms affiliated with KPMG International Cooperative, a Swiss entity.

179
Proj
ect
SU
N
179
Chapter page
METHODOLOGY
Overview 146
KPMG EU flows model 150
LDS 152
EPS 154
Non-domestic legal analysis 165
Illicit Whites analysis 178
EU tax loss calculation 180
APPENDICES
1. Limitation of results 182
2. EPS results by country 186
3. Sources 204
4. Scope of work 206
Met
hodo
logy
and
App
endi
ces
© 2016 KPMG LLP, a UK limited liability partnership, and a member firm of the KPMG network of independent member firms affiliated with KPMG International Cooperative, a Swiss entity.
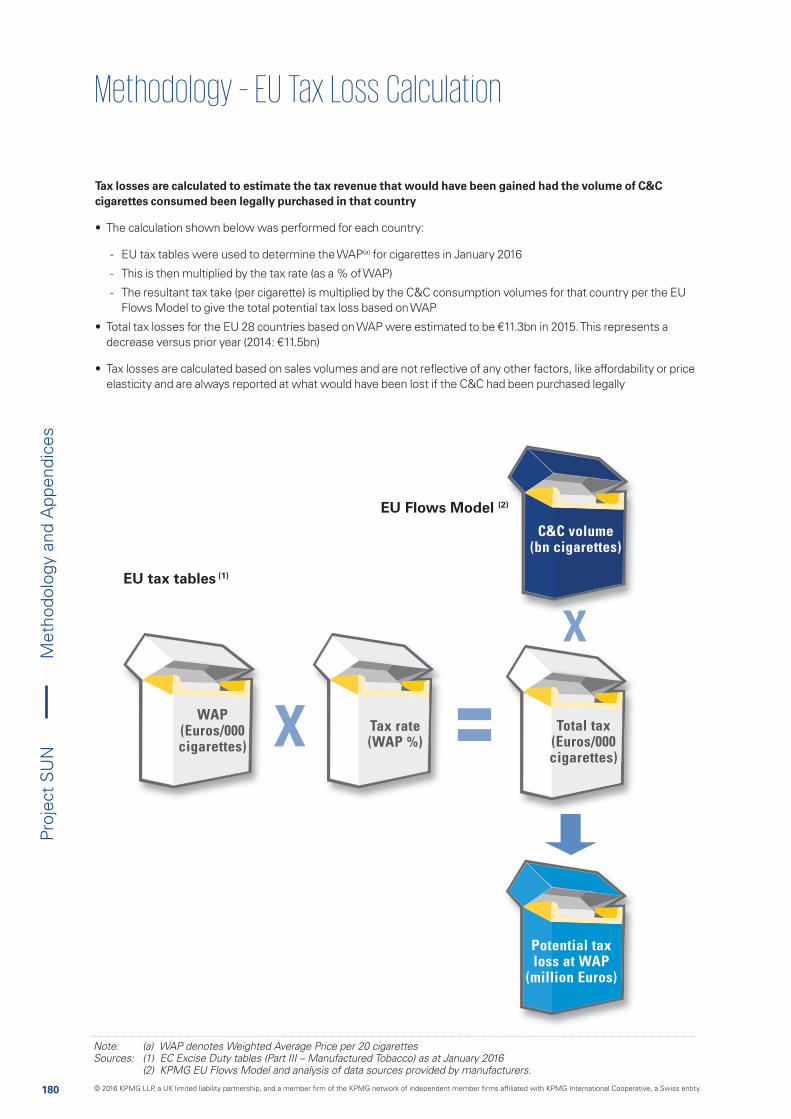
180
Proj
ect
SU
N
Note: (a) WAP denotes Weighted Average Price per 20 cigarettes Sources: (1) EC Excise Duty tables (Part III – Manufactured Tobacco) as at January 2016 (2) KPMG EU Flows Model and analysis of data sources provided by manufacturers.
Tax losses are calculated to estimate the tax revenue that would have been gained had the volume of C&C cigarettes consumed been legally purchased in that country
• The calculation shown below was performed for each country:
- EU tax tables were used to determine the WAP(a) for cigarettes in January 2016
- This is then multiplied by the tax rate (as a % of WAP)
- The resultant tax take (per cigarette) is multiplied by the C&C consumption volumes for that country per the EU Flows Model to give the total potential tax loss based on WAP
• Total tax losses for the EU 28 countries based on WAP were estimated to be €11.3bn in 2015. This represents a decrease versus prior year (2014: €11.5bn)
• Tax losses are calculated based on sales volumes and are not reflective of any other factors, like affordability or price elasticity and are always reported at what would have been lost if the C&C had been purchased legally
EU tax tables (1)
EU Flows Model (2)
WAP (Euros/000 cigarettes)
Tax rate (WAP %)
Total tax (Euros/000 cigarettes)
Potential tax loss at WAP
(million Euros)
2)
C&C volume (bn cigarettes)
Met
hodo
logy
and
App
endi
ces
© 2016 KPMG LLP, a UK limited liability partnership, and a member firm of the KPMG network of independent member firms affiliated with KPMG International Cooperative, a Swiss entity.
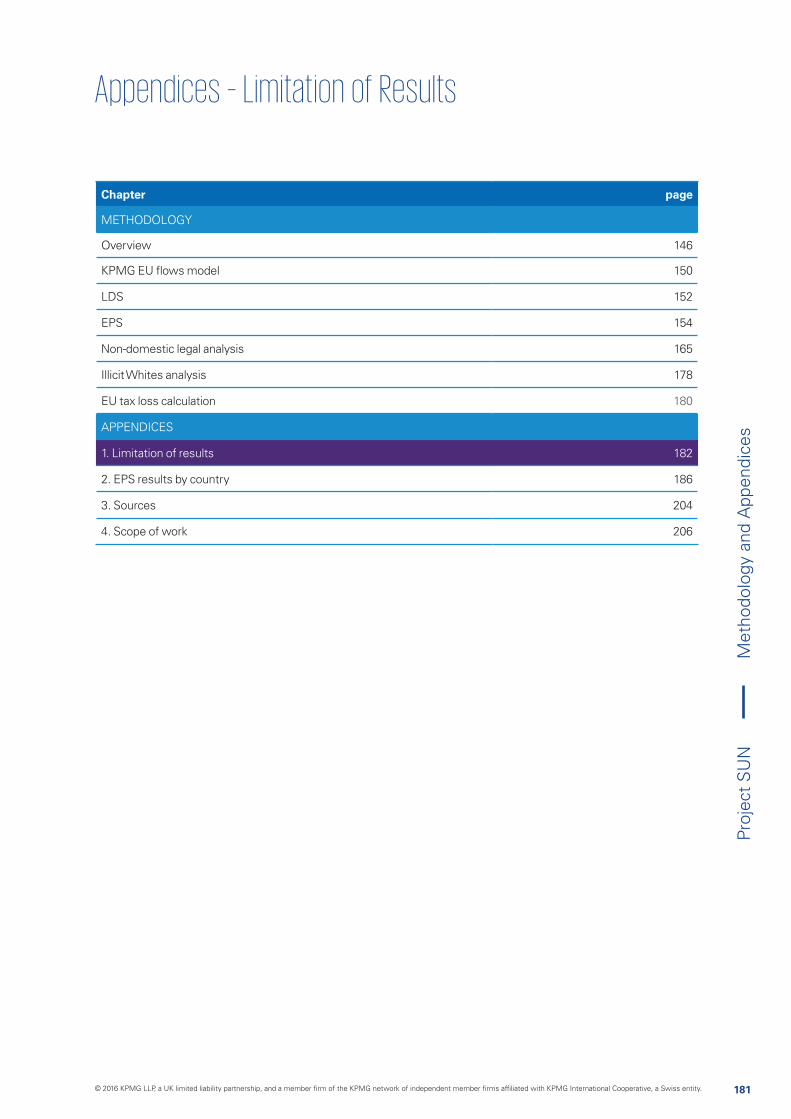
181
Proj
ect
SU
N
Chapter page
METHODOLOGY
Overview 146
KPMG EU flows model 150
LDS 152
EPS 154
Non-domestic legal analysis 165
Illicit Whites analysis 178
EU tax loss calculation 180
APPENDICES
1. Limitation of results 182
2. EPS results by country 186
3. Sources 204
4. Scope of work 206
Met
hodo
logy
and
App
endi
ces
© 2016 KPMG LLP, a UK limited liability partnership, and a member firm of the KPMG network of independent member firms affiliated with KPMG International Cooperative, a Swiss entity.
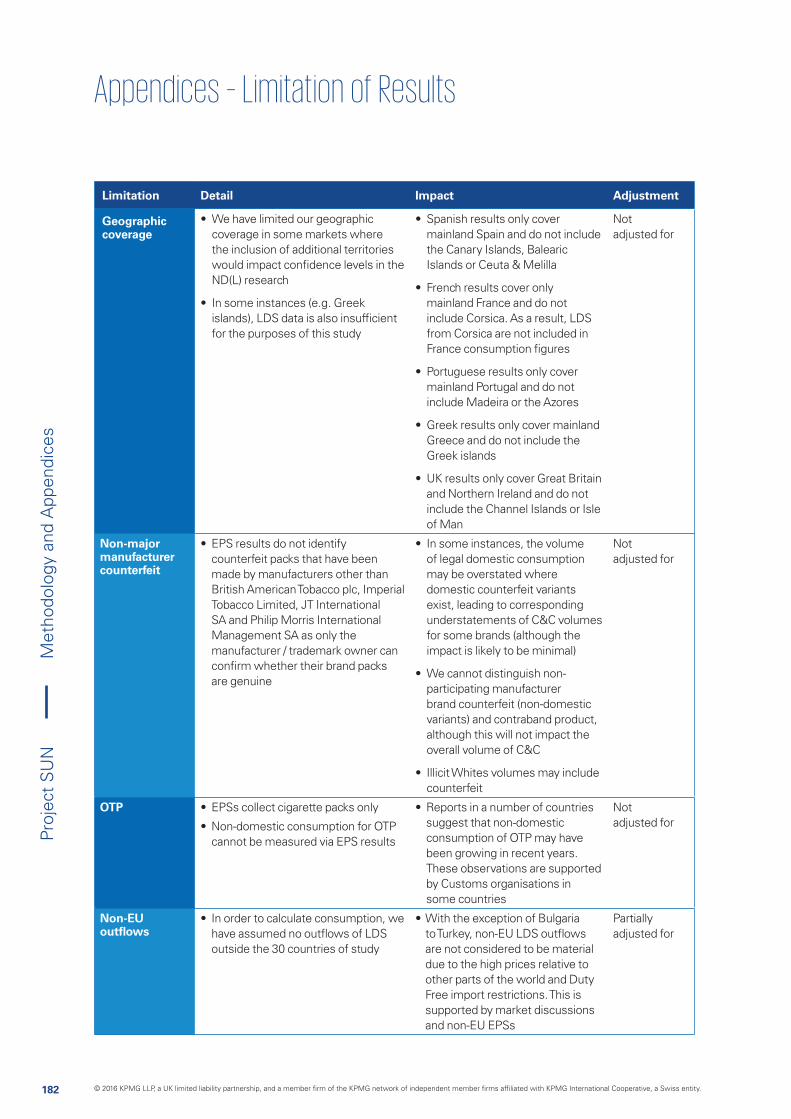
182
Proj
ect
SU
N
Limitation Detail Impact Adjustment
Geographic coverage
• We have limited our geographic coverage in some markets where the inclusion of additional territories would impact confidence levels in the ND(L) research
• In some instances (e.g. Greek islands), LDS data is also insufficient for the purposes of this study
• Spanish results only cover mainland Spain and do not include the Canary Islands, Balearic Islands or Ceuta & Melilla
• French results cover only mainland France and do not include Corsica. As a result, LDS from Corsica are not included in France consumption figures
• Portuguese results only cover mainland Portugal and do not include Madeira or the Azores
• Greek results only cover mainland Greece and do not include the Greek islands
• UK results only cover Great Britain and Northern Ireland and do not include the Channel Islands or Isle of Man
Not adjusted for
Non-major manufacturer counterfeit
• EPS results do not identify counterfeit packs that have been made by manufacturers other than British American Tobacco plc, Imperial Tobacco Limited, JT International SA and Philip Morris International Management SA as only the manufacturer / trademark owner can confirm whether their brand packs are genuine
• In some instances, the volume of legal domestic consumption may be overstated where domestic counterfeit variants exist, leading to corresponding understatements of C&C volumes for some brands (although the impact is likely to be minimal)
• We cannot distinguish non- participating manufacturer brand counterfeit (non-domestic variants) and contraband product, although this will not impact the overall volume of C&C
• Illicit Whites volumes may include counterfeit
Not adjusted for
OTP • EPSs collect cigarette packs only
• Non-domestic consumption for OTP cannot be measured via EPS results
• Reports in a number of countries suggest that non-domestic consumption of OTP may have been growing in recent years. These observations are supported by Customs organisations in some countries
Not adjusted for
Non-EU outflows
• In order to calculate consumption, we have assumed no outflows of LDS outside the 30 countries of study
• With the exception of Bulgaria to Turkey, non-EU LDS outflows are not considered to be material due to the high prices relative to other parts of the world and Duty Free import restrictions. This is supported by market discussions and non-EU EPSs
Partially adjusted for
Met
hodo
logy
and
App
endi
ces
© 2016 KPMG LLP, a UK limited liability partnership, and a member firm of the KPMG network of independent member firms affiliated with KPMG International Cooperative, a Swiss entity.

183
Proj
ect
SU
N
Source Limitation
EPSs • Whilst the EPS for every country is designed to be representative of the overall population, in some countries, owing to the geographical circumstances or demographics it is not possible to ensure that the sample is fully representative. This may be because:
– the sample is more heavily weighted towards populous, urban areas and therefore may not be fully representative of consumption habits in rural regions
– homes and workplaces or public spaces are not covered
• Results from Germany are based on a monthly analysis of approximately 10,000 packs collected at recycling centres. Therefore, they are not directly comparable with the EPS results from other countries due to the difference in the methodology. However, both methods produce similar results (see page 162 for details)(a)
• Although EPS dates are selected to minimise seasonal factors, there may be specific events that impact the results such as significant price changes between countries and major national events which result in large numbers visiting the country, such as the Olympics or World Cup
– in some instances the timing of EPSs has changed between years. In order to ensure comparability of results, monthly LDS figures, consumption trends and visitor data are all analysed and adjustments made where appropriate
– where there are specific outflows related to tourism limited to the summer months, the reported numbers may underrepresent the full picture as the EPS will only capture 1 point in time
• Brand and market variant share can only be extrapolated with a degree of statistical accuracy for brands where a sufficiently large number of packs have been collected
• EPS results are analysed to identify any outliers that may impact results, such as geographic concentrations of a specific brand or market variant. Brand specific data is also compared to known sales in the source market to identify whether results are credible
– where data suggests a sampling or data capture error may have occurred at a specific location, results are adjusted and the remainder of the survey is re-weighted accordingly
• In some specific instances it is not possible to differentiate between Duty Free and Duty Paid variants from the empty packs collected
– In some countries it is possible to purchase duty free labelled product but, when travelling within the EU, duty is in fact paid on the product. It is not possible to determine this distinction
– The study also does not take account of other duty free channels (for example, military, diplomats etc.) that exist for some travel within the EU
Note: (a) Over 500,000 packs were collected as part of the YBS in Germany; however once weighted, the survey is presented in 120,000 data lines
Met
hodo
logy
and
App
endi
ces
© 2016 KPMG LLP, a UK limited liability partnership, and a member firm of the KPMG network of independent member firms affiliated with KPMG International Cooperative, a Swiss entity.

184
Proj
ect
SU
N
Source Limitation
LDS • In some cases tax stamp data may not correspond to the calendar year and may also be distorted by inventory holdings in advance of increases in taxation. In these instances we have used the LDS source considered by local country management to be representative of smoker consumption during the calendar year, or official government data sources (for example, in Bulgaria)
• AC Nielsen Retail Audit data is derived from retail sales information but may exclude particular sales channels or retailers
– In markets where we have used Retail Audit data, AC Nielsen have calculated an appropriate uplift to derive total market sales, including volumes not accounted for in Retail Audit data
• Slight timing variances may arise between the date the product was shipped and actual consumption but, following discussions with local management, this is not considered significant and the full year LDS information we have is considered to be a fair and accurate representation in each market
ND(L) • From 2014, we have used business and tourism travel data from sources such as the World Tourism Organization and national statistics office to calculate the number of trips made
• We have calculated the volume of cigarettes purchased by assuming that smokers purchase the Duty Free limit, or the indicative legal limit for intra-EU travel
• This may over-weight ND(L) volume as a proportion of the total non-domestic flow
• Comparison of ND(L) volumes as calculated by travel flows analysis with historic consumer research has ensured that some of these limitations have been corrected, such as the number of packs purchased per trip
• In order to determine the ND(L) brand split, border sales data is used. Whilst this gives an accurate approximation of the likely brand split, some brands may be sold more specifically on the border than others, which could increase the share of that brand.
• Where border sales data is not available and the EPS cannot be used, the brands are categorized as “other”
Met
hodo
logy
and
App
endi
ces
© 2016 KPMG LLP, a UK limited liability partnership, and a member firm of the KPMG network of independent member firms affiliated with KPMG International Cooperative, a Swiss entity.

185
Proj
ect
SU
N
Chapter page
METHODOLOGY
Overview 146
KPMG EU flows model 150
LDS 152
EPS 154
Non-domestic legal analysis 165
Illicit Whites analysis 178
EU tax loss calculation 180
APPENDICES
1. Limitation of results 182
2. EPS results by country 186
3. Sources 204
4. Scope of work 206
Met
hodo
logy
and
App
endi
ces
© 2016 KPMG LLP, a UK limited liability partnership, and a member firm of the KPMG network of independent member firms affiliated with KPMG International Cooperative, a Swiss entity.

186
Proj
ect
SU
N
EU 28 countries, Norway and Switzerland Number of packs collected ND incidence in EPS
Region 2013 2014 2015 2013 2014 2015
Austria 25,485 12,811 13,000 20% 16% 14%
Belgium 5,600 5,600 5,600 17% 13% 13%
Bulgaria 13,000 12,700 13,000 19% 21% 13%
Croatia 3,000 3,000 3,000 5% 10% 5%
Cyprus 1,000 1,000 1,000 6% 5% 7%
Czech Republic 21,004 21,004 21,004 5% 4% 4%
Denmark 5,300 5,500 5,500 6% 5% 6%
Estonia 6,600 6,600 6,600 22% 20% 15%
Finland 5,000 5,000 5,794 21% 16% 18%
France 34,500 23,000 22,998 25% 25% 30%
Germany 120,000 120,000 120,000 21% 19% 18%
Greece 7,000 13,000 14,000 20% 21% 21%
Hungary 24,709 19,910 19,905 9% 12% 11%
Ireland 10,000 10,000 9,999 28% 24% 25%
Italy 40,000 40,000 39,982 5% 8% 8%
Latvia 9,800 9,800 9,800 30% 30% 28%
Lithuania 12,800 19,200 12,800 29% 30% 21%
Luxembourg 400 400 399 8% 7% 18%
Malta 1,000 1,000 1,000 15% 10% 12%
Netherlands 14,000 21,000 21,000 22% 21% 19%
Poland 51,000 51,000 51,000 15% 17% 18%
Portugal 3,000 3,000 3,000 2% 2% 4%
Romania 18,600 15,072 15,126 10% 16% 16%
Slovakia 5,000 12,800 12,800 3% 1% 9%
Slovenia 3,000 3,000 3,000 11% 9% 10%
Spain 29,404 29,997 29,983 11% 12% 10%
Sweden 10,000 19,909 10,031 13% 11% 13%
UK 38,099 38,100 25,400 15% 24% 28%
Norway - 5,000 5,000 - 47% 46%
Switzerland - 6,600 6,600 - 9% 14%
Total 518,302 535,003 508,321 15.50% 13.00% 16.72%
EPS results for EU 28 countries
Met
hodo
logy
and
App
endi
ces
© 2016 KPMG LLP, a UK limited liability partnership, and a member firm of the KPMG network of independent member firms affiliated with KPMG International Cooperative, a Swiss entity.

187
Proj
ect
SU
N
Austria Number of packs collected ND incidence in EPS
Region 2013 2014 2015 2013 2014 2015
Burgenland 2,987 1,544 440 15% 14% 17%
Kärnten 5,546 2,402 850 35% 23% 21%
Niederösterreich 3,871 1,555 2,484 19% 16% 15%
Oberösterreich 3,180 1,993 2,179 22% 18% 13%
Salzburg 1,663 759 816 9% 10% 12%
Steiermark 2,398 1,146 1,853 13% 15% 16%
Tirol 1,581 779 1,104 6% 6% 6%
Vorarlberg 308 658 574 2% 7% 9%
Wien 3,951 1,975 2,700 20% 20% 14%
Total 25,485 12,811 13,000 20% 16% 14%
Austria EPS results by region, 2013-15(1)(2)
Source: (1) Austria Chamber of Commerce Empty Pack Surveys, 2013-2015
Met
hodo
logy
and
App
endi
ces
© 2016 KPMG LLP, a UK limited liability partnership, and a member firm of the KPMG network of independent member firms affiliated with KPMG International Cooperative, a Swiss entity.
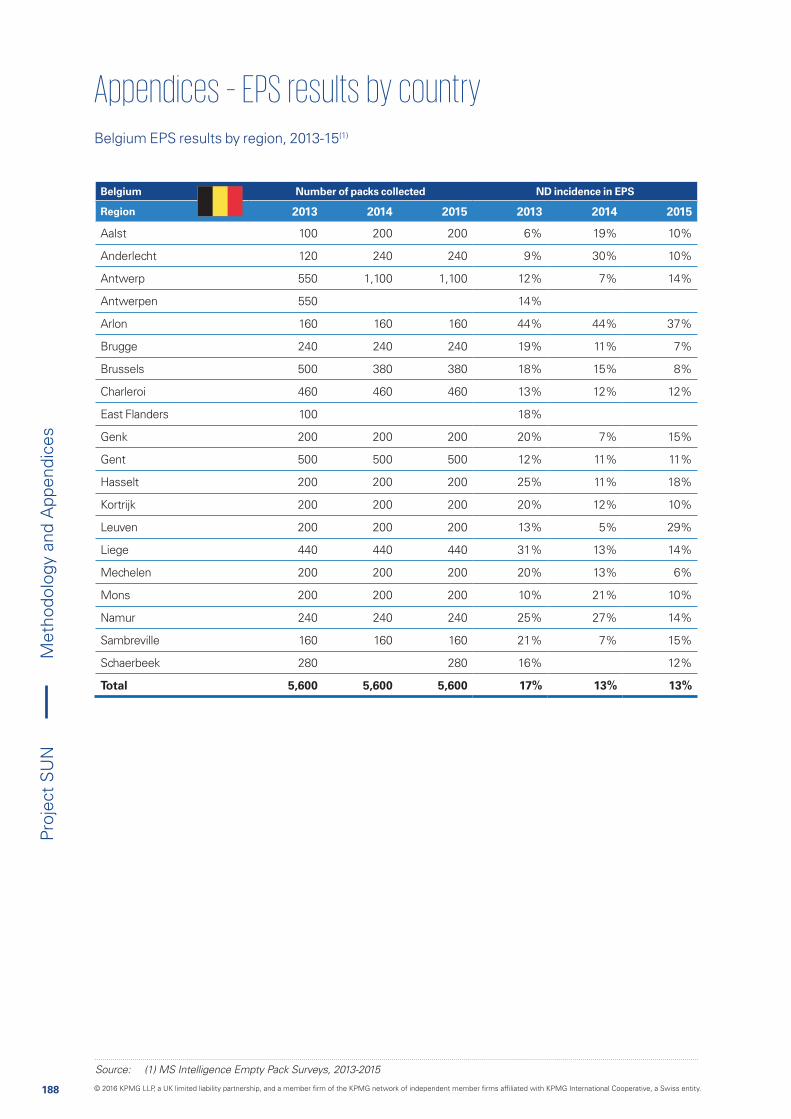
188
Proj
ect
SU
N
Belgium EPS results by region, 2013-15(1)
Source: (1) MS Intelligence Empty Pack Surveys, 2013-2015
Belgium Number of packs collected ND incidence in EPS
Region 2013 2014 2015 2013 2014 2015
Aalst 100 200 200 6% 19% 10%
Anderlecht 120 240 240 9% 30% 10%
Antwerp 550 1,100 1,100 12% 7% 14%
Antwerpen 550 14%
Arlon 160 160 160 44% 44% 37%
Brugge 240 240 240 19% 11% 7%
Brussels 500 380 380 18% 15% 8%
Charleroi 460 460 460 13% 12% 12%
East Flanders 100 18%
Genk 200 200 200 20% 7% 15%
Gent 500 500 500 12% 11% 11%
Hasselt 200 200 200 25% 11% 18%
Kortrijk 200 200 200 20% 12% 10%
Leuven 200 200 200 13% 5% 29%
Liege 440 440 440 31% 13% 14%
Mechelen 200 200 200 20% 13% 6%
Mons 200 200 200 10% 21% 10%
Namur 240 240 240 25% 27% 14%
Sambreville 160 160 160 21% 7% 15%
Schaerbeek 280 280 16% 12%
Total 5,600 5,600 5,600 17% 13% 13%
Met
hodo
logy
and
App
endi
ces
© 2016 KPMG LLP, a UK limited liability partnership, and a member firm of the KPMG network of independent member firms affiliated with KPMG International Cooperative, a Swiss entity.
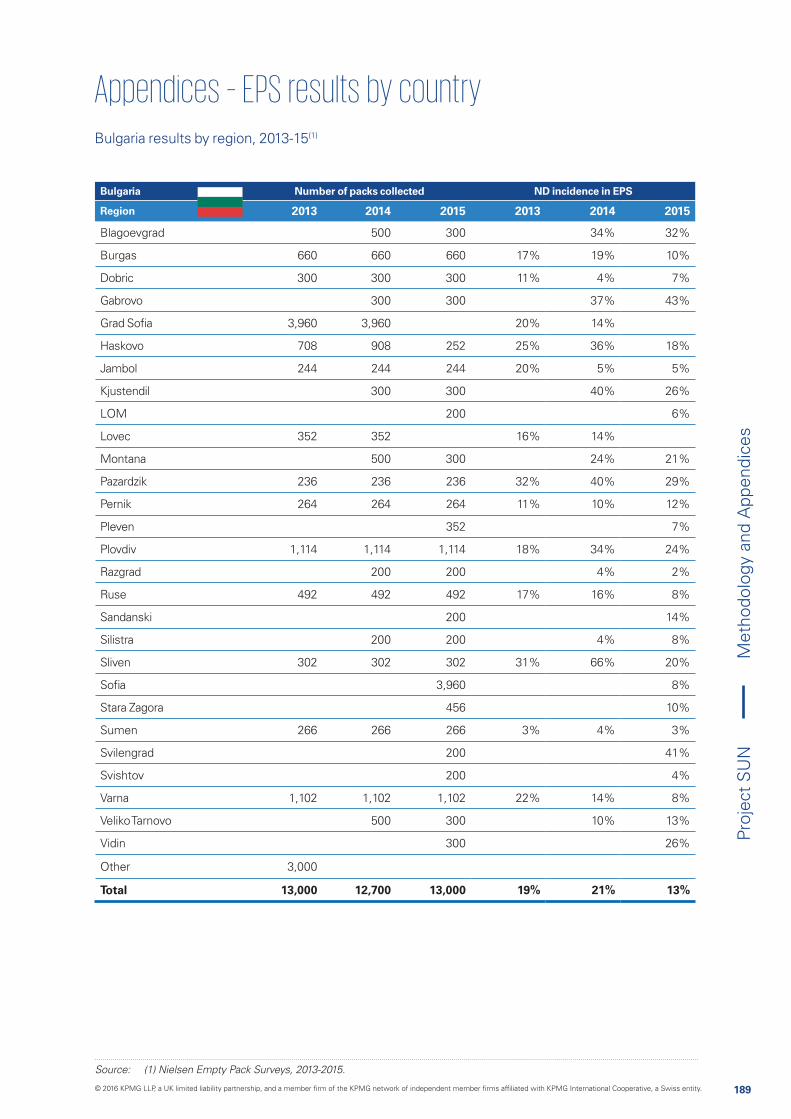
189
Proj
ect
SU
N
Bulgaria Number of packs collected ND incidence in EPS
Region 2013 2014 2015 2013 2014 2015
Blagoevgrad 500 300 34% 32%
Burgas 660 660 660 17% 19% 10%
Dobric 300 300 300 11% 4% 7%
Gabrovo 300 300 37% 43%
Grad Sofia 3,960 3,960 20% 14%
Haskovo 708 908 252 25% 36% 18%
Jambol 244 244 244 20% 5% 5%
Kjustendil 300 300 40% 26%
LOM 200 6%
Lovec 352 352 16% 14%
Montana 500 300 24% 21%
Pazardzik 236 236 236 32% 40% 29%
Pernik 264 264 264 11% 10% 12%
Pleven 352 7%
Plovdiv 1,114 1,114 1,114 18% 34% 24%
Razgrad 200 200 4% 2%
Ruse 492 492 492 17% 16% 8%
Sandanski 200 14%
Silistra 200 200 4% 8%
Sliven 302 302 302 31% 66% 20%
Sofia 3,960 8%
Stara Zagora 456 10%
Sumen 266 266 266 3% 4% 3%
Svilengrad 200 41%
Svishtov 200 4%
Varna 1,102 1,102 1,102 22% 14% 8%
Veliko Tarnovo 500 300 10% 13%
Vidin 300 26%
Other 3,000
Total 13,000 12,700 13,000 19% 21% 13%
Bulgaria results by region, 2013-15(1)
Source: (1) Nielsen Empty Pack Surveys, 2013-2015.
Met
hodo
logy
and
App
endi
ces
© 2016 KPMG LLP, a UK limited liability partnership, and a member firm of the KPMG network of independent member firms affiliated with KPMG International Cooperative, a Swiss entity.
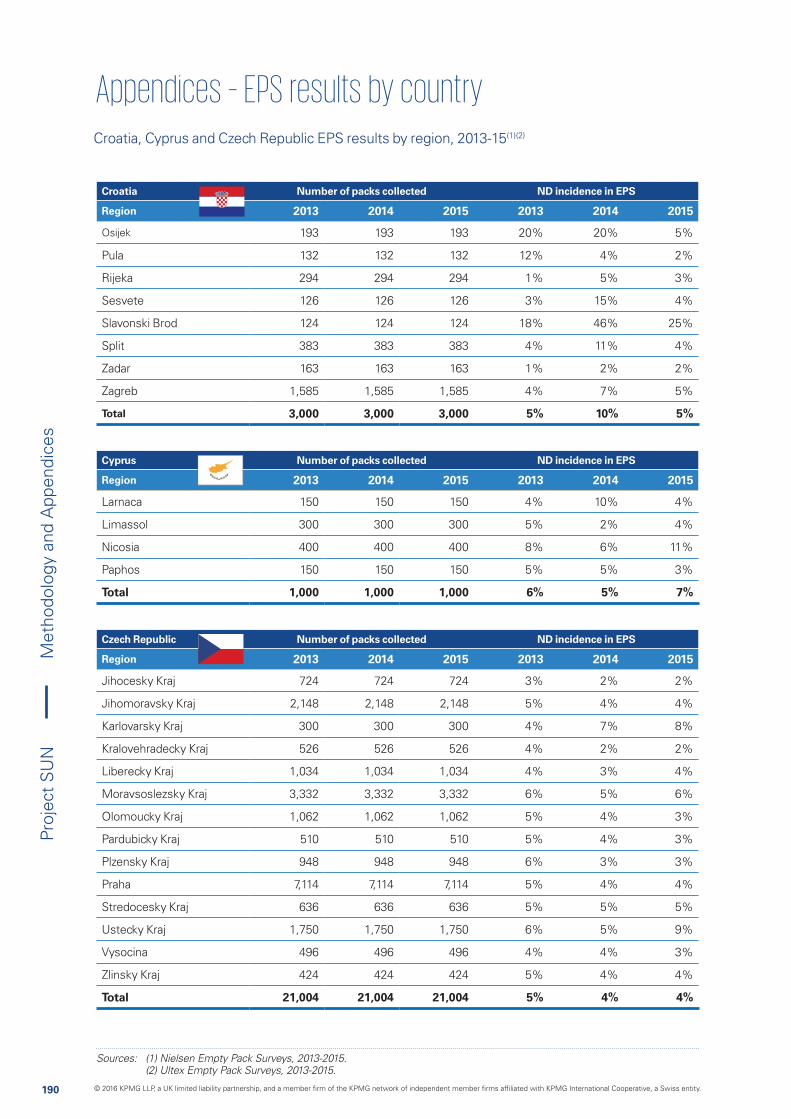
190
Proj
ect
SU
N
Czech Republic Number of packs collected ND incidence in EPS
Region 2013 2014 2015 2013 2014 2015
Jihocesky Kraj 724 724 724 3% 2% 2%
Jihomoravsky Kraj 2,148 2,148 2,148 5% 4% 4%
Karlovarsky Kraj 300 300 300 4% 7% 8%
Kralovehradecky Kraj 526 526 526 4% 2% 2%
Liberecky Kraj 1,034 1,034 1,034 4% 3% 4%
Moravsoslezsky Kraj 3,332 3,332 3,332 6% 5% 6%
Olomoucky Kraj 1,062 1,062 1,062 5% 4% 3%
Pardubicky Kraj 510 510 510 5% 4% 3%
Plzensky Kraj 948 948 948 6% 3% 3%
Praha 7,114 7,114 7,114 5% 4% 4%
Stredocesky Kraj 636 636 636 5% 5% 5%
Ustecky Kraj 1,750 1,750 1,750 6% 5% 9%
Vysocina 496 496 496 4% 4% 3%
Zlinsky Kraj 424 424 424 5% 4% 4%
Total 21,004 21,004 21,004 5% 4% 4%
Cyprus Number of packs collected ND incidence in EPS
Region 2013 2014 2015 2013 2014 2015
Larnaca 150 150 150 4% 10% 4%
Limassol 300 300 300 5% 2% 4%
Nicosia 400 400 400 8% 6% 11%
Paphos 150 150 150 5% 5% 3%
Total 1,000 1,000 1,000 6% 5% 7%
Croatia Number of packs collected ND incidence in EPS
Region 2013 2014 2015 2013 2014 2015
Osijek 193 193 193 20% 20% 5%
Pula 132 132 132 12% 4% 2%
Rijeka 294 294 294 1% 5% 3%
Sesvete 126 126 126 3% 15% 4%
Slavonski Brod 124 124 124 18% 46% 25%
Split 383 383 383 4% 11% 4%
Zadar 163 163 163 1% 2% 2%
Zagreb 1,585 1,585 1,585 4% 7% 5%
Total 3,000 3,000 3,000 5% 10% 5%
Croatia, Cyprus and Czech Republic EPS results by region, 2013-15(1)(2)
Sources: (1) Nielsen Empty Pack Surveys, 2013-2015. (2) Ultex Empty Pack Surveys, 2013-2015.
Met
hodo
logy
and
App
endi
ces
© 2016 KPMG LLP, a UK limited liability partnership, and a member firm of the KPMG network of independent member firms affiliated with KPMG International Cooperative, a Swiss entity.
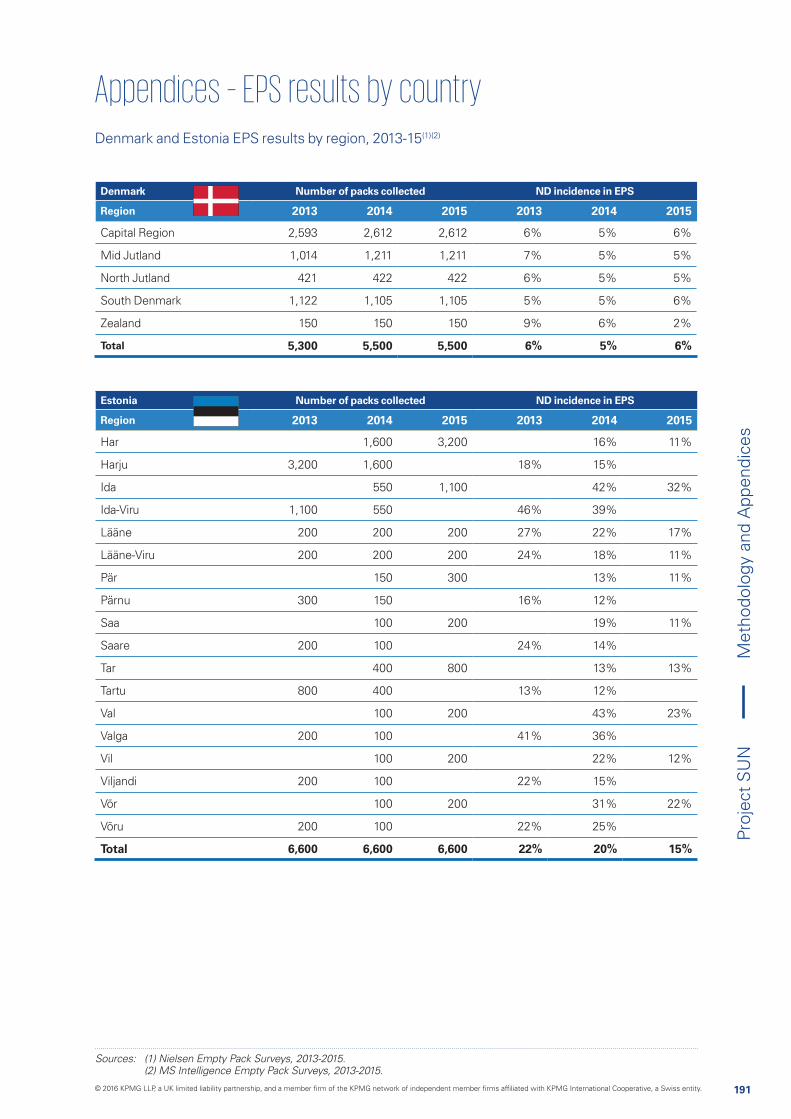
191
Proj
ect
SU
N
Estonia Number of packs collected ND incidence in EPS
Region 2013 2014 2015 2013 2014 2015
Har 1,600 3,200 16% 11%
Harju 3,200 1,600 18% 15%
Ida 550 1,100 42% 32%
Ida-Viru 1,100 550 46% 39%
Lääne 200 200 200 27% 22% 17%
Lääne-Viru 200 200 200 24% 18% 11%
Pär 150 300 13% 11%
Pärnu 300 150 16% 12%
Saa 100 200 19% 11%
Saare 200 100 24% 14%
Tar 400 800 13% 13%
Tartu 800 400 13% 12%
Val 100 200 43% 23%
Valga 200 100 41% 36%
Vil 100 200 22% 12%
Viljandi 200 100 22% 15%
Võr 100 200 31% 22%
Võru 200 100 22% 25%
Total 6,600 6,600 6,600 22% 20% 15%
Denmark and Estonia EPS results by region, 2013-15(1)(2)
Sources: (1) Nielsen Empty Pack Surveys, 2013-2015. (2) MS Intelligence Empty Pack Surveys, 2013-2015.
Denmark Number of packs collected ND incidence in EPS
Region 2013 2014 2015 2013 2014 2015
Capital Region 2,593 2,612 2,612 6% 5% 6%
Mid Jutland 1,014 1,211 1,211 7% 5% 5%
North Jutland 421 422 422 6% 5% 5%
South Denmark 1,122 1,105 1,105 5% 5% 6%
Zealand 150 150 150 9% 6% 2%
Total 5,300 5,500 5,500 6% 5% 6%
Met
hodo
logy
and
App
endi
ces
© 2016 KPMG LLP, a UK limited liability partnership, and a member firm of the KPMG network of independent member firms affiliated with KPMG International Cooperative, a Swiss entity.
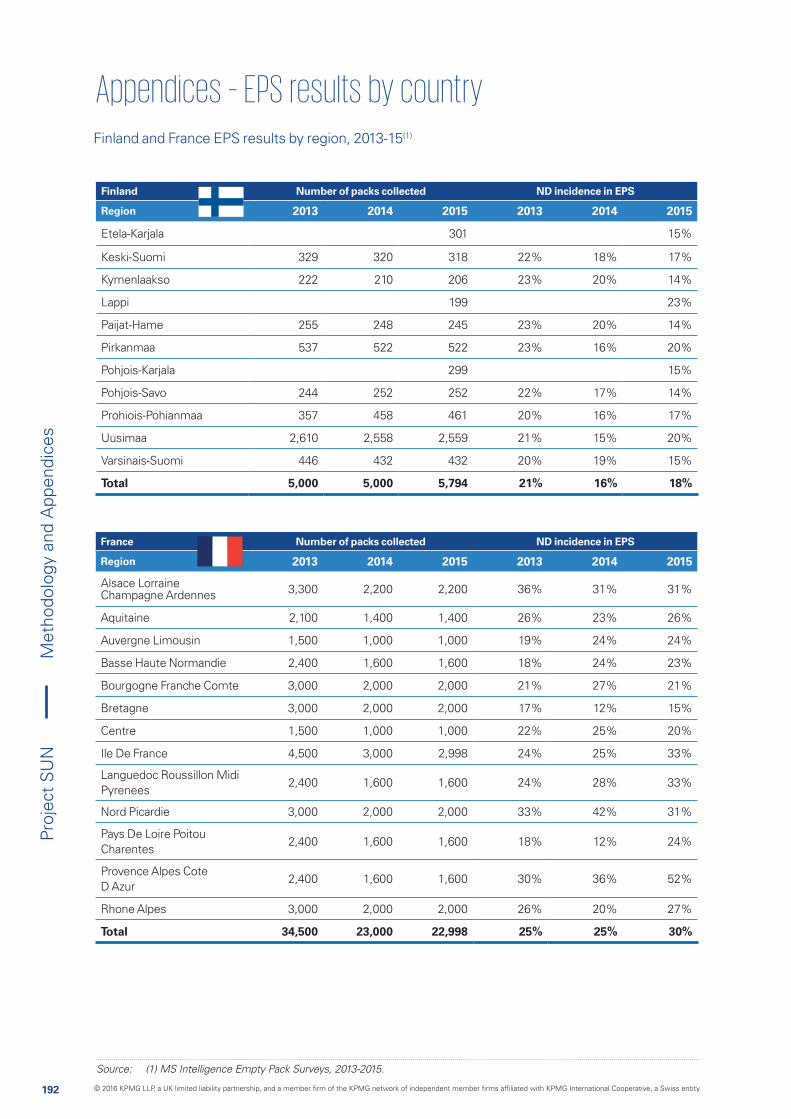
192
Proj
ect
SU
N
France Number of packs collected ND incidence in EPS
Region 2013 2014 2015 2013 2014 2015
Alsace Lorraine Champagne Ardennes 3,300 2,200 2,200 36% 31% 31%
Aquitaine 2,100 1,400 1,400 26% 23% 26%
Auvergne Limousin 1,500 1,000 1,000 19% 24% 24%
Basse Haute Normandie 2,400 1,600 1,600 18% 24% 23%
Bourgogne Franche Comte 3,000 2,000 2,000 21% 27% 21%
Bretagne 3,000 2,000 2,000 17% 12% 15%
Centre 1,500 1,000 1,000 22% 25% 20%
Ile De France 4,500 3,000 2,998 24% 25% 33%
Languedoc Roussillon Midi Pyrenees
2,400 1,600 1,600 24% 28% 33%
Nord Picardie 3,000 2,000 2,000 33% 42% 31%
Pays De Loire Poitou Charentes
2,400 1,600 1,600 18% 12% 24%
Provence Alpes Cote D Azur
2,400 1,600 1,600 30% 36% 52%
Rhone Alpes 3,000 2,000 2,000 26% 20% 27%
Total 34,500 23,000 22,998 25% 25% 30%
Finland Number of packs collected ND incidence in EPS
Region 2013 2014 2015 2013 2014 2015
Etela-Karjala 301 15%
Keski-Suomi 329 320 318 22% 18% 17%
Kymenlaakso 222 210 206 23% 20% 14%
Lappi 199 23%
Paijat-Hame 255 248 245 23% 20% 14%
Pirkanmaa 537 522 522 23% 16% 20%
Pohjois-Karjala 299 15%
Pohjois-Savo 244 252 252 22% 17% 14%
Prohiois-Pohianmaa 357 458 461 20% 16% 17%
Uusimaa 2,610 2,558 2,559 21% 15% 20%
Varsinais-Suomi 446 432 432 20% 19% 15%
Total 5,000 5,000 5,794 21% 16% 18%
Finland and France EPS results by region, 2013-15(1)
Source: (1) MS Intelligence Empty Pack Surveys, 2013-2015.
Met
hodo
logy
and
App
endi
ces
© 2016 KPMG LLP, a UK limited liability partnership, and a member firm of the KPMG network of independent member firms affiliated with KPMG International Cooperative, a Swiss entity.

193
Proj
ect
SU
N
Greece Number of packs collected ND incidence in EPS
Region 2013 2014 2015 2013 2014 2015
Attica 2,300 4,600 4,600 25% 25% 25%
Cenral Greece 200 400 400 19% 18% 17%
Central Macedonia 1,500 2,700 3,000 22% 22% 23%
Crete 500 1,000 1,000 22% 26% 13%
East Macedonia/Thrace 400 400 800 25% 23% 15%
Epirus 300 500 600 16% 20% 21%
Ionian Islands 200 400 400 16% 11% 19%
South Aegean 200 400 400 9% 11% 12%
Thessaly 600 1,200 1,200 15% 17% 16%
West Greece 600 1,200 1,200 8% 11% 17%
West Macedonia 200 200 400 17% 26% 21%
Total 7,000 13,000 14,000 20% 21% 21%
Germany and Greece EPS results by region, 2013-15(1)(2)(a)
500,000 packs were collected as part of the YBS in Germany; however once weighted, the survey is presented in 120,000 data lines Sources: (1) Ipsos Yellow Bag Surveys, 2014 and 2015 (Germany). (2) Nielsen Empty Pack Surveys, 2013-2015.
Germany Weighted number of packs collected ND incidence in EPS
Region 2014 2015 2014 2015
Nielsen 1 19,810 19,349 11% 10%
Nielsen 2 26,774 26,202 11% 10%
Nielsen 3a 16,388 15,857 10% 9%
Nielsen 3b 15,368 14,886 9% 10%
Nielsen 4 17,469 17,942 25% 24%
Nielsen 5 5,583 5,957 44% 39%
Nielsen 6 10,144 10,964 39% 32%
Nielsen 7 8,464 8,843 43% 42%
Total 120,000 120,000 19% 18%
Met
hodo
logy
and
App
endi
ces
© 2016 KPMG LLP, a UK limited liability partnership, and a member firm of the KPMG network of independent member firms affiliated with KPMG International Cooperative, a Swiss entity.
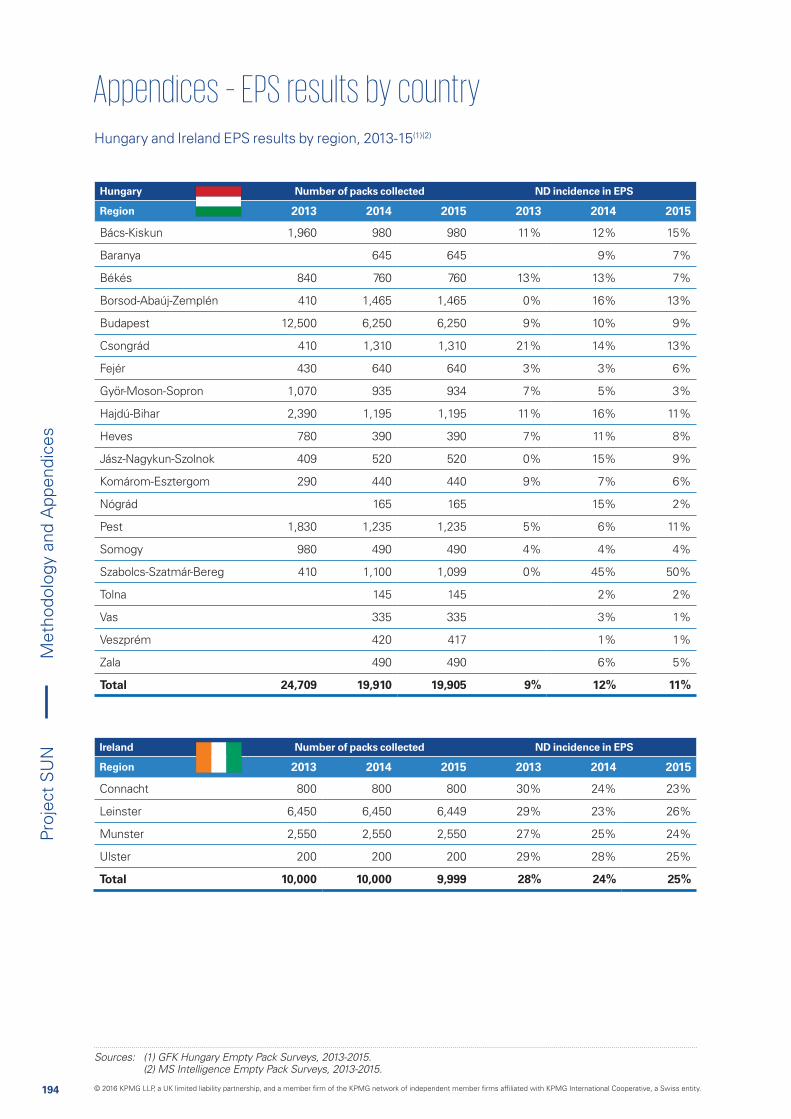
194
Proj
ect
SU
N Ireland Number of packs collected ND incidence in EPS
Region 2013 2014 2015 2013 2014 2015
Connacht 800 800 800 30% 24% 23%
Leinster 6,450 6,450 6,449 29% 23% 26%
Munster 2,550 2,550 2,550 27% 25% 24%
Ulster 200 200 200 29% 28% 25%
Total 10,000 10,000 9,999 28% 24% 25%
Hungary Number of packs collected ND incidence in EPS
Region 2013 2014 2015 2013 2014 2015
Bács-Kiskun 1,960 980 980 11% 12% 15%
Baranya 645 645 9% 7%
Békés 840 760 760 13% 13% 7%
Borsod-Abaúj-Zemplén 410 1,465 1,465 0% 16% 13%
Budapest 12,500 6,250 6,250 9% 10% 9%
Csongrád 410 1,310 1,310 21% 14% 13%
Fejér 430 640 640 3% 3% 6%
Györ-Moson-Sopron 1,070 935 934 7% 5% 3%
Hajdú-Bihar 2,390 1,195 1,195 11% 16% 11%
Heves 780 390 390 7% 11% 8%
Jász-Nagykun-Szolnok 409 520 520 0% 15% 9%
Komárom-Esztergom 290 440 440 9% 7% 6%
Nógrád 165 165 15% 2%
Pest 1,830 1,235 1,235 5% 6% 11%
Somogy 980 490 490 4% 4% 4%
Szabolcs-Szatmár-Bereg 410 1,100 1,099 0% 45% 50%
Tolna 145 145 2% 2%
Vas 335 335 3% 1%
Veszprém 420 417 1% 1%
Zala 490 490 6% 5%
Total 24,709 19,910 19,905 9% 12% 11%
Hungary and Ireland EPS results by region, 2013-15(1)(2)
Sources: (1) GFK Hungary Empty Pack Surveys, 2013-2015. (2) MS Intelligence Empty Pack Surveys, 2013-2015.
Met
hodo
logy
and
App
endi
ces
© 2016 KPMG LLP, a UK limited liability partnership, and a member firm of the KPMG network of independent member firms affiliated with KPMG International Cooperative, a Swiss entity.
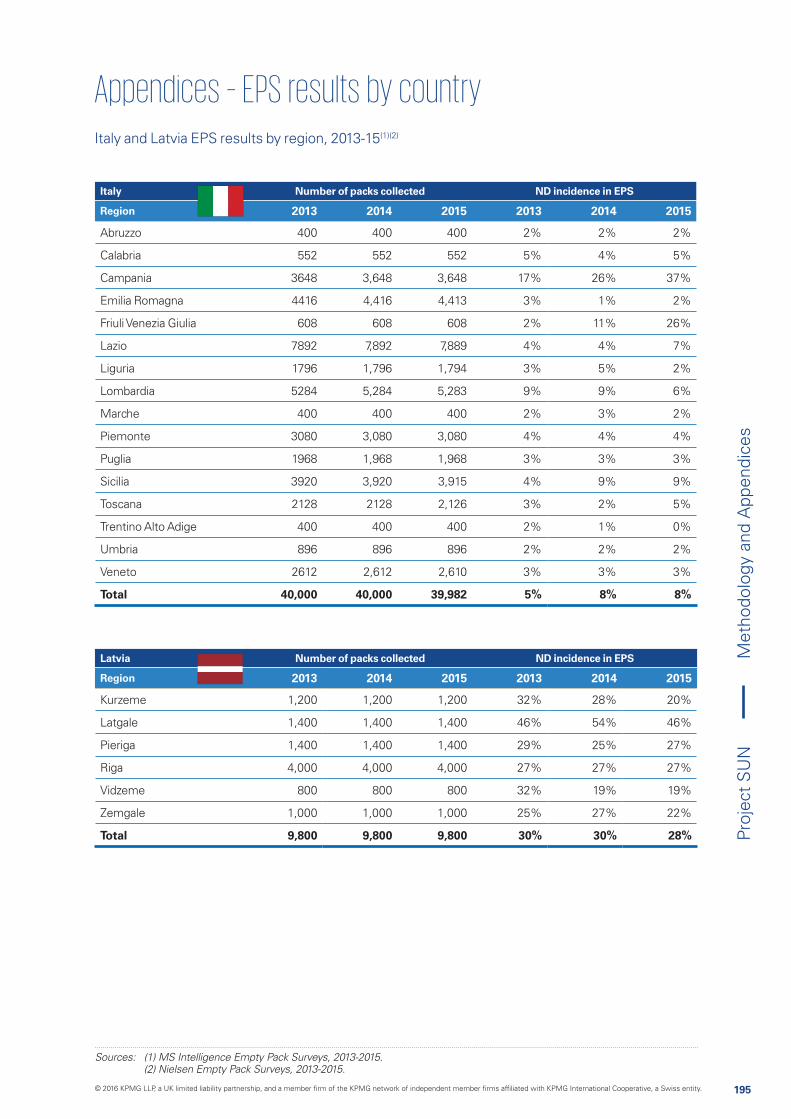
195
Proj
ect
SU
N
Latvia Number of packs collected ND incidence in EPS
Region 2013 2014 2015 2013 2014 2015
Kurzeme 1,200 1,200 1,200 32% 28% 20%
Latgale 1,400 1,400 1,400 46% 54% 46%
Pieriga 1,400 1,400 1,400 29% 25% 27%
Riga 4,000 4,000 4,000 27% 27% 27%
Vidzeme 800 800 800 32% 19% 19%
Zemgale 1,000 1,000 1,000 25% 27% 22%
Total 9,800 9,800 9,800 30% 30% 28%
Italy and Latvia EPS results by region, 2013-15(1)(2)
Sources: (1) MS Intelligence Empty Pack Surveys, 2013-2015. (2) Nielsen Empty Pack Surveys, 2013-2015.
Italy Number of packs collected ND incidence in EPS
Region 2013 2014 2015 2013 2014 2015
Abruzzo 400 400 400 2% 2% 2%
Calabria 552 552 552 5% 4% 5%
Campania 3648 3,648 3,648 17% 26% 37%
Emilia Romagna 4416 4,416 4,413 3% 1% 2%
Friuli Venezia Giulia 608 608 608 2% 11% 26%
Lazio 7892 7,892 7,889 4% 4% 7%
Liguria 1796 1,796 1,794 3% 5% 2%
Lombardia 5284 5,284 5,283 9% 9% 6%
Marche 400 400 400 2% 3% 2%
Piemonte 3080 3,080 3,080 4% 4% 4%
Puglia 1968 1,968 1,968 3% 3% 3%
Sicilia 3920 3,920 3,915 4% 9% 9%
Toscana 2128 2128 2,126 3% 2% 5%
Trentino Alto Adige 400 400 400 2% 1% 0%
Umbria 896 896 896 2% 2% 2%
Veneto 2612 2,612 2,610 3% 3% 3%
Total 40,000 40,000 39,982 5% 8% 8%
Met
hodo
logy
and
App
endi
ces
© 2016 KPMG LLP, a UK limited liability partnership, and a member firm of the KPMG network of independent member firms affiliated with KPMG International Cooperative, a Swiss entity.

196
Proj
ect
SU
N
Malta Number of packs collected ND incidence in EPS
Region 2013 2014 2015 2013 2014 2015
Northern 350 350 350 14% 10% 11%
Northern Harbour 550 550 550 16% 9% 14%
Southern Harbour 100 100 100 16% 12% 8%
Total 1,000 1,000 1,000 15% 10% 12%
Luxembourg Number of packs collected ND incidence in EPS
Region 2013 2014 2015 2013 2014 2015
Esch-Sur-Alzette 160 160 160 7% 3% 14%
Luxembourg 240 240 239 8% 9% 21%
Total 400 400 399 8% 7% 18%
Lithuania Number of packs collected ND incidence in EPS
Region 2013 2014 2015 2013 2014 2015
Alytus 800 1,200 800 40% 33% 23%
Kaunas 3,000 4,500 3,000 28% 31% 21%
Klaipeda 1,600 2,400 1,600 18% 18% 16%
Marijampole 600 900 600 35% 32% 22%
Panevezys 800 1,200 800 36% 34% 23%
Siauliai 800 1,200 800 28% 32% 31%
Taurage 200 300 200 44% 42% 19%
Telsiai 800 1,200 800 31% 25% 15%
Utena 600 900 600 16% 28% 14%
Vilnius 3,600 5,400 3,600 31% 32% 21%
Total 12,800 19,200 12,800 29% 30% 21%
Lithuania, Luxembourg and Malta EPS results by region, 2013-15(1)(2)
Sources: (1) Nielsen Empty Pack Surveys, 2013-2015. (2) MS Intelligence Empty Pack Surveys, 2013-2015.
Met
hodo
logy
and
App
endi
ces
© 2016 KPMG LLP, a UK limited liability partnership, and a member firm of the KPMG network of independent member firms affiliated with KPMG International Cooperative, a Swiss entity.

197
Proj
ect
SU
N
Netherlands and Poland EPS results by region, 2013-15(1)
Sources: (1) MS Intelligence Empty Pack Surveys, 2013-2015. (2) Almares Research Empty Pack Surveys, 2013-2015.
Poland Number of packs collected ND incidence in EPS
Region 2013 2014 2015 2013 2014 2015
Dolnoslaskie 3,900 3,900 3,900 7% 8% 6%
Kujawsko-Pomorskie 2,775 2,775 2,775 11% 12% 13%
Lodzkie 3,375 3,375 3,375 22% 24% 20%
Lubelskie 2,550 2,550 2,550 28% 34% 32%
Lubuskie 1,350 1,350 1,350 4% 5% 7%
Malopolskie 2,925 2,925 2,925 12% 13% 16%
Mazowieckie 8,100 8,100 8,100 22% 24% 29%
Opolskie 1,800 1,800 1,800 4% 6% 6%
Podkarpackie 2,850 2,850 2,850 28% 28% 32%
Podlaskie 1,425 1,425 1,425 40% 43% 39%
Pomorskie 2,325 2,325 2,325 2% 1% 0%
Slaskie 7,350 7,350 7,350 11% 12% 16%
Swietokrzyskie 1,575 1,575 1,575 5% 8% 8%
Warminsko-Mazurskie 2,400 2,400 2,400 41% 55% 58%
Wielkopolskie 4,050 4,050 4,050 2% 2% 4%
Zachodniopomorkskie 2,250 2,250 2,250 5% 6% 5%
Total 51,000 51,000 51,000 15% 17% 18%
Netherlands Number of packs collected ND incidence in EPS
Region 2013 2014 2015 2013 2014 2015
Drenthe 206 303 303 22% 14% 15%
Flevoland 502 756 756 20% 23% 20%
Friesland 334 498 498 18% 18% 15%
Gelderland 1,088 1,626 1,626 24% 20% 19%
Groningen 358 546 546 27% 23% 16%
Limburg 760 1,128 1,128 24% 23% 21%
North Brabant 1,862 2,790 2,790 25% 26% 23%
North Holland 3,078 4,635 4,635 24% 21% 19%
Overijssel 996 1,488 1,488 22% 21% 19%
South Holland 3,954 5,916 5,916 19% 20% 17%
Utrecht 862 1,314 1,314 24% 18% 17%
Total 14,000 21,000 21,000 22% 21% 19%
Met
hodo
logy
and
App
endi
ces
© 2016 KPMG LLP, a UK limited liability partnership, and a member firm of the KPMG network of independent member firms affiliated with KPMG International Cooperative, a Swiss entity.

198
Proj
ect
SU
N
198
Slovakia Number of packs collected ND incidence in EPS
Region 2013 2014 2015 2013 2014 2015
Banskobystricky Kraj 450 1,100 1,100 1% 1% 3%
Bratislavsky Kraj 1,200 2,400 2,400 1% 0% 3%
Kosicky Kraj 800 2,600 2,600 7% 3% 6%
Nitriansky Kraj 650 1,700 1,700 1% 0% 4%
Presovsky Kraj 600 2,200 2,200 7% 1% 5%
Trenciansky Kraj 400 800 800 0% 1% 4%
Trnavsky Kraj 300 800 800 3% 1% 3%
Zilinsky Kraj 600 1,200 1,200 1% 1% 4%
Total 5,000 12,800 12,800 3% 1% 9%
Romania Number of packs collected ND incidence in EPS
Region 2013 2014 2015 2013 2014 2015
Bucharest 5,027 1,586 1,600 8% 11% 10%
Center 2,512 1,497 1,531 2% 3% 2%
North-East 2,276 2,667 2,637 18% 33% 37%
North-West 2,278 2,087 1,891 10% 17% 20%
South 1,687 2,025 2,084 13% 5% 3%
South-East 2,573 2,087 2,062 11% 15% 11%
South-West 1,510 1,676 16% 24%
West 2,247 1,613 1,645 13% 28% 23%
Total 18,600 15,072 15,126 10% 16% 16%
Portugal Number of packs collected ND incidence in EPS
Region 2013 2014 2015 2013 2014 2015
Center 162 200 200 0% 1% 2%
Lisboa 1,910 1,900 1,900 2% 3% 3%
North 928 900 900 3% 2% 4%
Total 3,000 3,000 3,000 2% 2% 4%
Portugal, Romania and Slovakia EPS results by region, 2013-15(1)(2)
Source: (1) Nielsen Empty Pack Surveys, 2013-2015. (2) Novel Study, 2014-2015. (3) Ipsos Empty Pack Surveys, 2013-2015.
Met
hodo
logy
and
App
endi
ces
© 2016 KPMG LLP, a UK limited liability partnership, and a member firm of the KPMG network of independent member firms affiliated with KPMG International Cooperative, a Swiss entity.
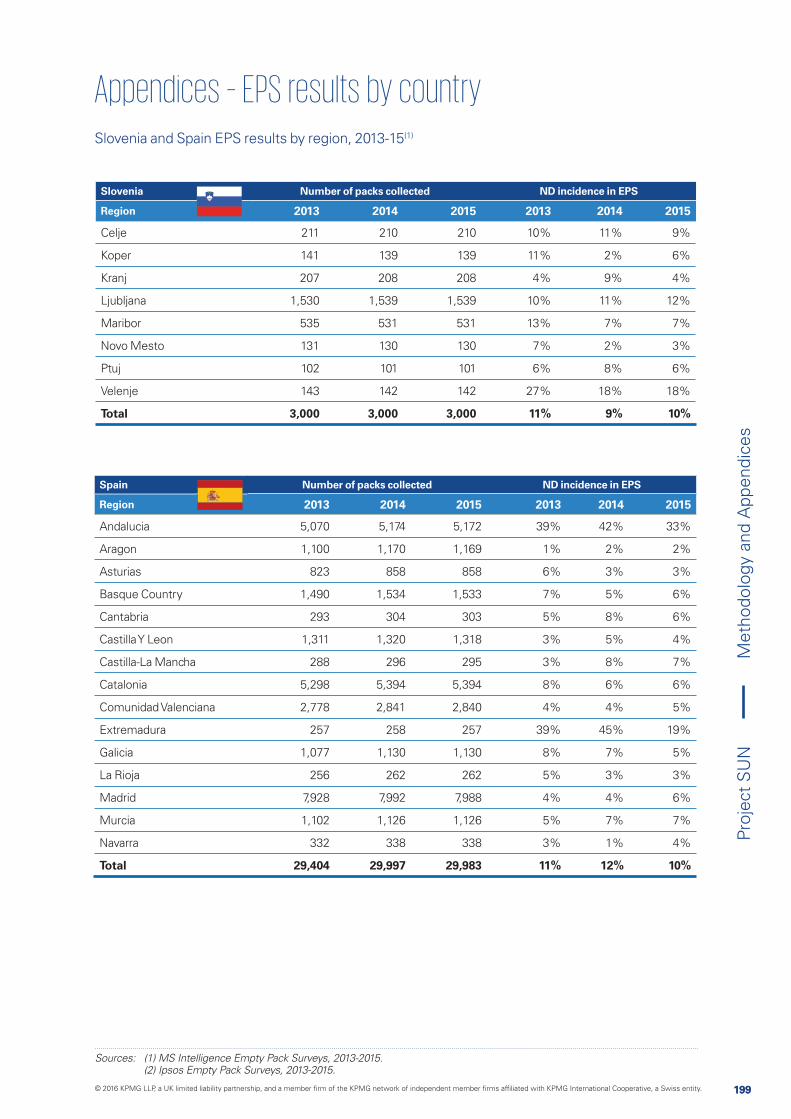
199
Proj
ect
SU
N
199
Slovenia and Spain EPS results by region, 2013-15(1)
Spain Number of packs collected ND incidence in EPS
Region 2013 2014 2015 2013 2014 2015
Andalucia 5,070 5,174 5,172 39% 42% 33%
Aragon 1,100 1,170 1,169 1% 2% 2%
Asturias 823 858 858 6% 3% 3%
Basque Country 1,490 1,534 1,533 7% 5% 6%
Cantabria 293 304 303 5% 8% 6%
Castilla Y Leon 1,311 1,320 1,318 3% 5% 4%
Castilla-La Mancha 288 296 295 3% 8% 7%
Catalonia 5,298 5,394 5,394 8% 6% 6%
Comunidad Valenciana 2,778 2,841 2,840 4% 4% 5%
Extremadura 257 258 257 39% 45% 19%
Galicia 1,077 1,130 1,130 8% 7% 5%
La Rioja 256 262 262 5% 3% 3%
Madrid 7,928 7,992 7,988 4% 4% 6%
Murcia 1,102 1,126 1,126 5% 7% 7%
Navarra 332 338 338 3% 1% 4%
Total 29,404 29,997 29,983 11% 12% 10%
Slovenia Number of packs collected ND incidence in EPS
Region 2013 2014 2015 2013 2014 2015
Celje 211 210 210 10% 11% 9%
Koper 141 139 139 11% 2% 6%
Kranj 207 208 208 4% 9% 4%
Ljubljana 1,530 1,539 1,539 10% 11% 12%
Maribor 535 531 531 13% 7% 7%
Novo Mesto 131 130 130 7% 2% 3%
Ptuj 102 101 101 6% 8% 6%
Velenje 143 142 142 27% 18% 18%
Total 3,000 3,000 3,000 11% 9% 10%
Sources: (1) MS Intelligence Empty Pack Surveys, 2013-2015. (2) Ipsos Empty Pack Surveys, 2013-2015.
Met
hodo
logy
and
App
endi
ces
© 2016 KPMG LLP, a UK limited liability partnership, and a member firm of the KPMG network of independent member firms affiliated with KPMG International Cooperative, a Swiss entity.
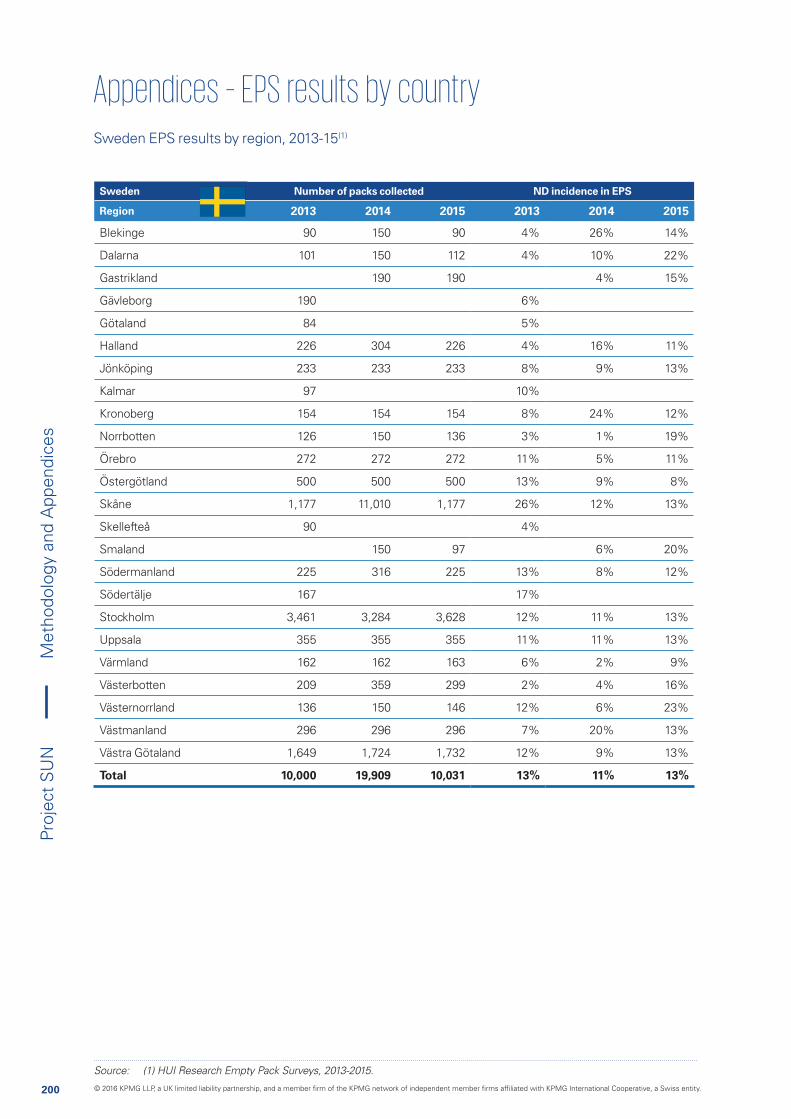
200
Proj
ect
SU
N
Sweden Number of packs collected ND incidence in EPS
Region 2013 2014 2015 2013 2014 2015
Blekinge 90 150 90 4% 26% 14%
Dalarna 101 150 112 4% 10% 22%
Gastrikland 190 190 4% 15%
Gävleborg 190 6%
Götaland 84 5%
Halland 226 304 226 4% 16% 11%
Jönköping 233 233 233 8% 9% 13%
Kalmar 97 10%
Kronoberg 154 154 154 8% 24% 12%
Norrbotten 126 150 136 3% 1% 19%
Örebro 272 272 272 11% 5% 11%
Östergötland 500 500 500 13% 9% 8%
Skåne 1,177 11,010 1,177 26% 12% 13%
Skellefteå 90 4%
Smaland 150 97 6% 20%
Södermanland 225 316 225 13% 8% 12%
Södertälje 167 17%
Stockholm 3,461 3,284 3,628 12% 11% 13%
Uppsala 355 355 355 11% 11% 13%
Värmland 162 162 163 6% 2% 9%
Västerbotten 209 359 299 2% 4% 16%
Västernorrland 136 150 146 12% 6% 23%
Västmanland 296 296 296 7% 20% 13%
Västra Götaland 1,649 1,724 1,732 12% 9% 13%
Total 10,000 19,909 10,031 13% 11% 13%
Sweden EPS results by region, 2013-15(1)
Source: (1) HUI Research Empty Pack Surveys, 2013-2015.
Met
hodo
logy
and
App
endi
ces
© 2016 KPMG LLP, a UK limited liability partnership, and a member firm of the KPMG network of independent member firms affiliated with KPMG International Cooperative, a Swiss entity.
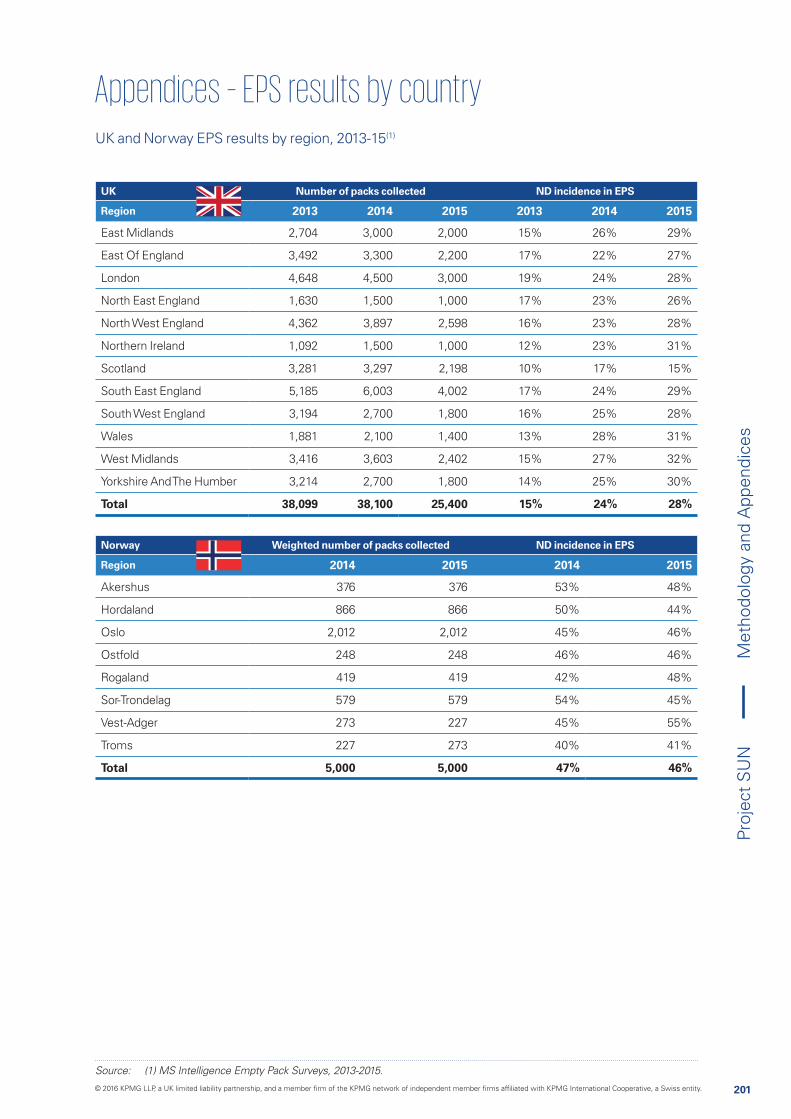
201
Proj
ect
SU
N
UK and Norway EPS results by region, 2013-15(1)
Source: (1) MS Intelligence Empty Pack Surveys, 2013-2015.
Norway Weighted number of packs collected ND incidence in EPS
Region 2014 2015 2014 2015
Akershus 376 376 53% 48%
Hordaland 866 866 50% 44%
Oslo 2,012 2,012 45% 46%
Ostfold 248 248 46% 46%
Rogaland 419 419 42% 48%
Sor-Trondelag 579 579 54% 45%
Vest-Adger 273 227 45% 55%
Troms 227 273 40% 41%
Total 5,000 5,000 47% 46%
UK Number of packs collected ND incidence in EPS
Region 2013 2014 2015 2013 2014 2015
East Midlands 2,704 3,000 2,000 15% 26% 29%
East Of England 3,492 3,300 2,200 17% 22% 27%
London 4,648 4,500 3,000 19% 24% 28%
North East England 1,630 1,500 1,000 17% 23% 26%
North West England 4,362 3,897 2,598 16% 23% 28%
Northern Ireland 1,092 1,500 1,000 12% 23% 31%
Scotland 3,281 3,297 2,198 10% 17% 15%
South East England 5,185 6,003 4,002 17% 24% 29%
South West England 3,194 2,700 1,800 16% 25% 28%
Wales 1,881 2,100 1,400 13% 28% 31%
West Midlands 3,416 3,603 2,402 15% 27% 32%
Yorkshire And The Humber 3,214 2,700 1,800 14% 25% 30%
Total 38,099 38,100 25,400 15% 24% 28%
Met
hodo
logy
and
App
endi
ces
© 2016 KPMG LLP, a UK limited liability partnership, and a member firm of the KPMG network of independent member firms affiliated with KPMG International Cooperative, a Swiss entity.
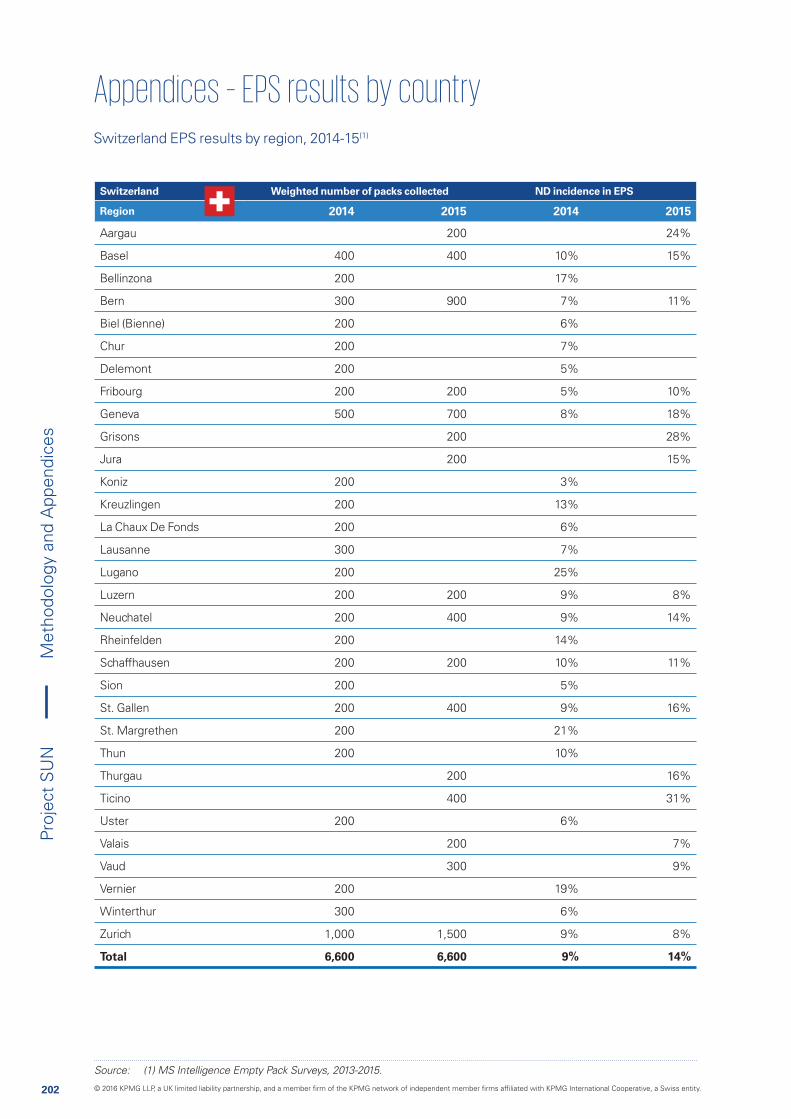
202
Proj
ect
SU
N
Switzerland Weighted number of packs collected ND incidence in EPS
Region 2014 2015 2014 2015
Aargau 200 24%
Basel 400 400 10% 15%
Bellinzona 200 17%
Bern 300 900 7% 11%
Biel (Bienne) 200 6%
Chur 200 7%
Delemont 200 5%
Fribourg 200 200 5% 10%
Geneva 500 700 8% 18%
Grisons 200 28%
Jura 200 15%
Koniz 200 3%
Kreuzlingen 200 13%
La Chaux De Fonds 200 6%
Lausanne 300 7%
Lugano 200 25%
Luzern 200 200 9% 8%
Neuchatel 200 400 9% 14%
Rheinfelden 200 14%
Schaffhausen 200 200 10% 11%
Sion 200 5%
St. Gallen 200 400 9% 16%
St. Margrethen 200 21%
Thun 200 10%
Thurgau 200 16%
Ticino 400 31%
Uster 200 6%
Valais 200 7%
Vaud 300 9%
Vernier 200 19%
Winterthur 300 6%
Zurich 1,000 1,500 9% 8%
Total 6,600 6,600 9% 14%
Switzerland EPS results by region, 2014-15(1)
Source: (1) MS Intelligence Empty Pack Surveys, 2013-2015.
Met
hodo
logy
and
App
endi
ces
© 2016 KPMG LLP, a UK limited liability partnership, and a member firm of the KPMG network of independent member firms affiliated with KPMG International Cooperative, a Swiss entity.
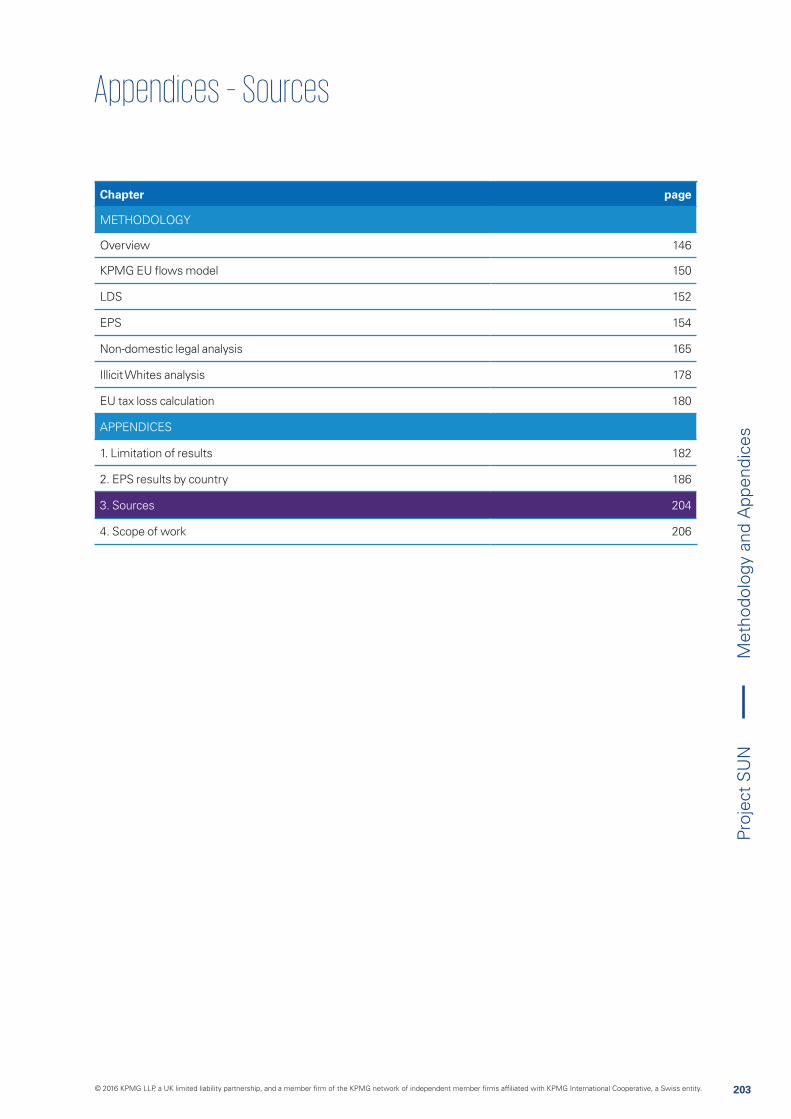
203
Proj
ect
SU
N
Chapter page
METHODOLOGY
Overview 146
KPMG EU flows model 150
LDS 152
EPS 154
Non-domestic legal analysis 165
Illicit Whites analysis 178
EU tax loss calculation 180
APPENDICES
1. Limitation of results 182
2. EPS results by country 186
3. Sources 204
4. Scope of work 206
Met
hodo
logy
and
App
endi
ces
© 2016 KPMG LLP, a UK limited liability partnership, and a member firm of the KPMG network of independent member firms affiliated with KPMG International Cooperative, a Swiss entity.
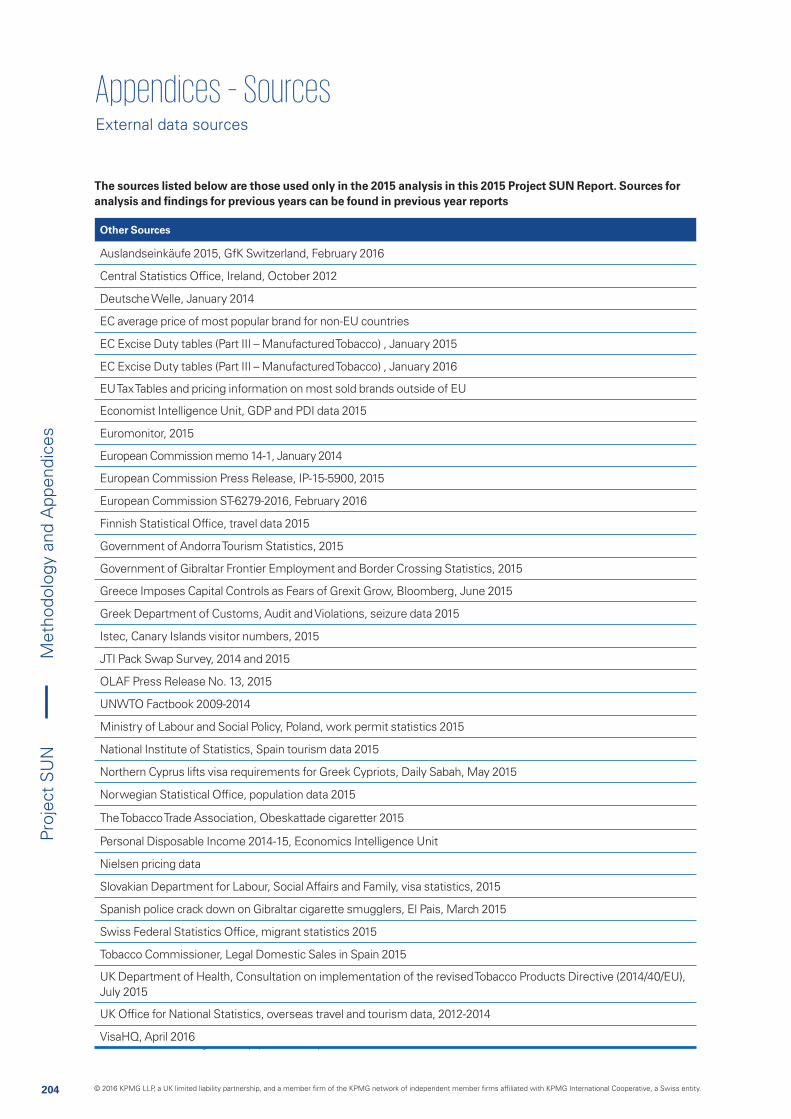
204
Proj
ect
SU
N
Source: (1) MS Intelligence Empty Pack Surveys, 2012-2014.
Other Sources
Auslandseinkäufe 2015, GfK Switzerland, February 2016
Central Statistics Office, Ireland, October 2012
Deutsche Welle, January 2014
EC average price of most popular brand for non-EU countries
EC Excise Duty tables (Part III – Manufactured Tobacco) , January 2015
EC Excise Duty tables (Part III – Manufactured Tobacco) , January 2016
EU Tax Tables and pricing information on most sold brands outside of EU
Economist Intelligence Unit, GDP and PDI data 2015
Euromonitor, 2015
European Commission memo 14-1, January 2014
European Commission Press Release, IP-15-5900, 2015
European Commission ST-6279-2016, February 2016
Finnish Statistical Office, travel data 2015
Government of Andorra Tourism Statistics, 2015
Government of Gibraltar Frontier Employment and Border Crossing Statistics, 2015
Greece Imposes Capital Controls as Fears of Grexit Grow, Bloomberg, June 2015
Greek Department of Customs, Audit and Violations, seizure data 2015
Istec, Canary Islands visitor numbers, 2015
JTI Pack Swap Survey, 2014 and 2015
OLAF Press Release No. 13, 2015
UNWTO Factbook 2009-2014
Ministry of Labour and Social Policy, Poland, work permit statistics 2015
National Institute of Statistics, Spain tourism data 2015
Northern Cyprus lifts visa requirements for Greek Cypriots, Daily Sabah, May 2015
Norwegian Statistical Office, population data 2015
The Tobacco Trade Association, Obeskattade cigaretter 2015
Personal Disposable Income 2014-15, Economics Intelligence Unit
Nielsen pricing data
Slovakian Department for Labour, Social Affairs and Family, visa statistics, 2015
Spanish police crack down on Gibraltar cigarette smugglers, El Pais, March 2015
Swiss Federal Statistics Office, migrant statistics 2015
Tobacco Commissioner, Legal Domestic Sales in Spain 2015
UK Department of Health, Consultation on implementation of the revised Tobacco Products Directive (2014/40/EU), July 2015
UK Office for National Statistics, overseas travel and tourism data, 2012-2014
VisaHQ, April 2016
The sources listed below are those used only in the 2015 analysis in this 2015 Project SUN Report. Sources for analysis and findings for previous years can be found in previous year reports
External data sources
Met
hodo
logy
and
App
endi
ces
© 2016 KPMG LLP, a UK limited liability partnership, and a member firm of the KPMG network of independent member firms affiliated with KPMG International Cooperative, a Swiss entity.
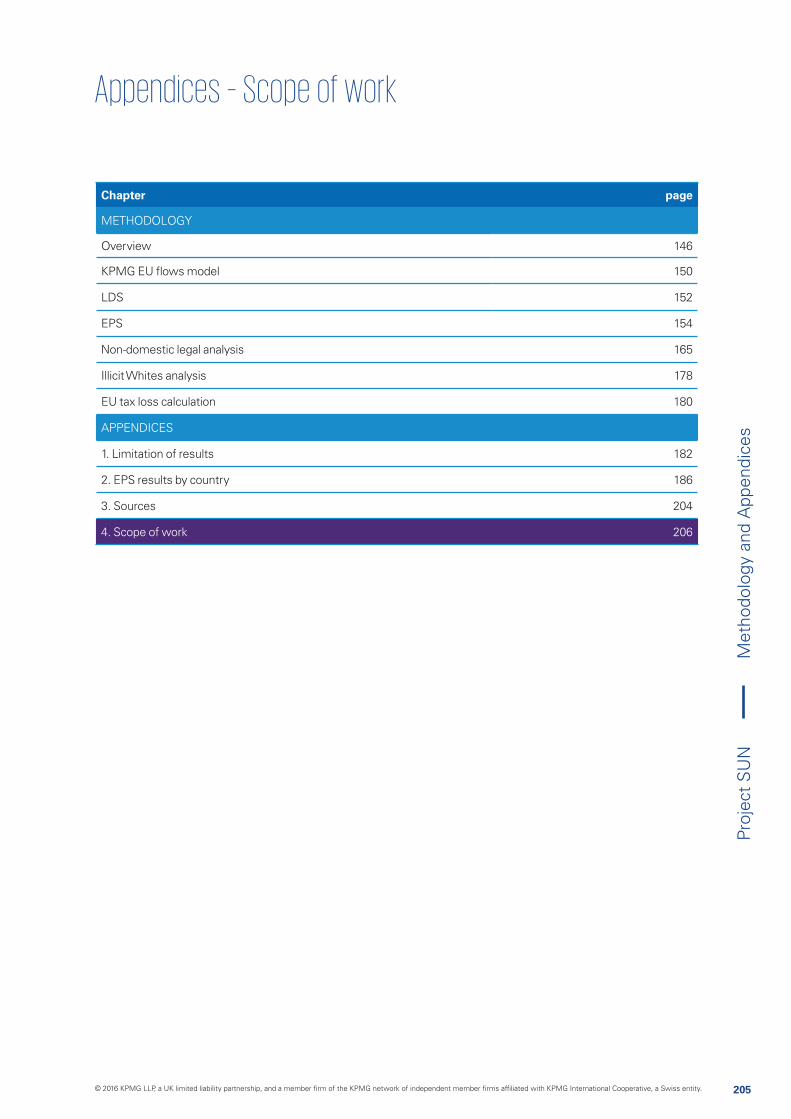
205
Proj
ect
SU
N
Chapter page
METHODOLOGY
Overview 146
KPMG EU flows model 150
LDS 152
EPS 154
Non-domestic legal analysis 165
Illicit Whites analysis 178
EU tax loss calculation 180
APPENDICES
1. Limitation of results 182
2. EPS results by country 186
3. Sources 204
4. Scope of work 206
Met
hodo
logy
and
App
endi
ces
© 2016 KPMG LLP, a UK limited liability partnership, and a member firm of the KPMG network of independent member firms affiliated with KPMG International Cooperative, a Swiss entity.
206
Proj
ect
SU
N
206
The scope of work below forms the basis of our contract with the Beneficiaries
Methodology and Reporting
1. This study will report on the estimated size and composition of the total cigarette market (including counterfeit and contraband products), as detailed below, for each of the 28 EU Member States, Norway and Switzerland.
2. The findings from the work on the 30 countries will be used to produce a report which includes an executive summary covering an overall view of the total market for the 28 EU Member States (with Norway and Switzerland to be included in any individual country figures quoted). We will also provide a section in the report on counterfeit and contraband flows for each of the 30 countries.
3. Our analysis of the cigarette market will be based on a methodology that incorporates primary research, market analysis, local expert interview programmes, and existing industry surveys.
- For each of the 30 countries, we will use in market sales data provided by all engaging parties to estimate legal domestic sales and estimate Legal Domestic Consumption by subtracting outflows to other countries based on the results of Empty Pack Surveys.
- Non-domestic inflows for each country will be based on the results of Empty Pack Surveys and added to Legal Domestic Consumption to estimate Total Consumption.
- Analysis of tourism flows and border sales data provided by all engaging parties will be used to estimate the proportion of non-domestic inflows that are counterfeit and contraband for each of the 30 countries
- The bespoke Project STAR/SUN methodology will be used to analyse the inflows and outflows between all of the 30 countries, based on the data sources above.
- Additional data sources (as per section 11 below) will be used to refine our analysis
4. KPMG will also conduct analysis on illicit whites which will be analysed in the same way as section 3 above. This will be reported in the consolidated section of the report.
5. Upon finalisation of our work, KPMG will provide separately to BAT, ITL, JTI and PMI data tables containing the following information:
- Summary of EU total counterfeit and contraband inflows by source and destination market;
- Detailed analysis of total non-domestic outflows to the EU split by destination market and brand
6. KPMG will present our initial findings to you at interim stages in the engagement as required. The KPMG Project SUN team will also be made available to support up to two other external stakeholder presentations following the completion of the report under the terms of this agreement. Additional presentations or interviews, translation costs and the costs of KPMG personnel from other KPMG network firms are outside the scope of this letter and we would agree the costs of such services with you separately and in addition to the fee as per section 5 of the Engagement Letter.
Process
7. BAT, ITL, JTI and PMI will form a Steering Group as the primary point of contact for KPMG, which will oversee the project from the client side, and will be responsible for data provision, arranging country meetings or calls where appropriate, collating central feedback where appropriate and overseeing the timetable. Data will be provided directly to KPMG separately by each of BAT, ITL, JTI and PMI. A dashboard which tracks data provided and highlights delays will be provided each week separately to BAT, ITL, JTI and PMI, so that each of BAT, ITL, JTI and PMI can identify missing data and deadlines and be aware of potential fee implications.
8. KPMG will undertake conference calls where required with each of BAT, ITL, JTI and PMI country leaders for 10 priority countries to help build a shared understanding of: data sources and their limitations; first draft results and their possible implications for the country’s anti- illicit trade activity; fact gaps and hypotheses; and additional research requirements.
- The 10 priority markets are: [Baltics; Bulgaria; France; Germany; Greece; UK; Italy; Poland; Romania; Spain]
Note: BAT: British American Tobacco plc ITL: Imperial Tobacco Limited JTI: JT International SA PMI: Philip Morris International Management SA
Met
hodo
logy
and
App
endi
ces
© 2016 KPMG LLP, a UK limited liability partnership, and a member firm of the KPMG network of independent member firms affiliated with KPMG International Cooperative, a Swiss entity.
207
Proj
ect
SU
N
207
Note: BAT: British American Tobacco plc ITL: Imperial Tobacco Limited JTI: JT International SA PMI: Philip Morris International Management SA
9. KPMG will share country specific preliminary results separately with the management teams of BAT, ITL, JTI and PMI for each of the priority EU Member States as outlined in section 8 above and provide opportunity for feedback and comment from each of those management teams within the agreed timetable. Each company will be in charge of reviewing its content and commenting on it within 10 working days. We will communicate the updated results to each of those management teams and provide opportunity for one further set of comments before finalising our results.
For the remaining 20 non-priority countries, KPMG will share preliminary findings of our analysis with the management teams of BAT, ITL, JTI and PMI for each non-priority country via a central point of contact for each of BAT, ITL, JTI and PMI. Feedback from non-priority countries will be collected centrally by a point of contact for each of BAT, ITL, JTI and PMI and communicated to us within the agreed timetable. KPMG will communicate directly with the management teams of non-priority countries on an exceptions basis. It should be noted that changes requested by BAT, ITL, JTI or PMI which KPMG agree to make will also have to be agreed with the other engaging parties. KPMG will be responsible for managing the transparency and alignment of the revision process. Each of BAT, ITL, JTI and PMI will be provided with the “pre-final” report and will be responsible for reviewing its content and commenting on it within 10 working days (including legal reviews). It should be noted that KPMG will determine which comments and amendments to make to our report.
10. In addition to the detailed report and management meetings, KPMG will also undertake to manage and lead key intervention sessions between the BAT, ITL, JTI, PMI Steering Group and KPMG team, these being: Project Kick Off (to take place week commencing 1st February 2016) to agree detailed project process and approach, reporting format and highlight potential communication considerations;
• A review of preliminary EU and country level findings for each of the 30 countries and address key challenges and actions, to take place in early March 2016;
• A review of updated EU and country level findings for each of the 30 countries and address key challenges and actions, to take place in early April 2016.
Data Sources
11. Information from several independent sources will be used. These sources will include:
• Tobacco industry research and statistics;
- Sales data provided by BAT, ITL, JTI and PMI and/or Tobacco Manufacturers’ Associations. Sales data will be provided separately for BAT, ITL, JTI and PMI and will not be shared between participants. The Project SUN report will only provide aggregated sales data that cannot be attributed to any of BAT, ITL, JTI or PMI;
- Where available, regional sales data will be provided by BAT, ITL, JTI and PMI to help corroborate cross border trends between neighbouring countries. This will be provided separately by BAT/ITL/JTI and PMI and will not be shared between participants (not to be included in the report);
- BAT, ITL, JTI and PMI consumer survey data will be provided where available to help corroborate consumption trends arising from Project SUN results and identify further areas of analysis (e.g. extent of smokers switching to roll-your-own (RYO) products).
• Estimates of non-domestic consumption used by BAT, ITL, JTI and PMI management teams in each market (where available). These estimates will be provided to us separately by BAT, ITL, JTI and PMI to provide evidence-based support for observed trends in each of the EU Member States, Switzerland and Norway and will remain confidential.
- Detailed survey results will be made available by BAT, ITL, JTI and PMI to KPMG in a timely manner for analysis purposes;
- Information regarding the methodology and sampling plan will be provided by BAT, ITL, JTI and PMI to KPMG for our work.
• Empty Pack Surveys commissioned jointly and/or individually by BAT, ITL, JTI and PMI will be conducted by third party research providers in a majority of Member States and the results thereof will be provided to KPMG as soon as they are available to allow us to consider these alongside market-specific information provided separately by BAT, ITL, JTI and PMI.
• Existing public studies and statistics;
• Research and data published by government agencies (including Ministries of Finance), health bodies, customs authorities, market researchers and academics will be provided by BAT, ITL, JTI and PMI management teams to help corroborate findings.
12. Data from external sources will be obtained on a best efforts basis. We will require access to identified BAT, ITL, JTI and PMI personnel throughout this engagement and our ability to deliver this scope depends on this access being made available.
Met
hodo
logy
and
App
endi
ces
© 2016 KPMG LLP, a UK limited liability partnership, and a member firm of the KPMG network of independent member firms affiliated with KPMG International Cooperative, a Swiss entity.

www.kpmg.com/uk
© 2016 KPMG LLP, a UK limited liability partnership, and a member firm of the KPMG network of independent member firms affiliated with KPMG International Cooperative, a Swiss entity. All rights reserved. The KPMG name and logo are registered trademarks or trademarks of KPMG InternationalCreate Graphics I CRT059500 I June 2016
If you would like further information, please talk to your usual KPMG contact or contact:
Jessica Liebmann KPMG press office
T: +44 20 7311 3245