project submission - mec library
TRANSCRIPT

1
Coventry University
Middle East College
Project Submission
in Partial Fulfilment of the requirements for the Degree of Master of
Science in Information Technology (MSC-IT)
Improve Intrusion Detection System Using Machine Learning
Author: Eman Zakaria Qudah
PG17F1858
Supervisor: Dr. Vishal Dattana
Academic Year: 2019/2020

2
MSc (IT) Project
Declaration by Examiners
I / We have examined this report titled “ Improve Intrusion Detection System Using Machine Learning” submitted
by Eman Zakaria Qudah ID No. PG17F1858 in partial fulfillment of the requirements of MSc (IT) Course during
Summer semester.
Signature of Supervisor Signature of 2nd Marker
Name of Supervisor: Dr. Vishal Dattana Name of 2nd Marker: Dr. Arun N.S. Shankarappa
Date: Date:

3
Acknowledgment
First of all, I would like to thank God Almighty for giving me the ability, patience and knowledge to
undertake and finish this project successfully.
Second, to my parents who played a great role in helping me complete this project. I present my success to
them because they have supported me and showed enthusiasm, assistance and encouragement.
I am honored that I had the opportunity to work with such a supervisor Dr. Vishal Dattana who spared no e
ffort to guide me during my journey. Not to forget the help by my college members that I have received fro
m the following: Dr. Arun N.S. Shankarappa, Dr. Munir, Dr. Raza Hasan and others.
This project would not have been completed without the assistance of some experts in the IT field from
outside the college who were generous enough to share their knowledge with me to finish this project
efficiently and they are: Dr. Muhammed Al-Bahri from the Higher College of Technology, Dr. Samer
Samarah and Dr. Mohammed Al-Zamel from Al-Yarmouk University.
To conclude, I hope I have mentioned all the names who participated in implementing this project
successfully.

4
Table of Contents 1. Introduction .......................................................................................................................................................... 10
1.1. Background ........................................................................................................................................................... 10
1.2. Overview of current situation of ML………………………………………………………………………………………………………………11
1.3. Project’s importance……………………………………………………………………………………………………………………………………..12
1.4. Project description…………………………………………………………………………………………………………………………………………12
1.5. Problem statement…………………………………………………………………………………………………………………………………………13
1.6. Research question………………………………………………………………………………………………………………………………………….13
1.7. Project aim and objectives………………………………………………………………………………………………………………………………14
2. Literature Review ................................................................................................................................................ 15
2.1. Introduction .......................................................................................................................................................... 15
2.2. Networking…………………………………………………………………………………………………………………………………………………15
2.2.1. Definition……………………………………………………………………………………………………………………………………………15
2.2.2. Networking issues………………………………………………………………………….……………………………………………….15
2.2.2.1. Traffic Congestion……………………………………………………………………………………………………………………15
2.2.2.2. Traffic Classification………………………………………………………………………………………………………………..16
2.2.2.3. Network Security……………………………………………………………………………………………………………………16
2.2.3. Network security methods………………………………………………………………………………………………………………17
2.3. Artificial Intelligence……………………………………………………………………………………………………………………………………19
2.4. Machine Learning…………………………………………………………………………………………………………………………………………20
2.4.1. Definition…………………………………………………………………………………………………………………………………………20
2.4.2. Advantages of Machine Learning……………………………………………………………………………………………………..20
2.4.3. Limitations of Machine Learning………………………………………………………………………………………………………21
2.4.4. Categories of Machine Learning……………………………………………………………………………………………………….21
2.4.5. Machine Learning Algorithms……………………………………………………………………………………………………………24
2.5. Deep Learning………………………………………………………………………………………………………………………………………………27
2.6. Using Machine Learning to Enhance Intrusion Detection System…………………………………………………………………27
2.6.1. Dataset for Intrusion Detection……………………………………………………………………………………………………….27
2.6.2. Feature Selection Techniques………………………………………………………………………………………………………….29
2.6.2.1. Feature Selection Categories………………………………………………………………………………………………30
2.6.2.2. Feature Selection Algorithms……………………………………………………………………………………………….32
2.7. Related Work ………………………………………………………………………………………………………………………………………………34
3. Methodology…………………………………………………………………………………………………………………………………………..36
3.1. Introduction……………………………………………………………………………………………………………………………………36
3.2. Research Methods…………………………………………………………………………………………………………………………36
3.3. Software Development Methodologies…………………………………………………………………………………………..39

5
4. Project Management…………………………………………………………………………………………………………………………………41
4.1. Introduction……………………………………………………………………………………………………………………………………41
4.2. Project Tasks…………………………….…………………………………………………………………………………………………….42
4.3. Gantt Chart…………………………………………………………………………………….……………………………………………..43
4.4. Risk Management…………………………………………………………………………………………………………………………..45
4.5. Mitigation Plan……………………………………………………………………………………………………………………..……….46
4.6. Communication Management ……………………………………………………………………………………………………….47
5. Project Design and Implementation………………………………………………………………………………………………………48
5.1. Introduction……………………………………………………………………………………………………………………………………48
5.2. Project Design…………………………………………………………………………………………………………………………………48
5.3. Project Implementation…………………………………………………………………………………………………………………50
6. Critical Appraisal……………………………………………………………………………………………………………………………………88
7. Conclusion and Future Work………………………………………………………………………………………………………………….92
8. Referencing…………………………………………………………………………………………………………………………………………..94
9. Appendices …………………………………………………………………………………………………………………………………………..99

6
List of Tables
Table 1: comparison between IDS and IPS ......................................................................................................................... 19
Table 2: Comparison between feature selection methods ................................................................................................ 32
Table 3: Comparison between feature selection algorithms ............................................................................................. 34
Table 4. Comparison between primary data collection methods (Kumar, 2011) ............................................................. 37
Table 5: Comparison between some software development methodologies ( Rajeswari & J., 2017) .............................. 40
Table 6: Potential risks in the project of “Improve IDS using Machine Learning” ............................................................. 46
Table 7. Mitigation plan of the risks mentioned in table 5 ................................................................................................ 47
Table 8. The project’s communication plan ...................................................................................................................... 47
Table 9: Comparison between the main parameters ........................................................................................................ 88
Table 10: Comparing the accuracy result of each one of the 41 attribute in GA .............................................................. 90

7
List of Figures
Figure 1. The project design ............................................................................................................................................... 13
Figure 2. The confusion matrix ........................................................................................................................................... 18
Figure 3. Overfitting and Under-fitting issues (Ghasemian, et al., 2018) ........................................................................... 21
Figure 4. The Reinforcement Learning Model(Dey, 2016) ................................................................................................ 23
Figure 5. The decision tree for two attributes of NSL-KDD dataset ................................................................................... 26
Figure 6. Development of AI, ML and DL (Gillikin , 2018) ................................................................................................ 27
Figure 7. NSL-KDD dataset features ................................................................................................................................... 29
Figure 8. Filter method ....................................................................................................................................................... 30
Figure 9. Wrapper method ................................................................................................................................................. 31
Figure 10: Steps of Agile methodology (Synopsys Editorial Team, 2017) .......................................................................... 40
Figure 11. Project tasks - Part 1.......................................................................................................................................... 42
Figure 12. Project tasks - Part 2.......................................................................................................................................... 42
Figure 13. Project tasks - Part 3.......................................................................................................................................... 43
Figure 14. Gantt Chart - Part 1 ........................................................................................................................................... 43
Figure 15. Gantt chart - Part 2 ............................................................................................................................................ 44
Figure 16. Gantt chart - Part 3 ............................................................................................................................................ 44
Figure 17. Gantt chart - Part 4 ............................................................................................................................................ 45
Figure 18. Flowchart of the project progress ..................................................................................................................... 48
Figure 19: User interface in WEKA ..................................................................................................................................... 50
Figure 20: Step 1 - open the dataset .................................................................................................................................. 51
Figure 21: Step 2 – Show details about the dataset and both duration attribute and class label ..................................... 52
Figure 22: Step 3 - Choose J48 classifier to build the model .............................................................................................. 53
Figure 23: Step 4 – Train the dataset ................................................................................................................................. 54
Figure 24: Training accuracy result .................................................................................................................................... 55
Figure 25: Step 5 - Test the dataset ................................................................................................................................... 56
Figure 26. Wrap the classifier............................................................................................................................................. 57
Figure 27: Classifier testing accuracy ................................................................................................................................. 58
Figure 28: Step 6 - Select best attributes using CFS method and “Use full training set” mode ........................................ 59
Figure 29: Step 6 - Select best attributes using CFS method and “Cross-validation” mode .............................................. 60
Figure 30: Step 7 - Keep only 5 attributes selected by CFS ................................................................................................ 62
Figure 31: Step 8 - Train the model with the attributes selected from CFS method only ................................................. 63

8
Figure 32: Step 9 – Test the model with the attributes selected from CFS method only .................................................. 64
Figure 33: Step 10 - Select best attributes using IG method and “Use full training set” mode ......................................... 65
Figure 34: Step 10 - Select best attributes using IG method.............................................................................................. 66
Figure 35: Step 11 - Keep only 6 attributes selected by IG ................................................................................................ 68
Figure 36: Step 12 - Train the model with the attributes selected from IG method only ................................................ 69
Figure 37: Step 13 – Test the model with the attributes selected from IG method only .................................................. 70
Figure 38: Step 14 - Select best attributes using GR method and “Use full training set” mode........................................ 71
Figure 39: Step 15 - Keep only 6 attributes selected by GR ............................................................................................... 72
Figure 40: Step 16 - Train the model with the attributes selected from GR method only ............................................... 73
Figure 41: Step 17 – Test the model with the attributes selected from GR method only ................................................. 74
Figure 42: Step 18 - Select best attributes using GR method and “Cross validation” mode ............................................. 75
Figure 43: Step 19 - Keep only 6 attributes selected by GR ............................................................................................... 76
Figure 44: Step 20 - Train the model with the attributes selected from GR method only ................................................ 77
Figure 45: Step 21 – Test the model with the attributes selected from GR method only ................................................. 78
Figure 46: Step 1: Launching Jupyter Notebook ................................................................................................................ 79
Figure 47: Importing libraries and upload dataset file ....................................................................................................... 80
Figure 48: Convert data type of class and flag column ...................................................................................................... 81
Figure 49: Identifying attributes and functions.................................................................................................................. 82
Figure 50. Printing accuracy and confusion matrix parameters ........................................................................................ 83
Figure 51. importing libraries and reading the dataset file ............................................................................................... 84
Figure 52. divide the dataset file into training and testing parts ....................................................................................... 85
Figure 53. calling TensorFlow library ................................................................................................................................. 86
Figure 54. generating the results ....................................................................................................................................... 87
Figure 55. Overall comparison between the 4 algorithms ................................................................................................. 91
Figure 56: Project progress ................................................................................................................................................ 93

9
Abstract
Machine learning (ML) has been broadly adopted nowadays by various organizations and it has been utilized
in different areas and aspects of our life such as marketing, entertainment, communication, education and
others as a result of data explosion and improvements in computing capabilities. Networking is one of the
areas that took the advantages of ML to improve its technologies and enhance the process of operation and
management. This project works one both of these topics to present how ML can be used to improve the
Intrusion Detection System (IDS). The aim of this project is to increase the accuracy of anomaly-based IDS
using some ML techniques represented in feature selection methods. In order to achieve the aim mentioned
above, the student applied each of CFS, Information Gain and Gain Ratio methods on NSL-KDD dataset
using WEKA tool. Furthermore, the student applied both of Forward Selection method and Genetic
Algorithm (GA) on the same dataset by using Jupyter Notebook to write their Python codes. The results
show that the GA achieved the highest accuracy and the lowest False Positive Rate (FPR). The findings
pointed out the relationship between four parameters which are the number of attributes of a dataset, time
needed to build a model, the model accuracy and its false positive rate. This project will enhance the network
security when it improves the quality of IDS by increasing its accuracy and decreasing the FPR.

10
Chapter 1: Introduction
1.1. Background:
For a long time, networking and distributed computing have been considered as the key infrastructure to
provide efficient technological services for different users and services’ providers. Nowadays, people and
organizations are highly dependent on technology and Internet in all of their life aspects. Since they are
sharing sensitive and private information over networks, it is mandatory to provide them with security. The
main issue that faces all individuals and organizations when they use the Internet is security because of the
various threats that are existing. Attacks can be divided into two types which are known and unknown
attacks. Known attacks are the old or already existing attacks that can be blocked and prevented using
traditional security products. Security products usually identifies an attack as known based on one variation
only, so any slight change to the code of the attack or malicious software will turn it into an unknown attack
and the security system will not be able to recognize it. While sometimes attackers can develop an attack
which is totally new and write the codes from the scratch and here the system will not be able to recognize
it too.
It is mandatory to protect systems and resources against all of these attacks from being exploited, misused
or exposed to unauthorized parties by using different security mechanisms. Intrusion Detection System
(IDS) is one of these security mechanisms that can be used to protect networks against hackers and intruders.
It focuses on detecting and finding out any malicious activity or policy violations. IDS works by one of
these two methods: one method to look for known attacks or malicious files by using predefined signatures
while the other method is by detecting any deviations of the normal activities by using Machine Learning
techniques.
Machine Learning (ML) is one of the new powerful techniques that can be utilized to extract knowledge
from data. This technique has been employed in many applications and fields to solve various problems and
enable automation. One of these applications is network security – specifically- intrusion Detection.
The main goal of this project is to enhance, improve and increase the accuracy and Detection Rate (DR) of
ID systems to increase the security level of IDS. This will help network administrators and system analysts
in decision making process to safeguard the network against any hazards and increase the security level to
protect the network resources and data. The project will provide a detailed analysis on the performance and
accuracy of using each of Genetic Algorithm, Forward Selection, Information Gain (IG), Gain Ratio (GR)

11
and CFS attribute evaluator on NSL-KDD dataset and compare between each one of them from the aspects
of Accuracy, False Positive (FP), number of attributes used and the time needed to build the model. The
aforementioned feature selection methods will be applied on NSL-KDD dataset using WEKA tool and
Python programming language to come up with the desired results and suggest the best solution for this
problem.
1.2. An overview of the current situation of Machine Learning in Oman:
Artificial Intelligence (AI) and Machine Learning (ML) nowadays are the buzzwords around the world
because many companies and organizations in different countries are embracing these technologies to
improve their work efficiency and reduce the labor costs. The Sultanate of Oman represented by the
government and private sector are working hard to ensure the meaningful deployment of AI and ML in
different national programs whenever it is possible. The Information Technology Authority (ITA) located
in Muscat held the Fourth Digital Trends Forum in April 2019 to emphasize on the importance of AI as a
backbone of the 4th industrial revolution.
Booz Allen Hamilton, the vice-president of MENA emphasized on the importance of using AI to shape the
countries’ future economies and improve the citizens’ life. The following are some examples on the real
implementation of AI in different sectors in Oman:
Banking Sector: Oman Arab Bank (OAB) launched an automation system that can perform the daily
transactions and solve repeated issues by applying AI. This system can be trained and learn how to
solve some issues that were done by the employees and create its own patterns to solve similar issues
in the future and employees will have more time to serve the customers better (Observer, 2019).
Health Sector: five hospitals in Oman which are the Royal, Khoula, Al Buraimi and Ibra hospitals
besides Sultan Qaboos Hospital in Salalah launched an AI-aided system for the early diagnosis of
breast cancer. This project is under the supervision of Ministry of Health (MoH), ITA, Microsoft
and ScreenPoint in order to facilitate and improve the healthcare for women to avoid this disease in
its early stages (Observer, 2019).
Education and Scientific Research Sector: different educational institutes are including AI and ML
in their curriculum to prepare the student to be ready for their future jobs. Also, ITA along with Bank
Muscat hosted Sas48 competition to sponsor the students’ projects in the IT field in general and in

12
AI specially. The winners were awarded with prizes to encourage young Omanis to turn their
innovative ideas into reality and establish Omani companies in the ICT field.
1.3. The Project’s Importance:
This project is very important for network administrators, data analysts and any network user because it
helps them to maintain a high level of network security and provide a trusted communication of information
between different organizations. Intrusion Detection System monitors the network resources and provides a
report on any malicious or strange patterns. The benefits of this project for any organization lies in: allow
the IDS to identify the unknown attacks, reduce the False Alarm Rate (FAR) and increase the accuracy of
detection.
There are many reasons behind choosing Intrusion Detection System (IDS) to be applied in this project.
First, it can monitor network traffic, analyze it and compare it with predefined patterns of activities to decide
whether they are normal or abnormal activities. Also, IDS generate alarms and reports about the monitored
activities, so users can be able to take the correct decision.
1.4. Project Description:
The project idea focuses on improving the accuracy of the Anomaly-based IDS by applying five feature
selection methods which are: CFS, IG, GR, forward selection and Genetic Algorithm (GA) and provide a
detailed analysis on their performance on the selected dataset specialized for intrusion detection. First of all,
J48 classifier will be used to calculate the model accuracy when using the whole dataset, then the student
will apply each of CFS, IG and GR methods separately in WEKA tool and use J48 classifier to calculate the
model accuracy after selecting a subset of features only (the best 5 or 6 attributes). Forward selection and
GA methods are not supported in WEKA tool that’s why the student will execute them by writing their
codes in Python to know the accuracy. Finally, the student will compare and analyze the results of all the
methods to choose and recommend the best one.

13
Figure 1. The project design
1.5. Problem Statement:
The project’s problem statement focuses on improving and increasing the accuracy of IDS by applying
various feature selection methods based on Machine Learning techniques using Python programming
language and WEKA data mining tool. The project will apply each of CFS, IG and GR method in WEKA
tool on NSL-KDD dataset to identify the attributes selected along with the accuracy for each method. While
forward selection method and Genetic Algorithm will be applied on the same dataset by writing Python
codes to calculate the accuracy since they are not supported in WEKA. Finally, a comparison will be
conducted by these methods to suggest the best one which provides higher security.
1.6. Research Questions:
The following are the main questions that will be answered at the end of this project:
How to detect abnormal network behavior?
What is the relationship between the number of attributes, time needed to build the model and its
accuracy?
How to minimize false alarms in IDS using Machine Learning?
How Machine Learning can support Anomaly-based Intrusion Detection System to be able to
identify network attacks?
Which attributes of the NSL-KDD dataset are highly affecting the accuracy result?

14
1.7. Project Aim and Objectives:
The main aim of this project is to increase the efficiency of Intrusion Detection System by making it able to
identify abnormal network traffic with high accuracy and detection rate which will help the network
administrators and system analysist in taking the correct decision to increase the network security and
protect its resources. The following are the main project objectives which are:
Investigate and identify the issues of and low accuracy and detection rate in identifying network
attacks that faces Anomaly-based IDS.
Identify how Machine Learning can solve the previous issue of Anomaly-based IDS.
Analyze the efficiency and accuracy of different feature selection methods on NSL-KDD dataset.
Evaluate feature selection methods and suggest the best solution that provides the highest accuracy
for IDS dataset using WEKA tool and Python programming language.

15
Chapter 2: Literature Review
2.1. Introduction:
With various computing technologies evolving nowadays, machine learning is considered as one of the
existing recent technologies in the field of Artificial Intelligence. Machine Learning has evolved from being
just enthusiastic for some math scientists into an independent wide research area that serves different fields
in our daily life. While the rapid development of computer networks, make them more complicated and
threatened by many problems that might effects its performance and efficiency. The following parts will
review a comprehensive literature on networking problems specially the security issue and how Machine
Learning can be used to enhance network security, specially intrusion detection problem.
2.2. Networking:
The rapid development of the Internet and communication technologies nowadays has resulted in large-
scale, complex and dynamic networks. Such complex network systems face a lot of challenges involving
management, maintenance, security and traffic optimization problems (Anand & Ahlawat, 2014).
2.2.1. Definition:
A computer network is a telecommunication system that consists of a group of interconnected devices and
nodes such as computers, routers, printers, fax machines and other devices together to allow them exchange
data via using one or more network protocol ( Fadlullah, et al., 2017).
2.2.2. Networking Issues:
2.2.2.1.Network Congestion:
Network congestion occurs when a network routes becoming too full and carrying more data than it can
handle, or in another words, when resource demands exceed its capacity which will affect the service quality.
Network congestion happens as a result of many reasons such as using outdated hardware, bad configuration
management, low network bandwidth, broadcast storms and many other reasons.
When a congestion happens, the transmitted traffic will be stored in queues till the previous packets are
delivered, which will result in significant packet delay specially if the queue is long. Also, in some cases
packets will be lost which will result in decreasing the service quality. The queue delay is the time a packet
waits in a queue until it can be processed. The queue length increases when the queue is filled up with more
packets that arrive before they can be processed.

16
According to (Limam, et al., 2018), congestion control is a fundamental mechanism or technique in a
network operation and it concerns about reducing the number of packets entering the network in order to
balance the resource utilization and ensure the network stability.
2.2.2.2.Traffic Classification:
Network traffic classification has been studied for a long time. It can be defined as the process of
categorizing the network traffic / packets into appropriate classes. Accurate traffic classification over any
network is considered as a fundamental procedure for network operators because it affects other network
activities such as Quality of Service (QoS), resource usage planning, security monitoring (malware and
intrusion detection) and many other activities. Traffic classification methods or techniques varies between
conventional methods such as port-based prediction to machine learning based prediction methods which
depends on deriving patterns from an existing dataset (Jamuna & Ewards , 2013). Traffic classification
process aims to match the corresponding traffic flows with the predefined network apps and protocols.
2.2.2.3.Network Security:
Network security concerns about protecting the network against any threat that may expose the network’s
availability and provide unauthorized access to the network resources. Intrusion detection is the main
problem that will be discussed in this project in details.
Internet has been used as a necessary method for personal and business transaction to access web services
and share information online but at the same time, networks’ security becomes threatened and under the risk
of being attacked. There are many hazards that threaten the network security but the following are the most
common ( Roozbahani & Azad , 2015):
Malware: or malicious software such as computer viruses, Trojan horses, worms and spyware.
Malware is a code that is intended to damage, steal or cause any terrible activity on a host of system
resources. If the malware code is an old one, then it can be detected by a signature-based IDS because
its signature will be stored in the IDS system database while if it is a new one, then it needs an
anomaly-based IDS.
Passive and Active attacks: such as Denial of Services (DoS), spoofing, eavesdropping and others.
A network attack is any attempt to destroy, expose, disable or gain unauthorized access to the system
resources. Attackers create new attacks every day by writing a new code from the scratch or by
modifying an old code but a typical anomaly-based IDS is not able to classify these attacks. The

17
problem statement of this project is to create an anomaly-based IDS that can detect and classify the
unknown attacks into novel attacks (written from scratch) and modified attacks.
Data interception and theft: which is the act of illegal transferring, storing or stealing confidential
information over the network such as password and financial information.
Intrusion is considered as any illegal or potential harmful attempt to compromise the confidentiality,
availability and integrity of a system, while intrusion detection is a kind of active defense technology
and it is responsible about detecting these illegal attempts or malicious activities in the network
(Satyanar, et al., 2017).
2.2.3. Network Security Methods:
According to (Shan , 2016), there are a lot of methods that can be used to protect networks against
the aforementioned threats such as:
Antiviruses: software or program that is developed to secure the computers and networks from
different types of malware such as viruses, worms, Trojans and spyware. The main function of these
programs is to scan, detect and remove the malware from your system. There are two main types of
antiviruses which are: network antivirus that can be used for a whole system and stand-alone
antivirus that is usually used for a specific device. It is worth mentioning that antiviruses are
considered as Signature-based IDS that will be discussed in the next part.
Firewall: hardware or software system that monitors the incoming and out coming network traffic
and then filter them (block or allow) based on predefined security rules. Firewall is used to protect
the internal network from the external networks such as the Internet.
Encryption: it is a technology that can be applied during data storage, data transfer and
authentication. It aims to translate the plain message into encrypted message or form by using the
encryption key.
Intrusion Detection System: even though routers and firewalls are used to protect networks
depending on access control list (ACL), they are not able to detect the new intrusions. The major
aim of using Intrusion Detection System (IDS) is to monitor the network traffic, detect and identify
any unknown or malicious traffic to provide the maximum security for a network along with routers
and firewalls. IDS can be either Network Based (NIDS) or Host Based (HIDS). HIDS is installed
on a single device, system or host and it is responsible about detecting the malicious activities
generated from the system configuration and application activities while a NIDS is responsible

18
about collecting and analyzing network traffic streams generated from routers and firewalls (Chapke
& Deshmukh, 2015).
Furthermore, IDS can be classified into two types according to the technique used which are:
o Signature Based: this technique is used to detect the known threats by utilizing a predefined
‘signature’ –typically a hash – that is related to a specific malicious activity. Computer anti-
viruses are examples on signature-based IDS because they can detect the viruses, Trojans,
worms, etc. which are already known and identified in its database. For example, when any
file is downloaded from the Internet, it will be checked, if it is a known malicious file, then
an alert is appeared. The main advantage of this type of IDS is that it is very rarely to produce
a false alarm, while the disadvantage is that it cannot detect the unknown or new malicious
activity (Pharate , et al., 2015)
More efforts and researches must be made on this type of IDS to enhance them, because
attackers can avoid them easily when writing their own codes or software.
o Anomaly or Machine Learning Based: this technique is used to detect any abnormal or
anomalous behavior in a network by utilizing ML algorithms. This type of systems takes
inputs (dataset) that involves many network features and divide them into anomalous and
normal output. The main advantage of this type of systems is that they can detect new or
unknown systems and they are very robust and hard to an attacker to avoid them, while the
main disadvantage is that it has a high-false alarm rates (confusion in data analysis).
In this project, the student will be focusing on anomaly-based detection technique in network
intrusion detection system and how reduce the false alarm rate.
It is very important to understand the confusion matrix in anomaly based detection.
According to ( Wu , et al., 2018), Anomaly-based IDS can classify the traffic streams into
one of the following labels based on prediction as the following:
Figure 2. The confusion matrix

19
Where
True Negative (TN) – Instances predicted correctly as attack.
False Negative (FN) – Instances predicted wrongly as normal flow.
False Positive (FP) – Instances predicted wrongly as attack.
True Positive (TP) – Instances predicted correctly as normal flow.
Intrusion Prevention System: this is considered as a control system because it accepts or rejects
the network packets depending on the results analyzed by the IDS (Azhagiri , et al., 2015). IPS
requires a database that is updated regularly with new threat data. The following table provides a
comparison between IDS and IPS:
Comparison IDS IPS
Advantages They can detect known and
unknown attacks.
They can deny malicious traffic
from passing the network.
Disadvantages They don’t take actions by their
own, human supervision is needed.
They depend on the results
gained by IDS.
Table 1: comparison between IDS and IPS
2.3. Artificial Intelligence (AI):
Artificial intelligence, machine learning and deep learning are three terminologies that are usually used
interchangeably and might cause overlap and confusion for many people. Artificial intelligence is defined
as “the capability of a machine to imitate intelligent human behavior”. This area of computer science starts
appearing in 1950’s and it concerns about creating machines that react like humans and it includes under its
umbrella Machine learning and deep learning. The robots playing a game of chess and voice recognition
systems are examples on AI application (Shacklett, 2019). The main advantage of AI is that it provides
reliable and cost effective solutions to solve complicated problems while the main disadvantage is that it
may lead to job losses for people since machines can do any task instead of humans.

20
2.4. Machine Learning (ML):
2.4.1. Definition:
According to (Das & Behera, 2017). Machine Learning is “ a paradigm that refer to learning from past
experience (which is in this case previous data) to improve future performance”. A machine refers to
any software system that can learn, improve or modify an algorithm depending on previous experiences
(datasets) automatically without any human interference.
While an algorithm is considered as a programming codes that consists of a sequence of instructions that
should be implemented to convert the input (datasets) to output (Smola & Vishwanathan, 2008). Usually,
ML and algorithms will be designed to serve a specific purpose or carry a desired task such as filtering
spam emails, advertisements placement, social media services when displaying a list of people, you may
know, displaying web search results, recommendation systems and many other applications used in our
daily life.
2.4.2. Advantages of Machine Learning:
Machine Learning is expected to bring significant changes to the world of technology, thus improving
businesses and our personal life since it is applied in many field such as healthcare, retail, social media,
banking and financial sector. The main aim of ML is to produce machines that can work and depend on
their own so they can get input data, analyze them and generate acceptable output. The following are
some of the advantages gained by ML (Shalev-Shwartz & Ben-David, 2014).
It provides solutions when a specific set of variables is changing over the time. For example, ML
algorithms are used in weather stations to provide the employees with accurate predictions for the
weather in the next days depending on previous dataset (old information about the weather)
It can be used to produce solutions that needs to be adapted in specific cases. For example, ML
algorithms are used in airports and police stations for security reasons to capture some individuals’
details such as their face ID and fingerprint then analyze them and predict the suspects.
It provides solutions when the problem size is too large and it is very difficult for humans to find a
suitable reasoning. Calculating webpage ranks in one example on these problems where ML is
applied.
It provides solutions where the humans experience is absent and they do not have enough knowledge
about it. It is extremely difficult and dangerous to navigate the space and planets for humans, that’s
why scientists are using ML for data collection, analyzing them and taking appropriate decisions.

21
It can perform repetitive tasks efficiently and quickly, thus save employees time and give them a
chance to do other tasks.
2.4.3. Limitations of Machine Learning:
Although the major benefits and advantages of ML, it has some limitations and shortcomings that are
illustrated below:
It needs a huge amount of training data to be processed and at the same time it might be cumbersome
to work with large amount of data.
It is challenging to understand the results of ML algorithms, so ensuring their effectiveness.
There’s a high chance of error susceptibility and they might not be discovered immediately and the
correction process is time consuming.
There is a high chance for Overfitting and Under-fitting problem to occur. Overfitting happens when
the ML algorithm models the data very well to the extent that effect its performance negatively.
While under-fitting problem happens when ML algorithm cannot neither model the training dataset
nor generalizing the new data.
Figure 3. Overfitting and Under-fitting issues (Ghasemian, et al., 2018)
2.4.4. Categories of Machine Learning:
ML is a very wide domain. Thus, the field has branched into various types that deals with different kinds
of tasks. The main aim of ML is to make the software able to learn from the data, regardless the approach
and techniques used. The following are the main types of ML:

22
Supervised Learning:
According to (Raut & Borkar, 2017), supervised learning is considered as the most widely used type in
ML, and it uses algorithms that needs external assistance. A machine learning model can be supervised
by teaching the model with knowledge so it can predict future instances. It will be taught by training it
on a labeled dataset, so it can predict the outcome of out-of-sample data. It means that the input dataset
will be divided into two groups which are train and test dataset where the first one comes in the form of
(X, Y) pairs and the goal is to generate a prediction Y in response to a query X. The training dataset will
be labeled, e.g. True/False, Positive/Negative, etc, and used later to predict the labels for the unlabeled
test dataset. Typically, supervised learning is using two techniques which are:
o Classification Problems: concerns about classifying or grouping the unlabeled dataset based on
the classes identified using the previously available labeled dataset. One example on
classification problem is to identify an attack as either Denial of Service (DoS), malware, Man-
in-the-middle, phishing attack or any other attack.
o Regression Problems: concerns about estimating the output variable for given input values. For
example, it can be used to predict the time of future attack after identifying its type.
Unsupervised Learning:
In this type, the ML model will not be supervised but it will work on its own to discover information
that might not be visible to the human eye, and the algorithm used can deal with unlabeled datasets.
Unsupervised learning uses more difficult algorithms than supervised learning since we know little
about the data, or the outcome that to be expected. In unsupervised learning, the algorithm in looking
to find things such as groups, clusters, patterns or relationships between the unlabeled datasets. In
comparison to supervised learning, unsupervised learning has fewer tests and fewer models that can
be used to ensure the outcome of the model is accurate. As such, unsupervised learning create a less
controllable environment as the machine create the output for us (Dey, 2016).
Typically, unsupervised learning is using two techniques, which are:
o Clustering: concerns about grouping similar data together and increasing the gap between them
so the clusters can be distinguished easily.
o Association: this technique concerns about creating association rules to describe large portions
of data. Such models can predict one attribute by looking at another attributes from the same
data point.

23
Semi-supervised Learning:
This type uses a combination of supervised and unsupervised learning techniques because the
training dataset consists of both labeled and unlabeled data. This type starts with unsupervised
learning initially because all of the input dataset will be unlabeled in the beginning, then the
classifier (algorithm) will label some portions of the large dataset and use that portion later to train
the model and then use it to predict the rest of the unlabeled dataset using neural networks ( Behera
& Das, 2017).
Reinforcement Learning:
In this type of learning, the machine (algorithm) is provided with just few instructions to train it on
how to map the most appropriate actions to take such that the outcome is more positive. The
following figure shows the general model of reinforcement learning:
Figure 4. The Reinforcement Learning Model(Dey, 2016)
In the figure, the learner (agent) receives the following from the environment: an input (i), the current state
(s), state transition (r), and input function (I) in order to generate two main outputs which are: a behavior
(B) and an action (a). The main aim of reinforcement learning algorithms is not to choose the action directly,
but instead trained to find the most suitable action depending on two main criteria that are: trial and error
search and delayed outcome.
Multi-task Learning (Learning to Learn):
The main purpose of using this type is to help the other learners (algorithms) to perform better and
solve more than one task at the same time. When a multi-task learning algorithm is applied, it tries
to remember the solution steps of a particular situation solved before and apply it on current similar

24
problems or tasks. As a result of using more than one learner at the same time, the experience can
be shared between them easily and solve the problem faster.
Ensemble Learning:
According to ( Behera & Das, 2017) (RP 15), more than one learning algorithm will be combined
together to form one learner. Individual learners can be Naïve Bayes, decision tree, neural network,
etc. Ensemble learner usually shows better performance than individual learners do in a particular
task. There are two main techniques existing under this type of learning which are:
o Boosting: this technique involves building a strong individual learner from a collection of weak
learners by training them to overcome and handle the previous mistakes. Any classifier that has
a substantial error rate is considered as a weak learner and the opposite with a strong learner
where it is strongly correlated with true classifier. AdaBoost is the most famous example on this
technique.
o Bagging: this technique is recommended to be used when we need to increase the accuracy and
stability of ML algorithm. Also, it helps in reducing the effect of overfitting issue by decreasing
the variance.
Instance-Based Learning (Memory-Based Learning):
This type of learning learns a particular type of pattern or instances and save it inside the memory,
then tries to apply that pattern on new data in order to determine the target function value. The old
instances or pattern can be replaced by the new one if they are better fitting the desired output. The
complexity of this type of learning increases when the problem size is bigger (Dey, 2016) (RP 5).
2.4.5. Machine Learning Algorithms:
There are many algorithms can be used in ML such as SVM, Naïve Bayes, Neural Networks, Decision
Tree and others but the student will discuss J48 algorithm only the because they will be used during the
project implementation:
Decision Tree:
This type of algorithms is one of the easiest and simplest ML algorithms used for classification
purposes which aims to create a model that predicts the value of the target variable depending
on various input variables. This algorithm divides the big problem into sub-problems in the form
of tree using IF-THEN rules. Each decision tree consists of nodes representing the dataset

25
attributes or features and leaves representing the possible instances of each attribute ( Kaya , et
al., 2016).
There are many decision tree algorithms such as CART, ID3 and C4.5. The J48 algorithm is
considered as Java implementation of C4.5 in WEKA tool while ID3 algorithm is the old version
on C4.5 algorithm and it was improved by the researcher Ross Quinlan (Sharma, et al., 2013).
The following figure shows the decision tree generated by J48 algorithm for two attributes from
NSL-KDD dataset (source_bytes and protocol_types) along with the class label. The tree started
by the source_bytes node and the branches are two (greater than or equal 28 and less than or
equal 28). If the value is <= 28 then the algorithm will use the same attribute for classification
while if the value is >=28 then the algorithm will consider the protocol_type for classification.
Under the protocol_type node, there are 3 branches which are ICMP, TCP and UDP (equals the
number of instances) and IF-THEN rules are applied again according to the value of the attribute
until it reaches the root leaf which represent the class label (the solution).

26
Figure 5. The decision tree for two attributes of NSL-KDD dataset

27
2.5. Deep Learning (DL)
Deep learning is a subset of ML and it was discovered after around 26 years from discovering ML. It
feeds data into “neural networks” that learn the characteristics of something like human faces. It’s how
facial recognition algorithms figure out who’s in your photos, based on tags. The main advantage of DL
is that it can discover the best features to be used in classification automatically by itself when ML
requires these features to be provided manually. On the other hand, the main disadvantage is it needs
huge amount of data (more than ML and AI) to be trained in order to generate accurate results.
Figure 6. Development of AI, ML and DL (Gillikin , 2018)
2.6. Using Machine Learning to enhance Intrusion Detection System:
Recently, Machine Learning has been employed in many fields to get benefited from its amazing power.
Networking is one of these fields or domains that uses ML to resolve the existing networking issues in
order to improve its performance and automate most of its activities.
As a result of network complexity and diversity, specific techniques and algorithms are built and
customized based on the network characteristics and users’ requirements. It is worth mentioning that
developing efficient algorithms to solve networking issues is considered as a challenging task.
2.6.1. Datasets for Intrusion Detection:
The concept of dataset in Machine Learning represents a file that contains a collection of data that are
collected for a specific purpose such as medical, insurance, finance, or other purposes. Usually, these

28
datasets are created by a single source and available on the Internet to be downloaded for research
purposes. They are presented in a tabular form where every column represents a particular type of
information or variable.
Intrusion detection datasets are special datasets that contains data about networks and devices such as
IP addresses, packets transferred, response time, and other features according to the dataset used. There
are different types of network intrusion datasets where some of them contains labeled, not-labeled, real
or simulated data.
The following are the most famous network intrusion datasets:
KDD99 dataset:
Was created in 1999 and it is considered as a very old dataset. Nevertheless, it is still widely used
in many researches for ML purposes. It is a feature extracted and preprocessed version of DARPA
network dataset. The training data size is 4898431 while the testing data size is 311029. The
following are some of its characteristics:
o It is suitable for anomaly detection because it has two weeks free of attacks instances and five
weeks of attack instances.
o The output classes are classified into 5 major categories which are: Denial of Service (DoS),
Root 2 Local (R2L), User 2 Root (U2R), Probe and normal.
o Training data contains 24 attacks types while testing data contains new 14 new attack types.
o Some types of attacks instances are too rare such as R2L and U2R which means that it is no
balanced with the other types of attacks.
o It contains a huge amount of data that’s why most of the researchers used a small percent of it (
Purwar & Rani, 2017).
NSL-KDD dataset:
This dataset a re-sampled version of KDD99 dataset because the dataset size is reduced and
redundant and duplicated instances are deleted. The purpose behind reducing the redundant data is
that some classifiers might be biased toward more frequent records which will result in bad
performance. The aforementioned characteristics of KDD99 are applied on NSL-KDD dataset and
it contains 41 features and one class attribute too.

29
Figure 7. NSL-KDD dataset features
The purpose behind choosing NSL-KDD dataset in this project:
The student will be using NSL-KDD dataset in her project because this dataset overcomes the limitations
of KDD99 dataset. NSL-KDD dataset is free from redundant records which means that the classifier will
not be biased to a specific result. Also, it has a reasonable number of records that are enough to execute
any experiment and available for training and testing data (Shantharajah & Dhanabal, 2015).
2.6.2. Feature Selection Techniques:
Since the amount of network traffic is increasing, the process of analyzing them to detect the network
intrusions is becoming more complicated and time consuming because of the variety of the attributes,
features and values. It is worth mentioning that not all of the features or attributes in a specific dataset
has the same importance and some of them will be affecting the final result more than others. That’s
why feature selection is considered as a useful step before starting any machine learning task and
building a model in order to get accurate results.
According to (Subashini & Velavan, 2014), feature selection is the process of removing irrelevant,
useless and redundant feature that have no use in the process of knowledge discovery from the original
dataset with respect to the task is to be performed. The following points explains the purpose of applying
feature selection process:

30
To improve the accuracy of machine learning algorithms and generate more intelligible results by
removing the irrelevant and redundant features.
To decrease the time needed to build a learning model because the number of features will be less.
To simplify the learning results and make them understandable and sufficient in terms of quality.
2.6.2.1.Feature selection categories:
According to (Zseby & Iglesias, 2015), feature selection algorithms can be classified under 3 main
categories which are:
Filter methods: in this category, feature selection algorithms are completely independent from the
machine learning algorithm and the evaluation function depends on the general characteristics of
the data such as distance based and margin based criteria. It uses ranking techniques to evaluate the
relevance of features.
Wrapper methods: in this category, any method consists of a search algorithm that is responsible
about selecting the features subsets progressively with the help of the predictive model (i.e.
classifier).
Figure 8. Filter method

31
Embedded methods: in this category, the feature selection algorithm is considered as a part of the
learning model. Decision tree algorithms are examples on embedded methods. The following table
provides a comparison between the three categories from different perspectives (Quadri & Khan ,
2013).
Comparison Filter Method Wrapper Method Embedded Method
Efficiency Less optimal than
other methods
The best solution
for supervised
learning problems
Its performance can
be affected
negatively if more
irrelevant features
are included
Execution
Speed
Faster than wrapper
methods.
Slower than filter
methods
Faster than wrapper
methods
Generality of
the results
The results
generated are more
general because
they lack the
interaction with the
classifier
The results
generated are less
general from those
general from filter
method because it
depends on a
specific classifier
It lacks generality
because it depends on
some classification
algorithms
Figure 9. Wrapper method

32
Computational
cost
Less cost compared
with wrapper
method
More cost compared
with filter method
Less cost compared
with wrapper method
Dependency on
the
classification
algorithm
Independent of the
classification
algorithm
Depending on
classification
algorithm
Depending on
classification
algorithm
Table 2: Comparison between feature selection methods
2.6.2.2. Feature Selection Algorithms:
The following table provides a comparison between five feature selection methods which will be
used during the project implementation.
Method
Name
How it works Category Advantages disadvantages
CFS It evaluates a subset of
features by selecting the
subsets that contains
features that are highly
correlated with the
classification, yet
uncorrelated with each
other.
The predictive ability
and redundancy of each
feature will be evaluated
( S , et al., 2018).
Filter
Method
Robust
against
overfitting
issue (Hall,
1999).
Lack of
attributes
dependencies
results in
decreasing the
classifier
performance
IG It predicts the amount of
information gained about
dependent variables by
Wrapper
Method
It prefers
features with
more values

33
observation. The
information gained about
Z after observing Y is
equal to the information
gained about Y after
observing Z ( Jha &
Ragha, 2012).
even if they
are not
informative
enough
GR This measurement was
developed to overcome
the problem of
compensate for the bias
of the IG. When
predicting a variable, it
normalizes the IG to
generate a value that falls
between 0 and 1. GR=1
means that the two
variables are highly
related to each other
while 0 means the
opposite.
Wrapper
Method
It is opposite
to IG, it
prefers
variables with
fewer values
Forward
Selection
This method starts with
one selected
feature/attribute from the
dataset to calculate the
model accuracy and
other attributes are added
individually every time
until a specific stopping
criteria is met. This
method iteratively
Wrapper
Method
Can find
the most
useful
features
efficiently
Prone to
overfitting

34
increases the number of
features that reduces the
error and to build a target
function.
Genetic
Algorithm
This search algorithm
depends on the
biological concepts of
genetics. The problem to
be solved is represented
in the form of
chromosomes and some
operations will be
applied like selection,
crossover and mutation
in order to generate the
different generations -
including the best
solution ( Hameed &
Mahmood, 2016).
Wrapper
Method
Table 3: Comparison between feature selection algorithms
2.7. Related Work:
In the literature, different approaches are discussed to identify and enhance intrusion detection. Hoque et al.
focused on using the Genetic Algorithm to improve the performance of intrusion detection system to be able
to detect different types of network intrusions efficiently. Their approach evaluates the information in order
to filter the network traffic to reduce its complexity. The dataset used is KDD 99 and the evaluation
parameters are accuracy, Detection Rate (DR) and False Positive Rate (FPR). The results show that the
highest accuracy 92% was achieved when predicting Denial of Service (DoS) traffic. The authors need to
improve their approach by using more statistical analysis and complex equations to enhance each of DR and
FPR ( Hoque, et al., 2012).

35
Ugarte-Pedrero et al. focused on the importance of malware detection in order to mitigate the risk of the
increased volume of malware. The authors proposed a new method to detect the unknown malware families
depending on the frequency of the appearance of opcode sequences. Also, they suggested a technique to
extract the relationship of each opcode and assess its sequence. This method proofed a good detection rate
and low false positive rate ( Ugarte-Pedrero, et al., 2013).
Jha and Ragha presented an approach that facilitate selecting the best features in intrusion detection system.
The suggested method is a hybrid approach which used both SVM and K-means algorithms and consists of
filter and wrapper models to select relevant features. SVM algorithm was used to select the best features for
NSL-KDD dataset. The authors confirmed on the needs of using scaling to reduce the error rate. 31 features
out of 41 were used from that dataset ( Jha & Ragha, 2014).
Furthermore, Munjal and Mudga came up with a similar hybrid approach that used both of SVM and Fuzzy
K-means algorithms and the authors ensures that using a hybrid method is easier and faster to detect and
classify an intruder. Their final results indicate that the new method make it easier and more quickly to find
the intruder attack compared to using one single method. The dataset used was KDD99 to test and analyze
the effect of different input parameters on the algorithm accuracy (Munjal & Mudga , 2014).
Dhamdhere and Solanki introduced an IDS system that uses four algorithms where SVM and K-means are
two of them. In the first step, K-means was used to generate different training subsets, secondly train
different FNN model, while SVM was used in the third step to produce a classification vector and finally
the decision tree were built using C4.5 algorithm. The combination of different algorithms results in
increasing the detection accuracy and precision and decrease the False Positive Rate (FPR). After collecting
the experimental results, the time required by this system to detect an intrusion is 0.0075 second (
Dhamdhere & Solanki, 2014).

36
Chapter 3: Methodology:
3.1. Introduction:
Usually, before start writing any research project, the researcher must consider a specific a problem and
focus on it to be solved by the end of this research. According to ( Pandey & Pandey, 2015), a research
problem is a question proposed for a solution while a research can be defined as a method of studying these
problems and try to derive a solution partly or wholly from facts. It is mandatory for the student to
understand and differentiate between the report method and methodology. A research method concerns
about “What did the researcher use for his study” including the tools and the actual steps taken while the
research methodology focuses on “How did the researcher complete his study” along with the techniques
suggested to handle the project. Since this project consists of two parts which are the research report and the
research product (system), the student will explain each of the method and methodology followed in this
project.
3.2. Research Methods:
Basically, there are two different types of research methods which are Quantitative and Qualitative and
under each type there are different approaches as illustrated below:
Qualitative methods: concerns about exploring the participants’ knowledge by using open-ended
questions such as questions that starts with what, why and how. The data collected from these
questions is a descriptive data which is a result of depth understanding of the topic. Interview
and observation are examples on the qualitative methods.
Quantitative methods: concerns about the mathematical models and statistics for analysis in
order to provide numerical results using close-ended questions that could be answered by one
word only such as Dichotomous question, multiple choice questions and rating scale questions.
Questionnaire and survey are examples on the qualitative methods. The following table provides
a comparison between questionnaire, interview and observation methods:

37
Method Type Explanation Strengths Weaknesses
Ques
tionnai
re
Quantitative A list of written
questions where
the answers of the
respondent are
recorded and
analyzed.
- covers wide range
of information
- less expensive
specially when using
the Internet for
answers
- some respondents may
provide inaccurate
answers
- might be useless in
some problems
- time consuming while
Inte
rvie
w
Qualitative Common method
to exchange
information with
others by asking
questions.
- provides face to
face contact with the
interviewee
- provides deep and
direct information
- the interviewee can
provide biased answers
- time consuming
Obse
rvat
ion
Qualitative Purposeful way to
gather facts about a
specific problem. It
is suitable to be
used when
information cannot
be collected by
questionnaire
- easily adapted to
situations
immediately
- provide reliable
information
- people can change
their attitude when they
know that they are
observed
- uses complicated
monitoring ratings
- expensive
Table 4. Comparison between primary data collection methods (Kumar, 2011)
Empirical Research: There are different types of researches and each one of them can be handled
to achieve a specific purpose and aim. Descriptive, analytical, applied, fundamental and
empirical researches are some examples on these types. The project of “Improve Intrusion
Detection System using Machine Learning” falls under the category of “Empirical” research
because it concerns about measuring and observing a phenomena and derives the knowledge
depending on the actual experience more than theory or belief. This type of research starts by
forming specific questions to be answered at the end of the research. Then the research idea must
be defined in order to use the suitable methodology including the criteria, tools for

38
implementation and testing. Finally, the research results or findings must be discussed to show
what was learned from these experiments ( Jasti & Kodali, 2014).
Primary method: involves gathering specific and new data that has not been collected before.
This method includes survey, questionnaire, interview, focus group, etc. The main advantage of
this method is you can collect customized data for a special case while the disadvantages are: it
can result in research errors because of the sample bias, its uniqueness make it not suitable to be
used for other cases, time and money consuming.
Secondary method: involves collecting data that has been collected by someone else before. This
method includes reading and analyzing the content of previous journal papers, conference
papers, books and websites ( Walliman , 2011). The advantages of this method are:
o Usually provides valid and reliable information.
o people can be benefited from its exploratory value.
o saving time and money.
While the disadvantages are represented in:
o data might be outdated (old resources usually are not recommended to be used).
o the author might be biased to one aspect more than the others.
The selected method and justification: based on the previous information, the student decided to go with
secondary data collection only because of the following reasons:
The project’s topic is considered as a new topic and there are various research papers that talks about it.
The project scope concerns about modifying an algorithm so the student needs to refer to accurate
information resources.
Primary data collection methods will not be useful for such kinds of project because no general data is to be
collected by a questionnaire from normal people (for example customer behavior or patients details). Also,
these methods are time consuming and the students is restricted to a short time.

39
3.3. Software Development Methodologies:
Any IT project involves software development, and it is necessary to understand the software development
life cycle (SDLC) models/methodologies and choose the correct one to guarantee the project’s success. A
typical life cycle consists of analysis, design, coding, testing and implementation phases. It is worth
mentioning that a single methodology cannot be suitable for all situations and the student must choose the
correct one to fulfil the project requirements (Despa, 2014). The following table compares between the most
common software development methodologies which are:
Method Merits Demerits
Wat
erfa
ll
Consists of a sequential phase that don’t
overlap. It is suitable for
- small and easy projects
- clear and fixed project objectives
- less experienced teams
- inflexible method because if a change is required
in one stage, previous stages must be revisited.
- depends on early identification of requirements
while users may be confused and not clear specially
in the beginning.
- problems cannot be discovered before testing
Pro
toty
pe
An approach to handle selected part of large
methodologies such as RAD based on the end
user participation. It is suitable for:
- projects that require communication between
the end users and developers
- projects with unclear objectives
- providing functional implementation of the
product
- designers may ignore documentation which
results in insufficient justification
- may increase the budget because of the continuous
iterations
- can lead to false expectations from the user’s
viewpoint
RA
D
An approach to segment the project into models
and develop them in parallel. It focuses on the
development phase more than the planning. It is
suitable for:
- saving money, time and human effort
- small-to-medium projects
- lower speed and cost may lead to decrease the
quality
- require staff with high qualifications and skills
- not suitable for large and complex projects

40
Ag
ile
An iterative approach that depends on
incremental design and implementation along
with integrated testing and development. It is
suitable for:
- small and medium projects with short time
- meeting the changing needs of the end users
- focusing on the working software more than
documentation
- depends on real time communication with end
users
- not suitable for large and complex projects
Table 5: Comparison between some software development methodologies ( Rajeswari & J., 2017)
Project software methodology chosen: Agile Methodology
Justification: This methodology is suitable for small and medium projects that must be developed in a short
time (in case of this project, the maximum duration is 5 months). Furthermore, it attempts to minimize the
project risks such as schedule overrun or changing requirements (when adding new functionalities) is the
product by executing frequent iterations. The benefit of executing these iterations is to increase the
efficiency by finding and solving the product’s defects early.
Figure 10: Steps of Agile methodology (Synopsys Editorial Team, 2017)

41
Chapter 4: Project Management
4.1. Introduction
Project management has been adopted for hundreds of years even in the old projects such as constructing
each of the Pyramids in Egypt and The Great Wall of China. Regardless the project type, it is mandatory to
plan for it very well before starting the implementation phase because it is the key for its success or failure.
According to (PMI Team, 2019), project management is the process of applying the knowledge, skills,
techniques and tools on all project activities and tasks in order to meet the project requirements.
According to PMBOK Guide, project management processes falls under the following phases which are
Initiating, Planning, Executing, Monitoring and Controlling and finally Closing. Each one of these phases
represents a set of interrelated processes that must be implemented to ensure the project’s integrity and
success. The main goal of each phase is explained below:
Phase 1: Initiating. To determine the vision of the project and gain approvals from the sponsor.
Phase 2: Planning. To build the project’s infrastructure by identifying the time, cost, risk, human
resources, communication plan and others.
Phase 3: Executing. To produce most of the project’s deliverables and put your plan into action.
Phase 4: Monitoring and Controlling. To keep an eye on the actual progress of the project and take
the corrective measures if any.
Phase 5: Closing. To deliver the project and secure an approval from the sponsor.
It is worth mentioning that the project management knowledge focuses on ten areas which are: Integration,
Scope, Time, Cost, Human Resources, Quality, Procurement, Communication, Risk Management and
Stakeholder Management.
42
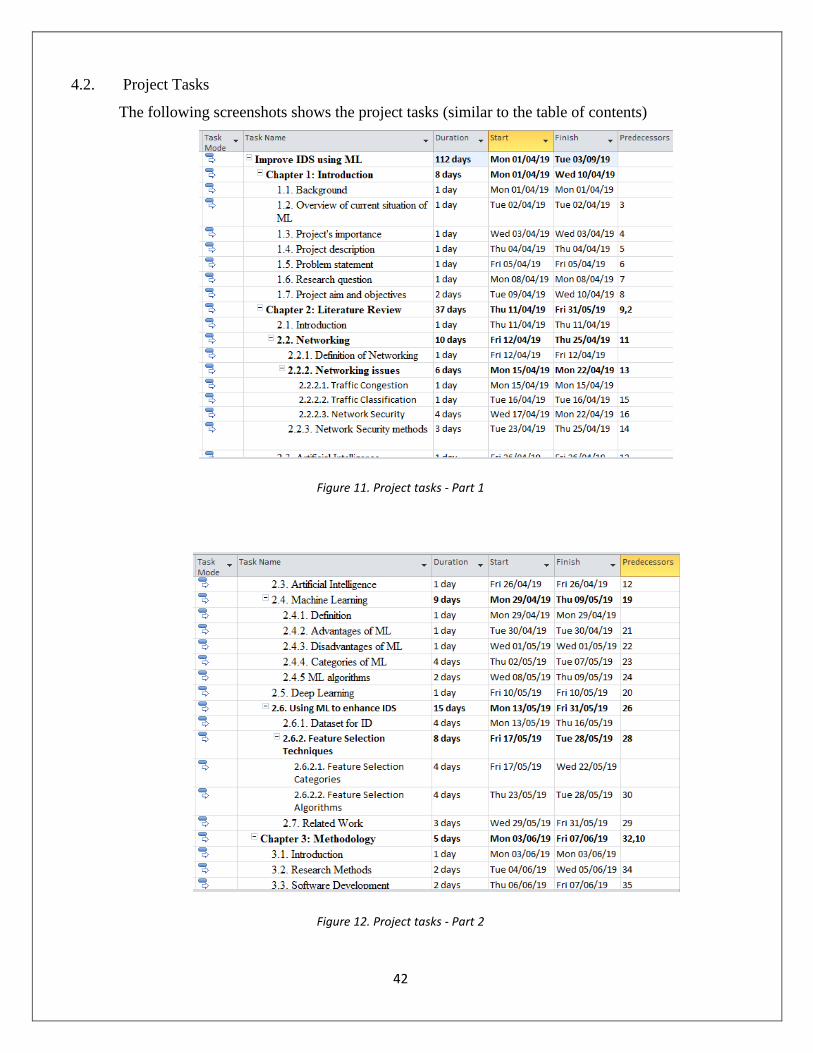
4.2. Project Tasks
The following screenshots shows the project tasks (similar to the table of contents)
Figure 11. Project tasks - Part 1
Figure 12. Project tasks - Part 2

43
Figure 13. Project tasks - Part 3
4.3. Gantt Chart
It is a graphical representation that describes the project schedule and the dependency relationship between
the project tasks (Hans , 2013). The following is the gantt chart for the project of “Improving the Intrusion
Detection System Using Machine Learning”.
Figure 14. Gantt Chart - Part 1

44
Figure 15. Gantt chart - Part 2
Figure 16. Gantt chart - Part 3

45
Figure 17. Gantt chart - Part 4
4.4. Risk Management
Risk management is the process of identifying, analyzing, prioritizing and mitigating the potential risks that
might face any project during its life cycle (Crispima & Rodrigues-da-Silva, 2014). This process is very
important because it gives the opportunity to avoid or mitigate losses such as user dissatisfaction, budget
and schedule overrun. The following table shows the potential risks that might be faced during the project
of improving IDS using ML along with their frequency and impact:
Risk Explanation Frequency Impact
Availability of
resources
The student may face difficulties in finding
some research papers on the same topic
because they are not available to the public. It
means that the student needs to search for an
alternative resource and consume more time
in collecting the requirements.
Low Medium
The solution’s
accuracy
The proposed method is very important to
detect network anomaly traffic correctly with
high accuracy and detection rate and the lack
Medium High

46
of accuracy and misclassification may will
lead to the project failure.
Schedule overrun The student may fail to finish the project tasks
on time and submit the final deliverables
accordingly as a result of the project
complexity and length.
Low High
Changing the
project’s scope
The student may need to change some parts of
the project’s scope by adding or deleting
some requirements while working.
Low High
Complexity of
the tool used
The student may face difficulties while using
WEKA tool for training and testing data
because she is using it for the first time.
Medium Low
Table 6: Potential risks in the project of “Improve IDS using Machine Learning”
4.5. Mitigation Plan
The purpose of identifying and analyzing the potential risks is to prepare the mitigation plan. It is a set of
strategies and procedures that aims to reduce the likelihood that a risk event will occur and reduce its impact
or negative effect when it happens too. The following table illustrates the suggested procedures to mitigate
the risks mentioned in table (5):
Risk Solution / Mitigation
Availability of
resources
The student can use the database of Sultan Qaboos University (SQU)
where more than 95% of the resources and documents are available.
The solution’s
accuracy
Combine two algorithms which are K-means and One-class SVM while
producing the solution to get the best features from each algorithm and
achieve more accuracy.
Schedule overrun Simplify the proposed solution as much as possible and work hard (around
35 hours) every week to finish the project tasks.
Changing the
project’s scope
Spend enough time during the project planning and designing phases to
avoid any unexpected significant changes.

47
Complexity of the
tool used
Depend on YouTube tutorials that are available on the Internet. Also, as
for help from other teachers and experts that already used this tool before.
Table 7. Mitigation plan of the risks mentioned in table 5
4.6. Communication Management:
Communication between the project’s stakeholders during their work is a fundamental process that must be
managed and controlled efficiently to avoid any failure. According to (Anon., 2018), more than 70% of the
project manager’s time is spent on communicating with others. That’s why communication plan is very
important. It is defined as a written document that identify, highlights and explains the communications
needs and expectations during the whole project. It focuses on the project deliverables, their frequency and
how they will be delivered to the desired party. The following table illustrates the communication plan for
this project between the student and her supervisor only since there are not other stakeholders engaged in
this project:
Project Stakeholders Deliverable Frequency Delivery Method
From To
Student Supervisor Project discussion Weekly Face-to-Face
Meeting
Student Supervisor Project diary Weekly Printed
Document
Student Evaluation
Committee
Midterm review
presentation
Once a semester Presentation
Student Supervisor Final report and
system
One time (1st
semester)
Submit on
Moodle
Student Evaluation
Committee
Final presentation One time (2nd
semester)
Presentation
Table 8. The project’s communication plan

48
Chapter 5: Project Design and Implementation
5.1. Introduction
Separating any project into phases, makes it easier to manage and control because the work load will be
divided into smaller tasks. The project design phase deliverables might vary between flowcharts, prototypes,
screen designs and others. The aim of the design phase is to develop the project specifications in details and
ensure that the strategy and tools will meet the users’ needs before starting the real implementation ( yadav
& Garg, 794).The next step is the implementation phase or the “Doing phase” because it includes the real
construction of the project results. In case of the programming projects, programmers start with encoding
and end with testing and evaluating the product according to a list of requirements or standards which are
usually the project objectives. This chapter combines the design and implementation phase for the project
as illustrated down.
5.2. Project Design
Since this project concerns about applying various feature selection algorithms on a specific dataset, there
will be no screen designs or prototype, but a flowchart can be used to illustrate the project strategy. A
flowchart is considered as a graphical representation that explains a step-by-step method to solve a specific
task. The following figure shows the flowchart of the implementation phase:
Figure 18. Flowchart of the project progress

49
Hardware used:
Dell laptop: the student used dell laptop to conduct this project. The laptop Intel® i7-8550U processor and
8GB Random Access Memory (RAM). The operating system installed is Windows 10 with 64-bit processor.
Software used:
o WEKA tool: is Waikato Environment Knowledge Analysis is a free software written in Java
programming language and it offers a collection of machine learning algorithms for data mining
purposes. This software provides different tools for data preprocessing, classification, clustering,
association, attributes selection and visualization. It was developed by a group of researchers in the
University of Waikato in New Zealand. The software provides friendly GUI and it is supported by
different operating systems such as Windows, OS-X and Linux (ML Group, 2015)
o Anaconda Navigator: is an Integrated Development Environment (IDE) which allows the user to
launch Conda packages and channels easily through user friendly GUI. This software is integrated
with Windows, OS-X and Linux operating system and it provides various applications as illustrated
in the following figure (Anaconda Cloud, 2019).
o Jupyter Notebook: is an open-source web application that supports more than forty programming
languages such as Python, R, Scala, etc. Also, it is compatible with big data tools and libraries such
as TensorFlow, pandas and scikit-learn. This application generates notebooks that can be shared with
others and the codes written can produce interactive output such as images, videos, HTML or
equation results. So, Jupyter notebook is one of the best solutions for machine learning, visualization,
statistical modeling and numerical problems (Jupyter Team, 2019).
o Python programming language: is simple, high-level, portable and object oriented language and it
highly recommended to be used for learning and real world programming purposes. It is the fastest
growing programming language because it is considered as the 5th largest StackOverflow
community, 4th most used language at GitHub and it offers various career opportunities for its users
(Srinath , 2017).

50
5.3. Project Implementation
This part shows the steps followed during the project implementation to apply the feature selection
algorithms using NSL-KDD dataset. As it was mentioned before, CFS, IG and GR were applied in WEKA
tool but forward selection and genetic algorithm codes were written in Python using Jupyter notebook. A
brief explanation is provided under each screenshot along with the results too.
Dealing with WEKA tool
Figure 19: User interface in WEKA
This is the first screen will be shown after launching WEKA and clicking on “Explorer” tab then the user
needs to open the dataset file.

51
Figure 20: Step 1 - open the dataset
Here, the student needs to select the file location and the file format, whether it is CSV or ARFF file.

52
This screen provides some details on the dataset uploaded such as the number of instances and attribute.
Also, when the user clicks on a specific attribute, extra details will be provided about it such as the minimum
and maximum values along with the data type and number of unique values (not repeated).
Figure 21: Step 2 – Show details about the dataset and both duration attribute and class label

53
Training and testing J48 classifier with the whole dataset (before applying feature selection)
This screen provides many machine learning algorithms that can be applied on the dataset. The student
chose J48 algorithm which belongs to the family of decision tree algorithms. Since the purpose of this project
is to increase the accuracy of IDS by improving the instances classification (binary classification that has
two options only which are normal and anomaly), so J48 is a good option for classification because it
provides a decision tree with a set of rules to illustrate how each single instance is classified. Another reason
behind choosing this algorithm is that the decision tree generated is simple, easy to understand and each
path shows a classification rule.
Figure 22: Step 3 - Choose J48 classifier to build the model

54
Choose “Use training set” to ask the classifier to evaluate the model based on the training file uploaded.
Wait until the model is built using the training dataset.
Figure 23: Step 4 – Train the dataset

55
Figure 24: Training accuracy result
The student must train the model using the training dataset and J48 classifier. Choose “Use training set”
option then click start and wait until the results appear. The training accuracy is 99.9095% when using the
whole dataset (with 42 attributes).

56
After training the classifier, the student must test its accuracy using the testing dataset file. Click on
“Supplied test set” option, then “Open file” then choose the file location.
Figure 25: Step 5 - Test the dataset
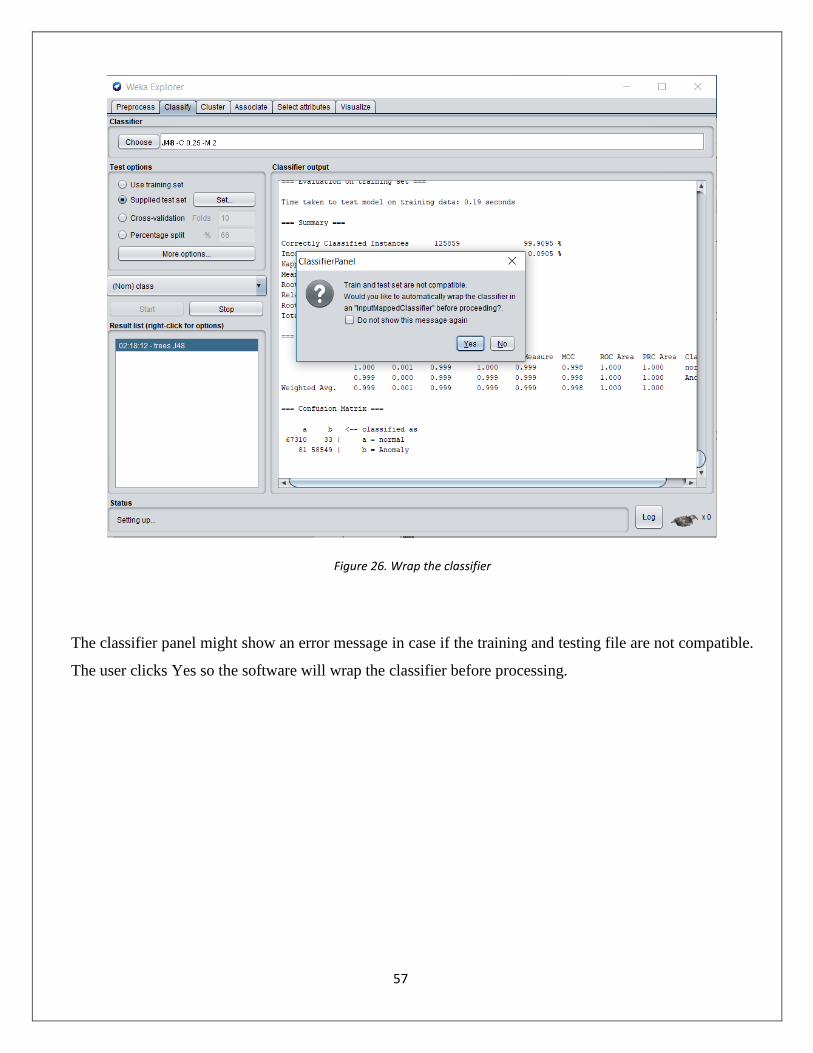
57
Figure 26. Wrap the classifier
The classifier panel might show an error message in case if the training and testing file are not compatible.
The user clicks Yes so the software will wrap the classifier before processing.

58
The testing accuracy is 83.0508 % and it must be lower than the training accuracy because the instances /
examples in the testing file will not be the same of that in the training file.
Figure 27: Classifier testing accuracy

59
Apply 1st method of feature selection: CFS Subset Evaluator
Attribute selection / feature selection searches all the possible combinations of attributes to find which subset
of attributes gives the best results. Attribute selection consists of two parts which are: attribute evaluator
such as CFS, Information Gain and Gain Ration and search method such as best first, ranker, random method
and others.
Figure 28: Step 6 - Select best attributes using CFS method and “Use full training set” mode

60
Figure 29: Step 6 - Select best attributes using CFS method and “Cross-validation” mode
CFS subset evaluator is one of the feature selection methods available in WEKA tool. It belongs to filter
methods category and it evaluates the weight of a group of attributes by considering the individual ability
of each attribute along with the degree of redundancy between them. Subsets of features that are highly
correlated with the class while having low inter correlation with the other attributes are preferred.
To apply it, click on “Select attributes” option, then choose “CFS Subset Evaluator” and “Best First”
searching method and start the selection process. The attributes selected are six which are A4 – flag, A5 –
src_bytes, A6 – dst_bytes, A12 – logged_in, A26 – srv_serror_rate and A30 – diff_srv_rate. There are two
options for the “Attribute Selection Mode” which are: Use full training set and Cross-validation. When using
CFS, both of these modes give the same results but cross-validation gives more details about each attribute

61
such as the percentage of their contribution in the accuracy. The student will select the attributes that appear
in all of the 10 folds (100%) which are A4, A5, A6, A12 and A26.

62
To test the efficiency of CFS method, the student deleted 36 attributes from the training dataset and kept the
best 5 attributes selected by CFS method only (attributes that achieved 100% weight in finding the accuracy)
along with the class label as illustrated above.
Figure 30: Step 7 - Keep only 5 attributes selected by CFS

63
Train the model using the best 5 attributes selected from CFS method only that are in the training file along
with the class label.
Figure 31: Step 8 - Train the model with the attributes selected from CFS method only

64
Test the model using the same 5 attributes selected from CFS method only that are in the testing file along
with the class label. The testing accuracy is 86.4407% and it is higher than the testing accuracy generated
by the whole dataset (83.0508%).
Figure 32: Step 9 – Test the model with the attributes selected from CFS method only

65
Apply 2nd method of feature selection: Information Gain Attribute Evaluator
The student repeats the same process from step 6 to step 9 with IG method but don’t forget to click undo
under Preprocess tab to retrieves all the 41 attributes.
Figure 33: Step 10 - Select best attributes using IG method and “Use full training set” mode
To apply the second method which is Information Gain, click on “Select attributes” option, then choose
“Information Gain Attribute Evaluator” and “Ranker” searching method and start the selection process.
Ranker search method was chosen because all the attributes are ranked according to their participant in the
finding the classifier accuracy. As it was mentioned in chapter 2, IG is considered as a wrapper method
where it evaluates each attribute separately (unlike CFS that evaluates the correlation between the
attributes), so the ranker search method is recommended to be used because it will provide the weight of

66
each attribute (Aggarwal, 2013). The best 6 attributes were selected by “Use full training set” mode are:
A5 – src_bytes, A3 – service, A6 – dst_bytes, A4 – flag, A30 – diff_srv_rate and A29 – same_srvrate.
When applying the second mode which is “Cross-validation” the best 6 attributes selected are the same, A5
– src_bytes, A3 – service, A6 – dst_bytes, A4 – flag, A30 – diff_srv_rate and A29 – same_srvrate. Both of
the attribute selection modes selected the same attributes listed above so the training and testing will be
applied one time only.
Figure 34: Step 10 - Select best attributes using IG method

67

68
To test the efficiency of IG method, the student deleted 35 attributes from the training dataset and kept the
best 6 attributes selected by IG method only along with the class label.
Figure 35: Step 11 - Keep only 6 attributes selected by IG

69
Train the model using the best 6 attributes selected from IG method only that are in the training file along
with the class label.
Figure 36: Step 12 - Train the model with the attributes selected from IG method only

70
Test the model using the same 6 attributes selected from IG method only that are in the testing file along
with the class label. The testing accuracy is 92.3729% and it is higher than the testing accuracy generated
by the whole dataset (83.0508%).
Figure 37: Step 13 – Test the model with the attributes selected from IG method only

71
Apply 3rd method of feature selection: Gain Ratio Attribute Evaluator
The student repeats the same process from step 6 to step 9 with GR method but don’t forget to click undo
under Preprocess tab to retrieves all the 41 attributes.
To apply the third method which is Gain Ratio, click on “Select attributes” option, then choose “Gain Ratio
Attribute Evaluator” and “Ranker” searching method and start the selection process. Ranker method was
chosen automatically by the tool because all the attributes are ranked according to their participant in the
finding the classifier accuracy. As it was mentioned in chapter 2, GR is considered as a wrapper method
where it evaluates each attribute separately (unlike CFS that evaluates the correlation between the
Figure 38: Step 14 - Select best attributes using GR method and “Use full training set” mode

72
attributes), so the ranker search method is recommended to be used because it will provide the weight of
each attribute. In this method, all the attributes are ranked according to their participant in the finding the
classifier accuracy. The student tries both of the attribute selection modes to check the attributes selected by
each mode and built one model for each one of these modes as the following:
“Use full training set” attribute selection mode
As illustrated in the above figure, the best 6 attributes are A12, A26, A4, A25, A39 and A30.
To test the efficiency of GR method, the student deleted 35 attributes from the training dataset and kept the
best 6 attributes selected by GR method only along with the class label.
Figure 39: Step 15 - Keep only 6 attributes selected by GR

73
2
Train the model using the best 6 attributes selected from GR method only (according to the ranking that is
more than 0.5) that are in the training file along with the class label.
Figure 40: Step 16 - Train the model with the attributes selected from GR method only

74
Test the model using the same 6 attributes selected from GR method only that are in the testing file along
with the class label. The testing accuracy is 80.5085% and it is lower than the testing accuracy generated by
the whole dataset (83.0508%).
Figure 41: Step 17 – Test the model with the attributes selected from GR method only

75
Evaluate cross validation: 12, 26, 4, 25, 39, 6
As illustrated in the above figure, the best 6 attributes selected are A12, A26, A4, A25, A39 and A6.
Figure 42: Step 18 - Select best attributes using GR method and “Cross validation” mode

76
To test the efficiency of GR method, the student deleted 35 attributes from the training dataset and kept the
best 6 attributes selected by GR method only along with the class label.
Figure 43: Step 19 - Keep only 6 attributes selected by GR

77
Figure 44: Step 20 - Train the model with the attributes selected from GR method only
Train the model using the best 6 attributes selected from GR method only that are in the training file along
with the class label.

78
Figure 45: Step 21 – Test the model with the attributes selected from GR method only
Test the model using the same 6 attributes selected from GR method only that are in the testing file along
with the class label. The testing accuracy is 85.5932% and it is higher than the testing accuracy generated
by the whole dataset (83.0508%).

79
Apply 4th method of feature selection: Forward Selection
Figure 46: Step 1: Launching Jupyter Notebook
The start writing Python codes, the student opened Anaconda Navigator then chose the file location and
finally the file name. After that, the file will be opened in a separated tab.

80
Figure 47: Importing libraries and upload dataset file
The code started by importing Pandas python library to load it in the software memory. This line is necessary
to open and load the dataset file “forward_selection_dataset.csv”. The next four lines were written to import
Scikit-learn library that supports python programming. Line 2 is responsible about importing tree algorithms
(for J48) while line 3 is responsible about importing and dividing the loaded file into training and testing
files. Line 4 and 5 imports the confusion metrics so the user will be able to print the accuracy, false positive,
false negative, etc. Line 6 is responsible about reading the CSV file from its location while line 7 concerns
about viewing the file in the form of table.

81
Figure 48: Convert data type of class and flag column
Line 8 and 9 are responsible about converting the data type of the Flag and Class columns from string to
float because the algorithm can’t calculate the accuracy when the file instances are string. Line 10 concerns
about showing details and information about the file attributes. Line 11 shows the first 3 rows in the data
file and the number of rows can be changed.

82
Figure 49: Identifying attributes and functions
In line 12 and 13, X and Y variables are defined. X equals all the attributes that must be used to find the
accuracy except the class column, while Y equals the class column only because the target is to classify the
instances correctly. In line 14, the dataset file is divided into training and testing where the testing part
equals 30% of the file size and 70% for training. In line 15, “clf” stands for classifier and Decision Tree
family is called here. Line 16 and 17 shows that the classifier will use the testing and training file to find the
confusion matrix in line 18. Line 19 is responsible about identifying accuracy function while line 20 identify
the data type of the accuracy output (float with two integers after the decimal point).

83
Figure 50. Printing accuracy and confusion matrix parameters
As it was mentioned in chapter 2, the confusion matrix consists of 4 parameters which are False Positive
(FP), False Negative (FN), True Positive (TP) and True Negative (TN). So to ensure that the accuracy
printed in line 21 is correct, the student printed the above mentioned parameters as shows and calculated the
accuracy using this formula:
𝐴𝑐𝑐𝑢𝑟𝑎𝑐𝑦 =𝑇𝑃 + 𝑇𝑁
TP + TN + FP + FN
𝐴𝑐𝑐𝑢𝑟𝑎𝑐𝑦 =17421 + 20144
17421 + 20144 + 168 + 59
𝐴𝑐𝑐𝑢𝑟𝑎𝑐𝑦 = 0.9939
From the above formula, the student confirmed that the accuracy printed in line 21 is correct but rounded to
two decimal points. Finally, the accuracy of J48 classifier when using forward selection method is around
99%.
Note: when run the code again the value of confusion matrix attributes will be different because the dataset
file is divided into 70% for training and 30% for testing but the instances selected are not fixed. Which
means that one fold might be chosen for training one time, but in another time it might be selected for testing.
Although the values are different, but the accuracy will remain the same.

84
Apply 5th method of feature selection: Genetic Algorithm
Figure 51. importing libraries and reading the dataset file
The code started by importing Pandas and Numpy libraries that are fundamental for Python programming.
The difference between Pandas and Numpy library is that the first one is necessary for data manipulation
and analysis and it offers data structures and functions to deal with tables and numbers while the second
library is important for supporting multi-dimensional arrays and their own functions. Line 3, 4, 5 are
responsible about calling Scikit-Learn library that provides the algorithms needed. Line 6 and 7 are creating
variables one to identify logistic regression and the other to call the classifier.
Line 8 and 9 are responsible about reading, loading and showing details about the CSV dataset file.

85
Figure 52. divide the dataset file into training and testing parts
Line 10 divides the dataset file into training (70%) and testing (30%) while 13 identifies that the class
column is the target and line 12 identifies that the other 41 attributes will be used for training that target
(each attribute will be trained and tested separately)

86
Figure 53. calling TensorFlow library
Line 15 and 16 has the same purpose of identifying the training attributes and class target. The next part
(from line 16 to 34) are responsible about calling TensorFlow library that support numerical computation
and makes ML easier and faster. At the end, the number of generation is identified (epochs).
Note: in this method, the student could not identify all the 41 attributes in X, so she trained each attribute
alone and separately. The above figure shows example on training “protocol_type” attribute.

87
Figure 54. generating the results
After some time, the code will show the results which are 5 generations for X (selected attribute) and 5
generations for the class attribute. The target accuracy achieved when using training “protocol_type” is
99.49% and it will be different if the user used another attribute. The loss attribute illustrates the deviation
between the result appeared and the actual result. It can be used to represent the False Positive value.

88
Chapter 6: Critical Appraisal
After implementing the five feature selection algorithms on NSL-KDD dataset, the student came up with
the following results:
Training
Accuracy
Testing
Accuracy
No. of
Attributes
Execution
time
(seconds)
False
Positive
Rate
Before
applying
feature
selection
99.9095% 83.0508% 41 32.96 0.160%
CFS
method
97.6098% 86.4407% 5
3.90 0.130%
IG method 99.7388% 92.3729% 6 4.95 0.075%
GR method 94.1932% 85.5932% 6 4.76 0.142%
Forward
Selection
- 99.00 % 10 5.40 Not fixed
(usually
between
40 and 60)
Genetic
Algorithm
- Each attribute
achieved
different
accuracy
Each
attribute
separately
Around
70 (for
every
attribute)
Each
attribute
has
different
FP
Table 9: Comparison between the main parameters

89
As it was illustrated in GA code, it is not possible to define all the attributes in one variable (X), so each
attribute must be defined individually and separately, then test the accuracy of that attribute and its false
positive rate. The following tables shows that for the whole 41 attributes:
Attribute
Number
Attribute Name Testing Accuracy False Positive
Rate
1 duration 99.50% 0.0141%
2 Protocol_type 99.47% 0.0150%
3 Service 99.49% 0.0170%
4 flag 99.46% 0.0150%
5 Src_bytes 99.52% 0.0156%
6 Dst_bytes 99.51% 0.0153%
7 Land 99.45% 0.0153%
8 Wrong_fragment 99.51% 0.0145%
9 Urgent 99.47% 0.0152%
10 hot 99.51% 0.0144%
11 Num_failed_logins 99.51% 0.0142%
12 Logged_in 99.50% 0.0152%
13 Num_compromised 99.55% 0.0137%
14 Root_shell 99.51% 0.0149%
15 Su_attempted 99.40% 0.0182%
16 Num_root 99.44% 0.0159%
17 Num_file_creations 99.51% 0.0148%
18 Num_shells 99.39% 0.0180%
19 Num_access_files 99.50% 0.0148%
20 Num_outbound_cmds 99.47% 0.0146%
21 Is_host_login 99.40% 0.154%
22 Is_guest_login 99.37% 0.0173%
23 Count 99.52% 0.0153%
24 Srv_count 99.43% 0.0170%
25 Serror_rate 99.50% 0.0143%

90
26 Srv_serror_rate 99.43% 0.0162%
27 Rerror_rate 99.51% 0.0143%
28 Srv_rerror_rate 99.44% 0.0155%
29 Same_srv_rate 99.52% 0.0141%
30 Diff_srv_rate 99.47% 0.0151%
31 Srv_diff_host_rate 99.50% 0.0152%
32 Dst_host_count 99.51% 0.0150%
33 Dst_host_srv_count 99.45% 0.0161%
34 Dst_host_same_srv_rate 99.49% 0.0146%
35 Dst_host_diff_srv_rate 99.47% 0.0156%
36 Dst_host_same_src_port_rate 99.51% 0.0154%
37 Dst_host_srv_diff_host_rate 99.44% 0.0160%
38 Dst_host_serror_rate 99.52% 0.0146%
39 Dst_host_srv_serror_rate 99.47% 0.0153%
40 Dst_host_rerror_rate 99.47% 0.0157%
41 Dst_host_srv_rerror_rate 99.44% 0.0162%
Table 10: Comparing the accuracy result of each one of the 41 attribute in GA
The following figure shows how the accuracy, false positive and time needed to build the model parameters
are related to each other:

91
Figure 55. Overall comparison between the 4 algorithms
From here, the student came up with the following findings:
When the number of attributes trained by a classifier decreased, the accuracy will be increased (inverse
proportion) because the redundant and irrelevant attributes will be removed which are affecting the
classification accuracy negatively (Pede , et al., 2017). If the user aims to increase the accuracy and
generate generic rules, he must reduce the number of attributes by applying one of the feature selection
methods. In this project, the Genetic Algorithm achieved the highest accuracy because of its principle
of working. It depends on gradient descent to allow searching and finding the minimum of functions
when derivatives exists and it keeps only one optimum solution. This algorithm generates different
solutions (generation) from the parents through different operations such as mutation and crossover,
then it keeps enhancing each solution until getting the best one.
When the accuracy of a classifier increased, the False Positive Rate will be decreased (inverse
proportion) because FPR concerns about the instances classified wrongly as normal traffic. So, when
the accuracy increased, the IDS must be more intelligent to classify the instances correctly. Genetic
algorithm and CFS method achieved the lowest FP because and this is normal for GA because it achieved
the highest accuracy.

92
When the number of attributes trained by a classifier increased, the execution time (time needed to build
the model by classifier will increase too) (direct proportion) because the classifier needs to train and test
more columns and instances. The shortest execution time was achieved by CFS method because the
number of attributes trained were only 5 attributes while other methods used 6 or more.
Chapter 8: Conclusion & Future Work
This research project digs into the role of machine learning in improving the intrusion detection system
specifically anomaly-based IDS. The project’s problem statement concerns about improving and increasing
the accuracy of IDS and decrease the FPR by applying different feature selection methods on NSL-KDD
dataset. The student formed a set of research questions that concerns about how to detect the abnormal
network behavior, what is the relationship between number of dataset attributes, time needed to build the
model, its accuracy and false positive rate. Furthermore, the project illustrates how false alarms can be
minimized in IDS using machine learning and which attributes of NSL-KDD dataset are affecting the
accuracy more. The student followed a suitable methodology to be able to answer the research questions
because WEKA tool were used to apply the three feature selection methods which are CFS, IG and GR
methods. Also, the student applied each of forward selection method and genetic algorithm on the same
dataset using Python programming in Jupyter Notebook because these two methods are not supported in
WEKA tool. After collecting the results, a comparison was conducted between the five methods regarding
the following parameters (Number of attributes, time needed to build the model, model accuracy and false
positive rate) in order to recommend the best method which was Genetic Algorithm. Finally, and after
analyzing the results, the student explained the findings and how they achieve and fulfil the project aim and
objectives that were identified in the beginning of the project.

93
Figure 56: Project progress
The student is planning to improve and expand the project in the future as the following:
Apply the project idea on another dataset such as Kyoto 2006+ or real dataset collected from any
organization to see how the methodology will perform. Knowing that the student will face new
challenges specially when preprocessing that dataset.
Apply other types of feature selection algorithms such as OneR attribute evaluator and Symmetrical
Uncert attribute evaluator on the same dataset and compare between them regarding the same parameters
(accuracy, FP, execution time and number of attributes).
Add new parameters to the comparison such as the Sensitivity and Specificity and discuss how they are
related and affecting the other parameters.

94
References
1- Behera, . R. N. & Das, K., 2017. A Survey on Machine Learning: Concept, Algorithms and Applications.
International Journal of Innovative Research in Computer and Communication Engineering, 5(2), p. 1304.
2- Dhamdhere, . V. & Solanki, M., 2014. Intrusion Detection System by using K-Means clustering, C 4.5, FNN, SVM
classifier. International Journal of Emerging Trends & Technology in Computer Science (IJETTCS) , 3(6), pp. 19-
22.
3- Fadlullah, Z., Mao, B. & Inoue, T., 2017. State-of-the-Art Deep Learning: Evolving Machine Intelligence Toward
Tomorrow’s Intelligent Network Traffic Control Systems. IEEE Communications Surveys & Tutorials, 19(4), p.
2432.
4- Hameed, S. & Mahmood, D., 2016. A Feature Selection Model based on Genetic Algorithm for Intrusion. Iraqi
Journal of Science, 1(Special), p. 170.
5- Hoque, M., Bikas, M. & Abdul Mukit , M., 2012. An Implementation of Intrusion Detection Algorithm Using
Genetic Algorithm. International Journal of Network Security & Its Applications, 4(2), pp. 109 - 116.
6- Jasti, N. & Kodali, R., 2014. A literature review of empirical research methodology in lean manufacturing.
International Journal of Operations & Production Management, 34(8), p. 1080.
7- Jha , J. & Ragha, L., 2014. Intrusion Detection System using Support Vector Machine. International Journal of
Applied Information Systems (IJAIS) , 1(1), pp. 25-27.
8- Jha , J. & Ragha, L., 2012. Intrusion Detection System using Support Vector Machine. International Journal of
Applied Information Systems, ICWAC(3), pp. 28-29.
9- Kadhum, L. E. & Ali, H. H., 2015. K- Means Clustering Algorithm Applications in Data Mining and Pattern
Recognition. International Journal of Science and Research (IJSR), 6(2), pp. 1577-1578.
10- Kaya , Ç., Yıldız , O. & Ay , S., 2016. Performance analysis of machine learning techniques in intrusion detection.
Zonguldak, IEEE.
11- Pandey , M. & Pandey, P., 2015. Research Methodology: Tools and Techniques. 1st ed. Romania : Bridge
Center.
12- Purwar, R. & Rani, N., 2017. Performance Analysis of various classifiers using Benchmark Datasets in Weka
tools. International Journal of Engineering Trends and Technology , 47(5), pp. 290-291.
13- Rajeswari , . S. & J., S., 2017. A Study on Software Development Methodologies. International Journal of
Innovative Research in Computer and Communication Engineering, 5(4), pp. 7728-7734.
14- Roozbahani , F. & Azad , R., 2015. Security Solutions against Computer Networks Threats. International Journal
of Advanced Networking and Applications , 7(1), pp. 2576-2577.
15- S , G., M , T., V.T , . M. & V , G., 2018. Classification Algorithms with Attribute Selection: an evaluation study
using WEKA. International Journal of Advanced Networking and Applications , 9(6), p. 3640.
16- Ugarte-Pedrero, . X., Brezo, F. & Santos, I., 2013. Opcode Sequences as Representation of Executables for
Data-mining-based Unknown Malware Detection. Information Sciences, 1(1), pp. 1-2.

95
17- Walliman , N., 2011. Research Methods: The Basics. 1st ed. New York: Routledge .
18- Wu , . Y., Jain , . A. & Arafat, M., 2018. Analysis of Intrusion Detection Dataset NSL-KDD Using KNIME Analytics.
Bowling Green, ProQuest.
19- Xiao, . S., Wang, . X., Cui, . Y. & Wang, M., 2018. Machine Learning for Networking: Workflow, Advances and
Opportunities. IEEE Network, 32(2), pp. 2-4.
20- Yadav, A. & Singh, 2013. Study of K-Means and Enhanced K-Means Clustering Algorithm. International Journal
of Advanced Research in Computer Science, 4(10), p. 103.
21- yadav, S. & Garg, S., 794. Project Planning and Management. International Journal of Innovative Research in
Technology, 1(5), p. 2014.
22- Aggarwal, M., 2013. Performance Analysis Of Different Feature Selection Methods In Intrusion Detection.
International journal of scientific & technology research, 2(6), p. 227.
23- Ahmadinejad, S., Jalili, S. & Abadi, M., 2011. A hybrid model for correlating alerts of known and unknown
attack scenarios and updating attack graphs. The International Journal of Computer and Telecommunications
Networking, 55(9), pp. 1-2.
24- Anaconda Cloud, 2019. Anaconda Navigator. [Online]
Available at: https://anaconda.org/anaconda/anaconda-navigator
[Accessed 2 July 2019].
25- Anand, A. & Ahlawat, A., 2014. An Introduction to Computer Networking. International Journal of Computer
Science and Information Technology Research, 2(2), p. 373.
26- Anon., 2018. Project Management Docs. [Online]
Available at: https://www.projectmanagementdocs.com/template/project-planning/communications-
management-plan/#axzz5rVjQ2Tim
[Accessed 3 5 2019].
27- Azhagiri , M., Rajesh , A. & Karthik, S., 2015. Intrusion detection and prevention system: technologies and
challenges. International Journal of Applied Engineering Research, 10(87), pp. 2-3.
28- Bhambhu, L. & Srivastava, D., 2010. Data classification using support vector machine. Journal of Theoretical
and Applied Information Technology, 12(1), p. 1.
29- Chapke, P. & Deshmukh, R., 2015. Intrusion Detection System using Fuzzy Logic and Data Mining Technique.
Unnao, ACM New York, pp. 1-2.
30- Crispima, . J. & Rodrigues-da-Silva, L., 2014. The project risk management process, a preliminary study. Braga,
Elsevier Ltd.
31- Das, K. & Behera, R. N., 2017. A Survey on Machine Learning: Concept, Algorithms and Applications.
International Journal of Innovative Research in Computer and Communication Engineering, 5(2), p. 1301.
32- Despa, M., 2014. Comparative study on software development methodologies. Database Systems Journal,
5(3), pp. 37-38.

96
33- Dey, A., 2016. Machine Learning Algorithms: A Review. International Journal of Computer Science and
Information Technologies (IJCSIT), 7(3), p. 1178.
34- Ghasemian, A., Hosseinmardi, H. & Clauset, . A., 2018. Evaluating Overfit and Underfit in Models of Network
Community Structure. International Journal of Electrical Sciences & Engineering (IJESE), 2(2), p. 1.
35- Gillikin , J. L., 2018. Perspectives: History of Artificial Intelligence. [Online]
Available at: https://www.viatech.com/en/2018/05/history-of-artificial-intelligence/
[Accessed 4 April 2019].
36- Hans , R., 2013. Work breakdown structure:A tool for software project scope verification. International Journal
of Software Engineering & Applications, 4(4), p. 19.
37- Jamuna & Ewards , V., 2013. Efficient Flow based Network Traffic Classification using Machine Learning.
International Journal of Engineering Research and Applications (IJERA), 3(2), pp. 1324-1325.
38- Jupyter Team, 2019. Home. [Online]
Available at: https://jupyter.org/
[Accessed 1 July 2019].
39- Kumar , A. & Venugopalan, S. R., 2016. A Novel Algorithm for Network Anomaly Detection Using Adaptive
Machine Learning. Bhubaneswar, International Conference on Advanced Computing and Intelligent
Engineering.
40- Kumar, R., 2011. Research Methodology: a step-by-step guide for beginners. 3rd ed. Singapor: SAGE
Publications Ltd.
41- Limam, N., Salahuddin, M. & Ayoubi, S., 2018. A Comprehensive Survey on Machine Learning for Networking:
Evolution, Applications and Research Opportunities. Journal of Internet Services and Applications, 2(1), pp. 37-
38.
42- ML Group, 2015. WEKA: Software. [Online]
Available at: https://www.cs.waikato.ac.nz/ml/weka/
[Accessed 1 7 2019].
43- Munjal, R. & Mudga , A., 2014. Fuzzy K-Means Based Intrusion Detection System Using Support Vector
Machine. International Journal of Science and Research (IJSR) , 3(7), pp. 1308-1310.
44- Observer, O., 2019. AI-aided breast cancer diagnosis in 5 hospitals. [Online]
Available at: http://www.omanobserver.om/ai-aided-breast-cancer-diagnosis-in-5-hospitals/
[Accessed 20 April 2019].
45- Observer, O., 2019. Five strategies for Omani organisations to harness AI in 2019. [Online]
Available at: http://www.omanobserver.om/five-strategies-for-omani-organisations-to-harness-ai-in-2019/
[Accessed 20 4 2019].
46- Pede , S., Chandurkar, S. & Bansode, S., 2017. Attribute Selection to Improve Accuracy of Classification.
International Journal of Computer Applications , 173(5), pp. 18-19.
47- Pharate , A., Bhat, H., Shilimkar, V. & Mhetre , N., 2015. Classification of Intrusion Detection System.
International Journal of Computer Applications , 118(7), pp. 23-25.

97
48- PMI Team, 2019. About Us: Learn About PMI. [Online]
Available at: https://www.pmi.org/about/learn-about-pmi/what-is-project-management
[Accessed 6 May 2019].
49- Quadri , . S. & Khan , M., 2013. Effects of Using Filter Based Feature Selection on the Performance of Machine
Learners Using Different Datasets. BVICAM’s International Journal of Information Technology , 1(1), pp. 597 -
599.
50- Radzik, T., Overill, R. & Saied, A., 2016. Detection of known and unknown DDoS attacks using Artificial Neural
Networks. Neurocomputing, 172(2), pp. 385-386.
51- Raut, P. & Borkar, N., 2017. Machine learning: trends, perspectives, and prospects. International Journal of
Engineering of Science and Computing (IJESC), 7(3), pp. 4884-4888.
52- Satyanar, . S., Aluvalu, . R. & Jabbar, 2017. Cluster Based Ensemble Classification for Intrusion Detection
System. Singapore, ICMLC 2017 Proceedings of the 9th International Conference on Machine Learning and
Computing , pp. 3-5.
53- Shacklett, . M., 2019. How to differentiate between AI, machine learning, and deep learning. [Online]
Available at: https://www.techrepublic.com/article/how-to-differentiate-between-ai-machine-learning-and-
deep-learning/
[Accessed 2 4 2019].
54- Shalev-Shwartz, S. & Ben-David, S., 2014. Understanding Machine Learning: From Theory to Algorithms. 2nd
ed. New York: Cambridge University Press.
55- Shan , J., 2016. Analysis and research of computer network security. Journal of Chemical and Pharmaceutical
Research, 6(7), p. 875.
56- Shantharajah, . S. & Dhanabal, L., 2015. A Study on NSL-KDD Dataset for Intrusion Detection System Based on
Classification Algorithms. International Journal of Advanced Research in Computer and Communication
Engineering, 4(6), p. 447.
57- Sharma, G., Bhargava, . N., Bhargava, R. & Mathuria, M., 2013. Decision Tree Analysis on J48 Algorithm for
Data Mining. International Journal of Advanced Research in Computer Science and Software Engineering, 3(6),
pp. 1114-1115.
58- Shrivastava , A. & Ahirwal, R., 2014. A SVM and K-means Clustering based Fast and Efficient Intrusion
Detection System. International Journal of Computer Applications, 72(6), pp. 27-28.
59- Smola, A. & Vishwanathan, . S., 2008. Introduction to Machine Learning. 2nd ed. New York: Cambridge
University Press
60- Srinath , K., 2017. Python – The Fastest Growing Programming Language. International Research Journal of
Engineering and Technology , 4(12), pp. 354 - 355.
61- Subashini, S. & Velavan, P., 2014. Correlation Based Feature Selection with Irrelevant Feature Removal.
International Journal of Computer Science and Mobile Computing, 3(4), p. 863.
62- Synopsys Editorial Team, 2017. Software Integrity Blog. [Online]
Available at: https://www.synopsys.com/blogs/software-security/top-4-software-development-

98
methodologies/
[Accessed 2 May 2019].
63- Wu, H. & Li, Y., 2012. A Clustering Method Based on K-Means Algorithm. Xinyang, ELSEVIER.
64- Zseby, T. & Iglesias, F., 2015. Analysis of network traffic features for anomaly detection. Journal of Machine
Learning, 101(1), pp. 8-9.

99
Appendices
1. Copy of publication acceptance letter

100
2. Ethics form

101

102

103

104

105

106

107
3. Weekly diaries

108

109

110

111

112

113

114

115

116

117

118

119

120