project management using earned value - humphreys and
TRANSCRIPT
Project Management Using
Earned ValueFourth Edition
Earned Value Management Consulting Training
© 2002, 2011, 2014, 2018 Gary C. HumphreysHumphreys & Associates, Inc. All rights reserved. No part of this book may be reproduced, distributed, or stored in any form or by any means without the written permission of the author.
First edition published 2002. Second edition published 2011. Third edition published 2014. Fourth edition 2018
Printed in the United States of America
ISBN 978-0-9965479-4-9
Humphreys & Associates, Inc.9910 Research DriveIrvine, CA 92618 USA(714) [email protected]
iii
T CList of Figures .................................................................................................................................xiiiPreface ...........................................................................................................................................xxiAcknowledgments ........................................................................................................................ xxiii
Section 1 Earned Value Project Management and Organization .................................................. 25
Chapter 1 Project Management Using Earned Value ............................................................. 27What is a Project? ...................................................................................................... 27Managing Projects ..................................................................................................... 28Background ................................................................................................................ 29The Performance-Oriented Approach ........................................................................ 30Summary Implementation Concerns .......................................................................... 32Factors Aff ecting System Implementation Detail ....................................................... 32Earned Value Management System Recognition ...................................................... 33The Earned Value Management Process .................................................................. 33The Process Steps ..................................................................................................... 34Conclusion ................................................................................................................. 37Review Questions ...................................................................................................... 38
Chapter 2 Defi nition of Scope, Work Breakdown Structure (WBS) and WBS Dictionary ... 39Defi ning Project Objectives ........................................................................................ 40The Work Breakdown Structure (WBS) ..................................................................... 41Considerations in Developing a WBS ........................................................................ 42WBS Examples .......................................................................................................... 42WBS Dictionary .......................................................................................................... 46Other Considerations in WBS Development .............................................................. 47The Contract Work Breakdown Structure (CWBS) .................................................... 50Scope Verifi cation ...................................................................................................... 50Conclusion ................................................................................................................. 51Review Questions ...................................................................................................... 51Case Study 2.1 Work Breakdown Structure Part 1 ................................................ 53Case Study 2.2 Work Breakdown Structure Part 2 ................................................ 59Case Study 2.3 WBS Element Description ............................................................ 63
Chapter 3 Managing Project Risk ............................................................................................ 67Introduction to Managing Project Risks .................................................................... 67The Process Flow Diagram ........................................................................................ 69Relationship of Risk Management to the Earned Value Management System .......... 75
Development of Estimates ................................................................................... 75Quantitative Schedule Risk Analysis .................................................................... 75Budgets ................................................................................................................ 75Management Reserve .......................................................................................... 75Variance Analysis ................................................................................................. 75Estimates at Completion ...................................................................................... 75
Conclusion ................................................................................................................. 76Review Questions ...................................................................................................... 76Case Study 3.1 Using the Risk Register ................................................................ 77
iv Table of Contents
Chapter 4 Relating Organizations, Responsibility, and Work Scope ................................... 79Organizational Structures .......................................................................................... 79Responsibility Assignment Matrix (RAM) ................................................................... 82Control Account Establishment .................................................................................. 83Conclusion ................................................................................................................. 86Review Questions ...................................................................................................... 86Case Study 4.1 Control Account Defi nition Part 1 .................................................. 87Case Study 4.2 Control Account Defi nition Part 2 .................................................. 93
Chapter 5 Work Teams .............................................................................................................. 95The Work Team .......................................................................................................... 95Advantages of Work Teams ....................................................................................... 97The Work Team Lead ............................................................................................... 103Conclusion ............................................................................................................... 103Review Questions .................................................................................................... 103Case Study 5.1 Organization Chart and Responsibility Assignment Matrix ......... 105
Section 1 Review Quiz ............................................................................................................... 111
Section 2 Scheduling ..................................................................................................................... 115
Chapter 6 What is Scheduling? Schedule Types ................................................................. 121Project Scheduling ................................................................................................... 121What is a Schedule and Why Use One? .................................................................. 123Data Requirements .................................................................................................. 124Data Processing ....................................................................................................... 125Using Results ........................................................................................................... 125Schedule Types ....................................................................................................... 126
Gantt Charts ....................................................................................................... 126Milestone Chart .................................................................................................. 126Bar Chart ............................................................................................................ 127Combination Chart ............................................................................................. 128Modifi ed Gantt/Milestone Chart.......................................................................... 128Flow Process Chart ............................................................................................ 128Set Back Chart ................................................................................................... 129Line of Balance .................................................................................................. 129Network Diagrams .............................................................................................. 129
Conclusion ............................................................................................................... 130Review Questions .................................................................................................... 131Case Study 6.1 Developing a Personal Schedule ............................................... 133
Chapter 7 Introduction to Network Logic Development ...................................................... 137Precedence Diagramming Method .......................................................................... 137Activity Durations ..................................................................................................... 139Activity Relationships ............................................................................................... 139Representations of Logic in Time-Phased Formats ................................................. 142Conclusion ............................................................................................................... 143Review Questions .................................................................................................... 143Case Study 7.1 Constructing a Network Diagram ................................................ 145
vTable of Contents
Chapter 8 Critical Path Method Fundamentals ..................................................................... 147The Critical Path Method ......................................................................................... 149Critical Path Example ............................................................................................... 149Network Calculations ............................................................................................... 150Total Float ................................................................................................................ 153Free Float ................................................................................................................. 154Directed Dates ......................................................................................................... 156Critical Path Characteristics ..................................................................................... 157Driving Paths ............................................................................................................ 158A Final Note ............................................................................................................. 158Conclusion ............................................................................................................... 159Review Questions .................................................................................................... 159Case Study 8.1 A More Complex Network ........................................................... 161Case Study 8.2 CPM Network Construction ........................................................ 163Case Study 8.3 Date, Float and Critical Path Calculation .................................... 167Case Study 8.4 Constructing a Bar Chart ............................................................ 171Case Study 8.5 Path Analysis Using Total Float .................................................. 173
Chapter 9 Resource Loading and Leveling the Schedule ................................................... 175The Resource Loading Process ............................................................................... 177Priority Rules and Strategies for Resource Leveling ............................................... 178Additional Considerations ........................................................................................ 179Leveled Start and Finish .......................................................................................... 180Resource Curves ..................................................................................................... 180Other Applications .................................................................................................... 182Conclusion ............................................................................................................... 182Review Questions .................................................................................................... 182Case Study 9.1 Resource Leveling ...................................................................... 185
Chapter 10 Considerations for Developing a Useful, Quality Network Schedule ............... 189Network Development Techniques: Top-Down ........................................................ 191Network Development Techniques: Bottom-Up ....................................................... 192Network Development Techniques: IMP/IMS ........................................................... 192Concerns in the Schedule Development Process .................................................... 195Using Hammocks, Summary Activities and Grouping for Concise Reporting .......... 195Templates ................................................................................................................. 197Lags, Leads and Date Constraints ........................................................................... 199Schedule Visibility Tasks .......................................................................................... 201Schedule Margin ...................................................................................................... 201
Schedule Margin Activity Method ....................................................................... 202Lag Method ........................................................................................................ 203Gap Method ....................................................................................................... 203Baseline Finish Variance Method ....................................................................... 203
Resource Application ............................................................................................... 203Schedule Approaches .............................................................................................. 203Schedule Visibility Versus Risk ................................................................................ 205Determining Detail ................................................................................................... 206Creating and Maintaining Quality Schedules ........................................................... 206Schedule Health Checks .......................................................................................... 207
vi Table of Contents
Fourteen Point Schedule Health Check – Correlation with GASP ........................... 212Conclusion ............................................................................................................... 213Review Questions .................................................................................................... 214Case Study 10.1 Build a Network Schedule .......................................................... 217
Chapter 11 Schedule Acceleration Techniques ...................................................................... 221The “Crashing” Procedure ....................................................................................... 223An Example of Network Crashing ............................................................................ 224Other Schedule Acceleration Techniques ................................................................ 230Conclusion ............................................................................................................... 231Review Questions .................................................................................................... 231Case Study 11.1 Crashing the Network or “What If” .............................................. 233
Chapter 12 Setting a Traceable Schedule Baseline ............................................................... 235Schedule Traceability ............................................................................................... 235A Solution ................................................................................................................. 239Defi ning the Schedule Baseline ............................................................................... 239Schedule Baseline Establishment ............................................................................ 240Realism and Schedule Detail ................................................................................... 243Timing of Schedule Baseline Establishment ............................................................ 243Schedule Baseline Revisions ................................................................................... 244The Baseline Schedule Versus the Current Schedule ............................................. 245Conclusion ............................................................................................................... 246Review Questions .................................................................................................... 246Case Study 12.1 Vertical and Horizontal Schedule Traceability ............................ 249
Chapter 13 Updating the Schedule .......................................................................................... 253Successful Schedule Update Process ..................................................................... 257Additional Statusing Considerations ........................................................................ 258Methods for Addressing Out-of-Sequence Logic Status .......................................... 258
Retained Logic ................................................................................................... 259Progress Override .............................................................................................. 261Impact on Total Float .......................................................................................... 262
Conclusion ............................................................................................................... 264Review Questions .................................................................................................... 264Case Study 13.1 Analyzing the Schedule .............................................................. 267
Chapter 14 Schedule Changes ................................................................................................. 269Duration Changes .................................................................................................... 271Measuring Schedule Status ..................................................................................... 272Defi ning Signifi cant Changes ................................................................................... 272Recording the Changes ........................................................................................... 272Work-Around Plans .................................................................................................. 273Baseline Changes .................................................................................................... 274Conclusion ............................................................................................................... 274Review Questions .................................................................................................... 275Case Study 14.1 Analyzing Schedule Changes ..................................................... 277
Chapter 15 Resolving Negative Float ...................................................................................... 281Float Analysis at Status Update ............................................................................... 283
viiTable of Contents
Isolating the Cause of Float Deterioration ................................................................ 284Impact of the Delay .................................................................................................. 286Resolution Alternatives for Negative Float ............................................................... 286Float Analysis by Project Team ................................................................................ 288Conclusion ............................................................................................................... 290Review Questions .................................................................................................... 290Case Study 15.1 Resolving Negative Float ............................................................ 291
Chapter 16 Special Networking Considerations ..................................................................... 293Directed Dates ......................................................................................................... 293Level of Eff ort ........................................................................................................... 303Calendar Considerations ......................................................................................... 304Conclusion ............................................................................................................... 305Review Questions .................................................................................................... 305Case Study 16.1 A More Complex Network ........................................................... 307
Chapter 17 Schedule Risk Assessment .................................................................................. 309Reasons for Risk Analysis ....................................................................................... 312Risk Defi nition and Use of a Risk Assessment ........................................................ 313The CPM Approach to Schedule Risk ...................................................................... 314Probabilistic Approach to Schedule Risk ................................................................ 314Example: Building Foundation Activity ..................................................................... 315Example: CPM Path Duration .................................................................................. 315Risk Analysis of Path Duration ................................................................................. 316Cumulative Likelihood Curves (S-Curves) ............................................................... 317Validity of the CPM Completion Estimates ............................................................... 319Highest Risk Path .................................................................................................... 319Schedule Risk at Path Convergence ....................................................................... 320Schedule Bias .......................................................................................................... 320Merge Bias at Path Convergence ............................................................................ 320Directed Dates ......................................................................................................... 321Reducing Durations to Fit the Schedule .................................................................. 322Fast Track Impacts ................................................................................................... 322Late Start Scheduling ............................................................................................... 322Early Start Scheduling ............................................................................................. 323Risk Analysis Pitfalls ................................................................................................ 323Risk Implementation ................................................................................................ 324Schedule Risk Analysis Output ................................................................................ 325Cost Risk Analysis Output ........................................................................................ 326Other Scheduling Issues .......................................................................................... 326Risk Assessment Tools ............................................................................................ 326
PERT .................................................................................................................. 326Monte Carlo Approach ....................................................................................... 329
Cost Eff ective Implementation ................................................................................. 329Conclusion ............................................................................................................... 329Review Questions .................................................................................................... 330Case Study 17.1 Making Activity Duration Distributions ........................................ 333Case Study 17.2 Combining Distributions Along a Path ........................................ 335Case Study 17.3 Schedule EAC and Path Convergence ...................................... 341
viii Table of Contents
Chapter 18 Scheduling in a Performance Measurement Environment ................................ 347System Description .................................................................................................. 347Schedule Traceability ............................................................................................... 347Reconciliation to Time-Phased Budgets .................................................................. 349Reconciliation of Progress and Performance ........................................................... 350Contract Requirements ............................................................................................ 350Special Requirements .............................................................................................. 352Conclusion ............................................................................................................... 353Review Questions .................................................................................................... 353Case Study 18.1 Schedule Traceability ................................................................. 355
Section 2 Review Quiz ............................................................................................................... 359
Section 3 Estimating ...................................................................................................................... 367
Chapter 19 The Estimating Process ........................................................................................ 369Impact of the Estimate ............................................................................................ 369Impacts of Poor Estimating ..................................................................................... 370Prerequisites for Estimate Development ................................................................. 371
Guidelines ......................................................................................................... 371Work Breakdown Structure (WBS) .................................................................... 371WBS Dictionary and Code of Accounts ............................................................. 371Estimate Formats and Templates ...................................................................... 372
Types of Estimates ................................................................................................... 373Conceptual Estimates ........................................................................................ 373Preliminary Estimates ........................................................................................ 373Detailed Estimates ............................................................................................. 374Defi nitive Estimate ............................................................................................. 374
Impact of “Fast Track” Projects on Estimating ......................................................... 374Estimate Review ...................................................................................................... 374
External Reviews ............................................................................................... 375Other Factors in Estimate Reviews .................................................................... 375Team Reviews .................................................................................................... 375
Estimate Development ............................................................................................. 376The Estimating Process ..................................................................................... 376Estimating Methods............................................................................................ 378Inputs for Estimate Development ....................................................................... 378Sources of Estimate Inputs ................................................................................ 379The Use of Defaults in Estimate Preparation ..................................................... 379Estimating Guidelines ........................................................................................ 379Level of Estimate Detail ..................................................................................... 380Calculation of Indirect Costs .............................................................................. 381Escalation Factors and Cost Flow Development ............................................... 381Use of Other Escalation Factors ........................................................................ 382Estimating Operating and Manufacturing Costs ................................................ 382Software Estimating ........................................................................................... 383
Learning Curves ....................................................................................................... 384Unit Learning Curve .......................................................................................... 384Cumulative Average Learning Curve ................................................................. 385The Diff erence between Unit Linear and Cumulative Average Linear ............... 385Determining the Learning Curve to Use ............................................................. 385
ixTable of Contents
Typical Learning Curve Values ........................................................................... 385Impacts to Learning Curves ............................................................................... 386
Estimate Traceability ............................................................................................... 386Conclusion ............................................................................................................... 388Review Questions .................................................................................................... 389Case Study 19.1 Assessing the Estimate .............................................................. 391Case Study 19.2 Estimate Modifi cation ................................................................. 393Case Study 19.3 Estimate History ......................................................................... 397
Section 4 Earned Value .................................................................................................................. 401
Chapter 20 Earned Value .......................................................................................................... 403The Concept ............................................................................................................ 405The Earned Value Process ...................................................................................... 408The Value of Earned Value ...................................................................................... 408Conclusion ............................................................................................................... 409Review Questions .................................................................................................... 409Case Study 20.1 The Importance of Earned Value ................................................ 411
Chapter 21 The Brick Wall ........................................................................................................ 413The Brick Wall Example ........................................................................................... 413Earned Value Brick Wall ........................................................................................... 415Conclusion ............................................................................................................... 418Review Questions .................................................................................................... 419Case Study 21.1 The Brick Wall............................................................................. 421
Chapter 22 Measuring Accomplishment ................................................................................. 423Work Packages ........................................................................................................ 423Typical Work Packages ............................................................................................ 425Discrete Eff ort .......................................................................................................... 425
Milestone Defi nition ............................................................................................ 426Incremental Milestone Technique ....................................................................... 42850/50 Technique ................................................................................................. 4290/100 Technique ................................................................................................. 430Units Complete Technique ................................................................................. 430Equivalent Units Technique ................................................................................ 432Percent Complete Technique ............................................................................. 434
Apportioned Eff ort .................................................................................................... 435Level of Eff ort ........................................................................................................... 436Other Earned Value Techniques .............................................................................. 436When is Earned Value Credited? ............................................................................. 437Other Comments ...................................................................................................... 437Conclusion ............................................................................................................... 438Review Questions .................................................................................................... 438Case Study 22.1 Control Account Plan Exercise 1 ................................................ 441
Chapter 23 Establishing the Performance Measurement Baseline ...................................... 445Performance Measurement Baseline Development ................................................ 445Rolling Wave Planning ............................................................................................. 447Performance Measurement Baseline Structure ....................................................... 449
x Table of Contents
Timing of the Baseline Establishment ...................................................................... 451Work Authorization ................................................................................................... 451Control Account Plan and Baseline Traceability ...................................................... 454Conclusion ............................................................................................................... 454Review Questions .................................................................................................... 455Case Study 23.1 Control Account Plan Exercise 2 ................................................ 457
Chapter 24 Collecting Actual Cost ........................................................................................... 459Actual Cost Components ......................................................................................... 459Data Element Sources ............................................................................................. 461Accounting Interface with Project Management ....................................................... 462Cash Flow Considerations ....................................................................................... 464Material Costs .......................................................................................................... 465Indirect Costs ........................................................................................................... 465Late Reporting of Actual Costs ................................................................................ 467Accuracy of Reported Actual Costs ......................................................................... 467Estimated ACWP ..................................................................................................... 469Reporting Labor Hours versus Labor Dollars ........................................................... 470Conclusion ............................................................................................................... 470Review Questions .................................................................................................... 471
Chapter 25 Performance Measurement Calculations and Estimates at Completion .......... 473Performance Measurement Calculations ................................................................. 473Developing the Estimate at Completion (EAC) ........................................................ 476Performance Indices ................................................................................................ 478
Cost Performance Index (CPI) ........................................................................... 478Schedule Performance Index (SPI).................................................................... 478To Complete Performance Index (TCPI) ............................................................ 479
Independent Estimates at Completion (IEAC) ......................................................... 479Preparing a Range of Estimates at Completion ...................................................... 481Percent Complete .................................................................................................... 482Independent Estimated Completion Date (IECD) .................................................... 482Average Performance Rate Required to Achieve the Estimated Completion Date (ECD) .............................................................................................................. 482Combining SPI with CPM Information ...................................................................... 483Combining SPI with CPI (Labor Only) ...................................................................... 484Reporting ................................................................................................................. 484Report Formats ........................................................................................................ 484Integrated Program Management Report ............................................................... 486Analyzing Material Cost Variances .......................................................................... 486Analyzing Labor Cost Variances .............................................................................. 487Earned Value and Cost/Schedule Impact Identifi cation ........................................... 487Conclusion ............................................................................................................... 488Review Questions .................................................................................................... 488Case Study 25.1 Project Performance Analysis ..................................................... 491Case Study 25.2 Project Control Analysis .............................................................. 495
Chapter 26 Variance Analysis and Corrective Action ............................................................ 499Variance Analysis ..................................................................................................... 499Variance Thresholds ................................................................................................ 500
xiTable of Contents
Variance Analysis Reports ....................................................................................... 503Heading Information/Earned Value Data ............................................................ 503Problem Analysis................................................................................................ 504Impact ................................................................................................................ 505Corrective Action Plan ........................................................................................ 505Estimate at Completion Justifi cation .................................................................. 506Approvals ........................................................................................................... 506
Conclusion ............................................................................................................... 506Review Questions .................................................................................................... 506Case Study 26.1 Calculation of Cost and Schedule Variances .............................. 509
Chapter 27 Baseline Revisions and Change Control ............................................................. 511Change Control ........................................................................................................ 511Types and Causes of Changes ................................................................................ 511Elements of a Change Control Program .................................................................. 513How to Control Changes .......................................................................................... 513Change Control and the Baseline ............................................................................ 514Baseline Changes at the Control Account Level ...................................................... 515Incorporating Changes into the PMB ....................................................................... 516Detailed Tracking of Changes .................................................................................. 516Authorized Unpriced Work ....................................................................................... 518Internal Replanning .................................................................................................. 520Stop Work Orders .................................................................................................... 521Rubber Baseline ...................................................................................................... 521Conclusion ............................................................................................................... 522Review Questions .................................................................................................... 522Case Study 27.1 Contract Budget Base Log ......................................................... 525
Chapter 28 Subcontract Management .................................................................................... 531Defi nition of Subcontracts ........................................................................................ 531Subcontract Flowdown Requirements ..................................................................... 532Subcontract Requests for Proposals ....................................................................... 533Subcontract Type ..................................................................................................... 534Subcontractor Reporting Requirements ................................................................... 535Integrating the Subcontractor WBS ......................................................................... 535Integrating the Schedule .......................................................................................... 536Post Award Baseline Establishment ........................................................................ 537Establishing the Schedule Baseline ......................................................................... 537Establishing the Budget Baseline ............................................................................ 537Prime Contractor Considerations for Subcontracts without EVMS Requirements ... 540
Cost Reimbursable ............................................................................................ 540Firm Fixed Price (FFP) ....................................................................................... 540Time and Materials (T&M) .................................................................................. 541Technical Services ............................................................................................. 541
Additional Considerations When Planning Subcontract Budgets ............................ 541Factoring Subcontract Budgets ................................................................................ 542Special Organizational Situations ............................................................................ 543
Inter-Divisional Work Authorization (IDWA)........................................................ 543Badgeless Organizations ................................................................................... 543
Revisions ................................................................................................................. 544
xii Table of Contents
Directed Changes .............................................................................................. 545Internal Replanning ............................................................................................ 546Formal Reprogramming ..................................................................................... 546
Subcontract Data Analysis ....................................................................................... 547Subcontract EVMS Reviews and Surveillance ........................................................ 548
EVMS Guideline Compliance with Validation ..................................................... 548EVMS Guideline Compliance without Validation ................................................ 548EV Reporting without EVMS Guideline Compliance .......................................... 549
Conclusion ............................................................................................................... 549Review Questions .................................................................................................... 549
Section 4 Review Quiz ............................................................................................................... 551
Section 5 Implementation of the Project Management Process ................................................ 557
Chapter 29 Implementation of the Project Management Process ........................................ 559Background .............................................................................................................. 559System Design ......................................................................................................... 560System Description .................................................................................................. 561The Creation of Storyboards .................................................................................... 564Identifi cation of Areas Needing Improvement .......................................................... 565Software Selection ................................................................................................... 566Development of Procedures and Training Material .................................................. 566System Start-up ....................................................................................................... 566Changes to System Operation ................................................................................. 567Routine Operation .................................................................................................... 567Implementation Schedules ....................................................................................... 567Tailoring the System for Project Unique Requirements ........................................... 568Conclusion ............................................................................................................... 569Review Questions .................................................................................................... 569
Section 6 Conclusion and References ......................................................................................... 571Earned Value Analysis Formulas .................................................................................................. 573Abbreviations and Acronyms ........................................................................................................ 577Glossary ....................................................................................................................................... 581Bibliography .................................................................................................................................. 597Index ............................................................................................................................................. 599About the Authors ......................................................................................................................... 607
xiii
Chapter 1 Project Management Using Earned Value ............................................................. 27Figure 1-1 Shocking Surprises ................................................................................................. 30Figure 1-2 Budget Plan vs. Actual Cost .................................................................................... 30Figure 1-3 Overrun or Ahead of Schedule? .............................................................................. 31Figure 1-4 Underrun or Behind Schedule? ............................................................................... 31Figure 1-5 Signifi cant Overrun or Accelerated Schedule? ........................................................ 31Figure 1-6 A Performance Oriented Approach Provides Better Visibility .................................. 32Figure 1-7 Cost and Schedule Impacts .................................................................................... 32Figure 1-8 Earned Value Project Management: The Process .................................................. 35
Chapter 2 Defi nition of Scope, Work Breakdown Structure (WBS) and WBS Dictionary ... 39Figure 2-1 Earned Value Project Management: The Process .................................................. 40Figure 2-2 600 Megawatt WBS ................................................................................................. 42Figure 2-3 Boiler Plant Equipment WBS ................................................................................... 43Figure 2-4 Coal Handling System WBS .................................................................................... 43Figure 2-5 Storage and Preparation WBS ................................................................................ 43Figure 2-6 Sewer Treatment Plant WBS ................................................................................... 44Figure 2-7 DOE Project Summary WBS ................................................................................... 44Figure 2-8 Sample Project WBS Software Development Project ............................................. 45Figure 2-9 Sample Project WBS Software Development Project Details ................................. 45Figure 2-10 CWBS Dictionary and Contract ............................................................................. 46Figure 2-11 Element of Cost Orientation .................................................................................. 47Figure 2-12 Phase Orientation .................................................................................................. 48Figure 2-13 Engineering/Design WBS - Example 1.................................................................. 49Figure 2-14 Engineering/Design WBS - Example 2.................................................................. 49Figure 2-15 Product - User Mapping ........................................................................................ 50
Chapter 3 Managing Project Risk ............................................................................................ 67Figure 3-1 Earned Value Project Management: The Process .................................................. 68Figure 3-2 Managing Project Risks: The Process .................................................................... 69Figure 3-3 Sample Risk Register .............................................................................................. 71Figure 3-4 Widget Project Risk Register ................................................................................... 73
Chapter 4 Relating Organizations, Responsibility, and Work Scope ................................... 79Figure 4-1 Earned Value Project Management: The Process .................................................. 80Figure 4-2 Functional Organization .......................................................................................... 81Figure 4-3 Project Organization ................................................................................................ 81Figure 4-4 Composite Organization .......................................................................................... 81Figure 4-5 Responsibility Assignment Matrix (RAM) ................................................................ 82Figure 4-6 Responsibility Assignment Matrix and Control Account Structure ........................... 83Figure 4-7 Control Account Example 1 ..................................................................................... 84Figure 4-8 Control Account Example 2 ..................................................................................... 84Figure 4-9 Control Account Example 3 ..................................................................................... 85Figure 4-10 Control Account Example 4 ................................................................................... 85
Chapter 5 Work Teams .............................................................................................................. 95Figure 5-1 Earned Value Management: The Process ............................................................... 96Figure 5-2 Typical Responsibility Matrix - Functional Alignment ............................................... 99Figure 5-3 Potential Work Team Alignment - 1 ......................................................................... 99Figure 5-4 Potential Work Team Alignment - 2 ....................................................................... 100
L F
xiv List of Figures
Figure 5-5 Potential Work Team Alignment - 3 ....................................................................... 101Figure 5-6 Work Team Application - Example 1 ...................................................................... 101Figure 5-7 Work Team Application - Example 2 ...................................................................... 102Figure 5-8 Work Team Application - Example 3 ...................................................................... 102
Chapter 6 What is Scheduling? Schedule Types ................................................................. 121Figure 6-1 Earned Value Project Management: The Process ................................................ 122Figure 6-2 Planning and Scheduling....................................................................................... 122Figure 6-3 Gantt Chart ............................................................................................................ 126Figure 6-4 Milestone Chart ..................................................................................................... 127Figure 6-5 Bar Chart ............................................................................................................... 127Figure 6-6 Combination Chart ................................................................................................ 128Figure 6-7 Modifi ed Bar/Milestone Chart ................................................................................ 128Figure 6-8 Process Flowchart ................................................................................................. 129Figure 6-9 Set Back Chart ...................................................................................................... 129Figure 6-10 Line of Balance Chart .......................................................................................... 129Figure 6-11 Network Diagrams ............................................................................................... 130
Chapter 7 Introduction to Network Logic Development ...................................................... 137Figure 7-1 Earned Value Project Management: The Process ............................................... 138Figure 7-2 Planning and Scheduling ...................................................................................... 138Figure 7-3 PDM Networks ...................................................................................................... 139Figure 7-4 Finish to Start ........................................................................................................ 139Figure 7-5 Finish to Finish ...................................................................................................... 140Figure 7-6 Start to Start .......................................................................................................... 140Figure 7-7 Start to Finish ........................................................................................................ 141Figure 7-8 Time-Phased Diagrams - Variable Box Length ..................................................... 142Figure 7-9 Time-Phased Bar Chart ......................................................................................... 143
Chapter 8 Critical Path Method Fundamentals ..................................................................... 147Figure 8-1 Earned Value Project Management: The Process ............................................... 148Figure 8-2 Planning and Scheduling ...................................................................................... 148Figure 8-3 Critical Path ........................................................................................................... 149Figure 8-4 Standard Notation ................................................................................................. 150Figure 8-5 Forward Pass (Activity Early Dates) ...................................................................... 151Figure 8-6 Forward Pass (Activity Relationship Early Dates) ................................................. 151Figure 8-7 Forward Pass (Early Dates - Converging Paths) .................................................. 151Figure 8-8 Forward Pass ........................................................................................................ 151Figure 8-9 Backward Pass (Activity Late Dates) .................................................................... 152Figure 8-10 Backward Pass (Activity Relationship Late Dates).............................................. 152Figure 8-11 Backward Pass (Late Dates - Converging Paths) ............................................... 152Figure 8-12 Backward Pass .................................................................................................... 152Figure 8-13 Early, Late Dates and Total Float - the Critical Path ............................................ 153Figure 8-14 Total Float as a Shared Value ............................................................................. 154Figure 8-15 Free Float Calculation ......................................................................................... 155Figure 8-16 Total and Free Float ............................................................................................ 155Figure 8-17 Impact of Directed Finish Date - Negative Float.................................................. 156Figure 8-18 Impact of Directed Finish Date - Positive Float ................................................... 157
Chapter 9 Resource Loading and Leveling the Schedule ................................................... 175Figure 9-1 Earned Value Project Management: The Process ............................................... 176Figure 9-2 Planning and Scheduling ...................................................................................... 176Figure 9-3 Resource Profi le .................................................................................................... 177
xvList of Figures
Figure 9-4 Skyline Chart ......................................................................................................... 178Figure 9-5 Time and/or Resource Constraints ........................................................................ 178Figure 9-6 Resource Boundaries ............................................................................................ 180Figure 9-7 Resource Boundaries - Time and Resource Floats............................................... 181Figure 9-8 Resource Boundaries - Less and More Critical Curves ........................................ 182
Chapter 10 Considerations for Developing a Useful, Quality Network Schedule ............... 189Figure 10-1 Earned Value Project Management: The Process ............................................. 190Figure 10-2 Planning and Scheduling .................................................................................... 190Figure 10-3 Top Level Schedule - Contractual Milestones ..................................................... 191Figure 10-4 “Unit A” Top Level Schedule ................................................................................ 191Figure 10-5 “Unit A” Widgets 1 and 2 Engineering Schedule ................................................. 192Figure 10-6 “Unit A” Widget 1 Engineering Schedule ............................................................. 192Figure 10-7 Integrated Master Plan for the Widget Project .................................................... 193Figure 10-8 Coding Relationship Between WBS, IMP, IMS .................................................... 194Figure 10-9 Hammock ............................................................................................................ 196Figure 10-10 Summaries Using Code Fields .......................................................................... 196Figure 10-11 Grouping Facility Showing Total Float by CAM ................................................. 196Figure 10-12 Templates .......................................................................................................... 197Figure 10-13 Legend for the Examples .................................................................................. 199Figure 10-14 Finish to Start with Lag ...................................................................................... 199Figure 10-15 Start to Start with Lag ........................................................................................ 200Figure 10-16 Finish to Finish with Lag .................................................................................... 200Figure 10-17 Schedule Margin Using Buff er Activity .............................................................. 202Figure 10-18 Qualitative Selection Criteria for Schedule Detail.............................................. 206Figure 10-19 Missing Logic - Goal: 5% or Less ...................................................................... 208Figure 10-20 Leads - Goal: 0% ............................................................................................... 208Figure 10-21 Lags - Goal: 5% or Less .................................................................................... 208Figure 10-22 Relationship Goals ............................................................................................ 208Figure 10-23 Hard Constraints - Goal: 5% or Less ................................................................. 209Figure 10-24 High Float of 44 Working Days or More - Goal: 5% or Less ............................. 209Figure 10-25 Negative Float - Goal: 5% or Less .................................................................... 210Figure 10-26 Durations Greater than 44 Working Days - Goal: 5% or Less ........................... 210Figure 10-27 Invalid Dates - Goal: 0% .................................................................................... 210Figure 10-28 Missing Resources on Activities with Durations of 1 Day or More - Goal: 0% .. 211Figure 10-29 Missed Activities - Goal: < 5% ........................................................................... 211Figure 10-30 Critical Path Test, Before and After ................................................................... 211Figure 10-31 CPLI Graphic Highlighting the .95 Threshold .................................................... 212Figure 10-32 Baseline Execution Index .................................................................................. 212Figure 10-33 Health Check/GASP Correlation ....................................................................... 213
Chapter 11 Schedule Acceleration Techniques ...................................................................... 221Figure 11-1 Earned Value Project Management: The Process .............................................. 222Figure 11-2 Planning and Scheduling .................................................................................... 222Figure 11-3 Activity “Crashing” Concept ................................................................................. 223Figure 11-4 “Crashing” a Network - An Example .................................................................... 224Figure 11-5 Step 1 and Step 2 - “6 Weeks” ............................................................................ 224Figure 11-6 Step 3 - Identify Crash Time and Crash Costs for Each Activity .......................... 225Figure 11-7 Cost of Crashing Activity “A” ................................................................................ 225Figure 11-8 Step 4 ................................................................................................................. 226Figure 11-9 Step 5 and Step 6 ............................................................................................... 226Figure 11-10 Step 7 ............................................................................................................... 227
xvi List of Figures
Figure 11-11 Alternatives ....................................................................................................... 227Figure 11-12 9 Weeks Cost ................................................................................................... 228Figure 11-13 8 Weeks Cost ................................................................................................... 228Figure 11-14 7 Weeks Schedule ............................................................................................ 229Figure 11-15 7 Weeks Cost ................................................................................................... 229Figure 11-16 Project Cost vs. Time Relationship - The Tradeoff Curve .................................. 230
Chapter 12 Setting a Traceable Schedule Baseline ............................................................... 235Figure 12-1 Earned Value Project Management: The Process ............................................. 236Figure 12-2 Planning and Scheduling .................................................................................... 236Figure 12-3 Horizontal Traceability Between Same Level of Detail ........................................ 237Figure 12-4 Vertical Traceability Between Diff erent Levels of Detail ...................................... 237Figure 12-5 Milestones ........................................................................................................... 238Figure 12-6 Vertical Traceability Coding Schema ................................................................... 238Figure 12-7 Baseline Change Request................................................................................... 240
Chapter 13 Updating the Schedule .......................................................................................... 253Figure 13-1 Earned Value Project Management: The Process ............................................. 254Figure 13-2 Planning and Scheduling .................................................................................... 254Figure 13-3 Calendar .............................................................................................................. 255Figure 13-4 Impact of Status on Duration and Float ............................................................... 257Figure 13-5 PDM Network ...................................................................................................... 259Figure 13-6 Schedule Bar Chart ............................................................................................. 259Figure 13-7 Out-of-Sequence Progress - Retained Logic Option (PDM Network) ................. 260Figure 13-8 Out-of-Sequence Progress - Retained Logic Option (Bar Chart) ........................ 260Figure 13-9 Out-of-Sequence Progress - Progress Override Option (PDM Network) ............ 261Figure 13-10 Out of Sequence Progress - Progress Override Option (Bar Chart) ................. 262Figure 13-11 Impact on Total Float - Sample Network ............................................................ 263Figure 13-12 Impact on Total Float - Retain Logic Option ...................................................... 263Figure 13-13 Impact on Total Float - Progress Override Option ............................................. 264
Chapter 14 Schedule Changes ................................................................................................. 269Figure 14-1 Earned Value Project Management: The Process ............................................. 270Figure 14-2 Planning and Scheduling .................................................................................... 270
Chapter 15 Resolving Negative Float ...................................................................................... 281Figure 15-1 Earned Value Project Management: The Process .............................................. 282Figure 15-2 Planning and Scheduling..................................................................................... 282Figure 15-3 Trend in Float by Path ......................................................................................... 284Figure 15-4 Baseline vs. Current - Date and Duration Variances ........................................... 285Figure 15-5 Resolution Alternatives ........................................................................................ 288Figure 15-6 Analysis - Most Critical Activities ......................................................................... 289Figure 15-7 Analysis - Number of Critical Activities ................................................................ 289Figure 15-8 Analysis - Number of Activities On or Behind Schedule ...................................... 289
Chapter 16 Special Networking Considerations ..................................................................... 293Figure 16-1 Earned Value Project Management: The Process .............................................. 294Figure 16-2 Planning and Scheduling..................................................................................... 294Figure 16-3 Start Not Earlier Than Constraint Impact ............................................................ 295Figure 16-4 Delayed Activity Using a Milestone ..................................................................... 296Figure 16-5 Start Not Earlier Than Constraint Bypassed ....................................................... 296Figure 16-6 Delay Using a Schedule Visibility Task ................................................................ 296Figure 16-7 Small Project Bar Chart 321 ................................................................................ 297Figure 16-8 Start Not Earlier Than Constraint ....................................................................... 297
xviiList of Figures
Figure 16-9 Finish Not Later Than Constraint ........................................................................ 298Figure 16-10 Must Start On Constraint ................................................................................... 298Figure 16-11 Must Finish On Constraint ................................................................................. 299Figure 16-12 Finish Date Constrained Network - Imposed Date Earlier Than Calculated Date ...................................................................................................................... 300Figure 16-13 Constraint Date Spectrum ................................................................................. 301Figure 16-14 Parallel, SS/FF Relationships 1 ......................................................................... 302Figure 16-15 Parallel, SS/FF Relationships 2 ......................................................................... 302Figure 16-16 Parallel, SS/FF Relationships 3 ......................................................................... 302Figure 16-17 Parallel, SS/FF Relationships 4 ......................................................................... 303Figure 16-18 LOE Example .................................................................................................... 304Figure 16-19 Alternate LOE Solution ...................................................................................... 304
Chapter 17 Schedule Risk Assessment .................................................................................. 309Figure 17-1 Earned Value Project Management: The Process .............................................. 310Figure 17-2 Planning and Scheduling..................................................................................... 310Figure 17-3 Risk Assessment with CPM Network .................................................................. 311Figure 17-4 Risk Assessment with CPM ................................................................................. 312Figure 17-5 Risk Analysis of the Project ................................................................................. 312Figure 17-6 Building Foundation Activity ................................................................................ 315Figure 17-7 Most Likely and Average Durations ..................................................................... 315Figure 17-8 Low and High Possible Durations ...................................................................... 316Figure 17-9 Risk Analysis of Path Duration Example ............................................................ 316Figure 17-10 Constructing the S-Curve .................................................................................. 317Figure 17-11 Likelihood of Slippages and Contingencies ....................................................... 318Figure 17-12 Cumulative Distribution for Path A ..................................................................... 318Figure 17-13 Validity of CPM Estimates ................................................................................. 319Figure 17-14 Identifying the Highest Risk Path ...................................................................... 320Figure 17-15 Identify the Highest Risk Path ........................................................................... 320Figure 17-16 Merge Bias at Convergence .............................................................................. 321Figure 17-17 Direct Dates ....................................................................................................... 322Figure 17-18 Reducing Durations to Fit the Schedule ............................................................ 322Figure 17-19 Two Path Example ............................................................................................ 323Figure 17-20 Late Starts on Path B ........................................................................................ 323Figure 17-21 Early Starts on Path B ....................................................................................... 323Figure 17-22 Schedule Risk Histogram ................................................................................. 325Figure 17-23 Cost Risk Histogram ......................................................................................... 325Figure 17-24 Standard Deviation ............................................................................................ 327Figure 17-25 Six Activity Network Example ............................................................................ 327Figure 17-26 PERT Calculations ............................................................................................ 328Figure 17-27 Distribution Curve for Path U-V-X-Z .................................................................. 328Figure 17-28 Distribution Curve for Path U-W-Y-Z ................................................................. 328
Chapter 18 Scheduling in a Performance Measurement Environment ................................ 347Figure 18-1 Earned Value Project Management: The Process .............................................. 348Figure 18-2 Planning and Scheduling..................................................................................... 348Figure 18-3 Schedule Integration - Schedules Must Tier ....................................................... 351Figure 18-4 WBS Levels vs. Schedule Levels ....................................................................... 351
Chapter 19 The Estimating Process ........................................................................................ 369Figure 19-1 Earned Value Project Management: The Process .............................................. 370Figure 19-2 Levels of Estimate Detail 1 .................................................................................. 372
xviii List of Figures
Figure 19-3 Levels of Estimate Detail 2 .................................................................................. 373Figure 19-4 The Estimating Process ...................................................................................... 376Figure 19-5 Inputs for Estimate Development ........................................................................ 378Figure 19-6 Estimate Outputs ................................................................................................. 379Figure 19-7 Estimate Development Example ......................................................................... 379Figure 19-8 Level of Detail Summarization ............................................................................. 380Figure 19-9 Estimate History Form ($ x 1000) ........................................................................ 388
Chapter 20 Earned Value .......................................................................................................... 403Figure 20-1 Earned Value Project Management: The Process .............................................. 404Figure 20-2 Budget Plan vs. Actuals....................................................................................... 405Figure 20-3 Overrun or Ahead of Schedule? .......................................................................... 405Figure 20-4 Planned Accomplishment .................................................................................... 406Figure 20-5 Earned Value of a Task ....................................................................................... 406Figure 20-6 Planned vs. Actual Accomplishment.................................................................... 406Figure 20-7 What’s Been Accomplished? What did it Cost? .................................................. 406Figure 20-8 Earned Value is a Good Approximation ............................................................... 407Figure 20-9 Cost Variance ...................................................................................................... 407Figure 20-10 Schedule Variance ............................................................................................ 407Figure 20-11 Cost and Schedule Impacts ............................................................................... 408
Chapter 21 The Brick Wall ........................................................................................................ 413Figure 21-1 Budget vs. Actuals ............................................................................................... 413Figure 21-2 Four Days of Bricking .......................................................................................... 414Figure 21-3 Budget vs. Actual Day Five ................................................................................. 414Figure 21-4 Planning Using Earned Value .............................................................................. 415Figure 21-5 Detailed Planning for Day One Using Earned Value ........................................... 415Figure 21-6 Earned Value After Day One ............................................................................... 416Figure 21-7 Earned Value Status Day One ............................................................................ 416Figure 21-8 Earned Value Status Day Two ............................................................................. 417Figure 21-9 Earned Value Status Day Three .......................................................................... 417Figure 21-10 Earned Value Status Day Four .......................................................................... 417Figure 21-11 Earned Value Status Day Five ........................................................................... 417Figure 21-12 Earned Value Graphics ..................................................................................... 418
Chapter 22 Measuring Accomplishment ................................................................................. 423Figure 22-1 Earned Value Project Management: The Process .............................................. 424Figure 22-2 Incremental Milestone - Planning ........................................................................ 428Figure 22-3 Incremental Milestone - Status ............................................................................ 428Figure 22-4 50% / 50% - Planning .......................................................................................... 429Figure 22-5 50% / 50% - Status .............................................................................................. 429Figure 22-6 0% / 100% - Planning .......................................................................................... 430Figure 22-7 0% / 100% - Status .............................................................................................. 430Figure 22-8 Units Complete - Planning ................................................................................... 431Figure 22-9 Units Complete - Status ...................................................................................... 431Figure 22-10 Percent Complete - Planning ............................................................................ 434Figure 22-11 Percent Complete - Status ................................................................................ 434Figure 22-12 Apportioned Eff ort - Planning and Status .......................................................... 435Figure 22-13 Level of Eff ort (LOE) - Planning ........................................................................ 436Figure 22-14 Level of Eff ort (LOE) - Status ............................................................................ 436
Chapter 23 Establishing the Performance Measurement Baseline ...................................... 445Figure 23-1 Earned Value Project Management: The Process .............................................. 446
xixList of Figures
Figure 23-2 Performance Measurement Baseline .................................................................. 446Figure 23-3 Rolling Wave Example 1 ..................................................................................... 447Figure 23-4 Rolling Wave Example 2 ..................................................................................... 448Figure 23-5 Reporting Structure Data Matrix .......................................................................... 449Figure 23-6 Total Project Cost Distribution ............................................................................. 449Figure 23-7 Elements of the Distributed Budget ..................................................................... 449Figure 23-8 Management Reserve ......................................................................................... 450Figure 23-9 Budget Summary ................................................................................................. 451Figure 23-10 Work Authorization Document ........................................................................... 453
Chapter 24 Collecting Actual Cost ........................................................................................... 459Figure 24-1 Earned Value Project Management: The Process .............................................. 460Figure 24-2 Cost Element Examples ...................................................................................... 460Figure 24-3 Data Source Matrix .............................................................................................. 461Figure 24-4 Accounting Subsystem Interfaces with Project Management.............................. 462Figure 24-5 Material Accounting ............................................................................................. 464Figure 24-6 Material Measurement ......................................................................................... 465Figure 24-7 Matrix of Indirect Costs ........................................................................................ 466Figure 24-8 Indirect Analysis - An Example ............................................................................ 467
Chapter 25 Performance Measurement Calculations and Estimates at Completion .......... 473Figure 25-1 Earned Value Project Management: The Process .............................................. 474Figure 25-2 Mixing Variances ................................................................................................. 475Figure 25-3 Graphical Schedule Conversion .......................................................................... 475Figure 25-4 Trend Analysis ..................................................................................................... 476Figure 25-5 Trend Analysis with Percentage Threshold ......................................................... 476Figure 25-6 Estimate at Completion ....................................................................................... 476Figure 25-7 To Complete Performance Index (TCPI)EAC ......................................................... 479Figure 25-8 Performance Indices Comparison ....................................................................... 479Figure 25-9 Range of Estimates at Completion ...................................................................... 481Figure 25-10 Performance Measurement Data Concern........................................................ 483Figure 25-11 Combining SPI and TF Data .............................................................................. 483Figure 25-12 Combining SPI and CPI (Labor Accounts) ........................................................ 484Figure 25-13 Performance Report - Work Breakdown Structure ............................................ 485Figure 25-14 Performance Report - Project Organization ...................................................... 485Figure 25-15 Material Cost Variance Components ................................................................. 487Figure 25-16 Labor Cost Variance Components .................................................................... 487Figure 25-17 Cost and Schedule Impacts .............................................................................. 487
Chapter 26 Variance Analysis and Corrective Action ............................................................ 499Figure 26-1 Earned Value Project Management: The Process .............................................. 500Figure 26-2 Data Traceability .................................................................................................. 501Figure 26-3 Variance Analysis Report .................................................................................... 504Figure 26-4 Corrective Action Log .......................................................................................... 506
Chapter 27 Baseline Revisions and Change Control ............................................................. 511Figure 27-1 Earned Value Project Management: The Process .............................................. 512Figure 27-2 Change Control ................................................................................................... 514Figure 27-3 Eff ect of Changes ................................................................................................ 515Figure 27-4 Control Account 1 ................................................................................................ 515Figure 27-5 Control Account 1 Closeout ................................................................................. 515Figure 27-6 Control Account 1A .............................................................................................. 516Figure 27-7 Contract Budget Base Log .................................................................................. 517
xx List of Figures
Figure 27-8 Baseline Change Request................................................................................... 519Figure 27-9 Internal Replanning ............................................................................................. 521Figure 27-10 Rubber Baseline ................................................................................................ 522
Chapter 28 Subcontract Management .................................................................................... 531Figure 28-1 Earned Value Project Management: The Process .............................................. 532Figure 28-2 Subcontract Risk Factor ...................................................................................... 533Figure 28-3 Relationship of Risk to Contract Type ................................................................. 533Figure 28-4 Subcontract EVM System and Reporting Requirements .................................... 534Figure 28-5 Prime Contract/Subcontract Integration (1 of 2) .................................................. 536Figure 28-6 Prime Contract/Subcontract Integration (2 of 2) .................................................. 536Figure 28-7 Planning the Defi nitized Subcontract .................................................................. 538Figure 28-8 BCWS Time Phasing for Prime Control Accounts (1 of 2)................................... 538Figure 28-9 BCWS Time Phasing for Prime Control Accounts (2 of 2)................................... 538Figure 28-10 Allocation Example ............................................................................................ 539Figure 28-11 The Subcontractor’s MR and UB ....................................................................... 539Figure 28-12 Prime Contractor Establishes BCWS Based on Subcontractor Submittals....... 540Figure 28-13 Factoring Objectives .......................................................................................... 542Figure 28-14 Badgeless Organization RAM ........................................................................... 544Figure 28-15 Class I Change Cycle ........................................................................................ 545Figure 28-16 Class II Change Cycle ....................................................................................... 545Figure 28-17 Over Target Baseline and Schedule .................................................................. 547
Chapter 29 Implementation of the Project Management Process ........................................ 559Figure 29-1 Earned Value Project Management: The Process .............................................. 560Figure 29-2 Design and Implementation of the Project Management System ....................... 561Figure 29-3 Baseline Schedule Development Flowchart ........................................................ 562Figure 29-4 Performance Measurement Flowchart ................................................................ 565Figure 29-5 Implementation Schedule .................................................................................... 568
xxi
P This book is about integrated project management. It is not about all aspects of project management but it includes some of the most important aspects. All projects contain three elements; scope of work, a scheduled time frame in which the work must be accomplished, and a budget to perform the work. Integrating these three elements using Earned Value Management provides the basis for eff ective project management. The planning, control, and management of projects can be improved through the use of Earned Value.This book is intended for anyone who desires to know more about project management, planning and control and how to improve these processes through the use of Earned Value. Intended readers include project and program managers, project control personnel, project technical personnel, procurement ac-tivity personnel and the stakeholders and owners of projects. While it is intended for a wide range of readers, each is assumed to have a basic familiarity with the requirements and the disciplines of project management. Readers new to this arena would be well advised to supplement this reading with a basic but general work on Project Management.The material in this book has been drawn from the collective experiences of the authors and many of the professional personnel of Humphreys & Associates, Inc., consultants in project and program manage-ment for over forty years. This material has been presented in seminars and workshops, and successfully used in assisting our clients in the United States and around the world. While introductory theory is ex-plained, time tested samples are provided. Samples are presented from specifi c industries. Please do not conclude that a sample does not apply to those of you in the construction, software, or other industries. In order to facilitate the learning experience, the topics covered are linked together in a process fl owchart. This fl owchart is displayed at the beginning of each chapter and the elements of the fl owchart addressed in that chapter are highlighted. In addition, the chapters have been grouped into Sections. Each Section represents a major topic in the planning and control process; Organization, Scheduling, Estimating, and Earned Value. These are supplemented by a Section on Implementation of the Project Management Process. Finally, there is a Conclusion and an Appendix. The Appendix contains the Earned Value anal-ysis formulas, abbreviations and acronyms, the glossary, the bibliography and index.To further aid the reader, a series of review questions are found at the conclusion of each chapter. At the end of each Section there is a Section Quiz. Finally, the majority of chapters contain one or more Case Studies. These are practical exercises that have been drawn from our consulting experiences and pre-sented in Humphreys & Associates, Inc. seminars and workshops. The Case Studies have been found to reinforce the participant’s learning. To obtain the answers to the Chapter Review Questions, the Section Quizzes and suggested solutions to the Case Studies, please call the Humphreys & Associates, Inc’s. offi ce at (714) 685-1730.
CH
APT
ER
1
27
What is a Project?Before delving into the intricacies of the earned value management process, projects and earned value management need to be defi ned fi rst. A proj-ect consists of a defi ned objective to develop or produce a new product, capability, or to expand capacity within a specifi ed time frame and budget. Examples of projects include large capital-inten-sive eff orts such as highway construction, new commercial buildings, power plants and petro-chemical plants, water treatment plants, fl ood con-trol, dams, bridges, hospitals, schools, prisons, and churches. These are the obvious, highly vis-ible projects. They are not the only types of projects as new product development is also a project. A new au-tomobile, engine, or communication satellite is a project. Other projects include research and de-velopment, defi nition of new information systems, design and installation of communication systems, creation of new software programs, and computer hardware advances. Projects are so widespread that it is diffi cult to get through the day without being involved in some way with a project, whether it is sitting in traffi c while road work continues, fi nding a more effi cient
information fl ow for offi ce communication, or man-aging a home improvement.A well conceived project could also be charac-terized as any endeavor that has a well-defi ned scope of work and optimistic yet achievable sched-ule and cost objectives. The words “project” and “program” are sometimes used interchangeably in industry, resulting in some confusion. A program is made up of individual proj-ects to be accomplished. For example, the inertial guidance system for an aircraft may be a sepa-rate project on a program. Because projects and programs share the same characteristics they can be treated in a similar manner. For that reason, throughout this text, the term “project” will be used generically to refer to both projects and programs. Now that project has been defi ned, what is earned value management? It is the process of defi ning and controlling the project so that defi ned ob-jectives are met. The controlling aspect includes scope control, schedule control, and budget con-trol. It also includes the process of identifying and minimizing risk. There are many aspects involved in earned value management, including develop-ment of the Earned Value Management System. An Earned Value Management System is a set of processes and tools used to facilitate the manage-ment of a project.
Objectives of this Chapter:1. Defi ne “project” and project management.2. Describe the performance-oriented approach using an Earned Value Management System and
explain why it is superior to actual versus budget comparisons. 3. Discuss factors aff ecting the appropriate level of detail for earned value implementation.4. Introduce the process fl owchart for the earned value project management process.
P M U E V
28 Section 1 Earned Value Project Management and Organization
Managing ProjectsMany projects result in highly successful comple-tions. Successful projects contain many common characteristics: they were well defi ned and orga-nized, had a closely monitored work scope, had optimistic yet achievable schedule and budget from the time of initiation, and were closely mon-itored and managed. Many projects have been successful for another reason: they benefi ted from mistakes on other projects. The primary factor ob-served on successfully managed projects is man-aging performance. The common thread through-out all of the topics in this textbook is exactly that. The approaches and techniques that will be dis-cussed have a performance measurement orien-tation, because the better something can be mea-sured, the better it can be managed. In a performance measurement system, cost and schedule targets are assigned to each activity planned in a project and to the project itself; prog-ress (performance) is measured against these tar-gets. Deviations from the activity targets and the causes of the deviations are identifi ed and action is taken to minimize adverse consequences to the project. Projects require expertise from many disciplines. Close coordination and communication are essen-tial parts of successful execution of a project. To achieve these, a separate “project team” is typical-ly assembled for accomplishing the project’s scope of work. This team is organized using individuals from various disciplines such as accounting, pur-chasing, engineering, manufacturing, testing, op-erations, fi nance, contracts, construction, project controls, and may also include subcontractors. Some people provide part time support to a proj-ect. These might include any of those mentioned above and others such as the legal department, record retention, fi nancial services, and executive management.The job of managing all of these organizations and people is typically assigned to a full time senior individual who is designated as the project man-ager. A project manager should meet several spe-cifi c qualifi cations: many years of experience in the type of project being managed to be technical-ly qualifi ed; a degree to be academically qualifi ed; and stamina to be physically qualifi ed. In addition,
project managers must have good processes and tools to eff ectively manage the people and the project. The project manager must orchestrate the entire project to achieve the technical, schedule, and cost objectives. If a project is an internal endeav-or, then a project manager’s role is to manage the internal departmental interfaces and contractors, and possibly other owners and customers, in addi-tion to all of the internal staff .Unlike normal functional organizations, a project has a specifi c duration. Even as a project is initiat-ed, its purpose is to accomplish defi ned objectives and disband. A project team’s job is to quickly ac-complish the technical scope of work, resource as effi ciently as possible, and then move on to the next project. The project manager’s job is, there-fore, inherently complex and challenging. Besides the interfaces that must be managed on a daily ba-sis, he or she must often be a motivational expert since the many players involved may have diff er-ent goals. For many reasons, a project manager has a great need for accurate status information. Only with reliable indication of project status can concerns be surfaced early enough to allow cor-rective action, preventing potential concerns from becoming real concerns that adversely impact technical, schedule, and cost objectives. Examples used throughout this text are extracted from actual experiences. Frequently it is easier to illustrate a concept by showing what can or will happen if certain fundamentals are ignored than what happens if they are followed. If the principles in this text are followed, there is a good probability of executing a well-managed project. If they are ignored, unpleasant, career-limiting, unsuccessful experiences can occur. Depending on project risk, project duration, and cost, (technical, schedule, and cost), certain as-pects may be implemented less stringently. The principles do not change. It is still necessary to de-fi ne the scope of work, have a plan for accomplish-ing the work, and to manage the plan. However, the level of detail of the implementation can vary. Unsuccessful applications of these principles have also happened when organizations went over-board on the level of detail of implementation. If common sense is forgotten, it is possible to create a management system that requires so much eff ort
29Chapter 1 Project Management Using Earned Value
that it requires an extensive staff just to provide the production and distribution of data. The cost of the management system is then not worth the addi-tional insight received regarding project status. The earned value management tools that are rec-ommended in this book have been eff ectively used to improve management on a multitude of projects. By selectively employing tools, the practitioner will improve management on current and future proj-ects and thus, the prospects for project success.There are several other topics related to earned value management that are not directly covered. These include contract administration, project ad-ministration, and material and subcontract man-agement. These are, however, incorporated within the discussions of related subjects generally per-formed by these functions. The contract type has an impact on the extent of earned value management implementation, but all of the basic information is still necessary to as-certain project status regardless of the contracting arrangement. Experience shows that too much attention is placed on the type of contract rather than incorporating all of the information, but at a diff erent level of detail. The human aspects of earned value management must not be forgotten either. As mentioned before, the project manager needs to be a motivational expert. The project manager also needs a strong supporting staff . No single person can successfully perform all of the work involved in a major project. He or she must rely on the support of many others. This makes the project a team eff ort. Even the best systems will be less eff ective in the hands of indi-viduals who do not cooperate with each other and do not work towards a common goal. An underly-ing assumption is that eff ective management tools will facilitate better management of a project and minimize the confusion that results from a project that is not well defi ned and planned.
BackgroundIn the past few decades, many large projects in numerous industries experienced signifi cant schedule delays and cost overruns. Nuclear power projects stretched for years beyond their original schedule and more than tripled in cost. Software development projects in most companies required
so much lead-time that the intended users had to fi nd alternative ways of accomplishing their goals. In other cases, competitors beat software devel-opment fi rms to the marketplace and millions of dollars were wasted. Water treatment and sewer treatment plants soared in cost, with immediate impact on the consumer’s water bill. Research and development projects and military projects were cancelled because of continually escalating schedule and cost projections. The U.S. auto in-dustry suff ered from a perceived lack of quality and unit prices increased. Many of these cases became highly visible to a large number of people. For the project managers, the owners, and cus-tomers of these projects, this was not the objec-tive envisioned in the project plan. How did this happen? Causes were both internal and external. Scope changes occurred without being recognized and incorporated into a revised plan for accomplishing the work. Customer needs changed, sometimes because of a delay in fi nishing a product, thus resulting in obsolescence. Delays in material de-livery occurred without properly refl ecting the im-pact to other work activities. Regulations changed, frequently aff ecting the time needed to acquire permits or authority to proceed. Lack of coordi-nation between contributing groups meant delays because of missing information, design or other-wise. When these and other disruptions occurred, resulting schedule slippage had large cost impacts because of high rates of escalation. Every delay was penalized with a signifi cant negative econom-ic consequence. Typically a domino eff ect is observed. First, a tech-nical problem occurs. This is followed by a nega-tive schedule variance and ultimately a negative cost variance. Sometimes the dominos fall very fast, but problems could evolve over months.Regardless of the source of diffi culty, the underly-ing problem was that impacts were not recognized quickly enough when conditions changed. In some cases, project managers were ignoring variances from the plan and failing to take action because they did not believe the variances were real. In others, they were not informed well enough about the variances. The situation was much like that shown in Figure 1-1.
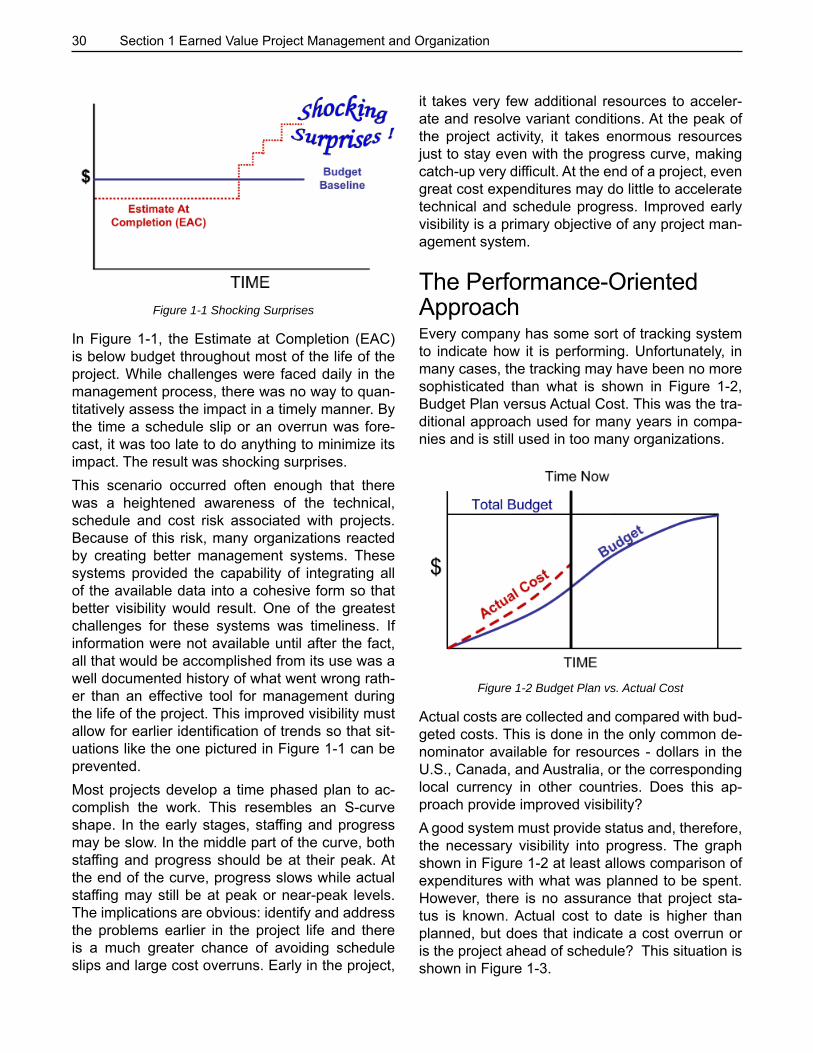
30 Section 1 Earned Value Project Management and Organization
Figure 1-1 Shocking Surprises
In Figure 1-1, the Estimate at Completion (EAC) is below budget throughout most of the life of the project. While challenges were faced daily in the management process, there was no way to quan-titatively assess the impact in a timely manner. By the time a schedule slip or an overrun was fore-cast, it was too late to do anything to minimize its impact. The result was shocking surprises. This scenario occurred often enough that there was a heightened awareness of the technical, schedule and cost risk associated with projects. Because of this risk, many organizations reacted by creating better management systems. These systems provided the capability of integrating all of the available data into a cohesive form so that better visibility would result. One of the greatest challenges for these systems was timeliness. If information were not available until after the fact, all that would be accomplished from its use was a well documented history of what went wrong rath-er than an eff ective tool for management during the life of the project. This improved visibility must allow for earlier identifi cation of trends so that sit-uations like the one pictured in Figure 1-1 can be prevented. Most projects develop a time phased plan to ac-complish the work. This resembles an S-curve shape. In the early stages, staffi ng and progress may be slow. In the middle part of the curve, both staffi ng and progress should be at their peak. At the end of the curve, progress slows while actual staffi ng may still be at peak or near-peak levels. The implications are obvious: identify and address the problems earlier in the project life and there is a much greater chance of avoiding schedule slips and large cost overruns. Early in the project,
it takes very few additional resources to acceler-ate and resolve variant conditions. At the peak of the project activity, it takes enormous resources just to stay even with the progress curve, making catch-up very diffi cult. At the end of a project, even great cost expenditures may do little to accelerate technical and schedule progress. Improved early visibility is a primary objective of any project man-agement system.
The Performance-Oriented Approach Every company has some sort of tracking system to indicate how it is performing. Unfortunately, in many cases, the tracking may have been no more sophisticated than what is shown in Figure 1-2, Budget Plan versus Actual Cost. This was the tra-ditional approach used for many years in compa-nies and is still used in too many organizations.
Figure 1-2 Budget Plan vs. Actual Cost
Actual costs are collected and compared with bud-geted costs. This is done in the only common de-nominator available for resources - dollars in the U.S., Canada, and Australia, or the corresponding local currency in other countries. Does this ap-proach provide improved visibility?A good system must provide status and, therefore, the necessary visibility into progress. The graph shown in Figure 1-2 at least allows comparison of expenditures with what was planned to be spent. However, there is no assurance that project sta-tus is known. Actual cost to date is higher than planned, but does that indicate a cost overrun or is the project ahead of schedule? This situation is shown in Figure 1-3.
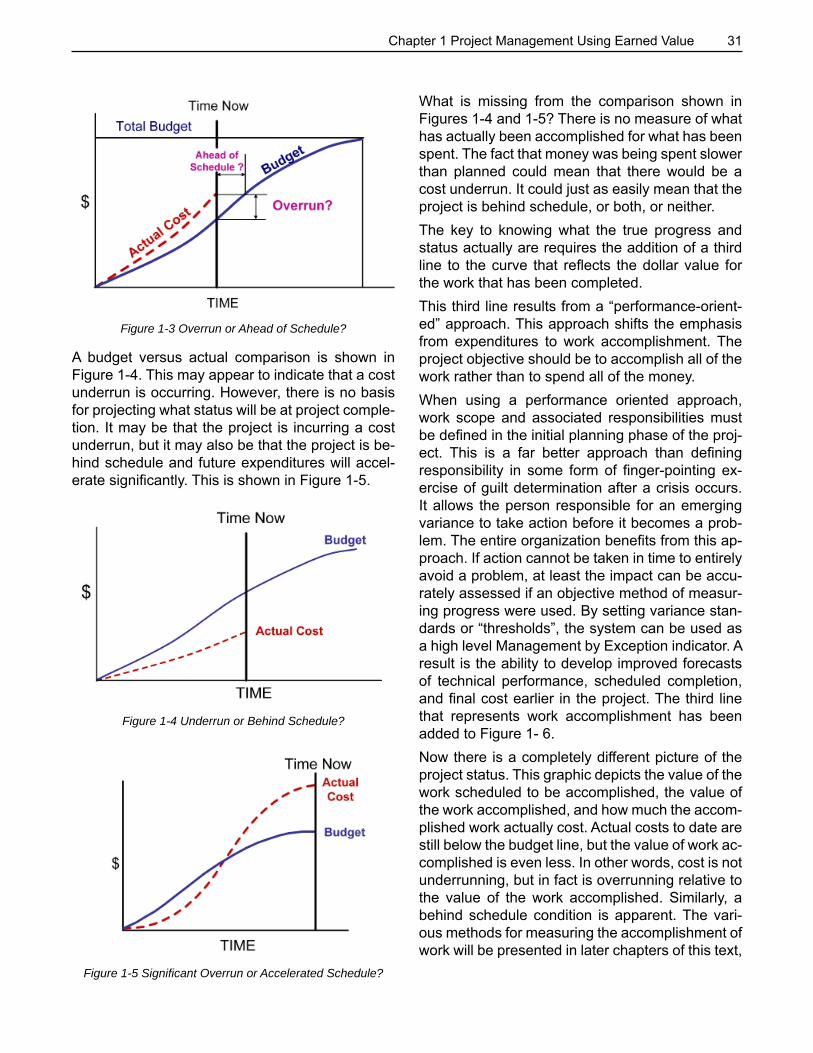
31Chapter 1 Project Management Using Earned Value
Figure 1-3 Overrun or Ahead of Schedule?
A budget versus actual comparison is shown in Figure 1-4. This may appear to indicate that a cost underrun is occurring. However, there is no basis for projecting what status will be at project comple-tion. It may be that the project is incurring a cost underrun, but it may also be that the project is be-hind schedule and future expenditures will accel-erate signifi cantly. This is shown in Figure 1-5.
Figure 1-4 Underrun or Behind Schedule?
Figure 1-5 Signifi cant Overrun or Accelerated Schedule?
What is missing from the comparison shown in Figures 1-4 and 1-5? There is no measure of what has actually been accomplished for what has been spent. The fact that money was being spent slower than planned could mean that there would be a cost underrun. It could just as easily mean that the project is behind schedule, or both, or neither. The key to knowing what the true progress and status actually are requires the addition of a third line to the curve that refl ects the dollar value for the work that has been completed. This third line results from a “performance-orient-ed” approach. This approach shifts the emphasis from expenditures to work accomplishment. The project objective should be to accomplish all of the work rather than to spend all of the money. When using a performance oriented approach, work scope and associated responsibilities must be defi ned in the initial planning phase of the proj-ect. This is a far better approach than defi ning responsibility in some form of fi nger-pointing ex-ercise of guilt determination after a crisis occurs. It allows the person responsible for an emerging variance to take action before it becomes a prob-lem. The entire organization benefi ts from this ap-proach. If action cannot be taken in time to entirely avoid a problem, at least the impact can be accu-rately assessed if an objective method of measur-ing progress were used. By setting variance stan-dards or “thresholds”, the system can be used as a high level Management by Exception indicator. A result is the ability to develop improved forecasts of technical performance, scheduled completion, and fi nal cost earlier in the project. The third line that represents work accomplishment has been added to Figure 1- 6. Now there is a completely diff erent picture of the project status. This graphic depicts the value of the work scheduled to be accomplished, the value of the work accomplished, and how much the accom-plished work actually cost. Actual costs to date are still below the budget line, but the value of work ac-complished is even less. In other words, cost is not underrunning, but in fact is overrunning relative to the value of the work accomplished. Similarly, a behind schedule condition is apparent. The vari-ous methods for measuring the accomplishment of work will be presented in later chapters of this text,
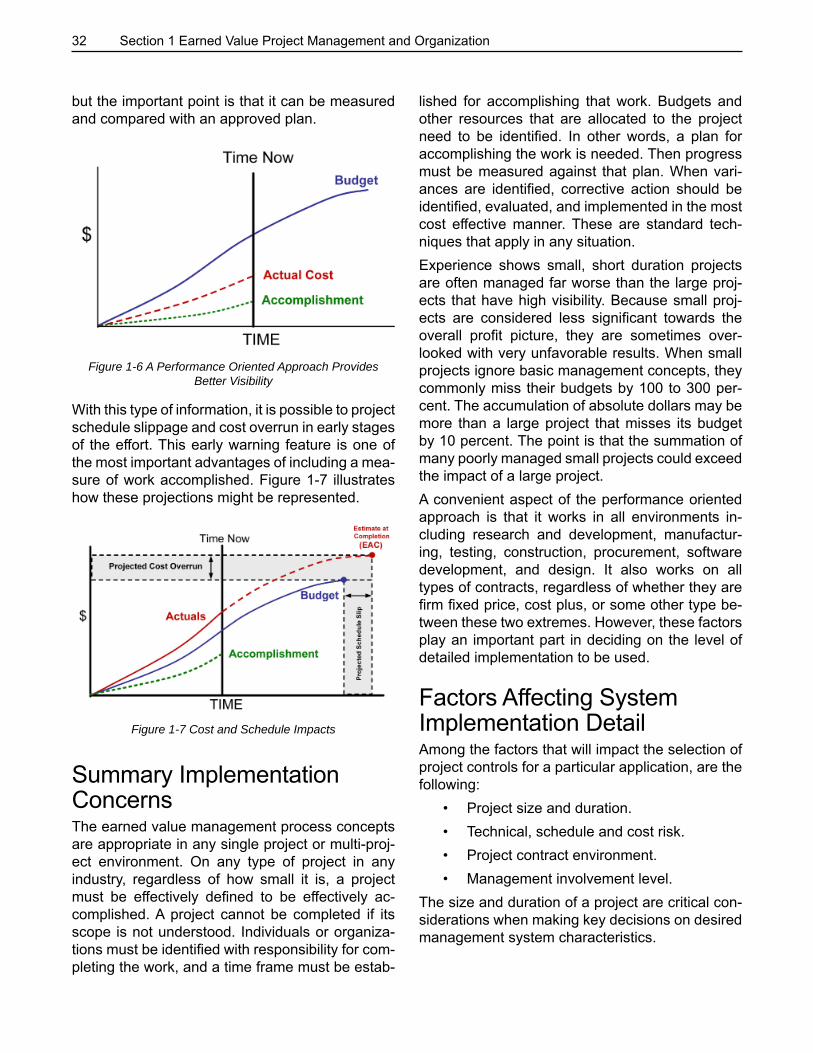
32 Section 1 Earned Value Project Management and Organization
but the important point is that it can be measured and compared with an approved plan.
Figure 1-6 A Performance Oriented Approach Provides Better Visibility
With this type of information, it is possible to project schedule slippage and cost overrun in early stages of the eff ort. This early warning feature is one of the most important advantages of including a mea-sure of work accomplished. Figure 1-7 illustrates how these projections might be represented.
Figure 1-7 Cost and Schedule Impacts
Summary Implementation Concerns The earned value management process concepts are appropriate in any single project or multi-proj-ect environment. On any type of project in any industry, regardless of how small it is, a project must be eff ectively defi ned to be eff ectively ac-complished. A project cannot be completed if its scope is not understood. Individuals or organiza-tions must be identifi ed with responsibility for com-pleting the work, and a time frame must be estab-
lished for accomplishing that work. Budgets and other resources that are allocated to the project need to be identifi ed. In other words, a plan for accomplishing the work is needed. Then progress must be measured against that plan. When vari-ances are identifi ed, corrective action should be identifi ed, evaluated, and implemented in the most cost eff ective manner. These are standard tech-niques that apply in any situation. Experience shows small, short duration projects are often managed far worse than the large proj-ects that have high visibility. Because small proj-ects are considered less signifi cant towards the overall profi t picture, they are sometimes over-looked with very unfavorable results. When small projects ignore basic management concepts, they commonly miss their budgets by 100 to 300 per-cent. The accumulation of absolute dollars may be more than a large project that misses its budget by 10 percent. The point is that the summation of many poorly managed small projects could exceed the impact of a large project. A convenient aspect of the performance oriented approach is that it works in all environments in-cluding research and development, manufactur-ing, testing, construction, procurement, software development, and design. It also works on all types of contracts, regardless of whether they are fi rm fi xed price, cost plus, or some other type be-tween these two extremes. However, these factors play an important part in deciding on the level of detailed implementation to be used.
Factors Aff ecting System Implementation Detail Among the factors that will impact the selection of project controls for a particular application, are the following:
• Project size and duration. • Technical, schedule and cost risk.• Project contract environment.• Management involvement level.
The size and duration of a project are critical con-siderations when making key decisions on desired management system characteristics.
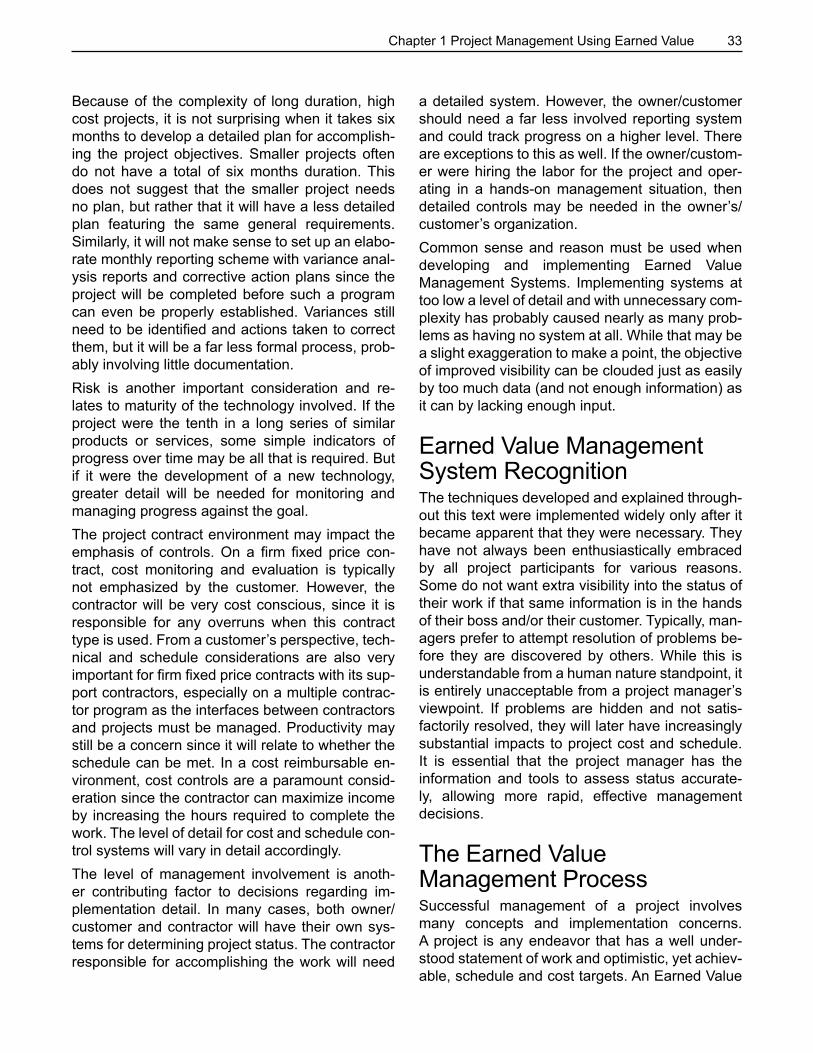
33Chapter 1 Project Management Using Earned Value
Because of the complexity of long duration, high cost projects, it is not surprising when it takes six months to develop a detailed plan for accomplish-ing the project objectives. Smaller projects often do not have a total of six months duration. This does not suggest that the smaller project needs no plan, but rather that it will have a less detailed plan featuring the same general requirements. Similarly, it will not make sense to set up an elabo-rate monthly reporting scheme with variance anal-ysis reports and corrective action plans since the project will be completed before such a program can even be properly established. Variances still need to be identifi ed and actions taken to correct them, but it will be a far less formal process, prob-ably involving little documentation. Risk is another important consideration and re-lates to maturity of the technology involved. If the project were the tenth in a long series of similar products or services, some simple indicators of progress over time may be all that is required. But if it were the development of a new technology, greater detail will be needed for monitoring and managing progress against the goal. The project contract environment may impact the emphasis of controls. On a fi rm fi xed price con-tract, cost monitoring and evaluation is typically not emphasized by the customer. However, the contractor will be very cost conscious, since it is responsible for any overruns when this contract type is used. From a customer’s perspective, tech-nical and schedule considerations are also very important for fi rm fi xed price contracts with its sup-port contractors, especially on a multiple contrac-tor program as the interfaces between contractors and projects must be managed. Productivity may still be a concern since it will relate to whether the schedule can be met. In a cost reimbursable en-vironment, cost controls are a paramount consid-eration since the contractor can maximize income by increasing the hours required to complete the work. The level of detail for cost and schedule con-trol systems will vary in detail accordingly. The level of management involvement is anoth-er contributing factor to decisions regarding im-plementation detail. In many cases, both owner/customer and contractor will have their own sys-tems for determining project status. The contractor responsible for accomplishing the work will need
a detailed system. However, the owner/customer should need a far less involved reporting system and could track progress on a higher level. There are exceptions to this as well. If the owner/custom-er were hiring the labor for the project and oper-ating in a hands-on management situation, then detailed controls may be needed in the owner’s/customer’s organization. Common sense and reason must be used when developing and implementing Earned Value Management Systems. Implementing systems at too low a level of detail and with unnecessary com-plexity has probably caused nearly as many prob-lems as having no system at all. While that may be a slight exaggeration to make a point, the objective of improved visibility can be clouded just as easily by too much data (and not enough information) as it can by lacking enough input.
Earned Value Management System RecognitionThe techniques developed and explained through-out this text were implemented widely only after it became apparent that they were necessary. They have not always been enthusiastically embraced by all project participants for various reasons. Some do not want extra visibility into the status of their work if that same information is in the hands of their boss and/or their customer. Typically, man-agers prefer to attempt resolution of problems be-fore they are discovered by others. While this is understandable from a human nature standpoint, it is entirely unacceptable from a project manager’s viewpoint. If problems are hidden and not satis-factorily resolved, they will later have increasingly substantial impacts to project cost and schedule. It is essential that the project manager has the information and tools to assess status accurate-ly, allowing more rapid, eff ective management decisions.
The Earned Value Management Process Successful management of a project involves many concepts and implementation concerns. A project is any endeavor that has a well under-stood statement of work and optimistic, yet achiev-able, schedule and cost targets. An Earned Value
34 Section 1 Earned Value Project Management and Organization
Management System is a tool set used to facilitate management of a project. There are many consid-erations in this complex discipline. A series of fl ow-charts are used throughout the text to exhibit how the various chapters interrelate. The master fl owchart is shown in Figure 1-8, “Earned Value Project Management: The Process”. This chart is repeated at the beginning of each chapter to show where that chapter fi ts in the over-all process.The fundamental concept of this entire book is that the earned value management process should be logical, well-defi ned, and integrate all of the perti-nent information relating to a project’s status into a comprehensive picture. Every organization im-plements many of the concepts; few of them in-tegrate those concepts into a unifi ed status. That is the primary challenge: to use all of the tools in the tool box in a coordinated manner so that they meet the objective of improved project visibility, allowing earlier management decisions based on accurate information. This provides a project man-ager the best opportunity to meet project schedule and cost objectives while achieving the technical requirements. The following is an overview of the process steps in Figure 1-8.
The Process StepsStep 1 – Project ObjectivesThe fi rst step in the process is defi nition of the project objectives. These objectives include a gen-eral description of the technical requirements of the project, its budget, and the time frame for the work to be completed. A targeted start date and a completion date are included in this description. There may even be some guidance provided as to whether this is a technical, schedule and/or cost critical project. These can be critical pieces of information: as an example, at one of the ma-jor auto manufacturers a project to design a new bumper system was being initiated. The time for this product to reach the market was critical, with a goal of eight and a half months. However, the con-tractor’s project manager assumed that the project was more cost critical than schedule critical. This resulted in the project plan being stretched to 18 months to lower the peak cost requirements.
When the owners and customers reviewed the contractor’s plan, they realized that the primary objectives had not been explained clearly enough. The contractor was sent back to completely redo the plan to support the eight and a half-month re-quirement. If this project had been managed to the 18-month plan, it would have lost much of its com-mercial appeal. The project plan is the set of documentation and directives that formalize the entire management process described in this text, including project objectives, general scope, project organization, desired schedule/cost goals, and a description of management systems and procedures to be used in completing the project. The project plan refl ects the project specifi c internal as well as customer management, reporting, and analysis require-ments. The approach used to code and organize the project data is an important up front activity to establish a standard approach to integrate the technical, schedule, cost, and risk data to gener-ate reliable information for eff ective management, reporting, and analysis for the life of the project.
Step 2 – Work Scope Defi nition, Risk Assessment and Management Once the project objectives have been defi ned, the next function that must be fulfi lled is to delineate, capture, and defi ne the entire scope of the project. This is the best opportunity to assure understand-ing among the various project participants. It also is the best chance to avoid later nightmares with numerous scope changes and possible litigation. The work breakdown structure (WBS) and work breakdown structure dictionary are the tools used to segregate the work into manageable compo-nents and to defi ne each component. A risk assessment of the technical goals is an im-portant part of this process. Risks are identifi ed and mitigation plans are developed. After the or-ganization is assigned in Step 3, additional risks may be identifi ed and the risk plans updated.
Step 3 – Responsibility Assignment, Work TeamsOnce the scope is crisply defi ned, the next step is to document who is responsible for the work. Each component of work defi ned in the work breakdown structure will have one individual assigned who will
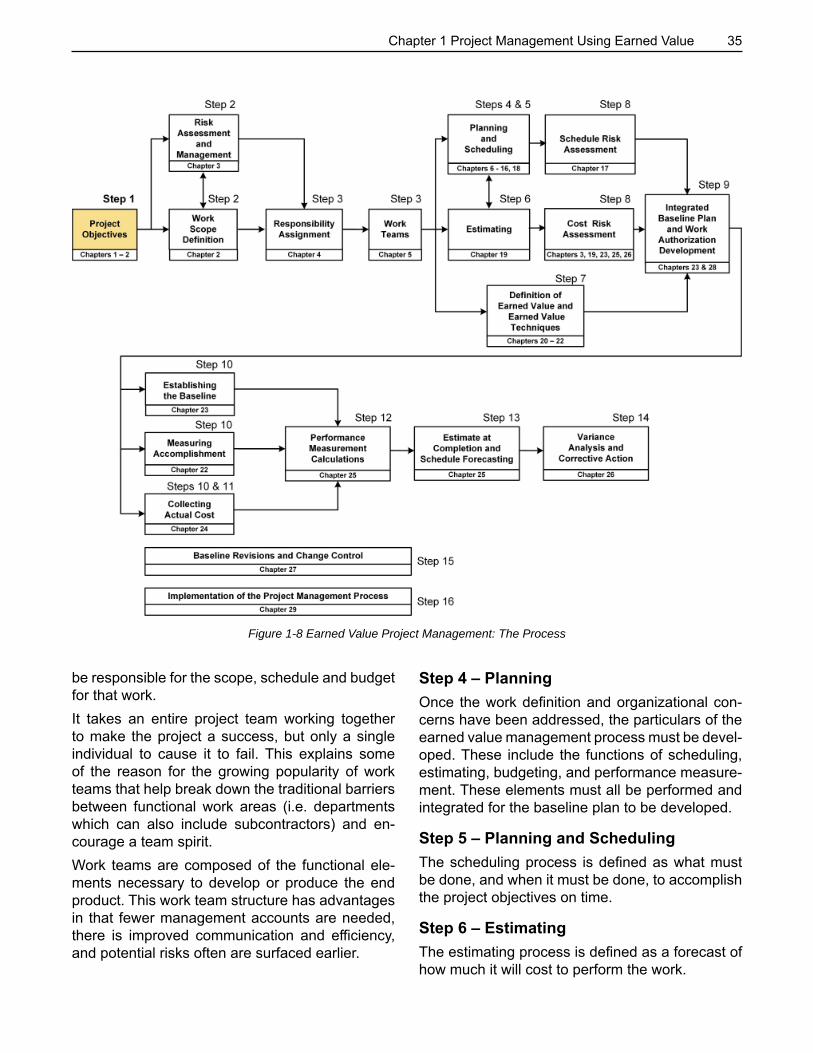
35Chapter 1 Project Management Using Earned Value
be responsible for the scope, schedule and budget for that work.It takes an entire project team working together to make the project a success, but only a single individual to cause it to fail. This explains some of the reason for the growing popularity of work teams that help break down the traditional barriers between functional work areas (i.e. departments which can also include subcontractors) and en-courage a team spirit. Work teams are composed of the functional ele-ments necessary to develop or produce the end product. This work team structure has advantages in that fewer management accounts are needed, there is improved communication and effi ciency, and potential risks often are surfaced earlier.
Step 4 – Planning Once the work defi nition and organizational con-cerns have been addressed, the particulars of the earned value management process must be devel-oped. These include the functions of scheduling, estimating, budgeting, and performance measure-ment. These elements must all be performed and integrated for the baseline plan to be developed.
Step 5 – Planning and Scheduling The scheduling process is defi ned as what must be done, and when it must be done, to accomplish the project objectives on time.
Step 6 – Estimating The estimating process is defi ned as a forecast of how much it will cost to perform the work.
Figure 1-8 Earned Value Project Management: The Process
36 Section 1 Earned Value Project Management and Organization
Step 7 – Defi nition of Earned Value and Earned Value TechniquesMeasuring performance against the baseline plan is accomplished through the use of earned value techniques, which is the key concept of the en-tire earned value management process. While this defi nition has been given earlier, it is import-ant enough to repeat here. It provides a critical element of information when project status is as-sessed by providing insight into what has actually been accomplished compared to the cost of per-forming that work. What has been accomplished can also be compared with what was planned to be accomplished to allow an accurate picture of the current cost and schedule position. Earned value is determined through numerous techniques. The techniques selected for a proj-ect will depend on each application, but objec-tive guidelines are available to help the selection process.
Step 8 – Schedule and Cost Risk Assessment A topic of growing importance is that of risk as-sessment. This earned value management pro-cess includes three components: technical risk, schedule risk, and cost risk. Each of these has its own considerations and impacts. Like the overall earned value management process, these are also interrelated. There has been some tendency over the years for managers to ignore the possi-bilities of identifying and especially quantifying risk because the results may be disconcerting. However, ignoring risk does not lessen its impact, and will most likely increase its eff ects. As profi t margins become slimmer in a highly competitive environment, the topic of risk assessment must be addressed. Project risk management is an ongoing process and is addressed in several chapters. Risk inter-sects with the Earned Value Management System in numerous ways: schedule risk analysis and as-sessment (Chapter 17), development of estimates to perform the work scope (Chapter 19), budgeting the technical scope (Chapter 23), management reserve establishment (Chapter 23), estimates at completion (Chapter 25), and variance analysis (Chapter 26).
Step 9 – Integrated Baseline Plan and Work Authorization DevelopmentNext we come to the center of the fl owchart for a concept that is central to the overall process: per-formance measurement baseline development. The performance measurement baseline is the of-fi cial, documented plan that shows in detail how the project objectives are to be achieved. All of the activities described thus far and the processes displayed on the Figure 1-8 fl owchart are needed to achieve a well-planned performance measure-ment baseline. At the completion of this step, the technical, schedule, and budget baselines have been es-tablished and integrated; the schedule refl ects the time frame where all of the detailed work scope is planned to be performed and the budgets are time phased based on the schedule requirements. The work is authorized to the responsible manager and the technical work commences.Subcontract management is a critical element for many projects. The subcontractor’s technical, schedule, and budget baseline must be integrat-ed with the prime contractor’s baseline. Since the integrated baseline must include this element, a separate chapter on subcontract management (Chapter 28), is included in this step.
Step 10 – Establishing the Baseline Plan, Measuring Progress At this point, there is a shift from the planning phase of baseline establishment to the control phase of the earned value management process. Once the performance measurement baseline has been established, the main concern from that point on is the determination of progress. Progress is measured using the same earned val-ue techniques that were established as part of the planning process. The techniques used when the performance measurement baseline (PMB) was established must be applied consistently when progress is determined. Progress is compared with the plan, and this comparison, in turn, pro-vides the schedule variance.
Step 11 – Collecting Actual Costs All projects will have a system for collection of ac-tual costs. Regardless of how unsophisticated a system may be this component must be includ-
37Chapter 1 Project Management Using Earned Value
ed. The challenge in this area is to defi ne account structures that can be used for consistently com-paring budgets, actuals, and performance. This could mean modifi cation to existing accounting structures. Actual costs are necessary so that they can be compared with progress, and this compari-son, in turn, provides the cost variance.
Step 12 – Performance Measurement CalculationsAfter progress is measured against the plan and the actual cost is entered, the three points nec-essary for data analyses are available. There are many calculations that aid in assessing the project status and assist the manager in targeting problem areas for corrective action. These calculations also assist in the Estimate at Completion and Variance Analysis reporting.
Step 13 – Estimate at Completion and Schedule Forecasting Organizations are very concerned with bottom line performance. One of the essential pieces of cor-ollary information needed to evaluate an ongoing project is, “When is it going to fi nish and what is it fi nally going to cost?” This answer will be used for many purposes, ranging from reward of project participants with better positions on new projects to project cancellation. The “Estimate at Completion” is so important that it can become a highly political number. A well-defi ned Earned Value Management System will have objective means of determining and evaluating estimates at completion to improve their accuracy even in the early stages of a proj-ect. This can only be achieved with defi ned perfor-mance factors that provide an accurate picture of what has happened to date and what is forecast to happen.
Step 14 – Variance Analysis and Corrective ActionVariance analysis and corrective action are very important to the overall process. Much time and eff ort are invested in baseline establishment, and now the baseline information can be used as a ba-sis for determining the course of the project. The tools defi ned in the previous two Steps directly feed variance analysis and corrective action. By comparing earned value to budget, schedule vari-ances can be determined. By comparing earned
value to actual cost, cost variances can be deter-mined. The second element, corrective action, is a critical part of the control phase. At this point in the process, there is a strong basis for determining the project’s true position versus the approved plan so that exceptions can be addressed. The carefully defi ned system will provide immediate feedback as to whether the corrective action was successful.
Step 15 – Baseline Revisions and Change ControlAn essential aspect of the earned value manage-ment process is managing change. After all of the eff ort that goes into developing the baseline plan and determining current status, it is always a dis-ruption to change that plan. Nevertheless, changes are a part of every project and must be addressed as to how they will be reviewed, approved, and in-corporated into the plan. Procedures are required to manage the change control process or, over time, the project’s reports will relate less and less to the current scope, schedule, and budget as well as the true status. One guideline stipulates that as much attention is needed for processing baseline changes as was used in developing the original baseline plan.
Step 16 – Implementation of the Project Management ProcessThis fi nal step provides information useful for im-plementation of the Project Management process. Topics such as system design, development of the system description and supporting procedures, fl owcharting and storyboarding, defi ning software requirements, and system training are discussed in this chapter.
ConclusionA project is any endeavor that has a scope of work and optimistic yet achievable schedule and cost targets. A project is typically managed by a sin-gle individual known as a project manager, who must be able to coordinate a multi-functional team towards the achievement of all of the project ob-jectives. One of the greatest needs of the project manager is accurate, reliable, and timely informa-tion to enable eff ective management decisions. The information needs to include a valid assess-ment of project progress and status. Projects were
38 Section 1 Earned Value Project Management and Organization
historically monitored by comparing planned ex-penditures against actual expenditures. This approach lacks the most important element of status: a measure of work accomplished. This shortcoming can be overcome by including a third data element that determines an objective value of work completed. This is known as the performance oriented approach. The performance oriented ap-proach allows early identifi cation of trends that in-dicate if a project’s objectives are in jeopardy. This “early warning system” allows a timely response on the part of management to mitigate unfavorable outcomes by making informed decisions. It is important that the tradeoff between adequate project status visibility and excessive data collec-tion be recognized and addressed. This is accom-plished by setting an appropriate level of detail in the implementation process. Factors that aff ect level of detail include project size and duration, risk (technical, schedule and cost), type of contract, and desired level of management involvement. The entire process of managing projects must be a logical one. Each of the steps of the earned val-ue management process is illustrated by the fl ow-chart in Figure 1-8 and will be discussed in detail in subsequent chapters.
Review Questions1-1. Explain the diff erence between a project
and a program.1-2. What aspects of a project are managed
during the controlling phase of earned val-ue management?
1-3. How is a project organized diff erently from a functional organization?
1-4. What are some frequent causes of project delays?
1-5. Why is a comparison of actual costs to date versus budgeted costs not adequate from an earned value management standpoint?
1-6. List at least three factors that will aff ect the level of detail appropriate for implementa-tion of earned value on a project.
True or False1-7. The earned value management process is
only applicable for large projects.1-8. The fact that more money has been spent
at a point in time than was planned to be spent means that an overrun in fi nal cost is indicated.
1-9. A program may be made up of multiple projects.
1-10. Performance measurement can be suc-cessfully applied in engineering, construc-tion, manufacturing, and software develop-ment applications, among others.
1-11. Using a measure of performance allows earlier indication of potential increases in fi nal cost.
1-12. From the customer’s viewpoint, a fi rm fi xed price contract suggests the need for tight cost controls.
599
IAaccounting calendar 463activity
changefuture duration 271in progress duration 271
critical 289duration
status impact 256durations 139example statused 255grouping 197hammock 195high duration 210invalid dates 210level of cost collection 463level of eff ort (LOE) 303missed 211missed baseline dates 211missing logic 207no assigned resources 210out of sequence 258relationships 139
fi nish-to-fi nish (FF) 140fi nish-to-start (FS) 139lag 199lead 199metrics 208parallel fi nish-to-fi nish 301parallel start-to-start 301start-to-fi nish (SF) 141start-to-start (SS) 140
summary 196with lags 208with leads 208
actual cost (AC). See actual cost of work performed (ACWP)
actual cost of work performed (ACWP) 401, 459, 464, 473
accuracy 467data sources 461estimated 469labor hours versus labor dollars (reporting) 470level of cost collection 463minimizing incorrect charges 468rates 466time lag 467
actual fi nish date 253actual start date 253analysis
critical path method (CPM) 147fl oat trends 283, 288
formulas 473–489formulas (list of) 573funding 464labor cost variances 487material variances 486performance measurement 473reporting 484risk 313, 325schedule network 284subcontract 547variance 499
apportioned eff ort 435, 450arrow diagramming method (ADM) 130, 137authorized unpriced work 517, 518
Bbackward pass 150, 151badgeless organizations 543baseline
changes 515over target 244, 450, 546rubber 521schedule 239, 245, 269, 271, 274
changes 244, 274establishment process 240establishment timing 243versus current 284
traceability 454baseline change request 239, 518baseline execution index (BEI) 212budget. See also budgeted cost for work scheduled
(BCWS)values 464versus funds 464
budget at completion (BAC) 464budgeted cost for work performed (BCWP) 401, 405,
464, 473calculating 423
consistent with baseline 427determining when earned 437equipment 465material 437, 465purchased services 465rates 466schedule as basis 350
budgeted cost for work scheduled (BCWS) 401, 464, 473. See also performance measurement baseline (PMB)
and work authorization 452estimate as basis for 374rates 466schedule as basis 243, 349
600 Section 6 Conclusion and References
budgeted cost of work remaining (BCWR) 479budget plan. See performance measurement baseline
(PMB)
Ccash fl ow 464change control 511, 513
and the PMB 514program 513
changes. See also change controlbaseline 515causes of 511directed 545documenting 272duration
future activity 271in progress activity 271
external 511formal reprogramming 546how to control 513internal replanning 511, 520, 546schedule 269–274schedule baseline 244, 274stop work order 521subcontract 544tracking 516tracking original estimate 386types of 511
charge number 449and work authorization 453
commitments 464time lag 464
constraint. See directed datecontract budget base (CBB) 449, 450
log 516Contract Performance Report (CPR) 466, 484, 486,
488, 503, 517, 531control account 450
and planning packages 423and summary level planning packages (SLPP)
448and work packages 423baseline changes 515dollar value 85duration 85establishment 83examples 84–85identifi cation 82level of cost collection 463level of detail 83, 84management responsibilities 84plan 454subcontract 537, 541
corrective action log 505corrective action plan 505Cost Accounting Standards (CAS) Disclosure
Statement 381, 459cost baseline. See performance measurement
baseline (PMB)cost elements 371, 461cost performance index (CPI)
combined with SPI 484effi ciency concept 478performance concept 478
cost riskanalysis output 326assessment 375–377reevaluation 388
cost variance (CV) 407, 474critical path 149, 153
characteristics 157length index (CPLI) 211near 153test 211
critical path length index (CPLI) 211critical path method (CPM) 130, 149
completion estimate validity 319estimate validity 317fundamentals 147risk approach 314schedule traceability 239
currentschedule 245, 269, 271, 274
versus baseline 284
Ddirect costs 459, 462directed changes 545directed date 156, 203, 209, 293
hard constraint 295imposed 293not earlier than 293not later than 293risk analysis impact 321soft constraint 295
discrete eff ort 425, 4500/100 technique 43050/50 technique 429equivalent units technique 432incremental milestone technique 428milestone 426percent complete technique 434units complete technique 430
distributed budget 450driving path 158
Eearly fi nish (EF) 150early start (ES) 150earned value (EV). See budgeted cost for work
performed (BCWP)earned value management

601Index
benefi ts 408defi ned 27fundamentals 30, 403, 408illustrated (the brick wall) 413–419implementation
concerns 32level of detail 28, 32
process 33–37, 408relationship to risk management 36, 75schedule applications in 347schedule contract requirements 350
earned value management systemcontinuous improvement 565defi ned 27description 347, 561design 560dollar values for compliance 533guidelines 119, 347, 350, 531, 533implementation 559
process 566schedule 567
interface with accounting system 462procedures 566storyboard 564training material 566
earned value techniques0/100 43050/50 429apportioned eff ort 435consistency with baseline 427discrete eff ort 425equivalent units 432functions 423incremental milestone 428level of eff ort (LOE) 436milestone 426other 436percent complete 434units complete 430
effi ciency variance 487EIA-748 119, 347, 531escalation factors 381, 382estimate
basis for BCWS 374basis for EAC 374changes 386compared to actual
variance sources 386cost fl ow development 381defaults 379development inputs 378documenting assumptions 375escalation factors 381, 382fast track impact 374fundamentals 369
guidelines 371, 379input sources 379level of detail 380manufacturing costs 382method
analogy 378engineering build-up 378parametric 378
operating costs 382prerequisites 371process 369, 376review
external 375other factors 375team 375
role of WBS 371software 383templates 372traceability 386type
conceptual 373defi nitive 374detailed 374preliminary 373
estimate at completion (EAC) 464comprehensive 477detailed 477development 476estimate as basis for 374independent 479justifi cation 506range of 481
estimated ACWP 469estimated completion date (ECD) 482estimate to complete (ETC) 464, 477
Ffast track 230, 322, 374fi nish-to-fi nish (FF) 140fi nish-to-start (FS) 139fl oat 147, 153
analysis 283, 288high 209negative 209, 281
monitoring 288resolving 281, 286
status impact 256forecast schedule. See current scheduleformal reprogramming 546forward pass 150, 151fourteen point schedule health check 207
activities with lags 208activities with leads 208baseline execution index (BEI) 212correlation with GASP 212critical path length index (CPLI) 211
602 Section 6 Conclusion and References
critical path test 211hard constraints 209high duration 210high fl oat 209invalid dates 210missed activities 211missing logic 207negative fl oat 209no assigned resources 210relationship types 208
free fl oat (FF) 154freeze period 448funding 450
analysis 464profi le 464
funds versus budget 464
GGAO Best Scheduling Practices 117, 237, 309GAO Cost Estimating and Assessment Guide 378Generally Accepted Scheduling Principles (GASP)
116, 199, 212, 237, 349
Hhammock 195hard date constraints 209high duration 210
Iincremental milestone. See also milestoneindependent estimate at completion (IEAC) 479independent estimated completion date (IECD) 482indirect costs 381, 459, 462, 465indirect pools 462integrated master plan (IMP) 191, 237
accomplishment 193coding 193criteria 193defi ned 193event 193IMS and WBS cross reference 193
integrated master schedule (IMS) 191, 192. See also schedule
coding 193, 238, 352IMP and WBS cross reference 193
Integrated Master Schedule (IMS) Data Item Description DI-MGMT-81650 201, 149, 239, 309, 347, 352, 486
integrated product team (IPT). See work teamIntegrated Program Management Report (IPMR) 149,
201, 239, 309, 347, 352, 466, 484, 488, 503, 517, 531
formats 486internal replanning 520, 546
Llag 199
late fi nish (LF) 150late start (LS) 150latest revised estimate 476lead 199learning curves 384
cumulative average method 384impacts 385selecting method to use 385slope 384, 385unit method 384unit values 385
leveled fi nish 180leveled start 180level of eff ort (LOE) 436, 450
activities 303logic network. See schedule networklogs 450, 516
Mmanagement reserve (MR) 450
log 516subcontract 539
milestone 137, 237, 448, 537and work measurement 426and work package progress 426defi nition 426examples 427
monte carlo 325, 329
Nnegative fl oat. See fl oatnonrecurring costs 383
Oorganization breakdown structure (OBS)
and work authorization 452chart defi nition 79intersection with WBS 79types 79
out of sequence logic 258progress override 258, 261retained logic 258, 259total fl oat impact 262
over target baseline (OTB) 244, 450, 546over target schedule (OTS) 231, 244, 287, 546
Ppercent complete
earned value technique 434physical 255, 256project 482schedule 255, 256
percent spent 482performance indices 478performance measurement baseline (PMB) 423, 445,
448, 450changes 511, 514, 516
603Index
development steps 446establishment timing 451structure 449
performance measurement calculations. See analysis formulas
planned value (PV). See budgeted cost for work scheduled (BCWS)
Planning and Scheduling Excellence Guide (PASEG) 116
planning package 425converted to work packages 271, 447
precedence diagramming method (PDM) 130, 137price variance (PV) 486Program Evaluation and Review Technique (PERT)
326progress override 258, 261project
characteristics of successful 28defi ned 27objectives defi ned 39, 40percent complete 482percent spent 482scheduling 121versus program 27
Qquantifi able backup data 205, 435, 437
Rrate variance 487recurring costs 383remaining duration 253, 256resource
availability constraint 178curves 180, 181early start curve 180fl oat 181late start curve 180leveled dates 180leveled start curve 180plan 175profi les 177reallocation 273requirements 177time constraint 178usage curve 178
resource leveling 203considerations 179process 178
resource loading 203considerations 179objective 177process 177requirement 210
responsibility assignment matrix (RAM) 79, 82, 451retained logic 258
revisions. See changesrisk. See also schedule risk assessment (SRA)
analysis 313output 325path duration 316pitfalls 323
and variance thresholds 502assessment 313
benefi ts 313cost 375–377developing useful mitigation strategies 313implementation 324, 329outputs 325tools 326
attributes 68classifi cation 68contract type 533cost analysis output 326cumulative likelihood curves 317cumulative probabilities 318defi ned 67identifi cation 70management
fundamentals 67plan 69, 70process 69relationship to earned value management 36,
75strategy 74
monte carlo 329PERT 326qualitative 73quantitative 73schedule 205, 311
analysis output 325bias 320directed dates impact on 321fast track impact on 322
subcontract 533threat or opportunity 67
rolling wave planning 244, 271, 274, 425, 447root cause analysis. See also variance analysis report
(VAR)cost impact assessment 487fl oat deterioration 284schedule impact assessment 286, 487
Sschedule
and earned value management 347and work authorization (period of performance)
452approach
aggressive 204conservative 204organizational 204
604 Section 6 Conclusion and References
project 205audit 206baseline 239, 269, 271, 274
changes 244establishment process 240establishment timing 243
basis for BCWP 350basis for BCWS/PMB 243, 349calendar 304changes 269–274
documenting 272duration 271
current 245, 269, 271, 274current status 245, 257defi nition 123development data requirements 124driving path 158earned value contract requirements 350fast tracking 230focused work 230fourteen point health check 207fundamentals 121integrating subcontract 536level of detail 205, 206, 243margin 201, 287
activity method 202baseline fi nish variance method 203gap method 203lag method 203
over target 231, 244, 287, 546percent complete 255, 256physical percent complete 255, 256purpose 125quality 206reconciliation
progress and performance 350time phased budgets 349
reserve 201risk 205, 311. See also schedule risk assessment
(SRA)analysis output 325and cost overrun 314and early start scheduling 323and late start scheduling 322at path convergence 320bias 320CPM approach 314directed dates impact on 321duration validity 322fast track impact on 322highest path 319merge bias at path convergence 320other issues 326path duration 316probabilistic approach 314
routine updates 269, 274status 238, 245, 272
considerations 258data 253fl oat analysis 283, 288
streamlining 230traceability 235
achieving 239historical 239, 271horizontal 237, 349vertical 237, 347
typesbar chart 127combination chart 128fl ow process chart 128gantt charts 126line of balance 129milestone chart 126modifi ed gantt or milestone chart 128network diagrams 129set back chart 129
update process 253, 257visibility task 200, 201, 296what if 271, 274work scope crosscheck 50
schedule networkacceleration 221
other techniques 230activity relationships 139analysis 284backward pass 150calculated dates 150, 256calculations 150, 155, 255coding 193, 238, 352components 137CPM analysis technique 147crashing 221
example 224process 223
development concerns 195development technique
bottom-up 192IMP/IMS 192top-down 191
directed dates 156display techniques 142forward pass 150out of sequence logic 258resource leveled dates 180resource loading 177resource loading requirement 210templates 197, 198
schedule performance index (SPI) 289, 478and schedule status 483combined with CPI 484
605Index
schedule risk assessment (SRA) 309–331schedule variance (SV) 289, 407, 474
converted to time variance 474dollar versus time 407
slack 147, 153start-to-fi nish (SF) 141start-to-start (SS) 140stop work order 521subcontract
badgeless organization 543change control 544classifi cation 463contract type
cost reimbursable 540fi rm fi xed price 540selecting 534technical services 541time and materials 541
control accountsimpacts on 537, 541
data analysis 547defi ned 531directed changes 545EVMS fl owdown requirements 532
impact on RFP 533EVMS guideline compliance 548EVMS reviews 548EV reporting 549factoring budget and earned value 542formal reprogramming 546integrating
BCWS/PMB 537schedule 536WBS 535
inter-divisional work authorization (IDWA) 543internal replanning 546major versus non-major 531management reserve (MR) 539price versus fee 538reporting requirements 535risk 533schedule milestones 537surveillance 548time lag (data) 541undistributed budget (UB) 539variance analysis report (VAR) 547WBS 538
summary activity 196summary level planning package (SLPP) 448surveillance 548
Tthresholds 500time now 253, 255to complete performance index (TCPI) 479total allocated budget (TAB) 450
total fl oat (TF) 150, 153analysis 283and SPI 483directed date impact 296, 299out of sequence logic method impact 262
traceabilitybaseline 454estimate 386
historical 387vertical 387
scheduleachieving 239historical 239, 271horizontal 237, 349vertical 237, 347
work scope 349
Uundistributed budget (UB) 450
log 516subcontract 539
usage variance (UV) 486
Vvariance
analysis 499at completion 474cost 407, 474duration 284effi ciency 487labor cost 487material cost 486price 486rate 487schedule 289, 407, 474schedule converted to time 474schedule fi nish 284schedule start 284thresholds 500usage 486
variance analysis report (VAR) 477, 503approval 506corrective action plan 505describing the problem 504EAC justifi cation 506impact 505subcontract 547
variance at completion (VAC) 474
Wwhat if schedule 271, 274work-around plan
strategies 273work authorization 451, 452
inter-divisional 543requirements 452
606 Section 6 Conclusion and References
work breakdown structure (WBS) 538and work authorization 452contract 50defi ned 41development considerations 42, 47dictionary 46, 516dictionary example 47examples 42–45IMP/IMS cross reference 193integrating subcontract 535intersection with OBS 79level of detail 42role in estimating 371work scope cross check 50
work defi nitionprocess 39
work package 423, 450characteristics 423examples 425level of cost collection 463
work scopeand schedule development 124and WBS elements 41and work authorization 452defi ned 39traceability 349verifi cation 50
work teamadvantages 95, 97alignment examples 98application examples 100defi ned 95lead role 103
607
A APaul F. Bolinger – Paul Bolinger began working on projects during his last tour with the U.S. Navy. In the many years since then he has been involved in proposing, winning, initiating, and managing projects both as an employee of a contractor and as a management and scheduling consultant. Paul has held many positions in project organizations, and has taught project management and scheduling to thousands of clients. His experience includes space systems, aircraft, submarines, surface ships, rotary wing aircraft, electronics, tracked vehicles, and missiles. His B.S. degree in engineering and his MBA put in place a solid foundation of study to which he has added practical experience and additional training.Christopher Humphreys – Chris Humphreys has focused on management system design by creating fl owcharts and their associated narratives, storyboards and the subsequent implementation activities with particular emphasis on scheduling and earned value techniques. He has assisted in the conduct of many Earned Value Management Systems reviews. Chris recently participated in the design and imple-mentation of Earned Value Systems for a number of companies without experience with Earned Value, which resulted in successful Integrated Baseline Reviews. Chris has supported large programs under-going Government reviews by preparing project personnel to be successful during those reviews. Chris has taught Earned Value for the past four years. He is responsible for managing various H&A customer engagements throughout the lifecycle of the program. Chris earned his Bachelor of Arts at the University of California, Santa Barbara.Gary C. Humphreys – Gary Humphreys is Chief Executive Offi cer (CEO) of Humphreys & Associates, Inc. As a consultant, Mr. Humphreys has provided technical support in all phases of project management to clients in the United States, Sweden, Australia, England, Holland, Hong Kong and other countries. As both a Team Member and Review Team Director, he has assisted, evaluated, and directed review teams leading to over 150 successful system acceptances. He has served as chairman of the National Defense Industrial Association (NDIA) Integrated Program Management Division (IPMD), and president and chairman of the board of the Performance Management Association, which became the College of Performance Management (CPM). Mr. Humphreys has been a keynote speaker on a variety of perfor-mance measurement related subjects to various Government and industry associations. He has also published several books on the subject of performance measurement and earned value.Mr. Humphreys is also a recipient of the 1998 David Packard Excellence in Acquisition Award and the Whitey H. Driessnack Award for Outstanding Contributions to the Advancement of Performance Management. Mr. Humphreys is a graduate of the University of California at Berkeley, with a Masters Degree in Business Administration from the University of Southern California.Hugh A. Langford – Hugh Langford has over forty years of experience in Project Management, Earned Value Management Systems, and test engineering. He holds a B.S. degree in Civil Engineering and a Master of Science degree in Research and Development System Management. He is a graduate of the Armed Forces Staff College, the Industrial College of the Armed Forces, and the USAF F100 Fighter Weapons School. As an EVMS Team Director for the USAF, he led over seventy-fi ve System Validation Reviews throughout the U.S., Canada, and the United Kingdom. He has provided Management Consulting support to the DoD, NASA, DOE, and over 300 companies throughout the U.S., Europe, United Kingdom, Canada, Australia, Singapore, and Hong Kong.Lynn Sandberg – Lynn Sandberg has forty years of project management experience both in defense corporations and consulting. While at major corporations, she was the Project Controls Manager and then the Earned Value Focal Point to the Government. She was the leader for Validation Reviews and Integrated Baseline Reviews, all with successful results. In both corporate and consulting positions, she has trained well over a thousand control account managers, and other management, in project manage-ment and other business topics. Lynn has participated in and led teams in analysis of projects for compli-
608 Section 6 Conclusion and References
ance to the EIA-748 Standard for Earned Value Management Systems, and implementation of corrective actions, to ensure positive outcomes. She has also been the technical writer for several project manage-ment publications. Lynn is a graduate of the University of Minnesota with a Bachelor of Arts degree.Charles H. (Buck) Wilkerson III – Charles “Buck” Wilkerson has over 30 years of project management and Earned Value Management experience in government and industry environments. He has a long history of successfully designing, developing, and implementing project management control systems. He is an expert with a wide variety of project management schedule and cost toolsets and is one of the best in the industry at designing and implementing integrated cost/schedule control systems. He has a unique ability to distill client unique business needs and transform those needs into an eff ective project controls system that complies with the guidelines in the EIA-748 Standard for Earned Value Management Systems. He also has extensive experience in conducting Integrated Baseline Reviews and preparing all levels of project personnel for compliance reviews. He also excels at developing, implementing, and maintaining complex project schedules and has deep hands-on experience conducting schedule analysis as a member of review teams and in preparation for a customer compliance review. As an experienced trainer, he has developed and delivered numerous program management, scheduling, and EVMS train-ing classes for clients in the U.S. government and contractor sites. He has been a certifi ed trainer for a variety of project management software toolsets. He has trained hundreds of schedulers, CAMs, and other project personnel on how to use software toolsets as well as EVMS processes and procedures.