prince 2 project management
TRANSCRIPT
1
Part 1
What is meant by the term eco-design? Provide three examples(other than the one covered in the lectures)
What is meant by open innovation? Research and give three examples (other than the one covered in the lectures)
Part 2
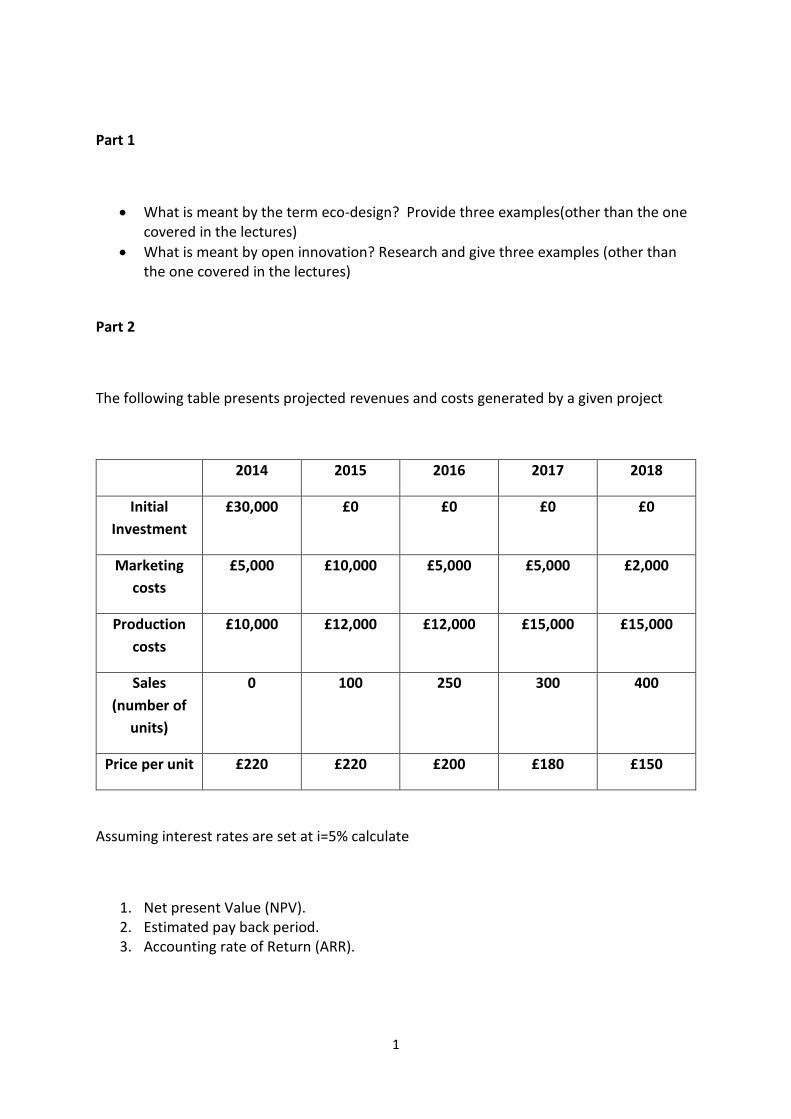
The following table presents projected revenues and costs generated by a given project
2014 2015 2016 2017 2018
Initial
Investment
£30,000 £0 £0 £0 £0
Marketing
costs
£5,000 £10,000 £5,000 £5,000 £2,000
Production
costs
£10,000 £12,000 £12,000 £15,000 £15,000
Sales
(number of
units)
0 100 250 300 400
Price per unit £220 £220 £200 £180 £150
Assuming interest rates are set at i=5% calculate
1. Net present Value (NPV). 2. Estimated pay back period. 3. Accounting rate of Return (ARR).
2
Table of Contents
1.0 Introduction 11
2.0 Eco Design 12
3.0 Open Innovation 16
4.0 Part 2 21
5.0 Business case for a smart refrigerator 24
6.0 References 40
3
1.0 Introduction
1.1 Assignment Objective
To acquire the high-level management skills necessary to support the specification, costing,
design and manufacture of an electronic product.
To satisfy the objectives specified in a case study, which integrates at least two technical major
areas of the course together with the product management skills developed in this module.
1.2 Abstract
This assignment focuses on the definition of 2 types of business strategy, the eco-design and open
innovation. The explanation and definition for both will be explored and appropriate examples to
products related to these types of methodologies will be given. Next, in order to further understand
the Net Present Value, Accounting rate of return and the Payback period formula and calculation, an
exercise will be done to show how the values are obtained. A step by step explanation will also be
given to explain why and which values are taken. Finally, a group input is done where a business case
is produced for a smart refrigerator concept. The business case will be accompanied by a risk
assessment, mitigation plans for the risk, work breakdown structure as well as a 10-year profitability
projection. From here, a suggestion will be made to identify the length of time before the project
becomes unattractive in the market based on the sales figures.
4
2.0 Eco-design
According to the European commission, 80% of product-related impacts on the environment are
determined during the design phase of the product. This can be associated with types of material,
life expectancy of the product and the manufacturing process itself. The product could be using
material that is not suitable for recycling, has a short operational life span and requires hazardous
material such as rare earth in its manufacturing process. All this contributes to the environmental
impact of a product.
However, it is possible to overcome this by applying eco-design rules. Eco-design is a legal initiative
that drives energy efficiency requirements to be considered during the design phases of the product.
By applying this rule during the design stages, suitable material and sustainable design can be
employed to further improve the impact that a product may have on the environment.
In 1994 at the International Symposium of Sustainable Consumption, a meeting defined the term
sustainable product development as using goods and services to a basic need to improve the quality
of life, yet at the same time reducing the usage of natural resources, toxic materials and emission of
waste and pollutants. In 2002, the UK government has championed the eco-design concept and
encouraged its use as a best practice design method. The government also launched the economic
regional development fund to market sustainable products. In short, this has allowed designers to
move from process efficiency to product efficiency instead. (1)
Papanek (1995) wrote that designers should consider the product’s ecological responsibility. From
here, he devised a function matrix to explain the phases of production and consideration that should
be taken during design:-
Material selection
Manufacturing process
Product packaging
Finished product
Transportation
Waste
All this should be considered in order for the product to fit the eco-design concept. Three different
examples of eco-design will be approached by performing case studies on actual companies that has
adopted this method.
5
2.1 Orangebox
Between September 2007 and August 2008, the Welsh Ecodesign Centre (EDC) has supported 4
multi-level ecodesign support package. For the manufacturing sector, Orangebox was selected.
Orangebox is a UK market leader in research, development, manufacturing and service of seats for
commercial environment. Orangebox provides design and manufacture services for businesses
around UK and Europe. One of the major challenges for furniture production is the supply chain. It is
common for furniture manufacturers to obtain material and components from various suppliers.
This increases the transport cost and also makes it harder to determine the full life cycle, as each
component would be designed based on its own life cycle. Orangebox has decided to analyse several
aspects for improvement to its latest chair product, the “Ara Chair” and reduce the known aspects to
have the highest environmental impact [3]:
Production phase resource consumption
Production phase emission
Production phase energy consumption
Transportation
End-of-life treatment
One of the steps taken by Orangebox is to localise the supply chain. This has allowed the company to
work closely with the suppliers and have more control over the design of their products.
Specification can be included in the design stage and constant audits can be done to ensure that the
design of the components suit the life cycle expectancy of the product. By using local suppliers, the
transportation cost is decreased significantly as well. In short, by localising supply chain, they have
decreased transportation, cost and increased product quality.
Another method taken is the design of the chair itself. The latest chair design is based on design for
disassembly and material reduction. The chair can now be disassembled faster than any of the
previous designs and uses 30% less resources. This mean that the time taken to set-up the chairs
would be shorter for new offices and the reduction of material means that the cost of raw materials
for the chair will be much lower. [3]
6
2.2 Crawford Hansford and Kimber
CH & K are designers and manufacturers of electronic and electrical equipment, particularly in
printed circuit boards. In 2008, 2 directives that were introduced changed the industry dramatically.
Waste from Electrical and Electronic Equipment (WEEE) and Restriction of the Use of Hazardous
Substances in Electrical and Electronic Equipment. Both this directives require that lead be
substituted to another less hazardous substance. Lead is used extensively in the semiconductor
industry as a solder paste.
CH & K then took this opportunity to implement the eco-design not just on its product, but its entire
manufacturing system. Several methods to replace lead have been identified, including J-alloy,
application of glue and diffusion soldering. While different methodology is required based on the
circuitry, the alternatives exist. By eliminating lead from the solder, the use of acid wash during pcb
production was also reduced significantly. This elimination method comes at no additional cost, as
the replacement material cost no more than using lead as solder paste. Hence, a more
environmental friendly method was adopted at no additional cost.
The PCB board itself was designed based on the design for recycling concept. It is easier to recycle
the components of the PCB board at the end of its life by disassembling its components. While
previously this proved to be a much more complicated procedure, the latest PCB boards from CH & K
allows for disassembly by just using one screwdriver.
In addition, the company has also subcontracted the removal of hazardous waste treatment after
PCB etching process. This treatment processes and dissolves copper in the solution, in which copper
can then be recycled. [4]
7
2.3 Kelvin Hughes
Kelvin Hughes produces data acquisition unit for electronic chart display system. This unit performs
efficient management and provides the navigational data to assist a seagoing vessel. Charts are then
stored on the computer and can be uploaded via satellite. Kelvin Hughes has performed the eco
design based on several aspects to improve its products. [5]
Design for flexibility
Kelvin Hughes designed a new data acquisition unit that can be used as the basis for the electronic
chart display (ECDIS), voyage data recorder (VDR) and the radar application. This new modular
efficiency was improved by reducing the inventory requirements. A review of all specifications was
done and this reduced the manufacturing cost of the unit. This allows the unit to be more flexible
and separate components can be improved individually without affecting the other components of
the unit.
Removal of battery
The battery system for the unit now comes as an optional pack as it is not a requirement for VDRs to
have a battery pack according to the IMO regulations. Hence, by removing the battery pack, the cost
has been reduced and the need for battery recycling has also been reduced.
Cable arrangements
Previously, the modular designs have been fitted using a full range dedicated connecters. The new
design uses a simpler, more flexible arrangement. This has reduced the cabling required and reduced
the connector cost as well.
Design for ease of installation
The new units were designed to be easily installed and also maintained. The hinged cases provide
easier access for maintenance to be done or for any repairs and upgrades as the access to the power
supply, ribbon cables and the hard drive sockets are made easily accessible.
End-of-life
The products are designed and tested for a minimum service life of 10 years.
8
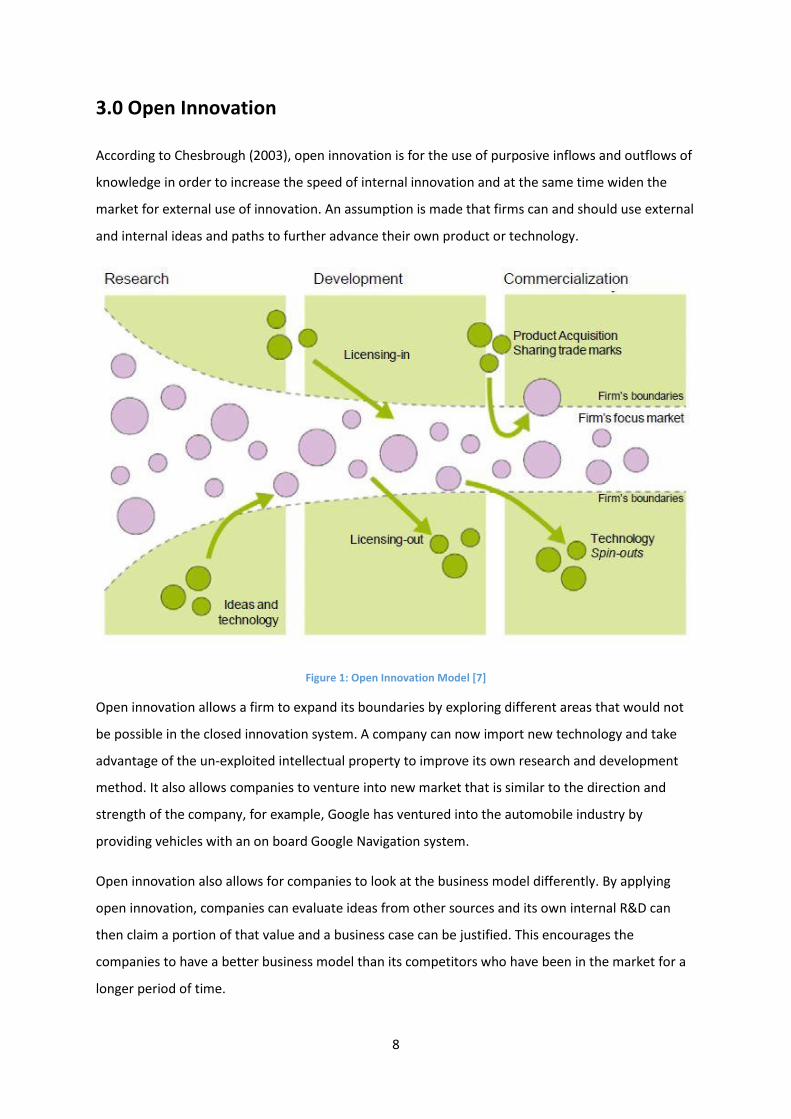
3.0 Open Innovation
According to Chesbrough (2003), open innovation is for the use of purposive inflows and outflows of
knowledge in order to increase the speed of internal innovation and at the same time widen the
market for external use of innovation. An assumption is made that firms can and should use external
and internal ideas and paths to further advance their own product or technology.
Figure 1: Open Innovation Model [7]
Open innovation allows a firm to expand its boundaries by exploring different areas that would not
be possible in the closed innovation system. A company can now import new technology and take
advantage of the un-exploited intellectual property to improve its own research and development
method. It also allows companies to venture into new market that is similar to the direction and
strength of the company, for example, Google has ventured into the automobile industry by
providing vehicles with an on board Google Navigation system.
Open innovation also allows for companies to look at the business model differently. By applying
open innovation, companies can evaluate ideas from other sources and its own internal R&D can
then claim a portion of that value and a business case can be justified. This encourages the
companies to have a better business model than its competitors who have been in the market for a
longer period of time.
9
Open innovation however does have its own disadvantages as well. There can be a serious concern
of the intellectual property, as the ownership is questionable. This can be related back to the case of
Samsung and Apple, where Apple has decided to bring Samsung to court for infringement rights to
its own IP. Due to the increased number of business interface, the management complexity also
increases as well. Companies also tend to look at short term opportunity exploitation, rather than a
business model that would be beneficial in the long term.
The 3 examples of open innovation will be explained using case studies of companies that have
adopted the open innovation method.
10
3.1 Natura
Natura, originated from Brazil is the market leader in cosmetics, fragrances and personal care. They
are also involved in direct selling and distribution method and are known to be the forerunner of
innovation in the cosmetics industry. Natura adopted the open innovation method in 2006.
Natura created a centralized unit within its vice-presidency and with a department consisting of 11
people; they have focused on innovation, management of innovation and group partnerships linking
them to the directors of other firms. Their main motivators are the improvement of internal and
external communication of the company and the university. They then focus on intellectual
properties, funding and licenses and partnership with University and research institute. By utilizing
the resources from the research institute, Natura was able to focus on services more, hence the
product of the company itself. The company’s product credibility has also increased as research
done by university shows more strength of confidence in the public’s eye.
Natura employed a bottom up approach in its OI implementation, as the idea emerged from a group
that is involved with the university itself. Natura adopted a strategy that promotes internal research
and to encourage the search for openness. There is also a centralized structure within the company
and a department dedicated to open innovation itself. However, its partnership with university is
informally done by means of joint research and research contracts. Natura also has a structured
research platform that allows contracted professionals in partnership with the open innovation
system.
Despite adopting the bottom up approach, the support from top management has become an
important enabler in its implementation. The matrix structure within the company also acts as an
enabler, as a department is allocated and responsible for open innovation.
However, initially, the idea was rejected as internal researchers felt inadequate. This has improved
over the years with the support from the top management in achieving a good collaboration and
moral drive.
11
3.2 Pininfarina
Pininfarina is an Italian firm that specializes in the automotive industry as well as other industries. As
a design company, Pininfarina often explores the niche market, by producing ideas and introducing
innovations in terms of technological advancement and designs way before its competitors. The
company was one of the first to work on the Nido, one of the first electric cars. Up to year 2007, the
company’s innovation process was funded by auto-financing. Collaboration with strategic partners
allowed the company to co-develop and build prototypes based on emerging technologies.
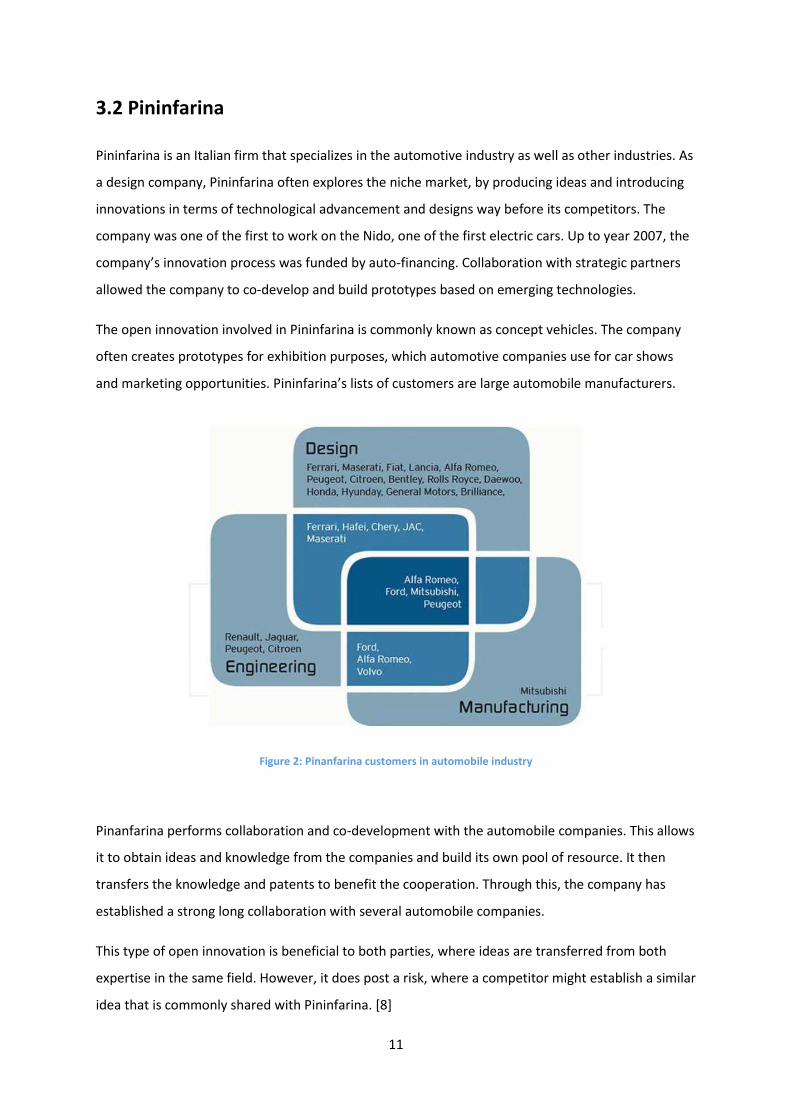
The open innovation involved in Pininfarina is commonly known as concept vehicles. The company
often creates prototypes for exhibition purposes, which automotive companies use for car shows
and marketing opportunities. Pininfarina’s lists of customers are large automobile manufacturers.
Figure 2: Pinanfarina customers in automobile industry
Pinanfarina performs collaboration and co-development with the automobile companies. This allows
it to obtain ideas and knowledge from the companies and build its own pool of resource. It then
transfers the knowledge and patents to benefit the cooperation. Through this, the company has
established a strong long collaboration with several automobile companies.
This type of open innovation is beneficial to both parties, where ideas are transferred from both
expertise in the same field. However, it does post a risk, where a competitor might establish a similar
idea that is commonly shared with Pininfarina. [8]
12
3.3 Dunkin Donuts
Dunkin’ Donuts is one of the largest baked donuts and coffee franchise chain in the world with more
than 7000 stores worldwide. The company has adopted several open innovation method to improve
its product and services.
One of the products identified is their brewed coffee. While they remained a market leader in coffee
sales, they did not have the distribution network or the business model for retail purposes; hence it
misses sales on a large market where packaged coffee is a potential market. The coffee was also
designed for commercial sales, and not for home-brewing. The research and development at
another company, P&G has developed a similar roast to dunkin’ donuts and by employing the
Dunkin’ Donuts brand, this product is marketed and sold in retail stores. Due to the branding, a
premium pricing was possible. This partnership involves Dunkin’ Donuts equity and brand marketing
while employing P&G’s distribution network.
Dunkin’ Donuts also involves its customers in the open innovation. This particular method is known
as crowdsourcing. In 2010, Dunkin’ Donuts organized a “Create Dunkin’s Next Donut” competition,
which allows fans to participate and experiment with different formulas. This provided Dunkin’
Donuts with a pool of new ideas to venture and explore.
The company also sponsored a custom playlist on an internet radio station, Pandora. By doing this, it
has also asked consumers to recommend favourite songs inspired by the flavours of its product,
Coolaata. While this serves as an advertisement by itself, but it also provides new ideas to improve
its marketing method and advertisements in the future by employing the fan’s ideas.
In overall, by employing the social media and the crowdsourcing method to engage with its
customers, it allows Dunkin’ Donuts to be the brand that distinguishes its willingness to engage in a
qualitative and quantitative way with its customers. They have also shown how the brand innovation
is based on the customer’s needs.
13
4.0 Part 2
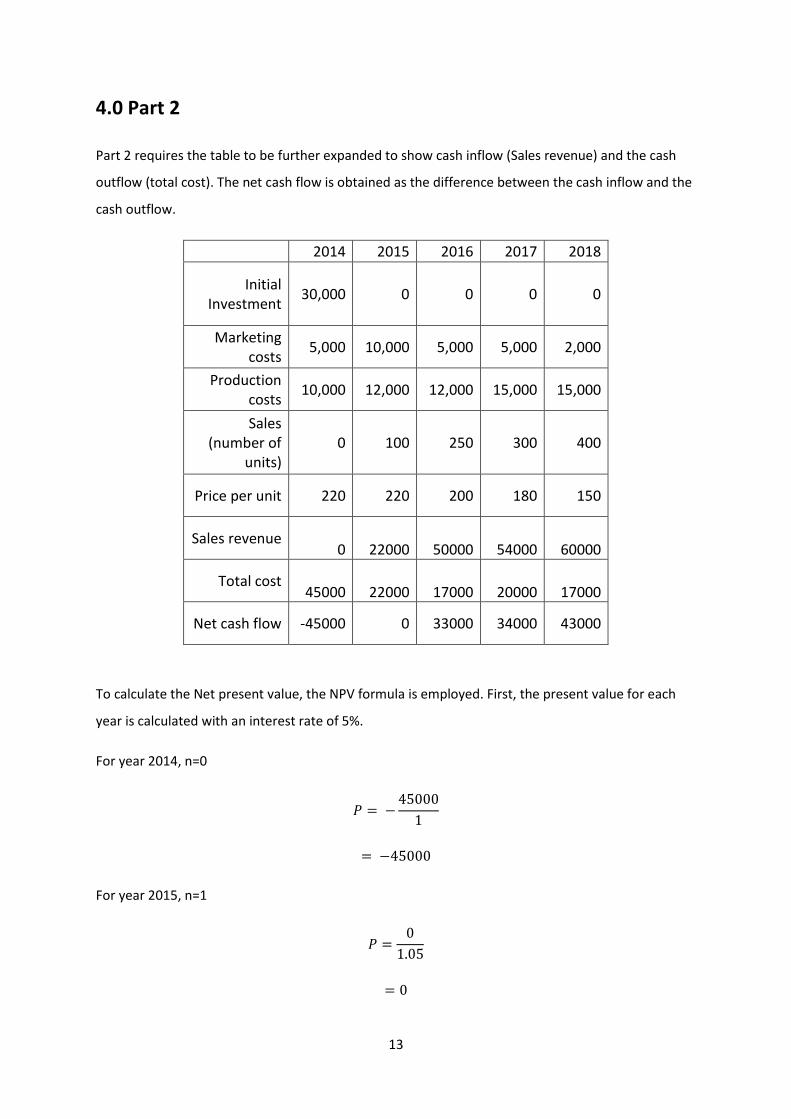
Part 2 requires the table to be further expanded to show cash inflow (Sales revenue) and the cash
outflow (total cost). The net cash flow is obtained as the difference between the cash inflow and the
cash outflow.
2014 2015 2016 2017 2018
Initial Investment
30,000 0 0 0 0
Marketing costs
5,000 10,000 5,000 5,000 2,000
Production costs
10,000 12,000 12,000 15,000 15,000
Sales (number of
units) 0 100 250 300 400
Price per unit 220 220 200 180 150
Sales revenue 0 22000 50000 54000 60000
Total cost 45000 22000 17000 20000 17000
Net cash flow -45000 0 33000 34000 43000
To calculate the Net present value, the NPV formula is employed. First, the present value for each
year is calculated with an interest rate of 5%.
For year 2014, n=0
𝑃 = −45000
1
= −45000
For year 2015, n=1
𝑃 =0
1.05
= 0
14
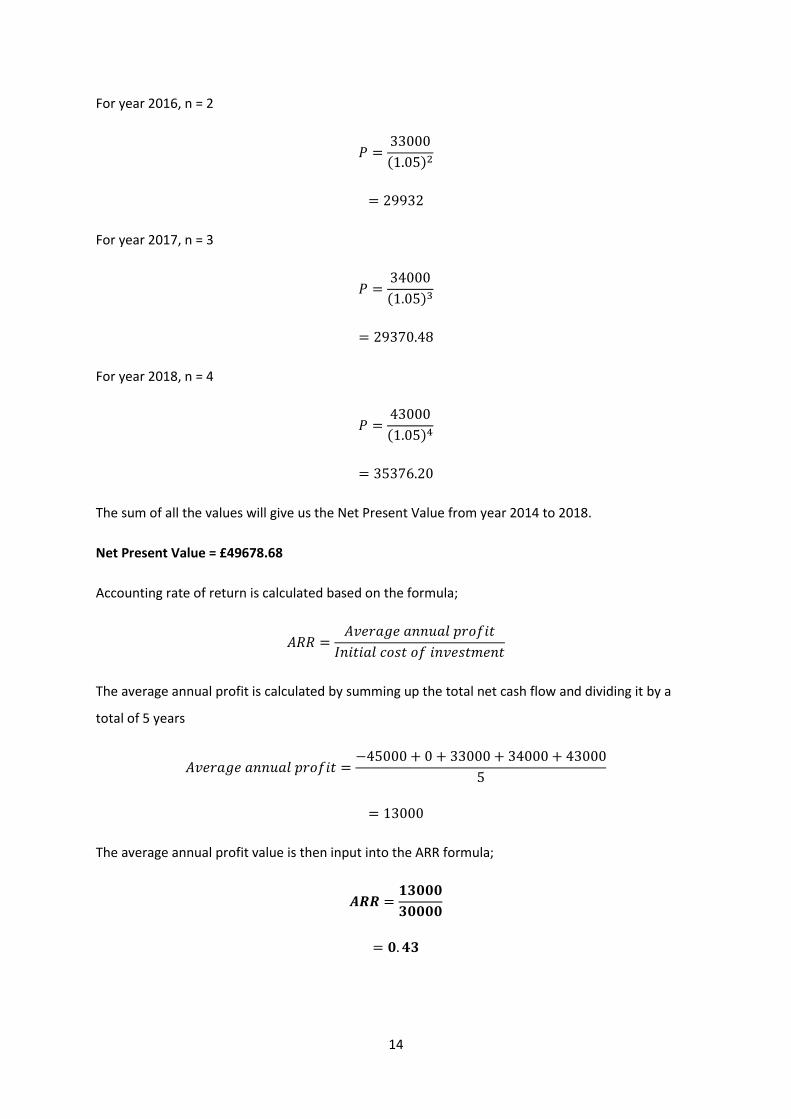
For year 2016, n = 2
𝑃 =33000
(1.05)2
= 29932
For year 2017, n = 3
𝑃 =34000
(1.05)3
= 29370.48
For year 2018, n = 4
𝑃 =43000
(1.05)4
= 35376.20
The sum of all the values will give us the Net Present Value from year 2014 to 2018.
Net Present Value = £49678.68
Accounting rate of return is calculated based on the formula;
𝐴𝑅𝑅 =𝐴𝑣𝑒𝑟𝑎𝑔𝑒 𝑎𝑛𝑛𝑢𝑎𝑙 𝑝𝑟𝑜𝑓𝑖𝑡
𝐼𝑛𝑖𝑡𝑖𝑎𝑙 𝑐𝑜𝑠𝑡 𝑜𝑓 𝑖𝑛𝑣𝑒𝑠𝑡𝑚𝑒𝑛𝑡
The average annual profit is calculated by summing up the total net cash flow and dividing it by a
total of 5 years
𝐴𝑣𝑒𝑟𝑎𝑔𝑒 𝑎𝑛𝑛𝑢𝑎𝑙 𝑝𝑟𝑜𝑓𝑖𝑡 =−45000 + 0 + 33000 + 34000 + 43000
5
= 13000
The average annual profit value is then input into the ARR formula;
𝑨𝑹𝑹 =𝟏𝟑𝟎𝟎𝟎
𝟑𝟎𝟎𝟎𝟎
= 𝟎. 𝟒𝟑
15
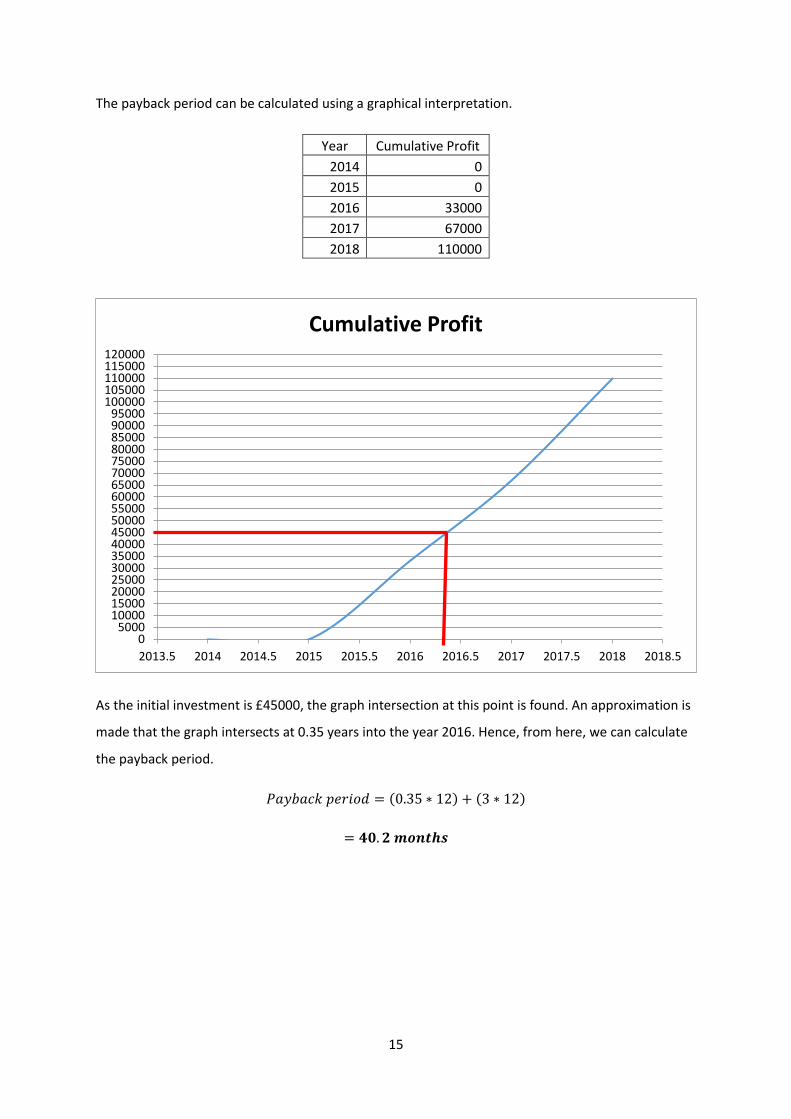
The payback period can be calculated using a graphical interpretation.
Year Cumulative Profit
2014 0
2015 0
2016 33000
2017 67000
2018 110000
As the initial investment is £45000, the graph intersection at this point is found. An approximation is
made that the graph intersects at 0.35 years into the year 2016. Hence, from here, we can calculate
the payback period.
𝑃𝑎𝑦𝑏𝑎𝑐𝑘 𝑝𝑒𝑟𝑖𝑜𝑑 = (0.35 ∗ 12) + (3 ∗ 12)
= 𝟒𝟎. 𝟐 𝒎𝒐𝒏𝒕𝒉𝒔
05000
100001500020000250003000035000400004500050000550006000065000700007500080000850009000095000
100000105000110000115000120000
2013.5 2014 2014.5 2015 2015.5 2016 2016.5 2017 2017.5 2018 2018.5
Cumulative Profit
16
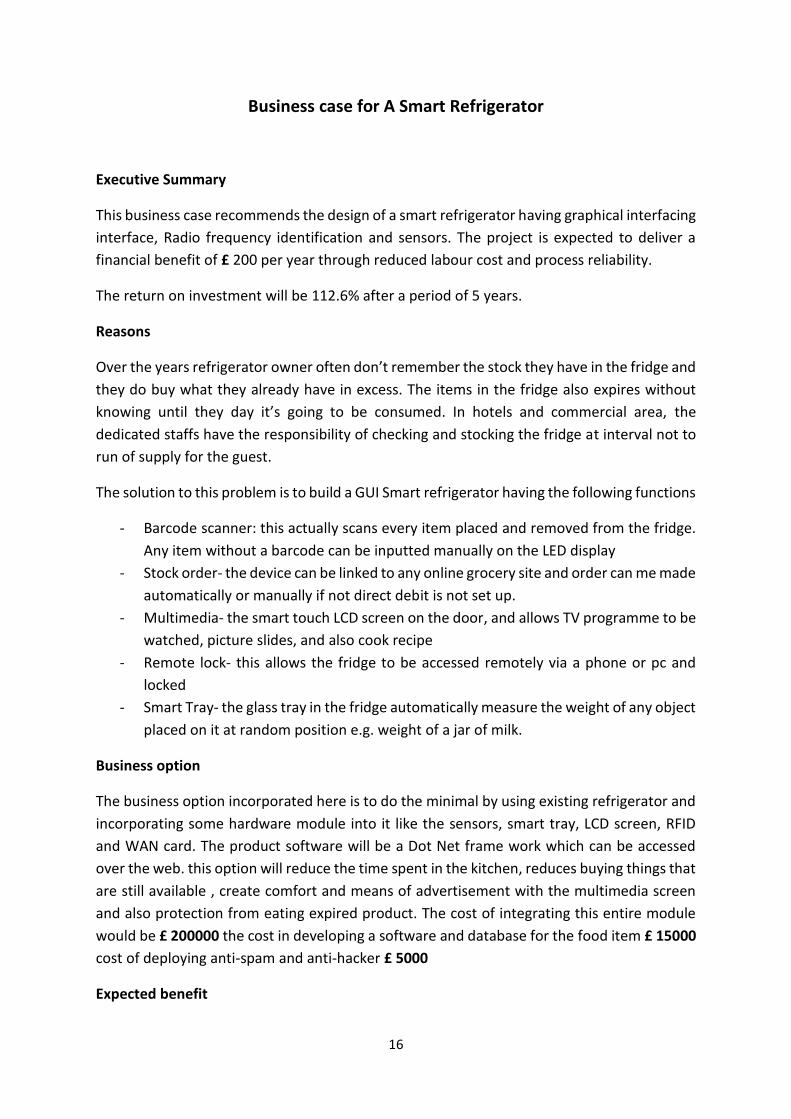
Business case for A Smart Refrigerator
Executive Summary
This business case recommends the design of a smart refrigerator having graphical interfacing
interface, Radio frequency identification and sensors. The project is expected to deliver a
financial benefit of £ 200 per year through reduced labour cost and process reliability.
The return on investment will be 112.6% after a period of 5 years.
Reasons
Over the years refrigerator owner often don’t remember the stock they have in the fridge and
they do buy what they already have in excess. The items in the fridge also expires without
knowing until they day it’s going to be consumed. In hotels and commercial area, the
dedicated staffs have the responsibility of checking and stocking the fridge at interval not to
run of supply for the guest.
The solution to this problem is to build a GUI Smart refrigerator having the following functions
- Barcode scanner: this actually scans every item placed and removed from the fridge.
Any item without a barcode can be inputted manually on the LED display
- Stock order- the device can be linked to any online grocery site and order can me made
automatically or manually if not direct debit is not set up.
- Multimedia- the smart touch LCD screen on the door, and allows TV programme to be
watched, picture slides, and also cook recipe
- Remote lock- this allows the fridge to be accessed remotely via a phone or pc and
locked
- Smart Tray- the glass tray in the fridge automatically measure the weight of any object
placed on it at random position e.g. weight of a jar of milk.
Business option
The business option incorporated here is to do the minimal by using existing refrigerator and
incorporating some hardware module into it like the sensors, smart tray, LCD screen, RFID
and WAN card. The product software will be a Dot Net frame work which can be accessed
over the web. this option will reduce the time spent in the kitchen, reduces buying things that
are still available , create comfort and means of advertisement with the multimedia screen
and also protection from eating expired product. The cost of integrating this entire module
would be £ 200000 the cost in developing a software and database for the food item £ 15000
cost of deploying anti-spam and anti-hacker £ 5000
Expected benefit
17
The expected benefit of this project is
- Income benefits when products are advertised on the LCD display
- Reduction of time spent visiting grocery stores
Expected dis-benefit
Higher market price makes it only affordable to certain range of user
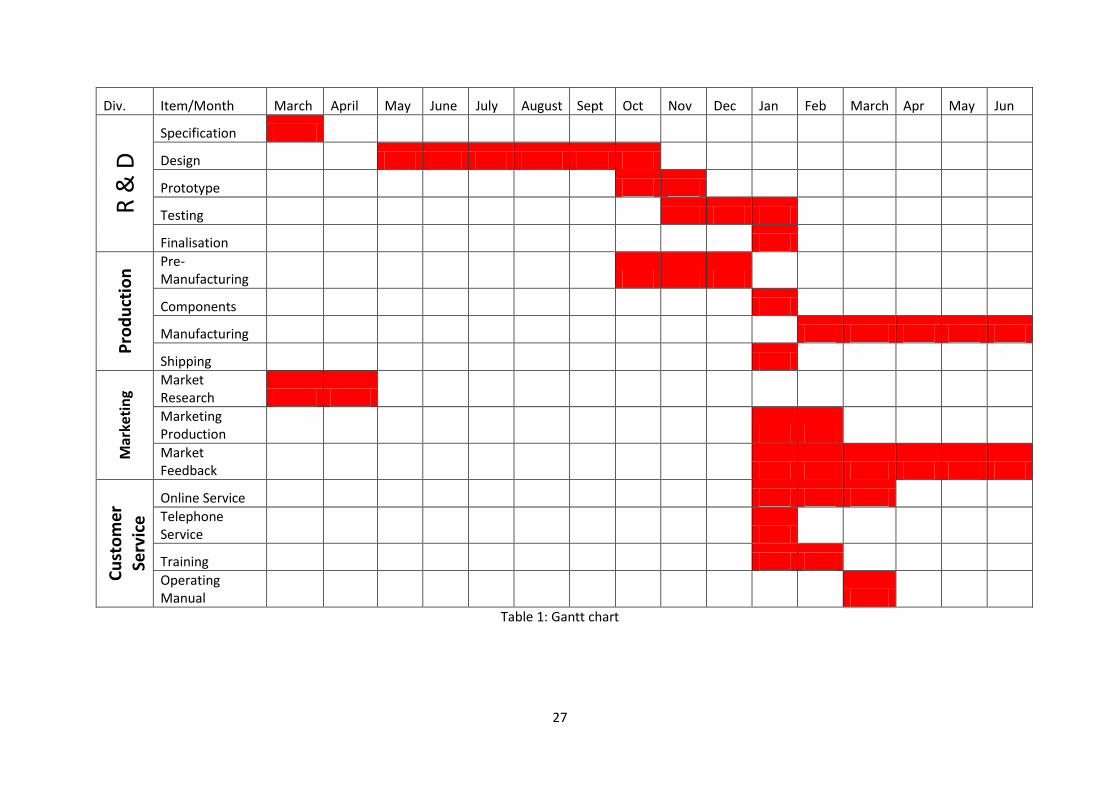
Timescale
The project is expected to take a period of 1 year from the design specification process to a
complete final product ready for sales. Manufacturing process will continue based on
customer’s demand. The work breakdown structure is included and the timescale is defined
clearly by using the Gantt chart.
Cost
Project cost:
- Hardware development cost
- Software development cost
Operational cost:
- Staff salary
Staff salary will be higher during the R&D process, as more staffs are required during
this stage for the development process. Once the development process has been
completed, salary will be distributed towards service engineers, manufacturing
personnel and customer service.
- Site rental
Site is required for office space for developers. Later a warehouse is to be converted
to a manufacturing plant.
- Annual Maintenance cost
Maintenance cost will cover the maintenance required for the manufacturing plant
- Customer support
Customer support will include warranty claims, call centre support and operating
manual production
- Overhead bills
Utility bills such as gas, electricity and water. Subject to inflation yearly.
- Manufacturing
Manufacturing cost involves purchase of raw material and other manufacturing
associated cost
18
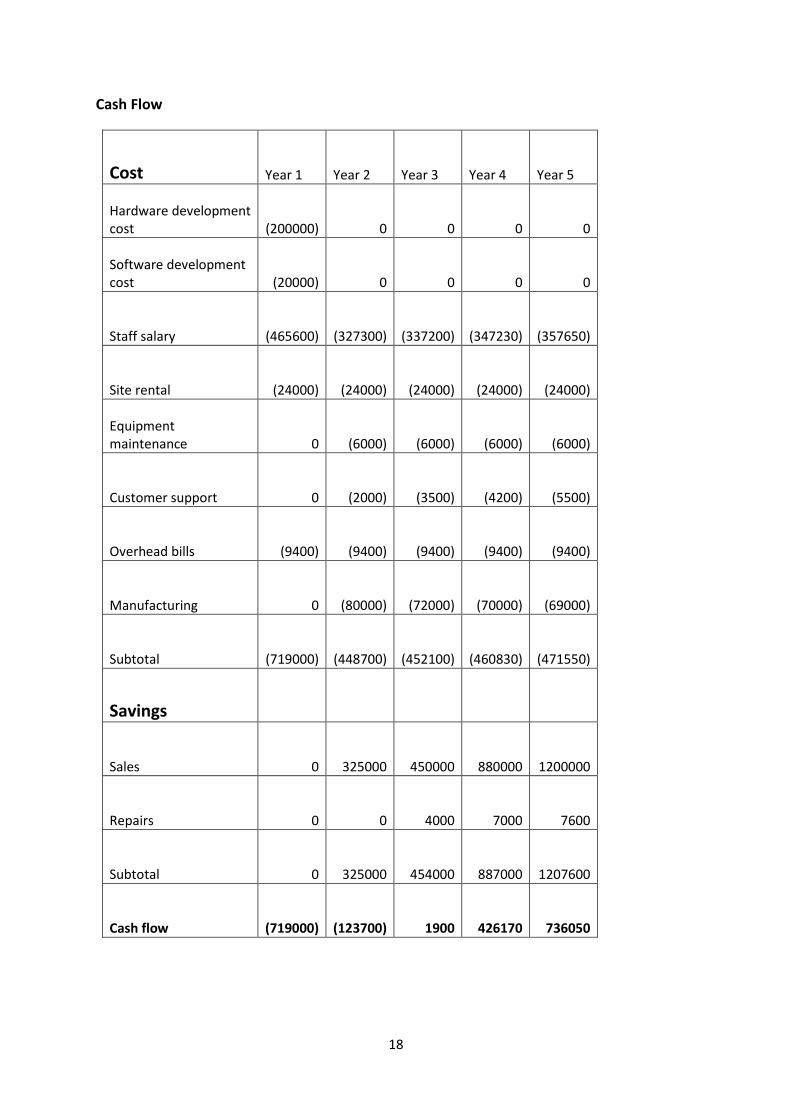
Cash Flow
Cost Year 1 Year 2 Year 3 Year 4 Year 5
Hardware development cost (200000) 0 0 0 0
Software development cost (20000) 0 0 0 0
Staff salary (465600) (327300) (337200) (347230) (357650)
Site rental (24000) (24000) (24000) (24000) (24000)
Equipment maintenance 0 (6000) (6000) (6000) (6000)
Customer support 0 (2000) (3500) (4200) (5500)
Overhead bills (9400) (9400) (9400) (9400) (9400)
Manufacturing 0 (80000) (72000) (70000) (69000)
Subtotal (719000) (448700) (452100) (460830) (471550)
Savings
Sales 0 325000 450000 880000 1200000
Repairs 0 0 4000 7000 7600
Subtotal 0 325000 454000 887000 1207600
Cash flow (719000) (123700) 1900 426170 736050
19
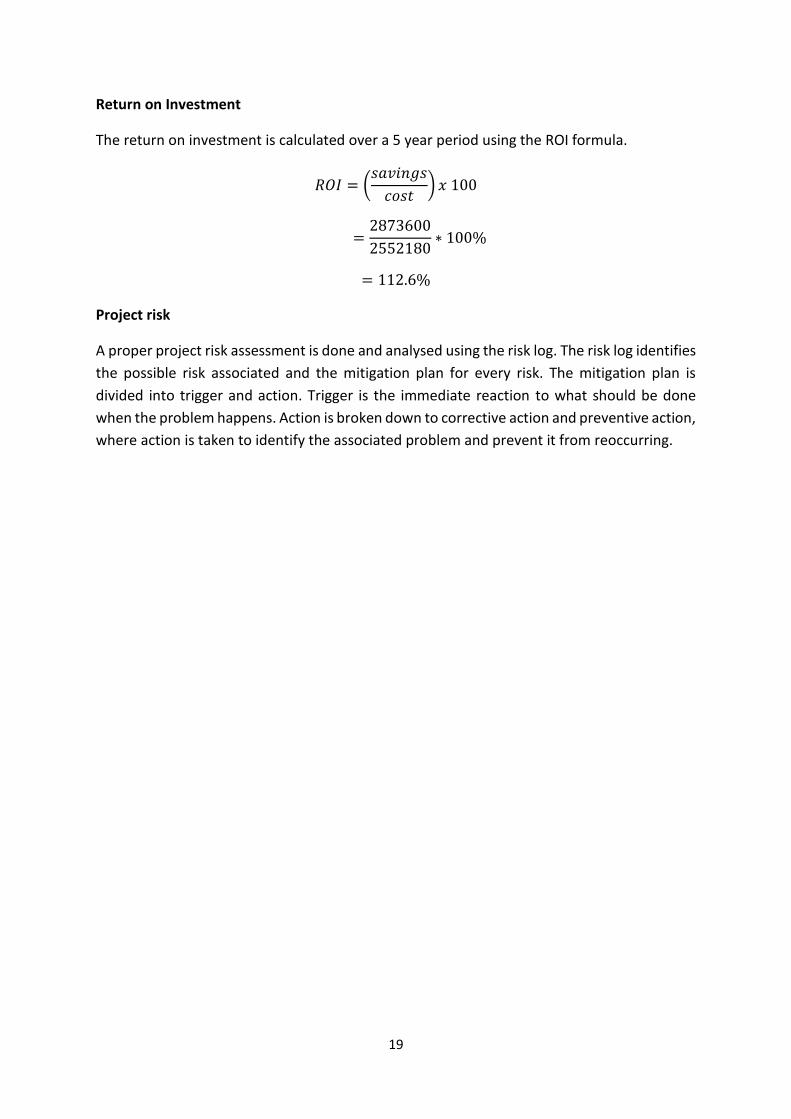
Return on Investment
The return on investment is calculated over a 5 year period using the ROI formula.
𝑅𝑂𝐼 = (𝑠𝑎𝑣𝑖𝑛𝑔𝑠
𝑐𝑜𝑠𝑡) 𝑥 100
=2873600
2552180∗ 100%
= 112.6%
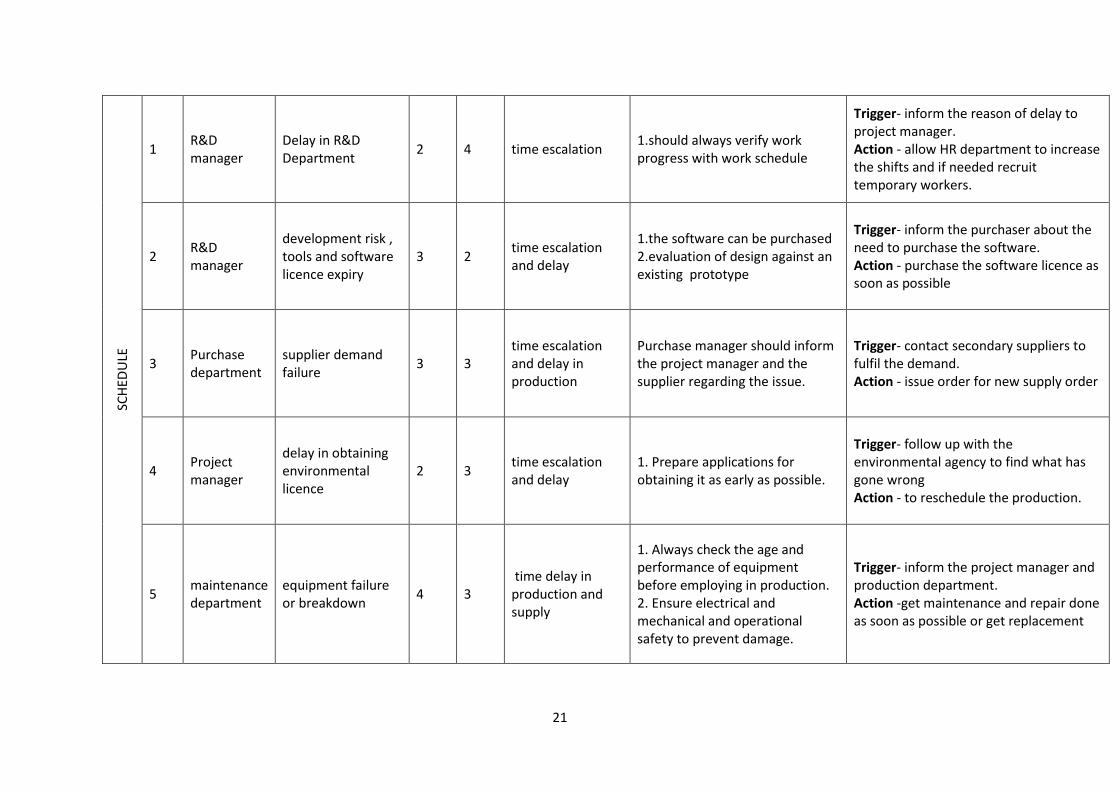
Project risk
A proper project risk assessment is done and analysed using the risk log. The risk log identifies
the possible risk associated and the mitigation plan for every risk. The mitigation plan is
divided into trigger and action. Trigger is the immediate reaction to what should be done
when the problem happens. Action is broken down to corrective action and preventive action,
where action is taken to identify the associated problem and prevent it from reoccurring.
20
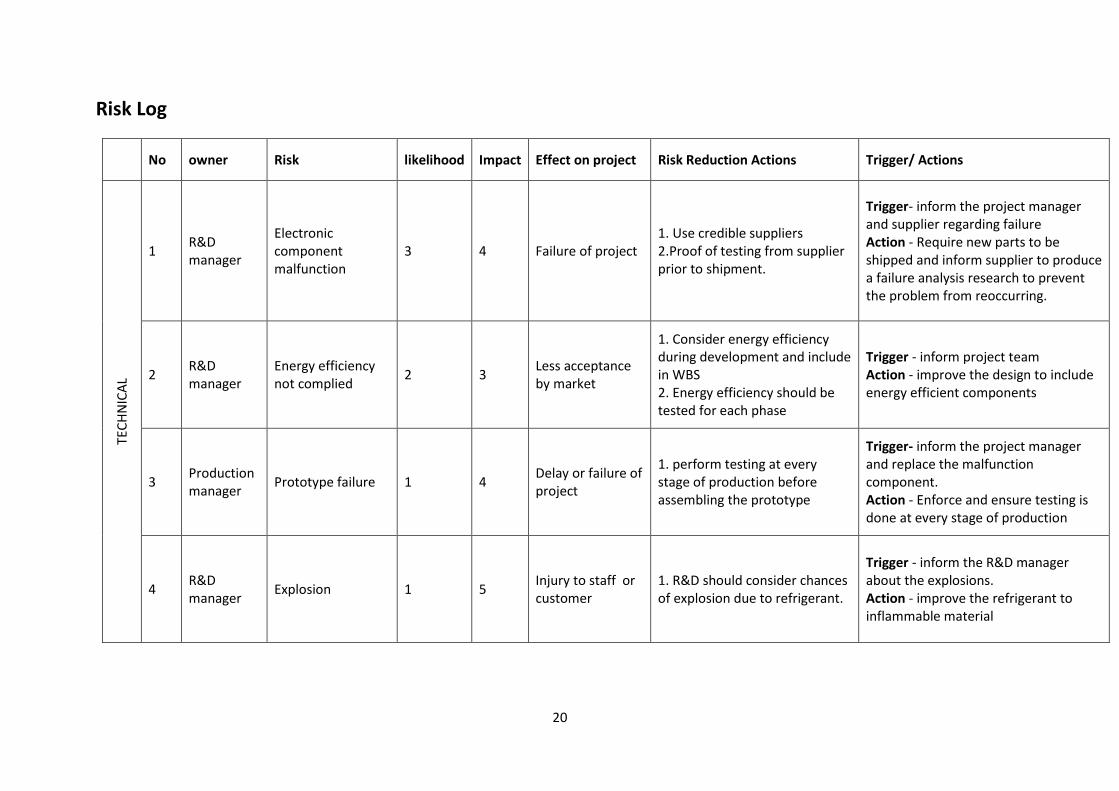
Risk Log
No owner Risk likelihood Impact Effect on project Risk Reduction Actions Trigger/ Actions
TEC
HN
ICA
L
1 R&D manager
Electronic component malfunction
3 4 Failure of project 1. Use credible suppliers 2.Proof of testing from supplier prior to shipment.
Trigger- inform the project manager and supplier regarding failure Action - Require new parts to be shipped and inform supplier to produce a failure analysis research to prevent the problem from reoccurring.
2 R&D manager
Energy efficiency not complied
2 3 Less acceptance by market
1. Consider energy efficiency during development and include in WBS 2. Energy efficiency should be tested for each phase
Trigger - inform project team Action - improve the design to include energy efficient components
3 Production manager
Prototype failure 1 4 Delay or failure of project
1. perform testing at every stage of production before assembling the prototype
Trigger- inform the project manager and replace the malfunction component. Action - Enforce and ensure testing is done at every stage of production
4 R&D manager
Explosion 1 5 Injury to staff or customer
1. R&D should consider chances of explosion due to refrigerant.
Trigger - inform the R&D manager about the explosions. Action - improve the refrigerant to inflammable material
21
SCH
EDU
LE
1 R&D manager
Delay in R&D Department
2 4 time escalation 1.should always verify work progress with work schedule
Trigger- inform the reason of delay to project manager. Action - allow HR department to increase the shifts and if needed recruit temporary workers.
2 R&D manager
development risk , tools and software licence expiry
3 2 time escalation and delay
1.the software can be purchased 2.evaluation of design against an existing prototype
Trigger- inform the purchaser about the need to purchase the software. Action - purchase the software licence as soon as possible
3 Purchase department
supplier demand failure
3 3 time escalation and delay in production
Purchase manager should inform the project manager and the supplier regarding the issue.
Trigger- contact secondary suppliers to fulfil the demand. Action - issue order for new supply order
4 Project manager
delay in obtaining environmental licence
2 3 time escalation and delay
1. Prepare applications for obtaining it as early as possible.
Trigger- follow up with the environmental agency to find what has gone wrong Action - to reschedule the production.
5 maintenance department
equipment failure or breakdown
4 3 time delay in production and supply
1. Always check the age and performance of equipment before employing in production. 2. Ensure electrical and mechanical and operational safety to prevent damage.
Trigger- inform the project manager and production department. Action -get maintenance and repair done as soon as possible or get replacement
22
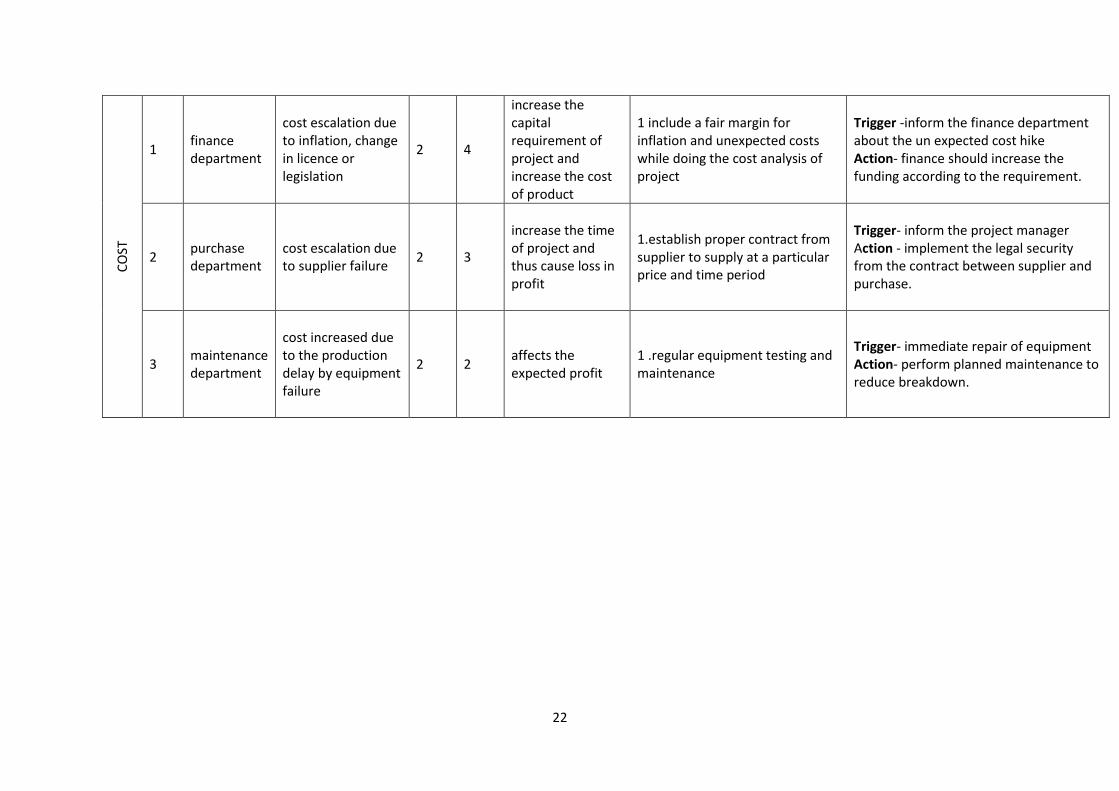
CO
ST
1 finance department
cost escalation due to inflation, change in licence or legislation
2 4
increase the capital requirement of project and increase the cost of product
1 include a fair margin for inflation and unexpected costs while doing the cost analysis of project
Trigger -inform the finance department about the un expected cost hike Action- finance should increase the funding according to the requirement.
2 purchase department
cost escalation due to supplier failure
2 3
increase the time of project and thus cause loss in profit
1.establish proper contract from supplier to supply at a particular price and time period
Trigger- inform the project manager Action - implement the legal security from the contract between supplier and purchase.
3 maintenance department
cost increased due to the production delay by equipment failure
2 2 affects the expected profit
1 .regular equipment testing and maintenance
Trigger- immediate repair of equipment Action- perform planned maintenance to reduce breakdown.
23
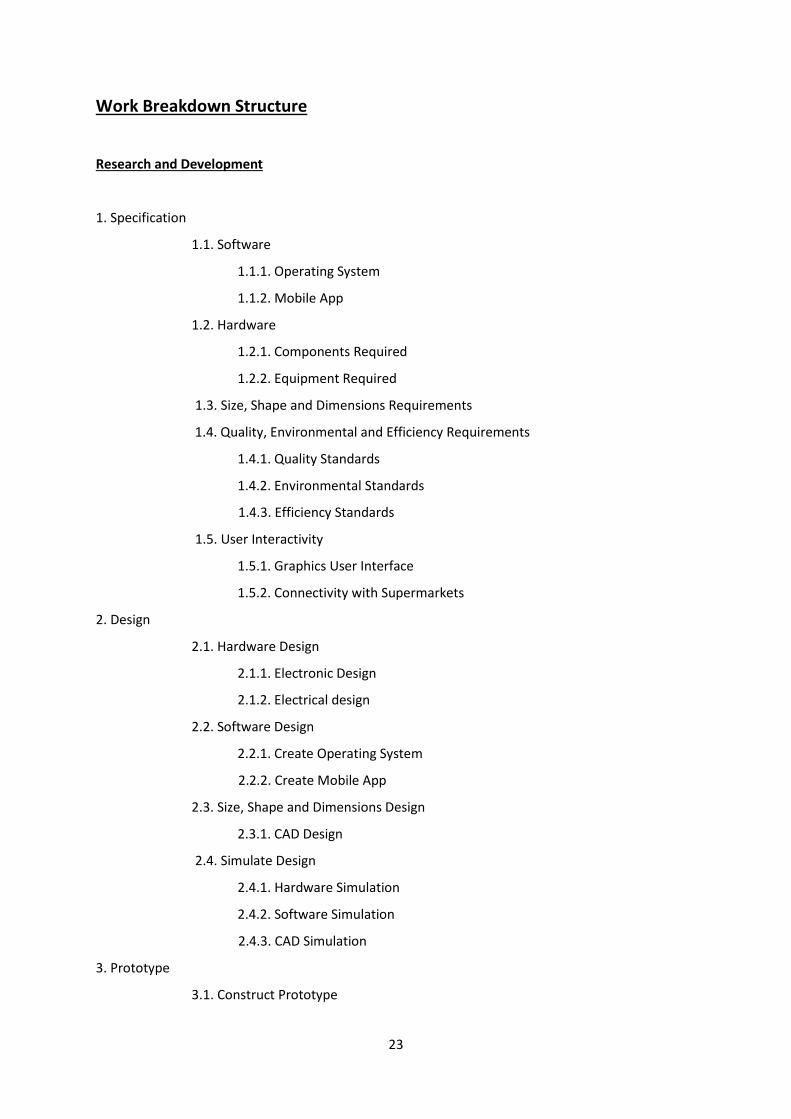
Work Breakdown Structure
Research and Development
1. Specification
1.1. Software
1.1.1. Operating System
1.1.2. Mobile App
1.2. Hardware
1.2.1. Components Required
1.2.2. Equipment Required
1.3. Size, Shape and Dimensions Requirements
1.4. Quality, Environmental and Efficiency Requirements
1.4.1. Quality Standards
1.4.2. Environmental Standards
1.4.3. Efficiency Standards
1.5. User Interactivity
1.5.1. Graphics User Interface
1.5.2. Connectivity with Supermarkets
2. Design
2.1. Hardware Design
2.1.1. Electronic Design
2.1.2. Electrical design
2.2. Software Design
2.2.1. Create Operating System
2.2.2. Create Mobile App
2.3. Size, Shape and Dimensions Design
2.3.1. CAD Design
2.4. Simulate Design
2.4.1. Hardware Simulation
2.4.2. Software Simulation
2.4.3. CAD Simulation
3. Prototype
3.1. Construct Prototype
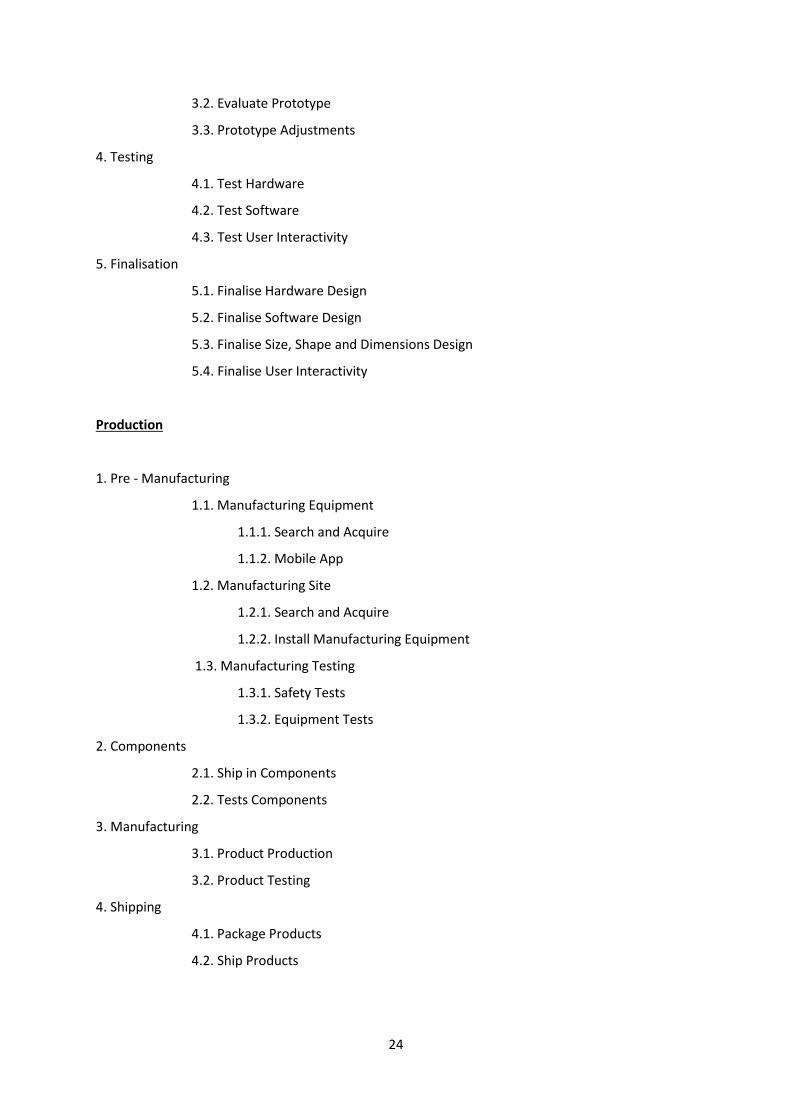
24
3.2. Evaluate Prototype
3.3. Prototype Adjustments
4. Testing
4.1. Test Hardware
4.2. Test Software
4.3. Test User Interactivity
5. Finalisation
5.1. Finalise Hardware Design
5.2. Finalise Software Design
5.3. Finalise Size, Shape and Dimensions Design
5.4. Finalise User Interactivity
Production
1. Pre - Manufacturing
1.1. Manufacturing Equipment
1.1.1. Search and Acquire
1.1.2. Mobile App
1.2. Manufacturing Site
1.2.1. Search and Acquire
1.2.2. Install Manufacturing Equipment
1.3. Manufacturing Testing
1.3.1. Safety Tests
1.3.2. Equipment Tests
2. Components
2.1. Ship in Components
2.2. Tests Components
3. Manufacturing
3.1. Product Production
3.2. Product Testing
4. Shipping
4.1. Package Products
4.2. Ship Products
25
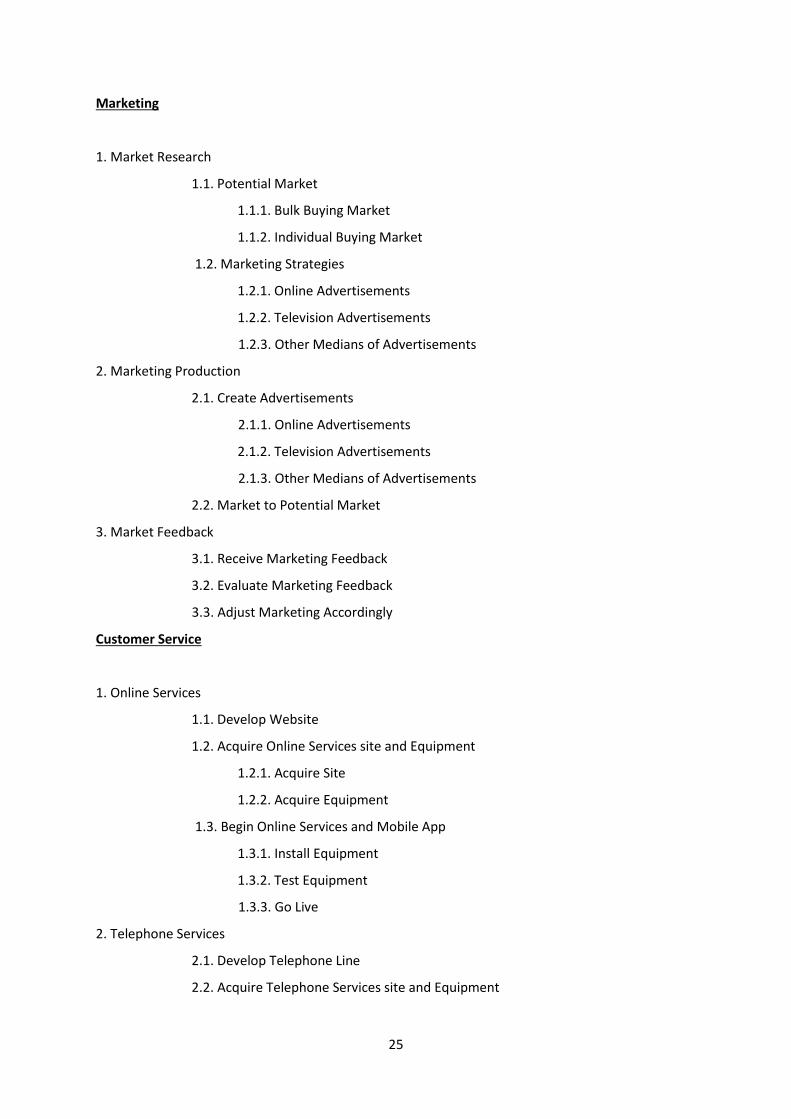
Marketing
1. Market Research
1.1. Potential Market
1.1.1. Bulk Buying Market
1.1.2. Individual Buying Market
1.2. Marketing Strategies
1.2.1. Online Advertisements
1.2.2. Television Advertisements
1.2.3. Other Medians of Advertisements
2. Marketing Production
2.1. Create Advertisements
2.1.1. Online Advertisements
2.1.2. Television Advertisements
2.1.3. Other Medians of Advertisements
2.2. Market to Potential Market
3. Market Feedback
3.1. Receive Marketing Feedback
3.2. Evaluate Marketing Feedback
3.3. Adjust Marketing Accordingly
Customer Service
1. Online Services
1.1. Develop Website
1.2. Acquire Online Services site and Equipment
1.2.1. Acquire Site
1.2.2. Acquire Equipment
1.3. Begin Online Services and Mobile App
1.3.1. Install Equipment
1.3.2. Test Equipment
1.3.3. Go Live
2. Telephone Services
2.1. Develop Telephone Line
2.2. Acquire Telephone Services site and Equipment
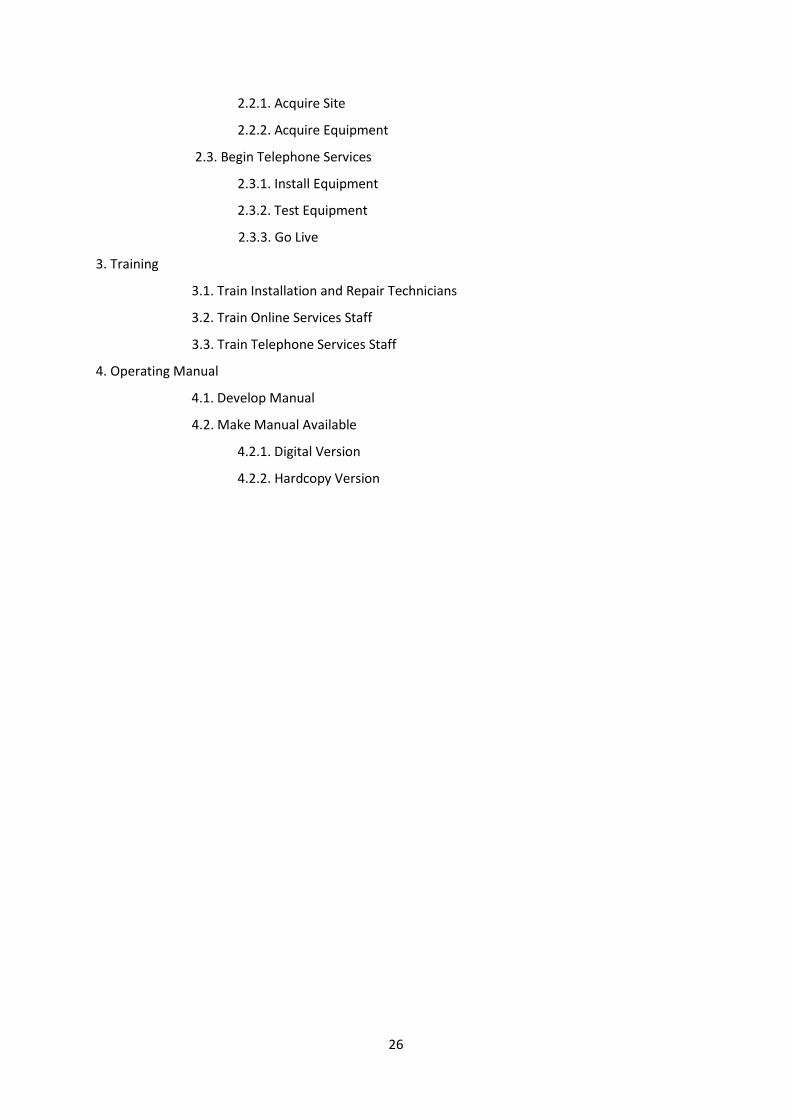
26
2.2.1. Acquire Site
2.2.2. Acquire Equipment
2.3. Begin Telephone Services
2.3.1. Install Equipment
2.3.2. Test Equipment
2.3.3. Go Live
3. Training
3.1. Train Installation and Repair Technicians
3.2. Train Online Services Staff
3.3. Train Telephone Services Staff
4. Operating Manual
4.1. Develop Manual
4.2. Make Manual Available
4.2.1. Digital Version
4.2.2. Hardcopy Version
27
Table 1: Gantt chart
Div. Item/Month March April May June July August Sept Oct Nov Dec Jan Feb March Apr May Jun
R &
D
Specification
Design
Prototype
Testing
Finalisation
Pro
du
ctio
n Pre-
Manufacturing
Components
Manufacturing
Shipping
Mar
keti
ng
Market Research
Marketing Production
Market Feedback
Cu
sto
mer
Se
rvic
e
Online Service
Telephone Service
Training
Operating Manual
28
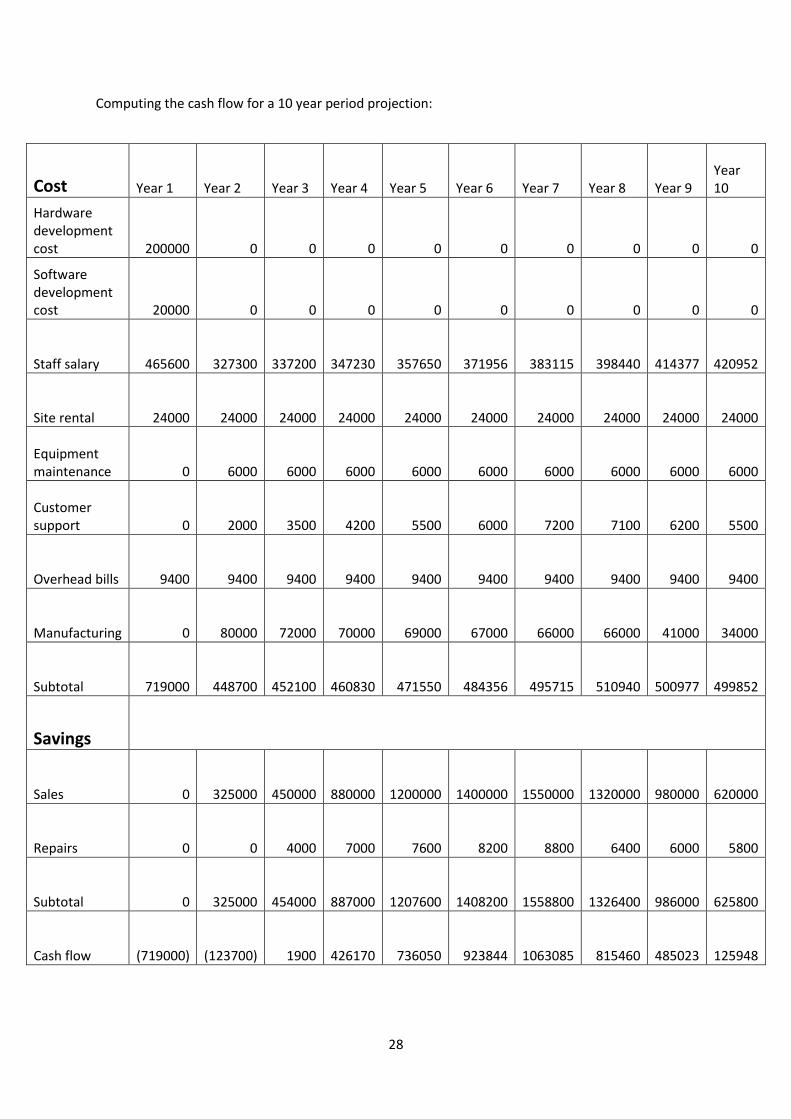
Computing the cash flow for a 10 year period projection:
Cost Year 1 Year 2 Year 3 Year 4 Year 5 Year 6 Year 7 Year 8 Year 9 Year 10
Hardware development cost 200000 0 0 0 0 0 0 0 0 0
Software development cost 20000 0 0 0 0 0 0 0 0 0
Staff salary 465600 327300 337200 347230 357650 371956 383115 398440 414377 420952
Site rental 24000 24000 24000 24000 24000 24000 24000 24000 24000 24000
Equipment maintenance 0 6000 6000 6000 6000 6000 6000 6000 6000 6000
Customer support 0 2000 3500 4200 5500 6000 7200 7100 6200 5500
Overhead bills 9400 9400 9400 9400 9400 9400 9400 9400 9400 9400
Manufacturing 0 80000 72000 70000 69000 67000 66000 66000 41000 34000
Subtotal 719000 448700 452100 460830 471550 484356 495715 510940 500977 499852
Savings
Sales 0 325000 450000 880000 1200000 1400000 1550000 1320000 980000 620000
Repairs 0 0 4000 7000 7600 8200 8800 6400 6000 5800
Subtotal 0 325000 454000 887000 1207600 1408200 1558800 1326400 986000 625800
Cash flow (719000) (123700) 1900 426170 736050 923844 1063085 815460 485023 125948
29
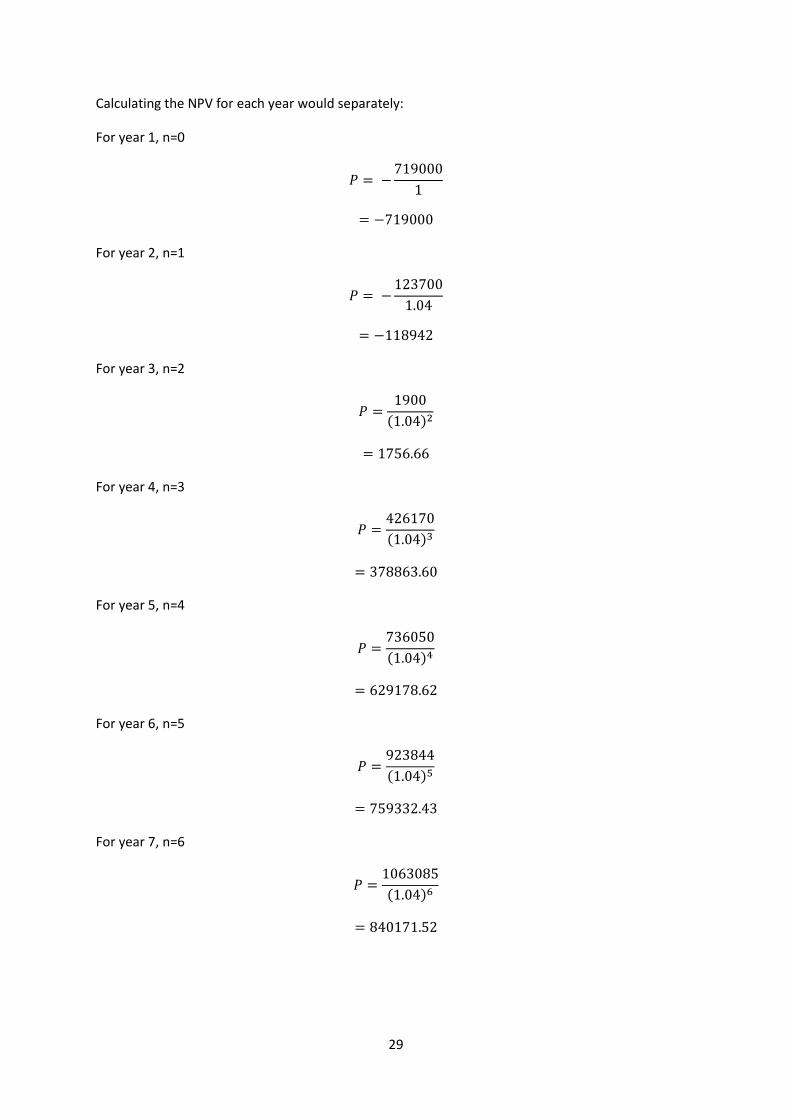
Calculating the NPV for each year would separately:
For year 1, n=0
𝑃 = −719000
1
= −719000
For year 2, n=1
𝑃 = −123700
1.04
= −118942
For year 3, n=2
𝑃 =1900
(1.04)2
= 1756.66
For year 4, n=3
𝑃 =426170
(1.04)3
= 378863.60
For year 5, n=4
𝑃 =736050
(1.04)4
= 629178.62
For year 6, n=5
𝑃 =923844
(1.04)5
= 759332.43
For year 7, n=6
𝑃 =1063085
(1.04)6
= 840171.52
30
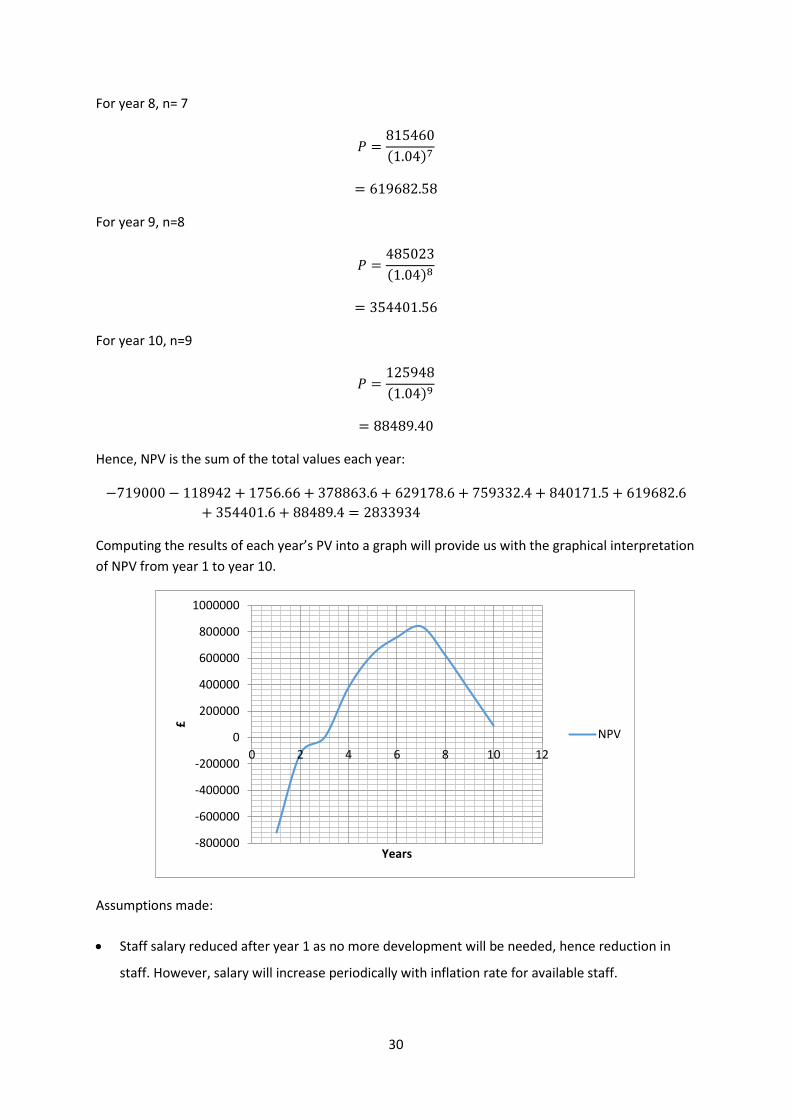
For year 8, n= 7
𝑃 =815460
(1.04)7
= 619682.58
For year 9, n=8
𝑃 =485023
(1.04)8
= 354401.56
For year 10, n=9
𝑃 =125948
(1.04)9
= 88489.40
Hence, NPV is the sum of the total values each year:
−719000 − 118942 + 1756.66 + 378863.6 + 629178.6 + 759332.4 + 840171.5 + 619682.6
+ 354401.6 + 88489.4 = 2833934
Computing the results of each year’s PV into a graph will provide us with the graphical interpretation
of NPV from year 1 to year 10.
Assumptions made:
Staff salary reduced after year 1 as no more development will be needed, hence reduction in
staff. However, salary will increase periodically with inflation rate for available staff.
-800000
-600000
-400000
-200000
0
200000
400000
600000
800000
1000000
0 2 4 6 8 10 12
£
Years
NPV
31
Manufacturing cost to be high in the beginning. Mass production will continually decrease the
manufacturing cost despite the increase in volume. Process Engineers are also responsible to
reduction of waste which would directly reduce the manufacturing cost.
Sales value to pick up until it reaches a peak period, in this case at year 7 then a steady decline
as the project reaches the end of its technological life cycle.
Based on the NPV graph, we can see that the project is approaching a limit at 0. Hence, before the
project reaches a negative value, the product should only be sold for a period of 10 years.
Assumption is made based on new innovation in the market that would be more attractive to
customers.
32
6.0 References
1. Papenek, V. 1995. The Green Emperitive: Ecology and Ethics in Design and Architecture, London,
Thames and Hudson.
2. European Commision, 2012. Eco-design of Energy-Related Products. [Online] Available at
http://ec.europa.eu/energy/efficiency/ecodesign/eco_design_en.htm
3. Palmer, L. 2011. Case Study: Orangebox Limited. [Online] Available at
http://www.ecodesigncentre.org/sites/default/files/EDC_Orangebox_EnablingEcodesignInWelshInd
ustry_1.pdf
4. Whitehead,P., Young, A.K., Charter, M. 2007. Eco-Design Case Study: Crawford Hansford & Kimber
(CH & K). Adding Value to the Supply chain with Smart ecoDesign. The centre for sustainable Design.
5. Bassett,D., 2010. Eco-Design Case Study: Kelvin Hughes. Kelvin Hughes Limited. Ilford, Essex.
6. Chesbrough, Henry W., 2003 “The Era of Open Innovation.” Sloan Management Review , 44, 3
(Spring): 35-41.
7. Ades, C., Figlioli, A., Sbragia, R., Porto., Plonski, G.A., Celadon, K., 2011. Implementing Open
Innovation: The case of Natura, IBM and Siemens. Journal of Technology Management and
Innovation, Vol 8, Special issue, pp 12-25
8. Massis, A., Lazzarotti, V., Pizzurno, E., Salzillo, E., 2012. Management of Technological Innovation
in developing and developed countries. Rijeka: InTech Europe
9. Idea Connection, 2007. How Dunkin’ Donuts uses open innovation to get ahead. [Online] Available
at http://www.ideaconnection.com/open-innovation-success/How-Dunkin-Donuts-Uses-Open-
Innovation-to-Get-Ahead-00336.html