prevalence of diabetes in mexican americans, cubans, and puerto ricans from the hispanic health and...
TRANSCRIPT
Prevalence of Diabetes in MexicanAmericans, Cubans, and PuertoRicans From the Hispanic Healthand Nutrition ExaminationSurvey, 1982-1984
Katherine M. Flegal, PhDTrena M. Ezzati, MSMaureen I. Harris, PhDSuzanne G. Haynes, PhDRumaldo Z. Juarez, PhDWilliam C. Knowler, MD, DrPHEliseo j . Perez-Stable, MDMichael P. Stern, MD
The purpose of this study was to estimate theprevalence of diagnosed and undiagnosed diabetesamong Mexican Americans, Cubans, and Puerto Ricansin the United States and compare these estimatesto data from prior surveys for U.S. non-Hispanicwhites and blacks. Data for this study are from theHispanic Health and Nutrition Examination Survey, amultipurpose cross-sectional survey of three U.S.Hispanic populations conducted in 1982-1984. Theinterviewed sample of people aged 20-74 yr included3935 Mexican Americans in the southwest, 1134 Cubansin Florida, and 1519 Puerto Ricans in the New York Cityarea. The diabetes component consisted of interviewquestions on diabetes diagnosis and treatment and anoral glucose tolerance test administered to a subsample.The prevalence of diabetes was two to three timesgreater for Mexican Americans and Puerto Ricans thanfor non-Hispanic whites surveyed in 1976-1980. InCubans, the prevalence was similar to that for non-Hispanic whites. In men and women 45-74 yr of age,the prevalence of diabetes was extremely high forboth Mexican Americans (23.9%) and Puerto Ricans(26.1%) compared with Cubans (15.8%) or non-Hispanicwhites (12%). The total prevalence of diabetes was notsignificantly different for Mexican Americans and PuertoRicans but was significantly lower for Cubans. Therelatively lower prevalence of diabetes among Cubansand the high prevalence in both Mexican Americansand Puerto Ricans may be related to socioeconomic,genetic, behavioral, or environmental factors. DiabetesCare 14 (Suppl. 3):628-38, 1991
The >15 million Hispanics living in the UnitedStates represent 7% of the U.S. population (1).The Hispanic Health and Nutrition ExaminationSurvey (HHANES) was a cross-sectional survey of
the Hispanic population in selected areas of the U.S.whose goal was to produce estimates of the health andnutritional status of three major Hispanic subgroups(Mexican Americans, Cubans, and Puerto Ricans).
The prevalence of diabetes among Hispanic popula-tions is of special concern because diabetes mellitus,primarily non-insulin-dependent diabetes, has beenidentified as a major cause of morbidity and mortalityamong Mexican Americans compared with non-His-panic whites (2-6). However, little is known about theprevalence of diabetes among other Hispanic subgroupsin the U.S. (7). To assess the impact of diabetes onMexican Americans, Cubans, and Puerto Ricans in theU.S., the HHANES included interview questions on di-abetes diagnosis and treatment and an oral glucose tol-erance test administered to a subsample of respondents.In this article, we present estimates from HHANES ofthe prevalence of diabetes and impaired glucose toler-ance in three major Hispanic subgroups in the U.S.and compare these estimates among the three sub-groups. We also present similar estimates for the U.S.non-Hispanic white and black populations from theSecond National Health and Nutrition Examination Sur-vey (NHANES II).
From the National Center for Health Statistics, Hyattsville; and the NationalInstitute of Diabetes and Digestive and Kidney Diseases, Bethesda, Maryland,and Phoenix, Arizona; the Pan American University, Edinburg; and the Uni-versity of Texas Health Science Center at San Antonio, San Antonio, Texas; andthe University of California, San Francisco, San Francisco, California.
Address correspondence and reprint requests to Katherine M. Flegal, PhD,Division of Health Examination Statistics, Room 900, National Center for HealthStatistics, 6525 Belcrest Road, Hyattsville, MD 20782.
RESEARCH DESIGN AND METHODS
HHANES was conducted in 1982-1984 by the NationalCenter for Health Statistics. A description of the planand operation of the survey has been published (8). Thetarget population consisted of the civilian, noninstitu-
628 DIABETES CARE, VOL. 14, NO. 7, SUPPL. 3, JULY 1991
K.M. FLEGAL AND ASSOCIATES
tionalized (armed forces, hospitals, and jails were ex-cluded) population of Mexican origin or ancestry inthe southwest (California, Arizona, New Mexico, Color-ado, and Texas), of Puerto Rican origin or ancestry in se-lected counties in New York, New Jersey, and Connec-ticut, and of Cuban origin or ancestry in Dade County(Miami), Florida. In this article, the terms MexicanAmericans, Cubans, and Puerto Ricans refer to thesethree geographically limited populations. The countiesselected for inclusion in the sampling frame included-76% of the 1980 Hispanic-origin population in theU.S.
The sampling scheme generated a stratified probabil-ity cluster sample of Hispanic households within eachuniverse and a sample of residents within these house-holds. Selected households were visited by a bilingualinterviewer who identified eligible Hispanic fami-lies and followed a predetermined sampling pattern tochoose specified family members to participate in thesurvey. Although a family was considered eligible if thenational origin or ancestry of at least one family membermet the criteria for eligibility (Mexican in the southwest,Puerto Rican in the New York City area, and Cuban inDade County), the selected sample people were notnecessarily of the same origin. Analyses in this articlewere based on data only for those sample people ofMexican origin or ancestry in the southwest, of Cubanorigin or ancestry in Dade County, Florida, and ofPuerto Rican origin or ancestry in the New York Cityarea. When the appropriate sample weights are used,direct statistical inferences may be made from these datafor the Mexican-origin population in the southwest, thePuerto Rican population in the New York City area, andthe Cuban-origin population in Dade County, Florida.
The survey included a household interview and aphysical examination. A rigorous back-and-forth trans-lation process was used to produce equivalent Spanishand English versions of all data collection instruments(8). In the household interview, respondents were asked"Do you have diabetes or sugar diabetes? (̂ Tiene usteddiabetes o azucar en la sangre?)" People answering af-firmatively were then asked "Did a doctor tell you thatyou have it? QLe dijo un medico que la tiene?)"
Participating family members were then scheduled forexaminations in mobile examination centers. Half of theadults aged 20-74 yr were assigned to a fasting subsam-ple designated to complete the glucose tolerance com-ponent. These people were requested to schedulemorning examinations and fast overnight for 10-16 hbefore the examination. The glucose tolerance compo-nent of the survey consisted of a brief questionnaire,followed by an oral glucose tolerance test administeredto all people not reporting current use of insulin.
Oral glucose tolerance tests were administered ac-cording to the recommendations of the National Dia-betes Data Croup (NDDG; 9). After a fasting bloodsample was taken, the person was given a dose of Glu-cola containing the equivalent of 75 g glucose. Addi-tional blood samples were taken 1 and 2 h after the
glucose challenge. Venous blood was collected into asodium fluoride-containing tube. Blood samples werecentrifuged, separated, frozen at -20°C, and sent foranalysis to the Division of Environmental Health Labo-ratories, Centers for Disease Control (Atlanta, GA).Plasma glucose levels were measured by a microadap-tation of the national glucose reference method on aGilford System 3500 Computer-directed Analyzer (10).
DEFINITIONS OF DIABETES AND IMPAIREDGLUCOSE TOLERANCE
People who reported in the interview that a doctor hadtold them they had diabetes were classified as havingpreviously diagnosed diabetes. Eight people who wereinterviewed could not be classified and were excludedfrom further analysis. Others who were interviewedwere classified as not having previously diagnoseddiabetes.
Respondents with no history of previously diagnoseddiabetes were further classified, on the basis of the re-sults from the glucose tolerance test, as having undi-agnosed diabetes, impaired glucose tolerance, orneither, first with the World Health Organization(WHO) diagnostic criteria (11) and then with the NDDGdiagnostic criteria (9). The WHO criteria for diabetesrequire either a fasting plasma glucose value of 5:7.8mM or a 2-h plasma glucose value of 5:11.2 mM,whereas the NDDG criteria for diabetes require thateither the fasting plasma glucose value be >7.8 mMor that both the 1- and 2-h plasma glucose values be5:11.2 mM. The WHO criteria for impaired glucose tol-erance require a fasting plasma glucose value of <7.8mM and a 2-h plasma glucose value between 7.8 and11.2 mM; in addition, the NDDG criteria require thatthe 1-h plasma glucose value be 5:11.2 mM.
For the analyses presented herein, people who fastedbetween 9 and 17 h were considered to have valid glu-cose tolerance tests. Only those 2-h values from bloodsamples taken within 105-135 min after drinking Glu-cola were used for purposes of classification. Respon-dents with some missing plasma glucose values wereclassified only if the classification was unambiguous.Statistical methods. Statistical procedures involvingweighted analyses of these data with appropriate ad-justments for the complex sample survey designwere implemented with SAS (12), SURREGR (13),SESUDAAN (14), and GENCAT (15). Subpopulation,age, and sex effects were estimated and tested in thecontext of an overall statistical model, as described byLandis et al. (16). The weighted least-squares algorithmin GENCAT was used to fit a specified model matrix tothe logit of the prevalence for each subgroup (15). Asaturated model that included separate terms for eachsubgroup and all interaction terms was first fitted. Asequential model-fitting process, in which nonsignifi-cant terms were removed one at a time and parametersthat showed no significant difference were combined,
DIABETES CARE, VOL. 14, NO. 7, SUPPL. 3, JULY 1991 629
DIABETES PREVALENCE IN U.S. HISPANICS
was used to develop a reduced model that would bothfit the data well, as shown by a nonsignificant x2-statisticfor goodness of fit, and include only significant param-eters. Only statistically significant parameters were re-tained in the final model. The absence of a main effector interaction term from the final model indicates thatthat term was tested in a previous model and was notfound to be statistically significant. If two Hispanicsubgroups are represented by a single term, that indi-cates that separate terms for each subgroup were testedin a previous model and were found not to be signifi-cantly different from each other.
The formulas used for prevalence estimates are givenin Appendix 1. The prevalence of previously diagnoseddiabetes was estimated directly with data from the entireinterviewed sample, but a two-step procedure was usedto estimate the population prevalence of undiagnoseddiabetes. The population prevalence of undiagnosed di-abetes was calculated by multiplying the prevalence ofdiabetes among those with no prior diagnosis (estimatedfrom the sample completing the glucose tolerance test)by the proportion of people with no prior diagnosis (es-timated from the entire interviewed sample). For ex-ample, if 90% of the population reported no priordiagnosis, and if the results of the glucose tolerance testindicated that 5% of people with no prior diagnosis haddiabetes, then the population prevalence of undi-agnosed diabetes would be 0.90 x 5% or 4.5%.
Design effects (the ratio of the variance computedwith the survey design to the variance computedassuming simple random sampling) estimated withSESUDAAN were averaged across age and sex sub-groups to give average design effects that were then usedto adjust the variances calculated under the assumptionof simple random sampling. Average design effects forthe prevalence of previously diagnosed diabetes were1.0 for Mexican Americans, 1.2 for Cubans, and 1.3 forPuerto Ricans. Average design effects for the prevalenceof undiagnosed diabetes among people with no priordiagnosis of diabetes were 1.2 for Mexican Americansand 1.1 for Cubans and Puerto Ricans.
The population prevalence of undiagnosed diabeteswas calculated by combining two estimates from differ-ent subsamples. Because one subsample (people withno prior diagnosis of diabetes who completed the glu-cose tolerance test) is a subset of the other sample (allinterviewed people), these two estimates are not inde-pendent and their covariance needs to be taken intoaccount in calculating the variance of the combination.Because no software was available to estimate this vari-ance, the jackknife method, as described by Cox andCohen (17) for complex sample survey data, was usedto calculate approximate standard errors for the popu-lation prevalence of undiagnosed diabetes and for thetotal prevalence of diabetes and the prevalence of im-paired glucose tolerance. Approximate confidence in-tervals were constructed with a t statistic with 7 df.
Because of the small numbers of people in some cells,age adjustment was not considered to be appropriate for
these data. Two broad groupings (20-44 and 45-74 yrof age) were used for analytic purposes. However, forreference purposes, age- and sex-specific estimates withnarrower age groupings are presented in the appendix.
NHANES II, conducted on a probability sample of thecivilian, noninstitutionalized U.S. population from 1976to 1980, included a diabetes component similar to thatin HHANES (18,19). The methods of analysis describedherein were applied to the diabetes data from NHANESII to derive estimates of diabetes prevalence for non-Hispanic whites and blacks. To limit the comparisongroup to non-Hispanics, people who reported their na-tional origin or ancestry as Latin American, Cuban,Puerto Rican, Mexican, Mexican American, or of otherSpanish ancestry were excluded. The average designeffect was 1.2 for all prevalence estimates.
RESULTS
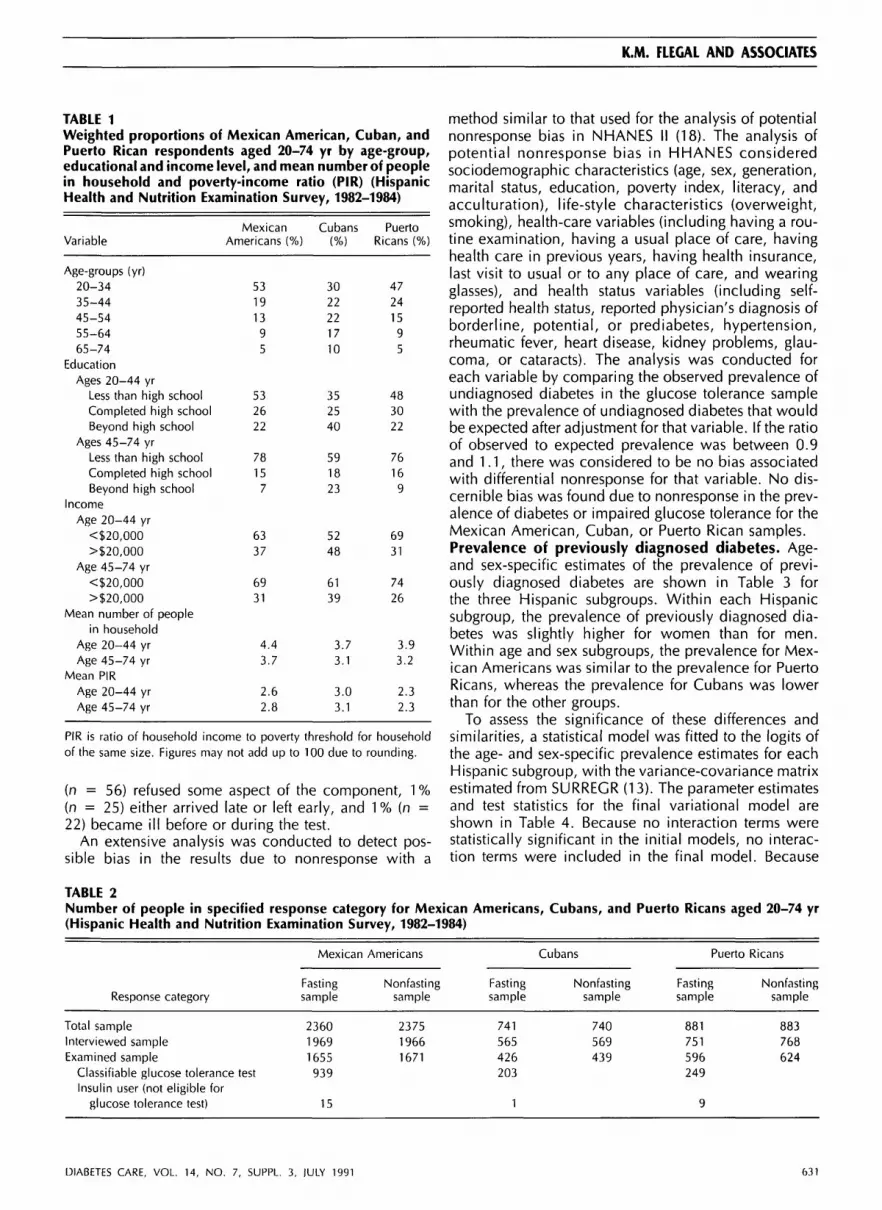
Sociodemographic characteristics of the three surveysamples are shown in Table 1. The age distributionswere similar in the Mexican-American and Puerto Ricansamples, but the Cuban sample was considerably older.The Cuban sample was also more highly educated thanthe Mexican-American and Puerto Rican samples. Al-though the proportion completing high school was sim-ilar in all three groups, the proportion of Cubans withsome education beyond high school graduation wasconsiderably higher than the proportions in the othertwo groups. A higher proportion of Cubans had house-hold incomes of >$20,000. The mean poverty-incomeratio (the ratio of total household income to the povertythreshold for a household of that size; 20) was highestfor the Cuban sample.Response rates and bias analysis. Estimates of theprevalence of previously diagnosed diabetes were basedon the household interview, which was completed by83% of the total sample 20-74 yr of age, as shown inTable 2. Of those interviewed, 82% were examined,with similar response rates in the fasting and nonfastingsubsamples. However, the response to the glucose tol-erance component of the examination was lower. Ofthe people who were examined in the fasting subsam-ple, only —50% completed the glucose tolerance com-ponent, ranging from 43% of Puerto Ricans to 58% ofMexican Americans.
The main reason for examined people not completingthe glucose tolerance component was the inability toschedule morning appointments for the examination,often because of conflict with work schedules. Of 2489examined people in the fasting subsample who reportedno prior diagnosis of diabetes, 53% (n = 1326) com-pleted the glucose tolerance component, 32% (n =785) did not complete the glucose tolerance componentbecause they were not examined in the morning, 8%(n = 190) had not fasted appropriately, 3% (n = 85)had incomplete results because of an error in test admin-istration or in the handling of the blood specimens, 2%
630 DIABETES CARE, VOL. 14, NO. 7, SUPPL. 3, JULY 1991
K.M. FLEGAL AND ASSOCIATES
TABLE 1Weighted proportions of Mexican American, Cuban, andPuerto Rican respondents aged 20-74 yr by age-group,educational and income level, and mean number of peoplein household and poverty-income ratio (PIR) (HispanicHealth and Nutrition Examination Survey, 1982-1984)
Variable
Age-groups (yr)20-3435-4445-5455-6465-74
EducationAges 20-44 yr
Less than high schoolCompleted high schoolBeyond high school
Ages 45-74 yrLess than high schoolCompleted high schoolBeyond high school
IncomeAge 20-44 yr
<$20,000>$20,000
Age 45-74 yr<$20,000>$20,000
Mean number of peoplein household
Age 20-44 yrAge 45-74 yr
Mean PIRAge 20-44 yrAge 45-74 yr
MexicanAmericans (%)
53191395
532622
78157
6337
6931
4.43.7
2.62.8
Cubans(%)
3022221710
352540
591823
5248
6139
3.73.1
3.03.1
PuertoRicans (%)
47241595
483022
76169
6931
7426
3.93.2
2.32.3
PIR is ratio of household income to poverty threshold for householdof the same size. Figures may not add up to 100 due to rounding.
(n = 56) refused some aspect of the component, 1 %(n = 25) either arrived late or left early, and 1 % (n =22) became ill before or during the test.
An extensive analysis was conducted to detect pos-sible bias in the results due to nonresponse with a
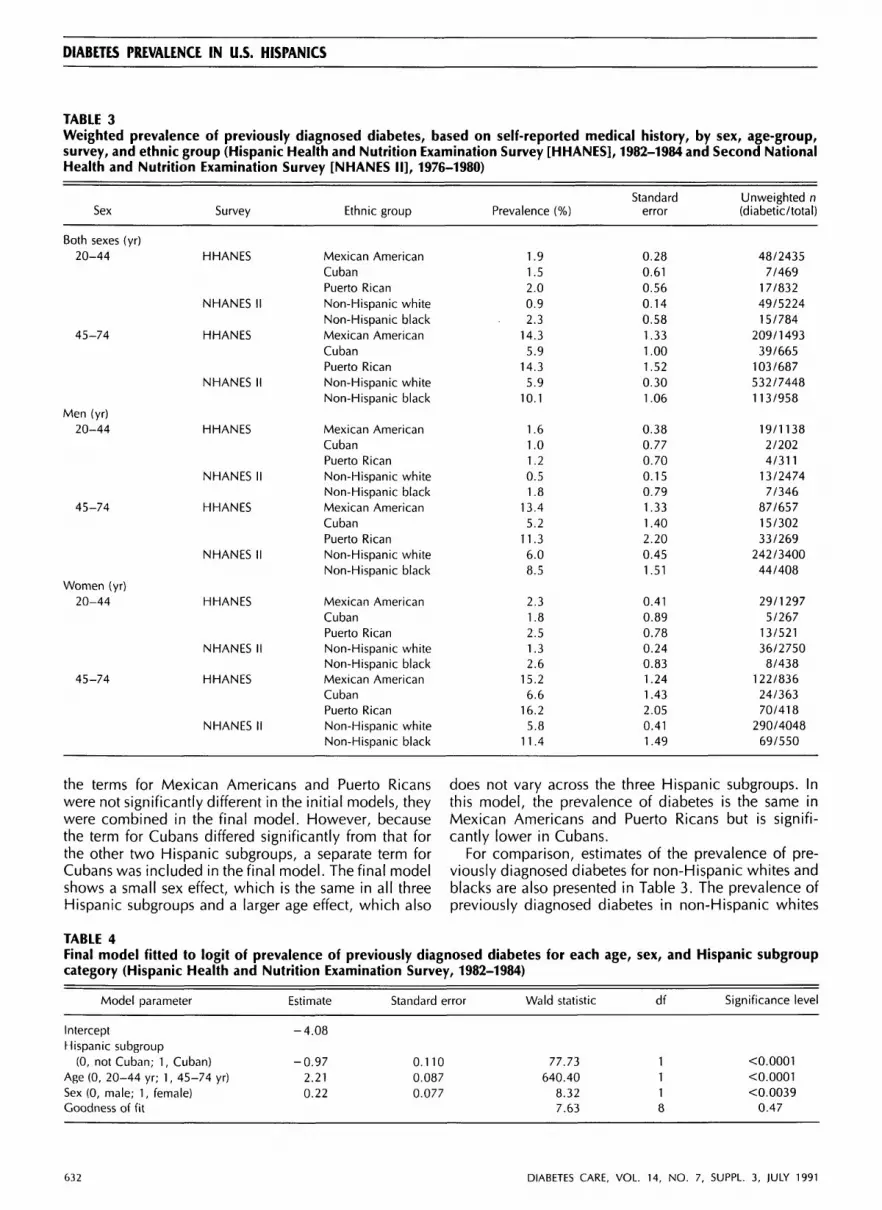
method similar to that used for the analysis of potentialnonresponse bias in NHANES II (18). The analysis ofpotential nonresponse bias in HHANES consideredsociodemographic characteristics (age, sex, generation,marital status, education, poverty index, literacy, andacculturation), life-style characteristics (overweight,smoking), health-care variables (including having a rou-tine examination, having a usual place of care, havinghealth care in previous years, having health insurance,last visit to usual or to any place of care, and wearingglasses), and health status variables (including self-reported health status, reported physician's diagnosis ofborderline, potential, or prediabetes, hypertension,rheumatic fever, heart disease, kidney problems, glau-coma, or cataracts). The analysis was conducted foreach variable by comparing the observed prevalence ofundiagnosed diabetes in the glucose tolerance samplewith the prevalence of undiagnosed diabetes that wouldbe expected after adjustment for that variable. If the ratioof observed to expected prevalence was between 0.9and 1.1, there was considered to be no bias associatedwith differential nonresponse for that variable. No dis-cernible bias was found due to nonresponse in the prev-alence of diabetes or impaired glucose tolerance for theMexican American, Cuban, or Puerto Rican samples.Prevalence of previously diagnosed diabetes. Age-and sex-specific estimates of the prevalence of previ-ously diagnosed diabetes are shown in Table 3 forthe three Hispanic subgroups. Within each Hispanicsubgroup, the prevalence of previously diagnosed dia-betes was slightly higher for women than for men.Within age and sex subgroups, the prevalence for Mex-ican Americans was similar to the prevalence for PuertoRicans, whereas the prevalence for Cubans was lowerthan for the other groups.
To assess the significance of these differences andsimilarities, a statistical model was fitted to the logits ofthe age- and sex-specific prevalence estimates for eachHispanic subgroup, with the variance-covariance matrixestimated from SURREGR (13). The parameter estimatesand test statistics for the final variational model areshown in Table 4. Because no interaction terms werestatistically significant in the initial models, no interac-tion terms were included in the final model. Because
TABLE 2Number of people in specified response category for Mexican Americans, Cubans, and Puerto Ricans aged 20-74 yr(Hispanic Health and Nutrition Examination Survey, 1982-1984)
Response category
Total sampleInterviewed sampleExamined sample
Classifiable glucose tolerance testInsulin user (not eligible for
glucose tolerance test)
Mexican
Fastingsample
236019691655939
15
Americans
Nonfastingsample
237519661671
Fastingsample
741565426203
1
Cubans
Nonfastingsample
740569439
Puerto Ricans
Fastingsample
881751596249
9
Nonfastingsample
883768624
DIABETES CARE, VOL. 14, NO. 7, SUPPL. 3, IULY 1991 631
DIABETES PREVALENCE IN U.S. HISPANICS
TABLE 3Weighted prevalence of previously diagnosed diabetes, based on self-reported medical history, by sex, age-group,survey, and ethnic group (Hispanic Health and Nutrition Examination Survey [HHANES], 1982-1984 and Second NationalHealth and Nutrition Examination Survey [NHANES II], 1976-1980)
Sex
Both sexes (yr)20-44
45-74
Men (yr)20-44
45-74
Women (yr)20-44
45-74
Survey
HHANES
NHANES II
HHANES
NHANES II
HHANES
NHANES II
HHANES
NHANES II
HHANES
NHANES II
HHANES
NHANES II
Ethnic group
Mexican AmericanCubanPuerto RicanNon-Hispanic whiteNon-Hispanic blackMexican AmericanCubanPuerto RicanNon-Hispanic whiteNon-Hispanic black
Mexican AmericanCubanPuerto RicanNon-Hispanic whiteNon-Hispanic blackMexican AmericanCubanPuerto RicanNon-Hispanic whiteNon-Hispanic black
Mexican AmericanCubanPuerto RicanNon-Hispanic whiteNon-Hispanic blackMexican AmericanCubanPuerto RicanNon-Hispanic whiteNon-Hispanic black
Prevalence (%)
1.91.52.00.92.3
14.35.9
14.35.9
10.1
1.61.01.20.51.8
13.45.2
11.36.08.5
2.31.82.51.32.6
15.26.6
16.25.8
11.4
Standarderror
0.280.610.560.140.581.331.001.520.301.06
0.380.770.700.150.791.331.402.200.451.51
0.410.890.780.240.831.241.432.050.411.49
Unweighted n(diabetic/total)
48/24357/469
17/83249/522415/784
209/149339/665
103/687532/7448113/958
19/11382/2024/311
13/24747/346
87/65715/30233/269
242/340044/408
29/12975/267
13/52136/27508/438
122/83624/36370/418
290/404869/550
the terms for Mexican Americans and Puerto Ricanswere not significantly different in the initial models, theywere combined in the final model. However, becausethe term for Cubans differed significantly from that forthe other two Hispanic subgroups, a separate term forCubans was included in the final model. The final modelshows a small sex effect, which is the same in all threeHispanic subgroups and a larger age effect, which also
does not vary across the three Hispanic subgroups. Inthis model, the prevalence of diabetes is the same inMexican Americans and Puerto Ricans but is signifi-cantly lower in Cubans.
For comparison, estimates of the prevalence of pre-viously diagnosed diabetes for non-Hispanic whites andblacks are also presented in Table 3. The prevalence ofpreviously diagnosed diabetes in non-Hispanic whites
TABLE 4Final model fitted to logit of prevalence of previously diagnosed diabetes for each age, sex, and Hispanic subgroupcategory (Hispanic Health and Nutrition Examination Survey, 1982-1984)
Model parameter Estimate Standard error Wald statistic df Significance level
InterceptHispanic subgroup
(0, not Cuban; 1, Cuban)Age (0, 20-44 yr; 1, 45-74 yr)Sex (0, male; 1, female)Goodness of fit
-4.08
-0.972.210.22
0.1100.0870.077
77.73640.40
8.327.63
1118
<0.0001<0.0001<0.0039
0.47
632 DIABETES CARE, VOL. 14, NO. 7, SUPPL. 3, JULY 1991

K.M. FLEGAL AND ASSOCIATES
TABLE 5Weighted prevalence of undiagnosed diabetes, as determined by oral glucose tolerance test, with World HealthOrganization diagnostic criteria, by age-group, survey, and ethnic group (Hispanic Health and Nutrition Survey[HHANES], 1982-1984 and Second National Health and Nutrition Examination Survey [NHANES II], 1976-1980)
Age-group(yr)
20-44
45-74
Survey
HHANES
NHANES II
HHANES
NHANES II
Ethnic group
Mexican AmericanCubanPuerto RicanNon-Hispanic whiteNon-Hispanic blackMexican AmericanCubanPuerto RicanNon-Hispanic whiteNon-Hispanic black
Entire
Prevalence(%)
1.8
1.02.10.71.09.69.9
11.86.1
9.3
population
95% Cl
0.1-3.60.0-2.71.1-3.10.1-1.30.0-3.27.2-11.95.1-14.77.3-16.45.0-7.24.4-14.1
Population
Prevalence(%)
1.91.02.10.71.0
11.210.513.8
6.5
10.3
with no
Standarderror
0.621.171.360.260.981.883.013.450.602.42
prior diagnosis
Unweighted n(diabetic/total)
11/5661/772/122
10/12892/150
35/33711/11413/110
145/186823/189
95% Cl, 95% confidence interval.
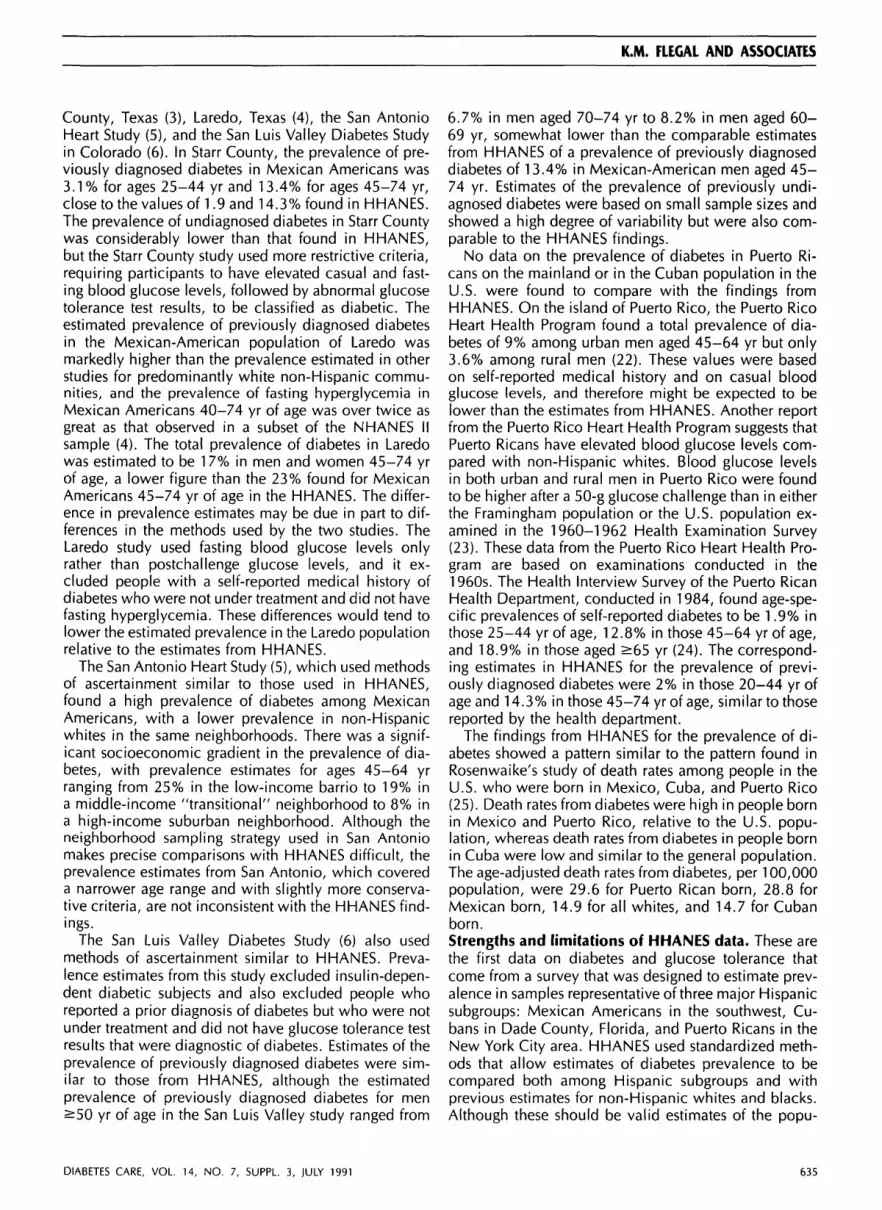
tended to be lower than the prevalence in Hispanics,particularly Mexican Americans and Puerto Ricans. Inthe younger age-group, the prevalence in Cubans was1.7 times as great as in non-Hispanic whites, whereasthe prevalence in Mexican Americans was 2.1 times asgreat and in Puerto Ricans was 2.2 times as great. Inthe older age-group, the prevalence in Cubans wasthe same as the prevalence in non-Hispanic whites,whereas the prevalence in both Mexican Americans andPuerto Ricans was 2.4 times as great as the prevalencein non-Hispanic whites. The estimated prevalence innon-Hispanic blacks was greater than the prevalence innon-Hispanic whites and similar to the prevalenceamong the Hispanic subgroups.Prevalence of undiagnosed diabetes. Estimates of theprevalence of undiagnosed diabetes, with WHO crite-ria, in people with no prior diagnosis of diabetes by age,survey, and ethnic group are shown in Table 5. ForCubans and Puerto Ricans, these estimates are based onsmall numbers of people with previously undiagnoseddiabetes. Estimates of the population prevalence of un-
diagnosed diabetes and approximate confidence inter-vals for these estimates are also presented in Table 5.Estimates are not presented for each age and sex group-ing because the small sample sizes make such estimatesunstable.
Judged by the degree of overlap of the confidenceintervals, there were few statistically significant differ-ences among the prevalence estimates either among thethree Hispanic subgroups or between the Hispanicsubgroups and non-Hispanic whites and blacks (Table5). However, some trends were apparent. Within eachage-group, the prevalence in each of the three Hispanicsubgroups was higher than the prevalence in non-Hispanic whites. Overall, non-Hispanic whites had thelowest rates. In both age-groups, the prevalence washighest in the Puerto Rican population. Almost identicalresults (not shown) were found with the NDDG diag-nostic criteria.Total prevalence of diabetes. Estimates of the totalprevalence of diabetes by age, survey, and ethnic groupare shown in Table 6. Within age-groups, the total prev-
TABLE 6Weighted total prevalence of diabetes (sum of previously diagnosed diabetes and undiagnosed diabetes) with WorldHealth Organization criteria, by age-group, survey, and ethnic group (Hispanic Health and Nutrition Survey [HHANES],1982-1984 and Second National Health and Nutrition Examination Survey [NHANES II], 1976-1980)
Age-group (yr)
20-44
45-74
Survey
HHANES
NHANES II
HHANES
NHANES II
Ethnic group
Mexican AmericanCubanPuerto RicanNon-Hispanic whiteNon-Hispanic blackMexican AmericanCubanPuerto RicanNon-Hispanic whiteNon-Hispanic black
Prevalence (%)
3.82.44.11.6
3.323.915.826.112.019.3
95% confidence interval
2.0-5.50.0-5.02.8-5.31.1-2.20.0-5.7
20.8-27.110.5-21.122.2-30.110.7-13.215.1-23.6
DIABETES CARE, VOL. 14, NO. 7, SUPPL. 3, JULY 1991 633
DIABETES PREVALENCE IN U.S. HISPANICS
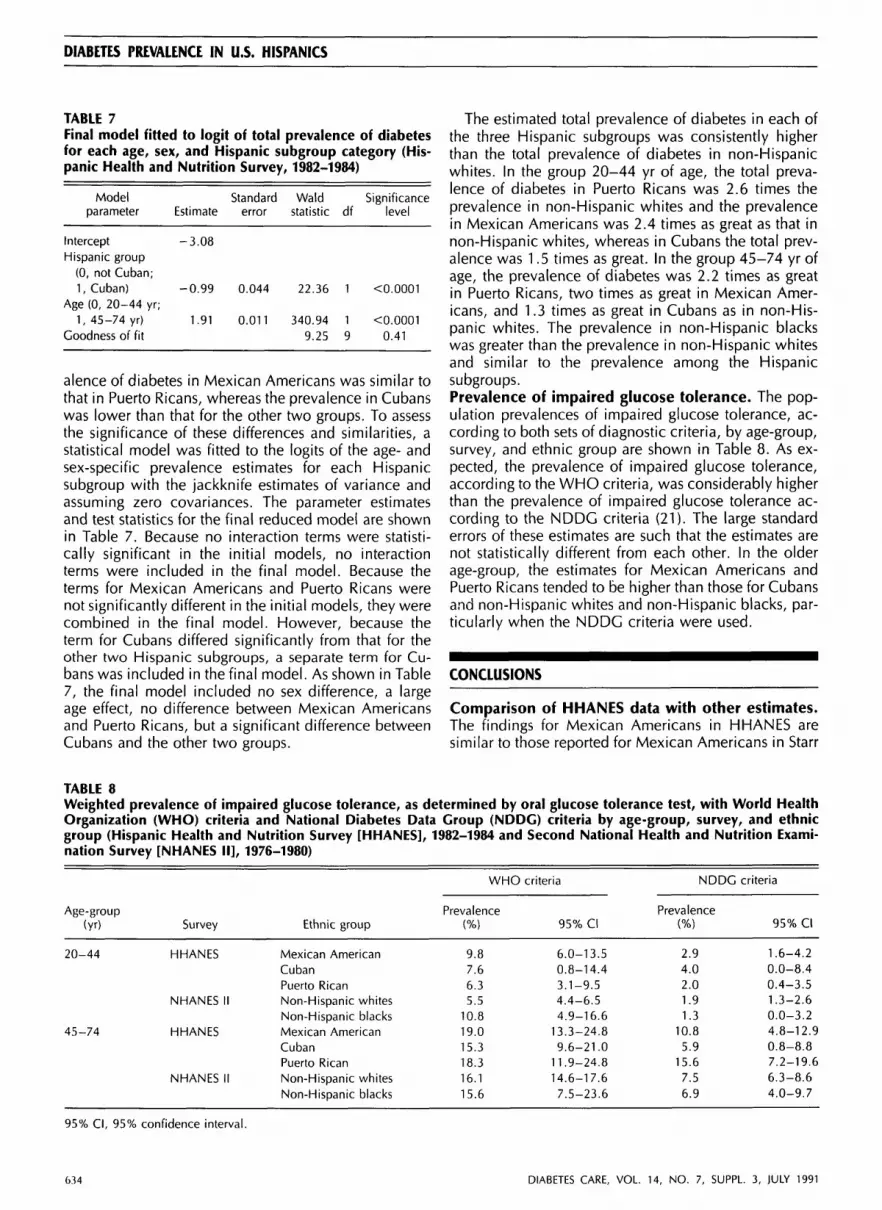
TABLE 7Final model fitted to logit of total prevalence of diabetesfor each age, sex, and Hispanic subgroup category (His-panic Health and Nutrition Survey, 1982-1984)
Modelparameter
InterceptHispanic group
(0, not Cuban;1, Cuban)
Age (0, 20-44 yr;1, 45_74 yr)
Goodness of fit
Estimate
-3.08
-0.99
1.91
Standarderror
0.044
0.011
Waldstatistic
22.36
340.949.25
df
1
19
Significancelevel
<0.0001
<0.00010.41
alence of diabetes in Mexican Americans was similar tothat in Puerto Ricans, whereas the prevalence in Cubanswas lower than that for the other two groups. To assessthe significance of these differences and similarities, astatistical model was fitted to the logits of the age- andsex-specific prevalence estimates for each Hispanicsubgroup with the jackknife estimates of variance andassuming zero covariances. The parameter estimatesand test statistics for the final reduced model are shownin Table 7. Because no interaction terms were statisti-cally significant in the initial models, no interactionterms were included in the final model. Because theterms for Mexican Americans and Puerto Ricans werenot significantly different in the initial models, they werecombined in the final model. However, because theterm for Cubans differed significantly from that for theother two Hispanic subgroups, a separate term for Cu-bans was included in the final model. As shown in Table7, the final model included no sex difference, a largeage effect, no difference between Mexican Americansand Puerto Ricans, but a significant difference betweenCubans and the other two groups.
The estimated total prevalence of diabetes in each ofthe three Hispanic subgroups was consistently higherthan the total prevalence of diabetes in non-Hispanicwhites. In the group 20-44 yr of age, the total preva-lence of diabetes in Puerto Ricans was 2.6 times theprevalence in non-Hispanic whites and the prevalencein Mexican Americans was 2.4 times as great as that innon-Hispanic whites, whereas in Cubans the total prev-alence was 1.5 times as great. In the group 45-74 yr ofage, the prevalence of diabetes was 2.2 times as greatin Puerto Ricans, two times as great in Mexican Amer-icans, and 1.3 times as great in Cubans as in non-His-panic whites. The prevalence in non-Hispanic blackswas greater than the prevalence in non-Hispanic whitesand similar to the prevalence among the Hispanicsubgroups.Prevalence of impaired glucose tolerance. The pop-ulation prevalences of impaired glucose tolerance, ac-cording to both sets of diagnostic criteria, by age-group,survey, and ethnic group are shown in Table 8. As ex-pected, the prevalence of impaired glucose tolerance,according to the WHO criteria, was considerably higherthan the prevalence of impaired glucose tolerance ac-cording to the NDDG criteria (21). The large standarderrors of these estimates are such that the estimates arenot statistically different from each other. In the olderage-group, the estimates for Mexican Americans andPuerto Ricans tended to be higher than those for Cubansand non-Hispanic whites and non-Hispanic blacks, par-ticularly when the NDDC criteria were used.
CONCLUSIONS
Comparison of HHANES data with other estimates.The findings for Mexican Americans in HHANES aresimilar to those reported for Mexican Americans in Starr
TABLE 8Weighted prevalence of impaired glucose tolerance, as determined by oral glucose tolerance test, with World HealthOrganization (WHO) criteria and National Diabetes Data Group (NDDG) criteria by age-group, survey, and ethnicgroup (Hispanic Health and Nutrition Survey [HHANES], 1982-1984 and Second National Health and Nutrition Exami-nation Survey [NHANES II], 1976-1980)
Age-group(yr)
20-44
45-74
Survey
HHANES
NHANES II
HHANES
NHANES II
Ethnic group
Mexican AmericanCubanPuerto RicanNon-Hispanic whitesNon-Hispanic blacksMexican AmericanCubanPuerto RicanNon-Hispanic whitesNon-Hispanic blacks
WHO
Prevalence(%)
9.87.66.35.5
10.819.015.318.316.115.6
criteria
95% Cl
6.0-13.50.8-14.43.1-9.54.4-6.54.9-16.6
13.3-24.89.6-21.0
11.9-24.814.6-17.67.5-23.6
NDDG
Prevalence(%)
2.94.02.01.91.3
10.85.9
15.67.56.9
criteria
95% Cl
1.6-4.20.0-8.40.4-3.51.3-2.60.0-3.24.8-12.90.8-8.87.2-19.66.3-8.64.0-9.7
95% Cl, 95% confidence interval.
6.34 DIABETES CARE, VOL. 14, N O . 7, SUPPL. 3, JULY 1991
K.M. FLEGAL AND ASSOCIATES
County, Texas (3), Laredo, Texas (4), the San AntonioHeart Study (5), and the San Luis Valley Diabetes Studyin Colorado (6). In Starr County, the prevalence of pre-viously diagnosed diabetes in Mexican Americans was3.1 % for ages 25-44 yr and 13.4% for ages 45-74 yr,close to the values of 1.9 and 14.3% found in HHANES.The prevalence of undiagnosed diabetes in Starr Countywas considerably lower than that found in HHANES,but the Starr County study used more restrictive criteria,requiring participants to have elevated casual and fast-ing blood glucose levels, followed by abnormal glucosetolerance test results, to be classified as diabetic. Theestimated prevalence of previously diagnosed diabetesin the Mexican-American population of Laredo wasmarkedly higher than the prevalence estimated in otherstudies for predominantly white non-Hispanic commu-nities, and the prevalence of fasting hyperglycemia inMexican Americans 40-74 yr of age was over twice asgreat as that observed in a subset of the NHANES IIsample (4). The total prevalence of diabetes in Laredowas estimated to be 17% in men and women 45-74 yrof age, a lower figure than the 23% found for MexicanAmericans 45-74 yr of age in the HHANES. The differ-ence in prevalence estimates may be due in part to dif-ferences in the methods used by the two studies. TheLaredo study used fasting blood glucose levels onlyrather than postchallenge glucose levels, and it ex-cluded people with a self-reported medical history ofdiabetes who were not under treatment and did not havefasting hyperglycemia. These differences would tend tolower the estimated prevalence in the Laredo populationrelative to the estimates from HHANES.
The San Antonio Heart Study (5), which used methodsof ascertainment similar to those used in HHANES,found a high prevalence of diabetes among MexicanAmericans, with a lower prevalence in non-Hispanicwhites in the same neighborhoods. There was a signif-icant socioeconomic gradient in the prevalence of dia-betes, with prevalence estimates for ages 45-64 yrranging from 25% in the low-income barrio to 19% ina middle-income "transitional" neighborhood to 8% ina high-income suburban neighborhood. Although theneighborhood sampling strategy used in San Antoniomakes precise comparisons with HHANES difficult, theprevalence estimates from San Antonio, which covereda narrower age range and with slightly more conserva-tive criteria, are not inconsistent with the HHANES find-ings.
The San Luis Valley Diabetes Study (6) also usedmethods of ascertainment similar to HHANES. Preva-lence estimates from this study excluded insulin-depen-dent diabetic subjects and also excluded people whoreported a prior diagnosis of diabetes but who were notunder treatment and did not have glucose tolerance testresults that were diagnostic of diabetes. Estimates of theprevalence of previously diagnosed diabetes were sim-ilar to those from HHANES, although the estimatedprevalence of previously diagnosed diabetes for men^50 yr of age in the San Luis Valley study ranged from
6.7% in men aged 70-74 yr to 8.2% in men aged 60-69 yr, somewhat lower than the comparable estimatesfrom HHANES of a prevalence of previously diagnoseddiabetes of 13.4% in Mexican-American men aged 45-74 yr. Estimates of the prevalence of previously undi-agnosed diabetes were based on small sample sizes andshowed a high degree of variability but were also com-parable to the HHANES findings.
No data on the prevalence of diabetes in Puerto Ri-cans on the mainland or in the Cuban population in theU.S. were found to compare with the findings fromHHANES. On the island of Puerto Rico, the Puerto RicoHeart Health Program found a total prevalence of dia-betes of 9% among urban men aged 45-64 yr but only3.6% among rural men (22). These values were basedon self-reported medical history and on casual bloodglucose levels, and therefore might be expected to belower than the estimates from HHANES. Another reportfrom the Puerto Rico Heart Health Program suggests thatPuerto Ricans have elevated blood glucose levels com-pared with non-Hispanic whites. Blood glucose levelsin both urban and rural men in Puerto Rico were foundto be higher after a 50-g glucose challenge than in eitherthe Framingham population or the U.S. population ex-amined in the 1960-1962 Health Examination Survey(23). These data from the Puerto Rico Heart Health Pro-gram are based on examinations conducted in the1960s. The Health Interview Survey of the Puerto RicanHealth Department, conducted in 1984, found age-spe-cific prevalences of self-reported diabetes to be 1.9% inthose 25-44 yr of age, 12.8% in those 45-64 yr of age,and 18.9% in those aged ^65 yr (24). The correspond-ing estimates in HHANES for the prevalence of previ-ously diagnosed diabetes were 2% in those 20-44 yr ofage and 14.3% in those 45-74 yr of age, similar to thosereported by the health department.
The findings from HHANES for the prevalence of di-abetes showed a pattern similar to the pattern found inRosenwaike's study of death rates among people in theU.S. who were born in Mexico, Cuba, and Puerto Rico(25). Death rates from diabetes were high in people bornin Mexico and Puerto Rico, relative to the U.S. popu-lation, whereas death rates from diabetes in people bornin Cuba were low and similar to the general population.The age-adjusted death rates from diabetes, per 100,000population, were 29.6 for Puerto Rican born, 28.8 forMexican born, 14.9 for all whites, and 14.7 for Cubanborn.Strengths and limitations of HHANES data. These arethe first data on diabetes and glucose tolerance thatcome from a survey that was designed to estimate prev-alence in samples representative of three major Hispanicsubgroups: Mexican Americans in the southwest, Cu-bans in Dade County, Florida, and Puerto Ricans in theNew York City area. HHANES used standardized meth-ods that allow estimates of diabetes prevalence to becompared both among Hispanic subgroups and withprevious estimates for non-Hispanic whites and blacks.Although these should be valid estimates of the popu-
DIABETES CARE, VOL. 14, NO. 7, SUPPL. 3, JULY 1991 635

DIABETES PREVALENCE IN U.S. HISPANICS
lation prevalence of diabetes in these three subgroups,the relatively low response rates to the glucose toleranceportion of the survey are cause for concern. Althoughanalyses were conducted to determine the potential de-gree of bias due to nonresponse and none was found,the possibility remains that these results are affected byunidentified types of bias. In NHANES II, there wasfound to be some bias associated with differential re-sponse among those with and without a parental historyof diabetes, although the magnitude of the bias wassmall (18). Because information on the family history ofdiabetes was not available in HHANES, bias associatedwith this variable was not identifiable. Although thegood agreement between the findings of HHANES andother data in the literature is reassuring, these findingsshould be confirmed in other studies of these Hispanicsubgroups, particularly the Puerto Ricans.
The number of people identified as diabetic was smallin some subgroups, particularly for the Cuban andPuerto Rican populations and for those identified as di-abetic by the glucose tolerance test results. The numberswere too small to support detailed analyses for age andsex groups or for analysis of trends in diabetes by in-come, education, or other factors.Differences among Hispanic subgroups. The highprevalence of diabetes in Mexican Americans comparedwith non-Hispanic whites appears to be only partiallyexplained by differences in adiposity and socioeco-nomic status between the two groups (5,26-28). Evenafter adjustment for differences in total adiposity andregional fat distribution, Mexican Americans without di-abetes have hyperinsulinemia compared with non-His-panic whites (26). A genetic predisposition to diabetesrelated to the degree of Native American admixture hasbeen suggested as a possible factor contributing to theexcess of diabetes among Mexican Americans (29,30).However, the degree of admixture is difficult to esti-mate, and the association between socioeconomicstatus and degree of admixture makes it difficult to dis-entangle genetic and environmental effects.
The three Hispanic subgroups examined in HHANESdiffer from each other culturally, geographically, in so-cioeconomic status, and in ethnic background. The Cu-ban population in the U.S. has higher levels of incomeand education than the Puerto Rican and Mexican-American populations. Although the historical and ge-netic information available on this topic is limited, therelative degree of Native American, European, and Af-rican admixture may well differ among these three pop-ulations. Thus, the relatively lower prevalence ofdiabetes among Cubans in the U.S. and the high prev-alence in both Mexican Americans and Puerto Ricansmay be related to socioeconomic, genetic, behavioral,or environmental factors or their joint effects. Althoughthe estimated prevalence of diabetes is similar amongMexican Americans and Puerto Ricans, the underlyingetiology may differ in these two groups.
In view of the findings of HHANES, it is important toassess further the impact of diabetes on the health of
Hispanic populations, both in terms of complications ofdiabetes and in terms of diabetes as a risk factor for otherchronic disease. Both public health authorities andpracticing clinicians in areas with substantial Mexican-American or Puerto Rican populations should be awareof the high prevalence of diabetes in these groups andits potential effects. Because diabetes is an importantcardiovascular risk factor, special attention should begiven to the management of other cardiovascular riskfactors in Hispanics. It is also important to ensure theadequacy and appropriateness of diabetes treatment andcare provided to Hispanic populations and to continueresearch aimed at elucidating the reasons for the highprevalence of diabetes among Mexican Americans andPuerto Ricans.
APPENDIX 1
Methods of estimating prevalence. Let P(M) denote the prob-ability of an individual having a prior diagnosis of diabetesand let P(G) denote the probability of an individual havingglucose tolerance test results that are diagnostic of diabetes.Then the prevalence of undiagnosed djabetes in people withno prior diagnosis of diabetes is P(G|M). The prevalence ofundiagnosed diabetes in the total population is P(G D M).
By definition P(G D M) = P(G|M) x P(M) (1)
The total prevalence of diabetes is the sum of P(M) andP(G n M)
P(D) = P(M) + P(G n M) = P(M) + (P(G|M) x P(M)) (2)
P(M) and its complement P(M) were estimated from the inter-viewed sample. P(G|M) was estimated from the sample of peo-ple with no prior diagnosis of diabetes who had classifiableglucose tolerance test results. The population prevalence ofundiagnosed djabetes was calculated from the estimates ofP(G|M) and P(M), as in equation 1. The total prevalence ofdiabetes, P(D),_was calculated from the estimates of P(M),P(M), and P(G|M), as in equation 2.
Age- and sex-specific estimates of prevalence of diagnosed diabetes,undiagnosed diabetes, and total diabetes (sum of diagnosed and un-diagnosed) by Hispanic subgroup (Hispanic Health and Nutrition Ex-amination Survey, 1982-1984)
National originor ancestry
MexicanAmerican (yr)Both sexes
20-4445-5455-6465-74
Men
20-4445-5455-6465-74+
Prevalence of diabetes (%)
Previouslydiagnosed
1.98.7
17.522.7
1.6
6.117.724.2
Previouslyundiagnosed
1.85.3
14.012.3*
2.48.2
12.7
Total
3.814.131.635.0*
4.014.330.5
636 DIABETES CARE, VOL. 14, NO. 7, SUPPL. 3, JULY 1991

K.M. FLEGAL AND ASSOCIATES
(continued)
National originor ancestry
Women20-4445-5455-6465-74t
Cuban (yr)Both sexes
20-4445-5455-6465-74t
Men20-4445-5455-64t65-74t
Women20-4445-5455-6465-74t
Puerto Rican (yr)Both sexes
20-4445-5455-6465-74t
Men20-4445-54t55-64t65-74t
Women20-4445-5455-64t65-74t
Prevalence of diabetes (%)
Previouslydiagnosed
2.311.017.321.4
1.53.04.7
14.6
1.0
1.84.7
15.0
1.84.04.8
14.3
2.010.415.623.7
1.28.1
15.113.6*
2.511.816.128.6
Previouslyundiagnosed
1.33.0
15.3
1.05.7
11.1*
0.0*10.9*
1.8*0.0*0.0*
2.113.012.1*
3.4*
1.28.0*
Total
3.614.032.6
2.48.6
15.8*
1.0*12.8*
3.6*4.0*4.8*
4.123.327.8*
4.6*
3.719.8*
*Sample size of 25-44 people for estimating prevalence of undi-agnosed diabetes in this subgroup (precision and reliability of estimatemay be low).tSample size of <25 people for estimating prevalence of undiagnoseddiabetes in this subgroup (no estimate presented).
ACKNOWLEDGMENTS
This study was supported by the National Center forHealth Statistics.
REFERENCES
1. U.S. Bureau of the Census: Persons of Spanish Origin inthe United States: March 1982. Washington DC, U.S.Govt. Printing Office, 1985 (Curr. Pop. Rep., Ser. P-20,no. 396)
10.
11
12.
13.
14.
15.
16.
17.
Stern MP, Caskill SP: Secular trends in ischemic heartdisease and stroke mortality from 1970 to 1976 in Span-ish-surnamed and other white individuals in BexarCounty, Texas. Circulation 58:537-43, 1978Hanis CJ, Ferrell RE, Barton SA, Aguilar L, Carza-lbarraA, Tulloch BR, Garcia CA, Schull WJ: Diabetes amongMexican Americans in Starr County, Texas. Am / Epide-miol 118:659-72, 1983Stern MP, Gaskill SP, Allen CR Jr, Garza V, Gonzales JL,Waldrop RH: Cardiovascular risk factors in MexicanAmericans in Laredo, Texas. I. Prevalence of overweightand diabetes and distributions of serum lipids. Am ) Epi-demiol 113:546-55, 1981Stern MP, Rosenthal M, Haffner SM, Hazuda HP, FrancoLJ: Sex difference in the effects of sociocultural status ondiabetes and cardiovascular risk factors in Mexican Amer-icans—the San Antonio Heart Study. Am ) Epidemiol120:834-51, 1984Hamman RF, Marshall JA, Baxter J, Kahn LB, Mayer EJ,Orleans M, Murphy JR, Stamler J: Methods and preva-lence of non-insulin-dependent diabetes mellitus in abiethnic Colorado population: the San Luis Valley Dia-betes Study. Am ) Epidemiol 124:295-311, 1989Stern MP: Diabetes in Hispanic Americans. In Diabetesin America, Diabetes Data Compiled 1984. National Di-abetes Data Group. Washington, DC, U.S. Depart, ofHealth and Human Services, 1985, p. IX-1-11 (NIH publ.no. 85-1468)National Center for Health Statistics: Plan and Operationof the Hispanic Health and Nutrition Examination Survey,1982-1984. Washington, DC, U.S. Govt. Printing Office,1985, Vital and Health Statistics, Ser. 1, no. 19 (DHHSpubl. no. [PHS] 85-1321)National Diabetes Data Group: Classification and diag-nosis of diabetes mellitus and other categories of glucoseintolerance. Diabetes 28:1039-57, 1979Neese JW, Duncan P, Bayse D, Robinson M, Cooper T,Stewart C: Development and Evaluation of a Hexokinase/Clucose-6-Phosphate Dehydrogenase Procedure for Useas a National Glucose Reference Method. Atlanta, GA,Centers for Disease Control, 1976 (DHEW publ. no.[CDC] 77-8330)World Health Organization: Second Report on DiabetesMellitus. Geneva, World Health Org., 1980 (Tech. Rep.Ser., no. 646)SAS Institute Inc: SAS User's Guide: Basics, Version 5Edition. Cary, NC, SAS Inst, 1985Holt MM: SURREGR: Standard Errors of Regression Coef-ficients From Sample Survey Data. Research TrianglePark, NC, Research Triangle Inst., 1982Shah BV: SESUDAAN: Standard Errors Program for Com-puting of Standardized Rates From Sample Survey Data.Research Triangle Park, NC, Research Triangle Inst., 1981Landis JR, Stanish WM, Freeman JL, Koch GG: A com-puter program for the generalized chi-square analysis ofcategorical data using weighted least squares (GENCAT).Comput Programs Biomed 6:196-231, 1976National Center for Health Statistics: Landis JR, Lep-kowski JM, Eklund SA, Stehouwer SA. A Statistical Meth-odology for Analyzing Data From a Complex Survey, TheFirst National Health and Nutrition Examination Survey.Washington, DC, U.S. Govt. Printing Office, 1982, Vitaland Health Statistics, Ser. 2, no. 92 (DHHS publ. no. 82-1366)Cox BG, Cohen SB: Methodological Issues for Health
DIABETES CARE, VOL. 14, NO. 7, SUPPL 3, JULY 1991 637

DIABETES PREVALENCE IN U.S. HIS PANICS
Care Surveys. New York, Dekker, 198518. Harris Ml, Hadden WC, Knowler WC, Bennett PH: Prev-
alence of diabetes and impaired glucose tolerance and 25.plasma glucose levels in U.S. population aged 20-74 yr.Diabetes 36:523-34, 1987
19. Hadden WC, Harris Ml for the National Center for Health 26.Statistics: Prevalence of Diagnosed Diabetes, Undi-agnosed Diabetes and Impaired Glucose Tolerance inAdults 20-74 Years of Age, United States, 1976-1980.Washington, DC, U.S. Govt. Printing Office, 1987, Vital 27.and Health Statistics, Ser. 11, no. 237 (DHHS publ. no.87-1687)
20. U.S. Bureau of the Census: Characteristics of the Popu-lation Below the Poverty Level: 1982. Washington, DC,U.S. Govt. Printing Office, 1984 (Curr. Pop. Rep. Ser. P- 28.60, no. 144)
21. Harris Ml, Hadden WC, Knowler WC, Bennett PH: In-ternational criteria for the diagnosis of diabetes and im-paired glucose tolerance. Diabetes Care 8:562-67, 1985 29.
22. Cruz-Vidal M, Costas R Jr, Garcfa-Palmieri MR, SorliePD, Hertzmark E: Factors related to diabetes mellitus inPuerto Rican men. Diabetes 28:300-307, 1979
23. Cruz-Vidal M, Garcfa-Palmieri MR, Costas R Jr, SorliePD, Havlik RJ: Abnormal blood glucose and coronary 30.heart disease: the Puerto Rico Heart Health program. Di-abetes Care 6:556-61, 1983
24. Department of Health, Commonwealth of Puerto Rico:Vital Statistics Report, 1985. San Juan, Puerto Rico, De-
partment of Health, Office of Planning, Evaluation andReports, 1985Rosenwaike I: Mortality differentials among persons bornin Cuba, Mexico and Puerto Rico residing in the UnitedStates, 1979-1981. Am J Public Health 77:603-60, 1987Haffner SM, Stern MP, Hazuda HP, Pugh JA, Patterson JK:Hyperinsulinemia in a population at high risk for non-insulin-dependent diabetes mellitus. N Engl) Med 315:220-24, 1986Haffner SM, Stern MP, Hazuda HP, Rosenthal M, Knapp,JA, Malina RM: Role of obesity and fat distribution in non-insulin-dependent diabetes mellitus in Mexican Ameri-cans and non-Hispanic whites. Diabetes Care 9:153-61,1986Stern MP, Gaskill SP, Hazuda HP, Gardner LI, HaffnerSM: Does obesity explain excess prevalence of diabetesamong Mexican Americans? Results of the San AntonioHeart Study. Diabetologia 24:272-77, 1983Gardner LI Jr, Stern MP, Haffner SM, Gaskill SP, HazudaHP, Relethford JH, Eifler CW: Prevalence of diabetes inMexican Americans: relationship to percent of gene poolderived from Native American sources. Diabetes 33:86-92, 1984Chakraborty R, Ferrell RE, Stern MP, Haffner SM, HazudaHP, Rosenthal M: Relationship of prevalence of non-in-sulin dependent diabetes mellitus to Amerindian admix-ture in the Mexican Americans of San Antonio, Texas.Genet Epidemiol 3:435-54, 1986
638 DIABETES CARE, VOL. 14, N O . 7, SUPPL. 3, JULY 1991