preparation of papers for jmoe
TRANSCRIPT
Journal of Microwaves, Optoelectronics and Electromagnetic Applications, Vol. 12, No. 2, December 2013
Brazilian Microwave and Optoelectronics Society-SBMO received 21 Oct 2012; for review 7 Dec 2012; accepted 4 July 2013
Brazilian Society of Electromagnetism-SBMag © 2013 SBMO/SBMag ISSN 2179-1074
454
Abstract — A new methodology to analyze electrical systems in the
time and frequency domain containing a large number of uncertain
parameters is presented. The methodology is based on screening
and design of experiments to build surrogate reduced models at a
well specified set of frequency values. As an example, the conducted
interferences of a Power Converter with uncertainties in its
component values are analyzed. The model has a large number of
parameters, which are described by Probability Density Functions
(PDF). The output considered is a standard measurement of
conducted interferences and its PDF is rapidly determined, if
compared to the Monte Carlo (MC) approach.
Index Terms — Electromagnetic Compatibility, Monte Carlo, Parametric
Uncertainty, Power Electronics, Probability Density Functions.
I. INTRODUCTION
The increased replacement of mechanical systems by electronic devices and the fast development of
semiconductor technology in the last decades are the main reasons that brought power electronics into
the vehicle industry, for instance airplanes and hybrid cars [1]. The behavior of these electronic
systems in the time and frequency domain is very complex due to the nonlinear characteristics of the
semiconductors, the constantly changing topology of the circuit due to switching, the parasitic effects
of self and mutual coupling between the components and Printed Circuit Board (PCB) tracks, and the
high frequency harmonics due to high frequency switching. Nevertheless, it is essential for analysis
and design of power converters to correctly quantify the impact of these phenomena in certain
variables of interest.
Nowadays, many EM modeling tools and circuit solvers for power electronics are available as
open-source or commercial software, such as Cedrat InCa3D [2] and Synopsys SABER [3], which are
used for inductive coupling of PCB tracks and high-accurate circuit simulation, respectively. These
tools can predict, through high-fidelity computer simulations, certain output variables of power
converters very accurately.
However, it is often not enough to predict the behavior of an electronic circuit for one set of
parameter values. In other words, an accurate and deterministic computation does not really
correspond to reality, where many random phenomena are present, like temperature and humidity
Uncertainty Analysis of the Conducted
Interferences in a Power Converter
M. Ferber, C. Vollaire, L. Krähenbühl Université de Lyon, Ecole Centrale de Lyon , Laboratoire Ampère (CNRS UMR5005), [email protected]
M.Ferber, J. A. Vasconcelos Universidade Federal de Minas Gerais, Laboratorio de Computação Evolucionaria, [email protected]
Journal of Microwaves, Optoelectronics and Electromagnetic Applications, Vol. 12, No. 2, December 2013
Brazilian Microwave and Optoelectronics Society-SBMO received 21 Oct 2012; for review 7 Dec 2012; accepted 4 July 2013
Brazilian Society of Electromagnetism-SBMag © 2013 SBMO/SBMag ISSN 2179-1074
455
variation, production dispersion of components, ageing and external disturbances. These phenomena
can lead to performance loss and even failure if they are not correctly quantified at design phase.
In order to perform a robust analysis and design, and thus more realistic, one must not suppose that
the system parameters are deterministic, but rather random or known up to a certain tolerance. This
fact motivates the uncertainty analysis in electrical engineering, which is being done recently at
increasing pace [4]-[15] even though it is a quite new subject in electromagnetic compatibility [16]-
[21].
The most common methodology for uncertainty analysis is the Monte Carlo (MC) technique [22],
but a large number of simulations are required. This approach is thus unfeasible for models requiring
minutes/hours to simulate. There are several other methodologies in the literature that require less
simulations than MC in order to quantify the statistical moments (average, standard deviation,
skewness, kurtosis, etc.) of a system and some of them have already been applied in EMC.
For instance, the Unscented Transform (UT) [23] was utilized in [24], [25] and [26] to quantify the
average and standard deviation of the dominant frequency of a cavity, the shielding effectiveness of
cabinets and the manufacturing uncertainties for microstrip filters respectively.
However, this methodology is not suitable for models with large number of uncertain parameters,
once the required number of simulations increase rapidly with the number of dimensions. There are
other collocation-based methodologies that the number of required simulations increases only linearly
with the number of dimensions. For instance, a Stroud-based collocation method was applied to
statistically characterize coupled voltages at the feed pins of cable-interconnected and shielded
computer cards as well as the terminals of cables situated inside the bay of an airplane cockpit [27].
The previous methods allow computing the average and standard deviation of a system with
parametric uncertainty, with relatively good accuracy, but the output probability density function
remains unknown. For many cases, the output PDF tends to a normal distribution, which is a result
from the Central Limit theorem [28], and thus it is possible to estimate confidence intervals. However,
for all other cases, the value of the standard deviation is not enough to construct accurate lower and
upper bounds for the output variable.
In this context, we propose a methodology based on screening and surrogate modeling, which is
suitable for large-scale problems and shows good agreement with MC, demanding far less simulations
and time. Moreover, it is suitable for any input PDF and provides great insight of the system behavior.
II. METHODOLOGY
A. Screening
The first step of the methodology consists in reducing the number of uncertain parameters of the
model, taking advantage of the fact that in many large-scale problems, only a few parameters actually
have a relevant influence. This step is widely known as screening. It can be carried out by a One-
factor-At-a-Time (OAT) approach [29], considering the system as a black-box model, or by a
Journal of Microwaves, Optoelectronics and Electromagnetic Applications, Vol. 12, No. 2, December 2013
Brazilian Microwave and Optoelectronics Society-SBMO received 21 Oct 2012; for review 7 Dec 2012; accepted 4 July 2013
Brazilian Society of Electromagnetism-SBMag © 2013 SBMO/SBMag ISSN 2179-1074
456
Reduced OAT (ROAT) using expert knowledge, in order to reduce the number of simulations
required. The OAT approach leads to the following expression,
|
| |
( ) ( ⃗⃗⃗⃗ )
| (1)
where is the parameter importance, is the system model, is the uncertain parameter
of , is the standard deviation of for ( ), being the number of parameters and ( ⃗⃗⃗⃗ )
is the evaluation of at the average input. The OAT approach requires simulations. After all
are calculated, only the ones with the highest values are considered in the next step. The choice
of how many parameters will be considered is a trade-off between precision and performance.
Another possibility for evaluating the important parameters with potentially less than
simulations is to use expert knowledge about the model. One must not evaluate the for a certain
in which: its relevance is known a priori or its relevance is similar to another parameter’s relevance
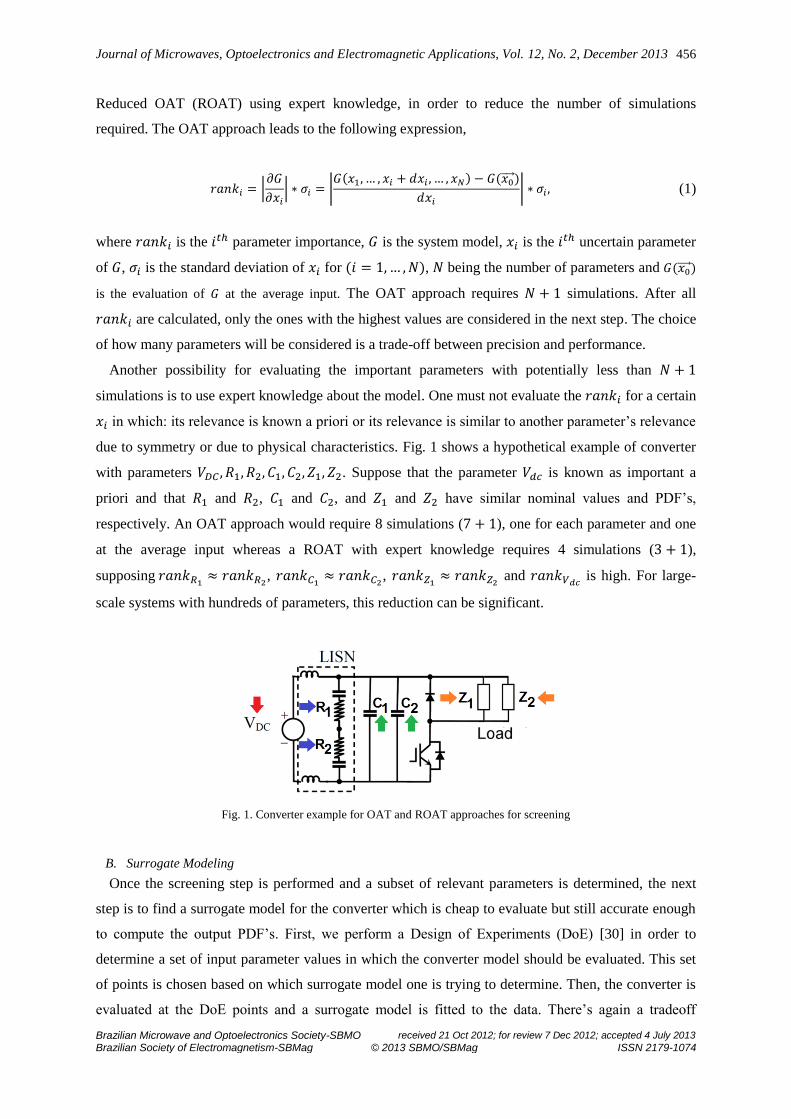
due to symmetry or due to physical characteristics. Fig. 1 shows a hypothetical example of converter
with parameters . Suppose that the parameter is known as important a
priori and that and , and , and and have similar nominal values and PDF’s,
respectively. An OAT approach would require 8 simulations ( ), one for each parameter and one
at the average input whereas a ROAT with expert knowledge requires 4 simulations ( ),
supposing , , and is high. For large-
scale systems with hundreds of parameters, this reduction can be significant.
Fig. 1. Converter example for OAT and ROAT approaches for screening
B. Surrogate Modeling
Once the screening step is performed and a subset of relevant parameters is determined, the next
step is to find a surrogate model for the converter which is cheap to evaluate but still accurate enough
to compute the output PDF’s. First, we perform a Design of Experiments (DoE) [30] in order to
determine a set of input parameter values in which the converter model should be evaluated. This set
of points is chosen based on which surrogate model one is trying to determine. Then, the converter is
evaluated at the DoE points and a surrogate model is fitted to the data. There’s again a tradeoff
Journal of Microwaves, Optoelectronics and Electromagnetic Applications, Vol. 12, No. 2, December 2013
Brazilian Microwave and Optoelectronics Society-SBMO received 21 Oct 2012; for review 7 Dec 2012; accepted 4 July 2013
Brazilian Society of Electromagnetism-SBMag © 2013 SBMO/SBMag ISSN 2179-1074
457
between precision and performance, since the number of required model evaluations increase rapidly
with the order of fitting.
Another possibility is again to use expert knowledge in order to reduce the number of model
evaluations. For instance, one knows a priori that not all cross term effects between parameters are
relevant in circuits. More specifically, one must not consider a cross term effect between a resistance
and a capacitance but one should consider the effect between an inductance and a capacitance. This
prior knowledge can greatly reduce the complexity of the surrogate modeling, as it will be shown in
the results section.
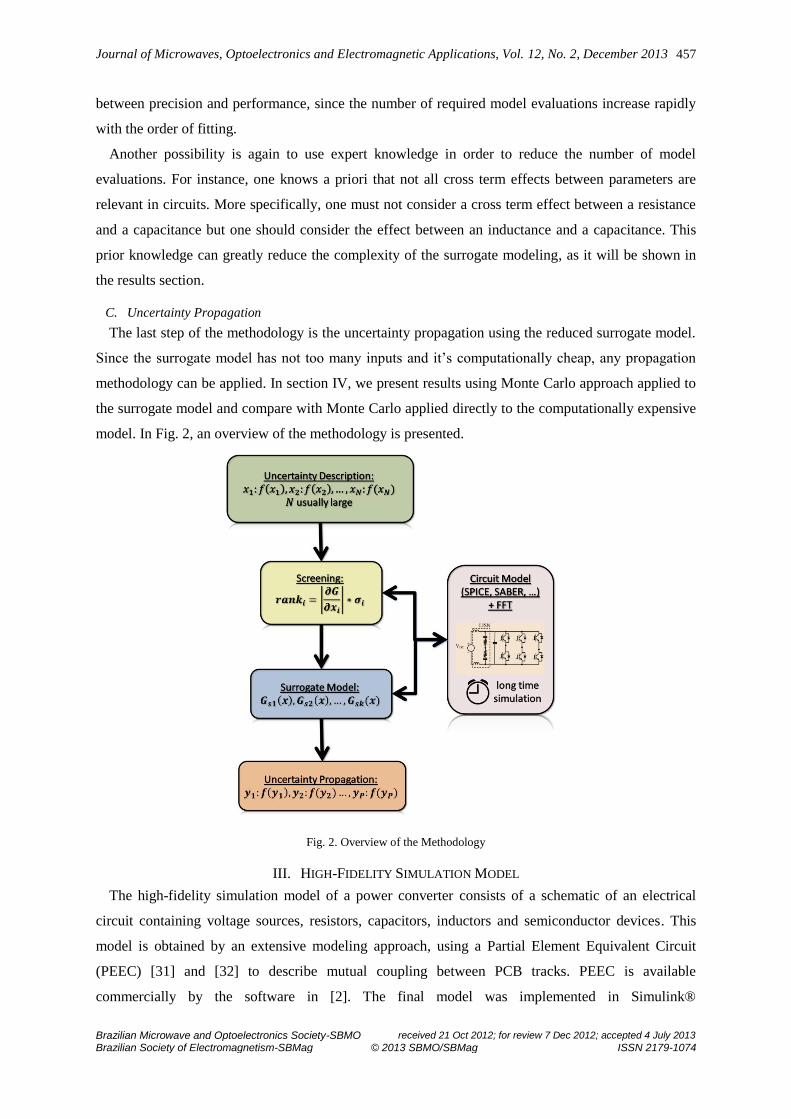
C. Uncertainty Propagation
The last step of the methodology is the uncertainty propagation using the reduced surrogate model.
Since the surrogate model has not too many inputs and it’s computationally cheap, any propagation
methodology can be applied. In section IV, we present results using Monte Carlo approach applied to
the surrogate model and compare with Monte Carlo applied directly to the computationally expensive
model. In Fig. 2, an overview of the methodology is presented.
Fig. 2. Overview of the Methodology
III. HIGH-FIDELITY SIMULATION MODEL
The high-fidelity simulation model of a power converter consists of a schematic of an electrical
circuit containing voltage sources, resistors, capacitors, inductors and semiconductor devices. This
model is obtained by an extensive modeling approach, using a Partial Element Equivalent Circuit
(PEEC) [31] and [32] to describe mutual coupling between PCB tracks. PEEC is available
commercially by the software in [2]. The final model was implemented in Simulink®
Journal of Microwaves, Optoelectronics and Electromagnetic Applications, Vol. 12, No. 2, December 2013
Brazilian Microwave and Optoelectronics Society-SBMO received 21 Oct 2012; for review 7 Dec 2012; accepted 4 July 2013
Brazilian Society of Electromagnetism-SBMag © 2013 SBMO/SBMag ISSN 2179-1074
458
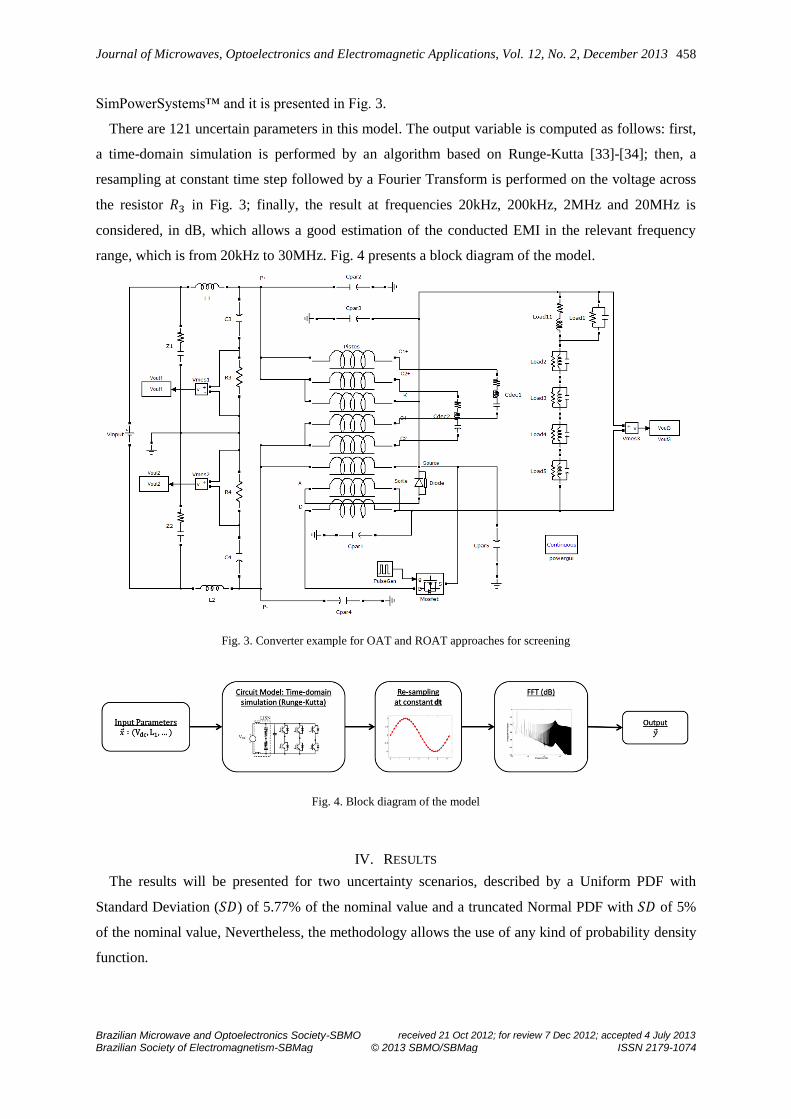
SimPowerSystems™ and it is presented in Fig. 3.
There are 121 uncertain parameters in this model. The output variable is computed as follows: first,
a time-domain simulation is performed by an algorithm based on Runge-Kutta [33]-[34]; then, a
resampling at constant time step followed by a Fourier Transform is performed on the voltage across
the resistor in Fig. 3; finally, the result at frequencies 20kHz, 200kHz, 2MHz and 20MHz is
considered, in dB, which allows a good estimation of the conducted EMI in the relevant frequency
range, which is from 20kHz to 30MHz. Fig. 4 presents a block diagram of the model.
Fig. 3. Converter example for OAT and ROAT approaches for screening
Fig. 4. Block diagram of the model
IV. RESULTS
The results will be presented for two uncertainty scenarios, described by a Uniform PDF with
Standard Deviation ( ) of 5.77% of the nominal value and a truncated Normal PDF with of 5%
of the nominal value, Nevertheless, the methodology allows the use of any kind of probability density
function.
Journal of Microwaves, Optoelectronics and Electromagnetic Applications, Vol. 12, No. 2, December 2013
Brazilian Microwave and Optoelectronics Society-SBMO received 21 Oct 2012; for review 7 Dec 2012; accepted 4 July 2013
Brazilian Society of Electromagnetism-SBMag © 2013 SBMO/SBMag ISSN 2179-1074
459
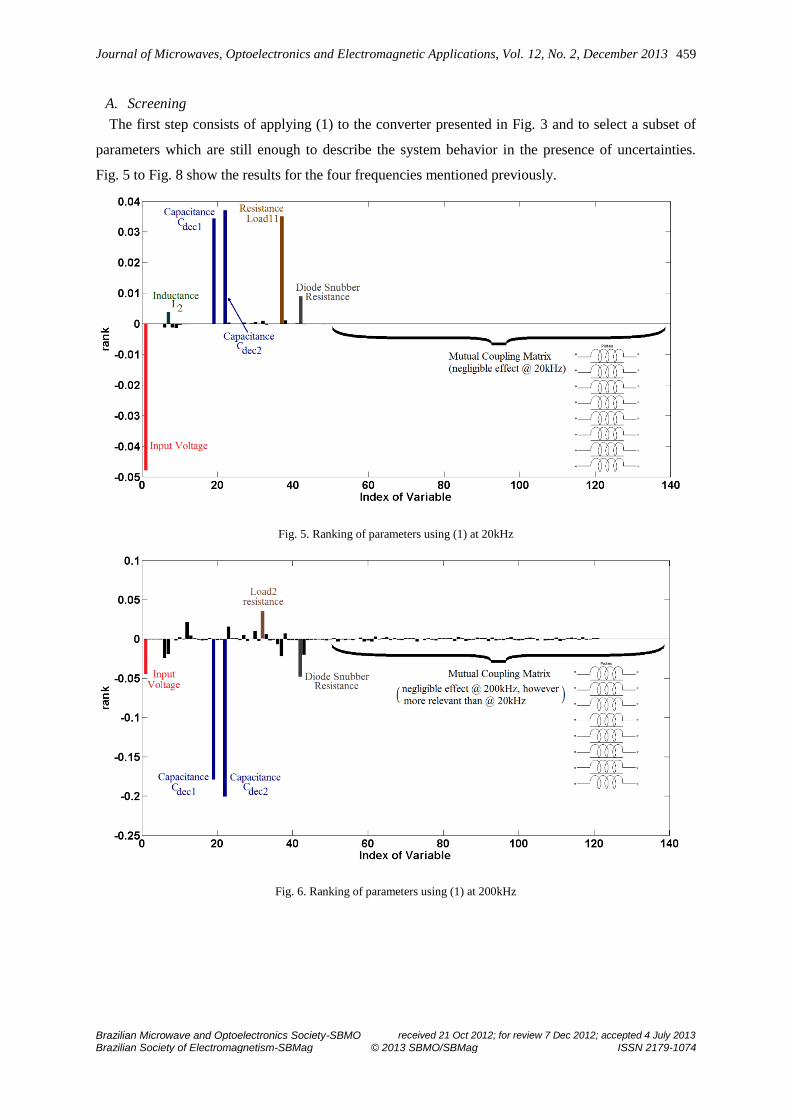
A. Screening
The first step consists of applying (1) to the converter presented in Fig. 3 and to select a subset of
parameters which are still enough to describe the system behavior in the presence of uncertainties.
Fig. 5 to Fig. 8 show the results for the four frequencies mentioned previously.
Fig. 5. Ranking of parameters using (1) at 20kHz
Fig. 6. Ranking of parameters using (1) at 200kHz
Journal of Microwaves, Optoelectronics and Electromagnetic Applications, Vol. 12, No. 2, December 2013
Brazilian Microwave and Optoelectronics Society-SBMO received 21 Oct 2012; for review 7 Dec 2012; accepted 4 July 2013
Brazilian Society of Electromagnetism-SBMag © 2013 SBMO/SBMag ISSN 2179-1074
460
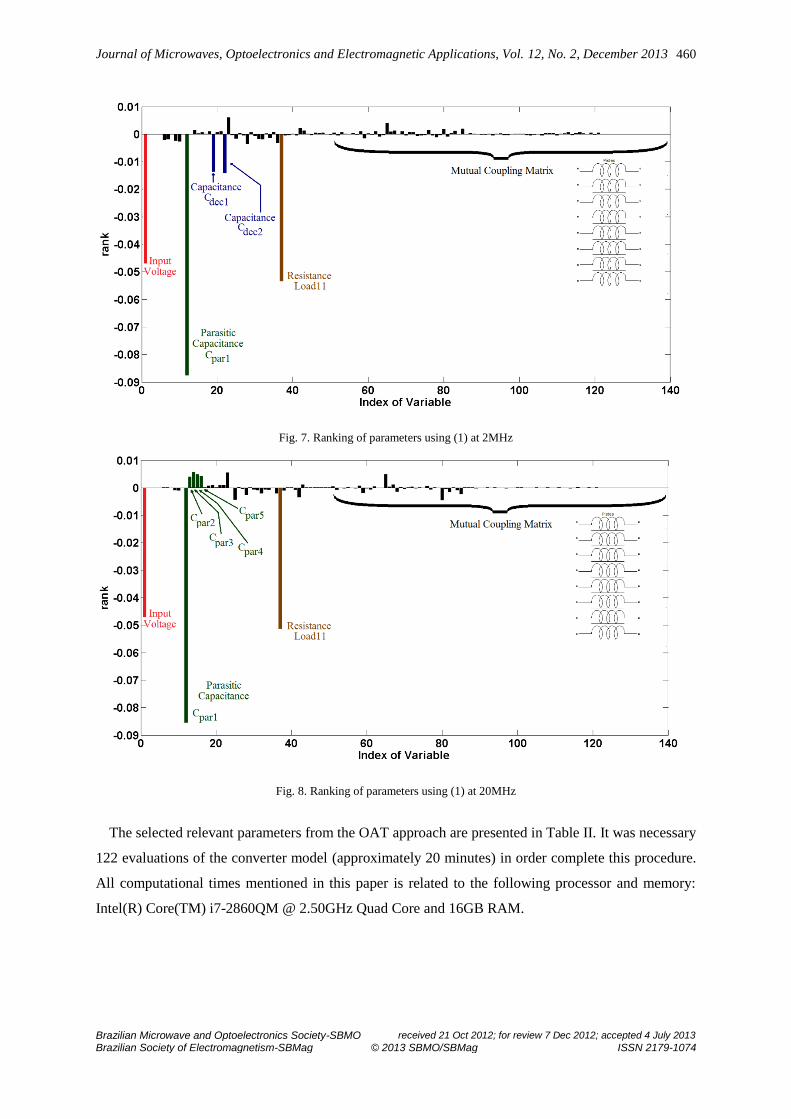
Fig. 7. Ranking of parameters using (1) at 2MHz
Fig. 8. Ranking of parameters using (1) at 20MHz
The selected relevant parameters from the OAT approach are presented in Table II. It was necessary
122 evaluations of the converter model (approximately 20 minutes) in order complete this procedure.
All computational times mentioned in this paper is related to the following processor and memory:
Intel(R) Core(TM) i7-2860QM @ 2.50GHz Quad Core and 16GB RAM.
Journal of Microwaves, Optoelectronics and Electromagnetic Applications, Vol. 12, No. 2, December 2013
Brazilian Microwave and Optoelectronics Society-SBMO received 21 Oct 2012; for review 7 Dec 2012; accepted 4 July 2013
Brazilian Society of Electromagnetism-SBMag © 2013 SBMO/SBMag ISSN 2179-1074
461
TABLE II. SELECTED RELEVANT PARAMETERS (OAT)
Frequency (MHz) Parameters
0.02 ( ) ( ) ( ) ( )
0.2 ( ) ( ) ( ) ( )
2 ( ) ( ) ( )
20 ( )
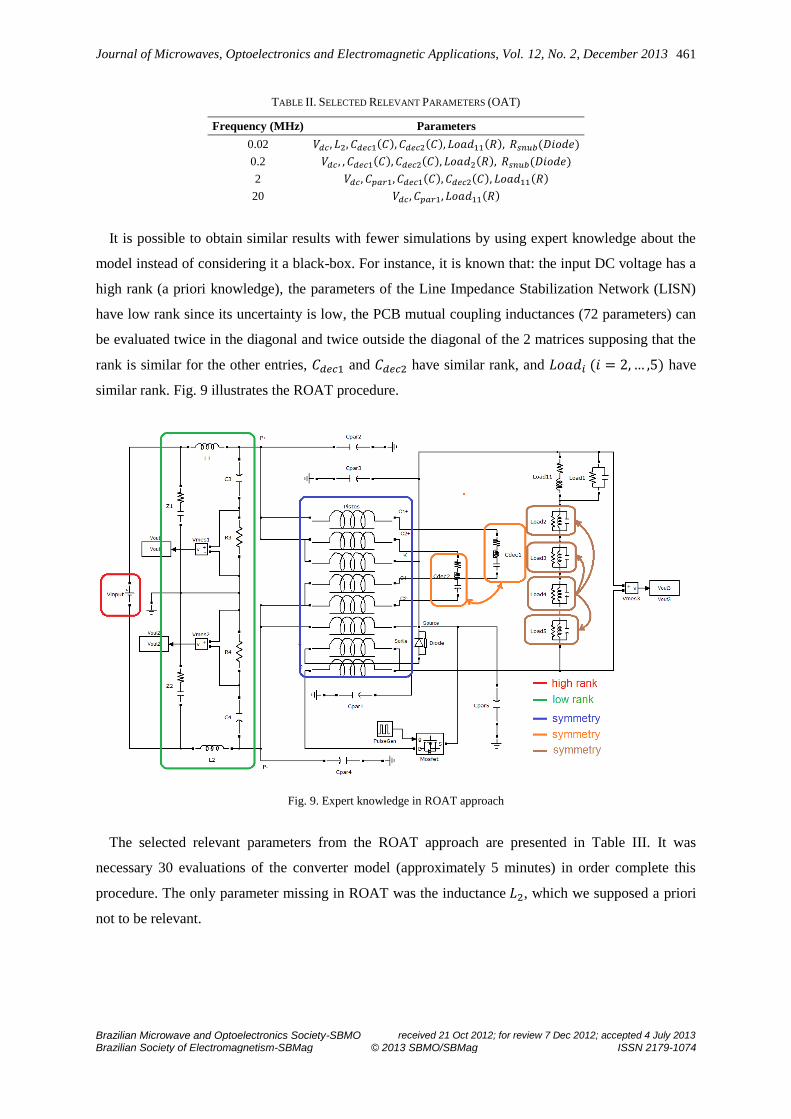
It is possible to obtain similar results with fewer simulations by using expert knowledge about the
model instead of considering it a black-box. For instance, it is known that: the input DC voltage has a
high rank (a priori knowledge), the parameters of the Line Impedance Stabilization Network (LISN)
have low rank since its uncertainty is low, the PCB mutual coupling inductances (72 parameters) can
be evaluated twice in the diagonal and twice outside the diagonal of the 2 matrices supposing that the
rank is similar for the other entries, and have similar rank, and ( ) have
similar rank. Fig. 9 illustrates the ROAT procedure.
Fig. 9. Expert knowledge in ROAT approach
The selected relevant parameters from the ROAT approach are presented in Table III. It was
necessary 30 evaluations of the converter model (approximately 5 minutes) in order complete this
procedure. The only parameter missing in ROAT was the inductance , which we supposed a priori
not to be relevant.
Journal of Microwaves, Optoelectronics and Electromagnetic Applications, Vol. 12, No. 2, December 2013
Brazilian Microwave and Optoelectronics Society-SBMO received 21 Oct 2012; for review 7 Dec 2012; accepted 4 July 2013
Brazilian Society of Electromagnetism-SBMag © 2013 SBMO/SBMag ISSN 2179-1074
462
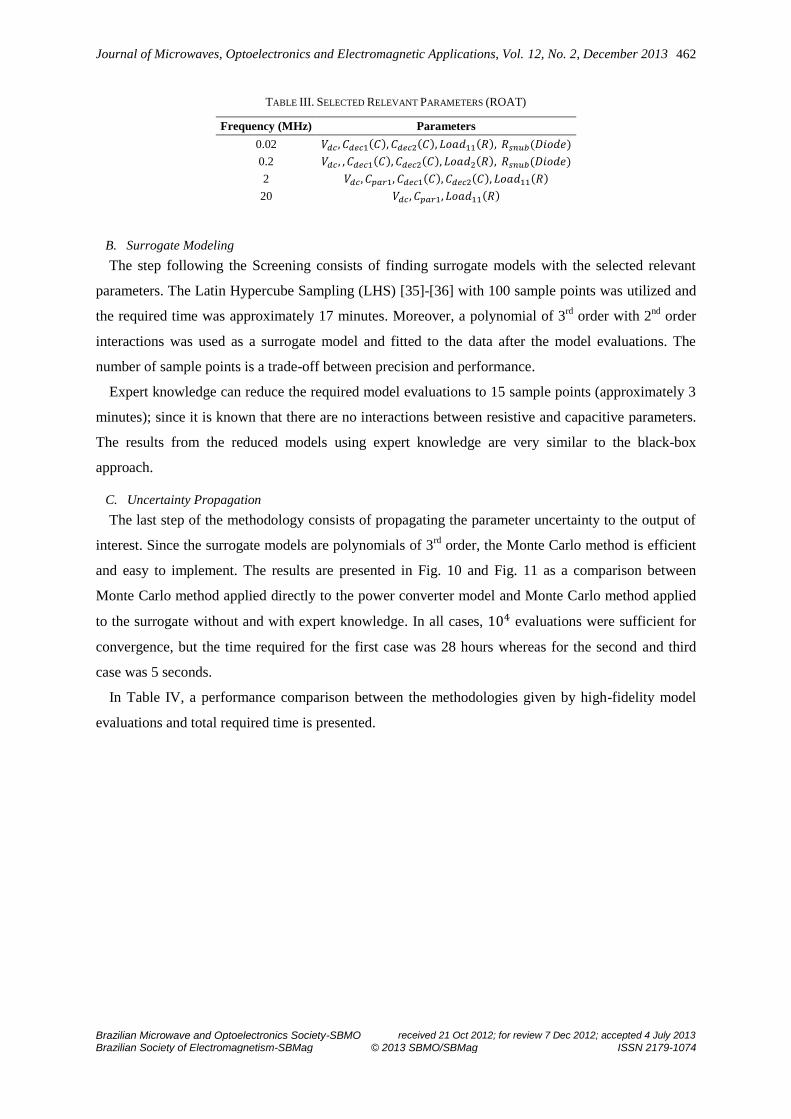
TABLE III. SELECTED RELEVANT PARAMETERS (ROAT)
Frequency (MHz) Parameters
0.02 ( ) ( ) ( ) ( )
0.2 ( ) ( ) ( ) ( )
2 ( ) ( ) ( )
20 ( )
B. Surrogate Modeling
The step following the Screening consists of finding surrogate models with the selected relevant
parameters. The Latin Hypercube Sampling (LHS) [35]-[36] with 100 sample points was utilized and
the required time was approximately 17 minutes. Moreover, a polynomial of 3rd
order with 2nd
order
interactions was used as a surrogate model and fitted to the data after the model evaluations. The
number of sample points is a trade-off between precision and performance.
Expert knowledge can reduce the required model evaluations to 15 sample points (approximately 3
minutes); since it is known that there are no interactions between resistive and capacitive parameters.
The results from the reduced models using expert knowledge are very similar to the black-box
approach.
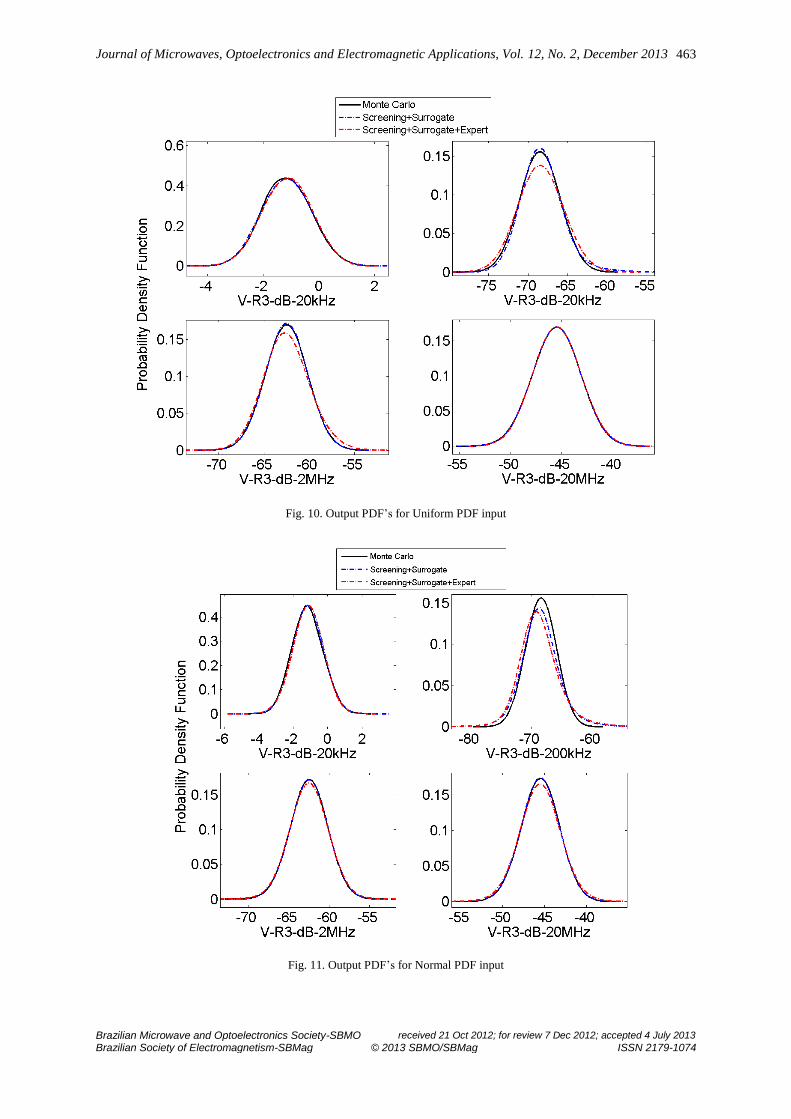
C. Uncertainty Propagation
The last step of the methodology consists of propagating the parameter uncertainty to the output of
interest. Since the surrogate models are polynomials of 3rd
order, the Monte Carlo method is efficient
and easy to implement. The results are presented in Fig. 10 and Fig. 11 as a comparison between
Monte Carlo method applied directly to the power converter model and Monte Carlo method applied
to the surrogate without and with expert knowledge. In all cases, evaluations were sufficient for
convergence, but the time required for the first case was 28 hours whereas for the second and third
case was 5 seconds.
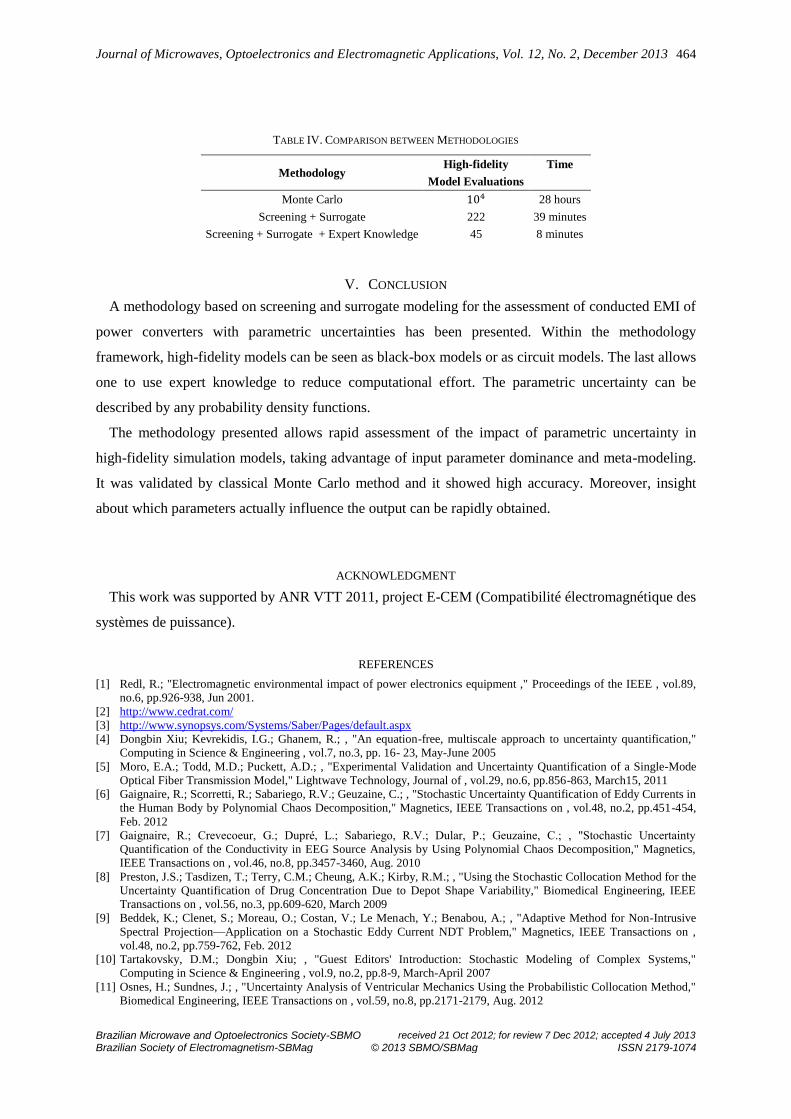
In Table IV, a performance comparison between the methodologies given by high-fidelity model
evaluations and total required time is presented.
Journal of Microwaves, Optoelectronics and Electromagnetic Applications, Vol. 12, No. 2, December 2013
Brazilian Microwave and Optoelectronics Society-SBMO received 21 Oct 2012; for review 7 Dec 2012; accepted 4 July 2013
Brazilian Society of Electromagnetism-SBMag © 2013 SBMO/SBMag ISSN 2179-1074
463
Fig. 10. Output PDF’s for Uniform PDF input
Fig. 11. Output PDF’s for Normal PDF input
Journal of Microwaves, Optoelectronics and Electromagnetic Applications, Vol. 12, No. 2, December 2013
Brazilian Microwave and Optoelectronics Society-SBMO received 21 Oct 2012; for review 7 Dec 2012; accepted 4 July 2013
Brazilian Society of Electromagnetism-SBMag © 2013 SBMO/SBMag ISSN 2179-1074
464
TABLE IV. COMPARISON BETWEEN METHODOLOGIES
Methodology High-fidelity
Model Evaluations
Time
Monte Carlo 28 hours
Screening + Surrogate 222 39 minutes
Screening + Surrogate + Expert Knowledge 45 8 minutes
V. CONCLUSION
A methodology based on screening and surrogate modeling for the assessment of conducted EMI of
power converters with parametric uncertainties has been presented. Within the methodology
framework, high-fidelity models can be seen as black-box models or as circuit models. The last allows
one to use expert knowledge to reduce computational effort. The parametric uncertainty can be
described by any probability density functions.
The methodology presented allows rapid assessment of the impact of parametric uncertainty in
high-fidelity simulation models, taking advantage of input parameter dominance and meta-modeling.
It was validated by classical Monte Carlo method and it showed high accuracy. Moreover, insight
about which parameters actually influence the output can be rapidly obtained.
ACKNOWLEDGMENT
This work was supported by ANR VTT 2011, project E-CEM (Compatibilité électromagnétique des
systèmes de puissance).
REFERENCES
[1] Redl, R.; "Electromagnetic environmental impact of power electronics equipment ," Proceedings of the IEEE , vol.89,
no.6, pp.926-938, Jun 2001.
[2] http://www.cedrat.com/
[3] http://www.synopsys.com/Systems/Saber/Pages/default.aspx
[4] Dongbin Xiu; Kevrekidis, I.G.; Ghanem, R.; , "An equation-free, multiscale approach to uncertainty quantification,"
Computing in Science & Engineering , vol.7, no.3, pp. 16- 23, May-June 2005
[5] Moro, E.A.; Todd, M.D.; Puckett, A.D.; , "Experimental Validation and Uncertainty Quantification of a Single-Mode
Optical Fiber Transmission Model," Lightwave Technology, Journal of , vol.29, no.6, pp.856-863, March15, 2011
[6] Gaignaire, R.; Scorretti, R.; Sabariego, R.V.; Geuzaine, C.; , "Stochastic Uncertainty Quantification of Eddy Currents in
the Human Body by Polynomial Chaos Decomposition," Magnetics, IEEE Transactions on , vol.48, no.2, pp.451-454,
Feb. 2012
[7] aignaire, . Crevecoeur, . Dupr , . Sa ariego, . . Dular, P. eu aine, C. , Stochastic Uncertainty
Quantification of the Conductivity in EEG Source Analysis by Using Polynomial Chaos Decomposition," Magnetics,
IEEE Transactions on , vol.46, no.8, pp.3457-3460, Aug. 2010
[8] Preston, J.S.; Tasdizen, T.; Terry, C.M.; Cheung, A.K.; Kirby, R.M.; , "Using the Stochastic Collocation Method for the
Uncertainty Quantification of Drug Concentration Due to Depot Shape Variability," Biomedical Engineering, IEEE
Transactions on , vol.56, no.3, pp.609-620, March 2009
[9] Beddek, K.; Clenet, S.; Moreau, O.; Costan, V.; Le Menach, Y.; Benabou, A.; , "Adaptive Method for Non-Intrusive
Spectral Projection—Application on a Stochastic Eddy Current NDT Problem," Magnetics, IEEE Transactions on ,
vol.48, no.2, pp.759-762, Feb. 2012
[10] Tartakovsky, D.M.; Dongbin Xiu; , "Guest Editors' Introduction: Stochastic Modeling of Complex Systems,"
Computing in Science & Engineering , vol.9, no.2, pp.8-9, March-April 2007
[11] Osnes, H.; Sundnes, J.; , "Uncertainty Analysis of Ventricular Mechanics Using the Probabilistic Collocation Method,"
Biomedical Engineering, IEEE Transactions on , vol.59, no.8, pp.2171-2179, Aug. 2012
Journal of Microwaves, Optoelectronics and Electromagnetic Applications, Vol. 12, No. 2, December 2013
Brazilian Microwave and Optoelectronics Society-SBMO received 21 Oct 2012; for review 7 Dec 2012; accepted 4 July 2013
Brazilian Society of Electromagnetism-SBMag © 2013 SBMO/SBMag ISSN 2179-1074
465
[12] Freitas, S.C.; Trigo, I.F.; Bioucas-Dias, J.M.; Gottsche, F.-M.; , "Quantifying the Uncertainty of Land Surface
Temperature Retrievals From SEVIRI/Meteosat," Geoscience and Remote Sensing, IEEE Transactions on , vol.48,
no.1, pp.523-534, Jan. 2010
[13] Hansen, N.; Niederberger, A.S.P.; Guzzella, L.; Koumoutsakos, P.; , "A Method for Handling Uncertainty in
Evolutionary Optimization With an Application to Feedback Control of Combustion," Evolutionary Computation, IEEE
Transactions on , vol.13, no.1, pp.180-197, Feb. 2009
[14] Hildebrand, R.; Gevers, M.; , "Quantification of the variance of estimated transfer functions in the presence of
undermodeling," Automatic Control, IEEE Transactions on , vol.49, no.8, pp. 1345- 1350, Aug. 2004
[15] Silly-Carette, J.; Lautru, D.; Wong, M.-F.; Gati, A.; Wiart, J.; Fouad Hanna, V.; , "Variability on the Propagation of a
Plane Wave Using Stochastic Collocation Methods in a Bio Electromagnetic Application," Microwave and Wireless
Components Letters, IEEE , vol.19, no.4, pp.185-187, April 2009
[16] van Dijk, N.; , "Numerical tools for simulation of radiated emission testing and its application in uncertainty studies,"
Electromagnetic Compatibility, IEEE Transactions on , vol.44, no.3, pp. 466- 470, Aug 2002
[17] Stievano, I.S.; Manfredi, P.; Canavero, F.G.; , "Stochastic Analysis of Multiconductor Cables and Interconnects,"
Electromagnetic Compatibility, IEEE Transactions on , vol.53, no.2, pp.501-507, May 2011
[18] S. 1. Julier and 1. K. Ulmann, "Unscented filtering and non-linear estimation", Proc. IEEE, vol. 92(3), pp. 401-422,
2004.
[19] . de Mene es, A. Ajayi, C. Christopoulos, P. Sewell, . A. Borges, “Efficient Computation of Stochastic
Electromagnetic Problems Using Unscented Transforms”, IET Science, Measurement & Technology, no.2 pp.88-95,
2008.
[20] L. R. A X. de Menezes et ai, "Statistics of the shielding effectiveness of cabinets", in Proc. ESA Workshop on
Aerospace EMC, Florence, Session 8, paper 1, 6 pages, 2009.
[21] A Ajayi et al, "Direct computation of statistical variations in EM problems", IEEE Trans. Electromagn. Compat., vol.
50(2), pp. 325-332,2008.
[22] Papoulis, A.: “Pro a ility, random varia les, and stochastic processes,” Mc raw-Hill, New York, 1991, 3rd Edition.
[23] S. J. Julier and J. K. Uhlmann, “Unscented filtering and nonlinear estimation”, Proc. IEEE, vol. 92, n. 3, pp. 401-402,
March 2004
[24] . . A. X. de Mene es et al, “Efficient computation of stochastic EM pro lems using unscented transforms,” IET Sci.
Meas. Technol., vol 2(2), pp. 88-95, 2008.
[25] . . A. X. de Mene es et al, “Statistics of the shielding effectiveness of ca inets,” in Proc. ESA Workshop on
Aerospace EMC, Florence, Session 8, paper 1, 6 pages, 2009.
[26] ORTEGA P., Abraham E.; MENEZES, Leonardo R.A.X. de and ABDALLA JR., Humberto. Statistical modeling of
manufacturing uncertainties for microstrip filters. J. Microw. Optoelectron. Electromagn. Appl. [online]. 2011, vol.10,
n.1 [cited 2012-10-18], pp. 179-202.
[27] Bagci, H.; Yucel, A.C.; Hesthaven, J.S.; Michielssen, E.; , "A Fast Stroud-Based Collocation Method for Statistically
Characterizing EMI/EMC Phenomena on Complex Platforms," Electromagnetic Compatibility, IEEE Transactions on ,
vol.51, no.2, pp.301-311, May 2009
[28] Heyde, C. 2006. Central Limit Theorem. Encyclopedia of Actuarial Science.
[29] Veronica Czitrom, One-Factor-at-a-Time Versus Designed Experiments, The American Statistician, May 1999, Vol.
53, No. 2
[30] Del Vecchio, R. J. (2007) Design of Experiments, in Handbook of Vinyl Formulating, Second Edition (ed R. F.
Grossman), John Wiley & Sons, Inc., Hoboken, NJ, USA.
[31] Heeb, H.; Ruehli, A.E.; , "Three-dimensional interconnect analysis using partial element equivalent circuits," Circuits
and Systems I: Fundamental Theory and Applications, IEEE Transactions on , vol.39, no.11, pp.974-982, Nov 1992.
[32] Brennan, Pierce A.; Raver, Norman; Ruehli, Albert E.; , "Three-Dimensional Inductance Computations with Partial
Element Equivalent Circuits," IBM Journal of Research and Development , vol.23, no.6, pp.661-668, Nov. 1979.
[33] Bank, R. E., W. C. Coughran, Jr., W. Fichtner, E. Grosse, D. Rose, and R.Smith, "Transient Simulation of Silicon
Devices and Circuits," IEEE Trans. CAD, 4 (1985), pp. 436–451.
[34] Shampine, L. F. and M. E. Hosea, "Analysis and Implementation of TR-BDF2," Applied Numerical Mathematics 20,
1996.
[35] Iman, R. L. 2008. Latin Hypercube Sampling. Encyclopedia of Quantitative Risk Analysis and Assessment.
[36] Michael Stein, Large Sample Properties of Simulations Using Latin Hypercube Sampling, Technometrics, Vol. 29, Iss.
2, 1987