call for papers - opec.org
TRANSCRIPT
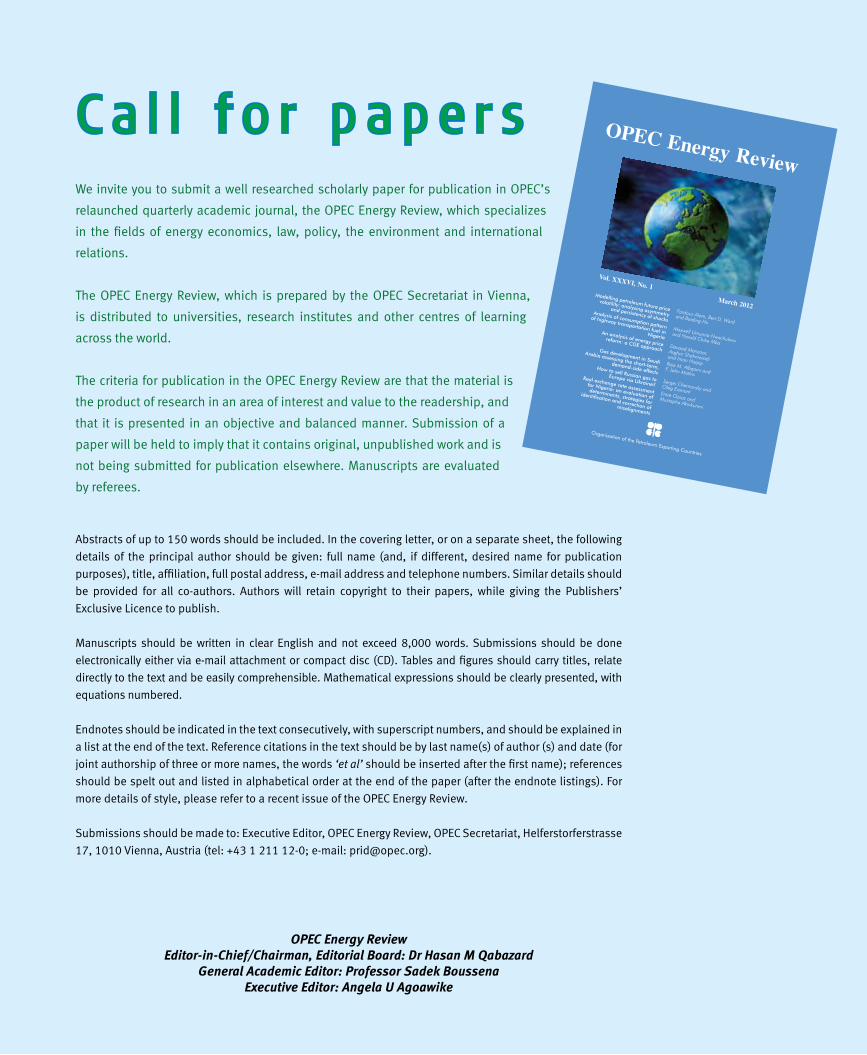
We invite you to submit a well researched scholarly paper for publication in OPEC’s
relaunched quarterly academic journal, the OPEC Energy Review, which specializes
in the fields of energy economics, law, policy, the environment and international
relations.
The OPEC Energy Review, which is prepared by the OPEC Secretariat in Vienna,
is distributed to universities, research institutes and other centres of learning
across the world.
The criteria for publication in the OPEC Energy Review are that the material is
the product of research in an area of interest and value to the readership, and
that it is presented in an objective and balanced manner. Submission of a
paper will be held to imply that it contains original, unpublished work and is
not being submitted for publication elsewhere. Manuscripts are evaluated
by referees.
Abstracts of up to 150 words should be included. In the covering letter, or on a separate sheet, the following
details of the principal author should be given: full name (and, if different, desired name for publication
purposes), title, affiliation, full postal address, e-mail address and telephone numbers. Similar details should
be provided for all co-authors. Authors will retain copyright to their papers, while giving the Publishers’
Exclusive Licence to publish.
Manuscripts should be written in clear English and not exceed 8,000 words. Submissions should be done
electronically either via e-mail attachment or compact disc (CD). Tables and figures should carry titles, relate
directly to the text and be easily comprehensible. Mathematical expressions should be clearly presented, with
equations numbered.
Endnotes should be indicated in the text consecutively, with superscript numbers, and should be explained in
a list at the end of the text. Reference citations in the text should be by last name(s) of author (s) and date (for
joint authorship of three or more names, the words ‘et al’ should be inserted after the first name); references
should be spelt out and listed in alphabetical order at the end of the paper (after the endnote listings). For
more details of style, please refer to a recent issue of the OPEC Energy Review.
Submissions should be made to: Executive Editor, OPEC Energy Review, OPEC Secretariat, Helferstorferstrasse
17, 1010 Vienna, Austria (tel: +43 1 211 12-0; e-mail: [email protected]).
C a l l fo r p a p e r s
OPEC Energy ReviewEditor-in-Chief/Chairman, Editorial Board: Dr Hasan M Qabazard
General Academic Editor: Professor Sadek BoussenaExecutive Editor: Angela U Agoawike
OPEC Energy Review
Vol. XXXVI, No. 1
March 2012
Modelling petroleum future price
volatility: analysing asymmetry and persistency of shocks
Analysis of consumption pattern
of highway transportation fuel in NigeriaAn analysis of energy price
reform: a CGE approachGas development in Saudi
Arabia assessing the short-term, demand-side effects
How to sell Russian gas to Europe via Ukraine?
Real exchange rate assessment for Nigeria: an evaluation of determinants, strategies for
identification and correction of misalignments
Fardous Alom, Bert D. Ward and Baiding Hu
Maxwell Umunna Nwachukwu and Harold Chike Mba
Davood Manzoor, Asghar Shahmoradi and Iman HaqiqiRaja M. Albqami and F. John Mathis
Sergei Chernavsky and Oleg EismontEmre Ozsoz and Mustapha Akinkunmi
Organization of the Petroleum Exporting Countries
Published and distributed on behalf of the
Organization of the Petroleum Exporting Countries, Vienna
Printed in Singapore by Markono Print Media Pte Ltd.
OP
EC
Energy R
eview
Vol. X
XX
VI, N
o. 1
March 2012
001_opec_v36_i1_cover_5.0mm.indd1 1
1/17/2012 6:36:04 PM
When OPEC’s Oil/Energy Ministers gathered in Vienna
for the 162nd Meeting of the Conference on December
12, they were faced with the challenge of addressing
an uncertain outlook for the international oil market
in 2013.
This in turn was tied in to the stuttering performance
of the world economy, which the latest OPEC Monthly Oil Market Report (MOMR), on the eve of the meeting, de-
scribed as experiencing “another year of deceleration”
in 2012, before adding a positive note: “Some indicators
are pointing to a tentative recovery in the second half of
the year and this momentum is likely to be carried over
into 2013.”
Then there was a word of caution: “Many uncertain-
ties remain. The most important will be avoiding the fis-
cal cliff in the US, further decisions on austerity issues
in the Euro-zone, and balancing the need to reduce the
fiscal debt burden while stimulating growth in Japan. In
the emerging economies, it remains to be seen how do-
mestic demand will be improved, given the likely con-
tinuation of low growth in their main exporting markets
in the developed world.”
Such doubts about the global economy, the MOMR
added, were “causing a great deal of uncertainty for the
forecast for world oil demand, which has a downward
risk, especially in the first half of the year.” Turning to
supply, the report noted that the growth in non-OPEC
supply, together with OPEC natural gas liquids and non-
conventional oils, was expected to outpace the increase
in world oil demand growth in 2013. Indeed, this was
already happening, with some notable downward pres-
sure on oil prices since mid-September.
This provided the backdrop for the Ministers as the
162nd Meeting began. In the closing press release, the
Conference was emphatic that the biggest challenge fac-
ing global oil markets in 2013 was uncertainty surround-
ing the global economy, at the same time noting that
projected demand for OPEC crude in 2013 was expected
to contract to 29.7 million barrels/day. Accordingly, the
Conference had decided to maintain the current produc-
tion level of 30.0m b/d. However, it added the important
Co
mm
en
tary
rider that Member Countries would, if necessary, take
steps to ensure market balance and reasonable price
levels for producers and consumers. This would mean re-
sponding swiftly to developments that might have a det-
rimental impact on an orderly oil market. The Conference
also directed the Secretariat to continue monitoring
closely supply and demand, as well as non-fundamental
factors, so as to keep Member Countries abreast of de-
velopments at all times.
The Meeting, which also extended Secretary General
Abdalla Salem El-Badri’s term of office for one year, effec-
tively brought to an end a busy year for the Organization
which, as ever, remains committed to achieving oil market
stability in support of steady world economic growth.
Following a winding down of activity across much of
the world for the festive season around the turn of the
year, in the northern hemisphere, the days will continue
getting shorter for about a week and the weather may
even turn colder and bleaker.
But then a transformation in the general mood is
likely to occur.
As we settle into the New Year, the promise of a
warmer, brighter spring soon becomes apparent, even
though there may still be lots of wintry weather to come
in the meantime. People will have benefitted from the
long festive break itself when they had the chance to re-
lax with family and friends.
The result of all this is that, as the pace of life picks
up again in early January, it will do so with a newfound
freshness and vigour in the minds and bodies of many
people. This will energise them in their day-to-day tasks
at home and at work.
The challenges facing the oil industry may not change
much as one year passes into the next, but, at the same
time, there will be a new drive and spirit among many
people who must handle them. It is, in effect, opening a
new chapter, with all the promise this can hold.
It is with this mood of optimism that we send sea-
sonal greetings to all our readers, as we all look forward
to peace and prosperity in 2013, supported by a sound,
stable international oil market.
OPEC focuses on market stabilityin 2013
Co
nte
nts
PublishersOPECOrganization of the Petroleum Exporting Countries
Helferstorferstraße 17
1010 Vienna
Austria
Telephone: +43 1 211 12/0
Telefax: +43 1 216 4320
Contact: The Editor-in-Chief, OPEC Bulletin
Fax: +43 1 211 12/5081
E-mail: [email protected]
Website: www.opec.org
Web site: www.opec.orgVisit the OPEC Web site for the latest news and infor-
mation about the Organization and back issues of the
OPEC Bulletin which are also available free of charge
in PDF format.
OPEC Membership and aimsOPEC is a permanent, intergovernmental
Organization, established in Baghdad, on September
10–14, 1960, by IR Iran, Iraq, Kuwait, Saudi Arabia
and Venezuela. Its objective — to coordinate
and unify petroleum policies among its Member
Countries, in order to secure fair and stable prices
for petroleum producers; an efficient, economic and
regular supply of petroleum to consuming nations;
and a fair return on capital to those investing in the
industry. The Organization comprises 12 Members:
Qatar joined in 1961; Libya (1962); United Arab
Emirates (Abu Dhabi, 1967); Algeria (1969); Nigeria
(1971); Angola (2007). Ecuador joined OPEC in
1973, suspended its Membership in 1992, and
rejoined in 2007. Gabon joined in 1975 and left in
1995. Indonesia joined in 1962 and suspended its
Membership on December 31, 2008.
CoverThis edition’s cover shows the record-breaking fireworks display that marked 50 years of Kuwait’s Constitution (see pp46–49). Photograph courtesy EPA/Raed Qutena.
OP
EC
bu
lle
tin
Vol XLIII, No 7, October/December 2012, ISSN 0474—6279
Energy Dialogue 28
WOO/ASB Presentation 36
IMF Meeting 42
Celebration 46
Symposium 50
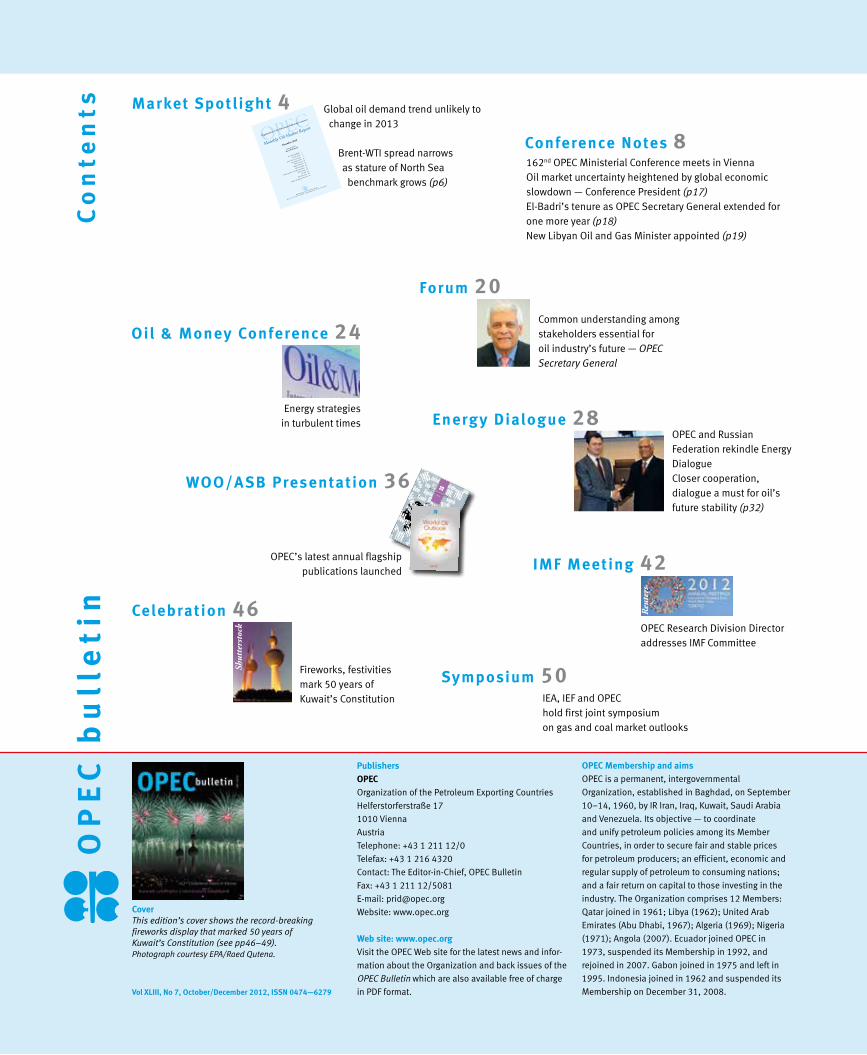
Market Spotl ight 4 Global oil demand trend unlikely to change in 2013
Brent-WTI spread narrows as stature of North Sea
benchmark grows (p6)
Forum 20
Conference Notes 8
Oil & Money Conference 24Common understanding among stakeholders essential for oil industry’s future — OPEC Secretary General
IEA, IEF and OPEChold first joint symposiumon gas and coal market outlooks
Fireworks, festivities mark 50 years of Kuwait’s Constitution
OPEC Research Division Director addresses IMF Committee
OPEC’s latest annual flagshippublications launched
OPEC and Russian Federation rekindle Energy DialogueCloser cooperation, dialogue a must for oil’s future stability (p32)
Energy strategies in turbulent times
Algeria celebrates50 years of independence
November 2012
Feature Article:
Brent-WTI spread
OPECOrganization
of thePetro
leumExpo
rtingCoun
tries
Monthly Oil
MarketRepo
rt
Tel +43 1 21112 Fax +43 1 2164320 E-mail: [email protected] Web site:www.opec.org
Helferstorferst
rasse 17, A-1010 Vienna, Austria
Oil market highlights
Feature article
Crude oil price movements
Commodity markets
World economy
World oil demand
World oil supply
Product markets and refinery o
perations
Tanker market
Oil trade
Stock movements
Balance of supply and demand
1
3
5
10
16
30
42
52
59
63
69
76
162nd OPEC Ministerial Conference meets in ViennaOil market uncertainty heightened by global economic slowdown — Conference President (p17)El-Badri’s tenure as OPEC Secretary General extended for one more year (p18)New Libyan Oil and Gas Minister appointed (p19)
Reu
ters
Shut
ters
tock

Workshop Annual 1stPR
Noticeboard 84
Puzzle Page 85
Obituary 86
Vacancies 87
Market Review 89
OPEC Publications 117
News Spotl ight 54
OPEC Fund News 70
Workshop 62
Ar ts & Li fe 72
Oil and Gas Summit 52
Secretar y General ’s Diar y 66
Newsline 56
Secretariat officialsSecretary GeneralAbdalla Salem El-BadriDirector, Research DivisionDr Hasan M QabazardHead, Finance & Human Resources DepartmentIn charge of Administration and IT Services DepartmentAlejandro RodriguezHead, Energy Studies DepartmentOswaldo TapiaHead, Petroleum Studies DepartmentDr Hojatollah Ghanimi FardHead, PR & Information DepartmentUlunma Angela AgoawikeGeneral Legal CounselAsma MuttawaHead, Office of the Secretary GeneralAbdullah Al-ShameriIn charge of Data Services DepartmentNabeel Almojil, IT Development Coordinator
ContributionsThe OPEC Bulletin welcomes original contributions on
the technical, financial and environmental aspects
of all stages of the energy industry, research reports
and project descriptions with supporting illustrations
and photographs.
Editorial policyThe OPEC Bulletin is published by the OPEC
Secretariat (Public Relations and Information
Department). The contents do not necessarily reflect
the official views of OPEC nor its Member Countries.
Names and boundaries on any maps should not be
regarded as authoritative. No responsibility is taken
for claims or contents of advertisements. Editorial
material may be freely reproduced (unless copyright-
ed), crediting the OPEC Bulletin as the source. A copy
to the Editor would be appreciated. Printed in Austria by Ueberreuter Print GmbH
Editorial staffEditor-in-Chief/Editorial CoordinatorUlunma Angela AgoawikeEditorJerry HaylinsAssociate EditorsKeith Aylward-Marchant, James Griffin, Alvino-Mario FantiniProductionDiana LavnickDesign & LayoutElfi PlakolmPhotographs (unless otherwise credited)Diana Golpashin and Wolfgang HammerDistributionMahid Al-Saigh
Indexed and abstracted in PAIS International
OFID and CAF join forces to bring energy to the poor
First OPEC Public Relations Workshop held
The Taipei ‘miracle’ continues … (p76)
The changing world of energy economics
Iraqi oil set to become game-changer for world markets — IEA
NOC Chairman attends North Africa conference in Vienna
Angola looking to start up iron ore production
Iraq’s oil exports rise again as 2013 budget gets approval (p57)
Standard and Poor’s upgrades Nigeria’s credit rating (p58)
New projects strengthening Saudi Arabia’s role in global energy sector (p59)
Venezuela on target to exceed growth expectations in 2012 (p60)
China’s crude oil imports surge in October (p61)
Briefings 68
ddp
imag
es
Reu
ters
Shut
ters
tock
Uni
vers
ity o
f Vie
nna
OPE
C bu
lleti
n 10
–12
/12
4
The current dampened trend for world oil demand is not
expected to change in the coming year, with the market
continuing to be characterized by high volumes of crude
supply and increasing production capacity, according to
OPEC’s Monthly Oil Market Report (MOMR) for October.
It said that given the uncertainty facing the global
economy and the ongoing downside risks, world oil
demand growth for 2012 had been frequently revised
down, while non-OPEC supply and output of OPEC nat-
ural gas liquids (NGLs) had continued to perform well,
outpacing demand growth.
In reviewing the state of the world economy in its
leading article, the MOMR noted that the global
economy had experienced a continuous decelera-
tion since the beginning of 2012.
The combination of an austerity-driven Euro-
zone, the weakening recovery in Japan and clear
signs of a slow-down in the major emerging
economies had been the main factors behind
this development, it maintained.
However, the report noted that despite
the prevailing weakness in the world econ-
omy, the slowing momentum was expected
to bottom out later in 2012.
As a result, global growth was pro-
jected to be slightly higher in 2013 at
3.2 per cent, compared with a down-
ward adjusted performance of 3.1 per
cent for this year.
But the MOMR warned that two major structural weak-
nesses represented continued risks to the forecasts.
Firstly, most of the incremental growth was set to
come from developing and emerging economies, which
to varying degrees were reliant on exports to the devel-
oped economies.
“Secondly, and even more of a concern, the growth
forecast is dependent on the effectiveness of the
Global oil demand trend unlikely to change in 2013
October 2012
Feature Article:
Review of the world economy
OPECOrganization of
the Petroleum
Exporting Co
untries
MonthlyOil Market R
eport
Tel +43 1 21112 Fax +43 1 2164320 E-mail: [email protected] Web site: www.opec.org
Helferstorferstrasse 17, A-1010 Vienna, Austria
Oil market highlights
Feature article
Crude oil price movements
Commodity markets
World economy
World oil demand
World oil supply
Product markets and refinery operations
Tanker market
Oil trade
Stock movements
Balance of supply and demand
1
3
5
11
16
31
43
53
60
64
70
76
October
Ma
rke
t S
po
tlig
ht
OPE
C bu
lleti
n 10
–12
/12
5
recently-announced monetary supply facilities provided
by central banks, as well as fiscal measures taken by
some governments,” it said.
The article maintained that such efforts might offer the
opportunity to alleviate the underlying problems, which
were mostly debt-related in the developed economies and
primarily growth-related in the developing economies.
“As monetary measures can only offer support to
some extent, if this momentum is not taken up in the real
sectors of the economy, the opportunity will be lost,” it
affirmed.
The MOMR pointed out that while the developed coun-
tries were clearly underperforming the emerging and devel-
oping economies in terms of growth — at 1.4 per cent com-
pared to 5.0 per cent in the current year — they remained
the main source of global output through their aggregate
demand and hence imports from the emerging markets.
Domestic consumption
“Overall, the OECD represents more than 60 per cent of
international trade. Therefore, the challenges facing the
major OECD economies will continue to be a key cause
of concern, particularly as domestic consumption in the
emerging and developing economies remains at a rela-
tively low level and is even decelerating in some cases,”
the report observed.
It noted that the United States continued to show a
better performance than the other major developed econ-
omies, although growth was expected to slow from 2.2
per cent for this year to 2.0 per cent in 2013, as quanti-
tative easing and other loose monetary supply measures
became less effective.
“However, major challenges remain, given the still
high levels of unemployment and the looming automatic
budget cuts scheduled for the start of next year.”
In Japan, said the MOMR, the economy was facing a
continued deceleration after a good performance in the
first half of 2012.
“As stimulus measures taken in response to last
year’s triple catastrophe are tapering off, low domestic
demand growth, appreciation of the yen and the slow-
down in international trade, particularly with its major
trading partners China and the European Union, are likely
to lead to a decline in the second half.”
As a result, growth in Japan was expected at 2.2 per
cent for 2012 and at 1.1 per cent in 2013.
The report stressed that the fragility of the Euro-zone
continued to be a core concern for the global economy.
The sovereign debt issues of Spain and Italy — coun-
tries which constituted almost a third of the Euro-zone’s
economy — had so far been contained, but certainly
needed continued close monitoring.
“The European Central Bank’s sovereign debt-buying
programme should help to alleviate some of the burden
facing these ailing economies in the short to medium term.
However, debt issues will remain a challenge, particularly
given the increasing opposition to austerity measures.”
In 2013, said the MOMR, the Euro-zone was expected
to expand by a marginal 0.1 per cent, following a con-
traction of 0.5 per cent in the current year, as many of its
economies were currently in recession.
It contended that both the situation in Europe and
the recent slowing pace of growth in the US had signifi-
cantly impacted China’s exports.
Despite government efforts to support growth domes-
tically, China’s economy was facing a continued decelera-
tion from around ten per cent in past years to a forecast
of 7.6 per cent this year and 8.0 per cent in 2013.
“This reflects expectations that further monetary and
fiscal stimuli will compensate for the lagging momentum,
as the government could still engage a wide range of sup-
port measures.”
The report said that, in contrast, given continued
high inflation, India was not expected to introduce fur-
ther major stimulus efforts and was forecast to expand
by 5.7 per cent this year and 6.6 per cent in 2013.
Other emerging and developing economies were fac-
ing similar challenges, due to the lowered export base.
“Nevertheless, developing and emerging economies
are still forecast to represent almost 80 per cent of global
growth,” the article added.
OPE
C bu
lleti
n 10
–12
/12
6
Brent light crude, since long the benchmark blend of the
North Sea oil sector, and estimated to be the marker
for pricing up to two-thirds of the crude oil traded
internationally every day, is in line to take an even
stronger foothold in global energy markets, as early
as next year.
A new set of circumstances, especially in the
United States, looks like paving the way for Brent
to finally overtake the US premier crude, West
Texas Intermediate (WTI), as the leading global
oil benchmark.
Trading volume of Brent
According to a report by Reuters, Brent is
becoming the hedge of choice for big inves-
tors, even those in the US.
It noted that the trading volume of
Brent futures and options had soared,
boosting liquidity, at the expense of
WTI.
Quoting exchange figures, it
revealed that average volumes
this year for Brent futures on
the InterContinental Exchange
(ICE) had overtaken WTI traded
on the New York Mercantile
Exchange (NYMEX) by more than
30,000 lots per day. Brent was
recorded at over 600,000 lots,
while WTI stood at around
570,000.
The report conceded that
while combined volumes
Brent-WTI spread narrows as statureof North Sea benchmark grows
November
November 2012
Feature Article:
Brent-WTI spread
OPECOrganization of
the Petroleum
Exporting Co
untries
MonthlyOil Market R
eport
Tel +43 1 21112 Fax +43 1 2164320 E-mail: [email protected] Web site: www.opec.org
Helferstorferstrasse 17, A-1010 Vienna, Austria
Oil market highlights
Feature article
Crude oil price movements
Commodity markets
World economy
World oil demand
World oil supply
Product markets and refinery operations
Tanker market
Oil trade
Stock movements
Balance of supply and demand
1
3
5
10
16
30
42
52
59
63
69
76
Ma
rke
t S
po
tlig
ht
OPE
C bu
lleti
n 10
–12
/12
7
of the London and New York exchanges still showed WTI
futures ahead in terms of volume and open interest, Brent
was closing the gap and looked set to outperform its US
rival early in 2013.
The November issue of OPEC’s Monthly Oil Market
Report (MOMR) also alluded to the changing position of
Brent over WTI in its feature article.
It maintained that the Brent-WTI spread was expected
to decline as a number of factors were expected to contrib-
ute to an easing of the supply glut at Cushing, Oklahoma,
in the US, the price settlement point for the NYMEX WTI
futures contract.
The MOMR observed that the opening of the Seaway
pipeline to the first crude flows in June 2012 had resulted
in a marginal short-lived decline in crude oil stockpiles
at Cushing.
“However, the fall in inventories coincided with a
widening of the spread between Brent and WTI, when
logically it should have narrowed. Instead, the spread
extended to its widest in a year.”
The report said that this counter-intuitive behav-
iour was a result of differing pressures affecting the two
benchmarks. The factors affecting Brent were escalating
Middle East tensions and the physical shortage of Brent
crude in the North Sea, because of an overall decline in
production in the region, seasonal maintenance and per-
sistent problems at the Buzzard oil field.
In contrast, WTI continued to be impacted by grow-
ing US shale oil production, which had pushed US oil
output to an estimated 9.7 million barrels/day in 2012,
its highest level in over 24 years. Moreover, planned and
unplanned outages at a number of US refineries had also
affected WTI negatively.
The MOMR noted that US crude oil inventories cur-
rently stood at around 43.4m b, some 35 per cent higher
than a year ago. Already, a jump in rail tank car traffic out
of the Bakken shale play had increased the flow of crude
past Cushing. There had also been an expansion in the use
of barges to move crude down the Illinois and Mississippi
rivers to the Gulf Coast, also bypassing Cushing.
“However, the most important factor will be the expan-
sion of the Seaway pipeline in early 2013 from 150,000
b/d to 400,000 b/d, which will increase flows out of
Cushing direct to the Gulf Coast,” the report stated.
“All of these domestic barrels reaching the coast will
relieve the Cushing stockpile — thus supporting WTI —
as well as exerting downward pressure on rival imported
grades, which are priced against Brent. As a result, the
Brent-WTI spread is expected to narrow.”
Pipeline capacity
Moreover, said the MOMR, the potential impact of addi-
tional takeaway pipeline capacity out of the Permian
Basin, with the expansion of the West Texas Gulf pipe-
line, would allow 80,000 b/d of Permian crude to flow
to the Gulf Coast.
“Altogether, by 2013, these additions will provide a
route to the Gulf Coast for about 330,000 b/d of crude
that can currently only be sent by pipeline to Cushing, or
to the Midwest.
“At the same time, the increasing trend in US shale
oil production will also impact WTI prices, consequently
affecting the spread. Furthermore, the trend of the future
forward curve appears to point to a narrowing in the Brent-
WTI spread,” it affirmed.
Looking at the forward curve of the Brent-WTI spread,
as of October 2012, it disclosed that the spread declined
quite rapidly from $20/b currently to $14/b in July 2013
and then more slowly to $8/b in November 2014.
“Although expected to narrow, the Brent-WTI spread
is likely to persist, driven by ongoing constraints in infra-
structure, combined with rising crude production from US
shale oil fields.
“At the same time, the strengthening of ICE Brent, due
to a continued decline in the mature North Sea fields, com-
bined with growing Asian demand for North Sea grades,
as well as Brent-like crudes from West Africa, will support
a continuation of the Brent premium over WTI,” the report
concluded.
8
OPE
C bu
lleti
n 10
–12
/12
Co
nfe
ren
ce
No
tes
Abdul-Kareem Luaibi Bahedh, Minister of Oil of Iraq (see
opening address on page 17), the Conference stipulated
that Member Countries would, if necessary, take steps to
ensure market balance and reasonable price levels for
producers and consumers.
“In taking this decision, Member Countries confirmed
that they will swiftly respond to developments that might
have a detrimental impact on an orderly oil market,” the
Ministers said in a communiqué issued after the one-day
Meeting, held at the OPEC Secretariat.
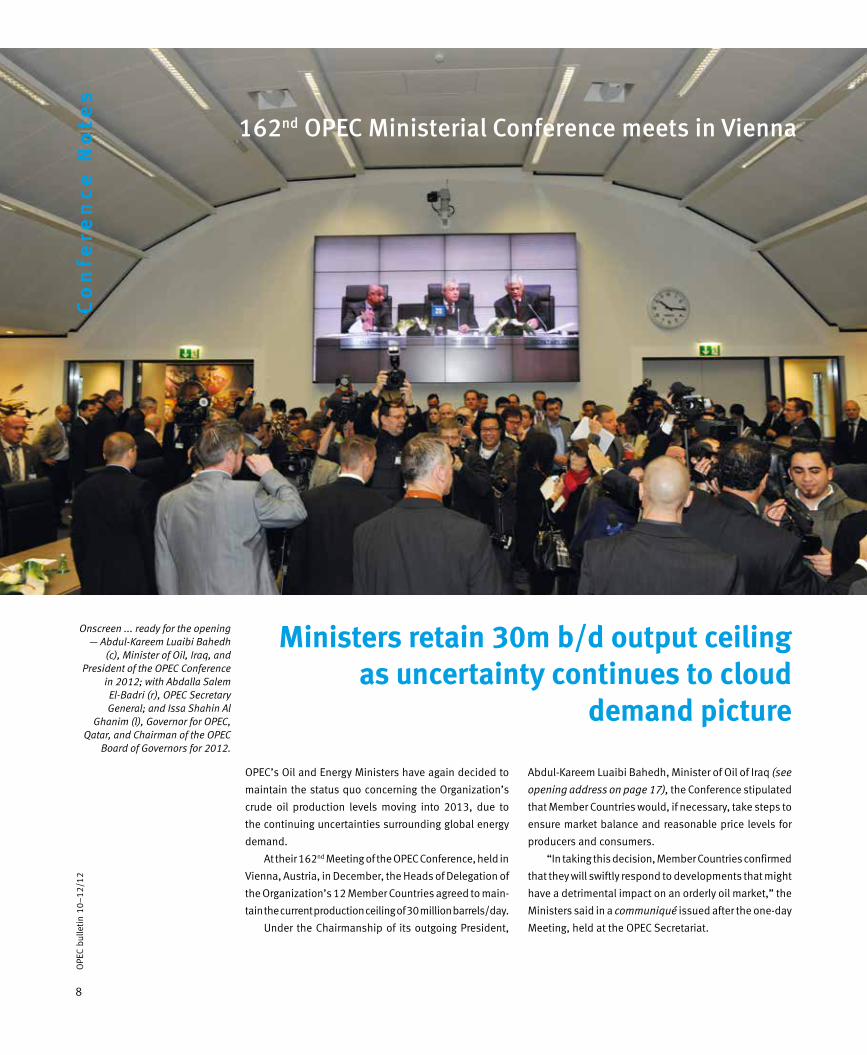
162nd OPEC Ministerial Conference meets in Vienna
OPEC’s Oil and Energy Ministers have again decided to
maintain the status quo concerning the Organization’s
crude oil production levels moving into 2013, due to
the continuing uncertainties surrounding global energy
demand.
At their 162nd Meeting of the OPEC Conference, held in
Vienna, Austria, in December, the Heads of Delegation of
the Organization’s 12 Member Countries agreed to main-
tain the current production ceiling of 30 million barrels/day.
Under the Chairmanship of its outgoing President,
Ministers retain 30m b/d output ceiling as uncertainty continues to cloud
demand picture
Onscreen ... ready for the opening — Abdul-Kareem Luaibi Bahedh
(c), Minister of Oil, Iraq, and President of the OPEC Conference
in 2012; with Abdalla Salem El-Badri (r), OPEC Secretary General; and Issa Shahin Al
Ghanim (l), Governor for OPEC, Qatar, and Chairman of the OPEC
Board of Governors for 2012.
9
OPE
C bu
lleti
n 10
–11
/12
It was similar action to that taken at their previous
Conference in June 2012, when the Conference decided
that Member Countries should strictly adhere to the exist-
ing oil production ceiling of 30m b/d, the ceiling that
was first decided upon during OPEC’s December 2011
Conference.
At their latest Meeting, Ministers directed the OPEC
Secretariat to maintain its close monitoring of develop-
ments in supply and demand, as well as non-fundamental
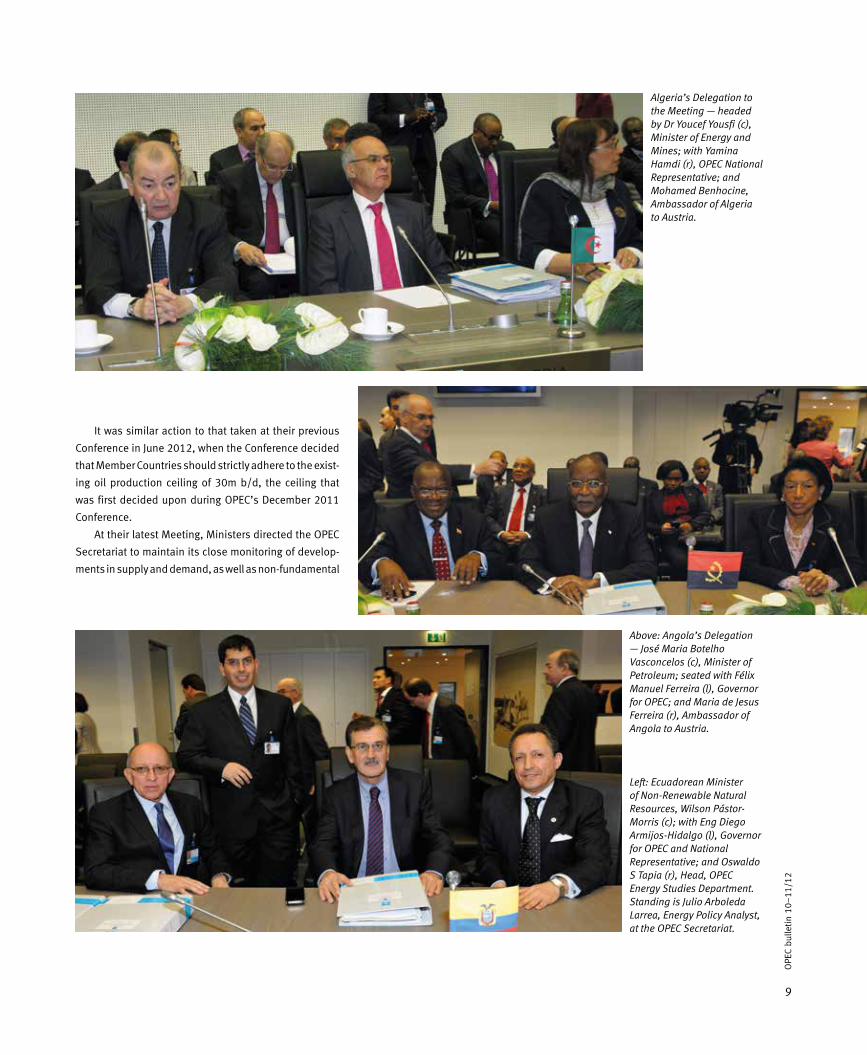
Algeria’s Delegation to the Meeting — headed by Dr Youcef Yousfi (c), Minister of Energy and Mines; with Yamina Hamdi (r), OPEC National Representative; and Mohamed Benhocine, Ambassador of Algeria to Austria.
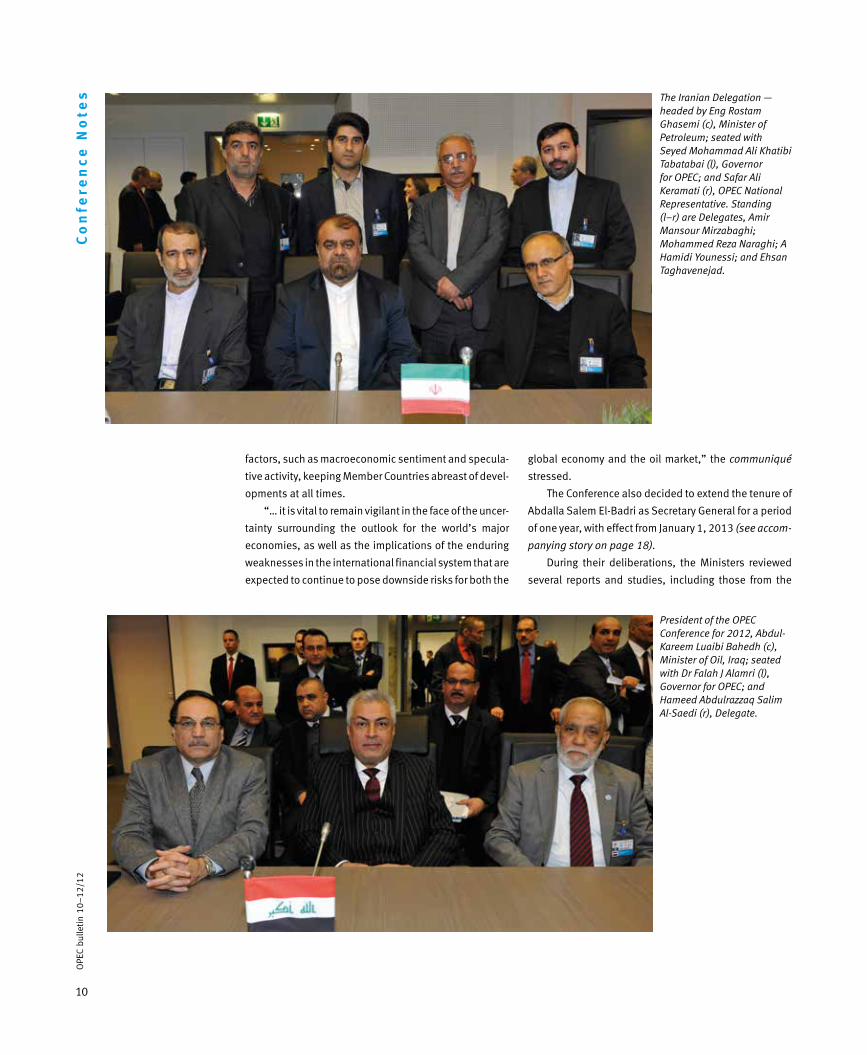
Above: Angola’s Delegation — José Maria Botelho Vasconcelos (c), Minister of Petroleum; seated with Félix Manuel Ferreira (l), Governor for OPEC; and Maria de Jesus Ferreira (r), Ambassador of Angola to Austria.
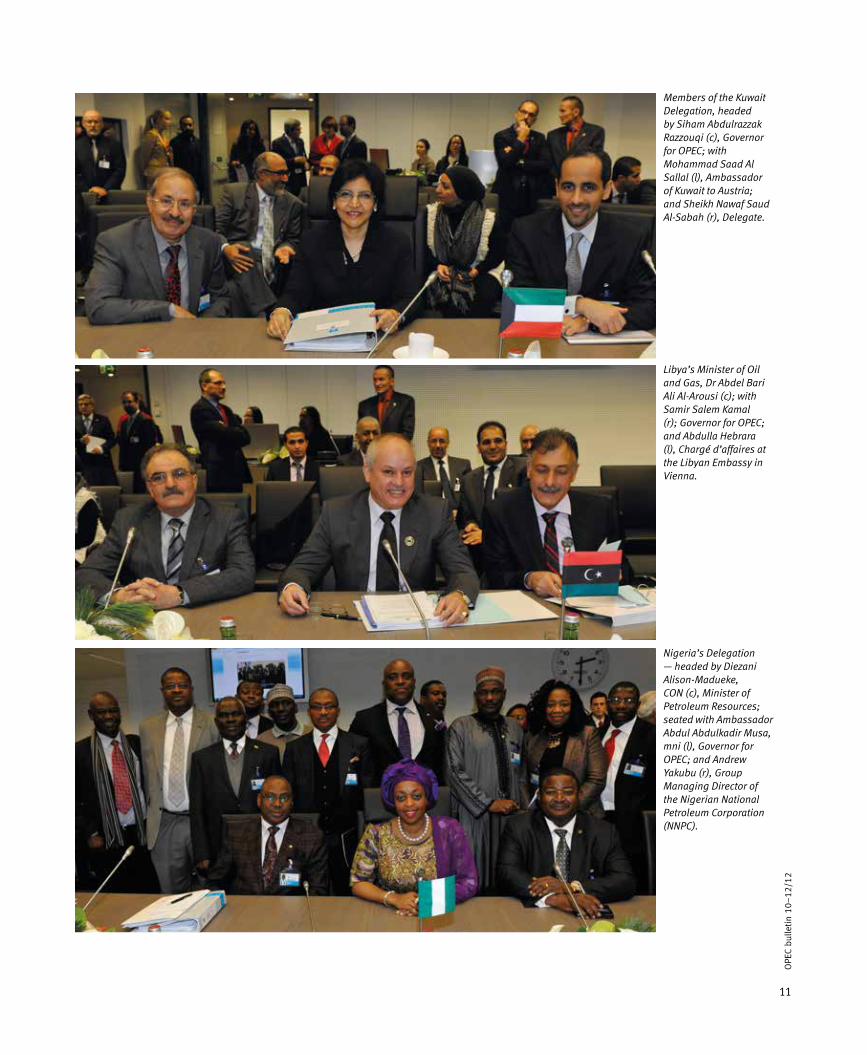
Left: Ecuadorean Minister of Non-Renewable Natural Resources, Wilson Pástor-Morris (c); with Eng Diego Armijos-Hidalgo (l), Governor for OPEC and National Representative; and Oswaldo S Tapia (r), Head, OPEC Energy Studies Department. Standing is Julio Arboleda Larrea, Energy Policy Analyst, at the OPEC Secretariat.
10
OPE
C bu
lleti
n 10
–12
/12
Co
nfe
ren
ce
No
tes
factors, such as macroeconomic sentiment and specula-
tive activity, keeping Member Countries abreast of devel-
opments at all times.
“… it is vital to remain vigilant in the face of the uncer-
tainty surrounding the outlook for the world’s major
economies, as well as the implications of the enduring
weaknesses in the international financial system that are
expected to continue to pose downside risks for both the
global economy and the oil market,” the communiqué
stressed.
The Conference also decided to extend the tenure of
Abdalla Salem El-Badri as Secretary General for a period
of one year, with effect from January 1, 2013 (see accom-
panying story on page 18).
During their deliberations, the Ministers reviewed
several reports and studies, including those from the
The Iranian Delegation — headed by Eng Rostam Ghasemi (c), Minister of Petroleum; seated with Seyed Mohammad Ali Khatibi Tabatabai (l), Governor for OPEC; and Safar Ali Keramati (r), OPEC National Representative. Standing (l–r) are Delegates, Amir Mansour Mirzabaghi; Mohammed Reza Naraghi; A Hamidi Younessi; and Ehsan Taghavenejad.
President of the OPEC Conference for 2012, Abdul-Kareem Luaibi Bahedh (c), Minister of Oil, Iraq; seated with Dr Falah J Alamri (l), Governor for OPEC; and Hameed Abdulrazzaq Salim Al-Saedi (r), Delegate.
11
OPE
C bu
lleti
n 10
–12
/12
Members of the Kuwait Delegation, headed by Siham Abdulrazzak Razzouqi (c), Governor for OPEC; with Mohammad Saad Al Sallal (l), Ambassador of Kuwait to Austria; and Sheikh Nawaf Saud Al-Sabah (r), Delegate.
Libya’s Minister of Oil and Gas, Dr Abdel Bari Ali Al-Arousi (c); with Samir Salem Kamal (r); Governor for OPEC; and Abdulla Hebrara (l), Chargé d’affaires at the Libyan Embassy in Vienna.
Nigeria’s Delegation — headed by Diezani Alison-Madueke, CON (c), Minister of Petroleum Resources; seated with Ambassador Abdul Abdulkadir Musa, mni (l), Governor for OPEC; and Andrew Yakubu (r), Group Managing Director of the Nigerian National Petroleum Corporation (NNPC).

12
OPE
C bu
lleti
n 10
–12
/12
Co
nfe
ren
ce
No
tes
Secretary General, the OPEC Economic Commission Board
(ECB) and the Ministerial Monitoring Sub-Committee
(MMSC), whose Members the Conference again com-
mended for their continued and appreciated efforts on
behalf of the Organization
El-Badri’s report on the oil market outlook particularly
focused on the supply/demand projections for 2013.
It highlighted that although world oil demand was
forecast to increase slightly during 2013, this was likely
to be more than offset by the projected increase in non-
OPEC supply. Forecast demand for OPEC crude in 2013
was expected to contract to 29.7m b/d.
Concerning crude oil prices, It was observed that the
volatility witnessed throughout 2012 remained mostly a
reflection of increased levels of speculation in the com-
modities markets, exacerbated by geopolitical tensions
and, latterly, exceptional weather conditions.
The Conference pointed to mounting pessimism over
the global economic outlook, with downside risks con-
tinuing to be presented by the sovereign debt crisis in the
Euro-zone; high unemployment in the advanced econo-
mies, especially the Euro-zone; and inflation risk in the
emerging economies.
“Indeed, the biggest challenge facing global oil
Qatari Minister of Energy and Industry, Dr Mohammed Bin Saleh Al-Sada (c); with Issa Shahin Al Ghanim (l), Governor for OPEC, and Chairman of the OPEC Board of Governors for 2012; and Mohammed Ali Al-Malki (r), Ambassador of Qatar to Austria.
Saudi Arabian Minister of Petroleum and Mineral Resources, Ali I Naimi (l); with Mohammed Abdulrahman Al Salloum (c), Saudi Arabia’s Ambassador to Austria; and HRH Prince Abdulaziz Bin Salman (r), Assistant Minister of Petroleum and Mineral Resources.
13
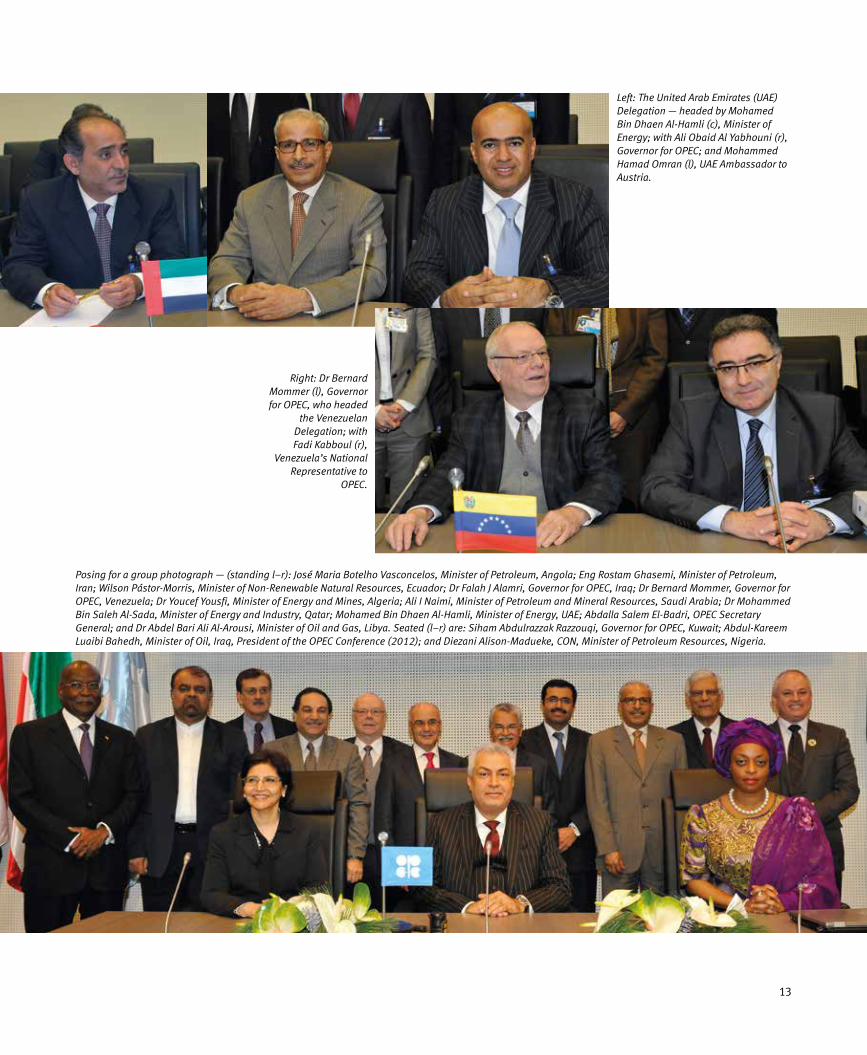
Left: The United Arab Emirates (UAE) Delegation — headed by Mohamed Bin Dhaen Al-Hamli (c), Minister of Energy; with Ali Obaid Al Yabhouni (r), Governor for OPEC; and Mohammed Hamad Omran (l), UAE Ambassador to Austria.
Right: Dr Bernard Mommer (l), Governor for OPEC, who headed
the Venezuelan Delegation; with Fadi Kabboul (r),
Venezuela’s National Representative to
OPEC.
Posing for a group photograph — (standing l–r): José Maria Botelho Vasconcelos, Minister of Petroleum, Angola; Eng Rostam Ghasemi, Minister of Petroleum, Iran; Wilson Pástor-Morris, Minister of Non-Renewable Natural Resources, Ecuador; Dr Falah J Alamri, Governor for OPEC, Iraq; Dr Bernard Mommer, Governor for OPEC, Venezuela; Dr Youcef Yousfi, Minister of Energy and Mines, Algeria; Ali I Naimi, Minister of Petroleum and Mineral Resources, Saudi Arabia; Dr Mohammed Bin Saleh Al-Sada, Minister of Energy and Industry, Qatar; Mohamed Bin Dhaen Al-Hamli, Minister of Energy, UAE; Abdalla Salem El-Badri, OPEC Secretary General; and Dr Abdel Bari Ali Al-Arousi, Minister of Oil and Gas, Libya. Seated (l–r) are: Siham Abdulrazzak Razzouqi, Governor for OPEC, Kuwait; Abdul-Kareem Luaibi Bahedh, Minister of Oil, Iraq, President of the OPEC Conference (2012); and Diezani Alison-Madueke, CON, Minister of Petroleum Resources, Nigeria.

14
OPE
C bu
lleti
n 10
–12
/12
Co
nfe
ren
ce
No
tes markets in 2013 is uncertainty surrounding the global economy, with the
fragility of the Euro-zone remaining a major concern,” the communiqué
stressed.
In attending to various administrative matters, the Ministers also
exchanged views on developments in multilateral environment matters,
including the outcome of COP18/CMP8 held in Doha, Qatar; the status of
the Organization’s ongoing Energy Dialogue with the European Union; its
continued cooperative work for the G20; and its dialogue with the Russian
Federation.
The Conference paid a special tribute to the government and people of
Qatar on the successful hosting of COP18/CMP8, noting with satisfaction
that the event’s positive conclusion “paved the way for a new course of
Above: Nigeria’s recently appointed Governor for OPEC, Ambassador Abdul Abdulkadir Musa, mni.
Below: OPEC’s Management team (top l–r): Dr Hasan M Qabazard, Director, Research Division; Ulunma Angela Agoawike, Head, Public Relations and Information Department; Alejandro Rodriguez Rivas, Head, Finance and Human Resources Department, in charge of the Administration and IT
Services Department; and Dr Hojatollah Ghanimi Fard, Head, Petroleum Studies Department. Bottom (l–r): Nabeel Almojil, Development Coordinator, in charge of the Data Services Department; Asma Muttawa, General Legal Counsel; Oswaldo S Tapia, Head, Energy Studies Department; and Abdullah Al-Shameri, Head, Office of the Secretary General.
15
OPE
C bu
lleti
n 10
–12
/12
action for designing the future climate change regime.”
In this connection, the Ministers also applauded the
work being done in this important area by climate change
negotiators from around the world.
The Conference elected Hani Abdulaziz Hussain,
Minister of Oil of Kuwait, as President of the Conference
for one year, with effect from January 1, 2013, and Dr
Abdel Bari Ali Al-Arousi, Minister of Oil and Gas of Libya,
as Alternate President, for the same period.
Al-Arousi was attending his first OPEC Conference as
Head of his country’s Delegation and the Ministers con-
gratulated him on his recent appointment as Minister of
Oil and Gas. They also thanked his predecessor in office,
Eng Abdurahman Benyezza, for his contribution to the
work of the Organization.
The Conference appointed Yasser M Mufti, Saudi
Arabian Governor for OPEC, as Chairman of the OPEC Board
of Governors for 2013, and Dr Ali Obaid Al Yabhouni, the
United Arab Emirates’ Governor for OPEC, as Alternate
Chairman for the same period, with effect from January
1, 2013.
The Ministers decided that the next Ordinary Meeting
of the OPEC Conference would convene in Vienna on May
31, 2013.
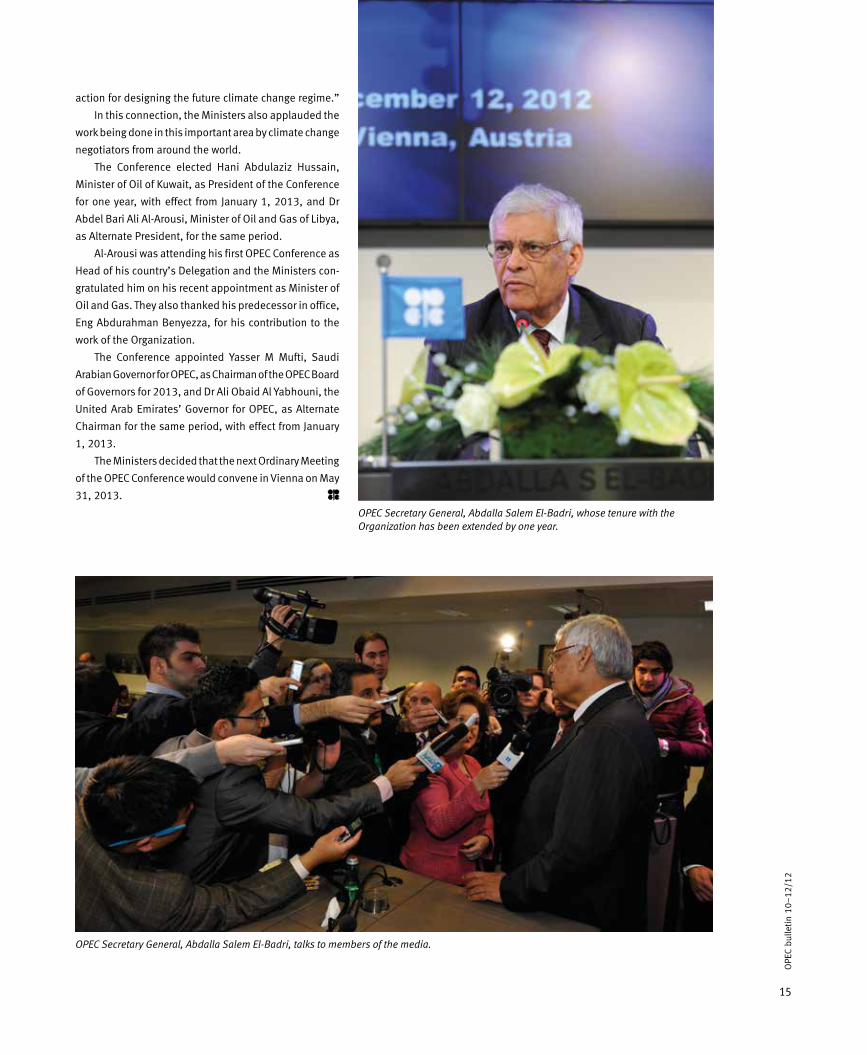
OPEC Secretary General, Abdalla Salem El-Badri, whose tenure with the Organization has been extended by one year.
OPEC Secretary General, Abdalla Salem El-Badri, talks to members of the media.

Co
nfe
ren
ce
No
tes
Kuwait’s Minister of Oil, Hani Abdulaziz Hussain, who was elected OPEC Conference President for 2013.
Dr Abdel Bari Ali Al-Arousi, Libya’s Minister of Oil and Gas, who was elected Alternate President of the OPEC Conference for 2013.
Yasser M Mufti, Saudi Arabia’s Governor for OPEC, who was elected Chairman of the OPEC Board of Governors for 2013.
Dr Ali Obaid Al Yabhouni, United Arab Emirates Governor for OPEC, who was elected Alternate Chairman of the OPEC Board of Governors for 2013.
16
OPE
C bu
lleti
n 10
–12
/12
New appointments for 2013
17
OPE
C bu
lleti
n 10
–12
/12
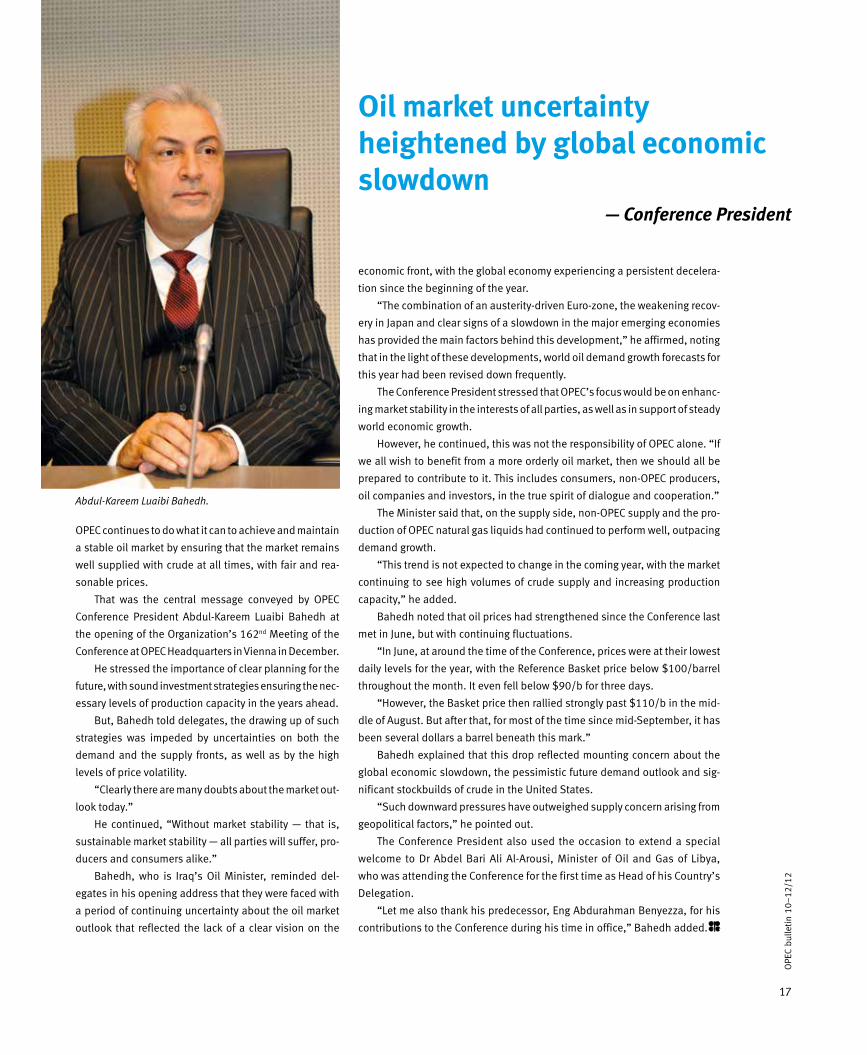
OPEC continues to do what it can to achieve and maintain
a stable oil market by ensuring that the market remains
well supplied with crude at all times, with fair and rea-
sonable prices.
That was the central message conveyed by OPEC
Conference President Abdul-Kareem Luaibi Bahedh at
the opening of the Organization’s 162nd Meeting of the
Conference at OPEC Headquarters in Vienna in December.
He stressed the importance of clear planning for the
future, with sound investment strategies ensuring the nec-
essary levels of production capacity in the years ahead.
But, Bahedh told delegates, the drawing up of such
strategies was impeded by uncertainties on both the
demand and the supply fronts, as well as by the high
levels of price volatility.
“Clearly there are many doubts about the market out-
look today.”
He continued, “Without market stability — that is,
sustainable market stability — all parties will suffer, pro-
ducers and consumers alike.”
Bahedh, who is Iraq’s Oil Minister, reminded del-
egates in his opening address that they were faced with
a period of continuing uncertainty about the oil market
outlook that reflected the lack of a clear vision on the
Oil market uncertainty heightened by global economic slowdown
— Conference President
economic front, with the global economy experiencing a persistent decelera-
tion since the beginning of the year.
“The combination of an austerity-driven Euro-zone, the weakening recov-
ery in Japan and clear signs of a slowdown in the major emerging economies
has provided the main factors behind this development,” he affirmed, noting
that in the light of these developments, world oil demand growth forecasts for
this year had been revised down frequently.
The Conference President stressed that OPEC’s focus would be on enhanc-
ing market stability in the interests of all parties, as well as in support of steady
world economic growth.
However, he continued, this was not the responsibility of OPEC alone. “If
we all wish to benefit from a more orderly oil market, then we should all be
prepared to contribute to it. This includes consumers, non-OPEC producers,
oil companies and investors, in the true spirit of dialogue and cooperation.”
The Minister said that, on the supply side, non-OPEC supply and the pro-
duction of OPEC natural gas liquids had continued to perform well, outpacing
demand growth.
“This trend is not expected to change in the coming year, with the market
continuing to see high volumes of crude supply and increasing production
capacity,” he added.
Bahedh noted that oil prices had strengthened since the Conference last
met in June, but with continuing fluctuations.
“In June, at around the time of the Conference, prices were at their lowest
daily levels for the year, with the Reference Basket price below $100/barrel
throughout the month. It even fell below $90/b for three days.
“However, the Basket price then rallied strongly past $110/b in the mid-
dle of August. But after that, for most of the time since mid-September, it has
been several dollars a barrel beneath this mark.”
Bahedh explained that this drop reflected mounting concern about the
global economic slowdown, the pessimistic future demand outlook and sig-
nificant stockbuilds of crude in the United States.
“Such downward pressures have outweighed supply concern arising from
geopolitical factors,” he pointed out.
The Conference President also used the occasion to extend a special
welcome to Dr Abdel Bari Ali Al-Arousi, Minister of Oil and Gas of Libya,
who was attending the Conference for the first time as Head of his Country’s
Delegation.
“Let me also thank his predecessor, Eng Abdurahman Benyezza, for his
contributions to the Conference during his time in office,” Bahedh added.
Abdul-Kareem Luaibi Bahedh.

18
OPE
C bu
lleti
n 10
–12
/12
The 162nd Meeting of the OPEC Conference, held in Vienna
in December 2012, decided to extend the tenure of
Abdalla Salem El-Badri as Secretary General for a period
of one year, with effect from January 1, 2013.
El-Badri had been due to leave the Organization at
the end of December on completion of two terms as Head
of the OPEC Secretariat in the Austrian capital.
“We have an experienced Secretary General in posi-
tion, extending (his tenure) by one year is a very, very,
good decision,” Ali I Naimi, Minister of Petroleum and
Mineral Resources of Saudi Arabia, was quoted as saying
after the one-day Ministerial Meeting. He stressed that
he was very happy with the decision to keep El-Badri in
place for another year.
Libya’s OPEC Governor, Samir Salem Kamal, also wel-
comed the move to extend El-Badri. He said the decision
to retain his services for a year “will give us time to recon-
sider the candidates again.” Three applicants were con-
sidered for the Secretary General position, but no agree-
ment was reached by the Conference.
Co
nfe
ren
ce
No
tes
El-Badri’s tenure as OPEC Secretary General extended for one more year
19
OPE
C bu
lleti
n 10
–12
/12
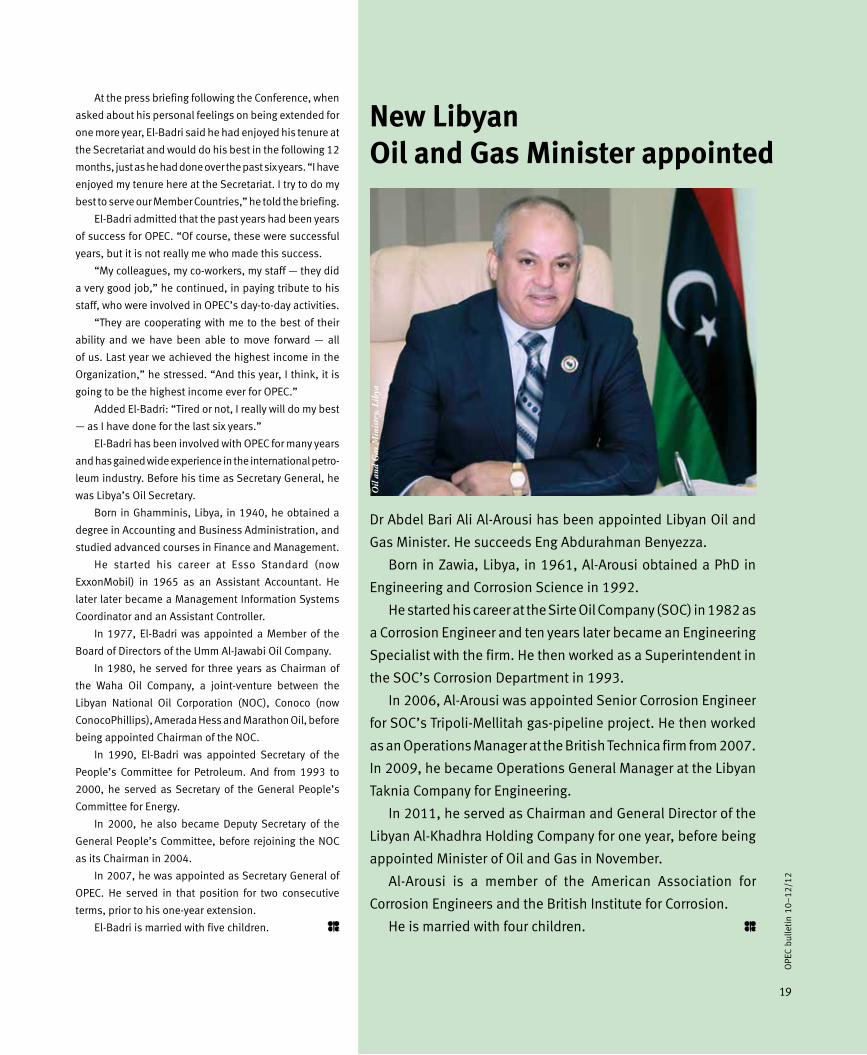
New LibyanOil and Gas Minister appointed
Dr Abdel Bari Ali Al-Arousi has been appointed Libyan Oil and
Gas Minister. He succeeds Eng Abdurahman Benyezza.
Born in Zawia, Libya, in 1961, Al-Arousi obtained a PhD in
Engineering and Corrosion Science in 1992.
He started his career at the Sirte Oil Company (SOC) in 1982 as
a Corrosion Engineer and ten years later became an Engineering
Specialist with the firm. He then worked as a Superintendent in
the SOC’s Corrosion Department in 1993.
In 2006, Al-Arousi was appointed Senior Corrosion Engineer
for SOC’s Tripoli-Mellitah gas-pipeline project. He then worked
as an Operations Manager at the British Technica firm from 2007.
In 2009, he became Operations General Manager at the Libyan
Taknia Company for Engineering.
In 2011, he served as Chairman and General Director of the
Libyan Al-Khadhra Holding Company for one year, before being
appointed Minister of Oil and Gas in November.
Al-Arousi is a member of the American Association for
Corrosion Engineers and the British Institute for Corrosion.
He is married with four children.
Oil
and
Gas
Min
istr
y, L
ibya
At the press briefing following the Conference, when
asked about his personal feelings on being extended for
one more year, El-Badri said he had enjoyed his tenure at
the Secretariat and would do his best in the following 12
months, just as he had done over the past six years. “I have
enjoyed my tenure here at the Secretariat. I try to do my
best to serve our Member Countries,” he told the briefing.
El-Badri admitted that the past years had been years
of success for OPEC. “Of course, these were successful
years, but it is not really me who made this success.
“My colleagues, my co-workers, my staff — they did
a very good job,” he continued, in paying tribute to his
staff, who were involved in OPEC’s day-to-day activities.
“They are cooperating with me to the best of their
ability and we have been able to move forward — all
of us. Last year we achieved the highest income in the
Organization,” he stressed. “And this year, I think, it is
going to be the highest income ever for OPEC.”
Added El-Badri: “Tired or not, I really will do my best
— as I have done for the last six years.”
El-Badri has been involved with OPEC for many years
and has gained wide experience in the international petro-
leum industry. Before his time as Secretary General, he
was Libya’s Oil Secretary.
Born in Ghamminis, Libya, in 1940, he obtained a
degree in Accounting and Business Administration, and
studied advanced courses in Finance and Management.
He started his career at Esso Standard (now
ExxonMobil) in 1965 as an Assistant Accountant. He
later later became a Management Information Systems
Coordinator and an Assistant Controller.
In 1977, El-Badri was appointed a Member of the
Board of Directors of the Umm Al-Jawabi Oil Company.
In 1980, he served for three years as Chairman of
the Waha Oil Company, a joint-venture between the
Libyan National Oil Corporation (NOC), Conoco (now
ConocoPhillips), Amerada Hess and Marathon Oil, before
being appointed Chairman of the NOC.
In 1990, El-Badri was appointed Secretary of the
People’s Committee for Petroleum. And from 1993 to
2000, he served as Secretary of the General People’s
Committee for Energy.
In 2000, he also became Deputy Secretary of the
General People’s Committee, before rejoining the NOC
as its Chairman in 2004.
In 2007, he was appointed as Secretary General of
OPEC. He served in that position for two consecutive
terms, prior to his one-year extension.
El-Badri is married with five children.
20
OPE
C bu
lleti
n 10
–12
/12
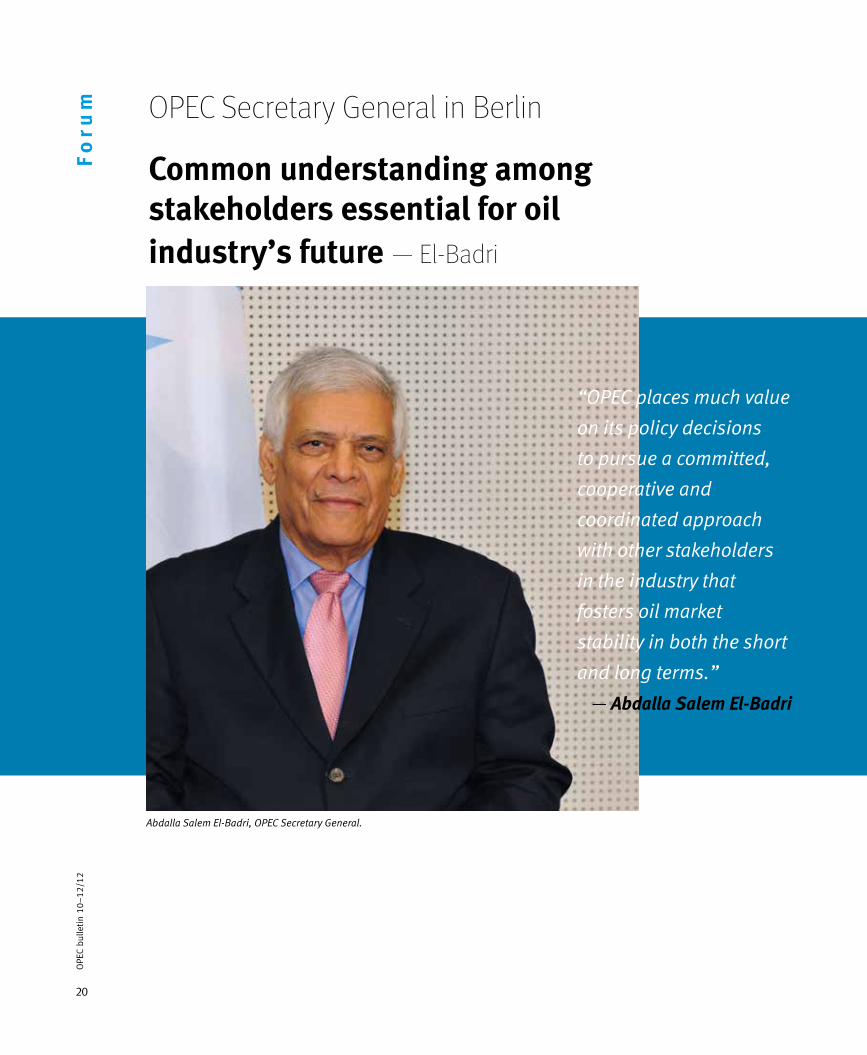
OPEC Secretary General in Berlin
Common understanding amongstakeholders essential for oil industry’s future — El-Badri
Fo
rum
Abdalla Salem El-Badri, OPEC Secretary General.
“OPEC places much value
on its policy decisions
to pursue a committed,
cooperative and
coordinated approach
with other stakeholders
in the industry that
fosters oil market
stability in both the short
and long terms.”
— Abdalla Salem El-Badri
21
OPE
C bu
lleti
n 10
–12
/12
El-Badri said it was easy to understand why that was.
Firstly, the global population was expected to reach more
than 8.6 billion by 2035, an increase of over 1.6bn from
today’s level.
“To put this into perspective, the world will add more
than a combined India and United States to its popula-
tion in just over 20 years.”
Secondly, he said, the global economy would rebound
in the longer term. “Of course, I cannot stand here and
say the current economic outlook is rosy. But, as we have
learned from the past, downturns do not go on forever.”
Thirdly, said El-Badri, with around 3bn people living
on less than $2 and 50¢/day, 1.4bn people having no
access to electricity and some 2.7bn relying on biomass
for their basic needs, there was huge potential for socio-
economic development.
Energy poverty
“This latter point also highlights the fact that, unfortu-
nately today, billions of people continue to suffer from
energy poverty. Let me stress — it is vital that every sin-
gle one of us in the world has access to modern energy
services,” he stated.
Referring to the expected expansion in world energy
demand, El-Badri noted that OPEC’s World Oil Outlook
(WOO) for 2011, forecast that all energies would witness
growth, although overall shares would shift over time.
Fossil fuels, which currently account for 87 per cent
of the world’s energy supply, would still contribute 82
per cent by 2035.
Oil would retain the largest share for most of the
period to 2035, although its overall share was slated to
fall from 34 per cent to 28 per cent. It would remain cen-
tral to growth in many areas of the global economy, espe-
cially the transportation sector. Coal’s share would remain
“When looking to the future, we need clarity to
understand stakeholders’ viewpoints,” Abdalla Salem
El-Badri, OPEC Secretary General, said in an energy debate
in Berlin at the end of September.
“We need to develop a common understanding and
positive dialogue. And we need to find the right balance
in handling the uncertainties and challenges before us in
a manner that allows us to achieve the overall objectives
of energy for economic growth and social progress.”
El-Badri told the gathering, organized by the German
Council on Foreign Relations and Wintershall Holding
GmBH, that this was true for producers and consumers,
national and international oil companies and service
firms — “in fact, all stakeholders.”
He maintained that the oil industry’s key challenge
going forward was meeting the forecast growth in world
energy demand, which, according to the Organization’s
latest calculations, was expected to rise by around 50
per cent by 2035.
And he stressed that the challenge was not just for
the producers and investors, but also the consumers.
“To meet this challenge, we need a stable and pre-
dictable market. We need to focus on the efficient and
sustainable development of all energies. We need to
appreciate just what each energy source can offer to
this future. And we need to allow producers and inves-
tors to make sure future energy demand can be met,”
he affirmed.
In underscoring the continuing importance of energy
to the world’s future welfare, the OPEC Secretary General
reminded officials at the debate that energy had been
central to a great deal of humanity’s progress over the
centuries.
“It has positively impacted the lives of billions. And
energy will be just as important to our future economic
and social progress.”
22
OPE
C bu
lleti
n 10
–12
/12
similar to today, at around 29 per cent, whereas gas was
expected to increase from 23 per cent to 25 per cent.
El-Badri said that in terms of non-fossil fuels, renew-
able energy was forecast to grow fast. But as it started
from a low base, its share would still be only three per
cent by 2035. Hydropower would increase only a little,
to three per cent by 2035. Nuclear power would also
witness some expansion, although prospects had been
affected by events in Fukushima, Japan. It was seen as
having only a six per cent share in 2035.
But he said he was in no doubt that the industry could
meet all the demand requirements in the years ahead.
Focusing specifically on the oil industry, El-Badri said
the WOO showed that demand for oil was expected to
increase by close to 23 million barrels/day over the period
2010-35, reaching almost 110m b/d by 2035. This was
driven mainly by developing Asia, which was home to 80
per cent of the oil demand growth over the period.
In contrast, said the OPEC Secretary General, the
OECD region actually witnessed a fall in demand.
“To meet this oil demand growth, resources are clearly
sufficient. Improved technology and enhanced recovery
have, over the years, increased the resource base to levels
well above past expectations. And today we are seeing
significant new resources and supplies,” he professed.
He pointed to recent estimates from the US Geological
Survey which showed ultimately recoverable resources
stood at around 3,500bn b.
“To put this into some context, cumulative oil
production has been less than a third of this. Moreover,
we can expect further advances to extend the reach of
the industry, helping to reduce costs, unlock additional
resources and increase supplies.
“So when some people talk about peak oil, let me
say it will not be any time soon. Of course, one day it will
come, but that day is certainly not yet.”
But El-Badri said that to push this day further and
further into the future, technologies needed to be con-
tinually developed in all spheres of the oil industry.
There was also the need to employ high-calibre peo-
ple to utilize the technologies to explore for oil in new
frontier areas, which were often in remoter, harsher and
deeper locations.
“Above all, however, you need management who has
the guts to take risks, because this is the name of the
game in the oil industry.”
In this regard, El-Badri had high praise for Wintershall
and its operations in his home country, Libya.
He recalled that the company had maintained a local
exploration and production presence in Libya since 1958,
but until the 1980s it was only a very small producer in
the country.
“Most people at that time knew little of the compa-
ny’s operations, but in the late 1980s and early 1990s
the company’s management changed its thinking and
policy. They decided to take some risks and invest con-
siderable resources into new exploration and develop-
ments. It proved to be a successful decision as it led to
significant new discoveries and production. As of 2011,
the company had drilled over 150 wells and become one
of the largest oil producers in the country.”
El-Badri said it was an example of how investment
could yield significant new resources and supply and
position a company as a significant producer.
“Of course, this type of risk-taking only tells part of the
story. We need to remember that all investments require
certain conditions. These obviously vary, but in general
the focus for producers is on stability,” he said.
At the heart of this, maintained El-Badri, was secu-
rity of demand. This was just as important to producers
as security of supply was to consumers. “Energy security
should be viewed as a full circle.”
He said that for producers, it was critical to have a
better understanding of demand side developments, par-
ticularly policies that discriminated against oil. If not, it
could lead to investment uncertainty and, in turn, future
market instability.
“To put it simply — producers do not want to waste
Fo
rum
“... it is vital that every single one of us in the worldhas access to modern
energy services.”
23
OPE
C bu
lleti
n 10
–12
/12
precious financial resources on infrastructure that might
not be needed. At the same time, however, if timely and
adequate investments are not made, then future con-
sumer needs might not be met.”
El-Badri said that this point was brought home to him-
when looking at the investments OPEC Member Countries
were making today. For the five-year period 2012–16, there
were currently 116 upstream projects in OPEC’s portfolio.
“Should all projects be realized, this could translate
into an investment figure of close to $280bn. These are
major investments, none of which our Member Countries
want to see as wasted,” he affirmed.
Turning to the many other challenges and uncer-
tainties facing the industry, the OPEC Secretary General
said that the one most talked about today was the global
economy.
The Euro-zone continued to struggle with such issues
as sovereign debt, the banking crisis and high unemploy-
ment. The Euro-zone’s economy was expected to contract
this year.
He noted that the US was one of the more resilient
developed economies, but the most recent indicators
offered a somewhat mixed picture.
And in normally fast-growing China, while economic
growth remained at around eight per cent, El-Badri said
recent data suggested the economy had slowed. However,
it was unclear whether this was a long-term trend, or just
a short-term issue.
He said that in the developing countries, in general,
there were concerns as to whether the problems in the
OECD region would spill over into their economies, par-
ticularly in terms of reduced demand for their exports.
There was also the human resource challenge. El-Badri
contended that the industry needed to make sure it was
attractive to prospective graduates, to keep its talented
people and to transfer knowledge to the next generation.
“They will be the ones that push the industry’s bound-
aries in the years ahead,” he told the debate.
The OPEC Secretary General said there was also the
challenge of protecting the environment, both locally and
globally.
In this regard, he said, it would be essential to pro-
mote the early development and deployment of cleaner
energy technologies.
“Given the continuing dominance of fossil fuels in
the energy mix, we need to look at options that allow
the continued use of fossil fuels in a carbon-constrained
world. In this regard, carbon capture and storage (CCS)
is a proven one that can be cost effective and has the
potential to contribute significantly to emissions reduc-
tions,” he maintained.
Looking at the current oil market situation, El-Badri
said that for 2012, OPEC had forecast world oil demand
to grow by 900,000 b/d. In 2013, growth was expected
to fall slightly to 800,000 b/d.
Non-OPEC supply was expected to increase by
700,000 b/d this year and by 900,000 b/d in 2013.
Demand for OPEC crude in 2012 was projected to aver-
age 29.9m b/d, falling slightly to 29.5m b/d in 2013.
In addition, informed El-Badri, OPEC spare produc-
tion capacity remained at relatively comfortable levels
and total commercial stock levels were healthy.
“It is clear the market is currently well-supplied.
Supply and demand fundamentals point to a stable mar-
ket. We see no shortages,” he stressed.
However, he pointed out that the current global eco-
nomic situation remained a major uncertainty in the
Organization’s short-term forecasts.
From an oil price perspective, said El-Badri, while
there had been both ups and downs in 2012, the vola-
tility witnessed had not been because of market funda-
mentals. Speculation had been behind much of the price
volatility.
“Given the continuing dominance of fossil fuels inthe energy mix,we need to look at options that allow the continued use offossil fuels in acarbon-constrained world.”
24
OPE
C bu
lleti
n 10
–12
/12
Oil
& M
on
ey
Co
nfe
ren
ce Oil & Money 2012
Energy strategies in turbulent times
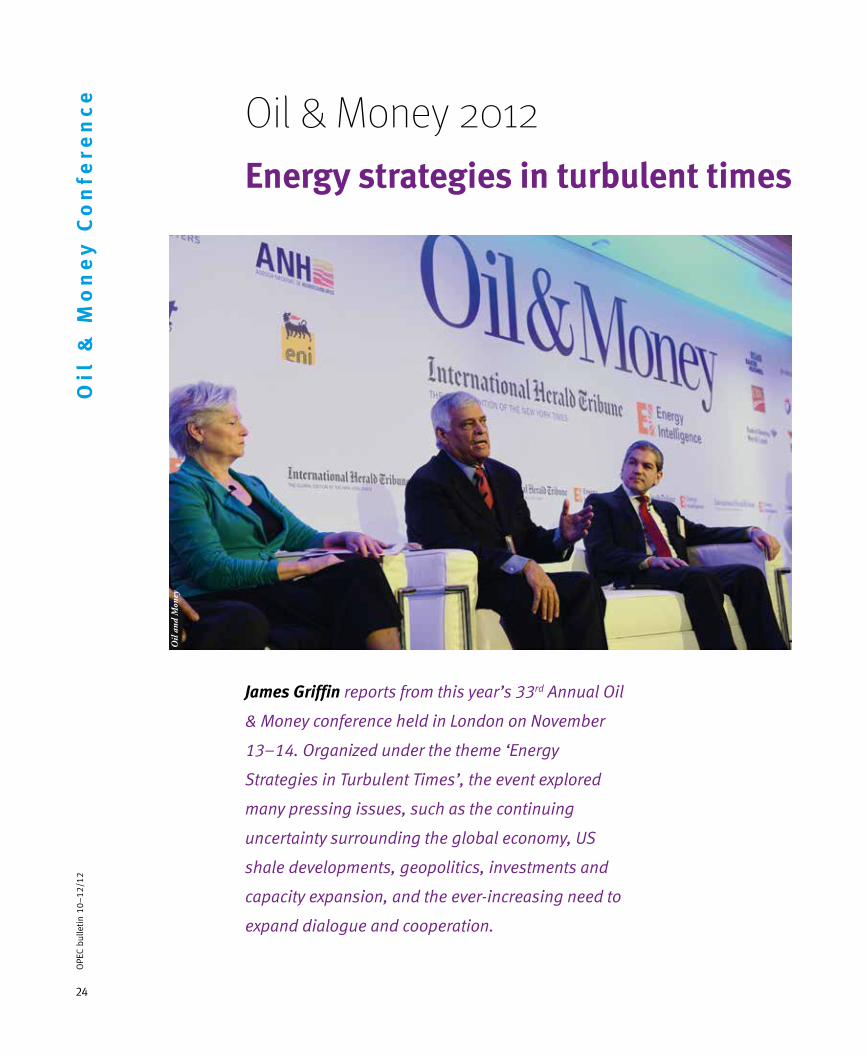
James Griffin reports from this year’s 33rd Annual Oil
& Money conference held in London on November
13–14. Organized under the theme ‘Energy
Strategies in Turbulent Times’, the event explored
many pressing issues, such as the continuing
uncertainty surrounding the global economy, US
shale developments, geopolitics, investments and
capacity expansion, and the ever-increasing need to
expand dialogue and cooperation.
Oil
and
Mon
ey
25
OPE
C bu
lleti
n 10
–12
/12
On arriving in London for the Oil & Money conference, I
was reminded by one delegate that it had been a week
since Barack Obama had tied up the US Presidency for
another four years. And that week, he said, had been a
blissful one, to which, I asked him why. Because he no
longer had to listen to the same old US election messages
and the same old speeches, he said in reply.
In fact, this may have been the reason why the organ-
izers of this year’s Oil & Money conference scheduled it
later than normal. Having the US election behind them
meant speakers and delegates could focus on other
issues. While true, the US was certainly not off the agenda
altogether. The conference saw much focus on the future
role of US shale resources.
US shale developments
This was evident in the opening panel session — the
Ministerial Discussion on the Global Oil Market. On the
panel were Abdullah bin Hamad Al Attiyah, Chairman,
Administrative Control and Transparency Authority of
Qatar; Abdalla Salem El-Badri, OPEC Secretary General;
Maria van der Hoeven, Executive Director of the
International Energy Agency (IEA); Aldo Flores-Quirgoa,
Secretary General of the International Energy Forum (IEF);
and the Chair, Nordine Ait-Laoussine, President of the
energy consulting firm, Nalcosa.
The main thrust of the panel’s discussion about US
shale stemmed from an IEA report earlier that week that
projected the US would become the largest global oil pro-
ducer by around 2020 — overtaking Saudi Arabia until
the mid-2020s.
There was a consensus that shale would play an
increasing role in the future, with Al Attiyah saying the US
shale gas boom “gives trust that the world has 300 years
of using gas”, El-Badri highlighting the added diversity
that shale resources bring to the energy mix and van der
Hoeven underscoring the impact these resources were
already having in the US. While an expanded role for shale
was not in doubt, there was much debate, however, over
exactly what this role will be. It was a question that many
speakers came back to during the conference, with some
deeming it a ‘revolution’ and others speaking more of an
‘evolution’ in shale’s development.
A number of speakers highlighted the vast potential
resources, as well as last year’s record gas production
from the Marcellus shale gas play and the recent ramp-
up in production for shale oil at the Bakken play. Others,
however, underlined the fact that many shale develop-
ments were already seeing a peak in production and
rapid decline rates, which raised questions about their
sustainability. And in regard to gas, reference was made
to the recent US gas production glut and the slide in US
gas prices, which have led to a significant scaling back
in shale gas drilling activities.
El-Badri’s views were that shale should not be viewed
as anything more than a positive new addition to the
energy mix. He highlighted, and later reiterated in inter-
views with the media, that while a forecast is only a fore-
cast, it was important to appreciate what certain mes-
sages (such as the one about the US overtaking Saudi
Arabia as the world’s biggest oil producer) might mean
“to producers, to consumers, to the market.” The worry
for him, he said, is how other oil producers may interpret
this forecast and apply it to their upstream investment
plans.
Upstream investment plans
In talking about investments, El-Badri said that despite
uncertainties — such as the global economy and some pol-
icies in consuming countries — OPEC Member Countries
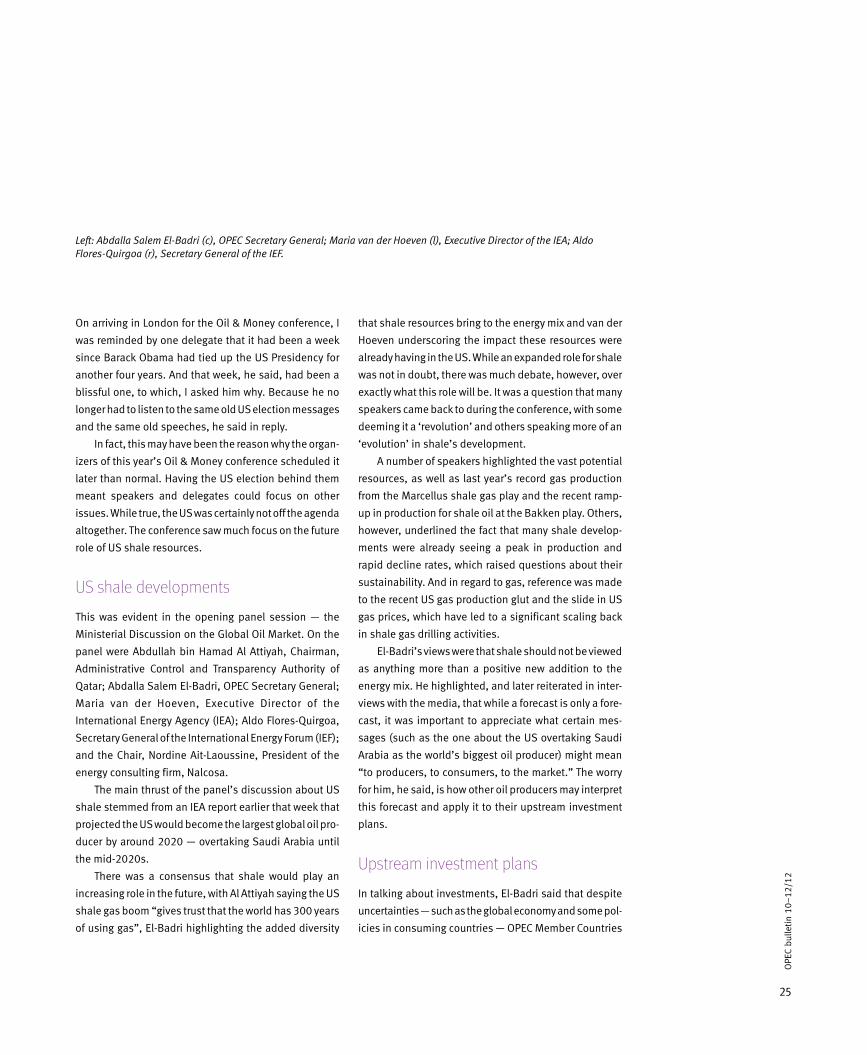
Left: Abdalla Salem El-Badri (c), OPEC Secretary General; Maria van der Hoeven (l), Executive Director of the IEA; Aldo Flores-Quirgoa (r), Secretary General of the IEF.
26
OPE
C bu
lleti
n 10
–12
/12
Oil
& M
on
ey
Co
nfe
ren
ce continue to invest to maintain and expand supply capaci-
ties, in order to meet future demand expectations. The
latest list of upstream projects, he said, shows Member
Countries undertaking or planning about 116 projects dur-
ing the 2012–16 period. “This corresponds to estimated
investments of about $270 billion,” he added. Given cur-
rent assumptions and projections in its Reference Case,
as well as natural decline rates in existing fields, it is esti-
mated that total OPEC liquids capacity will rise by five mil-
lion barrels/day over the period 2012–16. Thus, OPEC’s
spare capacity is set to stay at healthy levels.
On an individual country basis, this was further elab-
orated on later that morning by Hussain Al-Shahristani,
Deputy Prime Minister of Iraq. He said “Iraq has been
able to overcome many challenges to increase produc-
tion and exports” and is on its way to produce 4m b/d
in around 12 months. When asked about plans beyond
this, he said that “we are constantly reviewing our plans
about net production levels for Iraq and working with
IOCs to look at this.” He added that new numbers could
possibly be published early next year, but no decisions
have been made as yet.
Looking long-term, however, the world will cer-
tainly need more oil and Iraq can help meet this, said
Al-Shahristani. He added that for many decades there
have been no serious exploration efforts in Iraq and,
given that the success rate for finding oil and gas in
Iraq is round 70 per cent, there was much still to be
explored.
Current oil market situation
Of course, there was also much talk of the current oil mar-
ket situation. El-Badri and van der Hoeven both agreed
that the market has been and continues to be well sup-
plied, with El-Badri also pointing to the healthy level of
total commercial stock levels and the comfortable levels
of OPEC spare capacity. He said he expected the market
would continue to be well-supplied in 2013.
The main concern, however, remained the global
economy, particularly the Euro-zone debt situation and
impending US ‘fiscal cliff’. These issues were also touched
on by a number of speakers, with Christopher Allsopp,
Director of the Oxford Institute of Energy Studies, singling
out the Euro-zone crisis in particular as perhaps the big-
gest threat on the horizon. In terms of the US, however,
there was a general feeling that if the country’s policy-
makers could agree on a deal to avoid falling off the ‘fis-
cal cliff’, then the country, helped by the prospect of
continued cheap domestic energy sources, could poten-
tially emerge as a bright spot in the developed world.
El-Badri also stressed that excessive speculation
and price volatility remained a challenge for the market.
While stressing that the challenge is not about eliminat-
ing speculation and expectation altogether, since these
are part of the market, he believed more needed to be
done to tackle the issue and prevent extremes.
While it was evident that differences of opinion con-
tinue to exist in regard to the impact of speculation on
prices, there was general agreement that there was a
need to continue to push for greater transparency in the
market. This was underlined by the IEF’s Head, Flores-
Quirgoa, who stressed that the Joint Organizations Data
Initiative (JODI) had brought about more transparency,
improvements in data coverage and more frequent report-
ing of information. But he added that it was “still a work
in progress,” pointing out that there was particularly a
need for more information from the demand side.
Masdar award
Given the widespread recognition that fossil fuels will
remain dominant in the global energy mix for the foresee-
able future, it was issues surrounding these that domi-
nated the conference’s proceedings. However, the impor-
tance of diversifying the energy mix was underscored by
a number of speakers. One of the global leaders in this
regard, Masdar, was honoured as the first recipient of the
‘Leadership in New Energy’ award, created by the Energy
Intelligence Group, one of the conference’s organizers.
Masdar, with its home in an OPEC Member County, the
UAE, is at the forefront in looking at ways and means to
diversify the energy mix. Dr Sultan Ahmed Al Jaber, CEO of
Masdar, said: “This award underscores the visible impact
Masdar is making around the world. From developing the
world’s largest wind farm in the United Kingdom to the
largest solar installation in the Middle East, Masdar is
moving the industry forward and playing a role in diver-
sifying energy sources in the UAE and around the world.
“As an oil-producing nation we are leveraging our
hydrocarbon resources and capitalizing on our deep
energy expertise to develop a renewable energy industry,”
said Al Jaber. “We view this as a natural step forward to
support economic growth and diversification, while also
extending the UAE’s energy leadership. Masdar is con-
tributing to Abu Dhabi’s transition from a resource-based
economy to one based on knowledge and innovation,”
he added.
27
Deepening cooperation
The opening panel session also pointed the way for
another key element that became a mainstay of the two
days of discussions: the ever growing importance of coop-
eration. This was highlighted by both El-Badri and van
der Hoeven, who were quick to stress that despite their
respective organizations not agreeing on everything, rela-
tions between OPEC and the IEA were positive.
Looking at the industry as a whole, El-Badri also
stressed the importance of all industry stakeholders striv-
ing to advance cooperation. This point was later picked
up on by Nassed Al-Jaidah, CEO of Qatar Petroleum
International, who underscored the importance of partner-
ships between national oil companies and international
oil companies. He added that these kinds of relationships
had helped Qatar get to where it is today.
In an earlier keynote address to delegates, which
seemed to provide a succinct summary of the fundamental
message of cooperation in order to meet the diverse chal-
lenges facing the energy industry, Al Attiyah said that working
together “requires a serious engagement and a firm commit-
ment from all of us, in order to mitigate the risks, develop
winning strategies, find sustainable solutions and make
appropriate investment decisions.” He called on industry
leaders to “work in partnership, in order to reduce uncer-
tainties and take the necessary actions to ensure stability
in the energy markets.” Judging by the conversations and
discussions that took place over the two days, it was a mes-
sage that no one would want to ignore.
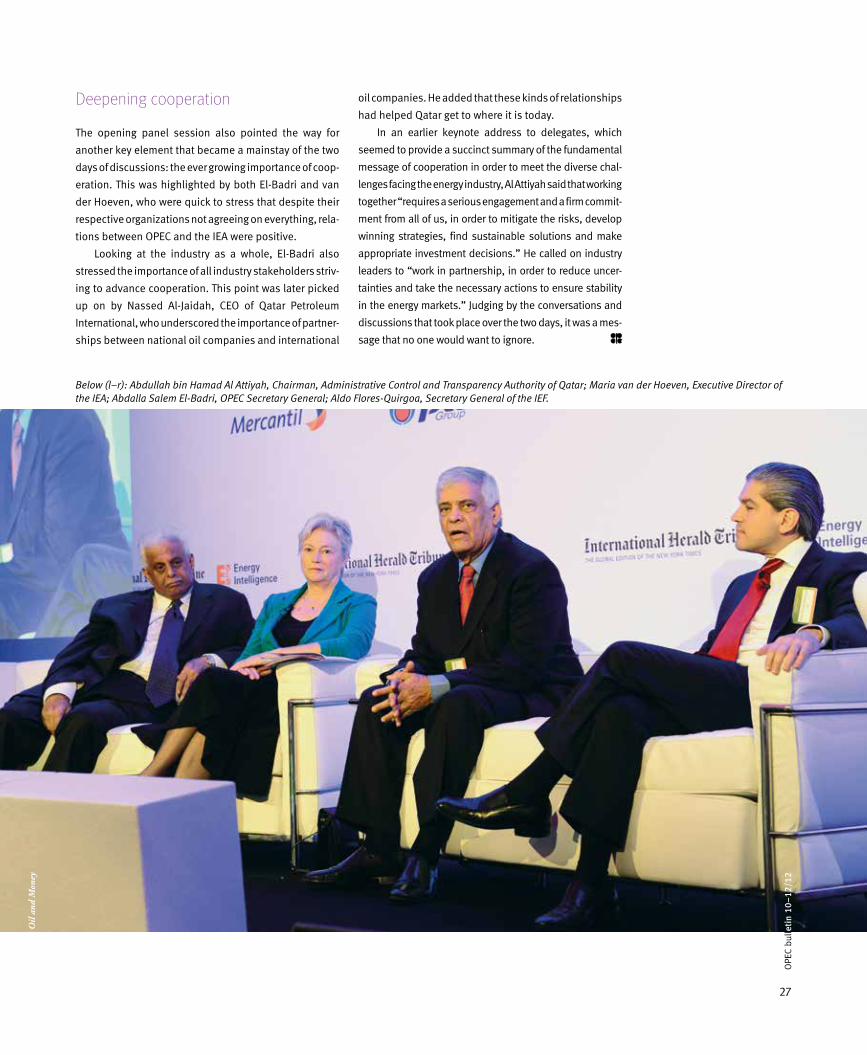
Below (l–r): Abdullah bin Hamad Al Attiyah, Chairman, Administrative Control and Transparency Authority of Qatar; Maria van der Hoeven, Executive Director of the IEA; Abdalla Salem El-Badri, OPEC Secretary General; Aldo Flores-Quirgoa, Secretary General of the IEF.
OPE
C bu
lleti
n 10
–12
/12
Oil
and
Mon
ey
28
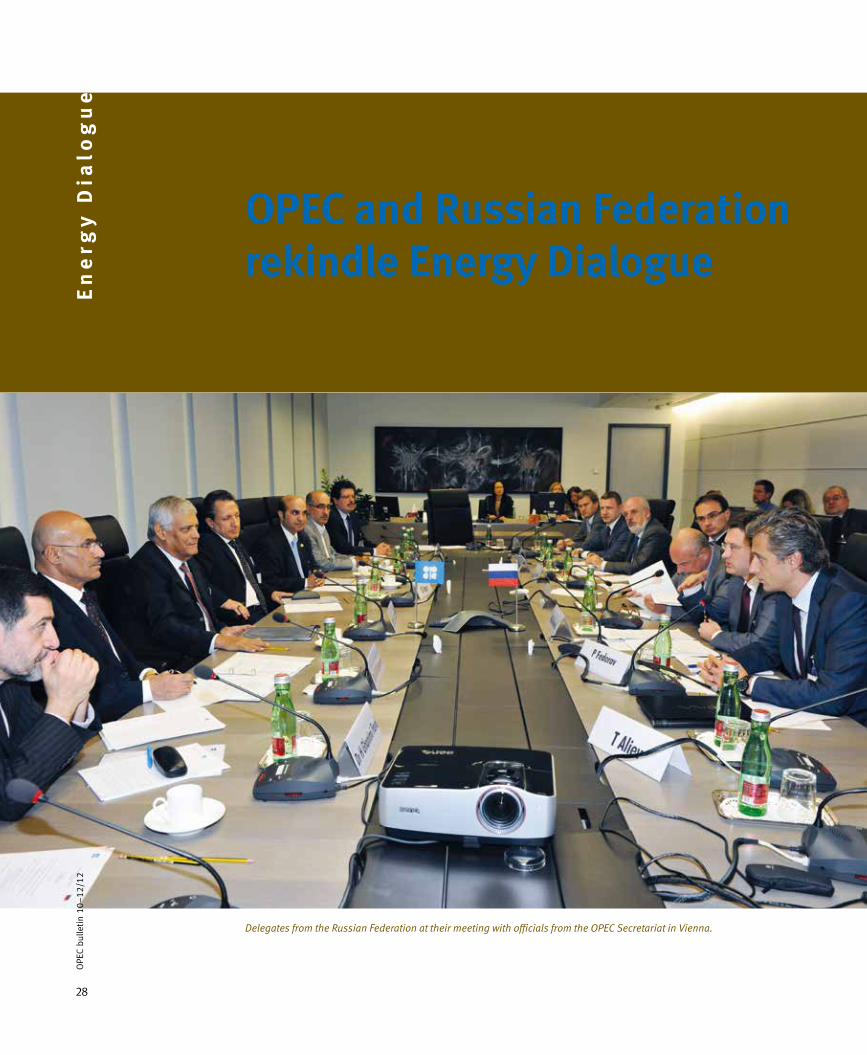
OPEC and Russian Federationrekindle Energy Dialogue
En
erg
y D
ialo
gu
e
Delegates from the Russian Federation at their meeting with officials from the OPEC Secretariat in Vienna.
OPE
C bu
lleti
n 10
–12
/12

29
OPE
C bu
lleti
n 10
–12
/12
The Russian Federation’s Minister of Energy, Alexander
Novak, has held talks with OPEC Secretary General,
Abdalla Salem El-Badri, to enhance the long-established
Russia-OPEC Energy Dialogue.
The meeting, held at the OPEC Secretariat in Vienna
towards the end of September, was attended by a high-
ranking delegation from the Russian Federation, as well
as officials from OPEC.
According to a joint press release issued after the
talks, the parties exchanged views on the current oil mar-
ket situation.
Both sides underscored the importance of stable
and predictable markets for the long-term health of the
petroleum industry and future investments, and above
all, the well-being of the global economy.
The discussions also covered the Russian Federation’s
Presidency of the G20 in 2013 and prospects for coop-
eration from OPEC.
Information exchange
The communiqué stressed that the parties proposed to
broaden their cooperation and look at the possibility of
establishing a joint working group, which would focus
on information exchange and analysis of the petroleum
industry.
It was agreed that the next high-level Russia-OPEC
meeting would be held in the second quarter of 2013.
In comments to the meeting, El-Badri noted that
Russia and OPEC had a long history of cooperation.
In 2003 and 2004, the OPEC Secretariat had held
two workshops with the Moscow State Institute of
International Relations. The first looked to enhance the
exchange of information, research and cooperation, while
the second covered a variety of issues of mutual interest,
such as the oil market, climate change and trade-associ-
ated challenges.
Constructive collaboration
The Russia-OPEC Energy Dialogue was then formally
established in 2005 during a meeting between minis-
ters and delegations.
“Since then, we have witnessed a number of con-
structive collaborations, including the effective engage-
ment during the Russian Federation’s Presidency of the
G8 in 2006; a third workshop in October 2008 to exam-
ine various oil market and related issues; and I also recall
my own positive meeting with the then President of the
Russian Federation, Dmitry Medvedev, that took place at
the same time as this workshop,” said El-Badri.
He said that in the last few years there had been less
activity, “but I believe we still all appreciate and under-
stand the benefits of dialogue and cooperation between
our two parties.”
Continued El-Badri: “Given the various global positions
The Russian Federation’s team was headed by Minister of Energy, Alexander Novak (above left), while the OPEC team was led by Secretary General, Abdalla Salem El-Badri (above).

30
OPE
C bu
lleti
n 10
–12
/12
of OPEC and Russia, there are many areas where we can
look to cooperate.”
He pointed out that OPEC Member Countries and the
Russian Federation were major oil producers, exporters
and investors in the industry.
“Thus, we both need predictable and steady markets
and a stable price level. Stability is crucial for investments
to be made; for our economies to grow; and for produc-
ers to realize a fair return from the exploitation of their
exhaustible natural resources.
“This is particularly true in the current economic envi-
ronment,” he added.
Multilateral issues
El-Badri said he looked forward to sharing analysis,
thoughts and opinions on both the current oil market and
the future outlook in the meeting’s discussions.
“In addition, there are various multilateral issues and
fora that we see as potential areas where we can exchange
ideas and possibly enhance our cooperation.”
As an example, said El-Badri, there was the United
Nations Framework Convention on Climate Change
(UNFCCC) and Kyoto Protocol, post-2012.
“As oil producers, I am sure we can all appreciate the
possible implications these negotiations could have on
our industries. It is important for oil producers to make
their voices heard and ensure the balanced integration
of economic development, social development and envi-
ronmental protection,” he maintained.
El-Badri also mentioned the G20, with the Russian
Federation taking up the Presidency of the group in 2013.
“OPEC has already been involved in collaborative work
related to the G20 Energy Agenda. We would, of course,
be interested in what the Russian Federation is propos-
ing for its Presidency,” he affirmed.
The OPEC Secretary General stressed that OPEC placed
great credence on enhancing its understanding with the
Russian Federation.
“We are continually looking to explore and evolve our
dialogue and cooperation with other parties. We recognize
the value of strong and mutually-beneficial relationships.
En
erg
y D
ialo
gu
e
Hands accross the table — Russian Minister of Energy,
Alexander Novak (l) and OPEC Secretary General, Abdalla
Salem El-Badri (r).
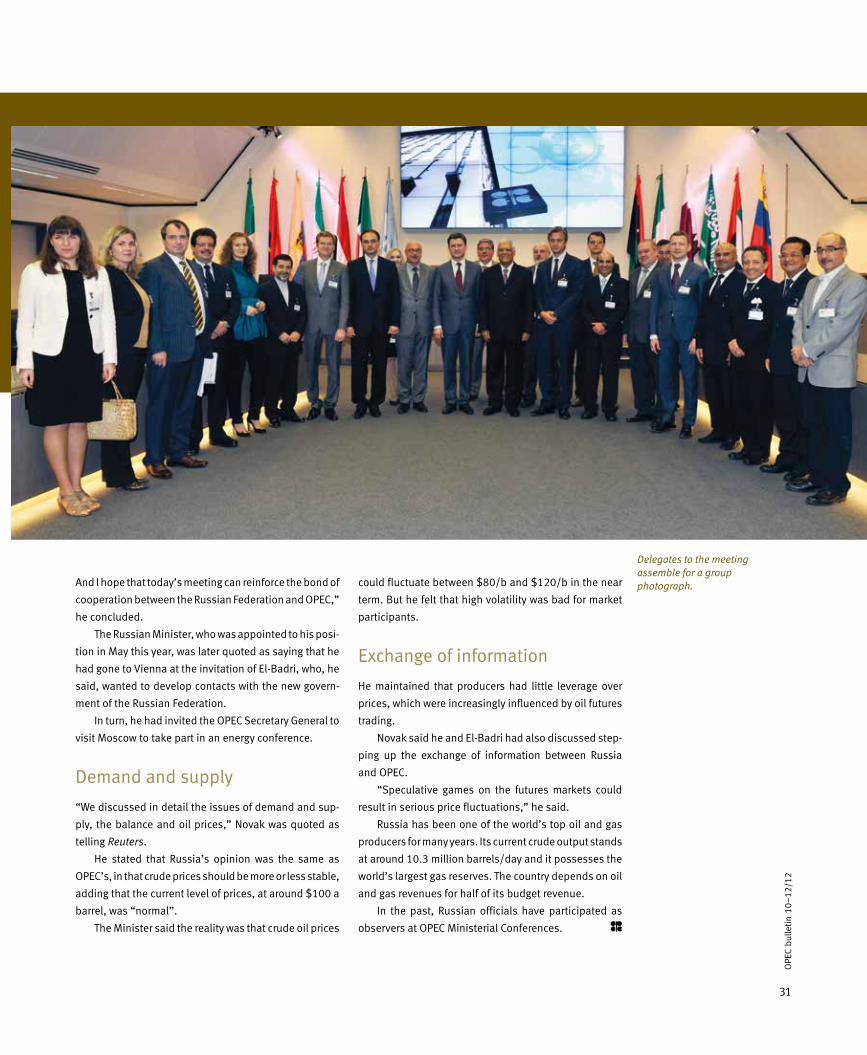
31
OPE
C bu
lleti
n 10
–12
/12
And I hope that today’s meeting can reinforce the bond of
cooperation between the Russian Federation and OPEC,”
he concluded.
The Russian Minister, who was appointed to his posi-
tion in May this year, was later quoted as saying that he
had gone to Vienna at the invitation of El-Badri, who, he
said, wanted to develop contacts with the new govern-
ment of the Russian Federation.
In turn, he had invited the OPEC Secretary General to
visit Moscow to take part in an energy conference.
Demand and supply
“We discussed in detail the issues of demand and sup-
ply, the balance and oil prices,” Novak was quoted as
telling Reuters.
He stated that Russia’s opinion was the same as
OPEC’s, in that crude prices should be more or less stable,
adding that the current level of prices, at around $100 a
barrel, was “normal”.
The Minister said the reality was that crude oil prices
could fluctuate between $80/b and $120/b in the near
term. But he felt that high volatility was bad for market
participants.
Exchange of information
He maintained that producers had little leverage over
prices, which were increasingly influenced by oil futures
trading.
Novak said he and El-Badri had also discussed step-
ping up the exchange of information between Russia
and OPEC.
“Speculative games on the futures markets could
result in serious price fluctuations,” he said.
Russia has been one of the world’s top oil and gas
producers for many years. Its current crude output stands
at around 10.3 million barrels/day and it possesses the
world’s largest gas reserves. The country depends on oil
and gas revenues for half of its budget revenue.
In the past, Russian officials have participated as
observers at OPEC Ministerial Conferences.
Delegates to the meeting assemble for a group photograph.
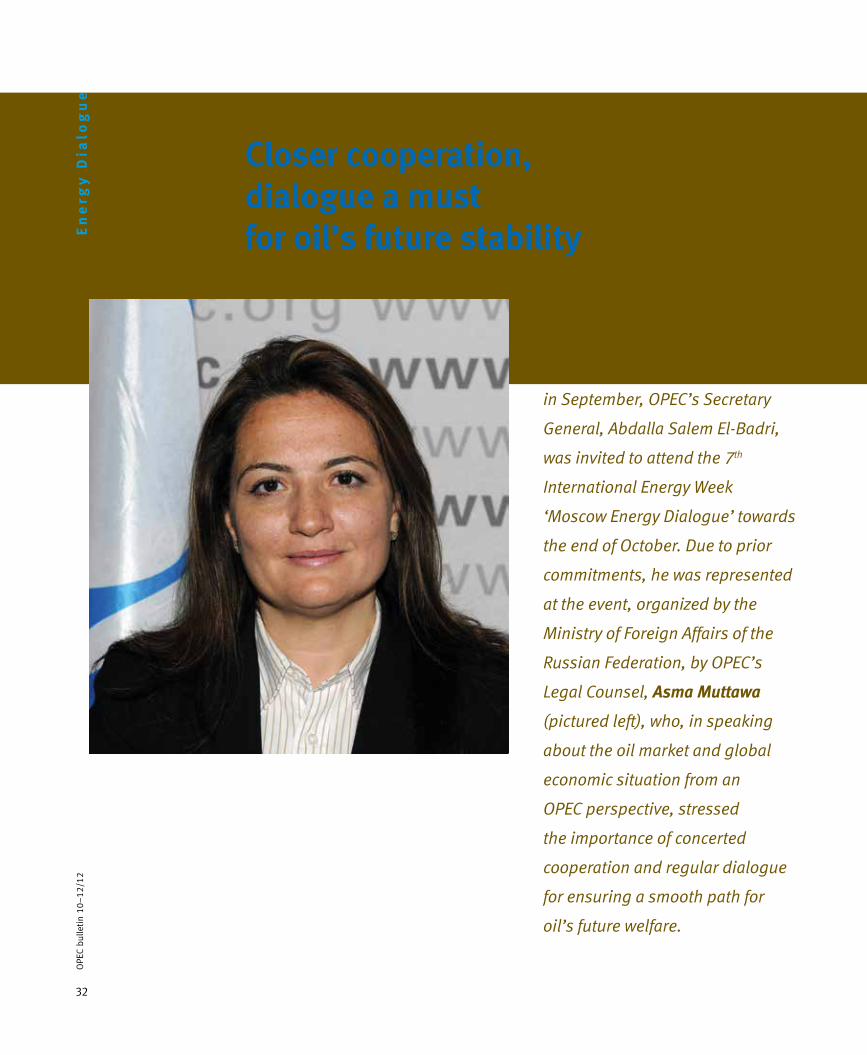
32
OPE
C bu
lleti
n 10
–12
/12
En
erg
y D
ialo
gu
e
Closer cooperation,dialogue a mustfor oil’s future stability
Following the Russia-OPEC
Energy Dialogue talks in Vienna
in September, OPEC’s Secretary
General, Abdalla Salem El-Badri,
was invited to attend the 7th
International Energy Week
‘Moscow Energy Dialogue’ towards
the end of October. Due to prior
commitments, he was represented
at the event, organized by the
Ministry of Foreign Affairs of the
Russian Federation, by OPEC’s
Legal Counsel, Asma Muttawa
(pictured left), who, in speaking
about the oil market and global
economic situation from an
OPEC perspective, stressed
the importance of concerted
cooperation and regular dialogue
for ensuring a smooth path for
oil’s future welfare.
33
OPE
C bu
lleti
n 10
–12
/12
Today, more than ever, closer cooperation between the
oil industry’s main stakeholders is essential, particu-
larly in view of the huge scale of investments required
in the petroleum sector, coupled with the current eco-
nomic uncertainties, according to OPEC’s Legal Counsel,
Asma Muttawa.
Addressing the Moscow Energy Dialogue on behalf
of the Organization’s Secretary General, Abdalla Salem
El-Badri, she said that today, more than ever, regular struc-
tured dialogue at various levels between the producers,
the consumers and the investors was critical for reach-
ing a better understanding of each other’s viewpoints,
handling the uncertainties and finding solutions to the
numerous challenges in a manner that allowed for future
economic growth and social progress.
“Energy — especially oil — will continue to be impor-
tant for the world’s future welfare, so it is imperative
that the industry continues to evolve and look to expand
cooperation and collaboration in the years ahead.
OPEC, for one, is fully committed to such an approach,”
she told delegates in a keynote speech to the two-day
conference.
Important dialogues
She pointed out that the Organization was already
involved in several important dialogues, including the
global producer-consumer dialogue, under the auspices of
the International Energy Forum (IEF), the European Union,
the Russian Federation, as well as with other international
organizations, such as the International Energy Agency,
the International Monetary Fund, the World Bank, and
the G20, in regard to energy-related issues.
Mrs Muttawa pointed to the meeting of the OPEC-
Russia Energy Dialogue, which was held in September
and attended by the Russian Federation’s Energy Minister,
Alexander Novak.
“The discussions were both forthcoming and fruitful
and once again demonstrated how valuable such interac-
tion among key energy stakeholders is to gaining clarity
and understanding on the various energy sector issues
and challenges we face.”
She stressed that OPEC placed much value on the
views and position of Russia in the world energy scene
as one of the most important oil and gas producers.
Mrs Muttawa told delegates that such cooperation
and understanding was particularly important going
forward. One of the main challenges for OPEC Member
Countries, she said, in fact for all oil producers, was
knowing, with some accuracy, just how much oil they
would need to supply to the relevant markets in the
years ahead.
“We term this security of demand, which compli-
ments the notion of supply security. It is an aspect that
is vital to our long-term investment planning. Producers
need to have a better understanding of future demand
requirements, particularly concerning policies that could
discriminate against their oil,” she explained
Mrs Muttawa pointed out that without accurate infor-
mation, coupled with assurances over demand levels,
uncertainty over future investment could arise.
“And no producer wants to waste precious financial
resources on spare capacity that might not be needed.”
Alternatively, she continued, if timely and adequate
investments were not made, then future consumer needs
might not be met.
“It is an important issue that we in OPEC feel war-
rants closer attention than it is getting from the consum-
ing side.”
OPEC’s Legal Counsel stated that OPEC, for its part,
remained committed to ensuring security of supply to all.
And it would not only continue to satisfy demand for OPEC
crude, but continue to maintain sizeable spare capacity
ready for use when it was needed.
Towards this end, she disclosed, the Organization
was pursuing 116 upstream oil projects for the period
2012–16. This involved huge investment of around $270
billion.
Looking at the current global landscape, Mrs Muttawa
noted that, today, the repercussions of the world financial
34
OPE
C bu
lleti
n 10
–12
/12
En
erg
y D
ialo
gu
e crisis, which erupted in 2008, and the subsequent reces-
sion, were still being felt.
The global economic recovery had at best been stut-
tering, she said, and was currently forecast to expand by
3.2 per cent in 2013, slightly higher than the 3.1 per cent
estimated for this year.
However, there was a significant imbalance in regional
economic performance with developing and emerging
economies continuing to contribute most of the incre-
mental growth.
Some leading OECD industrialized nations were still
struggling with sovereign debt issues. Significantly, the
Euro-zone’s economy, already in recession in 2012, was
only expected to rise by 0.1 per cent in 2013.
Outside the OECD region, there was also cause
for concern. Recent data revealed that normally fast-
growing China was showing signs of slowing down,
while there were fears the developing countries would
also suffer from reduced demand for their exports and
lower capital investment as a result of the Euro-zone’s
downturn.
However, she said it was not all bad news. There were
brighter spots emerging in the United States and Japan,
although some experts were saying it could take several
more years yet before “we are fully out of the woods”.
Mrs Muttawa said that this macroeconomic malaise
had brought a high level of uncertainty for OPEC and the
global oil industry in general.
The knock-on effect of the global downturn for the oil
sector was that demand had been significantly dampened.
She said that the OPEC Secretariat’s latest short-
term forecasts showed that global oil demand growth in
2012 was down to 800,000 barrels/day and expected to
remain at a similar level over the next year, though with
risks tilted towards the downside.
With OECD demand largely stagnating, the bulk of
the growth would continue to come from the developing
countries, she observed.
“Fortunately, there is no such problem from the
supply side. Crude deliveries, despite several disrup-
tions, are more than ample now. OPEC has been pro-
ducing in excess of 31million b/d this year, 1.5m b/d
more than in 2011, and its output of natural gas liquids
is also rising.
“Non-OPEC production is expanding too. In fact, it is
set to increase by around 900,000 b/d through 2013, a
performance supported by the exploitation of shale oil
formations in North America, particularly in the US, as
well as expanding biofuels output.
“And with all this extra oil, commercial petroleum
stocks in the OECD are comfortable with over 58 days of
forward cover,” she said.
Mrs Muttawa said that clearly, with the oil market
being well supplied, one might ask why prices in the
international energy markets remain volatile.
“That is because they are being affected by factors
other than the fundamentals of supply and demand
— mainly speculation over such issues as the current
economic uncertainties, geopolitical events, and even
weather patterns.”
And she said that since 2008, oil had increasingly
been seen as an asset class on world equity markets,
where speculators bid it up and down in paper transac-
tions, causing significant price swings.
“The industry is keenly awaiting market reform and
regulation that will limit these harmful actions,” she
stated.
Concerning prices, OPEC’s Legal Counsel made it clear
that OPEC had no interest in a price that was extremely
high or low.
Fair and reasonable price
“What we strive for is a price that is fair and reasonable,
one that sits comfortably with all the main parties — the
producers, the consumers, the oil companies and the
investors — and also fits with conditions supportive of
the global economic recovery and sustained growth,”
she said.
Regarding oil supplies, Mrs Muttawa contended that
with today’s sufficient resource availability, the prospects
for meeting future oil demand were good.
Referring to OPEC’s 2011 World Oil Outlook (the 2012
edition was launched in early November), she said its
reference case projections showed world primary energy
demand rising by over 50 per cent by 2035.
Fossil fuels would account for over 80 per cent of the
global energy mix through to this time, while oil demand
“What we strive for
is a price that is fair
and reasonable, one
that sits comfortably
with all the main
parties ...”
35
OPE
C bu
lleti
n 10
–12
/12
in this period was expected to expand by more than 20m
b/d to around 110m b/d.
With OECD oil demand peaking, over 80 per cent of
the overall demand increase would come from develop-
ing countries in Asia.
“Significantly, by 2015, non-OECD oil demand will
exceed that of the OECD for the first time,” she informed.
Renewables
Of the other energy sources in the mix, gas demand was
slated to rise strongly, backed by its environmental cre-
dentials and shale capability. Coal would remain sta-
ble, while the picture for nuclear was still unclear after
the Fukushima accident. Demand for renewables would
increase, but from a low base.
Looking at the oil supply portfolio, Mrs Muttawa said
it was estimated that by 2035 total non-OPEC liquids out-
put would rise to around 61m b/d, 9m b/d higher than
today. OPEC would be required to supply 39m b/d of crude
to the market, in addition to 10m b/d of NGLs and GTLs.
“With supplies increasingly shifting from the low-
demand West to the emerging market economies of
Asia, the Middle East will become the key supplier, with
exports to the Asia-Pacific region reaching over 20m b/d
by 2035,” she said.
Again, said OPEC’s Legal Counsel, uncertainty cast a
cloud over the energy forecasts, especially in relation to
the contribution expected from shale oil, biofuels and
renewables.
Turning to the industry’s downstream sector, Mrs
Muttawa said it was a somewhat mixed picture. On the
one hand, the stalling demand in Western nations had
led to a spate of plant closures, especially in Europe,
while, on the other, over 7m b/d of new crude distillation
capacity was expected to be provided over the medium
term, primarily in the major growth regions.
She stressed that one of the key elements govern-
ing future oil production capability would continue to be
technology. Technological developments were expected
to push the exploration and exploitation boundaries even
further in the coming years.
“Such high-tech innovations upstream are already
finding and freeing up oil previously considered inac-
cessible, or non-commercial, especially in the deep off-
shore, thus leading to significant growth in recoverable
resources and supply.
“Technology is also a crucial factor in transforming
the demand side, enabling better efficiency in industrial
applications and particularly in the oil captive transporta-
tion sector, thus increasingly impacting future world oil
demand,” she stated.
Equally as important, she continued, state-of-the-art
applications were helping in the environment, presenting
solutions for cleaner oil products and ground-breaking
processes, such as carbon capture and storage (CCS),
which dealt with harmful emissions.
“This is indeed a reflection of what the industry real-
ized a long time ago — that it needed to reduce its envi-
ronmental footprint by adapting and searching for tech-
nological options that accommodate the continued use
of fossil fuels in what is increasingly becoming a carbon-
constrained world,” Mrs Muttawa told delegates.
In conclusion, she said that one of the areas of dis-
cussion at the 7th International Energy Week was sustain-
able development, a point of global importance and a key
Millennium Development Goal.
“But however good the intentions of the global com-
munity and United Nations are, there are some disturb-
ing facts concerning energy poverty that make this truly
commendable socio-economic milestone appear a long
way off.
“Three billion people currently live on just over two
dollars a day. Some 2.7bn inhabitants rely on biomass
for their basics needs. And 1.4bn people have no access
even to electricity. That is troubling in an age when mod-
ern technology allows cars to drive themselves and men
to leap from the edge of space.”
OPEC’s Legal Counsel said that with the global popu-
lation expected to expand to more than 8.6bn by 2035,
unless there were drastic improvements, the current situ-
ation she described looked set to get worse.
“I am pleased to say that our sister Organization, the
OPEC Fund for International Development (OFID), is doing
a lot in this direction, helping to alleviate the energy pov-
erty problem in partnership with other global institutions.
“A worthy initiative indeed and one we should maybe
give some serious thought to,” she added.
“... high-tech
innovations upstream
are already finding and
freeing up oil previously
considered inaccessible,
or non-commercial ...”
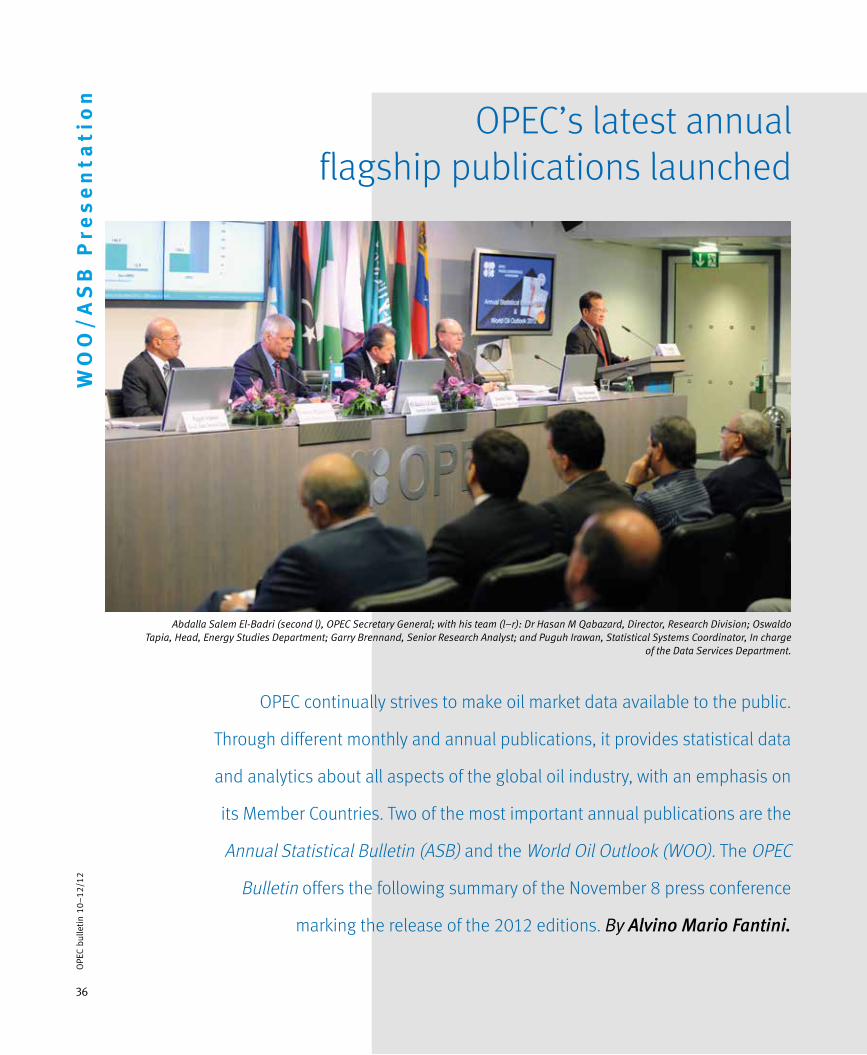
36
OPE
C bu
lleti
n 10
–12
/12
OPEC’s latest annualflagship publications launched
OPEC continually strives to make oil market data available to the public.
Through different monthly and annual publications, it provides statistical data
and analytics about all aspects of the global oil industry, with an emphasis on
its Member Countries. Two of the most important annual publications are the
Annual Statistical Bulletin (ASB) and the World Oil Outlook (WOO). The OPEC
Bulletin offers the following summary of the November 8 press conference
marking the release of the 2012 editions. By Alvino Mario Fantini.
WO
O/
AS
B P
res
en
tati
on
Abdalla Salem El-Badri (second l), OPEC Secretary General; with his team (l–r): Dr Hasan M Qabazard, Director, Research Division; Oswaldo Tapia, Head, Energy Studies Department; Garry Brennand, Senior Research Analyst; and Puguh Irawan, Statistical Systems Coordinator, In charge
of the Data Services Department.

37
OPE
C bu
lleti
n 10
–12
/12
The Annual Statistical Bulletin and the World Oil Outlook
are the annual flagship publications of the OPEC
Secretariat. They contain the Organization’s in-depth
analysis of the global oil industry from past, present and
future perspectives.
The ASB, now in its 47th year, gathers statistical
data about crude oil and natural gas activities in OPEC’s
Member Countries, while also providing detailed time-
series data on other aspects of the global petroleum
industry, including imports and exports, and exploration,
production and transportation activities.
The WOO was first published in 2007. It provides an
extensive review and assessment of various scenarios
and time periods, covering both the upstream and down-
stream sectors. The publication also provides critical
analyses of a wide range of key industry issues — such
as supply and demand, investments, costs, policies and
the environment — and has thus become an important
reference tool.
The 2012 editions of both publications were pre-
sented on November 8 in front of assembled press and
analysts at the OPEC Secretariat in Vienna, with OPEC
Secretary General, Abdalla Salem El-Badri, presiding over
the event and answering questions after the launch.
The Annual Statistical Bulletin
Puguh Irawan, Statistical Systems Coordinator, In charge
of the Data Services Department, presented the ASB’s
key findings. He said there were three main messages.
First, the growth in reserves has been solid. During
the last five years, Irawan explained, OPEC Member
Country crude oil reserves were reported to have contin-
ued increasing, reaching around 1.2 trillion barrels by the
end of 2011.
At the same time, non-OPEC oil reserves stood at 282
billion b in 2011. Specifically, the net addition to OPEC
Member Country oil reserves between 2007 and 2011
was over 250bn b. In terms of world share, OPEC Member
Countries held around 81 per cent of total world crude oil
reserves (1.48tr b).
In addition, Irawan pointed out that during the
last ten years alone, in the period 2002–11, the net
additions to OPEC Member Country crude oil reserves
exceeded their overall cumulative production during
the same period: 346bn b of oil reserves increment,
compared with only 108bn b of cumulative production.
He explained that this meant that the reserves-to-pro-
duction replacement ratio for OPEC was 320 per cent.
However, this was not the case for non-OPEC coun-
tries, where oil reserve additions were less than 13bn b,
which was much lower than their cumulative production
of 146bn b during the last ten years. This meant that the
reserves-to-production replacement ratio for non-OPEC
countries was only nine per cent.
Irawan said the second message was that OPEC
Member Countries played an important role in the global
natural gas market.
As a whole, OPEC Member Countries currently hold
95tr standard cubic metres, or 48 per cent of the world’s
gas reserves (196tr cu m). And in terms of production,
OPEC produced 618bn cu m, or around 19 per cent of the
world’s gas output, which stood at over 3.3tr cu m.
The main OPEC Members involved in gas produc-
tion were: Iran (189bn cu m), Qatar (117bn cu m), Saudi
Arabia (92bn cu m), Algeria (83bn cu m), the United Arab
Emirates (52bn cu m), Nigeria (41bn cu m), Venezuela
(21bn cu m), Kuwait (14bn cu m) and Libya (8bn cu m).
The third message this year from the statistical data
assembled had to do with trends in oil upstream activities
and, specifically, with the number of active rigs, observed
Irawan.
Active rigs, he explained, could consist of offshore
rigs (such as jack-up rigs, platform rigs, drill ships and
drill barges) and onshore rigs (which were
basically rotary drilling rigs). Rigs that were
in transit from one site or place to another,
or which were being rigged up or being
used in non-drilling activities, such as
completion or production testing, were
not counted as active rigs.
More importantly, a rig was consid-
ered to be active from the moment a
well was ‘spudded’ until it reached
its target depth. But then, to be
properly counted as active, Irawan
explained, a rig must be on loca-
tion and actively drilling.
Drilling activities continued
to increase to meet the growing
oil demand and consumption
seen over the last two years.
Irawan noted that the
data indicated that the num-
ber of active rigs in OPEC
Member Countries was up
from 529 in 2010 to 640
rigs in 2011, a 21 per cent
37
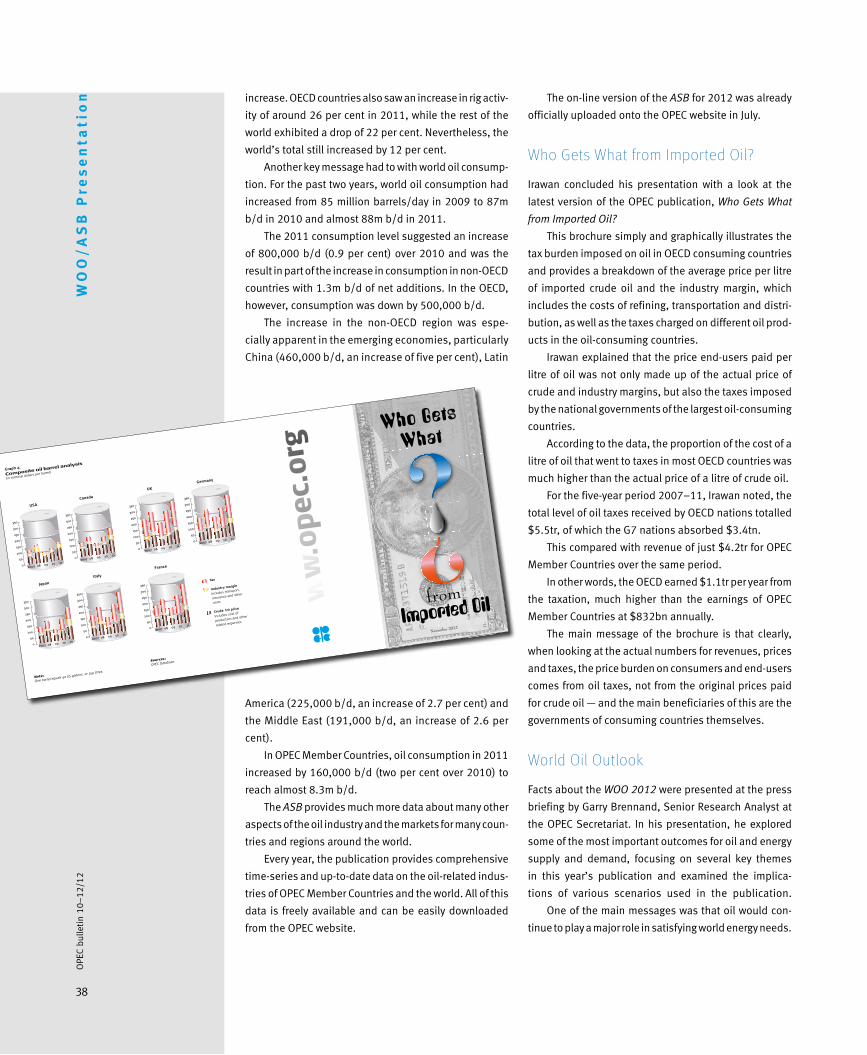
increase. OECD countries also saw an increase in rig activ-
ity of around 26 per cent in 2011, while the rest of the
world exhibited a drop of 22 per cent. Nevertheless, the
world’s total still increased by 12 per cent.
Another key message had to with world oil consump-
tion. For the past two years, world oil consumption had
increased from 85 million barrels/day in 2009 to 87m
b/d in 2010 and almost 88m b/d in 2011.
The 2011 consumption level suggested an increase
of 800,000 b/d (0.9 per cent) over 2010 and was the
result in part of the increase in consumption in non-OECD
countries with 1.3m b/d of net additions. In the OECD,
however, consumption was down by 500,000 b/d.
The increase in the non-OECD region was espe-
cially apparent in the emerging economies, particularly
China (460,000 b/d, an increase of five per cent), Latin
America (225,000 b/d, an increase of 2.7 per cent) and
the Middle East (191,000 b/d, an increase of 2.6 per
cent).
In OPEC Member Countries, oil consumption in 2011
increased by 160,000 b/d (two per cent over 2010) to
reach almost 8.3m b/d.
The ASB provides much more data about many other
aspects of the oil industry and the markets for many coun-
tries and regions around the world.
Every year, the publication provides comprehensive
time-series and up-to-date data on the oil-related indus-
tries of OPEC Member Countries and the world. All of this
data is freely available and can be easily downloaded
from the OPEC website.
The on-line version of the ASB for 2012 was already
officially uploaded onto the OPEC website in July.
Who Gets What from Imported Oil?
Irawan concluded his presentation with a look at the
latest version of the OPEC publication, Who Gets What
from Imported Oil?
This brochure simply and graphically illustrates the
tax burden imposed on oil in OECD consuming countries
and provides a breakdown of the average price per litre
of imported crude oil and the industry margin, which
includes the costs of refining, transportation and distri-
bution, as well as the taxes charged on different oil prod-
ucts in the oil-consuming countries.
Irawan explained that the price end-users paid per
litre of oil was not only made up of the actual price of
crude and industry margins, but also the taxes imposed
by the national governments of the largest oil-consuming
countries.
According to the data, the proportion of the cost of a
litre of oil that went to taxes in most OECD countries was
much higher than the actual price of a litre of crude oil.
For the five-year period 2007–11, Irawan noted, the
total level of oil taxes received by OECD nations totalled
$5.5tr, of which the G7 nations absorbed $3.4tn.
This compared with revenue of just $4.2tr for OPEC
Member Countries over the same period.
In other words, the OECD earned $1.1tr per year from
the taxation, much higher than the earnings of OPEC
Member Countries at $832bn annually.
The main message of the brochure is that clearly,
when looking at the actual numbers for revenues, prices
and taxes, the price burden on consumers and end-users
comes from oil taxes, not from the original prices paid
for crude oil — and the main beneficiaries of this are the
governments of consuming countries themselves.
World Oil Outlook
Facts about the WOO 2012 were presented at the press
briefing by Garry Brennand, Senior Research Analyst at
the OPEC Secretariat. In his presentation, he explored
some of the most important outcomes for oil and energy
supply and demand, focusing on several key themes
in this year’s publication and examined the implica-
tions of various scenarios used in the publication.
One of the main messages was that oil would con-
tinue to play a major role in satisfying world energy needs.
Sources:
OPEC Database.
Note:One barrel equals 42 US gallons, or 159 litres.
Tax
Industry margin
Includes transport,
insurance and other
costs
Crude fob price
Includes cost of
production and other
related expenses www.opec.org
Germany
UK
France
Canada
Italy
USA
Japan
November 2012
0
50
100
150
200
250
300
350
111009082007
USA
0
50
100
150
200
250
300
350
Tax
Industry
Crude
111009082007
Canada
0
50
100
150
200
250
300
350
111009082007
France
0
50
100
150
200
250
300
350
111009082007
Germany
0
50
100
150
200
250
300
350
111009082007
Italy
0
50
100
150
200
250
300
350
111009082007
UK
0
50
100
150
200
250
300
350
111009082007
Japan
0
50
100
150
200
250
300
350
111009082007
USA
0
50
100
150
200
250
300
350
Tax
Industry
Crude
111009082007
Canada
0
50
100
150
200
250
300
350
111009082007
France
0
50
100
150
200
250
300
350
111009082007
Germany
0
50
100
150
200
250
300
350
111009082007
Italy
0
50
100
150
200
250
300
350
111009082007
UK
0
50
100
150
200
250
300
350
111009082007
JapanGraph 4:
Composite oil barrel analysis
(in nominal dollars per barrel)
WO
O/
AS
B P
res
en
tati
on
38
OPE
C bu
lleti
n 10
–12
/12
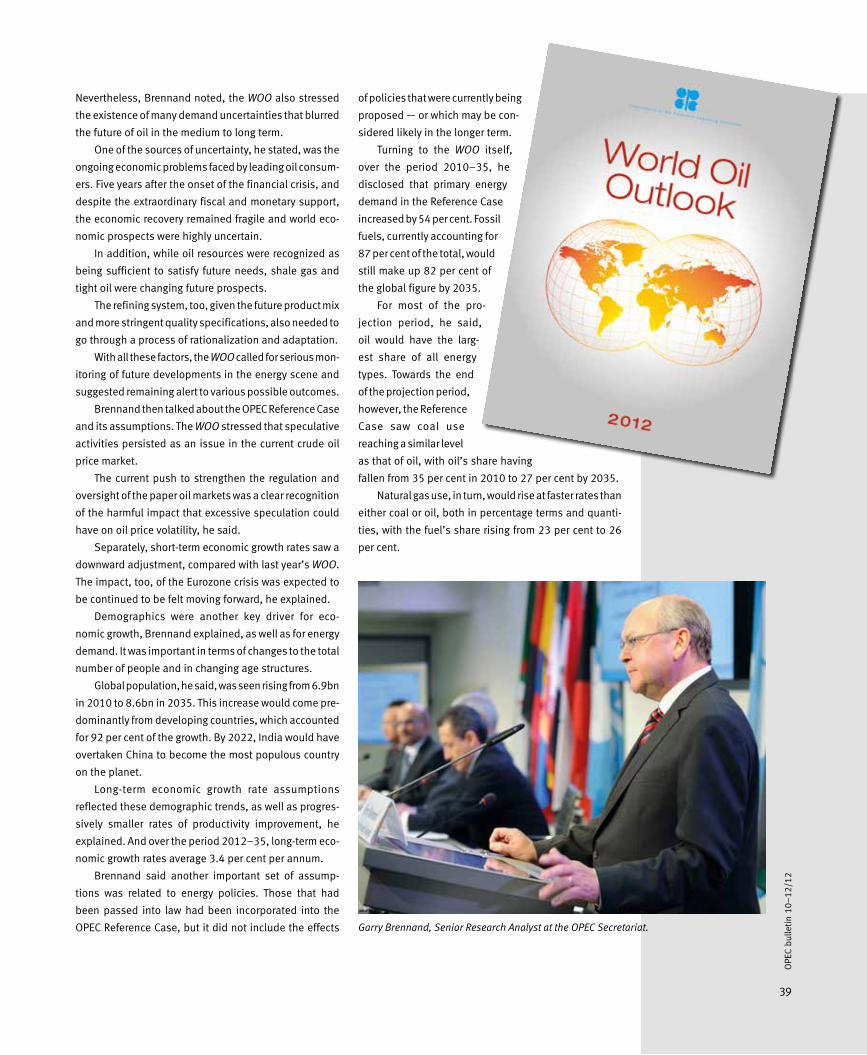
Nevertheless, Brennand noted, the WOO also stressed
the existence of many demand uncertainties that blurred
the future of oil in the medium to long term.
One of the sources of uncertainty, he stated, was the
ongoing economic problems faced by leading oil consum-
ers. Five years after the onset of the financial crisis, and
despite the extraordinary fiscal and monetary support,
the economic recovery remained fragile and world eco-
nomic prospects were highly uncertain.
In addition, while oil resources were recognized as
being sufficient to satisfy future needs, shale gas and
tight oil were changing future prospects.
The refining system, too, given the future product mix
and more stringent quality specifications, also needed to
go through a process of rationalization and adaptation.
With all these factors, the WOO called for serious mon-
itoring of future developments in the energy scene and
suggested remaining alert to various possible outcomes.
Brennand then talked about the OPEC Reference Case
and its assumptions. The WOO stressed that speculative
activities persisted as an issue in the current crude oil
price market.
The current push to strengthen the regulation and
oversight of the paper oil markets was a clear recognition
of the harmful impact that excessive speculation could
have on oil price volatility, he said.
Separately, short-term economic growth rates saw a
downward adjustment, compared with last year’s WOO.
The impact, too, of the Eurozone crisis was expected to
be continued to be felt moving forward, he explained.
Demographics were another key driver for eco-
nomic growth, Brennand explained, as well as for energy
demand. It was important in terms of changes to the total
number of people and in changing age structures.
Global population, he said, was seen rising from 6.9bn
in 2010 to 8.6bn in 2035. This increase would come pre-
dominantly from developing countries, which accounted
for 92 per cent of the growth. By 2022, India would have
overtaken China to become the most populous country
on the planet.
Long-term economic growth rate assumptions
reflected these demographic trends, as well as progres-
sively smaller rates of productivity improvement, he
explained. And over the period 2012–35, long-term eco-
nomic growth rates average 3.4 per cent per annum.
Brennand said another important set of assump-
tions was related to energy policies. Those that had
been passed into law had been incorporated into the
OPEC Reference Case, but it did not include the effects
of policies that were currently being
proposed — or which may be con-
sidered likely in the longer term.
Turning to the WOO itself,
over the period 2010–35, he
disclosed that primary energy
demand in the Reference Case
increased by 54 per cent. Fossil
fuels, currently accounting for
87 per cent of the total, would
still make up 82 per cent of
the global figure by 2035.
For most of the pro-
jection period, he said,
oil would have the larg-
est share of all energy
types. Towards the end
of the projection period,
however, the Reference
Case saw coal use
reaching a similar level
as that of oil, with oil’s share having
fallen from 35 per cent in 2010 to 27 per cent by 2035.
Natural gas use, in turn, would rise at faster rates than
either coal or oil, both in percentage terms and quanti-
ties, with the fuel’s share rising from 23 per cent to 26
per cent.
Garry Brennand, Senior Research Analyst at the OPEC Secretariat.
39
OPE
C bu
lleti
n 10
–12
/12
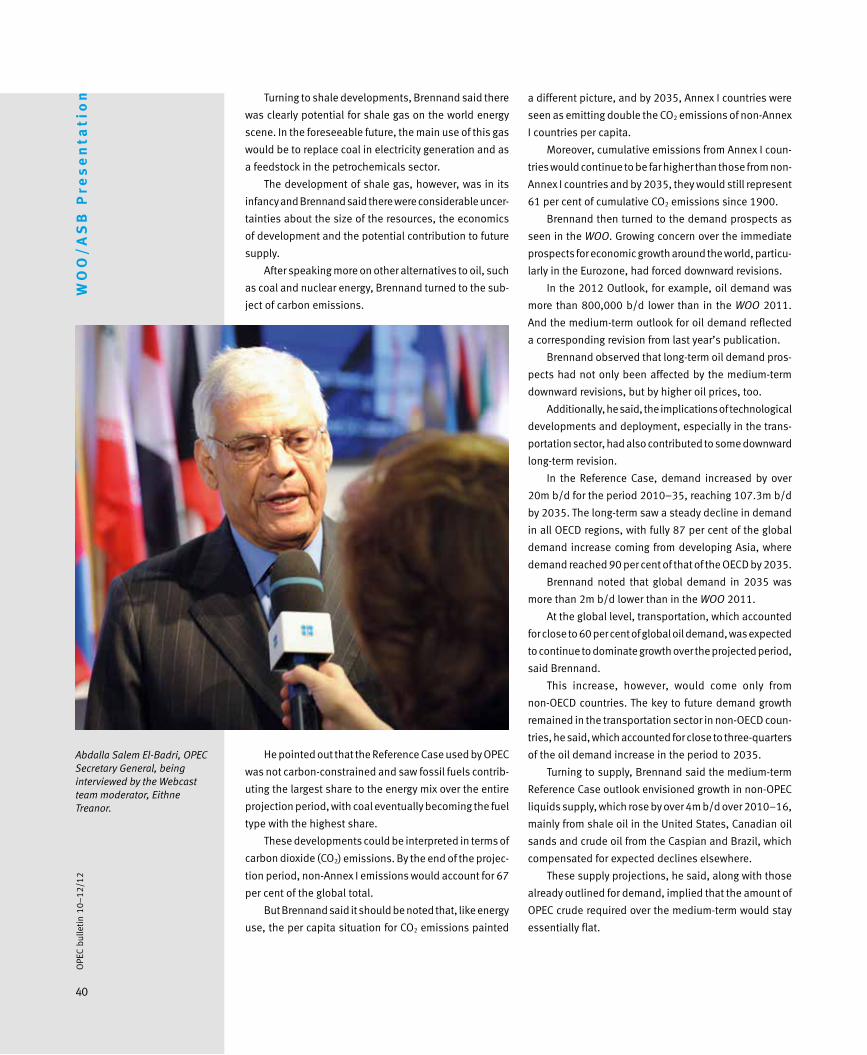
a different picture, and by 2035, Annex I countries were
seen as emitting double the CO2 emissions of non-Annex
I countries per capita.
Moreover, cumulative emissions from Annex I coun-
tries would continue to be far higher than those from non-
Annex I countries and by 2035, they would still represent
61 per cent of cumulative CO2 emissions since 1900.
Brennand then turned to the demand prospects as
seen in the WOO. Growing concern over the immediate
prospects for economic growth around the world, particu-
larly in the Eurozone, had forced downward revisions.
In the 2012 Outlook, for example, oil demand was
more than 800,000 b/d lower than in the WOO 2011.
And the medium-term outlook for oil demand reflected
a corresponding revision from last year’s publication.
Brennand observed that long-term oil demand pros-
pects had not only been affected by the medium-term
downward revisions, but by higher oil prices, too.
Additionally, he said, the implications of technological
developments and deployment, especially in the trans-
portation sector, had also contributed to some downward
long-term revision.
In the Reference Case, demand increased by over
20m b/d for the period 2010–35, reaching 107.3m b/d
by 2035. The long-term saw a steady decline in demand
in all OECD regions, with fully 87 per cent of the global
demand increase coming from developing Asia, where
demand reached 90 per cent of that of the OECD by 2035.
Brennand noted that global demand in 2035 was
more than 2m b/d lower than in the WOO 2011.
At the global level, transportation, which accounted
for close to 60 per cent of global oil demand, was expected
to continue to dominate growth over the projected period,
said Brennand.
This increase, however, would come only from
non-OECD countries. The key to future demand growth
remained in the transportation sector in non-OECD coun-
tries, he said, which accounted for close to three-quarters
of the oil demand increase in the period to 2035.
Turning to supply, Brennand said the medium-term
Reference Case outlook envisioned growth in non-OPEC
liquids supply, which rose by over 4m b/d over 2010–16,
mainly from shale oil in the United States, Canadian oil
sands and crude oil from the Caspian and Brazil, which
compensated for expected declines elsewhere.
These supply projections, he said, along with those
already outlined for demand, implied that the amount of
OPEC crude required over the medium-term would stay
essentially flat.
Turning to shale developments, Brennand said there
was clearly potential for shale gas on the world energy
scene. In the foreseeable future, the main use of this gas
would be to replace coal in electricity generation and as
a feedstock in the petrochemicals sector.
The development of shale gas, however, was in its
infancy and Brennand said there were considerable uncer-
tainties about the size of the resources, the economics
of development and the potential contribution to future
supply.
After speaking more on other alternatives to oil, such
as coal and nuclear energy, Brennand turned to the sub-
ject of carbon emissions.
He pointed out that the Reference Case used by OPEC
was not carbon-constrained and saw fossil fuels contrib-
uting the largest share to the energy mix over the entire
projection period, with coal eventually becoming the fuel
type with the highest share.
These developments could be interpreted in terms of
carbon dioxide (CO2) emissions. By the end of the projec-
tion period, non-Annex I emissions would account for 67
per cent of the global total.
But Brennand said it should be noted that, like energy
use, the per capita situation for CO2 emissions painted
Abdalla Salem El-Badri, OPEC Secretary General, being interviewed by the Webcast team moderator, Eithne Treanor.
WO
O/
AS
B P
res
en
tati
on
40
OPE
C bu
lleti
n 10
–12
/12
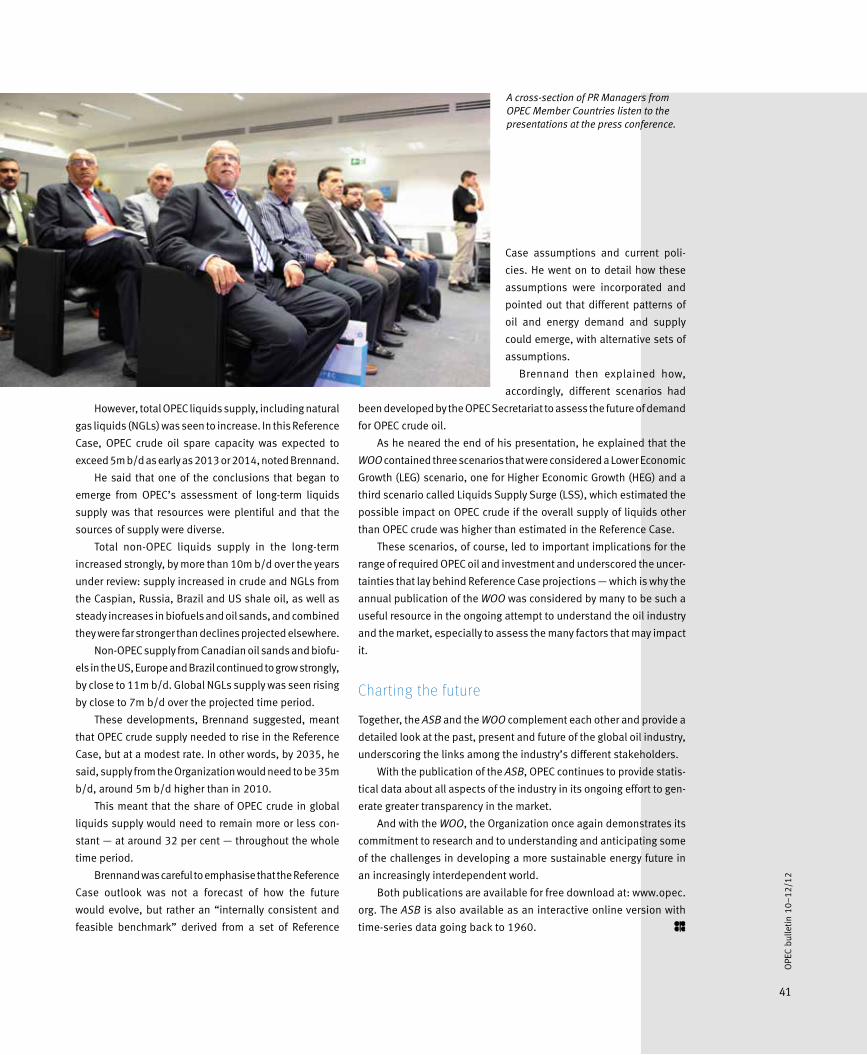
However, total OPEC liquids supply, including natural
gas liquids (NGLs) was seen to increase. In this Reference
Case, OPEC crude oil spare capacity was expected to
exceed 5m b/d as early as 2013 or 2014, noted Brennand.
He said that one of the conclusions that began to
emerge from OPEC’s assessment of long-term liquids
supply was that resources were plentiful and that the
sources of supply were diverse.
Total non-OPEC liquids supply in the long-term
increased strongly, by more than 10m b/d over the years
under review: supply increased in crude and NGLs from
the Caspian, Russia, Brazil and US shale oil, as well as
steady increases in biofuels and oil sands, and combined
they were far stronger than declines projected elsewhere.
Non-OPEC supply from Canadian oil sands and biofu-
els in the US, Europe and Brazil continued to grow strongly,
by close to 11m b/d. Global NGLs supply was seen rising
by close to 7m b/d over the projected time period.
These developments, Brennand suggested, meant
that OPEC crude supply needed to rise in the Reference
Case, but at a modest rate. In other words, by 2035, he
said, supply from the Organization would need to be 35m
b/d, around 5m b/d higher than in 2010.
This meant that the share of OPEC crude in global
liquids supply would need to remain more or less con-
stant — at around 32 per cent — throughout the whole
time period.
Brennand was careful to emphasise that the Reference
Case outlook was not a forecast of how the future
would evolve, but rather an “internally consistent and
feasible benchmark” derived from a set of Reference
Case assumptions and current poli-
cies. He went on to detail how these
assumptions were incorporated and
pointed out that different patterns of
oil and energy demand and supply
could emerge, with alternative sets of
assumptions.
Brennand then explained how,
accordingly, different scenarios had
been developed by the OPEC Secretariat to assess the future of demand
for OPEC crude oil.
As he neared the end of his presentation, he explained that the
WOO contained three scenarios that were considered a Lower Economic
Growth (LEG) scenario, one for Higher Economic Growth (HEG) and a
third scenario called Liquids Supply Surge (LSS), which estimated the
possible impact on OPEC crude if the overall supply of liquids other
than OPEC crude was higher than estimated in the Reference Case.
These scenarios, of course, led to important implications for the
range of required OPEC oil and investment and underscored the uncer-
tainties that lay behind Reference Case projections — which is why the
annual publication of the WOO was considered by many to be such a
useful resource in the ongoing attempt to understand the oil industry
and the market, especially to assess the many factors that may impact
it.
Charting the future
Together, the ASB and the WOO complement each other and provide a
detailed look at the past, present and future of the global oil industry,
underscoring the links among the industry’s different stakeholders.
With the publication of the ASB, OPEC continues to provide statis-
tical data about all aspects of the industry in its ongoing effort to gen-
erate greater transparency in the market.
And with the WOO, the Organization once again demonstrates its
commitment to research and to understanding and anticipating some
of the challenges in developing a more sustainable energy future in
an increasingly interdependent world.
Both publications are available for free download at: www.opec.
org. The ASB is also available as an interactive online version with
time-series data going back to 1960.
A cross-section of PR Managers from OPEC Member Countries listen to the presentations at the press conference.
41
OPE
C bu
lleti
n 10
–12
/12
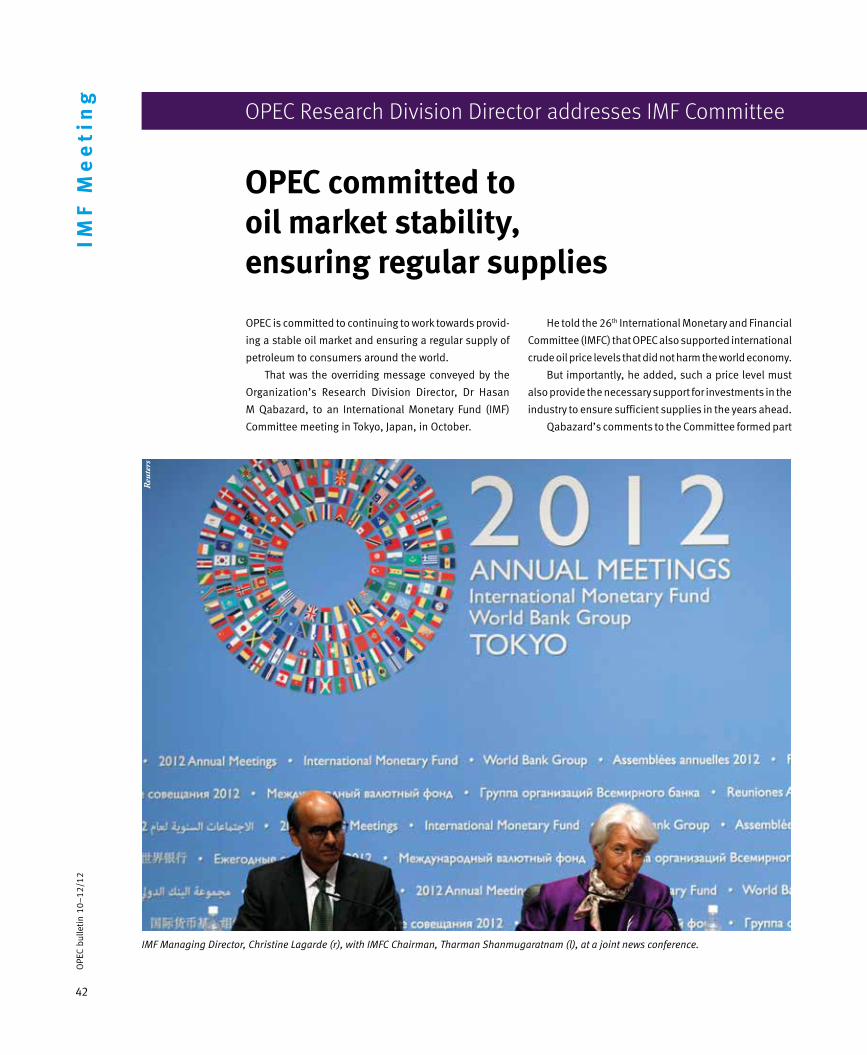
42
OPE
C bu
lleti
n 10
–12
/12
IMF
Me
eti
ng
OPEC is committed to continuing to work towards provid-
ing a stable oil market and ensuring a regular supply of
petroleum to consumers around the world.
That was the overriding message conveyed by the
Organization’s Research Division Director, Dr Hasan
M Qabazard, to an International Monetary Fund (IMF)
Committee meeting in Tokyo, Japan, in October.
OPEC Research Division Director addresses IMF Committee
OPEC committed tooil market stability,ensuring regular supplies
He told the 26th International Monetary and Financial
Committee (IMFC) that OPEC also supported international
crude oil price levels that did not harm the world economy.
But importantly, he added, such a price level must
also provide the necessary support for investments in the
industry to ensure sufficient supplies in the years ahead.
Qabazard’s comments to the Committee formed part
IMF Managing Director, Christine Lagarde (r), with IMFC Chairman, Tharman Shanmugaratnam (l), at a joint news conference.
Reu
ters

43
OPE
C bu
lleti
n 10
–12
/12
of OPEC’s increasing relations and dialogue with inter-
national organizations such as the IMF, aimed at provid-
ing stability to global energy markets and widening the
understanding of the workings of petroleum industry in
general.
The IMFC, which usually meets twice a year, reports to
the IMF Board of Governors. It discusses matters of con-
cern affecting the global economy and also advises the
IMF on the direction of its work. The IMFC has 24 mem-
bers who are central bank governors, ministers or other
officials of comparable rank and who are drawn from the
governors of the Fund’s 188 member countries.
In giving the Committee an outline of the latest
oil market developments, Qabazard said international
oil prices had been showing considerable volatility of
late.
For example, he said, OPEC’s crude Reference Basket,
which stood at almost $125/barrel in April this year, had
fallen to below $90/b by July, before again rising to almost
$115/b in September.
This fluctuation in prices, he observed, was a reflec-
tion of conflicting factors. On the one hand, prices had
been pushed higher by such factors as supply outages
in the North Sea, the hurricanes in the Gulf of Mexico,
Left: OPEC Research Division Director, Dr Hasan M Qabazard, who addressed the 26th IMFC (above) on the latest oil market develoments.
Reu
ters
44
OPE
C bu
lleti
n 10
–12
/12
IMF
Me
eti
ng This, said Qabazard, was visible in the sovereign debt
yields, which remained at high levels. The Euro-zone’s
economy was expected to decline by 0.4 per cent in 2012
and to grow by only 0.1 per cent in 2013.
He observed that while the US, the world’s biggest
energy consumer, had shown some resilience, it remained
to be seen how the discussion about fiscal tightening
would play out, as it could lead to a further reduction in
growth. The US was forecast to grow at 2.3 per cent this
year and by 2.0 per cent in 2013. This assumed that a
way was found to avoid the automatic budget cuts at the
start of next year.
“This expectation for US growth, in combination with
the forecast for lower growth in the coming year in Japan
of only 1.2 per cent, after this year’s forecast of 2.3 per
cent, could also prove challenging for the export-driven
developing and emerging economies.”
In China, said Qabazard, despite the country’s efforts
to support growth domestically, the economy was facing
a continued deceleration from around ten per cent growth
in the past years to a forecast of 7.6 per cent this year and
8.0 per cent in 2013.
He maintained that the impact of slowing exports had
lowered growth in the country’s economy, which would
have to be offset by domestic demand. It was expected
that the Chinese economy would be able to compensate
for the lagging momentum via further monetary and fiscal
stimuli as it could still engage a wide range of stimulus
measures.
Turning to India, Qabazard said that given the coun-
try’s continued high inflation, it was not expected to intro-
duce further major stimulus efforts and was forecast to
see growth of just 5.7 per cent this year, rising to 6.6 per
cent in 2013.
“Other emerging and developing economies are
facing similar challenges, due to the lower export base.
However, developing and emerging economies are fore-
cast to contribute around 80 per cent of global growth.”
Qabazard’s comments on the world economy were
echoed by the IMFC in its meeting communiqué, which
stated that global growth had decelerated and substan-
tial uncertainties and downside risks remained.
It said that key policy steps had been announced, but
their effective and timely implementation was critical to
rebuilding confidence.
“We need to act decisively to break negative feed-
back loops and restore the global economy to a path
of strong, sustainable and balanced growth,” said the
communiqué.
geopolitical factors in the Middle East and further mon-
etary easing by some governments.
On the other hand, economic concerns regarding the
Euro-zone and the potential spill-over to other regions,
along with signs of weakening oil demand in the United
States and China, had contributed to the decline in prices.
“While some supportive fundamental elements were
evident during this period, they were not sufficient to
explain a 20–30 per cent change in prices over such a
short period,” maintained Qabazard.
Speculative activity“This fluctuation in prices was accompanied by massive
inflows and outflows of speculative investments. The
strong co-movement between West Texas Intermediate
(WTI) crude prices and net long positions on the New York
Mercantile Exchange (NYMEX) clearly demonstrates the
influence of speculative activity on the oil market and
crude prices,” he affirmed.
Qabazard pointed out that interestingly this volatil-
ity in crude oil prices had occurred despite a well-sup-
plied market, with OPEC producing more than 31 million
barrels/day, well-above market needs, while total OECD
crude stocks remained above the five-year average.
Looking specifically at the world economy, he said that
with the fading impact of fiscal and monetary stimuli, there
had been decelerating growth in 2012, estimated at just 3.1
per cent. In 2013, the world economy was expected to grow
by 3.2 per cent, broadly in line with the 30-year average.
“However, the imbalance of economic growth remains
significant, with developing and emerging economies con-
tinuing to contribute the majority of additional growth,
although remaining mainly driven by exports to, and for-
eign investments from, developed economies.”
Qabazard noted that while this imbalance was fore-
cast to continue into 2013, the global economy was
expected to stabilize in the fourth quarter of 2012.
However, the fragility of the Euro-zone remained a
core concern, he said. The sovereign debt issues of Spain
and Italy, constituting around a third of the Euro-zone’s
economy, had been contained so far, but needed to be
closely monitored.
“The announcement of the European Central Bank’s
buying of sovereign debt in September certainly helped
in the beginning to alleviate some of the burden facing
these ailing economies, but given the austerity measures
that will need to be implemented, it is too early to con-
sider the debt problems as solved,” he contended.
45
OPE
C bu
lleti
n 10
–12
/12
“Advanced economies should deliver the necessary
structural reforms and implement credible fiscal plans.
Emerging market economies should preserve or use pol-
icy flexibility as appropriate to facilitate a response to
adverse shocks and support growth,” it observed.
The OPEC Research Director told the meeting that the
ongoing uncertainties facing Europe and the slowdown in
the emerging economies had resulted in downward revi-
sions in world oil demand growth for this year to a level
of 800,000 b/d.
This growth, he noted, could be reduced further if
the recent trend in consumption in the US and China was
confirmed. Total oil consumption in China rose by only
300,000 b/d in the first eight months of this year, com-
pared with 500,000 b/d a year ago.
US oil consumption had also contracted by 300,000
b/d between January and August this year, compared
with negative growth of only 100,000 b/d a year ago.
Qabazard disclosed that world oil demand growth
in 2013 was expected to be almost at the same level as
this year, with the bulk of the increase coming from non-
OECD countries, albeit at a slower pace than in 2012.
UncertaintiesChina’s oil demand growth would remain unchanged from
this year, in line with only slightly higher GDP growth.
However, the OECD region would continue contracting,
although an improvement in economic conditions, along
with a severe winter, could reduce the decline.
But Qabazard pointed out that risks to the global
demand forecast remained on the downside should the
economic malaise in Europe be prolonged and spill over
to some regions of the non-OECD.
He said that among the uncertainties for world oil
demand, non-OPEC supply for this year was seen to per-
form well with growth of 700,000 b/d, much higher than
in the previous year. This trend was expected to continue
in 2013 as non-OPEC supply was projected to increase
by 900, 000 b/d.
Qabazard said the key non-OPEC growth area was
North America. The US accounted for almost half of this
growth, with an anticipated surge in onshore production,
especially from shale developments.
In Canada, steady growth in oil sands and shale pro-
duction was forecast to add an additional 170,000 b/d
of crude supply in 2013.
After a significant fall in African output in 2012, due
to the disruption in supply from the Sudans, production
in the region was expected to expand in the coming year
by more than 100,000 b/d.
Qabazard said the outlook for non-OPEC supply in
2013 was subject to upward and downward risks from
economic, technical, environmental, geopolitical and
weather-related factors.
He said the forecast 900,000 b/d increase in non-
OPEC supply next year included an estimation of a rise
of around 100,000 b/d in biofuels. This figure was asso-
ciated with a high level of risk and uncertainty driven by
weather conditions, as well as government regulations.
Output of OPEC natural gas liquids (NGLs) was
expected to increase by 240,000 b/d in 2013. This sub-
sequently resulted in total non-OPEC supply, including
OPEC NGLs, growing by around 1.1m b/d.
Qabazard said the strong growth in non-OPEC sup-
ply and OPEC NGLs would outpace projected demand in
2013, leading to a reduction in demand for OPEC crude
for the second consecutive year — to average 29.5m b/d.
“This will contribute to an upward trend in OPEC spare
capacity, which is expected to increase by 1.1m b/d in
the coming year, putting total OPEC capacity at nearly
36.7m b/d. This will leave a high supply buffer to meet
any demand in the market,” he assured.
Qabazard said OECD commercial stocks indicated
a divergent picture between crude and products. While
crude stocks were at a comfortable level above the five-
year average, product inventories showed a deficit, mainly
due to unplanned shutdowns in several refineries and
ongoing export opportunities.
However, he stated that the shortage in OECD product
stocks could be readily met by utilizing the available idle
refinery capacity and available crude from inventories.
Within the OECD region, US inventories indicated a sur-
plus, Japanese stocks were in line with the five-year aver-
age, but European inventories were below the average.
However, despite falling crude stocks in Europe, days
of forward cover remained at 65 days, in line with the
last five-year average, due to weakening demand in the
region.
Overall, total OECD commercial inventories in terms
of days of forward cover stood at a comfortable level of
around 58.5 days. Moreover, non-OECD stocks had con-
tinued to show a steady increase, particularly in China,
added Qabazard.

46
OPE
C bu
lleti
n 10
–12
/12
Ce
leb
rati
on
uwait celebrated the 50th Anniversary of its Constitution
in early November. The occasion was marked by a number
of festivities, including a world record-breaking fireworks
display in the capital of one of the world’s most important
oil and gas producers and a Founding Member of OPEC.
The Emir of Kuwait, Sheikh Sabah Al-Ahmad Al-Jaber
Al-Sabah, led the Golden Jubilee celebrations with a trib-
ute to Sheikh Abdullah Al-Salem Al-Sabah, the prime
author of the Constitution.
“We ought to express gratitude to personalities
Fireworks, festivities mark 50 years of Kuwait’s Constitution
K

47
OPE
C bu
lleti
n 10
–12
/12
credited with establishing the regulated parliamentary
system, laying its foundations with guidance by the pre-
decessors who paved the path for this objective, issu-
ing a comprehensive Constitution that was worded with
great efforts, sweat, enlightened thinking; it will remain
an ever-lasting source of pride for all of us,” he said.
Sheikh Al-Sabah emphasized the importance of free-
dom and democracy as a basic guarantee for Kuwaiti
security and stability.
“Today, while I congratulate our dear homeland and
Fireworks, festivities mark 50 years of Kuwait’s Constitution
EPA
/Rae
d Q
uten
a
By Assel Serikbayeva
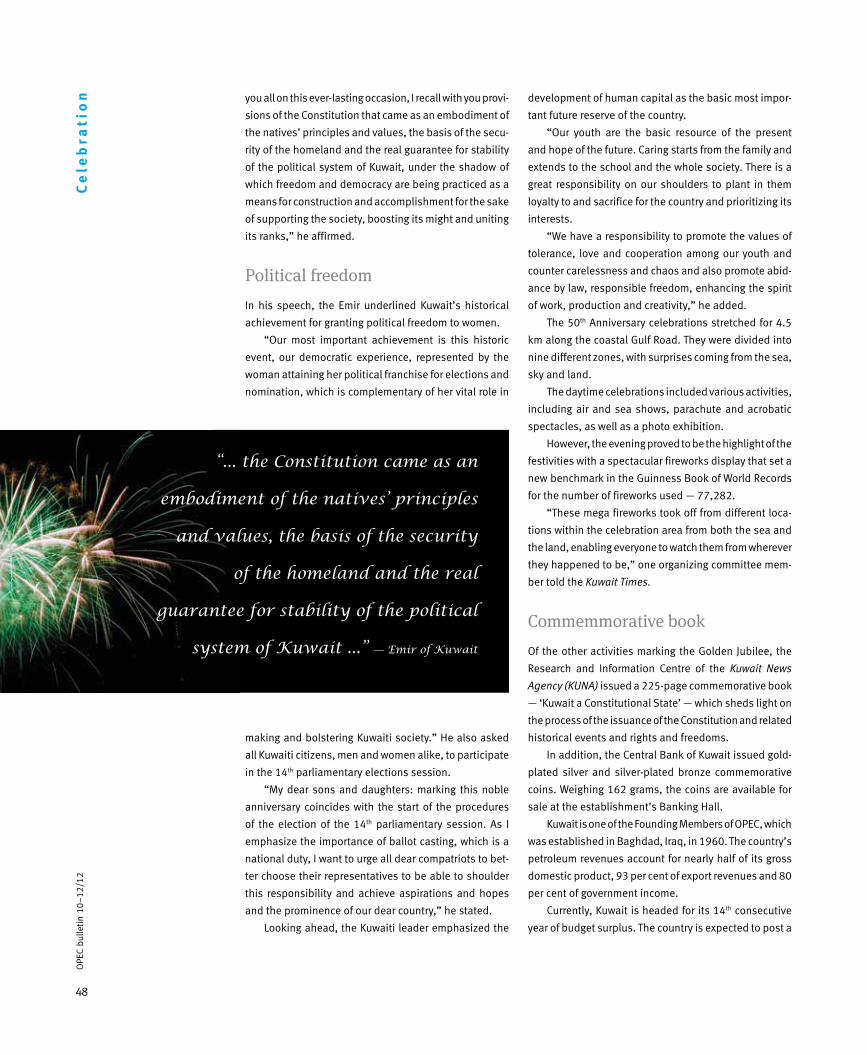
48
OPE
C bu
lleti
n 10
–12
/12
you all on this ever-lasting occasion, I recall with you provi-
sions of the Constitution that came as an embodiment of
the natives’ principles and values, the basis of the secu-
rity of the homeland and the real guarantee for stability
of the political system of Kuwait, under the shadow of
which freedom and democracy are being practiced as a
means for construction and accomplishment for the sake
of supporting the society, boosting its might and uniting
its ranks,” he affirmed.
Political freedom
In his speech, the Emir underlined Kuwait’s historical
achievement for granting political freedom to women.
“Our most important achievement is this historic
event, our democratic experience, represented by the
woman attaining her political franchise for elections and
nomination, which is complementary of her vital role in
making and bolstering Kuwaiti society.” He also asked
all Kuwaiti citizens, men and women alike, to participate
in the 14th parliamentary elections session.
“My dear sons and daughters: marking this noble
anniversary coincides with the start of the procedures
of the election of the 14th parliamentary session. As I
emphasize the importance of ballot casting, which is a
national duty, I want to urge all dear compatriots to bet-
ter choose their representatives to be able to shoulder
this responsibility and achieve aspirations and hopes
and the prominence of our dear country,” he stated.
Looking ahead, the Kuwaiti leader emphasized the
Ce
leb
rati
on development of human capital as the basic most impor-
tant future reserve of the country.
“Our youth are the basic resource of the present
and hope of the future. Caring starts from the family and
extends to the school and the whole society. There is a
great responsibility on our shoulders to plant in them
loyalty to and sacrifice for the country and prioritizing its
interests.
“We have a responsibility to promote the values of
tolerance, love and cooperation among our youth and
counter carelessness and chaos and also promote abid-
ance by law, responsible freedom, enhancing the spirit
of work, production and creativity,” he added.
The 50th Anniversary celebrations stretched for 4.5
km along the coastal Gulf Road. They were divided into
nine different zones, with surprises coming from the sea,
sky and land.
The daytime celebrations included various activities,
including air and sea shows, parachute and acrobatic
spectacles, as well as a photo exhibition.
However, the evening proved to be the highlight of the
festivities with a spectacular fireworks display that set a
new benchmark in the Guinness Book of World Records
for the number of fireworks used — 77,282.
“These mega fireworks took off from different loca-
tions within the celebration area from both the sea and
the land, enabling everyone to watch them from wherever
they happened to be,” one organizing committee mem-
ber told the Kuwait Times.
Commemmorative book
Of the other activities marking the Golden Jubilee, the
Research and Information Centre of the Kuwait News
Agency (KUNA) issued a 225-page commemorative book
— ‘Kuwait a Constitutional State’ — which sheds light on
the process of the issuance of the Constitution and related
historical events and rights and freedoms.
In addition, the Central Bank of Kuwait issued gold-
plated silver and silver-plated bronze commemorative
coins. Weighing 162 grams, the coins are available for
sale at the establishment’s Banking Hall.
Kuwait is one of the Founding Members of OPEC, which
was established in Baghdad, Iraq, in 1960. The country’s
petroleum revenues account for nearly half of its gross
domestic product, 93 per cent of export revenues and 80
per cent of government income.
Currently, Kuwait is headed for its 14th consecutive
year of budget surplus. The country is expected to post a
“... the Constitution came as an
embodiment of the natives’ principles
and values, the basis of the security
of the homeland and the real
guarantee for stability of the political
system of Kuwait ...” — Emir of Kuwait

49
OPE
C bu
lleti
n 10
–12
/12
surplus of between 9.8 billion and 12.8bn dinars ($34.8
to 45.4bn) in the 2012–13 fiscal year, the National Bank
of Kuwait stated.
The projections are based on an average oil price of
between $104 and $107/barrel for Kuwaiti crude and the
country’s current oil production of more than 2.8 million
barrels/day.
Kuwait plans to spend an estimated $56bn over the
next five years on developing its oil and gas projects.
The Chairman of the state-owned Kuwait Oil Company
(KOC), Sami Al-Rushaid, told delegates at the Abu Dhabi
International Petroleum Exhibition and Conference in
mid-November:
Capital expenditure
“The capital expenditure programme we need to man-
age will be $56bn.” This included $11.6bn during the
current fiscal year.
Kuwait aims to boost its oil production capacity to 4m
b/d by 2020. “In KOC, we are on track to grow from 3m
to 3.65m b/d by 2020,” Al-Rushaid stated. The remain-
ing 350,000 b/d was targeted to come from the Neutral
Zone shared with Saudi Arabia.
Under Kuwaiti law, ten per cent of state revenues
are deducted every year in favour of the country’s Future
Generation Fund, managed by the Kuwait Investment
Authority. This fiscal year, the Gulf state decided to trans-
fer 25 per cent of its oil revenues into the fund.
However, Kuwait will not cut down on spending as a
result of a plan to invest a greater percentage of its rev-
enues in the Future Generation Fund.
The decision “will not be at the expense of investment
spending,” Finance Minister, Dr Naif Al-Hajraf stated,
according to KUNA. He said he hoped the increased con-
tribution would continue the following fiscal year.
The Emir of Kuwait, Sheikh Sabah Al-Ahmad Al-Jaber Al-Sabah, led the Golden Jubilee celebrations.
“Our youth are the basic resource
of the present and hope of the future.
Caring starts from the family
and extends to the school and
the whole society.” — Emir of Kuwait
Reu
ters
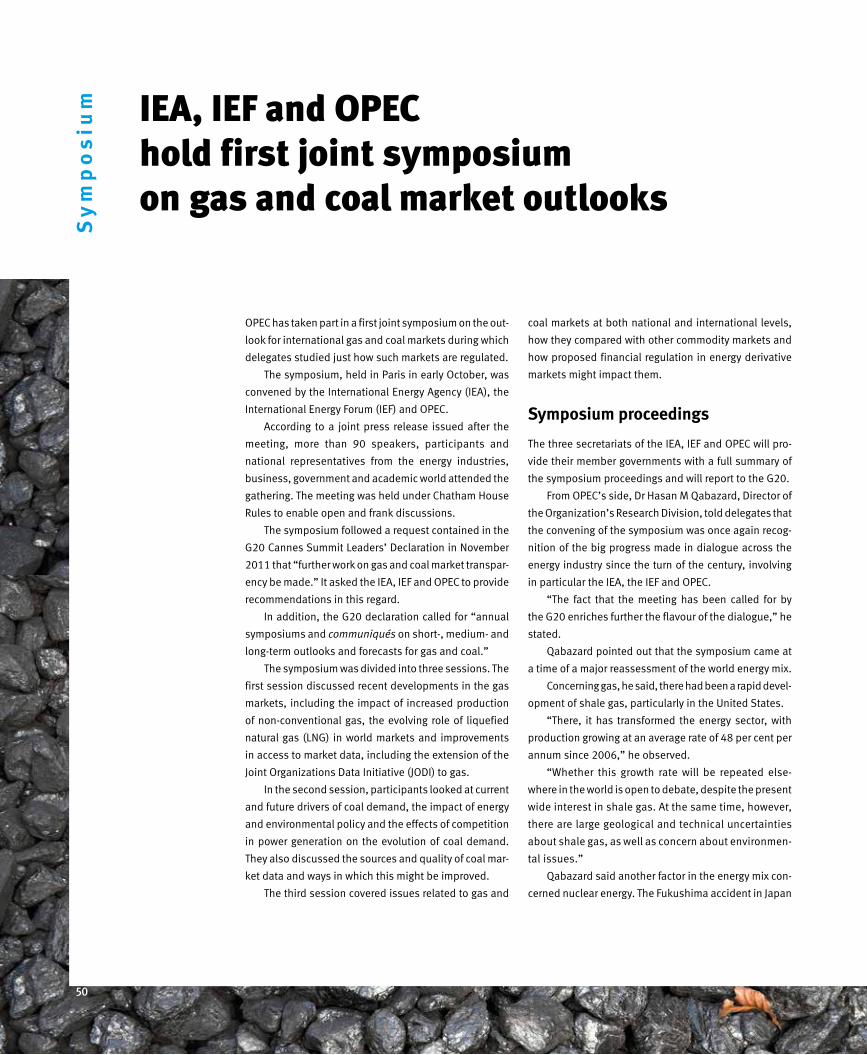
50
OPE
C bu
lleti
n 10
–12
/12
Sy
mp
os
ium IEA, IEF and OPEC
hold first joint symposiumon gas and coal market outlooks
OPEC has taken part in a first joint symposium on the out-
look for international gas and coal markets during which
delegates studied just how such markets are regulated.
The symposium, held in Paris in early October, was
convened by the International Energy Agency (IEA), the
International Energy Forum (IEF) and OPEC.
According to a joint press release issued after the
meeting, more than 90 speakers, participants and
national representatives from the energy industries,
business, government and academic world attended the
gathering. The meeting was held under Chatham House
Rules to enable open and frank discussions.
The symposium followed a request contained in the
G20 Cannes Summit Leaders’ Declaration in November
2011 that “further work on gas and coal market transpar-
ency be made.” It asked the IEA, IEF and OPEC to provide
recommendations in this regard.
In addition, the G20 declaration called for “annual
symposiums and communiqués on short-, medium- and
long-term outlooks and forecasts for gas and coal.”
The symposium was divided into three sessions. The
first session discussed recent developments in the gas
markets, including the impact of increased production
of non-conventional gas, the evolving role of liquefied
natural gas (LNG) in world markets and improvements
in access to market data, including the extension of the
Joint Organizations Data Initiative (JODI) to gas.
In the second session, participants looked at current
and future drivers of coal demand, the impact of energy
and environmental policy and the effects of competition
in power generation on the evolution of coal demand.
They also discussed the sources and quality of coal mar-
ket data and ways in which this might be improved.
The third session covered issues related to gas and
coal markets at both national and international levels,
how they compared with other commodity markets and
how proposed financial regulation in energy derivative
markets might impact them.
Symposium proceedings
The three secretariats of the IEA, IEF and OPEC will pro-
vide their member governments with a full summary of
the symposium proceedings and will report to the G20.
From OPEC’s side, Dr Hasan M Qabazard, Director of
the Organization’s Research Division, told delegates that
the convening of the symposium was once again recog-
nition of the big progress made in dialogue across the
energy industry since the turn of the century, involving
in particular the IEA, the IEF and OPEC.
“The fact that the meeting has been called for by
the G20 enriches further the flavour of the dialogue,” he
stated.
Qabazard pointed out that the symposium came at
a time of a major reassessment of the world energy mix.
Concerning gas, he said, there had been a rapid devel-
opment of shale gas, particularly in the United States.
“There, it has transformed the energy sector, with
production growing at an average rate of 48 per cent per
annum since 2006,” he observed.
“Whether this growth rate will be repeated else-
where in the world is open to debate, despite the present
wide interest in shale gas. At the same time, however,
there are large geological and technical uncertainties
about shale gas, as well as concern about environmen-
tal issues.”
Qabazard said another factor in the energy mix con-
cerned nuclear energy. The Fukushima accident in Japan
50
OPE
C bu
lleti
n 10
–12
/12
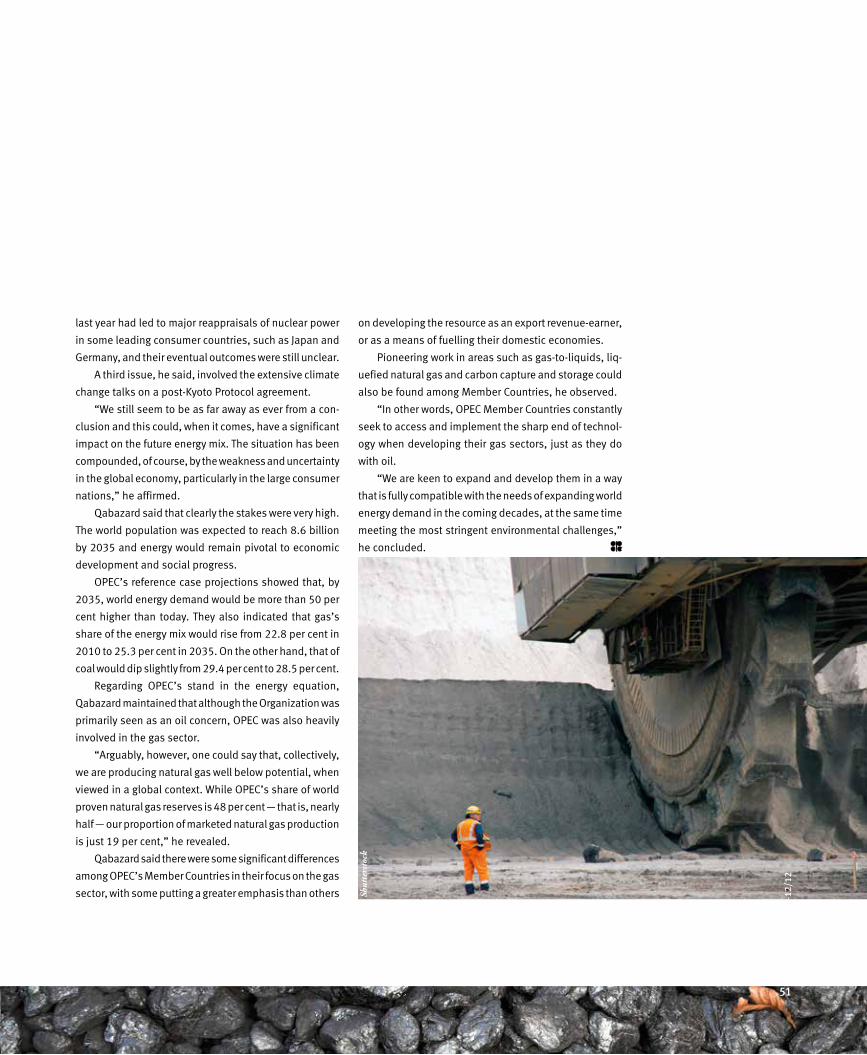
51
OPE
C bu
lleti
n 10
–12
/12
last year had led to major reappraisals of nuclear power
in some leading consumer countries, such as Japan and
Germany, and their eventual outcomes were still unclear.
A third issue, he said, involved the extensive climate
change talks on a post-Kyoto Protocol agreement.
“We still seem to be as far away as ever from a con-
clusion and this could, when it comes, have a significant
impact on the future energy mix. The situation has been
compounded, of course, by the weakness and uncertainty
in the global economy, particularly in the large consumer
nations,” he affirmed.
Qabazard said that clearly the stakes were very high.
The world population was expected to reach 8.6 billion
by 2035 and energy would remain pivotal to economic
development and social progress.
OPEC’s reference case projections showed that, by
2035, world energy demand would be more than 50 per
cent higher than today. They also indicated that gas’s
share of the energy mix would rise from 22.8 per cent in
2010 to 25.3 per cent in 2035. On the other hand, that of
coal would dip slightly from 29.4 per cent to 28.5 per cent.
Regarding OPEC’s stand in the energy equation,
Qabazard maintained that although the Organization was
primarily seen as an oil concern, OPEC was also heavily
involved in the gas sector.
“Arguably, however, one could say that, collectively,
we are producing natural gas well below potential, when
viewed in a global context. While OPEC’s share of world
proven natural gas reserves is 48 per cent — that is, nearly
half — our proportion of marketed natural gas production
is just 19 per cent,” he revealed.
Qabazard said there were some significant differences
among OPEC’s Member Countries in their focus on the gas
sector, with some putting a greater emphasis than others
on developing the resource as an export revenue-earner,
or as a means of fuelling their domestic economies.
Pioneering work in areas such as gas-to-liquids, liq-
uefied natural gas and carbon capture and storage could
also be found among Member Countries, he observed.
“In other words, OPEC Member Countries constantly
seek to access and implement the sharp end of technol-
ogy when developing their gas sectors, just as they do
with oil.
“We are keen to expand and develop them in a way
that is fully compatible with the needs of expanding world
energy demand in the coming decades, at the same time
meeting the most stringent environmental challenges,”
he concluded.
Shut
ters
tock
51
OPE
C bu
lleti
n 10
–12
/12
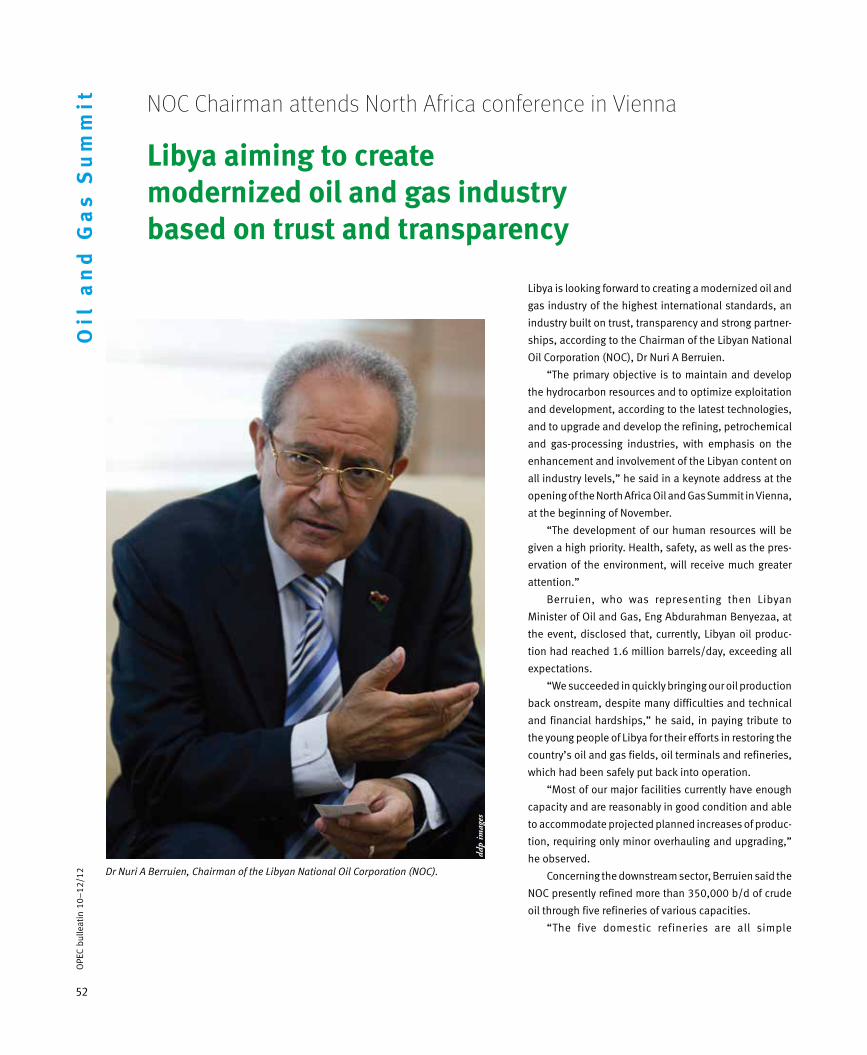
52
OPE
C bu
lleat
in 1
0–12
/12
Oil
an
d G
as
Su
mm
it
Libya is looking forward to creating a modernized oil and
gas industry of the highest international standards, an
industry built on trust, transparency and strong partner-
ships, according to the Chairman of the Libyan National
Oil Corporation (NOC), Dr Nuri A Berruien.
“The primary objective is to maintain and develop
the hydrocarbon resources and to optimize exploitation
and development, according to the latest technologies,
and to upgrade and develop the refining, petrochemical
and gas-processing industries, with emphasis on the
enhancement and involvement of the Libyan content on
all industry levels,” he said in a keynote address at the
opening of the North Africa Oil and Gas Summit in Vienna,
at the beginning of November.
“The development of our human resources will be
given a high priority. Health, safety, as well as the pres-
ervation of the environment, will receive much greater
attention.”
Berruien, who was representing then Libyan
Minister of Oil and Gas, Eng Abdurahman Benyezaa, at
the event, disclosed that, currently, Libyan oil produc-
tion had reached 1.6 million barrels/day, exceeding all
expectations.
“We succeeded in quickly bringing our oil production
back onstream, despite many difficulties and technical
and financial hardships,” he said, in paying tribute to
the young people of Libya for their efforts in restoring the
country’s oil and gas fields, oil terminals and refineries,
which had been safely put back into operation.
“Most of our major facilities currently have enough
capacity and are reasonably in good condition and able
to accommodate projected planned increases of produc-
tion, requiring only minor overhauling and upgrading,”
he observed.
Concerning the downstream sector, Berruien said the
NOC presently refined more than 350,000 b/d of crude
oil through five refineries of various capacities.
“The five domestic refineries are all simple
NOC Chairman attends North Africa conference in Vienna
Libya aiming to create modernized oil and gas industry based on trust and transparency
ddp
imag
es
Dr Nuri A Berruien, Chairman of the Libyan National Oil Corporation (NOC).
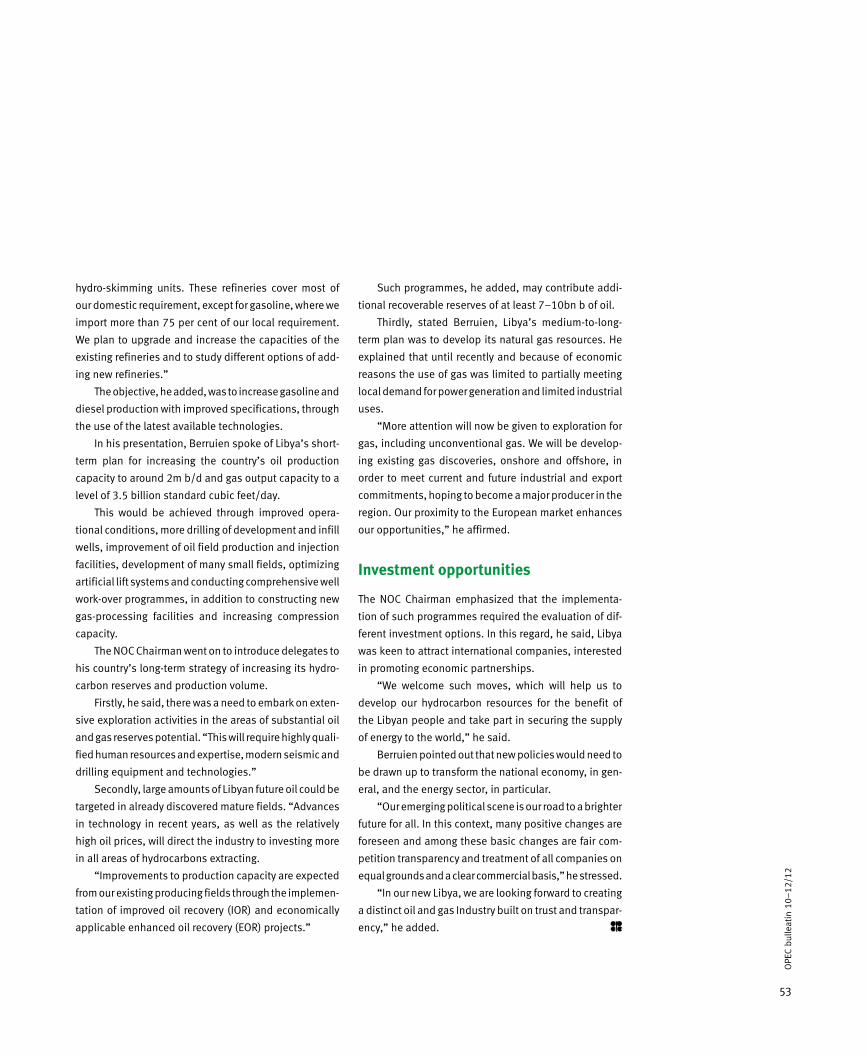
53
OPE
C bu
lleat
in 1
0–12
/12
hydro-skimming units. These refineries cover most of
our domestic requirement, except for gasoline, where we
import more than 75 per cent of our local requirement.
We plan to upgrade and increase the capacities of the
existing refineries and to study different options of add-
ing new refineries.”
The objective, he added, was to increase gasoline and
diesel production with improved specifications, through
the use of the latest available technologies.
In his presentation, Berruien spoke of Libya’s short-
term plan for increasing the country’s oil production
capacity to around 2m b/d and gas output capacity to a
level of 3.5 billion standard cubic feet/day.
This would be achieved through improved opera-
tional conditions, more drilling of development and infill
wells, improvement of oil field production and injection
facilities, development of many small fields, optimizing
artificial lift systems and conducting comprehensive well
work-over programmes, in addition to constructing new
gas-processing facilities and increasing compression
capacity.
The NOC Chairman went on to introduce delegates to
his country’s long-term strategy of increasing its hydro-
carbon reserves and production volume.
Firstly, he said, there was a need to embark on exten-
sive exploration activities in the areas of substantial oil
and gas reserves potential. “This will require highly quali-
fied human resources and expertise, modern seismic and
drilling equipment and technologies.”
Secondly, large amounts of Libyan future oil could be
targeted in already discovered mature fields. “Advances
in technology in recent years, as well as the relatively
high oil prices, will direct the industry to investing more
in all areas of hydrocarbons extracting.
“Improvements to production capacity are expected
from our existing producing fields through the implemen-
tation of improved oil recovery (IOR) and economically
applicable enhanced oil recovery (EOR) projects.”
Such programmes, he added, may contribute addi-
tional recoverable reserves of at least 7–10bn b of oil.
Thirdly, stated Berruien, Libya’s medium-to-long-
term plan was to develop its natural gas resources. He
explained that until recently and because of economic
reasons the use of gas was limited to partially meeting
local demand for power generation and limited industrial
uses.
“More attention will now be given to exploration for
gas, including unconventional gas. We will be develop-
ing existing gas discoveries, onshore and offshore, in
order to meet current and future industrial and export
commitments, hoping to become a major producer in the
region. Our proximity to the European market enhances
our opportunities,” he affirmed.
Investment opportunities
The NOC Chairman emphasized that the implementa-
tion of such programmes required the evaluation of dif-
ferent investment options. In this regard, he said, Libya
was keen to attract international companies, interested
in promoting economic partnerships.
“We welcome such moves, which will help us to
develop our hydrocarbon resources for the benefit of
the Libyan people and take part in securing the supply
of energy to the world,” he said.
Berruien pointed out that new policies would need to
be drawn up to transform the national economy, in gen-
eral, and the energy sector, in particular.
“Our emerging political scene is our road to a brighter
future for all. In this context, many positive changes are
foreseen and among these basic changes are fair com-
petition transparency and treatment of all companies on
equal grounds and a clear commercial basis,” he stressed.
“In our new Libya, we are looking forward to creating
a distinct oil and gas Industry built on trust and transpar-
ency,” he added.
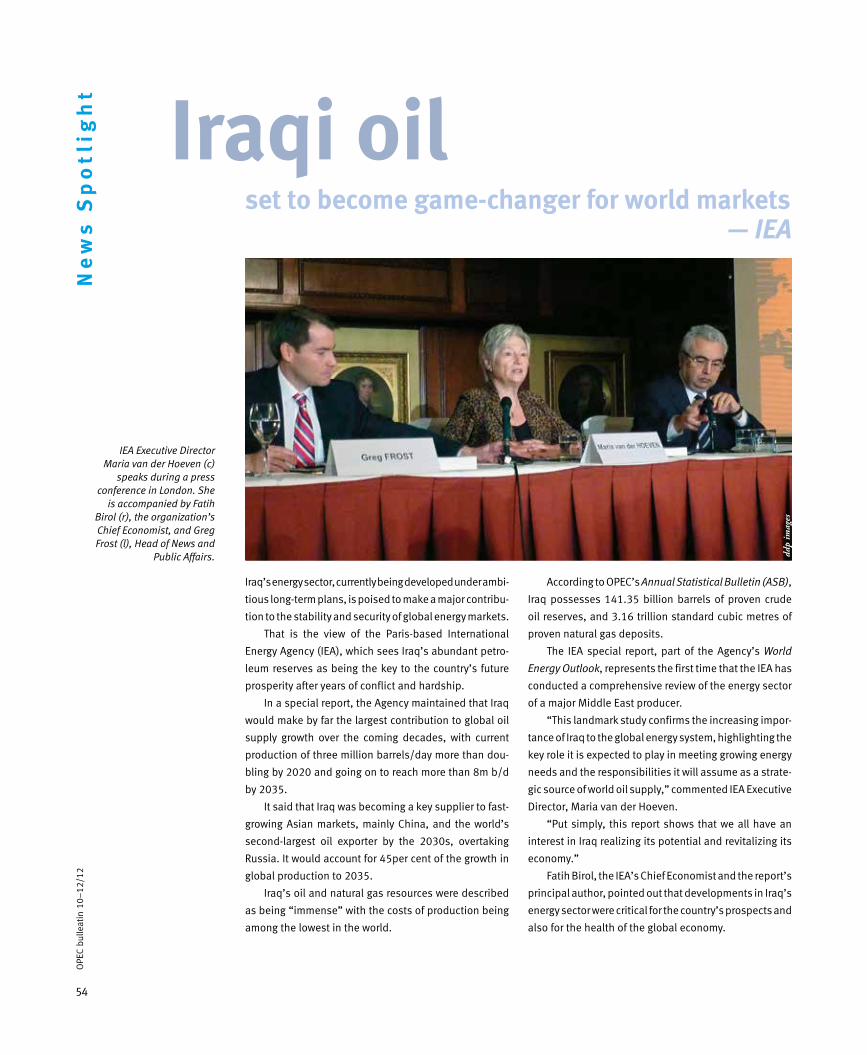
54
OPE
C bu
lleat
in 1
0–12
/12
Ne
ws
Sp
otl
igh
t
Iraqi oil
Iraq’s energy sector, currently being developed under ambi-
tious long-term plans, is poised to make a major contribu-
tion to the stability and security of global energy markets.
That is the view of the Paris-based International
Energy Agency (IEA), which sees Iraq’s abundant petro-
leum reserves as being the key to the country’s future
prosperity after years of conflict and hardship.
In a special report, the Agency maintained that Iraq
would make by far the largest contribution to global oil
supply growth over the coming decades, with current
production of three million barrels/day more than dou-
bling by 2020 and going on to reach more than 8m b/d
by 2035.
It said that Iraq was becoming a key supplier to fast-
growing Asian markets, mainly China, and the world’s
second-largest oil exporter by the 2030s, overtaking
Russia. It would account for 45per cent of the growth in
global production to 2035.
Iraq’s oil and natural gas resources were described
as being “immense” with the costs of production being
among the lowest in the world.
According to OPEC’s Annual Statistical Bulletin (ASB),
Iraq possesses 141.35 billion barrels of proven crude
oil reserves, and 3.16 trillion standard cubic metres of
proven natural gas deposits.
The IEA special report, part of the Agency’s World
Energy Outlook, represents the first time that the IEA has
conducted a comprehensive review of the energy sector
of a major Middle East producer.
“This landmark study confirms the increasing impor-
tance of Iraq to the global energy system, highlighting the
key role it is expected to play in meeting growing energy
needs and the responsibilities it will assume as a strate-
gic source of world oil supply,” commented IEA Executive
Director, Maria van der Hoeven.
“Put simply, this report shows that we all have an
interest in Iraq realizing its potential and revitalizing its
economy.”
Fatih Birol, the IEA’s Chief Economist and the report’s
principal author, pointed out that developments in Iraq’s
energy sector were critical for the country’s prospects and
also for the health of the global economy.
IEA Executive Director Maria van der Hoeven (c)
speaks during a press conference in London. She
is accompanied by Fatih Birol (r), the organization’s Chief Economist, and Greg Frost (l), Head of News and
Public Affairs. ddp
imag
es
set to become game-changer for world markets — IEA
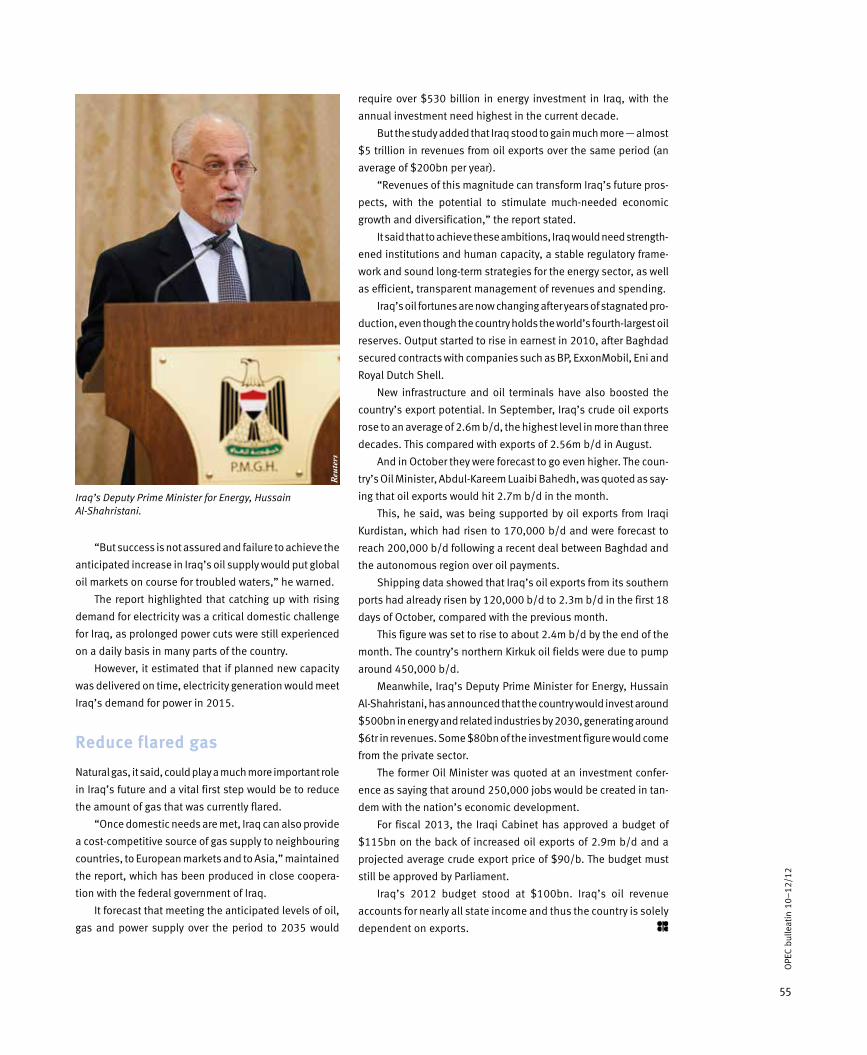
55
OPE
C bu
lleat
in 1
0–12
/12
“But success is not assured and failure to achieve the
anticipated increase in Iraq’s oil supply would put global
oil markets on course for troubled waters,” he warned.
The report highlighted that catching up with rising
demand for electricity was a critical domestic challenge
for Iraq, as prolonged power cuts were still experienced
on a daily basis in many parts of the country.
However, it estimated that if planned new capacity
was delivered on time, electricity generation would meet
Iraq’s demand for power in 2015.
Reduce flared gas
Natural gas, it said, could play a much more important role
in Iraq’s future and a vital first step would be to reduce
the amount of gas that was currently flared.
“Once domestic needs are met, Iraq can also provide
a cost-competitive source of gas supply to neighbouring
countries, to European markets and to Asia,” maintained
the report, which has been produced in close coopera-
tion with the federal government of Iraq.
It forecast that meeting the anticipated levels of oil,
gas and power supply over the period to 2035 would
require over $530 billion in energy investment in Iraq, with the
annual investment need highest in the current decade.
But the study added that Iraq stood to gain much more — almost
$5 trillion in revenues from oil exports over the same period (an
average of $200bn per year).
“Revenues of this magnitude can transform Iraq’s future pros-
pects, with the potential to stimulate much-needed economic
growth and diversification,” the report stated.
It said that to achieve these ambitions, Iraq would need strength-
ened institutions and human capacity, a stable regulatory frame-
work and sound long-term strategies for the energy sector, as well
as efficient, transparent management of revenues and spending.
Iraq’s oil fortunes are now changing after years of stagnated pro-
duction, even though the country holds the world’s fourth-largest oil
reserves. Output started to rise in earnest in 2010, after Baghdad
secured contracts with companies such as BP, ExxonMobil, Eni and
Royal Dutch Shell.
New infrastructure and oil terminals have also boosted the
country’s export potential. In September, Iraq’s crude oil exports
rose to an average of 2.6m b/d, the highest level in more than three
decades. This compared with exports of 2.56m b/d in August.
And in October they were forecast to go even higher. The coun-
try’s Oil Minister, Abdul-Kareem Luaibi Bahedh, was quoted as say-
ing that oil exports would hit 2.7m b/d in the month.
This, he said, was being supported by oil exports from Iraqi
Kurdistan, which had risen to 170,000 b/d and were forecast to
reach 200,000 b/d following a recent deal between Baghdad and
the autonomous region over oil payments.
Shipping data showed that Iraq’s oil exports from its southern
ports had already risen by 120,000 b/d to 2.3m b/d in the first 18
days of October, compared with the previous month.
This figure was set to rise to about 2.4m b/d by the end of the
month. The country’s northern Kirkuk oil fields were due to pump
around 450,000 b/d.
Meanwhile, Iraq’s Deputy Prime Minister for Energy, Hussain
Al-Shahristani, has announced that the country would invest around
$500bn in energy and related industries by 2030, generating around
$6tr in revenues. Some $80bn of the investment figure would come
from the private sector.
The former Oil Minister was quoted at an investment confer-
ence as saying that around 250,000 jobs would be created in tan-
dem with the nation’s economic development.
For fiscal 2013, the Iraqi Cabinet has approved a budget of
$115bn on the back of increased oil exports of 2.9m b/d and a
projected average crude export price of $90/b. The budget must
still be approved by Parliament.
Iraq’s 2012 budget stood at $100bn. Iraq’s oil revenue
accounts for nearly all state income and thus the country is solely
dependent on exports.
Iraq’s Deputy Prime Minister for Energy, Hussain Al-Shahristani.
Reu
ters
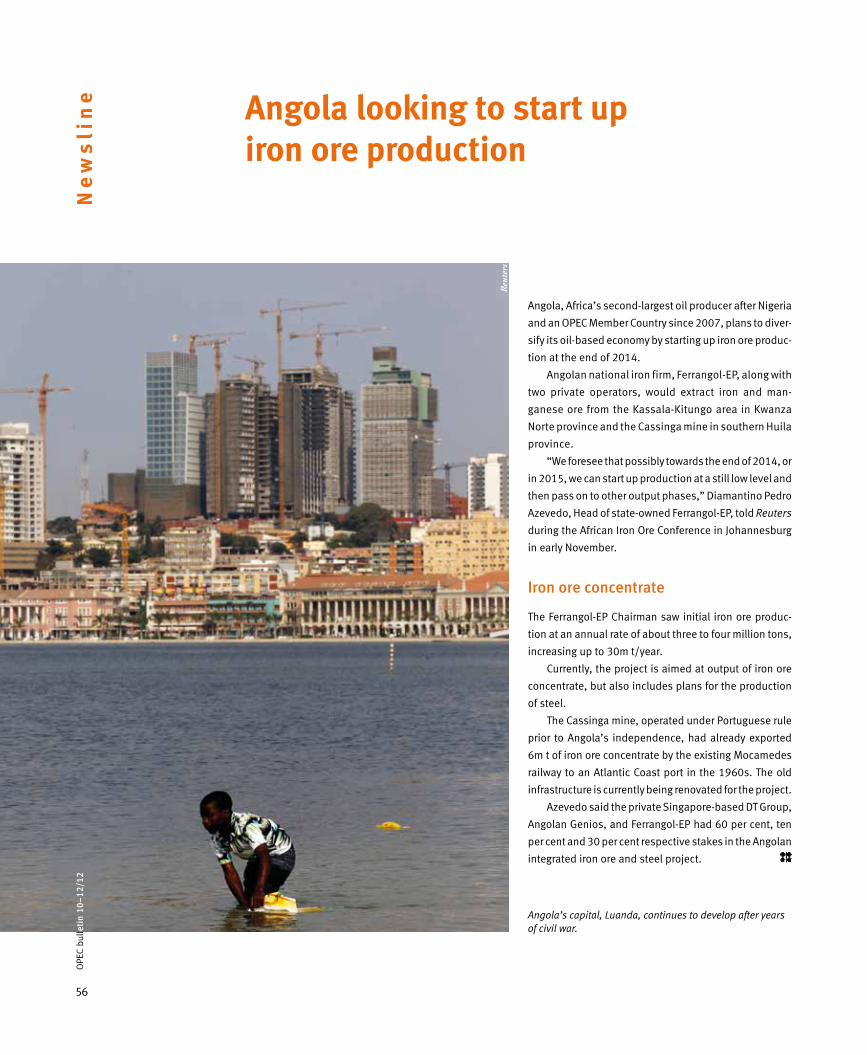
56
Ne
ws
lin
e Angola looking to start upiron ore production
Angola, Africa’s second-largest oil producer after Nigeria
and an OPEC Member Country since 2007, plans to diver-
sify its oil-based economy by starting up iron ore produc-
tion at the end of 2014.
Angolan national iron firm, Ferrangol-EP, along with
two private operators, would extract iron and man-
ganese ore from the Kassala-Kitungo area in Kwanza
Norte province and the Cassinga mine in southern Huila
province.
“We foresee that possibly towards the end of 2014, or
in 2015, we can start up production at a still low level and
then pass on to other output phases,” Diamantino Pedro
Azevedo, Head of state-owned Ferrangol-EP, told Reuters
during the African Iron Ore Conference in Johannesburg
in early November.
Iron ore concentrate
The Ferrangol-EP Chairman saw initial iron ore produc-
tion at an annual rate of about three to four million tons,
increasing up to 30m t/year.
Currently, the project is aimed at output of iron ore
concentrate, but also includes plans for the production
of steel.
The Cassinga mine, operated under Portuguese rule
prior to Angola’s independence, had already exported
6m t of iron ore concentrate by the existing Mocamedes
railway to an Atlantic Coast port in the 1960s. The old
infrastructure is currently being renovated for the project.
Azevedo said the private Singapore-based DT Group,
Angolan Genios, and Ferrangol-EP had 60 per cent, ten
per cent and 30 per cent respective stakes in the Angolan
integrated iron ore and steel project.
Reu
ters
Angola’s capital, Luanda, continues to develop after years of civil war.
OPE
C bu
lleti
n 10
–12
/12

57
OPE
C bu
lleat
in 1
0–12
/12
Iraq’s oil exports have shown a further increase in October,
while the country’s cabinet has given the green light to
the nation’s 2013 budget.
Oil exports stood at to 2.62 million barrels/day in
the month, up from 2.6m b/d in September, according
to figures from the Oil Ministry.
The Ministry disclosed that with an average crude
Iraq’s oil exports rise again as2013 budget gets approval
export price of $105.5/b in the month, oil revenues in
October amounted to $8.6 billion.
Exports from the southern ports of Basra were
recorded at 2.17m b/d, while 451,000 b/d of crude
was exported from the northern fields of Kirkuk, via
Ceyhan.
“Iraq’s October oil exports were more than in
September, despite repeated halts from the southern
ports, due to bad weather and sabotage action against
the Kirkuk-Ceyhan pipeline,” Oil Ministry spokesman,
Asim Jihad, was quoted as saying.
He stressed that exports were expected to attain suc-
cessive record levels in the coming months as the coun-
try’s production capability increased. It was aiming for a
potential export level of 6m b/d by 2017.
Meanwhile, the Iraqi cabinet has approved a 138 tril-
lion Iraqi dinar ($115bn) budget for 2013 on the back of
increased oil exports of 2.9m b/d and a projected average
crude export price of $90/b. In 2012, Iraq’s budget was
set at $100bn. The new budget must still be approved
by parliament.
The new budget has an operating allocation of 83tr
dinars, with 55tr dinars earmarked for investment.
The energy sector, including the oil and electricity
ministries, will have the biggest share of the budget at
29.45tr dinars, with security and defense being allotted
a sum of 19.86tr dinars.
The proposed budget carries a deficit amounting to
18.8tr dinars, but, as in the past, this could be wiped out
with higher crude oil prices.
It also again contains the, now, three-year-old ‘petro
dollar project’, which grants paymnets to provinces that
produce or refine crude or natural gas.
In addition, the budget stipulates that five per cent of
state oil revenues in fiscal 2013 will be sent to the United
Nations compensation commission to pay for damages
associated with Iraq’s conflict with Kuwait in 1990.
Reu
ters
An oil refinery tower and pipeline network in Iraq.
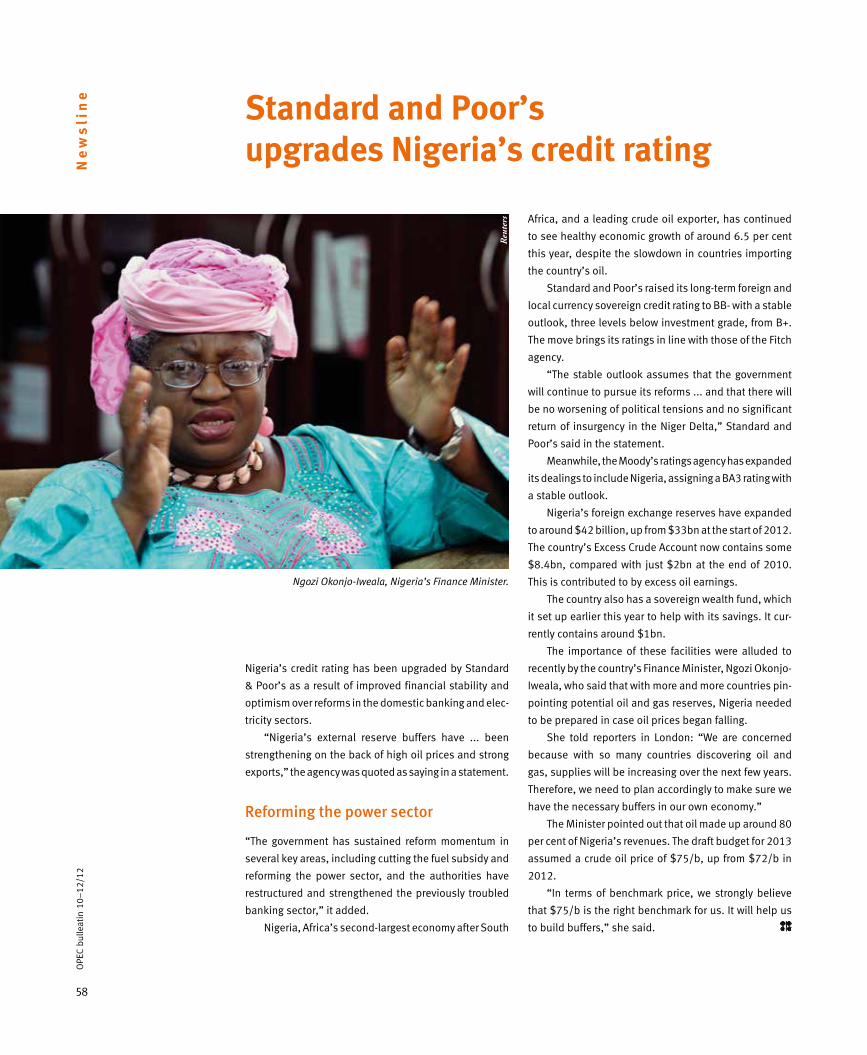
58
OPE
C bu
lleat
in 1
0–12
/12
Ne
ws
lin
e
Nigeria’s credit rating has been upgraded by Standard
& Poor’s as a result of improved financial stability and
optimism over reforms in the domestic banking and elec-
tricity sectors.
“Nigeria’s external reserve buffers have ... been
strengthening on the back of high oil prices and strong
exports,” the agency was quoted as saying in a statement.
Reforming the power sector
“The government has sustained reform momentum in
several key areas, including cutting the fuel subsidy and
reforming the power sector, and the authorities have
restructured and strengthened the previously troubled
banking sector,” it added.
Nigeria, Africa’s second-largest economy after South
Standard and Poor’supgrades Nigeria’s credit rating
Africa, and a leading crude oil exporter, has continued
to see healthy economic growth of around 6.5 per cent
this year, despite the slowdown in countries importing
the country’s oil.
Standard and Poor’s raised its long-term foreign and
local currency sovereign credit rating to BB- with a stable
outlook, three levels below investment grade, from B+.
The move brings its ratings in line with those of the Fitch
agency.
“The stable outlook assumes that the government
will continue to pursue its reforms ... and that there will
be no worsening of political tensions and no significant
return of insurgency in the Niger Delta,” Standard and
Poor’s said in the statement.
Meanwhile, the Moody’s ratings agency has expanded
its dealings to include Nigeria, assigning a BA3 rating with
a stable outlook.
Nigeria’s foreign exchange reserves have expanded
to around $42 billion, up from $33bn at the start of 2012.
The country’s Excess Crude Account now contains some
$8.4bn, compared with just $2bn at the end of 2010.
This is contributed to by excess oil earnings.
The country also has a sovereign wealth fund, which
it set up earlier this year to help with its savings. It cur-
rently contains around $1bn.
The importance of these facilities were alluded to
recently by the country’s Finance Minister, Ngozi Okonjo-
Iweala, who said that with more and more countries pin-
pointing potential oil and gas reserves, Nigeria needed
to be prepared in case oil prices began falling.
She told reporters in London: “We are concerned
because with so many countries discovering oil and
gas, supplies will be increasing over the next few years.
Therefore, we need to plan accordingly to make sure we
have the necessary buffers in our own economy.”
The Minister pointed out that oil made up around 80
per cent of Nigeria’s revenues. The draft budget for 2013
assumed a crude oil price of $75/b, up from $72/b in
2012.
“In terms of benchmark price, we strongly believe
that $75/b is the right benchmark for us. It will help us
to build buffers,” she said.
Ngozi Okonjo-Iweala, Nigeria’s Finance Minister.
Reu
ters
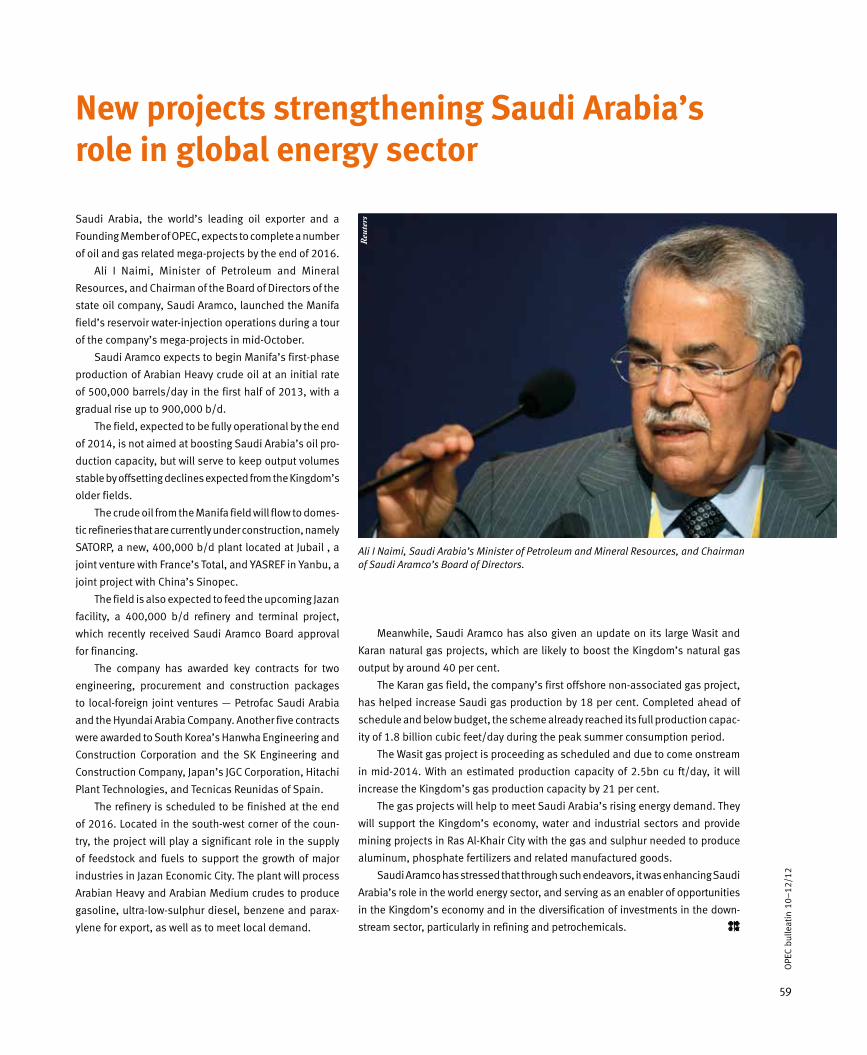
59
OPE
C bu
lleat
in 1
0–12
/12
Ali I Naimi, Saudi Arabia’s Minister of Petroleum and Mineral Resources, and Chairman of Saudi Aramco’s Board of Directors.
New projects strengthening Saudi Arabia’s role in global energy sector
Saudi Arabia, the world’s leading oil exporter and a
Founding Member of OPEC, expects to complete a number
of oil and gas related mega-projects by the end of 2016.
Ali I Naimi, Minister of Petroleum and Mineral
Resources, and Chairman of the Board of Directors of the
state oil company, Saudi Aramco, launched the Manifa
field’s reservoir water-injection operations during a tour
of the company’s mega-projects in mid-October.
Saudi Aramco expects to begin Manifa’s first-phase
production of Arabian Heavy crude oil at an initial rate
of 500,000 barrels/day in the first half of 2013, with a
gradual rise up to 900,000 b/d.
The field, expected to be fully operational by the end
of 2014, is not aimed at boosting Saudi Arabia’s oil pro-
duction capacity, but will serve to keep output volumes
stable by offsetting declines expected from the Kingdom’s
older fields.
The crude oil from the Manifa field will flow to domes-
tic refineries that are currently under construction, namely
SATORP, a new, 400,000 b/d plant located at Jubail , a
joint venture with France’s Total, and YASREF in Yanbu, a
joint project with China’s Sinopec.
The field is also expected to feed the upcoming Jazan
facility, a 400,000 b/d refinery and terminal project,
which recently received Saudi Aramco Board approval
for financing.
The company has awarded key contracts for two
engineering, procurement and construction packages
to local-foreign joint ventures — Petrofac Saudi Arabia
and the Hyundai Arabia Company. Another five contracts
were awarded to South Korea’s Hanwha Engineering and
Construction Corporation and the SK Engineering and
Construction Company, Japan’s JGC Corporation, Hitachi
Plant Technologies, and Tecnicas Reunidas of Spain.
The refinery is scheduled to be finished at the end
of 2016. Located in the south-west corner of the coun-
try, the project will play a significant role in the supply
of feedstock and fuels to support the growth of major
industries in Jazan Economic City. The plant will process
Arabian Heavy and Arabian Medium crudes to produce
gasoline, ultra-low-sulphur diesel, benzene and parax-
ylene for export, as well as to meet local demand.
Meanwhile, Saudi Aramco has also given an update on its large Wasit and
Karan natural gas projects, which are likely to boost the Kingdom’s natural gas
output by around 40 per cent.
The Karan gas field, the company’s first offshore non-associated gas project,
has helped increase Saudi gas production by 18 per cent. Completed ahead of
schedule and below budget, the scheme already reached its full production capac-
ity of 1.8 billion cubic feet/day during the peak summer consumption period.
The Wasit gas project is proceeding as scheduled and due to come onstream
in mid-2014. With an estimated production capacity of 2.5bn cu ft/day, it will
increase the Kingdom’s gas production capacity by 21 per cent.
The gas projects will help to meet Saudi Arabia’s rising energy demand. They
will support the Kingdom’s economy, water and industrial sectors and provide
mining projects in Ras Al-Khair City with the gas and sulphur needed to produce
aluminum, phosphate fertilizers and related manufactured goods.
Saudi Aramco has stressed that through such endeavors, it was enhancing Saudi
Arabia’s role in the world energy sector, and serving as an enabler of opportunities
in the Kingdom’s economy and in the diversification of investments in the down-
stream sector, particularly in refining and petrochemicals.
Reu
ters
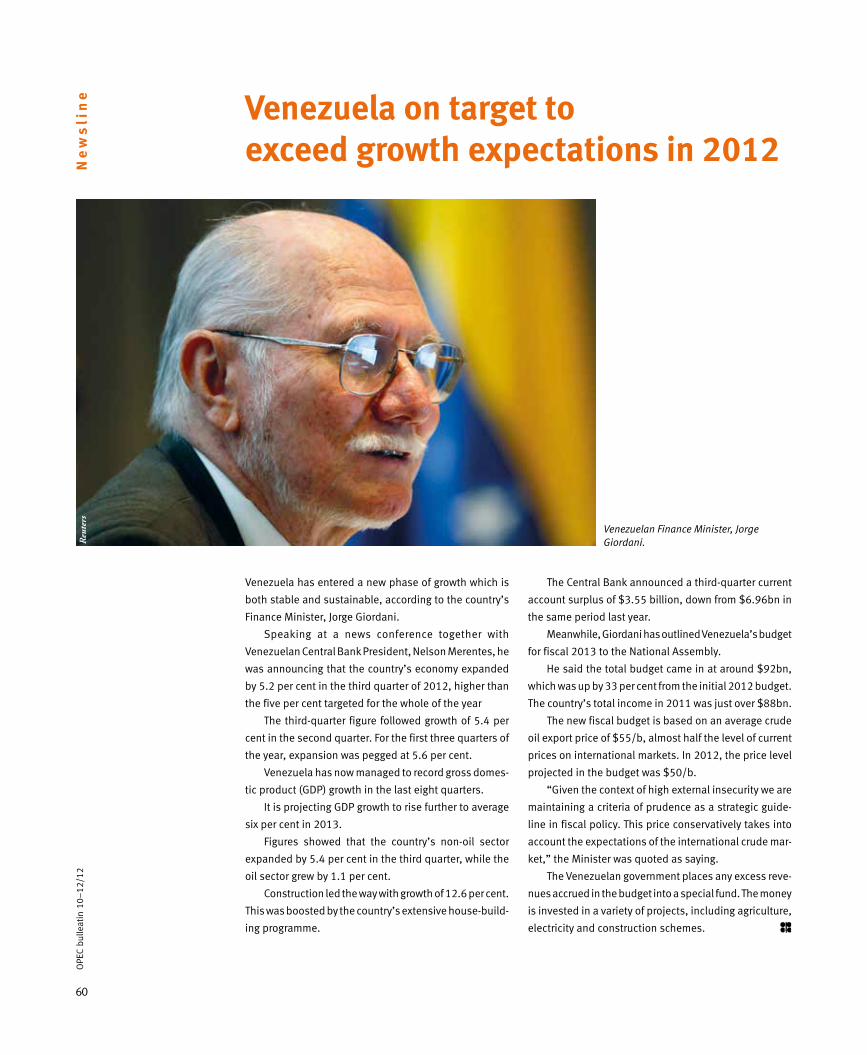
60
OPE
C bu
lleat
in 1
0–12
/12
Ne
ws
lin
e
Venezuela has entered a new phase of growth which is
both stable and sustainable, according to the country’s
Finance Minister, Jorge Giordani.
Speaking at a news conference together with
Venezuelan Central Bank President, Nelson Merentes, he
was announcing that the country’s economy expanded
by 5.2 per cent in the third quarter of 2012, higher than
the five per cent targeted for the whole of the year
The third-quarter figure followed growth of 5.4 per
cent in the second quarter. For the first three quarters of
the year, expansion was pegged at 5.6 per cent.
Venezuela has now managed to record gross domes-
tic product (GDP) growth in the last eight quarters.
It is projecting GDP growth to rise further to average
six per cent in 2013.
Figures showed that the country’s non-oil sector
expanded by 5.4 per cent in the third quarter, while the
oil sector grew by 1.1 per cent.
Construction led the way with growth of 12.6 per cent.
This was boosted by the country’s extensive house-build-
ing programme.
Venezuela on target toexceed growth expectations in 2012
The Central Bank announced a third-quarter current
account surplus of $3.55 billion, down from $6.96bn in
the same period last year.
Meanwhile, Giordani has outlined Venezuela’s budget
for fiscal 2013 to the National Assembly.
He said the total budget came in at around $92bn,
which was up by 33 per cent from the initial 2012 budget.
The country’s total income in 2011 was just over $88bn.
The new fiscal budget is based on an average crude
oil export price of $55/b, almost half the level of current
prices on international markets. In 2012, the price level
projected in the budget was $50/b.
“Given the context of high external insecurity we are
maintaining a criteria of prudence as a strategic guide-
line in fiscal policy. This price conservatively takes into
account the expectations of the international crude mar-
ket,” the Minister was quoted as saying.
The Venezuelan government places any excess reve-
nues accrued in the budget into a special fund. The money
is invested in a variety of projects, including agriculture,
electricity and construction schemes.
Venezuelan Finance Minister, Jorge Giordani.R
eute
rs

61
OPE
C bu
lleat
in 1
0–12
/12
China’s crude oil imports showed their fastest growth in
five months in October, rising by 13.8 per cent.
According to official figures, the country’s crude oil
imports in the month surged by 692,000 barrels/day over
September levels and were 680,000 b/d more than in the
same month last year.
China’s domestic output of crude oil fell by 26,000
b/d from September levels, while October crude exports
were 32,000 b/d higher than in the previous month.
Higher demand
October refining throughput was only marginally weaker
than in September, while China’s commercial crude stocks
fell by 8m b, or 258,000 b/d, in October, the largest drop
in eight months, and indicating the higher demand.
Refinery throughput in the month was recorded at
9.44m b/d, just below the record 9.47m b/d seen in
September, and 6.7 per cent higher than in October 2011.
The country’s commercial oil product stocks, which
stood at a high of 162.6m b in February this year, were
estimated to have fallen to 124m b in October.
China’s apparent oil demand in October was higher
by almost seven per cent at 9.91m b/d, compared with
2011 figures. In September, demand was gauged at a
record-high 9.8m b/d, an impressive 9.2 per cent more
than in the same month last year. This was after declin-
ing by 1.5 per cent in August.
September demand bettered the previous record of
9.77m b/d set in February this year.
Meanwhile, China’s National Bureau of Statistics has
announced that the country’s economy expanded by 7.4
per cent in the third quarter of this year, down for the sev-
enth straight quarter in a row.
However, for the first nine months of 2012, the econ-
omy was said to have grown by 7.7 per cent, which was
just above the 7.5 per cent target for full-year growth set
by the government.
Bureau data showed that September oil demand was
boosted by refinery runs and net oil product imports.
China’s crude oil importssurge in October
Refinery use rose by an annual seven per cent, while oil
product imports amounted to 323,680 b/d, the highest
since June. In August, refinery runs stood at 8.92m b/d.
In the third quarter, apparent oil demand aver-
aged 9.31m b/d, 3.2 per cent higher than in the same
period last year. It was also up from 9.25m b/d in the
second quarter, but down from the 9.64m b/d recorded
for the first three months of the year. So far this year,
China’s apparent oil demand has risen by 1.7 per cent to
9.4m b/d.
Over the same period, refinery throughput is higher
by 1.6 per cent at 9.1m b/d, while net product imports
have shown 6.4 per cent growth over last year.
Many analysts have been pointing to signs of an eco-
nomic recovery. HSBC was quoted as saying that “China’s
recent numbers suggest that the worst is over on the
mainland. The economy should accelerate from here”,
while Morgan Stanley recently upgraded its GDP growth
forecast for the country in 2012 from 7.5 per cent to 7.7
per cent.
And, according to Barclays, key economic indicators
remained encouraging, suggesting that the Chinese econ-
omy “is now on a steady path to recovery, which should
buttress real demand” for oil.
Further evidence of an improving economy came in
November with the news that China’s manufacturing sec-
tor had accelerated for the first time in 13 months.
The latest indicator of recovery in the real econ-
omy, the China HSBC Flash Manufacturing Purchasing
Managers’ Index (PMI), rose to a 13-month high of 50.4
in November. And a sub-index, which measures output,
rose to 51.3, also the highest since October 2011.
“This confirms that the economic recovery continues
to gain momentum towards year-end,” Qu Hongbin, Chief
Economist at index sponsor HSBC, was quoted as saying
in a statement.
“However, it is still the early stage of recovery and
global economic growth remains fragile. This calls for a
continuation of policy-easing to strengthen the recovery,”
he added.

62
OPE
C bu
lleat
in 1
0–12
/12
Wo
rks
ho
p
Public relations experts from OPEC Member Countries met
with their counterparts at the Organization’s Secretariat
on November 5–8 to discuss how to forge a closer work-
ing relationship through the exchange and sharing of
information.
The occasion was the First Annual PR Workshop for
Member Countries’ Public Relations Managers. The par-
ticipants consisted of 22 delegates from ten Member
Countries, together with staff members from the
Secretariat’s PR and Information Department (PRID).
The workshop was opened by OPEC Secretary General,
Abdalla Salem El-Badri, who stressed the importance
of promoting such an initiative in today’s challenging
environment.
“Even though the subject of public relations is becom-
ing very, very critical and important to OPEC, unfortunately
we are not really paying that much attention to it,” he told
assembled delegates.
“So we decided to have this workshop, where we can
exchange ideas and thoughts … (and) really tackle some
of the problems that we are facing.”
El-Badri pointed out that there should be the clear
message across OPEC Member Countries that “we should
talk the same language (and use) the same technology
for the benefit of our Member Countries.”
During the gathering, six presentations were made by
PRID, given by the Department’s Head, Angela Agoawike,
and her team, comprising Zoreli Figueroa, Alaa Al-Saigh,
First OPEC Public Relations Workshop held
Member Country and Secretariat PR experts meet in Vienna
Workshop Annual 1stPR
Workshop participants and Secretariat officials assemble with OPEC Secretary General, Abdalla Salem El-Badri, for a group photograph.
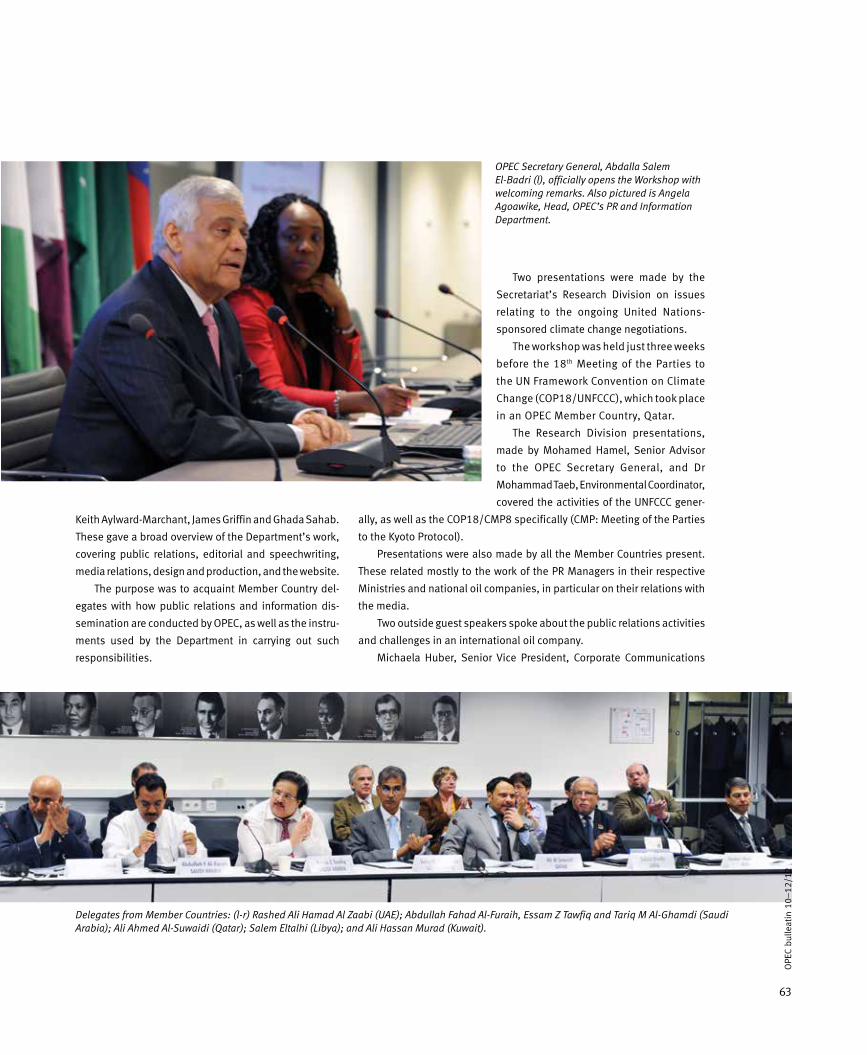
63
Keith Aylward-Marchant, James Griffin and Ghada Sahab.
These gave a broad overview of the Department’s work,
covering public relations, editorial and speechwriting,
media relations, design and production, and the website.
The purpose was to acquaint Member Country del-
egates with how public relations and information dis-
semination are conducted by OPEC, as well as the instru-
ments used by the Department in carrying out such
responsibilities.
Two presentations were made by the
Secretariat’s Research Division on issues
relating to the ongoing United Nations-
sponsored climate change negotiations.
The workshop was held just three weeks
before the 18th Meeting of the Parties to
the UN Framework Convention on Climate
Change (COP18/UNFCCC), which took place
in an OPEC Member Country, Qatar.
The Research Division presentations,
made by Mohamed Hamel, Senior Advisor
to the OPEC Secretary General, and Dr
Mohammad Taeb, Environmental Coordinator,
covered the activities of the UNFCCC gener-
ally, as well as the COP18/CMP8 specifically (CMP: Meeting of the Parties
to the Kyoto Protocol).
Presentations were also made by all the Member Countries present.
These related mostly to the work of the PR Managers in their respective
Ministries and national oil companies, in particular on their relations with
the media.
Two outside guest speakers spoke about the public relations activities
and challenges in an international oil company.
Michaela Huber, Senior Vice President, Corporate Communications
OPE
C bu
lleat
in 1
0–12
/12
OPEC Secretary General, Abdalla Salem El-Badri (l), officially opens the Workshop with welcoming remarks. Also pictured is Angela Agoawike, Head, OPEC’s PR and Information Department.
Delegates from Member Countries: (l-r) Rashed Ali Hamad Al Zaabi (UAE); Abdullah Fahad Al-Furaih, Essam Z Tawfiq and Tariq M Al-Ghamdi (Saudi Arabia); Ali Ahmed Al-Suwaidi (Qatar); Salem Eltalhi (Libya); and Ali Hassan Murad (Kuwait).
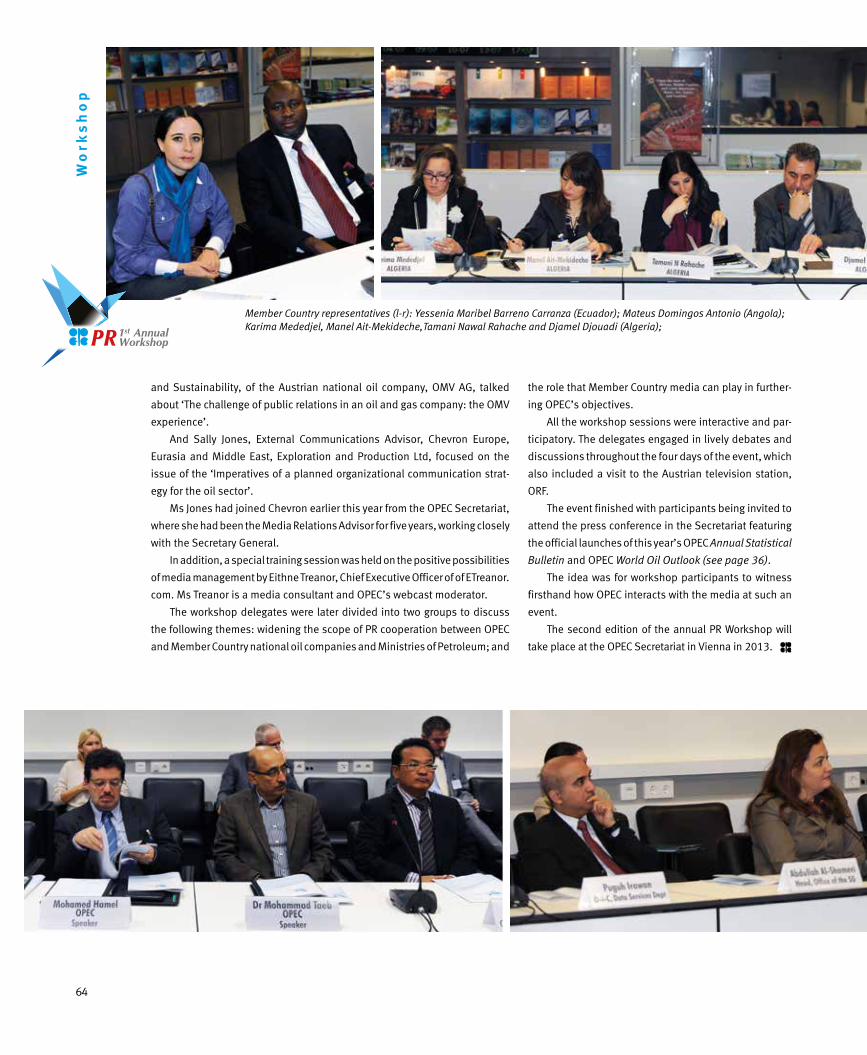
64
Wo
rks
ho
p
and Sustainability, of the Austrian national oil company, OMV AG, talked
about ‘The challenge of public relations in an oil and gas company: the OMV
experience’.
And Sally Jones, External Communications Advisor, Chevron Europe,
Eurasia and Middle East, Exploration and Production Ltd, focused on the
issue of the ‘Imperatives of a planned organizational communication strat-
egy for the oil sector’.
Ms Jones had joined Chevron earlier this year from the OPEC Secretariat,
where she had been the Media Relations Advisor for five years, working closely
with the Secretary General.
In addition, a special training session was held on the positive possibilities
of media management by Eithne Treanor, Chief Executive Officer of of ETreanor.
com. Ms Treanor is a media consultant and OPEC’s webcast moderator.
The workshop delegates were later divided into two groups to discuss
the following themes: widening the scope of PR cooperation between OPEC
and Member Country national oil companies and Ministries of Petroleum; and
the role that Member Country media can play in further-
ing OPEC’s objectives.
All the workshop sessions were interactive and par-
ticipatory. The delegates engaged in lively debates and
discussions throughout the four days of the event, which
also included a visit to the Austrian television station,
ORF.
The event finished with participants being invited to
attend the press conference in the Secretariat featuring
the official launches of this year’s OPEC Annual Statistical
Bulletin and OPEC World Oil Outlook (see page 36).
The idea was for workshop participants to witness
firsthand how OPEC interacts with the media at such an
event.
The second edition of the annual PR Workshop will
take place at the OPEC Secretariat in Vienna in 2013.
Member Country representatives (l-r): Yessenia Maribel Barreno Carranza (Ecuador); Mateus Domingos Antonio (Angola); Karima Mededjel, Manel Ait-Mekideche,Tamani Nawal Rahache and Djamel Djouadi (Algeria);
Workshop Annual 1stPR

65
OPE
C bu
lleat
in 1
0–12
/12
Below: OPEC Secretariat officials (l-r): Mohamed Hamel, Dr Mohammad Taeb, Puguh Irawan, Abdullah Al-Shameri, Asma Muttawa, Hojatollah Ghanimi Fard, Oswaldo Tapia, Alejandro Rodriguez Rivas, Angela Agoawike and Zoreli Figueroa.
Sally Jones Michaela Huber Eithne Treanor
Ehsan Taghavinejad, Ehsan Jenabi and Eshagh Rooyvar (Iran); Paola J Herrera (Ecuador); Hashim Faraj Al Musawi, Alya Sabeeh Jameel, Ihsan I Al-Attar and Amar A Hassan (Iraq).

66
OPE
C bu
lleat
in 1
0–12
/12
Se
cre
tary
Ge
ne
ral’
s D
iary In the course of his official duties, OPEC Secretary
General, Abdalla Salem El-Badri, visits, receives and holds talks with numerous dignitaries.These pages are dedicated to capturing those visits in pictures.
Ramachandran Swaminathan (l), Ambassador of India to Austria, paid a courtesy visit to Abdalla Salem El-Badri, OPEC Secretary General, on October 9, 2012.
Günther Oettinger (r), European Commissioner for Energy, paid a visit to Abdalla Salem El-Badri, OPEC Secretary General, on October 8, 2012.
Cheng Jingye, Ambassador, Permanent Representative of the PR of China to the United Nations and other International Organizations in Vienna, visited Abdalla Salem El-Badri, OPEC Secretary General, on November 9, 2012.

OPE
C bu
lleat
in 1
0–12
/12
67
Dr Inyang Ebong-Harstrup (l), Deputy Director of the Special Unit for South-
South Cooperation, UNDP, visited Abdalla Salem El-Badri, OPEC Secretary General, on
November 19, 2012.
Dr Badr Mohamed Zaher Al Hinai, Ambassador of Oman to Austria, during a visit of a delegation from the Sultan Qaboos University of Oman, with Abdalla Salem El-Badri, OPEC Secretary General, on November 9, 2012.

68
OPE
C bu
lleat
in 1
0–12
/12
Bri
efi
ng
s Students and professional groups wanting to know more about OPEC visit the Secretariat regularly, in order to receive briefings from the Public Relations and Information Department (PRID). In some cases, PRID visits schools to give them briefings on the Organization and the oil industry. Here we present some snapshots of such visits.
Visits
A group of students from the Gymnasium Baden visited the OPEC Secretariat on November 14, 2012.
A group of visitors from IIMC-ONGC, India, visited the OPEC Secretariat on November 16, 2012.
A group of students from the University of Debrecen, Hungary, visited the OPEC Secretariat on November 30, 2012.
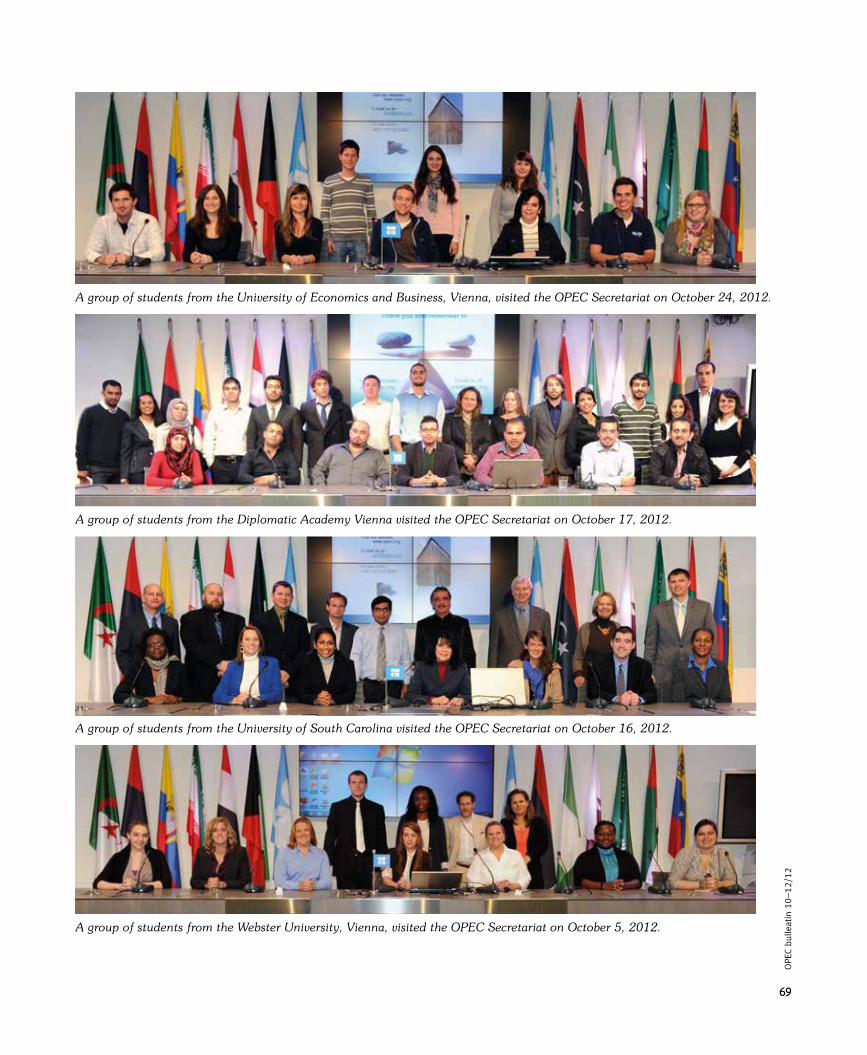
6969
OPE
C bu
lleat
in 1
0–12
/12
A group of students from the University of Economics and Business, Vienna, visited the OPEC Secretariat on October 24, 2012.
A group of students from the Webster University, Vienna, visited the OPEC Secretariat on October 5, 2012.
A group of students from the Diplomatic Academy Vienna visited the OPEC Secretariat on October 17, 2012.
A group of students from the University of South Carolina visited the OPEC Secretariat on October 16, 2012.
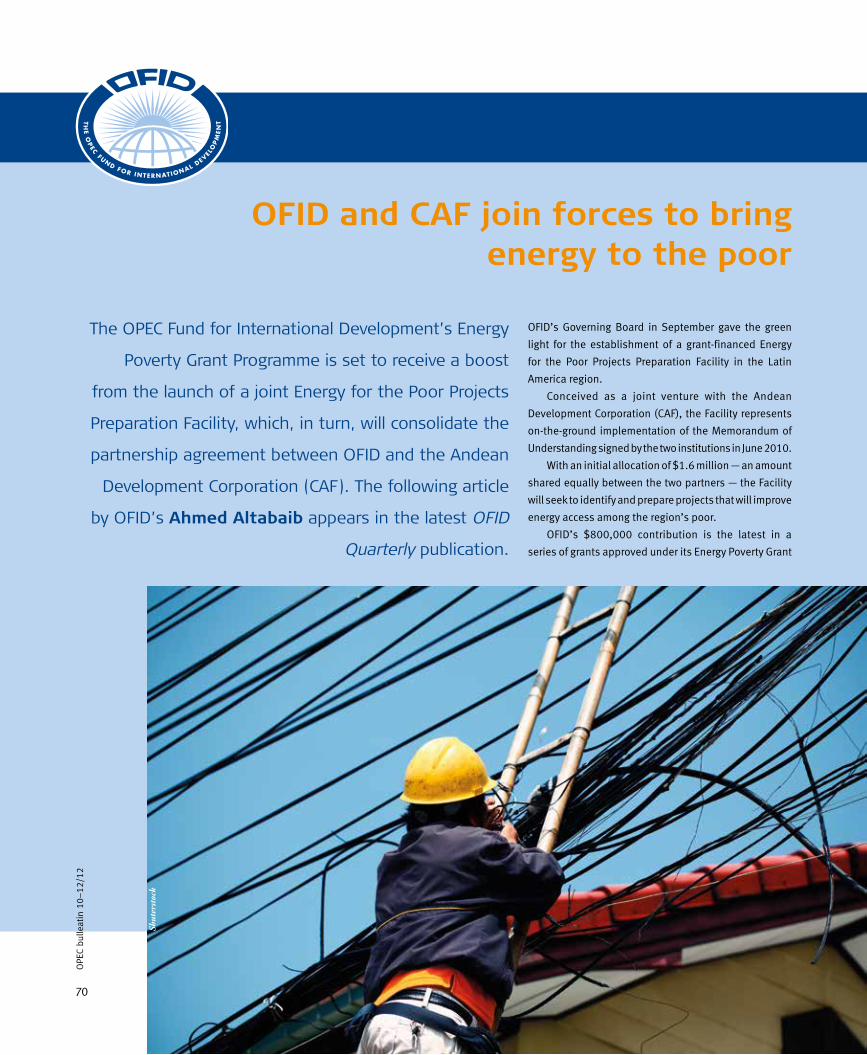
70
OPE
C bu
lleat
in 1
0–12
/12
OFID and CAF join forces to bring energy to the poor
OFID’s Governing Board in September gave the green
light for the establishment of a grant-financed Energy
for the Poor Projects Preparation Facility in the Latin
America region.
Conceived as a joint venture with the Andean
Development Corporation (CAF), the Facility represents
on-the-ground implementation of the Memorandum of
Understanding signed by the two institutions in June 2010.
With an initial allocation of $1.6 million — an amount
shared equally between the two partners — the Facility
will seek to identify and prepare projects that will improve
energy access among the region’s poor.
OFID’s $800,000 contribution is the latest in a
series of grants approved under its Energy Poverty Grant
The OPEC Fund for International Development’s Energy
Poverty Grant Programme is set to receive a boost
from the launch of a joint Energy for the Poor Projects
Preparation Facility, which, in turn, will consolidate the
partnership agreement between OFID and the Andean
Development Corporation (CAF). The following article
by OFID’s Ahmed Altabaib appears in the latest OFID
Quarterly publication.
Shut
erst
ock
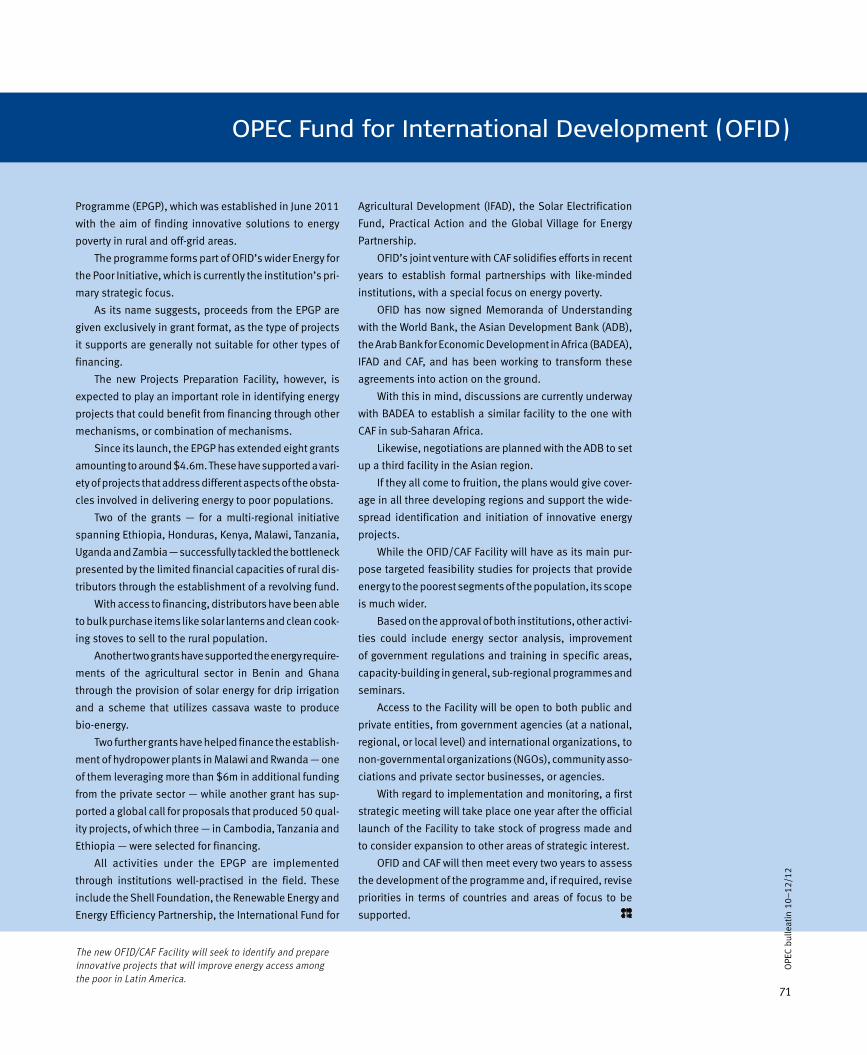
71
OPE
C bu
lleat
in 1
0–12
/12
OPEC Fund for International Development (OFID)
Programme (EPGP), which was established in June 2011
with the aim of finding innovative solutions to energy
poverty in rural and off-grid areas.
The programme forms part of OFID’s wider Energy for
the Poor Initiative, which is currently the institution’s pri-
mary strategic focus.
As its name suggests, proceeds from the EPGP are
given exclusively in grant format, as the type of projects
it supports are generally not suitable for other types of
financing.
The new Projects Preparation Facility, however, is
expected to play an important role in identifying energy
projects that could benefit from financing through other
mechanisms, or combination of mechanisms.
Since its launch, the EPGP has extended eight grants
amounting to around $4.6m. These have supported a vari-
ety of projects that address different aspects of the obsta-
cles involved in delivering energy to poor populations.
Two of the grants — for a multi-regional initiative
spanning Ethiopia, Honduras, Kenya, Malawi, Tanzania,
Uganda and Zambia — successfully tackled the bottleneck
presented by the limited financial capacities of rural dis-
tributors through the establishment of a revolving fund.
With access to financing, distributors have been able
to bulk purchase items like solar lanterns and clean cook-
ing stoves to sell to the rural population.
Another two grants have supported the energy require-
ments of the agricultural sector in Benin and Ghana
through the provision of solar energy for drip irrigation
and a scheme that utilizes cassava waste to produce
bio-energy.
Two further grants have helped finance the establish-
ment of hydropower plants in Malawi and Rwanda — one
of them leveraging more than $6m in additional funding
from the private sector — while another grant has sup-
ported a global call for proposals that produced 50 qual-
ity projects, of which three — in Cambodia, Tanzania and
Ethiopia — were selected for financing.
All activities under the EPGP are implemented
through institutions well-practised in the field. These
include the Shell Foundation, the Renewable Energy and
Energy Efficiency Partnership, the International Fund for
Agricultural Development (IFAD), the Solar Electrification
Fund, Practical Action and the Global Village for Energy
Partnership.
OFID’s joint venture with CAF solidifies efforts in recent
years to establish formal partnerships with like-minded
institutions, with a special focus on energy poverty.
OFID has now signed Memoranda of Understanding
with the World Bank, the Asian Development Bank (ADB),
the Arab Bank for Economic Development in Africa (BADEA),
IFAD and CAF, and has been working to transform these
agreements into action on the ground.
With this in mind, discussions are currently underway
with BADEA to establish a similar facility to the one with
CAF in sub-Saharan Africa.
Likewise, negotiations are planned with the ADB to set
up a third facility in the Asian region.
If they all come to fruition, the plans would give cover-
age in all three developing regions and support the wide-
spread identification and initiation of innovative energy
projects.
While the OFID/CAF Facility will have as its main pur-
pose targeted feasibility studies for projects that provide
energy to the poorest segments of the population, its scope
is much wider.
Based on the approval of both institutions, other activi-
ties could include energy sector analysis, improvement
of government regulations and training in specific areas,
capacity-building in general, sub-regional programmes and
seminars.
Access to the Facility will be open to both public and
private entities, from government agencies (at a national,
regional, or local level) and international organizations, to
non-governmental organizations (NGOs), community asso-
ciations and private sector businesses, or agencies.
With regard to implementation and monitoring, a first
strategic meeting will take place one year after the official
launch of the Facility to take stock of progress made and
to consider expansion to other areas of strategic interest.
OFID and CAF will then meet every two years to assess
the development of the programme and, if required, revise
priorities in terms of countries and areas of focus to be
supported.
The new OFID/CAF Facility will seek to identify and prepare innovative projects that will improve energy access among the poor in Latin America.
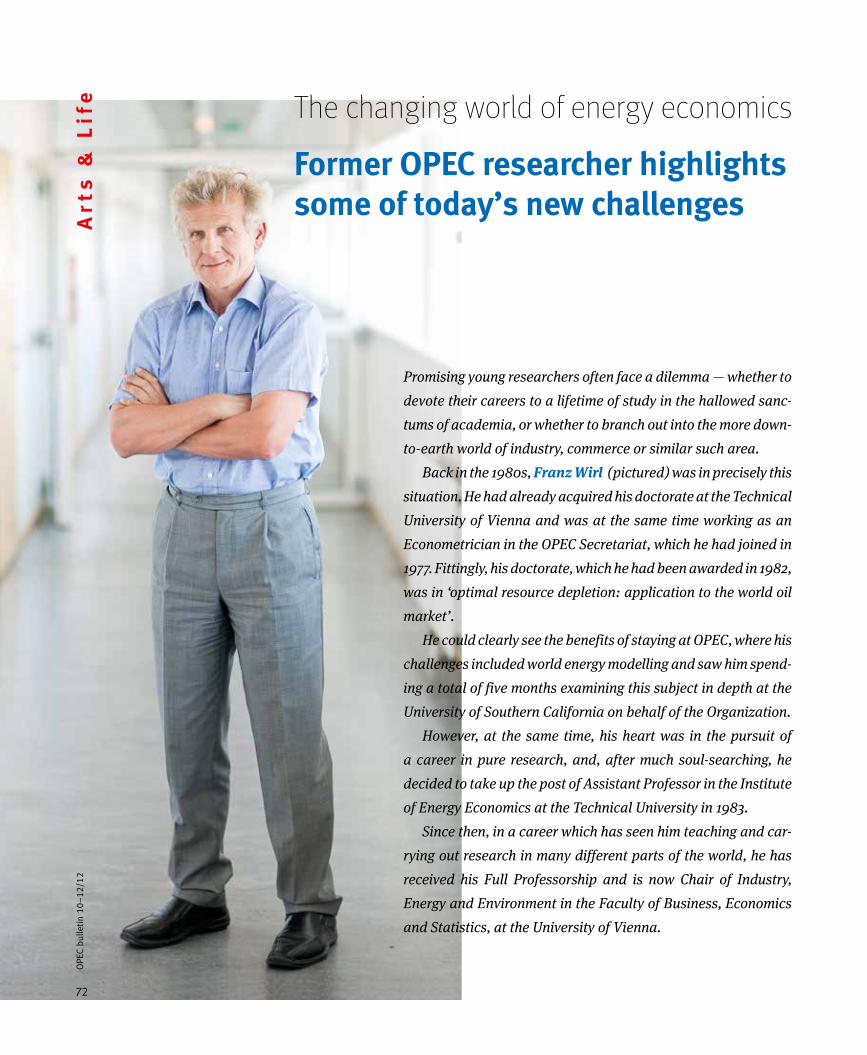
72
OPE
C bu
lleat
in 1
0–12
/12
Art
s &
Lif
e The changing world of energy economics
Former OPEC researcher highlightssome of today’s new challenges
Promising young researchers often face a dilemma — whether to devote their careers to a lifetime of study in the hallowed sanc-tums of academia, or whether to branch out into the more down-to-earth world of industry, commerce or similar such area. Back in the 1980s, Franz Wirl (pictured) was in precisely this situation. He had already acquired his doctorate at the Technical University of Vienna and was at the same time working as an Econometrician in the OPEC Secretariat, which he had joined in 1977. Fittingly, his doctorate, which he had been awarded in 1982, was in ‘optimal resource depletion: application to the world oil market’. He could clearly see the benefits of staying at OPEC, where his challenges included world energy modelling and saw him spend-ing a total of five months examining this subject in depth at the University of Southern California on behalf of the Organization. However, at the same time, his heart was in the pursuit of a career in pure research, and, after much soul-searching, he decided to take up the post of Assistant Professor in the Institute of Energy Economics at the Technical University in 1983. Since then, in a career which has seen him teaching and car-rying out research in many different parts of the world, he has received his Full Professorship and is now Chair of Industry, Energy and Environment in the Faculty of Business, Economics and Statistics, at the University of Vienna.
72
OPE
C bu
lleti
n 10
–12
/12
73
OPE
C bu
lleat
in 1
0–12
/12
Professor Wirl, can you please describe some of your work at the Secretariat in 1977–83, including your visits to Southern California on behalf of the Organization?
I started in the Statistics Section of the Data Services
Department, where I had to answer ad hoc requests,
developed a petroleum product prices data base and
began working on oil demand forecasts and finally on
OPEC strategies. A major change was my transfer to the
Energy Studies Department as an Econometrician, when
I became more involved in energy modelling.
A characteristic of the second half of the 1970s among
academics then was the confidence in large-scale model-
building (probably inspired by ‘The Club of Rome’ reports
at that time). In line with this, OPEC embarked on large-
scale, long-term world energy modelling.
One of the projects was contracted to the University
of Southern California (USC) in the United States, where
a number of OPEC officials spent some time, and I had
the opportunity to stay there too, in total, for almost five
months.
This was a teaching lesson and, as a young researcher,
In addition to energy and environment economics, his main areas of research and teach-ing are in industrial management, dynamic games, principal-agent-relationships and real options. He has written three books and contributed to more than 200 publications, mostly in international refereed journals. His roots with the OPEC Secretariat have always remained strong, however, and, since his leaving, have seen him carry out consultancy work for the Organization, as well as dis-cussing topical issues with staff members on a more informal basis. He has also contributed papers to both the OPEC Review (now the OPEC Energy Review) and the OPEC Bulletin. The OPEC Bulletin’s Keith Aylward-Marchant met up with Professor Wirl at the Fifth OPEC International Seminar in Vienna in June and invited him to reflect upon his career and some of the changes that have occurred in the oil industry during the past three decades.
I was surprised by the approach taken there — the people
at the USC were, as we say in Austria, only ‘cooking with
water’ (of course). What I mean by this is that those famous
professors could not perform miracles (to the surprise
of a young researcher); to use another expression, each
of them could only ‘put his pants on one leg at a time’.
With hindsight, one can say that the promise of the
large modelling efforts was not fulfilled. However, this
experience somehow helped shape my own preferences,
since I always preferred small models for the sake of the
insights one can achieve by simple model simulations.
You left OPEC in 1983 to pursue a full-time academic career. Can you briefly describe your achievements during this period and what have been the high-lights for you?
I have been quite successful in getting my papers pub-
lished. For example, in a publication-based ranking of
economists in the German-speaking area in the 1990s,
I was ranked in the top ten, and, indeed, number one
among the management professsors in 2009 and again
in 2012.

74
OPE
C bu
lleat
in 1
0–12
/12
However, given the narrow box — energy economics — into which I was appar-
ently put, I found it quite hard to find a full professorship, given the few positions
in energy economics. In 1995, I accepted an offer from the University of Magdeburg
in Germany, and my experience there was a very good one in professional terms.
Personally, however, it was a strenuous one, since I had to travel each week
between Vienna and Magdeburg to be with my family. In spite of a professionally
more attractive offer in 2000, I decided for family reasons to accept an offer from
the University of Vienna in its Business Department, and I have no regrets about
this on any count.
You have carried out some consultancy work for OPEC since 1983. What did this involve?
My involvement as a consultant was rather light and concerned three major tasks.
The first one was to transfer ‘my’ global energy and oil demand medium-term fore-
casting model from the mainframe to the PC (personal computer).
The other two involved contributions to the OPEC World Energy Model. One was
to assess the asymmetry — more precisely, the history-dependent price-sensitivity
— of energy demand after the price collapse of 1986. In my opinion, this aspect is
Dr Franz Wirl (standing,
centre), with the ‘OPEC
Oilers’ during his time at
the OPEC Secretariat.
Dr Franz Wirl skiing at Sonnblick.
Art
s &
Lif
e
still not fully understood in practice and in the academic literature; most papers
link asymmetry with price peaks, without accounting for the duration of such peaks
or high prices.
The other one was to design a module to forecast the energy demand of the
former centrally planned economies, since the energy data generated by the past
socialist planning was unreliable in making inferences about future developments.
Aside from that, I have stayed in contact most of the time and discussed some
issues with OPEC Secretariat staff.
How do you think the Organization has changed over the past three decades?
Fran
z W
irl
75
OPE
C bu
lleat
in 1
0–12
/12
I think the Organization has done very well, given the
uncertain environment and some formidable challenges
at times. In particular, OPEC has achieved an astonishing
degree of reliability of supply.
You have worked on important energy-related model-ling projects over the past 35 years. How do you think the modelling environment has changed during this time, bearing in mind the massive increase in com-puting power?
The confidence in global large-scale modelling has van-
ished (although its practice has not been abandoned
entirely). This seems ironic, if one relates this to the gigan-
tic increase in computing power, which, looking back,
remains unbelievable, actually a miracle, for us early
practitioners of computer-modelling (during my time in
the Secretariat, one company that no longer exists offered
a mainframe with 256 kilobyte RAM!).
In terms of analytical techniques, what has happened
is that the shift from large-scale to small-scale oil market
models was — and is — accompanied by accommodating
issues like uncertainty, strategic aspects (ie game the-
ory approaches) and empirical matters, eg there is now
a huge econometric literature, most of it, unfortunately,
rather sterile and mechanical.
This disappointment extends to the state of the
academic literature on energy economics (including, of
course, my own work) and is somewhat surprising, given
the many energy market-related problems.
One issue of much interest at the moment is how the recent price behaviour is affecting supply and demand. Indeed, in 1988, you published a paper in the OPEC Review on the ‘asymmetrical energy demand pattern’. How active is this effect today, over both the shorter and the longer terms?
This asymmetry is still not properly modelled, presum-
ably because it is hard to address empirically. The story
is, however, simple. Individual energy conservation (and
thus demand) as a reaction to price consists of at least
two components: (i) individual reductions by lowering
service demand; and (ii) investment into more efficient
appliances.
The appliances are, however, provided by industry.
Therefore, appliance efficiencies depend on past R&D
investments by firms. These investments do not depend
on price peaks (as most in the literature assume), but on
the duration and, even more, on the expectation of high
future energy prices.
Since the output from R&D is mostly irreversible (say,
once we know how to produce PV-panels with 20 per cent
efficiency, a more efficient engine, etc), this will also affect
future demand, even if prices turn out again to be low.
This explains why it took some 20 years and low
prices (and, on top of this, the fast increases in demand
in emerging economies) for energy and oil demand to
recover their past momentum. And it also explains why
high prices are necessary to trigger further efficiency
increases.
Over the past decade, there has been a big human resource challenge in the oil industry, trying to attract more high-calibre young people to replace a highly skilled older generation that is gradually disappear-ing. What do you think the industry should do to attract more young people after they graduate?
For a start, energy companies and, in particular, oil com-
panies should continue to pay good, above-average, sal-
aries. Of course, they cannot compete with the finance
industry, at least in the past. However, as an outsider,
I remain optimistic that the industry can attract suffi-
cient talent.
For young people wishing to pursue a career in energy economics, how should they go about this and what educational institutions, in your opinion, stand out in meeting their needs?
Energy economic issues involve topics from economics
(resources, environment, international, regulatory), man-
agement (in particular, contracts and finance) and politics
(I favour ‘public choice theory’ as a rational approach to
politics, but some may prefer more traditional political
science) and require tools (mathematics in general, but,
in particular, game theory, engineering, statistics and
econometrics).
I personally would recommend to anyone with a suf-
ficiently strong feel for formal tools and an interest in
energy markets to go for it.
Looking back, I must say that I had great luck to get,
actually to stumble, into this field and, in particular, to
do my apprenticeship at the OPEC Secretariat. Besides
that, I had a great time there, including playing football
with the ‘OPEC Oilers’! (the name of the Secretariat’s soc-
cer team at the time).

76
OPE
C bu
lleat
in 1
0–12
/12
Art
s &
Lif
e
Chinese Taipei is more than living
up to its reputation as one of
the renowned ‘Asian Tigers’ —
four countries also comprising
Hong Kong, Singapore and
South Korea, that have earned
their economic stripes through
rapid industrialization and
development.
Saadallah Al Fathi, a former Head
of Energy Studies at the OPEC
Secretariat, recently made his
first trip to the island state and
was more than impressed with
what he saw. As an oil man, he
was particularly interested to
learn just how the country, as an
increasing oil importer to fuel its
burgeoning economy, is forming
strong ties with OPEC Member
Countries.
The ‘miracle’ continues …
Saadallah Al Fathi, pictured in the Taipei Research Institute.
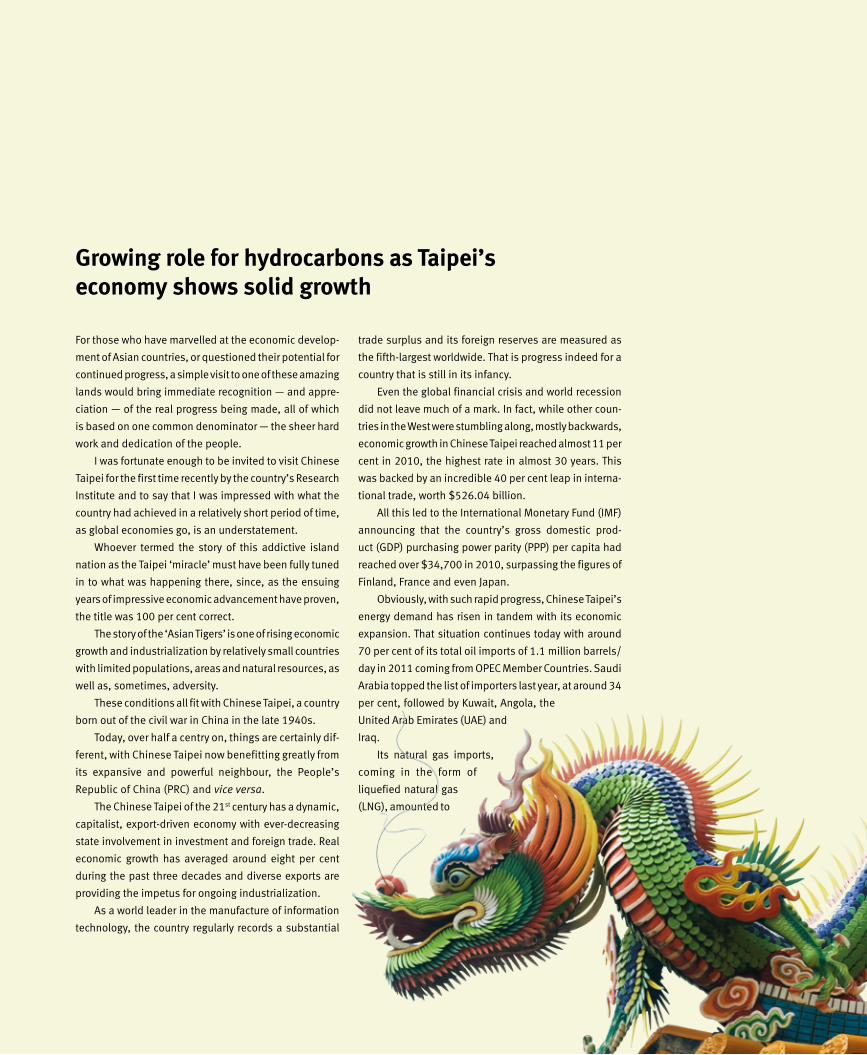
77
OPE
C bu
lleat
in 1
0–12
/12
Growing role for hydrocarbons as Taipei’s economy shows solid growth
For those who have marvelled at the economic develop-
ment of Asian countries, or questioned their potential for
continued progress, a simple visit to one of these amazing
lands would bring immediate recognition — and appre-
ciation — of the real progress being made, all of which
is based on one common denominator — the sheer hard
work and dedication of the people.
I was fortunate enough to be invited to visit Chinese
Taipei for the first time recently by the country’s Research
Institute and to say that I was impressed with what the
country had achieved in a relatively short period of time,
as global economies go, is an understatement.
Whoever termed the story of this addictive island
nation as the Taipei ‘miracle’ must have been fully tuned
in to what was happening there, since, as the ensuing
years of impressive economic advancement have proven,
the title was 100 per cent correct.
The story of the ‘Asian Tigers’ is one of rising economic
growth and industrialization by relatively small countries
with limited populations, areas and natural resources, as
well as, sometimes, adversity.
These conditions all fit with Chinese Taipei, a country
born out of the civil war in China in the late 1940s.
Today, over half a centry on, things are certainly dif-
ferent, with Chinese Taipei now benefitting greatly from
its expansive and powerful neighbour, the People’s
Republic of China (PRC) and vice versa.
The Chinese Taipei of the 21st century has a dynamic,
capitalist, export-driven economy with ever-decreasing
state involvement in investment and foreign trade. Real
economic growth has averaged around eight per cent
during the past three decades and diverse exports are
providing the impetus for ongoing industrialization.
As a world leader in the manufacture of information
technology, the country regularly records a substantial
trade surplus and its foreign reserves are measured as
the fifth-largest worldwide. That is progress indeed for a
country that is still in its infancy.
Even the global financial crisis and world recession
did not leave much of a mark. In fact, while other coun-
tries in the West were stumbling along, mostly backwards,
economic growth in Chinese Taipei reached almost 11 per
cent in 2010, the highest rate in almost 30 years. This
was backed by an incredible 40 per cent leap in interna-
tional trade, worth $526.04 billion.
All this led to the International Monetary Fund (IMF)
announcing that the country’s gross domestic prod-
uct (GDP) purchasing power parity (PPP) per capita had
reached over $34,700 in 2010, surpassing the figures of
Finland, France and even Japan.
Obviously, with such rapid progress, Chinese Taipei’s
energy demand has risen in tandem with its economic
expansion. That situation continues today with around
70 per cent of its total oil imports of 1.1 million barrels/
day in 2011 coming from OPEC Member Countries. Saudi
Arabia topped the list of importers last year, at around 34
per cent, followed by Kuwait, Angola, the
United Arab Emirates (UAE) and
Iraq.
Its natural gas imports,
coming in the form of
liquefied natural gas
(LNG), amounted to

78
OPE
C bu
lleat
in 1
0–12
/12
to concentrate on the provision of infrastructure and
expanding education.
The success of this approach meant that between
1952 and 1982, economic growth averaged 8.7 per cent,
while between 1983 and 1986 it stood at an average of
6.9 per cent.
What is striking at this time is that the people of
Chinese Taipei never shied away from entering into even
the simplest of industries to help boost their standing,
such as making umbrellas and bicycles, in addition to
manufacturing textiles.
This enabled the locals to gain valuable experience
in trading activities and to prepare for the day when they
would move into the more advanced, sophisticated and
lucrative industries, such as machinery, electronics, com-
puters and petrochemicals.
However, as with many manufacturing economies
in Asia that rely on the import of raw materials and the
export of finished products, high expansion rates are not
280,000 b/d of oil equivalent in 2011, of which over 32
per cent came from OPEC Member Qatar.
And the good news for OPEC is that Chinese Taipei’s
oil demand is forecast to continue rising to a level of 1.3m
b/d by the end of 2012, compared with 994,000 b/d in
2011. That undoubtedly spells more potential business
for the Organization’s Member Countries.
It has been a storybook journey for the island so
far, especially with regard to its economic development.
Even during its formative years, from the 1950s onwards,
Chinese Taipei managed to prosecute its rapid industri-
alization and attain high economic growth rates.
Over the years, resources brought from mainland
China and aid from other countries, coupled with a sta-
ble and accommodating government, enabled the sheer
hard work of the people to bring positive results for the
economy and country as a whole.
This was preceded by land reforms to increase agri-
cultural output sufficiently and to allow the government
Art
s &
Lif
e
The Taipai 101 tower, which up until 2010 was the world’s tallest building.
Shut
ters
tock

79
OPE
C bu
lleat
in 1
0–12
/12
always fully sustainable, especially when they so often
depend on conditions in the main importing countries.
Chinese Taipei learned this lesson in 2011 when it
saw its GDP expansion slump to just four per cent, which
was in stark contrast to the double-digit record growth
seen the previous year.
This was due to the continued economic and financial
problems in the United States and Europe, coupled with
a slowdown in mainland China, all main export destina-
tions of Chinese Taipei.
The growth forecast for Chinese Taipei for 2012 is
now estimated at two-to-three per cent, but the situa-
tion is expected to improve, particularly if the debt and
recessionary problems in Europe are resolved and the
economies pick up in other regions of the world.
But this apart, it is clear that the better relations with
the PRC since the early 1990s, has brought undoubted
additional opportunities to Chinese Taipei.
A futuristic bridge winding accross the capital Taipei. Inset is a typical rice field.
Shut
ters
tock
Shut
ters
tock
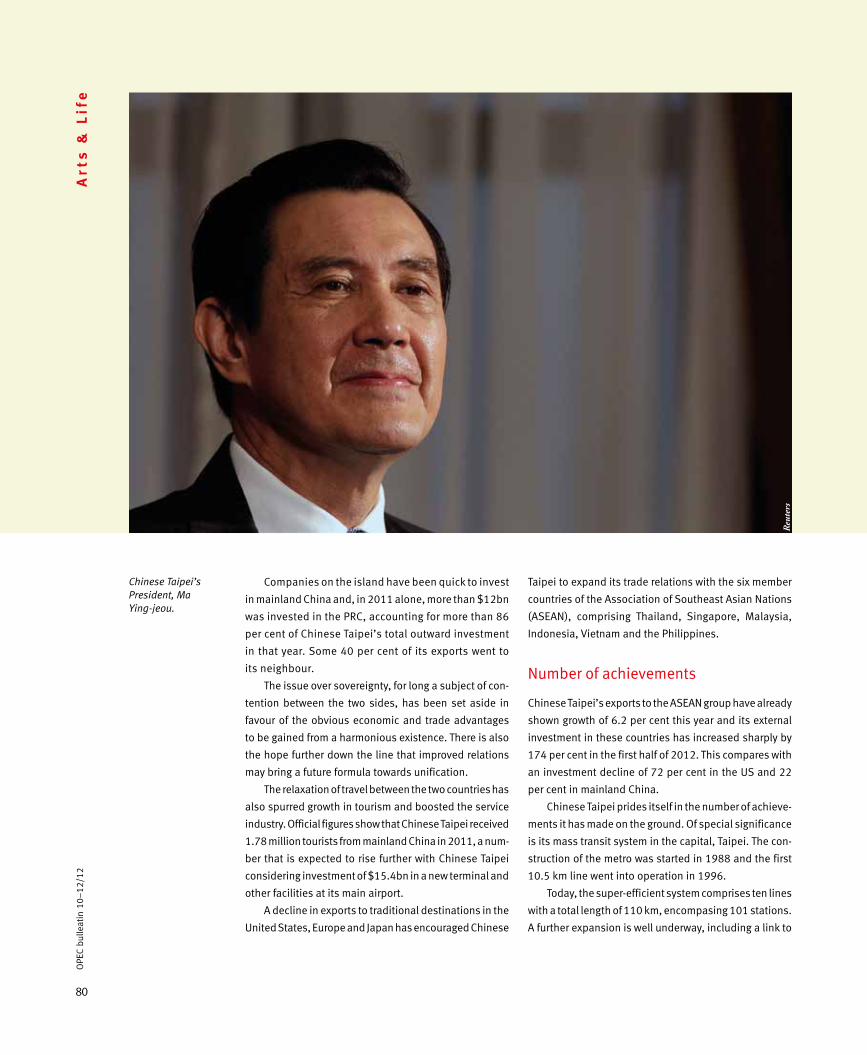
80
OPE
C bu
lleat
in 1
0–12
/12
Companies on the island have been quick to invest
in mainland China and, in 2011 alone, more than $12bn
was invested in the PRC, accounting for more than 86
per cent of Chinese Taipei’s total outward investment
in that year. Some 40 per cent of its exports went to
its neighbour.
The issue over sovereignty, for long a subject of con-
tention between the two sides, has been set aside in
favour of the obvious economic and trade advantages
to be gained from a harmonious existence. There is also
the hope further down the line that improved relations
may bring a future formula towards unification.
The relaxation of travel between the two countries has
also spurred growth in tourism and boosted the service
industry. Official figures show that Chinese Taipei received
1.78 million tourists from mainland China in 2011, a num-
ber that is expected to rise further with Chinese Taipei
considering investment of $15.4bn in a new terminal and
other facilities at its main airport.
A decline in exports to traditional destinations in the
United States, Europe and Japan has encouraged Chinese
Taipei to expand its trade relations with the six member
countries of the Association of Southeast Asian Nations
(ASEAN), comprising Thailand, Singapore, Malaysia,
Indonesia, Vietnam and the Philippines.
Number of achievements
Chinese Taipei’s exports to the ASEAN group have already
shown growth of 6.2 per cent this year and its external
investment in these countries has increased sharply by
174 per cent in the first half of 2012. This compares with
an investment decline of 72 per cent in the US and 22
per cent in mainland China.
Chinese Taipei prides itself in the number of achieve-
ments it has made on the ground. Of special significance
is its mass transit system in the capital, Taipei. The con-
struction of the metro was started in 1988 and the first
10.5 km line went into operation in 1996.
Today, the super-efficient system comprises ten lines
with a total length of 110 km, encompasing 101 stations.
A further expansion is well underway, including a link to
Chinese Taipei’s President, Ma Ying-jeou.
Art
s &
Lif
e
Reu
ters

81
OPE
C bu
lleat
in 1
0–12
/12
the Taipei international airport. Passengers using the net-
work in 2011 were close to 1.6m a day and the overall
number of users passed the 5bn mark in February this
year.
Building on this success, another mass transit sys-
tem started operations in the city of Kaohsiung in 2008
and similar systems are planned in other cities.
The country’s motorways have also been highly devel-
oped, as has the rail network. Chinese Taipei has com-
pleted its 345 km high-speed rail system to connect its
major cities and improve the transportation infrastructure.
This network started operations in January 2007 with
30 trains and already there are more on order. Investment
in this network so far is now close to $15bn.
The ultra-modern trains cruise at a speed of about
300 km per hour and are a joy to ride in. My experience
saw all seats occupied, which indicates just how popular
this mode of transport is.
Then we have the Taipei 101 tower, which was the
tallest building in the world from 2004 until 2010, when
it was surpassed by the Burj Khalifa in Dubai. But the
tower stands as a showpiece of Chinese Taipei engineer-
ing and construction and is a famous tourist attraction
for gaining the perfect panoramic view over the whole of
the capital.
But one only has to look at some of the economic indi-
cators to see the extent of the progress Chinese Taipei
has made over the years.
For instance, in 1962, Chinese Taipei had a per capita
gross national product (GNP) of $170, which grew rapidly,
such that by 2010 it became $35,227, adjusted for PPP.
By comparison, this is similar to the GNP of Germany (at
$36,033) in the same year.
In 2007, Chinese Taipei had $270bn in reserves,
which was about 73 per cent of its GDP, a figure that is
much higher than what the IMF suggests is optimal at 45
per cent.
Again, the rapid development and economic growth
seen in Chinese Taipei is reflected in its domestic energy
consumption.
Figures show that total primary energy consumption,
which stood at just 6.2 million tons of oil equivalent in
Space-age travel — the 300 km/hr ultra modern rail service.
Shut
ters
tock
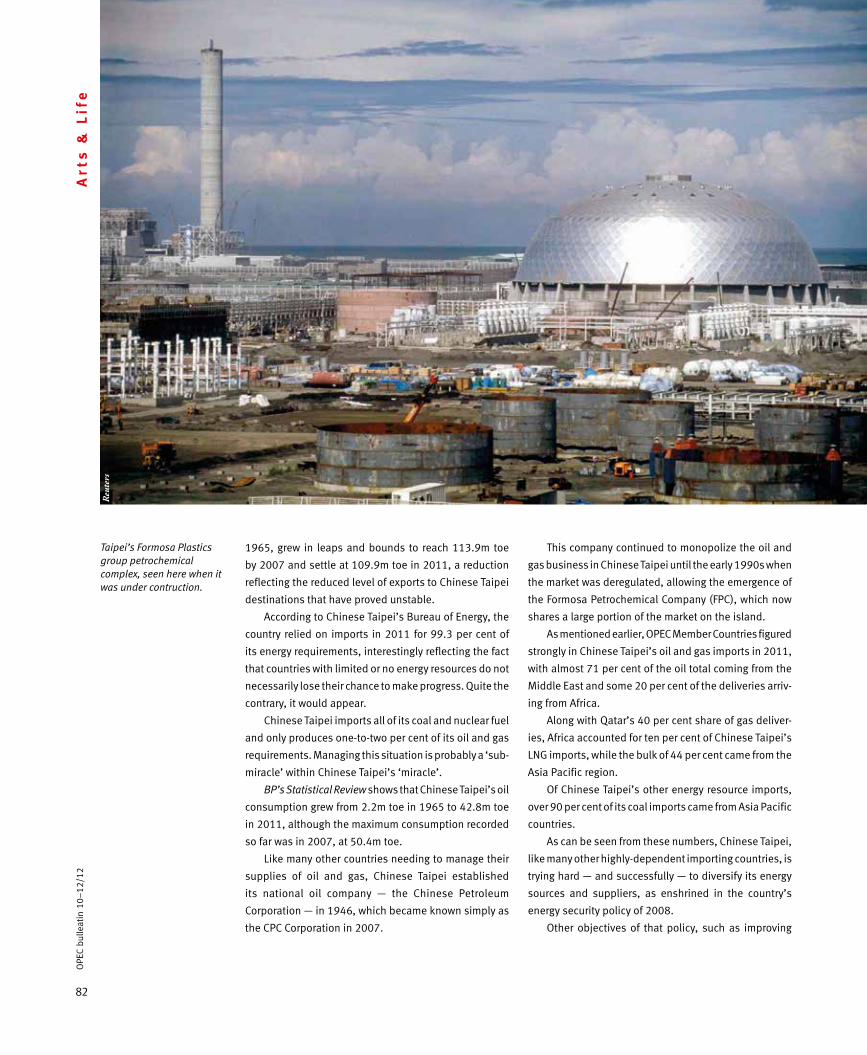
82
OPE
C bu
lleat
in 1
0–12
/12
Art
s &
Lif
e
1965, grew in leaps and bounds to reach 113.9m toe
by 2007 and settle at 109.9m toe in 2011, a reduction
reflecting the reduced level of exports to Chinese Taipei
destinations that have proved unstable.
According to Chinese Taipei’s Bureau of Energy, the
country relied on imports in 2011 for 99.3 per cent of
its energy requirements, interestingly reflecting the fact
that countries with limited or no energy resources do not
necessarily lose their chance to make progress. Quite the
contrary, it would appear.
Chinese Taipei imports all of its coal and nuclear fuel
and only produces one-to-two per cent of its oil and gas
requirements. Managing this situation is probably a ‘sub-
miracle’ within Chinese Taipei’s ‘miracle’.
BP’s Statistical Review shows that Chinese Taipei’s oil
consumption grew from 2.2m toe in 1965 to 42.8m toe
in 2011, although the maximum consumption recorded
so far was in 2007, at 50.4m toe.
Like many other countries needing to manage their
supplies of oil and gas, Chinese Taipei established
its national oil company — the Chinese Petroleum
Corporation — in 1946, which became known simply as
the CPC Corporation in 2007.
This company continued to monopolize the oil and
gas business in Chinese Taipei until the early 1990s when
the market was deregulated, allowing the emergence of
the Formosa Petrochemical Company (FPC), which now
shares a large portion of the market on the island.
As mentioned earlier, OPEC Member Countries figured
strongly in Chinese Taipei’s oil and gas imports in 2011,
with almost 71 per cent of the oil total coming from the
Middle East and some 20 per cent of the deliveries arriv-
ing from Africa.
Along with Qatar’s 40 per cent share of gas deliver-
ies, Africa accounted for ten per cent of Chinese Taipei’s
LNG imports, while the bulk of 44 per cent came from the
Asia Pacific region.
Of Chinese Taipei’s other energy resource imports,
over 90 per cent of its coal imports came from Asia Pacific
countries.
As can be seen from these numbers, Chinese Taipei,
like many other highly-dependent importing countries, is
trying hard — and successfully — to diversify its energy
sources and suppliers, as enshrined in the country’s
energy security policy of 2008.
Other objectives of that policy, such as improving
Taipei’s Formosa Plastics group petrochemical complex, seen here when it was under contruction.
Reu
ters
83
OPE
C bu
lleat
in 1
0–12
/12
energy efficiency by two per cent a year and reducing
energy intensity by 50 per cent by 2025, may be more
difficult to achieve, as is the desire to have low-carbon
energy resources at 55 per cent by the same year.
This sort of low-carbon energy now comprises just
over nine per cent of Chinese Taipei’s total energy sup-
ply, of which only a small fraction is in renewable form,
while the rest is nuclear. It is difficult to see renewable
energy hitting the eight per cent mark in 2025, as the
policy stipulates.
And increasing the country’s supply of nuclear energy
is also not going to be easy. Chinese Taipei has three
nuclear power plants, including six reactors with a total
capacity of 5,140 megawatts. One more plant is currently
under construction.
But concern over nuclear energy safety has under-
standably increased sharply after the Fukushima disas-
ter in Japan. In fact, nuclear became a political issue in
the January 2012 presidential elections.
In November last year, Chinese Taipei President, Ma
Ying-jeou, announced that no extension of the opera-
tional licences for existing nuclear reactors will be given
and the decommissioning of the reactors will follow the
expiration of their respective licences.
While the plant under construction will go ahead,
Chinese Taipei will seek a substantial expansion of renew-
able energy supplies and increase the use of natural gas,
as expected.
Even coal power plants are being promoted, as long
as they are coupled with carbon capture and storage sys-
tems, which will add substantially to their cost.
In the petroleum downstream sector, the CPC
Corporation has three refineries with a total capacity of
770,000 b/d, while Formosa Petrochemicals has one
450,000 b/d plant, which was recently revamped to ena-
ble it to process 540,000 b/d.
All the refineries are complex and integrated with vari-
ous petrochemical plants. Very little fuel oil is produced,
thereby allowing the plants to achieve better margins.
The total production of Chinese Taipei’s petrochemical
industry in 2010 was valued at $132bn, or 29.3 per cent
of the country’s total manufacturing industries’ output.
Chinese Taipei’s refining capacity is now more than
sufficient for its domestic consumption of oil products,
with the surplus exported to mainland China and other
countries.
This means there may not be any new refinery in
Chinese Taipei for some time to come, especially since
an increasing reliance on natural gas is forthcoming.
Chinese Taipei has two LNG regasification terminals — at Yung An
and Taichung — and the country’s gas-fired power generation capacity is
forecast to increase by 67 per cent by 2030, according to the Minister of
Economic Affairs, Shih Yen-shiang, in a statement in October last year.
Meanwhile, Business Monitor International forecasts that Chinese
Taipei’s demand should be around 19.5bn cubic metres by 2016 and
21.4bn cu m in 2021 with LNG imports increasing to these levels from
16.0bn cu m in 2011.
Therefore, CPC, which is the sole importer of the country’s LNG, has
decided on a third LNG regasification terminal close to Taipei. Obviously
the expected rise in LNG consumption is related to the gradual decom-
missioning of Chinese Taipei’s existing nuclear plants, starting from
2019.
With the current level of hydrocarbons demand, and in line with
the expansion expected in the years ahead, the CPC Corporation is try-
ing hard to enhance its modest resources in Chinese Taipei by ventur-
ing into many countries, including OPEC Members Ecuador, Libya and
Venezuela, in addition to non-OPEC countries, like Indonesia.
It is also cooperating in exploration with mainland China’s CNOOC
in the country’s offshore waters and elsewhere.
Overseas, CPC is reported to be taking a five per cent stake in Royal
Dutch Shell’s Prelude LNG project in Australia and will buy 2.7bn cu m
of gas from Shell for 20 years, starting in 2016.
Other LNG supply agreements include a 21-year accord with Qatar
for an annual 2.1bn cu m of supplies, starting from 2013, and another
agreement with Papua New Guinea, reflecting the expected sharp
increase in gas consumption for power generation.
CPC has not yet met with substantial success in the exploration and
production of hydrocarbons, but the level of domestic demand expected
will continue to propel Chinese Taipei to increase its own output, both
locally and internationally.
With all this going on — and with relations with the PRC seemingly
on a stable footing — Chinese Taipei will surely continue to go from
strength to strength, a mirror of its giant neighbour.
But having experienced the Taipei ‘miracle’ first-hand, I feel it should
be placed up there on a pedestal — as a model for other countries that
have much bigger resources, yet are lacking in the same level of progress.
Surely food for thought, as miracles go.
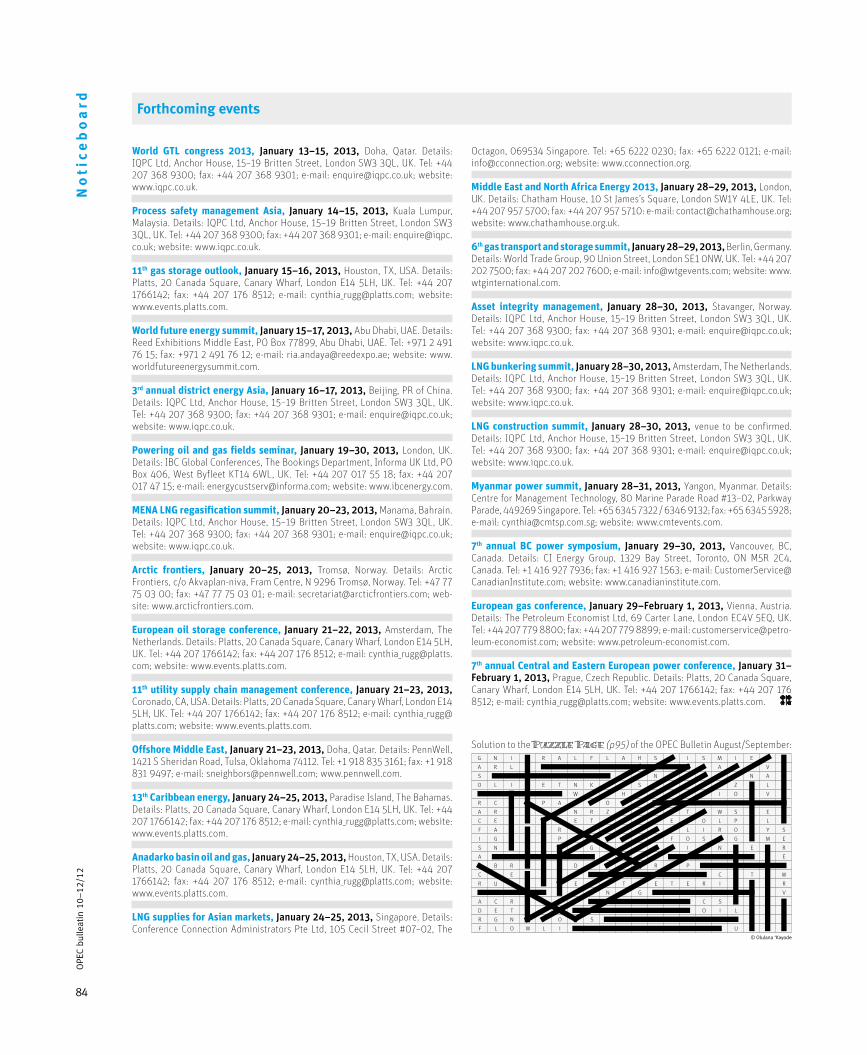
84
No
tic
eb
oa
rdO
PEC
bulle
atin
10–
12/1
2
Forthcoming events
World GTL congress 2013, January 13–15, 2013, Doha, Qatar. Details: IQPC Ltd, Anchor House, 15–19 Britten Street, London SW3 3QL, UK. Tel: +44 207 368 9300; fax: +44 207 368 9301; e-mail: [email protected]; website: www.iqpc.co.uk.
Process safety management Asia, January 14–15, 2013, Kuala Lumpur, Malaysia. Details: IQPC Ltd, Anchor House, 15–19 Britten Street, London SW3 3QL, UK. Tel: +44 207 368 9300; fax: +44 207 368 9301; e-mail: [email protected]; website: www.iqpc.co.uk.
11th gas storage outlook, January 15–16, 2013, Houston, TX, USA. Details: Platts, 20 Canada Square, Canary Wharf, London E14 5LH, UK. Tel: +44 207 1766142; fax: +44 207 176 8512; e-mail: [email protected]; website: www.events.platts.com.
World future energy summit, January 15–17, 2013, Abu Dhabi, UAE. Details: Reed Exhibitions Middle East, PO Box 77899, Abu Dhabi, UAE. Tel: +971 2 491 76 15; fax: +971 2 491 76 12; e-mail: [email protected]; website: www.worldfutureenergysummit.com.
3rd annual district energy Asia, January 16–17, 2013, Beijing, PR of China. Details: IQPC Ltd, Anchor House, 15–19 Britten Street, London SW3 3QL, UK. Tel: +44 207 368 9300; fax: +44 207 368 9301; e-mail: [email protected]; website: www.iqpc.co.uk.
Powering oil and gas fields seminar, January 19–30, 2013, London, UK. Details: IBC Global Conferences, The Bookings Department, Informa UK Ltd, PO Box 406, West Byfleet KT14 6WL, UK. Tel: +44 207 017 55 18; fax: +44 207 017 47 15; e-mail: [email protected]; website: www.ibcenergy.com.
MENA LNG regasification summit, January 20–23, 2013, Manama, Bahrain. Details: IQPC Ltd, Anchor House, 15–19 Britten Street, London SW3 3QL, UK. Tel: +44 207 368 9300; fax: +44 207 368 9301; e-mail: [email protected]; website: www.iqpc.co.uk.
Arctic frontiers, January 20–25, 2013, Tromsø, Norway. Details: Arctic Frontiers, c/o Akvaplan-niva, Fram Centre, N 9296 Tromsø, Norway. Tel: +47 77 75 03 00; fax: +47 77 75 03 01; e-mail: [email protected]; web-site: www.arcticfrontiers.com.
European oil storage conference, January 21–22, 2013, Amsterdam, The Netherlands. Details: Platts, 20 Canada Square, Canary Wharf, London E14 5LH, UK. Tel: +44 207 1766142; fax: +44 207 176 8512; e-mail: [email protected]; website: www.events.platts.com.
11th utility supply chain management conference, January 21–23, 2013, Coronado, CA, USA. Details: Platts, 20 Canada Square, Canary Wharf, London E14 5LH, UK. Tel: +44 207 1766142; fax: +44 207 176 8512; e-mail: [email protected]; website: www.events.platts.com.
Offshore Middle East, January 21–23, 2013, Doha, Qatar. Details: PennWell, 1421 S Sheridan Road, Tulsa, Oklahoma 74112. Tel: +1 918 835 3161; fax: +1 918 831 9497; e-mail: [email protected]; www.pennwell.com.
13th Caribbean energy, January 24–25, 2013, Paradise Island, The Bahamas. Details: Platts, 20 Canada Square, Canary Wharf, London E14 5LH, UK. Tel: +44 207 1766142; fax: +44 207 176 8512; e-mail: [email protected]; website: www.events.platts.com.
Anadarko basin oil and gas, January 24–25, 2013, Houston, TX, USA. Details: Platts, 20 Canada Square, Canary Wharf, London E14 5LH, UK. Tel: +44 207 1766142; fax: +44 207 176 8512; e-mail: [email protected]; website: www.events.platts.com.
LNG supplies for Asian markets, January 24–25, 2013, Singapore. Details: Conference Connection Administrators Pte Ltd, 105 Cecil Street #07–02, The
Octagon, 069534 Singapore. Tel: +65 6222 0230; fax: +65 6222 0121; e-mail: [email protected]; website: www.cconnection.org.
Middle East and North Africa Energy 2013, January 28–29, 2013, London, UK. Details: Chatham House, 10 St James’s Square, London SW1Y 4LE, UK. Tel: +44 207 957 5700; fax: +44 207 957 5710: e-mail: [email protected]; website: www.chathamhouse.org.uk.
6th gas transport and storage summit, January 28–29, 2013, Berlin, Germany. Details: World Trade Group, 90 Union Street, London SE1 0NW, UK. Tel: +44 207 202 7500; fax: +44 207 202 7600; e-mail: [email protected]; website: www.wtginternational.com.
Asset integrity management, January 28–30, 2013, Stavanger, Norway. Details: IQPC Ltd, Anchor House, 15–19 Britten Street, London SW3 3QL, UK. Tel: +44 207 368 9300; fax: +44 207 368 9301; e-mail: [email protected]; website: www.iqpc.co.uk.
LNG bunkering summit, January 28–30, 2013, Amsterdam, The Netherlands. Details: IQPC Ltd, Anchor House, 15–19 Britten Street, London SW3 3QL, UK. Tel: +44 207 368 9300; fax: +44 207 368 9301; e-mail: [email protected]; website: www.iqpc.co.uk.
LNG construction summit, January 28–30, 2013, venue to be confirmed. Details: IQPC Ltd, Anchor House, 15–19 Britten Street, London SW3 3QL, UK. Tel: +44 207 368 9300; fax: +44 207 368 9301; e-mail: [email protected]; website: www.iqpc.co.uk.
Myanmar power summit, January 28–31, 2013, Yangon, Myanmar. Details: Centre for Management Technology, 80 Marine Parade Road #13–02, Parkway Parade, 449269 Singapore. Tel: +65 6345 7322 / 6346 9132; fax: +65 6345 5928; e-mail: [email protected]; website: www.cmtevents.com.
7th annual BC power symposium, January 29–30, 2013, Vancouver, BC, Canada. Details: CI Energy Group, 1329 Bay Street, Toronto, ON M5R 2C4, Canada. Tel: +1 416 927 7936; fax: +1 416 927 1563; e-mail: [email protected]; website: www.canadianinstitute.com.
European gas conference, January 29–February 1, 2013, Vienna, Austria. Details: The Petroleum Economist Ltd, 69 Carter Lane, London EC4V 5EQ, UK. Tel: +44 207 779 8800; fax: +44 207 779 8899; e-mail: [email protected]; website: www.petroleum-economist.com.
7th annual Central and Eastern European power conference, January 31–February 1, 2013, Prague, Czech Republic. Details: Platts, 20 Canada Square, Canary Wharf, London E14 5LH, UK. Tel: +44 207 1766142; fax: +44 207 176 8512; e-mail: [email protected]; website: www.events.platts.com.
G N I G R A L F L A H S E I S M I E T E
A R L N N O I S S E C N O C G A R U V F
S E N I L O S A G I A N H N N E P N A F
O L I N E T N K M T S O I O T H Z E L L
C A S I N G W S U H K L I O G I O T V U
R C U F P A I B O E C T R U N K L I N E
A R L E L E N R Z Y A T O T P W S L E N
C E P R S O E T C C I R E R O L P O L T
F A H L H R W S O N H G O L I R O E Y S
I G U L A P A L G T N P F O S E G Z M E
S N R I L G L G I I A C T I L N K E S R
A A C R E A G E R N I N B A R R E L T E
G B R D O S D A E T E R C P C O R I N G
C O E V I I L R E G A S I F Y C O T A W
R U L A L F E H R T D E T E R I G C C R
S H A L E Y T E N L G P O L Y M E R I V
A C R V L N T S R E T S U D C S N U R C
D E T E Y E W O R K O V E R O I L D B O
R G N S D O W S P I P E L I N E S E U K
F L O W L I E V A P O R I T E S U S L E
© Olulana ‘Kayode
Solution to the Puzzle Page (p95) of the OPEC Bulletin August/September:

85
OPE
C bu
lleat
in 1
0–12
/12
Keys:
SWEETCRUDE TOOLPUSHER JOBBER COKING
POLYMERIZATION FIRE FLOODING GASOHOL CHRISTMAS TREE
OFFSHORE DOWNSTREAM CETANE POLYPROPYLENE
HYDROCARBONS DISCOVERY CATALYST BITUMEN
LEASELINE STRATIGRAPHY COKE BLOWOUT
MONOMER SEPARATOR DRY HOLE CORING
RESIDUAL OIL GATHERING LINE ETYLENE STABILIZERS
POLYSTYRENE TANKWAGON BRIDING CATALYST
SUPURLINE SULPHONATES BLOCK REFINE
DEADWEIGHT TONNAGE REFINE CHOKE
C H O K E E N E L Y P O R P Y L O P W E
A E A H M O N O M S U R F A C T A N T C
T R P Y H P A R G I T A R T S E O A A O
A S E D O W N S T R E A M J O B N S N K
L O N R E S I D U A L O I L B K E G L I
Y E E O D R D E R T H G I E W D A E D N
S E L C I O E N I F E R G A R T A F W G
T R Y A S T N C E T A N G J H S I A A T
A T H R C A A N C E I O E E E R G S G S
B S T B O R T Z K D N D R L E T O N E O
I S E O V A E O I E U I I F R H N R D C
L A N N E P C R T R N N L J O B B E R A
I M E S R E B U C G E O S L H P L F Y T
Z T M L Y S O T L G O M U P S E O I H A
E S U A E W E I A D O W Y G F P C N O L
R I T E O E N N I N A T K L F L K E L Y
S R I L W E N N O S U L P H O N A T E S
N H B S N O G M P E R E H S U P L O O T
I C R A T N E N I L R U P U S U L P H U
D I E N E R Y T S Y L O P G N I R O C R
© Olulana ‘Kayode
Pu
zz
le P
ag
e Puzzle PageThe OPEC Bulletin welcomes you to its ‘Puzzle page’, where readers get the chance to test their knowledge of the petro-leum industry in a variety of brain teasers, including word search puzzles and crosswords. This month we are challeng-ing you with a word search. Good luck!
Word SearchThere are some terminologies that are peculiar to the modern-day petroleum industry. You might have heard some of them in the
course of your conversations. In the word search below, you should try to look for some of the petroleum-related technologies,
identify them and mark them on the grid. There are 40 keys in all and you can pinpoint them diagonally, vertically and so
on. But you should make sure of the spelling before you make your mark.
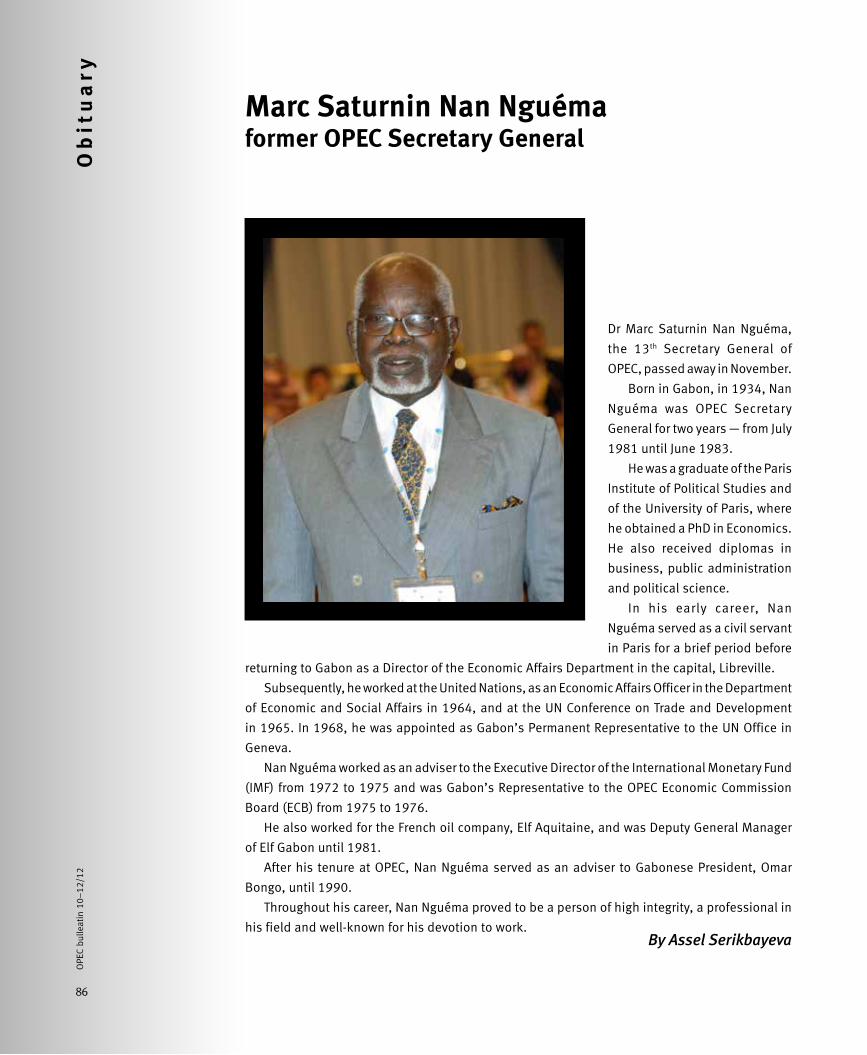
86
Ob
itu
ary
Dr Marc Saturnin Nan Nguéma,
the 13th Secretary General of
OPEC, passed away in November.
Born in Gabon, in 1934, Nan
Nguéma was OPEC Secretary
General for two years — from July
1981 until June 1983.
He was a graduate of the Paris
Institute of Political Studies and
of the University of Paris, where
he obtained a PhD in Economics.
He also received diplomas in
business, public administration
and political science.
In his early career, Nan
Nguéma served as a civil servant
in Paris for a brief period before
returning to Gabon as a Director of the Economic Affairs Department in the capital, Libreville.
Subsequently, he worked at the United Nations, as an Economic Affairs Officer in the Department
of Economic and Social Affairs in 1964, and at the UN Conference on Trade and Development
in 1965. In 1968, he was appointed as Gabon’s Permanent Representative to the UN Office in
Geneva.
Nan Nguéma worked as an adviser to the Executive Director of the International Monetary Fund
(IMF) from 1972 to 1975 and was Gabon’s Representative to the OPEC Economic Commission
Board (ECB) from 1975 to 1976.
He also worked for the French oil company, Elf Aquitaine, and was Deputy General Manager
of Elf Gabon until 1981.
After his tenure at OPEC, Nan Nguéma served as an adviser to Gabonese President, Omar
Bongo, until 1990.
Throughout his career, Nan Nguéma proved to be a person of high integrity, a professional in
his field and well-known for his devotion to work.
Marc Saturnin Nan Nguémaformer OPEC Secretary General
86
OPE
C bu
lleat
in 1
0–12
/12
By Assel Serikbayeva
Va
ca
nc
ies
OPE
C bu
lleat
in 1
0–12
/12
Vacancy announcements
Applications:Applicants must be nationals of Member Countries of OPEC and should not be older than 58 years. Applicants are requested to fill out the application form which can be received from their Country’s Governor for OPEC.In order for applications to be considered, they must reach the OPEC Secretariat through the relevant Governor not later than January 28, 2013 — job code: 5.2.02 (see www.opec.org — Employment).
Job dimensions:Within the Research Division, the Energy Studies Department is responsible for monitoring, analyzing and forecasting world energy developments in the medium and long term and reporting thereon, in particular providing in-depth studies and reports on energy issues. It monitors developments and undertakes spe-cific studies on energy demand and production-related technol-ogy, assessing implications for OPEC. It identifies and follows up key areas of energy-related emerging technologies and research and development (R&D), facilitates and supports planning and implementation of collaborative energy-related R&D programs of Member Countries, as well as identifies prospects for OPEC participation in major international R&D activities. It carries out studies and reports on developments in the petroleum industry, providing effective tools for carrying out model-based studies of analyses and projections of energy supply/demand and down-stream simulation. It elaborates OPEC Long Term Strategy and monitors, analyzes and reports on relevant national or regional policies (fiscal, energy, trade and environmental), assessing their impacts on energy markets.
Objective of position:The Alternative Sources of Energy Analyst studies, analyses and evaluates developments of global coal and non-hydrocarbon pri-mary energy sources with particular attention to their technical and economic potential, technology, economics and drivers, such as policies, taxation, market structuring, strategies of key players, etc. to conduct studies on relevant issues on coal and non-hydrocarbon sources of energy, including production, use by sector and region as well as potential for fuel substitution. In addition, he/she assesses their impact on world energy mix and on the demand for oil and contributes to the World Oil Outlook.
Main responsibilities:1. Conducts studies on the development of coal and non-hydro-
carbon sources of energy and prepares reports thereon.2. Collects, integrates and analyses data on technological, eco-
nomic, environmental and policy aspects of coal and non-hydrocarbon energy.
Alternative Sources of Energy Analyst
87
3. Studies and analyses developments of primary energy demand by fuel and sectoral energy use within a country/group of countries, taking into consideration various aspects of energy policy development, including environment, energy substitution and conservation and security of supply, and assesses the impact on the energy supply mix.
4. Monitors the technological evolution of coal and non-hydro-carbon sources of energy, and assesses potential for major breakthroughs and their impact on interfuel competition in various sectors.
5. Assesses investment requirements and the costs of finding, developing, producing and delivering energy from coal and non-hydrocarbon sources.
6. Contributes to and delivers speeches, articles and presenta-tions to internal meetings and various international forums.
Required competencies and qualifications:— University degree (advanced degree preferred) in Energy
Management, Economics or in a relevant Engineering discipline
— A minimum of eight years (six years in case of an advanced degree) in the field of energy studies
— Training/specialization in renewable and/or nuclear energy, full cycle cost evaluation, interfuel competition; knowledge of related environmental issues an asset
— Competencies: Communication skills, analytical skills, pres-entation skills, interpersonal skills, customer service orien-tation, initiative and integrity
— Language: English
Status and benefits:Members of the Secretariat are international employees whose responsibilities are not national but exclusively international. In carrying out their functions they have to demonstrate the personal qualities expected of international employees such as integrity, independence and impartiality. The post is at grade E reporting to the Head of Petroleum Studies Department. The compensation package, including expatriate benefits, is commensurate with the level of the post.
88
OPE
C bu
lleat
in 1
0–12
/12
Ma
rke
t R
ev
iew
OPE
C bu
lleat
in 1
0–12
/12
Va
ca
nc
ies
Job dimensions:
Within the Research Division, the Energy Studies Department
is responsible for monitoring, analyzing and forecasting world
energy developments in the medium and long term and report-
ing thereon, in particular providing in-depth studies and reports
on energy issues. It monitors developments and undertakes spe-
cific studies on energy demand and production-related technol-
ogy, assessing implications for OPEC. It identifies and follows up
key areas of energy-related emerging technologies and research
and development (R&D), facilitates and supports planning and
implementation of collaborative energy-related R&D programmes
of Member Countries, as well as identifies prospects for OPEC
participation in major international R&D activities. It carries out
studies and reports on developments in the petroleum industry,
providing effective tools for carrying out model-based studies of
analyses and projections of energy supply/demand and down-
stream simulation. It elaborates OPEC Long Term Strategy and
monitors, analyzes and reports on relevant national or regional
policies (fiscal, energy, trade and environmental), assessing their
impacts on energy markets.
Objective of position:
The Petroleum Industry Analyst studies and analyzes medium
to long-term strategies, plans, operations and performance of
petroleum-related companies and assesses the impact on OPEC
and on the medium to long-term oil outlook. In addition, he/she
monitors and analyzes developments in the petroleum industry
structure and assesses their impact on OPEC.
Main responsibilities:
1. Collects/treats data, and analyses and reports on major oil
companies’ strategies, plans, operations, performance and
investment.
2. Studies and analyses developments in petroleum industry
structure.
Petroleum Industry Analyst
88
3. Contributes to the preparation of technical reports on medium-
to long-term developments.
4. In collaboration with the Environment Matters Unit studies
and assesses developments in multilateral negotiations, in
particular within the WTO framework, with relevance to the
petroleum industry.
5. Contributes to speeches, articles and presentations to inter-
nal meetings and various international forums.
Required competencies and qualifications:
— University degree (advanced degree preferred) in Economics,
Finance or Engineering
— A minimum of eight years (six years in case of an advanced
degree) in the petroleum industry or in oil-related companies
or institutions
— Training/specialization in economic analysis, analysis of the
financial performance of companies, analysis of company
strategies, corporate planning and knowledge of oil compa-
nies’ operations along the value chain an asset
— Competencies: Communication skills, analytical skills, pres-
entation skills, interpersonal skills, customer service orien-
tation, initiative and integrity
— Language: English
Status and benefits:
Members of the Secretariat are international employees whose
responsibilities are not national but exclusively international. In
carrying out their functions they have to demonstrate the personal
qualities expected of international employees such as integrity,
independence and impartiality.
The post is at grade E reporting to the Head of Petroleum
Studies Department. The compensation package, including expa-
triate benefits, is commensurate with the level of the post.
Applications:Applicants must be nationals of Member Countries of OPEC and should not be older than 58 years. Applicants are requested to fill out the application form which can be received from their Country’s Governor for OPEC.In order for applications to be considered, they must reach the OPEC Secretariat through the relevant Governor not later than January 28, 2013 — job code: 5.3.03 (see www.opec.org — Employment).
89
OPE
C bu
lleat
in 1
0–12
/12
This section includes highlights from the OPEC Monthly Oil Market
Reports (MOMR) for October and November 2012, published by the
Petroleum Studies Department of the Secretariat, with additional graphs
and tables. The publication may be downloaded in PDF format from our
Website (www.opec.org), provided OPEC is credited as the source for any
usage.
Crude oil price movements
The OPEC Reference Basket was marginally
higher in September, settling above the key
$110/barrel level for the first time in four
months. Moreover, the Basket ended the third
quarter virtually unchanged from the second
quarter, in which it declined by ten per cent.
The Basket was basically flat in September
with prices initially rising slightly along with the
bullish global crude oil market in anticipation
of the bond-buying programme of the European
Central Bank (ECB) and the US Federal Reserve,
which announced a third, unlimited round of
quantitative easing.
However, prices then fell back on increas-
ing concerns about the global economy and oil
demand growth. Ample supply and a possible
release from strategic oil reserves also helped
to keep a lid on prices.
The OPEC Basket rose to $110.67/b in
September, gaining $1.15/b, or one per cent.
Year-to-date, the Basket averaged $110.18/b,
compared to last year’s average of $107.31/b for
the same period, a y-o-y increase of $2.87/b, or
2.67 per cent.
The performance of individual Basket
components was mixed in September as
Asia-destined crudes improved, while African
grades (with the exception of Angolan Girassol)
retreated. Saharan Blend, Es Sider, Bonny Light
and Girassol, the Brent-related crudes, fell by
17¢ to an average of $112.86/b, down by 0.2
per cent from the previous month.
The multi-destination Basket compo-
nents, namely Arab Light, Basrah Light, Kuwait
Export and Iran Heavy, gained 1.1 per cent in
September to end at $110.43/b, $1.21 higher
than in the previous month. The Iranian heavy
component was largely priced on the Asian for-
mula as little to none was exported to Europe
and the US.
Latin American Basket components,
Ecuador’s Oriente and Venezuelan Merey,
improved by $1.28, or 1.3 per cent. The Middle
Eastern crudes, Murban and Qatar Marine,
improved the most over the month, increas-
ing by $2.65, or 2.4 per cent, to an average of
$112.37/b.
On October 9, the OPEC Basket improved
to $109.46/b.
Following their substantial seven-to-ten per
cent m-o-m rally in August, crude oil futures
prices barely moved in September.
Both the ICE Brent and Nymex WTI
front-month contracts inched up by around half a
percentage point in September. ICE Brent prices
improved by 36¢, or around 0.3 per cent, to set-
tle at $113.03/b, the highest monthly average
since April. WTI also rose marginally by 0.42 per
cent, or 40¢, to average $94.56/b, the highest
settlement since May.
For the third quarter, front-month Brent
increased by 58¢ to average $109.48/b in the
third quarter, whereas WTI slipped by $1.27 to
$92.22/b.
Moreover, compared to the same period last
year, the Brent front-month average was 0.6
per cent higher at $112.20/b, compared to last
year’s level of $111.54/b. The WTI front-month
year-to-date average value was higher than that
of last year by 72¢ at $96.16/b, indicating a 0.7
per cent improvement from the same period
last year, after two months of lower year-to-date
averages.
On October 9, Nymex WTI settled up at
$92.39/b and ICE Brent moved up to $114.50/b.
Commodity markets
In September, energy and non-energy prices
rose by 0.8 per cent and 1.5 per cent, respec-
tively. Food prices eased by 1.2 per cent, but
OPEC Reference Basket: An average of Saharan Blend (Algeria), Girassol (Angola), Oriente (Ecuador), Iran Heavy (IR Iran), Basra Light (Iraq), Kuwait Export (Kuwait), Es Sider (SP Libyan AJ), Bonny Light (Nigeria), Qatar Marine (Qatar), Arab Light (Saudi Arabia), Murban (UAE) and Merey (Venezuela).
Ma
rke
t R
ev
iew
Oct/N
ov
October
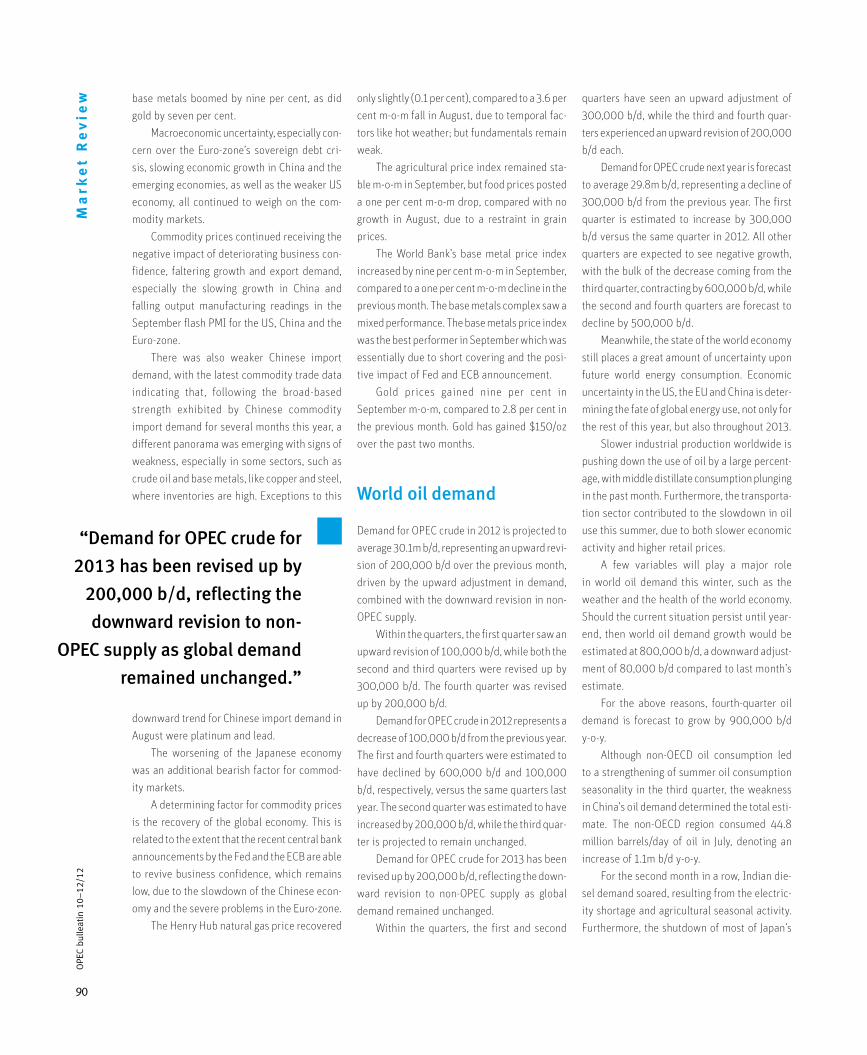
90
OPE
C bu
lleat
in 1
0–12
/12
Ma
rke
t R
ev
iew base metals boomed by nine per cent, as did
gold by seven per cent.
Macroeconomic uncertainty, especially con-
cern over the Euro-zone’s sovereign debt cri-
sis, slowing economic growth in China and the
emerging economies, as well as the weaker US
economy, all continued to weigh on the com-
modity markets.
Commodity prices continued receiving the
negative impact of deteriorating business con-
fidence, faltering growth and export demand,
especially the slowing growth in China and
falling output manufacturing readings in the
September flash PMI for the US, China and the
Euro-zone.
There was also weaker Chinese import
demand, with the latest commodity trade data
indicating that, following the broad-based
strength exhibited by Chinese commodity
import demand for several months this year, a
different panorama was emerging with signs of
weakness, especially in some sectors, such as
crude oil and base metals, like copper and steel,
where inventories are high. Exceptions to this
downward trend for Chinese import demand in
August were platinum and lead.
The worsening of the Japanese economy
was an additional bearish factor for commod-
ity markets.
A determining factor for commodity prices
is the recovery of the global economy. This is
related to the extent that the recent central bank
announcements by the Fed and the ECB are able
to revive business confidence, which remains
low, due to the slowdown of the Chinese econ-
omy and the severe problems in the Euro-zone.
The Henry Hub natural gas price recovered
only slightly (0.1 per cent), compared to a 3.6 per
cent m-o-m fall in August, due to temporal fac-
tors like hot weather; but fundamentals remain
weak.
The agricultural price index remained sta-
ble m-o-m in September, but food prices posted
a one per cent m-o-m drop, compared with no
growth in August, due to a restraint in grain
prices.
The World Bank’s base metal price index
increased by nine per cent m-o-m in September,
compared to a one per cent m-o-m decline in the
previous month. The base metals complex saw a
mixed performance. The base metals price index
was the best performer in September which was
essentially due to short covering and the posi-
tive impact of Fed and ECB announcement.
Gold prices gained nine per cent in
September m-o-m, compared to 2.8 per cent in
the previous month. Gold has gained $150/oz
over the past two months.
World oil demand
Demand for OPEC crude in 2012 is projected to
average 30.1m b/d, representing an upward revi-
sion of 200,000 b/d over the previous month,
driven by the upward adjustment in demand,
combined with the downward revision in non-
OPEC supply.
Within the quarters, the first quarter saw an
upward revision of 100,000 b/d, while both the
second and third quarters were revised up by
300,000 b/d. The fourth quarter was revised
up by 200,000 b/d.
Demand for OPEC crude in 2012 represents a
decrease of 100,000 b/d from the previous year.
The first and fourth quarters were estimated to
have declined by 600,000 b/d and 100,000
b/d, respectively, versus the same quarters last
year. The second quarter was estimated to have
increased by 200,000 b/d, while the third quar-
ter is projected to remain unchanged.
Demand for OPEC crude for 2013 has been
revised up by 200,000 b/d, reflecting the down-
ward revision to non-OPEC supply as global
demand remained unchanged.
Within the quarters, the first and second
quarters have seen an upward adjustment of
300,000 b/d, while the third and fourth quar-
ters experienced an upward revision of 200,000
b/d each.
Demand for OPEC crude next year is forecast
to average 29.8m b/d, representing a decline of
300,000 b/d from the previous year. The first
quarter is estimated to increase by 300,000
b/d versus the same quarter in 2012. All other
quarters are expected to see negative growth,
with the bulk of the decrease coming from the
third quarter, contracting by 600,000 b/d, while
the second and fourth quarters are forecast to
decline by 500,000 b/d.
Meanwhile, the state of the world economy
still places a great amount of uncertainty upon
future world energy consumption. Economic
uncertainty in the US, the EU and China is deter-
mining the fate of global energy use, not only for
the rest of this year, but also throughout 2013.
Slower industrial production worldwide is
pushing down the use of oil by a large percent-
age, with middle distillate consumption plunging
in the past month. Furthermore, the transporta-
tion sector contributed to the slowdown in oil
use this summer, due to both slower economic
activity and higher retail prices.
A few variables will play a major role
in world oil demand this winter, such as the
weather and the health of the world economy.
Should the current situation persist until year-
end, then world oil demand growth would be
estimated at 800,000 b/d, a downward adjust-
ment of 80,000 b/d compared to last month’s
estimate.
For the above reasons, fourth-quarter oil
demand is forecast to grow by 900,000 b/d
y-o-y.
Although non-OECD oil consumption led
to a strengthening of summer oil consumption
seasonality in the third quarter, the weakness
in China’s oil demand determined the total esti-
mate. The non-OECD region consumed 44.8
million barrels/day of oil in July, denoting an
increase of 1.1m b/d y-o-y.
For the second month in a row, Indian die-
sel demand soared, resulting from the electric-
ity shortage and agricultural seasonal activity.
Furthermore, the shutdown of most of Japan’s
“Demand for OPEC crude for
2013 has been revised up by
200,000 b/d, reflecting the
downward revision to non-
OPEC supply as global demand
remained unchanged.”
91
OPE
C bu
lleat
in 1
0–12
/12
nuclear power plants led to excess use of crude
and fuel oil burning during the summer, but by
not as much as was seen at the beginning of
the summer.
Lower gas and coal prices, along with the
heavy burden of subsidies, have forced both
the US and Europe to reduce financial support
for renewables. This move reduced mergers
within the industry by half in the fourth quar-
ter of 2011.
Furthermore, due to a high level of compe-
tition, the industry is focusing on expanding in
other clean technologies, rather than just wind
and solar. Given the financial turbulence in
the region, some governments are cutting the
expensive subsidies on renewables.
The latest monthly US oil consumption data
for July confirmed the downward trend, by show-
ing once more a decrease of 0.9 per cent y-o-
y. All main product categories, with the excep-
tion of propane/propylene and residual fuel oil,
recorded declines, and the bulk of the overall
decrease was seen in gasoline consumption, as
a result of lower mileage.
The weak economy and high retail fuel
prices have curbed gasoline demand by 0.3 per
cent so far this year. Taking into account weekly
data for August and September, the first nine
months of 2012 looked quite disappointing for
US consumption.
They showed contractions in all product
categories and mainly in distillates and resid-
ual fuel oil. The main factors influencing con-
sumption during the first three quarters of 2012
were weak industrial production, the struggling
economy, high fuel prices and fuel-switching,
especially towards natural gas.
Together with the low mileage driven, a
recent decline in industrial production has
affected oil use within the country on a mas-
sive scale. Apart from in May, US oil demand
growth has been negative since November last
year. The decline in the first three quarters is
almost double that of 2011.
Oil demand in North America is totally
dependent upon US economic development
and the level of gasoline prices. The outlook for
US oil consumption for the rest of the year and
for 2013 remains rather pessimistic, especially
when considering the development of the econ-
omy and fuel-switching.
The latest reported figure for Mexican oil
consumption in August showed an increase of
around 1.5 per cent, compared with the same
month last year. All product categories were pos-
itive, except gasoline, with increases in indus-
trial fuels dominating the pool of oil demand.
Canadian oil demand decreased by 1.4 per
cent in July, compared with last year; oil usage
in transportation, as well as in industrial prod-
ucts, caused this decrease.
In 2012, oil demand in North America is
projected to decrease by 250,000 b/d, while,
in 2013, it will remain at the same level as this
year.
The troubled European economy is taking
its toll on the continent’s oil demand. Not only
has the decline in industrial production nega-
tively affected oil use, but also the low mileage
driven has reduced the use of transport fuel
across the region.
European consumption contracted in
August for the 12th month in a row, mainly in
industrial and transport fuel. August oil con-
sumption in Germany, France, Italy and the
United Kingdom fell, with the bulk of decreases
seen in transportation and industrial fuels.
Undoubtedly, the short-term and medium-
term development of European oil consump-
tion does not appear to be positive, as the debt
problems in several European economies are
seen to be deteriorating further.
Oil demand in Europe’s ‘Big Four’ decreased
by 240,000 b/d in August, compared with the
same month in 2011. German oil use declined
by 30,000 b/d in the first three quarters of the
year, despite the increase in diesel use.
For 2012, European oil consumption is
expected to shrink by 400,000 b/d, as a result
of the turbulence in several regions’ economies,
while oil consumption in 2013 is projected to
decrease again by 240,000 b/d, thus showing
hardly any improvement.
In Japan, the latest August monthly data
was once more dominated by strong increases
in crude and residual fuel oil direct use. The
summer’s seasonally higher requirements led
to an extra increase in fuel usage. Direct crude
and residual fuel burning for electricity produc-
tion is expected to further continue throughout
2012 and 2013, but with less volume.
Although the Japanese government earlier
last month announced its decision to phase
out nuclear power by 2040, intense opposition
from business groups and communities, whose
economies depend upon nuclear plants, forced
the government to delay its decision. This could
weaken the government’s initial phase-out plan.
It might be some time before the govern-
ment comes to a final decision, since it remains
to be seen in which direction future Japanese
energy policy will be heading in the medium
and long terms.
Nevertheless, the current usage of fossil
fuel for electricity generation seems to be the
only option for covering the country’s needs in
the short term.
In South Korea, July data pointed towards a
strong increase in oil use by 4.7 per cent y-o-y;
the biggest additions were observed in indus-
trial products, naphtha for the petrochemical
sector and residual fuel oil.
OECD Pacific oil consumption is expected
to grow by 360,000 b/d y-o-y in 2012 and the
bulk of the increase will result from direct crude/
fuel oil burning for electricity generation and
substituting nuclear plants.
During 2013, OECD Pacific oil consumption
is projected to grow again, but at a lower level
of 60,000 b/d.
Despite an easing of India’s recent electric-
ity disruptions, the impact on diesel demand
could be seen for a second month in a row.
“In 2012, oil demand in
North America is projected
to decrease by 250,000
b/d, while, in 2013, it will
remain at the same level
as this year.”
92
OPE
C bu
lleat
in 1
0–12
/12
Ma
rke
t R
ev
iew Hence, the forecast oil demand growth has a
downside risk, especially in the first half of the
year.
The risk is attributed not only to the OECD,
but also to China and India. The current unclear
economic picture is making next year’s oil
demand growth forecast a challenging task, not
only due to GDP assessments, but also because
it is affected by retail petroleum prices and pos-
sible abnormal weather.
These variables could reduce the world oil
demand growth forecast by 20 per cent next
year. Furthermore, oil demand in the US and
China — the key drivers behind next year’s world
oil demand growth — can change the rhythm of
the oil demand pattern.
World oil demand is forecast to grow by
800,000 b/d in 2013 to average 89.6m b/d.
World oil supply
Preliminary figures show that global oil supply
averaged 89.88m b/d in September, a gain of
440,000 b/d from the previous month, sup-
ported by estimated increases in non-OPEC
supply.
OPEC crude is estimated to have a 34.6
per cent share in global supply. The estimate is
based on preliminary data for non-OPEC sup-
ply, estimates for OPEC NGLs and OPEC crude
production, according to secondary sources.
Meanwhile, non-OPEC oil supply is fore-
cast to grow by 560,000 b/d in 2012 to aver-
age 53.00m b/d. This represents a downward
revision of 150,000 b/d from the previous
assessment.
Many revisions were introduced to the fore-
cast in 2012, with more weight on the second
half. The largest revision took place in Latin
America, mainly on updated production data. All
2012 quarters were revised down, as the vari-
ous upward revisions seen in some countries’
supply forecasts were insufficient to offset the
downward adjustments.
North America is expected to have the
highest growth among all non-OPEC regions
in 2012, followed by the former Soviet Union
(FSU), China, and Latin America, while Africa,
As the country tried to cope with the summer
heat, excessive demand of electricity, along with
the agricultural seasonality, led to more diesel
demand countrywide.
The use of independent diesel-operated
power generation contributed to high diesel
consumption in August. As a result, diesel usage
increased by a massive 17 per cent in August,
adding another 200,000 b/d to the country’s
total diesel use. Diesel use in India is attrib-
uted not only to electricity usage but also to
the transportation, industrial and agricultural
sectors.
Gasoline demand increased by six per cent
in August, due to the summer driving season.
Despite the decrease of 16 per cent in fuel oil
demand, India’s total oil demand rose by six per
cent, or 200,000 b/d, in August y-o-y.
The country’s agricultural industry is greatly
affected by weather changes during the summer.
Consequently, the use of energy in this sector is
highly dependent upon the weather’s variations
from the norm.
Efficiency, along with economic slowdown,
has led to a decline in oil demand in Taiwan in
2012 year-to-date. The country’s oil demand
plunged by 2.3 per cent in July y-o-y. Most of the
decline was attributed to the industrial sector.
This trend can be seen in some other economies
across the globe.
And in the first seven months of the year,
Taiwan’s oil demand slid by five per cent y-o-y.
Most of that decline was related to lower use
of fuel oil and this reduced the country’s total
oil usage to an average of 940,000 b/d.
Given the strong oil demand in India,
Other Asia’s oil demand growth is estimated at
250,000 b/d y-o-y in 2012.
Oil consumption within the Middle East has
been growing by around 200,000 b/d, or 2.8 per
cent, annually. Most of the growth is attributed
to the transport and industrial sectors.
Despite a reduction in Iran’s total energy
use, the country’s total oil demand for the year
is forecast to be flat. The partial removal of gaso-
line subsidies in domestic consumption has led
to an easing in the country’s use of gasoline.
The excessive summer heat led to mas-
sive fuel demand by power generation in Saudi
Arabia in August. The country’s fuel and diesel
oil demand rose by 56 per cent and 16 per cent,
respectively. Both the power sector and sum-
mer transport fuel demand drove up the coun-
try’s total oil demand by 14 per cent y-o-y, or
by 300,000 b/d during the month.
The Middle East will consume 7.8m b/d of
crude by the end of 2012, denoting growth of
200,000 b/d y-o-y.
Venezuela’s booming economy of 3.4 per
cent growth this year has led to a 23 per cent rise
in the country’s oil use in the first seven months
of the year. Most of the growth is attributed to
jet kerosene and gasoline demand. More than
a third of Venezuela’s oil demand is in the form
of gasoline. Demand is expected to increase by
40,000 b/d in 2012 y-o-y.
Developing countries’ oil demand growth is
forecast at 600,000 b/d y-o-y, averaging 28.4m
b/d in 2012.
Chinese oil demand weakened this summer
to almost a standstill. This was caused mainly
by the slowdown in the industrial sector, which
fell heavily as a result of slower exports. Diesel,
fuel oil and other industrial product usage slid
down by a substantial amount.
Fuel oil imports in August sank by 37 per
cent y-o-y, as a result of weak orders from sev-
eral refineries and slower bunker demand.
Diesel consumption grew between September
2009 and last May; hence, China added almost
half a million barrels of diesel to its consump-
tion pool.
Nevertheless, despite the minor decline
since May, the country’s diesel demand grew by
one per cent in the year-to-date. Diesel is the most
consumed petroleum product in China, totalling
3.3m b/d, and its consumption is attributed to
the industrial, transport and agricultural sectors.
The country’s slowing economy caused its
August oil demand to grow by a slight 40,000
b/d y-o-y, the slowest rate since March 2009.
Oil demand growth is forecast at 300,000 b/d
in 2012 y-o-y. Should the country’s industrial
slowdown persist, then the downward risk will
be higher than anticipated.
In 2013, world oil demand growth is sub-
ject to considerable uncertainty, due primarily
to the ongoing challenges in the global economy.
93
OPE
C bu
lleat
in 1
0–12
/12
OECD Western Europe and the Middle East are
projected to be the regions with the biggest sup-
ply declines.
OECD supply is forecast to rise in 2012, as
growth in North America is seen to more than
offset the declines in Western Europe and the
OECD Pacific. The US, Canada, Russia, China and
Colombia are expected to be the main drivers of
supply growth in 2012, while Sudan and South
Sudan, Syria, the UK, Norway and Indonesia are
seen as having the largest declines.
On a quarterly basis, non-OPEC supply this
year is seen to average 53.23m b/d, 52.64m b/d,
52.67m b/d and 53.46m b/d, respectively.
According to preliminary and estimated
data, non-OPEC oil supply averaged 52.84m b/d
during the first three quarters of 2012, indicating
growth of 560,000 b/d, over the same period
of 2011.
Total OECD oil supply is expected to increase
by 740,000 b/d to average 20.88m b/d in 2012,
a minor upward revision of 15,000 b/d from the
previous month.
There were various upward and downward
revisions to regional and national oil supply
outlooks in 2012 that mostly offset each other.
An upward revision in North America offset the
downward revisions to OECD Western Europe
and OECD Pacific supply. Canada, Mexico and
Other Western Europe supply forecasts had
upward revisions that mostly offset the down-
ward adjustments in the UK and Australia.
In the fourth quarter, OECD supply is
expected to increase from the third quarter, as
output is seen to improve in North America and
OECD Western Europe.
On a quarterly basis, OECD oil supply this
year is expected to average 21.06m b/d, 20.83m
b/d, 20.68m b/d and 20.96m b/d, respectively.
North America’s oil supply is forecast to
increase by 960,000 b/d in 2012 to average
16.46m b/d, an upward revision of 35,000 b/d
from the previous month. Second-quarter oil
supply was revised down, while supply in the
third and fourth quarters was revised up, due
mainly to updated production data that was car-
ried over to the rest of the year.
The upward revision confirms North
America as the region with the highest growth
among all the non-OPEC regions in 2012. Strong
supply growth is now expected from the US and
Canada, while Mexico’s supply is seen to be sta-
ble in 2012, compared with the previous year.
On a quarterly basis, North America’s oil
supply this year is slated to average 16.48m
b/d, 16.38m b/d, 16.46m b/d and 16.53m b/d,
respectively.
US oil supply is expected to grow by
730,000 b/d in 2012, the highest growth among
all non-OPEC countries, to average 9.74m b/d,
unchanged from the previous report.
On a quarterly basis, US oil supply this year
is estimated to average 9.76m b/d, 9.75m b/d,
9.67m b/d and 9.78m b/d, respectively.
According to preliminary data, supply aver-
aged 9.72m b/d during the first three quarters
of 2012, indicating an increase of 890,000 b/d
over the same period of 2011.
Canada’s oil supply is forecast to increase
by 250,000 b/d in 2012 to average 3.81m b/d,
an upward revision of 25,000 b/d from the pre-
vious assessment.
On a quarterly basis, the country’s oil supply
this year is seen to average 3.81m b/d, 3.70m
b/d, 3.86m b/d and 3.85m b/d, respectively.
During the first half of 2012, Canada’s oil
supply increased by 320,000 b/d, compared
with the same period in 2011.
Mexico’s oil supply is forecast to decline by
20,000 b/d in 2012 to average 2.92m b/d, indi-
cating a minor upward revision of 20,000 b/d
from the previous report.
On a quarterly basis, Mexico’s oil supply this
year is seen to stand at 2.92m b/d, 2.93m b/d,
2.93m b/d and 2.89m b/d, respectively.
According to preliminary data, Mexico’s
oil supply averaged 2.93m b/d during the first
three quarters of 2012, down 20,000 b/d from
the same period of 2011.
Total OECD Western Europe oil supply is
forecast to drop by 180,000 b/d in 2012 to an
average of 3.88m b/d, representing a downward
revision of 10,000 b/d from the previous month.
On a quarterly basis, the region’s oil sup-
ply this year is estimated to average 4.07m
b/d, 3.91m b/d, 3.66m b/d and 3.89m b/d,
respectively.
Norway’s oil supply is projected to decline
by 80,000 b/d in 2012 and average 1.96m b/d,
unchanged from the previous report.
On a quarterly basis, the country’s oil sup-
ply this year is expected to average 2.08m
b/d, 1.98m b/d, 1.83m b/d and 1.95m b/d,
respectively.
During the first three quarters of 2012,
Norway’s oil supply is seen to have averaged
1.96m b/d, a decline of 80,000 b/d from the
same period a year earlier.
The UK’s oil supply is forecast to decline
by 110,000 b/d in 2012 to average 1.01m b/d,
representing a downward revision of 15,000
b/d from the previous month. This is the low-
est annual average level since 1977.
According to preliminary data, UK oil supply
averaged 1.0m b/d during the first three quar-
ters of 2012, a decline of 130,000 b/d from the
same period of 2011. On a quarterly basis, the
country’s oil supply is seen to average 1.08m
b/d, 1.01m b/d, 920,000 b/d and 1.04m b/d,
respectively.
Total OECD Pacific oil supply is forecast to
decline by 30,000 b/d and average 540,000
b/d in 2012, representing a minor downward
revision of less than 10,000 b/d compared with
the previous month.
On a quarterly basis, total OECD Pacific oil
supply this year is seen to average 510,000 b/d,
530,000 b/d, 560,000 b/d and 540,000 b/d,
respectively.
Australia’s oil supply is expected to average
450,000 b/d in 2012, a decline of 30,000 b/d,
indicating a minor downward revision of less
than 10,000 b/d from the previous report.
On a quarterly basis, the country’s oil
“North America’s oil supply
is forecast to increase by
960,000 b/d in 2012 to
average 16.46m b/d, an
upward revision of 35,000 b/d
from the previous month.”
94
OPE
C bu
lleat
in 1
0–12
/12
Ma
rke
t R
ev
iew supply this year is seen to average 430,000
b/d, 450,000 b/d, 470,000 b/d and 450,000
b/d, respectively.
During the first half of 2012, Australia’s
oil supply averaged 440,000 b/d, a decline of
40,000 b/d from the same period a year earlier.
Total developing countries’ oil supply is
estimated to decline by 360,000 b/d in 2012
to average 12.31m b/d, indicating a downward
revision of 90,000 b/d from the previous month.
Latin America and Other Asia experienced
downward revisions, while the Middle East was
revised up and Africa remained flat, compared
with the previous month. Latin America is the
only region expected to achieve supply growth,
while Africa, the Middle East and Other Asia are
seen to decline in 2012.
Colombia, Oman and Vietnam are expected to
achieve the highest growth among all countries
in the group, while Sudan and South Sudan,
Syria, Indonesia and Yemen are expecting the
largest declines.
On a quarterly basis, developing countries’
oil supply this year is seen to stand at 12.34m
b/d, 12.10m b/d, 12.29m b/d and 12.52m b/d,
respectively.
According to preliminary data, the group’s
first-half supply averaged 12.22m b/d, a decline
of 480,000 b/d from the same period a year
earlier.
Oil supply from Other Asia is expected to
average 3.62m b/d in 2012, a minor decline of
10,000 b/d from the previous year. Updated
production data indicated lower-than-expected
output from Brunei, India, Indonesia, Malaysia
and ‘Asia Others’.
Oil supply from India is expected to remain
steady in 2012 and average 890,000 b/d, being
revised down by 10,000 b/d from the previous
report.
Thailand’s oil supply is estimated to increase
by 20,000 b/d in 2012 to average 350,000 b/d,
an upward revision of 10,000 b/d from the pre-
vious month.
On a quarterly basis, Other Asia’s oil supply
this year is seen to stand at 3.65m b/d, 3.56m
b/d, 3.62m b/d and 3.65m b/d, respectively.
Indonesia’s oil supply is forecast to decline
by 50,000 b/d in 2012 to average 980,000 b/d,
flat from the previous month.
Vietnam’s oil supply is expected to increase
by 30,000 b/d in 2012 to average 380,000 b/d,
unchanged from the previous month. Vietnam’s
expected growth is the highest among the
region’s countries.
Latin American oil supply is anticipated
to increase by 40,000 b/d in 2012 to average
4.84m b/d, indicating a significant downward
revision of 75,000 b/d from the previous report.
Argentina’s oil supply forecast was revised up,
but this was more than offset by downward revi-
sions to Brazil’s and Colombia’s supply outlooks.
Argentina’s oil supply is expected to aver-
age 740,000 b/d in 2012, steady from the pre-
vious year and an upward revision of 10,000
b/d from the previous month.
Colombia’s oil supply is projected to
increase by 40,000 b/d in 2012, the largest
growth in the region, to average 970,000 b/d,
indicating a downward revision of 15,000 b/d
from the previous report.
On a quarterly basis, Latin America’s oil sup-
ply this year is seen to stand at 4.85m b/d, 4.71m
b/d, 4.75m b/d and 4.87m b/d, respectively.
During the first half of 2012, the region’s
oil supply averaged 4.78m b/d, an increase of
70,000 b/d from the same period a year earlier.
Brazil’s oil supply’s is projected to increase
by 10,000 b/d in 2012 to average 2.65m b/d,
indicating a significant downward revision of
70,000 b/d from the previous month.
On a quarterly basis, the country’s oil supply
is seen to average 2.72m b/d, 2.58m b/d, 2.60m
b/d and 2.70m b/d, respectively.
According to preliminary and estimated
data, Brazil’s oil supply averaged 2.63m b/d in the
first three quarters of 2012, a minor increase of
20,000 b/d from the same period a year earlier.
Middle East oil supply is estimated to decline
by 160,000 b/d in 2012 to average 1.54m b/d,
an upward revision of 10,000 b/d from the pre-
vious month. Bahrain’s oil supply experienced
a minor downward revision, while Oman’s and
Yemen’s forecasts were revised up.
On a quarterly basis, the Middle East’s oil
supply is seen to stand at 1.43m b/d, 1.53m b/d,
1.59m b/d and 1.59m b/d, respectively.
Africa’s oil supply is forecast to decline by
230,000 b/d in 2012 to average 2.36m b/d,
unchanged from the previous report.
Egypt’s and South Africa’s supply forecasts
were revised up slightly on updated produc-
tion data, while those of Equatorial Guinea and
Ghana had minor downward revisions. South
Sudan’s and Sudan’s oil supply forecasts were
revised up, on the agreement reached between
the two countries and on reports from opera-
tors of the restart of some shutdown volumes
before the end of the year.
On a quarterly basis, Africa’s oil supply this
year is estimated to average 2.41m b/d, 2.31m
b/d, 2.33m b/d and 2.41m b/d, respectively.
Total FSU oil supply is projected to increase
by 70,000 b/d in 2012 and average 13.30m b/d,
a downward revision of 50,000 b/d from the
previous month.
The FSU’s supply growth is supported mainly
by Russia, while Azerbaijan’s and Kazakhstan’s
supply is expected to decline in 2012.
According to preliminary data, FSU oil sup-
ply increased by 30,000 b/d during the first
three quarters of 2012, compared with the same
period a year earlier.
On a quarterly basis, total FSU oil supply this
year is estimated to average 13.36m b/d, 13.25m
b/d, 13.22m b/d and 13.39m b/d, respectively.
Other Europe’s oil supply is seen to remain
flat from 2011 and average 140,000 b/d in 2012.
Russia’s oil supply is expected to increase
by 80,000 b/d in 2012 to average 10.35m b/d,
unchanged from the previous month. Russian
supply, according to preliminary data, reached a
record high in September with a minor increase
over the previous month.
During the first three quarters of 2012,
“Total developing
countries’ oil supply is
estimated to decline by
360,000 b/d in 2012 to
average 12.31m b/d ...”
95
OPE
C bu
lleat
in 1
0–12
/12
Russian oil supply averaged 10.34m b/d, indi-
cating growth of 100,000 b/d from the same
period in 2011. Third-quarter supply increased
by 80,000 b/d, compared with the same period
of 2011.
On a quarterly basis, Russian oil supply this
year is estimated to average 10.34m b/d, 10.32m
b/d, 10.36m b/d and 10.38m b/d, respectively.
Supply averaged 10.39m b/d in September, up
by 30,000 b/d from a month earlier.
Kazakh oil supply is forecast to decline by
20,000 b/d in 2012 to average 1.58m b/d, indi-
cating a downward revision of 30,000 b/d from
the previous month.
During the first eight months of 2012, Kazakh
oil supply declined by 30,000 b/d from the same
period a year earlier.
On a quarterly basis, the country’s oil supply
this year is seen to stand at 1.62m b/d, 1.57m
b/d, 1.52m b/d and 1.62m b/d, respectively.
Azerbaijan’s oil supply is forecast to drop by
20,000 b/d in 2012 to average 940,000 b/d, a
downward revision of 20,000 b/d from the pre-
vious report.
On a quarterly basis, Azerbaijan’s oil sup-
ply this year is seen to stand at 960,000 b/d,
920,000 b/d, 910,000 b/d and 960,000 b/d,
respectively.
China’s oil supply is expected to increase
by 60,000 b/d in 2012 to average 4.19m b/d,
a downward revision of 20,000 b/d from the
previous month.
On a quarterly basis, China’s oil supply this
year is expected to average 4.16m b/d, 4.16m
b/d, 4.17m b/d and 4.27m b/d, respectively.
According to preliminary and estimated
data, China’s supply averaged 4.16m b/d during
the first three quarters of this year, unchanged
from the same period a year earlier.
Meanwhile, in 2013, non-OPEC oil supply is
forecast to increase by 890,000 b/d to average
53.89m b/d, representing a downward revision
of 200,000 b/d from the previous month.
Despite this adjustment, the growth in non-
OPEC supply was revised down by 60,000 b/d
from the previous report. Changes to the 2012
supply forecast were carried over to 2013, hence,
affecting the total non-OPEC supply figure.
North America remains the area with the
highest expected growth among all non-OPEC
regions, supported by forecast growth in the US
and Canada. The FSU is next in terms of growth,
due to projected supply increases from Russia
and Kazakhstan.
OECD Western Europe’s oil supply is
expected to experience the biggest decline in
2013 compared to other non-OPEC regions.
On a quarterly basis, non-OPEC supply next
year is expected to average 53.52m b/d, 53.53m
b/d, 53.87m b/d and 54.61m b/d, respectively.
The main changes to the non-OPEC supply
forecast in 2013 were experienced by the US,
India and Other Africa.
US oil supply in 2013 is expected to average
10.10m b/d, an increase of 360,000 b/d from
2012, indicating an upward revision of 15,000
b/d from the previous report.
The outlooks for supply from India and
Other Africa in 2013 were revised down on the
back of updated data in 2012, which provided
insights into expectations for 2013.
The US remains the country with the highest
expected growth in 2013, followed by Canada
and South Sudan and Sudan, while Norway,
Mexico and the UK are seen to experience the
largest declines among all non-OPEC countries.
OPEC oil production
Total OPEC crude oil production averaged
31.08m b/d in September, according to second-
ary sources, down by around 265,000 b/d from
the previous month.
OPEC crude oil production, not includ-
ing Iraq, averaged 27.95m b/d in September, a
decline of 276,000 b/d from the previous month.
The crude output of Angola, Nigeria and
Venezuela experienced declines in September,
compared to the previous month, while crude
production from Saudi Arabia and Libya showed
increases.
Output of OPEC NGLs and non-conventional
oils are forecast to increase by 350,000 b/d in
2012 to average 5.67m b/d.
In 2013, the production of OPEC NGLs and
non-conventional oils is expected to grow by
240,000 b/d to average 5.91m b/d.
Downstream operations
Refinery margins continued to strengthen
in the Atlantic Basin amid tighter product
sentiment.
Product markets continued to show a posi-
tive movement across the barrel in September.
This was on the back of tightening product senti-
ment, fuelled by the upcoming European main-
tenance season and by gasoline continuing to
take advantage of the tightness in the Atlantic,
which allowed refinery margins to continue
increasing in Europe and the US.
However, in Asia, the market eased,
with increasing supplies causing cracks to
retreat.
US Gulf Coast refining margins continued
to perform positively over the month. The rise
was witnessed across the product slate, led by
gasoline, which remained firm on the Atlantic
coast amid a tightened sentiment, due to the
switch to winter-grade production, as well as
stocks continuing to fall.
Another pillar of support was the solid
demand from Latin America, which kept senti-
ment firm. With Ecuador increasing its buying
interest, Brazil’s and Mexico’s appetite for gaso-
line remained healthy.
The margins for West Texas Intermediate
(WTI) and Light Louisiana Sweet (LLS) crudes
on the US Gulf Coast increased sharply, by more
than $5, to stand at around $36/b and $23/b,
respectively, in September.
European product cracks also increased
sharply over the month, on the back of sup-
ply tightness fuelled by the autumn refinery
“Total OPEC crude oil
production averaged 31.08m
b/d in September, according
to secondary sources, down
by around 265,000 b/d from
the previous month.”
96
OPE
C bu
lleat
in 1
0–12
/12
Ma
rke
t R
ev
iew maintenance season underway in Europe and
Russia.
Light distillate cracks in Europe continued
showing an upward trend, as support came from
the tight gasoline market in the Atlantic and
the continued recovery of the naphtha market,
with demand from the petrochemical sector
increasing.
With the improvement in product cracks,
refining margins for Brent in Northwest Europe
exhibited a sharp rise of $4 in September to
stand at $10.6/b, the highest level for several
months.
Singapore refining margins lost part of the
ground gained the previous month in bearish
sentiment, as the markets helped ease the tight
situation and as increasing supplies caused
the cracks to retreat, despite healthy demand.
Gasoline and fuel oil weakened, while naphtha
and gasoil remained relatively stable.
These developments, along with more
expensive crude, caused refinery margins in
Singapore to lose $1.3 and average $4.8/b in
September.
US refinery utilization continued to fall in
September, after several refineries were tempo-
rarily shut down as a preventive measure when
Hurricane Isaac threatened the region.
US refinery runs declined from the record
level of 92.5 per cent of utilization in July to an
average of 90.7 per cent in August and 87.3 per
cent in September.
This situation, along with the high export
levels from the US to markets in Latin America
and Europe, continued keeping distillate and
gasoline inventories below the five-year average.
In order to recover the inventory levels,
some US refiners raised gasoline yields dur-
ing the month, presumably to make up for
the production lost due to the hurricane’s
impact.
Since June, a relative tightening of the
Atlantic Basin balance has allowed margins to
become healthier in Europe, hitting the highest
level during September and encouraging refiners
to cash in those higher margins. Despite some
closures in the region, throughputs have also
been on the rise.
During the last two months, refinery utiliza-
tion increased by around three per cent to aver-
age over 81 per cent, the highest level seen so
far this year.
The refinery maintenance season in Asia
was seen coming to an end and, despite some
unplanned shutdowns of units in the region,
increasing supplies have eased the tight envi-
ronment, affecting product cracks.
China and India were running their refin-
eries at around 86 per cent and 91 per cent,
respectively.
Japanese throughputs dropped 3.7 per
cent to average around 73.6 per cent of capac-
ity in September, after some maintenance and
shutdowns.
US gasoline demand stood at around 8.7m
b/d in September, after peaking in August at 9.1m
b/d, and was down by around 30,000 b/d from
the same month a year earlier.
It picked up in August with the summer driv-
ing season, recovering to over 9m b/d. However,
by the end of the driving season, domestic
demand returned to a lower level on a y-o-y
basis.
Middle distillate demand stood at around
3.7m b/d in September, 370,000 b/d down from
the same month a year ago.
Export opportunities to Europe and Latin
America remained supportive of the US distil-
lates market. In fact, according to the US Energy
Information Administration (EIA), US gasoil/
diesel net exports in June broke the one million
barrel/day mark for the first time.
Product market sentiment showed a rise
in Europe across the barrel, at a time of tight-
ening sentiment fuelled by the upcoming
European maintenance season and gasoline
continuing to take advantage of the tightness
in the Atlantic.
Oil trade
According to preliminary data, US crude oil
imports averaged 8.5m b/d in September, down
by 86,300 b/d, or one per cent, from August and
385,000 b/d, or 4.3 per cent, from the same
month last year.
Year-to-date, US crude imports averaged
8.7m b/d, reflecting a decline of 3.3 per cent from
the same period last year. US product imports fell
by 50,000 b/d, or 2.3 per cent, from the previ-
ous month to 2.1m b/d, and were 247,000 b/d,
or ten per cent, down from last year.
In contrast, US product exports increased
by 27,000 b/d, or one per cent m-o-m to aver-
age 2.7m b/d, yet registered a y-o-y decline of
278,000 b/d, or nine per cent.
Consequently, US net oil imports averaged
7.7m b/d in September, reflecting monthly and
annual declines of two per cent and four per
cent, respectively.
As per the latest monthly government data
release, crude oil imports fell in July by 495,000
b/d, or 5.4 per cent, m-o-m, the lowest level
since April 2012, and by 670,000 b/d, or 7.2
per cent, y-o-y to average 8.6m b/d. Y-o-y, this
represents the largest drop since April 2011.
Japan saw a 182,000 b/d, or 5.3 per cent,
m-o-m increase in its crude oil imports to aver-
age 3.6m b/d in August, the highest figure since
April. In an annual comparison, crude imports
gained 101,000 b/d, or 2.9 per cent.
Japan’s product imports fell in August by
30,000 b/d, or 4.5 per cent, m-o-m to 629,000
b/d, the lowest level for four months. Y-o-y,
they dropped by 97,000 b/d, or 13.4 per cent,
although year-to-date they were 26,000 b/d, or
4.2 per cent, higher.
The country’s product exports gained
57,000 b/d in August to average 535,000 b/d,
up by 11.8 per cent m-o-m, but down 10.2 per
cent y-o-y.
As a result, Japan’s net trade imports
increased by 95,000 b/d in August to average
37m b/d, 2.6 per cent higher than in July, and
“Consequently, US net oil
imports averaged 7.7m b/d in
September, reflecting monthly
and annual declines of two per
cent and four per cent.”
97
OPE
C bu
lleat
in 1
0–12
/12
the highest figure for four months. In addition,
this reflected an increase of 1.8 per cent on an
annual basis.
China’s crude oil imports dropped for the
third consecutive month in August — by 812,000
b/d, or 15.7 per cent — to average 4.4m b/d, the
lowest level for 22 months. The decline came
as a result of lower demand amid the economic
downturn in general.
China’s imports were 626,000 b/d, or 12.6
per cent, lower than in the same month a year
earlier. Year-to-date, however, the figures show
an increase of 388,000 b/d, or 7.7 per cent.
China’s product imports fell from the pre-
vious month to average 549,000 b/d, down by
210,000 b/d, or 27.6 per cent. Y-o-y, they were
down by a considerable 477,000 b/d, or 46.5
per cent.
China’s crude exports declined in August by
5,000 b/d, or ten per cent, from the previous
month, while showing a y-o-y gain of 16,000
b/d, or 53.4 per cent.
In contrast, product exports saw a monthly
gain of 84,000 b/d, or 19.3 per cent, while
decreasing by 15,000 b/d, or 2.9 per cent, from
the previous year.
Accordingly, China’s net oil trade saw a drop
of 1.1m b/d, or 20.3 per cent, on both a monthly
and an annual basis.
India’s crude oil imports increased in August
by 108,000 b/d, or three per cent, m-o-m and
by four per cent y-o-y, to average 3.4m b/d. The
increase came as a result of an expansion in the
country’s refining capacity.
India’s product imports dropped in August
by 7,000 b/d, or 2.1 per cent, to average
339,000 b/d, which was, however, a gain of
10.5 per cent y-o-y.
This drop came on the back of lower imports
of diesel and fuel oil, which declined in August
by 46.2 per cent and 11.1 per cent, respectively.
With regard to India’s product exports, there
were declines on both a monthly and an annual
basis. They dropped by 4.2 per cent from the
previous month to average 12.2m b/d, and were
5.5 per cent down from a year earlier.
The monthly drop was due to lower exported
volumes of petrol and fuel oil. Diesel was the
only product which saw an increase in exports,
at 5.1 per cent, while exports of naphtha and
fuel ended the month flat.
In August, total crude oil exports from the
FSU increased by 74,000 b/d, or 1.2 per cent,
to average 63m b/d.
Total FSU product exports increased in
August by 460,000 b/d, or 16.6 per cent, to
average 32.4m b/d. All product exports rose by
between eight per cent and 39 per cent from the
previous month, with the only exception being
jet fuel, which fell by 7.7 per cent.
Stock movements
Preliminary data for August shows that total
OECD commercial oil stocks dropped by 29.0m
b over the previous month.
Crude oil led the fall, declining by almost
20.0m b, while products saw a stockdraw of
9.3m b. At 2,674m b, OECD commercial stocks
were 46m b below the five-year average.
But the picture among the components had
two sides to it. Crude commercial stocks showed
a surplus of 26.3m b, while product stocks saw
a deficit of 72m b. At the end of August, OECD
commercial stocks slipped to 28.0m b below
the level of the same period a year ago.
On a regional basis, the bulk of the drop in
OECD commercial inventories came from stocks
in North America falling by 21.6m b, reflecting
lower imports into the US, combined with fall-
ing US production, due to Hurricane Isaac.
OECD Europe’s inventories saw a decline of
5.6m b, following a weak performance in North
Sea production, as well as the backwardation
structure of Brent, which failed to encourage
stockpiling.
The OECD Pacific’s commercial stocks
declined by a marginal 1.8m b, reversing the
build of the previous month.
When compared with the five-year average,
the picture within the OECD regions was mixed.
Europe and the Pacific saw deficits of 65.4m
b and 8.4m b, respectively, while commercial
stocks in North America stood 27.7m b above
the five-year average.
It should be noted that the deficit observed
in OECD commercial stocks could diminish in
the coming months, as global supply is expected
to be running ahead of demand and the market
will continue to be well supplied, especially with
crude.
In terms of days of forward cover, OECD
commercial stocks stood at around 58.4 days
at the end of August, 0.4 day higher than the
last five-year average. This level looks comfort-
able and is not expected to fall, since demand
in the OECD is considered likely to continue to
decline in 2013. Indeed, OECD demand for next
year is expected to fall by 170,000 b/d vis-à-vis
this year.
The latest available data for August shows
that European stocks reversed the build of
the last month and fell by 5.6m b to stand at
1,058.7m b.
At this level, they ended the month 22.5m
b, or 2.1 per cent, lower than a year ago and
65m b, or 5.8 per cent, below the five-year
average. Both crude and products contributed
to this draw, declining by 3.9m b and 1.6m b,
respectively.
European crude inventories edged lower
in August for the second consecutive month
to stand at 453.0m b, which was 5.5m b, or 1.2
per cent, higher than a year ago. However, they
still remained 15m b, or 3.2 per cent, below the
seasonal norm.
At 605.7m b, oil product stocks in Europe
were 28.0m b, or 4.4 per cent, below the same
period last year and 50m b, or 7.6 per cent, lower
than the five-year average.
Within products, the picture was mixed.
Gasoline and residual fuel saw draws, while
distillate and naphtha stocks witnessed builds.
“China’s net oil trade
saw a drop of 1.1m b/d,
or 20.3 per cent, on both
a monthly and an annual
basis.”
98
OPE
C bu
lleat
in 1
0–12
/12
Ma
rke
t R
ev
iew Gasoline stocks fell by 1.3m b to end August
at 105.7m b, almost in line with a year ago, but
they remained 9.0m b, or 8.2 per cent, below
the seasonal average.
Distillate stocks ended August slightly higher
than the previous month, following the 3.4m b
build seen in July. At 375.8m b, they dropped by
12.0m b, or 3.1 per cent, from a year earlier and
remained 25m b, or 6.1 per cent, lower than the
five-year average.
Fuel oil stocks declined by 1.2m b to end
August at 89.5m b, which was 14m b below the
same period last year and 18.5m b lower than
the five-year average.
US total commercial oil stocks rose in
September after a substantial draw in August,
increasing by 9.7m b to stand at 1,101.4m b/d.
With this build, they switched the deficit with a
year ago last month to a surplus of 16.5m b, or
1.5 per cent. However, the difference with the
five-year average remained at a comfortable
level, indicating a surplus of 28.6m b, or 2.7
per cent. The build in US total commercial oil
stocks was attributed to both crude and prod-
ucts, as they increased by 7.6m b and 2.1m b,
respectively.
In September, US commercial crude stocks
reversed the downward trend of the last two
months and increased by 7.6m b to stand at
364.7m b. With this build, they widened the
surplus with a year ago to 32.9m b from only
7.8m b the previous month.
The surplus with the five-year average also
remained at a healthy level, at 36.3m b, or 11.1
per cent.
In September, US refineries operated at
87.3 per cent of capacity, which was 2.7 per cent
lower than in the previous month, and 0.4 per
cent below the same month last year.
US oil product inventories increased by 2.1m
b in September, reversing the draw of 8.9m b
observed the previous month. At 736.7m b, they
remained 16.5m b, or 2.2 per cent, below last
year’s level and 7.7m b, or 1.0 per cent, lower
than the five-year average.
Within products, the picture was mixed;
gasoline and distillates saw declines, while all
other products experienced builds.
Gasoline stocks fell for the second consec-
utive month, declining by 3.0m b to finish the
month at 195.9m b. At this level, inventories
were 20.2m b, or 9.3 per cent, below those of
a year ago and 12.0m b, or 5.8 per cent, below
the historical average.
US distillate stocks reversed the builds of
the last two months and declined by 3.0m b to
end September at 124.1m b. With this draw, they
were 29.6m b, or 19.3 per cent, below the year-
ago level and 26.9m b, or 17.8 per cent, lower
than the seasonal norm.
Jet fuel stocks rose for the third month run-
ning — by 1.3m b — from a month earlier. At
44.4m b, they stood at the highest level since
October 2011 and were 1.6m b, or 3.6 per cent,
lower than a year ago, but they switched the
deficit with the seasonal norm during the pre-
vious month to a surplus of 400,000 b, or 1.0
per cent.
Residual oil stocks rose by 2.0m b in
September, after two months of draws. At 35.1m
b, they were 600,000 b, or 1.6 per cent, lower
than the same month a year ago and 2.0m b, or
5.4 per cent, below the five-year average.
In Japan, in August, commercial oil stocks
reversed the builds incurred over the last five
months, declining by 1.9m b to 176.4m b. Despite
this draw, they remained 300,000 b, or 0.2 per
cent, above a year ago, but still showed a defi-
cit of 6.7m b, or 37 per cent, with the five-year
average.
The total stock-draw came from crude,
which declined by 3.0m b, while product stocks
abated this decline, increasing by 1.3m b.
Japanese commercial crude oil stocks fell
by 3.0m b for the third consecutive month to
end August at 101.4m b. At this level, they were
3.9m b, or 4.0 per cent, above the same time a
year ago and around 1.0m b above the five-year
average.
In August, Japan’s refineries were running
at 76.9 per cent, which was 2.6 per cent higher
than in the previous month and 0.2 per cent
more than in the same month last year.
Japan’s total oil product inventories contin-
ued their upward trend, rising by 1.3m b for the
fifth consecutive month to end August at 75.1m
b, the highest level since November 2011.
Despite this build, they showed a deficit
of 3.6m b, or 4.6 per cent, with a year ago and
were 7.4m b, or 9.0 per cent, below the seasonal
average.
Within products, distillates saw a build,
while naphtha, gasoline and residual fuel oil
experienced falls.
Distillate stocks rose for the fifth consec-
utive month, up by 3.2m b to end August at
34.5m b, the highest level since November 2011.
Despite the build, they still showed a deficit of
3.1m b, or 8.2 per cent, compared with a year
ago and were 4.5m b, or 11.6 per cent, below
the five-year average.
All distillate components saw builds, with
the bulk of the overall increase coming from
kerosene stocks as they rose by nearly 19 per
cent.
Jet fuel inventories rose by 5.4 per cent,
gasoil stocks increased by 1.6 per cent, while
gasoline stocks fell slightly by 200,000 b, revers-
ing the build of the previous month. At 13.9m b,
gasoline stocks were 700,000 b, or 5.1 per cent,
higher than a year ago, representing a surplus of
700,000 b, or 5.6 per cent, with the seasonal
average.
Residual fuel oil stocks declined by a slight
100,000 b in August to 17.2m b. At this level,
they were 200,000 b, or 1.4 per cent, above the
same period a year ago and 1.0m b, or 5.7 per
cent, below the five-year average.
Naphtha inventories saw a fall of 1.6m b,
ending August at 9.5m b. At this level, they
remained 1.5m b, or 13.4 per cent, below a year
ago and 2.6m b, or 21.3 per cent, lower than the
five-year average.
Preliminary weekly data from the Petroleum
Association of Japan showed Japanese total
“In September, US commercial
crude stocks reversed the
downward trend of the last
two months and increased by
7.6m b to stand at 364.7m b.”
99
OPE
C bu
lleat
in 1
0–12
/12
commercial oil stocks rose in September by
6.8m b to end the month at 183.2m b. The build
was driven by both crude and products as they
increased by 5.7m b and 1.1m b, respectively.
Within products, the picture was mixed as
gasoline, distillate and naphtha saw builds, while
residual fuel oil stocks experienced a draw. The
bulk of the build in product stocks came from
distillates, which increased by 1.1m b, followed
by naphtha with a build of 800,000 b, while
gasoline saw a minor build of 300,000 b. In
contrast, residual fuel oil declined in September
by 1.1m b.
In Singapore at the end of August, prod-
uct stocks declined for the second consecutive
month, falling by 3.3m b to end at 35.7m b. With
this drop, they remained below the level of the
same time a year ago, showing a deficit of 7.9m
b or 18.1 per cent.
Within products, middle distillate stocks saw
a build, while light distillate and fuel oil stocks
experienced drops.
Light distillate stocks ended August 1.7m
b lower than in the previous month to stand at
8.6m b, the lowest level for almost three years.
They were also 200,000 b, or 1.8 per cent, below
the year-ago level.
Fuel oil stocks dropped by 2.2m b to stand at
17.6m b at the end of August. At this level, they
were 3.9m b below the same period a year ago.
Middle distillate stocks rose by a slight
500,000 b to 9.4m b, the highest level since
March. At this level, they were 3.8m b, or 29.0
per cent, below the same time last year.
Product stocks in the ARA region at the end
of August rose by just 300,000 b to 32.0m b,
the highest level for five months. This meant
that they were 1.2m b, or 3.7 per cent, below
last year’s level over the same period.
Within products, the picture was mixed, as
gasoline, gasoil and jet fuel saw builds, while
fuel oil and naphtha witnessed declines.
Gasoline stocks rose by 200,000 b to 5.3m
b, leaving inventories 400,000 b, or 8.2 per
cent, above the same time a year ago, while jet
fuel inventories rose for the third consecutive
month — by 400,000 b — ending August at 3.1m
b. This represented a decline of 1.2m b, or 28.0
per cent, from the same period last year.
ARA fuel oil stocks fell for the second con-
secutive month — by 300,000 b — to stand at
4.7m b, representing a deficit of 1.7m b, or almost
27 per cent, with a year ago.
Naphtha inventories reversed the build of
the previous month and declined by 400,000 b
to end August at 1.1m b, nearly double the level
of a year ago.
Oil price movements
In October, the OPEC Reference Basket price fell
for the first time since the record 13 per cent
plunge in June. Nevertheless, its monthly aver-
age stayed well above the key $105/b mark and
its price in October last year.
Concern regarding the health of the global
economy and higher crude supply growth has
put oil prices, including the Basket, on a steady
decline since around mid-September.
Sentiment in crude oil markets weakened
internationally in October, as the global eco-
nomic slowdown triggered a pessimistic demand
outlook, coupled with substantial US crude oil
stock-builds, outweighed supply concerns, due
to geopolitical factors.
The Basket price fell to $108.36/b in
October, down $2.31/b, or 2.10 per cent. Year-
to-date, it has averaged $110.05/b, compared
with last year’s average of $107.19/b for the same
period, a y-o-y increase of $2.86/b, or 2.67 per
cent.
Although all the Basket’s component prices
dropped in October, the WTI-related ones dete-
riorated heavily, compared with the marginal
slip in the light African crude oil prices.
Latin American components lost around four
per cent of their value, while North African and
Bonny light crudes dropped by less than one per
cent.
Algerian Saharan Blend and Libyan Es
Sieder were supported earlier in the month by
strong demand for North African light sweet;
but weak demand for gasoline-rich crudes,
when the peak of the northern hemisphere
summer demand period ended, weighed on
the grades.
Distillate-rich Nigerian crude, Bonny light,
found support from strong Asian and higher-
than-usual European demand. Supply disrup-
tions, because of pipeline sabotage and flood-
ing in the Niger delta, also helped the grade.
Ecuador’s Oriente and Venezuelan Merey
were affected by ample supply in the West Texas
Intermediate (WTI) market, particularly with
the restart of the Keystone pipeline that ships
crude from Alberta to Cushing, Oklahoma and the
major refinery turnaround in the Midcontinent
region, putting pressure on WTI.
Moreover, the reduced performance of the
Latin American crudes also happened as a result
of the US West Coast crude oil market weakening.
Meanwhile, poor fuel oil demand in Asia had
a negative effect on the performance of Middle
Eastern heavy sour crudes. The resumption of
exports of Sudanese Nile Blend and Dar Blend
crudes, after a halt in production earlier this
year, added to the supply of heavy crude in the
region. This also put downward pressure on the
somewhat heavy sweet Angolan grades.
African grades Saharan Blend, Es Sider,
Bonny Light and Girassol — Brent-related
crudes — fell by $1.07 to average $111.78/b,
down by almost one per cent from the previ-
ous month.
The multi-destination Basket components,
namely Arab Light, Basrah Light, Kuwait Export
and Iran Heavy, lost more than two per cent in
October to end at $107.86/b, which was $2.58/b
lower than in the previous month.
The Middle Eastern crudes, Murban and
Marine, also fell, by a little over two per cent,
or $2.38, to average $110/b.
Latin American Basket components, Oriente
and Merey, lost a substantial $4.21, or four per
cent, of their levels to settle at a monthly aver-
age of $98.12/b, which was the first time below
the key $100/b mark since July.
On November 8, the Basket price dete-
riorated to $104.58/b, $3.78 below October’s
average.
For the first time since June’s unprecedented
m-o-m drop, crude oil futures prices slumped
in October, despite late support from fears that
November
100
OPE
C bu
lleat
in 1
0–12
/12
Ma
rke
t R
ev
iew Hurricane Sandy could disrupt US East Coast
gasoline and heating oil supplies.
Since around mid-September, higher crude
supply growth and concern regarding the health
of the global economy have put oil prices on a
steady decline, overriding supply fears.
In October, the downward pressure was
sustained as mounting concern about a global
economic slowdown, a pessimistic future
demand outlook and significant US crude stock-
builds outweighed enduring geopolitical supply
concerns.
During that month, soft economic data
from the Euro-zone helped bring the ICE Brent
front-month contract down by 1.34 per cent to
its lowest monthly level for more than three
months. This, coupled with a surprise build in US
crude stocks, also sent the New York Mercantile
Exchange (NYMEX) front-month WTI down by
more than five per cent to levels not seen since
the 13 per cent plunge in June.
ICE Brent slipped by roughly $1.50/b, or
around 1.3 per cent, to settle at $111.52/b,
although notably it has remained above the
$110 mark since August.
Meanwhile, NYMEX WTI dropped by a sig-
nificant 5.3 per cent or around $5/b to average
$89.57/b, which was below the $90/b mark for
the first time in three months.
In comparison with the same period last
year, ICE Brent’s front-month year-to-date aver-
age was 1.2 per cent higher at $112.27/b (com-
pared with $111.89/b). WTI’s front-month year-
to-date average was one per cent higher than
that of last year, at $95.55/b, versus $94.57/b.
Crude oil futures prices continued to slide
in the first week of November. On November 8,
WTI settled up at $85.09/b and Brent moved
up to $107.25/b.
Commodity markets
In October, energy and non-energy prices fell
by 2.4 per cent and 1.6 per cent m-o-m, respec-
tively. Food prices dropped by four per cent, base
metals by 1.3 per cent and gold prices remained
stable at $1,746.6/troy ounce.
The declining commodity prices were
essentially due to strong concern about fluctu-
ations in the global economic GDP growth rate
and outlook.
Commodity markets are closely leveraged
to economic global activity in the short term,
especially the slowing of Chinese GDP growth
and its negative impact on the rest of Asia, the
debt problem in the Euro-zone and the still-
fragile situation in the US and OECD.
Commodity prices have also been driven by
macroeconomic factors, such as asset prices.
The mood among investors remains bearish
and cautious, in expectation of a better macro-
economic outlook and a boost in confidence.
Despite the decline in commodity prices
there was some positive news for the month,
with a renewed optimistic view on China and
US GDP growth, and the wait for better perfor-
mances in the fourth quarter of 2012 and in
2013.
Other streams of encouraging data were on
the global manufacturing Purchasing Managers
Index (PMI) and a rise in the indices of orders and
output amid a collapse in the index of finished
goods inventories, suggesting a positive signal
that industrial activity was poised to rebound.
Demand momentum in the US and a sta-
bilization of China’s growth would be a posi-
tive development for emerging market Asian
exporters.
Nevertheless, important regional diver-
gences in the global performance reinforced
the message that the recovery that was taking
hold was constrained.
Uncertainty, especially with regard to the
Euro-zone’s sovereign debt crisis and setbacks
for the Japanese economy, continued to weigh
on commodity markets.
Sudden improvements in sentiment encour-
aged only short-term gains in commodities like
base metals, owing to a lack of fundamental
support and the global recession. Indeed, liquid-
ity-driven rallies in commodities faded without
fundamental support and on macroeconomic
pessimism.
The Henry Hub natural gas price jumped
by 16.7 per cent m-o-m, due to a positive turn
in market sentiment that was related to the
release of anxiety about storage in November,
which represented a resetting of the natural
gas market, when a return to normal weather
could provide significant support to natural gas
demand.
However, the rally in prices was not backed
by underlying fundamentals, as gas power
demand remained price-elastic. The net non-
commercial position for natural gas is now at
its highest level since October 2007, while total
futures’ open interest has increased by 11 per
cent since the end of September.
The agricultural price index declined by
2.95 per cent in October (as against –0.12 per
cent in September), with food prices posting a
four per cent drop during the month (compared
with –1 per cent in September).
Agricultural markets were affected by the
pessimistic global economic outlook and some
selling pressure.
The World Bank’s base metal price index
decreased by one per cent in October, follow-
ing the fading of the short-covering and the
positive impact of the Federal Reserve Board’s
and European Central Bank’s announcements
in September.
The complex was affected essentially by
great uncertainty about the growth trajectory
of China’s economy and its impact on metal
demand.
Following a nine per cent m-o-m rise in
September, gold prices remained the same at
$1,746.6/troy oz in October, amid concern about
Chinese economic growth and a stronger US dol-
lar. A discouraging factor was also lower demand
in India, Iran and China.
World oil demand
Estimated demand for OPEC crude in 2012
remains broadly unchanged from the previous
report, as demand and non-OPEC supply saw
only minor adjustments.
Within the quarters, the first, second and
fourth quarters experienced downward revi-
sions of 100,000 b/d, while the third quarter
was revised up by 100,000 b/d from the previ-
ous assessment.
Demand for OPEC crude this year stands at
101
OPE
C bu
lleat
in 1
0–12
/12
30.1m b/d, representing a decrease of 100,000
b/d from 2011. The first quarter is estimated
to have declined by 600,000 b/d, versus the
same quarter last year, while the second was
estimated to have increased by 400,000 b/d.
The second half of the year was seen remaining
virtually unchanged.
Estimated demand for OPEC crude in 2013
has seen a downward adjustment of 100,000
b/d from the previous report to stand at 29.7m
b/d, showing negative growth of 400,000 b/d,
compared with the previous year.
Within the quarters, the first, third and
fourth quarters have seen downward revi-
sions of 100,000 b/d, while the second quar-
ter has remained unchanged from the previous
assessment.
The first quarter is estimated to increase by
300,000 b/d versus the same quarter in 2012.
However, all the other quarters are expected
to see negative growth, with the bulk of the
decrease coming in the second quarter, falling by
700,000 b/d. The third and fourth quarters are
forecast to drop by 600,000 b/d and 400,000
b/d, respectively.
Meanwhile, the recent hurricane disaster in
the US is expected to have reduced the nation’s
oil demand in late-October and early November;
however, efforts to carry out subsequent main-
tenance activity would call for more energy in
November.
Year-end cold weather might put pressure
on heating oil, not only in the US, but also in
Europe. This could increase oil demand mar-
ginally in the fourth quarter.
On another front, economic activity across
the OECD region does not look totally healthy.
Although there was good news regarding indus-
trial activity in Germany and the US in October,
other areas have provided negative economic
signals.
The debt problem in Europe has been
hammering at the continent’s economy and
is expected to continue into next year. China’s
economy has been showing signs of slowing
down in the past few months. Also higher taxes
on fuel are affecting fuel use mainly in the OECD.
The fate of world oil demand in the near
future will be dependent upon not only the
weather and price level but also the rates of
industrial and petrochemical activity.
This will mostly affect middle distillate con-
sumption, which plunged in the past month as
a result of slower industrial production in the
US and China.
Furthermore, the transportation sector con-
tributed to the slowdown in oil use in its peak
summer season, as a result of both slower eco-
nomic activity and higher retail prices.
World oil demand growth in 2012 is esti-
mated at 800,000 b/d, averaging 88.8m b/d.
For the third month in a row, Indian diesel
demand soared, resulting from the use of inde-
pendent electricity generators and from agri-
cultural seasonal activity.
Furthermore, the shutdown of most of
Japan’s nuclear power plants has led to excess
use of crude and fuel oil burning during the first
three quarters of the year; however, this trend
is now fading.
A proposal has been submitted to the
European Commission demanding not only
eliminating subsidies, but also limiting the use
of biofuels made from food by the year 2020.
According to the Commission, the proposal
aims to promote biofuels that substantially cut
emissions, do not compete with food and can be
sustained over time. This new proposal would
reduce the blending mandate from ten per cent
to five per cent.
There has been much concern across the
world about the magnitude of the negative
effects of biofuels on food availability and the
environment. Furthermore, some companies in
the biofuels business have scrapped ventures to
produce cellulosic biofuels, due to their being
economically unfeasible.
Instead, the biofuels industry is facing a
challenge to commercially produce cellulosic
biofuels that are economically feasible.
Unlike the 2010 fiscal and monetary stim-
ulus plan in the US, the more recent monetary
actions are having only a slight effect on the
country’s oil demand in the fourth quarter.
This has been seen in the consumption of
industrial products and gasoline. The aftermath
of Hurricane Sandy could see a call for extra
energy, mainly in November. Also, the weather
conditions in the final two months of the year
could affect oil use in the fourth quarter.
A cold winter would trigger higher natural
gas prices, hence leading to less fuel-switching.
Furthermore, recent economic developments
caused a minor increase to the country’s oil
demand in October.
The latest monthly US oil consumption
data for August confirms the recent downward
trend, showing once again decreases of 0.9 per
cent y-o-y. All main product categories, with the
exception of propane/propylene, gasoline and
residual fuel oil, showed declines, and the bulk
of these were seen in distillate consumption as
a result of decreasing industrial activity.
Industrial fuel use has been on the decline,
due to a weak economy and high fuel prices.
Taking into consideration weekly data for
September and October, the first ten months of
2012 seem to have been generally disappoint-
ing for US consumption, showing contractions
in all product categories.
The main factors influencing consumption
for most of 2012 were weak industrial produc-
tion, the struggling economy, high retail fuel
prices, increased taxes and fuel-switching, espe-
cially towards natural gas.
Preliminary weekly data shows US oil con-
sumption for September and October decreas-
ing by 2.8 per cent and increasing by a slight
0.5 per cent, respectively.
The la test repor ted f igures for
September’s Mexican oil consumption
showed a slight decrease of around 0.5 per
cent, compared with the same month last
year. Jet fuel, diesel and naphtha were on
“Estimated demand for OPEC
crude in 2013 has seen
a downward adjustment
of 100,000 b/d from the
previous report to stand at
29.7m b/d ...”
102
OPE
C bu
lleat
in 1
0–12
/12
Ma
rke
t R
ev
iew the rise, while gasoline and liquefied petro-
leum gas faced shrinkages.
And the latest available data for Canada in
August saw oil demand decreasing by 0.7 per
cent, vis-à-vis last year; oil usage in transpor-
tation and industrial products dominated this
decrease.
All in all, North American oil demand is pro-
jected to decrease by 250,000 b/d in 2012.
European oil consumption contracted again
in September, for the 13th month in a row, reflect-
ing the region’s tumbling economy.
Consumption in Germany, France, Italy
and the United Kingdom fell, with the bulk of
decreases seen in transportation and industrial
fuels, as a result of the weak economies.
Undoubtedly, the short- and medium-term
development of European oil consumption does
not appear to be positive, as debt problems con-
tinue in several of the continent’s economies.
European ‘Big Four’ oil demand decreased by
350,000 b/d in September, compared with
September 2011.
For 2012, European oil consumption is
expected to shrink by 420,000 b/d, as a result
of the economic turbulence in several of the
region’s economies.
In Japan, record rainfall in July delivered
floods and landslides into southern Japan, affect-
ing transportation fuel consumption slightly.
Japan’s disappointing economic activities have
reduced the country’s oil use this summer. Crude
and fuel oil direct burning by power plants has
peaked and is expected to slide down in the last
four months of the year.
In Japan, the latest September monthly data
shows strong increases in crude consumption
and residual fuel oil direct use, as the summer
period came to an end.
The consumption of most other product cat-
egories remained flat (LPG, gasoline and gas/
diesel oil); jet fuel was the only category with
notable increases.
The direct crude and residual fuel burning
for electricity production is expected to con-
tinue throughout 2012 and 2013, but at a much
slower pace, as the current usage of fossil fuel
for electricity generation seems to be the only
option for covering the country’s needs in the
short term.
Kerosene is used for heating in Japan and
the preparation for the winter is expected to
increase the use of this product during the final
two months of the year.
In South Korea, August came up strong,
increasing by 1.4 per cent y-o-y; increases in
industrial products, notably naphtha, more than
offset declining consumption for transportation
and industrial fuels.
OECD Pacific oil consumption is expected
to grow in 2012 by 330,000 b/d, while the bulk
of the increase will result from direct crude/fuel
oil burning for electricity generation and the
substitution of nuclear plants.
The effect of India’s total massive power
shutdown has been seen in the country’s diesel
demand for the third straight month in the row.
This has led to the use of independent diesel-
operated power-generation.
The summer is the peak season for oil use
in India, for various reasons. High oil demand
in the summer is attributed to the transport,
agricultural and industrial sectors.
Diesel demand grew by more than 200,000
b/d in the past three months. Oil demand has
exceeded expectations this year for the above
reasons, as well as improved economic activity
during the year.
The early forecast was set at 3.4 per cent
oil demand growth for the year; however, the
current estimate is at 4.4 per cent.
As for September, the two most consumed
petroleum products were diesel and LPG, with
average consumption growth of 200,000 b/d
and 50,000 b/d, respectively.
Diesel alone grew by 11.8 per cent in the first
three quarters of the year, followed by gasoline
with growth of 6.3 per cent. This led to total oil
demand growth for the same period of 6.4 per
cent or 220,000 b/d y-o-y, averaging 3.6m b/d.
Taiwan’s oil demand has been on the decline
for the past seven quarters. This weakness is
attributed mostly to economic activity related
to the industrial sector. In the first nine months
of the year, demand slid by 2.8 per cent y-o-y,
or 30,000 b/d. Most of the decline was related
to the lower use of fuel oil.
Indonesian oil demand grew by two per
cent in the first three quarters of this year, in
comparison with the same period last year, add-
ing another 26,000 b/d to the country’s total
demand. This came about despite declines in
both diesel and fuel oil use.
Gasoline demand improved by six per cent in
September, leading to a total use of half a million
barrels. As for the first three quarters of the year,
Indonesia consumed 1.3m b/d, denoting growth
of 3.3 per cent, or 44,000 b/d. This growth is
attributed to a growing economy and minor sub-
sidies for some oil product consumption.
Given the strong oil demand by India,
Other Asia’s oil demand growth is estimated at
290,000 b/d y-o-y in 2012.
Oil consumption in the Middle East has been
growing strongly, reaching around 2.9 per cent
annually. Most of the growth is attributed to both
the transport and industrial sectors. Gasoline,
diesel and fuel oil are the most consumed prod-
ucts within the region.
The top consuming countries are Saudi
Arabia (2.8m b/d) and Iran (1.8m b/d). Led by
massive growth for diesel (87,000 b/d) and gas-
oline (31,000 b/d), Saudi oil demand increased
by 150,000 b/d in September y-o-y to average
2.5m b/d. Diesel demand grew the most, due
mainly to industrial use, since some power
plants within the Kingdom operate on diesel.
For the first three quarters of the year, Saudi
oil demand is estimated at 2.8m b/d, denoting
growth of four per cent.
It is forecast that the Middle East will con-
sume 7.8m b/d by the end of 2012, indicating
growth of 200,000 b/d for 2012 y-o-y.
In Latin America, Brazil’s oil demand in
August grew by a remarkable 5.4 per cent y-o-y.
“For 2012, European oil
consumption is expected to shrink
by 420,000 b/d, as a result of the
economic turbulence in several of
the region’s economies.”
103
OPE
C bu
lleat
in 1
0–12
/12
This came about despite a massive decline in
energy/alcohol use of 19.4 per cent in the same
period.
Bad weather forced the government in the
middle of the year to reduce the alcohol/etha-
nol-based blending mandate from 25 per cent to
19 per cent, and this caused the negative y-o-y
demand.
Gasoline and diesel demand grew by 14 per
cent and 7.35 per cent, respectively, y-o-y. The
first three quarters saw oil demand grow by 2.7
per cent, or 700,000 b/d y-o-y.
Venezuelan oil demand rose by 13 per cent
in August y-o-y, as a result of strong demand for
jet kerosene. This high demand growth was off-
set slightly by a decline of 29,000 b/d in fuel
oil. Jet kerosene is the second most consumed
petroleum product in Venezuela after gasoline.
Oil demand rose rapidly in the first three
quarters of the year by five per cent, or 36,000
b/d. Gasoline and jet fuel consumption increased
dramatically too. Venezuela’s strong economic
growth of 4.5 per cent was the engine behind
such strong energy demand.
Furthermore, subsidized transport fuel
pushed consumption higher. The strength in oil
demand is one that should continue into next
year.
Developing countries’ oil demand growth is
forecast at 700,000 b/d y-o-y, averaging 28.5m
b/d in 2012 and indicating an upward revision
of 60,000 b/d from the last OPEC report.
China’s oil demand has been faltering during
the summer, reducing heavily expected growth
projections.
Electricity demand from power plants,
which operate partly on fuel oil, increased by 2.9
per cent in September y-o-y, the lowest monthly
growth since January. This was an indicator of
a slowing economy.
This, of course, affected all types of energy
use, not only oil. September’s oil demand rose
by 200,000 b/d y-o-y, leading to third-quarter
growth of 170,000 b/d.
This slowdown resulted from both slowing
economic activity, mainly industrial, and the
country’s use of a different pricing mechanism.
China has embarked on two initiatives
affecting oil demand. One is the adoption of
new laws to curb sales of vehicles within large
cities, while the second is passing on most of
the increase in international oil prices to the
end-user. Hence domestic demand has shrunk
slightly.
Chinese gasoline demand reflected trans-
port expansion, growing by ten per cent in the
first three quarters. Diesel, on the other hand,
did not follow its normal trend, as a result of
slowing industrial activity. The country con-
sumed only 29,000 b/d of extra diesel in the
same period.
Lower-than-expected diesel demand is not
expected to be the trend in the near future. A
recovery in industrial manufacturing will push
diesel demand up in the next few months. Should
the country’s economy revive in the coming
months, then the use of oil will be as forecast
earlier.
The downside risk to the current forecast for
oil demand growth is estimated at 50,000 b/d
for the year. October’s oil demand is expected
to be slightly better than September’s, despite
the week-long holidays in October.
China’s oil demand growth is forecast at
three per cent, or 300,000 b/d, in the first three
quarters of the year.
Meanwhile, expected challenges in the
global economy next year are creating much
uncertainty about world oil demand. Hence the
forecast for oil demand growth has a notable
downside risk, especially in the first half of the
year.
Much of this risk is attributed to not only
the OECD, but also China and India. A spill-over
from the troubled European economy will affect
other regions of the world.
Some factors affecting next year’s oil
demand forecast are the current ambiguity in
the world GDP assessment, retail petroleum
prices and abnormal weather conditions, and
these could lead to a reassessment of world oil
demand later in the year.
Such variables could reduce the world oil
demand growth forecast by 20 per cent next
year. The outlook for US oil consumption in 2013
remains rather pessimistic, especially when tak-
ing into consideration economic developments
and fuel-switching.
Furthermore, oil demand in the US and
China, which are expected to be the main play-
ers in next year’s world demand growth profile,
can change the overall rhythm of the demand
pattern.
World oil demand is forecast to continue
its growth during 2013 to reach 800,000 b/d
y-o-y and average 89.6m b/d.
North America’s oil consumption during
2013 will remain weak, although it should be
in better shape than this year.
In OECD Europe, the continent’s oil con-
sumption is projected to decrease again, by
240,000 b/d, thus showing hardly any improve-
ment; this is as a result of the weak European
financial outlook. As for the OECD Pacific, con-
sumption is projected to lose the strength that
was seen in 2012 and be flat.
World oil supply
Preliminary figures indicate that global oil sup-
ply increased by 1.01m b/d in October to aver-
age 90.22m b/d.
Non-OPEC supply experienced growth of
1.08m b/d, while OPEC crude production expe-
rienced a decline.
The share of OPEC crude oil in global pro-
duction declined slightly to 34.3 per cent in
October. The estimate is based on preliminary
data for non-OPEC supply, estimates for OPEC
natural gas liquids (NGLs) and OPEC crude pro-
duction from secondary sources.
Meanwhile, non-OPEC oil supply is expected
to increase by 490,000 b/d in 2012 to average
“Preliminary figures
indicate that global oil
supply increased by
1.01m b/d in October to
average 90.22m b/d.”
104
OPE
C bu
lleat
in 1
0–12
/12
Ma
rke
t R
ev
iew 52.95m b/d. This represents a downward revi-
sion of 55,000 b/d from the previous OPEC
report.
The supply profiles of Canada, Norway, the
UK, Indonesia, Brazil and Colombia were revised
down, while upward revisions were made to
Australia’s and China’s supply projections.
The downward revisions were much larger
than the upward ones, resulting in the overall
downward revision to non-OPEC supply in 2012.
OECD Western Europe’s supply experienced
the biggest downward revision in the third quar-
ter, as preliminary data indicated lower-than-
expected output in Norway and the UK.
The largest upward revision was introduced
to OECD Pacific supply, as improved output from
Australia in the early parts of the third quarter
supported the revision.
North America remains the region with the
highest expected growth among all non-OPEC
regions in 2012, followed by China and the
former Soviet Union (FSU). Conversely, OECD
Western Europe, Africa and the Middle East are
seen as the regions expected to have the high-
est declines among non-OPEC producers.
According to preliminary and estimated
data, total non-OPEC supply in the third quar-
ter of 2012 increased by 430,000 b/d over the
same period a year earlier.
During the first three quarters of the year,
non-OPEC supply increased by 470,000 b/d,
compared with the same period the previous
year.
On a quarterly basis, non-OPEC supply this
year is expected to average 53.21m b/d, 52.61m
b/d, 52.49m b/d and 53.47m b/d, respectively.
OECD total oil supply is expected to increase
by 700,000 b/d in 2012 to average 20.87m b/d,
following a downward revision of 15,000 b/d
from the previous month.
This downward revision was introduced
to OECD Western Europe and North America,
while the forecast for OECD Pacific supply saw
an upward revision that offset part of the down-
ward one.
The OECD supply profile remains steady,
with strong growth in North America leading
the overall growth, a relatively sharp decline in
OECD Western Europe and steady supply from
OECD Pacific.
According to preliminary actual and esti-
mated data, OECD supply averaged 20.60m
b/d in the third quarter of this year, a decrease
of 190,000 b/d from the previous quarter and
an increase of 740,000 b/d, compared with the
same quarter last year.
During the first three quarters of 2012,
OECD supply witnessed an average increase of
860,000 b/d, compared with the same period
a year earlier.
On a quarterly basis, OECD oil supply in
2012 is seen to average 21.05m b/d, 20.79m
b/d, 20.60m b/d and 21.05m b/d, respectively.
North America’s oil production is forecast
to increase by 920,000 b/d in 2012, the high-
est rise among all non-OPEC regions, to average
16.45m b/d, denoting a minor downward revi-
sion of 15,000 b/d from the previous month.
The expected healthy supply growth from
the US and Canada and the relatively low antic-
ipated decline from Mexico all supported the
North American supply forecast.
On average, North American supply
increased by 1.11m b/d during the first three
quarters of 2012, compared with the same
period of 2011, according to preliminary data.
On a quarterly basis, North American oil
supply this year is expected to stand at 16.47m
b/d, 16.35m b/d, 16.43m b/d and 16.55m b/d,
respectively.
US oil supply is forecast to increase by
710,000 b/d in 2012 to average 9.74m b/d,
which is unchanged from the previous report.
The strong growth that has been achieved
so far and that is expected to continue through
2012 is supported by the shale developments
in Texas, North Dakota and other locations.
Furthermore, new NGL capacity further sup-
ported the expected growth in US supply in 2012.
North Dakota’s supply reached a new record
average of 701,000 b/d in August, depicting an
increase of 25,000 b/d from the previous month
and growth of 255,000 b/d over the same period
a year earlier.
This strong growth was driven by shale
developments in the Bakken formation, where
7,701 wells were producing in July, an increase
of 234 wells from the previous month.
Texas oil production averaged 2m b/d in
August, the highest monthly average since June
1988. The continued strong growth was sup-
ported by shale oil developments in the Eagle
Ford and other formations.
This meant an increase for Texas of 75,000
b/d from the previous month and growth of
515,000 b/d compared with the same month a
year earlier.
Moreover, US NGL production continued
to show healthy growth signs. The restart of
closed units and the opening of new petrochemi-
cal plants was seen supporting NGL prices and
production.
According to preliminary data, US oil sup-
ply decreased by 50,000 b/d in the third quar-
ter from the previous quarter and increased by
790,000 b/d over the same period a year ago.
On a quarterly basis, US oil supply this year
is estimated to average 9.74m b/d, 9.74m b/d,
9.69m b/d and 9.80m b/d, respectively.
Canadian oil supply is forecast to increase
by 230,000 b/d in 2012 to average 3.79m b/d,
indicating a minor downward revision of 15,000
b/d from the previous report.
Canada’s oil supply this year is expected to
achieve the highest annual growth since 1979
and this would be the second-largest among all
non-OPEC countries.
This growth is supported by oil sands, shale
oil and NGL production increases. Canadian NGL
supply is expected to continue increasing.
According to preliminary data, Canada’s oil
supply averaged 3.82m b/d in the third quarter
of 2012, an increase of 140,000 b/d from the
second quarter and growth of 200,000 b/d over
the third quarter of 2011.
“During the first three quarters
of 2012, OECD supply witnessed
an average increase of 860,000
b/d, compared with the same
period a year earlier.”
105
OPE
C bu
lleat
in 1
0–12
/12
On a quarterly basis, Canada’s oil supply in
2012 is expected to average 3.81m b/d, 3.68m
b/d, 3.82m b/d and 3.85m b/d, respectively.
Mexico’s oil production is expected to
decline by 30,000 b/d in 2012 to average 2.88m
b/d, unchanged from the previous month.
Preliminary data for October indicated a
minor decrease from September, while during
the first three quarters of the year, Mexico’s sup-
ply remained relatively steady, compared with
the same period in the previous year, with a
minor decline of 25,000 b/d on average.
On a quarterly basis, Mexico’s oil supply in
2012 supply is seen to average 2.92m b/d, 2.93m
b/d, 2.92m b/d and 2.89m b/d, respectively.
Total OECD Western Europe oil supply is
expected to decline by 230,000 b/d in 2012 to
average 3.83m b/d, denoting a downward revi-
sion of 50,000 b/d from the previous report.
OECD Western Europe is the region with the
biggest decline among all non-OPEC regions in
2012. According to preliminary data, its produc-
tion averaged 3.50m b/d in the third quarter, the
lowest quarterly output since 1983, indicating a
decline of 410,000 b/d from the second quar-
ter and a drop of 360,000 b/d from the same
quarter of 2011.
On a quarterly basis, OECD Western Europe’s
oil supply this year is seen standing at 4.07m
b/d, 3.91m b/d, 3.50m b/d and 3.86m b/d,
respectively.
Norway’s oil production is forecast to
decline by 100,000 b/d in 2012 and average
1.94m b/d, representing a downward revision
of 20,000 b/d from the previous report.
According to preliminary data, Norway’s oil
supply declined by around 95,000 b/d during
the first three quarters of this year, compared
with the same period in 2011.
On a quarterly basis, Norway’s oil supply in
2012 is expected to average 2.08m b/d, 1.98m
b/d, 1.76m b/d and 1.95m b/d, respectively.
The UK’s oil production is expected to
decline by 140,000 b/d in 2012 to average
980,000 b/d, which represents a downward
revision of 30,000 b/d from the previous month.
This would be the first time it has fallen below
the 1.0m b/d mark since 1977.
During the third quarter, the UK’s oil supply
averaged 830,000 b/d, the lowest level since
the third quarter of 1977. Output is expected to
increase in the fourth quarter as production from
some fields is seen to return to normal levels.
During the first three quarters of 2012, UK oil
production declined by an average of 150,000
b/d, compared with the same period last year.
On a quarterly basis, the UK’s oil supply in
2012 is expected to average 1.08m b/d, 1.01m
b/d, 830,000 b/d and 1.01m b/d, respectively.
The OECD Pacific’s total oil production is
predicted to remain steady in 2012, with a minor
increase of 20,000 b/d to average 590,000
b/d, indicating an upward revision of 50,000
b/d from the previous month.
This revision came from Australia, while
New Zealand’s supply estimate remained
unchanged.
On a quarterly basis, total OECD Pacific oil
supply this year is seen averaging 510,000 b/d,
530,000 b/d, 660,000 b/d and 640,000 b/d,
respectively.
Australia’s oil supply is projected to remain
relatively steady in 2012, with a minor increase
of 20,000 b/d from the previous year to aver-
age 500,000 b/d, constituting an upward revi-
sion of around 50,000 b/d from the previous
report.
During the first three quarters of 2012,
Australia’s oil supply remained steady, com-
pared with the same period of 2011.
On a quarterly basis, Australia’s oil supply in
2012 is seen to stand at 430,000 b/d, 450,000
b/d, 570,000 b/d and 550,000 b/d, respectively.
Developing countries’ total oil supply is
forecast to decline by 410,000 b/d in 2012 to
average 12.26m b/d, a downward revision of
55,000 b/d from the previous month.
Steady supplies are expected from Latin
America and Other Asia, while supply from Africa
and the Middle East is forecast to decline.
During the first three quarters of 2012,
developing countries’ oil supply is estimated to
have declined by 490,000 b/d, compared with
the same period of 2011.
On a quarterly basis, the group’s oil sup-
ply this year is expected to average 12.33m
b/d, 12.10m b/d, 12.16m b/d and 12.45m b/d,
respectively.
Other Asia’s oil production is estimated to
decrease by 20,000 b/d in 2012 to average 3.61m
b/d, representing a minor downward revision of
less than 10,000 b/d from the previous report.
India’s supply is seen to remain steady this
year at an average of 880,000 b/d, unchanged
from the previous month, while Vietnam’s sup-
ply is expected to average 390,000 b/d, an
increase of 40,000 b/d from 2011 and steady
from the previous report.
On a quarterly basis, Other Asia’s oil supply
is seen to stand at 3.65m b/d, 3.56m b/d, 3.59m
b/d and 3.66m b/d, respectively.
Oil supply from Indonesia, the region’s larg-
est producer, is expected to decline by 60,000
b/d in 2012 to average 970,000 b/d. This drop
was anticipated, since natural declines have
affected output, together with limited volumes
from new developments in 2012, as well as
unplanned shutdowns and land-clearing issues
that delayed permits.
Malaysia’s oil supply is forecast to average
650,000 b/d in 2012, steady from the previous
year and the last report.
Latin America’s oil production is projected
to remain relatively steady in 2012, averaging
4.76m b/d, constituting a downward revision of
40,000 b/d from the previous report.
Argentina’s oil supply is expected to aver-
age 740,000 b/d in 2012, flat from the previous
year, while Colombia’s oil production is expected
to increase by 30,000 b/d in 2012 to average
950,000 b/d, denoting a minor downward revi-
sion of 20,000 b/d from the previous month’s
assessment.
“India’s supply is seen
to remain steady this
year at an average
of 880,000 b/d,
unchanged from the
previous month.”
106
OPE
C bu
lleat
in 1
0–12
/12
Ma
rke
t R
ev
iew On a quarterly basis, Latin America’s oil sup-
ply in 2012 is seen to average 4.85m b/d, 4.71m
b/d, 4.67m b/d and 4.79m b/d, respectively.
Brazil’s oil supply is expected to decrease
by 10,000 b/d in 2012 to average 2.63m b/d,
indicating a downward revision of 20,000 b/d
from the previous month
On a quarterly basis, Brazil’s oil supply this
year is expected to average 2.72m b/d, 2.58m
b/d, 2.55m b/d and 2.66m b/d, respectively.
Middle East oil supply is forecast to decline
by 160,000 b/d in 2012 to average 1.53m b/d,
unchanged from the previous month. Oman
remains the only country in the Middle East with
expected oil supply growth in 2012, while sup-
ply from Syria, Yemen and Bahrain is expected
to decline.
Oman’s production is expected to rise by
40,000 b/d in 2012, which would be the larg-
est level of growth among developing countries,
to average 920,000 b/d, flat from the previous
report.
Yemen’s oil supply is estimated to average
190,000 b/d in 2012, a drop of 40,000 b/d from
the previous year, while Syria’s oil supply is seen
to average 220,000 b/d, a fall of 150,000 b/d
from 2011.
The supply forecasts of both Yemen and
Syria are associated with very high levels of
uncertainty, due to limited data and the ongo-
ing security issues.
On a quarterly basis, Middle East oil supply
in 2012 is estimated to average 1.53m b/d, 1.58m
b/d, 1.59m b/d and 1.53m b/d, respectively.
Africa’s oil production is predicted to
decrease by 230,000 b/d in 2012 to average
2.36m b/d, unchanged from the previous report.
Oil supply from Egypt, Equatorial Guinea
and South Africa is seen to experience minor
increases, while production from South Sudan
and Sudan is seen declining.
According to preliminary and estimated
data, during the first three quarters of 2012,
Africa’s oil supply is estimated to have declined
by 260,000 b/d, compared with the same period
of 2011.
On a quarterly basis, Africa’s oil supply this
year is seen to average 2.41m b/d, 2.31m b/d,
2.32m b/d and 2.41m b/d, respectively.
The FSU’s total oil supply is forecast to
increase by 70,000 b/d in 2012 to average
13.31m b/d, flat from the previous month.
The expected growth is supported by Russia
and Other FSU, while output from Kazakhstan
and Azerbaijan is seen declining.
Russia remains the country with the high-
est oil production levels among all non-OPEC
countries, a position the country has maintained
since 2003.
The expected growth from the FSU in 2012
of 70,000 b/d is significantly lower than the
average annual growth of the last five years of
250,000 b/d.
During the first three quarters of 2012, FSU
output increased by 30,000 b/d on average,
compared with the same period of 2011.
On a quarterly basis, total FSU oil supply this
year is estimated to average 13.36m b/d, 13.25m
b/d, 13.23m b/d and 13.40m b/d, respectively.
Russia’s oil production is forecast to grow
by 80,000 b/d in 2012 to average 10.35m b/d,
unchanged from the previous month.
According to preliminary data, Russia’s oil
production hit a new high in October, exceeding
the previous month’s record by 50,000 b/d.
During the first three quarters of 2012, Russian
oil production increased by 100,000 b/d on
average, compared with the same period in 2011.
On a quarterly basis, Russia’s oil supply this
year is seen to average 10.34m b/d, 10.32m
b/d, 10.36m b/d and 10.38m b/d, respectively.
Production averaged 10.44m b/d in October,
according to preliminary data.
Kazakhstan’s oil supply is seen falling by
20,000 b/d in 2012 to average 1.58m b/d, flat
from the previous report. The fall is expected on
limited new developments, declines in mature
producing areas and the impact of maintenance.
During the third quarter, Kazakhstan’s oil
supply averaged 1.52m b/d, a decline of 20,000
b/d, compared with the same quarter in 2011.
During the first three quarters of 2012, the
country’s production decreased by 30,000 b/d
on average, compared with the same period of
2011.
On a quarterly basis, the country’s oil sup-
ply this year is estimated to average 1.62m
b/d, 1.57m b/d, 1.52m b/d and 1.62m b/d,
respectively.
Azerbaijan’s oil supply is expected to decline
by 20,000 b/d in 2012 to average 940,000 b/d,
unchanged from the previous month.
During the first three quarters of 2012, the
country’s oil supply dropped by 60,000 b/d,
compared with the same period a year earlier.
On a quarterly basis, Azerbaijan’s oil supply
in 2012 is expected to stand at 960,000 b/d,
920,000 b/d, 910,000 b/d and 960,000 b/d,
respectively.
Other Europe’s oil supply is estimated to
remain flat from 2011 and average 140,000
b/d in 2012.
China’s oil production is expected to
increase by 80,000 b/d in 2012 to average
4.20m b/d, an upward revision of 10,000 b/d
from the previous month.
According to preliminary data, China’s oil
production during the third quarter saw an
increase of 40,000 b/d from the second quar-
ter and a rise of 160,000 b/d, compared with
the same quarter a year earlier, mainly from
offshore production.
During the first three quarters of 2012,
China’s oil supply increased by 30,000 b/d, com-
pared with the same period the previous year.
On a quarterly basis, China’s oil supply this
year is estimated to average 4.16m b/d, 4.16m
b/d, 4.20m b/d and 4.27m b/d, respectively.
Meanwhile, in 2013, non-OPEC oil produc-
tion is expected to increase by 900,000 b/d to
average 53.85m b/d.
The overall outlook for non-OPEC supply
“During the first three
quarters of 2012, Russian
oil production increased by
100,000 b/d on average,
compared with the same
period in 2011.”
107
OPE
C bu
lleat
in 1
0–12
/12
in 2013 sees little change, with strong growth
expected in North America, driven mainly by
the US and Canada. OECD Western Europe is
expected to see the largest decline in the year.
The FSU is projected to have the second-
largest regional growth after North America,
followed by Africa and Latin America. Africa’s
supply is forecast to increase strongly on the
return of the halted South Sudan production in
2013.
The US, Canada, South Sudan and Sudan,
Brazil, Australia, Kazakhstan, Russia and
Colombia are expected to drive growth in 2013,
while Mexico, Norway, the UK and Indonesia are
seen recording declines.
On a quarterly basis, non-OPEC supply
in 2013 is projected to average 53.48m b/d,
53.49m b/d, 53.83m b/d and 54.58m b/d,
respectively.
US oil supply in 2013 is now expected to
increase by 340,000 b/d to average 10.08m
b/d, while Australia’s oil supply is forecast to
increase by 70,000 b/d to average 570,000 b/d.
OPEC oil production
Total OPEC crude oil output averaged 30.95m
b/d in October, according to secondary sources, a
decline of 67,000 b/d from the previous month.
Crude oil production experienced a consid-
erable increase from Angola, while production
fell from Nigeria, Saudi Arabia and Iran.
OPEC crude production, not including Iraq,
stood at 27.76m b/d in October, a decrease of
63,000 b/d over the previous month.
Production of OPEC NGLs and non-conven-
tional oils is forecast to grow by 370,000 b/d in
2012 to average 5.76m b/d, following a histori-
cal upward revision to 2011 production.
In 2013, output of OPEC NGLs and non-
conventional oils is expected to increase by
240,000 b/d to average 6.00m b/d.
Downstream activity
Oil product markets showed a mix perfor-
mance during the past month. Middle distillates
continued stronger worldwide on the back of
tight sentiment for the products ahead of the
winter season, while gasoline exhibited a sharp
decline in the Atlantic Basin after the end of the
driving season.
This, along with the losses at the bottom
of the barrel, caused refinery margins to fall
worldwide.
US Gulf Coast refining margins reversed the
upward trend seen since June and lost ground
over the previous month, as gasoline came under
pressure from the end of the driving season and
increasing supplies, and its sharp loss weighed
on regional refining margins, despite the healthy
cracks exhibited by middle distillates.
The margins for WTI remained mostly
unchanged from the previous month at around
$36/b, as the WTI price fell. The margins for Light
Louisiana Sweet and Arabian Heavy crudes on
the US Gulf Coast suffered sharp drops of more
than $4, to stand at around $17/b and $16/b,
respectively, in October.
European product cracks showed a mixed
performance over the month. The middle of the
barrel remained strong and healthy in a tight
environment caused by the refinery mainte-
nance season in Europe, and falling inventories
continued to offer support, while gasoline and
fuel oil weakened.
Bearish signals from the US also affected
the European market during the month after the
end of the driving season.
Naphtha maintained its ground, with
demand from the petrochemical sector increas-
ing, and lent support. However, refining margins
weakened over the month, with a plunge in the
gasoline crack outweighing the positive perfor-
mance of its fellow products, and the refining
margins for Brent in Northwest Europe saw a
sharp drop of $3.4 in October to stand at $8/b
on average.
Refinery margins in Asia remained steady
over the month, despite a bearish performance
at the bottom of the barrel, with the fuel oil crack
losing ground due to the worldwide slump in
bunker demand.
With the exception of fuel oil, marginal
increases were recorded across all parts of
the barrel, as the market remained relatively
well-balanced with rising supplies being offset
by strong regional demand.
These developments, along with less
expensive crude, allowed refinery margins in
Singapore to cap losses and average $4.6/b in
October, a slight drop of 20¢.
US refinery utilization did not recover the
level lost in September, when several refin-
eries were shut down temporarily as a pre-
ventive measure when Hurricane Isaac hit
the region. This was because, at the end of
October, Hurricane Sandy’s impact on the East
Coast refineries also triggered some preventive
shutdowns.
US refinery runs declined from the level of
91 per cent in August to an average of 87.3 per
cent in September and remained at the same
level during October.
Since mid-year, a relative tightening of the
Atlantic Basin balance has allowed margins
to become healthier in Europe, and the heavy
maintenance season in Europe has kept middle
distillates tight.
In recent months, refinery utilization has
increased to average above 80 per cent, the
highest level seen so far this year.
The refinery maintenance season in Asia is
coming to an end and, despite some unplanned
shutdowns in the region, increasing supplies
have eased the tight environment, affecting
product cracks, although this loss has been
capped by support from strong regional demand,
mainly for distillates.
China and India ran their refineries at
“Total OPEC crude oil
output averaged 30.95m
b/d in October, according
to secondary sources,
a decline of 67,000 b/d
from the previous month.”
108
OPE
C bu
lleat
in 1
0–12
/12
Ma
rke
t R
ev
iew around 87 per cent and 89 per cent, respec-
tively, in September.
Japanese throughputs dropped 3.4 per
cent to average around 69.4 per cent of capac-
ity in October, after some maintenance and
shutdowns.
US gasoline demand stood at around 8.6m
b/d in October, dropping 80,000 b/d from the
previous month, and down by around 20,000
b/d from the same month last year.
The demand picture in the US remains
disappointing, with the Energy Information
Administration (EIA) showing the requirement
for motor fuel on a four-week average basis at
8.6m b/d, the lowest level since April.
With the end of the driving season and
refinery maintenance, the main supporting fac-
tors have disappeared and with them the bull-
ish market expectations. This has caused the
gasoline cracks to post a sharp decline, falling
to the lowest level seen in the last six months.
With Hurricane Sandy having passed along
the US East Coast, there are expectations of an
impact on the gasoline market in the coming
weeks, as the storm has led to disruptions and
will also have some impact on the consump-
tion side.
Middle distillate demand stood at around
3.7m b/d in October, 50,000 b/d above the pre-
vious month, but 200,000 b/d down from the
same month a year ago.
Export opportunities to Europe and Latin
America remained supportive of the US distil-
late market. In fact, according to the latest EIA
report, distillate exports remained steady at a
strong level of around 1m b/d.
Latin American demand for diesel has been
the main factor contributing to the tightness in
the US market, with Ecuador, Chile and Brazil
among the major buyers.
This factor has kept US distillate stocks
below the five-year average to drop beneath
120m b, the lowest level seen in years. At the
same time, US heating oil stocks are being drawn
down, in line with higher demand ahead of the
winter season.
Product market sentiment turned bearish
in Europe, as gasoline was hit by the end of
the Atlantic Basin driving season while fuel oil
demand remained lacklustre. The only exception
was the middle of the barrel, as tight sentiment
continued to give support.
Rising inventory levels also added pres-
sure, with gasoline stocks in the Amsterdam-
Rotterdam-Antwerp (ARA) region’s trading hub
increasing to a level higher than the five-year
average.
In addition, exports to West Africa dropped,
as the ongoing Nigerian subsidies saga contin-
ued to limit demand from the country.
In the coming weeks, reduced buying activ-
ity, due to Hurricane Sandy-related disruptions,
may also temporarily reduce demand for prod-
ucts, including gasoline, and exert further pres-
sure on the market.
Diesel market sentiment in Europe improved
over the month, with firm demand from
Germany, France and the UK adding support
to the market, while low inventories and the
ongoing refinery maintenance season helped
maintain the bullish sentiment.
At the bottom of the barrel, both high- and
low-sulphur fuel oil took hits, on the back of
sluggish regional demand and a lack of export
opportunities to the important Asian market, as
stocks in Singapore increased.
In addition, Russian fuel oil exports are
expected to be higher, in line with increased
winter production.
Asian markets remained relatively well-bal-
anced as increasing supplies eased the tight situ-
ation. Fuel oil weakened further, due to a lack of
demand and increasing inflows to the region.
Gasoline recovered a little of the ground
lost last month, while naphtha remained flat,
supported by the petrochemical sector.
Oil trade
Preliminary data shows that US crude oil imports
declined in October for the second consecutive
month — by 225,000 b/d, or 2.7 per cent, from
the previous month to average 8.3m b/d.
On an annual basis, this reflected a loss of
604,000 b/d, or 6.8 per cent, from a year ear-
lier. US crude imports reached their lowest level
since February 2011.
US product imports dropped by 82,000
b/d, or 3.9 per cent, to average 2.03m b/d m-o-
m, while, y-o-y, they fell by 119,000 b/d, or 5.5
per cent.
On a year-to-date comparison, crude and
product imports declined by four per cent and
18 per cent, respectively.
US oil product exports decreased in October
by 100,000 b/d, or 3.5 per cent, from the previ-
ous month to average 2.8m b/d. Y-o-y, the figures
reflected a greater drop of 297,000 b/d, or ten
per cent.
As a result, total US net imports declined
slightly to average 7.52m b/d, which was 2.7 per
cent lower than in the previous month and five
per cent less than last year’s level.
Japan’s crude oil imports experienced a
19,000 b/d, or 0.5 per cent, monthly decline
in September to average 3.6m b/d. Y-o-y, they
decreased by 15,000 b/d, or 0.4 per cent.
On the other hand, the country’s oil product
imports increased by 65,000 b/d in September
to average 694,000 b/d, denoting a gain of
10.3 per cent m-o-m and 0.2 per cent y-o-y. The
monthly product imports were considered to be
the highest since February.
Japan’s oil product exports declined by
38,000 b/d, or seven per cent, in September
to average 500,000 b/d. Y-o-y, the decline
was equal to 94,000 b/d, or 15.8 per cent.
Accordingly, Japan’s net imports rose by 83,000
b/d in September to average 3.78m b/d, reflect-
ing a monthly and annual gain of 2.2 per cent.
China’s crude oil imports increased by
“Preliminary data shows
that US crude oil imports
declined in October for
the second consecutive
month — by 225,000 b/d,
or 2.7 per cent.”
109
OPE
C bu
lleat
in 1
0–12
/12
“Total crude oil exports
from the former Soviet
Union increased by
191,000 b/d, or three
per cent, in September to
average 6.5m b/d.”
556,000 b/d, or 12.8 per cent, in September
from the previous month to average 4.9m b/d.
This increase came after China’s crude imports
had reached a 22-month low the previous month.
Y-o-y, China’s crude imports increased by
90,000 b/d, which was 1.8 per cent higher.
Year-to-date, the figures reflected an increase
of 336,000 b/d, or 6.7 per cent.
China’s crude oil exports increased in
September by 5,000 b/d to average 50,000
b/d. This meant a recovery to the same level as
in July, following the decline in August.
The increase was equivalent to 11.5 per cent
m-o-m, while y-o-y, it denoted a decrease of 40
per cent.
On the other hand, China’s oil product
exports saw a minor increase of 6,000 b/d, or
1.2 per cent, m-o-m and a decrease of 164,000
b/d, or 23.9 per cent, y-o-y. As a result, China’s
net oil imports increased by 865,000 b/d, or
19.9 per cent, from the previous month and
by 36,000 b/d, or 0.7 per cent, from a year
earlier.
India’s crude oil imports in September rose
for the second consecutive month — by 149,000
b/d, or 4.4 per cent, from the previous month
to average 3.5m b/d. This was considered to
be the highest level since May 2012 and con-
stituted an annual increase of 349,000 b/d, or
11 per cent.
India’s oil product imports saw a small
decrease of 14,000 b/d, or four per cent, m-o-m
in September to average 326,000 b/d. Y-o-y, it
meant an increase of 34,000 b/d, or 11.6 per
cent.
The country’s oil product exports rose by
99,000 b/d, or 8.1 per cent, in September to
average 13m b/d. Y-o-y, they declined by a slight
8,000 b/d, or 0.6 per cent.
Consequently, India’s net oil imports
increased by 36,000 b/d to average 2.5m b/d,
which meant a gain of 1.5 per cent m-o-m and
18.3 per cent y-o-y.
Total crude oil exports from the former
Soviet Union increased by 191,000 b/d, or three
per cent, in September to average 6.5m b/d.
The FSU’s total oil product exports decreased
by 235,000 b/d, or 7.3 per cent, from August to
average 3m b/d. This fall came on the back of
lower exported quantities of naphtha, jet, gasoil
and fuel oil, which decreased from the previous
month’s level by 16 per cent, 33 per cent, seven
per cent and nine per cent, respectively.
Stock movements
Preliminary data for September showed that
total OECD commercial oil stocks remained
virtually unchanged, following a 11.2m b drop
in August.
Crude oil showed a build of 1.1m b, while
products abated this build as they declined by
1.7m b. At 2,704m b, OECD commercial stocks
stood 34m b above the level of last year dur-
ing the same period and indicated a surplus of
6m b compared with the last five-year average,
making it the first gain since May.
Within the components of OECD commer-
cial inventories, crude stood at a comfortable
level, representing a surplus of 44m b with a year
earlier and 32m b above the five-year average,
while product stocks indicated a deficit of 10m
b with last year and 26m b with the seasonal
norm.
The upward trend in total OECD commercial
stocks observed since the beginning of this year
reflects the strong performance of non-OPEC
supply and the increase in OPEC crude produc-
tion amid relatively weaker demand.
Indeed, during the first three quarters of
this year, global supply increased by 2.6m b/d,
while world oil demand rose by only 700,000
b/d.
On a regional basis, North America’s stocks
declined by 3.5m b, with crude rising by 2.2m
b and products abating this build, declining by
5.7m b.
The build in US crude commercial stocks
came from lower refinery runs, reflecting the
period of refinery maintenance normal for this
time of year.
In September, US refineries operated at 87.3
per cent, which was 2.7 per cent lower than in
the previous month and 0.4 per cent below the
same month last year.
At 661m b, North America’s commercial
crude oil stocks stood at comfortable levels,
indicating a surplus with the last five-year aver-
age of 36m b, which was 28m b more than a
year ago at the same time.
However, product stocks in North America
still remained 13m b below the historical aver-
age in September and 19m b down y-o-y.
OECD Europe’s inventories saw a decline
of 2.0m b, driven mainly by the fall of 3.9m b
in crude, while products rose by 1.9m b.
With this total drop, OECD Europe commer-
cial stocks remained 23.2m b below the five-year
average, divided between crude and products,
as they showed a deficit of 13.0m b and 10.1m
b, respectively.
However, y-o-y, OECD Europe commercial
stocks indicated a gain of 13m b for the first time
since October 2010. Both crude and products
contributed to this gain as they showed a sur-
plus of 5.7m b and 6.8m b, respectively.
OECD Pacific commercial stocks rose in
September by 4.9m b, driven by an increase
of 2.8m b in crude inventories and 2.1m b in
products.
OECD Pacific commercial stocks stood 6.4m
b above the last five-year average and 13.1m b
above the same time a year ago.
However, within the components, the pic-
ture was mixed. OECD Pacific commercial crude
stood 9.2m b above the historical norm, while
products indicated a deficit of 2.8m b. Compared
with a year ago at the same period, crude showed
a surplus of 10.7m b, and products witnessed a
gain of 2.3m b.
In terms of days of forward cover, OECD
commercial stocks in September stood at 58.9
days and indicated a gain of nearly two days,
110
OPE
C bu
lleat
in 1
0–12
/12
Ma
rke
t R
ev
iew compared with the last five-year average and
one day, compared with the previous year in
the same period.
This comfortable level of OECD days of for-
ward cover is not expected to fall, since demand
in OECD countries is projected to decline fur-
ther in the coming year amid a continued good
performance of non-OPEC supply.
Indeed, OECD demand for 2013 is expected
to fall by 200,000 b/d vis-à-vis this year, while
non-OPEC supply is forecast to rise by around
900,000 b/d.”
The latest available data for September
shows that European stocks reversed the build
of the last two months and fell by 2.0m b to
stand at 1,063m b.
At this level, they ended the month 11.1m b,
or 1.0 per cent, lower than a year ago and 47m
b, or 4.3 per cent, below the five-year average.
The draw in total inventories came from crude,
which fell by 3.9m b, while product stocks rose
by 1.9m b.
European crude inventories fell by 3.9m b
in September, reversing the build of the previ-
ous month, and finished the month at 456.8m b.
Despite this decline, they remained 14.7m b, or
3.3 per cent, above a year earlier, but persisted
4.8m b, or 1.0 per cent, below the last five-year
average.
European crude throughputs were above
11.0m b in September, around 480,000 b/d
more than in the previous year in the same
period. The third quarter averaged 11.17m b/d,
the highest in two years, and corresponded to
almost 85 per cent of capacity.
European product stocks reversed the draw
of previous month and increased by 1.9m b to
end September at 606.0m b. At this level, they
were 26.0m b, or 4.1 per cent, below the same
period last year and 43.0m b, or 6.6 per cent,
lower than the five-year average.
Within products, distillates and naphtha
saw drops, while gasoline and residual fuel oil
witnessed builds. Gasoline saw the bulk of this
build, increasing by 1.9m b to stand at 106.9m
b, albeit showing a slight deficit of 1.9m b com-
pared with a year ago and remained 8.0m b, or
seven per cent, below the seasonal average.
Distillate stocks ended September slightly
lower than the previous month, following the
1.5m b build seen in August. At 373.1m b, they
dropped by 16.1m b, or 4.1 per cent, from a year
earlier and stand 20m b, or 5.1 per cent, lower
than the five-year average.
Fuel oil stocks rose by 1.3m b to end
September at 91.7m b, 7.3m b below the same
period last year and 18.0m b lower than the
five-year average.
Preliminary weekly data showed that US
total commercial oil stocks fell in October for
the third consecutive month by 3.2m b to stand
at 1,098.3m b/d.
Despite this draw, they stood 24.4m b, or
2.3 per cent, above a year ago during the same
period and 35.1m b, or 3.3 per cent, higher than
the last five-year average.
The fall in US total commercial oil stocks
was attributed to products as they decreased
by 11.6m b, while crude oil stocks abated the
decline, increasing by 8.4m b.
In October, US commercial crude stocks rose
by 8.4m b for the second consecutive month to
stand at 373.1m b. With this build, they indicated
a surplus with a year ago of 34.5m b, or 10.2 per
cent, and were 41.7m b, or 12.6 per cent, above
the five-year average.
However, it should be noted that during the
week ending October 26, US commercial crude
oil stocks fell by 2.0m b, reflecting the weekly
drop in imports of around 900,000 b/d to 7.9m
b/d.
On monthly basis, US crude imports aver-
aged 8.3m b/d in October, almost 600,000
b/d less than in the same period last year. The
monthly build in crude stocks came despite the
increase in crude oil refinery inputs by nearly
120,000 b/d to average 14.8m b/d.
The level of US crude runs was also higher
than the same period a year ago, by more than
300,000 b/d.
Oil product inventories fell by 11.6m b in
October for the third consecutive month. At
725.2m b, they remained 10.1m b, or 1.4 per
cent, below last year’s level and 6.6m b, or 0.9
per cent, lower than the five-year average.
Within products, the picture was mixed;
distillates and other unfinished products saw
declines, while gasoline, residual fuel oil and
jet fuel oil experienced builds.
Gasoline stocks reversed the falls of the last
two months and increased by 3.6m b to end
October at 199.5m b. At this level, inventories
were 8.9m b, or 4.3 per cent, below those of a
year ago and 5.1m b, or 2.5 per cent, below the
historical average.
Distillate stocks fell by 6.1m b for the second
consecutive month, ending October at 117.9m b.
With this draw, they were 24.9m b, or 17.5 per
cent, below the year-ago level and 29.6m b, or
20.1 per cent, lower than the seasonal norm.
Jet fuel stocks rose for the fourth month
running, by 100,000 b from a month earlier.
At 44.5m b, they stood at the highest level for
one year. But despite this upward trend, they
were still 1.1m b, or 2.4 per cent, lower than a
year ago, but indicated a surplus of 1.8m b, or
4.2 per cent, with the seasonal norm.
Residual oil stocks rose by 1.0m b in October
to finish the month at 36.1m b. At this level, they
were 700,000 b, or 1.8 per cent, lower than the
same month a year ago and 2.1m b, or 5.5 per
cent, below the five-year average.
In Japan, in September, commercial oil
stocks reversed the draw incurred over the
previous month, increasing by 4.9m b to end
the month at 181.3m b, the highest level since
February 2009.
With this build, the surplus with a year ago
increased to 1.4 per cent from only 0.1 per cent a
month earlier. The build also helped to switch the
deficits with the five-year average that occurred
in the last two months to a surplus of 2.1 per
cent in September. The total stock-build came
from crude and products as they increased by
2.7m b and 2.1m b, respectively.
Japanese commercial crude oil stocks
reversed the draws of the last three consecutive
“OECD demand for 2013 is
expected to fall by 200,000 b/d ...
while non-OPEC supply is forecast
to rise by around 900,000 b/d.”
111
OPE
C bu
lleat
in 1
0–12
/12
months and ended September at 104.1m b. At
this level, they were 4.3m b above the same
time a year ago and around 8.4m b above the
latest five-year average.
The build was due mainly to lower crude
throughput, which declined by around 187,000
b/d, or 5.4 per cent, over the previous month to
average 3.3m b/d, and stood 2.8 per cent below
the year-ago level.
In September, Japan’s refineries were run-
ning at 72.7 per cent, which was 4.2 per cent
lower than in the previous month, but 0.1 per
cent higher than in the same period last year.
Lower crude imports in September limited
the build in Japanese crude oil stocks. Indeed,
crude oil imports fell by 0.5 per cent from the
previous month, averaging 3.6m b/d, and were
0.4 per cent lower than the same period last year.
Japan’s total product inventories continued
their upward trend, rising by 2.1m b for the sixth
consecutive month to end September at 77.2m
b, the highest level since November 2011.
Despite this build, stocks showed a deficit
of 1.7m b, or 2.2 per cent, with a year ago and
were 4.7m b, or 5.7 per cent, below the seasonal
average. The stock-build for total products came
mainly from lower total oil product sales, which
decreased by nearly 200,000 b/d, or 5.8 per
cent, from the previous month, but they still
remained 1.6 per cent higher when compared
with the same period last year.
At 3.2m b/d, oil product sales in Japan were
higher for the 10th month in a row y-o-y when
demand was low after the triple disaster devas-
tated Japan in March. Lower refinery throughput
limited the build in product stocks.
All products saw builds with the bulk com-
ing from distillates as they increased by 1.4m
b, finishing September at 35.9m b, the highest
level since November 2011.
Despite the build, they still showed a deficit
of 1.9m b, or 5.0 per cent, compared with a year
ago, and were 3.2m b, or 8.3 per cent, below the
five-year average.
Within distillate components, jet fuel and
gasoil saw draws, while kerosene witnessed a
build. Kerosene stocks rose by 11.6 per cent
reflecting lower domestic sales, due to unusu-
ally hot weather in September.
Jet fuel inventories fell by 12.2 per cent,
driven by an increase of 12.4 per cent in domes-
tic consumption, combined with an 11.3 per cent
increase in exports.
Gasoil stocks also fell by 6.9 per cent, sup-
ported by a huge decline of almost 40 per cent
in imports. Lower output, which decreased by 13
per cent, contributed to the fall in gasoil stocks.
Gasoline stocks rose slightly by 200,000
b, reversing the drop of the previous month.
At 14.1m b, gasoline stocks were 1.2m b, or 8.9
per cent, higher than a year ago, representing
a surplus of 1.4m b, or 11.5 per cent, with the
seasonal average.
The build in gasoline stocks could be attrib-
uted mainly to lower domestic sales, which
decreased by 12.6 per cent.
Residual fuel oil stocks rose slightly in
September, ending the month at 17.3m b. At this
level, they were 200,000 b, or 1.1 per cent, less
than the same period a year ago and 1.1m b, or
6.0 per cent, below the five-year average.
Naphtha inventories saw an increase of
500,000 b, ending September at 10.0m b. At
this level, they were 800,000 b, or 7.6 per cent,
below a year ago and 1.8m b, or 15.0 per cent,
lower than the five-year average.
In Singapore, at the end of September, oil
product stocks reversed the falls of the previ-
ous two months and increased by 1.9m b to end
the month at 37.5m b. Despite this build, they
remained below the level of the same time a
year ago, showing a deficit of 4.9m b, or 11.5
per cent.
Within products, middle distillate stocks
saw a drop, while light distillates and fuel oil
stocks experienced builds.
Middle distillate stocks fell slightly by
200,000 b, reversing the builds of the last two
months, and ended September at 9.2m b. At this
level, they were 4.5m b, or 33 per cent, below
the same time last year.
Light distillate stocks ended September
1.5m b higher than in the previous month, fol-
lowing two consecutive months of draws. At
10.2m b, they stood 500,000 b, or 4.7 per cent,
higher than a year ago in the same period.
Fuel oil stocks saw an increase of 500,000
b after two consecutive months of a draw and
ended September at 18.2m b. Despite this build,
they were still 800,000 b, or 4.3 per cent, below
the same period a year ago.
Product stocks in the ARA region fell by 2.3m
b in September after three consecutive months
of builds and ended the month at 29.4m b, the
lowest level since December and 800,000 b,
or 2.7 per cent, below a year earlier at the same
time.
Within products, with the expectation of gas-
oline, all other products witnessed a draw, with
the bulk of the fall coming from gasoil. Indeed,
gasoil stocks fell by 1.8m b to finish September
at 16.0m b, the lowest level since the end of last
year.
At this level, they were 500,000 b, or 31 per
cent, lower than a year ago in the same period.
Fuel oil stocks fell for the third consecutive
month by 700,000 b to stand at 4.0m b, repre-
senting a deficit of 1.1m b, or 21 per cent, with
a year ago.
Jet fuel inventories reversed the builds
incurred during the previous three months and
dropped by 100,000 b to end September at
3.0m b, representing a decline of 100,000 b,
or 4.2 per cent, from the same period last year.
Naphtha inventories saw a decline of
300,000 b to stand at 900,000 b, up by
100,000 b, or 11.8 per cent, y-o-y.
Gasoline was the only product to show a
build of 200,000 b in September. At 5.5m b,
stocks stood 800,000 b, or 18.2 per cent, above
the same time a year ago.
However, gasoline inventories in ARA were
expected to fall in the following weeks, reflect-
ing seasonal refinery maintenance, which would
lead to a decline in gasoline production.
“Product stocks in the ARA region
fell by 2.3m b in September after
three consecutive months of
builds and ended the month at
29.4m b.”
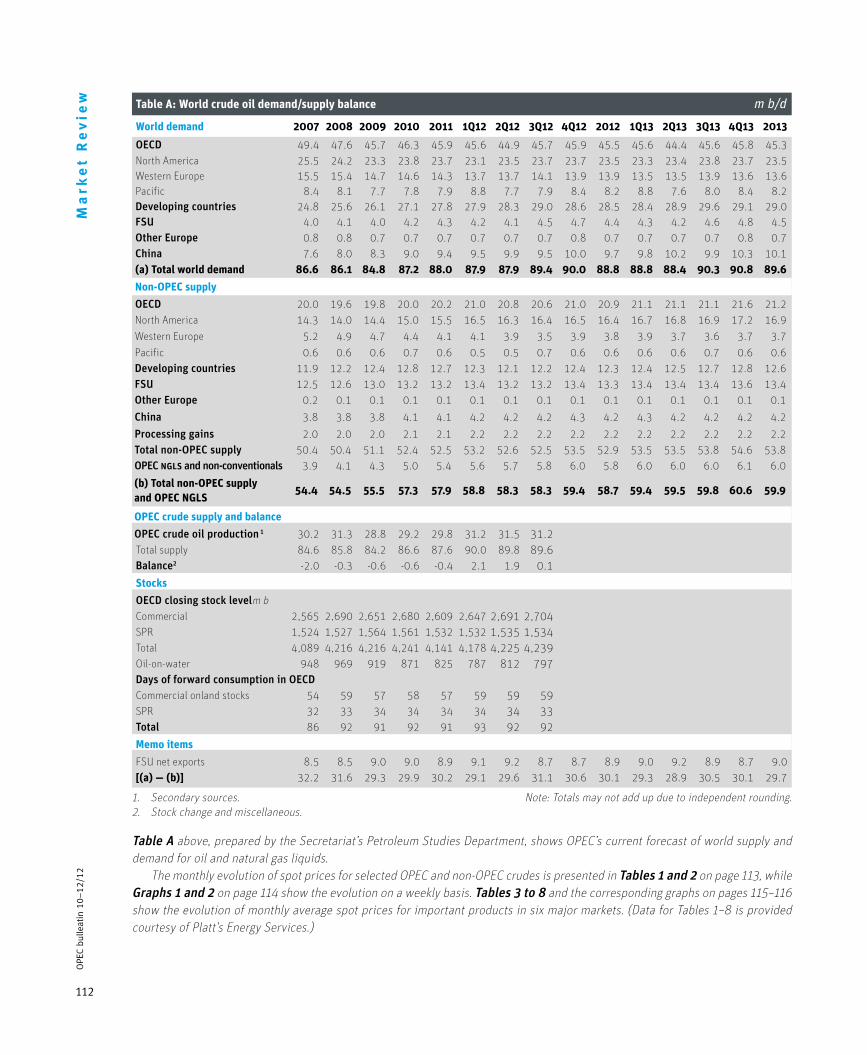
112
OPE
C bu
lleat
in 1
0–12
/12
Ma
rke
t R
ev
iew
1. Secondary sources. Note: Totals may not add up due to independent rounding.2. Stock change and miscellaneous.
Table A above, prepared by the Secretariat’s Petroleum Studies Department, shows OPEC’s current forecast of world supply and demand for oil and natural gas liquids. The monthly evolution of spot prices for selected OPEC and non-OPEC crudes is presented in Tables 1 and 2 on page 113, while Graphs 1 and 2 on page 114 show the evolution on a weekly basis. Tables 3 to 8 and the corresponding graphs on pages 115–116 show the evolution of monthly average spot prices for important products in six major markets. (Data for Tables 1–8 is provided courtesy of Platt’s Energy Services.)
World demand 2007 2008 2009 2010 2011 1Q12 2Q12 3Q12 4Q12 2012 1Q13 2Q13 3Q13 4Q13 2013
OECD 49.4 47.6 45.7 46.3 45.9 45.6 44.9 45.7 45.9 45.5 45.6 44.4 45.6 45.8 45.3North America 25.5 24.2 23.3 23.8 23.7 23.1 23.5 23.7 23.7 23.5 23.3 23.4 23.8 23.7 23.5Western Europe 15.5 15.4 14.7 14.6 14.3 13.7 13.7 14.1 13.9 13.9 13.5 13.5 13.9 13.6 13.6Pacific 8.4 8.1 7.7 7.8 7.9 8.8 7.7 7.9 8.4 8.2 8.8 7.6 8.0 8.4 8.2Developing countries 24.8 25.6 26.1 27.1 27.8 27.9 28.3 29.0 28.6 28.5 28.4 28.9 29.6 29.1 29.0FSU 4.0 4.1 4.0 4.2 4.3 4.2 4.1 4.5 4.7 4.4 4.3 4.2 4.6 4.8 4.5Other Europe 0.8 0.8 0.7 0.7 0.7 0.7 0.7 0.7 0.8 0.7 0.7 0.7 0.7 0.8 0.7China 7.6 8.0 8.3 9.0 9.4 9.5 9.9 9.5 10.0 9.7 9.8 10.2 9.9 10.3 10.1(a) Total world demand 86.6 86.1 84.8 87.2 88.0 87.9 87.9 89.4 90.0 88.8 88.8 88.4 90.3 90.8 89.6
Non-OPEC supply
OECD 20.0 19.6 19.8 20.0 20.2 21.0 20.8 20.6 21.0 20.9 21.1 21.1 21.1 21.6 21.2North America 14.3 14.0 14.4 15.0 15.5 16.5 16.3 16.4 16.5 16.4 16.7 16.8 16.9 17.2 16.9Western Europe 5.2 4.9 4.7 4.4 4.1 4.1 3.9 3.5 3.9 3.8 3.9 3.7 3.6 3.7 3.7Pacific 0.6 0.6 0.6 0.7 0.6 0.5 0.5 0.7 0.6 0.6 0.6 0.6 0.7 0.6 0.6Developing countries 11.9 12.2 12.4 12.8 12.7 12.3 12.1 12.2 12.4 12.3 12.4 12.5 12.7 12.8 12.6FSU 12.5 12.6 13.0 13.2 13.2 13.4 13.2 13.2 13.4 13.3 13.4 13.4 13.4 13.6 13.4Other Europe 0.2 0.1 0.1 0.1 0.1 0.1 0.1 0.1 0.1 0.1 0.1 0.1 0.1 0.1 0.1China 3.8 3.8 3.8 4.1 4.1 4.2 4.2 4.2 4.3 4.2 4.3 4.2 4.2 4.2 4.2Processing gains 2.0 2.0 2.0 2.1 2.1 2.2 2.2 2.2 2.2 2.2 2.2 2.2 2.2 2.2 2.2Total non-OPEC supply 50.4 50.4 51.1 52.4 52.5 53.2 52.6 52.5 53.5 52.9 53.5 53.5 53.8 54.6 53.8OPEC ngls and non-conventionals 3.9 4.1 4.3 5.0 5.4 5.6 5.7 5.8 6.0 5.8 6.0 6.0 6.0 6.1 6.0
(b) Total non-OPEC supply and OPEC NGLs
54.4 54.5 55.5 57.3 57.9 58.8 58.3 58.3 59.4 58.7 59.4 59.5 59.8 60.6 59.9
OPEC crude supply and balance
OPEC crude oil production 1 30.2 31.3 28.8 29.2 29.8 31.2 31.5 31.2Total supply 84.6 85.8 84.2 86.6 87.6 90.0 89.8 89.6Balance2 -2.0 -0.3 -0.6 -0.6 -0.4 2.1 1.9 0.1stocks
OECD closing stock levelm bCommercial 2,565 2,690 2,651 2,680 2,609 2,647 2,691 2,704SPR 1,524 1,527 1,564 1,561 1,532 1,532 1,535 1,534Total 4,089 4,216 4,216 4,241 4,141 4,178 4,225 4,239Oil-on-water 948 969 919 871 825 787 812 797Days of forward consumption in OECDCommercial onland stocks 54 59 57 58 57 59 59 59SPR 32 33 34 34 34 34 34 33Total 86 92 91 92 91 93 92 92Memo items
FSU net exports 8.5 8.5 9.0 9.0 8.9 9.1 9.2 8.7 8.7 8.9 9.0 9.2 8.9 8.7 9.0[(a) — (b)] 32.2 31.6 29.3 29.9 30.2 29.1 29.6 31.1 30.6 30.1 29.3 28.9 30.5 30.1 29.7
Table A: World crude oil demand/supply balance m b/d
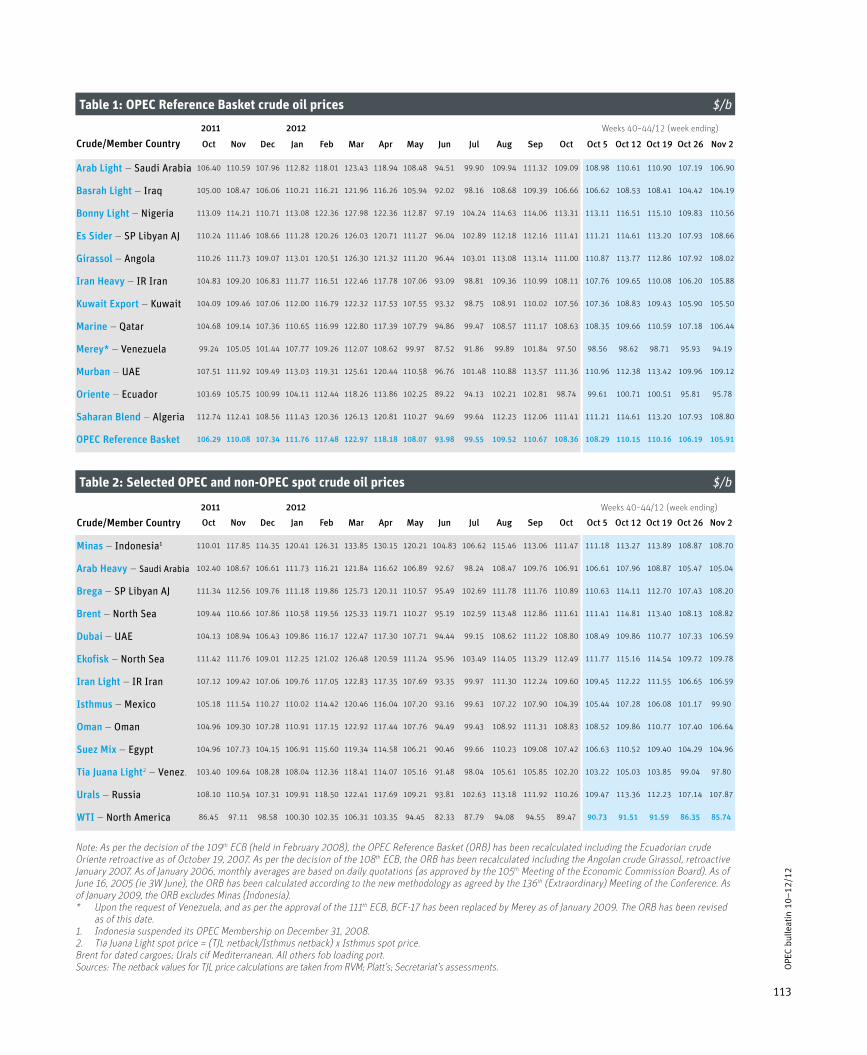
113
OPE
C bu
lleat
in 1
0–12
/12
Note: As per the decision of the 109th ECB (held in February 2008), the OPEC Reference Basket (ORB) has been recalculated including the Ecuadorian crude Oriente retroactive as of October 19, 2007. As per the decision of the 108th ECB, the ORB has been recalculated including the Angolan crude Girassol, retroactive January 2007. As of January 2006, monthly averages are based on daily quotations (as approved by the 105th Meeting of the Economic Commission Board). As of June 16, 2005 (ie 3W June), the ORB has been calculated according to the new methodology as agreed by the 136th (Extraordinary) Meeting of the Conference. As of January 2009, the ORB excludes Minas (Indonesia).* Upon the request of Venezuela, and as per the approval of the 111th ECB, BCF-17 has been replaced by Merey as of January 2009. The ORB has been revised
as of this date.1. Indonesia suspended its OPEC Membership on December 31, 2008.2. Tia Juana Light spot price = (TJL netback/Isthmus netback) x Isthmus spot price.Brent for dated cargoes; Urals cif Mediterranean. All others fob loading port.Sources: The netback values for TJL price calculations are taken from RVM; Platt’s; Secretariat’s assessments.
2011 2012 Weeks 40–44/12 (week ending)
Crude/Member Country Oct Nov Dec Jan Feb Mar Apr May Jun Jul Aug Sep Oct Oct 5 Oct 12 Oct 19 Oct 26 Nov 2
Minas — Indonesia1 110.01 117.85 114.35 120.41 126.31 133.85 130.15 120.21 104.83 106.62 115.46 113.06 111.47 111.18 113.27 113.89 108.87 108.70
Arab Heavy — Saudi Arabia 102.40 108.67 106.61 111.73 116.21 121.84 116.62 106.89 92.67 98.24 108.47 109.76 106.91 106.61 107.96 108.87 105.47 105.04
Brega — SP Libyan AJ 111.34 112.56 109.76 111.18 119.86 125.73 120.11 110.57 95.49 102.69 111.78 111.76 110.89 110.63 114.11 112.70 107.43 108.20
Brent — North Sea 109.44 110.66 107.86 110.58 119.56 125.33 119.71 110.27 95.19 102.59 113.48 112.86 111.61 111.41 114.81 113.40 108.13 108.82
Dubai — UAE 104.13 108.94 106.43 109.86 116.17 122.47 117.30 107.71 94.44 99.15 108.62 111.22 108.80 108.49 109.86 110.77 107.33 106.59
Ekofisk — North Sea 111.42 111.76 109.01 112.25 121.02 126.48 120.59 111.24 95.96 103.49 114.05 113.29 112.49 111.77 115.16 114.54 109.72 109.78
Iran Light — IR Iran 107.12 109.42 107.06 109.76 117.05 122.83 117.35 107.69 93.35 99.97 111.30 112.24 109.60 109.45 112.22 111.55 106.65 106.59
Isthmus — Mexico 105.18 111.54 110.27 110.02 114.42 120.46 116.04 107.20 93.16 99.63 107.22 107.90 104.39 105.44 107.28 106.08 101.17 99.90
Oman — Oman 104.96 109.30 107.28 110.91 117.15 122.92 117.44 107.76 94.49 99.43 108.92 111.31 108.83 108.52 109.86 110.77 107.40 106.64
Suez Mix — Egypt 104.96 107.73 104.15 106.91 115.60 119.34 114.58 106.21 90.46 99.66 110.23 109.08 107.42 106.63 110.52 109.40 104.29 104.96
Tia Juana Light2 — Venez. 103.40 109.64 108.28 108.04 112.36 118.41 114.07 105.16 91.48 98.04 105.61 105.85 102.20 103.22 105.03 103.85 99.04 97.80
Urals — Russia 108.10 110.54 107.31 109.91 118.50 122.41 117.69 109.21 93.81 102.63 113.18 111.92 110.26 109.47 113.36 112.23 107.14 107.87
WTI — North America 86.45 97.11 98.58 100.30 102.35 106.31 103.35 94.45 82.33 87.79 94.08 94.55 89.47 90.73 91.51 91.59 86.35 85.74
2011 2012 Weeks 40–44/12 (week ending)
Crude/Member Country Oct Nov Dec Jan Feb Mar Apr May Jun Jul Aug Sep Oct Oct 5 Oct 12 Oct 19 Oct 26 Nov 2
Arab Light — Saudi Arabia 106.40 110.59 107.96 112.82 118.01 123.43 118.94 108.48 94.51 99.90 109.94 111.32 109.09 108.98 110.61 110.90 107.19 106.90
Basrah Light — Iraq 105.00 108.47 106.06 110.21 116.21 121.96 116.26 105.94 92.02 98.16 108.68 109.39 106.66 106.62 108.53 108.41 104.42 104.19
Bonny Light — Nigeria 113.09 114.21 110.71 113.08 122.36 127.98 122.36 112.87 97.19 104.24 114.63 114.06 113.31 113.11 116.51 115.10 109.83 110.56
Es Sider — SP Libyan AJ 110.24 111.46 108.66 111.28 120.26 126.03 120.71 111.27 96.04 102.89 112.18 112.16 111.41 111.21 114.61 113.20 107.93 108.66
Girassol — Angola 110.26 111.73 109.07 113.01 120.51 126.30 121.32 111.20 96.44 103.01 113.08 113.14 111.00 110.87 113.77 112.86 107.92 108.02
Iran Heavy — IR Iran 104.83 109.20 106.83 111.77 116.51 122.46 117.78 107.06 93.09 98.81 109.36 110.99 108.11 107.76 109.65 110.08 106.20 105.88
Kuwait Export — Kuwait 104.09 109.46 107.06 112.00 116.79 122.32 117.53 107.55 93.32 98.75 108.91 110.02 107.56 107.36 108.83 109.43 105.90 105.50
Marine — Qatar 104.68 109.14 107.36 110.65 116.99 122.80 117.39 107.79 94.86 99.47 108.57 111.17 108.63 108.35 109.66 110.59 107.18 106.44
Merey* — Venezuela 99.24 105.05 101.44 107.77 109.26 112.07 108.62 99.97 87.52 91.86 99.89 101.84 97.50 98.56 98.62 98.71 95.93 94.19
Murban — UAE 107.51 111.92 109.49 113.03 119.31 125.61 120.44 110.58 96.76 101.48 110.88 113.57 111.36 110.96 112.38 113.42 109.96 109.12
Oriente — Ecuador 103.69 105.75 100.99 104.11 112.44 118.26 113.86 102.25 89.22 94.13 102.21 102.81 98.74 99.61 100.71 100.51 95.81 95.78
Saharan Blend — Algeria 112.74 112.41 108.56 111.43 120.36 126.13 120.81 110.27 94.69 99.64 112.23 112.06 111.41 111.21 114.61 113.20 107.93 108.80
OPEC Reference Basket 106.29 110.08 107.34 111.76 117.48 122.97 118.18 108.07 93.98 99.55 109.52 110.67 108.36 108.29 110.15 110.16 106.19 105.91
Table 2: selected OPEC and non-OPEC spot crude oil prices $/b
Table 1: OPEC Reference Basket crude oil prices $/b
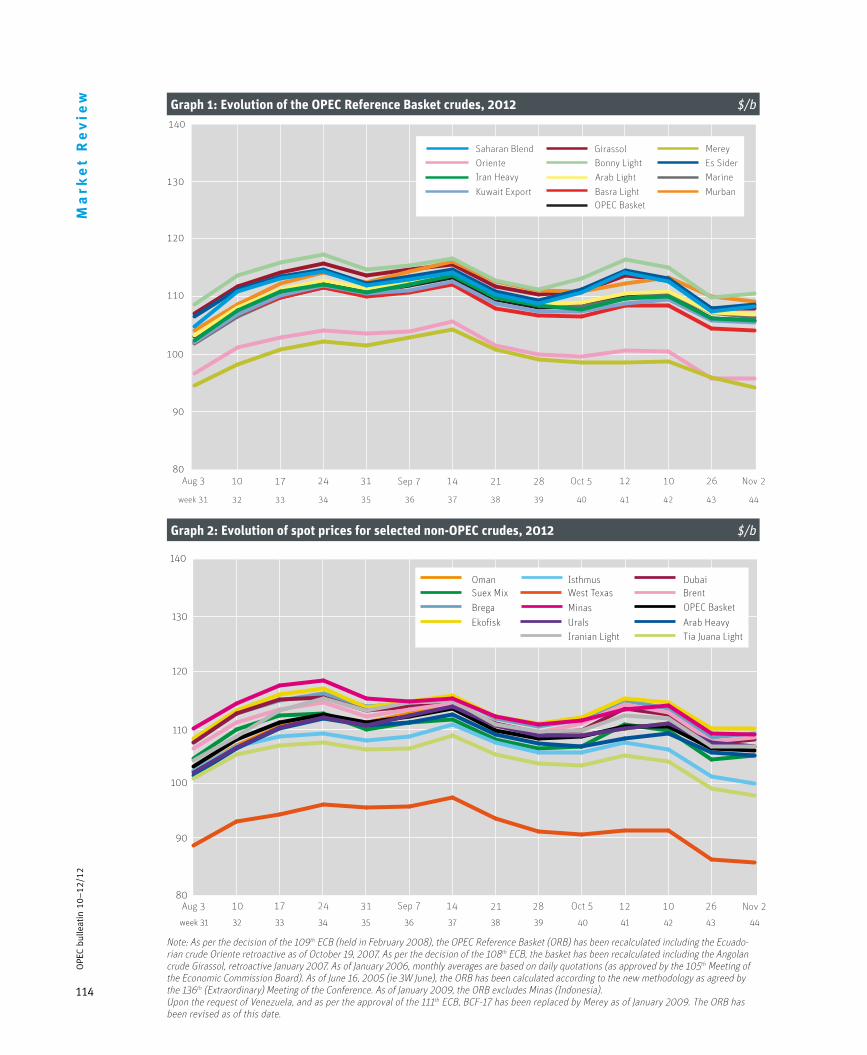
114
OPE
C bu
lleat
in 1
0–12
/12
Ma
rke
t R
ev
iew
80
90
100
110
120
130
140
Oriente
OPEC Basket
Girassol
MurbanMarineEs SiderMerey
Basra LightArab LightBonny Light
Kuwait ExportIran Heavy
Saharan Blend
44434241403938373635343332week 31
Sep 710 17 24 31 Oct 514 21 28 Nov 212 10 26Aug 3
80
90
100
110
120
130
140
44434241 403938373635343332week 31
Minas
Iranian Light Tia Juana Light
Dubai
Brega
Arab Heavy
OPEC Basket
Urals
West TexasIsthmus
Ekofisk
BrentSuex MixOman
Sep 710 17 24 31 Oct 514 21 28 Nov 212 10 26Aug 3
Graph 1: Evolution of the OPEC Reference Basket crudes, 2012 $/b
Graph 2: Evolution of spot prices for selected non-OPEC crudes, 2012 $/b
Note: As per the decision of the 109th ECB (held in February 2008), the OPEC Reference Basket (ORB) has been recalculated including the Ecuado-rian crude Oriente retroactive as of October 19, 2007. As per the decision of the 108th ECB, the basket has been recalculated including the Angolan crude Girassol, retroactive January 2007. As of January 2006, monthly averages are based on daily quotations (as approved by the 105th Meeting of the Economic Commission Board). As of June 16, 2005 (ie 3W June), the ORB has been calculated according to the new methodology as agreed by the 136th (Extraordinary) Meeting of the Conference. As of January 2009, the ORB excludes Minas (Indonesia).Upon the request of Venezuela, and as per the approval of the 111th ECB, BCF-17 has been replaced by Merey as of January 2009. The ORB has been revised as of this date.
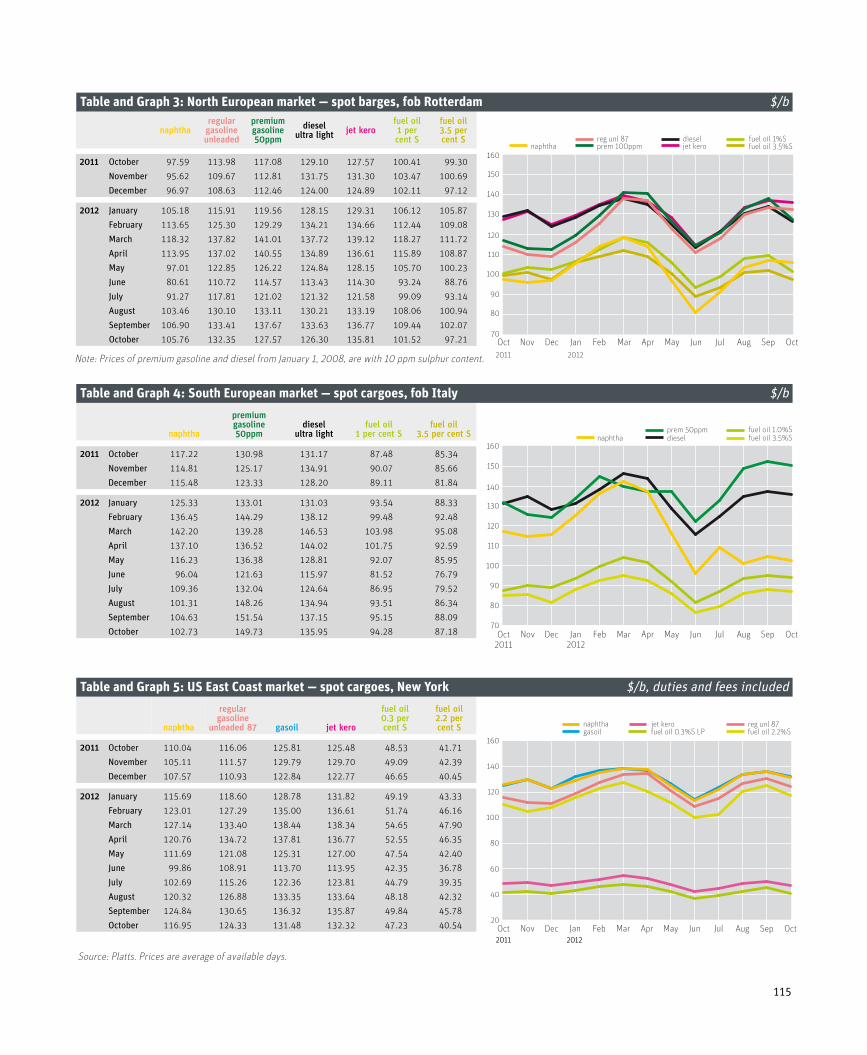
115
naphtharegular
gasolineunleaded
premium gasoline 50ppm
dieselultra light jet kero
fuel oil1 per cent S
fuel oil3.5 per cent S
2011 October 97.59 113.98 117.08 129.10 127.57 100.41 99.30
November 95.62 109.67 112.81 131.75 131.30 103.47 100.69
December 96.97 108.63 112.46 124.00 124.89 102.11 97.12
2012 January 105.18 115.91 119.56 128.15 129.31 106.12 105.87
February 113.65 125.30 129.29 134.21 134.66 112.44 109.08
March 118.32 137.82 141.01 137.72 139.12 118.27 111.72
April 113.95 137.02 140.55 134.89 136.61 115.89 108.87
May 97.01 122.85 126.22 124.84 128.15 105.70 100.23
June 80.61 110.72 114.57 113.43 114.30 93.24 88.76
July 91.27 117.81 121.02 121.32 121.58 99.09 93.14
August 103.46 130.10 133.11 130.21 133.19 108.06 100.94
September 106.90 133.41 137.67 133.63 136.77 109.44 102.07
October 105.76 132.35 127.57 126.30 135.81 101.52 97.21
naphtha
premium gasoline50ppm
diesel ultra light
fuel oil1 per cent S
fuel oil3.5 per cent S
2011 October 117.22 130.98 131.17 87.48 85.34
November 114.81 125.17 134.91 90.07 85.66
December 115.48 123.33 128.20 89.11 81.84
2012 January 125.33 133.01 131.03 93.54 88.33
February 136.45 144.29 138.12 99.48 92.48
March 142.20 139.28 146.53 103.98 95.08
April 137.10 136.52 144.02 101.75 92.59
May 116.23 136.38 128.81 92.07 85.95
June 96.04 121.63 115.97 81.52 76.79
July 109.36 132.04 124.64 86.95 79.52
August 101.31 148.26 134.94 93.51 86.34
September 104.63 151.54 137.15 95.15 88.09
October 102.73 149.73 135.95 94.28 87.18
naphtha
regular gasoline
unleaded 87 gasoil jet kero
fuel oil0.3 per cent S
fuel oil2.2 per cent S
2011 October 110.04 116.06 125.81 125.48 48.53 41.71
November 105.11 111.57 129.79 129.70 49.09 42.39
December 107.57 110.93 122.84 122.77 46.65 40.45
2012 January 115.69 118.60 128.78 131.82 49.19 43.33
February 123.01 127.29 135.00 136.61 51.74 46.16
March 127.14 133.40 138.44 138.34 54.65 47.90
April 120.76 134.72 137.81 136.77 52.55 46.35
May 111.69 121.08 125.31 127.00 47.54 42.40
June 99.86 108.91 113.70 113.95 42.35 36.78
July 102.69 115.26 122.36 123.81 44.79 39.35
August 120.32 126.88 133.35 133.64 48.18 42.32
September 124.84 130.65 136.32 135.87 49.84 45.78
October 116.95 124.33 131.48 132.32 47.23 40.54
Source: Platts. Prices are average of available days.
70
80
90
100
110
120
130
140
150
160
OctSepAugJulJunMayAprMarFebJanDecNovOct
fuel oil 3.5%Sfuel oil 1%S
jet kerodiesel
prem 100ppmreg unl 87
naphtha
Graph 3 Rotterdam
2011 2012
70
80
90
100
110
120
130
140
150
160
OctSepAugJulJunMayAprMarFebJanDecNovOct
fuel oil 3.5%Sfuel oil 1.0%S
dieselprem 50ppm
naphtha
Graph 4 South European Market
2011 2012
20122012
20
40
60
80
100
120
140
160
OctSepAugJulJunMayAprMarFebJanDecNovOct
fuel oil 2.2%Sfuel oil 0.3%S LPjet kero
gasoilreg unl 87
Graph 5 US East Coast Market
20112011
naphtha
Note: Prices of premium gasoline and diesel from January 1, 2008, are with 10 ppm sulphur content.
Table and Graph 5: Us East Coast market — spot cargoes, New York $/b, duties and fees included
Table and Graph 3: North European market — spot barges, fob Rotterdam $/b
Table and Graph 4: south European market — spot cargoes, fob Italy $/b
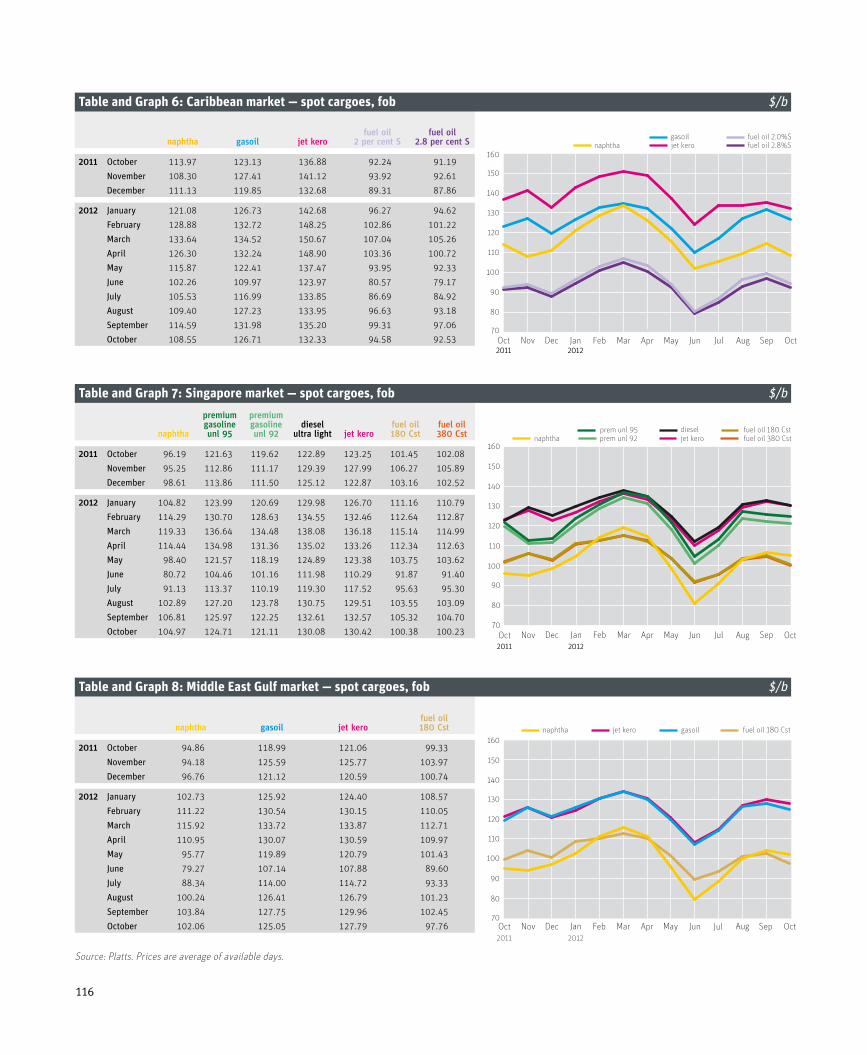
116
naphtha gasoil jet kerofuel oil
2 per cent Sfuel oil
2.8 per cent S
2011 October 113.97 123.13 136.88 92.24 91.19
November 108.30 127.41 141.12 93.92 92.61
December 111.13 119.85 132.68 89.31 87.86
2012 January 121.08 126.73 142.68 96.27 94.62
February 128.88 132.72 148.25 102.86 101.22
March 133.64 134.52 150.67 107.04 105.26
April 126.30 132.24 148.90 103.36 100.72
May 115.87 122.41 137.47 93.95 92.33
June 102.26 109.97 123.97 80.57 79.17
July 105.53 116.99 133.85 86.69 84.92
August 109.40 127.23 133.95 96.63 93.18
September 114.59 131.98 135.20 99.31 97.06
October 108.55 126.71 132.33 94.58 92.53
naphtha
premium gasoline unl 95
premium gasoline unl 92
dieselultra light jet kero
fuel oil180 Cst
fuel oil380 Cst
2011 October 96.19 121.63 119.62 122.89 123.25 101.45 102.08
November 95.25 112.86 111.17 129.39 127.99 106.27 105.89
December 98.61 113.86 111.50 125.12 122.87 103.16 102.52
2012 January 104.82 123.99 120.69 129.98 126.70 111.16 110.79
February 114.29 130.70 128.63 134.55 132.46 112.64 112.87
March 119.33 136.64 134.48 138.08 136.18 115.14 114.99
April 114.44 134.98 131.36 135.02 133.26 112.34 112.63
May 98.40 121.57 118.19 124.89 123.38 103.75 103.62
June 80.72 104.46 101.16 111.98 110.29 91.87 91.40
July 91.13 113.37 110.19 119.30 117.52 95.63 95.30
August 102.89 127.20 123.78 130.75 129.51 103.55 103.09
September 106.81 125.97 122.25 132.61 132.57 105.32 104.70
October 104.97 124.71 121.11 130.08 130.42 100.38 100.23
naphtha gasoil jet kerofuel oil180 Cst
2011 October 94.86 118.99 121.06 99.33
November 94.18 125.59 125.77 103.97
December 96.76 121.12 120.59 100.74
2012 January 102.73 125.92 124.40 108.57
February 111.22 130.54 130.15 110.05
March 115.92 133.72 133.87 112.71
April 110.95 130.07 130.59 109.97
May 95.77 119.89 120.79 101.43
June 79.27 107.14 107.88 89.60
July 88.34 114.00 114.72 93.33
August 100.24 126.41 126.79 101.23
September 103.84 127.75 129.96 102.45
October 102.06 125.05 127.79 97.76
Source: Platts. Prices are average of available days.
20122012
70
80
90
100
110
120
130
140
150
160
OctSepAugJulJunMayAprMarFebJanDecNovOct
fuel oil 2.0%Sfuel oil 2.8%S
gasoiljet keronaphtha
Graph 6 Caribbean Market
20112011
20112011
70
80
90
100
110
120
130
140
150
160
OctSepAugJulJunMayAprMarFebJanDecNovOct
fuel oil 380 Cstfuel oil 180 Cst
jet kerodiesel
prem unl 92prem unl 95
naphtha
Graph 7 Singapore
20122012
2012
70
80
90
100
110
120
130
140
150
160
OctSepAugJulJunMayAprMarFebJanDecNovOct
fuel oil 180 Cstjet keronaphtha gasoil
Graph 8 Middle East Gulf Market
2011
Table and Graph 6: Caribbean market — spot cargoes, fob $/b
Table and Graph 7: singapore market — spot cargoes, fob $/b
Table and Graph 8: Middle East Gulf market — spot cargoes, fob $/b
117
OPE
C bu
lleti
n 9/
11
Annual Report 2011(free of charge)
OPEC Bulletin(free of charge)
World Oil Outlook 2012(free of charge)
Contains research papers by international experts on energy, the oil market, economic development and the environment. Available quarterly only from the commercial publisher. Annual subscription rates for 2012:
Orders and enquiries: Blackwell Publishing Journals, 9600 Garsington Road, Oxford OX4 2DQ, UK.Tel: +44 (0)1865 776868Fax: +44 (0)1865 714591E-mail: jnlinfo@ blackwellpublishers.co.ukwww.blackwellpublishing.com
104-page book with CDThe CD (for MicrosoftWindows only) contains all the data in the book and much more.•Easytoinstallanddisplay•Easytomanipulateand
query•Easytoexporttospread-
sheets such as Excel
•Crudeoilandproductprices analysis
•MemberCountryoutputfigures
•Stocksandsupply/ demand analysis
OPEC offers a range of publications that reflect its activities. Copies can be obtained by contacting this Department, which regular readers should also notify in the event of a change of address:
PR & Information Department, OPEC SecretariatHelferstorferstrasse 17, A-1010 Vienna, Austria
Tel: +43 1 211 12-0; fax: +43 1 211 12/5081; e-mail: [email protected]
OP
EC
Pu
bli
ca
tio
ns
OPEC Energy ReviewOPEC Monthly Oil Market Report (free of charge)
Annual statistical Bulletin 2012 (free of charge)
Print Online Print & online
Europe € 493 493 567UK £ 388 388 447Rest of world $ 761 761 876Americas $ 652 652 750
November 2012
Feature Article:Brent-WTI spread
OPECOrganization of the Petroleum Exporting Countries
Monthly Oil Market Report
Tel +43 1 21112 Fax +43 1 2164320 E-mail: [email protected] Web site: www.opec.orgHelferstorferstrasse 17, A-1010 Vienna, Austria
Oil market highlights
Feature article
Crude oil price movements
Commodity markets
World economy
World oil demand
World oil supply
Product markets and refinery operations
Tanker market
Oil trade
Stock movements
Balance of supply and demand
1
3
5
10
16
30
42
52
59
63
69
76
OPEC Energy Review
Vol. XXXVI, No. 1 March 2012
Modelling petroleum future price volatility: analysing asymmetry
and persistency of shocksAnalysis of consumption pattern
of highway transportation fuel in Nigeria
An analysis of energy price reform: a CGE approach
Gas development in Saudi Arabia assessing the short-term,
demand-side effectsHow to sell Russian gas to
Europe via Ukraine?Real exchange rate assessment
for Nigeria: an evaluation of determinants, strategies for
identification and correction of misalignments
Fardous Alom, Bert D. Ward and Baiding Hu
Maxwell Umunna Nwachukwu and Harold Chike Mba
Davood Manzoor, Asghar Shahmoradi and Iman HaqiqiRaja M. Albqami and F. John Mathis
Sergei Chernavsky and Oleg EismontEmre Ozsoz and Mustapha Akinkunmi
Organization of the Petroleum Exporting Countries
Published and distributed on behalf of the Organization of the Petroleum Exporting Countries, Vienna
Printed in Singapore by Markono Print Media Pte Ltd.
OP
EC
Energy R
eview
Vol. X
XX
VI, N
o. 1 M
arch 2012
001_opec_v36_i1_cover_5.0mm.indd1 1 1/17/2012 6:36:04 PM
www.opec.org
OP
EC Bulletin January 2009
U4_U1:Layout 1 05.02.2009 14:42 Uhr Seite 1O
PEC B
ulletin February 2009O
PEC B
ulletin March 2011