preparation and characterization of iron oxide thin film electrodes
TRANSCRIPT
Digest Journal of Nanomaterials and Biostructures Vol. 5, No. 1, March 2010, p. 85 - 95
PREPARATION AND CHARACTERIZATION OF IRON OXIDES EMBEDDED IN FULLERITE MATRICES
G. A. LUNGU, C. M. TEODORESCU, D. MACOVEI National Institute of Materials Physics, P.O. box MG-7, 077125 Bucharest-Magurele, Romania Nanoparticles of iron oxide embedded in C60 matrices are synthesized by co-evaporation of iron and C60-fullerene in a partial oxygen atmosphere, and analyzed using X-ray photoelectron spectroscopy, X-ray absorption near-edge structure spectroscopy and MOKE magnetometry. C60 molecules in the neighborhood of the iron oxide nanoclusters transfer charge to the oxide, and the charge deficit fully delocalizes onto the fullerene molecules. The iron oxide nanoclusters contain both hematite and magnetite, in comparable proportions. One analyzes the amplitude of the pre-edge XANES peak, yielding the average ionization state of absorbing Fe atoms, which is confirmed by the simulations of XANES spectra. Keywords: nanoclusters, iron oxide, fullerite, XPS, EXAFS, MOKE
(Received December 12, 2009; Accepted January 18, 2010)
1. Introduction Magnetic nanoclusters embedded in fullerite matrices were subject of several studies
during the last years [1-5], since this method allows isolation in relatively inert matrices of non-interacting magnetic nanoparticles. Most of these past studies dealt with synthesis of metal nanoparticles embedded in fullerite. A first aim of the present study is to synthesize thin films of oxide nanoparticles exhibiting magnetic properties (e.g. iron oxides), embedded in fullerite matrices. Iron oxide nanoparticles are known to exhibit attractive magnetic properties: they present superparamagnetism (they are also currently abbreviated as SPION = Superparamagnetic Iron Oxide Nanoparticle [6]) and are currently used as biological markers [6], in targeted drug delivery [6,7], magnetic hyperthermia [7], etc. However, most of the synthesis processes achieved to date are via wet chemistry [8], sol-gel [9], eventually using micellar surfactant synthesis [10]. To date, few physical methods were employed to synthesize such nanoparticles and, to our knowledge, no attempt was made to employ co-deposition with fullerenes, although this method offers a quite good size control of the nanoparticles [4,5]. This is the main reason for the present work. Another point which needs to be investigated refers to the stoichiometry control of oxide nanoparticles and to the eventual influence of the stoichiometry on the magnetic properties of interest for applications.
The synthesized films are characterized by X-ray photoelectron spectroscopy (XPS), in order to deduce sample atomic composition and chemical states. XPS spectroscopy is, nevertheless, surface sensitive [11]; hence, this method is combined with the more bulk sensitive X-ray absorption near-edge structure (XANES) method, where it was proven recently that the analysis of the pre-edge peak of a K-edge X-ray absorption spectrum may prove information on the 3d orbital population (and hence on the ionization states) of the absorbing atoms [12]. Magneto-optical Kerr effect (MOKE) measurements were used in order to characterise the magnetic properties of the films.
2. Experimental The Fe oxide @ C60 thin films are obtained by using co-evaporation of the C60-fullerene
and of metal Fe in a oxygen atmosphere (1-2 × 10⁻⁶ Torr). We used a recently developed high vacuum installation with a high temperature evaporation device for thin films deposition, operating
Corresponding author: [email protected]
86 in a base pressure in the 10-8 Torr range [13]. The FexOy@C60 thin films are deposited on natural silicon oxide grown on Si(001) wafers. The ratio between the number of Fe and C evaporated atoms are determined from separate calibrations by using a quartz microbalance with the parameters of bulk Fe and respectively, that of graphite.
XPS measurements were performed by using a VG ESCA Mk-II installation, by using a (Specs) Al K (1486.7 eV) X-ray gun and a (Specs) flood gun operating at 3 eV acceleration energy and 0.3 mA electron current for sample neutralization. XANES measurements were performed at the E4 beamline at the Hasylab storage ring in DESY Hamburg, Germany. A double crystal Si(111) monochromator was utilized and the measurements were performed in fluorescence mode, by monitoring the Fe K fluorescence radiation and scanning the incident photon energy. The magneto-optical Kerr measurements (MOKE) were performed in transverse mode, in a "mini-MOKE" installation using a He-Ne laser and applied magnetic fields of up to 0.6 T (AMACC Anderberg & Modéer Accelerator AB).
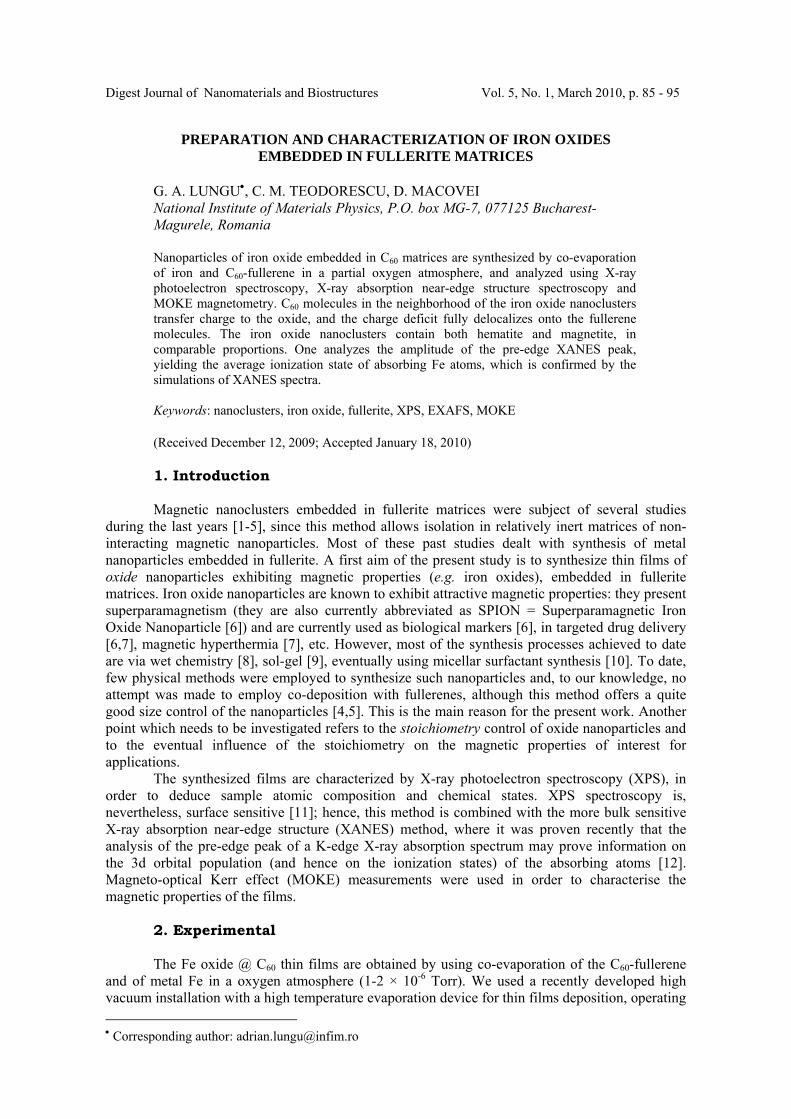
3. X-ray photoelectron spectroscopy 3.1. General features of XPS spectra. Contaminations A survey XPS scan is represented in Fig. 1. The observed sodium contaminations is due to
other samples being sodium chloride powder samples glued on adhesive tape, introduced on the same sample holder during the XPS measurements. On the other hand, as the FeOx@C60 samples were protected by a 2-3 nm fullerene film, it is reasonable to suppose that this sodium contamination does not influence the state of iron nanoclusters in the matrix.
One may also observe the presence of significant quantities of carbon and oxygen in the samples; for the iron, the intensities of XPS peaks related to the 2p peaks are small enough in the general spectrum, which enhanced the difficulty to measure separately these peaks (there was a time of ca. 3-5 hours dedicated to each sample).
Fig. 1. General XP spectra of the prepared samples
87
3.2. C 1s and Fe 2p peaks. Determination of chemical composition, concentration, and average size of particles
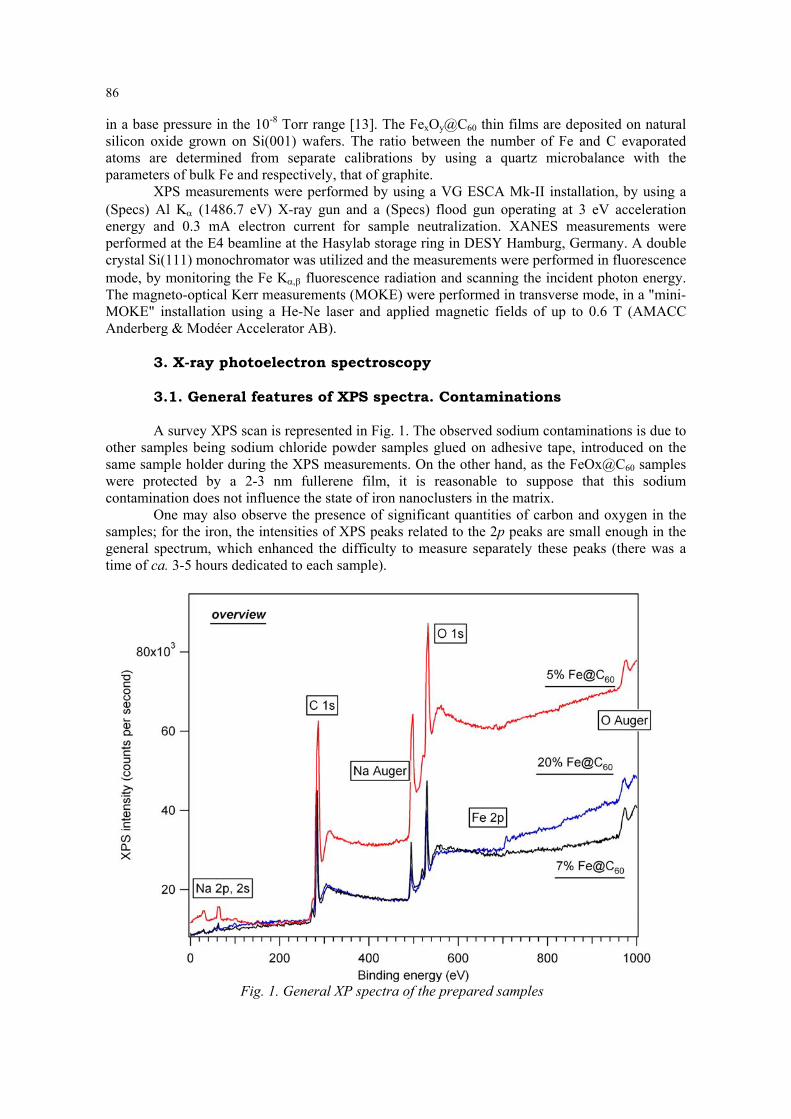
Detailed XPS spectra of the C 1s peak are shown in Fig. 2. One observes the occurrence of
a prominent maximum for a binding energy of 285.5 eV and of a satellite for a larger binding energy, i.e. ca. 289 eV [12]. The prominent maximum is represented by carbon atoms bonded to other carbon atoms, i.e. to atoms in the C60 matrix (including the atoms in the fullerene protection film). We may do the following presumption: the satellite of enhanced binding energy is represented by those carbon atoms bonded to Fe-O complexes, that is those carbon atoms found at the interface between the fullerite matrix and the iron oxide nanoparticles.
Fig. 2. Detailed XP spectra of C 1s peak
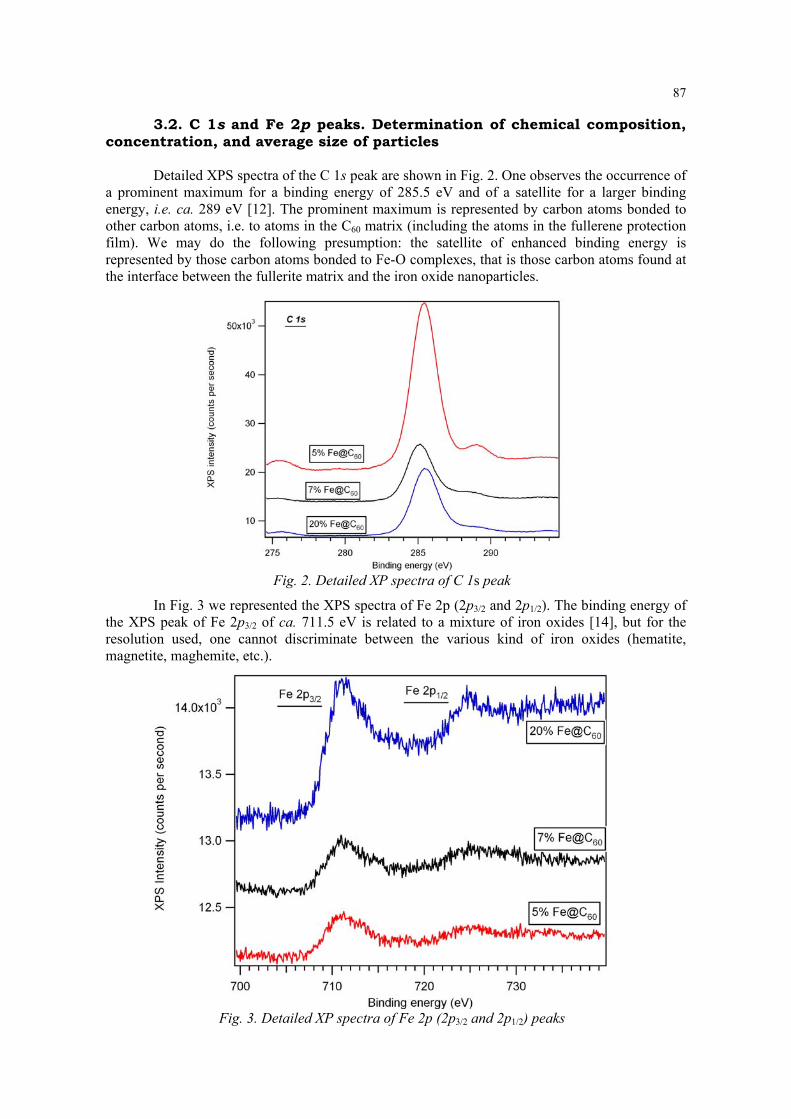
In Fig. 3 we represented the XPS spectra of Fe 2p (2p3/2 and 2p1/2). The binding energy of the XPS peak of Fe 2p3/2 of ca. 711.5 eV is related to a mixture of iron oxides [14], but for the resolution used, one cannot discriminate between the various kind of iron oxides (hematite, magnetite, maghemite, etc.).
Fig. 3. Detailed XP spectra of Fe 2p (2p3/2 and 2p1/2) peaks
88 Table 1 presents the results of the analyses of XPS spectra for carbon and iron. We determined the amplitudes of XPS lines which have been also corrected with the atomic sensivity factors existed in literature (for the excitation with Al Kα radiation, the atomic factor for C 1s is 0.25, and for Fe 2p3/2 is 2 [15]). We also computed the atomic ratio of iron and carbon atoms; one may observe that this ratio has a value of almost two orders of magnitude orders lower than the values of concentrations determined during the samples synthesis. The explanation of this missfit originates from the effect of finite mean free path of the photoelectron [11,16]. The mean free path is described by a so-called “universal curve” having a minimum of ca. 4-5 Å related to the value of 40-60 eV of the electron kinetic energy. For the kinetic energy of the electrons ejected from Fe 2p shell (ca. 776 eV), this mean free path is λ ≈ 8 – 9 Å [11]. Therefore, for a protection fullerite layer of 3λ ≈ 25 Å = 2.5 nm, the attenuation of iron signal occurs by a factor of e-3 ≈ 0.0498.
Table 1. The amplitudes of XPS lines for carbon and iron as well as the atomic ratio of iron and carbon atoms, as obtained and also corrected with the atomic sensivity factors existed in literature
Fe propor-
tion
C 1s Fe 2p
C1s corrected Fe 2p corrected
Fe/C matrix
Fe/C shell
Fe/C shell corrected matrix shell matrix shell
0.05 34177 5117 318 136708 20468 159 0.00116 0.00777 0.162 0.07 11741 1993 415 46964 7972 207.5 0.00442 0.02600 0.543 0.20 13667 1902 1041 54668 7608 520.5 0.00952 0.06840 1.428
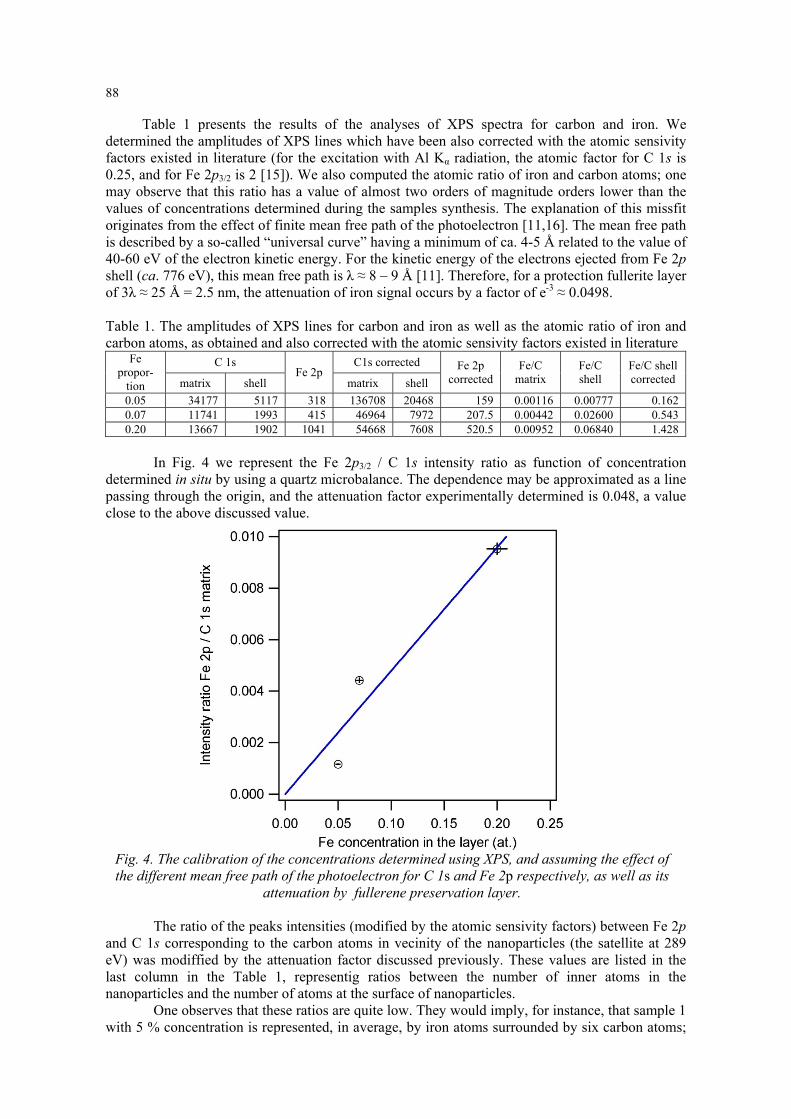
In Fig. 4 we represent the Fe 2p3/2 / C 1s intensity ratio as function of concentration determined in situ by using a quartz microbalance. The dependence may be approximated as a line passing through the origin, and the attenuation factor experimentally determined is 0.048, a value close to the above discussed value.
Fig. 4. The calibration of the concentrations determined using XPS, and assuming the effect of the different mean free path of the photoelectron for C 1s and Fe 2p respectively, as well as its
attenuation by fullerene preservation layer. The ratio of the peaks intensities (modified by the atomic sensivity factors) between Fe 2p
and C 1s corresponding to the carbon atoms in vecinity of the nanoparticles (the satellite at 289 eV) was modiffied by the attenuation factor discussed previously. These values are listed in the last column in the Table 1, representig ratios between the number of inner atoms in the nanoparticles and the number of atoms at the surface of nanoparticles.
One observes that these ratios are quite low. They would imply, for instance, that sample 1 with 5 % concentration is represented, in average, by iron atoms surrounded by six carbon atoms;
89
in this case, this ratio would be 1/6 ≈ 0.167, value close to the one of the table. For the 20 % Fe sample, one obtains in average 1.4 carbon atoms for a Fe atom. By considering the approximation that nanoparticles are spherical with radius R, surounded by a shell of width d, the average ratio between the core and shell atoms are Ncore / Nshell ≈ R/3d [4]. Now, we consider d as being the average distance between a carbon atom and a Fe oxide complex, a little bit below 2 Å. For the sample with 20 % Fe, the average nanoparticle radius obtained is R ≈ 3 × 1.4 d ≈ 8 Å. Hence, the average diameter of these nanoparticles is about 1.6 nm and such a nanoparticle would contain around 268 atoms (Fe and oxygen altogether). In other words, within this hypothesis, isolated atoms in fullerite are synthesized in the case of sample 1 and nanoparticles of some hundreds of atoms are synthesized for sample 3.
Another alternative is to consider that any fullerene molecule situated in contact with the iron oxide nanoparticles takes over the whole charge and delocalizes it on the entire C60 molecule. In other words, the chemically shifted C 1s component at 289 eV comes from all carbon atoms from any fullerene molecule in contact with the iron oxide nanoparticles. In that case, the last column from Table 1 must be again multiplied by a factor of 60. In this case, ratios between the total number of Fe atoms and the number of carbon atoms in the surrounding fullerenes are obtained such as 9.72; 32.6; 85.7 for samples 1, 2 and 3, respectively. This corresponds to average diameters of nanoparticles of 11.7, 39.1, and 103 nm, respectively. The average number of atoms is of order of 105, 4 × 10⁶, and 7 × 10⁷ for the three samples, respectively.
Therefore, two hypotheses may be advanced: (i) the component C 1s at 289 eV is due to the individual carbon atoms in contact with the nanoparticles, and one thus obtains nanoparticle average sizes of a few atoms to hundreds atoms; or (ii) the discussed component C 1s is due to the carbon atoms in fullerene molecules in vicinity of nanoparticles, and one thus obtains nanoparticles with average sizes of 105 - 107 atoms.
In a subsequent section, when analyzing the MOKE data, we will turn back to this problem and argue in favour of one the two hypotheses presented above.
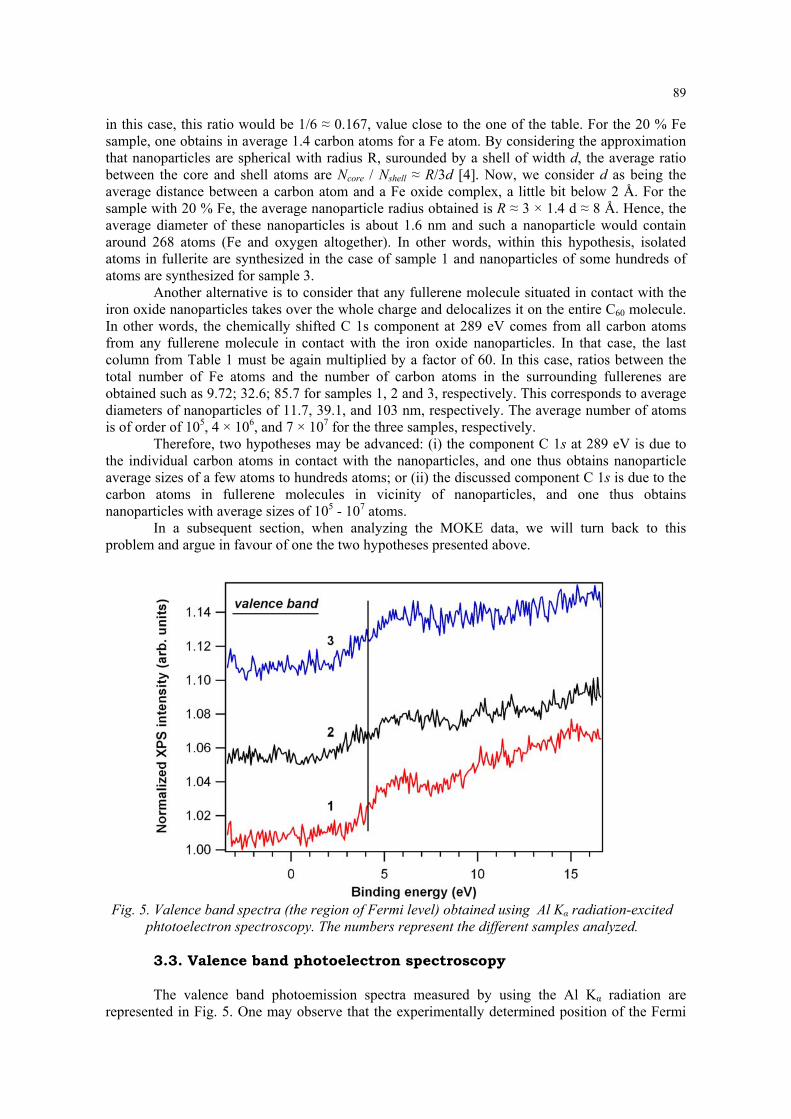
Fig. 5. Valence band spectra (the region of Fermi level) obtained using Al Kα radiation-excited
phtotoelectron spectroscopy. The numbers represent the different samples analyzed. 3.3. Valence band photoelectron spectroscopy The valence band photoemission spectra measured by using the Al Kα radiation are
represented in Fig. 5. One may observe that the experimentally determined position of the Fermi
90 level is the same for all the three samples; meanwhile, the sample with 5% iron concentration (the red curve) has a narrower Fermi edge than both other samples (i.e. ca. 2 eV as compared with 3-4 eV). We confer the detected conduction band to the fullerite matrix; it is possible that for a large quantities of iron the induced disorder and the charge transfer to the fullerite matrix produce “tails of states”, exhibiting a the broadening of the experimentally-derived density of states.
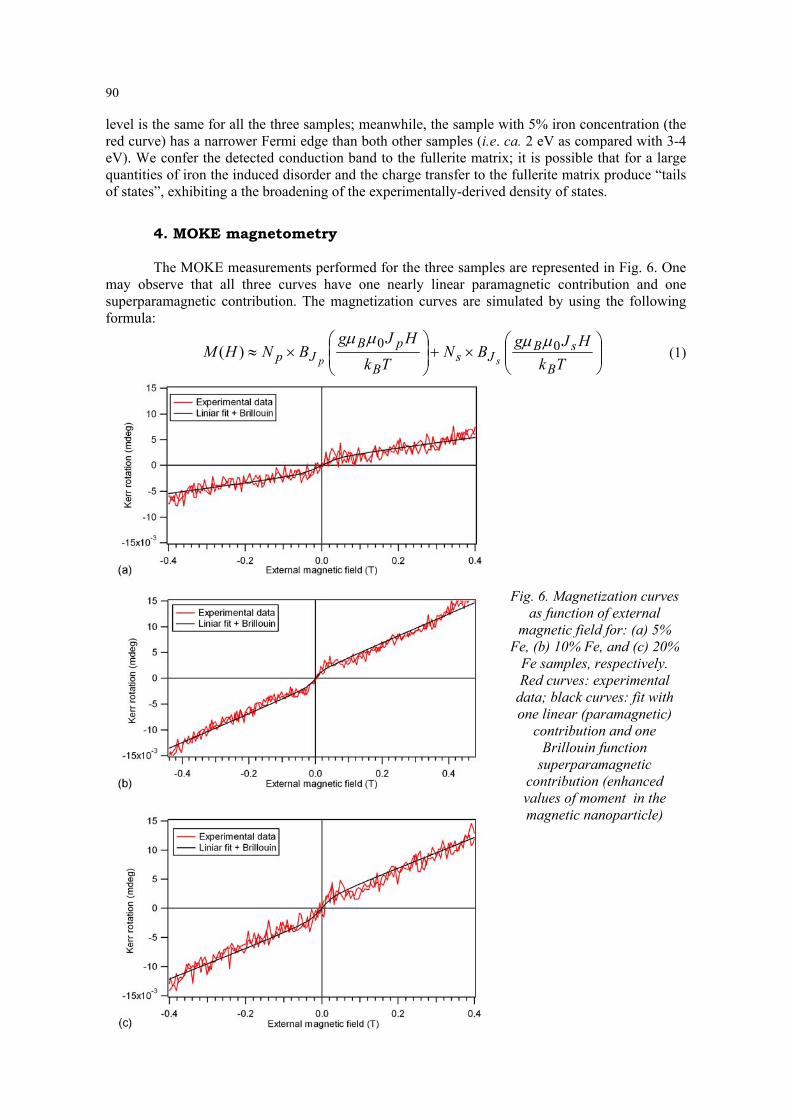
4. MOKE magnetometry The MOKE measurements performed for the three samples are represented in Fig. 6. One
may observe that all three curves have one nearly linear paramagnetic contribution and one superparamagnetic contribution. The magnetization curves are simulated by using the following formula:
Tk
HJgBN
Tk
HJgBNHM
B
sBJs
B
pBJp sp
00)(
(1)
Fig. 6. Magnetization curves as function of external
magnetic field for: (a) 5% Fe, (b) 10% Fe, and (c) 20%
Fe samples, respectively. Red curves: experimental
data; black curves: fit with one linear (paramagnetic)
contribution and one Brillouin function
superparamagnetic contribution (enhanced values of moment in the magnetic nanoparticle)
91
where:
TkJ
JHg
JTk
JHg
J
J
J
J
Tk
JHgB
B
B
B
B
B
BJ )12(
cot12
1
12
2cot
12
2 000 (2)
is the Brillouin function. Jp is the paramagnetic moment (the nearly liniar contribution), and Js is the superparamagnetic moment, measured in Planck units (ħ). Jp is on the order of one Planck unit (ħ), whereas Js is on the order of total momenta in nanoparticles (the number of atoms in nanoparticles multiplied by the atomic moment). Due to the small value of the paramagnetic moment and to the room temperature measurements, the argument of the first term is low and hence this first contribution may be approximated as a line:
Tk
BJgBAB
Tk
BJgBN
Tk
BJgNBM
B
sBJB
B
sBJs
B
pBp ss
)1()( (3)
B being the flux density of external field. The fits using Eq. (3) are also plotted in Fig. 6. One may obtain from this fit the following
parameters: (i) the average moment Js in superparamagnetic particles; (ii) ratio between the amplitude of the second term and the coefficient of the liniar dependence in the first term:
)1(
pB
B
p
sB
Jg
Tk
N
NAr
(4)
The results are given in Table 2.
Table 2. Fit analysis of Kerr magnetometry data
Sample no. Js (ħ units) AB (mdeg) a (mdeg/T) r (T) Ns / Np Ns(at)/Np
(at) 1 12 000 0,0015 0,010 0,15 0,0042 10,1 2 18 000 0,0013 0,0028 0,46 0,0129 46,4 3 28 000 0,0018 0,0026 0,69 0,0192 107,5
One observes that for the average total moment in nanoparticles the obtained values are
large enough (12,000 to 28,000 Planck units). For a average moment per Fe atom of 4 Planck units (3d6 configuration), this corresponds to 3,000 - 7,000 Fe atoms per superparamagnetic nanoparticle. For a average moment of iron of 5 Planck units (3d5 configuration), the range is of 2,400 - 5,600 iron atoms per nanoparticle. These values are closer to the values obtained using XPS analysis data with the hypotesis that the satelite at 289 eV in due to the fullerene molecules in contact with nanoparticles. We also bear in mind that the present magnetometry data analysis reffers only to nanoparticles which contribute to superparamagnetic behaviour. The column representing the Ns/Np ratio is related to the ratio of the number of paramagnetic nanoparticles to the number of atoms which contribute to the paramagnetism. To estimate this ratio, we have considered that the iron paramagnetic atoms are found in the (+3) ionization state, that is in Fe2O3-type compounds. To calculate the ratio of the number of atoms in superparamagnetic nanoparticle and the number of atoms which contribute to paramagnetism, one has to multiply with the average number of atoms in one superaparamagnetic nanoparticle. Just to estimate, we suppose that this number in Js value expressed in Planck units divided to 5 ħ, which is an estimate of atomic moment. This means that most Fe atoms are found in the superparamagnetic nanoparticles; however, even the lower number of remaining paramagnetic atoms (dispersed in the matrix) are sufficient to give the linear dependence observed in Fig. 6.
92
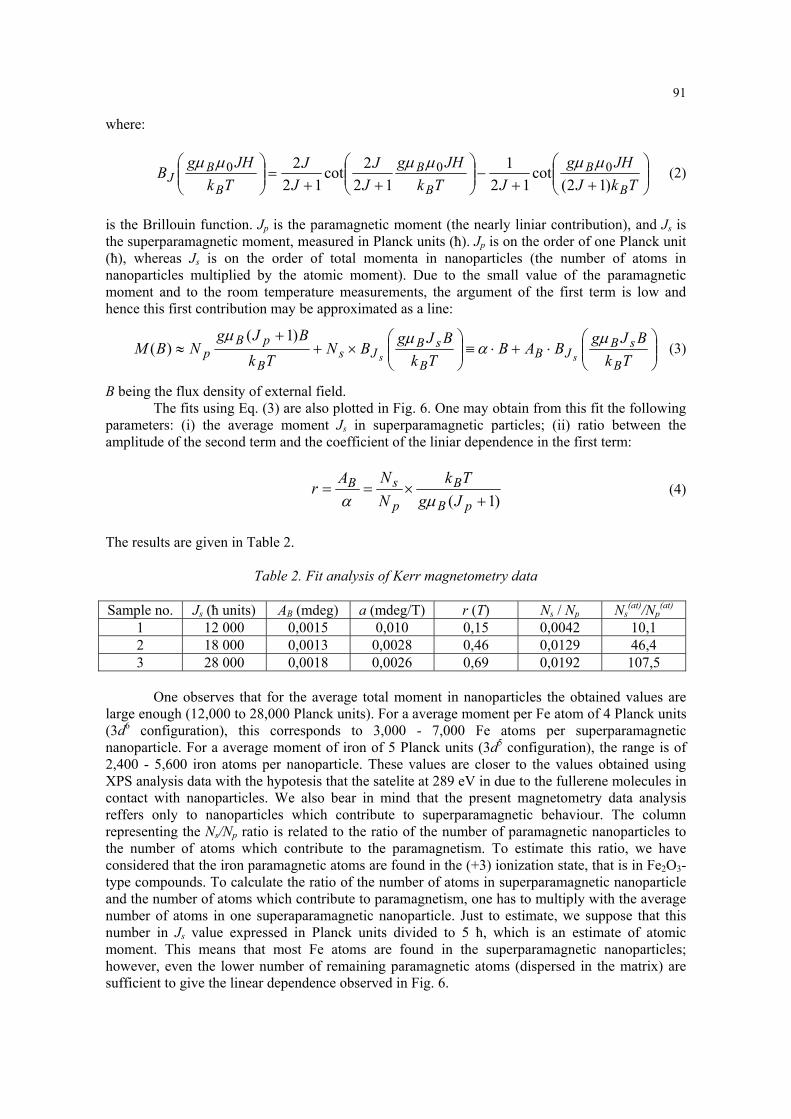
5. X-ray absorption spectroscopy 5.1. General features of the XANES spectra The X-ray absorption near-edge structure (XANES) spectra are represented in Fig. 7,
together with spectra registered on standard samples of metallic Fe (foil) or iron oxides (powders pressed in cellulose). These standard spectra were registered in “transmission” mode, whereas the thin films are recorded in "fluorescence" mode.
One remarks the similarity of the spectra measured for the FeOx@C60 samples to the spectra of iron oxides, but not to the spectrum of the metallic iron. Secondly, from the ratio of threshold amplitudes one may estimate with higher accuracy the ratio of the iron concentrations in the samples. This ratio between the so-called “20%” sample and the so-called “5%” sample is 4.05 ± 0:02. In other words, these a posteriori measurements confirm, at least from the point of view of concentration ratio, the accuracy of the performed determinantions during the samples preparation.
Fig. 7. The simulation of the spectrum of (20%) FeOx@C60 sample with a liniar combination of the spectra of magnetite and hematite (40% magnetite and 60% hematite). One also allowed a 0.6 eV shift to lower enenrgies of the position of absorption edge.
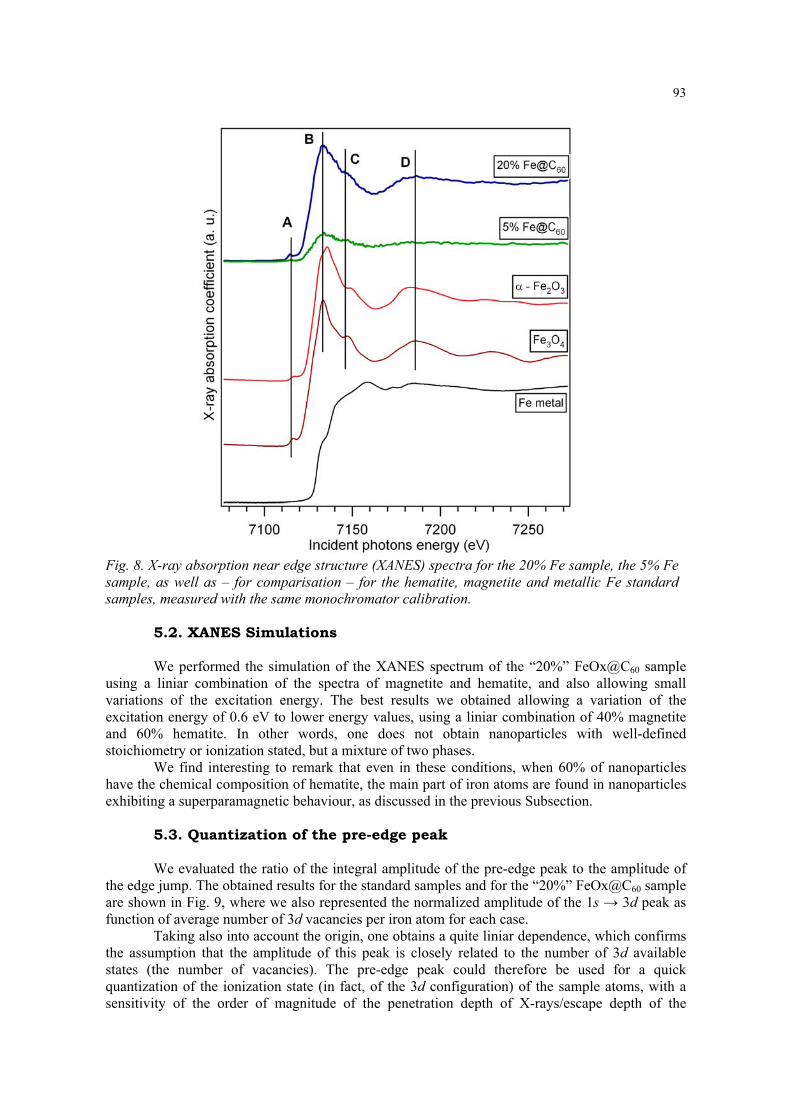
The XANES spectra of the iron oxides and of the FeOx@C60 samples are displayed in Fig.
8 with four XANES resonances, denoted as A, B, C, and D. The A resonance is the “pre-edge” peak, generated by 1s → 3d quadrupolar transitions and will treat it separately. The B peak is the “anionic cage” resonance [17] of the absorber cation (“shape resonance”) and it is related to 1s → 4p transitions. The C peak is related to the charge transfer transitions of the 1s electron to the second nearest neighbours cations [18] and it is found in the vicinity of the continuum. Finally, the D resonance is a typical XANES-type resonance generated by multiple scatterings of the free photoelectrons. As one could expect, the C and D resonances depend on crystalline structure and they differ between the Fe3O4 magnetite and Fe2O3 hematite. We investigate below the FeOx@C60 spectra using the iron oxides standards.
93
Fig. 8. X-ray absorption near edge structure (XANES) spectra for the 20% Fe sample, the 5% Fe sample, as well as – for comparisation – for the hematite, magnetite and metallic Fe standard samples, measured with the same monochromator calibration.
5.2. XANES Simulations
We performed the simulation of the XANES spectrum of the “20%” FeOx@C60 sample using a liniar combination of the spectra of magnetite and hematite, and also allowing small variations of the excitation energy. The best results we obtained allowing a variation of the excitation energy of 0.6 eV to lower energy values, using a liniar combination of 40% magnetite and 60% hematite. In other words, one does not obtain nanoparticles with well-defined stoichiometry or ionization stated, but a mixture of two phases.
We find interesting to remark that even in these conditions, when 60% of nanoparticles have the chemical composition of hematite, the main part of iron atoms are found in nanoparticles exhibiting a superparamagnetic behaviour, as discussed in the previous Subsection.
5.3. Quantization of the pre-edge peak
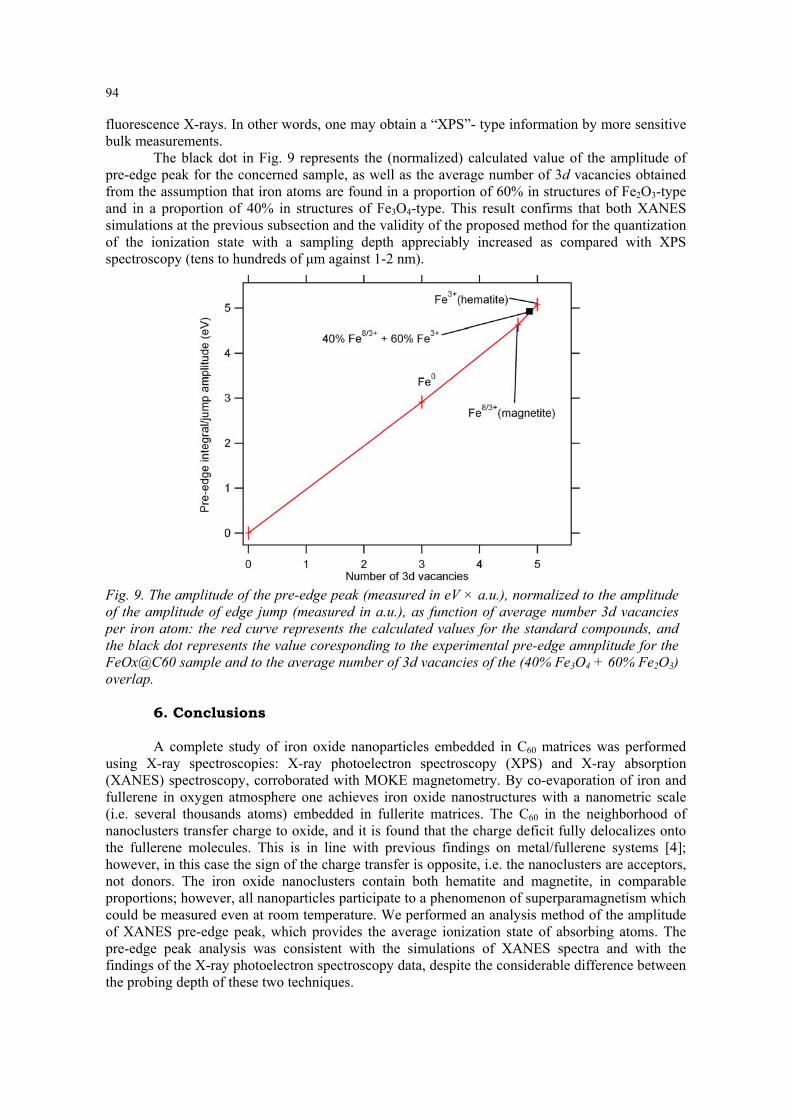
We evaluated the ratio of the integral amplitude of the pre-edge peak to the amplitude of the edge jump. The obtained results for the standard samples and for the “20%” FeOx@C60 sample are shown in Fig. 9, where we also represented the normalized amplitude of the 1s → 3d peak as function of average number of 3d vacancies per iron atom for each case.
Taking also into account the origin, one obtains a quite liniar dependence, which confirms the assumption that the amplitude of this peak is closely related to the number of 3d available states (the number of vacancies). The pre-edge peak could therefore be used for a quick quantization of the ionization state (in fact, of the 3d configuration) of the sample atoms, with a sensitivity of the order of magnitude of the penetration depth of X-rays/escape depth of the
94 fluorescence X-rays. In other words, one may obtain a “XPS”- type information by more sensitive bulk measurements.
The black dot in Fig. 9 represents the (normalized) calculated value of the amplitude of pre-edge peak for the concerned sample, as well as the average number of 3d vacancies obtained from the assumption that iron atoms are found in a proportion of 60% in structures of Fe2O3-type and in a proportion of 40% in structures of Fe3O4-type. This result confirms that both XANES simulations at the previous subsection and the validity of the proposed method for the quantization of the ionization state with a sampling depth appreciably increased as compared with XPS spectroscopy (tens to hundreds of μm against 1-2 nm).
Fig. 9. The amplitude of the pre-edge peak (measured in eV × a.u.), normalized to the amplitude of the amplitude of edge jump (measured in a.u.), as function of average number 3d vacancies per iron atom: the red curve represents the calculated values for the standard compounds, and the black dot represents the value coresponding to the experimental pre-edge amnplitude for the FeOx@C60 sample and to the average number of 3d vacancies of the (40% Fe3O4 + 60% Fe2O3) overlap.
6. Conclusions A complete study of iron oxide nanoparticles embedded in C60 matrices was performed
using X-ray spectroscopies: X-ray photoelectron spectroscopy (XPS) and X-ray absorption (XANES) spectroscopy, corroborated with MOKE magnetometry. By co-evaporation of iron and fullerene in oxygen atmosphere one achieves iron oxide nanostructures with a nanometric scale (i.e. several thousands atoms) embedded in fullerite matrices. The C60 in the neighborhood of nanoclusters transfer charge to oxide, and it is found that the charge deficit fully delocalizes onto the fullerene molecules. This is in line with previous findings on metal/fullerene systems [4]; however, in this case the sign of the charge transfer is opposite, i.e. the nanoclusters are acceptors, not donors. The iron oxide nanoclusters contain both hematite and magnetite, in comparable proportions; however, all nanoparticles participate to a phenomenon of superparamagnetism which could be measured even at room temperature. We performed an analysis method of the amplitude of XANES pre-edge peak, which provides the average ionization state of absorbing atoms. The pre-edge peak analysis was consistent with the simulations of XANES spectra and with the findings of the X-ray photoelectron spectroscopy data, despite the considerable difference between the probing depth of these two techniques.
95
Acknowledgements This work was financed by the Romanian National Authority for Scientific Research
through Contract No. 71-63/2007 MAMAINCOPAE. References
[1] A. Devenyi, R. Manaila, A. Belu-Marian, D. Macovei, E.M. Popescu, M. Tanase, D. Fratiloiu, N.D. Mihai, P.B. Barna, J. Labar, G. Safran, A. Kovacs, and T. Braun, Thin Solid Films 335, 258 (1998). [2] R. Popescu, D. Macovei, A. Devenyi, A. Belu-Marian, D.G. Fratiloiu, and R. Manaila, Full. Sci. Technol. 7, 77 (1999). [3] R. Manaila, A. Belu-Marian, D. Macovei, G. Brehm, D.T. Marian, and I. Baltog, J. Raman. Spectrosc. 30, 1019 (1999). [4] R. Popescu, D. Macovei, A. Devenyi, R. Manaila, P.B. Barna, A. Kovacs, and J.L. Labar, Eur. Phys. J. B 13, 737 (2000). [5] C.M. Teodorescu, D. Macovei, and A. Lungu, J. Optoel. Adv. Mater. 6, 1275 (2004). [6] A.K. Gupta and M. Gupta, Biomaterials 26, 3995 (2005). [7] Q.A. Pankhurst, J. Connolly, S.K. Jones, and J. Dobson, J. Phys. D - Appl. Phys. 36, R167 (2003). [8] B.L. Cushing, V.L. Kolesnichenko and C.J. O'Connor, Chem. Rev. 104, 3893 (2004). [9] Y. Lu, Y.D. Yin, B.T. Mayers, and Y.N. Xia, Nano Lett. 2, 183 (2002). [10] R. Turcu, O. Pana, A. Nan, I. Craciunescu, O. Chauvet, and C. Payen, J. Phys. D - Appl. Phys. 41, 245002 (2008); N. Aldea, R. Turcu, A. Nan, I. Craciunescu, O. Pana, X. Yaning, Z. Wu, D. Bica, L. Vekas, and F. Matei, J. Nanopart. Res. 6, 1429 (2009). [11] S. Hüfner, Photoelectron Spectroscopy: Principles and Applications (Springer, Berlin, 2003). [12] D. Mardare, V. Nica, C.M. Teodorescu, and D. Macovei, Surf. Sci. 601, 4479 (2007). [13] C.M. Teodorescu and N. Gligan, European Conference on Surface Science ECOSS-24, Paris (France), 2006 September 3-9. [14] J.F. Moulder, W.F. Stickle, P.E. Sobol, K.D. Bomben, Handbook of X-ray Photoelectron Spectroscopy, 2nd edition (Perkin-Elmer Corp., Eden Prairie, MN, USA, 1992) [15] C.D. Wagner, L.E. Davis, M.V. Zeller, J.A. Taylor, R.H. Raymond, L.H. Gale, Surf. Interface Anal. 3, 211 (1981) [16] M. Cardona and L. Ley (editors), Photoemission in Solids I: General Principles (Springer, Berlin, 1978) [17] C.M. Teodorescu, A. El Afif, J.M. Esteva, R.C. Karnatak, Phys. Rev. B 63, 233106 (2001). [18] C.M. Teodorescu, J.M. Esteva, M. Womes, A. El Afif, R.C. Karnatak, A.M. Flank, P. Lagarde, J. Electron Spectrosc. Relat. Phenom. 106, 233 (2000).