prepaid electricity program - atlantis press
TRANSCRIPT
Prepaid Electricity Program: Making it Easier or Causing Households Problems (An Approach to Increase Customer Trust)
Putu Hari Kurniawan1, Renniwati Siringoringo2 1 Putera Batam University, Batam, Indonesia [email protected] 2 Putera Batam University, Batam, Indonesia, [email protected]
Abstract In this paper we explore prepaid electricity program is also one of the strategies for
improving the image and corporate reputation. The purpose of this study was to
measure the level of trust public service corporate given to the prepaid electricity
program conducted by PT PLN Bright Batam as measured by the variable customer
value and its implications for the image of PT PLN Bright Batam as a public company.
The research population customers prepaid household electricity in 7 districts with a
sample take from of 205 respondents. sampling techniques using Proportional sampling
techniques. This research used explanatory survey to analyze the relationship between
customer value and trust in the company's image. The result of this study indicate all
variable manifested is fit through latent variable customer value, trust and image
corporate has positive effect for all manifest variable analysis. The results suggest that
the program needs to be made convenient for low income and elderly households.
Accompanying the program with additional information on energy savings might also
help make the program more effective and efficient. The analytical used Structural
Equation Model (SEM) analysis with the Lisrel for Windows version 9.3
Keywords: Customer value; Customer trust; Image corporate; Prepaid Electricity.
Introduction Developed information technology is changing rapidly, it was requiring various companies to
give proper and fast solutions according to the needs and desires of the customers, so customers
could be satisfied and loyal in the future. Today's in modern life society marketing pattern has
shifted, not just creating transactions to make success in sales and companies must also set up
relationships with customers for a long term. In the other hand likewise PT PLN Bright Batam as State
Owner Enterprises sells electrical energy I to serve household and manufactures explain gaining
profit from the business. It's no longer relies on sales volume, but satisfaction oriented were applied
in any conditions. Prepaid Electricity is one of the innovations based on information technology
which aims to improve services and streamline customers in terms for using and getting electricity.
Prepaid Electricity is one of the innovations based on information technology which aims to
improve services and streamline customers in terms of using and getting electricity. Prepaid
electricity planned came from the weakness of postpaid electricity, such as errors in reading the
meter, bills that are not appropriate with usage, delinquency accounts and termination of electricity
have a negative impact in the customers' mind. From the customer case, the Prepaid Electricity
program helps customers to regulate and control their own electricity usage, so that customers can
save electricity regularly. Prepaid electricity savings contribute to the amount of electricity that was
saved so that more Indonesian citizens be served by electricity. In addition, prepaid electricity a
strategy to improve image and reputation the corporate, which it starts from the corporate analysis
of customer complaints furthermore.
From the primary survey informed error prepaid electricity occur while amount charges being low
in customers meter indicator, the problems take place in Batam were many prepaid customers
complain.. The event of a power outage the meter panel is zero after the blackout,while at the time
before the balance out there is still contained a bill. The second problem policy of electricity tariff
increase that was officially imposed by PT Bright Batam in March 2017 also contributed to the public
2nd Padang International Conference on Education, Economics, Business and Accounting (PICEEBA-2 2018)
Copyright © 2019, the Authors. Published by Atlantis Press. This is an open access article under the CC BY-NC license (http://creativecommons.org/licenses/by-nc/4.0/).
Advances in Economics, Business and Management Research, volume 64
962
complain. Based on the governor regulation, PT Bright Batam imposes a new first-rate tariff for
several groups. In the other hand, the application of prepaid electricity only targets low-income
communities where high- income people are not sympathetic to this program because inefficient.
According to Suhartono (2012) in empirical research found that to create customer trust and
customer satisfaction, companies were able to increase customer value. Suggests that customer value
is a trade-off between customer perceptions of the quality or benefits of the product and the sacrifice
made through the price paid. customer value created through often service provided by the company
to its customers. The service quality can motivate the customer value the company more competitive.
Based from research (Rahman et al., 2017) It was found that the implementation of an effective
price scheme was implemented which was applied to the low and middle-income segments in
Bangladesh. From this study, it was found that the application of the price scheme in Bangladesh is
suitable for all types of segmentation in Bangladesh. Price schemes that are made effective were
applied in the economic household in the poverty community so they are able to reduce monthly
bills. But on the other hand investment in the development of facilities has been temporarily delayed
but electricity supply has become smoothly sustainable.
Further research (Telles Esteves et al,, 2016) compared the success rates of prepaid electricity
promotions in several countries such as Britain and South Africa. Technology diversification in the
two countries provides guidance on prepaid electricity services in Brazil so as to prevent abuse of
electricity in the country, one of the advantages is that the Brazilian people have the freedom to
migrate between payment systems. From the two studies, it is expected that future research will
emphasize more on improving prepaid electricity services, especially the lower and middle segments
in developing countries.
PT Bright Batam as a public company runs an electrical energy distribution business customers
need to support the company's image corporate . The negative implications occur the problem can
reduce customer customer trust to the company, which will ultimately reduce the company's image
corporate in customers mind.
Customer Value
(Kortge & Okonkwo, 1993) suggests that customer value is a trade-off between customer
perception of the quality or benefits the product and the sacrifice made through the price paid
whereas Butz & Goodstein (1996) confirms that customer value is the emotional bond between the
customer and the manufacturer after the customer uses the product or service produced by the
supplier, and finds that the product concerned provides added customer value (Tjiptono, 2014)
Meanwhile (Woodruff & Gudova, 2016) define customer value as perceptual preferences and
customer evaluations of product attributes, performance attributes, and consequences obtained from
the use of products that ease meet the goals and aims of customers in situations. From the above
explanations concluded that consumers directly or indirectly will asses customer needs that provided
the product. Evaluation based on the overall assessment between received and experienced which
compared to expected. (Lopez Sanchez, 2015).
Customer Trust
Customer trust is a company's willingness to depend on business partners (Kotler, 2011).
Customer trust depends on a number of interpersonal and inter-organizational factors, such as the
competence, integrity, honesty, and kindness company in customer mind. customer trust is the
power of knowledge that every customer conclusions made by the customer product have objects it,
attributes and benefits (Schiffman & Kanuk, 2007).
Mentions it bonding with consumers is a central problem in marketing strategies which fostering
consumer confidence. (Kilgour, 2006) represent customer trust influence by few factors which used
as a dimension, such as :1) Transparent, informed, honest, 2) The best quality products and services,
products and services to meet expectations, 3) incentives align to employees customer trust and fulfill
themselves, 4) Design collaboration, customers help design products individually and through the
community, 5) Product comparison and advice, comparing competitor products honestly and
Advances in Economics, Business and Management Research, volume 64
963

comprehensive community, 6) Supply chain, all supply chain partners unite to build customer trust,
7) Advocacy or pervasive, all functions work to build customer trust furthermore.
Corporate Image
Isaac Oladepo & Samuel Abimbola (2014) defines a company's image corporate as a set of beliefs,
ideas, and impressions that a person has toward an object. While (Sirgy & Danes, 1982), indicates that
the company's image corporate is a picture of the overall impression made by the public's views or
thoughts about the company. The Company's image corporate relate to the physical attributes and
behavior of the company, product innovation and service, and the impression of the communication
quality of its employees in establishing relationships with customers.
There are three important things related to image corporate that impression an object, the process
of forming an image corporate, and a customer trusted source. Objects include people and companies
that consist of a group of people. Image corporates formed by processing information that didn't a
close possibility in the image corporate of the object from the receipt of information at any time.
Amount of object customer trust dedicated source of information provides the basis for acceptance or
rejection source of information. Sources of information come directly from companies and other
parties directly. Corporate image corporate show impress objects against the company which formed
by processing information every time from various reliable sources related information.
Methods In this research we used descriptive and explanatory approach, practically there are two survey
methods applied in the field study. The analytical method described in every variables analized and
give positive relationship between an observed variable and the manifest variable. To collect data we
used a questionnaire instrument thus in the form of a questioner that will be distributed to PLN
bright prepaid electricity customer in 7 sub-district in Batam area. The data in this study were
collected through a survey from housing recidential segment area in Sagulung, Batuaji, Batam Centre,
Nongsa, Sekupang, Sei beduk and Lubuk Baja. The study was cross-sectional were the data collected
at point of time. The responden take from the household segment who used only prepaid electricity
service in residential area. The list of responden was obtained from the state public utility a PLN
bright. Sample calculation technique use the Krecjie & Morgan (2012) Approach formula were the
population obtained a sample of 196 respondent. A total 400 questioners were distributed to the
customer in 2017 and 196 were returned and found to be usable, resulting in a response rate of 54
percent. The sampling technique in field study used “Proportional Sampling. Data collection in field
study used 2 ways for distributing questionnaires through the "Google docs" online survey site and
distributing questioner to respondents with reference to prepaid electricity customers. Characteristic
of the population to collect the data used in this study are electricity customers oriented to
households”. .In accordance with the analysis model described above, data processing and analysis
using Structure Equation Model (SEM), How in processing data using the software analysis tool
Lisrel 9.3 For Windows.
Results and Discussion From the field study results more than 200 respondents obtained PLN Bright Batam customer profile
in Table 1.
After running LISREL program for each variable (Customer Value, Trust, Image Corporate)
sequentially then known customer value of t and λ of the indicators in each of the latent variables is
above the critical customer value that is> 1.85 for t customer values and > 0.30 for the customer value
of λ. Except for indicator X3 for the latent variable Customer, Trust is the average critical limit that is
equal to 0.87 and 0.64 this indicates that the indicator of each latent variable meets the criteria as a
valid indicator to represent each latent variable that it represents.
Advances in Economics, Business and Management Research, volume 64
964
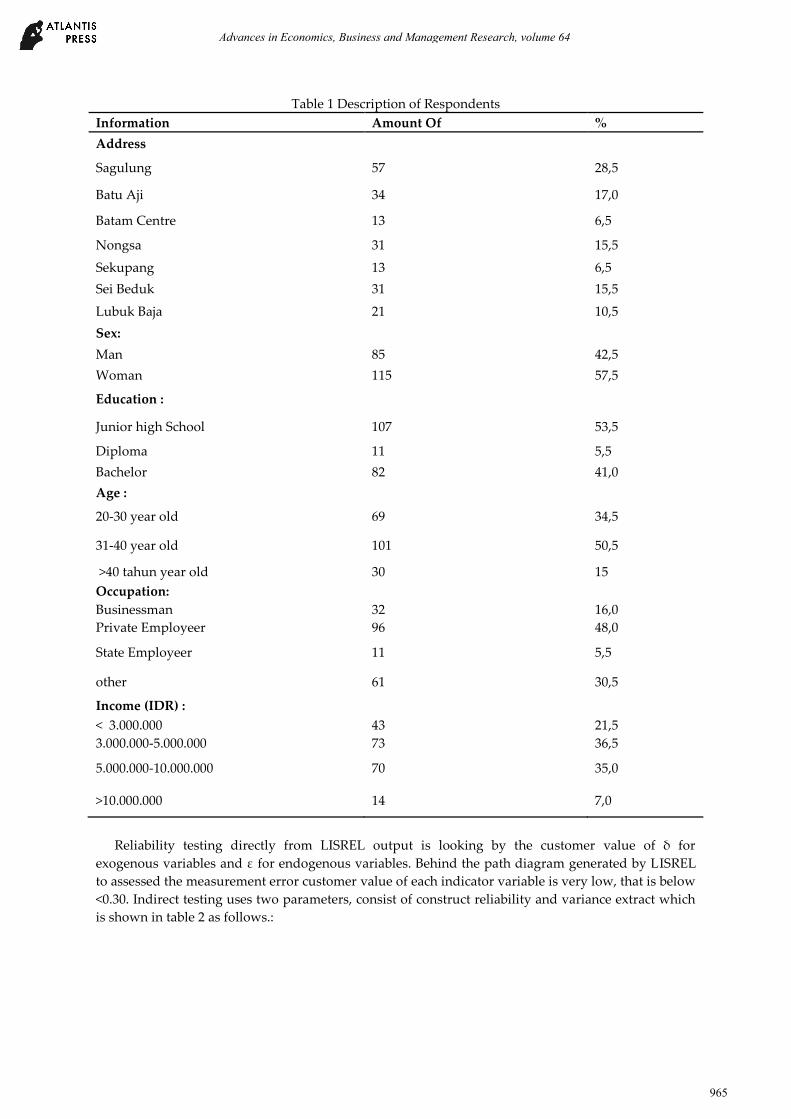
Table 1 Description of Respondents
Information Amount Of %
Address
Sagulung 57 28,5
Batu Aji 34 17,0
Batam Centre 13 6,5
Nongsa 31 15,5
Sekupang 13 6,5
Sei Beduk 31 15,5
Lubuk Baja 21 10,5
Sex:
Man 85 42,5
Woman 115 57,5
Education :
Junior high School 107 53,5
Diploma 11 5,5
Bachelor 82 41,0
Age :
20-30 year old 69 34,5
31-40 year old 101 50,5
>40 tahun year old 30 15
Occupation:
Businessman 32 16,0
Private Employeer 96 48,0
State Employeer 11 5,5
other 61 30,5
Income (IDR) :
< 3.000.000 43 21,5
3.000.000-5.000.000 73 36,5
5.000.000-10.000.000 70 35,0
>10.000.000 14 7,0
Reliability testing directly from LISREL output is looking by the customer value of δ for
exogenous variables and ε for endogenous variables. Behind the path diagram generated by LISREL
to assessed the measurement error customer value of each indicator variable is very low, that is below
<0.30. Indirect testing uses two parameters, consist of construct reliability and variance extract which
is shown in table 2 as follows.:
Advances in Economics, Business and Management Research, volume 64
965
Table 2 Reliability Construct
Variabel laten Parameter
CR VE
VALUE 0,9 0,81
TRUST 0,5 0,68
CORP IMAGE 0,8 0,54
From table 2 above described customer value of construct reliability, each variable above conform
critical limit of > 0.5. Whereas belong to variance extracted 3 the latent variable above the critical limit.
Customer value (VALUE) of 0.81 with construct reliability 0.79 and variance extract customer values
not in include the critical limit, it means indicator variables have good measurement consistency
through the latent variables represent it. As a comparison material by means of the results obtained
reference journal (Kumar & Reinartz, 2016) can be seen from table 3.
From the reliability measurement results with three parameters of Customer value (VALUE),
Image, Corporate and Customer Trust proven to reliable in each manifest variable. VALUE variable
even though the measurement error customer value is high (0.71) in one of the manifest variables X5
but it balances high customer value of Construct Reliability and Variance Extract that is 0.79 and 0.81
so that the VALUE and TRUST variable is proven reliable, with two parameters: measurement error
and extract variant above the critical limit but the Construct Reliability customer value is greater than
the critical limit (0.79> 70 so that it remains reliable.
Table 3 R square
Latent variable R square
VALUE 0.71
CORP IMAGE 0.65
TRUST 0.61
Test Of Hypotheses
Three research hypotheses are included in the structural equation as follows:
IMAGE CORP = 0.22*VALUE + 0.70*CUSTOMER TRUST, Errorvar. = 0.23 , R² = 0.77
(0.082) (0.094) (0.048)
2.74 7.43 4.84
Research hypothesis testing by examine the relationship between latent variables such as
equations and to test the relationship between latent variables. From each of these latent variables
generate customer value of score Factor, note that the structural model is tested simultaneously
The following are the results of testing hypotheses:
H1. Customer Value has a positive effect to the Corporate Image
With at customer value of 0.72, the amount far above the critical limit, the influence is given by the
Customer, Trust variable gives an effect of 0.22 on IMAGE CORPORATE, which is proven to
significant.
H2. Customer Trust has a positive effect to the Corporate Image
From the equation formula above shows that the variable customer value of 0.74 is higher the
critical limit. Coefficient customer value is 0.70 with a high R square validity customer value of 0.62
which means that the customer value of the Customer value has a positive effect of 0.70 to Customer
trust and the results obtained statistically significant then the latent variable Customer trust became
valid and reliable. In SEM there are 3 suitability tests conducted, namely: overall model suitability
testing: (Overall model fit)., testing suitable measurement model (fit model measurement) and testing
confirm structural model (Structural model fit). Suitability testing of measurement models carries out
Advances in Economics, Business and Management Research, volume 64
966
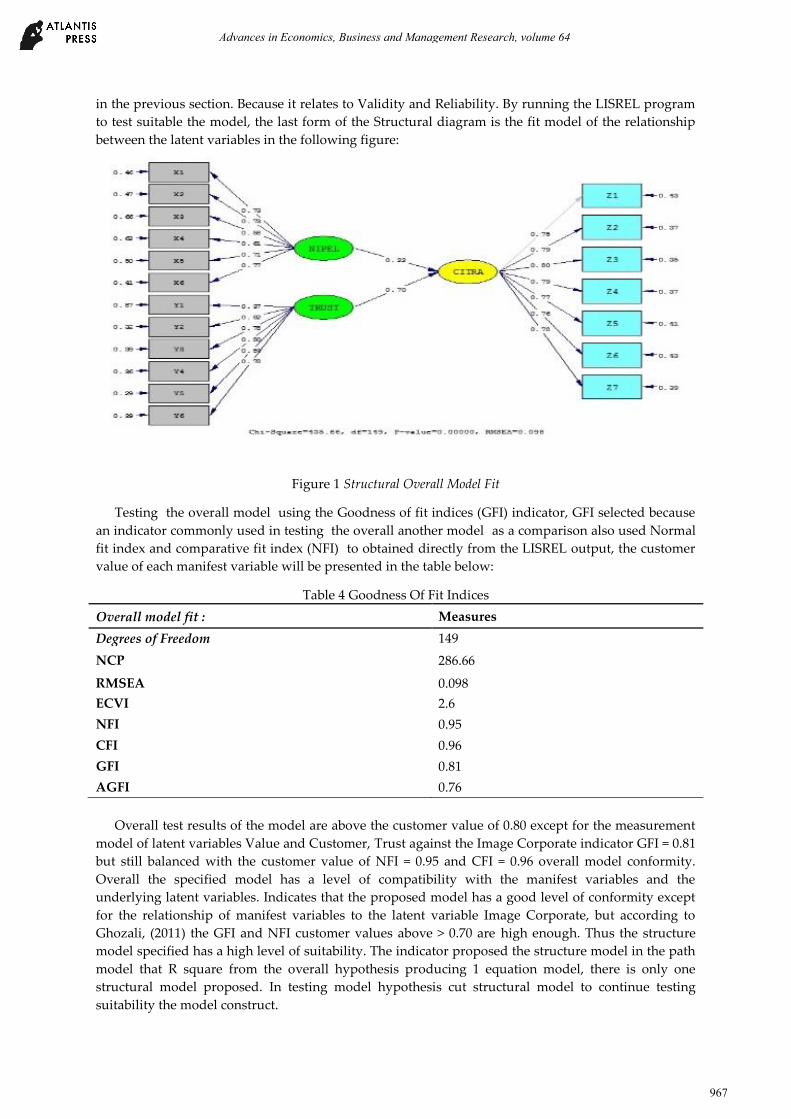
in the previous section. Because it relates to Validity and Reliability. By running the LISREL program
to test suitable the model, the last form of the Structural diagram is the fit model of the relationship
between the latent variables in the following figure:
Figure 1 Structural Overall Model Fit
Testing the overall model using the Goodness of fit indices (GFI) indicator, GFI selected because
an indicator commonly used in testing the overall another model as a comparison also used Normal
fit index and comparative fit index (NFI) to obtained directly from the LISREL output, the customer
value of each manifest variable will be presented in the table below:
Table 4 Goodness Of Fit Indices
Overall model fit : Measures
Degrees of Freedom 149
NCP 286.66
RMSEA 0.098
ECVI 2.6
NFI 0.95
CFI 0.96
GFI 0.81
AGFI 0.76
Overall test results of the model are above the customer value of 0.80 except for the measurement
model of latent variables Value and Customer, Trust against the Image Corporate indicator GFI = 0.81
but still balanced with the customer value of NFI = 0.95 and CFI = 0.96 overall model conformity.
Overall the specified model has a level of compatibility with the manifest variables and the
underlying latent variables. Indicates that the proposed model has a good level of conformity except
for the relationship of manifest variables to the latent variable Image Corporate, but according to
Ghozali, (2011) the GFI and NFI customer values above > 0.70 are high enough. Thus the structure
model specified has a high level of suitability. The indicator proposed the structure model in the path
model that R square from the overall hypothesis producing 1 equation model, there is only one
structural model proposed. In testing model hypothesis cut structural model to continue testing
suitability the model construct.
Advances in Economics, Business and Management Research, volume 64
967
Conclusions This study provides several implications for existing new organizations that will apply
information technology in general, especially with regard to the services corporate in large-scale. This
research use as a reference for developing literature both in the education sector and for practitioners
in measuring the level of satisfaction PLN Bright customers in Batam. This research follow ing the
footstep of several similar studies in the past that have sought to quantify the energy efficiency
behavior that prepaid energy product engender, and the efficiency finding fall in line with the finding
of these other studies. Unlike other studies that have tested regulated utility program. This study
shows the benefits are maintained in competitive market. Seen though the PLN Bright Batam. product
could present a compelling case to be a transformational product in the energy marketplace. The most
essential finding of the study is that prepaid electricity does have an energy efficiency benefits of
approximately 55.% with an average 40% for non lite household, which constitute the great majority
of household. The benefits in net of any reduction in consumption from disconnection. Energy
efficiency stem from more engagement by the customer with his or her energy service. The PLN
Bright Batam Has more frequent communication about his / her usage and the associated cost. More
granular information and more real time information. But beyond that customer image not only
provides deeper information; it enabled customer to relate his cost to his benefit in a timely and
concrete financial transaction that makes the communication “ more real”.
Implication of Finding
The financial impact of this efficiency can be quite significant. Energy managers using
approximately IDR 12583,37 000 per MWH per years and paying IDR 1467,28 per KWH. Would save
IDR 15436 per year for efficiency. By the way of example if all residential customers in Batam island
switched to saving would be top approximately IDR 1 million per years. If all residential customers
realized a 9,6% efficiency benefits. Besides the energy saving, the efficiency could lower peak capacity
requirement, meaning fewer expensive peaker-plant generator would need to be maintained in the
generation stack for the long-term period. The behavior of energy use especially in the household
sector very important as well as related electrical power with the development of electricity billing
systems using prepaid and the postpaid payload system. Using the prepaid electricity is organized 5
years ago which role model followed in other developing countries in South Africa. finally, the model
has applied need to use general electricity power in Batam island. The examined the study was
carried out in 7 districts using the “Proportional sampling to tested some aspects that interpreted as
descriptive analysis such as age, income, professionalism, and education, And the next step we used
inferential approach by SEM to analyze the customer perception. Nowadays the international
standards in electricity power take from the basic from a deeper research which related to user power
electricity in daily life. The perceived value, image company is accepted furthermore which
trustworthiness of the customer integrated with the psychological and social studies. The results of
the study show the implication that prepaid electricity made the consumers have more initiative to
carry out consistent savings from the expected time with better behavior than postpaid electricity
customers. Postpaid electricity consumers waste more energy in their various activities there is a
household member with a high-end family and low segment family who has a low percentage for
transferring prepaid electricity. The initiation caused by the time needed to fill in the existing billing.
Age and education level have important roles realization using an electric power in the future. There
are still a number of aspects that need to be in low segment community thinking related to energy
conservation. The case in Indonesia is different from other developing countries like South Africa,
Brazil, Ghana and other. Prepaid electricity was applied to populations under poverty who live on
the edge of cities or in remote areas. but in Indonesia, the service prepaid electricity usually find in
residential area or apartment in the urban and city downtown.
Advances in Economics, Business and Management Research, volume 64
968
Agenda For Future Research
Suggestions for future research important because the respondents in study very homogeneous
which observed only in one institution. Beyond the energy and money-saving approach can change
the way people interact with their energy and manage their household. This engagement with energy
can manage their household. This engagement with energy consumption can yield new dynamic as
we move into a distributed generation economy in which consumer of energy can also be produced of
energy. The outmoded monthly billing arrangement will not continue to be sufficient in a new energy
economy. We recommend in other research can develop and check the scope institutions or agencies
that have extensive networks with other business utility models. The sample used is expect
minimized according to the rule of thumb in Covariance basic SEM. By developing higher variables
and analysis such as PLS or GESCA Analysis may have better implications. This study has several
limitations that might influence the results of the research to do, among others: the limited number of
respondents so that data cannot be tested simultaneously (single step). Although the results of the
analysis produced will be the same but the resulting path diagram cannot describe model consisting
consist structural models (2) limitations inherent in the data obtained through questionnaires, because
of differences in the perception of the author with the respondents.
Funding
This research was funded by the 2017 Research and Technology Grant and implemented in
February 2018. Research Funds implementation was based on the decision of the Ministry of
Research, Technology and Higher Education Number SP DIPA-042.06.140151 / 6 2 0L8, dated
December 5, 2017.
References Ghozali, I. (2011). Moderated Structural Equation Modeling. In Model persamaan struktural. Konsep dan
aplikasi dengan program AMOS 19.0 (pp. 180–183).
Hair, J. (2009). Multivariate Data Analysis. Faculty Publications.
Oladepo, O. I., & Abimbola, O. S. (2014). Buku Pemasaran Produk. Yudistira.
Kilgour, M. (2006). Marketing Management: An Asian Perspective. Australasian Marketing Journal, Vol.
14, No. 2, pp. 52.
Kortge, G. D., & Okonkwo, P. A. (1993). Perceived customer value approach to pricing. Industrial
Marketing Management, Vol. 22, No. 2, pp. 133–140. https://doi.org/10.1016/0019-8501(93)90039-A
Kotler, P. (2011). Kotler on... Management Decision, Vol. 29, No. 2.
https://doi.org/10.1108/00251749110004961
Kotler, P. (2012). Marketing management. Pearson Education Limited, Vol. 817, No. 1.
Kotler & Keller. (2014). Manajemen Pemasaran. Manajemen Pemasaran, No. 111.
https://doi.org/10.1890/09-2296.1.Abrams
Kumar, V. & Reinartz, W. (2016). Creating Enduring Customer Customer value. Journal of Marketing,
Vol. 80, No. 6, pp. 36–68. https://doi.org/10.1509/jm.15.0414
Kurniawan, A., Loekito, L., & Solimun, S. (2016). Power Of Test Path Analysis and Partial Least
Square Analysis. CAUCHY, Vol. 4, No. 3, pp. 112–114.
Sanchez, J. A. L. (2015). Customer value (Perceived). In Wiley Encyclopedia of Management.
https://doi.org/10.1002/9781118785317.weom090273
Morgan, K. (2012). Sample Size Determination Using Krejcie and Morgan. Kenya Projects Organization
(KENPRO), Vol. 1. https://doi.org/10.1016/j.virusres.2015.06.012
Schiffman, L. & Kanuk, L. L. (2007). Perilaku Konsumen. Edisi Kedua. Jakarta: PT. Indeks Gramedia.
Rahman, M. M., Hettiwatte, S., Shafiullah, G. M. & Arefi, A. (2017). An analysis of the time of use
electricity price in the residential sector of Bangladesh. Energy Strategy Reviews, Vol. 18, pp. 183–
198. https://doi.org/10.1016/j.esr.2017.09.017
Sirgy, M. J. & Danes, J. E. (1982). Self-image corporate/product-image corporate congruence models:
Advances in Economics, Business and Management Research, volume 64
969

Testing selected models. Advances in Consumer Research, Vol. 9, No. 1, pp. 556–561.
https://doi.org/Article
Suhartono, S. (2005). A Comparative Study of Forecasting Models for Trend and Seasonal Time
Series : Does Complex Model Always Yield Better Forecast Than Simple Models. Jurnal Teknik
Industri, Vol. 7, No. 1, pp. 22–30. https://doi.org/10.9744/JTI.7.1.PP. 22-30
Rahman, M. M., Hettiwatte, S., Shafiullah, G. M. & Arefi, A. (2017). An analysis of the time of use
electricity price in the residential sector of Bangladesh. Energy Strategy Reviews, Vol. 18, pp. 183–
198. https://doi.org/10.1016/j.esr.2017.09.017
Telles Esteves, G. R., Cyrino Oliveira, F. L., Antunes, C. H. & Souza, R. C. (2016). An overview of
electricity prepayment experiences and the Brazilian new regulatory framework. Renewable and
Sustainable Energy Reviews, Vol. 54, pp. 704–722. https://doi.org/10.1016/j.rser.2015.10.002
Tjiptono. (2012). Strategi Pemasaran. Yogyakarta: Andi Offset.
Tjiptono, F. (2014). Pemasaran Jasa. Yogyakarta: Andi Offset.
Woodruff, D., & Gudova, E. (2016). Interview with David Woodruff: Financial Market Governs by
Panic. Journal Of Economic Sociology-Ekonomicheskaya Sotsiologiya, Vol. 17, No. 2, pp. 11–20.
Advances in Economics, Business and Management Research, volume 64
970