preliminary groundwater quality assessment in the central region of ghana
TRANSCRIPT

ORIGINAL ARTICLE
Preliminary groundwater quality assessment in the central regionof Ghana
Samuel Y. Ganyaglo • Shiloh Osae • Samuel B. Dampare •
Joseph R. Fianko • Mohammad A. H. Bhuiyan • Abass Gibrilla •
Edward Bam • Elikem Ahialey • Juliet Osei
Received: 10 July 2010 / Accepted: 20 July 2011 / Published online: 7 August 2011
� Springer-Verlag 2011
Abstract Insufficient knowledge of the hydrogeochem-
istry of aquifers in the Central Region of Ghana has
necessitated a preliminary water quality assessment in
some parts of the region. Major and minor ions, and trace
metal compositions of groundwater have been studied with
the aim of evaluating hydrogeochemical processes that are
likely to impair the quality of water in the study area. The
results show that groundwater in the area is weakly acidic
with mean acidity being 5.83 pH units. The dominant
cation in the area is Na, followed by K, Ca, and Mg, and
the dominant anion is Cl-, followed by HCO3- and SO4
2-.
Two major hydrochemical facies have been identified as
Na–Cl and Na–HCO3, water types. Multivariate statistical
techniques such as cluster analysis (CA) and factor anal-
ysis/principal component analysis (PCA), in R mode, were
employed to examine the chemical compositions of
groundwater and to identify factors that influenced each.
Q-mode CA analysis resulted in two distinct water types as
established by the hydrochemical facies. Cluster 1 waters
contain predominantly Na–Cl. Cluster 2 waters contain
Na–HCO3 and Na–Cl. Cluster 2 waters are fresher and of
good quality than cluster 1. Factor analysis yielded five
significant factors, explaining 86.56% of the total variance.
PC1 explains 41.95% of the variance and is contributed by
temperature, electrical conductivity, TDS, turbidity,
SO42-, Cl-, Na, K, Ca, Mg, and Mn and influenced by
geochemical processes such as weathering, mineral disso-
lution, cation exchange, and oxidation–reduction reactions.
PC2 explains 16.43% of the total variance and is charac-
terized by high positive loadings of pH and HCO3-. This
results from biogenic activities taking place to generate
gaseous carbon dioxide that reacts with infiltrating water to
generate HCO3-, which intend affect the pH. PC3 explains
11.17% of the total variance and is negatively loaded on
PO43- and NO3
- indicating anthropogenic influence. The
R-mode PCA, supported by R-mode CA, have revealed
hydrogeochemical processes as the major sources of ions in
the groundwater. Factor score plot revealed a possible flow
direction from the northern sections of the study area,
marked by higher topography, to the south. Compositional
relations confirmed the predominant geochemical process
responsible for the various ions in the groundwater as
mineral dissolution and thus agree with the multivariate
analysis.
Keywords Groundwater quality � Mineral dissolution �Multivariate analysis � Central Region � Ghana
Introduction
The chemical composition of groundwater is controlled by
many factors, including composition of precipitation, min-
eralogy of the aquifers, climate, topography, and anthropo-
genic activities. These factors combine to create diverse
water compositions that vary temporally and spatially.
Additionally, these factors may lead to contamination of
groundwater with diverse constituents, resulting in severe
environmental and socio-economic problems (Kumar and
Riyazuddin 2008). Hydrochemical characterization of such
systems requires knowledge of the major and minor ion
S. Y. Ganyaglo (&) � S. Osae � S. B. Dampare �J. R. Fianko � A. Gibrilla � E. Bam � E. Ahialey � J. Osei
National Nuclear Research Institute, Ghana Atomic Energy
Commission, P. O. Box LG 80, Legon-Accra, Ghana
e-mail: [email protected]
S. B. Dampare � M. A. H. Bhuiyan
Department of Earth Sciences,
Okayama University, Okayama, Japan
123
Environ Earth Sci (2012) 66:573–587
DOI 10.1007/s12665-011-1266-7

compositions of the groundwater and trace metals contents in
the groundwater. This will enable recharge and discharge
areas as well as flow paths to be defined.
The most reliable source of water supply in the Central
Region of Ghana is groundwater. Groundwater in this
region is used for domestic, agriculture, and industrial
purposes. Prior to its development, the inhabitants depen-
ded heavily on streams and rivers as their major source of
water supply. This led to outbreak of water borne and water
related diseases such as diarrhea, dysentery, cholera, and
guinea worm as the streams and rivers are often polluted.
The development of groundwater in the rural communities
coupled with health education led to the eradication of
most of these diseases in the region. Pipe schemes exist but
are concentrated only in the urban and peri-urban areas of
the region. The cost involved in extending this facility to
the rural areas is often high, making groundwater the most
cost effective and efficient water supply scheme in the rural
communities in the region. Even in the urban centers,
people are becoming aware of the use of groundwater as
the safest source of water supply. A few individuals and
industries have boreholes in their homes and premises,
respectively. In spite of the tremendous increase in cov-
erage of groundwater usage, its continuous development is
being threatened by numerous problems, including (1) high
salinity (high EC) in some of the boreholes especially in
the coastal areas, leading to their abandonment and (2)
insufficient knowledge of the aquifer systems, which is
likely to result in over exploitation of the resource. It thus
becomes difficult to put in place good management prac-
tices that will ensure long term sustainability of boreholes,
which tap various aquifers in the area.
In an attempt to address the problems outlined, a pre-
liminary investigation into the hydrogeochemistry of the
groundwater in the various aquifers in the study area has been
initiated. The major objective is to establish the hydro-
chemical facies in the area and the possible sources of vari-
ous ions in the groundwater. This is to be achieved through
groundwater sampling, analysis of major cations, anions,
minor ions, and trace metals. The major ion study is to
establish the hydrochemical facies in the area and possible
sources of the various ions in the groundwater. The study is to
help understand the hydrogeochemical characteristics of the
various aquifer systems for effective management measures
to be undertaken to mitigate poor groundwater quality in the
area. Interpretative techniques include graphical method,
multivariate, and compositional diagrams.
The study area
The study area lies within latitudes 5�180N–5�44.630N and
longitudes 1�4.070W–1�37.260W. It comprises parts of
Asikuma Odoben Brakwa, Assin, Twifo Praso, and Agona
areas of the region. Very few communities located along
the coast were investigated. Notably among them were
Afutuakwa and Brofoyedur (Fig. 1). The area is drained by
4 major streams. These are Narkwa, Kakuum, Amissah,
Ayensu, and the Pra in the Twifo praso areas. The drainage
patterns are described as dendritic (WRCS 2008). Most of
the streams end up in lagoons, wetlands, and finally into the
sea. The topography is generally undulating with steeper
hills inland. Vegetation in the coastal areas is made of
grassland and shrubs, few scattered trees, and semi-decid-
uous forest to secondary forest. In the northern parts of the
region, secondary forest can be found. Tall trees exhibit
deciduous characteristics during the dry season.
The climate, like the rest of the country, is dominated by
the movement of the Inter Tropical Convergence Zone
(ITCZ). The ITCZ is the region where the hot, dry, and dusty
harmattan air mass from the Sahara in the north meets the
cool, moist monsoon air from the South Atlantic. The ITCZ
is characterized by vigorous frontal activity and its move-
ment controls the amount and duration of rainfall. Normally,
from December to February, the front lies across the Gulf of
Guinea and the dry harmattan prevails over the whole
country. Between March and November, the ITCZ moves
across Ghana in a complex fashion crossing some areas
twice, which results in a distinctly bimodal rainfall pattern.
Two rainfall seasons (major and minor) thus occur in the
Central Region. The major one is from April to June, and the
minor is experienced from September to November.
The soils in the study area are made of four main groups
namely forest ochrosols, forest ochrosols and oxysols in-
tergrades, tropical black earth, and forest lithosols. The
forest ochrosols have a high nutrient value and are suitable
for both tree and food crops, such as cocoa, coffee, citrus,
maize, cassava, pineapple, and vegetables. The forest
ochrosols and oxysols integrates have lesser nutrients
compared with the forest ochrosols but have similar tex-
ture. This type of soil also supports true crops such as
cocoa and all food crops. The tropical black earth is thick,
sticky, and dark in color containing a mixture of high
percentage of magnesium, calcium, and lime. During the
rainy season, these soils become thick and sticky but
become compact and hard and crack up during the dry
periods. The soils are potentially suitable for rice, cotton,
and sugarcane especially when artificial irrigation is
applied. The tropical black earth exists along the coastal
areas and lagoons. The forest lithosols are found between
Nyanyano and Winneba. These soils are also referred to as
rocky soils due to underlying hardpan and mostly have
poor nutrient value. They can, however, support the culti-
vation of vegetables. Crops such as sugarcane, maize, and
pineapple are grown along the valleys. These soils cover a
wide area of the savanna belt of the area. Major fertilizers
574 Environ Earth Sci (2012) 66:573–587
123

employed in the area include nitrogen, phosphorus, and
potassium.
Geology
The Central Region of Ghana is underlain by the Early
Proterozoic Birimian rocks and associated Eburnean
granitoids (Leube et al. 1990). Traditionally, the Birimian
was divided into two main series:
1. A lower series of mainly sedimentary origin and
termed the sedimentary basin or previously called the
Lower Birimian.
2. An upper series of greenstones mainly metamorphosed
basic and intermediate lavas and pyroclastic rocks,
phyllites, and greywackes (Junner 1935, 1940). The
upper series is termed the volcanic belt or the Upper
Birimian.
The sedimentary basin is composed of phyllites, schists,
tuffs, and greywackes. At the transition zone between the
sedimentary basin and the volcanic belt are chemical sed-
iments namely chert, Mn-rich rock, Ca–Fe–Mg carbonates,
carbon-rich rock, and sulfide rich rock (Leube et al. 1990;
Hirdes et al. 1992; Taylor et al. 1992). It is now widely
accepted that the Lower Birimian and Upper Birimian
formed quasi-contemporaneously, as lateral facies equiva-
lents (Leube et al. 1990).
The Eburnean granitoids comprise the sedimentary
basin granitoids (previously called the Cape Caost type;
G1) and the volcanic belt granitoids (previously called the
Dixcove type; G2). Rock types in the sedimentary basin
granitoids include quartz diorites, tonalities, trondhjemites,
granodiorites, adamellites, and granites. Quartz diorites are
rare. The main ferromagnesian mineral is biotite that is
commonly accompanied by muscovite.
The belt granitoids comprise quartz diorite, tonalite,
trondhjemite, granodiorite, admellite, and to a minor extent
granite. The characteristic mafic mineral is hornblende
accompanied by increasing amount of biotite. The major
felsic components include the plagioclase feldspars, which
commonly alter to saussurite and sericite [KAl2(Si3Al)
O10(OH,F)].
Hydrogeology
The various rock types lack primary porosities and per-
meabilities. Groundwater occurrence is by weathering and
development of secondary porosities and permeabilities in
the form of fractures. The fractures include joints, faults,
folds, and shear zones. Appreciable amount of water is
obtained when these fractures are interconnected.
The thickness of the weathered zone in the study area
varies from 2 to 90 m with the average thickness being
33 m (WRCS 2008). The weathered depth is thickest in the
sedimentary basin and volcanic belts than in the granitoids.
Shallow weathered aquifers occur in the granitoids, and
their shallow nature exposes them to evaporation that may
concentrate dissolved salts in the aquifer zones to increase
salinity. Transmissivity in these aquifers is quite low and
may result in sluggish movement. The transmissivity
Fig. 1 Location map of the
study area
Environ Earth Sci (2012) 66:573–587 575
123
ranges from 24 9 10-5 to 45 9 10-5 m2/s (3,000 well
drilling program—Community Water and Sanitation
Agency). Groundwater is sometimes obtained from both
the weathered zone and fractured fresh rock, and there are
instances where water is obtained from only the weathered
zone. In cases where the weathered layer is very thin,
groundwater occurs only in the fractured fresh rock. It thus
follows that aquifer units may be continuous or discon-
tinuous, depending on the prevailing geological structures
in the area. Borehole yields range between 0.1 and 10 l/s
(Armah 2000). Borehole depth varies from near surface,
15 m to about 100 m with a mean depth of 39 m (Armah
2000). Recharge takes place by direct infiltration of rainfall
and to a lesser extent from influence of streams and rivers.
Materials and methods
Samples were collected from 14 boreholes between 2nd
and 5th May 2009. Sampling was done once, in the rainy
season. Samples were collected in 500 ml polyethylene
containers after filtering through 0.45 lm filters on acetate
cellulose with a hand operated vacuum pump. Filtrate for
metal analyses were acidified with 1% HNO3 to keep metal
ions in solution (Clark and Fritz 1997). All samples were
stored in ice chest at a temperature of 4�C and later
transferred to the laboratory for analysis.
In the field, parameters such as pH, temperature, con-
ductivity, and total dissolved solids (TDS) were measured
using a multi-purpose pH-conductivity meter. The pH
electrode was calibrated against pH 4, 7, and 9.2. Prior to
taking readings, pumping was carried out until the meter
readings were stable for each parameter. Alkalinity (as
HCO3-) was determined by field titration with 1.6 N
H2SO4 to pH 4.5 using HACH Digital multi Sampler
Model AL-DT.
In the laboratory, Cl- concentrations were obtained by
titrimetric method. SO42- and PO4
3- were obtained
employing Ultraviolet (UV) spectrometric technique. The
atomic absorption spectrometer was used in determining
the major cations (Ca and Mg) and trace metals (Fe, Mn,
Zn, Cu, Cd, Pb, Co, Cr, and Ni). Na and K were determined
using the flame photometer. The charge balance error for
the analysis ranges from ±2 to ±10%.
Conventional hydrochemical techniques such as the
Piper trilinear diagram and multivariate statistical analysis
(MVA) were used in interpreting the data obtained. The
MVA techniques employed included cluster analysis (CA)
and factor analysis using principal component analysis
(PCA) as extraction method. CA is an unsupervised pattern
recognition technique that uncovers intrinsic structure or
underlying behavior of a dataset without making a priori
assumption about the data, in order to classify the objects
of the system into clusters based on their similarities
(Kumar and Riyazuddin 2008; Hussain et al. 2008). The
main aim of CA is grouping objects (sampling stations)
into classes (clusters), so that objects within a class are
similar to each other but different from those in other
classes. There are two major categories of CA: hierarchical
and nonhierarchical. Hierarchical cluster analysis (HCA) is
the most common approach in which clusters are formed
sequentially, starting with the most similar pair of objects
and forming higher clusters step by step. The process of
forming and joining clusters is repeated until a single
cluster containing all samples is obtained. The result is
displayed as a dendrogram and provides a visual summary
of the clustering process, presenting a picture of the groups
and its proximity with a dramatic reduction in dimension-
ality of the original data. In this study, hierarchical cluster
analysis was performed using Ward’s method on the nor-
malized dataset and the squared Euclidean distance as a
measure of similarities between samples. Cluster analysis
was carried out in two modes, Q and R as mentioned by
Hussain et al. (2008). The statistical software SPSS version
16 was used in the analysis of the data. The Q-mode HCA
was used to classify the cases (samples), measured by the
variables, into statistically defined groups, whereas the
R-mode HCA was used to establish relationships between
the variables (analyzed parameters).
Factor analysis (FA) is designed to transform the ori-
ginal variables into new uncorrelated variables called fac-
tors, which are linear combinations of the original
variables. The FA is a data reduction technique and sug-
gests how many varieties are important to explain the
observed variances in the data. Principal components
method (PCA) is used for extraction of different factors.
The axis defined by PCA is rotated to reduce the contri-
bution of less significant variables (Najafpour et al. 2008).
This treatment provides a small number of factors that
usually account for approximately the same amount of
information as the original set of observations. The FA can
be expressed as:
Fi ¼ a1x1jþ a2x2jþ � � � þ am x mj ð1Þ
where Fi is the factor, a is the loading, x is the measured
value of variable, i is the factor number, j is the sample
number, and m is the total number of variables. The factor
scores can be expressed as:
Zij ¼ a1f 1jþ a2f 2jþ � � � þ am fmjþ eij ð2Þ
or where Z is the measured variable, a is the factor loading,
f is the factor score, the residual term accounting for errors
other source of variation. The hydrochemical data were
subjected to principal component analysis for identification
of the sources of the various ions in the groundwater.
Varimax rotation was used to maximize the sum of the
576 Environ Earth Sci (2012) 66:573–587
123
variance of the factor coefficients which better explained
the possible groups/sources that influenced the water sys-
tems (Bhuiyan et al. 2010 in press).
The factor scores from the R-mode PCA were used with
ArcGIS to determine the spatial variations of the dominant
processes influencing the groundwater hydrochemistry in
the area. Discussions on the interpolation techniques, such
as kriging, and integrated use of factor analysis and kriging
methods in the analysis of hydrochemical data have been
provided in literature (e.g., Yidana et al. 2010; Bhuiyan
et al. 2010).
Results and discussion
A statistical summary of hydrochemical parameters mea-
sured in the 14 groundwater samples is presented in
Table 1. Detailed hydrochemical parameters are presented
in Tables 2 and 3 in appendix. The pH varies from 5.17 to
6.28 pH units with mean of 5.83 and standard deviation of
0.36. The pH is thus slightly acidic. The electrical con-
ductivity (EC) values range from 30.6 to 3360 lS/cm.
Relatively low EC values occur inland whereas high EC
values are observed along the coast. High electrical con-
ductivities along the coast are usually attributed to seawater
intrusion, but Armah (2002) has indicated that dissolution
of minerals in the rocks is also a possible source of
salinization in the area. The TDS varies from 43 to
1,386 mg/l. Freeze and Cherry (1979) describe ground-
water with TDS value less than 1,000 mg/l as fresh water
and those with TDS values more than 1,000 mg/l as saline.
Clearly, saline water bodies exist in the study area.
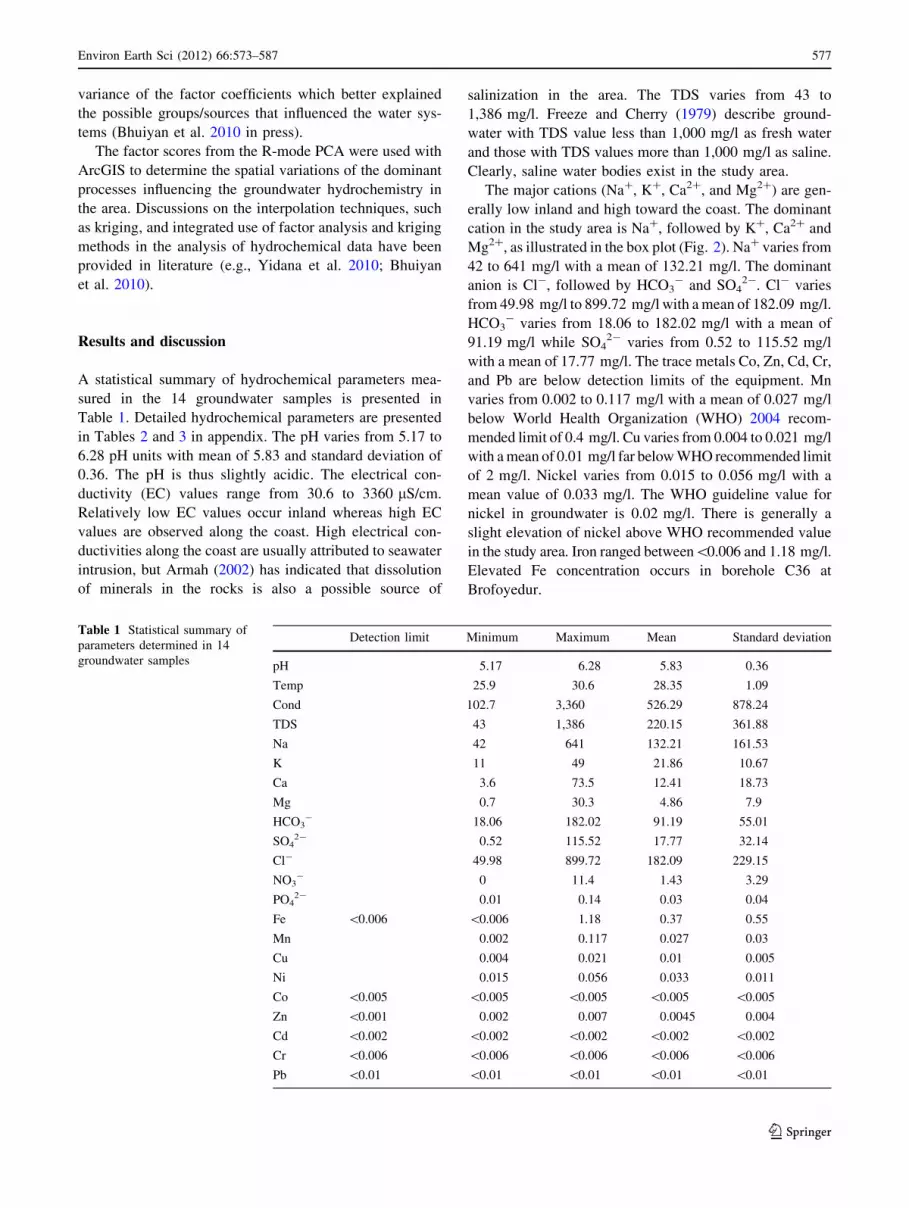
The major cations (Na?, K?, Ca2?, and Mg2?) are gen-
erally low inland and high toward the coast. The dominant
cation in the study area is Na?, followed by K?, Ca2? and
Mg2?, as illustrated in the box plot (Fig. 2). Na? varies from
42 to 641 mg/l with a mean of 132.21 mg/l. The dominant
anion is Cl-, followed by HCO3- and SO4
2-. Cl- varies
from 49.98 mg/l to 899.72 mg/l with a mean of 182.09 mg/l.
HCO3- varies from 18.06 to 182.02 mg/l with a mean of
91.19 mg/l while SO42- varies from 0.52 to 115.52 mg/l
with a mean of 17.77 mg/l. The trace metals Co, Zn, Cd, Cr,
and Pb are below detection limits of the equipment. Mn
varies from 0.002 to 0.117 mg/l with a mean of 0.027 mg/l
below World Health Organization (WHO) 2004 recom-
mended limit of 0.4 mg/l. Cu varies from 0.004 to 0.021 mg/l
with a mean of 0.01 mg/l far below WHO recommended limit
of 2 mg/l. Nickel varies from 0.015 to 0.056 mg/l with a
mean value of 0.033 mg/l. The WHO guideline value for
nickel in groundwater is 0.02 mg/l. There is generally a
slight elevation of nickel above WHO recommended value
in the study area. Iron ranged between\0.006 and 1.18 mg/l.
Elevated Fe concentration occurs in borehole C36 at
Brofoyedur.
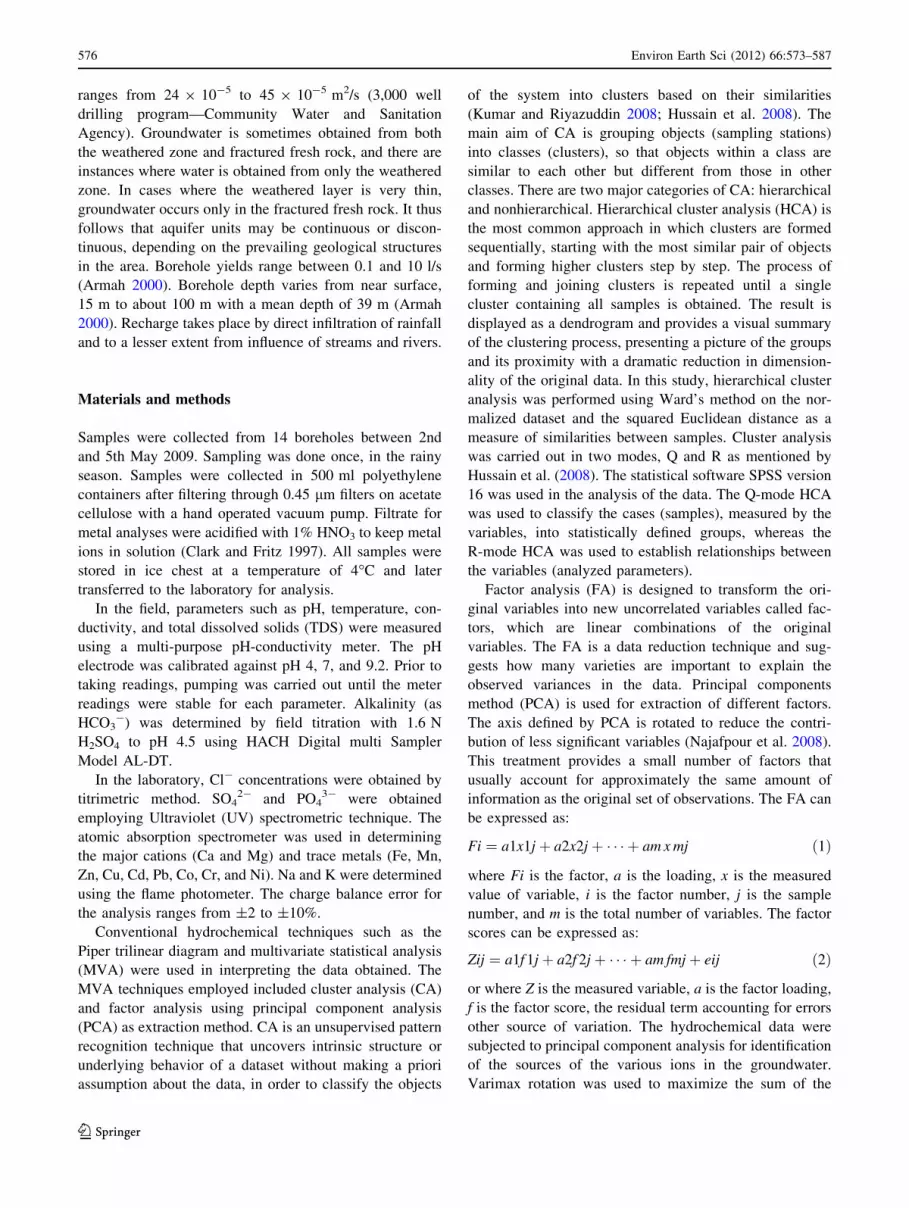
Table 1 Statistical summary of
parameters determined in 14
groundwater samples
Detection limit Minimum Maximum Mean Standard deviation
pH 5.17 6.28 5.83 0.36
Temp 25.9 30.6 28.35 1.09
Cond 102.7 3,360 526.29 878.24
TDS 43 1,386 220.15 361.88
Na 42 641 132.21 161.53
K 11 49 21.86 10.67
Ca 3.6 73.5 12.41 18.73
Mg 0.7 30.3 4.86 7.9
HCO3- 18.06 182.02 91.19 55.01
SO42- 0.52 115.52 17.77 32.14
Cl- 49.98 899.72 182.09 229.15
NO3- 0 11.4 1.43 3.29
PO42- 0.01 0.14 0.03 0.04
Fe \0.006 \0.006 1.18 0.37 0.55
Mn 0.002 0.117 0.027 0.03
Cu 0.004 0.021 0.01 0.005
Ni 0.015 0.056 0.033 0.011
Co \0.005 \0.005 \0.005 \0.005 \0.005
Zn \0.001 0.002 0.007 0.0045 0.004
Cd \0.002 \0.002 \0.002 \0.002 \0.002
Cr \0.006 \0.006 \0.006 \0.006 \0.006
Pb \0.01 \0.01 \0.01 \0.01 \0.01
Environ Earth Sci (2012) 66:573–587 577
123

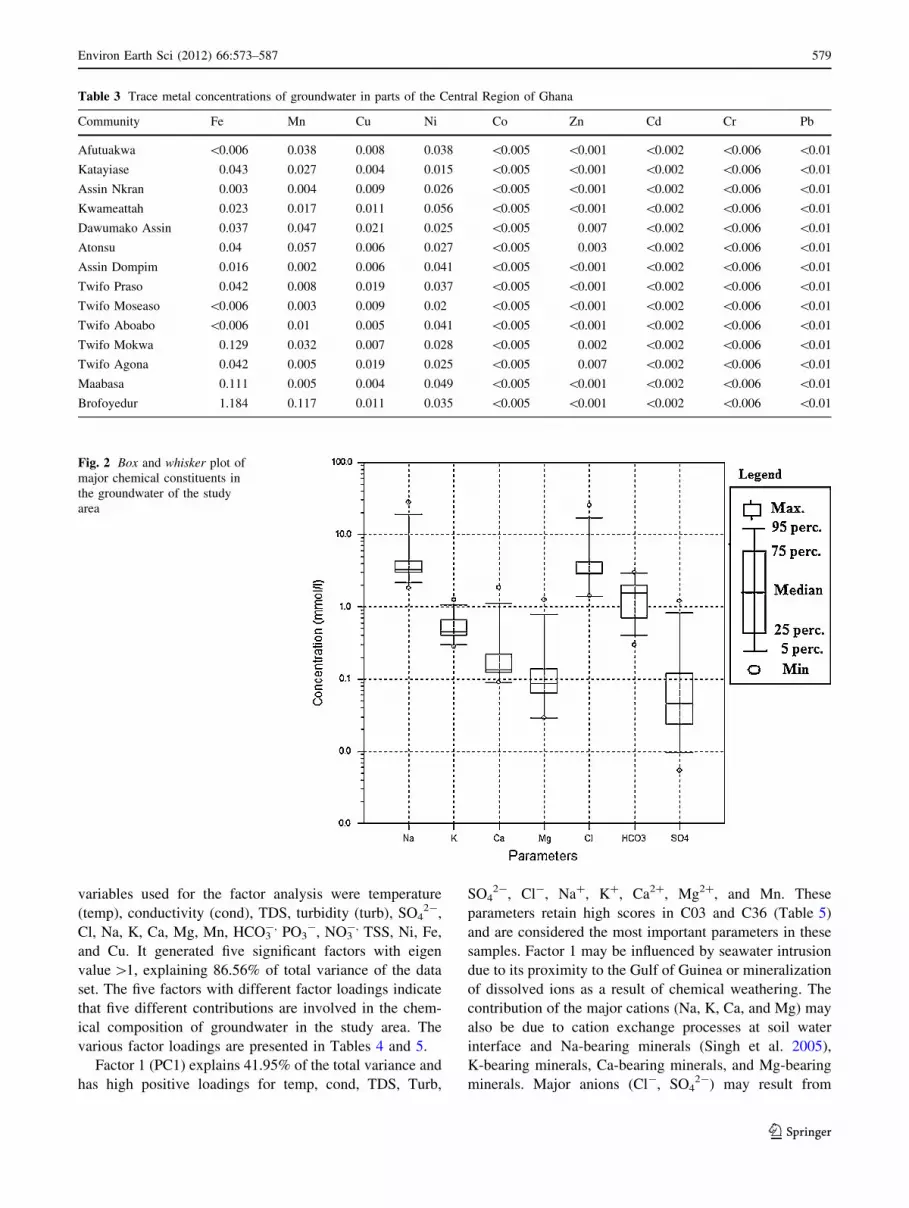
Hydrochemical facies
The major ion concentrations of the groundwaters are
plotted on the Piper (1944) trilinear diagram (Fig. 3). Two
main hydrochemical facies are identified, which are NaCl
and NaHCO3 water types. The NaCl water types dominate
the area.
Multivariate statistical analysis (MVA)
Q-mode cluster analysis was performed on the water
chemistry data to group the samples in terms of water
quality. On the basis of the visual assessment of the
rescaled distance in the dendrogram, with the phenon line
set at 15, two distinct hydrochemical clusters were iden-
tified (Fig. 4). Cluster 1 comprises C03 and C36 and has
higher TDS values. TDS for C03 is 578 mg/l and that for
C36 is 1,386 mg/l. Cluster 1 has the highest average TDS
of 982 mg/l. The averages of the chemical parameters in
the two clusters is presented in the stiff diagram (Fig. 5). It
is obvious from Fig. 5a that the dominant cation for cluster
1 is Na? and the dominant anion is Cl- indicating that the
most predominant water type is NaCl. These waters occur
along the coast. Cluster 2 comprises C09, C10, C11, C12,
C19, C20, C21, C25, C26, C28, and C31. It has an average
TDS of 93 mg/l. It contains NaCl and Na–HCO3 waters
(Fig. 5b). It occurs inland. On the basis of TDS, following
the approach of Freeze and Cherry (1979), cluster 2 waters
are fresher and of good quality than those of cluster 1.
Elevated concentrations of Na? and Cl- in cluster 1 may
be explained by the influence of geochemical processes,
sea water intrusion due to its close proximity to the Gulf of
Guinea, marine aerosols, and concentration of salts in the
soil zone. The stiff diagrams for individual clusters confirm
the overall chemical facies revealed by the Piper (1944)
trilinear diagram (Fig. 3).
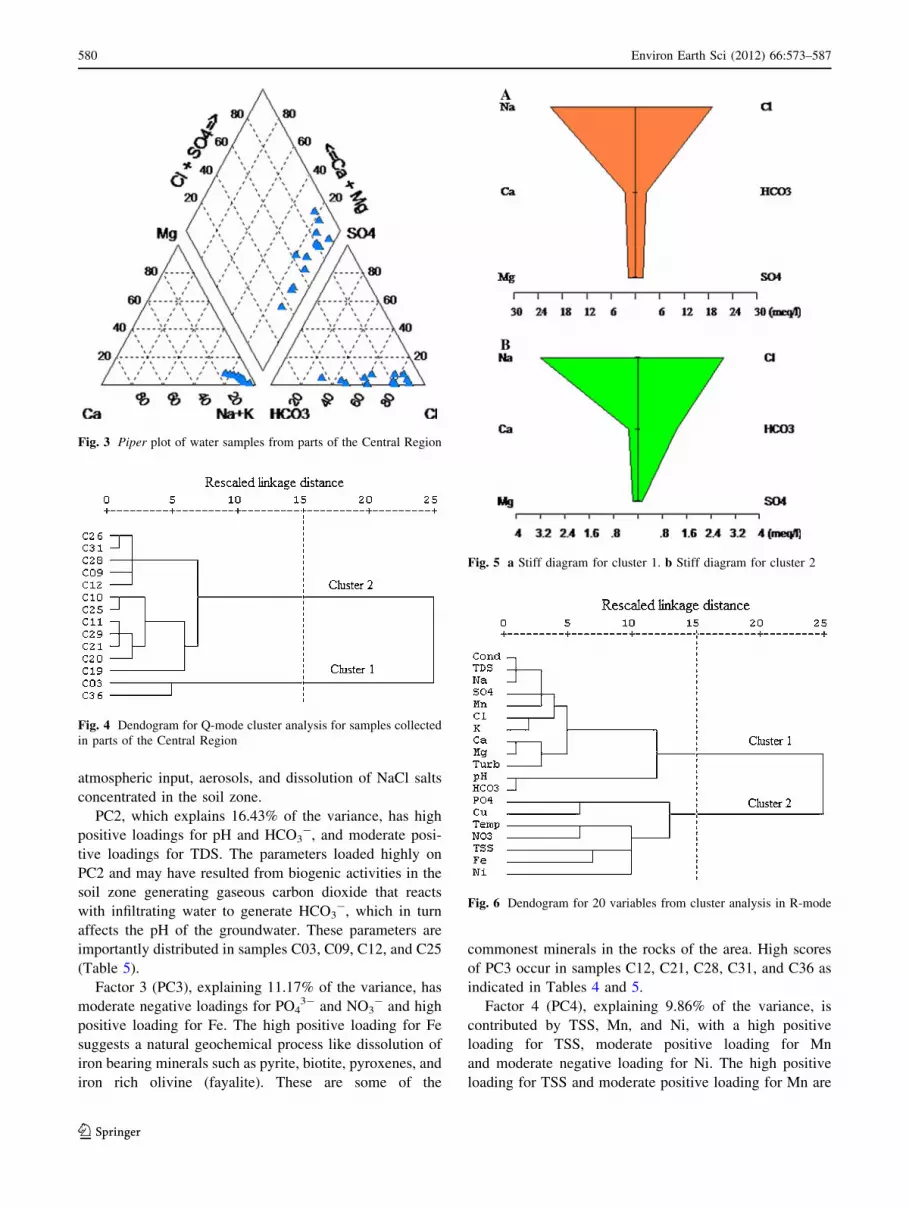
Cluster analysis in R-mode was performed on pH,
temperature, TDS, conductivity, calcium, magnesium,
potassium, sodium, chloride, sulfate, bicarbonate, nitrate,
phosphate, copper, iron, manganese, turbidity, total sus-
pended solids (TSS), and nickel. Two distinct groups of
clusters were revealed (Fig. 6). Cluster 1 includes pH,
conductivity, TDS, HCO3-, turbidity, SO4
2-, Cl-, Na?,
K?, Ca2?, Mg2?, and Mn2?. Cluster 2 consists of tem-
perature, TSS, PO43-, NO3
-, Fe, Cu, and Ni. Generally,
the field parameters and the major ions form cluster 1,
implying geochemical constituents, while the minor ions
and the trace metals form cluster 2. Cluster 2 also shows
geochemical variables.
R-mode factor analysis was applied to obtain correla-
tions among the hydrochemical constituents of ground-
water samples (Mondal et al. 2010) using principal
component analysis (PCA) as the extraction method. TheTa
ble
2H
yd
roch
emic
alp
aram
eter
so
fg
rou
nd
wat
erin
par
tso
fth
eC
entr
alR
egio
no
fG
han
a
Co
mm
un
ity
IDp
HT
emp
Co
nd
TD
SH
CO
3-
TS
ST
urb
idit
yP
O43-
NO
3-
SO
42-
Cl-
Na
KC
aM
gIo
nb
al
Afu
tuak
wa
C0
36
.15
28
.91
38
75
78
12
6.8
00
0.0
35
83
.25
9.0
62
54
49
.86
32
23
02
9.1
12
.92
.31
Kat
ayia
seC
09
6.1
28
.84
68
19
5.8
10
4.8
00
0.0
09
20
25
.52
08
14
9.9
51
02
27
8.9
3.5
-7
.83
Ass
inN
kra
nC
10
5.6
29
.31
31
.45
5.5
34
00
0.0
73
74
0.5
20
89
9.9
77
31
44
.52
1.8
74
.51
Kw
amea
ttah
C1
15
.51
28
.21
88
.87
8.8
35
.20
00
.04
55
03
.85
42
99
.97
76
22
5.8
22
.37
9.4
3
Daw
um
ako
Ass
inC
12
6.2
82
5.9
35
31
55
14
9.2
00
0.0
09
20
10
.52
08
49
.98
96
17
6.8
32
.77
5.8
1
Ato
nsu
C1
95
.28
29
27
61
16
23
.22
00
.00
92
11
.42
.18
75
14
9.9
59
93
73
.60
.75
.46
Ass
inD
om
pim
C2
05
.17
28
10
2.7
43
14
.80
00
.00
92
06
.35
42
99
.97
42
18
8.9
3.1
-4
.19
Tw
ifo
Pra
soC
21
5.5
32
91
15
.24
7.7
34
00
0.0
09
20
2.3
95
89
9.9
75
51
23
.60
.7-
9.4
5
Tw
ifo
Mo
seas
oC
25
5.9
22
81
78
.77
9.6
73
.60
00
.08
43
01
.35
42
49
.98
65
11
4.9
1.5
8.8
8
Tw
ifo
Ab
oab
oC
26
5.9
52
7.7
23
39
9.8
87
.20
00
.01
46
01
1.9
79
29
9.9
77
21
74
.81
.6-
10
Tw
ifo
Mo
kw
aC
28
6.0
42
8.1
19
68
4.6
83
.68
00
.00
92
05
.10
42
49
.98
71
15
5.1
1.8
9.7
4
Tw
ifo
Ag
on
aC
29
5.7
72
8.2
20
58
6.5
49
.60
00
.13
91
03
.22
92
14
9.9
67
92
14
.91
.5-
9.8
4
Maa
bas
aC
31
6.0
82
7.2
17
6.1
75
.88
3.6
00
0.0
10
20
1.1
45
89
9.9
75
81
69
.33
.4-
10
.24
Bro
foy
edu
rC
36
6.2
53
0.6
33
60
13
86
14
6.8
06
10
.00
92
01
15
.52
08
89
9.7
26
41
49
73
.53
0.3
6.9
4
578 Environ Earth Sci (2012) 66:573–587
123
variables used for the factor analysis were temperature
(temp), conductivity (cond), TDS, turbidity (turb), SO42-,
Cl, Na, K, Ca, Mg, Mn, HCO3-, PO3
-, NO3-, TSS, Ni, Fe,
and Cu. It generated five significant factors with eigen
value [1, explaining 86.56% of total variance of the data
set. The five factors with different factor loadings indicate
that five different contributions are involved in the chem-
ical composition of groundwater in the study area. The
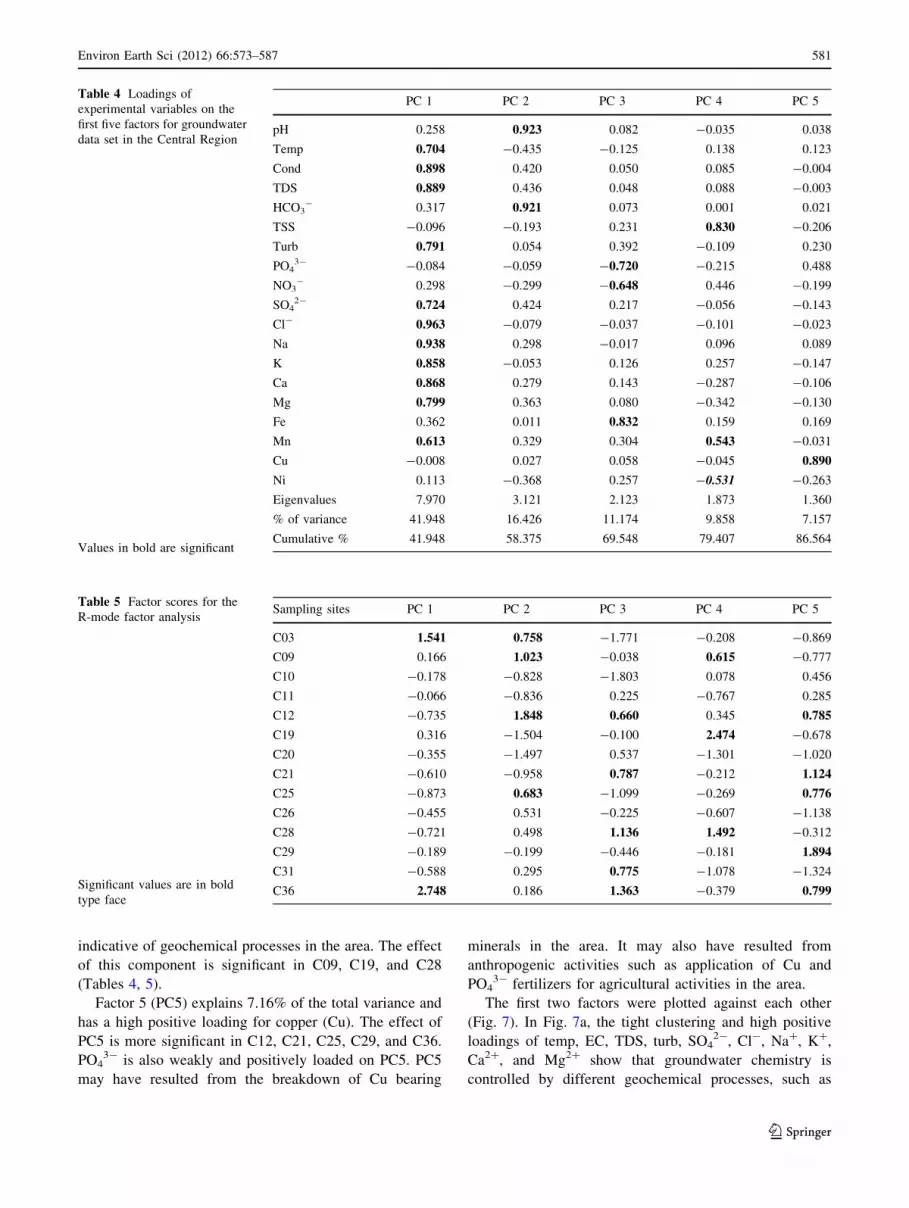
various factor loadings are presented in Tables 4 and 5.
Factor 1 (PC1) explains 41.95% of the total variance and
has high positive loadings for temp, cond, TDS, Turb,
SO42-, Cl-, Na?, K?, Ca2?, Mg2?, and Mn. These
parameters retain high scores in C03 and C36 (Table 5)
and are considered the most important parameters in these
samples. Factor 1 may be influenced by seawater intrusion
due to its proximity to the Gulf of Guinea or mineralization
of dissolved ions as a result of chemical weathering. The
contribution of the major cations (Na, K, Ca, and Mg) may
also be due to cation exchange processes at soil water
interface and Na-bearing minerals (Singh et al. 2005),
K-bearing minerals, Ca-bearing minerals, and Mg-bearing
minerals. Major anions (Cl-, SO42-) may result from
Table 3 Trace metal concentrations of groundwater in parts of the Central Region of Ghana
Community Fe Mn Cu Ni Co Zn Cd Cr Pb
Afutuakwa \0.006 0.038 0.008 0.038 \0.005 \0.001 \0.002 \0.006 \0.01
Katayiase 0.043 0.027 0.004 0.015 \0.005 \0.001 \0.002 \0.006 \0.01
Assin Nkran 0.003 0.004 0.009 0.026 \0.005 \0.001 \0.002 \0.006 \0.01
Kwameattah 0.023 0.017 0.011 0.056 \0.005 \0.001 \0.002 \0.006 \0.01
Dawumako Assin 0.037 0.047 0.021 0.025 \0.005 0.007 \0.002 \0.006 \0.01
Atonsu 0.04 0.057 0.006 0.027 \0.005 0.003 \0.002 \0.006 \0.01
Assin Dompim 0.016 0.002 0.006 0.041 \0.005 \0.001 \0.002 \0.006 \0.01
Twifo Praso 0.042 0.008 0.019 0.037 \0.005 \0.001 \0.002 \0.006 \0.01
Twifo Moseaso \0.006 0.003 0.009 0.02 \0.005 \0.001 \0.002 \0.006 \0.01
Twifo Aboabo \0.006 0.01 0.005 0.041 \0.005 \0.001 \0.002 \0.006 \0.01
Twifo Mokwa 0.129 0.032 0.007 0.028 \0.005 0.002 \0.002 \0.006 \0.01
Twifo Agona 0.042 0.005 0.019 0.025 \0.005 0.007 \0.002 \0.006 \0.01
Maabasa 0.111 0.005 0.004 0.049 \0.005 \0.001 \0.002 \0.006 \0.01
Brofoyedur 1.184 0.117 0.011 0.035 \0.005 \0.001 \0.002 \0.006 \0.01
Fig. 2 Box and whisker plot of
major chemical constituents in
the groundwater of the study
area
Environ Earth Sci (2012) 66:573–587 579
123
atmospheric input, aerosols, and dissolution of NaCl salts
concentrated in the soil zone.
PC2, which explains 16.43% of the variance, has high
positive loadings for pH and HCO3-, and moderate posi-
tive loadings for TDS. The parameters loaded highly on
PC2 and may have resulted from biogenic activities in the
soil zone generating gaseous carbon dioxide that reacts
with infiltrating water to generate HCO3-, which in turn
affects the pH of the groundwater. These parameters are
importantly distributed in samples C03, C09, C12, and C25
(Table 5).
Factor 3 (PC3), explaining 11.17% of the variance, has
moderate negative loadings for PO43- and NO3
- and high
positive loading for Fe. The high positive loading for Fe
suggests a natural geochemical process like dissolution of
iron bearing minerals such as pyrite, biotite, pyroxenes, and
iron rich olivine (fayalite). These are some of the
commonest minerals in the rocks of the area. High scores
of PC3 occur in samples C12, C21, C28, C31, and C36 as
indicated in Tables 4 and 5.
Factor 4 (PC4), explaining 9.86% of the variance, is
contributed by TSS, Mn, and Ni, with a high positive
loading for TSS, moderate positive loading for Mn
and moderate negative loading for Ni. The high positive
loading for TSS and moderate positive loading for Mn are
Fig. 3 Piper plot of water samples from parts of the Central Region
Fig. 4 Dendogram for Q-mode cluster analysis for samples collected
in parts of the Central Region
Fig. 5 a Stiff diagram for cluster 1. b Stiff diagram for cluster 2
Fig. 6 Dendogram for 20 variables from cluster analysis in R-mode
580 Environ Earth Sci (2012) 66:573–587
123
indicative of geochemical processes in the area. The effect
of this component is significant in C09, C19, and C28
(Tables 4, 5).
Factor 5 (PC5) explains 7.16% of the total variance and
has a high positive loading for copper (Cu). The effect of
PC5 is more significant in C12, C21, C25, C29, and C36.
PO43- is also weakly and positively loaded on PC5. PC5
may have resulted from the breakdown of Cu bearing
minerals in the area. It may also have resulted from
anthropogenic activities such as application of Cu and
PO43- fertilizers for agricultural activities in the area.
The first two factors were plotted against each other
(Fig. 7). In Fig. 7a, the tight clustering and high positive
loadings of temp, EC, TDS, turb, SO42-, Cl-, Na?, K?,
Ca2?, and Mg2? show that groundwater chemistry is
controlled by different geochemical processes, such as
Table 4 Loadings of
experimental variables on the
first five factors for groundwater
data set in the Central Region
Values in bold are significant
PC 1 PC 2 PC 3 PC 4 PC 5
pH 0.258 0.923 0.082 -0.035 0.038
Temp 0.704 -0.435 -0.125 0.138 0.123
Cond 0.898 0.420 0.050 0.085 -0.004
TDS 0.889 0.436 0.048 0.088 -0.003
HCO3- 0.317 0.921 0.073 0.001 0.021
TSS -0.096 -0.193 0.231 0.830 -0.206
Turb 0.791 0.054 0.392 -0.109 0.230
PO43- -0.084 -0.059 -0.720 -0.215 0.488
NO3- 0.298 -0.299 -0.648 0.446 -0.199
SO42- 0.724 0.424 0.217 -0.056 -0.143
Cl- 0.963 -0.079 -0.037 -0.101 -0.023
Na 0.938 0.298 -0.017 0.096 0.089
K 0.858 -0.053 0.126 0.257 -0.147
Ca 0.868 0.279 0.143 -0.287 -0.106
Mg 0.799 0.363 0.080 -0.342 -0.130
Fe 0.362 0.011 0.832 0.159 0.169
Mn 0.613 0.329 0.304 0.543 -0.031
Cu -0.008 0.027 0.058 -0.045 0.890
Ni 0.113 -0.368 0.257 -0.531 -0.263
Eigenvalues 7.970 3.121 2.123 1.873 1.360
% of variance 41.948 16.426 11.174 9.858 7.157
Cumulative % 41.948 58.375 69.548 79.407 86.564
Table 5 Factor scores for the
R-mode factor analysis
Significant values are in bold
type face
Sampling sites PC 1 PC 2 PC 3 PC 4 PC 5
C03 1.541 0.758 -1.771 -0.208 -0.869
C09 0.166 1.023 -0.038 0.615 -0.777
C10 -0.178 -0.828 -1.803 0.078 0.456
C11 -0.066 -0.836 0.225 -0.767 0.285
C12 -0.735 1.848 0.660 0.345 0.785
C19 0.316 -1.504 -0.100 2.474 -0.678
C20 -0.355 -1.497 0.537 -1.301 -1.020
C21 -0.610 -0.958 0.787 -0.212 1.124
C25 -0.873 0.683 -1.099 -0.269 0.776
C26 -0.455 0.531 -0.225 -0.607 -1.138
C28 -0.721 0.498 1.136 1.492 -0.312
C29 -0.189 -0.199 -0.446 -0.181 1.894
C31 -0.588 0.295 0.775 -1.078 -1.324
C36 2.748 0.186 1.363 -0.379 0.799
Environ Earth Sci (2012) 66:573–587 581
123

weathering, dissolution, oxidation–reduction, and ion
exchange involving major ions. In Fig. 7b, C03 and C36
plot in the first quadrant with higher TDS depicting a
discharge area. C10, C11, C19, C20, C21, and C29 plot
mostly in the third quadrant with considerable lower TDS
whereas C09, C12, C25, C26, C28, and C31 plot in the
fourth quadrant with lower TDS suggesting recharge areas.
Possible flow paths from the northern sections of the region
toward the Gulf of Guinea in the south is inferred and
shown in Fig. 7b. The PC1 versus PC2 plot also revealed
three main groupings. Group 1 comprises SO42-, TDS, EC,
Mn, Mg, Ca, Na, turb, K, Cl, and temp (Fig. 7a). Group 2
comprises pH and HCO3- whereas group 3 comprises Cu,
Fe, PO43-, NO3
-, TSS, and Ni. R-mode CA (Fig. 6)
retains two main clusters as compared to three by R-mode
PCA. In R-mode CA, there are sub-clusters of which
members include pH and HCO3. This is distinguished by
the R-mode PCA as a separate group (Fig. 7a). The members
of cluster 1 of R-mode CA are almost similar to that of PC1.
This implies that the CA results largely agree with the PCA
results. The R-mode PCA and CA yielded the following
physicochemical and elemental associations in the
groundwater data set: SO42-–Cl–Na?–K?–Ca2?–Mg2?
–Mn2?, HCO3-–pH, and PO4
3-–NO3-–Fe–Cu–Ni. These
are derived mainly from geochemical processes. R-mode
factor analysis for the sampling sites also revealed three
clusters (Fig. 7b) while the Q-mode CA reveled two clusters
(Fig. 4). Sub-clusters C09, C12, C26, C28, and C31 of
cluster 2 of Q-mode CA have emerged from R-mode PCA as
a separate cluster.
Factor scores were used with geographical coordinates
of the sampling locations to generate interpolation surfaces
that spatially indicate the strength of the major hydro-
chemical processes in the study area. Figures 8, 9, 10, 11,
12 represent the factor score maps for factors 1–5. In
Fig. 8, the area has factor scores ranging between -0.91
and 2.30. About 30% of the entire area has positive factor
scores and covers the southern to southeastern sections of
the study area. More than 75% has scores in the range of
-0.51 to C2.30. This suggests that chemical weathering of
the rocks and seawater intrusion have moderate to high
effects on the hydrochemical data in the study area. Gen-
erally, the effects of factor 1 decrease from southeastern to
northwestern parts of the study area. Since the highest
impact of factor 1 occurs at areas close to Gulf of Guinea, it
is anticipated that the saline water or seawater intrusion is
probably the dominant process and overrides the effect of
mineral weathering in these areas.
In Fig. 9, factor scores range from -1.65 to 1.31 and
about 90% are within the range -0.54 to 1.31 reflecting a
moderate to high impact on the hydrochemical dataset in
the area. High impact is observed in the northwestern
corner, northeastern section, and southeastern corner.
Decomposition of organic matter in the soil zone to gen-
erate carbon dioxide gas that in turn reacts with infiltrating
water to form HCO3- that gets into the groundwater zone
may account for the high impact.
Fig. 7 Plots of first two principal component loadings, PC1 versus
PC2 for all analyzed parameters (a, b) Fig. 8 Factor score map for factor 1
582 Environ Earth Sci (2012) 66:573–587
123

In Fig. 10, the factor scores range between -0.61 and
0.16. About 30% of the study area has positive factor
scores and covers the northwestern, northern, part of
northeastern, and part of the southwestern sections showing
a moderate to high localized impact in the area. The
geology of these areas is the sedimentary basin granitoids.
Typical rock types have already been mentioned in section
under geology. The main ferromagnesian mineral present is
biotite. Weathering of biotite may release iron (Fe) in the
water and accounts for the high localized impact.
Factor score map for factor 4 is developed in Fig. 11 and
factor scores range between -0.16 and 0.16. About 60%
have positive factor scores and cover the northern and
northwestern sections of the study area. Factor 4 is thus
pervasive in the study area and generally increases from
southern sections of the study area to the northern and
northwestern sections. This factor reflects a geochemical
component involving chemical breakdown of minerals in
the rocks resulting in the release of ions in the
groundwater. Manganese occurrences have been reported
in rocks of the study area (http://www.ghana-mining.org).
Dissolution of this mineral alongside others such as the
feldspars, micas, pyroxenes, and amphiboles accounts for
the pervasiveness of factor 4 in the area.
In Fig. 12, factor scores range between -0.22 and 0.10.
Ten percent of the study area has positive factor scores and
covers southwestern and northeastern corners of the study
area. Factor 5 has a moderate impact in the study area.
These areas have the sedimentary basin and its associated
granitiods as the dominant geology. Typical rock types
include schist, granite, and gneiss. These rocks are reported
to be associated with transition metals such as Cu, Ni, Co,
and Zn (Melcher 1995). Dissolution of copper bearing
minerals may therefore account for the moderate impact of
factor 4. The moderate impact could also be due to appli-
cation of Cu and PO43- fertilizers in the area for boosting
crop yield.
Fig. 9 Factor score map for factor 2
Fig. 10 Factor map for factor 3
Fig. 11 Factor score map for factor 4
Fig. 12 Factor score map for factor 5
Environ Earth Sci (2012) 66:573–587 583
123

Geochemical evolution of the groundwaters
Compositional relations have been used to assess the origins
of solutes and the processes that result in water compositions
(Rao 2008). The chemical data of the groundwater samples
are plotted on the Ca2??Mg2? versus HCO3- diagram
(Fig. 13). Majority of the data fall below the equiline (1:1),
which suggests that an excess of alkalinity in the water has
been balanced by alkalies (Na??K?). Similarly, sample
points fall below the equiline in a plot of Ca2??Mg2? versus
total cation (Fig. 14). This depicts an increasing contribution
of alkalies to the major ions caused by silicate weathering
(Devadas et al. 2007).
In Fig. 13, it is realized that few samples occur above the
equiline, suggesting that silicate weathering may not be the
only source of the ions in the water. In Fig. 15, a plot of Na?
against Cl- shows that most of the samples exhibit Na?–Cl-
ratio equal to one, and a few of them exhibit a ratio greater
than one. Rao (2008) indicated that a ratio equal to one
implies dissolution of NaCl and a ratio greater than one
reflects a release of Na? from silicate weathering. The
geology of the study area does not provide evidence for
occurrence of NaCl deposits. In fact, the area is a crystalline
basement terrain of which rock types are schist, granitoids,
phyllites, and volcanic rocks. NaCl in the groundwater is
therefore suspected to be concentrated in the soil zone as a
result of silicate weathering. Na rich feldspar (albite) is the
major component of the rocks in the area. Hence, the source
of Na? in the aquifers could be attributed to the breakdown of
albite, as illustrated in Eq. 3. The source of Cl- may be from
atmospheric input. Concentration of these ions in the soil
zone as a result of evaporation may be responsible for the
NaCl waters in the area.
2NaAlSi3O8 þ 2CO2 þ 11H2OAlbiteð Þ
! Al2Si2O5 OHð Þ4þ2Naþ þ 4H4SiO4
Kaoliniteð Þð3Þ
Cl- ? SO42- against Na? ? K? are normally plotted
to infer a common source for these ions from the dissolu-
tion of soil salts (Sarin et al. 1989). In Fig. 16, even though
there are not much data with higher concentrations of
Na? ? K? and Cl- ? SO42-, there is a general increase of
Na? ? K? with Cl- ? SO42- that seem to suggest dis-
solution of these salts in the soil zone. More data are,
however, required to confirm this accession.
In a plot of Ca2??Mg2? versus SO42- ? HCO3
- ?
CO32- (Fig. 17), a deficiency of Ca2??Mg2? relative to
SO42- ? HCO3
- ? CO32- is observed. Therefore, Na?
must balance the excess of negative charge of SO42- and
HCO3- ? CO3
2- ions. Higher concentration of Na? in the
groundwater may be an index of ion exchange process (Rao
2008).
Fisher and Mullican (1997) stated that if ion exchange is
the only controlling process of groundwater composition,
the relation between Ca2? ? Mg2? - SO42- - HCO3
-
? CO32- and Na?–Cl- should show negative linear trend
with a slope of unity, considering the participation of
cations in the ion exchange reaction. In Fig. 18, the sam-
ples show a trend of Ca2? ? Mg2? - SO42- - HCO3
-
? CO32- and Na?–Cl- with a negative slope of less than
Fig. 13 Relationship of Ca2??Mg2? with HCO3- ? CO3
2- in the
Central Region groundwaters
Fig. 14 Relationship of Ca2??Mg2? with TC
Fig. 15 Relation of Na? and Cl- in the Central Region groundwa-
ters. The solid line denotes 1:1 ratio
584 Environ Earth Sci (2012) 66:573–587
123

unity, but they spread above and below the linear trend.
This suggests that the controlling of groundwater quality
depends not only on the involvement of ion exchange
process but also involvement of other processes. Other-
wise, the spreading of sample points above and below the
linear trend should not be expected.
The possible geochemical processes controlling the
groundwater chemistry in the area include silicate or rock
weathering, dissolution of NaCl and cation exchange. The
dominant geochemical processes may be silicate weath-
ering and dissolution of NaCl salt in the soil zone.
The sources of Ca2? in the groundwater could be due to
weathering of calcic plagioclase feldspars (anorthite) that is
also a component of the granitoids, schist, and phyllites.
Mg2? may be leached from biotite [K(Mg,Fe)3(AlSi3)
O10(OH,F)2], hornblende [(Ca,Mg,Fe,Na,Al)7–8(AlSi)8
O22(OH)2], and the pyroxenes (R2[Si2O6]) where R is Ca,
Mg, and Fe2?. Weathering of hornblende and pyroxenes
could also produce Ca2? and Na? in groundwater. K? in
groundwater may be due to plagioclase feldspar alteration
into sericite ([KAl2(Si3Al)O10(OH,F)]) as captured in sec-
tion under geology. Break down of biotite may also yield
K? in groundwater. HCO3- is suspected to be generated
from the soil zone by reaction of CO2 generated from
decomposition of organic matter and infiltrating water.
SO42- concentrations are low; its source is therefore
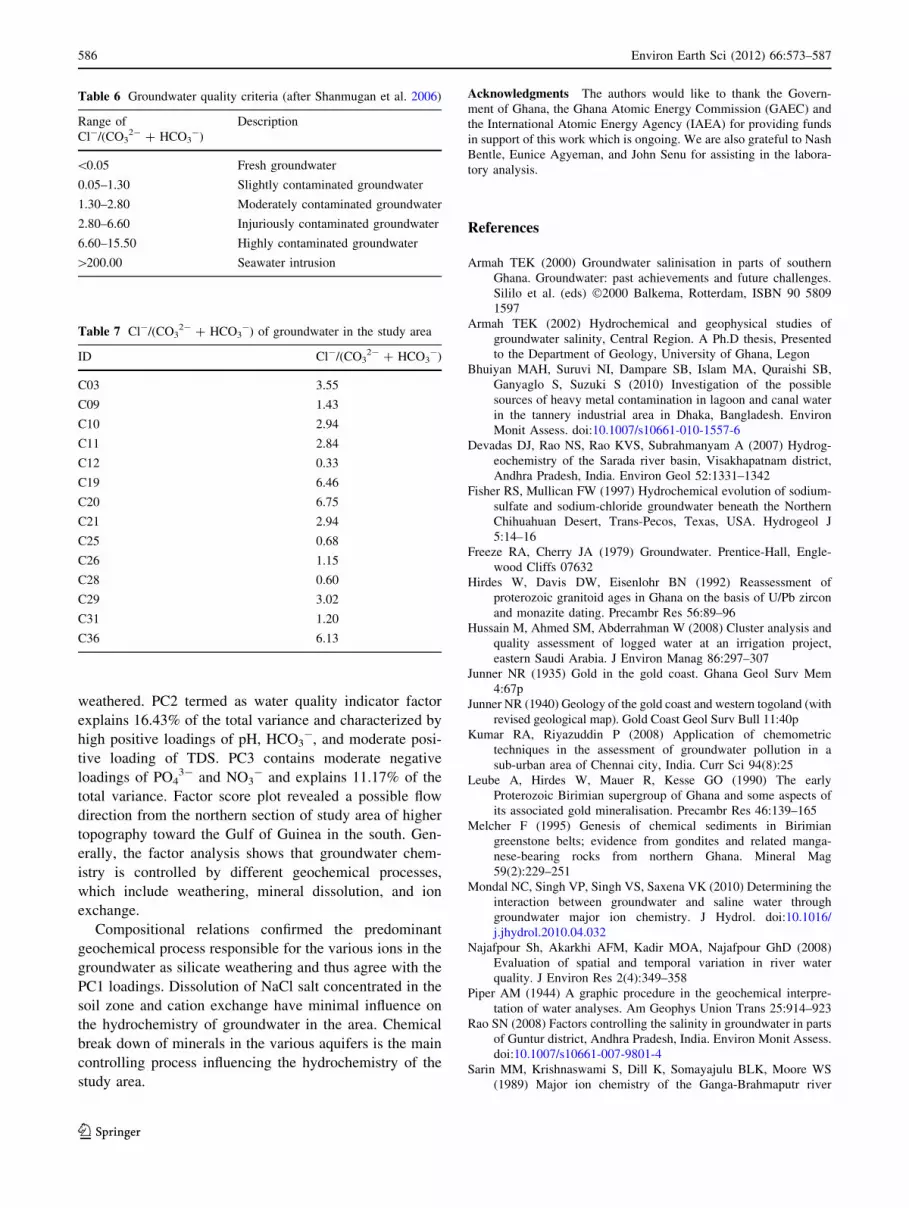
attributable to atmospheric input. Cl-/(CO32- ? HCO3
-)
ratios after ‘‘(Shamugan et al. 2006 Table 6)’’ were
determined in the area. Shamugan et al. (2006) stated that
groundwater with Cl-/(CO32- ? HCO3
-) [200 is attrib-
uted to seawater intrusion. Values obtained ranged between
0.33 and 6.75 (Table 7) ruling out a possible seawater
intrusion in the area. However, further work is required to
confirm some of these deductions.
Conclusion
The preliminary groundwater quality assessment in the
Central Region has revealed that groundwater is generally
weakly acidic with mean acidity being 5.83 pH units.
Electrical conductivity (EC) ranges from 30.6 to 3,360 lS/
cm. High EC is observed from inland toward the coast.
TDS varies from 43 to 1,386 mg/l. TDS greater than
1,000 mg/l indicates saline water bodies occur in the area.
The major dominant cation in the area is Na? followed
by K?, Ca2?, and Mg2?. The dominant anion is Cl- fol-
lowed by HCO3- and SO4
2-. Two major hydrochemical
facies have been identified, which are NaCl and Na–HCO3
water types. Cluster analysis in the Q-mode revealed two
distinct clusters with samples of cluster 1 showing saline
water characteristics and occurring along the coast. The
rest of the clusters represent fresher and good quality water
that occurs inland. R-mode cluster analysis indicated that
the major source of ions in groundwater is that of
hydrogeochemical variables. Factor analysis yielded five
significant factors explaining 86.56% of the total variance.
PC1 explains 41.95% of the variance and is contributed by
temperature (temp), conductivity (cond), TDS, turbidity
(Turb), SO42-, Cl-, Na?, K?, Ca2?, Mg2?, and Mn2?. PC1
loadings describe hydrogeochemical variables originating
from mineralogical compositions of rocks that haveFig. 16 Relationship between Cl- ? SO4
2- and Na??K? in the
groundwaters of the Central Region
Fig. 17 Relationship between Ca2??Mg2? versus SO42- ? HCO3
-
? CO32- in Central Region groundwaters
Fig. 18 Relationship between Ca2? ? Mg2? - SO42- - HCO3
- ?
CO32- against Na?–Cl- in parts of the Central Region groundwaters
Environ Earth Sci (2012) 66:573–587 585
123
weathered. PC2 termed as water quality indicator factor
explains 16.43% of the total variance and characterized by
high positive loadings of pH, HCO3-, and moderate posi-
tive loading of TDS. PC3 contains moderate negative
loadings of PO43- and NO3
- and explains 11.17% of the
total variance. Factor score plot revealed a possible flow
direction from the northern section of study area of higher
topography toward the Gulf of Guinea in the south. Gen-
erally, the factor analysis shows that groundwater chem-
istry is controlled by different geochemical processes,
which include weathering, mineral dissolution, and ion
exchange.
Compositional relations confirmed the predominant
geochemical process responsible for the various ions in the
groundwater as silicate weathering and thus agree with the
PC1 loadings. Dissolution of NaCl salt concentrated in the
soil zone and cation exchange have minimal influence on
the hydrochemistry of groundwater in the area. Chemical
break down of minerals in the various aquifers is the main
controlling process influencing the hydrochemistry of the
study area.
Acknowledgments The authors would like to thank the Govern-
ment of Ghana, the Ghana Atomic Energy Commission (GAEC) and
the International Atomic Energy Agency (IAEA) for providing funds
in support of this work which is ongoing. We are also grateful to Nash
Bentle, Eunice Agyeman, and John Senu for assisting in the labora-
tory analysis.
References
Armah TEK (2000) Groundwater salinisation in parts of southern
Ghana. Groundwater: past achievements and future challenges.
Sililo et al. (eds) �2000 Balkema, Rotterdam, ISBN 90 5809
1597
Armah TEK (2002) Hydrochemical and geophysical studies of
groundwater salinity, Central Region. A Ph.D thesis, Presented
to the Department of Geology, University of Ghana, Legon
Bhuiyan MAH, Suruvi NI, Dampare SB, Islam MA, Quraishi SB,
Ganyaglo S, Suzuki S (2010) Investigation of the possible
sources of heavy metal contamination in lagoon and canal water
in the tannery industrial area in Dhaka, Bangladesh. Environ
Monit Assess. doi:10.1007/s10661-010-1557-6
Devadas DJ, Rao NS, Rao KVS, Subrahmanyam A (2007) Hydrog-
eochemistry of the Sarada river basin, Visakhapatnam district,
Andhra Pradesh, India. Environ Geol 52:1331–1342
Fisher RS, Mullican FW (1997) Hydrochemical evolution of sodium-
sulfate and sodium-chloride groundwater beneath the Northern
Chihuahuan Desert, Trans-Pecos, Texas, USA. Hydrogeol J
5:14–16
Freeze RA, Cherry JA (1979) Groundwater. Prentice-Hall, Engle-
wood Cliffs 07632
Hirdes W, Davis DW, Eisenlohr BN (1992) Reassessment of
proterozoic granitoid ages in Ghana on the basis of U/Pb zircon
and monazite dating. Precambr Res 56:89–96
Hussain M, Ahmed SM, Abderrahman W (2008) Cluster analysis and
quality assessment of logged water at an irrigation project,
eastern Saudi Arabia. J Environ Manag 86:297–307
Junner NR (1935) Gold in the gold coast. Ghana Geol Surv Mem
4:67p
Junner NR (1940) Geology of the gold coast and western togoland (with
revised geological map). Gold Coast Geol Surv Bull 11:40p
Kumar RA, Riyazuddin P (2008) Application of chemometric
techniques in the assessment of groundwater pollution in a
sub-urban area of Chennai city, India. Curr Sci 94(8):25
Leube A, Hirdes W, Mauer R, Kesse GO (1990) The early
Proterozoic Birimian supergroup of Ghana and some aspects of
its associated gold mineralisation. Precambr Res 46:139–165
Melcher F (1995) Genesis of chemical sediments in Birimian
greenstone belts; evidence from gondites and related manga-
nese-bearing rocks from northern Ghana. Mineral Mag
59(2):229–251
Mondal NC, Singh VP, Singh VS, Saxena VK (2010) Determining the
interaction between groundwater and saline water through
groundwater major ion chemistry. J Hydrol. doi:10.1016/
j.jhydrol.2010.04.032
Najafpour Sh, Akarkhi AFM, Kadir MOA, Najafpour GhD (2008)
Evaluation of spatial and temporal variation in river water
quality. J Environ Res 2(4):349–358
Piper AM (1944) A graphic procedure in the geochemical interpre-
tation of water analyses. Am Geophys Union Trans 25:914–923
Rao SN (2008) Factors controlling the salinity in groundwater in parts
of Guntur district, Andhra Pradesh, India. Environ Monit Assess.
doi:10.1007/s10661-007-9801-4
Sarin MM, Krishnaswami S, Dill K, Somayajulu BLK, Moore WS
(1989) Major ion chemistry of the Ganga-Brahmaputr river
Table 6 Groundwater quality criteria (after Shanmugan et al. 2006)
Range of
Cl-/(CO32- ? HCO3
-)
Description
\0.05 Fresh groundwater
0.05–1.30 Slightly contaminated groundwater
1.30–2.80 Moderately contaminated groundwater
2.80–6.60 Injuriously contaminated groundwater
6.60–15.50 Highly contaminated groundwater
[200.00 Seawater intrusion
Table 7 Cl-/(CO32- ? HCO3
-) of groundwater in the study area
ID Cl-/(CO32- ? HCO3
-)
C03 3.55
C09 1.43
C10 2.94
C11 2.84
C12 0.33
C19 6.46
C20 6.75
C21 2.94
C25 0.68
C26 1.15
C28 0.60
C29 3.02
C31 1.20
C36 6.13
586 Environ Earth Sci (2012) 66:573–587
123

system: weathering processes and fluxes to the Bay of Bengal.
Geochim Cosmochim Acta 53:997–1009
Shanmugan P, Neelamani S, Ahn Y, Philip L, Hong G (2006)
Assessment of the levels of coastal marine pollution of Chennai
city, Southern India. Water Resour Manag. doi:10.1007/s11269-
006-9075-6
Singh KP, Malik A, Singh VK, Mohana D, Sinha S (2005)
Chemometric analysis of groundwater quality data of alluvial
aquifer of Gangetic plain. North India Analytica Chimica Acta
550:82–91
Taylor TN, Moorbath S, Leube A, Hirdes W (1992) Early Proterozoic
crustal evolution in the Birimian of Ghana: constraints on
geochronology and isotope geochemistry. Precambr Res
56:97–111
WHO (2004) World health organisation guidelines for drinking water
quality. vol 1, 3rd edn. pp 296–400, ISBN 92 4 154638 7
WRCS (2008) Baseline study of hydrogeology and water resources in
Central Region. Water resources consultancy services (WRCS)
Technical report vol 1, pp 7–10
Yidana SM, Banoeng-Yakubo B, Akabzaa TM (2010) Analysis of
groundwater quality usingmultivariate and spatial analyses in the
Keta basin, Ghana. J Afr Earth Sci. doi:10.1016/j.jafrearsci.
2010.03.003
Environ Earth Sci (2012) 66:573–587 587
123