predominance-zone diagrams in solution chemistry: dismutation processes in two-component systems...
TRANSCRIPT

Predominance-Zone Diagrams in Solution Chemistry
Dismutation Processes in Two-Component Systems (M-L)
A. Rojas-Hernandez, M. T. Ramirez, and I. Gonzalez Universidad Autonoma Metropolitana-lztapalapa, Departmento de Quimica, Apartado Postal 55-534,09340 Mexico, D.F. Mexico
J. G. lbanez Universidad Iberoamericana. De~artmento lnaenieria v Ciencias Quimicas, Prolongacion Reforma 880, Lomas de Santa Fe, 01210 MBX~CO, D. F. ~ e i c o
The concept of disproportionation or dismutation has been frequently used to analyze the stability of intermedi- ate oxidation states of different elements; nevertheless, i t has only been used sporadically (usually in a relatively nonsystematic fashion) in processes without electron ex- change. A recent paper in this Journal explains the con- struction of predominance-zone diagrams (PZD's) a s a n important aid for the comprehension of aqueous solution chemistry by using a general donor/acceptor/particle treat- ment (1). However, the dismutation concept is not dealt with in this reference.
In this paper we show the application of the concept of dismutation in nonredox processes and its relationship to the corresponding chemical-species distribution diagrams and PZDS. During the past few years, we have used this approach in analytical chemistry courses for students ma- joring in chemical engineering, chemistry, pharmacy, and biochemistry with gratifying results a t the Universidad Nacional Autdnoma de Mexico as well as a t the Universi- dad Autdnoma Metropolitana-Iztapalapa.
Distribution Diagrams and the Predominance of Chemical Species Systems of the Type ML, L... / M M L
In aqueous solutions containing two components, M and L, the chemical species,
ML, Mh, ML3, ..., ML,
can be produced by the following formation equilibria,
with an associated equilibrium constant,
i e lO,l,2 ,..., (i-111. j e l l , 2 ,..., nl
This notation includes successive and overall equilibria (2). Other formation equilibria that are useful in some cases are also included.
Taking logs on both sides of this equation and solving for pL (defined as pL = -log [LI), one obtains the following Henderson-Hasselbalch type of equation.
In Charlot's nomenclature (31, ML, is the polydonor spe- cies in the system; M is the polyacceptor; ML, MLz, ..., ML(,-1) are the ampholytes; and L is the particle. A com- mon, well-known graphical representation for this type of systems is a plot of the molar fractions of the species con- taining M vs. pL. This is called a chemical-species distribu- tion diagram (4, 5).
Molar Fractions of the Species
The equations of the molar fractions of the species of M depend on the concentration of L a s follows.
Table 1. Overall Formation Equilibria and log Values of their Equilibrium Constants for the Systems Used
System Equilibrium
Cu(II)-NH3 CU'++ NH3 = CU(NH~)'+
cu2++ 2NH3 = CU(NH,)?
cu2++ 3NH3 = C U ( N H ~ ) ~
cu2++ 4NH3 = CU(NH,)?
Proton-phosphates PO& + H+ = HPOK 4
PO: + 2Hi = H2POi
PO: + 3Hi = H3P0,
log p Ref
4.10 6 7.60
10.50
12.50
12.34 6
19.54
21.68
System Equilibrium 109 B
Zn(ll)-NH, 2n2+ + NH, = z ~ ( N H , ) ~ + 2.40
2n2+ + 2NH3 = Z~(NH,)? 2.30
zn2+ + 3NH3 = z~(NH,)? 2.60
zn2+ + 4NH3 = z ~ ( N H , ) ~ 2.10
Mn(ll)+xalates ~ n ' + + OX"= MnOx 2.40
Fe(ll)-(ophen) ~ e ' + + c-phen = Fe(ephen)'+ 5.84
~ e " + 2c-phen = Fe(ephen)$+ 11.20
Fez+ + 3c-phen = ~e(ophen)y 21.30
Volume 72 Number 12 December 1995
Ref -
6
7
7
1099

(4 Figure 1. Chemical-species distribution diagrams for some metal cat- ion systems as a function of pNH,. (a) Cu(II)-NH,. (b) Zn(ll)-NH,. (c) Ag(I)-NH,. (H fraction of M, A fraction of ML, x fraction of MI+, 0 fraction of ML,, and A fraction of Mb. The PZD's above each distri- bution diagram are obtained by projecting the intersection points of the greatest fractions over the pNH, scale.)
and [MQl
f ~ 3 E [MI + [MLI + ... + LMLJ =f&q~Y' ( 5 )
These functions are monotonic with respect to [LI (or to pL) for the polyacceptor as well as for the polydonor be- cause the functions in their denominators are polynomials containing only integer exponentials (positive for M, nega- tive for ML,,). However, the functions for the ampholytes present a maximum because here each polynomial pre- sents integer exponents that are both positive and nega- tive when the expression is simplified with the numerator.
Figure 2. Distribution diagrams and PZD's for systems of the type MLdMLIMIL. (a) Limiting case, where log/#: << log #: or
log GcM << 0. (b) Case where log #$ = ~ogKM~kor log Gc,M = 0.
(c) Limiting case where log #c >> log or log Gc,M >> 0. (.
fraction of M, A fraction of ML, and x fraction of ML2.)
When the fraction of MLj is larger than that of all the other species that contain M, then MLj is said to predomi- nate in the system. The chemical-species distribution dia- grams shown throughout this paper can be easily con- structed by introducing eqs 4 and 5 in a spreadsheet (e.g., Excel 4.0, Microsoft) and using equilibrium constants re- ported in the literature (6, 7). Table 1 shows the values of the equilibrium constants of the systems discussed in this paper.
1100 Journal of Chemical Education

Table 2. Dismutation Equilibria of the Ampholytes in the Systems
Proton-Phosphates, Manganese(ll1-Oxalates (Ox) an0 Iron(ll)-ofihoPhenantnro ine (opnen)
w th Correspond ng Val~es of !he log of the E ~ J I brun Constants
Arnpholyte Dismutation Equilibrium log K
H P O ~ ~ - 2 ~ ~ 0 : - = H,PO; + PO: -5.1
~ H P O ~ - = H,P04 + 2~0: -1 5.3
H2P04- 2H2POT = H3P04 + ~ ~ 0 2 - -5.1
3H2POT = 2H3P0, + PO: -1 5.3
MnOx 2MnOx = Mn0x: + Mn2+ 0.8
3MnOx = Mn0x: + 2Mn2+ -1.2
M n 0 x P 2MnOx:-= ~ n 0 $ + MnOx -2.9
3Mn0x:-= 2Mn0$ + Mn2+ -5.0
~e(o-phen?+ 2Fe(oPhen)'+ = ~e(o-~hen)F + Fez+ -0.5
~e(o.phen)~+ = Fe(ophen): + 2Fe2+ 3.78
2Fe(ophen)P = Fe(o-phen)? 4.7 + ~e(o.phen)~
Wo-phen)? 3~e(o-~hen$+ = ~e(o-~hen)? + Fez+ 9.0
In Figure 1 some distribution diagrams of metallic cat- ions (Cu(II), Zn(II), and &(I)) with ammonia are shown. In the case of comer. all of the soecies can predominate in a .. . given pNH3 interval. On the contrary, in the cases of silver and zinc the soecies monoamminesilver and diamminezinc cannot predoknate anywhere even though they are pre- sent in the system; thus it cannot be said that they do not exist.
Although this type of system (where not all the existing species have a predominance zone in the pL scale) is not considered in the paper mentioned above ( I ) , PZD's can be constructed for them. Suff~ce it to observe the pL interval for which the fraction of one species is larger than any other in order to construct the PZD of M-containing species in the system.
The Points of Intersection
The points of intersection of the fractions of the species MLi and ML, are given by the values of
accordlog to the Henderson-Hasselbalch type of equation. The uooer Dart of Fi~mre I also shows how the I'ZU:., of
the ~ u ( i i ) , LgU), andh(11) systems can be obtained as projections of the intersection points of the largest frac- tions on the pNH3 scale. At these points, the molar frac- tions of the predominant species become equal. Vale et al. ( I ) call these points acceptance potentials; they mark the predominance boundaries of the chemical species. Al- though PZD's can be constructed this way, this method does not show why some ampholytes cannot predominate in the system.
Dismutation Equilibria and Ampholyte Stability Ampholytes can r ead both as particle donors and ac-
ceptors; this enables them to react with themselves under some circumstances. Charlot (3) has pointed out that i t is useful to include the dismutation of ampholytes to simplify
(4 Figure 3. Sample distribution and PZD's for systems of the type MLJML,/MUM/L. (a) proton-phosphates. (b) Mn(ll)-Ox, (c) Fe(ll)- (o-phen). (. fraction of M, A fraction of ML, x fraction of ML,, and 0 fraction of ML3.)
the analysis of polydonor/ampholyte(s)/polyacceptor/parti- cle systems. This is shown below.
Two-Pa~ticle Donors (MLz/MUM/L)
Here, there is only one ampholyte (ML) with one dismu- tation equilibrium.
2 M L = M L 2 + M (6)
and with an associated equilibrium constant given by
Two possibilities arise from this: Either the ampholyte can predominate in the system (Fig. 2a), or i t cannot pre- dominate (Figs. 2b and 2c). This information can be ob- tained from the value of the dismutation constant of the
Volume 72 Number 12 December 1995 1101

(4 Figure 4. Placement of the successive donorlacceptor pairs of differ- ent systems according tothe points a, b, and cof Charlot'sconvention (3). (a) proton-phosphates system on the pH scale, (b) Zn(ll)-NH, system on the pNH3 scale. (c) Fe(ll)-(0-phen) system on the p(e phen) scale. The dotted diagonal arrows signal ampholyie dismuta- lion processes with equilibrium constants greater than 1.
ampholyte, as shown in Figure 2. Then, in this type of sys- tem ML can predominate in some interval of pL values if and only if
log ?E,M < 0 (8)
For example, the system Ag(IbNH3 has an ampholyte with a dismutation equilibrium,
ZAgCiH,)+ = Ag(NH3)C + Ag+
and an equilibrium constant:
obtained from Hess' law by using known equilibrium wn- stants shown in Table 1. Because this dismutation constant is greater than unity, the ampholyte cannot predominate (Fig. lc).
Three-Particle Donor Systems (MLdMLdMUMIL)
Here, there are two ampholytes (MLz and ML). Each one participates in two different dismutation equilihria. Table 2 shows the possible dismutation equilihria for the ampho- lytes in three selected example systems: phosphoric acid, Mn(I1)-oxalate and Fe(IIb-phenanthroline . The corre- sponding distribution diagrams are shown in Figure 3.
The information in Table 2 and the shape of the distrihu- tiou diagrams in Figure 3 show that if a t least one of the dismutation constants of a given ampholyte is greater that
PI I - - MLj - - - M:fi+l) ,, 1
I
I4 Figure 5. Graphical representation of dismutation equilibria of the type 2MLj= MLBll + MLFll according to Charlot's convention for the prediction of reactions (3). (a) The ampholyte ML, dismutates with log &M+,,,,,.Mb,, > 0 and thus cannot predominate in the system. (b)
The ampholyie ML, dismutates with log GMkqYMb,, = O and thus cannot predominate in the system. (Fhe lines joining the donorlac- ceptor pairs must bend because both pairs are located at the same point.) (c) The ampholyie ML, dismutates with log &2,vMbrl < 0
and can predominate in the interval log #?:,, < pL< log #k+. Tne oonor po nts loward tne acceptor, ano !hey proaxe the r corre- sponomg con.Jgaled prodJcts Tne snort an0 lhlck arrows oelme tne a recl on of the veclor, w h ch s oef.ned by lne slgn of log &%,,,Mk,).
unity (i.e., logK> O), then that ampholyte cannot predomi- nate in the system.
Multiparficle Donor Systems (MLd. ../MUM/L)
In general, for multiparticle donor systems there are (n - 1) ampholytes with dismutation equilihria of the type,
(k - ilMLj = (i - i)MLk + (k - j)MLi (9)
and their equilibrium constants are written as
1102 Journal of Chemical Education
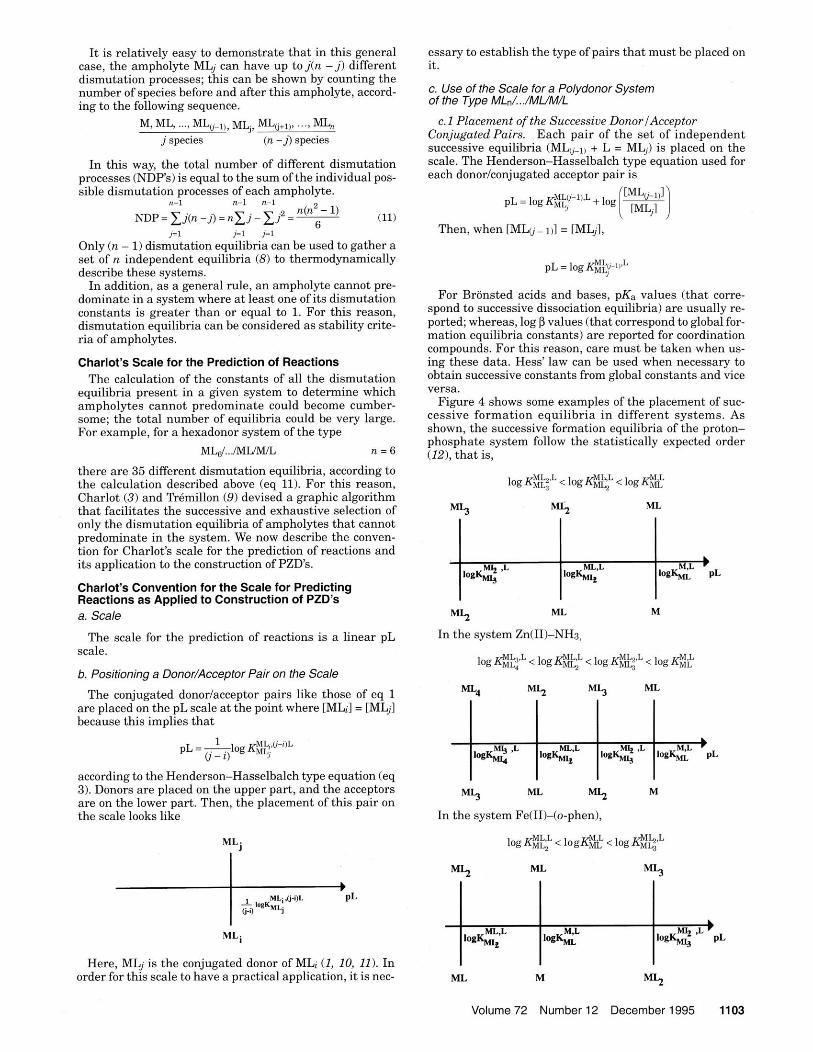
I t is relatively easy to demonstrate that in this general case, the ampholyte MLj can have up to j(n - j) different dismutation processes; this can be shown by counting the number of species before and after this ampholyte, accord- ing to the following sequence.
M, ML, ..., MLti-l,, M L ~ , MLti+~13 -.-, Mb, j species (n -J) species
In this way, the total number of different dismutation processes (NDP's) is equal to the sum of the individual pos- sible dismutation processes of each ampholyte.
"-1 "-1 "-1 n(n2 - 1)
NDP = C j(n - j) = n x j - j2 = ----- 6
(11) j=1 j4 j4
Only (n - 1) dismutation equilibria can be used to gather a set of n independent equilibria (8) to thermodynamically describe these systems.
In addition, as a general rule, an ampholyte cannot pre- dominate in a system where at least one of its dismutation constants is greater than or equal to 1. For this reason, dismutation equilibria can be considered as stability crite- ria of ampholytes.
Charlot's Scale for the Prediction of Reactions The calculation of the constants of all the dismutation
equilibria present in a given system to determine which ampholytes cannot predominate could become cnmber- some; the total number of equilibria could be very large. For example, for a hexadonor system of the type
ML$ ... IMLIM/L n = 6
there are 35 different dismutation equilibria, according to the calculation described above (eq 11). For this reason, Charlot (3) and Remillon (9) devised a graphic algorithm that facilitates the successive and exhaustive selection of only the dismutation equilibria of ampholytes that cannot predominate in the system. We now describe the conven- tion for Cbarlot's scale for the prediction of reactions and its application to the construction of PZD's.
Charlot's Convention for the Scale for Predicting Reactions as Applied to Construction of PZD's a. Scale
The scale for the prediction of reactions is a linear pL scale.
b. Positioning a Donor/Acceptor Pair on the Scale
The conjugated donor/acceptor pairs like those of eq 1 are placed on the pL scale a t the point where [MLil= [MLjl because this implies that
according to the Henderson-Hasselbalch type equation (eq 3). Donors are placed on the upper part, and the acceptors are on the lower part. Then, the placement of this pair on the scale looks like
Here, MLj is the conjugated donor of MLi (1, 10, 11). In order for this scale to have a practical application, i t is nec-
essary to establish the type of pairs that must be placed on it.
c Use of the Scale for a Polydonor System of the Type MLd. ../MUM/L
c.1 Placement of the Successiue DonorIAcceptor Conjugated Pairs. Each pair of the set of independent successive equilibria (MLti.lr + L = ML,) is placed on the scale. The Henderson-Hasselbalch type equation used for each donorlconjugated acceptor pair is
Then, when [MLy - 111 = [MLjl,
For Bronsted acids and bases, pK, values (that corre- spond to successive dissociation equilibria) are usually re- ported; whereas, log p values (that correspond to global for- mation equilibria constants) are reported for coordination compounds. For this reason, care must be taken when us- ing these data. Hess' law can be used when necessary to obtain successive constants from global constants and vice versa.
Figure 4 shows some examples of the placement of suc- cessive formation equilibria i n different systems. As shown, the successive formation equilibria of the proton- phosphate system follow the statistically expected order (121, that is,
ML2 ML M
In the system Zn(I1)-NH3,
In the system Fe(IIb(o-phen),
l o g S ? < l0gPdL < 10gKj$y
Volume 72 Number 12 December 1995 1103

is greater that 1 and so is that of the dismutation, 2+ 2Febphen),2i = ~do-phen)~ + Fek-phen12+
according to Figure 4c.
Figure 6. Simplification of the scale for the prediction of reactions of the system Zn(ll)-NH3 according to the points dand e of Charlot's convention (3). (a) Initial scale. (b) First and last scale simplification. (Dotted arrows show the assignment of species to their respective predominance zones.)
These graphical representations, developed from the convention points described above, show some chemical reactions and the log values of their equilibrium con- stants as well as some dismutation equilibria that are de- scribed below.
c.2 DirectedDistance. I t is well-known tha t the log value of the equilihrium constant of the following dismuta- tion equilibria,
d. PZD's from the Scale of Prediction of Reactions
From here, two possibilities arise.
d.1 All the dismutation constants corresponding to the equilibria of the type
(named here as stoichiometry 2:l:l) are less than 1. Thus, all the ampholytes can predominate according to the sta- tistically expected order shown below.
Then, the PZD is as follows.
d.2 One or more dismutation constants of 2:l: l stoichiometry, represented on the scale, are greater than 1.
In these cases, a simplification procedure must be used to obtain the corresponding PZD, as explained below.
e. Simplification of the Scale for the Prediction of Reactions
can be obtained by using Hess'law and combining the cor- responding successive equilibria as follows.
ML, + L = ML~,,, log K = + ~ o ~ K ~ $ . +U are no more ampholytes there.
2MLj = MLy+,, + MLti.l) 2ML. lag K M L ~ ~ , , ~ ~ ~ ~ , , = +logZ'$:;+:, -logK%y-", e.4 PZD's. The PZD is then constructed from the simnlified scale. followinp the statisticallv
The sign of the term, 2ML
log KML&ML~.,,
depends upon the values of
hg Z'$yl, and
1og*kyL
Because successive equilibria have been graphically rep- resented at pL = log K, with the donors on the upper side and with the acceptors on the lower side, the values of log K # ~ ~ , , M L ~ - I ) and their signs have also been repre- sented, as shown in Figure 5. Here, i t is also shown that this convention defines directed distances among the pairs; i t defines vectors. So this scale is just a graphical representation of Hess' law like any other graphical method of prediction of reactions (13,141. Then, Figure 4b shows that the equilibrium constant for the dismutation,
e.1 Identification. b o n g the ampholytes with equilih- rium constants greater than 1, the most unstable-that is, the one with the largest dismutation constant (e.g., M L , b is selected.
e.2 Substitution. Those pairs containing the most un- stable ampholyte, ML, are removed from the scale and sub- stituted with the pair that involves the products (MLj and MLk) from the dismutation equilibrium that prevents ML, from predominatingin the system (3,9).
e.3 Exhaustiue Repetition. Points e.1 and e.2 are then repeated until there are no more ampholytes in the scale with dismutation equilihrium con- stants greater than or equal to 1 or until there
expected order for the of species. An example of a PZD thus obtained is
Figure 4a shows that i t is not necessary to simplify the scale of the system proton-phosphates. Figures 4b and 4c show that i t is necessary to use the procedure described above for the systems Zn(IIkNH3 and Fe(1IHo-phen). Ex- a m ~ l e s of the sim~lification ~rocedure described above t i . e , point r of the convention, and the corresponding PZDk are mvcn in Fieures 6 and 7 . The simolificat~on ornc- - ess in Figure 6 is stopped when the amphoiyte ~ n ( ~ i 3 ) 2 ~ + is removed from the scale for the prediction of reactions because all the constants of the dismutation equilibria of the other two ampholytes (zn(NHdZt and z ~ ( N H ~ ) & are less than 1.0n the contrary, the scale for the system
1104 Journal of Chemical Education

Figure 7. Simplification of the scale for the prediction of reactions of the svstem Fe1ll)-(0-ohenl accordina to the Doints dand eof Char- ~,~ ~ . . . , . lot'sconventlon (3) (a) Inma1 sca e (5 F m &ale jmpltf cat on snow- mg tne o smdlaton of tne ampholyte Fe(ephen1 '. (cl Second an0 last scales m p ilcallon. (Done0 arrows signal me asslgnmenl of spe- cies to their corresponding predominance zones.)
Fe i l l~o -phen ) must be simplified twice, as shown in Fig- ure 7. This can be understood in the light of the above d ~ s - russion bv lookinv at the corres~ondine data in Table 2. ~~ ~~ ~
In Fi&e 7b thz dismutation kquilib&n constant for
3/2~e(o-phen)~+ = %~e(o-phen)? + I?e2+
(not plotted in Figures 7a nor 7c) is greaterthan 1, 2t
Fe(o-phen)z* log a ~ ~ ( ~ - ~ h ~ ~ ) ~ ,pelf = 1.89 > 0
Then, the constant for the equilibrium 3 ~ e ( o - ~ h e n ) ~ + = Fe(o-phen)$ + 2Fe2+ (which represents the same dismuta- tion process) is also greater than 1,
2+ ~ O ~ K " ~ [ ~ $ ~ ~ ~ , ~ ~ , Z ~ = 3.78 > 0
In the simplified scales for the prediction of reactions that appear along the procedure outlined in point e of the convention, some of the dismutation processes thereby represented no longer have a 2:l: l stoichiometry. Care must be used with the interpretation of the dismutation processes represented in the simplified scales.
Observations Charlot's convention for the scale for the prediction of reac-
tions is more comprehensive and powerful than we have shown in this limited space because the pL scale contains more than the dismutation equilibria, that is, other reaction equilibria among donors and nonconjugated acceptors not discussed here. The directed distance (defined in points a and
b of the convention) is applicable to other equilibria in addi- tion to the dismutation cases discussed here.
Other points of the convention (not treated here) allow for the placement of the particle L on the pL scale as well as for the overlap of all the necessary reduced scales in order to describe the composition of the solution. This en- ables the prediction of reactions in polydonor systems that exchange the same particle L, for example,
MLnI ...IMLIMIL, AL,I ... IAWAL, BLb/ .../BWB/L
This leads to adequate models for the calculation of equi- librium compositions in systems involved in processes such as titrations, hydrometallurgy, biochemistry, and processes in aqueous solutions in general (3,9).
The complete Chadot's convention is not presented here due to space limitations and because our main objective is to emphasize the importance of the dismutation processes in the construction of PZDH. We have used Ringbom's no- menclature (15) for the labeling of the different equilib- rium constants in an attempt to use one single convention because the IUPAC has not established a convention for writing equilibrium constants of dismutation processes.
Conclusions The main contribution of the concept of dismutation
equilibria as applied to solution chemistry is that i t ex- plains the nonpredominance of some ampholytes in a given system. The use of these equilibria combined with another graphical method of prediction of reactions (3, 9, 13, 141, can lead to the construction of PZD's without having to use the corresponding chemical-species distribution diagrams.
The PZD's discussed here (and earlier (I)), describe two- component systems. Actually, real-life chemical processes usually involve more than two componmts; nonethelrss, the algorithm discussrd here can 11r pmcralizcd for multi- component, multireacting systems inaqueous solutions by considering the formation of mixed complexes (16, 17), polynuclear species (18), condensed-phase equilibria (19, 20) and electron exchange (redox systems) (21).
Acknowledgment This paper is dedicated to Gaston Charlot (in memo-
riam) and Bernard Tr6millon for their contributions to the knowledge of solution chemistry. We acknowledge finan- cial support from CONACyT.
Literature Cited 1. Vale, J.: FernBndezPereira, C.; Alcalde, M. J. Chem Educ. 1993, 70,790-795. 2. Lagowski, J. J. Modern Inorganic Chemistry; Oekker: New York, 1973; Chapter 17. 3. Charlot. G. Chimis Anolyliyue G4ndroIe. Part I: Marson: Patis. 1967. 4. Kdthoff I . M.; Ssndell. E . B.; Meehan. E. J.: Brnckenaiein. S. Quonliloliu~ Chemi-
en1 Analysis: MacMillan: Iandon, 1969. 5. Hdgfddt. E. In l hs t i se onAnalytica1 Chemistry; Kolthoff, I . M.: Eluing. P J.. Eds:
Interscience: New York, 1979: Part 1. Val. 2, Section D (Continuedl, Chapter 15. 6. Hogieldt, E. Slobdity Constants ofMeLal-Ion Compler~s: Part A. Inorganic Ligands
(IUPAC Chemical Data Seties, No. 211; Pergamon: New York. 1979. 7. Perrin. D. D. Stability Constonis of Metal-Ion Complaes: Palf B: Organic Ligands
llUPAC Chemical Data Seties, No. 22): Pergamon: New York, 1979. 8. Smith. W. R.: Missen, R. W. Chemicol Reaction Eouilibrium Analysis: Thwly and
Algorithms: Wiley: New York. 1985. 9. ~4millon,B.El~cfmhimi~An~lylique~LR4aelionsenSolulon. Volume I:R4anionr
1952. 11. Fmsf. A. A. J. Am. C k m . Snr 1951, 73,2680-2683. 15. Ringb0rn.A Compleration in Anolylicnl Chemistry: Wiley: New York, 1963. 16. Rajas, A,: GonaBler. I .And. Chim. Ado 1986,187.279-265. 17. Roirs-Hemindez, A ; Rarnirez, M. T.; Ihanez, J. G.: Gondlez. I. A n d Chim. Aeto
i m , z a 6 . 435442. 18. Rojas-Hemindez, A ; Ramirez, M. T; GonzBlez. I.: banes, J. G . A n d . C h m Aelcl
1992,259.95-104. 19. Rojar-Hemindez. A,; Ramirez, M. T; Gonz8e8, lAno1. Chim Acfo 1993,278,321-
333. 20. RQjas-Hernindez, A: Ramirez, M. T; GonzBen, 1. A n d Chim. Act. 1993,278,335-
347. 21. Rolas-Hemindez, A ; Rarnirez. M. T; Ibmez. J. G.: GonrBler, I. J. Electmeham. Soe
1991,138,365371.
Volume 72 Number 12 December 1995 1105