predictive analysis praise for data mining and predictive analysis
TRANSCRIPT


Data Mining andPredictive Analysis

Praise for Data Mining and PredictiveAnalysis
“Dr. Colleen McCue pairs an educational background in neuroscience and psychology withextensive experience in the fields of behavioral science, cirme analysis, and intelligence gatheringto create Data Mining and Predictive Analysis, a must-read for all law enforcement professionals.Within the ever-growing fields of criminal justice and crime analysis, Dr. McCue combines allfacets of the public safety community, effortlessly examining techniques in which law enforce-ment, analysts, and researchers are able to delve deeper through her accessible explanationsof relative degrees of data quality, validity and reliability; all essential tools in this modern,technological era.”
Arthur E. Westveer (Associate Professor, L. Douglas Wilder School of Government and PublicAffairs, Virginia Commonwealth University)
“[Data Mining and Predictive Analysis] is a must-read . . ., blending analytical horsepower withreal-life operational examples. Operators owe it to themselves to dig in and make tactical decisionsmore efficiently, and learn the language that sells good tactics to leadership. Analysts, intellsupport, and leaders owe it to themselves to learn a new way to attack the problem in support oflaw enforcement, security, and intelligence operations. Not just a dilettante academic, Dr. McCueis passionate about getting the best tactical solution in the most efficient way—and she uses datamining to do it. Understandable yet detailed, [Data Mining and Predictive Analysis] puts forth asolid argument for integrating predictive analytics into action. Not just for analysts!”
Tim King (Director, Special Programs and Global Business Development, ArmorGroupInternational Training)
“Dr. McCue’s clear and brilliant guide to attacking society’s greatest threats reveals how to bestcombine the powers of statistical computation and the experience of domain experts. Her empha-sis on understanding the essential data through fieldwork and close partnership with the end usersof the information is vital to making the discovered patterns “actionable”. Anyone seeking toharness the power of data mining to “connect the dots” or “find needles in a haystack” will bene-fit from this lively and reliable book packed with practical techniques proven effective on toughreal-world problems.”
Dr. John Elder (Chief Scientist of Elder Research, Inc., www.datamininglab.com)
“[Data mining] is a hot area—not just for Hollywood any more—but real people and realsituations are benefiting from these analytical investigations. ”
Mary Grace Crissey (Technology Marketing Manager, SAS Institute)

Data Mining andPredictive Analysis
Intelligence Gatheringand Crime Analysis
Colleen McCue
AMSTERDAM • BOSTON • HEIDELBERG • LONDON
NEW YORK • OXFORD • PARIS • SAN DIEGO
SAN FRANCISCO • SINGAPORE • SYDNEY • TOKYO
Butterworth-Heinemann is an imprint of Elsevier

Contents ix
6.6 Conference Call Example 1036.7 Internet Data 1106.8 Operationally Relevant Variable Selection 1116.9 Bibliography 114
7 Predictive Analytics 117
7.1 How to Select a Modeling Algorithm, Part I 1177.2 Generalizability versus Accuracy 1187.3 Link Analysis 1197.4 Supervised versus Unsupervised Learning Techniques 1197.5 Discriminant Analysis 1217.6 Unsupervised Learning Algorithms 1227.7 Neural Networks 1237.8 Kohonan Network Models 1257.9 How to Select a Modeling Algorithm, Part II 1257.10 Combining Algorithms 1267.11 Anomaly Detection 1277.12 Internal Norms 1277.13 Defining “Normal” 1287.14 Deviations from Normal Patterns 1307.15 Deviations from Normal Behavior 1307.16 Warning! Screening versus Diagnostic 1327.17 A Perfect World Scenario 1337.18 Tools of the Trade 1357.19 General Considerations and Some Expert Options 1377.20 Variable Entry 1387.21 Prior Probabilities 1387.22 Costs 1397.23 Bibliography 141
8 Public Safety—Specific Evaluation 143
8.1 Outcome Measures 1448.2 Think Big 1498.3 Training and Test Samples 1538.4 Evaluating the Model 1588.5 Updating or Refreshing the Model 1618.6 Caveat Emptor 1628.7 Bibliography 163
Contents

x Contents
9 Operationally Actionable Output 165
9.1 Actionable Output 165
Applications 175
10 Normal Crime 177
10.1 Knowing Normal 17810.2 “Normal” Criminal Behavior 18110.3 Get to Know “Normal” Crime Trends and Patterns 18210.4 Staged Crime 18310.5 Bibliography 184
11 Behavioral Analysis of Violent Crime 187
11.1 Case-Based Reasoning 19311.2 Homicide 19611.3 Strategic Characterization 19911.4 Automated Motive Determination 20311.5 Drug-Related Violence 20511.6 Aggravated Assault 20511.7 Sexual Assault 20611.8 Victimology 20811.9 Moving from Investigation to Prevention 21111.10 Bibliography 211
12 Risk and Threat Assessment 215
12.1 Risk-Based Deployment 21712.2 Experts versus Expert Systems 21812.3 “Normal” Crime 21912.4 Surveillance Detection 21912.5 Strategic Characterization 22012.6 Vulnerable Locations 22212.7 Schools 22312.8 Data 22712.9 Accuracy versus Generalizability 22812.10 “Cost” Analysis 22912.11 Evaluation 229

Contents xi
12.12 Output 23112.13 Novel Approaches to Risk and Threat Assessment 23212.14 Bibliography 234
Case Examples 237
13 Deployment 239
13.1 Patrol Services 24013.2 Structuring Patrol Deployment 24013.3 Data 24113.4 How To 24613.5 Tactical Deployment 25013.6 Risk-Based Deployment Overview 25113.7 Operationally Actionable Output 25213.8 Risk-Based Deployment Case Studies 25913.9 Bibliography 265
14 Surveillance Detection 267
14.1 Surveillance Detection and Other Suspicious Situations 26714.2 Natural Surveillance 27014.3 Location, Location, Location 27514.4 More Complex Surveillance Detection 28214.5 Internet Surveillance Detection 28914.6 How To 29414.7 Summary 29614.8 Bibliography 297
Advanced Concepts and Future Trends 299
15 Advanced Topics 301
15.1 Intrusion Detection 30115.2 Identify Theft 30215.3 Syndromic Surveillance 30315.4 Data Collection, Fusion and Preprocessing 30315.5 Text Mining 30615.6 Fraud Detection 308
Contents

xii Contents
15.7 Consensus Opinions 31015.8 Expert Options 31115.9 Bibliography 312
16 Future Trends 315
16.1 Text Mining 31516.2 Fusion Centers 31716.3 “Functional” Interoperability 31816.4 “Virtual” Warehouses 31816.5 Domain-Specific Tools 31916.6 Closing Thoughts 31916.7 Bibliography 321
Index 323

Foreword
We all know crime doesn’t pay. But did you know there is “prophet” in polic-ing? Thanks to the fine work of Dr. Colleen McCue of the Richmond PoliceDepartment, Crime Analysis Unit, it is now possible to predict the future whenit comes to crime, such as identifying crime trends, anticipating hotspots in thecommunity, refining resource deployment decisions, and ensuring the greatestprotection for citizens in the most efficient manner.
A number of years ago, the United States Attorney’s Office for theEastern District of Virginia formed a partnership with the Richmond PoliceDepartment to address the pressing problem of gun violence in the city. In2002, we renewed that relationship and formed a new commitment as partof President George W. Bush’s antigun crime initiative, Project Safe Neighbor-hoods (PSN). At that time, Dr. McCue was selected as our research partnerto assist our efforts in evaluating the outcomes of our districtwide PSN ini-tiatives. In light of the work Dr. McCue was already doing for the RichmondPolice Department, we wanted to apply the innovative tools she had used soeffectively in Richmond to support our efforts targeting gun crime in other hotspots around eastern Virginia.
Dr. McCue has done pioneering work in the practical application of data-mining techniques to the administration of a police department. In this book,she describes her use of “off-the-shelf ” software to correlate data on gunviolence with data on other violent crimes in order to graphically depict crimetrends in a most compelling way and to predict where future crimes are likely tooccur. Armed with such analyses, the police executive is thus enabled to develop“risk-based deployment strategies,” permitting the executive to make informedand cost-efficient staffing decisions based on the likelihood of specific criminalactivity.
The application of Dr. McCue’s techniques has paid off in Richmond,where the police department used them to deploy resources during the periodsurrounding the New Year’s Eve holiday—December 31, 2003, throughJanuary 1, 2004. The results of that effort were dramatic. Not only were gunfirecomplaints reduced by almost 50% on New Year’s Eve, but the number of seized
xiii

xiv Foreword
illegal weapons increased by an impressive 246% from the previous year. Thesestatistics represent compelling evidence that these techniques are adding valueto the work of fighting gun crime. But there is more. This accomplishmentwas realized using fewer street officers than originally planned. In other words,risk-based deployment enabled the Richmond Police Department to deployfewer officers strategically, while at the same time obtaining better results.
In writing this book, Dr. McCue was mindful of the need to convey sophis-ticated analyses in practical terms and, accordingly, she prepared her text in avery user-friendly manner. As United States Attorney, I am proud to be associ-ated with such a dedicated partner in our shared mission. I am confident thatyou, too, will benefit from Dr. McCue’s exceptional contribution to the fieldof police science.
Paul J. McNulty

Preface
Like many kids growing up in America, I always had a love of science. I alsohappened to be blessed with two incredibly supportive and involved parents.My mother was always there with words of encouragement. Her typing skills gotme through high school and most of college. She also led by example, balancingher work as a probation and parole officer with her role as wife and mother. Myfather, on the other hand, would try to learn as much as he could about what wewere interested in so that he could participate in the activities with us. When Istarted graduate school, however, there was something of a dilemma. What doan engineer and a budding neuroscientist have in common, particularly whenthe engineer is not big on things like rats and brains? Fortunately, it was duringthis time that cognitive neuroscience and artificial intelligence systems startedbecoming accessible to the mainstream. So, throughout graduate school andmy subsequent career, my father would send me books and articles on topicssuch as neural nets, case-based reasoning, machine learning, and cognitive neu-roscience. It provided for interesting conversation and some common groundfor two professionals in relatively disparate fields.
As time went on and life changed, I found myself working as a behavioralscientist in the criminal justice field. In this environment, I was able to bringmy training as a scientist to the study of human criminal behavior. I found thatI was able to apply much of what I had learned about psychology, behavioralscience, and, perhaps most importantly, multivariate statistics and computermodeling to my new field. I was in an interesting position, working in a localpolice department and receiving first-hand training in a variety of topics, fromdeath investigation to CompStat. While I did not realize it at the time, I alsowas acquiring a tremendous amount of domain expertise, something absolutelyessential to competent data mining, which would distinguish my work frommany others trying to gain entry into a rather closed professional world. I alsobegan to understand the relative degrees of data quality, validity, and relia-bility associated with law enforcement and intelligence data. Although I wasfamiliar with the work regarding the often questionable reliability of eyewitness
xv

xvi Preface
testimony, it was not until I had read many offense reports that trends andpatterns to the witness statements began to emerge and make sense.
I became profoundly intrigued by how many of the seasoned detectives whoI worked with were often able to generate quick yet accurate hypotheses abouttheir cases, sometimes only moments after they had arrived at the scene. Likethe “profilers” on television and in the movies, many of them seemed to havean uncanny ability to accurately describe a likely motive and related suspectbased merely on a review of the crime scene and some preliminary knowledgeregarding the victim’s lifestyle and related risk factors. Over time, I started toacquire this ability as well, although to a lesser degree. It became much easierto read a report and link a specific incident to others, predict future relatedcrimes, or even calculate the likelihood that a particular case would be solvedbased on the nature of the incident. Drawing on my training as a scientist, Ifrequently found myself looking for some order in the chaos of crime, tryingto generate testable hypotheses regarding emerging trends and patterns, as wellas investigative outcomes. Sometimes I was correct. However, even when I wasnot, I was able to include the information in my ever-expanding internal rulesets regarding crime and criminal behavior.
Prior to working for the Richmond Police Department, I spent several yearsworking with that organization. Perhaps one of the most interesting aspects ofthis early relationship with the Department was my weekly meetings with theOfficer in Charge of Violent Crimes. Each week we would discuss the homi-cides from the previous week, particularly any unique or unusual behavioralcharacteristics. Over time, we began to generate casual predictions of violentcrime trends and patterns that proved to be surprisingly accurate. During thissame time period, I began to examine intentional injuries among incarcer-ated offenders. As I probed the data and drilled down in an effort to identifypotentially actionable patterns of risk, it became apparent that many of theindividuals I looked at were not just in the wrong place at the wrong time, asthey frequently indicated. Rather, they were in the wrong place at the wrongtime doing the wrong things with the wrong people and were assaulted as a resultof their involvement in these high-risk activities. As I explored the data fur-ther, I found that different patterns of offending were associated with differentpatterns of risk. This work had immediate implications for violence reduction,something that I continue to be involved in. Similarly, it had implications forthe analysis of crime and intelligence data. Fortunately, the field of data miningand predictive analytics had evolved to the point that many of the most sophis-ticated algorithms were available in a PC environment, so that everyone froma software-challenged psychologist like myself to a beat cop could begin to notonly understand but also use these incredibly powerful tools. Unfortunately, the

Preface xvii
transfer of this powerful technology to the public safety arena has not advancednearly as quickly.
While I did not realize it at the time, a relatively new approach to marketingand business was emerging at the same time we were engaging in this lively spec-ulation about crime and criminals at the police department. Professionals in thebusiness community were exploiting artificial intelligence and machine learningto characterize and retain customers, increase sales, focus marketing campaigns,and perform a variety of other business-related tasks. For example, each timeI went through the checkout counter at my local supermarket, my purchasinghabits were coded, collected, and analyzed. This information was aggregatedwith data from other shoppers and employed in the creation of models aboutpurchasing behavior and how to turn a shopper into a buyer. These models werethen used to gently mold my future behavior through everything from directmarketing based on my existing preferences to the strategic stocking of shelvesin an effort to encourage me to make additional purchases during my next tripdown the aisle. Similarly, data and information were collected and analyzedeach time I perused the Internet. As I skipped through web pages, I left cook-ies, letting the analysts behind the scenes know where I went and when and inwhat sequence I moved through their sites. All of this information was analyzedand used to make their sites more friendly and easier to navigate or to subtlyguide my behavior in a manner that would benefit the online businesses thatI visited. The examples of data mining and predictive analytics in our lives arealmost endless, but the contrast between my professional and personal lives wasprofound. Contrasting the state of public safety analytical capacity to that of thebusiness community only serves to underscore this shortcoming. Throughoutalmost every aspect of my life, data and information were being collected on meand analyzed using sophisticated data mining algorithms; however, the use ofthese very powerful tools was severely limited or nonexistent in the public safetyarena in which I worked. With very few exceptions, data mining and predictiveanalytics were not readily available for the analysis of crime or intelligence data,particularly at the state and local levels.
Like most Americans, I was profoundly affected by the events ofSeptember 11th. The week of September 10th, 2001, I was attending a spe-cialized course in intelligence analysis in northern Virginia. Like many, I canremember exactly what I was doing that Tuesday morning when I saw the firstplane hit the World Trade Center and how I felt as the horror continued tounfold throughout the day. As I drove back to Richmond, Virginia, that after-noon (the training had been postponed indefinitely), I saw the smoke rise upover the Beltway from the fire at the Pentagon, which was still burning. Thoseof us working in the public safety community were inundated with information
Preface

xviii Preface
over the next several days, some of it reliable, much of it not. Like many agen-cies, we were swamped with the intelligence reports and BOLOs (be on thelookout reports) that came in over the teletype, many of which were duplicativeor contradictory. Added to that were the numerous suspicious situation reportsfrom concerned citizens and requests for assistance from the other agenciespursuing the most promising leads. Described as the “volume challenge” byformer CIA director George Tenent, the amount of information almost con-tinuously threatened to overwhelm us. Because of this, it lost its value. Therewas no way to effectively manage the information, let alone analyze it. In manycases, the only viable option was to catalog the reports in three-ring binders,with the hope that it could be reviewed thoroughly at some later date. Likeothers in law enforcement, our lives as analysts changed dramatically that day.Our professional work would never again be the same. In addition to violentcrimes and vice, we now have the added responsibility of analyzing data relatedto the war on terrorism and the protection of homeland security, regardless ofwhether we work at the state, local, or federal level. Moreover, if there was onetake-home message from that day as an analyst, particularly in Virginia, it wasthat the terrorists had been hiding in plain sight among us, sometimes for years,and they had been engaging in a variety of other crimes in an effort to furthertheir terrorist agenda, including identity theft, forgery, and smuggling, not tomention the various immigration laws they violated. Many of these crimes fallwithin the purview of local law enforcement.
As we moved through the days and weeks following the attacks, I realizedthat we could do much better as analysts. The subsequent discussions regarding“connecting the dots” highlighted the sad fact that quite a bit of informationhad been available before the attacks; however, flaws in the analysis and sharingof information resulted in tragic consequences. While information sharing willrequire culture change and a paradigm shift in the larger public safety com-munity, advanced analytical techniques are available now. The same tools thatwere being used to prevent people from switching their cellular telephone ser-vice provider and to stock shelves at our local supermarkets on September 10thcan be used to create safer, healthier communities and enhance homeland secu-rity. The good news is that these techniques and tools are used widely in thebusiness community. The key is to apply them to questions or challenges inpublic safety, law enforcement, and intelligence analysis. Adapting existingtechnologies and analytics to the public safety domain will keep many of usbusy for years to come. If the past is any indicator, however, by the time wehave completed this initial technology transfer and have caught up to where thebusiness community is today, there should be other new and exciting technolo-gies to appropriate from the private sector. In all seriousness, the public safety

Preface xix
community has become extremely adept at developing and adapting new andadvanced technologies for operational capacity and support. The battlefieldshave changed, though. To achieve dominance in the war on terrorism, the waron drugs, and the war on crime, we need to devote additional attention to ourability to manage, analyze, and utilize the incredible amounts of informationavailable. Ultimately, data mining and predictive analytics offer the promise ofallowing data and information to serve as a transparent, fluid interface betweenanalytical and operational personnel, rather than the vast ideological divide thatfrequently is encountered today.
Although I say “I” quite a bit in this book, the book certainly was not createdin a vacuum. Countless individuals have helped me throughout my career, anda few have truly inspired me. What follows is a very brief list of those thatcontributed directly to this effort in some way.
I would like to thank Dave Dunn from Advizor Solutions, Inc. Dave firstsuggested that I write this book, and it never would have occurred to me thatthis was possible without his feedback and support. Mark Listewnik at Elsevierhas the patience of a saint. His ongoing support and encouragement, not tomention the very nice Christmas cards that I continued to receive despite thefact that I was horrendously late on my rewrite and edits, kept me going if forno other reason than I felt very guilty putting things off even further in theface of his ongoing kindness. Finally, Kayla Gray at RTI International editedthe manuscript and helped create something far more readable than what Ioriginally wrote. Her attention to detail and thoughtful comments are reflectedthroughout the text.
Most of the early work referenced came out of some very lively discus-sions that began several years ago with my colleagues at the Federal Bureauof Investigation. In particular, Supervisory Special Agents Charlie Dorsey andDr. Wayne Lord provided considerable guidance to my early research. Overtime, they have become both colleagues and friends, and my work definitelyreflects a level of quality that is attributable directly to their input. Also with theFBI, Mr. Art Westveer taught me almost everything that I know about deathinvestigation. I have learned a tremendous amount from his lectures, whichare punctuated with his dry sense of humor and wonderful anecdotes from avery successful career with the Baltimore Police Department. Rich Weaver andTim King, president and vice president, respectively, at International Training,Inc. graciously allowed me to attend their lectures and training on surveillancedetection in support of my research. They also provided some very uniqueopportunities for field testing many of my ideas in this area to see how wellthey would play in the real world.
Preface

xx Preface
While many of my former employers merely tolerated my analytical procliv-ities, the Project Safe Neighborhoods folks provided funding, as well as ongoingsupport and encouragement for much of the recent work outlined in this book.In particular, Paul McNulty, the United States Attorney for the Eastern Districtof Virginia, carried the message of our success far beyond the audience that Icould reach alone. I also want to recognize Frank Shults and Brian Whisler, whoare blessed with both excellent writing skills and unbridled humility. To them,I am grateful.
I also would like to thank Dr. Harvey Sugerman. I still remember the daywhen he called me out of the blue and told me that he thought that I should bepaid for the work I had been doing. A single mother, I had been responding tohomicide calls on my own time in the evenings in an effort to gain additionalknowledge and insight into violent crime and the investigative process. Thatparticular act made a tremendous positive impact in my life. I gained invaluableexperience through my affiliation with the University, but his gentle mentoringand decision to offer me compensation for my work only begins to underscorethe kindness in his heart.
I owe a tremendous debt of gratitude to the software companies that haveprovided me with some wonderful toys—I mean software. Without their sup-port, I would still be performing unnatural acts with multivariate statistics andtrying to convey the results to operational personnel with a lot of hand waving.In particular, Dr. Tom Khabaza and Bill Haffey with SPSS, Tracye Giles at SAS,and Dave Dunn with Advizor Solutions trusted me enough to give me the toolsto do a lot of the work outlined in this book.
My family at the Richmond, Virginia Police Department has taught mealmost everything that I know about police work and law enforcement. To nameevery individual that has contributed to my training and life would resemblea roll call of the current and previous command, as well as the line staff, whofrequently know as much if not more than their supervisors. In particular,I would like to thank Colonel Andre Parker and Lieutenant Colonel TeresaGooch for their ongoing support of my work. I also would like to thank JerryOliver, the former Chief of the Richmond Police Department, who, with TeresaGooch, recruited me for the most rewarding yet challenging position I have everenjoyed. Other colleagues in the Department include Captain David Martin,Majors Peggy Horn and Dave McCoy, the late Major Rick Hicks and CaptainDonnie Robinson, and my friend Alicia Zatcoff, Esq. I also owe a tremendousdebt to the Virginia Homicide Investigators Association, where I have receivedsome outstanding training in death investigation and was fortunate enough to

Preface xxi
meet my husband, who is a member of their board of directors. My colleaguesin law enforcement have taught me as much, if not more, about life in the manyyears that I worked with them.
Underscoring the length of time that it took me to complete the text, Ichanged employment during the writing of this book. After several years inthe applied setting, I joined RTI International, a nonprofit research organiza-tion with an international reputation for excellence in criminal justice research.The ability to work with other like-minded researchers in an effort to advancethe science and practice of public safety and security has been energizing. Inparticular, Dr. Victoria Franchetti Haynes, president and CEO of RTI Interna-tional, has created an environment that fosters creativity and the opportunityto improve the human condition by turning knowledge into practice. AdamSaffer and Brent Ward have helped me translate my work into something tan-gible that can be shared with other public safety and security organizationsthrough the creation of technology and the provision of professional services.Other colleagues at RTI include Drs. Al Miedema and Jim Trudeau, and MG(Ret) Lon “Bert” Maggart, as well as the other members of my research team,which includes Dr. Kevin Strom and Mark Pope. Confucius said that if youlove your job you will never work a day in your life, something that I am blessedto live.
I also would like to thank Mike Sullivan, USMC Staff Sergeant TomFerguson, and Special Agent BJ Kang for giving me permission to use theirphotographs throughout this book. Their photographs graphically illustrateour recent history as a nation and serve to further underscore the importanceof fighting the good fight, and doing so with honor. Joey Vail from SAS, BillHaffey from SPSS, Eric Greisdorf from Information Builders, and Kurt Rivardfrom Advizor Solutions all provided screen shots that illustrated the value thattheir software can bring to applied public safety and security analysis.
Perhaps most importantly, I would like to acknowledge my family. Myparents, Phil and Lucy McLaughlin, always expected the best from me andmy siblings, Michele and Tim, giving us the tools necessary to achieve thatand more. This included loving words and kind gestures, as well as giving uspermission to find our own way in life. My path has not always been director easy, but they always loved me enough to allow me to find my own way,having faith in me even when I did not. Some of the most challenging lecturesthat I have ever given professionally were the ones where they were in theaudience. To look out and see their faces filled with pride was at once humbling,heart-warming, and also terrifying. Who would have known that the girl from
Preface

xxii Preface
Downers Grove, Illinois, who started out as an aerospace engineering studentwould have taken the career path that I did? It still seems amazing to me at times,but I know that I am a far more successful person because of it. Unfortunately,I think that my parents went prematurely grey in the process. Hopefully, it wasworth it.
In many ways, my husband, Special Agent Rick McCue, has contributedmore than enough to have earned the right to be a coauthor. Through him,I have first-hand insight into the needs of operational personnel and theimportance of making analytical products accessible to the folks that needthem the most: those on the front lines. Whether with outright encour-agement or a vacant stare when I became long-winded or obtuse, he hasprovided invaluable guidance to my skills as an analyst. I also would liketo thank the United States government for sending him out of the coun-try so much during the writing of this book. I always looked for projectsto occupy my time when he was out of pocket; we could not afford anymore redecorating, so this book seemed like a good alternative. In all seri-ousness, though, I am forever grateful for the experiences that I have hadvicariously through my husband. As one of the team assigned to the Pentagonrecovery immediately after September 11th, my husband saw first-handthe devastation that the terrorist agenda can rain down on innocent lives.I know that neither of us will ever be the same. In his subsequent missionswith Operations Noble Eagle and Iraqi Freedom, I began to truly under-stand the value that good intelligence and analysis will bring to the war onterrorism.
Our children, Paul, Alexandra, Elaine, Patraic, and Gabriel, keep me hum-ble. Although Rick and I lead very exciting lives professionally, our kids stillthink that we are the biggest dorks in the whole world, clueless and goofy. Thatfact alone keeps me anchored in reality and reminds me daily what is mostimportant in life. Like many folks in public safety, there have been more thana few times that I have come home and hugged my children a little bit harderbecause of what I have seen or done at work. I am so grateful to be blessedwith such a wonderful life and family, which makes me work that much harderfor those who are not. I believe that other women love their children just as Ido. Unfortunately, too many of their children will not be coming home again.Whether it is the result of drugs, gang violence, or the war on terrorism, thereis too much pain and suffering in our world, too much killing. For that reason,as a homicide researcher, it always has been important for me to remember thatevery one of the “subjects” in my studies is a lost life, a devastated family, anda loss to our community. In all humility, it is my sincere wish that the tech-niques and approaches outlined in this book will help us increase the health

Preface xxiii
and well-being of our communities and create safer neighborhoods for all ofour children.
“If there must be trouble, let it be in my day, that my child may have peace.”Thomas Paine
Colleen McLaughlin McCue, PhDSenior Research ScientistRTI International
Preface


Introduction
Good analysts are like sculptors. They can look at a data set and see underlyingform and structure. Data mining tools can function as the chisels and hammer,allowing the analysts to expose the hidden patterns and reveal meaning in adata set so that others can enjoy its composition and beauty.
Whether it is called data mining, predictive analytics, sense making, orknowledge discovery, the rapid development and increased availability ofadvanced computational techniques have changed our world in many ways.There are very few, if any, electronic transactions that are not monitored, col-lected, aggregated, analyzed, and modeled. Data are collected about everything,from our financial activities to our shopping habits. Even casino gambling isbeing analyzed and modeled in an effort to characterize, predict, or modifybehavior.
One area that has been somewhat limited in its acceptance and use of thesepowerful new techniques is the public safety community, particularly in secu-rity, crime prevention, and crime analysis. This is somewhat surprising becausein many ways analysts, detectives, agents, professionals in the intelligence com-munity, and other operational personnel embody many of the principles of datamining or knowledge discovery. For example, the process of training detectivesin investigative techniques and practices bears a strong resemblance to case-based reasoning.i In addition, the characterization, modeling, and predictionassociated with the behavioral analysis of violent crime are very similar to someof the categorization, linking, and predictive analytics associated with datamining and predictive analytics.
While the relationship between the two areas seems to be natural, the lawenforcement community in particular has not enjoyed many of the analyticalbenefits coming from these powerful new tools. It is unclear whether this isdue to cost, training, or just a lack of knowledge of the existence and avail-ability of these tools, but when they are adopted, the increased quality of lifefor law enforcement personnel, as well as the communities that they serve, isremarkable. In these times of dwindling economic and personnel resources,
xxv

xxvi Introduction
no agency can afford to deploy carelessly. As organizations compete for quali-fied personnel, a candidate’s final decision often comes down to quality of lifeand job satisfaction issues. Just a few of the questions potential employees askthemselves before making a final decision are: Will I have a reasonable workschedule? Will I be able to manage my workload effectively? Will my time beused productively? Can I make a difference in my community? Similar decisionprocesses are associated with maintaining a satisfied work force and long-termretention—something that is increasingly difficult, given the rapidly emergingemployment opportunities for law enforcement personnel.
At the same time, requirements for accountability and outcome studies arecoming from funding agencies and constituents alike. It is no longer accept-able to run programs without the outcome indicators and metrics necessary todemonstrate their efficacy. The emphasis on these measures of accountabilityhighlights the need for new methodologies to document progress and changein response to new initiatives and strategies.
Given the infinitely increasing amounts of information, "connecting thedots" will be possible only with automated systems. Perhaps more importantthan trying to create these associations, though, will be addressing gaps ininformation and information sharing. Only after these challenges have beenaddressed will we be able to identify and characterize trends and patterns sothat future events can be predicted, anticipated, and perhaps even prevented.The emphasis needs to shift from describing the past to predicting the future.Only then will we have the possibility to enhance public safety and create safeneighborhoods for all.
Skill Set
Analysts are deluged with information on a daily basis. The ability to bringsome order into this informational chaos can have a huge impact on publicsafety and the quality of life in the communities that they serve. On the otherhand, the opportunity to bring analytical and predictive models directly intothe operational environment holds the promise of giving public safety and intel-ligence professionals the ability to maneuver within the decision and executioncycles of their opponent. Whether it is the war on terrorism, the war on drugs,or the war on crime, enhanced knowledge and the ability to anticipate futureactions can afford operational personnel essential situational awareness.
Knowledge of advanced statistics is not a prerequisite for using predictiveanalytics. In fact, the discovery process associated with data mining also couldbe viewed as after-the-fact explanations for unpredicted outcomes, something

Introduction xxvii
somewhat distasteful in inferential statistics. When examined under the intensescrutiny of the analyst’s domain knowledge, however, these unanticipated orsurprising findings can have significant value and greatly enhance our under-standing of crime and intelligence data. For those who are analytically inclined,it can be a wonderful and exciting process of data exploration and discovery.Those with a strong background in statistics, though, might be somewhat hand-icapped by the comparatively rigid nature of inferential statistics, with all of itsassociated rules and assumptions. With a little confidence and practice, evenstatisticians will be able to overcome their previous training and perform whatthey once considered to be unnatural acts with data and information.
On the other hand, data mining brings powerful analytics to those whoreally need them, including operational personnel. In my experience, it is fareasier to teach someone with interest who knows something about crime andcriminals how to effectively use these tools. With some guidance regarding afew “rules of the road” for data mining, and the application of off-the-shelfsoftware tools, data mining is well within the reach of any organization withan interest and willingness to put more science and less fiction into crime andintelligence analysis. Moreover, many of the new tools have been adapted to runin a web-based environment and are no more difficult than making a purchaseor completing a survey over the Internet. These advancements have created theopportunity for “24/7” analytical capacity,ii even within smaller agencies withcomparatively limited personnel resources.
The more that operational personnel, managers, and command staff under-stand the information requirements and possible outcomes from analyticalproducts; the more likely they will be to contribute data that is meaning-ful, detailed, and valuable. They also will be in a better position to work withthe analyst and participate in the analytical process, requesting output that hasincreased value for them as they acquire a better understanding of what is avail-able. By understanding the importance of the data inputs and the potentialrange of outputs, operational personnel, managers, and command staff alikecan become informed information consumers and increase the likelihood ofidentifying actionable output from the analytical process. This subtle change inrelationships and understanding can greatly enhance analysts’ ability to gatherthe necessary data and information, ultimately increasing their ability to supportoperational personnel, policy decisions, managers, and command staff.
At a recent security expo, Tom Clancy advised the security and intelligenceprofessionals in the audience to seek out the “smart people,” observing that,“[t]he best guys are the ones who can cross disciplines . . . [t]he smartest oneslook at other fields and apply them to their own.”iii In my opinion, many of
Introduction

xxviii Introduction
the "smart people" Clancy refers to will rise out of the operational ranks, giventhe intuitive nature and relative ease of use associated with the new generationof data mining and predictive analytics software tools. While most analystsprobably do not need to fear for their jobs just yet, increasingly friendly andintuitive computer systems will allow data and information to serve as a fluidinterface between analytical and operational personnel. At some point in thefuture, that distinction will become almost meaningless with the emergence ofincreasingly powerful software tools and systems and the “agent/analysts” thatemploy them.
“Agent/Analysts” and Future Trends
I see a day in the not-too-distant future when analysis will be availablewithout immediate access to an analyst. Information from operations will feedanalysis, while the analysis will concomitantly drive the operations, therebycreating a feedback loop of ever-increasing information and actionable intel-ligence. I see a day when a patrol officer will come back to work after severaldays off and, at the beginning of the tour, will be able to review recent patternsand trends within the context of historical data and accumulated knowledgefrom the mobile data terminal in his cruiser. After responding to his first call,he will be able to enter the incident information directly into the depart-ment’s computerized records management system (RMS) using direct voicecommands. This information then will be used to create the computerizedoffense report. Any digital images captured from the incident will be quicklyuploaded and linked directly to the offense report, as well as any associated orlinked information already stored in the RMS. During the data entry process,this new information will pass through an analytical filter prepared earlier inthe week by the analytical staff, who are home asleep at this hour. The algo-rithm running in the background will quickly link this most recent incident toa recent series and prompt the patrol officer to consider several possible alter-natives. With this real time, value-added analysis, the officer can make quick,information-based operational decisions that result in a rapid apprehension ofthe criminal.
This is handled similarly when an agent in a remote location is debriefing asuspected terrorist. The verbal information is recorded and transcribed directlyinto a free format text file using voice recognition software. The file is thenuploaded to an analytical fusion center a thousand miles away. An analyst thereuses sophisticated text mining technology to probe and characterize the resultsof the interview. Several key phrases are identified and compared to an existingdatabase generated from earlier interviews with members of the same terrorist

Introduction xxix
cell being held in other locations around the world. Based on the analysisof the current interview and its comparison to the existing models, areas ofpossible deception and truth are identified and highlighted, as are promisinginterviewing strategies. This information, including the interviewing strategiesand approaches, is sent back to the agent in the field, further informing andguiding the ongoing interview process, while concomitantly enhancing theexisting intelligence on the operations, practices, and strategies of this particularterrorist group.
Are these extravagant predictions? Absolutely not. Both scenarios out-lined above are based on existing technologies and resources. In many ways,approaches and methodologies similar to information management have beenused in the business community for years. All that is required to implementthese strategies is a commitment to take advantage of the currently existing ana-lytical tools and incorporate them into our world. Unfortunately, a paradigmshift in how we view information, analysis, and the relationship between ana-lytical and operational personnel also will be required. That probably will bethe most difficult task. Once we overcome that hurdle, however, adapting thesenew technologies promises to be one of the most exciting adventures in publicsafety in our lifetime.
How To Use This Book
All of the examples included in this book come from real experience. In somecases, though, the specifics have been changed to protect ongoing investiga-tions, sensitive data, or methods. Whenever possible, I have tried to distinguishbetween real cases, particularly those taken from published work, and thosegenerated specifically as examples. Given the nature of some topics covered inthis book, however, it would be inappropriate to provide too much specificdetail and compromise methods. To be sure, though, while the names mighthave been changed to protect the "not so innocent," the examples are based onreal experiences.
This book is divided into five main sections: “Introduction,” “Methods,”“Applications,” “Case Examples,” and “Advanced Concepts/ Future Trends.”The third and fourth sections include annotated examples focusing on the whyand how, as well as the limitless possibilities for data mining and predictiveanalytics in crime and intelligence analysis. While this organization is relativelylogical for training purposes, many readers will choose to read the book out ofsequence. In particular, managers, command staff, supervisors, policy makers,and operational personnel interested in learning more about data mining and
Introduction

xxx Introduction
predictive analytics but not expecting to use these tools first hand will haveneither an interest in nor a need for detailed information on specific methodsand algorithms. These readers could benefit from reading and understandingthe annotated examples if they make acquisition and purchasing decisions foranalytical products and determine the focus of their analytical personnel. More-over, operational personnel can more fully exploit the new technology and workmore effectively with analytical personnel if they understand the vast array ofpossibilities available with these new tools. With the opportunity to deploy datamining and predictive analytics directly into the field, an increasing number ofoperational personnel will be using data mining products. While they mightnot be generating the specific algorithms or models, a general understandingof data mining and predictive analytics will certainly enhance their ability toexploit these new opportunities.
Similarly, many analysts will use this book to explore the possibilities fordata mining in their environment; identifying ideas and strategies from theannotated examples in the third section, and then returning to the methodssection for specific information regarding the use and implementation of theseapproaches. This book is not intended to provide detailed information aboutspecific software packages or analytical tools, but merely provides an overview ofthem. It should serve as a starting point, using terminology, concepts, practicalapplication of these concepts, and examples to highlight specific techniques andapproaches in crime and intelligence analysis using data mining and predictiveanalytics, which each law enforcement or intelligence professional can tailor totheir own unique situation and responsibilities. While the basic approaches willbe similar, the available data, specific questions, and access to technology willdiffer for each analyst and agency, requiring unique solutions and strategies inalmost every setting.
Perhaps one of the most challenging aspects of writing this book was keepingabreast of the new developments and data mining applications that now appearon an almost daily basis. It is both frustrating and exciting to consider howmuch this field is likely to change even in the short time between completion ofthe manuscript and actual publication of the text. Therefore, the final section,"Advanced Concepts/ FutureTrends," should not be viewed as inclusive. Rather,this particular section is intended to serve as a beginning for ascending tothe next level of training for those interested in this field. This rapid paceof innovation, however, is what keeps the field of analysis fresh and exciting,particularly for those with the interest and creativity to define the cutting edgeof this new and evolving field.

Bibliography xxxi
Bibliography
i. Casey, E. (2002). Using case-based reasoning and cognitive apprenticeshipto teach criminal profiling and internet crime investigation. KnowledgeSolutions. www.corpus-delicti.com/case_based.html
ii. McCue, C. and Parker, A. (2004). Web-based data mining and predictiveanalytics: 24/7 crime analysis. Law Enforcement Technology, 31: 92–99.
iii. Fisher, D. (2003). Clancy urges CIOs: seek out the “smart people.” eWeek,www.eweek.com.
Bibliography


Introductory Section


1Basics
“There are three kinds of lies: lies, damned lies, and statistics.”
Benjamin Disraeli (1804–1881)
1.1 Basic Statistics
Some of my earliest work using data mining and predictive analytics on crimeand criminals employed the use of relatively advanced statistical techniques thatyielded very complex models. While the results were analytically sound, andeven of interest to a very small group of similarly inclined criminal justice andforensic scientists, the outcomes were so complicated and arcane that they hadvery little utility to those who needed them most, particularly those on the jobin the public safety arena. Ultimately, these results really contributed nothingin a larger sense because they could not be translated into the operationalenvironment. My sworn colleagues in the law enforcement world would smilepatiently, nodding their heads as if my information held some meaning forthem, and then politely ask me what it really meant in terms of catching badguys and getting the job done. I rarely had an answer. Clearly, advanced statisticswas not the way to go.
Data mining, on the other hand, is a highly intuitive, visual process thatbuilds on an accumulated knowledge of the subject matter, something alsoknown as domain expertise. While training in statistics generally is not a pre-requisite for data mining, understanding a few basic principles is important.To be sure, it is well beyond the scope of this book to cover statistics with any-thing more than a cursory overview; however, a few simple “rules of the road”are important to ensure methodologically sound analyses and the avoidance ofcostly errors in logic that could significantly confound or compromise analysisand interpretation of the results. Outlined below are some simple statisticalterms and concepts that are relevant to data mining and analysis, as well as afew common pitfalls and errors in logic that a crime analyst might encounter.These are by no means all inclusive, but they should get analysts thinking
3

4 1.3 Population versus Samples
and adjusting the way that they analyze and interpret data in their specificprofessional domain.
1.2 Inferential versus Descriptive Statistics andData Mining
Descriptive statistics, as the name implies, is the process of categorizing anddescribing the information. Inferential statistics, on the other hand, includesthe process of analyzing a sample of data and using it to draw inferences aboutthe population from which it was drawn. With inferential statistics, we can testhypotheses and begin to explore causal relationships within data and informa-tion. In data mining, we are looking for useful relationships in the informationor models, particularly those that can be used to anticipate or predict futureevents. Therefore, data mining more closely resembles descriptive statistics.
It was not that long ago that the process of exploring and describing data,descriptive statistics, was seen as the necessary though unglamorous prereq-uisite to the more important and exciting process of inferential statistics andhypothesis testing. In many ways, though, the creative exploration of data andinformation associated with descriptive statistical analysis is the essence of datamining, a process that, in skilled hands, can open new horizons in data and ourunderstanding of the world.
1.3 Population versus Samples
It would be wonderful if we could know everything about everything andeverybody, and have complete access to all of the data that we might need toanswer a particular question about crime and criminals. If we had access to everycriminal, both apprehended and actively offending, we would have access tothe entire population of criminals and be able to use population-based statistics.Similarly, if we had access to all of the information of interest, such as everycrime in a particular series, this also would resemble a population because itwould be all inclusive. Obviously, this is not possible, particularly given thenature of the subject and the questions. It is a common joke that everythingthat we know about crime and criminals is based on the unsuccessful ones,those that got caught. Most criminal justice research is based on correctionalpopulations, or offenders that have some sort of relationship with the criminaljustice system. Research on the so-called “hidden” populations can be extremelydifficult, even dangerous in some cases, as these hidden populations frequently

1.3 Population versus Samples 5
include criminals who are still criminally active. Moreover, any time that weextend beyond official documents and records, we step into a gray zone ofpotentially unreliable information.
Similarly, we have the disadvantage of relying almost exclusively on officialrecords or self-report information from individuals who are not very reliable inthe first place. Consequently, we frequently have access to a very limited amountof the total offense history of a particular offender, because generally only arelatively small fraction of criminal behavior is ever identified, documented, andadjudicated. Criminal justice researchers often are limited in this area becauseoffender interviews regarding nonadjudicated criminal activity approach the“third rail” in criminal justice research. For example, criminal justice researchersmust obey existing laws requiring the reporting of known or suspected childabuse. Similarly, researchers should consider the ethical issues associated withuncovering or gaining knowledge of unreported, ongoing, or planned criminalactivity. Because this information can cause potential harm to the offender dueto legal reporting requirements and ethical considerations, research involvingthe deliberate collection of unreported crime frequently is prohibited whenreviewed by institutional review boards and others concerned about the rightsof human research subjects. Similar to drug side effects, there are those crimesand behaviors that we know about and those that we do not. Also like drug sideeffects, it is generally true that the ones that we do not know about will comeup and strike us eventually.
What we are left with, then, is a sample of information. In other words,almost everything that we know about crime and criminals is based on arelatively small amount of information gathered from only a fraction of allcriminals—generally the unsuccessful ones. Similarly, almost everything thatwe work with in the operational environment also is a sample, because it isexceedingly rare that we can identify every single crime in a series or every pieceof evidence. In many ways, it is like working with a less than perfect puzzle.We frequently are missing pieces, and it is not unusual to encounter a few addi-tional pieces that do not even belong and try to incorporate them. Whether thisis by chance, accident, or intentional misdirection on the part of the criminal,it can significantly skew our vision of the big picture.
We can think of samples as random or nonrandom in their composition.In a random sample, individuals or information are compiled in the samplebased exclusively on chance. In other words, the likelihood that a particularindividual or event will be included in the sample is similar to throwing thedice. In a nonrandom sample, some other factor plays a significant role ingroup composition. For example, in studies on correctional samples, even if
Chapter 1

6 1.4 Modeling
every relevant inmate were included, it still would comprise only a sample of thatparticular type of criminal behavior because there would be a group of offendersstill active in the community. It also would be a nonrandom sample becauseonly those criminals who had been caught, generally the unsuccessful ones,would be included in the sample. Despite what incarcerated criminals mightlike to believe, it generally is not up to chance that they are in a confined setting.Frequently, it was some error on their part that allowed them to be caught andincarcerated. This can have significant implications for the analytical outcomesand generalizability of the findings.
In some cases, identification and analysis of a sample of behavior can helpto illuminate a larger array of activity. For example, much of what we knowabout surveillance activity is based on suspicious situation reports. In manycases, however, those incidents that arouse suspicion and are reported compriseonly a very small fraction of the entire pattern of surveillance activity, par-ticularly with operators highly skilled in the tradecraft of covert surveillance.In some cases, nothing is noted until after some horrific incident, and onlyin retrospect are the behaviors identified and linked. Clearly, this retrospectiveidentification, characterization, and analysis is a less than efficient way of doingbusiness and underscores the importance of using information to determineand guide surveillance detection efforts. By characterizing and modeling suspi-cious behavior, common trends and patterns can be identified and used to guidefuture surveillance detection activities. Ultimately, this nonrandom sample ofsuspicious situation reports can open the door to inclusion of a greater arrayof behavior that more closely approximates the entire sample or population ofsurveillance activity.
These issues will be discussed in Chapters 5 and 14; however, it always iscritical to be aware of the potential bias and shortcomings of a particular data setat every step of the analytical process to ensure that the findings and outcomesare evaluated with the appropriate level of caution and skepticism.
1.4 Modeling
Throughout the data mining and modeling process, there is a fair amount ofuser discretion. There are some guidelines and suggestions; however, there arevery few absolutes. As with data and information, some concepts in modelingare important to understand, particularly when making choices regarding accu-racy, generalizability, and the nature of acceptable errors. The analyst’s domainexpertise, or knowledge of crime and criminals, however, is absolutely essentialto making smart choices in this process.

1.5 Errors 7
1.5 Errors
No model is perfect. In fact, any model even advertised as approaching perfec-tion should be viewed with significant skepticism. It really is true with predictiveanalytics and modeling that if it looks too good to be true it probably is; there isalmost certainly something very wrong with the sample, the analysis, or both.Errors can come from many areas; however, the following are a few commonpitfalls.
Infrequent Events
When dealing with violent crime, the fact that it is a relatively infrequent eventis a very good thing for almost everyone, except the analysts. The smaller thesample size, generally, the easier it is to make errors. These errors can occurfor a variety of reasons, some of which will be discussed in greater detail inChapter 5. In modeling, infrequent events can create problems, particularlywhen they are associated with grossly unequal sample distributions.
While analyzing robbery-related aggravated assaults, we found that very fewarmed robberies escalate into an aggravated assault.1 In fact, we found thatless than 5% of all armed robberies escalated into an aggravated assault. Again,this is a very good thing from a public safety standpoint, although it presents asignificant challenge for the development of predictive models if the analyst isnot careful.
Exploring this in greater detail, it becomes apparent that a very simplemodel can be created that has an accuracy rate of greater than 95%. In otherwords, this simple model could correctly predict the escalation of an armedrobbery into an aggravated assault 95% of the time. At first blush, this soundsphenomenal. With such a highly accurate model, it would seem a simple thingto proactively deploy and wipe out violent crime within a week. Examiningthe model further, however, we find a critical flaw: There is only one decisionrule, and it is “no.” By predicting that an armed robbery will never escalateinto an aggravated assault, the model would be correct 95% of the time, but itwould not be very useful. What we are really looking for are some decision rulesregarding robbery-related aggravated assaults that will allow us to characterizeand model them. Then we can develop proactive strategies that will allow us toprevent them from occurring in the future. As this somewhat extreme exampledemonstrates, evaluating the efficacy and value of a model is far more than justdetermining its overall accuracy. It is extremely important to identify the natureof the errors and then determine which types of errors are acceptable and whichare not.
Chapter 1

8 1.5 Errors
One way to evaluate the specific nature of the errors is to create somethingcalled a confusion or confidence matrix. Basically, what this does is break downand depict the specific nature of the errors and their contribution to the overallaccuracy of the model. Once it has been determined where the errors are occur-ring, and whether they impact significantly the value of the overall error rateand model, an informed decision can be made regarding acceptance of themodel. Confusion matrices will be addressed in greater detail in Chapter 8,which covers training and test samples.
The confusion matrix is an important example of a good practice in analysis.It can be extremely valuable to challenge the results, push them around a bitanalytically and see what happens, or look at them in a different analytical light.Again, the confusion matrix allows analysts to drill down and examine whatis contributing to the overall accuracy of the model. Then they can make aninformed decision about whether to accept the model or to continue workingon it until the errors are distributed in a fashion that makes sense in light of theoverall public safety or intelligence objective. While this process might seemsomewhat obscure at this point, it underscores the importance of choosinganalysts with domain expertise. Individuals that know where the data camefrom and what it will be used for ultimately can distinguish between thoseerrors that are acceptable and those that are not. Someone who knows a lotabout statistical analysis might be able to create extremely elegant and highlypredictive models, but if the model consistently predicts that an armed robberywill never escalate into an aggravated assault because the analyst did not knowthat these events are relatively infrequent, there can be serious consequences.Although this might seem like an extreme example that would be perfectlyobvious to almost anyone, far more subtle issues occur regularly and can havesimilar harmful consequences. The ultimate consequence of this issue is that thefolks within the public safety community are in the best position to analyze theirown data. This is not to say that it is wrong to seek outside analytical assistance,but totally deferring this responsibility, as seems to be occurring with increasingfrequency, can have serious consequences due to the subtle nature of many ofthese issues that permeate the analytical process. This point also highlightsthe importance of working with the operational personnel, the ultimate endusers of most analytical products, throughout the analytical process. While theymight be somewhat limited in terms of their knowledge and understanding ofthe particular software or algorithm, their insight and perception regardingthe ultimate operational goals can significantly enhance the decision-makingprocess when cost/benefit and error management issues need to be addressed.
Given the nature of crime and intelligence analysis, it is not unusual toencounter infrequent events and uneven distributions. Unfortunately, many

1.5 Errors 9
default settings on data mining and statistical software automatically createdecision trees or rules sets that are preprogrammed to distribute the cases evenly.This can be a huge problem when dealing with infrequent events or otherwiseunequal distributions. Another way of stating this is that the program assumesthat the prior probabilities or “priors” are 50:50, or some other evenly dis-tributed ratio. Generally, there is a way to reset this, either automatically ormanually. In automatic settings, the option generally is to set the predicted orexpected probabilities to match the prior or observed frequencies in the sample.In this case, the software calculates the observed frequency of a particular eventor occurrence in the sample data, and then uses this rate to generate a model thatresults in a similar predicted frequency. In some situations, however, it can beadvantageous to set the priors manually. For example, when trying to managerisk or reduce the cost of a particularly serious error, it might be necessary tocreate a model that is either overly generous or very stringent, depending onthe desired outcome and the nature of misclassification errors. Some softwareprograms offer similar types of error management by allowing the user to specifythe “cost” of particular errors in classification, in an effort to create models thatmaximize accuracy while ensuring an acceptable distribution of errors.
Magnified or Obscured Effects
Uneven distributions also can create errors in the interpretation of link analysisresults, which is discussed in Chapter 3. Briefly, link analysis can be a greatway to show relationships between individuals, entities, events, or almost anyvariable that could be considered in crime and intelligence analysis. Some of thenew software tools are particularly valuable, in that actual photos of individualsor elements of interest can be inserted directly into the chart, which results invisually powerful depictions of organizational charts, associations, or events.Beyond just demonstrating an association, however, link analysis frequently isemployed in an effort to highlight the relative strength of relationships. Forexample, if Bob calls Joe 15 times, but Joe calls Paul 52 times, we might assumethat the relationship between Joe and Paul is stronger than the relationshipbetween Joe and Bob based on the relative difference in the amount of contactbetween and among these individuals (Figure 1-1).
These programs often allow the user to establish thresholds for link strength;however, this can provide a false sense of security. For example, in Figure 1-2, itappears that Paul has a stronger relationship with Pete, as compared to his rela-tionship with Joe, based on the relative levels of contact. Bob, on the other hand,appears to have relatively similar relationships with both Joe and Pete, basedon relatively equal levels of contact, as depicted in the link chart. Reviewing
Chapter 1

10 1.5 Errors
�Figure 1-1 Link charts can not only depict relationships between individuals or events, but also
relative strength of the relationship based on relative differences in the amount of contact.
Bob Joe
Paul
15 calls
52 calls
�Figure 1-2 Examination of this link chart suggests that Paul has a stronger relationship with Pete
compared to his relationship with Joe, while Bob appears to have relatively similarrelationships with both Joe and Pete, based on relatively equal levels of contact. Theseapparent differences in the relationships are based on differences in the strength of theassociation illustrated by relative differences in the lines in the link chart.
Joe
Paul
Pete
Bob
the related association matrix, however, indicates that this might not be true(Figure 1-3). The actual numbers of contacts indicates that both Paul and Bobhad contact with Pete almost twice as much as they did with Joe. The rela-tionship is skewed somewhat in the link analysis chart (Figure 1-1) because therelative levels of activity associated with Bob were much higher than those associ-ated with Paul. As a result, the settings used in the link analysis skewed the visualrepresentation of the relative strength of the relationships noted. For example,in this particular situation, it might be that weak links include 10 associations orless, while strong links require 20 associations or more. Unfortunately, unequal

1.5 Errors 11
�Figure 1-3 This simple association matrix depicts the number of contacts between a group of
individuals, and highlights the errors in the associated link chart depicted in Figure 1-2.
07020Pete
3510Joe
0Bob
Paul
PeteJoeBobPaul
distributions can skew the relative importance of certain associations. In thisexample, both Paul and Bob had similar ratios of contact with Pete and Joe,a 2:1 relationship, but this difference was magnified in Paul because he wasassociated with a lower overall frequency of contact. This allowed the differ-ence in his contact with Pete and Joe to be revealed. On the other hand, thesame relative difference in the number of contacts Pete and Joe had with Bobwas obscured due to the larger number of contacts overall.
Signal-to-noise issues like this can be particularly tricky for at least tworeasons. First, they can magnify differences in less-frequent events. Because ittakes less to show a difference, it is relatively easy to cross the arbitrary thresholdsestablished either by the user or preset in the software. Second, they can obscuredifferences in the events associated with greater frequencies. This is particularlytrue when simultaneously comparing relationships that are associated with verydifferent levels of activity. Again, if the thresholds are not set thoughtfully withan understanding of relative frequencies, some associations can be magnifiedwhile other relationships can be obscured. There are a variety of mechanismsavailable to address this potential confound, including the use of percentagesor ratios, which are discussed in Chapter 5; however, the key to addressing thisissue generally is awareness and caution when interpreting these types of results.
Outliers
“Outliers,” unusual subjects or events, can skew dramatically an analysis, model,or outcome with a small sample, as is found with relatively infrequent events.For example, if we analyze a sample of three armed robbers, one of whom likesfruitcake, we might assume erroneously that a preference for fruitcake is a good
Chapter 1

12 1.5 Errors
indicator of criminal behavior; after all, in our current sample, one-third ofthe subjects likes fruitcake. Perhaps we further expand our sample, though, toinclude a total of 100 armed robbers. Again, this one subject has a preference forfruitcake, but he remains the only one. In this case, a preference for fruitcake isassociated with only 1% of the sample, which is not nearly as exciting. While thisis a simple example, similar errors in judgment, analysis, and interpretation ofresults based on small, nonrandom samples have been made throughout history,sometimes with tragic consequences. All too frequently, public safety programsand policies are based on relatively small samples with unusual characteristics.
There is a saying in medicine that there are the side effects that you knowabout, and those that you do not. It is the side effects that you do not know aboutthat will get you every time. Similarly, when doing data mining and constructingmodels, it is absolutely imperative to remember that you are only working witha sample of the total information. Even if you believe that you have gathered thetotal universe of information related to a particular organization, investigation,or case, it is unlikely that you have. There is always that one little tidbit ofmissing information that will get you in the end. Be prepared for it. Maintaininga healthy degree of realism or skepticism regarding the information analyzedcan be extremely important, particularly when new information emerges thatmust be integrated. So keep in mind as you deal with potentially nonrandomsamples that “outliers” need to be considered seriously when analyzing thesetypes of data.
Remember the Baseline
It is important to consider baseline data when analyzing and interpretingcrime and intelligence information and what might skew or otherwise impactthat information. Failure to consider baseline data is an error that occursfrequently, and relates back to the incorrect assumptions that samples are rep-resentative of the larger population and that variables tend to be distributedevenly. During the sniper investigation in October 2002, when 10 people werekilled around the Washington, D.C. metropolitan area, one of the first assump-tions made was that the suspect would be a white male because almost all serialkillers are white males. When it turned out that the snipers were black, therewas great surprise, particularly among the media. As one stops to consider thelikely racial distribution among serial killers, it is important to note the relativedistribution of race in the population of interest, in this case the United States,which is approximately 12% black according to the 2000 census data.2 Takingthis information into consideration, we would not expect a 50:50 split alongrace lines when examining serial killers. Population statistics would indicate

1.5 Errors 13
fewer black serial killers, if the distribution mirrored the overall population.Moreover, serial killers are relatively rare, which further confounds our calcula-tions for reasons similar to those addressed earlier regarding small sample sizesand infrequent events. Further confounding the “conventional wisdom” regard-ing this subject is the highly skewed racial distribution of homicide offenders,which are 51.5% black and 46.4% white.3 When adjusted to per-capita rates,the FBI Uniform Crime Reports indicate that blacks are eight times morelikely to commit homicides than whites.4 These numbers are based on clearedcases and arrests, though, which have their own unique limitations. Therefore,when viewed in light of these apparently contradictory statistics, possible rea-sons for the apparent bias in the initial demographic predictions of the D.C.sniper case start to make sense. Clearly, baseline information should be used tofilter data and outcomes; however, this simple exercise demonstrates that evendetermining the appropriate baseline can be a challenge in many cases.
This example also highlights the importance of keeping an open mind.Seasoned investigators understand that establishing a mindset early in an inves-tigation can significantly affect interpretation of subsequent leads and clues,allowing important evidence to be overlooked, such as the “white van” empha-sized by the media in the sniper investigation, which artificially filtered manyleads from concerned citizens and cooperating public safety agencies alike.Similarly, analysts can fall prey to these same challenges if they are not carefuland consider appropriate comparative information with a clear mind that isopen to alternative explanations for the data. Again, knowledge of the potentialpitfalls is almost as important as the analysis, because ignorance can have asignificant impact on the analysis and interpretation of the data.
Arrest data is another area in which considering variances in populationdistribution can be essential to thoroughly understanding trends and patterns.When we think logically about where and when many arrests occur, particularlyvice offenses, we find that officer deployment often directly affects those rates.Like the proverbial tree falling in the woods, it follows that if an officer is thereto see a crime, it is more likely that an arrest will be made. This goes back to theearlier discussion regarding the crime that we know about and the crime that wedo not know about. Locations associated with higher levels of crime also tend tobe associated with heavier police deployment, which concomitantly increasesthe likelihood that an officer will either be present or nearby when a crimeoccurs, ultimately increasing the arrest rate in these locations. Unfortunately,the demographics represented among those arrested might be representativeof the residents of that specific area but differ greatly from the locality as awhole. This can greatly skew our interpretation of the analysis and findings.What does this mean to data mining and predictive analytics? Simply, that it
Chapter 1

14 1.7 Generalizability versus Accuracy
can be an error to use population statistics to describe, compare, or evaluate arelatively small, nonuniform sample, and vice versa. Remember the baseline,and give some thought to how it was constructed, because it might differsignificantly from reality.
1.6 Overfitting the Model
Remember the caution: If it looks too good to be true, it probably is too goodto be true. This can occur when creating models. One common pitfall is to keeptinkering with a model to the point that it is almost too accurate. Then whenit is tested on an independent sample, something that is critical to creatingmeaningful predictive models, it falls apart. While this might seem impossible,a model that has been fitted too closely to a particular sample can lose its value ofrepresenting the population. Consider repeatedly adjusting and altering a suitof clothes for a particular individual. The tailor might hem the pants, take in thewaist, and let out the shoulders to ensure that it fits that particular individualperfectly. After the alterations have been completed, the suit fits its owner like asecond skin. It is unlikely that this suit will fit another individual anywhere nearas well as it fits its current owner, however, because it was tailored specificallyfor a particular individual. Even though it is still the same size, it is now verydifferent as a result of all of the alterations.
Statistical modeling can be similar. We might start out with a sample anda relatively good predictive model. The more that we try fit the model to thatspecific sample, though, the more we risk creating a model that has started toconform to and accommodate the subtle idiosyncrasies and unique features ofthat particular sample. The model might be highly accurate with that particularsample, but it has lost its value of predicting for similar samples or representingthe characteristics of the population. It has been tailored to fit perfectly oneparticular sample with all of its flaws, outliers, and other unique characteristics.This can be referred to as “overfitting” a model. It is not only a common butalso a tempting pitfall in model construction. After all, who would not love tocreate THE model of crime prediction? Because this issue is so important togood model construction, it will be discussed in greater detail in Chapter 8.
1.7 Generalizability versus Accuracy
It might seem crazy to suggest that anything but the most predictive modelwould be the most desirable, but sometimes this is the case. Unlike other areas

1.7 Generalizability versus Accuracy 15
in which data mining and predictive analytics are employed, many situations inlaw enforcement and intelligence analysis require that the models be relativelyeasy to interpret or actionable. For example, if a deployment model is goingto have any operational value, there must be a way to interpret it and use theresults to deploy personnel. We could create the most elegant model predictingcrime or criminal behavior, but if nobody can understand it or use it, then it haslittle value for deployment. For example, we might be able to create a greaterdegree of specificity with a deployment model based on 30-minute time blocks,but it would be extremely difficult and very unpopular with the line staff totry and create a manageable deployment schedule based on 30-minute blocksof time. Similarly, it would be wonderful to develop a model that makes verydetailed predictions regarding crime over time of day, day of week, and relativelysmall geographic areas; however, the challenge of conveying that informationin any sort of meaningful way would be tremendous. Therefore, while wemight compromise somewhat on accuracy or specificity by using larger units ofmeasure, the resulting model will be much easier to understand and ultimatelymore actionable.
The previous example highlighted occasions where it is acceptable to com-promise accuracy somewhat in an effort to develop a model that is relatively easyto understand and generalize. There are times, however, when the cost of aninaccurate model is more significant than the need to understand exactly whatis happening. These situations frequently involve the potential for some harm,whether it is to a person’s reputation or to life itself. For example, predictiveanalytics can be extremely useful in fraud detection; however, an inaccuratemodel that erroneously identifies someone as engaging in illegal or suspiciousbehavior can seriously affect someone’s life. On the other hand, an inaccuratecritical incident response model can cost lives and/or property, depending onthe nature of the incident. Again, it is just common sense, but any time that aless-than-accurate model would compromise safety, the analyst must considersome sort of alternative. This could include the use of very accurate, althoughrelatively difficult to interpret, models. Attesting to their complexity, thesemodels can be referred to as a “black box” or opaque models because we cannot“see” what happens inside them. As will be discussed in subsequent chapters,though, there are creative ways to deploy the results of relatively opaque algo-rithms in an effort to create actionable models while maintaining an acceptablelevel of accuracy.
Deciding between accuracy and generalizability in a model generally involvessome compromise. In many ways, it often comes down to a question of publicsafety. Using this metric, the best solution is often easy to choose. In situ-ations where public safety is at stake and a model needs to be interpretable
Chapter 1

16 1.7 Generalizability versus Accuracy
to have value, accuracy might be compromised somewhat to ensure that theoutcomes are actionable. In these situations, any increase in public safety thatcan be obtained with a model that increases predictability even slightly overwhat would occur by flipping a coin could save lives. Deployment decisionsprovide a good example for these situations. If current deployment practicesare based almost exclusively on historical precedent and citizen demands forincreased visibility, then any increase over chance that can be gained throughthe use of an information-based deployment model generally represents animprovement.
When an inaccurate model could jeopardize public safety, though, it is gen-erally better to go without than risk making a situation worse. For example,automated motive determination algorithms require a relatively high degree ofaccuracy to have any value because the potential cost associated with misdi-recting or derailing an investigation is significant, both in terms of personnelresources and in terms of the likelihood that the crime will go unsolved.Investigative delays or lack of progress tend to be associated with an ulti-mate failure to solve the crime. Therefore, any model that will be used intime-sensitive investigations must be very accurate to minimize the likelihoodof hampering an investigation. As always, domain expertise and operationalinput is essential to fully understanding the options and possible consequences.Without a good understanding of the end user requirements, it can be verydifficult to balance the often mutually exclusive choice between accuracy andgeneralizability.
Analytically, the generalizability versus accuracy issue can be balanced in acouple of different ways. First, as mentioned previously, some modeling toolsare inherently more transparent and easier to interpret than others. For example,link analysis and some relatively simple decision rule models can be reviewed andunderstood with relative ease. Conversely, other modeling tools like neural netstruly are opaque by nature and require skill to interpret outcomes. In many ways,this somewhat limits their utility in most public safety applications, althoughthey can be extremely powerful. Therefore, selection of a particular modelingtool or algorithm frequently will shift the balance between a highly accuratemodel and one that can be interpreted with relative ease. Another option foradjusting the generalizability of a model can be in the creation of the modelitself. For example, some software tools actually include expert settings thatallow the user to shift this balance in favor of a more accurate or transparentmodel. By using these tools, the analyst can adjust the settings to achieve thebest balance between accuracy and interpretability of a model for a specific needand situation.

5Data
One of the most important tasks associated with analyzing crime and intelli-gence information is to know your data. Data and information are the currencywithin the analytical community; however, very little if any of the informa-tion that falls under the purview of crime and intelligence analysis is evercollected with that purpose in mind. Unlike the business and academic com-munities, in which data sets are designed and constructed with thought givento the ultimate analysis at almost every step of the way, some of the data thatfalls in the analysts’ laptops are so ugly that only a mother could love them.Without data and information, however, we analysts would perish. Data trulyare the lifeblood of the analytical community, and some of the most unrulydata sets can prove to be the most rewarding once they have been tamed andanalyzed.
Where Do Analysts Come From?
“Imagination is more important than knowledge . . .”
Albert Einstein
“A senior intelligence official used to ask his subordinates two questions about new analysts theywished to hire: ‘Do they think interesting thoughts? Do they write well?’ This official believed
that, with these two talents in hand, all else would follow with training and experience.”
Lowenthal, p. 791
In my experience, statistical degrees might make a good scientist, but a good analyst needs much more.Over time, I have almost always found it is easier to teach someone with an understanding of crimeand criminals and a need to know “why” how to analyze crime than it is to give domain knowledge to astatistician. Until the Vulcan mind meld becomes a reality, it seems that the only way to acquire domainexpertise is through experience and a hunger for a deeper understanding of “why.”
67

68 Data
As indicated in the above quotes, the ability to “think interesting thoughts,” or think creatively, alsoseems to be a prerequisite. It often appears that the bad guys are always working on new ways to commitcrimes and escape detection. Building a better mousetrap involves going above and beyond, often to theouter limits of our understanding of what can be expected, or even possible, in an effort to stay aheadin the game. Good analysts often have a dark side that they not only are in touch with but also arerelatively comfortable tapping. To anticipate the “what if” and “how,” we can find ourselves consideringthe proverbial “perfect crime,” placing ourselves in a criminal’s mind in an effort to unlock the secrets ofthe crimes that he has committed and to anticipate what might lie ahead, what it is that he would reallylike to do if given the chance.
In many ways, statistics and formal analytics are just a mathematical manifestation of how analyststhink and function in their native state. As data mining tools become increasingly more accessible andeasier to use, the need to teach the statistician will diminish, as those with intuitive analytical savvy anddomain expertise will gain a controlling interest in the field. Data mining tools are highly intuitive and veryvisual. Good analysts, as well as many operational personnel, seem to gravitate toward them naturally,embracing the intuitive processing and actionable output. Data mining tools represent the hammers andchisels that these information artisans can use to reveal the underlying form and structure in the data.It is my expectation that the new data mining tools will change dramatically what analytical positionsin the future look like and how they function, as well as the role that operational personnel will playin analysis and how they will work with the analytical staff. As data and information assume the roleof a seamless interface between analytical and operational personnel, I anticipate the emergence of an“agent analyst” class of personnel who can function in both worlds, utilizing data and intelligence asintegral tools in the operational environment, while guiding the analytical process from collection tooutput.
Data mining has been referred to as “sense making,” which often is how therequest for analysis is phrased. It is not unusual to find some random lists oftelephone numbers, a couple of delivery dates, and a bank statement deliveredalong with a plea for some clue as to the “big picture” or what it all means:“Please help me make some sense of this!” There are a few tips for understandingand managing data and information that will be addressed in this chapter, but itwould be impossible to anticipate every data source that is likely to surface. It isbetter to develop the ability to work with and through data in an effort to revealpossible underlying trends and patterns. This is a craft in some ways. In myexperience, there is a degree of creativity in the type of pattern recognition thatis associated with a good analyst: the ability to see the meaning hidden amongthe general disorder in the information. Data mining truly can be described as

5.2 Types of Data 69
a discovery process. It is a way to illuminate the order that often is hidden toall but the skilled eye.
5.1 Getting Started
When I worked in the lab as a scientist, one of the most important lessonsthat I learned was to know your subjects. The same is true for analysts. As it isnot advisable to experience crime firsthand, either as a victim or a perpetrator,there are other ways to know and understand the data and information. This isparticularly true for information that arrives with some regularity, like offensereports. Subject knowledge has been addressed in greater detail in Chapter 2; inbrief, it can be extremely useful for the analyst to develop some familiarity withthe operational environment. Whether through routine ride-alongs, attendanceat roll call, field training, or observing suspect interviews, the more that theanalyst can understand about where the data and information came from, thebetter the subsequent analysis.
5.2 Types of Data
Several years ago, I responded to a homicide scene during the very early hoursof the morning. Everyone was pretty tired, but as I walked into the house toview the scene, a member of the command staff who was taking a graduatecourse in criminal justice statistics stopped me and asked for a quick tutorialon the difference between continuous and nominal data. I have been askedsome really strange questions at crime scenes, but this one was memorable byits sheer absurdity. What did distinctions between different types of data haveto do with death investigation? In some ways nothing, but in other ways it haseverything to do with how data should be analyzed and used to enhance theinvestigative process.
Leave it to researchers to figure out a way describe and characterize evendata, creating subcategories and types for different kinds of information. Thereis a reason for this, other than the pain and agony that most students experi-ence when trying to figure out what it all means during a class in statistics andprobability (also known as “sadistics and impossibilities”). Data and informa-tion are categorized and grouped based on certain mathematical attributes ofthe information. This can be important, because different types of analytical
Chapter 5

70 5.3 Data
approaches require certain properties of the data being used. As a result, it isimportant to have at least a basic understanding of the different types of dataand information that might be encountered, and how this might guide selectionof a particular analytical approach or tool.
5.3 Data2
Continuous variables can take on an unlimited number of values between thelowest and highest points of measurement. Continuous variables include suchthings as speed and distance. Continuous data are very desirable in inferentialstatistics; however, they tend to be less useful in data mining and are frequentlyrecoded into discrete data or sets, which are described next.
Discrete data are associated with a limited number of possible values. Genderor rank are examples of discrete variables because there are a limited number ofmutually exclusive options. Binary data are a type of discrete data that encom-pass information that is confined to two possible options (e.g., male or female;yes or no). Discrete and binary data also are called sets and flag data, respectively.
Understanding the different types of data and their definitions is importantbecause some types of analyses have been designed for particular types of dataand may be inappropriate for another type of information. The good news is thatthe types of information most prevalent in law enforcement and intelligence, setsand flag data, tend to be the most desirable for data mining. With traditional,inferential statistics methodologies, on the other hand, discrete variables aredisadvantageous because statistical power is compromised with this type ofcategorical data. In other words, a bigger difference between the groups ofinterest is needed to achieve a statistically significant result.
We also can speak of data in terms of how they are measured. Ratio scalesare numeric and are associated with a true zero—meaning that nothing can bemeasured. For example, weight is a ratio scale. A weight of zero correspondsto the absence of any weight. With an interval scale, measurements betweenpoints have meaning, although there is no true zero. For example, althoughthere is no true zero associated with the Fahrenheit temperature scale, thedifference between 110 and 120 degrees Fahrenheit is the same as the differencebetween 180 and 190 degrees: 10 degrees. Ordinal scales imply some rankingin the information. Though the data might not correspond to actual numericfigures, there is some implied ranking. Sergeant, lieutenant, major, and colonelrepresents an ordinal scale. Lieutenant is ranked higher than sergeant, and majoris ranked higher than lieutenant. Although they do not correspond directlyto any type of numeric values, it is understood that there is a rank ordering

5.4 Types of Data Resources 71
of these categories. Finally, nominal scales really are not true scales becausethey are not associated with any sort of measurable dimension or ranking; theparticular designations, even if numeric, do not correspond to quantifiablefeatures. An example of this type of data is any type of categorical data, such asvehicle make or numeric patrol unit designations.
Finally, unformatted or text data truly are unique. Until recently, it wasvery difficult to analyze this type of information because the analytical toolsnecessary were extremely sophisticated and not generally available. Frequently,text data were recoded and categorized into some type of discrete variables.Recent advancements in computational techniques, however, have opened thedoor to analyzing these data in their native form. By using techniques suchas natural language processing, syntax and language can be analyzed intact,a process that extends well beyond crude keyword searches.
5.4 Types of Data Resources
Working with the Operators to Get Good Data
The business community provides some guidance on data collection. In some cases, information gatheringis anything but obvious, often hidden behind the guise of some sort of discount or incentive. For example,many supermarkets have adopted discount cards in an effort to provide incentives for gathering infor-mation. Rather than using coupons, the customer need only provide the store discount card to obtainreduced prices on various items. It is quick and easy, and the customer saves money. In exchange, thestore gains very detailed purchasing information. Moreover, if a registration form is required to obtainthe discount card, the store has access to additional shopper information that can be linked to purchas-ing habits. For example, stores might request specific address information so that they can mail flyersregarding sale items and specials to customers. Additional financial and demographic information might berequired for check cashing privileges. This additional information provides significant value when addedto the actual shopping information. Direct mailing campaigns can be targeted to select groups of shoppersor geographic areas, while common shopping patterns can be used to strategically stock shelves andencourage additional purchasing.
This same principle can be applied in crime analysis data collection. One frequently voiced frustrationfrom sworn personnel, particularly those working in patrol, is that they do not receive any benefitsfrom all of the paperwork that they complete. Field interview reports can take a considerable amount oftime, but they frequently confer benefits only to the investigative personnel. Analysts can greatly improve
Chapter 5

72 5.4 Types of Data Resources
data quality and volume by engaging in some proactive work to highlight the value of accurate, reliable,and timely data collection to the specific personnel units most likely to be tasked with the majority ofthis work. Providing maps or other analytical products on a regular basis can strengthen the partnershipbetween these frequently overworked, yet underappreciated, line staff and the analytical personnel. Thesefolks also can be a tremendous source of knowledge and abundant domain expertise, given their directproximity to the information source.
It is also important, whenever possible, to highlight any quality-of-life increases that might be associatedwith a particular analytical product or initiative. For example, the New Year’s Eve initiative in the RichmondPolice Department was associated with significant reductions in random gunfire and increased weaponsseizures,3 which were achieved with fewer personnel resources than originally anticipated. These results inand of themselves were impressive; however, one additional benefit was that approximately fifty membersof the department originally expecting to work that evening were able to take the night off. While thismight not be the most notable finding from a public safety perspective, it was pretty important to thedepartment members who were able to take the night off and spend it with their families and friends.
Partnering with the operational personnel reaps many benefits. Having a colleague in the field canprovide direct feedback regarding the reliability and validity of specific sources of information, as well asguidance regarding the direction and need for future analytical products. Some of the most interestingprojects that I have been involved with started out with the following question from someone working inthe field: “Hey doc, have you ever thought about this . . .?” Moving closer to an integrated operator-analystapproach benefits all participants. The analyst obtains access to better information and guidance regardingactionable analytical end products, and the operational personnel can not only better understand but evenplay a role in guiding the analytical process. Once information has been established as a thin, fluid interfacebetween the analytical and operational domains, the process becomes even more dynamic, operators andanalysts working handcuff-in-glove to achieve information dominance and operational superiority. Datamining and the associated technologies provide the tools necessary to realize this goal.
Records Management Systems
Most departments maintain large records management systems that containcrime incident data. In most cases, however, these “databases” were not neces-sarily designed to be analyzed. Rather, these databases were created and are usedfor case management and general crime counting. As a result, these databasesfrequently have standard or “canned” queries that facilitate gathering frequentlyused information or reports; however, these often have limited utility for crimeanalysis.
The benefit of these databases is that they have a known, stable structure.Queries can be developed and reused repeatedly because the structure associated

5.4 Types of Data Resources 73
with this type of database generally does not change frequently. The disadvan-tages associated with using a records management system, however, can includethe reliability and validity of the data, as well as the detail, type, and natureof information, and even access. Common limitations associated with genericrecords management systems include incomplete or inaccurate data. Unfortu-nately, reliability, validity, and completeness seem to be most compromised inthe information required for crime analysis, particularly information relatingto MO. MO characteristics generally are not included in routine crime reportsor canned queries, so it is not until the analyst attempts to use it that the holesin the data are revealed. Moreover, MO information can be compromised ifthe particular categories of information are not anticipated and collected. Forexample, information relating to the type of weapon, nature of the offense, andtime of day frequently are collected, but specific details regarding the behavioralnature of the crime, including the type of approach (e.g., con/ruse, blitz, etc.),verbal themes, and other behavioral characteristics used to analyze and linkcrimes frequently are incomplete or absent. Much of this information can befound in the narrative portion of the report. However, in most agencies, the nar-rative section has limited availability and utility, given the degree of complexityassociated with the analysis of this type of information. Recent advantages innatural language processing and text mining offer great promise for the retrievalof this information.
Another limitation associated with large records management systems canbe timely data entry. Ideally, the data and information would be enteredinto the database during the collection process, or immediately thereafter.Unfortunately, reports frequently are completed and then wait for review beforethe information is transcribed and entered. This can be particularly time-consuming if the information is collected in a location that is geographicallydistinct from the data entry and analysis location, or if field reports must becollected and shipped to another location for entry and subsequent analysis inanother part of the world. Even processing records in another part of town canintroduce a level of delay that is undesirable.
On the other hand, initial data entry can be almost simultaneous in depart-ments with mobile data computers, which facilitate direct data entry in the field.Although data review and validation might be delayed somewhat, the basiccrime incident information generally is entered in a timely fashion. In agencieswhere reports are completed with paper and pencil and then forwarded for dataentry, significant delays can occur. While this might not be a problem withhistorical reviews or long-term trend analysis and modeling, for certain typesof analysis, including the behavioral analysis of violent crime and/or analysisof a rapidly escalating series, any delay is unacceptable because it can cost lives.
Chapter 5

74 5.4 Types of Data Resources
Often in these cases, the analyst is required to create specialized databases forcertain types of crime or series under active investigation.
Technology has improved to the point where direct data entry in the field canbe associated with a concomitant rapid analytical response, even in the absenceof a live analyst. Crime frequently occurs at inconvenient times, particularlyduring the evenings and weekends when most civilian analysts are off duty.The ability to rapidly integrate crime incident information into the context ofhistorical data as well as rapidly emerging trends and patterns can provide theinvestigator valuable analytical support at the very beginning of an investigationwhen it is needed the most, rather than later when the analytical staff return.While still at the scene, an investigator can enter the relevant information andreceive a rapid analytical response, which can provide timely access to associatedcases, existing leads, and investigative guidance. By adding an analytical overlayor inserting an analytical filter into remote data entry, an organization canadd value to the mobile data and analytical capacity while at the same timeincreasing investigative efficacy.
Ad Hoc or Self-Generated Databases
In some situations, the department’s records management system does not meetthe needs of timely, complete crime analysis. Specialized databases can be cre-ated to address this need. These may be ongoing or case-specific. For example,in a department without direct field entry of data or limited availability of MOcharacteristics in existing data resources, the analytical team might constructdatabases specifically designed for crime or intelligence analysis. These databasesmight either be offense-specific, such as a homicide database or a robberydatabase, or associated with a unique series or pattern of crimes, such as a serialrapist or an unusual series of burglaries. These databases will include standardinformation likely to be found in the department’s records management system(e.g., case number and date, time, and location of offense), as well as informa-tion related to specific or unique MO characteristics or behavioral themes.
It is not unusual for a task force or department to establish a special-ized database for a particular series of crimes or a high-profile crime. Forexample, child abduction cases frequently receive large amounts of data andinformation that need to be entered, managed, and analyzed very rapidly insupport of these often fast-breaking investigations. Tip databases are createdin an effort to manage the rapid accumulation of data and information inresponse to a high-profile incident. For example, in the first few weeks ofthe Laci Peterson investigation, more than 2600 tips were received by lawenforcement authorities.4 Similarly, at the height of the Washington D.C.sniper investigation, authorities received as many as 1000 tips an hour.5

5.4 Types of Data Resources 75
The sheer volume of information associated with these cases requires somesort of automated system of information management.
Limitations to this approach include the initial time commitment necessaryto create the database, an ongoing commitment to data entry, and the possibilityof errors associated with data entry. While creation and maintenance of specificanalytical databases requires a commitment from the analyst or analytical team,it can reap huge benefits in terms of detail, additional information, analyticallyrelevant information, and timely data entry.
What do you include in a self-generated database? As much as you thinkthat you will need, and then some. When it is time to conduct the analysis,it always seems that no matter how many variables and how much detail wasincluded in the original data set, it would have been better to have included justa little more. Behavioral characteristics and themes and MO features are alwaysa good starting point. Some variables will become standard (e.g., approach,demeanor), while others might be unique to a specific pattern of offending orcrime series. It generally is a good idea to include the information in as closeto its original form as possible. Automated recoding later can be more efficientand accurate than trying to recode during the data entry process. In addition,early exploration of the data might indicate a need for one form of recodingover another. For example, during an analysis of police pursuits, preliminaryanalysis of the data revealed potential differences among high-speed pursuitsas compared to those at lower speeds. This was not readily apparent, however,until the data had been entered in their original form and then explored.
One challenge associated with tip databases is the fact that the analyst andinvestigative team typically have very little information early in the investi-gation, while the database is being created. With such limited information,it might be unclear which variables should be included because the overall direc-tion of the investigation might not have emerged or been developed. Moreover,although the team always tries to be objective, a favored outcome, suspect, orinterpretation can dramatically impact the structure of the database as well asthe interpretation of individual data elements or reports.
The analyst is challenged further by an overwhelming amount of infor-mation with an associated need for rapid analysis. During the D.C. sniperinvestigation, the investigative process was complicated by the involvement ofmultiple localities, jurisdictions, states, and task forces. The net result of thistype of situation is a data repository that is beyond the analytical capacity of asingle analyst or even an analytical team or task force. There is just too muchinformation to absorb, categorize, remember and draw meaning from, andthis significantly compromises the overall investigation. In these cases, the bestsolution is to employ automated search strategies and analysis. Software does
Chapter 5

76 5.4 Types of Data Resources
not favor any suspects or outcomes and does not become overwhelmed by theamount of information or the nature of the case.
Another challenge associated with tip databases is that the informationfrequently arrives in narrative format. Tipsters rarely call the hotline withdetailed, well-categorized information that has been recoded to match theexisting database structure. Rather, they tend to provide information that is ina narrative format, frequently is incomplete, and sometimes even is inaccurate.Armed with natural language processing and text mining tools, an analyst canexplore and analyze large amounts of narrative information extremely efficiently.
Consistency, consistency, consistency! This can be an issue when multipleanalysts are entering the same data. Even subtle differences in data entry cangreatly increase the variability, with concomitant reductions in the reliabilityand analytical value of a data set. The decision to develop and maintain adatabase is huge; do not sabotage your efforts with inconsistency or variabilityin the data entry process. There is enough variability in crime and intelligencedata; the analyst does not need to introduce more in the data categorizationand entry process.
The analyst frequently is called to analyze data or information that is col-lected specifically for a particular case. These data often embody the mostdifficult yet interesting work that an analyst can become involved in. Theopportunity to pull meaning and investigative value from a seemingly unin-telligible mass of information can be one of the most exciting challenges thatan analyst encounters. While it is impossible to anticipate the exact nature ofthese data sources, learning some basic data management techniques can helpto not only evaluate the reliability and validity but also do any data cleaning orrecoding that might be required. Some common data resources are addressedlater in this chapter and throughout the text.
Additional Data Resources
The analyst is likely to encounter two types of data that have their own setsof issues and challenges: relational data, like those associated with incident-based reporting and police calls for service, and dispatch data. These data areused frequently in public safety analysis; therefore, their unique features andchallenges are worth addressing.
Relational Data
Relational databases are comprised of a series of associated or linked tables.6 Thisfacilitates the inclusion of a greatly expanded amount of information; however,

5.4 Types of Data Resources 77
it can create some challenges in analysis and interpretation of data, as outlinedbelow. An example of a relational database that is frequently encountered in lawenforcement and public safety is the National Incident-Based Reporting System,or NIBRS.7 In marked contrast to Uniform Crime Reports (UCR), with NIBRSdata a single incident can be associated with multiple offenses, victims, andsuspects. For example, if two suspects broke into a home, vandalized the kitchen,stole a television set, and assaulted the homeowner when he came home early,it would be a single incident associated with as many as four separate offenses,two suspects, and one victim under NIBRS rules. With UCR, only the mostserious offense would be reported. The other, “lesser included” crimes wouldnot be reported. While NIBRS results in more complete reporting of crimestatistics, there are challenges associated with databases of this nature.
First, it is possible to greatly magnify the prevalence of crime if crimes arecounted by offense rather than incident. In the example above, simply addingup the offenses would greatly exaggerate total crime statistics. As many as four“crimes” could be reported for what really is one single crime incident thatwas associated with multiple offenses. Similarly, it is possible to underreportcrime when there are multiple victims. For example, using an incident-basedreporting method, a double homicide counts as one homicidal incident withtwo victims. This can be confusing for those accustomed to reporting homicidetotals in terms of a body count.
In terms of crime analysis, however, one particular challenge associated withrelational data as opposed to a simple “flat file” is that it can be difficult to main-tain relationships between variables and to ensure that certain variables are notoveremphasized during an analysis, particularly using standard methods. Forexample, gang-related crime frequently involves multiple suspects associatedwith a single incident. As illustrated in Figure 5-1, a gang robbery was per-petrated by three suspects, while another robbery was associated with a singlesuspect. When this information is entered into a spreadsheet, there are threerecords associated with gang-related robbery suspects as compared to a singlesuspect record associated with the other robbery. At a minimum, the gang-related information will be overrepresented in an analysis of robbery-relatedsuspect characteristics unless some precautions are taken to ensure that eachincident is counted only once.
For example, if the gang members used intimidation while the suspect in theother robbery used a gun, a simple suspect-based count of weapon involvementwould indicate that weapons were used in only 25% of the robberies, whenin fact a gun was used in one of the two, or 50%, of the incidents. On the
Chapter 5
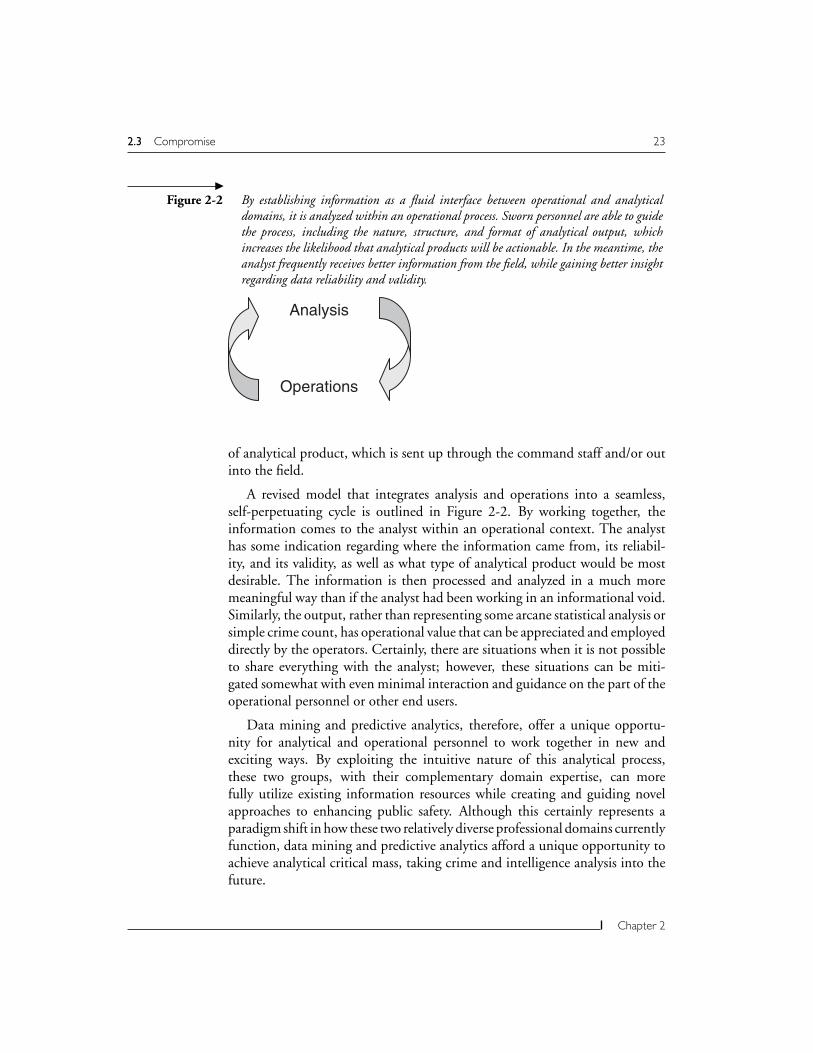
78 5.4 Types of Data Resources
�Figure 5-1 Relational data are associated with some unique challenges. In this example, a gang-
related robbery was perpetrated by three suspects while another robbery was associatedwith only one suspect. In a relational database, there could be as many as three suspectrecords associated the gang-related robbery, compared to a single suspect record associ-ated with the other robbery. The gang-related information will be overrepresented inthe analysis unless some precautions are taken to ensure that each incident is countedonly once.
Other
Robbery Data
Incident Suspect(s) Data
Gang-relatedGang
Gang
Gang
Other
Type
None
None
None
Gun
Weapon
other hand, the prevalence of gang-related crime might be skewed if suspect-based statistics are used to generate that information. It is always important tothink logically about what the question really is and what is the best way tocount it. Some crimes, including those involving juveniles and gangs, frequentlyinvolve multiple suspects. Obviously, this is not much of an issue with only twoincidents; however, when faced with hundreds of incidents, it is important toensure that these issues are considered and that crime is counted accurately.
Dispatch Data
One set of data maintained by most law enforcement agencies is police dispatch,or calls for service (CFS) data. This information can have tremendous valuewhen examining how police resources are deployed. These data also provide

5.4 Types of Data Resources 79
some insight into general crime trends and patterns in the community in thatthey reflect complaint data, or citizen-initiated police work.
Like most public safety data, however, CFS data have significant limitationsthat are not distributed uniformly in many cases. For example, a complaint of“man down” can mean almost anything from a sleeping vagrant to a murder.It is not unusual for the nature of the complaint to have very little in commonwith what actually happened.
Figure 5-2 depicts a vehicle driving through a neighborhood, engaging inrandom gunfire—something not unusual in many high-risk communities, par-ticularly those with active gang rivalries. In this situation, the vehicle enters theneighborhood in the 600 block of Elm Street and one of the occupants startsfiring a weapon in the vicinity of 545 Elm Street. The vehicle travels north onElm, east on Fourth, and north again on Maple Avenue, with five associatedbursts of gunfire.
�Figure 5-2 This
street mapillustrates a
vehicle drivingthrough a
neighborhoodengaging in
random gunfire.
First Street
Second Street
Third Street
Fourth Street
Fifth Street
Sixth Street
Oak
Str
eet
Elm
Str
eet
Juni
per
Str
eet
Haw
thor
ne L
ane
Map
le A
venu
e
Gunfire
End time 2328 hrs
Start time 2313 hrs
Chapter 5

80 5.4 Types of Data Resources
As can been seen on the spreadsheet in Table 5-1, the calls start coming intothe dispatch center almost immediately. Three separate calls come in withinminutes of the first burst of gunfire at 545 Elm Street. These are immediatelyrecognized as being the same incident and are all assigned the same call number.A fourth call comes in from someone at the corner of Sixth and Elm, whoreports having heard random gunfire in the neighborhood. Without a specificaddress, the caller’s location is entered and the report is given a new call number,reflecting the new address. A few minutes later, three additional calls come infrom Fourth Street. These calls are seen as related to each other but not to theearlier incident, so a new call number is assigned to these three complaints.As the car turns north on Maple Avenue, three additional calls come in tothe dispatch center. Again, these calls are not identified as being part of thesame incident and are given unique call numbers. Finally, the first caller at545 Elm Street, frustrated at not seeing a patrol car in the neighborhood yet,calls again to report random gunfire in the neighborhood. Because this callcame in later than the first call from that address, it is not linked to the earliercalls and is given another unique call number. By the time this incident ends,the dispatch center has received a total of eleven calls from citizens reportingrandom gunfire (Table 5-2), which are aggregated into seven distinct calls,
�Table 5-1 This table was created from the citizen complaints associated with the random gunfire
illustrated in Figure 5-2.
Date Time Location Nature Call Number
02-27-2004 2313 545 Elm St Shots fired 258
02-27-2004 2314 545 Elm St Shots fired 258
02-27-2004 2315 545 Elm St Shots fired 258
02-27-2004 2315 200 W 6th St Shots fired 259
02-27-2004 2318 150 W 4th St Shots fired 260
02-27-2004 2320 148 W 4th St Shots fired 260
02-27-2004 2321 50 W 4th St Shots fired 260
02-27-2004 2326 242 Maple Ave Shots fired 261
02-27-2004 2328 242 Juniper St Shots fired 262
02-27-2004 2329 105 Maple Ave Shots fired 263
02-27-2004 2345 545 Elm St Shots fired 264

5.4 Types of Data Resources 81
�Table 5-2 In this table, the eleven citizen complaints from a single series of random gunfire have
been aggregated into seven distinct calls, highlighting some of the challenges associatedwith using citizen complaint data as well as other public safety–related information.
Date Time Location Nature Call Number
02-27-2004 2313 545 Elm St Shots fired 258
02-27-2004 2315 200 W 6th St Shots fired 259
02-27-2004 2318 150 W 4th St Shots fired 260
02-27-2004 2326 242 Maple Ave Shots fired 261
02-27-2004 2328 242 Juniper St Shots fired 262
02-27-2004 2329 105 Maple Ave Shots fired 263
02-27-2004 2345 545 Elm St Shots fired 264
yet all are associated with a single series of random gunfire spanning bothgeography and time.
Which is the more accurate measure: complaints, CFS, or unique inci-dents? Further comparison of the map and the call sheet highlights some ofthe challenges associated with analyzing CFS. For example, should the totalnumber of complaints (11) or unique calls (7) be used for analysis? Dependingon the nature of the analysis, either option might be correct. For an analysisof workload and deployment, it might be necessary only to know how manycitizen-initiated complaints resulted in the dispatch of police personnel. Inthis case, the number of unique calls generally would suffice. But, what if thequestion related to community violence and how many incidents of randomgunfire occurred in a community? Clearly, neither the number of complaintsnor the number of calls would address that question directly. Further examina-tion of the data would be required, perhaps with the use of maps and a timeline.What happens when gunfire erupts and nobody calls? In some locations it is notunusual to receive a call of a man down, only to find a dead body surroundedby evidence of gunfire and to have received no citizen complaints of gunfire,whether due to fear or a lack of social efficacy.8
Chapter 5

82 5.5 Data Challenges
This issue of incident counting becomes further complicated if multipleunits are dispatched to the same incident and are recorded as unique records inthe database, or if a unit needs to disengage from a specific call to answer anothercall with greater urgency and then returns to the initial call. Depending on howthe data are recorded and maintained, the latter situation might be recordedas a single unit responding twice to the same call, two unique dispatch recordsfor a single call, or two unique calls for service. Which measure is correct reallydepends on the nature of the question. The most important point, though, isthat the analyst clearly understands the limitations of the measure selected andis able to convey those limitations to the command staff or other end users ofthe analysis so that they can be taken into account when any decisions are madebased on those data.
Other Considerations
Another important feature in this discussion is that not all crime is distributedevenly. In fact, it is rare to find evenly distributed crime. For example, criminals,at least successful criminals, will tend to select affluent areas to look for expensivejewelry and electronics, while most open-air drug markets are more likely tobe located in higher-risk areas. Even something as simple as traffic stops can beskewed by police patrol deployment, since areas associated with high crime alsotend to be associated with increased police deployment. Logic follows that thegreater the police presence, the more likely someone is to get caught with thatexpired city decal or burned-out headlight. Drugs, guns, and violence typicallygo together, and certain types of vehicles tend to be stolen more than others.Whether this is due to a preference for certain vehicles or the fact that somevehicles might just be easier to steal than others is important for preventionefforts.
5.5 Data Challenges
Reliability and Validity
Regardless of how perfect a data set might seem to be, it almost always hassome shortcomings. In law enforcement and intelligence analysis, the dataand information generally are anything but perfect. In fact, I often experience“data envy” when reading scientific or business-related papers on data miningbecause of the tremendous amount of quality control the authors often haveover their data. In contrast, it is not unusual for an analyst to receive some dataor information in a format completely unsuitable for analysis. For example,

5.5 Data Challenges 83
a billing invoice, complete with headers and other meaningless formatting,might contain information critical to the development of a timeline or iden-tification of routine expenditures. Not only do these data come in a less thandesirable format, there frequently is the expectation that they will be turnedaround very quickly. Any delay in the investigative process can make the dif-ference between a case that is cleared and one that languishes with no properclosure for a long time, if ever. The last thing that anyone wants is a delay in theinvestigative process because the analyst can neither tolerate nor accommodateless than perfect data.
Data layout and design often can be addressed. Beyond format, however,are far more sinister issues that need to be addressed: reliability and validity.Reliability implies a degree of stability in the measure. In other words, reliabilitymeans that if you conduct repeated measurements of the same thing over andover again, the measurements will not change significantly. For example, a wit-ness statement is reliable, in statistical terms, if the witness says approximatelythe same thing at each interview. This same statement has absolutely no value,however, if the witness is not telling the truth. Therefore, the second measureof interest is validity. Validity simply means that the measure, in this case thewitness statement, is an accurate measure of truth, or what actually happened.Another term for validity is accuracy.
These definitions differ somewhat from the traditional law enforcement orintelligence definitions of reliability. For example, a reliable informant is onethat is both dependable and accurate. In many ways, this working definition ofreliability represents a composite of statistical reliability and validity, which onlyserves to highlight the importance of each measure. A dependable witness withpoor information would be of little value, just as one who has good informationbut cannot be counted on also would have limited utility.
Inaccurate or unreliable data can arise from a variety of sources, includ-ing everything from keystroke errors to intentional corruption of data andinformation. Because these issues are important to accurate analysis and thedevelopment of meaningful and reliable models, some of the more commonchallenges will be addressed in detail.
Data Entry Errors
What happens when you run across a “juvenile offender” with a listed age of99 or a male with a previous pregnancy in his medical data? Several years ago,when analyzing juvenile offender data, I was assured that the medical sectionwas both accurate and reliable. It turns out that the data were neither.
Chapter 5

84 5.5 Data Challenges
To convince myself of this, I ran a quick frequency distribution that listedthe number of occurrences for each possible value associated with a particularmeasure. What I found was that a significant number of male offenders werelisted as having experienced pelvic inflammatory disease, something uniquelyfemale. It was unlikely that the physician performing the intake medical exam-ination made the error. Rather, it appeared to be an error that occurredlater during the data compilation or entry phase. Either way, it significantlycompromised the value of the information.
Data entry errors happen. It is a monotonous process, and people getfatigued. There might be incentives for speedy data entry without the necessaryquality control, although this seems to be changing, with some automated reli-ability and validity checks now being included in some records managementsystems. Sometimes people just do not care. It is not the most glamorous jobin law enforcement, and generally is not well compensated. Even under themost stringent conditions, however, data entry and keystroke errors happen.The solution, then, is identifying and correcting them.
Frequently, running a quick frequency distribution can highlight informa-tion that appears to be grossly out of range. For example, running a frequencydistribution on age will tell us how many 25-year-olds there are, how many26-year-olds there are, and so on. This method will highlight any data pointsthat are well beyond what one would normally expect and that should be inves-tigated further. As in the earlier example, a 99-year-old juvenile offender clearlyis incorrect. In many cases, however, the value “99” is used for missing data orwhen the information is not known. Therefore, an entry of “99” might meanthat the information was unavailable or unknown. This can be clarified andaddressed.
It is important to note that there are cases where the information is unknown.Developing ways to indicate this within a data set can be extremely important.If those methods were incorporated, the ages listed as “99” would be excludedautomatically, rather than contaminating subsequent analysis. Using indicatorvariables for missing data also is important because blank fields in a data setcan indicate many things. For example, if work history or current employmentis left blank in a file or data set, does it mean that the subject in question hasnever worked, or that this information has not been collected? Similarly, doesit mean anything that this information could not be found? For example, itcan be significant to know that a listed address does not exist. Understandingthe importance and implications of missing, inaccurate, or unreliable data cangreatly enhance the value and understanding of the information collected, aswell as the subsequent analyses.

5.5 Data Challenges 85
Returning to the juvenile offender data, there also were greatly differingreports of prior drug history in the section on substance use history. Furtherexamination revealed that the nurses were streetwise and savvy. Few inmateslied to them about their drug use, and those who did were challenged by thesehealth care providers. As a result, the medical history information collectedby the nurses was determined to be relatively accurate. The physicians, onthe other hand, frequently came from different environments and tended tohave less experience with juvenile offenders. As a consequence, they tended tobelieve what they were told. One physician in particular was extremely niceand soft-spoken. Interestingly enough, her physical examinations revealed verylittle substance use and even less sexual activity among the juvenile offenderswho she interviewed, which stood in stark contrast to information collectedin other environments by other personnel. Unfortunately, this finding cast ashadow of doubt over all of the other information that she collected during theintake process. This situation highlights how easy it is to encounter unreliableinformation. One detective might be particularly adept in an interview situ-ation, while others might have less skill in eliciting information. All of thesefactors can significantly affect the reliability of the information.
This highlights another important concept: the reliability check. Wheneverpossible, it is extremely valuable to cross-check information for consistencyand accuracy. In the example with the physician, we were able to check herinformation with that of other interviewers and found hers to be different.Further examination of the data that she collected proved it to be inaccurate,which cast doubt over almost everything else that she had collected. Similarly, ifwe can compare some data against known information, it gives a greater degreeof comfort with information that cannot be validated or checked. This is not anuncommon practice in law enforcement or intelligence information collection,and represents a form of best practice in the assurance of information integrity.
It also is possible to gain some information from response rates alone. Forexample, an unmanageable crowd at a crime scene can be unnerving, but thespookiest scenes for me were the ones where nobody was out. The total absenceof spectators said something. Similarly, increases in citizen complaints can bea troubling issue to address in an evaluation of a crime reduction initiative. Insome communities truly ravaged by crime, the citizens can become so discour-aged that they give up: “What is the point in calling if nothing ever changes?”Crime becomes so expected and normal that the outrage is gone. In these situ-ations, one of the first indicators of improvement can be a spike in complaints,as members of the community begin to reengage and participate in commu-nity public safety. As in music, sometimes the spaces between the notes can beimportant to identifying the tune.
Chapter 5
86 5.5 Data Challenges
Intentional Misrepresentation (aka CriminalsOften Lie)
Criminals often misrepresent the facts, both when it matters and when it doesnot. For that matter, so do witnesses, informants, and many other folks thatwe use on a regular basis to help us to gather information and data. Thisis not unique to law enforcement or intelligence data. Responders to mar-keting surveys lie as well. Consider the last time that you were completelyhonest and completed every question on a survey, if you even respondedto it in the first place. Think again about the last survey that you may ormay not have completed. Were you honest? How do you think your less-than-honest responses might have affected the results? Similarly, other peoplewithhold information because they have something to hide, are concernedthat they might implicate themselves or someone else, or just because. Allof this affects the reliability and particularly the validity of the data that weencounter.
In addition, victims can be emotional or confused, and often make poorhistorians. Filling out an accurate and reliable offense report generally is notwhat is going through their mind as they are getting robbed at gunpoint. It isnot unusual to receive a very detailed, if not somewhat exaggerated, descriptionof the weapon and little to no good information regarding the suspect. Thisis not surprising and reflects victims’ focus during the incident. In addition,the incident might be very brief and occur under less than optimal lighting.While convenience stores generally have done a good job of providing goodillumination and height markers by the door, the average victim of a streetrobbery is at somewhat of a disadvantage regarding all of the information thatwe might like to include in the analysis.
Unsuccessful Criminals
It bears repeating that almost everything that we know about crime and crim-inals is based on those who have been caught, unsuccessful criminals. We alllaugh when we hear about the bank robber who used his own deposit slip towrite the note or the burglar who dropped his wallet on his way out of thehouse, but the sad fact is that many criminals are caught because they makemistakes. Research on nonadjudicated samples is extremely difficult. For exam-ple, asking individuals about involvement in nonadjudicated criminal activity,particularly felonies, is challenging both legally and ethically, due to man-dated reporting requirements for some crimes. As a result, studies that involvegathering information on nonadjudicated crimes frequently are difficult to get

5.6 How Do We Overcome These Potential Barriers? 87
approved by human subject review committees. There also are challenges in evenidentifying these populations, particularly those with limited or no contact withthe criminal justice system. Certain types of ethnographic research, which fre-quently involve going out into the communities and locations where criminalsoperate, can be extremely risky. They also are prone to artifact in that they oftenrely on subject referrals from other criminals. Since criminals tend to be lessthan honest and frequently are unreliable, depending on them to help establisha solid research sample can be tenuous at best. Therefore, because most criminaljustice research is conducted on identified offender populations, such as thosealready in prison, there are some significant gaps in our knowledge regardingcrime and criminals. Knowing what is normal and what is not is absolutelyessential to developing the domain expertise necessary to evaluate the results.This is covered in greater detail in Chapter 10.
Outliers with Value
All outliers are not created equal. Should outliers universally be removed fromthe analysis or otherwise discounted? Or is an outlier or some other anomalyin the data worth considering? While most outliers represent some sort of erroror other clutter in the data, some are extremely important. In my experience,deviation from normal when considering criminal justice or intelligence dataoften indicates something bad or a situation or person with significant potentialfor escalation.
5.6 How Do We Overcome ThesePotential Barriers?
Establishing as many converging lines of evidence as possible for validity checkscan be helpful. This can include verification with known, reliable sources ofinformation like arrest records.
We also might look for similarities in false stories. For example, “the bul-let came out of nowhere” explanation is likely to arouse suspicion amonginvestigators. An analyst can benefit from the development of similar inter-nal norms, or domain expertise regarding normal trends and patterns, as wellas common themes of deception. People just are not that creative when itcomes to prevarication, and sometimes information about inaccurate or falsestatements can be as valuable as credible information. For example, in sometypes of statement analysis, the linguistic structure of a statement can be asimportant as the actual content in evaluating the validity of the statement.Most valid statements have a beginning, middle, and an end. False allegations
Chapter 5

88 5.7 Duplication
frequently deviate from valid statements in the emphasis of certain portionsof the story. Once this type of deviation has been identified, it is possible tobegin to evaluate content in a different light and look for potential secondarygain related to a possible false allegation. Data mining can be extremely valu-able, particularly regarding commonly occurring patterns associated with falseallegations.
But knowing certain data is false does not mean it can be ignored. Just theopposite: It is extremely important to know as many details as possible aboutany limitations in the data so that they can be dealt with during the analyticalprocess and interpretation of the results. It is like side effects. Generally thosethat you are not aware of create the most trouble in the end.
5.7 Duplication
What happens when duplicate records are encountered in a data set? This is notat all uncommon, as multiple citizens can call about the same fight or shoot-ing, multiple officers might respond to the same complaint, and so on. In therandom gunfire example outlined previously, some complaints were obviouslyduplicative. As such, they received identical call numbers. In Table 5-2, thissame data set is depicted without the duplicates. Obviously, there was dupli-cation beyond what could be culled through simple identification of duplicatecall numbers, but this would represent a good start.
When does duplication have value? Perhaps one of the more common areasis in workload studies and deployment. Knowing when multiple units aredispatched to a single incident is important in determining how personnelresources are being used. For example, knowing that multiple officers are dis-patched to domestic complaints, while only one officer generally responds to analarm call, is essential to a complete understanding of police personnel work-load. It would be difficult to anticipate every possible situation when duplicationoccurs and when it is necessary to answer a particular question.
A somewhat more complex example of both necessary and unnecessaryduplication in a data set occurred in the following example. Briefly, an orga-nization of interest was linked to a billing invoice that included hundredsof individual telephone conference calls comprised of thousands of individ-ual telephone call records. Further examination of the invoice revealed thatsome individuals regularly participated in calls with a similar group and thatcertain individuals appeared to have been involved in multiple conference calls.This was important information, in that identifying the key players and linkedindividuals helped begin to reveal an organizational structure and associated

5.8 Merging Data Resources 89
relationships. Review of the records also revealed that some individuals mighthave dialed into a particular conference call multiple times. This could havebeen related to bad or unreliable connections or a variety of other reasons. At thispoint, though, the underlying cause for the duplication in calls is not nearly asimportant as the fact that it exists. Calculating frequencies for individual callershad to be delayed until this unnecessary duplication was addressed. Unfortu-nately, culling the unnecessary duplication within calls while maintaining thenecessary duplication between calls can be a very complex task, particularlywith a large data set. Automated methods for accurately culling these data wereavailable and saved time while maintaining valuable relationships and featuresof the data set. In this example, the data set was reduced by almost one-half byremoving the unnecessary duplication in the data.
5.8 Merging Data Resources
The emergence of regional fusion centers throughout the country representsan analytical windfall for crime analysts. Patterns that transcend jurisdictionalboundaries can be identified and analyzed by merging data from neighboringor otherwise related communities. This approach can increase the number ofobservations, which can be particularly important with rare events. It also canidentify other patterns of offending and criminal groups that exploit juris-dictional boundaries. Examples of this may include traveling scam artists,large criminal gangs, and even serial killers like Ted Bundy with his expansivegeographic range. By spreading their crimes across a large geographic regionthat transcends local jurisdictional boundaries, these criminals can elude detec-tion and capture. Groups like the Mid-Atlantic Regional Gang InvestigatorsNetwork (MARGIN) and the FBI’s VIolent Crime Apprehension Program(VICAP) have been developed in an effort to identify patterns that crossjurisdictions and address this issue.
Data also can be aggregated across collection modalities, reflecting the factthat crime frequently does not exist in one domain. For example, throughthe analysis of telephone records one might be able to characterize the callingpatterns of a drug dealer as he sets up buys and deliveries, while an anal-ysis of banking records and deposits might be necessary to extrapolate cashflow and economic value of the products that he is moving. Being able toanalyze all of this information in the same analytical environment starts todevelop the big picture, which represents a powerful tool available to the ana-lyst. The following sections provide a few examples that highlight the value ofthis approach.
Chapter 5

90 5.10 Weather and Crime Data
5.9 Public Health Data
Be creative. One thing that I realized several years ago through the Cops & Docsprogram9 was that when new drugs enter a market, people generally get intotrouble medically before they get into trouble legally. Analyzing health care andlaw enforcement-related drug overdose data in the same environment providesa more comprehensive view of a pattern of behavior that transcends the healthcare and legal systems. Clearly, there are both legal and ethical issues associatedwith this type of analytical endeavor, but they are not insurmountable. Publichealth and public safety can be complementary functions, particularly if dataand information are shared in a meaningful fashion.
One particular example where this worked extremely well was with traumapatients admitted after being involved in car wrecks. During informal conversa-tion, the health care providers noted that several of the recent admissions for carwrecks were noteworthy in that the patients tested positive for illegal narcotics.A quick tutorial on the finding that many heroin addicts use their drugs almostimmediately after purchasing them enlightened the health care providers regard-ing substance use patterns and their direct link to trauma. This resulted in acomprehensive analysis of health care and law enforcement-related narcoticsdata in the same analytical environment. Although the health care informationwas zip code–based and relatively nonspecific due to medical confidentialityrequirements and investigative sensitivity, the resulting value-added analysis ofthe multidisciplinary narcotics data highlighted a population that had beenunderrepresented in other analyses. Ultimately, both the health care and lawenforcement professionals involved benefited from this information exchange,as did the communities experiencing these increases in illegal drug use.
5.10 Weather and Crime Data
Normal seasonal weather trends, as well as dramatic changes, can have animpact on crime trends and patterns. For example, during the colder months,many individuals preheat their vehicles. Since it is easier to steal a vehicle whenthe ignition key is available, these cold temperatures can be associated withan increased number of vehicle thefts during weekday mornings when peopleare preparing to leave for work. Similarly, people are frequently tempted toleave their vehicles running during the summer months in an effort to keeptheir vehicles cool when they run into the convenience store to make a quickpurchase. Analyzing crime and weather data in the same analytical environmentcan add significant value to police operational planning and crime prevention.

5.11 Bibliography 91
Data mining and predictive analytics tools are perfectly designed to fully exploitthe possibilities associated with this type of novel analysis.
Less frequent but significant weather events also can have an effect on crim-inal behavior. For example, looting after a devastating weather disaster is notuncommon. Several years ago, we noticed that violent crime, particularly streetviolence, decreased to almost nothing during a major snow event and thatsubsequent clearing of the weather and roads was associated with a concomi-tant spike in crime. While largely anecdotal, this highlights the value thatnontraditional crime measures can have with regard to forecasting and strategiccrime analysis. Historical weather data are relatively easy to get. For example,local television stations often maintain archival information, which is availableover the Internet in some locations.
Again, be creative. Crime patterns frequently are as unique as the individualsinvolved and can be affected by a variety of obvious, as well as not so obvious,factors in the community. By transcending the analytical boundaries associatedwith a single type of data or information, the analyst can begin to identify andanalyze a larger array of factors and potential consequences associated with theoriginal information of interest.
5.11 Bibliography1. Lowenthal, M.M. (2000). Intelligence: From secrets to policy. CQ Press,
Washington, D.C.
2. Howell, D. (1992). Statistical methods for psychology, 3rd ed. DuxburyPress, Belmont, CA. Those without recent, or even any, statistical trainingmight benefit from acquiring a basic introductory statistics text that can beused as a reference. This is a very good introductory text that would servewell in this capacity.
3. McCue, C., Parker, A., McNulty, P.J., and McCoy, D. Doing more withless: Data mining in police deployment decisions. Violent Crime Newsletter,U.S. Department of Justice, Spring 2004, 1, 4-5.
4. www.KXTV10.com. (2003). Despite avalanche of tips, police stymied inLaci Peterson case, January 9.
5. Eastham, T. (2002). Washington sniper kills 8, truck sketch released.October 12. www.sunherald.com
6. Agosta, L. (2000). The essential guide to data warehousing. Prentice Hall,Upper Saddle River, NJ.
Chapter 5

92 5.11 Bibliography
7. The IBR Resource Center can be found at www.jrsa.org. This is an excellentresource that includes many references, as well as analytical syntax specificto IBR data and contact information for others working with this type ofinformation.
8. Sampson, R.J., Raudenbush, S.W., and Earls, F. (1997). Neighborhoodsand violent crime: A multi-level study of collective efficacy. Science, 277,918–924.
9. McCue, C. (2001). Cops and Docs program brings police and ED stafftogether to address the cycle of violence. Journal of Emergency Nursing, 27,578–580.

6Operationally Relevant Preprocessing
This chapter covers operationally relevant preprocessing, including a specializedanalytical framework called Trinity Sight, which supports integrated analysis oftime, space, and behavioral indicators or threats. This chapter also covers somefrequently used data resources that have unique value as well as significantchallenges (e.g., telephone and Internet data).
6.1 Operationally Relevant Recoding
In general, analysts should expect to spend approximately 80% of their timepreparing the data and 20% of their time analyzing it.1 While this sounds like aterribly unattractive prospect, if the data preparation is done well, huge benefitsin the overall quality of the analysis can be reaped. Moreover, the analysts willgain additional insight into the data, which can further refine the analysis.
It frequently is advisable to categorize and recode as much continuous infor-mation as possible. Even categorical data can be further aggregated into smallersets or binary data, depending on the requirements and overall objectives ofthe analysis. For example, motive might be reduced to “drug-related” and“nondrug-related,” or “domestic” and “other.” In data mining, sets or binarydata (e.g., yes/no) seem to work well and often are preferable to continuousdata. Sets or binary data also tend to increase the likelihood that the gener-ated model will be actionable. Of course, if the data logically are continuous(e.g., pursuit speed), it does not make any sense to recode them into sets thisearly. But if it is possible to recode continuous data into categories, this canfacilitate subsequent exploration and analysis. This issue will be revisited dueto its importance to operationally relevant data mining.
This is not to say that the original data should be discarded during the recod-ing process. Recoding generally should represent the creation of new variablesthat are derived from the original data rather than replacement of the data.The original data may become particularly useful when the results are being
93

94 6.2 Trinity Sight
evaluated and validated. For example, it is not unusual for a large number ofcalls for service to be generated for the local emergency department. The abilityto link those calls back to a specific location may be important to accurateinterpretation of the findings. Similarly, when data have been derived fromunstructured narrative, it may seem reasonable to discard the original infor-mation. It is impossible to know, however, how subsequent information oranalysis may change the interpretation or meaning of the original information.Like the data mining process, data recoding also may represent an iterativeprocess. As the data are probed and explored, different strategies for recodingand analysis might emerge. Therefore, new variables should be created and theoriginal information retained.
6.2 Trinity Sight
Most problems or challenges in public safety and security can be reduced toan analysis of time, space, and the nature of the incident or threat. In responseto the unique importance of these three factors, our team at RTI Internationalhas developed the Trinity Sight analytical model. Trinity Sight is a special appli-cation of the Actionable Mining and Predictive Analysis model presented inChapter 4 and includes an integrated analysis of time, space, and the nature ofthe incident or potential threat. As always, the emphasis is on operationallymeaningful, actionable output, which frequently begins with operationallyrelevant preprocessing.
Time
There are many ways to begin exploring data for recoding; however, there aresome standard techniques that can be used to start the process. Preliminary stepsinclude parsing the data by various temporal measures (e.g., time of day, date,day of week, month, season). For ease of use, time of day can be divided intotime blocks or shifts. This is particularly useful when considering deploymentissues, as it is much easier to staff from midnight to 0800 hours than 0258 hours+/− 53 minutes. Four- to eight-hour time blocks work well for deploymentanalysis. Personnel generally do not work four-hour shifts, but using a four-hour level of analysis does afford some flexibility, as eight- or twelve-hour shiftscan be overlapped to provide additional coverage for time periods associatedwith greater anticipated workload. Shorter than four-hour time blocks becomescumbersome, as the number of time blocks within the day increases and it isunlikely that very brief time blocks will have any value from a deploymentstandpoint.

6.2 Trinity Sight 95
One exception to this is periods of time that are associated with specificincidents or anticipated events. For example, juvenile delinquency may spikefor the relatively short period between school dismissal and when parents returnhome from work. In this case, establishing a time-limited deployment strategyaround this relatively short yet high-risk time period makes sense. Similarly, it isnot unusual to observe transient increases in aggravated assaults associated withthe closing of bars and nightclubs, followed by an increase in armed robberies.In this situation, these relatively transient spikes in crime can be related to themovement of a common victim population: bar patrons. Aggravated assaults,brawls, and tussling frequently are associated with the generalized mayhem ofbar closings in areas densely populated with nightclubs. As these individualsmake their way back to their vehicles, they make good targets for street robberiesgiven the low lighting associated with the time of night and the increased like-lihood that the victims’ judgment has been impaired from a night of drinking.Therefore, an effective response to these related patterns could include relativelybrief, targeted deployment to the specific areas in question. The nightclub areawould be addressed first, with an established police presence in anticipationof bar closings and the associated crowd control issues. These same resourcescould then be flexed to parking lots, side streets, and other areas associated withstreet robberies of these same patrons. This type of fluid deployment strategycan serve as a functional force multiplier because two seemingly different crimepatterns are linked and addressed with the same resources. Because a commonvictim population is identified, the same personnel could be used to addresstwo, relatively brief, time-limited challenges that appear to be very differentat first glance (aggravated assaults and street robberies). Strategies like theserequire significant domain expertise and an excellent working relationship withoperational personnel to validate the interpretation of the results and associatedapproach. The use of creative analytical strategies and fluid deployment canoptimize public safety and security resource allocation.
Time blocks longer than eight hours often yield diminishing returns, asimportant fluctuations in activity are diminished with the increased amountof data, which can be referred to as regression toward the mean.2 Similarly,it does not make much sense to establish time blocks, even if they are theappropriate length, that do not match the existing or desired times for shiftchange. For example, in the development of a strategy to reduce random gunfireon New Year’s Eve, we found that the majority of the random gunfire occurredduring a four-hour period that spanned from 10:00 pm on New Year’s Eve to2:00 am on New Year’s Day. While it might be attractive from a cost standpointto craft a four-hour initiative to address this issue, it is not good personnelmanagement to ask the staff assigned to the initiative to come in and work
Chapter 6

96 6.2 Trinity Sight
for only four hours. In that situation, it made sense to expand the time blocksomewhat to make it more attractive to the folks working that night. If thereis not some pressing need to change existing times, it works best if the data areanalyzed and the models constructed to reflect existing shift change times.
This scheduling issue can be managed at several points along the analyticalprocess. During data entry and recoding, the analyst should consider what par-ticular time blocks would make sense from a scheduling standpoint. Doesthe department use eight-hour shifts, twelve-hour shifts, or is there someopportunity for overlap during particularly busy periods throughout the day?The answer to this question will dictate to a certain degree what level of dataaggregation more closely reflects the staffing preferences, and therefore be themost easy to interpret and use. This is not to suggest that everything shouldremain the same because “that is the way it always has been done.” This typeof thinking can really squander resources, particularly personnel resources.Rather, working within or relatively close to the realistic, real-world param-eters significantly increases the value of a model and the likelihood that it willbe used.
Recoding specific dates into days of the week is a relatively standard practice.It is important to remember, however, that time of day can be important in theanalysis of daily trends. For example, it was puzzling to discover a large numberof street robberies on Sundays until the specific times were examined. Thisanalysis almost always revealed that these robberies occurred during the earlymorning hours and actually reflected a continuation of activity from Saturdaynight. Seasonal variations also can be important, particularly if they are relatedto the migratory patterns of victim populations (e.g., tourists). Other temporalrecoding to consider may include school hours and holidays, as the unsuper-vised time between school dismissal and when parents return home from workcan be associated with considerable mischief. Curfew violations and truancyalso are associated with unique time periods that might have value if recodedappropriately.
Recoding should be considered an iterative process. As patterns andtrends are revealed, different approaches to recoding or emphasis will emerge.For example, it is not unusual to find increases in criminal activity associatedwith payday. Therefore, recoding the data to reflect paydays could add value tomodeling efforts and related operations. Similarly, events such as concerts andsporting events may be related to public safety challenges or issues. Revealingthose relationships and creating derived variables that document these eventscould result in the creation of more accurate or reliable models that will supportbetter operational decisions. The ultimate question to be answered, however,will determine what time parameters are most appropriate.

6.2 Trinity Sight 97
Space
The advancement of GIS capacity has enabled analysts to have access to veryprecise spatial data. While this information can be extremely helpful for map-ping tasks, it may not confer the same benefit to analysis. In fact, it might evenhinder analysis if it causes the analyst to focus on specific locations rather thantrying to identify general spatial patterns and trends. The criminals involvedin many patterns of offending, particularly those involved in serial crimes(e.g., burglary, robbery, rape), generally do not target the same location repeat-edly unless they are focusing on a common location for the identification of oraccess to victims. Rather, they tend to select locations that are similar in natureand/or geography. These similarities could be as simple as a series of armedrobberies in the same general location or as complicated as a group of similarlocations that span a broad geographic range. Therefore, a second task duringpreprocessing is spatial recoding.
Differences in reporting can further confound this issue. For example,a location could be reported as a specific address (401 Main Street), a hundredblock (the 400 block of Main Street), an intersection (4th and Main), a specificlandmark (in front of the convenience store), or even in terms of its longitudeand latitude. Hierarchical organizational strategies that can be expanded orcollapsed are quite useful in these situations. For example, 401 Main Streetalso could be recoded and analyzed as the “400 block of Main Street,” “MainStreet,” and a “convenience store.” Additional variables could be created thatcorrespond to various patrol areas, precincts, traffic zones, dispatch regions, orcensus tracts. Any or all of these can have value if they help to further defineand characterize a trend or pattern, and if they are actionable for the end user.While apparently simple, these decisions may not be easy or initially obvi-ous. For example, census data are rich with information that can be used tofurther characterize crime trends and patterns. Unfortunately, census bound-aries change over time and may not be linked directly to any recognized publicsafety patrol boundaries. Therefore, census data and associated tract bound-aries are limited in their ability to guide very specific deployment strategies orapproaches.
Additional spatial attributes to consider include the functional aspects ofthe location or space, particularly those attributes or features that would confersome tactical or strategic value or advantage to the suspect. Factors to considerinclude the nature of the space or facility. Is it a park, a single family dwelling,or a multiunit apartment? Is it a business? Is there known, ongoing criminalactivity such as an open-air drug market near the location of interest? Is thebehavior associated with a common person or event? Are the events or incidents
Chapter 6

98 6.2 Trinity Sight
in question associated with occupied or unoccupied dwellings? Considerationsalso include the identification of spatial features or attributes that could providecover, concealment, or easy access and/or exit for the criminal. For example,proximity to highway on-ramps may be an important qualitative feature toinclude as a variable. Banks that are in grocery stores also represent a uniquetarget and tend to show up in series. The use of orthophotography images orother detailed mapping layers can provide additional value to the analyst as theytry to reveal attributes.
It is important to remember that locations may not be fixed in space.The exact physical location may have little to no value in an analysis of unusualor suspicious behavior on a moving location like a commuter train or airplane.For example, several of the 9/11 highjackers were seated in first class, whichpresumably facilitated their access to the cockpit. In this situation, the relativeposition within the plane is the relevant spatial variable.
Notable exceptions to the “crime generally does not occur in exactly the samelocation” rule include open-air drug markets and hostile surveillance. Repeatedidentification of similar behavior or activity associated with a common locationcould suggest possible surveillance activity. Terrorists, burglars, and predatoryviolent offenders may spend considerable time observing possible target loca-tions or individuals. It is unlikely that the suspect in these situations will use theexact same location repeatedly. Rather, suspicious or unusual behavior will becorrelated in the same general location or focused on a common area or target,so it is important to identify qualitative aspects of these locations. For example,one person may be observed watching the same critical facility from severaldifferent vantage points. In this case, the observation point is important, butthe target of the observation can be even more critical to the analysis.
Two people to consider when recoding spatial data are the suspect and the enduser. Particularly in threat assessment and surveillance detection, it is importantto identify the object of the suspect’s interest. For example, if a suspicious personwas observed filming a fire drill in front of a bank, spatial variables of interestwould include not only the location of the suspect but also the target of interest:the bank. Thinking in terms of the end user, the information regarding theposition of the suspect can be used to guide surveillance detection operations.The object of the suspect’s interest, however, has significant implications forthreat assessment and related activities. Therefore, clarification of the potentialtarget can help refine the analysis further, as well as provide specific guidancefor the threat assessment. For example, noting that the suspect was observingthe north face of a school is good, but specifying interest in a specific aspect of

6.2 Trinity Sight 99
the building, like the school bus loading zone, provides even more informationregarding likely intentions and related operational value.
Always remember, though, to recode rather than replace. In some situations,the focus will change over time as the suspect refines his approach or plan.Being able to document these changes can be extraordinarily valuable from anoperational perspective, particularly if it can be used to highlight increasingspecificity of a threat or efficacy of target hardening and deterrence. So be sureto retain the original spatial measures to support subsequent analyses as thebehavior or interpretation of the behavior changes.
Nature of the Incident or Threat
The line between the spatial attributes of the incident and the nature of theincident or threat becomes increasingly blurred as the location is examined withprogressively more thought to the potential threat. For example, in a review ofstranger rapists, we found prior burglaries to be a reliable predictor.3 Furtheranalysis revealed that preferential targeting of occupied dwellings was an evenbetter indicator. While this feature could be considered as a spatial qualifier,it also had relevance in the evaluation of the nature of the incident or threat.A link between the behavioral aspects of an incident and the location can be aparticularly relevant variable when common behaviors are observed in the sameor similar locations. For example, observing someone taking a photograph of abuilding may not be relevant until it is noted that the same or similar buildingshave been photographed multiple times previously.
Some qualitative aspects can be used to document changes or infer escala-tion. For example, in an analysis of suspicious behavior in and around a criticalfacility, I categorized the behaviors generally into “photography,” which wasconfined to still photography; “video,” which included videotaped observa-tion; “approach,” which included probing the perimeter, attempting to gainaccess, or asking security-related questions of facility personnel; and “suspi-cious situations,” which encompassed everything that did not fit into anothercategory.4 The results of the analysis are covered in more detail in Chapter 14;however, recoding the nature of the activity into four discrete categories facili-tated characterization, analysis, and interpretation of the behavior, which wouldnot have been possible if the data remained in its native, unstructured form.Perhaps more importantly, this recoding strategy and analysis revealed a shift inthe suspicious behavior over time from still photography to more operationallyrelevant surveillance, including video and security probes—highlighting thisparticular facility as worthy of additional evaluation and focus.
Chapter 6

100 6.4 Data Imputation
Recoding offense information to highlight the nature of the incident orthreat can be particularly time consuming, as this information is almost alwaysincluded in the unstructured, narrative portion of the offense report, as wellas in supplementary investigative notes and even case briefings. Moreover, it isnot always readily apparent what is important, or even what the most relevantrecoding strategy might be at the beginning of an analysis. Over time, however,as the data are analyzed and/or additional cases come to the attention of theanalyst, a recoding strategy or organization generally will emerge. Most analystsrealize the importance of this information, particularly as it relates to MO, andalready engage in a certain amount of recoding. Common strategies and themesare addressed in Chapter 10.
6.3 Duplication
As mentioned in the previous chapter, law enforcement and security datafrequently contain significant amounts of duplication, which can inflate thenumbers for certain types of calls and skew analysis. For example, shots fired inan area can prompt several individuals to call 911. While it can be interestingto speculate about what it means when several people call in one neighborhoodwhile another neighborhood has less citizen involvement, police executives andcommand staff generally are more interested in what happened. That is, theirfocus is on how many specific incidents of random gunfire occurred in a par-ticular area at a specific time, not on how many people called in to report theincident. Working within the parameters of the particular data set (How arecalls numbered? Are duplicate calls identified and flagged?) will depend on thespecifics for each complaint database. The important thing, though, is that theanalyst always is aware of the potential for duplication within data and canidentify ways to address it if it will skew the analysis or results.
6.4 Data Imputation
Data imputation is the technical term for “filling in the blanks” when missingdata are encountered in a sample. There are multiple methods for data imputa-tion, but they all generally can be described as methods of determining a likelyvalue for missing data based on an analysis of available data. Many data miningsoftware tools and statistical packages include methods and tools for “filling inthe blanks” associated with missing data. Like almost anything, though, justbecause you can do something does not necessarily mean that you should.

6.5 Telephone Data 101
Missing data is a frequent occurrence in public safety and security analysis.In some situations, missing data can be important in and of itself. For example,an individual perpetrating fraud might complete every section on a fraudulentcredit application in the mistaken belief that this is routine practice for mostapplicants. The presence of missing data or common skip patterns in these appli-cations could be an important indicator of a valid application. Similarly, someinterviewing techniques or statement analysis tools (e.g., Scientific ContentANalysis, or SCAN), specifically look for missing information in a statementor interview as a possible indicator of deception. In those particular situations,the missing data are noteworthy in their absence, and to use data imputationtechniques would obscure that finding.
On the other hand, many incidents or events of interest to public safety andsecurity analysts are extremely rare. Missing data can seriously limit or even pre-clude meaningful analysis of these data, and it would seem that data imputationwould represent the only recourse in these situations. Further compounding thechallenge associated with infrequent events, however, is the finding that theserare events frequently tend to be heterogeneous. In other words, they may differbetween each other in important ways. Data imputation methods are based onthe assumption that the available data can be used to identify a reasonableproxy for the missing data. By using data imputation techniques, which fill inmissing data based on an analysis of complete records, unusual findings mightbe magnified or overrepresented. Again, just because a technique is availableto the analyst does not mean that it should be used. In some cases it is betterto accept the existing limitations of the data, even if this means terminationof the analysis, rather than to misdirect resources or otherwise compromisepublic safety.
6.5 Telephone Data
Analysis of telephone data can be extremely tedious. However, it is one areain which data mining and predictive analytics can make a huge difference inanalytical capacity. By using reverse lookup programs or websites, some valuecan be added to telephone numbers, even if specific information or identi-fiers associated with a particular number is unobtainable. For example, in theabsence of specific subscriber information or content, the telephone numbersthemselves can be decomposed, aggregated, and recoded to reveal additionalinformation regarding location. While staring at a page full of numeric data isnot much fun, manipulation of these data can reveal a considerable amountabout relationships, timelines, transactions, and a variety of other information
Chapter 6

102 6.5 Telephone Data
that holds value to public safety and security analysis. Therefore, telephonerecords comprise an extremely valuable data resource that can be exploited verywell through the use of automated methods.
There are several initial recoding steps that can add value to telephone dataalmost immediately. Many of these can be time intensive, but the major timecommitment in data mining frequently involves the initial cleaning and prepa-ration of data. This time investment almost always pays high dividends byincreasing both the data quality and our understanding of the data. Throughthe data preparation process, knowledge is increased, and subsequent analysesfrequently become apparent as the data are explored and prepared.
Most analysts know the value of reverse lookup tables and websites. In addi-tion, many analysts also know that telephone numbers can be decomposed intoseparate components that have value, even if the specific subscriber cannot beidentified. For example, a fair amount of information can be obtained from thefollowing telephone numbers:011-202-633-XXXX011-201-228-XXXXX
The first number is associated with a telephone number in Cairo, Egypt,while the second number is linked to a cell phone in Egypt. As illustrated inTable 6-1, some generic recoding can be done by breaking the numbers up intotheir component parts in a database. This will add value to subsequent analyses.
By using reverse lookup tables, information can be added to provide geo-graphic and regional specificity to the data. In some cases, individual subscriberscan be linked to a specific number. It is also frequently possible to identify orlink a particular service provider to a telephone number, even if the number isunpublished or associated with a cell phone. This service provider informationcan then be used to generate a subpoena for additional subscriber information,if necessary. Building onTable 6-1, information can be added through recoding,as shown in Table 6-2.
While this can seem tedious, recoding telephone numbers in this fashionadds value to the data that can be used later to identify and cluster seemingly
�Table 6-1 Example of preliminary recoding of telephone numbers.
International Prefix Area or Country Code Region Code Individual Subscriber
011 202 633 XXXX
011 201 228 XXXXX

6.6 Conference Call Example 103
�Table 6-2 Example of additional telephone number recoding.
Prefix Country Region Subscriber
011 International 202 Egypt 633 Cairo XXXX
011 International 201 Egypt 228 Mobile XXXXX
unique numbers based on geography and regions. This can be of tremendousvalue in and of itself and can be essential if additional, geographically specificdata (e.g., shipping records) are added to the analysis.
Additional points to consider include the fact that telephone numbers canvary in length and how the numbers are divided into sections. For example,some international numbers, like the Egyptian mobile phone number listedabove, do not have seven digits. Additional numbers associated with variousextensions or routing within a system can increase the variability in telephonenumbers. This information comes at the end of a telephone number and may(but does not always) include the “#” or “*” symbols to indicate the selectionof additional extensions. These differences can be accommodated, however,if the analyst is aware of or can anticipate them and includes some flexibilityin the data set.
The analysis of telephone data can become complicated further when thetarget of an investigation utilizes multiple telephone numbers. For example,many people now have cell phones in addition to home telephones. Whileadding a work or business phone greatly increases the amount of informationthat needs to be integrated and correlated, many new analytical packages canreadily accommodate this. In these cases, the use of date as a common link-ing variable or key generally represents a good option. Additional informationincluding meetings, delivery schedules, and financial transactions might alladd to the complexity of analyzing criminals and related organizations; how-ever, it can greatly enhance the analytical process. Again, the use of somecommon linking variable or key, such as date, can greatly facilitate analysis andinterpretation of the results.
6.6 Conference Call Example
The next example is based on an actual analysis, but many of the details havebeen changed to protect the confidentiality of the information and any asso-ciated investigations. This example highlights how complicated the analysis of
Chapter 6

104 6.6 Conference Call Example
telephone records can become, while highlighting the insight that data miningand predictive analytics can provide. In short, it would not have been possibleto analyze these data without the application of data mining and predictiveanalytics.
Recent advancements in telecommunications have influenced the way thatmany of us do business, and criminals are no exception. It now is possible tohold a meeting with individuals from the United States, South America, andthe Middle East without any of the participants needing to leave their home oroffice.
In the past, traditional surveillance techniques were used to determine rela-tionships and organizational structure by documenting liaisons and activities.While these techniques will always have value, the same telephone and Internetconferencing techniques that save time and money for businesses also afford agreater degree of anonymity to those wishing to keep their relationships andactivities hidden.
The following example is based on real case materials. While many of thedetails have been changed, the analytical approach and techniques are identical.
The local police department received a thirty-seven-page invoice that wasassociated with a large, unpaid bill (Figure 6-1). The telephone conference callservice quickly determined that the information used to establish the accountwas fraudulent, and they had no additional leads to pursue. Additional infor-mation from the company suggested that this series of calls might have beenassociated with a particular criminal enterprise. Therefore, it was determinedthat analysis of these data might provide some clues regarding the identity ofthe participants, so that the teleconference company might attempt to recoverits losses. This case also gave us an opportunity to gain additional insight intothis organization and how similar criminal organizations might use and exploitteleconferencing to plan operations and disseminate information.
The first step in the process was to obtain an electronic copy of the bill, whicharrived in text format. Unfortunately, this is not always possible. Rekeying datais both tedious and fraught with error, but it is necessary in some cases.
Like most invoices, this bill had a large amount of extraneous informa-tion that needed to be removed, including header information and additionaltext related to the organization’s invoice process (Figure 6-2). After this infor-mation had been removed, the resulting document included the conferenceIDs (a unique number assigned by the conference call company), the partici-pants’ telephone numbers, the duration of the calls, and the dates. A name waspresent in less than 5% of the cases. While it was assumed that these names

6.6 Conference Call Example 105
�Figure 6-1 Billing invoice that was associated with a large, unpaid bill.
were fraudulent, they were retained in the data because they could be used foradditional linking.
This information was then pulled into a statistical package. At this point, thearea code was separated from the rest of the information, because area codes canbe recoded to unique locations and used for additional linking or aggregatingof the information (Figure 6-3).
Initial recoding included linking a location to the area code and telephoneprefix (the first three digits of the telephone number). The date was convertedinto day of the week. Date frequently is important for determining timelinesand sequencing, while the day of the week can reveal other patterns (Figure 6-4).
An initial review of the data indicated 2,017 unique calls or records. A quickvisual check of the data, however, suggested that within particular conferences,the same individual might have dialed in more than once. Frequently, one ofthe calls was much longer while the others were of a minute’s duration or less.
Chapter 6

106 6.6 Conference Call Example
�Figure 6-2 An electronic version of the invoice was used as the starting point in the creation of
a database. This invoice included a large amount of unnecessary information andformatting that had to be removed, including headers, which have been highlighted.
Easy Dial Conference Cal1s Page1 of 37
S T A T E M E N T
NAME CONFERNC NUMBER DURATION DATE
BOB WHITE 04428769 201-615-XXXX 6 6/1/2002BOB WHITE 04428769 201-615-XXXX 27 6/1/2002MR B WHITE 04364606 201-615-XXXX 63 6/1/2002MR COOK 04428769 972-821-XXXX 54 6/1/2002MR GRAY 04428769 972-821-XXXX 4 6/1/2002MR GRAY 04428769 972-821-XXXX 25 6/1/2002MR GREY 04364606 972-821-XXXX 4 6/1/2002MR GREY 04364606 972-821-XXXX 7 6/1/2002MR GREY 04364606 972-821-XXX 213 6/1/2002MR YELLOW 04364606 312-261-XXXX 5 6/1/2002MR YELLOW 04364606 312-261-XXXX 6 6/1/2002MR YELLOW 04364606 312-261-XXXX 12 6/1/2002MR YELLOW 04364606 312-267-XXXX 204 6/1/2002MR YELLOW 04428769 312-821-XXXX 5 6/1/2002MR YELLOW 04428769 312-821-XXXX 82 6/1/2002BOB WHITE LDR 04429392 201-615-XXXX 8 6/2/2002MR B WHITE 04364607 201-615-XXXX 61 6/2/2002MR GRAY 04429392 972-821-XXXX 15 6/2/2002MR GRAY 04429392 972-821-XXXX 53 6/2/2002MR GRAY 04429392 972-821-XXXX 152 6/2/2002MR GREY 04364607 972-821-XXXX 163 6/2/2002MR YELLOW 04364607 312-261-XXXX 2 6/2/2002MR YELLOW 04364607 312-261-XXXX 2 6/2/2002MR YELLOW 04364607 312-261-XXXX 2 6/2/2002MR YELLOW 04364607 312-261-XXXX 159 6/2/2002MR YELLOW 04429392 312-267-XXXX 4 6/2/2002MR YELLOW 04429392 312-267-XXXX 4 6/2/2002
While this might be meaningful in some way, the most likely explanation wasthat these individuals had difficulty connecting to or maintaining a connectionwith the teleconference. Duplication between unique conferences, on the otherhand, had value, as it was important in the characterization of particular indi-viduals as well as the various conference calls. Therefore, a decision was made toremove the duplicate calls within a conference while retaining the duplicationacross conferences.

6.6 Conference Call Example 107
�Figure 6-3 After the headers and other unnecessary information were removed, the data were pulled
into a spreadsheet program for additional cleaning and recoding. During this step, thecountry code or regional area code was separated from the rest of the telephone numberto facilitate additional geographic recoding.
NAME CONF AREA NUMBER DURATION DATE
BOB WHITE 04428769 201 615XXXX 6 06/01/2002BOB WHITE 04428769 201 615XXXX 27 06/01/2002MR B WHITE 04364606 201 615XXXX 63 06/01/2002MR COOK 04428769 972 821XXXX 54 06/01/2002MR GRAY 04428769 972 821XXXX 4 06/01/2002MR GRAY 04428769 972 821XXXX 25 06/01/2002MR GREY 04364606 972 821XXXX 4 06/01/2002MR GREY 04364606 972 821XXXX 7 06/01/2002MR GREY 04364606 972 821XXXX 213 06/01/2002MR YELLOW 04364606 312 261XXXX 5 06/01/2002MR YELLOW 04364606 312 261XXXX 6 06/01/2002MR YELLOW 04364606 312 261XXXX 12 06/01/2002MR YELLOW 04364606 312 267XXXX 204 06/01/2002MR YELLOW 04428769 312 821XXXX 5 06/01/2002MR YELLOW 04428769 312 821XXXX 82 06/01/2002BOB WHITE LDR 04429392 201 615XXXX 8 06/02/2002MR B WHITE 04364607 201 615XXXX 61 06/02/2002MR GRAY 04429392 972 821XXXX 15 06/02/2002MR GRAY 04429392 972 821XXXX 53 06/02/2002MR GRAY 04429392 972 821XXXX 152 06/02/2002MR GREY 04364607 972 821XXXX 163 06/02/2002MR YELLOW 04364607 312 261XXXX 2 06/02/2002MR YELLOW 04364607 312 261XXXX 2 06/02/2002MR YELLOW 04364607 312 261XXXX 2 06/02/2002MR YELLOW 04364607 312 261XXXX 159 06/02/2002MR YELLOW 04429392 312 267XXXX 4 06/02/2002MR YELLOW 04429392 312 267XXXX 4 06/02/2002MR YELLOW 04429392 312 267XXXX 5 06/02/2002MR YELLOW 04429392 312 267XXXX 55 06/02/2002
As can be seen in Figure 6-5, duplicate numbers within a unique confer-ence call were deleted, while duplicated numbers across different conferencecalls were retained. Culling the duplicates revealed 1,042 unique calls. Again,these calls were confined exclusively to those without duplication of the sametelephone number within a single conference, while maintaining duplicationacross conferences.
Finally, the cleaned and recoded data set was analyzed. Using an unsu-pervised learning process, which is covered in Chapter 7, three groups orclusters of similar calls were identified based on the day of the month that
Chapter 6

108 6.6 Conference Call Example
�Figure 6-4 An additional variable was re-created, which indicated the country or general geographic
area associated with the recoded country and area codes. The date also was converted intoday of the week.
NAME CONF AREA LOCATION NUMBER DURATION DATE DAY
BOB WHITE 04428769 201 Hackensack NJ 615XXXX 6 6/1/2002 SAT BOB WHITE 04428769 201 Hackensack NJ 615XXXX 27 6/1/2002 SAT MR B WHITE 04364606 201 Hackensack NJ 615XXXX 63 6/1/2002 SAT MR COOK 04428769 972 Irving TX 821XXXX 54 6/1/2002 SAT MR GRAY 04428769 972 Irving TX 821XXXX 4 6/1/2002 SAT MR GRAY 04428769 972 Irving TX 821XXXX 25 6/1/2002 SATMR GREY 04364606 972 Irving TX 821XXXX 4 6/1/2002 SAT MR GREY 04364606 972 Irving TX 821XXXX 7 6/1/2002 SATMR GREY 04364606 972 Irving TX 821XXXX 213 6/1/2002 SATMR YELLOW 04364606 312 Chicago 261XXXX 5 6/1/2002 SATMR YELLOW 04364606 312 Chicago 261XXXX 6 6/1/2002 SATMR YELLOW 04364606 312 Chicago 261XXXX 12 6/1/2002 SAT MR YELLOW 04364606 312 Chicago 267XXXX 204 6/1/2002 SATMR YELLOW 04428769 312 Chicago 821XXXX 5 6/1/2002 SAT MR YELLOW 04428769 312 Chicago 821XXXX 82 6/1/2002 SATBOB WHITE LDR 04429392 201 Hackensack NJ 615XXXX 8 6/2/2002 SUN MR B WHITE 04364607 201 Hackensack NJ 615XXXX 61 6/2/2002 SUNMR GRAY 04429392 972 Irving TX 821XXXX 15 6/2/2002 SUNMR GRAY 04429392 972 Irving TX 821XXXX 53 6/2/2002 SUN MR GRAY 04429392 972 Irving TX 821XXXX 152 6/2/2002 SUN MR GREY 04364607 972 Irving TX 821XXXX 163 6/2/2002 SUN MR YELLOW 04364607 312 Chicago 261XXXX 2 6/2/2002 SUN MR YELLOW 04364607 312 Chicago 261XXXX 2 6/2/2002 SUN MR YELLOW 04364607 312 Chicago 261XXXX 2 6/2/2002 SUN MR YELLOW 04364607 312 Chicago 261XXXX 159 6/2/2002 SUN MR YELLOW 04429392 312 Chicago 267XXXX 4 6/2/2002 SUN MR YELLOW 04429392 312 Chicago 267XXXX 4 6/2/2002 SUN MR YELLOW 04429392 312 Chicago 267XXXX 5 6/2/2002 SUN MR YELLOW 04429392 312 Chicago 267XXXX 55 6/2/2002 SUN
the conference occurred and the number of participants involved in a particu-lar call (Figure 6-6). Further analysis of the participants involved in these callssuggested the possibility that the short calls early in the month involved the keyparticipants or leaders in the process. The gap in activity noted in the middle ofthe month possibly allowed the organizers of this criminal enterprise to ensurethat their activity had not been detected. After it was determined that it wassafe to continue, activity resumed later in the month, which escalated to abrisk pace.
The small and medium groups again involved many of the key participantsfrom early in the month, which might have been associated with the relativeimportance of these calls, their purpose, and some of the other participants. Theextremely large conference calls were consistent with the dissemination of infor-mation to large groups, such as lectures or fund raising. This activity continueduntil the end of the month, at which time it ceased abruptly. Termination of

6.6 Conference Call Example 109
�Figure 6-5 The data were culled to remove some duplicative calls that were determined to be
unnecessary for subsequent analyses.
MR YELLOW 04364606 312 261XXXX 5 06/01/2002MR YELLOW 04364606 312 261XXXX 6 06/01/2002MR YELLOW 04364606 312 261XXXX 12 06/01/2002MR YELLOW 04364606 312 267XXXX 204 06/01/2002
MR YELLOW 04428769 312 821XXXX 5 06/01/2002MR YELLOW 04428769 312 821XXXX 82 06/01/2002
MR YELLOW 04364607 312 261XXXX 2 06/02/2002MR YELLOW 04364607 312 261XXXX 2 06/02/2002MR YELLOW 04364607 312 261XXXX 2 06/02/2002MR YELLOW 04364607 312 261XXXX 159 06/02/2002
MR YELLOW 04364606 312 267XXXX 204 06/01/2002
MR YELLOW 04428769 312 821XXXX 82 06/01/2002
MR YELLOW 04364607 312 261XXXX 159 06/02/2002
activity at this time probably was preplanned, because the end of the monthalso represented the end of the billing cycle, which was when this fraud wasidentified. By terminating activity, access to those involved was also terminated,which significantly limited investigative options.
This example highlights the increased complexity associated with telephonerecords, as well as the value of recoding information and the fact that quite a bitof valuable information can be elicited from telephone data without access to theactual content of the calls or even specific subscriber information. This informa-tion can be modeled and applied to new data sets, which can reveal new infor-mation regarding the possible nature of the activity and related participants.
Key points include the importance of recoding telephone numbers inas much detail as possible. In addition, reverse lookup tables can provideinformation on country, area, and regional coding within telephone numbers,
Chapter 6

110 6.7 Internet Data
�Figure 6-6 An unsupervised learning algorithm was used to cluster the calls into similar groups.
This resulted in the identification of three distinct clusters of calls, based on the num-ber of participants and the day of the month that the conference occurred. Additionalinformation suggested possible operational differences between the clusters. (Screenshot ofTwo-Step output taken by the author is from Clementine 8.5; SPSS, Inc.)
as well as specific subscriber information in some cases. Again, it is not alwaysnecessary to identify the specific subscriber. Mining the data to identify regionalgeographic specificity can be adequate. This is particularly true in the devel-opment of scoring algorithms or classification systems. In those cases, specificsubscriber information might limit the identification of a meaningful modelthat can be applied to new data. If it is essential to identify a specific subscriber,provider information associated with the number can facilitate the informationrequest process.
6.7 Internet Data
Surveillance detection is addressed in Chapter 14, but it is worth mention-ing here. Methods of physical surveillance detection are very good; however,large categories of information might be overlooked if surveillance detectionis confined exclusively to physical surveillance. Increasingly, terrorists and

6.8 Operationally Relevant Variable Selection 111
extremist groups are utilizing Internet resources for preoperational surveillanceand information collection. “Correlation” in surveillance detection frequentlyrefers to seeing the same person or vehicle in space or time. Given the interestin technology, it might be time to extend this definition to include correlationbetween physical surveillance and surveillance activities on the Internet. Forexample, what happens if physical surveillance has been detected, and vigorouscorrelated activity is noted on a related website? Data mining tools have theanalytical muscle necessary to combine these relatively disparate and unrelateddata resources, integrate them, and analyze them in the same environment.By combining web mining tools with analysis of the products of traditionalphysical surveillance detection, a more compete model of surveillance activitycan be developed.
One aid in the task of characterizing and modeling web browsing patternsare “cookies.” Briefly, Internet “cookies” are similar to electronic breadcrumbsthat we leave behind as we move through the Internet. There are two types ofcookies: session cookies and persistent cookies. Session cookies are temporaryand only track your movement through a web site during a single visit or session.Persistent cookies, on the other hand, track your movement throughout theInternet. In some ways, persistent cookies have more value to law enforcementbecause they can help link information from a variety of websites or call outrepeat visits to the same site over a longer duration of time. These tend to beintrusive, however, particularly from a privacy standpoint, and many peopleturn them off as a matter of general principle. Unfortunately, many law enforce-ment and intelligence agencies do not set cookies on their websites, either forprivacy reasons or because they have not thought of it. Not to worry, though;if your agency does not set cookies, it still is possible to analyze and evencharacterize activity, since this type of behavior tends to be relatively uniqueyet specific, and very infrequent. These features allow the analyst to putativelylink activity based on common IP address or browsing patterns. Although notperfect, it can represent a viable option for further analysis of suspicious activity.
6.8 Operationally Relevant Variable Selection
After recoding, another area for consideration is determining which variableswill have value to the investigation, proposed operation, or analysis and shouldbe included in subsequent steps. This is not to suggest that some informationshould be discarded or excluded, but not every piece of information will havethe same amount of value in the analytical process. For example, middle namesfrequently are collected and entered into law enforcement records management
Chapter 6

112 6.8 Operationally Relevant Variable Selection
systems. I can honestly state that I have never seen this particular piece ofinformation have any predictive value whatsoever. I certainly would not start amovement to discard this information, because it does have value in terms ofidentifying unique individuals, particularly those with common first and lastnames, but it is not something that I would ever consider using in an analysisother than in some sort of link analysis or organizational chart.
Like data mining and analysis in other professions, data quality should beconsidered first. Issues regarding reliability and validity as well as the frequencyof missing data will directly affect confidence in the results and interpretationof the findings. While analysts in the applied public safety and security settinggenerally need to go with what they have, there will be situations where thedata quality issues so significantly limit their ability to effectively analyze thedata and trust the results that they must question whether it is even prudentto proceed. These decisions will almost always be situation dependent, butanalysts should always exercise caution regarding less than optimal data.
Two additional factors to consider in the selection of operationally relevantvariables are determining whether the variables of interest are available and areactionable. Even the most relevant variable has limited value if it is not availablewhen it is needed. For example, studies have shown that significant progressneeds to be made quickly on a death investigation if the case is going to besolved.5 Therefore, any information required for a motive determination modelshould be available quickly if the model is intended to provide investigativesupport. This is situation dependent. The identification of predictive variablesthat are not available in time for the immediate investigation could be consideredfor information-based prevention strategies or cold case investigation, wheretime is not an issue.
The next consideration is whether inclusion of the variable will result in amodel that is actionable. Referring back to the use of census data in modelspredicting crime, we noted that census tract boundaries change and may notmatch existing patrol boundaries. Therefore, while the information containedin census records might result in more accurate models, if the results cannot beused in the applied setting, they have limited value. It is important to rememberthat even if the relationships identified are not immediately actionable, theymay be considered for other venues. For example, in an analysis of drug-relatedviolence, we found that victims’ employment status was related to the riskfor drug-related violence in one specific location. The victims assaulted in oneparticular location were more likely to be employed, while in almost every otherlocation studied the victims tended to be unemployed. Although it was possibleto identify the victims’ employment status in a timely fashion, it appeared that

6.8 Operationally Relevant Variable Selection 113
this variable had limited value for deployment, because it was not clear howresources could be deployed to specifically address the employment status ofpotential victims. After additional consideration, however, we speculated thatthe assaults in these areas were related to robberies of individuals buying drugs.Using this working hypothesis, it was determined that the risk to these victimscould be reduced if they did not come into this particular area to buy drugs.The resulting operational strategy then focused on demand reduction in thislocation in an effort to reduce the risk for this specific group of victims.
There are other data elements with little or no value in analysis that arenot as readily apparent. Many times these elements emerge in a model as aresult of errors in logic. For example, we found that the suspect’s involve-ment in substance use and drug selling was a strong predictor of motive indrug-related murders.6 Knowledge of the suspect’s substance use patterns andcriminal history would require knowing the suspect’s identity. If we knew whodid it, then we could just ask them why. Generally, identification of a specificmotive is used to direct the investigation toward a possible suspect, rather thanthe other way around. Therefore, while inclusion of specific details regardingthe suspect might result in a highly predictive motive determination model, itwould have little value to the investigative process because the model requiresspecific suspect information to predict the motive, which is being designedto predict likely suspects. In retrospect, the circular logic is obvious, but inthe analytical environment, errors in logic such as these are not always obvi-ous. It is always important to keep focused on the ultimate goals of analysisand what is likely to be available for inclusion in the applied setting or oper-ational environment. Variable selection will be revisited during the modelingprocess.
Additional options for variable selection are available. These include stepwiseselection approaches, where the user provides an array of possible variables andthe most relevant or predictive variables are selected, and user-defined variableinclusion strategies, where the user specifically selects the variables that will beincluded in the analysis. Each approach has its own strengths and weaknesses,which are covered in Chapter 7.
Variable selection relies as much on analytical tradecraft as on science. Thisis particularly true in the applied public safety and security setting, where addi-tional consideration regarding the availability, data quality, and operationalrelevance also come into play. In the movie Apollo 13, the engineers are taskedwith creating a system that will make two incompatible carbon dioxide scrub-bing filters work together. The only catch is that they can only use parts alreadyaboard the spacecraft. The team leader walks into a conference room with a box
Chapter 6

114 6.9 Bibliography
of assorted items that they might use to create this system, and later walks outwith an ugly contraption that utilizes miscellaneous junk and a fair amount ofduct tape—but it works. It certainly is not elegant or state of the art, but it getsthe job done. Analysts are faced with a similar task, particularly when analyzinginformation associated with the investigative process. Frequently, we are givena box of seemingly useless information and are asked to create something thatwill assist in the investigative process. At times, I have discussed my analyticalwork within the operational environment with academic researchers and feltlike the proverbial country bumpkin, with my shoddy little models cobbledtogether with the equivalent of spare parts and duct tape. But that frequently iswhat is required in the applied setting. It certainly is possible to create extremelyelegant, highly predictive models, but if they require information that is notreadily available, have no relevance to the operational setting, or are so obtuseas to be inactionable, then they have no value. This can be a difficult conceptto stay on top of, but the operational personnel will yank the analyst right backinto reality with a roll of their eyes and a request for how they should know thesuspect’s middle name when they have not yet determined the possible motive.
Ultimately, variable selection is an area in which analysts must rely on theirdomain expertise to identify and select variables that are both appropriate andrelevant for inclusion in the analysis. Because only those variables selectedwill be considered, the analysts’ preconceived notions and biases can play arole in this process. All of the variables selected for inclusion in the analysis,whether appropriate or not, will at least be considered, if not included in anymodels developed. Although correlation does not mean causality, inclusion ofa particular variable in a predictive model may have implications that extendwell beyond the specific analysis. Again, any preconceived notions or biases willbe reflected in the variables selected. These are important issues to consider, ascriminal justice research is an area of science that has experienced its share ofcontroversy. Throughout history, individuals have used questionable researchsupported by loosely correlated relationships to confirm theories of criminalityand deviance based on prejudice and bias.7 As always, common sense andjudgment is an excellent partner to probable cause and ethics in the analyticalprocess.
6.9 Bibliography1. Helberg, C. (2002). Data mining with confidence, 2nd ed. SPSS, Inc.,
Chicago, IL.
2. Howell, D. (1992). Statistical methods for psychology, 3rd ed. DuxburyPress, Belmont, CA.

6.9 Bibliography 115
3. McCue, C., Smith, G.L., Diehl, R.L., Dabbs, D.F., McDonough, J.J., andFerrara, P.B. (2001). Why DNA databases should include all felons. PoliceChief, 68, 94–100.
4. McCue, C. (2004). Lecture presented to Diplomatic Security Servicepersonnel at U.S. Department of State (ArmorGroup, International Train-ing), Rosslyn, VA, May 14, June 25.
5. Wellford, C. and Cronin, J. (2000). Clearing up homicide clearance rates.National Institute of Justice Journal, 243, 1–7.
6. McLaughlin, C.R., Daniel, J., and Joost, T.F. (2000). The relationshipbetween substance use, drug selling and lethal violence in 25 juvenilemurderers. Journal of Forensic Sciences, 45, 349–353.
7. See Gould, S.J. (1981). The mismeasure of man. WW Norton & Company,New York; and Lewontin, R.C., Rose, S., and Kamin, L.J. (1984). Not inour genes. Pantheon Books, New York.
Chapter 6


7Predictive Analytics
In their Worldwide End-User Business Analytics Forecast, IDC, a globalprovider of market intelligence, divided the market and distinguished between“core” and “predictive” analytics.1 Core analytics are described as those toolsthat “analyze a current or past state,” generally focusing on descriptive statis-tics, query, and reporting. Predictive analytics, on the other hand, “are usedto determine the probable future outcome of an event or the likelihood of acurrent state where it is unknown.” These tools incorporate more sophisticatedanalytical strategies, and include data mining and modeling.
By using data mining, we can begin to characterize and describe trends andpatterns that reside in data and information. While this might help us gain abetter understanding of crime or intelligence data, it is limited in terms of theactionable intelligence or predictive models that can be obtained. To be able toanticipate, predict, and ultimately prevent bad things from happening in theworld, we need to be able to develop accurate and reliable models. Predictiveanalytics encompasses a variety of model making tools or algorithms that canbe employed to characterize historical information, which then can be usedto predict the nature and likelihood of future events or occurrences. In otherwords, although the focus has been on “connecting the dots,” that is only part ofthe task. What we really need to do is to connect the dots and use the resultingpicture to predict the next image or scenario so that we will have a chance toalter the future and prevent something bad.
7.1 How to Select a Modeling Algorithm, Part I
Although a complete understanding of exactly how these algorithms work is wellbeyond the scope of this text, a general understanding of the broad categoriesof modeling tools can help the analyst select the proper tool for the job. Just asyou do not want to bring a knife to a gunfight, you probably do not want touse a neural net for a deployment model.
117

118 7.2 Generalizability versus Accuracy
Selection should be a balance between availability and appropriateness of theparticular modeling tool. It would be naïve to insist that the algorithm selectedshould be based exclusively on the best fit for the particular data set and desiredoutcome, because most agencies do not have unlimited access to modelingtools. But confining analysis to only what is available because it is availableis probably just as inappropriate. Relegating analysis to last place and relyingonly on what is inexpensive or readily available is frequently the most expensive“cheap fix” in the public safety community. The best compromise is to anticipateroutine tasks and purchase the necessary analytical software to address this workappropriately. The personnel savings associated with the use of data miningand predictive analytics in deployment strategies is documented in Chapter 13.Similarly, the emergence of regional fusion centers has highlighted not only theenhanced analytical capacity but also the critical need for powerful analyticaltools given the increasing complexity of the data, as well as opportunities for costsharing across jurisdictions and/or agencies. Therefore, the savings associatedwith information-based decisions and shared resources can be used to expandanalytical capacity.
7.2 Generalizability versus Accuracy
Another important consideration in the selection of a specific modeling toolincludes the anticipated or desired use of the results. The topic of accuracyversus generalizability was addressed in Chapter 1; however, it is worth revis-iting within this context. Neural networks are truly amazing. That softwareengineers can even approximate human cognitive processing is a phenomenalachievement in the field of artificial intelligence. The fact that these networkscan be used in a PC environment with limited analytical training, albeit abun-dant domain expertise, was unthinkable even a few years ago. Unfortunately,neural networks have somewhat limited utility in many of the necessary publicsafety functions because they are relatively opaque. In other words, it is notpossible to just look at a neural net and understand the nature of the associa-tions, which significantly limits their applicability in certain tasks. Therefore,in many situations it is important to compromise somewhat on accuracy inan effort to identify an actionable model that can be used in the operationalsetting. While it is possible to run a scoring algorithm behind the scenes usingweb-based or remote analytical applications, the balance between accuracy andgeneralizability frequently guides model selection.
On the other hand, rule sets or decision trees can be relatively intuitive,such as “If X happens, then Y is likely to follow,” “Indicators suggestingoverkill generally imply anger or a personal relationship between the victimand perpetrator,” and so on. Even rule sets, however, can become extremely

7.4 Supervised versus Unsupervised Learning Techniques 119
difficult to interpret as the number of variables and options increase and theassociated model becomes progressively more complex. These rule sets oftenneed to be relatively transparent to ensure that they will be actionable and havevalue for the end users.
There are numerous algorithms that can be used, some specific to their associ-ated analytical tool sets or software packages. Those described in the followingsections include only a sampling but should represent a good starting pointfor consideration of specific application, desired outcome, and what is likelyto benefit each particular organization. Specific examples of these modelingalgorithms are highlighted in other chapters throughout the text.
7.3 Link Analysis
Link analysis tools can be used to identify relationships in the data. With alimited number of observations, association matrices and link charts can evenbe done by hand. As the number of observations increases, though, automatedmethods usually are required. These tools can be relatively inexpensive and mayrepresent an economical point of entry into data mining. Given this particularbenefit, many public safety agencies already use some sort of link analysis toolto analyze telephone call data. As can be seen in Figure 7-1, which illustratesan analysis of the conference call data covered in Chapter 6, associations orlinks can be depicted visually to help illuminate particular relationships in thedata. As shown in Figures 7-2 and 7-3, expert settings in some packages allowthe analyst to highlight different relationships or examine some associationsin greater detail. There are some limitations to link analysis; however, domainexpertise and a good understanding of the concept behind link analysis canhelp the analyst interpret the results. Some common pitfalls associated withlink analysis and their remedies are outlined in Chapter 3.
7.4 Supervised versus UnsupervisedLearning Techniques2
While this is somewhat simplistic, modeling algorithms can be divided generallyinto supervised and unsupervised learning techniques. Briefly, with supervisedlearning techniques, the goal is to develop a group of decision rules that can beused to determine a known outcome. These also can be called rule inductionmodels, and they include classification and regression models. Supervised learn-ing algorithms can be used to construct decision trees or rule sets, which workby repeatedly subdividing the data into groups based on identified predictor
Chapter 7

120 7.4 Supervised versus Unsupervised Learning Techniques
�Figure 7-1 Example of a sophisticated link analysis tool (Advizor Solutions, Inc.).
zoom
Many callers participated in mulitple
conference calls
�Figure 7-2 This example illustrates the ability to dissect specific attributes of a link analysis and
examine specific associations and relationships in greater detail (Advizor Solutions, Inc.).
Call Topography
Conference IDs(black dots)
Callers(light dots)
Isolated caller whomade 2 conference
calls alone
Links:• Represent participation in a conference call by a caller (Note: Duplicates removed)• Lighter shading ⇒ more recent conference calls
Dots in middle: Callers whotend to participate in morecalls

7.5 Discriminant Analysis 121
�Figure 7-3 This figure illustrates a “profile” of the top caller in context of all other callers. This caller
participated in more conference calls throughout the period (almost daily), and accountedfor some of the highest duration calls (Advizor Solutions, Inc.).
variables, which are related to the selected group membership. In other words,these techniques create a series of decision rules that can be used to separatedata into specific, predetermined groups. The use of classification models inautomated motive determination is described in Chapter 11. Some model-ing algorithms are designed specifically for categorical data, while others canaccommodate numeric as well as symbolic data. Rule induction models thatcan accommodate continuous data still end up parsing them into categories byidentifying breaks, or establishing “cut points,” in the range.
7.5 Discriminant Analysis
Discriminant analysis is covered in more detail in Chapter 11. Briefly, one ofthe assumptions of this model is that the data are categorical. This assumptioncan be violated with a certain degree of confidence given the relative strength ofthe algorithm and the nature of the errors likely to occur. Specifically, the typeof error more likely to occur if the assumptions are violated with discriminant
Chapter 7

122 7.6 Unsupervised Learning Algorithms
analysis is a failure to find a relationship in the data even though one may exist,and it is almost always better for the analysis to come up empty than to identifya spurious or false relationship in the data.3 I mention this point not to suggestthat the analyst should habitually violate rules and assumptions associated withmodeling algorithms. Rather, I wish to highlight two key points about predictiveanalytics and the associated modeling algorithms. First, some of the rules andassumptions associated with these techniques are more important than others,and it is possible to exercise some discretion with the statistical algorithms.And second, these tools are designed to identify and model relationships in thedata. The type of error most likely to occur is a failure to identify a relationshipwhen one actually exists. While this may be frustrating and even limiting ifthe analyst is being asked to provide information-based support for a particularoperation or investigation, unreliable, inaccurate, or spurious findings carry afar greater risk to public safety in most situations.
7.6 Unsupervised Learning Algorithms
Unsupervised learning algorithms are used to group cases based on similarattributes. These models also are referred to as self-organizing maps. Unsu-pervised models include clustering techniques and neural networks. Differentalgorithms use different strategies for dividing data into groups. Some methodsare relatively straightforward, quickly dividing the cases into groups based oncommon attributes or some other similarity. The Two-Step clustering methoddiffers somewhat in that an optimal number of clusters is determined in an ini-tial pass through the data, based on certain statistical criteria. Group assignmentis then made on a second pass through the data; hence the name “Two-Step.”Neural networks are more complicated than some of the other unsupervisedlearning algorithms and can yield results that are difficult to interpret.
Cognitive Neuroscience and Neural Nets
“My religion consists of a humble admiration of the illimitable superior spirit who revealshimself in the slight details we are able to perceive with our frail and feeble mind.”
Albert Einstein
For as long as I can remember, I have been fascinated by science and the wonders of the universe. Fromstargazing in the backyard with the homemade telescope that my father and I built to the absolute

7.7 Neural Networks 123
awe that I experience when contemplating the vastness of the cosmos and the subtle elegance of nature,I have been hooked on science from the start.
During college I began to focus my interest on neuroscience and the brain. What an incrediblemachine! As I sit here now I can recall the muffled quiet of my first snowfall at Dartmouth, the soundof a lawnmower running on a Saturday morning from my childhood in Downers Grove, Illinois, and thesmell of fresh cut grass. I can see the windows steam up in our kitchen on Thanksgiving, and smell mymother’s turkey, which I never have been able to replicate. The truly amazing thing about all of this,though, is that all of these memories, including their associated sights, smells, and sounds, reside in a massof biological material sitting between my ears that basically has two settings: on and off. Some might arguethat neuromodulators and other similar entities complicate the situation somewhat, but the bottom lineis that neurons, the basic components of our brains, are either on or they are off. Like a computer, it isthis combination of “on” and “off,” the interconnectedness of these simple elements and the associatedparallel processing, that gives us the complexity of what we know to be brain function.
While I do not necessarily hold the conviction with Descartes that the seat of my soul residessomewhere at the base of my brain, I do know that everything from unconscious activities like breathingto my preference for the color green sits up there with rarely a conscious thought from me. More to thepoint, I know that the individual differences that make the world so interesting, as well as the similaritiesboth between and within humans and their behavior that allow me to do my job as a behavioral scientist,also reside in this neural computer.
Analysts spend a considerable amount of time trying to categorize and model the complexities ofhuman behavior. This practice is complicated even further for crime analysts because the behavior beingmodeled differs in some way from “normal” behavior, if only for the reason that it is illegal. In additional,criminal behavior tends to be relatively infrequent and is something that most folks have limited experiencewith outside of the public safety and security worlds. The ability to reduce these behaviors to patterns andtrends that can be not only described but even anticipated or predicted in some situations still amazes mebecause it says as much about human nature as it does about analysis. In many ways, predictive analyticsand artificial intelligence are fascinating in their power and complexity, but perhaps the real wonder is thefact that human behavior can even be modeled and predicted at all.
The most incomprehensible thing about the world is that it is comprehensible.
Albert Einstein
7.7 Neural Networks
One of the most fantastic things about nature is her ability to create complexitywith unique combinations of a few simple elements. With a few exceptions
Chapter 7

124 7.7 Neural Networks
and some variation, the entire complexity of the human brain is created withtwo simple elements: neurons and synapses, the connections between neurons.All of our memories, our ability to engage in routine tasks like driving or playinga musical instrument, our capacity to think, even our sense of humor comesdown to unique combinations of neurons or synapses.
As the field of cognitive neuroscience has developed and progressed,scientists have been able to replicate some elements of human cognition. Thebrain is composed of a relatively small number of common elements. It isthe complex arrangement of these fundamental building blocks, the neurons,that achieves the tremendous complexity that we associate with the humanbrain and cognition. In some ways, the brain can be compared to the “SixDegrees of Kevin Bacon” game. Just as you can connect Kevin Bacon to anyother actor with six or fewer links, neuroscientists often brag that they canconnect any two locations in the brain with only a few synapses. It is theseconnections that add the complexity necessary to model complex processes anddata. Figure 7-4 depicts a very simple neural network. This particular networkincludes an input layer with four neurons, a hidden layer with three neurons,and an output layer with two neurons. More complex models could incor-porate additional hidden layers, which greatly increases the possible numbersof connections and associated complexity of the model. This ability to layer
�Figure 7-4
Simplified neuralnet model. Output layer
Input layer
Hidden layer

7.9 How to Select a Modeling Algorithm, Part II 125
connections adds a tremendous degree of additional complexity using onlya few common elements. Complexity is achieved through the nature of therelationships and the relative strength of the associations, which can result fromrepeated use or learning.
We see this repeated throughout nature and even behavior. Computerscientists have been able to replicate certain aspects of neural processing throughthe development of neural network algorithms. While perhaps simple in theirbasic elements, these sophisticated algorithms can be used to model extremelycomplex associations and relationships.
7.8 Kohonan Network Models
Kohenan network models are a type of neural network. The two unique featuresassociated with Kohonen networks are unsupervised learning and competition.Unsupervised learning models do not create models based on preexisting groups,clusters, categories, or classification schemes. Rather, these pattern recognitiontools seek to identify and characterize the underlying form and natural structurein a given data set, based on the attributes selected for inclusion in the model.In other words, the “correct” output is not known a priori, but is determinedthrough the analysis. “Competition” refers to how the structure of the modelis determined, which is based on how the human brain learns and is modifiedby the learning process. Also like the brain, which organizes similar or relatedfunctions in distinct and interconnected anatomical locations, Kohonen net-works group similar clusters in close proximity and dissimilar clusters at greaterdistances. Therefore, unlike other pattern recognition algorithms, the relativeposition of the clusters identified in a Kohonen network have additional valuein that clusters that are relatively close share more similarities than those posi-tioned at greater distance on the map. Perhaps for these reasons, the Kohonennetwork, or self-organizing map, is one of the more popular neural networkmodeling techniques.
7.9 How to Select a Modeling Algorithm, Part II
With the increased availability of comprehensive data mining suites, there isa dizzying array of modeling algorithms available to the analyst. Even afterdecisions are made regarding analytical strategy and the numeric features of thedata have been evaluated, there still may be more than one modeling algorithmthat would be a good match. It is entirely appropriate to run the data more than
Chapter 7

126 7.10 Combining Algorithms
�Figure 7-5 This figure highlights a model comparison feature that can be used to compare directly
different modeling approaches or strategies. (Created with SAS software. Copyright 2006,SAS Institute Inc., Cary, NC, USA. All Rights Reserved. Reproduced with permission ofSAS Institute Inc., Cary, NC.)
one way in an effort to find the analytical approach or algorithm that works best.It is unlikely that one particular modeling technique will emerge as a runawayleader, but subtle differences are not only possible, they are expected. As canbe seen in Figure 7-5, the Enterprise Miner includes a feature that allows theanalyst to run the data using more than one tool and then to compare the results.While this automated approach makes direct comparison relatively easy, it isstill possible for the analyst to run the data using several different approachesand expert settings and then compare the outcomes using the strategies forevaluating the results described above.
7.10 Combining Algorithms
Different modeling algorithms also can be used in sequence. For example, theanalyst can use unsupervised approaches to explore the data. If an interestinggroup or relationship is identified, then a supervised learning technique can bedeveloped and used to identify new cases. An example of this approach can beseen in fraud detection.
A similar combined approach includes the direct, sequential use of unsu-pervised and supervised learning algorithms in the same analysis. Using thisapproach, the unsupervised learning approach is run against the data. The groupassignment generated by the clustering algorithm then becomes a variable thatis used in the decision tree algorithm. A sample of this approach is shown inFigure 7-6.

7.12 Internal Norms 127
�Figure 7-6 This figure illustrates the sequential use of unsupervised and supervised algorithms in
the same analysis. (Created with SAS software. Copyright 2006, SAS Institute Inc.,Cary, NC, USA. All Rights Reserved. Reproduced with permission of SAS Institute Inc.,Cary, NC.)
7.11 Anomaly Detection
The subject of outliers was addressed briefly in Chapter 5. Within that context,outliers were seen as a hindrance—something that needed to be addressed orovercome. What happens, however, when these outliers have significance ormeaning? In law enforcement and intelligence analysis, sometimes the mostinteresting aspects of the job are these outliers. These anomalies in the data canalso be cause for significant concern.
7.12 Internal Norms
Seasoned investigators generally have excellent internal norms or gut instincts.It is not unusual when things are a little odd to have a group of detectivesstanding around a crime scene commenting on how something “just doesn’tfeel right” or reviewing something in an offense report and getting secondopinions. Frequently, what they are saying is that their anomaly detector hasgone off, although they probably will use less delicate terminology.
Sometimes an investigator’s internal anomaly detector will point out thatthings are just outright strange. The investigative training process resemblescase-based reasoning in many ways. Investigators come to understand a newexperience or a new case based on their prior experiences.4 By accumulating averitable internal database of previous cases and associated outcomes, they canattempt to match each new experience to their internal library. If an experiencematches a previous case, they have an internal scenario that can be used to
Chapter 7

128 7.13 Defining “Normal”
structure the current investigation. For example: A husband calls and reportshis wife missing; wife found murdered with signs of overkill; previous casesindicate domestic homicide; interview husband. If something new does notfit into their past experiences in any sort of logical fashion, then they haveencountered an anomaly, which requires further inquiry to either fit it into anexisting norm or create a new category. In many cases, listening closely to theseinternal anomaly detectors frequently can highlight situations or individualsthat bear further scrutiny.
7.13 Defining “Normal”
People often get tripped up and caught when they try to behave normally or“fly under the radar.” In many cases, however, they often do not have a goodsense of what normal truly looks like and get caught out of ignorance or becausethey stand out by trying to be inconspicuous. It is difficult to completely under-stand what normal looks like until we characterize it and then analyze it in somedetail. It is for this reason that understanding normal trends and patterns, aswell as “normal” abnormal trends and patterns, can be a valuable componentof public safety domain expertise.
How It Works
Briefly, there is a variety of clustering algorithms that group cases based onsimilarities between them.5 This clustering is something that is done in lawenforcement and public safety on a regular basis. For example, homicides aregrouped based on motive, while robberies can be grouped based on the locationof the incident (e.g., street, commercial, bank), whether the suspect was armed,or the value of what was taken (e.g., petit versus grand). What happens, though,when something is outside the norm, when it does not fit into any of thesepredetermined categories? These cases fall into the category of outliers, whichcan have a significant impact on model construction and evaluation if they arenot identified and addressed. As shown in the framed area in Figure 7-7, threecases do not fit into any of the larger clusters. These represent anomalies orpossible outliers in the data, something that is difficult to evaluate until thesecases have been examined in closer detail.
Sometimes, however, an anomaly represents more than just statistical clutter.Particularly in law enforcement and intelligence detection, anomalies often arecause for concern because they frequently indicate that something is where itdoes not belong, is doing something unusual, or has a potential for escalation.

7.13 Defining “Normal” 129
�Figure 7-7 This
figure illustratesthe results of a
clusteringalgorithm. Thebox highlights
three anomalouscases in the data
set, which do notfit into any of the
other clusters.(Screenshot taken
by the author isfrom Clementine8.5; SPSS, Inc.)
In general, deviations from normal in law enforcement and intelligence analysisindicate cause for concern and further evaluation.
Anomaly detection can have significant value in law enforcement andintelligence analysis and should be included in the core analytical functions.While automated detection systems can be wonderful, those without access tosophisticated software resources are encouraged to at least develop some under-standing of the “normal” crime within their purview. Many of the exampleshighlighted in other chapters were developed without access to sophisticateddata mining software. Periodically running frequency distributions and char-acterizing crime trends and patterns using descriptive statistics can greatlyincrease an analyst’s ability to detect unusual or emerging patterns. These“brute force” techniques, while not terribly elegant, still get the job donewhen nothing else is available and should be included as an essential analyticalfunction.
Outlined in the following sections are a few examples of the many potentialuses for anomaly detection within the public safety setting. Again, knowledgeof “normal” represents a very important component of the analyst’s acquireddomain expertise because in the public safety environment almost any devia-tion from normal or expected is cause for concern and further investigation.Moreover, it is extremely important to have a valid baseline upon which thesedeviations can be characterized and evaluated.
Chapter 7

130 7.15 Deviations from Normal Behavior
7.14 Deviations from Normal Patterns
It is almost always easier and more effective to respond to an emerging trend orpattern than to one that is established. The Regional Crime Analysis Program(RECAP) developed by researchers at the University of Virginia includes auto-mated control charting.6 Briefly, this control-charting function plots averagefrequencies of crime. Thresholds for unacceptable deviation from average fre-quencies can be preset. The analyst is alerted if the frequency transcendsthis preset threshold, which indicates that further inquiry into the change infrequency is warranted. This program can be set to run during the evening,providing any necessary alerts to the analytical personnel each morning.
The Cops & Docs program, developed by the Richmond, Virginia, PoliceDepartment in collaboration with local health care providers, has created asimilar program for drug-related incidents.7 Although it is not automated atthis point, local health care providers and law enforcement personnel sharedrug-related incident information in recognition of the fact that this type ofinformation frequently transcends both professional domains. Some drug over-doses result in a telephone call to the local poison control center; others end upin the emergency department; others go directly to the morgue. Consequently,health care providers and law enforcement personnel have only limited accessto the entire array of drug-related incidents. By sharing information withinappropriate legal and ethical guidelines, even through informal communica-tion routes, the ability to compile and monitor drug-related incidents in aneffort to detect deviations from normal is increased significantly. Althoughinvolving brute force techniques, this method has proven to be relatively effec-tive in identifying increases in drug-related incidents of potential concern toboth health care and law enforcement providers.
7.15 Deviations from Normal Behavior
The relationship between property crimes and stranger rapes has been dis-cussed in other chapters. The salient feature for anomaly detection, however, isthat even criminal behavior is associated with normal trends and patterns. Forexample, if the primary goals of a burglary are economic gain and to escapewithout detection, breaking into an occupied dwelling and taking something oflittle or no value would be unusual and counter to the assumed primary motiva-tions of the crime. Upon subsequent examination, there frequently is additionalsecondary gain associated with these crimes that indicates the potential forsignificant escalation into violent crime, particularly sexually violent crime.8

7.15 Deviations from Normal Behavior 131
Staged Crimes
The subject of “normal” crime is addressed in Chapter 10. The following exam-ple illustrates how a good understanding of normal criminal behavior can reveala possible staged crime or false allegation. Several years ago, a call came inadvising that an older gentleman had shot and killed his caretaker. The suspectreported that he had to shoot his caretaker because she had grabbed a knifeand attempted to stab him during an argument. Almost immediately the storywas suspicious. As can be seen in Figure 7-8, the suspect was standing next tothe door when he shot the victim. Not only was he close to an exit, but hehad cornered the caretaker, effectively blocking her escape. People occasionallymake unusual decisions when involved in a violent confrontation, but choos-ing not to flee the aggressor, as the caretaker was portrayed, would be unusual.This is particularly true given the proximity to the exit and the relative easewith which the suspect could have escaped this particular situation and gonefor help. People lie, however, especially if they believe that it will cast them in afavorable light. Perhaps the suspect had not been completely honest regardinghis role as an unwilling participant in the argument, fearing only for his lifewhen faced with the attacking caretaker. In most situations, it takes at least twofor an argument. It is entirely likely that the argument had been more recip-rocal than the gentleman had originally conveyed in this statement; however,something still felt strange.
Further review of the crime scene was consistent with the story. There was aknife on the right side of the victim’s body, next to her left hand. Left-handednessis relatively infrequent within the population, and a relatively easy mistake in
�Figure 7-8
Scene diagram ofa staged crime.
V
S
Exit
Knife
S – Suspect
V – Victim
Chapter 7

132 7.16 Warning! Screening versus Diagnostic
staging a crime is to take a knife in the right hand and drop it on the right sideof the victim, not realizing that it would be next to her left hand—an error inlogic. As it turned out, the suspect had staged the scene, planting the knife ina hurry without consideration for the handedness of the victim.
Sometimes things just look too good, too consistent, or too homogeneous.One tipoff to an embezzlement case was that the frequency of checks writtenfor whole dollar amounts was extremely high. This was especially unusualgiven that the checks ostensibly were written to pay bills and reimburse otherroutine expenditures. When we ran a frequency distribution on the amounts,the pattern became even more unusual: The number of checks written for $100was unusually high, particularly compared to what we would expect for usualexpenses.
What Are the Odds?
Things that occur with unusually high frequency also can be suspect. In 2005,a college coed staged her disappearance shortly after she reported being thevictim of a rather unusual abduction. Abductions by strangers are extremelyrare. Therefore, one might ask what the likelihood is that the same individ-ual would be abducted twice within such a short period of time—particularlyabductions associated with unusual circumstances. In another example, we wereable to trace several individuals involved in suspicious behavior around a crit-ical facility to addresses that were within walking distance from one another.While not definitive indicators of wrongdoing, most investigators and ana-lysts tend to become extremely suspicious when encountering coincidenceslike these.
7.16 Warning! Screening versus Diagnostic
In medicine, like many other professions, there is a difference between a screen-ing tool and a diagnostic tool. A screening test highlights possible cases, whilea diagnostic test provides confirmation. A screening test is not presumptiveevidence of anything other than that further evaluation is warranted. Similarly,in crime and intelligence analysis, anomaly detection should be considered ascreening process. While unusual or unlikely events often indicate somethingmore serious, they are not infallible. They pick up a number of other things,including equipment malfunctions, data entry error, and garden variety outliers.As such, they need to be interpreted with extreme caution until additionalinformation has been collected and evaluated.

7.17 A Perfect World Scenario 133
7.17 A Perfect World Scenario
In a perfect analytical world, there would be a variety of scoring systems run-ning that would automatically look at information presented (regarding a case,a medical claim, etc.) and analyze that information in terms of its deviationfrom the normal. In this perfect world, anomaly detectors also would be run-ning quietly in the background, constantly “sniffing” for something unusualthat might indicate that trouble is brewing. More and more we realize thatcriminals study our methods and techniques. It is not unusual to find booksand papers outlining police methods and procedures among criminals’ personaleffects. In one particular case, a teenage murderer was caught because the inves-tigator was able to elicit a confession by manipulating the suspect’s knowledgeof police procedures and forensic techniques. Subsequent search of the suspect’sbedroom revealed several books on serial killers and murder investigation. Morerecently, evidence has emerged indicating that Al Qaeda operatives have beenstudying the principles of Fourth Generation Warfare,9 while the Iraqis wereresearching psyops and related topics in the days prior to the most recent GulfWar.10 How do we accommodate this constantly evolving game of cat andmouse? By building a better mousetrap.
Many scoring algorithms are designed to detect known patterns of criminaloffending or unusual behavior. When a new pattern of criminal or suspiciousbehavior is identified, it can be characterized and modeled. The resulting modelcan then be used as a scoring algorithm to evaluate each event for signs thatindicate similarities with known patterns of criminal or suspicious behavior.If similarities are noted, the incident can be flagged and evaluated further.How likely is it, though, that we can anticipate every possibility for suspiciousor criminal behavior? Generally, it is the ones that we do not know about orhave not anticipated that catch us each time. Rather than trying to “connectthe dots” after something has happened, would it not be better to develop somesystem that would alert us to patterns of behavior and activities that are unusualor out of the norm, particularly within the public safety setting?
If there is one constant in crime analysis, it is that the creativity of thecriminal mind seems unbounded. It is often amazing to see what lengths someindividuals will go to in an effort to break the law. Therefore, if detectionsystems are required to be based exclusively on known patterns of criminalor suspicious behavior, we are always going to be playing the game of catch-up. While it is not likely that all of the possibilities can be anticipated, thereis another solution. Running anomaly detection in parallel with traditionalscoring algorithms further increases the likelihood that we will identify criminalor suspicious behavior that we do not know about (Figure 7-9). Clearly, this
Chapter 7

134 7.17 A Perfect World Scenario
�Figure 7-9 This
figure illustratesthe concept of
running anomalydetection in
parallel withtraditional
scoringalgorithms in aneffort to further
increase thelikelihood that
criminal orsuspicious
behavior will bedetected.
Scoring algorithm
Scoring algorithm
Scoring algorithm
Scoring algorithm
Data
Anomaly detection
system would not catch everything, but it would represent an analytical safetynet for those patterns of activities or behaviors that we do not know aboutcurrently or have not anticipated.
Which Tools???
The META Group market analysis of data mining tools11 recently has identified market leaders andprepared a forecast of future market trends in data mining technology. The report advised that leadershippositions for data mining vendors have been established by SAS, SPSS, and Oracle, and that marketgrowth in this area is expected to occur in the development of tools specifically designed for use byless technical users in niche markets. This is consistent with the IDC analysis,12 which recommends that“users of analytics should look for individualized relevancy . . . and the ability to easily move from analyticsto decision to action.”
Market share and success in other professional domains is an important consideration; however, otherissues including flexibility, power, and a user-friendly interface can significantly affect the analysts’ abilityto effectively use these tools and realize their potential in the applied setting. Even the most powerfultool will have limited value if the analysts cannot get their data into it, use it, and create operationallyactionable output. There are several good reviews of data mining tools that cover these issues,13 andmore products are being released and reviewed almost daily.

7.18 Tools of the Trade 135
Another issue for consideration is what other agencies are using. As discussed in this chapter, theanalytical processes can be captured, saved, and shared. This represents a unique opportunity for theapplied public safety and security community to share knowledge without needing to share data. Criminalsdo not respect jurisdictional boundaries and even exploit them in many patterns of offending. Data sharinghas been an issue fraught with technical limitations related to incompatibility between legacy systems and,perhaps more challenging, a general unwillingness or legal inability to effectively share data. By usinganalytical tools that can capture, save, and share analytical strategies, separate jurisdictions and agenciescan share knowledge without needing to share data.
As of this writing, the “niche market” of less technical subject matter experts described by the METAGroup is already being exploited. SPSS and Information Builders recently teamed in the development ofa law enforcement data mining application specifically created for use in the applied setting. Based onthe research and analytical framework developed by RTI International, this tool was specifically createdto support deployment decisions. Given the current interest in public safety, security, and intelligenceanalysis, other companies are sure to follow this example.
Regarding cost, there is no way around the issue; this is expensive stuff. Analytical software is notinexpensive and data mining software falls into the high end of the range. It is possible to do data miningwithout sophisticated software, although it really helps. Predictive analytics requires specialized softwareresources. This investment is what separates the men from the boys, so to speak. In contrast to evena few years ago, these products now are available for purchase “off the shelf” and can be used by meremortals. Many in law enforcement will experience sticker shock when considering the purchase of theseproducts. While it is true that the software purchase price will not compare favorably with the costof ballistic vests, radios, or even cruisers, the amount of money saved through effective deployment ofpersonnel resources can pay for these products quickly. The increased public safety achieved througheffective deployment and enhanced investigative efficacy can be difficult to quantify. Suffice it to say that asafe community attracts business, residents, and visitors, which can greatly enhance the economic healthof any location and pay for additional software upgrades.
Ultimately, it is important to remember that these tools support the data mining process and incor-porate the mathematical algorithms necessary but not sufficient for some of the data preparation andmodeling. As outlined in Chapter 4, it is the domain expertise and ability to create operationally actionableoutput that is the priceless element in the applied public safety and security analytical process.
7.18 Tools of the Trade
Some specific modeling algorithms and approaches were covered earlier in thischapter, and specific strategies also are suggested in each chapter. The following
Chapter 7

136 7.18 Tools of the Trade
section will go through the general layout and use of two popular data miningtools: Enterprise Miner (SAS) and Clementine (SPSS).
Figure 7-10 depicts a sample analytical “stream” that was used to analyze theconference call data reviewed in Chapter 6. This example was generated withthe Clementine suite of predictive analytics (SPSS Inc.). Figure 7-11 depicts a
�Figure 7-10 Sample Clementine Stream. Not all analytical packages use the same tools or format for
cleaning and recoding data; this illustration has been provided to depict the analyticalprocess. (Screenshot taken by the author is from Clementine 8.5; SPSS, Inc.)
�Figure 7-11 Sample Enterprise Miner analytical process. (Created with SAS software. Copyright
2006, SAS Institute Inc., Cary, NC, USA. All Rights Reserved. Reproduced withpermission of SAS Institute Inc., Cary, NC.)

7.19 General Considerations and Some Expert Options 137
similar analytical pathway that was generated using the SAS Enterprise Miner™data mining solution. Enterprise Miner and Clementine are increasing inpopularity among law enforcement and intelligence professionals, particularlyin light of the powerful analytics and ease of use.
Moving from left to right, the first icon indicates the source of the data. Thissource node specifies the location of the data to be analyzed in this particularanalytical stream. Although not depicted in this example, there are times whereit is useful or even necessary to merge data sources, which would require theinclusion of more than one source node.
The next node in the Clementine stream is the “type” node, which specifiesthe nature of the data to be analyzed. Different analytical packages addressdata specification in different ways, some with greater degrees of flexibilitythan others. Data definition is important in modeling because certain analysesrequire specific mathematical properties of the data.
The node that follows is a distinct node. As discussed in Chapter 6, there wasunnecessary duplication in the data set that would potentially compromise theanalysis. Therefore, the data were culled to remove the unnecessary duplicationwithin the data set.
The next node in the stream is the modeling node. In this particular example,a clustering algorithm was used to create groups of similar cases. This also isreferred to as an unsupervised learning approach because it does not start witha predetermined outcome or classification system.
The Enterprise Miner process includes a segmentation icon, which randomlyassigns the data into training and test samples. This analytical process alsoincorporates the use of multiple modeling algorithms, and includes an iconthat later will be used to evaluate and compare these different modeling tools.
7.19 General Considerations and SomeExpert Options
Some packages will “read” the data and identify preliminary numeric properties.Additional steps include selection of the target variables and the identificationof which variables should be included for further consideration and modeling.While it might seem foolish to leave anything out, most data sets generallyinclude information that would be inappropriate or irrelevant for modeling(e.g., case ID numbers). Figure 7-12 illustrates the Enterprise Miner dialogbox that allows the analyst to select variables for inclusion in subsequentanalyses.
Chapter 7

138 7.21 Prior Probabilities
�Figure 7-12 Sample dialog box illustrating the selection of variables. (Created with SAS software.
Copyright 2006, SAS Institute Inc., Cary, NC, USA. All Rights Reserved. Reproducedwith permission of SAS Institute Inc., Cary, NC.)
7.20 Variable Entry
Stepwise entry of data allows the inclusion of only those variables contributingto an increase in accuracy, in order of importance. Once the preset accuracyis achieved, no additional variables are included. There are other options thatallow the analyst to select additional strategies for variable inclusion, but thestepwise entry method is the most common.
7.21 Prior Probabilities
The issue of prior probabilities and its particular relevance in modeling rare orinfrequent events was mentioned in Chapter 1. Figure 7-13 illustrates a sampledialog box that supports this particular function. As can be seen, the programautomatically determines the prior probabilities of the target and accordingly

7.22 Costs 139
�Figure 7-13 Sample dialog box illustrating the automatic determination prior probabilities. (Created
with SAS software. Copyright 2006, SAS Institute Inc., Cary, NC, USA. All RightsReserved. Reproduced with permission of SAS Institute Inc., Cary, NC.)
sets the expected probabilities in the model. The analyst can adjust these prob-abilities in this dialog box in an effort to alter the predicted occurrence of thetarget; however, this usually is not necessary. In some modeling packages, theprior probabilities are preset to 50:50 and the analyst must determine the fre-quency of the target and adjust the prior probabilities manually to accuratelymodel and predict rare events. This generally is not a problem unless the ana-lyst forgets to do it. In these packages, the prior probabilities are automaticallydetermined and used in the modeling and prediction.
7.22 Costs
Costs were also mentioned in Chapter 1. Figure 7-14 illustrates the sam-ple dialog box. As much art as technology, the analyst simply adjusts thecosts of certain types of errors and then reviews the accuracy achieved todetermine the best trade-off for the particular analysis. It frequently takes a
Chapter 7

140 7.22 Costs
�Figure 7-14 Sample dialog box illustrating options for adjusting the cost of errors. (Created with SAS
software. Copyright 2006, SAS Institute Inc., Cary, NC, USA. All Rights Reserved.Reproduced with permission of SAS Institute Inc., Cary, NC.)
series of successive approximations before the “sweet spot” is found and themost favorable distribution of errors achieved.
As can be seen from the examples above, the new technology greatlyfacilitates analysis. Moreover, the inclusion of some of the expert options,including the abilities to determine prior probabilities and adjust costs, canhelp the analyst construct models that directly address some of the uniquechallenges and needs associated with applied public safety and security anal-ysis. These tools are very likely to improve even further between the time ofthis writing and the actual publication of this text, as each new release ofa data mining tool or suite includes greater functionality and capacity pack-aged in a more intuitive interface. All that being said, domain expertise alwayswill be the essential ingredient in applied public safety and security analysis.A quick review of the Applied Mining and Predictive Analysis model outlinedin Chapter 4 underscores the fact that analytical tradecraft and domain exper-tise are key — all the math in the world cannot save something without soliddomain expertise.

7.23 Bibliography 141
7.23 Bibliography1. IDC (2004). Worldwide end-user business analytics 2004-2008 fore-
cast: Core versus predictive; http://www.marketresearch.com/product/display.asp?productid=1073540
2. Helberg, C. (2002). Data mining with confidence, 2nd ed. SPSS, Inc.,Chicago, IL; and Two Crows (www.twocrows.com), which is an excellentsource of accurate, yet easy to understand information on data mining andpredictive analytics.
3. Klecka, W.R. (1980). Discriminant analysis. Quantitative Applications inthe Social Sciences.
4. Casey, E. (2002). Using case-based reasoning and cognitive apprentice-ship to teach criminal profiling and Internet crime investigation. KnowledgeSolutions; www.corpus-delicti.com/case_based.html
5. Helberg (2002).
6. Brown, D.E. (1998) The Regional Crime Analysis Program (RECAP):A framework for mining data to catch criminals. University of Virginia.
7. McCue, C. (2001). Cops and Docs program brings police and ED stafftogether to address the cycle of violence. Journal of Emergency Nursing, 27,578–580.
8. McCue, C., Smith, G.L., Diehl, R.L., Dabbs, D.F., McDonough, J.J., andFerrara, P.B. (2001). Why DNA databases should include all felons. PoliceChief, 68, 94–100.
9. Papyrus News. (2002). Fourth-generation wars: Bin Laden lieutenantadmits to September 11 and explains Al-Qa’ida’s combat doctrine,February 10; https://maillists.uci.edu/mailman/listinfo/papyrus-news
10. McWilliams, B. (2003). Iraq’s crash course in cyberwar. Wired News,May 22.
11. METAspectrum Market Summary (2004). Data mining tools: METAsprec-trum evaluation.
12. IDC (2004).
13. For specific product reviews, see Elder Research, Inc. at http://www.datamininglab.com, or KDnuggets.com.
Chapter 7


8Public Safety–Specific Evaluation
One question that comes up with increasing frequency is: How effective is aparticular deployment strategy or operational plan at reducing crime? Whatworks? More and more, funding agencies, government organizations, evencitizen groups are expecting outcome information demonstrating the efficacyof a particular crime fighting or prevention program. This is particularly truewith novel, innovative, or costly approaches. And, in many cases, the challengeinvolves the documentation of the absence of crime. So, if nothing happened,how do we show that nothing happened? The same creativity and domain exper-tise necessary for the use of data mining and predictive analytics in operationalplanning can be a huge asset during the evaluation process.
Evaluating the predictive efficacy of a particular model or scoring algorithmhas been addressed throughout this text; if the model cannot be used in theapplied setting, it does not matter if it is elegant and highly predictive. On theother hand, if the model is transparent enough to be understood in the opera-tional environment, its only value may be with regard to post hoc descriptionsof what happened. In other words, it can be used to “connect the dots” onlyafter something happened; it cannot predict and thereby prevent. Similarly,some enhancements are extremely difficult to measure. For example, enhancedinvestigative efficacy can be as difficult to document as it is to measure.
Outcome evaluation can be an extremely challenging proposition in thepublic safety arena. In a perfect world, our particular operation or interventionwould be the only public safety-related program being implemented and therewould be no other variables outside of our control. We would have a perfectlymatched comparison group or location with all factors, except the variables ofinterest, held constant. In the real world, however, it is very likely that a newdeployment strategy will be implemented at the same time as a variety of othercrime prevention strategies are being considered and/or implemented. At thisvery moment, there are multiple crime prevention strategies and programsrunning simultaneously in almost every community throughout this country,
143

144 8.1 Outcome Measures
very few of which have been coordinated to ensure that they are complementaryor at least not conflicting.
In reality, very little can be held constant, including crime trends andpatterns, criminals, and local citizens. One major event such as a hurricane,local fluctuations in illegal narcotics markets, or a factory closing can ruin themost well-planned crime prevention strategy. One example of a completelyunexpected event that skewed local crime trends and patterns was the attacksof September 11. This event and the changes related to the subsequent waron terrorism have been associated with wide-ranging effects, including every-thing from the immediate psychological impact of the event to radical changesin deployment in response to heightened alert status, travel restrictions, andmilitary activations. Entire agencies have been created and added to the publicsafety community. Even now, ongoing homeland security issues, as well as theperiodic changes in the alert status, tax law enforcement organizations.
Similarly, the impact of Hurricane Katrina on public safety in New Orleanshas been almost unimaginable. Rampant looting and intermittent violenceplagued the days following the hurricane, while the evacuation centersthemselves, most notably the Superdome, became mini communities that expe-rienced their own crime trends and patterns. Although extreme, these exampleshighlight the reality that the only constant in public safety is that everythingthat can change probably will, and those things that we see as being constantsprobably also will change, most likely when we least expect it.
8.1 Outcome Measures
The time to consider outcome measures is before the plan is implemented,in fact, preferably while the operational plan is being developed. Briefly, anoutcome measure is something that can be quantified and is expected to changeas a direct result of the operational plan or intervention. The outcome measuresshould be relatively specific in time, space, and nature, and relatively easy toassess.
Time
It is important to ensure that the measured change coincides with the imple-mentation of the operation or intervention. For example, in the New Year’s Eveinitiative1 first discussed in Chapter 6, one additional piece of the evaluation wasto measure the number of random gunfire complaints in the time period imme-diately preceding the initiative in an effort to document the specificity of the

8.1 Outcome Measures 145
operational plan. While the comparison between the two time periods indicatedmarked reductions in random gunfire associated with the initiative, it wasimportant to ensure that this was not merely the result of a generalized decreasein illegal weapons use that began before the operational plan was implemented.
There are some situations in which advance publicity might impact crimerates prior to deployment of the intervention of interest. The Project Exileprogram in Richmond, Virginia, exploited this to the benefit of the program.Using the reasoning that law enforcement could enhance the initiative by tellingthe bad guys that they were going to crack down on weapons violations, ProjectExile effectively used advertising outlets to enhance the aggressive prosecutorialand law enforcement strategies that formed the core of this program. Whilethis innovative approach resulted in a very successful gun violence reductionprogram, unintended consequences can be associated with advanced noticehighlighting an impending program. Some programs might be associated witha lag. In other cases, the implementation of a new program might result in theexact opposite of what was predicted, hoped for, and expected.
Project Exile initially was associated with a huge increase in the recovery ofillegal firearms, which later slowed to a trickle. In this example, there was con-fusion about what was the expected and more desirable outcome: a significantincrease in the weapon recovery rate, which illustrated directly that illegalfirearms were being taken off of the street; or lower recovery rates, whichreflected a reduced number of guns on the streets. Consideration of the goals ofthe program suggested that everything was going according to plan, althoughmany researchers and policy makers were mildly confused. This was becausethe real goal of the program was to reduce the carry rate of illegal firearms.In many ways, accomplishing this goal involved changing the decision-makingprocess for the criminals. The program was designed to increase the penaltyassociated with carrying an illegal firearm, so that the criminals would elect toleave them at home rather than face the consequences. It took a little while forthis message to trickle down to the streets. Prosecutors knew that the new pro-gram was going to be rough for the criminals, but the criminals did not realizeit until their colleagues started doing long, hard time in the federal system.Thoughtful analysis and abundant domain expertise frequently can be used toidentify and evaluate these possibilities.
Space
It is important to consider where the particular operational strategy has beendeployed and to measure the outcome accordingly. Looking at the NewYear’s Eve initiative, certain areas expected to be associated with an increased
Chapter 8

146 8.1 Outcome Measures
prevalence of random gunfire complaints were identified and targeted for heavydeployment. Although the citizen complaints of random gunfire were reducedcitywide, it is important to note that the intervention specifically targeted onlya portion of the city. If the data only had been analyzed at the aggregate level,it would have been entirely possible that any differences associated with thespecific intervention areas would have been lost in the noise of the other areas.
Focusing the analysis on the targeted location can be particularly impor-tant if crime displacement is a possibility. Some patterns of criminal offendingresemble a bubble under the carpet. When particular areas become inhospitableto crime due to a specific intervention, crime might just move over to the nextblock. For example, illegal narcotics markets can be extremely fluid. If a partic-ular corner becomes the subject of aggressive enforcement strategies, the dealersare very likely to move over to another area and resume business. Therefore,if the outcome is measured based on aggregate, citywide measures, this type ofdisplacement could potentially offset any benefits that might otherwise havebeen realized.
Another way of looking at this issue would be if a wonderful, very effec-tive violence reduction strategy was developed and deployed in Chicago, butstatistics for the whole nation were used to evaluate the efficacy of the program.It would be unlikely that an initiative in Chicago would confer a benefit to theentire nation, but this is similar to how many localities approach evaluation atthe community level. An intervention is deployed in a specific location, butcrime statistics are collected regionally. By using the wrong measures, promisinginterventions could be abandoned due to a failure in the evaluation, not theprogram. Therefore, it is important to drill down and evaluate specifically whatworked and where.
Nature
Most communities are heterogeneous. There is some variance to how thepopulation is distributed. Generally speaking, there are areas associated withlower crime rates, better schools, and greater affluence. Conversely, other areasmight be challenged with open-air drug markets, poverty, unemployment, andelevated school dropout rates. Crime control strategies for these two differentlocalities are going to be very different. Just as it would be inappropriate toschedule a series of aggressive, highly visible approaches including jump-outsor reversals in an area with relatively low crime rates, it would be irresponsible torely on community meetings and personal safety lectures for crime preventionin higher risk areas. While this makes sense from an operational standpoint,it is important not to sabotage the evaluation by utilizing aggregate crime ratesto measure the efficacy of a specific, targeted crime prevention strategy.

8.1 Outcome Measures 147
Specific Measure
It is very important to select the specific outcome measure with thoughtful con-sideration. One of the most popular violence prevention outcome measures ishomicide rate. While focus on the homicide rate frequently reflects a significantconcern over needless loss of life associated with a violent crime problem in acommunity, it can be a terrible outcome measure. These numbers tend to berelatively low, which is a good thing for the community, but a challenge froman evaluation standpoint. A homicide also can reflect other factors, includingaccess to timely, competent medical care. Aggravated assaults, on the otherhand, are more frequent and often represent incomplete or poorly plannedhomicides. As such, they represent a good proxy for homicides and are a moreeffective measure of violent crime.
Similar situations can occur with a variety of measures. For example, arrest-based crime reporting can incorrectly make it look as if crime is increasing inresponse to a particular initiative. For example, aggressive drug enforcementstrategies generally are associated with an increased arrest rate for narcoticsoffenses. Because arrests are used as the measure of crime, an increased arrestrate can suggest that the problem is getting worse. The truth actually mightbe that the aggressive enforcement strategy is getting drug dealers off of thestreet and making the community inhospitable to illegal drug markets, whichby almost any standard would be a measure of success. The arrest rate also canbe a good process measure, as it definitely shows that folks are out there doingsomething. Unfortunately, arrest rates can create particular challenges whenused as outcome measures. This is not necessarily bad, but it is important tounderstand what might impact this to ensure that the information is interpretedappropriately and within the proper context.
Consider how particular measures might change over time. For example, theProject Exile weapon recovery rate rose initially and then fell off as criminalsgot the message. Similarly, complaint data can change during an intervention.A community experiencing regular drive-by shootings might be somewhatless motivated to report gang-related tagging or graffiti in the area; graffitimight be bothersome, but it pales in comparison to the amount of lead flyingthrough the air each night. As the violent crime rate is addressed, however,and the community becomes reengaged, residents might be more motivatedto begin reporting some lesser crimes, which could appear to be an increase inthese crimes. Citizens also might be more likely to report random gunfireafter an initiative has been established and shown some promise. Prior todeployment of the initiative, there might have been a sense that nothingwould change or that there was danger associated with becoming involved.However, as improvements are noticed following the initiative, crime reporting
Chapter 8

148 8.1 Outcome Measures
might increase as neighborhoods become revitalized and the residents begin toreengage and participate in the enforcement efforts.
This point is related to a similar issue: All crime is not created equally.How many aggravated assaults equal a homicide? Is an armed robbery equal toa sexual assault? How about a drug-related murder? While these might seem likeabsurd questions, law enforcement agencies frequently compile and aggregatethese numbers and create a composite “violent crime index.” Formerly referredto as “Part I” crimes, these various measures generally are lumped together andused as a generic measure of violent crime in a community. This is unfortunatebecause combining all this information together increases the likelihood thatsomething important will be obscured.
Many of the crimes frequently included in composite violent crime indicesoccur with differential frequency. Generally, there are far more aggravatedassaults in a community than murders, and far more robberies than sexualassaults. A decrease in a relatively low-frequency crime might be lost when it isconsidered within the context of all of that additional information. Moreover,these crimes are not equivalent in terms of their impact on a community.Few would argue that homicide is far more serious than an aggravated assault.Why throw them together in a composite violent crime index that weights themequally?
This probably makes sense to most, but an important extension of thisissue arises with the use of generic offense categories to evaluate an initiativetargeting a specific pattern of offenses. For example, why create a specific modelof drug-related homicide if you are going to base the outcome evaluation onthe entire murder rate? It is very rare to develop and deploy a crime preven-tion strategy that addresses everything, even all the crime within a generalcategory. A particular robbery initiative might target street robberies, but theentire robbery rate traditionally is used to evaluate the efficacy of the initiative.Similarly, an initiative targeting commercial robberies is not likely to affectcarjackings, but it is very likely that carjackings will be included in the “robbery”outcome measure.
Another point to consider is whether it is even possible to measure whatthe program is designed to impact. An interesting question emerged out ofthe Project Exile work: How do we measure the firearms carry rate? This is avery important question, because the stated goal of Project Exile was to reducethe carry rate of illegal firearms. The illegal carry rate, however, would be verydifficult, if not impossible, to measure. As a result, additional proxy measureswere selected in an effort to measure the efficacy of the program. The proxymeasures included the number of illegal firearms recovered, as well as other

8.2 Think Big 149
measures of gun-related violent crime. While it was not possible to accuratelymeasure the true carry rate of illegal firearms, these other measures turned outto be just as important in terms of quantifying community public safety andwere linked intrinsically to the original measure of interest.
So, while it might not be possible to directly measure the outcome of interest,there generally are other indicators linked to the original measure that can bedocumented in its place. For example, investigative efficacy as a measure is likelyto be elusive. Case clearance rates, however, can be documented and used as areflection of an improved investigative process. Serious thought to the specificgoals of the operational plan and some creativity in the selection of outcomemeasures can address these challenges, particularly if these decisions are madeas part of the operational planning process.
8.2 Think Big
It is unfortunate, but violent crime often is evaluated based on one measure:the homicide rate. Generally, these tend to be low-frequency events comparedto other types of violent crime. While this is not a bad thing, it can seriouslyhamper evaluation efforts. Murders are committed for a variety of reasons, andit is unlikely that a single violence prevention effort will address the entire rangeof motives. For example, an initiative targeting domestic violence is unlikelyto address drug-related violence. Moreover, the provision of skilled medicalservices in a timely manner can make the difference between an aggravatedassault and a murder, and therefore greatly affect the homicide rate.
It is important not to start making broad, general claims based on differencesamong low-frequency events. For example, while it is tempting to report a50% reduction in the homicide rate when the numbers drop from four murdersto two, you must also be prepared to assume a 100% increase when the numberschange from two to four—again, a difference of two. Clearly, each murder isimportant, but it can be a very tough measure to use given the mathematicallimitations associated with the evaluation of low-frequency events. On the otherhand, all assaults can be thought of as incomplete or poorly planned homicides.As such, they are very similar to murders. They also tend to occur with greaterfrequency and tend to be a better outcome measure.
What does all of this have to do with data mining? Some things work,others do not, and some things make the problem worse. Those programs thatwork should be identified and replicated, while those that do not should bemodified or discarded. There is no place for programs that make things worsewithin the public safety arena. Outcome evaluation is critical for identifying
Chapter 8

150 8.2 Think Big
programs that exacerbate problems so they can be addressed quickly. But whathappens when a particular initiative does all three? Figure 8-1 illustrates justsuch an intervention. The first panel depicts hypothetical random gunfire com-plaints in several distinct geographic locations within a particular community.Note that the distribution of complaints varies greatly among the individualdistricts. The lighter portion of the bars, which is on the left, indicates thenumber of complaints during the period immediately preceding the interven-tion, while the darker bars on the right depict the number of complaints afterthe intervention has been implemented. The panel on the right depicts exactlythe same information as the one on the left, with one exception: The data havebeen normalized to facilitate comparison of the differences. The raw numbershave been transformed into percentages, which assist review of the interventiondespite the differences in overall numbers.
As can be seen, some areas showed improvement after the initiative whileothers appeared to show an increase in random gunfire. The encouraging find-ing was that there was an overall reduction—things generally got better after theinitiative. But what about areas that got worse? A potential first approach wouldbe to map those areas in an effort to evaluate whether the reduction representedcrime displacement. If the areas that showed increases were geographicallycontiguous with the specific target areas that showed improvement, we might
�Figure 8-1 This figure illustrates hypothetical random gunfire complaints in several distinct
geographic locations within a particular community.
Dis
tric
t
Dis
tric
t

8.2 Think Big 151
continue to explore this as a possible explanation for our findings. Drillingdown in an attempt to further evaluate this hypothesis might be warranted.
On the other hand, if crime displacement does not seem to provide a worthyexplanation for the findings, then additional data exploration and evaluationdefinitely is necessary. Drilling down from the aggregate level statistics is anessential component of this evaluation process. The ratio between random gun-fire complaints pre- and post-intervention must be conducted at the specificdistrict level in an effort to gain a complete understanding of how the interven-tion worked. Confining the analysis to aggregate or overall numbers would givea somewhat skewed perception of the effectiveness of the strategy. By drillingdown, it is possible to determine specifically where this particular programworked. Fortunately, in this case, it happened to be in the districts specificallytargeted by the intervention. Increases were also noted in other areas, whichneed to be explored further to address them in future strategies.
ROI
One concept in the business world is “return on investment,” or ROI. In other words, if I spend moneyupgrading my analytical capacity, what type of return can I expect? In these times of diminishing economicresources, it is difficult to justify big ticket purchases, particularly when there is no direct and tangible publicsafety-related increase. For example, how can a public safety organization justify investing in expensivesoftware resources when the fleet needs maintenance, when there are ongoing training requirements,and when law enforcement professionals are so poorly compensated for their time? Put another way,how many ballistic vests could this same amount of money purchase? These are difficult questions, butthey certainly are fair, given the ongoing decreases in public safety resources.
ROI is not an easy concept to measure in public safety. For example, how do we measure fear, lostrevenues, and lost opportunities in a community inundated with violence? Although many have tried, canwe really put a price tag on human lives? How do you measure enhanced investigative efficacy? More andmore, public safety agencies are encountering calls for accountability. Communities and funding agenciesalike now expect outcome measures and demonstrable effects. Yet increases in public safety can be verydifficult to quantify and measure.
Some frequently asked questions about the use of data mining and predictive analytics in law enforce-ment and intelligence analysis are: How do you know it works? What have you improved? Can you clearcases faster? How many lives have been saved? In response to these questions, specific outcome measureswere documented during the Richmond, Virginia, New Year’s Eve initiative2 discussed previously.
In some ways, identifying the specific outcome measures was relatively easy for this initiative.The deployment strategy was based largely on citizen complaints of random gunfire for the previous year.
Chapter 8

152 8.2 Think Big
The primary goal of the initiative was to reduce the number of random gunfire complaints in theselocations through the use of targeted deployment. It was anticipated that using heavy deployment in thespecific areas previously associated with random gunfire would serve to suppress that activity. Therefore,the number of random gunfire complaints represented one outcome measure. A second expectation ofthis initiative was that by proactively deploying police units in the locations expected to have an increasedprevalence of random gunfire, officers would be able to respond quickly to complaints and make rapidapprehensions. Therefore, a second outcome measure was the number of weapons recovered during theinitiative.
Both of these measures documented the success associated with this type of risk-based deploymentstrategy. Two other benefits also were achieved that night. First, while the original deployment plancalled for complete staffing, the risk-based deployment strategy required fewer personnel on the streets.Because personnel resources were used more efficiently, fewer were needed. This resulted in the releaseof approximately 50 sworn employees that night and a savings of approximately $15,000 in personnelcosts during the eight hours associated with the initiative. This figure does not include the fact that datamining was used to confine the initiative to an eight-hour time period. Above and beyond the quantifiedcost savings, the intangible benefit of being able to allow that many sworn personnel the opportunity totake leave on a major holiday was enormous.
Ultimately, data mining and risk-based deployment provided a significant return by several measures.Random gunfire in the community was decreased with fewer personnel resources. This yielded an increasein public safety, at a lower cost, with a concomitant increase in employee satisfaction. By any measurethis was an effective outcome.
This example highlights an important issue for analysts, managers, and command staff alike. The abilityto incorporate new technology such as data mining and predictive analytics into the public safety com-munity will not only be based on a willingness to interact with data and information in novel and creativeways. At some level, the organizations choosing to incorporate these exciting new technologies also willbe required to justify their acquisition and use. Being able to proactively identify measurable outcomesand use staged deployment of these powerful tools might be as related to their successful incorporationand implementation as the associated analytical training.
The New Year’s Eve initiative represents only one approach to documenting the value of data miningin a law enforcement environment. Each locality is different; therefore, specific deployment and eval-uation plans will likely differ as well. There are, however, a few elements in this example that weredirectly linked to the successful evaluation of this strategy and are worth highlighting. First, the outcomemeasures could be counted with relative ease. While this sounds very simple, it is not. Think aboutsome of the public safety-related “measures” that are often tossed around in casual conversation andspeeches. For example, fear in a community and investigative efficacy can be very difficult to measure.Even decreases in “crime” can be difficult to define and measure. Identifying a readily quantifiable outcomemeasure can have a significant impact on the success of the evaluation, as well as on the initiative beingmeasured.

8.3 Training and Test Samples 153
Second, the outcome measures were relatively high-frequency events, which provided greateropportunities for change. As mentioned, homicide rates, although a popular outcome measure, canbe extremely unforgiving. They tend to be relatively infrequent, which is a good thing but which meansthat it will take longer to achieve a meaningful difference in the rates. Moreover, many aspects of thismeasure are completely outside of the control of law enforcement, such as timely medical intervention.
One additional feature of this New Year’s Eve initiative evaluation is that the data were analyzed inaggregate form, and then parsed to identify specific areas of improvement. This was extremely importantbecause only a few areas were targeted. The target areas were evaluated specifically to ensure that theywere consistent with the overall pattern of reduced random gunfire complaints observed globally, whichthey were. In this case, the overall numbers for the entire city improved so significantly that it highlightsfurther that the appropriate choices were made in selection of the target areas.
Public safety professionals are told repeatedly that crime prevention is eco-nomical. Crime, particularly violent crime, can be extraordinarily expensivewhen the associated medical costs, pain and suffering, and lost productivityare tallied. Aggressive law enforcement strategies and incarceration can be sim-ilarly expensive. One strategy to consider when determining the value of datamining in your organization is the return on investment (ROI) of data mining-based operational or deployment strategies. Although expensive, data miningsoftware often can pay for itself by preventing even a single firearms-relatedaggravated assault. In addition, effective use of investigative or patrol resourcescan represent a unique approach to the evaluation of a particular strategy oroperation. Ultimately, the savings of human lives and suffering is priceless.
As with program results, it is important to evaluate results related to ROI,particularly in the public safety arena. Now matter how great the softwareor deployment plan, if it is not making a difference, then changes need tobe made. Radical changes in deployment, large operational plans, and datamining software can be expensive. Justification for the cost associated withthese endeavors frequently is, and should be, required. Some things work,others do not, and some things make crime worse. Data mining and predictiveanalytics can be used to enhance and guide the evaluation process by helpingus identify what works—for whom, when, and under what circumstances.
8.3 Training and Test Samples
If we work long enough and hard enough, we frequently can generate a model sospecific that we get almost complete accuracy when testing it on the original sam-ple; but that is not why we generate models. Ultimately, models are created with
Chapter 8

154 8.3 Training and Test Samples
the expectation that they will facilitate the accurate classification or predictionof future incidents, subjects, or events. Ideally, the sample data used to createthe model truly will be representative of the larger population. What happens,though, if you have something unique or weird in the sample data? Perhapsthe sample includes a couple of odd or unusual events that skews the results.When a model is over-trained, it might describe the sample well, but it willnot make accurate or reliable future predictions because it is based, at least inpart, on the specific features of the sample data, including outliers and otheridiosyncrasies. In other words, if a model is modified and refined repeatedly tothe point where it has been fit perfectly to the original training sample, then itprobably has limited utility beyond that initial sample.
The impact of outliers on the overall results is a particular challenge withsmaller samples. When there are a large number of data points, a couple ofunusual events or outliers probably will not have a tremendous impact on theoutcome. This is similar to baseball; a pitcher can have an off day without signif-icantly impacting his career performance statistics. When the data are confinedto a relatively small number of observations, however, anything unusual orout of range can greatly affect the analysis and outcomes. Similarly, a kickerwho misses several field goals, even during a single game, can compromise hisstatistics for the entire season.
One way to address this issue is through the use of training and test samples.If the sample is sufficiently large, it can be divided into two smaller samples:one for the development of the model, the “training” sample, and a second onethat is reserved and used to evaluate the model, the “test” sample. Generally,revising and adjusting a model will continue to increase its accuracy up to acertain point, at which time further modifications to the model result either inno change to the accuracy of the model or actually decreases the accuracy onthe test sample. At this point it is wise to stop or back off somewhat in the effortto select the model with the greatest predictive value for the population as awhole, rather than just the training sample. Through the use of training and testsamples, a model can be developed, tested, and altered while managing the riskof over-training the model. When a model works equally well on independenttest data, we call this property “generalizability.”
The best way to divide a sample into training and test samples is by usingsome sort of random selection process. By using random selection, the like-lihood that a particular record will be included in either the training or testsample is 50%, or approximately chance. As illustrated in Figure 8-2, somesoftware programs will do this automatically; however, it is possible to splita sample manually as long as there is some assurance that the data have been

8.3 Training and Test Samples 155
�Figure 8-2 This
dialog boxillustrates the
randomassignment of
data intotraining and test
samples.(Screenshot taken
by the author isfrom
Clementine 8.5.)
entered and are selected in a way that maximizes the possibility that the trainingand test samples will be selected randomly and are as similar as possible. Forexample, dividing subjects based on the final digit of their social security num-ber, even or odd, generally results in a random assignment to two differentgroups. Using the first digit, however, would not achieve the goal of randomassignment, as the first three digits in a social security number are associatedwith the location in which the number was issued initially. Therefore, thesenumbers are not random and could skew the selection of the samples.
Another consideration is when and how frequently to conduct the randomassignment to the groups. In a perfect world, it would not matter. The samplecould be split each and every time the model is adjusted, modified, and testedbecause the samples would be similar each time and the model would be robustenough to accommodate any slight differences. In fact, this is how some randomassignment software procedures function. In reality, however, it can happen thatthe samples are comparable, the model development is progressing nicely, andon the next iteration something happens, the training sample differs signifi-cantly from the test sample, and everything falls apart. When this occurs, theanalyst might be perplexed and goes back and refines the model in an effort toaccommodate this new development, but on the next iteration nothing worksagain. This can go on almost indefinitely. Because of this possibility, it is gen-erally best to split the sample, ensure that they are comparable, particularly onthe dimensions of interest, and then move forward into model development
Chapter 8

156 8.3 Training and Test Samples
and testing with a confidence that the training and test samples are similar, yetrandomly divided.
In modeling a particularly low-frequency event, it is important to ensurethat the factors of potential interest are distributed evenly. Because they areassigned randomly to the training and test samples, it is possible that the ana-lyst could end up with an uneven distribution that would skew the model basedon certain features or attributes that are associated with a few, unique cases. Forexample, Table 8-1 depicts a small sample of ages that were entered randomlyinto a database. The data shown is confined to the portion of the sample ofinterest, or the cases that we would like to model and predict. A quick checkreveals that the average age of the entire list of cases is 31 years; however, theaverage age of the training sample is 24 years, while the average age of thetest sample is 39 years. Is this a problem? It depends. If age was included as
�Table 8-1 A small sample of age data that has been divided into training and test samples. It is
important to ensure that training and test samples are similar, particularly when theyare relatively small.
Age Sample
25 Train
45 Test
24 Train
38 Test
23 Train
32 Test
21 Train
45 Test
24 Train
35 Test
27 Train
39 Test
24 Train
37 Test

8.3 Training and Test Samples 157
a discriminating or predictive variable in the model because of these artificialdifferences in the averages then, yes, this nonrandom selection could have asignificant impact on the created model. It could be that age makes no dif-ference, that the comparison sample, which has not been shown here, alsohas an average age of 31 years. The uneven selection of the training sample,however, generated an average age of 24 years, which might be different enoughto be included as a predictive factor in the model. When we come back withthe test sample, however, the average age is 39 years. With differences likethese, it is relatively easy to see how the performance of the model might sufferwhen tested with a sample that differs so significantly on a relevant variable.Similarly, if an average age of 24 was included in the model as a predictive vari-able, it would perform very poorly when deployed in an operational setting.This highlights further the importance of using training and test samples dur-ing the development process. Therefore, running a few quick comparisonsbetween the training and test samples on variables of interest can be helpfulin ensuring that they are as similar as possible and ultimately in protecting theoutcomes.
Remember that it also is important to consider the distribution of the out-come of interest between the training and test samples. For example, if the modelbeing created is to predict which robberies are likely to escalate into aggravatedassaults, there might be hundreds of robberies available for the generation ofthe model but only a small fraction that actually escalated into an aggravatedassault. In an effort to ensure that the model has access to a sufficient number ofcases and that the created model accurately predicts the same or a very similarratio of incidents, it is important to ensure that these low-frequency eventsare adequately represented in the modeling process. When working with verysmall numbers, training and test sample differences of even a few cases canreally skew the outcomes, both in terms of predictive factors and predictedprobabilities.
Sometimes, the events of interest are so rare that splitting them into trainingand test samples reduces the number to the point where it seriously compro-mises the ability to generate a valid model. Techniques such as boosting, whichincreases the representation of low-frequency events in the sample, can be used,but they should be employed and interpreted cautiously, as they also increasethe likelihood that unusual or unique attributes will be magnified. It is impor-tant to monitor the prior probabilities when boosting is used to ensure that thepredicted probabilities reflect the prior, not boosted, probabilities. In addition,other methods of testing the model should be considered, such as bootstrap-ping, in which each case is tested individually against a model generated usingthe remainder of the sample. These techniques are beyond the scope of this
Chapter 8

158 8.4 Evaluating the Model
text, but interested readers can refer to their particular software support foradditional information and guidance.
8.4 Evaluating the Model
While overall accuracy would appear to be the best method for evaluating amodel, it tends to be somewhat limited in the applied public safety and securitysetting given the relative infrequency of the events studied. As mentionedpreviously, it is possible to attain a high, overall level of accuracy in a modelcreated to predict infrequent events by predicting that they would never happen.Moreover, it is often the case that the behavior of interest is not only infrequentbut also heterogeneous, because criminals tend to commit crime in slightlydifferent, individual ways. Increasing the fidelity of the models in an effort toovercome the rarity of these events and accurately discriminating the cases orincidents of interest may include accurate measurement and use of the expectedor prior probabilities and subtle adjustment of the costs to shift the nature anddistribution of errors into an acceptable range. Prior probabilities are used inthe modeling process to ensure that the models constructed reflect the relativeprobability of incidents or cases observed during training, while adjusting thecosts can shift the distribution and nature of the errors to better match theoverall requirements of the analytical task. The following section details the useof confusion matrices in the evaluation of model accuracy, as well as the natureand distribution of errors.
Confusion matrices were introduced in Chapter 1. A confusion matrix canhelp determine the specific nature of errors when testing a model. While theoverall accuracy of the model has value, it generally should be used only as aninitial screening tool. A final decision regarding whether the model is actionableshould be postponed until it can be evaluated in light of the specific distributionand nature of the errors within the context of its ultimate use. Under theharsh light of this type of thoughtful review, many “perfect” models have beendiscarded in favor of additional analysis because the nature of the errors wasunacceptable.
Table 8-2 provides an example of a typical confusion matrix. In this example,a total of 53 cases were classified with 47 of them, or almost 89%, being classifiedcorrectly. The overall accuracy of this model is good, but it is important todetermine the exact nature of the errors. By drilling down and reviewing thespecific errors, we see that 33 of 38 “false” predictions, or 87%, were classifiedcorrectly. Further review indicates that 14 of 15 “true” predictions, or 93%, alsowere classified correctly. In public safety and intelligence modeling, these results

8.4 Evaluating the Model 159
�Table 8-2 This figure illustrates a typical confidence matrix.
Predictions
Actual
False True
False 33 5
True 1 14
would be extremely impressive, so much so that additional review probablywould be required to ensure that there were no errors in logic that could havecontributed to such an accurate model.
The confusion matrix for a second model with the same sample is depictedin Table 8-3. The overall accuracy of this model is much lower, 70%, but therehas been no degradation in the accuracy of predicting “true” events, which isstill 93%. Most of the errors with this model occur when the model incorrectlypredicts that something will happen. In other words, most of the decrease inoverall accuracy of the model is associated with false positives.
Clearly, if we had to choose between the two models, the first model with itsgreater overall accuracy would be the obvious choice. What happens, however,if we are developing a deployment model and the first model is too complicatedto be actionable? Can we use the second model with any confidence? It isimportant to think through the consequences to determine whether this modelwill suffice.
The second model accurately predicts that something will occur 93% ofthe time. As a deployment model, this means that by using this model weare likely to have an officer present when needed 93% of the time, which isexcellent. As compared to many traditional methods of deployment, which
�Table 8-3 The overall accuracy of this model is much lower than that seen in Table 8-2, but there
has been no degradation in the accuracy of predicting “true” events. Most of the decreasein overall accuracy of this model is associated with false positives.
Predictions
Actual
False True
False 23 15
True 1 14
Chapter 8

160 8.4 Evaluating the Model
include historical precedence, gut feelings, and citizen demands for increasedpolice presence, this model almost certainly represents a significant increaseover chance that our officers will be deployed when and where they are likelyto be needed.
Conversely, most of the errors in this model are associated with false positives,which means that the model predicts deployment for a particular time orplace where 39% of the time nothing will occur. From a resource manage-ment standpoint, this means that those resources were deployed when theywere not needed and were wasted. But were they? When dealing with publicsafety, it is almost always better to err on the side of caution. Moreover, inall reality, it is highly unlikely that the officers deployed to locations or timesthat were not associated with an increased risk wasted their time. Opportu-nities for increased citizen contact and self-initiated patrol activities abound.Therefore, although the model was overly generous in terms of resource deploy-ment, it performed better than traditional methods. Thoughtful considerationof the results still supports the use of a model with this pattern of accuracy anderrors for deployment.
In the next confusion matrix (Table 8-4), we see an overall classification accu-racy of 78%. While this is not bad for a model that will be used in policing,a potential problem occurs when we examine the “true” predictions. In thisexample, the “true” classifications are accurate only about 50% of the time.In other words, we could attain the same level of accuracy by flipping a coin;the model performs no better than chance in predicting true occurrences. If thisperformance is so low, then why is the overall level of accuracy relatively high,particularly in comparison? Like many examples in law enforcement and intelli-gence analysis, we are trying to predict relatively low-frequency events. Becausethey are so infrequent, the diminished accuracy associated with predicting theseevents contributes less to the overall accuracy of the model.
�Table 8-4 The overall classification accuracy of this model is not terrible; however, the “true”
classifications are accurate only about 50% of the time. This poor performance does notsignificantly degrade the overall accuracy because it is associated with a low-frequencyevent.
Predictions
Actual
False True
False 148 38
True 5 5

8.5 Updating or Refreshing the Model 161
�Table 8-5 This confidence matrix depicts a revised model for Table 8-2. The overall accuracy has
not been increased substantially but the “true” predictions or classifications have beenimproved.
Predictions
Actual
False True
False 151 33
True 3 6
As can be seen in the confusion matrix in Table 8-5, which is associatedwith a revised model for the previous example, the overall accuracy has notbeen increased substantially, but the “true” predictions or classifications havebeen improved to an accuracy of 67%. Additional thought will be required todetermine whether this level of accuracy is acceptable. For deployment pur-poses, almost anything above chance has the potential to increase public safety;however, it must be determined whether failing to place resources one-third ofthe time when they are likely to be needed is acceptable. On the other hand,if this model was associated with automated motive determination or somesort of relatively inconsequential anomaly detection, then the comparativelylow false positive rate might be of some benefit. A good understanding of thelimitations of this model in determining actual events is imperative to ensuringthat it is used properly.
8.5 Updating or Refreshing the Model
In our experience, models need to be refreshed on a relatively regular basis.In some ways, this is a measure of success. Many features, particularly behav-ioral characteristics, are unique to particular offenders. As these suspects areidentified and apprehended, new criminals take their places, and the patternsand trends change. In most situations, the changes are minimal, although theystill frequently warrant a revised model.
Seasonal changes can have an effect on some patterns of offending. As men-tioned, during the colder months, people often heat their vehicles in themornings before they leave the house. Therefore, lower temperatures wouldbe associated with an increased prevalence of vehicles stolen from residentialareas, with an increased frequency in the mornings when both the weather andvehicles are colder. When temperatures climb, people often leave their vehi-cles running while they make quick stops, in an effort to keep their cars cool.
Chapter 8

162 8.6 Caveat Emptor
A model tracking these incidents might predict an increase in motor vehiclethefts near convenience stores and day care centers, possibly later in the day,when temperatures are higher. Therefore, a motor vehicle theft model that takesinto account these trends might need to be refreshed or rotated seasonally. It alsomight require a greater sampling frame, or time span of data, to ensure that allof the trends and patterns have been captured.
8.6 Caveat Emptor
There is one area in which to be particularly cautious when using some out-side consultants. As mentioned earlier, it is relatively easy to develop a modelthat describes existing data very well but that is over-trained and therefore rela-tively inaccurate with new data. In other words, the model has been refined tothe point where it describes all of the little flaws and idiosyncrasies associatedwith that particular sample. It is highly predictive of the training data, butwhen checked against an independent sample of test data, the flaws are revealedthrough compromised accuracy. Unfortunately when this happens, the outside“expert” generally is gone, and the locals left behind might mistakenly assumethe blame for the poor outcome. This can be particularly troubling in situa-tions where accurately evaluating the performance of the model is beyond thetechnical expertise of the customer. In this situation, the same consultant isrehired and then “fixes” the model, generally by overfitting it to a new set ofsample data.
The best way to evaluate the performance of a model is to see how wellit can predict or classify a second sample, whether a “test” sample or futuredata. Be particularly leery of any consultant who advises you that he or shewill “adjust” the model until it reaches a certain level of performance, whichfrequently is very high, but warns you that in your hands the accuracy of themodel is likely to decrease significantly. Generally, what these folks are doingis “overfitting” the model to increase the apparent accuracy. The performanceof these models often will decrease significantly when used on new data, andfrequently will perform far worse than a more general, less accurate model. At aminimum, the informed consumer will require that any outside consultantemploy both training and test samples to ensure a minimal level of stabilityin the performance of the model. An even better scenario results when theagency analyzes its own data and creates its own models, perhaps with someoutside assistance or analytical support and guidance. It is the folks on theinside that have the best understanding of where the data came from andhow the model will be used. These individuals also have the requisite domain

8.7 Bibliography 163
expertise, or knowledge of crime and criminals, that is necessary to generatemeaningful data mining solutions. Generally, for law enforcement personnelto use predictive analytics effectively, some guidance is required regarding a few“rules of the road” and best practices, like the use of training and test samples,and perhaps some analytical support. But in my experience, this is not anoverwhelming challenge.
Finally, it is important to remember that the cost of errors in the appliedpublic safety setting frequently is life itself. Therefore, specific attention toerrors and the nature of errors is required. In some situations, anything thatbrings decision accuracy above chance is adequate. In other situations, however,errors in analysis or interpretation can result in misallocated resources, wastedtime, and even loss of life.
8.7 Bibliography1. McCue, C., Parker, A., McNulty, P.J., and McCoy, D. (in press). Doing
more with less: Data mining in police deployment decisions. Violent CrimeNewsletter, U.S. Department of Justice, Spring 2004, 1, 4–5.
2. Ibid.
Chapter 8


9Operationally Actionable Output
Albert Einstein is quoted as saying, “most of the fundamental ideas of scienceare essentially simple, and may, as a rule, be expressed in a language compre-hensible to everyone.” Everything that comes before means nothing in applieddata mining and predictive analysis unless it can be translated directly into theoperational setting and used for decision support. The ability to translate theanalytical products from the data mining process directly into the operationalenvironment holds the promise for significantly enhancing situational aware-ness, guiding information-based decisions, and ultimately changing outcomes.Unfortunately, analytical output, particularly output generated by advancedmodeling techniques, generally does not translate well into the applied set-ting, which significantly limits its operational value. The ability to create visualrepresentations of the analytical results in an operationally relevant format holdstremendous potential for bridging the gap between analytical science and oper-ational practice. Therefore, one of the hallmarks of the Actionable Mining andPredictive Analysis model is the use of operationally actionable visual represen-tation of the data that can significantly enhance the knowledge discovery whileguiding operational strategy and tactics. Ultimately, effective visual outputshould say to the end user, “Go here now and look for this.” “This” should beimmediately obvious, allowing the end users to build on their tacit knowledge,while enhancing their ability to “know it when they see it.”
9.1 Actionable Output
It is important to remember that an analyst may see things not readily apparentto others, given their experience with the data. Graphical representations canhelp them share their vision of the patterns and trends in the data with others.What follows is a brief overview of some novel visualization techniques.
165

166 9.1 Actionable Output
Heat Maps and Schedules
A heat map can be a relatively intuitive visual representation of the data. Basi-cally, the more intense the color, the greater the number represented on thefigure. These can be used to depict simple frequencies or risk. In Figure 9-1,different types of crime (INCDGRP) are depicted over different four-hour timeblocks (SHIFT). It is very easy to identify the most frequent crimes and whenthey occur. In this analysis, larcenies were the most frequent pattern of offend-ing, which is not surprising, given their relative frequency in most communities.Examining the chart further, however, reveals that larcenies were most frequentduring the 1200–1600 and 1600–2000 hours time blocks. Similarly, assaultand battery (A & B) offenses were more frequent during the evening timeblocks.
Recalling that deployment represents the allocation of resources across timeand space, a very simple deployment schedule was created to represent theoccurrence of crime in five different areas during six four-hour time blocks(Figure 9-2). We can see opportunities for fluid deployment strategies, in which
�Figure 9-1 “Heat map” example (B. Haffey, SPSS, Inc.; used with permission).

9.1 Actionable Output 167
�Figure 9-2 Sample deployment “schedule.”
5
4
3
2
1
2000-23591600-19591200-15590800-11590400-07590000-0359
Shift
Area
resources are proactively deployed to a particular location and then movedor flexed to accommodate anticipated changes in activity. In this particularexample, we can take advantage of the sequential increases and fluctuationin activity. For example, we can anticipate the greatest amount of activity inArea Three during the 1200–1559 hours time block and respond by deployingmost of our resources to that location before the anticipated increase in activity.Review of a map could provide additional insight regarding Area Four, helpingus determine whether this activity is contiguous with Area Three and representspossible risk for displacement in response to the planned suppression in AreaThree. Anticipating an increase in activity in Area Two at 1600 hours, we couldthen plan to flex our resources to that area.
Identifying ways to translate data mining output into a format with directrelevance to operational personnel has greatly increased optimization of ana-lytical resources. As illustrated in Figure 9-3, a scoring algorithm created by ananalyst can be made directly available to field-based personnel, providing accessto an agency’s analytical capacity when and where it is needed most. The enduser can enter a few relevant details and receive a risk assessment, automatedmotive determination, or some other analytical output without direct accessto an analyst. Figure 9-4 illustrates the relevant, easy-to-understand outputgenerated in response to the input illustrated in the previous figure.
Chapter 9

168 9.1 Actionable Output
�Figure 9-3 By using web-based deployment of data mining models, the investigator can benefit from
24/7 crime analysis, which means that analytical capacity will be available when andwhere it is needed, even at the crime scene. (Cleo, SPSS, Inc.)
Input Screen for Strategic Characterization of Likely Suspect
�Figure 9-4
Sample outputgenerated by thetool depicted in
Figure 9-3.(Cleo, SPSS,
Inc.)
Output from Strategic Characterization Algorithm

9.1 Actionable Output 169
Using these web-based tools and a secure Internet connection, analyticalcapacity can be made available to operational personnel when and where theyneed it, providing increased situational awareness and investigative support ona 24/7 basis. Whether in an officer’s car during a tour of duty (Figure 9-5) orat a crime scene (Figure 9-6), analytical support is just a keystroke away.
The particular example in Figure 9-7 is covered in Chapters 12 and 14;however, the novel strategy of depicting the results of an unsupervised learn-ing algorithm in a mapping environment, albeit crude, highlights the analyst’sability to convey the necessary information to the end user, ultimately con-verting relatively complex analytical output into something both intuitive andimmediately actionable.
Figures 9-8 through 9-11 illustrate the domain-specific tool developed bySPSS and Information Builders, which was based on the RTI International ana-lytical framework. Figure 9-8 depicts the probability of crime by dispatch zoneunder specific conditions. This information can be used directly by operationalpersonnel for deployment planning purposes. As seen in Figure 9-8, a specificarea has been captured within the square. Figure 9-9 includes the captured areaand provides additional detail through the use of an orthophotography layer.This image gives additional detail about the area, allowing the end users toincorporate their own knowledge to identify particular environmental features,
�Figure 9-5
Scoringalgorithms can be
pushed out intothe field through
web-basedinterfaces
through mobilecomputers . . .
Chapter 9

170 9.1 Actionable Output
�Figure 9-6
. . . or throughPDAs, providing
analyticalsupport when
and where it isneeded.
�Figure 9-7
Facility mapwith overlay of
unsupervisedlearning output.
Loadingdock
Employeeentrance
Visitorentrance

9.1 Actionable Output 171
�Figure 9-8 Map depicting probability of crime by dispatch zone. (Screen images of the Information
Builders’ Law Enforcement Application.)
landmarks, or physical attributes in the interpretation of the results, as well asany operational planning.
Figure 9-10 adds specific information pertaining to drug arrests through theuse of icons overlaid on the map. Again, the end users can exercise their knowl-edge of the area and domain expertise as they add value to the interpretationand operational use of these images. Finally, Figure 9-11 illustrates the directlink between the data and the image. By using this feature, the end user is ableto call up additional information about a specific incident portrayed on themap, providing even more value to the analysis.
Chapter 9

172 9.1 Actionable Output
�Figure 9-9 Orthophotography detail of area highlighted in box from previous figure. (Screen images
of the Information Builders’ Law Enforcement Application.)

9.1 Actionable Output 173
�Figure 9-10 Overlay illustrating the direct link between the visual image and the underlying data.
“Needle” icons represent locations associated with drug arrests. (Screen images of theInformation Builders’ Law Enforcement Application.)
Chapter 9

174 9.1 Actionable Output
�Figure 9-11 Pop-up screen illustrating the link between the incident data and the image.

Applications


10Normal Crime
“When people are free to do as they please, they usually imitate each other.”
Eric Hoffer
Crime is behavior. Like many other patterns of behavior, even the most seriousviolent crime frequently can be characterized, categorized, anticipated, andhopefully even predicted. In many ways, the behavioral analysis of violentcrime is based on this assumption. If it were not predictable, we would nothave the field of criminal profiling. We also would not have as many interestingmovies or books.
While it is relatively interesting to sit back and assume the role of an arm-chair behavioral psychologist, the field truly is much more complicated than thepopular press would lead one to believe. This can be a source of frustration foranalysts and other professionals in the field when confronted by lay “experts.”While most of us would never dream of suggesting a certain approach or tech-nique to a cardiac surgeon, it seems that everyone has an opinion regarding crimeand criminals, regardless of their training or education in the area. This cer-tainly is not meant to imply that crime or intelligence analysis approaches heartsurgery or other similarly complicated medical procedures. However, crime andintelligence analysis is not nearly as simple and straightforward as the movie ofthe week might suggest.
Why has this subject been included in a text on data mining and pre-dictive analysis? The relative degree of complexity associated with crime andcriminal behavior, even garden-variety offenses, is something that public safetyprofessionals can exploit in an effort to detect crime and other unusual orsuspicious behavior. Moreover, this area in particular can benefit from thesophisticated analysis and characterization associated with data mining andpredictive analytics.
In keeping with this idea, we can begin to develop a concept of “nor-mal” crime. Again, like most patterns of behavior, crime can be seen as beingsomewhat homogenous and relatively predictable. Moreover, in our experience,
177

178 10.1 Knowing Normal
deviation from normal generally indicates the potential for escalation or thepresence of something “bad.” “Normal” burglaries generally require that thecriminal get in and out without being detected, and that the criminals take,or at least attempt to take, something of value. In our experience, deviationsfrom this “normal” pattern generally are associated with the potential for seriousescalation and/or violence. This is addressed in greater detail in Chapter 11, butsuffice it to say that criminal behavior, although deviant by many definitions,can be described in terms of normal patterns of offending and certain routinebaseline behaviors.
10.1 Knowing Normal
“Science is nothing but trained and organized common sense.”
Thomas Henry Huxley
Criminals often get caught because they try to fly under the radar but end upsticking out like a sore thumb because they do not have a good understanding of“normal.” For example, in one case of suspected embezzlement, the accountingledgers had gone missing—only the bank statements were available for analysis,and the information on these were limited to the date and amount of eachtransaction. Any detailed information pertaining to the transaction recipienthad disappeared with the ledger books. The account in question was establishedand maintained to pay bills and reimburse expenses. It would appear that thiswould be a difficult situation to identify even the most brazen fiscal improprietybecause the information was so limited. In fact, as can been seen in Table 10-1,the initial review of the bank statements suggested that nothing seemed to beamiss in the accounting. After the data were put into a spreadsheet and graphed,however, it became apparent that the transaction amounts were very unusual.As depicted in Table 10-2, 23 of the 248 transactions reviewed were for $100.Similarly, 20 of the checks written were for exactly $200 and 12 were for $50.More than one in five, 22%, of the checks written from this account to pay billsand reimburse expenses were for the amounts of $200, $100, and $50. A quickreview of my own bank statement reveals no such pattern of even transactions.While it was not clear exactly who the checks were written to, the amountscertainly raised questions regarding the activity in that account.
In fact, this pattern of checks is similar to what one would expect fromsomeone writing a series of checks for “cash” in relatively even amounts. Armedwith this suspicion, the data were reviewed again, and it was noted that initiallythere were a series of “counter” transactions in which the suspect was simplywithdrawing funds from the bank teller, again, in even amounts. Generation of

10.1 Knowing Normal 179
�Table 10-1 Transaction records from a suspicious bank account.
date amount chkno bal
38 10/26/20XX 10.50 543 1640.46
39 09/29/20XX 120.90 544 3041.58
40 03/16/20XX 165.00 545 2406.63
41 10/20/20XX 39.12 546 1900.96
42 11/17/20XX 421.20 548 2536.81
43 10/19/20XX 42.00 549 1940.08
44 10/30/20XX 250.00 550 1390.46
45 11/20/20XX 75.58 551 1705.23
46 11/21/20XX 54.96 552 1584.82
47 11/20/20XX 756.00 553 1780.81
48 11/17/20XX 500.00 554 2958.01
49 11/21/20XX 65.45 555 1639.78
50 12/26/20XX 157.86 556 2068.47
51 11/28/20XX 39.49 557 1499.33
52 11/24/20XX 46.00 558 1538.82
53 01/10/20XX 11.40 559 1677.26
54 12/26/20XX 118.25 560 1950.22
55 01/03/20XX 71.56 561 1878.66
56 01/16/20XX 378.00 562 1299.26
57 01/31/20XX 8.00 563 1291.26
58 02/28/20XX 197.87 564 1620.39
a quick timeline revealed that these counter transactions stopped abruptly aftera duplicate statement was requested, suggesting that someone else might havebeen suspicious about the account activity.
This quick analysis provided the following information, which providedinvestigative leads for follow-up:
■ The pattern of activity was unusual for an account maintained to paybills and reimburse expenditures.
Chapter 10

180 10.1 Knowing Normal
�Table 10-2 Frequency distribution of the withdrawals associated with the bank account illustrated
inTable 10-1. An unusual distribution of expenditures in round amounts was suspiciousand warranted additional investigation.
80.05 1 .4 .4
81.00 1 .4 .4
87.86 1 .4 .4
88.78 1 .4 .4
89.00 1 .4 .4
89.50 1 .4 .4
95.70 1 .4 .4
96.00 2 .8 .8
97.50 1 .4 .4
100.00 23 9.3 9.3
105.00 1 .4 .4
110.00 1 .4 .4
117.74 1 .4 .4
118.25 1 .4 .4
120.00 1 .4 .4
120.90 1 .4 .4
125.00 2 .8 .8
125.25 1 .4 .4
126.43 1 .4 .4
126.50 1 .4 .4
128.00 1 .4 .4
130.00 3 1.2 1.2
■ The monetary total of suspicious transactions was approximately$6900.
■ The behavior changed after the duplicate statement was requested.The individual who requested the duplicate statement might have beensuspicious and would be someone worth identifying and interviewing.

10.2 “Normal” Criminal Behavior 181
This relatively simple exercise demonstrates the value of characterizing dataand drilling down to identify hidden details. It did not involve any sophisticatedanalyses and would be relatively easy to replicate in any setting. The importantfeatures were exploring the data and comparing it against what we know tobe normal. Moreover, this example, like the work with telephone call datadiscussed in Chapter 7, was able to highlight actionable investigative detailswithout specific information. Because the ledgers were missing, it was notpossible to document specific details regarding the disbursements. The use ofdata mining, however, revealed patterns of financial activity that were at leastcurious. The deviation from “normal” financial transaction patterns certainlysuggested that something unusual was occurring with this particular account,and supported the need for additional investigation.
10.2 “Normal” Criminal Behavior
In the next example, a more rigorous statistical approach was employed todetermine the relationship between different patterns of criminal offending,particularly as they relate to the potential for significant escalation.
Through a casual conversation, it was noted that most of the offendersidentified through the use of DNA cold hits had not been included in theCommonwealth of Virginia’s DNA database for previous violent or sexualcrimes.1 Rather, many of these individual were in the database for priorproperty-related crimes. Additional review of these cases revealed, however, thattheir property crimes differed qualitatively from “normal” trends and patternsassociated with property crimes. In many situations, these incidents appearedto represent “near-miss” rapes, or even seemed to indicate that the offenderswere developing their “victim access” methodology.
In other words, these crimes were not normal; they were not what one wouldexpect if the motive in the associated property crime were economic gain withminimal risk. By drilling down, it was determined that these incidents dif-fered from other property crimes in at least two significant elements. First,these crimes frequently were associated with occupied dwellings, which signifi-cantly increases the risk for detection and subsequent apprehension. Second, theoffenders generally took something of limited value, if anything was even takenduring the burglary. In some situations, the item taken could best be describedas something having souvenir or trophy value, rather than any sort of worth-while monetary value that would justify the risk associated with the offense.This “anomaly” suggests some other or additional secondary gain associatedwith the crime.
Chapter 10

182 10.3 Get to Know “Normal” Crime Trends and Patterns
In our experience, anything that deviates from “normal” patterns of offend-ing generally is cause for concern. Identifying the usual “secondary gain”associated with a particular type of crime can be very important in interpretingthe analytical results, which further highlights the importance of domain exper-tise in the analysis of crime and intelligence data. Behavior that deviates fromor generally appears to be inconsistent with the expected secondary gain in aparticular crime or series of crimes warrants further analysis.
10.3 Get to Know “Normal” Crime Trendsand Patterns
There is huge value in taking a few minutes periodically to mine routine crimedata. Through this process, conventional wisdom, gut instincts, and commonknowledge can be explored, confirmed, or reevaluated. This also is an excellenttime to “discover” information that can add value to existing knowledge orinvestigative practice. An example of this is the review of drug-related homi-cides to identify the relationship between the home address and crime location.Sometimes pulling back and looking at standard crime data with a fresh eye,drilling down and categorizing it a slightly different way, can reap huge benefitsfor the analyst and the investigator.
While it would be nice if crime would just go away, this is unlikely to happenany time soon. Rather, a certain baseline of criminal offending in a communitygenerally is to be expected. This probably is not something that policy makersand the command staff would want to discuss openly, but historical reviewsupports the existence of at least some unacceptable or criminal behavior thatemerges whenever and wherever groups of individuals congregate and coexist.One would imagine that back in the days of Australopithecus, certain individ-uals could be found stealing brontoburgers from their neighbor or writing badchecks on clay tablets to purchase a newer grass hut. We certainly have knowl-edge of crime that was present during the earliest days of recorded history andbiblical times.
Identifying and understanding normal rates of crime can help identifyunusual spikes that warrant additional consideration. An unexpected spike innormal or expected criminal behavior can indicate a brewing problem. Certaindata mining algorithms have been developed that monitor normal patterns ofcrime and offending. These are programmed to alert the analyst when significantdeviations in crime frequency occur. This approach, which is called a control-charting function, has been incorporated into the Regional Crime AnalysisProgram (RECAP), developed by researchers at the University of Virginia.2

10.4 Staged Crime 183
Effective, timely response to these localized fluctuations in crime will require agreater degree of fluidity in patrol deployment; however, it is much easier andmore efficient to address emerging rather than established changes in the localcrime climate.
On the other hand, some patterns of crime might fluctuate with weekly orseasonal periodicity, which can be anticipated. Therefore, an understanding ofnormal crime patterns and trends can provide a necessary baseline for the com-parison and evaluation of any perceived changes. In addition, characterizationof normal patterns also can facilitate forecasting, which would allow a proactiverather than a reactive response to any changes in offense rates. For example,seasonal changes frequently are associated with fluctuations in the number andlocation of auto thefts. Identifying this pattern can facilitate the developmentof proactive enforcement strategies, which are discussed in greater detail inChapter 12.
10.4 Staged Crime
One group of individuals that frequently gets it wrong with “normal” are peoplewho attempt to stage crimes. Again, having a good sense of what generally occursin crime can be of enormous benefit to the analyst encountering somethingunusual. Strange things happen, but most law enforcement and intelligenceprofessionals become suspicious when encountering too many coincidences orstrange occurrences. Everyone “knows” how crime works, or at least think theyknow, but very few actually get it right.
A recent example of a staged crime that deviated significantly from “normal”involved a college coed who went missing from her residence late one night.After she was found a few days later, several items supposedly belonging toher abductor also were recovered. Several unusual aspects of this crime arousedsuspicions that ultimately proved to be correct.
Most investigators have developed a keen sense of what is “normal” andexpected in crime and criminal behavior through experience. These internalnorms can be confirmed and characterized through the use of data mining andpredictive analytics. The resulting models can be used to identify more subtlepatterns of deception in future cases.
Similarly, through the discovery process, these definitions of “normal” canbe expanded to include additional, unexpected features. In its native state,crime frequently deviates from what we come to expect from its portrayal inthe popular media. Those trying to simulate a particular crime frequently base
Chapter 10

184 10.5 Bibliography
their manipulations on what they think crime should look like, which maydeviate significantly from what actually occurs. Knowledge based on ongoingreview and analysis of crime trends and patterns can reinforce internal normswhile enhancing existing domain expertise for the analyst as well as for theinvestigator. In combination, the characterization and modeling of normalcrime and behavior represent an extremely valuable tool in the investigativearsenal, particularly when criminals attempt to manipulate the investigativeprocess in an effort to elude detection or misdirect an investigation.
Can This Be Used Against Us
“Observe your enemies, for they first find out your faults.”
Antisthenes
One concern in writing a book like this is that the bad guys will buy it in an effort to learn somethingnew that will give them the upper hand. It is not unusual for criminals to study police methods andprocedures—perhaps as a means to stay one step ahead of law enforcement, or perhaps to enhance thethrill of the chase. More recently, we find that our adversaries in the war on terror have been studyingour methods and tactics.3 We study their tactics, methods, culture, and goals. Why should it be surprisingthat they do the same? The issue of “normal” behavior and “normal” crime is one of the things, however,that makes me relatively confident that the information contained within this book will not provide anunfair advantage to our adversaries. We can characterize crime and criminal behavior forever, and certaincommon features, trends, and patterns almost certainly will be identified. On the other hand, the moreI study behavior, the more I continue to be impressed by the subtle fluidity and adaptation that emergeover time. In many ways, change and transition truly are the status quo. Often I have been totally surprisedto find out what “normal” is in a certain situation. Whether examining routine traffic on the Internet orhow criminals typically function, I almost always have been perplexed by at least a few things that couldnot be explained readily. While this makes life interesting, it also gives me a relative degree of confidencethat it would be difficult to slip through undetected because, ultimately, “normal” is so strange.
10.5 Bibliography1. McCue, C., Smith, G.L., Diehl, R.L., Dabbs, D.F., McDonough, J.J., and
Ferrara, P.B. (2001). Why DNA databases should include all felons. PoliceChief, 68, 94–100.

10.5 Bibliography 185
2. Brown, D.E. (1998). The Regional Crime Analysis Program (RECAP):A framework for mining data to catch criminals. University of Virginia.
3. Papyrus News (2002). Fourth-generation wars: Bin Laden lieutenant admitsto September 11 and explains Al-Qa’ida’s combat doctrine. February 10;https://maillists.uci.edu/mailman/listinfo/papyrus-news
Chapter 10


11Behavioral Analysis of Violent Crime
“Outside of the killings, Washington has one of the lowest crime ratesin the country.”
Marion Shepilov Barry, Jr.
Although the above quote might seem humorous or absurd, it makes a goodpoint. In many ways, the key to reducing the crime rate is preventing crime.To effectively prevent crime, it is important to characterize and understand it sothat it can be anticipated and predicted. Therefore, the use of data mining andpredictive analytics to characterize and predict crime represents the first steps inthe preparation of a comprehensive, information-based approach to enhancedinvestigative efficacy and meaningful, targeted crime prevention.
For better or worse, people generally develop their impressions of crimein a community based on the number of murders or on the overall violentcrime rate (Figure 11-1). The ability to reduce community violence can reaptremendous benefits in terms of quality of life; rampant violent crime can impactalmost every aspect of life in a community. Aside from the immediate, directimpact on the victims and their families, the overall quality of life, includingeconomic opportunities, decreases significantly in a crime-ridden community.As the cycle of violence spins out of control, those residents that can, leave;existing businesses relocate; and new opportunities for development are lost.Even the young people are affected.1 Those growing up in urban combat zones(Figure 11-2) acquire the short-term approach to life so frequently observed inpeople with diminished perceptions of their value to the community, reducedaccess to opportunity, and shortened overall life expectancy.
Several years ago, I began a conversation with some colleagues who pos-sessed exceptional skills in the behavioral analysis of violent crime. The basic
187

188 Behavioral Analysis of Violent Crime
�Figure 11-1
Homicide ratescan alter
perceptions of therelative safety
and associateddesirability of a
community.
thesis of this discussion was that the behavioral analysis of violent crime orcriminal “profiling” works because violent crime is relatively homogeneous andpredictable.
Violence is a behavior, albeit an extreme behavior, when reduced to itsfundamental form. Social and behavioral scientists have been studying andcategorizing behavior for many years and have found that in many ways, natureis economical. Biologists frequently find the same common elements repeatedwithin an organism and across species. In other words, one of nature’s rulesseems to be, if it works, keep using it. Complexity often is achieved by uniquecombinations of simple common elements. This concept is explored further inthe chapter on modeling.

Behavioral Analysis of Violent Crime 189
�Figure 11-2
Manycommunities
inundated withdrugs and
violence resembleurban combat
zones.
Animal Models
“Innocence about Science is the worst crime today.”
Sir Charles Percy Snow
It may not be obvious, but animal research can help us understand violent crime and enhance datamining strategies. An understanding of the research on nonhuman animal behavior frequently holdssome insight for students of human behavior that can be applied to criminal or violent behavior in
Chapter 11

190 Behavioral Analysis of Violent Crime
some cases. While it is unlikely that there are any studies in scientific literature entitled “When MiceGo Bad,” some excellent comparison data can be identified with a creative approach to the literature.For example, the theory of species-specific defense reactions (SSDR), which was developed using animalsmodels, provides a good explanation for situations in which people fail to react in life-threatening situationsand perish as a result. Briefly, this theory suggests that there are certain behaviors that have been selectedfor during the evolutionary process that are preprogrammed, or hardwired into the brain, because theypreviously have been integral to survival. The fight or flight response falls into this category, as well asanother behavior called “freezing,” in which an individual “freezes,” or otherwise is incapable of movement.Why is an understanding of animal models of behavior important to the analysis of human public safetydata? First, it provides a general outline of existing behavioral categorization that can be adapted and usedto describe and understand human behavior. For example, we know based on the literature that animalresponses to threatening situations can be classified into three mutually exclusive and distinct categories:fight, flight, or freeze. Within a context of conservation of the behavioral mechanism, this same behavioralcategorization can be applied to human responses to threatening situations.
Second, by identifying and linking common behavioral elements found in animal research literature toquestions regarding human behavior, we often can enrich our understanding of the human behavior inquestion. There are some “experiments” that would be illegal or unethical to conduct on human subjects.Characterizing and reducing human behavior to common elements and themes, however, frequentlycan facilitate the identification of a similar animal model that might further illuminate other aspects oroutcomes related to the behavior not considered previously. For example, models describing predatorselection and acquisition of prey can be used to describe victim selection in some patterns of violentcrime.
Returning to the example of SSDR, we know from animal studies that it can be extremely difficultto elicit a behavior other than the natural response in a threatening situation. By further reviewing theliterature, specific examples can be identified and applied to human situations. For example, animalresearch information can be used to enhance escape planning in protective operations. If particularsituations or scenarios are likely to elicit a freeze or fight response when escape would be the bestchoice, then operational planning can be modified to incorporate our understanding of the natural orlikely response to this particular situation or combination of operational elements. Alternatively, anadaptive response can be taught in an effort to overcome the natural response in the scenario.
Why does this have value to data mining and predictive analytics? In many ways, the behavioral analysisof violent crime works because behavior is relatively homogeneous and predictable when reduced to itssimplest form. Therefore, examination of the nonhuman behavioral literature provides two benefits.First, it forces the analyst to reduce behavior to common elements. That is, it forces the development ofoperational definitions for the behavior of interest. For example, overkill can be extremely upsetting forresponders who encounter it but, operationally defined, it just means that the amount of force used wasgreater than that required to kill the victim. So overkill is either present or it is not, which reduces it toa yes/no question. It does not matter whether the victim was stabbed 50 times or 500 times—overkill

Behavioral Analysis of Violent Crime 191
is overkill. By reducing this question to a yes/no choice, a binary selection, the data and related questionshave been categorized in a way that is appropriate for data mining and predictive analytics.
Behavioral literature often can provide a level of insight and understanding that can be used to structureand guide data mining analysis of criminal behavior while illuminating likely outcomes or responses to thebehavior in question. For example, optimal foraging models and predatory behavior in animals can beused to describe the nature and function of some illegal drug markets. Therefore, by looking to theseexamples, drug enforcement also can be understood within a context of changing the behavioral cost ofthe criminal behavior, similar to the approach used in the very effective Project Exile.
This conservation mechanism also can be applied to behavior. In manyways, the behavioral analysis of violent crime involves describing, aggregating,and categorizing behavior, similar to the behavioral categories or taxonomiesdeveloped and employed in the laboratory setting. Many of the same behavioralconcepts developed in pigeons or rats can be applied to humans. While thiscomment might prompt a few uncharitable comments from those who workwith criminal behavior on a daily basis, the concept of behavioral reduction canhave profound implications for the use of data mining and predictive analyticsin the analysis and prediction of criminal behavior, particularly violent behavior,as well as victim selection, victim response, and victim-perpetrator interactions.
People tend to get into ruts with regard to their behavior, which is the basicfoundation for the routine activities theory of crime.2 A systematic review ofdrug-related homicide data in Richmond, Virginia, revealed that the victimsof drug-related homicides generally did not get killed on the opposite side ofthe river from where they lived. We have conducted similar analyses since thattime and have found a relatively consistent pattern of results. People still tendto get killed over drugs on the same side of the river where they reside.
In some ways, this should not have been a particularly surprising finding.The Richmond metropolitan area is divided by the James River. While peoplefrequently will cross the river for work and work-related functions, they gener-ally tend to stay on the same side of the river as their residence for most of theirother routine activities. Additional analysis of the illegal drug markets in the cityrevealed a similar pattern. At the time of the analysis, there were drug marketsthat had evolved to serve the population from each particular side of the river.They tended be in locations that were convenient for the particular marketor clientele being served, but a quick review of vehicle identification stickersrevealed very little crossover, particularly among users. Perhaps the one note-worthy exception to this finding was that dealers and other individuals involved
Chapter 11

192 Behavioral Analysis of Violent Crime
with the illegal networks were killed on the other side of town, possibly becausethey did not belong in that area.
What does this mean? First, it has some implications for drug enforcementstrategies. If people were not crossing the river and getting killed buying drugs,a logical assumption would be that they did not cross the river to buy drugs.These homicide data, in many ways, provided a snapshot into illegal drug buyinghabits in the city. Triangulating between the residence of the victims and thelocations of the murders also provided some insight regarding normal trafficpatterns and routes associated with the various drug markets. This informationhas considerable value for drug enforcement strategies.
What about folks working outside of the Richmond metropolitan area?What does this mean for them? Reducing this example to its common elementsreveals three features that can be applied to other settings. First, it highlightsthe use of the discovery and modeling process embodied within data miningand predictive analytics. Although using very simple techniques, this exampledemonstrates that we can learn new things about violent crime through theprocess of characterization and categorization. By drilling down into the infor-mation, new trends and patterns can be revealed or discovered. Moreover, thisinformation can be used to anticipate and predict future similar events, whichopens the door to meaningful enforcement and prevention strategies.
Second, humans are creatures of habit. If I can buy milk, watch a movie,and get my car washed near my home, why should I cross the river to buydrugs? Drug markets can be extremely adaptable and fluid, particularly whenresponding to the preferences of the users. In fact, it is really amazing to seethe differences between some of the inner-city open-air drug markets and thoseserving folks from the outlying areas. During various tours of the illegal markets,the differences in structure, setup, and function were noteworthy. At that time,the dealers associated with the inner-city markets tended to be savvier, able toquickly distinguish the unmarked vehicles—frequently after young children onbicycles called out, “Five-oh!,” heralding our impending arrival.3 The othermarkets, on the other hand, resembled a fast-food restaurant in terms ofconvenience and product availability, as well as setup and function.
The third benefit of this example is that it highlights the use of data miningand predictive analytics in the analysis of violent crime. If nothing else, thisexample should encourage other agencies to step outside the box in the analysisof violent crimes. Simply “counting crime” is not enough. To prevent crime, weneed to be able to anticipate and predict it. This extremely low-tech yet powerfulexample highlights the value of creative analysis. It also further supports the useof spatial analysis or mapping. Mapping should not be confined to pin maps

11.1 Case-Based Reasoning 193
showing what happened. Maps should be used to convey additional details orinformation regarding crime trends and patterns of interest.
11.1 Case-Based Reasoning
In many ways, the process of criminal investigative analysis, or behavioralprofiling of violent crime, truly is an amazing example of data mining and pre-dictive analytics. At first, the process seems like magic. When confronted witha jumbled mass of clues, the investigator is able to identify a likely suspect, likea magician pulling a rabbit out of the hat. On further investigation, though, itbecomes clear that are two important elements functioning in this investigativeprocess. The first is good case management. By reviewing the case thoroughly,items that have been overlooked or lost can be identified and addressed. Similarto identifying where missing puzzle pieces belong, this process in and of itselfcan result in tremendous clarification in the direction of an investigation andsignificant progress toward closing the case. It allows the investigator to revealthe big picture and identify any readily apparent trends and patterns. In manyways, this is similar to the process of data cleaning and management. By thor-oughly reviewing and organizing the case, missing details or data are identifiedand, if possible, addressed.
Similarly, using data mining and other automated methodologies canprompt consideration of evidence in a different light. By distilling the collectednarrative information through a categorical filter, the information can be furthercharacterized and categorized into smaller, readily identifiable groups that havevalue from an investigative perspective. How does this work in the field?Overkill, as discussed above, and many other factors considered during investi-gation can be broken down into “yes/no” or dichotomous decisions. Using thistype of approach, decision trees can be developed that guide the investigativeprocess, which ultimately can be used in automated motive determination algo-rithms and even strategic characterization models of likely suspect attributes.These and other data management techniques can add more structure andmeaning to investigative information.
The second key piece in the behavioral analysis process is pattern recognition.While this might sound easy, any good investigator knows that it can be muchmore difficult than it sounds. Investigators who are particularly good at thistask are those able to move beyond some of the obvious details and identifyunderlying themes and patterns. In addition, they will begin trying to matchthese elements in the current case to their internal database of previously solvedcases in an effort to identify a common theme or pattern that might give them
Chapter 11

194 11.1 Case-Based Reasoning
some insight. This process of comparing current evidence against historicalmemory to see what fits can be described as case-based reasoning. Case-basedreasoning is a model of learning in which people comprehend new experienceswithin the context of previous ones,4 a process that can be modeled using expertsystems or artificial intelligence.
In some ways, a good investigator can be thought of as a closet analyst.The process and approach associated with criminal investigations is one ofthe most analytical aspects of law enforcement. Attributes that are associatedwith a good patrol person or an excellent member of the SWAT team are verydifferent from those factors that are associated with a good investigator. Thecomparison between the Hawaii Five-O and Columbo detective shows providesa nice parallel. McGarrett and Danno are out there in the thick of things,catching bad guys, while Detective Columbo seems to be stumbling aroundin a clumsy fashion. Yet the viewer can almost see Columbo’s wheels turningand watch him mentally chewing on the evidence as he chews on his cigars,trying to make the pieces fit in an effort to understand the puzzle. In addition,Columbo always was “bothered by” the pieces that did not fit, highlightinggaps in an alibi or oddities in the crime scene. In many ways, Columbo is awalking example of data mining, case-based reasoning, and anomaly detectionrolled into one baggy trench coat. Again, not very elegant, but it works.
Cold case investigation can be seen as an extreme manifestation of the ana-lytical side of the investigative process. These very special investigators andanalysts are truly unique in their ability to move beyond the superficial natureof the evidence and look for the underlying form or commonalities with othersolved cases in the investigator’s repertoire. While this may sound almost likea Zen-like approach to investigation, much of it comes back to excellent casemanagement, anomaly detection, and some superb case-based reasoning.
Replicating this process through the use of computer programs or artificialintelligence algorithms certainly confers some benefits. First, a computer-ized database has the ability to store and quickly recover a large amountof information, with an associated capacity that extends well beyond thememory storage and retention abilities of a human. Expert systems havethe ability to store, retain, and simultaneously consider information frommore cases than any single investigator is likely to encounter in his or hercareer. In addition, the information is not subject to the same memorialdecay and errors in interpretation over time that can occur with the humanmemory.
Second, an expert system theoretically has no bias—bias that can favora particular scenario and color the course of future evidence collection and

11.1 Case-Based Reasoning 195
investigative process. It is not swayed by the suspicious boyfriend, or by the shiftylooks and dubious alibi given by the jilted lover. Similarly, it is not likely to evensubtlely discard or overlook evidence that is contrary to a favored hypothesis oroutcome. This certainly is not to suggest any lack of professionalism or ethicson the part of sworn investigators. They are some of the most honor-bound,committed professionals in law enforcement. Rather, human investigators bringtheir internal norms, life experiences, and feelings to every case. While this canmake them incredible champions for the victims and their families, it also shavesaway some of their objectivity. It is almost impossible to look at the face of a deadchild and remain objective; however, even a little compromise in objectivity canbe associated with a concomitant decrease in efficacy. Computers, on the otherhand, do not care.
Finally, expert systems are not bothered by crime scene details; they canget beyond the “yuck” factor that occasionally can catch even the most sea-soned investigator. Certain victims and certain scenes affect investigators indifferent ways. Those that are affected by everything that they see are limited intheir ability to effectively investigate violent crimes. On the other hand, thosewho do not respond to anything probably have been on the job too long andshould consider a change of pace in an effort to remain effective and retaintheir humanity. In short, even the most staid investigators are likely to be both-ered by something that they encounter. This limits their objectivity and cancompromise their ability to reduce the crime to common elements that canbe characterized and compared to previous cases. Artificial intelligence systemstruly embody the philosophy of “just the facts, ma’am” because they have nocapacity for anything else (at least at the time of this writing).
Does this mean that we should discard detectives in favor of computermodeling programs and expert systems? Absolutely not! Expert systems, nomatter how “smart,” lack one element critical to effective and meaningful datamining: domain expertise. Without an “expert” in the field to evaluate thenature of the evidence and information collected and to evaluate critically thevalue and validity of any created models, the risk for significant errors in logicand interpretation would seriously limit our ability to use these tools. Moreover,it is absolutely essential that professionals within law enforcement and publicsafety minimally have significant involvement in the analytical process. The bestscenario would be one in which analytical and investigative personnel worktogether in the data mining and modeling process, perhaps with some outsidehelp and support from statistical experts. It bears repeating that it seems to berelatively easy to teach data mining and predictive analytics to law enforcementpersonnel. These folks know where the data come from and how the models willbe used. They intuitively know what is available for models and when. As such,
Chapter 11

196 11.2 Homicide
they are much less likely to make critical errors that result in the creation ofa model based on circular logic, which essentially requires information that isdependent upon the output as an input or indicator variable. Many investigatorsare natural data miners, given the intuitive nature of their work, and seem toembrace the approach when given the opportunity. On the other hand, tryingto convey the internal norms, historical knowledge, and accumulated domainexpertise from an active investigative career to data mining experts has provento be extremely difficult.
In sum, data mining and predictive analytics can enhance the investigativeprocess, particularly through many of the automated pattern recognition pro-grams and scoring algorithms. However, the use of expert systems alone haslimited value and could significantly compromise the investigative process.
11.2 Homicide
At its most basic, homicide as a crime can be categorized and divided in manyways, most frequently based on victim-perpetrator relationship and motive.5
Figure 11-3 depicts a possible decision tree for murder. The first branch of
�Figure 11-3 Possible decision tree for categorizing murder.
Murder
Argument Robbery-related
Known
Drug-related
StrangerDomestic
Economic compulsive Systemic “Outlaw” lifestylePsychopharmacological

11.2 Homicide 197
the tree is divided by three possible victim-perpetrator relationships: famil-ial or domestic, acquaintance or known, and stranger. The second division inthe branches includes possible motives associated with stranger murder. Finally,within the various motives, it is possible to characterize the motive even further.In this case, the drug-related homicides have been divided using the TripartiteModel of Drug-Related violence developed by Goldstein.6 Briefly, this modeldescribes three types of drug-related violence: Psychopharmacological, eco-nomic compulsive, and systemic violence, which are related to the differentrole that drugs and/or the drug-related lifestyle may play in violent crime.
While the Goldstein model might be helpful for counting crime or deter-mining the proper focus for needed crime prevention strategies, it frequentlyadds little value to the investigative process because the nature of the victim-perpetrator relationship and true motive generally are not confirmed until asuspect has been identified and apprehended.
Information collected during the investigative process can be subdividedand used to determine the nature of the crime and possible suspects. As can beseen in Figure 11-4, much of the information collected and considered in theinvestigative process can be reduced to simple binary choices or sets, reinforcingthe fact that data preparation is one of the most important steps in the datamining process.
While startling to many, violent crime can be very homogeneous whenviewed in the proper light. One feature of the behavioral analysis of violent
�Figure 11-4
Possible decisiontree for
categorizingbehavioral and
forensic evidence.
Murder
Multiple scenes
One scene
Location
Injury patterns
Post mortem
Overkill
Chapter 11

198 11.2 Homicide
crime is the characterization of an incident based on common elements. Theseinclude victim as well as scene characteristics, which ultimately are associatedwith common perpetrator characteristics. The goal is to develop a profile ormodel of the type of person likely to have committed the crime, based on theknown characteristics of the crime. In many ways, the behavioral analysis ofviolent crimes is similar to algebra. Ultimately, the objective is to solve for “X,”the suspect’s identity, which is done by systematically revealing and examiningthe other elements of the equation.
Whether consciously or not, the death investigator goes through a series of“yes or no” questions, often as early as when the first call comes into the dispatchcenter. This information is used to begin characterization and categorizationof the crime based on characteristics of the victim(s) and crime scene(s). Theseinclude, but are not limited to the following:
■ Was there more than one crime scene? Was the victim moved or thebody dumped?
■ Was it a weapon of opportunity, or did the suspect bring the weaponto the scene?
■ Was the victim at high risk for violence, or did the suspect assume riskin selecting this particular victim?
The list goes on, but a considerable amount of information can be describedas binary in nature, meaning that it can be answered by a simple “yes” or“no.” Other information can be divided into categories or sets (e.g., race)—information ideal for data mining and predictive analytics.
These similarities can be used to link similar crimes perpetrated by the sameindividual or group of individuals. They also can be used to link similar crimesperpetrated by similar individuals or groups of individuals. In the former case,it is important to link crimes in a series because, like in a puzzle, individualelements present in one incident that were missing or overlooked in otherincidents can contribute to a greater understanding of all crimes in the series.In other words, the whole often is greater than a sum of the parts. It also isimportant to identify all of the crimes associated with a particular individualfor prosecutorial purposes. Presenting a linked series can be helpful in joggingthe memory of a reluctant suspect.
Associating a crime or series of crimes to known suspects associated withsolved cases can be helpful in at least two ways. First, it can provide guidanceas to the type of individual likely to have perpetrated a particular crime orseries. In contrast to television and movie portrayals of “profilers,” the behav-ioral analysis of violent crime does not identify a specific individual. Rather, it

11.3 Strategic Characterization 199
associates a crime or series with perpetrator characteristics that can be used toguide the investigation. By relating a current investigation to an earlier, solvedcase, additional elements can be highlighted (e.g., things that you might wantto look for, why they did something, and investigative strategies, particularlyinterviewing).
11.3 Strategic Characterization
Where Do Murderers Come From?
The “nature versus nurture” question has swirled around in behavioral biology through several generationsof scientists at this point, and the most reasonable answer seems to be that human development probablyincorporates a little bit of both. One area where this question has some particular urgency, however,involves juvenile murderers. Many people look at a particularly heinous crime that has been committedby an individual who meets both the legal and chronological definitions of a child and wonder just wherethis individual came from to be able to commit such a heinous crime. In the course of my research, I havereviewed more than a few cases that fit these criteria and have been impressed again by the relative degreeof behavioral homogeneity between the crimes committed by young people with relatively limited accessto information regarding their chosen field of criminal expertise, and those committed by others whoseem to have an abundant source of example and mentoring. Beyond the impulsive juvenile murdererswho kill secondary to the commission of another felony, there lies another group that has taken murderto a level that seems to truly transcend their age and relative amount of life experience. As a result of thisanecdotal experience, I have tended to informally subdivide juvenile murderers into two groups: thosewho learn how to kill, and those who seem to have an intuitive sense or need to kill.7
The first group generally uses violence or murder to achieve some sort of secondary objective. For thisgroup, violence frequently is a means to an end, a way to achieve a particular goal. This type of juvenilemurderer is especially prevalent in illegal drug markets. For example, in illegal drug markets, violencefrequently is used to enforce rules and norms, particularly as there is limited access to legal enforcementmechanisms.8 In other words, if Bob sold Joe some bad dope, Joe generally could not expect to receivemuch help from the economic crimes unit at the local police department. It is not unusual for theseoffenders to commit multiple murders, and even use crime scene behavior and postmortem mutilation orpositioning to send a message to the community, behaviors and practices frequently associated exclusivelywith serial killers. However, killing for these youthful offenders is a means to an end. Any additionalbehavior or manipulation of the victim’s remains often represents a punctuation mark to the underlyingmessage sent.
Chapter 11

200 11.3 Strategic Characterization
This group seems to have acquired their skills through a process of social learning. These kids learn bywatching others commit violent crimes and use violence to achieve secondary goals and objectives. Thisalso relates to the idea that drug selling, like law enforcement, is a 24/7 profession. If one is to succeedin the extremely predatory world of illegal drug sales, then it is important to convey a sense of powerand strength in every life domain. It would be extremely dangerous to be perceived as weak in a socialsetting, for example. This has been described previously as the “outlaw” lifestyle, and it can be linked tosome murders involving those linked to illegal drug markets but not directly to a drug-selling transaction.Drug-involved violence, in particular, has been studied and characterized in some detail, which formsa great foundation and framework for the use of data mining and predictive analytics in the analysis ofviolent crime.
Consistent with the social learning model, Bennet, DiIulio, and Walters wrote a book titled Bodycount.9
At the time of its publication, their concept of a juvenile “superpredator” received a tremendous amountof press. At first, the concept of a superpredator seemed alien, almost offensive. He was almost likea “robocriminal,” relatively automatic, with slim prospects for rehabilitation. Over time, however, as Iencountered more young killers like those involved in illegal drug markets, it became clear that therewere some kids who had been changed significantly and perhaps irrevocably by their environments.10
Ongoing and repeated insults during critical periods of emotional and moral development had changedtheir cognitive set, to the point where they employed different rules of the road as they negotiated thetwists and turns on their life path. That is why I am so sad to see young children in the arms of adultsat crime scenes, because these events often represent the first steps in the social learning process thatultimately turns out juvenile murderers and victims in our urban combat zones.
The second group of juvenile murderers just seems to like to kill, whether to fulfill a need to attain theultimate power over another human being or to gain the opportunity to engage in unlimited explorationof the human body. This group is particularly intriguing, given the intuitive sense that they seem to havefor what they want or need to do. Their intuition frequently is associated with very little outside input,although this has been changing in recent years.
It is interesting to study historical cases of serial sexual homicide, many of which were used as thebasis for the creation of criminal investigative analysis, and note the eerie similarities between many of thecrimes. The relative degree of homogeneity between the crimes committed by these different individualsis uncanny, given the lack of contact between the individuals and the relatively limited public knowledgeand understanding of this behavior even a few years ago. The fact that this behavior is so similar andpredictable that it can be used to enhance the investigative process really begs the question, “Where doesviolence come from?”
Even more intriguing are the young people who go through a similar developmental process as theybegin to explore violence. Recent increases in the prevalence and availability of reference materials regard-ing serial murder and other types of violence seem to have increased the sophistication of the methodsand desires associated with this group. It is for this reason, perhaps, that this group can be a particular

11.3 Strategic Characterization 201
challenge in terms of the relative degree of sophistication associated with their pattern and methods.Through the use of educational materials or facilitators, their crimes can be almost indistinguishable fromthose committed by much older individuals, which presents a significant challenge to those charged withinvestigating their crimes. Frequently, the question is not, “Could a child do this?” The answer to thatquestion is almost always, “Yes.” Rather, the question now has become, “Is the juvenile suspect that I amconsidering capable of committing this crime?”
Again, by using data mining and predictive analytics, it is possible to transcend human bias and opinion,particularly regarding juvenile suspects, in an effort to reveal the underlying elements of a crime, preparea strategic characterization of the likely offender, and close cases that formerly challenged even the mostseasoned investigators.
Frequently in an actual investigation, the nature of the victim-perpetratorrelationship is unknown. It is the crime scene characteristics and victim lifestylefactors that suggest a possible motive, which then is used to identify possiblesuspects. In fact, it is this type of strategic characterization of likely suspectsthat is embodied in the behavioral analysis process.
Some of our earliest work using advanced statistics for characterizing violentcrime involved the development of automated motive determination models.11
Again, this work arose out of some lively discussions regarding whetherit is possible to accurately model violent crime using automated methods.The cases used for this study included 25 juvenile murderers incarcerated in theCommonwealth of Virginia Juvenile Correctional Centers from February 1992to July 1996. Information pertaining to the victims, suspects, injury patterns,and the behavioral characteristics of the assault were identified and analyzed inan effort to determine whether it was possible to determine the motive usingautomated methods.
For the first analysis, all of the information that could possibly be obtainedwas put into the model. The analytical approach selected was discriminantanalysis, which is a classification modeling algorithm. These tools are coveredin greater detail in Chapter 7; in brief, discriminant analysis is a multivariatestatistical approach that can be used to identify factors that are useful in deter-mining group membership. Generally, one of the assumptions with the use ofdiscriminant analysis is that the variables used to create the model are continu-ous. While some of the data available for this study were continuous (e.g., age),most of the relevant information was either binary or categorical. As a mod-eling tool, however, discriminant analysis is robust enough to accommodate aviolation of this assumption. Basically, the type of error most likely to occur
Chapter 11

202 11.3 Strategic Characterization
with a violation of this type is that a model will not emerge, even though theremight be a relationship in the data.12 The issue of errors and how they shouldbe evaluated is addressed in Chapter 4. In a motive determination model, anyerror that would misdirect an investigation could potentially be catastrophic,as it would waste investigative resources. Moreover, delay in the investigativeprocess could seriously compromise the ultimate ability to solve the case. There-fore, failure to identify a model due to the violation of the data type assumptionwas determined to be acceptable after thoughtful consideration of the ultimaterole for any potential models.
The initial results were extremely promising. Using information related torecent victim drug use and suspect substance use history, it was possible toaccurately categorize 85% of the cases as drug-related or not drug-related. Oneinteresting finding regarded the direct relationship between the suspects’ use ofillegal drugs, particularly marijuana, and their involvement in a drug-relatedhomicide. Our earlier work had confirmed conventional wisdom among nar-cotics detectives: Most successful drug dealers do not use the drugs that theysell.13 In fact, substance use has been associated with an increased risk forfirearms assaults among drug sellers. Whether our finding was a cause or aconsequence was not entirely clear, but substance use was not a healthy choice,particularly among those involved in the sale and distribution of illegal narcotics.Therefore, this result was somewhat surprising. Further examination revealedthat the suspects’ substance use generally involved marijuana, while the recentvictim use included cocaine and opiates (e.g., heroin). This finding was con-sistent with a model of drug-related violence that proposed different subtypesof drug-related violence associated with different types of suspect, similar to adivision of labor within drug distribution networks.14 In particular, the sus-pects who emerged in this preliminary study were very similar to the “enforcers”described in this model.
The end result of this preliminary study was support for the notion thatviolent crime could be modeled using advanced statistics, as well as addi-tional knowledge regarding our understanding of drug distribution networksand the proposed division of labor. From an investigative standpoint this wassomewhat helpful, in that it offered additional information pertaining to thetypes of individuals likely to commit drug-related violence; however, it pro-vided little more in the way of enhanced investigative efficacy. In other words,the results of this study indicated that recent victim use and suspect use weregood indicators of drug-related violence. From an investigative standpoint,this creates circular logic: To identify the suspect, it is helpful to know themotive; to determine the motive, we need information regarding the suspect’ssubstance use; to know the suspect’s substance use habits, we need to know

11.4 Automated Motive Determination 203
who the suspect is, which is the original question. Clearly, further work wasneeded.
11.4 Automated Motive Determination
More recent work in this area has been confined exclusively to the informa-tion that is available early on in an investigation. Again, drug-related violencerepresents a good area of study for several reasons. First, drug-related violencefrequently drives the overall violent crime trends in many communities plaguedby serious increases in violent crime;15 the homicide rate often rises and falls asa direct consequence of the drug-related homicide rate. Therefore, addressingdrug-related violence can significantly reduce the violent crime rates in thesecommunities.
Drug-related crimes, particularly violent crimes, can be difficult to solvein a timely fashion. Witnesses may be reluctant to come forward or may beunreliable. In some cases, drug-related violence is seen as “part of doing busi-ness,” reducing sympathy for the victim and making others less likely to getinvolved. The more time that elapses, however, the less likely it is that a mur-der will be solved. If significant progress is not made in the first few days ofan investigation, it becomes increasingly unlikely that the case will be solved.Finally, and perhaps most importantly, drug-related violence appears to berelatively homogeneous and amenable to modeling, which makes it a goodcandidate to evaluate automated motive determination scoring algorithms.
Using automated classification techniques similar to those used earlier, drug-related homicides were analyzed in an effort to develop a model that could beused to automatically determine a motive using information available early inan investigation. The relevant variables that emerged were location, location,location. While this is an overly simplistic interpretation of the results, the mostsalient fact to emerge from this analysis was that certain areas were associatedwith an increased risk for drug-related violence (Figure 11-5).
The results were distilled and deployed through maps, which allowed forproactive, risk-based deployment specifically targeting drug-related violence.One interesting finding that emerged with the maps was that one particulararea was associated with victims who were more likely to be employed. Furtheranalysis of the location revealed a drug market frequented by users from thesurrounding localities, which was consistent with employed victims. While thisinitially appeared to be nothing more than an interesting factoid, the operationalimplications quickly became apparent. Drug violence associated with employedvictims was consistent with victims who were buyers. One way to reduce the
Chapter 11

204 11.4 Automated Motive Determination
�Figure 11-5 Drug-related violence models can be deployed through the use of mapping tools. These
facilitate the development of proactive deployment strategies. This particular map high-lights differences in victim characteristics, which might have additional value from anoperational perspective.
Drug-related violence Characterized by differential victim risk
violence in these areas was to reduce the number of potential victims. Demandreduction approaches offered the perfect solution to this finding, while differentapproaches could be used in other markets associated with different types ofdrug-related violence.
The opportunity to more fully characterize crime and tailor specific crimereduction approaches based on a thoughtful analysis of the problem is one pow-erful benefit of using data mining and predictive analytics in the developmentof operational strategies. Just as we cannot please all of the people all of thetime, there is no universal “crime reduction” strategy that will work for everysituation all of the time. While this seems entirely logical, it is very difficult toeven begin to match an appropriate operational plan to a particular issue if thenature of the problem has not been characterized and defined. For those whowould say, “Utilize, don’t analyze,” this approach offers a solution for evaluatingoperational approaches in a meaningful way—something that increasingly hasbecome a requirement as resources are increasingly limited.
When the time of day, day of the week, and victims’ employment statuswere included in the analysis, the accuracy of the model increased concomi-tantly. Again, this model included only that information available early in aninvestigation; however, when the new information was added to the model, itbecame too opaque to have any value in the deployment process. Therefore,these results were deployed through a web-based package, which provides for24/7 analytical capacity.16 As most homicide detectives can attest, people gen-erally do not kill each other when it is convenient for us, particularly when

11.6 Aggravated Assault 205
drugs are involved. Most analytical teams, however, work normal businesshours. By deploying algorithms through these web applications, operationalpersonnel have the benefit of analytical help when they most need it: early inan investigation, when the case is progressing most rapidly.
11.5 Drug-Related Violence
Like homicide in general, drug-related violence can be categorized and dividedfurther, based on the specific motive for the violence. When asking why thisis relevant, it is important to remember that the more an investigator knowsabout what happened and why, the higher the likelihood that a suspect will bedeveloped, effectively investigated, and prosecuted.
In his tripartite model of drug-related violence, Dr. Paul Goldstein17 hasproposed three categories of drug-related violence. A fourth type of drug-relatedviolence also should be considered that has been described as the “outlawlifestyle.”18 Briefly, this type of drug-related violence is related to the fact thatdrug dealers, like police officers, generally are “on the job 24/7.” What thismeans is that to function effectively in an extremely predatory environment,the individual needs to always be “on.” A drug dealer involved in a violent drugmarket is going to have difficulty maintaining his safety when he is selling if heis perceived as being weak in other domains of his life.
A second benefit of analyzing violent crime in this fashion is that theoutcomes can be used to guide the development of enforcement strategies.For example, a finding that in a certain area associated with open-air drugmarkets, most of the victims of drug-related homicides were employed is con-sistent with drug users being killed. A possible enforcement strategy in thissituation could include aggressive demand reduction techniques in an effort tokeep potential victims out of harm’s way. On the other hand, victim character-istics consistent with dealer rivalries or gang disputes over markets or territorieswould require a different approach.
11.6 Aggravated Assault
Many aggravated assaults can be viewed as incomplete or poorly planned homi-cides. Similarly, the line that separates a lethal from a nonlethal assault oftenreflects the quality of medical care or timeliness of response, rather than somespecific intent on the part of the suspect. With that in mind, homicides and
Chapter 11

206 11.7 Sexual Assault
aggravated assaults can be viewed more as a continuum, rather than as two sep-arate and distinct entities. When we explore this a little further, it makes sensebased on what we know of violent crime. For example, the number of innocentvictims associated with drive-by shootings supports the fact that drive-bys fre-quently do not go according to plan. Vehicle movement, unreliable weapons,and random bystanders all contribute to the variability associated with this typeof violence. Similarly, it is not unusual for there to be several nonlethal assaultsthat precede a domestic homicide. Therefore, many of the same approaches tothe analysis of murder can be applied to nonlethal assaults. One important dif-ference from a data mining perspective, however, is that there usually are morenonlethal assaults than homicides. While this is a good thing for a community,it also is a very good thing for the analyst, as there generally are more incidentsavailable for analysis and modeling.
11.7 Sexual Assault
Stranger rapists can be some the most disturbing predatory criminals a detec-tive will encounter. Even the hint of a serial stranger rapist can create aclimate of fear in a community. Several years ago, during a casual conversation,Dr. Paul Ferrara, the director of forensic scientists in Virginia, noted that asurprising number of the DNA “cold hits” for predatory sex crimes had comefrom criminals without prior histories of sex offending. At the time, Virginiawas noteworthy for having created a very successful offender DNA databasewith broad inclusion criteria. While some states were confining their samplesto convicted sex or violent criminals, the Commonwealth of Virginia obtainedDNA samples from all convicted felons.
Dr. Ferrara noted that several of the offenders identified by cold hits wereassociated with prior property crimes, particularly burglaries. In some ways, thisfinding was not surprising, in light of what we know about sexual predatorsand some violent criminals. In reviewing violent crimes, it is not unusual tofind a pattern of escalation that includes crimes that do not appear violentinitially. For example, Timothy Spencer, the “Southside Strangler” and firstperson convicted with DNA evidence, had a history of burglaries in northernVirginia that preceded the homicides that he committed later. Similar caseshave revealed a pattern of burglaries or trespassing that preceded escalation intomore serious patterns of offending.
An initial review of the data revealed that approximately 40% of the cold hitswere associated with offenders who had no documented history of either sexcrimes or violent offending. Perhaps more importantly, had the database been

11.7 Sexual Assault 207
confined to these patterns of offending, approximately 40% of the criminalsmight not have been caught and thus would have been allowed to continue toprey on their communities.19
Exploring this finding offered at least two benefits. First, the ability to charac-terize and identify patterns of offending that indicate an increased likelihood forescalation offers the promise of early detection, enhanced investigative efficacy,and increased community safety. This also creates increased opportunities forearly detection and intervention for sex offenders, who have a pattern of offend-ing that is noteworthy for its high recidivism rate and resistance to treatment.Second, an increased understanding of sex offenders, how they escalate, andhow they prey on the community gives behavioral scientists an opportunityto better understand this particularly challenging form of criminal behavior.This greater understanding offers the promise for early intervention and theconcomitant increase in public safety.
The initial study involved reviewing large correctional databases. Usingdiscriminant analysis, models were created to determine which factors werepredictive of subsequent stranger rapes. Not surprisingly, prior offense historyreliably emerged as the most predictive variable. What was a shock, however, wasthat a prior property crime actually was a better predictor for a stranger rapistthan a prior sex offense. It is important to note that discriminant analysis ideallyis used with continuous variables, while offense history frequently is confinedlargely to categorical variables. Because discriminant analysis is such a robuststatistical test,20 however, it was permissible to violate this assumption. Themost likely error to occur when this assumption is violated would be a failureto identify a model, which was acceptable given the nature of the question.
Subsequent manual review of the paper files associated with these offendersrevealed some differences in the nature of the property crimes they perpe-trated. In several cases, these offenders appeared to specifically target occupieddwellings. When someone was home at the time of the break-in, it frequentlywas a female alone, or a female with small children. In addition, these offendersfrequently took items of little or no value, if they removed anything at all fromthe residence. This behavior is inconsistent with a purely economic motive forthe crime.
In many ways, these crimes differed qualitatively from traditional burglaries.Reduced to its simplest form, a burglary is an economic crime in which theoffender tries to maximize the yield while managing the risk of being caught.The individuals associated with a subsequent stranger rape distinguished them-selves from “normal” burglars in that they incurred a greater degree of risk inpreferentially targeting occupied dwellings, and generally had little to show for
Chapter 11

208 11.8 Victimology
their efforts other than a few items that could be viewed as souvenirs. In otherwords, their crimes were abnormal.
The discovery and confirmation processes associated with data miningexpanded our understanding of stranger rapists. This new understanding wasused to generate a brute force anomaly detection system for identifying crimepatterns and trends determined to be at increased risk for escalation. Perhapsmore importantly, it also resulted in the development of a general principleregarding “normal” crime. Since the original study, this concept has been appliedsuccessfully to other nonviolent crimes that deviate in some way from “normal.”In other words, anything that suggests some type of secondary gain beyond orinstead of the economic motive generally associated with the crime is cause forconcern because it frequently indicates potential for escalation or more seriouspatterns of offending. Similarly, any preferential behavior on the part of theoffenders that increases their risk of detection or apprehension also is cause forconcern.
In England, the West Midlands police have conducted very successfulwork using predictive analytics to characterize and apprehend sexual preda-tors. Through the use of self-organizing maps or clustering algorithms, theywere able to identify clusters or groups of crimes that were similar. These simi-larities were based on a variety of relevant dimensions, which included methodof approach, verbal themes, precautions taken to prevent detection, and victimcharacteristics.21
This work is particularly encouraging because many of the category clustersidentified in this study match classifications described previously in the UnitedStates.22 This similarity suggests commonalities in some patterns of offendingthat might transcend national and perhaps even cultural boundaries. Therefore,unlike some business, health care, and educational applications of data min-ing and predictive analytics, work in the public safety and intelligence arenapromises to transcend national boundaries. This further increases the numberof potential end users for predictive algorithms, while enhancing the opportu-nities for increased resource exploitation of criminal justice data resources andpredictive algorithms.
11.8 Victimology
In some ways, victimology, or the study of the relationship between certainindividual attributes and the risk for violent crime, can be seen as a logicalextension of risk assessment. Examining victim characteristics can be used intwo ways. First, it frequently has value from an investigative standpoint because

11.8 Victimology 209
identification of victim lifestyle issues or risk factors often can suggest a possiblemotive and, by extension, a likely suspect.
On the other hand, some insight regarding potential risk factors associatedwith violent crime opens the door to meaningful, specifically targeted preven-tion strategies. Many victims of violence suggest that their injury was the resultof “bad luck” or that they were merely in the “wrong place at the wrong time.”If that was the case, there would be very little that we could do to reduce violentcrime, other than identify the perpetrators and get them off the streets as quicklyand for as long as possible in an effort to reduce crime. Crime prevention wouldrely almost exclusively on investigative efficacy.
We have come to realize that certain victim attributes can increase or evenbe related directly to an individual’s risk for violent victimization. For example,prostitutes are at increased risk for sexual assault and other violent crimes dueto their involvement in that pattern of criminal activity. Similarly, substanceusers are at increased risk for violence related to their involvement with illegaldrug markets. These frequently are referred to as “lifestyle” factors, meaningthat some aspect of the victim’s lifestyle increased his or her risk for violence.
This is a very important point, because if violent victimization truly is relatedonly to “bad luck,” we are limited in our ability to prevent violent crime.But if we can identify particular behaviors or activities that are linked to anincreased risk for violent crime, then we have an opportunity to try and changethose behaviors, which might concomitantly reduce the risk for violent crime.By reducing the risk associated with some of these individuals, the amount oflead flying through the air also will be reduced, which will reduce the “badluck” associated with those individuals who truly were in the wrong place atthe wrong time. By drilling down into the data, it is possible to identify certaingroups that are at greater risk for violence than others.
Victim Risk Factors
While it certainly is true that different people get killed for different rea-sons, what factors increase someone’s risk for being the victim of a violentcrime, and what does this have to do with data mining? Analysis of aggregatevictim data generally reveals little, if anything, regarding specific victim riskfactors. By drilling down into the data, researchers have found that one ofthe best predictors for violent victimization is involvement in criminal offend-ing. However, this remains too broad a category to identify any specific riskfactors. Therefore, it is necessary to parse the data even further in an effort toidentify relatively homogenous groups that would be acceptable for modelingpurposes.
Chapter 11

210 11.8 Victimology
By examining firearms injuries among juvenile offenders, certain patternsof associated risk could be identified and characterized. Certain attributes likepromiscuity were noted among most of the categories, but others differed sig-nificantly. One attribute of particular interest was involvement with firearms.In particular, it was found that violent offenders who had been shot previouslywere more likely to admit to possessing a weapon, while juvenile drug sellerswere much less likely to indicate that they carried a weapon. Additional infor-mation collected during this study ultimately had implications for officer safetyin the field.
Analysis of aggregate statewide injury rates really did not reveal many differ-ences among the different patterns of offending. When the data were categorizedby community, however, differences began to emerge. In particular, juveniledrug sellers were much more likely to be shot in poorer communities thanin those that were more affluent. Perhaps this was because there were moreopen-air drug markets in the impoverished communities, or perhaps robberywas the real motive. Regardless of the cause, this differential risk associatedwith specific community characteristics further illustrated the finding that vic-tim risk represented a complex array of individual and community factorsthat interacted to determine the composite threat associated with a particularindividual.
This finding was revisited several years later when it was noted that certainvictim characteristics were related to geography in determining drug-relatedhomicides associated with a particular drug market or area. During the devel-opment of the risk-based deployment strategies for drug-related violence, forexample, it was noted that certain areas were associated with more victims whowere employed, while other areas were associated with victims who were lesslikely to be employed. While correlation certainly does not imply causality,this particular finding had value in terms of creating meaningful enforcementstrategies that could be targeted specifically to the likely victims.
Child Abduction
Another area in which the characterization of victim attributes can indicatethe likely suspect and even probable outcome is child abduction. In a seriesof excellent papers, members of the Federal Bureau of Investigation’s NationalCenter for the Analysis of Violent Crime have characterized this pattern ofoffending in great detail.23 Briefly, these researchers have identified a reliableassociation between victim age and gender and the likely offender, reason for theabduction, and probable outcome. Again, this type of victim characterizationand modeling has tremendous implications for enhanced investigative efficacy

11.10 Bibliography 211
in cases where investigative speed can be related directly to the likelihood of agood outcome.
11.9 Moving from Investigation to Prevention
Improving investigative efficacy is very important, but what if violent crimecould be characterized, anticipated, and even predicted? If this were possible,then we would have an opportunity to engage in proactive strategies that wouldprevent crime before it happened. In death investigations, the act already hasbeen committed, but what if it was possible to anticipate who was next? Mini-mally, the high rate of subsequent assaults and murders documented in victimsof violent crimes24 identifies them as a group at extraordinarily high risk forviolent assault and murder. It is unknown whether this increase is associatedwith the idea that each aggravated assault really represents an incomplete orpoorly planned homicide, or because the same lifestyle factors that resultedin the first assault are still present. By identifying who is at risk, where, andwhy, traditional enforcement strategies can be matched and targeted to specificpatterns of risk. Through the use of predictive analytics to create a rule setfor drug-related homicides, for example, it could be determined that victimskilled near a particular drug market were more likely to be employed. Addi-tional information may indicate that this particular market was frequented byyounger, relatively affluent, recreational drug users from neighboring commu-nities. One possible approach in this situation would be a demand reductionstrategy such as “reversals,” where police officers play the role of drug dealers inan effort to identify and arrest users, ultimately keeping the potential victimsaway from a dangerous activity or market. A different approach might be war-ranted for drug-related homicides involving individuals associated with otherillegal drug markets. Identification, characterization, and modeling of victimrisk factors represent another use for data mining and predictive analytics inour efforts to reduce violent crime.
11.10 Bibliography1. McLaughlin, C.R., Yelon, J.A., Ivatury, R., and Sugerman, H.J. (2000).
Youth violence: A tripartite examination of putative causes, consequencesand correlates. Trauma, Violence & Abuse, 1, 115–127.
2. Cohen, L.E. and Felson, M. (1979). Social change and crime rate trends:A routine activity approach. American Sociological Review, 44, 588–608.
3. McLaughlin et al. (2000).
Chapter 11

212 11.10 Bibliography
4. Casey, E. (2002). Using case-based reasoning and cognitive apprentice-ship to teach criminal profiling and internet crime investigation. KnowledgeSolutions; www.corpus-delicti.com/case_based.html
5. See Westveer, A.E., ed. (2002). Managing death investigation. Washington,D.C. U.S. Department of Justice, Federal Bureau of Investigation; orGeberth, V.J. (1996). Practical homicide investigation: Tactics, procedures,and forensic techniques, 3rd ed. CRC Press: New York.
6. Goldstein, P.J. (1985). The drugs/violence nexus: A tripartite conceptualframework. J Drug Issues, 15, 493–506.
7. McCue, C. (2002). Juvenile murderers. In Managing death investiga-tion (Arthur E. Westveer, ed.), pp. 481–489. Washington, D.C., U.S.Department of Justice, Federal Bureau of Investigation.
8. Goldstein (1985).
9. Bennett, W.J., DiIulio, J.J., and Walters, J.P. (1996). Body count. Simon& Schuster, New York.
10. McLaughlin et al. (2000).
11. McLaughlin, C.R., Daniel, J., and Joost, T.F. (2000). The relationshipbetween substance use, drug selling and lethal violence in 25 juvenilemurderers. Journal of Forensic Sciences, 45, 349–353.
12. Klecka, W.R. (1980). Discriminant analysis, Sage: Beverly Hills.
13. McLaughlin, C.R., Reiner, S.M., Smith, B.W., Waite, D.E., Reams, P.N.,Joost, T.F., and Gervin, A.S. (1996). Firearm injuries among Virginiajuvenile drug traffickers, 1992 through 1994 (Letter). American Journalof Public Health, 86, 751–752.
McLaughlin, C.R., Smith, B.W., Reiner, S.M., Waite, D.E., andGlover, A.W. (1996). Juvenile drug traffickers: Characterization andsubstance use patterns. Free Inquiry in Creative Sociology, 24, 3–10.
McLaughlin, C.R., Reiner, S.M., Smith, B.W., Waite, D.E., Reams, P.N.,Joost, T.F., and Gervin, A.S. (1996). Factors associated with a history offirearm injuries in juvenile drug traffickers and violent juvenile offenders.Free Inquiry in Creative Sociology, Special Issue: Gangs, Drugs and Violence,24, 157–165.
14. Goldstein (1985).
15. McLaughlin, C.R., Robinson, D.W., and Faggiani, D. (1998). Declininghomicide rates in the 1990s: Not everywhere! Academy of Criminal JusticeSciences.

11.10 Bibliography 213
16. McCue, C. and Parker, A. (2004). Web-based data mining and predictiveanalytics: 24/7 crime analysis. Law Enforcement Technology, 31, 92–99.
17. Goldstein (1985).
18. McCue (2002).
19. McCue, C., Smith, G.L., Diehl, R.L., Dabbs, D.F., McDonough, J.J.,and Ferrara, P.B. (2001). Why DNA databases should include all felons.Police Chief, 68, 94–100.
20. Klecka (1980).
21. Adderly, R. and Musgrove, P.B. (2001). Data mining case study: Modelingthe behavior of offenders who commit serious sexual assault. ACM SpecialInterest Group on Knowledge Discovery and Data Mining.
22. Ressler, R.K., Burgess, A.W., and Douglas, J.E. (1988). Sexual homicide:Patterns and motives. Lexington Books, New York.
23. Lord, W.D., Boudreaux, M.C., and Lanning, K.V. (2001). Investigationof potential child abduction cases: A developmental perspective. FBI LawEnforcement Bulletin, April.
24. Sims, D.W., Bivins, B.A., OBeid, F.N., Horst, H.M., Sorenson, V.J., andFath, J.J. (1989). Urban trauma: A chronic recurring disease. Journal ofTrauma, 29, 940–947.
Chapter 11


12Risk and Threat Assessment
“Prediction is difficult, especially of the future.”
Neils Bohr
The world is filled with risk. Every action that we consider or take has somedegree of risk associated with it. We conduct risk or threat assessments internallyalmost constantly as we move through our lives. “Should I pull out in front ofthis car?” “Will I run out of gas?” “Can I skip my annual checkup?” These areonly a few of the many calculated risks that we take each day.
Part of risk assessment is weighing the likelihood of a particular outcomeassociated with a particular action or inaction against the potential seriousnessof the outcome. For example, when making a decision to fly, we know that therisk of a crash is extremely small; however, the potential consequences associatedwith an airplane crash can be very serious. It is much riskier to drive, but theperceived consequences associated with a crash are much less. Also factoringinto the equation in many cases are the perception of control. If I drive to mydestination, there is the perception that I have greater control over the outcome,which highlights the fact that some, if not most, of the information that we usein personal risk or threat assessment might be inaccurate or unreliable.
In the public safety community, we are asked to evaluate and mitigate riskon a regular basis. For example, is the potentially hostile crowd depicted inFigure 12-1 likely to riot, or will a show of force only escalate a relatively stablesituation? Are there other ways of dealing with this potentially volatile situationthat will reduce the risk? Perhaps one of the greatest challenges is that weusually are dealing with very unlikely events and with incomplete information.The likelihood of being a victim of crime generally is very low. This likelihoodor risk, however, can be increased by certain lifestyle factors or other relatedissues known to impact crime victimization rates. Data mining and predictiveanalytics can greatly assist the process of identifying factors associated withrisk, and are particularly adept at addressing the many issues that make accuraterisk and threat assessment such a challenge.
215

216 Risk and Threat Assessment
�Figure 12-1
Potentiallyhostile crowd
outside theCoalition
ProvisionalAuthority
headquarters inBasra, Iraq
(Courtesy of StaffSergeant Tom
Ferguson,USMC).
Fourth-Generation Warfare (4GW)
Modern warfare has been divided into three distinct generations by Lind et al.1 The first generation isbased on line and column and was largely driven by the weapons technology of the time: smoothboremuskets. Second-generation warfare was driven by changes in technology, which included the introductionof rifled muskets and the breechloader, barbed wire, the machine gun, and indirect fire. Second-generationwarfare remained predominantly linear, incorporating the tactics of fire and movement; however, it reliedon massed firepower rather than massed personnel. Second-generation warfare remained the foundationof U.S. doctrine until the 1980s, and is still used today.
While first- and second-generation warfare tended to be technology driven and linear, third- andnow fourth-generation warfare represent the first nonlinear tactics, which reflected changes in ideasrather than technology, and emphasizes maneuver over attrition. Several elements attributed to 4GWhave significant implications for local law enforcement. These include decreasing reliance on centralizedlogistics and the use of agile, compartmentalized units, which are similar to the cells frequently associatedwith international terrorist organizations or domestic hate groups. 4GW also emphasizes the goal ofcollapsing the enemy from within as opposed to annihilating him physically, and targets may include socialand cultural objectives as well as support for a war effort, economic stability, power plants, and industry.

12.1 Risk-Based Deployment 217
One needs only look at the stock market and the airline industry after 9/11 to see the larger impact ofthese tactics. Perhaps one of the most important issues for local law enforcement will be the blurreddistinction between civilian and military, and the absence of a traditional front or battlefield. According toLind and colleagues, the enemy will be targeted at every level, including social and cultural, and traditional“battlefields” might be difficult to identify in a 4GW scenario.
Risk and threat changed forever after the terrorist attacks of September 11.Increasingly, local law enforcement finds itself on the front lines of the waron terrorism. Knowledge of data mining and predictive analytical techniquesis only part of the requirements for the development of reliable and accuraterisk and threat assessment models that have value to the public safety commu-nity. Domain expertise is absolutely critical in the development and thoughtfulcreation and evaluation of risk models. Domain experts understand which dataare available, what types of models are needed, and which ones are actionableor have value. Just as it would be difficult for someone without a background ortraining in meteorology to develop weather models, domain expertise in publicsafety should be a prerequisite for work in this area.
12.1 Risk-Based Deployment
The concept of risk-based deployment was developed as part of the Project SafeNeighborhoods initiative in the Eastern District of Virginia,2 and it has beenused repeatedly throughout this text to illustrate various features of data miningand predictive analytics. Essential to development of the deployment model,however, was creation of the risk model.
Briefly, it was determined that while armed robberies were bad, an armedrobbery that escalated into an aggravated assault was worse. By developinga model of robbery-related aggravated assaults, it would be possible to iden-tify potential risk factors associated with this serious pattern of offending anddevelop targeted law enforcement initiatives that were designed specifically toreduce the risk for these crimes.
Perhaps one of the first challenges associated with this task was thatrobbery-related aggravated assaults, like many other examples in risk and threatassessment, were a very low-frequency event. Less than 5% of all armed robberiesescalated into an aggravated assault. This issue was addressed in the modelingprocess in two ways. First, it was important to collect a sample that included asufficient number of the events of interest so that this pattern of crime could
Chapter 12

218 12.2 Experts versus Expert Systems
be modeled adequately. Therefore, the sampling frame for the analysis was sixmonths. This represented an adequate number of events of interest for mod-eling purposes, yet it did not extend so long as to start incorporating a greateramount of variability, which also would compromise model preparation.
Crime trends and patterns tend to fluctuate over time, some more thanothers. Robberies frequently vary throughout the year, and can change as var-ious players come and go. Although this issue is addressed in Chapter 13,a sampling frame of approximately six months seemed to work well for thispattern of offending. Much beyond that, the amount of variability in theinformation associated with these long-term patterns and trends really compro-mised the model construction. Moreover, it also was questionable how muchvalue this type of model would have, as it would be based on relatively oldinformation.
The second method of addressing low-frequency events was to adjust thepredicted probabilities of the model. This has been addressed previously, butwhen modeling low-frequency events, it is important to ensure that the pre-dicted probabilities reflect the actual probabilities. In other words, a good modelin this case should predict that less than 5% of armed robberies will escalate intoan aggravated assault. In risk and threat assessment, we are asked to developa model that will predict an event that generally is relatively infrequent. It isimportant, therefore, that the model is created to predict future events with afrequency that is relatively close to what would be anticipated based on the rateof incidents historically.
12.2 Experts versus Expert Systems
If data mining and predictive analytics truly are game changing, why haven’tthey been universally adopted? It would seem that increased public safety issomething that everyone could get behind; however, there has been a lag inthe acceptance of automated tools in some areas. Research from the politicalscience community may provide an answer to this apparent disconnect betweenscience and practice. It seems that people are more inclined to trust an “expert”despite the finding that the accuracy of “expert” predictions does not differ fromthose of mere mortals, both of which perform well below predictions derivedusing statistics and mathematical modeling.3
I have direct personal experience with this phenomenon. Several years ago,I attended a scientific meeting that included a lively debate over expert versusstatistical estimates of risk for future violence. Despite the fact that the data over-whelmingly supported the accuracy and reliability of the statistical estimates,

12.4 Surveillance Detection 219
the attendees found a number of exceptions that would have been missed bycomputer models and ultimately elected to stay with the human judgments.
One possible explanation for this is that people may find comfort in theauthority that an “expert” conveys, rather than believing that human nature canbe reduced to math and equations.4 Given the capacity that data mining andpredictive analysis can bring to support public safety and security, however, thisdisconnect between science and practice really needs to be addressed. Perhapsthe best model for the paradigm shift required lies somewhere in betweenthose two extreme positions and could include domain experts using the expertsystems embodied in data mining and predictive analysis software.
12.3 “Normal” Crime
In many ways, solid internal norms or domain expertise is essential to effectiverisk and threat assessment. Knowing what is “normal,” particularly for crimeand criminal behavior, can be used to identify abnormal behavior, which gen-erally indicates an increased risk for escalation. Data mining and predictiveanalytics can function as invaluable tools in the characterization of normal, aswell as in the identification of abnormal incidents or trends that are worthy ofadditional investigation. For example, a series of suspicious situation reportscould mean totally different things, depending on the time of day and localcrime patterns. Suspicious behavior occurring during the daytime could indi-cate possible surveillance associated with burglaries or other property crimes.On the other hand, surveillance during the night, when residents are likelyhome alone, could suggest something far more sinister. This example under-scores the importance of knowing the community, normal patterns, and evennormal crime when evaluating analytical output. Again, characterization andanalysis of normal behavior, including crime, can be invaluable to identify-ing abnormal or potentially threatening behavior. This concept is addressed ingreater detail in Chapter 10.
12.4 Surveillance Detection
This topic is covered in Chapter 14; however, the ability to detect when a per-son or place is being watched or evaluated can be extremely important in riskand threat assessment. Not only does the identification of possible surveillanceactivity indicate the possibility of some type of preoperational planning or activ-ity, but it also can highlight previous undetected vulnerabilities in either the
Chapter 12

220 12.5 Strategic Characterization
physical or operational security of a particular location or activity. For example,consistent reports of suspicious activity indicating possible surveillance associ-ated with an area frequented by employees who smoke might reveal that a dooris propped open regularly to facilitate return into the building without having toutilize distant or inconvenient points of access. This surveillance activity, whilefocusing primarily on a particular area, ultimately reveals potential securityvulnerability that could be addressed.
12.5 Strategic Characterization
Generic profiles of suspected suicide bombers have been developed, althoughthe area of strategic characterization of possible or likely offenders has beenassociated with considerable controversy. These methods of strategic characteri-zation have been used to guide security screening processes, as well as mandatoryregistration and law enforcement interviewing protocols. A further examina-tion of these models starts to reveal the challenge associated with these generalprofiles.
While no one would dispute the fact that all of the 9/11 hijackers were ofMiddle Eastern descent, it is not equally true that all individuals of MiddleEastern descent are probable terrorists. A significant increase in false alarms is acommon problem associated with the challenge of modeling infrequent events.Worldwide, the number of likely terrorists is extremely small, something that ismagnified further when compared to the total world population. Attempts tofurther refine and characterize suspected terrorist profiles have included tighten-ing the possible age range and focusing on males. While significantly limitingthe relative percentage of possible suspects, these decision rules still catch avery large number of individuals in their net. Two problems emerge from thisinability to further refine the model.
First, by creating such a general model, the likelihood of a false positive isincreased significantly. Accurate prediction of very low-frequency events canbe extremely challenging. The nature of the errors must be considered whenevaluating the accuracy of the model. For example, model predicting an eventthat occurs only 1% of the time would be 99% accurate if it always predictedthat nothing would happen. Clearly, this is not acceptable, particularly whenpublic safety and human lives are in the balance. Therefore, a concomitantincrease in the number of false alarms generally is associated with acceptableprediction rates for these infrequent events. Given the very low frequency ofpotential terrorists within the general population and the limited knowledgeregarding this comparatively hidden group of individuals, these models are even

12.5 Strategic Characterization 221
more challenging to develop, particularly with acceptable levels of accuracy andfalse alarms.
Second, the numbers identified by these decision rules are so large as to bealmost useless for enforcement strategies. Even if the decision rules were refinedconsiderably, the selection process is still likely to include large numbers ofindividuals. To accommodate this volume challenge, random selection proto-cols have been implemented. In light of the extremely low frequency associatedwith the subjects of interest, however, the likelihood that anyone of interest willbe identified through this layered process of generic strategic characterization,which is further diluted by a random sampling procedure, is extremely low.
While refinements to these models are under development, the techniqueof tactical characterization of possible terrorist behavior also is being explored.This approach generally has been accepted by the public, perhaps because thereis a sense that if someone is acting suspiciously or strangely, then they shouldexpect to be stopped.
Characteristics of possible pre-incident surveillance or behavior have beencompiled. These include various types of surveillance activity and securityprobes. The Air Force Office of Special Investigations has further categorizedand characterized suspicious behaviors, which certainly represents an excellentfoundation for further analytical work in this area.5 Similarly, possible pre-attack behaviors have been characterized. These include nervous behavior andbulky clothing, which might be hiding a bomb vest or other weapon.6
These behavioral models also represent a good start, but still lack a certaindegree of specificity. For example, while the description of an individual who isoverdressed for the prevailing weather conditions make sense to most, it is nota perfect discriminator. In fact, it was not too long ago that it was possible todrive through the streets of Richmond, Virginia, and find groups of young mensimilarly dressed. Looking like a group of climbers ready to summit MountEverest, these individuals would be dressed in heavy coats and parkas. Theyfrequently were sweating and looked nervous, not because they were wearing abomb vest, but because they were on the corner selling drugs and it was reallyhot. Their reason for wearing the heavy coat was to avoid detection of drugs andweapons during a pat and frisk, but their potential threat to the communitywas very different than that of a potential suicide bomber.
Therefore, one missing piece in many of these models is a control group,which is a shortcoming in many studies of risk. For example, in medical stud-ies, people are much more likely report a side effect or another type of adverseoutcome than they are to let the drug company know that everything workedout fine. While some side effects are extremely rare and do not emerge until
Chapter 12

222 12.6 Vulnerable Locations
large numbers of individual have experience with a particular treatment ormedication, this can result in a pattern of bias in outcome studies. Similarly,in law enforcement and intelligence analysis, people are much more likely toreport cases when something actually happened, as opposed to suspicious situ-ations that turned out to be benign. This control group, however, is extremelyimportant to the development of meaningful models that will have signifi-cant predictive value with future, unknown samples of behavior. Therefore,it can be just as important to include the false alarms in the analysis as itis ensure that the accurate hits are represented. How can we predict thatsomething is likely to happen if we do not know how true incidents differfrom false alarms? These comparison data can have tremendous value in thatthey significantly increase our ability to create models that classify reliably andaccurately.
12.6 Vulnerable Locations
Some locations are uniquely vulnerable to attacks that could disrupt life or gen-erate a large number of casualties, either by the nature of the business conductedor by the value of the occupants. These locations include critical infrastructureand locations where large groups of people congregate. For example, we haveseen increasing evidence of hostile surveillance on critical financial facilities andthe transportation industry, while the developing security and military forcesin Iraq have been the target of ongoing attacks by the insurgents. Similarly,Israel has experienced attacks in crowded locations, such as shopping malls anddining establishments frequented by civilians, for many years. Recent attacksthroughout the world have targeted hotels and resorts, further underscoringthe increased risk associated with locations like these.
One location of increasing concern to public safety and security experts isour schools. Children represent something very important to us as individualsand society. Their innocence and vulnerability has been exploited by individualsand terrorist groups that hope to further an agenda or create fear in a commu-nity. As someone that was affected directly by the wave of random violenceassociated with the Washington, D.C. sniper in the autumn of 2002, I canspeak directly to the abject fear that can be created by the potential for risk toour children. Even the mere suggestion that school children in central Virginiamight be at risk resulted in school closings and widespread panic. Unlike typesof risk that are associated with involvement in high-risk activities, occupations,or lifestyles, there is something terribly unsettling about predators randomlytargeting children, particularly in the school setting.
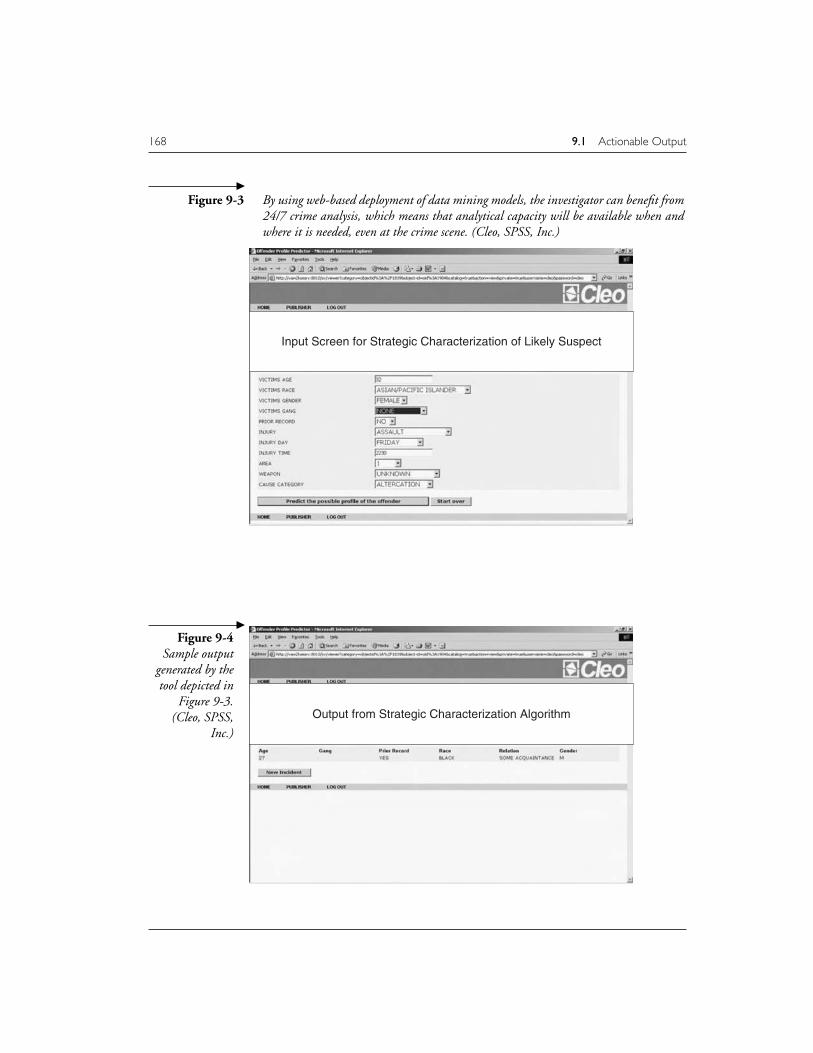
12.7 Schools 223
Sheep, Wolves, and Sheepdogs
Lieutenant Colonel (Ret.) Dave Grossman, a global expert on violence and terrorism, is a hero to manyin the operational worlds, and deservedly so. He is not only a dynamic lecturer who has studied violenceand our response to it, but he speaks with considerable authority about honor and the warrior lifestyle.In these lectures, Colonel Grossman frequently categorizes people as sheep, wolves, and sheepdogs.7
The vast majority of people in the world can be categorized as sheep. Grossman advises that this labelis not derogatory. Rather, it refers to the fact that most people are kind and gentle with few inclinationstoward violence; however, like sheep, they require protection from predators. The wolves, as one mightimagine, are the predators among us. Grossman describes these people as truly evil, preying on theweak and defenseless sheep at will. Finally, the sheepdogs are relatively few in number; it is their role toprotect the flock by confronting the wolves. According to Colonel Grossman, these are the “warriors,”the operational personnel in the public safety, security, and military fields that protect us against thepredators in the world. The sheepdog also has the capacity for violence, but only in its role as protectorof the flock.
This analogy is particularly relevant to several of the topics in this book. For example, Grossmandescribes research based on interviews with convicted violent offenders that suggests these predatorslook for weak victims: those off by themselves, demonstrating a lack of confidence or poor survival skills.Similarly, predators often target prey that wander off or get separated from the rest of the herd, orthose that are weak, show poor survival skills, or a lack of situational awareness. These interview dataare consistent with some of the research on victim risk factors and victimology outlined in Chapter 11.Grossman goes on to describe sheepdog behavior as being vigilant, “sniffing around out on the perimeter;”behaviors that are very similar to the surveillance detection described in Chapter 14.
This is a wonderful model for understanding the relationship between predators, public safety andsecurity personnel, and the people that they protect. As an analyst, however, the role of the shepherdimmediately comes to mind. Like analysts, the shepherd is not there to tell the sheepdog how to do its job;rather, the shepherd brings a unique perspective that can enhance the sheepdog’s situational awarenessand provide additional guidance. Ultimately, like the sheepdog and shepherd, analysts and operators mustwork together and support each other. To be truly effective, the sheepdog and shepherd must worktogether as a team. Although each functions in a different capacity, they both share a common goal ofprotecting the sheep, something that neither of them can do alone.
12.7 Schools
Colonel Grossman has studied the potential vulnerability associated withschools. He has suggested that schools are a particularly desirable target for
Chapter 12

224 12.7 Schools
Islamic fundamentalists and has cited several examples underscoring the numberof international terrorist attacks specifically targeting schools.8
Michael and Chris Dorn have compiled a historical accounting of attacks inand on schools and schoolchildren throughout the world.9 Going back to the1960s, terrorists and other predators have specifically targeted schools, under-scoring their value as potential targets to extremists and other individuals. Morerecently, Chechen terrorists attacked a school in Belsan, Russia, moving thechildren and their parents into the auditorium and planting 10 to 30 explosivedevices throughout the crowd.10 When the siege ended 52 hours later, 300 to400 were dead.11
Colonel Grossman suggests that while preparedness for weapons of massdestruction is important, all indicators suggest that terrorist groups will con-tinue to use conventional explosives, particularly car bombs, given their ongoingsuccess with these methods.12 This is not to suggest that they have no capacityfor improvement to their methods or that they do not learn. Rather, as JohnGiduck asserts in his analysis of the Belsan siege,13 these groups constantly areimproving their tactics and strategy in an effort to address operational flaws orlimitations, as well as countermeasures. The terrorists involved in the schoolhostage taking and subsequent siege and massacre had incorporated lessonslearned from the Nord-Ost Theater hostage siege and massacre two years ear-lier. Colonel Grossman highlights the terrorists’ use of an initial assault that isused to increase the number of victims by massing them in a common location(e.g., outside a building), or otherwise channel the victims to an area wherethey can be managed more easily (e.g., the Belsan school auditorium).
Why is it important for an analyst to understand terrorist tactics and strat-egy and how these incidents play out? There are several very important reasons.First, the complexity associated with some of the larger terrorist operationsunderscores not only the amount but also the prolonged duration of the preat-tack planning cycle. In many situations, this requires significant gathering ofintelligence regarding the facility or person of interest. While this may includesearches of open-source materials related to the potential target, it also fre-quently requires extensive on-site observation and collection. As a result of thisextensive preattack planning activity, it is not unusual for the hostile surveillanceor intelligence collection to be observed and reported in the form of suspicioussituation reports, which can be exploited by the analyst to identify and charac-terize potential preoperational surveillance and attack planning. The longer theplanning cycle, theoretically the more opportunities for identification, whichultimately supports proactive, information-based prevention, deterrence, andresponse efforts.

12.7 Schools 225
Prior to the attack on the school in Belsan, the terrorists had collectedintelligence on this and related facilities in support of target selection, as wellas preparation of the operational plan, tactics, and strategy. This informa-tion gathering had included preoperational surveillance of the school. In hisreview of the incident, John Giduck noted that the Belsan operation reflectednot only the lessons learned from the Nord-Ost Theater attack, but also alQaeda tactical training, particularly the sections that addressed how to dealwith hostages.14 This preattack planning activity represents opportunities foridentification, characterization, and proactive responses to potential threats,including prevention.
Studying previous attacks provides greater insight into tactics and strategy,which can be parlayed into the tacit knowledge frequently required to effectivelyidentify potential threats. For example, an understanding of how predatorypedophiles select and acquire their victims may give the analyst a greater abilityto identify likely predators before they harm a child, rather than after the fact.Forewarned truly is forearmed. Identifying an impending attack during theplanning phase allows public safety and security professionals an opportunityto move within their adversary’s decision cycle and to change outcomes.
By studying incidents and outcomes, the analyst can contribute to the iden-tification and understanding of changes in tactics and strategy. As illustratedby operational revisions incorporated into the Belsan siege that were associatedwith lessons learned after the attack on the Nord-Ost Theater, terrorist methodsare constantly changing and evolving in response to previous failures as well asimproved countermeasures and response. Data mining and predictive analyt-ics are well suited to identifying and capturing fluid changes in behavior andmodus operandi in a timely fashion. The powerful modeling algorithms incor-porated in the tools are able to accommodate and adjust to changes and refreshpredictive models accordingly. Again, the ability to stay within our adversary’sdecision cycle can be game changing in terms of the options available for pre-vention and deterrence. To support this function, however, the analyst shouldmaintain current knowledge regarding tactics and strategy, particularly as theyapply to the assessment of risk and threat.
Finally, knowledge of the operational aspects of risk and threat assessment,as well as response strategies and tactics, is necessary to the production of oper-ationally relevant and actionable output. For example, in terms of surveillancedetection, it is important to consider the nature of the activity and to create avariable that could be used to illustrate changes or escalation in the hostilesurveillance. Being able to depict this information in an operationally relevant
Chapter 12

226 12.7 Schools
manner increases the value of the analysis and allows the end users to incor-porate their tacit knowledge in the development of surveillance detection andresponse operations. Similarly, the identification of specific risk factors or vic-tims attributes associated with an increased risk for victimization can be usedto develop targeted operational tactics and strategies that directly address therisk or threat. For example, the finding that drug-related violence was associ-ated with the robbery of drug users coming into a particular area to purchasedrugs supported the use of a specific operational plan: demand reduction. Byidentifying why victims were at risk, the command staff was able to structurean operational strategy that kept potential victims out of the area and therebyreduced their risk. To support operational plans like these, though, the analystneeds a solid understanding of crime and criminals as well as operational tacticsand strategy to create actionable output.
Although I have highlighted schools as a vulnerable location, it is importantto remember that the predator selects the location. Although we can anticipatewhen and where they might attack, they ultimately select the location basedon access, availability, personal preference, secondary gain, and a host of otherfactors known only to them. Therefore, risk and threat assessment is a finebalance between identifying locations worthy of additional attention and vigi-lance and remaining open to subtle indicators and signs that reveal the predator’sintentions. This is one area where data mining and predictive analysis can bea tremendous asset. Identification of preoperational surveillance can not onlyilluminate interest in a particular facility but also be used as a starting point forrisk-based threat assessment and response.
The ability to identify, model, and characterize possible hostile surveillanceprovides at least two direct operational benefits. First, it allows us to identify thetimes and location of interest to our adversary, which then supports targetedsurveillance detection efforts. If we know when and where we are being watched,then we also know when and where to watch them (watch us). This can beinvaluable in revealing larger patterns of hostile surveillance and attack planning.
The second benefit is that it can reveal potential vulnerabilities or areas ofinterest to likely predators. The risk associated with a particular facility, location,or individual is unique and can fluctuate in response to prevailing conditions anda wide array of external events. I can speculate as to what might be of interestto someone; however, I am likely to be wrong, as I do not have sufficientinformation to see the big picture from another’s perspective. For example,someone interested in particular facility because spouse works there presentsa very different risk than someone interested in a facility because it supportscritical infrastructure or represents the potential for a high number of casualties.

12.8 Data 227
The potential threat, strategy, and required tactics associated with the domesticsituation would be expected to be very different in time, space, and methodthan the threat associated with someone interested in the entire facility. To tryto assume what might happen can blind the analyst to what is being considered.It is generally better to let predators reveal their intentions to us.
Specific issues to consider in information-based risk and threat assessmentinclude the following.
12.8 Data
The data used for risk and threat assessment are especially poor and are almostexclusively comprised of narrative reports. One of the first challenges associ-ated with collecting the data required for effective and thorough risk and threatassessment is to encourage people to report things. In his book The Gift ofFear, Gavin de Becker posits that people do not just “snap;” rather, there gen-erally are signs and indicators preceding the event that often go unanswered.15
“As predictable as water coming to a boil,”16 these signs can be observed andpredicted. He even notes that in cases of workplace violence, coworkers oftenknow exactly who the perpetrator is the moment the first shot rings out, furtherunderscoring the leading indicators present in these cases.
As the book title suggests, De Becker observes that most people have thegift of fear. Getting them to acknowledge and heed their fear can save their life.As an analyst, however, getting people to not only acknowledge but also reporttheir suspicions or concerns can save other lives as well.
Colonel Grossman has recommended providing digital cameras to person-nel working in and around schools to accurately and reliably collect informationsuggestive of hostile surveillance or some other threat.17 Not only would thisapproach be relatively simple for these folks, who are noteworthy for their levelof responsibility and lack of spare time and extra hands for the added respon-sibility of surveillance detection, but this method also provides an opportunityto retain the data for additional review, analysis, comparison, and follow-up.This approach is a relatively easy, low-cost one that could be applied to otherlocations, particularly those identified as being at risk.
Maintaining open communication and an open attitude is key to mak-ing people feel comfortable about reporting their suspicions. Although mostattention is on terrorism and homeland security issues, a facility is far morelikely to experience violence related to a domestic situation or a disgruntledemployee. People carry their personal risk with them, and two of the most
Chapter 12

228 12.9 Accuracy versus Generalizability
predictable locations are school and work. We are generally expected to arriveat a particular time and leave at a particular time. Frequently, our routes tothese locations are as set as our schedules, which makes school and work someof the easiest locations to find individuals. Ultimately, this increases the levelof natural surveillance in and around a facility, as well as the willingness toreport it.
12.9 Accuracy versus Generalizability
The issue of model accuracy versus generalizability and error types have beenpreviously covered in Chapter 1, but are worth addressing again within thecontext of risk and threat assessment.
One might think that it is always desirable to create the most accuratemodel possible, particularly in the public safety arena. Further examination ofthe issue, however, reveals several trade-offs when considering accuracy. First,and perhaps of greatest practical importance, is the fact that it is unlikely that wewill have all of the information necessary to either generate or deploy modelswith 100% accuracy. When analyzing historical data in the development ofmodels, it is extremely rare to be privy to all of the relevant information. Inmost cases, the information is similar to a puzzle with many missing piecesas well as the inclusion of a few extra ones that do not belong. On the otherhand, it is possible to generate some very accurate models, particularly whenusing previously solved closed cases in which most of the pieces and beenidentified and fit into place. It is extremely important, however, to be awareof what information is likely to be available and when. For example, whendeveloping models regarding drug-related homicides, we were able to achieve ahigh degree of accuracy when suspect information was included in the model.In an investigative setting, however, a model has considerably more value toinvestigators if it relies on information available early on in an investigation (seeChapter 13).
The second point to consider is how the model will be used. Very accuratemodels can be developed using some of the “black box” modeling tools currentlyavailable; however, those models are not very user friendly. In other words, theycannot be pulled apart and reviewed in an effort to generate actionable outputlike some of the decision tree models. Even some of the more complex decisiontrees are relatively opaque and will be difficult to interpret. If the model isintended to be used to guide an operational plan or risk reduction, like the risk-based deployment models, then some consideration to generalizability of themodel will need to be given. The ability to clearly interpret a model generally

12.11 Evaluation 229
increases at the cost of accuracy. Each circumstance will require thoughtfulreview and consideration of possible consequences and nature of errors.
12.10 “Cost” Analysis
No matter how accurate, no model is perfect. In an effort to manage theseinaccurate predictions, the nature of the errors in a model needs to be evaluated.Again, all errors are not created equal. The cost of each type of mistake needsto be evaluated. A “confusion” matrix can be generated to determine the natureof errors (see Chapter 4).
The cost analysis for risk and threat assessment should include the cost ofresponding, as compared to cost associated with a failure to respond. In manycases, the potential cost associated with a failure to respond or evacuate ina timely fashion can be enormous. One only needs to look at fatality ratesassociated with hurricanes prior to accurate prediction models and evacuationto see the enormous cost that can be associated with a failure to act in the face ofan imminent threat. Much of the discussion regarding the possible intelligencefailures leading up to 9/11 have focused on the number of lives that couldhave been saved had the threat been recognized and been acted upon in atimely fashion.
When making a decision to evacuate in response to a predicted hurricane,officials include the potential cost associated with a false alarm. Unnecessarycalls for evacuation can be extremely expensive, as the economic costs associatedwith evacuating an area can be enormous. Perhaps more importantly, they alsocan cause public safety personnel to lose credibility, which can impact futurecalls for evacuation. Concern regarding this type of “alert fatigue” has beenraised regarding the number of times the terrorist threat level has been raisedwithin the United States. Again, activation of an emergency response system orthreat level that is associated with a null event also can compromise public safetyif individuals begin to ignore a system that has been associated with repeatedfalse alarms.
12.11 Evaluation
Colonel Grossman has discussed U.S. regional responses to mass killings inschools that include mandated “lockdown” drills and a requirement for emer-gency response plans in schools.18 These responses have included enhancedefforts to identify possible incidents of preoperational surveillance. He has
Chapter 12

230 12.11 Evaluation
indicated that some schools have distributed digital cameras to school employeesto encourage reporting and increase the accuracy of the collected informationand has noted that these strategies can serve a deterrence function by creat-ing an inhospitable environment for the necessary preoperational surveillanceand planning. This particular strategy also would deter pedophiles and coulddiscourage school-based domestic child abductions.
This combined approach highlights the dual metrics that can be used toevaluate effective risk and threat assessment: prevention and response. Ideally,the identification and characterization of a potential threat will support thedevelopment of effective prevention strategies. Again, forewarned is forearmed.Although sometimes difficult to measure, one of the goals of data miningand predictive analysis in public safety and security is the identification andcharacterization of potential threats in support of effective, specifically targetedprevention and deterrence efforts.
Unfortunately, these approaches frequently are imperfect, falling well shortof the crystal ball each analyst secretly covets. Therefore, a second measure ofthe efficacy of risk and threat assessment is effective response planning. Thetransportation attacks in London during the summer of 2005 underscore thispoint well. Although the signs and indicators of an impending attack were notdiscovered until the subsequent investigation, the methodical response planningand high state of preparedness resulted in a response to those incidents that wasenviable. The interagency coordination and collaboration in support of anintegrated response was flawless, and almost certainly limited the loss of life tothat associated with the blasts.
Another excellent example of effective response planning occurred in thiscountry on September 11. Rick Rescorla, Vice President for Security at Morgan-Stanley/Dean-Witter, had the prescience to know that the World Trade Centerwas at risk for a terrorist attack. While his foreknowledge of the likely methodfor the attack was startling in its accuracy, it was his insistence on routineevacuation drills that was credited for saving the lives of 2700 of his colleaguesin the South Tower.19
Colonel Grossman has created a very interesting analogy to support pre-paredness for violence in schools and other public venues by citing the amountof resources and time devoted to fire safety. He highlights the number of firealarms and sprinklers, the use of fire-retardant materials, and the signage mark-ing exits and posted escape plans, noting that the likelihood of a fire is verysmall, yet there are considerable resources devoted to it. He extends the com-parison to the school setting and notes that the number of students killed in aschool during a fire during the last 25 years was zero, while the number of kids

12.12 Output 231
killed as the result of violence (either an assault or a school mass murders) wasin the hundreds, yet fire drills and response plans are mandated while similarplanning for violence (the greater threat) generally does not exist.20
12.12 Output
Figure 12-2 illustrates possible hostile surveillance activity in and around acritical facility and demonstrates an important point regarding the generationof operationally actionable output in risk and threat assessment. As can be seenin the figure, the concentration of activity associated with a specific aspect of thebuilding highlights the location of greatest interest to the individual or groupinvolved in the hostile surveillance. This information can be used to furtherrefine the threat assessment of this building by focusing on the areas associatedwith the greatest activity and highlighting particular spatial features or attributesworthy of additional review. Moreover, the analysis of the nature of surveillanceactivity (outlined in Chapter 14) can further underscore the escalation in theoperational relevance of the behavior observed. This information, together withFigure 12-2, which indicates spatial refinement and focusing of the behavior,suggests an increased level of risk associated with this facility.
�Figure 12-2
Figure depictingsuspected
preoperationalsurveillance
activityassociated with a
critical facility.The darker dots
represent thehypothesized
increase inoperational value
of thesurveillance
methodsemployed.
Loadingdock
Employeeentrance
Visitorentrance
Chapter 12

232 12.13 Novel Approaches to Risk and Threat Assessment
An important aspect of surveillance detection is to identify and characterizea possible threat so that effective countermeasures can be used. Ideally, theanalytical output should build on the end users’ tacit knowledge and increasetheir situational awareness in support of effective prevention, deterrence, andresponse planning. There is a fine line, though, that separates thoughtful analysisand interpretation of the findings, and reading too much into the data. Errorsin interpretation can misdirect resources and potentially cost lives. Therefore, itis almost always a better strategy to let the behavioral trends and patterns speakfor themselves and reveal the suspect’s intentions than to try to presuppose orsecond-guess what they might be considering.
12.13 Novel Approaches to Risk and ThreatAssessment
In The Gift of Fear, de Becker describes the small voice most of us have thatspeaks up and tells us when things are not right or that we are in danger.21
This is the “gift” of fear. As previously mentioned, it can be very difficult toencourage people to act on their intuition. Some novel approaches to risk andthreat assessment, however, use nontraditional means to tap into these gutfeelings and intuition, as well as insider information in some cases.
For example, an interesting extension of the “gut feeling” is the findingthat crowds tend to be smarter than individuals. Based on his experience withthe popular TV game show Who Wants to Be a Millionaire, Michael Shermerreviewed the literature that supports the accuracy of group decisions as com-pared to those made by individuals.22 He found that the audience was correct91% of the time, as compared to the “experts,” who were correct only 65% ofthe time on the show. In explaining this finding, Shermer notes that individ-ual errors on either side of the correct response tend to cancel each other out,bringing the group response closer to the truth than an individual response. It isimportant to note that this finding does not apply to all groups. Critical featuresof the group include autonomy, diversity, and decentralization to ensure therange of knowledge and opinion for this phenomenon to occur.
This has not gone unnoticed by the U.S. Department of Defense. ThePentagon’s Defense Advanced Research Projects Agency (DARPA) supportedresearch in this area, which included their Electronic Market-Based DecisionSupport and Futures Markets Applied to Prediction (FutureMAP) programs.23
Briefly, these programs were designed to artificially create groups that incorpo-rated the diversity of thinking found to be required for accurate group-baseddecision making. By tapping into the knowledge from a varied array of experts,

12.13 Novel Approaches to Risk and Threat Assessment 233
it was hypothesized that the consensus opinions would be superior to thosegenerated by individuals, even if these individuals were experts in their respec-tive fields. The DARPA scientists used market-based techniques to compileand consolidate these diverse opinions and generate a unified response. Thisconcept was not new to the Department of Defense. In 1968, naval scien-tist John Craven assembled a group of submarine commanders in an effort tofind the missing submarine Scorpion.24 Using Bayes’ Theorem and consensusexpert opinions generated by the commanders, Craven was able to constructan effective search strategy and find the submarine.
The DARPA programs used these market-based approaches to generate esti-mates of the likelihood of specific events of interest to the Department ofDefense. These included estimates for the development or acquisition of cer-tain technologies, as well as estimates of political stability in certain regions.The ultimate goal of these programs was to consolidate opinion from a varietyof sources, including expert opinion and insider information, in an effort toaccurately predict future events and avoid surprise attacks. Unfortunately, thisprogram came under attack and was cancelled when it became known publiclythat terrorist attacks and assassinations were included in the events of interest.The public outcry that ensued in response to the idea that the United States gov-ernment was essentially betting on tragedy was more than enough to terminatethe program.
Interestingly, this concept still exists. The website Tradesports.com sup-ports an electronic market that includes subjects of interest to those taskedwith preventing future terrorist attacks and supporting homeland security.Tradesports.com describes itself as a “person-to-person trading ‘Exchange’ ”where individuals can trade directly on a variety of events including sports,weather, entertainment, legal outcomes, and politics, to name just a fewcategories. Tradesports.com also accepts “contracts” on current events, includ-ing anticipated events related to the war on terrorism. For example, at thetime of this writing, current contracts relate to whether Osama Bin Laden andAbu Musab al-Zarqawi will be “captured/neutralized” by a certain date. Theirmarket-based predictions tend to be highly accurate, most likely due to thesame factors that DARPA was trying to exploit. Tradesports.com taps into avery large sample that includes a diverse array of individuals with expertise ina variety of areas. These opinions very likely include insider information in avariety of areas that can further enhance the accuracy of the consensus opiniongenerated. The exchange consolidates these opinions and generates a consensusprobability. These market-based approaches incorporate the speed and agilitynecessary to effectively track issues that may fluctuate rapidly. Public opinioncan change on a dime, far faster than most existing collection methods. As a
Chapter 12

234 12.14 Bibliography
result, tools like these bring the speed and agility required to instantly documentchanges and effectively track fluid trends.
It is important to remember, though, that groups also are able to generatesome very bad consensus opinions. For example, expectations regarding howsignificant events may affect gasoline prices or stock prices can actually alter theseevents, albeit temporarily. Like any risk assessment tool, group opinion is onlyas reliable as the inputs. Bad information results in inaccurate and unreliablepredictions, regardless of the method used to calculate the risk. The value thatcan be added by compiling and integrating diverse expert opinions cannotbe underestimated, however, and supports the importance of a close workingrelationship between the analytical and operational personnel. As always, soliddomain expertise and a healthy dose of skepticism are necessary tools in theevaluation of risk and threat.
12.14 Bibliography1. Lind, W.S., Nightengale, K., Schmitt, J.F., Sutton, J.W., and Wilson, G.I.
(1989). The changing face of war: Into the fourth generation. Marine CorpsGazette, October, 22–26.
2. McCue, C. and McNulty, P.J. (2003). Gazing into the crystal ball: Data min-ing and risk-based deployment. Violent Crime Newsletter, September, 1–2.
3. Colvin, G. (2006). Ditch the ‘experts.’ Fortune, February 6, 44.
4. Ibid.
5. United States Air Force, Office of Special Investigations (2003). Eagleeyes: Categories of suspicious activities. http://www.dtic.mil/afosi/eagle/suspicious_ behavior.html
6. The International Association of Chiefs of Police (2005). Suicide(Homicide) Bombers, Part I. Training Key #581. The InternationalAssociation of Chiefs of Police, Alexandria, VA. http://www.theiacp.org/pubinfo/IACP581SuicideBombersPart1.pdf.
7. http://www.blackwaterusa.com/btw2004/articles/0726sheep.html
8. Grossman, D. (2005). Lecture for ArmorGroup, International Training,Richmond, VA, October 31.
9. Dorn, M. and Dorn, C. (2005). Innocent targets: When terrorism comesto school. Safe Havens International, Macon, GA.
10. See Dorn, M. and Dorn, C.; and Giduck, J. (2005). Terror at Belsan.Archangel Group, Royersford, PA.

12.14 Bibliography 235
11. Dorn and Dorn.
12. Grossman.
13. Giduck.
14. Ibid.
15. De Becker, G. (1997). The gift of fear. Dell, New York.
16. Ibid.
17. Grossman.
18. Ibid.
19. Stewart, J. and Stewart, J.B. (2003). Heart of a soldier. Simon & Schuster,New York.
20. Grossman.
21. De Becker.
22. Shermer, M. (2004). Common sense: Surprising new research showsthat crowds are often smarter than individuals. ScientificAmerican.com;http://www.sciam.com/article.cfm?chanID=sa006&articleID=00049F3E-91E1-119B-8EA483414B7FFE9F&colID=13
23. DARPA - FutureMAP Program. Policy analysis market (PAM) can-celled. IWS - The Information Warfare Site; http://www.iwar.org.uk/news-archive/tia/futuremap-program.htm, July 29, 2003.
24. Sontag, S. and Drew, C. (1999). Blind man’s bluff: The untold story ofAmerican submarine espionage. HarperCollins, New York.
Chapter 12


Case Examples


13Deployment
In many ways, the goal of force deployment is similar to most resource allocationdecisions: try to do the most work possible with existing, or even fewer,resources, and try to have staff in place when and where they are needed. Thedeployment challenges facing police executives and command staff includemaintaining public safety, efficiently allocating increasingly scarce personnelresources, and responding to citizen needs for appropriate police presence intheir community.
Effective deployment of police resources can address all three challenges.By placing police units when and where they are likely to be needed, publicsafety can be increased. This can be achieved by the deterrent effect associatedwith police presence, as well as by the ability to respond quickly and rapidlyapprehend criminals. Concomitantly, deploying police personnel when andwhere they are likely to be needed decreases the likelihood that they will bedeployed frivolously or inefficiently. The inappropriate allocation of publicsafety resources can have tragic consequences if poor deployment decisionsdelay a timely response to an emergency. When crime is increasing, the firstresponse can be calls for increased personnel resources and heavy deployment;however, many public safety agencies do not have the luxury of addressing risingcrime with the indiscriminate use of resources, particularly given shrinking lawenforcement budgets and diminishing personnel resources.
Unfortunately, police deployment decisions often are made based onhistorical precedence, gut instincts, citizen requests, or decisions made byuniformed policy makers. But addressing the need for police presence can beachieved with effective deployment strategies. Frequently when crime is esca-lating, the citizen outcry is for increased visibility. The quickest solution oftenseems to be increased deployment in those areas, increased foot patrols and areemphasis on “community policing” in an effort to ensure that the citizensknow that the police are there for them. It is interesting to note, however,that when things are going well, citizen interest in a strong (i.e., visible) policepresence is not as great. In fact, a highly visible police presence might even beperceived as intrusive when crime is low. Therefore, reducing crime frequently
239

240 13.2 Structuring Patrol Deployment
addresses police visibility issues by reducing the perceived need for an addi-tional police presence. Ultimately, this results in an actual decreased need forresource deployment in these areas, which further supports an overall plan ofcost-effective resource allocation and savings.
Deployment can be divided grossly into patrol and tactical deployment,depending on the desired goal and associated tasks for these specific units.
13.1 Patrol Services
The general goals of police patrol deployment are to place officers in loca-tions where they can respond rapidly to citizen-initiated work, or calls forservice, while engaging in proactive policing. This could include everythingfrom crime deterrence through police presence to routine patrol and partici-pation in community policing initiatives. So, the ideal patrol deployment planwould place resources when and where they are likely to be needed, whilesimultaneously reducing deployment where the need is more limited. Becausepersonnel resources, especially patrol resources, are the single largest expendi-ture in almost any public safety agency, appropriate allocation of this resourcethrough effective, proactive patrol deployment can reap numerous benefitsfrom both a personnel and fiscal standpoint.
13.2 Structuring Patrol Deployment
In reviewing the timing of citizen-initiated complaints, we noted that mostagencies experience a typical cycle. On weekdays, calls might be steady through-out the day, picking up to a brisk pace in the evening, and then slowing downafter midnight. This pattern might be altered somewhat on the weekends, par-ticularly if the community has an active entertainment district or special events.For example, calls might continue after midnight, spiking for a period aroundthe time that the various nightspots close and the patrons begin flowing outinto the streets.
Complicating the model, however, is the fact that the specific nature ofthese calls frequently differs throughout the day. For example, there might bemore commercial robberies during the day; an increase in domestic complaintswhen people return home from work in the evening; and more street robberiesand vice complaints in the later evening. Activity after midnight might beconfined almost exclusively to alarm calls. Moreover, the time required to cleara call and the personnel requirements for a malfunctioning alarm as compared

13.3 Data 241
to a highly charged domestic situation will differ greatly, so we cannot relyexclusively on call numbers. The nature of the complaint must be included inany analysis.
Seasonal fluctuations might bring an increase in the number of streetrobberies related to a large, transient tourist population, while bad weathercan alternately suppress some types of crime while increasing others, and spe-cial events will bring unique issues all their own. The number of variables thatcan affect patrol deployment requirements is almost limitless, and each com-munity will have its own unique array of issues and circumstances that impactpolice workload. It is easy to see that we have quickly exceeded the compu-tational capacity of a pocket calculator or a simple spreadsheet program fordetermining demand for police services and related deployment strategies.
By using data mining and predictive analytics tools, analysts are able toconsider multiple factors simultaneously and drill down to determine and char-acterize further the unique constellation of risk or activity associated with aparticular area, location, or time period. It often can be interesting to see howthe manifest patterns of activity and risk flow throughout time and space asthe analyst drills down further, revealing additional detail and added refine-ment. This can be particularly true for relatively arbitrary distinctions like dayof week. For example, what might appear to be unusual activity associated witha particular day of the week could merely reflect the continuation of activityfrom the previous day. Ultimately, through the use of classification models orscoring algorithms, decision rules can be created for the specific pattern of riskor deployment needs, which can guide the development of effective deploymentstrategies.
13.3 Data
There are some obvious data that should be included in a deployment model. Forexample, citizen complaint data frequently are the most direct representationof citizen-initiated police work. Beyond absolute numbers of calls, though,it also is important to include the number of officers required for each call,as well as the estimated time to clear a call. Any additional crime-related dataalso should be included in the model. For example, illegal narcotics or vice-related arrests might further enhance a deployment model by incorporatingunderlying crime that might not be manifest in citizen complaint data. Thiscan be particularly true in areas where the issues associated with open-air drugselling pale in comparison to high rates of violent crime and might not beincluded in complaints.
Chapter 13

242 13.3 Data
This also is an opportunity to think outside of the box regarding what typesof additional information might have value with respect to crime prediction.These resources have been mentioned previously but are worth repeating, asthey can add considerable value to our analysis of crime data and ultimatelyresult in more accurate, complete predictive models.
Weather and Climate Data
It was conventional wisdom in one police department that any sort of majorweather event that restricted travel and confined people to their homes would befollowed by a sharp increase in random gunfire. This point was mentioned to anew chief during preparation for a hurricane. Incredulous, he told the analyststo document this effect and report back to him when we had the numbers.Sure enough, the period during the storm was relatively quiet, save for a fewfolks trying to buy drugs, while the period immediately after the storm musthave looked something like the OK Corral, based on the number of citizencomplaints for random gunfire in the community.
While I could speculate regarding the true meaning behind the associa-tion between inclement weather and random gunfire, the truth is that I haveabsolutely no idea why this occurred in that particular community. The impor-tant thing is, however, that the relationship was noted and documented andcould be anticipated and effectively responded to in the future. New Orleans,Louisiana, noted similar, unanticipated changes in criminal activity in the after-math of Hurricane Katrina. Some of this was likely related to dramatic changesin geography, including the fact that large sections of the city were under water.Similarly, Houston, Texas, noted significant storm-related changes in its crimepatterns and trends, including marked increases in some patterns of offendingassociated with the large numbers of displaced persons.
One advantage associated with some of the more powerful data mining andpredictive analytics tools is their speed and agility. This gives the analyst theability to crunch large, rapidly changing data sets quickly in response to rapidlychanging situations like those associated with large manmade and natural dis-asters and the associated recovery and rebuilding periods. These new tools alsoallow for flexibility in recoding variables, including spatial data, which can becritical when the existing geography has been changed dramatically by a naturalor manmade event.
Weather data usually are readily available and can add considerable value toa deployment strategy. For example, inclement weather might suppress sometypes of criminal activity that require that potential victims continue to engagein their routine activities. A severe winter snowstorm that significantly limits

13.3 Data 243
travel would be expected to decrease the number of street robberies, sincefewer potential victims will be out on the streets. On the other hand, thenumber of traffic wrecks associated with bad weather or hazardous drivingconditions might place additional demands on traffic units and patrol. Theability to anticipate these changes in demand can facilitate a fluid transitionfrom one operational plan to another, and from routine patrol deployment toa more reactive deployment mode that flexes residential patrol units to majorthoroughfares in support of increased traffic workload.
A specific example illustrating how weather can affect crime trends andpatterns is shown in Figures 13-1 and 13-2. A software tool that uses past crim-inal activity to predict areas in which crimes are most likely to occur generatedthe results in Figure 13-1, which illustrates the probability of crime by dispatchzone. The tool was developed by SPSS and Information Builders and is basedon an analytical framework developed by RTI International. Lighter areas areassociated with a greater probability of crime, while darker areas reflect a prob-ability of little to no criminal activity. Using operationally actionable analytical
�Figure 13-1 Map visually depicting the probability of crime by dispatch zone in Richmond, Virginia.
(Screen image of the Information Builders’ Law Enforcement Application.)
Chapter 13

244 13.3 Data
�Figure 13-2 Map highlighting the reduced probability of crime by dispatch zone, as compared to
Figure 13-1, in response to a forecast of fog. (Screen image of the Information Builders’Law Enforcement Application.)
products like these, command staff and managers can make information-baseddecisions regarding the allocation and deployment of patrol resources.
As can be seen in Figure 13-2, adjusting the parameters to change the localweather conditions to “fog” results in a dramatic reduction in the probability ofcrime throughout the city. Commanders can use images like these to structurepatrol deployment and resource allocation. Ultimately, these approaches canbe used to develop fluid deployment models that can accommodate up-to-the-minute information regarding conditions and allow public safety andsecurity organizations to assume proactive rather than reactive approaches todeployment.
Seasonal changes also can be associated with changes in demand in policeservices. Particularly cold weather might be associated with an increased num-ber of vehicle thefts from residential areas as people preheat their cars in themorning, and very hot weather might be associated with a similar increase

13.3 Data 245
in stolen vehicles from convenience store parking lots or daycare centers ascitizens leave their cars running in an effort to keep them cool. These andother trends can be identified, characterized, and modeled using data miningand predictive analytics. The associated scoring algorithms can be deployedwith triggering mechanisms that would prompt an immediate modificationin a deployment plan in response to changing conditions that are predictedto be associated with changing needs for police services. Personnel resourcesthen can be flexed proactively, rather than being placed in a reactive positionin response to changing conditions, which can significantly impair the effi-cient use of resources and result in poor service provision to the community.The weather department associated with the local news station almost certainlymaintains archival weather data in an electronic format that would be suitablefor inclusion in deployment modeling and analysis.
Census Data
Information related to population density, relative wealth, and otherpopulation-based measures can guide deployment strategies. For example, somepatterns of larceny and economic crimes are more likely to occur in wealthierenvironments. On the other hand, increased population density will requireheavier deployment, just based on the sheer numbers of people living in a par-ticular area. Criminals frequently will search for a “target-rich” environment inwhich to commit their crime, whether a known open-air drug market or a resi-dential area with an abundance of high-end electronics and vehicles. Therefore,while “target rich” might be defined as population density in one communityand relative affluence in another, census data can provide a valuable additionto crime modeling.
Other information to consider when creating deployment models includeschanges associated with transient population fluctuations. For example, resortcommunities or college towns can experience extremely large population fluc-tuations. Tourists often make easy targets for pickpockets and robbers, whilecollege student populations might be associated with increases in illegal nar-cotics trafficking, alcohol and other vice-related offenses, and sex offenses,including date rapes. Anticipation of these population fluctuations could trig-ger associated modifications in patrol deployment plans, as well as proactivecrime prevention strategies targeting these anticipated crime trends. Similarly,special events can create transient increases in patrol demand. Concerts or sport-ing events that are associated with disorderly crowds can be characterized andmodeled, creating deployment strategies to target specific issues and challengesknown to be associated with these particular events.
Chapter 13

246 13.4 How To
Domain expertise, as always, is critically important in the creation of deploy-ment strategies. For example, communities with a thriving entertainmentdistrict or seasonal trends in tourism will require very different deploymentstrategies when compared to locations with rampant drug-related crime. Thereis no “one size fits all” deployment strategy that will have value and meaningfor every locality. Even within the same city, crime might flex and flow arounddifferent areas during different times and be based on very different factors.Therefore, it is essential that all deployment-related data mining and predictivemodels be viewed and reviewed within the context of prevailing communityissues and needs, or domain expertise. Resource deployment represents one ofthe most critical functions within any public safety organization, not only dueto the personnel and economic assets involved, but because it can have sucha critical impact on public safety.
13.4 How To
The first task when examining issues related to patrol deployment generallyincludes characterization of the data and information through the use ofexploratory graphics,1 which allows the analyst to drill down into the data andconvey relative differences visually. The use of graphics permits visual reviewand analysis of the information in a format that is inherently actionable froman operational standpoint.
Figure 13-3 shows that there were 266 citizen calls for service during theweek selected for analysis. More than half of the calls (58%) were confined to thethree-day period between Friday and Sunday. This initial analysis already adds
�Figure 13-3
Frequencydistribution
depicting citizencalls for service
by the day ofweek during a
one-week period.
0
10
20
30
40
50
60
Sun Mon Tue Wed Thu Fri Sat
Cal
ls fo
r S
ervi
ce

13.4 How To 247
some value and specificity to the understanding of the differential distributionof police work throughout the week, which has implications for deployment.By looking at this distribution, the command staff or supervisors can determinethat three days out of the week accounted for more than one-half of thecitizen-initiated police work during this week. Further analysis of the typesof complaints, the number of units required, and the time to clear each callwould add additional value to this analysis, although each of those factors wouldadd another level of complexity to the analytical task and model, which wouldrequire increasingly powerful analytical resources. At a minimum, though, thisanalysis has value from a deployment perspective.
To further refine the specific deployment strategy, the information can besubdivided by time of day (Figure 13-4). For example, drilling down into theservice calls reported on Sunday reveals that most of them occurred betweenmidnight and 0400 hours. In other words, they represented a continuationof activity from Saturday night. This information, which indicates that thecomplaints are not distributed uniformly throughout the day in many cases,would have significant implications for deployment strategies. It also wouldbe worthwhile to examine what specific types of calls were associated withdifferent periods throughout the day, and what implications this might havefor deployment. For example, alarm reset calls that occur in the middle of thenight generally do not require extensive personnel resources and can be rela-tively quick to clear. A disorderly disturbance call associated with closing timeat a nightclub, however, might require multiple units and take a considerableamount of time to clear, particularly if arrests are involved. Again, a specificanalysis of time is important to ensure that adequate police resources are avail-able when and where they are needed and that deployment is limited duringtimes when the need for police presence is less.
�Figure 13-4
Citizen calls forservice from
Figure 13-3 bytime of day.
0
5
10
15
20
25
30
35
40
0000-0359
0400-0759
0800-1159
1200-1559
1600-1959
2000-2390
Cal
ls fo
r S
ervi
ce
Chapter 13

248 13.4 How To
�Figure 13-5
This figureillustrates ahypothetical
policedeployment
schedule thatincludes time ofday and police
district for aparticular day ofthe week, in this
case, Friday. Thisschedule was
created using theresults of a
self-organizingnetwork called a
Kohenennetwork.
3
1
5
4
2
2000-23591600-19591200-15590800-11590400-07590000-0359
ShiftDistrict
Friday
Determining deployment requirements across day of the week and time ofday certainly puts more science and less fiction into resource allocation, but agood deployment model also needs to take into account spatial differences in theneed for a police presence. Figure 13-5 depicts a hypothetical police deploymentschedule, which was extracted from a self-organizing network called a Kohenennetwork, that includes time of day and police district for a particular day of theweek, in this case Friday. This model has been created through the use of analgorithm, which associates a relative degree of risk for crime associated witha particular time and location for the day of interest. Relative levels of risk forcrime have been depicted visually as relative densities to fill in the various timeblocks.
As can be seen in the figure, Third District is associated with the greatestneed on Fridays, from 1200 to 1359 hours. Examination of the data revealedthat Gotham High was located in Third District, and that there had been alarge fight during a football game with their uptown rivals, the Spartans fromGroverville East. Further review indicated that this was a regular challengeassociated with this time and location, and that heavier proactive deploymentand some collaboration with the schools probably would address this issue.
The increased demand in Second District was linked to a regular after-workparty each Friday near the business corridor, while the increased demand in

13.4 How To 249
First and Fifth Districts was associated with a large block of nightclubs thattranscend the boundary between those two districts.
By incorporating time and space into a deployment schedule like the oneillustrated in Figure 13-5, the analytical team was able to deploy the resultsof their data mining analysis into a format that was inherently actionable forthe operational command staff. While additional options were available forfurther enhancements to the models by the inclusion of additional call-relateddetails, this deployment model represents an information-based schedule thathas considerable value over what had been used previously.
Figure 13-6 depicts a heat map (see Chapter 9) of different crimes overfour-hour time blocks. These results indicate an increased likelihood of larceniesbetween 1600 and 2000 hours, while burglaries are more likely to occur between0800 and 1200 hours.
�Figure 13-6 This type of graph is referred to as a heat map, because relative differences in intensity
depict relative differences in frequency or probability, similar to the relative differencesused in temperature gradients. In this illustration, higher intensity conveys an increasedlikelihood of the particular type of crime (B. Haffey, SPSS, Inc.; used with permission).
Chapter 13

250 13.5 Tactical Deployment
This example was created to be relatively simple in an effort to highlightspecific points. In the applied settling, a sampling frame longer than one weekalmost certainly would be used unless there were very specific reasons for choos-ing otherwise, such as the creation of a focused, short-term deployment modelor initiative that was linked to a specific time period, similar to the New Year’sEve initiative described previously. In addition, deployment models should beevaluated and refreshed periodically to ensure that they continue to addressrequirements for police-related work appropriately. In many ways, it can bea sign of success that the models need to be adjusted periodically. As crimepatterns are addressed, suppressed, or displaced, the model needs to be refinedand redeployed to accommodate the successes as well as new or rapidly emergingtrends.
13.5 Tactical Deployment
Many agencies have tactical units that supplement standard patrol deployment.These units are not necessarily anchored to any particular geographic areas, likepatrol units, which allows them to be rapidly mobilized and respond to crimesquickly and aggressively. Placing these tactical units when and where they mightbe needed serves two functions. First, response time is decreased, which increasesthe possibility of rapid identification and apprehension of the suspect. Second,and perhaps even more preferable, heavy deployment of these units in areasanticipated to be at greater risk for trouble might provide deterrence. As nice asit is to get bad guys off the streets, it is even better in many situations to preventcrime.
Identifying the Problem
One area where these units can be particularly effective is with narcotics-relatedor violent crime, which are linked in many situations. The basic approach toguiding tactical deployment with data mining and predictive analytics bearsmany similarities to the approaches used with traditional patrol deployment.The first step in the process generally involves the use of exploratory graphics inan effort to characterize the problem and drilling down in an effort to identifypatterns of associated risk and possible solutions.
Several years ago, review of the homicide data from Richmond, Virginia,showed an extremely high homicide rate that placed it repeatedly in the topten in the nation for its per capita murder rate. Several initiatives were createdin an effort to address this problem, including a federally funded homicidereduction program. Research into the homicide rates confirmed what everyone

13.6 Risk-Based Deployment Overview 251
knew to be true: that the homicide rate in Richmond was increasing ratherdramatically when rates in other locations were decreasing.2 In and of itself,however, the overall homicide rate in a community generally contributes littlevalue to a thoughtful understanding of the possible causes, nor are aggregatenumbers likely to be associated with the development of any meaningful orlong lasting solutions. Further inquiry was necessary.
Drilling down into the data, it became rapidly apparent that almost all ofthe increase noted over the examined time period could be attributed directlyto increases in the drug-related homicide rates. This indicated that proactivemeasures designed specifically to address drug-related homicides would go along way toward reversing these trends. Further parsing of the data indicatedthat at the same time that the drug-related homicide rate was increasing rapidly,the average age of the victims and suspects was decreasing. In other words,if violence is a disease, as it has been characterized so frequently, then drug-related violence is a disease that differentially impacts the young.3
Why is this important from a tactical deployment standpoint? If the goal ofa particular initiative is violence reduction, then it is important to understandin some level of detail what is driving the trends and who is involved. In thisexample, the rapid increase in the murder rate could be attributed directlyto an increased prevalence of drug-related homicide. Drugs, violence, anddrug-related violence can be addressed with relative efficacy through the useof strategies and initiatives that incorporate the use of tactical patrol units.Therefore, characterization of the problem provided some direction regardingpossible solutions. Had the increases in the homicide rates been associated withthe activity of a serial killer or with domestic violence, different strategies wouldhave been indicated. So, characterizing the problem is frequently the first stepin identifying a meaningful solution.
13.6 Risk-Based Deployment Overview
More recently, the Richmond Police Department has been exploring the useof “risk-based” deployment strategies as part of their role in the Project SafeNeighborhoods initiative with the United States Attorney General’s Office inthe Eastern District of Virginia.4 A detailed example of this approach is dis-cussed later in this chapter, but the fundamental idea behind this approachis that if a model of relative risk can be created, personnel resources can beproactively deployed in response to this anticipated risk. In other words, if itis possible to characterize and anticipate violent crimes, tactical units can bedeployed proactively and make rapid apprehensions due to their proximity in
Chapter 13

252 13.7 Operationally Actionable Output
time and space to the predicted crime locations. Ultimately, increased use ofthis method provides an opportunity to move into proactive policing, wherebycrime can be deterred or even prevented.
13.7 Operationally Actionable Output
As has been stated several times before, any analysis, no matter how elegant,sophisticated, or accurate, has no value in an operational environment if it is notactionable. The output shown in Figure 13-7 has limited value in an operationalsetting in its current form. In order for it to gain value it needs to be actionable;it needs to be apparent from looking at the analytical output which course ofaction would be best. This is particularly true with deployment. Outlined in thefollowing sections are two possible mechanisms for deploying analytical outputproducts directly into the operational environment in a format that can be usedreadily.
Web-Based Analytics
New improvements in the deployment of predictive analytics outputs and rulesets now allow the use of web-based analytics.5 With these systems, an analystis able to analyze data and create rule sets or scoring algorithms that can be
�Figure 13-7
Some analyticaloutput products,while accurate,
can be verydifficult to
interpret anddeploy within an
operationalenvironment
(B. Haffey,SPSS, Inc.; used
with permission).

13.7 Operationally Actionable Output 253
�Figure 13-8
Web-based dataentry screen that
can be used forremote access to
scoringalgorithms.
(Screenshot ofweb interfacetaken by the
author is fromCleo, SPSS, Inc.)
deployed remotely. The end users are then able to log on through a secureInternet or intranet connection. As illustrated in Figure 13-8, they are directedto a data entry screen, which prompts them to enter a few relevant detailsthrough the use of pull-down menus. For example, a supervisor can enterinformation relative to the time, day, and assigned location associated with hershift. Based on the calculated risk for each area within her purview (Figure 13-9),the supervisor then can proactively deploy resources in anticipation of likelyactivity or anticipated risk.
This system is no more difficult to use than making an online purchase.In many ways, it is much easier than using the remote data entry systems thatmany organizations have adopted, in that the amount of information requiredfor this transaction has been limited significantly. The only data required bythe model is the information determined to be relevant and necessary by thedeployed algorithm. Additional nonessential data entry is minimized, whichcan be extremely important in an operational setting. After the informationhas been entered, the output is available quickly, with form and content that isrelevant to the situational needs of the end user.
The advantages of a system like this are numerous. First, operational person-nel gain access to analytical support on a 24/7 basis. Crime frequently occurs
Chapter 13

254 13.7 Operationally Actionable Output
�Figure 13-9
Web-basedoutput generated
by a remotelydeployed scoring
algorithm inresponse to the
input depicted inFigure 13-8.
(Screenshot ofweb-based output
taken by theauthor is from
Cleo, SPSS, Inc.)
at times when civilian analytical personnel are not on duty. To wait until theyreturn can create an unacceptable delay, particularly in fast-breaking cases orthose requiring analysis in a timely fashion. In addition, these systems canbe deployed remotely. For example, the data can be analyzed and the modelsdeveloped in centralized areas far behind the front lines. Scoring algorithms canthen be deployed directly to operational personnel in their environment. Thismaximizes analytical personnel resources, while diminishing associated analyti-cal support requirements through the establishment of analytical fusion centersthat can be used by multiple operational units. Crime analysis functions canbe centralized and available to remote precinct locations and offsite specializedunits, as well as centrally located command units. This analytical utilizationmodel ensures that even remotely located operational units have access to thefull analytical capacity of the organization, without unnecessary duplication ofanalytical personnel, resources, and support.
Furthermore, as can be seen in Figure 13-10, utilization of centralized ana-lytical capacity and remote deployment of scoring algorithms and models alsofacilitates the integration of different types of data and information. Crimefrequently transcends traditional offense definitions and arbitrary boundaries.6
Prostitutes use drugs, drug users rob convenience stores, and gang memberscommit violent crimes. While a certain degree of operational specificity often

13.7 Operationally Actionable Output 255
�Figure 13-10
Centralizedanalytical
capacity and theremote
deployment ofscoring
algorithms andmodels can
facilitate theintegration and
deployment ofdifferent types of
data andinformation.
Robbery unit
Homicide unit
Narcotics unit
Street crimes
Centralizedanalytical
fusioncenter
= Information
= Integrated analysis and remote deployment of scoring algorithms
is required, a common analytical resource can integrate data and informationon related crime patterns and trends. The resulting models will be significantlyenriched through the use of these various related informational resources, whichthen can be deployed directly to the various operational end users through theuse of these web-based deployment tools.
Web deployment of data mining models also permits the use of morecomplex scoring algorithms, because the scoring algorithms do not need tobe interpreted directly to have value. This provides the opportunity to use rela-tively opaque or “black box” models with a greater degree of accuracy. The enduser need only enter the limited amount of information for use in the predictiverule set. This arrangement affords a high degree of accuracy through the use ofrelatively sophisticated modeling techniques, while requiring limited end usertraining and data entry.
Mapping
The ability to effectively convey the results of data mining can determinewhether the results are used operationally or not. If the command staff, opera-tors, or other end users are not able to interpret the results, it significantly limitsthe utility of the analysis. The “generalizability versus accuracy” challenge hasbeen addressed earlier; however, even a relatively simple predictive algorithmhas limited value if it cannot be used as actionable information. One excellenttool that can be used to add value to the results of data mining is mapping.
Chapter 13
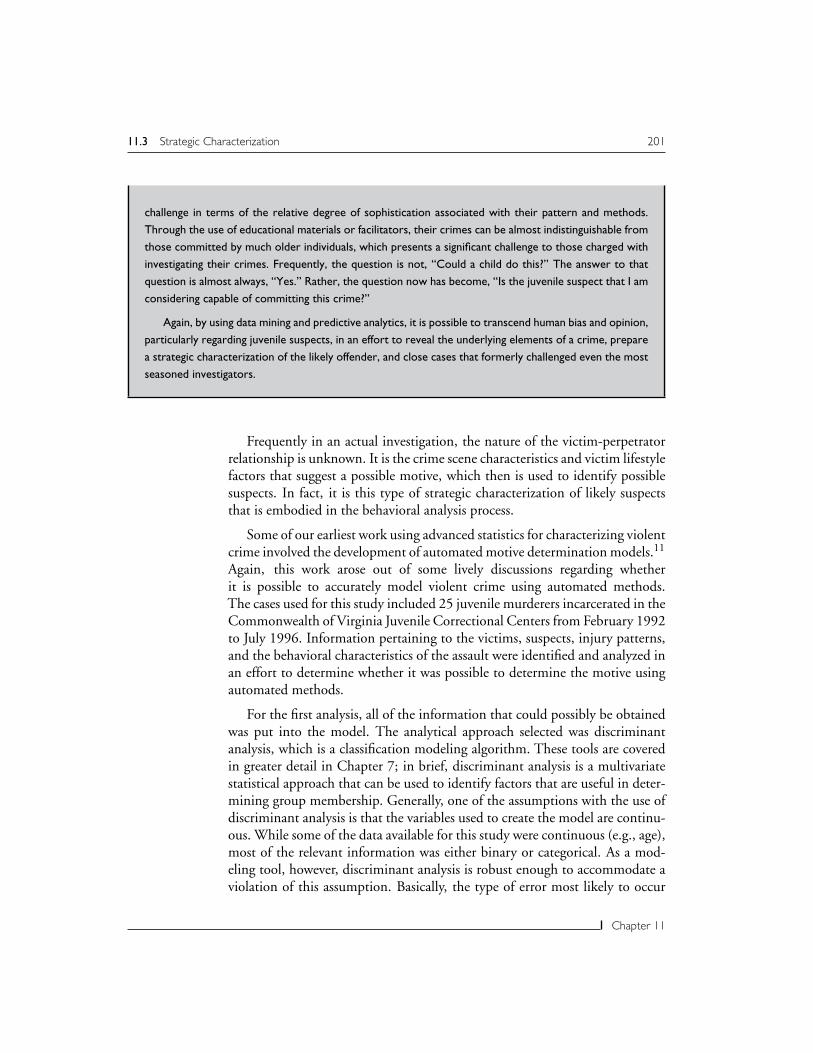
256 13.7 Operationally Actionable Output
Maps can be thought of as specialized graphs that convey information withinan operational context.
Deployment of data mining and predictive analytic products throughmapping are highlighted throughout this text. From a deployment standpoint,however, there are few systems that even approach the effectiveness and func-tional utility associated with mapping. Through the use of color, shape, shading,and other options, a tremendous amount of information can be conveyedthrough a two-dimensional mapping product.
Many patterns of offending tend to be geographically dependent. Forexample, certain locations are associated with open-air drug markets, whileothers might be linked to an increased likelihood of robberies. This informa-tion has tremendous value from a deployment perspective because, at its mostprimitive, deployment generally involves placing personnel resources in timeand space. Ideally, personnel are deployed in response to anticipated patternsof offending or calls for service, something that data mining and predictiveanalytics can facilitate. Through the creative use of mapping tools, meaning-ful differences in time and space can be conveyed in an actionable format tooperational personnel.
Data mining and mapping tools are evolving at a rapid pace. At the timeof this writing, data mining tools were being developed specifically to deploygenerated algorithms directly into a mapping environment. While it is possibleto do this with “brute-force” techniques now, this alternative approach will allowfor a more detailed depiction of risk, as well as the inclusion of a larger numberof parameters. For example, without these enhanced mapping techniques, theanalyst would be required to develop one map for each four-hour time blockduring each day of the week; that amounts to 42 different maps to convey aweek’s worth of information. This would be a tremendous amount of work andwould severely limit the amount of detail in each map. Moreover, the necessaryflipping between maps would be operationally cumbersome.
The ability to deploy data mining algorithms directly through mappingproducts would decrease the amount of work required for each map, shifting thefocus to the value of the algorithm and increasing the amount of detail availablewith each map. Ultimately, using these techniques, it would be possible to createa dynamic map that could depict “clouds” of risk moving throughout the com-munity depending on the time of day and day of week, similar to the weathermaps that highlight changing patterns and trends that also change with time andday. Ideally, the command staff and other planners would be able to scroll flu-idly through these maps, determining deployment while considering a varietyof different scenarios. The use of touch-screen technology that could activate

13.7 Operationally Actionable Output 257
additional embedded models would further enhance this rapidly developingtechnology. The opportunity to develop the predictive algorithms in a central-ized location with access to a range of data and intelligence would increase thevalue of these tools even more. Deployment of these maps directly into thefield would provide actionable analysis directly into the theater of operations,thereby concurrently increasing situational awareness and informed decisionmaking. These dynamic crime deployment maps would require a greater degreeof deployment fluidity, but would maximize personnel resources in a mannernot currently possible.
Figure 13-11 depicts a temporally compressed version of this type of map.This figure depicts three temporally distinct patterns of crime, associated withunique locations. By using different sizes of risk “clouds,” as well as differentialshading, differing levels of risk or anticipated frequency can be conveyed within
�Figure 13-11 These maps illustrate the distribution of crime over time and space. Relative differences in
intensity and area on the map correspond to relative differences in risk and indicate a needfor greater police resources in the residential area, as compared to the business corridor,and finally the nightclub area. Specifically, a greater level of activity is associated in thenightclub area by the beach on weekend nights (A), while a need for increased deploymentshifts over to the business corridor during weekdays (B), and the associated residentialareas on weekday evenings (C).
A
B
C
Chapter 13

258 13.7 Operationally Actionable Output
a two-dimensional representation of information. Review of this map highlightsrelative changes in expected criminal activity or citizen-initiated complaints.Specifically, a greater level of activity is associated with the nightclub area bythe beach on weekend nights (A), while a need for increased deployment shiftsto the business corridor during weekdays (B), and the associated residentialareas on weekday evenings (C). Relative differences in intensity and area on themap correspond to relative differences in risk and indicate a need for greaterpolice resources in the residential area, as compared to the business corridor,and finally the nightclub area.
Ideally, this information would be depicted in a series of maps that wouldtransition smoothly and further illustrate the relatively fluid nature associatedwith the movement of crime throughout a community across the time of dayand day of the week. This kind of direct linking of data mining and mappingsoftware further increases the amount of information that can be conveyed,as compared to the brute-force techniques that require manual entry of thevarious densities depicting risk.
Through the creative use of mapping and information-based deploymentstrategies, resources can be allocated to specific locations associated withincreased activity or risk. They also can help further characterize the problemand guide additional targeted responses. For example, increased activity linkedto a particular location within a multifacility complex might suggest the needfor some environmental changes, such as increased lighting, in addition toheavier patrol in the area. On the other hand, activity associated with a singleunit in the same building might suggest a different type of intervention, suchas counseling or eviction procedures for the identified tenants, which wouldnot necessarily require additional patrol.
Mapping need not be confined exclusively to traditional geographicboundaries. For example, “maps” can be generated for facilities or complexes,or even single buildings associated with differentially distributed risk. Thesemaps can facilitate the identification of specific patterns of offending or riskassociated with particular times and/or specific locations. This type of mapcan be extremely useful for personnel deployment or specifically targeted crimeprevention strategies. For example, in Figure 13-12, police calls for service areconcentrated on one end of the Happyland Apartments building. Additionalinvestigation might indicate the need for increased lighting in this area orperhaps a review of possible problem tenants. Further refining the map byincluding a time of day or day of week dimension might reveal additionalinformation regarding this citizen-initiated police work that would have directimplications for deployment, as well as possible proactive crime prevention workthat could reduce the complaint burden associated with this particular location.

13.8 Risk-Based Deployment Case Studies 259
�Figure 13-12Police calls forservice can bemapped in an
effort toilluminate
possible causeand support
related crimepreventionstrategies.
Multiunit Dwelling
Police call for service
Police Calls for Service
Happyland Apartments May 2003
Depicting information in a mapping format adds value to the information byplacing it within a spatial context and facilitates information-based deploymentdecisions, as opposed to traditional reactive responses.
Further enhancements with predictive algorithms might provide additionalguidance regarding which approaches could be particularly well-suited to a par-ticular challenge. Similar to treatment matching in medicine and psychotherapy,we now know that there is no “one size fits all” approach to crime reduction.These types of analyses are conducted regularly within the public safety envi-ronment; however, the combination of data mining and integrated mappingfurther automates this process, which reduces the amount of time and effortnecessary to conduct these types of value-added, operationally actionableanalyses. Therefore, in the Happyland Apartments example, evaluation of previ-ous outcomes in similar situations might provide additional guidance regardingthe approach or intervention most likely to succeed under this particular set ofconditions.
13.8 Risk-Based Deployment Case Studies7
“Telling the future by looking at the past assumes that conditions remainconstant. This is like driving a car by looking in the rearview mirror.”
Herb Brody
The idea behind the use of highly mobile tactical units is their ability to respondquickly to rapidly changing events. Unlike traditional patrol units, which tendto be anchored to a particular geographic area, tactical units can be deployed
Chapter 13

260 13.8 Risk-Based Deployment Case Studies
proactively to areas in anticipation of an increased need or a rapidly emergingsituation. With this in mind, it would seem ideal to identify a way in whichtrouble could be anticipated. This would support the concept of proactivedeployment, at a minimum permitting a rapid response to incidents. Ideally,heavy deployment in these areas would result in crime deterrence.
In many situations, “proactive” deployment decisions are based on ahistorical review of crime patterns, including pin maps. While these can begreat for counting crime and depicting it within the context of geography, theydo little to inform us of the future. By using data mining and predictive analytics,however, areas associated with an increased risk for certain types of crime canbe modeled and mapped. This might seem like such a subtle distinction as tohave no value in law enforcement, but read on.
The Richmond, Virginia, Police Department, as part of the Project SafeNeighborhoods strategy, began developing the use of risk-based deploymentstrategies in an effort to reduce gun violence. As the thinking goes, if armedrobberies are bad, then an armed robbery where the victim gets hurt is worse.8
Is there a way to model this so that we can deploy our tactical units proactivelyand keep people safe? The challenge was that the created model had to be simpleenough to be actionable. It also had to be confined to variables that had valuefrom a deployment standpoint. For example, it might be that robbers who areverbally aggressive with their victims are more likely to assault them, but a policedepartment cannot proactively deploy for aggressive robbers, so this particularvariable had little value from a deployment standpoint.
Information pertaining to geography, time of day, and day of week wereincluded in the analysis, while almost everything else, including type of weaponand suspect-related information, was excluded. The resulting model was rel-atively accurate, although not perfect. It should be noted that more accuratemodels were developed and deployed through the web-based analytics describedearlier,9 but the associated algorithms were too opaque to be deployed directlyinto the operational environment.
At this point, some very good questions might be, “Does it matter that theaccuracy is reduced?” or “How low can you go?” This issue has been addressedin much greater detail in previous chapters because it is extremely important.Briefly, in this case it was determined that anything that would increase theefficacy of the deployed resources above chance would be considered acceptable,because even a slight increase in public safety associated with the use of themodel could potentially save lives. For that reason, the errors associated with themodel were shifted toward being somewhat generous in terms of deployment.The consequences associated with missing a potentially high-risk circumstance

13.8 Risk-Based Deployment Case Studies 261
were determined to be much more serious than deploying resources to an areawhere they might not be needed. So the model was adjusted to permit more“false positives” in an effort to increase the likelihood that the personnel wouldbe in place when and where they were needed.
Another challenge associated with this deployment initiative was the fact thatarmed robbery-related aggravated assaults are relatively infrequent. While thisgenerally is a very good thing for a community, particularly for potential victims,it can be a significant challenge from a modeling perspective. There were a rela-tively limited number of incidents of interest for use in the creation of the model.In addition, it was important to ensure that the number of incidents predictedwere similar to the frequency of observed events. Many modeling algorithmsare preset to a 50:50 distribution, which would be extremely inaccurate in thecurrent situation.
For this same reason, close attention to the nature of the errors was extremelyimportant. Because less than 5% of all armed robberies in our sample escalatedinto an aggravated assault, it would have been possible to create a very simplealgorithm that was correct 95% of the time by simply predicting that an armedrobbery would never escalate. While the accuracy associated with this modelwould be enviable, particularly in an applied setting like ours, it would do littleto inform the deployment process, which would mean that it has no value.
Another challenge associated with such a low incident rate was the creationof separate training and test samples, which is addressed in detail in Chapter 8.In the current example, the sample was randomly split into training and testsamples. These samples were then evaluated to ensure that the factor of interest,robbery-related aggravated assaults, was distributed evenly and that there wereno unusual differences between the two groups. Because the samples were sosmall, these group assignments were subsequently maintained throughout themodeling process.
Because risk-based deployment maps are investigatively sensitive, the mapdepicted in Figure 13-13 does not include real data. Rather, it depicts howa possible distribution of robbery-related aggravated assault risk might lookthroughout a community.
The differential grades of shading on this map highlights areas that arepredicted to be at greater risk for a robbery-related firearms assault, based on areview of the armed robbery data for a six-month period. It is important to note,however, that the areas highlighted on the map are not predicted to be associ-ated with an increased number of armed robberies; rather, the armed robberiesin these areas are predicted to be more risky. This is an important considerationfor the type of deployment and this particular strategy. Traditional deployment
Chapter 13

262 13.8 Risk-Based Deployment Case Studies
�Figure 13-13
This figureillustrates a
fictionalrisk-based
deployment map.The differential
grades of shadingused on this map
highlights areasthat are predicted
to be at greaterrisk for a
robbery-relatedfirearms assault
(B. Haffey,SPSS, Inc.; used
with permission).
models generally consider only the frequency of crime and deploy accordingly.With specialized units, however, there is tremendous advantage in being able todeploy based on predicted risk of more serious crime, rather than relative fre-quencies of multiple patterns of offending. Therefore, by using a risk-baseddeployment strategy, areas predicted to be at greater risk for more seriouspatterns of offending are identified and highlighted for selected, tactical enforce-ment strategies, while patrol resources can be deployed in response to other typesof crime and citizen-initiated work.
With even more advanced technology, time can be added as a dynamicfeature in these maps. The supervisor or commander can scan through thevarious maps in a very efficient manner, easily seeing locations and times whereheavier deployment might be required. This affords a tremendous amount ofextremely fluid information that can be used for targeted troop deployment indirect response to anticipated risk or workload.
Finally, in our experience it has been necessary to periodically refresh themodels. Conditions change in the community and criminals are apprehended,which can serve to diminish the predictive efficacy of the models. This can bea sign of tremendous success.

13.8 Risk-Based Deployment Case Studies 263
These models evaluated reasonably well using training and test samples;however, it was difficult to generate a measurable outcome, particularly giventhe nature of this relatively low-frequency event. The question inevitably isasked, “How has this improved public safety?” Therefore, a different type ofrisk-based deployment strategy was developed for the 2004 New Year’s Eveholiday; one that incorporated embedded outcome measures.10
The New Year’s Eve holiday frequently is associated with increased reportsof random gunfire. Therefore, in an effort to increase public safety over NewYear’s Eve, a risk-based deployment strategy was developed as part of the ProjectSafe Neighborhoods initiative with the United States Attorney’s Office in theEastern District of Virginia. Briefly, Project Safe Neighborhoods is a violencereduction strategy that has been instrumental in supporting the use of datamining and risk-based deployment strategies in the development of innovatedapproaches to reducing gun violence.
To create this targeted strategy, random gunfire complaints from the previousyear were examined. By drilling down into the data, a unique array of activityacross time and space emerged that resulted in the development of a specific,targeted, risk-based deployment strategy. Examination of the activity patternsrevealed that almost all of the increase in random gunfire complaints occurredbetween 2200 hours on New Year’s Eve and 0200 hours the following day.While this made intuitive sense, this was the first time that the temporal patternsof activity had been examined in this manner. As a result of this finding, the risk-based deployment initiative was confined to an eight-hour period bracketingthe period anticipated to be associated with the most work.
Within this time period, activity across specific policing beats was analyzedfurther. The beats were rank ordered by relative activity during the previousNew Year’s Eve holiday, and the top locations were selected for increaseddeployment. Recent trends and patterns also were analyzed in an effort to iden-tify any areas that might be ramping up or experiencing significant increasesin activity that might require more attention during the holiday. Through thisapproach, additional locations were identified and added to the list.
A final list was developed that included areas previously associated withincreased random gunfire complaints during the New Year’s Eve holiday aswell as additional areas showing recent increases in random gunfire. An opera-tional plan was developed and implemented using a “beat-stacking” approach,which included heavy patrol and the deployment of additional tactical units inthe areas determined to be at elevated risk for random gunfire.
The results of the initiative supported the use of this type of risk-baseddeployment strategy for targeted deployment. Random gunfire complaints
Chapter 13

264 13.8 Risk-Based Deployment Case Studies
were decreased by 47% on New Year’s Eve and by 26% during the entiretwo-day holiday. Moreover, the number of weapons recovered during the ini-tiative was increased from 13 the previous year to 45 during the initiative—anincrease of 246%. To ensure that the random gunfire reductions were specificto the initiative, the period immediately prior to New Year’s Eve was analyzed.A comparison between the random gunfire complaints revealed no differencesbetween the two years.
Perhaps the most encouraging outcome measure involved the personnelresources used for the initiative. As a direct result of confining the initia-tive to an eight-hour period and the use of a risk-based deployment strategy,the number of required personnel was decreased significantly. By specificallytargeting personnel resources, approximately 50 sworn employees were releasedfrom duty over the holiday, which resulted in a economic savings of approx-imately $15,000 in personnel costs and associated holiday pay during aneight-hour period. Further information related to the outcome evaluation asso-ciated with this very successful initiative has been addressed in greater detail inChapters 6 and 8.
Homeland Security and Deployment
The war on terrorism has generated a variety of new challenges for law enforcement agencies attemptingto protect our homeland, while addressing routine crime issues that generally defined their purview priorto 9/11. Perhaps one of the biggest challenges is stretching already diminished personnel and budgetresources to accommodate the additional responsibilities associated with the war on terrorism. Theconcept of fourth-generation warfare and implications for local law enforcement is discussed in Chapter 12;however, the direct impact on resource allocation and deployment can be understood regardless of thecause.
Prior to 9/11, most agencies were in the unenviable position of doing more with less, particularlywith diminishing economic resources. After that date, local agencies increasingly became responsible forcollecting and compiling additional data and information, increased deployment related to sensitive or high-profile locations, and periodic escalation in readiness associated with heightened threat levels. Moreover,agencies already coping with limited troop strength lost additional personnel to military activation, federalhiring, and reallocated resources to homeland security tasks and task forces.
Doing more with less requires smart, data-based, results-driven deployment strategies. Personnelresources, in particular, need to be allocated judiciously to ensure complete coverage and maintain the

13.9 Bibliography 265
ability to respond adequately. This is true not only for routine patterns of offending and enforcement butfor rapidly emerging homeland security-related functions as well. Data mining, predictive analytics, andsimilar information-based deployment strategies facilitate the provision of more science and less fictionin personnel deployment. Similarly, further enhancements and integration of data mining and mappingsoftware offer additional opportunities for the development of actionable deployment strategies that canmove from the analysis unit directly into the operational environment.
13.9 Bibliography1. Helberg, C. (2002). Data mining with confidence, 2nd ed. SPSS, Inc.,
Chicago, IL.
2. McLaughlin, C.R., Robinson, D.W., and Faggiani, D. (1998). Declininghomicide rates in the 1990s: Not everywhere! Academy of Criminal JusticeSciences.
3. McLaughlin, C.R., Yelon, J.A., Ivatury, R., and Sugerman, H.J. (2000).Youth violence: A tripartite examination of putative causes, consequencesand correlates, Trauma, Violence & Abuse, 1, 115–127.
4. McCue, C. and McNulty, P.J. (2003). Gazing into the crystal ball:Data mining and risk-based deployment. Violent Crime Newsletter,September, 1-2.
5. McCue, C. and Parker, A. (2004). Web-based data mining and predictiveanalytics: 24/7 crime analysis, Law Enforcement Technology, 31, 92–99.
6. Faggiani, D. and McLaughlin, C.R. (1999). A discussion on the use ofNIBRS data for tactical crime analysis. Journal of Quantitative Criminology,15, 181–191.
7. McCue and McNulty.
8. Ibid.
9. McCue and Parker.
10. McCue, C., Parker, A., McNulty, P.J., and McCoy, D. (2004). Doingmore with less: Data mining in police deployment decisions. Violent CrimeNewsletter, U.S. Department of Justice, Spring, 1, 4-5.
Chapter 13


14Surveillance Detection
“We can learn even from our enemies.”
Ovid
14.1 Surveillance Detection and OtherSuspicious Situations
In the days following the 9/11 attacks, information, speculation, rumors, “be onthe lookout” or BOLOs, and suspicious situation reports flooded into everypublic safety agency, which generally compiled these reports in notebooks andclipboards. Many of these reports were investigated; however, the vast flow ofinformation made it difficult to conduct any sort of analysis. Similarly, infor-mation went up, down, over, around, and through almost every public safetyagency in this country, whether large, small, local, state, or federal; however,there were limited opportunities to ensure that this information-sharing processwas organized or even complete. As things have slowed down somewhat fromthat initial frenzy, two information-based challenges have emerged: informa-tion stovepipes and the failure to identify meaningful relationships and patterns.One of the goals of this text is to encourage analytical and operational personnelto work together more closely, even within the same organization. To addressinformation stovepipes in law enforcement and intelligence analysis is wellbeyond the scope of this book. The emerging emphasis on identifying mean-ingful patterns and relationships however, is well within the purview of datamining and predictive analysis. In my opinion, “connecting the dots” merelytells us what happened. To create safer neighborhoods for our children andensure our homeland security requires us to look forward in an effort to antic-ipate and ultimately prevent bad things from happening. Whether it is a streetcorner drug-related shooting or the next cataclysmic terrorist attack, figuringout what happened in retrospect is a costly approach to public safety.
While there are no crystal balls in law enforcement and intelligence analysis,data mining and predictive analytics can help characterize criminal behavior sothat we can make accurate and reliable predictions regarding future behavior
267

268 14.1 Surveillance Detection and Other Suspicious Situations
or actions, which is absolutely essential to effective crime prevention. One areawhere this has tremendous potential is surveillance detection. In many ways,surveillance is a systematic review of a person, route, facility, or some other itemof interest. Data mining and predictive analytics thrive on homogeneous andcoordinated behavior, such as that which is embodied in the aforementioned“systematic review.”
Most, if not all, suspicious situation reports should be analyzed for any con-sistent behavior, unusual patterns, or indications of possible intensification orescalation, even if they have been investigated already. The analyst frequentlycan provide preliminary information illuminating what the suspect might beconsidering. For example, ongoing repeated observations of the same facilitymight indicate an interest in that location as a particular target. Preliminaryanalysis of these reports might suggest clustering in the weekends. By separatingthe activity by different time blocks, the analyst might notice increased surveil-lance activity around closing time. By drilling down into the data, we mightidentify two types of suspicious activity. Perhaps there are two groups interestedin this location. One is considering a robbery, while the other might be inter-ested in an after-hours burglary. Characterizing and modeling this behavior canguide additional coordinated surveillance detection activities, or it might estab-lish a likely time frame and possible type of incident, which could be addressedby heavy deployment or some other proactive, targeted operation.
In many ways, surveillance detection techniques can play a significant rolein traditional crime analysis. Preoperational surveillance is not unusual formany patterns of offending. A criminal planning a bank robbery might driveby several banks looking for those with physical characteristics that appeal tohim. Easy access and egress might be imperative. Proximity to major highwaysor multiple escape routes might be important considerations. Once a specificlocation has been selected, the suspect might spend time watching the bank todetermine routine operations. When is it busy? When is it relatively slow? Arethere security personnel? If so, do they take breaks? In short, the potential bankrobber is interested in information that will maximize his gain while minimizingthe risk of apprehension. The suspect might have been noticed several timesduring this process. The bank tellers may have noticed the same vehicle sittingoutside the bank on multiple occasions. The suspect might even have come intothe bank and then left without transacting any bank business. In some cases thesuspect might engage in conversation with bank employees or make inquiriesregarding the security procedures. Unfortunately, this information often comesto the attention of law enforcement personnel only after something happens orif awareness has been heightened due to a high-profile event or series of events.The important point, though, is that preoperational surveillance is associated

14.1 Surveillance Detection and Other Suspicious Situations 269
with many patterns of offending, and that in many cases this behavior is noted.In some cases, preoperational surveillance is reported, but it is rare for it to becompiled and analyzed on a routine basis. If a particular agency understandsthe value of this information and proactive analysis, they might be able toanticipate the type of location to be targeted next, respond proactively, andmake a rapid apprehension. Unfortunately, law enforcement agencies generallydo not receive information that is proactive and specific unless they are inthe midst of a particular series. Regardless, “suspicious situation” reports ofthis nature should be analyzed whenever possible, as they frequently provide awindow into the criminal planning process.
Preoperational or hostile surveillance generally is intended to be covertor to appear relatively innocuous to uninformed observers. Frequently, it isonly when a larger pattern of suspicious behavior or presumptive preopera-tional surveillance activity has been identified, compiled, and characterizedthat the true nature of the activity is revealed. For example, reports in themedia have suggested increased interest in facilities in northwest Washingtonstate.1 These reports outline several incidents of unusual or suspicious behavior,including photo and video surveillance of sensitive locations and facilities aswell as attempts to obtain regional survey materials. This repeated and ongo-ing occurrence of suspicious and unusual behavior in and around Anacortes,Washington, the Deception Pass Bridge, and Whidbey Island has particular rel-evance given the critical infrastructure and military assets located in that area.These assets include the Whidbey Island Naval Station and the Washingtonstate ferry system, which provides critical access to many of the islands in thePuget Sound, as well as the neighboring oil refineries. This unusual behav-ior takes on added significance given the fact that the Millennium bomber wasapprehended at the Anacortes ferry terminal. When reviewed in isolation, thesereports might not be cause for concern. Analyzed as a larger pattern, however,these incidents suggest a coordinated effort to acquire information about aparticular geographic region.
Terrorist groups, including Al Qaeda, historically have shown a preferencefor multiple, simultaneous, yet geographically distinct attacks. Examples ofthis behavior include the African embassy bombings, the 9/11 attacks,2 andthe London and Madrid transportation bombings. Subsequent analysis in eachof these incidents revealed extensive, long-term preoperational surveillance ofthe targets, including a “dry run” in London several weeks before the attacks.Similarly, the casing reports collected on financial institutions within the UnitedStates indicate increased activity on Wednesdays.3 Again, reviewed in isola-tion, these events might indicate nothing more than something idiosyncraticor unique to the facility, or even reporting bias. On the other hand, the finding
Chapter 14

270 14.2 Natural Surveillance
of increased activity on Wednesdays across multiple facilities increases the valueof that observation and supports the idea of coordinated activities and commonplanning.
Suspicious actions or behavior suggestive of preoperational planning orsurveillance are both infrequent and subtle by their very nature. Trying to iden-tify unusual or suspicious behavior indicative of something far more sinisteroften resembles looking for the proverbial needle in the haystack. Frequently,indications of these types of activities almost always occur only when the poten-tial suspect makes a mistake, which further highlights their rarity. What wouldbe helpful in revealing these activities, the “needle in the haystack,” would besome sort of magnet. In many ways, the technique of anomaly detection canserve that function.
Building on the concept of risk-based deployment described in Chapter 13,similar data mining strategies can be used to maximize surveillance detectionresources.4 Like patrol deployment, the use of data mining takes advantage ofthe nonrandom or systematic nature of preoperational surveillance. Character-izing and predicting when and where this activity is likely to occur can guideproactive deployment of surveillance detection resources in a way that increasesthe likelihood that these personnel resources will be in place when and wherethe behavior of interest occurs. Moreover, this strategy also decreases the like-lihood that resources will be deployed when and where they are not needed,a feature that supports the thoughtful allocation of resources.
14.2 Natural Surveillance
It is not unusual to interview witnesses after a major event and have themrecount unreported suspicious behavior that indicated something bad was aboutto happen. In fact, Gavin de Becker in The Gift of Fear recounts cases ofworkplace violence in which the event was so anticipated that as soon as theshooting started people correctly identified the suspect before the actual natureof the event was even known.5 Similarly, during the 9/11 inquiries, reportssurfaced outlining unusual or troubling pre-incident behavior that was nottaken seriously, investigated, or linked. The challenge implicit in this pub-lic safety predicament, therefore, is threefold. First, the information needs tobe reported and compiled. While this is not a challenge specific to analyticalpersonnel, they can be greatly impacted by incomplete or inaccurate reporting.It is not possible to analyze what does not exist, so analysts have a vested inter-est in ensuring that suspicious situations and other indicators of preoperationalsurveillance are reported and compiled. Second, the information needs to be

14.2 Natural Surveillance 271
effectively analyzed. Compiling and storing suspicious situation reports in athree-ring binder is a waste of a potentially valuable resource. The informationshould be entered into a database, analyzed, periodically reviewed, and analyzedagain. And third, the results of the analysis need to be used operationally. Thisextends beyond preliminary investigation of the suspicious situation reports.Preoperational surveillance is designed to look innocuous. Frequently, it is onlywhen the larger pattern of suspicious activity or surveillance has been revealedthat it becomes actionable. If suspicious situation reports reflect mistakes onthe part of the potential bad guy, then those can be used to reveal the largerpattern of surveillance. Using a model of suspicious situation reports to guideadditional surveillance detection efforts can maximize often limited person-nel resources. By determining when and where the most activity is occurring,operational personnel can proactively deploy and increase the chances that theymight identify additional, less obvious behavior. Moreover, it also increases thelikelihood that specific individuals or vehicles will be identified, which furtherenhances the investigative effort.
Again, while increasing natural surveillance is not really a problem of datamining or predictive analytics, gathering information that is as complete aspossible is essential to creating accurate and reliable models. In many ways,enhancing information collection is an essential first step in creating a programof surveillance detection and threat assessment.
Plotting the total number of suspicious situation reports is a good firststep in the process of using analysis to identify possible surveillance behavior.Therefore, it is very important to support consistency in reporting if at allpossible. For example, in Figure 14-1, a marked increase in the number ofsuspicious situation reports was noted in March. The first question that shouldbe addressed is: What happened in March? If employee personal safety traininghad been offered in March, or if there had been a major incident in late Februarythat had heightened awareness, the increased number of reports received duringthe month of March would be viewed somewhat cautiously. However, if nothingobvious had changed, then it would be important to quickly assess the natureof these reports in an effort to determine whether there is cause for concern.
Similarly, the trend in the number of reports received appears to havedecreased over time. Again, it is important to put this information into acontext to determine whether this decline is real or something that needs to beaddressed. For example, additional information indicating that each report hadgenerated a rapid and aggressive security response would suggest that perhapsthis location has become a difficult target. If this is the case, a more com-plete review of the specific reports would help to further define the nature of
Chapter 14

272 14.2 Natural Surveillance
�Figure 14-1 Graph of suspicious situation reports over time.
0
10
20
30
40
50
60
Jan
uar
y
Feb
ruar
y
Mar
ch
Ap
ril
May
Jun
e
July
Au
gu
st
Sep
tem
ber
Oct
ob
er
No
vem
eber
Dec
emb
er
Nu
mb
er o
f R
epo
rts
the potential threat and might even form the basis for a security-related after-action report. On the other hand, a decline in reporting with no obvious changein security might indicate apathy or frustration on the part of the staff. Again, itis important to thoroughly review the reports and possibly to conduct a surveyto ensure that reporting is encouraged within the organization.
In a more complex example, we evaluate a series of reports of suspiciousactivity around a shopping mall. Several reports were received, but it was notclear whether this should be cause for concern. By creating a simple spreadsheetand graphing the data, it becomes apparent that most of the activity is occurringon Fridays and Saturdays (Figure 14-2). By further drilling down by time ofday, it also becomes obvious that most of the activity is occurring when themall is open and that the activity increases during the evening (Figure 14-3).Several questions come to mind at this point. For example, how does the mallactivity differ on the weekend as compared to weekdays, and what is differentabout the evening?
More importantly, though, does this really mean anything? Is there anythingof significant concern at this point? One could certainly argue that the mallpopulation increases on the weekend. Is the increased reporting related to atransient increase in the mall population observed on Fridays and Saturdays?We also might expect more young people in the mall on the weekends becausethey are out of school. Is the increased reporting an artifact of an increasednumber of kids who have been sensitized to “stranger danger” and all of the

14.2 Natural Surveillance 273
�Figure 14-2 Graph of suspicious situation reports at a shopping mall, by day of week.
0
5
10
15
20
25
30
35
40
Su
nd
ay
Mo
nd
ay
Tu
esd
ay
Wed
nes
day
Th
urs
day
Fri
day
Sat
urd
ay
Nu
mb
er o
f R
epo
rts
�Figure 14-3
Graph of samesuspicious
situation reportsdepicted in
Figure 14-2, bytime of day.
0
2
4
6
8
10
12
14
Num
ber
of R
epor
ts
0100
0300
0500
0700
0900
1100
1300
1500
1700
1900
2100
2300
Time of day
Chapter 14

274 14.2 Natural Surveillance
other victimization-prevention programming that is available today? In otherwords, can this apparent increase in activity be attributed to reporting bias?While this might explain the increase noted on the weekends, it does notnecessarily explain the increased number of reports associated with the eveninghours.
On the other hand, the pattern of results could have nothing to do withanything special or unique about the mall. Rather, it could represent a con-venient time or place or something unique about a potential suspect. It is notunusual for the timing and even location of crime to be related to the conve-nience or routine schedule of the criminals. In fact, this is referred to as their“comfort zone” and is not at all unusual with certain patterns of offending. Wefrequently focus on the location of the reports or some unique feature of thevictim or location targeted. For example, a series of bank robberies was analyzedseveral years ago using regression analysis in an effort to determine the lengthof time between incidents. The results of the analysis revealed that the timebetween robberies was related to the amount taken in the previous robbery.The criminal in this case needed to maintain a certain cash flow to meet hisexpenses, so if he was able to obtain a large amount from one bank, the timeto his next robbery was decreased. If, on the other hand, his take was relativelysmall, he would need to go back out and rob another bank sooner. The rela-tionship between amount taken and the crime interval is relatively commonamong drug addicts. Due to the compulsive nature of drug use and/or theneed to stave off withdrawal, many addicts commit economic crimes to sup-port their drug habits. Consequently, the frequency with which they commitcrimes might be related to the cost of maintaining their habit, or cash flow, andthe monetary yield from each crime. While this might be the best explanationfor the activity noted at the mall, it is generally a good idea to play the devil’sadvocate and consider an alternate hypothesis for a particular set of data orinformation, because it is not at all unusual for the particular time, location, orthe victim selection to be related to some unique but unknown feature of thesuspect.
Even if nothing more is done analytically at this point, by compiling theinformation and conducting this quick analysis, operational deployment canbe altered to respond specifically to the reported behavior. This results in threepossible benefits. First, if there is something unusual going on, by specificallydeploying operational personnel when and where it has been occurring, thelikelihood is increased that they also will observe this behavior or be able torespond more quickly should it occur again. Second, increased deploymentin the area might deter any additional suspicious or unusual behavior. Finally,targeted deployment in response to these reports visibly projects an increased

14.3 Location, Location, Location 275
presence, while concomitantly enhancing the perception of increased publicsafety in that area.
14.3 Location, Location, Location
Preoperational surveillance requires a certain amount of time for observation ofthe potential target, time during which the operator is vulnerable to detection.The ability to not only identify but also characterize and model this behaviorhas tremendous tactical and strategic value. Most frequently, this informa-tion arrives in the form of suspicious situation reports, which provide a generaldescriptive characterization of suspicious activity (e.g., photographing or video-taping a facility). Although suspicious situation reports rarely include specificinformation (e.g., exact location) in a standardized format, they can be thoughtof as spatial sets, which are particularly well suited for data mining and oper-ational planning. For example, relatively general information characterizingwhat the subject of a suspicious situation report was observing can provideinvaluable guidance regarding that individual’s likely intentions and the possi-ble vulnerabilities associated with a particular location. Similarly, informationpertaining to the individual’s general location or observation point can guide theplacement of surveillance detection resources. Neither of these analyses requiresspecific information. Rather, spatial sets match the available data resources andare sufficient for not only analysis but operational action as well.
Let us assume that the increased number of suspicious situation reports atthe mall is not related to any reporting bias and that the pattern of resultsis related to something associated with the mall itself. We could stop at thispoint and suggest that the mall increase patrol during the weekend, particularlyduring the evening hours, but there is some additional work that can be done tofurther refine the scope and add additional value to our understanding of whatmight be happening at the mall. Any additional trends or patterns that we canreveal in the data can provide additional insight into a possible motive for theunusual activity, which then translates into greater definition and refinementof the response options.
For example, it can add great value to an analysis to identify not onlywhen, but where. To identify specific locations or areas that are associatedwith increased interest can greatly assist in the spatial refinement of surveil-lance detection efforts by further defining the true or active zone of unusualor suspicious activity. Providing a map of suspicious activity to the operationalpersonnel for use in surveillance detection planning can be greatly appreci-ated and results in a much better operational plan by visually refining and
Chapter 14

276 14.3 Location, Location, Location
depicting potential target areas. This can be particularly helpful with multi-building facilities or complexes, like the mall in this example, by further refiningthe specific areas of interest. It also can begin to provide additional insightinto the true nature of the suspicious activity, or the “why” of the behavior.Mapping or otherwise providing some sort of visual depiction of any identifiedspatial patterns or trends can be especially useful in conveying this type ofinformation.
Sophisticated mapping software, although generally very beneficial andfrequently used by most public safety agencies, is not entirely necessary foran analysis of this nature. Internet-based mapping tools, orthophotographyimages, or even line drawings such as the one shown here all convey the nec-essary information and can be more than adequate for this type of analysis.In many ways, a map can be viewed simply as a specialized figure or graph, aunique way to visually depict data or information. Although many mappingprograms have sophisticated mathematical tools associated with them, in thissituation, visually depicting the information so that the operational personnelcan guide their efforts and begin to determine what is occurring and why isthe most important aspect of this exercise and does not require any additionalanalytical software.
Mapping the data over time also can be especially valuable in determin-ing whether the location associated with the greatest activity or most markedincreases appears to move, change, or otherwise refine itself over time. In somecases it is more useful to think of a relatively fluid “cloud” of potential riskthat has moved into or settled over a particular area, rather than struggling toidentify and define discrete areas. Thinking of the edges as being somewhatfuzzy will limit restricting the area too much and missing potentially significantactivity in the future.
By creating a map of the report locations throughout the mall, an obviouspattern emerges. The majority of the activity seems to be centered in the vicinityof the cinema (Figure 14-4). This finding also is consistent with the day andtime of the reports. The cinema tends to be more active in the evening hours,particularly on Friday and Saturday nights.
The mall’s suspicious situation reports could reflect preoperational surveil-lance for anything from robbers to sexual predators surveying a target-richenvironment for potential victims to an extremist group interested in callingattention to its agenda. Our analysis does not necessarily address the who orspecific why of this activity. What is does, though, is characterize the behav-ior sufficiently that coordinated surveillance detection efforts and operationaldeployment can be targeted specifically to the time and location associated

14.3 Location, Location, Location 277
�Figure 14-4 Map illustrating specific locations associated with the situation reports from Figures 14-2
and 14-3.
Parking lot
Parking lot
Store 2
Store 3
Cinema
Store 1 Courtyard
previously with possible surveillance activity. This limits the personnel resourcesrequired for formal surveillance detection and increases the likelihood thatsurveillance detection activities will be placed when and where they are mostbeneficial. Moreover, routine patrol can be concentrated when and where activ-ity is greatest. Minimally, this increases the opportunity for rapid responseshould something bad happen. Ideally, placement of operational personnelwhen and where they are likely to be needed gives us the opportunity toanticipate and possibly even prevent crime.
In the shopping mall example, a series of suspicious situation reports create avery simple database. We were then able to characterize the data and drill downto extract additional details that could be used to create a focused surveillancedetection plan while guiding additional public safety and crime preventionapproaches. Sometimes, however, additional steps will need to be taken tofurther characterize the data, link possible associated events, identify potentialtransitions or escalation in surveillance activity, and make predictions aboutpossible future behavior. This is particularly a challenge in high-profile sites orin locations where a variety of information has been compiled and needs to beculled for meaning.
Chapter 14

278 14.3 Location, Location, Location
�Figure 14-5 Frequency distribution depicting the relative occurrence of suspicious activity reports
associated with a facility of interest. (Screenshot of output taken by the author is fromClementine 8.5, SPSS, Inc.)
Date
In another situation, data mining and predictive analytics were used tocharacterize possible surveillance activity associated with a facility of interest.In this example, suspicious situation reports had been investigated and thencompiled, although never analyzed. As can be seen in Figure 14-5, a quick reviewof the frequency of reports over time revealed increasing activity consistentwith growing interest in the facility. Analysis of the activity by day of weekfurther highlighted the nonrandom nature of this activity; 25% of the reportedincidents occurred on Wednesdays (Figure 14-6).
The incidents were recoded into operationally relevant categories that moreaccurately described the suspect behavior. These included still photography(“photo”); video photography (“video”); any movement toward the facility,attempted interaction with the security personnel, or probing of the perimeter(“approach”); and all other behaviors not appropriate for inclusion in any ofthe previous categories (“suspsit”). These recoded incidents were plotted overtime, but, as can be seen in Figure 14-7, any interpretation of these results waslimited by the complexity of the graph created.

14.3 Location, Location, Location 279
�Figure 14-6 Distribution of suspicious activity by day of week. (Screenshot of output taken by the
author is from Clementine 8.5, SPSS, Inc.)
�Figure 14-7 This figure depicts the distribution of suspicious behavior over time. “Approach” indicates
that the suspect physically approached the facility or attempted to probe the security featuresor personnel, “Photo” indicates the suspect use of still photography, “Video” refers to thesuspect use of video photography, and “Suspsit” includes all other behavior not includedin the previous groups. (Screenshot of output taken by the author is from Clementine 8.5,SPSS, Inc.)
Date
v
Nature
Approach
Photo
Suspsit
Video
Chapter 14

280 14.3 Location, Location, Location
Moving beyond simple descriptive statistics and characterization, a cluster-ing technique was used to determine whether the events could be grouped basedon their time, nature, or location. This analysis revealed two different groupsof suspicious situation incidents, which generally were associated with differ-ent types of observed behavior (e.g., still photography versus video and otheroperationally oriented surveillance). As can been seen in Figure 14-8, graphingthese groups across time reveals a transition in the nature of suspicious activ-ity from relatively simple behavior to more operationally oriented surveillance,suggesting an escalation in the nature of surveillance activity that paralleled theincrease in frequency over time.
Using relatively simple techniques, it was possible to generate operationallyactionable output from the analysis. As illustrated in Figure 14-9, preparation ofa crude facility map highlighted the relative spatial distribution of the incidents.
�Figure 14-8 Pattern of suspicious behavior. This figure depicts an identified pattern of suspicious
behavior over time, as revealed through the use of a clustering or unsupervised learn-ing technique. Group membership was determined largely by the nature of the activity.Cluster 1 generally was associated with still photography of the facility, while the inci-dents in Cluster 2 tended to be associated with more operationally oriented activity,including video surveillance. (Screenshot of Two-Step output taken by the author is fromClementine 8.5, SPSS, Inc.)
Date

14.3 Location, Location, Location 281
�Figure 14-9
“Map” depictingthe spatial
distribution ofsuspicious
activity aroundthe facility ofinterest. Note
that the shade ofthe icon is
associated withthe cluster
membership,which visuallyhighlights the
spatial focusingof interest over
time.
Loadingdock
Employeeentrance
Visitorentrance
Additional value was added to the map through the use of using different shadesof gray to depict the nature of the activity and different intensities to conveyrelative differences across time. This simple technique also can serve to highlightthe emerging geographic specificity of the suspected surveillance activity.
As outlined in this case study, the techniques do not need to be fancy orsophisticated. Rather, the key is to convey analytical output and informationin a format that is relevant to the end user and immediately actionable inthe applied setting. For example, the use of risk-based deployment maps6 or“schedules” provides operationally actionable analytical products that can begiven directly to personnel in the field. The ability to integrate and analyze datafrom multiple, disparate locations can further enhance our understanding, par-ticularly regarding those groups and organizations with a historical preferencefor multiple, simultaneous, geographically distinct attacks. In this situation,access to and analysis of integrated data resources can be used to identifyinfrequent events and reveal subtle trends or patterns. Moreover, determin-ing “when” and “where” often can provide insight regarding “why.” Therefore,the identification and characterization of surveillance activity can not onlyrefine surveillance detection planning and deployment but also can be used tohighlight potential vulnerabilities and threats, which ultimately can be used tosupport the information-based deployment of countermeasures.
Chapter 14

282 14.4 More Complex Surveillance Detection
14.4 More Complex Surveillance Detection
At a minimum, the ability to characterize suspicious behavior providesinvaluable guidance for those interested in establishing surveillance detection.Operational resources almost always are in short supply and must be deployed asefficiently as possible. The ability to take a series of suspicious situation reportsand identify trends and patterns gives us the opportunity to deploy surveillancedetection when and where it is most likely to gather additional information, butwhat happens when there are multiple potential locations of apparent interest?A multibuilding complex or facility with several layers of physical security isgoing to require more complex surveillance activity, and concomitantly moresophisticated surveillance detection to accurately detect, dissect, and conveythe overall pattern of activity.
In this fictitious example, there is a multibuilding complex, which isdepicted in Figure 14-10. The facility is surrounded by a six-foot perimeterfence (Figure 14-11). There is only one point of access to the facility, through
�Figure 14-10 Map of a fictitious multifacility complex associated with suspicious activity.
6’ perimeter fence
Main Road
Entrance
Dining hallKitchen

14.4 More Complex Surveillance Detection 283
�Figure 14-11Six-foot fence
surrounding theperimeter of the
compound. (StaffSergeant Tom
Ferguson,USMC; used
with permission.)
the front sally port, which is continuously manned. Due to the nature ofthe complex, suspicious activity is aggressively reported and investigated. Thereports are then compiled for historical archiving (Figure 14-12).
After an incident at a related facility, the security manager decides that thesuspicious activity reports should be reviewed, characterized, and analyzed.Using data mining and predictive analytics, the reports were analyzed andclassified into four separate groups. The analyst assigned to the task selected anunsupervised learning technique, which clustered the incident reports based onsimilar characteristics. In an effort to convey the information to the operationalpersonnel in an actionable format, a facility map diagram was prepared in whichthe locations associated with the different clusters of activity were marked andhighlighted.
The location indicators on the map were intentionally depicted as vague areasrather than solid areas in an effort to convey a general area of risk, rather than spe-cific indicators or points, which might indicate specific locations. Again, usingthese “clouds” of risk conveys increased activity associated with this general loca-tion that might be associated with a concomitant elevation in associated risk.Similarly, size, color, and even relative differences in color saturation or inten-sity can be used to convey additional information, such as frequency of activity,
Chapter 14

284 14.4 More Complex Surveillance Detection
�Figure 14-12
Samples ofsuspicious
situation reportsreceived and
logged by security.Report # 20020515-003
On 05/15/2002 at 1500 hours an employee reported observing asubject photographing the employeeentrance to the facility. Subject was awhite male, approximately 5’10”and168 lbs. NFD
R. Jones
Report # 20020218-007
Report # 20020831-005
On 08/31/2002 at 1630 hours I observed a white male (6’01”190 lbs)with a video camera outside theemployee entrance. Subject wasapproximately 25-28 yoa. NFD
B. Smith
or temporal variance. By using these techniques, the analyst can convey a rela-tively large amount of information through the use of a two-dimensional map.
The first cluster of activity, which is indicated by the number “1” onFigure 14-13, was characterized by activity outside the perimeter. This wasfrequent, as indicated by larger clouds of risk on the diagram. In particular, sig-nificant activity was associated with the front gate (Figure 14-14). Analysisrevealed that the activity associated with this cluster not only increased infrequency over time but appeared to intensify as well. Additional surveillanceactivity was associated with the area outside the fence (Figure 14-15) in relativeproximity to the dining hall. Further refinement associated with the time of thisactivity was noted, which initially appeared random and subsequently appearedto coincide with meals.
The second cluster of activity was associated with the kitchen. This alsowas associated with relatively frequent reporting of unusual behavior, and evenincluded one situation where an unauthorized person gained access to the facilityin a delivery truck. The activity in the second cluster differed from the first inthat it represented very little overt surveillance, but did include several suspicioustelephone calls and inquiries regarding delivery and dining schedules.
The third cluster of activity was associated with the entrance. Again, therewas not much overt visual surveillance of the facility. This cluster was associated

�Figure 14-13 Map depicting “clouds” of risk associated with various locations within the compound.
Main Road
Entrance1
1
2
3
Dining hall
4
6’ perimeter fence
�Figure 14-14
Front gate ofcompound. (Staff
Sergeant TomFerguson,
USMC; usedwith permission.)

286 14.4 More Complex Surveillance Detection
�Figure 14-15
Area outside thefence near the
dining hall.(Staff SergeantTom Ferguson,
USMC; usedwith permission.)
with security probes, which included conversations and inquiries involving thepersonnel manning the entrance. This pattern of activity also distinguisheditself in that it started to occur after the perimeter surveillance had already beenoperating for a period of time.
The fourth cluster of activity was by far the least frequent and the last tooccur in the time series. In many ways, the incidents included in this “cluster”comprised such a diverse array of incidents that they were almost discardedas outliers or anomalies. They occurred much later than all other incidents,after a break in activity. They differed significantly in terms of the natureof the behavior and time of day, and included an unauthorized person whotried to gain access to the dining hall during a meal, as well as a triggeredalarm at the entrance to the same dining facility one night. The only consis-tent factor was the location: the entrance to the dining hall. After the otherclusters were mapped and evaluated, however, it was determined that this loosearray of incidents might represent the final preoperational planning stage to anincident.
In response to this analysis, surveillance detection, physical securityenhancements, and proactive deployment operational plans were developed.These were based on the specific decision rules associated with each identified

14.4 More Complex Surveillance Detection 287
cluster, which ultimately were linked to a particular set of vulnerabilitiesidentified in the fictitious complex. This permitted the specific targeting ofresources, as well as the development of additional security enhancements thatwere based on the associated risks related to each specific location within thecomplex.
By using operationally actionable mining and predictive analysis, forceprotection resources and strategies can be deployed in direct response to theanalytical output. This includes the specific targeting of resources, as well asthe development of additional security enhancements that are based on theunique constellation of associated risks related to each specific location withina multifacility base or complex.
Internet Surveillance:To Delete Information or Not
This is a relatively tough question that the analyst generally does not participate in, but there are benefitsboth ways. If the information truly has the potential to either create or contribute to serious threats topublic safety, then prudence might dictate removal of the information. Unfortunately, electronic infor-mation that is deleted might still be available through Internet archives and other related sites. On theother hand, leaving the information intact, perhaps with a few modifications, offers unique opportunitiesfor surveillance detection and strategic misdirection.
Of course, now that this subject has been reported in the popular press, the false sense of securitythat these Internet interlopers might have had, thinking that they were lost in the vastness of municipalweblog data, has been lost. This probably means that they will choose another way to assess our capacityand response systems, which highlights an important point in surveillance detection. Once the watchersrealize that they have been discovered, the activity generally stops. Therefore, any surveillance detection,even at the analytical level, should be conducted surreptitiously in an effort not to alert the watchers thatthey also are being watched.
In their discussion of fourth-generation warfare, Lind et al.7 noted that,“Terrorists use a free society’s freedom and openness, its greatest strengths,against it.” Many organizations, agencies, and localities deploy a tremendousamount of sensitive information over the Internet in a misguided attempt toachieve the ideal of “transparent government.” For example, a cursory review ofmunicipal websites reveals everything from specific details regarding emergencyresponse equipment, including equipment model numbers, to detailed, high-resolution orthophotography images of sensitive locations. Similarly, whilecertain military facilities have been blocked (e.g., Navy facilities in theTidewater
Chapter 14

288 14.4 More Complex Surveillance Detection
area of Virginia), the surrounding localities deploy detailed information relatedto military facilities. As early as 2001, the Israelis reported that their adversarieswere exploiting the increased availability of orthophotography images freelyavailable over the Internet.8
Even information included in contractor solicitations can have value if itoutlines direction, internal capacity, abilities, or vulnerabilities. Most local,state, and federal agencies have requirements for a competitive bid processassociated with any major purchase or contract. Frequently included in thesesolicitations is sufficient information regarding the desired product or servicespecifications as well as anticipated deployment. This is meant to ensure thata potential contractor can generate a bid that is both responsive and com-petitive. One of the easiest ways to disseminate this information is throughthe Internet. Unfortunately, detailed bid solicitations for systems, equipment,and services, while essential for a fair and effective bid process, also sends astrong message regarding the current and future capacity of the organization.Moreover, requests for proposals such as these provide unique opportunitiesfor cover, as individuals might request access to secure locations or requestadditional documents and specifications under the guise of attempting to pre-pare a competitive bid, something of great potential value to a surveillanceoperation.
A recent Rand report concluded that the U.S. government generally doesnot deploy enough information with operational value over the Internet to aidin terrorist planning.9 The report cautioned, however, that some nongovern-mental agencies might. Therefore, the next question should be: Who else isreleasing information about my organization or locality, and will they let meanalyze the traffic, as well as future behavior? Keep in mind that the informa-tion pertaining to your community or location of interest probably is deployedover a variety of websites, few if any of which you have any control over oraccess to for security or analysis purposes. For example, at the time of this writ-ing, detailed orthophotography images of Washington, D.C. were availablethrough two academic institutions that were located outside of the District.Similarly, shared public safety and response information related to mutual aidagreements might be available through multiple websites. Vendors, consultants,and contractors might deploy information related to customers and projects.Tourism and public interest sites provide relatively detailed information, includ-ing photographs of locations of interest. At the time of this writing, the trainbombings in Madrid were very recent. Despite the heightened level of alert inthe travel industry as a whole after this brutal attack, it was still possible tolocate a simulated “webcam” in a major transportation portal in this country.Although the images were not live, it was possible to scan the “camera” and

14.5 Internet Surveillance Detection 289
view the entire area in tremendous detail, again from the anonymity of theInternet.
Another downside to the deployment of potentially sensitive informationover the Internet is the high degree of anonymity associated with it. Justas child predators have been able to exploit the anonymity of the Internet;other individuals with malevolent intentions have been able to take advan-tage of the vast amounts of information available in relative anonymity. Thereis a tremendous degree of anonymity associated with movement through-out the Internet. By using anonymizers or spoofed IP addresses, it can beextremely difficult to identify a particular source or individual. This allows anindividual or group to use the exploitation of readily available open-sourcematerial to conduct preliminary surveillance virtually undetected. On theother hand, these measures might not even be necessary given the tremen-dous amount of traffic currently on the Internet superhighway. The amount ofinformation contained in weblogs alone can be staggering, and it is increasingcontinuously.
Articles and tutorials outlining military thinking, tactics, and strategy arealso available over the Internet. Abu ‘Ubeid Al-Qurashi, one of Osama BinLaden’s aides, has made specific mention of the concept of fourth-generationwarfare when outlining the al Qaeda combat doctrine.10 Other reports havenoted activity on the C4I.org site that was associated with Internet addresseslinked to Iraq.11 A review of the activity suggested that most of their interestappeared to be related to psychological tactics, information warfare, and othermilitary issues.
14.5 Internet Surveillance Detection
What does this have to do with data mining? Approaches and tools similar tothose employed by online retailers to characterize online shopping behavior andcreate models of potential buyers, so-called web mining tools, can be exploitedby analysts in an effort to identify and monitor possible Internet surveillanceand protect critical infrastructure. Using these same web mining tools, Internetactivity can be analyzed in a timely, comprehensive fashion. Integration ofthe data across multiple sites or reference points can provide additional valuethrough the revelation of complex patterns of activity or behavior. Moreover,compilation and analysis of data from multiple sites provides the added ben-efit of comparison between sites. These data then can then be merged withadditional surveillance detection information and used to support the integratedsurveillance detection process outlined above.
Chapter 14

290 14.5 Internet Surveillance Detection
Many localities have reported suspicious or unusual activity on their web-sites. In particular, IP addresses associated with locations in the Middle East havebeen noted searching pages related to local infrastructure and public safety.12 Inone particular community, activity associated with the suspicious IP addressesfrequently came in and out of the site through one specific page. While thisparticular web page was not noteworthy or unusual in and of itself, analysisof “normal” traffic patterns revealed that less than one-half of one percent ofall page hits on this website were associated with this particular page. In otherwords, visits to this web page associated with “normal” or routine traffic wereextremely rare. Yet it was unusual for a session associated with the suspiciousIP addresses to not include at least one hit on this page.
Using this method of brute-force anomaly detection, this particular webpage could be used as a screening tool or “magnet” for suspicious or unusualactivity. By comparing screened traffic against known patterns of activity pre-viously associated with suspicious IP addresses, additional IP addresses wereidentified. Ultimately, it was possible to create some simple filters to iden-tify and capture potentially suspicious behavior on this website by screeningfor known IP addresses, as well as patterns of activity or particular page hitspreviously associated with suspicious addresses and behavior. Therefore, whilemany agencies and organizations have focused on intrusion detection, anotherpotential vulnerability includes surveillance or misuse of information availablethrough the Internet and other open-source venues. The ability to identify,characterize, and monitor unusual or suspicious Internet activity can provideadditional insight regarding our adversaries’ interests and possible intentions,thereby increasing our battlespace awareness. Again, it is possible to gather atremendous amount of information regarding potential surveillance activity onwebsites of interest by simply using a good understanding of “normal” behaviorand anomaly detection.
Internet Surveillance Example
A fictitious local law enforcement agency identified regular, consistent activ-ity on its website that was associated with an IP address linked to a particularterrorist group. Through data mining, the agency was able to identify oneparticular page that was visited frequently by the group of interest. By charac-terizing “normal,” the crime analysts were able to determine that this page wasassociated with limited activity beyond the terrorist group. In fact, less than 1%of all of the page hits on the entire website were associated with this page, andalmost all of the visits associated with IP addresses not linked to the terroristgroup came from one single referring site, the local chamber of commerce.

14.5 Internet Surveillance Detection 291
�Figure 14-16
“BusinessOpportunities”
web pageassociated with
suspiciousactivity.
Main Street America is business friendly!Consider these facts when relocating your business:
Demographics:Drawn by the diverse employment opportunities, Main Street America residents come from all over the world to enjoy our community. In the downtown area, a falafel standcan be found right outside of the kosher deli. In Main Street America, beautiful housingoptions abound. A relatively affluent community, most of the high-end homes arelocated on the southern banks of Lake Hospitality, where beautiful million-dollarmansions are located next to affordable high-rise apartment housing.
Infrastructure and Recreation:Main Street America boasts state-of-the-art infrastructure that includes its ownhydroelectric plant associated with the Muy Grande Dam that feeds beautiful LakeHospitality, source for the region’s power and water. The lake also cools the ring of thehigh-tech Main Street Nuclear Accelerator Lab.
Main Street America has created state-of-the-art emergency response capacity through grants and creattive partnerships with the business community. Including both enhanced and reverse-911 systems, the emergency response system is accepting bids for their new Emergency Command Operations Center (ECOC).
Initial review of the page did not offer any clues as to why this group mightbe so interested in it (Figure 14-16). The page was constructed in an effortto provide additional information for businesses considering relocating to thecity, which we will call Main Street America. General information, includ-ing regional demographics, existing infrastructure resources, and emergencyresponse capacity were provided. Further examination, however, provided someindication as to why the terrorist group might be interested in it.
The page in question made it clear that damage to the dam would causeloss of power and water to the region, as well as possible flooding to the homessurrounding the lake formed by the dam. The page also indicates that housingon the shores of the lake includes apartments. This high-density housing wouldincrease the potential casualty estimates in the event of a disaster at the dam. Thedemographic information also provides clues as to who might appear unusualor out of the ordinary and what would be necessary to blend into that commu-nity. Information pertaining to the local population provides insight regardinglocal possibilities for recruitment. The existence of a nuclear laboratory in theregion has value in terms of potential resources, including highly trained per-sonnel, equipment, and raw materials, as well as potential target opportunities.In sum, the information provided innocently for potential recruiting, whichdid not seem critical when viewed simply as a page on a website, has significant
Chapter 14

292 14.5 Internet Surveillance Detection
potential tactical and strategic value to individuals with less than positiveintentions.
This example combined data mining with some “brute force” techniques.Characterizing activity on a website is only the first step in the process. Again,domain expertise is essential to the accurate and meaningful review of weblogdata. In most cases, it is extremely important to review the actual contentof the pages visited, particularly those that are associated with unusual orrepeated activity. In some cases, “brute force” manual review of the pages forkey words, concepts, or other valuable information may be necessary. Text min-ing techniques, however, promise to automate this process further. Additionaladvantages of text mining include not only speed of analysis but also complete-ness and accuracy. The brain can only take in and hold a limited number ofconcepts. Expert systems, on the other hand, have almost unlimited capacityto identify and consider multiple concepts simultaneously without error, bias,or fatigue.
Going back to the “business opportunities” page, we noted that less than1% of the hits on that particular website were to that page. Many of theminvolved the IP address that had been associated previously with a suspectedterrorist group, and some others were associated with referrals from the localchamber of commerce website. What about the remaining IP addresses asso-ciated with hits to this page? In many ways, looking for suspicious activity ona website is like looking for a needle in a haystack. These generally are veryinfrequent events that can be extremely difficult to identify. In some cases,however, we can find a “magnet” that makes finding the needle a little easier.One obvious magnet is a list of IP addresses associated with known or sus-pected terrorist groups or locations. Another magnet is IP addresses identifiedby their involvement in unusual or suspicious activity. In the Main Street Amer-ica example, the “business opportunities” page represents a possible magnet thatcould be used to identify other IP addresses worthy of additional review andanalysis.
After initial data mining and characterization, browsing patterns can becharacterized and modeled using sequence analysis techniques similar to thoseemployed by online retailers for the analysis of consumer behavior. Specialattention needs to be paid to prior probabilities, however, because the behaviortends to be extremely infrequent when viewed in light of the total volumeof activity of a particular website. Failure to account for this could maskimportant details and seriously limit the ability to identify any unique trendsor patterns.

14.5 Internet Surveillance Detection 293
Internet Honeypots
What happens once suspicious activity has been identified and characterized? One solution would be toremove the information from the website; however, this could be comparable to closing the proverbialbarn door after all of the horses are gone. In addition, Internet archives exist that can hold information longafter it has been removed from active web pages. An alternate solution would be to establish electronicsurveillance detection. In many ways, electronic surveillance detection and countersurveillance has valuethat might extend beyond blocking access to the information.
Once suspicious activity has been detected, there are additional opportunities to evaluate the interestand intentions of the bad guys. For example, a particular pattern of activity might suggest interest insome areas. Deploying additional information provides an opportunity to engage in additional “hypothesistesting” regarding their true intentions. For this approach to work, actual information does not need to bedeployed. The pages of interest might deploy generic information or be “under construction” indefinitely.In fact, the opportunities for disinformation abound with this arrangement. Through a specific series ofnew information and links, additional informational specificity can be identified and determined.
In terms of Main Street America, the analysts noted three potential areas of interest or concernassociated with the web page. Figure 14-17 depicts a possible scenario that could help identify the specificarea of interest associated with the suspicious activity.
�Figure 14-17
Conceptualillustration of
possible Internethoneypot for
furthercharacterizing
suspiciousactivity. Infrastructure
Emergency responseDemographics
Demographics
Emergency response(disinformation)
Infrastructure(“under construction”)
Existing Page New Pages
Chapter 14

294 14.6 How To
14.6 How To
The first step in this process is to review and assess what information is availableand what value it might have for someone with less than altruistic intentions.Why is this process important? First, as always, the key to effective and mean-ingful data mining is domain expertise. Knowledge of what information isdeployed over the Internet, how it is organized, and what it might mean fromeither a tactical or strategic perspective is critical to understanding the informa-tion held in the weblogs. It also is important to consider how this informationmight be combined with other information on the same website or with otherresources to add value. For example, patrol boundaries can be very helpfulin extrapolating average response times. Information pertaining to workload,including crime rates or calls for service, would add value to the calculation ofdeployment and potential response times.
The second reason that a review or threat assessment of the informationdeployed over the website is important is because if you are reading this, thenyou probably have some responsibility for or involvement in public safety.Knowing what information has been deployed publicly and considering howit might be used against you, your agency, or locality can help guide possiblesurveillance detection efforts and response planning.
The analysis from this point on is not trivial. The amount of informationcontained in weblogs can be staggering, even for an analyst who has some experi-ence wrestling with large complaint databases or telephone records. In addition,the information itself is ugly and can be very difficult to manipulate without thecorrect tools. Those choosing to tackle Internet data most certainly will wantto bring power tools, rather than a hammer and chisel, to this battle.
Some very detailed materials and excellent software tools are available forthe analysis of Internet data, but some tasks can be completed with standarddata mining tools. Many public safety agencies are at a disadvantage in miningInternet data, however, because they do not set cookies. Briefly, session cookiesare temporary and can be used to track movement through a website during asingle session. Persistent cookies, on the other hand, not only track movementthrough your site, but follow the user out into the Internet, leaving a trail similarto electronic breadcrumbs. Without cookies, it is very difficult to link relatedpage hits into a single session. This issue received some attention a few years agoafter it was reported that the Central Intelligence Agency used cookies on itswebsite.13 After they were criticized for this practice, they, as well as many otherpublic safety agencies, made the decision to discontinue this practice. Whilethis might limit analysis somewhat, it is still possible to presumptively link

14.6 How To 295
some activity based on IP address and other unique characteristics, particularlywith some of the more sophisticated web mining tools. Additional “brute force”techniques can be used to characterize and analyze some of the activity on awebsite, particularly if the IP addresses of interest are not prevalent.
The first step generally involves an overview and characterization of routineactivity on the website. As always, it is helpful to develop an understanding of“normal” behavior in an effort to create a baseline for future comparison. Forexample, where do people go, how to they normally enter the site, are therecommon referring pages, which pages are popular, and which are not? While wewould like to think that every detail that is deployed over our website has valueand interest, most of it is relatively boring. Thankfully, most of the informationthat has tactical or strategic value for those with bad intentions generally fallsinto the boring category, so almost any activity associated with those pages isworthy of note. For example, pages deploying critical infrastructure informationgenerally do not appear on the list of top ten websites, but they have been someof the more popular ones associated with unusual or suspicious activity.
A second activity might include characterizing activity based on the userIP address. There will be some relatively common addresses; particularly thoseassociated with local service providers, but some relatively infrequent addressesmight be identified as well. These can be checked through reverse lookup mech-anisms, similar to those used for telephone numbers. If suspicious activity orpatterns are identified, then modeling algorithms can be created to furthercharacterize the activity and generate rule sets that can be used to screen futurebehavior. Similarly, specific IP addresses or web pages associated with unusualor suspicious activity can be identified, and any future activity associated withthose addresses or pages flagged for further investigation.
Unsupervised learning or clustering techniques also may be used to char-acterize “normal” patterns of Internet activity in an effort to identify possiblesurveillance activity. This method of anomaly detection frequently can revealpatterns of unusual behavior or potential misuse of open-source information.People often get tripped up and caught when they try to behave normally or “flyunder the radar.” In many cases, however, they do not have a good sense of what“normal” truly looks like and get caught out of ignorance or because they standout even more in their attempts to be inconspicuous. It is often difficult to com-pletely understand what “normal” looks like until we characterize it and thenanalyze it in some detail. Similarly, language or cultural differences can impairan individual’s ability to melt into the background noise. Ignorance of culturalsubtleties, nuances, or norms can serve as a spotlight, highlighting unusualor suspicious behavior. It is for this reason that characterizing normal trends
Chapter 14

296 14.7 Summary
and patterns can have value, as it provides a baseline against which unusual orsuspicious behavior can be measured.
14.7 Summary
A good understanding of “normal” can be invaluable in the detection andidentification of possible preoperational surveillance activities at the local level.Just as staging can be detected in violent crime because most criminals do nothave a good working knowledge of “normal crime trends” and patterns, thoseunfamiliar with “normal” in other environments or those from other culturesalso might reveal themselves when they fail to blend into the surroundingenvironment.
Again, identifying suspicious or unusual activity can be compared to findinga needle in the haystack. This is where anomaly detection, which is an very pow-erful, automated process that can be used to identify and characterize extremelylow-frequency events, can have tremendous value. Once a single event has beenidentified and characterized, it can be modeled and used as a veritable data“magnet” to identify additional needles in the informational haystack.
As described above, characterization and analysis of suspicious situationreports can guide future surveillance detection operations by highlighting thetimes and/or locations that are generating the greatest apparent interest. It isalways important to remember, though, there are the incidents that the analystsknow about, and those that they do not. Suspicious situation reports gener-ally reflect only a small percentage of all surveillance behavior. By identifyingthe times and/or locations associated with the greatest degree of apparentinterest, as indicated by an increased number of suspicious situation reports,operational resources can be deployed. This has the potential to increase theamount of behavior that is documented through good, targeted surveillancedetection.
It is always essential to review surveillance detection or suspicious situationreports within a larger context. Obvious changes, including surveillance detec-tion training, reports that heighten awareness, or major incidents, can greatlyimpact natural surveillance and reporting and concomitantly influence the data.While high-profile events or recent training can increase awareness, apathy,complacency or frustration can decrease reporting. Efforts to maintain reportingand surveillance detection efforts can include reminders and refresher courses,particularly if personnel changes are frequent, to ensure that the information isvalued and that attitude is conveyed to the frontline personnel.

14.8 Bibliography 297
Any analytical program, regardless of the sophistication of the analyticaltools employed, will be severely compromised by incomplete, inaccurate, orunreliable reporting. You cannot analyze what you do not have, so it behoovesthe analyst to work with the larger team in an effort to ensure data quality towhatever degree possible. Finally, all results should be interpreted cautiously.Abundant domain expertise and a certain degree of caution is an asset toreviewing these data.
14.8 Bibliography1. Carter, M. (2004). Why feds believe terrorists are probing ferry system.
The Seattle Times, October 10. http://seattletimes.nwsource.com/cgi-bin/PrintStory.pl?document_id=2002058959&zsection_id=2001780260&slug=ferry10m&date=20041010
2. The National Commission on Terrorist Attacks Upon the UnitedStates, T.H. Kean, Chair (2004). The 9/11 Commission Report. www.9-11commission.gov/.
3. Joint DHS and FBI Advisory. (2004). Homeland security system increasedto orange for financial institutions in specific geographic areas. August 1.www.dhs.gov/interweb/assetlibrary/IAIP_AdvisoryOrangeFinancialInst_080104.pdf
4. McCue, C., Parker, A., McNulty, P.J., and McCoy, D. (2004). Doingmore with less: Data mining in police deployment decisions. Violent CrimeNewsletter, Spring, 1, 4–5; McCue, C. and McNulty, P.J. (2003). Gazinginto the crystal ball: Data mining and risk-based deployment. Violent CrimeNewsletter, September, 1–2; McCue, C. and McNulty, P.J. (2004). Guns,drugs and violence: Breaking the nexus with data mining. Law and Order,51, 34–36.
5. De Becker, G. (1997). The gift of fear. Little, Brown and Company,New York.
6. McCue, C. and McNulty, P.J. (2003). Gazing into the crystal ball:Data mining and risk-based deployment. Violent Crime Newsletter,September, 1–2.
7. Lind, W.S., Nightengale, K., Schmitt, J.F., Sutton, J.W., and Wilson, G.I.(1989). The changing face of war: Into the fourth generation. Marine CorpsGazette, October, 22–26.
8. Shapira, R. (2001). We are on the Palestinians’ map. Maariv (Tel Aviv),May 18.
Chapter 14

298 14.8 Bibliography
9. Baker, J.C., Lachman, B., Frelinger, D., O’Connell, K.M., Hou, A.C.,Tseng, M.S., Orletsky, D.T., and Yost, C.W. (2004). Mapping theRisks: Assessing the Homeland Security Implications of Publicly AvailableGeospatial Information, Rand Corporation.
10. Papyrus News. (2002). Fourth-generation wars: Bin Laden lieutenantadmits to September 11 and explains Al-Qa’ida’s combat doctrine. February10; https://maillists.uci.edu/mailman/listinfo/papyrus-news
11. McWilliams, B. (2003). Iraq’s crash course in cyberwar. Wired News,May 22.
12. Gellman, B. “Cyber-attacks by Al Qaeda feared.” WashingtonPost, June 27; http://www.washingtonpost.com/wp-dyn/articles/A50765-202June26.html
13. CIA caught sneaking cookies. (2002). CBSNews.com, March 20.

Advanced Concepts and FutureTrends


15Advanced Topics
I have attempted to outline some of the more common public safety and securitychallenges in the preceding chapters; however, these topics represent only alimited glimpse of the potential for data mining and predictive analytics in lawenforcement and intelligence analysis. Therefore, the goal of this chapter is toprovide an overview of additional work in this area and to whet the reader’sappetite for further study.
The following list, while not complete, highlights several areas in whichanalysts are actively using these techniques with considerable success.
15.1 Intrusion Detection
People tend to move through the world in predictable patterns. Generally whenthey show up where they should not be, they are either lost or have some otherpurpose for being there. Intrusion detection is a rapidly growing industry in theinformation technology world. Within the field of intrusion detection, unac-ceptable behavior has been further subdivided into intrusion detection, whichgenerally looks for outside intruders, and misuse detection, which evaluatesthreats from within.1 It is well beyond the scope of this text to delve into allof the intricacies of intrusion detection systems, which often change rapidlyin response to industry requirements and novel ways to access a system with-out authorization. Briefly, intrusion detection can be used to identify unusualactivity or access patterns that might indicate someone has breached or hasattempted to breach a system. These can be set to identify common patterns ofattempted access or unusual behavior that warrants additional review.
Similarly, misuse detection looks for unusual patterns of behavior orattempted access within a system. For example, someone from the mailroomtrying to access executive salaries or a disgruntled employee logging on late atnight from a remote location in an effort to secure some intellectual partinggifts prior to resignation would be cause for concern within an organization.These tools work not only on intranet servers but also on automated access con-trol systems. Again, most individuals will move though the physical structure
301

302 15.2 Identify Theft
with predictable, readily identifiable patterns associated with their function androutine activities. Deviation from these normal patterns can indicate almostanything from industrial espionage to a budding romance between someonein maintenance and a member of the secretarial pool. Either way, unusualmovement throughout or activity within a facility generally warrants additionalanalysis.
Another pattern of unusual activity that can be detected within a system isvanity checks. While not presumptive evidence of criminal behavior or intent,checking one’s internal records and who might have accessed them is certainlyunusual behavior that often indicates that one has something to hide. RobertHansen, the FBI agent involved in espionage, was found to have engaged inperiodic vanity checks within the FBI’s computer systems.
In some situations, people might have a legitimate reason for browsing aparticular system; however, their movement through the system highlights theirbehavior as unusual. Recently, it was reported that individuals from the MiddleEast had been accessing municipal websites, apparently in search of public safetyinfrastructure information. In this case, the origin of the activity as well as theactivity itself was unusual and worthy of further investigation. This particularsubject was addressed in greater detail in Chapter 14.
15.2 Identify Theft
Identity theft is not a new problem. In fact, my own grandfather, to whom thisbook is dedicated, assumed the identity of a deceased older sibling so that hecould go to work in the central Illinois coal mines before he was old enough.More recently, however, many consumers have had their financial lives ruinedby thieves who assumed their identities in an effort to commit economic fraud.
This problem escalated in importance when the 9/11 attacks were inves-tigated and it was determined that the highjackers were able to obtain falsecredentials necessary to move throughout our country with relative ease. Under-scoring the breakdown in our ability to identify and prevent identity theft, 7 ofthe 19 terrorists involved in the attacks were able to obtain valid Virginia stateID cards, although they lived in Maryland hotels. Subsequent investigationuncovered a group of individuals who had provided hundreds of false ID cardsto individuals with questionable documents.
Detection of identity theft frequently occurs only after something bad hashappened, either fraud or some other misuse of a person’s identity. Proactiveefforts involving manual searches of credit records and personal data in an

15.4 Data Collection, Fusion and Preprocessing 303
effort to proactively identify cases of identity theft or misuse, however, arenot only difficult but also very inefficient, given the extremely large amountof information involved. Searching public records for duplicate social securitynumbers or birth dates would be extremely laborious and inefficient using exist-ing methods. Alternatively, automated searches of these databases using datamining and predictive analytics could not only flag invalid, suspicious recordsbut also could create models associated with common patterns of identify theftor fraud. Additional information exploitation for illegal purposes, including theuse of aliases and fraudulent addresses, could be identified with data miningtools. Ultimately, this approach would facilitate the development of proactivestrategies in an effort to identify identity theft before serious consequencesoccur. While it is not likely that even automated methods will identify everycase of identity theft, it might detect enough identity theft and fraud to makethis type of illegal activity more difficult, deterring some illegal use of validcredentials in the future.
15.3 Syndromic Surveillance
Syndromic surveillance systems have been developed for the detection of dis-ease outbreak and bioterrorism. By using anomaly detection, these automatedsystems are able to identify unusual clusters of symptoms or unanticipatedchanges in normal disease rates. There are many challenges associated with thistype of monitoring, including similar signal-to-noise issues discussed previ-ously, that might be associated with an isolated or unevenly distributed outbreakoccurring within a large association of monitored facilities.2 By enhancing stan-dard anomaly detection with decision rules, the performance of these screeningalgorithms can be increased.3
15.4 Data Collection, Fusion and Preprocessing
The topic of surveillance detection is addressed in Chapter 14, but it is worthrevisiting it here. Methods of physical surveillance detection are very good;however, large categories of information might be overlooked if surveillancedetection is confined exclusively to physical surveillance. Increasingly, terror-ists and extremist groups are utilizing Internet resources for preoperationalsurveillance and information collection.
“Correlation” in surveillance detection frequently refers to seeing the sameperson or vehicle in space or time. Given the interest in technology, though, it
Chapter 15

304 15.4 Data Collection, Fusion and Preprocessing
might be time to extend this definition to include correlation between physicalsurveillance and surveillance activities on the Internet. For example, what hap-pens if physical surveillance has been detected, and vigorous correlated activityis noted on a related website? Data mining tools have the analytical musclenecessary to combine these relatively disparate and unrelated data resources,integrate them, and analyze them in the same environment. By combining webmining tools with analysis of the products of traditional physical surveillancedetection, a more complete model of surveillance activity can be developed.Similarly, concurrent surveillance of multiple, geographically isolated targetsalso can be detected through the use of data mining algorithms on combineddata resources (Figure 15-1).
An overview of anomaly detection was provided in Chapter 7, whichincluded a “perfect world” scenario that employed a two-pronged monitoringand detection approach. The monitoring component utilized predetermineddecision rules or scoring algorithms based on previously identified, character-ized, and modeled bad behavior; the detection part of the process incorporatedthe use of anomaly detection in an effort to identify behavior that had notbeen previously observed or anticipated. In many ways, surveillance detec-tion offers a great opportunity for deploying this type of analytical approach.Suspicious situation reports often reflect only a small fraction of the ongoingsurveillance activity. Moreover, as the example above highlights, a certain degree
�Figure 15-1Data mining
tools can be usedto correlate
physicalsurveillance with
Internetsurveillance and
suspectinterviews.
Suspicious situationreports
Surveillancedetection
Web mining
Model
Access control system

15.4 Data Collection, Fusion and Preprocessing 305
of preliminary analysis and classification can significantly enhance the analyti-cal products and overall understanding. These initial analyses can represent thefirst component of a multilevel analysis of unusual or suspicious activity, whileconcomitantly guiding additional collection efforts.
A possible integrated surveillance analytical model is depicted inFigure 15-2. This model incorporates the use of predetermined scoring algo-rithms that are based on a known behavior of interest, with anomaly detectionrunning in the background, as described previously, in an effort to identify anyunusual or unanticipated activity. Information inputs would include suspicioussituation reports as well as other complementary information, including accesscontrol systems, sensors, the agency intranet, and even their website. Ongo-ing analysis of suspicious situation reports would guide additional surveillancedetection and information collection efforts, which also would be includedin the analysis. In this model, the analytical outputs would be used to fur-ther guide and refine additional collection efforts, highlighting the potentialintelligence enhancements that can occur when data and analysis are viewedas dynamic components of the analytical–operational continuum, rather thanstatic commodities in the collection process.
Again, certain types of space, including those associated with transporta-tion (e.g., trains, airplanes, trucks), are not easily linked to absolute spatialindicators such as longitude and latitude, center lines, patrol regions, or assess-ment boundaries. Rather, relative indicators may have far greater value whencharacterizing movement and identifying a potential risk or threat.
�Figure 15-2
Integratedsurveillance
analysis model,which
incorporateddynamic
feedback withinthe model to
further enhancesurveillance
detection efforts.
Physical surveillance
Internet surveillance
Suspect debriefing Analysis
Chapter 15

306 15.5 Text Mining
It is also worth considering the fact that the space in and around a facility isnot homogenous. For example, unusual or suspicious behavior around a facilityfrequently is informally weighted. Different types of activity are given greateror lesser value. The value given to a potential behavior is an interaction betweenthe location, existing rules, norms, and boundaries, and the specific attributesof the behavior itself. Some movement is of more consequence than others.For example, forcing through a checkpoint would be an obvious transgression.Any incursion into this area would be cause for concern. Other behaviors arenot as obvious. For example, photographing or videotaping a facility might notraise as much suspicion, but repeated activity or focus on a particular facilityor specific aspect of a facility might be cause for concern.
Perhaps more subtlely, buildings and facilities also are associated with normalflow patterns and boundaries. Delineation of these spatial boundaries might beexplicit through signage or implicit through group norms and behaviors. Similarto “personal space,” some buildings or facilities have an invisible buffer. Also like“personal space” violations, transgressions of these spatial rules and norms canattract attention. Therefore, by creating spatial sets associated with the facility ofinterest, it is possible to look for possible focusing or spatial specificity. Similarly,by weighting different locations within the created spatial sets, as well as thebehaviors, it is possible to identify and document potential escalation.
On the other hand, the exact physical location of a possible incident ofsurveillance generally is not as important as where the person was and what heor she was looking at. Extending this, five different individuals could occupyfive slightly different locations, but if they were all observing the same person,building, or specific aspect of a facility, then it is important. In fact, it couldadd even greater value to know that the same facility, person, or location wasobserved multiple times in multiple locations or from several different van-tage points. Correlations in behavior across time and space can be powerfulindicators of coordinated surveillance efforts.
15.5 Text Mining
Text mining tools are increasing in capacity and in value to the analyst on analmost daily basis, particularly as the software developers continue to expandthe capacity of these tools.
Figure 15-3 illustrates the inclusion of a text mining process in an analysis.In this particular example, related narrative information has been included inan analysis of truck crashes. By using text mining, key concepts can be extractedfrom this unstructured information and used to enhance the modeling process.

15.5 Text Mining 307
�Figure 15-3 Example of a text mining tool and its use in the analysis of truck crash data. (Created
with SAS software. Copyright 2006, SAS Institute Inc., Cary, NC, USA. All RightsReserved. Reproduced with permission of SAS Institute Inc., Cary, NC.)
�Figure 15-4Sample of the
narrative portionused in the text
mining example.(Created withSAS software.
Copyright 2006,SAS Institute
Inc., Cary, NC,USA. All Rights
Reserved.Reproduced with
permission ofSAS Institute
Inc., Cary, NC.)
Figure 15-4 illustrates the type of narrative information that was used inthe text mining process. Figure 15-5 demonstrates the key concepts extracted,as well as the frequency with which they occur. These frequency estimates canhelp the analyst identify concepts and terms that will be used in the analysisby identifying very frequent or extremely rare terms and concepts. The parts ofspeech have been identified and labeled here. As can be seen in the highlighted
Chapter 15

308 15.6 Fraud Detection
�Figure 15-5 Example of the concepts extracted from the narrative. The highlighted section illustrates
the ability to identify and differentiate different parts of speech. (Created with SASsoftware. Copyright 2006, SAS Institute Inc., Cary, NC, USA. All Rights Reserved.Reproduced with permission of SAS Institute Inc., Cary, NC.)
portion, “driver” and “drive” have been correctly identified as noun and verb,further highlighting the capacity of this tool.
The results of the text mining process then can be used in the creation of themodel. As illustrated in Figure 15-6, “crash” has been selected as the target oroutcome variable. Those variables selected as inputs are available for inclusionin the created model. The ability to use the terms and concepts identified duringthe text mining process allows the analyst to tap into the vast potential associatedwith unstructured narrative data and increase the fidelity of the models created.
Finally, as can be seen in Figure 15-7, additional language options furtherincrease the capacity of these tools to incorporate narrative data captured inlanguages other than English.
15.6 Fraud Detection
This topic is so large that an entire textbook could be devoted to it; however,it is important to note that data mining and predictive analytics representthe most effective approaches to addressing this pattern of illegal behavior.

15.6 Fraud Detection 309
�Figure 15-6 This dialog box demonstrates the use of concepts identified using text mining as variables
in a modeling algorithm. The highlighted record illustrates the selection of the binaryvariable “crash” as the target or outcome variable selected. (Created with SAS software.Copyright 2006, SAS Institute Inc., Cary, NC, USA. All Rights Reserved. Reproducedwith permission of SAS Institute Inc., Cary, NC.)
Specifically, modeling algorithms that incorporate clustering techniques andanomaly detection can be used to identify patterns of behavior or activity thatdeviate from established patterns and trends. Data diverging or deviating from“normal” can be identified for further evaluation.
On the other hand, rule induction models capitalize on the fact that peo-ple frequently are not creative or unique when they commit fraud. Althoughthere are important individual differences in this type of criminal behavior,the secondary gain or desired goal generally structures the approach somewhat,which may limit the options for committing fraud. Therefore, rule inductionmodels can be used to characterize and model known patterns of fraudulentbehavior that can be applied to new data in an effort to quickly identify thesepatterns.
Finally, the use of integrated approaches that utilize both scoring algorithmsand unsupervised learning models can allow the analyst to exploit knowledge
Chapter 15

310 15.7 Consensus Opinions
�Figure 15-7
This dialog boxillustrates the
enhancedlanguage capacity
increasinglyavailable with
text mining tools.(Created withSAS software.
Copyright 2006,SAS Institute
Inc., Cary, NC,USA. All Rights
Reserved.Reproduced with
permission ofSAS Institute
Inc., Cary, NC.)
regarding previously identified or otherwise known or suspected patterns ofcriminal behavior, while remaining open to discovering unknown or unantici-pated patterns of suspicious behavior. This combined approach of confirmationand discovery represents one of the more powerful aspects of data mining.
15.7 Consensus Opinions
Although the DARPA FutureMAP program was cancelled due to publicoutrage over government-sponsored wagering on future terrorist attacks andassassinations, consensus opinions have been used with some success. In aunique application of Bayes’s theorem, naval scientist John Craven used con-sensus expert opinions to locate the U.S. nuclear submarine Scorpion.4 Bayesianinference is particularly appealing for applied public safety and security analysisbecause it supports the incorporation of tacit knowledge and domain expertisefrom experts representing diverse backgrounds, potentially bringing the “bestof all worlds” to the analytical process.

15.8 Expert Options 311
15.8 Expert Options
Several expert options, including prior probabilities and costs, have been dis-cussed earlier. While it would be impossible to address every option availablewith each tool, two additional options are worth mentioning at this point giventheir potential value and relatively common use.
Boosting
Boosting methods can be used to address extremely small sample sizes orinfrequent events. These methods confer additional weight or emphasis toinfrequent or underreported events. While these frequently can yield greateroverall accuracy, like the limitations associated with the data imputation tech-niques described in Chapter 6, the heterogeneous nature of many patterns ofcriminal activity can limit the ability to use approaches like this, particularly ifthey magnify unusual or spurious findings.
Data Partitioning
The important of using training and test samples was covered in Chapter 8.Different approaches to training and validating models exist, however, whichuse slightly different partitioning techniques. A three-sample approach to datapartitioning is illustrated in Figure 15-8. The three samples include training,validation and test. Like the partitioning method outlined in Chapter 8, thetraining sample is used to train or build the model. The difference between thisapproach and the one described earlier resides in the inclusion of a validationsample. The validation sample is used to provide the first estimate of the accuracyof the model created using the training data. These results frequently are alsoused to fine-tune the model. Finally, as described earlier, the test sample is usedto evaluate the performance of the model on a new set of data.
Additional approaches to data partitioning include the use of different per-centages of data to the training and test samples. For example, a model canbe trained on 80% of the data and tested on 20%, rather than the 50:50approaches outlined earlier. This approach to data partitioning can be particu-larly useful when modeling infrequent or rare events, as it results in an increasednumber of cases of interest from which to create the model, without overrep-resenting unusual or spurious findings, which is a limitation with boostingmethods.
The topics listed above represent a small sampling of the additional workthat has been done using data mining and predictive analytics in the applied
Chapter 15

312 15.9 Bibliography
�Figure 15-8 Example of the inclusion of data partitioning in the analytical process. The dialog box
illustrates a three-sample method for partitioning data, which includes training, valida-tion, and test samples. (Created with SAS software. Copyright 2006, SAS Institute Inc.,Cary, NC, USA. All Rights Reserved. Reproduced with permission of SAS Institute Inc.,Cary, NC.)
public safety and security setting. Work in this area is developing at a rapid pace,which underscores its value to the law enforcement and intelligence domains,as well as to the analysts who benefit directly from the enhanced capacity thatthese approaches provide.
15.9 Bibliography1. Phung, M. (2000). Data mining in intrusion detection. SANS Institute
Resources (10/24/2000).
2. Reis, B.Y. and Mandl, K.D. (2003). Integrating syndromic surveillance dataacross multiple locations: Effects on outbreak detection performance. ProcAMIA Symp, 549–553.

15.9 Bibliography 313
3. Wong, W.K., Moore, A., Cooper, G., and Wagner, M. (2002). Rule-based anomaly pattern detection for detecting disease outbreaks. AmericanAssociation for Artificial Intelligence.
4. Sontag, S., Drew, C., and Drew, A. (1999). Blind man’s bluff: The untoldstory of american submarine espionage. HarperCollins, New York.
Chapter 15


16Future Trends
“Computers in the future may weigh no more than 1.5 tons.” PopularMechanics (“Forecasting the Relentless March of Science,” 1949)
As the above quote illustrates, it is pretty easy to go far astray when tryingto project the future of technology. In the cases of data mining and predic-tive analytics, however, the future is becoming reality at such a rapid pacethat almost anything that I write will be outdated before the first copy of thisbook is purchased. Therefore, I will confine my comments to a few areas thatI am particularly excited about, even if that “future” represents current reality.In many ways, that is one of the features that make this area of research andpractice so exciting.
16.1 Text Mining
Text mining holds considerable promise for applied public safety and securitymining and analysis. The ability to tap directly into and use unstructurednarrative data will be game changing in many ways. Most analysts understandthe value represented in those resources; however, the work required to manuallyextract that information and recode it is extremely time consuming and generallynot as accurate as automated methods. In my own experience, I was able toquickly search a large number of robbery reports in an effort to identify a seriesdefined by a unique MO. In that first foray into text mining, the tool identifiedseveral incidents that I knew about and a few more that were new to me. Afterthis experience, I was a true believer in the power and capacity embodied intext mining tools.
315

316 16.1 Text Mining
In the very near future, I envision the development of public safety andsecurity-specific glossaries that will incorporate the unique lexicon and termsassociated with law enforcement and intelligence analysis. Like the specializedglossaries developed for other professions that represent their own unique lan-guage and terms (e.g., medicine), these enhanced capabilities will allow analyststo build on the work of others, creating a critical mass of shared knowledge thatwill allow all of us to do our jobs better. Also, as outlined in the Introductionand illustrated in Figure 16-1, I envision the development of tools that will linkvoice recognition and translation software directly to these text mining tools andprovide “just-in-time” analytical support to operationans when and where theyneed it, without the need for cumbersome and time-consuming data collectionand entry processes. Integrated tools can be used to integrate and analyze datafrom a variety of geographically distinct collection locations, further enhancingthe depth of knowledge afforded to the operational personnel serving on thefront lines. Ultimately, tools like these not only promise to enhance field-basedinterviewing but also will provide a level of situational awareness not currentlyavailable. They will increase the efficacy of the operational personnel whilekeeping them safer.
�Figure 16-1 This model conceptually illustrates how information and analysis can inform and feed
the operational process.
Voice recognitionand transcription
Interview
Text mining Data from otheranalytical cells
Scoring algorithm
Analyticalfusion center
Interviewstrategies

16.2 Fusion Centers 317
16.2 Fusion Centers
The concept of regional data fusion and the emergence of regional fusion cen-ters supporting this task has been mentioned. While the idea of even moredata to analyze secretly thrills most analysts, creation of these fusion centersrepresents only the first step in the process. Currently, many of these centersfocus almost exclusively on the collection aspect of the process and support onlylimited analytical capacity. The analytical functions offered by these centers fre-quently include only the capacity to search the data repository and some abilityto perform descriptive statistics. The next step in the process should involvemoving away from counting crime and toward characterizing and modelingincidents in an effort to anticipate, predict, prevent, and deter.
As we link these regional fusion centers and include options for predictiveanalysis, we set the stage for the creation of analytical webs that becomealmost self-perpetuating in their identification of associations and relation-ships. As illustrated in Figure 16-2, an array of linked collection nodes thatare supported by a common analytical fusion center starts to resemble a neuralnetwork model. Enhancing the connectivity by integrating predictive analyticswould bring this model even closer to a true neural network. The knowledgediscovery and predictive analysis that could be supported by a model like this
�Figure 16-2
Conceptualillustration of aninformation webthat includes an
analytical core orfusion center.
Fusion centerFusion center
= Analytical filter = Information nodes
Chapter 16

318 16.4 “Virtual” Warehouses
example could be game changing in its ability to support information-baseddecisions in the applied setting.
16.3 “Functional” Interoperability
The concept of interoperability has received considerable attention recently, yetthe true success of this approach lies in the ability to achieve “functional inter-operability.” Functional interoperability involves more than just informationaccess and can be achieved only when the shared resources are used effec-tively to support joint decisions and complementary responses. By using datamining tools and emphasizing “operationally actionable” output that focuses onthe time, location, and nature of potentially threatening behavior, the relevantpublic safety resources can be deployed efficiently in support of public safetyand homeland security objectives.
16.4 “Virtual” Warehouses
Traditional data warehouses can be extremely costly and generally lack the speedand agility required by public safety and security analysis. Tools like Google andthe FAST Enterprise Search Platform represent a new approach to informationaccess and management. By indexing large data sets, including the World WideWeb, these tools give analysts the ability to create “virtual” warehouses thatembody the speed and flexibility generally not available with traditional datawarehouses. These indices can be updated and refreshed, noting changes in theinformation available as they occur. The accessibility and ease with which thesetools can be used are reflected in their ubiquitous use and the fact the “Google”has gained status as a verb (e.g., “Why don’t you Google this and see whatcomes up?” or “I Googled you last night and came up with a number of hits.”).
These tools also give analysts an opportunity to tap into open-source materialmore effectively. I continue to be absolutely amazed at the amount of informa-tion available over the Internet. While chat rooms and blogs have representeda valuable source of information for several years, the sheer magnitude of theamount of data freely available and accessible over the World Wide Web is stag-gering, far beyond what the human mind can monitor and track. In addition,propaganda highlighting terrorist tactics and strategy has been showing up onthe Internet, including the Al Qaeda handbook and streaming video demon-strating preoperational surveillance, target selection, and attack planning.1 Thisinformation has tremendous value if identified, monitored, and studied, a taskthat these indexing tools has made more manageable.

16.6 Closing Thoughts 319
16.5 Domain-Specific Tools
The emergence of tools designed specifically for public safety and security anal-ysis is an exciting trend that I hope continues. While data mining and predictiveanalytics can be very intuitive, matching an analyst’s style of investigation andquery, many of the existing tools are somewhat limited in their ability to beused directly in the applied setting. To be sure, almost every example includedin this book was generated using standard, off-the-shelf versions of existing datamining software tools, which supports the fact that these products can be usedin the applied setting. The development of applications designed specifically forpublic safety and security analysis, however, makes them even more accessible.Similarly, advances in the visual depiction of complex analytical output are thefocus of considerable research effort. Analytical output that builds on the enduser’s tacit knowledge and that can be transferred directly to the applied settingin support of information-based decisions and operations is an exciting areathat is sure to grow considerably in the very near future.
16.6 Closing Thoughts
“Information analysis is the brain of homeland security. Used well, it can guidestrategic, timely moves throughout our country and around the world. Done
poorly, even armies of guards and analysts will be useless.” Markle Foundation’sTask Force on National Security in the Information Age 2
If we have learned anything since 9/11, it is that we need to do morethan collect data; we need to effectively analyze it in a way that facilitates thedirect translation of the analytical output into information-based decisions andoperational support.
Most of the data used in crime and intelligence analysis was gathered forsome other purpose: billing, case management, and so on. In some situa-tions, however, data sets are generated for the purpose of crime and intelligenceanalysis. Whenever possible, it is best to use data management systems that weredesigned for that purpose. There are a variety of database and data managementtools commercially available. But be extremely cautious of analytical tools thatalso have an integrated database function that does not demonstrate clearly thefuture accessibility of the stored information.
One of the most exciting things in the public safety sector is the increasedavailability of technology resources for data management and analysis. Thisrapid increase in technology certainly is related to increased need, as well as toincreased demand for new products. Unfortunately, some of the increase in the
Chapter 16

320 16.6 Closing Thoughts
availability of products also might be related to the lucrative nature of publicsafety technology. Particularly after 9/11, the availability of funding for home-land security-related technology has increased astronomically. Unfortunately,not all of the products made available have the necessary internal capacity andflexibility to make them part of a long-term plan for meaningful, integratedtechnology enhancements.
The worst-case scenario associated with this proliferation of new technologyis that information can be entered into some type of database or program and,when a need arises in the future, it becomes readily apparent that retrieval of thedata is extremely difficult, if not impossible. In other words, the data has beenput in an information “lockbox” and is inaccessible to other types of informationprocessing or analytical tools. Unfortunately, this situation seems to arise withincreasing frequency as agencies attempt to automate without consideration offuture needs.
New programs and techniques are being developed daily, and most agencieshave limited funds, particularly for purchasing new technology. Multifunc-tion software can be appealing, particularly those programs that store as wellas analyze data. While attractive to some, the use of a “one-stop shopping”approach to data storage and analysis can have a disastrous effect if it is diffi-cult or impossible to extract data. Rather than saving money, these packagesoften end up costing more in the long run. Double entry of data is not onlyextremely unpleasant but also costly in terms of duplicative personnel efforts.Perhaps more importantly, though, it significantly increases the possibility oferrors. When considering these options, therefore, one question that shouldalways be asked is, “Can I get the data out of here if another software programcomes along that I would like to use?” It is critical to ensure that data andinformation are maintained in a common, readily accessible format, prefer-ably something that was designed to store data and permit access. Whether asimple spreadsheet program or something more elaborate like a data ware-house, the important consideration is whether it will allow the analyst toaccess the information and exploit new analytical packages as they becomeavailable.
If we have learned little else in the past few years, one thing that has becomeabundantly clear is that there probably is no Rosetta Stone of crime and intel-ligence information. The sharp organizations on the cutting edge of analyticshave acquired and maintain the ability to integrate different data resources andexploit new technologies as soon as they become available. Similarly, one con-sistent theme throughout this text is the importance of maintaining flexibilityin the analytical process. It is unclear what challenges will be present tomorrow,

16.7 Bibliography 321
or what new analytical tools are just over the horizon. The paradigm shift asso-ciated with incorporating business tools and analysis in crime and intelligenceanalysis has been absolutely amazing, and analysts are an incredibly resourcefulgroup out of necessity. As a result, it is exciting to consider what will be incor-porated into our world tomorrow. Do not get left behind. Ensure that yourdata are accessible and available as these new technologies come on line.
16.7 Bibliography1. Diamond, J. (2006). Insurgents give U.S. valuable training tool. USAToday,
January 26.
2. The Markle Task Force on National Security in the Information Age,including James B. Steinberg, Vice President and Director, Foreign PolicyStudies. (2002). Protecting America’s Freedom in the Information Age, MarkleFoundation.
Chapter 16


Index
NOTE: An italicized f, ff, and t following a page number denotes a figure, multiple figures, andtables, respectively, on that page.
AAbduction, child, 210–211Accuracy, generalizability versus, 117–118,
228–229, 255Actionable Mining model, 99–100Ad hoc databases, 74–76Alert fatigue, 229Algorithms
applied to data, 60–61clustering, 129f, 309combining, 126, 127fmodeling, 51predictive, 29selecting, 125–126unsupervised learning, 169
Al Qaeda, 269Al Qaeda handbook, 38, 318Analysis. See also Link analysis
sequential iterations of, 46–47Analysis of Violent Crime, National Center
for the, 210Analysts
domain expertise for, 20–22, 67–68fieldwork, 20–22operational personnel and, 22–24rapid analysis, 75
Analytical capacity, 169, 204–205Analytical stream, sample, 136fAnalytics, predictive, 28
Analytics, web-based, 252–255, 252fAnimal research, 189–191Anomaly detection, 127, 304–305Antisthenes, 184Apollo 13 (movie), 113–114Arrest-based crime reporting, 147Arrest data, 13–14Assaults
aggravated, 205–206, 217–218among drug sellers, 202robbery-related, 7sexual, 206–208
Automated classification techniques, 203Automated motive determination,
203–205
BBaseline data, 12–14Bayes’ Theorem, 233Behavior
criminal, 177deviations from, 130economic motive for crime, 207effect of weather events on, 91future, predictions about, 277identification and analysis of a
sample of, 6“normal” criminal, 181–182similar, repeated identification of, 98–99
323
324 Index
Behavior (continued)suspicious, 269, 279ff, 280fviolence, 188
Belsan siege, 224–225Billing invoice, telephone, 105f–109fBinary data, 70Bohr, Neils, 215Boosting, 311Brody, Herb, 259“Brute force” analytics, 28Business understanding, 50
CCalls for service data
during analysis, 246–247challenges associated with analyzing,
81–82citizen complaints, random gunfire,
80t-81tlimitations, 79–80, 79f, 80t–81toverview, 78–79
Cameras, digital, 227Car theft, 161–162Case-based reasoning, 28–29, 193–196Cash flow, 274Categorical data, 93Census data, 245–246Central Intelligence Agency
Intelligence Process modelsanalysis and production phase,
48–49collection phase, 47–48dissemination phase, 49feedback, 49processing and exploitation phase, 48requirements phase, 47
Changes, documenting, 99Characterization, 31, 46–47Chat rooms, 318Child abduction, 210–211CIA. See Central Intelligence Agency
CIA Intelligence Process modelcompared to CRISP-DM process, 52t, 64foverview, 52support for, 52
Circular logic, 202–203Classification techniques, automated, 203Clementine stream, sample, 136fClustering, Two-Step, 122Clustering algorithms, 129fCoalition Provisional Authority
headquarters, 216fCognitive Neuroscience, 122–125Cold case investigation, 194Collection modalities, 89Columbo (t.v. show), 194Communication, 227–228Community violence, 187Composite crime indices, 148Compromise, 22–24Confidence matrix, 159tConfusion matrix, 8, 158, 160–161Consensus opinions, 232–233, 310Consistency, 76Continuous data, 70, 93Control-charting function, 182Cookies, 111, 294–295Cops & Docs program, 130Cost analysis, 229Craven, John, 233Crime
benefits of analyzing, violent, 205economic motive for, 207evaluation based on homicide rate, 149fluctuation of patterns, 183, 218normal, 177–178“normal,” 182–183, 219probability by dispatch zone, 169, 171fstaged, 183–184tools used in analysis, 192–193victimology, 208–209
Crime control strategies, 146

Index 325
Crime data, 89Crime displacement, 150–151Crime prevention, economical viewpoint,
153Crime reporting, arrest-based, 147Crimes. See also Assaults; Homicides; Violent
crimesassociating to known suspects, 198–199D.C. sniper investigation, 32–33drug-related, 203evenly distributed, 82frequency, related to cash flow, 274gunfire, random, 79–82, 79f, 80t–81theat maps, 249–250identifying frequent, 166Laci Peterson disappearance, 32nonadjudicated activity, 86–87property-related, 181reduction, targeted approaches to, 31specialized databases, 74–75staged, 131–132, 131f
Criminal behavior. See BehaviorCriminals
D.C. sniper, 32–33drug dealers, 35–36population samples, 4–6understanding of “normal,” 178–181,
179tCRISP-DM process
compared to CIA Intelligence processmodel, 52t, 64f
domain expertise, 52evaluation, 51overview, 49–50phases of, 50–51
DData. See also Text data
accurately characterizing, 35–36calls for service (See Calls for service)continuous, 70
partitioning, 311–312resources, 71–72for risk and threat assessment, 227spatial attributers (See Trinity Sight
analytical model)Databases
for case management, 72–73specialized, 74–75tip, 39–40
Data inventory, 57–58Data mining
definition, 25future trends, 40intuitive nature of, 23–25translating output, 167web-based deployment, 168f
Data Mining Moratorium Act (2003), 25Data mining tools
“black box,” 228considerations based on needs, 33–34data mining algorithms, 304domain-specific tools, 319for information-based operations, 45mapping software, 276software, 33, 37, 38–39specialty niche markets, 34text mining, 39–40
Data partitioning, 311–312D.C. sniper investigation, 32–33, 222de Becker, Gavin, 227, 232, 270Decision making, group-based, 232–233Decision tree models, 61, 196–197Defense Advanced Research Projects Agency
(DARPA), 26, 232–233Department of Defense, U.S., 232Deployment
census data, 245–246data, 241–242decisions, 239–240effects of weather on, 242–245exploratory graphics, 246–247
Index

326 Index
Deployment (continued)goals, 239homeland security and, 264–265of information over the Internet, 288patrol services, 240of police resources, 239risk-based case studies, 259–265schedule, 248fstructuring, 240–241tactical, 250–252threat assessment of information, 294
Deployment analysis, 94Deployment schedule, 166–167, 167fDeployment strategy, 95, 151–153Descriptive statistics
definition, 4Diagnostic tool, 132Digital cameras, 227Discrete data, 70Discriminant analysis
learning algorithms, 122Dispatch data, 76, 78–82, 80t-81tDisraeli, Benjamin, 3Distribution of complaints, 150fDistributions, uneven, 9–11DNA
cold hits, for sex crimes, 206database, 181offenders identified by, 181Southside Strangler case, 30–31
Documents, escalation, 99Domain expertise
for analysts, 20–22definition, 19–20deployment strategies for, 246–247importance of, 52variable selection process, 59–60
Domain-specific tools, 319Dorn, Chris, 224Dorn, Michael, 224Drive-by shootings. See Victims
Drug arrests, information map, 173fDrug markets, illegal, 191
changing patterns and trends, 46rule sets, 29–30
Drug-related violence. See ViolenceDuplication, 100
EEinstein, Albert, 67, 122, 165Embezzlement, 178–181Enterprise Miner analytical process, 136fEnterprise miner analytical process, 136fErrors in data entry, 83–85Events
infrequent, 7–8low-frequency, 217–218
Evidence. See also DNA evidencevalidity checks on, 87
Expert systemsexperts versus, 218–219lack of bias in, 194–195
FFacility map with overlay, 170fFahrenheit temperature scale, 70False positives, 159–160, 159t, 220Fear, 227Federal Bureau of Investigation
National Center for the Analysis ofViolent Crime, 210
Uniform Crime Reports, 13Violent Crime Apprehension Program, 89
Ferrara, Paul, 206Fieldwork, 20–21Fight or flight response, 190–191Firearms
assaults among drug sellers, 202involvement with, 210Project Exile, 144–145sawed-off shotguns, 59violent offenders and, 210

Index 327
Flag data, 70Formatting, 82–83Fourth-generation warfare (4GW),
216–217, 287–288Fraud detection, 308–310, 309fFrequency distribution, 246f, 278fFunctional interoperability, 318Fusion centers, 317–318, 317fFusion of multiple resources, 56–57Futures Markets Applied to Prediction
(FutureMAP) program, 232–233
GGeneralizability versus accuracy, 118–119,
255Generalizability vs accuracy, 14–17Giduck, John, 224–225The Gift of Fear (de Becker), 227, 232, 270Goldstein, Paul, 205Goldstein model, 196Google, 318Graphical representations, heat maps, 166Grossman, Dave, 223–224, 227, 229Gunfire
citizen complaints of, 145–146New Year’s Eve initiative, 151–153random complaints, hypothetical, 150,
150f
HHawaii Five-O (t.v. show), 194Heat maps, 166, 249–250Hierarchical organizational strategies, 97Hoffer, Eric, 177Homicide rate, 147Homicides
categorizing, 46–47data analysis, 27–28decision tree models, 196–197drug-related, 17–18, 191–192, 203drug-related rule set for, 211
identifying motives, 29Southside Strangler case, 30–31victim-perpetrator relationships, 196–197
Hostage siege and massacre, Nord-OstTheater, 224
Human-Source Intelligence (HUMINT), 48Hurricane Katrina, 144Huxley, Thomas Henry, 178
IIdentity theft, 302–303Illegal drug markets. See Drug markets,
illegalImagery Intelligence (IMINT), 48Improvement, indicators of, 85Imputation, data, 100–101Incident reports, 55–56Incidents, nature of, 99–100Indicator variables, 84Inferential statistics, 4Information samples, 5Information web, 317fInjury
aggregate analysis of, 210behavioral styles associated with risk,
35–36Insider information, 233Integrated surveillance analytical model, 305Intelligence Process model, CIA, 47–49.
See also ModelsInternal rule sets, 29International Association of Chiefs of
Police, 40Internet activity patterns, 295–296Internet data, 110–111Internet honeypots, 293Internet surveillance, 287Internet surveillance detection, 289–294,
291fInteroperability, functional, 318Interval scale, 70
Index

328 Index
Intrusion detection, 301–302Investigative efficacy, 211Iterative processes, 45–47
JJuvenile delinquency, 95
KKohonan network models, 125
LLaw enforcement
officer safety, 36predictive analytics, 28
Learning techniques, 119–121Likelihood
false positives in infrequent events, 220of risk, 215
Lind, W. S., 216, 287Link analysis, 10ff, 38f
call topography, 120fidentifying relationships in data, 119interpreting, 37overview, 9–11software, 38–39tool, example, 120f
Link chart, 9–10Link charts, 10ffLocations vulnerable to attack, 222Low-frequency events, 217–218
MMapping, 192–193, 255–259MARGIN. See Mid-Atlantic Regional Gang
Investigators NetworkMcLaughlin, Phillip, 19Measure, specific, 147–149Measurement and Signature Intelligence
(MASINT), 48
Mid-Atlantic Regional Gang InvestigatorsNetwork, 89
Millennium bomber, 269Minority Report (movie), 28Misrepresentation
emotional victims, 86nonadjudicated crimes, 86–87outliers, 87
Missing, 84Missing data, 84Models. See also Central Intelligence Agency,
Intelligence Process models; specificmodels
accuracy, 62Actionable Mining model, 53–54,
99–100in the applied setting, 60comparisons, 64fcomplexity of, 15deployment, 16drug-related homicides, 17–18evaluating, 7–8, 62–63, 158–161, 162evaluation phase, 61–62generalizability vs accuracy, 14–17lack of a control group in, 221–222overfitting, 14overview, 6purpose of, 153–154revised, 23revising and adjusting, 154rule induction, 61traditional, 22–23, 22fupdating, 161–162
Motive determination, automated, 203–205Motive determination model, 113Motives
identifying, 29predictor of, 113
Multiple resources, 56–57Murder. See Homicides

Index 329
NNarrowing the focus on, 34–35, 35fNational Center for the Analysis of Violent
Crime, 210National Incident-Based Reporting System,
77National Security in the Information Age,
319Nature, 146Nature of the incident, 99–100Network models, Kohonan, 125Neural net model, 124–125, 124fNeural nets, 122–123Neural networks, 123–125New relationships within, 30–31New Year’s Eve initiative, 145–146, 151–153NIBRS. See National Incident-Based
Reporting SystemNominal scales, 71Nonobvious relationship analysis (NORA),
37–39NORA. See Nonobvious relationship
analysis (NORA)Nord-Ost Theater hostage siege and
massacre, 224Normal (term definition), 128–129Norms, internal, 127,128
OOffending patterns, 256Officer safety, 36Open-Source Information (OSINT), 48Operational limitations, 21Operationally actionable output, 63Operational personnel
analysts and, 22–24definition, 20
Operational value, 59–60Ordinal scales, 70Organizing tips, 32–33Orthophotography, 172f
Outcome evaluation, 143Outcome measures, 144–146“Outlaw lifestyle,” 205Outliers, 11–12, 87, 154Output
hostile surveillance activity, 231–232operationally actionable, 63sample, 168f
Overkill, 193Overview, 51–52
PPart I crimes, 148Pattern recognition, 193–194Patterns
identifying changes in, 46identifying patterns of, 207
PDAs, 170f“Perfect world scenario,” 133–134Persistent cookies, 111Peterson, Laci, 32, 74–75Police deployment. See DeploymentPolice reports, 39Population, samples versus, 4Population statistics, 12–13Predators, sexual, 208Predictions
armed robbery escalation, 7bias in, 13
Predictive algorithms, 29Predictive analytics, 28, 208, 278Preparation, 50–51Prior probabilities, 9Priors. See Prior probabilitiesPrivacy issues, 25–27Probabilities, prior, 138–139Project Exile, 144–145, 147–148Project Safe Neighborhoods initiative, 217,
251–252, 260, 263Promiscuity, 210Property-related crimes, 181
Index

330 Index
Public health data, 90Public safety and security, 55, 151–153
QQuality issues, 58Quality-of-life increases, 72
RRacial distribution, 12–13Random assignment software procedures,
155Random selection, 154–155Rapists, stranger, 206–208Ratio scale, 70Reality testing, 29–30Reasoning, case-based, 28–29, 193–196RECAP. See Regional Crime Analysis
ProgramRecoding
about, 39continuous information, 93iterative process, 95offense information, 100relevant preprocessing, 57–59spatial, 97specific dates, 95
Recordsduplicate, 88–89management systems, 72–74
Regional Crime Analysis Program,130, 182
Regional fusion centers, 89Relational data, 76–78, 78f
flat file vs., 77–78Relationships, victim-perpetrator, 201Reliability, 83Reliability check, 85Request for analysis, 68–69Rescorla, Rick, 230Response planning, 230–231Response rates, 85
Return on investment, 151–153Reverse lookup programs, 101–102Risk-based deployment overview, 251–252Risk-based deployment strategies, 45Risk evaluation and mitigation, 215Risk factors, victim, 209–210ROI. See Return on investmentRule induction models, 61
SSamples
behavior, 6population vs, 4random composition, 5–6
Schoolscameras in, 227Chechen attack on, 224emergency response plans, 229–230hostile surveillance of, 227–228preparedness for violence, 230–231vulnerability of, 222–224
Screening test, 132Screening tool, 132Seasonal changes, 161Self-generated databases, 74–76Self-perpetuating cycle, 23, 23fSets, 70Sexual assault, 206–208Sexual predators, 208Shermer, Michael, 232Signals Intelligence (SIGINT), 48Signal-to-noise issues, 11Situational awareness, 165Snow, Charles Percy, 189Software products. See Data mining toolsSouthside Strangler case, 30–31Space, 145–146Spatial boundaries, delineation of, 306Spatial recoding, 97Spatial refinement, 231Specialty niche markets, 34

Index 331
Species-specific defense reactions, 190Specific measure, 147–149Spectators, 85Spencer, Timothy, 31Spikes, unexpected, 182SPSS and Information Builders, 169SSDR. See Species-specific defense reactionsStatement analysis, 39–40Statements, value of, 87–88Statistics, 4Strategic characterization, 220–222Strategies, 45Street maps, 79fSuicide bombers, profiles of, 220Surveillance
correlation in detection, 303–304hostile, 226–227, 269identifying specific locations, 275–276important aspect of detection, 232Internet, 287, 289–294, 291finternet data, 110–111natural, 270–275operational benefits, 225–226operational plans, 286–289preoperational, 226, 276–277risk and threat assessment, 219–220schools, 227–228syndromic, 303techniques in crime analysis, 268–269
Suspectscircular logic, 202–203
Suspicious situation reports, 267, 271, 272f,273ff, 282
Syndromic surveillance, 303
TTelephone conference calls, 88–89,
103–110, 106f–110fTelephone data, 101–103, 102t–103tTelevision station KXTV, 32Temporal measures, 94
Terrorismalert fatigue, 229Chechen attack on a school, 224cost analysis, 229deployment of information, 288geographically distinct attacks, 269–270Nord-Ost Theater hostage siege and
massacre, 224response planning, 230–231school emergency response plans,
229–230September 11th attack, 217strategic characterization of terrorists,
220–222tactics, importance of understanding,
224–225Terrorism Information Awareness system, 26Test samples, 154–158Text data, 71Text mining, 39–40, 306–308, 307ff,
315–316The Gift of Fear (de Becker), 227, 232, 270Time blocks, 94Tip databases, 76Tools. See Data mining toolsTotal Information Awareness system (TIA),
26Trinity Sight analytical model
nature of the incident, 99–100space, 97–99time, 94–97
Tripartite model, 197, 205Two-Step clustering, 122
UUCR. See Uniform Crime ReportsUneven distributions, 9–11Unformatted data, 71Uniform Crime Reports, 77U.S. Department of Defense, 232
Index

332 Index
VValidity, 83Variables
continuous, 70domain expertise to identify, 114selection, 111–114spatial, 98
Variable selection, 59actionable model, 112–113data quality, 112
VICAP. See Violent Crime ApprehensionProgram
Victimology, 208–209Victim-perpetrator relationship, 201Victim risk factors, 209–210Victims
attributes related to risk, 209characteristics, 17, 208–209drive-by shootings, 206emotional, 86identification of risk factors, 226impaired judgment, 95
Violencedrug-related, 203–204, 204fglobal injury prevention programs, 47–48
reduction strategy, 263risk-based deployment strategies, 260in schools, preparedness for, 230–231
Violent Crime, National Center for theAnalysis of, 210
Violent Crime Apprehension Program, 89Violent crime index, 148Violent crimes
behavior analysis of, 198–199modeled using advanced statistics, 202
Virginia, Commonwealth of, 30–31Virtual warehouses, 318Volume challenge, 26, 32–33Vulnerability, children, 222
WWarehouses, virtual, 318Warfare, fourth-generation (4GW), 216–217Weapons. See FirearmsWeapons of mass destruction, 224Weather, 242–245Weather data, 89–90Web-based deployment, 168fWeb browsing patterns, 111

