predation influences the structure of biofilm developed on ultrafiltration membranes
TRANSCRIPT

ww.sciencedirect.com
wat e r r e s e a r c h 4 6 ( 2 0 1 2 ) 3 3 2 3e3 3 3 3
Available online at w
journal homepage: www.elsevier .com/locate/watres
Predation influences the structure of biofilm developedon ultrafiltration membranes
Nicolas Derlon a,*, Maryna Peter-Varbanets a, Andreas Scheidegger a, Wouter Pronk a,Eberhard Morgenroth a,b
aEawag, Swiss Federal Institute of Aquatic Science and Technology, Uberlandstrasse 133, P.O Box 611, CH-8600 Dubendorf, Switzerlandb Institute of Environmental Engineering, ETH Zurich, 8093 Zurich, Switzerland
a r t i c l e i n f o
Article history:
Received 15 July 2011
Received in revised form
14 March 2012
Accepted 15 March 2012
Available online 2 April 2012
Keywords:
Ultrafiltration
Predation
Biofilm structure
Permeate flux
Optical Coherence
Tomography (OCT)
Confocal Laser Scanning
Microscopy (CLSM)
Gravity-driven membrane
(GDM) filtration
* Corresponding author. Tel.: þ41 44 823 537E-mail address: [email protected]
0043-1354/$ e see front matter ª 2012 Elsevdoi:10.1016/j.watres.2012.03.031
a b s t r a c t
This study investigates the impact of predation by eukaryotes on the development of
specific biofilm structures in gravity-driven dead-end ultrafiltration systems. Filtration
systems were operated under ultra-low pressure conditions (65 mbar) without the control
of biofilm formation. Three different levels of predation were evaluated: (1) inhibition of
eukaryotic organisms, (2) addition of cultured protozoa (Tetrahymena pyriformis), and (3) no
modification of microbial community as a control. The system performance was evaluated
based on permeate flux and structures of the biofilm. It was found that predation had
a significant influence on both the total amount and also the structure of the biofilm. An
open and heterogeneous structure developed in systems with predation whereas a flat,
compact, and thick structure that homogeneously covered the membrane surface devel-
oped in absence of predation. Permeate flux was correlated with the structure of the bio-
film with increased fluxes for smaller membrane coverage. Permeate fluxes in the presence
or absence of the predators was 10 and 5 L m�2 h�1, respectively. It was concluded that
eukaryotic predation is a key factor influencing the performance of gravity-driven ultra-
filtration systems.
ª 2012 Elsevier Ltd. All rights reserved.
1. Introduction osmosis, intensive pre-treatment is used. Practical experi-
Biofouling reduces the water flux in membrane filtration
systems and significant efforts are directed towards prevent-
ing or reducing biofilm formation on the surface of
membrane. For example, in membrane bioreactors for
wastewater treatment, biofilm formation is controlled by
coarse bubble aeration resulting in increased shear stress at
the membrane surface and by chemical cleaning (Le-Clech
et al., 2006). In drinking water systems, membrane modules
are regularly back flushed and cleaned with hypochlorite
multiple times per week. In nanofiltration and reverse
8.(N. Derlon).ier Ltd. All rights reserved
ence, however, demonstrates that biofilm formation cannot
be prevented. Removal of biofilms requires significant
amounts of energy and chemicals, which significantly
increases costs of operation of membrane systems. Thus,
a different approach for the operation of membrane systems
has to be investigated, avoiding extensive cleaning and
flushing operations.
A different strategy was proposed by Peter-Varbanets et al.
(2010) where biofilm formation on the membrane is tolerated
and the focus was on maximizing the permeability of the
biofilm. In their study ultrafiltration (UF) systems were
.
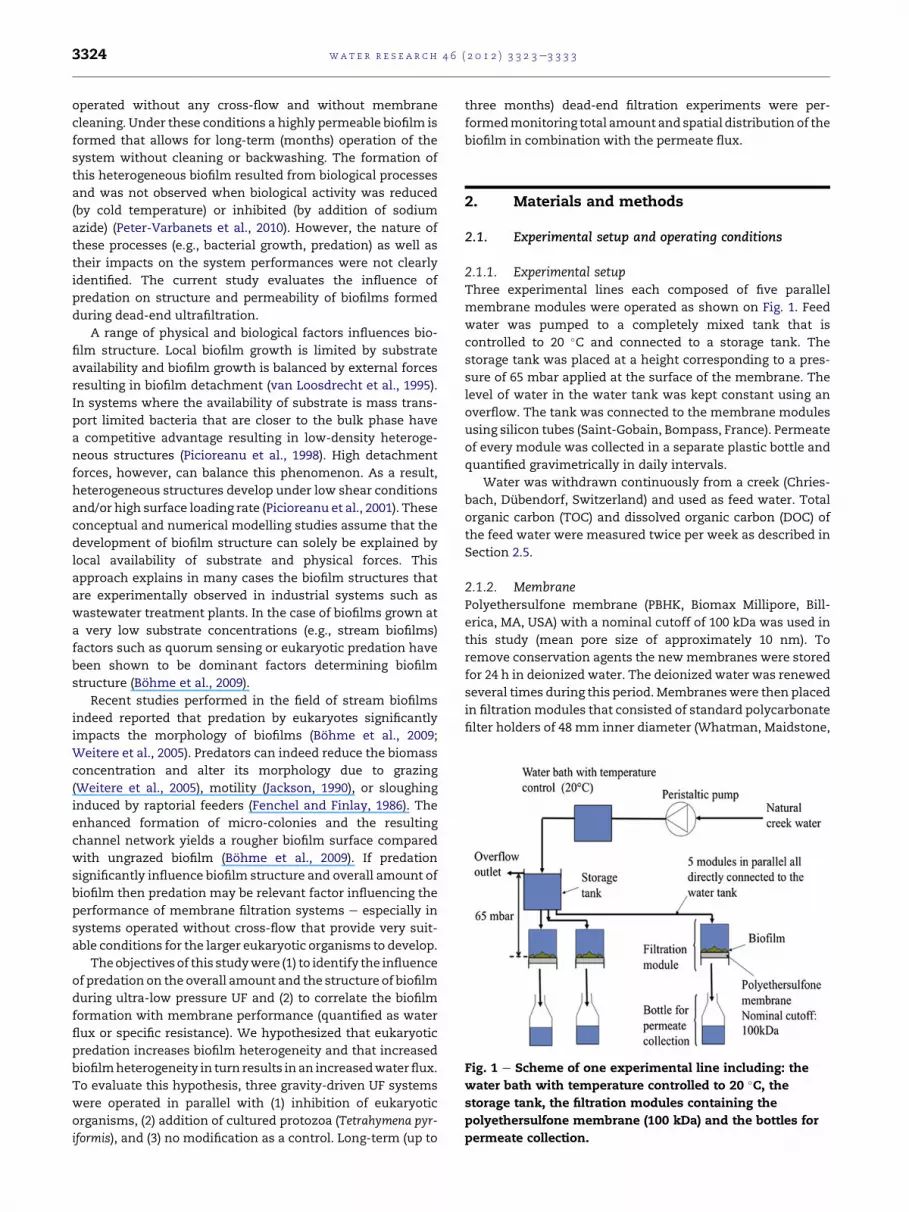
Fig. 1 e Scheme of one experimental line including: the
water bath with temperature controlled to 20 �C, thestorage tank, the filtration modules containing the
polyethersulfone membrane (100 kDa) and the bottles for
permeate collection.
wat e r r e s e a r c h 4 6 ( 2 0 1 2 ) 3 3 2 3e3 3 3 33324
operated without any cross-flow and without membrane
cleaning. Under these conditions a highly permeable biofilm is
formed that allows for long-term (months) operation of the
system without cleaning or backwashing. The formation of
this heterogeneous biofilm resulted from biological processes
and was not observed when biological activity was reduced
(by cold temperature) or inhibited (by addition of sodium
azide) (Peter-Varbanets et al., 2010). However, the nature of
these processes (e.g., bacterial growth, predation) as well as
their impacts on the system performances were not clearly
identified. The current study evaluates the influence of
predation on structure and permeability of biofilms formed
during dead-end ultrafiltration.
A range of physical and biological factors influences bio-
film structure. Local biofilm growth is limited by substrate
availability and biofilm growth is balanced by external forces
resulting in biofilm detachment (van Loosdrecht et al., 1995).
In systems where the availability of substrate is mass trans-
port limited bacteria that are closer to the bulk phase have
a competitive advantage resulting in low-density heteroge-
neous structures (Picioreanu et al., 1998). High detachment
forces, however, can balance this phenomenon. As a result,
heterogeneous structures develop under low shear conditions
and/or high surface loading rate (Picioreanu et al., 2001). These
conceptual and numerical modelling studies assume that the
development of biofilm structure can solely be explained by
local availability of substrate and physical forces. This
approach explains in many cases the biofilm structures that
are experimentally observed in industrial systems such as
wastewater treatment plants. In the case of biofilms grown at
a very low substrate concentrations (e.g., stream biofilms)
factors such as quorum sensing or eukaryotic predation have
been shown to be dominant factors determining biofilm
structure (Bohme et al., 2009).
Recent studies performed in the field of stream biofilms
indeed reported that predation by eukaryotes significantly
impacts the morphology of biofilms (Bohme et al., 2009;
Weitere et al., 2005). Predators can indeed reduce the biomass
concentration and alter its morphology due to grazing
(Weitere et al., 2005), motility (Jackson, 1990), or sloughing
induced by raptorial feeders (Fenchel and Finlay, 1986). The
enhanced formation of micro-colonies and the resulting
channel network yields a rougher biofilm surface compared
with ungrazed biofilm (Bohme et al., 2009). If predation
significantly influence biofilm structure and overall amount of
biofilm then predation may be relevant factor influencing the
performance of membrane filtration systems e especially in
systems operated without cross-flow that provide very suit-
able conditions for the larger eukaryotic organisms to develop.
Theobjectivesof this studywere (1) to identify the influence
of predation on the overall amount and the structure of biofilm
during ultra-low pressure UF and (2) to correlate the biofilm
formation with membrane performance (quantified as water
flux or specific resistance). We hypothesized that eukaryotic
predation increases biofilm heterogeneity and that increased
biofilmheterogeneity in turn results in an increasedwaterflux.
To evaluate this hypothesis, three gravity-driven UF systems
were operated in parallel with (1) inhibition of eukaryotic
organisms, (2) addition of cultured protozoa (Tetrahymena pyr-
iformis), and (3) no modification as a control. Long-term (up to
three months) dead-end filtration experiments were per-
formedmonitoring total amount and spatial distribution of the
biofilm in combination with the permeate flux.
2. Materials and methods
2.1. Experimental setup and operating conditions
2.1.1. Experimental setupThree experimental lines each composed of five parallel
membrane modules were operated as shown on Fig. 1. Feed
water was pumped to a completely mixed tank that is
controlled to 20 �C and connected to a storage tank. The
storage tank was placed at a height corresponding to a pres-
sure of 65 mbar applied at the surface of the membrane. The
level of water in the water tank was kept constant using an
overflow. The tank was connected to the membrane modules
using silicon tubes (Saint-Gobain, Bompass, France). Permeate
of every module was collected in a separate plastic bottle and
quantified gravimetrically in daily intervals.
Water was withdrawn continuously from a creek (Chries-
bach, Dubendorf, Switzerland) and used as feed water. Total
organic carbon (TOC) and dissolved organic carbon (DOC) of
the feed water were measured twice per week as described in
Section 2.5.
2.1.2. MembranePolyethersulfone membrane (PBHK, Biomax Millipore, Bill-
erica, MA, USA) with a nominal cutoff of 100 kDa was used in
this study (mean pore size of approximately 10 nm). To
remove conservation agents the newmembranes were stored
for 24 h in deionized water. The deionized water was renewed
several times during this period. Membraneswere then placed
in filtrationmodules that consisted of standard polycarbonate
filter holders of 48 mm inner diameter (Whatman, Maidstone,

wat e r r e s e a r c h 4 6 ( 2 0 1 2 ) 3 3 2 3e3 3 3 3 3325
Kent, UK). The filtration modules were operated continuously
without flushing or cleaning.
2.1.3. Predation levels and operating conditionsThree different predation levels were applied in three exper-
imental lines operated in parallel. One line was operated with
inhibition of eukaryotes (Low Predation, Low-P). Eukaryote
inhibition was achieved by continuous addition of cyclohexi-
mide, an antibiotic specific to eukaryotic organisms. A second
line was operated without control of predators (Natural
Predation, Nat.-P). A third line was inoculated with an exog-
enous source of protozoa (T. pyriformis) (High Predation, High-
P). The details of Cycloheximide and T. pyriformis addition are
presented in parts 2.2 and 2.3, respectively.
Two experimental runs were performed to identify the
impact of predation on the biofilm structure and in turn on the
system performances. Experiment 1 was operated for a period
of four weeks where inhibition of eukaryotes and addition of
T. pyriformis was done at the beginning of the experimental
run and the water temperature was controlled at 20 �Cthroughout the entire experiment. Experiment 2 was per-
formed in two phases where during the first two months all
systems were first conditioned without inhibition of eukary-
otes and addition of T. pyriformis and the systems were oper-
ated with creek water without temperature control
(approximately 7 �C). After this conditioning phase the
systems were exposed to the different treatments and the
water temperature was controlled to 20 �C. For experiment 2
the end of the conditioning phase is defined as the start of the
experiment.
2.2. Inhibition of predation
Cycloheximide solution at a concentration of 3.5 g L�1 was
injected in the five Low-P modules using a syringe-pump. The
flow rate (approximately 30mL d�1) was adjusted based on the
observed filtration flux to reach a stable concentration of
100 mg L�1 in the permeate.
2.3. Enhancement of the predation
The ciliate T. pyriformis (1630/1W, Culture Collection of Algae
and Protozoa, Dunbeg, UK) was used in the High-P case. T.
pyriformis was grown anexically in PPY (Proteose Peptone
Yeast extract) medium. PPY medium is composed of proteose
peptone (20.0 g L�1) and yeast extract (2.5 g L�1) added to 1 L of
Evian water (Evian-les-Bains, France). The medium was
autoclaved at 15 psi for 15min. 50mL of twoweeks old culture
werewas centrifuged at 4500g for a period of 10min to remove
the supernatant and then resuspended in Evian water. This
step was once repeated before injecting the culture directly
into the silicon tubes connecting the water tank with the
filtration modules. Viability of the protozoa after centrifuga-
tion and before inoculation was controlled by direct micro-
scopic observations.
2.4. Eukaryote abundance
Fluorescent In Situ Hybridization (FISH) was used to qualita-
tively evaluate the abundance of eukaryote organisms. A
eukaryote specific FISH probewas used: EUK1209 (50- GGG CAT
CAC AGA CCT G -30) (Amann et al., 1990). First, entire
membranes were sampled and fixed with formaldehyde
solution (2.5%), and then cut into subsections of around
0.25 cm2. Subsections were then placed in microtubes filled
with a hybridization buffer (750 mM NaCl, 100 mM TriseHCl
[pH 7.8], 5 mM EDTA, 0.1% sodium dodecyl sulphate). FISH
probes were then added to reach a final concentration of
250 ng mL�1. Hybridization was performed for a period of 4 h
at 45 �C. The membrane subsections were then placed in
microtubes containing Evian water filtered at 0.45 mm to stop
the hybridization process. Organisms were observed with
a Confocal Laser Scanning Microscope (CLSM) (Leica SP5,
Wetzlar, Germany) using 20� or 63� glycerol immersion Leica
objectives. Numerical Apertures (NA) were 0.7 and 1.3 for the
20� and 63� lenses, respectively.
Direct microscopic observations of the eukaryote abun-
dance were in addition performed in parallel of the FISH
analysis. For this purpose, the biofilms developed on the
membrane subsections were scratched with the help of
a scalpel and resuspended in filtered Evian water. A stereo-
microscope (Leica M205, Wetzlar, Germany) was used.
2.5. Chemical analysis
The accumulated mass of the biofilm (g C m�2) was measured
through the measurement of the Total Organic Carbon (TOC).
Membranes were sampled and the entire biofilms detached by
flushing 100 mL of nanopure water with the help of a sterile
syringe. Since biofilms were flushed with significant amounts
of nanopure water, the Dissolved Organic Carbon was insig-
nificant and thus the TOCwas equal to the particulate organic
matter. The TOC concentration of the samples was measured
using an automatic total organic carbon analyser (TOC-V,
Shimadzu, Japan). Before determination, the unfiltered
samples were homogenized with a mixer (Polytron PT 3100,
Kinematica, Bohemia (NY), USA) (2 min with 15,000 rpm),
a magnetic stirrer was added, and the sample was then closed
using parafilm. Homogenization during injection ensured
measurement is performed on a representative sample
(avoiding sedimentation during injection into the TOC analy-
ser). The analyser was calibrated with a stock solution
composed of sodium nitrate (6.068 g L�1), potassium hydro-
phtalate (2.126 g L�1), and orthophosphoric acid (85%,
2 mL L�1) dissolved in carbon-free water.
2.6. Biofilm characterization
2.6.1. Micro-scale characterization (CLSM)The micro-scale structure of the biofilm (morphology, thick-
ness) was characterized by CLSM. First, membranes were
sampled and fixed with formaldehyde solution (2.5%), washed
twice with filtered Evian water and cut in sections of around
0.25 cm2. Then, biofilm sampleswere stained, incubated in the
dark (4 h, 20 �C) andwashed again. SYBR�Gold nucleic acid gel
stain (1000 fold diluted stock solution, Invitrogen, Basel,
Switzerland) was used to detect all microorganisms. Conca-
navalin A (50 fold diluted stock solution, Invitrogen, Basel,
Switzerland) was used to stain the a-D -mannose and a-D-
glucose groups of biopolymers. These stains were applied on

wat e r r e s e a r c h 4 6 ( 2 0 1 2 ) 3 3 2 3e3 3 3 33326
the samemembrane subsections. Dehydration of the samples
was then performed and consisted of six immersion steps of
20 min each in glycerol/water solutions with an increasing
gradient (40, 60, 80, 90, 95 and 100%). The fluorescence of
SYBR� Gold was detected by excitation at 488 nm and emis-
sion at 495e540 nm. Concanavalin A was detected with an
excitation at 514 nm and emission at 550e620 nm. The
reflection from surfaces impermeable for light was detected at
the wavelength of 633 nm using CLSM reflective mode. Ten
side-view images and five z-stacks were recorded for each
environment at weekly intervals. The position of the objec-
tives was randomly changed in the x and y directions when
recording side-view images and z-stacks to avoid subjective
impact of the user and thus to record representative data.
Biofilmmorphologies were evaluated throughout the analysis
of these images. No quantification of CLSM images (e.g. bio-
volume, biofilm thickness) was performed.
2.6.2. Optical Coherence Tomography (OCT)Optical Coherence Tomography (OCT) (model 930 nm Spectral
Domain, Thorlabs GmbH, Dachau, Germany) with a central
light source wavelength of 930 nmwas used to investigate the
meso-scale structure of the biofilm. The use of long wave-
length light allows to penetrate up to a depth of 2.7 mm with
axial and lateral resolutions of 4.4 mmand 15 mm, respectively.
For the image acquisition filtration modules were opened and
carefully placed on the OCT stage. OCT images were recorded
keeping the samples immersed in a thin layer of permeate.
Around 20 A-Scans (i.e., XZ plane pictures) of either 5 � 1 mm,
5� 0.5mm, or 3� 0.5mm (depending of the biofilm thickness)
were acquired at different time intervals and for each filtra-
tion modules. Image analysis software developed under
Matlab� (MathWorks, Natick, US) was used to analyse OCT
image. Image analysis consisted of the following steps:
(1) detecting the membraneebiofilm interface (grey-scale
gradient analysis);
(2) binarizing the image (automatic thresholding);
(3) calculating physical properties of the biofilm:mean biofilm
thickness (z in mm), absolute (Ra in mm) and relative
roughness ðR0aÞ coefficients.
These parameters were calculated according the following
equations:
z ¼ 1
n
XNi¼1
zi (1)
Ra ¼ 1n
XNi¼1
ðjzi � zjÞ (2)
R0a ¼
1n
XNi¼1
�jzi � zjz
�(3)
where N is the number of thickness measurements, zi is the
local biofilm thickness (mm), and z is the mean biofilm thick-
ness (mm).
Linear regression analysis was performed to statistically
evaluate the effect of the level of predation on the biofilm
physical structure in terms of mean biofilm thickness and
relative roughness coefficient. The linear least square func-
tion of R (R Development Core Team, 2011) version 2.13.0 was
used to fit the model. This approach consisted in comparing
the slope of the change in the mean biofilm thickness or
relative roughness to the slope of natural predation (Nat.-P).
First-order equations with qualitative variables were used for
this analysis Eq. (4):
Yt ¼ b0 þ b1$tþ b2$IðLow� PÞ$tþ b3$IðHigh� PÞ$tþ εt (4)
Where Yt is the quantitative variable that is considered (mean
biofilm thickness or relative roughness coefficient), b1 is the
slope of the Nat.-P case, b2 is the difference in slope of the
Nat.-P and Low-P and b3 the difference in slope betweenNat.-P
and High-P. I(Low-P) and I(High-P) are the indicator variables
(equal to 0 or 1 depending of the data set that is considered). T-
test and P-value calculations were then performed to statis-
tically distinguish the different slopes that were calculated.
2.6.3. Top view biofilm picturesTop views of the biofilms developed on the membranes were
recorded using an Olympus C-7070 digital camera (Olympus,
Le Mont-sur-Lausanne, Switzerland). The meso-scale char-
acterization of biofilms consisted inmeasuring themembrane
coverage as the fraction of the membrane surface that is
covered by biofilms. Top view pictures were treated using
ImageJ (http://rsb.info.nih.gov/ij/). First, the images were
converted into 8-bits pictures. A threshold was thenmanually
adjusted and applied to obtain binary images. The value of
threshold was determined in order to distinguish the relevant
structure, i.e., the biofilm and the uncovered membrane. The
effective surface of membrane was finally selected to calcu-
late the membrane coverage.
2.7. Flux and hydraulic resistance
2.7.1. Filtration fluxThe permeate flux was calculated by measuring the mass of
water collected in each bottle and dividing the results by the
filtration period and by the membrane area. The mass of
permeate was weighed daily using a scale (Ohaus Adventure
Pro�, Pine Brook (NJ), USA).
2.7.2. Hydraulic resistancesThe total resistance of the fouled membrane was calculated
according to the Darcy’s law:
J ¼ DPm$Rtotal
(5)
Where DP (Pa) is the transmembrane pressure (65 mbars in
this study), m is the viscosity (Pa s) of the filterate, Rtotal is the
total resistance (m�1), and J is the filtration flux (m s�1).
The total resistance Rtotal can be represented as the sum of
individual resistances:
Rtotal ¼ Rmembrane þ Rbiofilm þ Rirreversible (6)
Where Rmembrane is resistance of the pristine membrane,
Rbiofilm is resistance of the biofilm, and Rirreversible is resistance
caused by the irreversible fouling. Two membranes per line
were sampled to estimate Rbiofilm. First, the biofilm was

wat e r r e s e a r c h 4 6 ( 2 0 1 2 ) 3 3 2 3e3 3 3 3 3327
detached from themembrane surface by flushing with 100mL
of deionized water using a syringe. Membranes were then
returned to filtration modules and the flux of the flushed
membrane was determined by filtering nanopure water. It is
assumed that the after flushing the resistance is the sum of
Rirreversible and Rmembrane. Based on the resistances measured
of the fouledmembrane, the resistance after flushing, and the
resistance of the virgin membrane the different resistances in
Eq. (6) can be calculated.
The biofilm resistance (Rbiofilm) can be correlated to the
thickness of a homogeneous biofilm layer (H ) following the
CarmaneKozeny equation:
Rbiofilm ¼ 75$ð1� εÞ22$ε3$a2
$H (7)
Where ε (dimensionless) is the biofilm porosity, a (m) is the
characteristic radius of the particles forming the cake layer,
and H (m) corresponds to the thickness of the biofilm
(Katsoufidou et al., 2005). During dead-end filtration all
retained material is deposited on the membrane, causing an
increase of biofilm thickness. According to Eq. (3), the resis-
tance of the biofilm is defined by its thickness of the layer and
structural parameters.
3. Results
The abundance of eukaryotic organisms was evaluated after
staining with FISH probes and imaging with CLSM (Fig. 2) after
one week of operation under the different predation levels, in
experiment 1.
Clear differences in terms of eukaryote abundance were
observed between the different treatments (Low-P, Nat.-P, and
High-P) after one week of growth. In the Low-P case eukary-
oteswere either absent or very rarely observed (Fig. 2a). On the
contrary, many eukaryotes were observed in the Nat.-P
(Fig. 2b) and High-P cases (Fig. 2c). Based on staining with
FISH probes and qualitative comparison of images the
eukaryote organism abundancewas greater in the High-P case
that had been inoculated with T. pyriformis, compared to the
Nat.-P case. These qualitative observations suggest that both
predation inhibition in the Low-P case and the protozoa
inoculation in the High-P resulted in significantly different
Fig. 2 e Eukaryote abundance based on CLSM pictures of the biofi
Nat.-P and (c) High-P conditions (experiment 1). A red signal (Re
organisms. Grey colour is related to the reflected signal of the so
this figure legend, the reader is referred to the web version of t
conditions compared to the control (Nat.-P). These results
were in addition confirmed by directmicroscopic observations
performed in experiment 1 and 2 after several weeks of
operation that revealed the presence of numerous eukaryotes
in both the Nat.- and High-P cases.
3.1. Impact of predation on the development of thebiofilm
In Fig. 3 top view pictures (Fig. 3 aec, gei) and CLSM pictures
(Fig. 3 def, jel) of the biofilms after two weeks and one month
under different predation conditions (experiment 1) are pre-
sented. Comparing the structure of the biofilms after two
weeks of operation (Fig. 3, columns 1 and 2) only a small
influence of the level of predation can be observed. For the
cases with predation (Nat.-P and High-P) the biofilms had
a thickness of around 25 mm while the biofilm for the case
without predation (Low-P) was slightly thicker (40e50 mm). For
all cases the biofilms covered the entire membrane surface
but the biofilm structure was more heterogeneous with an
increasing predation level. In absence of predation the biofilm
surface was rather smooth whereas heterogeneities, i.e.,
peaks and valleys were observed in presence of predation.
After two weeks of operation, biofilms developed in the Nat.-
and High-P cases are not homogeneous but characterized by
a varying thickness and showing mounds of biofilm, espe-
cially in the case of High-P (Fig. 3 bec). No clear distinction
was, however, visible between the Nat.-P and High-P levels at
a large scale (e.g. membrane coverage). After 4 weeks of
operation these differences in biofilm structure become even
clearer. In the Low-P case a compact biofilm thicker than
50 mm covered homogeneously the entire surface of the
membrane based on the CLSM observations (Fig. 3 gej). The
membrane coverage did not change between day 15 and day
30 and the membrane remained almost fully covered. Low
surface heterogeneity was observed for this biofilm, due to
loosely attached particulate matter, which probably accu-
mulated on top of the biofilm during filtration. Inorganic
particulatematterwas identified by the reflection signal of the
CLSM. Thus, areas with high particle density can be identified
by the shadowing effect occurring underneath of these areas.
In the Nat.-P and High-P cases, heterogeneous and open
structures were observed. Between days 14 and 28 the
lm developed after one week of growth under (a) Low-P, (b)
d-EUK1209 FISH probe) indicates the presence of eukaryote
lid surface. (For interpretation of the references to colour in
his article.)

Fig. 3 e Top view and CLSM images of an optical cross-section of biofilms developed after two weeks and one month of
growth (experiment 1) under different levels of predation: Low-P (first row), Nat.-P (second row), and High-P (third row).
Images are presented for the biofilm developed after two weeks (columns 1 and 2) and after four weeks (columns 3 and 4).
The following colours are used in the CLSM images: Green[ SYBR� Gold (all bacterial cells), red[ Concanavalin A (presence
of a-D-mannose and a-D-glucose groups of biopolymers), purple [ reflected signal (the membrane). The white arrows in def
and jel indicate the position of the membrane surface. CLSM pictures def were record using the 633 objective (NA: 1.3). The
red square shown in figures gei corresponds to a view field of 750 mm 3 750 mm indicating the location imaged using CLSM
with the 203 objective (NA: 0.7). (For interpretation of the references to colour in this figure legend, the reader is referred to
the web version of this article.)
wat e r r e s e a r c h 4 6 ( 2 0 1 2 ) 3 3 2 3e3 3 3 33328
membrane coverage decreased significantly in both cases
(Fig. 3 b, c, h, i). After 30 days the biofilm was composed of
a thin basal layer with large and locally thick biomass
mounds, as can be observed both visually and by CLSM
images. The thickness of the basal layer ranged from several
microns to around 25 mm (Fig. 3 k and l). CLSM images also
revealed the existence of cavities in some structures devel-
oped in presence of predators (images not shown). This open
and heterogeneous structure was slightly more pronounced
in the case of a High-P than in the Nat.-P case. Due to the
thick biofilms observed after one month of growth, different
objective lenses were used to capture the entire structures in
the z-direction. 63� and 20� objectives were used after two
weeks and after one month, respectively. The lower NA of the
20� lens is associated with a lower resolution and in turns
a lower image quality. This explains the differences between
CLSM pictures captured after two weeks and after one
month.
The change in the meso-scale biofilm structure was
monitored using OCT (Fig. 4). OCT images confirmed obser-
vations with CLSM on micro-scale. As shown in Fig. 4, OCT
results confirmed that the surface heterogeneity of biofilms
increased with an increasing level of predation. Image anal-
ysis was applied to quantify OCT images and monitor the
change in the biofilm structure (Fig. 5). During the first month
of biofilm development, similar mean biofilm thicknesses
ranging from 50 to 80 mm were monitored regardless of the
level of predation. Then biofilms cultivated in presence of
predation became thicker than biofilms developed in absence
of predation: mean biofilm thicknesses measured for each
filtrationmoduleswas ranging from150 to 200 mmand from80
to 120 mm in presence and absence of predation, respectively.
Predation had even a greater impact on the relative biofilm
roughness (Fig. 5). In absence of predation (Low-P) the relative
roughness coefficient remained constant over three months
at 0.25. In presence of predation (Nat.-P and High-P cases), this
coefficient varied between 0.5 and 0.75 indicating that some
parts of the biofilms were locally very thin or very thick. In
addition, it is important to notice that the variability in flux
and structure between these parallel modules was
pronounced in the case of predation (Nat.- and High-P). This is
likely due to random natural inoculation of protists. In
absence of predation the variability between modules was
insignificant.

Fig. 4 e Typical OCT images of biofilms developed after one month under (A) Low-P, (B) Nat.-P and (C) High-P conditions.
wat e r r e s e a r c h 4 6 ( 2 0 1 2 ) 3 3 2 3e3 3 3 3 3329
Additional physical properties of the different biofilm
structures (morphology, accumulated mass, average
membrane coverage) are summarized in Table 1. The main
differences were observed between the structures developed
in absence of predation (Low-P) compared to structures
developed in presence of predation (Nat.-P and High-P). In
addition to themorphological differences described in section
3.2, the mass of the biofilm accumulated at the surface of the
membranes (g C m�2) was also influenced by predation. TOC
concentration measured in the High-P case was 30% lower
than the onemeasured in the Nat.-P case. No clear distinction
was done between the concentration measured in the Low-
and Nat.-P cases. In addition, the averagemembrane coverage
decreases with an increasing predation level. In presence of
predators the average membrane coverage was decreased by
10%. An accurate determination of the membrane coverage
was possible thanks to the good contrast between the biofilm
and the uncovered membrane.
Statistical analysis was performed to evaluate the influ-
ence of the predation level on the change in the mean biofilm
thickness and in the relative roughness coefficient (Table 2).
0
100
200
300
400
0 50 100 150
Time (d)
Mea
n bi
ofilm
thic
knes
s ( µ
m)
Low-P
Nat.-P
High-P
Fig. 5 e Change in the mean biofilm thickness and in the relativ
three grazing conditions (experiment 2). Physical properties we
Slopes of the change in the mean biofilm thickness and in the
relative roughness coefficient were different for the three
different levels of predation. P-values calculated for mean
biofilm thicknesses and relative roughness coefficients,
however, indicated that the slope for High-P is statistically not
different from the slope of Nat.-P. The biofilms with predation
(Nat.-P and High-P) were statistically different from the bio-
films developed without predation (Low-P case) indicating
that the biofilm structure formation is mainly determined by
the presence or absence of predators in the system.
3.2. Impact of predation on permeate flux and onhydraulic resistances of the biofilm
The average flux measured during experiment 1 and 2 are
shown in Fig. 6. According to the data shown in Fig. 6, a rela-
tion exists between the predation level and the average flux.
Fluxmonitored in the systemswith predators was around two
times higher than flux measured in absence of predation.
Indeed, a stable flux of 5 L m�2 h�1 was measured in both
experiment 1 and 2 for the Low-P condition. In the Nat.-P case,
0
0,25
0,5
0,75
1
0 50 100 150
Rel
ativ
ero
ughn
ess
coef
fici
ent(
%)
Time (d)
Low-P
Nat.-P
High-P
e roughness coefficient of the biofilms developed under the
re calculated by image analysis from OCT images.

Table 1 e Physical properties of the different types of biofilm structure developed in experiment 2.
Case Low-P Nat.-P High-P
Treatment Cycloheximide No treatment One-time inoculation
with T. Pyriformis
Biofilm morphology Flat structure without
significant heterogeneities
Open and heterogeneous
with biomass mounds
Open and heterogeneous
with large biomass mounds
Accumulated mass
of biofilm after
one month (g C m�2)
3.9 � 0.6 4.5 � 0.1 2.9 � 0.8
Average membrane
coverage (%)
97 � 1 89 � 7 87 � 1
wat e r r e s e a r c h 4 6 ( 2 0 1 2 ) 3 3 2 3e3 3 3 33330
a constant but higher flux of 9 L m�2 h�1 was measured. The
average flux monitored in the High-P case evolved differently:
after twoweeks, this flux was lower than the fluxmeasured in
the Nat.-P case (15% and 27% lower than Nat.-P case in
experiment 1 and 2, respectively). Then, this flux gradually
increased and at the end of the experiment the flux for the
High-P casewas 17% and 20%higher than the flux of theNat.-P
in experiments 1 and 2, respectively.
These different fluxes measured correspond to different
hydraulic resistances of the biofilm. For example in experi-
ment 2 and after onemonth of development, the resistance of
the biofilm (Rbiofilm) in the case of a Low-P was 4.1 � 1012 m�1,
which corresponds to 95% of Rtotal. The resistances of the
biofilm in the Nat.-P and High-P cases were 2.1 � 1012 m�1 and
2.0� 1012m�1, respectively (which corresponded tomore than
95% of Rtotal). Resistances measured in experiment 1 after one
month of operation were in the same order of magnitude.
3.3. Relationship between the flux and the coverage ofthe membrane by biofilm
Significant differences in the structure of the biofilms and in
coverage of the membrane surface by the biofilm were
observed for different experimental durations and different
predation levels (Fig. 3 aec and gei). A correlation between the
membrane coverage and flux at end of experiment 2 is
provided in Fig. 7 for the different predation levels. The extent
Table 2 e Results of the statistical analysis of theinfluence of the predation level on the change in themean biofilm thickness and on the relative roughnesscoefficient. b1 is the slope of the Nat-P case, b2 is thedifference in slope of the Nat-P and Low-P and b3 thedifference in slope between Nat-P and High-P.
Estimate Standard error T-test P-value
Statistical analysis of the mean biofilm thickness data
b0 (Intercept) 55.2 14.7 3.7 0.0005
b1 1.38 0.26 5.4 2.5e�06
b2 (Low-P) �0.64 0.22 �2.9 0.005
b3 (High-P) �0.31 0.22 �1.4 0.17
Statistical analysis of the relative roughness coefficient
b0 (Intercept) 0.2107 0.0424 4.96 1.20e�05
b1 0.0048 0.0007 6.599 5.47e�08
b2 (Low-P) �0.0048 0.0006 �7.878 8.30e�10
b3 (High-P) �0.0006 0.0007 �0.900 0.373
of membrane coverage was determined from photographs
using quantitative image analysis.
Two clusters of data are highlighted in Fig. 7 indicating the
presence (Nat.- and High-P cases) or absence (Low-P case) of
predators in the system. In the case of Low-P, the biofilm
homogeneously covered the entire surface of the membrane
resulting in an observed membrane coverage larger than 95%.
This almost complete coverage of the membrane was asso-
ciated with fluxes smaller than 5 L m�2 h�1. No spreading of
the data points was observed in this case. In the case of Nat.-P,
a heterogeneous biofilm was formed resulting in a partial
coverage ranging from 87% to 94%. This reduced observed
membrane coverage resulted in fluxes of around 10 L m�2 h�1
according data recorded during experiment 1 and 2. A slightly
lower coverage of the membrane was observed for the High-P
case. In this case, membrane coverage was observed with the
highest average flux, i.e., a flux higher than 10 Lm�2 h�1. Thus,
it can be concluded that lower membrane coverage is related
to higher fluxes with an increasing level of predation.
4. Discussion
4.1. How does predation impact the biofilm structure?
Compact and flat biofilms that covered the entire membrane
surface (see schematic representation in Fig. 8a) developed in
absence of predation (Low-P case) whereas open and hetero-
geneous structures composed of a thin basal layer plus
biomass mounds were observed in presence of predation
(Nat.-P and High-P) (Fig. 8b). Formation of different biofilm
structures was thus governed by the presence/absence of
predation. The presence/absence of predation can explain the
observed differences in biofilm structures in two ways: an
indirect and a direct way. The indirect influence of predation
results from predators triggering a reaction of the bacterial
population. The formation of micro-colonies is promoted
when bacterial biofilms are developed in presence of eukary-
otes (Bohme et al., 2009), presumably induced by quorum
sensingmechanisms in the bacterial biofilm (Matz et al., 2004).
Predation stimulates the production of exo-polymeric
substances (e.g. alginate) and bacteria tend to aggregate in
dense and disparate structures. In such structures like the
biomass mounds, the bacteria are better protected from
predation. The development of micro-colonies triggered by
the presence of predators during the early stages of biofilm

Fig. 6 e Average fluxmeasured in (a) Experiment 1 and in (b) Experiment 2 under different predation levels. Bars indicate the
standard errors (n [ 5).
wat e r r e s e a r c h 4 6 ( 2 0 1 2 ) 3 3 2 3e3 3 3 3 3331
growth potentially explains the heterogeneous structure
observed at the meso-scale.
The direct influence results from predators actively
shaping an existing structure. The presence of cavities in the
biofilm structure could be explained by the activity of raptorial
feeders such as amoeba (Jackson and Jones, 1991). Also, the
motility of predators like worms or nematodes can create
channel networks, which result in a higher porosity of the
structure. Bohme et al. (2009) reported porosity values from
1.5 to 1.8 times higher in presence of protozoa. Predation also
reduces significantly the amount of biomass and thus its
volume. The amount of biomass on the membrane surface
was 30% less in the High-P case than in the Low-P case but
similar mean biofilm thicknesses were measured, which
suggests that biofilm densities were different. A reduction of
70 and 39% of the biomass concentration was reported in the
case of Pseudomonas aeruginosa biofilms of a non-toxic alginate
overproducing strain and of a wild-type strain toxic to
protozoa, respectively (Weitere et al., 2005), confirming the
influence of predators on the biomass volume. In the present
study, T. pyriformis that were added in the High-P, were
presumably outcompeted by other protists and Metazoa that
were naturally present in the creek river water. Competition
between T. pyriformis. and other protists could explain that
Fig. 7 e Flux (L mL2 hL1) versus themembrane coverage (%)
measured at the end of experiment 2. Two clusters of data
are identified depending of the presence or absence of
predators in the system.
biofilm structures developed in the Nat.-P and High-P cases
were statistically not different. It is expected that continuous
addition of Protozoa or Metazoa can reduce the membrane
coverage to an even larger extent. Also, the use of a raptorial
feeder (i.e., amoeba) or of worms that grazes only on attached
biomass should be more effective than the use of ciliates such
as T. pyriformis in the current study. More likely, operating the
GDM systems in a way that “natural” predation is enhanced
would have a greater effect than modifying the protistan
ecology by adding an exogenous species.
Finally, all thesemechanisms yield rougher andmore open
structures comparedwith the ungrazed biofilms. In absence of
predation, the biofilms developed at the surface of
membranes are formed by accumulation of particulate
matter, physico-chemical interactions and bacterial activity.
It could be shown that these processes still cause stabilization
of flux. However without predation, they lead to the devel-
opment of flat and compact structures. In systems operated
with cross-flow like in drinking water distribution pipes, the
development of flat structures is usually explained by high
shear stress conditions and low loading (van Loosdrecht et al.,
1995). In addition to growth and detachment processes,
predation contributes significantly to the development of
biofilm structures. Therefore, we suggest that predation
should be more considered when questions related to biofilm
structure are addressed. From a process-engineering point of
view, a crucial issue is however to understand to what extent
an open and heterogeneous structure impacts the hydraulic
resistances and thus the filtration process.
4.2. How does an open and heterogeneous structureenhance the filtration flux?
The use of optical methods such as CLSM or Optical Coher-
ence Tomography has revealed the porous and heterogeneous
structure of biofilms. Mass transfer is directly influenced by
biofilm morphology. For homogeneous biofilm developed on
impermeable substratum and under cross-flow conditions,
mass transfer is governed by diffusion and results in
a gradient of concentrations over biofilm depth. For hetero-
geneous biofilms developed on impermeable substratum,
substrate diffuses only in the top of the peaks and not in the

Fig. 8 e Schematic representation of the two distinct structures developed: (a) Compact and flat structure developed in
absence of predation, (b) Open and heterogeneous structure developed in presence of predation. In both cases there is
a basal layer but in the case of predation this basal layer is much thinner compared to the homogeneous layer in a system
without predation.
wat e r r e s e a r c h 4 6 ( 2 0 1 2 ) 3 3 2 3e3 3 3 33332
valleys (Eberl et al., 2000; Picioreanu et al., 2000). In this case
convection can contribute to mass transfer in pores but does
not necessarily enhance significantly to the overall mass
transfer from the bulk liquid to the biofilms matrix. Mass
transfer in the case of heterogeneous biofilm structures
developed on permeable substratum, like in our study, is not
reported in the literature.
According to the CarmaneKozeny equation (Eq. (6)), the
hydraulic resistance of a biofilm is proportional to its thick-
ness. The hydraulic resistance of biofilms developed in pres-
ence of predation was heterogeneously distributed over the
surface of the membrane, due to the spatial variation of the
biofilms thickness. In addition, the hydraulic resistance of the
thick mounds can be expected to be significantly higher than
the hydraulic resistance of the basal layer on which they
developed. It can be postulated that the water does not
penetrate these thick biomass mounds but only follows their
surface. Then, it is likely that water passes through the
membranewhere only a very thin biofilm is present, i.e., in the
valleys between the mounds. According to this hypothesis
mass transfer would be governed by advection in the valleys
and by diffusion in the peaks. This suggests that biofilm
growth should be higher in the valleys than in the peaks and
should lead to a decrease of the biofilm roughness. However
relative roughness coefficient was increasing over time indi-
cating that predation helps to maintain large biofilm hetero-
geneities. This result reinforces the idea that predation is
a crucial process in the case of biofilm developed without
cross-flow on permeable substratum.
Also, CarmaneKozeny equation applies for systems with
homogeneous and packed bed-like biofilm structures. In our
study the presence of predation resulted in an increasing
mean biofilm thickness but not in an increase of the hydraulic
resistance. Correlating the hydraulic resistance to the mean
biofilm thickness is thus not correct in the case of biofilms that
are heterogeneous at the meso-scale. In our study the filtra-
tion performances are governed by the biofilm structure
(coverage and surface heterogeneities) and not only by the
mean biofilm thickness. A more accurate prediction of the
permeate flux requires considering biofilm heterogeneities in
the X and Y directions (e.g. the biofilm roughness, i.e., the
change in the local biofilm thickness). Further investigations
are however required to characterize the flow distribution in
the case of heterogeneous biofilms structures. Evaluation of
the flow distribution can be performed experimentally and
numerically using fluorescent micro-beads or computational
fluid dynamics, respectively.
4.3. Relevance for decentralized water treatment
Dead-end ultrafiltration operated without control of the bio-
film formation and at very low hydrostatic pressure (kwon as
Gravity-Driven Membrane (GDM) filtration) represents a rele-
vant alternative for the decentralized production of drinking
water in developing and transition countries (see http://www.
eawag.ch/membranefilter). In these countries, centralized
systems are relevant for the production of drinking water in
densely populated zones but not in rural areas. For the
production of high-quality drinking water in rural zones,
decentralized systems such as GDM systems need to be
developed. In these areas, surface waters (river water, pond
water, etc) are usually used for the production of drinking
water. It can be assumed that the microbial ecology of the
surface waters influences the biofilm structure and in turn the
performance of the GDM systems. An improved control of
grazing in GDM could eventually lead to an optimization of the
permeability in such systems and contribute to a broader
application of membrane technology for decentralized use. In
conventional membrane systems operated with control of the
biofilm and at high pressure, the effect of predation on biofilm
structure and filtration performance is negligible compared to
biofilm control strategies (e.g., chlorination and high shear).
5. Conclusions
(i) Predation by eukaryotic microorganisms influences the
structure of the biofilm developing on the ultrafiltration
membrane.
(ii) Heterogeneous biofilm structures characterized by
a reduced membrane coverage and a thin basal layer
developed in presence of predation. Flat and compact
structures that homogeneously cover the membrane
surface are developed in absence of predation. Addition of
exogenous protists did not result in a change in the bio-
film structure.

wat e r r e s e a r c h 4 6 ( 2 0 1 2 ) 3 3 2 3e3 3 3 3 3333
(iii) The presence of predation resulted in an increased
permeate flux. Permeate flux of around 10 L m�2 h�1 was
monitored in presence of eukaryotes compared to the flux
of around 5 L m�2 h�1 monitored in absence of predation.
(iv) The meso-scale heterogeneities of biofilm influence its
hydraulic resistance. A more open structure (lower
coverage by thick biomass mounds and thinner basal
layer) resulted in an increased permeate flux.
r e f e r e n c e s
Amann, R.I., Binder, B.J., Olson, R.J., Chisholm, S.W., Devereux, R.,Stahl, D.A., 1990. Combination of 16S rRNA-targetedoligonucleotide probes with flow cytometry for analyzingmixed microbial populations. Applied and EnvironmentalMicrobiology 56 (6), 1919e1925.
Bohme, A., Risse-Buhl, U., Kusel, K., 2009. Protists with differentfeeding modes change biofilm morphology. FEMSMicrobiology Ecology 69 (2), 158e169.
Eberl, H.J., Picioreanu, C., Heijnen, J.J., van Loosdrecht, M.C.M.,2000. A three-dimensional numerical study on the correlationof spatial structure, hydrodynamic conditions, and masstransfer and conversion in biofilms. Chemical EngineeringScience 55 (24), 6209e6222.
Fenchel, T., Finlay, B.J., 1986. Photobehavior of the Ciliatedprotozoan Loxodes - Taxic, Transient, and Kinetic Responsesin the presence and absence of Oxygen. Journal ofProtozoology 33 (2), 139e145.
Jackson, G.J., 1990. Parasitic protozoa and worms relevant to theUnited-States. Food Technology 44 (5), 106.
Jackson, G.J., Jones, E.B.G., 1991. Interactions within biofilms: thedisruption of biofilm structure by protozoa. Kiel Meeresforsch(Sonderh) 8, 264e268.
Katsoufidou, K., Yiantsios, S.G., Karabelas, A.J., 2005. A study ofultrafiltration membrane fouling by humic acids and fluxrecovery by backwashing: experiments and modeling. Journalof Membrane Science 266 (1e2), 40e50.
Le-Clech, P., Chen, V., Fane, T.A.G., 2006. Fouling in membranebioreactors used in wastewater treatment. Journal ofMembrane Science 284 (1e2), 17e53.
Matz, C., Bergfeld, T., Rice, S.A., Kjelleberg, S., 2004.Microcolonies, quorum sensing and cytotoxicity determinethe survival of Pseudomonas aeruginosa biofilms exposed toprotozoan grazing. Environmental Microbiology 6, 218e226.
Peter-Varbanets, M., Hammes, F., Vital, M., Pronk, W., 2010.Stabilization of flux during dead-end ultra-low pressureultrafiltration. Water Research 44 (12), 3607e3616.
Picioreanu, C., van Loosdrecht, M.C.M., Heijnen, J.J., 1998. A newcombined differential discrete cellular automaton approachfor biofilm modellingdApplication for growth in gel beads.Biotechnology and Bioengineering 58, 101e116.
Picioreanu, C., van Loosdrecht, M.C.M., Heijnen, J.J., 2000. Effect ofdiffusive and convective substrate transport on biofilmstructure formation: a two-dimensional modeling study.Biotechnology and Bioengineering 69 (5), 504e515.
Picioreanu, C., van Loosdrecht, M.C.M., Heijnen, J.J., 2001. Two-dimensional model of biofilm detachment caused by internalstress from liquid flow. Biotechnology and Bioengineering 72(2), 205e218.
R Development Core Team, 2011. R: A Language and Environmentfor Statistical Computing. Austria, Vienna [online]. http://www.R-project.org/.
van Loosdrecht, M.C.M., Eikelboom, D., Gjaltema, A., Mulder, A.,Ti jhuis, L., Heijnen, J.J., 1995. Biofilm structures. WaterScience and Technology 32, 35e43.
Weitere, M., Bergfeld, T., Rice, S.A., Matz, C., Kjelleberg, S., 2005.Grazing resistance of Pseudomonas aeruginosa biofilms dependson type of protective mechanism, developmental stage andprotozoan feeding mode. Environmental Microbiology 7 (10),1593e1601.