practical quantitative biomedical applications of maldi-tof mass spectrometry
TRANSCRIPT
Practical Quantitative Biomedical Applicationsof MALDI-TOF Mass Spectrometry
Martin Bucknall and Kim Y. C. FungRay Williams Biomedical Mass Spectrometry Facility, University of New South Wales, Sydney, Australia
Mark W. DuncanDepartment of Pharmaceutical Sciences, School of Pharmacy, University of Colorado Health Sciences Center,Denver, Colorado, USA
Matrix-assisted laser desorption ionization time-of-flight mass spectrometry (MALDI-TOFMS)is used to obtain fast and accurate determinations of molecular mass, but quantitativedeterminations are generally made by other techniques. In this study we illustrate the practicalutility of automated MALDI-TOFMS as a tool for quantifying a diverse array of biomoleculescovering an extensive molecular weight range, and present in biological extracts and fluids.Growth hormone was measured in rat pituitary tissue; insulin in human pancreatic tissue;homovanillic acid in human urine; and LVV-hemorphin-7, epinephrine and norepinephrine inhuman adrenal and pheochromocytoma tissues. Internal standards including compounds ofsimilar molecular weight, structural analogs or isotopomers were incorporated into eachanalysis. We report on the current practical limitations of quantitative MALDI-TOFMS andhighlight some of the potential benefits of this technique as a quantitative tool. (J Am SocMass Spectrom 2002, 13, 1015–1027) © 2002 American Society for Mass Spectrometry
Since its inception and commercial availability, theversatility of MALDI-TOFMS has been demon-strated convincingly by its extensive use for qual-
itative analysis. For example, MALDI-TOFMS has beenemployed for the characterization of synthetic polymers[1, 2], peptide and protein analysis [3–5], DNA andoligonucleotide sequencing [6–8], and the characteriza-tion of recombinant proteins [9, 10]. Recently, applica-tions of MALDI-TOFMS have been extended to includethe direct analysis of biological tissues and single cellorganisms with the aim of characterizing endogenouspeptide and protein constituents [11–18].
The properties that make MALDI-TOFMS a popularqualitative tool—its ability to analyze molecules acrossan extensive mass range, high sensitivity, minimalsample preparation and rapid analysis times—alsomake it a potentially useful quantitative tool. MALDI-TOFMS also enables non-volatile and thermally labilemolecules to be analyzed with relative ease. It is there-fore prudent to explore the potential of MALDI-TOFMSfor quantitative analysis in clinical settings, for toxico-logical screenings, as well as for environmental analy-sis. In addition, the application of MALDI-TOFMS tothe quantification of peptides and proteins is particu-larly relevant. The ability to quantify intact proteins in
biological tissue and fluids presents a particular chal-lenge in the expanding area of proteomics and investi-gators urgently require methods to accurately measurethe absolute quantity of proteins.
While there have been reports of quantitativeMALDI-TOFMS applications, there are many problemsinherent to the MALDI ionization process that haverestricted its widespread use [19–39]. These limitationsprimarily stem from factors such as the sample/matrixheterogeneity that is believed to contribute to the largevariability in observed signal intensities for analytes,the limited dynamic range due to detector saturation,and difficulties associated with coupling MALDI-TOFMS to on-line separation techniques such as liquidchromatography. Combined, these factors are thoughtto compromise the accuracy, precision, and utility withwhich quantitative determinations can be made.
Because of these difficulties, practical examples ofquantitative applications of MALDI-TOFMS have beenlimited. Most of the studies to date have focused on thequantification of low mass analytes, in particular, alka-loids or active ingredients in agricultural or food prod-ucts [40–45], whereas other studies have demonstratedthe potential of MALDI-TOFMS for the quantificationof biologically relevant analytes such as neuropeptides,proteins, antibiotics, or various metabolites in biologicaltissue or fluid [23, 27–29, 33, 35, 38, 46].
In earlier work we were able to show that linearcalibration curves could be generated by MALDI-TOFMS provided that an appropriate internal standard
Published online July 24, 2002Address reprint requests to Dr. M. W. Duncan, Department of Pharmaceu-tical Sciences, School of Pharmacy, C238, University of Colorado HealthSciences Center, Denver, CO 80262, USA. E-mail: [email protected]
© 2002 American Society for Mass Spectrometry. Published by Elsevier Science Inc. Received February 6, 20021044-0305/02/$20.00 Revised May 13, 2002PII S1044-0305(02)00426-9 Accepted May 13, 2002
was employed [33]. This standard can “correct” for bothsample-to-sample and shot-to-shot variability. Never-theless, our work was restricted to low mass analytes:The catecholamines, acetylcholine, and a peptide. Wewere severely hampered by the limited mass resolutionof our previous instrument (Finnigan Lasermat 2000),so it was only in those few instances where we couldcompletely resolve the analyte and internal standardthat satisfactory quantification was achievable. Stableisotope labeled internal standards (isotopomers) gavethe best result; when we employed a structural analogas the internal standard it was at the expense of bothaccuracy and precision.
With the marked improvement in resolution avail-able on modern commercial instruments, primarilybecause of delayed extraction [47, 48], the opportunityto extend quantitative work to other examples is nowpossible; not only of low mass analytes, but alsobiopolymers. Of particular interest to us is the prospectof absolute multi-component quantification in biologi-cal samples (e.g., proteomics applications).
This study explores the utility of MALDI-TOFMS forthe quantification of five different biomolecules in bio-logical tissue or fluid: homovanillic acid in humanurine; catecholamines (epinephrine and norepineph-rine) in human adrenal tissue; insulin in human pan-creatic tissue; LVV-hemorphin-7 in human adrenalgland; and growth hormone in the rat pituitary gland.These samples cover a wide mass range and representpractical examples of quantification in complex real-world biological matrices.
Methods
Materials and Reagents
Trifluoroacetic acid (TFA), norepinephrine hydrochlo-ride, homovanillic acid (HVA), �-lactoglobulin, 4-hy-droxy-3-methoxycinnamic acid (ferulic acid), porcineinsulin, and bovine serum albumin (BSA) were allobtained from Sigma Chemical Co. (Sydney, NSW, Aus-tralia). Recombinant methionyl rat growth hormone (met-rGH, �97% monomer; 21,943 Da) was purchased fromGropep Pty. Ltd. (Adelaide, SA, Australia). Epinephrine,�-cyano-4-hydroxycinnamic acid (4HCCA), 2,5-dihy-droxybenzoic acid (DHB), and 3,5-dimethoxy-4-hydroxy-cinnamic acid (sinapinic acid) were obtained from AldrichChemical Co., Inc. (Milwaukee, WI). Caffeic acid waspurchased from ICN Biomedical Inc. (Aurora, OH). Syn-thetic rat LVV-hemorphin-7 (H–LVVYPQWTQRY–OH)and synthetic human LVV-hemorphin-7 (H–LVVYP-WTQRF–OH) were custom synthesized by Chiron Tech-nologies Pty., Ltd. (Clayton, Victoria, Australia). DL-Norepinephrine-���-[2H3]�HCl and 4-hydroxy-3-methoxyphenyl-2,5,6-[2H3]-acetic-2,2-[2H2] acid ([2H5]-HVA) were obtained from Merck and Co., Inc.,(Rahway, NJ). DL-Epinephrine-���-[2H3] was a gener-ous gift from Cambridge Isotope Laboratories (An-dover, MA). Crystalline human insulin monocompo-
nent (CSL, Melbourne, Australia) was a gift from Assoc.Professor B. E. Tuch, Prince of Wales Hospital, Sydney,Australia. All other solvents and reagents were of thehighest grade available, and were obtained from com-mercial suppliers. Water was purified by a Milliporewater purification system and had a resistivity �18M�/cm.
Sep-Pak C18 Cartridges (Waters Corporation, Mil-ford, MA) were preconditioned with CH3CN:H2O:TFA(80:20:0.1; 5 mL), and washed with dilute aqueous TFA(0.1%; 10 mL) prior to use.
Sample Preparation
MALDI matrices and sample plate preparation. Sinapinicacid (5 mg/mL), 4HCCA (5 mg/mL), and caffeic acid(10 mg/mL) were prepared in CH3CN:H2O:TFA (80:20:0.1). Ferulic acid (5 mg/mL) and DHB (10 mg/mL)were prepared in 100% CH3CN.
All of the samples analyzed in this study were mixedwith the MALDI matrix solution immediately prior toanalysis. For those samples stored frozen, fresh dilu-tions were made immediately before analysis. Aliquots(0.5–1 �L) were applied to between 10 and 20 samplepositions on a 100 position flat MALDI target (Persep-tive Biosystems, Framingham, MA). Samples weredried at room temperature and pressure. The number oftarget positions used for each sample was chosen toprovide a suitable compromise between precision andanalytical speed.
Preparation of tissue extracts. Tissue slices (ca. 5–10 mg)were shaved from frozen sections and accuratelyweighed. The samples were macerated mechanically inaqueous TFA (0.1%; 10 mg/mL) and an ultrasonicprobe was then employed to completely disrupt theresidual tissue. Internal standards were added and thesample mixed thoroughly. Samples were then centri-fuged (14,000 g, 15 min) and the supernatant collectedand stored.
ANALYSIS OF GROWTH HORMONE IN RAT PITUITARY
TISSUE. Male Sprague-Dawley rats �300 g bodyweight) were decapitated and their pituitary glands (ca.15–20 mg) were surgically removed and stored at �20°C until required. Whole glands were extracted inaqueous TFA (0.1%; 1.5 mL), and the internal standard�-lactoglobulin (15 nmol) was then added. Standardsolutions containing met-rGH (0, 10, 20, 40, 100, 150,and 200 pmol) and �-lactoglobulin (100 pmol) wereprepared in aqueous TFA (0.1%; 20 �L) to generate thestandard curve. Standard solutions and samples werethen diluted 1:5 in caffeic acid solution before analysis.Met-rGH was used in place of human growth hormone(hGH) in the standards because it was readily accessi-ble. We assumed that equal amounts of rat growthhormone (rGH) and N-terminal methionyl rat growthhormone (met-rGH) on target yield the same ion cur-rent.
1016 BUCKNALL ET AL. J Am Soc Mass Spectrom 2002, 13, 1015–1027
ANALYSIS OF INSULIN IN HUMAN PANCREATIC TISSUE.
Control human pancreatic tissue was obtained fromcadavers (n � 2) and frozen at �20 °C until analysis.[Pancreas 1 was obtained from a 40 year old male roadtraffic accident victim and pancreas 2 was from a 60year old female who had suffered a subarachnoidhemorrhage.] These tissues (3 � ca. 50 mg lots of each)were solubilized in dilute aqueous TFA (0.1%; 1 mL)with the addition of porcine insulin (2.5 nmol) as theinternal standard. The extracts were passed throughpreconditioned C18 Sep-Pak cartridges, washed withaqueous TFA (0.1%; 5 mL), and the insulin was elutedin CH3CN:H2O:TFA (80:20:0.1; 1 mL). Eluents wereevaporated under reduced pressure to yield aliquots ofca. 50 �L. These were mixed and diluted 1:20 insinapinic acid matrix solution and 1 �L aliquots appliedto the MALDI target. Standard solutions containinghuman insulin (0, 40, 120, 400, 1200, 2800, 4000 pmol)and porcine insulin (200 pmol) were prepared in aque-ous TFA (0.1%; 20 �L; containing 5 nmol/mL BSA).
ANALYSIS OF HEMORPHINS AND CATECHOLAMINES IN
HUMAN ADRENAL AND PHEOCHROMOCYTOMA TISSUE.
Hemorphins. Extracts of control adrenal glands (n � 10)and surgically removed, histologically verified pheo-chromocytoma (n � 3) had previously been prepared asdescribed above, but with the addition of proteaseinhibitors. Hemorphin content was determined by elec-trospray MS at that time [49]. The extracts were thenstored at �20 °C until the present study. These sameextracts were thawed, mixed with rat LVV-hemor-phin-7 (300 pmol/mg tissue, internal standard), diluted1:30 with 4HCCA solution and then analyzed byMALDI-TOFMS.
A single tissue extract, previously found to have thelowest LVV-hemorphin-7 concentration, was employedas the sample matrix for the preparation of a standardaddition calibration curve. Aliquots of this sample werespiked with human LVV-hemorphin-7 (0, 10, 30, 60,100, 300, and 600 pmol/mg tissue) and a fixed amountof rat LVV-hemorphin-7 (300 pmol/mg tissue).
Control samples (n � 3) were also included in theanalysis. These were prepared from each of the pheo-chromocytoma extracts by adding internal standardand spiking with human LVV-hemorphin-7 (100pmol/mg tissue).
Catecholamines. Frozen tissue samples (�70 °C; ca.100 mg each) from control adrenal glands (n � 3) andhistologically verified pheochromocytoma (n � 3) wereextracted into aqueous TFA (0.1%, 1 mL) as previouslydescribed.
Aliquots (10 �L) from each tissue extract were mixedwith the internal standards (i.e., [2H3]-epinephrine {2nmol} and [2H3]-norepinephrine {3 nmol}). The sampleswere then diluted 1:25 in ferulic acid matrix solution,mixed, cooled to 4 °C for 10 min and centrifuged (14,000g, 10 min.) to precipitate protein. Aliquots (0.25 �L) ofthe supernatant were loaded directly on the MALDItarget for analysis.
An extract of surgically resected adrenal cortex wasemployed as the sample matrix for the preparation of astandard addition calibration curve. Aliquots of thissample, each corresponding to 5 mg of tissue, werespiked with 0, 0.5, 1.5, 3, 5, 15, 30, 45, 60, and 90 nmol ofboth epinephrine and norepinephrine, together withfixed amounts of the internal standards ([2H3]-epineph-rine {20 nmol} and [2H3]-norepinephrine {30 nmol}).These spiked extracts were diluted 1:25 in ferulic acidsolution prior to analysis.
ANALYSIS OF HOMOVANILLIC ACID IN HUMAN URINE
SAMPLES. Urine samples were collected from 19healthy volunteers and adjusted to pH 2.5. The internalstandard, [2H5]-HVA (100 nmol) was added to aliquotsof each sample (50 �L) and the mixture was extractedinto ethyl acetate (four volumes, three times). Extractswere combined, taken to dryness under reduced pres-sure and the residue reconstituted in dilute HCl (0.1 M,50 �L). Samples were diluted 1:10 in DHB matrixsolution and were then spotted on to the MALDI target.Each urine sample was also independently analyzed forHVA content at a commercial clinical chemistry labora-tory.
Standard solutions containing HVA (0, 25, 50, 100,500, and 1000 pmol) and [2H5]-HVA (100 pmol) wereprepared in water and diluted 1:5 in DHB matrixsolution prior to analysis (final volume 20 �L).
Mass Spectrometry
Equipment. A Perseptive Voyager DE STR MALDItime-of-flight mass spectrometer (Perseptive Biosys-tems, Framingham, MA), equipped with a TektronixTDS 540C digital oscilloscope (500 MHz, digitizationrate 2 Gigasamples/s) was used for all mass spectro-metry. The instrument was used in both positive ionlinear (LDE) and reflector (RDE) modes with delayedextraction.
Data acquisition parameters. Samples were run in theautosampler mode and the laser was operated at a fixedfluence that was manually optimized for each sampleset. Optimization involved obtaining peaks with thehighest possible signal to noise ratio without significantpeak broadening. Laser firing patterns started at thecenter of each sample spot and spiraled progressivelyoutwards to a notional spot perimeter. The laser firedbetween 1 and 16 times at each location in the firingpattern. For each sample spot, spectra meeting accep-tance criteria (i.e., minimum and maximum peak inten-sity thresholds) obtained from 256 laser shots wereaveraged to form a single spectrum. The parametersused for the analysis of each sample are summarized inTable 1. Between 10 and 20 sample spots were analyzedfor each standard solution and biological sample.
For the hemorphin assay, the instrument was pro-grammed to fire multiple laser shots at a single point onthe sample spot, averaging the intensity of the compos-
1017J Am Soc Mass Spectrom 2002, 13, 1015–1027 QUANTITATIVE MALDI-TOFMS
ite spectrum in the digitizer, before downloading it to thecomputer. The computer compared the spectrum withuser-defined minimum and maximum absolute intensitycriteria, and then either accepted or rejected each spec-trum. If the full range of signal intensities is acquired,individual spectra with high ion intensities for either theanalyte or internal standard can dominate averaged peakratio statistics in the final spectrum. To minimize thisproblem, the hemorphin data were acquired using a smallnumber of laser shots per position (eight shots) with themaximum intensity set to approximately one quarter ofthe saturation limit. This approach reduced the availableinstrument dynamic range, but kept analysis times rea-sonably short (3 to 6 min per sample spot). Because wewere only interested in calibration over a dynamic rangeof two orders of magnitude, this approach did not com-promise the study.
An alternative approach, used for the HVA assay,excludes saturated data from the final spectrum andallows the instrument’s full dynamic range to be uti-lized. Data from individual laser shots are downloadedfrom the digitizer and signal intensity compared with auser-defined maximum intensity threshold set just be-low the saturation limit. This approach completelyeliminates saturated data without compromising thedynamic range.
Mass calibration
GROWTH HORMONE. Spectra were externally masscalibrated on the singly and doubly charged molecularspecies of �-lactoglobulin ([M � H]� � 18,364.4 Da and[M � 2H]2� � 9182.7 Da).
INSULIN. Insulin spectra acquired in LDE modewere externally calibrated on the (average) mass of thesingly protonated molecule of porcine insulin ([M �H]� � 5778.7 Da). Each spectrum acquired in RDEmode was internally calibrated to correctly identify themonoisotopic species in each insulin peak cluster. Eachmass spectrum was heavily smoothed (Savitsky-Golay,second order polynomial, 150 points) to produce asingle peak for porcine insulin. The centroid of thispeak ([M � H]� � 5778.7 Da) was used to calibrate theoriginal isotopically resolved data.
HEMORPHINS. The mass spectrometer was exter-nally calibrated using the monoisotopic protonated
molecular ion of substance P ([M � H]� � 1347.7 Da).All data were acquired in LDE mode.
CATECHOLAMINES AND HOMOVANILLIC ACID. Cat-echolamine and HVA data were acquired in RDE modeat reduced accelerating voltage (7 kV). For the cat-echolamines, each spectrum was internally calibratedon the protonated molecules of [2H3]-epinephrine([M � H]� � 187.1162) and [2H3]-norepinephrine ([M �H]� � 173.1005). For homovanillic acid, spectra wereinternally mass calibrated on the molecular ion of[2H5]-HVA (M� � 187.0893 Da) and the singly proton-ated molecule of DHB (M� � 154.0266 Da).
Data processing and calibration curves. Individual spec-tra were obtained for the analysis of each sample spotand the heights of the relevant peaks were determined.The analyte to internal standard peak height ratio wascalculated for each spectrum and then the mean valueand standard deviation were determined for each sam-ple and standard. For homovanillic acid, peak arearatios of analyte/internal standard were also deter-mined to construct a calibration curve and to determineits concentration in urine.
Calibration curves were constructed by plottingmean values for the observed signal intensity ratioagainst the nominal molar ratio. The calibration curveswere used to determine the concentration of each ana-lyte in its respective biological matrix.
The RDE data obtained for insulin were processed in aspecific manner. The peak heights of the first eight iso-topes of human insulin (5804.7 to 5811.7 Da) were re-corded and summed. Similarly, the peak heights of thecorresponding ions (5774.7 to 5781.7 Da) in the porcineinsulin isotope cluster were recorded and summed. Thecalibration curve was obtained by plotting the ratio ofsummed analyte peak heights to summed internal stan-dard peak heights against their nominal molar ratio.
Results and Discussion
Analysis of Growth Hormone in Rat PituitaryTissue
Growth hormone in rat pituitary tissue (n � 2) wassuccessfully quantified using �-lactoglobulin as theinternal standard. Figure 1 shows a MALDI mass spec-trum of rat pituitary extract spiked with �-lactoglobulin
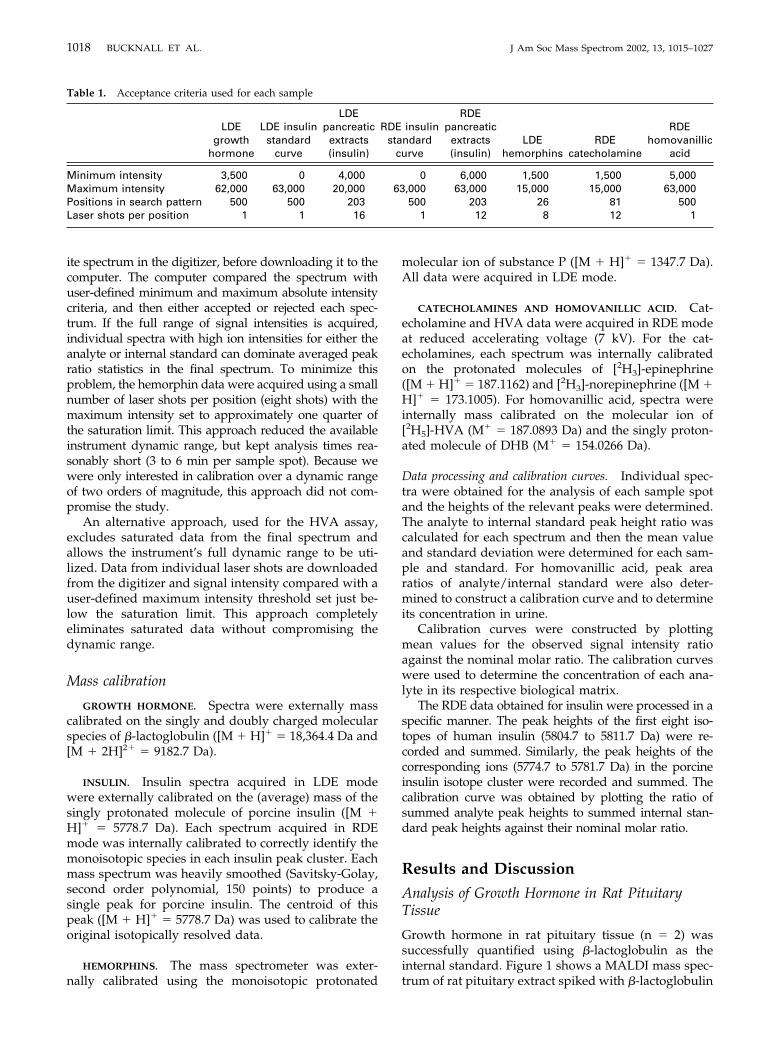
Table 1. Acceptance criteria used for each sample
LDEgrowth
hormone
LDE insulinstandard
curve
LDEpancreatic
extracts(insulin)
RDE insulinstandard
curve
RDEpancreatic
extracts(insulin)
LDEhemorphins
RDEcatecholamine
RDEhomovanillic
acid
Minimum intensity 3,500 0 4,000 0 6,000 1,500 1,500 5,000Maximum intensity 62,000 63,000 20,000 63,000 63,000 15,000 15,000 63,000Positions in search pattern 500 500 203 500 203 26 81 500Laser shots per position 1 1 16 1 12 8 12 1
1018 BUCKNALL ET AL. J Am Soc Mass Spectrom 2002, 13, 1015–1027
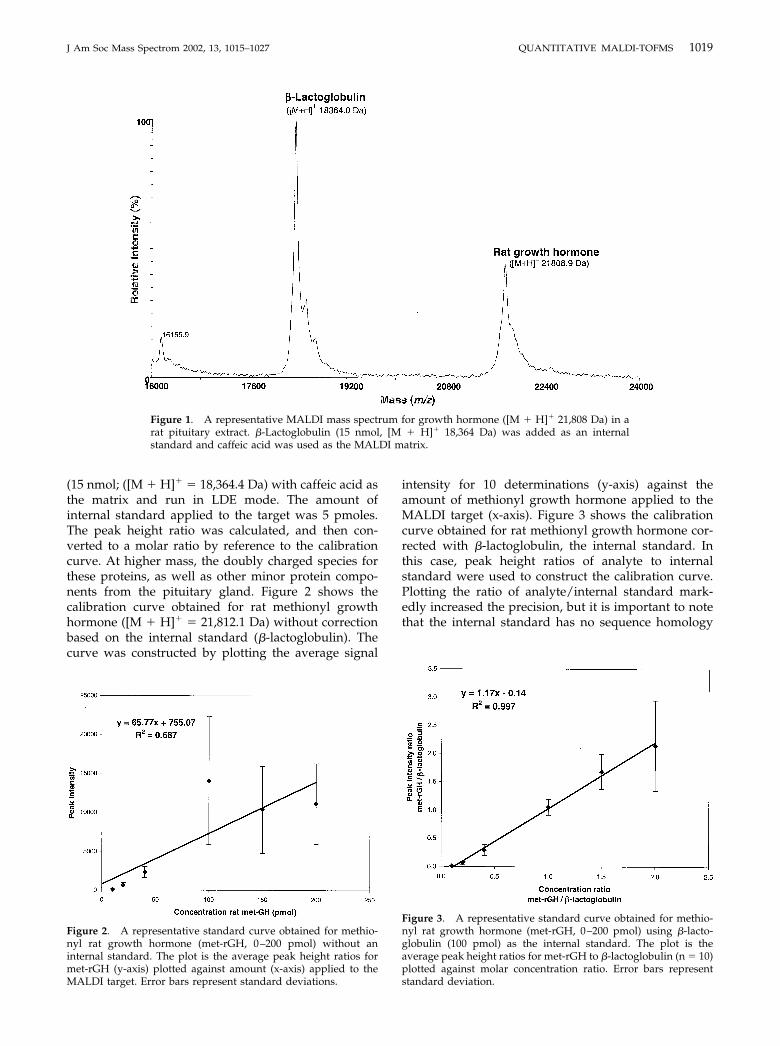
(15 nmol; ([M � H]� � 18,364.4 Da) with caffeic acid asthe matrix and run in LDE mode. The amount ofinternal standard applied to the target was 5 pmoles.The peak height ratio was calculated, and then con-verted to a molar ratio by reference to the calibrationcurve. At higher mass, the doubly charged species forthese proteins, as well as other minor protein compo-nents from the pituitary gland. Figure 2 shows thecalibration curve obtained for rat methionyl growthhormone ([M � H]� � 21,812.1 Da) without correctionbased on the internal standard (�-lactoglobulin). Thecurve was constructed by plotting the average signal
intensity for 10 determinations (y-axis) against theamount of methionyl growth hormone applied to theMALDI target (x-axis). Figure 3 shows the calibrationcurve obtained for rat methionyl growth hormone cor-rected with �-lactoglobulin, the internal standard. Inthis case, peak height ratios of analyte to internalstandard were used to construct the calibration curve.Plotting the ratio of analyte/internal standard mark-edly increased the precision, but it is important to notethat the internal standard has no sequence homology
Figure 1. A representative MALDI mass spectrum for growth hormone ([M � H]� 21,808 Da) in arat pituitary extract. �-Lactoglobulin (15 nmol, [M � H]� 18,364 Da) was added as an internalstandard and caffeic acid was used as the MALDI matrix.
Figure 2. A representative standard curve obtained for methio-nyl rat growth hormone (met-rGH, 0–200 pmol) without aninternal standard. The plot is the average peak height ratios formet-rGH (y-axis) plotted against amount (x-axis) applied to theMALDI target. Error bars represent standard deviations.
Figure 3. A representative standard curve obtained for methio-nyl rat growth hormone (met-rGH, 0–200 pmol) using �-lacto-globulin (100 pmol) as the internal standard. The plot is theaverage peak height ratios for met-rGH to �-lactoglobulin (n � 10)plotted against molar concentration ratio. Error bars representstandard deviation.
1019J Am Soc Mass Spectrom 2002, 13, 1015–1027 QUANTITATIVE MALDI-TOFMS
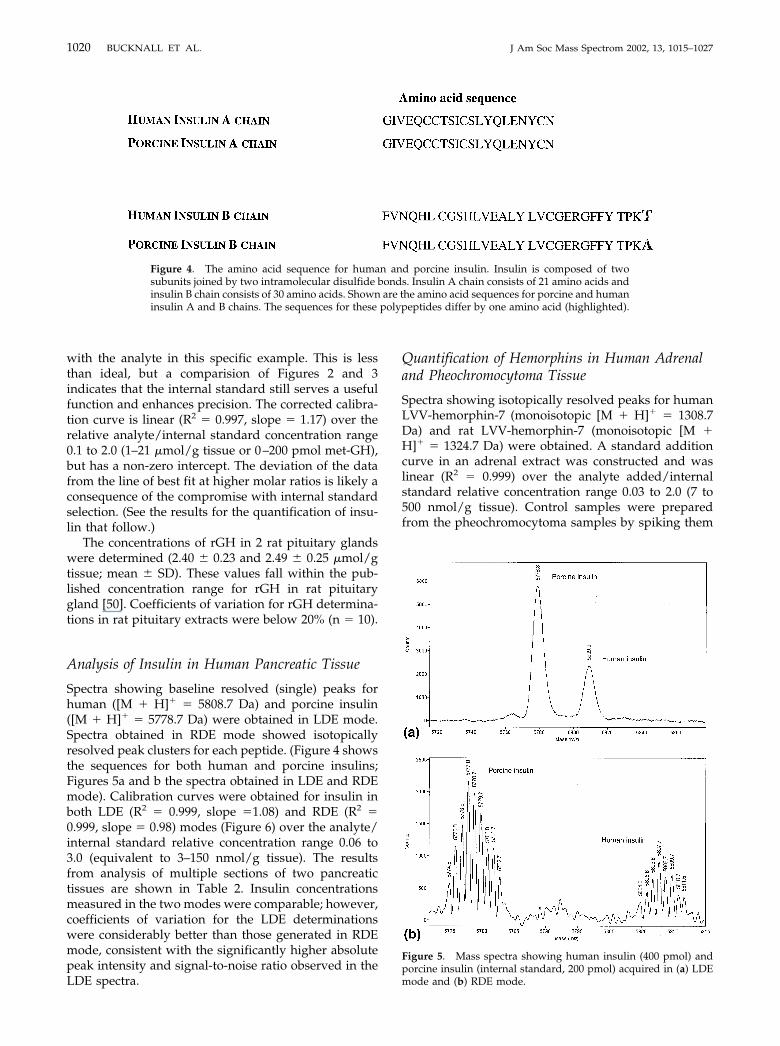
with the analyte in this specific example. This is lessthan ideal, but a comparision of Figures 2 and 3indicates that the internal standard still serves a usefulfunction and enhances precision. The corrected calibra-tion curve is linear (R2 � 0.997, slope � 1.17) over therelative analyte/internal standard concentration range0.1 to 2.0 (1–21 �mol/g tissue or 0–200 pmol met-GH),but has a non-zero intercept. The deviation of the datafrom the line of best fit at higher molar ratios is likely aconsequence of the compromise with internal standardselection. (See the results for the quantification of insu-lin that follow.)
The concentrations of rGH in 2 rat pituitary glandswere determined (2.40 � 0.23 and 2.49 � 0.25 �mol/gtissue; mean � SD). These values fall within the pub-lished concentration range for rGH in rat pituitarygland [50]. Coefficients of variation for rGH determina-tions in rat pituitary extracts were below 20% (n � 10).
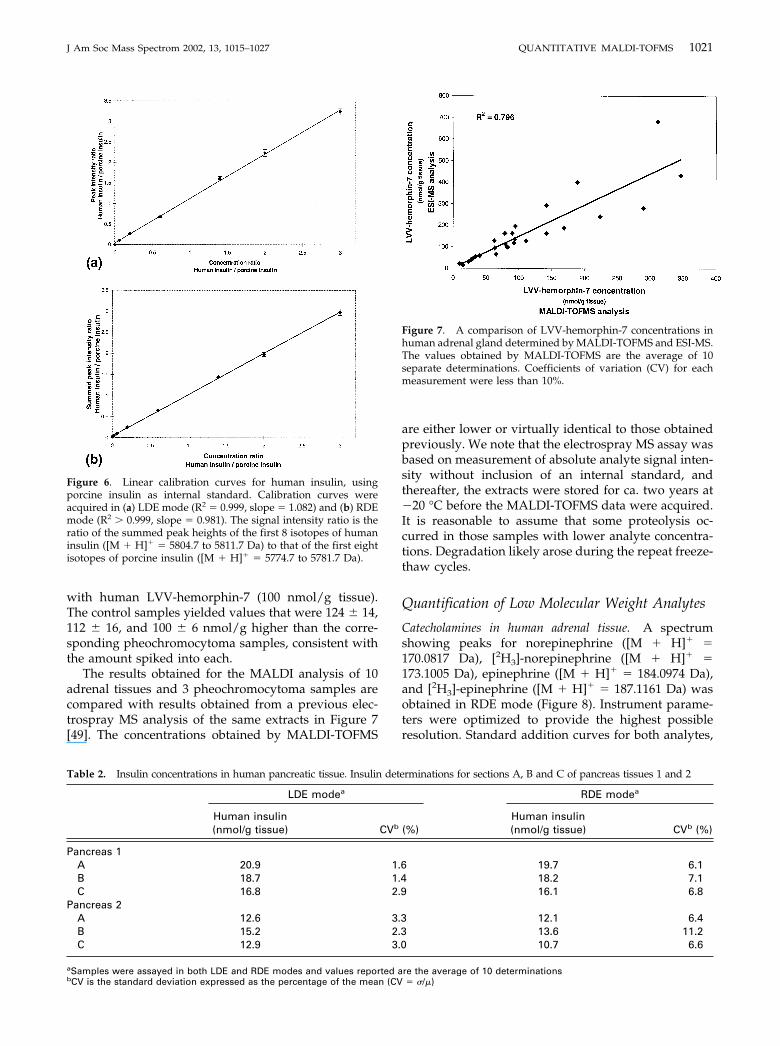
Analysis of Insulin in Human Pancreatic Tissue
Spectra showing baseline resolved (single) peaks forhuman ([M � H]� � 5808.7 Da) and porcine insulin([M � H]� � 5778.7 Da) were obtained in LDE mode.Spectra obtained in RDE mode showed isotopicallyresolved peak clusters for each peptide. (Figure 4 showsthe sequences for both human and porcine insulins;Figures 5a and b the spectra obtained in LDE and RDEmode). Calibration curves were obtained for insulin inboth LDE (R2 � 0.999, slope �1.08) and RDE (R2 �0.999, slope � 0.98) modes (Figure 6) over the analyte/internal standard relative concentration range 0.06 to3.0 (equivalent to 3–150 nmol/g tissue). The resultsfrom analysis of multiple sections of two pancreatictissues are shown in Table 2. Insulin concentrationsmeasured in the two modes were comparable; however,coefficients of variation for the LDE determinationswere considerably better than those generated in RDEmode, consistent with the significantly higher absolutepeak intensity and signal-to-noise ratio observed in theLDE spectra.
Quantification of Hemorphins in Human Adrenaland Pheochromocytoma Tissue
Spectra showing isotopically resolved peaks for humanLVV-hemorphin-7 (monoisotopic [M � H]� � 1308.7Da) and rat LVV-hemorphin-7 (monoisotopic [M �H]� � 1324.7 Da) were obtained. A standard additioncurve in an adrenal extract was constructed and waslinear (R2 � 0.999) over the analyte added/internalstandard relative concentration range 0.03 to 2.0 (7 to500 nmol/g tissue). Control samples were preparedfrom the pheochromocytoma samples by spiking them
Figure 4. The amino acid sequence for human and porcine insulin. Insulin is composed of twosubunits joined by two intramolecular disulfide bonds. Insulin A chain consists of 21 amino acids andinsulin B chain consists of 30 amino acids. Shown are the amino acid sequences for porcine and humaninsulin A and B chains. The sequences for these polypeptides differ by one amino acid (highlighted).
Figure 5. Mass spectra showing human insulin (400 pmol) andporcine insulin (internal standard, 200 pmol) acquired in (a) LDEmode and (b) RDE mode.
1020 BUCKNALL ET AL. J Am Soc Mass Spectrom 2002, 13, 1015–1027
with human LVV-hemorphin-7 (100 nmol/g tissue).The control samples yielded values that were 124 � 14,112 � 16, and 100 � 6 nmol/g higher than the corre-sponding pheochromocytoma samples, consistent withthe amount spiked into each.
The results obtained for the MALDI analysis of 10adrenal tissues and 3 pheochromocytoma samples arecompared with results obtained from a previous elec-trospray MS analysis of the same extracts in Figure 7[49]. The concentrations obtained by MALDI-TOFMS
are either lower or virtually identical to those obtainedpreviously. We note that the electrospray MS assay wasbased on measurement of absolute analyte signal inten-sity without inclusion of an internal standard, andthereafter, the extracts were stored for ca. two years at�20 °C before the MALDI-TOFMS data were acquired.It is reasonable to assume that some proteolysis oc-curred in those samples with lower analyte concentra-tions. Degradation likely arose during the repeat freeze-thaw cycles.
Quantification of Low Molecular Weight Analytes
Catecholamines in human adrenal tissue. A spectrumshowing peaks for norepinephrine ([M � H]� �170.0817 Da), [2H3]-norepinephrine ([M � H]� �173.1005 Da), epinephrine ([M � H]� � 184.0974 Da),and [2H3]-epinephrine ([M � H]� � 187.1161 Da) wasobtained in RDE mode (Figure 8). Instrument parame-ters were optimized to provide the highest possibleresolution. Standard addition curves for both analytes,
Figure 6. Linear calibration curves for human insulin, usingporcine insulin as internal standard. Calibration curves wereacquired in (a) LDE mode (R2 � 0.999, slope � 1.082) and (b) RDEmode (R2 � 0.999, slope � 0.981). The signal intensity ratio is theratio of the summed peak heights of the first 8 isotopes of humaninsulin ([M � H]� � 5804.7 to 5811.7 Da) to that of the first eightisotopes of porcine insulin ([M � H]� � 5774.7 to 5781.7 Da).
Table 2. Insulin concentrations in human pancreatic tissue. Insulin determinations for sections A, B and C of pancreas tissues 1 and 2
LDE modea RDE modea
Human insulin(nmol/g tissue) CVb (%)
Human insulin(nmol/g tissue) CVb (%)
Pancreas 1A 20.9 1.6 19.7 6.1B 18.7 1.4 18.2 7.1C 16.8 2.9 16.1 6.8
Pancreas 2A 12.6 3.3 12.1 6.4B 15.2 2.3 13.6 11.2C 12.9 3.0 10.7 6.6
aSamples were assayed in both LDE and RDE modes and values reported are the average of 10 determinationsbCV is the standard deviation expressed as the percentage of the mean (CV � �/�)
Figure 7. A comparison of LVV-hemorphin-7 concentrations inhuman adrenal gland determined by MALDI-TOFMS and ESI-MS.The values obtained by MALDI-TOFMS are the average of 10separate determinations. Coefficients of variation (CV) for eachmeasurement were less than 10%.
1021J Am Soc Mass Spectrom 2002, 13, 1015–1027 QUANTITATIVE MALDI-TOFMS

prepared in an extract of surgically resected adrenalcortex, were assayed in ferulic acid matrix. The curveswere linear over the analyte added/internal standardrelative concentration ranges 0.02 to 2.0 for norepineph-rine (R2 � 0.998) and 0.025 to 4.5 for epinephrine (R2 �0.999).
Table 3 shows the results for the analysis of threesections of whole adrenal tissue and 3 pheochromocy-toma samples. Initially, norepinephrine analyte/inter-nal standard peak height ratios for the pheochromocy-toma samples were higher than those obtained for thehighest standard in the calibration curve. The extractsfor these samples were reanalyzed using a higherconcentration (3 nmol/�L extract) of the internal stan-dard.
The catecholamine spectrum shown in Figure 8 illus-trates the additional specificity available in RDE modefor low molecular weight analytes. This is importantbecause in several samples, the signal for norepineph-
rine ([M � H]� � 170.0817 Da) was not the most intenseat the nominal mass value of 170 Da. It was onlypossible to accurately quantify norepinephrine in theadrenal tissue extracts because its signal could be com-pletely resolved from other peaks of the same nominalmass. When spectra were internally calibrated, massassignments for both catecholamines were accurate tobetter than 5 ppm. This limits possible elemental com-positions to a unique formula, or just a few alternatives.
Homovanillic acid in human urine. Spectra showing sig-nals for the protonated molecule of HVA (M� �182.0579 Da) and [2H5]-HVA (M� � 187.0893 Da) wereobtained in RDE mode. Linear calibration curves wereconstructed for the analyte/internal standard relativeconcentration range 0 to 10 using either peak heightratios or peak area ratios (peak height ratios: R2 � 0.999,slope � 0.972; peak area ratios: R2 � 0.999, slope �1.055). (The spectra were of comparable resolution and
Figure 8. A representative MALDI-TOF mass spectrum for norepinephrine ([M � H]� � 170.0817Da) and epinephrine ([M � H]� � 184.0974 Da) and their respective internal standards [2H3]-norepinephrine ([M � H]� � 173.1005 Da), [2H3]-epinephrine ([M � H]� � 187.1162 Da) in humanadrenal extracts. The spectrum was acquired in RDE mode.
Table 3. Catecholamine concentrations in human adrenal gland
Sample
Norepinephrinea Epinephrine
Mean value(nmol/g tissue) CV (%)
Mean value(nmol/g tissue) CV (%)
Adrenal gland A 233 16 279 6Adrenal gland B 510 13 582 10Adrenal gland C 499 17 690 19Pheochromocytoma 1 3,989 7 184 16Pheochromocytoma 2 6,708 8 2,854 8Pheochromocytoma 3 59,940 5 5,735 4
aThe norepinephrine data for all pheochromocytoma samples were obtained using higher concentrations of the internal standards ([2H3]-norepinephrine, i.e., 3 nmol/�L extracts).
1022 BUCKNALL ET AL. J Am Soc Mass Spectrom 2002, 13, 1015–1027
mass accuracy to those obtained for epinephrine andnorepinephrine in tissue extracts.)
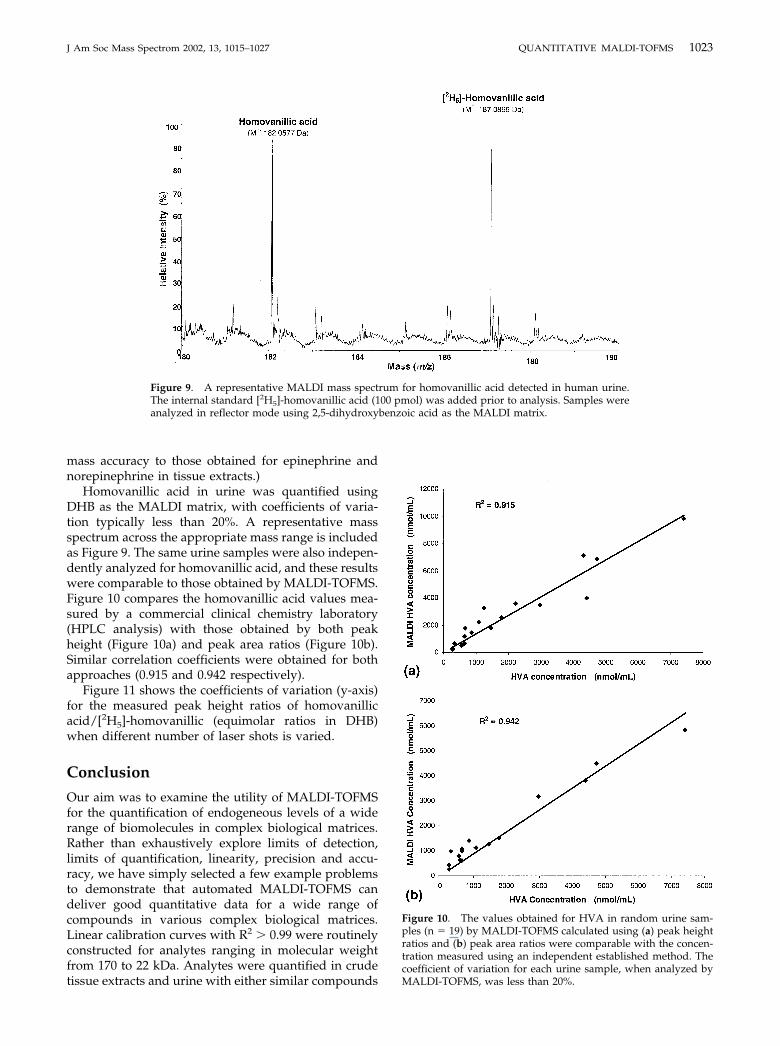
Homovanillic acid in urine was quantified usingDHB as the MALDI matrix, with coefficients of varia-tion typically less than 20%. A representative massspectrum across the appropriate mass range is includedas Figure 9. The same urine samples were also indepen-dently analyzed for homovanillic acid, and these resultswere comparable to those obtained by MALDI-TOFMS.Figure 10 compares the homovanillic acid values mea-sured by a commercial clinical chemistry laboratory(HPLC analysis) with those obtained by both peakheight (Figure 10a) and peak area ratios (Figure 10b).Similar correlation coefficients were obtained for bothapproaches (0.915 and 0.942 respectively).
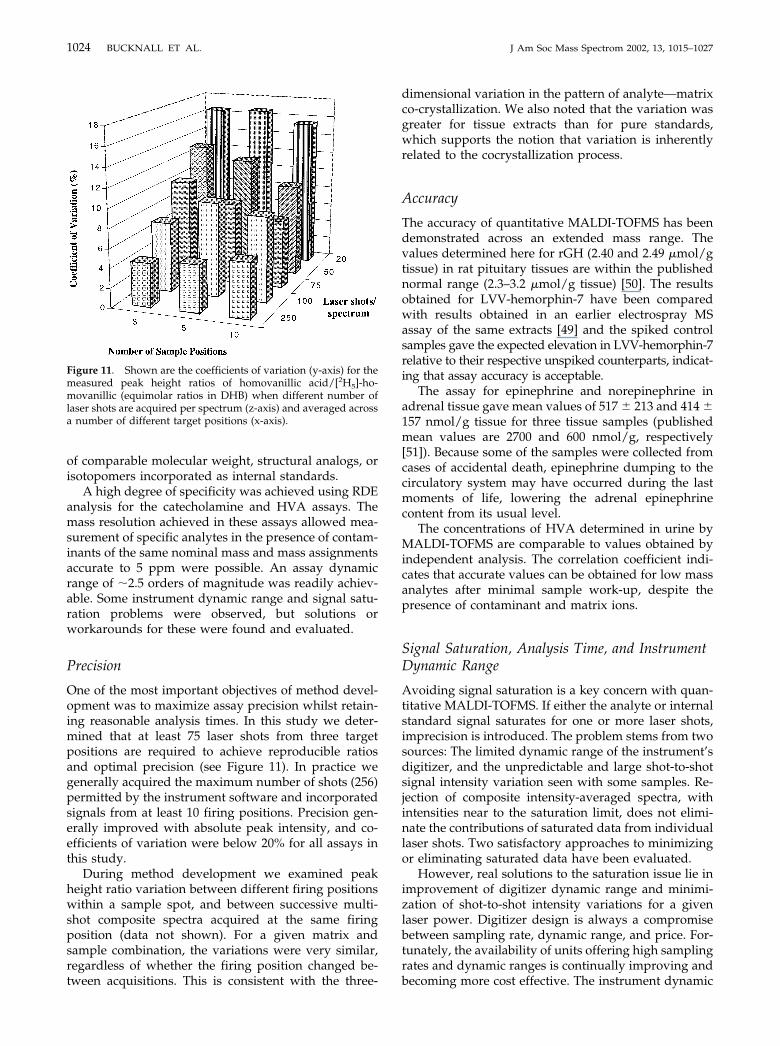
Figure 11 shows the coefficients of variation (y-axis)for the measured peak height ratios of homovanillicacid/[2H5]-homovanillic (equimolar ratios in DHB)when different number of laser shots is varied.
Conclusion
Our aim was to examine the utility of MALDI-TOFMSfor the quantification of endogeneous levels of a widerange of biomolecules in complex biological matrices.Rather than exhaustively explore limits of detection,limits of quantification, linearity, precision and accu-racy, we have simply selected a few example problemsto demonstrate that automated MALDI-TOFMS candeliver good quantitative data for a wide range ofcompounds in various complex biological matrices.Linear calibration curves with R2 � 0.99 were routinelyconstructed for analytes ranging in molecular weightfrom 170 to 22 kDa. Analytes were quantified in crudetissue extracts and urine with either similar compounds
Figure 9. A representative MALDI mass spectrum for homovanillic acid detected in human urine.The internal standard [2H5]-homovanillic acid (100 pmol) was added prior to analysis. Samples wereanalyzed in reflector mode using 2,5-dihydroxybenzoic acid as the MALDI matrix.
Figure 10. The values obtained for HVA in random urine sam-ples (n � 19) by MALDI-TOFMS calculated using (a) peak heightratios and (b) peak area ratios were comparable with the concen-tration measured using an independent established method. Thecoefficient of variation for each urine sample, when analyzed byMALDI-TOFMS, was less than 20%.
1023J Am Soc Mass Spectrom 2002, 13, 1015–1027 QUANTITATIVE MALDI-TOFMS
of comparable molecular weight, structural analogs, orisotopomers incorporated as internal standards.
A high degree of specificity was achieved using RDEanalysis for the catecholamine and HVA assays. Themass resolution achieved in these assays allowed mea-surement of specific analytes in the presence of contam-inants of the same nominal mass and mass assignmentsaccurate to 5 ppm were possible. An assay dynamicrange of �2.5 orders of magnitude was readily achiev-able. Some instrument dynamic range and signal satu-ration problems were observed, but solutions orworkarounds for these were found and evaluated.
Precision
One of the most important objectives of method devel-opment was to maximize assay precision whilst retain-ing reasonable analysis times. In this study we deter-mined that at least 75 laser shots from three targetpositions are required to achieve reproducible ratiosand optimal precision (see Figure 11). In practice wegenerally acquired the maximum number of shots (256)permitted by the instrument software and incorporatedsignals from at least 10 firing positions. Precision gen-erally improved with absolute peak intensity, and co-efficients of variation were below 20% for all assays inthis study.
During method development we examined peakheight ratio variation between different firing positionswithin a sample spot, and between successive multi-shot composite spectra acquired at the same firingposition (data not shown). For a given matrix andsample combination, the variations were very similar,regardless of whether the firing position changed be-tween acquisitions. This is consistent with the three-
dimensional variation in the pattern of analyte—matrixco-crystallization. We also noted that the variation wasgreater for tissue extracts than for pure standards,which supports the notion that variation is inherentlyrelated to the cocrystallization process.
Accuracy
The accuracy of quantitative MALDI-TOFMS has beendemonstrated across an extended mass range. Thevalues determined here for rGH (2.40 and 2.49 �mol/gtissue) in rat pituitary tissues are within the publishednormal range (2.3–3.2 �mol/g tissue) [50]. The resultsobtained for LVV-hemorphin-7 have been comparedwith results obtained in an earlier electrospray MSassay of the same extracts [49] and the spiked controlsamples gave the expected elevation in LVV-hemorphin-7relative to their respective unspiked counterparts, indicat-ing that assay accuracy is acceptable.
The assay for epinephrine and norepinephrine inadrenal tissue gave mean values of 517 � 213 and 414 �157 nmol/g tissue for three tissue samples (publishedmean values are 2700 and 600 nmol/g, respectively[51]). Because some of the samples were collected fromcases of accidental death, epinephrine dumping to thecirculatory system may have occurred during the lastmoments of life, lowering the adrenal epinephrinecontent from its usual level.
The concentrations of HVA determined in urine byMALDI-TOFMS are comparable to values obtained byindependent analysis. The correlation coefficient indi-cates that accurate values can be obtained for low massanalytes after minimal sample work-up, despite thepresence of contaminant and matrix ions.
Signal Saturation, Analysis Time, and InstrumentDynamic Range
Avoiding signal saturation is a key concern with quan-titative MALDI-TOFMS. If either the analyte or internalstandard signal saturates for one or more laser shots,imprecision is introduced. The problem stems from twosources: The limited dynamic range of the instrument’sdigitizer, and the unpredictable and large shot-to-shotsignal intensity variation seen with some samples. Re-jection of composite intensity-averaged spectra, withintensities near to the saturation limit, does not elimi-nate the contributions of saturated data from individuallaser shots. Two satisfactory approaches to minimizingor eliminating saturated data have been evaluated.
However, real solutions to the saturation issue lie inimprovement of digitizer dynamic range and minimi-zation of shot-to-shot intensity variations for a givenlaser power. Digitizer design is always a compromisebetween sampling rate, dynamic range, and price. For-tunately, the availability of units offering high samplingrates and dynamic ranges is continually improving andbecoming more cost effective. The instrument dynamic
Figure 11. Shown are the coefficients of variation (y-axis) for themeasured peak height ratios of homovanillic acid/[2H5]-ho-movanillic (equimolar ratios in DHB) when different number oflaser shots are acquired per spectrum (z-axis) and averaged acrossa number of different target positions (x-axis).
1024 BUCKNALL ET AL. J Am Soc Mass Spectrom 2002, 13, 1015–1027
range issues discussed here are now being resolved byhardware improvements.
Selection of Appropriate Internal Standards
For peptides and proteins, instrument response be-comes less dependent on compound character as mo-lecular weight increases (provided that pI values arenot drastically different). �-Lactoglobulin and rGH arevery different but gave signals of similar intensity forequimolar solutions. By way of contrast, epinephrineand norepinephrine are relatively similar in structure,but the instrument molar response ratio is 10:1. Internalstandard selection is therefore critical at low mass, andhere stable isotopomers are clearly the ideal choice. Inadditional work (data not shown) we have comparedvariation in the analyte/internal standard ratio using2H versus 13C and 15N isotopomers. The variationsobserved were not dependent on the label, even in acomplex sample matrix.
Low Molecular Weight Species and Accurate MassDeterminations
Quantification of low molecular weight compounds byMALDI-TOFMS is potentially powerful and this wasillustrated in the assays for the catecholamines, inparticular, for norepinephrine. In all of the low molec-ular weight assays the spectra were acquired at thefastest sampling rate available on the digitizer. We alsoreduced the accelerating voltage from the usual 25 to 7kV. This gave ion intensities similar to those seen at fullaccelerating voltage but allowed a greater number ofdigital samples over the peaks of interest. In this waythe peak shape was better described and a more precisemass value was assigned.
Attributes of the Technique and Potential Areas ofApplication
The determination of unique elemental composition forunknown analytes, along with absolute quantitativedata may be valuable in both clinical and environmen-tal analyses. These situations often require speed, min-imal sample work-up, high specificity, and simplicity ofoperation. Precision is sometimes less of a concern. Forexample, in screening procedures where the analyte ispresent in huge excess for abnormal cases, and speed isvery important, quantification by MALDI-TOFMS mayoffer an ideal approach: Fast, specific, and sensitive.
Determinations involving high molecular weightbiomolecules—where electrospray mass spectrometrywould present complex spectra due to multiple charg-ing effects—quantitative MALDI-TOFMS can proveuseful. The predominance of the singly charged speciesin a complex mixture enables easier interpretation ofspectra, and the ability of MALDI-TOFMS to analyze
complex biological samples aids in eliminating the needfor chromatographic steps.
AcknowledgmentsThis work was funded in part by a grant from the AustralianResearch Council. The authors thank Cambridge Isotope Labora-tories for their generous support of this work through its stableisotope research grant program. They also thank: Mr. Ray Wil-liams for his support; Associate Professor Bernie Tuch for his giftof pancreatic tissues and human insulin standard; Dr. MinotiApta, Gastroenterology Unit, Prince of Wales Hospital (Sydney),for the rats used in this study; Professor John Hilton, Institute ofForensic Medicine (Sydney) for the supply of normal humanadrenal glands, and Dr. Lyn Tobiansky, Department of ClinicalPathology, St. Vincent’s Hospital (Sydney), for collection andclassification of pheochromocytoma.
References1. Marie, A.; Fournier, F.; Tabet, J. C. Characterization of Syn-
thetic Polymers by MALDI-TOF/MS: Investigation into NewMethods of Sample Target Preparation and Consequence onMass Spectrum Finger Print. Anal. Chem. 2000, 72, 5106–5114.
2. Wu, K. J.; Odom, R. W. Characterizing Synthetic Polymers byMALDI MS. Anal. Chem. 1998, 70, 456A–461A.
3. Zaluzec, E. J.; Gage, D. A.; Watson, J. T. Matrix-Assisted LaserDesorption Ionization Mass Spectrometry: Applications inPeptide and Protein Characterization. Protein Expr. Purif. 1995,6, 109–123.
4. Roepstorff, P. MALDI-TOF Mass Spectrometry in ProteinChemistry. Exs. 2000, 88, 81–97.
5. Nguyen, D. N.; Becker, G. W.; Riggin, R. M. Protein MassSpectrometry: Applications to Analytical Biotechnology.J. Chromatogr. A. 1995, 705, 21–45.
6. Miketova, P.; Schram, K. H. Mass Spectrometry of Nucleotidesand Oligonucleotides. Mol. Biotechnol. 1997, 8, 249–253.
7. Faulstich, K.; Worner, K.; Brill, H.; Engels, J. W. A SequencingMethod for RNA Oligonucleotides Based on Mass Spectro-metry. Anal. Chem. 1997, 69, 4349–4353.
8. Bentzley, C. M.; Johnston, M. V.; Larsen, B. S.; Gutteridge, S.Oligonucleotide Sequence and Composition Determined byMatrix-Assisted Laser Desorption/Ionization. Anal. Chem.1996, 68, 2141–2146.
9. Kanazawa, K.; Ashida, K.; Itoh, M.; Nagai, H.; Sasaki, H.;Fukuda, M. Establishment of a Method for Mapping ofN-Linked Oligosaccharides and Its Use to Analyze Industri-ally Produced Recombinant Erythropoietin. Biol. Pharm. Bull.1999, 22, 339–346.
10. Villanueva, J.; Canals, F.; Querol, E.; Aviles, F. X. Monitoringthe Expression and Purification of Recombinant Proteins byMALDI-TOF Mass Spectrometry. Enzyme Microb. Technol.2001, 29, 99–103.
11. Li, L.; Garden, R. W.; Sweedler, J. V. Single-Cell MALDI: ANew Tool for Direct Peptide Profiling. Trends Biotechnol. 2000,18, 151–160.
12. Li, L.; Garden, R. W.; Romanova, E. V.; Sweedler, J. V. In SituSequencing of Peptides from Biological Tissues and SingleCells Using MALDI-PSD/CID Analysis. Anal. Chem. 1999, 71,5451–5458.
13. Lynn, E. C.; Chung, M. C.; Tsai, W. C.; Han, C. C. Identifica-tion of Enterobacteriaceae Bacteria by Direct Matrix-AssistedLaser Desorptiom/Ionization Mass Spectrometric Analysis ofWhole Cells. Rapid Commun. Mass Spectrom. 1999, 13, 2022–2027.
1025J Am Soc Mass Spectrom 2002, 13, 1015–1027 QUANTITATIVE MALDI-TOFMS
14. Stoeckli, M.; Farmer, T. B.; Caprioli, R. M. Automated MassSpectrometry Imaging with a Matrix-Assisted Laser Desorp-tion Ionization Time-of-Flight Instrument. J. Am. Soc. MassSpectrom. 1999, 10, 67–71.
15. Stoeckli, M.; Chaurand, P.; Hallahan, D. E.; Caprioli, R. M.Imaging Mass Spectrometry: A New Technology for theAnalysis of Protein Expression in Mammalian Tissues. Nat.Med. 2001, 7, 493–496.
16. Caprioli, R. M.; Farmer, T. B.; Gile, J. Molecular Imaging ofBiological Samples: Localization of Peptides and ProteinsUsing MALDI-TOF MS. Anal. Chem. 1997, 69, 4751–4760.
17. Chaurand, P.; Stoeckli, M.; Caprioli, R. M. Direct Profiling ofProteins in Biological Tissue Sections by MALDI Mass Spec-trometry. Anal. Chem. 1999, 71, 5263–5270.
18. Jespersen, S.; Chaurand, P.; van Strien, F. J.; Spengler, B.; vander Greef, J. Direct Sequencing of Neuropeptides in BiologicalTissue by MALDI-PSD Mass Spectrometry. Anal. Chem. 1999,71, 660–666.
19. Kazmaier, T.; Roth, S.; Zapp, J.; Harding, M.; Kuhn, R.Quantitative Analysis of Malto-Oligosaccharides by MALDI-TOF Mass Spectrometry, Capillary Electrophoresis, and AnionExchange Chromatography. Fres. J. Anal. Chem. 1998, 361,473–478.
20. Ling, Y. C.; Lin, L.; Chen, Y. T. Quantitative Analysis ofAntibiotics by Matrix-Assisted Laser Desorption/IonizationTime-of-Flight Mass Spectrometry. Rapid Commun. Mass Spec-trom. 1998, 12, 317–327.
21. Abell, D. C.; Sporns, P. Rapid Quantitation of Potato Glycoal-kaloids by Matrix-Assisted Laser Desorption/IonizationTime-of-Flight Mass Spectrometry. J. Ag. Food Chem. 1996, 44,2292–2296.
22. Bruenner, B. A.; Yip, T. T.; Hutchens, T. W. QuantitativeAnalysis of Oligonucleotides by Matrix-Assisted Laser De-sorption/Ionization Mass Spectrometry. Rapid Commun. MassSpectrom. 1996, 10, 1797–1801.
23. Muddiman, D. C.; Gusev, A. I.; Martin, L. B.; Hercules, D. M.Direct Quantification of Cocaine in Urine by Time-of-FlightMass Spectrometry. Fres. J. Anal. Chem. 1996, 354, 103–110.
24. Gusev, A. I.; Wilkinson, W. R.; Proctor, A.; Hercules, D. M.Direct Quantitative Analysis of Peptides Using Matrix As-sisted Laser Desorption Ionization. Fres. J. Anal. Chem. 1996,354, 455–463.
25. Tang, X. D.; Sadeghi, M. E.; Olumee, Z.; Vertes, A.; Braatz,J. A.; McIlwain, L. K.; Dreifuss, P. A. Detection and Quantita-tion of �-2-Microglobulin Glycosylated End Products in Hu-man Serum by Matrix-Assisted Laser Desorption/IonizationMass Spectrometry. Anal. Chem. 1996, 68, 3740–3745.
26. Jespersen, S.; Niessen, W. M. A.; Tjaden, U. R.; van der Greef,J. Quantitative Bioanalysis Using Matrix-Assisted LaserDesorption/Ionization Mass Spectrometry. J. Mass Spectrom.1995, 30, 357–364.
27. Muddiman, D. C.; Gusev, A. I.; Stoppeklangner, K.; Proctor,A.; Hercules, D. M.; Tata, P.; Venkataramanan, R.; Diven, W.Simultaneous Quantification of Cyclosporin A and Its MajorMetabolites by Time-of-Flight Secondary-Ion Mass Spectro-metry and Matrix-Assisted Laser Desorption/Ionization MassSpectrometry Utilizing Data Analysis Techniques—Compari-son with High-Performance Liquid Chromatography. J. MassSpectrom. 1995, 30, 1469–1479.
28. Nelson, R. W.; McLean, M. A.; Hutchens, T. W. QuantitativeDetermination of Proteins by Matrix-Assisted Laser Desorp-tion Ionization Time-of-Flight Mass Spectrometry. Anal. Chem.1994, 66, 1408–1415.
29. Muddiman, D. C.; Gusev, A. I.; Proctor, A.; Hercules, D. M.;Venkataramanan, R.; Diven, W. Quantitative Measurement ofCyclosporin A in Blood by Time-of-Flight Mass Spectrometry.Anal. Chem. 1994, 66, 2362–2368.
30. Tang, K.; Allman, S. L.; Jones, R. B.; Chen, C. H. QuantitativeAnalysis of Biopolymers by Matrix-Assisted Laser Desorption.Anal. Chem. 1993, 65, 2164–2166.
31. Harvey, D. J. Quantitative Aspects of the Matrix-AssistedLaser Desorption Mass Spectrometry of Complex Oligosac-charides. Rapid Commun. Mass Spectrom. 1993, 7, 614–619.
32. Gusev, A. I.; Wilkinson, W. R.; Proctor, A.; Hercules, D. M.Quantitative Analysis of Peptides by Matrix-Assisted LaserDesorption Ionization Time-of-Flight Mass Spectrometry.Appl. Spectrosc. 1993, 47, 1091–1092.
33. Duncan, M. W.; Matanovic, G.; Cerpa-Poljak, A. QuantitativeAnalysis of Low Molecular Weight Compounds of BiologicalInterest by Matrix-Assisted Laser Desorption Ionization. RapidCommun. Mass Spectrom. 1993, 7, 1090–1094.
34. Horak, J.; Werther, W.; Schmid, E. R. Optimization of theQuantitative Determination of Chlormequat by Matrix-As-sisted Laser Desorption/Ionization Mass Spectrometry. RapidCommun. Mass Spectrom. 2001, 15, 241–248.
35. Gobom, J.; Kraeuter, K. O.; Persson, R.; Steen, H.; Roepstorff,P.; Ekman, R. Detection and Quantification of Neurotensin inHuman Brain Tissue by Matrix-Assisted Laser Desorption/Ionization Time-of-Flight Mass Spectrometry. Anal. Chem.2000, 72, 3320–3326.
36. Wang, J.; Sporns, P. MALDI-TOF MS Quantification of Coc-cidiostats in Poultry Feeds. J. Agric. Food Chem. 2000, 48,2807–2811.
37. Desiderio, D. M.; Wirth, U.; Lovelace, J. L.; Fridland, G.;Umstot, E. S.; Nguyen, T. M.; Schiller, P. W.; Szeto, H. S.;Clapp, J. F. Matrix-Assisted Laser Desorption/Ionization MassSpectrometric Quantification of the Mu Opioid Receptor Ag-onist Damgo in Ovine Plasma. J. Mass Spectrom. 2000, 35,725–733.
38. Wu, J.; Chatman, K.; Harris, K.; Siuzdak, G. An AutomatedMALDI Mass Spectrometry Approach for Optimizing Cyclo-sporin Extraction and Quantitation. Anal. Chem. 1997, 69,3767–3771.
39. Nicola, A. J.; Gusev, A. I.; Proctor, A.; Jackson, E. K.; Hercules,D. M. Application of the Fast-Evaporation Sample PreparationMethod for Improving Quantification of Angiotensin II byMatrix-Assisted Laser Desorption/Ionization. Rapid Commun.Mass Spectrom. 1995, 9, 1164–1171.
40. Wang, J.; Sporns, P. Analysis of Anthocyanins in Red Wineand Fruit Juice Using MALDI-MS. J. Agric. Food Chem. 1999, 47,2009–2015.
41. Wang, J.; Sporns, P.; Low, N. H. Analysis of Food Oligosac-charides Using MALDI-MS: Quantification of Fructooligosac-charides. J. Agric. Food Chem. 1999, 47, 1549–1557.
42. Jiang, G.; Vasanthan, T. MALDI-MS and Hplc Quantificationof Oligosaccharides of Lichenase-Hydrolyzed Water-Soluble�-Glucan from Ten Barley Varieties. J. Agric. Food Chem. 2000,48, 3305–3310.
43. Wang, J.; Kalt, W.; Sporns, P. Comparison between HPLC andMALDI-TOF MS Analysis of Anthocyanins in Highbush Blue-berries. J. Agric. Food Chem. 2000, 48, 3330–3335.
44. Yang, Y.; Chien, M. Characterization of Grape ProcyanidinsUsing High-Performance Liquid Chromatography/Mass Spec-trometry and Matrix-Assisted Laser Desorption/IonizationTime-of-Flight Mass Spectrometry. J. Agric. Food Chem. 2000,48, 3990–3996.
45. Wittmann, C.; Heinzle, E. MALDI-TOF MS for Quantificationof Substrates and Products in Cultivations of Corynebacte-rium Glutamicum. Biotechnol. Bioeng. 2001, 72, 642–647.
46. Mirgorodskaya, O. A.; Kozmin, Y. P.; Titov, M. I.; Korner, R.;Sonksen, C. P.; Roepstorff, P. Quantitation of Peptides andProteins by Matrix-Assisted Laser Desorption/IonizationMass Spectrometry Using (18)O-Labeled Internal Standards.Rapid Commun. Mass Spectrom. 2000, 14, 1226–1232.
1026 BUCKNALL ET AL. J Am Soc Mass Spectrom 2002, 13, 1015–1027
47. Bahr, U.; Stahl-Zeng, J.; Gleitsmann, E.; Karas, M. DelayedExtraction Time-of-Flight MALDI Mass Spectrometry of Pro-teins above 25,000 Da. J. Mass Spectrom. 1997, 32, 1111–1116.
48. Takach, E. J.; Hines, W. M.; Patterson, D. H.; Juhasz, P.; Falick,A. M.; Vestal, M. L.; Martin, S. A. Accurate Mass Measure-ments Using MALDI-TOF with Delayed Extraction. J. ProteinChem. 1997, 16, 363–369.
49. Cerpa-Poljak, A.; Lahnstein, J.; Mason, K. E.; Smythe, G. A.;Duncan, M. W. Mass Spectrometric Identification and Quan-
tification of Hemorphins Extracted from Human Adrenal andPheochromocytoma Tissue. J. Neurochem. 1997, 68, 1712–1719.
50. Dickerman, E.; Dickerman, S.; Meites, J. Influence of Age, Sex,and Estrous Cycle on Pituitary and Plasma Growth HormoneLevels in Rats. In Growth and Growth Hormone—InternationalSymposium on Growth Hormone; Pecile, A.; Muller, E. E., Eds.;Excerpta Medica: Amsterdam, 1971; p 252–260.
51. Soffer, L. J.; Doffman, R. I.; Gabrilove, J. L. The Human AdrenalGland; Lea and Febiger: Philadelphia, 1961; p 117.
1027J Am Soc Mass Spectrom 2002, 13, 1015–1027 QUANTITATIVE MALDI-TOFMS