potential of tipping flush gate for sedimentation management in open stormwater sewer
TRANSCRIPT
This article was downloaded by: [Universiti Sains Malaysia]On: 12 January 2015, At: 16:51Publisher: Taylor & FrancisInforma Ltd Registered in England and Wales Registered Number: 1072954 Registered office: Mortimer House,37-41 Mortimer Street, London W1T 3JH, UK
Click for updates
Urban Water JournalPublication details, including instructions for authors and subscription information:http://www.tandfonline.com/loi/nurw20
Potential of tipping flush gate for sedimentationmanagement in open stormwater sewerC.H.J. Bonga, T.L. Laub & A. Ab. Ghanica Department of Civil Engineering, Faculty of Engineering, Universiti Malaysia Sarawak,Sarawak, Malaysiab School of Civil Engineering, Universiti Sains Malaysia, Engineering Campus, Seri Ampangan,Penang, Malaysiac River Engineering and Urban Drainage Research Centre (REDAC), Higher Institution Centreof Excellence (HICoE) for Service, Universiti Sains Malaysia, Engineering Campus, SeriAmpangan, Penang, MalaysiaPublished online: 12 Jan 2015.
To cite this article: C.H.J. Bong, T.L. Lau & A. Ab. Ghani (2015): Potential of tipping flush gate for sedimentationmanagement in open stormwater sewer, Urban Water Journal, DOI: 10.1080/1573062X.2014.994002
To link to this article: http://dx.doi.org/10.1080/1573062X.2014.994002
PLEASE SCROLL DOWN FOR ARTICLE
Taylor & Francis makes every effort to ensure the accuracy of all the information (the “Content”) containedin the publications on our platform. However, Taylor & Francis, our agents, and our licensors make norepresentations or warranties whatsoever as to the accuracy, completeness, or suitability for any purpose of theContent. Any opinions and views expressed in this publication are the opinions and views of the authors, andare not the views of or endorsed by Taylor & Francis. The accuracy of the Content should not be relied upon andshould be independently verified with primary sources of information. Taylor and Francis shall not be liable forany losses, actions, claims, proceedings, demands, costs, expenses, damages, and other liabilities whatsoeveror howsoever caused arising directly or indirectly in connection with, in relation to or arising out of the use ofthe Content.
This article may be used for research, teaching, and private study purposes. Any substantial or systematicreproduction, redistribution, reselling, loan, sub-licensing, systematic supply, or distribution in anyform to anyone is expressly forbidden. Terms & Conditions of access and use can be found at http://www.tandfonline.com/page/terms-and-conditions
RESEARCH ARTICLE
Potential of tipping flush gate for sedimentation management in open stormwater sewer
C.H.J. Bonga*, T.L. Laub and A. Ab. Ghanic
aDepartment of Civil Engineering, Faculty of Engineering, Universiti Malaysia Sarawak, Sarawak, Malaysia; bSchool of CivilEngineering, Universiti Sains Malaysia, Engineering Campus, Seri Ampangan, Penang, Malaysia; cRiver Engineering and UrbanDrainage Research Centre (REDAC), Higher Institution Centre of Excellence (HICoE) for Service, Universiti Sains Malaysia,
Engineering Campus, Seri Ampangan, Penang, Malaysia
(Received 10 March 2014; accepted 29 September 2014)
This paper presents the design of a tipping flush gate and its potential use in servicing open storm sewers in terms ofsedimentation management. The tipping flush gate was installed in a section of open concrete storm sewer located in acommercial area in Taman Pekaka, Nibong Tebal, Penang, Malaysia. Monitoring of the gate operation and performance wasdone from 14th November 2012 to 15th March 2013 covering the beginning and end of the wet season. The sediment profileinside the sewer was measured after each operation of the gate or rainfall event. Results showed that the gate was effective inreducing naturally accumulated sediment in the chosen sewer section. However, proper litter management is needed if thegate is to be implemented in open storm sewer systems. A design guideline for the usage of a tipping flush gate for openstorm sewers is also presented in this paper.
Keywords: open storm sewer; sedimentation management; tipping flush gate
1. Introduction
Open channels are frequently used in developing and less
developed countries to convey storm water runoff (Geiger,
1990). However, without proper maintenance; sediment
tends to build up in open storm sewers. Losses of hydraulic
capacity of storm sewers due to sedimentation have been
identified as one of the factors of flash flooding in urban
areas (Ab. Ghani et al., 2008; Liew et al., 2012; Rodrıguez
et al., 2012). Sediments in developing countries that use
open storm sewers, like India (Kolsky, 1998) and Malaysia
(Ab. Ghani et al., 2000; Bong et al., 2014), tend to be
coarser than those found in European countries (Ashley
et al., 2004). Clearly open sewers allow easier ingress of
larger sediments (Ashley et al., 2004) as compared to
closed conduit sewers.
Conventionally, removal of sediment from open storm
sewers often involves manual handling which is costly due
to periodic maintenance (Bong et al., 2013). On the other
hand, various techniques have been developed, especially
in European countries, to clean sediment in closed conduit
sewers. These techniques may be manual or automated
and include the use of rodding, balling, flushing, poly pigs
and bucket machines (Dinkelacker, 1991). With the
exception of flushing, these techniques are generally used
in ‘reactive’ mode to clear blockages once they have
formed and as preventative maintenance (Ashley et al.,
2004). Hydraulic flushing was probably the most widely
applied (Bertrand-Krajewski, 2008) and a preferred
technique as a control concept and is a means both to
reduce hydraulic restriction problems and to prevent
pollution. The flushing effect can be created by storing
water in upstream chambers and then being discharged
through a gate/tipping bucket located above water level or
mobile tipping plates like the Hydrass gate (Chebbo et al.,
1996; Lorenzen et al., 1996). Though there exists various
flushing methods, flushing gate technology appeared to be
the most cost-effective means of flushing sediments in
large diameter flat sewers (Pisano et al., 2003).
Various experimental studies are available in the
literature on the effect of flushes for flushing devices such
as sluice gate/lifting gate (Campisano et al., 2004, 2008),
vacuum flushing (Guo et al., 2004) and the Hydrass gate
(Bertrand-Krajewski et al., 2005). A long term study on
flushing in a man-entry sewer in Lyon, France had shown
that the Hydrass gate was efficient and themass of sediments
appeared to move downstream linearly with the number of
flushes (Bertrand-Krajewski et al., 2006). Bong et al. (2013)
conducted a preliminary laboratory study on the hydraulic
characteristics of a tipping flush gate and the efficiency of
flushing in removing uniform sediment with different sizes.
Numerical simulation on the erosive effects of sewer
flushing revealed that the modelling of sediment bed erosion
q 2015 Taylor & Francis
*Corresponding author. Formerly with River Engineering and Urban Drainage Research Centre (REDAC), Universiti Sains Malaysia.Email: [email protected]
Urban Water Journal, 2015
http://dx.doi.org/10.1080/1573062X.2014.994002
Dow
nloa
ded
by [
Uni
vers
iti S
ains
Mal
aysi
a] a
t 16:
51 1
2 Ja
nuar
y 20
15
required the use of sediment transport formulae specifically
developed for high stress conditions (Campisano et al.,
2007; Shirazi et al., 2014).What is lacking in the literature is
the on-site use of flushing devices for sediment management
in open storm sewers.
Since the existing flushing gates in the literature, such as
the Hydrass gate, are designed to function in closed conduit
sewers; some modifications are needed if the gate is to be
used in open storm sewers. The Hydrass gate has a lower
part (below the gate hinge/axis) with a smaller area but
heavier than the upper part (above the gate hinge/axis)
(Schaffner, 2008). This design is suitable for closed conduit
sewerswhich can allow a highwater level for gate operation
without overflow. This condition is different with open
storm sewers which could not allow a high water level for
gate operation in order to avoid overflow and nuisance.
Thus a modification in the design for the Hydrass gate is
needed before it could be used in an open storm sewer.
This paper highlights the design of a tipping flush gate
(which was modified from the Hydrass gate) and its
potential to be used for sedimentation management in an
open storm sewer. From on-site installation and monitor-
ing of the tipping flush gate, the potential of the gate for
usage in open storm sewer could be evaluated in terms of
the performance of sediment removal and the problems
faced in using the gate. A design guideline for the usage of
a tipping flush gate for open storm sewers was also
presented. It is hoped that this study will fill the gap in the
literature on the usage of flushing devices in open storm
sewers as a technique for sedimentation and sewer asset
management, which is still lacking.
2. Methodology
2.1. Site description
To test the potential of the tipping flush gate for
sedimentation management, a section of the open concrete
storm sewer located in a commercial area in Taman
Pekaka, Nibong Tebal, Penang, Malaysia was chosen as
shown in Figure 1. The chosen storm sewer section was
straight with no discontinuity. The total length of the
chosen section for monitoring purposes was 46m (the
sewer section with the straightest alignment) with the
cross-section of the rectangular sewer being 1.20m (W)
£ 0.80m (D). The catchment that drained into the chosen
Figure 1. Site map of study area in Taman Pekaka, Nibong Tebal, Penang, Malaysia with the insert photo showing the chosen opensewer section for this study.
C.H.J. Bong et al.2
Dow
nloa
ded
by [
Uni
vers
iti S
ains
Mal
aysi
a] a
t 16:
51 1
2 Ja
nuar
y 20
15
sewer section has an area of about 0.11 km2 with a roughly
90% impervious area. From site survey work, the average
slope for the sewer was 0.00021m/m.
The last sewer clean out was done on 1st August 2012
by the local council, Majlis Perbandaran Seberang Perai
(MPSP), prior to the study. Monitoring of water level and
sediment level were done daily using a steel ruler with the
flat end of a measuring tape with an accuracy of^0.5mm
from 2nd August 2012 prior to the installation of the
tipping sediment flush gate. Sediment samples were
scooped randomly from the surface to the bottom of the
sediment across the sewer’s cross-section at a few
randomly selected points in the chosen sewer section.
Results from the sediment sampling have shown that
the median grain size of the sediment sample was
d50 ¼ 1.00mm and geometric standard deviation sg ¼ 3.8
(non-uniform) with a specific gravity of 2.52. The
sediment sample was non-cohesive with predominantly
sand at 68.4%, gravel at 30.1%, and silt and clay at 1.5%.
2.2. Site installation
For site monitoring purposes, two closed-circuit televi-
sions (CCTVs) were installed on top of a tree by the
chosen sewer section; about 40m downstream from the
tipping flush gate. One CCTV was to capture the video
clips of the gate operation while another CCTV was to
monitor the water level at 40m downstream of the gate
(the end of the monitoring section). Stick gauges were also
installed at 10m interval along the chosen sewer section.
For reference purpose, rainfall data was obtained from the
Department of Irrigation and Drainage (DID), Malaysia
for Kolam Takongan Bkt. Panchor (station no: 5105051)
which is about 5.45 km from the site.
2.3. Tipping flush gate design
The Hydrass gate, as mentioned in the existing literature
(Chebbo et al., 1996; Lorenzen et al., 1996), has a lower
part (below the gate hinge/axis) with a smaller but heavier
area than the upper part (Schaffner, 2008). This results in a
high water level to provide more force to open the gate
with a heavier lower part; a condition which closed-
conduit sewers could allow without overflowing. This
condition however is different with open storm sewer. The
tipping flush gate for the current study in open storm sewer
was designed with the bottom part (below the gate hinge)
lighter than the upper part of the gate by positioning the
gate hinge so that the bottom part of the gate has smaller
area as compared to the upper part of the gate. This allows
easier tipping of the gate during an opening phase which
requires a lower water level as compared to a gate with
heavier lower part so as to prevent overflow from the open
storm sewer.
2.3.1. Forces on tipping flush gate
The tipping flush gate was designed based on the
difference of moment on the upper portion (above the
hinge) and lower portion (below the hinge) of the gate
(see Figure 2). The water force above the gate hinge F1[N]
is given as:
F1 ¼ 1
2gwbh
21 ð1Þ
where gw is the specific weight of water [N/m2]; b is the
width of the gate [m] and h1 is the distance of the water
surface to the centre of the hinge [m]. The force below the
gate hinge F2[N] is made up of two components of force
namely F2a[N] (the triangle shape pressure prism) and
F2b[N] (the rectangle shape pressure prism) as shown in
Figure 2 and given by:
F2a ¼ 1
2gwðh2 2 h1Þðh2 2 h1Þb ð2Þ
F2b ¼ gwh1ðh2 2 h1Þb ð3Þ
where h2 is the distance of the water surface to the bottom
of pressure prism [m].
Taking the moment at the hinge which is off centre, the
gate will open if the sum of the moment above the gate
hinge is larger than the moment below the gate hinge.
Thus:
F1 £ h1
3
� �. F2a £ 2
3ðh2 2 h1Þ
� �
þ F2b £ 1
2ðh2 2 h1Þ
� �ð4Þ
Figure 2. Forces acting on the tipping flush gate beforeopening.
Urban Water Journal 3
Dow
nloa
ded
by [
Uni
vers
iti S
ains
Mal
aysi
a] a
t 16:
51 1
2 Ja
nuar
y 20
15
or
1
2gwbh
21
� �h1
3
� �.
1
2gwðh2 2 h1Þðh2 2 h1Þ
b2
3ðh2 2 h1Þ þ gwh1ðh2 2 h1Þb 1
2ðh2 2 h1Þ
ð5Þ
Equation (5) could be simplified by removing gw, band 1/2 from both sides of the equation and obtain:
h313. ðh2 2 h1Þðh2 2 h1Þ 2
3ðh2 2 h1Þ
þ h1ðh2 2 h1Þðh2 2 h1Þð6Þ
or
h1 . ½2ðh2 2 h1Þ3 þ 3h1ðh2 2 h1Þ2�1=3 ð7ÞBy using trial and error, the position of the hinge for the
tipping flush gate could be calculated by fulfilling Equation
(7) and the allowable water level upstream of the gate just
before the gate tips open and the gate height hg were
predetermined from the condition on-site. The height of the
hinge hhng from the bottom of the pressure prism is given by:
hhng ¼ h2 2 h1 ð8ÞAfter the gate has tipped to open, it will close if the
moment below the hinge is larger than the moment above
the gate hinge (see Figure 3). This happens when the water
starts to recede after opening.
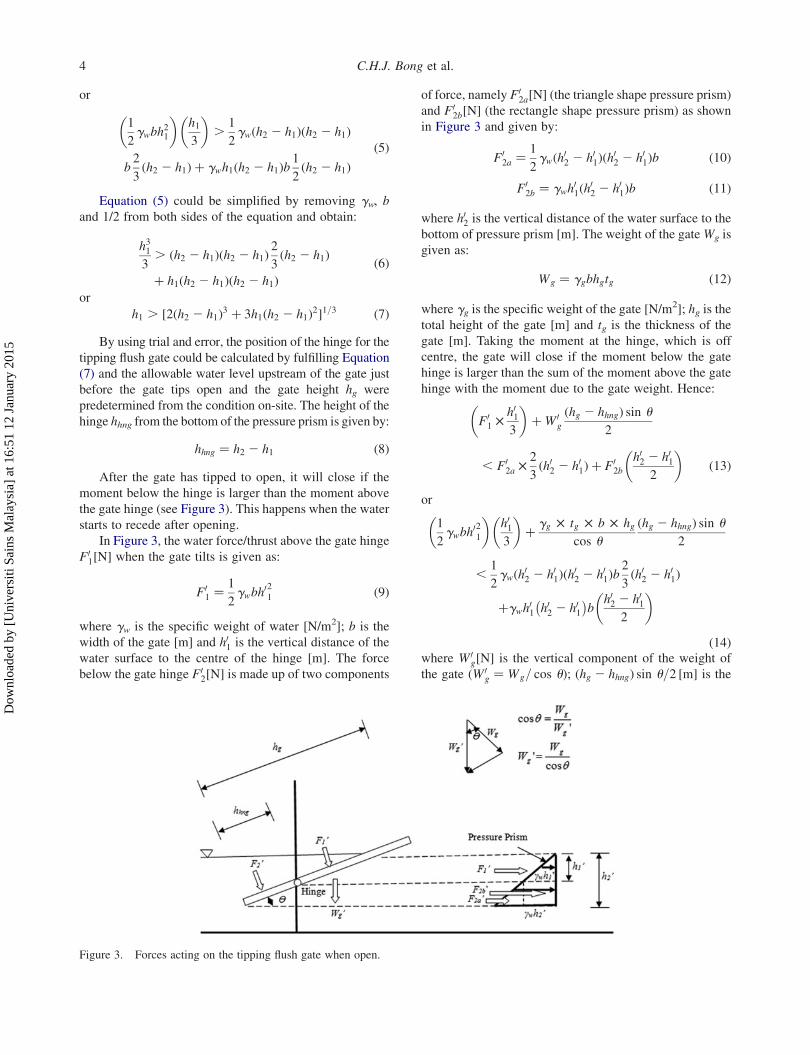
In Figure 3, the water force/thrust above the gate hinge
F01½N� when the gate tilts is given as:
F01 ¼
1
2gwbh
021 ð9Þ
where gw is the specific weight of water [N/m2]; b is the
width of the gate [m] and h01 is the vertical distance of thewater surface to the centre of the hinge [m]. The force
below the gate hinge F02½N� is made up of two components
of force, namely F02a½N� (the triangle shape pressure prism)
and F02b½N� (the rectangle shape pressure prism) as shown
in Figure 3 and given by:
F02a ¼
1
2gwðh02 2 h01Þðh02 2 h01Þb ð10Þ
F02b ¼ gwh
01ðh02 2 h01Þb ð11Þ
where h02 is the vertical distance of the water surface to thebottom of pressure prism [m]. The weight of the gateWg is
given as:
Wg ¼ ggbhgtg ð12Þ
where gg is the specific weight of the gate [N/m2]; hg is the
total height of the gate [m] and tg is the thickness of the
gate [m]. Taking the moment at the hinge, which is off
centre, the gate will close if the moment below the gate
hinge is larger than the sum of the moment above the gate
hinge with the moment due to the gate weight. Hence:
F01 £
h013
� �þW 0
g
ðhg 2 hhngÞ sin u
2
, F02a £
2
3ðh02 2 h01Þ þ F0
2b
h02 2 h012
� �ð13Þ
or
1
2gwbh
021
� �h013
� �þ gg £ tg £ b £ hg
cos u
ðhg 2 hhngÞ sin u
2
,1
2gwðh02 2 h01Þðh02 2 h01Þb
2
3ðh02 2 h01Þ
þgwh01 h02 2 h01� �
bh02 2 h01
2
� �
ð14Þwhere W 0
g½N� is the vertical component of the weight of
the gate ðW 0g ¼ Wg= cos uÞ; ðhg 2 hhngÞ sin u=2 ½m� is the
Figure 3. Forces acting on the tipping flush gate when open.
C.H.J. Bong et al.4
Dow
nloa
ded
by [
Uni
vers
iti S
ains
Mal
aysi
a] a
t 16:
51 1
2 Ja
nuar
y 20
15
vertical distance between the gate hinge and the centre of
gravity of the gate where the weight of the gate acted; and
u is the angle of gate opening from the horizontal axis.
Equation (14) could be simplified by taking the
thickness of the gate as 0.012m (thickness of plasboard in
this study) and the specific weight of gate (material is
plasboard and homogeneous) gg ¼ 10712.5 N/m2 and
gw ¼ 9810N/m2. Hence:
1635h031 þ64:275hgðhg 2 hhngÞ sin u
cos u
, 3250ðh02 2 h01Þ2 þ 4905h01ðh02 2 h01Þ2 ð15Þ
or
h031 þ 0:0393hgðhg 2 hhngÞ tan u
, 2ðh02 2 h01Þ3 þ 3h01ðh02 2 h01Þ2 ð16Þ
Using trial and error to solve Equation (16), the water
level h02 when the gate closes could be determined
provided that the height of the hinge, the angle of gate
opening and gate height have been predetermined.
2.3.2. Tipping flush gate sizing
To determine the sizing of the tipping flush gate, the on-
site conditions such as the storm sewer dimensions and the
invert level of the inlet pipes to the sewer needed to be
determined. As mentioned earlier, the chosen storm sewer
had a dimension of 1.20m (W) £ 0.80m (D). It was also
observed that there were inlet pipes of 0.15m diameter
spaced at an interval of every 6m along the right wall
(looking downstream) of the sewer to convey stormwater
from the main road next to the sewer; and at every 14m
along the left wall of the sewer to convey stormwater from
the parking lots next to the sewer. The lower invert level of
the pipe was about 0.61m from the bottom of the sewer
(see Figure 4).
In considering the width, the gate opening width must
be as close as possible to the width of the sewer (so as not to
have much contraction effect on the flow during the storm).
As for the gate opening height, there must be an allowable
freeboard between the height of the gate with the total depth
of the sewer (for emergency overflow). The gate opening
height must be below the lower invert level of the inlet
pipes to prevent backwater through the inlet pipes.
Based on the observation on-site and also taking the
consideration for sizing as mentioned in the previous
paragraph, it was decided that the gate has an opening
width of 1.00m (to allow for the gate frame on both side of
the gate and also less contraction effect) with the gate
opening height of 0.50m (so that the water level behind
the gate just before the gate open will not be higher than
the lower invert level of the inlet pipes, thus preventing
backwater through the inlet pipe and water ponding on the
road and parking lots). The dimension for the gate
(including the frame) was 1.20m (W) £ 0.60m (D).
Though the total depth of the drain was 0.80m, the total
height of the gate including the frame was 0.60m which
has an allowable freeboard of 0.20m. This is for the
purpose of emergency cases, for example if the gate stuck
and cannot open; stormwater could still flow over the gate
installation.
To determine the level of the hinge hhng for the gate,
trial and error was performed using Equation (7) to find h1.
To perform the trial and error, it was first determined that
the allowable water level h2 behind the gate was 0.56m
from the bottom of the sewer so that there was a difference
of 0.05m between the allowable water level and the lower
invert of the inlet pipes. From the trial and error, the right
hand side (RHS) of Equation (7) must be smaller than the
value of h1 (see Table 1). This is achieves when h1 is
0.40m and the location of the hinge hhng as calculated
using Equation (8) is 0.16m from the bottom of the
pressure prism (see Figure 2).
To determine when the gate will close, trial and error
was performed using Equation (16). Trial and error was
performed by taking the angle of opening for the gate as
308 from the horizontal axis and h2 2 h1 is 0.16m (based
on hinge location calculated previously). Preliminary
Figure 4. Distance between lower invert of inlet to sewerbottom.
Table 1. Trial and error to determine the hinge level of gate.
h1(m) h2(m) RHS hhng(m) Gate Condition
0.20 0.56 0.56 0.36 Close0.30 0.56 0.51 0.31 Close0.31 0.56 0.46 0.26 Close0.35 0.56 0.40 0.21 Close0.40 0.56 0.34 0.16 Open
Urban Water Journal 5
Dow
nloa
ded
by [
Uni
vers
iti S
ains
Mal
aysi
a] a
t 16:
51 1
2 Ja
nuar
y 20
15
testing for the gate before the on-site installation had found
that 308 from the horizontal axis was the suitable opening
angle due to the ease of self-automated closing of the gate
when the water level recedes. From trial and error as
shown in Table 2, the gate starts to close when the water
level h02 is 0.40m.
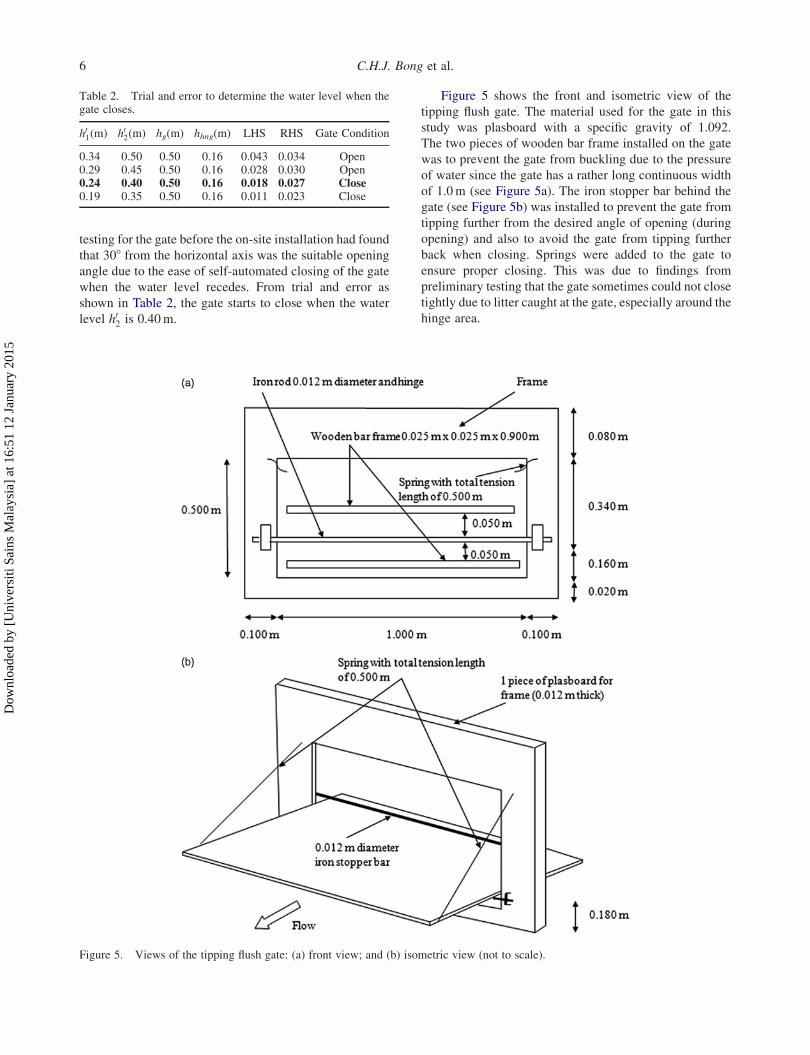
Figure 5 shows the front and isometric view of the
tipping flush gate. The material used for the gate in this
study was plasboard with a specific gravity of 1.092.
The two pieces of wooden bar frame installed on the gate
was to prevent the gate from buckling due to the pressure
of water since the gate has a rather long continuous width
of 1.0m (see Figure 5a). The iron stopper bar behind the
gate (see Figure 5b) was installed to prevent the gate from
tipping further from the desired angle of opening (during
opening) and also to avoid the gate from tipping further
back when closing. Springs were added to the gate to
ensure proper closing. This was due to findings from
preliminary testing that the gate sometimes could not close
tightly due to litter caught at the gate, especially around the
hinge area.
Table 2. Trial and error to determine the water level when thegate closes.
h01(m) h02(m) hg(m) hhng(m) LHS RHS Gate Condition
0.34 0.50 0.50 0.16 0.043 0.034 Open0.29 0.45 0.50 0.16 0.028 0.030 Open0.24 0.40 0.50 0.16 0.018 0.027 Close0.19 0.35 0.50 0.16 0.011 0.023 Close
Figure 5. Views of the tipping flush gate: (a) front view; and (b) isometric view (not to scale).
C.H.J. Bong et al.6
Dow
nloa
ded
by [
Uni
vers
iti S
ains
Mal
aysi
a] a
t 16:
51 1
2 Ja
nuar
y 20
15
2.4. Sediment profiles monitoring
Sediment was left to accumulate naturally in the chosen
sewer section since 1st August 2012 until 14th November
2012. After installation of the tipping flush gate on 14th
November 2012, sediment profile was measured after each
operation of the gate or after each rainfall event. The
sediment profile was measured manually using a steel ruler
together with the flat end of a measuring tape with an
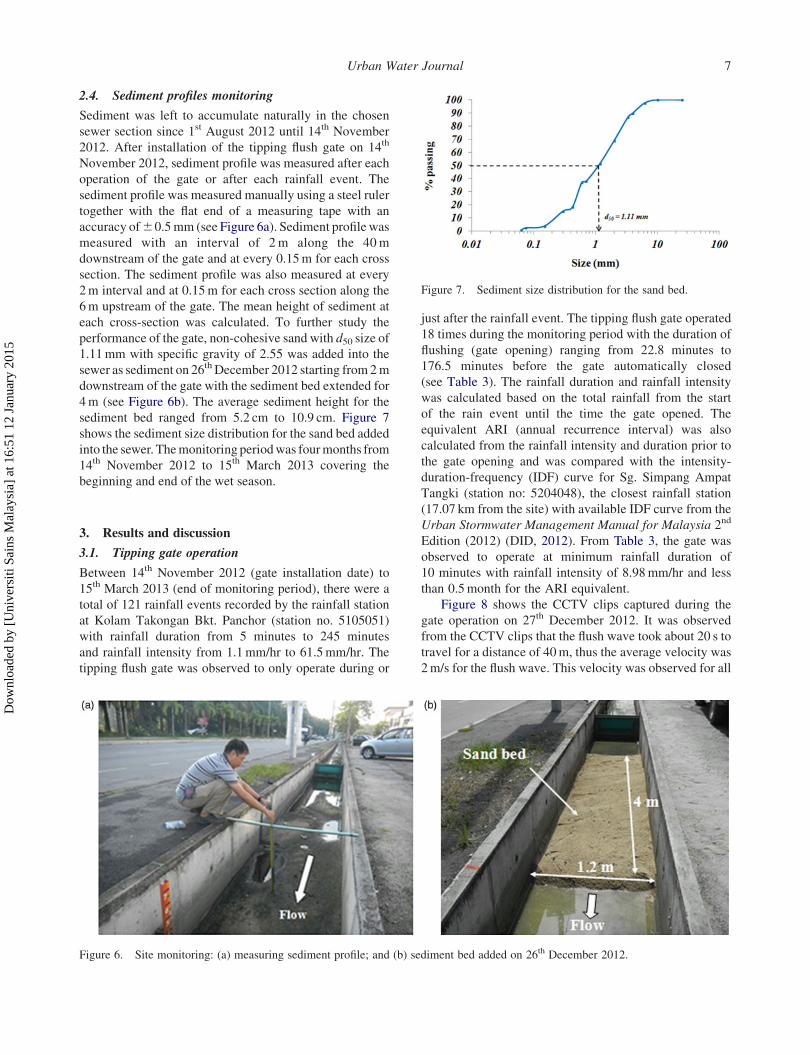
accuracy of^0.5mm (see Figure 6a). Sediment profilewas
measured with an interval of 2m along the 40m
downstream of the gate and at every 0.15m for each cross
section. The sediment profile was also measured at every
2m interval and at 0.15m for each cross section along the
6m upstream of the gate. The mean height of sediment at
each cross-section was calculated. To further study the
performance of the gate, non-cohesive sand with d50 size of
1.11mm with specific gravity of 2.55 was added into the
sewer as sediment on 26th December 2012 starting from2m
downstream of the gate with the sediment bed extended for
4m (see Figure 6b). The average sediment height for the
sediment bed ranged from 5.2 cm to 10.9 cm. Figure 7
shows the sediment size distribution for the sand bed added
into the sewer. Themonitoring periodwas fourmonths from
14th November 2012 to 15th March 2013 covering the
beginning and end of the wet season.
3. Results and discussion
3.1. Tipping gate operation
Between 14th November 2012 (gate installation date) to
15th March 2013 (end of monitoring period), there were a
total of 121 rainfall events recorded by the rainfall station
at Kolam Takongan Bkt. Panchor (station no. 5105051)
with rainfall duration from 5 minutes to 245 minutes
and rainfall intensity from 1.1mm/hr to 61.5mm/hr. The
tipping flush gate was observed to only operate during or
just after the rainfall event. The tipping flush gate operated
18 times during the monitoring period with the duration of
flushing (gate opening) ranging from 22.8 minutes to
176.5 minutes before the gate automatically closed
(see Table 3). The rainfall duration and rainfall intensity
was calculated based on the total rainfall from the start
of the rain event until the time the gate opened. The
equivalent ARI (annual recurrence interval) was also
calculated from the rainfall intensity and duration prior to
the gate opening and was compared with the intensity-
duration-frequency (IDF) curve for Sg. Simpang Ampat
Tangki (station no: 5204048), the closest rainfall station
(17.07 km from the site) with available IDF curve from the
Urban Stormwater Management Manual for Malaysia 2nd
Edition (2012) (DID, 2012). From Table 3, the gate was
observed to operate at minimum rainfall duration of
10 minutes with rainfall intensity of 8.98mm/hr and less
than 0.5month for the ARI equivalent.
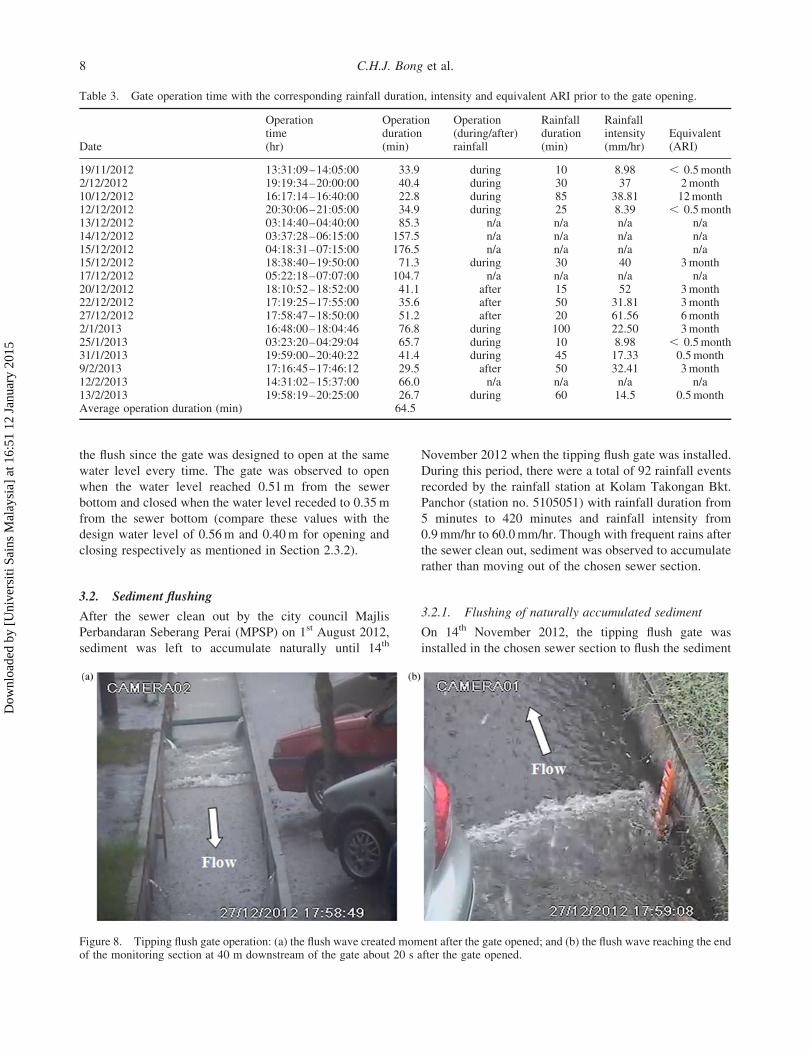
Figure 8 shows the CCTV clips captured during the
gate operation on 27th December 2012. It was observed
from the CCTV clips that the flush wave took about 20 s to
travel for a distance of 40m, thus the average velocity was
2m/s for the flush wave. This velocity was observed for all
Figure 6. Site monitoring: (a) measuring sediment profile; and (b) sediment bed added on 26th December 2012.
Figure 7. Sediment size distribution for the sand bed.
Urban Water Journal 7
Dow
nloa
ded
by [
Uni
vers
iti S
ains
Mal
aysi
a] a
t 16:
51 1
2 Ja
nuar
y 20
15
the flush since the gate was designed to open at the same
water level every time. The gate was observed to open
when the water level reached 0.51m from the sewer
bottom and closed when the water level receded to 0.35m
from the sewer bottom (compare these values with the
design water level of 0.56m and 0.40m for opening and
closing respectively as mentioned in Section 2.3.2).
3.2. Sediment flushing
After the sewer clean out by the city council Majlis
Perbandaran Seberang Perai (MPSP) on 1st August 2012,
sediment was left to accumulate naturally until 14th
November 2012 when the tipping flush gate was installed.
During this period, there were a total of 92 rainfall events
recorded by the rainfall station at Kolam Takongan Bkt.
Panchor (station no. 5105051) with rainfall duration from
5 minutes to 420 minutes and rainfall intensity from
0.9mm/hr to 60.0mm/hr. Though with frequent rains after
the sewer clean out, sediment was observed to accumulate
rather than moving out of the chosen sewer section.
3.2.1. Flushing of naturally accumulated sediment
On 14th November 2012, the tipping flush gate was
installed in the chosen sewer section to flush the sediment
Table 3. Gate operation time with the corresponding rainfall duration, intensity and equivalent ARI prior to the gate opening.
Date
Operationtime(hr)
Operationduration(min)
Operation(during/after)rainfall
Rainfallduration(min)
Rainfallintensity(mm/hr)
Equivalent(ARI)
19/11/2012 13:31:09–14:05:00 33.9 during 10 8.98 , 0.5month2/12/2012 19:19:34–20:00:00 40.4 during 30 37 2month10/12/2012 16:17:14–16:40:00 22.8 during 85 38.81 12month12/12/2012 20:30:06–21:05:00 34.9 during 25 8.39 , 0.5month13/12/2012 03:14:40–04:40:00 85.3 n/a n/a n/a n/a14/12/2012 03:37:28–06:15:00 157.5 n/a n/a n/a n/a15/12/2012 04:18:31–07:15:00 176.5 n/a n/a n/a n/a15/12/2012 18:38:40–19:50:00 71.3 during 30 40 3month17/12/2012 05:22:18–07:07:00 104.7 n/a n/a n/a n/a20/12/2012 18:10:52–18:52:00 41.1 after 15 52 3month22/12/2012 17:19:25–17:55:00 35.6 after 50 31.81 3month27/12/2012 17:58:47–18:50:00 51.2 after 20 61.56 6month2/1/2013 16:48:00–18:04:46 76.8 during 100 22.50 3month25/1/2013 03:23:20–04:29:04 65.7 during 10 8.98 , 0.5month31/1/2013 19:59:00–20:40:22 41.4 during 45 17.33 0.5month9/2/2013 17:16:45–17:46:12 29.5 after 50 32.41 3month12/2/2013 14:31:02–15:37:00 66.0 n/a n/a n/a n/a13/2/2013 19:58:19–20:25:00 26.7 during 60 14.5 0.5monthAverage operation duration (min) 64.5
Figure 8. Tipping flush gate operation: (a) the flush wave created moment after the gate opened; and (b) the flush wave reaching the endof the monitoring section at 40 m downstream of the gate about 20 s after the gate opened.
C.H.J. Bong et al.8
Dow
nloa
ded
by [
Uni
vers
iti S
ains
Mal
aysi
a] a
t 16:
51 1
2 Ja
nuar
y 20
15
which had naturally accumulated since 1st August 2012.
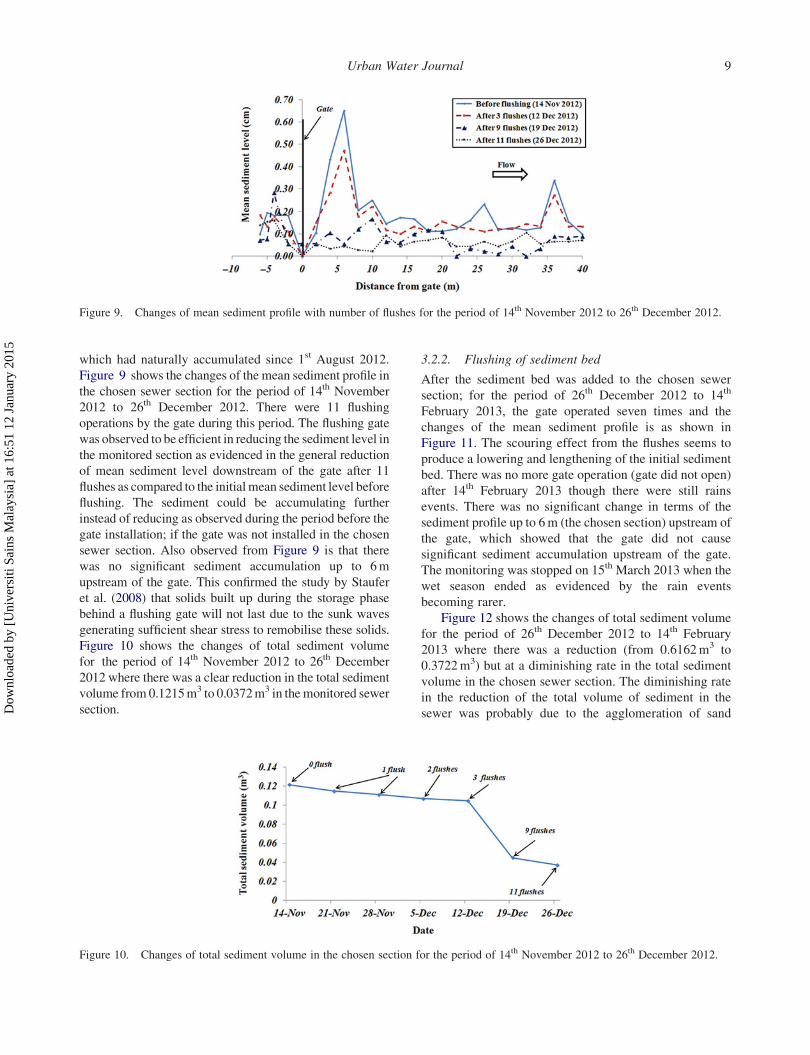
Figure 9 shows the changes of the mean sediment profile in
the chosen sewer section for the period of 14th November
2012 to 26th December 2012. There were 11 flushing
operations by the gate during this period. The flushing gate
was observed to be efficient in reducing the sediment level in
the monitored section as evidenced in the general reduction
of mean sediment level downstream of the gate after 11
flushes as compared to the initialmean sediment level before
flushing. The sediment could be accumulating further
instead of reducing as observed during the period before the
gate installation; if the gate was not installed in the chosen
sewer section. Also observed from Figure 9 is that there
was no significant sediment accumulation up to 6m
upstream of the gate. This confirmed the study by Staufer
et al. (2008) that solids built up during the storage phase
behind a flushing gate will not last due to the sunk waves
generating sufficient shear stress to remobilise these solids.
Figure 10 shows the changes of total sediment volume
for the period of 14th November 2012 to 26th December
2012 where there was a clear reduction in the total sediment
volume from0.1215m3 to 0.0372m3 in themonitored sewer
section.
3.2.2. Flushing of sediment bed
After the sediment bed was added to the chosen sewer
section; for the period of 26th December 2012 to 14th
February 2013, the gate operated seven times and the
changes of the mean sediment profile is as shown in
Figure 11. The scouring effect from the flushes seems to
produce a lowering and lengthening of the initial sediment
bed. There was no more gate operation (gate did not open)
after 14th February 2013 though there were still rains
events. There was no significant change in terms of the
sediment profile up to 6m (the chosen section) upstream of
the gate, which showed that the gate did not cause
significant sediment accumulation upstream of the gate.
The monitoring was stopped on 15th March 2013 when the
wet season ended as evidenced by the rain events
becoming rarer.
Figure 12 shows the changes of total sediment volume
for the period of 26th December 2012 to 14th February
2013 where there was a reduction (from 0.6162m3 to
0.3722m3) but at a diminishing rate in the total sediment
volume in the chosen sewer section. The diminishing rate
in the reduction of the total volume of sediment in the
sewer was probably due to the agglomeration of sand
Figure 9. Changes of mean sediment profile with number of flushes for the period of 14th November 2012 to 26th December 2012.
Figure 10. Changes of total sediment volume in the chosen section for the period of 14th November 2012 to 26th December 2012.
Urban Water Journal 9
Dow
nloa
ded
by [
Uni
vers
iti S
ains
Mal
aysi
a] a
t 16:
51 1
2 Ja
nuar
y 20
15
particles as observed on-site in the sediment bed after
being left too long in the sewer with infrequent flush
operation and rain events. It could also be due to the higher
sediment level near the sediment bed front (around 5m
downstream of the gate) owing to sediment accumulation
or build up near the sediment bed front after being
pushed by the flush waves several times during flushing
operations. This higher level of sediment near the
sediment bed front may cause difficulty for the sediment
bed advancement. For the period of 3rd January 2013 to
25th January 2013, fewer rain events were observed with
only five days with rain events with intensity between
2.3mm/hr to 27.8mm/hr. This caused the storm sewer to
be dry or have almost no flow during this period and no
gate operation; thus causing agglomeration of the sand
particles. Besides that, the amount of the sediment that was
too large and too thick also makes it harder to be removed
and in need of a more frequent flush. It has yet to be seen
whether more flushes happening more frequently could
remove this sediment bed and this could be a subject for
further study. Nevertheless, the tipping flush gate was
proven to be effective in removing naturally accumulated
sediment in the chosen storm sewer section.
3.3. Feasibility to use tipping flush gate on-site
Results from Section 3.2.1 and Section 3.2.2 have shown
that a tipping flush gate has the potential for sediment
removal, especially for naturally accumulated sediment.
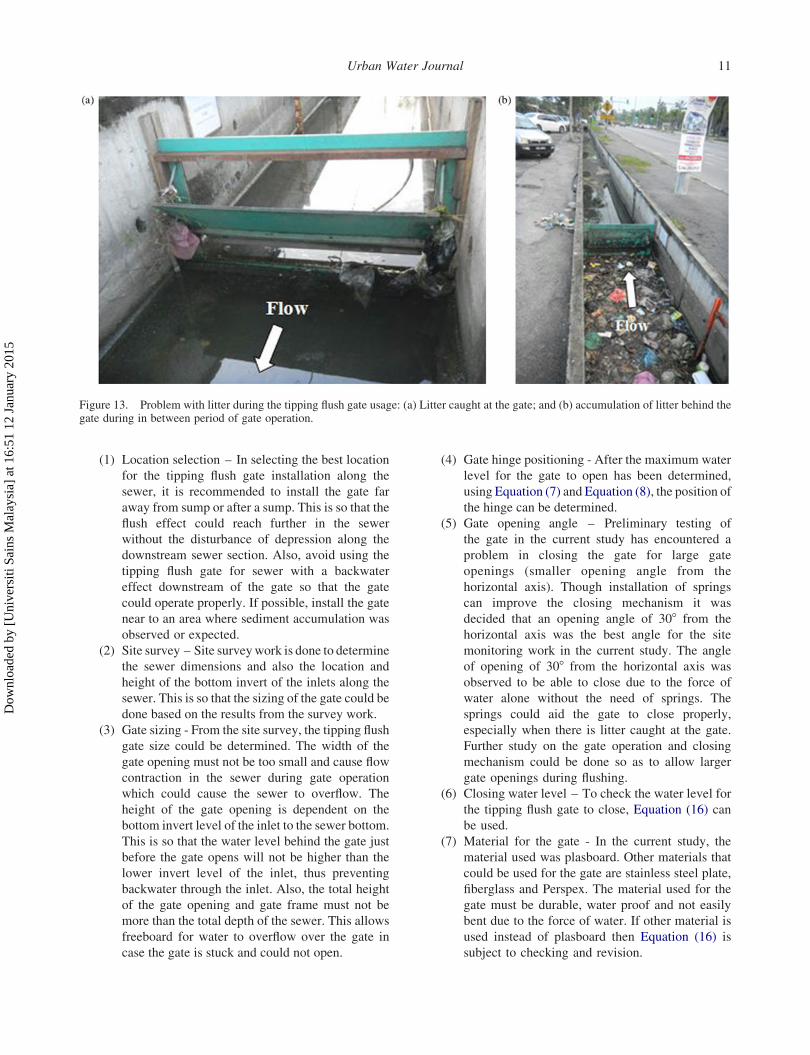
However, some problems were observed in the usage of
the tipping flush gate on-site. For an open storm sewer
system, litter such as dry leaves, tree branches, plastic
bottles, plastic bags and papers tend to get into the sewer
system more easily when compared to closed conduit
sewer systems. This litter sometimes tends to get caught at
the gate, thus preventing the gate from closing properly
(see Figure 13a). During the period of the current study,
the tipping flush gate was cleaned weekly of litter that
might catch at the gate. Litter also tends to accumulate
behind the gate between periods of the gate operation (see
Figure 13b). Proper litter management is needed if this
tipping flush gate is to be installed in an open storm sewer
system such as installation of trashrack and grids and also
to educate the community so as not to throw litter into the
sewer system. Another concern is the ponding of water
behind the gate between the periods of gate operation
could be a breeding ground for mosquitoes.
4. Design guideline for tipping flush gate on-site
The purpose of installing a tipping flush gate on-site is to
flush sediment to a section of the open storm sewer where
self-cleansing is possible or where the sediment could be
easily extracted such as a sump rather than cleaning the
whole section of the sewer manually. The tipping flush
gate could also be installed for sewers that are not easy to
access for manual cleaning such as covered open storm
sewers. The following steps were suggested as guidelines
for installation of a tipping flush gate on-site:
Figure 11. Changes of mean sediment profile (after adding sediment bed) with number of flushes for the period of 26th December 2012to 14th February 2013.
Figure 12. Changes of total sediment volume in the chosensection for the period of 26th December 2012 to 14th February2013 (after adding sediment bed).
C.H.J. Bong et al.10
Dow
nloa
ded
by [
Uni
vers
iti S
ains
Mal
aysi
a] a
t 16:
51 1
2 Ja
nuar
y 20
15
(1) Location selection – In selecting the best location
for the tipping flush gate installation along the
sewer, it is recommended to install the gate far
away from sump or after a sump. This is so that the
flush effect could reach further in the sewer
without the disturbance of depression along the
downstream sewer section. Also, avoid using the
tipping flush gate for sewer with a backwater
effect downstream of the gate so that the gate
could operate properly. If possible, install the gate
near to an area where sediment accumulation was
observed or expected.
(2) Site survey – Site surveywork is done to determine
the sewer dimensions and also the location and
height of the bottom invert of the inlets along the
sewer. This is so that the sizing of the gate could be
done based on the results from the survey work.
(3) Gate sizing - From the site survey, the tipping flush
gate size could be determined. The width of the
gate opening must not be too small and cause flow
contraction in the sewer during gate operation
which could cause the sewer to overflow. The
height of the gate opening is dependent on the
bottom invert level of the inlet to the sewer bottom.
This is so that the water level behind the gate just
before the gate opens will not be higher than the
lower invert level of the inlet, thus preventing
backwater through the inlet. Also, the total height
of the gate opening and gate frame must not be
more than the total depth of the sewer. This allows
freeboard for water to overflow over the gate in
case the gate is stuck and could not open.
(4) Gate hinge positioning - After the maximum water
level for the gate to open has been determined,
using Equation (7) and Equation (8), the position of
the hinge can be determined.
(5) Gate opening angle – Preliminary testing of
the gate in the current study has encountered a
problem in closing the gate for large gate
openings (smaller opening angle from the
horizontal axis). Though installation of springs
can improve the closing mechanism it was
decided that an opening angle of 308 from the
horizontal axis was the best angle for the site
monitoring work in the current study. The angle
of opening of 308 from the horizontal axis was
observed to be able to close due to the force of
water alone without the need of springs. The
springs could aid the gate to close properly,
especially when there is litter caught at the gate.
Further study on the gate operation and closing
mechanism could be done so as to allow larger
gate openings during flushing.
(6) Closing water level – To check the water level for
the tipping flush gate to close, Equation (16) can
be used.
(7) Material for the gate - In the current study, the
material used was plasboard. Other materials that
could be used for the gate are stainless steel plate,
fiberglass and Perspex. The material used for the
gate must be durable, water proof and not easily
bent due to the force of water. If other material is
used instead of plasboard then Equation (16) is
subject to checking and revision.
Figure 13. Problem with litter during the tipping flush gate usage: (a) Litter caught at the gate; and (b) accumulation of litter behind thegate during in between period of gate operation.
Urban Water Journal 11
Dow
nloa
ded
by [
Uni
vers
iti S
ains
Mal
aysi
a] a
t 16:
51 1
2 Ja
nuar
y 20
15
(8) Maintenance - Frequent maintenance of the gate,
especially during the wet season, such as weekly
cleaning of litter caught at the gate and checking the
tipping flush gate could operate properly is
recommended. This is to prevent the tipping flush
gate from not working properly such as failure to
open which could cause backflow and overflow for
the section of sewer behind the gate. Less frequent
maintenance with bi-weekly or monthly frequency
could be carried out during the dry season.
(9) Other considerations – Other things that need to be
considered in installing the flush gate on-site are to
have proper litter management like installing a
trash rack and grids so as to prevent litter from
getting caught at the gate. Besides that, if the site
allows, it is recommended to construct a water
storage chamber just behind the gate so that the
water level could build up faster and the flush could
happen more frequently. The gate for the site
monitoring in the current study was observed to be
effective in sediment removal up to 40m down-
stream of the gate which was the limit of the
monitoring. However it was yet to determine the
maximum length the flush waves are still effective
in sediment removal and this could be the subject
for further study.
5. Conclusions
The current study highlights the potential of a tipping
flush gate being used for servicing open storm sewers in
terms of sedimentation management. The design consider-
ations for the tipping flush gate specifically for open storm
sewer were also presented in this paper. Monitoring of the
gate operation and performance in Taman Pekaka, Nibong
Tebal, Penang, Malaysia from 14th November 2012 to 15th
March 2013 had proven that the tipping flush gate was
effective in reducing naturally accumulated sediment.
However, proper litter management is needed if the tipping
flush gate is to be implemented in open storm sewer
systems. Design guidelines that give general rules on
location selection for the gate, initial site surveying work
for the gate design, gate sizing, gate hinge positioning
calculation, gate opening angle determination, water level
for gate closing, material for the gate, maintenance and
other considerations were also presented.
Acknowledgements
Special appreciation goes to the city council; Majlis PerbandaranSeberang Perai (MPSP) for giving the permission to use the sitefor the study.
Funding
The authors would like to thank Universiti Malaysia Sarawak forthe financial support under the SGS grant No. F02
(S149)/1129/2014(14) and Universiti Sains Malaysia for theRU-PRGS grant No. 1001/PREDAC/8044050.
References
Ab. Ghani, A., Ghani, A., Zakaria, N.A., and Kassim, M., 2008.Sediment deposition in a rigid monsoon drain. InternationalJournal of River Basin Management, 6 (1), 23–30.
Ab. Ghani, A., Zakaria, N A., Kassim, M., and Nasir, B.A., 2000.Sediment size characteristics of urban drains in Malaysiancities. Urban Water, 2 (4), 335–341.
Ashley, R.M., Bertrand-Krajewski, J.-L., and Hvitved-Jacobsen,M. Verbanck, T., eds., 2004. Solids in sewers - character-istics, effects and control of sewer solids and associatedpollutants. London: IWA Publishing.
Bertrand-Krajewski, J.-L., 2008. Flushing urban sewers until thebeginning of the 20th century. 11th International Conferenceon Urban Drainage, 31 August–5 September 2008,Edinburgh, Scotland, United Kingdom. Available from:http://web.sbe.hw.ac.uk/staffprofiles/bdgsa/11th_Inter-national_Conference_on_Urban_Drainage_CD/ICUD08/pdfs/503.pdf [Assessed 9 March 2014].
Bertrand-Krajewski, J.-L., Bardin, J.-P., and Gibello, C., 2006.Long term monitoring of sewer sediment accumulation andflushing experiments in a man-entry sewer. Water Scienceand Technology, 54 (6–7), 109–117.
Bertrand-Krajewski, J.-L., Campisano, A., Creaco, E., andModica, C., 2005. Experimental analysis of the Hydrassflushing gate and field validation of flush propagation model.Water Science and Technology, 51 (2), 129–137.
Bong, C.H.J., Lau, T.L., and Ab. Ghani, A., 2013. Hydraulicscharacteristics of tipping sediment flushing gate. WaterScience & Technology, 68 (11), 2397–2406.
Bong, C.H.J., Lau, T.L., and Ab. Ghani, A., 2014. Sediment sizeand deposition characteristics in Malaysian urban concretedrains – a case study of Kuching City. Urban Water Journal,11 (1), 74–89.
Campisano, A., Creaco, E., and Modica, C., 2004. Experimentaland numerical analysis of the scouring effects of flushingwaves on sediment deposits. Journal of Hydrology, 299 (3–4), 324–334.
Campisano, A., Creaco, E., and Modica, C., 2007. Dimensionlessapproach for the design of flushing gates in sewer channels.Journal of Hydraulic Engineering, 133 (8), 964–972.
Campisano, A., Creaco, E., and Modica, C., 2008. Laboratoryinvestigation on the effects of flushes on cohesive sedimentbeds. Urban Water Journal, 5 (1), 3–14.
Chebbo, G., Laplace, D., Bachoc, A., Sanchez, Y., and Guennec,B.L., 1996. Technical solutions envisages in managing solidsin combined sewer networks.Water Science and Technology,33 (9), 237–244.
DID, 2012. Urban stormwater management manual forMalaysia, 2nd ed., Kuala Lumpur, Malaysia: Departmentof Irrigation and Drainage, Malaysia.
Dinkelacker, A., 1991. Cleaning of sewers. Water Science &Technology, 25 (8), 37–46.
Geiger, W.F., 1990. Appropriate technology for urban drainagein developing countries. In: H. Massing, J. Packman and F.C. Zuidema, eds. Hydrological processes and watermanagement in urban areas. University of Michigan, MI:IAHS Publ., 125–134.
Guo, Q., Fan, C.-Y., Raghaven, R., and Field, R., 2004. Gate andvacuum flushing of sewer sediment: laboratory testing.Journal of Hydraulic Engineering, 130 (5), 463–466.
C.H.J. Bong et al.12
Dow
nloa
ded
by [
Uni
vers
iti S
ains
Mal
aysi
a] a
t 16:
51 1
2 Ja
nuar
y 20
15
Kolsky, P., 1998. Storm drainage: an engineering guide to thelow-cost evaluation of system performance. London: ITPublisher.
Liew, Y.S., Selamat, Z., Ab. Ghani, A., and Zakaria, N.A., 2012.Performance of dry detention pond: case study of KotaDamansara, Selangor, Malaysia. Urban Water Journal, 9 (2),129–136.
Lorenzen, A., Ristenpart, E., and Pfuhl, W., 1996. Flush cleaningof sewers. Water Science and Technology, 33 (9), 221–228.
Pisano, W.C., O’Riordan, O.C., Ayotte, F.J., Barsanti, J.R., andCarr, D.L., 2003. Automated sewer and drainage flushingsystems in Cambridge, Massachusetts. Journal of HydraulicEngineering, 129 (4), 260–266.
Rodrıguez, J.P., McIntyre, N., Diaz-Granados, M., andMaksimovic, C., 2012. A database and model to support
proactive management of sediment-related sewer blockages.Water Research, 46 (15), 4571–4586.
Schaffner, J., 2008. Numerical investigations on the function offlush waves in a reservoir sewer, Thesis (PhD). TechnischenUniversitat Darmstadt, Germany.
Staufer, P., Dettmar, J., and Pinnekamp, J., 2008. Upstreamprocesseswithin flushingwaves. 11th International ConferenceonUrbanDrainage, 31August–5September2008,Edinburgh,UK. Available from: http://web.sbe.hw.ac.uk/staffprofiles/bdgsa/11th_International_Conference_on_Urban_Drainage_CD/ICUD08/pdfs/610.pdf [Assessed 9 March 2014].
Shirazi, R.H.S.M., Campisano, A., Modica, C., and Willems, P.,2014. Modelling the erosive effects of sewer flushing usingdifferent sediment transport formulae. Water Science &Technology, 69 (6), 1198–1204.
Urban Water Journal 13
Dow
nloa
ded
by [
Uni
vers
iti S
ains
Mal
aysi
a] a
t 16:
51 1
2 Ja
nuar
y 20
15