post enumeration surveys (pes) - laboratory of
TRANSCRIPT
ESA/STAT/AC.84/13 10 December 2001
English only
Symposium on Global Review of 2000 Round of Population and Housing Censuses: Mid-Decade Assessment and Future Prospects Statistics Division Department of Economic and Social Affairs United Nations Secretariat New York, 7-10 August 2001
POST ENUMERATION SURVEYS (PES): ARE THEY WORTH IT?*
David C. Whitford and Jeremiah P. Banda **
* This document was reproduced without formal editing. ** US Bureau of Census, USA and UN Statistics Division, New York respectively. The views expressed in the paper are those of the authors and do not imply the expression of any opinion on the part of the United Nations Secretariat.

POST ENUMERATION SURVEYS (PES): ARE THEY WORTH IT? David C. Whitford, United States Bureau of the Census1 Jeremiah P. Banda, United Nations Statistics Division
Contents
1. INTRODUCTION
1.1 Purpose of a Post-Enumeration Survey 1.2 Problems and constraints associated with Post-Enumeration Surveys
2. DESIGN AND METHODOLOGICAL ISSUES
2.1 The P or population sample 2.2 The E sample 2.3 Frames 2.4 Sample design 2.5 Listing 2.6 Interviewing 2.7 Matching 2.8 Reconciliation 2.9 Estimation
2.9.1 Dual System Estimate Incorporating an E sample 2.9.2 Missing Data 2.9.3 Poststratification
3. COUNTRY PRACTICES
3.1 Cambodia 3.1. 1 Sample design 3.1.2 Matching 3.1.3 Coverage error 3.1.4 Content error
3.2 Palestine 3.2.1 Sample design 3.2.2 Matching and coverage error 3.2.3 Quality and independence
3.3 Zambia 3.3.1 Sample design 3.3.2 PES enumeration 3.3.3 Matching 3.3.4 Field reconciliation 3.3.5 Coverage error 3.3.6 Content error
3.4 Mongolia 3.4.1 Sample design and data collection 3.4.2 Matching 3.4.3 Problem with the Mongolia PES
3.5 Burundi and Rwanda 3.5.1 Sample design 3.5.2 Data collection 3.5.3 Field staff 3.5.4 Matching
3.6 Namibia 3.6.1 Matching
3.7 United States 3.7.1 Introduction and Sample Design 3.7.2 Interviewing 3.7.3 Matching 3.7.4 Reconciliation and Estimation 3.7.5 Results
3.8 Use of PES Results
3.9 Lessons Learned from Country Examples
4. CONCLUSIONS AND RECOMMENDATIONS
REFERENCES
1. INTRODUCTION
Census taking is improving constantly throughout the world. As censuses improve and people get used to using information from them, they undergo more and more scrutiny. For instance, given one census, the science of demographic analysis can produce independent estimates of population size for comparison with the results of the following census. Differences between the demographic analysis predictions and the actual results of the new census are inevitable. These differences can take the form of unreasonable sex ratios or wild disparities in age cohorts. We reiterate that as censuses improve, they are used more and examined more. A country’s last census may have not undergone much scrutiny, but its next one could be a bombshell waiting to explode. As time passes, the need for self-evaluation of census results inevitably increases. It should also be noted that a population census is the most extensive and expensive data collection exercise any country can undertake. With vast amounts of resources spent, there is usually tremendous pressure on census takers to ensure that census results are accurate. As a result of the massive nature of the census operation, it is inevitable that some inaccuracies arise from deficiencies including errors of coverage and response. The major difference among countries is the extent of such errors. This, however, does not diminish the importance of the census as long as users understand the limitations of the data and the errors do not affect the major uses of the data (National Statistical Institute, 1999). It is against this background that a number of methods, for evaluating censuses, have been developed. Such methods include demographic analysis, comparison of census totals with figures from other sources and matching census returns with those from interviews selected on the basis of a probability sample in a post enumeration survey (PES). This paper focuses on PES as a method of evaluation. The paper discusses the purpose of PESs; problems and constraints associated with PES; design and methodological issues; country experiences; uses of PESs and suggestions are made to improve PES programmes.
1.1 Purpose of a Post-Enumeration Survey While a number of methods have been developed to evaluate census data, for many developing countries the PES seems to be the most ideal owing to paucity of appropriate data to facilitate the effective use of other methods. The lack or incompleteness of registration systems and absence of regular population/demographic surveys contributes to non-or limited use of other methods of census evaluation. In general, a number of countries have relied primarily on PES methodology to evaluate the census undercount (Biemer et al., 2001). Post-Enumeration Surveys are an accepted census self-evaluation tool. Cryptically, a PES is an independent survey that replicates a census. The survey and the census results are then compared (matched). The results of the comparison are used to measure the coverage and/or errors in content of the census. Estimates of net coverage, the number of people omitted in the census, the number erroneously enumerated and content error rates for specific questions are typical products of a PES. Additionally, these estimates can be broken down further into their component parts. One can design the survey such that reliable estimates of under- and/or over-count can be obtained for the entire census, for geographic areas of interest in the census, and for any of a host of demographic characteristics such as age, race and sex for which one might desire census coverage statistics. The survey results also enable one to be able to uncover census methodologies or operations that, when implemented, produced less than desirable results. Suppose, for instance, that a high census omission rate was observed in rural areas. One might then use specific PES results to examine whether the rural errors were due to whole housing units being missed. If so, this might well imply an incomplete census frame and cause one to re-examine the methodology for building an address list in rural areas.

PES results can be used to adjust census results. Using a carefully designed survey, under- or over-counts can be converted into adjustment factors and the census population increased/decreased accordingly by these factors. Later in this document we will discuss poststratification and the need to ensure homogeneity within each adjustment cell. It has been reported that in some African countries, PES results have been used to support or defend census results when the accuracy of the census is challenged (Onsembe, 1999). In addition, censuses are used for many other purposes such as updating population estimates; developing and updating sampling frames; correcting and updating population registers and the establishment and updating of key components of the Geographic Information Systems (GIS). These many uses suggest that there is need to use an objective method for assessing coverage and content errors as a crucial step for concluding a census operation (Abu-Libdeh, 1999). Quality assurance alone, introduced at various stages of census operations, cannot ensure a complete evaluation of the qualitative and quantitative accuracy of census data (ECA, 1975). In summary, Post-Enumeration Surveys have many good purposes. They basically inform users regarding the quality of the census data. As earlier stated providing limitations of published census data increases the confidence, of informed users, in such data. On the other hand, there are distinct limitations and constraints in managing and implementing the evaluation survey.
1.2 Problems and constraints associated with Post-Enumeration Surveys Although a PES can be an important component of a census programme, which can contribute to the process of building confidence in the census results, a poorly designed and executed survey can inflict considerable damage to census legitimacy. We list below some of the problems and constraints associated with PESs:
§ Planning and management of a PES, ideally, have to be undertaken by a staff that is separate from the census staff. This is not usually the case in many countries;
§ The design of the survey, especially the matching step is relatively complex. For example, in the United States planners continue to find design flaws in their matching system, however, as corporate experience grows they become more and more minor;
§ The survey must be independent of the census. In the survey’s sample areas, census results must not be biased by the implementation of the PES;
§ The PES interview itself is demanding. Usually it incorporates questions to determine if the respondent should “really” be counted at the residence in question. Also, the PES interview usually transpires after the census interview at which point the respondent may feel overburdened and not be as forthcoming with accurate information;
§ Some of the developing countries lack technical personnel with experience and skills in survey methodology in general and PES in particular;
§ Past failures of some countries in conducting PESs has discourage such countries and others to conduct PESs in subsequent census rounds;
§ Some of the countries, such as the United States of America, which have conducted PESs have not used the results to adjust population census figures. In such cases questions have been raised about the rationale for conducting PESs;
§ In some countries, census planners feel it is enough to institute good quality assurance procedures at various stages of census activities, therefore they see no need for a PES (UNSD/SADC, 2001).
Lastly, some of the countries are ambivalent about conducting a PES because a census is usually a gruelling and taxing operation, which saps the energy of those involved. The general fatigue it generates is sufficient to discourage the conduct of the survey. Additionally by the time the census enumeration is completed there is usually a feeling of accomplishment among census planners. They may, therefore, not see the need for conducting a PES which, after all, may just expose glaring discrepancies between census and PES results to the detriment of the reputation of the census/statistical organisation.
2. DESIGN AND METHODOLOGICAL ISSUES
Considering whether a Post-Enumeration Survey is worth it or not leads immediately to some decisions that have to be made regarding the design of the survey. These decisions revolve around what goals one has for the survey and what answers best suit the individual situation in which the survey will be conducted. We will assume in this paper that the goal of the PES interview is to establish carefully who lived in the subject housing unit on the day the census was officially taken. In the next step we match the results from the interview to appropriate census forms in a well defined area around that subject housing unit.[6]
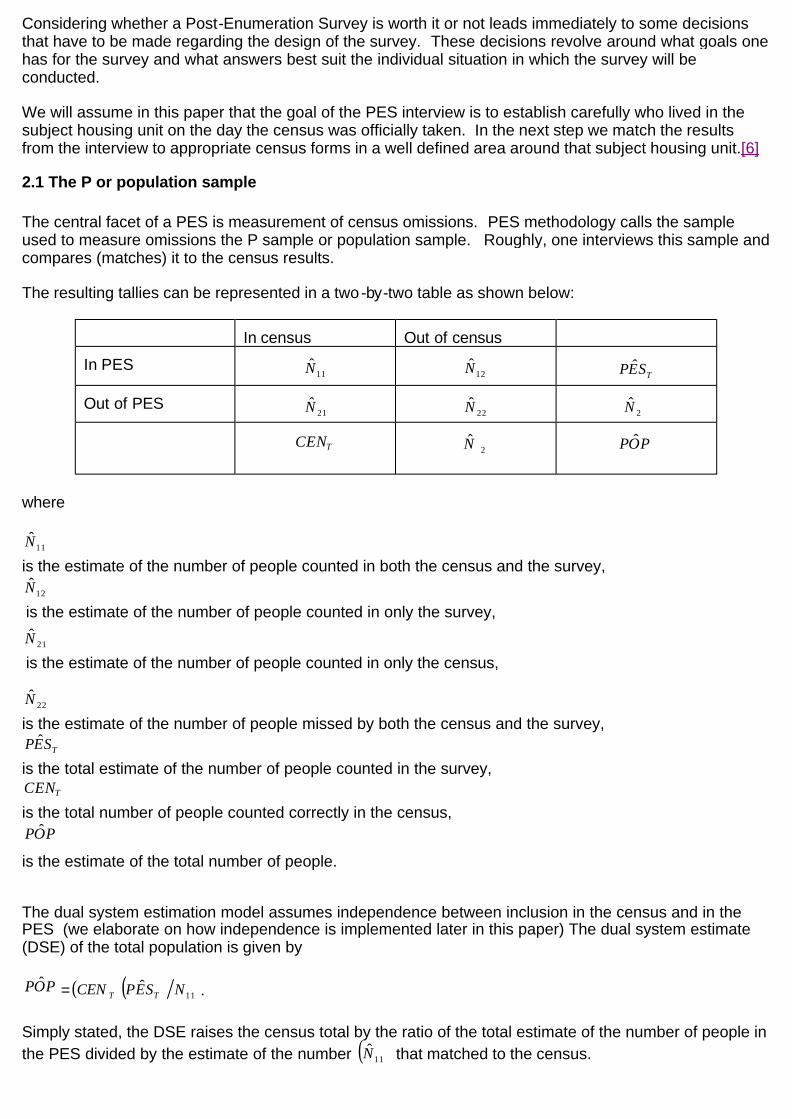
2.1 The P or population sample The central facet of a PES is measurement of census omissions. PES methodology calls the sample used to measure omissions the P sample or population sample. Roughly, one interviews this sample and compares (matches) it to the census results. The resulting tallies can be represented in a two-by-two table as shown below:
where
is the estimate of the number of people counted in both the census and the survey,
is the estimate of the number of people counted in only the survey,
is the estimate of the number of people counted in only the census,
is the estimate of the number of people missed by both the census and the survey,
is the total estimate of the number of people counted in the survey,
is the total number of people counted correctly in the census,
is the estimate of the total number of people. The dual system estimation model assumes independence between inclusion in the census and in the PES (we elaborate on how independence is implemented later in this paper) The dual system estimate (DSE) of the total population is given by
= .
Simply stated, the DSE raises the census total by the ratio of the total estimate of the number of people in the PES divided by the estimate of the number that matched to the census.
In census
Out of census
In PES
11N
12N
TSEP ˆ
Out of PES
21N
22N
+2N
TCEN
2ˆ
+N
POP ˆ
11N
12N
21N
22N
TSEP ˆ
TCEN
POP ˆ
POP ˆ ( )( ) 11ˆ NSEPCEN TT
( )11N
In the “Purposes” section we discussed about breaking down the DSE estimates by geographic areas and for any of a host of demographic characteristics-age such as, race and sex for which one might desire census coverage statistics. If direct estimates are desired for any of these breakdowns, one might poststratify the sample results into the categories desired. The objective of poststratification is to include in each dual system estimate people who have similar capture probabilities in the census.
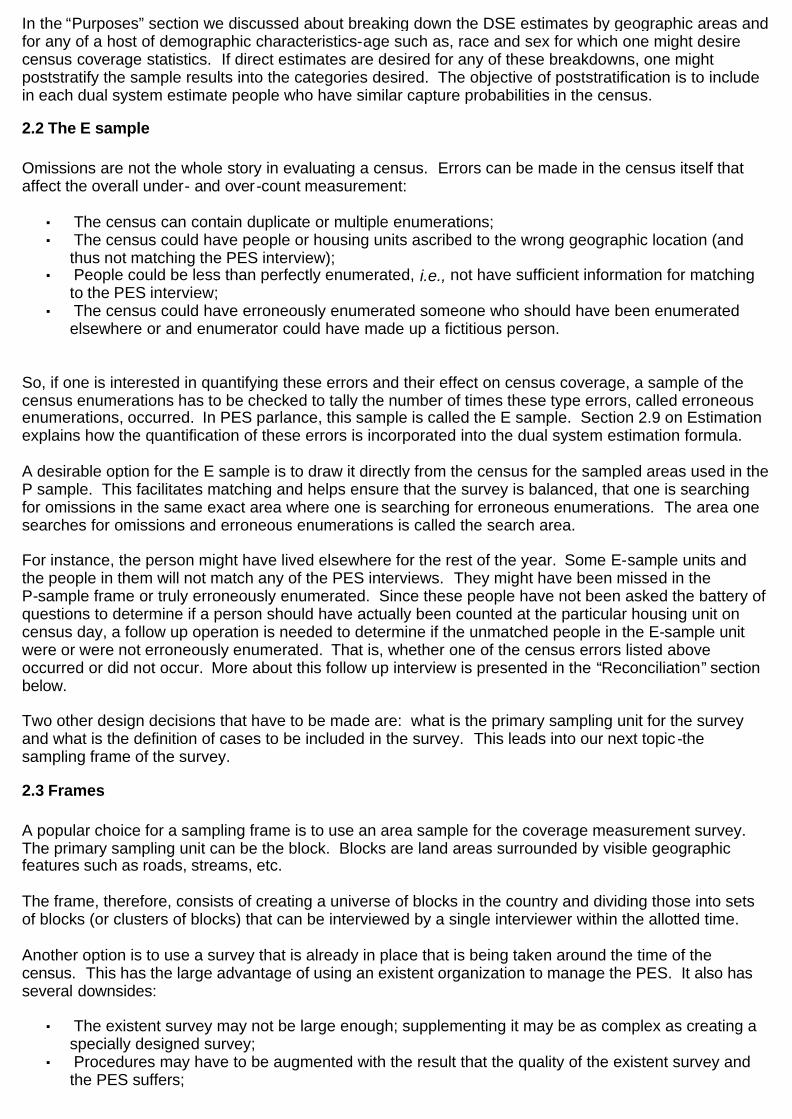
2.2 The E sample Omissions are not the whole story in evaluating a census. Errors can be made in the census itself that affect the overall under- and over-count measurement:
§ The census can contain duplicate or multiple enumerations; § The census could have people or housing units ascribed to the wrong geographic location (and
thus not matching the PES interview); § People could be less than perfectly enumerated, i.e., not have sufficient information for matching
to the PES interview; § The census could have erroneously enumerated someone who should have been enumerated
elsewhere or and enumerator could have made up a fictitious person. So, if one is interested in quantifying these errors and their effect on census coverage, a sample of the census enumerations has to be checked to tally the number of times these type errors, called erroneous enumerations, occurred. In PES parlance, this sample is called the E sample. Section 2.9 on Estimation explains how the quantification of these errors is incorporated into the dual system estimation formula. A desirable option for the E sample is to draw it directly from the census for the sampled areas used in the P sample. This facilitates matching and helps ensure that the survey is balanced, that one is searching for omissions in the same exact area where one is searching for erroneous enumerations. The area one searches for omissions and erroneous enumerations is called the search area. For instance, the person might have lived elsewhere for the rest of the year. Some E-sample units and the people in them will not match any of the PES interviews. They might have been missed in the P-sample frame or truly erroneously enumerated. Since these people have not been asked the battery of questions to determine if a person should have actually been counted at the particular housing unit on census day, a follow up operation is needed to determine if the unmatched people in the E-sample unit were or were not erroneously enumerated. That is, whether one of the census errors listed above occurred or did not occur. More about this follow up interview is presented in the “Reconciliation” section below. Two other design decisions that have to be made are: what is the primary sampling unit for the survey and what is the definition of cases to be included in the survey. This leads into our next topic -the sampling frame of the survey.
2.3 Frames A popular choice for a sampling frame is to use an area sample for the coverage measurement survey. The primary sampling unit can be the block. Blocks are land areas surrounded by visible geographic features such as roads, streams, etc. The frame, therefore, consists of creating a universe of blocks in the country and dividing those into sets of blocks (or clusters of blocks) that can be interviewed by a single interviewer within the allotted time. Another option is to use a survey that is already in place that is being taken around the time of the census. This has the large advantage of using an existent organization to manage the PES. It also has several downsides:
§ The existent survey may not be large enough; supplementing it may be as complex as creating a specially designed survey;
§ Procedures may have to be augmented with the result that the quality of the existent survey and the PES suffers;

§ The ultimate sampling units may not lend themselves to being an efficient erroneous enumeration sample, where duplication, geocoding errors, etc. need to be easily discernable.
2.4 Sample design Above, we mentioned the option of using block clusters as a frame for the survey. One might want design the sample in several stages by first choosing a group of these clusters and then optimizing the sample by subsampling. For instance the housing unit totals from a previous census might be used to choose the initial sample of clusters, then after the addresses of all of the housing units in the sample clusters are listed, the block clusters might be divided into small, medium and large sampling strata, where:
§ Small clusters might consist of 0 -2 housing units; § Medium clusters might consist of 3 -79 housing units; § Large clusters might consist of 80 or more housing units.
the next step could be to subsample some of these clusters:
§ Medium and large clusters might be subsampled whenever their actual counts of housing units differed significantly from what was expected (from the previous census);
§ Probably, there are many small block clusters in rural areas. These can be subsampled to keep the field work manageable;
§ Again, to keep the field work manageable, some within cluster subsampling can be undertaken in very large clusters.
2.5 Listing For the block clusters in which interviewers are to enumerate, interviewers need maps to find each subject housing unit and a listing of all the housing units in the block cluster. The Listing operation is done independently of any census activity. Not only are the addresses of existent housing units listed, but inquiries are made at commercial structures and other structures to ensure that no people live in them. One option is to give listers blank maps upon which they put a numbered spot representing each living quarter or potential living quarters in the cluster. Listing needs to be of high quality, not only ensuring that the correct block(s) are listed but that a complete list is obtained within the cluster. So, a quality assurance plan needs to be created to ensure correct listings, for instance, to ensure that commercial structures have, indeed, been checked to see if they contain residences.
2.6 Interviewing The interview approach is currently the common method used in PES. The questionnaire asks about all people who resided at the sample address on census day and asks questions to ensure the respondents should have been counted at this address (and subsequently searches for them at that address and in the search area surrounding it). Obviously, since people move, it is most efficient if the PES interview can occur as soon after census day as practical. Getting information about out -movers (those who move out of the sample address between census day and the PES interview) is usually difficult. The training book, Evaluating Censuses of Population and Housing, Statistical Training Document (U.S. Bureau of the Census, 1985), gives a set of basic questions for PESs that are still valid today. Essentially they are:
§ What are the names of all people living here on census day? § What are their relationships to each other? § What is each person ’s age and sex? § Is each person still residing here? If not what is his/her current address? § What are the names and relationships of other people living here on census day?
The last two questions are examples of probing questions. To ensure that people didn’t live elsewhere on

census day, the interview could include more probing “other residence” questions that fit the country’s existing situation. Since this information is going to be matched to the census, it is obviously important that it be complete. Some countries have chosen to have the PES interview completed on a laptop computer which can check within its program to ensure complete data. Quality control measures need to be employed in any case. When measuring a small fraction of the population, those not counted in the census, it is very difficult to deal with a high noninterview rate. To keep the noninterview rate low, a second and final phase of interviewing might be planned during which the best interviewers attempt to convert the remaining noninterviewed cases.
2.7 Matching After data capture is completed for the PES interviews and the census data prepared for each PES cluster, the next step is to match the two. One approach is to accomplish this in two steps: computer matching, which “skims the cream”, thus the easiest matching cases, followed by clerical matching of the remaining non-matches and possible matches as determined by the computer process. Of course, matching can be completed manually. The process involves clerks first gathering materials to facilitate matching in a particular cluster. The materials include:
§ Address lists from both the census and PES; § Census forms for the cluster; § PES interview results for the cluster; § Maps for the cluster from the census and the PES.
Gathering materials for a cluster is indeed a cumbersome part of the matcher ’s job. Regardless how it is done, the basic process of matching remains the same: comparing people ’s names and demographic characteristics between the census form and the PES interview form. One design has clerical matching comprised of four basic steps. The clerk:
§ Must first determine if the (s)he has sufficient information for matching. That is, whether the names and demographic information are complete enough to be able to discern a definite match. The clerk must determine this before looking at households from the other survey. It is a violation of independence to have the census or PES results from a household biasing a clerk’s ability to read, for instance, a sloppily written name;
§ Matches the P sample to the census throughout the cluster (or search area); § Then looks for duplicates within the E sample; § Lastly, one option is to have clerks do some surrounding block matching; § Looking for matches in the blocks surrounding the cluster if and only if one balances this by
looking for E-sample correct enumerations with equal exactness.
2.8 Reconciliation We earlier mentioned (in the E-sample section) that many PES interviews ask a battery of questions to determine if a person should have actually been counted at the particular housing unit on census day. If whole households of E-sample housing units have not matched to anyone in the P sample, they would have not been asked the residence questions. A field follow up operation is needed to determine if the unmatched people in the E-sample unit were or were not erroneously enumerated. Additionally, in a coverage measurement survey follow up operation, P-sample interviews with unmatched people that had been completed by proxy respondents can be sent to follow up. Some research has indicated that PES interviews by proxy respondents need this additional attention to ensure accuracy. After the follow up operation, forms are received in the processing office and their final match status coded, probably by the same people who did the earlier matching. This completes the operations for the PES, and we move into estimating the under-/over-count.
2.9 Estimation
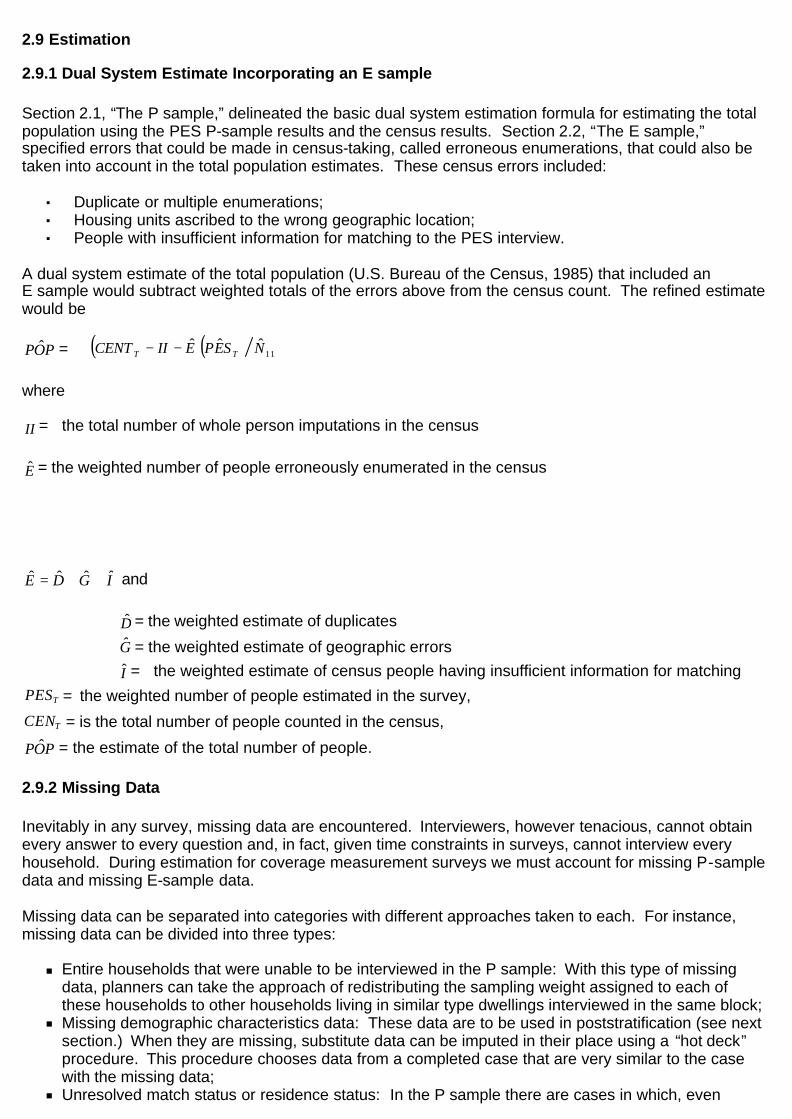
2.9.1 Dual System Estimate Incorporating an E sample Section 2.1, “The P sample,” delineated the basic dual system estimation formula for estimating the total population using the PES P-sample results and the census results. Section 2.2, “The E sample,” specified errors that could be made in census-taking, called erroneous enumerations, that could also be taken into account in the total population estimates. These census errors included:
§ Duplicate or multiple enumerations; § Housing units ascribed to the wrong geographic location; § People with insufficient information for matching to the PES interview.
A dual system estimate of the total population (U.S. Bureau of the Census, 1985) that included an E sample would subtract weighted totals of the errors above from the census count. The refined estimate would be
=
where
= the total number of whole person imputations in the census
= the weighted number of people erroneously enumerated in the census
and
= the weighted estimate of duplicates
= the weighted estimate of geographic errors
= the weighted estimate of census people having insufficient information for matching
= the weighted number of people estimated in the survey,
= is the total number of people counted in the census,
= the estimate of the total number of people.
2.9.2 Missing Data Inevitably in any survey, missing data are encountered. Interviewers, however tenacious, cannot obtain every answer to every question and, in fact, given time constraints in surveys, cannot interview every household. During estimation for coverage measurement surveys we must account for missing P-sample data and missing E-sample data. Missing data can be separated into categories with different approaches taken to each. For instance, missing data can be divided into three types:
n Entire households that were unable to be interviewed in the P sample: With this type of missing data, planners can take the approach of redistributing the sampling weight assigned to each of these households to other households living in similar type dwellings interviewed in the same block;
n Missing demographic characteristics data: These data are to be used in poststratification (see next section.) When they are missing, substitute data can be imputed in their place using a “hot deck” procedure. This procedure chooses data from a completed case that are very similar to the case with the missing data;
n Unresolved match status or residence status: In the P sample there are cases in which, even
POP ˆ ( )( ) 11ˆˆˆ NSEPEIICENT TT −−
II
E
IGDE ˆˆˆˆ ++=
D
G
I
TPES
TCEN
POP ˆ
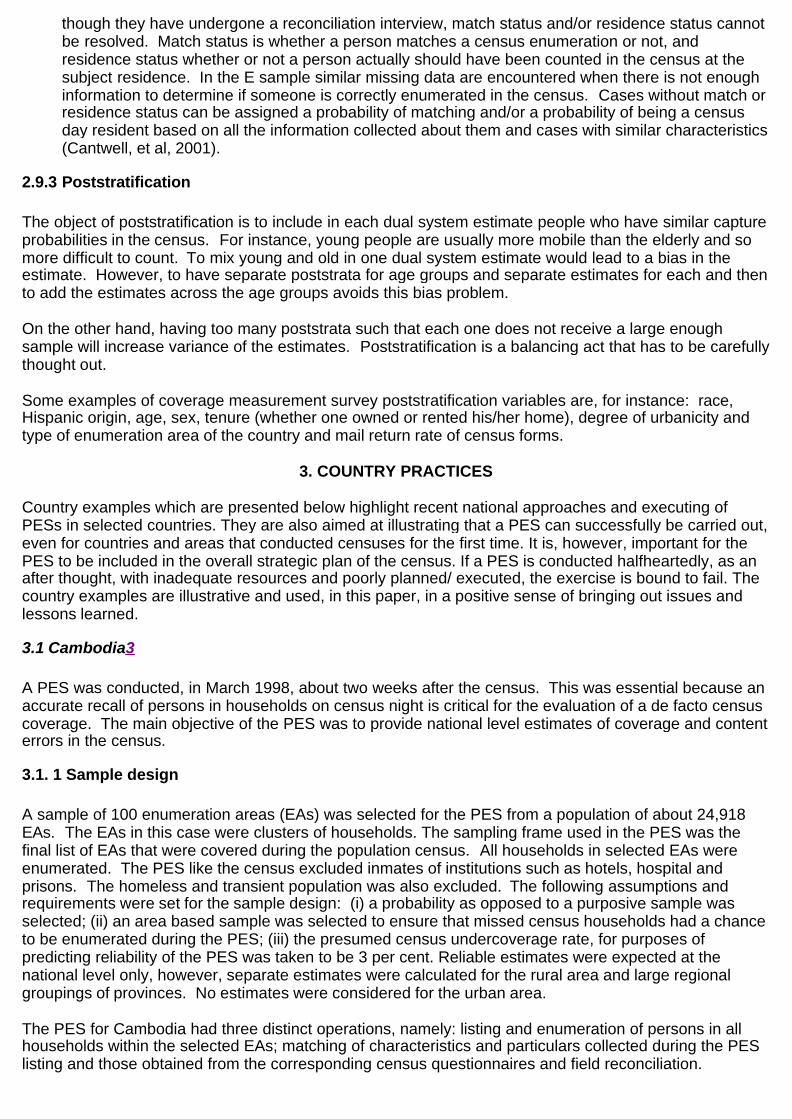
though they have undergone a reconciliation interview, match status and/or residence status cannot be resolved. Match status is whether a person matches a census enumeration or not, and residence status whether or not a person actually should have been counted in the census at the subject residence. In the E sample similar missing data are encountered when there is not enough information to determine if someone is correctly enumerated in the census. Cases without match or residence status can be assigned a probability of matching and/or a probability of being a census day resident based on all the information collected about them and cases with similar characteristics (Cantwell, et al, 2001).
2.9.3 Poststratification The object of poststratification is to include in each dual system estimate people who have similar capture probabilities in the census. For instance, young people are usually more mobile than the elderly and so more difficult to count. To mix young and old in one dual system estimate would lead to a bias in the estimate. However, to have separate poststrata for age groups and separate estimates for each and then to add the estimates across the age groups avoids this bias problem. On the other hand, having too many poststrata such that each one does not receive a large enough sample will increase variance of the estimates. Poststratification is a balancing act that has to be carefully thought out. Some examples of coverage measurement survey poststratification variables are, for instance: race, Hispanic origin, age, sex, tenure (whether one owned or rented his/her home), degree of urbanicity and type of enumeration area of the country and mail return rate of census forms.
3. COUNTRY PRACTICES
Country examples which are presented below highlight recent national approaches and executing of PESs in selected countries. They are also aimed at illustrating that a PES can successfully be carried out, even for countries and areas that conducted censuses for the first time. It is, however, important for the PES to be included in the overall strategic plan of the census. If a PES is conducted halfheartedly, as an after thought, with inadequate resources and poorly planned/ executed, the exercise is bound to fail. The country examples are illustrative and used, in this paper, in a positive sense of bringing out issues and lessons learned.
3.1 Cambodia3 A PES was conducted, in March 1998, about two weeks after the census. This was essential because an accurate recall of persons in households on census night is critical for the evaluation of a de facto census coverage. The main objective of the PES was to provide national level estimates of coverage and content errors in the census.
3.1. 1 Sample design A sample of 100 enumeration areas (EAs) was selected for the PES from a population of about 24,918 EAs. The EAs in this case were clusters of households. The sampling frame used in the PES was the final list of EAs that were covered during the population census. All households in selected EAs were enumerated. The PES like the census excluded inmates of institutions such as hotels, hospital and prisons. The homeless and transient population was also excluded. The following assumptions and requirements were set for the sample design: (i) a probability as opposed to a purposive sample was selected; (ii) an area based sample was selected to ensure that missed census households had a chance to be enumerated during the PES; (iii) the presumed census undercoverage rate, for purposes of predicting reliability of the PES was taken to be 3 per cent. Reliable estimates were expected at the national level only, however, separate estimates were calculated for the rural area and large regional groupings of provinces. No estimates were considered for the urban area. The PES for Cambodia had three distinct operations, namely: listing and enumeration of persons in all households within the selected EAs; matching of characteristics and particulars collected during the PES listing and those obtained from the corresponding census questionnaires and field reconciliation.
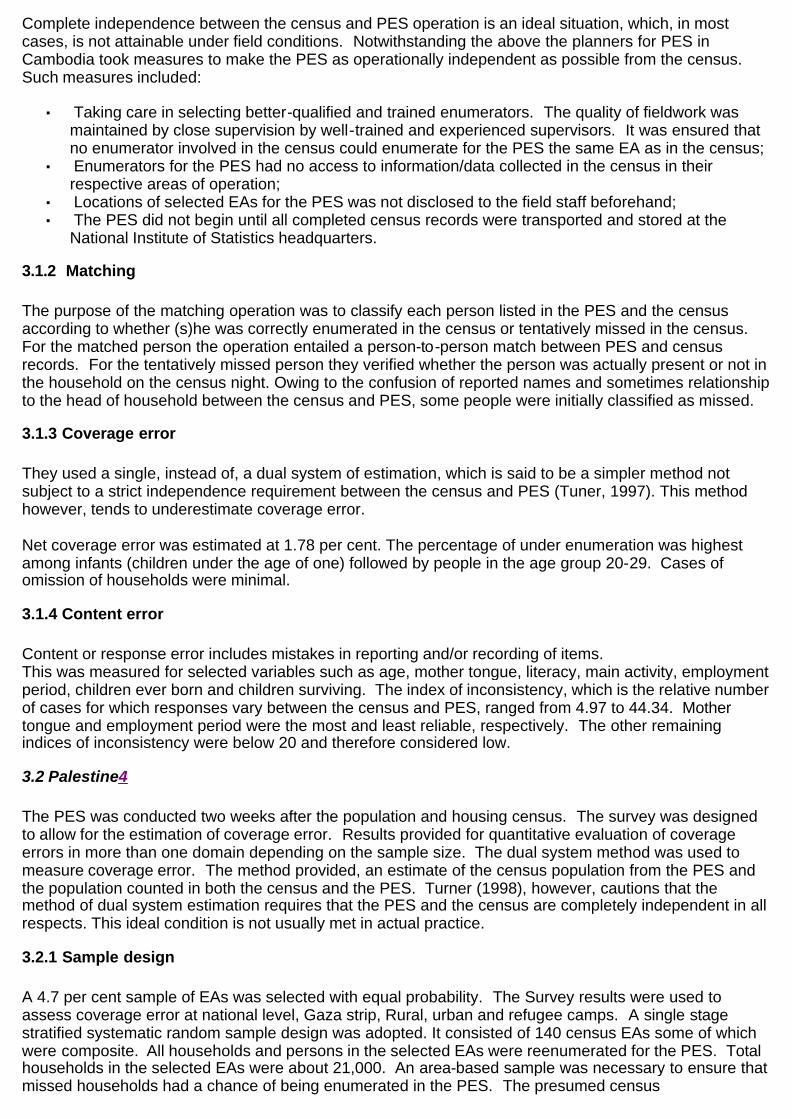
Complete independence between the census and PES operation is an ideal situation, which, in most cases, is not attainable under field conditions. Notwithstanding the above the planners for PES in Cambodia took measures to make the PES as operationally independent as possible from the census. Such measures included:
§ Taking care in selecting better-qualified and trained enumerators. The quality of fieldwork was maintained by close supervision by well-trained and experienced supervisors. It was ensured that no enumerator involved in the census could enumerate for the PES the same EA as in the census;
§ Enumerators for the PES had no access to information/data collected in the census in their respective areas of operation;
§ Locations of selected EAs for the PES was not disclosed to the field staff beforehand; § The PES did not begin until all completed census records were transported and stored at the
National Institute of Statistics headquarters.
3.1.2 Matching The purpose of the matching operation was to classify each person listed in the PES and the census according to whether (s)he was correctly enumerated in the census or tentatively missed in the census. For the matched person the operation entailed a person-to-person match between PES and census records. For the tentatively missed person they verified whether the person was actually present or not in the household on the census night. Owing to the confusion of reported names and sometimes relationship to the head of household between the census and PES, some people were initially classified as missed.
3.1.3 Coverage error They used a single, instead of, a dual system of estimation, which is said to be a simpler method not subject to a strict independence requirement between the census and PES (Tuner, 1997). This method however, tends to underestimate coverage error. Net coverage error was estimated at 1.78 per cent. The percentage of under enumeration was highest among infants (children under the age of one) followed by people in the age group 20-29. Cases of omission of households were minimal.
3.1.4 Content error Content or response error includes mistakes in reporting and/or recording of items. This was measured for selected variables such as age, mother tongue, literacy, main activity, employment period, children ever born and children surviving. The index of inconsistency, which is the relative number of cases for which responses vary between the census and PES, ranged from 4.97 to 44.34. Mother tongue and employment period were the most and least reliable, respectively. The other remaining indices of inconsistency were below 20 and therefore considered low.
3.2 Palestine4 The PES was conducted two weeks after the population and housing census. The survey was designed to allow for the estimation of coverage error. Results provided for quantitative evaluation of coverage errors in more than one domain depending on the sample size. The dual system method was used to measure coverage error. The method provided, an estimate of the census population from the PES and the population counted in both the census and the PES. Turner (1998), however, cautions that the method of dual system estimation requires that the PES and the census are completely independent in all respects. This ideal condition is not usually met in actual practice.
3.2.1 Sample design A 4.7 per cent sample of EAs was selected with equal probability. The Survey results were used to assess coverage error at national level, Gaza strip, Rural, urban and refugee camps. A single stage stratified systematic random sample design was adopted. It consisted of 140 census EAs some of which were composite. All households and persons in the selected EAs were reenumerated for the PES. Total households in the selected EAs were about 21,000. An area-based sample was necessary to ensure that missed households had a chance of being enumerated in the PES. The presumed census
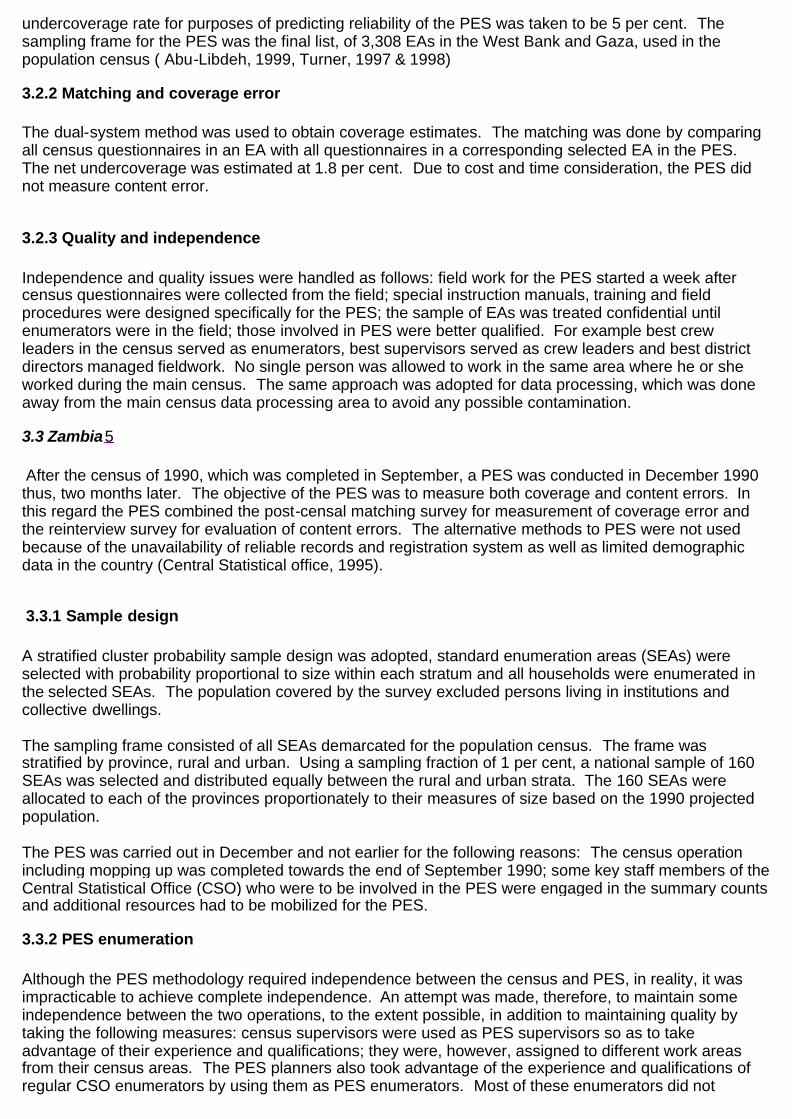
undercoverage rate for purposes of predicting reliability of the PES was taken to be 5 per cent. The sampling frame for the PES was the final list, of 3,308 EAs in the West Bank and Gaza, used in the population census ( Abu-Libdeh, 1999, Turner, 1997 & 1998)
3.2.2 Matching and coverage error The dual-system method was used to obtain coverage estimates. The matching was done by comparing all census questionnaires in an EA with all questionnaires in a corresponding selected EA in the PES. The net undercoverage was estimated at 1.8 per cent. Due to cost and time consideration, the PES did not measure content error.
3.2.3 Quality and independence Independence and quality issues were handled as follows: field work for the PES started a week after census questionnaires were collected from the field; special instruction manuals, training and field procedures were designed specifically for the PES; the sample of EAs was treated confidential until enumerators were in the field; those involved in PES were better qualified. For example best crew leaders in the census served as enumerators, best supervisors served as crew leaders and best district directors managed fieldwork. No single person was allowed to work in the same area where he or she worked during the main census. The same approach was adopted for data processing, which was done away from the main census data processing area to avoid any possible contamination.
3.3 Zambia5 After the census of 1990, which was completed in September, a PES was conducted in December 1990 thus, two months later. The objective of the PES was to measure both coverage and content errors. In this regard the PES combined the post-censal matching survey for measurement of coverage error and the reinterview survey for evaluation of content errors. The alternative methods to PES were not used because of the unavailability of reliable records and registration system as well as limited demographic data in the country (Central Statistical office, 1995).
3.3.1 Sample design A stratified cluster probability sample design was adopted, standard enumeration areas (SEAs) were selected with probability proportional to size within each stratum and all households were enumerated in the selected SEAs. The population covered by the survey excluded persons living in institutions and collective dwellings. The sampling frame consisted of all SEAs demarcated for the population census. The frame was stratified by province, rural and urban. Using a sampling fraction of 1 per cent, a national sample of 160 SEAs was selected and distributed equally between the rural and urban strata. The 160 SEAs were allocated to each of the provinces proportionately to their measures of size based on the 1990 projected population. The PES was carried out in December and not earlier for the following reasons: The census operation including mopping up was completed towards the end of September 1990; some key staff members of the Central Statistical Office (CSO) who were to be involved in the PES were engaged in the summary counts and additional resources had to be mobilized for the PES.
3.3.2 PES enumeration Although the PES methodology required independence between the census and PES, in reality, it was impracticable to achieve complete independence. An attempt was made, therefore, to maintain some independence between the two operations, to the extent possible, in addition to maintaining quality by taking the following measures: census supervisors were used as PES supervisors so as to take advantage of their experience and qualifications; they were, however, assigned to different work areas from their census areas. The PES planners also took advantage of the experience and qualifications of regular CSO enumerators by using them as PES enumerators. Most of these enumerators did not

participate in the census. The few who participated in the census had their work places swapped. PES field staff did not know preliminary census results of areas to which they were assigned. There were 160 interviewers, one for each selected SEA and 51 supervisors giving a ratio of about one supervisor for every three enumerators. The low ratio ensured effective supervision, thereby enhancing quality of the data collected by enumerators. Instruction manuals and control forms were prepared for the enumerators and supervisors. The enumeration in the PES was on the de jure basis while that of the census was both de jure and de facto. To facilitate matching the questionnaire contained pre-coded answers and shaded spaces for recording census responses.
3.3.3 Matching The PES questionnaires were matched to the census questionnaires by pairing each household and each person with corresponding census records. A two- way matching system, which was done manually, was adopted to identify omissions and census erroneous enumerations. Non-movers and out mover categories were matched, while in-movers were identified but not matched. The matching was done at two levels, initially by identifying housing units and households and subsequently matching individual characteristics. The matching status was classified into, perfect match, possible match and no-match. At the initial stage, while using strict matching rules, there was a high incidence of possible matches and low incidence of perfect matches. This was mainly due to differences in reported names of members of households between the two sources, particularly in rural areas. The use of alternate names is very common in Zambia (Banda, 1984). Large age variation, especially among older members of households also posed problems to matchers. Subsequently age tolerance limits for the old age groups were somewhat relaxed. Another reason for high incidence of possible matches was partly caused by the differences in the use of the concept of household between the PES and census enumerators with respect to polygamous families. There were a number of areas where polygamous families were regarded as one household, in one case and two or more households, depending on the number of wives, in other cases. This caused some persons to be counted more than once in PES or census.
3.3.4 Field reconciliation Field reconciliation was considered necessary because some unmatched cases identified in the office could be matched in the field. The non-matched questionnaires were, therefore, referred back into the field in order to identify erroneously enumerated cases and resolving cases which had insufficient matching information. The exercise contributed to the increase in perfect matches.
3.3.5 Coverage error The net coverage error was 1.92 per cent. The urban net coverage rate was 2.57 per cent, much higher than that of the rural areas (0.92 per cent). Some Provinces had high net coverage errors mainly due to poor mapping and demarcation of areas into SEAs.
3.3.6 Content error In general, the index of inconsistency for age was higher for rural areas for all ages compared to urban areas. The results also showed unexpectedly high index of inconsistency for the relationship of son/daughter to head of household. The African extended family system which, in most cases, does not distinguish between one’s children and those of brother or sister was identified as the main reason. This finding must have helped in framing better questions with respect to this item in the subsequent census and surveys.
3.4 Mongolia6 Plans for census evaluation were less elaborate mainly due to a shortage of funds. Following the completion of field work of the 2000 census, a limited PES was undertaken in Mongolia, with the main objective of evaluating the coverage of the census. The PES was, therefore, not intended to be a major source of information on quality of responses. Only a few items were considered for evaluating content
error. For a sub-sample of the PES an attempt was made to compare the census and PES responses for the same questions to provide some insights into consistency of interviews. The PES was conducted three days after the completion of the census fieldwork. Emphasis was placed on quality assurance rather than a good evaluation. The PES was therefore restricted to the most difficult areas, mainly in urban areas.
3.4.1 Sample design and data collection A two stage cluster sample design was adopted with first stage units selected purposively. The PES form was adapted from the census questionnaire. The National Statistical Office used best available staff that had not worked as enumerators in the census. The enumerators were not notified of their selection until after the census fieldwork had been completed. Similar instructions and definition of concepts were used in the PES and during the census.
3.4.2 Matching Following the PES, names and characteristics of persons included in the census and PES were matched and the results compared. The matching as expected was confined to persons enumerated in either the census or the PES or in both.
3.4.3 Problem with the Mongolia PES The importance of probability sample selection was not recognized. The selection, for the PES, was adhoc and purposive. The operation of the census and PES were not always independent as it was possible for some managers to see to it that high agreement between census and PES where achieved. For example, in four areas there where no differences between census and PES results, which was an usual while some other areas displayed large errors. A solution adopted was to exclude the extreme high and low ends of the distribution of sample areas to remove most, if not all, of the suspect areas from the analysis (National Statistical Office, 2000).
3.5 Burundi and Rwanda Dapuphin and Canamucio (1993) have reported successful PESs conducted in Burundi and Rwanda during the 1990 round of censuses, which are summarised below.
3.5.1 Sample design In both Burundi and Rwanda the smallest areas for which boundaries could be verified on maps were EAs. The sampling frame of EAs in Burundi contained total of 5,500 EAs while in Rwanda they were 6,2000 EAs. In both countries a single stage stratified cluster sample design was adopted. All households in the selected EAs were enumerated to facilitate matching against the census records. In Burundi the strata corresponded to the domains of estimation, namely, the urban and rural areas. Similarly for Rwanda, the first level of stratification corresponded to domains of estimation, namely, urban, rural and the capital city. The second level of stratification was geopolitical subdivisions, even though no estimates were expected for these subdivisions. Seventy EAs were selected in Burundi and 120 in Rwanda.
3.5.2 Data collection PES questionnaires were prepared based on final census questionnaires. The questionnaires allowed for the classification of each listed person in the households into non-mover, in-mover, out-mover, or erroneously enumerated. In Both Burundi and Rwanda, the data collection aimed at identifying all usual residents at the time of the census in addition to those found as of the date of the PES. Data collection started two weeks after the completion of the census fieldwork. The PES response rates in Burundi and Rwanda were 98.0 and 99.9 per cent, respectively.
3.5.3 Field staff
To control nonsampling errors and ensure the quality assurance of the PES, they deployed 70 enumerators in Burundi and 167 in Rwanda, at least one in each EA. The enumerators were detailed to verify EA boundaries, conducted preliminary listings and enumerated all households within EAs independently from the census count. In Burundi they selected PES staff from the census pool taking advantage of their better qualifications, but were assigned to different areas for the PES. In Rwanda some of the PES enumerators had not participated in the census.
3.5.4 Matching The PES methodology, which was adopted, included a two-way matching of households and household members with census records of the same EAs. The matching operation resulted in the classification of all PES and census enumerated persons within the selected EAs, in specified categories that permitted the calculation of coverage error and the determination of cases for which content error was calculated.
3.6 Namibia[7] Namibia conducted its first PES in 1991. Sample selection was made from a frame of EAs compiled from the census. At the time of selecting EAs, they were assumed to be almost equal in size with respect to population. The selection of EAs was therefore was based on equal probability. During the enumeration, however, EAs showed wide variation in population size. The PES for Namibia faced a number of operational problems, among them:
n There was confusion over boundaries of EAs. In certain parts of the country many enumerators did not follow the EA boundaries during enumeration. The use of well defined and identifiable EAs, on the ground, with clear written boundary descriptions are essential requirements of a successful PES;
n Many enumerators did not cover their EAs in a systematic way, for example some households and houses were omitted;
n Some enumerators started field work without prelisting, especially in small towns and villages without street names and house numbers;
n Call backs were, in some cases, not effected; n There were no pretests of questionnaires and procedures owing to staffing, time and financial
constraints. n Reconciliation was not done therefore possible matches were not verified.
3.6.1 Matching Listing was made of all persons and classified them as non-movers, in-movers and out-movers. The first stage of matching was not satisfactory, as there were a low percentage of matched cases. Some respondents may have used different names during the census and PES, especially illegal immigrants. There were, at times different interpretations of concepts of house and locality. Households, in some cases, were classified as one during the PES and two during the census. If a field reconciliation exercise was done some of the possible matches could have translated into perfect matches. The low percentage of matches could also be attributed to unqualified staffs who were initially involved in the matching exercise. Corrective measures were taken later and the situation somewhat improved ( de Graft Johnson, 1992). The assumption was that the unmatched persons were presumed to have been missed during the census. This assumption may not be necessarily true. Among those high misses included children below the age of four and female heads of households. Two items included in the census but not in the PES could have been better variables for matching purposes, these are birth place and place of usual residence. Tests in some African countries have shown that the former has low index of inconsistency. The latter could have assisted in the search for addresses of persons who stated that they were enumerated during the census in a particular household but who could not be matched.
3.7 United States
3.7.1 Introduction and Sample Design The United States undertook an extensive coverage measurement survey during its last census; Census Day was April 1, 2000. The survey included 314,000 households a sampling rate of about two tenths of one percent. The survey results had to be produced by April of 2001 for a decision about whether or not to adjust the census counts. Many operational decisions were made based on the need to do the survey quickly but with the utmost attention to quality. The survey did not include several things: any content assessment, any use of administrative records or any inclusion of demographic analysis results into the estimation process. Demographic analysis results were used instead as an independent benchmark for the survey results. The first stage in drawing the sample was to divide the entire country into clusters of blocks such that each cluster had an expected 30 housing units. Enumerators then listed the addresses of all the housing units in the cluster. A stringent quality assurance (QA) program was imposed upon the listing operation. Listing occurred well before the census itself and was scrupulously independent of it. The population residing in group quarters (typically housing units with temporary or transient occupants) and institutions (such as nursing homes for the elderly) was not included in the survey. Subsampling was undertaken in the manner described in section 2.4 so that an efficient sample (with respect to field operations) was used.
3.7.2 Interviewing Interviewing by telephone of about 30 percent of the sample began three weeks after census day, and personal visits of the remaining cases began in mid-June. All interviewing was completed on personal computers by 6,500 field staff. These laptops permitted interviewing and data capture to be executed much more quickly than a paper instrument would allow. Since completed interviews were downloaded each evening, an added benefit was that reports on the quality of these interviews were available to supervisors the next day. QA on interviewing was extremely fast and effective. The final two weeks of an 8 week personal interviewing period was dedicated to converting nonresponse cases into interviews. The noninterview rate for housing units occupied on census day was 2.9 percent (Hogan, 2001).
3.7.3 Matching Matching was carried out in two stages: computer matching and clerical matching. About two-thirds of the time people in the census and the PES were matched by a conservative computer matching algorithm. To prepare for clerical matching in the remainder of the cases, the computer linked census and PES households where the residents had a high probability of matching. Clerks examined the linkages using an automated software system. The system allowed them to access computerized address lists, census forms, PES interview results and maps for the cluster and use this information to make objective matching decisions. This software allowed the matching workforce to be one-tenth the size it was for the 1990 PES. All the matchers were able to work at one site. This improved the ability to ensure everyone was doing the same task with the same quality.
3.7.4 Reconciliation and Estimation Many cases that were not matched were sent to the field for reconciliation. All E-sample cases were sent as were P-sample cases with proxy respondents. (The reasoning for this is given in section 2.8.) After this follow up, the last cases were given match codes and sent to estimation which is described in section 2.9.
3.7.5 Results The PES estimated the net national undercount to be 1.18 percent (0.13 percent standard error). This
compared well with the previous, 1990 census, measurement of 1.61 percent (0.20 standard error). Additionally, the undercount of some minority groups in the United States was reduced compared to the 1990 census: Non-Hispanic Blacks undercount dropped from 4.57 percent (0.55 percent standard error) to 2.17 percent (0.35 percent standard error), and the undercount for Hispanics dropped from 4.99 percent (0.82 percent standard error) to 2.85 percent (0.38 percent standard error) (Hogan, 2001). However, these results differed significantly from the demographic analysis estimates of the undercount. As of the April 1, 2001 deadline, based on these differences and other considerations all of which needed time to be researched, the U.S. government decided not to adjust the official census counts using the PES results. Research continues and decisions about adjusting the counts for other uses will be made in the near future.
3.8 Use of PES Results The use of PES results should be viewed within the context of the many possible specific objectives, which fall under the umbrella of measuring coverage and content errors. Countries can therefore emphasize all or some of these specific uses. Such uses include:
n Providing statistical basis for adjusting census results; n Evaluating the EAs as sampling units for intercensal surveys; n Identifying procedural and conceptual improvements needed for future censuses; n Providing to users of census data, such as researchers, information on sources and causes of
errors. As already stated one of the major criticisms labelled against PESs is that, in some cases, the results are not used for adjusting census data. It should, however, be pointed out that while estimates of undercount may be made, adjusting census numbers is not universal. In some countries the question of adjustment is settled as a matter of policy rather than a statistical decision. From the listed specific objectives, it is clear that the uses of PES results are multifaceted, the question therefore is whether countries should fulfill all the objectives or some of them to justify the conduct of PESs. In this connection, it has been suggested that it is better to use the PES, not for adjustment, but as an evaluation tool to help assess and analyse the quality of the census and to uncover potential problems to correct in future censuses (Turner, 1998). We highlight below, some of the practical uses of PES results in selected countries. The PES is part of methodological work, which contributes to the additional knowledge that may help to improve future censuses as well as intercensal surveys. The Zambian 1990 de jure official census figures were adopted after studying the de jure PES results. In addition, the content error analysis showed that age reporting was more accurate than anticipated in developing African countries. As a result of the high consistency index for age data, the census age data was not graduated to smooth out age distortions. Consequently PES results helped analysts and policy makers to notice, at an early stage, the possible effects, to the age structure, of HIV/AIDS epidemic especially for women between ages 15-34. AIDS is at the peak between these ages. Without the PES results it would have been assumed that there were age reporting errors and would have missed the opportunity to address the problem at an opportune moment. PES results were used to adjust the Palestine census results. In the case of Cambodia the PES results threw some light on the potential sources of undercount and over-count in the census. The findings will help in the planning future censuses. In addition, while it was not possible to adjust population figures down to the village level based on national undercount, for the purpose of projections, the base population at national level was adjusted taking into account net coverage error. Swaziland plans to use the PES results in adjusting population projections and South Africa plans to use PES results to adjust its population census figures. Adjusting of census data based on PES results can at times be controversial at both political and technical levels. At a political level adjustment may introduce possible realignment of polling districts, which may be undesirable in some quarters, and therefore would be resisted. At a technical level, in many countries the sample sizes for PES are small therefore results can only be inferred for larger domains such as national, rural, urban domains. It is however, tempting after getting the adjusting factors from the PES results to make adjustments at lower administrative domains. The latter may not be justified if the sample sizes for such domains are small and inadequate there by rendering the results unreliable.
It is evident from above that some countries have used the PESs, to adjust census results and also as an evaluation tool considered crucial to the completion of the census task.
3.9 Lessons Learned from Country Examples It is clear, from country examples, that PESs had mixed results. For some countries relatively successful PESs were conducted. It is, however, also true that some countries had unsuccessful PESs, mainly because the best practices of conducting PESs were not followed. The examples are revealing as they highlight problems that tend to crop up in PESs which require a focused approach in order to resolve them. A summary of problems experienced by various countries whose PESs have been described in this paper are:
n Poor cartographic work; n Neglect of operational independence, as it relates to field staff, between census and PES activities; n Inadequate resources allocated to PES; n Lack of qualified personnel to manage and carry out various PES activities; n Inclusion in the PES questionnaire items, which were not useful for matching, purposes; n Not following basic principles of probability sample design and selection; n Not carrying out field reconciliation for possible matches; n Difficulties in matching alternate names, because of the common practice especially in Africa for
individuals to have more than one name; n Difficulties of matching names because of absence of unique addresses, especially in the rural
areas; n Neglect of pretesting PES procedures; n Flawed inferences based on relatively small samples; n Delay in undertaking the PES in case of one country.
4. CONCLUSIONS AND RECOMMENDATIONS Post enumeration surveys are worth conducting if, as pointed out in the United Nations Principles and Recommendations for population and housing censuses, they are carefully planned and function within operational and statistical constraints (United Nations, 1998). The PES methodology is adaptable to many circumstances such as the use of single or dual methods of estimation. While independence between the census and PES is a fundamental requirement, in practice operational independence seems to suffice because it is not possible to make all the various aspects of census and PES operations mutually exclusive. Since there is no error free census, there is need to continue to consider PESs as part of census programmes. In many developing countries the PES seems to be the most feasible method of evaluating census results owing to the lack of comprehensive and, at times, accurate data from other sources such as civil registration and population registers. For the PES to be useful in measuring coverage and content errors it must be well planned and implemented. We therefore propose that efforts should be made to:
§ Develop good area frames, with well defined and mutually exclusive enumeration areas; § Design plausible probability samples to facilitate objective generalization of PES results to relevant
domains; § Adopt efficient but realistic matching rules; § Adhere, to the extent feasible, to the ideals of independence between PES and census operations; § Harmonise definitions and concepts used in both the census and PES; § Ensure that items included in the PES for matching purposes are relevant and useful; § Involve well trained and qualified field staff; § Train key staff, involved in the design of PES samples, in survey sampling methods; § Carry out pretests for the PES process and field reconciliation; § Allocate adequate funds to the PES within the framework of the census; § Keep the PES as simple as possible and stick to objectives that are attainable.
Notwithstanding the conventional wisdom, a PES may not be as complex as perceived. It normally covers few variables compared to other household surveys and is usually based on a comparatively smaller sample. While the PES calls for additional resources, when carried out immediately after the census, its overhead costs may greatly be reduced. Overhead costs such as vehicles, office space, computers and census maps are usually covered by the census programme, thus making PESs more affordable.

Onsembe (1999) observes, from his African experience, that the direct cost of a PES programme is about one per cent of the census costs. For example, the cost of PES programme for Kenya is anticipated not to exceed one per cent of the total census costs.
REFERENCES
Abu-Libdeh (1999). Evaluation Census Data: Coverage Evaluation. Paper presented at the UNSD/ ECE Workshop on Methodology for Census Evaluation and Dissemination for the CIS and Baltic Countries. Almaty, Kazakhstan. Banda Jeremiah P. Census Coverage Evaluation: Recent Experience in some African Countries: Bulletin of the International Institute, contributed paper, 49th ISI session, Florence, Italy, 25 August 2 September 1993. Banda Jeremiah P. Integrated data collection for the rural sector the Zambia experience: Tenth conference of Commonwealth Statisticians, Nuffield college: Oxford, 31 July to 9 August 1985. Commonwealth Secretariat, London SWIY 5N. Biemer, Paul P. et al. Enumeration accuracy in a population census: an Evaluation Using Latent Class Analysis, Journal of Official Statistics Vol.17, No.1, 2001, Statistics Sweden. Cantwell, Patrick et al. Accuracy and Coverage Evaluation: Missing Data Results. Decenial Statistics Studies Division (DSSD) USA Bureau of Census, Census 2000 Procedures and Operations Memorandum Series, B-7*. February 28, 2001. Central Statistical Office (1995). Post Enumeration Survey. Lusaka, Zambia. Dauphin Marjorie and Canamucio Anne (1993). Design and Implementation of Post-Enumeration Survey: developing Country Example. International Statistical Programs Center, US Bureau of the census. De Graft- Johnson, Kweku T.(1992). Mission Report on the Post Enumeration Survey, Central Statistical Office, Windhoek, Namibia. Economic Commission for Africa. Technical Report on the Post-Enumeration Survey for Coverage Evaluation of Africa Population Censuses. Ninth Session of the Conference of African Statisticians, Lome, 6-15 October 1975. National Institute of Statistics (1999). Ministry of Planning, Phnom Penh, Cambodia. Turner Anthony G. Report on Mission to Palestine National authority, United Nations Statistics Division, New York, 9-21 November 1997. Turner Anthony G. Report on Mission to Palestine National authority, United Nations Statistics Division, New York, 15-21 April 1998. National Statistical Office (2000). Population and Housing Census 2000 Mongolia Administrative Report Vol. 1. Ulaanbaatar, Mongolia. Onsembe, Jason. Post Enumeration Survey for coverage and content error evaluation: Paper presented at a training Workshop for National Census Personnel within the framework of 2000 Round of Population and Housing Censuses, Addis Ababa, Ethiopia, 15-19 November 1999. UNSD/SADC workshop reports on Sample Survey Design. Lusaka, Zambia, 28 February 4 March 2000. U.S. Bureau of the Census, Evaluating Censuses of Population and Housing, Statistical training Document, ISP-TR-5, Washington, D.C., 1985. Hogan, Howard. Data and Analysis to Inform the ESCAP Report. U.S. Bureau of the Census. DSSD Census 2000 Procedures and operations Memorandum Series, B-1*. February 28, 2001.
1 Part of this paper reports the results of research and analysis undertaken by Census Bureau staff. It has undergone a Census Bureau review more limited in scope than that given to official Census Bureau publications. This report is released to inform interested parties of ongoing research and to encourage discussion of work in progress .
[6] This scenario for the PES is called the Procedure -A, Definition II approach. The Procedure -B approach differs in that it establishes census day residency at the time of

the interview, establishes where persons in the subject housing unit lived on census day and searches for matches around their census day address. Definition I differs in that it asks for alternative census day addresses and searches them also.
3 Based on the Kingdom of Cambodia National Institute of Statistics Report of 1999
4 Based on paper by Hasan Abu -Libdeh on evaluation of census data and reports by Anthony Turner (full references given at the end of the paper). 5 Based on the Zambian Central Statistical office’s post enumeration survey report and Jeremiah Banda=s contributed paper the 49th ISI session held in Florence in 1993. 6 Based on the Administrative Report of the Mongolian national statistical office on Population and Housing Census 2000.
[7] Based on the report by. Kweku de Graft-Johnson, on post enumeration for Namibia and Jeremiah Banda ’s contributed paper the 49th ISI session held in Florence in 1993.