porosity and mineralogy evolution during the decay process involved in the chellah monument stones
TRANSCRIPT

ORIGINAL ARTICLE
Porosity and mineralogy evolution during the decay processinvolved in the Chellah monument stones
Abderrahim Samaouali Æ Larbi Laanab ÆMohamed Boukalouch Æ Yves Geraud
Received: 29 June 2007 / Accepted: 11 February 2009 / Published online: 6 March 2009
� Springer-Verlag 2009
Abstract The objective of this work is to study the decay
process involved in the historical Roman Chellah located in
the Rabat city (Morocco). This monument is made up of
porous calcarenite stone. Several samples, taken from
altered and unaltered blocks, were analyzed by the water
saturation, the mercury intrusion porosimetry techniques
and using the scanning electron microscopy coupled to
energy dispersive X-ray spectrometer (SEM–EDX). To
perform a reliable chemical analysis, some samples were
also analyzed by inductively coupled plasma-atomic emis-
sion spectroscopy (ICP-AES). The mercury porosimetry
results show a bimodal porous network for this porous
material, the deterioration process of these stones involved
an increase in porous volume of about 2%. The lowest
porosity observed in the unaltered block is connected to the
presence of sparitic cement which causes a partial inter-
granular porosity clogging. The highest porosity of the
deteriorated block without crust is due to the increase in
inter-granular space. SEM photographs of the unaltered
sample show the presence of the porous primary grains, of
ovoid forms and millimeter-length sizes, and of the sec-
ondary grains, of rhombohedric forms and micro size.
Porosity is essentially located between the primary grains
and can be completely clogged by secondary precipitations.
Various forms of deterioration are observed on the altered
samples such as the dissolution of the secondary grains
edges, wells of dissolution and also the presence of argil-
laceous residues on the surface. This last was also detected
by the ICP-AES and EDX analysis which show an increase
of the silicon and aluminum contents toward the surface.
Keywords Calcarenite rocks decay � Moroccan historic
building � Porosity measurements � Dissolution �Clay precipitation
Introduction
The citadel of Chellah was built by the Romans, 23 cen-
turies ago, on a hill near the Bouregreg River valley
(Fig. 1). It is located approximately 2 km from Rabat
center (Morocco) and 3 km from the Atlantic Ocean. This
site, re-used by the Almohade dynasties, is now protected
by the Moroccan authorities who seized all the historical
and tourist interests. The building materials (cobble stones
with cobs), used in this site subjected to a subhumid
Mediterranean climate under strong oceanic influence,
undergo an important deterioration process. The question is
to determine the importance, the origin, the mechanisms
and the kinetics.
Several studies (Zaouia et al. 2005; Azeroual et al.
2005) were carried out on other sites in the city center, the
ramparts and the old medina doors. These sites are con-
stituted of calcareous stones similar to those which are the
A. Samaouali (&) � M. Boukalouch
Laboratoire de Thermodynamique, Departement de Physique,
Faculte des Sciences, Mohammed V University, B. P. 1014,
Rabat, Morocco
e-mail: [email protected]
L. Laanab
Centre de Microscopie, Departement de Physique,
Faculte des Sciences, Mohammed V University,
B. P. 1014, Rabat, Morocco
Y. Geraud (&)
Ecole et Observatoire des Sciences de la Terre,
Institut de Physique du Globe Strasbourg UMR 7516,
Universite Louis Pasteur, 1 rue de Blessing,
67084 Strasbourg Cedex, France
e-mail: [email protected]
123
Environ Earth Sci (2010) 59:1171–1181
DOI 10.1007/s12665-009-0106-5

subject of our study. The authors studied the surface
deterioration of these monuments and showed that the
sodium chloride formation (halite) constitutes the main
factor of deterioration of these stones located very close to
the ocean. Moreover, several pollution compounds were
detected on the black crust of these monuments such as
SO4-, NO3, Mg2?, Pb2?. The stone decay caused by salt
crystallization was the subject of many studies (Goudie and
Viles 1997; Benavente et al. 2004; Rijniers et al. 2005;
Genkinger and Putnis 2006; Van et al. 2007), and is widely
recognized as an important cause of porous building
materials damage.
Meanwhile, other kinds of alteration were observed, like
precipitation of products on the surface or inside the rock,
cracking, disintegration, dissolution or biological coloni-
zation (Samaouali et al. 2005). Thus, various decay
mechanisms are to be brought into account to explain the
obtained degradation of implemented materials. One can
quickly state the processes of secondary phase precipitation
inside or outside the blocks. This process enhanced by
freezing phenomena which occurs if stone water content
reaches a critical value. So, when there is enough porosity
and water uptake in the porous network, the volume
expansion at the time of the transition water freezes (*9%)
exerts a destructive pressure on the stone (Prick 1995).
These decay phenomena involve black crusts formation if
precipitation takes place on the blocks, and causes cracking
when precipitation or freezing occur inside. They are
associated to the water transfer by capillarity and the
evaporation process (Hammecker 1995; Alves et al. 1996);
both depend on the porous network geometry. Among the
other mechanisms of deterioration, one can quote the bio-
logical activity related to the action of micro-organisms
like the bacteria, or plants such as moss. In fact, different
kinds of organisms were observed at the surface of these
monument stones. They can grow using the mineral com-
ponents of stones and its superficial deposits. The main
consequence of their metabolic activities, such as the
excretion of enzymes, inorganic and organic acids and of
complex forming substances, is the minerals dissolution of
the stone. Moreover, the roots or biochemical attack of the
plants, mainly, mosses and lichens induce physical stresses
Fig. 1 The red arrow indicates
the geographical location of
Chellah monument in the Rabat
area (extracted from Morocco
map). 275 9 275 mm
(96 9 96 DPI)
1172 Environ Earth Sci (2010) 59:1171–1181
123
and mechanical breaks (Tiano 1994). A last factor deter-
mining, under these climatic conditions, is the action of
wind charged with sand and aerosols, thus causing
important surface erosions.
Finally, stones deteriorate continuously as a result of
physical, chemical and biological processes, depending on,
e.g.,: air constituents, relative humidity, temperature, wind
velocity, solar radiation, frequency and intensity of rain,
sea spray, composition of the soil, living organisms
(Camuffo 1995).
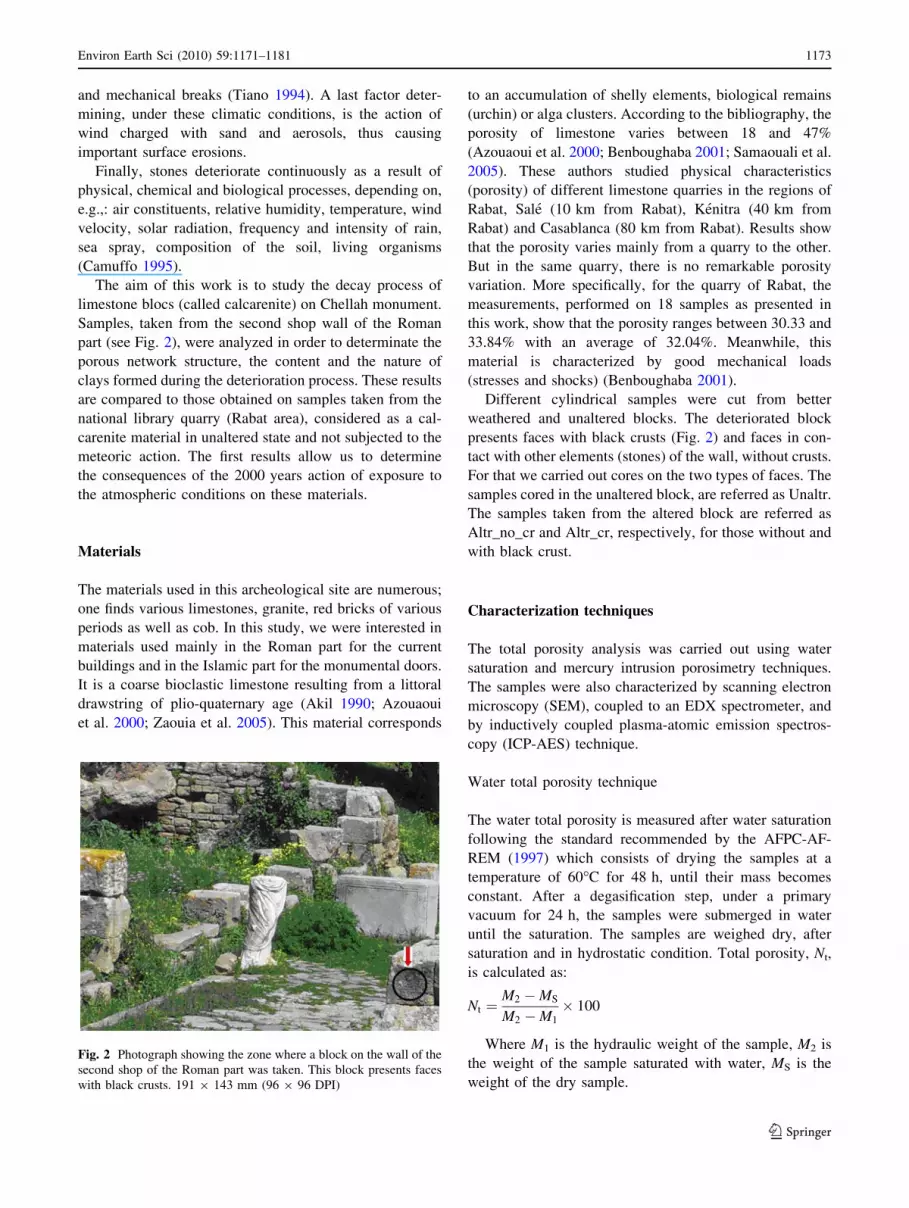
The aim of this work is to study the decay process of
limestone blocs (called calcarenite) on Chellah monument.
Samples, taken from the second shop wall of the Roman
part (see Fig. 2), were analyzed in order to determinate the
porous network structure, the content and the nature of
clays formed during the deterioration process. These results
are compared to those obtained on samples taken from the
national library quarry (Rabat area), considered as a cal-
carenite material in unaltered state and not subjected to the
meteoric action. The first results allow us to determine
the consequences of the 2000 years action of exposure to
the atmospheric conditions on these materials.
Materials
The materials used in this archeological site are numerous;
one finds various limestones, granite, red bricks of various
periods as well as cob. In this study, we were interested in
materials used mainly in the Roman part for the current
buildings and in the Islamic part for the monumental doors.
It is a coarse bioclastic limestone resulting from a littoral
drawstring of plio-quaternary age (Akil 1990; Azouaoui
et al. 2000; Zaouia et al. 2005). This material corresponds
to an accumulation of shelly elements, biological remains
(urchin) or alga clusters. According to the bibliography, the
porosity of limestone varies between 18 and 47%
(Azouaoui et al. 2000; Benboughaba 2001; Samaouali et al.
2005). These authors studied physical characteristics
(porosity) of different limestone quarries in the regions of
Rabat, Sale (10 km from Rabat), Kenitra (40 km from
Rabat) and Casablanca (80 km from Rabat). Results show
that the porosity varies mainly from a quarry to the other.
But in the same quarry, there is no remarkable porosity
variation. More specifically, for the quarry of Rabat, the
measurements, performed on 18 samples as presented in
this work, show that the porosity ranges between 30.33 and
33.84% with an average of 32.04%. Meanwhile, this
material is characterized by good mechanical loads
(stresses and shocks) (Benboughaba 2001).
Different cylindrical samples were cut from better
weathered and unaltered blocks. The deteriorated block
presents faces with black crusts (Fig. 2) and faces in con-
tact with other elements (stones) of the wall, without crusts.
For that we carried out cores on the two types of faces. The
samples cored in the unaltered block, are referred as Unaltr.
The samples taken from the altered block are referred as
Altr_no_cr and Altr_cr, respectively, for those without and
with black crust.
Characterization techniques
The total porosity analysis was carried out using water
saturation and mercury intrusion porosimetry techniques.
The samples were also characterized by scanning electron
microscopy (SEM), coupled to an EDX spectrometer, and
by inductively coupled plasma-atomic emission spectros-
copy (ICP-AES) technique.
Water total porosity technique
The water total porosity is measured after water saturation
following the standard recommended by the AFPC-AF-
REM (1997) which consists of drying the samples at a
temperature of 60�C for 48 h, until their mass becomes
constant. After a degasification step, under a primary
vacuum for 24 h, the samples were submerged in water
until the saturation. The samples are weighed dry, after
saturation and in hydrostatic condition. Total porosity, Nt,
is calculated as:
Nt ¼M2 �MS
M2 �M1
� 100
Where M1 is the hydraulic weight of the sample, M2 is
the weight of the sample saturated with water, MS is the
weight of the dry sample.
Fig. 2 Photograph showing the zone where a block on the wall of the
second shop of the Roman part was taken. This block presents faces
with black crusts. 191 9 143 mm (96 9 96 DPI)
Environ Earth Sci (2010) 59:1171–1181 1173
123

Water total porosity measurements were taken on a set
of eighteen cylinders of 40 mm in diameter and 55 mm in
length. This technique gives access to the connected porous
volume of the sample. The weighing is made with a pre-
cision of 0.001 g; however the porosity measurements
precision is estimated at about 0.4%.
Mercury intrusion porosimetry technique
This technique consists in injecting the non-wetting fluid
(mercury), under various pressures in previously desiccated
and degassed samples (Van Brakel et al. 1981; Gueguen
and Palciauskas 1992). It allows porosity and pore size to
be estimated by measuring the volume of injected mercury
and the injection pressure. The applied pressure is con-
nected to the threshold access of the pore by the Young-
Laplace equation:
P ¼ 2r cos hR
where P is the mercury pressure, r is the air-mercury
interfacial tension (0.486 Nm-1 at 25�C), R is the radius of
the capillary tube (Washburn 1921) or the distance of the
pore walls in slit-shaped pore (Lenormand et al. 1983), h is
the contact angle between mercury and solid, h = 140� for
the non-wetting fluid (Fripiat et al. 1971).
These porosimetry measurements are performed using
an apparatus Micromeritics Pore Sizer 9320 which makes
it possible to inject mercury with pressures ranging
between 0.001 and 300 MPa. So the access threshold
ranges between 400 and 0.003 lm. This technique
determines the connected porous volume and its distri-
bution according to the injection pressure and the
thresholds access.
Cylindrical samples, of 25-mm length and 20 mm in
diameter, were dried at 60�C, weighed and placed in an
injection cell. After a degasification step under a 50-lm
mercury depression, the injection cell is filled with
mercury, and then the vacuum is broken gradually until
atmospheric pressure. The intrusion measurement, i.e.,
the volume of mercury injected into the sample, is made
for low pressures (between 0.001 and 0.15 MPa) and for
high pressures (between 0.15 and 300 MPa). The pres-
sure rises are carried out in stages; after each stage, the
injected mercury volume is measured. From these data, it
Table 1 Statistical results of
water total porosity
measurements
Number
of samples
Minimal
value (%)
Maximal
value (%)
Mean
(%)
Standard
deviation (%)
Unaltered 18 30.33 33.84 32.04 0.88
Altered 18 33.75 35.60 34.67 0.56
Fig. 3 a Mercury porosimetry curves obtained for the unaltered
sample (Unaltr), the altered one without crust (Altr_no_cr) and with
crust (Altr_cr). b Mercury porosimetry curves, giving the increment-
ing of the injected mercury volume versus pores access ray of the
unaltered sample (Unaltr), the altered one without crust (Altr_no_cr)
and with crust (Altr_cr). 313 9 228 mm (96 9 96 DPI)
1174 Environ Earth Sci (2010) 59:1171–1181
123

is possible to determine the saturation curve according to
the injection pressure. The precision of the measurements
calculated by Carrio-Schaffhauser (1987) is about 4%.
Scanning electron microscopy and EDX analysis
Samples were observed, after a metallization step, using a
JEOL JSM 840. This technique, based on electron beam
interaction with sample’s atoms, leads to X-ray, secondary
and backscattered electrons emission. Each signal is pro-
cessed to extract more information about the analyzed
sample. To perform reliable EDX analysis an environ-
mental scanning electron microscopy (ESEM) Quanta 200,
coupled to an energy dispersive X-ray spectrometer (EDX)
was used. In the low vacuum mode, samples were analyzed
without a metallization step.
Inductively coupled plasma-atomic emission
spectroscopy (ICP-AES)
ICP-AES is an emission spectrophotometric technique, in
which excited electrons emit energy at a given wavelength
as they return to ground state. The characteristic of this
process is that each element emits energy at specific
wavelengths. The intensity of the energy emitted at the
chosen wavelength is proportional to the amount of that
element in the analyzed sample. Thus, by determining
which wavelengths are emitted by a sample and by deter-
mining their intensities, the analyst can quantify the
elemental composition of the given sample relative to a
reference standard. Since ICP-AES analysis requires a
sample to be in solution, samples were dissolved by a
combined attack employing HNO3 and HCl acids.
Results and discussions
Two set of 18 samples were analyzed by water porosity
technique for the altered and the unaltered blocks. Results
presented in Table 1 show that the values vary between
30.33 and 33.84% with an average value of 32.04% and a
standard deviation of 0.88% for the unaltered samples.
Meanwhile, the connected porosity varies between 33.75
and 35.60% with an average porosity of 34.67% and a
standard deviation of 0.56%, for the altered samples. These
results show that the decay process of these monument
stones lasted about 20 centuries, involved a porous volume
increase of about 2% only.
Figure 3a, b presents the results of mercury porosimetry
analysis performed on the altered and unaltered samples.
These curves present a bimodal porous network. The
access to the porous volume of the unaltered sample is
controlled by access thresholds ranging from 300 to 10 lm
for 90% of the total porous volume which constitutes a
macro porous network.
Moreover, these curves also highlight a microporous
network (about 10%) corresponding to access thresholds
ranging between 10 and 0.005 lm. In order to clarify the
variation of porosity according to the sample state, various
mercury porosity values (NHg), deduced from Fig. 3 for
various access rays intervals, are presented on the Table 2. It
shows that total porosities of the samples Unaltr, Altr_cr and
Altr_no_cr are, respectively, 32.80, 34.37 and 34.90%. It is
obvious that the unaltered sample (Unaltr), at uncertainties
close, has the lowest porosity compared to the two other
samples in both microporosity and macroporosity fields.
Nevertheless, a constant porosity was observed for the
three types of samples along the access rays ranging from 0.2
to 2 lm and over 200 lm. Meanwhile, a light reduction of
Table 3 Mercury porosimetry results obtained at different access ray intervals for Unaltr, Altr_8 cm and Altr_surf samples
Access ray intervals (lm) [0.001, 0.2] [0.2, 20] [2, 40] [40, 100] [100, 200] Over 200 Total porosity (%)
NHg (%) Unaltr 2.36 %0 6.18 3.55 15.65 5.06 32.80
NHg (%) Altr_8 cm 2.39 %0 6.24 3.54 15.69 5.01 32.87
NHg (%) Altr_surf 3.40 %0 2.92 3.60 19.29 5.15 34.36
Kind of porosity Microporosity Interval change Macroporosity
Table 2 Mercury porosimetry results for the three samples obtained at different access ray intervals
Access ray intervals (lm) [0.001, 0.2] [0.2, 2] [2, 40] [40, 100] [100, 200] Over 200 Total porosity (%)
NHg (%) Unaltr 2.36 %0 6.18 3.55 15.65 5.06 32.80
NHg (%) Altr_cr 3.40 %0 2.92 3.60 19.29 5.15 34.36
NHg (%) Altr_no_cr 3.48 %0 2.83 3.73 19.76 5.10 34.90
Kind of porosity Microporosity Interval change Macroporosity
Environ Earth Sci (2010) 59:1171–1181 1175
123
porosity was observed in the altered sample with crust; that
may be caused by a partial cementing of the inter-granular
space. This important result was also observed by Beck
(2006) on the white tuffeau taken from a site in the Paris area.
The Fig. 3a represents the porosity variation according
to the pores access ray for the three studied samples. It
clearly confirms the total volume increase of the pores,
noted by the water saturation technique. However, these
curves show a macropore volume increase of about 1% (for
access thresholds ranging from 200 to 2 lm) and also a
micropore volume increase of about 1% (for the access
thresholds lower than 0.2 lm). The porosity variations are
comparable in the samples covered and not covered by
black crust. This porosity increase can be due to a cavities
widening or/and to an increase in cavities number. Mean-
while, no porosity variation was observed for access
thresholds ranging from 0.2 to 2 lm that can be attributed
to the absence of the porous network in this interval. The
development of deterioration in the samples with and
without crust results in the increase of macroporosity as
well as of microporosity. The macroporosity is induced by
partial cement dissolution, whereas microporosity, lower
than 0.5 lm, tends to be intra-granular and develops in the
primary grains as well as in the secondary grains. Although
the difference between the porosity curves of samples with
and without crust is in the error margin of the technique,
the variations could be attributed to a partial cementing of
the porous network by secondary products as could be
observed by Beck (2006) on the Touraine tuffeau.
In order to determine if the slight porosity increase in
the altered sample is linked to the natural inhomogeneities
of the stones, two small fragments of altered sample, cored,
respectively, at the surface and at the core (8 cm below the
surface) were analyzed by mercury intrusion porosimetry
technique. Results are shown in Fig. 3c. We also present in
this figure the results previously obtained on the unaltered
sample. As it was checked by SEM observations, we make
the hypothesis that the alteration did not occur deeply in
the core of the altered stone (or only slightly). In order to
show the variation of the porosity according to the sample
state, various mercury porosity values (NHg), deduced from
Fig. 3c for various access rays intervals, are presented on
the Table 3. It shows that total porosities of the samples
Unaltr, Altr_8 cm and Altr_surf are, respectively, 32.80,
32.87 and 34.36%. It is obvious that the Unaltr and
Alter_8-cm samples have the same behavior, at uncer-
tainties close and exhibit the lowest porosity compared to
Altr_surf sample, in both microporosity and macroporosity
fields. These results clearly show that the slight porosity
increase is mainly due to the alteration process and not
strongly linked to the stones’ inhomogeneities.
Comparison between both kinds of measurements, per-
formed on samples taken on the same altered bloc or on
different blocs, shows that the alteration process is clearly
associated to the porosity development for the high
threshold volumes and for the lowest ones.
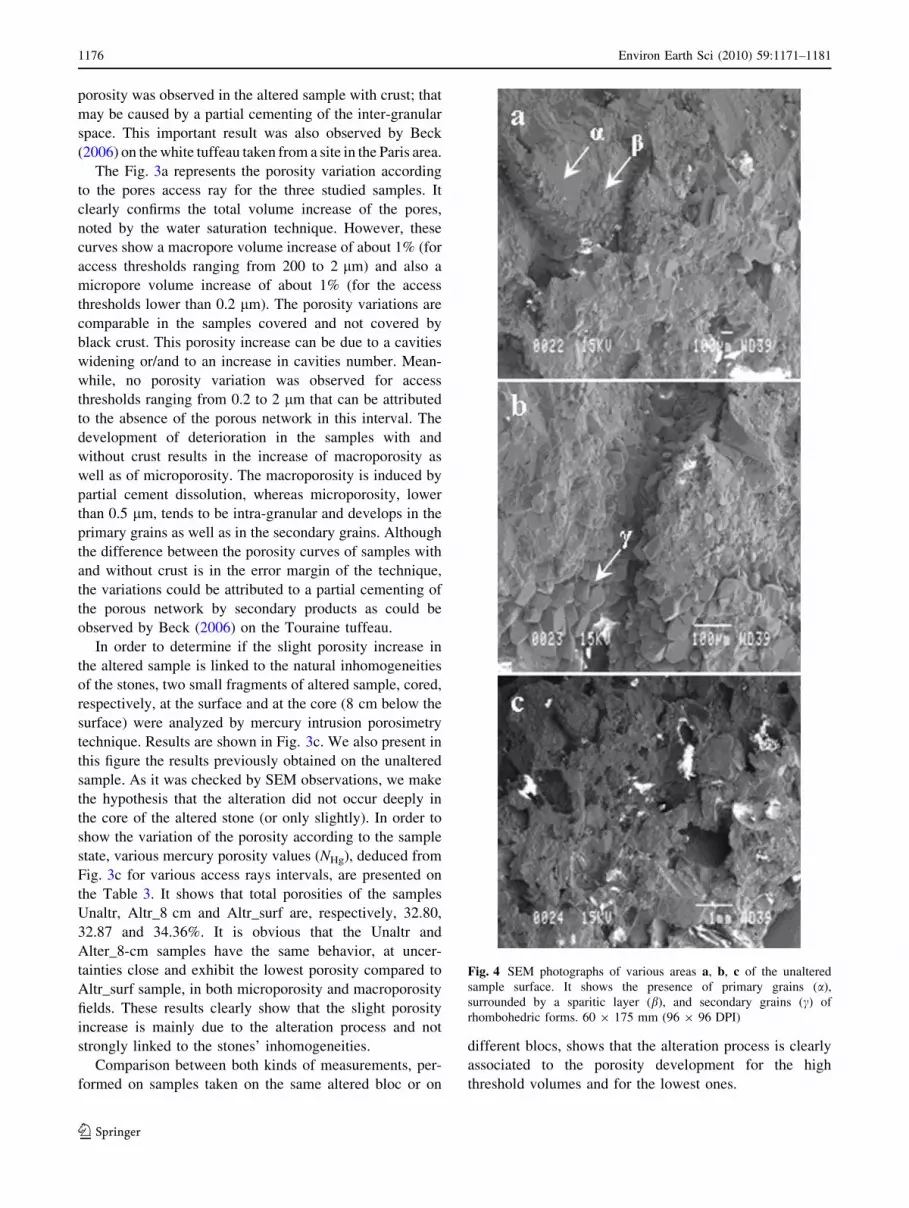
Fig. 4 SEM photographs of various areas a, b, c of the unaltered
sample surface. It shows the presence of primary grains (a),
surrounded by a sparitic layer (b), and secondary grains (c) of
rhombohedric forms. 60 9 175 mm (96 9 96 DPI)
1176 Environ Earth Sci (2010) 59:1171–1181
123

Scanning electron microscopy (SEM)
Surface of the unaltered sample
Figure 4 presents SEM micrographs of fragments taken on
the surface of the unaltered sample. It shows the presence
of two families of calcite grains: on one hand, porous
primary grains (a), of ovoid forms and millimeter-length
sizes, which are coated with a precipitated calcite layer (b)
of approximately 20 lm of thickness; the other hand,
secondary grains of rhombohedra forms (c) and micro-
metric sizes (between 50 and 5 lm), which precipitated
around the primary grains and lead to cement formation. In
addition to the calcite peripheral layer, the primary grains
interior is empty (dissolved) or made up of a smaller
crystalline material (1–2 lm). Porosity, of relatively
lengthened form, is located primarily between the primary
grains and can be completely clogged by secondary pre-
cipitation phases.
Surface of the altered sample
SEM micrographs of four fragments taken on different
areas of the altered block surface are presented on Fig. 5.
Various decay forms are visible. Image (Fig. 5a) shows
the presence of altered calcite grains testifying to an
unbalanced medium favorable to the dissolution which
preferentially affects the secondary calcite grains in par-
ticular on their edges. Meanwhile, the primary grains, little
or not altered, preserve their initial forms. Secondary cal-
cite grains, corroded by well dissolution development (a),
are visible on the images (Fig. 5a, b, d). This phenomenon
involves the local development of a high porosity. More-
over, the image (Fig. 5d) shows a zone of high dissolution
privileging the low index crystallographic orientations of
the calcite. In addition, these images show the presence of
an argillaceous deposit (b and u) on the surfaces; that tends
to reduce porous space.
Structure of altered sample substrate
SEM micrographs of three fragments, taken at 8-cm depth
of the same altered block, are presented in Fig. 6. Image
(Fig. 6a) presents a zone made up of micrite surrounded by
a zone of strong sparitic calcite precipitation (a). A dis-
solution phenomenon, in presence of clay, is still observed
on the images (Fig. 6b) and (Fig. 6c). Meanwhile, the
image (Fig. 6c), shows unaltered primary grains (u)
Fig. 5 SEM photographs, of
various areas a, b, c of the
altered sample surface, showing
altered calcite grains (c)
testifying to an imbalance
medium; secondary calcite
grains, corroded with
development of dissolution
wells (a). Meanwhile, the
images b and d show the
presence of an argillaceous
deposit (b and u) on the surface.
129 9 122 mm (96 9 96 DPI)
Environ Earth Sci (2010) 59:1171–1181 1177
123
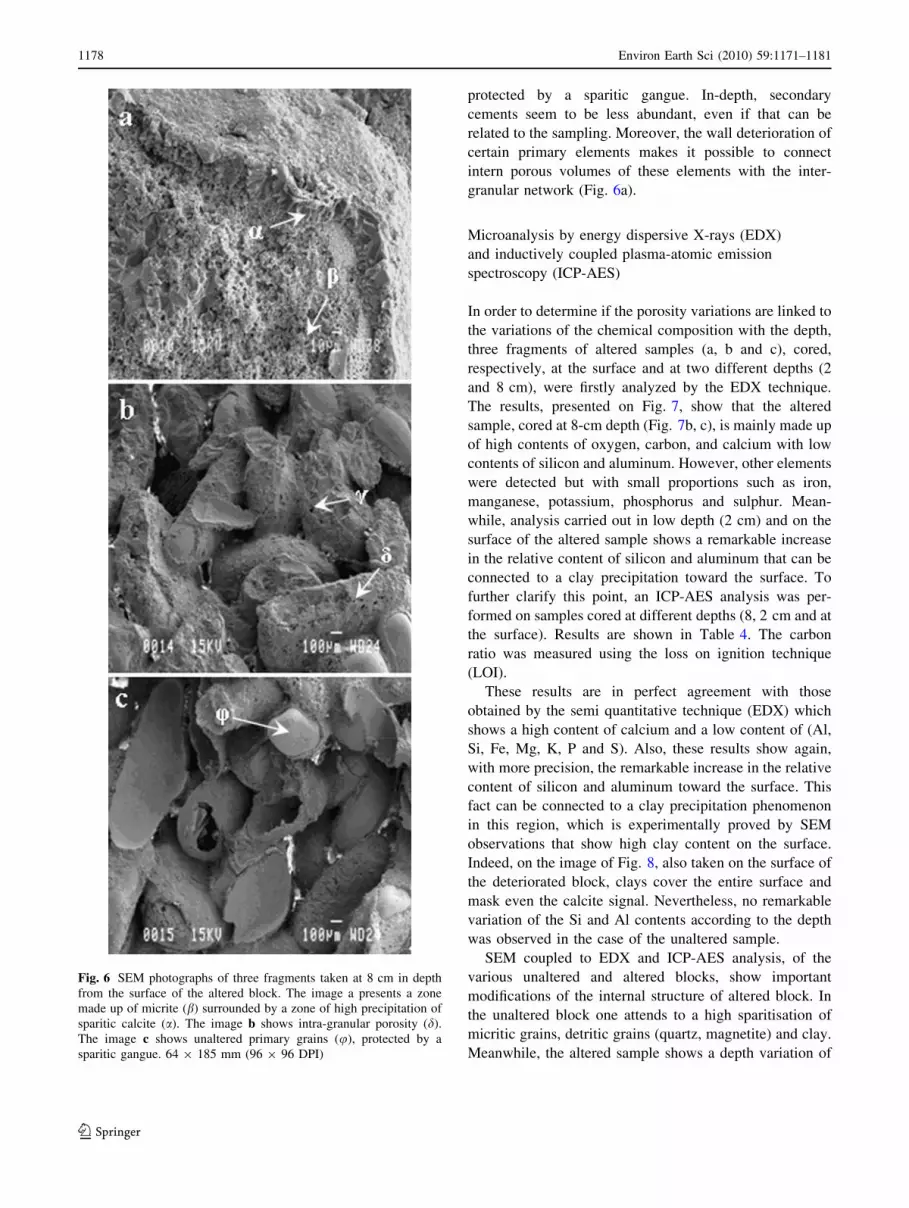
protected by a sparitic gangue. In-depth, secondary
cements seem to be less abundant, even if that can be
related to the sampling. Moreover, the wall deterioration of
certain primary elements makes it possible to connect
intern porous volumes of these elements with the inter-
granular network (Fig. 6a).
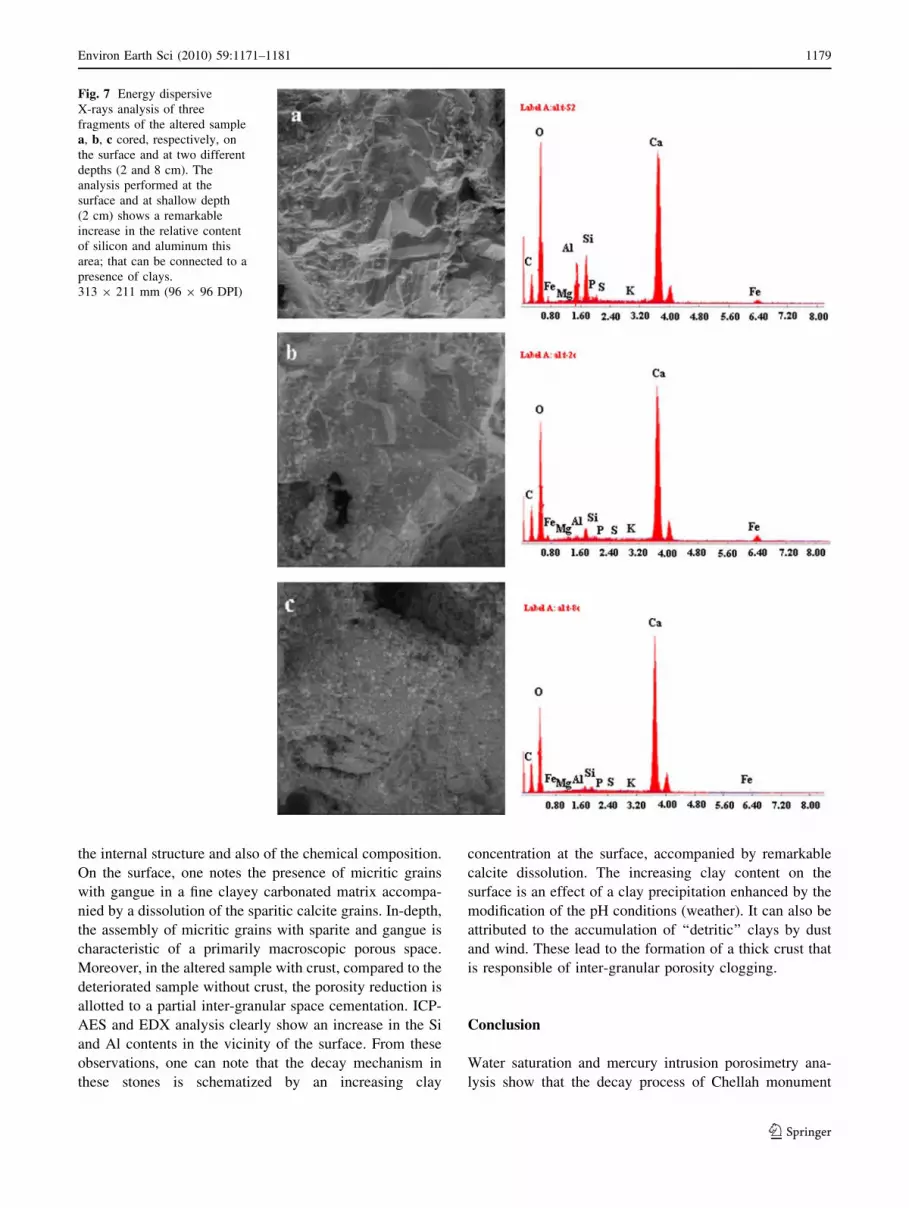
Microanalysis by energy dispersive X-rays (EDX)
and inductively coupled plasma-atomic emission
spectroscopy (ICP-AES)
In order to determine if the porosity variations are linked to
the variations of the chemical composition with the depth,
three fragments of altered samples (a, b and c), cored,
respectively, at the surface and at two different depths (2
and 8 cm), were firstly analyzed by the EDX technique.
The results, presented on Fig. 7, show that the altered
sample, cored at 8-cm depth (Fig. 7b, c), is mainly made up
of high contents of oxygen, carbon, and calcium with low
contents of silicon and aluminum. However, other elements
were detected but with small proportions such as iron,
manganese, potassium, phosphorus and sulphur. Mean-
while, analysis carried out in low depth (2 cm) and on the
surface of the altered sample shows a remarkable increase
in the relative content of silicon and aluminum that can be
connected to a clay precipitation toward the surface. To
further clarify this point, an ICP-AES analysis was per-
formed on samples cored at different depths (8, 2 cm and at
the surface). Results are shown in Table 4. The carbon
ratio was measured using the loss on ignition technique
(LOI).
These results are in perfect agreement with those
obtained by the semi quantitative technique (EDX) which
shows a high content of calcium and a low content of (Al,
Si, Fe, Mg, K, P and S). Also, these results show again,
with more precision, the remarkable increase in the relative
content of silicon and aluminum toward the surface. This
fact can be connected to a clay precipitation phenomenon
in this region, which is experimentally proved by SEM
observations that show high clay content on the surface.
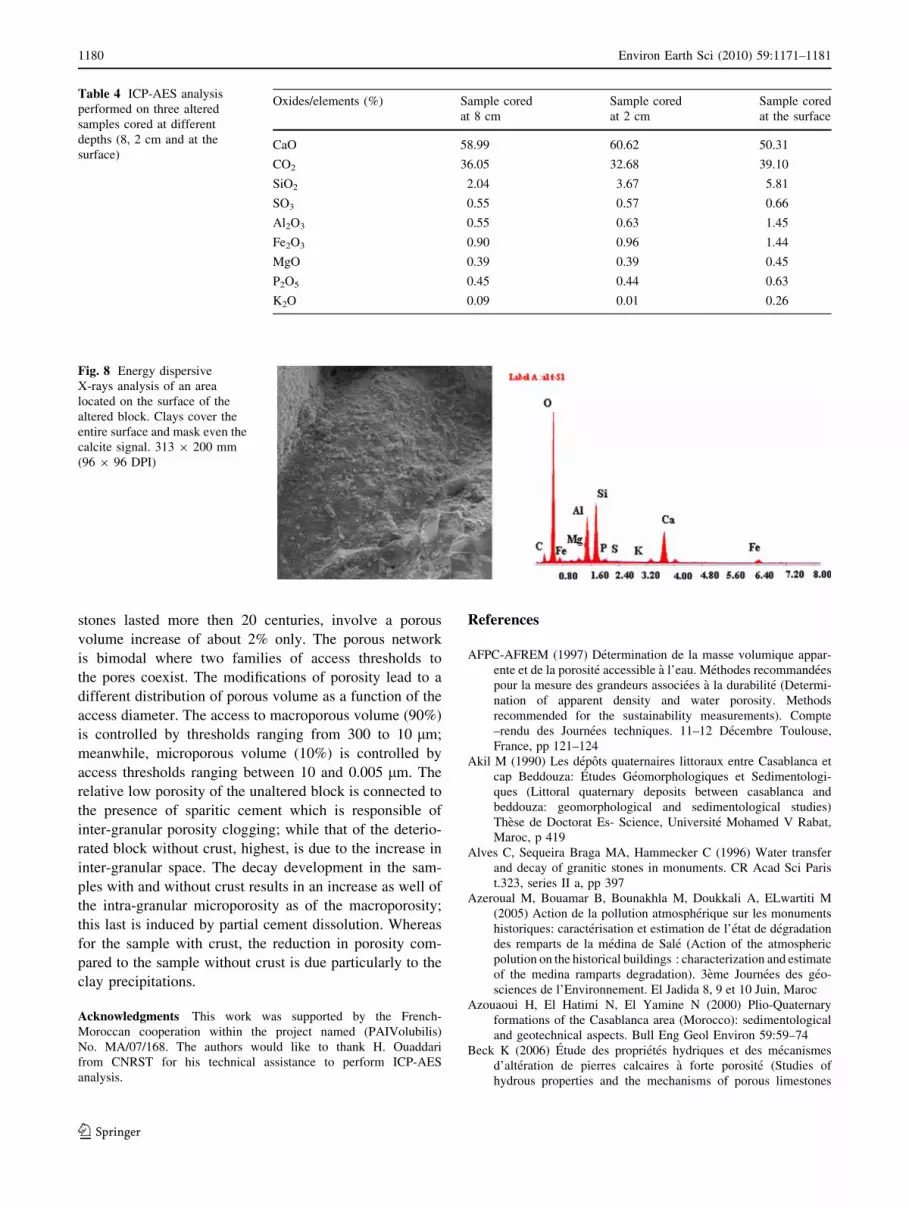
Indeed, on the image of Fig. 8, also taken on the surface of
the deteriorated block, clays cover the entire surface and
mask even the calcite signal. Nevertheless, no remarkable
variation of the Si and Al contents according to the depth
was observed in the case of the unaltered sample.
SEM coupled to EDX and ICP-AES analysis, of the
various unaltered and altered blocks, show important
modifications of the internal structure of altered block. In
the unaltered block one attends to a high sparitisation of
micritic grains, detritic grains (quartz, magnetite) and clay.
Meanwhile, the altered sample shows a depth variation of
Fig. 6 SEM photographs of three fragments taken at 8 cm in depth
from the surface of the altered block. The image a presents a zone
made up of micrite (b) surrounded by a zone of high precipitation of
sparitic calcite (a). The image b shows intra-granular porosity (d).
The image c shows unaltered primary grains (u), protected by a
sparitic gangue. 64 9 185 mm (96 9 96 DPI)
1178 Environ Earth Sci (2010) 59:1171–1181
123
the internal structure and also of the chemical composition.
On the surface, one notes the presence of micritic grains
with gangue in a fine clayey carbonated matrix accompa-
nied by a dissolution of the sparitic calcite grains. In-depth,
the assembly of micritic grains with sparite and gangue is
characteristic of a primarily macroscopic porous space.
Moreover, in the altered sample with crust, compared to the
deteriorated sample without crust, the porosity reduction is
allotted to a partial inter-granular space cementation. ICP-
AES and EDX analysis clearly show an increase in the Si
and Al contents in the vicinity of the surface. From these
observations, one can note that the decay mechanism in
these stones is schematized by an increasing clay
concentration at the surface, accompanied by remarkable
calcite dissolution. The increasing clay content on the
surface is an effect of a clay precipitation enhanced by the
modification of the pH conditions (weather). It can also be
attributed to the accumulation of ‘‘detritic’’ clays by dust
and wind. These lead to the formation of a thick crust that
is responsible of inter-granular porosity clogging.
Conclusion
Water saturation and mercury intrusion porosimetry ana-
lysis show that the decay process of Chellah monument
Fig. 7 Energy dispersive
X-rays analysis of three
fragments of the altered sample
a, b, c cored, respectively, on
the surface and at two different
depths (2 and 8 cm). The
analysis performed at the
surface and at shallow depth
(2 cm) shows a remarkable
increase in the relative content
of silicon and aluminum this
area; that can be connected to a
presence of clays.
313 9 211 mm (96 9 96 DPI)
Environ Earth Sci (2010) 59:1171–1181 1179
123
stones lasted more then 20 centuries, involve a porous
volume increase of about 2% only. The porous network
is bimodal where two families of access thresholds to
the pores coexist. The modifications of porosity lead to a
different distribution of porous volume as a function of the
access diameter. The access to macroporous volume (90%)
is controlled by thresholds ranging from 300 to 10 lm;
meanwhile, microporous volume (10%) is controlled by
access thresholds ranging between 10 and 0.005 lm. The
relative low porosity of the unaltered block is connected to
the presence of sparitic cement which is responsible of
inter-granular porosity clogging; while that of the deterio-
rated block without crust, highest, is due to the increase in
inter-granular space. The decay development in the sam-
ples with and without crust results in an increase as well of
the intra-granular microporosity as of the macroporosity;
this last is induced by partial cement dissolution. Whereas
for the sample with crust, the reduction in porosity com-
pared to the sample without crust is due particularly to the
clay precipitations.
Acknowledgments This work was supported by the French-
Moroccan cooperation within the project named (PAIVolubilis)
No. MA/07/168. The authors would like to thank H. Ouaddari
from CNRST for his technical assistance to perform ICP-AES
analysis.
References
AFPC-AFREM (1997) Determination de la masse volumique appar-
ente et de la porosite accessible a l’eau. Methodes recommandees
pour la mesure des grandeurs associees a la durabilite (Determi-
nation of apparent density and water porosity. Methods
recommended for the sustainability measurements). Compte
–rendu des Journees techniques. 11–12 Decembre Toulouse,
France, pp 121–124
Akil M (1990) Les depots quaternaires littoraux entre Casablanca et
cap Beddouza: Etudes Geomorphologiques et Sedimentologi-
ques (Littoral quaternary deposits between casablanca and
beddouza: geomorphological and sedimentological studies)
These de Doctorat Es- Science, Universite Mohamed V Rabat,
Maroc, p 419
Alves C, Sequeira Braga MA, Hammecker C (1996) Water transfer
and decay of granitic stones in monuments. CR Acad Sci Paris
t.323, series II a, pp 397
Azeroual M, Bouamar B, Bounakhla M, Doukkali A, ELwartiti M
(2005) Action de la pollution atmospherique sur les monuments
historiques: caracterisation et estimation de l’etat de degradation
des remparts de la medina de Sale (Action of the atmospheric
polution on the historical buildings : characterization and estimate
of the medina ramparts degradation). 3eme Journees des geo-
sciences de l’Environnement. El Jadida 8, 9 et 10 Juin, Maroc
Azouaoui H, El Hatimi N, El Yamine N (2000) Plio-Quaternary
formations of the Casablanca area (Morocco): sedimentological
and geotechnical aspects. Bull Eng Geol Environ 59:59–74
Beck K (2006) Etude des proprietes hydriques et des mecanismes
d’alteration de pierres calcaires a forte porosite (Studies of
hydrous properties and the mechanisms of porous limestones
Table 4 ICP-AES analysis
performed on three altered
samples cored at different
depths (8, 2 cm and at the
surface)
Oxides/elements (%) Sample cored
at 8 cm
Sample cored
at 2 cm
Sample cored
at the surface
CaO 58.99 60.62 50.31
CO2 36.05 32.68 39.10
SiO2 2.04 3.67 5.81
SO3 0.55 0.57 0.66
Al2O3 0.55 0.63 1.45
Fe2O3 0.90 0.96 1.44
MgO 0.39 0.39 0.45
P2O5 0.45 0.44 0.63
K2O 0.09 0.01 0.26
Fig. 8 Energy dispersive
X-rays analysis of an area
located on the surface of the
altered block. Clays cover the
entire surface and mask even the
calcite signal. 313 9 200 mm
(96 9 96 DPI)
1180 Environ Earth Sci (2010) 59:1171–1181
123
deterioration). These de Doctorat, l’Universite d’Orleans, Paris,
France
Benavente D, Garcia del Cura MA, Garcia-Guinea J, Sanchez-Moral
S, Ordonez S (2004) Role of pore structure in salt crystallisation
in unsaturated porous stone. J Cryst Growth 260:532–544
Benboughaba R (2001) Etude Sedimentologique et Geophysique des
formations littorales plio-quaternaires de l’axe Rabat-Kenitra
(Maroc) (Sedimentological and geophysical studies of the plio-
quaternary littoral formations of the Rabat-Kenitra axis). These
de doctorat, Universite Mohammed V Agdal, Rabat, Maroc,
p 233
Camuffo D (1995) Physical weathering of stones. Sci Total Environ
167:1–14
Carrio-Schaffhauser E (1987) Evolution des proprietes petro phy-
siques d’un calcaire: le role de la dissolution cristallisation dans
une deformation cassante (Evolution of the petrophysical
properties of a limestone : the role of dissolution crystallization
in a breakable deformation). These de l’Universite de Aix-
Marseille I, pp 291
Fripiat J, Chzaussidon J, Jelli A (1971) Chimie physique des
phenomenes de Surface (Physical chemistry of surface phenom-
ena). Edition Masson, Paris, p 387
Genkinger S, Putnis A (2006) Crystallisation of sodium sulfate:
supersaturation and metastable phases. Environ Geol 52:329–
337. doi:10.1007/s00254-006-0565-x
Goudie AS, Viles H (1997) Salt weathering hazards. Wiley,
Chichester, p 241
Gueguen Y, Palciauskas V (1992) Introduction a la physique des
roches (Introduction to rock physics). Hermann (ed) pp 299
Hammecker C (1995) The Importance of the petrophysical properties
and external factors in the stone decay on monuments. Pure Appl
Geophys 145(2):337–361
Lenormand R, Zarcone C, Sarr A (1983) Mechanisms of displacement
of one fluid by another in a network of capillary ducts. J Fluid
Mech 135:337–353
Prick A (1995) Dilatometrical behaviour of porous calcareous rock
samples subjected to freeze-thaw cycles. Catena 25:7–20
Rijniers LA, Huinink HP, Pel L, Kopinga K (2005) Salt crystalliza-
tion as damage mechanism in porous building materials—a
nuclear magnetic resonance study. Magn Reson Imaging
23:273–276
Samaouali A, Laanab L, Geraud Y, Nounah H, Boukalouch M (2005)
Chemical alteration of stones of monuments Chellah Roman.
Paper presented at the first international meeting on Mediterra-
nean Architectural Culture Heritage, in Collaboration with
CICRP (Marseille, France). 26–28 September, Meknes, Morocco
Tiano P (1994) Biodeterioration of stone monuments. A critical
review. In: Garg KL, Garg N, Mukerji KG (eds) Bio deterio-
ration of cultural heritage, vol I. Naya Prokash, Calcutta,
pp 301–321
Van Brakel JG, Modry S, Svata M (1981) Mercury porosimetry: state
of the art. Powder Technol 29:1–12
Van TT, Beck K, Al-Mukhtar M (2007) Accelerated weathering tests
on two highly porous limestones. Environ Geol 52:283–292. doi:
10.1007/s00254-006-0532-6
Washburn EW (1921) Note on method of determining the distribution
of pores sizes in a porous material. Proc Nat Acad Sci 7:115–116
Zaouia N, ELwartiti M, Baghdad B (2005) Superficial alteration and
soluble salts in the calcarenite weathering. Case study ofAlmohade monuments in Rabat: Morocco. Environ Geol
48:742–747
Environ Earth Sci (2010) 59:1171–1181 1181
123