polymerization of ethylene and propylene promoted by group 4 metal complexes bearing...
TRANSCRIPT

PolymerChemistry
PAPER
Cite this: Polym. Chem., 2015, 6,4657
Received 1st April 2015,Accepted 9th May 2015
DOI: 10.1039/c5py00488h
www.rsc.org/polymers
Polymerization of ethylene and propylenepromoted by group 4 metal complexes bearingthioetherphenolate ligands†
Ermanno Luciano,a,b Francesco Della Monica,a,b Antonio Buonerba,a,b
Alfonso Grassi,a,b Carmine Capacchione*a,b and Stefano Milionea,b
The synthesis of four new group 4 metal complexes 1–4 (1 = (t-BuOS)2TiCl2; 2 = (CumOS)2TiCl2; 3 =
(t-BuOS)2Zr(CH2Ph)2; 4 = (CumOS)2Zr(CH2Ph)2) bearing two bidentate thioetherphenolate ligands
(t-BuOS-H = 4,6-di-tert-butyl-2-phenylsulfanylphenol; CumOS-H = 4,6-bis-(α,α-dimethylbenzyl)-2-
phenylsulfanylphenol) has been accomplished. These complexes exhibit fluxional behaviour in solution
and this was revealed by VT 1H NMR and supported by density functional theory (DFT) calculations. All
these complexes are active catalysts in ethylene polymerization, producing linear polyethylene. Notably,
the zirconium complex 3 displays, under proper reaction conditions, very high activity (1422 kgPE molcat−1
bar−1 h−1), which compares well with that of the most active post-metallocene catalysts. Furthermore,
propylene polymerization catalyzed by the titanium complex 1 yields atactic polypropylene, whereas the
zirconium complexes 3 and 4 selectively produce oligopropylene with Schultz–Flory distribution. NMR
analysis of the unsaturated chain ends in the latter samples provides evidence of a regioselective propa-
gation reaction with a large preference for 1,2-monomer insertion. DFT calculations allowed the model-
ling of the elementary reaction steps, namely, the chain propagation reaction, β-hydrogen elimination and
transfer, highlighting the importance of the flexibility and steric hindrance of the ancillary ligands in deter-
mining the high activity of the title catalysts.
Introduction
The search for new catalytic systems for the polymerization ofα-olefins has been the object of intensive endeavours fromboth industrial and academic researchers. Indeed, the last twodecades have witnessed the emergence in this field of so-called post-metallocenes based on early transition metals,which have shown impressive performance in terms of activity,molecular weight control and stereoselectivity.1 In particular,among the wide array of ligands used to form group 4 metalcomplexes those based on a bis(phenolate) framework bearingadditional donor heteroatoms have attracted the attention ofmany research groups due to the possibility of easy modifi-cation of their electronic and steric properties by changing the
nature of the heteroatoms in the ligand backbone and the sub-stituents on the phenolate rings. As a matter of fact, the bis(phenoxy-imine) group 4 complexes developed by Fujita andCoates2 have been shown to be a versatile class of catalysts forthe polymerization of many olefinic monomers, displaying un-precedented qualities in the polymerization of ethylene andpropylene such as giving, for example, polyethylene with ultra-high activity and syndiotactic polypropylene under living con-ditions. Another successful class of catalysts is based on tetra-dentate diaminobis(phenolato) ligands, the so-called ONNO-type ligands, developed by Kol et al.3 In this case, the presenceof a more rigid ligand framework allows a high degree ofstereocontrol in the polymerization of α-olefins. In both bis(phenoxy-imine) and diaminobis(phenolato) ligands, bis-phenoxo units are coupled to two nitrogen atoms that arestrong hard donors. Later on, Okuda et al. introduced OSSO-type group 4 complexes, in which, while maintaining a struc-tural design similar to ONNO-type ligands, the nitrogen atomsare replaced by soft-donor sulfur atoms.4 This class of catalystshas exhibited unique behaviour in the polymerization ofstyrene and dienes, giving intriguing results in many copoly-merization reactions.5 More recently, the family of OSSO-type
†Electronic supplementary information (ESI) available: NMR spectra of com-plexes, polymers and oligomers. DSC and GPC traces of polymers. See DOI:10.1039/c5py00488h
aDipartimento di Chimica e Biologia, Università degli Studi di Salerno, via Giovanni
Paolo II 132, 84084 Fisciano (SA), Italy. E-mail: [email protected], Interuniversity Consortium Chemical Reactivity and Catalysis, Via Celso
Ulpiani 27, 70126 Bari, Italy
This journal is © The Royal Society of Chemistry 2015 Polym. Chem., 2015, 6, 4657–4668 | 4657

group 4 complexes was expanded by Kol et al.6 and Ishii et al.,7
giving in the last case the living isospecific polymerization ofα-olefins. In spite of these successful examples, the use ofbidentate OS-type ligands analogous to phenoxy-imine ligandshas been less explored.8 Here, we report on the synthesis of anew family of group 4 complexes bearing two bidentatearylthioetherphenolate ligands per metal centre and their cata-lytic behaviour in ethylene and propylene polymerization.
ExperimentalMaterials
All air- and moisture-sensitive manipulations were performedunder a nitrogen atmosphere using standard Schlenk tech-niques and a MBraun glove box. All reagents and solvents werepurchased from Sigma-Aldrich. Dry solvents were obtained bystandard methods and distilled before use.
The ligands 4,6-di-tert-butyl-2-phenylsulfanylphenol(t-BuOS-H) and 4,6-bis-(α,α-dimethylbenzyl)-2-phenylsulfanyl-phenol (CumOS-H) were synthesized following a literature pro-cedure.9 Methylaluminoxane (MAO) was purchased fromAldrich as a 10 wt% solution in toluene. Before use, the vola-tile components were removed under vacuum and the result-ing white powder was washed twice with dry hexane in orderto remove Al(CH3)3. Polymerization-grade ethylene and propy-lene were purchased from Rivoira and further purified by bub-bling through a 5 mol% xylene solution of Al(t-Bu)3.
Synthesis of (t-BuOS)2TiCl2 (1). A solution of t-BuOS-H(0.503 g; 1.6 mmol) in toluene (16 mL) was added dropwise toa stirred solution of TiCl4 in toluene (0.1 M; 8 mL) at −78 °C.After stirring for 3 h at −78 °C, the resulting mixture waswarmed to room temperature and stirred for 3 h. The solventwas distilled off in vacuo forming a red solid. The residue wascrystallized from a toluene-pentane solvent mixture at −20 °C,washed with pentane and dried to give (t-BuOS)2TiCl2 (1) as ared solid (0.46 g, 77%). Spectroscopic data: 1H-NMR (400 MHz,CD2Cl2, 25 °C): δ (ppm) = 1.26 (9H, s); 1.33 (9H, s); 6.98 (2H,m); 7.22 (1H, d, Ar-H phenol); 7.27 (3H, m, Ar-H); 7.43 (1H, d,Ar-H phenol). 13C-NMR (100 MHz, CD2Cl2, 25 °C): δ (ppm) =29.73; 31.51; 35.16; 35.76; 123.35; 126.96; 128.57; 128.66;128.74; 129.38; 135.45; 136.74; 147.89; 165.53. Elemental ana-lysis calcd (%) for C40H50Cl2O2S2Ti: C, 64.42; H, 6.76; S, 8.60.Found: C, 64.46; H, 6.82; S, 8.73.
Synthesis of (CumOS)2TiCl2 (2). A solution of CumOS-H(0.438 g, 1.0 mmol) in toluene (16 mL) was added dropwise toa stirred solution of TiCl4 in toluene (0.1 M; 5 mL) at −78 °C.After stirring for 3 h at −78 °C, the resulting mixture waswarmed to room temperature and stirred for 12 h. The solventwas distilled off in vacuo forming a red solid. The residue wascrystallized from a toluene–hexane solvent mixture at −20 °C,washed with hexane and dried to give (CumOS)2TiCl2 (2) as a redsolid (0.41 g, 82%). Spectroscopic data: 1H-NMR (300 MHz,CDCl3, 25 °C): δ (ppm) = 1.61 (12H, s); 6.83 (2H, d); 6.91 (1H, s,Ar-H); 6.94–6.99 (1H, m, Ar-H); 7.00–7.29 (13 H, m, Ar-H).13C-NMR (75 MHz, CDCl3, 25 °C): δ (ppm) = 29.02; 30.91; 42.62;
43.07; 125.51; 125.96; 126.34; 126.69; 127.88; 128.21; 128.38;128.63; 128.88; 129.19; 129.76; 134.72; 136.42; 146.21; 149.06;150.22; 164.55. Elemental analysis calcd (%) for C60H58Cl2O2S2Ti:C, 72.50; H, 5.88; S, 6.45. Found: C, 73.02; H, 6.01; S, 6.51.
Synthesis of (t-BuOS)2Zr(CH2Ph)2 (3). A solution of t-BuOS-H(0.628 g; 2.0 mmol) in toluene (10 mL) was added dropwise toa stirred solution of Zr(CH2Ph)4 (0.454 g, 1.0 mmol) in toluene(15 mL). After stirring for 3 h at −78 °C, the resulting solutionwas warmed to room temperature and stirred for 3 h. Thesolvent was distilled off in vacuo forming a light yellow solid.The residue was crystallized from pentane at −20 °C to give(t-BuOS)2Zr(CH2Ph)2 (3) as a yellow solid (0.67 g, 74%). Thereaction was carried out in the absence of light. Spectroscopicdata: 1H-NMR (400 MHz, CD2Cl2, 25 °C): δ (ppm) = 1.23 (9H,s); 1.44 (9H, s); 1.76 (2H, s); 6.62 (2H, d); 6.78–6.82 (3H, m,Ar-H); 6.86 (1H, d, Ar-H phenol); 6.93 (2H, m, Ar-H); 7.06 (3H,m, Ar-H); 7.34 (1H, d, Ar-H phenol). 13C-NMR (100 MHz,CD2Cl2, 25 °C): δ (ppm) = 29.86; 31.60; 34.69; 35.66; 67.06;119.81; 122.47; 126.94; 127.19; 128.25; 128.67; 129.13; 129.23;135.79; 137.50; 143.07; 143.60; 162.74. Elemental analysiscalcd (%) for C54H64O2S2Zr: C, 72.03; H, 7.16; S, 7.12. Found:C, 72.10; H, 7.20; S, 7.23.
Synthesis of (CumOS)2Zr(CH2Ph)2 (4). A solution of CumOS-H(0.790 g; 1.8 mmol) in toluene (10 mL) was added dropwise toa stirred solution of Zr(CH2Ph)4 (0.410 g, 0.9 mmol) in toluene(15 mL). After stirring for 3 h at −78 °C, the resulting solutionwas warmed to room temperature and stirred for 3 h. Thesolvent was distilled off in vacuo forming a light yellow solid.The residue was crystallized from pentane at −20 °C to give(CumOS)2Zr(CH2Ph)2 (4) as a yellow solid (0.85 g, 82%). Thereaction was carried out in the absence of light. 1H-NMR(400 MHz, C6D6, 25 °C): δ (ppm) = 1.48 (9H, s); 1.73 (5H, s);6.38 (2H, d); 6.76 (1H, m); 6.83–6.94 (6H, m); 7.00–7.08 (4H,m); 7.12–7.22 (6H, m); 7.28–7.30 (2H, d); 7.41 (1H, d).13C-NMR (100 MHz, CD2Cl2, 25 °C): δ (ppm) = 31.00; 31.07;42.95; 43.07; 65.82; 120.87; 122.62; 125.88; 126.13; 126.87;127.07; 127.53; 128.06; 128.14; 128.24; 128.41; 128.90; 129.40;130.73; 136.12; 136.50; 142.10; 142.90; 151.52; 151.34; 162.36.Elemental analysis calcd (%) for C74H72O2S2Zr: C, 77.37;H, 6.32; S, 5.58. Found: C, 77.46; H, 6.35; S, 5.63.
Ethylene and propylene polymerization
Polymerization runs were carried out following a standard pro-cedure using a 250 mL Buchi glass pressure reactor equippedwith a mechanical stirrer. A toluene solution of MAO wascharged into the reactor and equilibrated with a monomer gasfeed at an appropriate temperature under stirring. Thepolymerization run was started upon injection of a toluenesolution containing 10 µmol precatalyst. In the case ofpolymerization runs conducted at −60 °C, liquid propylenewas condensed in a Schlenk flask containing a solution ofMAO in 20 mL toluene. After the prescribed reaction time,polymerization was stopped by venting the reactor andpouring the polymerization mixture into ethanol acidified withaqueous HCl. The polymer was coagulated with excessethanol, recovered by filtration, washed with fresh ethanol and
Paper Polymer Chemistry
4658 | Polym. Chem., 2015, 6, 4657–4668 This journal is © The Royal Society of Chemistry 2015

dried under vacuum at 80 °C. In the case of propylenepolymerization promoted by 3 and 4, the absence of polymersand the formation of two well-defined layers indicated thepresence of oligomers. The oligomers were extracted from thereaction mixture with CHCl3 and the organic phase was driedwith anhydrous MgSO4. Finally, the excess solvent wasremoved by distillation.
Characterization of the polymers and oligomers1H and 13C NMR spectra were recorded with a Bruker AVANCE400 spectrometer at 25 °C. Chemical shifts were referred toTMS as an external standard using the residual protio impuri-ties of the deuterated solvent as reference. 13C NMR spectra ofthe polyethylene samples were recorded with a Bruker AM 250spectrometer (63 MHz for 13C) or a Bruker AVANCE 300(75 MHz for 13C) at 110 °C using 1,1,2,2-tetrachloroethane-d2as solvent (0.5 mL, 20 wt%). Spectra were recorded with anacquisition time of 1.5 s and a delay time of 4.0 s.
Analysis of the polymers by gel permeation chromatography(GPC) was carried out at 140 °C using 1,2,4-trichlorobenzeneas solvent and a narrow-MWD polystyrene standard sample asreference. Measurements were performed on a PL-GPC210with four PL-Gel Mixed A columns, RALLS (light scattering)detector (PD2040), H502 viscometer (Viscotek), refractivedetector, and DM400 data manager (Viscotek).
Thermal analysis of the polymers was performed by differ-ential scanning calorimetry (DSC) with a TA Instruments DSC2920 using a heating rate of 10 °C min−1.
Gas chromatography data were obtained using an HP-5capillary column (5% diphenyl-95% dimethyl-polysiloxane,50 m, 0.20 mm i.d.) and a flame ionization detector. Tempera-ture profile: isothermal at 40 °C (10 min), 10 °C per minute,isothermal at 280 °C. Solutions of oligopropene were obtainedby quenching the polymerization mixture with ethanol.Benzene or heptene were used as internal standards.
Computational details
Density functional theory (DFT) calculations were performedwith the Gaussian 09 program suite.10 All geometries wereoptimized without constraints at the BP86 level, i.e. employingthe exchange–correlation functionals of Becke and Perdew,11
respectively. The basis set employed was LANL2DZ12 withassociated effective core potentials for Ti, Zr, and S and SVP13
for O, C, and H. To save computational resources, the tert-butyl substituents were replaced by hydrogen atoms. Stationarypoint geometries were characterized as local minima on poten-tial energy surfaces. The absence of imaginary frequenciesconfirmed that structures were true minima at their respectivelevels of theory. The structures of transition states were locatedby applying Schlegel’s synchronous transit-guided quasi-Newton (QST2) method as implemented in Gaussian 09. Tran-sition states were verified using frequency calculations toensure they were first-order saddle points with only one nega-tive eigenvalue.
The differences in energy reported in Fig. 3, 5 and 8 are inthe gas phase without zero-point correction. Cartesian coordi-nates of all DFT optimized structures are available on request.Structures were visualized by the CYLview program.14
Results and discussionSynthesis of complexes
o-Thiophenols including a phenoxo anionic donor and an arylthioether neutral donor (t-BuOS-H = 4,6-di-tert-butyl-2-phenyl-sulfanylphenol; CumOS-H = 4,6-di-cumyl-2-phenylsulfanyl-phenol) were prepared by a reaction between a lithiated derivativeof the appropriate phenol and benzenesulfenyl chloride.9 Thesynthesis of complexes 1–4 was accomplished by treating TiCl4or Zr(CH2Ph)4, respectively, in toluene with 2 equivalents ofthe corresponding ligand (Scheme 1).
Complexes 1–4 were characterized by elemental analysis aswell as by NMR spectroscopy. In the 1H NMR spectra of com-plexes 1–4 at room temperature, one set of signals wasdetected for the coordinated ligands, which suggests a highlysymmetric coordination environment at the metal centre. Theresonances were shifted with respect to the signals of theprotons of the free ligands, which indicates coordination ofthe sulfur donor of the chelating ligand to the metal centre. Inthe 1H NMR spectra of 3 and 4, the resonances of the ZrCH2Phgroups appear as sharp singlets, which suggests the fast re-orientation of an η1 benzyl ligand around the metal centre. Thecoordination of the sulfur donor was confirmed by a NOESY
Scheme 1 Synthesis of complexes 1–4.
Polymer Chemistry Paper
This journal is © The Royal Society of Chemistry 2015 Polym. Chem., 2015, 6, 4657–4668 | 4659

experiment on complex 3. In the corresponding spectrum, theortho protons of the S-C6H5 groups exhibited a cross peak withthe methylene protons of the benzyl groups and a cross peakwith the ortho-butyl of the phenoxo group, which indicatesthe proximity of the S-C6H5 groups to the metal centre (seeFig. S8†).
In principle, the coordination of two asymmetric bidentateligands to a metal centre (Ti or Zr) can produce the five octa-hedral stereoisomers A–E in Scheme 2. In A–C the two mono-dentate ligands X are in a cis stereochemical relationship,whereas in D and E they are in a trans relationship. The stereo-isomers A–C are chiral.
A useful tool for investigating the number and geometry ofstereoisomers is variable-temperature (VT) 1H NMR spectro-scopy. In the case of the titanium complexes 1 and 2 theonly useful information can be obtained by considering the 1Hsignals of the tert-butyl or cumyl substituents on the phenolrings. Cooling a dichloromethane solution of 1 to −80 °Cresulted in the two signals related to tert-butyl groups splittinginto four signals, which suggests the presence of either onlyone stable asymmetric isomer in solution or two interconvert-ing isomers in a 1 : 1 molar ratio (see Fig. S3†).
In order to get more information about the behaviour insolution of this new class of complexes, we then decided toinvestigate the 1H NMR spectrum at −80 °C of the zirconiumcomplex 3. As a matter of fact the presence in this case of twobenzyl groups directly linked to the metal centre offers thepossibility to discriminate between possible isomers withdifferent symmetries. In fact, the signals of the tert-butyl sub-stituents each resolved into two new signals, in analogy to thetitanium complex 1, in a 1 : 3 molar ratio (see Fig. 1). Eventhough the resonances are quite broad, the spectrum suggeststhe presence in solution of two distinct structures. Further-more, the methylene protons of the benzyl groups belongingto the isomer present in lower amounts (δ 1.69 and 2.49 ppm,2JHH = 10.0 Hz) displayed the characteristic AB pattern, whichis attributable to a C2 symmetric structure (isomers A or B). Incontrast, the methylene groups in the other isomer exhibitedcomplicated non-first-order splitting of signals that consist ofa pseudo-doublet at 1.48 ppm correlated with a broad multi-plet at 1.02 ppm. These signals seem to suggest the formationof the asymmetric C1 isomer (isomer C). The coupling patterns
of these methylene protons were determined by a COSY experi-ment (see Fig. S10†). Moreover, an EXSY experiment clearlyrevealed the presence of an exchange regime. Fig. 2 showspositive cross peaks correlating the signals of the ortho-butylgroups and cross peaks correlating the signals of the methy-lene groups of the two species.
Frequently, group 4 complexes bearing ligands that containthe soft donor S have a stereochemically non-rigid coordi-nation environment at the metal centre; in solution, they existas different isomers or display a fluxional process.4d,6,8
Notably, such fluxional behaviour has also been observed inthe case of titanium and zirconium complexes that incorporate
Scheme 2 Possible stereoisomers of the octahedral complexes of general formula (OS)2MX2.
Fig. 1 Aliphatic region of the 1H NMR spectra of complex 3 at 20 °Cand −80 °C. The signals marked in red are attributed to the C1 sym-metric isomer and the signals marked in blue are attributed to the C2
symmetric isomer. The signals marked with asterisks are due to solvents:hexane (one asterisk); toluene (two asterisks) (CD2Cl2, 400 MHz).
Paper Polymer Chemistry
4660 | Polym. Chem., 2015, 6, 4657–4668 This journal is © The Royal Society of Chemistry 2015

the same bidentate OS ligands, in which the ligand X is analkoxy group (X = i-PrO for Ti and X = t-BuO for Zr). In thatcase, the solid-state structure exhibits a C2 symmetrical con-figuration with two cis-arranged t-BuO groups, two cis sulfuratoms and two trans phenoxo units.9b Despite several attempts,we could not obtain single crystals of complexes 1–4 suitablefor X-ray structure analysis. To propose reasonable structuresand explain the fluxional behaviour observed in these com-plexes by NMR analysis, DFT calculations were performed. Thestereoisomers A–D for the titanium and zirconium complexeswere successfully located; the minimum-energy structures forthe Zr complexes are shown in Fig. 3. All our attempts to opti-mize stereoisomers E met with failure.
In all structures the coordination geometry around themetal centre is a distorted octahedron effectively κ2-chelatedby the sulfur and oxygen atoms of the bidentate ligand. TheTi–S and Zr–S bond lengths are slightly longer than thosereported for the corresponding complexes in which the twosulfur atoms are linked by an alkyl bridge,4d,15 in agreementwith the electron-withdrawing properties of the aryl groupsbound to the sulfur atoms. The differences in free energybetween stereoisomers A–D in the case of the titaniumcomplex lie in the range 0.0–8.3 kcal mol−1. The most stablestructures are those of stereoisomers A and C. Stereoisomer Dexhibits slightly higher energy with respect to A and C. Stereo-isomer B is thermodynamically less favoured. Analogousresults were obtained for the model zirconium complex: thedifferences in free internal energy between stereoisomers A–D
lie in the range 0.0–3.8 kcal mol−1 (see Fig. 3). For bothmetals, the most stable structures are those of the C2 sym-metric stereoisomer A and C1 symmetric stereoisomer C,which would correspond to the isomers experimentallyobserved in solution at low temperature by 1H NMRspectroscopy.
Interconversion between isomers A–D may occur viaopening (κ2 → κ1) or closing (κ1 → κ2) of the OS ligand. Thedifference between the energy of pentacoordinate isomers (inwhich one of the ligands is κ1-coordinated) and hexacoordi-nate isomers gives a measure of the dissociation energies ofthe S donor group (see ESI†). The values calculated for theTi and Zr complexes are 1.6 kcal mol−1 and 3.8 kcal mol−1,respectively. These values indicate that the coordination of thependant group is weak, especially for the Ti complex.
Polymerization studies
Complexes 1–4 activated by MAO have been studied as catalystsin the polymerization of ethylene. Data are reported in Table 1.
Fig. 2 Aliphatic region of the EXSY spectrum of 3 at −80 °C The signalsmarked with asterisks are due to solvents: hexane (one asterisk); toluene(two asterisks) (τm = 0.400 s, CD2Cl2, 600 MHz).
Fig. 3 Minimum-energy structures of stereoisomers A–D for a modelof (OS)2Zr(CH2Ph)2 and differences in free energy obtained by DFT cal-culations in kcal mol−1.
Table 1 Ethylene polymerization with complexes 1–4/MAO
Runa CatalystT(°C)
Yield(g)
Activityb
(kgPE molcat−1
bar−1 h−1)Tm
c
(°C)Mw
d
(kDa) PDId
1 1 30 29.0 527 138 759 3.82 1 50 10.5 190 133 940 4.13 1 80 2.9 53 134 622 3.14e 1 30 8.3 500 n.d. n.d. n.d.5 f 1 30 10.5 190 132 994 3.26 2 30 9.4 170 133 967 2.57e 3 30 23.7 1422 132 50 1.68 4 30 17.0 309 132 76 1.8
a Reaction conditions: 10 μmol precatalyst, Al/M = 500, Pethylene = 5.5bar, 150 mL toluene, 1 h. b kgPE molcat
−1 bar−1 h−1. cMeltingtemperature determined by DSC. dDetermined by GPC with respect topolystyrene standards. e Reaction time = 20 min. f 10 μmol precatalyst,Al/M = 1000, Pethylene = 5.5 bar, 150 mL toluene, 1 h; n.d. = notdetermined.
Polymer Chemistry Paper
This journal is © The Royal Society of Chemistry 2015 Polym. Chem., 2015, 6, 4657–4668 | 4661
The catalytic activity of catalyst 1 was explored at different reac-tion temperatures in the range 30–80 °C and displayed thebest performance at lower temperatures, thus suggestingpartial deactivation of the catalyst at higher temperatures. Thehighest activity observed for the titanium complexes (527 kgPEmolcat
−1 bar−1 h−1) (Table 1, run 1) compares well with otherpost-metallocenes based on titanium and is one order of mag-nitude higher than related complexes bearing two OS ligands,in which the sulfur atom is bonded to the phenol ring via amethylene spacer.8a The zirconium complex 3 exhibits veryhigh activity (1422 kgPE molcat
−1 bar−1 h−1) (Table 1, run 7) inthe polymerization of ethylene, which confirms the beneficialeffect of soft donors on the catalytic activity for this class ofcatalyst. The related titanium and zirconium complexes 2 and4, which bear bulkier cumyl groups on the aromatic ring,exhibit appreciably lower activity, which suggests that a lessaccessible metal centre leads to a decrease in catalytic activity.
The obtained polyethylenes display melting points rangingfrom 130 to 138 °C, which indicates a highly linear polymer asconfirmed by 13C NMR analysis (see Fig. S16†).
The molecular weight distributions (Mw/Mn) are ratherbroad but monomodal, probably as a result of the high flux-ionality of the precatalysts in solution. The molecular weightsare high in the case of the titanium complexes (622–994 kDa),whereas in the case of the zirconium complexes they decreaseby one order of magnitude (50–89 kDa). A similar trend hasbeen observed in the case of OSSO complexes, in which thechange from titanium to zirconium while maintaining thesame ligand skeleton has a dramatic effect on the molecularweight, resulting in the selective production of oligoethene inthe case of the zirconium derivative.16
Complexes 1–4 were also investigated in propylene polymeri-zation. The most significant results for propylene polymeri-zation are summarized in Table 2.
Complex 1 activated by methylaluminoxane producesatactic polypropylene with good activity, whereas catalyst 2,which has already displayed the lowest activity in ethylenepolymerization, is virtually inactive. Moreover, the zirconiumcatalysts 3 and 4 selectively produce oligopropylene samples.
13C NMR analysis of polypropylene obtained at 30 °C using1/MAO shows, in the methyl pentad region, the typical pattern
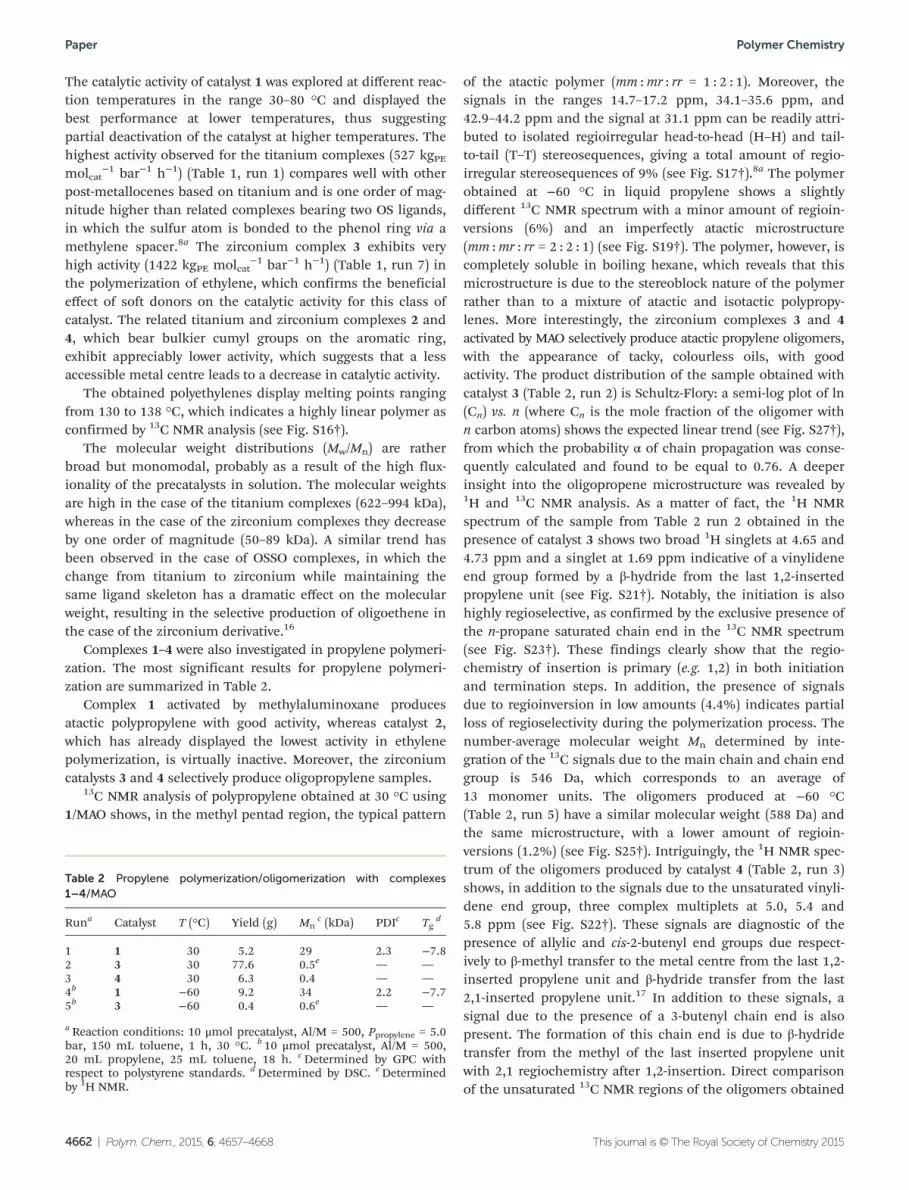
of the atactic polymer (mm :mr : rr = 1 : 2 : 1). Moreover, thesignals in the ranges 14.7–17.2 ppm, 34.1–35.6 ppm, and42.9–44.2 ppm and the signal at 31.1 ppm can be readily attri-buted to isolated regioirregular head-to-head (H–H) and tail-to-tail (T–T) stereosequences, giving a total amount of regio-irregular stereosequences of 9% (see Fig. S17†).8a The polymerobtained at −60 °C in liquid propylene shows a slightlydifferent 13C NMR spectrum with a minor amount of regioin-versions (6%) and an imperfectly atactic microstructure(mm :mr : rr = 2 : 2 : 1) (see Fig. S19†). The polymer, however, iscompletely soluble in boiling hexane, which reveals that thismicrostructure is due to the stereoblock nature of the polymerrather than to a mixture of atactic and isotactic polypropy-lenes. More interestingly, the zirconium complexes 3 and 4activated by MAO selectively produce atactic propylene oligomers,with the appearance of tacky, colourless oils, with goodactivity. The product distribution of the sample obtained withcatalyst 3 (Table 2, run 2) is Schultz-Flory: a semi-log plot of ln(Cn) vs. n (where Cn is the mole fraction of the oligomer withn carbon atoms) shows the expected linear trend (see Fig. S27†),from which the probability α of chain propagation was conse-quently calculated and found to be equal to 0.76. A deeperinsight into the oligopropene microstructure was revealed by1H and 13C NMR analysis. As a matter of fact, the 1H NMRspectrum of the sample from Table 2 run 2 obtained in thepresence of catalyst 3 shows two broad 1H singlets at 4.65 and4.73 ppm and a singlet at 1.69 ppm indicative of a vinylideneend group formed by a β-hydride from the last 1,2-insertedpropylene unit (see Fig. S21†). Notably, the initiation is alsohighly regioselective, as confirmed by the exclusive presence ofthe n-propane saturated chain end in the 13C NMR spectrum(see Fig. S23†). These findings clearly show that the regio-chemistry of insertion is primary (e.g. 1,2) in both initiationand termination steps. In addition, the presence of signalsdue to regioinversion in low amounts (4.4%) indicates partialloss of regioselectivity during the polymerization process. Thenumber-average molecular weight Mn determined by inte-gration of the 13C signals due to the main chain and chain endgroup is 546 Da, which corresponds to an average of13 monomer units. The oligomers produced at −60 °C(Table 2, run 5) have a similar molecular weight (588 Da) andthe same microstructure, with a lower amount of regioin-versions (1.2%) (see Fig. S25†). Intriguingly, the 1H NMR spec-trum of the oligomers produced by catalyst 4 (Table 2, run 3)shows, in addition to the signals due to the unsaturated vinyli-dene end group, three complex multiplets at 5.0, 5.4 and5.8 ppm (see Fig. S22†). These signals are diagnostic of thepresence of allylic and cis-2-butenyl end groups due respect-ively to β-methyl transfer to the metal centre from the last 1,2-inserted propylene unit and β-hydride transfer from the last2,1-inserted propylene unit.17 In addition to these signals, asignal due to the presence of a 3-butenyl chain end is alsopresent. The formation of this chain end is due to β-hydridetransfer from the methyl of the last inserted propylene unitwith 2,1 regiochemistry after 1,2-insertion. Direct comparisonof the unsaturated 13C NMR regions of the oligomers obtained
Table 2 Propylene polymerization/oligomerization with complexes1–4/MAO
Runa Catalyst T (°C) Yield (g) Mnc (kDa) PDIc Tg
d
1 1 30 5.2 29 2.3 −7.82 3 30 77.6 0.5e — —3 4 30 6.3 0.4 — —4b 1 −60 9.2 34 2.2 −7.75b 3 −60 0.4 0.6e — —
a Reaction conditions: 10 μmol precatalyst, Al/M = 500, Ppropylene = 5.0bar, 150 mL toluene, 1 h, 30 °C. b 10 μmol precatalyst, Al/M = 500,20 mL propylene, 25 mL toluene, 18 h. cDetermined by GPC withrespect to polystyrene standards. dDetermined by DSC. eDeterminedby 1H NMR.
Paper Polymer Chemistry
4662 | Polym. Chem., 2015, 6, 4657–4668 This journal is © The Royal Society of Chemistry 2015
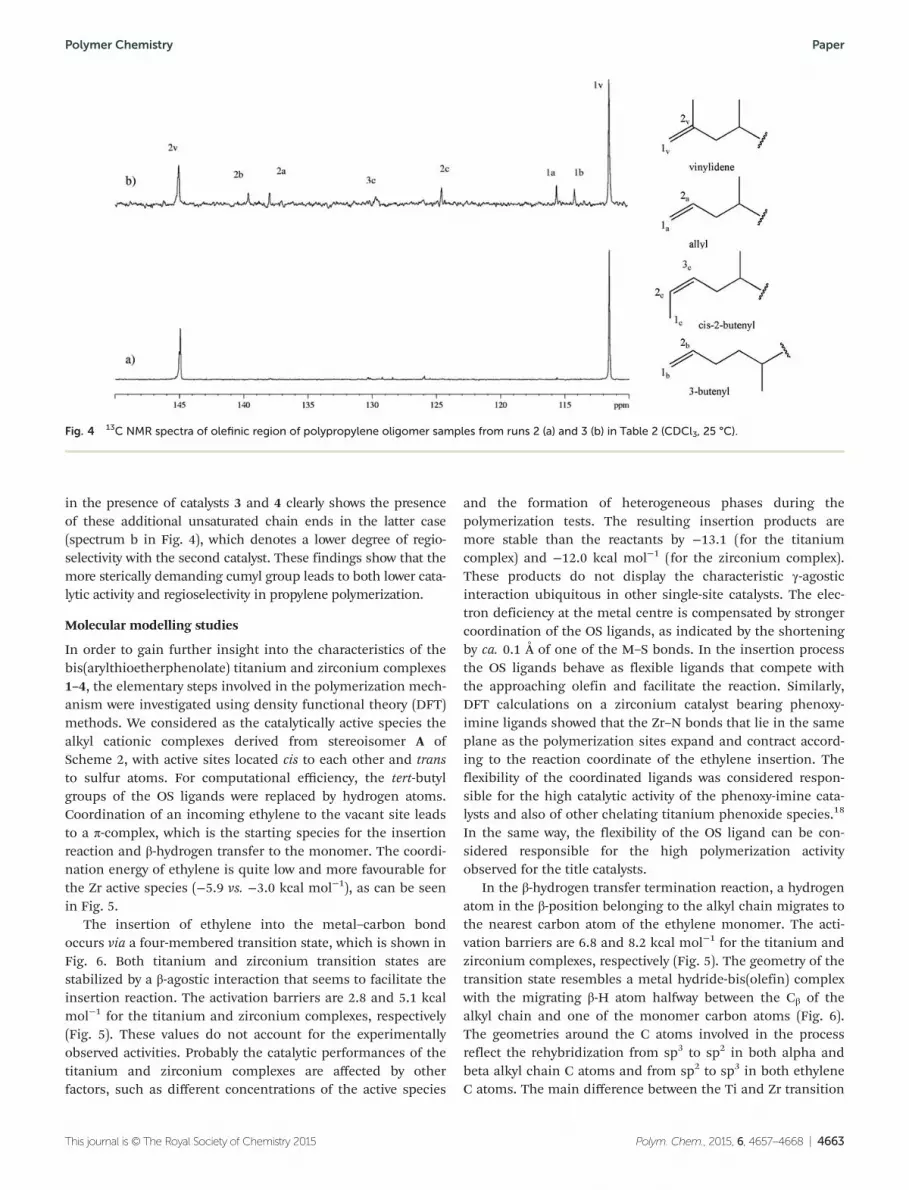
in the presence of catalysts 3 and 4 clearly shows the presenceof these additional unsaturated chain ends in the latter case(spectrum b in Fig. 4), which denotes a lower degree of regio-selectivity with the second catalyst. These findings show that themore sterically demanding cumyl group leads to both lower cata-lytic activity and regioselectivity in propylene polymerization.
Molecular modelling studies
In order to gain further insight into the characteristics of thebis(arylthioetherphenolate) titanium and zirconium complexes1–4, the elementary steps involved in the polymerization mech-anism were investigated using density functional theory (DFT)methods. We considered as the catalytically active species thealkyl cationic complexes derived from stereoisomer A ofScheme 2, with active sites located cis to each other and transto sulfur atoms. For computational efficiency, the tert-butylgroups of the OS ligands were replaced by hydrogen atoms.Coordination of an incoming ethylene to the vacant site leadsto a π-complex, which is the starting species for the insertionreaction and β-hydrogen transfer to the monomer. The coordi-nation energy of ethylene is quite low and more favourable forthe Zr active species (−5.9 vs. −3.0 kcal mol−1), as can be seenin Fig. 5.
The insertion of ethylene into the metal–carbon bondoccurs via a four-membered transition state, which is shown inFig. 6. Both titanium and zirconium transition states arestabilized by a β-agostic interaction that seems to facilitate theinsertion reaction. The activation barriers are 2.8 and 5.1 kcalmol−1 for the titanium and zirconium complexes, respectively(Fig. 5). These values do not account for the experimentallyobserved activities. Probably the catalytic performances of thetitanium and zirconium complexes are affected by otherfactors, such as different concentrations of the active species
and the formation of heterogeneous phases during thepolymerization tests. The resulting insertion products aremore stable than the reactants by −13.1 (for the titaniumcomplex) and −12.0 kcal mol−1 (for the zirconium complex).These products do not display the characteristic γ-agosticinteraction ubiquitous in other single-site catalysts. The elec-tron deficiency at the metal centre is compensated by strongercoordination of the OS ligands, as indicated by the shorteningby ca. 0.1 Å of one of the M–S bonds. In the insertion processthe OS ligands behave as flexible ligands that compete withthe approaching olefin and facilitate the reaction. Similarly,DFT calculations on a zirconium catalyst bearing phenoxy-imine ligands showed that the Zr–N bonds that lie in the sameplane as the polymerization sites expand and contract accord-ing to the reaction coordinate of the ethylene insertion. Theflexibility of the coordinated ligands was considered respon-sible for the high catalytic activity of the phenoxy-imine cata-lysts and also of other chelating titanium phenoxide species.18
In the same way, the flexibility of the OS ligand can be con-sidered responsible for the high polymerization activityobserved for the title catalysts.
In the β-hydrogen transfer termination reaction, a hydrogenatom in the β-position belonging to the alkyl chain migrates tothe nearest carbon atom of the ethylene monomer. The acti-vation barriers are 6.8 and 8.2 kcal mol−1 for the titanium andzirconium complexes, respectively (Fig. 5). The geometry of thetransition state resembles a metal hydride-bis(olefin) complexwith the migrating β-H atom halfway between the Cβ of thealkyl chain and one of the monomer carbon atoms (Fig. 6).The geometries around the C atoms involved in the processreflect the rehybridization from sp3 to sp2 in both alpha andbeta alkyl chain C atoms and from sp2 to sp3 in both ethyleneC atoms. The main difference between the Ti and Zr transition
Fig. 4 13C NMR spectra of olefinic region of polypropylene oligomer samples from runs 2 (a) and 3 (b) in Table 2 (CDCl3, 25 °C).
Polymer Chemistry Paper
This journal is © The Royal Society of Chemistry 2015 Polym. Chem., 2015, 6, 4657–4668 | 4663

states for the termination reaction occurs mainly in the posi-tion of the migrating H atom with respect to both donor andacceptor C atoms.
β-Hydrogen elimination (BHE) can occur in the absence ofa coordinated alkene. In this termination reaction, a hydrogenatom in the β-position belonging to the alkyl chain migrates tothe metal centre via a transition state with barriers of 35.2 and31.3 kcal mol−1 for the titanium and zirconium complexes,respectively. These results suggest that BHE termination isunfeasible and that β-hydrogen transfer to the monomer is thepredominant termination reaction. The polymerization degreeis therefore determined by competition between chain propa-gation and β-hydrogen transfer, which can be evaluated by thedifference between the activation barriers of the two corres-ponding processes (ΔE#BHT-CP). The ΔE#BHT-CP values are 4.0and 3.1 kcal mol−1, respectively, for the titanium and zirco-nium complexes and indicate a more competitive BHT processfor Zr-containing species than for Ti-containing species. As amatter of fact, the experimental molecular weights (Mn andMw) of polyethylene samples obtained in the presence of thezirconium catalysts 3 and 4 are lower by about one order ofmagnitude with respect to those from catalysts 1 and 2.
It is worth noting that the competition between chainpropagation and β-hydrogen transfer is very similar to thatcomputed for titanium and zirconium complexes featuring thetetradentate OSSO ligand (OSSO = 1,4-dithiabutanediyl-2,2′-bis-butylphenoxy) at the same level of theory.16a Titanium cata-lysts featuring tetradentate OSSO ligands produce branchedpolyethylene, which contains side groups with an evennumber of carbon atoms.16b The formation of branches wasascribed to the release of linear alkenes in the reactionmedium and their successive reinsertion in the polymerchain.16 The different behaviours of these two classes of
Fig. 5 Relative energy profiles corresponding to the competitive insertion reaction of ethylene into the metal–ethyl bond and the termination reac-tion via BHT as examined in this study. Energies are given in kcal mol−1.
Fig. 6 Transition-state structures for ethylene insertion (TSCP) andbeta-hydrogen transfer (TSBHT) for the titanium model complex. Dis-tances are given in Å.
Paper Polymer Chemistry
4664 | Polym. Chem., 2015, 6, 4657–4668 This journal is © The Royal Society of Chemistry 2015
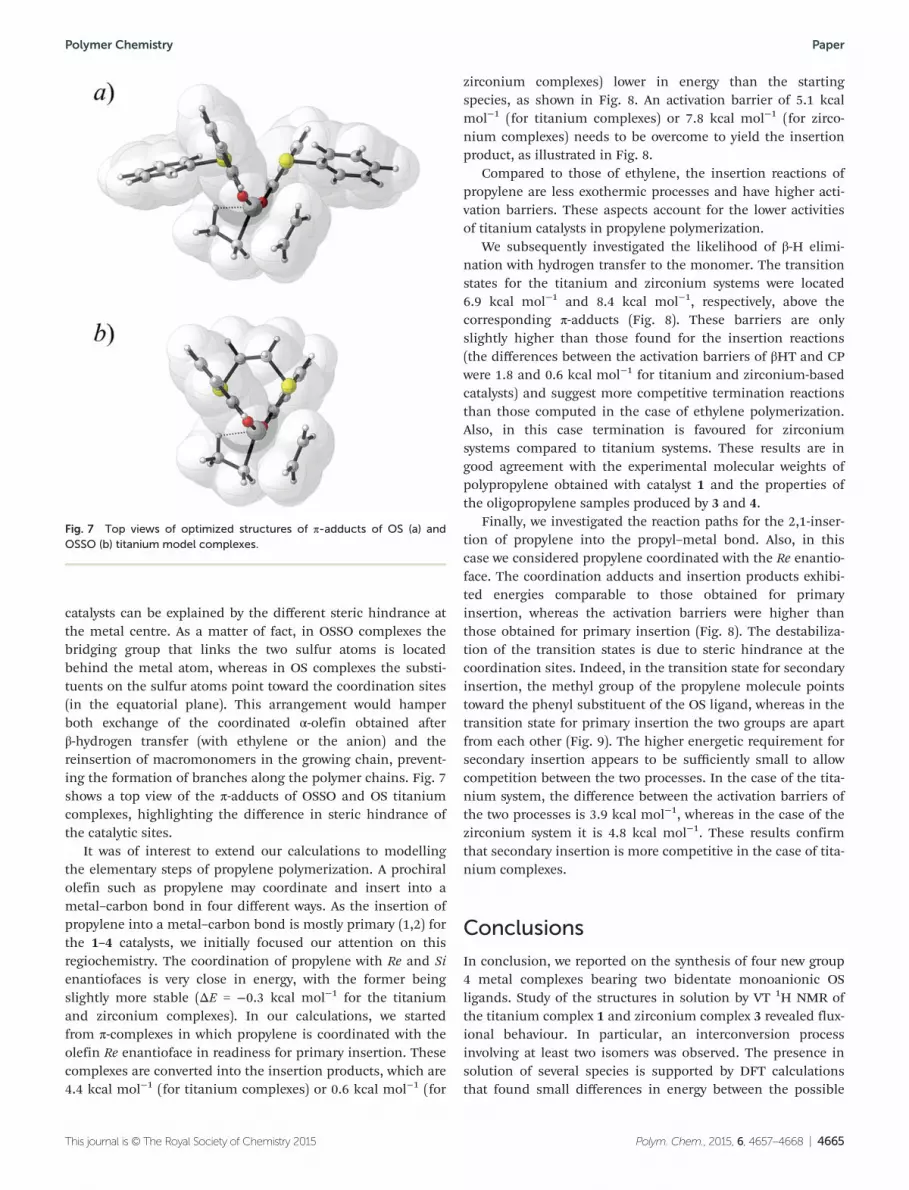
catalysts can be explained by the different steric hindrance atthe metal centre. As a matter of fact, in OSSO complexes thebridging group that links the two sulfur atoms is locatedbehind the metal atom, whereas in OS complexes the substi-tuents on the sulfur atoms point toward the coordination sites(in the equatorial plane). This arrangement would hamperboth exchange of the coordinated α-olefin obtained afterβ-hydrogen transfer (with ethylene or the anion) and thereinsertion of macromonomers in the growing chain, prevent-ing the formation of branches along the polymer chains. Fig. 7shows a top view of the π-adducts of OSSO and OS titaniumcomplexes, highlighting the difference in steric hindrance ofthe catalytic sites.
It was of interest to extend our calculations to modellingthe elementary steps of propylene polymerization. A prochiralolefin such as propylene may coordinate and insert into ametal–carbon bond in four different ways. As the insertion ofpropylene into a metal–carbon bond is mostly primary (1,2) forthe 1–4 catalysts, we initially focused our attention on thisregiochemistry. The coordination of propylene with Re and Sienantiofaces is very close in energy, with the former beingslightly more stable (ΔE = −0.3 kcal mol−1 for the titaniumand zirconium complexes). In our calculations, we startedfrom π-complexes in which propylene is coordinated with theolefin Re enantioface in readiness for primary insertion. Thesecomplexes are converted into the insertion products, which are4.4 kcal mol−1 (for titanium complexes) or 0.6 kcal mol−1 (for
zirconium complexes) lower in energy than the startingspecies, as shown in Fig. 8. An activation barrier of 5.1 kcalmol−1 (for titanium complexes) or 7.8 kcal mol−1 (for zirco-nium complexes) needs to be overcome to yield the insertionproduct, as illustrated in Fig. 8.
Compared to those of ethylene, the insertion reactions ofpropylene are less exothermic processes and have higher acti-vation barriers. These aspects account for the lower activitiesof titanium catalysts in propylene polymerization.
We subsequently investigated the likelihood of β-H elimi-nation with hydrogen transfer to the monomer. The transitionstates for the titanium and zirconium systems were located6.9 kcal mol−1 and 8.4 kcal mol−1, respectively, above thecorresponding π-adducts (Fig. 8). These barriers are onlyslightly higher than those found for the insertion reactions(the differences between the activation barriers of βHT and CPwere 1.8 and 0.6 kcal mol−1 for titanium and zirconium-basedcatalysts) and suggest more competitive termination reactionsthan those computed in the case of ethylene polymerization.Also, in this case termination is favoured for zirconiumsystems compared to titanium systems. These results are ingood agreement with the experimental molecular weights ofpolypropylene obtained with catalyst 1 and the properties ofthe oligopropylene samples produced by 3 and 4.
Finally, we investigated the reaction paths for the 2,1-inser-tion of propylene into the propyl–metal bond. Also, in thiscase we considered propylene coordinated with the Re enantio-face. The coordination adducts and insertion products exhibi-ted energies comparable to those obtained for primaryinsertion, whereas the activation barriers were higher thanthose obtained for primary insertion (Fig. 8). The destabiliza-tion of the transition states is due to steric hindrance at thecoordination sites. Indeed, in the transition state for secondaryinsertion, the methyl group of the propylene molecule pointstoward the phenyl substituent of the OS ligand, whereas in thetransition state for primary insertion the two groups are apartfrom each other (Fig. 9). The higher energetic requirement forsecondary insertion appears to be sufficiently small to allowcompetition between the two processes. In the case of the tita-nium system, the difference between the activation barriers ofthe two processes is 3.9 kcal mol−1, whereas in the case of thezirconium system it is 4.8 kcal mol−1. These results confirmthat secondary insertion is more competitive in the case of tita-nium complexes.
Conclusions
In conclusion, we reported on the synthesis of four new group4 metal complexes bearing two bidentate monoanionic OSligands. Study of the structures in solution by VT 1H NMR ofthe titanium complex 1 and zirconium complex 3 revealed flux-ional behaviour. In particular, an interconversion processinvolving at least two isomers was observed. The presence insolution of several species is supported by DFT calculationsthat found small differences in energy between the possible
Fig. 7 Top views of optimized structures of π-adducts of OS (a) andOSSO (b) titanium model complexes.
Polymer Chemistry Paper
This journal is © The Royal Society of Chemistry 2015 Polym. Chem., 2015, 6, 4657–4668 | 4665

stereoisomers. Complexes 1–4 are active catalysts for thepolymerization of ethylene producing linear polyethylene.Notably, catalyst 3 displays, under proper reaction conditions,a very high activity that compares well with the most activepost-metallocene catalyst.1a Furthermore, complex 1 is able topolymerize propylene with good activity giving an atacticpolymer and the zirconium complexes 3 and 4 selectivelyproduce propylene oligomers with Schultz–Flory distribution.NMR analysis of these oligomers gave useful informationabout the oligomerization process, in particular regarding theregiochemistry of insertion of the polymer and the terminationprocesses. DFT calculations were performed to evaluate thecompetition between the different elementary processes thatcontrol the polymerization process, i.e., monomer insertioninto the growing alkyl chain, β-hydrogen transfer to the
monomer and β-hydrogen elimination. It was shown thatβ-hydrogen elimination is a rare event due to its rather highactivation barrier and that the polymerization degree is deter-mined by the difference between the activation energies ofmonomer insertion and competitive β-hydrogen transfer. Itwas found that the ΔE#BHT-CP values decrease in moving fromtitanium to zirconium and from ethylene to propylene, inagreement with experimental observations; the obtained mole-cular weights decrease in the same order. Moreover, the DFTstudy provided evidence of the importance of the flexibility ofancillary ligands during the insertion reaction in determininghigh catalytic activities. In the case of propylene polymeri-zation, DFT data showed that primary insertions of propyleneinto the metal–alkyl bond are more favourable than secondaryinsertions, because of lower steric repulsions.
Fig. 8 Relative energy profiles corresponding to competitive insertion reactions of propylene into the metal–propyl bond and the termination reac-tion via BHT as examined in this study. Energies are given in kcal mol−1.
Paper Polymer Chemistry
4666 | Polym. Chem., 2015, 6, 4657–4668 This journal is © The Royal Society of Chemistry 2015

Acknowledgements
We gratefully acknowledge the Ministero dell’Istruzione, dell’Università e della Ricerca (MIUR, Roma, Italy) for FARB 2014and PRIN 2010-11. Dr Patrizia Oliva is acknowledged for tech-nical assistance.
Notes and references
1 (a) V. C. Gibson and S. K. Spitzmesser, Chem. Rev., 2003,103, 283–316; (b) Y. Imanishi and N. Naga, Prog. Polym.Sci., 2001, 26, 1147–1198; (c) G. J. P. Britovsek, V. C. Gibsonand D. F. Wass, Angew. Chem., Int. Ed., 1999, 38, 428–447;(d) H. Makio and T. Fujita, in Stereoselective Polymerizationwith Single-Site Catalysts, ed. L. S. Baugh and J. A. M. Canich,CRC Press, Boca Raton, FL, 2008, pp. 157–168.
2 For review see: (a) H. Makio, H. Terao, A. Iwashita andT. Fujita, Chem. Rev., 2011, 111, 2363–2449; (b) H. Makioand T. Fujita, Acc. Chem. Res., 2009, 42, 1532–1544;(c) H. Makio, N. Kashiwa and T. Fujita, Adv. Synth. Catal.,2002, 344, 477–493; For recent works see: (d) S. Matsui,Y. Tohi, M. Mitani, J. Saito, H. Makio, H. Tanaka,
M. Nitabaru, T. Nakano and T. Fujita, Chem. Lett., 1999,1065–1066; (e) S. Matsui, M. Mitani, J. Saito, Y. Tohi,H. Makio, N. Matsukawa, Y. Takagi, K. Tsuru, M. Nitabaru,T. Nakano, H. Tanaka, N. Kashiwa and T. Fujita, J. Am.Chem. Soc., 2001, 123, 6847–6856; (f ) J. Tian andG. W. Coates, Angew. Chem., Int. Ed., 2000, 39, 3626–3629;(g) J. Tian, P. D. Hustad and G. W. Coates, J. Am. Chem.Soc., 2001, 123, 5134–5135; (h) P. D. Hustad, J. Tian andG. W. Coates, J. Am. Chem. Soc., 2002, 124, 3614–3621.
3 (a) E. Y. Tshuva, I. Goldberg and M. Kol, J. Am. Chem. Soc.,2000, 122, 10706–10707; (b) S. Segal, I. Goldberg andM. Kol, Organometallics, 2005, 24, 200–202; (c) A. Cohen,J. Kopilov, I. Goldberg and M. Kol, Organometallics, 2009,28, 1391–1405.
4 (a) C. Capacchione, A. Proto, H. Ebeling, R. Mülhaupt,K. Möller, T. P. Spaniol and J. Okuda, J. Am. Chem. Soc.,2003, 125, 4964–4965; (b) C. Capacchione, A. Proto,H. Ebeling, R. Mülhaupt, K. Möller, R. Manivannan,T. P. Spaniol and J. Okuda, J. Mol. Catal. A: Chem., 2004,213, 137–140; (c) K. Beckerle, C. Capacchione, H. Ebeling,R. Manivannan, R. Mülhaupt, A. Proto, T. P. Spaniol andJ. Okuda, J. Organomet. Chem., 2004, 689, 4636–4641;(d) C. Capacchione, R. Manivannan, M. Barone,K. Beckerle, R. Centore, L. Oliva, A. Proto, A. Tuzi,T. P. Spaniol and J. Okuda, Organometallics, 2005, 24, 2971–2982; (e) K. Beckerle, R. Manivannan, T. P. Spaniol andJ. Okuda, Organometallics, 2006, 25, 3019–3026.
5 (a) C. Capacchione, M. D’Acunzi, O. Motta, L. Oliva,A. Proto and J. Okuda, Macromol. Chem. Phys., 2004, 205,370–373; (b) C. Capacchione, A. Proto, H. Ebeling,R. Mülhaupt and J. Okuda, J. Polym. Sci., Part A: Polym.Chem., 2006, 44, 1908–1913; (c) F. De Carlo,C. Capacchione, V. Schiavo and A. Proto, J. Polym. Sci., PartA: Polym. Chem., 2006, 44, 1486–1491; (d) S. Milione,C. Cuomo, C. Capacchione, C. Zannoni, A. Grassi andA. Proto, Macromolecules, 2007, 40, 5638–5643;(e) C. Capacchione, A. Avagliano and A. Proto, Macro-molecules, 2008, 41, 4573–4575; (f ) A. Proto, A. Avagliano,D. Saviello and C. Capacchione, Macromolecules, 2009, 42,6981–6985; (g) A. Proto, A. Avagliano, D. Saviello,R. Ricciardi and C. Capacchione, Macromolecules, 2010, 43,5919–5921; (h) C. Capacchione, D. Saviello, A. Avaglianoand A. Proto, J. Polym. Sci., Part A: Polym. Chem., 2010, 48,4200–4206; (i) C. Capacchione, D. Saviello, R. Ricciardiand A. Proto, Macromolecules, 2011, 44, 7940–7947;( j) C. Costabile, C. Capacchione, D. Saviello and A. Proto,Macromolecules, 2012, 45, 6363–6370; (k) A. Buonerba,M. Fienga, S. Milione, C. Cuomo, A. Grassi, A. Proto andC. Capacchione, Macromolecules, 2013, 46, 8449–8457.
6 A. Cohen, A. Yeori, I. Goldberg and M. Kol, Inorg. Chem.,2007, 46, 8114–8116.
7 For review see: (a) N. Nakata, T. Toda and A. Ishii, Polym.Chem., 2011, 2, 1597–1610; For recent works see: (b) A. Ishii,T. Toda, N. Nakata and T. Matsuo, J. Am. Chem. Soc.,2009, 131, 13566–13567; (c) A. Ishii, K. Asajima, T. Todaand N. Nakata, Organometallics, 2011, 30, 2947–2956;
Fig. 9 Transition-state structures for primary (TSCP Prim) and secondarypropylene insertion (TSCP Sec) for the titanium model complex.
Polymer Chemistry Paper
This journal is © The Royal Society of Chemistry 2015 Polym. Chem., 2015, 6, 4657–4668 | 4667

(d) N. Nakata, T. Toda, T. Matsuo and A. Ishii, Macro-molecules, 2013, 46, 6758–6764.
8 (a) M. Lamberti, M. Mazzeo and C. Pellecchia, DaltonTrans., 2009, 8831–8837; (b) B. Lian, K. Beckerle, T. P. Spanioland J. Okuda, Eur. J. Inorg. Chem., 2009, 311–316.
9 (a) T. Kruse, T. Weyhermüller and K. Wieghardt, Inorg.Chim. Acta, 2002, 331, 81–89; (b) F. Della Monica,E. Luciano, G. Roviello, A. Grassi, S. Milione andC. Capacchione, Macromolecules, 2014, 47, 2830–2841;(c) F. Della Monica, E. Luciano, A. Buonerba, A. Grassi,S. Milione and C. Capacchione, RSC Adv., 2014, 4, 51262–51267.
10 M. J. Frisch, G. W. Trucks, H. B. Schlegel, G. E. Scuseria,M. A. Robb, J. R. Cheeseman, G. Scalmani, V. Barone,B. Mennucci, G. A. Petersson, H. Nakatsuji, M. Caricato,X. Li, H. P. Hratchian, A. F. Izmaylov, J. Bloino, G. Zheng,J. L. Sonnenberg, M. Hada, M. Ehara, K. Toyota, R. Fukuda,J. Hasegawa, M. Ishida, T. Nakajima, Y. Honda, O. Kitao,H. Nakai, T. Vreven, J. A. Montgomery Jr., J. E. Peralta,F. Ogliaro, M. Bearpark, J. J. Heyd, E. Brothers,K. N. Kudin, V. N. Staroverov, R. Kobayashi, J. Normand,K. Raghavachari, A. Rendell, J. C. Burant, S. S. Iyengar,J. Tomasi, M. Cossi, N. Rega, J. M. Millam, M. Klene,J. E. Knox, J. B. Cross, V. Bakken, C. Adamo, J. Jaramillo,R. Gomperts, R. E. Stratmann, O. Yazyev, A. J. Austin,R. Cammi, C. Pomelli, J. W. Ochterski, R. L. Martin,K. Morokuma, V. G. Zakrzewski, G. A. Voth, P. Salvador,J. J. Dannenberg, S. Dapprich, A. D. Daniels, O. Farkas,
J. B. Foresman, J. V. Ortiz, J. Cioslowski and D. J. Fox,Gaussian 09, revision A.02, Gaussian, Inc., Wallingford, CT,2009.
11 (a) A. D. Becke, Phys. Rev. A, 1988, 38, 3098–3100;(b) J. P. Perdew, Phys. Rev. B: Condens. Matter, 1986, 33,8822–8824; (c) J. P. Perdew, Phys. Rev. B: Condens. Matter,1986, 34, 7406–7406.
12 P. J. Hay and W. R. Wadt, J. Chem. Phys., 1985, 82, 270–283.13 A. Schaefer, H. Horn and L. Ahlrichs, J. Chem. Phys., 1992,
97, 2571–2577.14 C. Y. Legault, CYLview, v1.0b, Université de Sherbrooke,
2009, http://www.cylview.org.15 J.-C. Buffet and J. Okuda, Chem. Commun., 2011, 47, 4796–
4798.16 (a) C. Capacchione, A. Proto and J. Okuda, J. Polym. Sci.,
Part A: Polym. Chem., 2004, 42, 2815–2822; (b) M. Mella,L. Izzo and C. Capacchione, ACS Catal., 2011, 1, 1460–1468.
17 (a) A. Carvill, L. Zetta, G. Zannoni and M. C. Sacchi, Macro-molecules, 1998, 31, 3783–3789; (b) L. Resconi, L. Cavallo,A. Fait and F. Piemontesi, Chem. Rev., 2000, 100, 1253–1345.
18 (a) T. Matsugi and T. Fujita, Chem. Soc. Rev., 2008, 37,1264–1277; (b) A. v. d. Linden, C. J. Schaverien,N. Meijboom, C. Ganter and A. G. Orpen, J. Am. Chem. Soc.,1995, 117, 3008; (c) R. D. J. Froese, D. G. Musaev,T. Matsubara and K. Morokuma, J. Am. Chem. Soc., 1997,119, 7190–7196; (d) R. D. J. Froese, D. G. Musaev andK. Morokuma, Organometallics, 1999, 18, 373–379.
Paper Polymer Chemistry
4668 | Polym. Chem., 2015, 6, 4657–4668 This journal is © The Royal Society of Chemistry 2015

S-1
ELECTRONIC SUPPLEMENTARY INFORMATION (ESI)
Polymerization of Ethylene and Propylene
Promoted by Group 4 Metal Complexes Bearing
Thioetherphenolate Ligands
Ermanno Luciano,a Francesco Della Monica,
a Antonio Buonerba,
a Alfonso Grassi,
a
Carmine Capacchionea* and Stefano Milione
a
a Dipartimento di Chimica e Biologia and NANOMATES Research Centre for NANOMAterials and
nanoTEchnology, Università degli Studi di Salerno, via Giovanni Paolo II 132 - 84084 Fisciano
(SA).
* E-mail: [email protected].
Electronic Supplementary Material (ESI) for Polymer Chemistry.This journal is © The Royal Society of Chemistry 2015

S-2
Table of Contents
Figure S1. 1H NMR spectrum (CD2Cl2, 25 °C, 600 MHz) of complex (
t-BuOS)2TiCl2 (1). ................ 3
Figure S2. 13
C NMR spectrum (CD2Cl2, 25 °C, 100 MHz) of complex (t-Bu
OS)2TiCl2 (1). ............... 3
Figure S3. VT- 1H NMR spectra (CD2Cl2, 600 MHz) of complex (
t-BuOS)2TiCl2 (1). ....................... 4
Figure S4. 1H NMR spectrum (CDCl3, 25 °C, 400 MHz) of complex (
CumOS)2TiCl2 (2).................. 5
Figure S5. 13
C NMR spectrum (CDCl3, 25 °C, 75 MHz) of complex (Cum
OS)2TiCl2 (2). ................. 5
Figure S6. 1H NMR spectrum (CD2Cl2, 25 °C, 400 MHz) of complex (
t-BuOS)2ZrBn2 (3)................ 6
Figure S7. 13
C NMR spectrum (CD2Cl2, 25 °C, 100 MHz) of complex (t-Bu
OS)2ZrBn2 (3). ............. 6
Figure S8. 1H-
1H NOESY spectrum of complex (
t-BuOS)2ZrBn2 (3) at room temperature. ............... 7
Figure S9a. VT- 1H NMR spectra (CD2Cl2, 400 MHz) of complex (
t-BuOS)2ZrBn2 (3). ................... 8
Figure S9b. VT- 1H NMR spectra (CD2Cl2, 400 MHz) of complex (
t-BuOS)2ZrBn2 (3) in the region
from 0.7 to 3.1 ppm. ............................................................................................................................. 8
Figure S10. COSY spectrum (CD2Cl2, 600MHz) of complex (t-Bu
OS)2ZrBn2 (3) showing the scalar
coupling of the Zr-CH2-Ph resonances at -80 °C. ................................................................................ 9
Figure S11. 1H-
1H NOESY spectrum (CD2Cl2, 600 MHz) of complex (
t-BuOS)2ZrBn2 (3) at -80 °C. 10
Figure S12. 1H-
13C HSQC spectrum (CD2Cl2, 600 MHz) of complex (
t-BuOS)2ZrBn2 (3) at -80 °C. . 11
Figure S13. 1H NMR spectrum (CD2Cl2, 25 °C, 400 MHz) of complex (
CumOS)2ZrBn2 (4). .......... 12
Figure S14. 13
C NMR spectrum (CD2Cl2, 25 °C, 75 MHz) of complex (Cum
OS)2ZrBn2 (4). ........... 12
Table S1. Internal and Free Energy differences (kcal/mol) of the minimum energy structures for the
five diastereoisomers of the (OS)2MX2 complexes (M = Ti, X = Cl; M = Zr, X = Me). .................. 13
Figure S15. The opening (κ2 → κ
1) of one of the OS ligands in the titanium and zirconium
(OS)2TiCl2 and (OS)2ZrMe2 complexes. The stereoisomers C and A were considered as starting
species for the titanium and zirconium complexes, respectively. ...................................................... 14
Figure S16. 13
C NMR spectrum (TCDE, 110°C, 75 MHz) of polyethylene of run 1, Table 1. ........ 15
Figure S17. Aliphatic region of 13
C NMR spectrum (TCDE, 110°C, 75 MHz) of polypropylene
sample of run 1 in Table 2. ................................................................................................................ 16
Table S2. 13
C NMR chemical shift of polypropylene sample and the corresponding literature values
for regioirregular polypropylene.1 ...................................................................................................... 17
Figure S18. Possible modes of 2,1 insertion during the propylene polymerization. ........................ 18
Figure S19 13
C NMR spectra (TCDE, 110 °C, 75 MHz) of polypropylene samples of run 4 (a) and
1 (b) Table 2. ...................................................................................................................................... 19
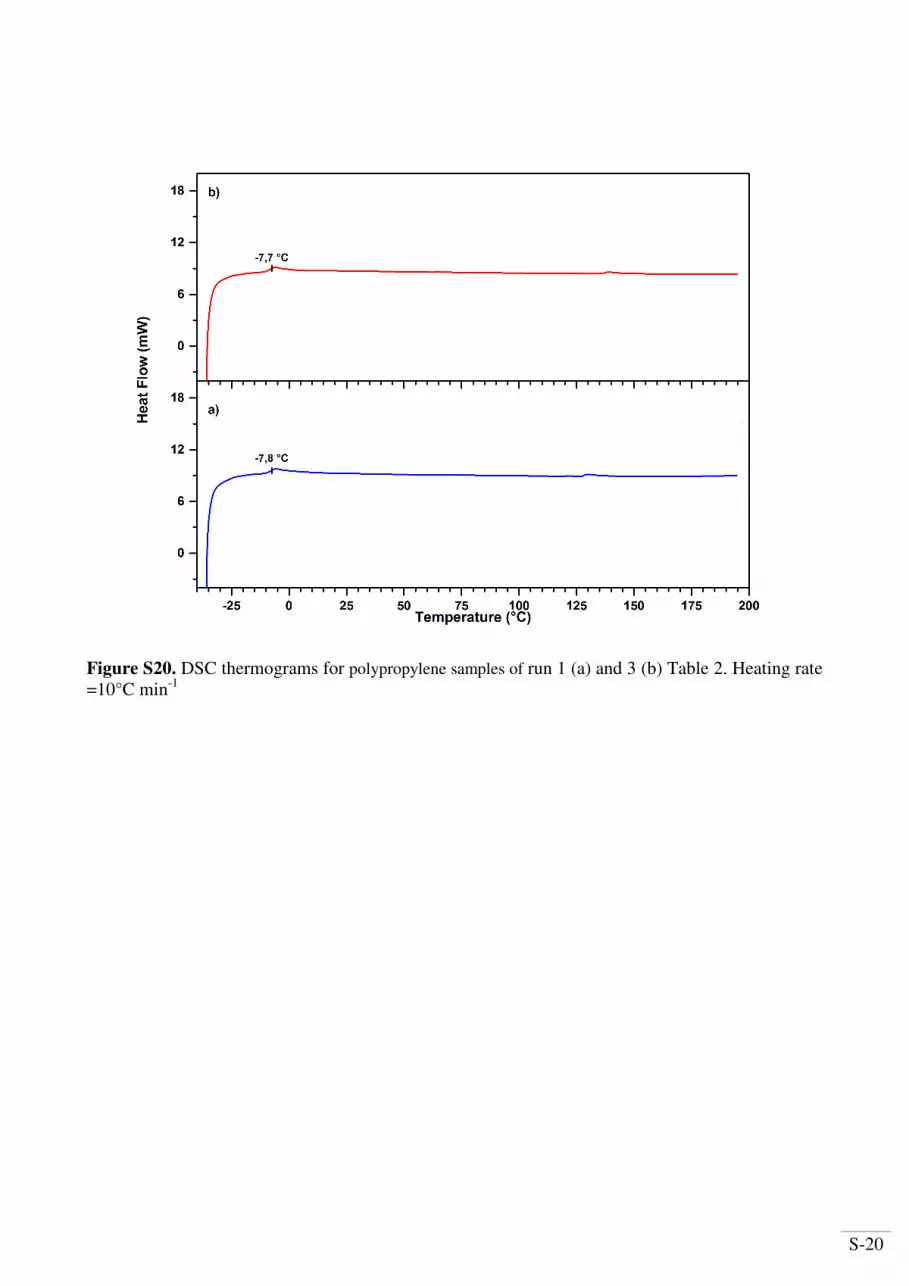
Figure S20. DSC thermograms for polypropylene samples of run 1 (a) and 4 (b) Table 2. ........... 20
Figure S21. 1H NMR spectrum (CDCl3, 25 °C, 300 MHz) of oligomers obtained from the run 2
Table 2................................................................................................................................................ 21
Figure S22. 1H NMR spectrum (CDCl3, 25 °C, 300 MHz) of oligomers obtained from the run 3
Table 2................................................................................................................................................ 21
Figure S23. Aliphatic region of 13
C NMR spectrum (CDCl3, 25 °C, 75 MHz) of oligomers obtained
from the run 2 Table 2........................................................................................................................ 22
Figure S24. Aliphatic region of 13
C NMR spectrum (CDCl3, 25 °C, 75.5 MHz) of oligomers
obtained from the run 3 Table 2. ........................................................................................................ 22
Figure S25. 13
C NMR spectra (CDCl3, 25 °C, 75 MHz) of oligomers samples of run 5 (a) and 2 (b)
Table 2................................................................................................................................................ 23
Figure S26. GC trace of the oligomers sample from run 2 Table 2. ................................................. 24
Figure S27. Schulz-Flory distribution of oligomers sample of run 2 Table 2. (R = 0.969). ............. 25
Figure S28. Schulz-Flory distribution of oligomers sample of run 3 Table 2. (R = 0.979). ............. 25
References ......................................................................................................................................... 26

S-3
Figure S1. 1H NMR spectrum (CD2Cl2, 25 °C, 600 MHz) of complex (
t-BuOS)2TiCl2 (1).
Figure S2. 13
C NMR spectrum (CD2Cl2, 25 °C, 100 MHz) of complex (t-Bu
OS)2TiCl2 (1).

S-4
30 °C
0 °C
- 40 °C
- 60 °C
- 80 °C
*
*
*
*
*
*
Figure S3. Variable-temperature 1H NMR spectra (CD2Cl2, 600 MHz) of complex (
t-BuOS)2TiCl2
(1). The signals marked with an asterisk are due to pentane impurity.

S-5
1.01.52.02.53.03.54.04.55.05.56.06.57.07.5 ppm
Figure S4. 1H NMR spectrum (CDCl3, 25 °C, 400 MHz) of complex (
CumOS)2TiCl2 (2)(* =
toluene).
Figure S5. 13
C NMR spectrum (CDCl3, 25 °C, 75 MHz) of complex (Cum
OS)2TiCl2 (2).
*

S-6
1.01.52.02.53.03.54.04.55.05.56.06.57.07.5 ppm
Figure S6. 1H NMR spectrum (CD2Cl2, 25 °C, 400 MHz) of complex (
t-BuOS)2ZrBn2 (3).
2030405060708090100110120130140150160 ppm
Figure S7. 13
C NMR spectrum (CD2Cl2, 25 °C, 100 MHz) of complex (t-Bu
OS)2ZrBn2 (3).

S-7
Figure S8. 1H-
1H NOESY spectrum (τm = 0.400 s, CD2Cl2, 600 MHz) of complex (
t-BuOS)2ZrBn2
(3) at room temperature.

S-8
Figure S9a. Variable-temperature 1H NMR spectra (CD2Cl2, 400 MHz) of complex (
t-BuOS)2ZrBn2
(3).
Figure S9b. Variable-temperature 1H NMR spectra (CD2Cl2, 400 MHz) of complex (
t-BuOS)2ZrBn2
(3).in the region from 0.7 to 3.1 ppm.

S-9
ppm
1.01.52.02.5 ppm
0.8
1.0
1.2
1.4
1.6
1.8
2.0
2.2
2.4
2.6
Figure S10. COSY spectrum (CD2Cl2, 600MHz) of complex (t-Bu
OS)2ZrBn2 (3) showing the scalar
coupling of the Zr-CH2-Ph resonances at -80 °C.

S-10
1.52.02.53.03.54.04.55.05.56.06.57.07.5 ppm
6.66.87.07.27.4 ppm
ppm
1.01.52.02.5 ppm
6.4
6.6
6.8
7.0
7.2
7.4
1.01.21.41.61.82.02.22.42.6 ppm
Figure S11. 1H-
1H NOESY spectrum (τm = 0.400 s, CD2Cl2, 600 MHz) of complex (
t-BuOS)2ZrBn2
(3) at -80 °C.

S-11
Figure S12. 1H-
13C HSQC spectrum (CD2Cl2, 600 MHz) of complex (
t-BuOS)2ZrBn2 (3) at -80 °C.

S-12
Figure S13. 1H NMR spectrum (CD2Cl2, 25 °C, 400 MHz) of complex (
CumOS)2ZrBn2 (4).
Figure S14. 13
C NMR spectrum (CD2Cl2, 25 °C, 75 MHz) of complex (Cum
OS)2ZrBn2 (4).

Table S1. Internal and Free Energy differences (kcal/mol) of the minimum energy structures for the five diastereoisomers of the (OS)2MX2
complexes (M = Ti, X = Cl; M = Zr, X = Me).
M
XSO
OS X
M
XOS
SO X
M
XSO
SO X
M
OOX
XS S
Diasteroisomer A B C D E
Symmetry C2 C2 C1 C2 Ci
Titanium
Minimum
Energy structure
Imag. freq.a 0 0 0 0 2
∆E 0.0 3.9 -1.7 0.4 15.5
∆EZPEb 0.0 3.5 -1.8 0.3 -
∆Gc 0.0 8.3 3.9 4.8 -
Zirconium
Minimum
Energy structure
Imag. freq.
a 0 0 0 0 3
∆E 0.0 3.8 2.0 2.7 37.6
∆EZPEb 0.0 4.5 2.3 3.0 -
∆Gc 0.0 6.2 3.0 4.5 -
a Number of imaginary frequencies
b Zero Point Energy (ZPE) Corrected Energies (at 0 K);
c Free Energies in gas phase thermodynamically
corrected to 298 K.

S-14
Zr
Zr
+ 3.6 Kcal/mol
+ 1.6 Kcal/mol
Ti
Ti
Figure S15. The opening (κ2 → κ
1) of one of the OS ligands in the titanium and zirconium
(OS)2TiCl2 and (OS)2ZrMe2 complexes. The stereoisomers C and A were considered as starting
species for the titanium and zirconium complexes, respectively.

S-15
Figure S16. 13
C NMR spectrum (TCDE, 110°C, 75 MHz) of polyethylene of run 1, Table 1.

S-16
Figure S17. Aliphatic region of 13
C NMR spectrum (TCDE, 110°C, 75 MHz) of polypropylene
sample of run 1 in Table 2.

S-17
Table S2. 13
C NMR chemical shift of polypropylene sample and the corresponding literature values
for regioirregular polypropylene.1
Line Chemical shift
(ppm from TMS)
H-T H-H T-T 1-r
exp Literature1
a 45.7-47.6 45.7-47.7 Sγααγ (1)
45.7-46.5 Sγααδ (7)
b 42.9-44.2 43.3-44.1 r0-Sβααγ (4) r0-Sβααγ (19)
40.9-42.3 m0-Sβααγ (4)
36.8-39.1 r0-Tδγαγ (15)
36.5 r1-Sγαβγ (13)
c 35.6 35.4-35.6 m0-Tαβ (5) r1-Sγαβδ (10) m1-Sγαβγ (13)
d 34.1-34.8 34.2-34.8 r0-Tαβ (5) m1-Sγαβδ (10) r0-Tδαβδ (17)
e 32.6 32.6 r0-Sδβαβ (14)
f 31.1 31.1-31.3 Tδβγδ+ (8) Tδβγδ (11)
g 28.4 28.3-28.4 Tββ (2)
h 20.1-21.8
20.1-21.7 Pββ (3)
20.1-20.9 m1-Pβγ (9)
r1-Pβγ (9)
m1-Pδβγδ (12)
r1-Pδβγδ (12)
i 16.8-17.2 16.6-17.2 m0-Pαβ (6)
l 15.5-17.5
m
14.7-15.2 14.7-15.1 r0-Pαβ (6) r0-Pδγαγ (16)
r0-Pδαβδ (18)
The table contains the chemical shifts of peaks observed in the 13
C spectrum of PP obtained from
run 1 Table2. The observed chemical shifts are listed in the column exp, and compared to those
reported in literature and listed in the column Literature. The letters in column Line refer to Figure
S17 and the numbers reported in brackets refer to the Figure S18.

S-18
1) Head-to tail sequence
2) Isolated head-to-head regio-error
3) Isolated tail-to-tail regio-error
4) Single inverted unit in the head-to tail sequence
Figure S18. Possible modes of 2,1 insertion during the propylene polymerization.

S-19
Figure S19 13
C NMR spectra (TCDE, 110 °C, 75 MHz) of polypropylene samples of run 4 (a) and 1
(b) Table 2.
S-20
Figure S20. DSC thermograms for polypropylene samples of run 1 (a) and 3 (b) Table 2. Heating rate
=10°C min-1

S-21
Figure S21. 1H NMR spectrum (CDCl3, 25 °C, 300 MHz) of oligomers obtained from the run 2 Table 2.
Figure S22. 1H NMR spectrum (CDCl3, 25 °C, 300 MHz) of oligomers obtained from the run 3 Table 2.

S-22
Figure S23. Aliphatic region of 13
C NMR spectrum (CDCl3, 25 °C, 75 MHz) of oligomers obtained
from the run 2 Table 2.
Figure S24. Aliphatic region of 13
C NMR spectrum (CDCl3, 25 °C, 75.5 MHz) of oligomers obtained
from the run 3 Table 2.

S-23
Figure S25. 13
C NMR spectra (CDCl3, 25 °C, 75 MHz) of oligomers samples of run 5 (a) and 2 (b)
Table 2.

S-24
Figure S26. GC trace of the oligomers sample from run 2 Table 2.

S-25
Figure S27. Schulz-Flory distribution of oligomers sample of run 2 Table 2. (R = 0.969).
Figure S28. Schulz-Flory distribution of oligomers sample of run 3 Table 2. (R = 0.979).

S-26
References
1) T. Asakura, N. Nakayama, M. Demura, A. Asano, Macromolecules 1992, 25, 4876-4881.
2) L. Resconi, L. Cavallo, A. Fait, F. Piemontesi, Chem. Rev. 2000, 100, 1253-1345.