policy options to improve the educational impact of the malawi
TRANSCRIPT
POLICY OPTIONS TO IMPROVE
THE EDUCATIONAL IMPACT OF THE MALAWI SOCIAL CASH TRANSFER
PROGRAMME
FINAL REPORT
2020

i
Authors
UNICEF Office of Research – Innocenti
Frank Otchere and Kaku Attah Damoah
Carolina Population Centre – University of North Carolina at Chapel Hill
Clare Barrington, Sudhanshu Handa, Humberto Gonzalez Rodriguez, Courtney Turner
Centre for Social Research – University of Malawi
Maxton Tsoka
Acknowledgements
This study was commissioned by the Ministry of Gender, Community Development and Social
Welfare and UNICEF to the University of North Carolina at Chapel Hill, the Centre for Social
Research at the University of Malawi and UNICEF Office of Research. The study was financially
supported by the German Government through Kreditanstalt fuer Wiederaufbau (KfW) and
UNICEF.
The authors wish to thank the strong engagement of the professional staff of the Ministry of
Gender, Community Development and Social Welfare of the Government of Malawi, who provided
excellent input through the entire duration of the study. Thanks also to the Ministry of Education
Science and Technology and District Commissioner’s Offices of Salima, Mulanje and Nkhata Bay
who contributed greatly to this study. The authors also wish to thank the development partners
in Malawi for their open discussion of programmatic and policy issues around the Social Cash
Transfer Programme, particularly KfW, UNICEF-Malawi and the World Bank. Thanks also Ayala
Consulting who supported the study team by providing vital data and information on the Social
Cash Transfer Programme.
Thanks most of all to the Malawian households in Salima, Mulanje and Nkhata Bay that
participated and gave their time and interest to be interviewed for this study.
ii
List of Abbreviations
ECD Early Childhood Development
EMIS Education Management Information System
ESIP Education Sector Implementation Plan
FGD Focus Group Discussion
FPE Free Primary Education
GABLE Girls Attainment in Basic Education and Literacy programme
GoM Government of Malawi
GPS Global Positioning System
IHS Integrated Household Survey
IRB Institutional Review Board
KII Key Informant Interviews
MIS Management Information System
MoGCDSW Ministry of Gender, Community Development and Social Welfare
MSCE Malawi School Certificate Examination
PSLE Primary School Leaving Certificate Examination
SSN Social Safety Net
SCTP Social Cash Transfer Programme
TA Traditional Authority
UNC University of North Carolina
USAID United States Agency for International Development
VC Village Cluster
iii
Contents
Authors ........................................................................................................................................ i
Acknowledgements ...................................................................................................................... i
List of Abbreviations .................................................................................................................... ii
Contents .................................................................................................................................... iii
1. Executive Summary ............................................................................................................. ix
1. Background ......................................................................................................................... 1
1.1 Context ............................................................................................................................. 1
2. Study design and fieldwork .................................................................................................. 4
2.2 Quantitative study design and methods .......................................................................... 4
2.2.1 Sample size determination ......................................................................................... 4
2.2.2 Sampling frame, sample allocation, and sampling ...................................................... 5
2.2.3 Survey instruments .................................................................................................... 6
2.3 Qualitative study design and methods ............................................................................ 6
2.3.1 Sample ....................................................................................................................... 6
2.3.2 Focus group guides and data collection ..................................................................... 7
2.3.3 Data Analysis ............................................................................................................. 8
2.4 Implementation of fieldwork ............................................................................................ 8
2.5 Output of fieldwork and sample weights ......................................................................... 9
2.6 Secondary sources of data ............................................................................................. 9
3. Malawi education system, policy environment and educational attainment .........................11
3.1. The Education system in Malawi ..................................................................................11
3.2. Policy environment (supply, fees, school feeding, other costs) .....................................14
3.3. Education attainment among the general population ....................................................15
4. Sample Characteristics .......................................................................................................18
4.1. Household composition ................................................................................................18
iv
4.2. Economic activities .......................................................................................................19
4.3. Time use ......................................................................................................................20
4.4 Youth as caregivers .........................................................................................................22
4.5 Shocks and coping to shocks ........................................................................................23
4.6 Access to social safety nets (SSN) ................................................................................23
5. Schooling among household members 6 – 23 years ..........................................................25
5.1. Enrolment and attendance (2016 – 2019) .....................................................................25
5.2 Age appropriate enrolment ............................................................................................28
5.3 Progression and repetition (2016 – 2019) ......................................................................31
6. School availability, quality and efficiency ............................................................................36
6.1 Availability of schools at VC level ..................................................................................36
6.2 Distance and geographic distribution .............................................................................37
6.3 School facilities and quality ...........................................................................................42
7. Determinants of Schooling ..................................................................................................43
7.1 Household and individual level non-monetary factors ....................................................43
7.1.1 Children’s Material Well-being ...................................................................................44
7.1.2 Household labour constraint ......................................................................................45
7.1.3 Violence at School and Assignments ........................................................................47
7.1.4 Teacher induced sexual harassment and violence at school .....................................48
7.1.5 Violence perpetrated by peers ...................................................................................49
7.1.6 Household-based violence and school participation ..................................................49
7.2 Monetary barriers to education ......................................................................................51
7.2.1 Household Consumption, Education Cost, and SCTP School Bonus ........................51
7.2.2 Education Outcome and SCTP Benefits ....................................................................55
7.2.3 Opportunity cost of education ....................................................................................56
7.3 Supply side determinants (school availability, quality and efficiency) .............................58
7.3.1 School proximity and availability ................................................................................58
v
7.3.2 School quality and infrastructure ...............................................................................59
7.3.3 School efficiency .......................................................................................................60
7.4 Socio-cultural barriers to the demand for education ......................................................61
7.4.1 Parental/guardian support .........................................................................................61
7.4.2 Community role models .............................................................................................64
7.4.3 School barriers specific to girls ..................................................................................65
7.4.4 Peer influences .........................................................................................................67
8. Limitations and Unexpected Findings ....................................................................................68
9. Summary, Policy Issues and Policy Options..........................................................................69
9.1 Interpretation of Findings .................................................................................................69
9.2. Summary of policy discussions with reference group ......................................................71
9.2.2 Objectives and capabilities of the SCTP ....................................................................71
9.2.3 Linkages with mother’s groups ..................................................................................72
9.2.4 Move to a child bonus ...............................................................................................73
9.2.5 Young adults and school dropouts ............................................................................74
9.3 Other policy issues ..........................................................................................................75
9.3.1 Promoting age-appropriate enrolment .......................................................................75
9.3.2 Incentive for successful completion ...........................................................................76
9.3.3 The distinct constraints faced by girls ........................................................................76
9.3.4 Responsiveness to household shocks .......................................................................76
9.4 Policy Options .................................................................................................................77
10. References..........................................................................................................................79
11. Annex A: Sampling of TAs for the study ..............................................................................80
12. Annex B: Sample size calculation for quantitative sample ...................................................82
13. Annex C: Projected Education Cost Structure .....................................................................83
14. Annex D: Summary of Key Informant Interviews with District Education Staff .....................84
15. Annex E: Example Field Guide for Out of School Youth ......................................................91
vi
16. Annex F: Example Guide for Field Notes ............................................................................93
vii
List of Tables
Table 1: Distribution of households in frame and the sample allocation ........................................... 5
Table 2: Planned groups for FGDs for qualitative study ...................................................................... 7
Table 3: Output of quantitative data collection ...................................................................................... 9
Table 4: Basic overview of primary and secondary schools in 2017/2018 ..................................... 12
Table 5: Household composition ........................................................................................................... 18
Table 6: Share in age group participating in activity ........................................................................... 20
Table 7: Time spent on various activities ............................................................................................. 21
Table 8: Shocks and coping to shocks ................................................................................................. 23
Table 9: Access to social safety nets .................................................................................................... 24
Table 10: Enrolment by age-group, sex and academic year ............................................................. 26
Table 11: Regular attendance by age-group, sex, term and academic year .................................. 27
Table 12: Effective enrolment rate by age-group, sex and academic year ..................................... 28
Table 13: Age-grade enrolment in 2018-2019 academic year .......................................................... 30
Table 14: Progression rate by age-group, sex and academic year .................................................. 32
Table 15: Repetition rate by age-group, sex and academic year ..................................................... 32
Table 16: Yearly projected education cost and school bonus ........................................................... 51
Table 17: Household consumption and expenditures by percentiles (Total HH & Per Capita) ... 53
Table 18: School cost structure ............................................................................................................. 83
viii
List of Figures
Figure 1: Primary School Enrolment ..........................................................................................13
Figure 2: Secondary School Enrolment .....................................................................................14
Figure 3: Trend in primary school enrolment .............................................................................16
Figure 4: Trend in primary completion rate ................................................................................17
Figure 5: Age-sex composition of study sample and IHS4 comparison group ...........................19
Figure 6: Share of households participating in various economic activities ................................19
Figure 7: Age-grade distribution of enrolment ...........................................................................29
Figure 8: Number of schools at village cluster level ...................................................................36
Figure 9: Structure of school ownership ....................................................................................37
Figure 11: Distribution of schools within district .........................................................................40
Figure 12: Student type and mode of transport to school ..........................................................40
Figure 14: Education outcome and child material well-being .....................................................45
Figure 15: Education outcome and household chores activities ................................................46
Figure 16: Violence, school assignments and education outcome.............................................47
Figure 17: Shares of expenditures and SCTP on total consumption ..........................................54
Figure 18: Education outcome and SCTP monetary benefits ....................................................56
Figure 19: Household expenditures and SCTP benefits ............................................................57
Figure 20: Education expenditures and SCTP benefits .............................................................58
Figure 21: School availability and education outcome ...............................................................59
Figure 22: Education outcome and school characteristics .........................................................60
Figure 23: Education outcome and school efficiency .................................................................61

ix
1. Executive Summary
The impact evaluation1 (IE, 2016) of the Malawi Social Cash Transfer Programme (SCTP) in
2013-15 estimated large, positive effects on school enrolment, but no effects on grade
progression or attainment. Against this backdrop the Ministry of Gender, Community
Development and Social Welfare (MoGCDSW) commissioned the current study to provide an in-
depth analysis of the barriers to schooling among children and young people living in SCTP
households, and based on the findings, to provide policy options to strengthen the programme’s
effects on educational attainment.
The study entails a qualitative component consisting of focus group discussions (FGDs) with
young people in- and out-of-school, and focus group discussions with their caregivers to
understand the perceived benefits and challenges surrounding the schooling decision. Based on
the findings from the qualitative study, a quantitative survey of 1,500 SCTP households was
administered in the districts of Salima, Mulanje and Nkhata Bay to provide quantitative information
on the determinants of schooling. Finally, secondary data from the Education Management
Information System (EMIS) of the Ministry of Education was analysed to provide the supply-side
context within which schooling decisions are being made by SCTP households. An Inception
Workshop was held in Lilongwe with the Study Reference Group in May 2019, followed by a
Writing Workshop in September 2019 in Salima, also with the Reference Group, to discuss the
interpretation of the results.
1. School infrastructure: There were 200 schools identified in the household survey that were
then linked to the EMIS. Average travel time is estimated to be 35 for primary and 80
minutes for secondary school day students. The pupil teacher ratio is 148 at the primary
schools and 50 at the secondary schools attended by learners in SCTP households. Over-
crowded schools and classrooms were a common theme in the FGDs with young people.
2. Correlates of school attendance: The quantitative analysis uncovered several key factors
associated with school enrolment and school progression. An increase in domestic chores
and lower school quality (measured by school quality index) were both associated with a
decrease in schooling outcomes. School-based violence perpetrated by peers or teachers
is also associated with lower school outcomes. FGDs revealed that violence at home was
also an important factor associated with lower school outcomes.
1 Impact Evaluation of 2013-2015 will hereafter be referenced as Impact Evaluation (IE, 2016).
x
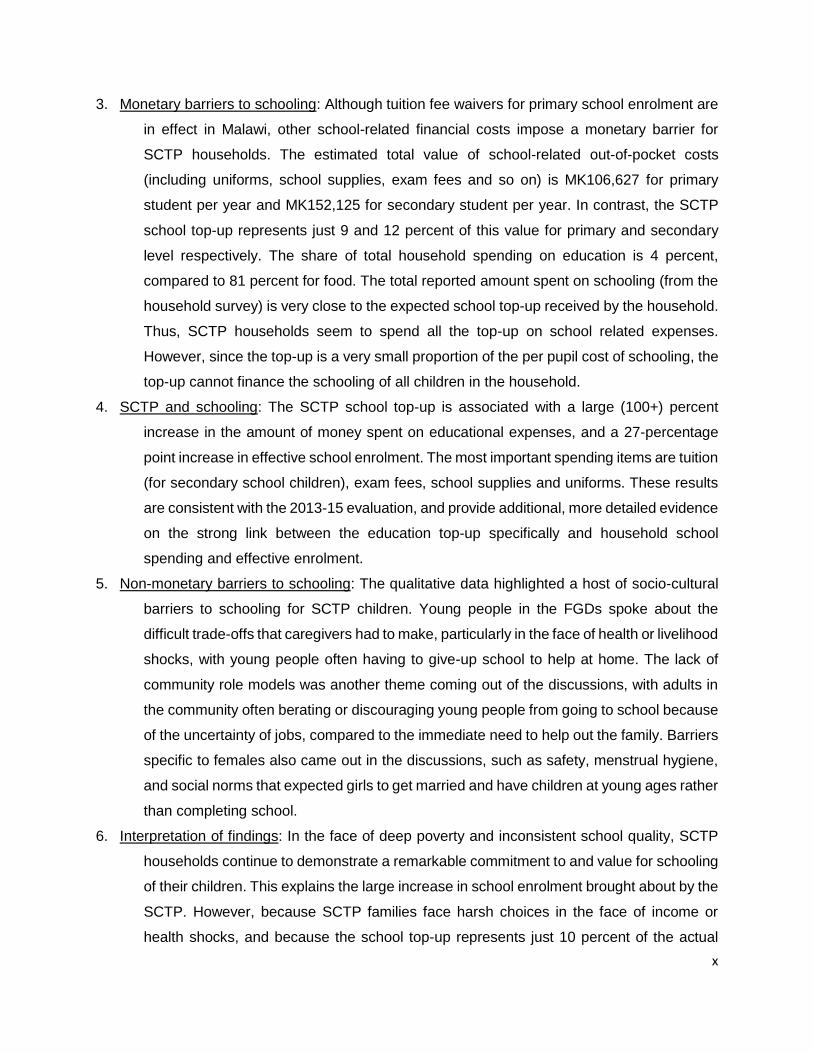
3. Monetary barriers to schooling: Although tuition fee waivers for primary school enrolment are
in effect in Malawi, other school-related financial costs impose a monetary barrier for
SCTP households. The estimated total value of school-related out-of-pocket costs
(including uniforms, school supplies, exam fees and so on) is MK106,627 for primary
student per year and MK152,125 for secondary student per year. In contrast, the SCTP
school top-up represents just 9 and 12 percent of this value for primary and secondary
level respectively. The share of total household spending on education is 4 percent,
compared to 81 percent for food. The total reported amount spent on schooling (from the
household survey) is very close to the expected school top-up received by the household.
Thus, SCTP households seem to spend all the top-up on school related expenses.
However, since the top-up is a very small proportion of the per pupil cost of schooling, the
top-up cannot finance the schooling of all children in the household.
4. SCTP and schooling: The SCTP school top-up is associated with a large (100+) percent
increase in the amount of money spent on educational expenses, and a 27-percentage
point increase in effective school enrolment. The most important spending items are tuition
(for secondary school children), exam fees, school supplies and uniforms. These results
are consistent with the 2013-15 evaluation, and provide additional, more detailed evidence
on the strong link between the education top-up specifically and household school
spending and effective enrolment.
5. Non-monetary barriers to schooling: The qualitative data highlighted a host of socio-cultural
barriers to schooling for SCTP children. Young people in the FGDs spoke about the
difficult trade-offs that caregivers had to make, particularly in the face of health or livelihood
shocks, with young people often having to give-up school to help at home. The lack of
community role models was another theme coming out of the discussions, with adults in
the community often berating or discouraging young people from going to school because
of the uncertainty of jobs, compared to the immediate need to help out the family. Barriers
specific to females also came out in the discussions, such as safety, menstrual hygiene,
and social norms that expected girls to get married and have children at young ages rather
than completing school.
6. Interpretation of findings: In the face of deep poverty and inconsistent school quality, SCTP
households continue to demonstrate a remarkable commitment to and value for schooling
of their children. This explains the large increase in school enrolment brought about by the
SCTP. However, because SCTP families face harsh choices in the face of income or
health shocks, and because the school top-up represents just 10 percent of the actual
xi
monetary cost of school attendance, not all children in SCTP households can be
supported to attend school. In addition, regular school attendance and progression
continues to be a challenge for those children who are enrolled in school.
Beyond financial constraints, the overall environment is not particularly conducive to regular
school attendance and completion. Qualitative data paint a picture of a school environment that
can be harsh for children. There is a perception that teachers administer punishment that is unfair
and punitive, rather than developmental, and that violence (sexual and otherwise) is common.
The quantitative data also show that self-reported (by the parent/guardian) violence significantly
reduces school enrolment. Beyond the behaviour of teachers, the overall quality of schools, as
documented from the EMIS, is low, with an average pupil/teacher ratio of 148 in the primary
schools in the study sites. In the face of all these barriers, one interpretation of the findings is that
the commitment demonstrated by SCTP households to schooling is actually quite remarkable.
The SCTP is primarily a social protection programme: Given the complex, multi-dimensional
factors associated with successful school outcomes, the policy and programmatic options for the
SCTP are not straightforward. This is because the SCTP is primarily a social protection
programme rather than an educational programme, and many of the barriers to schooling
described in this report (such as school quality, teacher attitude, and safety) are beyond the
responsibility of the MOGCDSW.
Based on the findings of the quantitative and qualitative data and the discussions with the
Reference Group, the report provides a list of key policy options for the MoGCDSW to consider
in order to enhance the educational outcomes of SCTP beneficiary households. The ultimate
decision to pursue these options will need to consider the objectives of the SCTP as a broad-
based social protection programme that serves households in structural poverty and as a human
capital development programme, vis a vis the relative cost and benefit of each individual option.
A complete discussion of the options is provided in Chapter 8 of the report. The options are
summarized below.
1. Increase the overall value of the transfer and school bonus: The bonus represents just 10
percent of the estimated direct cost of school enrolment, and when the opportunity cost is
accounted for, this figure is even lower. The low value of the bonus is the most important
reason for irregular school attendance. And the erosion of the real value of the family
xii
transfer itself is the reason why households cannot cope with shocks and thus pull children
out of school.
2. Incentives for girls’ education: Access to education for girls remains a major challenge
among SCTP beneficiaries and provides the basis for dedicated policies to support girls.
A higher school bonus for girls is commonly used in other cash transfer programmes and
would be a straightforward option. Links with community mother’s groups, by providing
them with a list of SCTP girl beneficiaries, would also help support girls’ education within
the SCTP.
3. Strengthen linkages with the Ministry of Education: Specific activities, proposed by the
Ministry of Education, have been described in the report. Of these activities, inviting the
District Education Commissioner (DEC) to the pay parade prior to the beginning of the
academic year, and providing schools with lists of SCTP children enrolled in school, seem
to be very low cost/high benefit options.
4. Condition the school bonus on minimum school attendance: Moving to a conditional
programme would entail significant administrative and financial costs for the MoGCDSW.
Administrative costs include a transparent system of monitoring and appeals. Financial
costs include a significant increase (at least doubling) in the bonus to offset the actual
direct costs of school attendance. The main benefit would be potential improvements in
regular attendance, which may translate into progression. This decision would significantly
change the fundamental scope and nature of the SCTP.
5. Automatic secondary school fee waivers for SCTP children: Very few current SCTP
children actually reach secondary school because the out of pocket costs of attending
secondary school is much steeper relative to primary school. This combination means this
a relatively low-cost option that would potentially provide a strong incentive for grade
progression.
6. Direct incentives for school progression: There are several creative ways to structure the
school bonus to promote schooling performance, which is a key educational challenge
among SCTP children. The bonus could be increased if a child progresses from one grade
to the next each year, and an additional one-time bonus provided for writing the PSLE.
Special publicity could be provided for SCTP secondary school scholars, including a
privately endowed bursary scheme, and a one-time bonus could be provided for sitting for
the MSCE. Giving the top-up directly to the student could incentivize students in school
progression.
xiii
7. Labelled child bonus in lieu of educational bonus: Renaming to a child bonus rather than
an educational bonus would solve some internal conflicts within the SCTP, such as the
pressure to monitor school enrolment and attendance, and the relatively low value of the
bonus. Education can still be promoted by explicitly ‘labelling’ the bonus as a way to
support children’s schooling and material well-being (e.g. clothing, food). This is already
being done with the current schooling bonus. The additional benefit is that children under
age 5 would also qualify for the bonus—currently this group of “under 5” is not addressed
through the SCTP although nutrition and food security is a programme objective and
young children have unique nutritional requirements that would justify a top-up.
8. Linkages for young adult dropouts: The qualitative narratives suggest there is demand for
schooling from this group, but they do not feel comfortable within the traditional school
system due to their age. Linking this group to adult education initiatives and ensuring the
school bonus is available to them, would encourage their school enrolment.
1
1. Background
1.1 Context
Malawi’s Social Cash Transfer Programme (SCTP) is one of the largest cash transfer
programmes in sub-Sahara Africa, and currently reaches 7 percent of the population. It is a key
component of the social protection strategy of the Government of Malawi’s (GoM). The SCTP is
an unconditional cash transfer programme targeted to ultra-poor and labour-constrained
households. The programme began as a pilot in Mchinji district in 2006 and has since had positive
impact on household welfare consistent with the programme’s theory of change. Since 2009, the
programme has expanded progressively in breadth and depth, and achieved national coverage
in all districts in 2018. In 2019, the SCTP reached an estimated 282,213 beneficiary households
with approximately 1,194,473 members in total. More than half (56 percent) of the individual
beneficiaries are children between the ages of 0-18 years, with equal representation of males and
females.
The motivation behind the scaling up of the SCTP stems from the acknowledgement by the
GoM of the widespread prevalence of poverty and deprivation in Malawi, and its consequences
for the growth and development of the nation. To elucidate further, Malawi ranks 170 out of 188
countries on the human development index, according to the United Nations Human Development
Report (United Nations Development Program, 2018). Furthermore, the Malawi Integrated
Household Survey (IHS) of 2016/2017 (The World Bank, 2019) found that approximately 51
percent of the population living below the national poverty line, essentially remains unchanged
from the poverty rate of 50.7 percent in 2010 as reported in the IHS3 (National Statistical Office,
2012).
The SCTP provides households with an average monthly payment of Malawi Kwacha (MK)
7000, (approximately USD 9.4) including an unconditional school bonus for children. The transfer
that households receive per month is based on the number of people living within a household: 1
person: MK2600, 2 people: MK3300, 3 people: MK4400, 4 people and above: MK5600. The cash
transfers are intended to financially enable and support the targeted households to increase food
security, and to support child nutrition and school enrolment. The school bonus is calculated
according to the age and school enrolment status of children living within a household. Whereas
primary school bonus is given unconditionally, secondary school bonus is only given when school
verification process has confirmed that children are enrolled and attending school. The schedule
of the school bonus is as follows:
2
Primary school bonus: 800 MK per child (children 5-20 years old enrolled in primary school)
Primary school incentive: 800 MK per child (children 6-15 years not enrolled in school)
Secondary school bonus: 1500 MK per child (children 10-25 years enrolled in secondary school).
The SCTP has had some promising results with regards to education. The SCTP Endline
Impact Evaluation (IE, 2016) found a moderate positive impact on education – with increased
school attendance for children already enrolled in school, but had no strong effect on new
enrolment or grade progression. The impact on attendance seems to be stronger for 14-17-year-
old enrolled in secondary school, especially among boys, especially when compared to primary
school. However, no effect on grade progression was reported and school drop-out rates begin
to increase steadily after age 12. A recent analysis by the Ministry of Gender, Community
Development and Social Welfare (MoGCDSW) reported even lower overall rates of school
enrolment by children in SCTP households raising questions on the effectiveness of the SCTP
schooling bonus in addressing the existing barriers to school enrolment, and the necessary
changes in programme design required to improve schooling outcomes of SCTP children in
Malawi.
1.2 Study Objectives and Research Questions
It is against this background that the MoGCDSW commissioned a new study to explore ways
to improve schooling outcomes among children and young people in SCTP households. The
University of North Carolina at Chapel Hill (UNC), the UNICEF Office of Research (OoR),
Innocenti and the Centre for Social Research (CSR) at the University of Malawi were engaged as
partners for this research, which used a combination of qualitative and quantitative methods.
The overarching study objectives were:
1. Examine the school enrolment, attendance and retention in SCTP households compared
to national school enrolment, attendance and retention;
2. Identify and analyse the contribution of different barriers keeping SCTP children from
attending or remaining in school; and
3. Propose feasible policy and programme options for the SCTP, including a school
attendance tracking option, to address these barriers and support children, girls in
particular, attending school.
3
Within these objectives, the key questions guiding the study were:
1. What are the underlying causal factors that affect primary and secondary school
enrolment, attendance and drop-out rates for children in SCTP households?
2. How does the currently provided SCTP school bonus impact SCTP children’s schooling?
3. Does the SCTP school bonus affect the relationships between school enrolment,
attendance and retention rates?
4. What are school attendance tracking options suitable for the unconditional Malawi SCTP?
5. How can the SCTP be modified to increase the educational impact of the SCTP on
enrolment, attendance and retention of SCTP children, particularly of adolescent girls?
This document describes the methodological approach, study instruments, field operations,
characteristics of the sample, and the findings, as well as the policy options that can be
implemented to improve education outcomes of children in SCTP households.
4
2. Study design and fieldwork
2.1 Selection of study sites
The study was conducted in three districts: Salima, Mulanje and Nkhata Bay. The decision on
the number of districts was based on financial and logistical considerations. The choice of these
districts was purposive to satisfy i) geographical and ii) other criteria related to past inclusion in
impact evaluation (IE, 2016) and iii) sources of support for the SCTP. Malawi is divided into three
regions with twenty-eight administrative districts. Nkhata Bay represents a region from the North
of Malawi and is one of the districts supported by the World Bank. Salima represents both the
Central Region and one of the districts which was covered in the impact evaluation (IE, 2016) of
the SCTP that accompanied the expansion phase between 2012 and 2016. Including such a
district affords the research team to get household specific data collected during the previous
impact evaluation (IE, 2016) and to use it for this study. Further, Salima is an EU supported
district. Mulanje represents both the Southern Region and is a KfW supported district. An
additional reason for selecting Nkhata Bay and Mulanje is because they have not been studied
as much as the other districts in the programme since 2012.
In each district, two Traditional Areas (TAs) were covered. For Salima, the study visited the
same TAs that were included in the impact evaluation (IE, 2016), namely Ndindi and Maganga.
For Nkhata Bay and Mulanje, two TAs each were randomly selected from the list of available TAs
during the inception meeting held in Lilongwe on May 15, 2019. The selected TAs were Nkanda
and Mthiramanja for Mulanje and Fukamapiri and Mankhambera for Nkhata Bay. Annex A
provides additional details on the procedure for selecting the TAs.
Overall, data was collected from 6 TAs in 3 districts across 3 regions. This is considered
adequate to provide enough breadth and variability in experiences such that the findings are
reasonably representative of the national picture.
2.2 Quantitative study design and methods
2.2.1 Sample size determination
The total sample size for the study was 1500 households, comprising 500 households from each
of the three districts. The key consideration in the sample size determination was to obtain a
reliable estimate of the share of school-age children of in SCTP households who are enrolled in
5
school. Details of the sample size calculation are given in Annex B. The minimum sample size
required was initially calculated to be 1293 households, but this was increased to 1500 to ensure
a safe number of responses in the study is met anticipating a 10 percent non-response rate, and
to provide more precision if the parameters used for the sample size determination are achieved.
2.2.2 Sampling frame, sample allocation, and sampling
The sampling frame for Salima was the list of treatment households that were interviewed during
the last round of data collection for the impact evaluation in 2015/2016 (IE, 2016). For the two
new districts, the sampling frame is the most recent list of SCTP beneficiary households provided
by the implementing partners.2 An initial screening criterion was applied to restrict the frame to
only households with at least one child or young adult of school going age (age 6 -25 years). This
was considered necessary to ensure all households would have some information to contribute
regarding education.
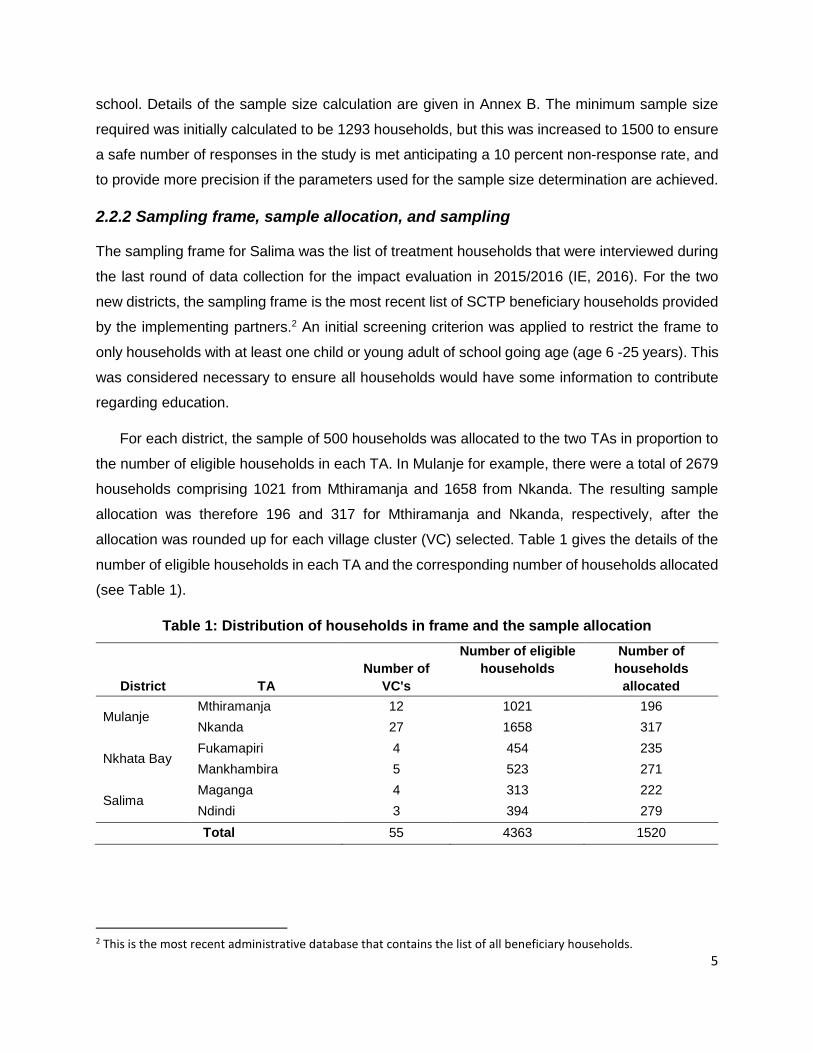
For each district, the sample of 500 households was allocated to the two TAs in proportion to
the number of eligible households in each TA. In Mulanje for example, there were a total of 2679
households comprising 1021 from Mthiramanja and 1658 from Nkanda. The resulting sample
allocation was therefore 196 and 317 for Mthiramanja and Nkanda, respectively, after the
allocation was rounded up for each village cluster (VC) selected. Table 1 gives the details of the
number of eligible households in each TA and the corresponding number of households allocated
(see Table 1).
Table 1: Distribution of households in frame and the sample allocation
District TA
Number of
VC's
Number of eligible
households
Number of
households
allocated
Mulanje Mthiramanja 12 1021 196
Nkanda 27 1658 317
Nkhata Bay Fukamapiri 4 454 235
Mankhambira 5 523 271
Salima Maganga 4 313 222
Ndindi 3 394 279
Total 55 4363 1520
2 This is the most recent administrative database that contains the list of all beneficiary households.
6
Within each TA, the sample was further allocated to the VCs based on the share of
households in each VC. As shown in Table 1, Nkhata Bay and Salima has a total number of 9
and 7 village clusters respectively, whilst Mulanje has 39 village clusters. Sampling 500
households from 39 VCs in Mulanje will lead to an over dispersion of the sample spread across
a wide geographic area. To mitigate this concern, 10 VCs were randomly selected from the two
TAs in Mulanje. For Nkhata Bay and Salima, all the VCs were included in the sampling framework
for the survey. Once the sample allocation was done, selecting of the households was by simple
random sampling. Overall, there were 4363 eligible households out of which 1520 were sampled.
2.2.3 Survey instruments
The main household survey instrument is modelled along the lines of the instrument used for
the impact evaluation of 2016 (IE, 2016). The instrument had information on household
demographics, education, health, time use, consumption and household dwelling characteristics
among others. The education module was modified to gather more information on enrolment,
attendance and drop-outs over the following three academic years, 2016/2017, 2017/2018, and
2018/2019. This was done to determine the pattern of school participation. For example, are
children more likely to drop-out of school in a particular school term? A detailed information on
the pattern of attendance can be correlated with household members’ economic activities to
determine whether there are any seasonal effects of the agricultural production cycle on school
participation. The survey also collected information on potential monetary and non-monetary
factors that contribute to school enrolment/participation behaviour.
2.3 Qualitative study design and methods
2.3.1 Sample
The qualitative study was conducted in Salima and Mulanje to limit translations to Chichewa
and English. The qualitative sample was stratified by sex, as males and females were expected
to have different concerns, motivations and constraints to accessing educational opportunities.
For example, for females, issues around reproductive health, menstrual hygiene and safety may
be more prominent factors in education decision making. For males, on the other hand, financial
concerns may be more prominent. The sample was further stratified by in-school and out-of-
school respondents, to allow the discussions to focus on reasons for drop-out and inability to
return to school (for school-leavers) and factors enabling respondents to continue in school and
not drop-out (for those in-school). Having fairly homogenous groups by sex and school
attendance facilitated more open conversation. Finally, since the cash transfer is provided to the
7
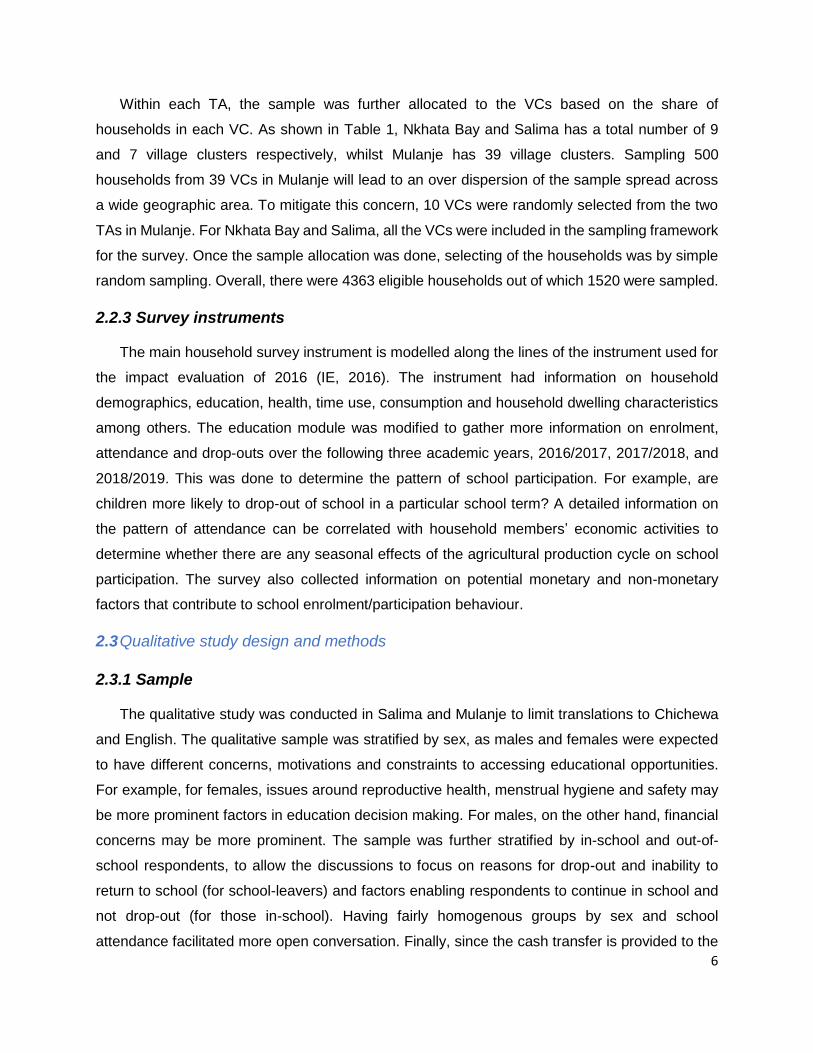
guardians/parents and not the children directly, we also conducted focus group discussions
(FGDs) with guardians/parents of young people to obtain their perspectives on the decision to
send children to school. Table 2 provides a summary of the qualitative sample (see Table 2).
The sample from Salima was drawn from the existing list of households from the Impact
Evaluation (IE, 2016). Households from Mulanje were selected from the roster of beneficiaries
provided by the MoGCDSW. The age range for youth participants was 15 to 24 years. The lower
bound is determined by Ethics Committee citing concerns about the welfare and rights of
participants, their ability to provide informed consent, and the reliability of data provided by
participants below the age of 15. The upper age bound of 24 is determined by the upper age
bound of the current SCTP education bonus of 24. It takes into account that many people up to
age 24 are still in primary and secondary school due to delayed entry and repetition.
Table 2: Planned groups for FGDs for qualitative study
Category Salima Mulanje Total
groups
In-school youth Males (2 groups) Males (2 groups) 4
Females (2 groups) Females (2 groups) 4
Out of school youth Males (2 groups) Males (2 groups) 4
Females (2 groups) Females (2 groups) 4
Parents/guardians In-school (1 group) In-school (1 group) 2
Out-of-school (1 group) Out-of-school (1 group) 2
Total 10 10 20
2.3.2 Focus group guides and data collection
The research team used FGDs to foster an environment of open dialogue among participants
about both community norms as well as personal experiences. The research team developed
semi-structured focus group guides for youth and guardians/parents to elicit experiences and
opinions about both barriers and facilitators to school attendance, and to elicit reflections on how
the SCTP has impacted attendance, or not. Facilitators began FGDs with a series of ‘ice-breakers’
to make focus group participants comfortable with each other, encourage group participation and
discussion, and get contextual information about each community. Facilitators used vignettes to
illustrate a situation of a person going to school or dropping out and probed on different scenarios
8
to obtain descriptive information. Each FGD had approximately 8-10 participants along with a
facilitator and an observer/note-taker. FGD were audio-recorded, transcribed, and translated
verbatim by the research team. All participants provided oral consent before the focus groups and
interviews. Interviewers would read the consent form to the potential participant and answer any
questions. By obtaining oral consent, participants did not have to provide their name in writing
which served to protect their confidentiality. All focus group participants agreed to maintain
confidentiality at the beginning of the discussion. Annex E includes FGD guides used in this
study.
Since one objective of the education study is to understand how to strengthen links and
working relationships with schools to support the education of SCTP students, we also conducted
and included Key Informant Interviews (KIIs) (n=10) with school head teachers and/or Ministry of
Education administrators at the district level to understand how the two ministries (Ministry of
Education and Ministry of Gender) can work together at the local level to support educational
outcomes for children from SCTP households. The research team documented these interviews
via interview field notes.
2.3.3 Data Analysis
Based on the FGD guide, the research team developed a field note template (see Annex F),
which was completed immediately following each FGD based on notes and audio review by the
facilitator and the note taker. For analysis, the research team reviewed field notes (written in
English) and organised main themes, such as educational experiences (past and present),
barriers and facilitators to staying in school, and SCTP perceptions into a matrix that mirrored the
structure of the field note template. This matrix was used to reduce data as well as facilitate
comparison of key themes by sex, school attendance, and between youth and caregivers. Next,
the research team read transcripts to understand, interpret and present key themes with quotes
and additional context. Where appropriate, findings among the sub-groups were compared.
2.4 Implementation of fieldwork
Training and data collection for the qualitative survey took place in July 2019. The training and
data collection for the quantitative survey occurred in August of 2019. This study obtained
Institutional Review Board (IRB) approval from UNC and Malawi.
9
2.5 Output of fieldwork and sample weights
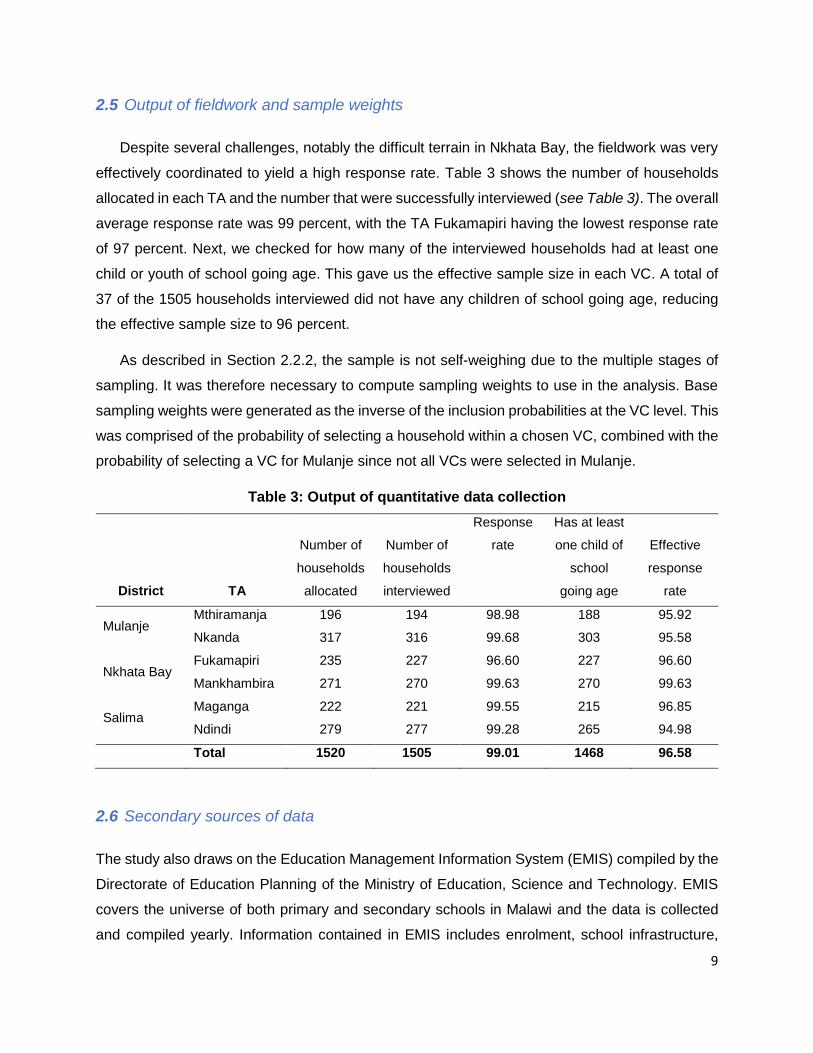
Despite several challenges, notably the difficult terrain in Nkhata Bay, the fieldwork was very
effectively coordinated to yield a high response rate. Table 3 shows the number of households
allocated in each TA and the number that were successfully interviewed (see Table 3). The overall
average response rate was 99 percent, with the TA Fukamapiri having the lowest response rate
of 97 percent. Next, we checked for how many of the interviewed households had at least one
child or youth of school going age. This gave us the effective sample size in each VC. A total of
37 of the 1505 households interviewed did not have any children of school going age, reducing
the effective sample size to 96 percent.
As described in Section 2.2.2, the sample is not self-weighing due to the multiple stages of
sampling. It was therefore necessary to compute sampling weights to use in the analysis. Base
sampling weights were generated as the inverse of the inclusion probabilities at the VC level. This
was comprised of the probability of selecting a household within a chosen VC, combined with the
probability of selecting a VC for Mulanje since not all VCs were selected in Mulanje.
Table 3: Output of quantitative data collection
District TA
Number of
households
allocated
Number of
households
interviewed
Response
rate
Has at least
one child of
school
going age
Effective
response
rate
Mulanje Mthiramanja 196 194 98.98 188 95.92
Nkanda 317 316 99.68 303 95.58
Nkhata Bay Fukamapiri 235 227 96.60 227 96.60
Mankhambira 271 270 99.63 270 99.63
Salima Maganga 222 221 99.55 215 96.85
Ndindi 279 277 99.28 265 94.98
Total 1520 1505 99.01 1468 96.58
2.6 Secondary sources of data
The study also draws on the Education Management Information System (EMIS) compiled by the
Directorate of Education Planning of the Ministry of Education, Science and Technology. EMIS
covers the universe of both primary and secondary schools in Malawi and the data is collected
and compiled yearly. Information contained in EMIS includes enrolment, school infrastructure,
10
teachers, and other indicators. In few instances, additional sources such as the World Bank
Development Indicators are used to complement analysis. To provide context in the interpretation
of the results, where necessary, the study sample is compared to rural ultra-poor households from
the most recent Malawi Integrated Household Survey (IHS4).
11
3. Malawi education system, policy environment and educational
attainment
3.1. The Education system in Malawi
This section provides an overview of the Malawi education system with respect to access to
schools, number of students and teachers. The overview seeks to describe the policy context
under which the SCTP’s schooling component works.
The basic education system in Malawi comprises Early Childhood Development (ECD), adult
literacy and primary education. However, only primary education falls under the formal education
system, while ECD falls under infant care and support, and adult literacy falls under non-formal
education. The formal educational system in Malawi is based on an 8-4-4 structure, which
comprise of 8 years of primary education, 4 years of secondary education, and 4 years of tertiary
level. At the end of basic formal education, students need to take the Primary School Leaving
Certificate Examination (PSLE) in order to transition into the secondary level education. Likewise,
at the end of secondary education, students must take the Malawi School Certificate Examination
(MSCE) before they can access tertiary level education.
In the formal education system, there are 6,127 primary schools and 1,412 secondary school
as of 2017/2018 scholastic year. These numbers show a continuous increase in the number of
schools since 2012/13 scholastic year, when the Government of Malawi launched phase II of the
Education Sector Implementation Plan II (ESIP II). Prior to the launch of the programme, there
were 5,405 registered primary schools. This shows a cumulative increase of over 13 percent over
the five years’ implementation of ESIP II.
It can be observed in Table 4 that as of 2017/2018 scholastic year, government and public-
funded schools account for 91 percent of all primary schools, whilst the private sector accounts
for the rest. There has been no significant change in the share of the public and private schools
over the period. Private-owned primary schools still account for less than 10 percent of the total
primary schools; they have grown from 470 units in 2012/2013 to 566 units in 2017/2018
representing a cumulative growth rate of 20 percent over five years.
Access to secondary education in terms of number of secondary schools has been mixed
over the last decade. In 2008/2009 scholastic year, there were 1,160 registered secondary
schools, and in 2012/13, this number dropped to 1,015 units. The number of private-owned
secondary schools decreased from 372 units to 159 units, representing a decline from 32 percent
12
in 2008/2009 to 16 percent of secondary schools respectively in 2012/2013. Over the same period
the number of public schools increased from 788 units in 2008/2009 to 856 units in 2012/2013.
However, this declining trend in the number of secondary schools reversed over the ESIP II
implementation period that followed in 2012/13 (see Table 4).
After 2012/13 the number of secondary schools began to increase. As shown in table 4, in
2017/18 scholastic year, there were 1,412 registered secondary schools in Malawi. Private-owned
secondary schools have increased from 159 units to 346 units between 2012/2013 and 2017/2018
scholastic years representing a total share of 25 percent of all secondary schools. Remarkably,
government and public-funded secondary schools continue to grow surpassing one-thousand
threshold in 2017/2018.
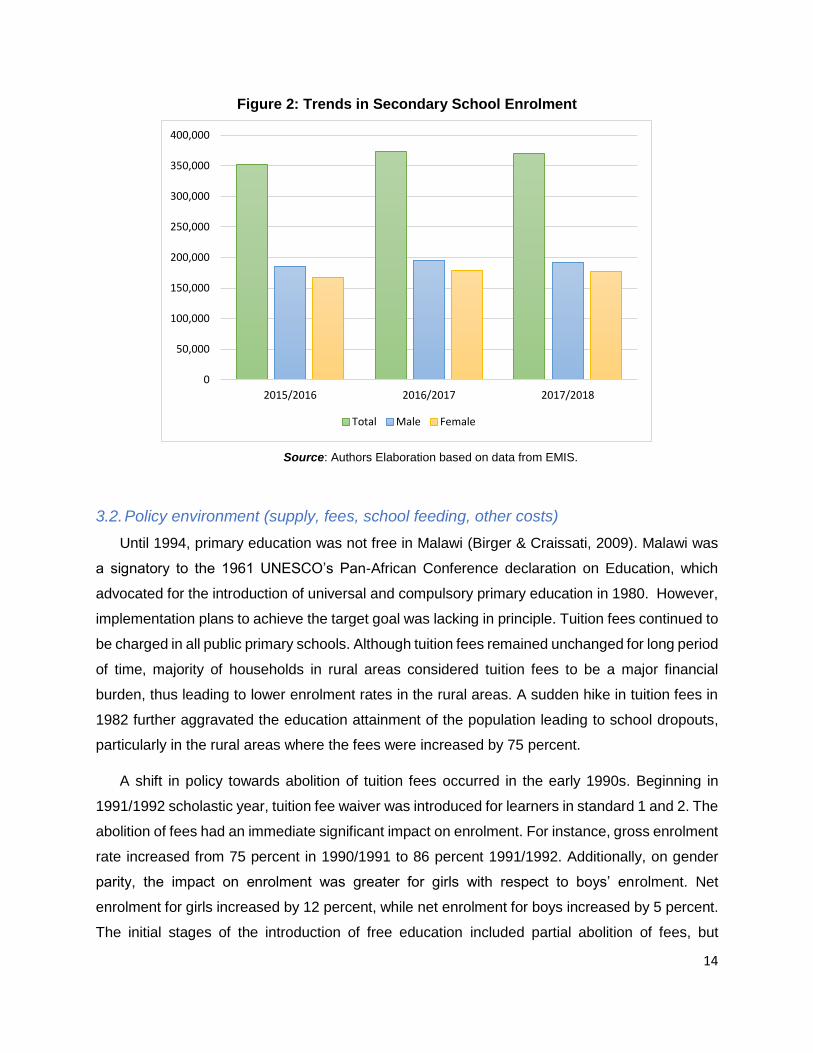
Table 4: Basic overview of primary and secondary schools in 2017/2018
Primary Schools Secondary Schools
Number Share
Number Share
Number of
Schools
6,127 100 1,412 100
Public 5,561 90.8 1,066 75.5
Private 566 9.2 346 24.5
Urban 559 9.1 250 17.7
Rural 5,439 88.8 1,079 76.4
Semi-Urban 129 2.1 83 5.9
Total Enrolment 5,245,008 100 369,773 100
Male 2,662,690 50.8 192,575 52.1
Female 2,582,318 49.2 177,198 47.9
Number of
Teaching Staff
77,792 100 14,353 100
Male 43,795 56.3 3280 22.9
Female 33,997 43.7 11,073 77.1
Source: Authors Elaboration based on data from EMIS 2018.
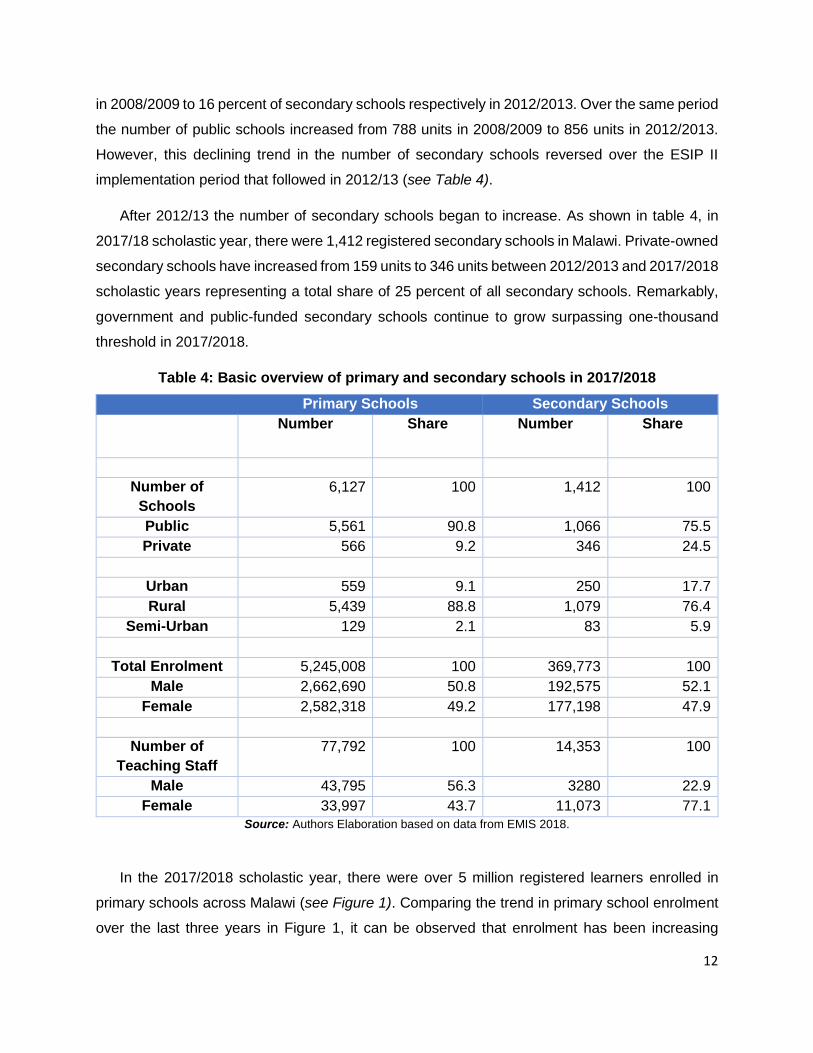
In the 2017/2018 scholastic year, there were over 5 million registered learners enrolled in
primary schools across Malawi (see Figure 1). Comparing the trend in primary school enrolment
over the last three years in Figure 1, it can be observed that enrolment has been increasing
13
marginally over year-on-year basis. However, there seems to be a marginal drop in female
enrolment over the same period. In 2016/2017 scholastic year, female enrolment was slightly
higher than male enrolment. However, there seems to be a downward trend with female
enrolment potentially creating a small gender gap.
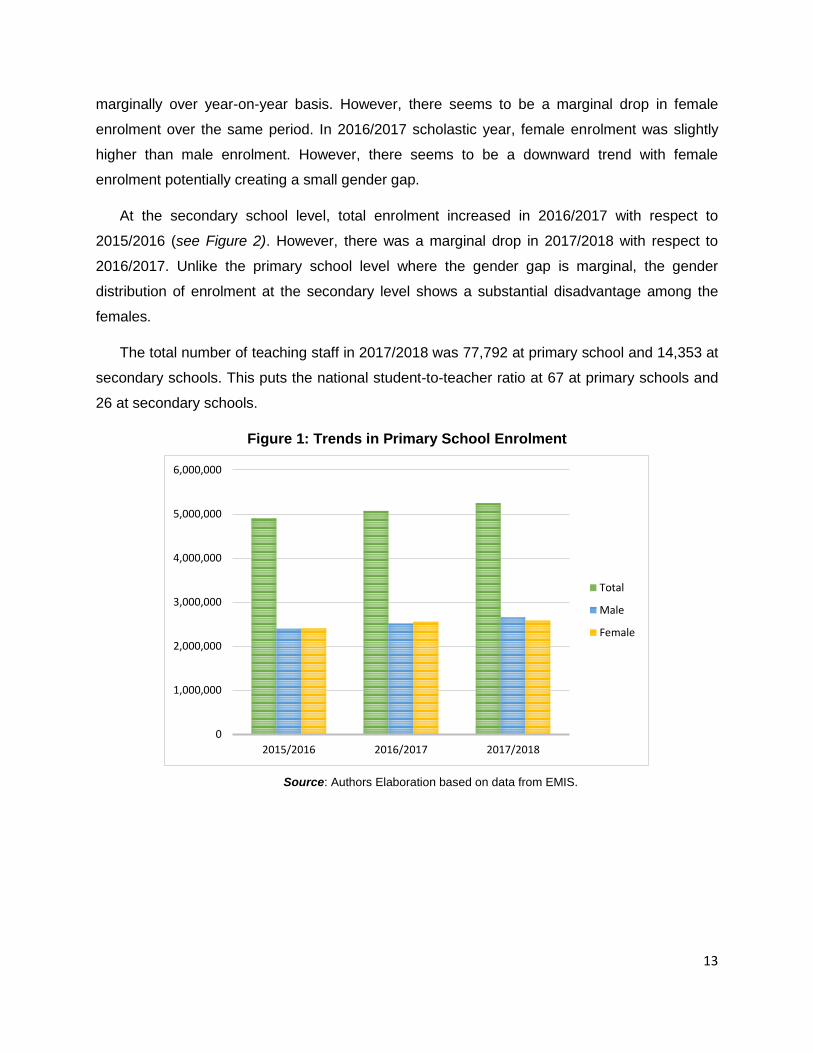
At the secondary school level, total enrolment increased in 2016/2017 with respect to
2015/2016 (see Figure 2). However, there was a marginal drop in 2017/2018 with respect to
2016/2017. Unlike the primary school level where the gender gap is marginal, the gender
distribution of enrolment at the secondary level shows a substantial disadvantage among the
females.
The total number of teaching staff in 2017/2018 was 77,792 at primary school and 14,353 at
secondary schools. This puts the national student-to-teacher ratio at 67 at primary schools and
26 at secondary schools.
Figure 1: Trends in Primary School Enrolment
Source: Authors Elaboration based on data from EMIS.
0
1,000,000
2,000,000
3,000,000
4,000,000
5,000,000
6,000,000
2015/2016 2016/2017 2017/2018
Total
Male
Female
14
Figure 2: Trends in Secondary School Enrolment
Source: Authors Elaboration based on data from EMIS.
3.2. Policy environment (supply, fees, school feeding, other costs)
Until 1994, primary education was not free in Malawi (Birger & Craissati, 2009). Malawi was
a signatory to the 1961 UNESCO’s Pan-African Conference declaration on Education, which
advocated for the introduction of universal and compulsory primary education in 1980. However,
implementation plans to achieve the target goal was lacking in principle. Tuition fees continued to
be charged in all public primary schools. Although tuition fees remained unchanged for long period
of time, majority of households in rural areas considered tuition fees to be a major financial
burden, thus leading to lower enrolment rates in the rural areas. A sudden hike in tuition fees in
1982 further aggravated the education attainment of the population leading to school dropouts,
particularly in the rural areas where the fees were increased by 75 percent.
A shift in policy towards abolition of tuition fees occurred in the early 1990s. Beginning in
1991/1992 scholastic year, tuition fee waiver was introduced for learners in standard 1 and 2. The
abolition of fees had an immediate significant impact on enrolment. For instance, gross enrolment
rate increased from 75 percent in 1990/1991 to 86 percent 1991/1992. Additionally, on gender
parity, the impact on enrolment was greater for girls with respect to boys’ enrolment. Net
enrolment for girls increased by 12 percent, while net enrolment for boys increased by 5 percent.
The initial stages of the introduction of free education included partial abolition of fees, but
0
50,000
100,000
150,000
200,000
250,000
300,000
350,000
400,000
2015/2016 2016/2017 2017/2018
Total Male Female
15
households were still required to cover book fees and other contribution to school development
(Birger & Craissati, 2009).
Tuition fees and other education related costs were completely abolished under the
government flagship Free Primary Education programme (FPE) in 1994. As part of the
programme, the government abolished all forms of fees including contributions to school
development fund. Under the free primary education programme, the government committed to
absorb all financial burdens for the provision of education in the country. School items and
facilities, such as teaching and learning materials, school infrastructure needs including teachers’
houses were also included. In addition to the above provisions, previously unassisted schools
were integrated into the government run schools by merging them wherever possible. However,
over time, many of the non-tuition costs, such as PTA fees, and school development/capital fees
crept back and today these expenses represent a non-trivial out-of-pocket cost for primary school
participation.
Besides the cost-absorbing channel of the free primary education, few policies were
implemented to boost enrolment and school attendance. The formal requirement for school
uniforms at the primary level was eliminated by the government. This was done to encourage
children who could not afford school uniforms to enrol in school by removing a barrier they faced.
Another important policy was the use of local languages as a medium of instruction in standards
1-4. This was to make it easier to integrate new learners into the school system before migrating
them to English as the medium of instruction. The array of the reforms also targeted the teaching
staff and school management team, whereby the government moved from an inspection-based
system to teacher support and development.
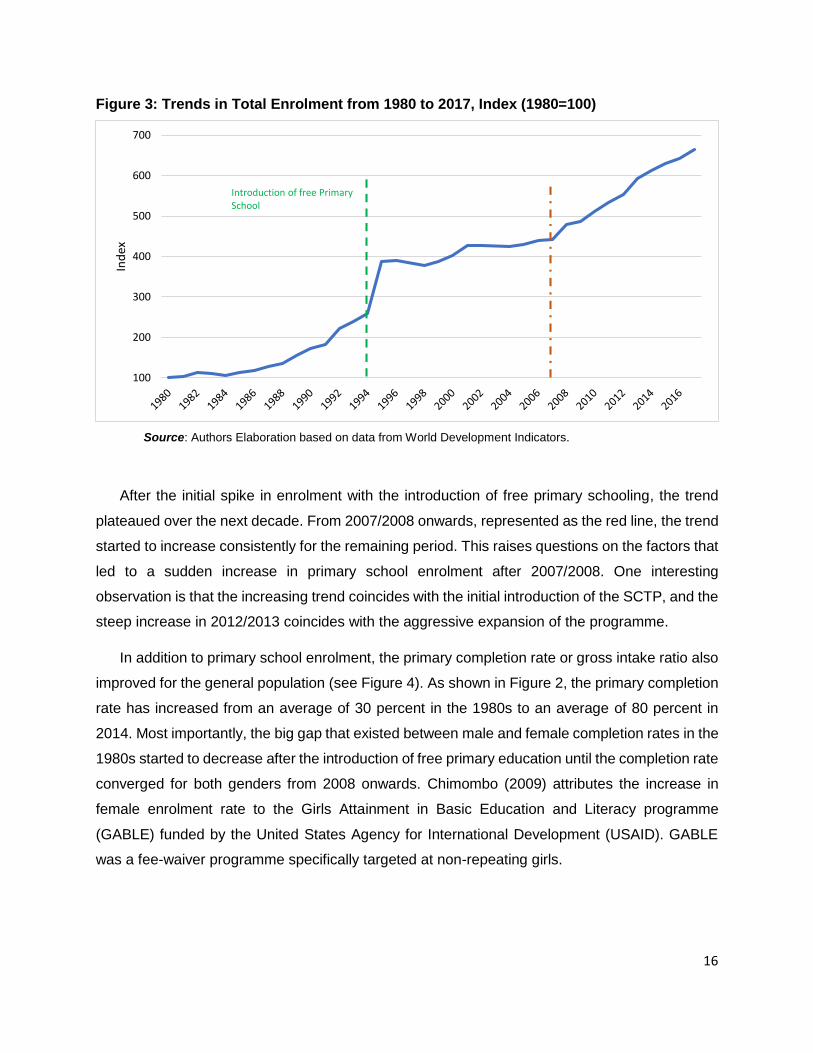
3.3. Education attainment among the general population
The introduction of free primary school had positive impacts on the education attainment of
the general population. Looking at the trend in primary school enrolment from 1980 till 2017, we
see the rate of increase in enrolment was minimal for most part of the 1980’s (see Figure 3).
Enrolments in primary school started to increase during the pilot years of free education between
1991 and 1993. Once the policy was introduced in 1994/1995 there was a huge spike in the
number of new learners enroling into primary school as marked by the green line (see Figure 3).
16
Figure 3: Trends in Total Enrolment from 1980 to 2017, Index (1980=100)
Source: Authors Elaboration based on data from World Development Indicators.
After the initial spike in enrolment with the introduction of free primary schooling, the trend
plateaued over the next decade. From 2007/2008 onwards, represented as the red line, the trend
started to increase consistently for the remaining period. This raises questions on the factors that
led to a sudden increase in primary school enrolment after 2007/2008. One interesting
observation is that the increasing trend coincides with the initial introduction of the SCTP, and the
steep increase in 2012/2013 coincides with the aggressive expansion of the programme.
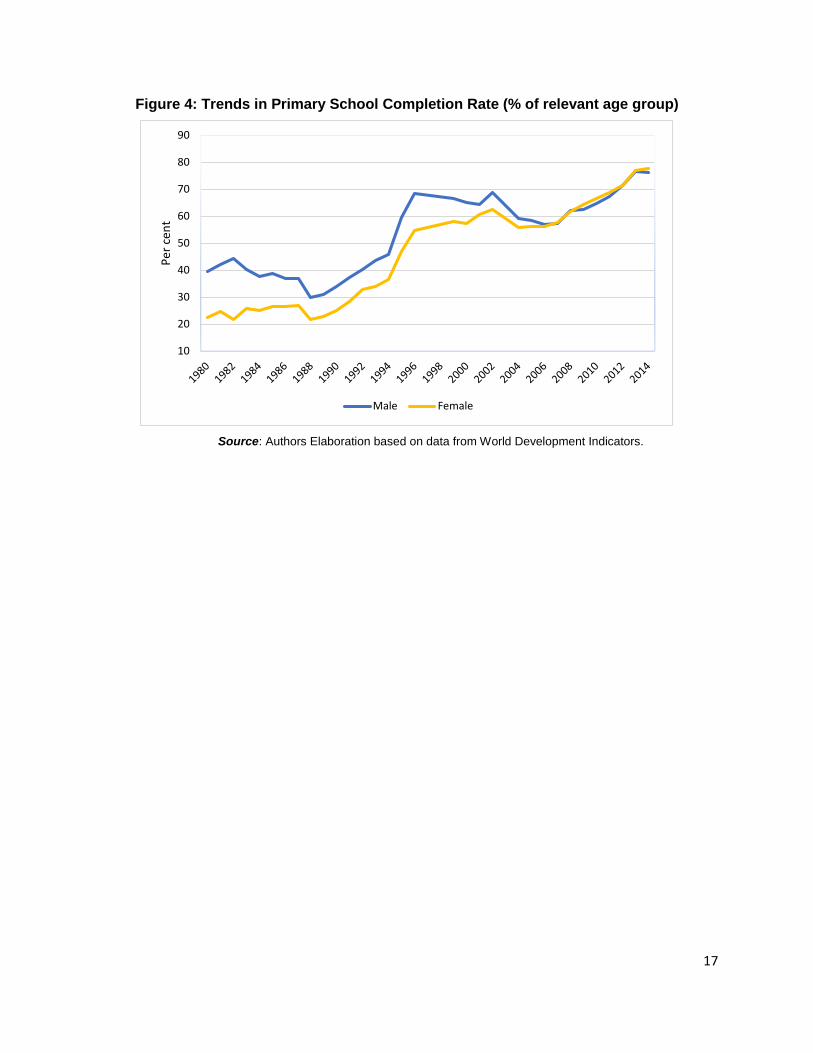
In addition to primary school enrolment, the primary completion rate or gross intake ratio also
improved for the general population (see Figure 4). As shown in Figure 2, the primary completion
rate has increased from an average of 30 percent in the 1980s to an average of 80 percent in
2014. Most importantly, the big gap that existed between male and female completion rates in the
1980s started to decrease after the introduction of free primary education until the completion rate
converged for both genders from 2008 onwards. Chimombo (2009) attributes the increase in
female enrolment rate to the Girls Attainment in Basic Education and Literacy programme
(GABLE) funded by the United States Agency for International Development (USAID). GABLE
was a fee-waiver programme specifically targeted at non-repeating girls.
100
200
300
400
500
600
700In
dex
Introduction of free Primary School
17
Figure 4: Trends in Primary School Completion Rate (% of relevant age group)
Source: Authors Elaboration based on data from World Development Indicators.
10
20
30
40
50
60
70
80
90
Per
cen
t
Male Female
18
4. Sample Characteristics
This section presents the characteristics of the study sample including household composition,
participation in economic activities, time use, shocks and coping to shocks and access to social
safety nets.
4.1. Household composition
Table 5 gives the characteristics of household head and of all household members in the
study sample in comparison to the IHS4 rural sample for the selected districts. SCTP household
size ranged from 1 to 20 persons with an average of 5.5. With regards to the heads of household,
the average age was 57 years with 70 percent being female, with 78 percent identifying as
Christians. 35 percent of them are currently married, and 61 percent ever attended school. Close
to 4 in 10 of them have a chronic health condition and 15 percent have some form of disability.
In contrast, the average age of heads of household from the IHS4 sample was 45 years with
32 percent being female, while 66 percent being married and 16 percent having a chronic health
condition (see Table 5).
This highlights the fact that the SCTP sample is quite different from the typical rural household
in terms of the characteristics of the head of household. It is however instructive to note that the
characteristics of the household members are quite comparable except for the share of members
with a chronic condition.
Table 5: Household composition
Study sample IHS4 comparison sample Characteristic Household Head All Household
members Household Head All household
members
Age (years) 57.1 25.7 44.8 22.4 Female 0.7 0.6 0.3 0.5 Christian 0.8 0.6 0.8 0.6 Married (age 18+) 0.4 0.3 0.7 0.6 Ever attended school 0.6 0.8 0.8 0.8 Has a disability 0.2 0.1 Has a chronic condition
0.4 0.1 0.2 0.1
N 1,485 7,832 1,071 4,969 *IHS4 households in rural areas of selected districts
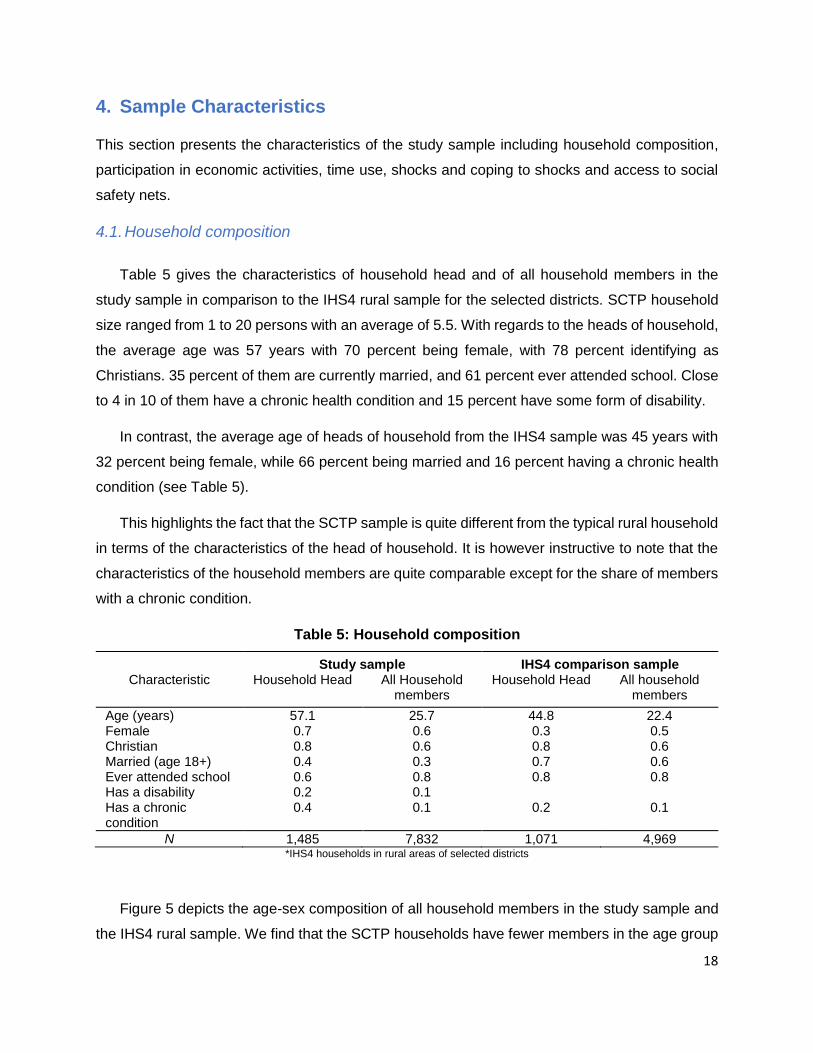
Figure 5 depicts the age-sex composition of all household members in the study sample and
the IHS4 rural sample. We find that the SCTP households have fewer members in the age group
19
0-4 years than in the age group 10 – 19 years (see Figure 5). In addition, the SCTP households
have older women than the general rural population.
Figure 5: Age-sex Composition of Study Sample and IHS4 Comparison Group
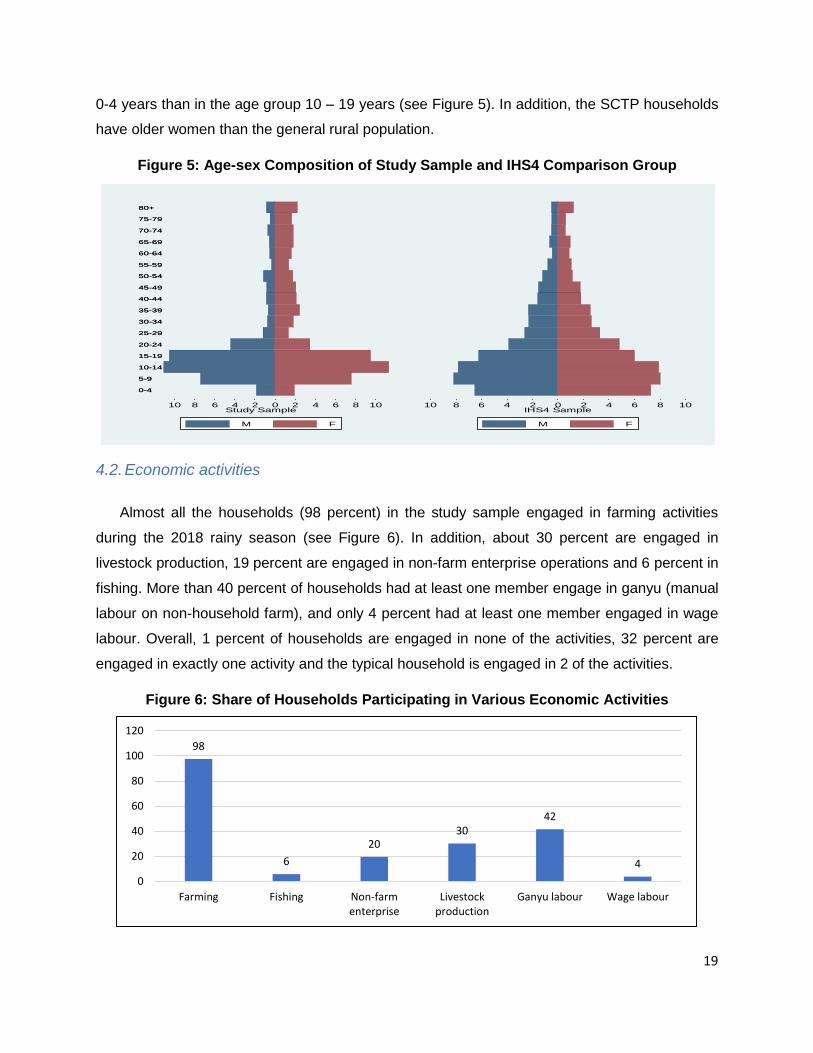
4.2. Economic activities
Almost all the households (98 percent) in the study sample engaged in farming activities
during the 2018 rainy season (see Figure 6). In addition, about 30 percent are engaged in
livestock production, 19 percent are engaged in non-farm enterprise operations and 6 percent in
fishing. More than 40 percent of households had at least one member engage in ganyu (manual
labour on non-household farm), and only 4 percent had at least one member engaged in wage
labour. Overall, 1 percent of households are engaged in none of the activities, 32 percent are
engaged in exactly one activity and the typical household is engaged in 2 of the activities.
Figure 6: Share of Households Participating in Various Economic Activities
10-14
5-9
40-4440-44
10-14
15-19
60-64
80+
5-9
75-79
50-54
35-39
20-24
15-19
0-4
65-69
70-74
20-24
50-54
25-29
45-49
30-34
55-59
65-69
80+
45-49
25-29
70-74
35-39
0-4
60-64
30-34
55-59
75-79
10 8 6 4 2 0 2 4 6 8 10Study Sample
M F
10 8 6 4 2 0 2 4 6 8 10IHS4 Sample
M F
98
6
2030
42
4
0
20
40
60
80
100
120
Farming Fishing Non-farmenterprise
Livestockproduction
Ganyu labour Wage labour
20
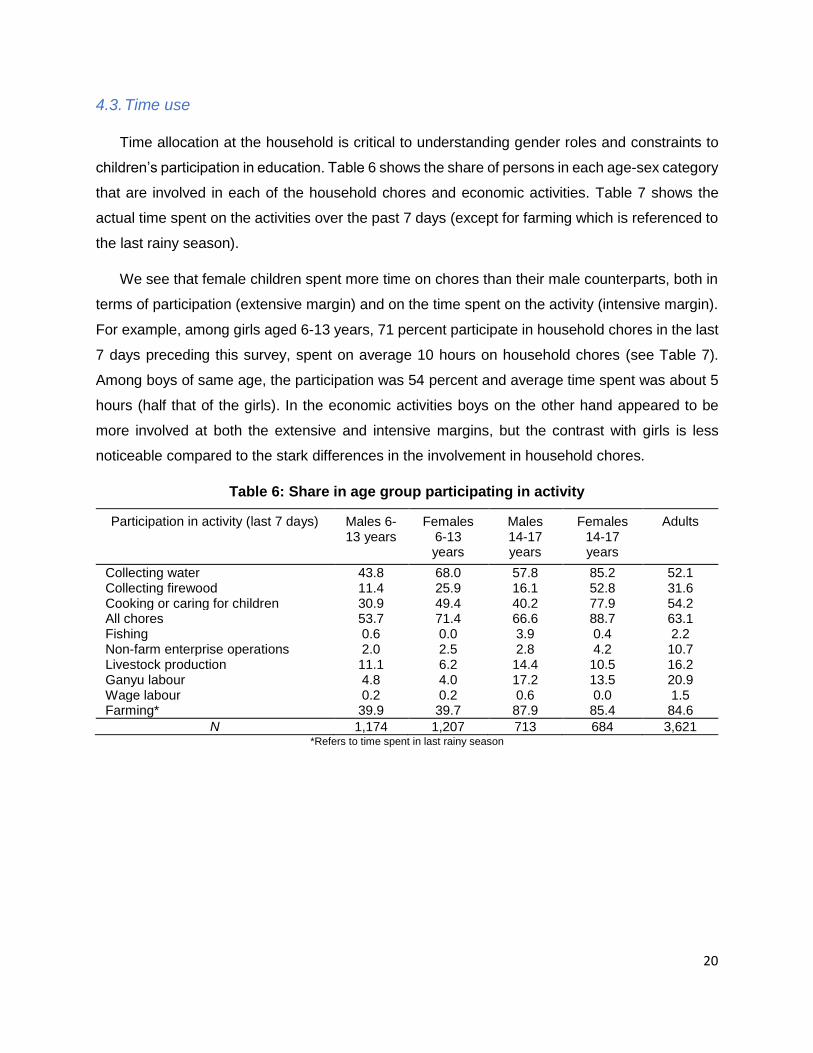
4.3. Time use
Time allocation at the household is critical to understanding gender roles and constraints to
children’s participation in education. Table 6 shows the share of persons in each age-sex category
that are involved in each of the household chores and economic activities. Table 7 shows the
actual time spent on the activities over the past 7 days (except for farming which is referenced to
the last rainy season).
We see that female children spent more time on chores than their male counterparts, both in
terms of participation (extensive margin) and on the time spent on the activity (intensive margin).
For example, among girls aged 6-13 years, 71 percent participate in household chores in the last
7 days preceding this survey, spent on average 10 hours on household chores (see Table 7).
Among boys of same age, the participation was 54 percent and average time spent was about 5
hours (half that of the girls). In the economic activities boys on the other hand appeared to be
more involved at both the extensive and intensive margins, but the contrast with girls is less
noticeable compared to the stark differences in the involvement in household chores.
Table 6: Share in age group participating in activity
Participation in activity (last 7 days) Males 6-13 years
Females 6-13 years
Males 14-17 years
Females 14-17 years
Adults
Collecting water 43.8 68.0 57.8 85.2 52.1 Collecting firewood 11.4 25.9 16.1 52.8 31.6 Cooking or caring for children 30.9 49.4 40.2 77.9 54.2 All chores 53.7 71.4 66.6 88.7 63.1 Fishing 0.6 0.0 3.9 0.4 2.2 Non-farm enterprise operations 2.0 2.5 2.8 4.2 10.7 Livestock production 11.1 6.2 14.4 10.5 16.2 Ganyu labour 4.8 4.0 17.2 13.5 20.9 Wage labour 0.2 0.2 0.6 0.0 1.5 Farming* 39.9 39.7 87.9 85.4 84.6
N 1,174 1,207 713 684 3,621 *Refers to time spent in last rainy season
21
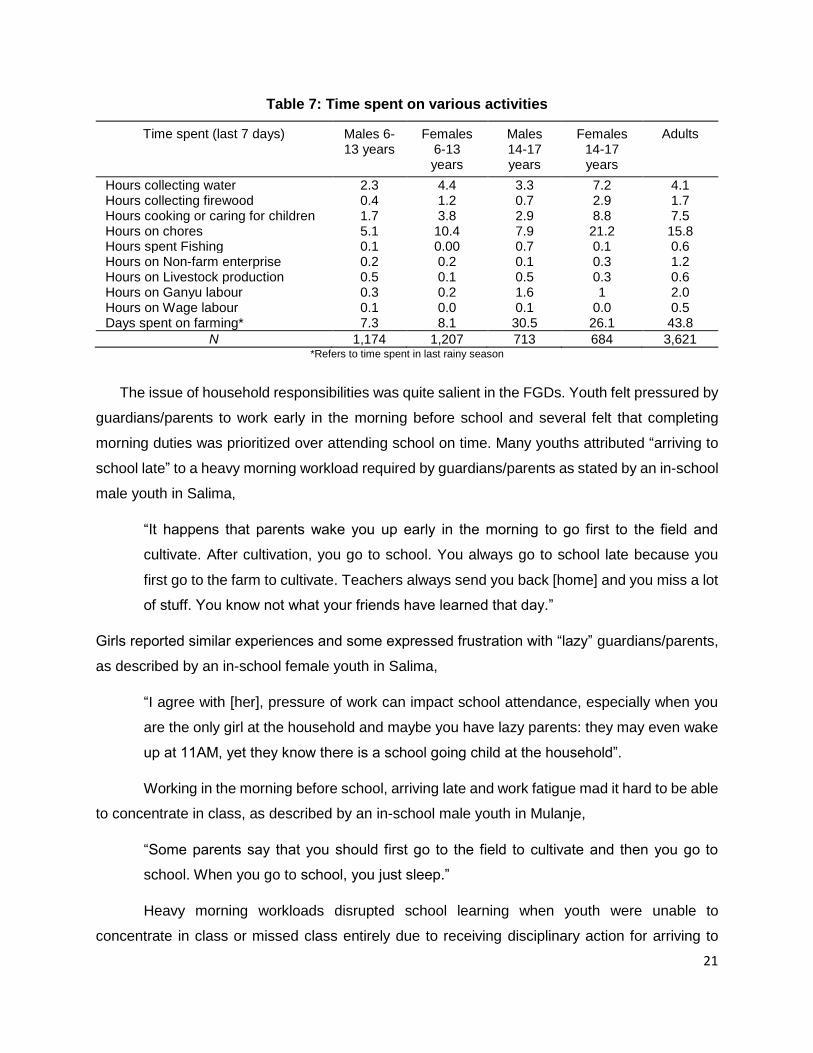
Table 7: Time spent on various activities
Time spent (last 7 days) Males 6-13 years
Females 6-13 years
Males 14-17 years
Females 14-17 years
Adults
Hours collecting water 2.3 4.4 3.3 7.2 4.1 Hours collecting firewood 0.4 1.2 0.7 2.9 1.7 Hours cooking or caring for children 1.7 3.8 2.9 8.8 7.5 Hours on chores 5.1 10.4 7.9 21.2 15.8 Hours spent Fishing 0.1 0.00 0.7 0.1 0.6 Hours on Non-farm enterprise 0.2 0.2 0.1 0.3 1.2 Hours on Livestock production 0.5 0.1 0.5 0.3 0.6 Hours on Ganyu labour 0.3 0.2 1.6 1 2.0 Hours on Wage labour 0.1 0.0 0.1 0.0 0.5 Days spent on farming* 7.3 8.1 30.5 26.1 43.8
N 1,174 1,207 713 684 3,621 *Refers to time spent in last rainy season
The issue of household responsibilities was quite salient in the FGDs. Youth felt pressured by
guardians/parents to work early in the morning before school and several felt that completing
morning duties was prioritized over attending school on time. Many youths attributed “arriving to
school late” to a heavy morning workload required by guardians/parents as stated by an in-school
male youth in Salima,
“It happens that parents wake you up early in the morning to go first to the field and
cultivate. After cultivation, you go to school. You always go to school late because you
first go to the farm to cultivate. Teachers always send you back [home] and you miss a lot
of stuff. You know not what your friends have learned that day.”
Girls reported similar experiences and some expressed frustration with “lazy” guardians/parents,
as described by an in-school female youth in Salima,
“I agree with [her], pressure of work can impact school attendance, especially when you
are the only girl at the household and maybe you have lazy parents: they may even wake
up at 11AM, yet they know there is a school going child at the household”.
Working in the morning before school, arriving late and work fatigue mad it hard to be able
to concentrate in class, as described by an in-school male youth in Mulanje,
“Some parents say that you should first go to the field to cultivate and then you go to
school. When you go to school, you just sleep.”
Heavy morning workloads disrupted school learning when youth were unable to
concentrate in class or missed class entirely due to receiving disciplinary action for arriving to
22
class late. Many youths believed guardians/parents needed to prioritize arriving to school on time
over completing morning work. Guardians/parents agreed with the observations of youth, though
typically described the actions of other parents or guardians rather than themselves. Some
parents/guardians said they reduced the morning workload of youth so that youth did not have
any excuses to arrive to school late.
4.4 Youth as caregivers
Youth who were themselves caregivers in their households had difficulty staying in school.
For example, an out-of-school female youth in Mulanje left school to care for sick and ageing
parents and help them with household and farm work. An in-school male youth in Salima, reacting
to a vignette for a youth caretaker, suggested some youth had to choose between continuing their
education and caring for others in their family,
“To me, I can see that there are some responsibilities that we as youth we ought not to do
or assume. If we dare it means, we will doom our future. If you take the whole responsibility
at home, you cannot make it to go to school. You have to leave school so that you should
be able to fully support the household. You cannot do both. You have to leave the other
one.”
An out-of-school male youth in Mulanje also left school to support his sick mother. However,
unlike other youth who left school, he resumed school after a two-year hiatus when his mother’s
health improved health. He reflected on his experience,
“I started business when I was in standard five, if not six… I take the money home and
give my mother. Seeing that [the situation got] worse, I decided to go to town to make
more money so that I should be sending money to my mother monthly for her to buy maize
for the household. I went to town and stayed for 2 years…Then I return home and I started
schooling again. She [my mother] is supporting the family [and] I am back to school.”
These examples show the limits of the cash as a sole source of money for school expenses
and how shocks can limit the positive impact of the SCTP on school attendance. Generally, youth
had little choice to continue school if parents/guardians or other family members became sick
and/or were unable to work and provide for others. Most youth found it difficult to resume school
after leaving, suggesting that youth motivation, opportunity and means (i.e. financial stability,
healthy parents) were important determinants in school retention and re-admission.

23
4.5 Shocks and coping to shocks
Negative economic shocks are a common feature of the livelihoods of the rural poor. The
responses to questions on negative shocks shows that more than 80 percent of households
experienced at least one negative shock over the past 12 months (see Table 8). These shocks
include idiosyncratic shocks, which are more household specific (such as death of a breadwinner
of the household, catastrophic health expenditure, etc.) and covariate shocks, which affect a large
part of the community at the same time (such as floods, draughts, pest invasion). About 75 percent
of households reported at least one idiosyncratic shock, while 56 percent reported at least one
covariate shock.
When shocks hit, households resort to either positive coping strategy (using own savings,
accessing unconditional help, etc.) or negative coping strategies (withdrawing children from
school, eating less, selling agricultural assets, etc.), or ambiguous coping strategies (intensifying
farming or work, selling livestock, etc.). Among all the coping strategies utilized for dealing with
shocks, 67 percent were classified as positive, 21 percent as negative and 12 percent as
ambiguous (Table 8).
Table 8: Shocks and coping to shocks
Shock/coping type Share of households
Any shock 85.8 Any covariate shock 55.7 Any idiosyncratic shock 75.8 Positive coping to shock 67.5 Negative coping to shock 20.9 Ambiguous coping to shocks 11.6
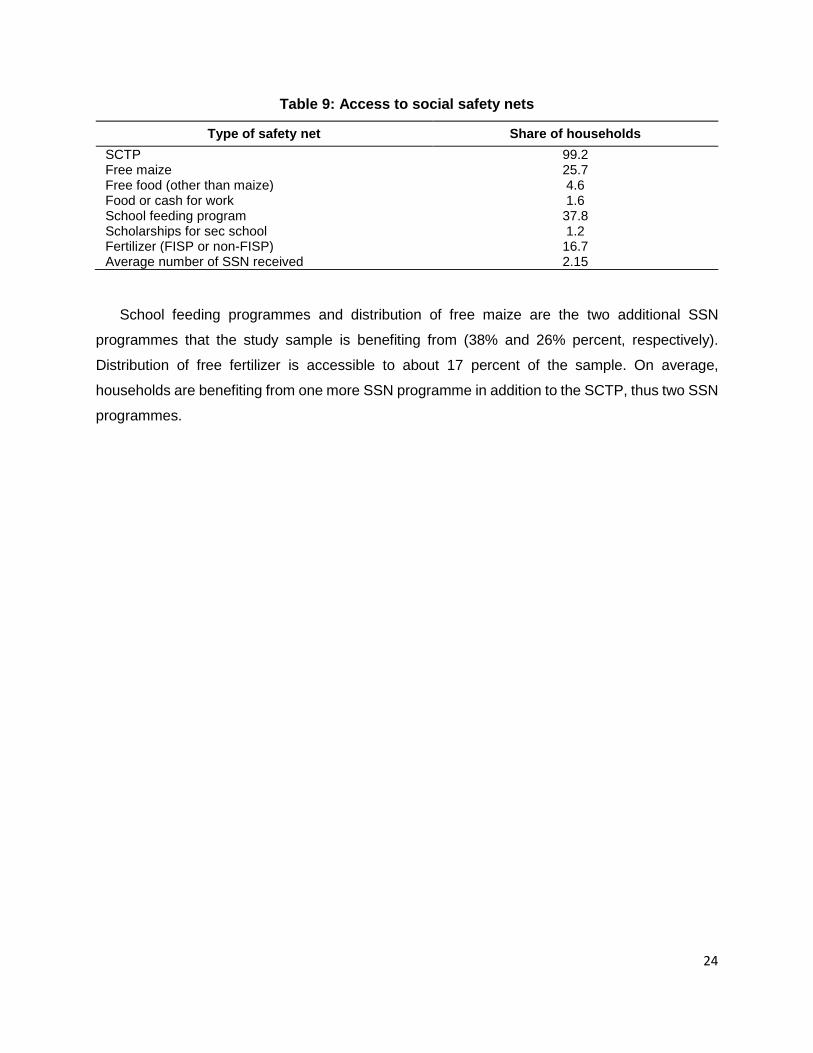
4.6 Access to social safety nets (SSN)
Apart from the SCTP, there are other social safety net programmes operating in the study areas
(see Table 9). These include distribution of free maize or other food, school feeding programmes,
scholarships for secondary school, and distribution of free fertilizers. Table 9 shows that some of
the households reported they do not currently receive SCTP benefit even though the
administrative records show otherwise. There are plausible explanations for this. For instance,
some households have split, and the interviewed household is the breakaway part which is
currently not benefiting from the SCTP.
24
Table 9: Access to social safety nets
Type of safety net Share of households
SCTP 99.2 Free maize 25.7 Free food (other than maize) 4.6 Food or cash for work 1.6 School feeding program 37.8 Scholarships for sec school 1.2 Fertilizer (FISP or non-FISP) 16.7 Average number of SSN received 2.15
School feeding programmes and distribution of free maize are the two additional SSN
programmes that the study sample is benefiting from (38% and 26% percent, respectively).
Distribution of free fertilizer is accessible to about 17 percent of the sample. On average,
households are benefiting from one more SSN programme in addition to the SCTP, thus two SSN
programmes.
25
5. Schooling among household members 6 – 23 years
5.1. Enrolment and attendance (2016 – 2019)
The analysis in this section is based on the quantitative household survey of current SCTP
beneficiary households in the three districts, as described earlier. In the survey, for each school-
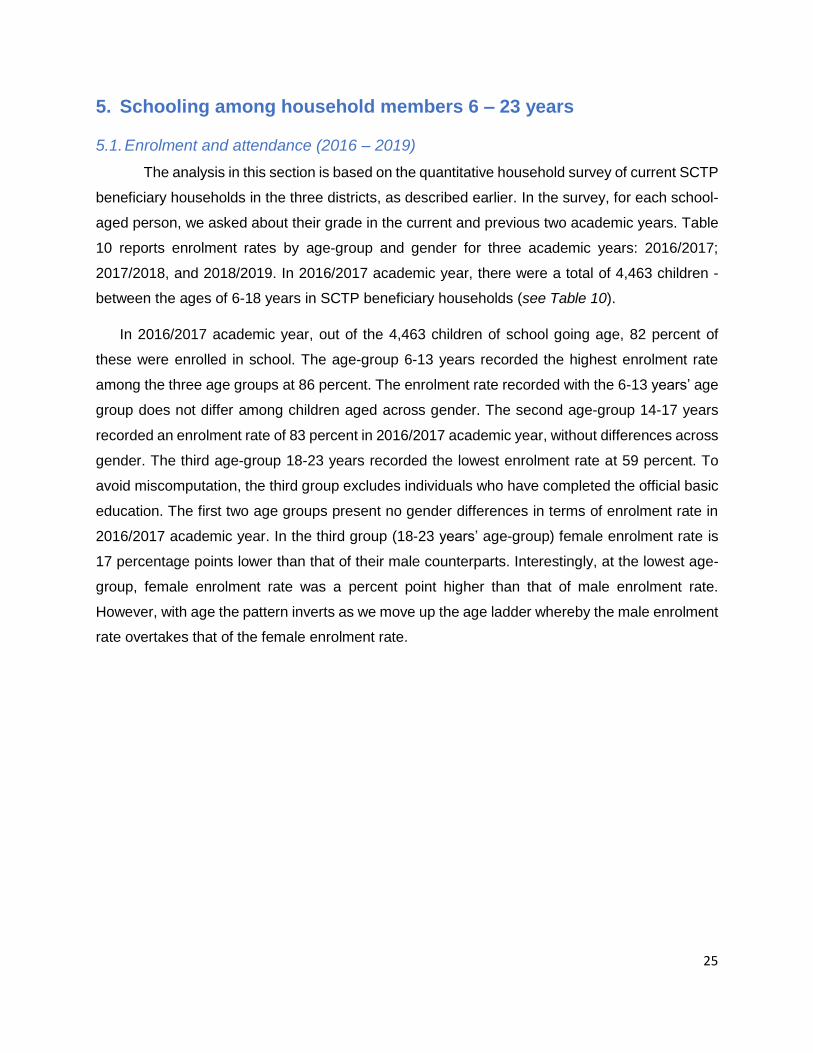
aged person, we asked about their grade in the current and previous two academic years. Table
10 reports enrolment rates by age-group and gender for three academic years: 2016/2017;
2017/2018, and 2018/2019. In 2016/2017 academic year, there were a total of 4,463 children -
between the ages of 6-18 years in SCTP beneficiary households (see Table 10).
In 2016/2017 academic year, out of the 4,463 children of school going age, 82 percent of
these were enrolled in school. The age-group 6-13 years recorded the highest enrolment rate
among the three age groups at 86 percent. The enrolment rate recorded with the 6-13 years’ age
group does not differ among children aged across gender. The second age-group 14-17 years
recorded an enrolment rate of 83 percent in 2016/2017 academic year, without differences across
gender. The third age-group 18-23 years recorded the lowest enrolment rate at 59 percent. To
avoid miscomputation, the third group excludes individuals who have completed the official basic
education. The first two age groups present no gender differences in terms of enrolment rate in
2016/2017 academic year. In the third group (18-23 years’ age-group) female enrolment rate is
17 percentage points lower than that of their male counterparts. Interestingly, at the lowest age-
group, female enrolment rate was a percent point higher than that of male enrolment rate.
However, with age the pattern inverts as we move up the age ladder whereby the male enrolment
rate overtakes that of the female enrolment rate.
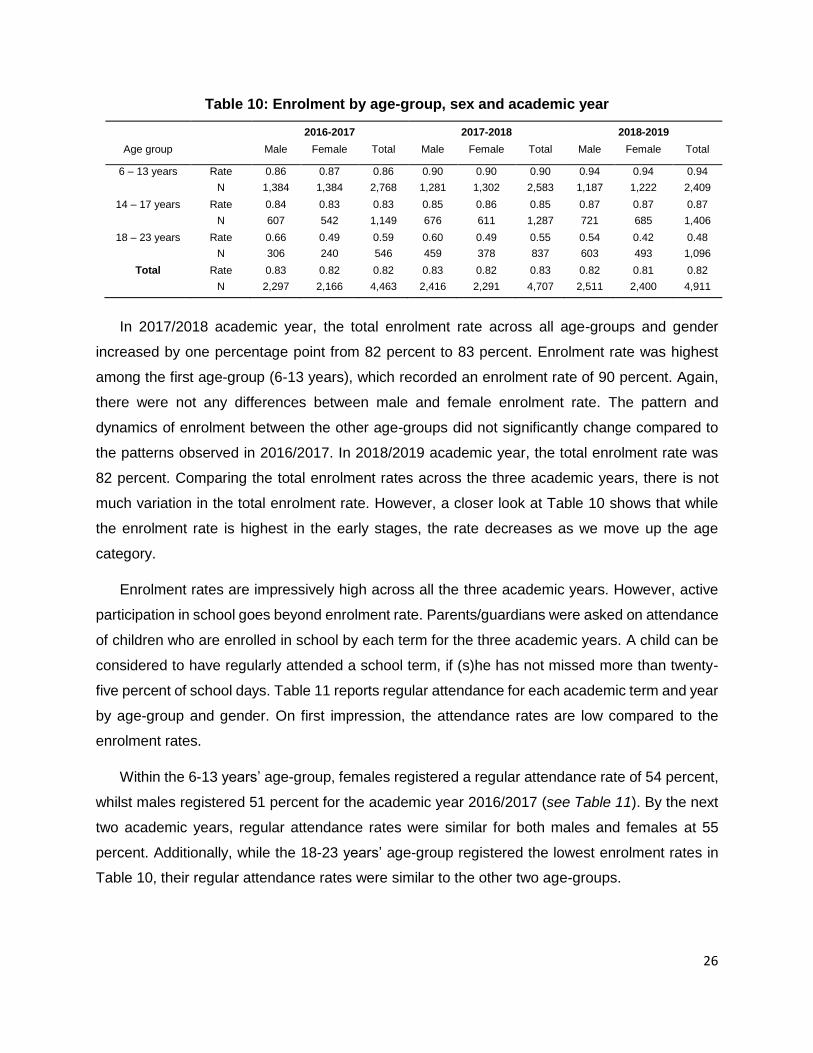
26
Table 10: Enrolment by age-group, sex and academic year
2016-2017 2017-2018 2018-2019
Age group Male Female Total Male Female Total Male Female Total
6 – 13 years Rate 0.86 0.87 0.86 0.90 0.90 0.90 0.94 0.94 0.94
N 1,384 1,384 2,768 1,281 1,302 2,583 1,187 1,222 2,409
14 – 17 years Rate 0.84 0.83 0.83 0.85 0.86 0.85 0.87 0.87 0.87
N 607 542 1,149 676 611 1,287 721 685 1,406
18 – 23 years Rate 0.66 0.49 0.59 0.60 0.49 0.55 0.54 0.42 0.48
N 306 240 546 459 378 837 603 493 1,096
Total Rate 0.83 0.82 0.82 0.83 0.82 0.83 0.82 0.81 0.82
N 2,297 2,166 4,463 2,416 2,291 4,707 2,511 2,400 4,911
In 2017/2018 academic year, the total enrolment rate across all age-groups and gender
increased by one percentage point from 82 percent to 83 percent. Enrolment rate was highest
among the first age-group (6-13 years), which recorded an enrolment rate of 90 percent. Again,
there were not any differences between male and female enrolment rate. The pattern and
dynamics of enrolment between the other age-groups did not significantly change compared to
the patterns observed in 2016/2017. In 2018/2019 academic year, the total enrolment rate was
82 percent. Comparing the total enrolment rates across the three academic years, there is not
much variation in the total enrolment rate. However, a closer look at Table 10 shows that while
the enrolment rate is highest in the early stages, the rate decreases as we move up the age
category.
Enrolment rates are impressively high across all the three academic years. However, active
participation in school goes beyond enrolment rate. Parents/guardians were asked on attendance
of children who are enrolled in school by each term for the three academic years. A child can be
considered to have regularly attended a school term, if (s)he has not missed more than twenty-
five percent of school days. Table 11 reports regular attendance for each academic term and year
by age-group and gender. On first impression, the attendance rates are low compared to the
enrolment rates.
Within the 6-13 years’ age-group, females registered a regular attendance rate of 54 percent,
whilst males registered 51 percent for the academic year 2016/2017 (see Table 11). By the next
two academic years, regular attendance rates were similar for both males and females at 55
percent. Additionally, while the 18-23 years’ age-group registered the lowest enrolment rates in
Table 10, their regular attendance rates were similar to the other two age-groups.
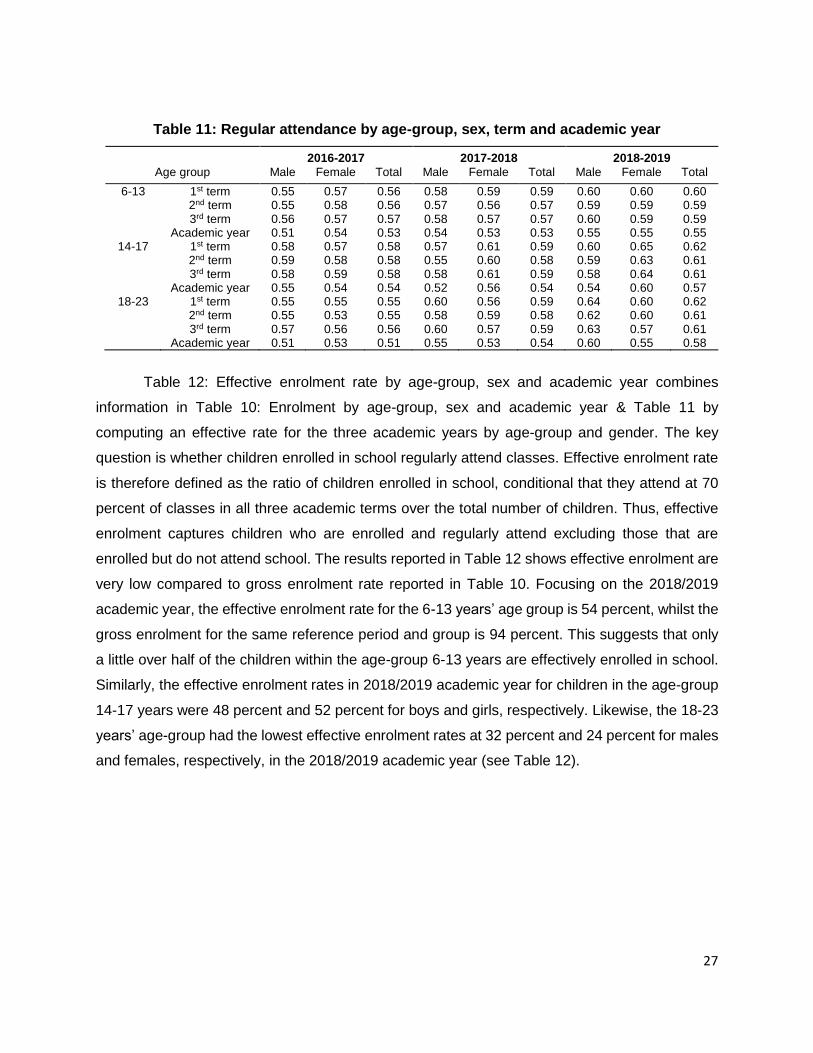
27
Table 11: Regular attendance by age-group, sex, term and academic year
2016-2017 2017-2018 2018-2019
Age group Male Female Total Male Female Total Male Female Total
6-13 1st term 0.55 0.57 0.56 0.58 0.59 0.59 0.60 0.60 0.60 2nd term 0.55 0.58 0.56 0.57 0.56 0.57 0.59 0.59 0.59 3rd term 0.56 0.57 0.57 0.58 0.57 0.57 0.60 0.59 0.59 Academic year 0.51 0.54 0.53 0.54 0.53 0.53 0.55 0.55 0.55
14-17 1st term 0.58 0.57 0.58 0.57 0.61 0.59 0.60 0.65 0.62 2nd term 0.59 0.58 0.58 0.55 0.60 0.58 0.59 0.63 0.61 3rd term 0.58 0.59 0.58 0.58 0.61 0.59 0.58 0.64 0.61 Academic year 0.55 0.54 0.54 0.52 0.56 0.54 0.54 0.60 0.57
18-23 1st term 0.55 0.55 0.55 0.60 0.56 0.59 0.64 0.60 0.62 2nd term 0.55 0.53 0.55 0.58 0.59 0.58 0.62 0.60 0.61 3rd term 0.57 0.56 0.56 0.60 0.57 0.59 0.63 0.57 0.61 Academic year 0.51 0.53 0.51 0.55 0.53 0.54 0.60 0.55 0.58
Table 12: Effective enrolment rate by age-group, sex and academic year combines
information in Table 10: Enrolment by age-group, sex and academic year & Table 11 by
computing an effective rate for the three academic years by age-group and gender. The key
question is whether children enrolled in school regularly attend classes. Effective enrolment rate
is therefore defined as the ratio of children enrolled in school, conditional that they attend at 70
percent of classes in all three academic terms over the total number of children. Thus, effective
enrolment captures children who are enrolled and regularly attend excluding those that are
enrolled but do not attend school. The results reported in Table 12 shows effective enrolment are
very low compared to gross enrolment rate reported in Table 10. Focusing on the 2018/2019
academic year, the effective enrolment rate for the 6-13 years’ age group is 54 percent, whilst the
gross enrolment for the same reference period and group is 94 percent. This suggests that only
a little over half of the children within the age-group 6-13 years are effectively enrolled in school.
Similarly, the effective enrolment rates in 2018/2019 academic year for children in the age-group
14-17 years were 48 percent and 52 percent for boys and girls, respectively. Likewise, the 18-23
years’ age-group had the lowest effective enrolment rates at 32 percent and 24 percent for males
and females, respectively, in the 2018/2019 academic year (see Table 12).
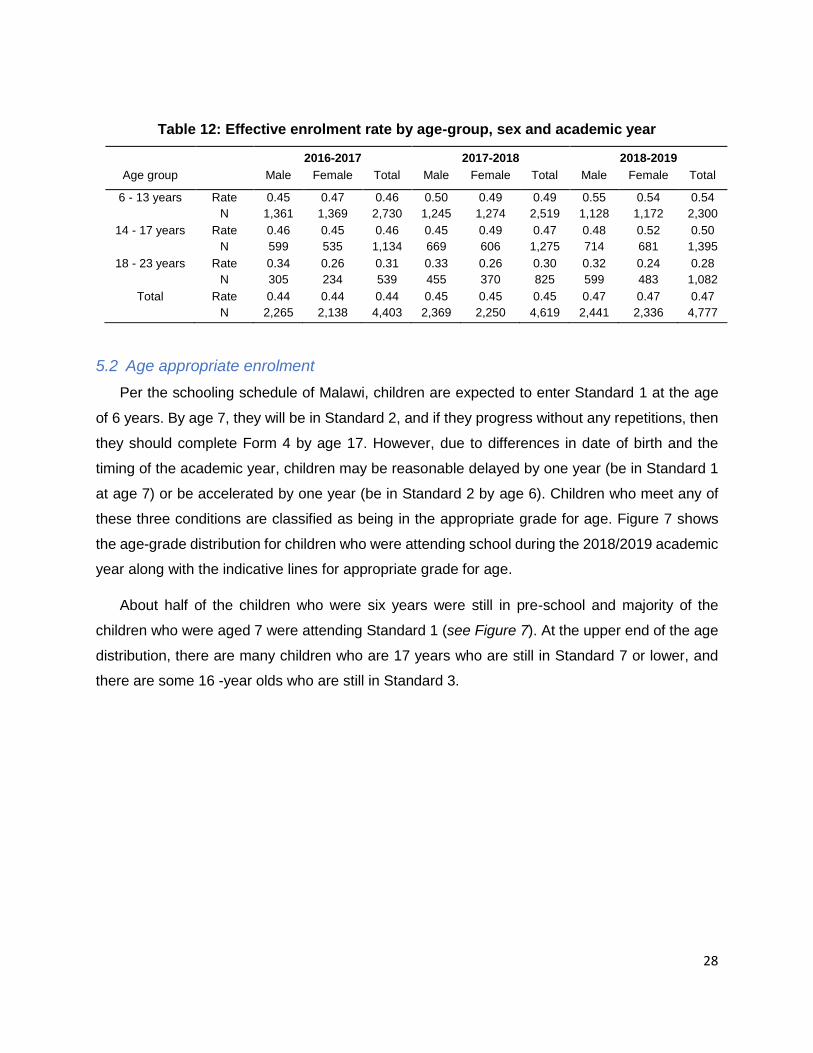
28
Table 12: Effective enrolment rate by age-group, sex and academic year
2016-2017 2017-2018 2018-2019
Age group Male Female Total Male Female Total Male Female Total
6 - 13 years Rate 0.45 0.47 0.46 0.50 0.49 0.49 0.55 0.54 0.54
N 1,361 1,369 2,730 1,245 1,274 2,519 1,128 1,172 2,300
14 - 17 years Rate 0.46 0.45 0.46 0.45 0.49 0.47 0.48 0.52 0.50
N 599 535 1,134 669 606 1,275 714 681 1,395
18 - 23 years Rate 0.34 0.26 0.31 0.33 0.26 0.30 0.32 0.24 0.28
N 305 234 539 455 370 825 599 483 1,082
Total Rate 0.44 0.44 0.44 0.45 0.45 0.45 0.47 0.47 0.47
N 2,265 2,138 4,403 2,369 2,250 4,619 2,441 2,336 4,777
5.2 Age appropriate enrolment
Per the schooling schedule of Malawi, children are expected to enter Standard 1 at the age
of 6 years. By age 7, they will be in Standard 2, and if they progress without any repetitions, then
they should complete Form 4 by age 17. However, due to differences in date of birth and the
timing of the academic year, children may be reasonable delayed by one year (be in Standard 1
at age 7) or be accelerated by one year (be in Standard 2 by age 6). Children who meet any of
these three conditions are classified as being in the appropriate grade for age. Figure 7 shows
the age-grade distribution for children who were attending school during the 2018/2019 academic
year along with the indicative lines for appropriate grade for age.
About half of the children who were six years were still in pre-school and majority of the
children who were aged 7 were attending Standard 1 (see Figure 7). At the upper end of the age
distribution, there are many children who are 17 years who are still in Standard 7 or lower, and
there are some 16 -year olds who are still in Standard 3.
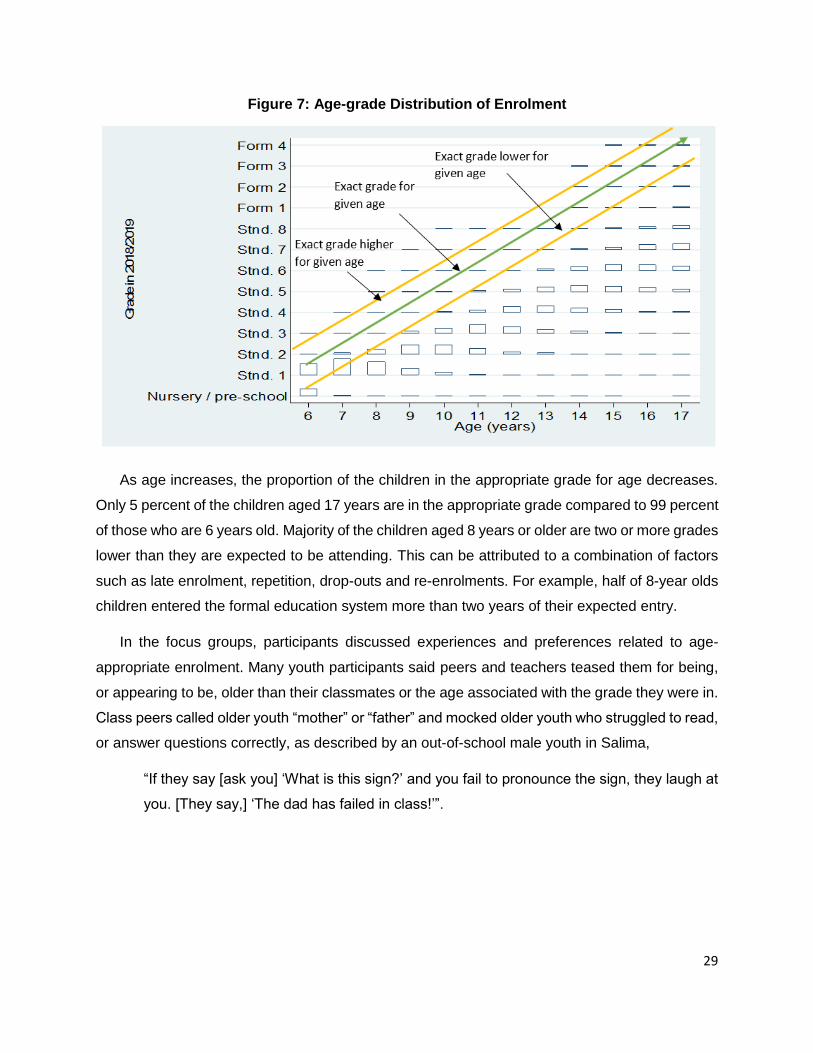
29
Figure 7: Age-grade Distribution of Enrolment
As age increases, the proportion of the children in the appropriate grade for age decreases.
Only 5 percent of the children aged 17 years are in the appropriate grade compared to 99 percent
of those who are 6 years old. Majority of the children aged 8 years or older are two or more grades
lower than they are expected to be attending. This can be attributed to a combination of factors
such as late enrolment, repetition, drop-outs and re-enrolments. For example, half of 8-year olds
children entered the formal education system more than two years of their expected entry.
In the focus groups, participants discussed experiences and preferences related to age-
appropriate enrolment. Many youth participants said peers and teachers teased them for being,
or appearing to be, older than their classmates or the age associated with the grade they were in.
Class peers called older youth “mother” or “father” and mocked older youth who struggled to read,
or answer questions correctly, as described by an out-of-school male youth in Salima,
“If they say [ask you] ‘What is this sign?’ and you fail to pronounce the sign, they laugh at
you. [They say,] ‘The dad has failed in class!’”.
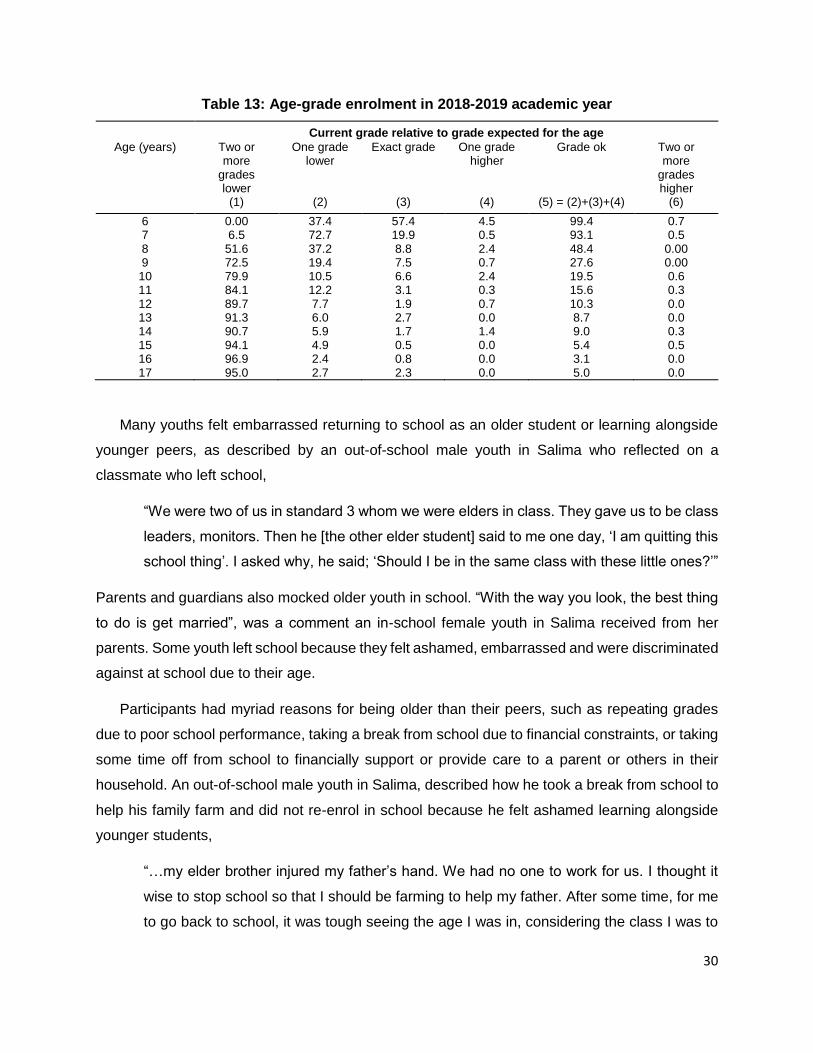
30
Table 13: Age-grade enrolment in 2018-2019 academic year
Current grade relative to grade expected for the age
Age (years) Two or more
grades lower
One grade lower
Exact grade One grade higher
Grade ok Two or more
grades higher
(1) (2) (3) (4) (5) = (2)+(3)+(4) (6)
6 0.00 37.4 57.4 4.5 99.4 0.7 7 6.5 72.7 19.9 0.5 93.1 0.5 8 51.6 37.2 8.8 2.4 48.4 0.00 9 72.5 19.4 7.5 0.7 27.6 0.00 10 79.9 10.5 6.6 2.4 19.5 0.6 11 84.1 12.2 3.1 0.3 15.6 0.3 12 89.7 7.7 1.9 0.7 10.3 0.0 13 91.3 6.0 2.7 0.0 8.7 0.0 14 90.7 5.9 1.7 1.4 9.0 0.3 15 94.1 4.9 0.5 0.0 5.4 0.5 16 96.9 2.4 0.8 0.0 3.1 0.0 17 95.0 2.7 2.3 0.0 5.0 0.0
Many youths felt embarrassed returning to school as an older student or learning alongside
younger peers, as described by an out-of-school male youth in Salima who reflected on a
classmate who left school,
“We were two of us in standard 3 whom we were elders in class. They gave us to be class
leaders, monitors. Then he [the other elder student] said to me one day, ‘I am quitting this
school thing’. I asked why, he said; ‘Should I be in the same class with these little ones?’”
Parents and guardians also mocked older youth in school. “With the way you look, the best thing
to do is get married”, was a comment an in-school female youth in Salima received from her
parents. Some youth left school because they felt ashamed, embarrassed and were discriminated
against at school due to their age.
Participants had myriad reasons for being older than their peers, such as repeating grades
due to poor school performance, taking a break from school due to financial constraints, or taking
some time off from school to financially support or provide care to a parent or others in their
household. An out-of-school male youth in Salima, described how he took a break from school to
help his family farm and did not re-enrol in school because he felt ashamed learning alongside
younger students,
“…my elder brother injured my father’s hand. We had no one to work for us. I thought it
wise to stop school so that I should be farming to help my father. After some time, for me
to go back to school, it was tough seeing the age I was in, considering the class I was to
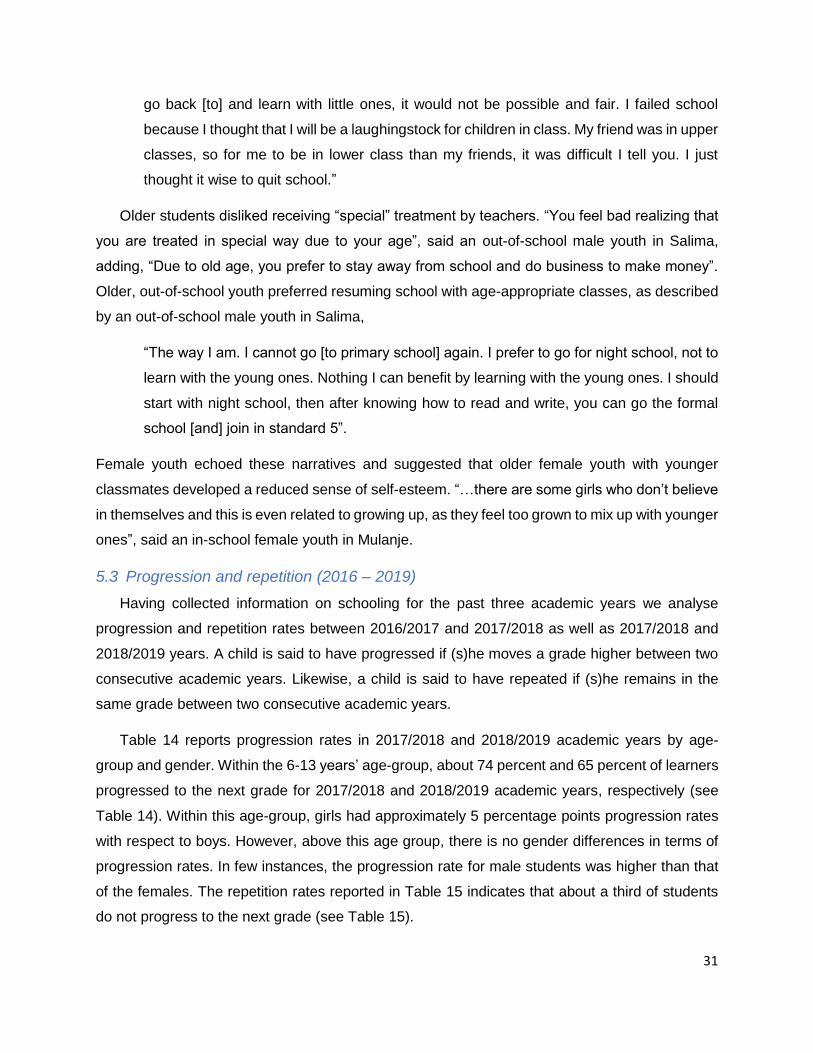
31
go back [to] and learn with little ones, it would not be possible and fair. I failed school
because I thought that I will be a laughingstock for children in class. My friend was in upper
classes, so for me to be in lower class than my friends, it was difficult I tell you. I just
thought it wise to quit school.”
Older students disliked receiving “special” treatment by teachers. “You feel bad realizing that
you are treated in special way due to your age”, said an out-of-school male youth in Salima,
adding, “Due to old age, you prefer to stay away from school and do business to make money”.
Older, out-of-school youth preferred resuming school with age-appropriate classes, as described
by an out-of-school male youth in Salima,
“The way I am. I cannot go [to primary school] again. I prefer to go for night school, not to
learn with the young ones. Nothing I can benefit by learning with the young ones. I should
start with night school, then after knowing how to read and write, you can go the formal
school [and] join in standard 5”.
Female youth echoed these narratives and suggested that older female youth with younger
classmates developed a reduced sense of self-esteem. “…there are some girls who don’t believe
in themselves and this is even related to growing up, as they feel too grown to mix up with younger
ones”, said an in-school female youth in Mulanje.
5.3 Progression and repetition (2016 – 2019)
Having collected information on schooling for the past three academic years we analyse
progression and repetition rates between 2016/2017 and 2017/2018 as well as 2017/2018 and
2018/2019 years. A child is said to have progressed if (s)he moves a grade higher between two
consecutive academic years. Likewise, a child is said to have repeated if (s)he remains in the
same grade between two consecutive academic years.
Table 14 reports progression rates in 2017/2018 and 2018/2019 academic years by age-
group and gender. Within the 6-13 years’ age-group, about 74 percent and 65 percent of learners
progressed to the next grade for 2017/2018 and 2018/2019 academic years, respectively (see
Table 14). Within this age-group, girls had approximately 5 percentage points progression rates
with respect to boys. However, above this age group, there is no gender differences in terms of
progression rates. In few instances, the progression rate for male students was higher than that
of the females. The repetition rates reported in Table 15 indicates that about a third of students
do not progress to the next grade (see Table 15).
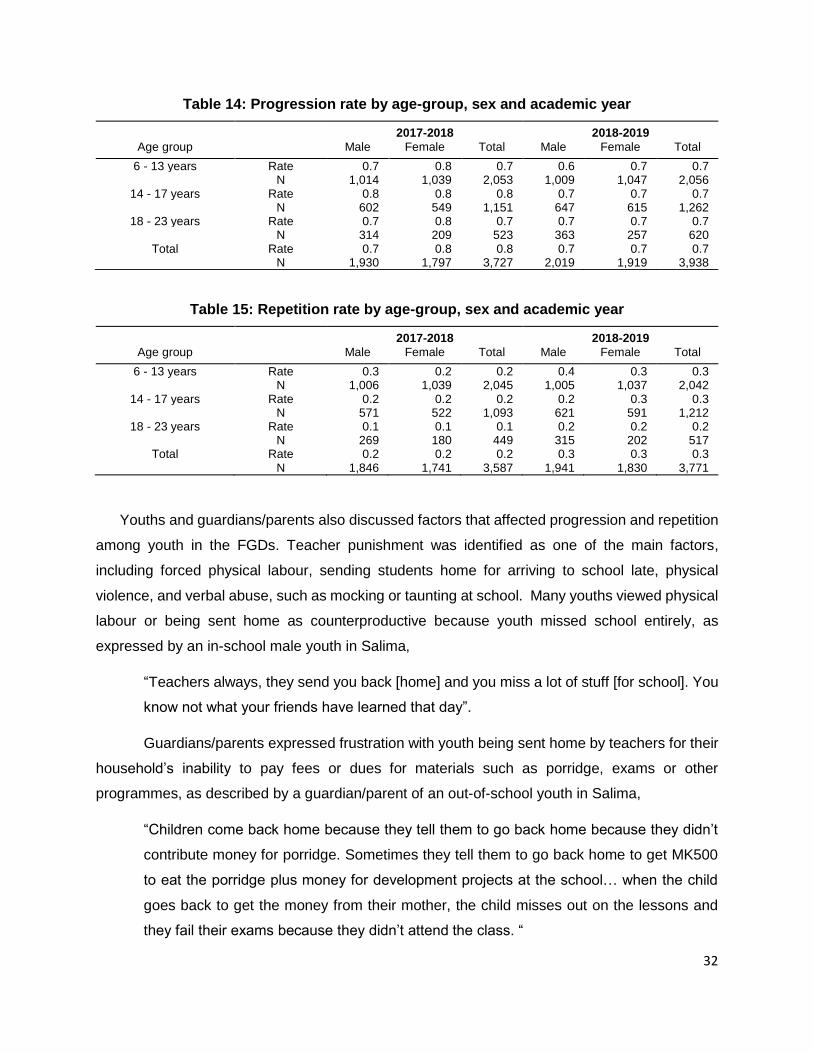
32
Table 14: Progression rate by age-group, sex and academic year
2017-2018 2018-2019
Age group Male Female Total Male Female Total
6 - 13 years Rate 0.7 0.8 0.7 0.6 0.7 0.7 N 1,014 1,039 2,053 1,009 1,047 2,056
14 - 17 years Rate 0.8 0.8 0.8 0.7 0.7 0.7 N 602 549 1,151 647 615 1,262
18 - 23 years Rate 0.7 0.8 0.7 0.7 0.7 0.7 N 314 209 523 363 257 620
Total Rate 0.7 0.8 0.8 0.7 0.7 0.7 N 1,930 1,797 3,727 2,019 1,919 3,938
Table 15: Repetition rate by age-group, sex and academic year
2017-2018 2018-2019
Age group Male Female Total Male Female Total
6 - 13 years Rate 0.3 0.2 0.2 0.4 0.3 0.3 N 1,006 1,039 2,045 1,005 1,037 2,042
14 - 17 years Rate 0.2 0.2 0.2 0.2 0.3 0.3 N 571 522 1,093 621 591 1,212
18 - 23 years Rate 0.1 0.1 0.1 0.2 0.2 0.2 N 269 180 449 315 202 517
Total Rate 0.2 0.2 0.2 0.3 0.3 0.3 N 1,846 1,741 3,587 1,941 1,830 3,771
Youths and guardians/parents also discussed factors that affected progression and repetition
among youth in the FGDs. Teacher punishment was identified as one of the main factors,
including forced physical labour, sending students home for arriving to school late, physical
violence, and verbal abuse, such as mocking or taunting at school. Many youths viewed physical
labour or being sent home as counterproductive because youth missed school entirely, as
expressed by an in-school male youth in Salima,
“Teachers always, they send you back [home] and you miss a lot of stuff [for school]. You
know not what your friends have learned that day”.
Guardians/parents expressed frustration with youth being sent home by teachers for their
household’s inability to pay fees or dues for materials such as porridge, exams or other
programmes, as described by a guardian/parent of an out-of-school youth in Salima,
“Children come back home because they tell them to go back home because they didn’t
contribute money for porridge. Sometimes they tell them to go back home to get MK500
to eat the porridge plus money for development projects at the school… when the child
goes back to get the money from their mother, the child misses out on the lessons and
they fail their exams because they didn’t attend the class. “
33
This participant continued by describing how punishment affected youth learning, and created
worry for parents/guardians,
“When they finally find the money, the child has missed out on most of the lessons. When
they sit for exams, they fail because they missed a lot of classes. Because they didn’t
have money to contribute money for porridge. Maybe if they said, “okay, even though you
didn’t contribute for porridge, you can still attend classes and you will eat later at home”,
but they send the child back home because of porridge. We worry about this a lot.”
Youth also missed class when punished with physical labour (i.e. digging, trimming grass,
etc.) during class at school. Several students believed teachers punished students with difficult
manual labour to demoralize them or make them to drop out of school completely. An in-school
male youth in Salima, described his observations,
“They [teachers] tell you to remove the remains [of] the chuck of a big tree. I tell you, this
[is] bad. Thinking about it, it is better you quit school that to remove the chuck. Sometimes,
the teacher demands that ‘You should remove it today’, the teacher says, ‘You dig a pit-
latrine, three of them only today’ so you can imagine. You are alone and the punishment
is too big. You just end up dropping out.”
An out-of-school male youth in Mulanje, described how excessive punishment affected his
grades and motivation to be in school,
“I was going to school late and I was given stiff punishment while my friends are in class
learning. I was missing a lot, and this made me to drop out from school. Then comes
exams [and] I fail [them].”
These narratives suggest harsh teacher administered punishment caused students to miss
school, which disrupted learning and consequently, reduced academic performance; a process
which discouraged youth from attending school.
Generally, boys felt teachers tended to disproportionately punish them compared to girls, as
described by an out-of-school male youth in Salima,
“If a boy makes a mistake in class, he is given stiff punishment while girls are not punished.
Because of this stiff punishment, boys prefer to leave school. If a girl makes mistake at
school, she is given a small punishment. I can give another example. It happens that a girl
34
touches your private part. Nothing happens. If you report, nothing will follow. If you touch
a girl breasts or buttocks the case is set, you are under attack.”
He further described the “stiff” punishment of digging a large hole in addition to a two-week school
suspension,
“I was given punishment to dig, a hard punishment for me. I was told to dig a pit whereby the
headmaster will not touch his head, this side both width and length. Then I was told that I
should stay home for two weeks without going to school.”
The salience of physical labour made several youths believe that teachers treated girls better than
they treated boys. However, all youth believed excessive punishment discouraged school
attendance for all students.
Participants also said punishment may not always be in direct response to the student’s
actions. “Sometimes the schools may have harsh leaders who may already have had hatred
towards [certain students] and they give harsh punishment,” said an in-school female youth in
Salima. An in-school male youth in Salima, believed teachers gave hard punishments to
discourage some students from being in school,
“Instead of giving you punishment that you deserve they give you a punishment that you
will fail to do it. They tell bad about your parents because of the bad thing you have done
at school. This discourage one to go to school. They raise your temper.”
Students also described experiencing physical violence from teachers. “Some [students] are
beaten by teachers at school to the point of getting sick”, added an out-of-school female youth in
Salima. “…the teachers are violent teachers; they treat us badly. Some learners drop out of school
because of this”, said another youth. Other youth said teachers insulted youth, by saying, ‘mbuli
iwe’ [unintelligent you are] or ‘amangokutailira kwanu’ [they do not caution you at home]. Teachers
mocked and taunted youth who reported teacher abuse, as described by an in-school male youth
in Salima,
“So, the teachers say rude words [like], ‘Even though you reported the case to the rights
groups, I still receive my salary. Go anywhere you will, but I have my salary in my pocket’”
Notably, many youths believed excessive teacher-administered punishment was
counterproductive to school attendance, retention and success; rather than disciplining youth,
punishments disrupted their education, increased school absence, and subsequently, decreased
35
school performance. In addition, excessive punishment appeared to foment feelings of
resentment among youth towards school, teachers and other school peers.
For their part, guardians/parents echoed that some teachers abused youth but shifted
some of the blame to parents, whom they believed were not doing enough to watch or discipline
their children. In echoing sentiments about excessive teacher punishment, guardians/parents
described physical punishment and verbal abuse rather than the labour-based punishment youth
described. One in-school parent said she took her child to a clinic for injuries caused by a
teacher’s beating, which the child hid from her mother. Another in-school parent said physical
punishment discouraged youth from attending school,
“Imagine the child is asked by a teacher to pump air in the mouth and inflate the cheeks,
then the teacher deflates the cheeks with a hard slap”
While guardians/parents believed teachers needed to discipline youth, they disagreed with
excessive physical punishment (though what parents consider “excessive” remains unclear). An
out-of-school parent in Salima, described what may happen when some parents confronted
teachers about physical punishment,
“Because even you as a parent, when the teachers whip the child, some get angry. ‘How
can you beat my child? Have you ever had a child? I had labour pains for this child!’ so
the teachers say, ‘This child’s father is difficult. We will fail him or her. They will repeat
Standard 8’”
In addition to physically hitting youth, this parent suggested some teachers punished or
made youth repeat classes in retaliation for parents shouting at teachers. An out-of-school parent
in Salima, shared a similar experience,
“As he said, when [children] come home because they have been sent back, you ask them
why they were sent back. ‘Because of this reason’, but the parent goes to the school and
demands to know why the child was punished. They shout at the teachers and the
teachers say, ‘Oh, so you are rude because your parents taught you how to be rude?’. So,
to show the parents that they didn’t like what they did, they keep repeating their children,
like someone said earlier. Even if they pass, the teachers say they will only go to the next
class when they stop being rude.”
These responses suggest that some parents believe teachers punish their children because they
dislike the student and/or the student’s parents
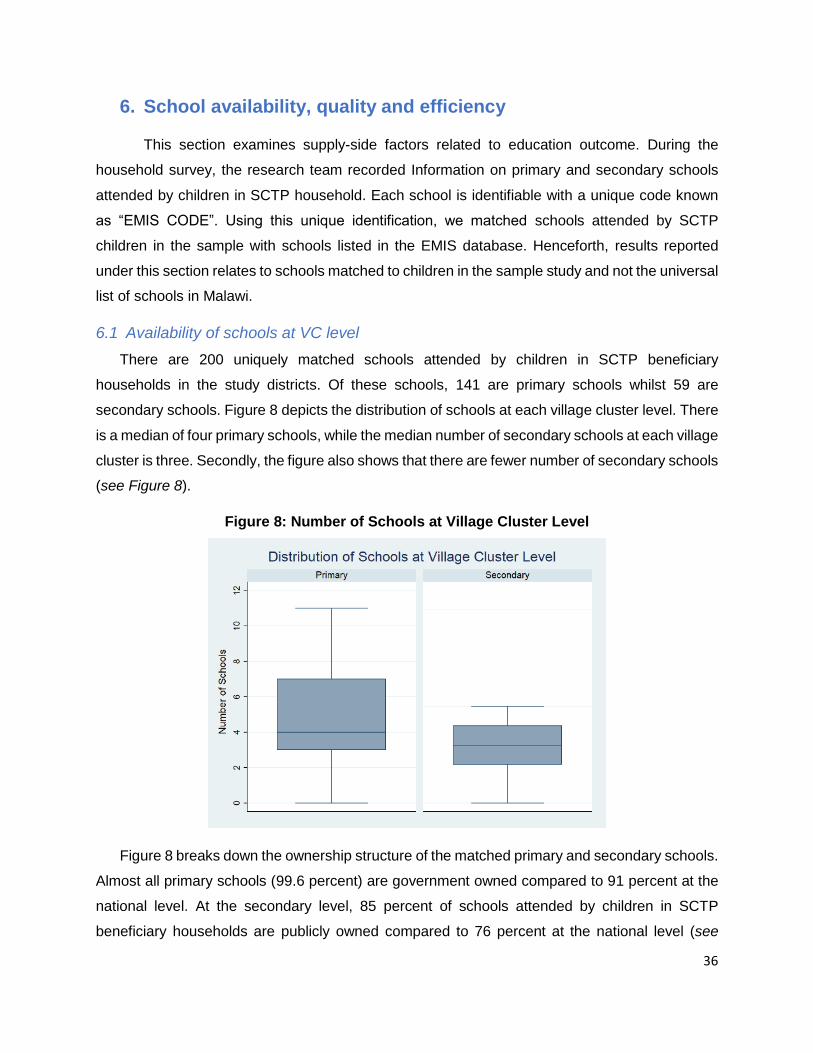
36
6. School availability, quality and efficiency
This section examines supply-side factors related to education outcome. During the
household survey, the research team recorded Information on primary and secondary schools
attended by children in SCTP household. Each school is identifiable with a unique code known
as “EMIS CODE”. Using this unique identification, we matched schools attended by SCTP
children in the sample with schools listed in the EMIS database. Henceforth, results reported
under this section relates to schools matched to children in the sample study and not the universal
list of schools in Malawi.
6.1 Availability of schools at VC level
There are 200 uniquely matched schools attended by children in SCTP beneficiary
households in the study districts. Of these schools, 141 are primary schools whilst 59 are
secondary schools. Figure 8 depicts the distribution of schools at each village cluster level. There
is a median of four primary schools, while the median number of secondary schools at each village
cluster is three. Secondly, the figure also shows that there are fewer number of secondary schools
(see Figure 8).
Figure 8: Number of Schools at Village Cluster Level
Figure 8 breaks down the ownership structure of the matched primary and secondary schools.
Almost all primary schools (99.6 percent) are government owned compared to 91 percent at the
national level. At the secondary level, 85 percent of schools attended by children in SCTP
beneficiary households are publicly owned compared to 76 percent at the national level (see
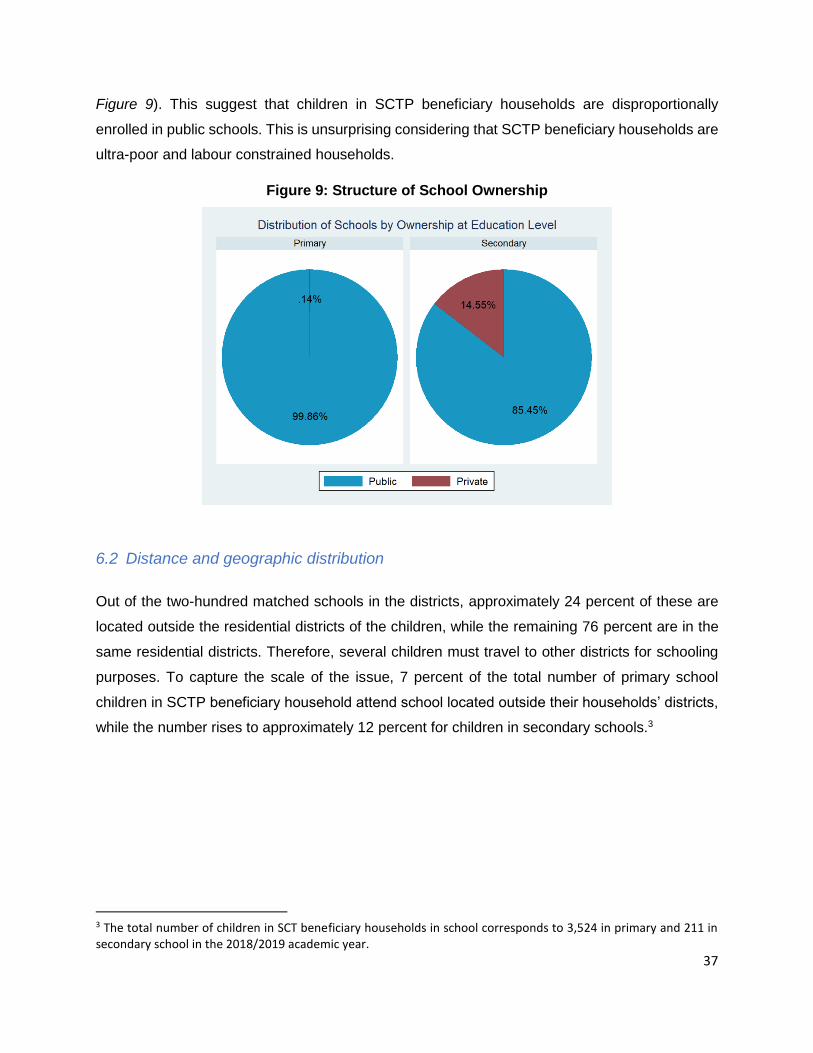
37
Figure 9). This suggest that children in SCTP beneficiary households are disproportionally
enrolled in public schools. This is unsurprising considering that SCTP beneficiary households are
ultra-poor and labour constrained households.
Figure 9: Structure of School Ownership
6.2 Distance and geographic distribution
Out of the two-hundred matched schools in the districts, approximately 24 percent of these are
located outside the residential districts of the children, while the remaining 76 percent are in the
same residential districts. Therefore, several children must travel to other districts for schooling
purposes. To capture the scale of the issue, 7 percent of the total number of primary school
children in SCTP beneficiary household attend school located outside their households’ districts,
while the number rises to approximately 12 percent for children in secondary schools.3
3 The total number of children in SCT beneficiary households in school corresponds to 3,524 in primary and 211 in secondary school in the 2018/2019 academic year.
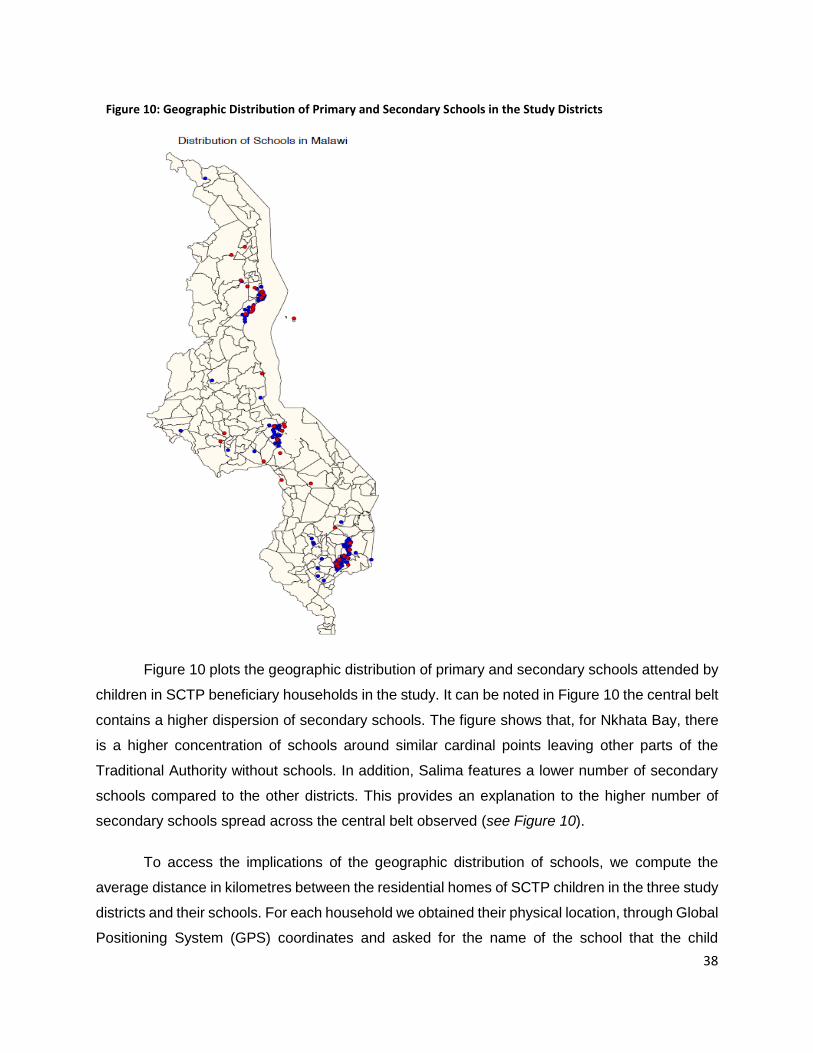
38
Figure 10 plots the geographic distribution of primary and secondary schools attended by
children in SCTP beneficiary households in the study. It can be noted in Figure 10 the central belt
contains a higher dispersion of secondary schools. The figure shows that, for Nkhata Bay, there
is a higher concentration of schools around similar cardinal points leaving other parts of the
Traditional Authority without schools. In addition, Salima features a lower number of secondary
schools compared to the other districts. This provides an explanation to the higher number of
secondary schools spread across the central belt observed (see Figure 10).
To access the implications of the geographic distribution of schools, we compute the
average distance in kilometres between the residential homes of SCTP children in the three study
districts and their schools. For each household we obtained their physical location, through Global
Positioning System (GPS) coordinates and asked for the name of the school that the child
Figure 10: Geographic Distribution of Primary and Secondary Schools in the Study Districts
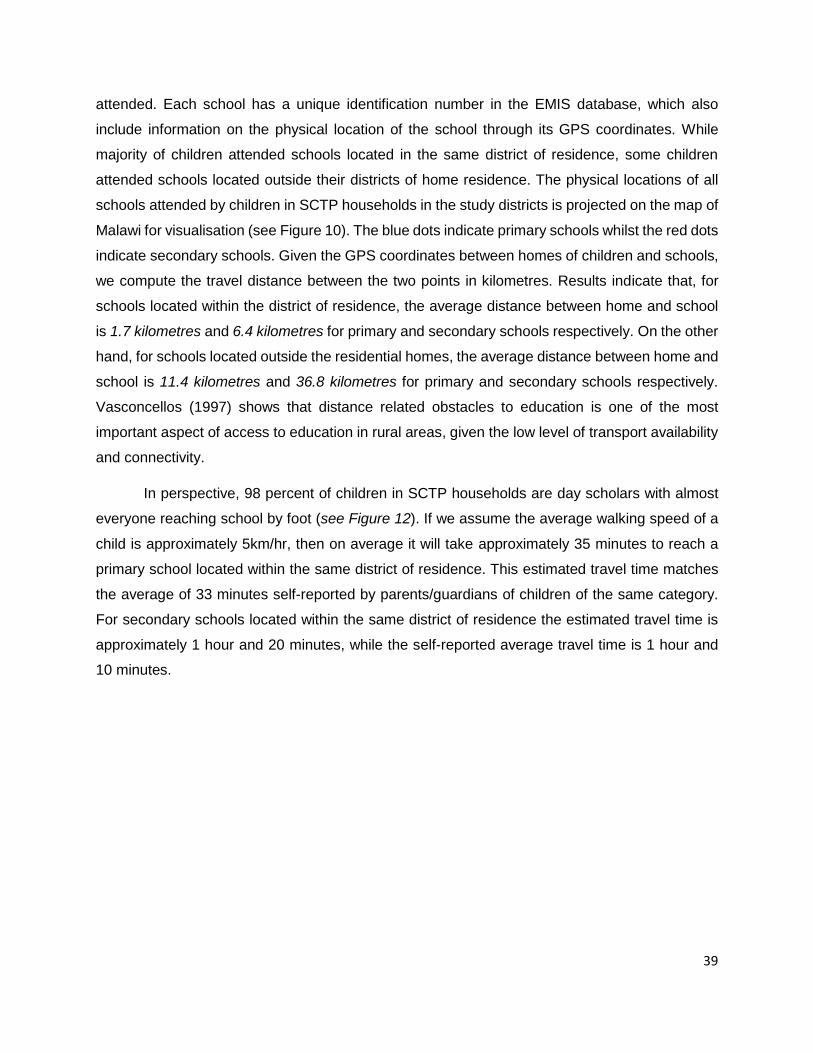
39
attended. Each school has a unique identification number in the EMIS database, which also
include information on the physical location of the school through its GPS coordinates. While
majority of children attended schools located in the same district of residence, some children
attended schools located outside their districts of home residence. The physical locations of all
schools attended by children in SCTP households in the study districts is projected on the map of
Malawi for visualisation (see Figure 10). The blue dots indicate primary schools whilst the red dots
indicate secondary schools. Given the GPS coordinates between homes of children and schools,
we compute the travel distance between the two points in kilometres. Results indicate that, for
schools located within the district of residence, the average distance between home and school
is 1.7 kilometres and 6.4 kilometres for primary and secondary schools respectively. On the other
hand, for schools located outside the residential homes, the average distance between home and
school is 11.4 kilometres and 36.8 kilometres for primary and secondary schools respectively.
Vasconcellos (1997) shows that distance related obstacles to education is one of the most
important aspect of access to education in rural areas, given the low level of transport availability
and connectivity.
In perspective, 98 percent of children in SCTP households are day scholars with almost
everyone reaching school by foot (see Figure 12). If we assume the average walking speed of a
child is approximately 5km/hr, then on average it will take approximately 35 minutes to reach a
primary school located within the same district of residence. This estimated travel time matches
the average of 33 minutes self-reported by parents/guardians of children of the same category.
For secondary schools located within the same district of residence the estimated travel time is
approximately 1 hour and 20 minutes, while the self-reported average travel time is 1 hour and
10 minutes.
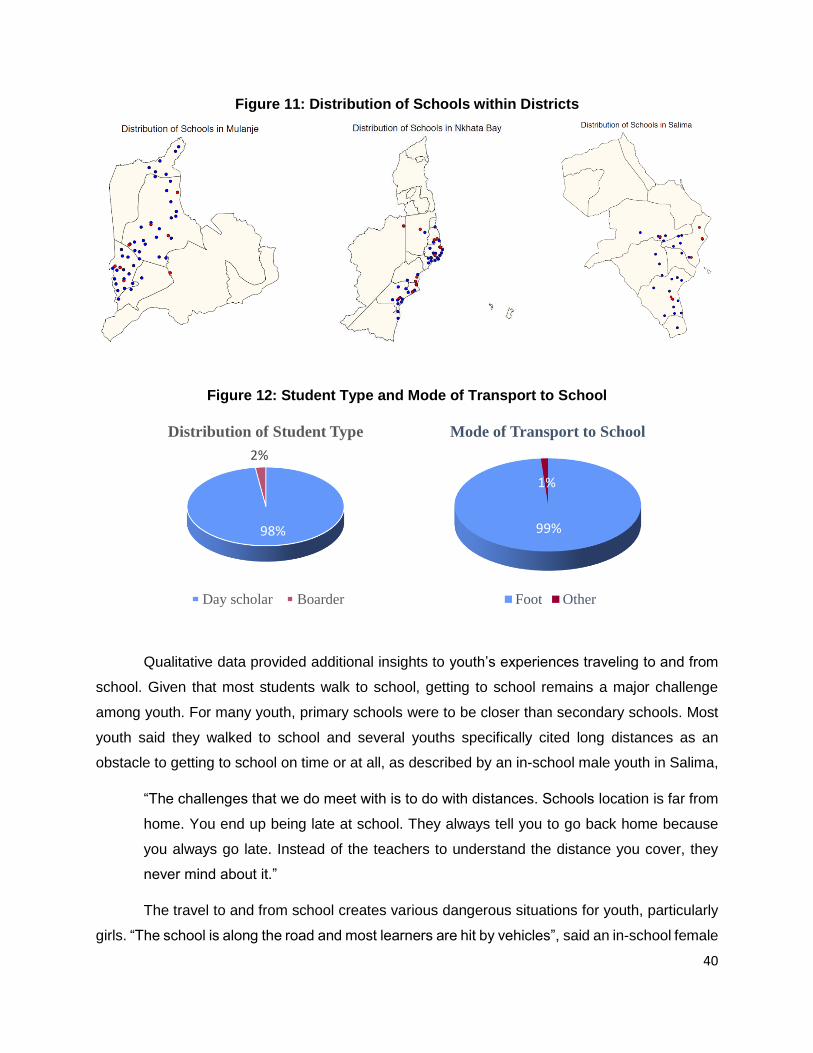
40
Figure 11: Distribution of Schools within Districts
Figure 12: Student Type and Mode of Transport to School
Qualitative data provided additional insights to youth’s experiences traveling to and from
school. Given that most students walk to school, getting to school remains a major challenge
among youth. For many youth, primary schools were to be closer than secondary schools. Most
youth said they walked to school and several youths specifically cited long distances as an
obstacle to getting to school on time or at all, as described by an in-school male youth in Salima,
“The challenges that we do meet with is to do with distances. Schools location is far from
home. You end up being late at school. They always tell you to go back home because
you always go late. Instead of the teachers to understand the distance you cover, they
never mind about it.”
The travel to and from school creates various dangerous situations for youth, particularly
girls. “The school is along the road and most learners are hit by vehicles”, said an in-school female
98%
2%
Distribution of Student Type
Day scholar Boarder
99%
1%
Mode of Transport to School
Foot Other
41
youth in Mulanje. Some youth, like an in-school female youth in Mulanje, said that girls risked
violence from boys, “We face a lot of challenges along the road to school, boys may get to ask us
and say they will beat us if we refuse”. The rainy season posed safety concerns as well. An in-
school male youth in Salima, tended to stay home during the rainy season out of safety, “Rainy
season rumours go that thugs are everywhere. Because of this, I do stay at home without going
to school. I am afraid of being attacked”. “The reasons why youth fail to go to school is because
of the river. If the river is full, young ones cannot make it to cross the river. There is no bridge.
This is mainly rainy season”, said an in-school male youth in Salima. As noted earlier, many
youths said heavy morning workloads caused them to arrive late to school.
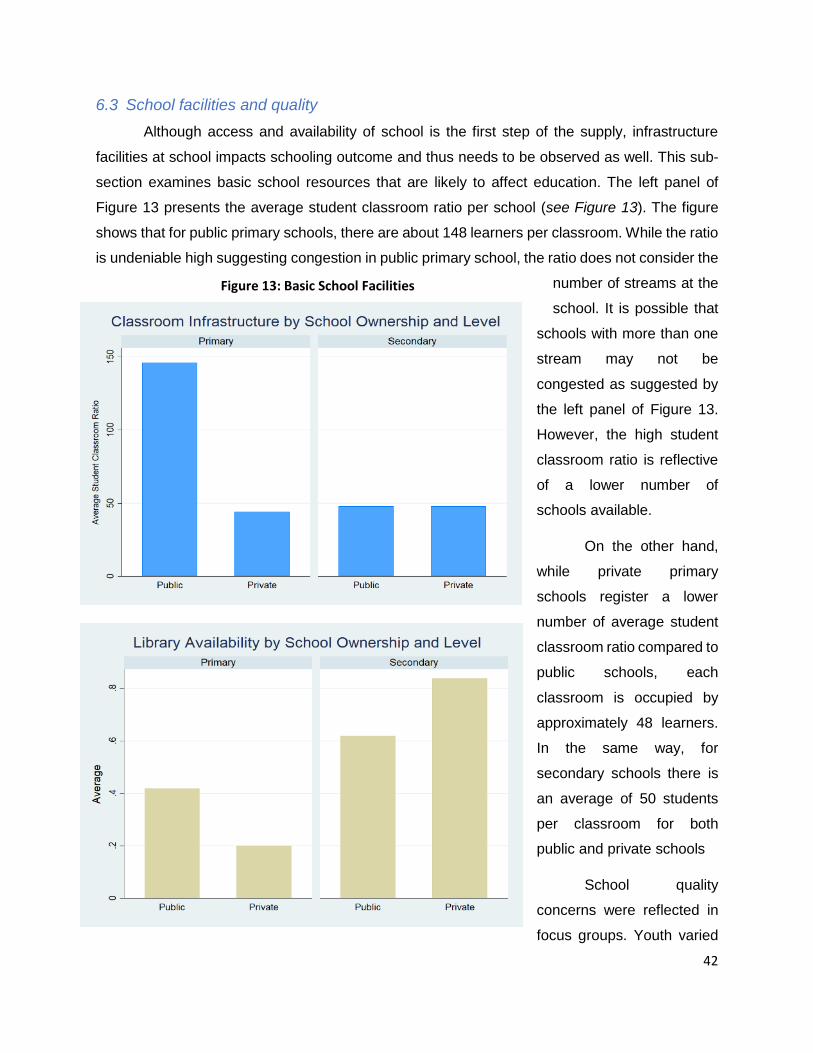
42
6.3 School facilities and quality
Although access and availability of school is the first step of the supply, infrastructure
facilities at school impacts schooling outcome and thus needs to be observed as well. This sub-
section examines basic school resources that are likely to affect education. The left panel of
Figure 13 presents the average student classroom ratio per school (see Figure 13). The figure
shows that for public primary schools, there are about 148 learners per classroom. While the ratio
is undeniable high suggesting congestion in public primary school, the ratio does not consider the
number of streams at the
school. It is possible that
schools with more than one
stream may not be
congested as suggested by
the left panel of Figure 13.
However, the high student
classroom ratio is reflective
of a lower number of
schools available.
On the other hand,
while private primary
schools register a lower
number of average student
classroom ratio compared to
public schools, each
classroom is occupied by
approximately 48 learners.
In the same way, for
secondary schools there is
an average of 50 students
per classroom for both
public and private schools
School quality
concerns were reflected in
focus groups. Youth varied
Figure 13: Basic School Facilities
43
in their descriptions of school facilities. For example, some in-school male youth in FGD in Salima
described their schools as, Manyaka [nothing good], Maphunziro alipo [quality education], Mbola
[nothing], Osowa [needy], Osauka [poor], Ya bho [well]. An in-school male youth in Salima,
explained his description, manyaka [nothing good],
“We have one secondary school, but the area is too large; the population is too high for
single secondary school. Students walk long distances to come to this school. A lot of
leaners drop out before completing their studies. The other reason is that teaching
materials are not adequate. School blocks are not there. This is the reason why I have
called them ‘manyaka’ [nothing good]”
“…some leaners learn under trees’” added a participant in the same focus group. Youth
cited deteriorated school buildings, lack of electricity, overcrowded classrooms and poor school
materials as issues with their school facilities. Others however, described their school facilities
with more pride, “I can say our school is a flower” said an in-school female youth in Mulanje, while
a fellow peer added, “Our school is good and was built well and most people admire it.” In some
communities, participants described school grounds as important community places in the
community where people gathered to celebrate weddings, host community meetings or play
sports.
7. Determinants of Schooling
This section examines the potential determinants of education outcomes among children
living in SCTP beneficiary households. We focus on two outcome variables presented in Chapter
0 of this report: effective enrolment and grade progression. The analysis of effective enrolment
will shed light on the factors that impede school enrolment and regular attendance simultaneously.
Effective enrolment thus captures the basic form of school participation. Additionally, the second
outcome variable – progression – will capture favourable human capital development, whereby
the child can expand acquired knowledge at each higher grade. Sections 7.1 and 7.2 examine
demand-side factors whilst section 7.3 examines supply-side factors. Thereafter, section 7.4 then
discusses other cultural barriers to school attendance that come out of the qualitative discussions
with youth and their parents/guardians.
7.1 Household and individual level non-monetary factors
This section examines non-monetary demand-side factors that affect education outcome. For
all sub-sections under this section, we estimate the following latent variable model using Probit:
44
𝑌𝑖 = 𝐗P𝛽 + 𝜀𝑖,
where 𝑌𝑖 is the outcome variable equal to one if the child is effectively enrolled or progressed in
the 2018/2019 academic year and zero otherwise. The vector 𝐗P contains sets of policy variables
hypothesized to be a determinant of the two outcome variables, whiles 𝜀𝑖 is idiosyncratic error
term. The estimated equations consider the survey nature of the dataset while all standard errors
are bootstrapped. Additionally, to account for gender heterogeneity, for each outcome variable
we estimate separate equations for males and females. Data comes from the quantitative
household survey implemented by the research team. School supply indicators are constructed
from the EMIS.
We plot the results of the estimated coefficients while the detailed tables are reported in the
appendix. The horizontal bars indicate the estimated 90 percent confidence intervals, while the
diamond shape dot indicate the point estimate. For each estimated policy variable in the vector,
𝐗P, we test the null hypothesis that the estimated coefficient is equal to zero against the alternative
hypothesis that the coefficient is different from zero. This is summarized in the vertical line on 𝑥 =
0. For a policy variable to be a statistically significant determinant of any of the education outcome
we must reject the null hypothesis that the estimated coefficient is equal to zero. Hence, whenever
the confidence interval crosses the vertical line, it means the variable is not statistically significant.
In other words, the variable is not a determinant of our objective outcome variable.
7.1.1 Children’s Material Well-being
Kilburn, et al., (2017) showed that beneficiary households in Malawi are likely to invest in
child material well-being items such us clothes, shoes, and blankets. We extend on that analsysis
to determine whether children lacking at least two sets of clothes or shoes are less likely to
participate in schooling. Figure 14 plots the estimated confidence intervals, with coefficients
marked as a dot for lack of two sets of clothes and two pairs of shoes on effective enrolment and
progression. The figure shows that the lack of two sets of clothes reduces school participation
through effective enrolment (see Figure 14). The estimated coefficient is statistically significant
for males while narrowly misses out for females.
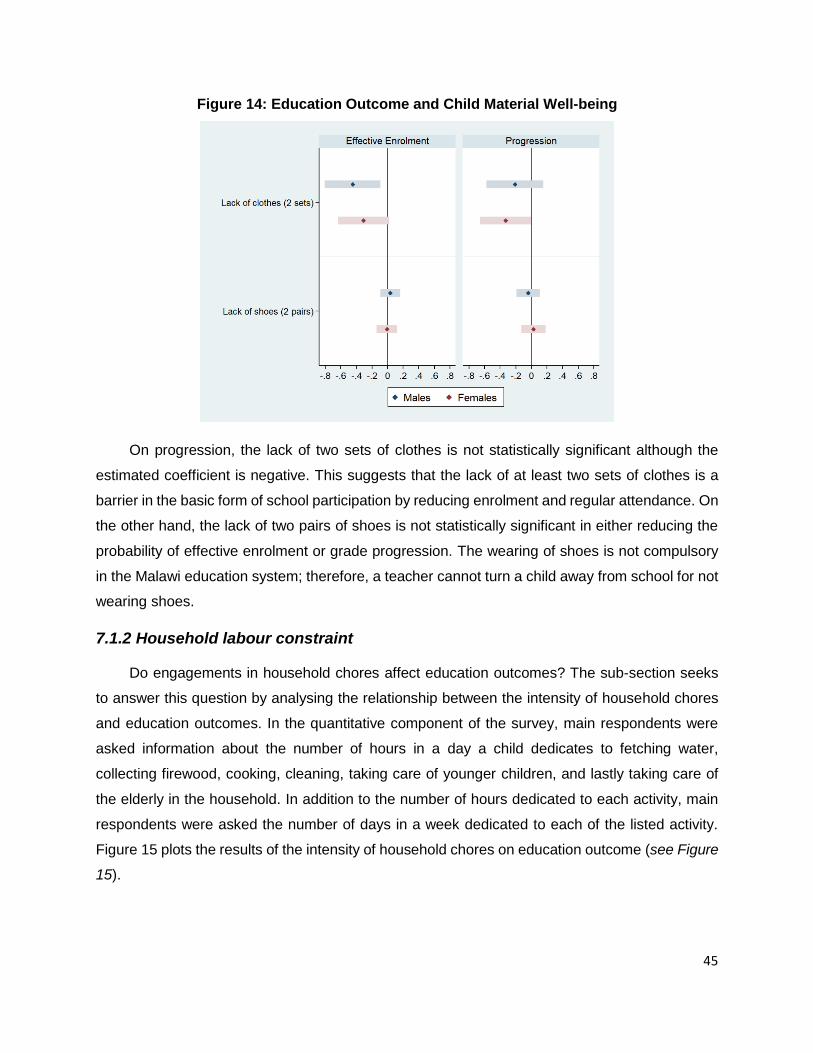
45
Figure 14: Education Outcome and Child Material Well-being
On progression, the lack of two sets of clothes is not statistically significant although the
estimated coefficient is negative. This suggests that the lack of at least two sets of clothes is a
barrier in the basic form of school participation by reducing enrolment and regular attendance. On
the other hand, the lack of two pairs of shoes is not statistically significant in either reducing the
probability of effective enrolment or grade progression. The wearing of shoes is not compulsory
in the Malawi education system; therefore, a teacher cannot turn a child away from school for not
wearing shoes.
7.1.2 Household labour constraint
Do engagements in household chores affect education outcomes? The sub-section seeks
to answer this question by analysing the relationship between the intensity of household chores
and education outcomes. In the quantitative component of the survey, main respondents were
asked information about the number of hours in a day a child dedicates to fetching water,
collecting firewood, cooking, cleaning, taking care of younger children, and lastly taking care of
the elderly in the household. In addition to the number of hours dedicated to each activity, main
respondents were asked the number of days in a week dedicated to each of the listed activity.
Figure 15 plots the results of the intensity of household chores on education outcome (see Figure
15).
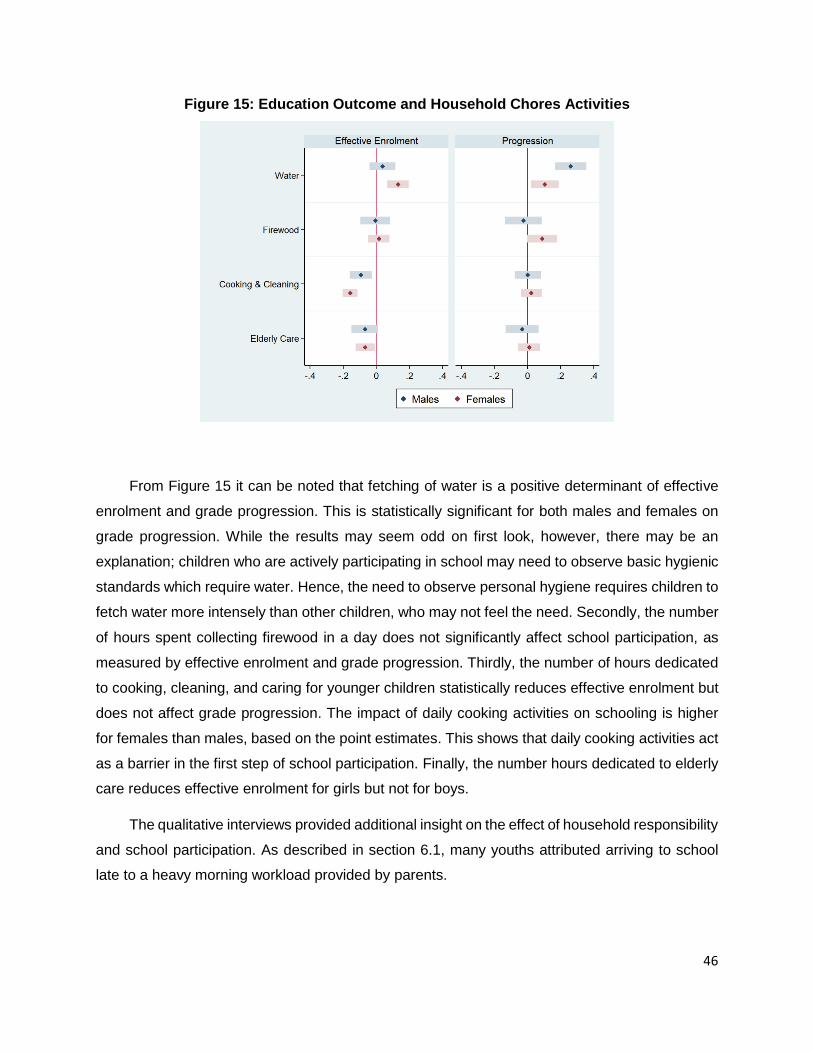
46
Figure 15: Education Outcome and Household Chores Activities
From Figure 15 it can be noted that fetching of water is a positive determinant of effective
enrolment and grade progression. This is statistically significant for both males and females on
grade progression. While the results may seem odd on first look, however, there may be an
explanation; children who are actively participating in school may need to observe basic hygienic
standards which require water. Hence, the need to observe personal hygiene requires children to
fetch water more intensely than other children, who may not feel the need. Secondly, the number
of hours spent collecting firewood in a day does not significantly affect school participation, as
measured by effective enrolment and grade progression. Thirdly, the number of hours dedicated
to cooking, cleaning, and caring for younger children statistically reduces effective enrolment but
does not affect grade progression. The impact of daily cooking activities on schooling is higher
for females than males, based on the point estimates. This shows that daily cooking activities act
as a barrier in the first step of school participation. Finally, the number hours dedicated to elderly
care reduces effective enrolment for girls but not for boys.
The qualitative interviews provided additional insight on the effect of household responsibility
and school participation. As described in section 6.1, many youths attributed arriving to school
late to a heavy morning workload provided by parents.
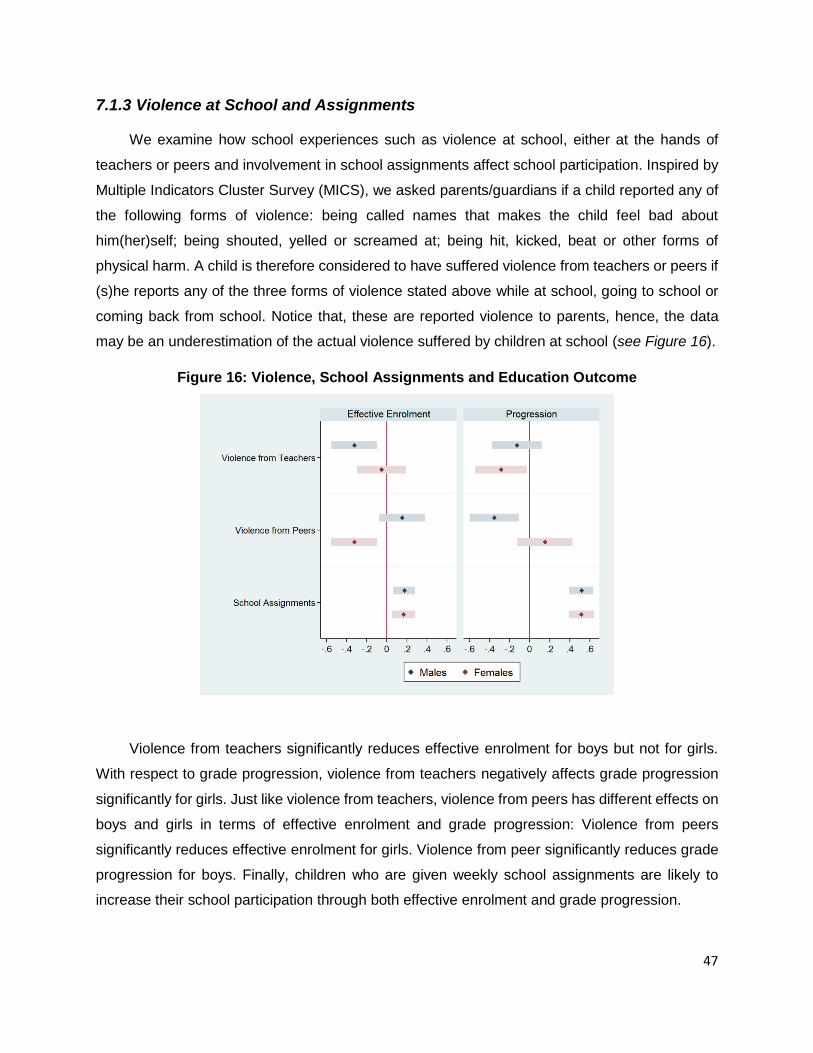
47
7.1.3 Violence at School and Assignments
We examine how school experiences such as violence at school, either at the hands of
teachers or peers and involvement in school assignments affect school participation. Inspired by
Multiple Indicators Cluster Survey (MICS), we asked parents/guardians if a child reported any of
the following forms of violence: being called names that makes the child feel bad about
him(her)self; being shouted, yelled or screamed at; being hit, kicked, beat or other forms of
physical harm. A child is therefore considered to have suffered violence from teachers or peers if
(s)he reports any of the three forms of violence stated above while at school, going to school or
coming back from school. Notice that, these are reported violence to parents, hence, the data
may be an underestimation of the actual violence suffered by children at school (see Figure 16).
Figure 16: Violence, School Assignments and Education Outcome
Violence from teachers significantly reduces effective enrolment for boys but not for girls.
With respect to grade progression, violence from teachers negatively affects grade progression
significantly for girls. Just like violence from teachers, violence from peers has different effects on
boys and girls in terms of effective enrolment and grade progression: Violence from peers
significantly reduces effective enrolment for girls. Violence from peer significantly reduces grade
progression for boys. Finally, children who are given weekly school assignments are likely to
increase their school participation through both effective enrolment and grade progression.
48
7.1.4 Teacher induced sexual harassment and violence at school
In the FGD, youth and guardians/parents suggested that apart from physical abuse suffered
at the hands of teachers, sexual violence perpetrated by teachers was one of the factors that
affect school participation, most notably among girls. Youth and guardians/parents believed
female students had increased risk and vulnerability of being sexually assaulted by male teachers.
“Some [male] leaders are also inappropriate that they touch some girls’ breasts”, said an in-school
female youth in Salima. Male youth also said male teachers asked out female youth or asked
them for sexual favours, as echoed by an in-school female youth in Mulanje, who said, “being
asked out by [male] teachers for better grades” was a problem for female youth in school.
Parents and guardians echoed concerns about male teachers behaving inappropriately
with female youth. “The male teachers here usually deceive the children”, said an out-of-school
parent in Salima. An out-of-school parent in the same focus group, voiced concerns about male
teachers targeting economically vulnerable girls,
“Like (other participant) said, the teachers are male. A girl is sweeping, and he sees that
things are not well here (because the dressing is not modest) so even the teachers turn
loose. But it all starts at home.”
Some guardians/parents blamed other parents and guardians for neglecting their children
and leaving them vulnerable to sexual assault by male teachers. Other guardians/parents said
male teachers are a reason some female youth leave school, as described by an out-of-school
parent in Mulanje,
“They drop out from school because they go at school without any motive. They meet with
a teacher and they [the male teacher] ask love [girls] to them, they deny. They prefer to
stay at home. Asking them, ‘Why not going to school?’, they say, ‘My teacher proposed
me. So, I better stay away from him’”.
Female students did their best to stay motivated in school. Several female youths remained
inspired by female teachers and teachers who treated students well. Some students like an in-
school female youth in Salima, tried to focus on the positive aspects in school, “The lessons are
good, and I get inspired by the female teachers and not focus on men”.
49
7.1.5 Violence perpetrated by peers
Violence perpetuated by peers was also discussed in the FGD. Youth described peer-
induced violence as less of a barrier or threat to school participation. As noted earlier, some girls
said boys would physically hit them if they rejected their romantic or sexual advances. Youth also
described fights between friends at school. Lastly, youth described bullying, often described as a
form of emotional violence. Youth were bullied by peers for their income, physical appearances,
age, clothing, perceived intellect, gender, relationships with others and more “Most girls have low
self-esteem and they look at themselves and feel not fit for the class or mix up with children still
drilling mucus. They choose to stay home”, said one in-school female youth. Guardians/parents
similarly described emotional violence among peers (teasing) but not physical violence. No
participants described sexual violence among peers. Instead, they alluded to having romantic or
sexual partners (boyfriends, girlfriends). Physical, sexual or emotional violence was not discussed
among school going youth with romantic or sexual partners.
7.1.6 Household-based violence and school participation
FGD also provided insights to household-based violence and its impact on school
participation. Youth described economic and sexual violence occurring within households,
typically perpetuated by parents/guardians an additional important factor leading to early school
drop-out or non-attendance. Youth tended to describe situations observed in other households
rather than provide personal examples of their own. Many youth, males and females alike,
believed families encouraged, pressured, or forced girls and young women to drop out of school
and marry older men for economic reasons, as described by an in-school male youth in Salima,
“It happens that parents force their daughter to get married to older men so that they
should have benefits from the marriage such as tea. Parents do abuse these girls by
forcing them to get married while young”
Another in-school male youth in Salima described the situation of a girl in his village,
whose parents withheld money for exams in order to force her to marry. “Due to poverty, it
happens to some girls, they get to be forced to marry someone older so that the man gives the
family money,” said an in-school female youth, reflecting the common prevalence of child
marriage in Malawi. Guardians/parents echoed these narratives, though some blamed girls and
young women for their interest in older men. Many guardians/parents, like an in-school parent in
Mulanje, believed youth “don’t listen” to advice and counsel,
50
“I differentiate this generation to the past ones, the past one would listen, but now, no! For
the boys, you will hear he was smoking weed. For the girls you will hear she was with an
older man, [having] relationships. So, what can you do?”
Guardians/parents blamed girls and their parents for girls having sexual relationships and
marrying young. Interestingly, many female parents married young themselves and left school
early. One out-of-school parent in Salima reflected on her own experiences when confronted
about her own past,
“Once they feel good, that’s it. They even forget school and all they want is a man, and
when you intervene, they will ask, ‘Did you go to school yourself?’ How far did you go?’
Then you have nothing to say.”
Some guardians/parents said they found it difficult to have these conversations with youth
because they themselves are not able to lead by example. The topics of sex and marriage
appeared to create tension between youth and guardians/parents; guardians/parents spoke
negatively of female youth they believed were having sex with older men and yet, older youth felt
pressured by their families to start families of their own and some female youth felt pressured to
marry older men. Sex was a salient theme among focus groups discussions as many participants
described the consequences of sex such as early pregnancy and marriage, both of which caused
youth to drop out of school and made it increasingly difficult for them to return. As illustrated, while
parents often blamed female youth for pregnancy but blamed the roles of men or boys in
pregnancy to a much lesser extent, highlighting the discrepancy of gendered expectations
between men and women.
Other youth, notably young men, suggested sexual violence within a household as a factor
leading to female dropouts and early marriage, as reflected by an out-of-school male youth in
Salima,
“We have violence against children in homes we are coming from. If you have been
violated, you cannot perform better because you are under attack. You cannot make it in
class. You just think of what you are passing through. This is the reason why she preferred
to [leave school and] get married.”
Parents described the effects of household violence on youth differently, suggesting that
youth leave school to support their mothers, as described by an out-of-school parent in Mulanje,
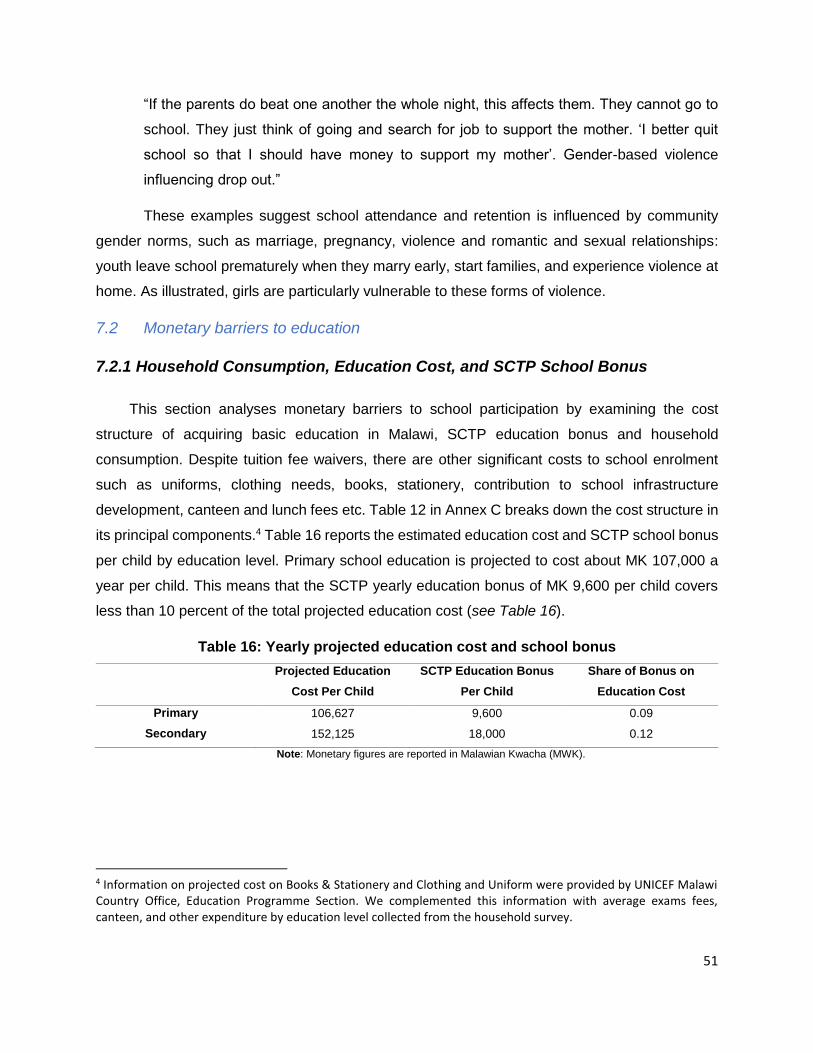
51
“If the parents do beat one another the whole night, this affects them. They cannot go to
school. They just think of going and search for job to support the mother. ‘I better quit
school so that I should have money to support my mother’. Gender-based violence
influencing drop out.”
These examples suggest school attendance and retention is influenced by community
gender norms, such as marriage, pregnancy, violence and romantic and sexual relationships:
youth leave school prematurely when they marry early, start families, and experience violence at
home. As illustrated, girls are particularly vulnerable to these forms of violence.
7.2 Monetary barriers to education
7.2.1 Household Consumption, Education Cost, and SCTP School Bonus
This section analyses monetary barriers to school participation by examining the cost
structure of acquiring basic education in Malawi, SCTP education bonus and household
consumption. Despite tuition fee waivers, there are other significant costs to school enrolment
such as uniforms, clothing needs, books, stationery, contribution to school infrastructure
development, canteen and lunch fees etc. Table 12 in Annex C breaks down the cost structure in
its principal components.4 Table 16 reports the estimated education cost and SCTP school bonus
per child by education level. Primary school education is projected to cost about MK 107,000 a
year per child. This means that the SCTP yearly education bonus of MK 9,600 per child covers
less than 10 percent of the total projected education cost (see Table 16).
Table 16: Yearly projected education cost and school bonus
Projected Education
Cost Per Child
SCTP Education Bonus
Per Child
Share of Bonus on
Education Cost
Primary 106,627 9,600 0.09
Secondary 152,125 18,000 0.12
Note: Monetary figures are reported in Malawian Kwacha (MWK).
4 Information on projected cost on Books & Stationery and Clothing and Uniform were provided by UNICEF Malawi Country Office, Education Programme Section. We complemented this information with average exams fees, canteen, and other expenditure by education level collected from the household survey.
52
Comparatively, secondary school education is projected to cost MK152,125 per child per
year. The SCTP secondary school education bonus of MK18,000 per child per year covers
approximately 12 percent of the projected secondary school cost.
(Admittedly, having used the same books and stationery, clothing and uniform projected
cost for primary and secondary school, one can argue that the cost of education in the two levels
may differ in the projected cost. If books and stationery, clothing and uniform is discounted by 30
percent for primary school, then the total projected primary school cost per child is MK75,660 per
year. In this case the primary school education bonus covers about 12.7 percent of the projected
cost, a similar rate covered by the secondary school bonus.)
To ascertain the implications of the projected education cost on a household’s decision to
invest in education, we contextualise the cost by looking at the household income through their
consumption. Given that households differ on income levels, we first group households based on
their consumption percentiles. Panel A of Table 17 presents average household expenditure
information for each of the quintile group. The average consumption of the households in the top
quintile is almost six times that of those in the bottom quintile. Using the number of household
members and the number of children and young adults in school and out of school, we compute
the total expected SCTP benefits for each household.5 As shown in Figure 17, the average
expected total SCTP amount (including school bonus) accounts for 38 percent of the total average
consumption for households in the bottom quintile with respect to 8 percent for those in the top
quintile (with an average of 21 percent for the full sample) (see Table 17).
5 The maximum household size was capped at four, given that SCTP beneficiary amount do not change from four and above member households.
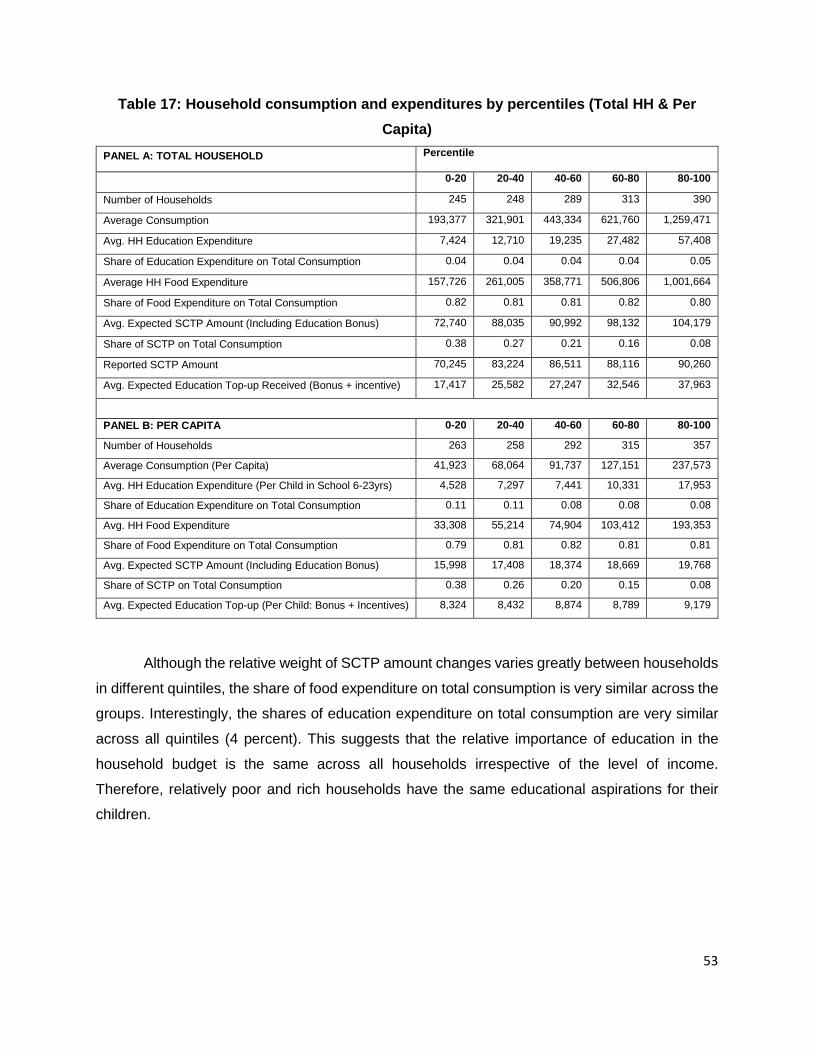
53
Table 17: Household consumption and expenditures by percentiles (Total HH & Per
Capita)
PANEL A: TOTAL HOUSEHOLD Percentile
0-20 20-40 40-60 60-80 80-100
Number of Households 245 248 289 313 390
Average Consumption 193,377 321,901 443,334 621,760 1,259,471
Avg. HH Education Expenditure 7,424 12,710 19,235 27,482 57,408
Share of Education Expenditure on Total Consumption 0.04 0.04 0.04 0.04 0.05
Average HH Food Expenditure 157,726 261,005 358,771 506,806 1,001,664
Share of Food Expenditure on Total Consumption 0.82 0.81 0.81 0.82 0.80
Avg. Expected SCTP Amount (Including Education Bonus) 72,740 88,035 90,992 98,132 104,179
Share of SCTP on Total Consumption 0.38 0.27 0.21 0.16 0.08
Reported SCTP Amount 70,245 83,224 86,511 88,116 90,260
Avg. Expected Education Top-up Received (Bonus + incentive) 17,417 25,582 27,247 32,546 37,963
PANEL B: PER CAPITA 0-20 20-40 40-60 60-80 80-100
Number of Households 263 258 292 315 357
Average Consumption (Per Capita) 41,923 68,064 91,737 127,151 237,573
Avg. HH Education Expenditure (Per Child in School 6-23yrs) 4,528 7,297 7,441 10,331 17,953
Share of Education Expenditure on Total Consumption 0.11 0.11 0.08 0.08 0.08
Avg. HH Food Expenditure 33,308 55,214 74,904 103,412 193,353
Share of Food Expenditure on Total Consumption 0.79 0.81 0.82 0.81 0.81
Avg. Expected SCTP Amount (Including Education Bonus) 15,998 17,408 18,374 18,669 19,768
Share of SCTP on Total Consumption 0.38 0.26 0.20 0.15 0.08
Avg. Expected Education Top-up (Per Child: Bonus + Incentives) 8,324 8,432 8,874 8,789 9,179
Although the relative weight of SCTP amount changes varies greatly between households
in different quintiles, the share of food expenditure on total consumption is very similar across the
groups. Interestingly, the shares of education expenditure on total consumption are very similar
across all quintiles (4 percent). This suggests that the relative importance of education in the
household budget is the same across all households irrespective of the level of income.
Therefore, relatively poor and rich households have the same educational aspirations for their
children.
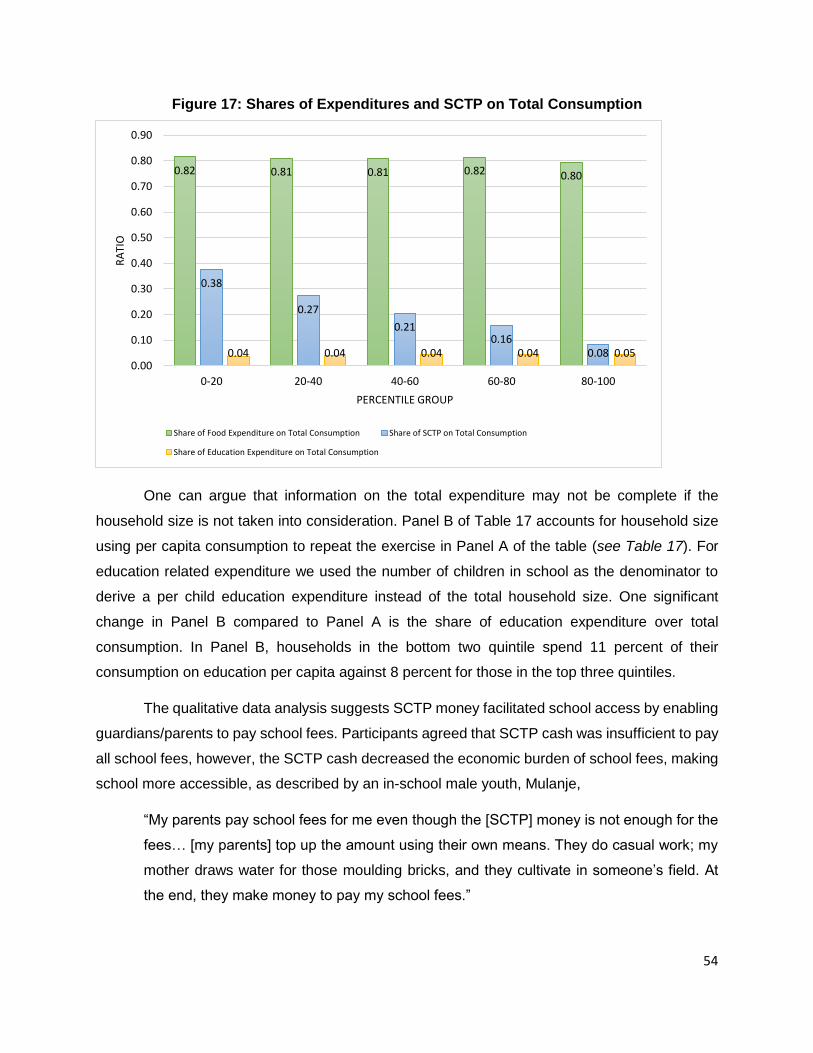
54
Figure 17: Shares of Expenditures and SCTP on Total Consumption
One can argue that information on the total expenditure may not be complete if the
household size is not taken into consideration. Panel B of Table 17 accounts for household size
using per capita consumption to repeat the exercise in Panel A of the table (see Table 17). For
education related expenditure we used the number of children in school as the denominator to
derive a per child education expenditure instead of the total household size. One significant
change in Panel B compared to Panel A is the share of education expenditure over total
consumption. In Panel B, households in the bottom two quintile spend 11 percent of their
consumption on education per capita against 8 percent for those in the top three quintiles.
The qualitative data analysis suggests SCTP money facilitated school access by enabling
guardians/parents to pay school fees. Participants agreed that SCTP cash was insufficient to pay
all school fees, however, the SCTP cash decreased the economic burden of school fees, making
school more accessible, as described by an in-school male youth, Mulanje,
“My parents pay school fees for me even though the [SCTP] money is not enough for the
fees… [my parents] top up the amount using their own means. They do casual work; my
mother draws water for those moulding bricks, and they cultivate in someone’s field. At
the end, they make money to pay my school fees.”
0.82 0.81 0.81 0.82 0.80
0.38
0.27
0.210.16
0.080.04 0.04 0.04 0.04 0.050.00
0.10
0.20
0.30
0.40
0.50
0.60
0.70
0.80
0.90
0-20 20-40 40-60 60-80 80-100
RA
TIO
PERCENTILE GROUP
Share of Food Expenditure on Total Consumption Share of SCTP on Total Consumption
Share of Education Expenditure on Total Consumption
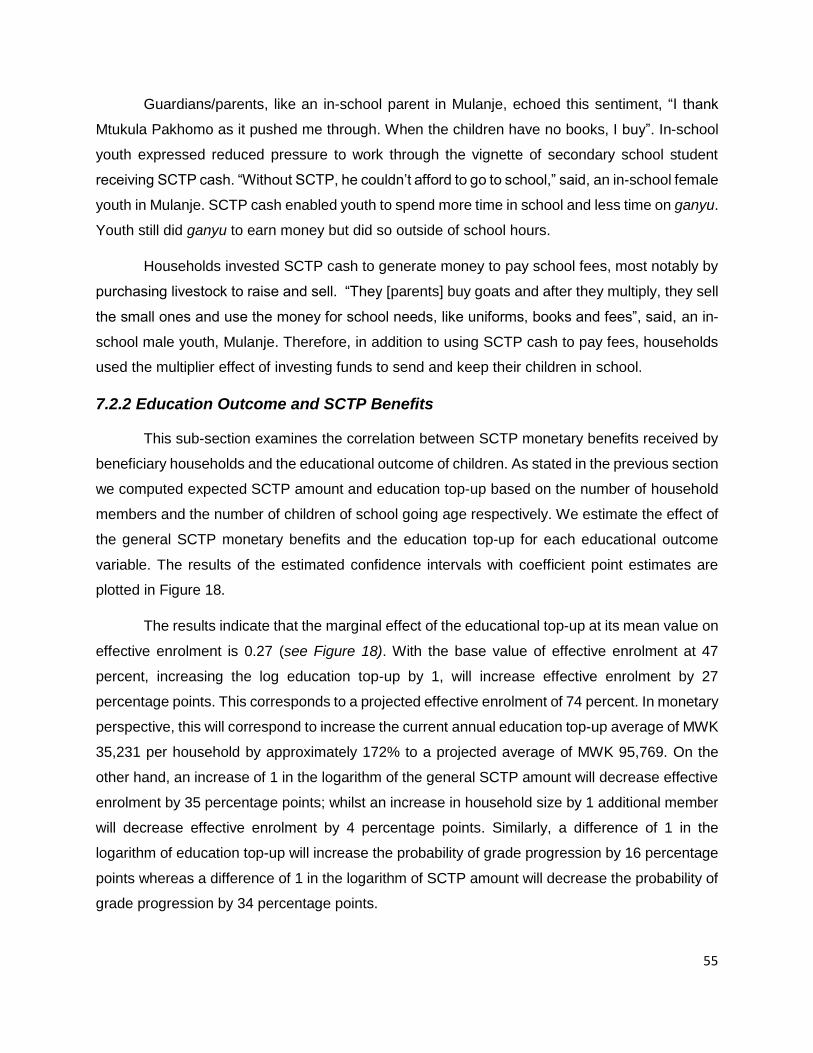
55
Guardians/parents, like an in-school parent in Mulanje, echoed this sentiment, “I thank
Mtukula Pakhomo as it pushed me through. When the children have no books, I buy”. In-school
youth expressed reduced pressure to work through the vignette of secondary school student
receiving SCTP cash. “Without SCTP, he couldn’t afford to go to school,” said, an in-school female
youth in Mulanje. SCTP cash enabled youth to spend more time in school and less time on ganyu.
Youth still did ganyu to earn money but did so outside of school hours.
Households invested SCTP cash to generate money to pay school fees, most notably by
purchasing livestock to raise and sell. “They [parents] buy goats and after they multiply, they sell
the small ones and use the money for school needs, like uniforms, books and fees”, said, an in-
school male youth, Mulanje. Therefore, in addition to using SCTP cash to pay fees, households
used the multiplier effect of investing funds to send and keep their children in school.
7.2.2 Education Outcome and SCTP Benefits
This sub-section examines the correlation between SCTP monetary benefits received by
beneficiary households and the educational outcome of children. As stated in the previous section
we computed expected SCTP amount and education top-up based on the number of household
members and the number of children of school going age respectively. We estimate the effect of
the general SCTP monetary benefits and the education top-up for each educational outcome
variable. The results of the estimated confidence intervals with coefficient point estimates are
plotted in Figure 18.
The results indicate that the marginal effect of the educational top-up at its mean value on
effective enrolment is 0.27 (see Figure 18). With the base value of effective enrolment at 47
percent, increasing the log education top-up by 1, will increase effective enrolment by 27
percentage points. This corresponds to a projected effective enrolment of 74 percent. In monetary
perspective, this will correspond to increase the current annual education top-up average of MWK
35,231 per household by approximately 172% to a projected average of MWK 95,769. On the
other hand, an increase of 1 in the logarithm of the general SCTP amount will decrease effective
enrolment by 35 percentage points; whilst an increase in household size by 1 additional member
will decrease effective enrolment by 4 percentage points. Similarly, a difference of 1 in the
logarithm of education top-up will increase the probability of grade progression by 16 percentage
points whereas a difference of 1 in the logarithm of SCTP amount will decrease the probability of
grade progression by 34 percentage points.
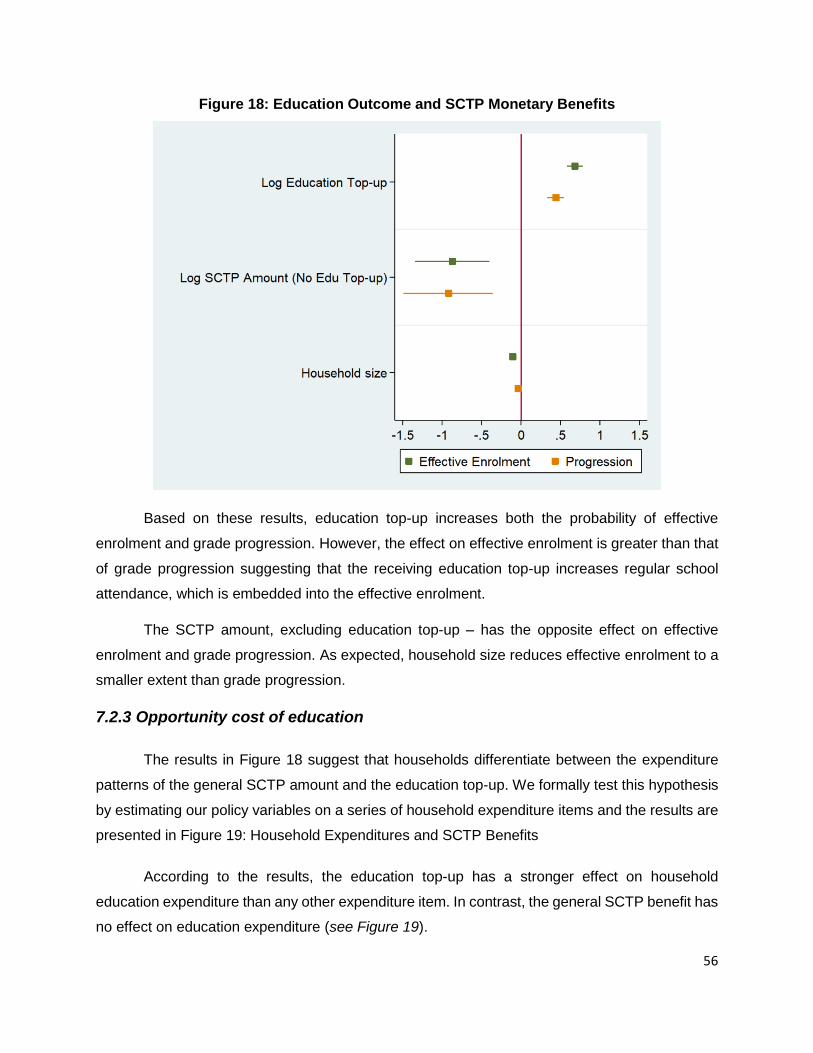
56
Figure 18: Education Outcome and SCTP Monetary Benefits
Based on these results, education top-up increases both the probability of effective
enrolment and grade progression. However, the effect on effective enrolment is greater than that
of grade progression suggesting that the receiving education top-up increases regular school
attendance, which is embedded into the effective enrolment.
The SCTP amount, excluding education top-up – has the opposite effect on effective
enrolment and grade progression. As expected, household size reduces effective enrolment to a
smaller extent than grade progression.
7.2.3 Opportunity cost of education
The results in Figure 18 suggest that households differentiate between the expenditure
patterns of the general SCTP amount and the education top-up. We formally test this hypothesis
by estimating our policy variables on a series of household expenditure items and the results are
presented in Figure 19: Household Expenditures and SCTP Benefits
According to the results, the education top-up has a stronger effect on household
education expenditure than any other expenditure item. In contrast, the general SCTP benefit has
no effect on education expenditure (see Figure 19).
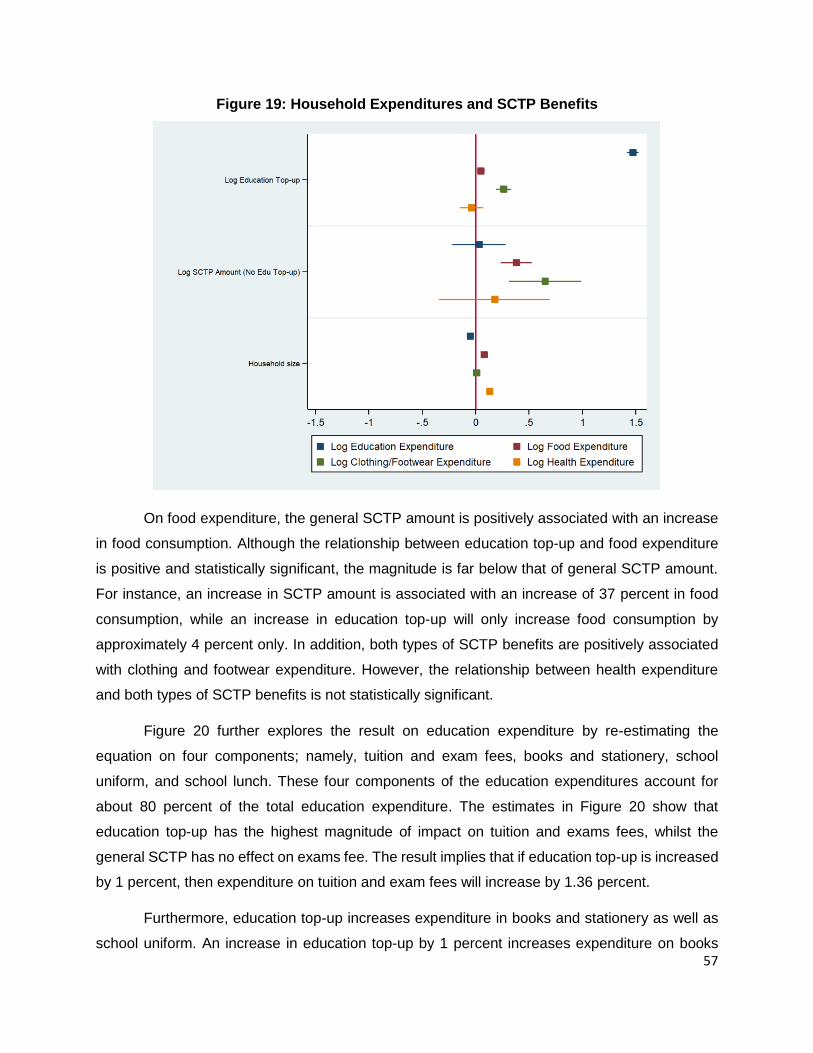
57
Figure 19: Household Expenditures and SCTP Benefits
On food expenditure, the general SCTP amount is positively associated with an increase
in food consumption. Although the relationship between education top-up and food expenditure
is positive and statistically significant, the magnitude is far below that of general SCTP amount.
For instance, an increase in SCTP amount is associated with an increase of 37 percent in food
consumption, while an increase in education top-up will only increase food consumption by
approximately 4 percent only. In addition, both types of SCTP benefits are positively associated
with clothing and footwear expenditure. However, the relationship between health expenditure
and both types of SCTP benefits is not statistically significant.
Figure 20 further explores the result on education expenditure by re-estimating the
equation on four components; namely, tuition and exam fees, books and stationery, school
uniform, and school lunch. These four components of the education expenditures account for
about 80 percent of the total education expenditure. The estimates in Figure 20 show that
education top-up has the highest magnitude of impact on tuition and exams fees, whilst the
general SCTP has no effect on exams fee. The result implies that if education top-up is increased
by 1 percent, then expenditure on tuition and exam fees will increase by 1.36 percent.
Furthermore, education top-up increases expenditure in books and stationery as well as
school uniform. An increase in education top-up by 1 percent increases expenditure on books
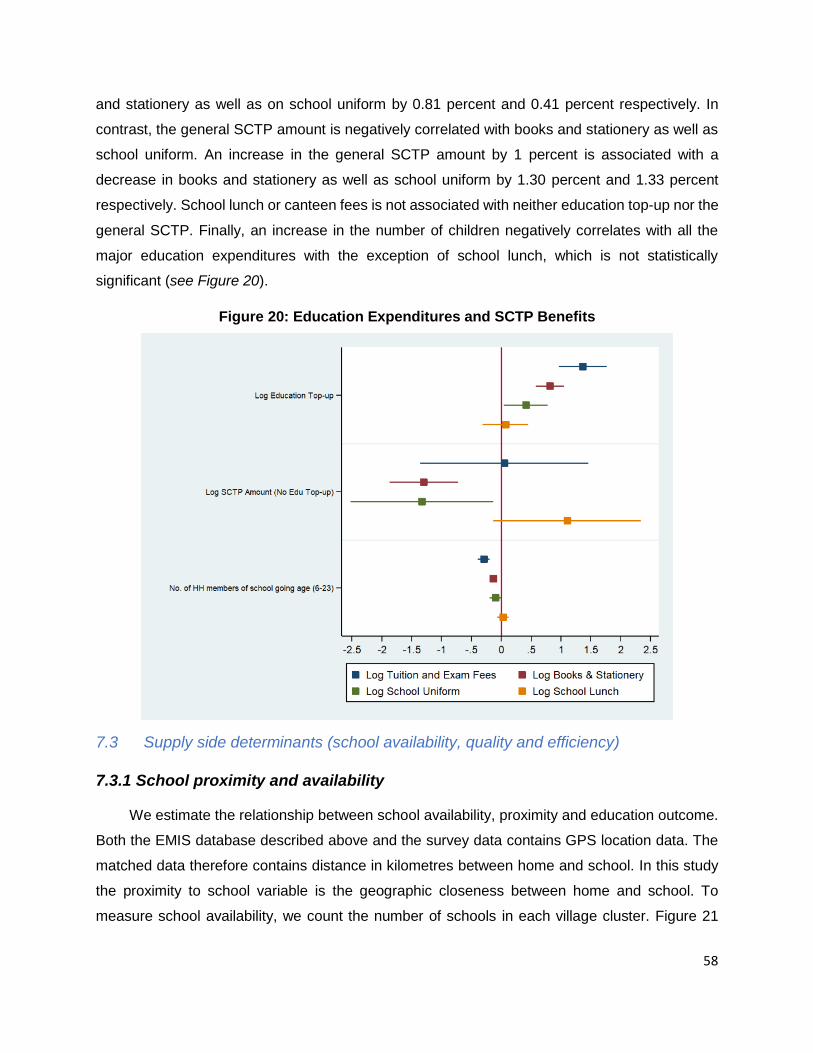
58
and stationery as well as on school uniform by 0.81 percent and 0.41 percent respectively. In
contrast, the general SCTP amount is negatively correlated with books and stationery as well as
school uniform. An increase in the general SCTP amount by 1 percent is associated with a
decrease in books and stationery as well as school uniform by 1.30 percent and 1.33 percent
respectively. School lunch or canteen fees is not associated with neither education top-up nor the
general SCTP. Finally, an increase in the number of children negatively correlates with all the
major education expenditures with the exception of school lunch, which is not statistically
significant (see Figure 20).
Figure 20: Education Expenditures and SCTP Benefits
7.3 Supply side determinants (school availability, quality and efficiency)
7.3.1 School proximity and availability
We estimate the relationship between school availability, proximity and education outcome.
Both the EMIS database described above and the survey data contains GPS location data. The
matched data therefore contains distance in kilometres between home and school. In this study
the proximity to school variable is the geographic closeness between home and school. To
measure school availability, we count the number of schools in each village cluster. Figure 21
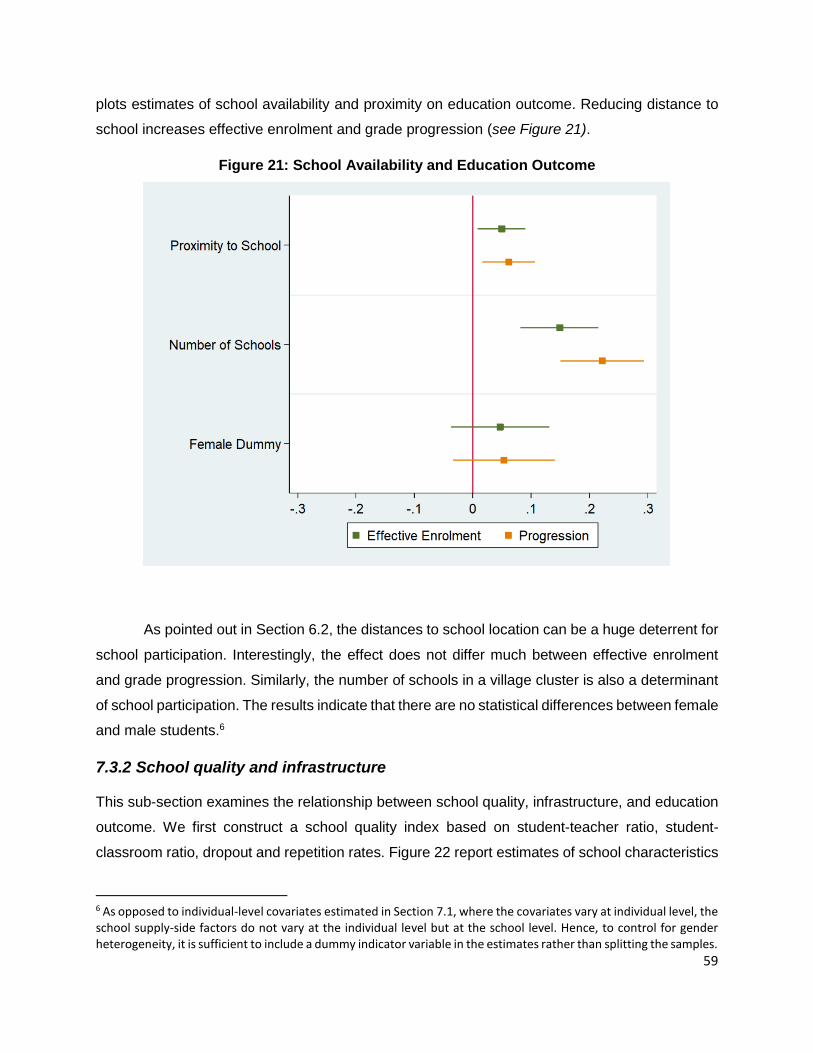
59
plots estimates of school availability and proximity on education outcome. Reducing distance to
school increases effective enrolment and grade progression (see Figure 21).
Figure 21: School Availability and Education Outcome
As pointed out in Section 6.2, the distances to school location can be a huge deterrent for
school participation. Interestingly, the effect does not differ much between effective enrolment
and grade progression. Similarly, the number of schools in a village cluster is also a determinant
of school participation. The results indicate that there are no statistical differences between female
and male students.6
7.3.2 School quality and infrastructure
This sub-section examines the relationship between school quality, infrastructure, and education
outcome. We first construct a school quality index based on student-teacher ratio, student-
classroom ratio, dropout and repetition rates. Figure 22 report estimates of school characteristics
6 As opposed to individual-level covariates estimated in Section 7.1, where the covariates vary at individual level, the school supply-side factors do not vary at the individual level but at the school level. Hence, to control for gender heterogeneity, it is sufficient to include a dummy indicator variable in the estimates rather than splitting the samples.
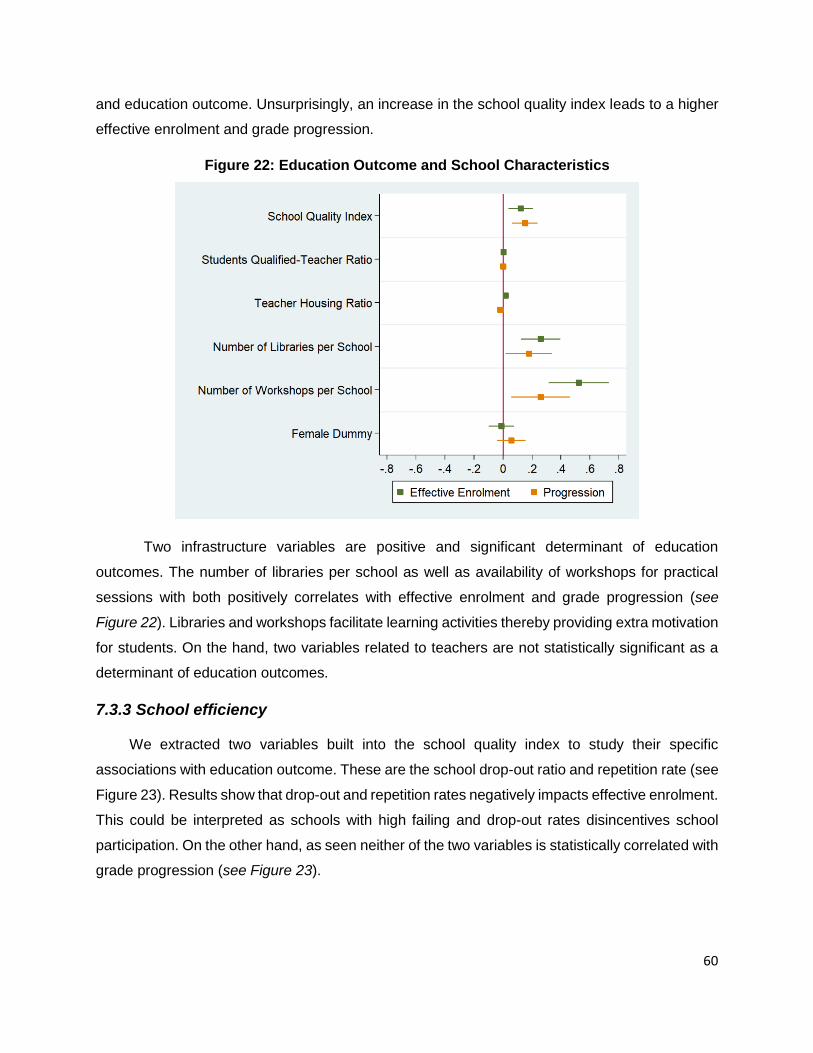
60
and education outcome. Unsurprisingly, an increase in the school quality index leads to a higher
effective enrolment and grade progression.
Figure 22: Education Outcome and School Characteristics
Two infrastructure variables are positive and significant determinant of education
outcomes. The number of libraries per school as well as availability of workshops for practical
sessions with both positively correlates with effective enrolment and grade progression (see
Figure 22). Libraries and workshops facilitate learning activities thereby providing extra motivation
for students. On the hand, two variables related to teachers are not statistically significant as a
determinant of education outcomes.
7.3.3 School efficiency
We extracted two variables built into the school quality index to study their specific
associations with education outcome. These are the school drop-out ratio and repetition rate (see
Figure 23). Results show that drop-out and repetition rates negatively impacts effective enrolment.
This could be interpreted as schools with high failing and drop-out rates disincentives school
participation. On the other hand, as seen neither of the two variables is statistically correlated with
grade progression (see Figure 23).
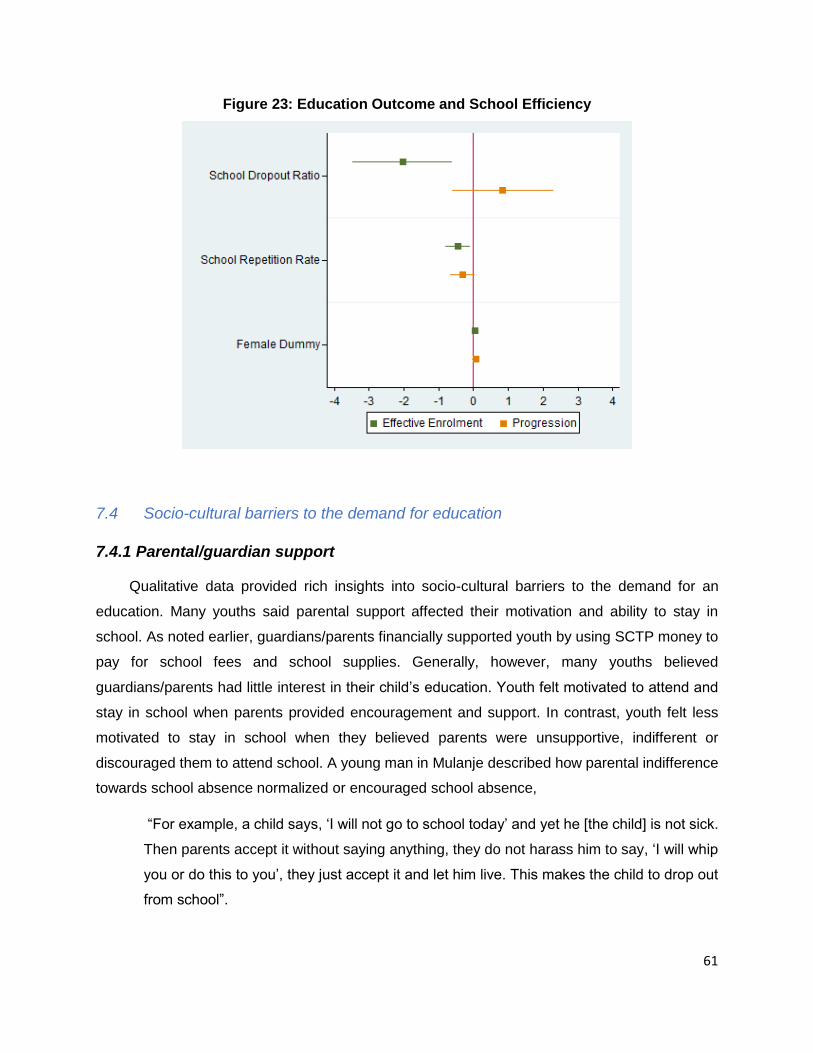
61
Figure 23: Education Outcome and School Efficiency
7.4 Socio-cultural barriers to the demand for education
7.4.1 Parental/guardian support
Qualitative data provided rich insights into socio-cultural barriers to the demand for an
education. Many youths said parental support affected their motivation and ability to stay in
school. As noted earlier, guardians/parents financially supported youth by using SCTP money to
pay for school fees and school supplies. Generally, however, many youths believed
guardians/parents had little interest in their child’s education. Youth felt motivated to attend and
stay in school when parents provided encouragement and support. In contrast, youth felt less
motivated to stay in school when they believed parents were unsupportive, indifferent or
discouraged them to attend school. A young man in Mulanje described how parental indifference
towards school absence normalized or encouraged school absence,
“For example, a child says, ‘I will not go to school today’ and yet he [the child] is not sick.
Then parents accept it without saying anything, they do not harass him to say, ‘I will whip
you or do this to you’, they just accept it and let him live. This makes the child to drop out
from school”.

62
This narrative suggests some youth may believe school is unimportant if they perceive
parents as indifferent towards their education. Perceived parental indifference also affected youth
behaviour in school attendance. Several out-of-school youths attributed their own school dropout
to inadequate parental support, as described by an out-school female youth in Mulanje,
“It was not my intention to stay away from school. It was lack of [parental] support. I wanted
to become a doctor. I felt bad that I failed to stay in school.”
Many youths believed parents tended to support girls to stay in school less, suggesting
some parents’ perceived money spent on girls’ education is a loss rather than an investment. An
in-school female youth in Salima, described her mother’s reactions to her request for books,
“For me, sometimes when I ask for money for books, my mother tells me to get [it] from
my boyfriend, and she even says, ‘Just quit [school]’. [Group laughs] You don’t want me
to say the truth”.
A peer in the same focus group, agreed, adding, “They [parents] tell you to get a boyfriend, they
say, ‘If you are finding life hard, then find a boyfriend to support you’. Parents echoed these
narratives, as illustrated in an exchange below,
Male: “…so parents just say, ‘Just get married, then! Since you have a boyfriend!’ This
does happen.
Female: “Better to marry than to get pregnant”
Young men, such as an in-school male youth in Salima, also shared their observations on parents’
support or lack thereof for female students,
“Some parents see that their daughter, one day, will be pregnant like the [others] in the
community, [so] they prefer not to support a girl knowing that they will lose money for
nothing, in terms of school fees.”
Interestingly, youth and parents referenced young women’s relationship with males as
both a suggestion of what girls should do to seek financial support and to justify their lack of
support for education expenses. An out-of-school parent in Mulanje, said some parents do not
support girls in school despite receiving SCTP money, suggesting reluctance to support girls in
school is rooted in gendered norms and expectations rather than financial resources,
“Each and every girl goes through this. She was not cared for though they were receiving
the social cash transfer money. The parents were not providing the necessities to her.
63
…Since the child was not cared for, hence she resolves by getting married. Some parents
they want their daughter to get married at tender age. They never take care of their
daughter education. They are in this category of not supporting girl child.”
These experiences suggest that some parents are less willing, financially or otherwise, to
support girls in school, affecting school access and retention, and may discourage them from
attending or completing school altogether. Some parents said some parents and guardians
treated orphaned youth much more harshly than they treated their biological children. For
example, guardians/parents gave orphaned youth more work or forced them to leave school so
that parents’ own biological children could attend school instead.
While decreased support for girls in school was salient among youth and
guardians/parents, it was certainly not universal. Several females in school felt supported by their
parents to attend school. An in-school female youth in Mulanje, reflects on her mother’s
experiences with education,
“[My mother says,] ‘we didn’t go to school and we have accepted it. I struggle doing ganyu
for you to go to school, so that [one day] your children shouldn’t suffer.’”
She felt motivated to stay and do well in school because she appreciated her parents’
sacrifice to make her schooling possible. Notably, she was one of the few participants who
described parental encouragement for school. Others included an in-school female youth in
Salima, who said, “My parents encourage me to go to school by telling me that school is important
in life”. Other youth described indirect parental support, such as receiving reduced or no
housework in the morning before school.
Most guardians/parents described their support for youth through financial or material
support and said they encouraged youth to attend school. An out-of-school parent in Mulanje,
described her involvement and support for her children,
“I have 3 daughters and a son. They all go to school. I do tell them and encourage them
to say, ‘Go to school, your future is in school, the education.’ They come to me and say
‘At school they need some school contributions’, I do tell them that ‘I have no money to
pay’ I just stay. I cannot help them. When they come back from school, we go and do
casual labour together to have the money to pay at school so that we should contribute to
school [PTA fund]”
64
In many ways, this participant described an ideal scenario: all children in school and youth
and parents working alongside one another to supplement income for school fees. Parents
described working hard to pay for youth’s school-related expenses or alleviating children’s
morning workload as ways in which they encouraged school attendance. Both youth and parents
agreed that students benefit from parents forcing/pushing them to go to school.
Beyond material or financial support, parents said they encouraged youth by telling them
to work hard so that youth could one-day support ageing parents. Many guardians/parents
emphasised a “working hard” narrative for themselves and youth. Some parents described talking
with youth and helping them with their schoolwork. Others provided support by referencing the
success of community role models that went to school. Meanwhile other guardians/parents
encouraged youth to attend school so they could have more opportunities for employment and
have a better quality of life than their parents. However, several guardians/parents alluded to
needing additional support to counsel, encourage or force out-of-school youth to resume their
schooling. In reference to counselling students to do well in school or resume schooling, several
out-of-school guardians/parents suggested seeking help from village headman and chiefs, non-
governmental organisations (NGOs) or other role models in their community. One male out-of-
school parent in Salima described how NGOs could help out-of-school youth return to school,
“For me, they say there are rights and we have NGOs… If you told an NGO, they would
come and encourage the child. Some [NGOs] came and said, “If you don’t take the child
to school, we will arrest you!” We all heard. So if you don’t want to be arrested, you go to
the same NGO and tell them your situation and they would say, “We will arrest you plus
your parents and you will die in jail”, then the child might be afraid. If we followed that
procedure they said, then maybe this one wouldn’t have dropped out of school. That’s
what I think.”
These findings suggest guardians/parents could benefit from additional support to support
and encourage youth to stay in school and re-enrol for the youth that have dropped out. This
support is especially needed if guardians/parents themselves have limited capacities to read or
write.
7.4.2 Community role models
FGD data suggested youth felt discouraged when others, particularly dropouts, dismissed
the benefits of school.
65
“When you go to school, they say ‘Look at her, what is that? You think you will finish
school? You are no different from us, you will find us here’”,
said an in-school female youth in Salima, in reference to a comment suggesting educated persons
were no better off than persons who had left school. “They say ‘You are going to school? Workers
in government are enough’ and you feel discouraged”, added an in-school female youth in Salima.
Generally, discouraging messages about school were designed to demoralize or undermine the
importance of education, especially among girls. Messages like, “Who have you seen that has
benefited with school?” were particularly hurtful, as they suggested educated persons would have
little impact in communities burdened by poverty and high unemployment.
However, youth felt motivated to stay in school by community role models (i.e. doctors,
teachers, government employees and researchers). These role models also inspired out-of-
school youth to resume school, many of whom regretted leaving school. Many youths aspired to
be role models themselves, “It is important [to be educated] so that I get better and support my
household and be a role model to my friends, so that they should work hard by looking at the level
I am at”, said an in-school female youth in Salima. Youth enjoyed being recognized as “educated”
by others and enjoyed applying their skills to help others through NGO or government work.
Parents echoed the youths’ sentiments about community role models. For parents, the
success of their children translated into respect from the community for raising an educated child,
as illustrated by an out-of-school parent in Mulanje,
“If the child is educated, parents receive respect in community…. People should respect
you to say, ‘You did good to educate the child’. Educating a child, it is worthy living and its
desirable thing in community. I prefer my child to be educated up to form 4. He starts job
and be able to support me.”
Like youths, guardians/parents aspired to be respected role models in their community.
These narratives suggest that education of youth is a transformative experience for parents and
youth alike.
7.4.3 School barriers specific to girls
Menstruation: Girls varied on their perceptions regarding menstruation and school attendance.
“The whole experience is new, and one feels strange, and going to school is hard”, said an out-
of-school female in Mulanje, suggesting girls needed time to adapt to attending school while
66
menstruating. An out-of-school female youth in Salima, said she used to miss school out of
embarrassment of menstruating,
“Like myself, I had stopped going to school for some time after I had started my period…as
I thought everyone would notice me and I felt shy”
Some youth worried about staining their clothing at school. Others, like an out-of-school female
youth in Mulanje, missed school due to the physical symptoms associated with menstruation,
“It is hard, it may have started within the week, maybe Monday or Tuesday and you may
get sick, have stomach pains, heavy flow, so one chooses not to go. Some even have bad
backache that they can’t move.”
Other girls said menstruation should not excuse school absence and encouraged girls to ask
other women for help.
“But again, the period wasn’t a good excuse to be absent from school, in the past, people
used local things to help themselves when menstruating, so even when one doesn’t have
pads, you have to use the local ways”,
said, an in-school female youth in Mulanje. Other girls agreed. “I don’t think it is a problem, we
choose to make it a problem, because once you tell your mother, they explain that it is natural”,
said, an out-of-school female youth in Mulanje. “When you are menstruating, you need to dress
well and go to school”, said an in-school female youth in Mulanje.
Guardians/parents agreed, and blamed other parents for failing to teach girls about
menstrual care. An out-of-school parent in Mulanje, blame other parents in reaction to a vignette,
“Here in village, we use torn and unused cloths to cover ourselves. [Parents] would have also
made it to buy her pad for her to use. The blame goes to the parents.” An out-of-school parent in
Salima, suggested some parents used menstruation to justify keeping their girls from school to
instead do housework,
“If this girl really wants school, don’t we have women who advise her? Why is it that when
they are menstruating, they are still able to draw water and to go farm in the fields?”
Other parents suggested girls used menstruation as an excuse to skip school, shifting the
blame on youth. Youth narratives suggest girls may initially miss school upon first starting
menstruation. However, youth and parents generally believed menstruation did not justify school
absence.
67
Pregnancy: Many out of school female youth cited pregnancy as their reason for dropping
out of school. “For me I got a boyfriend while I was in school and got pregnant unexpectedly then
I dropped out”, said an out-of-school female youth in Salima. Other girls shared similar stories.
An out-of-school female youth in Salima, described how having a boyfriend while in school
resulted in pregnancy,
“The time I was going to school, I got myself a boyfriend who looked serious to marry me,
then he asked me that we had to try having sex, the very first time, I got pregnant [laughing]
right from the sneaking sex, I got pregnant then I quit”
Having children made it very difficult for girls and young women to resume school. Many
young mothers said they wanted to resume school because they felt motivated to learn how to
read and write. However, an out-of-school female youth in Salima described the sobering barriers
many young mothers faced,
“As she said, [I would like] to learn how to read and write, but in reality, I don’t see myself
going back to school as I don’t have money and I have children who may need someone
to care for them, but only if it was near, like I said, adult literacy, I would definitely go.
Young mothers were particularly vulnerable among out-of-school youth, as many were
single mothers needing to provide for their children, themselves, and sometimes, others in their
household. While many of these youth wanted to resume school, many said they did not have the
adequate resources, such as time, money and geographically accessible schools, to do so.
7.4.4 Peer influences
Peers influenced youth to both attend and leave school. Many youths said peers who left
school discouraged them to stay in school. Youth also felt peer pressured into “bad behaviour”,
such as skipping school to watch movies, drink alcohol, smoke weed, have romantic partners and
have sex. Boys felt peer pressured to leave school to work, sometimes to “impress girls”.
Many out-of-school youths felt misled by others to leave school, as reflected by an out-of-
school male youth in Mulanje,
“We rush for money… We copy [others] because he left school. I will also its enticing
spirits. If I tell my friend, ‘Nothing good [results] out of school’ then he will be like me, he
will also stop going to school. We do not go to school because we have bad examples of
those who drop out from school. They are many who drop out from school. We want to
68
make money and yet we are not educated. We source money out from casual labour. We
want to enjoy the time we have to be in class [but] if we hear that ‘So and so sells water
at [the] trading centre’ then we want to be like him. ‘I should also go and do the same’ [I
say to myself]. When realizing [leaving school is a] disaster, we are already in it. You start
blaming one another, [saying], ‘You are the one who made me to do this!’ So, the problem
is that we entice others to follow you if you drop out from school”
This participant suggests out-of-school peers persuaded youth to leave school, despite
regretting leaving school themselves. Most out-of-school youth regretted leaving school,
particularly when they saw their peers develop new skills, graduate and obtain good jobs. Many
out-of-school youths left school because they did not see its benefits or felt they had learned
enough (read, write) to manage on their own. Many of these youth struggled to find good jobs and
felt discouraged being unable to work with NGOs requiring a “school certificate” for employment.
On the other hand, some peers also encouraged school retention among youth. Youth felt
motivated attending school to meet new friends, learn new skills and felt motivated by other peers
to work. Youth also enjoyed playing sports and learning art.
8. Limitations and Unexpected Findings
The quantitative component of the study is limited by the fact that the household reports of
enrolment and attendance were not validated at the school level. Given that recent analysis by
the Ministry of Gender, Community Development and Social Welfare (MoGCDSW) reported lower
overall rates of school enrolment by children in SCTP households than were reported in the impact
evaluation (IE, 2016), an additional step of directly reconciling the reported enrolment and
attendance from the schools would have helped to resolve any potential desirability bias in the
reporting. Another limitation has to do with the quality of the expenditure data. Recall of
expenditures incurred over the past year can be challenging and the results presented here is
subject to the individual reporting biases.
The qualitative component of the study was limited by the short time available for fieldwork
which did not allow for more extensive iterative analysis during data collection to improve depth
of study findings. The research team, however, engaged in rich debriefing during fieldwork which
aided in the identification of robust and relevant findings. Additionally, by only interviewing youth
from SCTP households, we are not able to compare findings with youth from non-beneficiary
households. This decision was made to facilitate depth and saturation of information among those
69
in the programme and to keep within the scope of the time and resources available for the study.
By having multiple groups of SCTP beneficiaries (in and out of school youth, caregivers) we were
able to obtain a rich understanding of the context of education.
One unexpected finding identified during fieldwork was that boys expressed feeling left
out of NGO programmes that used gender-based incentives. This raises an important question
about how to address gender-based disparities affecting girls without increasing social exclusion
of boys, especially those in SCTP households with extremely limited resources for secondary
education. Another unexpected finding was that the issue of child marriage was much more
frequently discussed in Mulanje than in Salima. This may simply reflect that child marriage was
more salient to the participants in Mulanje but warrants further exploration in future research.
9. Summary, Policy Issues and Policy Options
9.1 Interpretation of Findings
The impact evaluation of the SCTP in 2013-15 (IE, 2016) established that the programme
had large, positive impacts on schooling of children, particularly among older children aged 13-
17. Despite these positive results, there is concern that the SCTP is not education sensitive
enough and that the school bonus is not having the impact it could have. The 2013-15 evaluation
established that programme impacts were only on enrolment but not grade progression, and the
impact was higher on boys than girls.
The detailed analysis of schooling behaviour presented in this report reveals that the
education bonus represents just 10 percent of actual total school costs based on the official
government schedule of fees. On the other hand, the school transfer is associated with a 4 percent
increase in food consumption, and a 100+ percent increase in school spending among
beneficiaries. The largest component of this school spending is fees and supplies. In the sample,
the average (simulated) school bonus is MK8721 per child compared to the average actual
spending on school expenses of MK9512 per child. The view from programme staff on the ground
stated that many school-aged children are not attending school while the family receives the top-
up. These findings suggest that while households are collecting the top-up for all children,
the cash transfer is utilized to fund the schooling of only some children in each household.
This is largely because the top-up amount is insufficient to fund the enrolment of all
children in a household. Further evidence to support this conclusion is the increased spending
of households on education with an increase in the top-up amount This explains why measured
school spending of households is essentially the same as the (simulated) value of the bonus, yet
70
some children are not in school, and overall school spending is strongly associated with the
receipt of the top-up.
The importance of schooling among SCTP households is perhaps best demonstrated by
the (per child) share of total spending that goes to a child’s schooling. This share is 4 percent
across all quintiles of consumption, even though the per capita consumption in the richest quintile
is six times that of the poorest quintile. In other words, the importance of education in the budget
of the poorest SCTP household is the same as in the richest household despite their relative
poverty.
On the other hand, while school enrolment and associated school-related spending is
high, effective enrolment, which accounts for regular attendance at school, is low at less than 60
percent. This irregular attendance may account for the overall lack of grade progression. The
qualitative data indicates that some of this irregular attendance is explained by household (i.e.
demand-side) factors, including cultural norms, deep poverty and income shocks. Both youth and
parents acknowledged that guardians/parents do not always support schooling, especially for
girls, and the low level of the bonus relative to the opportunity cost of time exerts enormous
pressure on families to make hard choices to survive. In addition, community norms and values
can also undermine the intentions of children to stay in school. The qualitative data suggest that
students often face derision and ridicule from adults in the community, and even their peers who
have already dropped out of school.
Another key feature of the schooling decision is the inability of the school system to ensure
a safe, productive environment for students. The qualitative data paints a picture of a school
environment that can be harsh for children. There is a perception that teachers administer
punishment that is unfair and punitive, rather than developmental, and that violence (sexual and
otherwise) is common. The quantitative data also show that self-reported (by the parent/guardian)
violence significantly reduces school enrolment for boys more than girls, though there may be
more underreporting among parents/guardians of girls. Beyond the behaviour of teachers, the
overall quality of schools, as documented from the EMIS, is low, with an average pupil/teacher
ratio of 148 in the primary schools in the study sites.
In the face of all these barriers, the commitment demonstrated by SCTP households to
schooling is remarkable—these are some of the poorest and most vulnerable families in the
country.
71
9.2. Summary of policy discussions with reference group
Preliminary results of the study were presented to the reference group in Salima on
September 8-9, 2019. The following is a summary of the key issues that were discussed.
9.2.2 Objectives and capabilities of the SCTP
The SCTP has multiple objectives, including reducing poverty, hunger and starvation in
households and increasing school enrolment and improve the health and nutrition of children. The
study aims to answer if SCTP can and should do more in the area of schooling, and whether it
has the means to do so. Currently the education bonus represents less than 15 percent of the
value of total transfers made by the SCTP, while children make up over 50 percent of residents
in beneficiary households. With such a relatively small share of total transfers, one can argue that
the school bonus already generates tremendous value-for-money, as the increase in school
enrolment is 10 percent, and even higher at 13 percent for children age 13-17, as shown in the
2016 Impact Evaluation (IE, 2016). These impacts are higher than those reported for cash transfer
programmes that are conditional on schooling such as Mexico’s PROGRESA. While school
enrolment is on the rise, regular attendance and grade progression does not seem to be
improving. However, some factors influencing progression, such as school quality, are not under
the control of the MoGCDSW.
9.2.2 Strengthening linkages with the Ministry of Education
The Key Informant Interviews (KIIs) with district education managers, primary education
advisors and head teachers indicate a willingness on the part of the district education departments
and schools to collaborate more closely with the MoGCDSW to monitor the school performance
of SCTP children. Recognizing the shared objective of the Ministry of Education and the SCTP,
the Ministry of Education officials proposed three specific activities for collaboration. First, at the
time of initial interviewing and selection, the list of school-going children in prospective SCTP
households could be provided to schools for verification against attendance registers. Second,
once enrolled into the programme, the list of school-goers in SCTP families could be provided to
the respective schools, and their attendance could be tracked via the school registers, with
summary reports prepared at the end of each term. This would allow the SCTP to have real-time
monitoring of school attendance. Third, district education managers or head teachers could be
invited to the pay parade at the beginning of the school year and speak to recipients and
encourage them to enrol their children in school. The head teachers confirmed that they already
72
provide attendance monitoring reports to NGOs that provide school support to students and would
be able to do the same for the SCTP.
9.2.3 Linkages with mother’s groups
The KIIs also highlighted the important role that mother’s groups play within the community
in addressing early drop-outs, especially among girls. Ministry of Education officials strongly
encouraged the District Social Welfare Officers to make linkages with these groups in order to
enlist them in monitoring the schooling of SCTP children and addressing issues of early drop-
outs. The mother’s groups are quite knowledgeable about family and personal issues arising
within the community and are in a good position to support SCTP families with respect to school
enrolment.
Conditions: The SCTP might best be described as a ‘labelled’ transfers, which means that
a portion of the monthly transfer (the school bonus) comes with a label or strong message about
its intended purpose of use. However, there are aspects of the operation of the programme that
make it closer to a conditional programme. For example, an annual school verification report
conducted by the MoGCDSW seeks to confirm the enrolment status of children and adjust the
bonus accordingly. This is done just once per year, and the accuracy is of concern due to the
practice of children changing their names after the initiation ceremony. In addition, programme
administrators on the ground (social workers, committee members) are known to threaten
households with loss of the bonus if they do not send children to school.
The question was raised about whether the SCTP should officially move to a conditional
programme and change its operating manual. Currently the operating manual does not explicitly
state that the primary school bonus is conditional on actual school enrolment and is, instead,
viewed as an incentive for families to send children to school. The secondary school bonus
however is given conditional on verified school enrolment and is referred to as a top-up. Moving
from a currently unconditional cash programme to a conditional programme would bring a
significant cost increase in programme administration. The SCTP would need to develop clear
and transparent guidelines on the actual conditions, and set-up a process to monitor compliance
routinely in a way that is accurate and transparent. Conditional programmes have complex appeal
mechanisms in cases where families believe they have been incorrectly punished, and such
programmes must also have policies regarding school absences due to short-term and long-term
sickness. Finally, programmes must be able to guarantee the availability of a minimum quality of
service within a reasonable distance from each household. The analysis around Figure 10 in this

73
report indicates mean travel time to the nearest secondary school is 80 minutes and can be much
higher for some families, while mean travel time is 35 minutes for primary schools. There is also
the question of whether there are spaces in local secondary schools for any student who wishes
to attend. On the other hand, adequate school quality is clearly an issue, with high pupil/teacher
ratios and other issues of safety and the development environment. The SCTP would need to
develop a clear policy on cases where a child drops out due to violence at school (perpetrated by
either another student or a teacher). The programme could also find itself in a position where it
requires families to send children to facilities where they are not learning anything, essentially
limiting the choice set of those who are already the poorest and most vulnerable in the country.
Against these costs would be the potential benefits of such a policy. Current school
enrolment among primary age children is close to 95 percent, while attendance is closer to 65
percent, so a minimum attendance condition (which is typical of conditional programmes—usually
set at 85 percent) might improve regular attendance. Larger benefits seem likely at the secondary
level, where overall enrolment and attendance rates are lower, and less than 10 percent of all
SCTP children attend secondary school. Indeed, the key educational outcome of concern is grade
progression, which might be resolved through regular attendance, assuming other factors are
also supportive of student learning.
Within the context of a conditional programme the level of the school bonus would come
under serious scrutiny. The current value is just 10 percent of the official out-of-pocket cost of
attending school, which does not account for the opportunity cost, so the effective level is lower
than 10 percent. A policy requiring regular enrolment as a condition for receipt of the bonus would
have to also provide an adequate amount to support families with the full (direct and opportunity)
financial cost of school. While it would not be necessary to cover the entire cost, even attempting
to cover 20 percent of the full financial cost would require at least a doubling of the current benefit
level to obtain the intended behavioural response. This is an additional increase in monetary cost
next to the administrative costs that would come with a conditional school bonus transfer, as
described earlier.
9.2.4 Move to a child bonus
An option that moves in the opposite direction of a conditional cash transfer is to convert the
educational bonus to a child top-up or child bonus and limit the beneficiaries to residents age 0-
17. This would institutionalize what is already the de facto approach for primary school age
children since for that age group the education bonus is given automatically, and attendance only
74
checked through the annual verification, and not necessarily used to systematically reduce the
amount of the grant. On the administrative side this approach is clearly the least costly, as it would
streamline the payment of the bonus, and not require additional monitoring. This move would also
make the current level of the educational bonus more rational. Currently the bonus is labelled for
education yet covers just 10 percent of actual out-of-pocket school costs (and less when allowing
for the opportunity cost of schooling).
One potential drawback of renaming the bonus is that programme staff would lose the
considerable leverage they have to send a strong message to families to send their children to
school. Clearly this message has been effective given the large programme impacts on school
enrolment. One way to address this is to articulate to families what the purpose of the child bonus
is for. This is done for example in the Kenya CT-OVC, where families are explained that they
receive the cash transfer to support orphans and vulnerable children in their care, to ensure they
are fed, clothed, and sent to school. This type of labelling approach could also be used in the
SCTP, with schooling (along with food and clothing) included as a key justification for the bonus.
The renaming of the bonus would remove the accountability pressure the programme currently
faces of having to verify school enrolment, while still affirming the programme’s commitment to
improving schooling outcomes. Such an approach also recognizes that out-of-pocket costs are
just one of a complex set of factors that influence the schooling decision, but that it is the one
factor that is directly under the control of the MoGCDSW.
A child bonus could also address the situation when youth in SCTP household have
children. When young adults within recipient households have children, these “new” sub-units
(mother-child pair) are not explicitly recognized within the programme. The child bonus would
provide for a transfer that is directly tied to this new child (if there is a way to update the household
roster, through a birth certificate for example). The typical objection to this approach is that it
provides an incentive to have a child, but there is in fact no empirical evidence of a fertility effect
from a child grant in developing countries (Palermo, Handa, Peterman, Prencipe, & Seidenfeld,
2016).
9.2.5 Young adults and school dropouts
The SCTP school bonus is targeted to members up to age 23 years, within this group school
enrolment among those aged 18-23 is just 50 percent. The qualitative interviews highlighted a
problem faced by older school-leavers to return to school, they did not feel comfortable going
back to a traditional school, and often did not feel welcome by staff or peers. There is a fruitful
75
potential for stronger linkages between the SCTP and adult education programmes and other
organisations working to improve educational outcomes among girls and young women, by linking
them with training and educational opportunities. Here the main issue is for the SCTP to recognize
that for an important group of beneficiaries within the school bonus target age range, traditional
forms of school are not an optimal choice, and so to realize the programme’s schooling objectives,
special effort are needed to address schooling outcomes among this group.
9.2.6 School progression
The empirical analysis clearly shows that the SCTP has had an enormous impact in raising
school enrolment among children in recipient households, but this enrolment has not translated
(yet) into improved progression and completion rates. This is a not an issue specific to SCTP but
is a widespread phenomenon in rural Malawi. While evidence in this report shows the positive
effect of school quality on school progression, school quality is outside the mandate of
MoGCDSW.
9.3 Other policy issues
In this section we identify for discussion other policy issues that the MoGCDSW could
consider in order to improve schooling outcomes.
9.3.1 Promoting age-appropriate enrolment
The evidence presented in this report and in the 2013-15 evaluation is that the SCTP has
had tremendous success in boosting school enrolment, but not on school regular attendance,
progression and completion. In order for SCTP to emphasise school progression as a
performance indicator for itself, it could consider varying the bonus by grade, or explicitly
rewarding progression. For example, a child in grade 4 this year that is enrolled in grade 5 the
following year would receive an extra top-up. This provides a clear incentive for performance but
require additional monitoring. However, additional monitoring would require an annual school
verification similar to what is currently being done, to confirm the exact grade of the child. The
strength of this approach is that it does not explicitly punish children for not progressing (they
would receive the same bonus value), this is important given the other, non-financial factors that
hinder children’s performance in school. Conditional cash transfer programmes in Turkey,
Philippines and in Latin America stagger the value of the school-related transfer based on grade.
76
9.3.2 Incentive for successful completion
The overall grade attainment rate is extremely low in Malawi and in the SCTP population.
The SCTP could consider a one-time bonus payment if the child sits for or passes the Primary
School Leaving Examination (PSLE), and an even larger bonus for sitting or passing the
Secondary School Completion Examination (MSCE). In practice very few of the target population,
if any, would be candidates for the sitting or passing the MSCE, so this policy would largely affect
the PSLE. Such a policy could be implemented in tandem with increasing bonuses for each grade
completed. In the Jamaican PATH conditional cash transfer programme, beneficiaries are granted
automatic secondary school fee waivers, and secondary school graduates are publicly celebrated.
A handful of PATH ‘graduates’ are awarded full bursaries for tertiary schooling. The SCTP could
likewise consider a public celebration of SCTP children who pass the PSLE. The private
fundraising potential for the PSLE bonus would be quite high as well. Indeed, donors may also
consider funding the bonus for these SCTP scholars.
9.3.3 The distinct constraints faced by girls
There is undisputable evidence that girls in Malawi and throughout the developing world face
distinct constraints when attending school. The key issues include sexual violence and safety in
general, menstrual hygiene management, sexual and reproductive health (early pregnancy), early
marriage, and social and cultural norms. Some conditional cash transfer programmes apply a
higher schedule of school bonuses for girls relative to boys in recognition of these circumstances.
Any policy reform within the SCTP aimed at improving schooling outcomes would need to
consider the special circumstances of girls and young women, especially considering that SCTP
households tend to have more females than males.
9.3.4 Responsiveness to household shocks
Ultra-poor households, despite receiving the cash transfer, remain extremely vulnerable to
shocks such as ill-health or bad weather. The qualitative evidence we presented here indicates
that these shocks are often the reason that children are pulled from school, rather than any active
decision to not invest in schooling. This underlying cause of school drop-outs is important to
acknowledge when considering policy reforms. For example, a move to punitive conditions based
on schooling would effectively doubly punish a household that removes a child from school to
care for a suddenly sick/disabled parent/guardian. This would in fact undermine the fundamental
objective of the programme itself. On the other hand, the SCTP could proactively work to support
77
specific families during periods of crisis, as it currently does on a larger scale in districts that face
a food crisis due to drought or crop failure.
9.4 Policy Options
Based on the findings of the quantitative and qualitative data and the discussions with the
reference group, we list the key policy options for the MoGCDSW to consider in order to enhance
the educational outcomes of SCTP beneficiary households.
1. Increase the overall value of the transfer and school bonus: The bonus represents just 10
percent of the estimated direct cost of school enrolment, and when the opportunity cost is
accounted for, this figure is even lower. The low value of the bonus is the most important
reason for irregular school attendance. And the erosion of the real value of the family
transfer itself is the reason why households cannot cope with shocks and thus pull children
out of school.
2. Incentives for girls’ education: Access to education for girls remains a major challenge among
SCTP beneficiaries and provides the basis for dedicated policies to support girls. A higher
school bonus for girls is commonly used in other cash transfer programmes and would be
a straightforward option. In addition, links with community mother’s groups, by providing
the mother’s groups with a list of SCTP girl beneficiaries, would also help support girls’
education within the SCTP.
3. Strengthen linkages with Ministry of Education: Specific activities, proposed by the Ministry of
Education, have been described in the report. Of these activities, inviting the District
Education Manager (DEM) or head teachers to the pay parade prior to the beginning of
the academic year, and providing schools with lists of SCTP children enrolled in school,
seem to be very low cost/high benefit options.
4. Condition the school bonus on minimum school attendance: Moving to a conditional
programme would entail significant administrative and financial costs for the MoGCDSW.
Administrative costs include a transparent system of monitoring and appeals. Financial
costs include a significant increase (at least doubling) in the bonus to offset the actual
direct costs of school attendance. The main benefit would be potential improvements in
regular attendance, which may translate into progression. This decision would significantly
change the fundamental scope and nature of the SCTP.
5. Automatic secondary school fee waivers for SCTP children: Very few current SCTP children
actually reach secondary school given the out of pocket costs of attending secondary
78
school is much steeper relative to primary school. This combination means this is a
relatively low-cost option that would potentially provide a strong incentive for grade
progression.
6. Direct incentives for school progression: There are several creative ways to structure the
school bonus to promote schooling performance, which is a key educational challenge
among SCTP children. The bonus could be increased if a child progresses from one grade
to the next each year, and an additional one-time bonus provided for writing the PSLE.
Special publicity could be provided for SCTP secondary school scholars, including a
privately endowed bursary scheme, and a one-time bonus could be provided for sitting for
the MSCE. Given directly to the student could incentivize students in school progression.
7. Labelled child bonus in lieu of educational bonus: Renaming to a child bonus rather than an
educational bonus would solve some internal conflicts within the SCTP, such as the
pressure to monitor school enrolment and attendance, and the relatively low value of the
bonus. Education can still be promoted by explicitly ‘labelling’ the bonus as a way to
support children’s schooling and material well-being (e.g. clothing, food). This is already
being done with the current schooling bonus. The additional benefit is that children under
age 5 would also qualify for the bonus—currently this group of “under 5” is not addressed
in any way through the SCTP.
8. Linkages for young adult dropouts: The qualitative narratives suggest there is demand for
schooling from this group, but they do not feel comfortable within the traditional school
system due to their age. Linking this group to adult education initiatives and ensuring the
school bonus is available to them, would encourage their school enrolment.
79
10. References
Birger, F., & Craissati, D. (2009). Abolishing school fees in Africa: lessons learned in Ethiopia,
Ghana, Kenya and Mozambique. The World Bank. https://doi.org/10.1596/978-0-8213-
7540-2
Chimombo, Joseph. 2009. “Changing Patterns of Access to Basic Education in Malawi: A Story
of a Mixed Bag?” Comparative Education 45 (2): 297–312.
https://doi.org/10.1080/03050060902921003.
Handa, S., Angeles, G., Barrington, C., Mvula, P., & Tsoka, M. (2016). Malawi Social Cash
Transfer Programme Endline Impact Evaluation Report. Carolina Population Center.
Kilburn, K., Handa, S., Angeles, G., Mvula, P., & Tsoka, M. (2017). Short-term Impacts of an
Unconditional Cash Transfer Program on Child Schooling: Experimental Evidence from
Malawi. Economics of Education Review, 59, 63–80.
https://doi.org/10.1016/j.econedurev.2017.06.002
National Statistical Office. (2012, September). Integrated Household Survey 2010-2011.
Retrieved October 22, 2019, from
http://www.nsomalawi.mw/index.php?option=com_content&view=article&id=190:third-
integrated-household-survey-ihs3&catid=3&Itemid=79
Palermo, T., Handa, S., Peterman, A., Prencipe, L., & Seidenfeld, D. (2016). Unconditional
government social cash transfer in Africa does not increase fertility. Journal of Population
Economics, 29(4), 1083–1111. https://doi.org/10.1007/s00148-016-0596-x
The World Bank. (2019, January 29). Authors computational based on Malawi Fourth Integrated
Household Survey 2016-2017. Retrieved October 22, 2019, from
https://microdata.worldbank.org/index.php/catalog/2936/study-description
United Nations Development Program. (2018). Human Development Reports. Retrieved October
22, 2019, from http://hdr.undp.org/en/2018-update
Vasconcellos, Eduardo A. 1997. “Rural Transport and Access to Education in Developing
Countries: Policy Issues.” Journal of Transport Geography 5 (2): 127–36.
https://doi.org/10.1016/s0966-6923(96)00075-0.
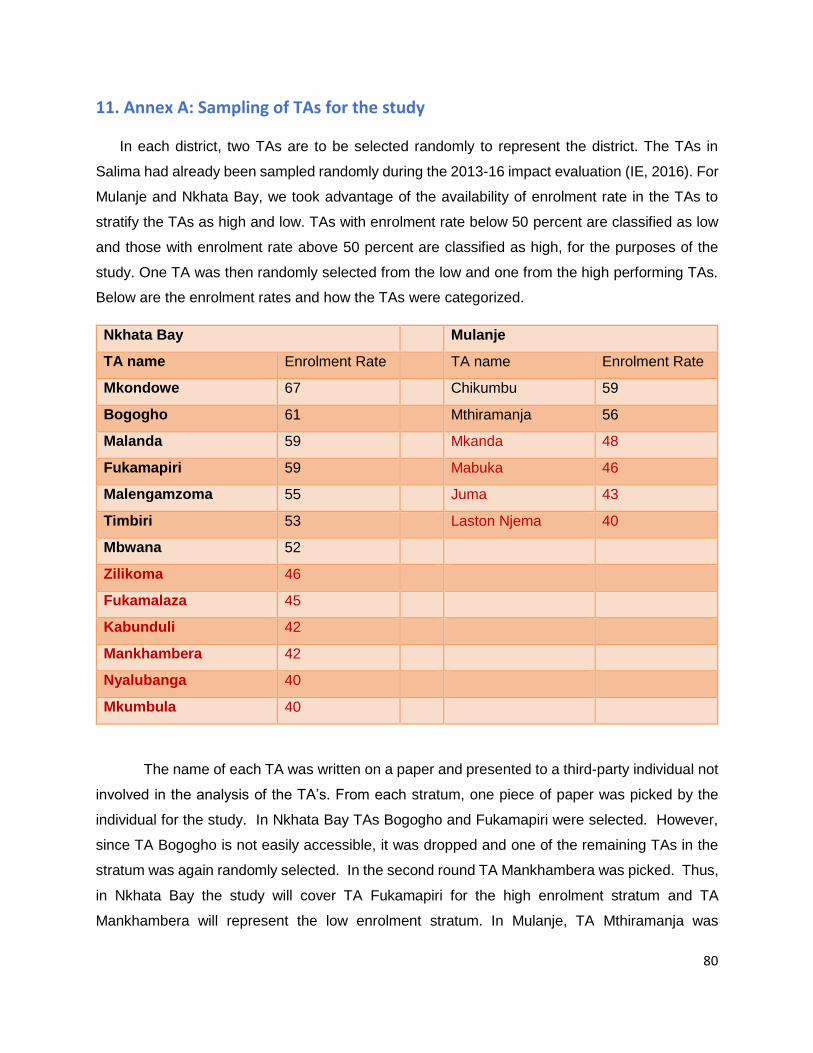
80
11. Annex A: Sampling of TAs for the study
In each district, two TAs are to be selected randomly to represent the district. The TAs in
Salima had already been sampled randomly during the 2013-16 impact evaluation (IE, 2016). For
Mulanje and Nkhata Bay, we took advantage of the availability of enrolment rate in the TAs to
stratify the TAs as high and low. TAs with enrolment rate below 50 percent are classified as low
and those with enrolment rate above 50 percent are classified as high, for the purposes of the
study. One TA was then randomly selected from the low and one from the high performing TAs.
Below are the enrolment rates and how the TAs were categorized.
Nkhata Bay Mulanje
TA name Enrolment Rate TA name Enrolment Rate
Mkondowe 67 Chikumbu 59
Bogogho 61 Mthiramanja 56
Malanda 59 Mkanda 48
Fukamapiri 59 Mabuka 46
Malengamzoma 55 Juma 43
Timbiri 53 Laston Njema 40
Mbwana 52
Zilikoma 46
Fukamalaza 45
Kabunduli 42
Mankhambera 42
Nyalubanga 40
Mkumbula 40
The name of each TA was written on a paper and presented to a third-party individual not
involved in the analysis of the TA’s. From each stratum, one piece of paper was picked by the
individual for the study. In Nkhata Bay TAs Bogogho and Fukamapiri were selected. However,
since TA Bogogho is not easily accessible, it was dropped and one of the remaining TAs in the
stratum was again randomly selected. In the second round TA Mankhambera was picked. Thus,
in Nkhata Bay the study will cover TA Fukamapiri for the high enrolment stratum and TA
Mankhambera will represent the low enrolment stratum. In Mulanje, TA Mthiramanja was
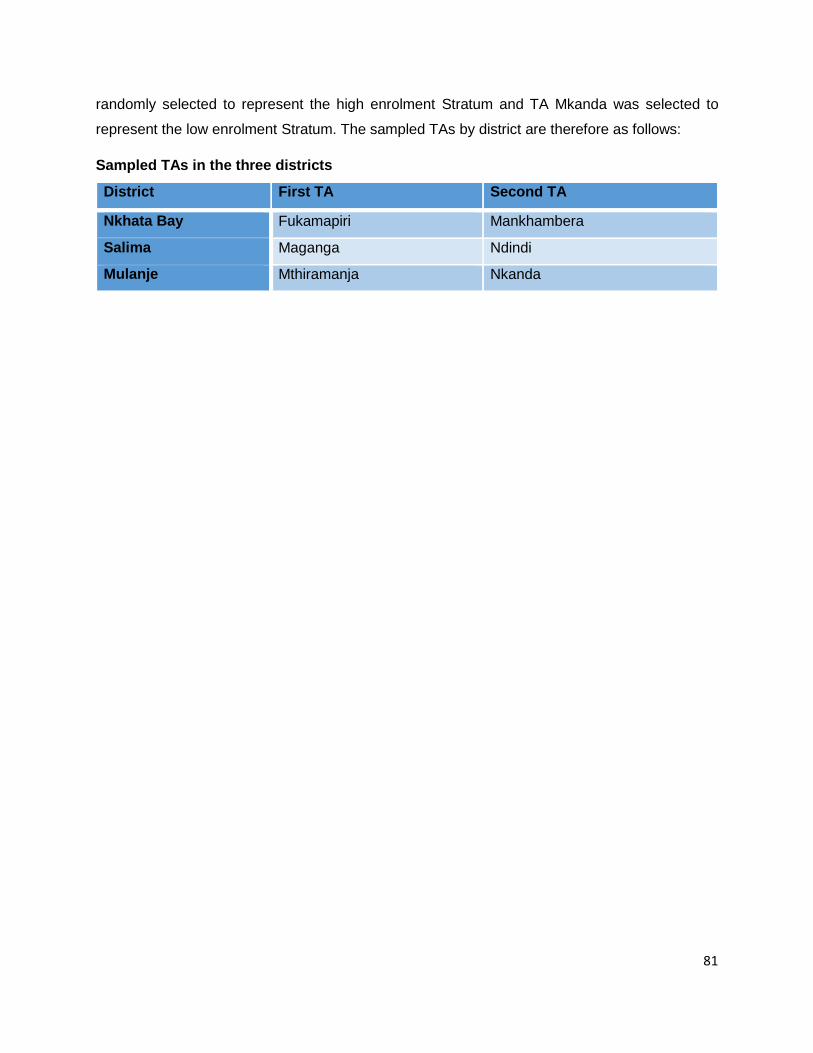
81
randomly selected to represent the high enrolment Stratum and TA Mkanda was selected to
represent the low enrolment Stratum. The sampled TAs by district are therefore as follows:
Sampled TAs in the three districts
District First TA Second TA
Nkhata Bay Fukamapiri Mankhambera
Salima Maganga Ndindi
Mulanje Mthiramanja Nkanda

82
12. Annex B: Sample size calculation for quantitative sample
The minimum sample size required for the survey was determined by:
𝑛 =4(𝑟)(1−𝑟)(1+𝑡)
(0.05𝑟)2(𝑝)(�̅�)(𝐷𝑒𝑓𝑓), where
- n is the required sample size, expressed as number of households
- 4 is a factor to achieve the required 95 percent level of confidence
- r is the predicted or anticipated enrolment rate of children of school going age in SCTP
households (0.5 is chosen to give the largest sample size)
- t is the anticipated non-response rate at the household (assumed to be 10 percent)
- Deff is the design effect to account for clustering effect (taken to be 1.175 based on Malawi
DHS data)
- 0.05 is the margin of error to be tolerated at the 95 percent level of confidence
- p is the proportion of children of school going age in the population upon which the
indicator, r, is based (taken to be 0.40)
- �̅� is the average household size (number of persons per household) taken to be 4
Thus, the minimum required sample size is given by
𝑛 =4(0.5)(1−0.5)(1+0.1)
(0.05(0.5))2
(0.4)(4)(1.175) = 1293.
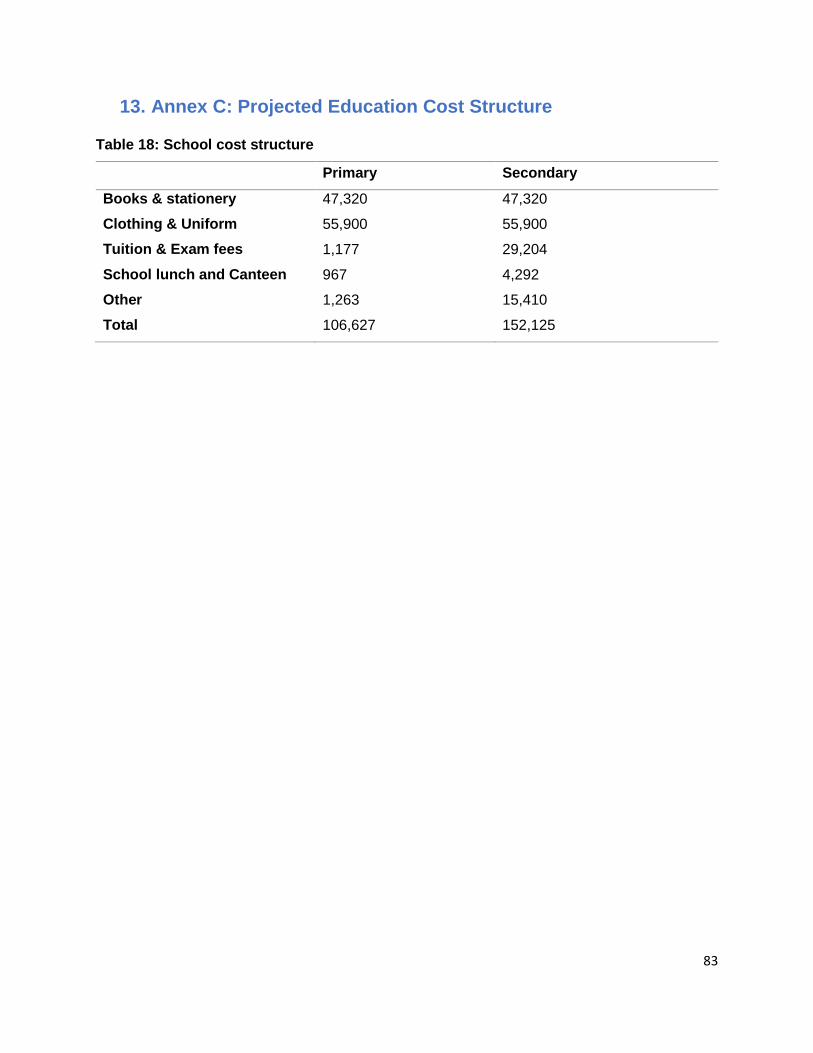
83
13. Annex C: Projected Education Cost Structure
Table 18: School cost structure
Primary Secondary
Books & stationery 47,320 47,320
Clothing & Uniform 55,900 55,900
Tuition & Exam fees 1,177 29,204
School lunch and Canteen 967 4,292
Other 1,263 15,410
Total 106,627 152,125
84
14. Annex D: Summary of Key Informant Interviews with District
Education Staff
Introduction
During the presentation and discussion of the inception report, it was felt that there is need
for the Ministry of Gender and Ministry of Education to coordinate better to ensure that school-
goers in SCTP households can be identified and monitored. This is in line with part of the
objective of the Education study which is to understand how to strengthen links and working
relationships with schools to support the education of SCTP students in order to support
educational outcomes for children from SCTP households.
One of the possible ways this can be done is to provide a list of SCTP children to their
respective school boards. This would ensure that the school head teachers and the respective
class teachers would assist in the monitoring of the pupils. One other area worth investigating is
automatic qualification for any bursaries or fee waivers of SCTP school going children.
The informal discussions with the district education manager (DEM), primary education
advisor (PEA) and head teachers (HT) were considered appropriate at this stage of the study.
Below is the report on findings from Salima on the feasibility of using the education system to
monitor SCTP children who are said to be in school.
Salima DEM’s office
The DEM was busy with MSCE examination deliveries and was therefore not in the office.
The meeting was therefore done with Mr January Chisi, who deputises the DEM. One key finding
was that the officer was unaware that one of the objectives of the SCTP is education related. He
quickly said that one of the reasons the SCTP may fail to achieve its objectives is this lack of
appreciation of its objectives by the education officials on the ground. He said that with a good
working relationship, the DEM office could have a list of all such children which would be passed
on to PEAs and PEAs to HTs and then class teachers.
He also said that once the children are being monitored, the class teachers would work
hand in hand with mother groups to follow up on enrolled children who are struggling to attend
school or have dropped out. He said that mother groups are active in many schools and they are
doing commendable work. He also said that PEAs, whose task is to inspect schools, would also
use the same list to follow up on children from these vulnerable households.
85
The message from Mr. Chisi was that the monitoring of SCTP children in school is feasible
with proper linkages between the two ministries. Routinely the class teacher would use the class
register to determine the attendance of those children. This can be compiled by either the school
or CSSC or study members.
Ngodzi Teachers Development Centre (TDC)
Just like the case with the DEM’s office. The PEA was not available in the office. Instead,
the meeting was done with the Assistant to the PEA, Mrs Gloria Chaone, who is also a teacher at
Ngodzi primary school.
Regarding the feasibility of schools monitoring SCTP children she said there would be no
challenge for schools to do that. She said there have been some organisations (World Vision,
WFP) that used schools to monitor their beneficiaries. She said the SCTP can use similar
structures to monitor. She said that mother’s groups in the various schools can be used to track
down enrolled children who are either missing classes or have dropped out.
She also said that guardians/parents are also to blame for absenteeism and drop out. She
said that school children are either given chores or not encouraged to continue attending school.
She also said that many school children who drop out do not necessarily do to because they are
pregnant or have found a suitor to marry them. Others simply drop out and stay home. In this
case using mother groups may provide even better sources of information as to why some
children drop out of school. Members of mother groups sometimes meet resistance from parents
when the members are following up on children that not attending school or have dropped out.
Mpitilira and Ngodzi primary schools
The sentiments from the TDC were also expressed by HTs of the two schools visited.
Mpitiliza is one of the schools in Nkhwidzi cluster. Ngodzi was visited because Mpitiliza falls under
Ngodzi TDC. The HT for Mpitiliza Primary School, Ms Mpatsa, said that it is feasible for schools
to monitor SCTP children. Using class registers teachers can give a picture of how each child is
performing regarding absenteeism and dropout. She also highlighted the important role mother
group would play in the monitoring exercise. She said the members being community members
themselves they are more likely to know more about the child’s circumstances and challenges
than teachers.
She said the main problem in her area is not necessarily financial but cultural. She said
school children who have gone through initiation do not seem to be interested to continue with or
86
work hard in school. She gave an example of a pupil whose mother insisted that her daughter
attend the initiation rite. The HT advised the mother to wait until the girl sat for the primary school
leaving certificate examinations because she feared the girl would not continue to be an A student.
The mother said insisted and argued that there was no way the rites would not affect the
performance of the child. However, after the child came back her performance dropped
significantly.
The HT of Ngodzi Primary School, where the TDC is based, Mr Trywell Victor Chatuluka
also stated that monitoring of the children is feasible as long as the list is provided. He said the
schoolteacher and mother group would work hand in hand in that exercise.
Salima DEM – Mr Enock Chumachao
The discussion was on two issues. The first was the feasibility of linking the district
education office with the Social Cash Transfer programme vis-à-vis the monitoring of school
enrolment and attendance by teachers. The second was the possibility of automatic qualification
of SCTP children in secondary school. On the first issue, his view was that it is feasible. However.
That it is not the only way there can be some linkage. He said it would be important for the DEM
office to be involved during pay parade. He said during the pay parade district officials speak to
the beneficiaries before handing out the money. This presents a unique opportunity for the DEM’s
office to make a presentation on the necessity of having their children in school. While this is
done in some districts where he has ever been, it is not the case in Mulanje.
On the second issue, he said that the issue is not straight forward. One of the reasons is
that demand outstrips supply. The government bursary is too small for the number of pupils who
need the bursary including those on Mtukula Pakhomo. Another is that organisations offering
bursaries use criteria for inclusion in the bursary. For example, others only focus on pupils in
community day secondary school, leaving out those in boarding schools, which also pay her than
community day secondary schools. He did not specifically
The take home message is that monitoring of SCTP pupils is feasible but not automatic
qualification. Automatic qualification would work if the bursary fund was increased substantially
or the bursaries provided by various organisations were consolidated.
87
Mpachika Full Primary School – Mr. Harry Namangale HT
The HT started by stating that school administrators and teachers are not aware of the
objectives and modalities of Mtukula Pakhomo. He recalled a time when a child protection worker
came to the school with a list of names of children. The children were called from various classes,
but teachers were not involved in the discussion. The head teacher also bemoaned the lack of
transparency, especially the fact that the school children do not know that their households
receive school bonuses.
Regarding how the school can get involved in the monitoring of SCTP children, he stated
that it would not be a problem given the school currently works with an NGO that monitors its
beneficiaries at the school. The NGO, One Community, provides pens, uniform and school bags
to its beneficiaries. To monitor the children the NGO designed a form which is filled every month
by class teachers. Teachers can also follow up with children in the community if they are absent
for a long time or have dropped out. The NGO collects the form for their analysis. He said a
similar system can easily be adopted and the Mtukula Pakhomo administrators can use it for its
purposes.
Members of Mother Groups can also be tasked to follow up with these children specifically.
Although the group focuses on girls, as mothers of both girls and boys, they can also include boys
from these ultra-poor households in their monitoring.
Mombo TDC PEA – Ms Thokozile Kambale-Livuza
The office has not officially been involved apart from the social welfare section requesting
their services in following up SCTP children in her zone’s schools. The district team brought a
list to follow up with the school children. This has taken place in the past two years. (This is
possibly during the annual monitoring exercise conducted by the Ministry for Gender).
Her observation was that the Mtukula Pakhomo is not transparent; schools are not
involved, and school children are not informed that their education is supported through their
caregivers. She said that if school administrators are given a list of guardians/parents and
children who are on the programme, the school could follow up with guardians/parents, on behalf
of the school children. This is within their TORs as they already follow up with parents if there is
an issue they need to follow up. Parents are called to schools to discuss such an issue. She also
said that if the children also are aware of the school support, they would approach the parents
with knowledge and request the necessary support. Thus, by being transparent, the teachers

88
would go directly to parents whose children are either not in school or are habitual absentees or
have dropped out and request an explanation.
Another issue the PEA mentioned was that the school administration would assist in
verifying the enrolment of children in school. She said that guardians/parents who know the
system list underage children as school going children in order to receive more money. They also
list children as being in school when they are not. Using the school administration would assist
in either encouraging out of school children to enrol or reduce fraud that surrounds the enrolment
of households into the Mtukula Pakhomo.
Regarding the role of mother groups, the PEA said these groups are doing a good job at
encouraging girls to stay in school. They follow up with girls who are not attending school and
assist girls who are in school with their needs, including sanitary needs. If the mother’s groups
are used, they would assist in encouraging SCTP children to continue with their education. The
advantage with mother groups, as opposed to teachers, is that members reside with the children
and are aware of the situation of the children and their households.
Regarding the role the education system would play in monitoring SCTP children in school, she
said teachers would provide monitoring data to head teachers who would further present a
consolidated school report to the PEA at the TDC. Such a report would be passed on to the
DEM or whosoever is interested.
Chikuli Full Primary School – Ms Anna Kandoje HT and Mr Yohane Mathewe
The administrators said they only knew about Mtukula Pakhomo when district officials
came for monitoring. The team came and requested the HT to bring children whose parents were
on Mtukula Pakhomo. Both the school administration and the visitors did not have the required
list of children. The school managed to bring the children out but they were not involved in the
meeting the visitors had with the children. They did not ask about the attendance and performance
records.
Regarding what the school could do to assist in the monitoring of the SCTP children the,
administrators proposed the following:
Teachers should be sensitized and b oriented on the Mtukula Pakhomo programme and
its modalities to promote the linkage between the programme and education. This would
also promote ownership on the part of the teachers and managers

89
The Mtukula Pakhomo should provide a list of children whose households are
beneficiaries
The school will operate a special register for closer follow up of the SCTP children
Class teachers will also monitor the children specifically
The school in conjunction with the Mtukula Pakhomo officials should develop a report card
that will be used to track down the SCTP school children. These report cards will be filled
every term. The system of using special report cards has ever been used at the school
for Amazing Grace, a CBO, who follow up their children using the school system
Parents should be encouraged to come and check on the progress of their children
Mother groups should be involved because of their roles as education promoters. In
particular, members of the mother groups should follow up with children since they live
with them.
PEA Thuchila Zone Ms Mpate
The key point from the PEA was that if Mtukula Pakhomo has to benefit school going
children, their portion of the transfer should directly go for school items like writing materials,
uniforms and jerseys. She proposed that such items should be provided when the children are
actually in school and be withdrawn if they are no longer attending school.
On monitoring, she said teachers should be responsible using their class registers and when a
pupil is absent the class teachers should follow up with the parent/guardian. The teachers should
produce a report for their class which will be passed on to the head teacher followed by a
consolidated report to the PEA.
Concluding remark
The education authorities seem to have no problem towards getting involved in the monitoring
of SCTP school children. The key basis is that monitoring of school children is within their TOR
and the schools have worked with organisations in the past doing the same. The two main
suggestions provided by the stakeholders is as follows;
The first pertains to the registration of beneficiaries. The stakeholders propose that
households that register in the UBR/SCTP to have children in school or having children
of school going age should be verified by the school authorities. If the children are not in
school, it would be the work of the school through the mother groups or directly with the
teachers to follow them up after household registration in the programme.
90
The second suggestion involves households that have been registered. The list of SCTP
children and the school they are attending should be given to the DEM/PEA/Head
teachers for monitoring. The head teacher would rely on the routine register to monitor
the school children. The children can be followed up by mother’s groups or class
teachers. The school could be required to have a monthly report. A form to monitor SCTP
children’s school attendance that the schools fill out every month or term could be
designed and provided. It is feasible to use the education system to monitor SCTP school
children at both primary and secondary school levels.
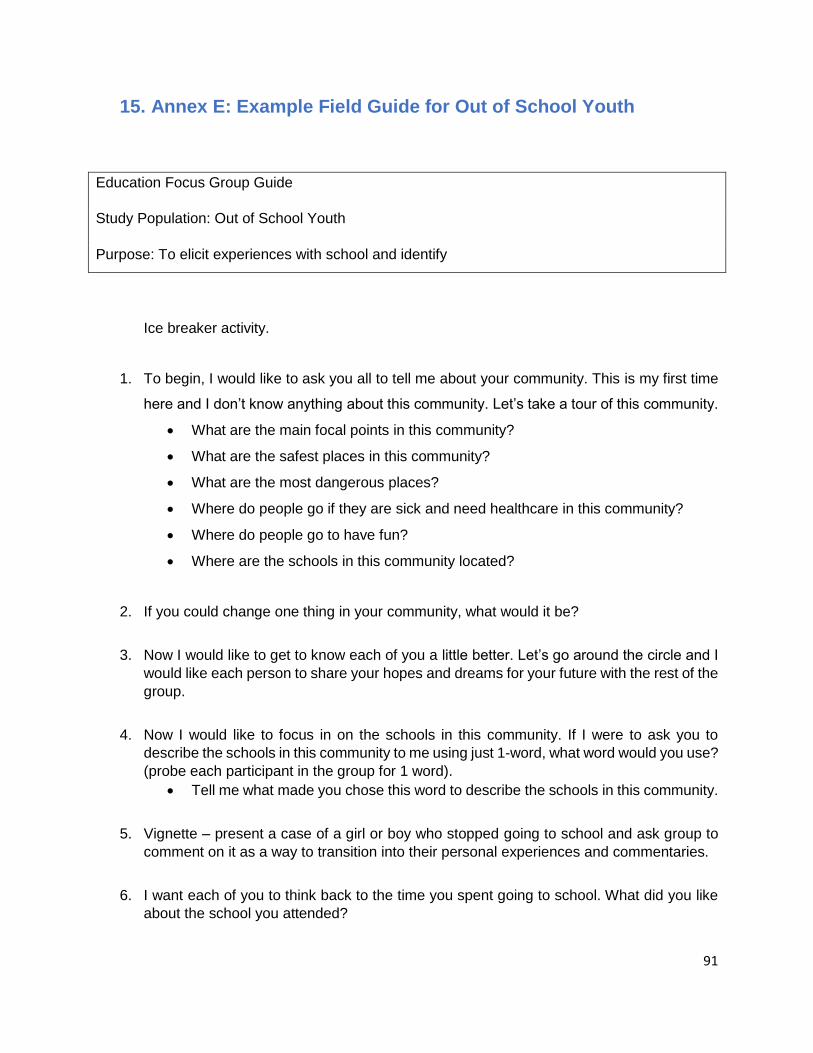
91
15. Annex E: Example Field Guide for Out of School Youth
Education Focus Group Guide
Study Population: Out of School Youth
Purpose: To elicit experiences with school and identify
Ice breaker activity.
1. To begin, I would like to ask you all to tell me about your community. This is my first time
here and I don’t know anything about this community. Let’s take a tour of this community.
What are the main focal points in this community?
What are the safest places in this community?
What are the most dangerous places?
Where do people go if they are sick and need healthcare in this community?
Where do people go to have fun?
Where are the schools in this community located?
2. If you could change one thing in your community, what would it be?
3. Now I would like to get to know each of you a little better. Let’s go around the circle and I
would like each person to share your hopes and dreams for your future with the rest of the
group.
4. Now I would like to focus in on the schools in this community. If I were to ask you to
describe the schools in this community to me using just 1-word, what word would you use?
(probe each participant in the group for 1 word).
Tell me what made you chose this word to describe the schools in this community.
5. Vignette – present a case of a girl or boy who stopped going to school and ask group to
comment on it as a way to transition into their personal experiences and commentaries.
6. I want each of you to think back to the time you spent going to school. What did you like
about the school you attended?

92
7. What made it difficult to get to school? Tell me about the challenges you all experienced
getting to and staying in school. (probe on both financial and non-financial barriers to
school attendance)
8. What was happening your life and within your household when you stopped going to
school (probe around the group to elicit different experiences).
9. All of your households have been participating in the Social Cash Transfer Programme.
What is your understanding of this programme?
10. How has the programme helped your household?
Did your household receive any additional support for your education from the
SCTP programme?
11. How has the programme helped you personally?
12. Vignette of girl or boy who continues going to school despite living in a poor family and
probe on what made it possible and how much participants can relate to this example.
13. How many of you would like to go back to school?
If you would like to go back, what it would take for you to be able to go back to
school.
What keeps you or has kept you from going back to school?
What makes you not want to go back to school?
Does anyone have anything else they would like to say?
Are there any questions?
Thank you all for participating.
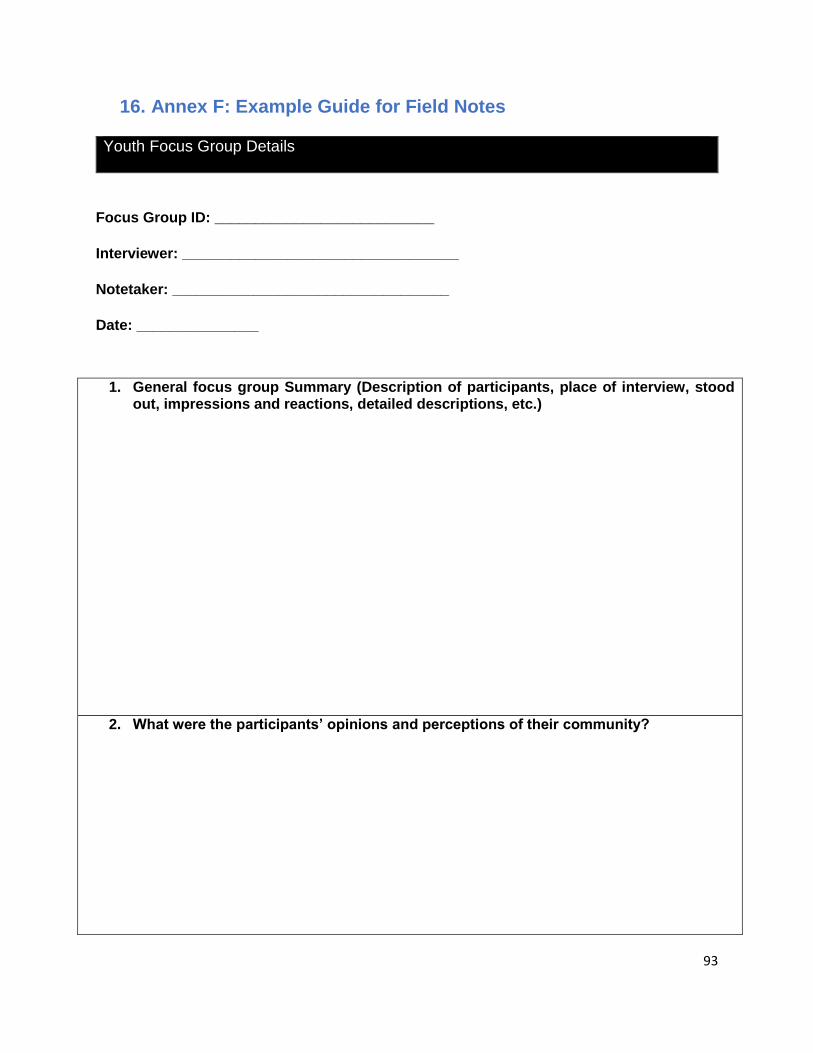
93
16. Annex F: Example Guide for Field Notes
Youth Focus Group Details
Focus Group ID: ___________________________
Interviewer: __________________________________
Notetaker: __________________________________
Date: _______________
1. General focus group Summary (Description of participants, place of interview, stood out, impressions and reactions, detailed descriptions, etc.)
2. What were the participants’ opinions and perceptions of their community?
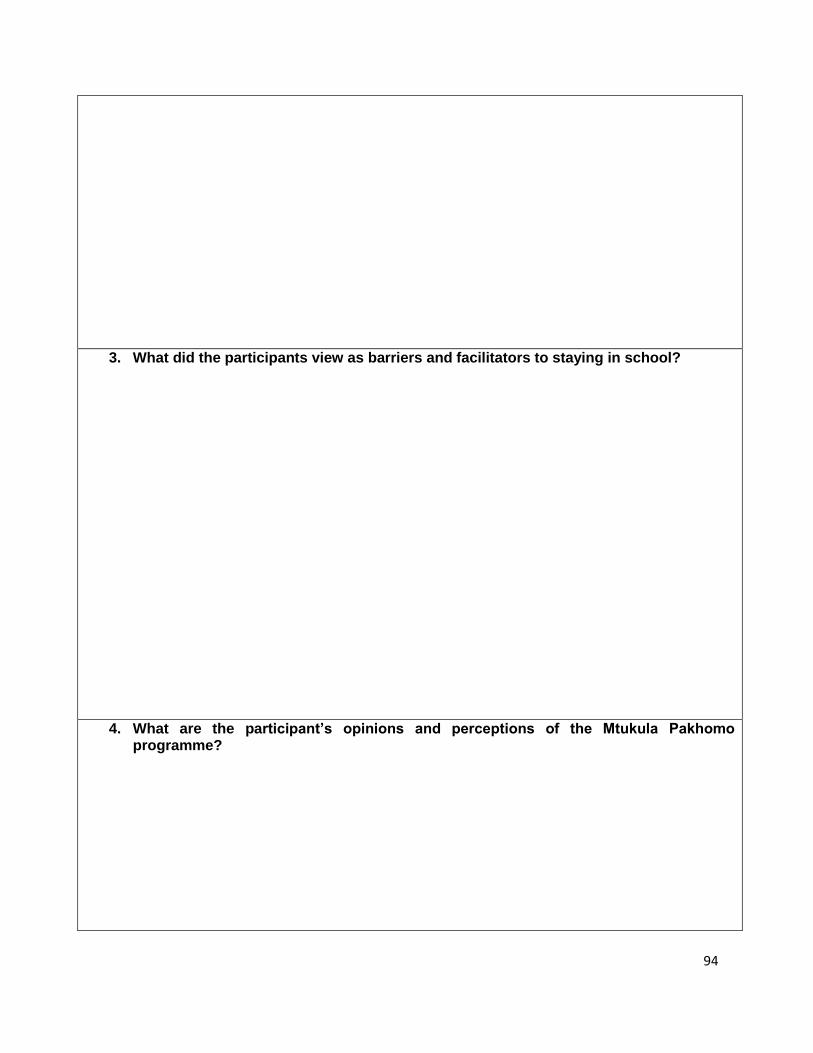
94
3. What did the participants view as barriers and facilitators to staying in school?
4. What are the participant’s opinions and perceptions of the Mtukula Pakhomo programme?
95
5. For out of school students, what were the circumstances around them leaving school? What happened after they left?
6. Reflect on the discussion and any group dynamics from your perspective and identify follow-up questions.
96
Participant
Number
Name Age Sex Marital
Status
Household
Size
Education
Level
1
2
3
4
5
6
7
8
9
10
11
12