malawi operational plan cop16 strategic direction summary
TRANSCRIPT
July 1, 2016
1
Malawi Operational Plan
COP16
Strategic Direction Summary
July 1, 2016
July 1, 2016
2
Table of Contents
Goal Statement ..................................................................................................................................4
1.0 Epidemic, Response, and Program Context ..............................................................................5
Figure 1.1.1 Distribution of HIV prevalence by age and sex ..................................................................5
Figure 1.1.2 HIV Prevalence and PLHIV Population Density ................................................................6
Table 1.1.1 Key National Demographic and Epidemiological Data ........................................................9
Table 1.1.2 Cascade of HIV diagnosis, care and treatment (12 months)* ............................................ 11
1.2 Investment Profile ...................................................................................................................... 11
1.3 National Sustainability Profile ..................................................................................................... 14
1.4 Alignment of PEPFAR investments geographically to disease burden ........................................... 15
1.5 Stakeholder Engagement ............................................................................................................ 18
2.0 Core, Near-Core and Non-Core Activities ...................................................................... 19
3.0 Geographic and Population Prioritization ......................................................................... 20
Geographic Prioritization: ................................................................................................................ 20
Population Prioritization: ................................................................................................................. 23
3.3.Voluntary Medical Male Circumcision (VMMC) ........................................................................... 24
4.0 Program Activities for Epidemic Control in Scale-up Locations and Populations ..................... 24
4.1 Targets for Scale-up locations and populations ............................................................................ 25
Program Area Summaries ................................................................................................................. 30
4.2 Priority population prevention .................................................................................................... 30
Adolescent Girls and Young Women (AGYW): .................................................................................... 31
Key Populations: ................................................................................................................................. 32
Reaching Men ..................................................................................................................................... 33
Prisons ................................................................................................................................................. 34
Condom Programming ........................................................................................................................ 34
Gender Based Violence and Stigma and Discrimination ..................................................................... 35
4.3 Voluntary Male Medical Circumcision (VMMC) ........................................................................... 36
4.4 PMTCT ....................................................................................................................................... 38
4.5 HIV Testing and Counselling ..................................................................................................... 39
4.6 Facility and Community Based Treatment, Care and Support ....................................................... 41
4.7 TB/HIV ..................................................................................................................................... 44
4.8 Adult ART ................................................................................................................................ 45

July 1, 2016
3
4.9 Pediatric ART ........................................................................................................................... 47
4.10 Orphans and Vulnerable Children ............................................................................................. 50
5.0 Program Activities in Sustained Support Locations and Populations ............................. 52
5.1 Package of services in sustained support locations and populations ............................................. 52
5.1 Maintenance package of services in other locations and populations ......................................... 52
6.0 Program Support Necessary to Achieve Sustained Epidemic Control ............................................ 52
6.2 Critical Systems Investments for Achieving Priority Policies ......................................................... 61
6.3 Proposed system investments outside of programmatic gaps and priority policies. ...................... 65
7.0 Staffing Plan............................................................................................................................ 67
Appendix A Core, Near Core, Non-Core .......................................................................................... 69
Table A.1 Program Core, Near-core, and Non-core Activities for COP 16 ............................................ 69
Table A.2 Program Area Specific Core, Near-core, and Non-core Activities for COP 15 ........................ 72
APPENDIX B B.1 Planned Spending in 2016 ....................................................................................... 79
Appendix C. Acronym ............................................................................... Error! Bookmark not defined.
Appendix D Humanitarian Crisis ....................................................................................................... 83
Appendix E VMMC Demand Creation Strategy .................................................................................. 85
Appendix F Consideration for Differentiated Care ............................................................................ 86

July 1, 2016
4
Goal Statement Despite Malawi being among the poorest countries in the world, ranking 174 out of 187 on the UN
Human Development Index, the country is a recognized leader for promoting a public health
approach to address the significant national HIV/AIDS epidemic. Beyond having designed and been
the first to implement Option B+, Malawi is also the first country to include Test and Start and the
90-90-90 objectives for epidemic control within its National Strategic Plan, initiating rollout in mid-
2016. This commitment to adopt bold strategies has brought Malawi closer towards epidemic
control: there are approximately 34,000 new HIV infections compared to the estimated 67,000 HIV-
related deaths annually (Spectrum 2014). Reaching saturation (80% coverage) of HIV+ people on
antiretroviral treatment (ART), however, remains a major challenge in the context of an increasingly
fragile health system. Malawi has made significant progress in expanding ART access through task
shifting and decentralization, but treatment scale-up in the highest burden areas is hampered by one of
the severest health worker shortages in Africa, with only 28 nurses and 2 physicians per 100,000
population and a crumbling health facility infrastructure. Reaching missed populations, including men,
will also require new strategies to accelerate ART coverage over the next two years.
Consistent with the principle that USG must maximize investments in areas of high HIV burden, the
PEPFAR/Malawi program prioritized support to the Ministry of Health in 427 priority sites representing
60 percent of total sites in the country covering 88% of ART patients and HIV burden. This focused
approach, which started in COP 2014 and was refined in COP15 is projected to result in 10 of 28 districts
reaching 80% ART saturation by 2017, of which 6 are within the 10 scale up districts; by FY 18 half the
districts (14 of 28) in Malawi, comprising 77% of the estimated PLHIV, will have reached saturation
including Blantyre and Lilongwe. To achieve these targets, COP16 outlines an even more focused
approach with additional aggressive interventions in the three highest HIV burdened districts (Lilongwe,
Blantyre, and Zomba) and more intensive and targeted efforts in the remaining seven scale-up districts.
Eighteen1 districts will receive sustained PEPFAR support, a shift from 14 in COP 2015. COP16 outlines
strategies for increased and targeted HIV testing; the roll out of differentiated care models to enhance
efficiency and quality, and more active measures to improve adherence, retention in treatment, and
viral suppression. There is an additional focus on community-based service delivery models to facilitate
the decongestion of high burden facilities and to more effectively reach men and others who are not
actively seeking services at health facilities. Saturation targets cannot be achieved through these
programmatic interventions alone. Investment in health infrastructure and the health workforce,
focused on the three highest HIV burdened districts, will be critical. PEPFAR/Malawi is submitting a
supplementary request with this COP submission to address these challenging bottlenecks which will
inhibit attainment of FY 17 and 18 targets. With COP16 resources and through strategic leveraging of a
new high value Global Fund grant - particularly for HIV commodities, interventions reaching adolescent
girls and young women and key populations, PEPFAR/ Malawi is well positioned to accelerate Malawi’s
progress toward achievement of 90-90-90 goals.
1 Note that Chiradzulu receives only commodity support

July 1, 2016
5
1.0 Epidemic, Response, and Program Context
The Demographic and Health Survey (DHS) and Malawi Population HIV Impact Assessment (MPHIA),
available by the end of 2016, will provide robust data for a more accurate picture of the HIV epidemic. In
the absence of this updated information, data used to define intervention strategies and targets
originated from older sources, and may not accurately reflect the current status of the HIV/AIDS
epidemic in the country.
HIV prevalence among adults (15–49) increased sharply in Malawi in the 1990s, peaking at 16.4% in
1999 and declining to 10.6% by 2010. HIV prevalence is highest in the densely populated Southern
region (14.5%), followed by Central (7.6%) and Northern regions (6.6%).2 HIV ‘hot spots’ are found
across all districts, primarily along major transportation routes, and in areas where large agricultural or
business interests exist3. HIV prevalence varies considerably by gender, age, socio-economic
characteristics, and geographic location., HIV prevalence in the 15-49 age group is higher among women
(13%) than men (9%); 58% of PLHIV are female ( Figure 1.1.1)
Figure 1.1.1 Distribution of HIV prevalence by age and sex
Source: MDHS 2010
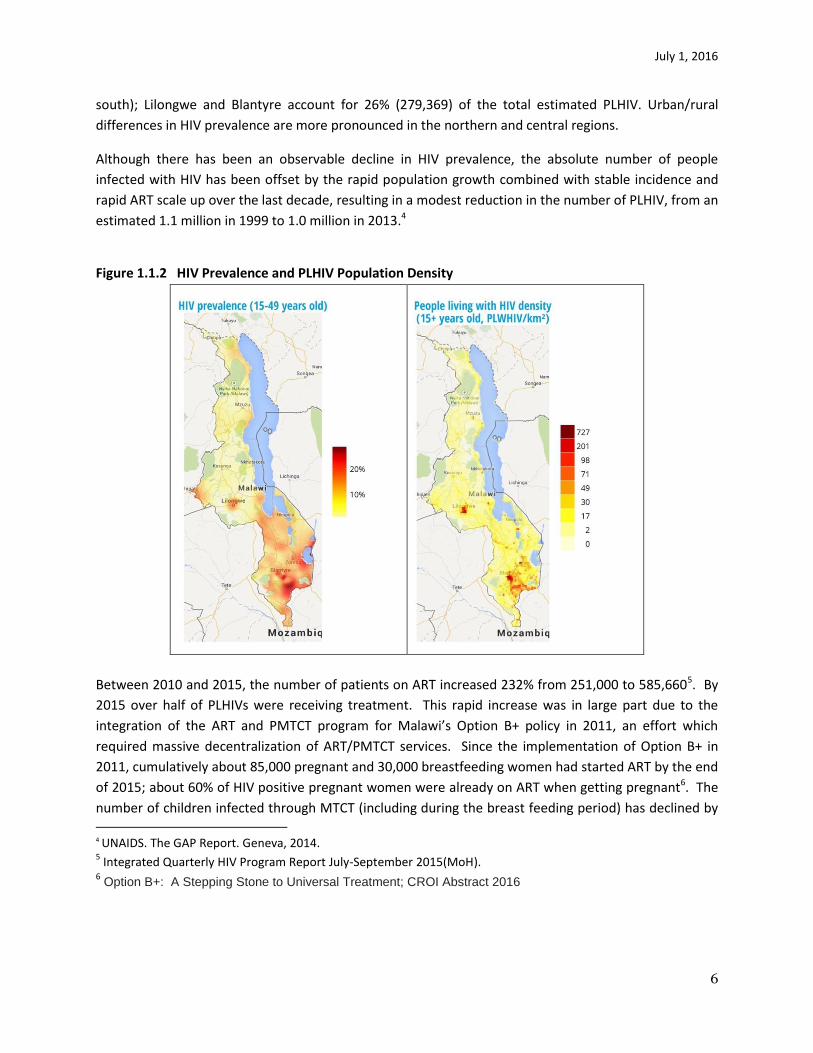
Figure 1.1.2 shows the geographic distribution of HIV, which broadly aligns with the population density.
This translates into a considerable concentration of PLHIV in the south and in a few urban and market
centres in the north and central regions. In 2013, over 50% of the estimated 1 million PLHIV were living
in six of Malawi’s 28 districts, which account together for 42% of the country’s population (all six in the
2 National Statistical Office (NSO) and ICF Macro. 2011. Malawi Demographic and Health Survey 2010. Zomba, Malawi, and Calverton, Maryland, USA: NSO and ICF Macro. 3 St Johns Mission Hospital in Mzimba district has a HIV testing yield of 10% although the district prevalence is
5.1%. Dwangwa Matiki clinic. In Nhkhotakota has an HIV positive yield of about 9% whereas the district HIV prevalence is estimated at 3.1%.
July 1, 2016
6
south); Lilongwe and Blantyre account for 26% (279,369) of the total estimated PLHIV. Urban/rural
differences in HIV prevalence are more pronounced in the northern and central regions.
Although there has been an observable decline in HIV prevalence, the absolute number of people
infected with HIV has been offset by the rapid population growth combined with stable incidence and
rapid ART scale up over the last decade, resulting in a modest reduction in the number of PLHIV, from an
estimated 1.1 million in 1999 to 1.0 million in 2013.4
Figure 1.1.2 HIV Prevalence and PLHIV Population Density
Between 2010 and 2015, the number of patients on ART increased 232% from 251,000 to 585,6605. By
2015 over half of PLHIVs were receiving treatment. This rapid increase was in large part due to the
integration of the ART and PMTCT program for Malawi’s Option B+ policy in 2011, an effort which
required massive decentralization of ART/PMTCT services. Since the implementation of Option B+ in
2011, cumulatively about 85,000 pregnant and 30,000 breastfeeding women had started ART by the end
of 2015; about 60% of HIV positive pregnant women were already on ART when getting pregnant6. The
number of children infected through MTCT (including during the breast feeding period) has declined by 4 UNAIDS. The GAP Report. Geneva, 2014. 5 Integrated Quarterly HIV Program Report July-September 2015(MoH).
6 Option B+: A Stepping Stone to Universal Treatment; CROI Abstract 2016
July 1, 2016
7
66% (from 30,000 in 2010 to 10,000 in 2014.In spite of ART scale-up, HIV remains the leading cause of
death among adults. In 2013, 38,000 (66%) of 56,500 deaths in this age group were attributed to HIV.
Despite impressive gains in addressing the HIV epidemic, there are significant contextual concerns that
are already affecting progress. Extreme poverty is pervasive with a per capita GDP of $262. Eighty-five
per cent of households are engaged in agriculture but they account for only 30% of GDP, a reflection of
low productivity, which is rooted in small land holdings made smaller by population growth, degraded
soils, uncertainty due to climate change and other economic and policy barriers. Poor domestic
revenue generation at national level has constrained growth in domestic resources for the health sector.
More recently the country instituted a hiring freeze for the civil service because the national budget can
no longer effectively accommodate a constantly increasing wage bill, particularly in light of limited
government revenues.
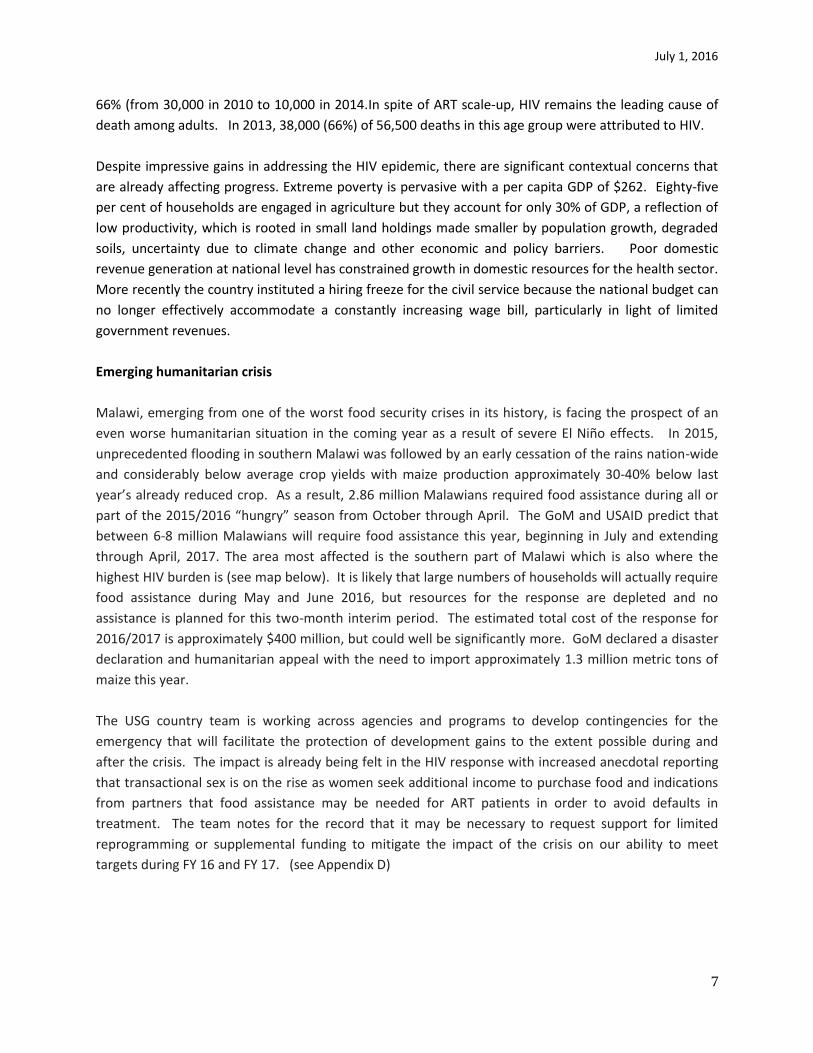
Emerging humanitarian crisis
Malawi, emerging from one of the worst food security crises in its history, is facing the prospect of an
even worse humanitarian situation in the coming year as a result of severe El Niño effects. In 2015,
unprecedented flooding in southern Malawi was followed by an early cessation of the rains nation-wide
and considerably below average crop yields with maize production approximately 30-40% below last
year’s already reduced crop. As a result, 2.86 million Malawians required food assistance during all or
part of the 2015/2016 “hungry” season from October through April. The GoM and USAID predict that
between 6-8 million Malawians will require food assistance this year, beginning in July and extending
through April, 2017. The area most affected is the southern part of Malawi which is also where the
highest HIV burden is (see map below). It is likely that large numbers of households will actually require
food assistance during May and June 2016, but resources for the response are depleted and no
assistance is planned for this two-month interim period. The estimated total cost of the response for
2016/2017 is approximately $400 million, but could well be significantly more. GoM declared a disaster
declaration and humanitarian appeal with the need to import approximately 1.3 million metric tons of
maize this year.
The USG country team is working across agencies and programs to develop contingencies for the
emergency that will facilitate the protection of development gains to the extent possible during and
after the crisis. The impact is already being felt in the HIV response with increased anecdotal reporting
that transactional sex is on the rise as women seek additional income to purchase food and indications
from partners that food assistance may be needed for ART patients in order to avoid defaults in
treatment. The team notes for the record that it may be necessary to request support for limited
reprogramming or supplemental funding to mitigate the impact of the crisis on our ability to meet
targets during FY 16 and FY 17. (see Appendix D)

July 1, 2016
8
The GOM expends only $7.60 per capita per annum on health. Substantial donor resources
bring Total Health Expenditures to $39 per capita per annum, compared to an average of $147 for the
Southern Africa region. The HIV sector is heavily dependent on donor support, receiving 74% from
Global Fund (GF) and PEPFAR and a further 12% from other donor resources. The GF principally supports
the procurement and distribution of ARVs and other key commodities, supply chain management,
minimal HRH pre- and in-service -training, and community interventions. Infrastructure and HRH remain
critical gaps that have not been adequately supported. These areas require, therefore, the coordination
of other donors, including USG, to meet the most critical needs. A request for reprogramming of GF
grant savings ($8.8 million) due to a reduction in the price of commodities to temporarily support
salaries for 1,200 new health workers has yet to be approved.
Malawi’s adoption of Test and Start in April 2016 demonstrates the national commitment to
aggressively address the epidemic and to achieve the 90-90-90 goals nationally by 2020.
July 1, 2016
9
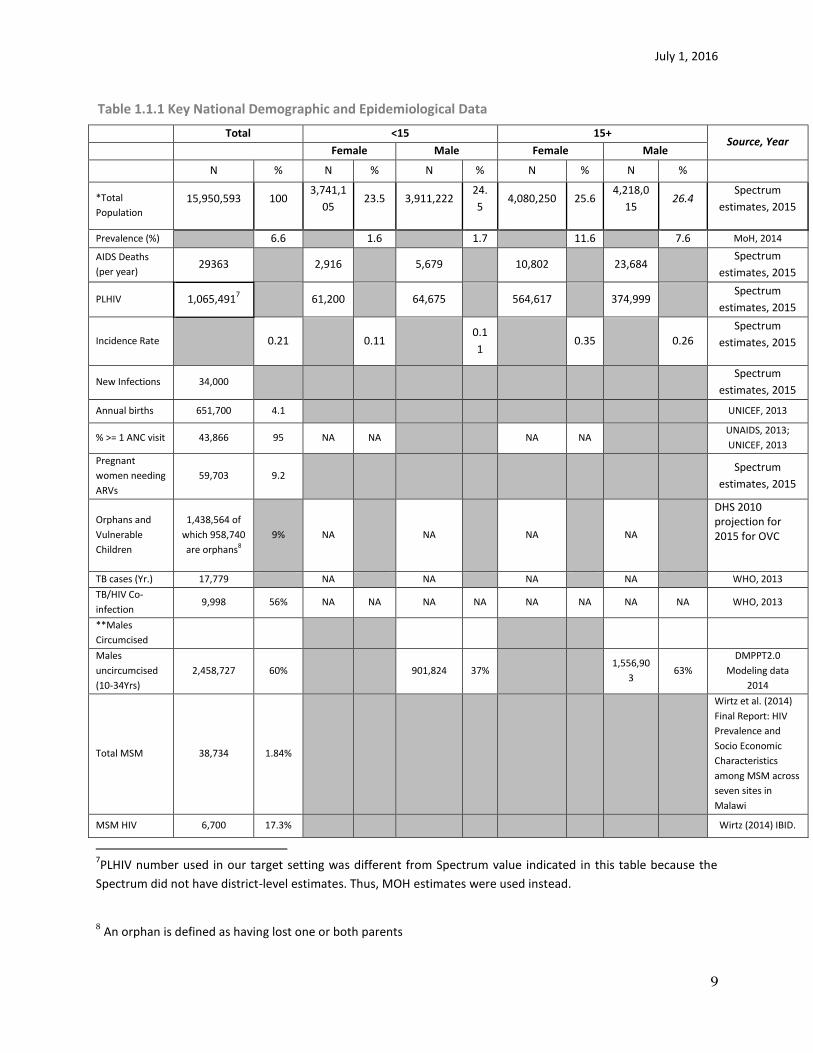
Table 1.1.1 Key National Demographic and Epidemiological Data
Total <15 15+
Source, Year
Female Male Female Male
N % N % N % N % N %
*Total
Population
15,950,593 100 3,741,1
05 23.5 3,911,222
24.
5 4,080,250 25.6
4,218,0
15 26.4
Spectrum
estimates, 2015
Prevalence (%) 6.6 1.6 1.7 11.6 7.6 MoH, 2014
AIDS Deaths
(per year) 29363 2,916 5,679 10,802 23,684
Spectrum
estimates, 2015
PLHIV 1,065,4917 61,200 64,675 564,617 374,999
Spectrum
estimates, 2015
Incidence Rate 0.21 0.11 0.1
1 0.35 0.26
Spectrum
estimates, 2015
New Infections 34,000 Spectrum
estimates, 2015
Annual births 651,700 4.1 UNICEF, 2013
% >= 1 ANC visit 43,866 95 NA NA NA NA UNAIDS, 2013;
UNICEF, 2013
Pregnant
women needing
ARVs
59,703 9.2 Spectrum
estimates, 2015
Orphans and
Vulnerable
Children
1,438,564 of
which 958,740
are orphans8
9% NA NA NA NA
DHS 2010 projection for 2015 for OVC
TB cases (Yr.) 17,779 NA NA NA NA WHO, 2013
TB/HIV Co-
infection 9,998 56% NA NA NA NA NA NA NA NA WHO, 2013
**Males
Circumcised
Males
uncircumcised
(10-34Yrs)
2,458,727 60% 901,824 37% 1,556,90
3 63%
DMPPT2.0
Modeling data
2014
Total MSM
38,734
1.84%
Wirtz et al. (2014)
Final Report: HIV
Prevalence and
Socio Economic
Characteristics
among MSM across
seven sites in
Malawi
MSM HIV 6,700 17.3% Wirtz (2014) IBID.
7PLHIV number used in our target setting was different from Spectrum value indicated in this table because the
Spectrum did not have district-level estimates. Thus, MOH estimates were used instead.
8 An orphan is defined as having lost one or both parents
July 1, 2016
10
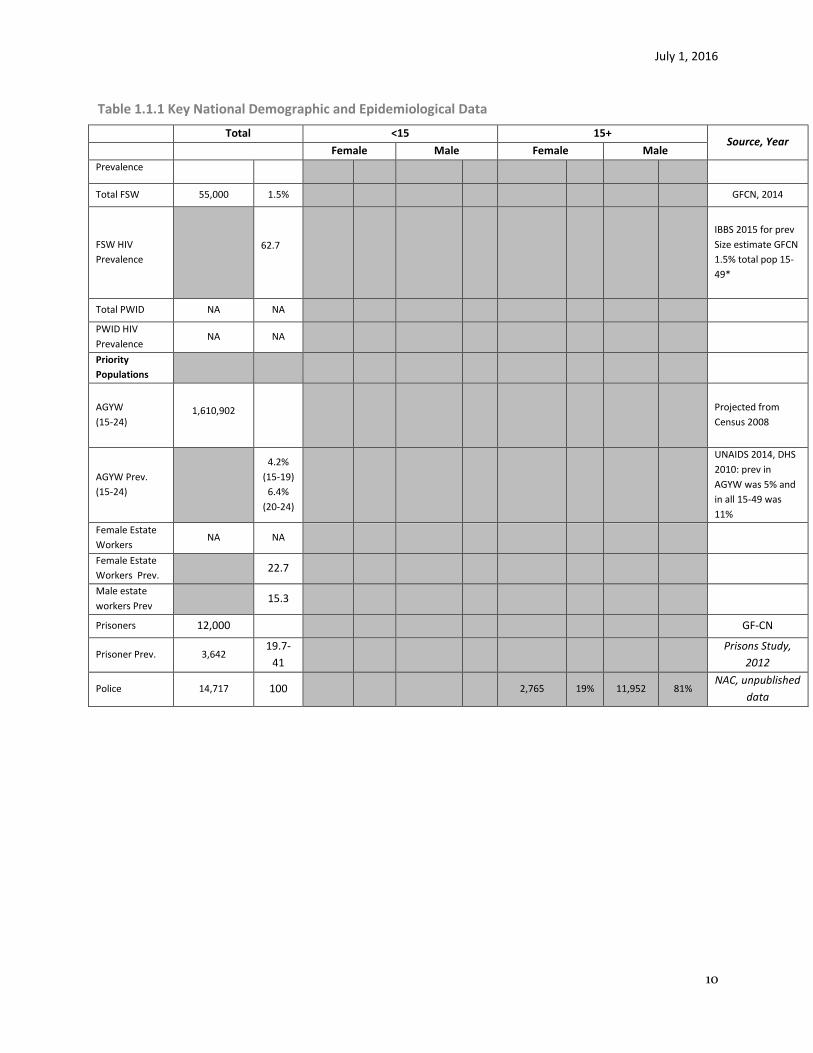
Table 1.1.1 Key National Demographic and Epidemiological Data
Total <15 15+
Source, Year
Female Male Female Male
Prevalence
Total FSW 55,000 1.5% GFCN, 2014
FSW HIV
Prevalence
62.7
IBBS 2015 for prev
Size estimate GFCN
1.5% total pop 15-
49*
Total PWID NA NA
PWID HIV
Prevalence NA NA
Priority
Populations
AGYW
(15-24)
1,610,902
Projected from
Census 2008
AGYW Prev.
(15-24)
4.2%
(15-19)
6.4%
(20-24)
UNAIDS 2014, DHS
2010: prev in
AGYW was 5% and
in all 15-49 was
11%
Female Estate
Workers NA NA
Female Estate
Workers Prev. 22.7
Male estate
workers Prev 15.3
Prisoners 12,000 GF-CN
Prisoner Prev. 3,642 19.7-
41
Prisons Study,
2012
Police 14,717 100 2,765 19% 11,952 81% NAC, unpublished
data
July 1, 2016
11
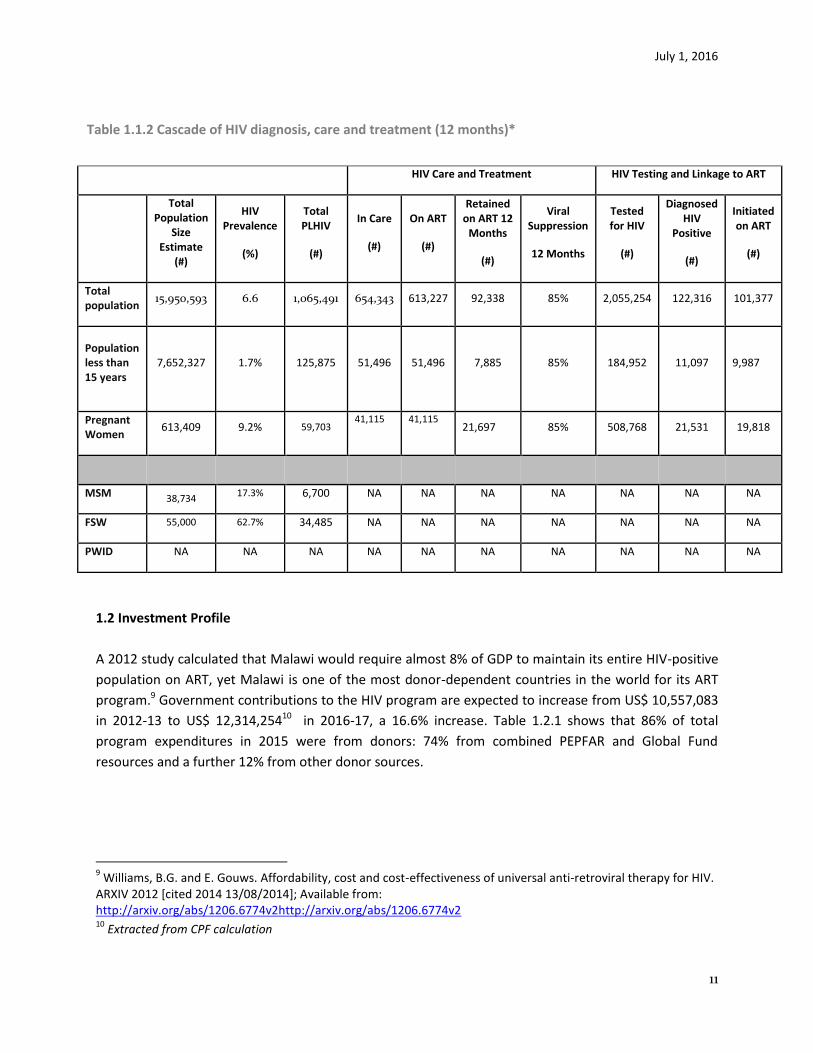
Table 1.1.2 Cascade of HIV diagnosis, care and treatment (12 months)*
HIV Care and Treatment HIV Testing and Linkage to ART
Total Population
Size Estimate
(#)
HIV Prevalence
(%)
Total PLHIV
(#)
In Care
(#)
On ART
(#)
Retained on ART 12
Months
(#)
Viral Suppression
12 Months
Tested for HIV
(#)
Diagnosed HIV
Positive
(#)
Initiated on ART
(#)
Total population
15,950,593 6.6 1,065,491 654,343 613,227 92,338 85% 2,055,254 122,316 101,377
Population less than 15 years
7,652,327
1.7%
125,875
51,496 51,496 7,885 85% 184,952 11,097 9,987
Pregnant Women
613,409 9.2% 59,703 41,115 41,115
21,697 85% 508,768 21,531 19,818
MSM 38,734 17.3% 6,700 NA NA NA NA NA NA NA
FSW 55,000 62.7% 34,485 NA NA NA NA NA NA NA
PWID NA NA NA NA NA NA NA NA NA NA
1.2 Investment Profile
A 2012 study calculated that Malawi would require almost 8% of GDP to maintain its entire HIV-positive
population on ART, yet Malawi is one of the most donor-dependent countries in the world for its ART
program.9 Government contributions to the HIV program are expected to increase from US$ 10,557,083
in 2012-13 to US$ 12,314,25410 in 2016-17, a 16.6% increase. Table 1.2.1 shows that 86% of total
program expenditures in 2015 were from donors: 74% from combined PEPFAR and Global Fund
resources and a further 12% from other donor sources.
9 Williams, B.G. and E. Gouws. Affordability, cost and cost-effectiveness of universal anti-retroviral therapy for HIV.
ARXIV 2012 [cited 2014 13/08/2014]; Available from: http://arxiv.org/abs/1206.6774v2http://arxiv.org/abs/1206.6774v2 10
Extracted from CPF calculation
July 1, 2016
12
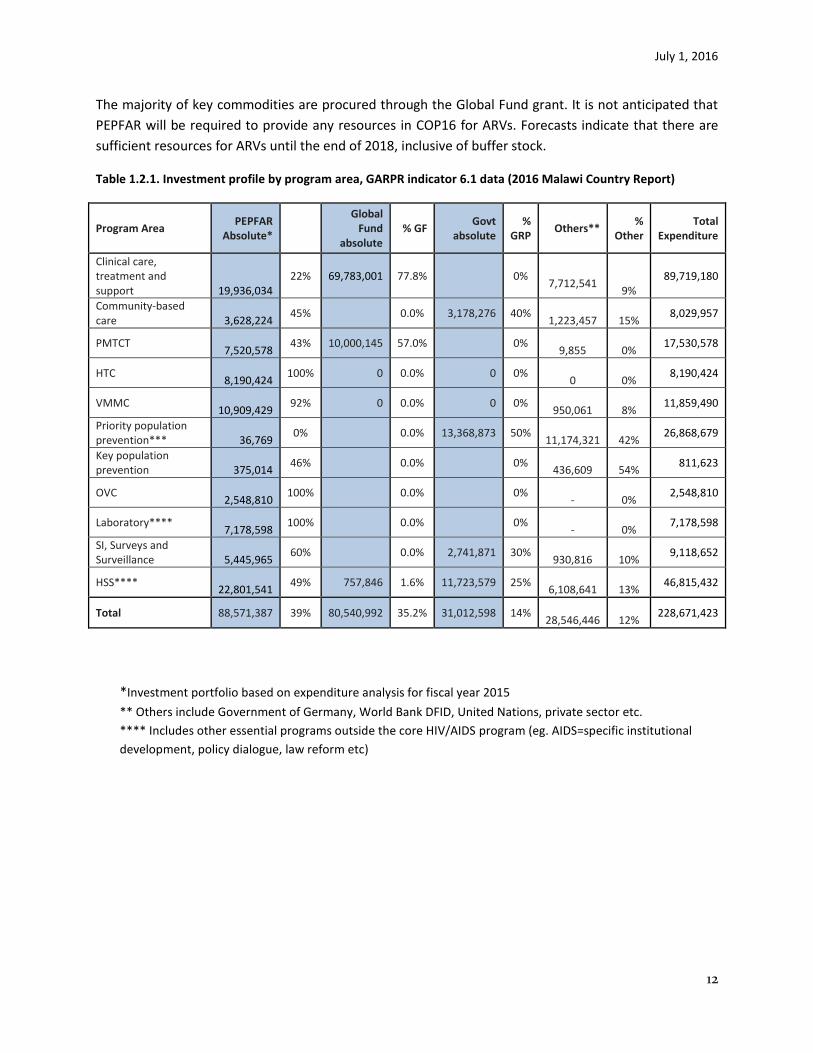
The majority of key commodities are procured through the Global Fund grant. It is not anticipated that
PEPFAR will be required to provide any resources in COP16 for ARVs. Forecasts indicate that there are
sufficient resources for ARVs until the end of 2018, inclusive of buffer stock.
Table 1.2.1. Investment profile by program area, GARPR indicator 6.1 data (2016 Malawi Country Report)
Program Area PEPFAR
Absolute*
Global Fund
absolute % GF
Govt absolute
% GRP
Others** %
Other Total
Expenditure
Clinical care, treatment and support 19,936,034
22% 69,783,001 77.8% 0%
7,712,541 9%
89,719,180
Community-based care 3,628,224
45% 0.0% 3,178,276 40%
1,223,457 15% 8,029,957
PMTCT 7,520,578
43% 10,000,145 57.0% 0%
9,855 0% 17,530,578
HTC 8,190,424
100% 0 0.0% 0 0%
0 0% 8,190,424
VMMC 10,909,429
92% 0 0.0% 0 0%
950,061 8% 11,859,490
Priority population prevention*** 36,769
0% 0.0% 13,368,873 50%
11,174,321 42% 26,868,679
Key population prevention 375,014
46% 0.0% 0%
436,609 54% 811,623
OVC 2,548,810
100% 0.0% 0% - 0%
2,548,810
Laboratory**** 7,178,598
100% 0.0% 0% - 0%
7,178,598
SI, Surveys and Surveillance 5,445,965
60% 0.0% 2,741,871 30%
930,816 10% 9,118,652
HSS**** 22,801,541
49% 757,846 1.6% 11,723,579 25%
6,108,641 13% 46,815,432
Total 88,571,387 39% 80,540,992 35.2% 31,012,598 14%
28,546,446 12% 228,671,423
*Investment portfolio based on expenditure analysis for fiscal year 2015
** Others include Government of Germany, World Bank DFID, United Nations, private sector etc.
**** Includes other essential programs outside the core HIV/AIDS program (eg. AIDS=specific institutional
development, policy dialogue, law reform etc)
July 1, 2016
13
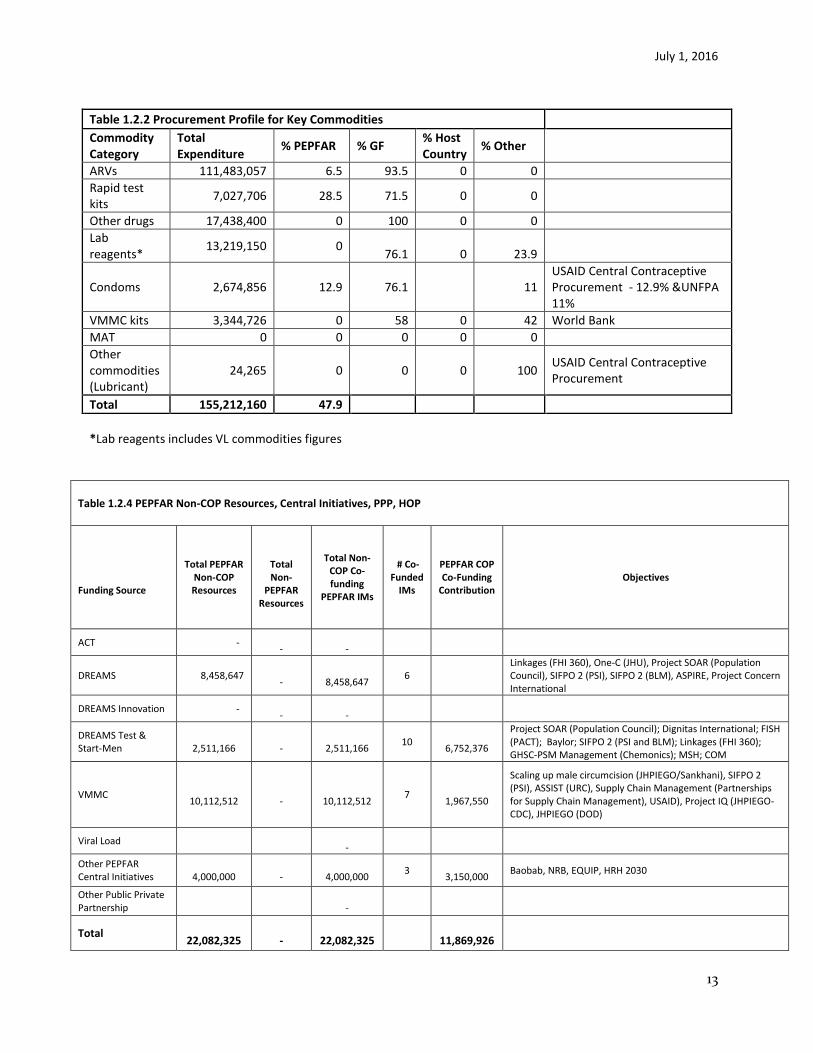
Table 1.2.4 PEPFAR Non-COP Resources, Central Initiatives, PPP, HOP
Funding Source
Total PEPFAR Non-COP Resources
Total Non-
PEPFAR Resources
Total Non-COP Co-funding
PEPFAR IMs
# Co-Funded
IMs
PEPFAR COP Co-Funding
Contribution Objectives
ACT - -
-
DREAMS 8,458,647 -
8,458,647
6 Linkages (FHI 360), One-C (JHU), Project SOAR (Population Council), SIFPO 2 (PSI), SIFPO 2 (BLM), ASPIRE, Project Concern International
DREAMS Innovation - -
-
DREAMS Test & Start-Men
2,511,166
-
2,511,166
10
6,752,376
Project SOAR (Population Council); Dignitas International; FISH (PACT); Baylor; SIFPO 2 (PSI and BLM); Linkages (FHI 360); GHSC-PSM Management (Chemonics); MSH; COM
VMMC
10,112,512 -
10,112,512
7
1,967,550
Scaling up male circumcision (JHPIEGO/Sankhani), SIFPO 2 (PSI), ASSIST (URC), Supply Chain Management (Partnerships for Supply Chain Management), USAID), Project IQ (JHPIEGO-CDC), JHPIEGO (DOD)
Viral Load -
Other PEPFAR Central Initiatives
4,000,000
-
4,000,000
3
3,150,000 Baobab, NRB, EQUIP, HRH 2030
Other Public Private Partnership
-
Total
22,082,325 -
22,082,325
11,869,926
Table 1.2.2 Procurement Profile for Key Commodities
Commodity Category
Total Expenditure
% PEPFAR % GF % Host Country
% Other
ARVs 111,483,057 6.5 93.5 0 0
Rapid test kits
7,027,706 28.5 71.5 0 0
Other drugs 17,438,400 0 100 0 0
Lab reagents*
13,219,150 0 76.1 0 23.9
Condoms 2,674,856 12.9 76.1
11 USAID Central Contraceptive Procurement - 12.9% &UNFPA 11%
VMMC kits 3,344,726 0 58 0 42 World Bank
MAT 0 0 0 0 0
Other commodities (Lubricant)
24,265 0 0 0 100 USAID Central Contraceptive Procurement
Total 155,212,160 47.9
*Lab reagents includes VL commodities figures
July 1, 2016
14
1.3 National Sustainability Profile
Country Overview: Malawi has a strong national HIV/AIDS response; however, the GOM continues to
face chronic systems and services challenges to achieving sustained epidemic control. Eight-six percent
of the national response is donor-funded, with the USG and Global Fund constituting the largest share of
funding. Advocacy for increased GOM commitment to covering costs is ongoing; however, as Malawi is
one of the poorest nations in the world, the likelihood of GOM contributing significant levels of
additional funding towards the HIV response in the next few years is low.
SID Process: The Malawi SID Consultation was conducted jointly by UNAIDS and the USG on February
2016, and jointly-hosted. Each of the four domain working groups was co-facilitated by a USG and
UNAIDS representative. The event was well-attended with representation from a cross-section of
stakeholders including the GOM, civil society, private sector representatives, and external donors.
Sustainability Strengths: The two highest-scoring elements for 2016 are Planning and Coordination, and
Policies and Governance. The national strategy, the participatory process for its development, the
existence of a mechanism for coordination to track and map HIV/AIDS activities and convene planning
and strategy meetings were identified as successes. The establishment of sub-national unit performance
targets in 2015 was recognized as progress towards achieving goals. High scores in the Policies and
Governance element are attributed to the existence of a wide range of policies to support the national
response in HIV treatment initiation, service delivery, non-discrimination protection and recognition of
the right to access services. Engagement of civil society and the private sector as key stakeholders to
inform the national response are also strengths. Other noted successes include existing structures to
promote community engagement in service delivery; incremental growth in domestic financing for
HIV/AIDS; availability of HIV clinical data; regularity of surveys and surveillance; and the effectiveness of
the government to collect expenditure data through the GARP, NASA and NHA.
Sustainability Weaknesses: The GOM continues to face chronic systems and services challenges in
achieving sustained epidemic control and greater long-term planning and partnership is required. . The
lowest-scoring elements are Technical and Allocative Efficiencies and Epidemiological and Health Data –
both scoring as unsustainable. Limited accountability for how resources are tracked and monitored was
noted as vulnerability. Under Epidemiological and Health Data, most surveys and surveillance rely on
significant external TA. Nationally-approved data quality assurance policies and procedures were not in
place and, while there is cost tracking, cost-effectiveness and cost-efficiency analyses are not done.
Data analysis was an additional vulnerability as most results are not presented against targets to
measure achievement
July 1, 2016
15
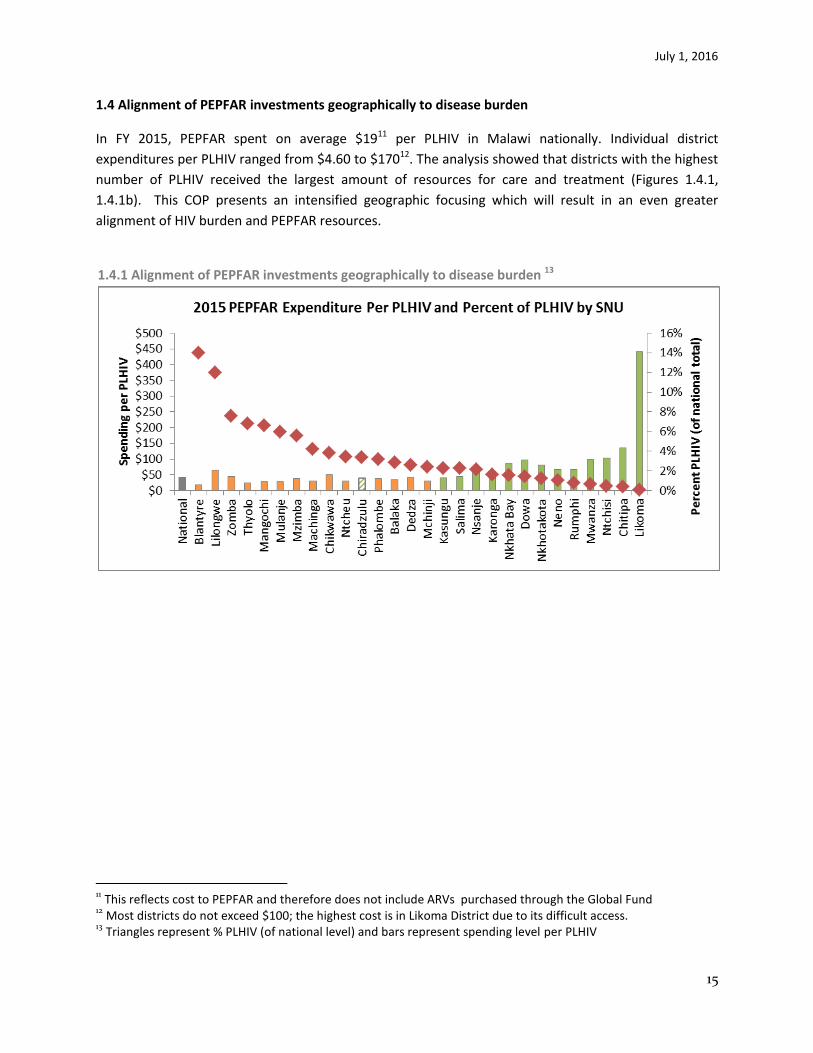
1.4 Alignment of PEPFAR investments geographically to disease burden
In FY 2015, PEPFAR spent on average $1911 per PLHIV in Malawi nationally. Individual district
expenditures per PLHIV ranged from $4.60 to $17012. The analysis showed that districts with the highest
number of PLHIV received the largest amount of resources for care and treatment (Figures 1.4.1,
1.4.1b). This COP presents an intensified geographic focusing which will result in an even greater
alignment of HIV burden and PEPFAR resources.
1.4.1 Alignment of PEPFAR investments geographically to disease burden 13
11 This reflects cost to PEPFAR and therefore does not include ARVs purchased through the Global Fund
12 Most districts do not exceed $100; the highest cost is in Likoma District due to its difficult access.
13 Triangles represent % PLHIV (of national level) and bars represent spending level per PLHIV

July 1, 2016
16
1.4.1b

July 1, 2016
17
Figure 1.3.2 Total expenditure, PLHIV, and Expenditure per PLHIV by District
Figure 1.4.2 Total expenditure and PLHIV by District
July 1, 2016
18
1.5 Stakeholder Engagement
Government of Malawi
The PEPFAR/Malawi team principally interacts with the Department of HIV/AIDS (DHA) in the Ministry of
Health (MoH). Regular meetings are held to review programmatic data and discuss programming plans.
USG staff participate in GOM convened technical working groups (TWGs). Outcomes of the Washington,
DC Management Meeting were shared and discussed with DHA. Further meetings have elaborated
strategies for optimization addressing differentiated service delivery; identification of new sites for
PEPFAR support, principally within Lilongwe and Blantyre; further definition by site of HRH and
infrastructure barriers. It was decided to hold quarterly joint meetings with DHA, PEPFAR and
Implementing Partners (IPs) to review programmatic performance, share successes and discuss
concerns. PEPFAR/Malawi also engages with other key units in the MOH: Human Resources
Department, Health Technical Support Services Department (includes Diagnostics and Supply Chain
Management) and Department of Planning.
The USG PEPFAR team meets regularly with the National AIDS Commission (NAC), which is currently
coordinating a National DREAMS Task Force and leading coordination of key populations and VMMC
activities. NAC convenes prevention-related technical working groups.
Representatives from MoH DHA and Planning Department as well as NAC have been invited to attend
the COP16 review meeting.
Global Fund and other External Donors
PEPFAR/Malawi team members actively participate in the monthly HIV/AIDS Donor (HADG) and Health
Development Partners (HDG) Groups. USAID currently serves as the chair of HADG. Members include
bilateral and multilateral donors. MOH and NAC participate in these fora from time to time.
USG engagement with GF in country is strong. USG staff were involved in supporting Concept Note
development for the new award valued at over $300 million and continue to support planning efforts
with the Principal Recipients. The USAID Mission Director is currently the second Vice Chair on the
Executive Committee of the CCM. PEPFAR/Malawi leadership is also directly consulted by Global Fund
on key programming decisions.
Civil Society
Beginning with POART Q4 2015, PEPFAR Malawi will hold quarterly stakeholders meetings to engage civil
society organizations (CSOs) to review of PEPFAR progress and planning efforts. PEPFAR/Malawi team fully
engaged civil society in COP16 development. A meeting timeline was developed and invitations sent through
network groups (Malawi Network of AIDS Service Organizations - (MANASO) and MSF. Civil society
representatives took part in the Sustainability Index and Dashboard development process. Outcomes from the
Washington DC Management Meeting were shared, providing an overall summary of the direction of COP 16.
CSOs highlighted issues and provided feedback and input into COP16 , (e.g. establishing a practice of ‘twinning”
July 1, 2016
19
monitoring and accountability; use of expert clients for retention and defaulter tracing; key populations; and
capacity building for CSOs). CSOs contributed to the SBOR exercise. Representatives from PLHIV groups (youth,
journalists) and key populations participated and provided constructive input to improve service delivery and
involvement of PLHIV. Written feedback was solicited and received, especially for community-based
interventions and greater involvement of men in HIV prevention, care, and treatment. Another meeting was
held with CSOs to discuss in greater depth the findings and recommendations submitted. There is an
agreement to continue dialogue on issues of concern (limited direct funding to CSOs). An invitation has been
extended to civil society to attend the COP16 review meeting. Prior to the COP review, the PEPFAR Malawi
team will hold a stakeholders’ meeting to solicit feedback on the COP submission.
Private Sector
There is limited private sector involvement. Children’s Investment Fund Foundation (CIFF), as part of the
ACT initiative, is co-funding activities to increase pediatric access to care and treatment services. Girl
Effect Foundation, a global DREAMS partner, is working closely with PEPFAR/Malawi and the National
DREAMS Task Force to develop a brand for girls and provide mass media communication support for
implementation of AGYW interventions. PEPFAR supported partners work closely with private sector
providers to deliver integrated HIV/FP services through social franchise. PEPFAR and the Elton John
Foundation are coordinating to ensure complementarity in programs reaching out to MSM in PEPFAR
supported districts.
2.0 Core, Near-Core and Non-Core Activities (See Appendix A)
The following technical areas are core: improving the quality of pre-ART, ART, PMTCT, pediatric ART and
TB through clinical and systems mentoring at the health facility level; increased focus on TB in urban
settings and TB hotspots; support for neglected and hard-to-reach populations (AGYW, key
populations); HTC for active case findings; VMMC; condom promotion and distribution; community-
based prevention, care, OVC, and impact mitigation focused on linkage to care and treatment services,
adherence and retention; targeted key population and youth services; bursary support for HRH and
iHRIS to support PEPFAR bonding requirements and improved deployment, distribution, and tracking of
human resources for health; strategic support for blood safety, labs, sample transport systems, and
supply chain systems. New priorities in COP 16 are: expanding reach to underserved male populations
through a range of strategies, implementation of differentiated care models to enhance efficiency and
quality; salary support for HIV service providers, and targeted investments in infrastructure to support
HIV service optimization
Near-core activities are: integration of HIV into maternal and child health services, STI screening and
treatment; improving pre-service raining institutions, KP GBV screening and treatment, capacity building
July 1, 2016
20
for CSOs, block grants to support schools and sub-grants to local CSOs, NACS, OVC national data base b
development, scaling up of SLMTA, HRH (curriculum development, strengthening HRH regulations).
Procurement of laboratory equipment (hematology, chemistry) and consumables, procurement of
bicycles and motorbikes, district support to conduct HIV outreach clinics targeting hard-to-reach
communities have been moved from core to near core.
Non-core activities are: general population prevention; food packages and nutrition support to
vulnerable households has been shifted to other USG technical areas and other development partners.
However with the emerging humanitarian crisis this may need to be reconsidered, Cervical cancer
screening and cryotherapy at PEPFAR high priority sites, CD4 testing systems, ensuring water and
electricity are available at facilities, improved waste management and support for health care financing
have been moved into the non-core category.
3.0 Geographic and Population Prioritization
Geographic Prioritization:
Data from multiple sources for population, PLHIV, and prevalence were reviewed (UNAIDS’ Malawi 2008
Census projection data, MOH Department of HIV/AIDS (DHA) estimations and quarterly reported data,
as well as OGAC SAE and DOM estimations). Estimates are based on data collected from 2010 DHS
prevalence, ANC sentinel surveillance or before (last census conducted in 2008) and many assumptions
have been used to arrive at these data points. Spectrum data is not available at the district level.
Technical staff and leadership choose DHA estimations, which are available at district level and whose
total was closest to UNAIDS Spectrum national estimates for 2016, as the foundation for COP16
planning. Currently, the country is conducting three national surveys: Sentinel surveillance, MPHIA and
DHS. The results of these surveys will be available towards the end of 2016 and will undoubtedly result
in more accurate figures and recalculation of targets and coverage based on these.
Further stratification analysis in Lilongwe and Blantyre for urban and rural populations indicated large
gaps in testing and linkage into services in urban areas. This analysis did not affect the overall SNU
achievement but highlighted programmatic challenges. The merging of SNUs based on population
migration, specifically Chiradzulu, for health access also did not show significant improvements in
coverage of ART for Blantyre District.
At the end of FY15, there was a 54.1% national coverage of PLHIV on ART. For COP16, Malawi has
projected to reach 70% in FY17 and 78% in FY18. In order to maximally intensify progress towards
saturation in the highest burden SNUs, COP16 will further concentrate efforts in 10 Scale up districts,
of which 6 are predicted to achieve 80+% saturation in FY17 and a further 4 districts will reach
saturation by FY 18. Nationally by FY18, 14 of 28 districts will have reached saturation, covering 77% of
July 1, 2016
21
estimated PLHIV. In COP16, the status of 4 districts was changed to sustain to reflect concerted efforts
to move as rapidly as possible towards epidemic control. (See Table 3.1 of coverage rates.)
Upon review of the projected coverage rates of SNUs, PEPFAR/Malawi has chosen to intensify focus on
three “fast track districts;” Lilongwe (SC-Sat), Blantyre (SC-Sat) and Zomba (SC-Sat). The estimated
number of PLHIV in these three highest burden districts represents one third of all PLHIV in Malawi.
These districts have distinct urban and rural populations and interventions will be refined to reach both
groups. Prevalence rates vary between these different populations: Lilongwe urban - 11.6%, rural - 1.6%;
Blantyre urban - 13%, rural - 5.3%; and Zomba urban - 14.4% and rural - 8.25%. In addition to increasing
efforts to achieve greater efficiencies, it is critical in these three districts to improve the crumbling
infrastructure and mitigate the dearth of health workers. Analysis of HRH and infrastructure needs
within these districts form the basis of a supplemental request to be submitted with the COP document,
which is intended to facilitate attainment of FY18 targets in the three “fast track” districts. In Zomba,
which is now projected to achieve saturation at 80% by FY 2017, these investments will be accompanied
by an aggressive outreach testing approach at community level, targeting adolescent girls and young
women (AGYW) and their partners, and high prevalence groups including fishing communities, estate
workers, and prisoners.

July 1, 2016
22
Table 3.1 Estimated coverage rates by SNU
District Prioritization PLHIV FY15 FY16 FY17 FY18
PEPFAR NATIONAL PEPFAR NATIONAL
Blantyre District ScaleUp Sat 136,438 54,670 40% 73,365 54% 82,018 60% 92,349 68% 103,788 76% 115,128 84%
Lilongwe District ScaleUp Sat 142,931 62,634 44% 83,263 58% 89,194 62% 96,795 68% 109,323 76% 118,459 83%
Zomba District ScaleUp Sat 74,489 36,474 49% 43,567 58% 59,424 80% 61,932 83% 58,347 78% 62,912 84%
Thyolo District ScaleUp Sat 69,091 40,985 59% 52,255 76% 51,721 75% 57,883 84% 54,049 78% 60,500 88%
Mangochi District ScaleUp Agg 59,160 28,858 49% 39,104 66% 44,954 76% 50,731 86% 52,584 89% 59,618 101%
Mulanje District ScaleUp Sat 60,473 38,173 63% 42,276 70% 45,345 75% 48,511 80% 50,656 84% 51,302 85%
Mzimba District ScaleUp Sat 46,989 23,661 50% 31,734 68% 32,937 70% 41,516 88% 36,611 78% 47,280 101%
Machinga District ScaleUp Agg 50,210 20,311 40% 23,667 47% 35,995 72% 37,592 75% 39,552 79% 42,687 85%
Chikwawa District ScaleUp Sat 35,917 17,612 49% 20,105 56% 25,787 72% 27,373 76% 26,579 74% 28,358 79%
Ntcheu District Sustained 43,607 15,582 36% 20,381 47% 17,179 39% 19,156 44% 17,739 41% 19,877 46%
Chiradzulu District Sustained Com 35,045 34,887 100% 32,115 92% 32,408 92% 32,408 92% 33,088 94% 33,088 94%
Phalombe District ScaleUp Sat 32,150 23,044 72% 26,641 83% 26,050 81% 26,686 83% 26,655 83% 27,671 86%
Balaka District Sustained 32,551 12,665 39% 18,037 55% 14,963 46% 17,996 55% 15,189 47% 18,263 56%
Dedza District Sustained 35,100 11,283 32% 15,511 44% 12,695 36% 15,612 44% 12,973 37% 16,107 46%
Mchinji District Sustained 32,766 10,838 33% 12,595 38% 11,939 36% 12,678 39% 12,828 39% 13,720 42%
Kasungu District Sustained 24,352 10,065 41% 13,747 56% 11,859 49% 14,616 60% 12,887 53% 16,059 66%
Salima District Sustained 27,619 8,972 32% 12,082 44% 11,442 41% 12,682 46% 12,242 44% 13,490 49%
Nsanje District Sustained 24,652 15,104 61% 17,203 70% 13,694 56% 14,002 57% 13,819 56% 14,113 57%
Karonga District Sustained 19,808 10,125 51% 11,099 56% 10,298 52% 11,529 58% 11,117 56% 12,493 63%
Nkhata Bay District Sustained 17,886 5,274 29% 7,952 44% 5,885 33% 7,681 43% 5,960 33% 7,981 45%
Dowa District Sustained 17,745 6,708 38% 10,420 59% 5,735 32% 11,134 63% 6,284 35% 11,868 67%
Nkhotakota District Sustained 11,926 6,786 57% 10,185 85% 6,687 56% 9,519 80% 6,828 57% 9,646 81%
Neno District Sustained 10,744 5,892 55% 7,711 72% 6,262 58% 7,582 71% 6,286 59% 7,681 71%
Rumphi District Sustained 8,786 4,363 50% 7,049 80% 4,618 53% 6,902 79% 4,637 53% 7,031 80%
Mwanza District Sustained 7,052 3,777 54% 4,886 69% 4,182 59% 4,577 65% 4,129 59% 4,998 71%
Ntchisi District Sustained 5,904 2,166 37% 3,960 67% 2,546 43% 3,825 65% 2,559 43% 3,892 66%
Chitipa District Sustained 4,493 2,775 62% 4,800 107% 3,241 72% 4,134 92% 3,254 72% 4,202 94%
Likoma District Sustained 652 446 68% 465 71% 425 65% 533 82% 459 70% 566 87%
National Totals 1,068,536 514,130 48% 646,175 60% 669,483 63% 747,934 70% 740,421 69% 828,990 78%
July 1, 2016
23
Population Prioritization:
Targeting populations most affected by and vulnerable to HIV is critical for rapid epidemic control.
Prioritized population groups are identified based on analysis of districts with highest HIV
prevalence, treatment gaps, estimated population size and contribution to new infections, profiles
of specific at-risk groups, and known vulnerability for acquisition and transmission. Underserved
populations include FSW, MSM/TG, OVC, AGYW, and OVP (i.e. prisons, military, police, estate
workers, fishermen and women, and clients of FSW). Building on activities started in COP15,
PEPFAR/Malawi is focusing additional efforts to reach adolescent girls and young women (AGYW)
and men. AGYW interventions will saturate two DREAMS districts (Machinga and Zomba). These are
complemented by GF supported AGYW activities (modeled on the Malawi DREAMS intervention
package) in Mangochi, Mulanje and Lilongwe Urban. Data from the MOH DHA shows that women
account for a significantly greater proportion of adults on ART, 66% versus 34% for men. As Malawi
has a strong Option B+ program, HIV services have been strongly linked to ANC and maternity
platforms, easy entry points for accessing women of reproductive age. Men on the other hand are
often not routinely accessing/utilizing health services and tend to present at HF only when sick.
Building on efforts that started in COP15, additional strategies will be initiated for finding HIV
infected men and initiating them into treatment.
In COP15, PEPFAR/Malawi started a large integrated community prevention, impact mitigation, and
care program to provide additional support for targeted, case finding, service linkages, and
adherence support in the eight scale-up districts (Blantyre, Zomba, Mangochi, Machinga, Mulanje,
Chikwawa, Phalombe, Balaka). With the increased focus on high burden districts in COP16, Balaka
District has been re-classified as “sustained.” As a result, activities currently underway in Balaka with
continue with a lighter footprint (without incurring longer term investments). The option for
potential transition will be revisited in COP17. These districts have significant OVC populations and
AGYW at risk, as well as priority subpopulations (estate workers, fishing communities, vendors,
police, teachers, prisoners). Traditional Authorities in these districts were selected based on the
location of PEPFAR rapid scale up treatment sites. Comprehensive interventions for AGYW are
integrated in the community programs where OVC populations are high, early sexual initiation and
childbearing are reported, there are high school dropout rates, high reported transactional sex, and
damaging cultural norms and practices (MDHS 2010). DREAMS funding, in Machinga and Zomba
districts complements these efforts to identify high risk male sexual partners for HTC and linkage to
ART or VMMC services, based on their status. Intensive coordination efforts between PEPFAR,
ActionAid (Global Fund PR), NAC, and other stakeholders will support the roll out of similar activities
in Mangochi, Mulanje and Lilongwe Urban. We are hopeful that Malawi will receive DREAMS
Incentive Fund resources to expand these efforts address HIV transmission to AGYW.
Due to shifts in district prioritization for an intensified focus on Blantyre, Lilongwe, and Zomba, the
integrated community platform will be expanded to include priority Lilongwe treatment catchment
areas for mobilization, linkage, targeted community-based HTC, and community care.
Key Populations (KPs) are targeted in Lilongwe, Blantyre, Mzuzu, and Mangochi where there is high
population density, HIV prevalence, unmet need for treatment, and hot spots based on current data
sources.
July 1, 2016
24
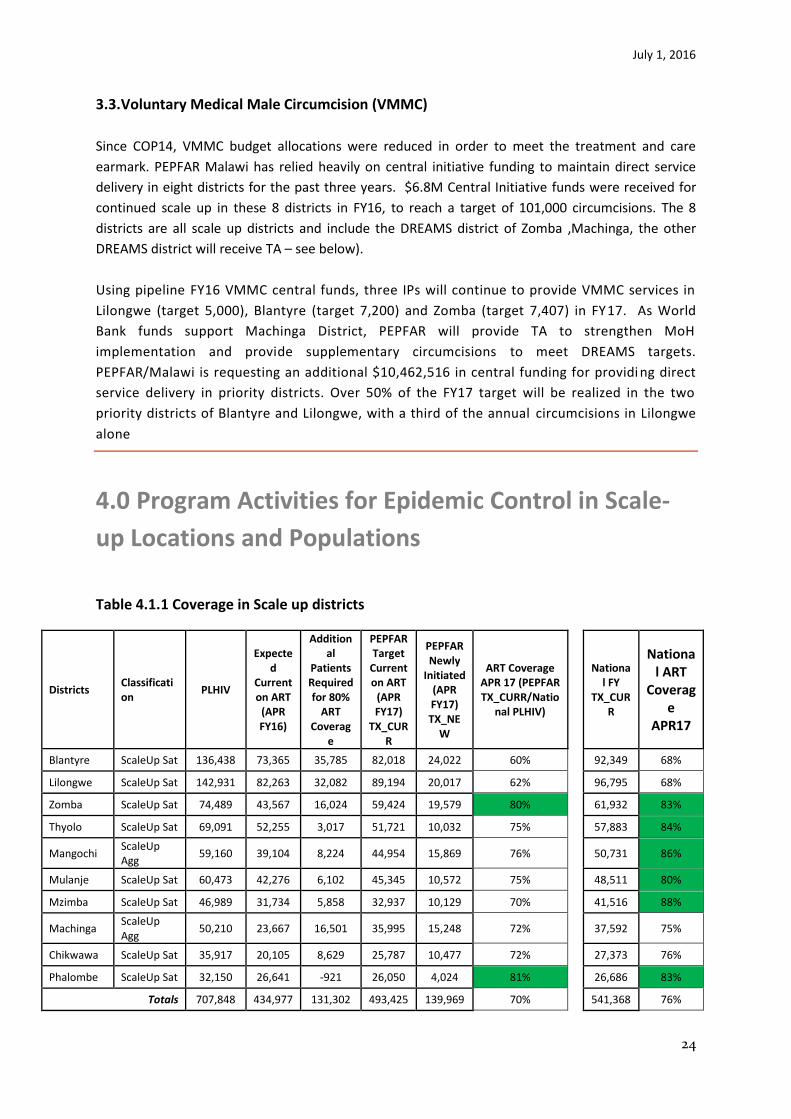
3.3. Voluntary Medical Male Circumcision (VMMC)
Since COP14, VMMC budget allocations were reduced in order to meet the treatment and care
earmark. PEPFAR Malawi has relied heavily on central initiative funding to maintain direct service
delivery in eight districts for the past three years. $6.8M Central Initiative funds were received for
continued scale up in these 8 districts in FY16, to reach a target of 101,000 circumcisions. The 8
districts are all scale up districts and include the DREAMS district of Zomba ,Machinga, the other
DREAMS district will receive TA – see below).
Using pipeline FY16 VMMC central funds, three IPs will continue to provide VMMC services in
Lilongwe (target 5,000), Blantyre (target 7,200) and Zomba (target 7,407) in FY17. As World
Bank funds support Machinga District, PEPFAR will provide TA to strengthen MoH
implementation and provide supplementary circumcisions to meet DREAMS targets.
PEPFAR/Malawi is requesting an additional $10,462,516 in central funding for providi ng direct
service delivery in priority districts. Over 50% of the FY17 target will be realized in the two
priority districts of Blantyre and Lilongwe, with a third of the annual circumcisions in Lilongwe
alone
4.0 Program Activities for Epidemic Control in Scale-
up Locations and Populations
Table 4.1.1 Coverage in Scale up districts
Districts Classification
PLHIV
Expected
Current on ART
(APR FY16)
Additional
Patients Required for 80%
ART Coverag
e
PEPFAR Target
Current on ART
(APR FY17)
TX_CURR
PEPFAR Newly
Initiated (APR FY17) TX_NE
W
ART Coverage APR 17 (PEPFAR TX_CURR/Natio
nal PLHIV)
National FY
TX_CURR
National ART
Coverage
APR17
Blantyre ScaleUp Sat 136,438 73,365 35,785 82,018 24,022 60%
92,349 68%
Lilongwe ScaleUp Sat 142,931 82,263 32,082 89,194 20,017 62%
96,795 68%
Zomba ScaleUp Sat 74,489 43,567 16,024 59,424 19,579 80%
61,932 83%
Thyolo ScaleUp Sat 69,091 52,255 3,017 51,721 10,032 75%
57,883 84%
Mangochi ScaleUp Agg
59,160 39,104 8,224 44,954 15,869 76%
50,731 86%
Mulanje ScaleUp Sat 60,473 42,276 6,102 45,345 10,572 75%
48,511 80%
Mzimba ScaleUp Sat 46,989 31,734 5,858 32,937 10,129 70%
41,516 88%
Machinga ScaleUp Agg
50,210 23,667 16,501 35,995 15,248 72%
37,592 75%
Chikwawa ScaleUp Sat 35,917 20,105 8,629 25,787 10,477 72%
27,373 76%
Phalombe ScaleUp Sat 32,150 26,641 -921 26,050 4,024 81%
26,686 83%
Totals 707,848 434,977 131,302 493,425 139,969 70%
541,368 76%
July 1, 2016
25
4.1 Targets for Scale-up locations and populations
COP16 target setting combined multiple methodologies. The PEPFAR Malawi team reviewed,
cleaned and modified the OGAC Datapack. Calculations used FY16 quarter 1 achievement as
baseline. In a few circumstances where quarter 1 achievement was questionable for a specific site or
the target was not reported in Q1, APR 15 was used as baseline. This methodology varied from the
pre-set Data Pack baseline of FY16 targets. Malawi shifted the baseline in order to accurately
account for trends and expected achievements based on the varied intensity of interventions to be
implemented.
The second method conducted a detailed trend analysis of all MOH sites and SNUs since 2013.
Multiple projection models were then applied to the historical trends to determine targets. The
projection models differentiated rates of linkages, yields, coverage etc. for the different
prioritization levels. The final projection model for district SNU and sites used the following
assumptions:
1. Although Test & Start is planned to begin in April, initiations due to Test & Start are expected
in July-Sept 2016- 70% of Pre-ART to initiate
2. 20% of Pre-ART to initiate in Oct-Dec 2016.
3. Calculated TX_NEW using Test & Start Assumptions and applied to TX_Curr projections
(included lost to follow up and other interventions which varied by SNU prioritization.
4. Saturation districts: 80% linkage to treatment
5. Aggressive districts: 75% linkage to treatment
6. Sustained districts: 70% linkage to treatment
These projections were then reviewed with district saturation coverage rates and modified
proportionally to match the Datapack SNU totals.
This is a significant change from target setting methodology in COP 15, where target setting started
at the site level with testing numbers and concluded with district current on treatment.
The following assumptions and parameters were used to set site level targets from the modified
Datapack:
Number of individuals tested for HIV (HTC_TST)
District and site-level targets for HTC assumed that the HIV testing numbers will increase through
the end of FY18 due to recent PEPFAR investments, by a quarterly growth value equal to the district
median change, estimated using data on HIV testing from January 2013 to September 2015. HTC
targets have been adjusted to increase in scale up districts while targets in sustained districts were
reduced to reflect the more passive testing approaches implemented there. Community outreach
testing is implemented only in scale up districts, reported at facility level, and expected to account
for 4-12% of testing in “fast track” and saturation districts. Six percent community outreach was
used for targeting in aggressive districts. Community testing targets at SNU level were set by
incrementally increasing COP 15 targets. For the general population, index case testing was set at
5%, home based testing at 10%, mobile testing at 50% and other testing at 35%. In Key Population
July 1, 2016
26
centric testing, mobile testing is assumed to be 20% and other testing (drop-in centers, campaigns,
etc.) is estimated to be 80%.
Number of HIV positive individuals identified (HTC Positives)
The estimated number of positives identified was calculated by applying site specific yields on the
projected number of HTC_TST, reduced by an average decline in yield over time estimated from
current data. The totals obtained for each site were adjusted to ensure that the district HTC_TST
_POS totals are the same as in the Data Pack.
Number of pregnant women with known HIV status (PMTCT_Stat)
PMTCT_STAT was calculated using existing formulae in the Data Pack. Site-level PMTCT_STAT
estimates were calculated by determining the proportion of pregnant women who were newly
tested for each site using actual data. This proportion was applied to the number tested per site to
determine the number of pregnant women newly tested for each site. This number was added to
those previously tested to determine site specific PMTCT _STAT.
Number of pregnant women who are HIV positive (PMTCT_STAT_Pos).
Site specific targets for positive pregnant women identified were calculated by applying district level
yields to the site level number of pregnant women tested. This was done to ensure that the total
number of positive pregnant women for each district would align with Data Pack district totals.
Number of pregnant women who are on ART
The data pack PMTCT_STAT yield for district was used as an estimate for the yield for each facility in
the district. Ninety five percent of the calculated PMTCT_STAT(pos) was taken as PMTCT_ART
based on national data reports. The obtained value was adjusted for the district total in Datapack.
Number of Early Infant Diagnosis (PMTCT_EID)
An estimate of the number of HIV-positive pregnant women (DEN for PMTCT_ART) obtained by
multiplying the PMTCT_STAT for each facility by the PMTCT yield for the district in which the
facilities were located. An estimate of the proportion of HIV-exposed Infants tested for each district
was obtained from Datapack. These were then multiplied to give PMTCT_EID targets.
New on Treatment (Tx_New)
Tx_New was calculated by incorporating the assumptions for accelerated case finding under
HTC_TST and HTC_POS, and then by assuming that Test and Start is likely to start around July 2016
and that 70% of those who are currently in pre ART will be put on treatment by September 2016. A
further 20% of those in pre-ART were assumed to start treatment by December 2016. It was also
assumed that in Scale-up to Saturation sites, 80% of those who tested positive will start treatment;
for sustained and centrally supported sites, linkage rates were assumed to be 75% and 70%. These
linkage rates are considerably higher than current and assume programmatic improvements through
PEPFAR investments. Review of site-level targets was conducted based on site-level data, and
knowledge of facility, infrastructure, and expansion potential.
July 1, 2016
27
Current on ART (TX_Curr)
Calculation of the current number of PLHIV on ART took into account district specific averaged
quarterly drop off rates plus TX_new calculated as described above. The numbers obtained were
used to calculate district coverage. Site level targets for TX_Curr were calculated using the same
assumptions as district TX_Curr but the district averaged drop-off rate was applied to site level.
Notably, as the district level ART cohorts increase, the number lost to follow-up becomes greater
relative to those new on treatment, resulting in decreasing marginal annual gains in TX_CURR.
Number Retained on Treatment (TX_RET)
TX_RET was obtained by dividing the expected FY16 TX-New by the estimated retention rate for
each district. The estimated retention rate for each district was obtained from Data pack. The
estimated TX-NEW for FY16 was obtained from the projections and the actual TX-New for the period
October-December, 2015.
Number of TB patients with known HIV Status (TB_STAT)
The FY15 value for TB_STAT for each facility and district were used as baseline. Using the facility and
district, the proportional contribution of each facility was determined in relation to the total FY15
TB_STAT. This was then multiplied against the total TB_STAT for each district obtained from data
pack. The TB_STAT denominator was obtained by dividing TB_STAT from district in Datapack by the
percent of TB_STAT who know status obtained from Datapack for each district.
Number HIV patients screen for TB. (TB_SCREENDX)
TB_SCREENDX was obtained by multiplying .95*TX_CURR. The denominator for TB_SCREENDX was
obtained by diving TB_SCREENDX by .95= TX_CURR.
Prevention Targets
KP_PREV and PP_PREV targets were set in consultation with partners based on current results,
planned activities, and expected increase in achievement dependent of district prioritization. For
most partners conducting PP_PREV activities, a 5-10% increase in targets was set. For KP_PREV, new
preliminary site level estimations show a reduction in the denominator, and thus the targets were
adjusted to reflect a smaller population.
OVC targets
With the start of a new integrated community program in COP15 and OVC guidance from HQ,
OVC_SERV targets were set with a greater focus on comprehensive programming which is
geographically focused.
July 1, 2016
28
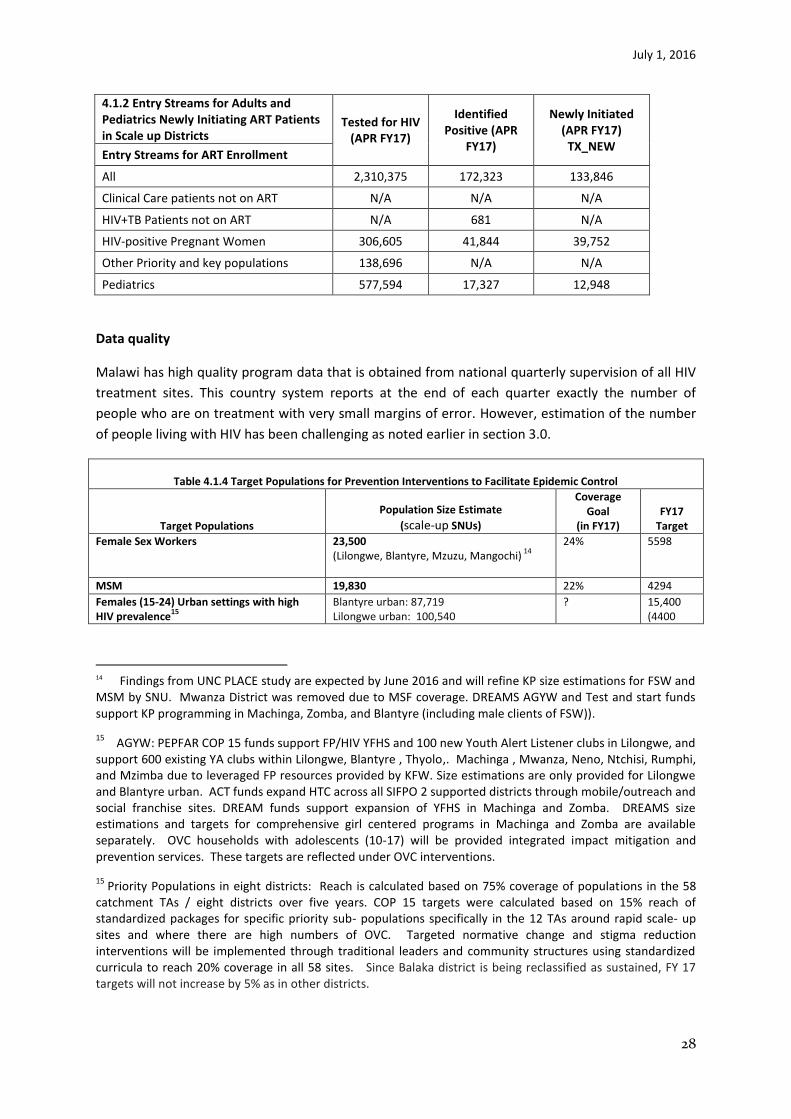
4.1.2 Entry Streams for Adults and Pediatrics Newly Initiating ART Patients in Scale up Districts
Tested for HIV (APR FY17)
Identified Positive (APR
FY17)
Newly Initiated (APR FY17)
TX_NEW Entry Streams for ART Enrollment
All 2,310,375 172,323 133,846
Clinical Care patients not on ART N/A N/A N/A
HIV+TB Patients not on ART N/A 681 N/A
HIV-positive Pregnant Women 306,605 41,844 39,752
Other Priority and key populations 138,696 N/A N/A
Pediatrics 577,594 17,327 12,948
Data quality
Malawi has high quality program data that is obtained from national quarterly supervision of all HIV
treatment sites. This country system reports at the end of each quarter exactly the number of
people who are on treatment with very small margins of error. However, estimation of the number
of people living with HIV has been challenging as noted earlier in section 3.0.
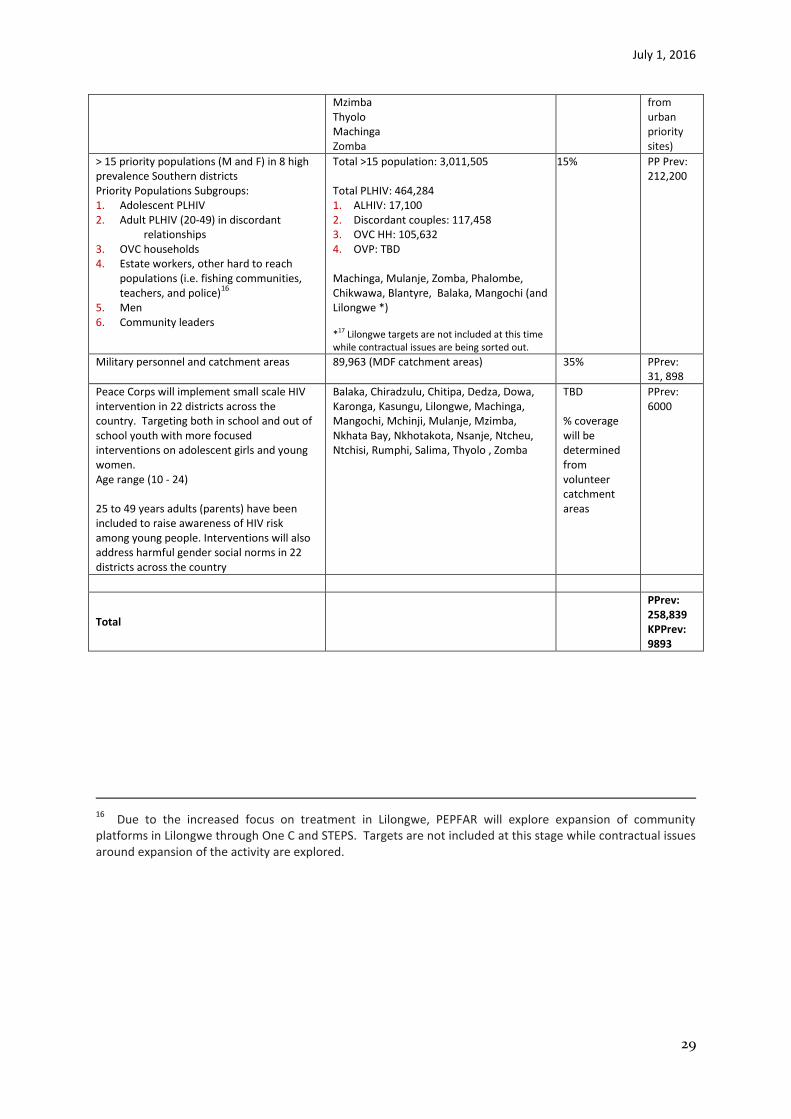
Table 4.1.4 Target Populations for Prevention Interventions to Facilitate Epidemic Control
Target Populations
Population Size Estimate
(scale-up SNUs)
Coverage Goal
(in FY17) FY17
Target
Female Sex Workers 23,500 (Lilongwe, Blantyre, Mzuzu, Mangochi)
14
24% 5598
MSM 19,830 22% 4294
Females (15-24) Urban settings with high HIV prevalence
15
Blantyre urban: 87,719 Lilongwe urban: 100,540
? 15,400 (4400
14 Findings from UNC PLACE study are expected by June 2016 and will refine KP size estimations for FSW and MSM by SNU. Mwanza District was removed due to MSF coverage. DREAMS AGYW and Test and start funds support KP programming in Machinga, Zomba, and Blantyre (including male clients of FSW)).
15 AGYW: PEPFAR COP 15 funds support FP/HIV YFHS and 100 new Youth Alert Listener clubs in Lilongwe, and
support 600 existing YA clubs within Lilongwe, Blantyre , Thyolo,. Machinga , Mwanza, Neno, Ntchisi, Rumphi, and Mzimba due to leveraged FP resources provided by KFW. Size estimations are only provided for Lilongwe and Blantyre urban. ACT funds expand HTC across all SIFPO 2 supported districts through mobile/outreach and social franchise sites. DREAM funds support expansion of YFHS in Machinga and Zomba. DREAMS size estimations and targets for comprehensive girl centered programs in Machinga and Zomba are available separately. OVC households with adolescents (10-17) will be provided integrated impact mitigation and prevention services. These targets are reflected under OVC interventions.
15 Priority Populations in eight districts: Reach is calculated based on 75% coverage of populations in the 58
catchment TAs / eight districts over five years. COP 15 targets were calculated based on 15% reach of standardized packages for specific priority sub- populations specifically in the 12 TAs around rapid scale- up sites and where there are high numbers of OVC. Targeted normative change and stigma reduction interventions will be implemented through traditional leaders and community structures using standardized curricula to reach 20% coverage in all 58 sites. Since Balaka district is being reclassified as sustained, FY 17 targets will not increase by 5% as in other districts.
July 1, 2016
29
Mzimba Thyolo Machinga Zomba
from urban priority sites)
> 15 priority populations (M and F) in 8 high prevalence Southern districts Priority Populations Subgroups: 1. Adolescent PLHIV 2. Adult PLHIV (20-49) in discordant
relationships 3. OVC households 4. Estate workers, other hard to reach
populations (i.e. fishing communities, teachers, and police)
16
5. Men 6. Community leaders
Total >15 population: 3,011,505 Total PLHIV: 464,284 1. ALHIV: 17,100 2. Discordant couples: 117,458 3. OVC HH: 105,632 4. OVP: TBD Machinga, Mulanje, Zomba, Phalombe, Chikwawa, Blantyre, Balaka, Mangochi (and Lilongwe *) *17 Lilongwe targets are not included at this time while contractual issues are being sorted out.
15% PP Prev: 212,200
Military personnel and catchment areas 89,963 (MDF catchment areas) 35% PPrev: 31, 898
Peace Corps will implement small scale HIV intervention in 22 districts across the country. Targeting both in school and out of school youth with more focused interventions on adolescent girls and young women. Age range (10 - 24) 25 to 49 years adults (parents) have been included to raise awareness of HIV risk among young people. Interventions will also address harmful gender social norms in 22 districts across the country
Balaka, Chiradzulu, Chitipa, Dedza, Dowa, Karonga, Kasungu, Lilongwe, Machinga, Mangochi, Mchinji, Mulanje, Mzimba, Nkhata Bay, Nkhotakota, Nsanje, Ntcheu, Ntchisi, Rumphi, Salima, Thyolo , Zomba
TBD % coverage will be determined from volunteer catchment areas
PPrev: 6000
Total
PPrev: 258,839 KPPrev: 9893
16
Due to the increased focus on treatment in Lilongwe, PEPFAR will explore expansion of community platforms in Lilongwe through One C and STEPS. Targets are not included at this stage while contractual issues around expansion of the activity are explored.

July 1, 2016
30
Program Area Summaries
4.2 Priority population prevention
The NSP and GF Concept Note outline the importance of community models to support 90-90-90
targets and keep negative priority populations HIV free. Components of community platforms to
address population needs across the cascade include condom programming, high yield HTC, VMMC,
linkage to treatment and retention for positives, and community care. PEPFAR gender analysis
recommendations are in alignment with the NSP. Interventions which address gender inequality,
harmful cultural practices, discrimination, and other human rights violations should be prioritized in
order to meet 90:90:90 treatment targets.
Close partnership between clinical and community platforms is essential to facilitate timely
mobilization for service uptake, address gender barriers of specific target populations, provide
linkage strategies across the cascade and deliver community retention and adherence programs.
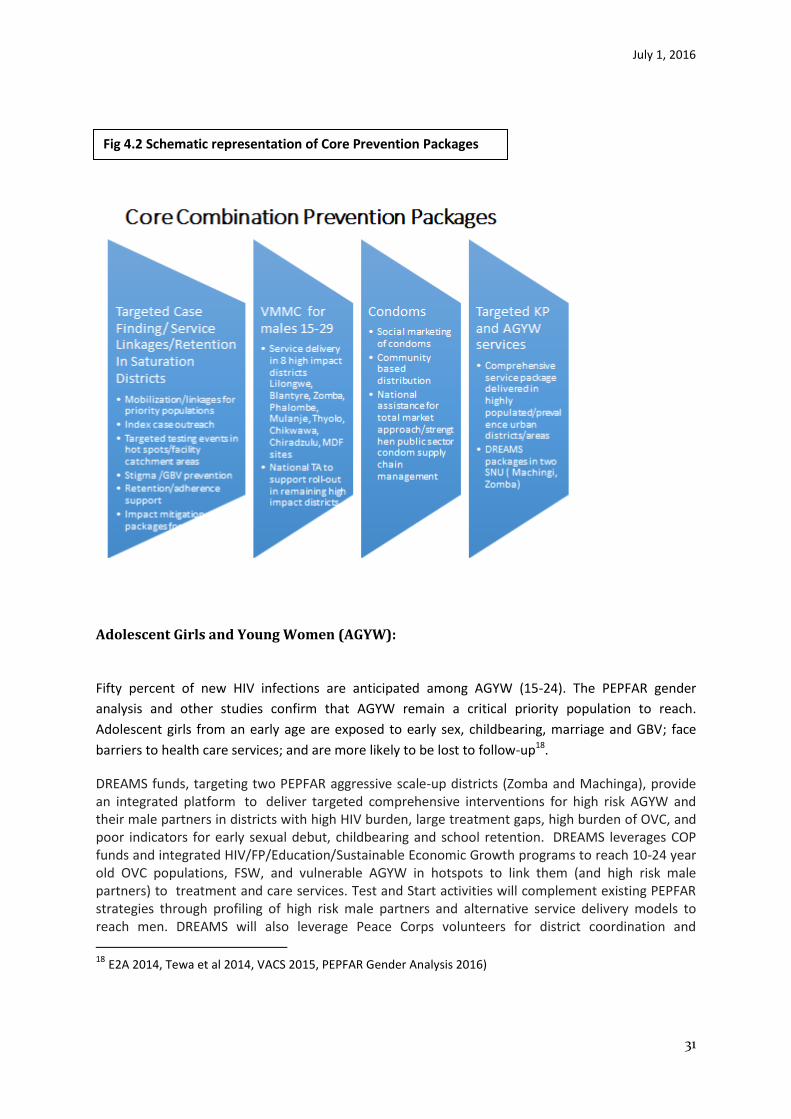
COP16 will employ a core set of combination prevention packages ( Fig 4.2). These address targeted
case finding, linkage into service and retention, VMMC for males 15-29, condoms, and focused
activities for AGYW and key populations.
For the first “90,” PEPFAR will support targeted outreach HIV testing strategies using index clients,
hot spot testing, and community open days for high risk children and families in PEPFAR priority
districts. PEPFAR supports staff at facilities (HIV Diagnostic Assistants HDA, expert clients),
community engagement facilitators, and KP peer navigators who will develop joint plans to follow-
up on index client households, for family HTC, household visits, and testing events.
HTC and linkage are integrated into OVC household case management strategies through
community case managers who will identify sick children for testing and treatment. PEPFAR will
support comprehensive community packages which integrate impact mitigation interventions for
vulnerable households, prevention services (i.e. outreach HTS, condom distribution), and child
protection. Community platforms will use community engagement facilitators linked to facilities,
community-based peer educators, and expert clients to facilitate linkage to HIV services (HTC,
VMMC, PMTCT, ART), and deliver community-based services including condoms, child protection,
education, nutritional support, and VSL. These community actors will work together to facilitate bi-
directional referrals between facility and community while providing different components of the
package through direct service delivery. Community leaders and structures (i.e. committees and
CBOs) will also be strengthened to guide community plans, monitoring and evaluation
July 1, 2016
31
Adolescent Girls and Young Women (AGYW):
Fifty percent of new HIV infections are anticipated among AGYW (15-24). The PEPFAR gender
analysis and other studies confirm that AGYW remain a critical priority population to reach.
Adolescent girls from an early age are exposed to early sex, childbearing, marriage and GBV; face
barriers to health care services; and are more likely to be lost to follow-up18.
DREAMS funds, targeting two PEPFAR aggressive scale-up districts (Zomba and Machinga), provide an integrated platform to deliver targeted comprehensive interventions for high risk AGYW and their male partners in districts with high HIV burden, large treatment gaps, high burden of OVC, and poor indicators for early sexual debut, childbearing and school retention. DREAMS leverages COP funds and integrated HIV/FP/Education/Sustainable Economic Growth programs to reach 10-24 year old OVC populations, FSW, and vulnerable AGYW in hotspots to link them (and high risk male partners) to treatment and care services. Test and Start activities will complement existing PEPFAR strategies through profiling of high risk male partners and alternative service delivery models to reach men. DREAMS will also leverage Peace Corps volunteers for district coordination and
18 E2A 2014, Tewa et al 2014, VACS 2015, PEPFAR Gender Analysis 2016)
Fig 4.2 Schematic representation of Core Prevention Packages

July 1, 2016
32
expansion of activities. Peace Corps health, education and environment volunteers will provide targeted interventions on HIV prevention and school retention to AGYW and male counterparts through camps, clubs and other activities in 23 districts. Strong partnership forged with GOM and Global Fund/ActionAid on coordination, synergistic program design and robust M&E will support expansion of the core DREAMS package to additional PEPFAR aggressive scale-up districts. Building on USG supported integrated HIV/FP youth friendly health services (YFHS) models and DREAMS investments, COP16 funds for YFHS and community packages will expand coverage of select DREAMS interventions to include scale-up districts of Lilongwe, Blantyre, Mangochi, and Mulanje. Targeted YFHS in urban areas of Lilongwe, Blantyre, Mzimba and Thyolo will continue to deliver HTC, FP, STI screening and treatment; ART; and linkage through a combination of social franchise sites and mobile outreach services. They will further provide peer support through youth clubs, and increase teen clubs for older children and adolescents living with HIV. ACT resources expand testing to identify HIV-positive adolescents and households, and link them into HIV care services. Complementary community-wide approaches will reach high-risk male partners with targeted male HTC, linkage to ART and VMMC. Key Populations Key Populations (KP) face a disproportionate burden of disease and known barriers to service access and utilization including criminalization of behavior, human rights abuses, stigma, poor health worker attitudes and GBV. The NSP and GF Concept Note highlight the need to reach these groups with targeted approaches and safe, non-stigmatizing services. KP standard operating procedures were incorporated into the following national guidelines currently under review: STI management guidelines, HTS guidelines and Malawi Clinical HIV guidelines. In FY16, start-up activities for KP programming included district mapping; development of refined
strategies for case identification (screening and linkage to HIV services), peer education curriculum,
and M&E tools; training of peer educators/peer navigators; and capacity development of local
partners. Districts prioritized for comprehensive KP models are Lilongwe, Blantyre, Mzuzu and
Mangochi which have confirmed hot spots. Results for KP district size estimations, using PLACE, are
expected by June 2016 and will validate denominators of both FSW and MSM in the priority districts
as well as identifying additional geographic hot spots within the districts. Preliminary findings
identified 2,100 FSW and 100 unique MSM hot spots in Lilongwe alone. Differentiated service
delivery models for KP (FSW, MSM, TG) include drop-in centers, mobile/outreach, one stop shops,
and hybrid models which link KPs to general clinical services through peer educators/navigators.
DREAMS and Test and Start funds will expand program reach to FSW, male clients, MSM and TG in
Zomba and Machinga districts. HIC-based services serve an estimated 80% of KPs targeted in the
prioritized KP districts. PEPFAR service delivery partners working in the health facilities (HF)
continue to promote services that reduce stigma and promote access to KP. First quarter data
confirm that delivery models are acceptable to KP, showing a testing yield of 58% HIV positivity rate
among FSW.
Other activities include a KP GBV and stigma study, PrEP assessment for KP, and expansion of
activities to Machinga and Zomba districts with DREAMS and Test and Start funds. PEPFAR provides
TA to ActionAid to adopt tested KP service delivery models and tools for planned expansion to
unsupported districts and will to continue to provide intensive TA and capacity development of GF
sub-recipients in other PEPFAR priority districts.
COP16 will focus on strategies to facilitate immediate Test and Start for KP, address leakages in the
clinical cascade based on enhanced M&E strategies, and capacity development of local partners. The

July 1, 2016
33
full range of services for KPs includes: STI screening, self-testing for HIV, routine peer
educator/navigator support, regular quarterly checkups (SRH/STI services and transport) and linkage
to impact mitigation programs for exploited children.
An MOU will be signed between our key KP implementing partner with a private laboratory to
support VL scale up at HICs in Blantyre and potentially other KP districts. Strategies under Test and
Start will also pilot ways to reach male clients of KP in hot spots through targeted peer educators,
and linkage strategies. Operations research will compare at least two distinct KP service delivery
modalities (HIC-based services vs. hybrid clinics) to determine effective strategies to optimize access
to HIV services.
Health workers in HF around known hot spots will receive ongoing mentorship and supervision and
KP issues will be integrated in health care worker in-service training. Linkage to existing HF will be
promoted where there are no available comprehensive service models for KP. A national technical
advisor for KP seconded by ActionAid will be placed at NAC to facilitate roll out of effective service
delivery models, coordination of GF supported CSO capacity development and strengthening M&E
system.
Leveraged PEPFAR KP investments by the Department of State, GF, and Elton John Foundation
funded programs will strengthen documentation of rights violations, advocacy and linkage to
protection and legal services for both LGBTI (principally MSM) and FSW.
Reaching Men
MoH DHA data shows that males are less likely to go for HTC, and initiate treatment when they are
healthy. While roll-out of Malawi’s universal Test and Start strategy will be an important enabler for
testing among males who were not eligible for treatment before, there are other barriers (noted in
the PEPFAR gender analysis and other regional studies) which impact timely service uptake and
retention. These indicate poor knowledge and low risk perception in men, masculinity norms, and
stigma, perceived access to services (i.e. distance to HIV services and challenges for working men to
queue), perceived quality of health care (i.e. perception that facilities are female spaces,
privacy/confidentiality, security of bicycles), and lack of effective community linkages or targeted
service delivery models.
In COP16, proposes strategies to increase male reach to complement existing HTC and linkage
strategies. DREAMS Test and Start funds will identify male-specific barriers and identify responsive
service delivery models. Male oriented service delivery strategies for testing and initiation include
expanded PITC (through male oriented entry points like STI, inpatient wards); flexible service
delivery hours (weekend, extended hours, dedicated male days); targeted site-based infrastructure
changes to improve privacy and security of bicycles; mobilization and outreach testing in KP and
geographic hot spots; through integrated TB/HIV outreach case finding, and addressing norms of
masculinity to encourage early service up-take. Expanded partnership with private sector as well as
VMMC sites will further increase reach of targeted male populations.
Targeted male mobilisation efforts will focus on Test and Start for all, use of male PLHIV
champions/role models for advocacy, and as community peer navigators. Other activities will reach
male partners of HIV positive females through a combination of expanded community mobilization,
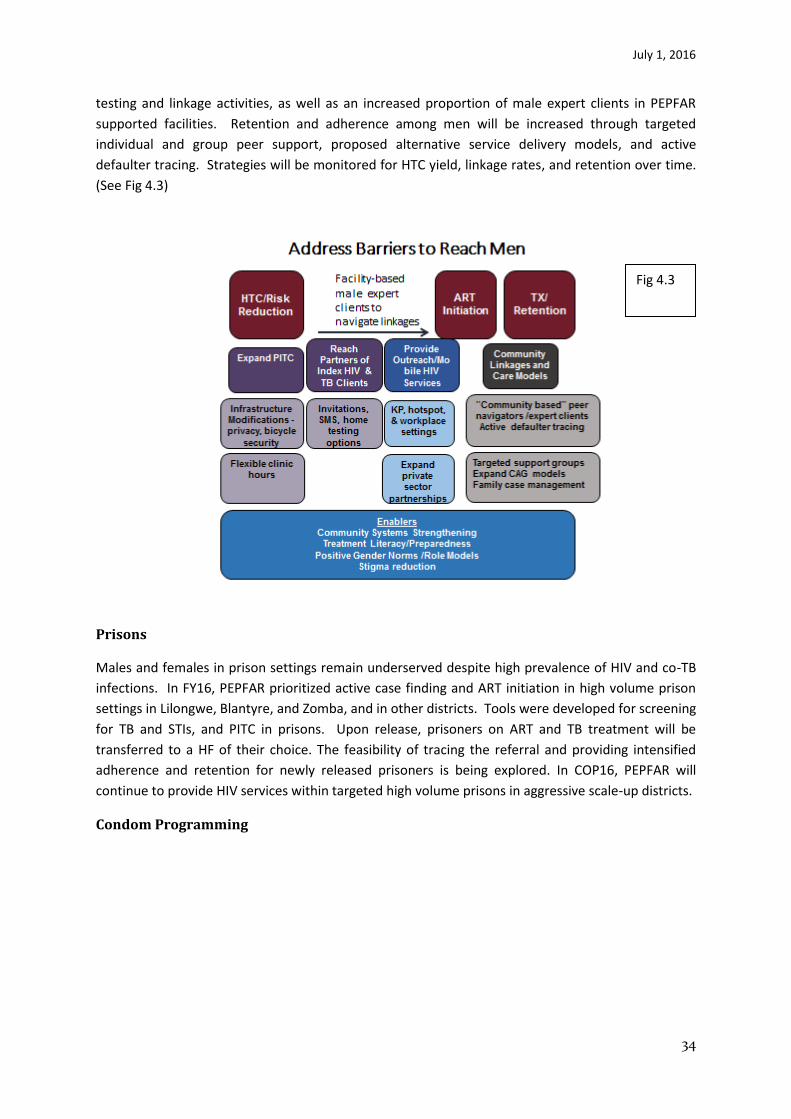
July 1, 2016
34
testing and linkage activities, as well as an increased proportion of male expert clients in PEPFAR
supported facilities. Retention and adherence among men will be increased through targeted
individual and group peer support, proposed alternative service delivery models, and active
defaulter tracing. Strategies will be monitored for HTC yield, linkage rates, and retention over time.
(See Fig 4.3)
Prisons
Males and females in prison settings remain underserved despite high prevalence of HIV and co-TB
infections. In FY16, PEPFAR prioritized active case finding and ART initiation in high volume prison
settings in Lilongwe, Blantyre, and Zomba, and in other districts. Tools were developed for screening
for TB and STIs, and PITC in prisons. Upon release, prisoners on ART and TB treatment will be
transferred to a HF of their choice. The feasibility of tracing the referral and providing intensified
adherence and retention for newly released prisoners is being explored. In COP16, PEPFAR will
continue to provide HIV services within targeted high volume prisons in aggressive scale-up districts.
Condom Programming
Fig 4.3
July 1, 2016
35
Reinvigorating condom programming as a core HIV prevention intervention is a national priority.
Within the NSP, strategies include emphasis on a total market approach for comprehensive condom
programming and effective and efficient supply. Targets to reach 280 million condoms per annum
were set to increase condom consumption using traditional and non-traditional platforms.
Additionally, lubricant would be procured and distributed to KPs .
Nationally, condoms are procured, warehoused and distributed to service delivery partners by MoH.
Recent improvements in LMIS reporting have strengthened supply chain management (SCM);
nevertheless, condom availability, access and stigma associated with both male and female condoms
remain challenges among priority populations. There are chronic stock outs of public sector
condoms; socially marketed CHISANGO and CARE brands show record sales - CHISHANGO has
already achieved 14,000,000. Public sector condom distribution, however, increased only slightly to
33,441,236. PEPFAR will work with GOM to strengthen SCM for procured public sector condoms and
lubricant.
In COP16, PEPFAR will continue to champion a total condom market approach, mapping of condom
distribution points and agents; technical assistance to operationalize national condom policy
documents, and sharing of best practices for condom planning, programming, and monitoring,
through public, private and socially marketing sectors.
Additional public sector condoms and lubricant will be procured as requested (Commodity Fund),
warehoused and distributed to PEPFAR priority district community distribution. PEPFAR’s community
platform will distribute 12 million condoms in eight priority districts through community based
condom distributors. Condom social marketing activities of CHISHANGO will expand coverage in
urban areas and hotspots to reach 20 million condom sales. CARE and the new Whisper female
condom brands will be marketed in urban settings, through salons, and by FSW Queens. Intensive
demand generation activities at national and community levels will seek to increase demand for
male, female condoms and lubricant among key and priority groups.
Gender Based Violence and Stigma and Discrimination
Responsive GBV prevention, impact mitigation, and comprehensive post-GBV services have been
highlighted as a gap disproportionately affecting vulnerable children, AGYW, women, and key
populations19. Although there are positive developments in gender related national policy, there is
concern that there is not a sufficiently enabling environment to effectively operationalize responses
to GBV, stigma and discrimination into district plans20. While a combination of DREAMS and COP
funded impact mitigation resources provides an opportunity to expand targeted community social
behavior change interventions to address GBV, raising awareness of the new Marriage Act, and
facilitating linkages, there are significant challenges to delivering comprehensive health, legal and
19
VACS 2015, PEPFAR Gender Analysis 2016 20
Recent policy developments include the Divorce and Family Relations Act (2015) which raises the minimum age of marriage to 18, the National Plan of Action to Combat GBV in Malawi (2014-2020), the National Violence Against Children Plan of Action (still in draft) and the new National Gender and HIV Implementation Plan, which integrates priorities from NSP and National Gender Policy (still in draft)
July 1, 2016
36
psycho-social support services. While districts have victim support units (VSU) – managed under the
National Police Service, post-GBV services are very limited and challenging to navigate.
Coordination with HF for timely post-rape support is lacking, and reach is low. Past PEPFAR support
expanded the number of trained social welfare/child protection officers in targeted districts to
provide linkage for OVC to VSU and legal services; however, it is likely they reached only a fraction of
GBV cases – with limited legal action against perpetrators of violence. Other challenges include
limited capacity of health providers to respond to GBV cases and lack of direction within the national
ART guidelines to provide comprehensive standard operating procedures for rape beyond post
exposure prophylaxis (PEP).
In COP16, PEPFAR will provide more focused GBV responses and on-going monitoring particularly
among highlighted vulnerable populations. PEPFAR’s community platform will address harmful
gender norms (i.e. child abuse, child marriage, GBV, and sexual cleansing) and reduce stigma
through community mobilization, with capacity development of district, CBO and community
champions to strengthen policy awareness and focus on GBV monitoring and research. Although the
revised national ART guidelines were finalized before additional GBV guidance could be included,
PEPFAR-supported providers in priority districts will incorporate GBV sensitization and clinical
protocols through mentorship to improve the quality of post-rape care within HFs. Under DREAMS,
targeted approaches to expand comprehensive GBV programming will be developed to reach AGYW.
Linkages between community, facility settings and VSUs will be better coordinated. Community
resource persons, social welfare/child protection officers and HSAs will also be trained to improve
screening and complete referrals of survivors to appropriate services.
KP GBV prevention and mitigation include documentation of human rights abuses, integration of
State Department and USAID Democracy and Governance funding, and closer collaboration with the
Malawi Human Rights Commission. Documentation of GBV/abuse and stigma reported by KP
through PEPFAR supported activities will inform operational policies for HIV at national and district
level. A targeted GBV prevention and response system with relevant standard operating procedures
will be developed for KP.
4.3 Voluntary Male Medical Circumcision (VMMC)
GOM has an ambitious VMMC scale-up strategy for 2015-2020 implemented with financial resources
from PEPFAR, World Bank (WB) and GF. For the last three years, PEPFAR/Malawi has provided
technical leadership to GOM and contributes the majority of national results, cumulatively at
240,000 circumcisions21. WB resources, implemented in 10 districts, using MoH routine service
delivery and small campaigns, have contributed only a small number of VMMCs to date due to
difficulties faced by MoH in rolling out WB supported plans. This phenomenal growth in PEPFAR
supported circumcisions will not be maintained without continued OGAC Central Funds and remains
at risk of collapse.
In COP16, USG VMMC partners support eight priority districts with a target of 101,000 circumcisions.
PEPFAR will prioritize clients aged 15-29 years reaching 80% coverage among this group over the
21
PEPFAR/Malawi Annual Program Report 2015
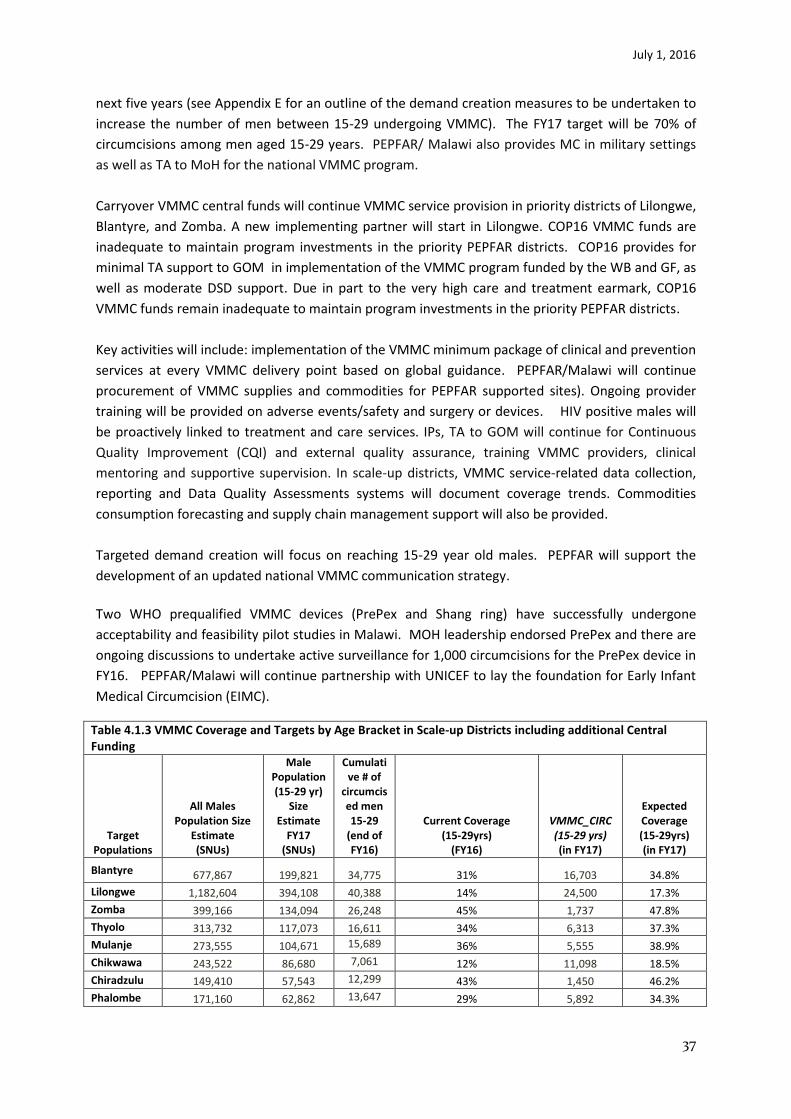
July 1, 2016
37
next five years (see Appendix E for an outline of the demand creation measures to be undertaken to
increase the number of men between 15-29 undergoing VMMC). The FY17 target will be 70% of
circumcisions among men aged 15-29 years. PEPFAR/ Malawi also provides MC in military settings
as well as TA to MoH for the national VMMC program.
Carryover VMMC central funds will continue VMMC service provision in priority districts of Lilongwe,
Blantyre, and Zomba. A new implementing partner will start in Lilongwe. COP16 VMMC funds are
inadequate to maintain program investments in the priority PEPFAR districts. COP16 provides for
minimal TA support to GOM in implementation of the VMMC program funded by the WB and GF, as
well as moderate DSD support. Due in part to the very high care and treatment earmark, COP16
VMMC funds remain inadequate to maintain program investments in the priority PEPFAR districts.
Key activities will include: implementation of the VMMC minimum package of clinical and prevention
services at every VMMC delivery point based on global guidance. PEPFAR/Malawi will continue
procurement of VMMC supplies and commodities for PEPFAR supported sites). Ongoing provider
training will be provided on adverse events/safety and surgery or devices. HIV positive males will
be proactively linked to treatment and care services. IPs, TA to GOM will continue for Continuous
Quality Improvement (CQI) and external quality assurance, training VMMC providers, clinical
mentoring and supportive supervision. In scale-up districts, VMMC service-related data collection,
reporting and Data Quality Assessments systems will document coverage trends. Commodities
consumption forecasting and supply chain management support will also be provided.
Targeted demand creation will focus on reaching 15-29 year old males. PEPFAR will support the
development of an updated national VMMC communication strategy.
Two WHO prequalified VMMC devices (PrePex and Shang ring) have successfully undergone
acceptability and feasibility pilot studies in Malawi. MOH leadership endorsed PrePex and there are
ongoing discussions to undertake active surveillance for 1,000 circumcisions for the PrePex device in
FY16. PEPFAR/Malawi will continue partnership with UNICEF to lay the foundation for Early Infant
Medical Circumcision (EIMC).
Table 4.1.3 VMMC Coverage and Targets by Age Bracket in Scale-up Districts including additional Central Funding
Target Populations
All Males Population Size
Estimate (SNUs)
Male Population (15-29 yr)
Size Estimate
FY17 (SNUs)
Cumulative # of
circumcised men 15-29
(end of FY16)
Current Coverage (15-29yrs)
(FY16)
VMMC_CIRC (15-29 yrs) (in FY17)
Expected Coverage (15-29yrs) (in FY17)
Blantyre 677,867 199,821 34,775 31% 16,703 34.8%
Lilongwe 1,182,604 394,108 40,388 14% 24,500 17.3%
Zomba 399,166 134,094 26,248 45% 1,737 47.8%
Thyolo 313,732 117,073 16,611 34% 6,313 37.3%
Mulanje 273,555 104,671 15,689 36% 5,555 38.9%
Chikwawa 243,522 86,680 7,061 12% 11,098 18.5%
Chiradzulu 149,410 57,543 12,299 43% 1,450 46.2%
Phalombe 171,160 62,862 13,647 29% 5,892 34.3%
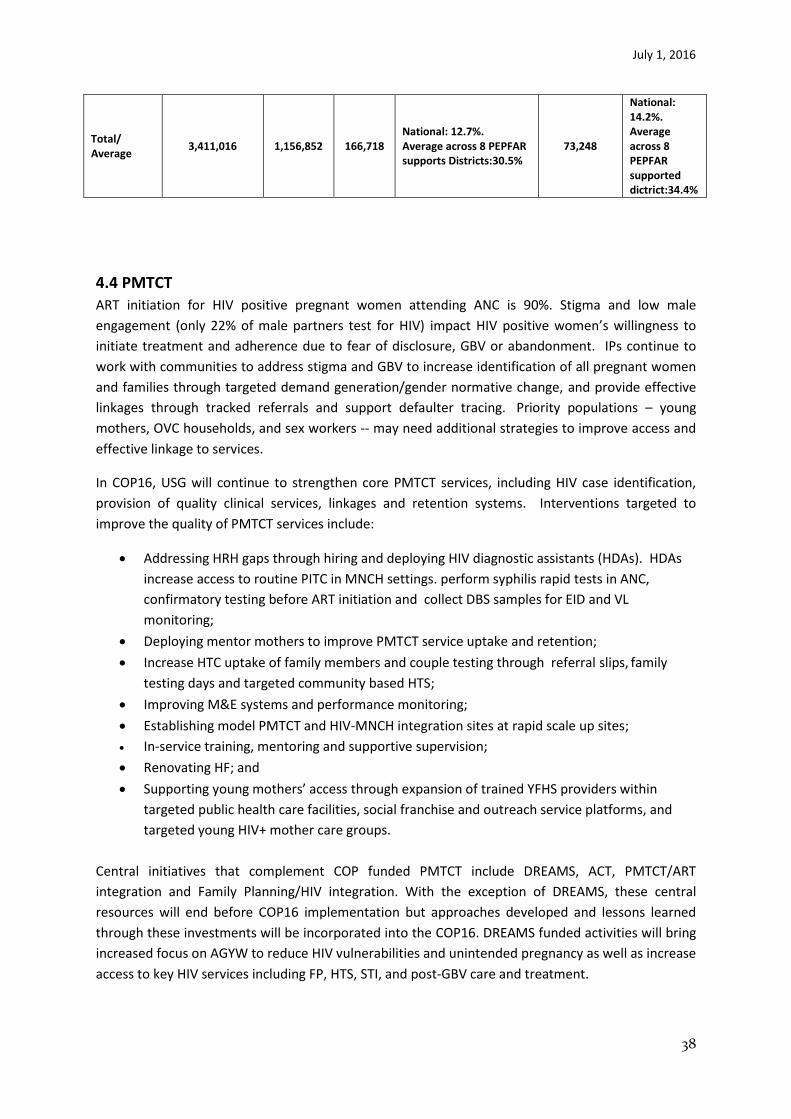
July 1, 2016
38
Total/ Average
3,411,016
1,156,852
166,718 National: 12.7%. Average across 8 PEPFAR supports Districts:30.5%
73,248
National: 14.2%. Average across 8 PEPFAR supported dictrict:34.4%
4.4 PMTCT
ART initiation for HIV positive pregnant women attending ANC is 90%. Stigma and low male
engagement (only 22% of male partners test for HIV) impact HIV positive women’s willingness to
initiate treatment and adherence due to fear of disclosure, GBV or abandonment. IPs continue to
work with communities to address stigma and GBV to increase identification of all pregnant women
and families through targeted demand generation/gender normative change, and provide effective
linkages through tracked referrals and support defaulter tracing. Priority populations – young
mothers, OVC households, and sex workers -- may need additional strategies to improve access and
effective linkage to services.
In COP16, USG will continue to strengthen core PMTCT services, including HIV case identification,
provision of quality clinical services, linkages and retention systems. Interventions targeted to
improve the quality of PMTCT services include:
Addressing HRH gaps through hiring and deploying HIV diagnostic assistants (HDAs). HDAs
increase access to routine PITC in MNCH settings. perform syphilis rapid tests in ANC,
confirmatory testing before ART initiation and collect DBS samples for EID and VL
monitoring;
Deploying mentor mothers to improve PMTCT service uptake and retention;
Increase HTC uptake of family members and couple testing through referral slips, family
testing days and targeted community based HTS;
Improving M&E systems and performance monitoring;
Establishing model PMTCT and HIV-MNCH integration sites at rapid scale up sites;
In-service training, mentoring and supportive supervision;
Renovating HF; and
Supporting young mothers’ access through expansion of trained YFHS providers within
targeted public health care facilities, social franchise and outreach service platforms, and
targeted young HIV+ mother care groups.
Central initiatives that complement COP funded PMTCT include DREAMS, ACT, PMTCT/ART
integration and Family Planning/HIV integration. With the exception of DREAMS, these central
resources will end before COP16 implementation but approaches developed and lessons learned
through these investments will be incorporated into the COP16. DREAMS funded activities will bring
increased focus on AGYW to reduce HIV vulnerabilities and unintended pregnancy as well as increase
access to key HIV services including FP, HTS, STI, and post-GBV care and treatment.
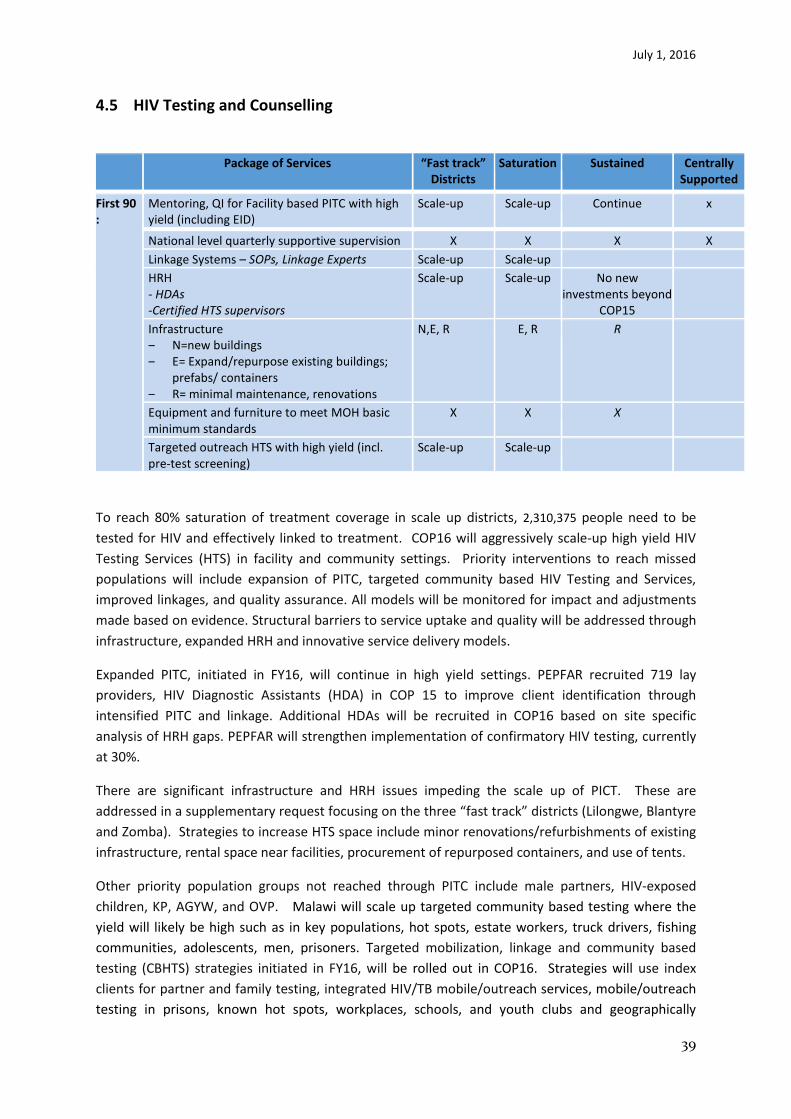
July 1, 2016
39
4.5 HIV Testing and Counselling
Package of Services “Fast track” Districts
Saturation Sustained Centrally Supported
First 90 :
Mentoring, QI for Facility based PITC with high yield (including EID)
Scale-up Scale-up Continue x
National level quarterly supportive supervision X X X X
Linkage Systems – SOPs, Linkage Experts Scale-up Scale-up
HRH - HDAs -Certified HTS supervisors
Scale-up Scale-up No new investments beyond
COP15
Infrastructure ‒ N=new buildings ‒ E= Expand/repurpose existing buildings;
prefabs/ containers ‒ R= minimal maintenance, renovations
N,E, R E, R R
Equipment and furniture to meet MOH basic minimum standards
X X X
Targeted outreach HTS with high yield (incl. pre-test screening)
Scale-up Scale-up
To reach 80% saturation of treatment coverage in scale up districts, 2,310,375 people need to be
tested for HIV and effectively linked to treatment. COP16 will aggressively scale-up high yield HIV
Testing Services (HTS) in facility and community settings. Priority interventions to reach missed
populations will include expansion of PITC, targeted community based HIV Testing and Services,
improved linkages, and quality assurance. All models will be monitored for impact and adjustments
made based on evidence. Structural barriers to service uptake and quality will be addressed through
infrastructure, expanded HRH and innovative service delivery models.
Expanded PITC, initiated in FY16, will continue in high yield settings. PEPFAR recruited 719 lay
providers, HIV Diagnostic Assistants (HDA) in COP 15 to improve client identification through
intensified PITC and linkage. Additional HDAs will be recruited in COP16 based on site specific
analysis of HRH gaps. PEPFAR will strengthen implementation of confirmatory HIV testing, currently
at 30%.
There are significant infrastructure and HRH issues impeding the scale up of PICT. These are
addressed in a supplementary request focusing on the three “fast track” districts (Lilongwe, Blantyre
and Zomba). Strategies to increase HTS space include minor renovations/refurbishments of existing
infrastructure, rental space near facilities, procurement of repurposed containers, and use of tents.
Other priority population groups not reached through PITC include male partners, HIV-exposed
children, KP, AGYW, and OVP. Malawi will scale up targeted community based testing where the
yield will likely be high such as in key populations, hot spots, estate workers, truck drivers, fishing
communities, adolescents, men, prisoners. Targeted mobilization, linkage and community based
testing (CBHTS) strategies initiated in FY16, will be rolled out in COP16. Strategies will use index
clients for partner and family testing, integrated HIV/TB mobile/outreach services, mobile/outreach
testing in prisons, known hot spots, workplaces, schools, and youth clubs and geographically
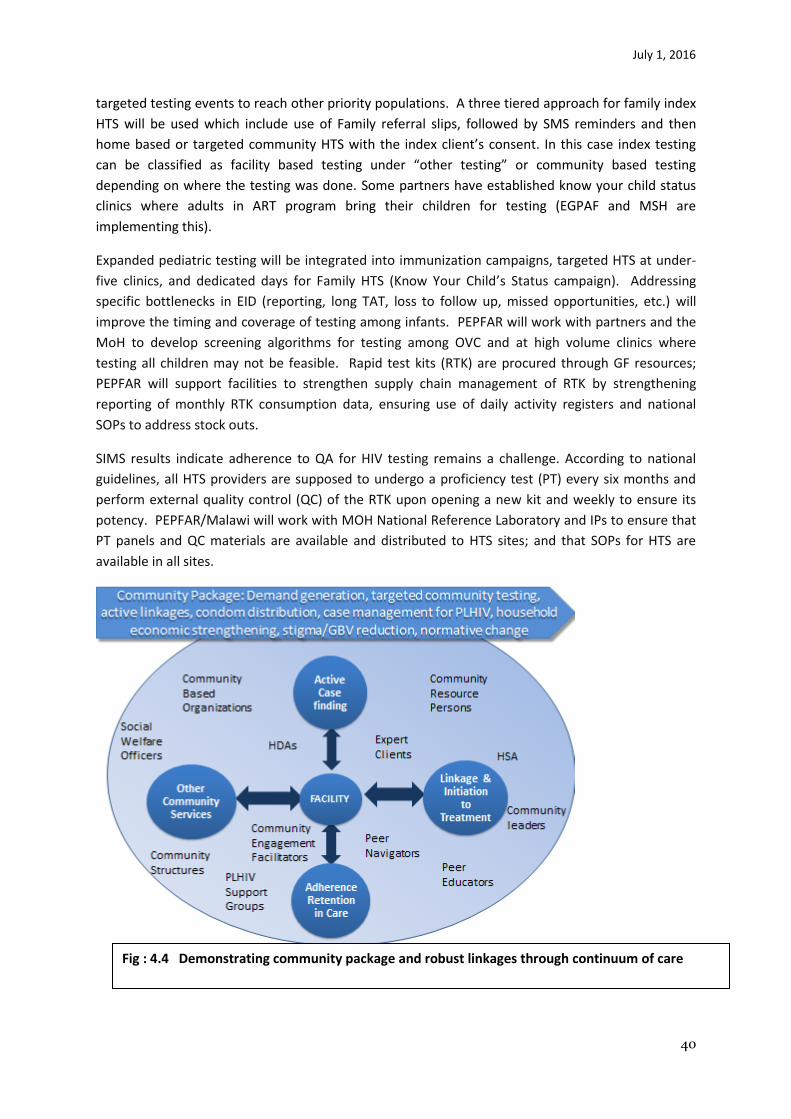
July 1, 2016
40
targeted testing events to reach other priority populations. A three tiered approach for family index
HTS will be used which include use of Family referral slips, followed by SMS reminders and then
home based or targeted community HTS with the index client’s consent. In this case index testing
can be classified as facility based testing under “other testing” or community based testing
depending on where the testing was done. Some partners have established know your child status
clinics where adults in ART program bring their children for testing (EGPAF and MSH are
implementing this).
Expanded pediatric testing will be integrated into immunization campaigns, targeted HTS at under-
five clinics, and dedicated days for Family HTS (Know Your Child’s Status campaign). Addressing
specific bottlenecks in EID (reporting, long TAT, loss to follow up, missed opportunities, etc.) will
improve the timing and coverage of testing among infants. PEPFAR will work with partners and the
MoH to develop screening algorithms for testing among OVC and at high volume clinics where
testing all children may not be feasible. Rapid test kits (RTK) are procured through GF resources;
PEPFAR will support facilities to strengthen supply chain management of RTK by strengthening
reporting of monthly RTK consumption data, ensuring use of daily activity registers and national
SOPs to address stock outs.
SIMS results indicate adherence to QA for HIV testing remains a challenge. According to national
guidelines, all HTS providers are supposed to undergo a proficiency test (PT) every six months and
perform external quality control (QC) of the RTK upon opening a new kit and weekly to ensure its
potency. PEPFAR/Malawi will work with MOH National Reference Laboratory and IPs to ensure that
PT panels and QC materials are available and distributed to HTS sites; and that SOPs for HTS are
available in all sites.
Fig : 4.4 Demonstrating community package and robust linkages through continuum of care

July 1, 2016
41
4.6 Facility and Community Based Treatment, Care and Support
In priority sites, all PEPFAR service delivery partners will implement a standardized package of DSD
interventions (Table 4.6.1). In consultation with the MoH, a number of intensified approaches
supporting the 90-90-90 cascade have been added in COP16. In line with Test and Start, facility-
based activities will include evidence based interventions to address service delivery bottlenecks and
improve treatment outcomes. An intensified emphasis on community systems is intended to
improve retention efforts and reduce LTFU rates.
Various differentiated models of service delivery are already being implemented in Malawi, aligned
with the WHO definition. The Malawi guidelines recommend 3 monthly visits for clinic and drug
refills for patients who are adherent and stable on ART. Examples of differentiated care models
already being implemented include integrated TB/HIV, ANC/ ART clinics, teen clubs, Community ART
groups. ART service delivery has been task-shifted with nurses playing a key role in ART initiation and
follow up, and lay cadres such as Expert Clients playing an increasingly leading role in treatment
literacy, adherence counseling and active defaulter tracing. With the exception of viral load
monitoring, stable ART patients do not routinely undergo any laboratory tests. Modelling has been
undertaken to determine the impact differentiated care models would have in alleviating HR and
Infrastructure gaps in COP 16. Although MOH has not endorsed pharmacy fast track and 6 monthly
refill visits in the national guidelines, PEPFAR has endorsement to establish demonstration sites. On
the basis of these projects PEPFAR will continue to advocate for scale up of these models, especially
in the higher burden clinics. The considerations for differentiated care models are described in
figures 4.2, 4.6.2, 4.8 and in appendix E.
Retention rates of ART cohorts are monitored on a quarterly basis. PEPFAR will scale up
interventions at facility and community level to reduce loss to follow up (LTFU). Strategies are
already being implemented in COP 15 with the development of operational guidance and tools for
active patient tracing. The investment package to reduce LTFU includes low cost HRH support
through the engagement of expert clients and volunteers, appointment reminders (registers, SMS
technology, EMRS prompts, physical tracing), establishment and strengthening of support groups
such as teen clubs. Expert clients and community models (see Fig.4.4) will address barriers to
retention such as stigma and discrimination, facilitate disclosure, enhance treatment literacy, linkage
with economic strengthening and psychosocial support programs The investment package will be
further refined with the findings of a HOP funded study to optimize retention in care, including
screening tools to identify patients who are more likely to default.
In all of the facilities in the scale up districts PEPFAR will support at least one community
engagement facilitator who will be charged with coordinating with Community based structures
(including CSOs and support groups) in order to achieve increase targeted testing, treatment and
viral suppression.
The following categories of patients will received additional support efforts for effective disease
control:
- New Positive – Not yet linked to Care
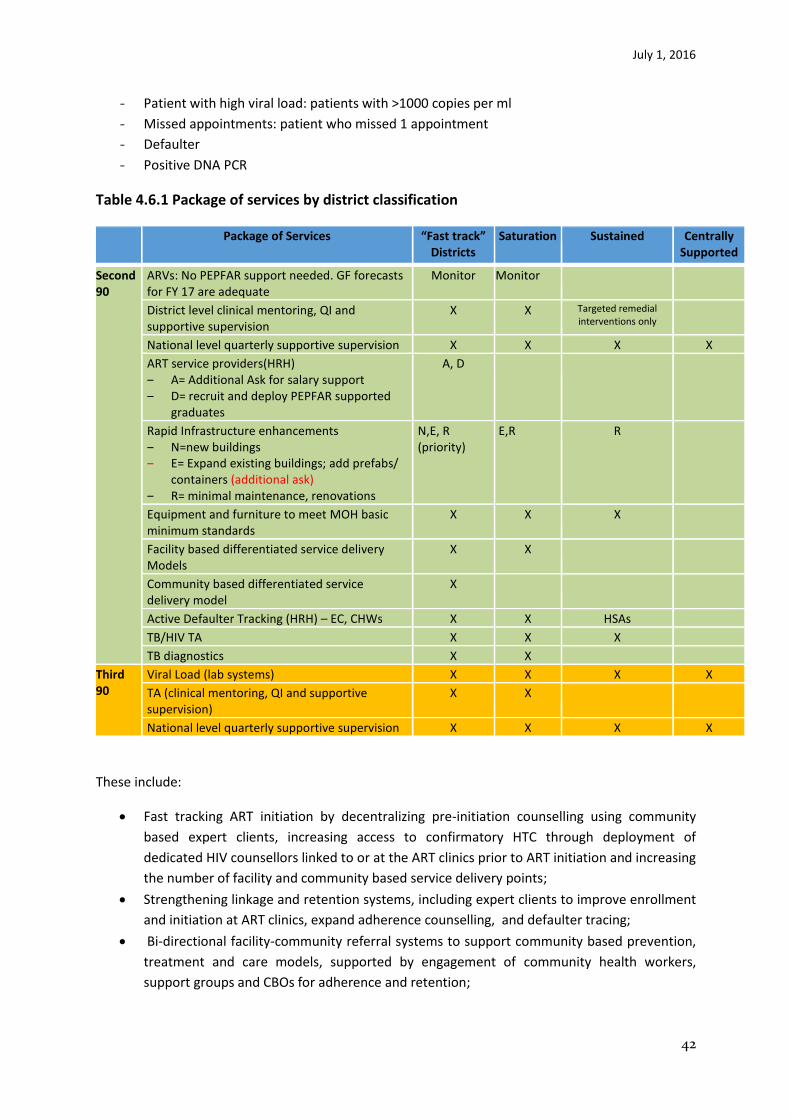
July 1, 2016
42
- Patient with high viral load: patients with >1000 copies per ml
- Missed appointments: patient who missed 1 appointment
- Defaulter
- Positive DNA PCR
Table 4.6.1 Package of services by district classification
Package of Services “Fast track” Districts
Saturation Sustained Centrally Supported
Second 90
ARVs: No PEPFAR support needed. GF forecasts for FY 17 are adequate
Monitor Monitor
District level clinical mentoring, QI and supportive supervision
X X Targeted remedial interventions only
National level quarterly supportive supervision X X X X
ART service providers(HRH) ‒ A= Additional Ask for salary support ‒ D= recruit and deploy PEPFAR supported
graduates
A, D
Rapid Infrastructure enhancements ‒ N=new buildings ‒ E= Expand existing buildings; add prefabs/
containers (additional ask) ‒ R= minimal maintenance, renovations
N,E, R (priority)
E,R R
Equipment and furniture to meet MOH basic minimum standards
X X X
Facility based differentiated service delivery Models
X X
Community based differentiated service delivery model
X
Active Defaulter Tracking (HRH) – EC, CHWs X X HSAs
TB/HIV TA X X X
TB diagnostics X X
Third 90
Viral Load (lab systems) X X X X
TA (clinical mentoring, QI and supportive supervision)
X X
National level quarterly supportive supervision X X X X
These include:
Fast tracking ART initiation by decentralizing pre-initiation counselling using community
based expert clients, increasing access to confirmatory HTC through deployment of
dedicated HIV counsellors linked to or at the ART clinics prior to ART initiation and increasing
the number of facility and community based service delivery points;
Strengthening linkage and retention systems, including expert clients to improve enrollment
and initiation at ART clinics, expand adherence counselling, and defaulter tracing;
Bi-directional facility-community referral systems to support community based prevention,
treatment and care models, supported by engagement of community health workers,
support groups and CBOs for adherence and retention;

July 1, 2016
43
Expanding the roles of clinical mentors to monitor workload, identify health systems
bottlenecks to access and high quality care and treatment services, and develop site specific
SOPs for differentiated models of care;
Increasing access to confirmatory HTC through deployment of dedicated HIV counsellors
linked to or at the ART clinics prior to ART initiation;
Scaling-up QA/QI interventions to comply with national HIV guidelines.
Fig 4.6.2
The following activities will be undertaken at sites anticipated to have a higher ART patient volume
as a result of intensified and comprehensive interventions in the “fast track” districts. Salary support
and infrastructure investments are dependent on a supplementary request to OGAC, which will
support attainment of FY18 targets and service quality.
Assure service delivery standards for ART:
• Assure adequate HRH, infrastructure, and essential equipment (salary support for ART
service providers at targeted sites in the “fast track” districts);
• Use standard national tools for supportive supervision and monitoring of the quality of
services and treatment outcomes.
Implement data-driven approaches:
• Define capacity thresholds for ART clinics and determine threshold for the
implementation of differentiated service delivery models;
• Monitor facility stock levels of ARVs, RTK, condoms, VL reagents, etc.;
• Service delivery optimization as an immediate intervention; and
• Any site with over 3,000 patients alive on ART be considered for:
July 1, 2016
44
o Rapid Investments in infrastructure (pre-fab or containers) and HRH
recognizing the rate of cohort growth in these sites, and
o Enhancement of the facility-community continuum: implement
community-based interventions for demand creation, treatment literacy,
adherence support and retention.
Peace Corps Health volunteers placed in scale-up sites will collaborate with USG IPs for behavior
change prevention activities. Additionally, PEPFAR/Malawi is exploring the possibility of leveraging
additional Global Health Service Partnership Peace Corps health volunteers to be placed in large
sites in Lilongwe, Blantyre and Zomba to provide service delivery and capacity building.
4.7 TB/HIV
TB is a leading cause of mortality and morbidity among HIV positive patients but a 2014 survey indicated only half of expected TB cases were diagnosed. Most TB patients (91%) in clinics know their HIV status but TB case notification has been declining over the past decade, averaging 18,000 new and relapse cases per year. Diagnosing TB patients is a key challenge and priority. COP16 will focus on core TB/HIV activities aligned with the TB National Strategic Plan through:
Hiring and training of dedicated HTC counselors for routine PITC for TB patients;
Active case finding in the urban centers in Zomba, Blantyre, Lilongwe and Mzuzu where 55% of TB cases are notified (community mobilization, mobile clinics for screening, diagnosis and treatment),
Increasing early ART and TB treatment initiation for co-infected patients,
Enhanced case finding through systematic screening in HIV clinics and linkage e to diagnostic services. HSAs and expert clients trained at high burden sites to systematically screen for TB;
Implementation of SOPs for TB/HIV integration,
Improving M&E systems and performance monitoring;
Technical support for in-service training, mentoring and supportive supervision;
Review IPT policy to extend provision of IPT to patients on ART in whom TB has been ruled out;
Renovating and equipping HF;
Increasing access to TB diagnostic facilities including optimized utilization of GeneXpert platforms;
Secondment of technical staff to the MoH to address capacity gaps for program management, commodity security and supply chain, monitoring and evaluation;
Triaged approach for TB patients in high volume OPD and ART clinics and prisons;
Supporting the national program to implement an electronic TB register and improve TB/HIV data recording and reporting;
Decentralization of TB/HIV services through establishment of new TB diagnostic and TB treatment initiation services; and
Supporting HF to develop and implement TB infection control plans.
The bulk of TB resources are from Global Fund grants and continued funding is critical for an
effective TB response. Integration of TB/HIV programs is expected to streamline and improve
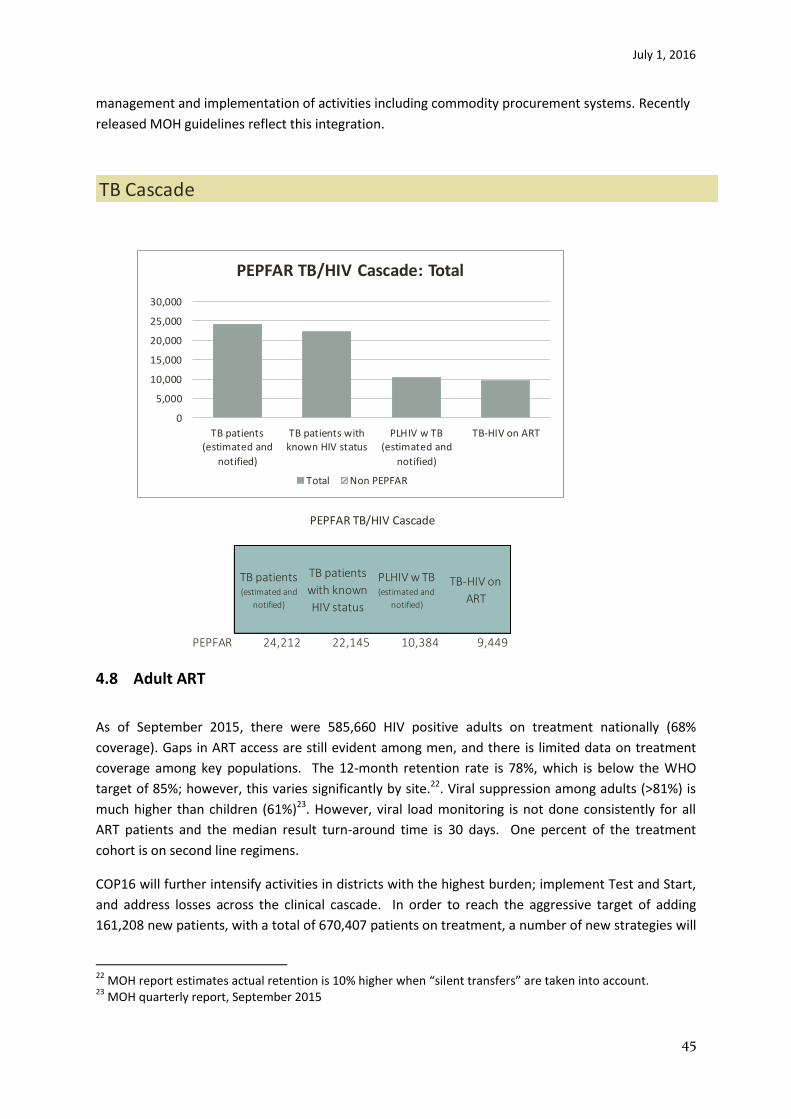
July 1, 2016
45
management and implementation of activities including commodity procurement systems. Recently
released MOH guidelines reflect this integration.
4.8 Adult ART
As of September 2015, there were 585,660 HIV positive adults on treatment nationally (68%
coverage). Gaps in ART access are still evident among men, and there is limited data on treatment
coverage among key populations. The 12-month retention rate is 78%, which is below the WHO
target of 85%; however, this varies significantly by site.22. Viral suppression among adults (>81%) is
much higher than children (61%)23. However, viral load monitoring is not done consistently for all
ART patients and the median result turn-around time is 30 days. One percent of the treatment
cohort is on second line regimens.
COP16 will further intensify activities in districts with the highest burden; implement Test and Start,
and address losses across the clinical cascade. In order to reach the aggressive target of adding
161,208 new patients, with a total of 670,407 patients on treatment, a number of new strategies will
22
MOH report estimates actual retention is 10% higher when “silent transfers” are taken into account. 23
MOH quarterly report, September 2015
TB patients (estimated and
notified)
TB patients
with known
HIV status
PLHIV w TB (estimated and
notified)
TB-HIV on
ART
PEPFAR 24,212 22,145 10,384 9,449
TB Cascade
PEPFAR TB/HIV Cascade
0
5,000
10,000
15,000
20,000
25,000
30,000
TB patients(estimated and
notified)
TB patients withknown HIV status
PLHIV w TB(estimated and
notified)
TB-HIV on ART
PEPFAR TB/HIV Cascade: Total
Total Non PEPFAR
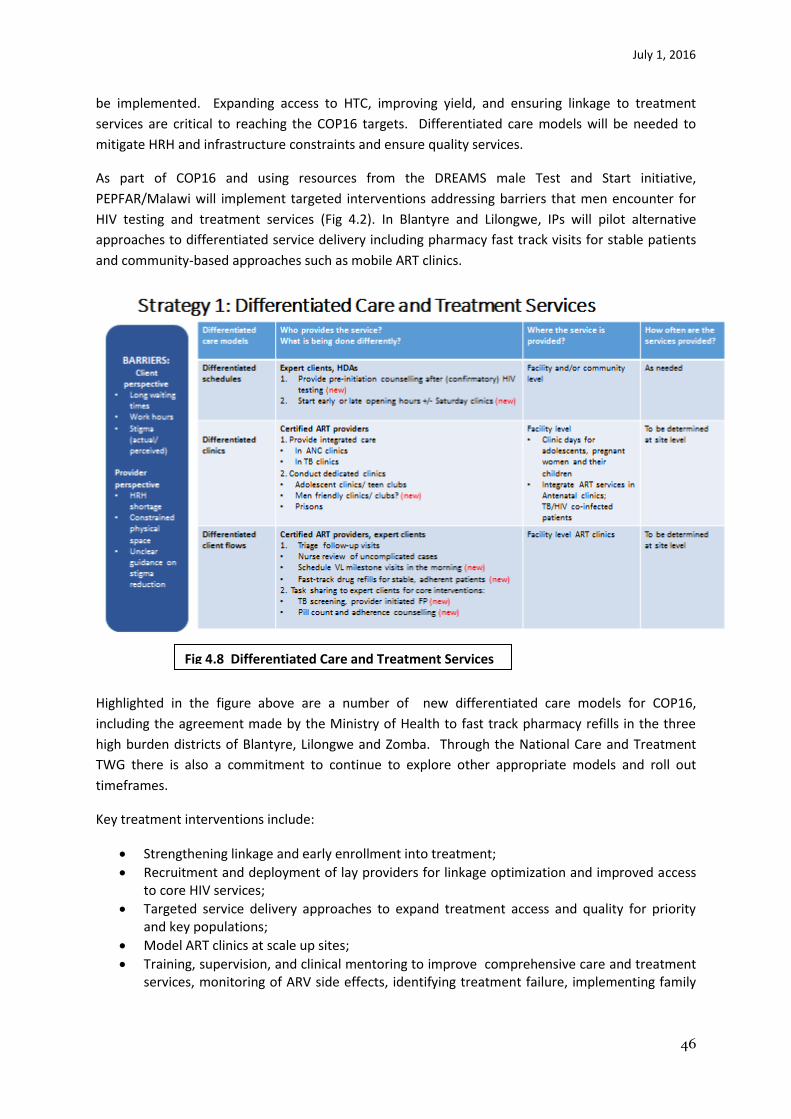
July 1, 2016
46
be implemented. Expanding access to HTC, improving yield, and ensuring linkage to treatment
services are critical to reaching the COP16 targets. Differentiated care models will be needed to
mitigate HRH and infrastructure constraints and ensure quality services.
As part of COP16 and using resources from the DREAMS male Test and Start initiative,
PEPFAR/Malawi will implement targeted interventions addressing barriers that men encounter for
HIV testing and treatment services (Fig 4.2). In Blantyre and Lilongwe, IPs will pilot alternative
approaches to differentiated service delivery including pharmacy fast track visits for stable patients
and community-based approaches such as mobile ART clinics.
Highlighted in the figure above are a number of new differentiated care models for COP16,
including the agreement made by the Ministry of Health to fast track pharmacy refills in the three
high burden districts of Blantyre, Lilongwe and Zomba. Through the National Care and Treatment
TWG there is also a commitment to continue to explore other appropriate models and roll out
timeframes.
Key treatment interventions include:
Strengthening linkage and early enrollment into treatment;
Recruitment and deployment of lay providers for linkage optimization and improved access to core HIV services;
Targeted service delivery approaches to expand treatment access and quality for priority and key populations;
Model ART clinics at scale up sites;
Training, supervision, and clinical mentoring to improve comprehensive care and treatment services, monitoring of ARV side effects, identifying treatment failure, implementing family
Fig 4.8 Differentiated Care and Treatment Services
Differentiated Care and Treatment Services

July 1, 2016
47
centered chronic care models, bidirectional facility-community referral system to strengthen the care and treatment continuum;
Coordination with communities, CBOs, FBOs and community health workers for awareness, stigma reduction and demand creation for ART services;
Implementation of active defaulter tracing. Expert clients will play a central role in intensive post-test counseling, disclosure support, routine and targeted adherence counseling and defaulter tracing;
Site-level M&E systems and data use for continuous QI;
Renovating HF to increase clinic space and drug warehousing capacity;
TA to implement NSP for viral loads scale-up support of viral load centers, sample transportation systems and Electronic Medical Record System (EMRS), VL module to improve clinical compliance;
Identify first line regimen failures through VL, and certification of additional second line ARV prescribers;
Procuring laboratory clinical monitoring commodities to complement the GF investment;
National HIV Drug Resistance survey;
Secondment of technical staff to MoH to address capacity gaps in program management, commodity security and supply chain, monitoring and evaluation; and
Optimizing the National EMRS by extending its functionality as a point-of-care decision-support tool.
Demand creation for services will include mass media/communications design for treatment literacy,
and intensive community mobilization by community partners will occur within the scale-up districts.
Targeted community-oriented care interventions will support defaulter tracing and positive
prevention dignity and health including adherence, partner testing and on-going linkage to services
as well as stigma and discrimination reduction and GBV prevention. Close partnership with facility
partners will facilitate expansion of community oriented adherence and treatment models pending
MoH approval.
4.9 Pediatric ART The number of children receiving ART increased from 42,220 in June 2014 to 50,533 by September
2015, coverage of 39%. COP16 follows-on from the ambitious ACT initiative which covered a two
year period (FY15 and FY16). This strategy resulted in doubling the number of children tested by the
deployment of HDAs and scaling-up of high-yield testing approaches.
In FY 17, 16,712 children will be newly initiated on treatment and 72,767 will be alive and on
treatment.

July 1, 2016
48
Clinical (ART) Cascade
Number PLHIV Diagnosed Linked to
care Currently
on ART Virally
Suppressed
1,068,536 950,087 736,741 670,407 569,846
Key interventions include:
Site-level clinical mentorship, training and supervision, including differentiated care models such as integration into pediatric service delivery points, family centered approaches, synchronized mother-infant pair visits, decentralized treatment in high burden ART sites that exceed capacity, specialized clinic days, teen clubs;
Assigning CHWs, including expert clients, and provider-initiated testing and counseling providers (HDAs) to actively link and/or refer to HIV care and treatment, including physical escort, and to rapidly trace children who default
PITC in high-yield settings utilizing HDAs;
Scale-up Community Testing - Immunization outreach posts to include EID;
Continuous Quality Improvement (CQI) initiatives specifically for EID ;
Scale-up facility and community index testing;
An algorithm to screen and optimize yield for HIV in OPD and OVC settings;
Scale-up Youth Friendly Health Services;
Strengthen use of bi-directional linkage and referral tools;
Support pediatric HIV technical advisors seconded to district hospitals in high burden districts;
Scale-up the CQI approach for pediatric treatment;
Active defaulter tracing systems at all priority facilities – Routine review of records to identify missed appointments, use of community workers (lay cadres, HSAs) for tracing and bringing patients back to care; and
90% 81%
73%
0
200,000
400,000
600,000
800,000
1,000,000
1,200,000
Number PLHIV Diagnosed Linked to care Currently onART
VirallySuppressed
PEPFAR Clinical (ART) Cascade: Total
Total Non-PEPFAR 90-90-90 Targets
July 1, 2016
49
Support VL scale-up (sample collection and transportation, LMIS, HRH).
Introduce LPVr regimen as per new ART guidelines with minimum requirement of at least one MOH certified level 2 (second line) prescriber as these are trained in the use of LPVr.
Interventions to address three key pediatric gaps identified through routine program performance
review include:
(i) Low EID Coverage
By May 2016 sample transportation will scale-up to all 28 districts;
Reducing EID turnaround time for selected scale-up sites (Phone calls from lab to facility for all positive results, LMIS direct link for EMRS sites, SMS printers, etc.);
Due to the format of the EID registers and exposed infant patient cards (“pink cards”) it is possible that a number of EID tests are not recorded and/or reported. PEPFAR/Malawi will work with MOH to improve current M&E tools including documentation of children on adult ART patient records to enhance identification, linkage and retention of family members of index client, and
Opportunities for integrating EID services in community-based immunization points.
(ii) Gaps in linkage and treatment services for adolescents
Integration of HIV testing and treatment services in reproductive health clinics will be a key strategy.
In line with suggestions received from CSOs, teen clubs and teen support hotlines will be expanded
to more priority sites and districts. PEPFAR will work with DHA to improve current M&E systems for
better age, sex and yield data. Some observed gaps are believed to be due to data quality issues.
Utilizing PEPFAR community platforms, bi-directional referrals between community and facility-
based HIV testing services and treatment facilities enhanced to maximize treatment services for
adolescents.
(iii) Low VL coverage among children
IPs will work with sites to significantly increase VL coverage for children and adolescents with CQI
initiatives). PEPFAR will advocate for inclusion of effective and well-tolerated pediatric regimen into
the national guidelines.
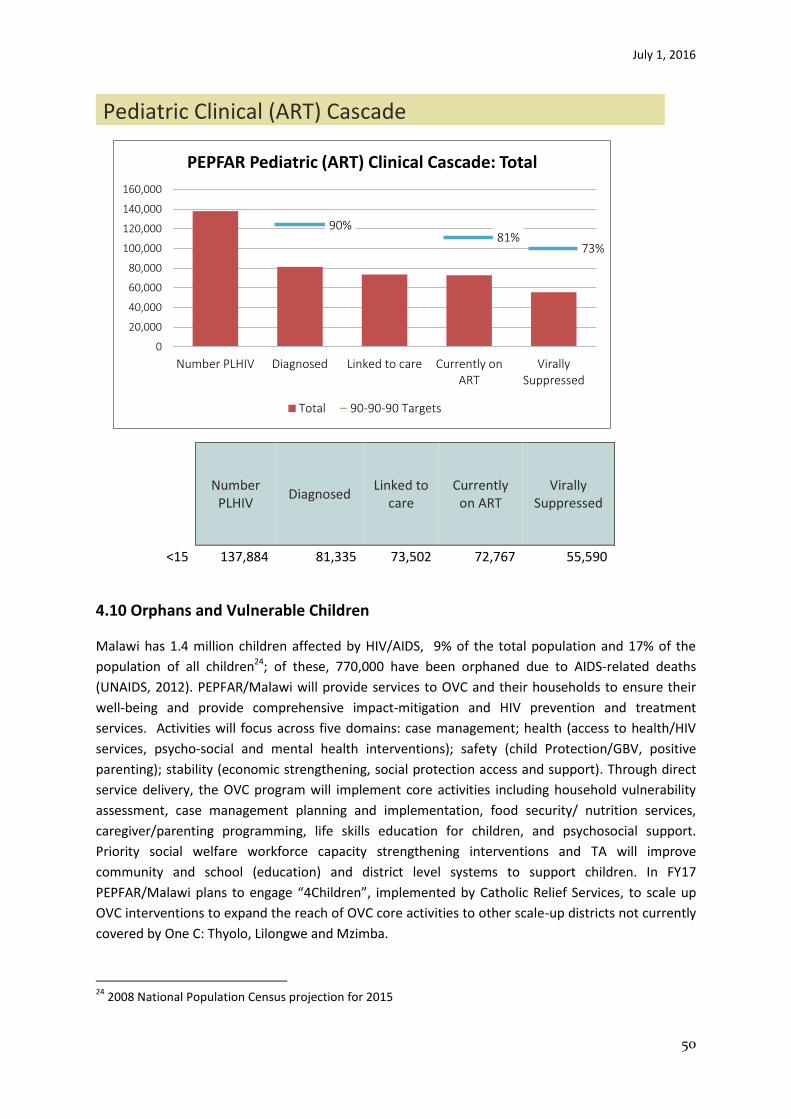
July 1, 2016
50
Pediatric Clinical (ART) Cascade
Number
PLHIV Diagnosed
Linked to care
Currently on ART
Virally Suppressed
<15 137,884 81,335 73,502 72,767 55,590
4.10 Orphans and Vulnerable Children
Malawi has 1.4 million children affected by HIV/AIDS, 9% of the total population and 17% of the
population of all children24; of these, 770,000 have been orphaned due to AIDS-related deaths
(UNAIDS, 2012). PEPFAR/Malawi will provide services to OVC and their households to ensure their
well-being and provide comprehensive impact-mitigation and HIV prevention and treatment
services. Activities will focus across five domains: case management; health (access to health/HIV
services, psycho-social and mental health interventions); safety (child Protection/GBV, positive
parenting); stability (economic strengthening, social protection access and support). Through direct
service delivery, the OVC program will implement core activities including household vulnerability
assessment, case management planning and implementation, food security/ nutrition services,
caregiver/parenting programming, life skills education for children, and psychosocial support.
Priority social welfare workforce capacity strengthening interventions and TA will improve
community and school (education) and district level systems to support children. In FY17
PEPFAR/Malawi plans to engage “4Children”, implemented by Catholic Relief Services, to scale up
OVC interventions to expand the reach of OVC core activities to other scale-up districts not currently
covered by One C: Thyolo, Lilongwe and Mzimba.
24
2008 National Population Census projection for 2015
90% 81%
73%
0
20,000
40,000
60,000
80,000
100,000
120,000
140,000
160,000
Number PLHIV Diagnosed Linked to care Currently onART
VirallySuppressed
PEPFAR Pediatric (ART) Clinical Cascade: Total
Total 90-90-90 Targets
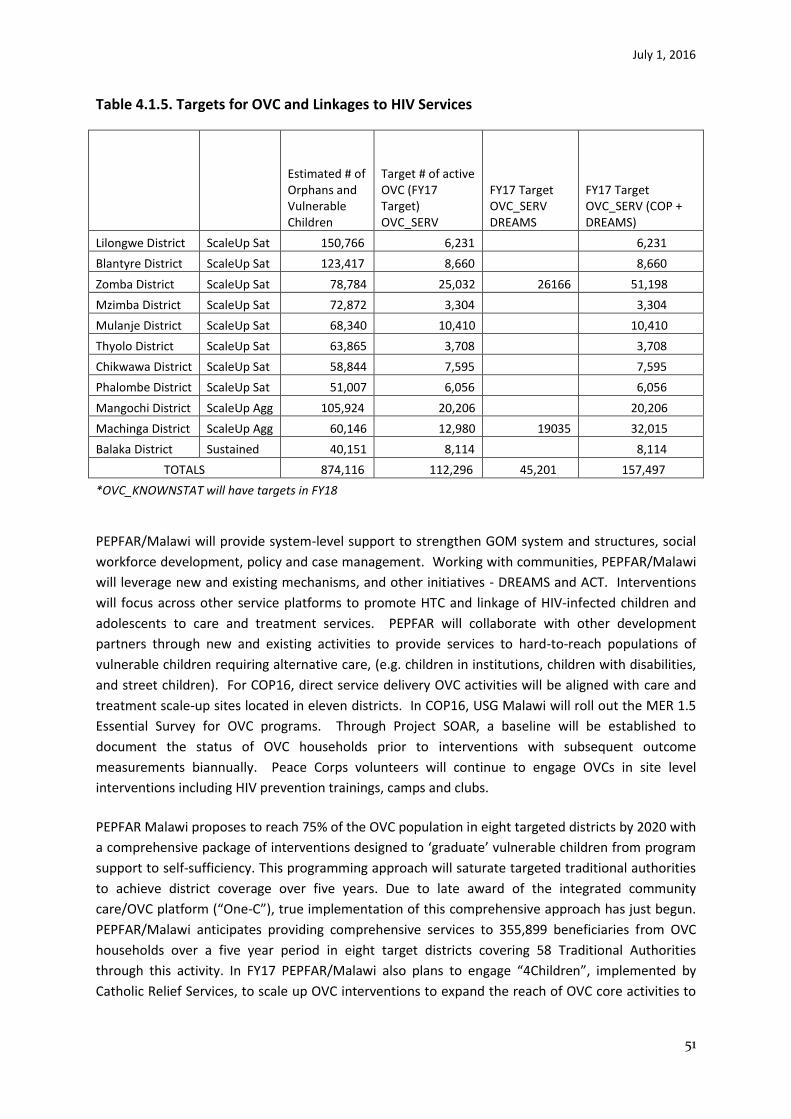
July 1, 2016
51
Table 4.1.5. Targets for OVC and Linkages to HIV Services
Estimated # of Orphans and Vulnerable Children
Target # of active OVC (FY17 Target) OVC_SERV
FY17 Target OVC_SERV DREAMS
FY17 Target OVC_SERV (COP + DREAMS)
Lilongwe District ScaleUp Sat 150,766 6,231 6,231
Blantyre District ScaleUp Sat 123,417 8,660 8,660
Zomba District ScaleUp Sat 78,784 25,032 26166 51,198
Mzimba District ScaleUp Sat 72,872 3,304 3,304
Mulanje District ScaleUp Sat 68,340 10,410 10,410
Thyolo District ScaleUp Sat 63,865 3,708 3,708
Chikwawa District ScaleUp Sat 58,844 7,595 7,595
Phalombe District ScaleUp Sat 51,007 6,056 6,056
Mangochi District ScaleUp Agg 105,924 20,206 20,206
Machinga District ScaleUp Agg 60,146 12,980 19035 32,015
Balaka District Sustained 40,151 8,114 8,114
TOTALS 874,116 112,296 45,201 157,497
*OVC_KNOWNSTAT will have targets in FY18
PEPFAR/Malawi will provide system-level support to strengthen GOM system and structures, social
workforce development, policy and case management. Working with communities, PEPFAR/Malawi
will leverage new and existing mechanisms, and other initiatives - DREAMS and ACT. Interventions
will focus across other service platforms to promote HTC and linkage of HIV-infected children and
adolescents to care and treatment services. PEPFAR will collaborate with other development
partners through new and existing activities to provide services to hard-to-reach populations of
vulnerable children requiring alternative care, (e.g. children in institutions, children with disabilities,
and street children). For COP16, direct service delivery OVC activities will be aligned with care and
treatment scale-up sites located in eleven districts. In COP16, USG Malawi will roll out the MER 1.5
Essential Survey for OVC programs. Through Project SOAR, a baseline will be established to
document the status of OVC households prior to interventions with subsequent outcome
measurements biannually. Peace Corps volunteers will continue to engage OVCs in site level
interventions including HIV prevention trainings, camps and clubs.
PEPFAR Malawi proposes to reach 75% of the OVC population in eight targeted districts by 2020 with
a comprehensive package of interventions designed to ‘graduate’ vulnerable children from program
support to self-sufficiency. This programming approach will saturate targeted traditional authorities
to achieve district coverage over five years. Due to late award of the integrated community
care/OVC platform (“One-C”), true implementation of this comprehensive approach has just begun.
PEPFAR/Malawi anticipates providing comprehensive services to 355,899 beneficiaries from OVC
households over a five year period in eight target districts covering 58 Traditional Authorities
through this activity. In FY17 PEPFAR/Malawi also plans to engage “4Children”, implemented by
Catholic Relief Services, to scale up OVC interventions to expand the reach of OVC core activities to
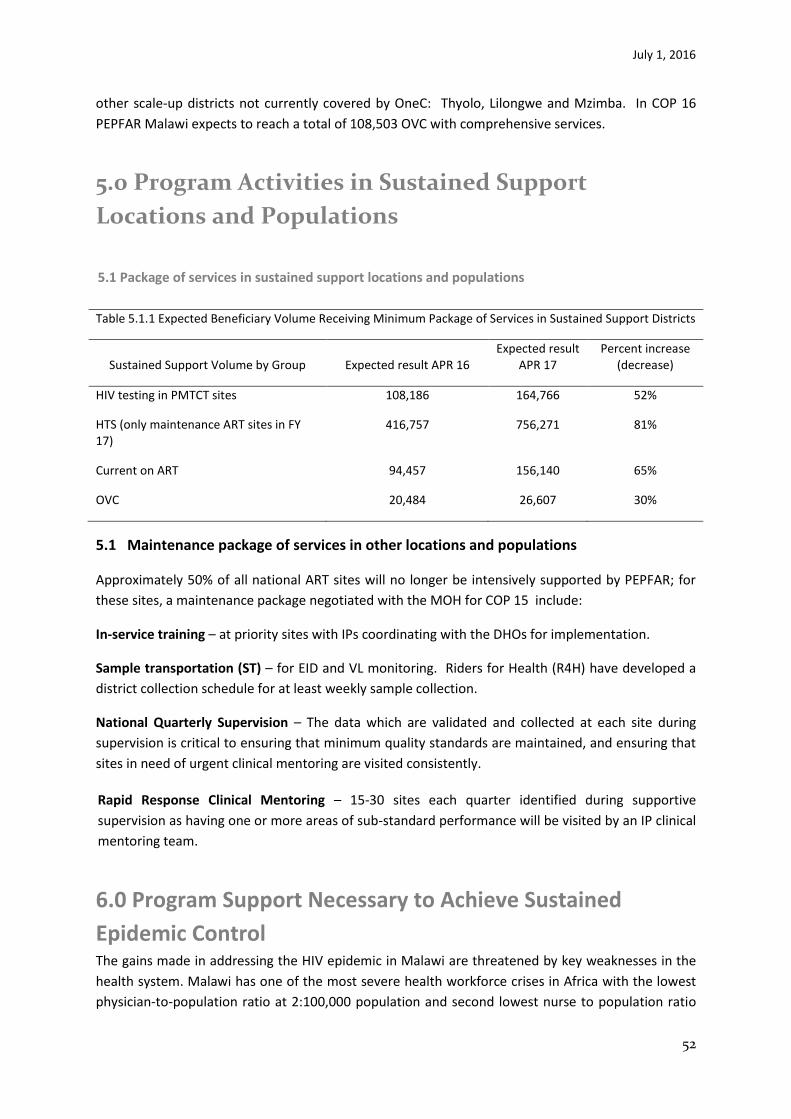
July 1, 2016
52
other scale-up districts not currently covered by OneC: Thyolo, Lilongwe and Mzimba. In COP 16
PEPFAR Malawi expects to reach a total of 108,503 OVC with comprehensive services.
5.0 Program Activities in Sustained Support
Locations and Populations
5.1 Package of services in sustained support locations and populations
Table 5.1.1 Expected Beneficiary Volume Receiving Minimum Package of Services in Sustained Support Districts
Sustained Support Volume by Group Expected result APR 16 Expected result
APR 17 Percent increase
(decrease)
HIV testing in PMTCT sites 108,186 164,766 52%
HTS (only maintenance ART sites in FY 17)
416,757 756,271 81%
Current on ART 94,457 156,140 65%
OVC 20,484 26,607 30%
5.1 Maintenance package of services in other locations and populations
Approximately 50% of all national ART sites will no longer be intensively supported by PEPFAR; for
these sites, a maintenance package negotiated with the MOH for COP 15 include:
In-service training – at priority sites with IPs coordinating with the DHOs for implementation.
Sample transportation (ST) – for EID and VL monitoring. Riders for Health (R4H) have developed a
district collection schedule for at least weekly sample collection.
National Quarterly Supervision – The data which are validated and collected at each site during
supervision is critical to ensuring that minimum quality standards are maintained, and ensuring that
sites in need of urgent clinical mentoring are visited consistently.
Rapid Response Clinical Mentoring – 15-30 sites each quarter identified during supportive
supervision as having one or more areas of sub-standard performance will be visited by an IP clinical
mentoring team.
6.0 Program Support Necessary to Achieve Sustained
Epidemic Control The gains made in addressing the HIV epidemic in Malawi are threatened by key weaknesses in the
health system. Malawi has one of the most severe health workforce crises in Africa with the lowest
physician-to-population ratio at 2:100,000 population and second lowest nurse to population ratio
July 1, 2016
53
28:100,000; vacancy rates for nurses, lab staff, clinical officers and pharmacists range from 51% to
88%25,26. Recently the country instituted a hiring freeze for civil service because the national
budget can no longer accommodate a constantly increasing wage bill. Of the 719 functioning HF
across the country, 81% are in rural areas and are unevenly distributed forcing many people to walk
more than 10 km to access services.
Lack of access to health services is compounded by urban/rural disparities in staffing. Overall weak
HRH management systems, poor enforcement of existing pre-service training, deployment and
retention policies further compounds the poor HRH skill mix and unavailability across the country.
There has been little infrastructure investment in HF since the 1980s. The population has doubled
since then while the HIV epidemic has significantly increased service demand. Forty percent of
public HF have no regular electricity supply, only half have running water, and two thirds do not
have latrine facilities. From several surveys and SIMS visits, 68% of HF visited required increased
space for counselling and testing. Three quarters of all facilities having inadequate pharmacy
storage space for current needs. With a move toward multi-month prescribing options, increased
pharmacy storage space is critical. While the national supply chain is functional, there have been
challenges reported at facility/site level around commodity management. Although there is
adequate stock of commodities nationally, facilities have reported stock-outs of EID and RTKs
generally resulting from lack of, and poor, inventory commodity management skills. In FY 16, 11% of
facilities reported a stock-out of “Determine” kits. The stock-out of these commodities directly
affects the achievement of the 90-90-90 targets.
Laboratory systems are weak and cannot efficiently support the third “90” targets without
considerable additional investments in sample transportation systems, information systems,
commodity forecasting, equipment procurement, and improved laboratory staffing levels.
PEPFAR/Malawi has identified the following three key programmatic gaps in the care cascade that
are critical for achieving PEPFAR epidemic control targets.
Programmatic Gap #1 Low identification of HIV positives at facility and community levels and
linkage rates (testing to care/treatment).
Improving HIV testing strategies to identify specific groups of PLHIV is critical to increasing positivity
yield. Initiation of Test and Start services is expected to reduce some linkage barriers for PLHIV
however employing strategies that proactively identify PLHIV at facility and community level is
necessary to increase number PLHIV eligible for treatment.
Systems are barriers affecting achievement of overall testing goals:
Lack of private space for testing which limits acceptability of PITC and HCT and
accessibility for men; 68% of sites had inadequate space for testing;
25
EHRP evaluation report 2010 26
HRH strategic plan 20102-2016
July 1, 2016
54
Inadequate HRH to specifically focus on providing PITC at facility and at community level;
Continued stock-outs of HIV test kits at facility level in spite of sufficient national stock;
Lack of demand and health seeking behaviors for testing and services; and,
Lack of standardized guidelines, operating procedures and monitoring tools for HTS linkage interventions.
Programmatic Gap #2 High defaulter rate and Low retention rate in treatment services
Retention in the national treatment program is 78% at 12 months, and 72% at 24 months. High rates
of loss to follow-up will hinder capacity to accelerate new and current on treatment and reach viral
suppression targets.
Systems barriers affecting retention rates:
Inadequate space for providing optimal care and treatment services (consultation rooms,
waiting areas, pharmacy space and space for physical integration of services); 58% of
facilities had grossly inadequate space for ART delivery and 77% facilities had inadequate
commodity storage space;
Inadequate HRH to provide ART services through any given working day. Most facilities
operate special ART clinic days or provide ART services for only half the day as a way of
rationing staff time for service provision which affects service quality in cases of high patient
volumes;
Poor quality of ART services, affecting individual efficacy for treatment retention (long wait
times, long distances to facilities, lack of alternative models of care to reach communities or
decongest facilities, inadequate psychosocial counselling, limited recognition of treatment
failure (1%) of patients on second-line treatment);
Weak community support and linkage systems at community level; and,
Lack of a robust national pharmaco-vigilance system.
Programmatic Gap #3: Low coverage of Viral Load (27%) and EID testing (30% at 2 months, 48% at
12 months)
Viral Load testing coverage is 27% of ART patients; coverage of EID is 30% at 2 months and 48% at 12
months. Scale-up of VL is necessary to improve quality of care, recognition of treatment failure, and
improve retention of patients in treatment. Low coverage of EID suggests that a high proportion of
HIV-exposed infants are not receiving the care they need to prevent transmission of HIV; this is a lost
opportunity to identify HIV positive children and initiate them on treatment.
Systems barriers affecting VL and EID testing:
• Shortage of lab sample kits;
• Lack of adherence to SOPs for documentation;
• Limited coverage of sample transport network; and,
• Limited demand for VL testing.
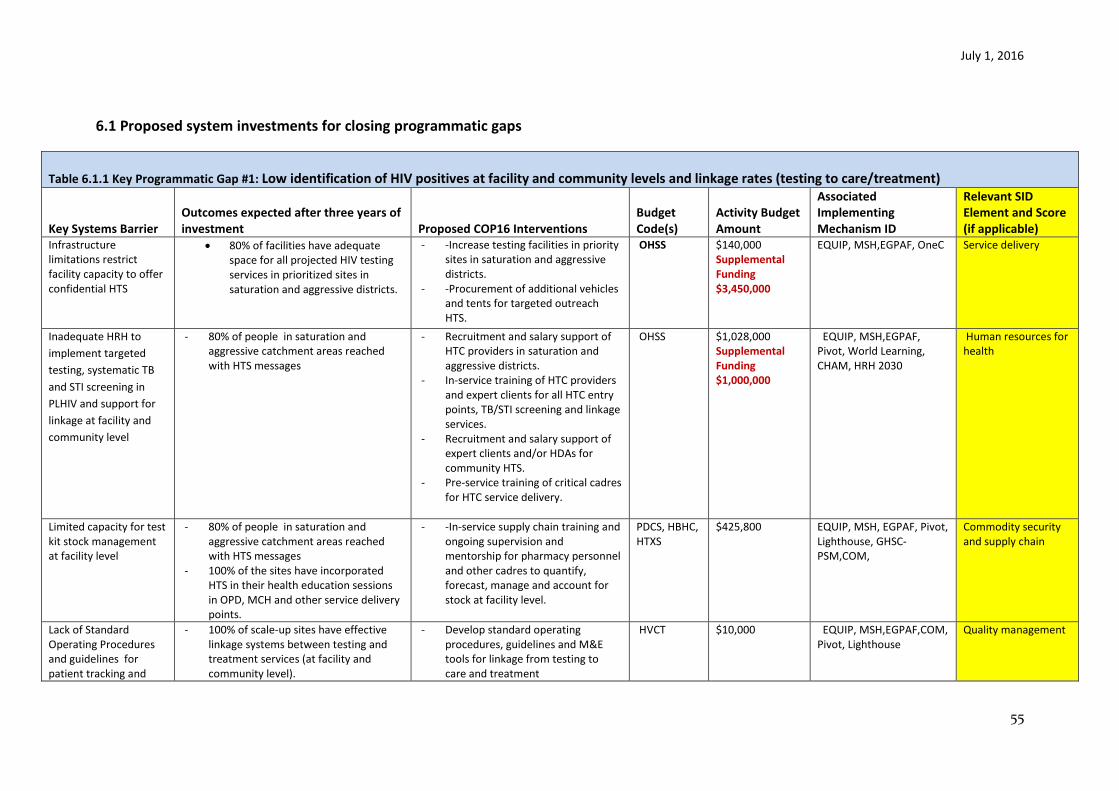
July 1, 2016
55
6.1 Proposed system investments for closing programmatic gaps
Table 6.1.1 Key Programmatic Gap #1: Low identification of HIV positives at facility and community levels and linkage rates (testing to care/treatment)
Key Systems Barrier
Outcomes expected after three years of investment Proposed COP16 Interventions
Budget Code(s)
Activity Budget Amount
Associated Implementing Mechanism ID
Relevant SID Element and Score (if applicable)
Infrastructure limitations restrict facility capacity to offer confidential HTS
80% of facilities have adequate space for all projected HIV testing services in prioritized sites in saturation and aggressive districts.
- -Increase testing facilities in priority sites in saturation and aggressive districts.
- -Procurement of additional vehicles and tents for targeted outreach HTS.
OHSS $140,000 Supplemental Funding $3,450,000
EQUIP, MSH,EGPAF, OneC Service delivery
Inadequate HRH to
implement targeted
testing, systematic TB
and STI screening in
PLHIV and support for
linkage at facility and
community level
- 80% of people in saturation and aggressive catchment areas reached with HTS messages
- Recruitment and salary support of HTC providers in saturation and aggressive districts.
- In-service training of HTC providers and expert clients for all HTC entry points, TB/STI screening and linkage services.
- Recruitment and salary support of expert clients and/or HDAs for community HTS.
- Pre-service training of critical cadres for HTC service delivery.
OHSS $1,028,000 Supplemental Funding $1,000,000
EQUIP, MSH,EGPAF, Pivot, World Learning, CHAM, HRH 2030
Human resources for health
Limited capacity for test kit stock management at facility level
- 80% of people in saturation and aggressive catchment areas reached with HTS messages
- 100% of the sites have incorporated HTS in their health education sessions in OPD, MCH and other service delivery points.
- -In-service supply chain training and ongoing supervision and mentorship for pharmacy personnel and other cadres to quantify, forecast, manage and account for stock at facility level.
PDCS, HBHC, HTXS
$425,800 EQUIP, MSH, EGPAF, Pivot, Lighthouse, GHSC-PSM,COM,
Commodity security and supply chain
Lack of Standard Operating Procedures and guidelines for patient tracking and
- 100% of scale-up sites have effective linkage systems between testing and treatment services (at facility and community level).
- Develop standard operating procedures, guidelines and M&E tools for linkage from testing to care and treatment
HVCT $10,000 EQUIP, MSH,EGPAF,COM, Pivot, Lighthouse
Quality management
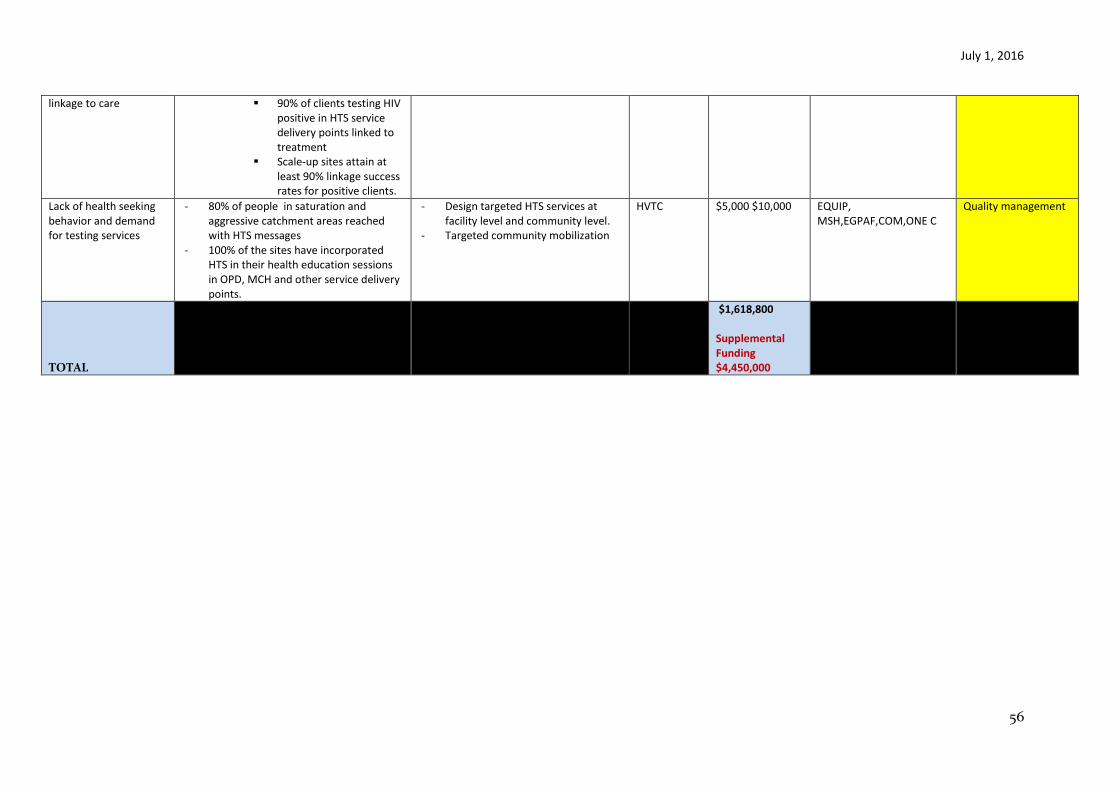
July 1, 2016
56
linkage to care 90% of clients testing HIV positive in HTS service delivery points linked to treatment
Scale-up sites attain at least 90% linkage success rates for positive clients.
Lack of health seeking behavior and demand for testing services
- 80% of people in saturation and aggressive catchment areas reached with HTS messages
- 100% of the sites have incorporated HTS in their health education sessions in OPD, MCH and other service delivery points.
- Design targeted HTS services at facility level and community level.
- Targeted community mobilization
HVTC $5,000 $10,000 EQUIP, MSH,EGPAF,COM,ONE C
Quality management
TOTAL
$1,618,800 Supplemental Funding $4,450,000
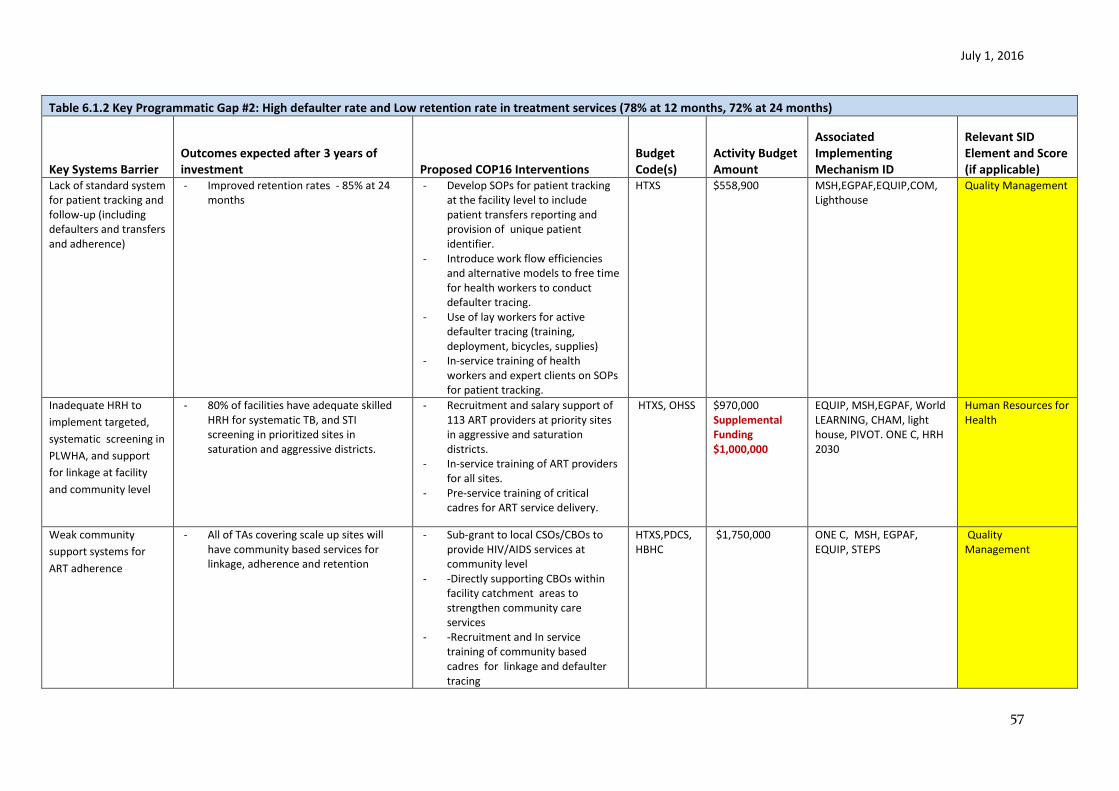
July 1, 2016
57
Table 6.1.2 Key Programmatic Gap #2: High defaulter rate and Low retention rate in treatment services (78% at 12 months, 72% at 24 months)
Key Systems Barrier Outcomes expected after 3 years of investment Proposed COP16 Interventions
Budget Code(s)
Activity Budget Amount
Associated Implementing Mechanism ID
Relevant SID Element and Score (if applicable)
Lack of standard system for patient tracking and follow-up (including defaulters and transfers and adherence)
- Improved retention rates - 85% at 24 months
- Develop SOPs for patient tracking at the facility level to include patient transfers reporting and provision of unique patient identifier.
- Introduce work flow efficiencies and alternative models to free time for health workers to conduct defaulter tracing.
- Use of lay workers for active defaulter tracing (training, deployment, bicycles, supplies)
- In-service training of health workers and expert clients on SOPs for patient tracking.
HTXS $558,900 MSH,EGPAF,EQUIP,COM, Lighthouse
Quality Management
Inadequate HRH to
implement targeted,
systematic screening in
PLWHA, and support
for linkage at facility
and community level
- 80% of facilities have adequate skilled HRH for systematic TB, and STI screening in prioritized sites in saturation and aggressive districts.
- Recruitment and salary support of 113 ART providers at priority sites in aggressive and saturation districts.
- In-service training of ART providers for all sites.
- Pre-service training of critical cadres for ART service delivery.
HTXS, OHSS $970,000 Supplemental Funding $1,000,000
EQUIP, MSH,EGPAF, World LEARNING, CHAM, light house, PIVOT. ONE C, HRH 2030
Human Resources for Health
Weak community
support systems for
ART adherence
- All of TAs covering scale up sites will have community based services for linkage, adherence and retention
- Sub-grant to local CSOs/CBOs to provide HIV/AIDS services at community level
- -Directly supporting CBOs within facility catchment areas to strengthen community care services
- -Recruitment and In service training of community based cadres for linkage and defaulter tracing
HTXS,PDCS,HBHC
$1,750,000 ONE C, MSH, EGPAF, EQUIP, STEPS
Quality Management
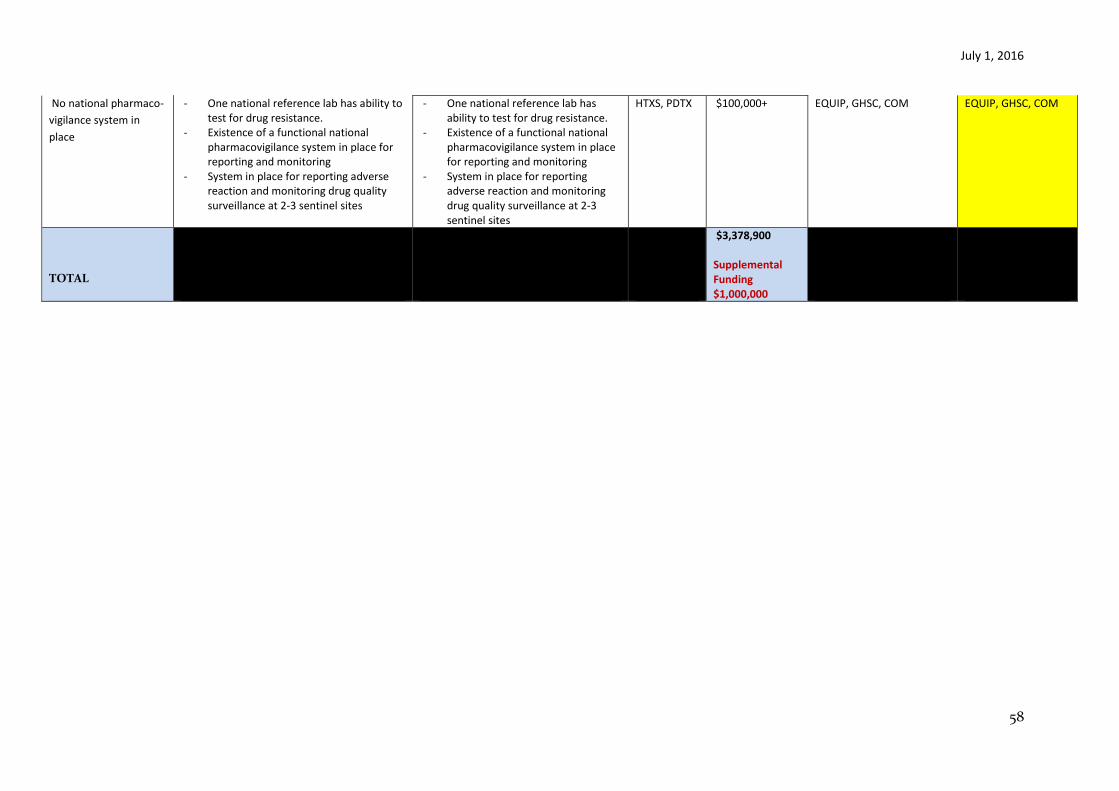
July 1, 2016
58
No national pharmaco-
vigilance system in
place
- One national reference lab has ability to test for drug resistance.
- Existence of a functional national pharmacovigilance system in place for reporting and monitoring
- System in place for reporting adverse reaction and monitoring drug quality surveillance at 2-3 sentinel sites
- One national reference lab has ability to test for drug resistance.
- Existence of a functional national pharmacovigilance system in place for reporting and monitoring
- System in place for reporting adverse reaction and monitoring drug quality surveillance at 2-3 sentinel sites
HTXS, PDTX $100,000+ EQUIP, GHSC, COM EQUIP, GHSC, COM
TOTAL
$3,378,900 Supplemental Funding $1,000,000

July 1, 2016
59
Table 6.1.3 Key Programmatic Gap #3: Low coverage of viral load (27%) and EID testing (30% at 2 months 48% at 12 months)
Key Systems Barrier Outcomes expected after three years of
investment Proposed COP/ROP16 Budget Code(s)
Activity Budget Amount
Associated Implementing Mechanism ID
Relevant SID Element and
Score (if applicable)
Inadequate skilled HCWs at facility level to conduct quality VL sample collection and at lab to efficiently run VL tests
- 80% of facilities in prioritized sites in saturation and aggressive districts and 100% of labs have adequate skilled HRH for quality EID and VL services.
- Turnaround time for results reporting decreased by 50%.
- In-service training of HSAs, HDAs and other clinical cadres on quality and safe VL sample collection.
- In-service training of laboratory technicians/technologists on molecular testing to allow efficient rotation of staff and reporting of results.
HTXS $73,500 MSH, EGAPF, URC, EQUIP Human Resources for Health, Laboratory, Quality management
Weak supply chain management at facility and district levels leading to stock-outs of DBS bundles
- Reduced stock-outs of DBS bundles at facility level to less than 5%.
- Develop curriculum for stock
management training for health
workers and support roll-out of
training on lab commodity
management SOPs.
HLAB $195,000 GHCS Commodity Security and supply chain
- In-service training of pharmacy and
lab personnel, HDAs, HSAs in DBS
bundle stock management.
HTXS See above MSH, EGPAF, EQUIP, GHSC Quality management, Commodity Security and supply chain
Poor adherence to VL SOPs and documentation of VL and EID results contributing to limited data availability for improved patient tracking and care
- 80% of eligible ART patients receiving VL testing and results.
- Increased coverage of EID to 90% of exposed infants by 8 weeks.
- In-service training of ART providers
on VL SOPs.
HTXS See trainings above
MSH, EGPAF, EQUIP, URC Quality management
- Develop M&E tools and accountability systems for tracking number of eligible clients for VL against number of VL test done.
- Development and distribution of SOPs, algorithms
PDCS,HTXS,MTCT, HLAB
$78,000 EQUIP, COM, URC, MSF, EGPAF
Service Delivery; Quality management
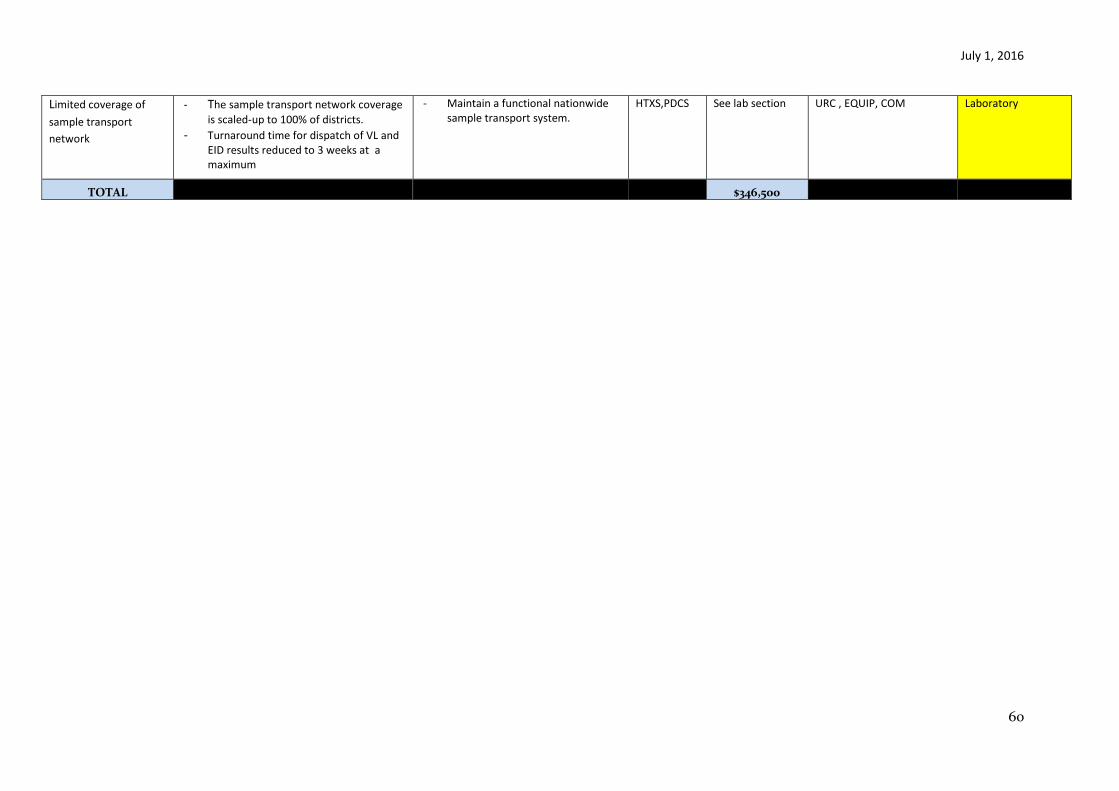
July 1, 2016
60
Limited coverage of
sample transport
network
- The sample transport network coverage
is scaled-up to 100% of districts.
- Turnaround time for dispatch of VL and EID results reduced to 3 weeks at a maximum
- Maintain a functional nationwide sample transport system.
HTXS,PDCS See lab section URC , EQUIP, COM Laboratory
TOTAL
$346,500

July 1, 2016
61
6.2 Critical Systems Investments for Achieving Priority Policies
Table 6.2.1 Test and Start
Key Systems Barrier Outcomes expected after three years of investment Proposed COP16
Budget Code(s)
Activity Budget Amount
Associated Implementing Mechanism ID
Relevant SID Element and Score (if applicable)
Limited GOM capacity for evidence-based management of drug and commodity procurement and supply chain
- 90% of priority sites submit monthly LMIS report (including HIV/ AIDS and related commodities
- 100% of pharmacy personnel trained in inventory management, drug requisition and reporting
- Strengthen utility of LMIS for commodity procurement and supply and roll out of eLMIS.
- Support deployment of eLMIS. - Train health facility staff on use
of LIMS and LMIS data. - Expand EMRS coverage. - In-service training of pharmacy
on data use, stock management and accountability.
OHSS $2,890,666 GHSC, Baobab, URC
Commodity Security and supply chain
Inadequate HCWs to meet the increased patient volume as treatment coverage rises
- 80% of facilities in prioritized sites in saturation and aggressive districts have adequate trained ART providers for their volume of patients.
- 100% of ART providers retrained to offer HIV treatment according to Test and Start.
- Recruitment of additional ART providers, HTC providers and pharmacy personnel health care workers in three “fast track” districts to meet demand.
- Implement differentiated care models such as 3 monthly fast-track drug refill with 6 monthly clinic visits for stable patients
$2,000,000 TBD, HRH 2030 Human Resources for Health
Limited GOM capacity for evidence based management of
- All PEPFAR prioritized Health information systems strengthened and generated data analyzed for
- Providing TA to Department of HIV/AIDS for Strategic information and logistics management
OHSS $430,000 I-TECH Epidemiological and Health data
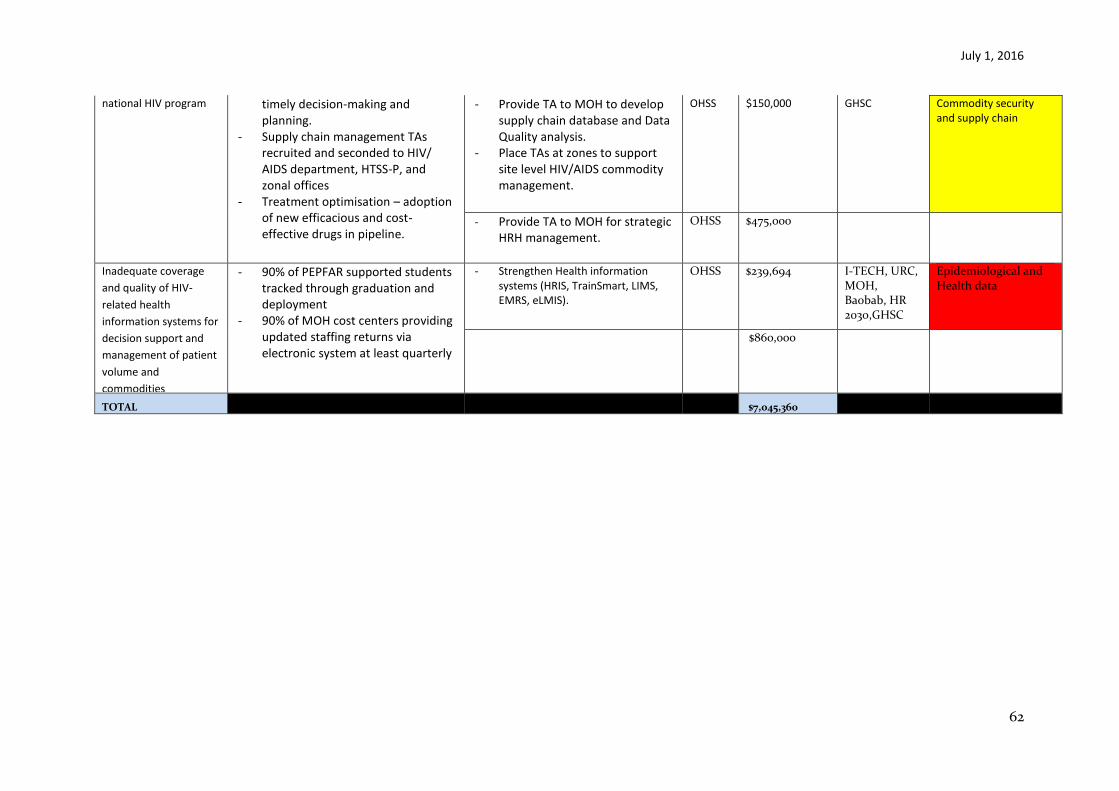
July 1, 2016
62
national HIV program
timely decision-making and planning.
- Supply chain management TAs recruited and seconded to HIV/ AIDS department, HTSS-P, and zonal offices
- Treatment optimisation – adoption of new efficacious and cost-effective drugs in pipeline.
- Provide TA to MOH to develop supply chain database and Data Quality analysis.
- Place TAs at zones to support site level HIV/AIDS commodity management.
OHSS $150,000 GHSC Commodity security and supply chain
- Provide TA to MOH for strategic HRH management.
OHSS $475,000
Inadequate coverage
and quality of HIV-
related health
information systems for
decision support and
management of patient
volume and
commodities
- 90% of PEPFAR supported students tracked through graduation and deployment
- 90% of MOH cost centers providing updated staffing returns via electronic system at least quarterly
- Strengthen Health information systems (HRIS, TrainSmart, LIMS, EMRS, eLMIS).
OHSS $239,694 I-TECH, URC, MOH, Baobab, HR 2030,GHSC
Epidemiological and Health data
$860,000
TOTAL $7,045,360
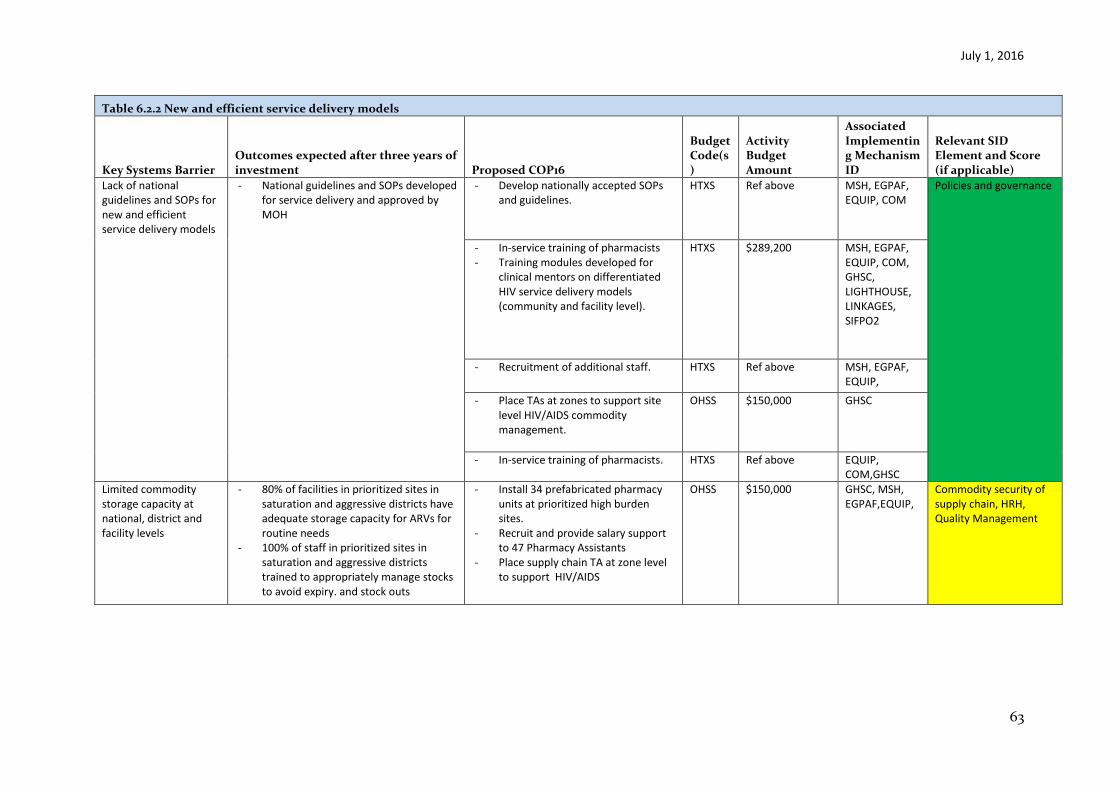
July 1, 2016
63
Table 6.2.2 New and efficient service delivery models
Key Systems Barrier Outcomes expected after three years of investment Proposed COP16
Budget Code(s)
Activity Budget Amount
Associated Implementing Mechanism ID
Relevant SID Element and Score (if applicable)
Lack of national guidelines and SOPs for new and efficient service delivery models
- National guidelines and SOPs developed for service delivery and approved by MOH
- Develop nationally accepted SOPs and guidelines.
HTXS Ref above MSH, EGPAF, EQUIP, COM
Policies and governance
- In-service training of pharmacists - Training modules developed for
clinical mentors on differentiated HIV service delivery models (community and facility level).
HTXS $289,200 MSH, EGPAF, EQUIP, COM, GHSC, LIGHTHOUSE, LINKAGES, SIFPO2
- Recruitment of additional staff. HTXS Ref above MSH, EGPAF, EQUIP, COM,GHSC - Place TAs at zones to support site
level HIV/AIDS commodity management.
OHSS $150,000 GHSC
- In-service training of pharmacists. HTXS Ref above EQUIP, COM,GHSC
Limited commodity storage capacity at national, district and facility levels
- 80% of facilities in prioritized sites in saturation and aggressive districts have adequate storage capacity for ARVs for routine needs
- 100% of staff in prioritized sites in saturation and aggressive districts trained to appropriately manage stocks to avoid expiry. and stock outs
- Install 34 prefabricated pharmacy units at prioritized high burden sites.
- Recruit and provide salary support to 47 Pharmacy Assistants
- Place supply chain TA at zone level to support HIV/AIDS
OHSS $150,000 GHSC, MSH, EGPAF,EQUIP,
Commodity security of supply chain, HRH, Quality Management
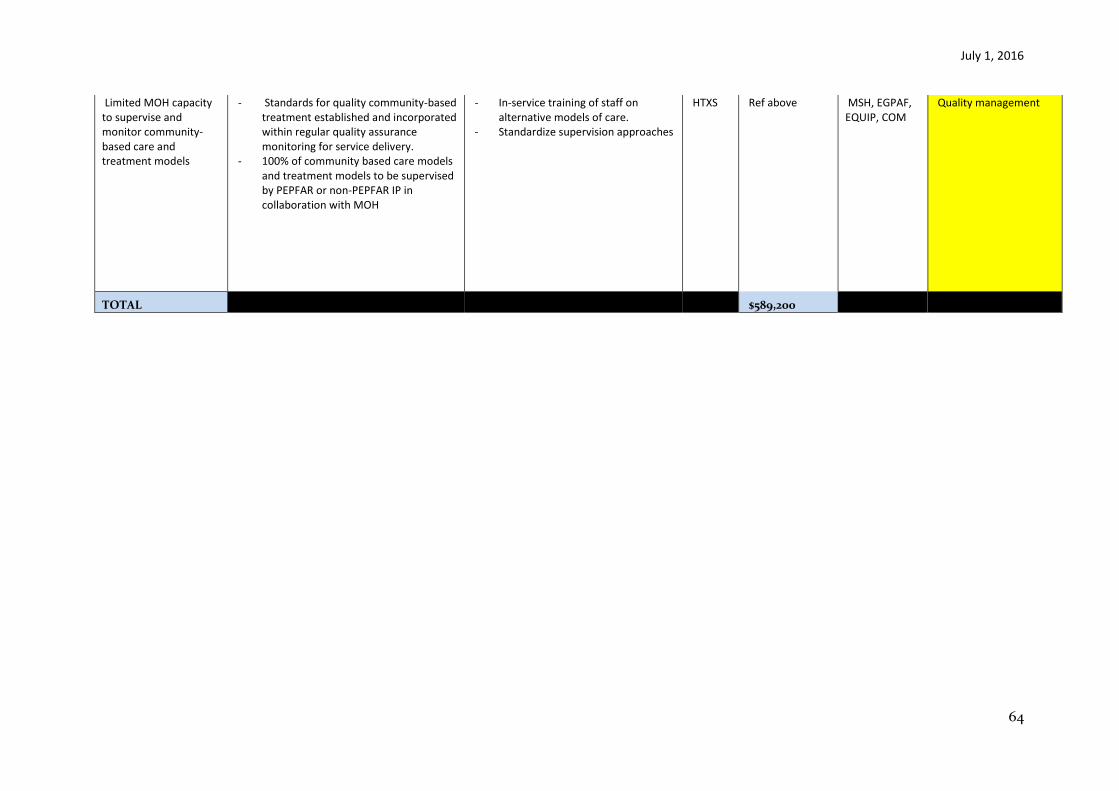
July 1, 2016
64
Limited MOH capacity to supervise and monitor community-based care and treatment models
- Standards for quality community-based treatment established and incorporated within regular quality assurance monitoring for service delivery.
- 100% of community based care models and treatment models to be supervised by PEPFAR or non-PEPFAR IP in collaboration with MOH
- In-service training of staff on alternative models of care.
- Standardize supervision approaches
HTXS
Ref above
MSH, EGPAF, EQUIP, COM
Quality management
TOTAL $589,200
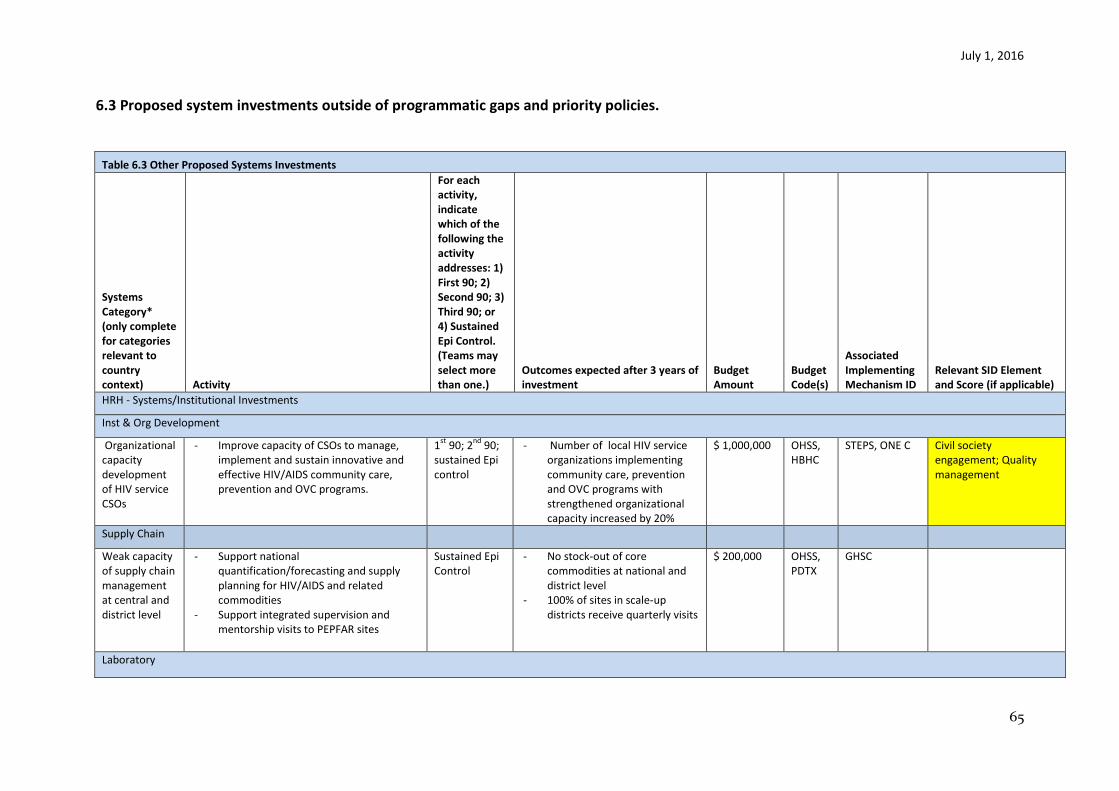
July 1, 2016
65
6.3 Proposed system investments outside of programmatic gaps and priority policies.
Table 6.3 Other Proposed Systems Investments
Systems Category* (only complete for categories relevant to country context) Activity
For each activity, indicate which of the following the activity addresses: 1) First 90; 2) Second 90; 3) Third 90; or 4) Sustained Epi Control. (Teams may select more than one.)
Outcomes expected after 3 years of investment
Budget Amount
Budget Code(s)
Associated Implementing Mechanism ID
Relevant SID Element and Score (if applicable)
HRH - Systems/Institutional Investments
Inst & Org Development
Organizational capacity development of HIV service CSOs
- Improve capacity of CSOs to manage, implement and sustain innovative and effective HIV/AIDS community care, prevention and OVC programs.
1st
90; 2nd
90; sustained Epi control
- Number of local HIV service organizations implementing community care, prevention and OVC programs with strengthened organizational capacity increased by 20%
$ 1,000,000 OHSS, HBHC
STEPS, ONE C Civil society engagement; Quality management
Supply Chain
Weak capacity of supply chain management at central and district level
- Support national quantification/forecasting and supply planning for HIV/AIDS and related commodities
- Support integrated supervision and mentorship visits to PEPFAR sites
Sustained Epi Control
- No stock-out of core commodities at national and district level
- 100% of sites in scale-up districts receive quarterly visits
$ 200,000 OHSS, PDTX
GHSC
Laboratory

July 1, 2016
66
Sample transportation
- Maintain national coverage of motorcycle based sample transportation system
1st
90 (EID) and 3
rd 90
(viral load)
- Sample Transport offered at least weekly to all ART and PMTCT sites in the country
$1,500,000 HTXS, PDCS
URC 10. Laboratory
Laboratory renovations
- Renovate laboratories in “saturation and aggressive” districts
2nd
90 At least one laboratory able to provide drug resistance testing to all saturation and aggressive districts
$750,000 HLAB URC 10. Laboratory
Laboratory strengthening
- Laboratory information system 3rd
90 All (10) labs connected to central LIMS data system Targeted scale up from 1-7 labs for comprehensive internal LIMS system
$135,000 HLAB, HTXS
Baobab Epi and health data
Strategic Information
Strengthening M&E tools
- Strengthen data collection, monitoring and evaluation nationally
1st
, 2nd
and 3rd
90; Sustained Epi control
High quality data originating at site level and disseminated through the reporting chain.
$100,000 HTXS MSH, EGPAF, EQUIP, COM
Epi and health data
Operational Research
- Utilize OR methods to explore barriers and successes to achieving the three 90s
2nd
90, 3rd
90 Understanding of barriers and development of interventions to reach the 2
nd & 3
rd 90s.
$100,000 MSH, EGPAF, EQUIP, COM
Epi and health data
Surveillance and operational Research
- Surveillance and operational Research 1st
, 2nd
and 3rd
90
Evidence based interventions. $1,400,000 HVSI Surveillance Award
Surveillance and Operational Research
Health Information Systems Strengthening
- Civil Registration Vital Statistics Sustained Epi control
CRVS maintenance plan from 4 to 28 Districts
$400,000 HTXS National Registration Bureau
Epi and health data
TOTAL $5,585,000
*Reference Appendix C for a list of activity types that fit in each category.
July 1, 2016
67
7.0 Staffing Plan
Summary:
The interagency PEPFAR staffing pattern has grown and shifted to better reflect skill sets and adapt to the demands of PEPFAR 3.0. By early FY 17, the team will be better positioned to provide quality TA and project/activity oversight with enhanced capacity for data analysis
There has been significant growth in size and complexity of the CDC program as a result of increased PEPFAR funds, new initiatives, increased data processes and shifting interventions. CDC conducted a staffing review and determined an appropriate size and mix for staffing. Following the review, the staffing footprint increased in COP15 with the addition of seven technical staff (two USDH and five LES) to 41 employees. The consolidation of CDC and Embassy Motorpool has resulted in four fewer drivers to 37 employees in COP16. CDC does not propose any new positions for COP16.
USAID anticipates a full staff complement on board before the beginning of FY17 Once fully trained, this team, expanded through COP14 and 15, will be better positioned to meet the increased demands for data analysis, partner management, stakeholder engagement, and quality control. USAID proposes two new positions for COP16, detailed below.
Explain Long-term Vacant Positions:
CDC
Of seven vacant positions at CDC, (six LES and one USDH) six positions (five LES and one USDH) were approved in COP15. The hiring processes for one of the seven vacant positions (LES Key Populations) is in the advanced stage of recruitment; two of the LES positions will be filled by contractors (Epi and Stats), two are in the selection process (Lab-LES and Deputy of Programs-DH) and the remaining two LES positions (HIV/TB and Asset Mgmt) are being classified by State Department/Africa Bureau and are likely to be filled by end of June 2016.
The position of Epidemiologist-LES has been vacant for over two years. It has, been decided that this position will be filled by one of the two Contractor positions mentioned above. In addition, CDC had a USDH Epidemiologist included in COP 15; this position is now filled.
The position of Statistician-LES has also not been filled because the local labor market does not offer a large enough pool of qualified personnel). CDC has planned to use the second Contractor for this position in COP16.
USAID

July 1, 2016
68
USAID is in the final stages of recruitment for the Quality Assurance/Quality Improvement Adviser that will provide technical support to the treatment and clinical services activities. This position, initially approved in COP 14, was previously advertised as a FSN position and reclassified in COP 15 as a third country national position when the recruitment process did not yield any acceptable candidates. Interviews have been conducted and final selections are being made for the following positions added in COP 15: pediatric specialist, monitoring and evaluation specialists (4).
3) Justify Proposed New Positions:
CDC has no new positions in COP16.
USAID proposes two new positions in COP16: DREAMS Manager, approved in the DREAMS proposal to support national- and district-level coordination of DREAMS activities and partner management. This position is DREAMS funded during FY16. Approval is sought in COP16 to add this position with possibility of requesting funding to continue this position FY17. Due to space constraints, USAID does not have capacity to add any future new staff positions..
The second position is a Strategic Information Adviser for the PEPFAR Coordination Office. This individual will report directly to the PEPFAR Coordinator, but USAID will manage the hiring mechanism. This individual will also take on some Deputy PEPFAR Coordinator responsibilities in the absence of the PEPFAR Coordinator. This profile is necessary to enhance coordination of strategic information activities including data collection, analysis and reporting.
Peace Corps has no new positions.
Explain major changes to CODB:
USG Staff Salaries and Benefits (Both Local and International hires): This increase is due to the fact that in COP15 New Positions were requested with nil budgets to avoid pipeline build-up due to approval and time lags in recruitment. Vacancies are now being budgeted in COP16.
USAID’s budget for staff salaries has decreased due to reclassification of some benefits under other cost categories and availability of some pipeline due to longer than expected recruitment processes.
Computers IT: USAID experienced increases in IT cost recovery leading to a relative increase in this budget line in COP16.
ICASS: Consolidation of State and ASP ICASS costs led to a higher ICASS budget for USAID in COP16.
Capital Security Cost Sharing: Increases due to increased rate and net increases in Desk Positions. This is a cost outside Management control.
US Government renovations: Office renovation costs are not going to recur in COP16
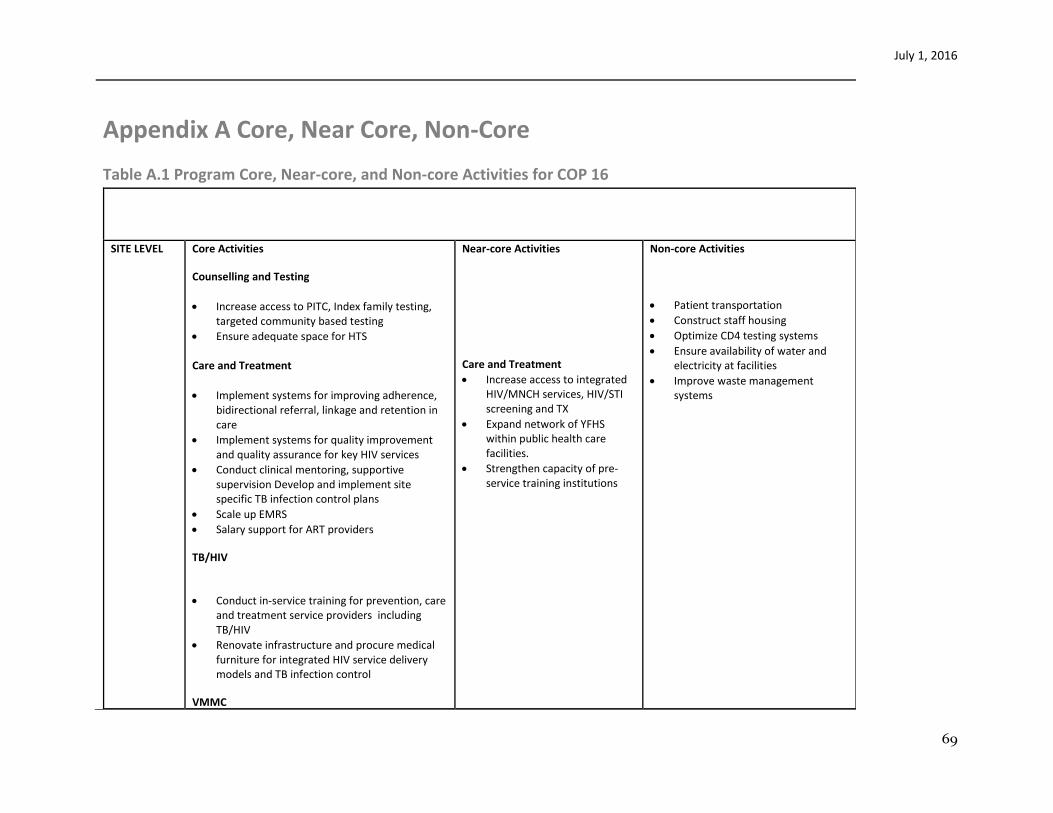
July 1, 2016
69
Appendix A Core, Near Core, Non-Core
Table A.1 Program Core, Near-core, and Non-core Activities for COP 16
SITE LEVEL Core Activities
Counselling and Testing
Increase access to PITC, Index family testing, targeted community based testing
Ensure adequate space for HTS
Care and Treatment
Implement systems for improving adherence, bidirectional referral, linkage and retention in care
Implement systems for quality improvement and quality assurance for key HIV services
Conduct clinical mentoring, supportive supervision Develop and implement site specific TB infection control plans
Scale up EMRS
Salary support for ART providers
TB/HIV
Conduct in-service training for prevention, care and treatment service providers including TB/HIV
Renovate infrastructure and procure medical furniture for integrated HIV service delivery models and TB infection control
VMMC
Near-core Activities
Care and Treatment
Increase access to integrated HIV/MNCH services, HIV/STI screening and TX
Expand network of YFHS within public health care facilities.
Strengthen capacity of pre-service training institutions
Non-core Activities
Patient transportation
Construct staff housing
Optimize CD4 testing systems
Ensure availability of water and electricity at facilities
Improve waste management systems
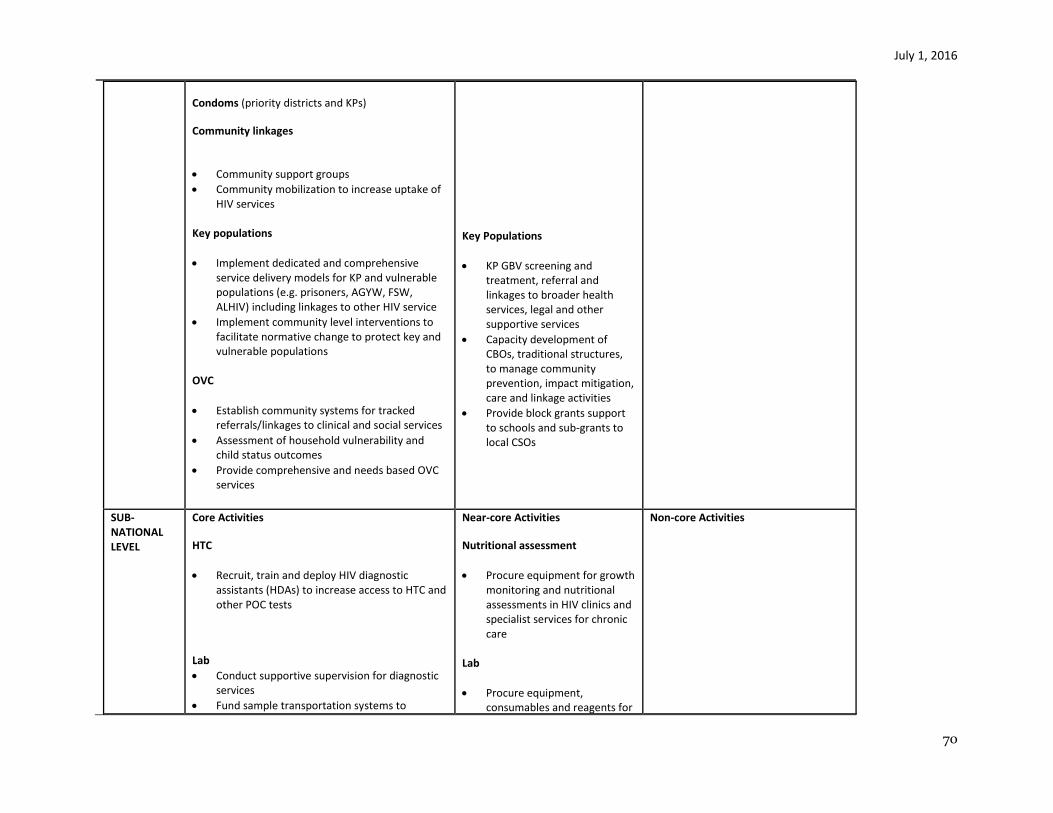
July 1, 2016
70
Condoms (priority districts and KPs)
Community linkages
Community support groups
Community mobilization to increase uptake of HIV services
Key populations
Implement dedicated and comprehensive service delivery models for KP and vulnerable populations (e.g. prisoners, AGYW, FSW, ALHIV) including linkages to other HIV service
Implement community level interventions to facilitate normative change to protect key and vulnerable populations
OVC
Establish community systems for tracked referrals/linkages to clinical and social services
Assessment of household vulnerability and child status outcomes
Provide comprehensive and needs based OVC services
Key Populations
KP GBV screening and treatment, referral and linkages to broader health services, legal and other supportive services
Capacity development of CBOs, traditional structures, to manage community prevention, impact mitigation, care and linkage activities
Provide block grants support to schools and sub-grants to local CSOs
SUB-NATIONAL LEVEL
Core Activities
HTC
Recruit, train and deploy HIV diagnostic assistants (HDAs) to increase access to HTC and other POC tests
Lab
Conduct supportive supervision for diagnostic services
Fund sample transportation systems to
Near-core Activities
Nutritional assessment
Procure equipment for growth monitoring and nutritional assessments in HIV clinics and specialist services for chronic care
Lab
Procure equipment, consumables and reagents for
Non-core Activities
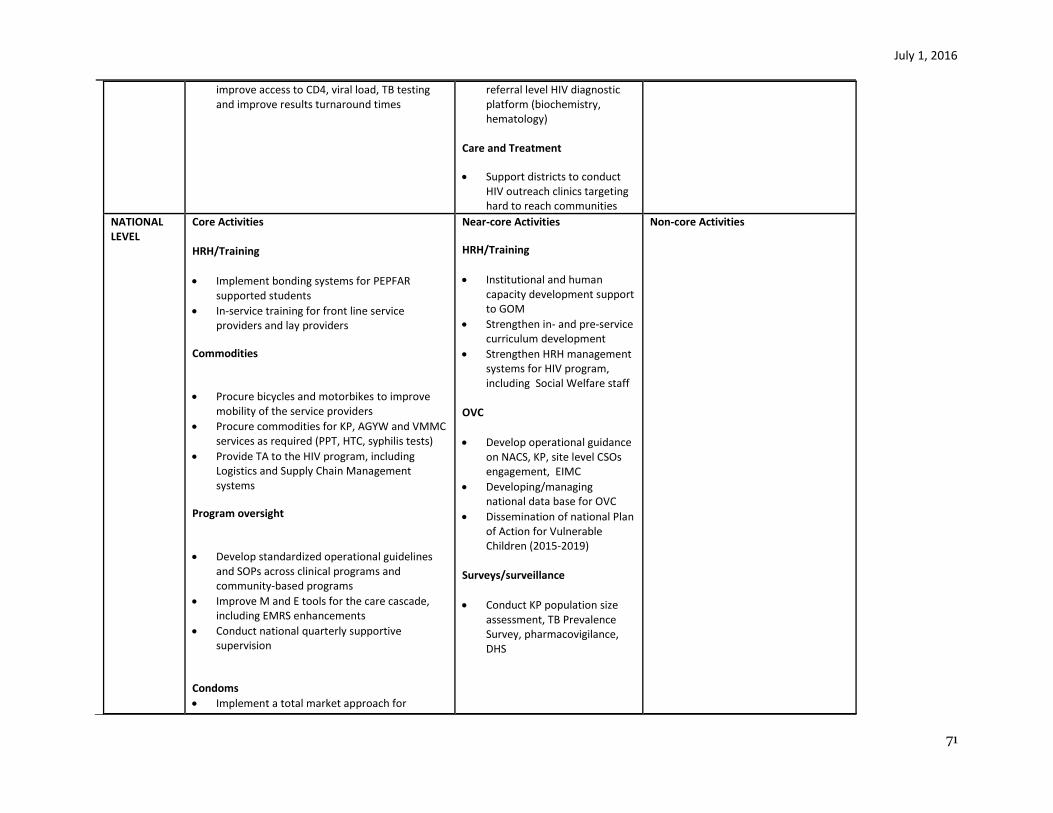
July 1, 2016
71
improve access to CD4, viral load, TB testing and improve results turnaround times
referral level HIV diagnostic platform (biochemistry, hematology)
Care and Treatment
Support districts to conduct HIV outreach clinics targeting hard to reach communities
NATIONAL LEVEL
Core Activities HRH/Training
Implement bonding systems for PEPFAR supported students
In-service training for front line service providers and lay providers
Commodities
Procure bicycles and motorbikes to improve mobility of the service providers
Procure commodities for KP, AGYW and VMMC services as required (PPT, HTC, syphilis tests)
Provide TA to the HIV program, including Logistics and Supply Chain Management systems
Program oversight
Develop standardized operational guidelines and SOPs across clinical programs and community-based programs
Improve M and E tools for the care cascade, including EMRS enhancements
Conduct national quarterly supportive supervision
Condoms
Implement a total market approach for
Near-core Activities
HRH/Training
Institutional and human capacity development support to GOM
Strengthen in- and pre-service curriculum development
Strengthen HRH management systems for HIV program, including Social Welfare staff
OVC
Develop operational guidance on NACS, KP, site level CSOs engagement, EIMC
Developing/managing national data base for OVC
Dissemination of national Plan of Action for Vulnerable Children (2015-2019)
Surveys/surveillance
Conduct KP population size assessment, TB Prevalence Survey, pharmacovigilance, DHS
Non-core Activities
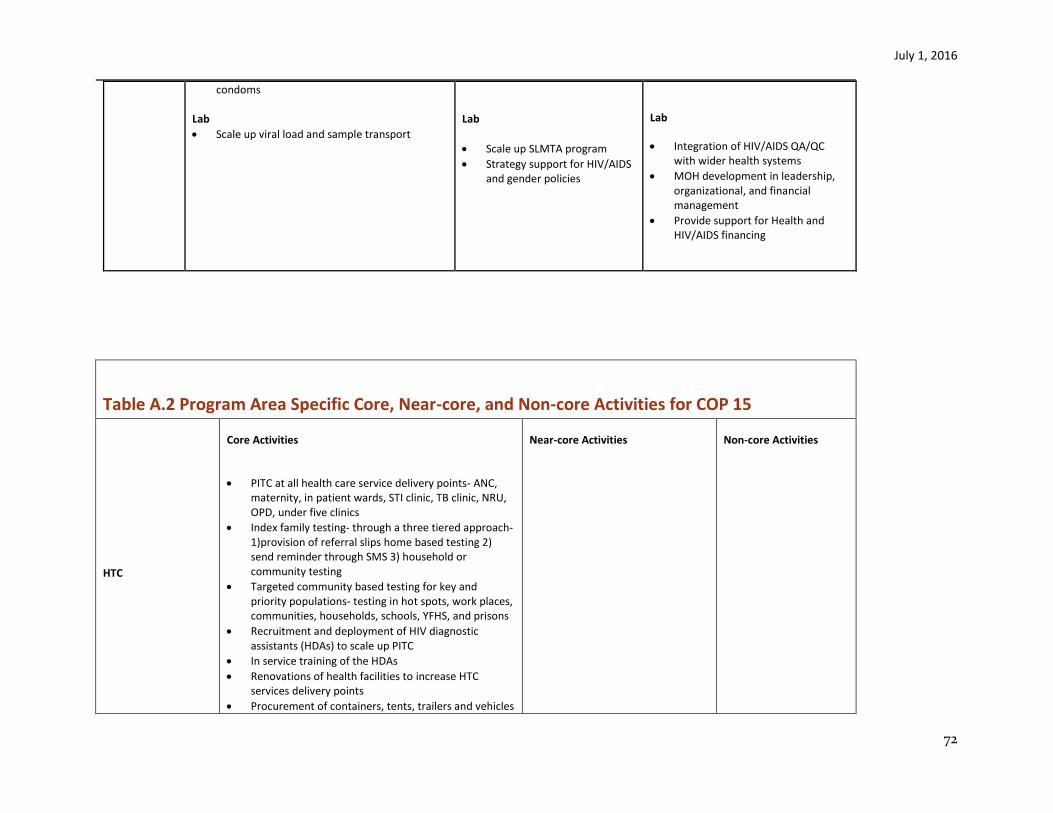
July 1, 2016
72
condoms Lab
Scale up viral load and sample transport
Lab
Scale up SLMTA program
Strategy support for HIV/AIDS and gender policies
Lab
Integration of HIV/AIDS QA/QC with wider health systems
MOH development in leadership, organizational, and financial management
Provide support for Health and HIV/AIDS financing
Table A.2 Program Area Specific Core, Near-core, and Non-core Activities for COP 15
HTC
Core Activities
PITC at all health care service delivery points- ANC, maternity, in patient wards, STI clinic, TB clinic, NRU, OPD, under five clinics
Index family testing- through a three tiered approach-1)provision of referral slips home based testing 2) send reminder through SMS 3) household or community testing
Targeted community based testing for key and priority populations- testing in hot spots, work places, communities, households, schools, YFHS, and prisons
Recruitment and deployment of HIV diagnostic assistants (HDAs) to scale up PITC
In service training of the HDAs
Renovations of health facilities to increase HTC services delivery points
Procurement of containers, tents, trailers and vehicles
Near-core Activities Non-core Activities
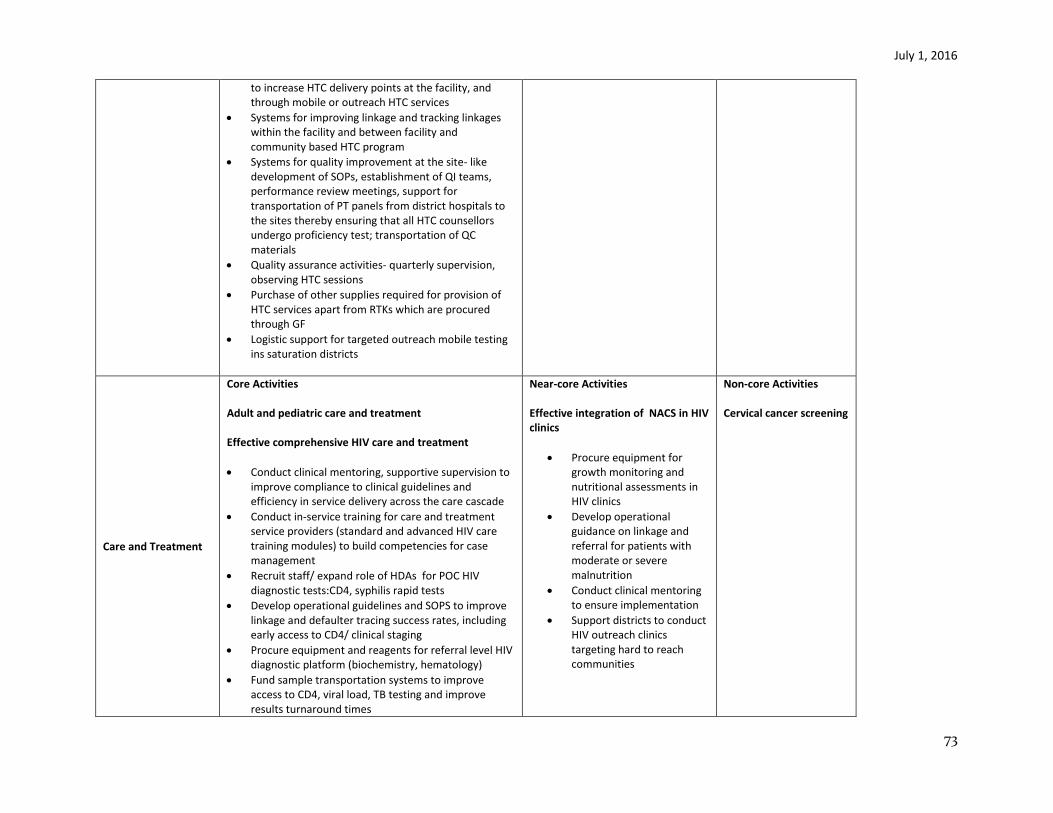
July 1, 2016
73
to increase HTC delivery points at the facility, and through mobile or outreach HTC services
Systems for improving linkage and tracking linkages within the facility and between facility and community based HTC program
Systems for quality improvement at the site- like development of SOPs, establishment of QI teams, performance review meetings, support for transportation of PT panels from district hospitals to the sites thereby ensuring that all HTC counsellors undergo proficiency test; transportation of QC materials
Quality assurance activities- quarterly supervision, observing HTC sessions
Purchase of other supplies required for provision of HTC services apart from RTKs which are procured through GF
Logistic support for targeted outreach mobile testing ins saturation districts
Care and Treatment
Core Activities Adult and pediatric care and treatment Effective comprehensive HIV care and treatment
Conduct clinical mentoring, supportive supervision to improve compliance to clinical guidelines and efficiency in service delivery across the care cascade
Conduct in-service training for care and treatment service providers (standard and advanced HIV care training modules) to build competencies for case management
Recruit staff/ expand role of HDAs for POC HIV diagnostic tests:CD4, syphilis rapid tests
Develop operational guidelines and SOPS to improve linkage and defaulter tracing success rates, including early access to CD4/ clinical staging
Procure equipment and reagents for referral level HIV diagnostic platform (biochemistry, hematology)
Fund sample transportation systems to improve access to CD4, viral load, TB testing and improve results turnaround times
Near-core Activities Effective integration of NACS in HIV clinics
Procure equipment for growth monitoring and nutritional assessments in HIV clinics
Develop operational guidance on linkage and referral for patients with moderate or severe malnutrition
Conduct clinical mentoring to ensure implementation
Support districts to conduct HIV outreach clinics targeting hard to reach communities
Non-core Activities Cervical cancer screening

July 1, 2016
74
Conduct supportive supervision to improve the quality of sample collection and specimen integrity for CD4, VL, TB
Effective linkage and retention
Provide technical assistance to adapt site level SOPS to strengthen linkage and retention systems of consenting PLHIV to age-appropriate community support groups and structures (including OVC, teen clubs, M2M)
Efficient scale-up of integrated models of care
Provide on-site technical assistance to scale up mother-baby care point model for PMTCT cascade; family centered care models and youth friendly services at targeted sites
Procure equipment, supplies other resources for community health workers, lay providers, expert patients providing linkage, adherence and retention support for consenting PLHIV (phones, bicycles, incentives for volunteers)
Establish community support groups to provide peer support and improve adherence and conduct defaulter tracing
Develop and implement standardized referral guidelines and SOPs across clinical programs (IMCI, MNCH, TB, OVC, nutrition) and community-based programs
Effective use information, data for decision making and quality improvement
Establish QI teams and systems to improve the quality of comprehensive HIV care and treatment services
Renovate infrastructure and procure medical furniture for integrated HIV service delivery models
Procure equipment to ensure reliable power and water supply for HIV diagnostic services
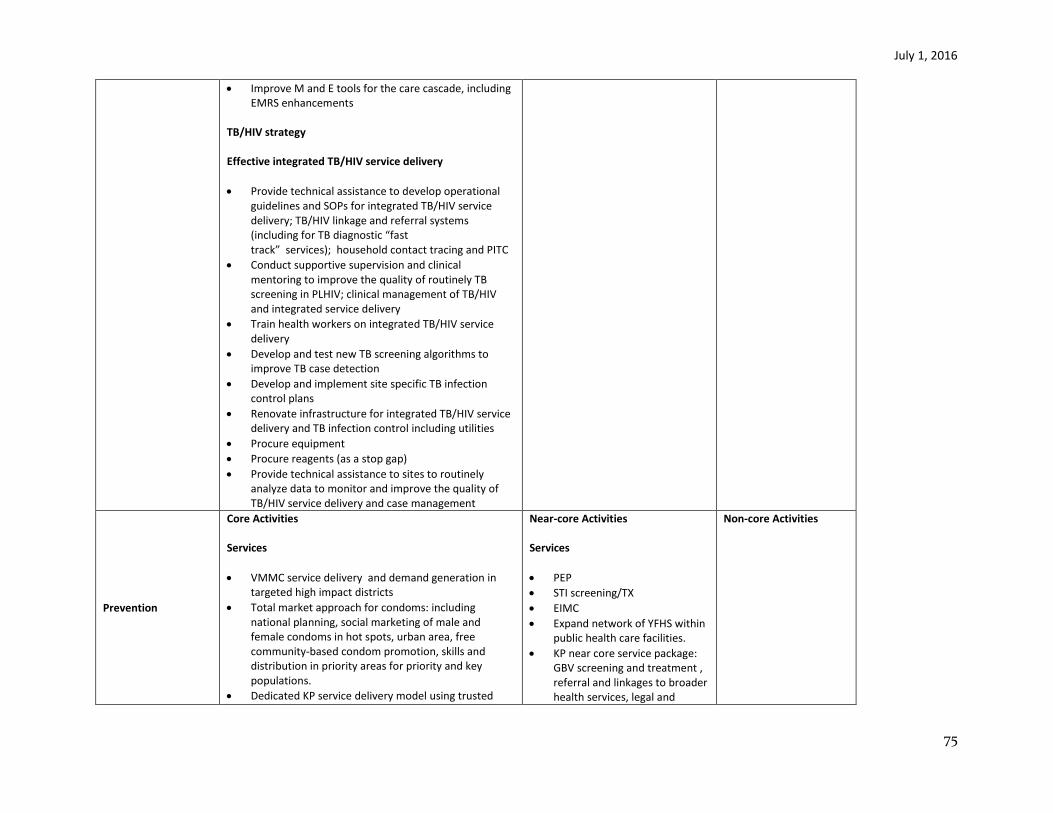
July 1, 2016
75
Improve M and E tools for the care cascade, including EMRS enhancements
TB/HIV strategy Effective integrated TB/HIV service delivery
Provide technical assistance to develop operational guidelines and SOPs for integrated TB/HIV service delivery; TB/HIV linkage and referral systems (including for TB diagnostic “fast track” services); household contact tracing and PITC
Conduct supportive supervision and clinical mentoring to improve the quality of routinely TB screening in PLHIV; clinical management of TB/HIV and integrated service delivery
Train health workers on integrated TB/HIV service delivery
Develop and test new TB screening algorithms to improve TB case detection
Develop and implement site specific TB infection control plans
Renovate infrastructure for integrated TB/HIV service delivery and TB infection control including utilities
Procure equipment
Procure reagents (as a stop gap)
Provide technical assistance to sites to routinely analyze data to monitor and improve the quality of TB/HIV service delivery and case management
Prevention
Core Activities Services
VMMC service delivery and demand generation in targeted high impact districts
Total market approach for condoms: including national planning, social marketing of male and female condoms in hot spots, urban area, free community-based condom promotion, skills and distribution in priority areas for priority and key populations.
Dedicated KP service delivery model using trusted
Near-core Activities Services
PEP
STI screening/TX
EIMC
Expand network of YFHS within public health care facilities.
KP near core service package: GBV screening and treatment , referral and linkages to broader health services, legal and
Non-core Activities
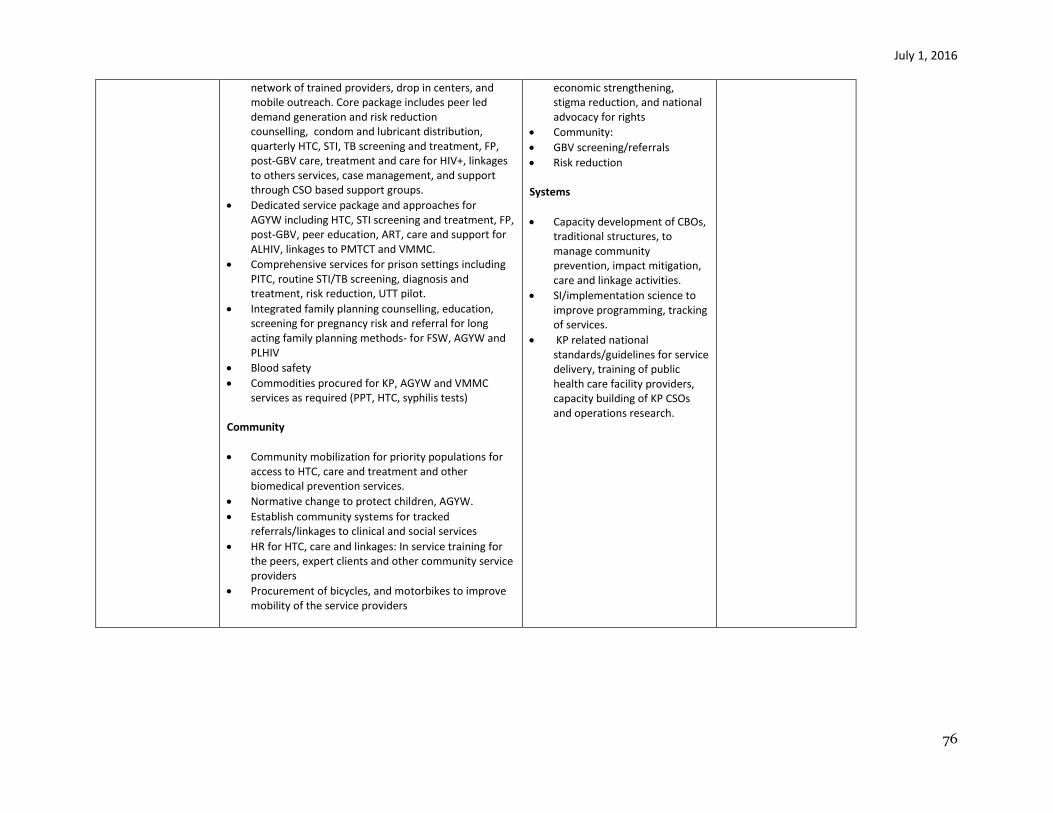
July 1, 2016
76
network of trained providers, drop in centers, and mobile outreach. Core package includes peer led demand generation and risk reduction counselling, condom and lubricant distribution, quarterly HTC, STI, TB screening and treatment, FP, post-GBV care, treatment and care for HIV+, linkages to others services, case management, and support through CSO based support groups.
Dedicated service package and approaches for AGYW including HTC, STI screening and treatment, FP, post-GBV, peer education, ART, care and support for ALHIV, linkages to PMTCT and VMMC.
Comprehensive services for prison settings including PITC, routine STI/TB screening, diagnosis and treatment, risk reduction, UTT pilot.
Integrated family planning counselling, education, screening for pregnancy risk and referral for long acting family planning methods- for FSW, AGYW and PLHIV
Blood safety
Commodities procured for KP, AGYW and VMMC services as required (PPT, HTC, syphilis tests)
Community
Community mobilization for priority populations for access to HTC, care and treatment and other biomedical prevention services.
Normative change to protect children, AGYW.
Establish community systems for tracked referrals/linkages to clinical and social services
HR for HTC, care and linkages: In service training for the peers, expert clients and other community service providers
Procurement of bicycles, and motorbikes to improve mobility of the service providers
economic strengthening, stigma reduction, and national advocacy for rights
Community:
GBV screening/referrals
Risk reduction Systems
Capacity development of CBOs, traditional structures, to manage community prevention, impact mitigation, care and linkage activities.
SI/implementation science to improve programming, tracking of services.
KP related national standards/guidelines for service delivery, training of public health care facility providers, capacity building of KP CSOs and operations research.
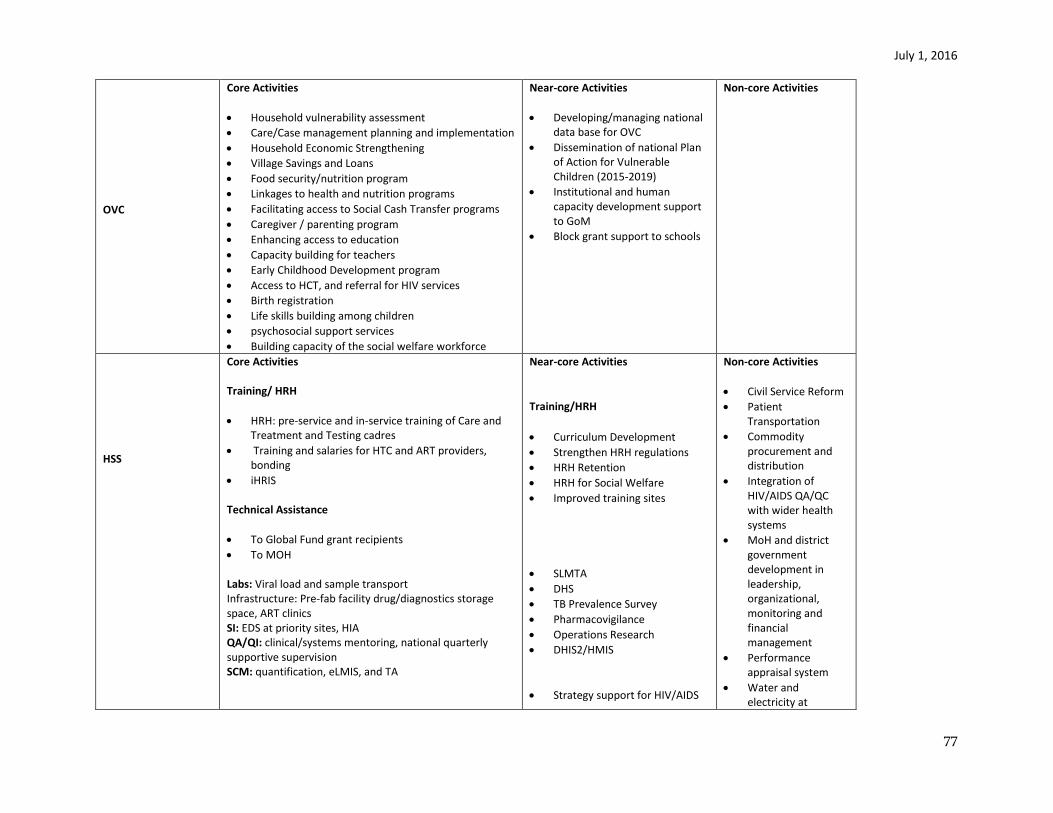
July 1, 2016
77
OVC
Core Activities
Household vulnerability assessment
Care/Case management planning and implementation
Household Economic Strengthening
Village Savings and Loans
Food security/nutrition program
Linkages to health and nutrition programs
Facilitating access to Social Cash Transfer programs
Caregiver / parenting program
Enhancing access to education
Capacity building for teachers
Early Childhood Development program
Access to HCT, and referral for HIV services
Birth registration
Life skills building among children
psychosocial support services
Building capacity of the social welfare workforce
Near-core Activities
Developing/managing national data base for OVC
Dissemination of national Plan of Action for Vulnerable Children (2015-2019)
Institutional and human capacity development support to GoM
Block grant support to schools
Non-core Activities
HSS
Core Activities Training/ HRH
HRH: pre-service and in-service training of Care and Treatment and Testing cadres
Training and salaries for HTC and ART providers, bonding
iHRIS
Technical Assistance
To Global Fund grant recipients
To MOH Labs: Viral load and sample transport Infrastructure: Pre-fab facility drug/diagnostics storage space, ART clinics SI: EDS at priority sites, HIA QA/QI: clinical/systems mentoring, national quarterly supportive supervision SCM: quantification, eLMIS, and TA
Near-core Activities
Training/HRH
Curriculum Development
Strengthen HRH regulations
HRH Retention
HRH for Social Welfare
Improved training sites
SLMTA
DHS
TB Prevalence Survey
Pharmacovigilance
Operations Research
DHIS2/HMIS
Strategy support for HIV/AIDS
Non-core Activities
Civil Service Reform
Patient Transportation
Commodity procurement and distribution
Integration of HIV/AIDS QA/QC with wider health systems
MoH and district government development in leadership, organizational, monitoring and financial management
Performance appraisal system
Water and electricity at
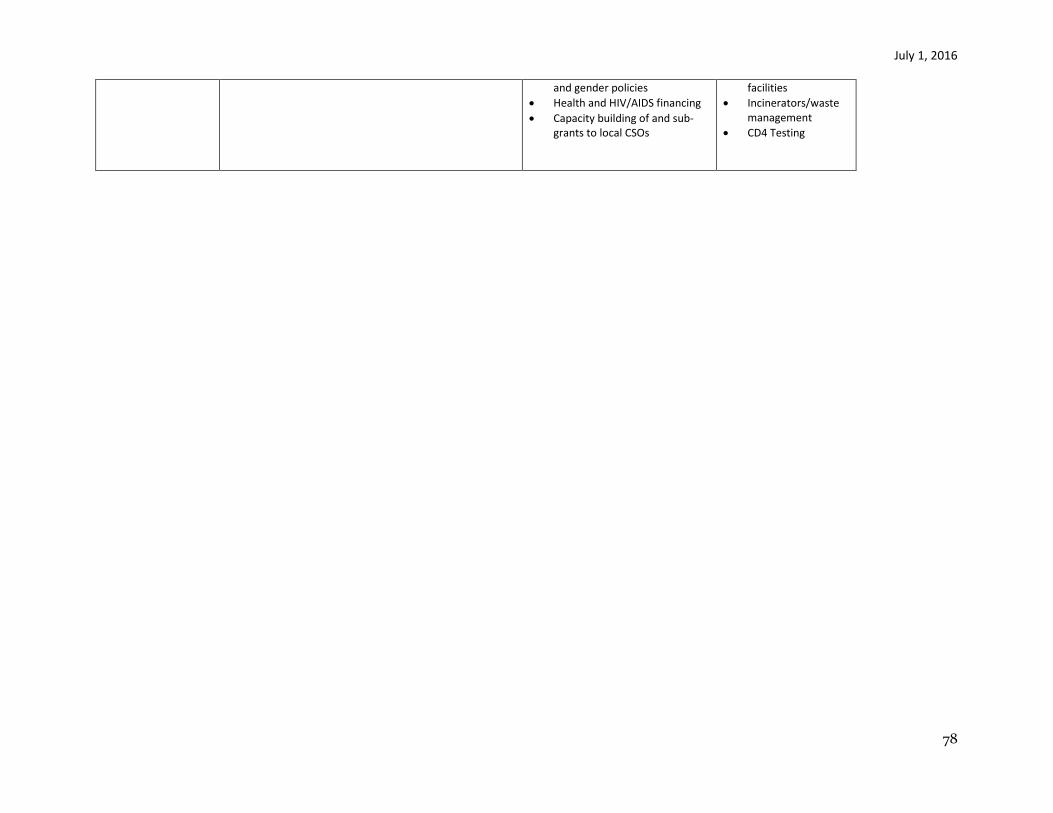
July 1, 2016
78
and gender policies
Health and HIV/AIDS financing
Capacity building of and sub-grants to local CSOs
facilities
Incinerators/waste management
CD4 Testing
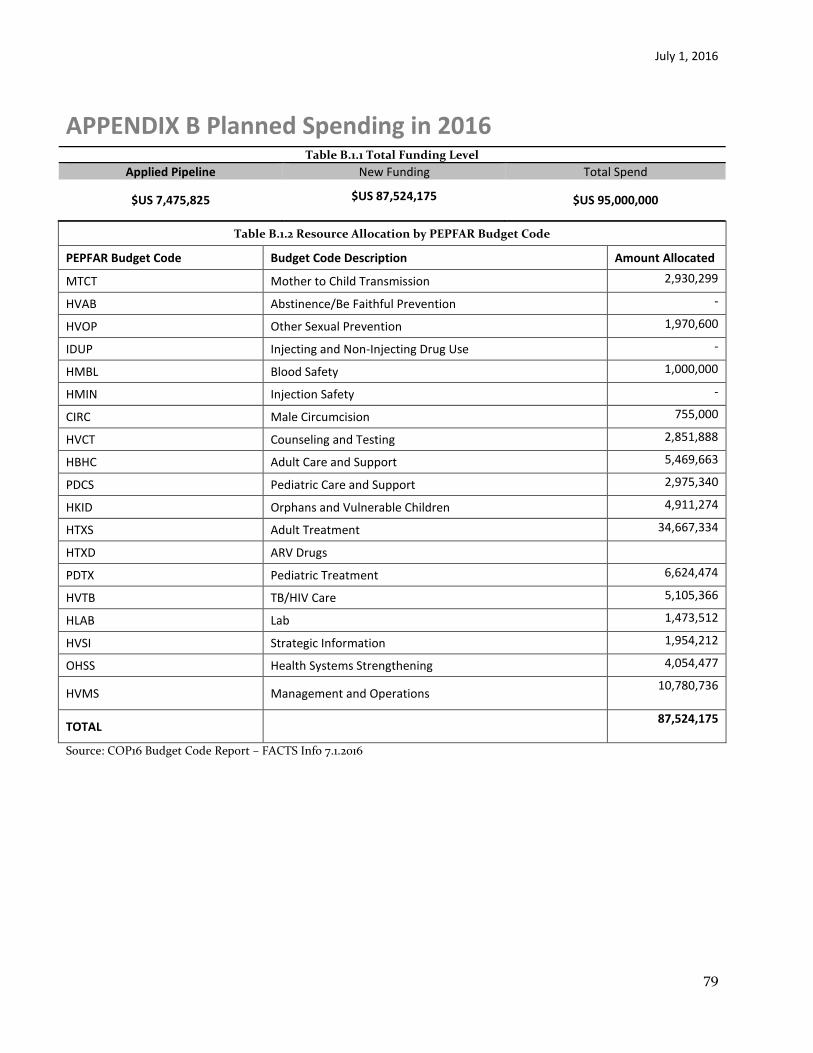
July 1, 2016
79
APPENDIX B Planned Spending in 2016 Table B.1.1 Total Funding Level
Applied Pipeline New Funding Total Spend
$US 7,475,825 $US 87,524,175
$US 95,000,000
Table B.1.2 Resource Allocation by PEPFAR Budget Code
PEPFAR Budget Code Budget Code Description Amount Allocated
MTCT Mother to Child Transmission 2,930,299
HVAB Abstinence/Be Faithful Prevention -
HVOP Other Sexual Prevention 1,970,600
IDUP Injecting and Non-Injecting Drug Use -
HMBL Blood Safety 1,000,000
HMIN Injection Safety -
CIRC Male Circumcision 755,000
HVCT Counseling and Testing 2,851,888
HBHC Adult Care and Support 5,469,663
PDCS Pediatric Care and Support 2,975,340
HKID Orphans and Vulnerable Children 4,911,274
HTXS Adult Treatment 34,667,334
HTXD ARV Drugs
PDTX Pediatric Treatment 6,624,474
HVTB TB/HIV Care 5,105,366
HLAB Lab 1,473,512
HVSI Strategic Information 1,954,212
OHSS Health Systems Strengthening 4,054,477
HVMS Management and Operations 10,780,736
TOTAL 87,524,175
Source: COP16 Budget Code Report – FACTS Info 7.1.2016

July 1, 2016
80
Appendix C
Acronyms and Abbreviations
AB – Abstinence and Be Faithful AFG – AIDS-Free Generation AGYW – Adolescent Girls and Young Women AIDS – Acquired Immune Deficiency Syndrome ANC – Antenatal Clinic APR – Annual Program Results ART – Antiretroviral therapy ARV – Antiretroviral CBO – Community-based Organization CCM – Country Coordinating Mechanism CDC – Centers for Disease Control and Prevention (part of HHS) CIFF – Children’s Investment Fund Foundation CN – Congressional Notification CODB – Costs of Doing the U.S. government’s PEPFAR Business COP – Country Operational Plan CQI – Continuous Quality Improvement CSO – Civil Society Organizations DHA – Department of HIV/AIDS DHS – Demographic and Health Survey DOD – U.S. Department of Defense DOS – U.S. Department of State EA – Expenditure Analysis EID – Early-Infant Diagnosis FP – Family Planning FSN – Foreign Service National FSW – Female Sex Worker FTE – Full-Time Equivalent FY – Fiscal Year GAP – Global AIDS Program (CDC) GBV – Gender Based Violence GDP – Gross Domestic Product GFATM – The Global Fund to Fight AIDS, Tuberculosis, and Malaria (also “Global Fund”) GHAI – Global HIV/AIDS Initiative (funding account; replaced by GHCS-State) GHCS – Global Health Child Survival funds (funding account) GHI – Global Health Initiative GoM – Government of Malawi HCN – Host Country National HCW – Health Care Workers HDG – Health Development Partners HHS – U.S. Department of Health and Human Services HIV – Human Immunodeficiency Virus HMIS – Health Management Information System HRSA – Health Resources and Services Administration (part of HHS)
July 1, 2016
81
HRH – Human Resources for Health HTS – HIV Testing Services (formerly HIV Testing and Counseling – HTC) ICASS – International Cooperative Administrative Support Services ICF – Intensified Case Finding ICPI – Interagency Cooperative for Program Improvement INH – Isoniazid IPT – Isoniazid Preventive Therapy IP – Implementing Partner LE – Locally Employed (Staff) LGBTI – Lesbian, Gay, Bisexual, Transgender and Intersex LOE – Level of Effort LTFU – Loss to Follow-Up MANASO – Malawi Network of Aids Service Organizations M&E – Monitoring and Evaluation MER – Monitoring, Evaluation and Reporting M&O – Management and Operations MC – Male Circumcision MDHS – Malawi Demographic and Health Survey MSF – Medicines Sans Frontiers MSM – Men who have Sex with Men MoH – Ministry of Health MOU – Memorandum of Understanding MPHIA – Malawi Population HIV Impact Assessment NAC – National Aids Commission NACS INH Nutrition Assessment Counseling and Support NIH – National Institutes of Health (part of HHS) NSO – National Statistical Office OU – Operating Unit OVC – Orphans and Vulnerable Children PEPFAR – President’s Emergency Plan for AIDS Relief PLHIV/PLWHA/PLWA – People Living with HIV/AIDS or People Living with AIDS PMTCT – Prevention of Mother-to-Child HIV Transmission POART – PEPFAR Oversight and Accountability Response PPP – Public-Private Partnership PR – Principal Recipient PSE – Private Sector Engagement PWID – People Who Inject Drugs QA – Quality Assurance RCNF – Robert Carr civil society Networks Fund RFA – Request for Application RFP – Request for Proposal ROP – Regional Operational Plan SAPR – Semi-Annual Program Results SCMS – Supply Chain Management System SDS – Strategic Direction Summary S/GAC and S/GAC – Office of the U.S. Global AIDS Coordinator (part of State) SI – Strategic Information SID – Sustainability Index Dashboard SIMS – Site Improvement through Monitoring System TA/TC – Technical Assistance/Technical Collaboration TB –Tuberculosis TBD – To Be Determined TCN – Third Country National
July 1, 2016
82
TTFs – Tools, Templates and Frameworks TWG – Technical Working Group UNAIDS – Joint United Nations Program on HIV/AIDS UNDP – United Nations Development Program UNICEF – United Nations Children’s Fund USAID – U.S. Agency for International Development USDH – U.S. Direct Hire USG – United States Government USPSC – U.S. Personal Services Contractor VCT – Voluntary Counseling and Testing VMMC – Voluntary Male Medical Circumcision VL – Viral Load YFHS – Youth Friendly Health Services WHO – World Health Organization
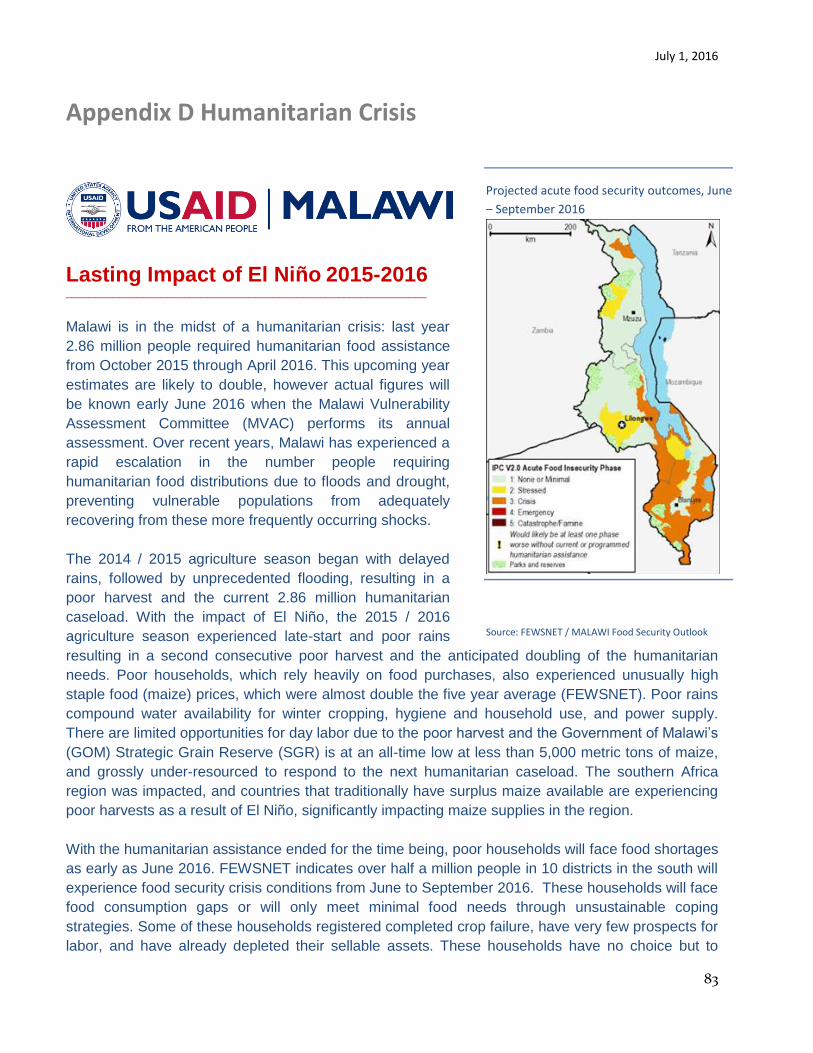
July 1, 2016
83
Appendix D Humanitarian Crisis
Lasting Impact of El Niño 2015-2016 _____________________________________________________________
Malawi is in the midst of a humanitarian crisis: last year
2.86 million people required humanitarian food assistance
from October 2015 through April 2016. This upcoming year
estimates are likely to double, however actual figures will
be known early June 2016 when the Malawi Vulnerability
Assessment Committee (MVAC) performs its annual
assessment. Over recent years, Malawi has experienced a
rapid escalation in the number people requiring
humanitarian food distributions due to floods and drought,
preventing vulnerable populations from adequately
recovering from these more frequently occurring shocks.
The 2014 / 2015 agriculture season began with delayed
rains, followed by unprecedented flooding, resulting in a
poor harvest and the current 2.86 million humanitarian
caseload. With the impact of El Niño, the 2015 / 2016
agriculture season experienced late-start and poor rains
resulting in a second consecutive poor harvest and the anticipated doubling of the humanitarian
needs. Poor households, which rely heavily on food purchases, also experienced unusually high
staple food (maize) prices, which were almost double the five year average (FEWSNET). Poor rains
compound water availability for winter cropping, hygiene and household use, and power supply.
There are limited opportunities for day labor due to the poor harvest and the Government of Malawi’s
(GOM) Strategic Grain Reserve (SGR) is at an all-time low at less than 5,000 metric tons of maize,
and grossly under-resourced to respond to the next humanitarian caseload. The southern Africa
region was impacted, and countries that traditionally have surplus maize available are experiencing
poor harvests as a result of El Niño, significantly impacting maize supplies in the region.
With the humanitarian assistance ended for the time being, poor households will face food shortages
as early as June 2016. FEWSNET indicates over half a million people in 10 districts in the south will
experience food security crisis conditions from June to September 2016. These households will face
food consumption gaps or will only meet minimal food needs through unsustainable coping
strategies. Some of these households registered completed crop failure, have very few prospects for
labor, and have already depleted their sellable assets. These households have no choice but to
Projected acute food security outcomes, June
– September 2016
Source: FEWSNET / MALAWI Food Security Outlook
Update April 2016
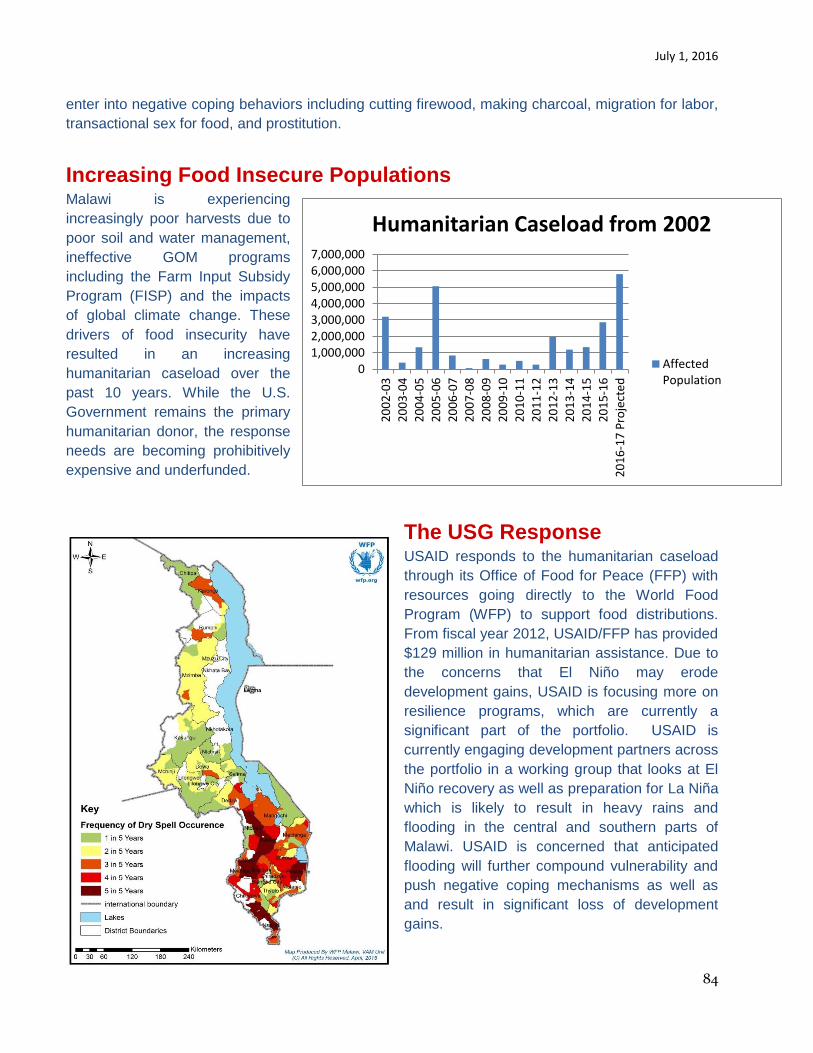
July 1, 2016
84
enter into negative coping behaviors including cutting firewood, making charcoal, migration for labor,
transactional sex for food, and prostitution.
Increasing Food Insecure Populations
Malawi is experiencing
increasingly poor harvests due to
poor soil and water management,
ineffective GOM programs
including the Farm Input Subsidy
Program (FISP) and the impacts
of global climate change. These
drivers of food insecurity have
resulted in an increasing
humanitarian caseload over the
past 10 years. While the U.S.
Government remains the primary
humanitarian donor, the response
needs are becoming prohibitively
expensive and underfunded.
The USG Response USAID responds to the humanitarian caseload
through its Office of Food for Peace (FFP) with
resources going directly to the World Food
Program (WFP) to support food distributions.
From fiscal year 2012, USAID/FFP has provided
$129 million in humanitarian assistance. Due to
the concerns that El Niño may erode
development gains, USAID is focusing more on
resilience programs, which are currently a
significant part of the portfolio. USAID is
currently engaging development partners across
the portfolio in a working group that looks at El
Niño recovery as well as preparation for La Niña
which is likely to result in heavy rains and
flooding in the central and southern parts of
Malawi. USAID is concerned that anticipated
flooding will further compound vulnerability and
push negative coping mechanisms as well as
and result in significant loss of development
gains.
01,000,0002,000,0003,000,0004,000,0005,000,0006,000,0007,000,000
20
02
-03
20
03
-04
20
04
-05
20
05
-06
20
06
-07
20
07
-08
20
08
-09
20
09
-10
20
10
-11
20
11
-12
20
12
-13
20
13
-14
20
14
-15
20
15
-16
20
16
-17
Pro
ject
ed
Humanitarian Caseload from 2002
AffectedPopulation
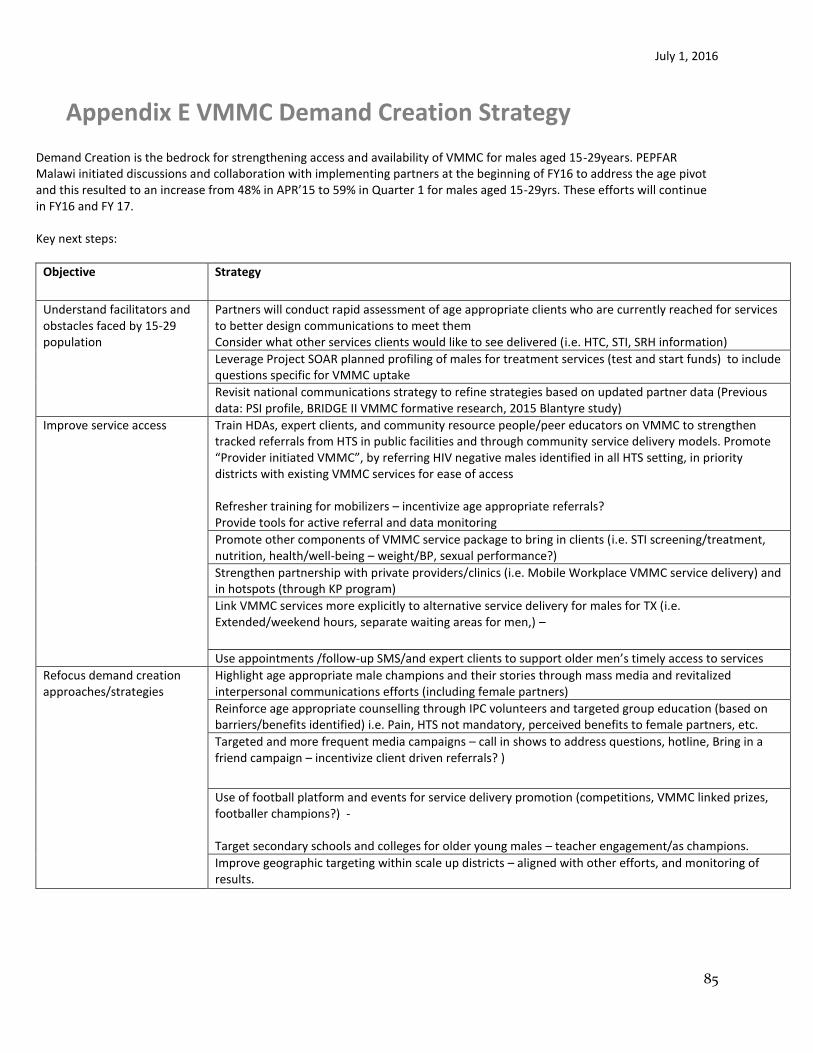
July 1, 2016
85
Appendix E VMMC Demand Creation Strategy Demand Creation is the bedrock for strengthening access and availability of VMMC for males aged 15-29years. PEPFAR Malawi initiated discussions and collaboration with implementing partners at the beginning of FY16 to address the age pivot and this resulted to an increase from 48% in APR’15 to 59% in Quarter 1 for males aged 15-29yrs. These efforts will continue in FY16 and FY 17. Key next steps:
Objective Strategy
Understand facilitators and obstacles faced by 15-29 population
Partners will conduct rapid assessment of age appropriate clients who are currently reached for services to better design communications to meet them Consider what other services clients would like to see delivered (i.e. HTC, STI, SRH information)
Leverage Project SOAR planned profiling of males for treatment services (test and start funds) to include questions specific for VMMC uptake
Revisit national communications strategy to refine strategies based on updated partner data (Previous data: PSI profile, BRIDGE II VMMC formative research, 2015 Blantyre study)
Improve service access Train HDAs, expert clients, and community resource people/peer educators on VMMC to strengthen tracked referrals from HTS in public facilities and through community service delivery models. Promote “Provider initiated VMMC”, by referring HIV negative males identified in all HTS setting, in priority districts with existing VMMC services for ease of access Refresher training for mobilizers – incentivize age appropriate referrals? Provide tools for active referral and data monitoring
Promote other components of VMMC service package to bring in clients (i.e. STI screening/treatment, nutrition, health/well-being – weight/BP, sexual performance?)
Strengthen partnership with private providers/clinics (i.e. Mobile Workplace VMMC service delivery) and in hotspots (through KP program)
Link VMMC services more explicitly to alternative service delivery for males for TX (i.e. Extended/weekend hours, separate waiting areas for men,) –
Use appointments /follow-up SMS/and expert clients to support older men’s timely access to services
Refocus demand creation approaches/strategies
Highlight age appropriate male champions and their stories through mass media and revitalized interpersonal communications efforts (including female partners)
Reinforce age appropriate counselling through IPC volunteers and targeted group education (based on barriers/benefits identified) i.e. Pain, HTS not mandatory, perceived benefits to female partners, etc.
Targeted and more frequent media campaigns – call in shows to address questions, hotline, Bring in a friend campaign – incentivize client driven referrals? )
Use of football platform and events for service delivery promotion (competitions, VMMC linked prizes, footballer champions?) - Target secondary schools and colleges for older young males – teacher engagement/as champions.
Improve geographic targeting within scale up districts – aligned with other efforts, and monitoring of results.

July 1, 2016
86
Appendix F Considerations for Differentiated Care
1. SERVICE INTENSITY: COP15:
ART initiation Clinical monitoring Adherence support Viral load monitoring OI treatment Psychosocial support
COP16:
As above (COP15) Interventions for advanced HIV:
o Renal Function Test /Liver Function Test in district hospital o Screening for Cryptococcus antigen for
Enhanced adherence support 2. SERVICE FREQUENCY: OPTIMISE CLINIC VISTS COP 15:
3 monthly (all sites) COP 16:
Differentiated schedules, clinics and client flows (all high burden sites) Appointment spacing: 6 monthly (only stable patients at high burden sites)
3. SERVICE LOCATION: IMPROVE ACCESS COP 15:
Facility and community HTS Bidirectional linkages Facility based -treatment services Renovate facilities, repurpose space
COP 16:
As above (COP 15) Add sites: pre-fab, new clinics Conduct mobile HTS and treatment services (fast track districts) Community based ART initiation Pilot community based drug delivery
4. HEALTH WORKER CADRE: ADDRESS HRH GAPS
COP 15: HDAs Expert clients
COP 16:
July 1, 2016
87
As above (COP 15) Frontline ART providers Pharmacy assistants