policies for full employment
TRANSCRIPT
RL340a 21 October 2002
1
POLICIES FOR FULL EMPLOYMENT
J. de Koning, R. Layard, S. Nickell and N. Westergaard-Nielsen
1. Principles The lump-of-labour fallacy Unemployment when vacancies abound How unemployed people are treated Older workers Mothers Wage flexibility and regional unemployment Employment flexibility Conclusion: flexibility is not enough
2. The British experience How unemployed people are treated Single mothers and older workers Wage flexibility Employment flexibility
3. The Danish experience
How unemployed people are treated Older workers and leave schemes Wage flexibility Employment flexibility What can be learned from the Danish experience
4. The Dutch experience
How unemployed people are treated Early retirement and other policies for employed people Labour market participation Wage flexibility Employment protection and labour market flexibility Conclusions from the Dutch experience
5. Recommendations to E.U. heads of government The treatment of unemployed people Wage flexibility Early retirement
References Sources of figures and tables End notes

RL340a 21 October 2002
2
1. PRINCIPLES
European unemployment is too high, and employment is too low. Over 7½ per cent of Europe’s workforce is unemployed, and only two thirds of people aged 15-64 are in work.
At the Lisbon summit two years ago the heads of government set the target that by 2010 the employment rate should rise from 64 per cent to at least 70 per cent. And for older workers between 55 and 64 the employment rate should rise from 38 per cent to at least one half.
These are ambitious targets. They will require two big changes: more people must seek work, and among those seeking work a higher proportion must get a job. So we need higher participation, and (for full employment) we need a much lower unemployment rate.
Can it be done? A mere glance at the experience of different European countries shows that it can. As Table 1 shows, four E.U. countries already exceed the overall target for 2010 (Britain, Denmark, the Netherlands and Sweden). And eight of the 15 countries in the E.U already have lower unemployment than the United States (the previous four plus Austria, Ireland, Luxembourg and Portugal).
So there is no such thing as “the European unemployment problem”. The fundamental problem is high unemployment in four of the five large countries: France, Germany, Italy and Spain. If high overall unemployment in Europe is to be reduced, these large countries will have to learn what they can from the experience of the rest of Europe. At the same time no European country can be satisfied with its current performance. In every country unemployment is higher than in the 1960s, and the participation rate (especially among older workers) is unsustainably low. There will have to be improvement on both points if Europe’s employment target is to be met. More people should look for work, and those who look should be helped to look more effectively.

RL340a 21 October 2002
3
Table 1 Unemployment rates and employment/population ratios, 2001 (%)
Employment/Population**
Unemployment rate* 15-64 55-64 Austria 4.0 68 27 Belgium 6.8 60 25 Denmark 4.2 76 57 Finland 9.1 68 46 France 9.2 62 37 Germany 8.1 66 37 Greece 7.3 56 38 Ireland 4.4 65 47 Italy 9.0 55 19 Luxembourg 2.4 63 25 Netherlands 2.6 74 39 Portugal 4.4 69 50 Spain 11.3 59 39 Sweden 5.3 75 67 UK 5.2 71 52
EU 7.5 64 39
EU Target (2010) 70 50
USA 6.0 73 58 Japan 5.2 69 62 * April 2002 ** 2001
THE LUMP-OF-LABOUR FALLACY
But many people doubt whether more jobs will result if more people look for work. Indeed some people believe that the only way to reduce unemployment is to reduce the number of people looking for work – for example through early retirement. This is a profound error, and, unless people understand the process of job-creation, there is no chance of our hitting Europe’s employment target.
The number of jobs is determined by the amount people want to buy – that is
by aggregate demand. Aggregate demand is influenced by many factors, mostly outside the direct control of policy makers. However, monetary policy, in particular, is very important and is set so as to try and ensure that inflation remains low and stable. In a recession, aggregate demand is low and this is reflected in higher levels of unemployment. Monetary policy is then generally loosened in order to stimulate aggregate demand. As the economy recovers, at some stage it runs into labour shortages and inflationary pressure. In anticipation of rising inflation, monetary policy is then generally tightened. There is an unemployment problem if, at this point, unemployment is still high.

RL340a 21 October 2002
4
The key issue is how much unemployment remains when labour shortages become excessive and inflation therefore starts rising. This level of unemployment is known as the NAIRU (non-accelerating-inflation rate of unemployment). It is, if you like, the sustainable rate of unemployment and, if there is no trend in inflation up or down, it will also be the average rate of unemployment over a run of years.
This rate of unemployment differs greatly between countries and over time,
and depends on the institutions and policies existing at the time. It is these factors which determine the average unemployment rate – in other words they determine how many jobs there will be for a given total labour force. As we have said, at all times the number of jobs will depend on aggregate demand. But, because of the inflation constraint, aggregate demand will be restricted by the amount of available labour. So, over a run of years, the number of jobs will ultimately depend on the available supply of labour – that is, on the number of those who are ready and willing to take up jobs. This proposition is crucial, and many of the mistakes in employment policy come from a failure to understand it.
Consider for example policies to encourage early retirement. If we start at the
sustainable rate of unemployment and labour supply is then reduced by early retirement, unemployment will fall at first. But then, as labour shortages bite, inflation will rise and aggregate demand and employment will be cut back until employment is back in line with the now reduced supply of labour. Alternatively, if we encourage more older people to work and labour supply increases, inflation will at first tend to fall, permitting a rise in aggregate demand and in the number of jobs. This is the direction in which Europe has to move if we are to support an ageing population from a reduced flow of births.1
So it is quite wrong to think of the number of jobs as given, independent of the
supply of labour. That is the lump-of-labour fallacy. If you think of the changes in employment and labour supply over the centuries it is quite obvious how wrong it is. And here is some further evidence from the recent past.
As Figure 1 shows, the supply of labour has grown at hugely different rates in
different countries. But the number of jobs in each country has grown more or less in line with the growth in labour supply.
Countries also differ in their levels of labour force participation. If the lump-
of-labour theory were true, one might expect those with lower labour force participation rates to have lower unemployment. But, as Figure 2 shows, this is not so. If anything it is the other way round.
One might also expect that countries which had lowered their participation
rate most would have also lowered their unemployment most. Again, as Figure 3 shows, this is not so.
So the starting point is that, if we increase the supply of labour, we will
increase employment. This has two implications. First, we can increase employment by increasing labour force participation (for example that of single mothers or older people). We return to this issue shortly. Second, we can increase

RL340a 21 October 2002
5
employment by increasing the effective supply of labour from people who are already unemployed and searching unsuccessfully.
We begin with the unemployment issue, because it is a source of major
suffering and one of the greatest failings of contemporary European civilisation.2 Our analysis is based on the mass of evidence provided by the different experience of different countries.3
Source: For sources to all figures and tables, see Endnotes.
Figure 2 Labour force participation rate (15-64) and unemployment rate, 2000 (%)
Employment
Unemployment
Figure 1 Percentage growth in the labour force and employment 1960-2000

RL340a 21 October 2002
6
Figure 3 Change in labour force participation rate (15-64) and change in unemployment
rate. 1990s compared with 1980s (% points)
UNEMPLOYMENT WHEN VACANCIES ABOUND
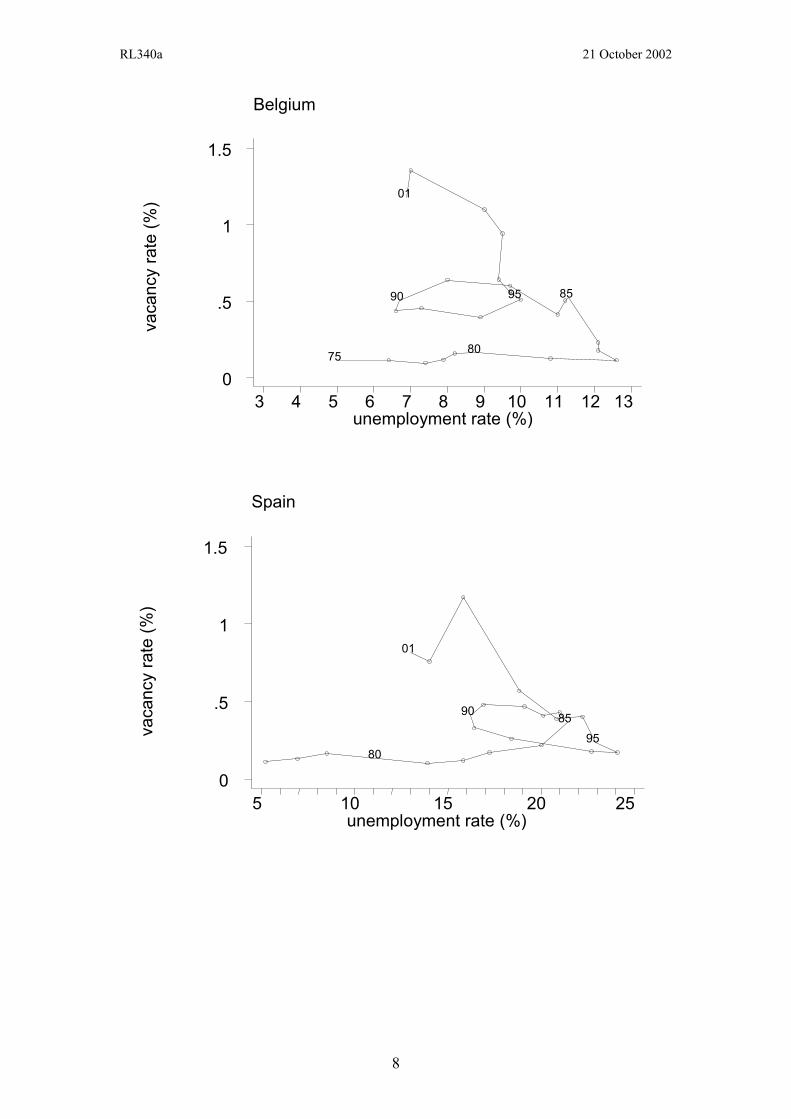
The key evidence concerns the relation between unemployment and vacancies. When vacancies are high, unemployment should be relatively low – because it is easy for unemployed people to find work. Yet, strikingly, in France, West Germany, Belgium and Spain vacancies in recent years have been extremely high by historical standards4, despite high unemployment. It is this high level of vacancies that helped to generate increasing European inflation in 2000/1, which led to higher interest rates and the end of the European recovery.
The situation is shown in Figure 4. In all four countries vacancies in 2000/1
were far higher than in 1975. One would therefore expect that unemployment would have been lower in 1975. But in fact it was more than double (except in Belgium).
The main upward shift of unemployment relative to vacancies occurred in the
1980s. During that period a similar shift occurred in almost every European country. As Figure 5 shows, it occurred as well in Britain, Denmark, and the Netherlands (see Figure 5). But in those countries something different then occurred in the 1990s. Unemployment fell back to close to its level in 1975. This reflected a structural shift, since vacancies did not rise compared with 1990 – if anything the reverse. So in those countries the unemployed became much more effective at filling vacancies, while in France, Germany, Belgium and Spain they did not. Why was this?
C
hang
e in
labo
ur fo
rce
part
icip
atio
n
-5 0 5 1 0
-5 0 5 1 0
-4
-2
0
2
4
-
-
2
4
B E
D K
G E
G R
S P
F RIR
IT
N L A U
P O
F N
S W
U K
C h a n g e in u n e m p lo y m e n t

RL340a 21 October 2002
7
There is no evidence of any major change in the mismatch between the characteristics of the unemployed and the characteristics of the jobs in any of the countries we are discussing.5 So the change must have been a change in the matching process – in how unemployed people are treated.
Figure 4 High-unemployment countries
(During the 1990s unemployment at given vacancies rose)
France
labo
ur s
horta
ge in
dex*
unemployment rate (%) 3 4 5 6 7 8 9 10 11 12 13
5
10
15
20
25
75 80
85
90
95
01
West Germany
vaca
ncy
rate
(%)
unemployment rate (%) 3 4 5 6 7 8 9 10 11 12 13
0
.5
1
1.5
2
75
80
85
90 95
01
* Survey Data: Percentage of firms reporting shortages of labour
RL340a 21 October 2002
8
Belgium
vaca
ncy
rate
(%)
unemployment rate (%) 3 4 5 6 7 8 9 10 11 12 13
0
.5
1
1.5
75 80
85 90 95
01
Spain
vaca
ncy
rate
(%)
unemployment rate (%) 5 10 15 20 25
0
.5
1
1.5
80
85 90
95
01

RL340a 21 October 2002
9
Figure 5 Low-unemployment countries
(During the 1990s unemployment at given vacancies fell)
Britain la
bour
sho
rtage
inde
x*
unemployment rate (%)3 4 5 6 7 8 9 10 11 12 13
0
5
10
15
75
80
85 9095
01
Denmark
vaca
ncy
rate
(%)
unemployment rate (%)3 4 5 6 7 8 9 10 11 12 13
0
.05
.1
.15
75 80
85
9095
01
* CBI Survey: (1/2)*( % firms reporting shortage of skilled labour + % of firms reporting shortage of other labour)

RL340a 21 October 2002
10
Netherlands
vaca
ncy
rate
(%)
unemployment rate (%) 3 4 5 6 7 8 9 10 11 12 13
0
1
2
3
75 80
85
90
95
01
HOW UNEMPLOYED PEOPLE ARE TREATED
Even in the 1980s it was evident that unemployment differences between countries were influenced by how unemployed people were treated.6 It was striking that the United States had virtually no long-term unemployed (with a duration of over a year), while Europe had almost as many long-term unemployed as short-term employed. The most obvious explanation was the long-duration unemployment benefits that existed in Europe but not the U.S. This relationship is depicted crudely in Figure 6, and it exists even when other factors are allowed for.7
Figure 6 Long-term unemployment and the duration of benefits
0 20 40 60
0 20 40 60
0
1
2
3
0
1
2
3
AU
BE
DE
FN
FR
GE IR
NE
NO
SP
SWSZ
UK
JA
ALNZ
CA
US
Max
imum
dur
atio
n of
ben
efits
(yea
rs),
1992
% of unemployed people out of work for over 12 months, 1989-98
4+4+
0 20 40 60
0 20 40 60
0
1
2
3
0
1
2
3
AU
BE
DE
FN
FR
GE IR
NE
NO
SP
SWSZ
UK
JA
ALNZ
CA
US
Max
imum
dur
atio
n of
ben
efits
(yea
rs),
1992
% of unemployed people out of work for over 12 months, 1989-98
4+4+

RL340a 21 October 2002
11
The duration and level of benefits are one set of factors influencing unemployment. But even more important is the help which unemployed people get in finding work and the conditions which apply to the receipt of benefit. These two factors, active labour market policy and benefit conditionality, work best in conjunction with each other.
Benefit conditionality
Clearly, one way to reduce long-term dependence on benefits is to make sure that benefits are used for their intended purpose – to support people who are not working and who really cannot find work. In other words, the right to benefits must be matched by an obligation to get a job if jobs exist. There must be a “test of willingness to work”.
As a recent OECD conference revealed, countries differ amazingly in the framework within which benefits are dispensed.8 Experience shows that unemployed people are more available to fill employers’ vacancies if
(i) benefits are paid through the same office as that where people are placed in work;
(ii) unemployed people have to attend regularly in person, and (iii) unemployed people are expected after a period to be available for most
types of work, even if this involves substantial journey times or even (as in a few countries) moving home with the help of a subsidy.
Thus the organisation and effectiveness of the public employment service are crucial factors affecting the level of unemployment.
The problem with imposing strict availability conditions is that these are difficult to apply unless the employment service is extremely active in helping people to get offers of work. So a “stricter benefit regime” to reduce “passive” dependence on benefits only makes sense if linked to an “active” labour market policy to help people back into work. The two should be complementary.
Active labour market policy This is the policy known as “welfare-to-work”. The phrase comes from
America, where it mainly applies to lone mothers. But the practice as applied to unemployed people has been mainly developed in Europe. Denmark, the Netherlands and Britain all introduced major welfare-to-work policies in the 1990s - hence the changes shown in Figure 5. And in the last year or two France, Germany and Spain have taken more limited steps towards greater conditionality.
In labour market policy there has to be an especial focus on preventing long-
term unemployment, since it is so destructive.9 This means ensuring that everyone gets offers of work or training within a year or so of becoming unemployed, as required by the E.U. Luxembourg Guidelines. Britain, Denmark and the Netherlands do this for young people, but only Denmark and the Netherlands do it for people of all ages. The aim must if possible be to channel offers of work from regular employers,

RL340a 21 October 2002
12
mainly in the private sector. But, to prevent long-term dependence on benefits, we need to ensure some worthwhile activity for everyone. It must be actively aimed at employability, so that, when we cannot secure a regular job, we should offer meaningful work with NGOs or socially-useful projects. The measure of success is the number who get regular work and keep it.
The right to offers of work will only work fully if linked to an obligation
to accept one of the offers. Welfare-to-work must involve the principle of mutual obligation. The state has an obligation to ensure that offers of work are channelled to every unemployed person within a reasonable time after becoming unemployed. But in return the citizen should take advantage of those offers, and lose some or all of their benefit if they do not do so, unless there are medical reasons to the contrary. The Luxembourg Guidelines should be extended to include this.
Additionality As always, there is the issue of whether such policies can really expand
employment. Many people doubt whether active labour market measures can work owing to “displacement” and “substitution”. In extreme form, these fears derive from the ‘lump-of-labour fallacy’: if the number of jobs is fixed and we enable Mr X to get one of them, then some other person must by definition go without work.
In the very short-term of course the number of jobs is fixed. For example an
employer may have a vacancy which would have gone to Mrs Y but instead the employment service induce the employer to take Mr X, who was hard to place. At that instant Mrs Y stays unemployed rather than getting a job. But by definition Mrs Y is inherently employable since she would normally have got the job. If she does not get it, she will look for another one. Employers will then find that there are more employable people in the market - they can more easily fill their vacancies. This will exert downwards pressure on wages, and this will then make possible a higher level of employment at the same level of inflationary pressure. So eventually employment will rise.
But by how much? Evidence on substitution and replacement is by its nature
difficult to obtain. In the past it has been mainly got by asking questions to employers. When a subsidy is evaluated, employers are often asked the following:
1. Of the individual subsidised, how many would you have hired anyway?
(“Deadweight”)
2. Of the remaining jobs subsidised, how many would have been filled by other recruits in any case? (“Substitution”)
3. Of those remaining subsidised jobs which represent an increase in your own
employment, how many were at the expense of your competitors? (“Displacement”)
The net job creation resulting from the subsidy is then said to be the total number of subsidised jobs minus 1, 2 and 3.

RL340a 21 October 2002
13
Until recently this procedure has been used almost universally, and often implies that net job creation is only 20 per cent of the total number of jobs subsidised. Yet these estimates of substitution and deadweight are based on a theory of the labour market which is never used for any other purpose.
The theory being used is that, if somebody would have been employed in one
place and that opportunity closes down, then unemployment increases permanently – by that amount. This makes no allowance for the possibility (discussed above) that people who find one channel of employment blocked will find another channel. The procedure is especially extraordinary when one considers that typically half the people supposedly sent into unemployment by the process of substitution are people who already have a job and would have simply been changing jobs.
Only recently have economists began to realise that the old assumptions about
substitution are invalid. Lawrence Katz of Harvard University for example, has insisted on a more rational analysis of the main U.S. wage subsidy programme for youth, the Targeted Jobs Tax Credit. Until 1988 it covered disadvantaged young people aged 18-24, but from then onwards it ceased to apply to people aged 23-24. This change provided a good controlled experiment, enabling one to isolate the effects which the subsidy had previously had on the employment of 23-24 year olds. The conclusion was the 40-52 per cent of the subsidised jobs had represented net additions to employment.10 This shows the crucial importance of analysing active labour market policies within their overall setting.11
Interestingly, evaluations of more intensive job search assistance have never
suffered from the problems discussed above. And they have generally shown good value for money. These can have the added advantage that extra effort is easily focussed on those who really need it. This is an important element in any active labour market policy, and helps to reduce deadweight.
One further point on unemployed people. Throughout Europe, ethnic
minorities are a growing proportion of the labour force and their unemployment rates are usually much higher than the average. Ethnic minorities need especial help and the same principle applies to them as to all citizens: the principle of rights and responsibilities. They, more than most, need the right to offers of work or training but they also have the responsibility to master the language of their adopted country and to use the offers that are available to them.
OLDER WORKERS If we move from unemployed people to older workers and mothers, there are
two issues which these groups share in common. First, there is the issue of distortions. Those not working may for that reason be receiving state benefits, in which case there is a cost to the rest of society and therefore a possibility that incentives are inefficiently distorted away from work. Second, there is the issue, arising from increased longevity and decreased birth rates, that we need to increase the numbers in work in order to pay for the growing numbers of dependent elderly. That said, the reasons for non-participation are very different for older people and for single mothers – and so are the policies needed to increase participation.

RL340a 21 October 2002
14
Among older people (55-64) only 42 per cent are in the labour force and only 38½ per cent are working – making an unemployment rate of 8 per cent, the same as the overall rate. The situation is very similar to what it was ten years earlier, but it is highly unsatisfactory. To find out what is causing it, we can learn a lot from the huge differences in participation rates and employment rates across countries (see Table 1) and their time series variation.12 There are a number of key explanatory factors.
The first is the standard age of retirement at which state benefits become
payable. The second is the use of unemployment benefits as a form of early retirement benefit, with none of the usual job-search conditions attached. And the third is the availability of invalidity benefits, often not properly monitored to see whether the person still suffers from the problem they had when they first went on to benefit. (Some 15 per cent of all men aged 55-64 are on invalidity benefit in Britain, Germany, Italy and 25 per cent in the Netherlands.13) To achieve higher participation of older workers will require changes in all of these practices, and especially in the standard age of requirement.
But there must also be wider changes in society’s attitudes and approaches to
older people. From 2006 at the latest every European country must now introduce laws against age discrimination in employment. But this will only succeed if at the same time older workers become genuinely more attractive to employers through progressive updating of skills, either through workplace learning or independent study. Continuous learning and adequate job mobility in middle age are important to prevent workers become burned out or bored before their natural working life is over.
One key handicap facing older workers is their low level of ICT skill and this
must be urgently addressed.14 More flexible pay for older workers could also help, as could lower social security payments levied on the employers of older workers.
MOTHERS Among people of working age, mothers are the other main group who are
often not working. The number of non-working mothers is falling rapidly, but must continue to fall if employment targets are to be met.
For policy purposes it is important to distinguish between those whose choice
is relatively undistorted (married mothers) and those who may be eligible for state benefits. The single mothers are the more serious problem and we shall focus on them especially.15
The first issue is the availability and conditionality of income support from the
state. In some countries like Britain support is available without any job-search requirement. In some others job-search is required except when the children are very young. Generally participation is higher where job-search is required. A second issue is the availability of work with suitable hours. Where part-time work is readily available, some mothers who would not otherwise work will choose to do so. Then there is the question of leave. If a pregnant mother retains her right to return to her job, employment rates will be higher. And finally there is the issue of childcare – the

RL340a 21 October 2002
15
more childcare is available, the more women will work.16 If Europe wishes to achieve its employment targets, all these issues will have to be addressed.
WAGE FLEXIBILITY AND REGIONAL UNEMPLOYMENT We have focussed so far on the supply side of the market, which in the long-
run is the ultimate determinant of unemployment and employment rates. But the demand side is also very important. If wages are held too high, employers will not employ the available supply. There are two issues. One is the general level of real wages. At a given level of unemployment, these will be pushed too high if either the unemployed are not effectively supplying their labour (which we have already considered), or if there is autonomous wage push, due for example to union militancy or rises in import prices. Wage push is only likely in the context of unions and has been avoided in many of the smaller European countries by coordinated efforts of employers and unions (the Netherlands) or sometimes by the unions on their own (as at times in Sweden) or by employer solidarity (Portugal).
The second and most serious problem concerns relative wages, across skills or
regions. Across skills unemployment rates are much higher for unskilled people. One reason for this is a greater rigidity of wages at the bottom end. However, most legal minimum wages in Europe are low enough to cause no problem, and in some monopsonistic markets they may even raise employment. The more serious consequences of wage rigidity occur at the regional level, where overly high wages are a major cause of unemployment in East Germany, Southern Italy and Southern Spain.
Experience in the U.S. and to a degree the U.K. suggests that marked
differences in unemployment rates across regions can be reduced whenever two re-equilibrating factors are at work.17 The first is wage adjustment. If unemployment is higher in one region than another, wages in the high-unemployment region decline vis-à-vis wages in the low-unemployment region. This attracts investment, which leads to more jobs in areas of high unemployment. The second re-equilibrating factor is regional labour mobility: there is net migration away from the high-unemployment regions.
In Continental Europe, these two re-equilibrating factors are often not allowed
to operate properly. Centralised wage-setting institutions deter the emergence of significant regional wage differentials. At the same time, a number of factors – including state transfers to the high-unemployment areas – reduce the pressure to migrate. Thus, large regional labour market imbalances – the North-South divide in Italy and Spain or the West-East divide in Germany – are a prominent feature of the European landscape. Persistently high unemployment in some regions is also associated with low participation rates and a deterioration of the environment in which firms have to operate. In high-unemployment regions the public sector tends to pay more than the private sector (at least in terms of entry wages) and provides more job security. If it is difficult to get a public sector job when already employed in the private sector, this encourages “wait-unemployment” where people (sometimes the most educated people) queue for public sector jobs to become vacant.

RL340a 21 October 2002
16
In order to move these regions away from the high-unemployment low-participation equilibria in which they are trapped, it is therefore necessary to act on both the demand and the supply side. On the demand side, it is necessary to pursue greater decentralisation in collective bargaining; wages should be allowed to vary across regions so as to reflect more closely the differences in labour productivity and the cost of living. Decentralisation in pay determination should extend to the public administration, and be accompanied by the introduction of incentives for higher productivity and hiring procedures which discourage queuing.
On the supply side, the task is to bring welfare-to-work principles into the cash
transfers provided to non-employed individuals in these regions. A key requirement for this is to have unemployment benefits, rather than other instruments (like early retirement and invalidity pensions) which merely encourage non-participation in the labour market rather than supporting job search. Welfare-to-work should encourage regional labour mobility, but should circulate information on jobs available in more buoyant labour markets and sometimes also subsidise moving costs. Regional mobility should not necessarily involve long-range migration, as there are often areas within the high-unemployment regions that are more dynamic.
EMPLOYMENT FLEXIBILITY Finally there is the thorny issue of employment protection. In public rhetoric
it is common to attribute “high European unemployment” to high employment protection. But in fact employment protection is especially high in some European countries (like Portugal, Sweden, Norway and the Netherlands) where unemployment is well below the U.S. level. The bulk of the economic evidence suggests that employment protection raises long-term unemployment (by reducing hiring), reduces short-term employment (by reducing firing), and has no clear effect on total employment.18 But specific policies to prevent the closure of enterprises are inefficient.19
The main danger of employment protection is that it strengthens the hand of
workers in wage bargaining, leading to excessive wage pressure even when unemployment is high. Any effort to reduce employment protection should have this issue firmly in view. Unfortunately the famous Spanish labour market reform of 1984 did not.20 It introduced temporary employment contracts, while actually increasing the security of the insiders who were already employed. As a result there was no reduction in wage pressure. All efforts aimed at creating a dual labour market are likely to fail in exactly the same way as the original Spanish reform.
CONCLUSION: FLEXIBILITY IS NOT ENOUGH Our conclusion is that for unemployment what really matters is
• how unemployed people are treated, and • regional wage flexibility.
For the employment of older workers what matters is • reduced subsidies to inactivity, used if necessary to finance
employment subsidies

RL340a 21 October 2002
17
• lifelong learning • an older official retirement age, where appropriate, and • anti-discrimination legislation.
And for single mothers we need • reduced subsidies to inactivity • more child-care help, and • more opportunities to work part-time.
Can these principles be useful summarised as “more labour market flexibility”? Surely not. In many cases what is needed is more activism and even sometimes more regulation. So can we please stop pretending that “more flexibility” is the answer to all our problems.

RL340a 21 October 2002
18
2. THE BRITISH EXPERIENCE During the last decade the sustainable rate of unemployment in Britain has
been reduced from around 8½ per cent to around 5 per cent. The simplest way to demonstrate this is shown in Table 2. In 1989 labour shortages were intense and inflation rising, even though unemployment was nearly 7½ per cent. By contrast, in 2001 labour shortages were less than average, inflation stable and unemployment only 5 per cent.
The explanation of these changes lies mainly in changes in how unemployed
people are treated. But it also reflects the increased wage flexibility following the trade union reforms of the Thatcher period.
HOW UNEMPLOYED PEOPLE ARE TREATED We can divide the history of how unemployed people are treated into three
phases. In the first phase, lasting until 1986, there was a progressive relaxation of the “willingness to work” as a condition for getting unemployment benefits. In the mid 1970s the payment of benefit and the placing of unemployed people, which had previously been done in one office, was split into two separate offices making any work test more difficult to apply. And from 1982-86 benefit recipients did not even have to register for work. In addition signing on at the benefit office, which had been weekly, became fortnightly. It is not surprising that the sustainable rate of unemployment rose.
But from 1986 onwards the work test began to be used again and the system
tightened. In 1986 six-monthly work-focussed interviews (called Restart Interviews) began, and since 1990 benefit recipients have been formally expected to be “actively seeking work”. From 1990 onwards the benefit office and job centres were progressively reunited, and in 1996 the Job Seekers Allowance was introduced which allowed a personal adviser to issue directions to the job seeker.
Then in 1997 the Labour government came to power, with a strong
commitment to spend more money on helping the unemployed, but linking this to stricter obligations laid on the unemployed person. The central concept was the New Deal, under which unemployed people can no longer continue to live indefinitely on benefit. Instead they must be fully active after some period (6 months for people under 25, and 18 months for others). To understand how the New Deal works, one must begin with the overall framework for handling the unemployed.
Table 2 Britain: a comparison of two “peak” years
Unemployment rate Labour shortage index Change in
wage inflation 1989 2001
7.3 5.1
Highest ever since 1973 Much lower
+1% 0

RL340a 21 October 2002
19
Unemployment Benefit System Most unemployed people in Britain receive Job Seeker’s Allowance. The
level of benefit is unrelated to previous earnings, but it is higher if the person has a dependent spouse or children. It is means-tested, so that an unemployed person can gain very little extra income from small amounts of work. The level of cash benefit is quite low, but a half of all unemployed people also get their housing costs paid for in full.
Even so, for some people with large families the replacement ratio is quite
high: 5 per cent of people in work would keep 70 per cent of their net income if they became unemployed. To improve things, the government has “made work pay” better, by increasing the benefits paid to people who are in work but on low incomes, through a revamped and more generous system of Tax Credits. This has been a major part of government policy, which is aimed both at reducing poverty and encouraging work.
But more important for encouraging work are the conditions applying to
receipt of Job Seeker’s Allowance.
(i) The person must sign on at the job centre once a fortnight (on a specific day and time). He will have conversations of around 5 minutes with an adviser, who is meant to draw his attention to suitable vacancies.
(ii) Longer interviews lasting around an hour are held every six months. The person must have an “action plan” and can be subject to specific direction by the adviser – for example to attend a course.
(iii) For up to 13 weeks a person need look only for jobs like the one he lost. But after that he is in principle expected to consider any job in any occupation, provided it involves less than 1 hour’s travel each way. In practice these obligations are still not fully applied.
(iv) If individuals do not satisfy the above requirements, or become unemployed by quitting their previous job without just cause or being sacked for misconduct, they get no Job Seeker’s Allowance for up to 6 months, unless they qualify for hardship payments.
(v) Formally Job Seekers Allowance can be drawn without any time limit, but in practice the New Deal (discussed below) imposes a limit of roughly 10 months for people under 25 and 21 months for people over 25.
It is the job of the employment service to monitor whether people satisfy the
criteria for receiving benefit. If there is evidence to the contrary, the matter goes to an adjudicator. Table 3 shows how many people have their benefit cut. Sanctions may last for between a few days and six months. In addition those in the last three rows of the table lose their Housing Benefit, but not the others. (The numbers in Table 3 can be compared with some 3 million people who enter unemployment during the year and with nearly 1 million unemployed benefit recipients at a point in time).

RL340a 21 October 2002
20
Table 3 Number whose benefits were cut during the year: by reason for cut in benefits (2001/2)
Quit last job without good cause Lost last job through misconduct
77,000 16,000
Refused work without good cause Refused to attend course/programme Failed to attend interview
39,000 20,000
112,000
Not now available for work Not actively seeking work
10,000 11,000
Public employment service
The agency responsible for all this is a new agency called Jobcentre Plus. It is
responsible both for helping people find work (the old Employment Service) and for paying benefits to people of working age (the old Benefits Agency). In a single jobcentre building it helps not only people on Job Seekers Allowance but also lone parents on Income Support and people on disability benefits. The last two groups are not required to seek work, but everyone applying for any of these benefits must now start with a work-focussed interview.
Jobcentre Plus works through 1,000 job centres, and employs some 85,000
staff (full-time equivalents), who include those who calculate and pay benefits. It currently services about 950,000 unemployed benefit recipients at any one time. It has about 2.5 million vacancies referred to it each year – about ⅓ of the total vacancies created in the country. It fills about 1.1 million of these vacancies itself, mainly with unemployed people, thus placing about a third of all the people who become unemployed each year. Clearly with more resources it could place more unemployed people more rapidly. It has a computerised system of vacancies, but with the existing IT facilities it is not yet possible to print off a list of suitable vacancies for every unemployed person each time they sign on. This would be highly desirable. It also provides information on vacancies through touch-screen computers, which job seekers can use at job centres, printing off relevant details.
There are no limits on the rights of private sector companies to set up as job-
brokers in competition with Jobcentre Plus. For, though the market for job-matching is imperfect and therefore needs public intervention, this provides no argument for limiting entry.
To do its work most effectively, Jobcentre Plus must be able to help people
become more employable. Many people are so disadvantaged that they need to be referred to courses in job-search methods, or to job clubs which assist job-search, or to vocational training. It has long been the job of the employment service to do this, and it has always had some funds to buy these services.

RL340a 21 October 2002
21
New Deal But since Labour came to power a quite new line of thought has been added in
– that people ought not to remain unemployed beyond a certain time limit. It is very bad for anyone to continue unemployed for a long time. If they are desperate to work, it is deeply depressing. Or, if they are working the system (for example “working while drawing benefit”, as a number do), it is an abuse of tax-payers’ money. On top of this, long-term unemployment stigmatises a worker and makes it increasingly difficult for him to find work.
So there should be a point at which it becomes impossible for a person to
remain at home drawing benefit. Instead people ought after a period to be guaranteed activity and to receive their income through activity rather than inactivity. Activity should be a mandatory condition for income. This is the idea behind the New Deal.
Since 1998 there has been a New Deal for Young People, and since 2001 a
comparable New Deal for people over 25. Each New Deal has a “gateway” lasting up to 3-4 months, during which intensive efforts are made to place the person in regular work or on suitable New Deal programmes. Once placed a person must be active for at least 6 months (young people) or 3 months (adults) before they can again be inactive recipients of benefits.
For young people the possible forms of activity are
• a subsidised job with a regular employer (secured by a 6-month subsidy of £60 a week
• work experience in the voluntary sector (while receiving benefit plus £15 a week) • work experience in an environmental project (ditto) • full-time vocational education (while receiving benefit) All the options include training for at least a day a week. For adults the options are less structured and are focussed on leading as soon as possible to a regular job.
The Youth New Deal has been a clear success. Despite the obligations it has put on young people, it has been very popular. It has virtually eliminated long-term unemployment among young people, but has not (as was feared) led to any increase in short-term unemployment (due to increased churning). It has been subject to a number of independent evaluations, which all come to broadly similar conclusions.21 The programme is judged to cut youth unemployment by at least 35,000. It costs about £350 million a year in gross terms but is estimated to cost under £150 million net, after allowing for savings in unemployment benefits and extra taxes. So the net cost to the Exchequer per extra person in work is about £4,000 per annum. On the test of net benefit to society it passes with flying colours.
The adult New Deal has only existed for a year in its present form, so it is too
early to offer definitive evidence. But the results appear to be as good as for the Youth New Deal. The same is true of the less tightly focussed arrangements provided through the private sector in so-called Employment Zones.
Many of Britain’s unemployed are virtually illiterate and innumerate. About a
third cannot read the instructions on a medicine bottle or calculate the change they should receive after a simple purchase at a shop. Plans are being prepared for

RL340a 21 October 2002
22
compulsory screening and training of unemployed people with basic skills problems. It is important that this screening happens as early as possible so that no unnecessary time is wasted.
SINGLE MOTHERS AND OLDER WORKERS Britain has a remarkably large number of working-age households in which no
one is working – one of the highest rates in Europe. This is a major cause of poverty – both among children and among older people. One third of Britain’s children live in families with under half the average income per head. Many of them are one-parent families, where the mother does not work – Britain is almost the only E.U. country where single mothers are less likely to work than women in general.22 But in all families where no one is working it is highly desirable to increase employment.
The government has two main methods to promote this. One is to ‘make work
pay’. The government has greatly enhanced and rationalised income support for workers who are low paid, as well as introducing a National Minimum Wage.
But equally important effects on employment are likely to follow from the
second strand of current reform, which is to alter the conditions for entitlement to benefits. At present 850,000 single parents are living on Income Support, and some 1.7 million working-age people are living on long-term disability benefits and not working. (Half of these are over 50.) Many single parents stay on Income Support for long periods (60 per cent for over 2 years). And once somebody goes on disability benefits they rarely come off before they reach pension age, even if their health condition improves enough for them to do many kinds of work.
Neither of these groups is currently required to seek any kind of work. But for
both groups the government has introduced compulsory work-focussed interviews when they first apply for benefit and at specified intervals thereafter. There is no compulsion to work, so far at least, but there is compulsion to attend the interview. In addition there is an evolving New Deal for Lone Parents in which a much wider range of help is provided, and a comparable New Deal for Disabled People.
We do not yet know what the effects of all this will be. But it is an area of
major potential change. Since information about jobs and the payment of benefits are now linked in a quite new way through the new unified Jobcentre Plus, we now have a system which over the medium term is highly likely to increase participation and to reduce unemployment.
WAGE FLEXIBILITY As we mentioned in section 1, the greatest problem with wage rigidity is its
impact on regional (and sub-regional) unemployment. This has historically been a major problem in Britain. In the 1989 boom the level of unemployment in the North remained high, while that in the South fell sharply (see last two rows of Table 4). However, during the 1990s most of the gross regional inequalities have disappeared,

RL340a 21 October 2002
23
leaving high unemployment blackspots within every region but low-unemployment areas in every region also.23
So what has changed? As Table 4 shows, there has been a dramatic reversal in
the drain of jobs out of the North. This change in employers’ behaviour results in part from the lowering of wages in the North relative to those in the South. As Figure 7 shows, relative wages have responded to differences in unemployment rates. Moreover, this responsiveness has risen over time, reflecting the diminished power of national trade unions caused by a series of legal changes in the 1980s and by a smaller membership.
As the drain of jobs ceased, migration from North to South fell. But some
migration continued in response to differences in wages and job opportunities. It was the combination of more jobs and fewer people that cut the relative unemployment rate in the North.
Table 4
Britain's North-South divide, and how it was reduced
1979 1989 2000
Unemployment Rate North 5.1 7.7 6.3 South 3.1 3.8 4.6
Employment
North as % of South 129.1 115.3 117.1 Labour Force
North as % of South 131.8 120.1 118.5 Wages
North as % of South 91.3 80.4 81.9 Note: In this analysis, South=South-East, South-West and East Anglia;North=rest of Britain
Figure 7 Unemployment rates and the change in male wages : (1974-1997)
South East East Anglia
South West
Scotland
North West
Yorkshire and Humberside
East Midlands
Wales
North
West Midlands
6
7
8
9
10
11
12
13
14
15
16
-12 -10 -8 -6 -4 -2 0 2 4 6 8 10 Relative change in male wages (%)
Une
mpl
oym
ent r
ate
(%) 1
984
Figure 7 Unemployment rates and the change in male wages:
Britain 1974-1997

RL340a 21 October 2002
24
EMPLOYMENT FLEXIBILITY Employment protection has never been as strong in Britain as on the
Continent. Between 1965 and 1975 the government introduced successively minimum levels of severance pay, protection against unfair dismissal, and minimum periods of notice for redundancy. These laws applied from 1975 onwards to workers who had been in the employer’s service for over 1 year. However in the 1980s the Conservative government weakened the laws by confining them to people employed for over 2 years. But in the 1990s Labour again reverted to the 1-year cut-off.
This issue has not been a major source of controversy in Britain. For most
Britons the main issues about government policy concern benefits and the conditions attaching to them. In particular people ask why unemployment is still so high compared with the 1960s, even though vacancies often exist within travelling distance of the unemployed.

RL340a 21 October 2002
25
3. THE DANISH EXPERIENCE
During the last decade unemployment has declined from 10.6 per cent (1993) of the labour force to 4.2 per cent (2001)24. At the same time employment has increased by about 6.5 per cent of the labour force and the number of full time persons taking part in training and other active policy measures has been reduced from 6.6 per cent per cent in 1996 to 4.5 per cent in 2001. OECD (2001) estimates the costs of the active labour market policy in Denmark to be 1.6 per cent of GDP, which is among the highest in the OECD-countries.
The explanation of these changes lies in changed labour market policies, changed macroeconomic conditions, changed wage expectations and changes in the bargaining system. Below, we will focus on the role of labour market policies and the changes in that.
HOW UNEMPLOYED PEOPLE ARE TREATED
Since unemployment became a problem in the Danish economic policy in the mid-1970s, various policies have been tried to weaken the adverse effects on individuals and society. For a long time, the main emphasis was to prevent direct loss of income, to maintain the ability to work and to prevent psychological problems for those hit by severe unemployment. Therefore, most labour market policies had income maintenance as the main focus. Some of these policies have had the clear objective of diminishing the labour force. For long, the main policy instrument was to prolong the maximum period of unemployment benefit so that as few as possible would exhaust their benefits. That policy was given up with the reforms in 1994 and later. However, the backbone of the unemployment system is still the UI-benefit.
UI-benefits
In Denmark, unemployment insurance is organized on a voluntary basis as in Finland, Sweden and Belgium, with a common offspring in the guild system and the German UI-funds.25 There are 35 unemployment insurance funds, and most of them are informally linked to one or two Trade Unions. Legally, there is no connection, but in reality memberships of a union and the UI-fund are solicited by union representatives as one package. In order to get UI-benefits, an employee must have been a member for more than 1 year, unless he has graduated from an education/vocational training lasting more than 1.5 years, and he has worked for more than 52 weeks within the last 3 years. Furthermore, he has to be registered at the Employment Service and has to be available for work. Members of the UI-system get their benefit through the UI-fund, while counselling and activation are administrated by a system of state-run employment offices. The membership fee (tax deductible) is equal to maximum benefits for 6 days plus some costs (about €500 in 2001). Expenditure of the UI-fund in excess of this revenue is paid by the state. This indirect subsidy is probably the reason why 78 per cent of the workforce is a member of the UI-system.

RL340a 21 October 2002
26
The benefit is 90 per cent of the previous hourly wage up to a maximum of € 406 per week, which is € 10.99 per hour in 2002. This means that people earning less than € 12.21 per hour have a replacement ratio of 90 per cent and people earning more have a lower replacement ratio. The reference wage is calculated as the mean wage over the last 3 months. If the unemployment in one week is less than a full workweek, i.e. below 37 hours, benefits are reduced to 82 per cent of the normal benefits on an hourly basis. The same rule applies to eligible members who come directly from education. Benefits are taxable like most other income support in Denmark.
For non-members losing their jobs, there is a similar welfare payment, though it is means-tested on the basis of the household income and wealth. The welfare benefit is part of the social welfare programs, which also run a separate activation system for those who are able to work. Active labour market policies 26
Until 1994, active labour market policies consisted of a job offer and a training programme, an educational subsidy system, AMU courses and a programme for subsidies to newly-started self-employed people. The job offer scheme offered 7 or 9 months’ jobs to long-term unemployed with a total unemployment duration of more than 2 years. These jobs counted against eligibility to another period on unemployment benefit. The maximum duration of benefits was at that time 9 years. Participants in these schemes were paid the normal unemployment benefit. The scheme to promote self-employment paid half of max UI-benefits for a 3-year-period. Finally, there were AMU courses, where unemployed and employed could get training in specific skills, for example in operating specific equipment.
After the “Labour Market Reform of 1994” and subsequent changes,
unemployed members of an unemployment insurance fund have the right and the responsibility to take part in some type of activation program after 12 months of unemployment measured over a 24-month-period.27 The first period of 12 months is without other obligations than looking for a job. The activation period can then last for up to 3 years. In this period, the unemployed person has to be active more than 75 per cent of the time. The unemployed person will receive unemployment benefit throughout the 4 years, though the wage under job training may be higher according to the type of job.
As a result of the 1994 reform, none of the subsidized job-training periods
under the labour market programmes count against eligibility to further unemployment benefits. However, this did not lead to more people exhausting their benefits than before the change. The reason is probably that the labour exchange offices use a lot of effort to provide jobs to this group. Another exit possibility is health-related retirement. This issue has not been dealt with in any investigation so far.
The main activation measures are job training and education. The purpose is
to give the unemployed an opportunity to get back into work through a job-training period with a private or public employer. A private employer receives a fixed subsidy

RL340a 21 October 2002
27
of about half a normal low salary for a 6-month-period and has to pay a wage usual for that particular job, whereas the public sector pays a fixed, relatively low wage. The ratio between private and public job training has been around 1 to 4 before and after the reform. Furthermore, individual job training can be arranged for people who have difficulties getting a job because of long-term unemployment or poor educational background. In addition, activation can occur in so-called pool jobs in the public sector.
Education is another type of activation. Education can be taken at ordinary
educational institutions or as courses designed for the unemployed. Ordinary educational courses have to be on a list issued by the Ministry of Employment. Unemployed people enrolled in education can obtain unemployment benefits for a period of up to 5 years. Ordinary educational courses with benefits have become very popular in recent years, so 4 out of 5 in the education programme choose ordinary educational courses.
The other big programme providing education was the leave scheme for
education. This was in effect from 1992 to the end of 2000. The leave scheme for education gave paid leave from a job on condition of the consent of the employer. Even unemployed people could get leave for education and would not be bothered with job offers. Benefits were full UI-benefits and educations should be picked from a list. The number and variety of educations started out with few constraints, but became more and more limited over time until it was abandoned by the end of 2000.
Finally, it should be mentioned that a few other programmes were introduced,
which never really caught big numbers: job rotation and the home service scheme. Job rotation introduced in 1992 gave support to education and training schemes for employed people, provided an unemployed person was employed as substitute. The improved business cycles probably worked like a severe tranquilliser on this programme. The home service scheme is an arrangement where certified firms can get state subsidies to employ people to do household services. This subsidy makes firms able to compete with black market activities.
A special youth programme was introduced in 1996, which covered young
people below 25. The initial period on normal UI-benefit lasts only 6 months.28 After that, the youth has the right and the responsibility to take education of at least 18 months duration, if he/she has no prior vocational training. If the unemployed person has a vocational qualification, the compulsion is to take job training. For both groups benefit is 50 per cent of the UI-benefit. Non-compliance means a complete stop for all benefits.
This program has clearly had an impact on the unemployment of youth.29 But the relatively high growth rate in the economy has also had a positive impact on the demand for youth. The other programs have also been evaluated. The general impression is that the subsidized job training schemes in the private sector have a positive impact because they create a match. If the person does not stay with the employer after the training period, the effect is rather dubious. Similarly for the public sector jobs. It is also hard to find a clear positive effect of the educational programs. At face value some of the programs look beneficial, but when taking the

RL340a 21 October 2002
28
relatively long duration of the program where people do no search into account, most programs look less favourable.
Incentive problems
The purpose of the high replacement ratio is to prevent a possible loss in welfare, if the person becomes unemployed. However this creates, an incentive problem because the high replacement ratio makes the income from finding a job little different from the income as unemployed. If the unemployed person is eligible to other transfer payments, the problem is aggravated. It has been demonstrated that in Denmark 23 per cent of all employed women and 12 per cent of all employed men earn less than € 67 extra per month by working compared to receiving benefits.30 Similar incentive problems exist in many other countries but they are probably more serious in Denmark because benefits for low-wage earners are so high (90 per cent) and benefits are not reduced over time as in most other countries. Furthermore, income tax is high meaning that extra income earned is taxed by a minimum tax of 43 per cent. Similarly, on the employers’ side there is only a small incentive to limit the use of unemployment as a means to adjust to temporary business downturns and to seasonal fluctuations in labour demand. An employer-paid first day for each unemployment spell was introduced in 1988. This was later extended to two days.31
The effect is not only that a number of people choose to leave work with
benefits if they can, but also that the labour supply by low-wage groups is limited. Thus, it has been shown that the average number of hours worked during a year by men in the lowest decile of the wage distribution is less than 2/3 of a full working year. The main source of finance for this is the UI-system32 and even with low overall unemployment in 2001 20 per cent of the employed have received unemployment benefit. At the peak of unemployment, this percentage was 32 per cent.
Incentive problems are even more serious for those who are not insured and
receive welfare payment but are able to work. Since welfare benefits are means-tested, labour income is taxed at 100 per cent up to the maximum income for eligibility of welfare benefits. For couples where both are unemployed this means that one spouse must actually receive a relatively high income if their total income is to exceed the welfare payment. The incentive problems are especially serious for workers with low skills, low wage and high replacement ratios and for those with high opportunity costs of working. The groups most affected are accordingly immigrants families where both spouses are on welfare, low skilled workers and, especially, lone mothers.
A reform in 2002 has lowered the maximum welfare pay in order to reduce the
problem of welfare recipients. Furthermore, the special youth package has been extended to cover the age group 25-30, with some special concerns for low-income families.
Earlier, single mothers received means-tested child support. The implicit tax
rate for the low-wage single mothers was as a consequence very high, and the resulting labour participation rate was accordingly low. Child benefit was therefore
RL340a 21 October 2002
29
changed into a lump-sum benefit for most mothers, and it was clearly seen that the labour force participation rate increased.33
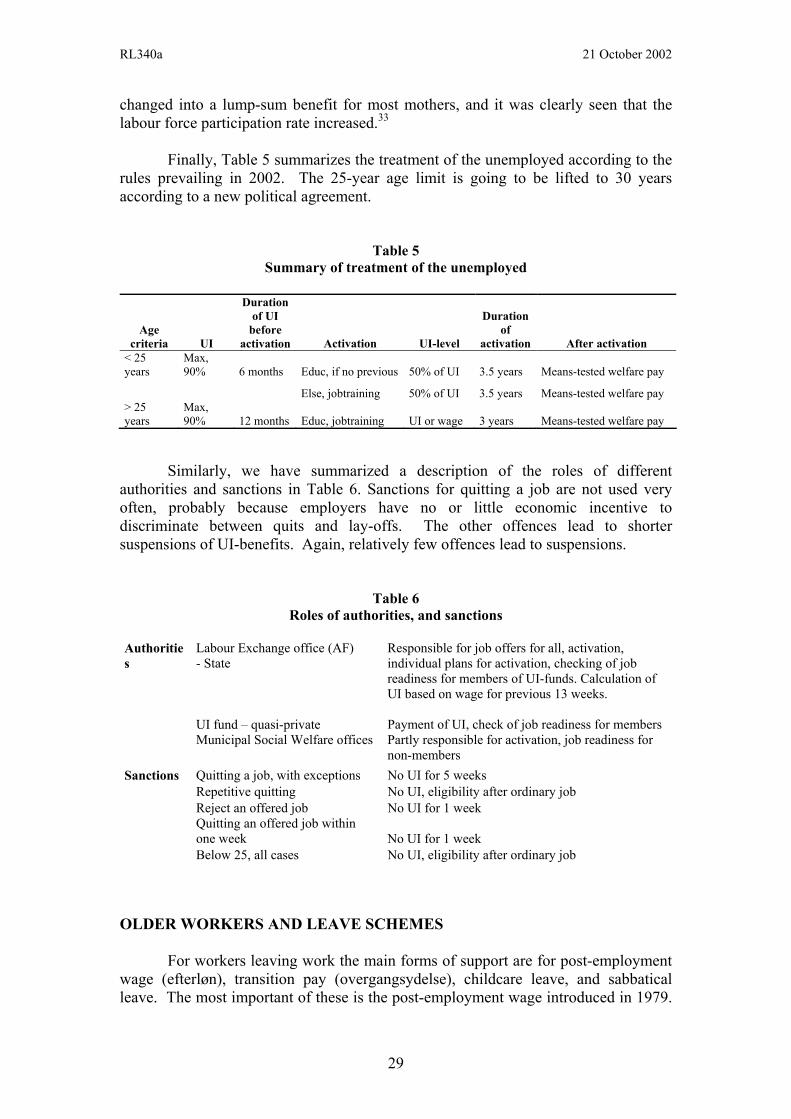
Finally, Table 5 summarizes the treatment of the unemployed according to the
rules prevailing in 2002. The 25-year age limit is going to be lifted to 30 years according to a new political agreement.
Table 5 Summary of treatment of the unemployed
Age criteria UI
Duration of UI
before activation Activation UI-level
Duration of
activation After activation < 25 years
Max, 90% 6 months Educ, if no previous 50% of UI 3.5 years Means-tested welfare pay
Else, jobtraining 50% of UI 3.5 years Means-tested welfare pay > 25 years
Max, 90% 12 months Educ, jobtraining UI or wage 3 years Means-tested welfare pay
Similarly, we have summarized a description of the roles of different
authorities and sanctions in Table 6. Sanctions for quitting a job are not used very often, probably because employers have no or little economic incentive to discriminate between quits and lay-offs. The other offences lead to shorter suspensions of UI-benefits. Again, relatively few offences lead to suspensions.
Table 6 Roles of authorities, and sanctions
Authorities
Labour Exchange office (AF) - State
Responsible for job offers for all, activation, individual plans for activation, checking of job readiness for members of UI-funds. Calculation of UI based on wage for previous 13 weeks.
UI fund – quasi-private Payment of UI, check of job readiness for members
Municipal Social Welfare offices Partly responsible for activation, job readiness for
non-members Sanctions Quitting a job, with exceptions No UI for 5 weeks Repetitive quitting No UI, eligibility after ordinary job Reject an offered job No UI for 1 week
Quitting an offered job within one week No UI for 1 week
Below 25, all cases No UI, eligibility after ordinary job OLDER WORKERS AND LEAVE SCHEMES
For workers leaving work the main forms of support are for post-employment wage (efterløn), transition pay (overgangsydelse), childcare leave, and sabbatical leave. The most important of these is the post-employment wage introduced in 1979.

RL340a 21 October 2002
30
Here, insured members of the UI-funds, who are between 60 and 67 of age, can obtain early retirement. In the first year 48,000 persons went into this programme. After the start, more and more of each age cohort above 60 have taken the post-employment wage, with the result that in 2001 158,000 persons or 5.5 per cent of the labour force were on the scheme. From the age of 62, more than 50 per cent of the formerly working cohorts are now on the post-employment wage.
In 1999 the programme was supplemented by a substantial premium if
participation in the post-employment pay program was postponed until after the age of 62. At the same time the required membership duration was extended. These changes in the rules have not stopped the reduction of the retirement age. The reason is undoubtedly that the benefit paid by the state to those leaving early is so big that when it is added to the alternative value of time, the extra premium for continuing work does not materially alter the economic incentive to work.
Transition pay was an offer to unemployed between 50 and 60. The offer was that they could get 82 per cent of the highest UI-benefit if they left the labour force for good. This programme was in effect from 1992 to 1995 and was chosen by about 44,000 persons.
The leave scheme programme, introduced in 1992 and reinforced in 1994, made it possible to take childcare leave. The leave period is 8 to 52 weeks. All parents with children below the age of 9 are eligible for childcare leave. Unemployed people and welfare recipients are also eligible. The benefit is 60 per cent of the highest UI-pay. To a large extent, childcare leave is used to extend maternity leave and it has been used to reduce the pressure on many municipal day care programmes. Finally, the sabbatical leave programme should be mentioned. It was in effect from 1994 to 1999 and made it possible to take leave for purely sabbatical reasons. The rules were similar to the other programmes with two exceptions: the employer must give his consent and he should employ a long-term unemployed person as a substitute.
The rationale behind the leave schemes was undoubtedly to create temporary job openings for the unemployed, making it possible for the unemployed to get a foothold in the labour market. But the programme was not limited to the employed. Indeed a large fraction of the leave takers were unemployed. In other words the unemployed got an alternative to searching for a job. Thus, the introduction of the new schemes can be interpreted as a rise in the reservation wage for the unemployed and for those who are considering taking leave from a job. Furthermore, the introduction of the programmes coincided with a growing demand for labour. As a result, a real shortage was created in some professions (nurses for example), where the loss for the individual due to the lower replacement ratio (the UI pay divided by the alternative wage) was limited. Finally, the de facto extension of maternity leave was considered by some to be harmful to the careers of women.
The leave programs have now been stopped because they lack political support.

RL340a 21 October 2002
31
WAGE FLEXIBILITY
Until 1987 wage bargaining in Denmark was characterised as central, though there was also decentralized wage bargaining. The system was characterised by fixed wage scales where experience in the trade, or age and education, were important parameters. However, wages have always been allowed to differ in level between firms. The first step towards decentralizing the wage bargaining was taken in 1987. Bargaining was shifted down to industry and firm level and the system was characterised as coordinated wage bargaining within strict guidelines.34 These guidelines were finally abandoned in 1993 and wages were then fully negotiated at firm level. This has started a process whereby more and more wages are individualized and more and more employees negotiate their wages directly with their employer. Table 7 shows that the centrally-bargained contracts have been replaced first by decentralized bargaining and later to some extent by contracts where there is not even a wage rate. This means that firms will have to negotiate the wage with the employee without any constraints. This allows for the use of modern performance-related pay at all levels in private firms.
Table 7 The development in bargaining, 1989-2000, private sector. Percentage.
1989 1991 1993 1995 1997 2000
Central Bargaining 34 19 16 16 16 15
Wage is in principle negotiated between employer and employee 62 77 80 73 67 65
No wage rate in workplace contract 4 4 4 11 17 20
Total 100 100 100 100 100 100
The decentralization of wage setting is probably important for the explanation of the growth of the Danish employment in the 1990s, which took place without the usual sharp increase in all wages and prices following a period with increasing demand and falling unemployment. Firm-level wage setting makes it possible for firms to reward workers for higher productivity without creating inflation.
A similar development has not yet occurred in the public sector. Here, wages
are to a great extent still largely determined at the central bi-annual bargaining. But even here local possibilities for giving individual allowances on top of the wage scales have been created. The new wage system called “New-wage” has many fewer steps on the ladder than used to be the case. It is the intention that more of earnings should be paid as personal allowances, depending on qualifications, job functions and individual productivity.

RL340a 21 October 2002
32
EMPLOYMENT FLEXIBILITY
Denmark has one of the lowest levels of employment protection in Europe. In most cases, blue-collar workers can be laid off at very short notice. This has been widely accepted among unions and legislators because it creates a flexible labour market that allows for the most efficient use of labour. For the trade unions, the compensating arrangement is undoubtedly the high UI-benefit. One of the immediate costs of lowering employment protection is undoubtedly higher turnover. Danish turnover is as high as 30 per cent on average. It is somewhat higher among young people, but the general result is that all ages and occupational groups more or less equally share the “burden”.
By contrast in countries with stricter employment protection those without
tenure tend to carry the burden of turnover, and this creates the usual insider-outsider problems. In several E.U. countries the unemployment rate of youth is more than 20 per cent while it is about 3 per cent for Danish youth. Of course, there are other reasons for this, the most important being the Danish apprentice system. But one may conclude that higher employment flexibility (and higher turnover) in Denmark does not lead to higher unemployment.
WHAT CAN BE LEARNED FROM THE DANISH EXPERIENCE?
The major changes in the labour market policies after 1994 were a gradual reduction of the maximum length on UI, and earlier activation. These elements clearly reduced the reservation wage for the unemployed and therefore reduced unemployment. At the same time a number of leave schemes were introduced for employed and unemployed people and a supplementary early retirement scheme allowed unemployed people in the age group 50-60 years to retire early. These policies had the reverse effect on reservation wages and unemployment. More recently, these latter policies have all been abandoned.
The youth program, which combines early activation and lower benefits (after
6 months of unemployment) seems to have had an effect. The lack of economic incentives to take work (except for young people) means that many resources are spent on counseling, control, and activation. The better employment and lower unemployment is of course associated with the relatively high economic growth and relatively low wage increases in Denmark since the beginning of the 1990s.35

RL340a 21 October 2002
33
4 THE DUTCH EXPERIENCE36
Nowadays the Netherlands is one of the countries with the lowest unemployment rate. In 2001 registered unemployment amounted to only two per cent of the labour force, which is probably below the equilibrium level of unemployment. Many firms have considerable problems in filling their vacancies.
It has not always been like that. In the second half of the 1970 and the first
half of the 1980s unemployment in the Netherlands grew to levels unprecedented in the post-war period and higher than in most other European countries. In 1983 the unemployment rate reached its highest level of 12 per cent. In that period both the participation rate and the employment rate were much lower than in most other Western European countries. In 1983 the participation rate (16-64), for example, was only 59 per cent, compared to a E.U. average of almost 66 percent. By 2000, however, the Dutch figure had grown to 75 per cent, while the E.U. average was only slightly higher than in 1983 (70 per cent).37 A similar pattern can be observed with respect to the participation rate. Admittedly, a considerable part of the new jobs are part-time jobs. Furthermore, a substantial number of people have disability benefit, but some of them could also be labelled as unemployed. However, even if we take account of these points, the labour market performance of The Netherlands is impressive compared to most other countries.
Why did the labour market situation in the Netherlands improve to such an
extent while other countries such as France, Germany and Italy still experience high unemployment rates? Given the fact that all these countries face more or less similar external circumstances, internal factors must be responsible for the relatively good performance of the Netherlands.
In this chapter we focus on labour market policy in the Netherlands and the
extent to which it may have contributed to the favourable situation on the Dutch labour market. What has changed in Dutch labour market policy since the 1980s? What makes Dutch policies different from those in the other E.U. countries?
HOW UNEMPLOYED PEOPLE ARE TREATED Active labour market policy
What makes Dutch active labour market policy (ALMP) different from that in (most) other countries? The following points seem to be most important:
• the radical change of the institutional structure; • the high level of ALMP expenditure and the emphasis on subsidized labour; • the emphasis on prevention in active policies.
Institutional aspects
Logically we have to begin with the changes in institutional structure,
although these are not the main reasons for the success of the policy. In the early

RL340a 21 October 2002
34
1990s the Netherlands still had the traditional structure in which the Public Employment Service (PES) was a part of the Ministry of Social Affairs and Employment and was mainly responsible for implementing active labour market policy. It held, for example, a monopoly in job brokerage. By the end of the century the system had been transformed into a market-driven system in which implementation is largely outsourced to private companies. During the transformation process a tripartite system was attempted and finally abandoned.
It is unlikely that these institutional changes have increased the effectiveness of ALMP. The change to a tripartite system in the early 1990s, which was accompanied by decentralization of the PES and abolishment of the state monopoly in job brokerage, was evaluated in 199538. No evidence was found for a positive effect, neither on the output of the PES, nor on labour market performance. The reason why the abolition of the state monopoly in job brokerage did not have an effect was that, despite this monopoly, de facto many private temporary work agencies (TWAs) were already highly active in job placement. Often employers used temporary work as a hiring and selection device for new workers.
After the 1995 evaluation several changes in the institutional structure of AMLP took place, which gradually transferred the responsibility for ALMP from the PES to the bodies dealing with unemployment benefits. The UWV is responsible for social security benefits, including unemployment insurance benefits. Unemployed persons who are not entitled to an unemployment insurance benefit may apply for a social assistance benefit, which is paid by the municipality. Nowadays funding for ALMP is almost completely done by the UWV and the municipalities. The latter organizations must outsource implementation of placement and training activities largely to private organizations using auctions or beauty contests. The part of the former PES dealing with such activities has been privatized and is now one of competitors in this market. Employment offices still exist, but became part of new local organizations, the Centers for Work and Income. Their main tasks are collecting and diffusing labour market information; profiling clients; and referring the latter to UWV or municipalities for a benefit and, for clients at high risk of long-term unemployment, for special help (job counseling, training or placement in a subsidized job). The CWIs offer no specific services to employers.
The new system is clearly suffering from teething troubles.39 The responsible bodies (UWV and municipalities) are still learning to deal with tender procedures. However, there are some points of concern:
- There is little we know about the effectiveness of the measures. Evidently, evaluation is more complex when a large number of institutions are involved.
- There is a strong focus on short-term placement results leading to underutilization of the training instrument.
- The incentives for the benefit-paying organizations to reduce the number of beneficiaries are insufficient.
In attempting to improve the performance of ALMP too much emphasis has been put on the institutional framework. What was and is still missing is a thorough analysis of market failure, effectiveness of various measures and policy priorities.

RL340a 21 October 2002
35
Expenditure and types of measures
Up to the early 1990s ALMP expenditure as a percentage of GDP amounted to approximately one percent. Then it gradually increased to some 1.6 percent, which is higher than in most other E.U. countries. However, during most of the period under consideration, the figure was not higher than the E.U. average and often below it.40
What seems to be different in the Netherlands is the emphasis on subsidized labour. In 2000 two-thirds of the available resources was spent on sheltered employment for the disabled and on subsidized jobs for the long-term unemployed. The increase in ALMP expenditure between 1990 and 2000 is largely due to higher expenditure on subsidized jobs. Therefore, we are inclined to conclude that as far as ALMP has contributed to the improved labour market performance, the effect can largely be attributed to the increased use of job-creation schemes for the long-term unemployed. Evaluation studies indicate that the percentage of the participants that would have remained unemployed is much higher for this type of measure than for most other measures. It is also clear that most of the subsidized labour is useful to society and would not exist without the subsidies (although in many cases the work has previously existed and has disappeared owing to budget cuts). Forerunner in preventive policies
Already in the second half of the 1980s the Netherlands started to move from an essentially reactive approach to ALMP to a more proactive one. During the early 1990s a law was introduced obliging the government to do two things:
- to reinforce its efforts to place young jobless people in regular jobs or find them a position as an apprentice;
- to offer a subsidized job to those unable to find a regular job or training position, preferably not later than six months after entering unemployment, but certainly not later than one year.
This contributed to solving the youth unemployment problem. Later on, the same approach was introduced for the other age groups among the unemployed. This became known as the ‘full-coverage approach’ (‘sluitende aanpak’ in Dutch). Nowadays, this approach forms one of the corner stones in the guidelines for the European Employment Strategy. Benefits
In the Dutch situation benefits have had a distorting effect on the labour market. It became clear that, for those depending on low-paid jobs, accepting a job hardly increased their income as social benefits are related to net minimum wages. Furthermore, most municipalities had special arrangements for minimum income families (such as free access to certain services). Owing to these arrangements people could in some cases even experience a reduction in net family income when accepting a job, which may lead to prolonged unemployment (the so-called unemployment trap). More generally, high replacement rates increased the use of social security and

RL340a 21 October 2002
36
social assistance and reduced the outflow from it, resulting in a high incidence of long-term unemployment. Until 1998 the share of the long-term unemployed in total unemployment was almost 50 per cent. Then, it dropped rapidly.
Several measures have been taken to reduce the inflow of new benefit recipients and to increase the transition from beneficiaries to a paid job. First, the entitlement criteria for an unemployment insurance benefit have been stiffened. Furthermore, benefit duration has been made dependent on work history. These changes have led to a lower inflow into unemployment and a shorter average unemployment duration.
In the Netherlands benefits are connected to the net minimum wage. As a percentage of the average wage the latter has decreased significantly over the years (see below), implying that benefits have also considerably lagged behind average wages. There is evidence that this development has contributed to the reduction in unemployment.41 However, the connection with the minimum wage implied that the unemployment trap was hardly reduced for people depending on the low-wage segment of jobs. In the second half of the 1990s a situation emerged in which many beneficiaries could find a job, but not all wished to accept one. So far the government has been reluctant to further lower benefits. The tendency has been to reinforce penalties and to introduce bonuses rather than to further reduce benefit levels.
A number of studies have shown that the threat of losing (part of) one’s
benefit in case of inactive job search behaviour and reluctance to accept jobs is already an effective tool to stimulate the transition to work.42 Furthermore, the incentive for unemployed people to accept a job was increased. First, people in work received tax reductions. In 2001 specific bonuses for the long-term unemployed taking work were also introduced on a national scale. Before the introduction of this national scheme individual municipalities applied their own specific bonus schemes. An evaluation study suggests that the effects of these municipal schemes have been small.43
So far, we have dealt with unemployment benefits. However, the pressure
was not only increased on workers and benefit recipients, but also on employers. The reform of the Disability Act (see the next section) is particularly important in this respect. Furthermore, unemployment insurance is only partly financed on the basis of a collective system on the national level. The other part is financed collectively at the level of the industry. Therefore, premiums differ between industries. During the period under consideration, the component that differs between industries has been increased twice. EARLY RETIREMENT AND OTHER POLICIES FOR EMPLOYED PEOPLE
During the 1970s and 1980s early retirement was still seen as an important way to increase the job chances of young people in a situation of high unemployment. The government stimulated early retirement both in official and unofficial ways. The official way was creating fiscal incentives. Unofficial ways were:
- allowing people to use the disability scheme (WAO) in case of skills obsolescence;

RL340a 21 October 2002
37
- allowing employers to fire older workers first, during an economic downturn;
- exempting older unemployed people from the duty to look for a job. Using the disability scheme was both attractive for employers and older workers. For employers it was an easy way to get rid of workers with relatively high costs and low productivity. As disability benefits were relatively high, it was also attractive for workers. Not surprisingly, the participation rate of older workers fell considerably.
The increasing financial burden of the disability act (WAO) induced the government to limit access to this scheme. Several changes in the disability act were carried through, reducing the incentive for both the worker and the employer to use the scheme. It is no longer possible for older workers to obtain a disability benefit when the transition to inactivity is essentially caused by economic reasons. Furthermore, the level of disability benefits has been cut considerably. Finally, a system of experience rating was introduced making the premiums for the employer dependent on the number of his workers that have enrolled in disability in the past.
There is a similar tendency to reduce the attractiveness of early retirement schemes, which are determined by the social partners at the sectoral level. The fiscal advantages of early retirement have been reduced somewhat and a further reduction is planned. Finally, it is no longer possible for firms to give priority to firing older workers.
Not only lowering the inflow into disability, but also increasing the outflow from it, reduces the use of the disability schemes. Specific measures have been developed to stimulate the outflow by making use of instruments such as training and placement. In a recent evaluation positive net effects on job entry rates are found for these measures.44
Burnout and disability at older age can to some extent be reduced by increasing job mobility, training, and opportunities for temporary withdrawal from the labour market during one’s career. The concept of “transitional labour markets” stresses the importance of more diverse patterns in work, training, and time for care activities over the life cycle.45 Slowly, some institutional changes in this direction have been made. Possibilities for temporary leave are somewhat enlarged and plans have been developed for the introduction of a so-called life cycle insurance for individual employees to save time for leave and training in the future. However, the Netherlands is not the forerunner in this field: international statistics show, that regarding participation in continuous training, for example, the Netherlands holds an average position among the E.U.-countries.
To what extent did the measures taken improve the employment rate among the people aged over 55-64? Between 1995 and 2000 it increased from 30 to 38 per cent and is now almost at the European average.46 This points to some success. However, the increasing employment rate in this age category reflects partly the general increase in participation and employment for women (see the next section).

RL340a 21 October 2002
38
LABOUR MARKET PARTICIPATION The labour market participation of the category aged over 50 was discussed in the previous section. In this section we deal with two other groups: women and ethnic minorities. Women
The Netherlands clearly differ from other E.U. countries in the sense that: - the labour market participation rate among women was historically very
low; - this rate has increased rapidly since the early 1970s and is now higher than
in most other E.U. countries; - most women work part-time.
Some believe that the increasing labour market participation of women caused the wage moderation, which was a key factor behind the successful performance of the Dutch labour market (see below).
Both cultural and economic factors may explain the increasing participation of women. However, both government policies as well as the collective bargaining system have most likely contributed to this development. The key to the success was the upgrading of part-time labour. In many countries part-time labour is associated with temporary work and relatively poor working conditions and low pay. In the Netherlands most part-time workers have a permanent contract and do similar work to full-timers. There is still a gap between full-time and part-time work, but it is not so wide. The government laid the legal foundation for the relatively secure position of part-time workers. Furthermore, as one of the main employers in the Netherlands, the government set an example by allowing its workers to work part-time.
Activation is also one of the ways along which the government has promoted female labour market participation. Women returnees to the labour market benefited from active policies such as training. Capacity in child care has been increased, and parents receive a government subsidy when they buy child care services, although there is still a big unfilled need. Indirectly, the government has contributed to the increased labour market participation of women by its liberal attitude to TWAs. Many women found a job through the mediation of TWAs in the period when job brokerage by private agencies was not formally allowed. Finally, unemployed single parents (in practice mostly women) on social assistance benefit are now obliged to look for a job when their children are five years or older.
It is clear, however, that we are still far away from equality between men and women. Women spend more time on non-market activities, work less hours, are paid less for the same work, and hardly have access to jobs in higher management. Ethnic minorities
The ethnic minority population has grown steadily since the mid-1960s. There is a big variety of ethnic groups. With the exception of some groups such as the

RL340a 21 October 2002
39
people originating from Surinam (a former Dutch colony), ethnic minorities tend to have an extremely weak position in the labour market. Labour market participation and employment rates are very low and unemployment rates are very high. The relatively low skill level of most ethnic minorities compared to the autochthonous population is an important factor causing this situation. However, discrimination also plays a role. And finally differences in culture and language add to the problem.
The government has tried to improve the labour market situation of ethnic minorities in several ways such as:
- by making ethnic minorities a target group in active labour market policy; - by taking measures in initial education to reduce drop-out among students
from ethnic origin; - by stimulating industries to make collective agreements containing
arrangements concerning the inflow of workers from foreign origin; - by introducing a law forcing companies to publish information about the
representation of ethnic minorities among their staff; - by making arrangements with the 100 largest firms concerning the ethnic
component in their human resource policies; - by introducing courses for newcomers, including language courses and
courses in Dutch culture and institutions. However, so far the effectiveness of these measures has been limited. In 1999 the employment rate among ethnic minorities was only 45 per cent compared to 66 per cent among the autochthonous population. Compared to 1994 the relative position of the former had hardly improved. WAGE FLEXIBILITY
A striking difference between the Netherlands and the other E.U. countries is that in the former wage increases have been significantly lower from the early 1980s onwards. During the period 1979-1989 unit labour costs fell by 0.6 per cent per year, compared to an increase of 5.8 per cent for the E.U. as a whole. For the period 1988-1998 the figures are 1.3 and 2.7 per cent, respectively. Only in recent years was this situation reversed. The moderate wage development over such a long period is probably one of the major explanations for the spectacular increase in employment.
Why did the moderate wage development happen? The specific Dutch institutions are an important factor. The Netherlands has a corporatist structure of wage formation in which collective agreements are made at the industry level. However, there is also a centralist element of co-ordination. Unions and employers’ organizations are part of national federations. These federations together with the government define the average wage increase that is thought to be desirable from a macroeconomic point of view. In this process the federations, of course, consult their members. Economic projections made by CPB, an independent government policy research institute, also play a role in this process. In specific industries unions and employer’s organizations deviate from the targets defined at the national level depending on the specific situation in their sector. In practice the deviation from the targets at the central level appears to be relatively small.

RL340a 21 October 2002
40
Another aspect of collective bargaining in the Netherlands is that the government can make the agreements binding for all employers and workers in the industry involved. Thus, the agreements also hold for employers and workers that are not members of an employers’ organization or a union involved in the bargaining process. Legally, the government also has the possibility to intervene in wage setting.
In 1982 the economic situation had deteriorated to such an extent, that the social partners agreed to moderate wage increases for a considerable period of time, as long as it took to improve the situation substantially. This is the so-called Wassenaar agreement. However, it is fair to say that the threat of government intervention in wage setting also played a role. Without the agreement between the social partners the government would almost certainly have intervened.
The Wassenaar agreement included more than wage moderation. In return for the unions’ acceptance of moderate wage increases, the government and the employers agreed to shorten labour hours, although reluctantly. In the Dutch case the reduction in hours was mainly achieved by increasing opportunities for part-time work, causing a substantial increase in the labour supply of women and thereby in total labour supply. Without the continued growth in the level of labour supply it would have been difficult to prolong the wage moderation.
Another explanation for the moderate wage development and the small wage differentials between industries in the Netherlands is given by Teulings.47 He argues that while Dutch unions do the contract negotiations on behalf of all the workers in an industry, only a minority of the workers (on average 28 per cent) are union members. Thus, unions do not have sufficient power for an antagonistic strategy. There is always the threat that employers will switch to negotiations at company level. Although occasionally it has been proposed to have the workers’ councils negotiate wages at the company level, there has not been much support among employers for the idea. The collective bargaining structure has also proved useful in creating arrangements in fields such as training (including the apprenticeship system and the inflow of disadvantaged groups).
So far, we have dealt with wage developments in general. However, not only were generally high wages a problem. The so-called productivity trap was also a major problem. Wages for low-productivity people were simply too high to make it profitable for employers to hire them. The government took several measures to deal with this problem: 1) The level of the statutory minimum wage relative to the average wage level
was reduced. It dropped from 65 per cent in 1996 to somewhat less than 50 per cent in 1997. Already in the 1970s youth minimum wages were severely lowered.
2) The government used its power to refuse to make collective agreements generally binding unless the social partners on the industry level were willing to introduce lower wage scales approaching the statutory minimum wage level.
3) It introduced the so-called SPAK, which implied a general reduction in social premiums paid by employers for workers earning the statutory minimum wage or a wage just above that level. This was in fact a general wage-subsidy for low-paid labour.
RL340a 21 October 2002
41
EMPLOYMENT PROTECTION AND LABOUR MARKET FLEXIBILITY
The share in total labour hours of what is often called ‘flexible labour’ (temporary contract, homeworkers, etc.) has hardly changed since the mid-1980s. The full-time worker with a permanent contract is still the dominant type of worker. Furthermore, most part-time workers have a permanent contract. Neither can we observe a rising trend in job mobility. There has been a lot of talk about the new self-employed worker. Inspired by the high expectations of the new economy, some people envisaged a labour market in which workers would no longer have permanent or even semi-permanent labour contracts, but would sell labour hours to different employers. However, on the macro scale such self-employed workers form only a tiny minority of the total workforce. In some industries, though, such as road transport, it is a significant phenomenon.
According to the new ‘Flex law’ employers can renew a temporary contract
twice, so long as the total length of the contract is less than three years. When the contract is renewed for the third time or the total contract period is more than three years, the contract becomes permanent by law. In the past a temporary contract could only be renewed once. However, in practice there is hardly any change, as companies could find other ways to avoid permanent contracts. One might even argue that the new law reduced flexibility as it limits the options for TWAs. There is no reason to believe that separation costs in the Netherlands are lower than in most other E.U.-countries.
What is different compared to most other European countries is the liberal
attitude towards commercial temporary work agencies that dates back to the 1970s. Particularly women returnees and school leavers find their way on the labour market by starting as agency workers. Therefore, temporary work has played an important role in increasing the participation of women. It also offered flexibility to employers to deal with short-term fluctuations in the demand for labour. CONCLUSIONS FROM THE DUTCH EXPERIENCE
After a period of high unemployment during the late 1970s and the 1980s, the
Dutch labour market went through a process of remarkable recovery. From one of the worst performers in terms of labour market outcomes the Netherlands turned into one of the countries with the most favourable labour market situation. In trying to find the causes for this development, we have looked for factors that have changed considerably through time and in which the Netherlands differs markedly from other countries.
The first three factors are: the comparatively low wage increases, the increase
in the level of labour supply and the growing popularity of part-time work. These factors are closely connected to each other. The increase in labour supply is to a considerable degree due to the growing labour market participation of women. Most newcomers took a part-time job. It would not have been possible to keep moderate wage increases for such a long time without a continued growth in labour supply. Some argue that the underlying factors are completely autonomous. However, we think that institutional factors did play an important role. The typical Dutch wage

RL340a 21 October 2002
42
bargaining system, that combines both centralist and decentralized features, has, in our view, made a difference. Furthermore, the government has facilitated the growth of part-time labour in several ways.
Next come government policies towards labour costs. Unemployment rates
are much higher than average among the low-skilled. Therefore, several wage-related policies have been launched to create additional employment for this category of workers. The most important ones are: lowering the relative level of statutory minimum wages and a general wage-subsidy on low-paid labour through the social security system.
Another important factor explaining the favourable labour market
development in the Netherlands is the reform of social security and social assistance. Benefits have been made less attractive both in terms of level and duration. Furthermore, entitlement criteria have become stricter. And finally, sanctions for inactive jobsearch behaviour and abuse have been reinforced. However, more pressure was put not only on (potential) beneficiaries, but also on employers.
Active labour market policy may have contributed to increasing employment
and diminishing unemployment, but we do not see the institutional reform as a major factor. During the last decade the institutions dealing with ALMP have changed almost permanently, not always for the best. Making a completely privatized system of ALMP implementation work, as the Dutch are currently trying to do, requires so many arrangements that the costs of such a system seem to outweigh the benefits. Involvement of private providers, and the use of tender procedures to choose between them, is certainly worth-wile considering, but one public organization (the Public Employment Service) should stay in charge of ALMP implementation.
On two points ALMP has made a significant contribution to the improved
labour market situation. First, the increased use of subsidized jobs for the long-term unemployed has made a difference. Many of these people would have remained jobless otherwise. The current plans to cut the budget for subsidized jobs do not seem wise, particularly in a period of rising unemployment. The second point is that ALMP helped facilitate training and job placement of women returnees to the labour market.
Increasing the labour market participation and employment rates of older
workers and ethnic minorities is the most important policy issue for the coming years. Partly, the problems of older workers date back to the structure of their working career (lack of mobility and opportunities to learn; work pressure that has been too high too long). Solving these problems requires a different work pattern in which people have more opportunities to switch between work and non-market activities (training, care-taking and leisure) during their working life. Then, most people would be able to remain active longer. Policies are gradually evolving in that direction and the employment rate of older workers is slowly rising again. Unfortunately, there is less reason for optimism regarding the labour market participation of ethnic minorities. So far, policies in this field have not been very successful. There is general agreement that employment rates among ethnic minorities should be much higher than they are. However, and this is a marked difference compared to the early 1980s at the time of the Wassenaar agreement, there is disagreement about the

RL340a 21 October 2002
43
approach to follow. An antagonist atmosphere rather than a cooperative mood surrounds this problem. Perhaps other countries could offer examples of good practice in these fields to the Dutch.

RL340a 21 October 2002
44
5 RECOMMENDATIONS TO E.U. HEADS OF GOVERNMENT
The current unemployment rates in much of Europe are intolerable. In popular discussion many factors are blamed, and this leads to lack of focus in the effort to reduce unemployment. The Luxembourg Guidelines agreed in 1997 include 17 items. This is too many. We believe that the best results can be achieved by concentrating heavily on the two main factors which explain the very different unemployment rates in our different member countries: the treatment of unemployed people, and the flexibility of wages.
THE TREATMENT OF UNEMPLOYED PEOPLE It should not be possible for a person to continue in unemployment year after
year, living on benefit. Instead there should be a system of mutual obligation. The state should have the duty to secure offers of work or training for everybody within one year of becoming unemployed. And in return the individual should have the obligation to take advantage of these offers.
The Luxembourg Guidelines enshrined the first of these: the duty of the state
to the unemployed citizen. To this duty should now be added the duty of the citizen to take advantage of these offers. People have a right to be helped and they need active assistance with job search throughout their period of unemployment. But they should clearly take advantage of any offers that result.
The majority of E.U. countries have not yet implemented the first two
Luxembourg guidelines, and it is imperative that they do so. But it is also vital that people who receive offers and repeatedly reject them should lose some or all of their benefits, except where there are medical or health-related reasons. Otherwise we shall continue to see high unemployment, even when there are enough vacancies to push up wage inflation, thus aborting economic recovery.
This is a difficult political issue but it is crucial. Countries which have
grasped this nettle have greatly reduced their unemployment, and the shocking unemployment which still remains in Europe cannot be much reduced unless this now happens throughout the E.U.
WAGE FLEXIBILITY The other key requirement is greater flexibility of wages, especially as
between regions. Much of Europe’s unemployment is concentrated in regions like Southern Italy, Southern Spain and Eastern Germany, while at the same time there is nearly full employment in other parts of the same country – Lombardy, Catalonia or Bavaria. This is a clear sign that relative labour costs are too high in the high unemployment regions. It would be fiscally impossible to rectify all of these imbalances by wage subsidies. So there have to be mechanisms which allow wages to

RL340a 21 October 2002
45
grow less fast in the high unemployment regions. In most cases the mechanism will involve a greater decentralisation of wage-setting. And needless to say, wage moderation is needed throughout the economy.
EARLY RETIREMENT Finally there is the crucial question of early retirement. Many Europeans have
believed wrongly that, if more people retired early, this would reduce unemployment. This was based on the fallacious belief that the amount of work to be done is fixed: the so-called “lump-of-labour fallacy”. In fact early retirement has imposed a heavy financial burden on companies and governments, and removed the sense of purpose in life from very many citizens. It has made it increasingly difficult for many older people to compete in the job market.
This whole approach needs to be totally reversed. Individuals and employers
should be encouraged to think in terms of a longer working life. Individuals should continually upgrade their skills and vary their work in order to avoid burnout. And they should be retrained where necessary, with a view to working to at least 65. Retirement ages should where appropriate be increased. All fiscal subsidies to early retirement should be phased out, and companies forced to disclose their own costs of early retirement.
On the demand side, discrimination against older workers needs to be tackled
strongly, as required in the E.U. directive. And, where appropriate, social security taxes on employers of older workers could be reduced.
Reversing the tide of early retirement is a major element in the Lisbon agenda,
with the target of raising the average employment rate in Europe at age 55-64 to at least 50 per cent in 2010, from its present 38 per cent. This will be a major challenge requiring action in every country, even where employment is already high. It can only be achieved by vigorous and focussed action.
CONCLUSION
Full employment is not an unattainable dream. We can eliminate long-term unemployment and ensure that all who want work can find it within a reasonable time. But this requires a clear focus on the three main issues which will make a difference: the treatment of the unemployed, the flexibility of wages, and the treatement of older workers.

RL340a 21 October 2002
46
References Andersen, T.M., Dalum, B., Linderoth, H., Smith, V. and Westergaard-Nielsen, N.
(2001) The Danish Economy, Copenhagen 2001.
Bentolila, S. and Bertola, G. (1990), ‘Firing costs and labour demand: how bad is
eurosclerosis’, Review of Economic Studies, 57 (3): 381-402. Bertola, G. (1994), ‘Flexibility, investment and growth’, Journal of Monetary
Economics, 34, pp.215-238. Blanchard, O. and Jimeno, J. (1995) ‘Structural unemployment: Spain versus
Portugal’, American Economic Review, May, 85 (2): 212-18.
Blanchard, O. and Katz, L. (1992) ‘Regional evolutions’, Brookings Papers on Economic Activity, No.1: 1-75.
Blöndal, S. and Scarpetta, S. (1998), ‘The retirement decision in OECD countries’,
OECD Economics Department Working Paper, No.202. Broersma, L., Koeman, J. and Teulings, C. (2000) ‘Labour supply, the natural rate,
and the welfare state in the Netherlands: the wrong institutions at the wrong point in time’, Oxford Economic Papers.
Clark, A.E. and Oswald, A.J. (1994) ‘Unhappiness and unemployment’, Economic
Journal, 104: 648-59.
Danish Ministry of Finance (1999), The Danish Economy: Medium Term Economic Survey, Copenhagen: Ministry of Finance.
de Koning, J. (2001a) ‘How can we make active policies more effective? The role of
organisation, implementation and optimal allocation in active labour market policy’, Labour Market Policies and the Public Employment Service, Paris: OECD.
de Koning, J. (2001b) ‘Aggregate impact analysis of active labour market policy’,
International Journal of Manpower, 22 (8): 707-35. de Koning, J. (2002) Labour Market Policies in the Netherlands, Rotterdam. Dykstra, M. and de Koning, J. ‘Competitive procurement of reintegration services in
the Netherlands’, forthcoming in M. Janssen, Auctions and Beauty Contests: A Policy Perspective.
Engelen, M., Bunt, S. and Samson, L. (1999) ‘Activeringsinstrumenten in de
bijstandswet’ (Activation instruments in the Social Assistance Act), Research voor Beleid.

RL340a 21 October 2002
47
Frederiksen, A. and Westergaard-Nielsen, N. (2000) ‘Where did they go?’, Department of Economics, Aarhus School of Business, Denmark.
Gelderblom, A. and de Koning, J. (2002) ‘ICT and older workers: no unwrinkled
relationship’, Paper for the EALE-conference, University of Paris, Pantheon Sorbonne, September 19-22.
Heckman, J.J., Lalonde, R.J. and Smith, J.A. (1999) ‘The economics and
econometrics of active labor market programs’, in O. Ashenfelter and D. Card (eds) Handbook of Labor Economics.
Heyma, A.O.J. and de Vos, E.L. (2002) ‘Reïntegratie-instrumenten zijn effectief’
(‘Reintegration instruments are effective’) ESB. Jensen, P., Rosholm, M. and Svarer, M. (2003) ‘The response of youth unemployment
to benefits, incentives and sanctions’, forthcoming in European Journal of Political Economy.
Jensen, P. and Westergaard-Nielsen, N. (1990) ‘Temporary layoffs’, in J. Hartog, G.
Ridder and J. Theeuwes, Panel Data and Labour Market Studies, North-Holland.
Katz, L.F. (1997), ‘Wage subsidies for the disadvantaged’, in R. Freeman and P.
Gottschalk (eds) Generating Jobs: How to Increase Demand for Less-skilled Workers, New York: Russell Sage Foundation.
Layard, R. (2000), ‘Welfare-to-work and the New Deal’, World Economics, 1 (2),
April-June. Layard, R., Nickell, S. and Jackman, R. (1991), Unemployment: Macroeconomic
Performance and the Labour Market, Oxford: Oxford University Press. Neumann, G., Pedersen, P.J. and Westergaard-Nielsen, N. (1991) ‘Long-run
international trends in aggregate unionization’, European Journal of Political Economy, 7, 249-74.
Nickell, S. and Layard, R. (1999), ‘Labor market institutions and economic
performance’, in O. Ashenfelter and D. Card (eds) Handbook of Labor Economics Vol.3, Amsterdam: Elsevier Science.
Nickell, S., Nunziata, L., Ochel, W. and Quintini, G (2001), ‘The Beveridge Curve,
unemployment and the wages in the OECD from the 1960s to the 1990s’, Discussion Paper No. 502, Centre for Economic Performance, London School of Economics.
OECD (1991), Labour Market Policies and the Public Employment Service. Pedersen, P.J. and Smith, N. (2002) ‘Unemployment traps: do financial disincentives
matter’, European Sociological Review, Vol.18, No.3: 271-88.

RL340a 21 October 2002
48
Schmid, G.S. (1998) ‘Transitional labour markets: a new European employment strategy’, WZB Discussion Paper FS I 98-206, WZB, Berlin.
Smith, N. (1998) ‘Incentives to work’, (in Danish) in Smith (ed.) Work, Incentives
and Unemployment, Denmark: Aarhus University Press. Smith, N., Walker, I. and Westergaard-Nielsen, N. (1996) ‘The labour behaviour of
UK and Danish lone mothers’, in B. Allen (ed.) Proceedings of the 10th World Conference of the International Economic Association 1992, Vol. 2, London: Macmillan.
Teulings, C. (1997) ‘A new theory of corporatism and wage setting’, European
Economic Review, 41, 659-69. van den Berg, G.J., van der Klaauw, B. and van Ours, J.C. (1998)
‘Arbeidsmarkteffecten van sancties in the RWW;, Working Paper No. 75, Ministry of Social Affairs and Employment.
Van Reenen, J. (2002), ‘No more skivvy schemes? The British New Deal for Youth in
context’, in R. Blundell, D. Card and R. Freeman, (eds) Seeking a Premier League Economy, [forthcoming].
Westergaard-Nielsen, N. (2002) ‘The European labour market now and in the future’,
Paper presented at EU Employment Committee EMCO, July 18, Elsinore.
Westergaard-Nielsen, N. (2002) ‘Twenty years of labour market policies in Denmark’, in Koskela et al. (eds) Bank of Finland.
White, M. and Riley, R. (2002) ‘Findings from the macro evaluation of the New Deal
for Young People’, Department of Work and Pensions, Research Report No. 168, May.

RL340a 21 October 2002
49
Sources of figures and tables Figure 1: OECD Labour Force Statistics, 1958-1978, pages 18 and 24 OECD Labour Force Statistics, 1979-1999, pages 11-13 European Economy, 73, 2001, pages 274, 275
Figure 2: OECD Employment Outlook, July 2002, pages 208, 209
Figure 3: OECD Employment Outlook, various issues
Figure 4: OECD Employment Outlook, various issues European Economy 73, 2001, pages 274, 275 France – Labour shortage index Definition: Proportion of manufacturing companies that face difficulties in hiring Source: Survey data provided by INSEE, France West Germany – Registered vacancies
Definition: Data refer to vacancies for jobs of 7 days’ duration or more reported by employers to employment agencies to be filled within 3 months and remaining unfilled at the end of the month.
Source: Federal Institute of Labour, Germany Note: From 1991 onwards, vacancies data include also East Germany, but given the small number of vacancies in East Germany we believe that this is not going to be a problem in our analysis.
Belgium – Registered vacancies Definition: Data refer to vacancies notified to the ONEM remaining unfilled at the end of the month. They include vacancies within the framework of “special temporary work” (Cadre special temporaire), youth apprenticeships and special vacancies (Troisiéme circuit du travail) Source: Statistical Office of Belgium
Spain – Registered vacancies Definition: Data refer to pending or effective job vacancies notified to the National Institute for Employment (INEM) and which remain unfilled at the end of the month. Source: National Institute for Employment
Figure 5: OECD Employment Outlook, various issues European Economy 73, 2001, pages 274, 275 Britain – Labour Shortage Index
Definition: ½ (% firms reporting shortage of skilled labour + % firms reporting shortage of other labour) Source: CBI Industrial Trends Survey

RL340a 21 October 2002
50
Netherlands – Vacancies Definition: Data refer to those vacancies for which someone is required within a short time Source: Statistics Netherlands (CBS)
Denmark – Vacancies reported to public employment offices Definition: Number of vacancies at the end of the month which have remained vacant for more than one week Source: Data were kindly provided by the Danish Ministry of Labour
Figure 6: Benefit duration is from Nickell and Layard in O. Ashenfelter and D. Card, Handbook of Labor Economics Vol.3C, 1999 and it relates to 1992. LTU data relate to 1989-98 and are based on tables at the end of OECD Employment Trends.
Table 1: HM Treasury Pocket Databank, 31st July 2002, pages 28,29 based on OECD and Eurostat OECD Employment Outlook, July 2002, pages 304-309
Table 2:
OECD Economic Outlook, various issues CBI Industrial Survey Index Average earnings index
Table 3:
UK Department of Work and Pensions
Table 4: UK Regional Trends, various issues
Table 5: www.danmark.dk
Table 6: www.danmark.dk Table 7: Employers Federation, DA, Arbejdsmarkedsrapport, 2001.

RL340a 21 October 2002
51
Endnotes
1 On this and other aspects of labour market strategy required in Europe see Westergaard-Nielsen (2000). 2 As Clark and Oswald (1994) show, unemployment causes similar distress to divorce and bereavement. Other forms on non-employment have no such effect. 3 See for example Nickell and Layard (1999) which analyses the cross-sectional evidence, and Nickell et al. (2001) which analyses the time-series. Both analyses reach similar conclusions. On cross-sectional evidence concerning benefit conditionality see Danish Ministry of Finance (1999). 4 Different systems of measurement make it impossible to compare vacancy rates across countries. But they can be compared within countries over time. (No vacancy data are available for Italy.) 5 Mismatch can be mainly by skill or by region. In Britain there was some reduction in regional mismatch but this was not the main factor reducing overall unemployment. 6 See Layard, Nickell and Jackman (1991). 7 See note 1. 8 OECD, Labour Market Policies and the Public Employment Service, 2001. 9 See for example de Koning (2001a) on the importance of preventing entry to long-term unemployment. It may also be desirable to have some automatic intervention for people who spend much of their time unemployed through a series of short spells of unemployment. 10 Katz (1997). 11 On this wider issue see also de Koning (2001b). 12 See Blöndal and Scarpetta (1998). 13 Blöndal and Scarpetta (1998, Table IV.1). 1990 data. 14 See Gelderblom and de Koning (2002). 15 See OECD, Employment Outlook, 2001, Chapter 4. 16 The employer will take the extra cost of this out of the wage-bill. 17 Layard, Nickell and Jackman (1991) Chapter 6. For the U.S., Blanchard and Katz (1992) stress the greater importance of mobility than of wage adjustment. 18 See Bentolila and Bertola (1990) and Bertola (1994). 19 See Frederiksen and Westergaard-Nielsen (2000). 20 See Blanchard and Jimeno (1995). 21 White and Riley (2002), Layard (2000), Van Reenen (2002). 22 Chapter 5 in E.U. Joint Report for the Commission and the Council, “Increasing labour-force participation and promoting active ageing”. 23 There remain substantial, and even growing, disparities in in-activity rates across regions. 24 Standardized unemployment rates according to OECD, Employment Outlook. 25 See Neumann et al., (1991). 26 Rules and amounts refer to 2002, if not otherwise stated. Source: www.danmark.dk. 27 The new rules were only gradually implemented. Thus, the actual unemployment period prior to activation was gradually reduced from two years to one year beginning in 1999. 28 This programme started without any introductory period. 29 See Jensen, Rosholm and Svarer (2003). 30 See Smith (1998) and Pedersen and Smith (2002). 31 See Jensen and Westergaard-Nielsen (1990). 32 See Andersen et al., (2001). 33 See Smith, Walker and Westergaard-Nielsen (1996). 34 See Andersen et al., (2001). 35 See Westergaard-Nielsen (2002). 36 This chapter is based on a paper which gives a more detailed description of the policies (De Koning, 2002). 37 OECD Employment Outlook. 38 Dercksen and De Koning (1995). 39 Dykstra and De Koning, forthcoming. 40 It is also important to note that the evaluation literature points to a rather small net impact of ALMP on employment and unemployment. See for example Heckman et al., (1999) and De Koning (2002). 41 Broersma et al., (2000). 42 Van de Berg et al., (1998). 43 Engelen et al. (1999).

RL340a 21 October 2002
52
44 Heyma and De Vos (2002). 45 Schmid (1998). 46 OECD Employment Outlook. 47 Teulings (1997).