police operations and data ... - greenfield, ca
TRANSCRIPT
08 Fall
POLICE OPERATIONS AND DATA ANALYSIS REPORT GREENFIELD POLICE DEPARTMENT
CENTER FOR PUBLIC SAFETY MANAGEMENT, LLC 475 K STREET NW STE 702 • CALIFORNIA, DC 20001 WWW.CPSM.US • 716-969-1360
Exclusive Provider of Public Safety Technical Services for International City/County Management Association
CE
NT
ER
F
OR
P
UB
LI
C
SA
FE
TY
M
AN
AG
EM
EN
T,
L
LC
P O L I C E O P E R A T I O N S
i
THE ASSOCIATION & THE COMPANY The International City Management Association is a 103-year old, nonprofit professional association of local government administrators and managers, with approximately 13,000 members located in 32 countries.
Since its inception in 1914, ICMA has been dedicated to assisting local governments and their managers in providing services to its citizens in an efficient and effective manner. ICMA advances the knowledge of local government best practices with its website (www.icma.org), publications, research, professional development, and membership. The ICMA Center for Public Safety Management (ICMA/CPSM) was launched by ICMA to provide support to local governments in the areas of police, fire, and emergency medical services.
ICMA also represents local governments at the federal level and has been involved in numerous projects with the Department of Justice and the Department of Homeland Security.
In 2014, as part of a restructuring at ICMA, the Center for Public Safety Management (CPSM) was spun out as a separate company. It is now the exclusive provider of public safety technical assistance for ICMA. CPSM provides training and research for the Association’s members and represents ICMA in its dealings with the federal government and other public safety professional associations such as CALEA, PERF, IACP, IFCA, IPMA-HR, DOJ, BJA, COPS, NFPA, and others.
The Center for Public Safety Management, LLC, maintains the same team of individuals performing the same level of service as when it was a component of ICMA. CPSM’s local government technical assistance experience includes workload and deployment analysis using our unique methodology and subject matter experts to examine department organizational structure and culture, identify workload and staffing needs, and align department operations with industry best practices. We have conducted more 305 such studies in 41 states and provinces and 215 communities ranging in population from 8,000 (Boone, Iowa) to 800,000 (Indianapolis, Ind.).
Thomas Wieczorek is the Director of the Center for Public Safety Management. Leonard Matarese serves as the Director of Research & Program Development. Dr. Dov Chelst is the Director of Quantitative Analysis.
ii
CENTER FOR PUBLIC SAFETY MANAGEMENT PROJECT CONTRIBUTORS Thomas J. Wieczorek, Director Leonard A. Matarese, Director, Research & Project Development Dov Chelst, Ph.D. Director of Quantitative Analysis Shan Zhou, Data Analyst Ryan Johnson, Data Analyst Jackie Gomez-Whiteley, Senior Public Safety Consultant – Team Lead Wayne Hiltz, Senior Public Safety Consultant Dennis Kouba, Senior Editor
iii
CONTENTS Tables ............................................................................................................................ vi Figures .......................................................................................................................... vii Section 1. Executive Summary..................................................................................... 1
General Observations ..................................................................................................................................2
Key Recommendations................................................................................................................................4
Section 2. Methodology ............................................................................................. 10
Section 3. Community and Department Overview .................................................. 11
Demographics ............................................................................................................................................ 11
Law Enforcement Services ....................................................................................................................... 11
Uniform Crime Report/Crime Trends ................................................................................................... 12
Department Authorized Staffing Levels ............................................................................................. 19
Future Operational Considerations for the Department ................................................................ 19
Section 4. Patrol Division ............................................................................................. 21
Patrol Section .............................................................................................................................................. 21
Patrol Staffing .......................................................................................................................................... 21
Work Schedule ........................................................................................................................................ 22
Roll Call Training ...................................................................................................................................... 23
Call / Workload Demand ......................................................................................................................... 23
Calls for Service Efficiency .................................................................................................................... 27
Call Disposition ........................................................................................................................................ 29
Patrol Beat Configuration and Workload Demand ........................................................................ 30
High-volume Calls for Service Locations ............................................................................................ 31
Call Mitigation ......................................................................................................................................... 33
Workload Demand Analysis ................................................................................................................. 34
Response Time – High-priority Calls ..................................................................................................... 43
Traffic ........................................................................................................................................................ 45
Specialized Patrol Functions / Collateral Duties ................................................................................... 49
School Services / SRO ............................................................................................................................ 49
Bicycle Patrol ........................................................................................................................................... 50
Gang Unit ................................................................................................................................................. 50
Code Enforcement ................................................................................................................................ 50
Animal Control ........................................................................................................................................ 51
Community Services Officer ................................................................................................................. 51
Alternate Work Schedule Option ............................................................................................................ 52
iv
Patrol Division Staffing Summary ............................................................................................................. 54
Police Explorer Program ............................................................................................................................ 55
Temporary Holding Facility ....................................................................................................................... 57
Section 5. Criminal Investigations .............................................................................. 58
Investigations ............................................................................................................................................... 58
Case Management ............................................................................................................................... 59
Clearances .............................................................................................................................................. 59
Victim Services ........................................................................................................................................ 60
Training ..................................................................................................................................................... 60
Technology .............................................................................................................................................. 60
Workload Demand ................................................................................................................................ 60
Forensics ................................................................................................................................................... 61
Investigations Staffing Summary .............................................................................................................. 62
Section 6. Property and Evidence ............................................................................. 64
Work Schedules / Public Access Hours .............................................................................................. 64
Training ..................................................................................................................................................... 64
Audits, Inventories and Inspections .................................................................................................... 65
Access Control ........................................................................................................................................ 66
Security ..................................................................................................................................................... 67
Property/Evidence Storage .................................................................................................................. 68
Purging Property ..................................................................................................................................... 69
Section 7. Records ....................................................................................................... 73
Records Staffing .......................................................................................................................................... 74
Work Schedules / Public Access Hours .............................................................................................. 74
Workload Demand .................................................................................................................................... 74
FBI UCR/NIBRS Reporting ....................................................................................................................... 76
Records Staffing Recommendations...................................................................................................... 78
Section 8. Administrative Functions ........................................................................... 79
Employment Services................................................................................................................................. 79
Recruitment ............................................................................................................................................. 79
Pre-employment Investigations ........................................................................................................... 79
Training ......................................................................................................................................................... 80
Sergeants’ Training ................................................................................................................................. 81
Roll Call Training ...................................................................................................................................... 82
Entry-level/Sworn Training ..................................................................................................................... 82
Personnel Investigations / Public Complaints ....................................................................................... 84
Use of Force ................................................................................................................................................. 86
v
Workers’ Compensation ....................................................................................................................... 89
Policy Manual.............................................................................................................................................. 90
Performance Evaluation Instrument ....................................................................................................... 91
Section 9. Miscellaneous ............................................................................................ 93
Fleet............................................................................................................................................................... 93
Facility ........................................................................................................................................................... 94
Technology .................................................................................................................................................. 95
Automated External Defibrillator (AED) ............................................................................................. 96
Automatic License Plate Readers (ALPRs) ........................................................................................ 96
Section 10. Data Analysis ........................................................................................... 98
Workload Analysis....................................................................................................................................... 98
Out of Service Activities .......................................................................................................................... 119
Deployment ............................................................................................................................................... 122
Response Times ......................................................................................................................................... 132
All Calls ................................................................................................................................................... 133
High-Priority Calls .................................................................................................................................. 137
Appendix A: Call Type Classification .................................................................................................... 139
Appendix B: Uniform Crime Report Information ................................................................................. 143
vi
TABLES TABLE 3-1: Comparison of Reported Crime Rates, 2016, by Jurisdiction, per 100,000 ...................... 13 TABLE 3-2: Greenfield Police Department, Number of Reported Part 1 Offenses for 2016–2018 ... 14 TABLE 3-3: Reported City, State, and National Crime Rates, by Year, 2007–2016 ............................. 17 TABLE 3-4: Reported City, State, and National Clearance Rates in 2016 ............................................ 18 TABLE 3-5: Authorized Staffing Levels for Fiscal Years 16/17–18/19 ....................................................... 19 TABLE 4-1: Calls per Day, by Category ....................................................................................................... 24 TABLE 4-2: Primary Unit’s Average Occupied Times, by Category and Initiator ................................ 25 TABLE 4-3: Average Number of Responding Units, by Initiator and Category ................................... 26 TABLE 4-4: Number of Responding Units, by Category, Community-initiated Calls .......................... 27 TABLE 4-5: CFS Comparisons to other CPSM Study Cities ....................................................................... 28 TABLE 4-6: Calls and Work Hours by Beat, per Day .................................................................................. 30 TABLE 4-7: Average Dispatch, Travel, and Response Times, by Priority ................................................ 43 TABLE 4-8: Traffic Tickets Issued in Greenfield, 2015–2017 ....................................................................... 46 TABLE 4-9: Traffic Accidents in Greenfield, 2014 - 2016 ........................................................................... 46 TABLE 4-10a: Proposed 4/10 Work Schedule for Weekday Shifts .......................................................... 52 TABLE 4-10b: Proposed 3/12 Schedule for Weekend Shifts .................................................................... 53 TABLE 7-1: Records Section Personnel ........................................................................................................ 74 TABLE 8-1: Personnel Investigations 2015-2017 .......................................................................................... 85 TABLE 8-2: Workers’ Compensation Claims, FY 2016-2018 ...................................................................... 89 TABLE 10-1: Events per Day, by Initiator .................................................................................................... 100 TABLE 10-2: Events per Day, by Category ................................................................................................ 102 TABLE 10-3: Calls per Day, by Category ................................................................................................... 104 TABLE 10-4: Calls per Day, by Initiator and Months ................................................................................ 105 TABLE 10-5: Calls per Day, by Category and Month ............................................................................. 107 TABLE 10-6: Primary Unit’s Average Occupied Times, by Category and Initiator ............................ 109 TABLE 10-7: Average Number of Responding Units, by Initiator and Category ............................... 111 TABLE 10-8: Number of Responding Units, by Category, Community-initiated Calls ...................... 113 TABLE 10-9: Calls and Work Hours by Beat, per Day .............................................................................. 114 TABLE 10-10: Calls and Work Hours per Day, by Category, Summer 2017 ........................................ 116 TABLE 10-11: Calls and Work Hours per Day, by Category, Winter 2018 ............................................ 118 TABLE 10-12: Activities and Occupied Times by Description ................................................................ 119 TABLE 10-13: Activities per Day, by Month ............................................................................................... 120 TABLE 10-14: Activities per Day, by Day of Week ................................................................................... 121 TABLE 10-15: Average Response Time Components, by Category .................................................... 135 TABLE 10-16: 90th Percentiles for Response Time Components, by Category ................................. 136 TABLE 10-17: Average Dispatch, Travel, and Response Times, by Priority ......................................... 137 TABLE 10-18: Call Type, by Category ........................................................................................................ 139 TABLE 10-19: Reported Crime Rates in 2016, by City ............................................................................. 143 TABLE 10-20: Reported Greenfield, California, and National Crime Rates, by Year ....................... 145 TABLE 10-21: Reported Greenfield, California, and National Crime Clearance Rates .................. 145
vii
FIGURES FIGURE 3-1: Greenfield Reported Violent and Property Crime Rates, by Year, 2007 through 2016 15 FIGURE 3-2: Reported City and State Combined Crime Rates, by Year, 2007 through 2016 .......... 16 FIGURE 4-1: High-volume Locations for Crime Calls ................................................................................. 31 FIGURE 4-2: High-volume Locations for Calls for Service Stemming from Noncriminal Activity ...... 32 FIGURE 4-3: Deployment and All Workload, Weekdays, Summer 2017 ............................................... 38 FIGURE 4-4: Percentage of Workload, Weekdays, Summer 2017 ......................................................... 38 FIGURE 4-5: Deployment and All Workload, Weekends, Summer 2017 ............................................... 39 FIGURE 4-6: Percentage of Workload, Weekends, Summer 2017 ......................................................... 39 FIGURE 4-7: Deployment and All Workload, Weekdays, Winter 2018 .................................................. 40 FIGURE 4-8: Percentage of Workload, Weekdays, Winter 2018 ............................................................ 40 FIGURE 4-9: Deployment and All Workload, Weekends, Winter 2018 .................................................. 41 FIGURE 4-10: Percentage of Workload, Weekends, Winter 2018 .......................................................... 41 FIGURE 4-11: Average Response Times and Dispatch Delays for Priority 1 Calls, by Hour ............... 44 FIGURE 4-12: Top Traffic Accident Locations in Greenfield .................................................................... 48 FIGURE 10-1: Percentage Events per Day, by Initiator .......................................................................... 100 FIGURE 10-2: Percentage Events per Day, by Category ...................................................................... 101 FIGURE 10-3: Percentage Calls per Day, by Category ......................................................................... 103 FIGURE 10-4: Calls per Day, by Initiator and Month ............................................................................... 105 FIGURE 10-5: Calls per Day, by Category and Month ........................................................................... 106 FIGURE 10-6: Primary Unit’s Average Occupied Times, by Category and Initiator ......................... 108 FIGURE 10-7: Number of Responding Units, by Initiator and Category .............................................. 110 FIGURE 10-8: Number of Responding Units, by Category, Community-initiated Calls .................... 112 FIGURE 10-9: Percentage Calls and Work Hours, by Beat .................................................................... 114 FIGURE 10-10: Percentage Calls and Work Hours, by Category, Summer 2017 ............................... 115 FIGURE 10-11: Percentage Calls and Work Hours, by Category, Winter 2018 .................................. 117 FIGURE 10-12: Activities per Day, by Month ............................................................................................ 120 FIGURE 10-13: Activities per Day, by Day of Week................................................................................. 121 FIGURE 10-14: Deployed Officers, Weekdays, Summer 2017 ............................................................... 123 FIGURE 10-15: Deployed Officers, Weekends, Summer 2017 ............................................................... 123 FIGURE 10-16: Deployed Officers, Weekdays, Winter 2018 .................................................................. 124 FIGURE 10-17: Deployed Officers, Weekends, Winter 2018 .................................................................. 124 FIGURE 10-18: Deployment and All Workload, Weekdays, Summer 2017 ......................................... 126 FIGURE 10-19: Deployment and All Workload, Weekends, Summer 2017 ......................................... 126 FIGURE 10-20: Deployment and All Workload, Weekdays, Winter 2018 ............................................ 127 FIGURE 10-21: Deployment and All Workload, Weekends, Winter 2018 ............................................ 127 FIGURE 10-22: Percentage of Workload, Weekdays, Summer 2017 ................................................... 129 FIGURE 10-23: Percentage of Workload, Weekends, Summer 2017 ................................................... 129 FIGURE 10-24: Percentage of Workload, Weekdays, Winter 2018 ...................................................... 130 FIGURE 10-25: Percentage of Workload, Weekends, Winter 2018 ...................................................... 130
viii
FIGURE 10-26: Average Response Time and Dispatch Delays, by Hour of Day, Summer 2017 and Winter 2018 .................................................................................................................................................... 133 FIGURE 10-27: Average Response Time by Category, Summer 2017 ................................................. 134 FIGURE 10-28: Average Response Time by Category, Winter 2018 .................................................... 134 FIGURE 10-29: Average Response Times and Dispatch Delays for High-priority Calls, by Hour ..... 137 FIGURE 10-30: Reported Violent and Property Crime Rates, by Year ................................................ 144 FIGURE 10-31: Reported City and State Crime Rates, by Year ............................................................ 144
1
SECTION 1. EXECUTIVE SUMMARY The Center for Public Safety Management, LLC (CPSM) was commissioned to review the operations of the Greenfield Police Department. While our analysis covered all aspects of the department’s operations, particular areas of focus of this study included: identifying appropriate staffing of the department given the workload, community demographics, and crime levels; the effectiveness of the organizational structure; and efficiency and effectiveness of division/unit processes.
We analyzed the department workload using operations research methodology and compared that workload to staffing and deployment levels. We reviewed other performance indicators that enabled us to understand the implications of service demand on current staffing. Our study involved data collection, interviews with key operational and administrative personnel, focus groups with line-level department personnel, on-site observations of the job environment, data analysis, comparative analysis, and the development of alternatives and recommendations.
Based upon CPSM’s detailed assessment of the Greenfield Police Department (GPD), it is our conclusion that the department, overall, provides quality law enforcement services. The staff is professional and dedicated to the mission of the department. Throughout this report, we will strive to enable the reader to look inside the department to understand its strengths and its challenges. We sincerely hope that all parties utilize the information and recommendations contained herein in a constructive manner to make a fine law enforcement agency even better.
As part of this Executive Summary, below we have listed general observations that we believe identify some of the more significant issues facing the department. Additionally, we have included a master list of recommendations for consideration. We believe these recommendations will enhance organizational effectiveness. Some of these recommendations involve the reassignment/repurposing of job duties to other functions, and include a limited number of new but essential positions. It is important to note that in this report we will examine specific sections and units of the department, and will offer a detailed discussion of our observations and recommendations for each.
The list of recommendations is extensive. Should the City of Greenfield and the Greenfield Police Department choose to implement any or all recommendations, it must be recognized that this process will take not just weeks or even months to complete, but perhaps years. The recommendations are intended to form the basis of a long-term improvement plan. It is important that we emphasize that this list of recommendations, though lengthy, is common in our operational assessments of agencies around the country and should in no way be interpreted as an indictment of what we consider a fine department. While all the recommendations are important, we suggest that those with a nexus to items within the General Observations listed below receive priority.
2
GENERAL OBSERVATIONS ■ Over the past five years, the department has experienced a significant turnover in staff at
nearly all positions. At present the command staff, though experienced based upon lengthy careers at other agencies, have less than one-year of service at Greenfield, sergeants have only about one year of experience in grade, and officers average only two to three years in total law enforcement experience. Nonetheless, CPSM was impressed with the commitment and enthusiasm of staff at all levels of the organization. It is clear that there is a strong and unified interest in improving both the department and individual performance. Strong mentoring and a comprehensive training program will be essential to harnessing this energy to the betterment of the organization.
■ A significant interface issue exists between the computer-aided dispatch (CAD) 911/dispatch system (call records), operated by Monterey County, and the department’s records management system (RMS). The department, as do virtually all Monterey County law enforcement agencies, contracts with the Monterey County Department of Emergency Communications (MCDEC) for 911/dispatch services. The county utilizes the TriTech Software Systems CAD platform. The department utilizes TracNet technology for its records management system, as do most other Monterey County law enforcement agencies. Normally, CAD data automatically transfers to RMS, thus enabling departments to effectively manage calls for service and a myriad of records in the workflow related to those calls. In this case, however, there is no interface between the CAD and RMS systems, so call history is not transferred to the RMS. Only those calls that result in a formal police report (about 40 percent of calls) are entered into the department’s RMS server. To create that RMS entry, patrol officers obtain call number and time information from the MCDEC and manually enter this information into the department’s RMS system. Calls that do not result in a formal police report are never captured in RMS. To obtain CAD data, the department must query CAD, a cumbersome process that is rarely if ever utilized. As a result, CAD data is rarely examined. We point this issue out as it significantly challenges the department in accurately tracking its workload and the performance of individual officers. This will be addressed further throughout the report.
■ There is a general absence of management reports that could aid the department’s leadership and supervisors in effectively managing the department. This is in part due to the aforementioned CAD/RMS interface issue. Reports that are lacking include monthly personnel performance reports for patrol officers; detective case management reports; and management reports in areas of risk such as training, force, complaints, and traffic collisions. Rather, the department largely relies upon an informal process of tracking these activities/incidents from memory, or does not adequately track them at all. The type of reports mentioned would be a valuable resource to the department’s command and supervisory personnel and should be regularly produced for collective review. For instance, individual patrol sergeants are expected to be aware of all calls handled by officers on a shift, and sergeants are supposed to ensure that officers’ reports are completed and submitted through the report submission process. Given the myriad of duties of a patrol sergeant, this is an unrealistic expectation. As well, an individual’s performance data is reviewed only in the event that a sergeant chooses to go to great lengths to analyze both CAD and RMS data, a cumbersome process that isn’t occurring. It is vitally important for the effectiveness of supervisors that they be provided each month with performance data on the personnel they supervise. It is understood that this may be limited to RMS data due to the interface issue.
■ A significant issue exists with regard to the department’s criminal investigations function. The department has no dedicated detective unit exclusively serving the City of Greenfield. Rather, it has jointly established a Major Crimes Unit with King City PD. However, the case management criteria and lack of resources severely limits the type and number of cases that
3
this unit “accepts” for investigation. As a result, the department’s patrol force, though limited in tenure and experience, is called upon to handle nearly all crimes, be they felonies or misdemeanors, to completion. This is not in keeping with best law enforcement practices and will be addressed further throughout the report.
As noted previously, key specific recommendations follow and are discussed in detail throughout the report. These recommendations are offered to enhance the operation of the Greenfield Police Department. The recommendations provided are to ensure that law enforcement resources are optimally deployed, operations are streamlined for efficiency, and services provided are cost-effective, all while a high level of service to the citizens of the City of Greenfield is maintained.
CPSM staff would like to thank City Manager Paul Wood, Police Chief Denise Oglesby, Captain Jim Hunt, and the entire staff of the Greenfield Police Department for their gracious cooperation and assistance in completing this project.
4
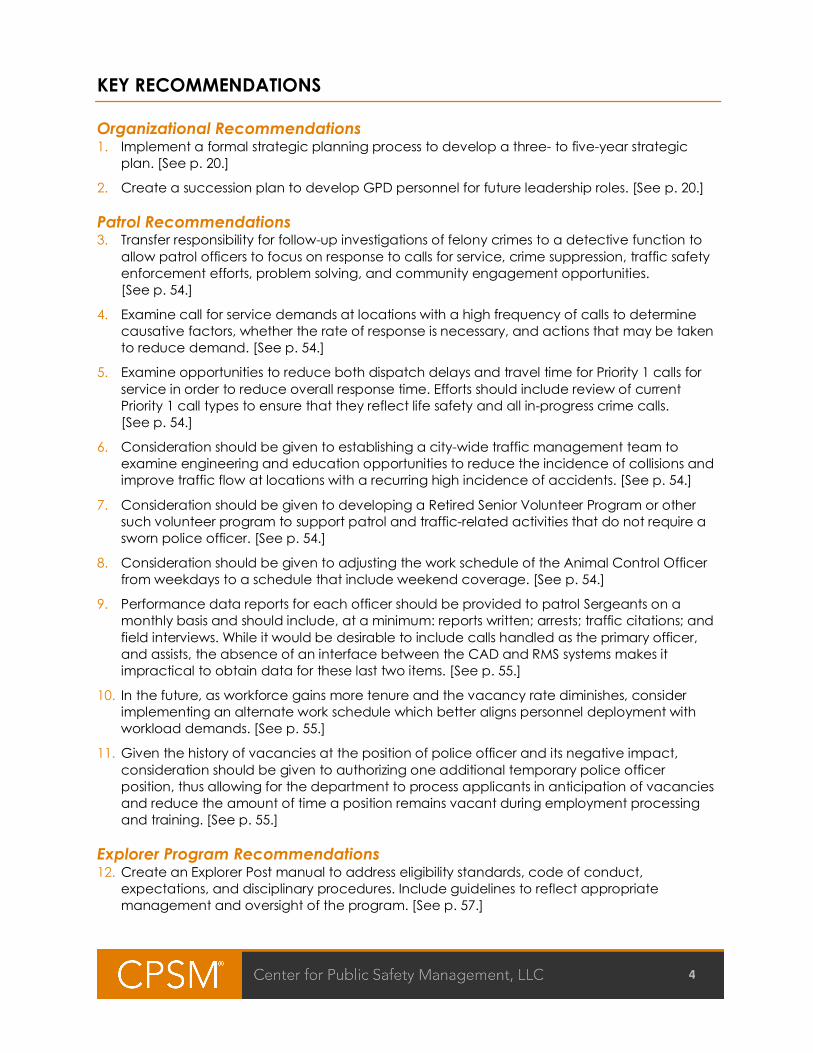
KEY RECOMMENDATIONS
Organizational Recommendations 1. Implement a formal strategic planning process to develop a three- to five-year strategic
plan. [See p. 20.]
2. Create a succession plan to develop GPD personnel for future leadership roles. [See p. 20.]
Patrol Recommendations 3. Transfer responsibility for follow-up investigations of felony crimes to a detective function to
allow patrol officers to focus on response to calls for service, crime suppression, traffic safety enforcement efforts, problem solving, and community engagement opportunities. [See p. 54.]
4. Examine call for service demands at locations with a high frequency of calls to determine causative factors, whether the rate of response is necessary, and actions that may be taken to reduce demand. [See p. 54.]
5. Examine opportunities to reduce both dispatch delays and travel time for Priority 1 calls for service in order to reduce overall response time. Efforts should include review of current Priority 1 call types to ensure that they reflect life safety and all in-progress crime calls. [See p. 54.]
6. Consideration should be given to establishing a city-wide traffic management team to examine engineering and education opportunities to reduce the incidence of collisions and improve traffic flow at locations with a recurring high incidence of accidents. [See p. 54.]
7. Consideration should be given to developing a Retired Senior Volunteer Program or other such volunteer program to support patrol and traffic-related activities that do not require a sworn police officer. [See p. 54.]
8. Consideration should be given to adjusting the work schedule of the Animal Control Officer from weekdays to a schedule that include weekend coverage. [See p. 54.]
9. Performance data reports for each officer should be provided to patrol Sergeants on a monthly basis and should include, at a minimum: reports written; arrests; traffic citations; and field interviews. While it would be desirable to include calls handled as the primary officer, and assists, the absence of an interface between the CAD and RMS systems makes it impractical to obtain data for these last two items. [See p. 55.]
10. In the future, as workforce gains more tenure and the vacancy rate diminishes, consider implementing an alternate work schedule which better aligns personnel deployment with workload demands. [See p. 55.]
11. Given the history of vacancies at the position of police officer and its negative impact, consideration should be given to authorizing one additional temporary police officer position, thus allowing for the department to process applicants in anticipation of vacancies and reduce the amount of time a position remains vacant during employment processing and training. [See p. 55.]
Explorer Program Recommendations 12. Create an Explorer Post manual to address eligibility standards, code of conduct,
expectations, and disciplinary procedures. Include guidelines to reflect appropriate management and oversight of the program. [See p. 57.]
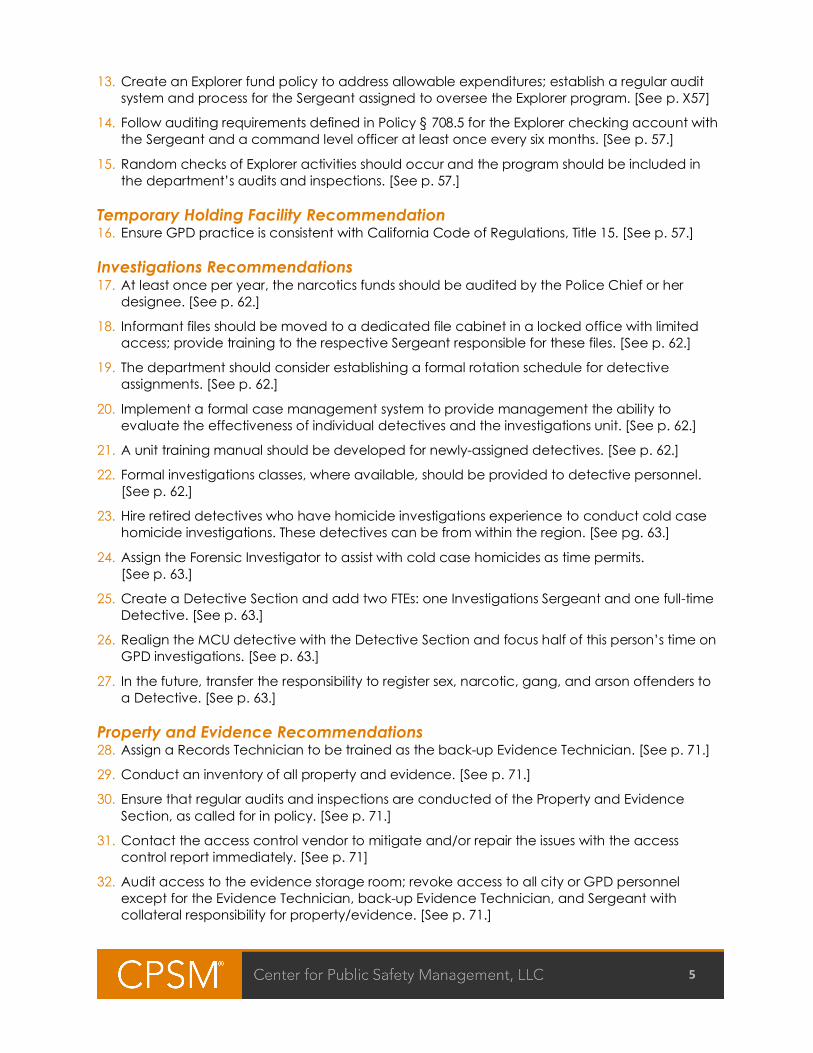
5
13. Create an Explorer fund policy to address allowable expenditures; establish a regular audit system and process for the Sergeant assigned to oversee the Explorer program. [See p. X57]
14. Follow auditing requirements defined in Policy § 708.5 for the Explorer checking account with the Sergeant and a command level officer at least once every six months. [See p. 57.]
15. Random checks of Explorer activities should occur and the program should be included in the department’s audits and inspections. [See p. 57.]
Temporary Holding Facility Recommendation 16. Ensure GPD practice is consistent with California Code of Regulations, Title 15. [See p. 57.]
Investigations Recommendations 17. At least once per year, the narcotics funds should be audited by the Police Chief or her
designee. [See p. 62.]
18. Informant files should be moved to a dedicated file cabinet in a locked office with limited access; provide training to the respective Sergeant responsible for these files. [See p. 62.]
19. The department should consider establishing a formal rotation schedule for detective assignments. [See p. 62.]
20. Implement a formal case management system to provide management the ability to evaluate the effectiveness of individual detectives and the investigations unit. [See p. 62.]
21. A unit training manual should be developed for newly-assigned detectives. [See p. 62.]
22. Formal investigations classes, where available, should be provided to detective personnel. [See p. 62.]
23. Hire retired detectives who have homicide investigations experience to conduct cold case homicide investigations. These detectives can be from within the region. [See pg. 63.]
24. Assign the Forensic Investigator to assist with cold case homicides as time permits. [See p. 63.]
25. Create a Detective Section and add two FTEs: one Investigations Sergeant and one full-time Detective. [See p. 63.]
26. Realign the MCU detective with the Detective Section and focus half of this person’s time on GPD investigations. [See p. 63.]
27. In the future, transfer the responsibility to register sex, narcotic, gang, and arson offenders to a Detective. [See p. 63.]
Property and Evidence Recommendations 28. Assign a Records Technician to be trained as the back-up Evidence Technician. [See p. 71.]
29. Conduct an inventory of all property and evidence. [See p. 71.]
30. Ensure that regular audits and inspections are conducted of the Property and Evidence Section, as called for in policy. [See p. 71.]
31. Contact the access control vendor to mitigate and/or repair the issues with the access control report immediately. [See p. 71]
32. Audit access to the evidence storage room; revoke access to all city or GPD personnel except for the Evidence Technician, back-up Evidence Technician, and Sergeant with collateral responsibility for property/evidence. [See p. 71.]
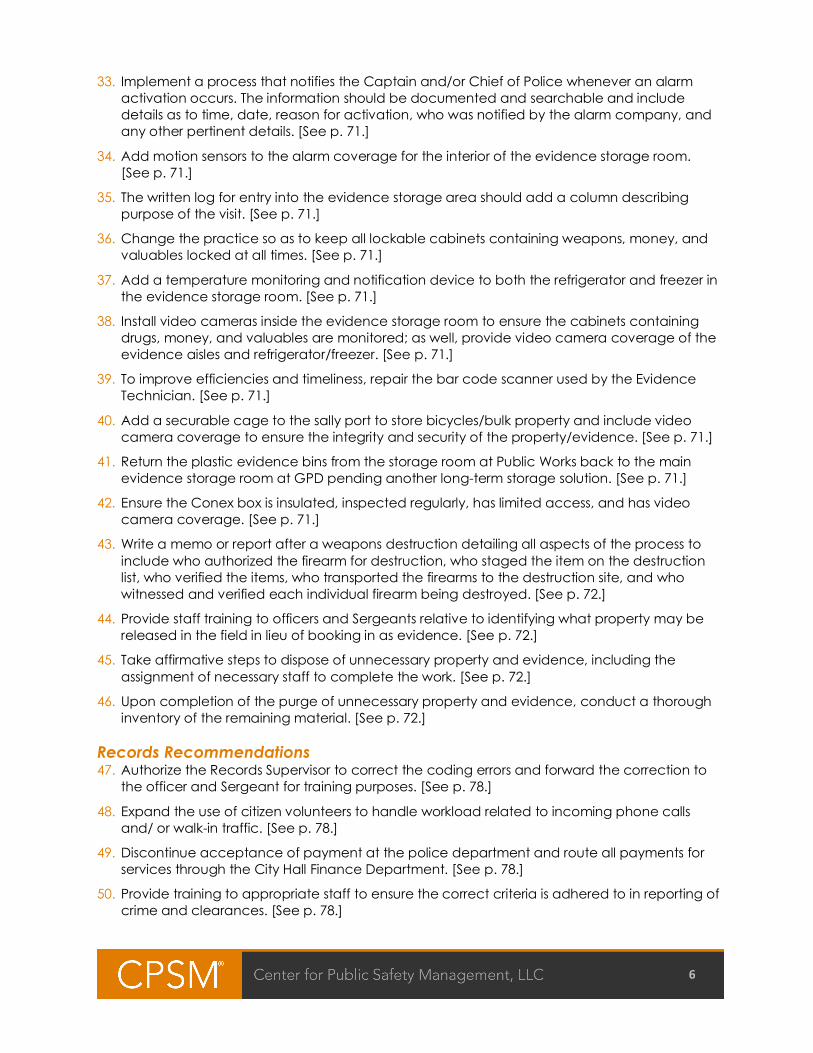
6
33. Implement a process that notifies the Captain and/or Chief of Police whenever an alarm activation occurs. The information should be documented and searchable and include details as to time, date, reason for activation, who was notified by the alarm company, and any other pertinent details. [See p. 71.]
34. Add motion sensors to the alarm coverage for the interior of the evidence storage room. [See p. 71.]
35. The written log for entry into the evidence storage area should add a column describing purpose of the visit. [See p. 71.]
36. Change the practice so as to keep all lockable cabinets containing weapons, money, and valuables locked at all times. [See p. 71.]
37. Add a temperature monitoring and notification device to both the refrigerator and freezer in the evidence storage room. [See p. 71.]
38. Install video cameras inside the evidence storage room to ensure the cabinets containing drugs, money, and valuables are monitored; as well, provide video camera coverage of the evidence aisles and refrigerator/freezer. [See p. 71.]
39. To improve efficiencies and timeliness, repair the bar code scanner used by the Evidence Technician. [See p. 71.]
40. Add a securable cage to the sally port to store bicycles/bulk property and include video camera coverage to ensure the integrity and security of the property/evidence. [See p. 71.]
41. Return the plastic evidence bins from the storage room at Public Works back to the main evidence storage room at GPD pending another long-term storage solution. [See p. 71.]
42. Ensure the Conex box is insulated, inspected regularly, has limited access, and has video camera coverage. [See p. 71.]
43. Write a memo or report after a weapons destruction detailing all aspects of the process to include who authorized the firearm for destruction, who staged the item on the destruction list, who verified the items, who transported the firearms to the destruction site, and who witnessed and verified each individual firearm being destroyed. [See p. 72.]
44. Provide staff training to officers and Sergeants relative to identifying what property may be released in the field in lieu of booking in as evidence. [See p. 72.]
45. Take affirmative steps to dispose of unnecessary property and evidence, including the assignment of necessary staff to complete the work. [See p. 72.]
46. Upon completion of the purge of unnecessary property and evidence, conduct a thorough inventory of the remaining material. [See p. 72.]
Records Recommendations 47. Authorize the Records Supervisor to correct the coding errors and forward the correction to
the officer and Sergeant for training purposes. [See p. 78.]
48. Expand the use of citizen volunteers to handle workload related to incoming phone calls and/ or walk-in traffic. [See p. 78.]
49. Discontinue acceptance of payment at the police department and route all payments for services through the City Hall Finance Department. [See p. 78.]
50. Provide training to appropriate staff to ensure the correct criteria is adhered to in reporting of crime and clearances. [See p. 78.]
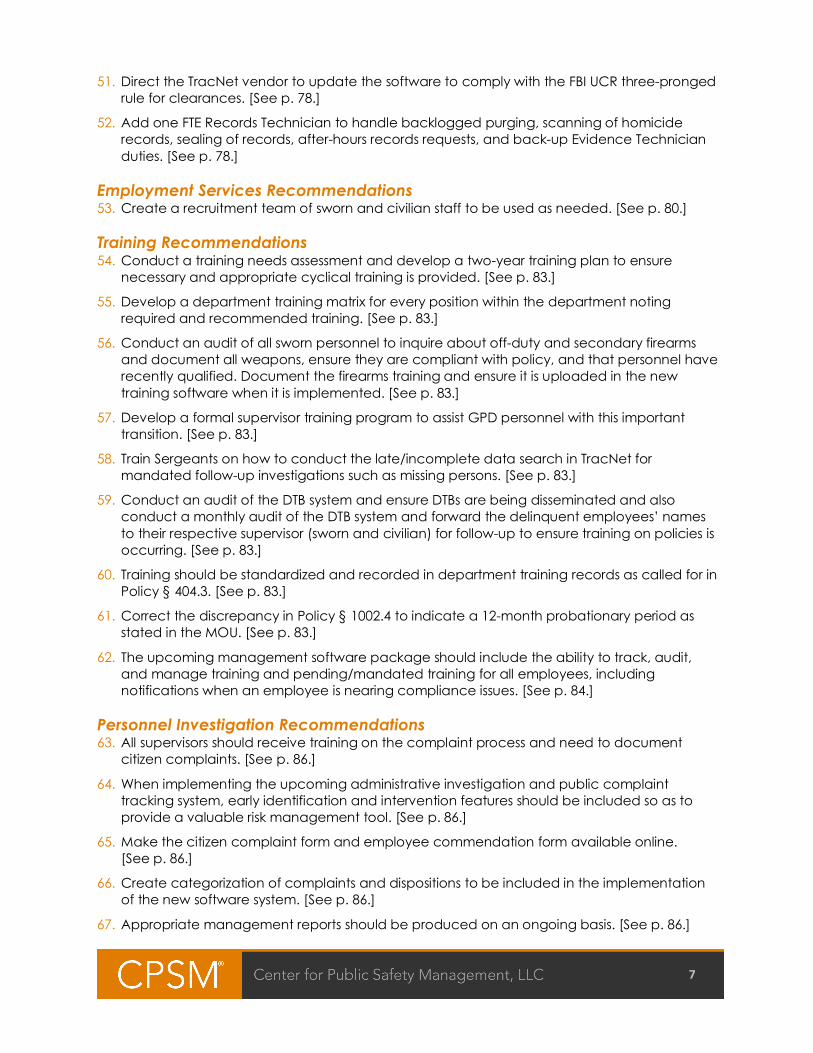
7
51. Direct the TracNet vendor to update the software to comply with the FBI UCR three-pronged rule for clearances. [See p. 78.]
52. Add one FTE Records Technician to handle backlogged purging, scanning of homicide records, sealing of records, after-hours records requests, and back-up Evidence Technician duties. [See p. 78.]
Employment Services Recommendations 53. Create a recruitment team of sworn and civilian staff to be used as needed. [See p. 80.]
Training Recommendations 54. Conduct a training needs assessment and develop a two-year training plan to ensure
necessary and appropriate cyclical training is provided. [See p. 83.]
55. Develop a department training matrix for every position within the department noting required and recommended training. [See p. 83.]
56. Conduct an audit of all sworn personnel to inquire about off-duty and secondary firearms and document all weapons, ensure they are compliant with policy, and that personnel have recently qualified. Document the firearms training and ensure it is uploaded in the new training software when it is implemented. [See p. 83.]
57. Develop a formal supervisor training program to assist GPD personnel with this important transition. [See p. 83.]
58. Train Sergeants on how to conduct the late/incomplete data search in TracNet for mandated follow-up investigations such as missing persons. [See p. 83.]
59. Conduct an audit of the DTB system and ensure DTBs are being disseminated and also conduct a monthly audit of the DTB system and forward the delinquent employees’ names to their respective supervisor (sworn and civilian) for follow-up to ensure training on policies is occurring. [See p. 83.]
60. Training should be standardized and recorded in department training records as called for in Policy § 404.3. [See p. 83.]
61. Correct the discrepancy in Policy § 1002.4 to indicate a 12-month probationary period as stated in the MOU. [See p. 83.]
62. The upcoming management software package should include the ability to track, audit, and manage training and pending/mandated training for all employees, including notifications when an employee is nearing compliance issues. [See p. 84.]
Personnel Investigation Recommendations 63. All supervisors should receive training on the complaint process and need to document
citizen complaints. [See p. 86.]
64. When implementing the upcoming administrative investigation and public complaint tracking system, early identification and intervention features should be included so as to provide a valuable risk management tool. [See p. 86.]
65. Make the citizen complaint form and employee commendation form available online. [See p. 86.]
66. Create categorization of complaints and dispositions to be included in the implementation of the new software system. [See p. 86.]
67. Appropriate management reports should be produced on an ongoing basis. [See p. 86.]
8
68. Related personnel records should be maintained in appropriate files whose location is known by the management team. [See p. 86.]
Use of Force Recommendations: 69. Provide a memorandum to all supervisors clarifying specific supervisory responsibilities at use
of force incidents until the current policy is updated. [See p. 88.]
70. Revise the use of force policy to ensure a thorough and complete force investigation of any use of force incident. [See p. 89.]
71. Conduct the annual force analysis as directed by current policy. [See p. 89.]
72. When implementing the upcoming use of force tracking software, ensure it provides the necessary management tool for tracking incidents and early intervention. [See p. 89.]
73. Review Policy §302, Use of Force Review Boards, to ensure it meets the needs of the department. [See p. 89.]
Workers’ Compensation Recommendations: 74. Supervisors should accompany an employee to a treating facility when the employee seeks
initial medical treatment/evaluation for an on-duty injury. The supervisor should consult with the treating physician and discuss with them the availability of temporary modified duty assignments to assist in determining if such work can be performed where available. [See p. 90.]
75. In the event an injured worker is found to be temporarily disabled and will be on a lost-time status, his or her first-line supervisor should be in weekly contact with the employee to ensure that his or her needs are being met, as well as provide encouragement for a speedy recovery. [See p. 90.]
Policy Manual Recommendations: 76. Explore the opportunity to contract with the Lexipol service to maintain the policy manual;
remove policies or sections that do not apply. [See p. 91.]
77. Ensure all employees are uploaded into Lexipol’s Knowledge Management System (KMS) in order to manage policy updates and acknowledgements. [See p. 91.]
78. Share the KMS app with all personnel for remote access to the policy manual. [See p. 91.]
Performance Evaluation Recommendation: 79. A tracking system for evaluations should be implemented to provide management reports
regarding the status of employee performance evaluations. [See p. 92.]
Fleet Recommendations: 80. GPD accident rates should be examined quarterly by GPD management. [See p. 93.]
81. Training on Below 100 should be included annually to increase officer safety. [See p. 93.]
Facility Recommendations: 82. Place additional video cameras in the evidence storage room, the sally port area
containing long-term bike and bulk property/evidence, the upcoming Conex area in the back police parking lot, and the armory. [See p. 95.]
83. Conduct an audit of all access cards granting access to the police department to ensure only authorized police employees are granted access to the facility. [See p. 95.]
9
84. Reconsider moving forward with the jail and instead consider other more pressing needs such as the Detective Section area; long-term property and evidence storage; training room and/or emergency operations center. [See p. 95.]
Technology Recommendations: 85. Purchase at least two automated external defibrillators (AEDs) to deploy in the field and at
the police facility; provide training on AEDs to all staff. [See p. 97.]
86. Explore the opportunity to deploy automated license plate readers, either as fixed, mounted instruments at high-traffic locations, or on patrol vehicles, or both. [See p. 97.]
10
SECTION 2. METHODOLOGY Data Analysis CPSM used numerous sources of data to support our conclusions and recommendations for the Greenfield Police Department. Information was obtained from the FBI Uniform Crime Reporting (UCR) Program, Part I offenses, along with numerous sources of internal information. UCR Part I crimes are defined as murder, rape, robbery, aggravated assault, burglary, larceny-theft, and larceny of a motor vehicle. Internal sources included data from the computer- aided dispatch (CAD) system for information on calls for service (CFS).
Interviews This study relied extensively on intensive interviews with personnel. On-site and in-person interviews were conducted with all division commanders regarding their operations.
Focus Groups A focus group is an unstructured group interview in which the moderator actively encourages discussion among participants. Focus groups generally consist of eight to ten participants and are used to explore issues that are difficult to define. Group discussion permits greater exploration of topics. For the purposes of this study, focus groups were held with a representative cross-section of employees within the department.
Document Review CPSM consultants were furnished with numerous reports and summary documents by the Greenfield Police Department. Information on strategic plans, personnel staffing and deployment, monthly and annual reports, operations manuals, intelligence bulletins, evaluations, training records, and performance statistics were reviewed by project team staff. Follow-up phone calls were used to clarify information as needed.
Operational/Administrative Observations Over the course of the evaluation period, numerous observations were conducted. These included observations of general patrol; investigations; support services such as records, communications, property and evidence; and administrative functions. CPSM representatives engaged all facets of department operations from a “participant observation” perspective.
Staffing Analysis In virtually all CPSM studies, we are asked to identify appropriate staffing levels. That is the case in this study as well. In the following subsections, we will present an extensive discussion on workload, operational and safety conditions, and other factors to be considered in establishing appropriate staffing levels. Staffing recommendations are based upon our comprehensive analysis of all relevant factors.
11
SECTION 3. COMMUNITY AND DEPARTMENT OVERVIEW The City of Greenfield is located in southern Monterey County, California. The city has a total land area of 2.14 square miles. The U.S. Census Bureau’s 2017 estimate of the city’s population of approximately 17,517 represents a 7.2 percent increase over the 2010 base population of 16,330. The city is governed under a Council/ Manager form of government.
DEMOGRAPHICS According to U.S. Census Bureau data, the City of Greenfield is a largely homogeneous community; its population is 90.2 percent Hispanic, 7.2 percent white, 1.3 percent two or more races, and all other races at less than 1 percent per.
The owner-occupied housing rate is 48.4 percent in the city, compared to 49.7 percent in Monterey County as a whole. The rate of persons per household for the city is 4.59 compared to 3.27 for the county. The median household income is $46,506 for the city, compared to $60,889 for the county. Per capita income in the city is $12,992, while per capita income countywide is $25,947. Persons living in poverty make up 25.5 percent of the city’s population, compared to 12.9 percent for the county. It is interesting to note that while owner-occupancy rates between city and county are similar, the rate of persons per household is significantly higher in the city. As well, per capita income rates for the county are double those of the city, and poverty rates for the city are essentially double those of the county.
LAW ENFORCEMENT SERVICES The Greenfield Police Department provides a full range of law enforcement services, excluding custody operations and 911/dispatch. As such, adequate leadership, management, training, staffing, and expertise are required to ensure the delivery of high-quality policing services.
The Greenfield Police Department is guided by clear Mission Statement as follows:
The Greenfield Police Department will protect the public peace, safeguard lives and property, protect the rights of individuals and groups, and the security and freedom of our community.
To achieve these ends, the Greenfield Police Department will: • Provide a superior level of law enforcement and related services. • Maintain a learning and proactive organization. • Effectively respond to current and future community needs, and make maximum use of available resources, personnel, and technology.
12
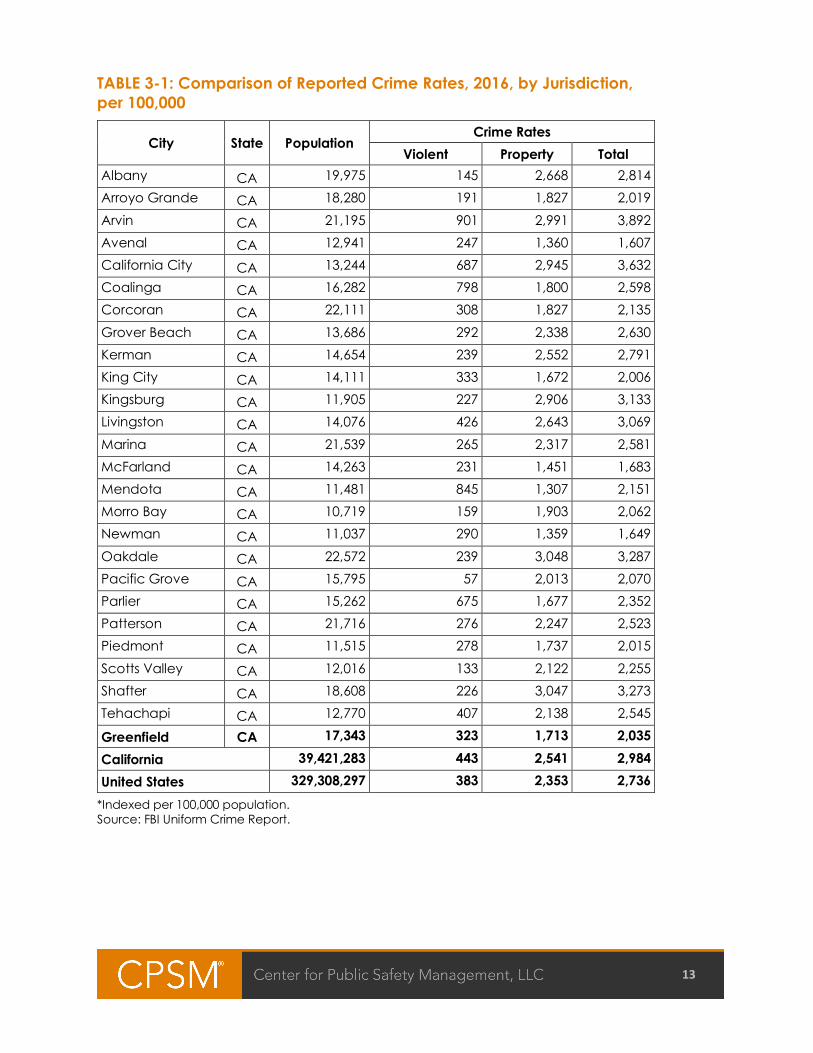
Uniform Crime Report/Crime Trends While communities differ from one another in population, demographics, geographical landscape, and socio-economically, comparisons to other jurisdictions can be helpful in illustrating how crime rates in the City of Greenfield measure against those of other local California agencies as well as the State of California and the nation overall.
The FBI’s Uniform Crime Reporting (UCR) Program assembles data on crime from police departments across the United States; the reports are utilized to measure the extent, fluctuation, and distribution of crime. For reporting purposes, criminal offenses are divided into two categories: Part 1 offenses and Part 2 offenses. For Part 1 offenses, which represent the most serious crimes, the UCR indexes incidents in two categories: violent crimes and property crimes. Violent crimes include murder, rape, robbery, and aggravated assault. Property crimes include burglary, larceny, and motor vehicle theft. Crime rates are expressed (indexed) as the number of incidents per 100,000 population to allow for comparison.
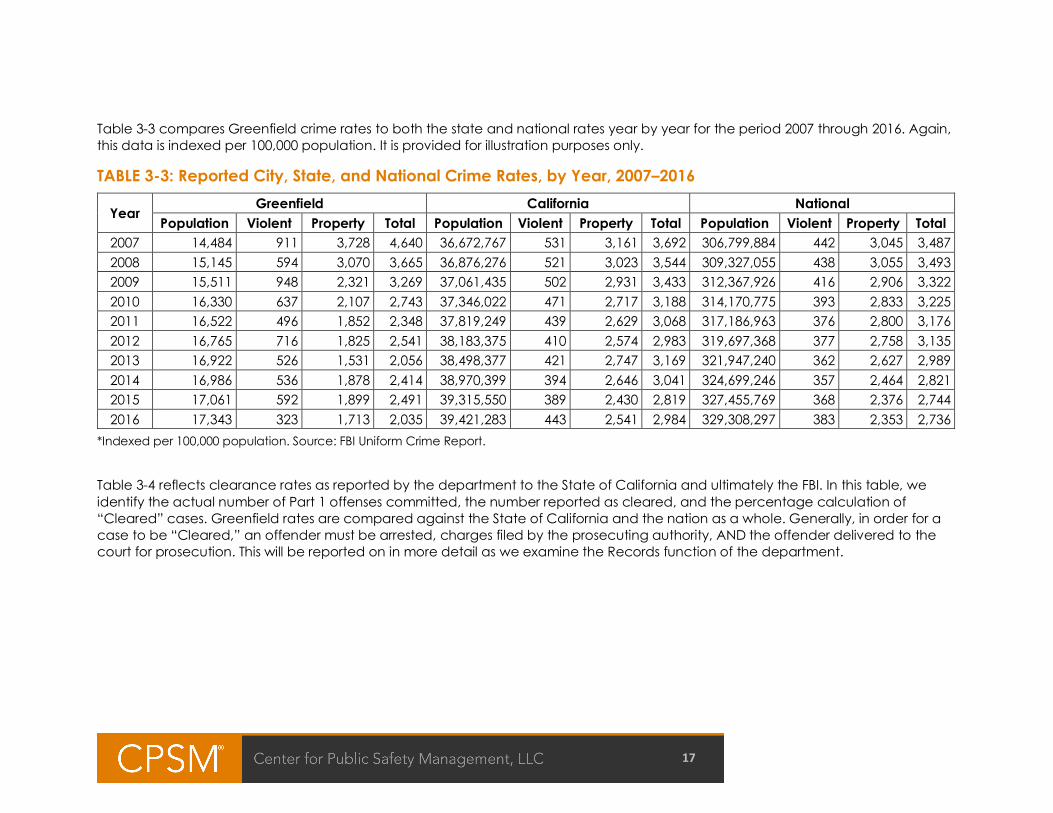
Data acquired by CPSM from the FBI for use in this reporting reflects that information that is most currently available (2016). To allow for comparisons, information is reported as crimes per 100,000 population (indexed). As indicated in Table 3-1, in 2016, Greenfield Police Department reported a UCR Part I violent crime rate of 323 (indexed) and a property crime rate of 1,713 (indexed). Table 3-2 shows the actual number of offenses. In Table 3-2, we have included data for 2017 and 2018, through October, as provided by the department. Again, 2017 and 2018 data from the FBI UCR was not yet available at the time of this review.
In comparing Greenfield Police Department data with average rates for both California and the nation, one can see that, on average, Greenfield reports lower rates for both violent crime and property crime than both California and the nation as a whole.
Comparisons against several similarly sized cities within the region and throughout California reflect that Greenfield rates are higher than some, and lower than others. Again, this is simply intended to allow for comparisons of Greenfield’s crime rates against those of other communities locally and throughout the nation.
Table 3-1 presents information derived from the FBI UCR. This information, and all of this section’s tables and figures, include the most recent information that is publicly available at the national level. Again, crime rates are expressed as incidents per 100,000 population.
13
TABLE 3-1: Comparison of Reported Crime Rates, 2016, by Jurisdiction, per 100,000
City State Population Crime Rates
Violent Property Total Albany CA 19,975 145 2,668 2,814 Arroyo Grande CA 18,280 191 1,827 2,019 Arvin CA 21,195 901 2,991 3,892 Avenal CA 12,941 247 1,360 1,607 California City CA 13,244 687 2,945 3,632 Coalinga CA 16,282 798 1,800 2,598 Corcoran CA 22,111 308 1,827 2,135 Grover Beach CA 13,686 292 2,338 2,630 Kerman CA 14,654 239 2,552 2,791 King City CA 14,111 333 1,672 2,006 Kingsburg CA 11,905 227 2,906 3,133 Livingston CA 14,076 426 2,643 3,069 Marina CA 21,539 265 2,317 2,581 McFarland CA 14,263 231 1,451 1,683 Mendota CA 11,481 845 1,307 2,151 Morro Bay CA 10,719 159 1,903 2,062 Newman CA 11,037 290 1,359 1,649 Oakdale CA 22,572 239 3,048 3,287 Pacific Grove CA 15,795 57 2,013 2,070 Parlier CA 15,262 675 1,677 2,352 Patterson CA 21,716 276 2,247 2,523 Piedmont CA 11,515 278 1,737 2,015 Scotts Valley CA 12,016 133 2,122 2,255 Shafter CA 18,608 226 3,047 3,273 Tehachapi CA 12,770 407 2,138 2,545
Greenfield CA 17,343 323 1,713 2,035
California 39,421,283 443 2,541 2,984 United States 329,308,297 383 2,353 2,736
*Indexed per 100,000 population. Source: FBI Uniform Crime Report.
14
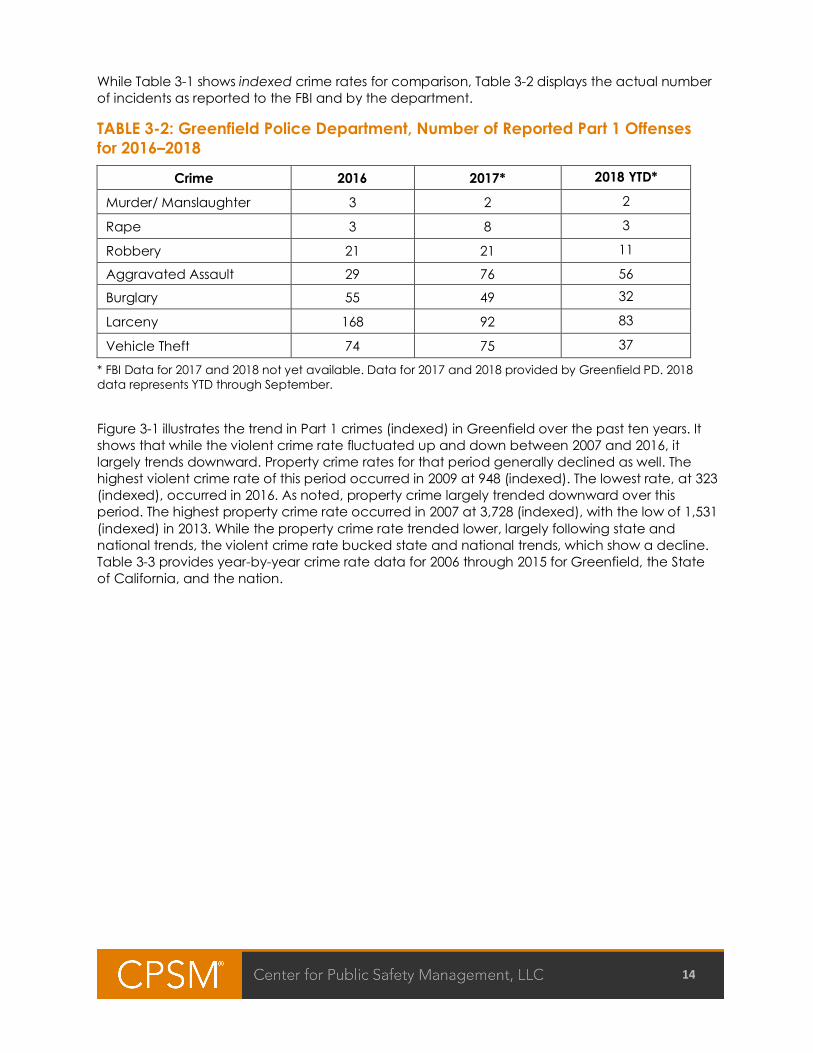
While Table 3-1 shows indexed crime rates for comparison, Table 3-2 displays the actual number of incidents as reported to the FBI and by the department.
TABLE 3-2: Greenfield Police Department, Number of Reported Part 1 Offenses for 2016–2018
Crime 2016 2017* 2018 YTD*
Murder/ Manslaughter 3 2 2
Rape 3 8 3
Robbery 21 21 11
Aggravated Assault 29 76 56
Burglary 55 49 32
Larceny 168 92 83
Vehicle Theft 74 75 37
* FBI Data for 2017 and 2018 not yet available. Data for 2017 and 2018 provided by Greenfield PD. 2018 data represents YTD through September.
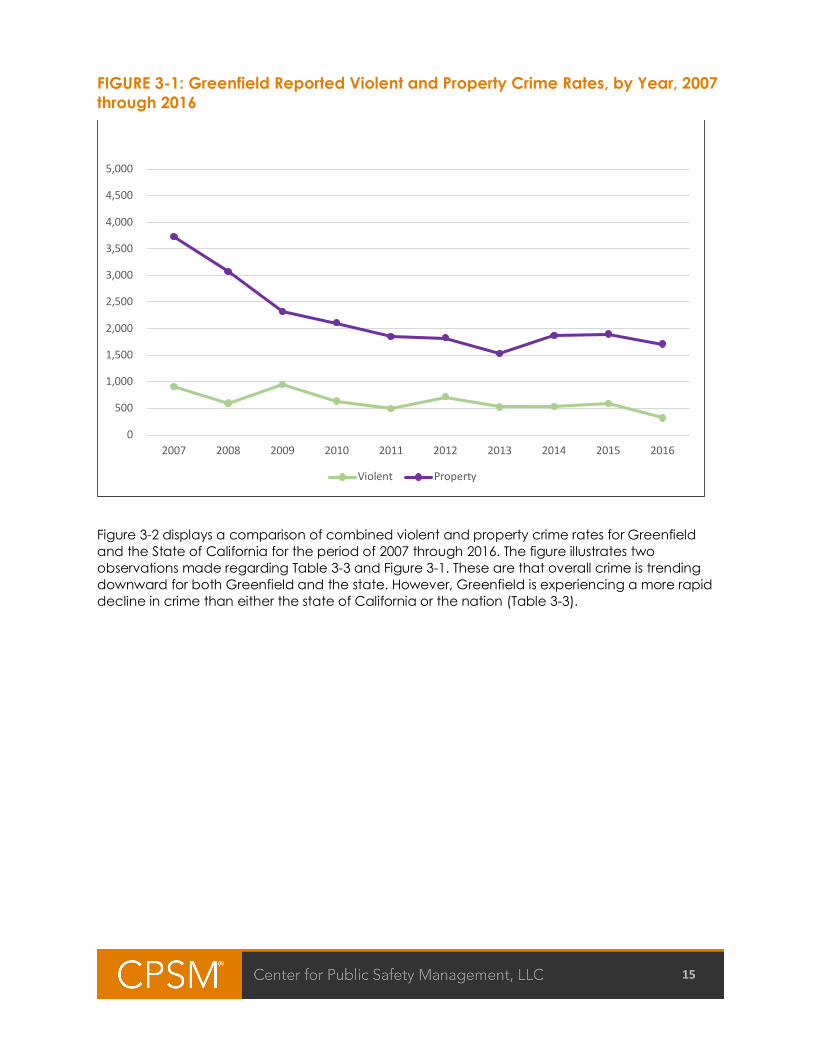
Figure 3-1 illustrates the trend in Part 1 crimes (indexed) in Greenfield over the past ten years. It shows that while the violent crime rate fluctuated up and down between 2007 and 2016, it largely trends downward. Property crime rates for that period generally declined as well. The highest violent crime rate of this period occurred in 2009 at 948 (indexed). The lowest rate, at 323 (indexed), occurred in 2016. As noted, property crime largely trended downward over this period. The highest property crime rate occurred in 2007 at 3,728 (indexed), with the low of 1,531 (indexed) in 2013. While the property crime rate trended lower, largely following state and national trends, the violent crime rate bucked state and national trends, which show a decline. Table 3-3 provides year-by-year crime rate data for 2006 through 2015 for Greenfield, the State of California, and the nation.
15
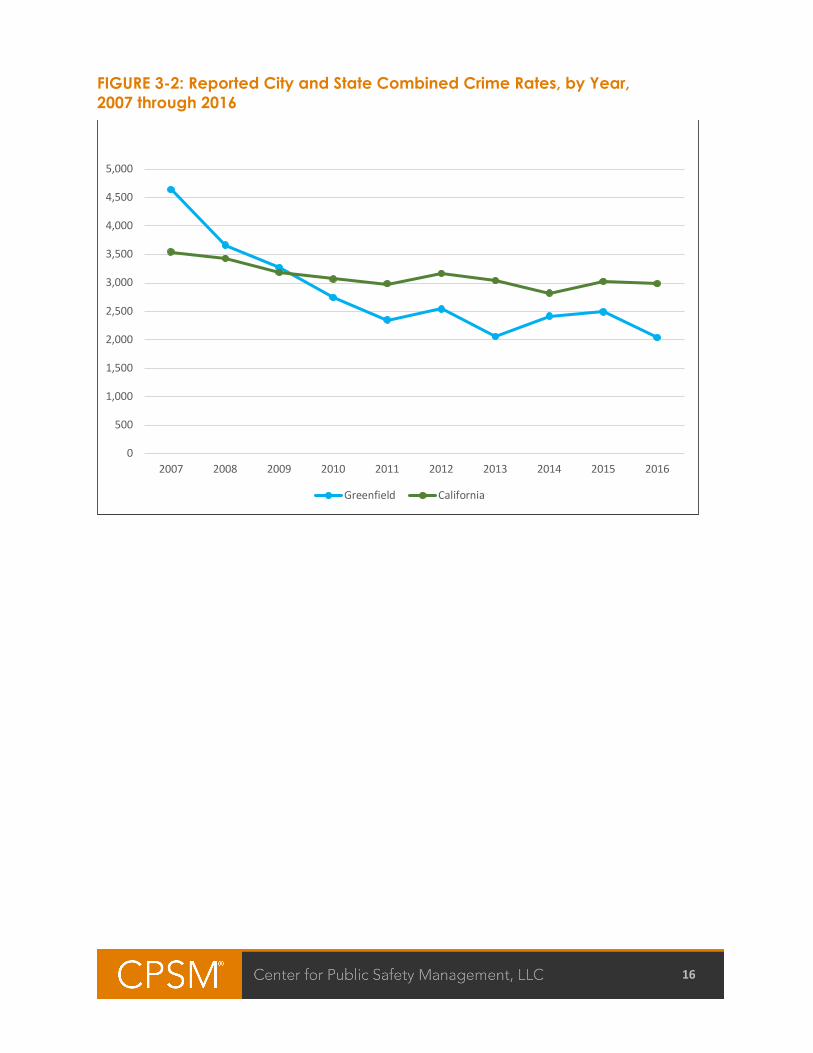
FIGURE 3-1: Greenfield Reported Violent and Property Crime Rates, by Year, 2007 through 2016
Figure 3-2 displays a comparison of combined violent and property crime rates for Greenfield and the State of California for the period of 2007 through 2016. The figure illustrates two observations made regarding Table 3-3 and Figure 3-1. These are that overall crime is trending downward for both Greenfield and the state. However, Greenfield is experiencing a more rapid decline in crime than either the state of California or the nation (Table 3-3).
0
500
1,000
1,500
2,000
2,500
3,000
3,500
4,000
4,500
5,000
2007 2008 2009 2010 2011 2012 2013 2014 2015 2016
Violent Property
16
FIGURE 3-2: Reported City and State Combined Crime Rates, by Year, 2007 through 2016
0
500
1,000
1,500
2,000
2,500
3,000
3,500
4,000
4,500
5,000
2007 2008 2009 2010 2011 2012 2013 2014 2015 2016
Greenfield California
17
Table 3-3 compares Greenfield crime rates to both the state and national rates year by year for the period 2007 through 2016. Again, this data is indexed per 100,000 population. It is provided for illustration purposes only.
TABLE 3-3: Reported City, State, and National Crime Rates, by Year, 2007–2016
Year Greenfield California National
Population Violent Property Total Population Violent Property Total Population Violent Property Total 2007 14,484 911 3,728 4,640 36,672,767 531 3,161 3,692 306,799,884 442 3,045 3,487 2008 15,145 594 3,070 3,665 36,876,276 521 3,023 3,544 309,327,055 438 3,055 3,493 2009 15,511 948 2,321 3,269 37,061,435 502 2,931 3,433 312,367,926 416 2,906 3,322 2010 16,330 637 2,107 2,743 37,346,022 471 2,717 3,188 314,170,775 393 2,833 3,225 2011 16,522 496 1,852 2,348 37,819,249 439 2,629 3,068 317,186,963 376 2,800 3,176 2012 16,765 716 1,825 2,541 38,183,375 410 2,574 2,983 319,697,368 377 2,758 3,135 2013 16,922 526 1,531 2,056 38,498,377 421 2,747 3,169 321,947,240 362 2,627 2,989 2014 16,986 536 1,878 2,414 38,970,399 394 2,646 3,041 324,699,246 357 2,464 2,821 2015 17,061 592 1,899 2,491 39,315,550 389 2,430 2,819 327,455,769 368 2,376 2,744 2016 17,343 323 1,713 2,035 39,421,283 443 2,541 2,984 329,308,297 383 2,353 2,736
*Indexed per 100,000 population. Source: FBI Uniform Crime Report.
Table 3-4 reflects clearance rates as reported by the department to the State of California and ultimately the FBI. In this table, we identify the actual number of Part 1 offenses committed, the number reported as cleared, and the percentage calculation of “Cleared” cases. Greenfield rates are compared against the State of California and the nation as a whole. Generally, in order for a case to be “Cleared,” an offender must be arrested, charges filed by the prosecuting authority, AND the offender delivered to the court for prosecution. This will be reported on in more detail as we examine the Records function of the department.
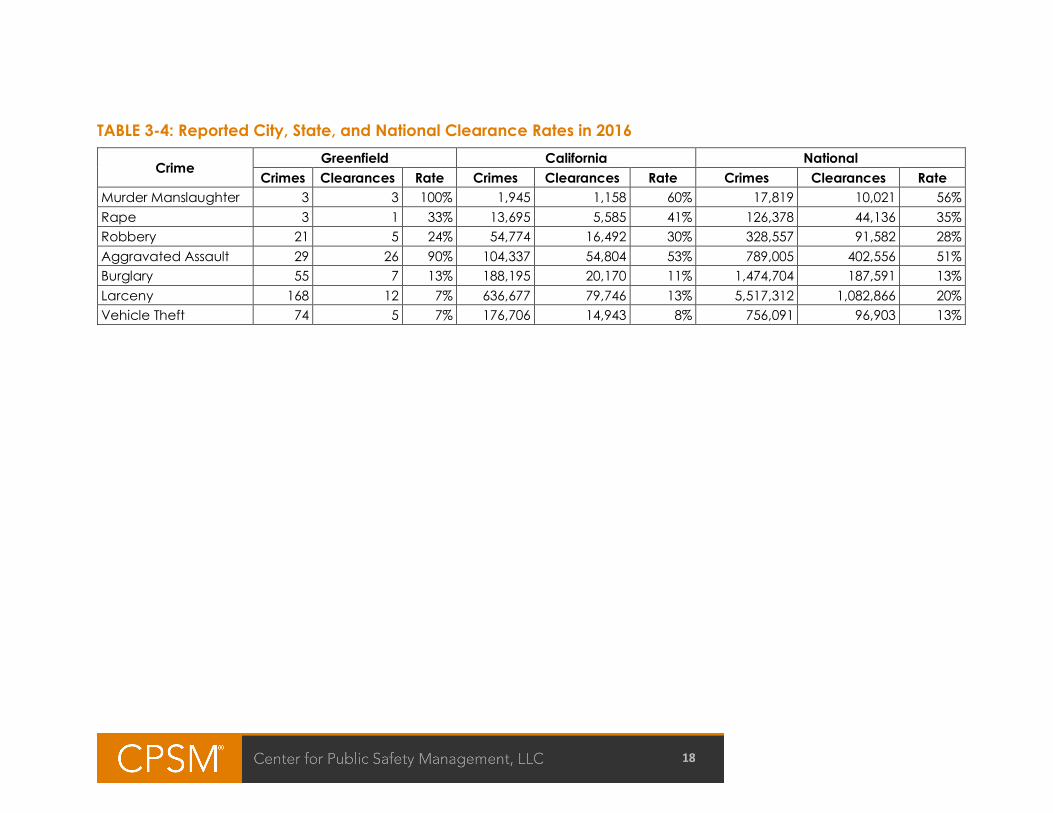
18
TABLE 3-4: Reported City, State, and National Clearance Rates in 2016
Crime Greenfield California National
Crimes Clearances Rate Crimes Clearances Rate Crimes Clearances Rate Murder Manslaughter 3 3 100% 1,945 1,158 60% 17,819 10,021 56% Rape 3 1 33% 13,695 5,585 41% 126,378 44,136 35% Robbery 21 5 24% 54,774 16,492 30% 328,557 91,582 28% Aggravated Assault 29 26 90% 104,337 54,804 53% 789,005 402,556 51% Burglary 55 7 13% 188,195 20,170 11% 1,474,704 187,591 13% Larceny 168 12 7% 636,677 79,746 13% 5,517,312 1,082,866 20% Vehicle Theft 74 5 7% 176,706 14,943 8% 756,091 96,903 13%
19
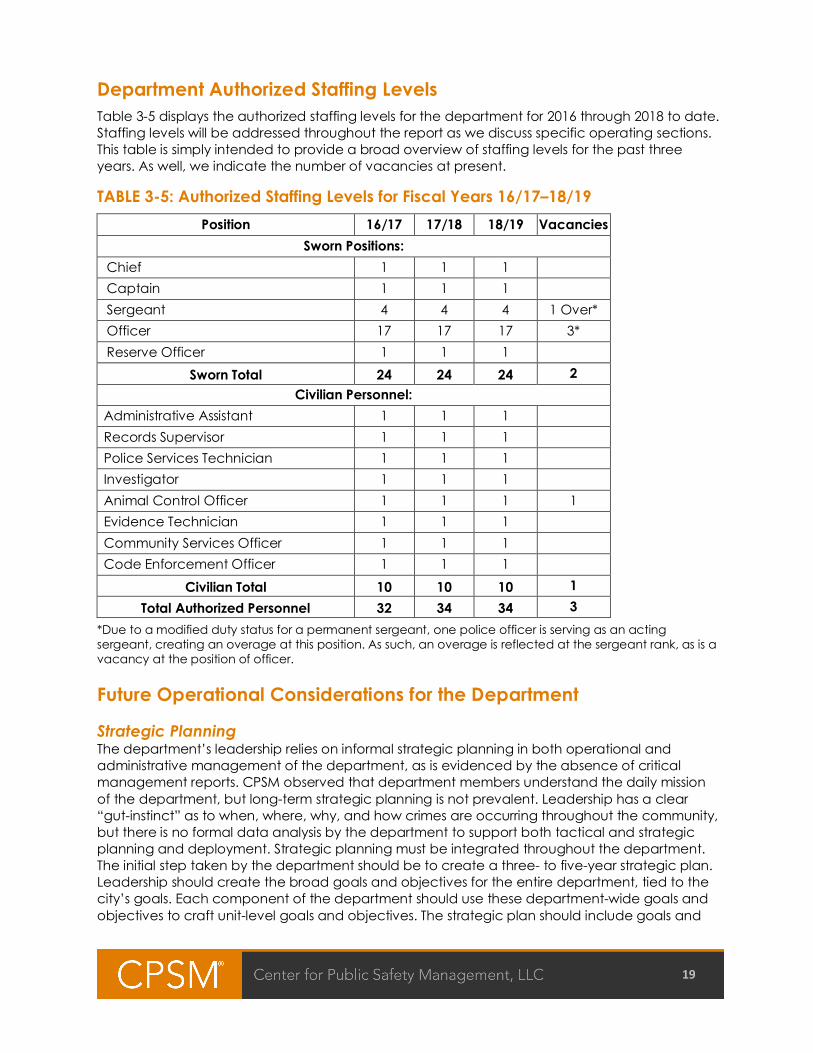
Department Authorized Staffing Levels Table 3-5 displays the authorized staffing levels for the department for 2016 through 2018 to date. Staffing levels will be addressed throughout the report as we discuss specific operating sections. This table is simply intended to provide a broad overview of staffing levels for the past three years. As well, we indicate the number of vacancies at present.
TABLE 3-5: Authorized Staffing Levels for Fiscal Years 16/17–18/19 Position 16/17 17/18 18/19 Vacancies
Sworn Positions: Chief 1 1 1 Captain 1 1 1 Sergeant 4 4 4 1 Over* Officer 17 17 17 3* Reserve Officer 1 1 1
Sworn Total 24 24 24 2 Civilian Personnel:
Administrative Assistant 1 1 1 Records Supervisor 1 1 1 Police Services Technician 1 1 1 Investigator 1 1 1 Animal Control Officer 1 1 1 1 Evidence Technician 1 1 1 Community Services Officer 1 1 1 Code Enforcement Officer 1 1 1
Civilian Total 10 10 10 1 Total Authorized Personnel 32 34 34 3
*Due to a modified duty status for a permanent sergeant, one police officer is serving as an acting sergeant, creating an overage at this position. As such, an overage is reflected at the sergeant rank, as is a vacancy at the position of officer.
Future Operational Considerations for the Department
Strategic Planning The department’s leadership relies on informal strategic planning in both operational and administrative management of the department, as is evidenced by the absence of critical management reports. CPSM observed that department members understand the daily mission of the department, but long-term strategic planning is not prevalent. Leadership has a clear “gut-instinct” as to when, where, why, and how crimes are occurring throughout the community, but there is no formal data analysis by the department to support both tactical and strategic planning and deployment. Strategic planning must be integrated throughout the department. The initial step taken by the department should be to create a three- to five-year strategic plan. Leadership should create the broad goals and objectives for the entire department, tied to the city’s goals. Each component of the department should use these department-wide goals and objectives to craft unit-level goals and objectives. The strategic plan should include goals and
20
objectives, measurable outcomes, and projected personnel and capital expenses, with the end goals being to reduce crime and increase the quality of life in the City of Greenfield. A detailed strategic plan will enable the department to work with city leadership to determine priorities and funding.
Strategic Planning Recommendation: ■ CPSM recommends implementing a formal strategic planning process to develop a three- to
five-year strategic plan. [Recommendation No. 1.]
Succession Planning / Mentoring An important aspect of succession planning for any police department is to provide for professional development relevant to leadership and supervisory positions throughout the department. The Police Chief and several other personnel, including mid-level supervisors, are at or near retirement age. Their departures could create a leadership/supervisory vacuum and should be anticipated and addressed.
Previously, we addressed the need for the development of a variety of management systems such as performance data reports, case management systems, training, and internal affairs software programs. Assigning these responsibilities to sergeants, where appropriate, would be of value to both to the development of the sergeants and to meet the departmental need for such systems. Another opportunity for growth would be to expose sergeants to the budgeting process. These are examples of available opportunities for development of personnel.
It is understood that, given the present staffing situation, assigning additional duties to sergeants, at least within patrol, is not practical at this time. However, as vacancies are filled and field training completed, succession planning should become an active element of the organizational culture.
Part of succession planning is to create opportunities for staff at all levels to learn about other areas of the department they normally are not involved with. Being exposed to different experiences enhances the perspective of staff and broadens their understanding of the intricacies involved in providing a full complement of services to the community. There are a variety of ways to provide mentoring, both internally and externally, such as offering staff the chance to work alongside a supervisor to learn about leadership, management, and the administrative aspects of public service. Another is to send staff to training where mentorship is a key element offered. Ultimately, department management should clearly communicate the value of mentorship and include it as part of the expectations for supervisors and managers that they are expected to mentor others.
Succession Planning/Mentoring Recommendation: ■ Create a succession plan to develop GPD personnel for future leadership roles.
[Recommendation No. 2.]
21
SECTION 4. PATROL DIVISION The Patrol Division serves under the direction of a Captain who reports directly to the Chief of Police. In the absence of a separate traffic section, traffic enforcement and accident investigation duties fall to the Patrol Division.
PATROL SECTION The Greenfield Police Department provides the community with a full range of police services including responding to emergencies and calls for service (CFS), performing directed patrol activities, and neighborhood problem solving. The department is service oriented. Essentially, every call for service from the public gets a police response and every criminal case gets reviewed. The department embraces this approach and considers every request for service from the public important and deserving of a police response.
Uniformed patrol is considered the “backbone” of American policing. Officers assigned to this important function are the most visible members of the department and command the largest share of resources committed by the department. Proper allocation of these resources is critical to ensuring that the department can respond to emergency calls for service and provide general law enforcement services to the public.
As noted in the Executive Summary, our work followed two tracks; (1) the operational assessment, and (2) a data analysis of workload, primarily related to patrol. In the following pages relative to the Patrol Section, we draw upon the data analysis report to assist in our operational assessment. The data analysis report, in full, can be found following the operational assessment and readers are encouraged to thoroughly review it. It is rich with information, only a portion of which is included in this segment of the report. For purposes of our analysis, we use computer-aided dispatch (CAD) records supplied by the department’s regional dispatch center. These records pertain to identifiable workload associated with specific units and create the most accurate, verifiable, and comprehensive records available.
Patrol Staffing The Patrol Division is responsible for 24/7 policing services in the City of Greenfield. Its authorized patrol staffing is four Sergeants and 15 police officers. At present, however, due to an injury related modified duty status of a Sergeant, one officer is serving as an Acting Sergeant. As well, there are currently two additional vacant officer positions.1 This results in a total of 12 officers available for deployment. Included in this number are two officers who recently graduated from the academy and will be on training status for approximately six months. As such, patrol is presently operating with 10 full-service police officers, or 2.5 per shift.
Staffing levels are affected by both the total number of officers assigned to the Patrol Division as well as the impacts of time off associated with vacations, training, court appearances, FMLA, and illness/injury. The combination of these leave factors generally results in officers being unavailable for a shift at a rate of 20 to 25 percent of the time.
The department has established a minimum staffing of three officers (including a supervisor) on duty throughout the 24-hour day, seven days per week. Given the present staffing level of the
1. Two vacant officer positions scheduled to be filled by end of 2018 – refer to Recruitment portion page X.
22
Patrol Division, shift coverage will normally range from a low of three officers on duty (may include an overtime position), to a high of four, again inclusive of a supervisor. However, minimum staffing is commonplace at present due to the vacancy rate.
Sergeants serve as watch commanders and are oftentimes the highest-ranking officer on duty during the night and weekend hours. If a Sergeant is unavailable, a senior officer may serve as the shift supervisor. Additionally, there is one reserve police officer who provides added patrol coverage, assists with prisoner transportation, and provides other related support services to the patrol function and at special events.
In virtually all CPSM studies, we are asked to identify appropriate staffing levels. That is the case in this study as well. In the following subsections, we will extensively discuss workload and other factors to be considered in establishing staffing levels. Upon thorough evaluation of all contributing factors, we will make staffing recommendations.
Work Schedule The Patrol Division operates under a 3/12 work schedule within a 14-day cycle. That is to say, each officer is assigned to work four consecutive 12-hour shifts one week, with three days off, and three consecutive 12-hour shifts in week two, with four days off. Under this schedule, the two-week work total amounts to 84 hours. Therefore, each officer, based upon seniority, selects a day within the two-week period to work an 8-hour shift rather than 12 hours. As such, work time in the two-week period is reduced to 80 hours. In so doing, staffing is reduced/balanced throughout the two-week period, and staffing is not adversely impacted.
There are myriad schedules used in patrol staffing. Most commonly in use are those in which officers work a 3/12 schedule (three 12-hour days) or a 4/10 schedule (four 10-hour days), with various schedule options within each. Some agencies combine to use both such schedules over a seven-day period. There can be positives and negatives to each. As well, there is a mountain of research exploring the benefits and liabilities of each, though it often draws conflicting conclusions. One such publication is available through the Washington, D.C.-based Police Foundation, The Shift Length Experiment; What We Know About 8-, 10, 12 Hour Shifts in Policing.
CPSM contends that more important than the schedule chosen is that staffing must align with workload demand and adequate resources should be available at all times to meet that demand. We will explore this further as we examine workload.
Shift reporting times are 6:00 a.m. and 6:00 p.m. As such, there is no overlap of shifts. The off-going shift generally returns to the station 15 to 30 minutes prior to the end of the shift to complete paper work, download body-worn camera videos, and other related duties. The on-coming shift goes through briefing procedures and deployment preparation procedures, often lasting 30 minutes. Thus, there are no officers deployed to the field during these changeover periods. This may occur for up to an hour between the hours of 5:30 a.m. and 6:30 a.m. and 5:30 p.m. and 6:30 p.m. When CPSM inquired about the absence of officers deployed to the field during these periods, anecdotal reports were shared of gang members using these time periods, in the past, to commit crimes. Though these individuals were later arrested, this continues to present a vulnerability that should be remedied. Adjusting the reporting time for one officer per shift by one hour would address this deployment issue. Later in this report, we will provide a sample alternate work schedule for future consideration. At this point in time, however, given the vacancy rate and lack of tenure of employees both overall and in grade, CPSM is not recommending a modification of the existing work schedule with the exception of the minor adjustment to ensure coverage during shift change periods.
23
Roll Call Training Predeployment roll call training is vital to the organization and utilized by virtually all law enforcement agency patrol operations in preparation for shift deployments. In addition to verifying available personnel, it provides opportunities for organizational communication regarding changes or directives, provides on-coming officers with information on recent criminal activities or other community events taking place, offers the opportunity to collectively review tactical actions recently undertaken, and provides opportunities for training on a variety of matters. Policy § 404 addresses these important functions as stated, and many, in fact, occur.
One apparent shortfall is the absence of structured roll call training. That is, a training plan that calls for all patrol officers to receive the same information, regardless of which shift they are assigned to. This may include California Peace Officers Standards and Training (POST) training videos and/or review of critical policies such as use of force, pursuits, biased based policing, etc. where applicable training may meet some POST Continued Professional Training (CPT) requirements. Regardless of the source, the training should be standardized and recorded in department training records as called for in Section 404.3. At this point in time, this does not occur, and should be addressed. We will report further on department training later in this report.
CALL / WORKLOAD DEMAND Crime statistics (indexed for population) for the City of Greenfield indicate a low to moderate level of violent crime in comparison to both the State of California and the nation. Property crime rates are low to moderate as well. These figures were discussed in Section 3, and depicted in Table 3-3: Reported City, State, ad National Crime Rates by Year, 2007–2016. Property crime in Greenfield is trending downward, following a path that began nationally in the 1990s. Violent crime, however, has varied during the 2007 to 2016 period, going up and down periodically, but largely trending downward. This may be attributable to the relatively small numbers of incidents (56 total violent crimes in 2016), where a short-term spike or decline in violent crime incidents can substantially impact the crime rate index.
Certainly, the prevention of crime and the apprehension of criminals is at the forefront of the list of responsibilities for police departments, but demands on police resources involve much more than crime. Traffic enforcement, the efficient flow of traffic through the community, and maintaining peace and order are but a few of the many such noncrime activities that fall into the scope of work of a police department. As we examine workload demands we will explore all activities.
Table 4-1 presents information on the main categories of calls for service the department handled during the study period of July 1, 2017 to June 30, 2018. The Monterey County Department of Emergency Communications (regional 911/dispatch) recorded approximately 21,539 events that were assigned a call number and which included an adequate record of a responding patrol unit. When measured daily, the department reported an average of 59.0 patrol-related events per day.
While the total number of events reaches nearly 60 per day, some were for directed patrol activities rather than call-specific, others were for out of service/administrative duties that were not call related, and still others had fewer than 30 seconds spent on the call (indicating the call was canceled) or lacked arrival times or other pertinent call information. Excluding these categories, the analysis focused on the remaining 18,103 calls for service. The data includes both officer-initiated activity and activity initiated by other sources (i.e., citizens, alarm companies, transfers from other law enforcement agencies, etc.). It is important to note that our focus here is
24
on call data. As we examine workload impacts later in this section, we will capture all reported occupied time, including that spent on directed patrol, out of service/administrative duties, etc.
TABLE 4-1: Calls per Day, by Category Category No. of Calls Calls per Day
Accident 264 0.7 Alarm 534 1.5 Animal 712 2.0 Arrest and prisoner 125 0.3 Assist citizen 588 1.6 Assist other agency 552 1.5 Check 3,391 9.3 Crime–person 396 1.1 Crime–property 600 1.6 Disturbance 1,013 2.8 Follow-up 1,280 3.5 Investigation 773 2.1 Miscellaneous 581 1.6 Suspicious incident 492 1.3 Traffic enforcement 849 2.3 Traffic stop 5,953 16.3
Total 18,103 49.6 Note: The focus here is on recorded calls rather than recorded events. We removed 3,436 events that were either directed patrol activities, out-of-service activities, or events with zero time on scene.
In total, department officers were involved in 18,103 calls during the 12-month study period, or 49.6 calls per day, or 2.1 per hour. The top three categories of calls accounted for 72 percent of all calls: 39 percent of calls were traffic-related; 19 percent of calls were to check on businesses, pedestrian stops, welfare/safety, etc.; and 14 percent of calls were general, noncriminal calls including animal calls, follow-up activities, and miscellaneous activities that did not fit into a specific call classification. Only 6 percent of calls were for crimes (person and property).
In Table 4-2, we examine both the origin of the call and the average time spent on a call by the primary unit. Community-initiated calls are calls from citizens, businesses, alarm companies, transfers from other law enforcement agencies, etc. Police-initiated calls refers to calls generated by a patrol officer or other Greenfield police employee.
25
TABLE 4-2: Primary Unit’s Average Occupied Times, by Category and Initiator
Category Community-initiated Police-initiated Minutes Calls Minutes Calls
Accident 37.2 245 32.6 19 Alarm 13.1 520 9.2 14 Animal 38.0 346 34.8 365 Arrest and prisoner NA 0 62.1 125 Assist citizen 25.7 240 21.9 348 Assist other agency 26.9 475 28.2 77 Check 26.3 506 18.5 2,885 Crime–person 46.2 359 49.4 37 Crime–property 33.8 563 32.3 37 Disturbance 31.7 959 16.1 53 Follow-up 30.2 309 31.1 968 Investigation 17.5 731 18.5 41 Miscellaneous 29.7 389 20.6 192 Suspicious incident 27.5 425 23.8 67 Traffic enforcement 22.5 309 26.9 540 Traffic stop 8.7 1 15.0 5,952
Weighted Average/Total Calls 28.2 6,377 19.5 11,720 Note: The information in Table 4-2 is limited to calls and excludes all events that show zero time on scene, directed patrol, and out-of-service activities. A unit’s occupied time is measured as the time from when the unit was dispatched until the unit becomes available again. The times shown are the average occupied minutes per call for the primary unit, rather than the total occupied minutes for all units assigned to a call.
Table 4-3 looks at the average number of police units that responded to an activity. Generally, as GPD deploys one-officer units, that translates to the average number of officers that responded.
26
TABLE 4-3: Average Number of Responding Units, by Initiator and Category
Category Community-initiated Police-initiated
No. of Units Calls No. of Units Calls Accident 1.8 245 1.7 19 Alarm 2.0 520 1.6 14 Animal 1.4 346 1.3 366 Arrest and prisoner NA 0 1.6 125 Assist citizen 1.2 240 1.2 348 Assist other agency 1.9 475 1.4 77 Check 1.6 506 1.5 2,885 Crime–person 1.9 359 1.8 37 Crime–property 1.5 563 1.5 37 Disturbance 2.2 960 1.8 53 Follow up 1.2 309 1.2 971 Investigation 1.3 731 1.1 42 Miscellaneous 1.5 389 1.2 192 Suspicious incident 2.0 425 1.9 67 Traffic enforcement 1.4 309 1.1 540 Traffic stop 1.0 1 1.6 5,952 Weighted Average/Total Calls 1.7 6,378 1.5 11,725
Note: The information in Table 4-3 is limited to calls and excludes directed patrol, and out-of-service activities, and zero time on scene calls.
27
In Table 4-4, we look at the number of units responding to calls, by category, for community-initiated calls.
TABLE 4-4: Number of Responding Units, by Category, Community-initiated Calls
Category Responding Units
One Two Three or More Accident 109 86 50 Alarm 102 337 81 Animal 248 77 21 Assist citizen 189 51 0 Assist other agency 205 156 114 Check 291 153 62 Crime–person 167 121 71 Crime–property 342 157 64 Disturbance 178 473 309 Follow-up 253 49 7 Investigation 548 156 27 Miscellaneous 221 131 37 Suspicious incident 116 219 90 Traffic enforcement 212 73 24 Traffic stop 1 0 0
Total 3,182 2,239 957
Calls for Service Efficiency Further examination of various elements of the CFS and patrol response data also warrants discussion. Data from Tables 4-1 through 4-4 provide a wealth of information about demand, workload, and deployment per call in Greenfield. Taken together these statistics provide an excellent lens through which to view the efficiency of patrol operations.
According to the data in Table 4-2, Greenfield primary patrol units on average take 28.2 minutes to handle a call for service initiated by the public. This time is slightly lower than the CPSM benchmark time of about 28.7 minutes for a CFS, based upon our experience. As well, the primary unit handling an officer-initiated call spends an average of 19.5 minutes on the call. This is somewhat higher than the CPSM benchmark of 17.7 minutes, again based upon our experience. In neither case is the variation statistically significant when considered alone.
Additionally, according to Table 4-3, the department dispatches 1.7 officers per community-initiated CFS. The number of officers dispatched (like occupied time) varies by category of call, but is slightly higher than the policing norms of about 1.6 officers per CFS.2 It is further noted that the number of officers on an officer-initiated CFS,1.5, is higher than policing norms of 1.2 as well. Again, these variations are not significant when considered alone.
In the above discussion we speak of CPSM benchmarks. Table 4-5 that follows provides a comparison of handling calls for service and workload for the Greenfield Police Department in 2. CPSM benchmarks are derived from data analyses of police agencies similar to that performed at GPD.
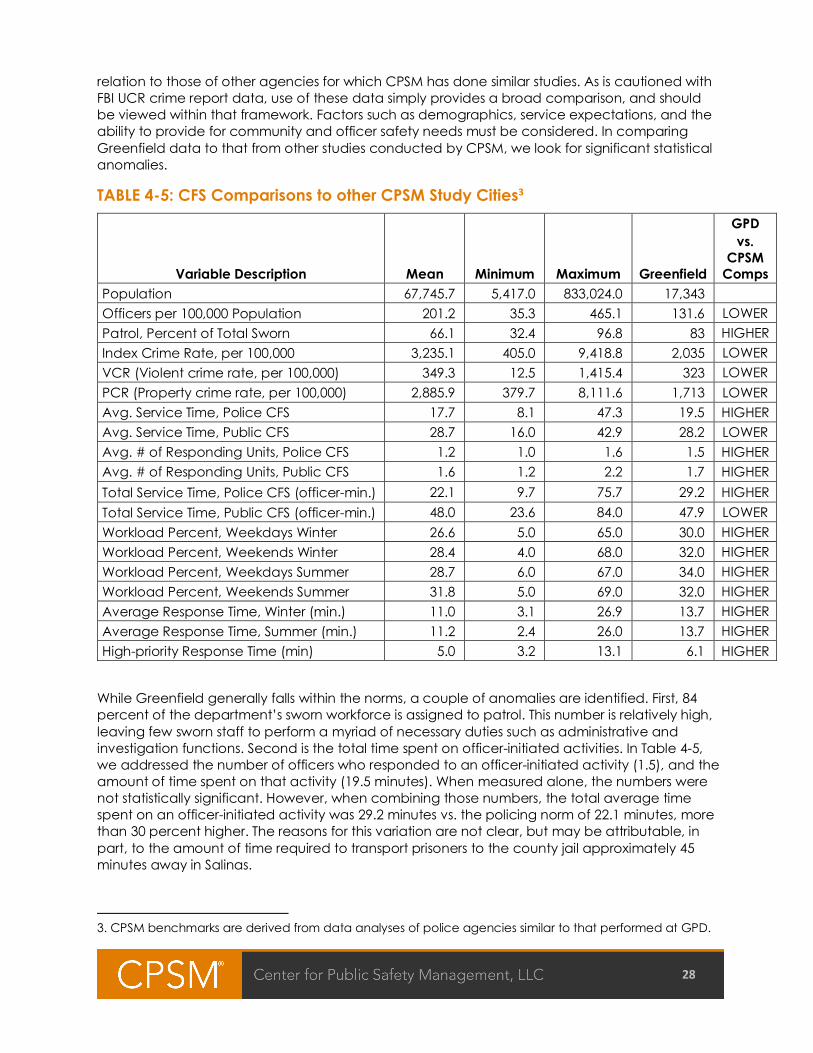
28
relation to those of other agencies for which CPSM has done similar studies. As is cautioned with FBI UCR crime report data, use of these data simply provides a broad comparison, and should be viewed within that framework. Factors such as demographics, service expectations, and the ability to provide for community and officer safety needs must be considered. In comparing Greenfield data to that from other studies conducted by CPSM, we look for significant statistical anomalies.
TABLE 4-5: CFS Comparisons to other CPSM Study Cities3
Variable Description Mean Minimum Maximum Greenfield
GPD vs.
CPSM Comps
Population 67,745.7 5,417.0 833,024.0 17,343 Officers per 100,000 Population 201.2 35.3 465.1 131.6 LOWER Patrol, Percent of Total Sworn 66.1 32.4 96.8 83 HIGHER Index Crime Rate, per 100,000 3,235.1 405.0 9,418.8 2,035 LOWER VCR (Violent crime rate, per 100,000) 349.3 12.5 1,415.4 323 LOWER PCR (Property crime rate, per 100,000) 2,885.9 379.7 8,111.6 1,713 LOWER Avg. Service Time, Police CFS 17.7 8.1 47.3 19.5 HIGHER Avg. Service Time, Public CFS 28.7 16.0 42.9 28.2 LOWER Avg. # of Responding Units, Police CFS 1.2 1.0 1.6 1.5 HIGHER Avg. # of Responding Units, Public CFS 1.6 1.2 2.2 1.7 HIGHER Total Service Time, Police CFS (officer-min.) 22.1 9.7 75.7 29.2 HIGHER Total Service Time, Public CFS (officer-min.) 48.0 23.6 84.0 47.9 LOWER Workload Percent, Weekdays Winter 26.6 5.0 65.0 30.0 HIGHER Workload Percent, Weekends Winter 28.4 4.0 68.0 32.0 HIGHER Workload Percent, Weekdays Summer 28.7 6.0 67.0 34.0 HIGHER Workload Percent, Weekends Summer 31.8 5.0 69.0 32.0 HIGHER Average Response Time, Winter (min.) 11.0 3.1 26.9 13.7 HIGHER Average Response Time, Summer (min.) 11.2 2.4 26.0 13.7 HIGHER High-priority Response Time (min) 5.0 3.2 13.1 6.1 HIGHER
While Greenfield generally falls within the norms, a couple of anomalies are identified. First, 84 percent of the department’s sworn workforce is assigned to patrol. This number is relatively high, leaving few sworn staff to perform a myriad of necessary duties such as administrative and investigation functions. Second is the total time spent on officer-initiated activities. In Table 4-5, we addressed the number of officers who responded to an officer-initiated activity (1.5), and the amount of time spent on that activity (19.5 minutes). When measured alone, the numbers were not statistically significant. However, when combining those numbers, the total average time spent on an officer-initiated activity was 29.2 minutes vs. the policing norm of 22.1 minutes, more than 30 percent higher. The reasons for this variation are not clear, but may be attributable, in part, to the amount of time required to transport prisoners to the county jail approximately 45 minutes away in Salinas.
3. CPSM benchmarks are derived from data analyses of police agencies similar to that performed at GPD.
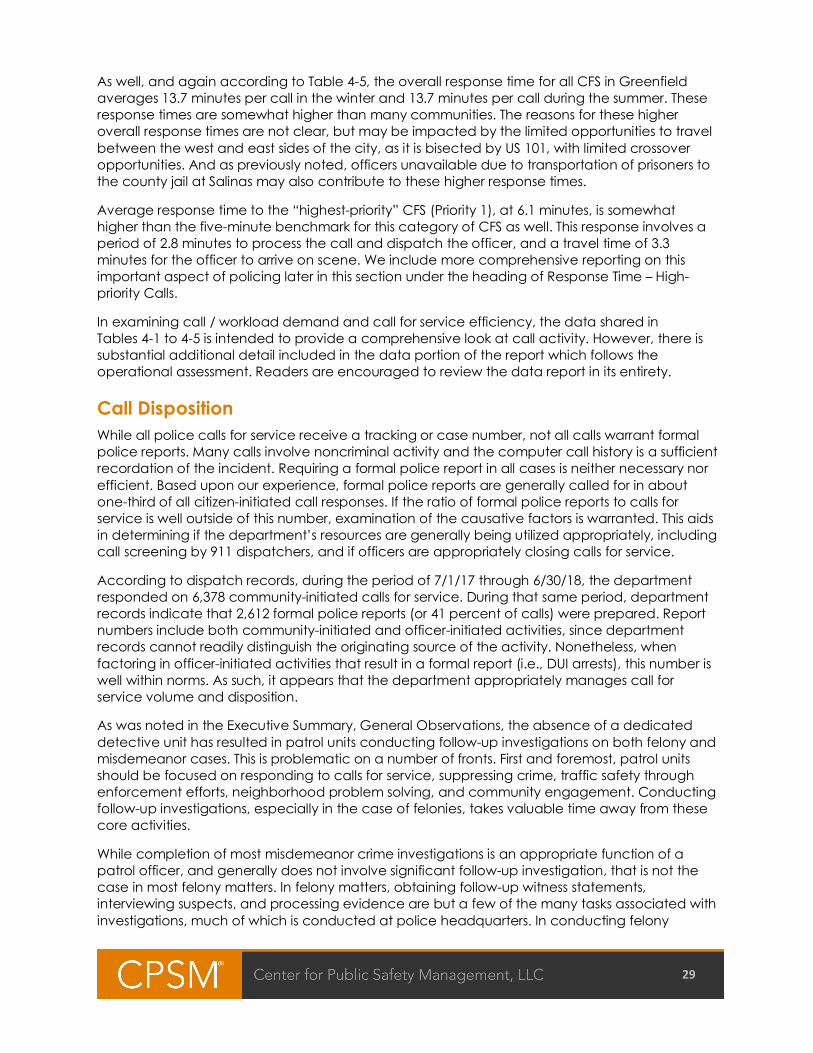
29
As well, and again according to Table 4-5, the overall response time for all CFS in Greenfield averages 13.7 minutes per call in the winter and 13.7 minutes per call during the summer. These response times are somewhat higher than many communities. The reasons for these higher overall response times are not clear, but may be impacted by the limited opportunities to travel between the west and east sides of the city, as it is bisected by US 101, with limited crossover opportunities. And as previously noted, officers unavailable due to transportation of prisoners to the county jail at Salinas may also contribute to these higher response times.
Average response time to the “highest-priority” CFS (Priority 1), at 6.1 minutes, is somewhat higher than the five-minute benchmark for this category of CFS as well. This response involves a period of 2.8 minutes to process the call and dispatch the officer, and a travel time of 3.3 minutes for the officer to arrive on scene. We include more comprehensive reporting on this important aspect of policing later in this section under the heading of Response Time – High-priority Calls.
In examining call / workload demand and call for service efficiency, the data shared in Tables 4-1 to 4-5 is intended to provide a comprehensive look at call activity. However, there is substantial additional detail included in the data portion of the report which follows the operational assessment. Readers are encouraged to review the data report in its entirety.
Call Disposition While all police calls for service receive a tracking or case number, not all calls warrant formal police reports. Many calls involve noncriminal activity and the computer call history is a sufficient recordation of the incident. Requiring a formal police report in all cases is neither necessary nor efficient. Based upon our experience, formal police reports are generally called for in about one-third of all citizen-initiated call responses. If the ratio of formal police reports to calls for service is well outside of this number, examination of the causative factors is warranted. This aids in determining if the department’s resources are generally being utilized appropriately, including call screening by 911 dispatchers, and if officers are appropriately closing calls for service.
According to dispatch records, during the period of 7/1/17 through 6/30/18, the department responded on 6,378 community-initiated calls for service. During that same period, department records indicate that 2,612 formal police reports (or 41 percent of calls) were prepared. Report numbers include both community-initiated and officer-initiated activities, since department records cannot readily distinguish the originating source of the activity. Nonetheless, when factoring in officer-initiated activities that result in a formal report (i.e., DUI arrests), this number is well within norms. As such, it appears that the department appropriately manages call for service volume and disposition.
As was noted in the Executive Summary, General Observations, the absence of a dedicated detective unit has resulted in patrol units conducting follow-up investigations on both felony and misdemeanor cases. This is problematic on a number of fronts. First and foremost, patrol units should be focused on responding to calls for service, suppressing crime, traffic safety through enforcement efforts, neighborhood problem solving, and community engagement. Conducting follow-up investigations, especially in the case of felonies, takes valuable time away from these core activities.
While completion of most misdemeanor crime investigations is an appropriate function of a patrol officer, and generally does not involve significant follow-up investigation, that is not the case in most felony matters. In felony matters, obtaining follow-up witness statements, interviewing suspects, and processing evidence are but a few of the many tasks associated with investigations, much of which is conducted at police headquarters. In conducting felony
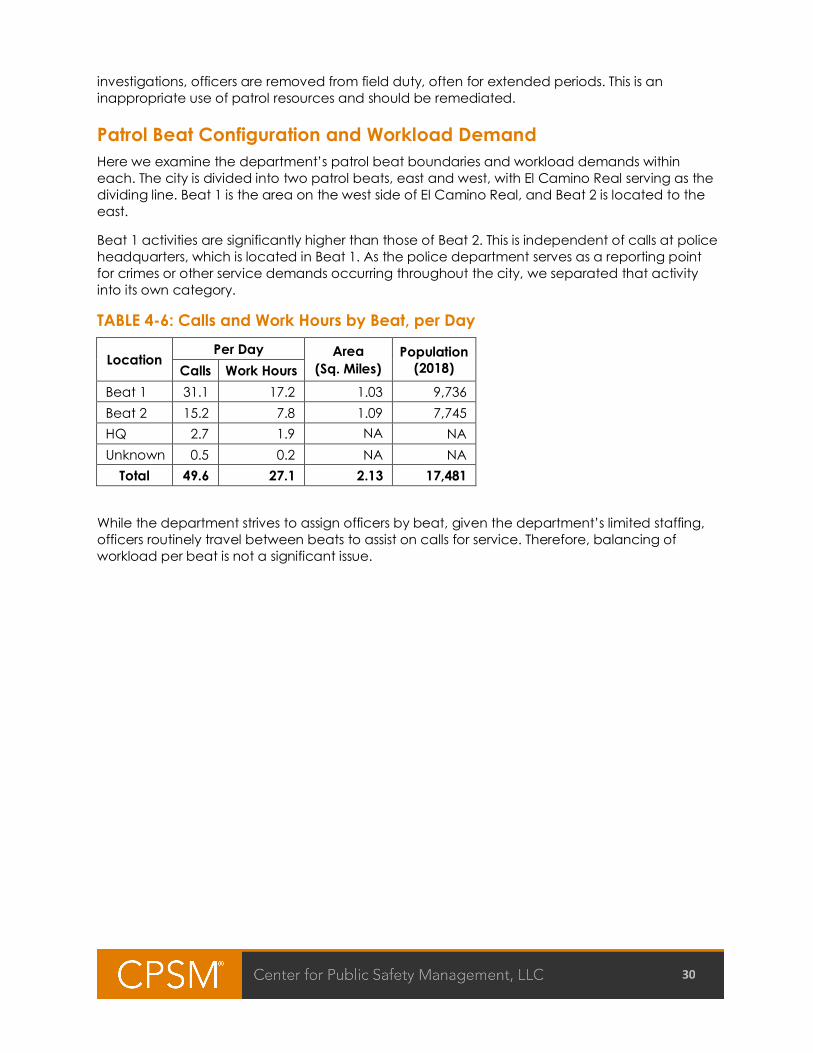
30
investigations, officers are removed from field duty, often for extended periods. This is an inappropriate use of patrol resources and should be remediated.
Patrol Beat Configuration and Workload Demand Here we examine the department’s patrol beat boundaries and workload demands within each. The city is divided into two patrol beats, east and west, with El Camino Real serving as the dividing line. Beat 1 is the area on the west side of El Camino Real, and Beat 2 is located to the east.
Beat 1 activities are significantly higher than those of Beat 2. This is independent of calls at police headquarters, which is located in Beat 1. As the police department serves as a reporting point for crimes or other service demands occurring throughout the city, we separated that activity into its own category.
TABLE 4-6: Calls and Work Hours by Beat, per Day
Location Per Day Area
(Sq. Miles) Population
(2018) Calls Work Hours Beat 1 31.1 17.2 1.03 9,736 Beat 2 15.2 7.8 1.09 7,745 HQ 2.7 1.9 NA
N NA
Unknown 0.5 0.2 NA NA Total 49.6 27.1 2.13 17,481
While the department strives to assign officers by beat, given the department’s limited staffing, officers routinely travel between beats to assist on calls for service. Therefore, balancing of workload per beat is not a significant issue.
31
High-volume Calls for Service Locations In Figure 4-1 we look at the locations, citywide, that have the highest volume of calls related to criminal activity. While the police department is listed, this number is derived from incidents occurring at other locations and reported at the police department, and is therefore not included within the map. When excluding the police department, two of the top three locations are schools, and the third is a private residence.
FIGURE 4-1: High-volume Locations for Crime Calls
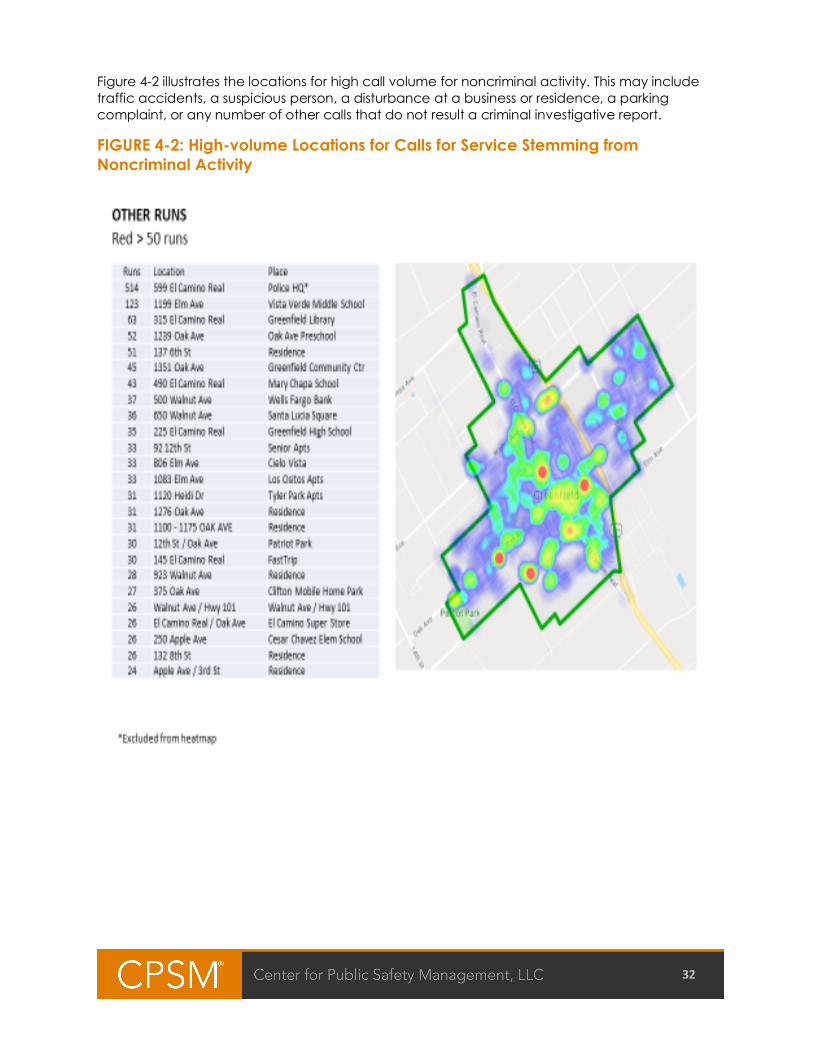
32
Figure 4-2 illustrates the locations for high call volume for noncriminal activity. This may include traffic accidents, a suspicious person, a disturbance at a business or residence, a parking complaint, or any number of other calls that do not result a criminal investigative report.
FIGURE 4-2: High-volume Locations for Calls for Service Stemming from Noncriminal Activity
33
Again, as we examine this data, it should be noted that police headquarters is among the locations with high call demand. Police headquarters is a reporting center for incidents occurring at other locations. Therefore, as previously noted, we exclude it from consideration here.
There are a couple of observations of interest related to Figures 4-1 and 4-2. First and foremost, the K-12 schools have a high volume of police calls for service. For instance, Vista Verde Middle School recorded the highest rate of both “Crime” and “Other” calls in the city. Greenfield High School was tied for second on “Crime” calls, and was ninth on “Other” calls. Oak Ave. Elementary was the third highest in “Other” calls, and Mary Chapa School also recorded frequent responses. There were limited calls to Cesar Chavez Elementary. And it must be pointed out as well that the citywide numbers, including responses to the schools, are based upon one-year of data, 24 hours a day, seven days per week, 365 days. The schools are only open a fraction of that time, which makes their service demand rates extraordinarily high. In discussions with police department staff, and specific to Vista Verde, it was reported that while the past school year saw a significant calls to the location for non-law enforcement related purposes, a change in leadership at the school this year, along with a different philosophy relative to the need to call for police services, has resulted in a significant reduction in calls to that location.
Secondarily, the location of 137 6th St. is near the top of the high volume call locations for both “Crime” and “Other” calls. This location is a single-family residence, the occupants of which called the police department for service on 75 occasions during the one-year study period. This is an extraordinarily high number of police responses to a single residence, and action should be taken to address this demand.
Here again, the absence of an interface between the CAD and RMS systems provides a challenge for the department, as the department’s RMS would not identify these locations with a high volume of calls unless every response resulted in a formal police report, which appropriately does not occur.
Nonetheless, examination of the nature of calls to locations with a high volume of calls included in this report should be conducted to determine the appropriateness of the necessity of these responses and/or actions that may be taken to reduce demand.
Call Mitigation In all studies we conduct, CPSM examines call mitigation as a tool to reduce workload demand. In evaluating the workload, response to alarm calls is always considered, as alarm response numbers as a percentage of calls for service are generally high, and the ratio of legitimate to false alarms is extremely low. In general, the rate of false alarms is about 97 to 98 percent of all activations. Though not popular with residents and the business community, some police departments have found it necessary to discontinue the response to alarms in certain circumstances due to the burden associated with false alarm response.
The City of Greenfield regulates alarm activity through Chapter 8.40 of the Municipal Code. The ordinance was thoroughly reviewed and found to be comprehensive. It requires owners of alarm systems to provide contact information to the police department in the event of an alarm activation so that a responsible party may be contacted, and includes a fee structure for fines related to multiple false alarm activations within a defined period. The department reports, however, that there are no efforts made to enforce the ordinance, no fines are collected, and the department does not maintain a contact list for responsible parties in the event of an alarm activation.
34
During the one-year study period, GPD responded to 534 alarm calls, or 1.5 per day. For a city of this size, this number does not significantly impact workload.
CPSM suggests that no changes are required of the department’s protocol in response to false alarms. Averaging less than two responses per day does not significantly impact workload, and any modification of current practices would undoubtedly prove unpopular in the community. However, revisiting the decision to ignore the ordinance should be considered.
Along with reducing responses to alarms, another option commonly considered by police departments to reduce workload is to discontinue responses to non-injury traffic accidents where the involved vehicles do not pose a traffic hazard. Many agencies have adopted this policy, or one that limits the response and investigation to an exchange of driver information.
CPSM considered this for Greenfield as well. However, with an average of just 0.7 accidents per day, response to accidents does not have a significant impact on workload. For the same reasons that apply to our recommendation to not modify response protocols to alarm calls, we suggest that accident response protocols remain unchanged.
To this point, we have focused largely upon the number of calls and other patrol workload activities for the one-year study period. In the section that follows we will examine how the patrol force allocates time and resources to this workload and other activities. This analysis will assist the city in determining necessary staffing of the patrol function.
Workload Demand Analysis Although some police administrators suggest that there are national standards for the number of officers per thousand residents that a department should employ, that is not the case. The International Association of Chiefs of Police (IACP) states that ready-made, universally applicable patrol staffing standards do not exist. Furthermore, ratios such as officers-per-thousand population are inappropriate to use as the basis for staffing decisions.
According to Public Management magazine, “A key resource is discretionary patrol time, or the time available for officers to make self-initiated stops, advise a victim in how to prevent the next crime, or call property owners, neighbors, or local agencies to report problems or request assistance. Understanding discretionary time, and how it is used, is vital. Yet most police departments do not compile such data effectively. To be sure, this is not easy to do and, in some departments may require improvements in management information systems.”4
Essentially, “discretionary time” on patrol is the amount of time available each day where officers are not committed to handling CFS and workload demands from the public. It is “discretionary” and intended to be used at the discretion of the officer to address problems in the community and be available in the event of emergencies. When there is no discretionary time, officers are entirely committed to service demands, do not get the chance to address other community problems that do not arise through 911, and are not available in times of serious emergency. The lack of discretionary time indicates a department is understaffed. Conversely, when there is too much discretionary time, officers are idle. This may be an indication that the department is overstaffed.
Staffing decisions, particularly for patrol, must be based on actual workload as well as ensuring that sufficient staffing exists to respond to emergency situations involving the safety of the public and officers alike. Once the actual workload is determined, and, the amount of discretionary 4. John Campbell, Joseph Brann, and David Williams, “Officer-per-Thousand Formulas and Other Policy Myths,” Public Management 86 (March 2004): 22-27.

35
time is determined, then staffing decisions can be made consistent with the department’s policing philosophy and the community’s ability to fund it. The Greenfield Police Department is a full-service police department, and its philosophy is to address essentially all requests for service in a community policing style. With this in mind, it is necessary to look at workload to understand the impact of this style of policing in the context of community demand.
To understand actual workload (the time required to complete certain activities) it is critical to review total reported events within the context of how the events originated, such as through directed patrol, administrative tasks, officer-initiated activities, and citizen-initiated activities. Analysis of this type allows for identification of activities that are really “calls” from those activities that are some other type of event.
Understanding the difference between the various types of police department events and the resulting staffing implications is critical in determining deployment needs. This portion of the study looks at the total deployed hours of the police department with a comparison to current time spent to provide services.
From an organizational standpoint, it is important to have uniformed patrol resources available at all times of the day to deal with issues such as proactive enforcement and community policing. Patrol is generally the most visible and most available resource in policing and the ability to harness this resource is critical for successful operations.
From an officer’s standpoint, once a certain level of CFS activity is reached, the officer’s focus shifts to a CFS-based reactionary mode. Once that threshold is reached, the patrol officer’s mindset begins to shift from one that looks for ways to deal with crime and quality-of-life conditions in the community to one that continually prepares for the next call. After saturation, officers cease proactive policing and engage in a reactionary style of policing. The outlook becomes, “Why act proactively when my actions are only going to be interrupted by a call?” Any uncommitted time is spent waiting for the next call. Sixty percent of time spent responding to calls for service is believed to be the saturation threshold.
Rule of 60 – Part 1 According to personnel data available at the time of the site visit (November 2018), the department is authorized 23 full-time commissioned officers. When fully staffed, 19 (includes sergeants and officers) of those 23 are assigned to patrol. Therefore, patrol staffing represents approximately 83 percent of the authorized commissioned officers in the Greenfield Police Department.
Accordingly, the department exceeds the first component of the “Rule of 60,” that is, that about 60 percent of the total sworn force be dedicated to patrol operations. Given the limited assignments outside of patrol in smaller agencies, the percentage is expected to be slightly higher. This is especially true in Greenfield where the absence of a dedicated detective unit contributes to this unusually high rate. CPSM recommendations for additional detective staffing and administrative support would allow for this rate to be brought more into balance.
Rule of 60 – Part 2 The second part of the “Rule of 60” examines workload and discretionary time and suggests that no more than 60 percent of time should be committed to calls for service and self-initiated arrests, etc. In other words, CPSM suggests that no more than 60 percent of available patrol officer time be spent responding to the service demands in the community. The remaining 40 percent of the time is the “discretionary time” for officers to be available to address community problems and be available for serious emergencies. This Rule of 60 for patrol deployment does
36
not mean the remaining 40 percent of time is downtime or break time. It is simply a reflection of the point at which patrol officer time is “saturated” by CFS.
This ratio of dedicated time compared to discretionary time is referred to as the “Saturation Index” (SI). It is CPSM’s contention that patrol staffing is optimally deployed when the SI is somewhat below the 60 percent range. An SI greater than 60 percent indicates that the patrol manpower is largely reactive and overburdened with CFS and workload demands. An SI of somewhat less than 60 percent indicates that patrol manpower is optimally staffed. SI levels much lower than 60 percent, however, indicate patrol resources may be underutilized, and may signal an opportunity for a reduction in patrol resources or reallocation of police personnel.
Departments must be cautious in interpreting the SI too narrowly. For example, one should not conclude that SI can never exceed 60 percent at any time during the day, or that in any given hour no more than 60 percent of any officer’s time be committed to CFS. The SI at 60 percent is intended to be a benchmark to evaluate overall service demands on patrol staffing. When SI levels exceed 60 percent for substantial periods of a given shift, or at isolated but consistent and specific times during the day, then decisions should be made to reallocate or realign personnel to reduce the SI to levels below 60. Lastly, this is not a hard-and-fast rule, but a benchmark to be used in evaluating staffing decisions. Other factors such as the availability of sufficient resources to safely, efficiently, and effectively respond to emergency calls for service must be considered.
While the call data referenced in Tables 4-1 to 4-4 reflected call activity for the entire one-year study period, for this portion of the study we drilled down to examine not just the total number of calls, but the actual time spent on these calls as well as other duties. Here, we compare “all” workload, which includes community-initiated calls, police-initiated calls, directed patrol work, and out-of-service activities. We examined deployment and workload for four weeks in summer (July 7 through August 3, 2017) and four weeks in winter (January 4 through January 31, 2018). The department’s main patrol force consists of patrol officers and patrol sergeants. Patrol operates on 12-hour shifts starting at 6:00 a.m., and 6:00 p.m.
Patrol staffing (sergeants and officers) averaged 4.4 personnel per hour on weekdays during the 24-hour day during the summer 2017 study period, and 3.6 personnel per hour during the 24-hour day on weekends. For the winter 2018 study period, patrol staffing averaged 4.6 personnel during the week, and 3.2 personnel on weekends.
In Figures 4-3 through 4-10 that follow, the analysis looks specifically at patrol deployment. This allows for assessment of how the department is positioned to meet the demands of calls for service while also engaging in proactive policing to combat crime, disorder, and address traffic issues in the community. Relative to the number of personnel identified, we consider only those personnel who reported for duty rather than authorized staffing levels. We describe the deployment and workload in distinct steps, distinguishing between winter and summer and between weekdays (Monday through Friday) and weekends (Saturday and Sunday).
Figures 4-3, 4-5, 4-7, and 4-9 illustrate the deployment of patrol resources (left axis) to handle the workload. Workload includes community-initiated CFS, police-initiated CFS, out-of-service activities, and directed patrol activities. When the patrol time (shown in green) is factored in, one can see, by hour (bottom axis), how much of total available time is committed to each activity. In these figures, you will note the category of “added patrol. “Added patrol” includes the SRO, Animal Control, Code Enforcement, and personnel assigned to special events.
In Figures 4-4, 4-6, 4-8, and 4-10, the saturation index is explored. Patrol resources available are denoted by the dashed black line at the top. The 100 percent value indicates the total police officer hours available during the 24-hour period. This amount varies during the day consistent
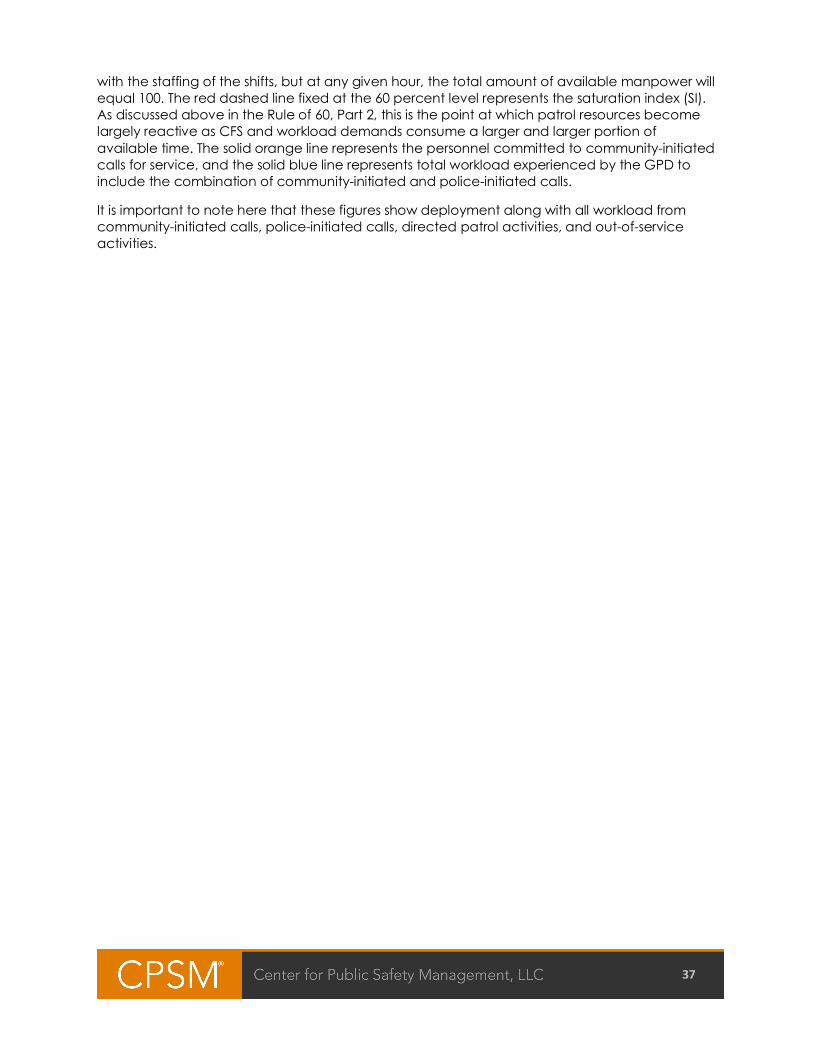
37
with the staffing of the shifts, but at any given hour, the total amount of available manpower will equal 100. The red dashed line fixed at the 60 percent level represents the saturation index (SI). As discussed above in the Rule of 60, Part 2, this is the point at which patrol resources become largely reactive as CFS and workload demands consume a larger and larger portion of available time. The solid orange line represents the personnel committed to community-initiated calls for service, and the solid blue line represents total workload experienced by the GPD to include the combination of community-initiated and police-initiated calls.
It is important to note here that these figures show deployment along with all workload from community-initiated calls, police-initiated calls, directed patrol activities, and out-of-service activities.
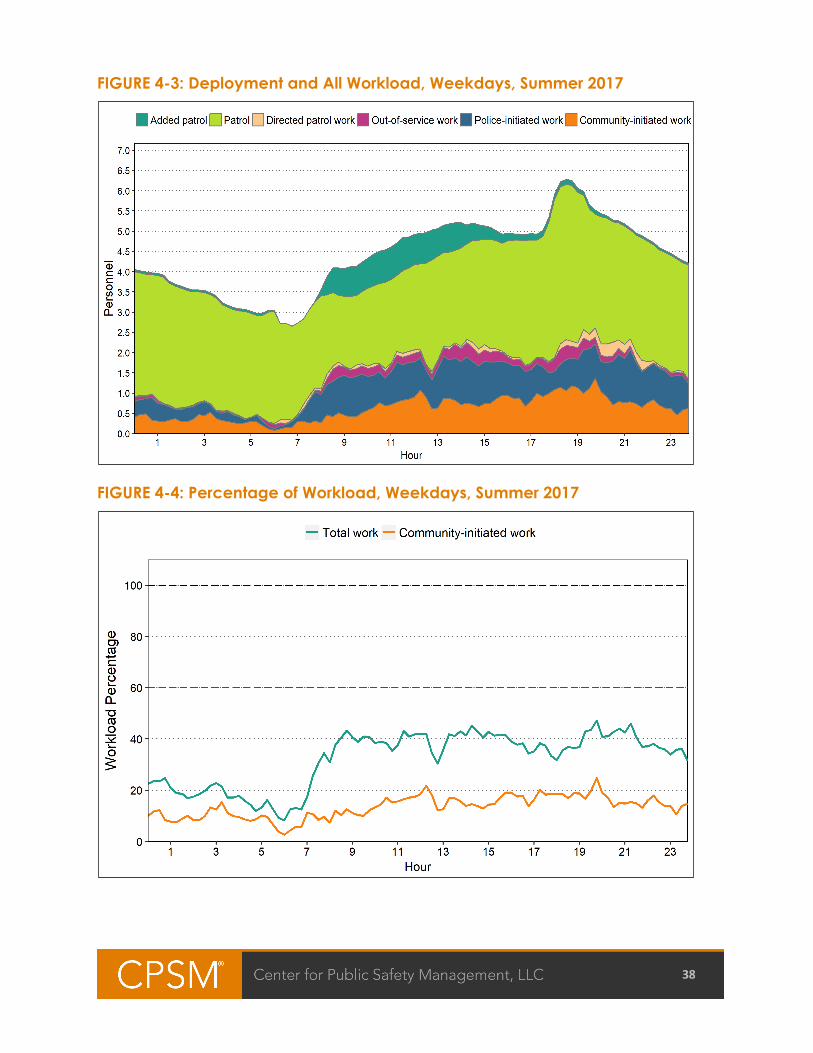
38
FIGURE 4-3: Deployment and All Workload, Weekdays, Summer 2017
FIGURE 4-4: Percentage of Workload, Weekdays, Summer 2017
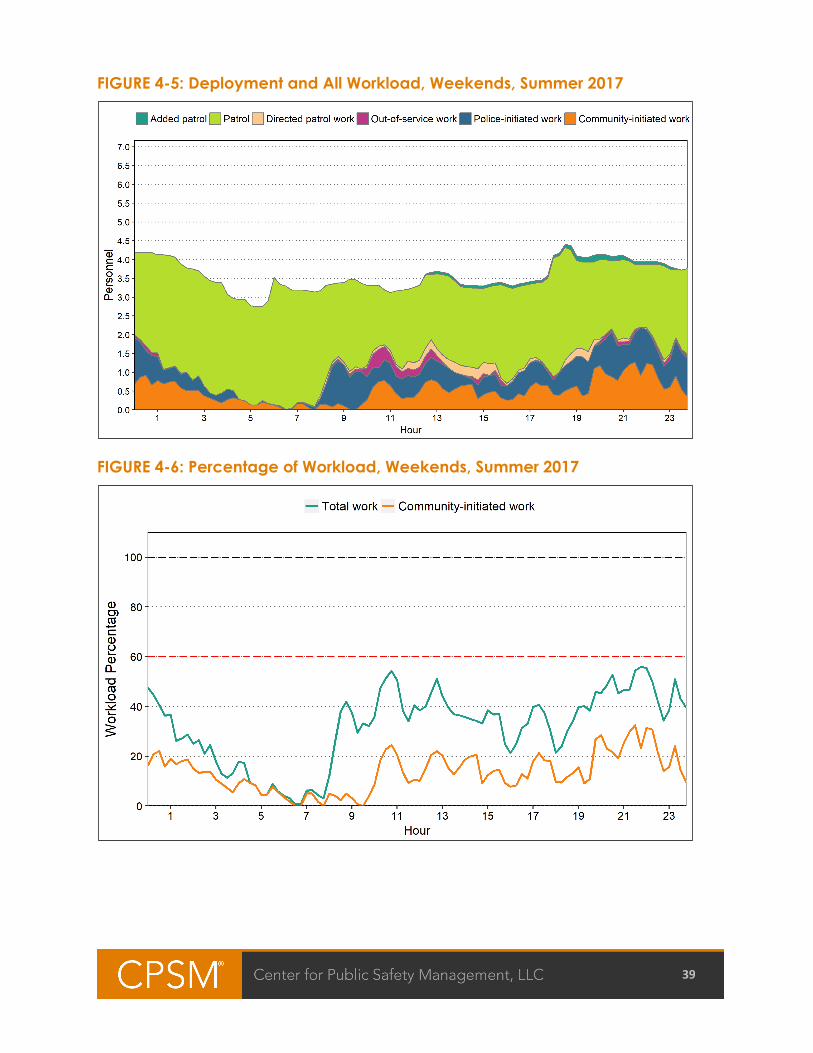
39
FIGURE 4-5: Deployment and All Workload, Weekends, Summer 2017
FIGURE 4-6: Percentage of Workload, Weekends, Summer 2017
40
FIGURE 4-7: Deployment and All Workload, Weekdays, Winter 2018
FIGURE 4-8: Percentage of Workload, Weekdays, Winter 2018
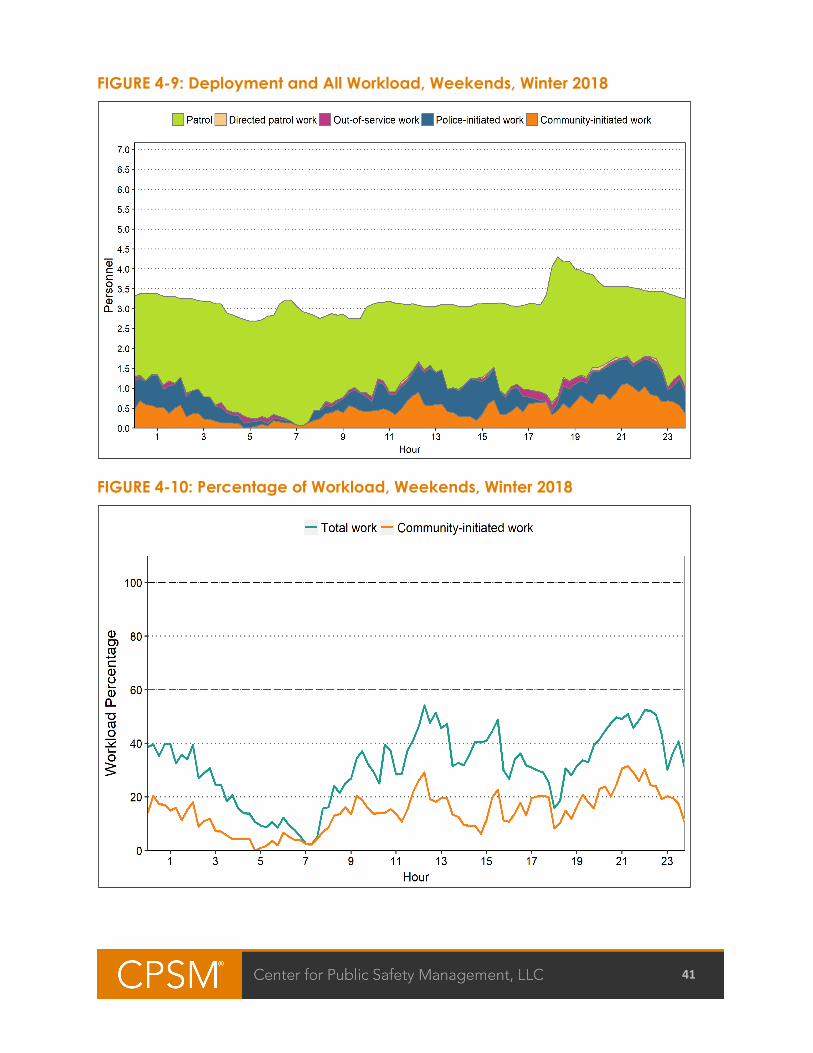
41
FIGURE 4-9: Deployment and All Workload, Weekends, Winter 2018
FIGURE 4-10: Percentage of Workload, Weekends, Winter 2018
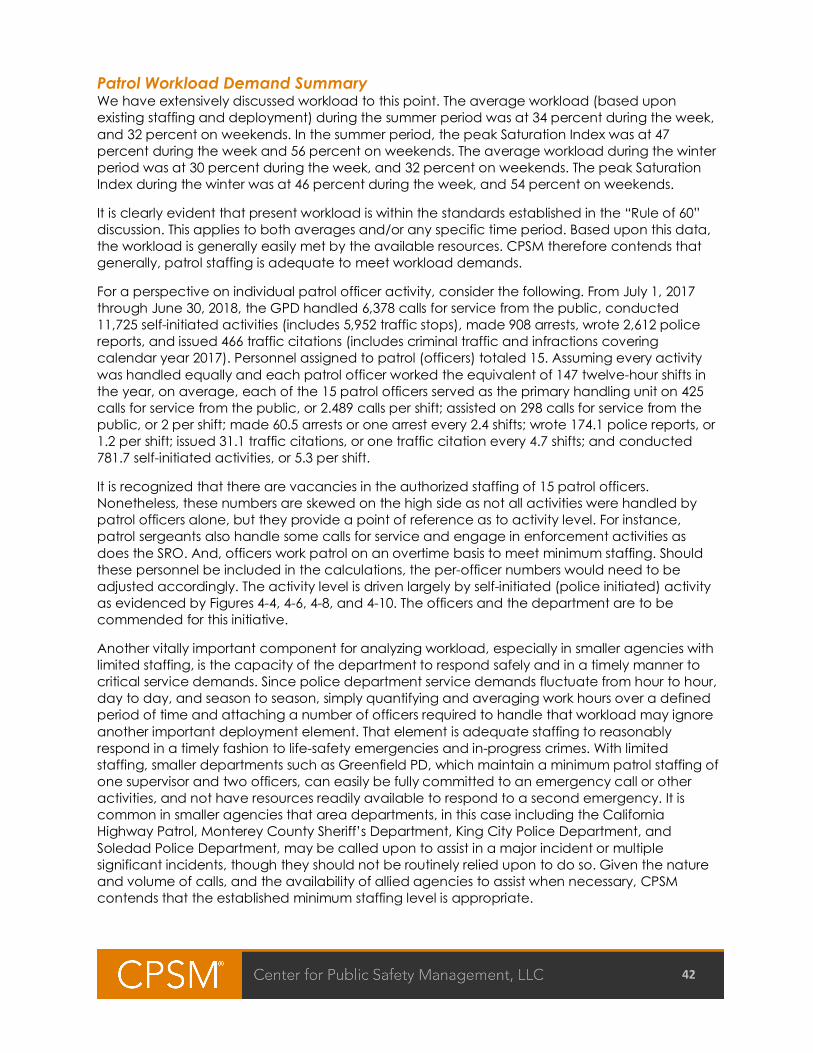
42
Patrol Workload Demand Summary We have extensively discussed workload to this point. The average workload (based upon existing staffing and deployment) during the summer period was at 34 percent during the week, and 32 percent on weekends. In the summer period, the peak Saturation Index was at 47 percent during the week and 56 percent on weekends. The average workload during the winter period was at 30 percent during the week, and 32 percent on weekends. The peak Saturation Index during the winter was at 46 percent during the week, and 54 percent on weekends.
It is clearly evident that present workload is within the standards established in the “Rule of 60” discussion. This applies to both averages and/or any specific time period. Based upon this data, the workload is generally easily met by the available resources. CPSM therefore contends that generally, patrol staffing is adequate to meet workload demands.
For a perspective on individual patrol officer activity, consider the following. From July 1, 2017 through June 30, 2018, the GPD handled 6,378 calls for service from the public, conducted 11,725 self-initiated activities (includes 5,952 traffic stops), made 908 arrests, wrote 2,612 police reports, and issued 466 traffic citations (includes criminal traffic and infractions covering calendar year 2017). Personnel assigned to patrol (officers) totaled 15. Assuming every activity was handled equally and each patrol officer worked the equivalent of 147 twelve-hour shifts in the year, on average, each of the 15 patrol officers served as the primary handling unit on 425 calls for service from the public, or 2.489 calls per shift; assisted on 298 calls for service from the public, or 2 per shift; made 60.5 arrests or one arrest every 2.4 shifts; wrote 174.1 police reports, or 1.2 per shift; issued 31.1 traffic citations, or one traffic citation every 4.7 shifts; and conducted 781.7 self-initiated activities, or 5.3 per shift.
It is recognized that there are vacancies in the authorized staffing of 15 patrol officers. Nonetheless, these numbers are skewed on the high side as not all activities were handled by patrol officers alone, but they provide a point of reference as to activity level. For instance, patrol sergeants also handle some calls for service and engage in enforcement activities as does the SRO. And, officers work patrol on an overtime basis to meet minimum staffing. Should these personnel be included in the calculations, the per-officer numbers would need to be adjusted accordingly. The activity level is driven largely by self-initiated (police initiated) activity as evidenced by Figures 4-4, 4-6, 4-8, and 4-10. The officers and the department are to be commended for this initiative.
Another vitally important component for analyzing workload, especially in smaller agencies with limited staffing, is the capacity of the department to respond safely and in a timely manner to critical service demands. Since police department service demands fluctuate from hour to hour, day to day, and season to season, simply quantifying and averaging work hours over a defined period of time and attaching a number of officers required to handle that workload may ignore another important deployment element. That element is adequate staffing to reasonably respond in a timely fashion to life-safety emergencies and in-progress crimes. With limited staffing, smaller departments such as Greenfield PD, which maintain a minimum patrol staffing of one supervisor and two officers, can easily be fully committed to an emergency call or other activities, and not have resources readily available to respond to a second emergency. It is common in smaller agencies that area departments, in this case including the California Highway Patrol, Monterey County Sheriff’s Department, King City Police Department, and Soledad Police Department, may be called upon to assist in a major incident or multiple significant incidents, though they should not be routinely relied upon to do so. Given the nature and volume of calls, and the availability of allied agencies to assist when necessary, CPSM contends that the established minimum staffing level is appropriate.
43
Response Time – High-priority Calls All police departments prioritize calls for service based upon the seriousness of the call. The highest priority calls are referred to as Priority 1 calls. While definitions of a Priority 1 call may vary from agency to agency, such calls should include those involving life safety and in-progress crimes. For such calls, citizens expect and demand that their police department be adequately staffed and prepared to respond in a timely fashion. While the data report contains considerable information concerning response times to all priorities of calls for service and should be reviewed in its entirety, here we will focus on the highest priority of calls for service. For this analysis, we utilized data from citizen-initiated calls for service.
Table 4-7 depicts the average response time to Priority 1 calls as well as all other calls (all other priorities). It must be noted that the response time to a call begins when the first keystroke is entered into the CAD (computer-aided dispatch) call screen by the 911 operator. This begins what we refer to as the “dispatch” period. The “dispatch” period ends when a patrol unit is assigned to the call, at which time the “travel” period begins. When the patrol unit arrives at the scene of the call, the “travel” period ends and the “response time” (dispatch plus travel) is calculated.
TABLE 4-7: Average Dispatch, Travel, and Response Times, by Priority Priority Dispatch Delay Travel Time Response Time Calls
1 2.8 3.3 6.1 410 2 6.4 5.0 11.4 641 3 7.9 5.4 13.2 2,315 4 11.0 7.1 18.1 909 5 9.7 9.0 18.7 380 6 11.3 8.8 20.1 10
Weighted Average/Total 8.0 5.8 13.8 4,665 Note: The total average is weighted according to the number of calls within each priority level.
It should be noted that relative to Priority 1 calls, 364 of the 410 calls were either fire or emergency medical service (EMS) calls. However, excluding those calls would not significantly alter the overall response time data for Priority 1 calls.
44
Figure 4-11 depicts Priority 1 response times by hour of day.
FIGURE 4-11: Average Response Times and Dispatch Delays for Priority 1 Calls, by Hour
A response time of 6.1 minutes for Priority 1 calls is excessive. This is especially true in that the city encompasses only 2.14 sq. miles. Given this, response times to these types of calls should consistently be in the range of five minutes or less. As was described, response times are the combination of both dispatch delay and travel time. In the case of Greenfield, the dispatch delay to Priority 1 calls at 2.8 minutes is a significant contributing factor to the overall response time.
A 6.1 minute response time to an in-progress crime will nearly always result in the perpetrator having fled from the scene prior to the officer’s arrival. More importantly, in a life-safety incident such as a baby not breathing or an active shooter or other aggravated assault, serious injury or death may occur. While those possibilities exist on any call, such a lengthy delay for Priority 1 calls is cause for concern. Given this situation, a department analysis of issues contributing to excessive response times is warranted.
There are a number of steps to be taken in conducting the analysis. It is understood that dispatch services are provided on a regional basis by the Monterey County Department of Emergency Communications. An operations advisory board provides direction to this agency. GPD is a represented on this board by the Police Chief of King City. While this study is limited to response times for Greenfield, addressing dispatch delays would be of interest to all participating entities. The steps for such an analysis include:
■ Review the category of calls that are established as Priority 1 to ensure that only life-safety incidents and in-progress crimes are included. Even low-grade crimes such as theft should be
45
included when it is an in-progress incident. Most crimes are reported after the fact, and this creates limited opportunity to make an arrest or solve the crime. Where such crimes can be solved, the investigative time and effort is often considerable. Therefore, the importance of prioritizing these in-progress incidents cannot be overstated.
■ Identify reasons associated with the dispatch delay. For these high-priority calls, a protocol to expedite the dispatch of an officer is imperative. The objective should be to reduce the dispatch delay to no more than one minute. It is understood that some CAD operating systems do not allow for the assignment of an officer to a call history (ending the dispatch period) until the call data is transferred from the 911 operator to the dispatcher. For high-priority calls, a protocol should be in place that allows the dispatcher to notify units of the call so that a response may be initiated pending more information. In that case, the officer would be responding prior to the ending of the recorded dispatch period and the true dispatch delay is lessened; however, the travel time would be extended and the overall response time would be unchanged.
■ A 3.3 minute travel period for a city of 2.14 sq. miles is excessive. Examine deployment of patrol resources to ensure that adequate staffing is in the field to respond to high-priority calls. The absence of adequate field staffing can be attributed to insufficient overall staffing, or inefficient management of personnel. This includes out-of-service time and/or time spent in the station, which could more appropriately be spent in the field. Due to the absence of staggered shifts at shift start/end times, there may be no units deployed in the field for as much as an hour. Another common issue is the writing of police reports in the station in lieu of in the patrol vehicle strategically positioned within the city. In studies of communities similar to Greenfield and which experience high response time rates, it is common for officers to return to the station to write reports. Anecdotal reports suggest that this is the case in Greenfield. The reasons vary from convenience to officer safety. Still, the patrol vehicles are equipped to allow for the reports to be written in the field, and in most cases, it is appropriate to do so.
Traffic Traffic safety and the efficient flow of traffic are always important factors for any community, and thus its police department. While concerns often emanate from residential areas and school zones, it is often the case that traffic accidents occur more frequently in areas with a high retail concentration and/or high traffic volumes. Anecdotal evidence suggests that this is the case in Greenfield as well. For that reason, it is imperative that GPD commit adequate resources to address all traffic-related issues.
GPD has no dedicated traffic unit. Rather, patrol officers are responsible for traffic-related functions. Given the size and workload in Greenfield, this is appropriate. Therefore, as we examined traffic enforcement efforts, we looked at the efforts of all patrol officers who share in the responsibility to address traffic issues.
Table 4-8 shows the total number of traffic citations issued by Greenfield PD for three calendar years, 2015 to 2017. Given the authorized staffing in Patrol, and assuming that each officer works 147 12-hour days per year, this amounts to each patrol officer issuing one traffic citation every 6.1 work days. This number is based upon total citation output averaged over three years and divided by the number of patrol officers (15). This calculation errors on the high side, as any citations issued by other than patrol officers (i.e., patrol sergeants, SRO) are included in the calculations credited to patrol officers. Parking citation information is provided as well. Over the past three years, the department issued an average of 1.4 parking citations der day.
46
TABLE 4-8: Traffic Tickets Issued in Greenfield, 2015–2017
Year Traffic
Infractions Criminal*
Traffic Traffic
Citations Parking
Citations 2015 270 183 453 635 2016 357 162 519 490 2017 466 284 750 446
Source: Greenfield PD * Criminal Traffic includes DUI, Unlicensed Driving or Driving on a Suspended License, and Hit and Run citations.
The above data pertain specifically to traffic citations. Citations are also issued for nontraffic criminal incidents. These include shoplifting, vandalism, petty theft, and other crimes of similar severity. Citations issued for nontraffic criminal incidents are not accounted for in the above table.
There is no industry standard for the number of citations expected of a patrol officer, and establishing quotas is both undesirable and unlawful. Nonetheless, as part of the overall work effort, agencies can demand that sufficient effort be directed to those areas of greatest concern to the community. As such, measuring performance relative to traffic enforcement, both individually and collectively is appropriate when used as part of a broader measure of overall performance. The number of citations at one per 6.05 workdays reflects a lack of priority on the part of the department to traffic enforcement efforts.
There are many factors that go into the level of commitment given to traffic enforcement at a police agency. Included are the department’s performance expectations and the level of demand for other services such as crime and community disorder. As was reflected in prior reporting on workload demands, the capacity to address this important issue exists.
CPSM also examined data on traffic accidents. Overall, the collision rate in the city is quite low, at less than one per day. Table 4-9 reflects RMS traffic accident data for the past three calendar years. As can be seen, the accident rate has remained relatively consistent for the period examined.
TABLE 4-9: Traffic Accidents in Greenfield, 2014 - 2016
Year Property Damage
Injury Collisions
Fatal Accidents
Total Collisions
2015 132 12 0 144 2016 119 10 1 129 2017 119 11 0 130
Source: Greenfield PD
It should be noted that the numbers do not appear to reconcile with numbers from Tables 4-1 and 4-2 where CAD records indicate that between the period of 7/1/17 and 6/30/18, the department responded to 264 traffic accidents. As such, it would appear that officers write formal accident reports in less than fifty percent of dispatched accident calls. Policy § 502 addresses traffic collision reporting and related issues. Section 502.4.5 addresses reporting and suggests that reports are required only under limited circumstances as follows:
(a) When there is a death or injury to any persons involved in the collision.
47
(b) When there is an identifiable violation of the Vehicle Code.
(c) When a report is requested by any involved driver.
Given that the majority of collisions do not involve a death, injury, or an identifiable Vehicle Code violation, it is understood that the policy allows for officers to close an accident without a formal police report. However, this does not allow for an analysis of collisions that would serve to identify primary collision factors that may be addressed as part of a traffic safety plan. Additionally, Section 502.3 calls for accident reports to be forwarded to the “Traffic Bureau.” Monthly and quarterly, the Traffic Sergeant is to prepare reports on traffic collisions. As noted, there is no Traffic Bureau, nor a Traffic Sergeant, even as a collateral duty.
CPSM also examined data to identify high-frequency collision locations using CAD data for the one-year period of study. Figure 4-12 identifies and maps locations with three or more collisions during the study period. As noted, El Camino Real, Walnut Ave., and Oak Ave. appear repeatedly on the list. Given that these serve as thoroughfares through the city, this is not a surprise.
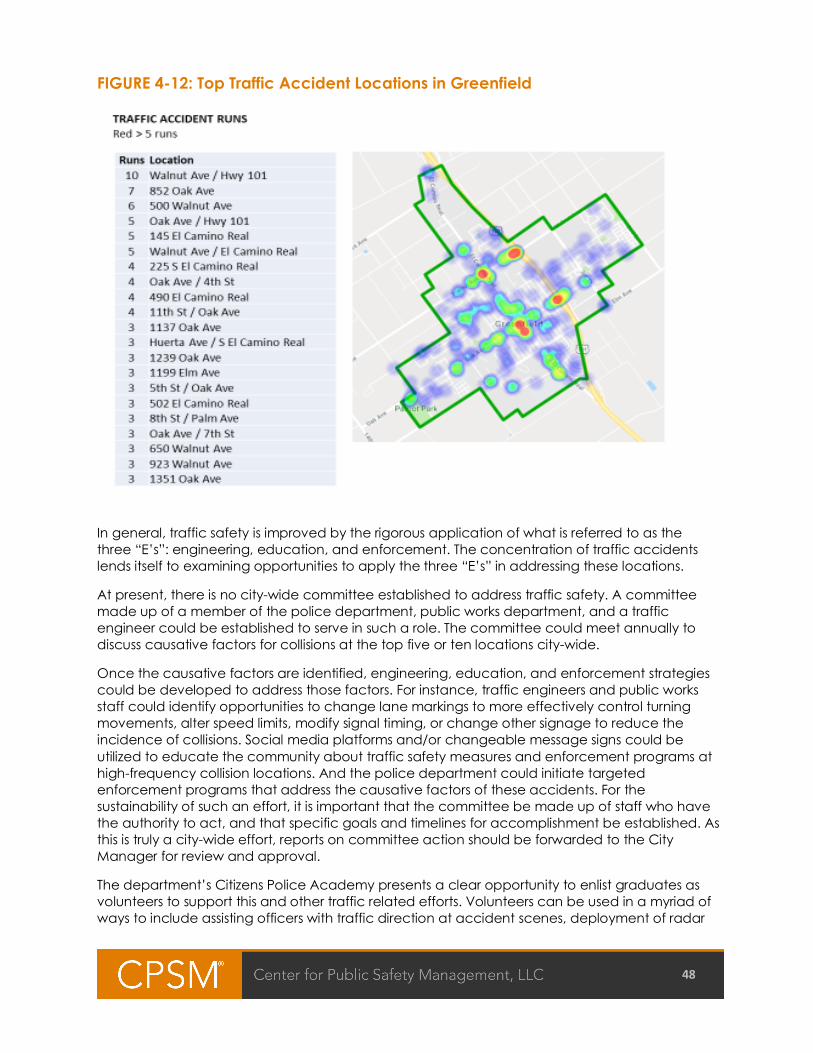
48
FIGURE 4-12: Top Traffic Accident Locations in Greenfield
In general, traffic safety is improved by the rigorous application of what is referred to as the three “E’s”: engineering, education, and enforcement. The concentration of traffic accidents lends itself to examining opportunities to apply the three “E’s” in addressing these locations.
At present, there is no city-wide committee established to address traffic safety. A committee made up of a member of the police department, public works department, and a traffic engineer could be established to serve in such a role. The committee could meet annually to discuss causative factors for collisions at the top five or ten locations city-wide.
Once the causative factors are identified, engineering, education, and enforcement strategies could be developed to address those factors. For instance, traffic engineers and public works staff could identify opportunities to change lane markings to more effectively control turning movements, alter speed limits, modify signal timing, or change other signage to reduce the incidence of collisions. Social media platforms and/or changeable message signs could be utilized to educate the community about traffic safety measures and enforcement programs at high-frequency collision locations. And the police department could initiate targeted enforcement programs that address the causative factors of these accidents. For the sustainability of such an effort, it is important that the committee be made up of staff who have the authority to act, and that specific goals and timelines for accomplishment be established. As this is truly a city-wide effort, reports on committee action should be forwarded to the City Manager for review and approval.
The department’s Citizens Police Academy presents a clear opportunity to enlist graduates as volunteers to support this and other traffic related efforts. Volunteers can be used in a myriad of ways to include assisting officers with traffic direction at accident scenes, deployment of radar

49
display trailers, conducting radar surveys based upon neighborhood complaints, supporting traffic control efforts at special events, and clerical duties as appropriate. Each of these efforts allow for officers to be freed up for more proactive policing activities.
It appears that traffic safety has not been a priority for the department for some time. It is suggested that the department examine traffic safety and related activities as well as its related policies and address shortfalls and inconsistencies in both.
SPECIALIZED PATROL FUNCTIONS / COLLATERAL DUTIES
School Services / SRO The City of Greenfield is serviced by two independent school districts; (1) Greenfield Union School District, and (2) South Monterey County Joint Union High School District, the latter of which provides regional services to high schools including Greenfield High School. Schools include Oak Avenue, Cesar Chavez, and Mary Chapa Academy Elementary Schools, Vista Verde Middle School, and Greenfield High School.
The City of Greenfield and the South Monterey County Joint Union High School District entered into an agreement for the city and the Greenfield Police Department to provide a sworn School Resource Officer (SRO) to be assigned at Greenfield High School. Funding for this position is split between the district and the city, with the city’s contribution provided through a federal grant.
While the SRO is dedicated to Greenfield High School, he can and does respond to calls for service at other schools within the district when he is available. This provides for significant time savings for patrol officers since, as was noted in discussions on high volume calls for service locations, the schools command significant resource utilization.
In discussions with the SRO, whose enthusiasm about his work and commitment to the students is evident, we found that the high frequency of calls for service at Vista Verde Middle School last year resulted from a reliance on the SRO to perform duties not necessarily in keeping with his responsibilities. A change in leadership at the school this year, and efforts by the school to handle more minor incidents administratively rather than involving the SRO, has led to a reduction in calls at Vista Verde this year. Nonetheless, the department must be mindful that the SRO not be called upon to needlessly become involved in minor administrative actions at any school site. Should the schools feel the need to notify the police department of an incident that they handled administratively, and that did not require police involvement, an administrative report could be prepared by the school administration and forwarded to the department’s Records Section for issuance of a case number and filing without further action by the department.
The SRO maintains both daily and monthly data reports reflecting his work activities. The reports contain both the number and nature of activities, and are broken down by the school where the service was provided. The reports were found to be comprehensive. Duties captured in the report include group and individual counseling, crisis intervention, presentations for both students and parents, truancy intervention, traffic enforcement, and much more. Overall, CPSM was impressed with the SRO program.
50
Bicycle Patrol The utilization of bicycles for patrol deployment is a fairly new function for Greenfield PD at approximately one year. Policy § 452 governs this function and addresses personnel selection, training, deployment, and equipment. It was found to be comprehensive. Four patrol officers serve on the department’s Bicycle Unit as a collateral duty to their permanent duty assignment in patrol. As required by policy, each of the officers has completed a POST-approved one-week training course.
To date, deployments have been limited to a small number of community events such as Fourth of July celebrations. All such deployments are on an overtime basis. At this point, there is no plan to expand the deployments to include routine patrol operations. Given the nature of service demands and staffing levels, this is appropriate. As well, given the limited role of the unit, there is no statistical data maintained regarding the unit’s activities.
Gang Unit Recently, the department initiated a Gang Unit. As is the case with the bicycle patrol function, officers assigned to this unit serve in a collateral duty capacity to their permanent assignment in patrol. At present, efforts are coordinated by a patrol sergeant, with two officers serving as gang officers. Directed enforcement focuses on known gang members and gang locations and occurs as time permits during normal patrol shifts or on an overtime basis as needed. As of this point, there are no summary data reports to reflect the efforts of this unit.
Anecdotal reports from department staff suggested that gang members are involved in a significant percentage of reported crimes. Still, given the overall crime rate, total department staffing, and the workload of patrol, there is insufficient activity at this time to warrant a full-time Gang Unit, which if appropriately staffed, would require a full-time sergeant and two full-time officers.
However, there is no question that the availability of additional patrol resources to focus on gang-related activity would be beneficial. As has been mentioned, the lack of a Detective Unit negatively impacts patrol officers’ ability to focus on core duties in the field, including gang-related crime suppression. If the department were to establish a Detective Unit to investigate felony offenses, patrol officers time would be freed up to better address gang activity.
Code Enforcement The Greenfield PD has one full-time civilian Code Enforcement Officer. The primary responsibility is to handle all code enforcement complaints and investigations in the City of Greenfield. The Code Enforcement Officer works Monday through Friday from 8:00 a.m. to 5:00 p.m. The Code Enforcement Officer recently received full certification as a Certified Code Enforcement Officer through the California Association of Code Enforcement Officers.
Calls for service for the Code Enforcement Officer involve violations of the City of Greenfield’s municipal code, primarily vehicles parked on the lawn, abandoned vehicles, and residential over-crowded living conditions. There is a designated code enforcement vehicle.
In cases where a citation is given, the defendant can appeal the citation through the patrol sergeant who oversees code enforcement as a collateral duty. The sergeant can either uphold or dismiss the notification of violation. If the case is upheld and the person still desires an appeal, the case is transferred to the City Attorney’s office, which will file the case with the court.
51
Animal Control Greenfield PD has one full-time civilian Animal Control Officer position that recently became vacant. There is a designated animal control vehicle that includes cages that are temperature controlled. There are five kennels located in the police department back parking lot for temporary housing of animals until they can be returned to the owner or transferred to the county humane society.
Historically, the Animal Control Officer has dealt with municipal violations relating to animals and mainly focused on animal licensing and vaccinations, loose animals, animal bites, and neglect cases. Although the main focus was dealing with animal-related calls for service, staff is reevaluating the position to encompass all municipal code violations. In so doing, there is an opportunity to explore scheduling this position to work weekends rather than Monday through Friday, as has recently been the case. Working some weekend shifts would allow the animal control officer greater opportunity to contact residents who are not working on the weekends. With the position being cross-trained in code enforcement, this would provide seven-day coverage for municipal code enforcement.
Community Services Officer Greenfield PD has one full-time Community Services Officer (CSO) who works Monday through Friday from 8:00 a.m. to 5:00 p.m. Recently, the sole volunteer was hired as the CSO. The CSO handles vacation checks, assists with front desk duties, and is back-up to animal control duties.

52
ALTERNATE WORK SCHEDULE OPTION As we examine alternate work schedule options, we look at community-initiated workload rather than all workload. While there are clearly variations throughout the day, in reviewing the workload figures reflecting percentage of committed time (Figures 4-4 and 4-8) it is noted that weekday community-initiated workload is generally higher in the 10:00 a.m. to 8:00 p.m. time period, while higher weekend workload in the winter (Figures 4-6 and 4-10) begins at 10:00 a.m. and continues until 3:00 a.m. Again, this is not absolute, and the figures clearly reflect some peaks in activity throughout much of the day. Nonetheless, for purposes of deployment of resources, the observations noted are of value.
As was noted, patrol units operate on a strict 3/12 work schedule with two set reporting times. Tables 4-10a and 4-10b below represent an alternative to the existing schedule; this alternative incorporates both 4/10 and 3/12 shifts. As well, it incorporates four reporting times to better match coverage with workload demands.
As well as better matching coverage to workload demands, the proposed schedule eliminates the absence of field coverage at the 5:30 a.m. to 6:30 a.m. and 5:30 p.m.to 6:30 p.m. timeframes. Additionally, with overlapping shifts, late in-shift reports which at present may necessitate overtime could be largely eliminated by assigning such calls to officers whose shifts are not scheduled to end.
For purposes of this table, we utilized the current authorized, not actual, staffing numbers. Note that the SRO is not included as his duties prevent him from assisting patrol on a consistent basis.
TABLE 4-10a: Proposed 4/10 Work Schedule for Weekday Shifts Monday Tuesday Wednesday Thursday
DAY SGT 1 SGT 1 SGT 1 SGT 1 0600- 1600
X X X X X X X X
Total 3 3 3 3 MID 1030- 2030
X X X X X X X X
Total 2 2 2 2 NIGHT SGT 2* SGT 2* SGT 2* SGT 2* 1500 0100-
X X X X
Total 2 3 3 3 GRAVE 2030- 0630
X X X X X X X X
Total 2 2 2 2 * Night sergeant reports at 1600 hrs. and covers until 0200.
Note that while this would increase staffing during peak workload hours, staffing falls to two officers between the hours of 2:00 a.m. and 6:00 a.m., and there is no sergeant coverage during this period. However, both the data report referenced and anecdotal information from staff indicate that there is very limited activity during these hours. In the event of an emergency,
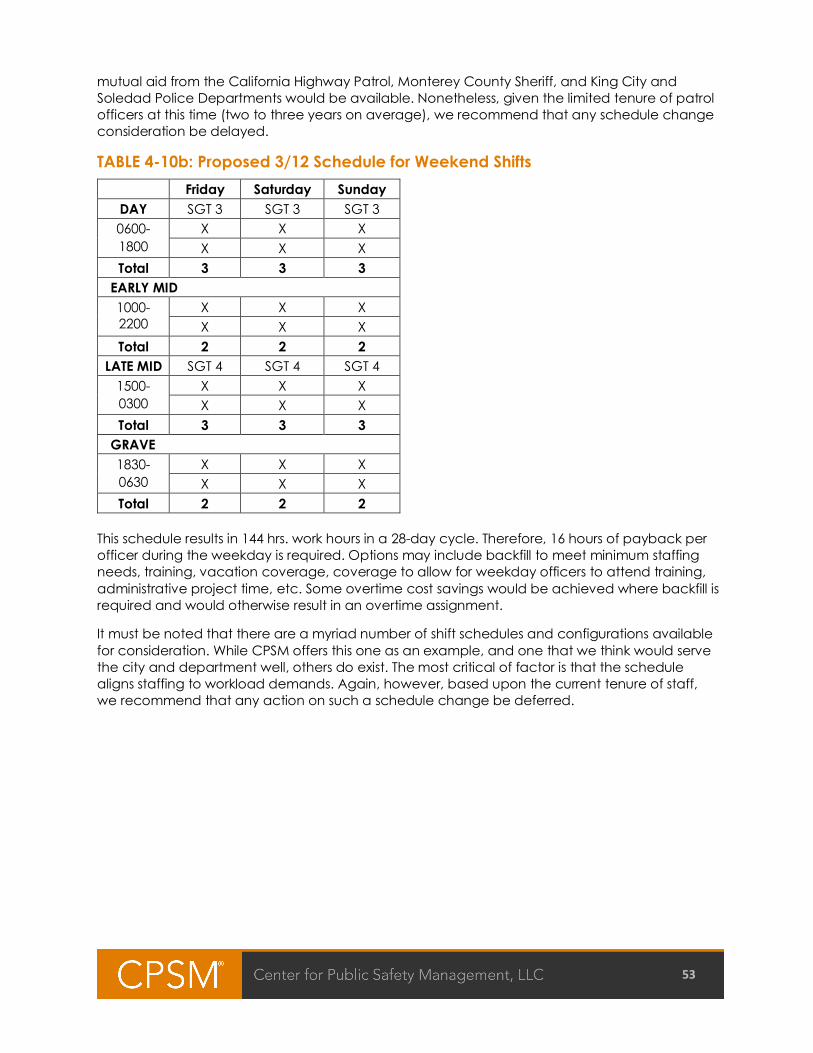
53
mutual aid from the California Highway Patrol, Monterey County Sheriff, and King City and Soledad Police Departments would be available. Nonetheless, given the limited tenure of patrol officers at this time (two to three years on average), we recommend that any schedule change consideration be delayed.
TABLE 4-10b: Proposed 3/12 Schedule for Weekend Shifts Friday Saturday Sunday
DAY SGT 3 SGT 3 SGT 3 0600- 1800
X X X X X X
Total 3 3 3 EARLY MID
1000-2200
X X X X X X
Total 2 2 2 LATE MID SGT 4 SGT 4 SGT 4
1500- 0300
X X X X X X
Total 3 3 3 GRAVE
1830- 0630
X X X X X X
Total 2 2 2 This schedule results in 144 hrs. work hours in a 28-day cycle. Therefore, 16 hours of payback per officer during the weekday is required. Options may include backfill to meet minimum staffing needs, training, vacation coverage, coverage to allow for weekday officers to attend training, administrative project time, etc. Some overtime cost savings would be achieved where backfill is required and would otherwise result in an overtime assignment.
It must be noted that there are a myriad number of shift schedules and configurations available for consideration. While CPSM offers this one as an example, and one that we think would serve the city and department well, others do exist. The most critical of factor is that the schedule aligns staffing to workload demands. Again, however, based upon the current tenure of staff, we recommend that any action on such a schedule change be deferred.
54
PATROL DIVISION STAFFING SUMMARY At present, the department’s authorized Patrol Division staffing is made up of four sergeants and 15 patrol officers. As was previously noted, minimum patrol staffing for the department is one supervisor and two officers. In some cases, this may include a sergeant and two officers, and at other times, a senior officer serves as the supervisor overseeing two additional officers. Command officers are available on call during this period should the need arise.
CPSM suggests that this is an appropriate staffing level except during the early morning hours when it could drop to two. In emergencies, local agencies often assist one another through mutual aid, and the department reported good relationships with these agencies.
The lack of availability of full-duty police officers has strained the department’s patrol force. As noted, only 10 full-duty police officers have been available for duty. While CPSM was unable to acquire current overtime expenditure reports, anecdotal evidence suggests that overtime utilization in meeting minimum staffing is common. While this, at least in part, can simply be a transfer from regular salary savings from vacancies, management of this shortfall puts a strain on both the department and officers called upon to work overtime these mandated overtime assignments.
Nearly all law enforcement agencies struggle with vacancies. Clearly, Greenfield is among them. CPSM suggests that the city adopt a policy of allowing the department to over-hire by one police officer position (temporary) in anticipation of vacancies. In reality, this will simply lessen the impact of future vacancies and rarely if ever would the department actually exceed permanent authorized staffing levels.
Patrol Recommendations: ■ Transfer responsibility for follow-up investigations of felony crimes to a detective function to
allow patrol officers to focus on response to calls for service, crime suppression, traffic safety enforcement efforts, problem solving, and community engagement opportunities. [Recommendation No. 3.]
■ Examine call for service demands at identified locations with a high frequency of calls to determine causative factors, whether the rate of response is necessary, and actions that may be taken to reduce demands. [Recommendation No. 4.]
■ Examine opportunities to reduce both dispatch delays and travel time for Priority 1 calls for service in order to reduce overall response time. Efforts should include review of current Priority 1 call types to ensure that they reflect life safety and all in-progress crime calls. [Recommendation No. 5.]
■ Consideration should be given to establishing a city-wide traffic management team to examine engineering and education opportunities to reduce the incidence of collisions and improve traffic flow at locations with a recurring high incidence of accidents. [Recommendation No. 6.]
■ Consideration should be given to developing a Retired Senior Volunteer Program or other such volunteer program to support patrol and traffic-related activities that do not require a sworn police officer. [Recommendation No. 7.]
■ Consideration should be given to adjusting the work schedule of the Animal Control Officer from only weekdays to a schedule that includes weekend coverage. [Recommendation No. 8.]
55
■ Performance data reports for each officer should be provided to patrol Sergeants on a monthly basis and should include, at a minimum: reports written; arrests; traffic citations; and field interviews. While it would be desirable to include calls handled as the primary officer, and assists, the absence of an interface between the CAD and RMS systems makes it impractical to obtain data for these last two items. [Recommendation No. 9.]
■ In the future, as workforce gains more tenure, and the vacancy rate diminishes, consider implementing an alternate work schedule which better aligns personnel deployment with workload demands. [Recommendation No. 10.]
■ Given the history of vacancies at the position of police officer and its negative impact, consideration should be given to authorizing one additional temporary police officer position, thus allowing for the department to process applicants in anticipation of vacancies and reduce the amount of time a position remains vacant during employment processing and training. [Recommendation No. 11.]
POLICE EXPLORER PROGRAM Explorer programs in police departments have proven to be successful recruiting avenues for departments looking for future law enforcement officers and professionals. Police Explorer Posts help youth gain insight into a variety of programs that offer hands-on career activities as well as character building experiences. For young men and women interested in a career in law enforcement, Explorer opportunities offer experiential learning with lots of fun, hands-on activities that promote growth and development. Being a Police Explorer provides an opportunity for young people to better determine if a career as a law enforcement officer or professional is right for them.
Greenfield PD’s Explorer Post provides young adults in Greenfield an opportunity to broaden their understanding and develop firsthand knowledge of the challenges present in the field and introduce them to the necessary job skills to assist in their attainment of a career in law enforcement. Members develop their leadership skills through intensive training and community service, while also being mentored by Greenfield PD personnel.
Explorer programs are designed for youth between 14 and 21 years of age and Explorers are volunteers. The program provides mentorship, lessons in leadership, and the ability to learn about emergency and public service. The program presents a great opportunity to recruit potential applicants while they are still in school and provide an opportunity for them to be involved in the department and stay the course of good citizenship. It also allows the department to develop a hiring pool of members from the community who have grown up in and around Greenfield, have ties to the community, have family in the city, and most likely if provided employment would stay in the community. It is widely accepted that if departments can hire members of their community, those people most likely will have a greater vested interest in the community. The Explorer Advisors are working with the local schools to recruit Explorers from the student council, athletes, and other areas.
The Greenfield Police Explorer Post 306 has been in existence and part of Exploring Learning for Life for several years. It remained dormant until five years ago when the Explorer Post was brought back into existence. Currently, there are ten Explorer Advisors comprised of sworn, civilian, and volunteers of GPD—five men and five women—who are responsible for 15 Police Explorers. Each year, newer explorers attend the San Diego Explorer Academy where they experience high-intensity training designed to build character, leadership, and teamwork. The GPD Explorer Post was recognized as the Explorer Post of the Year in 2015-16 by the San Jose
56
Law Enforcement Explorer Advisor Association, which is a testament to the leadership and commitment to the program.
Recruitment for the program occurs by word of mouth through the Explorers and staff at GPD as well as through partnerships with school counselors in the region. The GPD SRO often posts pictures on social media and the department website of the Explorers working in the community.
CPSM learned there is no Explorer program manual to define eligibility requirements, expectations for conduct of participants, attendance at meetings, and other policies important to establish rules of conduct, expectations, being a member in good standing, and disciplinary procedures. Eligibility standards could include being of good moral character, maintaining a 2.0 or higher GPA, successfully passing an oral interview and background investigation, and committing to attending meetings and events. Learning for Life and other Police Explorer programs are good resources to contact for examples of Explorer program manuals. CPSM would recommend an Explorer Post manual be created to fit the needs of the Greenfield Police Explorer program. The manual should include guidelines to reflect appropriate management and oversight of the program.
Explorers have weekly meetings at GPD where they attend training, sign up for upcoming events in the city and/or county, and continue to learn more about the criminal justice system. The advisors collaborate with other Explorer Advisors through the San Jose Law Enforcement Explorer Advisor Association (SJLEEAA) where information on countywide events is shared and supported.
Each year, the City of Greenfield hosts the Harvest Festival, Fourth of July, Christmas at the Park, National Night Out, and DUI checkpoints. Through collaborative partnerships with other Explorer programs, the Explorers provide a key function to assist GPD in providing safe and enjoyable events while reducing costs to the city in hosting these events.
The Explorers assist in cleaning the patrol units and are funded $2,500 bi-annually from the city’s general fund. The Explorer Post also receives donations throughout the year. The funding helps pay for uniforms, equipment, and training as well as providing the Explorer Program with an Explorer van to transport the explorers to area events. The Greenfield Police Explorer program also has a checking account with associated debit card. CPSM learned there are no systems or processes in place to reconcile the Explorer checking account. Rather, the Explorer Advisor with treasurer responsibilities reviews the statements; however, the police Sergeant assigned to oversee the program does not participate in an auditing process. CPSM recommends a policy be established that describes allowable expenditures from the checking account, purchasing limitations, any prior authorization for specific usage, as well as a monthly audit by the Sergeant to ensure accountability. Further, per Policy § 708, Cash Handling, Security and Management, once than no less than every six months (Policy § 708.5) the police Sergeant and police Captain shall review and audit the Explorer checking account; this process currently is not occurring.
CPSM has cautioned agencies regarding these programs due to the unfortunate number of programs receiving wide publicity in the media due to misconduct between police employees and Explorer youth. Recent allegations in a large California agency brought this issue to light again. That agency identified deficiencies in training for assigned officers regarding how to interact with minors, making it difficult to hold them accountable if a problem arose. It also published an updated program manual outlining guidelines and restrictions aimed at eliminating the chances of misconduct in the future.
GPD is commended for its commitment to community youth, but it is imperative that random checks of Explorer activities occur and that the program be included in the department audits and inspections.
57
Explorer Program Recommendations: ■ Create an Explorer Post manual to address eligibility standards, code of conduct,
expectations, and disciplinary procedures. Include guidelines to reflect appropriate management and oversight of the program. [Recommendation No. 12.]
■ Create an Explorer fund policy to address allowable expenditures; establish a regular audit system and process for the Sergeant assigned to oversee the Explorer program. [Recommendation No. 13.]
■ Follow auditing requirements defined in Policy § 708.5 for the Explorer checking account with the Sergeant and a command level officer at least once every six months. [Recommendation No. 14.]
■ Random checks of Explorer activities should occur and the program should be included in the department’s audits and inspections. [Recommendation No. 15.]
TEMPORARY HOLDING FACILITY The Greenfield PD has a room near the back door of the police department that is used as a prisoner processing room for prebooking into the county jail, citation, or release. The room contains a LiveScan machine, computer, booking photo area, and one bench with handcuffs to detain arrestees. Policy § 900, Temporary Custody of Adults, outlines the policies governing operation of the THF. CPSM recommends staff ensure compliance with Title 15.
Temporary Holding Facility Recommendation: ■ Ensure GPD practice is consistent with California Code of Regulations, Title 15.
[Recommendation No. 16.]
58
SECTION 5. CRIMINAL INVESTIGATIONS INVESTIGATIONS Greenfield PD has one full-time sworn Detective and one part-time civilian Forensics Investigator assigned to the Major Crimes Unit (MCU). MCU is a multi-agency investigations unit with the GPD and King City Police Department (KCPD). Its mission is to conduct investigations of major crimes occurring in both jurisdictions. The two cities operate under a Memorandum of Understanding and associated protocol that defines the types of crimes the MCU handles. Major crimes include homicide, attempt homicide with major life-threatening injuries, kidnapping, armed robbery with major injury to the victim, rape, assault with deadly weapon to peace officer, theft cases with loss exceeding $500,000, arson, and any other crimes deemed appropriate by the Chiefs of both agencies. The team is comprised of the GPD Captain who manages MCU, the KCPD Sergeant who supervises the unit half-time, a full-time KCPD Detective, a full-time GPD Detective, and a half-time GPD civilian Forensics Investigator.
All other crimes that occur in Greenfield are investigated by the initiating GPD patrol officer and overseen by their respective GPD patrol shift Sergeant. The remaining time for the civilian Forensics Investigator is focused on other GPD investigations. There is a patrol Sergeant who oversees investigations as a collateral duty; however, he has no functional oversight of either MCU or the investigations occurring at the patrol level. Instead, the patrol Sergeant with collateral investigative oversight is responsible for managing the existing GPD informant files, narcotics funds, equipment, and recently created patrol-based Gang Unit [See Patrol portion of the report for details.]
The narcotics funds and equipment are audited daily at the beginning of each shift by the oncoming Sergeant; with two shifts working daily this audit happens twice. CPSM reviewed the handwritten log and noted the standard practice taking place. GPD’s practice exceeds the requirements set forth in Policy § 707, Cash Handling Security and Management. The policy also requires at least once per year the funds be audited by the Police Chief or her designee, which was absent from the log. CPSM recommends the Police Chief or her designee ensure this occurs.
The use of informants to assist in criminal investigations is a normal practice in law enforcement agencies. Due to the risks associated with informants, it is important to have a thorough policy to ensure the integrity of the confidential informants and criminal investigations. Policy § 608, Informants, describes the practice for working with confidential informants and is consistent with best practice. Upon review of the informant file, CPSM noted the file was contained in the patrol Sergeant’s (with investigations collateral duty) locked desk drawer in the office that is shared with the other Sergeants. Although the office can be locked, the sensitive nature of confidential informant files would necessitate maintaining the files in a locked cabinet in a locked office with limited access to staff. CPSM would recommend the informant files be moved to a dedicated file cabinet in a locked office with limited access and that training be provided to the respective Sergeant responsible for the files.
A review of the informant log showed a missing component regarding the history of the informant, which was brought to the Sergeant’s attention. These details are due in part to the limitations inherent in assigning detective supervision tasks as a collateral duty and are not a reflection of a performance deficiency. Rather, this is a consequence of not having a dedicated Detective Section wherein the detective Sergeant responsible for the files would be
59
the same Sergeant overseeing the use the informants, and could thus closely review the documentation.
As mentioned, there is no Detective Section devoted to investigating all other crimes occurring in the City of Greenfield, which is not in keeping with standard practices of most police organizations. Rather, the patrol officer who responds to handle a call for service resulting in a case requiring further investigation is tasked with completing that investigation, regardless of whether it is a misdemeanor of felony. This may take several days and possibly weeks, especially when follow-up is needed. With the concurrence of the patrol supervisor, patrol officers otherwise retain assignment of crime reports they initiated which are not assigned to or selected by MCU as described above. The officer is required to investigate all potential leads to conclusion. Patrol cases can be accepted by an MCU detective when follow-up beyond the patrol officer’s capabilities is required. If possible, patrol officers can file a case with the District/City Attorney, including in-custody cases. Due to the patrol officers’ primary function of responding to calls for service, on-going investigations may be delayed based on the daily activity level in the field.
For special assignment to Detective, officers are appointed to the role of “Detective” and serve at the discretion of the Chief of Police. Assignment as a Detective is generally five years in length; however, this is not included in Policy § 1004, Promotional and Transfer Policy. CPSM recommends a formal rotation schedule be considered to provide opportunities for sworn personnel to acquire additional training and experience, which will serve both the individual and organization into the future. This is especially important for an organization the size of GPD, which offers relatively few specialized assignment opportunities for its personnel. Other agencies of similar size provide a three-year assignment with the opportunity to request a one-year extension twice, for a total of five years. The annual extensions are based on good performance. To ensure that some level of expertise is maintained in the unit, the rotational schedule should be overlapping once a Detective Section is added to the organizational structure in the future.
Case Management GPD does not have a standard case assignment process. MCU detectives handle major person’s crimes, child sex offense investigations, and complex and/or sensitive investigations as previously described. Patrol officers are tasked with handling all other investigations that are overseen by their respective supervisor. There is no case management system to track cases, which is especially important to keep track of case efficiencies, follow-up, and criminal prosecutions. As noted in the Patrol portion of this report, the lack of ability to track reports further complicates the ability to actively monitor the progression of an open investigation, regardless of whether it is handled at the patrol level or by MCU. In cases where the District Attorney’s office requests investigative follow-up, an email is sent to all Sergeants and the handling officer. However, there is no check and balance to ensure the follow-up is taking place and no auditing process to examine trends that could be used to train department personnel.
Cases may be closed by arrest, prosecutors declining to file charges, refusal by victims to cooperate, or other reasons. This means that as officers/detectives are assigned new cases they are still responsible for follow-up and closure on the older cases, which is a standard policing practice. Crime reports are entered into the TracNet records management system (RMS), but the system is not used for active case management.
Clearances GPD does not actively track detective case assignment or case clearance rates [see Records portion of the report below], so no method exists to assess individual productivity, whether it be
60
current caseload or historical. GPD also does not have an ability to evaluate the productivity of its investigative unit as a whole. This lack of a case management system limits GPD management’s ability to evaluate the effectiveness of the department’s investigative function and the success of its efforts to address crime in the community. CPSM recommends implementing a formal case management system to provide management the ability to evaluate the effectiveness of individual detectives and the investigations unit.
Due to the lack of a case management system, CPSM was unable to evaluate the investigative unit’s staffing, workload, or overall effectiveness. FBI UCR clearance rates can provide some perspective on investigative effectiveness, but the confidence in GPD’s UCR rates is minimal, as will be discussed in reporting in the Records portion of the report.
Victim Services Greenfield PD does not currently have a dedicated victim services unit. Instead, GPD refers victims to the Monterey County District Attorney’s Office, which works with the Victim-Witness Coordinator to assist with services.
Training Training for newly-assigned Detectives is primarily “on-the-job.” This should be formalized through a unit training manual and formal investigations classes offered through POST and other providers. CPSM learned there is no detective manual to describe procedural aspects of the assignment, including fundamentals such as search warrant preparation, informants, drugs and narcotics, victim response letters and communication, policy and operations, case management, etc. CPSM recommends a unit training manual be created, similar to a field training manual, to ensure consistency and competence for newly-assigned detectives.
In an effort to improve the case investigations and preparation for cases being turned over to the District Attorney’s office for prosecution, the Monterey County District Attorney’s Office was conducting training at GPD during the site visit. The importance of ongoing training and maintaining professional working relationships with the DA’s office is in keeping with best practices. GPD staff is commended for proactively addressing this need and is encouraged to look for other opportunities that will assist, especially due to the limited tenure of staff.
Technology GPD has a dedicated interview room that is outfitted with audio/video monitoring. Court cases are often based upon the strength of the video and audio recordings of the interviews of victims or witnesses. It is essential that these systems are of top quality and operationally effective to create the best video and audio possible. CPSM found the interview room and accompanying monitoring room to be properly equipped.
Workload Demand CPSM inquired about the number of unsolved homicides and learned the longest open homicide case dates back to 1959. GPD has more than 50 open, cold-case homicides, with many homicide cases remaining open from the later 1990s, two from the late 1980s, and three from 1959-1963. With the lack of a full-time Detective Section, these open homicide cases risk not being actively investigated. In light of the technological advancements in evidence processing, there may be workable leads that have not yet been realized. Consideration should be given to hiring retired GPD or other area law enforcement investigators on a temporary part-time, non-benefitted basis to conduct cold case homicide investigations. This would reduce the collateral
61
duty burden of the officers/detectives who also oversee gangs and investigations, and other functions as assigned. Funding for such a position could be drawn from the salary savings from the vacant position(s). No new appropriation would be required. CPSM recommends hiring retired detectives from the region who have homicide investigation experience to examine the evidence and workability of these cases in order to pursue prosecution where applicable.
With regard to sex registrants, the law stipulates anyone required to register as a sex registrant per Penal Code § 290 do so with the law enforcement agency of their place of residency. The annual (at minimum depending on tier) registration requirement allows the local law enforcement agency to gather important information regarding the sex registrant’s place of residence, appearance, and other factors intended to ensure quality of life and safety in the city where they live. Currently, the Records Supervisor is tasked with completing the registration process. This is problematic in two areas: (1) a Records Supervisor does not have the experience to address potential areas of concern regarding a sex registrant, and (2) potential intelligence regarding criminal behavior could be missed with the lack of an interview by a trained detective. Policy § 356, Registered Offender Information, recommends “an investigator assigned to related investigations should conduct the registration in order to best evaluate any threat the person may pose to the community.” An experienced law enforcement officer responsible for these types of crimes is better suited to register and interview registered sex offenders. CPSM would recommend that a detective handle registering offenders. During the site visit, CPSM learned that GPD is transitioning this responsibility from the Records Supervisor to a patrol Sergeant as a collateral duty. Additionally, the Sergeant will also be responsible for registering narcotics offenders, and gang and arson registrants. GPD is commended for proactively addressing this issue. Although this transition will address the immediate concern, best practice would necessitate this responsibility be transferred to the Detective Section in the future.
In speaking with various staff members, CPSM learned that mandated follow-up on cases such as missing persons may not be consistently performed. Due to the lack of a report tracking system, it is up to the respective Sergeant to search for incomplete reports, review the cases for thoroughness, and ensure proper follow-up investigation is occurring. With a high number of newly-promoted sergeants, this important responsibility could be easily overlooked. CPSM recommends training be included in the new Sergeant’s field training binder to ensure this issue is being addressed as well as providing them training on how to conduct the late/incomplete data search in TracNet. [See Training portion of the report.]
Forensics Forensic investigation of crime scenes is a highly specialized function. Successful identification and collection of evidence, especially trace and biological evidence, is of paramount importance in successfully solving crimes. Investigators must have a high degree of training, experience, skill, and commitment to master this art.
The collection, processing, and preserving of evidence is regulated by Policy § 800 (except for computers and other electronic devices – see Policies 600 and 810). These policies, 15 pages in length, direct all aspects of evidence collection. The policies include details for the collection of items such as currency, drugs, and firearms and are in keeping with best practices.
The part-time Forensics Investigator has over 20 years of experience in investigations and forensics and started at GPD in late 2016. He is a certified crime analyst from the International Association for Identification, a current board member for the Crime Scene Certification Board of the International Association for Identification, and a certified POST instructor. He is trained in specialized techniques and skills required in the processing major incidents. He works midweeks from 9:00 a.m. to 4:00 p.m. and adjusts his workdays based on investigative needs or when
62
called out to active crime scenes. The forensics investigator has a designated CSI vehicle that is properly equipped and meets the needs of the assignment.
Training in basic crime scene processing, evidence handling, collection, and packaging is provided to all GPD police officers through the academy as well as recent training provided by the evidence technician.
A GPD patrol Sergeant oversees the forensic activities of the Forensics Investigator as a collateral duty, while the KCPD MCU Sergeant oversees the forensic activities of major investigations.
CPSM staff requested data reports on the frequency of collection as well as the evidentiary value of that evidence which is collected; however, there was only limited information collected by GPD. The information provided indicated there were 41 cases handled in 2017 and 29 cases handled YTD in 2018 since the Forensic Investigator has been in the part-time role. With the aforementioned number of open homicides, CPSM recommends assigning the Forensic Investigator to assist with evaluating these cold cases as active cases, time permitting.
INVESTIGATIONS STAFFING SUMMARY It is apparent that the absence of a dedicated Investigations Section for GPD contributes to inefficient case management, lack of follow-up on significant cases such as homicides and missing persons, lack of proper oversight of informants and registrants, and other service delivery shortcomings. Again, this is not to say that staff is not committed to quality service delivery, but instead indicates a key section to the police department for these purposes is missing. CPSM strongly recommends GPD create an Investigations Section and add two FTEs: one Investigations Sergeant and one full-time Detective. Further, it is recommended the MCU Detective focus at least half time on GPD cases. This would allow the investigations unit to proactively address criminal investigations for the City of Greenfield and provide the proper level of service to the community. The issues raised with informant files and properly handling sex, narcotics, gang, and arson registrants could also be addressed. The Sergeant could also assist with the administrative duties involved in implementing management systems and processes in detectives and other areas of the department that are identified later in this report.
Investigations Recommendations: ■ At least once per year, the narcotics funds should be audited by the Police Chief or her
designee. [Recommendation No. 17.]
■ Informant files should be moved to a dedicated file cabinet in a locked office with limited access; provide training to the respective Sergeant responsible for these files. [Recommendation No. 18.]
■ The department should consider establishing a formal rotation schedule for detective assignments. [Recommendation No. 19.]
■ Implement a formal case management system to provide management the ability to evaluate the effectiveness of individual detectives and the investigations unit. [Recommendation No. 20.]
■ A unit training manual should be developed for newly-assigned detectives. [Recommendation No. 21.]
■ Formal investigations classes, where available, should be provided to detective personnel. [Recommendation No. 22.]
63
■ Hire retired detectives who have homicide investigation experience to conduct cold case homicide investigations. These detectives can be from within the region. [Recommendation No. 23.]
■ Assign the Forensic Investigator to assist with cold cases homicides as time permits. [Recommendation No. 24.]
■ Create a Detective Section and add two FTEs: one Investigations Sergeant and one full-time Detective. [Recommendation No. 25.]
■ Realign the MCU Detective with the Detective Section and focus half of this person’s time on GPD investigations. [Recommendation No. 26.]
■ In the future, transfer the responsibility to register sex, narcotic, gang, and arson offenders to a Detective. [Recommendation No. 27.]
64
SECTION 6. PROPERTY AND EVIDENCE The intake, processing, storage, and disposal of evidence and property are important functions of any law enforcement agency. It is especially true for weapons, narcotics and dangerous drugs, currency, and valuable jewelry. Too frequently, law enforcement agencies across the country have faced the consequences of mismanaged property and evidence sections. This has resulted in terminations and arrests of police employees ranging from janitors to police chiefs for thefts of narcotics, cash, jewelry, and guns. In some cases, audits that revealed unaccounted-for property and evidence led to the termination of police executives. Controlling access to the property and evidence areas, inventory control, and regular audits are critical to the effective management of the property and evidence function.
Law enforcement officers take custody of physical evidence, lost and stolen property, and contraband that can directly or indirectly solve a crime. The integrity of these items depends upon the proper handling of the items from the moment law enforcement takes possession of them until they are presented to the court, legally returned to their owners, sold, destroyed, or retained for agency use. Property and evidence rooms are not just warehouses; rather, they must provide for the security and storage of valuable and sensitive items.
Procedures must preserve a chain of custody that enables the admission of evidence in subsequent court proceedings. The mishandling of property and evidence by law enforcement agencies reduces the public’s confidence in law enforcement and, ultimately, in the integrity of the criminal justice system. The application of comprehensive property and evidence policies can mitigate these issues by informing department personnel of their responsibilities, outline acceptable procedures to follow, establish general performance standards, and create consistency among employees in carrying out their numerous tasks.
Work Schedules / Public Access Hours The GPD Property and Evidence Unit function falls within the Records Section; however, supervisory oversight is under the direction of a Sergeant assigned to the Patrol Division as a collateral duty. Under the direction of this Sergeant, the interim Evidence Technician works part-time and handles day-to-day management of property and evidence processing and storage. The technician has received the Basic 40-hour Property & Evidence Technician training through CJTC, is a past member of the California Association of Property and Evidence (CAPE), and recently retired after serving eight years as a Property & Evidence Technician for another local law enforcement agency. The Chief’s Administrative Assistant serves as a back-up Evidence Technician; however, she has not received any formalized training for this critical function. The interim Evidence Technician works Tuesday through Thursday from 7:30 a.m. to 1:30 p.m., and the back-up Evidence Technician works Monday through Friday from 8:00 a.m. to 5:00 p.m., excluding holidays. Public access for the release of property is available during these working hours or by appointment. The interim Evidence Technician has been in place since September 2017 after the patrol Sergeant handling these responsibilities as a collateral duty left in the summer of 2017. Recruitment for a full-time Evidence Technician is currently being conducted.
Training When the prior Sergeant performed the duties of property and evidence manager, there was a lack of systems in place for purging items or processes for packaging and storing property/evidence in an orderly fashion. At that time, the Records Supervisor was assigned as
65
the back-up; however, she had no training for these duties and responsibilities and was minimally involved.
CPSM learned the current back-up Evidence Technician has no training or prior experience in property/evidence practices. Due to the lack of identified staff member, the Administrative Assistant assumed this responsibility. A back-up Evidence Technician is necessary for the efficient operations of a police property/evidence room. However, the Administrative Assistant has a number of duties and responsibilities that leave her with little time to devote to evidence duties. Further, assignment to the Chief’s Office and being directly involved in managing property/evidence is counterintuitive and not consistent with best practice. Per International Association of Property and Evidence, Inc. Professional Standard 8.2 (Version 2.5.1 / REV March 8, 2015), those permitted access should include the property officer(s) and the supervisor. The manager/administrator who has oversight of the property unit and the Chief of the agency should not have independent, unescorted access into the property room and/or storage areas. Since the Administrative Assistant works directly for the Police Chief, it is not the best position to serve as back-up Evidence Technician. CPSM recommends a Records Technician be trained in the back-up role and responsibility as it is more aligned with integrity and security of sensitive items. [See Records portion of the report for further staffing details.]
Audits, Inventories and Inspections Department Policy § 800, Property and Evidence, governs the property and evidence function. This policy was found to be well written and comprehensive. The nine-page policy addresses the intake of property and evidence, covering collection, storage, disposal, security, audits and inspections. Property and evidence control is maintained through the property module of the TracNet RMS. Section 808.8 calls for an annual audit of the property room and requires monthly inspections. Additionally, this section directs that an unannounced inspection be conducted annually as directed by the Chief of Police. CPSM asked to review the inventory and audit reports as called for in policy and was advised that no audits or inspections have been conducted. This includes when the interim Property and Evidence Technician took control and/or when the current Chief of Police was appointed. Per Policy § 808.8(d) and best practice from CAPE and IAPE, an inventory should be conducted any time there is a change in either position. The International Association of Property and Evidence, Inc. Professional Standard 15.1 (Version 2.5.1 / REV March 8, 2015) specifically recommends an inventory be conducted of property and evidence upon change in the Chief of Police. Since GPD’s Police Chief was recently appointed, CPSM recommends an inventory be completed as soon as possible.
An inventory is the process of individually checking all or a specified portion of the property/evidence items against the agency’s records. The purpose of an inventory is to ensure that all items of property/evidence are accounted for. A complete inventory involves matching each piece of property/evidence with its corresponding documentation. Conducting annual inventories will identify property/evidence that is missing or misplaced from its assigned location, and it will identify items that are present in a particular location that should have been previously removed. Routine inventories will limit the time frame for investigating missing items. Without a timely inventory the time frame of an investigation and the total number of persons involved will expand significantly. Additionally, it is unfair to burden a new employee, supervisors, or managers with responsibility for items that may have been misplaced, lost, or stolen prior to his/her assignment. Agencies that conduct regular inventories are far less likely to experience an internal loss of property and evidence. An inventory would also assist in the assessment of cold case homicides as it would provide an opportunity to determine the viability of evidence as mentioned in the Investigations portion of the report.
66
Access Control The property/evidence room is located within the interior of the Greenfield police facility. Entry to the primary evidence storage room is granted through the officer’s evidence processing room. First, entry into the officer’s evidence processing room is granted through key card access control. All sworn personnel have access to the evidence processing room. There is a second door granting entry to the primary evidence storage room by key card access. Only the interim Evidence Technician and back-up Evidence Technician should have access cards granting access to the evidence storage room. However, during the site visit CPSM learned that other sworn personnel key cards provide access during normal business hours. CPSM learned that this was an oversight and access was not provided by design, rather a continued past practice. Nonetheless, CPSM recommends all access to other city or GPD personnel be revoked immediately and that only the interim and back-up Evidence Technicians have key card access to the evidence storage room. GPD may also choose to grant key card access to the Sergeant who has responsibility for property/evidence as a collateral duty. In case of emergency such as a power outage, there is one actual door key that provides access into the evidence storage room and the interim Evidence Technician retains this key at all times.
Staff advised that a report can be run to audit who has made entry using an access card to these areas; however, CPSM learned access audits are not typically conducted unless there is a question about missing evidence. When CPSM asked to review a report of all access-controlled entry into the evidence storage room, it was determined that the report was not able to be generated. The inability to run an access report creates a concern for the integrity and security of the property and evidence stored. CPSM recommends GPD staff contact the access control vendor to mitigate and/or repair the issues with the access control report immediately. Once repaired, GPD can run a report to assist in first determining who is granted access and then restricting access to the three personnel responsible for the evidence storage room.
The primary evidence storage room door also has an alarm that is monitored by All-Safe. Only the Property and Evidence Technician and back-up Technician have the codes for the alarm system. Once the Evidence Technician enters the office, the alarm is deactivated by using the touchpad with a code. The sensors for the evidence office cover the door, but do not cover motion inside the evidence storage room in the event of an intrusion through other means such as the ceiling. In the event of an activation, a signal is sent to All-Safe, which would in turn notify someone from the GPD contact list to ascertain if a response is needed. In the event a response is necessary, Monterey County Department of Emergency Communications (MCDEC) would be contacted and an alarm call for GPD would be generated. CPSM inquired about the number of alarm activations to the evidence storage room and learned there were 36 activations last year; however, they did not require a response. No further details were readily available such as accidental activation, who was contacted at GPD, how the no-response was determined, or if there was a defect with the alarm system. Since the integrity and security of property/evidence is critical, CPSM recommends a process be implemented that notifies the Captain and/or Chief of Police whenever an alarm activation occurs. The information should be documented and searchable and include details as to time, date, reason for activation, who was notified by the alarm company, and any other pertinent details. CPSM also recommends motion sensors be added to the alarm coverage for the interior of the evidence storage room.
The access card is the normal means of entry and the use of the door key is limited to power outages where the access card is inoperable. Since access card entry is granted to the back-up Evidence Technician and Sergeant, the door key can remain with the Evidence Technician unless she is on vacation at which time it should be given to the Sergeant.
67
The GPD Evidence Technician maintains a written log for anyone who enters the evidence storage room. A review of the access logs indicated the date, name, organization, time in and time out. CPSM recommends including a column for purpose of visit. This would be advantageous in the future when GPD conducts inspections and audits as a means to maintain a quick reference to ensure these checks are taking place as well as validating the reasons for others making entry.
Security All areas containing property/evidence are secured by either a key or a lock (combination and key lock). In the officer processing area, there are four types of secure storage locations for property/evidence of various sizes or requiring refrigeration. These include one-way evidence lockers, a steel gun locker, evidence slot to the main evidence storage room door, and a small lockable refrigerator.
Twelve one-way, in-wall, temporary evidence lockers of various sizes are available for use by the officers to submit items. These lockers are located in a common interior wall between the officer processing area and the evidence storage room. Once closed, the officer places the key to the locker into a hole in that same locker. At that point, the locker cannot be opened from the officer processing area, it can only be opened from the evidence storage room by unlocking padlocks rails that secure a section of locker doors.
Adjacent to the temporary evidence lockers, there is also a green, steel gun locker able to store rifles/shotguns or other large sized evidence temporarily until the evidence technician processes it into the evidence storage room. The locker is secured by a padlock.
The main door to the evidence storage room has a metal slot for officers to book small items of evidence typically packaged in envelopes. This assists in not unduly using an in-wall evidence locker with such a small item of property or evidence, thus keeping the in-wall evidence lockers available for other items.
There is a small refrigerator in the officer processing area for officers to place biological and other items of evidence requiring refrigeration. The door can be secured by a lockable door, and the key is maintained in the Sergeants’ office. Next to the refrigerator is a DrySafe evidence dryer that allows evidence saturated by blood or other biological evidence to be properly dried.
Inside the evidence storage room, property/evidence is stored either in bins that are located on steel racks, lockable cabinets, a safe, a full-size refrigerator, or full-size freezer for evidence preservation.
Evidence is stored in plastic bins with the crime report number written on a label and attached to the respective bin. This information is cross-referenced in TracNet with the aisle number. There are three vertical, lockable metal cabinets containing shelves to store guns, ammunition, drugs, paraphernalia, and digital media. CPSM learned the steel cabinets are left unsecured. During the site visit, staff acknowledged the importance of securing the cabinets containing drugs, money, and valuables. CPSM recommends making it a practice to keep all lockable cabinets containing weapons, money, and valuables locked at all times.
A floor safe with a combination on the door is used to store valuables and currency until it is processed. The safe remains locked at all times.
The refrigerator and freezer are both stand-alone and do not have temperature monitoring and recording devices capable of sending notifications if there is a significant change in temperature that could cause a degradation in the evidence. In the event of a power outage,
68
this could be crucial, as evidence from major investigations such as homicides could be compromised if staff is unaware of fluctuations in temperature that could be detrimental to evidence preservation. CPSM recommends adding a temperature monitoring and notification device to both the refrigerator and freezer.
A security camera is in place inside the officer’s evidence processing room. The camera is not actively monitored or reviewed at any interval. The camera is motion activated and the recorded video is stored until overwritten on the server, which takes approximately three years. The footage is accessible by all Sergeants, Captain, Chief, Administrative Assistant, and the full-time IT Technician. Per California Government Code § 34090.6, video recordings should be retained for at least 100 days unless otherwise specified by state law. By practice, GPD exceeds this statute. Since the Records Supervisor is the custodian of records, it would be more in keeping with her duties to provide access rather than the Administrative Assistant.
There are no security cameras located in the evidence storage room, which is not in keeping with best practices. The lack of video coverage in the evidence storage room is critical to maintaining the integrity and security of property/evidence in storage. Per IAPE Standard 8.6 (Version 2.5.1 / REV March 8, 2015) Security–Video Surveillance, installation of video surveillance equipment should be considered to act as both a deterrent for good internal controls and externally to dissuade unauthorized entry without detection. CPSM recommends installing video cameras inside the evidence storage room to ensure the cabinets containing drugs, money, and valuables are monitored as well as for covering the evidence aisles and refrigerator/freezer.
Property/Evidence Storage The intake process is as follows. Officers who have seized property/evidence transport the items to the police facility. There, they package and document all property/evidence in TracNet with information to include the owner, nature of item, chain of custody, etc. Upon completion, the property/evidence is properly packaged, a barcode is printed, and the item(s) is placed in a one-way temporary locker. The key to the respective locker is placed in a small hole in that locker. Once the property/evidence is secured in the locker, access is no longer available from that officer’s processing side.
The Evidence Technician then collects the property/evidence from the other side of the locker in the evidence storage room. The technician manually inputs the information, including aisle and bin location into the TracNet property management software module and assigns it a storage location. During the site visit, CPSM inquired about the use of a bar code scanner for processing evidence by the Evidence Technician and learned the scanner has been inoperable for several months. CPSM recommends the bar code scanner be repaired and used for improved efficiencies as designed by the system. Use of the bar code scanner would save time versus manually inputting the data into TracNet and creating handwritten labels for the storage bins.
CPSM learned there are two other areas used for storing property and evidence: the GPD sally port and a small room at an offsite city-owned public works building. Staff advised that GPD previously stored bicycles outside the public works building; however, the area was accessible by anyone who wandered into the fenced city property area and the items were not protected from the weather and elements. Recently, the Evidence Technician worked with an officer to attempt to locate owners for the bicycles and/or otherwise properly dispose of them so no bicycles remain at the public works facility. Staff is commended for recognizing the issues inherent with past practice and being proactive in resolving this issue.
Currently, the sally port is used to store found bicycles, as well as police bicycles, old office furniture, and what appears to be a catch-all for other miscellaneous items. The sally port is not
69
used as designed to bring prisoners into a secure area of the police facility for booking and processing. Rather, prisoners are brought into the secure rear parking area of the police department. [See Jail portion of this report for further details.] The sally port area provides protection from the elements and improved security for bulk items being stored. However, comingling items of property/evidence with other department-related items is not advisable and contrary to best practice. GPD is in the process of getting bike racks to better organize the items in the sally port. CPSM recommends adding a cage to the sally port to store the bicycles/bulk property and control access. Video camera(s) should also be added to the storage cage to ensure the integrity and security of the property/evidence.
The offsite public works room is located in a large storage area on the second floor of a metal building a few blocks from the police facility. There is a wood stairway leading to the room, which is of exposed wood and metal framing construction and is not a finished, insulated space. The open storage area is divided between public works and GPD. A small room was essentially created to store long-term evidence in plastic evidence bins. The walls of the storage room are comprised of a single layer of plywood as is the floor. A hollow core door with a combination lock controls access to the room. The room is not alarmed and there is no video surveillance. Many agencies deal with the challenges of storage space for property and evidence. However, this space is not climate controlled, and lacks proper design and security. The room is a bare-bones storage room and not a functional property/evidence storage room. Rather than spend city resources to bring this storage area into compliance with property/evidence standards, CPSM recommends moving the few plastic bins in the storage room back to the main evidence storage area at GPD pending another long-term storage solution.
GPD staff indicated a climate controlled Conex box is slated to be purchased and installed within the fenced back lot of GPD. CPSM recommends ensuring the Conex box has limited access and video surveillance. GPD is cautioned to ensure inspections of the exterior and interior of the Conex box are conducted routinely as these forms of long-term storage have been known to rust and/or have leaks or issues with temperature control that can compromise the preservation of evidence.
A main area of focus for the interim Evidence Technician is providing the proper resources for packaging and booking property/evidence and training GPD staff on how to properly package and book property/evidence. During the site visit, CPSM noted the clean and orderly officer’s processing area as a result of the Evidence Technician’s efforts. The processing area had various types of packaging material including cans, boxes, paper bags, and sealable plastic bags. GPD is commended for placing a priority on improving the preservation of property/evidence processing and providing the proper resources to staff.
Purging Property As noted in the IAPE Professional Standards Section 11.9 (Version 2.5.1 / REV March 8, 2015), firearms pending destruction have the greatest likelihood of being pilfered from storage or during transportation to a destruction site, as there is generally no longer any interest in the item for prosecution or release. As a result, there is a need for thorough documentation and verification of every step in the destruction process to leave no room for doubt or suspicion as to its final disposition. Maintaining a running firearm destruction list that includes the case number, item number, tracking number, defendant’s name, and an accurate description of each item enhances the integrity of the process. Once the firearms are authorized for destruction and have been listed, they should be staged, verified by an independent witness, and placed in a sealed container with the validated firearm destruction list attached. Each item on the list should be individually initialed and witnessed. The documentation should include: who authorized the
70
firearm for destruction, who staged and verified the item on the destruction list, who transported the firearms to the destruction site, and who witnessed and verified each individual firearm being destroyed.
GPD last conducted weapons destruction in October 2018. Weapons are destroyed per court order, adjudication of a case, or when unclaimed by owner. A review of the documentation provided indicated not all of the standard steps listed above were followed—particularly having an independent witness verify the destruction items, details, and list as well as storing them in large plastic bags rather than a sealed container. The weapons are destroyed at the Covanta facility in Newman, California. The Evidence Technician and accompanying GPD sworn officer physically places all firearms in the top of the multilevel grinder at Covanta and witnesses them being churned with other metal items and destroyed. Upon completion, Covanta provides documentation, including providing the weight of GPD vehicle brought in and the weight of the vehicle after destruction. CPSM recommends a report or memo be written and approved by the supervisor with collateral oversight to document the aforementioned details of personnel at each step and include the case numbers and details of the weapons.
In 2007, the TracNet property and evidence module was implemented to process and store property and evidence. Some cases preceding this technology have been manually inputted into TracNet and typically include evidence cases from significant investigations such as homicides.
The current interim Evidence Technician found a significant backlog of property needing to be purged and has worked diligently to reorganize and dispose of items no longer requiring retention. Due to the overcrowding in the evidence storage room that the technician discovered and the lack of systems established to properly manage the evidence room, the Evidence Technician is unable to provide an accurate count of property/evidence being stored. Inventory at the time of the CPSM study shown through TracNet indicated 6,408 items are being maintained as property and evidence; however, this number would not account for items in property/evidence preceding TracNet. Without an inventory, this number cannot be validated.
Many more items require disposal, and the technician is working to identify and process these items. Although work still lies ahead, the new Evidence Technician has made great strides in the reorganization of and processing practices of the GPD property and evidence function. GPD recently updated the property release letter to community members by creating one in Spanish. Staff indicated this has helped noticeably in getting property returned rather than remaining unnecessarily in the property/evidence storage room. GPD staff is commended on the great strides taken to reduce the amount of property/evidence no longer requiring retention.
Reducing the glut of property/evidence can be addressed on intake by the department so that only necessary property/evidence is received. For instance, rather than collecting items from shoplifting cases, photographing the evidence and returning it to the owner is appropriate. Not only does that reduce the workload in property/evidence by eliminating intake, storage, and disposal, but it also reduces the workload for the handling officer. As well, it returns the product to its owner for sale or other use. The second factor is the disposal of property/evidence that is no longer needed. Providing staff assistance or overtime to the Evidence Technician to address this backlog would be appropriate. The department’s administration will need to identify options that meet its needs. Steps must be taken to address this backlog of property and evidence that has no evidentiary value. Once the surplus property/evidence has been purged, a complete inventory should be conducted and the audit recommendations implemented. This is an issue that will require support and reinforcement from sworn management staff. It is not realistic to expect the Evidence Technician to address this problem without such support.
71
During the site visit, CPSM noted an insufficient work space for the technician. There is no defined work space or desk; rather, a computer sits on a counter with administrative documents next to or posted on a board behind the computer. This space is not conducive to work flow or employee considerations for ergonomics. [See Facility portion of the report for recommendations for a larger property/evidence storage room at the GPD.]
Property and Evidence Recommendations: ■ Assign a Records Technician to be trained as the back-up evidence technician.
[Recommendation No. 28.]
■ Conduct an inventory of all property and evidence. [Recommendation No. 29.]
■ Ensure that regular audits and inspections are conducted of the Property and Evidence Section, as called for in policy. [Recommendation No. 30.]
■ Contact the access control vendor to mitigate and/or repair the issues with the access control report immediately. [Recommendation No. 31.]
■ Audit access to the evidence storage room; revoke access to all city or GPD personnel except for the Evidence Technician, back-up Evidence Technician, and Sergeant with collateral responsibility for property/evidence. [Recommendation No. 32.]
■ Implement a process that notifies the Captain and/or Chief of Police whenever an alarm activation occurs. The information should be documented and searchable and include details as to time, date, reason for activation, who was notified by the alarm company, and any other pertinent details. [Recommendation No. 33.]
■ Add motion sensors to the alarm coverage for the interior of the evidence storage room. [Recommendation No. 34.]
■ The written log for entry into the evidence storage area should add a column describing purpose of the visit. [Recommendation No. 35.]
■ Change the practice so as to keep all lockable cabinets containing weapons, money and valuables locked at all times. [Recommendation No. 36.]
■ Add a temperature monitoring and notification device to both the refrigerator and freezer in the evidence storage room. [Recommendation No. 37.]
■ Install video cameras inside the evidence storage room to ensure the cabinets containing drugs, money, and valuables are monitored; as well, provide video camera coverage of the evidence aisles and refrigerator/freezer. [Recommendation No. 38.]
■ To improve efficiencies and timeliness, repair the bar code scanner used by the Evidence Technician. [Recommendation No. 39.]
■ Add a securable cage to the sally port to store bicycles/bulk property and include video camera coverage to ensure the integrity and security of the property/evidence. [Recommendation No. 40.]
■ Return the plastic evidence bins from the storage room at Public Works back to the main evidence storage room at GPD pending another long-term storage solution. [Recommendation No. 41.]
■ Ensure the Conex box is insulated, inspected regularly, has limited access, and video camera coverage. [Recommendation No. 42.]
72
■ Write a memo or report after a weapons destruction detailing all aspects of the process to include who authorized the firearm for destruction, who staged the item on the destruction list, who verified the items, who transported the firearms to the destruction site, and who witnessed and verified each individual firearm being destroyed. [Recommendation No. 43.]
■ Provide staff training to officers and Sergeants relative to identifying what property may be released in the field in lieu of booking in as evidence. [Recommendation No. 44.]
■ Take affirmative steps to dispose of unnecessary property and evidence, including the assignment of necessary staff to complete the work. [Recommendation No. 45.]
■ Upon completion of the purge of unnecessary property and evidence, conduct a thorough inventory of the remaining material. [Recommendation No. 46.]
73
SECTION 7. RECORDS Contrary to the common perception that functions performed in law enforcement records sections are as simple as filing reports and providing copies as needed, there is an exhaustive list of duties performed. Among the general duties performed daily are: reviewing and processing of incident reports; conducting criminal history checks; answering telephone calls related to the records operation; handling walk-in customers at the front desk; organizing and maintaining reports in various databases; uploading and maintaining digital photographs; maintaining records on incarcerated individuals; responding to document and/or photographic image requests from the public and law enforcement/criminal justice community; preparing and distributing reports for prosecutors and others; processing court subpoenas and services; maintaining information on local wanted/missing persons and property in local, state, and federal databases; monitoring and responding to requests received through the agency’s central email box; responding to requests for the release of various documents/tapes/photographs as required under the California Public Records Act; processing accounts payable; receiving and distributing incoming and outgoing mail; purging records as directed by the California archive retention guidelines; managing grants including compiling data and submitting periodic reports; ordering and maintaining department supplies for records-related duties; preparing statistical reports including those for the state of California and the FBI; and more.
The records function in the GPD is governed by policies 802 - Records, 803 – CLETS/NCIC/CJIS Confirmation, 806 – Records Maintenance and Release, and 808 – Protected Information, which together total 17 pages in length. The policies address the intake, storage, and release of records with appropriate citations regarding safeguarding of records and the California Public Records Act. CPSM reviewed the policies and found them to be comprehensive.
Additionally, the Records Section is in the process of creating a procedures manual to provide staff with step-by-step directions relative to the myriad number of functions performed. Such a manual helps to ensure that Records staff comply with legal mandates and department operating guidelines. Due to the existing workload, the manual is still in progress and has not yet been completed. Staff is to be commended for undertaking this effort.
The records management system (RMS) for the Greenfield PD is part of the TracNet public safety platform. With the exception of two agencies, all local law enforcement police departments and the sheriff’s office in Monterey County also use TracNet RMS, which helps to provide GPD with limited regional information. In most agencies, both CAD and RMS operate on the same platform, which helps to minimize the connectivity problems between the systems. However, the Monterey County Department of Emergency Communications (MCDEC) handles dispatching duties for GPD and operates on an unrelated CAD system developed by TriTech (which is now a part of a merged form known as Central Square Technologies). These systems, like any computer systems, require regular maintenance and programming updates. As there are currently two separate platforms involved, these updates at times result in a disruption of the integrity of the transfer of information. In such cases, vendors often place blame on the other party for any system failures.
While this issue is beyond the scope of our work, we must point out that staff does report that the system interoperability issue does result in a duplication of work when information must be reentered due to lack of interoperability where otherwise the data would transfer automatically from CAD to RMS. Furthermore, CPSM learned of a management issue wherein case numbers are not automatically generated for specific calls (such as mandated reporting of domestic
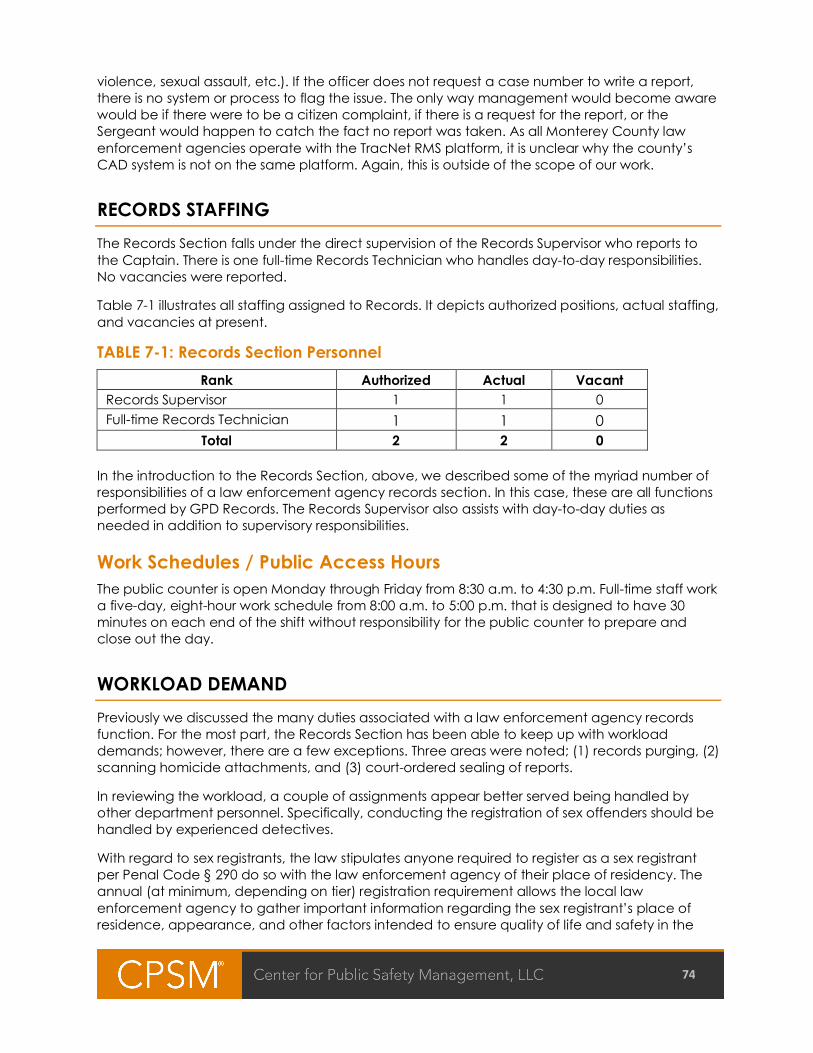
74
violence, sexual assault, etc.). If the officer does not request a case number to write a report, there is no system or process to flag the issue. The only way management would become aware would be if there were to be a citizen complaint, if there is a request for the report, or the Sergeant would happen to catch the fact no report was taken. As all Monterey County law enforcement agencies operate with the TracNet RMS platform, it is unclear why the county’s CAD system is not on the same platform. Again, this is outside of the scope of our work.
RECORDS STAFFING The Records Section falls under the direct supervision of the Records Supervisor who reports to the Captain. There is one full-time Records Technician who handles day-to-day responsibilities. No vacancies were reported.
Table 7-1 illustrates all staffing assigned to Records. It depicts authorized positions, actual staffing, and vacancies at present.
TABLE 7-1: Records Section Personnel Rank Authorized Actual Vacant
Records Supervisor 1 1 0 Full-time Records Technician 1 1 0
Total 2 2 0 In the introduction to the Records Section, above, we described some of the myriad number of responsibilities of a law enforcement agency records section. In this case, these are all functions performed by GPD Records. The Records Supervisor also assists with day-to-day duties as needed in addition to supervisory responsibilities.
Work Schedules / Public Access Hours The public counter is open Monday through Friday from 8:30 a.m. to 4:30 p.m. Full-time staff work a five-day, eight-hour work schedule from 8:00 a.m. to 5:00 p.m. that is designed to have 30 minutes on each end of the shift without responsibility for the public counter to prepare and close out the day.
WORKLOAD DEMAND Previously we discussed the many duties associated with a law enforcement agency records function. For the most part, the Records Section has been able to keep up with workload demands; however, there are a few exceptions. Three areas were noted; (1) records purging, (2) scanning homicide attachments, and (3) court-ordered sealing of reports.
In reviewing the workload, a couple of assignments appear better served being handled by other department personnel. Specifically, conducting the registration of sex offenders should be handled by experienced detectives.
With regard to sex registrants, the law stipulates anyone required to register as a sex registrant per Penal Code § 290 do so with the law enforcement agency of their place of residency. The annual (at minimum, depending on tier) registration requirement allows the local law enforcement agency to gather important information regarding the sex registrant’s place of residence, appearance, and other factors intended to ensure quality of life and safety in the
75
city where they live. Currently, the Records Supervisor and Records Technician are tasked with completing the registration process. This is problematic in two areas: (1) a Records Supervisor/Technician may lack the experience to address potential areas for concern regarding a sex registrant, and (2) potential intelligence regarding criminal behavior could be missed. Policy § 356 Registered Offender Information recommends “an investigator assigned to related investigations should conduct the registration in order to best evaluate any threat the person may pose to the community.” An experienced law enforcement professional responsible for these types of crimes is better suited to register and interview registered sex offenders. CPSM learned that a patrol Sergeant was recently assigned this responsibility in addition to registering gang and arson registrants, tasks that Records staff were also conducting. GPD is commended for recognizing this area of misalignment and reassigning the responsibilities.
The Records Supervisor has assisted with back-up duties to the Evidence Technician in the past; however, she has not received any training for the duties and responsibilities. Although her involvement is minimal as another staff member currently handles the back-up Evidence Technician duties, it is overly burdensome to assign these duties to the Records Supervisor in light of responsibilities for critical reporting duties and records oversight.
There are a variety of state and federal mandates regarding the reporting of crime and other police department-related issues. These include FBI Uniform Crime Reports/National Incident Based Reporting System, which we will address in more detail later in this section. Data for these reports must be delivered to the State of California for processing prior to submittal to the FBI. These are time bounded reports. The department reports that, due to overall workload, it is routinely late in submitting these reports.
Records reports being behind on the coding of reports. Coding is used for classification of crimes and clearance rates. Both the classification of crime and accurate reporting of clearances is strictly regulated by the FBI. It is a complex and time-consuming process that involves detailed review of crime reports. Delays in coding have an impact on the reported lack of timeliness in submitting the required reports as noted above.
Currently, each officer is responsible for including the category and classification on the report taken. Upon review and approval, the officer’s respective Sergeant is responsible for ensuring the accuracy of the coding: category and classification. At the beginning of each month, the Records Supervisor pulls the prior month’s crime reports and reviews the accuracy of classification of crimes. There are two scenarios that delay the ability to complete the mandated monthly FBI UCR report: reports have not yet been submitted by officers and/or the coding is incorrect. Once all reports are accounted for, the Records Supervisor checks each report for the proper coding. However, frequently the coding is erroneous and is sent back to the officer and Sergeant for correction. The process is laborious and CPSM recommends authorizing the Records Supervisor to correct the coding error and then forward the correction to the officer and Sergeant for training on the error.
One option that could aid Records to “catch up” and remain timely in completing purging records, scanning reports, and sealing cases includes the use of volunteers to supplement the workforce. As Greenfield facilitates an annual Citizens Police Academy, this creates a pool of potential volunteers. Use of volunteers not only provides a valuable resource to manage workload, but also facilitates the building of relationships between the department and the community. Such volunteers invariably become community advocates for the department.
Volunteers can be helpful with some of the workload that is disruptive to Records Section staff. This includes answering incoming calls that often must be transferred to personnel outside of Records, and welcoming and directing walk-in traffic. While both are disruptive to the work
76
efforts of Records Section staff, they require minimal training to prepare a volunteer to handle the duties and free up valuable time for paid staff.
Records accepts cash payments from the public for copies of police reports, vehicle releases, citation sign-offs, and other fees. Although there is one internal video camera pointed at the front lobby window of GPD, it does not capture the detail of money exchange between the community member and Records staff member and neither of the two registers used by each Records staff member are included in the video frame. Each Records staff member has their own assigned register and the registers are reconciled the following morning for the prior day’s work; however, there is no witnessing staff member to observe the balancing of the registers. The handling of cash by staff is a concern to CPSM. Cash transactions present an unnecessary risk to the city and the department. Many examples can be cited in other law enforcement agencies where easy access to cash created an opportunity for staff theft to occur. CPSM does not imply that suspicious activity has occurred at the GPD; however, CPSM does maintain that the current system presents an unnecessary risk and should be changed.
Due to the close proximity to City Hall in the same lobby, CPSM recommends all payments for services be routed through the City Hall Finance Department. Members of the public could either (1) come to the GPD lobby window and receive a document listing the services and fees and take that document to Finance to submit payment, have the GPD document date/time stamped PAID by City Hall, and return to GPD for the requested documents, or (2) a predefined list of fees could be provided to Finance for the public to start the process at Finance then proceed to GPD with the receipt for paid documents. In either event, CPSM strongly discourages the policy of accepting payments for services at GPD.
In 2007, GPD transitioned to TracNet for its RMS, including police reports being handled electronically. Major cases such as homicide cases are still maintained as hard copies and filed in shelves in a separate secure room across the hall from the Records Section. There are some cases prior to 2007 that are still maintained in hard copy format as well as a few years of hard copies when GPD was transitioning to paperless report writing. There is no public access to these files. The records storage area is accessible by a door key and restricted to department executive staff and records members.
FBI UCR/NIBRS Reporting Virtually all law enforcement agencies provide statistical data to the FBI on crime rates and clearances. At present, the traditional Uniform Crime Report (UCR) remains the most common reporting methodology. However, over the past several years, the FBI has encouraged agencies to report under an updated, more detailed, reporting methodology, the National Incident Based Reporting System (NIBRS). At present, about 40 percent of agencies nationally have converted to, or are in the process of using the NIBRS reporting criteria. Greenfield is one such agency that has not yet converted to reporting using NIBRS criteria. GPD is aware of the need to transition to NIBRS and the vendor for TracNet is currently in the process of creating an update to the software for agencies using TracNet to report with NIBRS.
Essentially, under UCR criteria, an incident of crime was reported as a single crime, even in the event of multiple offenses within that one incident. The reported offense was that which was the most serious of the crimes from that single incident. For instance, an armed robbery that included an aggravated assault was reported as one incident, an armed robbery. Under NIBRS, that incident would be reported as two separate offenses, an armed robbery and an aggravated assault. Therefore, in this example, the NIBRS methodology results in more reported crimes, even though no increase in crime incidents has occurred. This has caused the perception in some communities that crime is spiking when, in actuality, no change other than
77
reporting criteria has occurred. For purposes of consistency, CPSM utilizes UCR comparisons in our data analysis to ensure an apples-to-apples comparison.
At the Greenfield Police Department, as previously described, the responsibility for reporting crime rates rests with the Records Section. While this would seem to be a simple, straightforward task, it is anything but. To ensure consistency in reporting, the FBI has issued strict and detailed guidelines regarding classification and crime clearance criteria (coding). Among the important aspects of such reporting is to enable the reporting agency to effectively measure its crime-fighting and solvability rates against other communities. This information is not to be used to grade an agency against any other agency, but rather, to be used as a tool to better identify crime-fighting strategies and measure the effectiveness of the department and its investigators in solving crime. Should the department have low solvability (clearance) rates, or extraordinarily high rates, examination of the reasons should be undertaken. It may suggest a performance anomaly, or, it may stem from improper coding.
While preventing crime is of utmost importance to law enforcement agencies, solving crime should also have parity. The solving of crimes, which results in the prosecution of offenders, not only prevents future crime, it also provides much-needed closure to crime victims. Clearance rates, as defined and measured by the FBI, are the benchmark for a department’s effectiveness in solving crime.
The FBI establishes a three-pronged rule, each of which must be met to clear a case. For FBI reporting purposes, a crime is considered cleared when: (1) a law enforcement agency has arrested the offender; (2) the offender has been charged with the offense; AND (3) the offender is turned over to the court for prosecution (whether following arrest, court summons, or police notice). The arrest of one person may clear several crimes or the arrest of several persons may clear only one crime. There are clearances via exceptional means as well, but the exceptions are extremely limited and result in numbers that are not statistically sufficient to warrant consideration for our purposes here. Examples include the death of an offender or the lack of an extradition treaty with a foreign government in a nation to which the offender has fled.
CPSM discussed with various staff the reporting practices (coding) and found there to be a lack of awareness as to the clearance criteria established by the FBI UCR. This is inadvertent, and results from a lack of training on this matter. As well, it is important to note that such a lack of familiarity and adherence to FBI guidelines is somewhat commonplace in many agencies. Nonetheless, as was described, solving of crimes both prevents future crime and provides closure for victims. Therefore, accurate reporting is important not just for FBI UCR purposes, but for use by the department in measuring the effectiveness of its staff and for the peace of mind for crime victims. CPSM learned that Records staff pulls data from TracNet RMS to gather clearance information. The information is generated from reports approved by GPD Sergeants who use a dropdown menu in the TracNet management portion while reviewing reports. The menu offers two options out of the six under UCR clearance coding that would count as a clearance: “Adult – Arrest” and “Juvenile – Arrest” that the sergeant would check if an adult/juvenile suspect is “arrested, charged and sent to DA.” In essence these boxes would be checked upon the arrest stage of the case and do not necessarily mean the suspect was actually charged and/or turned over to the court for prosecution—the other two prongs required for the case to be cleared. Subsequently, the manner in which the TracNet system has been designed is not consistent with the requirements for clearances and this system can result in reporting inaccurate clearance information for FBI UCR purposes.
CPSM recommends that training be provided to appropriate staff and to ensure the correct criteria is adhered to in reporting of crime and clearances. Additionally, the TracNet vendor should update the software to comply with the three-pronged rule for clearances. Based upon
78
the complexity of coding criteria, coding should be the responsibility of a limited number of staff, not to exceed two. The Records Supervisor should also have the authority to correct errors and notify the respective Sergeant rather than forwarding the erroneous reports to be corrected and returned, a timely process.
RECORDS STAFFING RECOMMENDATIONS Recently, the Monterey County Sheriff’s Office (MCSO) advised all regional agencies that records functions during normal business hours would no longer be provided effective the end of the year. These services include records checks including wants and warrants, entering stolen vehicle information, updating missing persons information, and other critical records functions. These responsibilities will fall back onto the respective agency and create a need for additional staff to handle these requests.
Responsibilities for records sections can vary widely among agencies. In some, Records staff are responsible for transcribing crime reports dictated by officers/detectives, others do not, some register sex offenders and narcotic registrants, and again, others do not. As the functions performed by law enforcement records sections vary greatly from agency to agency, there is no universally accepted formula for establishing a department’s staffing level. Therefore, CPSM draws upon our experience in both leading law enforcement agencies and our work across the nation in conducting studies such as this to provide the opinion that, with anticipated changes from MCSO and growing needs within the GPD, the present staffing level will be inadequate.
In light of the backlog of records responsibilities (records purging, homicide scanning, and records sealing), a need for a back-up evidence technician, and the additional workload from records requests during business hours, CPSM recommends adding one FTE Records Technician to handle these duties. Although one Records Technician will not be able to cover seven after-hours work days, GPD may consider partnering with another local agency to assist in covering records needs seven days a week for the combined agencies’ records requests that will no longer be handled by MCSO.
With the other recommendations offered, this should provide sufficient staffing to allow the Records Section to more effectively and efficiently handle workload demands while providing the additional services required.
Records Recommendations: ■ Authorize the Records Supervisor to correct the coding errors and forward the correction to
the officer and Sergeant for training purposes. [Recommendation No. 47.] ■ Expand the use of citizen volunteers to handle workload related to incoming phone calls and/
or walk-in traffic. [Recommendation No. 48.] ■ Discontinue acceptance of payment at the police department and route all payments for
services through the City Hall Finance Department. [Recommendation No. 49.] ■ Provide training to appropriate staff to ensure the correct criteria is adhered to in reporting of
crime and clearances. [Recommendation No. 50.] ■ Direct the TracNet vendor to update the software to comply with the FBI UCR three-pronged
rule for clearances. [Recommendation No. 51.] ■ Add one FTE Records Technician to handle backlogged purging, scanning of homicide
records, sealing of records, records requests, and back-up evidence technician duties. [Recommendation No. 52.]
79
SECTION 8. ADMINISTRATIVE FUNCTIONS EMPLOYMENT SERVICES
Recruitment The law enforcement profession always faces the challenge of renewing its ranks. For nearly every agency, this is an ongoing effort. However, for some time and especially more recently, finding qualified applicants who have the desire and ability to meet the selection process and academy training requirements has become an even more challenging proposition, adding to a growing shortage of law enforcement officers nationwide.
GPD does not have an active recruitment program. The recruiting responsibilities currently fall to the Captain with a patrol Sergeant assisting with recruitment as a collateral duty. Recently, the Captain and Sergeant reviewed all candidates who had previously expressed an interest and hired one academy trainee who is scheduled to graduate in December. A recruiting banner was placed near the front of the police station and recruitment ads were added to the city website. Early this year, two academy trainees successfully completed the academy and are currently being trained in the Field Training Officer (FTO) Program. Two officers are scheduled to be hired by the end of the year: a lateral police officer and an entry level officer who will be starting the police academy. Subsequently, all vacant police officer positions will be filled by the end of 2018. Given the history of vacancies at the position of police officer and its negative impact, consideration should be given to authorizing one additional temporary police officer position, thus allowing for the department to process applicants in anticipation of vacancies and reduce the amount of time a position remains vacant during employment processing and training.
GPD does not maintain an active recruiting program or do any formal recruiting. When GPD has an opening that it is authorized to fill, the position is advertised with the banner outside the police department, on the city website and through social media. Although there are no current openings, CPSM recommends seeking sworn and civilian staff to represent the agency as a recruitment team at job fairs and other recruitment opportunities as needed. By involving other members of the department in the recruitment process, a sense of duty and pride can assist in recruiting qualified candidates.
Pre-employment Investigations The pre-employment background investigation is one of the most important investigations a law enforcement agency will ever conduct. The investigations must be very comprehensive if they are to lead to informed hiring decisions. They must assure compliance with all applicable minimum standards for appointment and screen out candidates who are found unsuitable for the position, based on relevant information and their past history. Background investigations are also among the most challenging investigations to conduct. The manner in which background investigations are conducted, from areas investigated to the evaluation of resulting information, must be treated consistently across all candidates.
GPD’s backgrounds are conducted by one of two outside vendors who submit the completed investigations to the Captain. Training and experience are essential for a position as critical as background investigator for a law enforcement organization. Conducting thorough investigations to identify the best candidates for police work is critically important and requires
80
consistency and expertise. Due to the number of collateral duties and responsibilities of the patrol Sergeants, the background investigations are handled by outside background investigators experienced in conducting law enforcement background investigations. Many agencies of similar size rely on experienced investigators to assist with this process for timeliness, thoroughness, and cost savings.
Employment Services Recommendations: ■ Create a recruitment team of sworn and civilian staff to be used as needed.
[Recommendation No. 53.]
TRAINING Training is one of the most important functions in a police department. Effective training is critical in providing essential information and minimizing risk and liability. The outcome of effective training can be measured in part by such measures as a high level of proactive policing and low level of citizen complaints, low numbers of claims or lawsuits, high citizen satisfaction with the police, well-written and investigated reports, safe driving records, and appropriate implementation and documentation of use-of-force incidents.
Greenfield PD training Section is handled as an ancillary duty by a patrol Sergeant who serves as the department’s Training Sergeant and reports to the Captain. The Training Sergeant recently attended the POST Training Manager’s course in the beginning of 2018. The Training Sergeant uses other department members to handle in-house training for firearms, Taser, and crisis intervention training (CIT). All other POST-mandated training is handled through outside trainers. The in-house firearms instructor also serves as the department’s armorer and oversees firearms qualifications for all sworn staff. The firearms instructor/armorer is responsible for maintaining firearms and equipment in the department armory.
Staff indicated each officer or staff member and their respective supervisor assists in identifying required courses for specified assignments. The logistical arrangements for training and processing of reimbursements is handled by the Chief’s Administrative Assistant. Ensuring that training file systems, POST, EDI, and the department’s training manager system (TMS) are updated is the responsibility of the Training Sergeant.
The California Commission on Peace Officer Standards and Training (POST) was created in 1959 to establish standards and provide training to criminal justice professionals, including peace officers and law enforcement staff. POST also conducts annual compliance reviews at California law enforcement agencies to ensure that every local officer has consistent and high-quality training and that departments are compliant with POST regulations. A review of the last POST compliance check in April 2017 indicated compliance with the agency roster and training standards; however, three background files were incomplete. Staff is aware of this and understands these issues need to be resolved in order to become POST-compliant prior to the next annual POST audit.
The training policy for GPD is outlined in Policy § 208, revised as of November 2014. The purpose of the policy is to administer a training program that will provide for the professional growth and continued development of department personnel. The goal of the training program is to ensure GPD personnel possess the knowledge and skills necessary to provide a professional level of service that meets the needs of the community. Training is provided within the confines of funding, requirements of a given assignment, staffing levels, and legal mandates. Whenever possible, the department uses courses certified by POST.
81
Department training is tracked by utilizing a spreadsheet for firearms, Taser and CIT training. CPSM learned that GPD is in the final stages of customizing a recently purchased software system to handle tracking of all training including the Field Training Officer (FTO) Program, department training, outside training, and risk areas such as complaints and internal affairs. The system is slated to be implemented by the end of 2018 and will document the total training hours each employee receives in a particular calendar year and the details of each course attended.
To comply with the state mandate of 24 hours of in-service training for peace officers, GPD provides the required training in both mandated topics and optional courses relevant to current critical issues and/or identified department training needs. These training topics include department use of force and deadly force policies, including less-than-lethal weapons, firearms training/qualifications, crisis intervention, de-escalation, active shooter response, EVOC, first-aid/CPR, and defensive tactics.
Existing policy requires a training plan for all employees be developed and maintained, and that this plan be reviewed and updated on an annual basis. Policy also requires an annual training-needs assessment of the department be conducted. CPSM was advised the training plan and assessment are not currently conducted or documented. GPD does not maintain a two-year training calendar or training matrix. However, doing so would assist the department in developing a comprehensive training plan that is especially helpful with a relatively young department that will require more training. Preparing a calendar from this plan would ensure necessary and appropriate cyclical training is provided. CPSM recommends a training needs assessment and subsequent training plan be developed for the next two-year cycle. In addition, CPSM recommends a training matrix for each position in the department be created to establish required training and recommended training per position.
All GPD personnel who carry a firearm while on duty are required by Policy § 312 to successfully complete training quarterly with their duty firearms. In addition to quarterly training, all members will qualify at least annually with their duty firearms. Members will qualify with off-duty and secondary firearms at least twice a year. Training and qualifications must be on an approved range course. At least annually, all members carrying a firearm should receive practical training designed to simulate field situations including low-light shooting. A review of the most recent annual firearms qualification showed two sworn members were on vacation. There was no documentation indicating the officers had since qualified. With regard to off-duty and secondary weapons, there is no form or documentation indicating qualification per policy. Rather, there were three officers’ names written on a sheet of paper with the firearms make, model, caliber, and serial number. CPSM recommends the Training Sergeant or firearms instructor (1) conduct an audit of all sworn personnel to inquire about off-duty and secondary firearms to ensure they are compliant with policy and have recently qualified, and (2) document this required training in a retrievable format. Once the new training software is implemented, it will be important that historical training data in critical areas such as firearms, use of force, first aid, CIT, EVOC, etc. be uploaded.
Sergeants’ Training New GPD sergeants are trained in a ride-along setting with an experienced sergeant and this training is documented in a sign-off binder for important areas such as handling critical incidents, citizen complaints, and workers’ compensation, etc. The transition from line officer to supervisor is an important and sometimes difficult transition. Departmental guidance and encouragement is important to the development of a new supervisor. CPSM recommends GPD develop a formal
82
sergeants’ training program in addition to the POST supervisor school. The format could be adapted from another agency’s training to fit Greenfield’s protocol and philosophy.
Due to the number of ancillary duties, the sergeants’ training could also include a portion of time handling administrative supervisory duties with mentorship by the Captain. The informal “ride-along” with an experienced sergeant is prone to overlook what a systematic and carefully construed training format delivers. This provides an excellent foundation for the supervisor as he or she begins a new role in the organization. Leadership is an ongoing learning experience and with the number of new supervisors and managers in the department, it would be beneficial to them to attend ongoing leadership training through POST, the California Police Officers Association, and other presenters. To maximize savings, the department could also sponsor leadership training at GPD and invite other agency supervisors and managers to attend for a cost that would offset the cost of the training for GPD personnel.
Roll Call Training There is a training binder in the sergeants’ office to log any briefing topics addressed by supervisors at roll call, although the practice is not consistently used. Upon review, CPSM observed the training topic, who was present, and notes on the points covered in training; however, there were gaps in training dates. GPD also utilizes the Daily Training Bulletins (DTBs) provided through the department’s policy vendor, Lexipol, to review critical policies such as use of force, pursuits, etc. CPSM learned employees are responsible for reviewing the DTBs; however, audits are not routinely performed to ensure this is occurring. CPSM recommends the Training Sergeant conduct an audit of the DTB system and ensure DTBs are being disseminated, as well as audit those employees who have not completed their DTB training and forward those names to their respective supervisor (sworn and civilian) for follow up to ensure the training is occurring.
In speaking with a number of staff members, we found that there is no structured training for roll call. That is, a training plan that calls for all patrol officers to receive the same information, regardless of which shift they are assigned to. This may include California Peace Officers Standards and Training (POST) training videos and/or review of critical policies (DTBs) where applicable training may meet some POST Continued Professional Training (CPT) requirements. Regardless of the source, the training should be standardized and recorded in department training records as called for in Policy § 404.3. At this point in time, this does not occur, and should be addressed.
Entry-level/Sworn Training In July 2016, the U.S. Department of Justices’ Bureau of Justice Statistics published a 2013 survey of state and local training academies. The average length of a basic law enforcement training program in a training academy (not including field training) was 840 hours or 21 weeks. Academies operated by state POST agencies averaged 650 hours.
California POST establishes certification and training standards for peace officers in the state of California. GPD uses the South Bay Regional Public Safety Training Academy where individuals seeking employment as a peace officer must complete 888 hours of basic training (24 weeks). Applicants seeking employment with the GPD who do not possess their POST certification attend the academy prior to entering the Field Training Officer (FTO) program.
CPSM learned that in 2016 and 2017, GPD had two recruits attend the academy, one each year with only one successfully graduating in 2016. In 2018, two recruits successfully completed the academy and are currently in the FTO program. Another entry level recruit is scheduled to start the academy in December 2018. Upon graduation from the academy, the new officer obtains
83
a POST academy certification and starts the 12-month probationary training, which consists of in-house training and field training. CPSM learned that Policy § 1002.4, Full-Time Probationary Personnel, indicates an 18-month probationary period. CPSM recommends this discrepancy be corrected in the policy to mirror the current MOU between the City of Greenfield and Greenfield Police Officers’ Association Article X, Section C – Probationary Period of 12 months.
Probationary officers attend a 40-hour in-house training that covers GPD policies, tactics, and City of Greenfield rules and regulations prior to starting the FTO program. Once in-house training is successfully completed, the trainee begins the probationary16-week FTO program consisting of four training phases. The first three training phases consist of four weeks in each phase with a certified Field Training Officer (FTO) who teaches, supervises, and evaluates the probationary officer’s performance. Evaluations are provided daily, weekly, and monthly. The probationary officer is assigned to a different FTO for each training phase. The final/fourth training phase consisting of two to three weeks is the shadow phase where the probationary officer demonstrates proficiency in working as a solo officer. The four training phases account for over 700 hours of supervised field training. With the 40-hour in house training, the probationary officer receives nearly 800 hours post-academy training prior to operating as a solo officer. CPSM reviewed the FTO manual and found it to be the template used by POST. CPSM learned the template is in the process of being updated by the training software company to align with GPD practices. The FTO program currently has four certified FTOs; one officer is assigned as the School Resource Officer and does not typically train due to his assignment. The GPD’s entry-level training program meets California POST standards. Over the past three years, a total of 17 trainees were trained in the FTO program and 13 officers completed the program successfully.
Training Recommendations: ■ Conduct a training needs assessment and develop a two-year training plan to ensure
necessary and appropriate cyclical training is provided. [Recommendation No. 54.]
■ Develop a department training matrix for every position within the department noting required and recommended training. [Recommendation No. 55.]
■ Conduct an audit of all sworn personnel to inquire about off-duty and secondary firearms and document all weapons, ensure they are compliant with policy, and that personnel have recently qualified. Document the firearms training and ensure it is uploaded in the new training software when it is implemented. [Recommendation No. 56.]
■ Develop a formal supervisor training program to assist GPD personnel with this important transition. [Recommendation No. 57.]
■ Train sergeants on how to conduct the late/incomplete data search in TracNet for mandated follow-up investigations such as missing persons. [Recommendation No. 58.]
■ Conduct an audit of the DTB system and ensure DTBs are being disseminated and also conduct a monthly audit of the DTB system and forward the delinquent employees’ names to their respective supervisor (sworn and civilian) for follow-up to ensure training on policies is occurring. [Recommendation No. 59.]
■ Training should be standardized and recorded in department training records as called for in Policy § 404.3. [Recommendation No. 60.]
■ Correct the discrepancy in Policy § 1002.4 to indicate a 12-month probationary period as stated in the MOU. [Recommendation No. 61.]
84
■ The upcoming management software package should include the ability to track, audit, and manage training and pending/mandated training for all employees, including notifications when an employee is nearing compliance issues. [Recommendation No. 62.]
PERSONNEL INVESTIGATIONS / PUBLIC COMPLAINTS Public trust is vital to the law enforcement mission, and this trust rests on departmental responsiveness to community needs and expectations. The department must receive commendations and complaints with equal professional interest and courtesy, and give both appropriate supervisory and management attention to foster public confidence and to promote constructive communication.
Personnel complaints consist of any allegation of misconduct or improper job performance against any department employee that, if true, would constitute a violation of department policy, or federal, state, or local law. Greenfield PD protocols for reporting and investigating public complaints and employee misconduct are established in Policy 340, Disciplinary Policy, and Policy 1019, Personnel Complaint Procedure, and in the City of Greenfield Personnel Rules and Regulations procedures set forth in Rules 11, 12, and 13. GPD management said ten administrative investigations were conducted over the last three years; two in 2015, none in 2016, and eight in 2017. Regarding the absence of complaints in 2016, CPSM learned that an unknown number of informal complaints were addressed by supervisors.
In practice, the informal complaint resolution method is employed most often by GPD and is generally not documented. The practice of informally resolving complaints from the public is appropriate. It is beneficial for police supervisors to personally meet with complainants both to be more informed about facts surrounding an incident and to explain an officer’s conduct. Many times, complainants are satisfied with this and choose not to file a formal complaint. Other times, supervisors may elicit more information that was omitted from a complaint form, forming the basis for a more thorough investigation. Those complaints determined to be more egregious may become formal investigations as deemed necessary by the Captain. In any case, when a member of the public submits a complaint, whether resolved formally or informally, it should be documented, retained, and tracked for statistical purposes. The data will be needed to complete the annual Citizen Complaint report submitted to the California Department of Justice. CPSM recommends all supervisors receive training on the complaint process and the need to document citizen complaints.
Data regarding administrative investigations and public complaints are valuable as a risk management tool to identify training needs, performance deficiencies, or patterns of misconduct. GPD does not maintain statistics in writing or digitally on complaints or administrative investigations whether by number, type, names of involved parties, findings, or discipline. Currently, GPD retains completed administrative investigations and public complaint files in the Captain’s office for an indeterminate period of time. The actual number of these activities is specifically known only to the Captain. CPSM recommends internal affairs files be organized and available to the management team. Summary reports for risk management purposes do not exist. These data, even if numbers are small, are important for the department management team to be aware of on an ongoing basis. GPD does not currently have a software system to track these administrative activities and is in the final phase of implementing one at the end of the year to track internal affairs, use of force, and pursuits. Once online, early identification and intervention features should be part of the software and shared with supervisory staff to provide proper training and oversight of personnel.
85
Personnel complaint forms are available in English and Spanish at the station’s front counter and are provided to the public upon request. They are also openly available, along with other forms, in the main lobby. Per Policy § 1019.4.1, Personnel Complaint Forms, citizen’s complaint forms should be accessible through the department website. GPD staff is aware that the form is not yet on line and is in the process of making it available electronically. This will promote transparency of the department’s actions. The public should not have to ask station staff for a complaint form or respond to the station to lodge a complaint.
While it is important that the public can easily report suspected misconduct, the GPD should also consider making it easy for the public to commend officers and staff for excellent work. CPSM recommends that the GPD make both personnel complaint and commendation forms readily accessible in print and electronically.
A review of personnel investigations for the past few years revealed the data shown in Table 8-1.
TABLE 8-1: Personnel Investigations 2015-2017
Year Citizen Complaint Internal
Investigation Total
DOJ Reported Citizen
Complaints 2015 0 2 2 0 2016 0 0 0 0 2017 4 4 8 14
2018 YTD 7 2 9 N/A The spreadsheets provided indicated there was no systematic way to determine whether the complaint was generated internally or by citizens. A number of agencies use an alpha identifier to more easily decipher the type of personnel investigation. For instance, using “IA” (internal affairs) or “CC” (citizen complaint) prior to the year and case number are standard ways to categorize these types of personnel investigations. CPSM noted the disposition listed in the spreadsheet was not in keeping with acceptable options as listed in Policy § 1019.6.4: unfounded, exonerated, sustained, or not sustained. Instead, there were administrative reviews that may have been summarily closed without an initial investigation. Although these instances were rare, it is apparent training in this area is lacking. In speaking with staff, we determined it would be beneficial to have all supervisors attend the Internal Affairs course as part of the sergeant’s training. (The internal affairs training would be a required training in GPD’s future training matrix for sergeant). This would not only teach them about the internal affairs processes, but also make them aware of procedural aspects that if violated may place the city or sergeant at risk of liability exposure. CPSM recommends both the categorization of complaints and dispositions are areas that will need to be included in the implementation of the new software system.
CPSM noted a discrepancy with the number of citizen complaints reported to the Department of Justice and the number listed on file in 2017. Staff indicated the number (14) for the report was provided by a prior administrator and the data to reconcile the numbers was unable to be located. This underscores the importance of implementing risk management software that is not only searchable, but also retains data for future reporting needs.
Moving forward, staff is aware of the importance of properly documenting and investigating personnel complaints, as demonstrated by the number of personnel investigations for the current year. Aside from the reporting anomaly in 2017, the number of investigations is consistent with an agency of this size.
86
Under the new administration, significant personnel investigations regardless of being initiated by a citizen complaint or internally are handled by an outside investigative firm experienced in law enforcement investigations. Taking this approach will assist in more timely investigations and is a consistent practice by agencies of similar size. The executive team is to be commended for this approach as it demonstrates a commitment to fairness, impartiality, and transparency that will foster greater public trust.
Once the new electronic tracking system is in place, CPSM recommends quarterly audit reports be conducted and discussed with supervisors on areas of risk and training they can focus on for improved department operations and levels of service.
Personnel Investigation Recommendations: ■ All supervisors should receive training on the complaint process and need to document citizen
complaints. [Recommendation No. 63.]
■ When implementing the upcoming administrative investigation and public complaint tracking system, early identification and intervention features should be included so as to provide a valuable risk management tool. [Recommendation No. 64.]
■ Make the citizen complaint form and employee commendation form available online. [Recommendation No. 65.]
■ Create categorization of complaints and dispositions to be included in the implementation of the new software system. [Recommendation No. 66.]
■ Appropriate management reports should be produced on an ongoing basis. [Recommendation No. 67.]
■ Related personnel records should be maintained in appropriate files whose location is known by the management team. [Recommendation No. 68.]
USE OF FORCE Enforcement of federal, state, and local laws is a core, though highly complex duty of law enforcement and the Greenfield Police Department. The necessary and appropriate use of force in carrying out these duties, up to and including the taking of a human life, is among the most complex and critiqued actions of law enforcement. With respect to the use of deadly force, no other responsibility of the city or department has more importance.
It is the responsibility of the City of Greenfield to ensure its officers are adequately trained and equipped to reasonably and appropriately use force. At no time in the past has force been looked at, examined, and judged as it is today. With the ease with which people are recording officers in the performance of their duties, including their use of force, it is essential and critical that a department have and follow a comprehensive policy on the use of force. It must dictate comprehensive training, appropriate supervision, detailed reporting, in-depth review, and critical analysis of force incidents.
Use of force by GPD personnel is governed by Policy § 300, Use of Force. The policy provides guidelines on the determination and application of reasonable force. The policy directs each member of the department to use the policy guidelines to determine the appropriate amount of force in a professional, impartial, and reasonable manner, while recognizing and respecting the value of all human life and dignity without prejudice to anyone.
87
The policy defines two types of force:
■ Deadly Force - Force reasonably anticipated and intended to create a substantial likelihood of causing death or very serious injury.
■ Force - The application of physical techniques or tactics, chemical agents or weapons to another person. It is not a use of force when a person allows him/herself to be searched, escorted, handcuffed, or restrained.
The GPD policy provides a discussion of reasonableness. It emphasizes that reviewers of force used by officers must judge it from the perspective of the officer on the scene at the time of the incident, allowing for the fact that officers are often forced to make split-second decisions about the amount of force that was reasonably necessary.
Policy requires any use of force by GPD personnel be documented promptly, completely, and accurately in an appropriate report, depending on the nature of the incident. The officer has to articulate the factors perceived and why he/she believed the use of force was reasonable under the circumstances. Supervisory notification is required as soon as practicable following the application of force.
GPD policy requires any officer present and observing another officer using force that is clearly beyond that which is objectively reasonable under the circumstances shall, when in a position to do so, intercede to prevent the use of unreasonable force. The observing officer must promptly report these observations to a supervisor.
Policy directs that when a supervisor is able to respond to an incident in which there has been a reported application of force, the supervisor is to obtain the basic facts, identify witnesses, and photograph injured parties. The supervisor investigating the use of force is required to evaluate the circumstances surrounding the incident and initiate an administrative investigation if there is a question of policy noncompliance or if for any reason further investigation may be appropriate. In the event that a supervisor is unable to respond to the scene of an incident involving the reported application of force, the supervisor is still expected to complete as many of the above items as circumstances permit.
GPD policy does not require supervisors to conduct an administrative investigation unless there is a question of policy non-compliance or if for any reason further investigation may be appropriate. CPSM learned that supervisors are expected to prepare a “Use of Force Report – Supervisor Review,” which is subsequently reviewed by the Captain and Chief of Police. GPD is in the process of reviewing and updating the use of force policy and the Captain recently instructed the sergeants about his expectations for their role to be more proactive in handling these types of incidents. CPSM recommends that a memorandum be generated to clarify specific supervisory responsibilities at use of force incidents until the current policy is updated.
The policy directs that at least annually, the Patrol Division Commander should prepare a force analysis report on use of force incidents which is to be submitted to the Chief of Police. The report should identify force trends and recommendations for training, equipment, and policy revisions. CPSM was advised this force analysis has not been prepared in years. The new administration is currently establishing systems and processes as described above and will be initiating reviews.
The force policy as written lacks any language requiring that each use of force by GPD officers be reviewed by department management. As noted, although the policy requires a supervisor to take certain actions when advised of a use of force, policy and practice do not require any documentation of these actions or of the subsequent information obtained or observations
88
made. CPSM was advised that no documentation of a force incident is prepared or maintained other than that of the officer(s) using force. In practice, CPSM was advised that all written reports containing a reporting of the use of force by an officer are reviewed by the Captain. However, the policy lacks any directives requiring the documentation of this review by the Captain or that assessment of the force be documented by the Captain, nor that any documentation be retained with the original police report containing the force reporting. Also, the policy contains no provisions for tracking use of force incidents collectively or individually, nor is the production of any management reports mandated. GPD management had no method of providing CPSM with use of force review results or department or individual statistics in any manner, and could only estimate how many use of force incidents had occurred in the last few years.
The current policy should be revised to include, at a minimum: detailed direction regarding officer reporting of the use of force to include the tactics leading up to the use of force, the actions of the suspect necessitating the use of force, and the specific force used in response to the suspect's actions; directing witnessing officers to verbally report and document their observations of a use of force in appropriate reports; supervisory investigation and evaluation of the use of force as required in current policy to include timely interviewing of all civilian witnesses to the use of force and making a video recording of their statements; collecting all available evidence, including available video recordings (officer and other) with a possible view of the incident; interviewing medical staff for their opinion as to the consistency of the injury to the type and degree of force reported; photographing the scene and injuries of officers and involved parties; documentation of such investigation as a separate document from the incident report; evaluation and documentation of the circumstances of the use of force by management; and the required retention of the investigation, evaluation, and related documents in a separate administrative use of force file. The tracking of the department’s use of force both individually and collectively, and the production of periodic management reports, must also be included in the policy revision.
A thorough, objective, and fair investigation of the use of force will ensure management has all the facts available to determine the appropriateness of the force. In the event of litigation, such a policy and investigation will also provide supporting evidence that GPD officers have been adequately trained and equipped to reasonably and appropriately use force, and that GPD management is diligent in their review and evaluation of GPD officers’ use of force.
The RMS system has the capability to audit and print use of force incidents. However, if the supervisor does not check the “Use of Force” box when entering the data, the information will not be retrieved when data mining for these types of incidents.
Policy §302, Use of Force Review Boards, describes the process for convening a board to review the use of force. As GPD continues to review the use of force policy, it is encouraged to update the review board policy to meet the needs of the department.
GPD is in the process of implementing software mentioned in the Training portion of the report and that will have a risk management component to capture use of force, internal affairs, and pursuit data. CPSM recommends the software include search and tracking capabilities of use of force incidents to include a range of early identification and intervention features along with customer configurable thresholds.
Use of Force Recommendations: ■ Provide a memorandum to all supervisors clarifying specific supervisory responsibilities at use of
force incidents until the current policy is updated. [Recommendation No. 69.]

89
■ Revise the use of force policy to ensure a thorough and complete force investigation of any use of force incident. [Recommendation No. 70.]
■ Conduct the annual force analysis as directed by current policy. [Recommendation No. 71.]
■ When implementing the upcoming use of force tracking software, ensure it provides the necessary management tool for tracking incidents and early intervention. [Recommendation No. 72.]
■ Review Policy §302, Use of Force Review Boards, to ensure it meets the needs of the department. [Recommendation No. 73.]
Workers’ Compensation Injuries and exposure to health hazards resulting in workers’ compensation claims are inherent in policing. While workplace safety training is necessary and helpful in some circumstances, the unpredictable and volatile nature of policing makes it impossible to prevent injuries/claims. GPD is not alone in coping with this disruptive and costly reality.
The State of California Department of Industrial Relations (CDIR) oversees the workers’ compensation program in the State of California. Injured GPD employees report their injury to their GPD supervisor and are provided the necessary medical treatment. CDIR receives the required documents via GPD and the city’s Human Resources Department. If the claim is approved, CDIR will cover medical bills directly related to the employee’s injury.
As part of CPSM’s operational assessment, the GPD claim rate for calendar years 2017-2018 was examined. Specifically, CPSM was looking for an unusually high incidence of claims as well as patterns of injuries that may lead to identification of performance risk factors that could be addressed to reduce the incidence of injuries and associated costs.
GPD staff provided documents pertaining to the number and type of claims filed for the period noted. These files were reviewed for patterns and performance risk factors as mentioned. Nothing in the claim documentation provided or interviews with concerned parties suggested patterns of injuries or abuse of the process.
TABLE 8-2: Workers’ Compensation Claims, FY 2016-2018 FY 2016-17 FY 2017-18
Indemnity 1 4 Medical-only 10 14 Total Number of Claims 11 18 Indemnity Claims $20,064.13 $6,929.13 Medical-only Claims $7,994.79 $5,355.76
* Source: City of Greenfield Human Resources.
To address costs, it is imperative that treating physicians fully understand that temporary, short-term modified duty, outside of the normal duty demands, may be available to an injured worker. As work restrictions oftentimes include lifting of not more than 5 lbs., standing and or sitting restrictions, etc., it is important for the treating physician to be aware that such assignments are a desired option to “temporary total disability.” Supervisors should accompany an employee to a treating facility when the employee seeks initial medical treatment / evaluation for an on-duty injury and discuss this matter with the treating physician.
90
Workers’ Compensation Recommendations: ■ Supervisors should accompany an employee to a treating facility when the employee seeks
initial medical treatment/evaluation for an on-duty injury. The supervisor should consult with the treating physician and discuss with them the availability of temporary modified duty assignments to assist in determining if such work can be performed where available. [Recommendation No. 74.]
■ In the event an injured worker is found to be temporarily disabled and will be on a lost-time status, his or her first-line supervisor should be in weekly contact with the employee to ensure that his or her needs are being met, as well as provide encouragement for a speedy recovery. [Recommendation No. 75.]
POLICY MANUAL A comprehensive policy manual is essential for any law enforcement agency. These manuals reflect the operating principles of an agency, and should be constantly reviewed to ensure that the policies are contemporary, conform with legislative mandates, follow case law as determined by the courts, and respond to operational needs and community expectations. Legislative mandates and frequent changes in case law are routine.
Keeping a policy manual up-to-date is no small task. In some instances, departments develop and maintain policy manuals in-house. While not always the case, this option should be reserved for the largest of agencies that can devote adequate resources to this labor-intensive function. This often requires near full-time dedication, with assistance from legal counsel. In CPSM studies, we often find policy manuals, especially in smaller departments such as GPD, are not current.
There are several options available to maintain policy manuals in house. To its credit, GPD has chosen the Lexipol service to develop and assist in the maintenance of its policy manual. Lexipol is owned and operated by former law enforcement professionals and attorneys. As is their practice, they work collaboratively with the GPD to develop the department’s policy manual by providing drafts of each and every policy. The department reviews the draft, modifies as appropriate, and returns the draft to Lexipol for publishing through the electronic Knowledge Management System (KMS). Lexipol produces both print and electronic copies for the department’s use. In all cases, the department maintains control of the content/directives of each policy.
Importantly, Lexipol attorneys track legislative changes and court decisions that may impact policing operations. At least annually, but routinely more often, Lexipol provides draft policy revisions to the department based upon changes the firm has tracked. Again, it works collaboratively with the department to implement those changes and update the manual. It is an excellent system and is in use throughout the United States and internationally. For an additional cost, Lexipol has added an optional service to customize the policy to the agency’s practices. This service is helpful for smaller agencies with staffing limitations. While examining policies as part of this assessment, we found there were instances where obsolete or terms not applicable to GPD were included in the text and/or discrepancies existed between policy and practice. For instance, Policy § 820, Jeanne Cleary Campus Security Act, is not applicable as there is no college campus in Greenfield. A thorough review with either a GPD staff member or the additional Lexipol service would be able to update the policy. CPSM recommends exploring the opportunity to contract Lexipol services for maintaining the policy manual.
91
The online Lexipol policy allows GPD to designate specific personnel with administrative rights. CPSM recommends each employee be loaded onto the system so he/she can create their own login account to review policies electronically either on computer or mobile app. By uploading each user onto the Lexipol system, GPD staff can audit the system to ensure personnel are acknowledging the policy updates. Lexipol also provides an app that can be loaded onto a mobile phone. The app requires the same login procedure as used for a computer so staff can access the policy manual in the field or remotely. CPSM recommends the KMS app for Lexipol be shared with all personnel.
GPD provided CPSM with an electronic copy of the department policy manual. It is 487 pages in length. Many of the critical policies such as use of force, pursuit, etc. were reviewed as part of our evaluation of the policy manual. Others were reviewed as part of our review of specific operating sections. Overall, with minor exceptions, we found the manual to be comprehensive and consistent with best practices. Where necessary, policy modifications or compliance recommendations are included in section-specific reporting.
Policy Manual Recommendations: ■ Explore the opportunity to contract the Lexipol service for maintaining the policy manual and
removing policies or sections that do not apply. [Recommendation No. 76.]
■ Ensure all employees are uploaded into Lexipol’s Knowledge Management System (KMS) in order to manage policy updates and acknowledgements. [Recommendation No. 77.]
■ Share the KMS app with all personnel for remote access to the policy manual. [Recommendation No. 78.]
PERFORMANCE EVALUATION INSTRUMENT The evaluation of employees affords a tremendous opportunity to help guide their development, enhance their opportunity for a successful career, and increase their value to the organization. Absent a formal mechanism, supervisors frequently fail to take advantage of this opportunity to the detriment of both the employee and the organization. While the performance evaluation instrument in and of itself will not ensure that the review takes full advantage of this opportunity, it can certainly contribute to the process. As well, senior management review of the evaluations provides insight as to which supervisors are putting forth worthwhile effort in reviewing and developing their personnel.
A comprehensive performance evaluation instrument challenges the rating supervisor to thoughtfully assess the employees’ performance in a broad range of categories and challenges the employee to identify his or her own strengths, weaknesses, and opportunities for improvement. Performance evaluations should be meaningful for employees and contain input to foster development and growth. Evaluation forms need to be tailored to the specific duties and responsibilities of the job category being assessed.
Under Policy § 1002, Evaluation of Employees, supervisors are required to complete an evaluation of employees reporting to them. The evaluation report is intended to serve as a guide for work planning and review by the supervisor and employee.
When completing the evaluation, the rater places a check mark in the column that best describes the employee's performance utilizing the definitions of each rating category as described in the policy. The rating categories cover the relevant job performance areas
92
including practical job knowledge, judgement, interpersonal skills, problem solving, professionalism, and community involvement.
Space for written comments is provided at the end of the evaluation in the rater comments section. This section allows the rater to document the employee's strengths, weaknesses, and suggestions for improvement. Any rating under any job dimension marked other than “meets expectations” is to be substantiated in the rater comments section.
The rating supervisor discusses the completed evaluation with the employee, during which any questions the employee may have can be addressed. The supervisor may make appropriate changes to the evaluation if the employee provides reasonable rebuttal evidence. Areas of improvement and goals are to also be discussed with the employee by the supervisor. Employees may also write comments in the “Officer Comments” section of the performance evaluation report.
Per Policy § 1002.6.1, Discriminatory Harassment Form, supervisors are required to read the city and department harassment and discrimination policies. Following such policy review, the supervisor shall provide the employee a form to be completed and returned by the employee certifying that the employee understands the harassment and discrimination policies, whether any questions from the employee have been sufficiently addressed, that the employee knows how and where to report harassment policy violations, and whether the employee has been the subject of, or witness to, any conduct that violates the discrimination or harassment policy.
All sworn and civilian supervisory personnel are required to attend, within one-year of the supervisory appointment, an approved supervisory course that includes training on the completion of performance evaluations. The policy encourages continued coaching and feedback to enable supervisors and employees the opportunity to correct performance issues as they arise.
Per current Policy § 1002.5, evaluations of permanent employees shall be completed annually by the employee's immediate supervisor. It is estimated that most of the evaluations are submitted on time; however, the Captain indicated some evaluations for his review are backlogged. Adequate management reports are not prepared or maintained to track actual evaluation status as to assigned rater, evaluation due date, date of rater submission, management approval date, employee signature date, or forwarding date of the completed evaluation to the city’s Human Resources Department. Rather, Human Resources forwards a list of evaluations that are upcoming and status reports are not consistently forwarded to ensure timeliness. CPSM recommends a system for evaluations should be implemented to provide management reports regarding the status of employee performance evaluations.
Performance Evaluation Recommendation: ■ A tracking system for evaluations should be implemented to provide management reports
regarding the status of employee performance evaluations. [Recommendation No. 79.]
93
SECTION 9. MISCELLANEOUS FLEET The Greenfield Police Department operates a fleet of 19 vehicles. The fleet is made up of a combination of Dodge Charger, Ford Crown Victoria, Ford Explorer, Ford Expedition, Ford Taurus, and Dodge Durango models, Dodge and Ford trucks, and Dodge and Chevrolet Vans. Vehicles are assigned as take-home cars to the Police Chief and Captain; the remaining are pool and special-use vehicles. The department fleet is managed as a collateral duty by a patrol Sergeant. Policies 704 and 706 outline the guidelines regarding the assignment, operation, and maintenance of department vehicles.
Vehicle replacement has been based on mileage and maintenance costs of the vehicle. Mounting maintenance costs or significant damage to a vehicle prior to the mileage target for the vehicle can also cause it to be removed from the fleet as can unserviceable condition of a dated vehicle. Vehicles removed from the fleet are sent to auction. Funds garnered from vehicle auctions are returned to the city general fund. In 2018, the GPD fleet received three replacement vehicles: one marked and two unmarked. The department is also in the process of replacing the code enforcement truck and marked Sergeant’s unit.
The city historically has funded police vehicles straight through the General Fund. Depreciation for existing police vehicles is not being funded; however, the department has focused on updating the vehicle fleet recently. With a number of newer police vehicles, the replacement schedule is adequate at present.
GPD maintains an ongoing preventive maintenance program. Vehicle maintenance for warranty is sent to the respective dealer and repairs are contracted with a local garage. Appropriate chain of command review is in place for approval of escalating repair costs versus removing a vehicle from the fleet.
GPD personnel receive training annually on emergency vehicle operation during the department-wide mandated training. GPD accident rates have decreased from 2017 (five on-duty collisions) vs. zero to date in 2018. Quarterly reviews of accident rates are another valuable management tool that can be used to provide training and reduce risk and injury to employees and the community. CPSM recommends quarterly reviews of accident rates and including Below 100 training as a means to remain vigilant in driver safety.
Fleet Recommendations: ■ GPD accident rates should be examined quarterly by GPD management.
[Recommendation No. 80.]
■ Training on Below 100 should be included annually to increase officer safety. [Recommendation No. 81.]
94
FACILITY
The Greenfield Police Department operates out of a relatively new facility within the footprint of City Hall. It appears that the facility serves the needs of the department well. The perimeter of the building has video cameras recording key areas including the front of the building, access to the rear parking area, and rear of the building. Important interior areas are also recorded including the lobby, front desk, booking area, and officer’s processing room. CPSM recommends additional video cameras be placed in the evidence storage room, the sally port area containing long-term bike and bulk property/evidence, the upcoming Conex area in the back police parking lot, and the armory.
There is an armory inside the police facility that is contained within a locked equipment room. The equipment room is keyless access card-controlled and all sworn staff have access to the room to store their equipment. A secondary door exists within the equipment room that is alarmed and access card controlled; however, only the Sergeants have access to the armory. Each Sergeant has a unique alarm code to the armory. CPSM observed the armory to contain department-issued handguns in gun cases as well as other weapons and equipment. There were a few flashbangs from the past SWAT team that the department armorer is in the process of working with the Department of Alcohol, Tobacco and Firearms to appropriately dispose of through training. There were no video cameras recording the armory. Both the armory and equipment room were clean and orderly.
During the site visit, the main hallway walls inside the department were being painted and updated. Office furniture and meeting rooms appeared to be adequate to meet staff needs. Recognition plaques for employees of the quarter and other historical items of department history were displayed showing a sense of pride for the organization.
Access control to the police department is controlled by keycards. Since a police facility maintains sensitive information and access to California Law Enforcement Telecommunications Systems (CLETS), DOJ and other law enforcement sensitive databases, facility security is mandated through the CLETS management control agreement to include no unauthorized viewing of or access to computer terminals, access devices, or stored/printed data. As mentioned earlier in the report, CPSM recommends an audit be conducted of all access cards granting access to the police department to ensure only authorized police employees are granted access to the facility.
During the site visit, we observed there was a large room that is used in part as a gym for police employees. The other portion of the room was being considered for constructing a new jail. Due to the extensive building and safety requirements involved in building a jail, CPSM strongly cautions the City of Greenfield about the costly and extensive process for such a venture. Further, the number of arrests generated by GPD officers does not necessitate the need for a new jail.
By repurposing the sally port and additional space by the gym, there are other more pressing needs these spaces could be used for, including (1) a Detective Section to house the proposed Detective Sergeant, Detective, and existing MCU Detective and team; (2) long-term storage room for property and evidence; or (3) a training room to host training and/or use as an Emergency Operations Center. CPSM provides these suggestions as a means to ensure the best use of funds for the police department to provide services consistent with the needs of the community.
95
Facility Recommendations: ■ Place additional video cameras in the evidence storage room, the sally port area containing
long-term bike and bulk property/evidence, the upcoming Conex area in the back police parking lot, and the armory. [Recommendation No. 82.]
■ Conduct an audit of all access cards granting access to the police department to ensure only authorized police employees are granted access to the facility. [Recommendation No. 83.]
■ Reconsider moving forward with the jail and instead consider other more pressing needs such as the Detective Section area; long-term property and evidence storage; training room and/or emergency operations center. [Recommendation No. 84.]
TECHNOLOGY
The department is fortunate to have an on-site IT person who serves the police department and City Hall. The City of Greenfield is commended for providing a commitment of these important resources. CPSM examined the use of technology by the GPD. Aside from human resources, technology is the lifeblood of policing operations. Following is a listing of some of the technologies in use at present:
■ 911, cellular, and landline telephone systems.
■ CalPhoto: CDL and ID inquiries.
■ CLEW: Law enforcement website to review case law and updates.
■ Comcate: Code enforcement and animal control incident tracking, animal licensing registration and renewal.
■ CopLink: Regional investigative tool.
■ CrimeReports.com: Provides statistical information regarding incidents and trends in the area.
■ Desktop computers and related programs, printers, monitors, and related devices for day-to-day operations.
■ ExTexting: Mass texting platform.
■ Honeywell: Programmable access cards and reports.
■ Knowledge Management System: Lexipol policies and updates.
■ In-car Cameras: Police units are equipped with audio/video cameras to capture interactions with the officers and community members.
■ InCode: Software for cashiering, inputting fees and fines collected, generating reports pertaining to budget and creation of purchase orders.
■ Kustom: In-car cameras to capture activities in the field from the front windshield view of the police unit.
■ MDTs: Mobile computer systems (laptop computers equipped with GPS and GIS Mapping). Officers’ patrol vehicles are their “offices.” The computers enable them to write reports, search various law enforcement-related databases, map calls that they are responding to, and more. The GPS system ensures that they can be located in an emergency.
■ Nextest: CLETS testing software.
■ Parking Management Bureau: Electronically generate parking citations and generate reports.
96
■ PlanIt: Scheduling program to assist with personnel scheduling and court management.
■ Portable breath testers: Breathalyzers are used in the field to determine blood alcohol content.
■ ScenePD: This system is used by patrol personnel for diagramming crime scenes and traffic accidents.
■ Social Media: Facebook, Twitter to communicate with the public for announcements and information.
■ TracNet: Provides the records management and property management system.
■ TriTech: Computer-aided dispatch system used by MCSO and generates crime report numbers.
■ Videotaping – Surveillance of external areas of GPD as well as interior areas including audio/video recording of suspect interviews.
■ VieVu: Body-worn cameras; officers wear audio/video cameras to capture incidents in the field.
Law enforcement technology, as all technology, is in a constant state of innovative change. There are many new applications for field and investigative use being deployed throughout the country. These range from simple smartphone applications to significant software and hardware systems requiring considerable capital expenditure. Few agencies can afford all of the state-of-the-art technology that is available. Agencies must review the options available and assess the benefit of any option. Below, we identify some of those options we would consider useful in Greenfield. Again, with any new technology, additional costs are involved beyond acquisition. Those include upgrades, maintenance, storage, and providing access. The city must weigh the cost and benefit of each.
Automated External Defibrillator (AED) CPSM learned that GPD has an outdated automated external defibrillator (AED) and staff needs updated training. AEDs are designed to be simple to use for first responders; their use is taught in many first aid, first responder, and basic life support (BLS)-level CPR classes. Neither the police facility or patrol vehicles are equipped with AEDs. The deployment of AEDs at the police department and in marked police vehicles would greatly enhance the life-saving capabilities of the department. As mentioned earlier in the Patrol portion of this report, a significant number of calls for service are EMS-related. These inexpensive (less than $2,000 each unit) and easy-to-use devices would be a tremendous asset to the GPD. CPSM recommends the purchase of at least two: one to be maintained at the police department and one to be deployed in a patrol vehicle at all times.
Automatic License Plate Readers (ALPRs) ALPRs capture a video image of the license plates of passing vehicles and search databases to determine if the vehicle is stolen or otherwise wanted in connection with a criminal offense. Such devices can scan hundreds of plates per minute and cause the local law enforcement agency to be notified of the presence of a wanted vehicle. Such devices can be placed at a fixed location, or in a mobile patrol unit. Clearly, these are invaluable tools for law enforcement and serve as a force multiplier for any agency. Placement of cameras would help to identify persons coming into the city that may be involved in criminal activity and pose a threat to the city. CPSM does not endorse vendors, but is aware that costs of such devices, including installation, approach $10,000 per camera per lane.
97
CPSM is aware of pending legislation in the California State Legislature that would block the use of such devices. We and the entire law enforcement community would hope that the value of such technology would far outweigh any perceived privacy concerns and that the bill would fail.
Technology Recommendations: ■ Purchase at least two automated external defibrillators (AEDs) to deploy in the field and at the
police facility; provide training on AEDs to all staff. [Recommendation No. 85.]
■ Explore the opportunity to deploy automated license plate readers, either as fixed, mounted instruments at high-traffic locations, on patrol vehicles, or both. [Recommendation No. 86.]
98
SECTION 10. DATA ANALYSIS This data analysis focuses on three main areas: workload, deployment, and response times. These three areas are related almost exclusively to patrol operations, which constitute a significant portion of the police department’s personnel and financial commitment.
All information in this report was developed using the computer-aided dispatch (CAD) data provided by the Monterey County Department of Emergency Communications.
CPSM collected data for a one-year period of July 1, 2017 through June 30, 2018. The majority of the first section of the report, concluding with Table 10-8, uses call data for the one-year period. For the detailed workload analysis, we use two four-week sample periods. The first period is from July 7 through August 31, 2017, or summer, and the second period is from January 4 through February 28, 2018, or winter.
WORKLOAD ANALYSIS When CPSM analyzes a set of dispatch records, we go through a series of steps:
■ We first process the data to improve accuracy. For example, we remove duplicate patrol units recorded on a single event as well as records that do not indicate an actual activity. We also remove incomplete data, as found in situations where there is not enough time information to evaluate the record.
■ At this point, we have a series of records that we call “events.” We identify these events in three ways:
□ We distinguish between patrol and nonpatrol units.
□ We assign a category to each event based upon its description.
□ We indicate whether the call is “zero time on scene” (i.e., patrol units spent less than 30 seconds on scene), “police-initiated,” or “community-initiated.”
■ We then remove all records that do not involve a patrol unit to get a total number of patrol-related events.
■ At important points during our analysis, we focus on a smaller group of events designed to represent actual calls for service. This excludes events with no officer time spent on scene and directed patrol activities.
In this way, we first identify a total number of records, then limit ourselves to patrol events, and finally focus on calls for service.
As with similar cases around the country, we encountered a number of issues when analyzing Greenfield’s dispatch data. We made assumptions and decisions to address these issues.
■ 1,119 events (about 5.2 percent) involved patrol units spending zero time on scene.
■ 6 calls lacked accurate busy times. We excluded these calls when evaluating busy times and work hours.
■ The computer-aided dispatch (CAD) system used approximately 146 different event descriptions, which we condensed to 18 categories for our tables and 12 categories for our
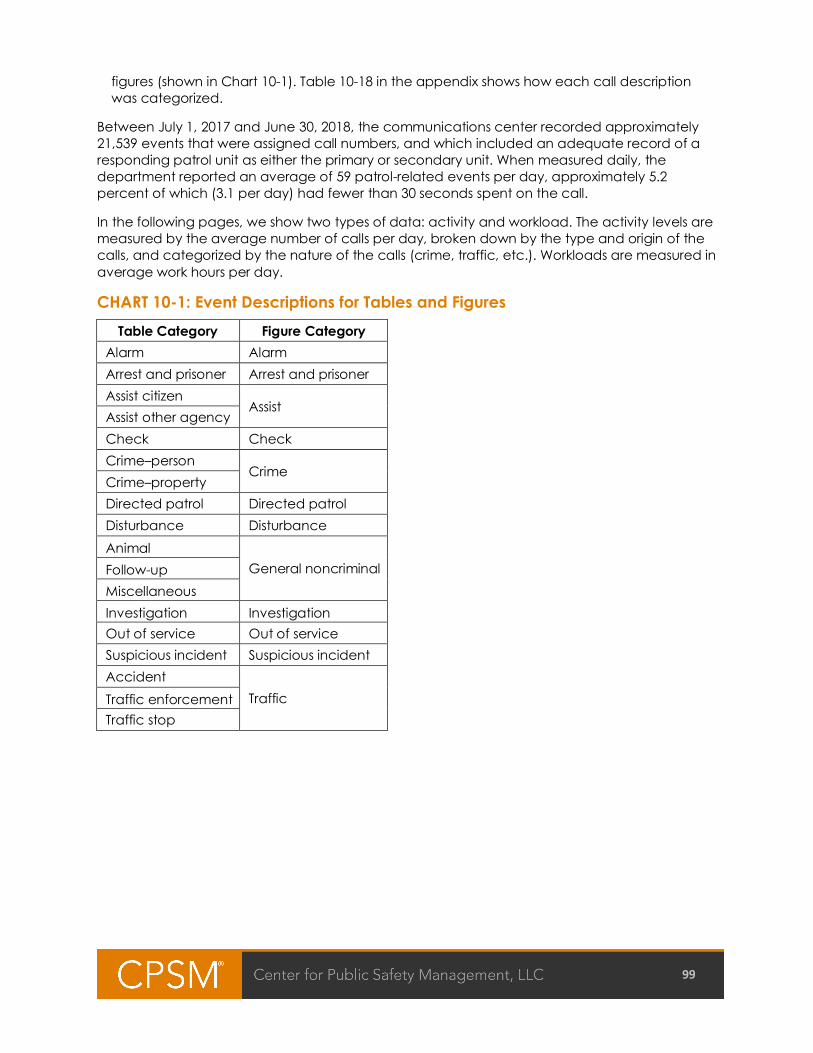
99
figures (shown in Chart 10-1). Table 10-18 in the appendix shows how each call description was categorized.
Between July 1, 2017 and June 30, 2018, the communications center recorded approximately 21,539 events that were assigned call numbers, and which included an adequate record of a responding patrol unit as either the primary or secondary unit. When measured daily, the department reported an average of 59 patrol-related events per day, approximately 5.2 percent of which (3.1 per day) had fewer than 30 seconds spent on the call.
In the following pages, we show two types of data: activity and workload. The activity levels are measured by the average number of calls per day, broken down by the type and origin of the calls, and categorized by the nature of the calls (crime, traffic, etc.). Workloads are measured in average work hours per day.
CHART 10-1: Event Descriptions for Tables and Figures Table Category Figure Category
Alarm Alarm Arrest and prisoner Arrest and prisoner Assist citizen
Assist Assist other agency Check Check Crime–person
Crime Crime–property Directed patrol Directed patrol Disturbance Disturbance Animal
General noncriminal Follow-up Miscellaneous Investigation Investigation Out of service Out of service Suspicious incident Suspicious incident Accident
Traffic Traffic enforcement Traffic stop
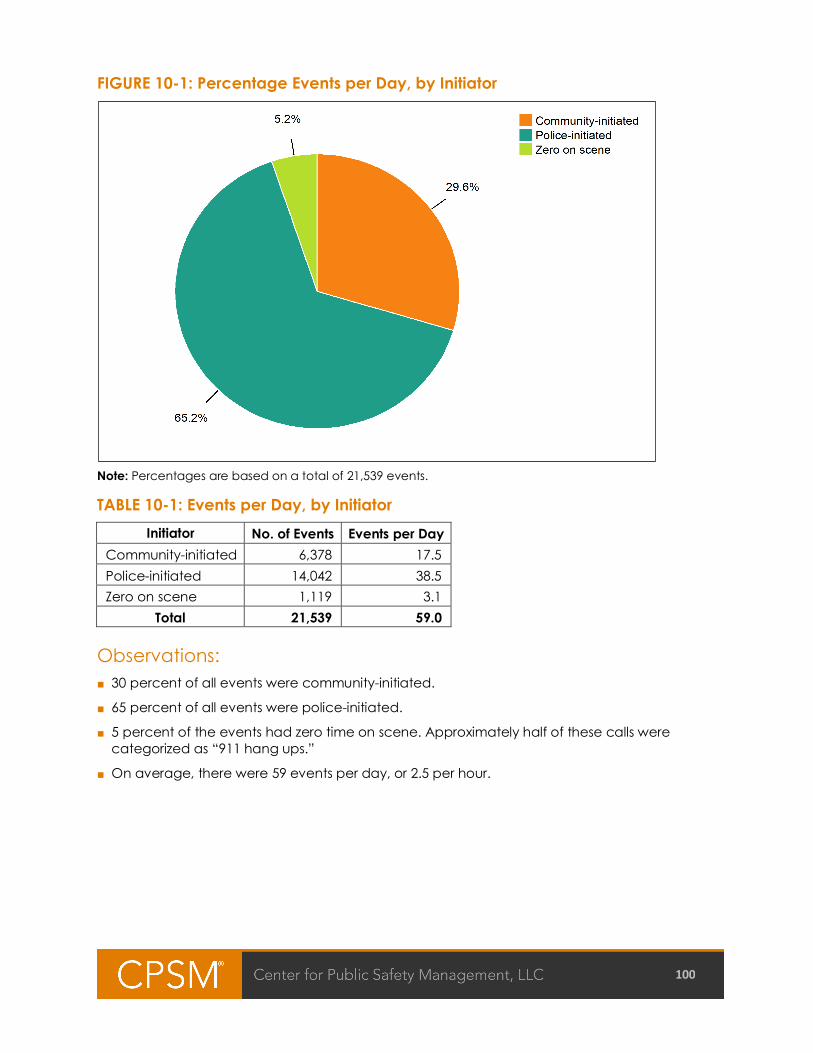
100
FIGURE 10-1: Percentage Events per Day, by Initiator
Note: Percentages are based on a total of 21,539 events.
TABLE 10-1: Events per Day, by Initiator Initiator No. of Events Events per Day
Community-initiated 6,378 17.5 Police-initiated 14,042 38.5 Zero on scene 1,119 3.1
Total 21,539 59.0
Observations: ■ 30 percent of all events were community-initiated.
■ 65 percent of all events were police-initiated.
■ 5 percent of the events had zero time on scene. Approximately half of these calls were categorized as “911 hang ups.”
■ On average, there were 59 events per day, or 2.5 per hour.
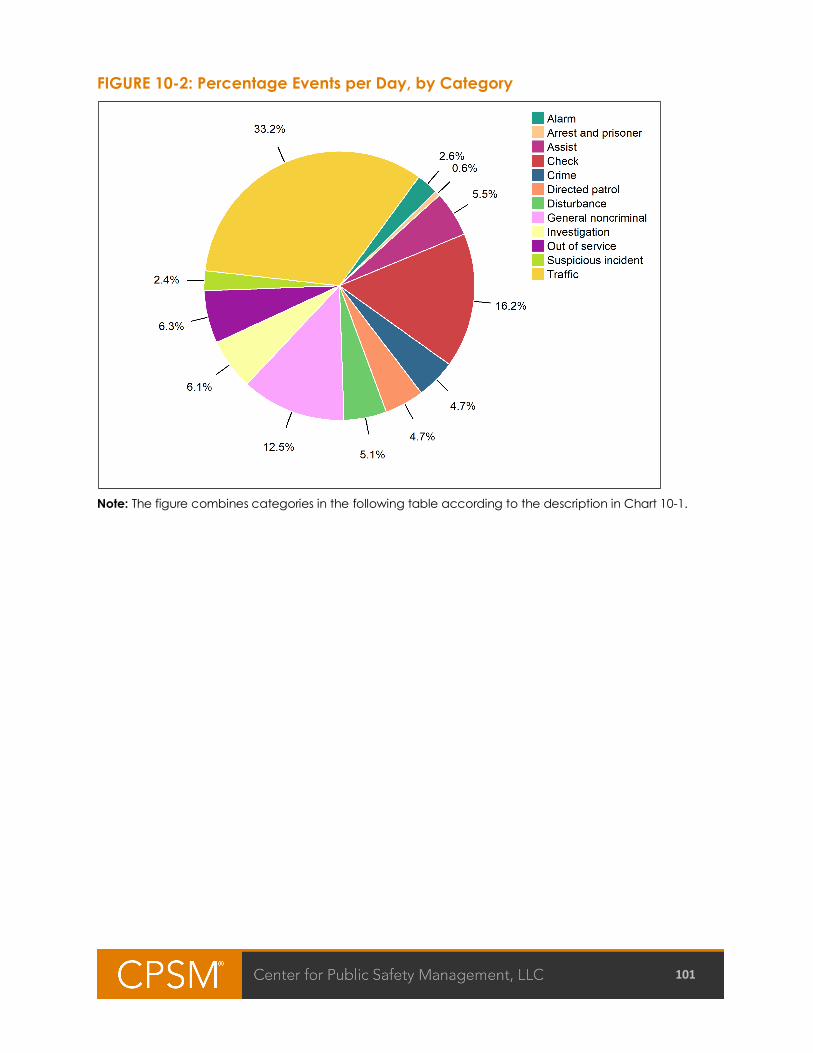
101
FIGURE 10-2: Percentage Events per Day, by Category
Note: The figure combines categories in the following table according to the description in Chart 10-1.
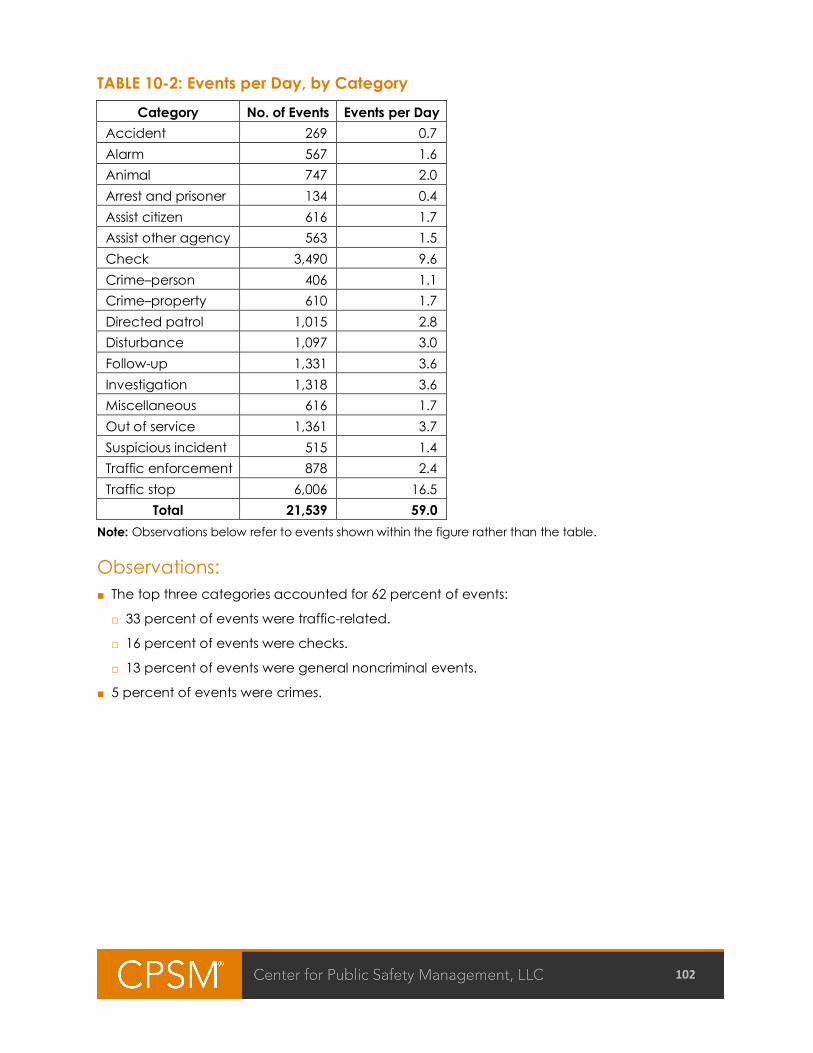
102
TABLE 10-2: Events per Day, by Category Category No. of Events Events per Day
Accident 269 0.7 Alarm 567 1.6 Animal 747 2.0 Arrest and prisoner 134 0.4 Assist citizen 616 1.7 Assist other agency 563 1.5 Check 3,490 9.6 Crime–person 406 1.1 Crime–property 610 1.7 Directed patrol 1,015 2.8 Disturbance 1,097 3.0 Follow-up 1,331 3.6 Investigation 1,318 3.6 Miscellaneous 616 1.7 Out of service 1,361 3.7 Suspicious incident 515 1.4 Traffic enforcement 878 2.4 Traffic stop 6,006 16.5
Total 21,539 59.0 Note: Observations below refer to events shown within the figure rather than the table.
Observations: ■ The top three categories accounted for 62 percent of events:
□ 33 percent of events were traffic-related.
□ 16 percent of events were checks.
□ 13 percent of events were general noncriminal events.
■ 5 percent of events were crimes.
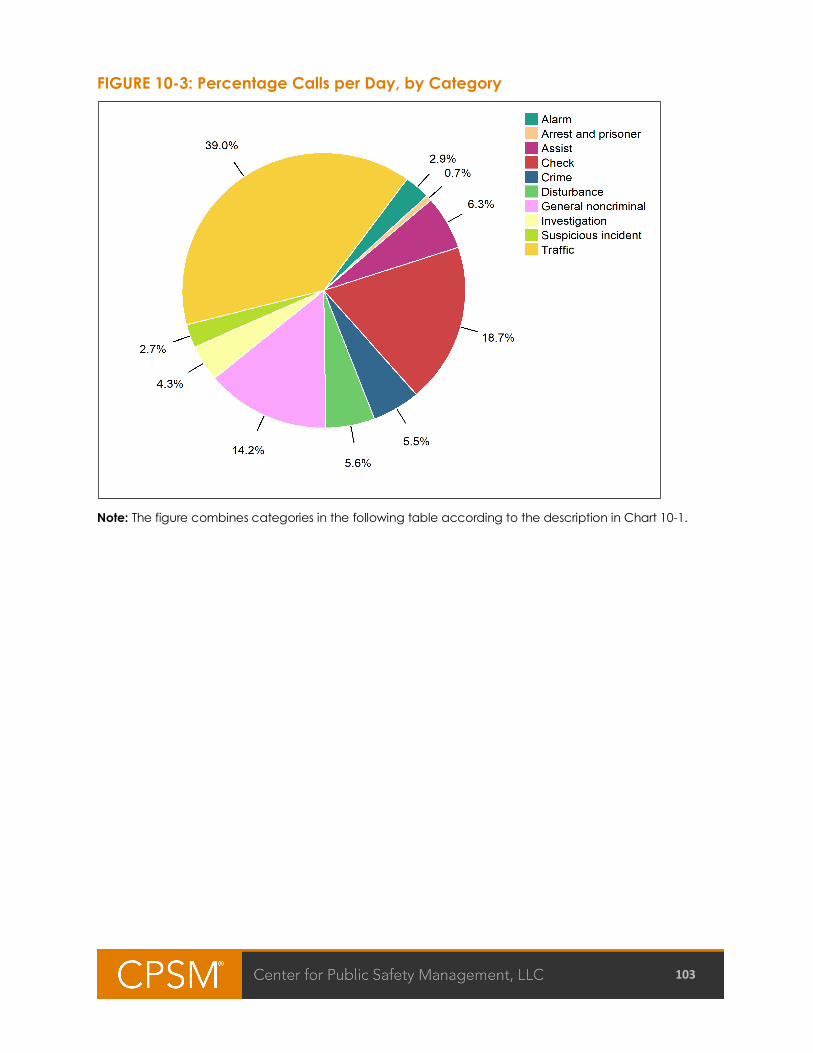
103
FIGURE 10-3: Percentage Calls per Day, by Category
Note: The figure combines categories in the following table according to the description in Chart 10-1.
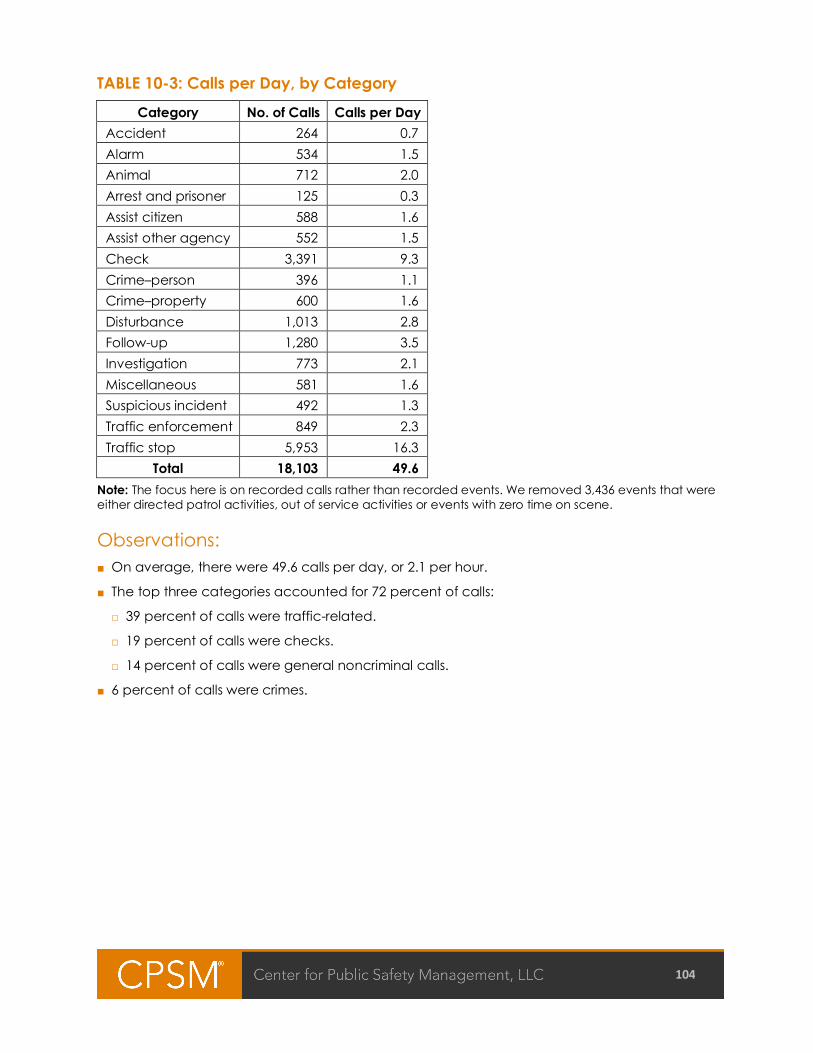
104
TABLE 10-3: Calls per Day, by Category Category No. of Calls Calls per Day
Accident 264 0.7 Alarm 534 1.5 Animal 712 2.0 Arrest and prisoner 125 0.3 Assist citizen 588 1.6 Assist other agency 552 1.5 Check 3,391 9.3 Crime–person 396 1.1 Crime–property 600 1.6 Disturbance 1,013 2.8 Follow-up 1,280 3.5 Investigation 773 2.1 Miscellaneous 581 1.6 Suspicious incident 492 1.3 Traffic enforcement 849 2.3 Traffic stop 5,953 16.3
Total 18,103 49.6 Note: The focus here is on recorded calls rather than recorded events. We removed 3,436 events that were either directed patrol activities, out of service activities or events with zero time on scene.
Observations: ■ On average, there were 49.6 calls per day, or 2.1 per hour.
■ The top three categories accounted for 72 percent of calls:
□ 39 percent of calls were traffic-related.
□ 19 percent of calls were checks.
□ 14 percent of calls were general noncriminal calls.
■ 6 percent of calls were crimes.
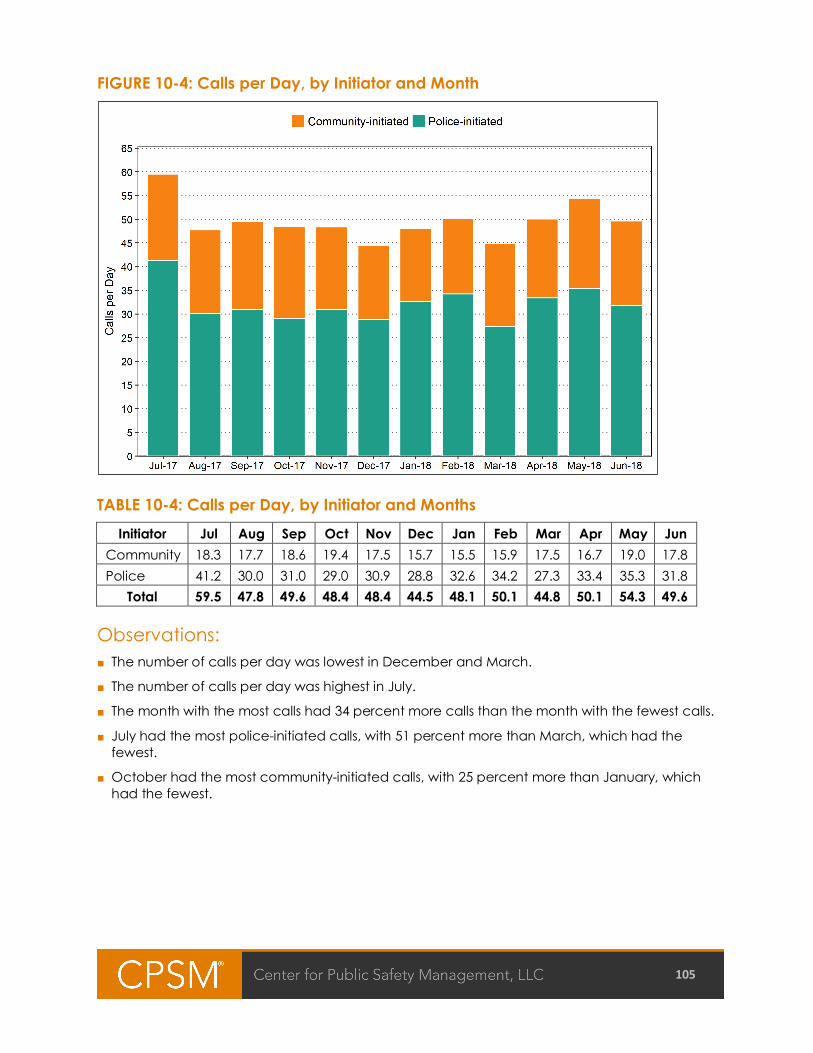
105
FIGURE 10-4: Calls per Day, by Initiator and Month
TABLE 10-4: Calls per Day, by Initiator and Months
Initiator Jul Aug Sep Oct Nov Dec Jan Feb Mar Apr May Jun Community 18.3 17.7 18.6 19.4 17.5 15.7 15.5 15.9 17.5 16.7 19.0 17.8 Police 41.2 30.0 31.0 29.0 30.9 28.8 32.6 34.2 27.3 33.4 35.3 31.8
Total 59.5 47.8 49.6 48.4 48.4 44.5 48.1 50.1 44.8 50.1 54.3 49.6
Observations: ■ The number of calls per day was lowest in December and March.
■ The number of calls per day was highest in July.
■ The month with the most calls had 34 percent more calls than the month with the fewest calls.
■ July had the most police-initiated calls, with 51 percent more than March, which had the fewest.
■ October had the most community-initiated calls, with 25 percent more than January, which had the fewest.
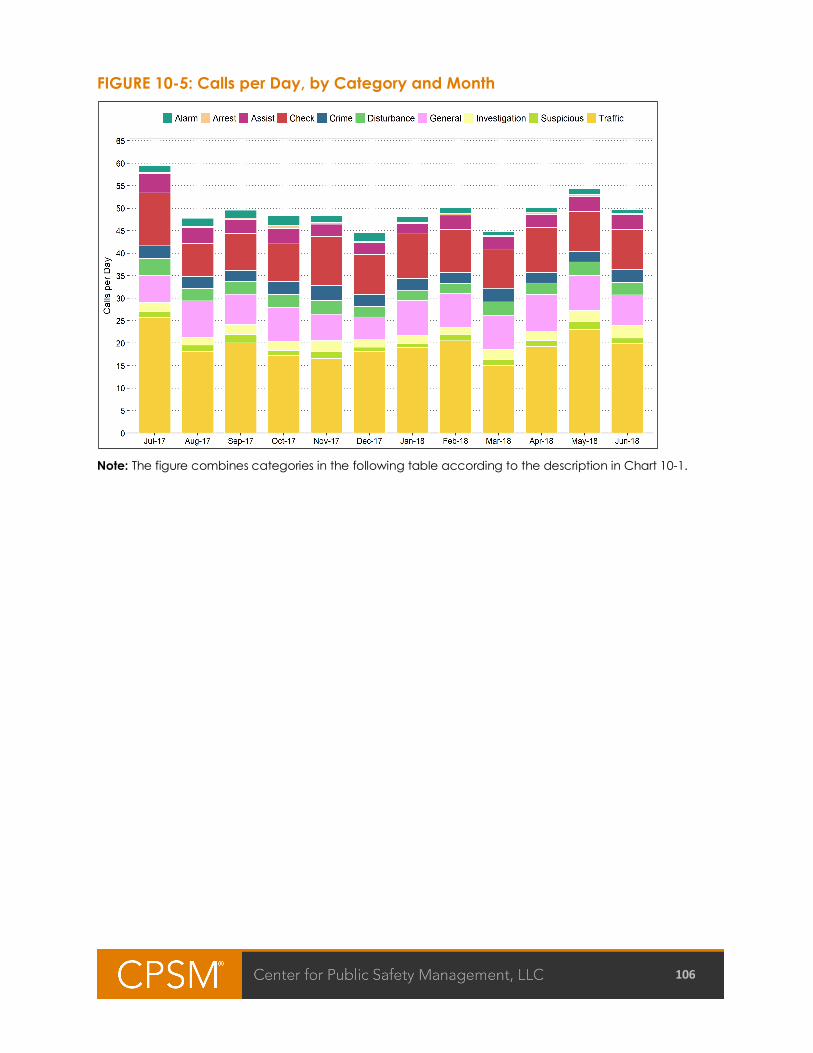
106
FIGURE 10-5: Calls per Day, by Category and Month
Note: The figure combines categories in the following table according to the description in Chart 10-1.
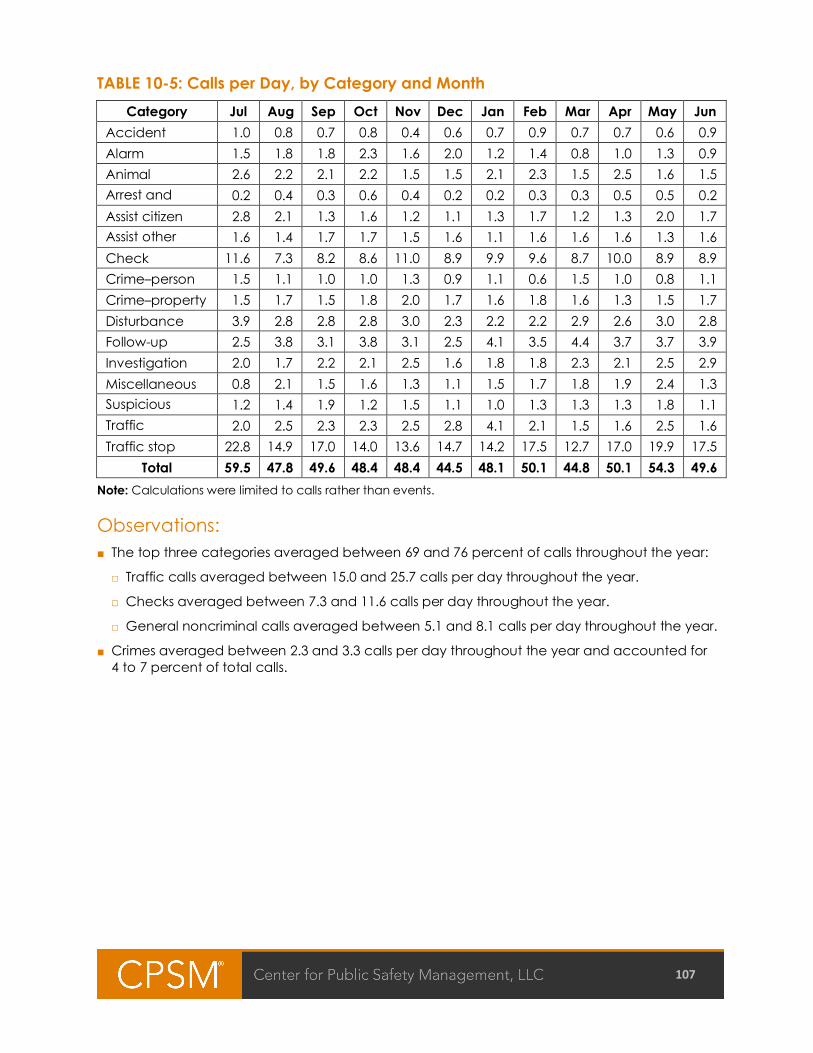
107
TABLE 10-5: Calls per Day, by Category and Month Category Jul Aug Sep Oct Nov Dec Jan Feb Mar Apr May Jun
Accident 1.0 0.8 0.7 0.8 0.4 0.6 0.7 0.9 0.7 0.7 0.6 0.9 Alarm 1.5 1.8 1.8 2.3 1.6 2.0 1.2 1.4 0.8 1.0 1.3 0.9 Animal 2.6 2.2 2.1 2.2 1.5 1.5 2.1 2.3 1.5 2.5 1.6 1.5 Arrest and prisoner
0.2 0.4 0.3 0.6 0.4 0.2 0.2 0.3 0.3 0.5 0.5 0.2 Assist citizen 2.8 2.1 1.3 1.6 1.2 1.1 1.3 1.7 1.2 1.3 2.0 1.7 Assist other agency
1.6 1.4 1.7 1.7 1.5 1.6 1.1 1.6 1.6 1.6 1.3 1.6 Check 11.6 7.3 8.2 8.6 11.0 8.9 9.9 9.6 8.7 10.0 8.9 8.9 Crime–person 1.5 1.1 1.0 1.0 1.3 0.9 1.1 0.6 1.5 1.0 0.8 1.1 Crime–property 1.5 1.7 1.5 1.8 2.0 1.7 1.6 1.8 1.6 1.3 1.5 1.7 Disturbance 3.9 2.8 2.8 2.8 3.0 2.3 2.2 2.2 2.9 2.6 3.0 2.8 Follow-up 2.5 3.8 3.1 3.8 3.1 2.5 4.1 3.5 4.4 3.7 3.7 3.9 Investigation 2.0 1.7 2.2 2.1 2.5 1.6 1.8 1.8 2.3 2.1 2.5 2.9 Miscellaneous 0.8 2.1 1.5 1.6 1.3 1.1 1.5 1.7 1.8 1.9 2.4 1.3 Suspicious incident
1.2 1.4 1.9 1.2 1.5 1.1 1.0 1.3 1.3 1.3 1.8 1.1 Traffic enforcement
2.0 2.5 2.3 2.3 2.5 2.8 4.1 2.1 1.5 1.6 2.5 1.6 Traffic stop 22.8 14.9 17.0 14.0 13.6 14.7 14.2 17.5 12.7 17.0 19.9 17.5
Total 59.5 47.8 49.6 48.4 48.4 44.5 48.1 50.1 44.8 50.1 54.3 49.6 Note: Calculations were limited to calls rather than events.
Observations: ■ The top three categories averaged between 69 and 76 percent of calls throughout the year:
□ Traffic calls averaged between 15.0 and 25.7 calls per day throughout the year.
□ Checks averaged between 7.3 and 11.6 calls per day throughout the year.
□ General noncriminal calls averaged between 5.1 and 8.1 calls per day throughout the year.
■ Crimes averaged between 2.3 and 3.3 calls per day throughout the year and accounted for 4 to 7 percent of total calls.
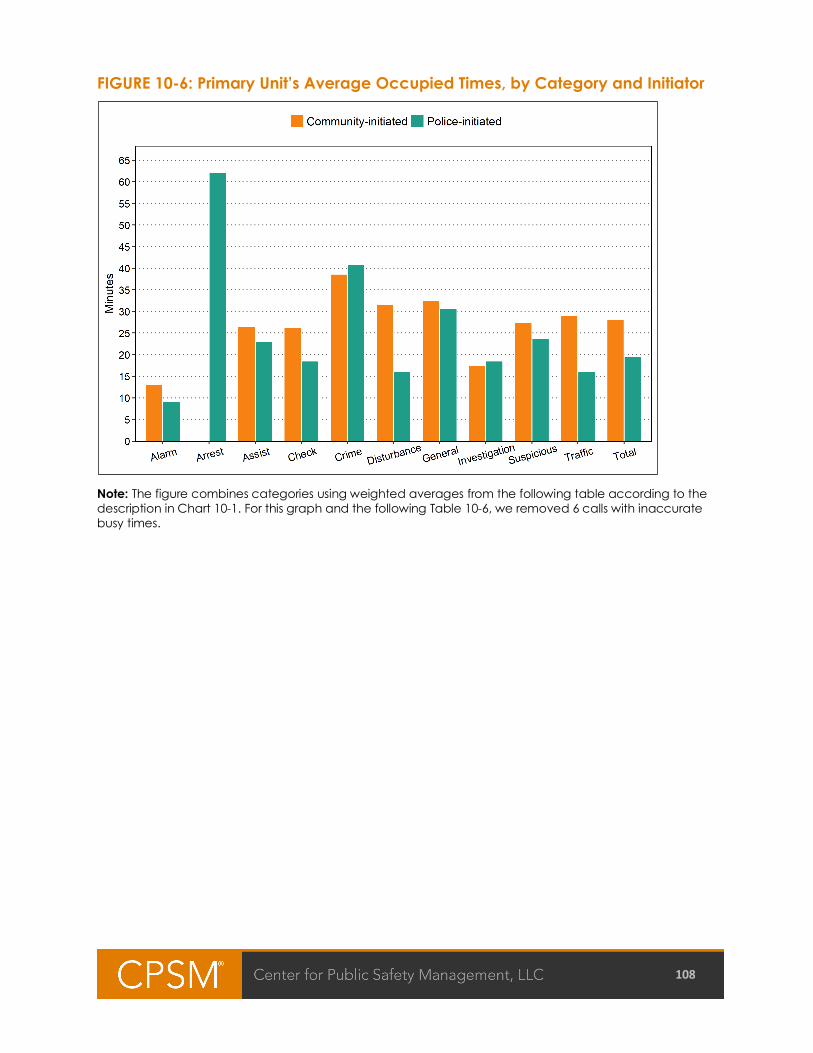
108
FIGURE 10-6: Primary Unit’s Average Occupied Times, by Category and Initiator
Note: The figure combines categories using weighted averages from the following table according to the description in Chart 10-1. For this graph and the following Table 10-6, we removed 6 calls with inaccurate busy times.
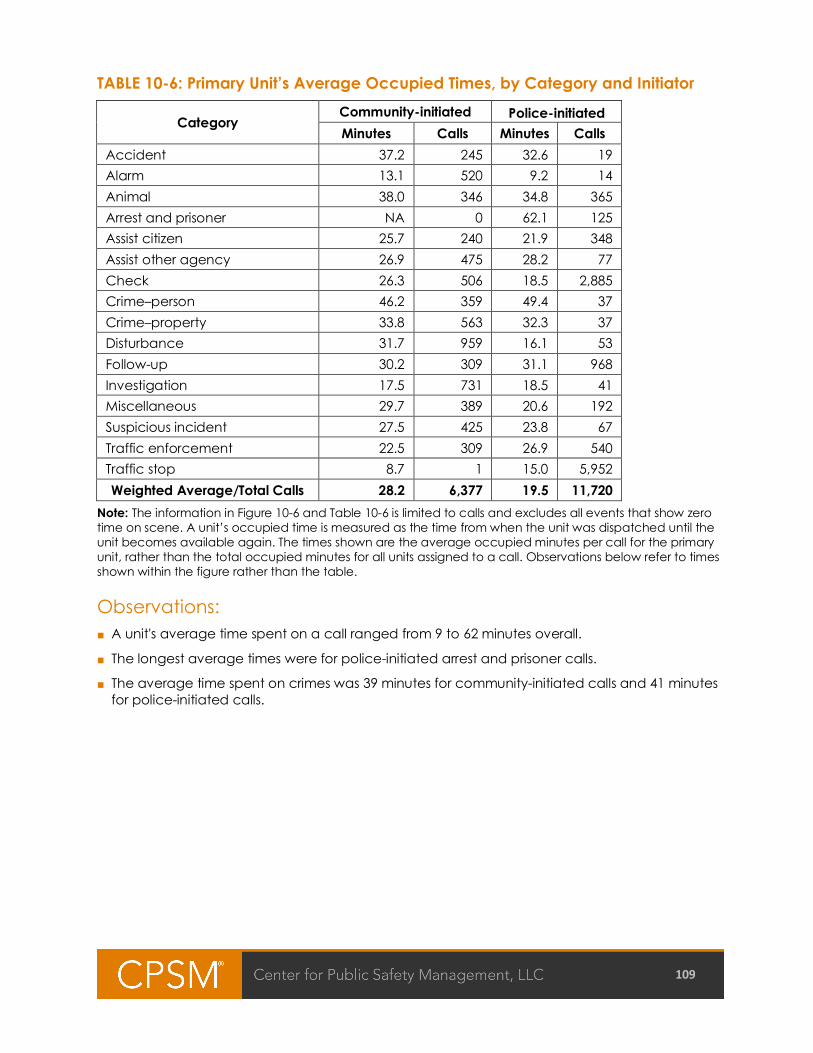
109
TABLE 10-6: Primary Unit’s Average Occupied Times, by Category and Initiator
Category Community-initiated Police-initiated Minutes Calls Minutes Calls
Accident 37.2 245 32.6 19 Alarm 13.1 520 9.2 14 Animal 38.0 346 34.8 365 Arrest and prisoner NA 0 62.1 125 Assist citizen 25.7 240 21.9 348 Assist other agency 26.9 475 28.2 77 Check 26.3 506 18.5 2,885 Crime–person 46.2 359 49.4 37 Crime–property 33.8 563 32.3 37 Disturbance 31.7 959 16.1 53 Follow-up 30.2 309 31.1 968 Investigation 17.5 731 18.5 41 Miscellaneous 29.7 389 20.6 192 Suspicious incident 27.5 425 23.8 67 Traffic enforcement 22.5 309 26.9 540 Traffic stop 8.7 1 15.0 5,952 Weighted Average/Total Calls 28.2 6,377 19.5 11,720
Note: The information in Figure 10-6 and Table 10-6 is limited to calls and excludes all events that show zero time on scene. A unit’s occupied time is measured as the time from when the unit was dispatched until the unit becomes available again. The times shown are the average occupied minutes per call for the primary unit, rather than the total occupied minutes for all units assigned to a call. Observations below refer to times shown within the figure rather than the table.
Observations: ■ A unit's average time spent on a call ranged from 9 to 62 minutes overall.
■ The longest average times were for police-initiated arrest and prisoner calls.
■ The average time spent on crimes was 39 minutes for community-initiated calls and 41 minutes for police-initiated calls.
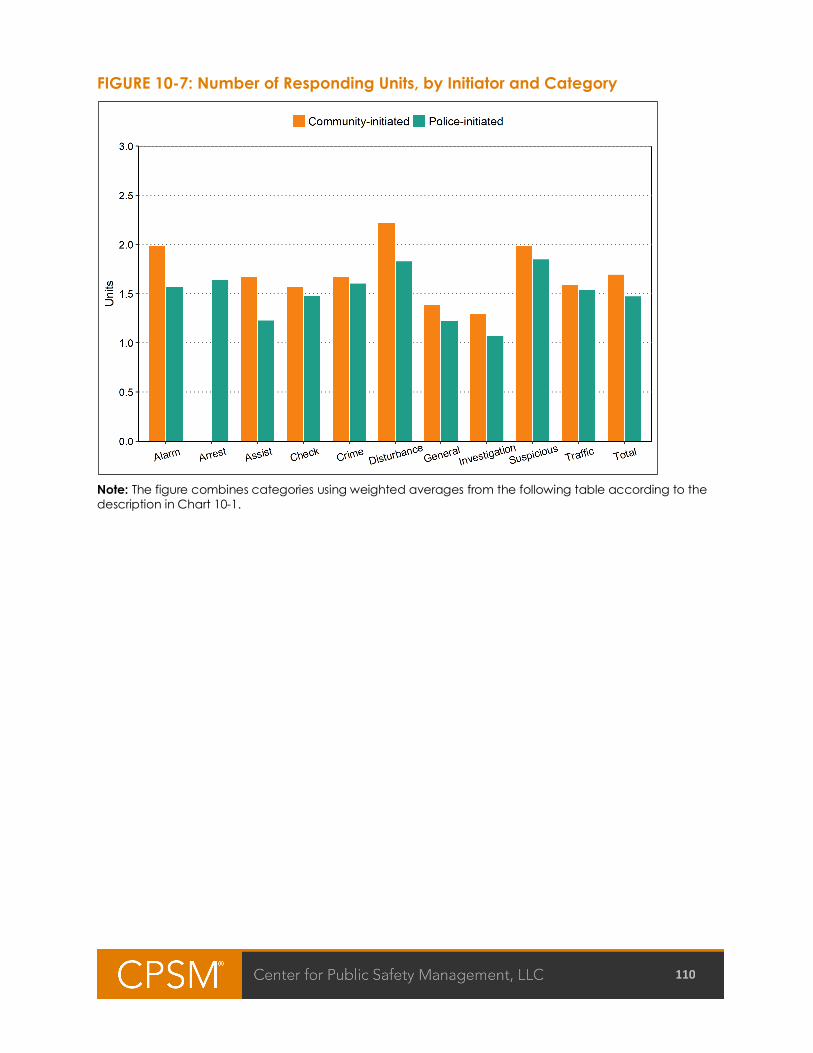
110
FIGURE 10-7: Number of Responding Units, by Initiator and Category
Note: The figure combines categories using weighted averages from the following table according to the description in Chart 10-1.
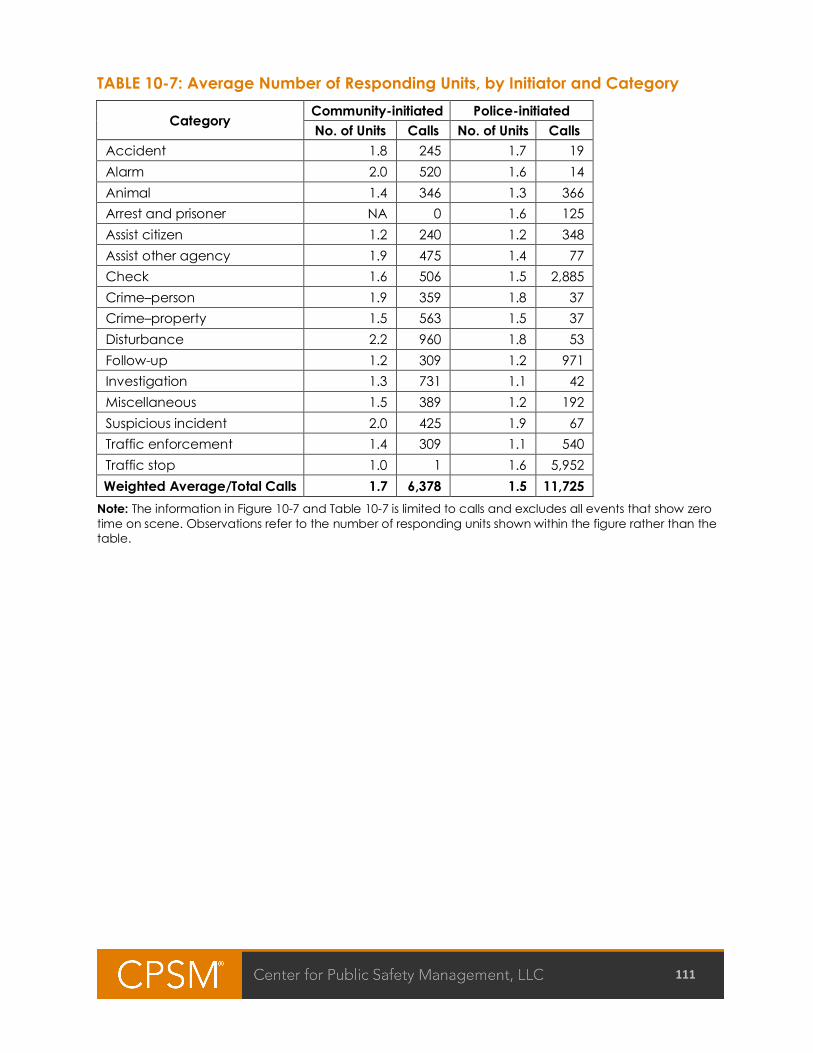
111
TABLE 10-7: Average Number of Responding Units, by Initiator and Category
Category Community-initiated Police-initiated No. of Units Calls No. of Units Calls
Accident 1.8 245 1.7 19 Alarm 2.0 520 1.6 14 Animal 1.4 346 1.3 366 Arrest and prisoner NA 0 1.6 125 Assist citizen 1.2 240 1.2 348 Assist other agency 1.9 475 1.4 77 Check 1.6 506 1.5 2,885 Crime–person 1.9 359 1.8 37 Crime–property 1.5 563 1.5 37 Disturbance 2.2 960 1.8 53 Follow-up 1.2 309 1.2 971 Investigation 1.3 731 1.1 42 Miscellaneous 1.5 389 1.2 192 Suspicious incident 2.0 425 1.9 67 Traffic enforcement 1.4 309 1.1 540 Traffic stop 1.0 1 1.6 5,952 Weighted Average/Total Calls 1.7 6,378 1.5 11,725
Note: The information in Figure 10-7 and Table 10-7 is limited to calls and excludes all events that show zero time on scene. Observations refer to the number of responding units shown within the figure rather than the table.
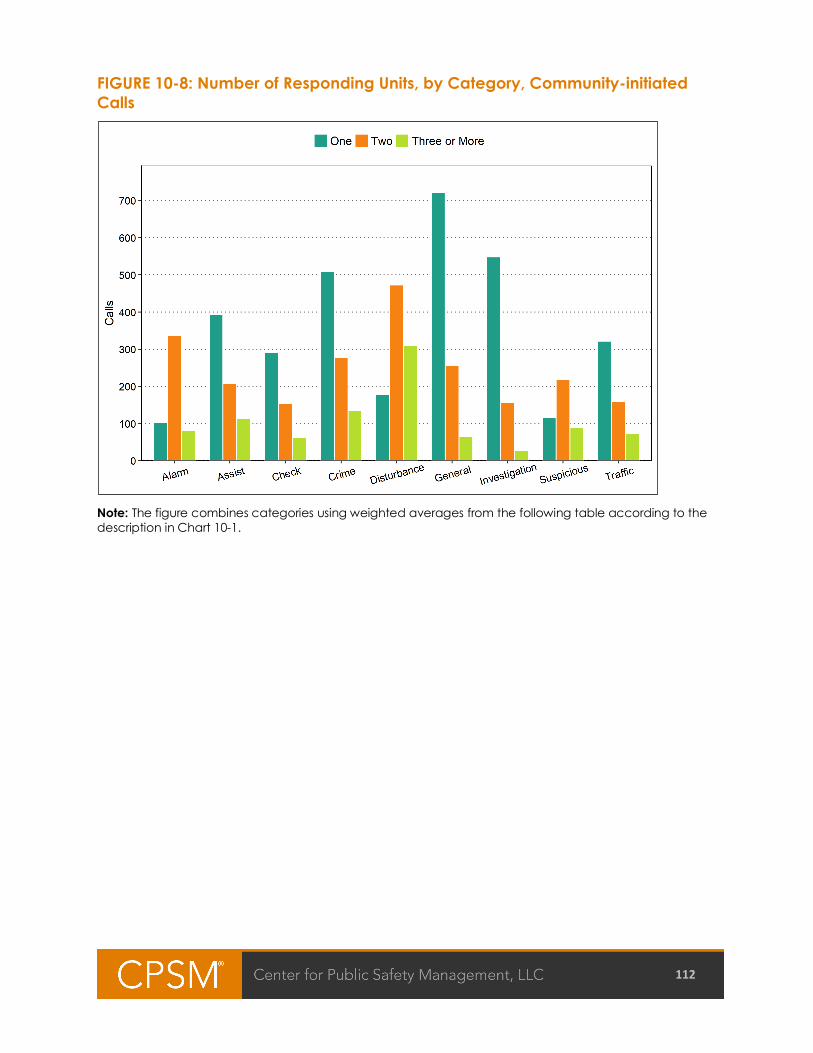
112
FIGURE 10-8: Number of Responding Units, by Category, Community-initiated Calls
Note: The figure combines categories using weighted averages from the following table according to the description in Chart 10-1.
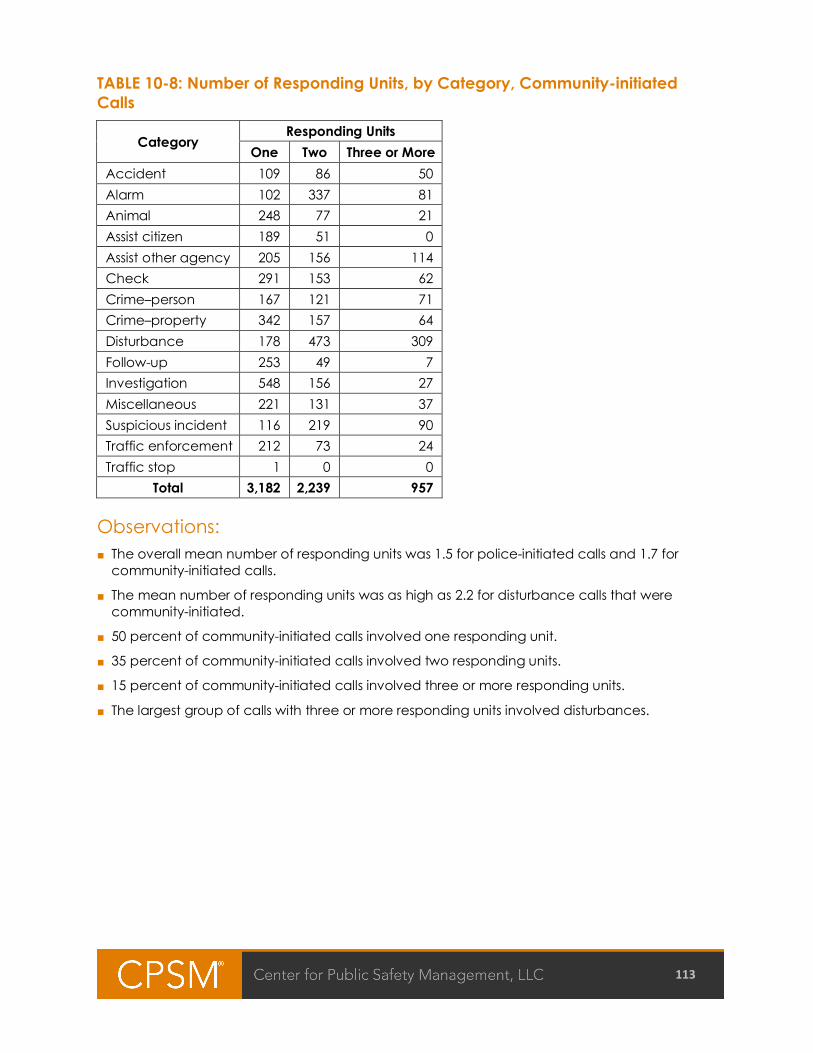
113
TABLE 10-8: Number of Responding Units, by Category, Community-initiated Calls
Category Responding Units
One Two Three or More Accident 109 86 50 Alarm 102 337 81 Animal 248 77 21 Assist citizen 189 51 0 Assist other agency 205 156 114 Check 291 153 62 Crime–person 167 121 71 Crime–property 342 157 64 Disturbance 178 473 309 Follow-up 253 49 7 Investigation 548 156 27 Miscellaneous 221 131 37 Suspicious incident 116 219 90 Traffic enforcement 212 73 24 Traffic stop 1 0 0
Total 3,182 2,239 957
Observations: ■ The overall mean number of responding units was 1.5 for police-initiated calls and 1.7 for
community-initiated calls.
■ The mean number of responding units was as high as 2.2 for disturbance calls that were community-initiated.
■ 50 percent of community-initiated calls involved one responding unit.
■ 35 percent of community-initiated calls involved two responding units.
■ 15 percent of community-initiated calls involved three or more responding units.
■ The largest group of calls with three or more responding units involved disturbances.
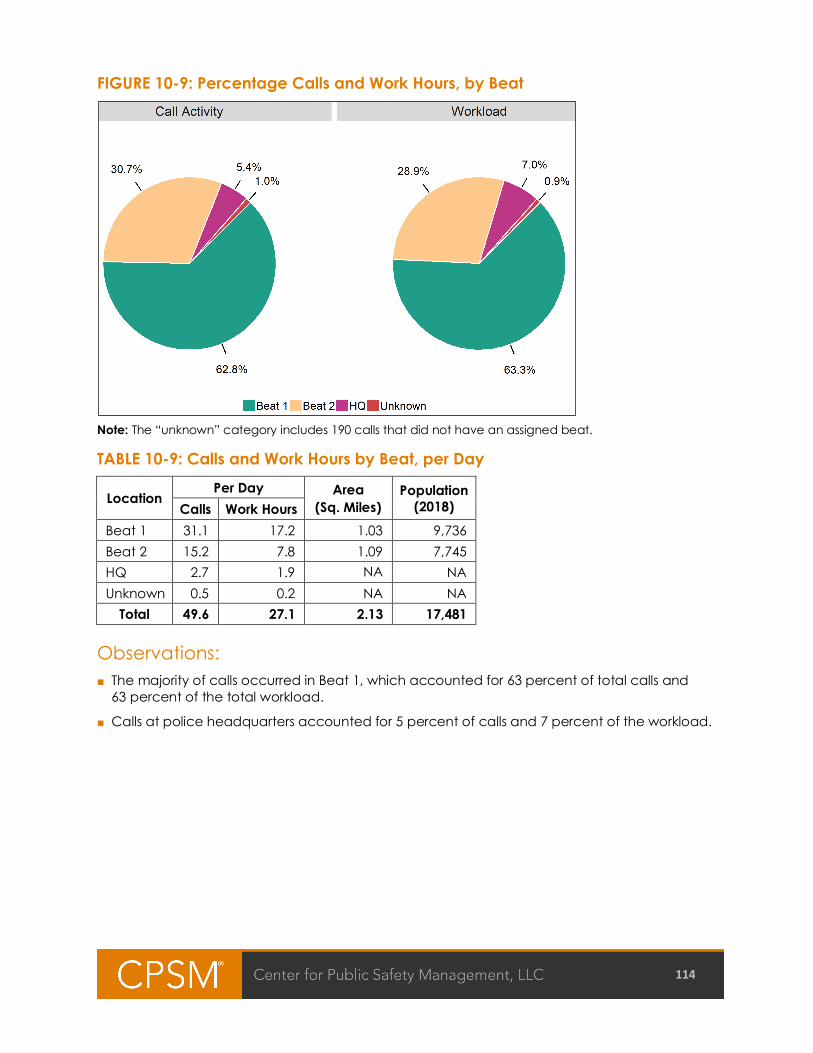
114
FIGURE 10-9: Percentage Calls and Work Hours, by Beat
Note: The “unknown” category includes 190 calls that did not have an assigned beat.
TABLE 10-9: Calls and Work Hours by Beat, per Day
Location Per Day Area
(Sq. Miles) Population
(2018) Calls Work Hours Beat 1 31.1 17.2 1.03 9,736 Beat 2 15.2 7.8 1.09 7,745 HQ 2.7 1.9 NA
N NA
Unknown 0.5 0.2 NA NA Total 49.6 27.1 2.13 17,481
Observations: ■ The majority of calls occurred in Beat 1, which accounted for 63 percent of total calls and
63 percent of the total workload.
■ Calls at police headquarters accounted for 5 percent of calls and 7 percent of the workload.
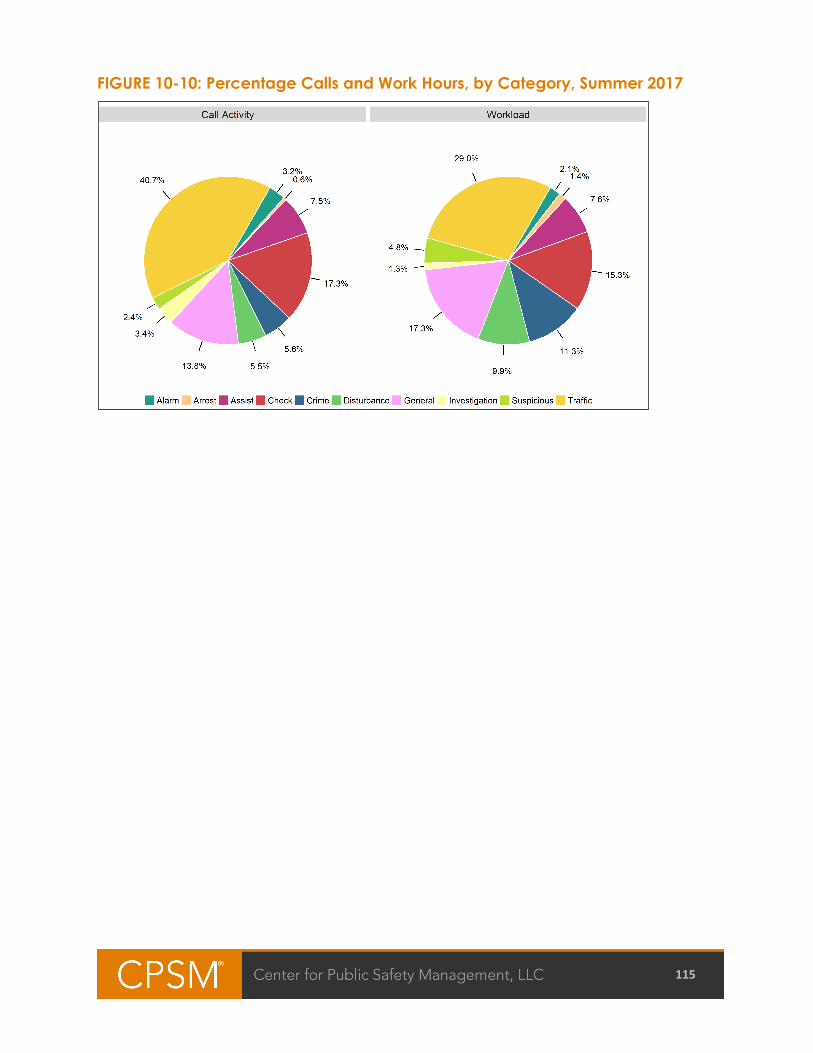
115
FIGURE 10-10: Percentage Calls and Work Hours, by Category, Summer 2017

116
TABLE 10-10: Calls and Work Hours per Day, by Category, Summer 2017
Category Per Day
Calls Work Hours Accident 0.9 1.1 Alarm 1.7 0.6 Animal 2.3 1.4 Arrest and prisoner 0.3 0.4 Assist citizen 2.4 0.9 Assist other agency 1.5 1.3 Check 9.0 4.5 Crime–person 1.3 2.1 Crime–property 1.6 1.2 Disturbance 2.8 2.9 Follow-up 3.3 2.7 Investigation 1.8 0.4 Miscellaneous 1.6 1.0 Suspicious incident 1.2 1.4 Traffic enforcement 2.2 1.1 Traffic stop 18.0 6.2
Total 52.1 29.2 Note: Workload calculations focused on calls rather than events.
Observations: ■ The average number of calls per day was higher in summer than in winter.
■ The average daily workload was also higher in summer than in winter.
■ On average, there were 52 calls per day, or 2.2 per hour.
■ Total workload averaged 29 hours per day, meaning that on average 1.2 officers per hour were busy responding to calls.
■ Traffic calls constituted 41 percent of calls and 29 percent of workload.
■ Checks constituted 17 percent of calls and 15 percent of workload.
■ General noncriminal calls constituted 14 percent of calls and 17 percent of workload.
■ These top three categories constituted 72 percent of calls and 62 percent of workload.
■ Crimes constituted 6 percent of calls and 11 percent of workload.
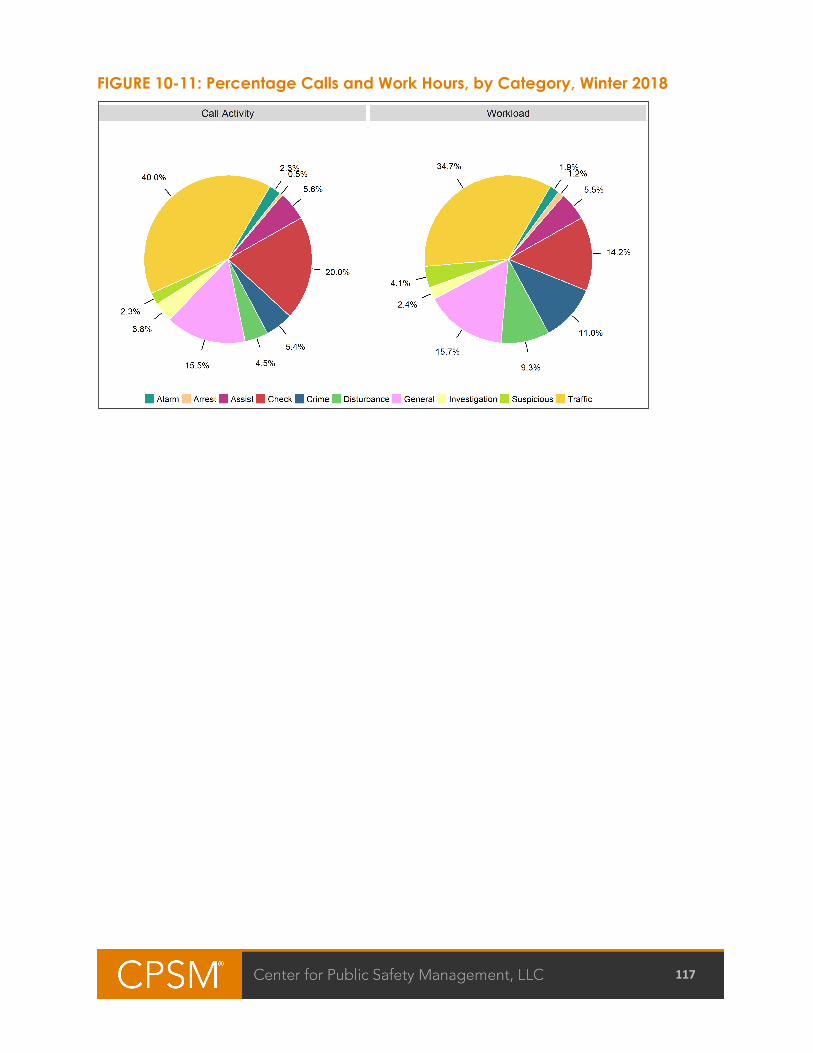
117
FIGURE 10-11: Percentage Calls and Work Hours, by Category, Winter 2018
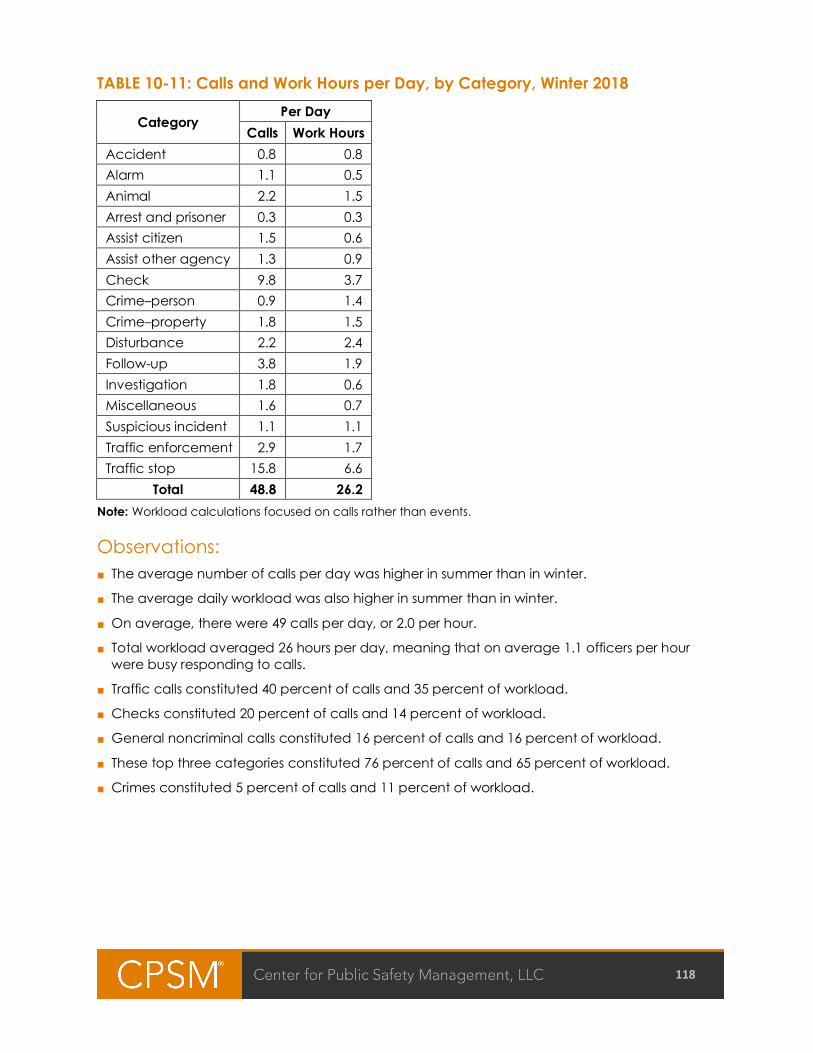
118
TABLE 10-11: Calls and Work Hours per Day, by Category, Winter 2018
Category Per Day
Calls Work Hours Accident 0.8 0.8 Alarm 1.1 0.5 Animal 2.2 1.5 Arrest and prisoner 0.3 0.3 Assist citizen 1.5 0.6 Assist other agency 1.3 0.9 Check 9.8 3.7 Crime–person 0.9 1.4 Crime–property 1.8 1.5 Disturbance 2.2 2.4 Follow-up 3.8 1.9 Investigation 1.8 0.6 Miscellaneous 1.6 0.7 Suspicious incident 1.1 1.1 Traffic enforcement 2.9 1.7 Traffic stop 15.8 6.6
Total 48.8 26.2 Note: Workload calculations focused on calls rather than events.
Observations: ■ The average number of calls per day was higher in summer than in winter.
■ The average daily workload was also higher in summer than in winter.
■ On average, there were 49 calls per day, or 2.0 per hour.
■ Total workload averaged 26 hours per day, meaning that on average 1.1 officers per hour were busy responding to calls.
■ Traffic calls constituted 40 percent of calls and 35 percent of workload.
■ Checks constituted 20 percent of calls and 14 percent of workload.
■ General noncriminal calls constituted 16 percent of calls and 16 percent of workload.
■ These top three categories constituted 76 percent of calls and 65 percent of workload.
■ Crimes constituted 5 percent of calls and 11 percent of workload.
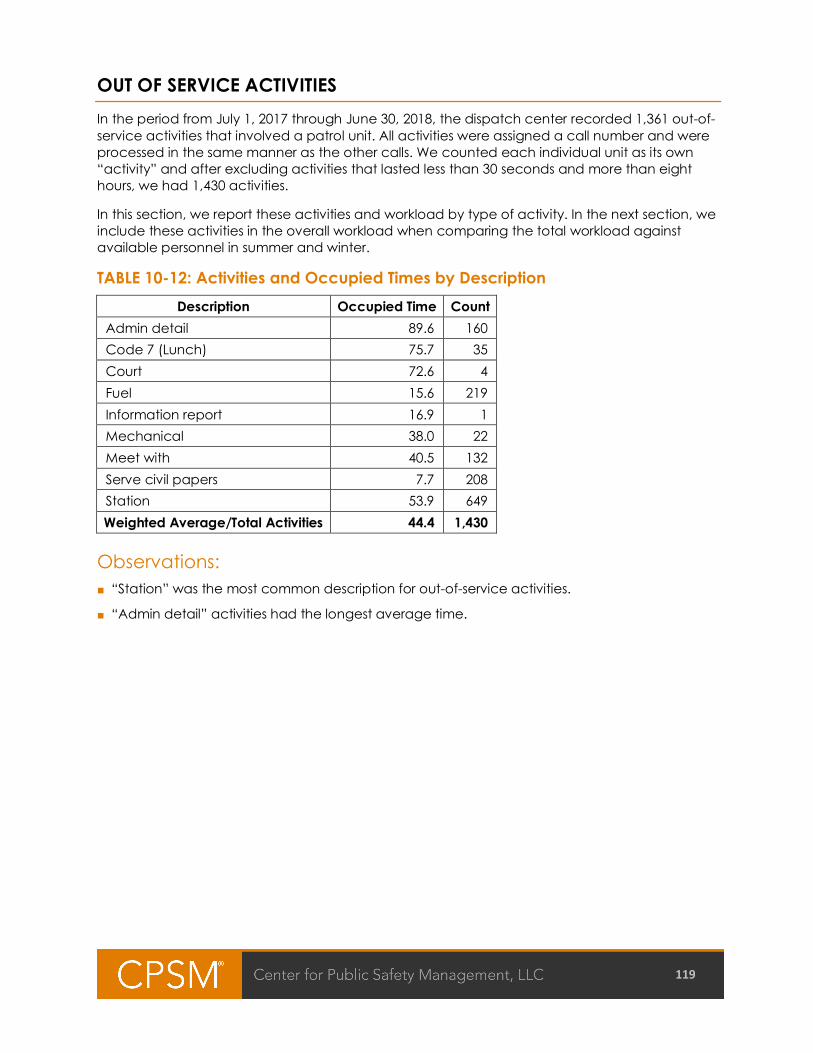
119
OUT OF SERVICE ACTIVITIES In the period from July 1, 2017 through June 30, 2018, the dispatch center recorded 1,361 out-of-service activities that involved a patrol unit. All activities were assigned a call number and were processed in the same manner as the other calls. We counted each individual unit as its own “activity” and after excluding activities that lasted less than 30 seconds and more than eight hours, we had 1,430 activities.
In this section, we report these activities and workload by type of activity. In the next section, we include these activities in the overall workload when comparing the total workload against available personnel in summer and winter.
TABLE 10-12: Activities and Occupied Times by Description Description Occupied Time Count
Admin detail 89.6 160 Code 7 (Lunch) 75.7 35 Court 72.6 4 Fuel 15.6 219 Information report 16.9 1 Mechanical 38.0 22 Meet with 40.5 132 Serve civil papers 7.7 208 Station 53.9 649 Weighted Average/Total Activities 44.4 1,430
Observations: ■ “Station” was the most common description for out-of-service activities.
■ “Admin detail” activities had the longest average time.
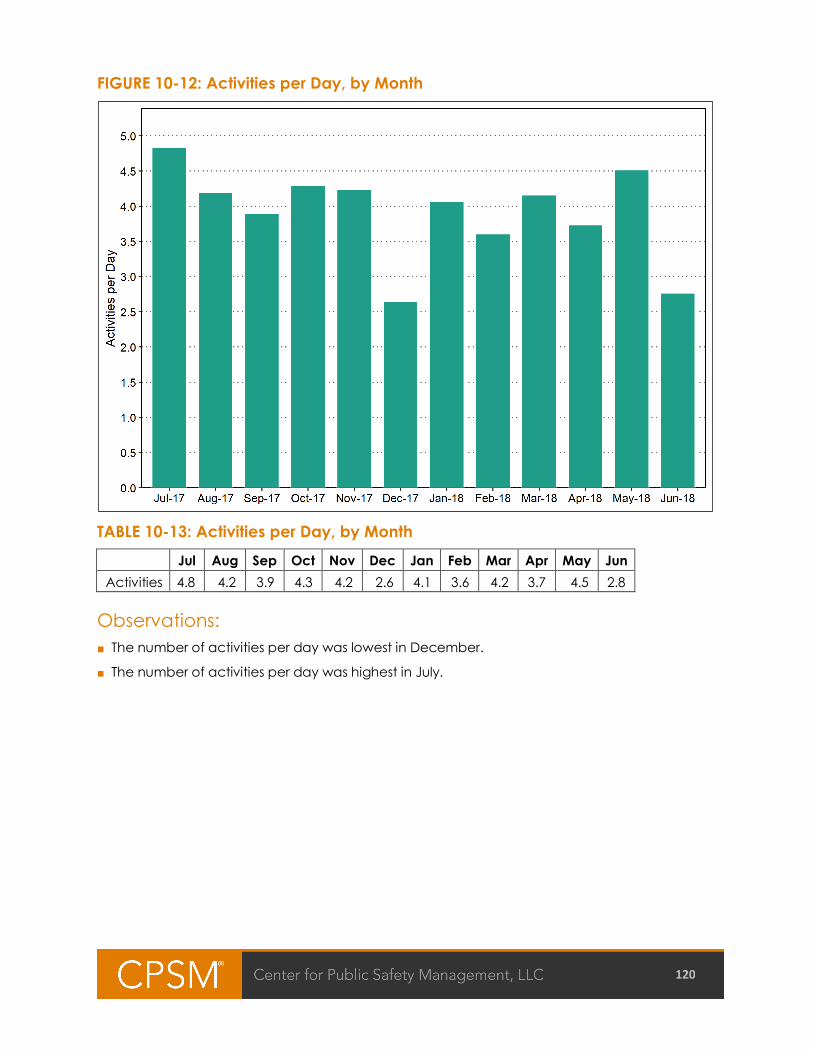
120
FIGURE 10-12: Activities per Day, by Month
TABLE 10-13: Activities per Day, by Month Jul Aug Sep Oct Nov Dec Jan Feb Mar Apr May Jun
Activities 4.8 4.2 3.9 4.3 4.2 2.6 4.1 3.6 4.2 3.7 4.5 2.8
Observations: ■ The number of activities per day was lowest in December.
■ The number of activities per day was highest in July.
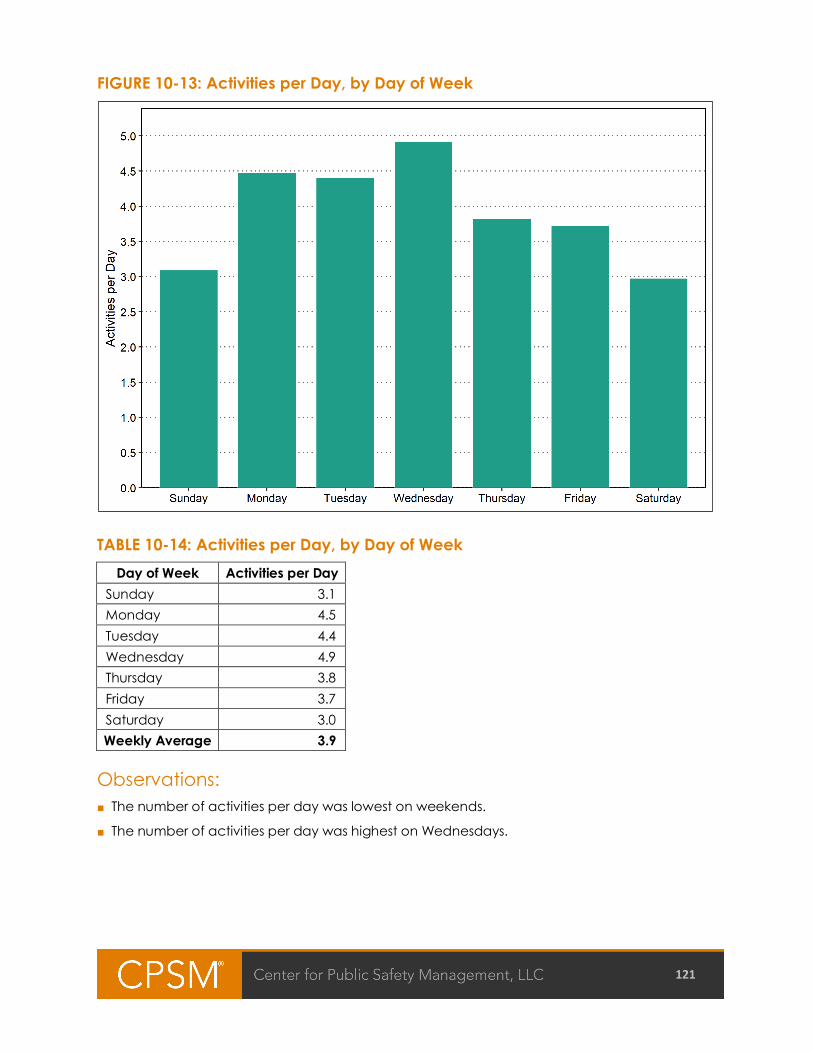
121
FIGURE 10-13: Activities per Day, by Day of Week
TABLE 10-14: Activities per Day, by Day of Week
Day of Week Activities per Day Sunday 3.1 Monday 4.5 Tuesday 4.4 Wednesday 4.9 Thursday 3.8 Friday 3.7 Saturday 3.0 Weekly Average 3.9
Observations: ■ The number of activities per day was lowest on weekends.
■ The number of activities per day was highest on Wednesdays.
122
DEPLOYMENT For this study, we examined deployment information for four weeks in summer (July 7 through August 3, 2017) and four weeks in winter (January 4 through January 31, 2018). The department’s main patrol force consists of patrol officers and patrol sergeants, the majority of whom operate on 12-hour shifts starting at 6:00 a.m. and 6:00 p.m. The police department's main patrol force deployed an average of 4.0 officers per hour during the 24-hour day in summer 2017 and 3.6 officers per hour during the 24-hour day in winter 2018. When additional animal control, code enforcement, school resource officers, and special event officers are included, the department averaged 4.2 officers per hour during the 24-hour day in summer 2017 and in winter 2018.
In this section, we describe the deployment and workload in distinct steps, distinguishing between summer and winter and between weekdays (Monday through Friday) and weekends (Saturday and Sunday):
■ First, we focus on patrol deployment alone.
■ Next, we compare “all” workload, which includes community-initiated calls, police-initiated calls, directed patrol activities, and out-of-service activities.
■ Finally, we compare workload against deployment by percentage.
Comments follow each set of four figures, with separate discussions for summer and winter.

123
FIGURE 10-14: Deployed Officers, Weekdays, Summer 2017
FIGURE 10-15: Deployed Officers, Weekends, Summer 2017
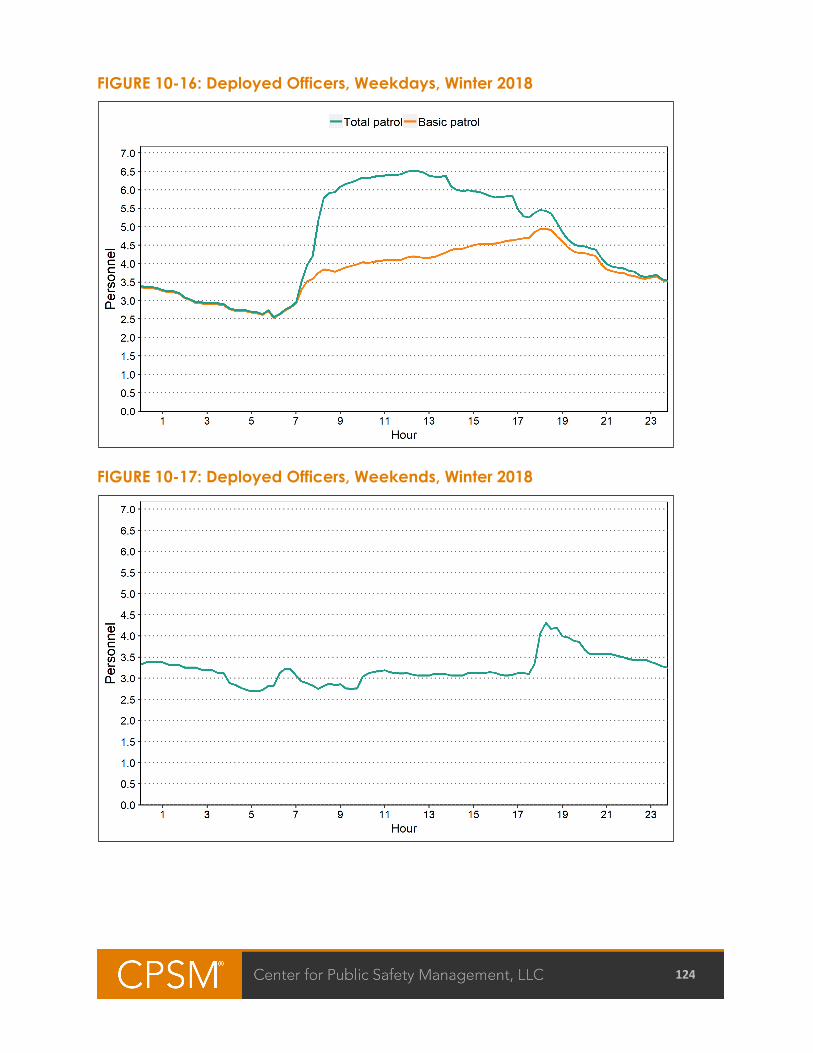
124
FIGURE 10-16: Deployed Officers, Weekdays, Winter 2018
FIGURE 10-17: Deployed Officers, Weekends, Winter 2018
125
Observations: ■ For summer (July 7 through August 3, 2017):
□ The average deployment was 4.4 officers per hour during the week and 3.6 officers per hour on the weekend.
□ Average deployment varied from 2.7 to 6.3 officers per hour on weekdays and 2.8 to 4.4 officers per hour on weekends.
■ For winter (January 4 through January 31, 2018):
□ The average deployment was 4.6 officers per hour during the week and 3.2 officers per hour on the weekend.
□ Average deployment varied from 2.6 to 6.5 officers per hour on weekdays and 2.7 to 4.3 officers per hour on weekends.
126
FIGURE 10-18: Deployment and All Workload, Weekdays, Summer 2017
FIGURE 10-19: Deployment and All Workload, Weekends, Summer 2017
127
FIGURE 10-20: Deployment and All Workload, Weekdays, Winter 2018
FIGURE 10-21: Deployment and All Workload, Weekends, Winter 2018
Note: Figures 10-18 to 10-21 show deployment along with all workload from community-initiated calls and police-initiated calls, directed patrol work and out-of-service work.
128
Observations: Summer: ■ Community-initiated work:
□ The average community-initiated workload was 0.6 officers per hour during the week and 0.5 officers per hour on weekends.
□ This was approximately 14 percent of hourly deployment during the week and on weekends.
■ All work:
□ The average total workload was 1.5 officers per hour during the week and 1.2 officers per hour on weekends.
□ This was approximately 34 percent of hourly deployment during the week and 32 percent of hourly deployment on weekends.
Winter: ■ Community-initiated work:
□ The average community-initiated workload was 0.5 officers per hour during the week and on weekends.
□ This was approximately 10 percent of hourly deployment during the week and 15 percent of hourly deployment on weekends.
■ All work:
□ The average total workload was 1.4 officers per hour during the week and 1.0 officers per hour on weekends.
□ This was approximately 30 percent of hourly deployment during the week and 32 percent of hourly deployment on weekend.
129
FIGURE 10-22: Percentage of Workload, Weekdays, Summer 2017
FIGURE 10-23: Percentage of Workload, Weekends, Summer 2017

130
FIGURE 10-24: Percentage of Workload, Weekdays, Winter 2018
FIGURE 10-25: Percentage of Workload, Weekends, Winter 2018
131
Observations: Summer: ■ Community-initiated work:
□ During the week, workload reached a maximum of 25 percent of deployment between 7:45 p.m. and 8:00 p.m.
□ On weekends, workload reached a maximum of 32 percent of deployment between 9:30 p.m. and 9:45 p.m.
■ All work:
□ During the week, workload reached a maximum of 47 percent of deployment between 7:45 p.m. and 8:00 p.m.
□ On weekends, workload reached a maximum of 56 percent of deployment between 9:45 p.m. and 10:00 p.m.
Winter: ■ Community-initiated work:
□ During the week, workload reached a maximum of 21 percent of deployment between 2:30 p.m. and 2:45 p.m.
□ On weekends, workload reached a maximum of 31 percent of deployment between 9:00 p.m. and 9:30 p.m.
■ All work:
□ During the week, workload reached a maximum of 46 percent of deployment between 2:30 p.m. and 2:45 p.m.
□ On weekends, workload reached a maximum of 54 percent of deployment between 12:15 p.m. and 12:30 p.m.
132
RESPONSE TIMES We analyzed the response times to various types of calls, separating the duration into dispatch delay and travel time, to determine whether response times varied by call type. Response time is measured as the difference between when a call is received and when the first unit arrives on scene. This is further divided into dispatch delay and travel time. Dispatch delay is the time between when a call is received and when the first unit is dispatched. Travel time is the remaining time until the first unit arrives on scene.
We begin the discussion with statistics that include all calls combined. We started with 2,915 calls for summer and 2,730 calls for winter. We limited our analysis to community-initiated calls, which amounted to 1,005 calls for summer and 869 calls for winter. After excluding calls without valid arrival times and excluding calls located within the Greenfield Police Department’s building, we were left with 760 calls in summer and 651 calls in winter for our analysis. For the entire year, we began with 18,103 calls, limited our analysis to 6,378 community-initiated calls, and further focused our analysis on 4,665 calls after excluding those lacking valid arrival times or those located at the Greenfield Police Department’s headquarters.
Our initial analysis does not distinguish calls on the basis of their priority; instead, it examines the difference in response to all calls by time of day and compares summer and winter periods. We then present a brief analysis of response time for high-priority calls alone. We examined the average response times by beat and found minimal differences between beats.
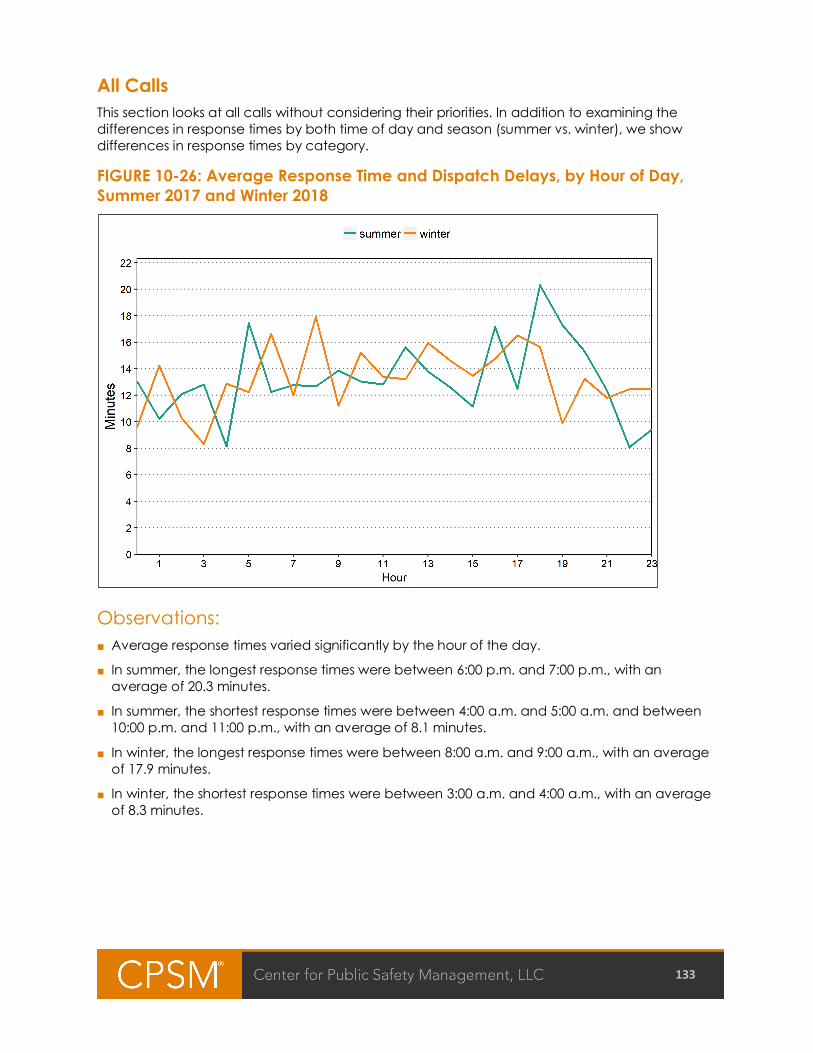
133
All Calls This section looks at all calls without considering their priorities. In addition to examining the differences in response times by both time of day and season (summer vs. winter), we show differences in response times by category.
FIGURE 10-26: Average Response Time and Dispatch Delays, by Hour of Day, Summer 2017 and Winter 2018
Observations: ■ Average response times varied significantly by the hour of the day.
■ In summer, the longest response times were between 6:00 p.m. and 7:00 p.m., with an average of 20.3 minutes.
■ In summer, the shortest response times were between 4:00 a.m. and 5:00 a.m. and between 10:00 p.m. and 11:00 p.m., with an average of 8.1 minutes.
■ In winter, the longest response times were between 8:00 a.m. and 9:00 a.m., with an average of 17.9 minutes.
■ In winter, the shortest response times were between 3:00 a.m. and 4:00 a.m., with an average of 8.3 minutes.
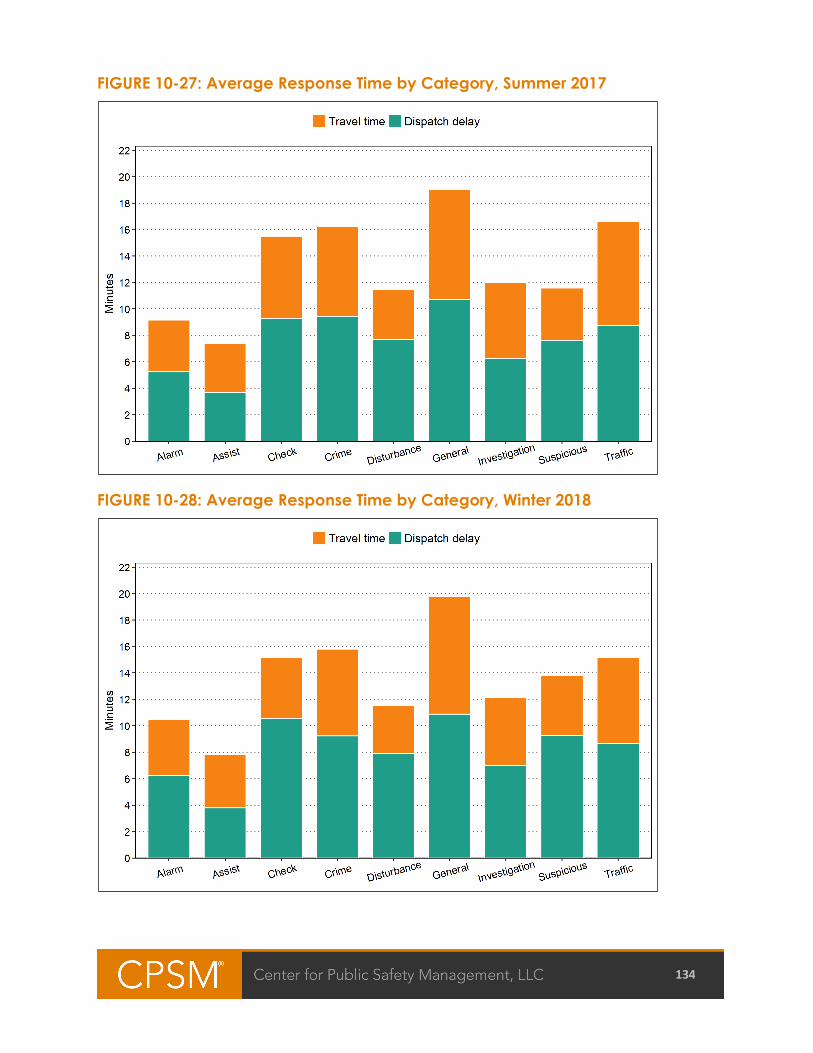
134
FIGURE 10-27: Average Response Time by Category, Summer 2017
FIGURE 10-28: Average Response Time by Category, Winter 2018
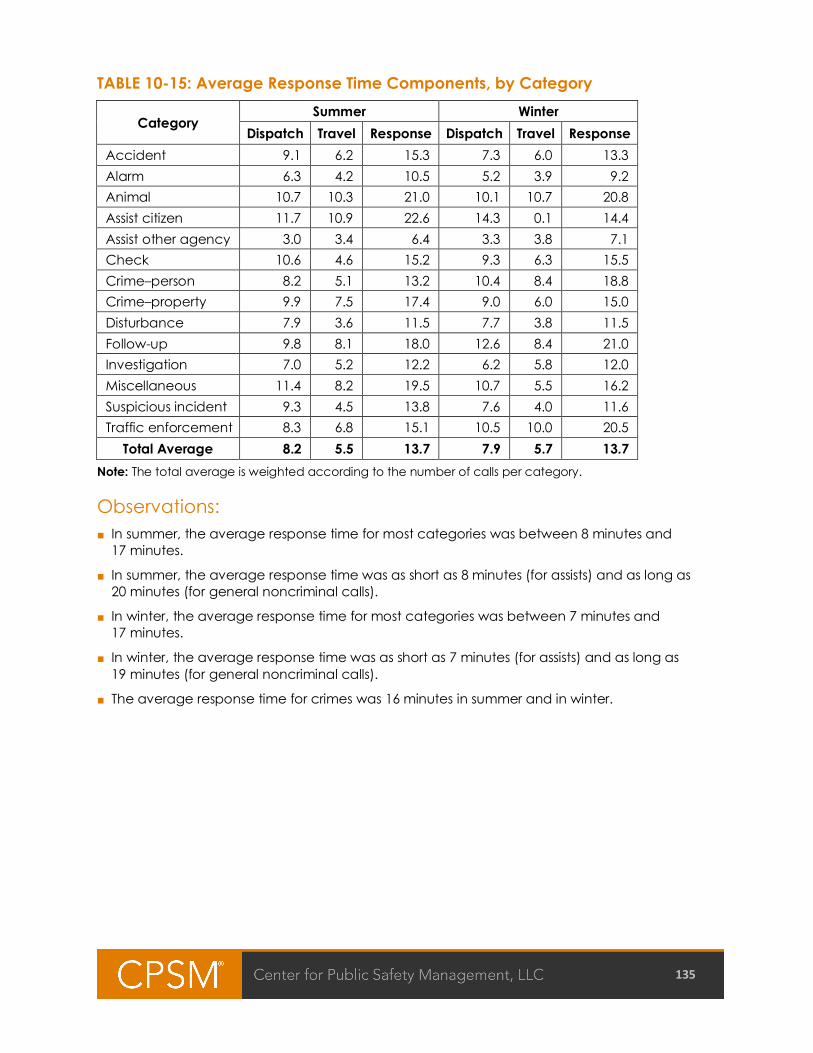
135
TABLE 10-15: Average Response Time Components, by Category
Category Summer Winter
Dispatch Travel Response Dispatch Travel Response Accident 9.1 6.2 15.3 7.3 6.0 13.3 Alarm 6.3 4.2 10.5 5.2 3.9 9.2 Animal 10.7 10.3 21.0 10.1 10.7 20.8 Assist citizen 11.7 10.9 22.6 14.3 0.1 14.4 Assist other agency 3.0 3.4 6.4 3.3 3.8 7.1 Check 10.6 4.6 15.2 9.3 6.3 15.5 Crime–person 8.2 5.1 13.2 10.4 8.4 18.8 Crime–property 9.9 7.5 17.4 9.0 6.0 15.0 Disturbance 7.9 3.6 11.5 7.7 3.8 11.5 Follow-up 9.8 8.1 18.0 12.6 8.4 21.0 Investigation 7.0 5.2 12.2 6.2 5.8 12.0 Miscellaneous 11.4 8.2 19.5 10.7 5.5 16.2 Suspicious incident 9.3 4.5 13.8 7.6 4.0 11.6 Traffic enforcement 8.3 6.8 15.1 10.5 10.0 20.5
Total Average 8.2 5.5 13.7 7.9 5.7 13.7 Note: The total average is weighted according to the number of calls per category.
Observations: ■ In summer, the average response time for most categories was between 8 minutes and
17 minutes.
■ In summer, the average response time was as short as 8 minutes (for assists) and as long as 20 minutes (for general noncriminal calls).
■ In winter, the average response time for most categories was between 7 minutes and 17 minutes.
■ In winter, the average response time was as short as 7 minutes (for assists) and as long as 19 minutes (for general noncriminal calls).
■ The average response time for crimes was 16 minutes in summer and in winter.
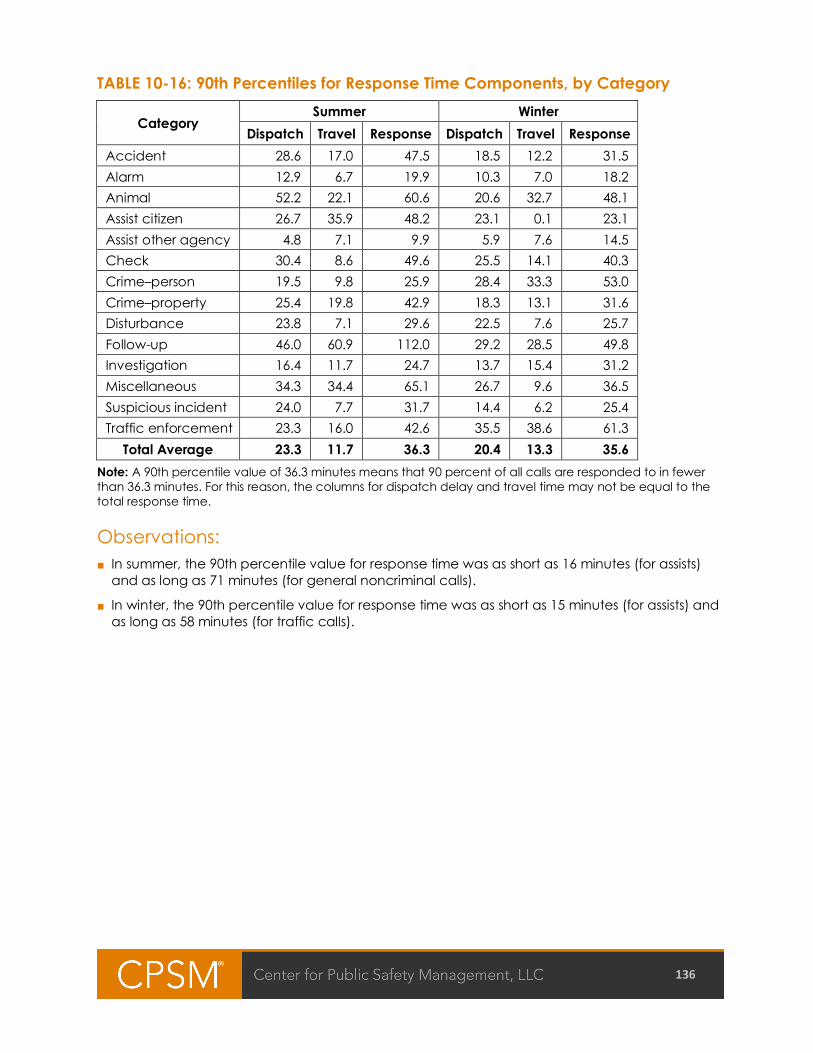
136
TABLE 10-16: 90th Percentiles for Response Time Components, by Category
Category Summer Winter
Dispatch Travel Response Dispatch Travel Response Accident 28.6 17.0 47.5 18.5 12.2 31.5 Alarm 12.9 6.7 19.9 10.3 7.0 18.2 Animal 52.2 22.1 60.6 20.6 32.7 48.1 Assist citizen 26.7 35.9 48.2 23.1 0.1 23.1 Assist other agency 4.8 7.1 9.9 5.9 7.6 14.5 Check 30.4 8.6 49.6 25.5 14.1 40.3 Crime–person 19.5 9.8 25.9 28.4 33.3 53.0 Crime–property 25.4 19.8 42.9 18.3 13.1 31.6 Disturbance 23.8 7.1 29.6 22.5 7.6 25.7 Follow-up 46.0 60.9 112.0 29.2 28.5 49.8 Investigation 16.4 11.7 24.7 13.7 15.4 31.2 Miscellaneous 34.3 34.4 65.1 26.7 9.6 36.5 Suspicious incident 24.0 7.7 31.7 14.4 6.2 25.4 Traffic enforcement 23.3 16.0 42.6 35.5 38.6 61.3
Total Average 23.3 11.7 36.3 20.4 13.3 35.6 Note: A 90th percentile value of 36.3 minutes means that 90 percent of all calls are responded to in fewer than 36.3 minutes. For this reason, the columns for dispatch delay and travel time may not be equal to the total response time.
Observations: ■ In summer, the 90th percentile value for response time was as short as 16 minutes (for assists)
and as long as 71 minutes (for general noncriminal calls).
■ In winter, the 90th percentile value for response time was as short as 15 minutes (for assists) and as long as 58 minutes (for traffic calls).
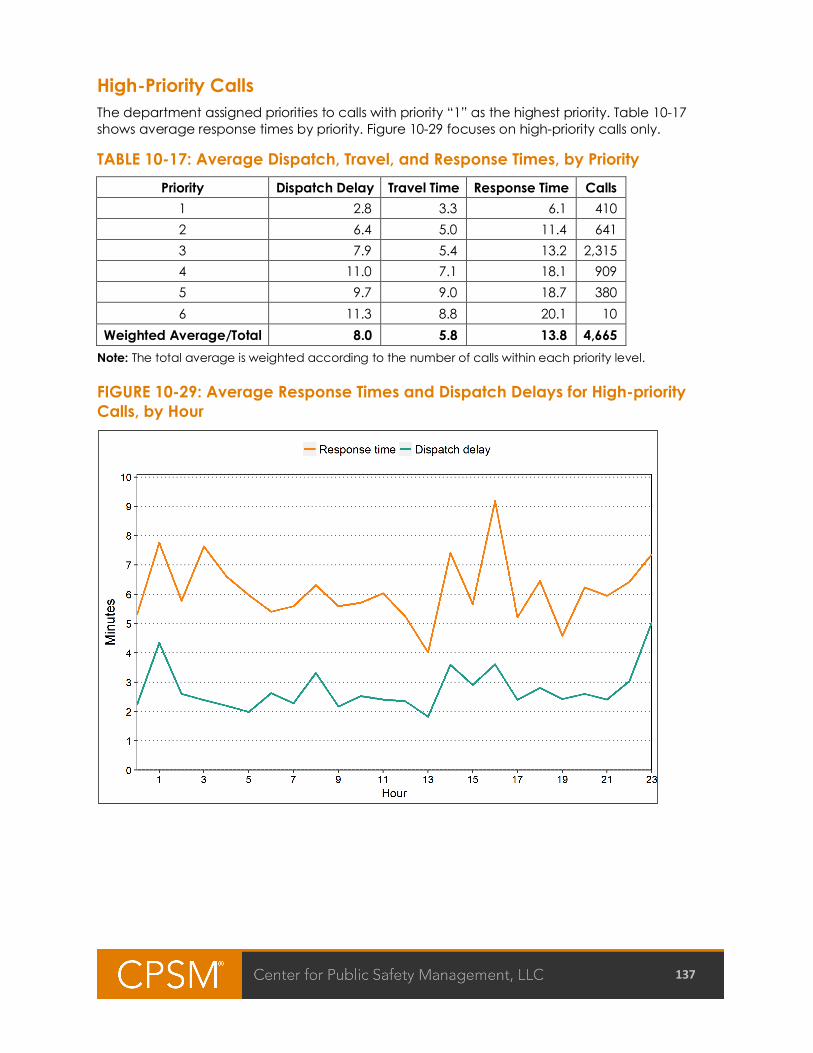
137
High-Priority Calls The department assigned priorities to calls with priority “1” as the highest priority. Table 10-17 shows average response times by priority. Figure 10-29 focuses on high-priority calls only.
TABLE 10-17: Average Dispatch, Travel, and Response Times, by Priority Priority Dispatch Delay Travel Time Response Time Calls
1 2.8 3.3 6.1 410 2 6.4 5.0 11.4 641 3 7.9 5.4 13.2 2,315 4 11.0 7.1 18.1 909 5 9.7 9.0 18.7 380 6 11.3 8.8 20.1 10
Weighted Average/Total 8.0 5.8 13.8 4,665 Note: The total average is weighted according to the number of calls within each priority level. FIGURE 10-29: Average Response Times and Dispatch Delays for High-priority Calls, by Hour
138
Observations: High-priority calls: ■ High-priority calls had an average response time of 6.1 minutes, lower than the overall
average of 13.8 minutes for all calls.
■ Average dispatch delay was 2.8 minutes for high-priority calls, compared to 8.0 minutes overall.
■ For high-priority calls, the longest response times were between 4:00 p.m. and 5:00 p.m., with an average of 9.2 minutes.
■ For high-priority calls, the shortest response times were between 1:00 p.m. and 2:00 p.m., with an average of 4.0 minutes.
■ Average dispatch delay for high-priority calls was consistently 3.6 minutes or less, except between 11:00 p.m. and 2:00 a.m.
139
APPENDIX A: CALL TYPE CLASSIFICATION Call descriptions for the department’s calls for service from July 1, 2017, to June 30, 2018, were classified into the following categories.
TABLE 10-18: Call Type, by Category Problem type Description Table Category Figure Category
AL211 Robbery Alarm
Alarm Alarm
AL459 Burglary Alarm ALF Fire Alarm ALM Audible Alarm ALV Vehicle Alarm PANIC Panic Alarm 5150 5150 Transport
Arrest and prisoner Arrest and prisoner TSP Transport WS Warrant Service 111 CONTACT CITIZEN
Assist citizen
Assist
ASC Assist Citizen FLG Flagdown SRO CONTACT SRO CONTACT 108 ASSIST OTH AGCY
Assist other agency
ABC Alcohol Violation ASP Assist Public Safety FIRE Miscellaneous Fire FYI Fire Info LEAK Main / Leak Problem MED MED SF Structure Fire SFU Unconfirmed SF SMK Smoke Investigation UABURN ILLEGAL FIRE VF Vehicle Fire VGF Vegetation Fire AC Area Check
Check Check
ATC Attempt To Contact ATL Attempt To Locate BCK Business Check CALL Telephone OPD/OPW OPD/OPW PC Probation Check SS SUBJECT STOP SVC Service Call
140
Problem type Description Table Category Figure Category WELFARE CHECK WELFARE CHECK WLF Check Welfare 207 Kidnapping
Crime–person
Crime
211 Robbery 211A Armed Robbery 215 Carjacking 215A Armed Carjacking 242 Assault / Battery 245 Assault w/ Weapon 246 Driveby Shooting 261 Rape 273 Corporal Injury 288 Child Molestation 290 Sex Registrant 314 Indecent Exposure 417 Brandishing 647F Intoxicated 653M Harassing Calls GSW Gun Shot Wound H&S H&S HAR Harassment SUT Suicide Threat THR Threats VRO Viol of Restraining Order 10851 Stolen Vehicle
Crime–property
459 Burglary 484 Theft 487 Grand Theft 496 Stolen Property 537 Defrauding An Innkeeper 594 Malicious Mischief 647H Prowler FRAUD Check / Creditcard LIT Littering TRES Trespasser 123 STATION DETAIL
Directed patrol Directed patrol C5 Stakeout CPAT Close Patrol ESCORT Escort FPAT Foot Patrol
141
Problem type Description Table Category Figure Category MISC PATROL MISC PATROL SDT SPECIAL DETAIL SRO SRO 415 Peace Disturbance
Disturbance Disturbance
415F Fight DOM Domestic FRKS Fireworks GANG RELATED GANG RELATED LM Loud Music LOI Loitering NEI Neighbor Problem SHOT Shots Fired 106 ANIMAL CALL
Animal
General noncriminal
ANB Animal Bite ANC Animal Call FUP Follow Up Follow-up 110 CIVIL PROBLEM
Miscellaneous
CIV Civil Problem COVER2 Code 2 Backup HZC Hazardous Condition INFO Information Only JUV Juvenile Problem MUNI Muni Code Violation STBY Standby SUBPOENA SERVICE SUBPOENA SERVICE TRANSLATION DETAIL TRANSLATION DETAIL 911 911 Hang Up
Investigation Investigation
CHILD Missing Child MP Missing Person PRF Found Property PRL Lost Property RJ Runaway Juvenile ADMIN Admin Detail
Out of service Out of service
CODE 7 CODE 7 COURT COURT CS Serve Civil Papers FUEL FUEL INFORMATION REPORT INFORMATION REPORT
142
Problem type Description Table Category Figure Category MECHANICAL MECHANICAL MEET Meet With STN STATION 126 SUS PERSON
Suspicious incident Suspicious incident
127 SUS VEHICLE SC Suspicious Circumstance SP Suspicious Person SUSPICIOUS CIRCUMSTANCE
SUSPICIOUS CIRCUMSTANCE
SUSPICIOUS PERSON SUSPICIOUS PERSON SUSPICIOUS VEHICLE SUSPICIOUS VEHICLE SV Suspicious Vehicle BOL HR
Accident
Traffic
HR 20002 NIA Non-Injury Accident TRAFFIC ACCIDENT TRAFFIC ACCIDENT UIA Unknown Injury Accident VIA Vehicle Injury Accident 101 ABAN VEHICLE
Traffic enforcement
142 PARKING CIT ISS AV Abandoned Vehicle DUI 23152 DV Disabled Vehicle HAZ Hazard In Road HAZARD CITE ISSUED HAZARD CITE ISSUED PARKING CITATION ISSUED
PARKING CITATION ISSUED
PK Parking Problem PUR Pursuit RV Reckless Vehicle TC Traffic Control TLM Traffic Light Malfunction TS Traffic Stop
Traffic stop VCK Vehicle Check

143
APPENDIX B: UNIFORM CRIME REPORT INFORMATION This section presents information obtained from Uniform Crime Reports (UCR) collected by the Federal Bureau of Investigation (FBI) and the California Department of Justice. The tables and figures include the most recent information that is publicly available at the national level. This includes crime reports for 2007 through 2016, along with clearance rates for 2016. Crime rates are expressed as incidents per 100,000 population.
TABLE 10-19: Reported Crime Rates in 2016, by City
City State Population Crime Rates
Violent Property Total Albany CA 19,975 145 2,668 2,814 Arroyo Grande CA 18,280 191 1,827 2,019 Arvin CA 21,195 901 2,991 3,892 Avenal CA 12,941 247 1,360 1,607 California City CA 13,244 687 2,945 3,632 Coalinga CA 16,282 798 1,800 2,598 Corcoran CA 22,111 308 1,827 2,135 Grover Beach CA 13,686 292 2,338 2,630 Kerman CA 14,654 239 2,552 2,791 King City CA 14,111 333 1,672 2,006 Kingsburg CA 11,905 227 2,906 3,133 Livingston CA 14,076 426 2,643 3,069 Marina CA 21,539 265 2,317 2,581 McFarland CA 14,263 231 1,451 1,683 Mendota CA 11,481 845 1,307 2,151 Morro Bay CA 10,719 159 1,903 2,062 Newman CA 11,037 290 1,359 1,649 Oakdale CA 22,572 239 3,048 3,287 Pacific Grove CA 15,795 57 2,013 2,070 Parlier CA 15,262 675 1,677 2,352 Patterson CA 21,716 276 2,247 2,523 Piedmont CA 11,515 278 1,737 2,015 Scotts Valley CA 12,016 133 2,122 2,255 Shafter CA 18,608 226 3,047 3,273 Tehachapi CA 12,770 407 2,138 2,545 Greenfield CA 17,343 323 1,713 2,035 California 39,421,283 443 2,541 2,984 United States 329,308,297 383 2,353 2,736
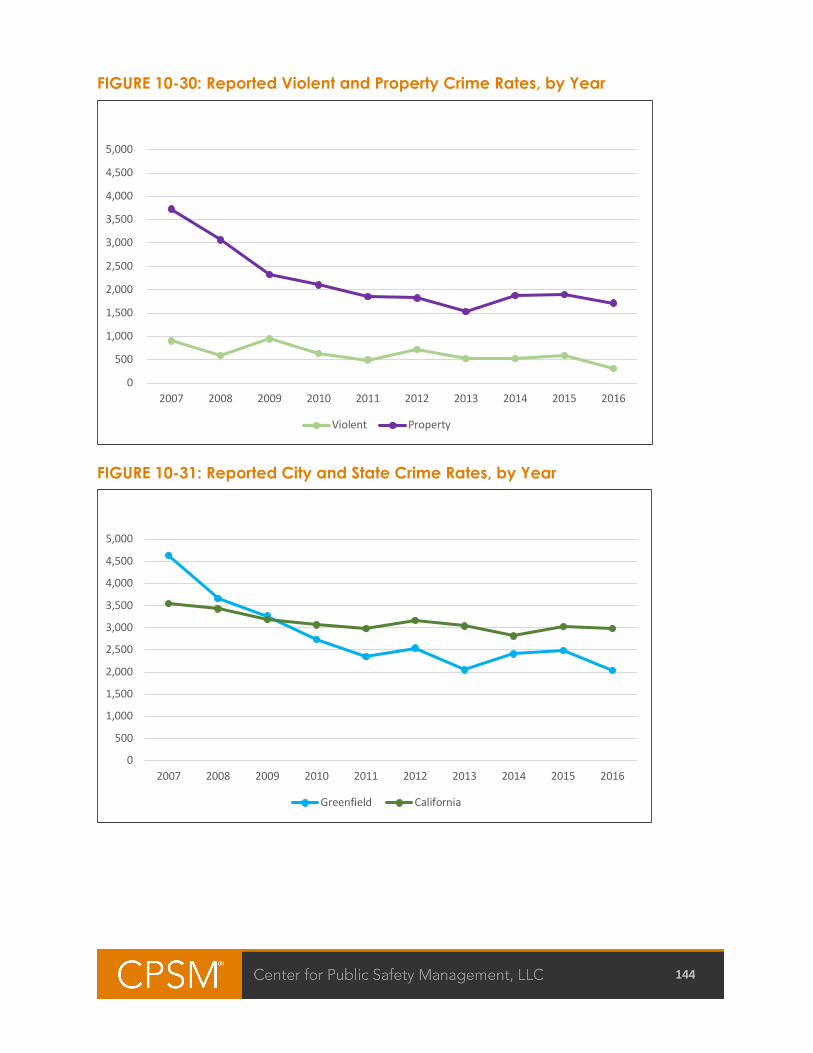
144
FIGURE 10-30: Reported Violent and Property Crime Rates, by Year
FIGURE 10-31: Reported City and State Crime Rates, by Year
0
500
1,000
1,500
2,000
2,500
3,000
3,500
4,000
4,500
5,000
2007 2008 2009 2010 2011 2012 2013 2014 2015 2016
Violent Property
0
500
1,000
1,500
2,000
2,500
3,000
3,500
4,000
4,500
5,000
2007 2008 2009 2010 2011 2012 2013 2014 2015 2016
Greenfield California
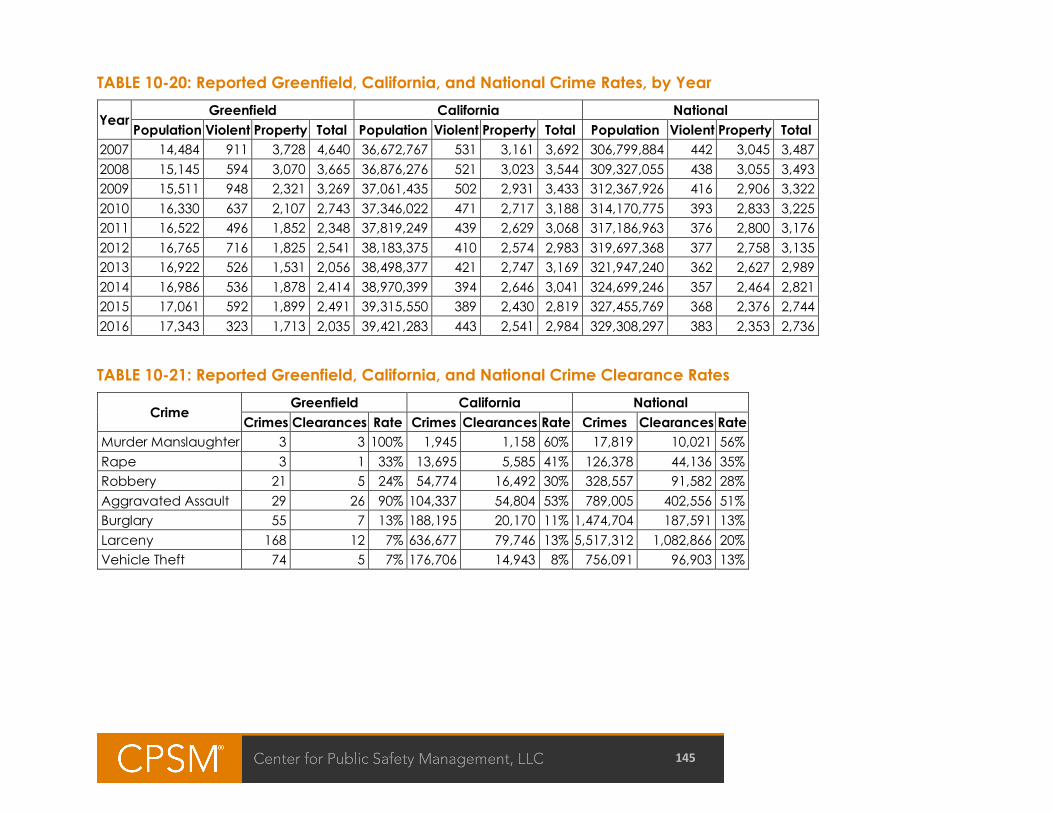
145
TABLE 10-20: Reported Greenfield, California, and National Crime Rates, by Year
Year Greenfield California National
Population Violent Property Total Population Violent Property Total Population Violent Property Total 2007 14,484 911 3,728 4,640 36,672,767 531 3,161 3,692 306,799,884 442 3,045 3,487 2008 15,145 594 3,070 3,665 36,876,276 521 3,023 3,544 309,327,055 438 3,055 3,493 2009 15,511 948 2,321 3,269 37,061,435 502 2,931 3,433 312,367,926 416 2,906 3,322 2010 16,330 637 2,107 2,743 37,346,022 471 2,717 3,188 314,170,775 393 2,833 3,225 2011 16,522 496 1,852 2,348 37,819,249 439 2,629 3,068 317,186,963 376 2,800 3,176 2012 16,765 716 1,825 2,541 38,183,375 410 2,574 2,983 319,697,368 377 2,758 3,135 2013 16,922 526 1,531 2,056 38,498,377 421 2,747 3,169 321,947,240 362 2,627 2,989 2014 16,986 536 1,878 2,414 38,970,399 394 2,646 3,041 324,699,246 357 2,464 2,821 2015 17,061 592 1,899 2,491 39,315,550 389 2,430 2,819 327,455,769 368 2,376 2,744 2016 17,343 323 1,713 2,035 39,421,283 443 2,541 2,984 329,308,297 383 2,353 2,736
TABLE 10-21: Reported Greenfield, California, and National Crime Clearance Rates
Crime Greenfield California National
Crimes Clearances Rate Crimes Clearances Rate Crimes Clearances Rate Murder Manslaughter 3 3 100% 1,945 1,158 60% 17,819 10,021 56% Rape 3 1 33% 13,695 5,585 41% 126,378 44,136 35% Robbery 21 5 24% 54,774 16,492 30% 328,557 91,582 28% Aggravated Assault 29 26 90% 104,337 54,804 53% 789,005 402,556 51% Burglary 55 7 13% 188,195 20,170 11% 1,474,704 187,591 13% Larceny 168 12 7% 636,677 79,746 13% 5,517,312 1,082,866 20% Vehicle Theft 74 5 7% 176,706 14,943 8% 756,091 96,903 13%