pnacc313.pdf - usaid
TRANSCRIPT

~~Melhorando a qual~dade de vtda na Afr~ca rural atraves do mslhorarnentos dos recursos hfdrrcos, aarmento
de produggo alrmentar e fornecimento de servyos senit&rios ''
Av MLo Ts6Tung 519
4 " andar Esq CXP 2978
Tel (258-1 ) 492998/493069
Fax (258-1) 493033
Maputo/Mozaanbique
Rua da Zlrnbla. 617
Caixa Postal 435
Tei (2580511 23615/6
Fax (258 051 ) 2361 7
Chirno~o/Mozambique
November 5, 1997 AFR/M #I49198
Bob Wtlson ??FP OEcer - L~SMDMozamb~que
Subject Submission Of Baseline Momtonng and Evaluat~on Report ,
Dear Bob
Attached please find the FY 1997 Baseline Momtoring and Evaluat~on Report for the iailamca 011 Seed Food Secunty Hmt~ati~e, whach began during FY'97 Thls document 11s a presentatlon of data-gathemg and research completed by .*care st& slnce estabhshng field operations in Mamca Provlnce in March 1997 The ~nfonnation contained nn ths document has greatly Increased our knowledge of the five dnstncts where t h s food secunty act~vrty 1s tahng place and has been mcorporated into the ~rnplementation of our outreach act~vitles dunng FY 1998
One Important result of thas research has been the rehlslon of our loglcal framework's momtormg and Impact mdicators The final section of tkts report 1s a presentatlon of our revised ~ndlcators for both components (011 Seed Promotion and Household Kutntlon), lncludlng actual values for the baselrne year (FY 2997) and targets for each year (where appropnate), md-term and end-hne Ths report 1s bemg submtted to U S f l l I l B m I F B by AfncmeAVashmgton Some of the tnfomat~on contsllned wnU be incorporated Into the FY 1997 Annual Results Report, to be subnutted to USAH)/M[ozarnb~que on 01/15/98
I lnvlte you to share ths report wth your colleagues at USL4DM, and look forward to recelvmg your react~on -- to the mfonnat~on, conclusaons and recommendations mcluded
N
A
Smcerely, fl&f y ~ ~ & N he G.;d-@~LO\
i -W&am P Noble / A h - k 830% 9 Country 'Represeirtat~ve -2 A h c a r e / M o ~ m k 1 6 ]Hb-~ZZQ-&-W -
-c .-
-"a 3 063 -00 enc F3? (997 Baselme Monitoring and Evaluat~on Report
BEST AVAILABLE COPY

AFRICARE "Me:horando a qualMade de vlda na Africa rural atravtSs do melhoramentos dos recursos hfdricos, sumento
de produ~lo allmentar e for;nffilmento de servi~css sanlttlrlos '*
Av MBo Ts6Tung 519 4" andar Esq CXP 2978 Tel (258-1) 492998/493069
Fax (25&11 493033 Maputo/Mozarnb~que
Rua da Zlmbta, 637
Calxa Postal 435
Tel (258051 ) 23615/6 Fax (258 0511 23617
Chimofo/Mozambique
AFMC-OZAMBIQUE:
MANICA OIL SEED FOOD SECURITY INITLATTVE
FISCAL YEAR 1997 BASELINE ZbfONHTOPIPNG AND EVAL1L'ATPBN IREPORT
NOVEMBER 1997
BEST AVAlLA BL E COPY

Table Of Contents
Section I
Section 11
Section 111
Sectlon IV
Introduction And Research Methodology
Agncuitural Data Analysis/Interpretatlon
Health/Nutntional Data halys~sflnterpretation
Revlsed Indicators And Targets

Introduction
Ahcare began nrnptementatlon of the Mamca 011 Seed Food Security Initiative during FY'97 Ths activity has two interrelated objectives an oil seed promotion component and a household nutrition component Both take place 1n the hllowng five distncts of the provlnce Barue, Gondola, Guro, Mmca and Sussendenga The oil's program wdl develop a sustamable, small scale oil seed production and processing industry, the nutrition activities will increase awareness and application of improved nutntlon and health practices (including increased oil conwmption)
After establishing a field office in the provincial capital Choio (February 1997), Africare initiated a series of data-gathering and information collection activities to increase understand~ng ofthe target area Another object~ve of these activitnes was to promde specific input about the dikrent indicators that will be measured during the h e year implementa~on perlod to assess the impact of outreach activities These research activities included
e Two detailed basdine household surveys (780 households each, one in agriculture and the other m hcaltldnutntnon)
0 Rapd rural reconnaissance bis~ts to ident~fy communit~es that wll receive support
Data-gathering wsits wth health and agncultural oficials at the distnct level
o S h m g of experiences with other development agencies working in the province
h t ta l monitoring of participants (oll press owners) at the d a g e level and their experience with this new small-scde enterprise
These act~t-ities were completed d u n g the per~od April - September 1997 Besides the fficare/CErnoio permanent staff, a s~gntficant number of temporary personnel were used (enumerators, comanaua~ guides) Ths information that has been collected during FY 1997 has been incorporated into field actrwties to be mplemented during FY 1998 One example of th~s is the revised implementation plan for the Household Nutrition Component that was completed at the end of Ff 1997 'Plais document provides more specific operatnonal guxdel~nes for Afncare's nutntaon activities dumg FY 1998, and mmrporates the information that was gathered d
Another important objective of these research activities was to refine the monitoring and evaluation system that faad been presented in the originid Development Activity Proposal (DAP) in 1996 Specifically, this rekement includes a review of each indicator in the Iogicd framework and the identification of an actual baseline value for each, upon which specific targets can be made for the remaining years of ~mplementation
Ths document is the FY 1997 Baseline Monitoring And Evaluatnon Report for the Manica Oil Seed Food Security Init~ative This report contains four parts
1) A presentation of the research methodology

2) The Data Analys~sfinterpretatmn of the Agricultural Sune)
3) The Data Analysisfinterpretatlon of the HealthNutntion Survey
4 ) A presentation s f the rewsed rndtcatars to be measured dumg Llfe Of Activity, ~ncluding actual baselme values (for FY 1997) and annual, rmd-term and end-hne targets (where appropriate)
Baseline Survey Time Frame
A principle objective of the household surveys was to obtan a basellne value for key indicators prior to the start of activities Many ofthe baseline values presented in the last section of ths report are denved from the baseline survey analys~s Those that are not have been derived &om periodic visits to the field, document revim and duect observation by &care staff The baseline survey was the first step to establish Afi7eareYs monitoring and evaluation system The time period allocated for the survey was Apnl - September 1997 April and May were spent developing the study design, devising the m p l i n ~ methodology, . selecting clusters, and deslgmng the quest~onna~res Training of the lntervlewers was done in the early part of Jbne after whch the survey was launched and continued through July Data entry started the begmng of July and was completed by md-Aupst Data analysls and mterpretation was completed fkom mid-August through the end of September
Study Design
The study design selected was a repeat cross-sectional survey at baseline, mid-term and end h e vvlth add~tional measurements of certain key indcators between surveys Multiple measurements over tune will provide trends but does not directly confirm the program's impact For this reason, an effort was made to Identify a possible cornpanson group mth which to compare program sites However, the dollowing issues were rased
1) If target versus non-target areas were compared, it was felt that ~t was unethical to ask for the cooperaQon of non-target comrnurut~es and then deny them assistance if asked
2) An attempt was made to identfi sites where Afi.icare would start their activities and compare those sites with the remamng sites targeted for a later date However, the 011's program planned to start where communities showed an interest and were mUmg to take a risk (i e , the early adopters) Thus it was dficult to predict where f f icare would start wthout first doing press demonstrations and promoting oilseed production.
3) Afiicare selected genera9 target areas, to work with communities within these areas that expressed an interest in oil seed production and processing (thls critena was strongly recommended by USGIh) during the PAA review of Afiicare's program in May'97) It was suggested that at mid-term, sites that ioltlated activities would be compared to the remainiPlg sites which would serve as a nonequivalent control group One potential &fEculty is that the two groups would be too different to compare (differences in income level, access to potential markets and other characteristics)

The study design selected is an ~rnprobed pretest-post test des~pn uhere repeat measurements of specific indicators w11 be taken throughout Ahcare's 5-year program and compared to the baselme results
Sampling Methodology
Target areas of the program were selected based om the following criteria relevant to the 011 component
a Presence of ollseed fields Prevlous history of ollseed production
• Accessibility a Interest in o~lseed productton by small holders determed dunng field ~nterviews a Suggestions made by the district government officials
Cluster sampling as described by WH8 for EPI coverage surveys was used in the selection of villages for the baseline survey (WMO, the EPI[ coverage survey, 1991) This method IS a varlat~on on multistage sampllng in whch the probabiflty of selecrlng a cluster IS
proportional to ~ t s slze and m equal number of elements is sampled wthn each cluster
The sample size was calculated wtk the followang formula n=Z2 x p(l-p)/d2 The rmrumum sample slze was detemned using the fo'ollowmg values Z= 1 96 (error nsk of 5%), p=O 5 (based on prevalence of stunting which is one variable with hgh prevalence of 54% in Guro in 1995 according to MSF-CISfACNUR), d=O 05 (precision of k 5%) The sample size calculated, n=384, was doubled to make up for the design effm of cluster sampling, thus N=768 ( M S F , U N H C m , 199 1) Although a larger sample size is preferred to show stat~st~cdly signrficant differences at the end of the project, this smpk size was maintained due to resource and time lhtations
A total number of 78 clusters were randomly selected and 10 households were ~ n t e ~ e w e d 1x1 each commumty Because of the nature of the 011 program, it was prefirable to select as many cornurnties as possible for the survey to cover more of the target areas Oil seed is a lucrative cash crop and f m e r s are quick to follow if someone m their community produces and sells it successhlly, this is especially true wth d o w e r For this reason, more vanation was expected between cornurnties than w t h cornurnties It therefore made more sense to increase the number of clusters sampled rather than the number of households sampled in each community
In the Geld, interviewers were instructed to divide each community, with the help of local authorities, into sectors of approximately equal population density (h 500) and to randomly select one sector in which to conduct their interviews They were abte to refer to rough community maps drawn by community leaders and key informants prior to the hFlementation of the survey To select individual households, intepviewers followed the WHO'S method of s p i m g the bottle, randomly selecting a house along the chosen direction for the first mntewiew and systematically selecting subsequent households based on proximity One small modtfication was made to avoid interviewing close-knit f d e s which was to skip one house in between households

The agr~culture and nutrltlon surveys were conducted in d~fferent households for the following reasons
1) The oil component iss almed at all farmers, the agriculture survey was designed to collect tnformation about all farmers The nutnt~on component's maln target are fmhes wth chddren under five, therefore only these f d e s were ~nterviewed dunng the survey
2) Both questionnaires were quite lengthy and to conduct both Interviews in the same household would have taken 1 %-2 hours of their time Because each component was going to base its activities in large part on the lnformat~on collected in the baselme, ~t was important to include a number of questions for program planning purposes
Selection Of Clusters
Clusters were selected following WHO'S guidelines for cluster surveys, Population sue est~mates were very difficult to obtain A 1st of vlllageshainos an each area was comp9ed Gth the~r corresponding population size est~rnates An attempt was made to obtaln updated ~nformatlon at the d~stnct level Whenever such ~nformation was not available, the officld population numbers were used from the department of statlstlcs m Chmoio The exceptions were Dombe, an administratwe post in Sussendenga, and Pumbuto, a locality in Gondola, where popdat~on estunates at the commumty Ievel could not be obtmed in ths case, the indimdual communities were selected randomly regardless of population size Attached are population estimates of the target areas and the different clusters that were selected
The totd population size of the target areas selected was calculated %om these estimates to be about 320,800 With 78 clusters, the smplmg interval was calculated as follows 320,800/78 = 41 12 The random number was selected using a currency note 3982 The clusters were then selected using these two numbers
Once selected, a preparatory vlsit was made to each cluster, to inform the local authorities of the survey and make the necessary arrangements The leaders md key informants were asked to assist in developing a rough map of their community whch was used to facilatate household selection dunng the survey During ths time, a few comunit~es had to be substituted by others @referably nearby) after ~t was deterwed that they were in fact not accessible by road
Questionnaires
Separate questlomres were designed for household and child-based idormation The agricultural survey was conducted with head of households (female or male), the nutrition survey with mothers of children under five years of age In designmg the questionnaires, a number of surveys were reviewed and some of their questions were adopted or modified (see bibi~ography list) The questions were developed pnmariiy to obtain either a measurement for one of the key indicators or information needed for program plamng. A few questions were added to measure some aspects of overall food security

The nutr~tion questronnaire focussed on the follon~ng areas d~etary intake of 3 basic food groups as well as vltarmn A nch foods, breastfeed~ng hab~ts, QII consumption, management of diarrheal episodes and poor weight gain Antfiropometric measurements (height, weight and age) were also taken
The principal focus of the agriculture questlonnare was ohseed productron and sales Ths included 1995-96 as well as 1996-97 production Questions pertaining to general food secunty lncluded a senes of proxy measurements compiled by Mlchlgan State University's Food Security Project to measure income levels as well as infomation about agricultural and non-agricultural sources of income, food shortages, and pnncnpal crops Prices of pmcipal crops sold were obtaned at local markets rnstead of during household lntewews because it was felt that fanners, hoping they wodd receive assistance, were likely to repofl a lower income The questionnsures were translated Into Portuguese in-house and then checked by an external reviewer Translation into local languages was not done (although some of the i n t e ~ e w s were conducted rn local languages) A copy of each questtomaxe is included at the end of each data analysis & interpretation
The questionnares were field-tested numerous ttmes before and dur~ng traimng A number of questions were ehmnated due to the~r complexity and some were reworded During the survey, the folowng questions were found to be most problematic
In the apculturd questlomaire, Sectlon A, some nntemewers were hawng cfifticulty differentiating between fady-owned businesses (A00 1 3) and salaried work (A00 14) Also, some interviewers kept forgetting that the fist type of work does not include the sale of their own crops or animals (as defined by MSU) Section B, question #2, the tenn "house" did not have a clear definition Some intervlewers included any man-made shelter as a house For question 15 and 16, no time penod was sgecnfied, and intermewers did not know how far back to Investigate Also, some mtervlewers were satisfied with the answer "quando tiver dinhe~ro (when there 1s money avadable)" whch does not grve a clear mdicat~on of how many times the f d l y consumed od Also, m Section L, some Internewers had some trouble converting amounts sold of the different crops into standard measurements
En the nutrition quesbonnaire, Sectmn B, intervlewers had trouble limiting their answers to the 2 most important types of vegetables, h t s and other cereals Some wrote down more than 2, instead of aslang whch ones were the 2 most unportant Section C the organization that came to the village to do an activity dnd not always do house-to-house visits arid since the questionnaire only asks about the latter? mterviewers did not find out who did the demonstration or health actlvlty Section D for questions 14 and 15 regarding oll consumption, interviewers had the same problems as in the agridtural questionnaire, Also, ~t was difficult to d e t e m e the exact day the famdy last bought oll and the exact amounts In 4 cases, the interviewer erroneous2y recorded information about pig f&t instad of vegetable oil Section H Question M0 about warning signs of diarrhea was not always well understood Some mothers just described what diarrhea meant to them Copies of each questionnaire are attached to the two data analysis reports (Sections ll and III)

The process to select enumerators mcluded the following a bas~c test was given to determine local language ab~hties, basic math shlls, abll~ty to track and complete forms The test also helped to Identi9 candidates wth knowfedge and trairung in e~ther nutrit~odhealth or agnculturdo~lseed production One or both coordmators rn te~ewed those who passed the test Selection for the training was based on prior experience with surveys and/or one of the two program components and recommendations fiom the~r prevtous employer For the final selection, only those who succeeded in the training were hired for the actual survey (25 out of 33 trainees) Although 24 were needed for the actual field work, an addit~onal person was hred to serve as back up m case of Illness
The tralmng of the internewers took place at the Red Cross facililty m Chirnoio for a penod of 8 days fiom June 4 to June 12 The following topics were covered wth the entire tralmng group roles of interviewers and team leaders, interviewng principles and techques, and household selection methodology Participants were then divided into 2 groups, one for each type of survey, nutrition and agriculture Each group reviewed their questionnaire in detal, and pract~sed conductmng Intermews In the field and recording the data collected The nutr~t~on group also pract~sed weighng and measuring chldren Following the practlce sessions, the quest~onnaires were slmpllfied and modified according to the results of the field- test
For the nutntlon group, interviewers were given a list of common contamers used for oil wath the~r corresponding volume For bottle caps, they were asked to measure whenever possible the diameter and height of the cap (used to calculate the volume), and ifunavailable, they were told to ask for a detaded description of the cap For the agriculture group, to determne how the crops were being utihzed, trainees were taught a part~cipatory rural apprasal techque using the dlstnbution of twenty beans The pile of twenty beans represented the total production whch the farmer then distributed mto smaller piles proportionate to the amount eaten, sold, lost, and so on The tranees were also given a llst of common umt conversions to help wlth cafculations of amounts sold Both groups were gxven a calendar of events to asslst them m deterrmmng ages of household members
Implementation Of The Survey
The survey started on June 16 and ended August 1,1997 The survey had to be completed by this date so as not to interfere with the nat~onal Population and Housmg Census planned for the month of August T i m g was convenient for it did not disrupt any major agricultural work On the other hand, informat~on collected for t h s year's oilseed production and sales was incomplete because harvesting time for these crops extended into August
The survey was planned as follows 24 lntervlewers were chided lnto 6 teams of 4 people each In each team, two interviewers conducted the nutritional survey, the other two completed the agricultural interviews It was assumed that a team of 2 interviewers could complete I cluster m 2 days ?4 day for studylng the map, selectrng the area to conduct the ~mterview, and making final arrangements for food and lodging, and 1 '/2 days for five questionnaires per interviewer Allowing for 35 day travel time between clusters, one team

couid easri? complete 2 clusters per ueeL During the actual field l\orL. the lnbervlewer5, after the first week, were able to fimsh thelr weekly quota of lntemews more quickly than expected They were asked to use ths extra time to renew thelr qasestlonnalres more carefully and improve the quality of their work
For logstical reasons, both the nutrition and agnculture surveys were conducted simultaneously but not in the same households Once the directton was determined by spinning the bottfe, the team for one of the surveys went one way ckhile the other team went ln the opposite direction All participation m the survey was voluntary
The mtemewers were supervised by the senior staff' of both oil and nutrltlon components as well as the M&E Coordinator They were responsible to make sure the intentlewers' were completing the~r work as instructed and to answer any quest~ons they mght have had Due to the number of mtemewers, and other responsibilities assigned to the supervisors, ~t was impossible to accompany every single interwe~ver worlung m the field Some of the interviewers would have benefited from closer supervision
Vehcles were used to transport the lnterclesers out to thex wte. make them mid- week to then next slte, and transport them back to Chmoio Because of the amount of baggage and equ~gment, the cars were always packed Coord~nat~on of cars was a major task and had to be planned as best as possible beforehand
Interviewers were informed to take their own beddlng, mat, food, and coolung utensds Africare provided water, buckets and tents Each commumty was asked to provlde 2- 4 guides to accompany the ~ntenviewers dunng their work, a sheltered place to set up camp, and some assistance with coolung meals However, the participating local authorities dlffered In their interest and enthusiasm and some teams were left to fend for themselves The initial preparatory =sit and the confirmation letter that followed was apparently not sufiicient in some cases to ensure adequate preparations for the survey Tents were available and were used m some cases but they were not adequate for rsuny days Mso, the local gu~des were not always wlllng to volunteer thar t~me espec~ally when the intervrewers expected them to carry thew survey equipment They felt they should have been pad for their semces
Data Cleaning And Entry
Enumerators were instructed to revlew each questiomare at the end of the interwew before moving on to the next household At the end of each day, whle st111 m the field, team leaders carehlly reviewed all questlonnalres completed by their team members for msslng data, errors and inconsistencies The team leaders then consulted the enumerators to resolve any questlons To encourage quality work, the Internewers received an Incentive m cash for each questionnaire properly completed
M e r this cleaning in the field, questionnaires were sent to Ahcare's office where the data-entry team revlewed the data a thrd time A few answers were clarified at the end of the week when the enumerators returned from the field Any open-ended questlons were coded and the data entered into EPI-INFO 6

ACKNOWLEDGEMENTS
The baseline survey would not have been possible without the hard work and dedication of the following people:
Veron~ca Fletcher, a consultant, who deslgned the survey and planned and coordmated the execution of field work Blll Noble, the National D~ector , Collm A Ellas, the Project Coordmator and Bdl Messlter, the oll cornponene Coordinator who provided general gu~dance and support.
Afrime Staff Fieldwork
Anux A Lat~fo Abdula Angelo Miguel Adriano Jose Almenda Manuel Mdrlo Jose Almelda Eduardo Ctpriano Faduco Pedro A M Ginga Concalves M Margarida Santos
Data Entry
Manual JoSo Madrige Olga Marna Guimaroes do Rodrio Marta Ivone Pack Luisa Eurits Chm Pack W6
Dornmgos Catique Franciso Lisboa Josl Antonio Manuel Geraldo Polmario Patrick Muzarabam Ermellnda Fdeque Jorlo Almeida Jose Tegua F e r n d o Hortensilio Afonso Luc~ana Gimo Dornmgos Thabo Mhawenbe Antorno Dias Margarida h c i o Zingai Emesto Dos Santos Adnano Dame1 Victor Jose Abreu Susana Pedro Canote Eteluina U m Pascoal Guta Emilio Comado Alus~o Consaga Plo Antiomo Joaquiin da Rocha Aurora Arcema Zandamela Michael G h i h m

TABLE OF CONTENTS
INTRODUCTION 1
METHODOLOGY 1
GENERAL CHARACTERISTICS OF THE MOTHERlClhRETAKER OF CKLDREN UNDER FIVE YEARS General 4 Health related visitslactivities 5 Agr~cultural activities 5
GENERAL DIETARY KNOWLEDGE AND PRACTICES General KnowIedge about three food groups
FOOD CONSUMPTION Oil consumption 24-hour recall Seven day recall Sufficiency of intake
BREAST-FEEDMG PR4CTICES 12
INCIDENCE OF DLPLRRHOEA AND PRACTICES Inc~dence of diarrhoea Feeding and drinking practices during diarrhoea Treatment of diarrhoea Practises after diarrhoea ended
ANTHROPOMETRIC PROFILES OF CHILDREN UNDER FNE 15
INDICATORS 17
CONCLUSIONS AND RECOMMENDATIONS 18
REFERENCES 2 1
UPEND% A Detailed tables
APPENDIX B Quest:onnaire

LIST OF TABLES
Table 1 L~st of sampled areas 2
Tdhlt 1 Knowledge ahnut food groups 7
Table 3 Intake of protein rich foods dwmg the seven days p r e w h g the survey 10
Table 4 Intake of vitamudmmeral rich foods during the seven days precedmg the survey 11
Table 5 Anthropometr~c measures 16
Table 6 Indicators 17
LIST OF GRAPHS
G:J!?-I 1 Percentage of households who attended health related demonstrations 5 durmg the past year
Grdph 2 Households who produced and sold at least one kurd of h i t and vegetables 5
Graph 3 Frequency with which ofl is used to prepare the maln meal 8
Graph 4 Protern rich fmds consumed during the seven days pr&mg the survey 10
Graph 5 Frequency of consumpion of d~fferent kinkinds of fruit and vegetables 11
Graph 6 Feedmg practices when a chdd has d~arrhoea 14
Graph 7 Knowledge of recommended pracrrces m the absence of welght gam 15

The goal of the Africare/USAll[d Manica Oilseed Food Security Initiative IS to significantly enhance food security in five districts in Manica Provance Africare dnms to do this through the development of a sustamable, small scale oll seed productnon and processing industry and by Prncreaslng levels of awareness and application of unproved nutIltIon and health practices
Thls baselme survey had two objechves to provlde general mforrnabon for p l m g purposes and to obtam baselme values for measurrng progamne lmpact Based on the lncldence of stuntmg m Guro (MSF-CIS 1995), a mmmm sample size of 384 households was d e t e m e d Ths figure was doubled to 768 to compensate for the destgn effect of cluster sampling The fmal sample coasnsted of a random selechon of 78 clusters fiom the target MLlages in each of these, 10 households were mterviewed Two separate queshonnaires (agndture and health) were ahmstered m each of the selected clusters Both swrveys used the same methodology, but the actual mtervlews were conducted m Merent households In the case of rhe healtWnutntion survey only households wth cMdren under five years were mcluded in the survey
The project target areas were pnmanly selected because of thelr potenbd for ollseed product~on and nutntional consaderat~orrs piayed httle, d any role m the selechon process The nutrihon component 1s therefore cornplement~ to the agncultural activ~tles and auns to enhance the benefits that wll be denled &om oilseed productnon and 011 extraction Relatlve to other parts of the pro\ince and quite Ilkel! other parts of the selected dlstr~cts the sampled clusters (mad! along the mam roads) have good access to markets, transport and other social mfi-astnrcture such as schools and cllmcs Access to health sen Ices 1s part~cularl) relet ant m the case of a nutntlon onented programme as poor health can as much reduce the unpact of nutnhon education as the lack of food
In the surveyed area general health service provnslon and the use of bed& services IS relatively good * The mcldence of darrhoea (20%) amongst chldren under five was low compared to
other parts of Mozmblque At the same tune a large percentage of mothers reported s e e h g help dunng the chld's nllness - more than 80% of the affected ch~ldren were taken for asslstance
* Growth momtomg is known m the area and 80% of the under fives have road to health charts Fifty six percent of them were neighed dunng the past four months, wMst fort) five percent of the mothers sad that they take theu cMdren to the hospital af they do not g m welght
* Even though home t ~ s ~ t s by health personnel are largelj unkno\in, more than half the households m Mamca and Sussendenga reported aatendmg a hedth related achvity d m g the year precedmg the survey
in the llght of all the potenQal support fiom the formal (and NGO) Health sectors, AFRICARE wdl maxlrmze thew mpact if they focus on acbwties that mcrease &e potenhal nutnhonal benefits of mcreased 011 productron and household mcorne through nutatlon education The benefits d be greatly enhanced If the programme is mtegrated as far as possible wth exlstmg programmes run by the Government and NGO's
There is a close relationshp between food avsulab~hty and Qetary mtakes and nutntional status In agrarian societ~es, such as the one stud~ed, food supply IS largely dependent on household food produchon actwitm The agricultural smey showed a comparatively vibrant agncultural economy m the target area with the production and commercialization of a large variety of

zsa
-pa$:,ap aiaM sahg lapun a q $0 lua:,lad h a k i ~ k m s q 8mpa3aid qaaM OW ayS %unp eaoquep VIM w a d ahg lapun
ply3 auo lwa1 IV peq sp~oqmoqyo %SZ @o - M O ~ L ~ a ~ r ~ e l a ~ S ~ M vaoqmrpjo a:,uapr:,m aqL
-(%PE) w ~ ~ a a w ~ l n o d pw (%,I£) n k 3 / a m s a s / s l n q o ' ( % 6 ~ ) aspmod pa133 paprr13m q u o m p neq JapIo
na1ppq3 Ourpaaj-lma~q jo sraqrrmn imr3@rs 03 u a d spood Sysuom 8 E spmbq 103 pne stpuou~ p seki SPOOJ PIiOSj0 u01l3npoaur 1 ~ ~ 3 ayl JOJ aBa maw a u spmbrj 1ay)o pw l a m 'a8pruod
leala3 aJaM uane rCpamm porn spoo.~ k m s ayl8mpa3a1d s h p uanas atp nr qmsI!aJq my laqo pooj lo spmbq yo01 1aSuno i pw stpuow moj jo uaqqqa jo % ~ 9 - L~lea ueaa 01
mls osle slaylow Alle~auaf) moq ~ s q aayl mqlm Bmpaaj ssny ayl aao% %gp Lpo st! pFnq lage ilalerpaumn -1s )on op s~aqlo~y q:,wsrp uaawaq 201 o h a IOU p q sa:,rmeid %mpaaj-wasg
alaq \\asla wyl e8uapuassncj pw e 3 m n ur JaDaq 4pqBrls aq 03 s ~ a d d e sdnofi pooj inoqe a 8 p a p o q sdnoB pj a a ~ I[" ur pooj jo sad& OW Map slaylorn JO %8 spooj q3u
lelaU[WLpmlrA o m %ZI pue spooj q3u malo~d o . ~ a m a ppo:, %OE 'spsoj q3er aie.~pAqoqn:, o q ma1 la a m u ppm ~ua3lad a m j l J r + ~ sdnoB pooj mem a a q ayl m spooj jo awzu
pw u o r z ~ q ayl ql~zz m1pu1~3 ha^ IOU aJaAz a q lapun uaqlnpjo s'Jaylow ayLL a8palr~zouq Ieuorlwnu xseq UI ~tracualso~dun ~ o j wool osp sr slaw spooj y2u v m z r n 01 ssame
a xey lou op illeuuou spioyasnoq uayri saw1 Bump alqepe.%e aq IIIM I E ~ sdom 8u11oruo~d uo aq plnoys sn3oj atp pm Ienoseas a n slrng asaql 30 Lmm sajqelaZa z pw slmg q3u v m s r n jo
uorp~rl~n:, ayljo uor)omo~d a q uo sasn3oj auop 'smels pu011ulnu amvyua 03 ~esua~od la881q ua ia rn aAeq saq1~1l3e uo~3npold pood .Qqanb pm k ~ n b a p e &lap 01 uorlnqrqum 1na~gn~2rs
e aFm IIIM SPOOJ q3u malo~d jo uorlouro~d ayl ' J ~ A ~ M O H u o ~ ~ ~ n p o ~ d ~em?p:,&v pooB s~ 1IaAi sa (iahms auqamq @ J I Q ~ & ) spwsrp asoyt m sn~els ~~u~ouo:,a-orms ~ a $ q pauasqo ay) y l r ~
puodsauo:, 'a8uapuassns prn e 3 m ~ .C~~trrwdsa 'spooj y:,u ana~o~d JO saFlm q3q L1anr1ala~ a q l uoseas lsamq a q Z m p spooj ~ua~aj j rp jo ha-A a%el e 01 ssa33v poo% ahoq L11e~aua8
sppyasnoq se 'van la8m ayl ur Jo~csrpur ~ % I I I S U ~ S Gai t! 10u SI auolc aywm 30 i3uanba.q 38yl lsa88ns s8rrrpmj a q l ( p a 4 moq 92 pm iep L yloq) ~ o r ~ d a r n s u o ~ pooj jo buanbag
ayl uo pasn~oj s3uaruamseaw aFlm im~alp amsearar 01 q n q p p sn isenbape Ge~arp a3mr~
alqep~ojjm~orn amo3aq osIe Avu~ srnalo~d se q3ns -spooy Jawo a w l a m s a q 3~ a1qrssa33e pw alqeploge aJow
PO 2 q m m aloJ e rie~d n t ~ 1uanodmo3 pto aqq pyl p d o q si q llauom enoua aheq ~ o u op Aatg pm a~rsuadxa sr 11 lsyl s e ~ sq JOJ noseai mru a q P ~ O pres M O ~ asaa savlur l ~ j / p o naql ley,
qaj o q ~ sploqasnoq $SON Ivan mew n a g 30 uorlemda~d ayl m B p e a3iuo ]sea1 lo 110 alqv3aZan 3msn pavoda~ spjoqasnoq a q jo %8 1 Apo ~ u a s s ~ d OQ a m J ~ A O sajw 3mws p a ~ n p a ~
ur pava0a.i aq 01 i~ayil osle a n sigauaq 1cuor)wnu a y ' a m B o ~ d a y j o wd paas 110 aql m a:,m~srsm a~~hasuapn alom loj pp ta8~l a= k y p l e g palmdw SI J! puv samoid :,rsamodoqne
~sa~ood ayl peq osp q31.~srp a m s asaql ( ~ 6 6 1 an31gv) o lopog put! a m 8 'ornt) aE uor1dumsuo3 110 put! suorlrpuo~ 31zuono:,a-0130s ' sa~go~d uorl:,nposd ~omp3&t? lsaiood ayl q l r k i
s~~rrssrp aaryl a u hms pmqnau8o a q JO s 8 q q ayl sran_~atoa 438rel(81q kan losm aJaM s13ulsrp uaakqaq sa:,uaiajjrp $nov uaza) s~o~e:,cpur :,u~awodorylue a u 8 u r ~ ~ s j o salm q%q ayi pue saplur h l a r p zuam:, uaamaq uorlelauo:, aINlj SI alay) amsse Sem auo 'dnofi aioqm
ayl jo l ay wqt la@q qana sr s~ealC 5-2 ua3plq.s 1s8nom O m ~ w s yo a~uapram a g ley? pm sicai akg lstld ayl8uunp .Cur! wtp aallaq ala\z suoseas OMI ~ w d ayi l e v 3uuaprsuo3 (a~o3sz
l- tiolaq 3~15 lapun ualpliy3jo ~ O S ) saseasrp ilqissod pue savlrnr ircjaip ~eun~ldo-qns ~u~al-8uol jo lpsal e se 8rn~urags si tran ayl m ualqoid puollwnar 1sa38lq ayl ~vyl alesrpm sluamamseaur
3rr]auodongw atpjo qpsal a u (qrae)lodun lsow ayl a n azmm /Cllepnmd) saldtrls aql y3ryhz jo 'sdo~3 luaiapp jo L ~ a m 4 a3.q e 4iod Elaq asay UQ (splag A~mj 01 uolsrppc
ui) splay UMO iraql aieq Lay7 leql p~cs a q aapun uaqlour ayl jo ~ua3.iad i l x ~ ~ sdom l u a q ' p

Variations betmecn d~stricts were not sign~ficnnt. but folloc\ed a slmalnr pattern as kanatrons in
socio-econormc concbtrons and anthropometnc ~ndlcators The h~ghest inc~dences of dlarrhoca. poorest socro-economc con&t~ons and hghest mcidence of rnahutntlon were found m Guro, Bme and Gondola Feedmg practices d m g and after darrhoea lndncate that there u still a lot of room for improvement The adoptron of proper feeding practrces ma1 have a s~g~llficant mpact on anthropometnc profiles, as reduced food mtake dunng diarrhoea rmpacts negatrl. el! on nutntrond status Only 55% of mothers rep~rted @vmg the same or more hqwds, w u s t 33% sad that they gave the same amount or more food More than 80% of mothers (both those wth chldren w ~ t h darrhoea and those wthout), reported loolung for help when theu chldren had harrhoea

1 INTRODUCTION
The AhcareNSAID M m c a Ollseed Food Security h t l a t ~ v e 1s a five year programme which started In October 1996 and ~ 1 1 1 contlnue urnill October 2001 The goal of the project is to siplficantiy enhance food secunb In Man~ca Provmce The programme has h ~ o main components
* The dekeloprnent of a sustamable, small scale 011 seed product~on and processing mdmtry m five &smcts m M m c a Provmce
* Increased levels of awareness and apphcatnon of unproked nutntron and health practices
The first objectnke ~4111 be acheved through mcreaslng knowledge about o~lseed product~on. creatmg a demand for odseed production, facilatatmg the marketing of oilseeds, prov~dung crecht for the pwchasmg of o~f presses and the t r a m g of sales agents and repau techcnans m the sale and mamtenance of o l presses The nutntion and health component d focus on nutntion educatron, cornmum& based growth momtomg and tramng m the prevenhon and treatment of dnmhoea All act~vit~es related to nuthltlon and health vvlll be a subcomponent of the 011 seed programme m so far as its target popdatlon nlll be the communlfles selected for the 011 seed programme
The Logcal Framework of the Project makes prot !ston for a t met., of dfferent ~nd~cators and rncasllnng tools for morutonng and et aluatmg programme lmpacr A large number of these are based on rnformation from household quest~onnalre surveys, making it necessary to conduct a baselme survey Smce M c a r e has not worked m M m c a Province before it was decided to do a comprehensive baselme survey whch m addtt~on to m e a s m g the basehe values of unpact indicators also included domatnon necessary for p l m g purposes Two baselme surveys were conducted one to cover the agricultural cornponent and the other for the nutnhodhealth component T h s report on14 deals wth the fmdmgs of the nutntrodhealth s m e y whilst Report 1 describes the agplcultural sltuatlon of the target commumt~es Both sun et s were camed out dunng June and July 1997
Afncare made use of two consultants for the baselme smeys Veronica Fletcher developed the survey methodology, desrped the questionnares and planned and coordmated the execution of fieldwork Research Consdtancy Services prov~ded comments dmg the development of the methodology and questlomawe desngn, but its mam task was to analyze the data and prepare the reports
2 METHODOLOGY
The 320 800 people (49354 households) targeted by the programme was also the target population of the survey At the begmnmg of lailplementat~on, Ahcare consulted wdely wtb cornmuties and Government officials to t d e n w vnllages that produced o~lseeds m the past and showed an Interest m o J seed production Another mportant factor was accessib~Ilty - only those v~llages that are presently accessible were considered for the survey Poor access would have acted as a dsmcentive to traders, makmg oilseeds unmarketable and demotavattng farmers

Thc calculation of sample S I X was based on the inctdcncc of stunting in Guro Stunt~ng IS a good ~ndlcator of soclo-econormc status and food ultakcs According to MSF (1995) 54% ofthe chlhiren under five m Gwo are stunted Uslng the f o d a n=Z9-cg(I-p)ld2, the m m u m sample sue was calculated as 384 households' In order to compensate for the des~gn effect of cluster sarnpl~ng the sample s u e was doubled to n=768 T h ~ s translated m practice to a random selection of 78 clusters of 10 households each
Table 1: List of sampled areas
essica, Bamo Chunolo, Bamo
I 1 Rotanda 1 Mussambudz~ (tsetsera)
Z= 1 96 (error nsk of 5%), p=O 5 (prevalence of shmtmg of 54%)- d=O 05 (preasnon of & 5%)

The map on the nevt page s h o x ~ the distribution of these sampled clusters Dunng fieldwork. ke? mfomants helped to dir ide each c o m m Q mto sectors of approwately 500 people Thereafter one of these sectors was randomly selected for the s u n 3 The fieldworkers then used the WHO method of sphntslng the bottle to d e t e m e the staring pomt of each team The first household was randomly selected along the durect~on of the boetle by usmg the random numbers appearing on a currency note The agncdtural team went m the &rechon where the bottle was potntmg, whlst the health team sent the other way Thereafter exery second household was selected for mtervtewmg h the case of the nutntionhealth sun?. households had to have chldren under five years old to be mcludd m the survey If there were more than one mother per household mth chddren under five, only one was selected for Inten lewmg All quest~ons then related to only her and her chuldren The agncullturail and health surveys were conducted m the same clusters, but m Merent l~ouseho~ds. The mam reasons for t hs are. both quesbonna~m are x ery long and domg both m one household would have been tinng to the mterv~ewees The health survey also targeted households wth chrldren under five years, s W t the agnculiural survey looked at households m general A copy of the nutnt~orzlhealth questiomarre is attached m Appendx B
Nhamassonge Nharnassonge Phmphwa
B.r\RVE Catandca
Nhmpassa
Catand~ca-sede
Ch~waBa
Mazorua
1 hislo Sahantunz~. Sabao
Honde Chin ala-centro
Matundu. Nhangaze
Nhampassa
Nlhassacara
Fudv
h p a s s a - s e d e
Nhassacaaa-sede
Pmhera, Cmazashenga, Fudu-sede

Map 1. Manica province and the target districts of the project
3 GENERAL CHARACTERISTICS OF THE MCsTHEWCAWTL4KER OF CHILDREN UNDER FIVE YEARS
3.1 General
The mean number of people per household (6 5) &d not vary a lot between d~s~ncts and corresponded \tell \nth the fmdmgs of the agncuiturail basehe sun e) Most of the mothers ~ 7 t h children under five years, were younger than 35 years (mean age 28) and there was also little vanat~on between dstncts Nearly half ofthem had no educatlota (49%) and the mean number of >ears completed at school was 1 6 The percentage of dliterates amongst mothers wth chtldren lander five 1s s~gmficantly hgher than that m the populat~on as a whole For example m the agricultural survey, whch was c a m 4 out MI the same clusters, olly 35% of m&vtduals older than 10 years did not recelve any education
A t h ~ d of these mothers are mvohed m mcome generatmg activltles m addtlon to ralsmg chldren, domg household chores and tend to f d y fields In Barue and Mmca apprownately 20% of mothers engaged m mcome generatmg activities The level of achvlty was s~gnrficantly higher m Sussendenga (32%), Gondola (38%) and Guro (49%) The most s ~ ~ c a n t Income generatmg actlvlhes m all &stncts were the sale of agricultural produce (50%) and the sale of food prepared at home (22%)
It \\as difficult to ~dentib any patterns related to the church that people belong to and ~ t s ~mpl~cat~ons for nutr~tron education The blggest rel~glous groupmg was m the 'no relrgron (37%) category m s was followed by 'other Christian churches' (33%) and traditional rel~gons ( 12%) All three of these groups are heterogenous and it wll be d~fficult to define the effect of the~r teachngs and bellefs about d~et and nutrit~on and then appl! it to a nutnt~on education strateg
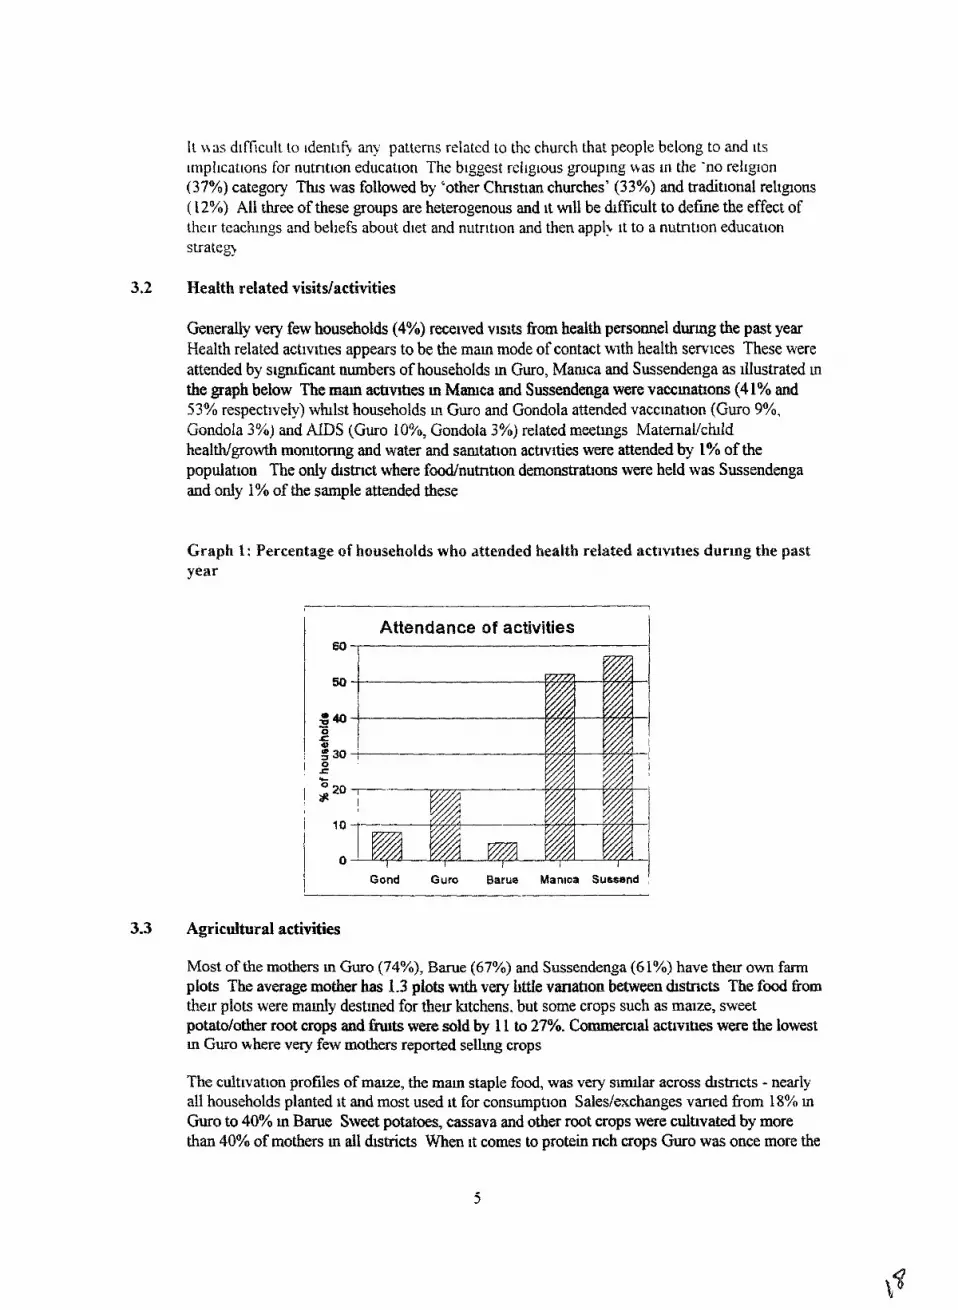
3.2 Health related visitslactivities
Generally very few households (4%) recaved v~slts fiom health personnel dunng the past year Health related act~vaties appears to be the rnam mode of contact w~th health services These were attended by s~pf i can t numbers of households m Guro, Mmca and Sussendenga as illustrated m the graph below The m m actlvlbes m Mmca and Sussendenga were vaccmat~ons (4 1% and 53% respect~vely) whlst households m Guro and Gondola attended vacctnataon (Guro 9%. Gondola 3%) and ADS (Guro lo%, Gondola 3%) related meetmgs MaternaVchlld healtwgrowth momtomg and water and samtabon actlvlties were attended by 1% of the population The only &strict where fdnu tn t lon demonstratlorn were held was Sussendenga and only 1% of the sample attended these
Graph 1: Percentage of households who attended health related actlvltles dur~ng the past year
1
Attendance of activities I
i I
Gond Guro Barue Manlca Sussand 1
3.3 Agricultural activities
Most of the mothers m Guro (74%), Barue (67%) and Sussendenga (6 1%) have theu own fann plots The average mother has 1.3 plots with very httle vanation between Qstncts The food from the~r plots were m a d y destined for thew lutchens. but some crops such as malze, sweet potatotother root crops and hts were suld by 1 1 to 27%. Commercial activrties were the lowest m Guro where very few mothers reported selling crops
The cultlvatlon profiles of malze, the marn staple food, was very slnular across rnstncts - nearly all households planted it and most used it for consumption Sales/exchanges vaned fiom 18% m Guro to 40% m Barue Sweet potatoes, cassava and other root crops were culhvated by more than 40% of mothers m ail chstricts When ~t comes to protein nch crops Guro was once more the

exception, but instead of hav~ng the lotvest number of producers Curo had the hlghest #~lst between 28 and 5370 of mothers w Baruc, Mmrca and Sussendenga grew beans and groundnut, 69% of the Guro households produced groundnua/sesame and 6 1% beans The lowest prduct~on rates of protem crops were found in Gondola where only 3 1% produced beans and 28% goundnut/sesame The graph below ~llustrates production and saie patterns for f ru~t and I egetables Wot~ce the dtfferences between d~stncts and the e.rceptionaliq high lex eis of Gult sales
Graph 2: Households who produced and sold at least one kind of fruit and vegetables
Vegetables and fruit
1 Gond Guro Barue Man~ca Sussen 1
V Cult v sale 1 F cult fSJ F Sale
Abbrevlatlons used V Cult- Vegetable cultivation V Sale- Vegetable sale F Cult- Fruit cultnatlon F Sale- Fmlt sale
4 GENERAL DIETARY KNOWLEDGE AND PRACTICES
4.1 General
An Important factor to cons~der in terns of nutnbon educat~on is the actual dstnbutlon of food ~ w h the household, parhcularly when food is m short supply According to the households mten lewed, children are gwen pnonty if there IS not enough food m 49% of the households and men m 35% Only 12% of households sad that nobody gets preference as food IS dlvided equally amongst all members The only &stncts whch daffered s ~ ~ c a n t ~ y fiom the others m tenns of dstnbutlon practices was Gwo and Barue Whereas the vast rnajonty of cases m the other &stncts gve cMdren pnonty, most households m Guro (5 1%) gve men preference and only 37% consider chilidren first Barue was the only &smct were men (39%) and cMdren (40%) had approxunately the same lstnbution
4.2 Knowledge about three food groups
The Department of Health uses three food groups m the^ nutrition education programme Carbohydrates are referred to as food that gt es 'forqa' , grotem nch foods as foods that help wth growth and wtamrns and manerds as food that defend agamst diseases In order to test the knowiedge of mothers and children under five, they were asked to name foods m each of these three categones The Table on the next page summarues thelr responses to h s question

kARLE 2 : Knowledge about food gmups
I
'YO of mothers that know 2 7 ~tems from each group 1 % oi mothers who couId name at least two carbohydrate nch foods
Carbohydrate nch foods correctl> named by the largest numbers of mothers
Cereals (72) Sweetpo- tat0 (34) OiYfat/co- conut (20)
% of mothers who could name at least tmo proteln r l ~ h toads
Protein nch foods listed by the iargest numbers ot mother s
Mother s rmk (5) Mlk ( I 8) Meat (1 6)
% of mothers who could name at least two t ~ t d m e r a l nch foods
Vi tdmmera l nch foods Itsted bq the largest numbers of mother's
Fruits ( 1 6) Eggs (1 3) Mother s mu (12)
Guro
n=l In
Mmca Sussen- TOTAL denga n= 140 n=7 Xc I
5 3 63 b 3 49 59
Cereals (68) Cereals(82) Cereals (87) Cereals (8 1) Cereals (78) Sweetpo- Sweetpo- Sweetpo- Sweetpo- Sweetpotato
Mother's Mother's Mother's
Less than 10 % of mothers know at least two items from each of the three maan food groups Most of the dstncts, except Guro had s m l a r profiles In Guro only one percent of the mothers could name two types of food m all three food groups Generallq proteln and rnlneraYvitarmn nch foods (and their h c t ~ o n ) Mere the least known Carbohydrate nch foods were cfifferent - sl&icantly hgh percentages of mothers knew that cereals gve energy Saeetpotato/tubers were also mentioned by 40% of households Mdk and eggs are recogrued (albent by small percentages of mothers) as nutntlous and prov~ders of both growth and protect~on agalnst cfiseases hterestmgly enough, Gum, the mam groundnut producer m the area also had some mothers who recognized the nutritional value of groundad
5 FOOD CONSUMPTION
5.1 Oil consumption
The vast majonty of households (94%) bought the 011 they have been usmg most recently There were no s~gmficant vanattons between h c t s and most (82%) reported b u p g 'coiza' Around 10% reported usrng sesame 011 rn all districts, except Guro Here a sigmtlcantly hgher number
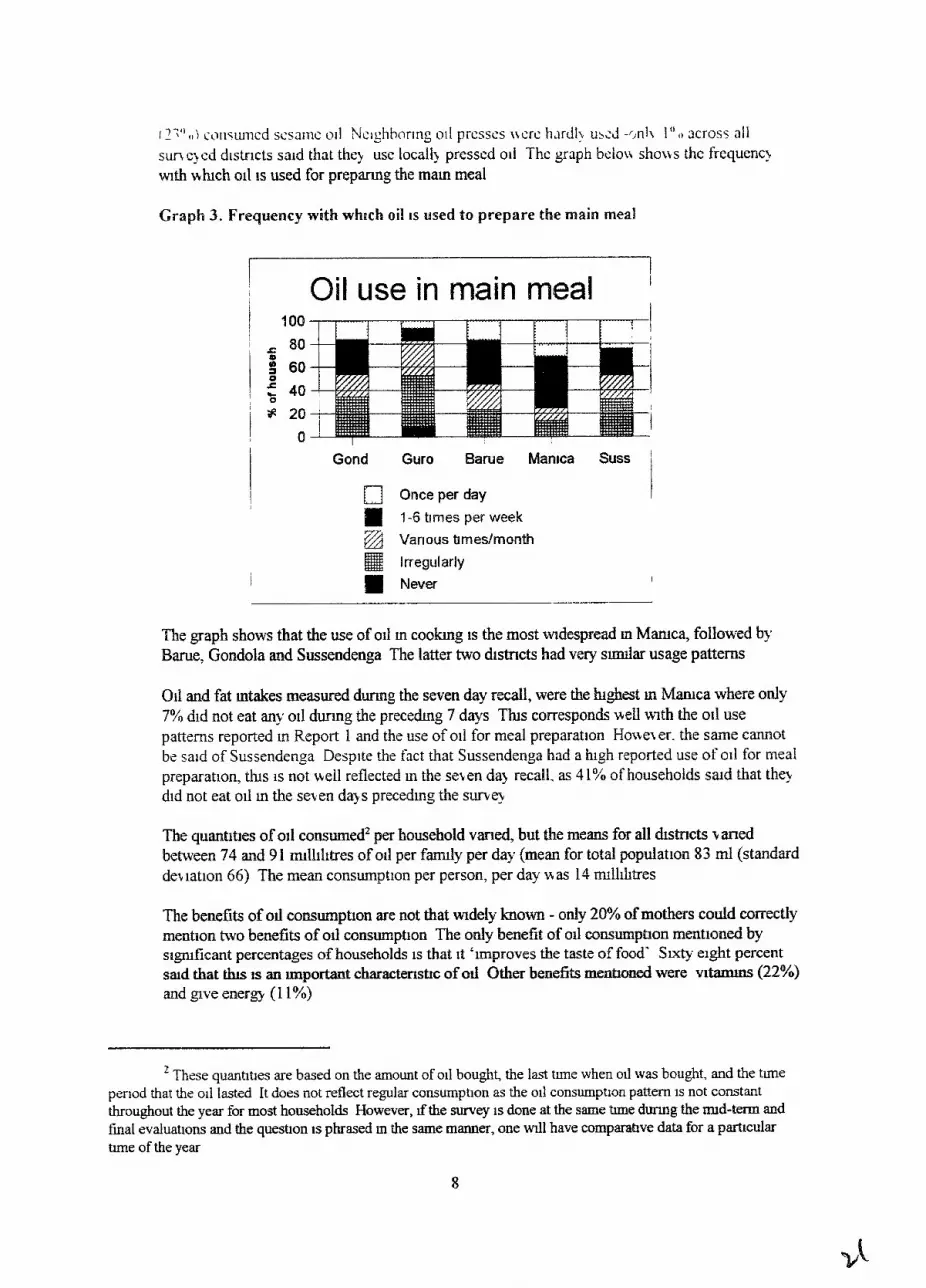
I cor~s~uncd scsrtrnc 011 Ncr~hhorrng o ~ l prcsscs iicrc t~,~rdl! u s d -r,nl\ l o I , across all suncjcd dlsthicts s a~d that the) use locallj pressed oil Thc graph beloit. shons the frequent? wth whch oil 1s used for prepamg the mam meal
Graph 3. Frequency with whnch oil IS used to prepare the main meal
1 I Oil use in main meal I
I
I Gond Guro Barue Man~ca Suss /
I I Once per day 1
1-6 tmes per week
a Var~ous bmeslmonth
@ Irregularly i Never I
The graph shows that the use of oil m c o o b g IS the most wdespread m Mmca, followed by Barue, Gondola and Sussendenga The latter two d~stncts had very s d a r usage pattern
011 and fat intakes measured d w g the seven day recall, were the hghest rn Mmca where only 7% did not eat any oil d w g the precehg 7 days Th~s corresponds well wth the otl use patterns reported m Report 1 and the use of oil for meal preparation Hostes er. the same cannot be said of Sussendenga Despite the fact that Sussendenga had a high reported use of 018 for meal preparation, h s 1s not well reflected m the se\en daq recall. as 41% of households sald that the) did not eat oil m the seven daj s preceding the s w e q
The quant~tnes of oil consumed2 per household vaned, but the means for all chstncts \and bettveen 74 and 91 mlhP1tres of 011 per farmly per day (mean for total population 83 ml (standard de%lation 66) The mean consumption per person, per day nas 14 rmllhtres
The benefits of od consmptlon are not that wclely h o r n - only 20% of mothers could correctly rnentron two benefits of olI consumption The only benefit of oil consumpbon mentioned by s~gmficant percentages of households is that ~t 'mproves the taste of food' Sixty eight percent s ad that h s IS an mportant charactenstxc of od Other benefits ment~ond were vitam2ns (22%) and grve energy (1 1%)
These quant~t~es are based on the amount of oil bought, the last time when 011 was bought, and the tune penod that the oli tasted It does not reflect regular consumption as the 011 consumption pattern is not constant throughout the year for most households However, ~f the survey is done at the same tune dunng the md-term and final evaluations and the question a phrased m the same manner, one wdl have compmbve data for a part~cular tune of the year

5 2 24-hour recall
The twenty four hour recall focused on the types rather than guantrtles of food consumed on the day precedmg the survey Approvlmately 95% of households m all rfistncts except Gondola descnbed the previous da? 's eatmg patterns as normal In Gondola, 15% regarded thelr food intahe as unusual' As tias s\pcctzd near11 all househoids atc: staple foods/czreals on the da! precebg the survey h terms of proteln nch foods and foods providmg muaerals and t ~tarmns, there was considerable vanance between d~stncts The reported Wakes of protem md ~ ~ t m d m i n e r a l nch foods uere surpnsmgi! hgh Between 7 1'10 (Gondola) and 85% (Guro and Barue) reported eatmg at least one type of protem nch food on the daj precechg the suney Plant protems (beansl~oun~ut~sesame) was the maln source of protem for most houseboIds In Guro (73%). Barue (62%) and Sussendenga (6 1%) In Gondola (48%) and Mmca (61%) m a 1 protern m the fonn of meat/poultry/fish were the most mportant
The lntake of at least one type of vegetable and h u t was exceptiond~ hgh m most dlstncts except Gondola h Gondola ody 60% sad that they ate products from the category on the day precedmg the survey Elsewhere this statistic ranged from 8 1% m Guro to 97% m Sussendenga The most frequently used source of vltamuas and nunerds was vegetables m all rfistncts (range between 68% an Gondola and 90% un Barue) The make of leaves was the lowest m Mmca ( 1 lo/;, compared to a total of 35% across dnstncts) and fruits ~ e r 2 most eaten m Gondola (33% as opposed to 18% across districts) Also see Table 4 in the Appendix for more detalls
5.3 Seven day recall
5 3 1 Carbohydrate nch foods
Maize and Sweetpotatolother tubers were the most mportant staples consumed d u n s the seven days precedmg the survey 64% of househoIds ate maize once or more tmes per day, wMst sweetpotato/tubers were consumed wth the same frequency bq 46% of households In most &stncts wth the exception of Guro, malze and sweetpotato were the most mportant staples In Guro both these crops played an mportant role, sorghum also featured strongly 33% of households ate sorghum at least once per daj, as opposed to the 12% across the whole provlnce
The least consumed items were bread and nce whach appromatel? 70% of all households d ~ d not eat at all m h e 7 days precehg the s w q Maruca was the on14 dstnct where s~gtuficant percentages of households ate bread (46%) whch may be a reBmon of the relat~vely lugher soc~o-economc s t a b of households m that hstnct as descnkd MI the agncultuaal basetme s m q
See sectton 5 1 for a &scms~on of o~llfat consumption.
5 3 2 Protern nch foods
The lntake of protem nch foods as measured an the seven day recal4 differed sipificant1y &om that measured m the 24 hour recall Given crop product~on pattern and the anthropomethlc measurements one would hnk that the 7 day recall grves a better reflechon of hab~tud mtakes
3 The survey was carned out on June 26th m Gondola The specla! meal probably refers to feasts held on the public hohday, June 25th If only those who reported normal meals are considered 68% (24 hour recall) and 55% (7 day recall) consumed at least one protem nch food per day The mtake of m&sh poultry as measured m 24 hour recall also dropped from 48% to 42% donly those who had a n o d meal are constdered
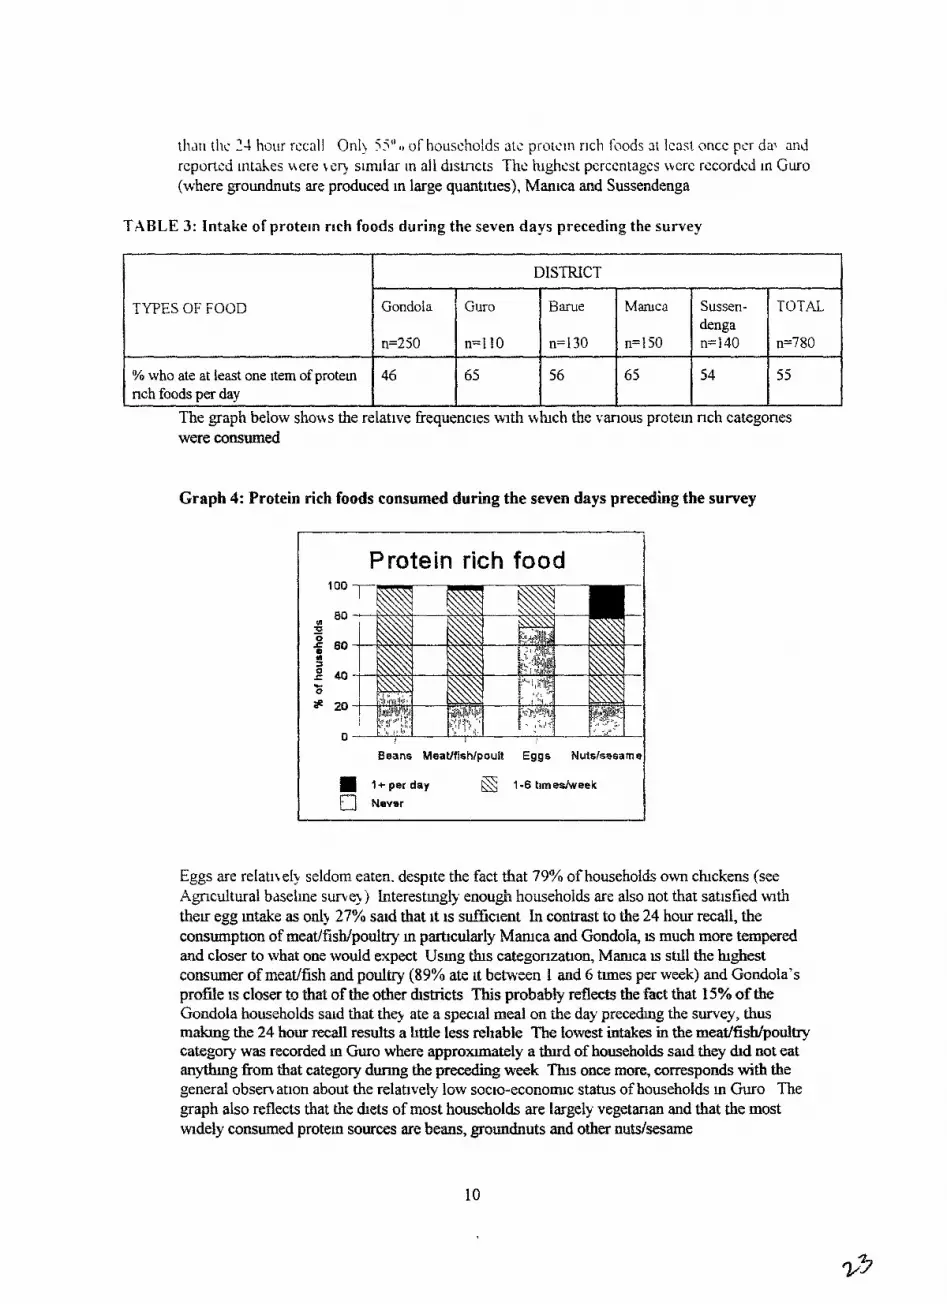
th'in tllc 111 hottr rccall Onl) 55' ' , , of households ats protc'111 rlch fonds 3t l c x t once pcr dal nttd
reported ~n tdes uere c e q s~mllar In ail d~slncts The hghcst percentages were rzcordcd tn Guro (where groundnuts are produced m large quantities), Manica and Sussendenga
TABLE 3: Intake sf protein rach foods during the seven days preceding the survey
Graph 4: Protein rich foods consumed during the seven days preceding the survey
TYPES OF FOOD
% who ate at least one item of proteln nch foods per day
Eggs are relat~r el) seldom eaten. despite the fact that 79% of households own chickens (see Agricultural bdsetme sweq) Interestmgly enough households are also not that satisfied with thelr egg mtake as on13 27% sad that it e suEfc~ent In contrast to the 24 hour recall, the consumption of meat/fish/poudtry m partncularly Mmca and Gondola, a much more tempered and closer to what one would expect Usmg t h s categonzaQon, Mmca a stdl the lughest consumer of meadfish and poultry (89% ate ~t between B and 6 tunes per week) and Gondola's profile 1s closer to that of the other drstricts This probably reflects the fact that 15% of the Gondola households sad that the) ate a special meal on &e day precechg the survey, thus makmg the 24 hour recall results a I~ttle less reliable The lowest intakes in the meatlfishlpodtry category was recorded m Guro where approxunately a thud of households said they &d not eat an-g fiom that category dunng the p-g week Tfus once more, corresponds with the general obserc ation about the relatively low soclo-econormc status of households m Guro The graph also reflects that the &ets of most households are largely vegetarian and that the most tvldely consumed proteln sources are beans, groundnuts and other nub/sesame
The graph below shows the relative frequencies w1t.h \dxch the vanous protem nch categones were consumed
DISTRICT
Sussen- denga n=140
54
Gondola
n=250
46
TOTAL
n=780
55
Barue
n=130
56
Guro
n=110
65
Mamca
n=150
65

4 3 Vitatn~nimmeral rich foods
TABLE 4: Intake of vitamin/miner
I 1 1 i PEb OF FOOD
1 y4 who ate dt ledst om Item of vitarmn/mroeral nch food per day
O/o who ate at least one food nch m vltarmn A per day (leaves, kale, lettuce, orange colored fmts, orange colored \ egetables, eggs)
~1 rich foods during the seven days preceding the survey
DISTRICT
Eighty percent of the households interviewed ate h u t or vegetables at least once per day The intake of these foods ranged m most districts, except Guro, between 80 and 88% In Guro f'nut and vegetable consumptron was excepbonaly low wth 54% of 'households who consumed ~t dally Foods nch in v~tarmn A was eaten less frequently ' .An estmaied 3336 of households ate at least one k~tamut A nch item per daq The most mportmt source of t l e m A m all &stmcts was leafy vegetables, as orange colored fruits and tegetables \\ere eaten bt less than 30% of households dunng that week Barue was the euceptlon when ~t comes to orange colored vegetables - 49% of households ate ~t On the other hand. the mtake of orangz colored h i t mas the second iouest m Barue (17%) and the lowest m Guro (7%) In Sussendenga, B m e and Gondola between 33 and 46% of households sad that they ate foods nch m vitamin A dally Mothers in Gondola r e p o d the ivghest frequency of consurmng vltarmn A nch foods (3 1%) and Guro reported the lowest (20%)
Graph 5: Frequency of consumption of different kinds of fruit and vegetables
1 Vitarninlrnineral rich foods ,
i %+perday 1-6 tlrnerlwwk @ Never i
Abbrev~at~ons used Or Veg Orange colored vegetables KaleILet Kale and lettuce 0th Veg Other vegetables Or h i t Orange colored f h ~ t 0th Fmt Other h t

5.4 Sufficiency of intake
The question that dealt urlh the seven day recall also look& at the mother's perceptions about the sufficient) of their dietap intakes The results showed that households are general11 satisfied \\.cth thelr carbohqdrate mtakes, although a s~gnlficant percentage would IAe to see mcreases in bread and nce consumphon Presently only 9% are happy wth theu bread- and 17% with theu nce intakes
Other types of food where more than 50% of households said &at they were mssatisfied with theu present consuanptlon were * Brange colored vegetables (5 1%) * Orange colored fruits (56%) * F~sWmeat/podtr?/ (54%) * OIY fat (7 1 %) * Eggs (73%)
The most common reasons gven by mothers as to why they felt that thew Intake of these products are ~nsufficlent %ere * Orange colored ~egetables Not the nght tune (33%) lo\\ ?~elds (27%)
do not produce ( 19%) 4! Orange colored fruits Not the nght tune (39%). do not produce (20%). eupenslve/lacb
of money (1 7%) * Fishlmeattpoult~?, Elpensn e/lack of mane? (96%) * Eggs Expensit eAack of money (68%), do not produce (1 8%) * OlVFat ExpenslveAack of money (98%)
4 BREAST-FEEDING PRACTICES
6.11 General
Sax9 set en percent of the households interviewed ha\ e at least one chld under five that is breast-feebg The vanation between hstncts was small The lghest percentage of households wxth nwsmg chldren was found m Guro (74%) and the lowest m Mmca (62%) Appromately htllf of these cluldren started breast-feeding w b the first hour after buth Eight percent of the mothers reported wa~tmg for el&t hours or more before mtlatmg breast-fehg There were no s~pf icant differences between dastncts m terms of the interval between birth and the rnltlatlon of breast-feedmg The oldest cbld stdl breast-feedmg at the tune of the survey was 4 1 months old and 6% of the breast-feedmg cluldren were older than 2 years
6.2 Weaning practices and knowledge
The mean age when mothers belaeve solld foods need to be mtroduced did not varj a Iot between drstncts It ranged from 4.1 months m Guro and Matllca to 4.5 m Goudoia. Accorhg to the mothers flu1d.s have to be antroduced shghtly earher The responses ranged gom a mean of 3 4 months m Sussendenga to 4 2 m Gum The overall mean was 3 8 months

Thc findings of the 24 hour reca!! and seven da! recall rrert. ven slrnllar when ~t comes to foods g1kt.n in addition to breastm~lb The most important supplemcntq foods and lrquds gnen at least once d m g the seven days precedmg the survey was water (8 I%), cereal pomdge (74%). other soiid/serm-sohd foods4 (45%)
Chlldren older than 4 months recened a pretb rn~xed diet d u n g the m e n daqs preced~ng the survey Cereal pomdge was the most mportant food stuffgven to them - 79% ate ~t at least once m the set en days precehng the survey Other mportant foods were groundnut/sesame/caju (36%) fisWpoultrj/rneat (340/0), beans (26%) Other solid/semi solid foods' were eaten b) jJ% of the population
6.3 Children of 4 months and younger
N~neteen percent of the breast-feeding ch~Pdren were four months and younger Of them 6j0/n took hquds/sohds/serm-sohds dunng the seben days precehg the suney Mother's appeared to rather plve food than fluds as supplements to h s age group - thnrty seven percent receir ed llqh~ds as opposed to the 52% who took sohddserm-sollds The most commonly gven fltuds/foods m the week before the survey were cereal pomdge (50%), water (3 1%) and other 11qurds~ (12%)
7 mCTDENCE OF DIARRHOEA AND PRACTICES
7.1 Incidence of diarrhoea
The rncrdence of darrhoea across the surveyed area was low compared to other parts of Mozambique - only 25% of households had a ch~ld/children wth diarrhoea d m g the two weeks precedmg the survey and 20% of the chldren under five were affected There was I~ttle vanation between dstncts wth h e tughest percentages recorded m Gondola (28%) and Barue (27%) Tbs IS followed by Guro and Mmca (23%) and Sussendenga (19%)
" 1 Feedang and drinking pract~ces during diarrhoea
Feedlng and dnnkmg practices dunng charrhoea mdcate that the rnajonty of mother's gn e the same or less food and hquds d w g an episode of harrhoea Only 30% of mothers sa~d that the! gave their cMdren more hqmds and 4% gave them more food The graph on the next page ~llustrates these feedmg practices
"he questlomarre had a categorq 'other sohd/serm-foods' whch referred to foods other than cereal pomdge, sweet potatoiother tuber pomdge, beans, eggs, fish/b~rds/meat, groundnutlsesame/caju
The queshomare had a category 'other 11qruds7 wbch referred to all Inqulds except water, water with sugar, juice, tea, any type of mlk and ORS

Cla aph 6 Feeding practnces when a child has diarrhoea
1 Feeding practices 1
~reast f ~iquids F O O ~ I @ Stopped More
The same Less -
7 3 Treatment of diarrhoea
7 3 1 Pract~ces of mothers whose chldren had &anhoea d u n g the b%o weeks preced~ng the s u n q
E~ght\. three percent of the ch~ldren \sere taken to others for ad\ ~ce/assistance G-om others dunng thelr bout of &an"noea The percentages of afflrcted chlldren m each &str~ct that were taken for ass~stance were the tughest m Guro (92%) and Mamca (89%) The remalntng dlstr~cts, Gondola (79?40), Sussendenga (8 1%) and Barue (83%) had sllghtly lower, but smla r profiles
The lunds of treatments gven to the cMdren who were taken to health professionals vaned The most unportant were modern rnehcuaes (48%), oral rehydrat~on fluid (39%) and traditional rcrned~es teas etc (34%)
7 3 2 Practices of mothers m general
When a chld has diarrhoea most mothers (82%) sa~d that they take the chld to a hospitaVclmc Other actlons that they often take are Gve them modern medicines (38%), grve them oral rehydration flwd (36%) and gyve them traht~onal rnehcmes (30%)
The signs most generally used to base a decis~on on whether treatment should be sought are * Watery stools/constant diarrhoea6 462%) * Fever (35%) * Weakness/t~redmess (34%) * Loss of appeWe (1 7%) % Vomts (14%) * Sunken eyes (1 1%)
Th~s general phrase was often pven by the mothers when asked about the symptoms that they base a decision on seekmg help on. Desp~te problng the mterv~ewers were not able to get more specdic mformation Th~s response was not considered as 'correct' when calculatmg the mdlcator for knowledge on signs of senous diarrhoea

T ~ L diftc~cnccs bcl\tccn dlstrlcts were relael\ cli nltnor Onc s r p loohcd at b> s~gnrficnnt numbers of households m Gondola and Guro. but not m the otl-ier, was the duration of d~arrlioea Eighteen and 15% respectrvely looked for help when darrhoea lasted for fourteen days7 or more
7.3 Pract~ces after diarrhoea has ended
Practices after harrhoea ended &d not vary a lot Approuunateiy half of the mothers gve extra food or food hrgh m calones to thelr chldren after an episode of &&a Twenty three percent of the mothers bel~ete that they should gite theu ctuldren small quantlt~es of food more frequently after an ep~sode of harrhoea, twenty percent rather Dve them more than they normally eat and on!? 15% g.c e them food \nth more calones Interestmgiy enough sign~ficantly more households m Mmca (25% as opposed to a mean percentage of 15% across all drstncts) reported gvmg food wth more calones to thew cMdren after episodes of &arrboea
8 ANTHROPOMETRTC PROFEES OF CHTLDREN UNDER FIVE
The acttons most commonly taken when a c u d does not gain weight are * Take to hosgttal (45%) * GI\ e food w-~th protems (42%) * GI\ e food more frequently ( 16%) The graph below ~llustrates the differences between districts when ~t comes to the recommended actions m the absence of welght gam
Graph 7: Knowledge of recommended practices in the absence of weight gain
I 1 Knowledge of practices 1
1
I Gond Guro Barue Man~ca Suusnd ,
Abbrevlahons used Freq(give food more frequenffy), 011 (put more oil in food), Proteins (gne food filth protems), Hosp (Take to hospital)
The opbon 'fourken days or more' came from a model KPC queshonnaxe However, ~t IS beheved that the mterviewers sometmes also selected this optlon Ifmothers said 'when ~t lasts for a long tune' rather than just for the two week penod menboned

Thc s u r \ ~ > tcnrn dctcmmrncd thc \ \c~ght hcigh! and 392 mca\urcntc'nt< clf'ch~ldrcn In add~tlon to general anformat~on about edema, possesslon of a health card and thew grottth monltorlng hstory Compared to other parts of Mozambique the target d~stncts are relatrvely well served wth health personnel and health mfrastmcture Consldermg that most of the selected areas were close to main roads and state prot lded lnfrastructwe one ltould e~pect reasonabl) good health profiles Gondola has the hlghest peoplehealth personnel ratio (3267 people to each health worker), whereas Sussendenga and Barue had the lowest and very smlar profiles (899 per health worker) The fact that 80% of the surveyed chldren under five were m possesslon of a road to health chart reflects good access to health care services Gronth monltonng also appears to take place although ~t 1s st141 qwte megular Only f@ SIX percent of the chldren wrth road $0 health charts were we~ghed wthm the last 4 months The hlghest percentages were recorded m Guro and Sussendenga (6 1 and 60% respectively) and the lowest m Gondola 49% Table 5 summarizes
the anthropornetnc mrllcators used m the shrdy.
TABLE 5: Anthsooometric measures
ANTHROPOMETRY Gondola
n=250
Numbsr health posts (centers)* lo( ] )
Number of health personnel* 100 Ratio per lnhab~tant 1 3267
He~ght for age(0-59 rnnths) Z-score <-2 ( ' ~ 5 % CI) Z-score <-3 (95% CI)
Welght for Height (0-59 mnths) Z-score <-2 (95% CI) Z-score <-3 (95% CI)
Weight for age (0-59 mnths) Z-score 6 2 (95% CI)
: Z-score 6 3 (95% Cr) 1 (10-18)
* Sources ACIWJRPNZR) I996
Guro
n=110
Stuntmg or height for age, is generally used as an rndrcator of long-term dietary mtake and also gives a good reflect~on of general socio-economc status Weight for helght on the other hand reflects acute malnutntlon and IS usually related to short-term deficiencres Wlthrn the context of h s study, one should remember that the anthropornetnc measurements were taken towards the end of the 'season of plenty' and acute cases of rnahufnt~on is unhke1y to be

cncountcrsd !loitc\cr gitcn thc fact that tfic Agnctrlttlr.tt hascllnc sunc) did not 1dcntl6 n sigruficant or prolonged hunger penod one ma) e\pcct that the mctdcncc of wastlng IS unl~hei> to increase s ipdcant ly dunng the hunger season
lJslng the cntena recommended b) MSF-CIS (1995b) the anthropometnc profiles of the target population can be sunamansed as follows t The ~nc~dence of severe stuntrng is the htghest m Gondola (55%), Guro (59%) and Barue
(52%) where more than half of the chldren have low hetghts for thelr ages The situation In M m c a (42%) and Sussendcnga (40°4) IS slightl.4 better, although still on the h~gh slde Most of ttus probably relates back to food supply problems experienced 3 years ago or more as the incidence of stuntmg was higher amongst the chtldren bebeen 2 and 5 years than rn the group as a whole (see Table 17, Appendix A)
* Acute mdnutnrtton (low weight for hetght) was not present m any &stnet although its mcidence lmndlcate that the s~tuat~on should be momtored This tvas confirmed by the low presence of edema m the feet of the children, whch IS usually a sign of kwashorkor Across the area surveyed, 5% or less of them showed s~gns of edema The 4% below the -3 2-score m Barue shows that the s~tuatton may be senous and the potentla1 exlst for t h s area to have senous problems 1~1th wastmg dunng the harvest season
9 INDICATORS
The table below summarizes the impact mdlcator t alues at baselme
TABLE 6: Indicators
INDICATOR 1 Ind~catm value I
I % of households consuming vegetable 011 once per day I 18 I % of households consurmng locally processed oil at least once per week as measured d m g the harvest season 1 'YO of mothers nho can name at least 2 benefits of adequate 011 consumpbon I General nutrit~on
I I I % households consurmrag on average at least 1 item of proteln
nch foods each dav (7 day recall) I
% of mothers who can name at least 2 Items from each ofthe three food groups % mothers who can name at least 2 Items &om 'food group that gves energy' % of mothers who can name at least 2 items from 'food group that make children p v ' % of mothers who can name at least 2 Items fkom 'food group that protects'
% househoids consummg vitarmn A nch foods (leavesforange coloured vegetables & fru~ts/ eggs on average at least oncelday
37

Brrart-tccdlng
1 Diarrhoea 1
% of ch~ldren under four months old who receive no foods or i~quids other than breastrmllc
" 1, ~ l t n~othtrl ln~tiaiing br~~st - t sedvg n ~ t h ~ n one hour d e r dcliter],
35
JS
% mothers contmumg feedmg chid (same amount or more) dunng dtarrheal episode * I
% mothers gvmg ORS or home flulds for management of diarrhoeddehydrat~on dunng an episode of d~anhoea
% of mothers offering extra flulds to chld dunng drarrhoeal eptsode *
3 8
30
baleif on a b i l ~ to name at least 2 n a m g sings
% of mothers gvmg extra food and or food hi& m calones to cluld mechately follo~mg a diarrhoeal episode
5 1
1 ?/. mothers addmg od to food of c u d wth poor weight garn I 15 I O h of mothers p ~ m g extra food to chld alth poor we~ght gam
I % mothers gvmg extra protern nch foods to chid wth poor I 42 I
% of mothers who know when to seek treatment for dtarrhoea
16
( weight gam I I
45
I % chldren wasted (wetght for her@) (0-59) c -2 z-score I
10 CONCLUSIONS AND RECOhiIMENDATIONS
<-3 2-score
% chldren underweight (weaght for age) (0-59) <-2 Z-score (-3 2-score
% chldren stunted (hetght for age) (0-59) c 2 Z-score (-3 Z-score
10.1 General
1
36 12
50 22
The project target areas were p m a n l y selected because of thew potentla1 for oiiseed production and nutritional consrderahons played little if any role m the sele&on process The nutrition component 1s therefore complementary to the agncdtural achvlties and mm to enhance the benefits that wdl be denved fiom odseed production and oil extraction Relative to other parts of
* These mdcators relate to the pracbces of mothers whose chlldren had Qarrhoea durmg the survey The other md~cators on d~arrhoea are more general and was asked of all mothers regardless of whether theu cluldren had diarrhoea or not d m g the two weeks precedmg the survey

thc pro\ snce and qu~ tc lakcl> orher parts of thc sclccted d~stricts thc sampled clusters (ninnnl> aiong the mam roads) have good access to markets, transport and other social mfrastructure such as schools and cllrucs Access to health servlces is particularly relevant m the case of a nubntion oriented programme as poor health can as much reduce the unpact of nutnt~on education as the lack of food
In the surveyed area general health service provision and the use of hedth services IS relatively good * The incidence of &mhoea (20%) amongst chlldren under five nas Ion compared to
other parts of Mozambique At the same tune a large percentage of mothers reported seelung help dumg the chlld's illness More than 80% of these children were taken for assistance d m g their dlness
* Growth monitoring 1s h o w m the area and 80% of the under fives have road to health charts Fifty slu percent of them were weighed dunng the past four months, whlst fore five percent of the mothers sald that they take theu cMdren to the hosp~tal If they do not gam we@
* Even though home v~srts by health personnel are largely d n o ~ v n , more than half the households in Mmca and Sussendenga reported attendug a health related acbvity d m g the year precedmg the survey
In the light of all the potentla1 support fiom the formal (and NGO) health sectors, AFRICARE n111 mavlrmze theu unpact if the) focus on actlv~ties * That mawruzes the potentla1 nutritional benefits of mcreased 011 production and
household lncome through nutntion education Focusrng on aspects such as food &stnbu&on w h households, the nutntlonally correct preparation a d composition of meals usmg locally avsulable foods
* Integrate thelr programme as much as poss~ble wth the exlsting Government programmes, so that health and nutntion messages wrll be mutually remforcmg
10 2 Agricultural activities and nutrit~on
The structure of the question on agricultural production made 11 dfficult to extract quahty data on the h d s of crops produced by the mothers who have thelr own fields/crops One does however get an idea of the nature of thelr duect mvolvement m food production even though ~t can be assumed that they do a large share of the work m the farmly fields too S l x ~ percent of the mothers s ad that they have theu own fields The b d s of crops gowm dtd not vary a lot, but the patterns generally corresponded wth the findwigs of the agmultural baseilne survey and reported Qetarq mtakes There was for example a 11nk between the hgh percentages of households m Guro who planted beans, gpoun~uts/sesame and the reported dietary mtakes of both the 24 hour and seven day recall
The results of the anhopornetnc measurements mhcate that the b~ggest nutntional problem m the area is m g , as a result of long-tenn sub-optunal &etary intakes and possrbly hseases (50% of chlldren under five years below -2Zscore) Cons~demg that the past two seasons were better than any during the past five years and that the incidence of stunting amongst chtldren 2-5 years is much hgher than that of the whole group, one may assume there is not a blg comelabon between current dtetary mtakes and the hgh rates of stuntmg Thc agndtural survey and statistics on the production and sale of staple crops suggest that the availab~lity of staples dunng the past season and particularly d m g the harvest season was good m most areas It is also expected that the greater availabdty of od and subsequent redrachon of 011 prices (through the oil component of the programme) is &ely to make a sigdicant cxznb'lbuhon to energy Intake and

thc reduction of chrldrcn under f i ~ e Guro Barue and Gondola had the poorest soclo-economlc profiles and if they are targeted for more mtenslte asslstmcc in the oil seed part of thc programme, the nutritional benefits are also IQely to follow Part~cularly af thls 1s supplemented by educational activities on the benefits of otl conswptlon
The relatlvel) hgh mtahcs of proteln rich foods. cspsciall> In Maruca and Sussendenga, correspond with the observed hgher socio-economic status m those &shcts (agricultural baselme s m e ) ) as well as good apcultural production Ho~tcver, there is stdl a lot of room for mprolement m so far as protern mtakes are concerned Most households who felt that the~r fisWmeat/poultry and otVfat mtakes were low said that the maln reason for thls was that it is expensive and they do not hate enough money It 1s hoped that the 011 component will play a role m r n h g these foods more affordable
Food production act1.c ities bate the b~ggest potential to enhance nutnt~onal status if one focuses on the promohon of vltarmn A nch h t s and vegetables Many of these huts are seasonal and the focus should be on promotmg crops that wll be ava~lable dunng tunes when households normally do not have access to vitarmn A nch foods
11.3 Nutrition education messages
The mother's of chldren under five were not very farmliar tl-ith foods &om the three mam food moups Flftt nine percent could name st least tuo carbohtdrate nch foods 30'41 could name m o - protein nch foods and 12% two L itamdrmneral nch foods Only 870 of mothers h e w ttko Qpes of food m each food group Knottledge about food groups appears to be slightl) better m Mmca and Sussendenga than elsewhere
Breast-feedmg practices &d not vary a lot between dtstncts Mothers do not start mmedately after blrtlh as ody 48% gave the f ~ s t feedmg w h the first hour Generally mothers also start to wean earIy - 65% of chldren of four months and younger took Iiqwds or food m the seven days precedmg the survey Foods most commonly gven were cereal pomdge, ttater and other ilqulds The mean age for the first introduction of solid foods was 4 2 months and for llqruds 3 8 months Foods gn en to s~gruficmt numbers of breast-feedmg chldren older than 4 months mcluded cereal pomdge (79%), groundnuts/sesame/caju (37%) and podtry/meat/fish (34%)
110.4 Diarrhoea: its incidence and treatment
The lncldence of d~arrtnoea was relatively low - on11 25% of households had at least one chld under five 3ears with darrhoea dblllng the two weeks precedmg the surcey and 20% of the under fives were affected Vanat~ons between &stncts were not slpficant, but followed a slrmlar pattern as vanations m soclo-econormc condltlons and anthropornetric mdlcators The hghest mctdences of Qarrhoea, poorest soc~o-economc condations and lughest lncldence of malnutrition were found HI Guro, B w e and Gondola
Feedmg practices d m g and after darrhoea mdcate that there is stdl a lot of room for improvement ']The adopoon of proper feeding practices may have a ssgiuficant mpact on anthropometnc profiles, as reduced food mtake d m g Qarrhoea impacts negahvely on nutnt~onal status Only 55% of mothers reported gvmg the same or more hqunds, lvhlst 33% said that they gave the same amount or more food More than 80% of mothers (both those wth chnldren wth Qarrhoea and those wthout), reported loolung for help when theu chldren had &aprhoea
SC WIjRPhZ13 1996a Perfis de daenvolt unento dlstntal Dlstnto de Gondola, Provtnc~a de I f ~ q ~ i z Xiaputo \cnu4"Pud
AC W N U D 1996b PtrGs de h v o l v m m t o hstntal Drstna~ de Guro, Provinc~a de Mmsa Maputo Acnug/Pnud
?ICPJC QJ-: 1997 hfncareKJsaid Mmca 011 seed Food S e c u n ~ h t l a tne Agncdtural basehe mvey Maputo Ahcan, M o d i ~ .
*<;r ,- < ' ' I u , ; ~ 3>:\:-*:q 22 Ssml:ancl A ] mc.;l:Jr Cl(; '- 5;' lu=just !3'+5 'I<\! _ t - . - Sans Frontems Maputo, Mozmbnque

APPENDIX A
DET AILED T 4BLES

I i R I Y 1 Gencr~1 characterrsttc\ of the mother caretaLer o f rhildrcn under fi\t ?ears - - -- - - -- I
-- - - -
h i ~ ~ number uf peuplt' u hcl nomdilj eat m the household
Dib I KIc i
%fern, number of vears completed at xhool c SD, OPo w~th no er4ucatl~n
Gondola n=li~l
") L? . ~ ! t ed m mcornc ;en actl\lries
Twes of actimbes ? o Non-agricultural srlr'-cmploqmat % Temporary agndtud work % Sale of agnculapal pmduce '
'A1-. t.; : >I),! p-rpx-:d J' h c r ~ . . . I _
/ C L P ~ ~ T L ~ J ~ ti^ i t ~ s 3riT ernp I " / I
1 ' 1 . , - --,) 1 , I - - a -
n/o Jehovas wtness O o 4sstmbhes of God % Evangel~cai church
Most unportant toptcs ofheal& dan~nstaatndach~hes "4 Vaccmat~ans
% bfaternavc'dd health/ growth O 7 Smtat1~)n and %ater ','a F d j planing % Vaccmahdm- plannrng 0 Yo Food deIn~nstr&otls
--
GWO n=: 1 ,
Barue q= 1 7 f
TOTAi n=-4'
Maruca r,= 1 5 ' m
Sussend n = 141;

TABLE 2: Agneultural activities of the motber/ppianary caretaker of children under five
I I
% who consumed u bn mld/euchanged
o LV ho plantea % who c o r n e d % who sold/rxchanged
b
6 0
- - -- “1
25 18
1' 17 10
20 20 11
! 3 13 7
18 I
I8 I 1

Number of tunes u hen the maln meal is prepared wth 011
?,'o Nel er YO Ebery day % Two to stx tunes per week O/u Once per week % Vanous tlrnes per month % hegular/seasonal1y/~0metxmes
Number of tunes when locally pressed sunflower1 sesame 011 used % Never 99 97
Source of oil most recently used % Bought 96 87 !An Exchanged 1 n
Recelled donat~on 1 10 90 Who got from press 0 0 '!/a ClaHorne produced 7 3
T\ pe ot 011 obtalned most re~entlq '% Sesame 7 2 3 9 % Colza 86 70 89 % Sunflower 0 0 0 % Coconut 0 0 0 % Grondnut 5 3 0 % Vegetable oil 0 0 0
011 consumptlon Mean rmlhhtres/daq./fdm& 91(71) Mean rmll~htres/person/da~ 15(111 I % of mothers who know at least two benefits of 011 consumptlon Benefits of consurmng oil* % Taste O/o Softens food % Has vvltamns % Give energy % Help w~th blood circulation % Satisfies hunger % Increase weight % Give health % Cooks well % Improves accompanying foods % Not answered % Do not know
* Respondents could g v e three answers to this question - columns do not add to one hundred

I 4 R I F 4 f o n d ~ n t a h e r on the d3! preceding the rune!
I T, - ?,<.I\
( % Normal S ~ e c l a l
% Staple food (cereals)
. - I -. , I, .tt?at poulrn fish 1 48 - A - .I 1 45 1 b i 2 - 1 -ij
I I I 1 1 I . I .. f -
DISTRICT
C.ood~>! 1 ) Gore Barus
n=I38 n-250 n=110
Zfsr,l:a
~ 1 5 0
Cucssn- dsng;l n=140
, TOTAL
n=780

"f'
c*
r,
0 P
2 2
2 c
-l

TABLE 5 {ccent). Frequency of food intake during the pas? seven days
Leaves "1 did not eat "D at2 once per week O / o m C e ~ s u r ~ p e r w c d c a 8, once per diit '? u twce pzr daq
Ormge colored t egetables % QQ not eat O ~ O ate once per week
Gondola n=250
( kaleiiemce " ? d:d not sat I I b
90 ate ooce per twek 19 % tt\;lce to six tmes per ~ e e k 5 6 O'i once per day 4 ' $1
$1 :uxe per daq 5
Other esetables I " o dtd not sat 7 3
2:: Cri‘,' Fc'T \\.2rh I 1:
i " cr i\.r!Cc 13 SIX t l f ~ l ~ ~ per nee!, ''0 cncc per dax
1 Orange colored h r t s " 1 did nor eat " $1 ate Once per ~ e e b '('0 twce to SLY tunes per week ''9 once per da)
~~ " o &d not eat % a t e o a c e p e r ~ O/o mce to slx tunes per week %onceperday O o n t ~ c c per da?
I Guro Barue Maruca Sussen TOTAL n=110 n=130 n=ljO n=14O n=780
I

TABLE 5 (eont): Frequency of food intake during the past seven days
Food Iten and hequenc) of mtahe
E l e m ' did not eat "10 ate once per s e e k % ~ c e t o s ~ ~ ~ p e r w e ~ k ' - 3 once per d q % twce per day
Groun&ue/caju/sesame %dldwteat
ate once per week ;-. la 5!\ i:n2.r p"r \\:ti,
Gondola n=250
\!eat fish. pod@ i " 9 did not cat 24 % ate once per week 38 % h ~ c e to sm tunes per week 35 '6 once per day 2 " ~ I C Z per dag, 1
Eggs I ) t
r d:i: Rc7C 5aL , 5R . , * ,-:: ;<- \l?<L 1 '< :;;I to SLI tmcs per ~veek y: a once per da?
O/b dtd not eat , " u a!? once per \\eel\. I
i 15 ' h%lce to st\ m e s per meek 4U % once per day 5 %hlcXperday 10
%ateoactperwu?c %mice toslxtunes per week
1 Mama I n=lSO
Sussen TOTAL n-140 I n-780 1

TABLE 6: Sesscierncy of food intake
I Qcrccntagz of, households who W that theu present mtgke IS
a cufficrr'nt
SO Sueet potatol8ther tubers
' Bread
Gondola CUPO Barue I Manlca Sussen TOTAL n=ljO n= l l U n=12u n = i i d 1 n=L4U n-7811
96 9 2 04 9 5 99 96 I 1 I

DISTRIC't Inctdence md practises
Gondola Gwo B m e M m c a Sussen TOTAL n=:50 n-=I 1 = I I n=lJCt n 7 5 0 ,
': o of households who hate at least one chnld under fit e that 1s stall breast-feeding Number of howehoids wth cktlckcn under fibe that are st111 breast-feehg
% of c h i h under five h u g brcast-fed N W of&ctut&m being breast- k d
% of elddhen who started breast- fcsdin;. krlthin the first horn of - - >
I
~ \ ! e a n s c a h s n r o l ~ d f o a d h ~ ~ r ~ 5 ( 1 1 1 2 2 1 I 1 1 ! 2 2 i 4 1 1 4 1 ! - I 4 1 1 1 l - l ? : l 4
t
mothers mlk on the da) p recebg
" $1 tea 1 mciudmg hrdtiona!
" a fisb%lpds!meat

1 I f 3 1 1 - B r t ~ \ t f ~ . t ~ i ~ r y pr . I C ~ I L C \ ( C O P ! ) - -. - -- - -- -- - -- - -- - - ---
DISTRICT Inctdence aand pract~ces
Gondola Cnuro I
c7nc.: 9" water
, O I 1 an\ npe 3f ml!h " o S RO % other 11qwds O n cereal porndge
O/G beans '30 g.oun&ue/sesadcago! % eggs
fish%uds/meat - r p : r > L ~ , l J sep~-;ol:tj f c ~ &

t ' tR I k X Hre~,r-fezdin- pr,nctrce\ o f ch~ldsen of filar montias and >ounger - - --- -
- - -- - - - - 9 o o t chldpen 4 monk and
%0fcMh4moattLsalld ?omger wbo took dds/sem-
-- - . --+-<:, - :: L e :
sn da) s r+ ho ya\ c leiis: C'nc. O o water ''0 an? tqpe of mnUc % SRO ' 0 other (iqt~ds
cereal pmdge ' 0 porndgr of potatolother tubers " , hems
" 0 eggs i I I 'b fishbvdsimeat 2 ' \o other sohd/sem-sohd foods 5 I

T !R! F 4 t%.tt.ai~lne foods = p e n to chlldren older than f ou r months - -- - -- r ----,
1
PRACTICE
% tea (mciudmg tradmonal remedres) $ 0 an1 gpe of mlL ''0 ORS O/P other hqwds % cereal porndge
C 3 T -
* > e521 I " fish '?rdslrneat

K \ E l F 10 lnrrdence of d i a r r k o c ~ and prsctrces wtth ch~ldrrn under h e who had diarrhoea
< r .- 3 % ; :
Qumtities o f ~ o d l glygl by
tl,ther'c; mriln. '. . - L > ~ J !
I 0 T ~ C s m e quanr~n \ r
r - .-22 ficfin:
% The same quant~~ O b More than n m d " o Stopped Sernx-solids and solids
f I' o Less ban usual I 1 T 1
I 1 >AT-< ?L3Xt1?\
' t, \Iar: &&I n c ~ m ~ ~ ,
O / o nce ~ t . ater or water of other
'tb tradlt~onal, remedies. teas ets
i Th~s excludes cases &ere the qwsbon was non-apphdle Fm example chaldren who were not breast- feedmg are not d i e ~ t e d m the percentages on tbc mtake of breasbrzulk

T !tRf F 1 1 General practices m he - - -- --
/ PRACTICE
''0 Start to g v e flu& mediatea?,
"/ GI\ t them anore fluids than normail!
'5' Gike them more to dnnk more
% Give them more f d than nomall: I----
[ % Gve them food mm &equfdy m small quant~t~es
chtfdren have d~tarrhoea - DIbTRlCI
TOTAL -I
I I - i - ' -<) .-- - - - <kt 2 > L-: ' Y ? x 2 * 1 : %:
I hospital, clmlc i L I I
f O,O stop ~ t h f i ~ d s
Stop with food

1 I F 1 ht hen do thq look for help dur lne ,I Rout of diarrhoes r --- f
--------.
<I(;\ 1'5ED TO GO 4ND LOOK
Y U L E 13. Practices after the diarrhoea has stopped 1 - -
I I
3i5T?.-\

H fie11 there ih not enough tvod rn the
% w t r o c o u l d g l ~ r : a n ~ o I f a e n 1 ~ $ 2 >houl;I be d ~ n r u hen .I
1 > -- - .. - - 2 ><. qc t t ~~-~:,l\~ I 1 I A~tl, 'r-. that sbculd he taken ui le~ 2
- .,.. 2 L Y , ~ * L : : A .
I i 1 i l1 G ~ L S t i x i more fiequent~~
' I Pu: nore 011 m iood 90 Give tbod vat$ p r o m (eggs, rmk beam, fish etc ) % Take b hosp~*bi "'a Tradltnonal merficmls (tea made of
18 C
40
42 I?,
rcots etc) " o Modem med~cmes O b Other
1 4 i 8 40
45 6
i b I i 5 42
4 5 7
241 19 1 1 3 f _ . -
12 I , - - 32 4 1 55
47 43 42 7 9 4
! 1 i7
15 9 2 3 2 Cl 1 1 1' 1: 9 - - 9 - - / :i

I 4fi;l k 1; knowledge ahout food_\ that ' y r e encrEb'
% Other cereds '.Ib I' 71 I Dlffereni cereal. ment~onrJ
% Sueet potato and dha tubem
! L 5 T ~ d d b
%W 5 2 5
% Mother's m& 13 6 11 I
"0 Fruits i 0 6 9 Mean no Drffeaent hits

I ] H I I I t 1 hi~{i\.rlt.J;ji ~ t l * j u t I r ~ ~ ~ < l * t!l.tt h t ! p ' w i t t i thc grr ~ 1 1 1 o f i t r ~ l r f r t [ I
\ I l l
DISTRICT
( , n 2 1 1 L.7 Y IPit \,lrni~r L P 1 Tl'i 4
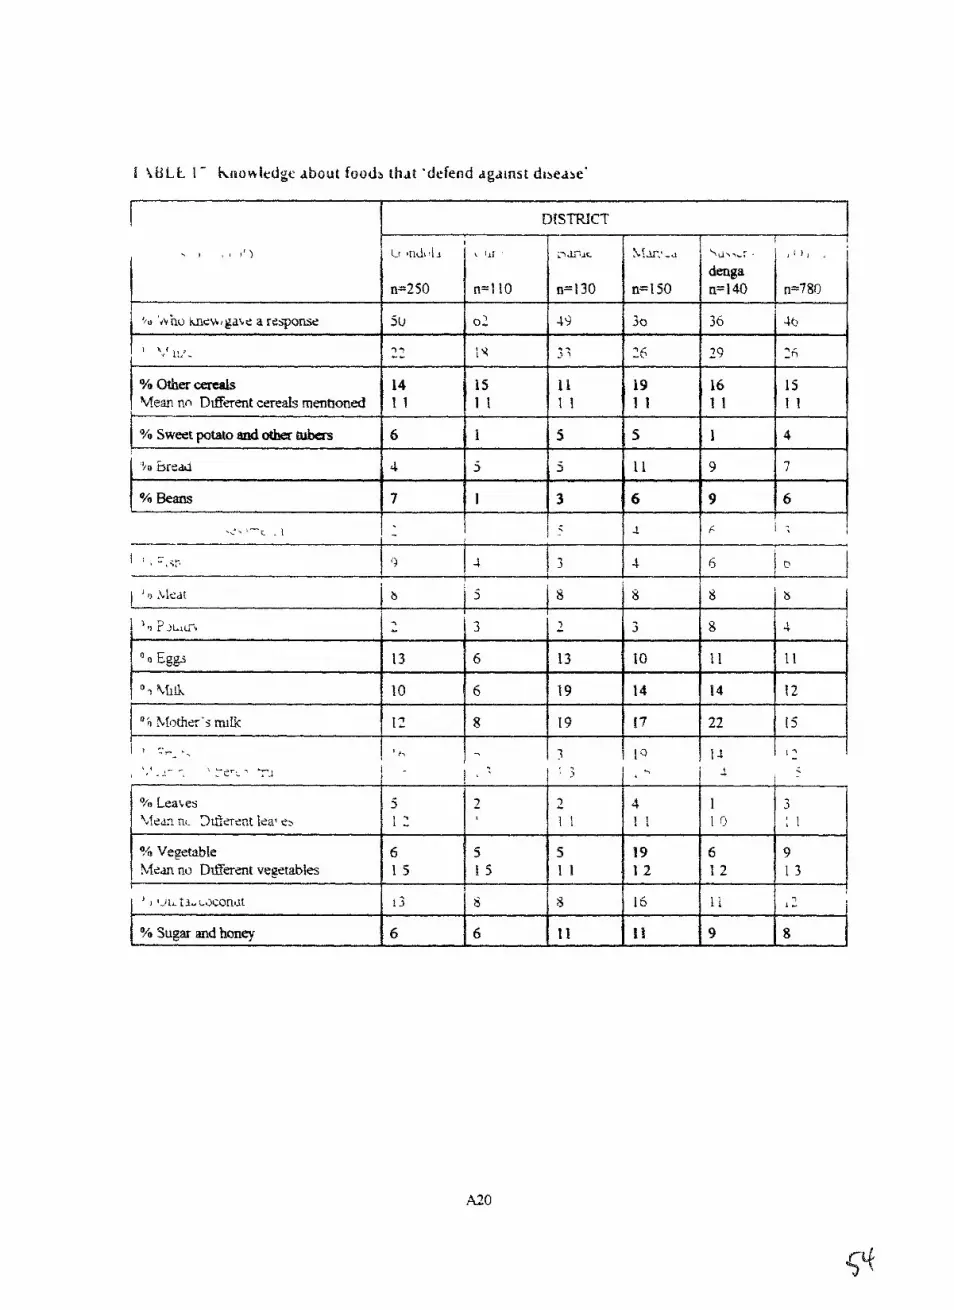
I i i 3 L t 1 - knulnlcdgc. dbout food3 that 'defend against diseabe'
% Other certals bfean no Different cereals menhoned
% Sweet potato and other t u k s
% Lea~es Lfedn nt. 3dsrear lea' rtb
% VegrtabIe Mean no Merznt vegetables
I x sugar and honey
DISTRICT
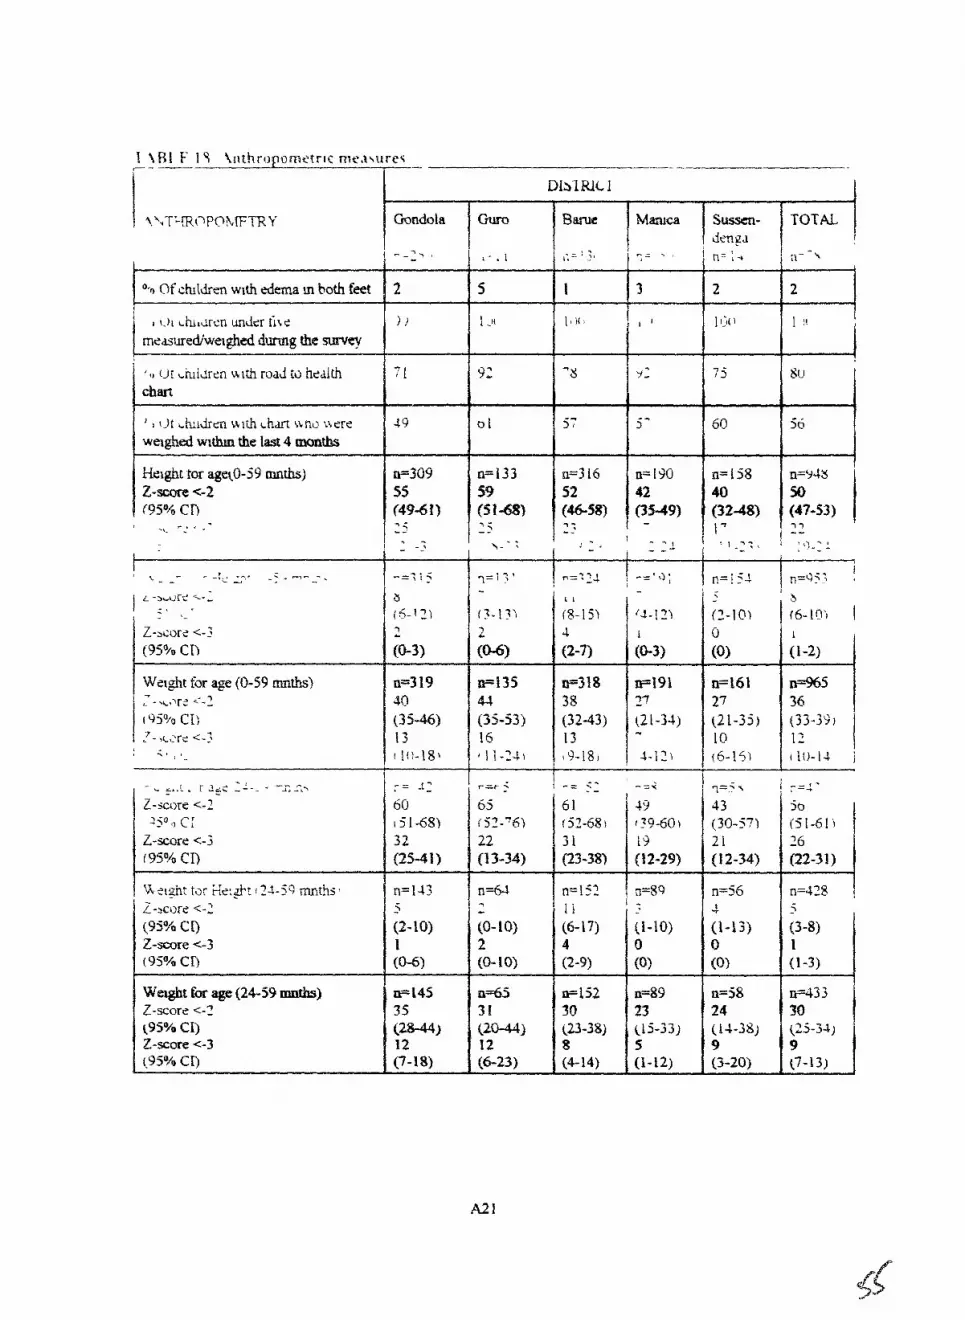
O.9 Of chljren w ~ t h edema m both feet
'$, UI L ~ i d r e n ultt~ road to hedih j .him
t?t ~hii j rsn c t ~ t h ~ h m i b n d :\ere w a & d w~than the last 4 months
Height for ageto-59 mttrs) Z-score <-2 ~950h cn
.< 7 - r .
We~&t for age (0-59 mths) ! - i , - . ~ , > r z '-1
I ( sISo/o CII 7- ,Ls?re <-3
L - I .t
t I _
Gondola
Dl31 RIC I
GUbo Bglve Mmca Susscn- TOTAL dcngcl
i - . 1 / ,;= I 3 , , j n= ;-+ 1 I , - - \
We-Ipbt for age (24-59 rnnths) Z-score c-2 195% CI) 2-score (-3

-1FRIC.4RE: L M A DE BASE DE NUTRICAO E SACBE aWlCi-41 JbNfiO 1997
A\?SO .A 5ra izrr-i itiieiro a nao partlcipar nesa entreblsta il sua pmictpdcao e litseuamente boiclntaria \ ? e n ; ~ ~ i t a \ale a pena ~ n d ~ s a s que, saso de Sra particlpar na entreblsta toda a 1nfomaq5o recohda sera wmpletamente co&dencial -em n e ~ ~ czl-clit o seu nome sera assoc~ado a nenhuma resposta.
Acelta participar nesta entret3sta3
Posto admmrra61vo 1
Rev~sado no campo por Data.
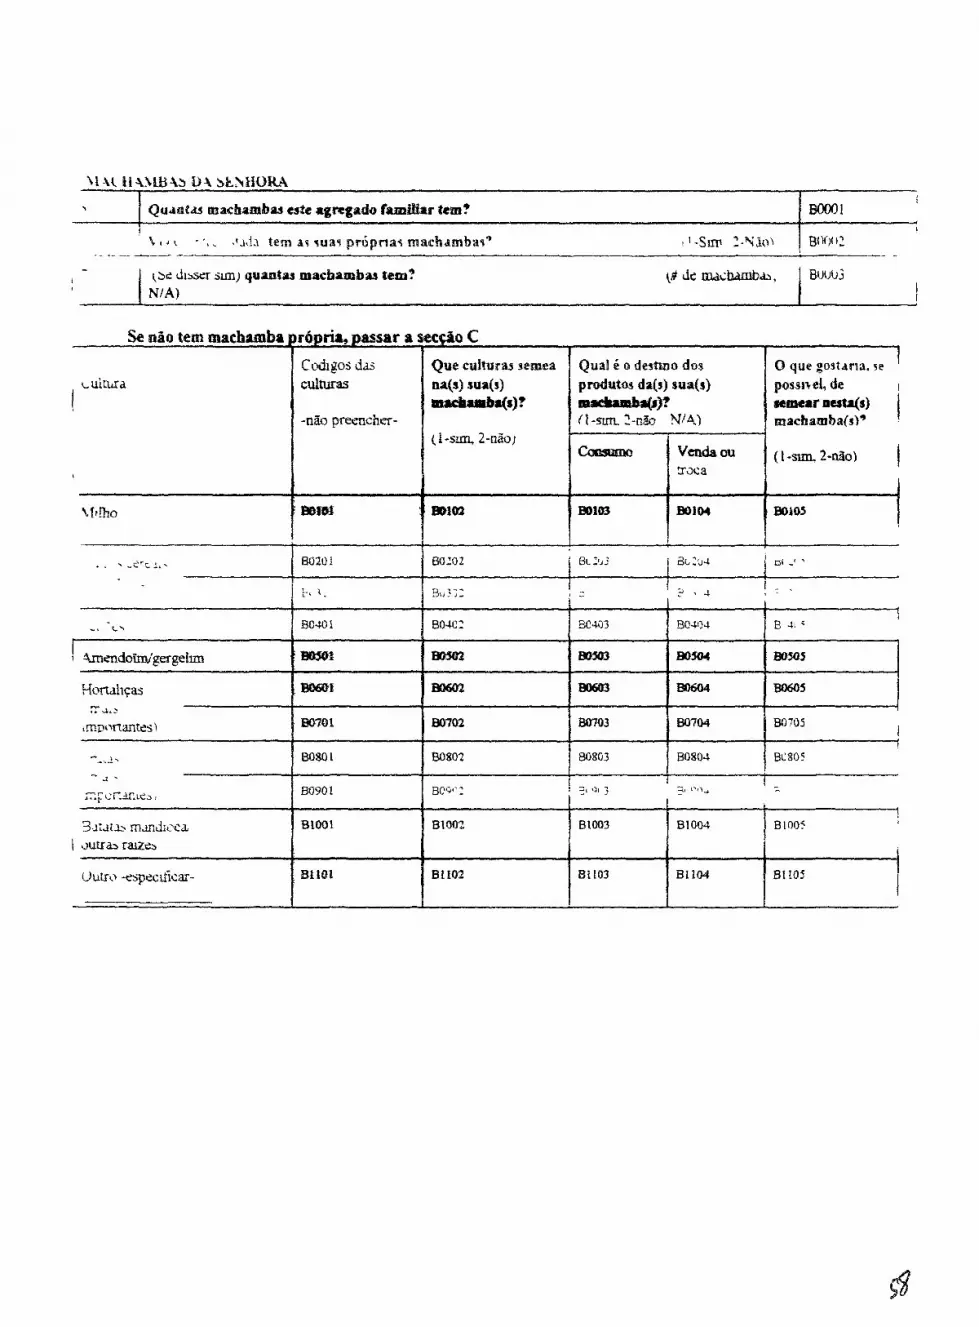
Que culturas semea W(S) sua(3) p d u t o s da(9) szna(s) mjrlr*u(a)?
( 1 - s w 2-nio)
8 que gostma. r e 1 possl.rs1, de ttmear nuta(s) naachamba(~)' !
BIKlLlj
1 -
I (32 d~bssr sun) qumta~ macbambl~ tern? (B dz whanabb, NIA)
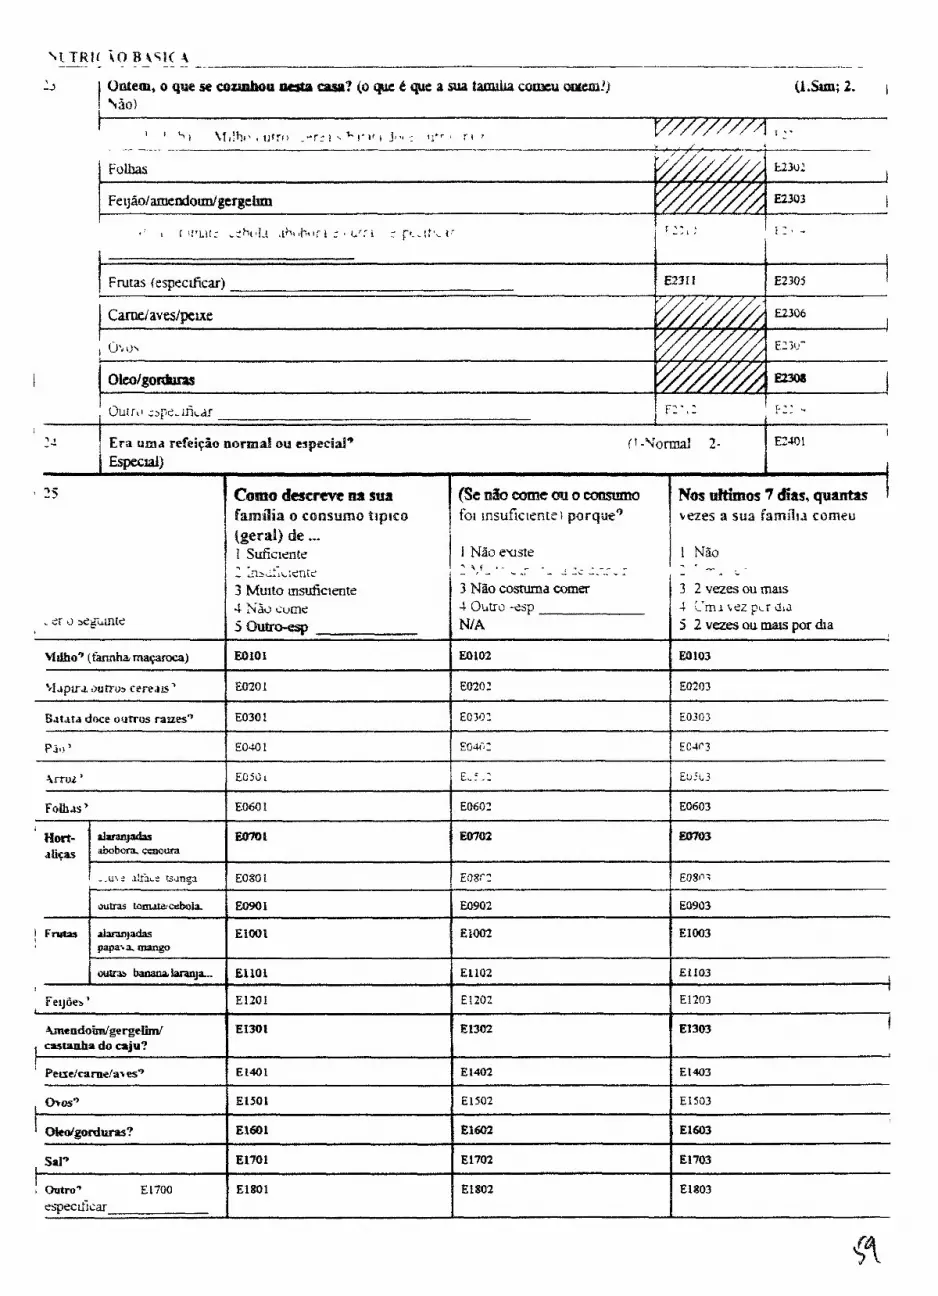
I , Outrtl :>p2,iricd!!
I I 22 I Era umn refriplo normal ou espceial* (1-t'ormal 2- E3r) 1
Corn &tnw na sua familia o csasmmo ~ ~ X C O
(geral) de ... 1 Sufic~entr 7 - - - a>d:,~:en[2 3 Muito msu?iclente 4 S&J surnt:
I Nlo cvlslr 2 + - - 2 - - J :c :--:- : 3 N b comma comer 4 0LLt-i-u -esp NiA
Nos uftimos 7 bias, wantas \ a e s a sua famitaa rumeu

- F R L - - l(LO< - DF E\Th%<44) -- - - -- --- - j ( h e aoo, recebcro vasntas em class de psma @& B saude? ( I Sim 1 510) j CUYUl I
I
Concern C i002 i 1
PAC [hog ram de Acnvlsaas Cultwas) c1m7 I
ADPP C10(3d I
, L hme ano, YBU alpma demomtm@o por p r t e de fl~osso;n ligada A saude?
3 2 vrzes ou m s p r serarana 7 Dzpende da 2pca 3 Uma vez por semana
i ' Quanta %riies a S U ~ familu atxiam 61eo de g w a s s c ~ t g e r g e h da prensa t u r d u propma' i ~ : i , > i
i Nmca 5 Ag~lmas vezes p r 3 Todos os daa. 6 De vez em qundo{esp) I 3 2 vezes QU mas popor seraana 7-Pei@leode~~cspecdimr 4. Ulnas vez por s e m
I 1
@dm0 c m s q p h ests! biko? 1 Cmnprou 3. R m d - 5.OMO e~pecficaa Z Trwou 4 C o n s e m da preasa
Qact$ r , t~W I. GuassoI 3. Azeite 5 Buno esqecficar 2. Coln 4. eergcml
Que ~ t i c l a d c ampmu w &a?
(Sc resta 6ko) qut gum&lade & 61co trrn agma? Anom a quaratadade e unxbde
mufa cm Ksnwm I
7 7 -- (Se &a resta 61eo) qumtos dias durom?

Se mas & 24 has, anotar a d i ~ : ( ~ e nunca mamentou por '993 I
'YO peritdo de ontern. que dees au
I , 'rtj?vlE; 1 alrm do lene matemot
F2702 f
n802 I
..
1 cha (inclue rm&os trxhaona~s) ~ ~ 9 0 7 ~ ' 2 9 ~ 1 1 -at: d mde nm &U nadq anotar 'nb" k I
Data de ~ascunento ( m b e ano) F2701
psire akes came F?923 nw4 i I
:O NQS M ~ O S 7 Bas, deramte i g ~ a CO~UUI? -1 FM(IZ 4 quantos d i a dela ao W Q M ] o sepasmte9 qudgass Pips de kite9 (dm do late F3M3 F3m4
. Quanta tempo dcpois do n I * , tm~ntcl dl$ r ! ' . I )' I concqrsu r t?. I. r i >ra>tx 1 b a ~ 15 1
h o t s as boru: nm1

{'"ma da\ qua5 cr tvn~a l (rnmcxeu de 5 mos) ?eve danrPila am rikbm duas ,emmnas?c I -Sun. 2-Narj) -x nau pasar a srcr;&, tt-
i , i r r \ t 1 ~ S J L lht dcu para bsber btu comer?
-se nao fr?~ &do aada. armotar 720 p a tr~db as oopC8es-

) \a uur expenracaa, que dsvc fater q~;rsrdo a crian$a tern dtarmia? (St f i t ' 5 ' ih~ 3 1 1 3 t l i -50- F3C3 t d d ~ 35
1 p . c ~ c \ ) W3801 ---+ - - -----
Dar-the dc beber mas dt costu;ne
Da- ihr dr corner mass vaes em qmhdades mas pequenas (frequcncla) H3806 1 1
I
i '1 3 S U ~ expe rrencra, que de\ e fazer depoas da dirrreia acabar'
Dar-he de comer mars de crratMke WL3903
3x-ihc ahcntos 20171 a s saionas @or oleo, aqtcar na corm&)
I t?~!: -~specLfi i~- 83W I
(Se G o sak anour '1150' para t&s as op~drs)
1

I Dnr-lhc maa al~mmfm corn p r o w (avos Inre, hlju, came, pew ) 1 14204 1
' t * A . I \ I $ < T i t lit 1.l. ~ U C d t \ L f ~ l ~ r t i~l . lnrf*' d cr2.sR\.4 n d l , .tilum~ntd d l y)c.ro ' 1 -+sJ. -
14206 1 V/r-d*camm:os tndtciona!~ como cha de m a s ou de rakes I
I
(Se G o sabe, an-r 'ruo' para t&s as 1 op~dsr) I
t11201 I I
t F o b cspecdcar- 14403 i1U)t Il SOZ 11 S M
I Hartabcas -espec&car- 14404 I1501 i150L 11603
Defendan C rat, d L - - *ma&. ddoencp\'
1- I-\ js
- - I \r ,u .~ e\prriaucra, quais sao or aimeotos que.. ' DSo f o r f d 9 1ju&m I)
' rn~iho
Outros cereas -esmcar- 14401
!
> - -: \ A - ~ ~ z - r ~ i *G>* 'LA& 35 :cq'tbj
I t
10-20 1
I030 1
I - ~ i m 2 - ~ 3 o
crescunrnt~ d~ c m p '
1-Slm 2-hilo
&320?
M3M
i
10203 I
I0303 1

1 Quantor anor completou na esrola9 (Quai ; a clar: qu: c~rnpI;t~u'' I I I ' 2 1
I ? Faz a l g m trabahtno que the d4 rendim~enatos? i.Sm 2 Nio I
(Se d o faz trabalho que da rendmentos, anotar ' d o - para todas as op@es) AOjOl I

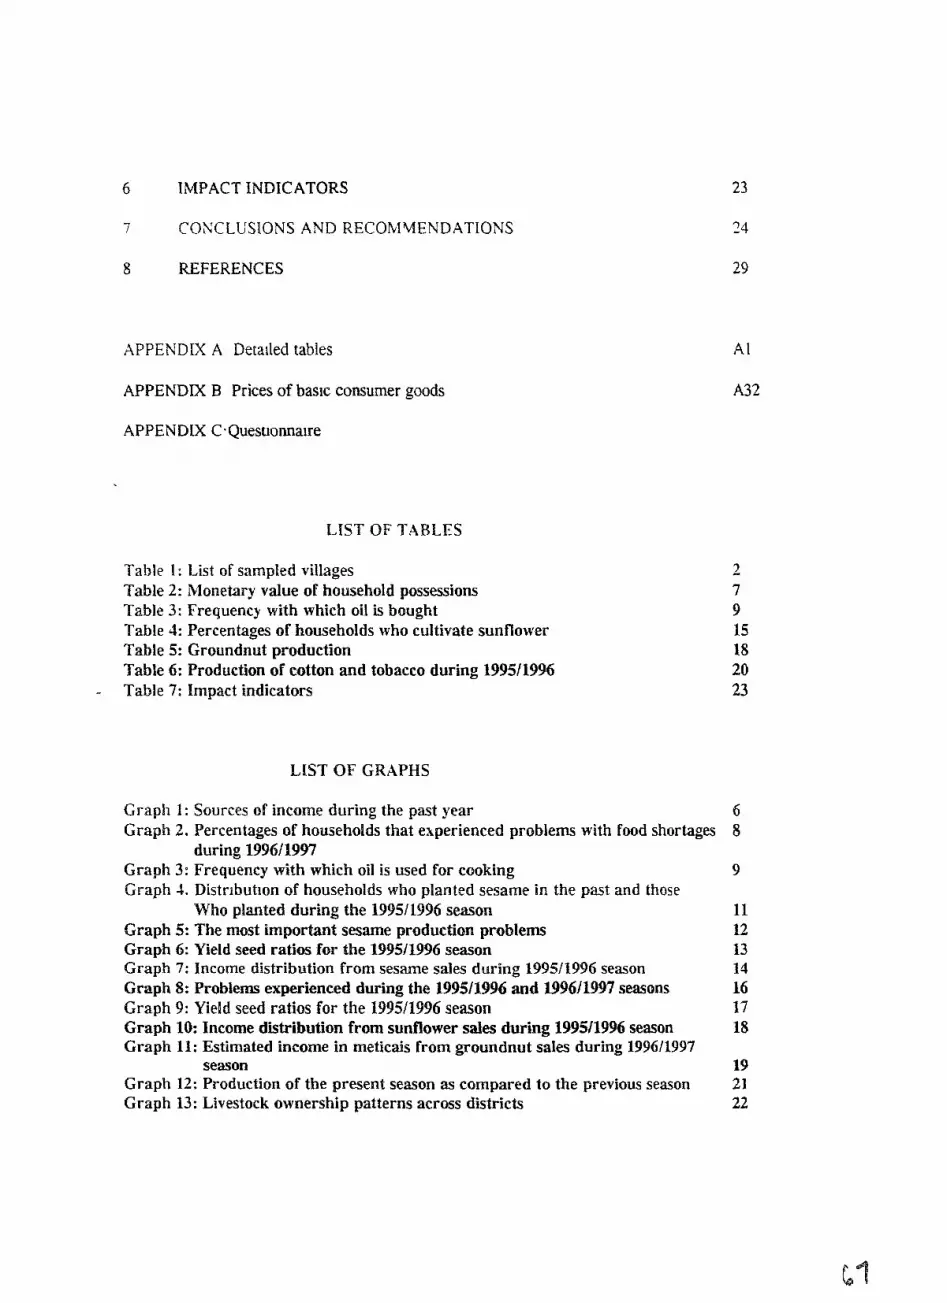
6 IMPACT INDICATORS
7 CONCLUSIONS AND RECOhIMENDATIONS
8 REFERENCES
APPENDIX A Detailed tables
APPENDIX B Prices of basic consumer goods
APPENDlX C* Questionnaire
LIST OF TABLES
Table 4: List of sampled villages Table 2: Monetary value of household possessions Table 3: Frequency with which oil is bought Table 4: Percentages of households who cultivate sunflower Table 5: Groundnut production Table 6: Production of cotton and tobacco during 199511996
- Table 7: Impact indicators
LIST OF GRAPHS
Graph I: Sources of income during the past year Graph 2. Percentages of households that experienced problems with food shortages
during 199611997 Graph 3: Frequency with which oil is used for cooking Graph 1. Distnbutlon of households who planted sesame in the past and those
Who planted during the 199511996 season Graph 5: The most important sesame production problems Graph 6: Yield seed ratios for the 199511996 season Graph 7: Income distribution from sesame sales during 199511 996 season Graph 8: Problems experienced during the 199511996 and L996i1997 seasons Graph 9: Yield seed ratios for the 1995/1996 season Graph 10: Income distribution from sunflower sdes during 1995i1996 season Graph 11: Estimated income in meticais from groundnut sales during 199611997
season Graph 12: Production of the present season as compared to the previous season Graph 13: Livestock ownership patterns across districts

TABLE OF CONTENTS
METHODOLOGY
GENERAL SOCIO-ECONOMIC INFORMATION Introduction Household demographic profiles House construction Economic acth ities Household possessions Food shortages Oil consumption
CROP PRODUCTION Profiles sf the crop producers tlse of radio and extension sen ices General agricultural practices Sesame production Cultivation patterns Cultivation practlces Product~on problems Labor Yields Uses for sesame Commercral~zation Sunflower production Cult~v ation patterns Cultrvatlon practlces Production problzms Labor Y ieIds Uses for sesame Commerc~dlization Groundnut production Genera1 Comrnerc~alization Production of tobacco and cotton Principal food crops General Harvests in comparison with the previous year Comrnerc~al~atlon
LIVESTOCK Characteristics of livestock herders Livestock ownership patterns Livestock feeding practices

The sltuatlon mn? hottetcr dctcriorate s l ~ g h t l ~ dunng the next t\\elxe months as more than 70°;, of thc maix conpca and sorgllun~ prodilccrs s a d that the? produccd less rh~s >car vhc-n compared to the prevlous season
Ths snlc of food crops is another ~nd~cator of food sccunt? espec~ally rn areas where no large scale commerc~al bug lng of food crops takes p lxc and ti hcre there 1s ~ o o d tnarhel access Generallj households sell elcess production once thelr o\in food requlrernents have been sat~sfied Relative to districts such as Maganja dn Costa In Zarnbezta, the sale of food crops In the prot lnce n a s JeQ h~gh (76% of households sold at least ons crop) In terms of cultlt atlon and commercialization pattems of food crops, households 1n Guro not only produced a smaller \ aneh of different crops, but the): also sold less This ma? be an ~ndlcatlon that thls d~stnct IS
rclat1re14 less food secure than the others The effect of the louer production letels on household Income IS compounded by the lack of other rncome generatmg activities
Normally 011 consurnpt~on pattems glve a good reflection of a i ailabilit~ of011 on the local market, d ~ e t a e preferences and the avallab~l~ty of cash for b u t ~ n g 011 In Manlca d~stnct 78% of households reported usmg or1 at least once a week to prepare the maln meal T h s \$as followed nlth Sussendenga (65%), B(me (59%), GondoIa (44%) and Guro (36%) G~xen other soclo-economlc lnd~cators the hlgh lncldence of oil use In Manrca and Sussendenga IS probabh a ii~rlciisn of hl_chcr lncomss (as r*:flcctsd b\ L nrloils sncio-cconomic status ~ndtcators) T ~ \ t n n L ~ \ O percent of households In thc prot Incc s a d that the) use 011 for cooking dad)
Thc 1 ast nlajorlt> of households ~ h o planted ollseeds at some or othcr time d ~ d so tiith~n the past 5 >ears Sesame IS at presznt far more important than sunflo\+er During thc 1996/1997 season 8% of households planted sesame and 1% sunfloner These differences are most Ilkel, related to the fact that sesame forms part of the local dlet and can be marketed locally wthout the need of outslde buqers or the presence of 011 presses Gondola and Sussendenga are the most important sesame producing d~stncts In the provlnce as a whole 27% reported plantmg sesame at least once before This number decreased to 14% dunng the 1995/ 1996 season and 8% m 1996/1997 The reasons for neter cultli atlng scsnnle or stopplng zre \ erq stnl~lar throughout all dlstncts and across all the production >ears The most Important constralnts are Lach of seeds (43%) lack of markets ( 3 1°,a) and Inch of labor ( looh) In most dlstrlcts the dccrs~oii to plant sesame was mors or less et enl) dlr,ided bettteen n~en (4 1%)) and ajolnt male/femalz declsion (38%) Sesame sssd IS usuallj sa\ ed from the pret ious )ear or bought from fr~ends or neighbors Problems cncountercd during 1995/1996 xtith the storage of s x d s t,:rc rats (3 i%) and Insects ( ? - I 0 , , ) Thlrt? eight percent of households had no problems The 1 ast rnajonty of households \tho planted sesame (8 1%) scattered the seeds and d ~ d not use rotr,s 58% Intercrop and most of them use nlalze and sorghum The biggest production problsms expcnenccd during the 1996!1997 ssason there Insects (28%), raln (23%) and birds (2 1%) Fortl, percent of households nho produced sesame at least once, sold some of their crop d m n g the past fit e years Half of those \tho sold, sold ~t lo call^ and a further 30% sold to traders The b~ggest marketmg problems encountered \\ere Iach of bujers (2 1%) d~stance to the market (10%) and problems $nth pnce ( 10%)
Smflouer production takes place at such low levels at present that ~t was not stahstlcail] possible to do a lot of dstnct spec~fic analysls Of the 80 households (10%) who produced sunflower at least once before, the biggest numbers come from Guro, Barue and Mmca In the case of sunflotver the most Important reasons for ceasing cultit ation or never cultlc atmg are lack of seeds (40%), lack of a market (33%) and lack of labor (7%) Durang 1995/1996 and 1996/1997 the lack of a market superseded the lack of seeds m importance Sunflower 1s more clearly a 'male' crop than sesame Less than 1 % of the growers sald the decislon to gron
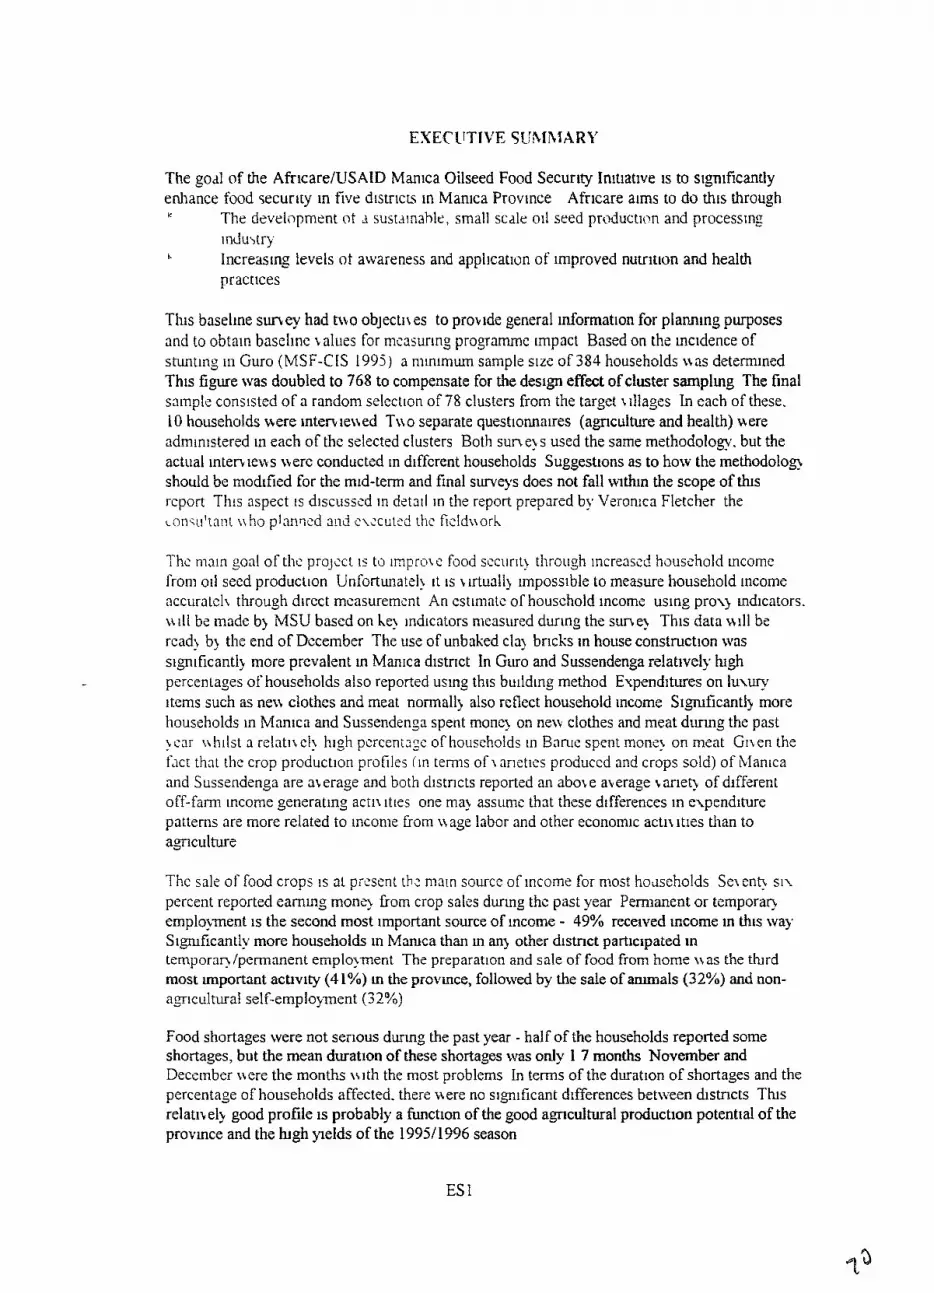
The goal of the AfricareiUSAID Manica Oilseed Food Security Initiative is to significantly enhance food security in five d~str~cts in Manica Province Afr~care alms to do t h ~ s through K The development nt J susrdtnahie, small scale oil seed product~on and process~ng
~ncfultry I. Increas~ng levels ot awareness and application of lmproved nuuition and health
practices
T h ~ s baselrne s m e y had two objectnes to prok~de general infomation for plannlng purposes and to obtain baseline balues for mtasurlng proyamme Impact Based on the lnc~dence of stuntlng 111 Guro (MSF-CIS 1995) a minimum sample slze of 384 households n a s determined This figure was doubled to 768 to compensate for the des~gn effect of cluster sampllng The final sample cons~sted of a random select~on of 78 clusters from the target \~llages In each of these. 10 households tt ere mten lett ed TI\ o separate questionnaires (apculture and health) \\ere administered In each of the selected clusters Both sune>s used the same methodology. but the actual Inten tews \\ere conductzd In different households Suggeshons as to how the methodolog?. should be modlfied for the m~d-tern and final surveys does not fall \ d u n the scope of h s rcport This aspect is dlscusssd In detail In the report prepared by Veron~ca Fletcher the ~on.;u'tant nho pinn~sd and c\ccutod rhe fislduorL
Thc nwn goal of thc project 1s to IrnproLc food sccur~tl, through Increased household tncome lion] 011 seed product~on Unfortunatzl> it is t irtuaIIj impossible to measure household Income nccuratcl~ through direct mcasuremcnt An cstlmati. of household incomz using pro\) tndicators. bid1 bz made bj MSU based on he! lndicalors nleasured durlng the sune? This data will be read) b j the end of December The use of unbaked claj bricks in house construction was slgnlficantlq more prevalent m Manica d~strlct In Guro and Sussendenga relatively hgh percentages of households aiso reported uslng this bu~ldlng method Evpenditures on 1u1w-y Items such as nekt clothes and meat normallj also reflect household income S~gn~ficantlq more households In Mnnlca and Sussendeny spent rnonej on new clothes and meat dtumg the past >car uhllst a relati\el> h~gh pcrcentags of households In Ban~z spent rnone? on meat Gnen the fact that the crop production profiles ( in ternis of \ nnetics produccd and crops sold) of klanica and Sussendenga are aberage and both districts reported an abote abetage carieb of different off-farm income generating actn ltles one ma) assume that these d~fferences In expenditure patterns are more related to inconle from n age labor and other economic actit lties than to agriculture
The sale of food crops 1s at prssent th? main source of income for most hodseholds Sel enc s11 percent reported earnmg monq from crop sales durlng thc past year Permanent or ternporq employment IS the second most important source of income - 49% received mcome m this way Significantly more households in Mamca than m a q other distnct part~cipated m temporar1,lpermnnent emplosment The preparation and sale of food from home \\as the thrd most important aclvlty (4 1%) m the provmce, followed by the sale of anunals (32%) and non- agr~cultuual self-employment (32%)
Food shortages were not serious durlng the past year - half of the households reported some shortages, but the mean durat~on of these shortages was only I 7 months November and December nere the months \ r~ th the most problems In terms of the duration of shortages and the percentage of households affected. there were no s~gnificant differences between districts Tlus relatne14 good profile is probably a function of the good agncultuhal production potentla1 of the provrnce and the hrgh velds of the 1 9951 1996 season

sunflolilcr !\a< tatcn b\ nomcn 53% male and 46"0 both males and females Those who planted sunfloncr at lcast oncc bcforc, rnalnl) sold thcir crop to traders (37?0) Agicom (29'50) and Mozambique lndustnal(23%) Therr biggest problems were a tack of bu>ers (26%), distance to the market ( 1 I%), problems tv~th price (1 1?4) and the cost of transport (10%) Cultivation techniques are probabl) ciosel! related to intercropping practices 42% Intercropped and t h ~ s ma1 bc the reason tih) thc inten als bctitecn rons and plants vsre conststentlq highcr than thc reconunended d~stances The b~ggest sunflo~ver productron problems dunng the 199611997 season were blrds (3 1%). insects (23%) and (15%)
Conslderrng socio-economlc conditions, food secunt) letels and the product~on of other crops, this project 1s llhel) to h a ~ e the blggest ~mpact on food secur~t? ~f nark IS concentrated In Gondola. Guro and Barue The main reasons for this are * Even though sunflower production was low, most of the producers wrth espenence m
sinfloner production came from these d~stricts * These districts have little alternative sources of income and poorer socio-economrc
profiles than Manlca and Sussendenga c Guro and Barue appear to hale low Ievels of crop productton and commercialization m
general The lntroduct~on of on! seeds as a cash crop has the potential to make a significant contrtbut~on to household Income and food secunb
+ Constdcrlng thc rcIat~\i.l 10,ic.r rainFnll lc\sls ln certnir, parts ct Garo and ~ t s I~rniting cifect on the ranze of crop altemnti\es. sesame ma) be the best uaq of promoting thc growth and dzi elopment of this particular district
Three cash crops ha\ e potcnttal in the pro\ ince These arc groundnut, tobacco and cotton Groundnut is of part~cular lntzrest because it ma) be a source of oil in sltuatlons \\here there 1s excess production and low prices Of the three crops, only groundnut 1s presently produced by slgnlficant numbers of producers Fort?. eight percent of households reported plantlng groundnut
- durlng the past season The hrghest proport~on of producers was found in Guro (69%) and the lowest In Sussendenga (32%) Relatibely fen households sold groundnut (66% of the producers) and hancsts \\ere reportcd to be less than the prei lous !,ear Less than 2% of the households were 111\01ied in cotton andlor tobacco production S I \ ~ sehen percent of the cotton production reported higher xields than the presious >ear nhilst 79% of the tobacco goners said that thc? hanested less The latter 1s probabl) related to higher than a\erage rainfall In the begming of 1997
Nearl! half of the households ha\ e rad~os and listen to programmes for small producers Veq few farmers reeened any 1 sits from agncuitural e\tension staff or sau agricultural demonstrations during the past >ear The onl? s~gnlficnnt percentages verz recorded in Banle and Sussendengrt. I\ here 13% of households recei~ ed a \ isit dunng the past ht elbe months Some actrvit) was also recorded m Manica, but an Gondola and Guro there eust nearly no extension support
The food crops produced by most households were maze (99%), sorghum (7 I%), sweet potato (65%) and cassava (55%) The mean number of crops planted per household was 5 8% with the lowest mean number of d~fferent crops recorded in Guro (5 0) and the lughest m Gondola (6 4) The h~ghest percentages of crop sellers were found in Gondola and Barue, \\here approxlmatelb 80% sold at least one crop T h s contrasts sharply n ~ t h Guro where onll 65% of f m h e s sold an! crops
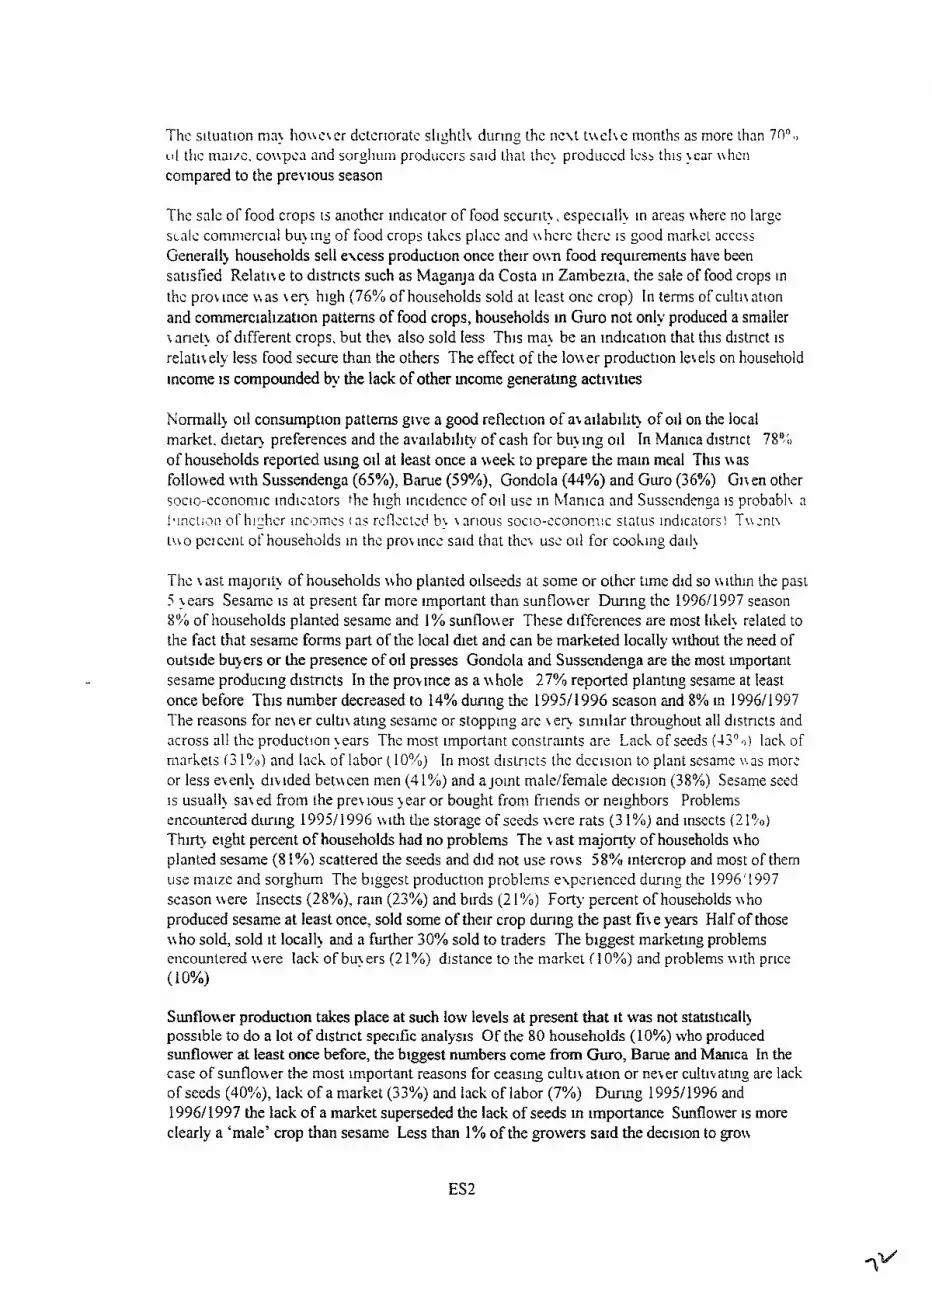
Thc sltuatlon ma! houeter dctenoratc slightlk dunng the nc\t h t c h e months as inore than 70n0 (11 thc maus, co\\pca and sorgliit~n producers s a d that ihc? produccd 1csb this \car nhcn compared to the prevlous season
The sale of food crops ts another lndlcator of food sccurlt?, espec~nll> tn areas !\here no largc s ~ a l c commerc~al b u ing of food crops tabcs p l ~ c c and ~Ihcre thcrc IS good markel access General!) households sell excess production once their onn food requirements have been sat~sfied Relatlce to districts such as Maganja da Costa in Zarnbezia, the sale of food crops [n the pro\ lnce \ins ier]l h~gh (76% of households sold at least one crop) In terms of cuitii ation and commercialization patterns of food crops, households In Guro not only produced a smaller x anet! of different crops, but the-, also sold less This ma! be an ~ndlcat~on that thls dlstnct 1s relatl~ely less food secure than the others The effect of the loner productlon lesels on household Income IS compounded by the lack of other Income generabng acti~ttles
Normallj 011 consumption patterns give a good reflect~on of a\ alfabllit) of oil on the local market. d~e taq prefersnces and the avallabrllty of cash for bu>lng oil In Manlca d~stnci 7S0,h of households reported using 011 at least once a week to prepare the maln meal This nas followed ruth Sussendenga (65%), B m e (59%), Gondola (44%) and Guro (36%) Gnen other socio-economlc ~ndiators the h~gh ~nctdsncc of 011 use in klanlcn and Sussendenga IS probabli n 181r,ctii7n ol'h1;hcr tnc~?rncs (as reflcstcd b> \. nnous soslo-sconorn:c status ~ndlcaiors) ?~\:nt\ L ~ L O P C I C ~ I I L of households In thc pro\lncc satd that thcx usc 011 for coohlng dad!
Thc \ ast majorit]v of hoi,tseholds ~ h o planted otlseeds at some or othcr time did so nithln the past 5 >ears Sesamc is at present far more important than sunfloncr During the 199611997 season 8% of households planted sesame and 1% sunflouer These differences are most Iihei> related to the fact that sesame forms part of the local dlet and can be marketed locally wthout the need of outslde buyers or the presence of 011 presses Gondola and Sussendenga are the most Important sesame produc~ng districts In the proklnce as a n hole 27% reported plantmg sesame at least once before This number decreased to 14% dunng the 199511996 season and 8% m 199611997 The reasons for ne\ er cultl\, ating sesame or stopping are erl, similar throughout all d~stncts and across a11 the productron \ears The most important constraints are Lack of seeds (43")) lack of markets (3 190) and lacb of labor In most d~strlcts the dccis~on to plant scsarns \,\as mor: or less elenl) dibtded betncen men (4 1%) and a jotnt malelfemale declslon (38%) Sesame sesd is usuall> s a ~ ed from the prel ious )ear or bought froni fr~ends or ne~ghbors Problems encountered during 19951 1996 with the storage of seeds vere rats ( 3 1 %) and Insects (2 190) Thirt? elght percent of households had no problems The \ ast rnajonty of households nho planted sesame (8 1%) scattered the seeds and d ~ d not use rows 58% tntercrop and most of them use nlalze and sorghum The biggest productlon problems e\perlenccd during the 1996'1997 season \\ere Insects (28%), rain (23%) and blrds (2 I YO) F o q percent of households \tho produced sesame at Ieast once, sold some of thetr crop dur~ng the past fi.r e years Half of those \tho sold, sold ~t local11 and a further 30% sold to traders The blggest marketing problems encountered {\ere lack of bu?ers (2 1%) d~stance to the market ( 1 0%) and problems 111th prlce (10%)
Sunflower production takes place at such low levels at present that ~t was not stamticall) posslble to do a lot of dlstnct spec~fic analysls Of the 80 households (10%) who produced sunflower at least once before, the biggest numbers come from Guro, Barue and Mmca In the case of sunflower the most important reasons for ceasing cultibatron or neber cdt~vatmg are lack of seeds (40%), lack of a market (33%) and lack of labor (7%) D u g 199511996 and 199611997 the lack of a market superseded the lack of seeds In importance Sunflower IS more clearly a 'male' crop than sesame Less than 1% of the growers sald the declsion to gron

I INTRODUCTION
The Afrtcare/USAID Man~ca Oilseec! Food Security Initiative is a five year programme which started UI October 1996 and w11l contmue until October 200 1 The goal of the project IS to sign~ficanti! enhance food securit? In hIanlcn Pro\ ince The programme has tno maln components
* The deceloprnent of a sustainable, small scale oil seed production and processing
~ndustq m fixe dlstr~cts in M m c a Proc ince
* Increased lex els of axiareness and agpl~catlon of improt ed nutrition and health practices
The fust objective will be achieved through increasing knowledge about oilseed production, ircating n demand for ollseed production, facil~tatlng thc marhcting of oliseeds, prokiding credlt for the purchasmg of oil presses and the tramrng of sales agents and repaw techn~cians m the sale and maintenance of 011 presses The nutrrtion and health component w~ti focus on nutrition education, cornmuruty based growth momtonng and & a m g in the prevention and treatment of d~arrhoea All activ~tles related to nutntlon and health wll be a subcomponent of the otl seed programme In so far as its target popu la t~on j~111 be the comrnunlties selsctcd for the oli seed progranune
The Logical Frarnc\iori\ of the Project makes pro\ ision for a \met? of diffzrent lnd~cators 'and measunng tools for morutoring and evaluating programme Impact A large number of these are based on mforrnat~on from household questionnaire s w e c s , rnahng i t necessaq to conduct a baseline sunreq' S~nce Ahcare has not \+orked in Mamca Provmce before it was dectded to do a cornprehensi\e baselme s u n ey which m additlon to measunng the baseline values of unpact rndicators also included mfomat~on necessary for planning purposes Two baseline surveys nere - conducted one to cover the agricultural component and the other for the nutntionhealth component T h ~ s report only deals with the findings of the agr~cultural sun ey whilst Report 2 dcscrlbes the nutritlonhealth situation of the target communities Both suneys \\ere canled out during Junc and Jul! 1997
Afr~care made use of t h o consultants for the basellne suneqs Veromca Fletcher deceloped the sune) rnethodolo3. deslgned the questionnaires and planned and coordrnated the e\ecut~on of fieldi\orh Research Consultant) Sen ices prot ~ded comments dur~ng the det elopment of the methodoIogy and questionnaire des~gn, but ~ t s maul task nas to analyze the data and prepare the reports
2 METHODOLOGY
The 320 800 people (49354 households) targeted by the programme \$as also the target populahon of the survey At the begiran~ng of nplementatton. Akcare consulted bwdely lath communities and Gotemment offic~als to ident~fy villages that produced ollseeds in the past and showed an interest m otl seed production Another unportant factor was accessiblllty - only those 1 ~llages that are presentl) accessible were considered for the survey Poor access would have acted as a dismcentive to traders, making o~lseeds unmarketable and demotivatmg farmers

The catculation of samplc size \\as based on the inc~dence ofstunt~ng in Guro Stunting is a good ~nd~cntor of soci+>-ccononl~c statlis aild fond ~nt, thzs 4ccording to hfSF (1095) 54% of the ch~ldren under fice In Guro are stunted Using the formula n=Z2xp(l-p)/d2, the minimum samplc sue \!as calculated as 3 8 1 households' In order to compensate for the design effect of cluster sarnpllng the sample s17e nas doubled to n=768 Thls translated In practice to a random selectron o l 7X cl~istcrs of 10 hoilscholds each
Table 1 t i s t of sampled areas
Z=1 96 (error nsk of 5%), p=O 5 @re% alence of stunt~ng of 54%), d=O 05 (preclslon o f t 5%)
DISTRICT
GONDOLA
LOCALITY
Doeroi
POST
Inchope
SELECTED CLUSTERS
Centro de rnehichira, centro de AcornodaqZo, Doer01
Chpmndam-we, Pmdanganga-centro
Macate-sede, Mevumbe, Macuenjere. Musmsadzl lntenor
f hlatamlra. Z i n s n 1
SUSSEN- DENGA
Amatongas
Macate
Ptndanganga
Macate
3larzra
Zembe
Cafiunpe
hlal onde
Chissassa ---- Maconha
Zembe-sede/Trangapasso
Boa1 lsta
Chiongo
Purnbuto
Ch~ttmga
Fernandcs Uhnmatanda Ch~ssassa-sede 1 Macoropa, Josina Machel. Nhar~rmro
Re\ ue-Kamba, Chauranga. hpongue
Nhanda, Nhaulanga
Tique-tique
Purnbuto-sede
hlocumbus 4
Belas I. Alinada, Verde, Barrro Centro. 25 de Junho
Ctuhmdo. Nhamat~quit~
2 da Bairro Vila Mess~ca, 5 ta Ba~rro \ Vila Messicrt, Bairro Chlmoio, Bairro Mutse
Alde~a Garuzo, Ch~camba Real, 3 a Bairro Bandula
Nhamemara 25 Junho 1&2, Chcueu Nharna\vsua
Chunbua
Mussarnbudzi (tsetsera)
Vanduz~
kIess~cn
Sussendengs
Rotanda
Vanduzt
Pungue-sul
hlzss~ca
Bandula
Sussendenga-sede
Munhlnga 2
Rotanda

The map on the nekt page shons the dlstrlbutlon of these sampled clusters D m g fieldwork, he! informants helped to dl\ tde each conmunib lnto sectors of approumaezl> 500 people Thereafter one of these sectors was randomi!, selected for the sune? The fieldworhers then used the WHO method of sp~nnlng the bottle to d e t e m e the startlng pomt of each team The f i s t household mas randomi! selected along the dtrect~on of the bottle b> uslng the numbers on a ctmency note The agricultural team went m the dmct~on nhere the bottle was pomtmg, ~ v h l s t the health team Nent the other \\a> Thereafter every second household was selected for intrnie\img The agr~cultural and health sune?s \\ere conducted rn the same clusters. but m d~ffcrent households The maln reasons for thls are both questronnaires are ve? long and domg both m one household would ha\ie been t m g to the mten ieaees The health surve) also targeted households wth chldren under fi\e years, evhlst the agrncdtural sun el looked at households m general A cop? of the agricultural baselme questlonnairc IS attached m Appendn C
3 GENERAL SOCIO-ECONOMIC INFORMATION
Yo clt~stc'rs S L ' I C C ~ C ~
No clusters selected
Mak ita-sede
hloians chgurnete
Ndongue Sanguene
Tussene Macocue
1 de hlaio B. Nhansana, Tsetsekama B Tsetsekama A, 1 de Ma10 A, Tongogara A, Samora Machel A, Catoe-local
Juilasse Nyerere
3 de Fei ereiro
Phumphu a
I r\.lalc. Sahantuni.1 Sabao
Honde Chu ala-centro
Matundu. Nhmgaze
Nharnpassa-sede
Nhassacara-sede
Panhera Camazashenga. Fudzl-sede
klunhlnga 1
3.1 Introduction
This project targets f ib e of the tune districts rn the pro\ lnce These are Gondola. Guro, Barue, M m c a and Sussendenga The map on the next page gnes an mdlcahon of the geographc dlstnbuhon of the target l s tncts
Mussapa
Muoha
Mabala
Darue
Matarara
Guro-sede
Mungan
C h ~ u l ~
Nlhamassonge
Cntandica-scdc
Chtwala
Nhazonra
Nhampassa
Nhassacara
Fudzl
Muoha
S A R C E
Dornbe
Guro
Mungan
Nbarnassonge
Catandm
Nhampassa

>Tap 1. Manica province and the target d~stricts of the project
Barue is a long. nearl: rectangular dlstnct, bordcring Zirnbab~te and straddling the mam tarred road to Tete It generall? has good access to transport and marketing opportun~ties Dunng thrs past hko )ears vanous roads and bndges were rehabhtated m the area (ACNURIPNUD 1996c) Traders buy and reseIl agricultural produce In Tete, Chuno~o, Zimbabwe and Belra The sale of charcoal, frettood and chlckens are common sources of addit~onal Income for smallholders Th~s d~strict has a lot of I d s nllh Z~mbabne because of its prournit], to the border and sornc adrnmstrative posts for example Choa, IS inaccessible from Mozambique, but has better road access to Zimbabue The most important orgmzatlons promot~ng cash crops in the dlstnct are TABEX bvho \\arks w ~ t h the family sector and promotes tobacco production and TextAhca that purchases cotton (Messiter 1997)
Just north of Barue is Guro Thls distnct has lower leseis of commercial actlvit~es and appears to have large tracts of unused land (Mess~ter 1997) The rainfall 1s more Irregular and lower than in the other parts of Mmca and the northern pat has great potential for goat production (AClWFUPNUD 1996b) When short of food, ~nhabatants go to Barue and Changara (Tete) to buq Groundnut is an Important crop and has potentiail as an 011 crop because of low pnces m the area (Messiter 1997)

Thc soiithcm most dtstr~ct [n the pro1 lnce is Sussendenga - the so called bread basket of thc pro1 incc Silsbcndcnga h,zs n t arlct) of aglculturd actti ~tlcs tncluiilng squnculture {rna~nl:* carp and tilapla), has s~gnlficant numbers of Itiestoch owners, an~mal traction is not uncommon and In the more rnountalnous parts fmle r s use g a t it). lrr~gatlon for nheat production amongst other thtngs (Mcsstter 1997. A C N W P N U D 1996e) 70% of thc roads hate been rehabtlitated (nlosti? b! GTZ) and arc tn a g o d condli~on Organl~at~ons tniol~ed in cornrncrc~al ag~iculturc are Mozarnb~que industrial MI& a sunflo\ter farm. TABEX (who ~iorks on a Iimtted scale itlth tobacco) and some cotton projects belng ~mplemented b) Text Afnca NGO's norkmg In the district tnclude GTZ MHC World Vlston (onl) field trtals) and CVM (hlesstter 1997)
Gondola is the plncc of fruit trees espectall\ bananas The d~stnct IS dl\ lded in half b) the BeIra corridor and has relati\ ell good ~nfrastructure Thcre appears to be some land ounershlp disputes as there are a large number of commerc~ai apcultural producers Theu presence appear to ltm~t the amount of land a\ ailable to smallholders Concern has rehah~litated some roads and bridges in the d~strlct Other f.iG0.s ~iorking there ~nclude Redd-Barna, GTZ-MAW, ADPP and MCH (Mess~ter 1997) The maln gatexva? to Zimbab~ce is m Manica d~strlct Comrnun~tles along the BeIra corridor generallq has good access to traders and a varlet). of commerc~alizatton opportunities Most roads, elcept those In the rnountalnous parts are In a reasonable cond~tion Cotton and Tobacco is grou11 xcrth support from Tabel and SAGREV respect~w el! Tuo groups of Cntllollc s~stcrs nrz ncittel! promotln: 2nd ~~or l \ lns tilth iionlen s groups In the dlstrlct (hlcssitcr 19977)
3.2 Household dernograph~c profiles
Mean household st7es In the sune>ed areas ranged between 6 1 and 7 9. ic~th a mean for the province of 6 5 Less than 3% of household members are aikay for 6 or more months during the E ear Nearly half of the household heads (48%) are returnees who has been In their present c~llage for less than five years Seventeen percent have been there betueen 5 and 10 years and 34% for more than 10 years There were no srgnlficant differences between dlstncts except that households an Manlca seemed to hate been less disrupted by the liar as 69% reported betng In their present place for more than 5 !ears (compared to 5 1% In the district as a \thole)
Thc reported relattonsh~ps of thc household members to the household hzad ret eal that * The awerage household has 3 6 children 111 lng most of the tune nith the household * A sign~ficant percentage (10%) of household members are other relattxes nho arc' not
part of the nuclear fam~ty 80% of these are younger than 20 years * Ln Guro, 103 male household heads share 165 w r es amongst them T h s may indrcate a
h~gh incidence of poi^, ganlous houszholds ~bleh more than one I\ ~ f e residing at the same homestead
Ltteracy rates amongst people older than 10 )ears 1s the poorest m Guro and Barue, vhere appro\~mately 42% h a ~ e no educat~on In the other three dlstncts the pzrcentage of people n ~ t h no education is near11 10% lower (between 29 and 34%)
Eleven percent of the lnterv~eaved households are female headed The tughest proportion of female headed households was recorded m Man~ca (1 5%) and the lowest in Guro (8%) Female household heads have statlsbcally significantly (chl-square p-value=Q 0) less years education than their male counterparts E i g h ~ four percent of the female household heads receii ed no education compared to on14 a quarter of thclr male counterparts

3 3 House construction
The mean number of houses2 per household vaned from three in Gondola Manlca and Sussendenga to four in Guro and Barue There were consnderable vanat~ons betneen districts {then ~t comes to the materlal used for the construction of the maln house Generally, 90% of housel~olds elthcr used mud and stlchs or iinbnhed cia! bricks for thc ir ! I i > of thcir nmn house Houe\er, the use ofgust wood and cia) was significantl) more pre~alent m Gondola (84%) and Barue (72%) In Guro (56%), Manlca (39%), and Sussendenga (56%) s~gnificantly fewer households use these build~ng materials and more far ored the use of unbahed cla) brlcks The iast majonb of houses (91%) had roofs made of grass, regardless of thz materlal used for will constnlctlon
3.4 Economic activities
hlost households are dependent on agr~cultural production for sun 1) a1 Xpproumatelq 14'20 of households reported receiving remittances dunng the past )ear There was vey l~ttle vanat~on between districts m t h s respect Off-farm economic actlvltles of lnditiduals also showed little L ariat~on behveen districts Approximately 19% engage m economc actn~ties classified as self- emplo)ment. whilst 14% are employed b) others (either temporanl! or permanently) Also see Appendl, ,4 for more details The graph bslon iiii~strarss the main souri:s of Income of the sun e\ ed howeholds
Graph 1 : Sources of income during the past year
Sources of income
Gond Guro 8ar Man Suss 1 5 Sale of food cmps Sale of an~mals I Ei3 Sale ot food prepared at horre . Non-agr~c self-employment
R~egularltemporary wages I
Generally less households m Guro sold crops, but there were signdicantl> more livestock sellers(43%) than m the other areas In Gondola and Manlca, the sale of food crops and regularltemporary wages were the most sigmficant sources of rncome Mmca had s~gruficantly more households (6 1%) who reported lncome from wages (temporary or regular) than any of the othcr districts (mean 49%) Bes~des the sale of food crops Sussendenga had a balanced spread of
AH structures, lncludlng the small shelters on the 'machambas' were Included m these house counts

other actl\iltcs Non-agricultural self-emplo!ment \\as the second most reported mcome source in the district and thc significant!> more pcoplc In Susscndcnga \\ere ~niolxed In these act~iltics than m the other distncts
3 5 Household possessions
Giken that i t is veq d~fficult to make accurate Income measurements, one of the tools that ma) be used for measwng changes In household income, IS a companson of the monetan \. alue of household possessions oxer tlme The monetan 1 alues of household possessrons as measured In June/Julq are summanzed m Table 2 See Appendn B for the detailed list of goods and mean prices used
Table 2: Monetary vahe of household possessions
These talues represent the current replacement values of these goods and do not incorporate factors such as the age/state of repalr of these items Houever, one tvould assume that the degree of error bullt In as a result of h s kieakness wlll be sirn~lar over time The companson of subsequent measurements \ \ ~ t h baseline alues then becomes meanmgful. if one makes provision
for the fact that the age of goods arc not considered In the calculation For example, ~f the socio- economic sttustlon detenoratss, households arc Ilkel> to sell somc of thzlr possesslons to raise monej for food and this uil! be rsilzcted in the total monetaq ~alut . h%at nil1 not be reflected \ k i l l be the fact that old/worn production implements \\-dl not be replaced If the s~tuat~on deteriorates. but not suffic~ent1.i to necessitate the selling of goods this ~ 1 1 1 be reflected as no change m household possessions If there ~s a no change situat~on', it is more lllielj that the soc~o-econom~c status of households deterlorated rather than remamed stable because of the de- \ aluat~on of goods OL er tlme
DISTRfCT
The data ~nd~cates that * The d~fferences beh\een districts are relativelj smafl * Guro and Manica ha\ e s ~ m ~ l a r profiles The fact that Guro d ~ d not have a \ lsibI> poorer
profile \then compared to all the other districts, desp~te all other mdncations that it IS a poor d~stnct. 1s related to the fact that h ~ g h value ammals such as goats and plgs, are owned by large numbers of households
Calculotlons were based on thc standard MSU list of households possesslons and the mean pnces across all districts as measured In August 1997 If the Items nrrr available, prices \\ere recorded for d~stnct capitals, the rural areas surrounding ~t and Chuno~o Some Items such as sewmg machmes and motorcycles are only avatlable m Chmoio and those pnces were used m the calcuiatlons Append]\ A contalns a summary of the mean monetq t a1 ues
Sussen- denga n=140
22 20 22 3 6
TOTAL
n=780
37, 'l- - )
17 2 8
Guro
n=110
3 5 2 0 1 I
Barue
n=l3O
Monetary value m Metlcais Gondola Mmca
n-150 t
1 otai rnunctdl-j \alue3 of posaesblonb o / ~ , Lcsb thnrl 1 000 000
BLt\\ eerl 1 000 GO I and 2 000 000 U/o Betu em 2 000 00 1 and 3 000 000
n=750
3 6 27 16
'YO More than 3 000 00 1
I
3 5 23 2 1 2 1 2 1
32 2 I 12 3 5 35

* Sussendenga has the most etenl) d~stnbuted possession 1 alues. wth a greater pcrceiltagc of housctiolds in thc' ?0000QO+ caiegorl, than 111 thc Jottcst catcgon (Icsr than 1000000 mct~cals)
3.6 Food shortages
Approut~atcl) half of all households suffirzd food shortages for at least onc month of the past >ear Generally the dnfferences between dlsbcts are not stat~stically slgmficant Gondola had the most households (52%) reportlng food shortages and Barue the least (43%) The mean number of months when food shortages were elpenenced d ~ d not 1 arj a lot betwen the districts and IS
approwmately 1 7 months The hlghest percentage of households reportlng food shortages for an) one month 1s 4 1 % for the month of December The graph beloxi shot\ s that ex en di~nng the months u ~ t h the most serious problems (Noxember, December and January) only betneen 30 and 40% of households experienced problems Smce most producers of the maln staples (maize and sorghum) s a ~ d that the! produced I s s this 1 s ~ r than thz pic& lous >ear i t 1s posslble that food shortages m No\ember/Decmber 1997 ma: be more prevalent
Graph 2: Percentages of households that exper~enced problems n ~ t h food shortages dunng 1996!1997 -----
Food shortages I
I Jun Jut Aug Sep Oct Nov Dec Jan Feb Mar Apr ~ a y '
3.7 011 consumption
The preceding section showed that there was lnttle kanatlon betueen dlstncts In terms of food secunt). and food shortages However, the same is not true for oil consumptlon patterns4 There 2re signlficant differences between districts and these may be as much related to socio-economlc conditions than to nutrlt~on education about the mportance of oil consumption Variations m the consumpbon of 011 may also be llnked to ava~lability and price, although a qulck assessment rex ealed that oil is readily aballable throughout most of the projeci area (Messiter 1997) The use of oil m food preparation 1s s~pf icant l> lomer in Curo and Gondola than in any other of the sun eyed d~stncts
1 011 consurnptlon only measwed the consurnptlon of extracted oll and not mduect consurnptlon m the form of coconut, sesame and groundnuts
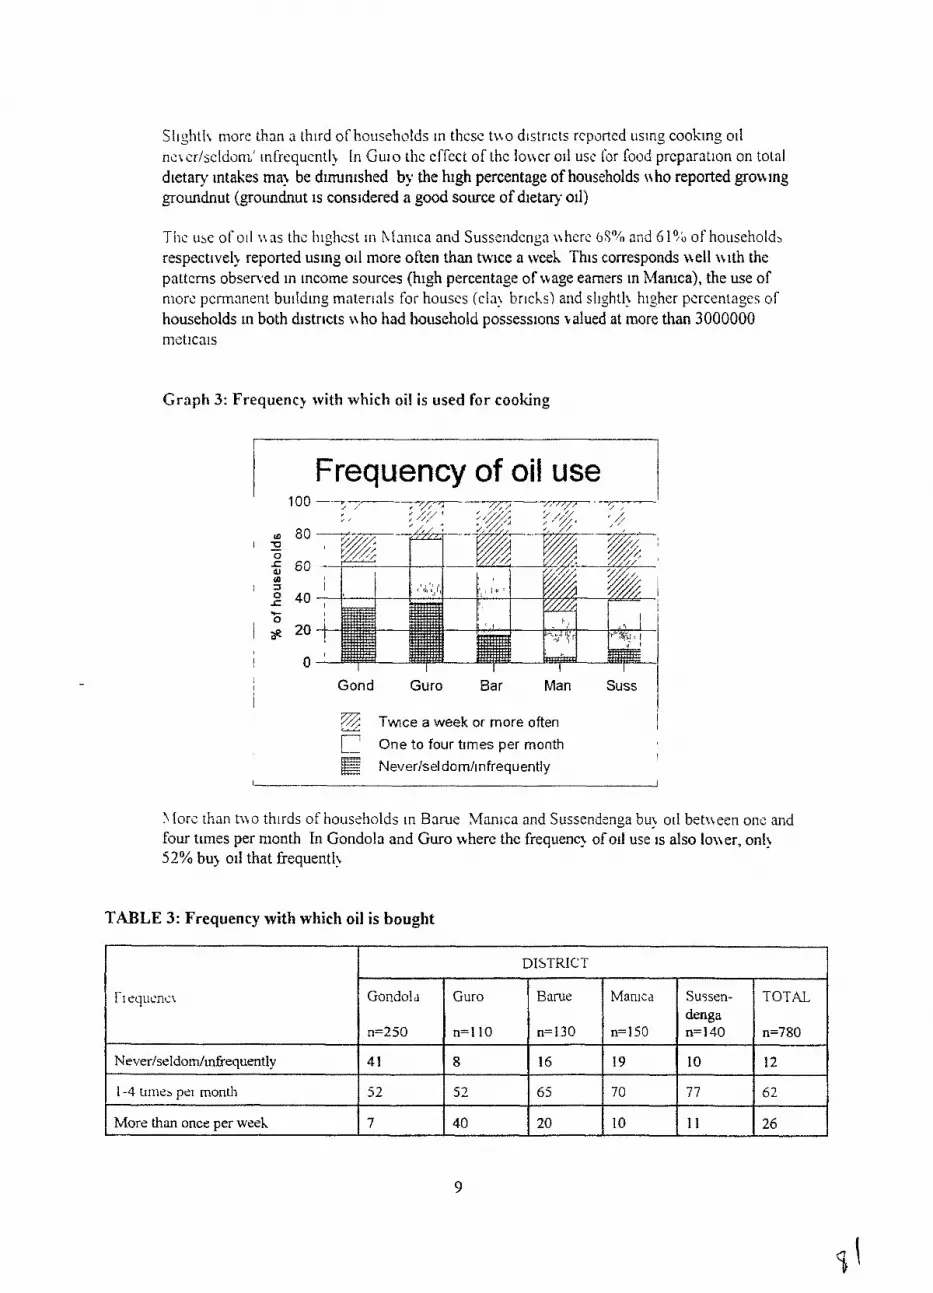
Sli~hil \ more than a thlrd of ~ O L I S L ? ~ L ~ I J S In thcsc tuo d~strlcts rcp~rted ilcing cook~ng 011
ncicrlseldorn' ~nTrequcntl> In G u ~ o the effect of thc loiicr o11 use Tor food prcpnration on total d~etary intakes ma? be dlrrunnshed by the hlgh percentage of households nho reported growing groundnut (groimdnut is considered a good source of dietaiy oil)
Thc use of or1 bins thc highest ln hfnrllca and Sussendcn~n nherc CIS"/" and 6 I?; of household5 respect~vell reported using 011 more often than twice a week Th~s corresponds well n ~ t h the patterns observed in income sources (h~gh percentage of wage earners in Man~ca), the use of marc pcnnnnent bu~ldlng mnterlnls for houses icl? brlchs) and sllghtl? higher percentages of househoids in both d~st r~cts nho had household possessions valued at more than 3000000 rnetlcais
Graph 3: Frequency with which oil is used for cooking
Frequency of oil use
I Gond Guro Bar i Man Suss I
Twce a week or more often 1 One to four t~mes per month
I I Ne\/erlseldom/tnfrequently
1Iot-c than tibo thlrds of houszholds in B x u e Mnnica and Siissendznga bu) oil betibeen onc and four tunes per month In Gondola and Guro where the frequenq of or1 use 1s also louer, onl) 52% bu3 011 that frequentl?
TABLE 3: Frequency with which oil is bought
1-1 equc'nzi
Never/seldom/lnfrequently
1-4 tlllleb PSI month
More than once per weel\
DISTRICT
Gondold
n=250
4 1
5 2
7
Guro
n=110
8
5 2
Manlcd
n=150
19
70
Bnme
n=130
16
6 5
40
Sussen- denga n=140
10
7 7
TOTAL
n=7S0
12
6 2
1 1 26 20 10

Stai~st~cs on the ata~labllih of oil [n thc market place seems to confim~ the obsenat~ons of the R,~p~cf Rur~ l Asscssnlcnt (Llcssitcr 1 0 0 7 ) Three quarters or morc of tlouscholds 111 most d~str~cts norrnallq buj thelr 011 at the rnarkets/shops In thelr village The only exception IS
Gondola tihere 67% bought 011 IocaIlq and 22% in Chimoio None of the households sune)ed In Gondola Barue and Sussendenga reported uslng the 011 press of a neighbor Four percent of I~oi~s~llolds in Guro (Guro - s d c Tsc.tschnma A & Sarnora Pvlachcl) and onc pcrccnr of households in Man~ca (Vandun Ba~rro Centro) reported getting oil from a nelghborloun 011
extrnct~on These mnq refer to traditional methods of 011 eltract~on, but further mlestlgatlon 1s necdcd
4 CROP PRODUCTION
4.1 Profiles of the crop producers
The charactenstlcs of the people who worked regularlq5 In the farmi) s fields dunng the past ?ear, can be summanzed as f o l l o ~ ~ s
* They represent 43% of the total popuiat~on
* Thlrt! percent itcrc h~usehold hcnds 37" 1 the 1\1fc of thc household head and 3 2 " ~ chlliiren
!+ Sllghtl> more than half (57%) \$ere female, and 43"/;, malc
* The mean age of these workers tias 34 years
* Guro and Bame had the poorest educational profiles Approximatel) 54% of these workers had no education at all Compared to the approximate]? 40% with no education in the other three districts, thls indicates sigmficantl) poorer lei els of educat~on amongst the producers
* It orhing in the ficlcis itas not thc on14 occupation of some ~ n d n tduals Tneni! set en percent of thcm also sold thelr labor to others as tzmpora~/permanent norkers and 36'?i, \\ere engaged in off-farm self-emplo?ment
4.2 Use of rad~o and extension services
fi3 Gondola. Guro and Banie appro\imatel> 40°~/0 of households hale a funct~oning rad~o In Manica and Sussendenga the figure IS much hlgher at 57 and 5 1% respect11 ell The latter t ~ i o d~stncts also have the highest percentages of households who reported llstemg to the radio programmes for small producers - in Manlca 54% and m Sussendenga 49% listens The lowest lexel of l~stemng was reported In Guro \%here onl? 30% tuned m to these programmes See Table 6 m the Appendlx for more details The most unportant reason gilen for not llstemng to these programs nas that the) do not ha1 e a radio or do not have a functlomng radio (58%) Other reasons mcluded. not mterested (20%) and a lack of batteries (10%)
Presently, estremely few households reported recelvmg vislts from extension officers The highest percentages itere recorded m Barue and Sussendenga \\here 13% of households said that thcy had a \isit Gom an extension officer
Regularly refers to household members who alwaysloften worked on the farmi) farm d m g the past ]Year

In Barue and Manica more than 94'! of those nho recened .cisits r ece~~ed it from an eltcnslon officcr of the D~str~ct Dcpnrtinent of 4gr1culrurc In Su~sendcng 61% of the I sits \\ere Crom ~ h c D~strict Department of Agriculture and a futher 22% from CN de Algodiio A W h e r 17% recelted t l s ~ t s from GTZ In Gondola 29% of the visits \\ere from the D~stnct Department of Agriculture and 75% from Concern
The on14 dlstrtcts were s~gn~ficant niimbers of households sawlatrended an agricuItural demonstration dur~ng the past year nere Barue, Manlca and Sussendenga In Barue 11%. Man~ca 7% and Sussendenga 9% benefited from demonstrat~ons
1.3 General agricultural practices
Most households st111 use traltional agricultural practices The onij dlstncts uhere more than 5% of households used ~rnproved inputs (~rnprobed seeds/~nsectictdes/herb~cides) were Manica (7'90) and Sussendenga (10%) None of these districts had s ~ p f i c a n t numbers of households \i ho reported uslng chernlcal fertll~zers Support from commercnal agricultural organlzatrons was also l~mited Sussendenga H a s the only distnct where a sigrHficant number of households (5%) sald that they rece~ved help for the production of cash crops
4 4 Sesame production
4 4 1 Cult~r at~on patterns
Gondola and Sussendenga are h~storically the most important sesame produc~ng dtstncts Thc graph below s h o ~ s that the percentages of households nho engaged m sesame production mas lo\\ m all districts Dunng the 199611997 season only 8% of hous&olds6 in the dlstricts surveyed, reported plantrng sesame
Graph 4: Distribution of households who planted sesame 1n the past and those who planted durtng the 199511994 season
I 1
I Planting of sesame ! I 40 ,
-
I Gand Guro Borue Man, Sursgn I
@ Planted at leari once in the pad Planted durtng 199511996 season
I I
ti The number of households who planted dunng the 19961 1997 season was too low to do rne-gful statistical analysis at dtstnct lecel - hence the cornbmed figure One w ~ l l have to rel:, on hstonc trends to get an idea of the vanat~ons behveen d~stncts

Sc\ c ~ i pcrcent of houc.cholds planted sesame more than 5 >cars azo 5'0 planted betuccn 2 2nd i \cars ago. 8% pimtcd for the last tlme durlng 1995/1996 and another 8% planted durlrlg thc 1 9961 1997 season
Households !tho planted In the past but d ~ d not plant during the 199611997 season had Lanous reasons for stopping nith cult^^ atlon, but there were no clear pattems/s~gxficant d~ffcrenccs bctween d~stricts The main reasons for stopplng w ~ t h cultivat~onlnever culti~ating Mere * Lack of seeds (43%) 4 Lack of markets (3 1%) * Lack of labor (10%)
The dec~sion to plant sesame as etenly divided In most d~stncts beheen men (4 1%) and ajolnt dec~s~on between males and females (38%) Only 20% of the decision makers were women Guro \%as the onl> drstnct where men had statist~crilly s~gnlficant (55%) more declslon malilng pouers than \\omen or ajoint declsion
Saxed seed from the prcvlous !.ear (34?/o) and bought from neighborslpn~ ate sals (44%) nere thc most important soiirccs of sesame sczd dunng the 19q5! 1996 season Th~s \ear 82'',, used seeds that the! sa\ed from the przvlous )ear The kast majorit) (6 i%) of those nho planted sesame at some point in tlme scattered the sesame seed when planting and d ~ d not use rows 51?4 of households made sure that no more than 2 plants grow together Intercropp~ng betueen sesame and other crops \\ere the most n~del! used in Guro (73%). Barue (8 1 %) and Manica (77%) The most common1 used crops \\ere maue (46%) sorghum (12%) groundnut (3%) and beans (2%)
4 4 3 Production problems -
Insects b~rds and rats pose the blggest threat to small holder's sesame crops During 199611997 13r3c amounts of ram also had a negatne Impact on production The graph belon summarizes the b~ggest problems e~penenced during the 1995'1996 and the current season
Graph 5: The most important sesame production problems
Production problems ,
! Insect6 B~rds Rats Rain Disease

4 -1 4 Labor
On11 seven percent reported using laborers d w n g the present season The number of laborers employed vaned between 2 and 5
Responses nere prett} miled uhen comparing the present season wlth the preLlous season 41% s a ~ d that their hanests v.ere better. 259b sald that the> had less and 15% felt that ~t \bas the same S~nce ~t u very d~fficult to get accurate land size mfonnation, rt was decided to use seed ! izld rat~os to g n e an indlcat~on of > ~elds Based on the data suppl~ed b) sesame producers for the 199511996 season, the seed/} leld rat~os can be swnmar~zed as follons
Graph 6: Yleld seed ra.ttos for the 1995/1996 season
YIELD SEED RATIOS
Yields of less than 30 kg's per kg seed
1 67 Yields of 31 -75 kg's per kg of saed
1 Ytelds of 76+ kg's per kg of seed --
i L ---
The wide range of yeld seed rat~os ma) be an lndlcation that the qualitl, of the ~nfomat~on IS not as rcl~ablc as one hoped that ~t \\auld be Honever. the general trends do ~ndicate low yields for at lcnst half ofthe populat~on Slit? fike pzrcent of sesame groners said that the) lost somz of the~r crop before harvest during the 199511 996 season
1 4 6 Vscs for sesame
Sesame w pmclpally used for consumption Ninety nine percent of the 1995/1996 producers said that they consumed some of the seeds
Other rmportant uses lnclude * Seed production 8-t56 of households * Sales 5 3 % of households * Storage 58% of households * Oil productlon7 6% of households
7 Probably usmg traditional methods of 011 extraellon
13

Th~rt) etght pcrccnt of those vho storcd scsnmc sccd cxpcricnccd no problems Thc rerna~ndcr had problems ~ ~ t h rats (3 l'k), tnsects (21%), theft (5%) and htmlldit) YO)
Unlihe sunflouer seeds, sesame seed has been tncorporatecl Into local d~t'is T h ~ s created a local market demand wh~ch gave sesame an ad> antage above sunfloiier m the absence of the large scale commerc~al bujlng Fort) percent of tliose n ho produced sesame at some or other pomt ln thc past, sold part of the~r crop during the past fike 3ears Half of these sellers sold to netghbors or in pr~vate sales, bvhlle a further 30% sold to traders D m g the 199511996 season a sl~ghtl? geater proportion of households (53%) sold sesame
Barue had the smallest percentage of households (44%) who reported problems with the commerc~nl~zatton of sesame and In Gondola the most (72%) Thz problems ekpencnced uere key s~mllsr across distrlcts The most unportant being a lack oi'bujers (2 I%), dtstance to the market (10%) and problems u ~ t h the pnce (i0%)
Graph 7 - lncorne distribletson from sesame sales during 199511996 season
i Income from sesame sales I 1 1400 I
0 20 40 6 0 8 0 Percentage of households
The graph shows that the mcorne from sales ivas very skewed The percentile dlstnbution belon shoibs that 50?6 ~Chouseholds earned less than 153000 metlcais
25 th percenttie 5 1000 metlcias 50 th percentile 153000 metlcias 75 th percentile 330000 metlcais Maximum 1400000 metlcias

1.5 Sunflower produlct~on
4 5 1 Cultivation patterns
The habit of cultl\atlng sunflower 1s nd w~del> establ~shed amongst the suneqed households hs~gn~ficant numbers of fanners m Gondola (4%), cultivated sunflo-er at least once before h the other four hstncts between 9 and 15 percent planted tt Cukimon is also not a very old practice - 80% of those who reported plant~ng sunflower said that they did so durlng the past five years More deta~ls about the geographic distr~bution of sunflower growers can be found m AppmQx A
TABLE 4: Percentages of households who cultivate sunflower
When cultivated Percentage of households
Reasons why people never cult~vated or stopped wrth the cuk~mtlom of sunflower dtd not vary a lot between dlstncts The maln reasons were lack of seed (40%), lack of markets (33%) and lack of labor (7%) Unlake wth sesame, nearly no women made the decis~on to plant sunflower om their own The decision was either made by a male (53%) or by both males and females (46%)
4 5 2 Cultivation practices
The most important sources of seeds dunng the 1995 '1 996 season were seed sated from the prevlous year (33%) donat~on from Mozambique mdustnal(22) and exchange of seed (19Oh) Seed for the present season were mamly saved (500/0), bought from neighbors (25%), bought at markdshop (1 3% = 1 household) and a g~fc (1 3y0)
Fifty percent or more of the sunflower planters m Sussendenga and %lanica SOW the recommended 2-3 see& per hole In Guro and Barue more than 55% of households plant bm-een 4-6 seeds per hole
Cultltat~on practrces did not vary s~glficantly between dlstncts8 Households generally use plant spacing that is much wder than the recommended spacmg Only 13% use 60-80 cm intervals between rows and 16% use 25-30 cm mtervals betwcen plants The biggest portlon of growers use more than 80cm spaces between rows (42%) and 49% use more than 35 cm between plants The big spacmg between plants may be related to the fact that nearly half (42%) of households plant other crops 4 sunflower
Gondola had in many nnstances profiles that were very Merent However, gwen the small numbers of households a ho planted d o w e r m that &stnd one should mterpret those statlacs wth great cautlon, especially when comparing mth the other dtstncts

I?!L?I/c (0-4'0) 1 5 thc 1110st important crop 11sed for intercropping ~jhtlst groundnut and sorghum ucre uscd b~ the rcnlamdcr oi households Sunilo\ier plots arc gcnirall: turther from home than sesame plots 76% of households had sunflotter plots fbrther than 30 rnsnutes anay from home as opposed to 32% n ~ t h sesame plots 88% of the growers said that the~r sunflouer plots are on Scrt~!c land
4 5 3 Product~on problems
The nature of the production problcrns c\pcr~enced dur~ng thc 199jf 1996 season did not d~ffcr significantly from those l~sted for the present season However it does appear as ~f buds and rats \\ere a b~gger problem durlng 1995/1996 than at present Insects on the other hand. pro1 ~ded problems during the present season This phenomenon ma! be related to the h~gh ramfall figures reported dunng the present season The graph belou ~llustrates the relative unportance of the \ nrloiis problems
Graph 8.Problems experienced during the 199511996 and 1996/1997 seasons
Problems experienced ' 40---
35 -
I Nona insects B ~ r d s Rats Wind ' - -?
I 199511996 199611957 d
4 4 4 Labor
Thrcz of the elght sunfloncr grouers (1996'1997) enlplo~ ed laborers Ttio of these households emploqed 2-3 workers ~vh~ls t the other had four or more iiorkers Less than 1 percent of households in general s a ~ d that one or more of the~r members worked on someone else's sunflower/sesarne farm d m g the past two ?ears
4 4 5 Yields
All the sunflower groners sard that they had better yelds thls year when compared to the prevlous 3 ear The previous year 74% s a ~ d that the!, lost some of thelr crop before harvest The graph on the next page shows that yeIds during the 199511 996 season were very low - nearly 909; of the sunfloner growers reported )~elds of less than 100 kg s per kg seed. 85% said that the) hanested 76kg's or less per kg of seed sonn

G r a ~ 1 1 9 I'feld seed ratios for the 199511996 season
I YIELD SEED RATIOS I
1 Y~elds of less man 100 kg's per kg seed 1 -----
I Yields of 100+ per kg of seed - -- - - - -- - ---A
4 5 6 Uses for sunflouer
Dur~ng the 1 9 9 3 1996 season households reported uslng thew sunflower in the follow~ng wa) s
* 44% sold their crop * Nobody produced 011 for sale * 7% made oil for home consumption * 48" said the! produced seeds * 37" consumed some of their produce * 3 7'41 stored surdlo\\ er
Sl\t? nlne pzrcent of households reported experrenclng problems durlng the storage of sunflo~ter seeds The bigsest problems nere rats (38%) and insects (19%)
Fort\ four percent of the people nho have been gowrng sunflower for some tune, sold part of theu crop during the past five 3ears The major port~on of the producers sold to Mozambique ~ndustnal (23%), traders (37%) and Agr~com (29%) Dunng the 1995/1996 season, all of the households ~ i h o sold smflo\ter, sold more than 50% of tkelr crop 75% of the sunflower sellers earned less than 180000 metlca~s per annum The graph on the next page shons the d~stributlon of lncome The maytmum 1s not Included m the graph because one lnd~vidual reportedly earned 32000000 rnetlc~as nhlch makes the d i ~ IsLon of the y-aws too blg to ~liustrate the dlstnbut~on of the majontl, of cases

C I : ~ ~ ! I 10 lncome d~stl-tbutron iron1 sunflower sales dunng 1995/1996 season
Income from sunflower sales ' 2000 -. -- -- . - - -- -. - -- -- -
0 25 50 75 Percentage of hou~eholds i
4 6 Groundnut product~on
Groundnuts are produced by more than 40% of households in all districts except Sussendenga In addition to being a cash crop, it also has potentla1 as a source of 011 in areas nhere pnces are ver) loit For e~ample ~n Guro, Afiicare ma! imestigate the posslb~ilt> of promoting the use of groundnuts \\it11 011 presses, gii en the abundance of groundnuts and the Ion prices (Messlter 1997) The table below s m a r l z e s the most important charactenshcs of the groundnut producers
TABLE 5: Grotandnut productron profile for the 1996/1997 season
% of households who planted groundnut durlng the past season
% of housrholds who sold groundnut ~ J I lng the past season
O/o of groundnut producers who eupenencd crop losses dunng the past year
Production compared to the prevlous > ear % More % Less
1 % The same
DISTRICT
Gondola n=230
43
10
46
22 67 1 1
Guro n=110
69
3 4
5 1
40 55 5
Sussen n=14O
32
9
43
4 1 5 7 0
B arue n=130
5 5
17
6 1
34 63 3
TOTAL n=780
48
16
52
33 60 6
Mmca n=150
48
18
57
3 9 5 1 8

Elen though a s~zeable proportion of households produced groundnut, the rnajor~b of them consumed rather than sold thelr crop T h ~ s may reflect hot~seholds consumptive needs or tt mar bc n s\niptom of cornnicrc~al~/ation problcrns such as a lack of bu)ers 66"~ of thc groundnut producers dtd not sell an) o l thcir crop Most of those \\ho sold sold less than 50% of thc~r total _c ield
The d~strlbution of hilograms sold nas her) shened As can bc seen from the surnmaq bclo\\ 75% of households sold less than 126 kg's per household. ivhilst the hoiisehold who sold most sold 20 times more than that
25 th percentile 23 kg s 50 th percentile 45 kg's 75 th percentile 136 kg's Maumum 2520 kg's
Generally, producers in Sussendenga sold the least per household, h l s t Gondola and Guro sold the b~ggest quant~t~es per producer This IS reflected ueli m the estnmated lncomes from groundnut as gir en In the graph bclon
Graph 1 1 : Estimated Income In rnet~cais from groundnut sales dur~ng 199611997 season'
I i Income from groundnut 1 700 1
0 25 50 75 I I
% of households i Gond ----- Guro Barue I
- - 1
Man~ca - - Suss I
More households In Gondola rece~ved a slightly hgher Income from groundnut sales than the other four districts On the higher end of the scale, households from Guro and Man~ca (albelt relatively few) gamed h~gher lncomes than households m the other dlstncts
I t IS tnlportant to note that ~t IS \1rtuali4 lrnposstble to get accurate ~nformatlon about cluantltles sold Mamh because sales take place over a penod of tune and often IS m small quantitres These figures therefore only gtve a rough idea about the Incomes earned 6om groundnut sales Pnces used, represent mean pnce estimates for August for each dlstnct Both the pnces in the dlstnct caplhaf and the pnces m the outlymg areas were taken lnto cons~derat~on

4.7 Product~o~l of tobacco and cotton
Ins~gn~ficant percentages (less than 2%) of households greu tobacco and cotton during the past !ear Generall! Tobacco h a n esrs n as reported to be poorer than the previous season - thls IS
most Ilhcl> related to the h~gh rainfall figures rcportcd dunng 199611 997 In contrast to this cotton hnn ests nere reported to bz better than the prei lous 4 ear
TABLE 6. Product~on of cotton and tobacco during 1995/1996
- 4.8 Principal food crops
PRODUCTION VARIABLES
O ~ I of hou,rholds uho planted
Compared to 199SJ1996 product~on \'v dS
% More % Less " 11 7 hc \,trnc.
5 I, of huubel-iold, who bold
4 S 1 General
h~lnrze IS the most Important crop planted and sold b~ households nn the siinc>ed districts 99?0 said that they plant marze and 59% sold some of their malze crop during the past season Sorghum IS the second most Important crop ~n all dlstrlcts except Gondola nhere cassava nas slight13 more popular (7?0 more households planted cassaJ a than sorghum)
CROPS
Crops gro\\-n b) more than 50% of households m the anous dlstrlcts are
Tobacco
2
7 79 15
I I
Gondola: Ma~ze (loo%), cassax a (76%), sorghum (69%), s l~ee t potato (63%) and bananas (63%)
Cotton
1
67 3 3 0
1
Mean 759 (51) 683) I - > t i r n L ~ .A qumtitiey sold/b;m:red in
Guro: Maize (98%), sorghum (SO%), millet (75%). groundnut (69%), cowpea (54%). s\\eet potato (53%)
75 th pzrc 0 6 50 t.h perc 3 6 75 th pcrc 200 Maumum 324
Barue: Ma~ze (99%), sorghum (85%), sweet potato (70%), groundnut (55%) and cassava (55%)
Manlca: Maize (99%). s\xeet potato (69%), sorghum (59%) and conyea (50%)
Sussendenga: Ma~ze (99%), sorghum (69%), cassava (59%) and sweet potato (56%)

4 8 ? Hancsts In comp,lrison ulth thc past \.car
The graph shows that the vast majonb of the producers of the principal food crops felt that the1 had poorer han ests thls year when compared to 19951 1996
Graph 12 Productaon of the present season as compared to the pre\lous season
I Yield Comparison I
M a c e Cowpea Sarghum Grirundnut Cassava Sweet P
Do not know The same
I ~ e s s More I I
The rootcrops such as sweet potato and cassac a generally fared better than the other food crops There itere also some vanatlons betikeen dlstrlcts Harvests In Guro were generallj poorer than elsewhere Nlnety two percent (maize) and 89% (sorghum) s a ~ d that the! harvested less than the preklous year Cowpea harvests \\ere the poorest nn Gondola,Gwo and Manlca - approximately 80% of hcirseholds tn thosc districts reportcd poorer harvests
in general 76% of the households sunleqed. sold some of their crops Gondola and Barue had appro\arnatel> the same percentage of households (80%) nho sold nh~lst Xlanica and Sussendenga had similar profiles (73%) Guro is the only dlstrict that chffered slpficantly from the others Not oni? did only 65% of households reported selling crops. but the mean number of crops sold per household was also significnntl~ l o ~ ~ e r in Guro (1 5 ) than ~n the others Thz mzan number of crops sold across all drstncts \\as 2 2 The hghest mean Has recorded In Gondola. \i here the average household sold 2 6 crops
Crops sold b more than a quarter of households In the \ anous dlstncts were Gondola: Maize, cassava and bananas Guro: Maze and groundnut Barue: Maze and sweet potato Manlca: Ma~ze Sussendenga: Ma~ze and bananas

5.1 Characteristics of livestock herders
Appro\~n~ntzl> 1270 of thc populat~on nas ~nxoltcd in 11\cstoch herdlng act11 1t1es during thc past a e uns 19 >car SI\L? si\ percent of them \\ere chlldren of the household head and them mean s
>ears In 11nc is~th the tradltronal practice of gix~ng males the respons~bl l l~ for Ii\estock keeping G5?6 of these herders \sere male Thetr l e ~ els of education nere much higher than that of ~ h c norksrs In the famil} fields, as sttent? one percent of them received at least one )ear of educat~on Other actlvitles that t h ~ s group engage in are off-farm self-emplo>ment (14%) and salc of labor to others as temporar?,/psrmanent norLers ( iO%)
5.2 Livestock ownership patterns
In terms of the types of livestock general11 oimed there Here little variation bemeen districts The most frequently kept I i j estock are chichens, pigs, goats and ducks Hot\e\ er, as can be seen from the graph below there nere consrderable cbfferences between dtstncts when it comes to the percentage of households who reported keep~ng specific h d s of animals Gondola, Bante and Siiss=ndcngn had th,: b~ggzst percentages of ho~lscbolds heep~ng chickens \ \h~lst the most ~i~nlficnn: numbers of pig ol\ncrs could be found 111 Guro Bnru: and hlanlcn Bes~dss chlchcns goats are the most irequentl) kept In all d~stricts e\cept Barue Fife three percent of the hous:holds surve>ed Aept gonrs
Graph 13 L~vestach ownersh~p patterns across districts
Livestock Ownership
Ch~ckens Goats P ~ g s Ducks ]
@ Gondola Guro a Barue
@ Man~ca @ Sussen
h%sn consldcrlng ihe 1i\ estock onnersh~p d~stnbut~on patterns the mean 1s not an appropriate tool because of the b ~ g standard vanatlon Percenttles gves one a better tdea of the number of livestock onned bq the average farmlj The line graph below shows the distribution of the different lands of livestock for the dlstnct as a \\hole
Set en& fi\ e percent of the * Chcken owners own 20 or less chickens * Pig owners own 6 pigs or less

4 Goat ouncrs omn 8 goats or lcss * Duck ouncrs own 6 ducks or less
5 3 L~vsstoch feedrng practices
Li~es toch [ceding pattenls arc of lntercst to the project as some of the \taste products of oll presslns ma] be used as liresloch feed More than 96% of the oiiners of ch~ckens. pigs and ducks normall! gibe the~r animals agrtcultural products or bought food to eat Goats \sere the on14 animals were the vast majontj of households rel) on natural grazing
6 IMPACT INDICATORS
Vanous ~mpact rndrcators had to be measured dunng the baselme surve? These are stunmar~zed in the table belon In sonle cases problems were encoimtered n ~ t h the ongnal indicators and alternatii es were suggested
TABLE 7: Indicators related to the oil seed component that had to be measured through the househotd questionnaire survey
Ind~cators 5.9, 1 1 All extraplat~ons are based on a 370800 target populabon estlmate for 1996 &\en the mean ho~isehold slze o r6 5 In the d~str~ct, the est~mated number of households targeted were 49354 households Because ofthe lack of d~curate ~ ~ ~ l b r m a t ~ o ~ i c\trapolatlons dunng nud-term and final sur\e)s w~ll have to use the same population ctst~mats T h ~ s estlmate ~ 1 1 1 have to be Increased each year to make provlslon for norrnai population growth rates Sample data was mult~pl~ed by a factor of 63 27 to amve at populat~on estimates
WDSCXTBR
l 1 T h ~ s 1s ~ncamplete/estrmates as hanestlng was not fin~shed when the survey was done
PROBLEbI
OILS COMPONENT'"
StlGGESTED ALTEItaiATIVEl CObIhIENT
Goal loci: I ) Cash lncome trom oil seed production increases 7 % per partic~pating household
Purpose let ci: 5 ) 011 ceed ploduction (ha's) planted \tith~n txgrt dibtncts ~ncreascs 7 %
Output level: 0 , ' Kg , of 011 wed h ~ n ested pzr tear In the target diitncta
84SE- LINE VALUE
9% 7%
463 14 2192 94
3 3 1 610 1 426 296
208 158 95 158
Income d~stnbut~on too skened to use mean as the measure of central tendency
The iellab~litj of data on tht area planted i i
e\ en niore questionable than data on qu~nl~tles plantedihm ested
-
% of households \tho earned an income kom thz sale of otlseed (1 9991 996) ( 1 99611 997)
Sampled L alue 96: 97 Jesamt: 7 37 ha Sunflouar 34 66 ha
Sampled value '95/'96 ce~arne 5251 Sunflower 22513 Sampled value '96/'97" Sesame 3290 Sunflo.r\er 1504

Vanous problems h a ~ e been identified n ~ t h the orlginal lnd~cators and alternatr~es \\ere suggested The most appropnate indicators need to be selected and target ~ a l u e s need to be set for each indicator Thzre IS also uncerta~nt? whether the ttrnlnz of the baselme sune! \\as late enough to get complete infonnntlon about the present scason At the sarnz time the 199511 996 data may be less accurate because of recall problems Thus a decision has to be made about the appropriateness of uslng data from either 1 ear
7 CONCLUSIONS AND RECOMMENDATIONS
BASELINE VALUE
9%
9680 57133 6707 1835
I\DICATOR
10) ' Farmers plantlng 011 seed per i L 11 in the tdrget dr.;tr ~c t s
1 1 , Kg's of plantrng seed planted rn thc tar get drstrict>
7.1 Socio economic conditions and economic activities
The maln goal o f the project 1s to Improve food secunty through mcreased household income Gom 011 seed production Unfortunate15 it is I ~rtuall? unposs~ble to measure household lncome accurately through dlrect measurement An estimate of household lncome usmg proxy mdcators \i 111 be made by MSU, based on key md~cators measured durmg the s u n e y This data tvil be ready b) the end of December It may however be useful for Ahcare to use an assessment of the
PROBLEhl
E\trapolat~ons not \ e n relrable brcauce ol 1,ich ot ,ic~urdtc popul~rron statrstlc5
-
NUTRITION COMPONENT
SUGGESTED ALTERii ATII'E
% of households ho planted oil seeds
Sampled \ alues 1993/1996 5esarnc 153 Sunkloner 903 1996/1997 Sesame 106 Suniloner 29
1 i. ) I, oi tdrnille, \r ithin the target dr\tl lcta that consume 011 at least once per ~ e e k during the 6 months dktr the 011 seed harvest
56%
ADD%THO'L'AL L"rlDIC4TORS
ar A~rrdge nurnba ot hectdle\ planted \\ 111 \ A ~ I ~ I I ~ ' s~rn l lc~ ~r pcr orl.;ccd 13: I~~LULPI th~a \.ear
b) Acerage kg's of sunflouer/sesarne x e d han ested per 011 seed producer last \ c,li lthls \ ear
Drstrrbut~on too skencd to lib^ nlcdns tor ~eniral tendr'n~)
Dlstnbutron too skewed to use means for cent1 a1 tendencb
19961 139: ' a of ho~lithold~ ii ho 339" planted one or niorz hectare tr rth sesame % of households 1.r ho planted one or more hectare uith sunflower
199511 996 % of sesame producers it ho han ented more than 50 hg s of besaxe
of suntloacr producers !rho h a n e-.ted rwrs than 100 kg's suntloner
50%
3 8%
25%

prcscnt monctan \ alue of houst--hold posscsslons as an addrtlonal indicator of changes in houschold lncomc The dlstr~but~on of the monetaq value of household possesslons is parabolic ~u\rlth a third of households havmg possesslons valued at less than 1000000 meticals, 23% between 1000000 and 2000000. i 7% bctueen 3000000 and 3000000 and 2891, ntth more than 3000000
Dlrferences betwen most drstrlcts were not slgn~ficant. but households in Sussendenga had a more e\enl> dlstnbut~on of househoid goods and significantly more households In the 2000000 and more catego? The use of unbaked cia> bricks (a posslble ind~cator of h~gher soclo- economlc status) nas slgn~ficantl) more prevalent in Manlca In Guro and Sussendenga relativcl) high percentages of households reported uslng this bullding method E\pendlhtres on l u x q ~tems such as new clothes and meat, norn~allj also reflect household Income Sign~ficantlj more farn~iies m Mamca and Sussendenga spent mone) on new clothes and meat durmg the past year, 11 hllst a relatit el! h~gh percentage of households In Barue spent money on meat Giien the fact [hat the crop production profiles (m terms of vanctles produced and crops sold) of Manlca and Sussendenga are alerage and both districts reported an above alerage vane0 of different off- farm Income generating activrhes, one may assume that these differences m e..~pendihire patterns are also related to Income from wage labor and other economlc acttvltles
Crop production and thr. sals of food crops 1s thc nlan source of lncome for most households 76':" rzported earning rnoneq from crop sales durlng thc past ]ear in addition to farm related economic nctil ltles 19"'; of indn ldunls itere ~niol\ed In off-Dma sclf-en~plo>ment and 14% liere emploqed b others (pcmanent or temporar)) The latter is Indeed the second most Important source of lncome - 49% of households reported some lncome from thls source S~gnlGcantl) morc farnlltcs 111 Man~ca dlstr~ct s a ~ d that the? get an lncome from ternpora~fpermanent employment The preparation and sale of f d from home Ifas the third most Important act~vlty (4 I%), foliowed by the sale of animals (32%) and non-agricultural self- employment (32%)
Food security
The oil component of thc programme alms to Improl e food securit) b? raislng household income Food shortages Itas not a serlous problem during the past year - half of the households reported some shortages. but the mean duratlon of these nas onl? 1 7 months Most households had problcms dur ln~ No\ cmber and December In terms of the duration of shortages and the percentage of households affected, there were no slgnlficane d~fferences behleen d~stncts T h s relatlvely good profile IS probablq a funct~on of the h g h agnculhrral production potentla1 of the proi lnce and the aboke alerage ~ ie lds of the 1995/1996 season The situation 1s npected to dcterlorate slightl: during the next twelve months - more than 70% of the maize, conpea and sorghum producers s a ~ d that they produced less this year
The sale of food crops 1s another good Indicator of food security. espec~all} In areas n ~ t h relatlvely good market access Generally households seli excess producbon once theu o w food requirements hale been satisfied Relatsie to districts such as Maganja da Costa In Zarnbez~a, the sale of food crops m the provmce was very hgh (76% of households sold at least one crop) Households In Guro appears to be the worst of all the target d~stncts Farmlles m ths dstnct not only produced a smaller variety of hfferent crops, but they also sold less Only 65% sold crops as opposed to 8 1% In Gondola and 80% In Barue The effect of the relatlvel> low food prodiictlon 1s compounded by the lack of other lncome generating actlvihes besides the sale of livestock

7 3 Orl seed consumpt~on
Stnce locally pressed oil IS not a\allable (less than 1% said that the\ sometimes buy from the otl press of a ne~ghbor), oil consumption patterns gii e a good reflection of at aliabiliQ of 011 on the local markets dlctan preferenccs and perhaps more than all a\ ailabll~t\ of cash to bu) oil 1~1th Slncc 7b'!,, of hoilseholds reponzd ba! ~ n g 011 at tthmr Iloc~l rnar't,t.t shop onc rnJ! snfcl\ assume that cash rather than the avallabilrt) of oil are the most tmportant factors that influence conswnptlon patterns The intake of or1 was the h~,ohcst in Manrca and Sussendenga - the tuo districts \ \hue other indicators of socio-econom~c status such as e\pendtture patterns and reported sources of lncorne were also better than in other d~stncts In Manlca 78% of households reported using 011 to prepare the maln meal at least once per ueek The second hlghest consumption patterns uere reported in Sussendenga nhere 65% of households reported consumption of once a week or more often Gondola and Guro had the lowest 011 consumpt~on ~51th 44Y0 and 36% reporting preparing the mail meal at least once a neek n ~ t h 011 It IS
important to note that these use of oil for coohng does not necessmlj total dietar) otl intake For eumple in Guro, euceptionaH) large percentages of households planted groundnuts - thls may signify hgher groundnut (and 011) consumption than n hat IS reflected in food preparation statistics
" 1 011 seed productlorl
Thc planting of both sesame and groundnut in th: pro) ince does not appear to haxe a long hlslov nor are signilicant percentazes of households ~nkolxed in it The major15 of households nho planted oilseeds at some or other time, did so itlthin the past 5 )ears Sesame 1s presentl! far more important than sunflouer Dunng the 1996/1997 season 8% planted sesame and 1% sunfloner These differences are most Ilkel) related to the fact that sesame forms part of the local diet and can be marketed locall;\ utthout the need for outs~de bpers or the presence of oil presses
Gondola and Sussendenga produce the most sesame Sesame mas produced in the past b) at least 37'10 of households in Gondola and 35% of households In Sussendenga In the pro) lnce as a \) hole 27% reported planting sesame at least once This number decrsnsed to 14';) dunng the 199511996 season and 8% 1n 199611997 The reasons for neler cultir atlng sesame or stopplng uith sesame cultit ation are t e q sim~lar throughout all districts and across all the production j e x s The most important constra~nts are Lack of seeds (43%). lack of markets (3 1%) and lack of labor (10%) In most drstricts the dectsion to pIant sesame itas more or less e\enl;\ &vlded bettieen men onl? (41%) and a jomt rnale/female decis~on (33%) Guro was the onl? dlstnct \\hers more than half of the decislon makers \i as in one catsgoc Thcre 55'1; of the decision makers \\ere male, suggesting slgnificantij less nomen in the d~stnct are in\ol\ed or consulted nhen production decisions about sesame is made
Sesame seed IS malnl! s a e d from the pre\ ious >ear and bought from &ends or neighbors The fact that seed avanlability u a problem 1s agam reflected m sources of seed used d u n g 15951 1996 and 1996/1997 Dur~ng last 3 ear. seed saved from the prex ious ?ear \\as used by 44% of households and 44% used bought seed But h s year, 82% used bought seeds probably rndicat~ng that there was less seed a\ allable on the market - thus households who drd not save seeds d ~ d not produce dus year Problems encountered dunng 1995/1996 tvlth the storage of seeds were rats ( 3 1%) and insects (2 1%) Thl* e~ght percent of households had no problems The \. ast majortt~ of hoiseholds nho planted sesame (8 1%) scattered the seeds and d ~ d not use roms 58% mtercrop and most of them use malze and sorghum The biggest production problems dunng the 1996/1997 season were Insects (28%), ram (23%) and blrds (2 1%)

f art! pc'rccnt of households \iho produced sesame In the past sold some of thc~r crop durlng thc pnst f i ~ e >ears Half of the sellers found a local mnrhet and a further 3Oo/o sold to tradcrs The btggest marketing problems were lack of buyers (2 I%), distance to the market (10%) and problems nith prlce (1 0%)
Cul~llo\icr production tnhes place at such lot\ lei els at prcscnt that ~t itas not statist~cnll\ poss~ble to do a lot of distnct specific analjsls Of the 80 households (10Y0) \tho produced suntlo\ier at least once before. the biggest numbers come from Guro, Barue and Man~ca In the case of simflower the most Important reasons for stopping cultivatron or neier cultii atmg are lach of seeds (40%), lack of a market (33%) and lack of labor (7%) Dunng 199511 996 and 199611997 the lack of a market was cons~stentl\ ment~oned bq more households (approwmatel) 48% tersus 30%) than the lack of seeds
Sunfloiter is more clearl? a 'male' crop than sesame Less than 1% of the goners s a d the dsc~sion to gTon sunfloiicr uas taken b j itomen In 5370 of the households n~alcs tool. the dcc~sion and 46% of the cases both males and females participated Those who planted sunflower before, mainly sold to traders (37%), Agncom (29%) and Mozambique mdustnal(23%) The~r b~ggest problems were a Iack of buyers (26%), distance to the market (1 1%), problems with price ( 1 1 Oh) and the cost of transport ( 1 0%)
Cult~i atlon techniques are probabll closel) related to ~ntcrcropp~ng pracilces 12% lntzrcropped 2nd this nia? be thc reason n h ? the lntenals betneen rons and plants nere consistentl) h~ghcr than the recommended distances Elen though 4j7b of horiseholds s a d the) plant more than 3 sceds per hole, most (82%) stdl left the recommended 1-2 plants per hole after th1111ung the crops In the case of sunflouer the biggest problems e\perienced dunng the 19961 1997 season were b~rds (3 1 %), insects (23%) and ~ i ~ n d (1 5%)
Cons~der~ng the socio-ecoraomlc condrtlons in the vanous d~stncts, the food secunty sltuatron and product~on of other crops, the project is llkely to have the b~ggest mpact on food secunty if work IS concentrated rn Gondola. G ~ r o and Barue The maln reasons for this are * These districts hai e lrttle alternatiie sources of income and poorer socio-econornlc
conditions than Manlcn and Sussendenga .k Guro and B m e appear io hale lou lei els of crop productron and cornnlerc~al~zation at
present * Considering the reIat~tel> loner ramfall lzlels in certain parts of Guro and ~ t s Iimltlng
effect on the range of crop alternatives. sunflouer may be the best iiay of promoting the groiith and deielopment of th~s particular d~strict
7.5 Other cash crops
Three cash crops have potent~al m the proi znce, namely groundnut, tobacco and cotton Groundnut IS of part~cular Interest because it also has potential as an oilseed in sltuatlons \%here there 1s excess produchon and low pnces Of the three, only groundnut IS presently produced by s~gnlficant numbers of producers Fort) eight percent of households reported plantlng groundnut dunng the past season. The hghest proportilon of producers was found In Guro (69%) and the lobtest m Sussendenga (32%) Relat~veiy few households reported sellmg groundnut (66% of the producers) and harvests were reported to be less than the previous year by 60% of the producers Less than 2% of the households were in~ol\ed In cotton and/or tobacco product~on Cotton productron was reported to be hrgher than the prei rous year by 67% of the producers uh~lst 79% of the tobacco growers sald that they harvested less The latter IS probably related to hlgher than a> erage rainfall m the beglmng of 1997

7 6 Production of other food crops
Individuals who spent most tlme uorklng In the fields were nearly equally d~vided amongst the sexes (57% female) and 44% had no educat~on Most farmers still use trad~tional farming mcd~ods Less than 5% of households uscd improtcd 111puts such as irnpro~cd sceds fcrt~ll/crs and other chemicals Near11 half of thc households hnhe radlos and listzn to programmes for small producers on the radio Ven fen households recen ed any visits from agricultural extension staff or sat1 agr~cultural demonstrations during the past >ear The onl? s~gn~ficant percentages ucre recorded In Barue and Susscndenga tihere 13% of households reported recen lng a \ 1st durmg the past twelve months Some actit@ u a s also recorded In Manica, but in Gondola and Guro t trtuaIIy no eltension support tt as recorded
The food crops produced by most households were maize (99%), sorghum (7 I%), sweet potato (65%) and cassava (55%) The mean number of crops planted per household was 5 8% w ~ t h the louest karizty recorded m Guro ( 5 0) and the iughest In Gondola (6 4) The highest percentagzs of crop sellers were found in Gondola and Barue \there approvmatel\ 80% of households sold at least one crop Ths contrasts sharply wth Guro where only 65% sand that they sold any craps Maize was the only crop sold by 50% or more of households In Gondola bananas a a s m ~mportant commerc~nl crop (Shni) groundnut in Guro (34%) meet potato In B a n ~ e (2504) and A l mica (3 1 %)

X REFERENCES
ACNURIPNUD 1996a Perfis de desenlolt ment to d~s t r~ ta l Distrito de Gondola, Prot~ncia de Man~ca Maputo Acnur/Pnud
ACNURiPNUD 1996b Perfis de desens oli lrnento distr~tal Diser~to dc Guro Proi lncls dz Manlca Maputo AcnurPnud
ACNUWPWUD 1996c Perfis de desen\ol~imento distrital Distnto de Barue. Provlncia dt. Manica Maputo AcnurPnud
ACNUWPNUD 1996d Perfis de desenvolv~mento distrital Dlstrlto de Manics, Prov~nc~a de Mnnica Maputo AcnnrPnud
ACNUWPNUD I996e Perfis de desenvolt lmento d~stntal Drstnto de Sussendenga, Prosincla de Mantca Maputo Acnur/Pnud
Mcss~tcr Bill 1997 Rnpld Assessment Internal document Ch~moio Afi~care
\[SF-CIS 1995 Inquzrlto Nutr~cionnl Rap~do Disir~ro de Guro Proi lncia dc Rlnnlc~ April 1995 klnputo hledccins Sans Frontieres

APPENDIX A
DETAILED TABLES
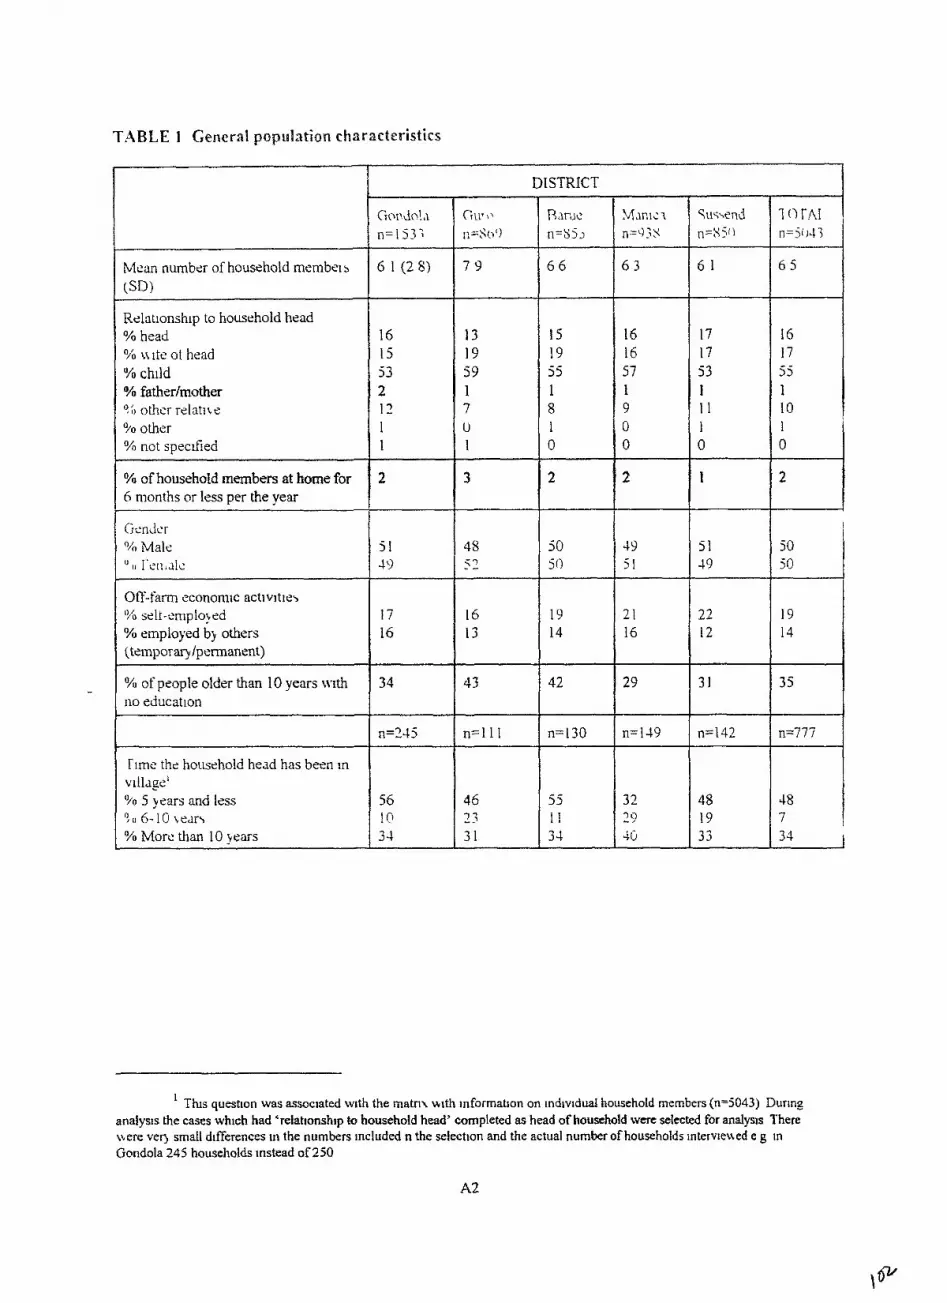
TABLE 1 General popu4ation characteristics
Thls question was assoc~ated w ~ t h the matn, w ~ t h lnformat~on on indlvrdual household members (n=5043) Dur~ng analysis the cases whlch had 'reiat~onsh~p to household head' completed as head of hou&old rverc selected for analys~s There \\ere ver) small differences ln the numbers Included n the selection and the actual number of households ~ntervleaed e g in Gondola 245 households instead of 250
r
Mean number of household rnembel s
(SD)
Relationship to household head % head % u lie 01 head O/o chlld % fatherhother '?h other rclatlte % other O/o not specfied
% of household members at home for
DISTRICT
I 0 TAI n=5043
6 5
16 17 5 5 1 10 1 0
Gor-\dc>I.\ n=l j3 ;
6 1 (2 8)
16 IS 53 2 1 :! I 1
5 1 4 9
2 2 12
3 1
n=132
6 months or less per the year
CJenlicr %I Male
~ C [ I , ~ I C
Off-farm economic actlvltle\ '36 sell-emplo)-ed O/o employed b j others (temporqipennanent)
%I of people older than 10 years w~th no educat~on -
rlmc the ho~lsehold head has been in vill'lgz' U/o 5 years and less '?GI 6- I0 % More than 10 q ears
n n=333
6 3
16 16 57 1 9 0 0
45 - i - 7
16 13
4 3
n=l 1 1
46 23 3 1
50 50
19 14
35
n=777
5 I 49
17 16
34
n=?45
56 10 3 J
Curwnd n=S50
6 1
17 17 5 3 1 1 1 1 0
2
Gut i \ I~=Sh')
7 9
13 19 59 1 7 0 1
~ ~ r d c n=Sj3
6 6
I5 19 5 5 1 8 I 0
1 t
48 19 33
3 2
50 5 o
19 14
42
7 48 / 3 3 1
2 2
4 9 j 1
2 1 16
29
n=130
5 5 1 1 3 4
n=143
3 2 29 4ii

?'4Bt,E 2 Household structures - -- -
Mcan number of houses per houcehold (SD)
Root of maln house ".o GI a>s/other natural rnatennl ",;I Comgdted lron O/u Tdes Yn Other
Consuuctlon rnatenal ot main house Wood and claj
% Unbaked ciay bnclis YU Cement or baked clay bncks '%I CrrC1>s
'?I, R e d , ?;I Othzr s
h1~tr.r ~ 1 1 thdt the dm1 of ihr m,un house la made of O i l Wood 9:) Strchs ?h Reeds % Other
\u\senCi
n=I41r
3(1 8)
83 12 4 1
56 3 7 7 0 IJ
0
6 3 0 3 1 6
I .
n=750
3(1 6 )
94 4 1
' 1
84 8 3 -,
G -I
1
4 1 2 4 1 16
TO 1 Al n-780
3(1 8)
9 1 6 2 1
65 28 5 I 1
I 0
50 1 40 9 -
DISTRICT
Guro n=l 10
4t1 9 )
97 3 0 0
56 3 9 1 2 - 'I 0
25 4 7 1 0
I; rue n=i3[1
4(2 1)
97 3 0 0
72 25 2 0 1
i'i
MJPIL'I n=]S11
3(1 5 )
82 10 8 0
39 47 14 0 0 0
4 2 1 54 3
79 0 13 8

TABLE 3: Income sources and selected expenditures
Sources of income % Sale of food crops
I % Sale of sunflower/sesarne " I , Sale of other cash crops '40 Sale of home produced 011 ?b Salc of anunals % Food prepared at hame %Non-agncself-employment " :, BLI! ~ns and selling of clothes CtC
Y'o Sale of natural resources Sal: of donated goods
% Rcgular or temporary wages " Pcnsionstothcr soclnl secur~t? '40 Other
Gondola
n=250
8 2 11 2 1 3 1 43 28 10
12 0 5 1 3 0
Guro
n=110
66 4 0 0 4 3 40 3 2 1 S
16 0 46 1 0
A farnilq member worked on someone else's farm t h ~ s year 'h Sunlloner 0/0 Sesame f a m ~
A farnll) member worked on someone else's farm last tear % Sunflouer 'XI Sesnn~c farm
% of households who spent mane! on new clothes dumng the past ]year
% of households who spent monet on meat dunng the past year
0 0
0 0
18
6 1
1 0
2 0
18
50
DISTRICT
Bane
n=l30
7 7 4 2 0 29 3 9 3 6 15
12 0 40 2 0
0 0
I 2
16
7 8
hlanica
n=ljO
74 6 1 0 2 7 43 2 7 16
2 1 0 6 1 9 2
0 1
0 1
3 3
8 5
Sussen- denga n=140
73 16 6 1 34 3 7 43 19
6 0 4 1 6 1
TOTAL
n=780
7 6 9 2 0 32 4 1 32 15
13 0 49 5 1
0 0
0 0
33
79
0 0
1 1
23
6 8

.IABLE 4. Ownersh~p of pi oduct~on implements and household goods
Oiincrship of product~on ~mplements %I \\ith hoes % \\ ith pangas % wrth axe
t\ ith spndc SO nith rakes O/o \\ ith sickles % u tth files % iv~th plough " 0 \\ l t l l c,1n
Otinersh~p of other hoiisehold goods 9,) Seu lng ~llachines "'0 Wooden tables 9 Wooden beds % Bicycles % Motorcycles % Radlos O/;, Mattresses 'YO Watch "A Aluminiun pots
Gondola
n=250
100 9 5 8 1 18 12 5 0 3 2 0 1
8 2 1 14 20 1 4 3 9 40 4 7
Guro
n=110
100 60 86 I4 13 5 6 25 3 4
8 2 6 14 3 8 0 43 14 44 52
DISTRICT
Rnruc
n=l30
100 77 95 25 1 1 65 18 1 1
6 2 5 13 3 2 0 4 1 7 44 5 1
h l a n ~ c d
n=IjO
99 83 82 3 1 17 5 1 24 15 13
5 44 33 ? ?
3 1 1 5 9 23 53 6 1
Sussen- denga n=140
99 9 9 93 25 16 60 29 10 7
11 35 29 36 1 5 1 26 44 54
TOT 41-
n=780
100 55 86 7 2 14 - i - i 27 5 >
S 29 2 0 30 1 47 i 5 41 - < - 7
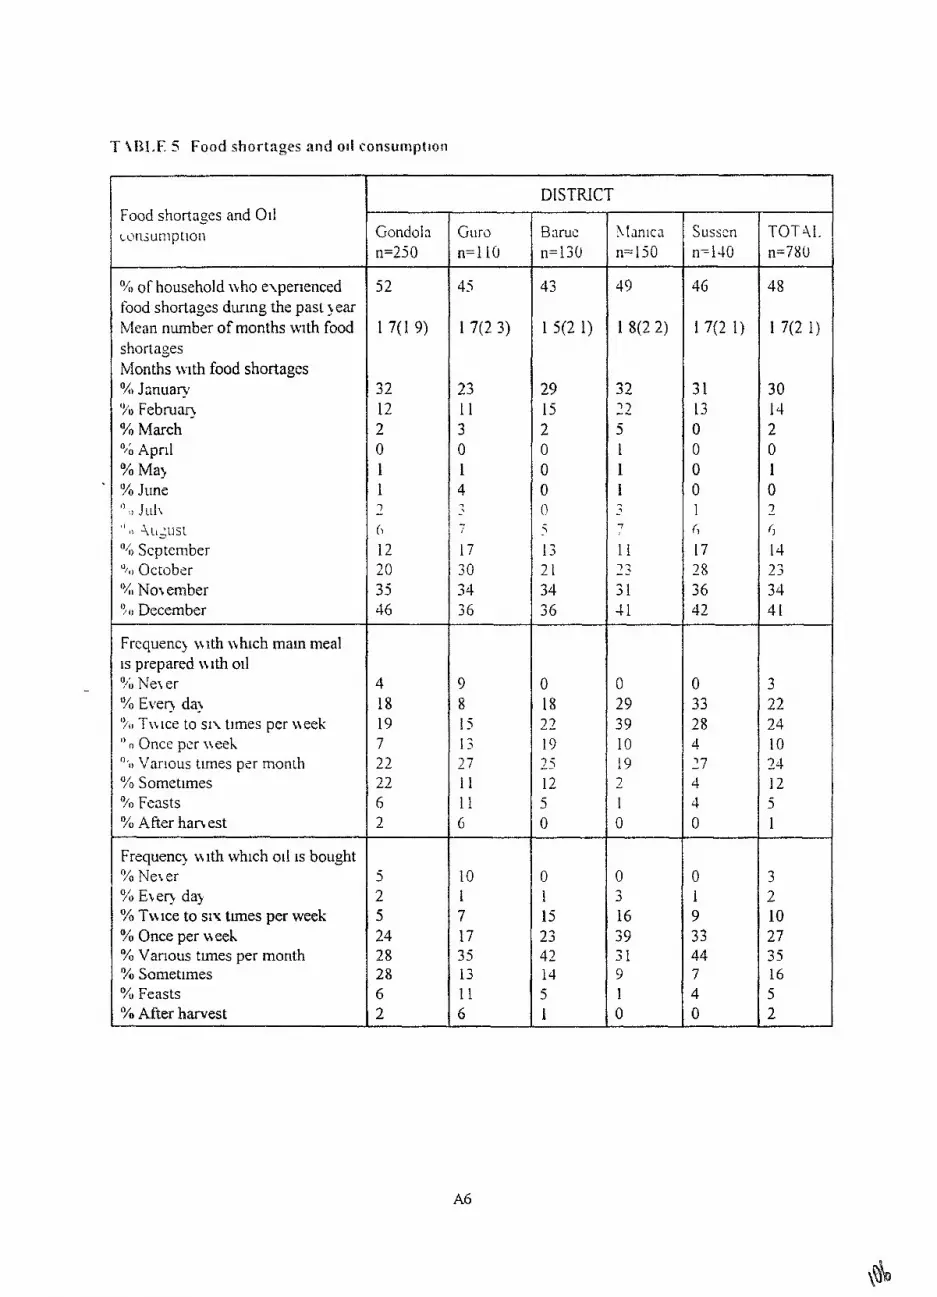
T \iZLI,E 5 Food shortages and on! consunlpt3oti - - - -- --
Food shortages and 011 ~on;uniptlon
% of household n ho elper~enced food shortages duulng the past )ear Mean number of months 1~1th food shortages Months 5~1th food shortages O h Jznuary O/o Februa~) % March O/b April % Ma) % June " { I .llll\ " 1, ? I ? I ~ U S L "0 September '/o October "41 No\ ember '>o December
Frcquencj \I ~ t h ~khlch m a n meal is prepared nlth 011 9 4 Nel er % Even da! 'hI T~ i ice to s n tlmes per meek " 0 Once per neeh ";I Various times psr month % Sometimes % Feasts 0/0 A Fter han est
Frequenq with which or1 1s bought % Nes er % E1eq day % Twice to sru tunes per week % Once per H eeh % Vanous tunes per month YO Sonmetimes "/U Feasts % After harvest
TOT41. n=780
4 8
1 7(2 1)
30 14 2 0 1 0 2 6 14 2 3 3 4 4 1
3 2 2 2 4 10 24 12 5 1
3 2 10 27 3 5 16 5 2
Gondola n=250
52
1 7(1 9)
32 12 2 0 1 1 7 - h
12 20 35 46
4 18 19 7 2 2 22 6 2
5 2 5 24 28 28 6 2
Guro n=110
4 5
1 7(2 3)
2 3 I 1 3 0 1 4 - - 17 30 3 4 36
9 8 15 13 2 7 11 11 6
10 1 7 17 3 5 13 I 1 6
DISTRICT
Bnruc n=130
43
1 5(2 1)
29 15 2 0 0 0 0 5
13 2 1 34 3 6
hlanicn n=150
4 9
1 8(2 2)
3 2 - 7) - 5 1 1 1 9 3
7
1 1 -- 7;
3 1 4 1
Susscn n=lJO
46
1 7(2 1)
3 1 13 0 0 0 0 1 0 17 2 8 3 6 42
0 33 2 8 4 27 4 4 0
0 1 9 3 3 ""
44 7 4 0
0 18 23 19 - 7 - i 12 5 0
0 2 9 3 9 10 19 2 I 0
0 1 15 2 3 4 2 14 5 i
0 3 16 39 3 1 9 1 0
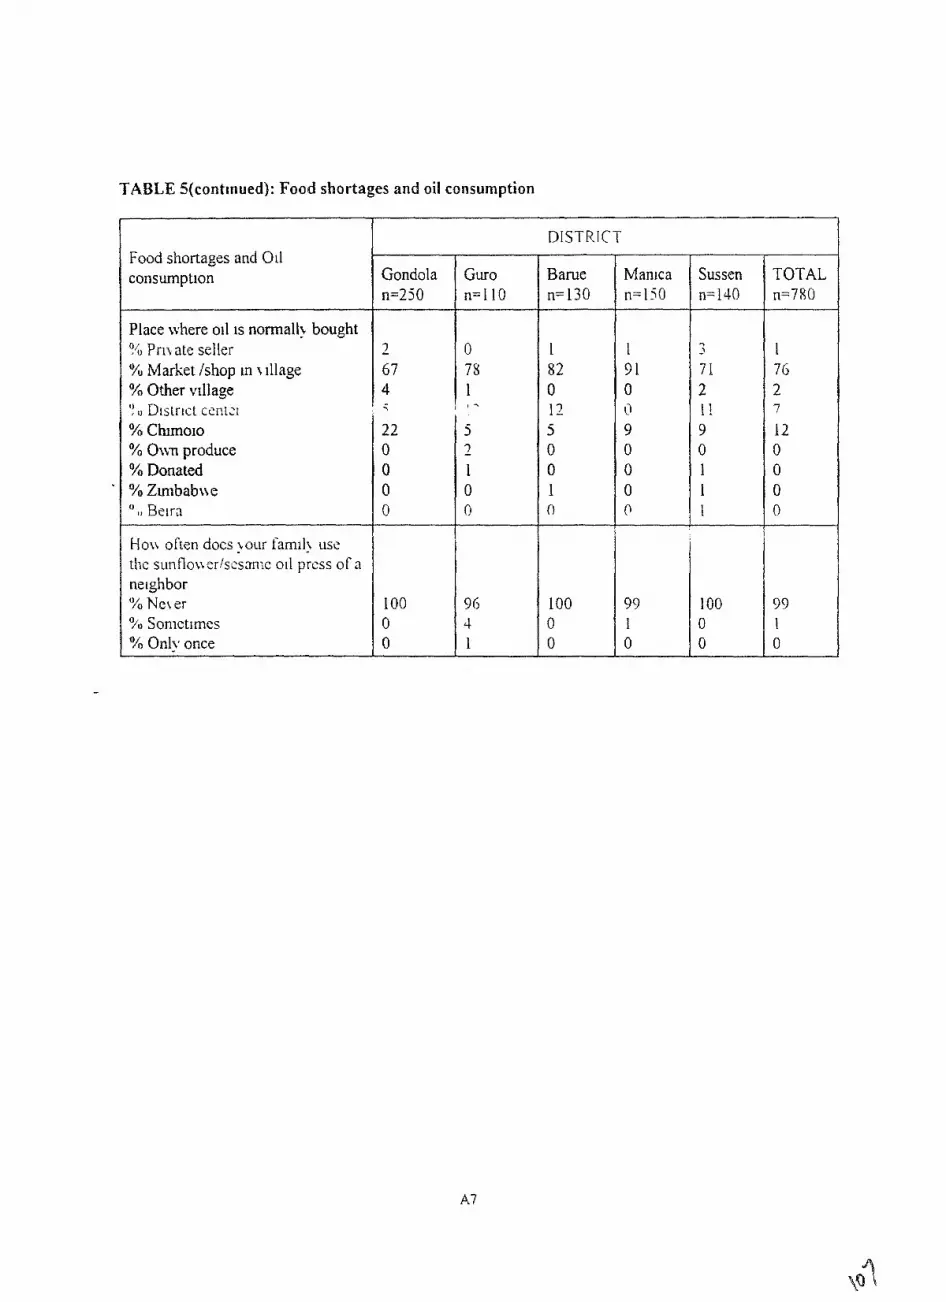
TABLE S(contlnued): Food shortages and oil consumption
Food shortages and 011 consumption
Place where oil IS normall\. bought l / o Prn ate seller % Market /shop in J illage
1 DISTP.ICT
Gondola n=250
2 67
% Other v~llage 1: 1 '! o Dlstr~ct ccn ta ! I - % Chlmo10 22 5 % Oun produce 0 2 % Donated 0 1 % Zunbabne 0 0 " I, Barn 0 0
Sussen n=140
I 1
7 1 2 I 1 9 0 1 I I I
Guro n=110
0 75
0 12 5 0 0 1 n
TOTAL n=7XO
I 76 2 7
12 0 0 0 0
0 0 9 0 0 0 0
Hou often docs !our farnil! use thc sunfloncrlsesnnle 011 prcss of a neighbor 'Yo Ne\ er O/u Somct~rnes % Only once
100 0 0
Barue n=130
1 8 2
Man~ca n=liO
1 9 1
100 0 0
9 6 4 1
99 I 0
I
I
99 1 0
100 0 0

TABLE 6: Profiles of household members who alwaysloften worked on the family farm during the past year
CHARACTERISTICS
% of total population involved
Number of people who alwaysloften worked on the famlly farm
Relat~onship to household head % head % wife of head % child '% fathcrlmothcr O/u other relative 'I/o other D/o NO response
Gcnder % Male % female
Mean age (SD)
% with no education O/u 1-5 years education '!4 5+ years education
% engaged in other Income generating actlvltles (off-farm self- employment)
% who sold their labor to others as temporarylpermanent workers
Gondola
n=l533
47
n=7 18
3 1 30 24 3 11 2 1
48 52
34(17)
40 5 3 7
3 2
27
TOTAL
~ 5 0 4 3
43
n=2143
30 37 22 2
. 8 1 0
43 57
34(16)
44 48 8
3 6
27
Guro
n=869
42
n=36 1
27 43 22 1 6 0 1
38 62
33(15)
53 42 5
3 1
2 7
DISTRICT
Barue
n=853
43
n=363
3 2 42 20 1 4 1 0
42 5 8
36(17)
55 3 8 7
3 7
2 8
Manica
n=938
39
n=366
3 1 3 8 2 1 2 8 0 0
4 1 59
34(15)
39 46 15
42
32
Sussen- denga n=850
3 9
n=335
3 1 39 19 2 8 1 0
42 58
35(15)
40 50 10
42
2 1

- #'
TABLE 7: The use of radio and extension services
Respondents may have received a vlslt from more than one respondent
A9
VARIABLE
% with a hnctionlng rad~o
% ~ 1 1 0 listen? to programmes for snlall producers
lieasons why people do not llsten % Do not have rad~olnot functioning % Do not know kvhe~e to go % Not ~nterested % Do not have time % Lack of batteries % Did not know existed % Cannot recelve progranlrnes
% of households who rcceived visit ti om euension staff
Ongln of those who v~slted U/o DDA YO Concern % GTZ % Unicef % Redd Barna % Africare % CN de algodHo % Tabacos de Man~ca % Outro (esp)
% of l~ouseholds who saw an agr~cultural demonstration by an extension agent during the past year
TOTAL
n=780
4 5
42
n=454
58
20 7 10 ' 1 1 1
n=780
7
1-144
76 0 7 0 0 0 7 A
2 2
n=54
5
Gondola
n=250
40
40
n=151
47
26 9 11 2 1 0
n=250
3
n=7
29 57 0 0 0 0 0 0 14
n=250
1
Guio
n=110
39
30
n=77
60
18 9 3 3 5 3
n=110
I
n= l
100 0 0 0 0 0 0 0 0
n=l 10
0
Sussen- denga n=140
5 1
49
n=7 2
7 2
14 3 10 0 0 0
n=140
13
n= 18
6 1 0 17 0 0 0 22 0 0
n=18
9
DISTRICT
B m e
n=130
3 9
35
n=85
58
2 1 5 13 0 1 1
n=130
13
n=17
94 0 6 0 0 0 0 6 0
n=130
11
M a c a
n=150
5 7
54
n=69
62
15 7 13 1 0 0
n=150
7
n=l 1
100 0 0 0 0 0 0 0 0
n=l l
7

/
TABLE 8: General agricultural practices
PRACTICES
Mean number of plots cult~vated durlng the past season
% who used chermcnl fertilizer durmg the past season
% who used other inputs (~mproved seeds, insectiadzs, herbicides etc )
U/o who recelved support from an organ~zation for the production of cash clops durlng the past season
DISTRICT
TOTAI.,
n=780
2 4(1 4)
1
5
1
Gondola
~ 2 . 5 0
2 4(1 3)
0
4
0
Guio
n=110
3 l(2 2)
1
0
0
Sussm- denga n=140
2 2(1 0)
4
10
5
Bmye
n=130
2 4(1 4)
0
2
1
Man~ca
n=150
2 O(1 1)
1
7
0

/
TABLE 9: Production of sesame in the past
Where percentages do not add to 100% the remainder 1s represented by rnisslng data or ma) be the result of rounding off the numbers Each famly could give two responses to this question Percentages represent the percentage of total responses and not percentage of households
VARIABLE
Number of years cultcvated % Ncver cultivated it % 1-5 years 90 6-10 years O.b I0 + years
Last time when cult~vated 90 Never % More than 10 years 9b Behveen 5 and LO years ago % Behveen 2-5 years ago % Last year % This ycar
Roasons for not cult~vat~ng or stopping cult~vat~on ' % Lack of seeds O/b Lach of land Sb Lack of labor 30 Lack ol markets % Storagc proble~ns % War % Lacb of money % Lach of ~ncentivcs 90 Too much rain % Lack of tanehntercst O/u DO iiot know thc crop % Fanilly problcrlis % So11 poor/unsu~tabla % Probleins w~th lnsects % Problcrns wtth birds
Nurnber of households who planted sesarne before
Who decided to plant the crop % Men % Women % Both
Number of seeds per hole % Scattered seed % Le$s than 2-3 O/b 2-3 seeds % 4-6 seeds % Do not know
TOTAL
n=780
73 18 3 6
73 4 3 5 8 8
n=j18
43 6 10 3 1 1 1 2 1 0 1 3 0 0 0 0
n=210
4 1 20 38
8 1 I I 6 9
Sussen- denga n=140
65 26 3 6
65 3 2 4 12 14
n=131
36 5 I5 37 3 1 0 1 0 1 0 0 0 0 0
n=49
45 18 37
82 0 0 14 4
Manica
n=150
77 15 4 4
77 4 3 6 5 5
n= 143
47 12 11 2 5 1 1 0 1 1 1 2 0 0 0 0
n=34
3 5 27 38
88 0 3 3 6
Gondola
n=250
63 23 4 10
63 5 4 7 10 10
n=224
4 1 5 I I 28 1 1 1 1 1 3 3 I I 0 0
n=90
42 18 38
84 2 - 7
2 7
Guro
n=110
90 9 0 1
90 1 5 0 4 1
n= 108
50 2 I 3 1 0 1 0 1 0 1 9 0 1 1 0
n=ll
5 5 18 27
27 0 0 0 73
DISTRICT
Bane
n=130
80 14 1 5
80 5 2 4 4 6
n=122
44 5 8 38 1 1 0 3 0 0 0 0 0 0 0
n=26
35 23 42
85 0 8 8 0

54 10 34 2
3 4 6 56 3 1
18 16 15 - 5 1
58
40 . 30 2 50 1 16
4 1 2 1 10 2 3 0 10 5 10
Number of plants left per hole % 1-2 plants % More than 2 plants 90 Do not hnow % Leave as sown
Intervals behveen rons 90 Less than 60 cm O/o 60-80 cm % More than 80cm 9 0 Do not hnow % Do not use rows
Intenals behveen plants % Less than 25 cm % 25-35 cm % More than 35cm % Do not Anow
% of households who ~ntercrop
% \\ho sold sesame dur~ng the past 5 years
To whom the myor part was sold YO Trader 90 Agr~coln O/b Nelgbots'pnvatt '(0 DDA '30 No response
Problelns encountered during the sale of produce YO None % Lack of buyers 70 Market is far % Poor qualdy product % Problem with storage until salc O/u Lack of produce Jo Problems w1t11 the price Jo Cost of transport % No response
56 3 36 3
3 2 5 50 38
30 19 12 39
42
4 1
3 1 0 49 0 2 1
28 19 12 3 5 0 7 12 14
64 36 0 0
0 0 18 46 36
9 9 46 36
73
36
0 50 25 0 25
33 33 0 0 0 0 17 17 0
47 9 44 0
3 3 3 68 24
3 12 12 74
77
32
27 0 64 0 9
50 19 1 0 0 0 1 13 1
65 4 27 4 -
4 8 12 54 23
12 23 12 54
8 1
3 1
2 5 0 38 13 25
56 11 0 0 0 0 11 0 22
49 14 35 2
2 4 8 6 1 2 5
10 10 22 57
57
47
38 0 54 0 8
44 2 1 8 3 0 0 15 10 0
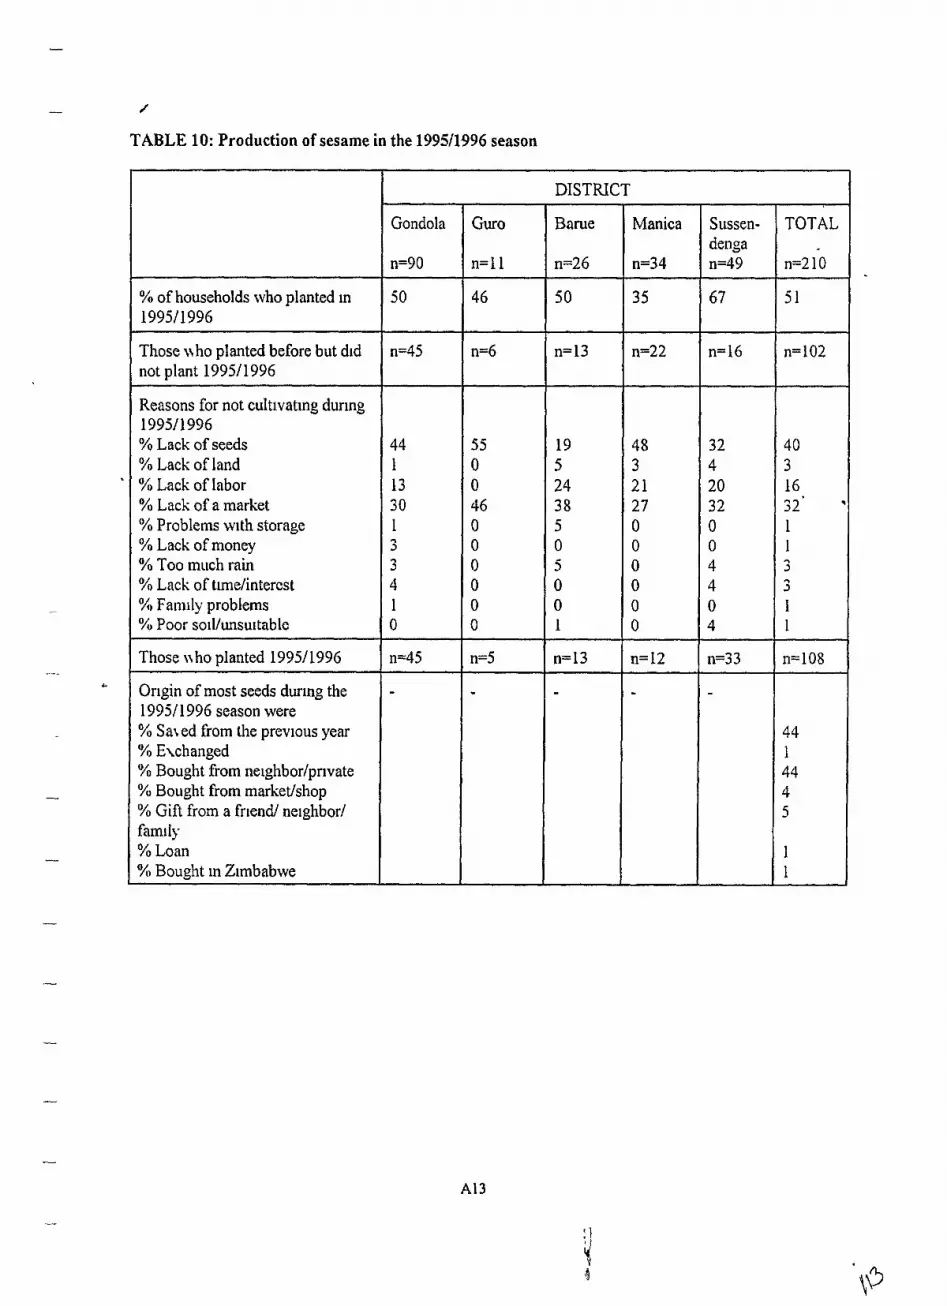
- 4
TABLE 10: Production of sesame in the 199511996 season
% of households who planted in 199511996
Those who planted before but did not plant 199511996
Reasons for not cultivating during 19951 1996 % Lack of seeds % Lack of land % Lack of labor % Lack of a market % Problems with storage % Lack of money % Too much rain % Lack of timelintercst % Fanlily problems % Poor soillunsu~tablc
Those uho planted 199511996
Ongin of most seeds during the 1995/ 1996 season were % Sai ed from the prevlous year % Exchanged % Bought from nelghborlprivate O/o Bought from market/shop % Gift from a friend/ neighbor1 fam~ly % Loan % Bought in Zimbabwe
DISTRICT

The b~ggest problems experienced d m g the 1995/1996 season were. % None % Illnesses % Insects % Birds % Theft % Rats % Wind % Rain % Sun % Planted too late % Poor germmatlon % Baboons % Blrds % Late harvest D/o pigs
Problems esper~enced during storage of seed % None % Insecls % Rats O/o Humid~ty U/U Theft
Uses for sesame % of households \\ ho sold % of households who produced oil for selllng % of households who produced 011
for home consumption O/o of households who produced sceds O/U of households who lost % of households who consumed % of households who stored some of their produce
-
15 16 33 8 1 10 I 8 2 1 1 1 2 1 1
3 8 2 1 3 1 4 5
5 3 0
6
84
65 9 9 5 8
-
-
-
-
-
-

- J
TABLE 11: Production of sunflower in thc past
-
Where percentages do not add to 100% the remamder is represented by missmg data or may be the result of rounding off the numbers Each family could give two responses to this question Percentages represent the
.- percentage of total responses and not percentage of households
Number of years cult~vated % Never cult~vated it % 1-5 years % 6- 10 years % 10 -I-. years
Last time when cultivated ?4 Never % More than 10 years % Between 5 and 10 years ago % Between 2-5 years ago % Last year % This year
IZeasons for never cultivating oi stopping cultivation % Lack of seeds % Lack of land % Lack of labor % Lack of markets % Storage problems % Wai % Lack of money % Lack of incentives % Too much raln % Lach of timelmterest % Do not h o w the ci op % Family problems % So11 pooi/unsuitabIe % Problems with b~rds
Numbei of households who planted sunflower before
Who decided to plant the crop % Men % Women % Both
Gondola
n=250
96 4 0 0
96 2 0 1 1 0
n=239
37 5 8 27 2 0 1 4 1 2 6 1 0 0
n=l 1
50 0 50
Sussen- denga n=110
9 1 7 1 1
9 1 1 1 1 5 1
n=128
3 7 3 12 3 7 3 0 0 1 0 I 5 0 0 0
n=12
5 S 0 42
TOTAL
n=7SO
90 8 1 1
90 2 2 2 2 3 a
n=700
40 4 7 3 3 2 1 0 3 0 1 6 1 0 0
n=8O
5 3 1 46
Guro
n=110
86 11 1 2
86 2 4 6 2 2
n=94
48 I 2 37 0 1 0 1 0 1 9 0 1 0
n=16
44 0 56
DISTRICT
Barue
n=130
85 1 I 0 4
85 3 3 4 5 1
n=110
43 I 4 43 1 0 0 3 0 0 4 0 0 0
n=20
65 5 3 0
Maiiica
n=150
86 10 1 3
86 4 3 2 3 2
n=129
4 1 9 8 26 3 0 0 4 0 1 8 0 0 0
n=2 1
48 0 52

Usslng values and roundlng off accounts for totals lower than 100%
A16
Number of seeds per hole % Scattered seed '~ Less than 2-3 % 2-3 seeds % 4-6 seeds
Number of plants left per hole % 1-2 plants % More than 2 plants % Do not know
Intervals between rows % Less than 60 cm % 60-80 cm % More than 80cm % Do not know % DO not use rows
Intemals between plants % Less than 25 cm % 25-35 cm % More than 35cm O/o DO not know
'% of households who intercrop
% w i ho sold sunflowber durrng the past 5 }ears
To \L hom the major part was sold Mozambique lndustrlal TI adel Agrrcom Girassol Man~ca Ne~gbors/pr~vute No I ebponse
PI obIems encountered dul lng the sale of pr oduceS O/U None % Lack of buyers % Mruket IS far % Poor quality product % PI oblem wlth storage untll sale % Lack of produce % Problems with the prtce % Cost of transport
30 10 3 0 30
80 10 10
10 20 10 20 40
40 10 3 0 20
20
46
20 80 0 0 0 0
3 3 22 22 0 22 0 0 0
5 4 48 4 3
82 15 3
I5 13 42 18 13
17 16, . 49 18
4 2
44
23 3 7 29 3 6 3
29 26 1 I 6 6 0 I I 10
0 0 3 8 62
75 25 0
6 6 50 10 19
6 25 56 13
69
38
0 33 33 17 17 0
17 39 6 1 1 0 0 I I 17
0 10 67 24
90 10 0
19 24 3 8 10 5
19 19 5 2 10
48
38
38 25 38 0 0 0
2 9 14 14 0 7 0 14 2 1
0 0 45 55 \
75 2 5 0
15 10 50 20 5
15 15 50 20
45
40
13 13 50 0 13 13
3 3 27 7 7 7 0 13 0
8 0 50 42
92 0 8
2 5 0 42 25 8
8 8 50 3 3
8
67
38 50 13 0 0 0
43 2 1 7 7 0 0 14 7
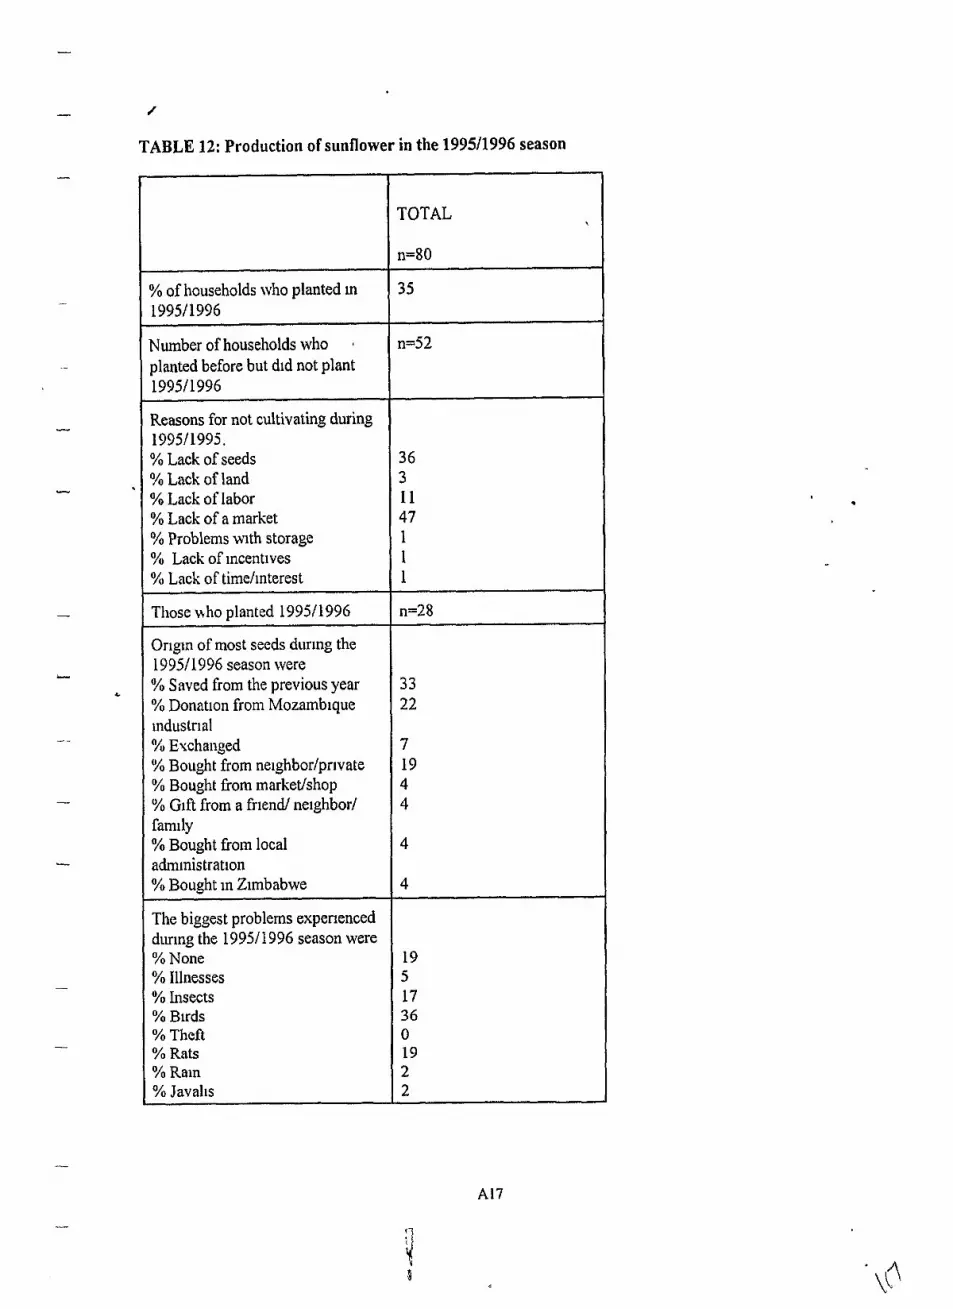
TABLE 12: Production of sunflower in the 1995/1996 season
TOTAL
n=80
Reasons for not cultivating during 199511995, % Lack of seeds % Lack of land % Lack of labor % Lack of a market % Problems wtth storage % Lack of incentives U/U Lack of timelinterest
- -
% of households who planted In 19951 1996
Number of households who a
planted before but dtd not plant 199511996
I Those who planted 199511996
35
n=52
Origln of most seeds durrng the 199511996 season were % Saved from the previous year % Donation from Mozambique induslrial % Exchanged '% Bought from neighborlprivate % Bought from rnarketlshop 'YO Gift from a friend, neighbor1 fanlily % Bought flom local adrn~nistrat~on % Bought in Zimbabwe
The biggest problems expenenced during the 19951 1996 season were % None % Illnesses % Insects % Birds % Theft % Rats % Rain
I % Javal~s
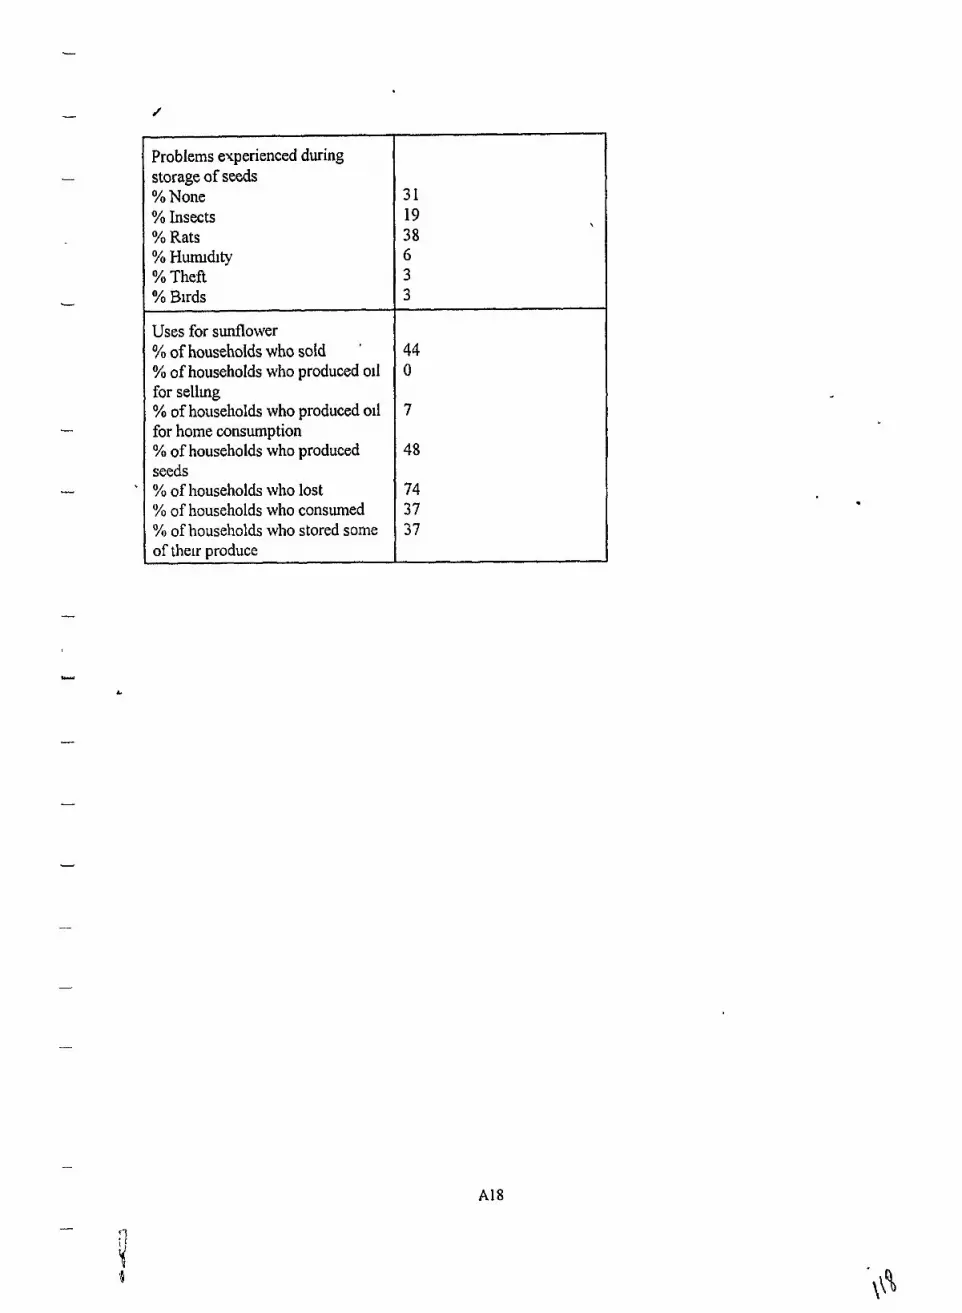
Problems experienced during storage of seeds % None % Insects % Rats % Hurmdity % Theft % Birds
Uses for sunflower % of households who sold
'
% of households who produced 011 for selling % of households who produced 011 for home consumption % of households who produced seeds % of households who lost % of households who consumed % of households who stored some of their produce
3 1
19 \
38 6 3 3
44 0
7
48
74 37 37

TABLE 13 Production of sesame and sunflower in the 199611997 season
,
% of households who planted in this year
Number of households who planted before but did not plant this year
Reasons for not cultivat~ng this year % Lack of seeds % Lack of land % Lack of labor % Lack of a market % Problems with storage % Too much rain % Lack of timelinterested % Famrly problems % Problems with insects
Those uho planted this year
Origin of most seeds durrng the past season were '% Saved from the prevrous year % Exchanged ?/o Bought from ncighbor/private % Bought from marketlshop % Gift from a fnendl neighbor1 family
% who employed laborers
Number of laborers employed O/o none % 2-3 % 4+
SESAME
n=2 10
29
n=149
30 4 2 0 32 2 5 3 1 1
n=6 1
82 2 5 8 3
7
93 4 4
SUNFLOWER
n=80
10
n=72
3 0 3 11 4 8 2 1 1 2 1
n=8
50 0 25 13 13
3 8
63 25 13

TABLE 14: Details on the land planted with sesame and sunflower during the past season -
15 23 8 3 1 8 15 0 0 0 0 0
100 0 0 0
The biggest problems experienced dur~ng the past season were % None % Insects 94 Rats YO Buds O/o Illnesses % Wlnd % Rain % Sun % Late pIanting % Monkeys % Plgs
In comparison w t h the previous year the harvest was % Better % Smaller D/U The same O/;, Do not know
13 2 8 11 2 1 12 1 23 2 8 2 8
44 3 5 15 G
Distancc to plots. % 0-30 minutes U/U 30-60 mlnutes % More than one hour
Mean plot s~zes ~n ha (SD) % of households who planted Less than 1 hectare Bet)\ een 1 and 2 hectares More than 2 hectares
Qual~ty of the land % Fert~le % Normal % Infertile
SESAME
67 24 8
0 57(0 67)
5 3 36 10
6 9 24 7
SUNFLOWER
25 63 13
0.125(0 35)
88 12 0
8 8 0 12

TABLE 15: Geographic distribution of sunflower and sesame growers
SUNFLOWER
Mevumbe
Mocumbue, Balrro Centro, 3 'Balrro Bandula
Sanguene
JuIiasse Nyerere, Phurnphwa
Fudzl-sede
- - -
GONDOLA
MANICA
SUSSENDENGA
GURO
BARUE
SESAME
Centro de metuchra, centro de acomoda~lo Doeroi, Pmdanga-centro, Macata sede, Mevumbe, Macuenjere, Musangadzi intenor, Nhamatanda, Josina Machel, Nharimiro, Revue- Khamba, Ripongue, Nhaulanga, Purnbuto- sede
Mucombue, Almada, Verde, Bairro centro, Ba~rro Mutse, 3 Balrro Bandula
Chimbua, Manta-sede, Moiant?, Ch~gunlete, Ndongue, S anguene, Tussene, Macocue
1 de Maio By Juliasse Nyerere, Phumphivn
Chlwala-centro, Nhampassa-sede, Fudzi- sede
- -

'
TABLE 16: General crop production
% of households who planted crops
Mean number of crops planted per household
% of housellolds who planted % Maize % Cowpea % Butter bean % Sorghum % Groundnut % h c e % Cassava % Millet % Cotton % Tobacco % Bananas % Citrus O/u Tomato % Onions ?4 Garlic O/u Inhme % Sweet potato
% of housel~olds who soId crops
Mean number of crops sold per l~ousehold
TOTAL n=780
100
5 8(2 7)
99 47 2 1 7 1 4 8 18 55 ' 20 1 2 36 7 29 16 12 30 65
76
2 2(2 0)
Gondola n=250
100
6,4 (2 8)
100 47 3 1 69 43 16 76 5 1 2 63 16 29 16 16 44 69
8 1
2 6(2 1)
Guro n=110
100
5 O(2 1)
98 5 4 7 80 69 6 16 75 0 2 6 0 23 8 4 2 53
65
1 5(1 7)
DISTRICT
Barue n=130
100
5.9(2 9)
9 9 42 16 85 5 5 26 5 5 3 2 1 2 2 1 2 3 5 15 12 19 70
80
2 l(2 0)
Manlca n=ljO
9 9
5 3(2 7)
99 50 19 5 9 4 8 19 45 11 0 1 2 1 24 15 8 35 6 9
74
2 3(2 1)
Sussen- n=140
99
5 j(2 7)
9 9 43 20 69 3 2 2 1 5 9 2 5 3 34 7 3 5 22 14 30 5 6
73
1 9(1 8)

% of surveyed households who I sold % Ma~ze % Cowpea % Butter bean % Sorghum % Groundnut % fice % Cassava % Millet % Cotton % Tobacco % Bananas % Citrus % Tomato % Onions % Garl~c % Inhame % S\i7eet potato
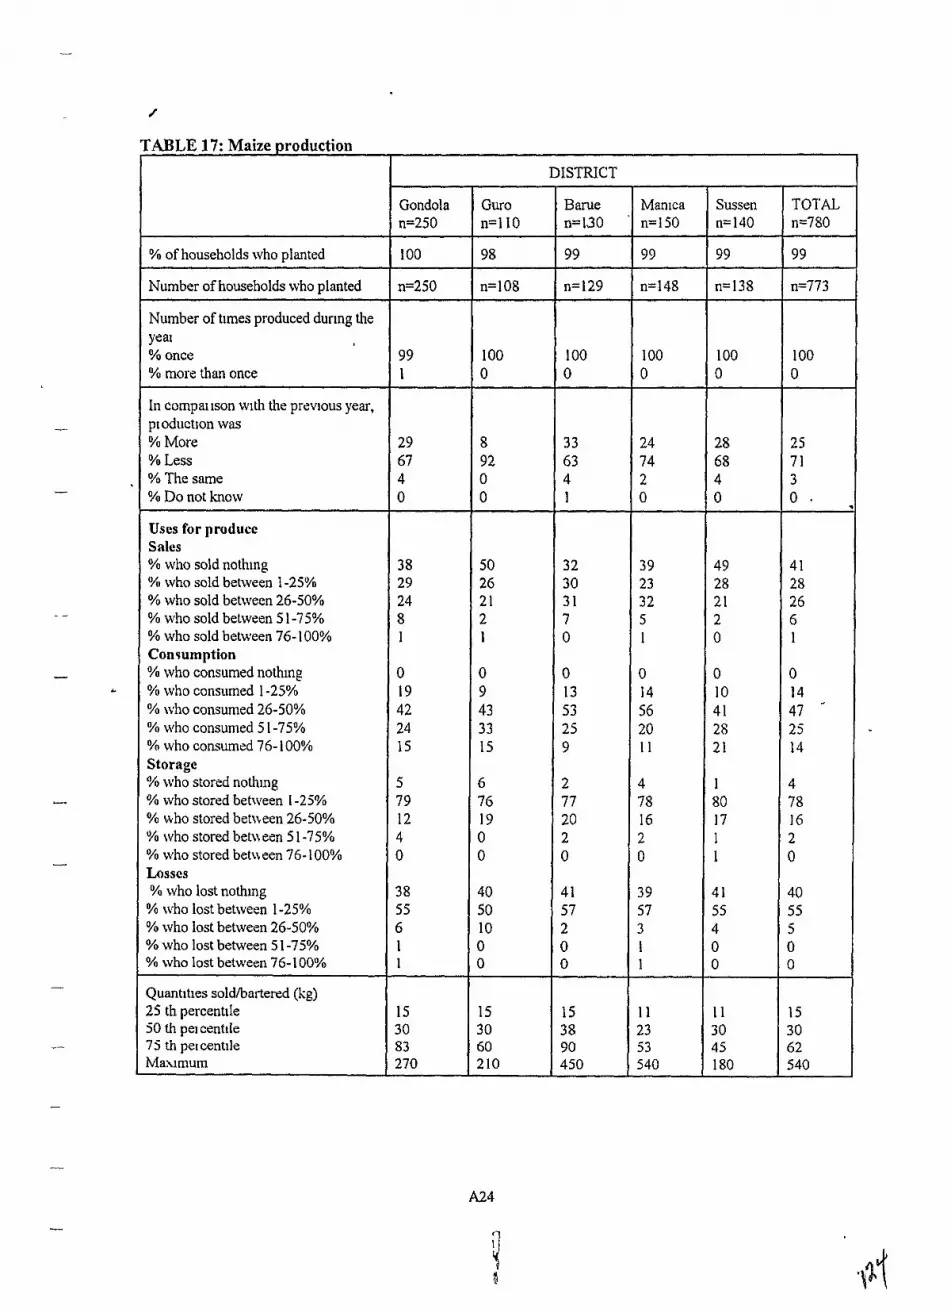
.
TABLE 17: Maize production
% of households who planted
Number of households who planted
Number of tlmes produced durlng the yea1 % once O/u more than once
In cornpal lson wlth the prcvlous year, p~oduct~on was % More % Less %Thesame % Do not know
Uses for produce Sales % who sold noth~ng V/n who sold between 1-25% % who sold between 26-50% % who sold between 5 1-75% % who sold between 76- 100% Con~umption % who consumed nothing % who consumed 1-25% % who consumed 26-50% % who consumed 5 1 -75% Yi who consumed 76- 100% Storage % who stored nothlng % who stored between 1-25% % who stored betneen 26-50% % who stored betueen 5 1-75% % who stored bettbeen 76- 100% Losscs % who lost nothlng % who lost between 1-25% % who lost between 26-50% % who lost between 5 1-75% % who lost between 76-1 00%
Quantities soldtbartered (kg) 25 th percent~le 50 th pel centile 75 th pe~centile Maximum
Gondola n=250
100
n=250
99 1
29 67 4 0
3 8 29 24 8 1
0 19 42 24 15
5 79 12 4 0
38 5 5 6 1 1
15 30 83 270
Sussen n=140
99
n=138
100 0
28 68 4 0
49 28 2 1 2 0
0 10 4 1 28 2 1
1 80 17 1 1
4 1 55 4 0 0
I1 3 0 45 180
TOTAL n=78O
99
n=773
100 0
25 7 1 3 0 . .
4 1 28 26 6 1
0 14 47 2 5 14
4 7 8 16 2 0
40 55 5 0 0
15 3 0 62 540
Guro n=110
98
n=108
100 0
8 92 0 0
50 26 2 1 2 1
0 9 43 33 15
G 76 19 0 0
40 50 10 0 0
15 3 0 60 210
DISTRICT
B arue n=130 '
99
n=129
100 0
3 3 63 4 1
3 2 30 3 1 7 0
0 13 53 25 9
2 77 20 2 0
4 1 57 2 0 0
15 38 90 450
Man~ca n=15O
99
n=148
100 0
24 74 2 0
39 2 3 32 5 1
0 14 56 20 11
4 78 16 2 0
39 57 3 I 1
11 23 5 3 540
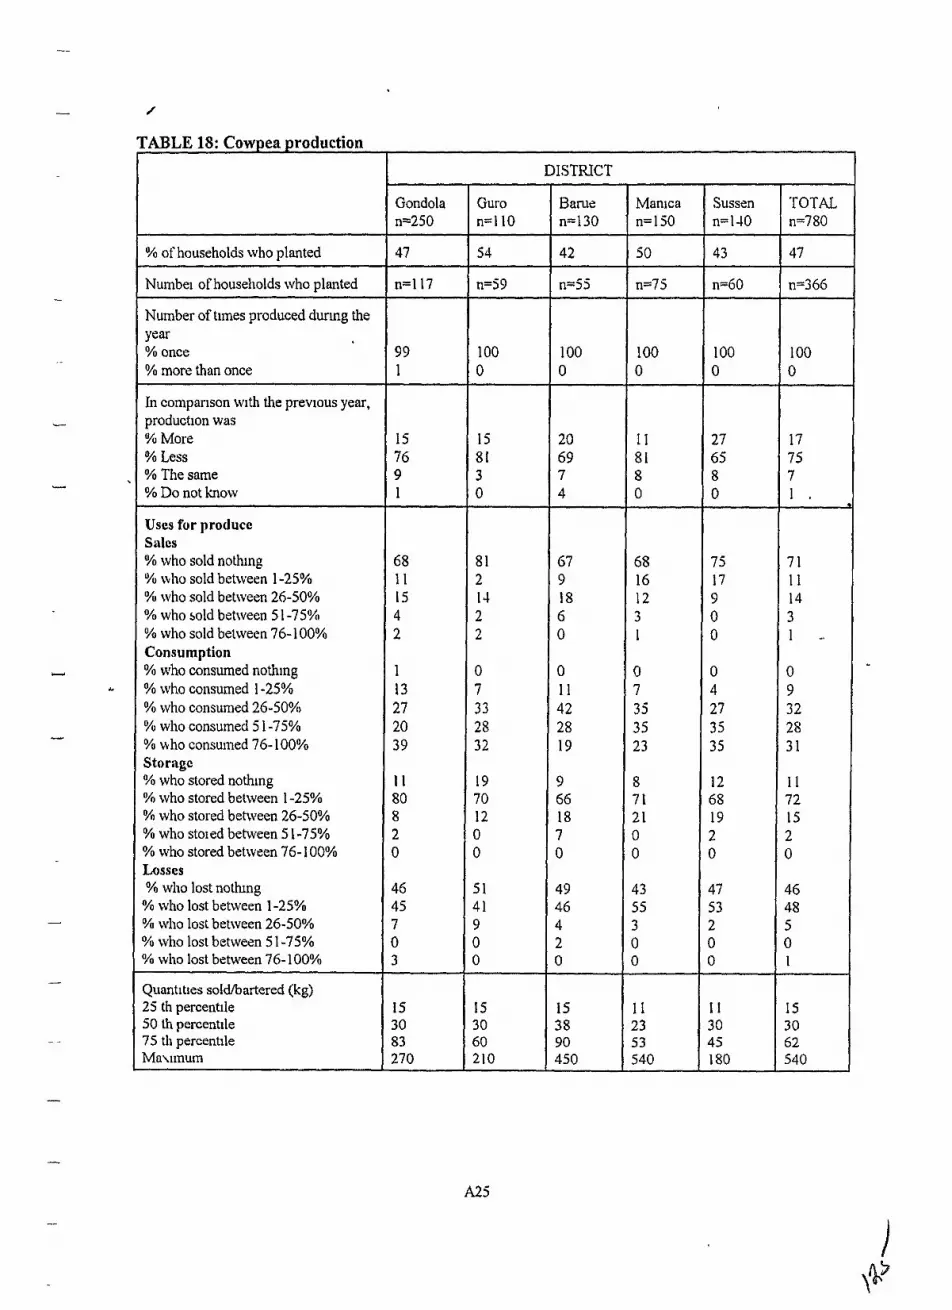
TABLE 18: Cowpea production
DISTRTCT
% of households who planted
Numbel of households who planted
Number of t~mes produced dur~ng the Year % once % more than once
In comparison w~th the prevlous year, production was % More % Less % The same YO Do not know
Uses for produce Sales % who sold noth~ng '?4 n110 sold between 1-25% % who sold between 26-50% % who sold between 5 1-75% % who sold between 76-1 00% Consumption % who consumed nothing % who consumed 1-25% % who consumed 26-50% % who consumed 5 1-75% % ckho consumed 76- 100% Storagc % who stored noth~ng % who stored between 1-25% % who stored between 26-50% % who stored between 5 1-75% % who stored between 76- 100% Losses % who lost nothrng % who lost between 1-25% % who lost between 26-50% % who lost between 5 1-75% % who lost between 76-1 00%
Quant~ttes soldhartered (kg) 25 th percentile 50 th percentile 75 th percentile Maunum
Gondola n=250
47
n=l17
99 1
15 76 9 1
68 11 15 4 2
1 13 27 20 39
1 1 80 8 2 0
46 45 7 0 3
15 30 83 270
Guro n=110
54
n=59
100 0
15 8 1 3 0
8 1 2 14 2 2
0 7 33 2 8 3 2
19 70 12 0 0
5 1 4 1 9 0 0
15 30 60 210
Barue 11-130
42
n=5j
100 0
20 69 7 4
67 9 18 6 0
0 11 4 2 2 8 19
9 66 18 7 0
49 46 4 2 0
15 38 90 450
Mantca . n=ljO
50
n=7 5
100 0
11 8 1 8 0
68 16 12 3 I
0 7 35 35 2 3
8 7 1 2 1 0 0
43 5 5 3 0 0
1 1 23 53 540
Sussen n=IJO
43
n=60
100 0
27 65 8 0
7 5 17 9 0 0
0 4 27 35 35
12 68 19 2 0
47 5 3 2 0 0
I I 3 0 45 180
TOTAL n=780
47
n=366
100 0
17 75 7 1 .
t
7 1 1 1 14 3 1 -
0 9 3 2 28 3 1
1 1 7 2 15 2 0
46 48 5 0 1
I5 3 0 62 540

TABLE 19: Sorghum production
I DISTRICT I
.
U/o of households ii ho planted
Number of households who planted
Number of times produced dur~ng the Year % once
In comparlson with the previous year, product~on was % More % Less % The same % Do not knob\
Uses for produce Sales U/o who sold nothing % who sold between 1-25% % \tho sold between 26-50% % who sold between 5 1-75% % who sold beti$ een 76- 100% Consuniption U/U who consumed nothing % who consumed 1-25% % who consumed 26-50% % who consumed 5 1-75% % who consumed 76- 100% Storage % who stored nothing % who stored betnem 1-25% % who sto~ed between 26-50% % who stoied between 5 1-75% U/n who stored betwen 76- 100% Losses % who lost notlung
U/n who lost behireen 1-25% % who lost between 26-50% % who lost between 5 1-75% % who lost between 76- 100%
Quantities sold/bartcrcd (kg) 25 th percent~le 50 th percent~le 75 th percentile Max~mum
..
TOTAL n=780
7 1
n=556
100
24 70 a
5 1 ,
83 9 G 2 1
1 6 32 35 26
8 69 20 4 0
4 1 52 6 1 0
54 162 270 2700
Gondola n=250
69
n= 172
100
28 62 7 2
87 8 4 1 1
1 9 19 38 3 4
12 7 1 13 4 0
46 46 5 2 1
54 90 270 2214
Sussen n=140
69
n=96
100
32 66 2 0
8 1 10 6 2 0
1 3 32 40 24
7 7 1 2 1 I 0
4 1 54 4 1 0
108 180 3 24 2700
Guro n=110
80
n=88
100
8 89 1 2
89 6 5 1 0
0 4 39 3 1 27
9 66 24 1 0
3 9 5 1 10 0 0
54 162 270 450
Barue n=130
85
n=ll l
100
23 7 1 5 0
7 9 12 6 3 0
1 5 40 37 I8
6 66 20 7 0
39 5 5 5 1 0
108 180 3 24 648
Mamca n=150
5 9
n=89
100
25 69 6 1
7 8 8 10 2 2
1 9 42 24 2 5
1 68 27 3 0
3 7 58 5 0 0
45 108 243 97 2

-
- .
TABLE 20: Groundnut production
% of households who planted
Number of households who planted
Number of tunes produced durlng the ycar % once % more than once
In companson with the previous year, production was % More % Less %The same % Do not know
-
-
U
-
-
Gondola n=250
43
n= 108
99 1
2 2 67 1 1 1
66 1 1 13 9 I
1 15 35 3 0 20
12 69 18 1 0
48 44 6 1 0
23 45 126 2520
5 1 13 19 16 1
1 23 30 29 16
12 76 10 1 1
49 48 3 0 0
30 56 158 1350
Uses for produce Sales % who sold nothing % who sold between 1-25% % nho sold behveen 26-50% % who sold between 5 1-75% % ho sold between 76- 100% Consumption % who consumed nothlng % who consumed 1-25% % mho consumed 26-50% % \I ho consumed 5 1 -75% % who consumed 76- 100% Storage % who stored nothing % who stoted between 1-25% % who stored between 2640% % who stored between 5 1-75% % who stored between 76-100% Losses % who lost nothing % who lost between 1-25% % who lost between 2640% % who lost between 5 1-75% % who lost between 76- 100%
Qui~ntities soldlbartered (kg) 25 th percentile 50 th percent~le 75 th percentile Ma\imum
7 6 8 6 9 1
1 15 23 24 3 2
22 63 16 0 0
54 33 50 3 0
3 0 44 113 2520
rOTAL n=780
48
n=37 1
100 0
33 60 6 1 . .
Guro n=110
69
n=76
100 0
40 5 5 5 0
--- pp
69 7 16 7 1
0 13 44 2 8 15
I 1 6 1 24 4 0
39 55 4 0 1
20 44 168 420
DISTRICT
B m e n=130
5 5
n=7 1
100 0
34 63 3 0
63 14 18 6 0
1 11 46 27 14
4 7 2 24 0 0
4 3 4 9 7 1 0
12 45 135 70
7 1 16 9 5 0
0 5 26 52 17
6 80 16 0 0
57 39 2 2 0
14 45 70 126
Man~ca n=150
48
n=7 2
100 0
39 5 1 8 1
Sussen n=140
32
n=44
100 0
4 1 57 0 2
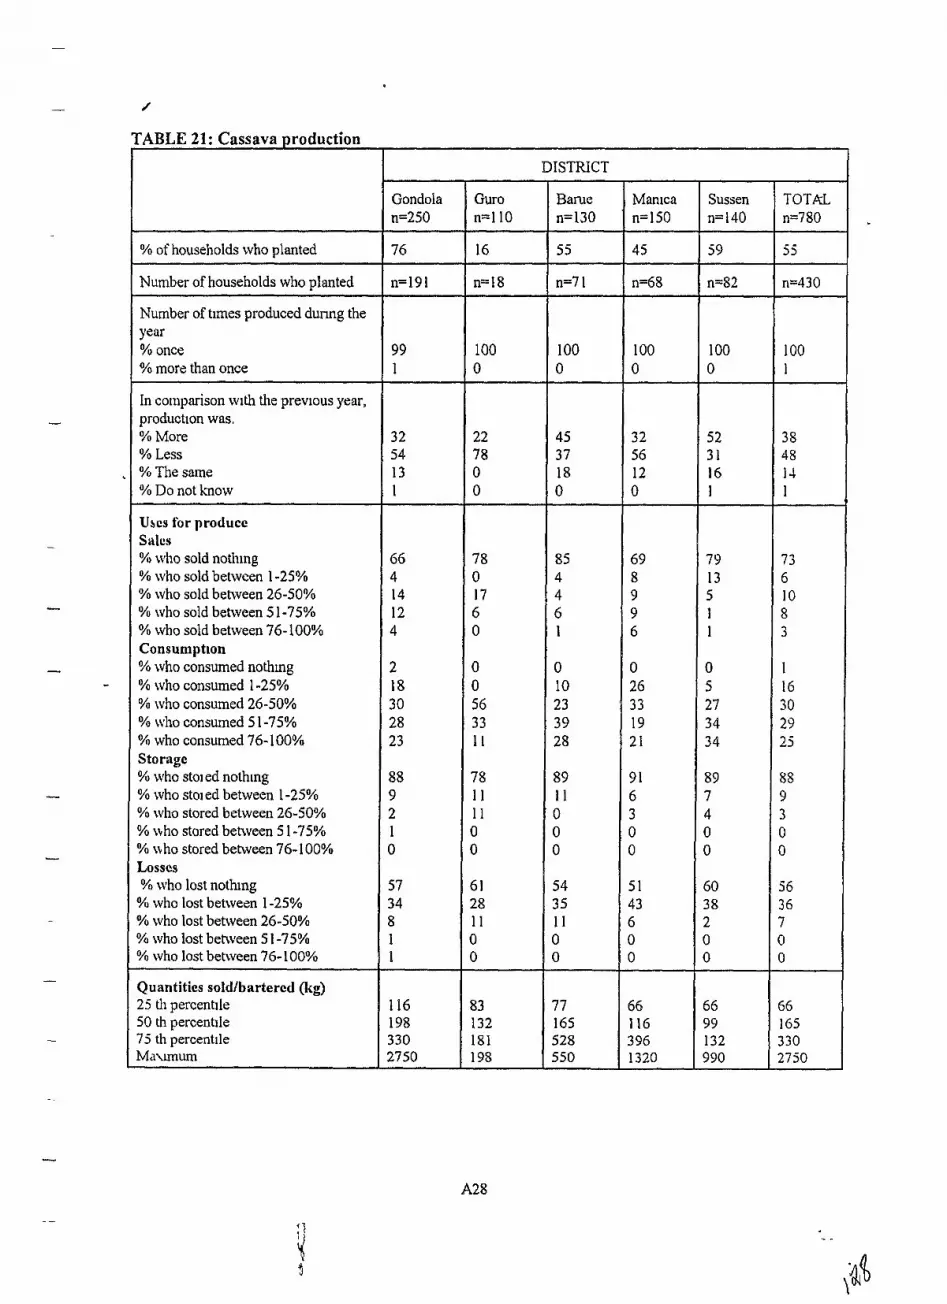
,
TABLE 21: Cassava production
% of households who planted
Number of households who planted
Number of times produced dunng the year ?h once % more than once
In comparison with the previous year, production was. % More % Less % Thesame % Do not know
Uses for produce Sales % who sold nothing % who sold between 1-25% % who sold behveen 26-50% % who sold between 5 1-75% % who sold between 76- 100% Consumpt~on Yo who consumed nothlng % who consumed 1-25% % who consumed 26-50% % who consumed 5 1-75% O/o who consumed 76- 100%
% who st01 ed nothing % who st01 ed between 1-25% % who stored between 26-50% % who stored between 5 1-75% % ho stored behveen 76- 1 00%
% who lost nothing 94 who lost between 1-25% % who lost between 2640%
Gondola n=250
76
n= 19 1
99 1
32 54 13 1
66 4 14 12 4
2
Quantities soldlbartered (kg) 25 th percentile 50 th percentile 75 th percentile Maurnurn
Guro n-110
16
n=18
100 0
22 7 8 0 0
7 8 0 17 6 0
0
116 198 330 2750
DISTRICT
Barue n=130 '
5 5
n=7 1
100 0
45 3 7 18 0
85 4 4 6 1
0
83 132 181 198
Manica n=150
4 5
n=68
100 0
3 2 56 12 0
69 8 9 9 6
0
77 165 528 550
Sussen n=140
5 9
n=82
100 0
5 2 3 1 I6 1
7 9 13 5 1 1
0
66 116 3 96 1320
TOTAL n=780
5 5
n=4 3 0
100 1
3 8 4 8 14 1
73 6 10 8 3
1
66 99 132 990
66 165 330 2750

I
-
- .
-
- -
-
TABLE 22: Sweet potato production
% of households who planted
Number of households who planted
Number of tunes produced d u n g the yea1 % once % more than once
In cornpailson with the previous year, production was 96 Mole % Less %Thesame % Do not know
Uses for produce Salcs I/o who sold nothlng % who sold between 1-25% % who sold between 26-50% % who sold between 5 1-75% % who sold between 76-100% Con%umption % who consumed nothing % who consumed 1-25% O/o who consumed 26-50% % who consumed 5 1-75% % who consumed 76- 100% Storage % who stored nothing % who stored between 1-25% % who stored behkeen 26-50% % who stored between 5 1-75% % who stored between 76-100% Losscs % who lost nothlng % who lost between 1-25% % who lost between 26-50% % who lost between 5 1-75% % who lost between 76- 100%
Quantities soldhartered (kg) 25 th percent~le Median 75 th percentile Maklmunl
TOTAL n=780
65
n=504
99 1
5 1 3 8 1 1 1 .
67 14 10 6 3
1 16 3 2 2 5 27
9 1 7 2 0 0
56 38 5 0 0
46 104 207 2760
Sussen n=140
56
n=78
100 0
64 27 9 0
54 11 17 10 9
2 4 33 29 3 1
93 4 3 0 0
65 3 2 3 0 0
35 104 207 690
Gondola n=250
69
n=174
97 3
47 40 12 2
7 2 7 9 9 3
0 17 23 24 3 6
90 8 2 1 0
56 36 6 1 1
46 115 276 2760
Gulo n=110
5 3
n=58
100 0
38 47 16 0
60 9 16 14 2
0 11 34 40 14
93 7 0 0 0
60 35 5 0 0
46 69 207 690
DISTRICT
B awe n=130
70
n=9 1
100 0
54 40 7 0
64 7 19 10 0
0 11 37 26 26
93 6 I 0 0
53 44 3 0 0
8 1 115 173 1265
Manlca n-150
69
n=103
100 0
52 3 5 13 0
54 11 17 10 9
I 25 39 17 17
89 9 2 0 0
50 44 6 1 0
3 5 104 173 1518

TABLE 23: Tobacco production
% of household5 who planted
Number of households who planted
Number of tlmes produced dunng the year % once
In comparison w~ th the previous year, production was YO More % Less % The same % Do not know
Quant~tles soldhartered (kg) 25 th percentlle 50 th peicentlle 75 th percentlle Mavm~im
I I DISTRICT
L
TABLE 24: Cotton production
% of households who planted
Number of households who planted
Number of tunes produced durlng the year % once
In comparison with the prevrous year, production was % More % Less % The same % Do not know
Mean Quant~t~es so~dibartered in kg (SD)
DISTRICT
Gondola
n=250
1
n=2
-
Guro
n=110
0
n=O
Barue
n=130
1
n= 1
Manica
n=150
0
n=O
Sussen- denga n=140
5
n=7
TOTAL
n=780
1
n=10
100
67 3 3 0 0
759(683)

TABLE 25: Profiles of household members who looked after livestock during the past year
% of population involved
DISTRICT
Gondola
n-1533
13
Number of people who looked n= 195 n=73 n=73 n=141 n=131 n=58G after l~vestock
Relationship to household head % head % wlfe of head U/o child % fathedmother % other relatlve ?4, other % not specified
Gender O/U Male U/o Female
Mean age (SD)
% with no educat~on % 1-5 years education % 5+ years education
% engaged in other income generating actn itics (off-farm self- employment)
O/;, who sold the~r labor to others as temporaqdpermanent workers
Guro
n=869
8
10 14 65 0 9 1 1
6 0 4 1
19(14)
2 5 72 3
14
16
Sussen- denga n=850
15
Banre
n=853
9 - - -__1____1_
TOTAL
n=5043
12
8 4 7 1 0 15 1 0
82 18
16(11)
3 4 65 1
7
8
Manica
n=938
15
12 18 66 0 4 0 0
6 0 40
20(14)
33 5 9 8
14
I1
13 8 6 8 0 9 2 0
66 3 4
18(11)
19 69 12
I8
6
10 14 6 1 1 15 0 0
62 38
19(15)
36 5 7 7
15
5
I I 12 66 0 10 1 . 0
64 36
19(13)
29 65 6
14
10

Percentages for feed~ng practices that do not add to 100% had some mlsslng values - hence the outstanding percentages
-
--
- ,
-
-
TABLE 26: Livestock ownership
LIVESTOCK OWNERSHIP
% of households wtth chtckens Number of chickens per household 25 th percentde Med~ati 75 th percent~le Maumum Feedtng PI actices6 O/O agrtcultural product/bought food % natural pastures
90 of households w ~ t h ptgs Numbel of pigs pel household 25 th percentde Med~sn 75 th percentile Ma\~mi~rn Feed~ng pt actices
9.6 agr~cultural producVbought food O.0 natural pastures
O/O of households wtth rabb~ts
'30 of households w ~ t h goats Numbet of goats per household 25 th percent~le M e d m 75 th percent~le Maurnurn Feeding PI actlcus % agr~cullural product/bought food 90 natural pasture5
50 of households w ~ t h oxen
O/O of households w ~ t h donkey5
50 of households u ~ t h ducks Numbel of d u c b pel household 25 th percent~le Med~an 75 th percent~le Mavmum Feeding PI a~t ices YO agrtcuftural productrbought food Oh ~iatural pastures
patterns
Gondola n=250
92
8 15 28 200
97 2
11
2 5 4 5 6 26
96 4
0
53
2 4 7 5 28
3 92
1
0
29
2 5 4 5 6 15
96 1
Guro n=110
65
5 10 20 110
100 0
37
2 4 6 14
100 0
0
46
4 6 10 42
0 100
0
0
29
3 5 12 28
97 3
DISTRiCT
Barue n=130
80
3 5 10 15 5 50
95 5
35
2 2 6 24
100 0
1
30
3 4 10 20
0 100
1
0
3 1
2 4 8 5 18
100 0
Man~ca n=150
66
5 9 13 1000
95 5
13
2 3 5 27
100 0
- 3
43
1 4 7 36
3 97
I5
0
3 1
-I
4 7 120
100 0
Sussen n=140
80
9 15 25 70
95 5
5
4 5 8 10
100 0
0
58
3 5 10 58
0 100
12
0
35
2 4 7 35
98 0
TOTAL n=780
79
6 12 20 1000
96 3
20
- 7
3 6 27 . 99 I
0
53
2 5 8 5 8
2 97
6
0 .- - -
3 1
2 4 7 120
98 1

- APPENDIX B -
L. PRICES USED FOR THE CALCULATION OF MONETARY VALUES OF HOUSEHOLD POSSESSIONS

Machados ( M m c a S, Sussendenga C, Barue C, Clumoio 1 18 625 I I I
1 lnstrumentslgoodshnimals
Enxadas 1 I
Catatlas
PIS I M m c a S, Sussendenga C, Chimo~o 1 99 667 I I I
Places for which prices were available 1997
Gondola C, Mmca C, Mauca S, Sussendenga C, Barue S, Barue C, C b o ~ o
Mauca C, Mmca S, Barue C, C h o i o
Fo~ces 1 M m c a S, Sussenden~a C. Barue C, Chunoio 1 20 125 I
Mean price used in calculation
22 214
13 600
Anclnhos Sussendenga C, Chmo~o
Llmas I M a m a S, Sussendenna C. Barue S. Clumoio 1 14 000 I
75 000 I I
I Mai~ca S, Sussendenga C (Zlmbabwe), Barue 1 162 500 S, Chim0l0 I
Charruas de tracqso a m 1
Maquulas de costura I Sussendenga C, Clunoio ( 1 637 500 1 Mesas de nladeira
I I Sussendenga C (Zimbabwe) 400 000
I Gondola C, Mmca C, Mxuca S, Sussendetiga C, Barue S. CIllnlo~o
- - - - - - - -
1 - Gondola C, Mmca C, M;uCca S, Sussendenga 26 200 C, Sussendenga S, Barue C, Barue S, Guro S
403 000
B~c~cletas
Motorizadas
Rad~os
ColchOes
Reloglo
Palelas de alumuuo
Porco
Gondola C, Mauca C, M m c a S, Sussendeuga C, Sussendenga S, Barue S, Chuno~o
Cllunolo
M a m a C, Susseildetlga C, Sussendeiiga S, Barue S, Clumo~o
Sussetidznga S, Clllmo~o
Gondola C, Mauca C, M m c a S, Sussendenga S, Sussendenga C, Barue S, Chuno~o
Maiuca C, Maica S, Cluno~o
1 22 1 429
67 000 000
458 000
1 500 000
78 938
66 540
- -
Golidola C, Mauca C, Mxuca S, Sussendenga C, Sussendenga S, Barue C, Barue S, Guro S
Burro I Sussendenga C 1 200 000 I Lbbre\iations used: C: In the rural villages S: In the drstrict capital
234 938
Cabrito
BOI
Gondola C, M m c a C, M m c a S, Sussendenga C, Sussendenga S, Barue C, Barue S, Guro S
Manica C, Mauca S, Sussendenga C, Sussendenga S, Barue S
194 375
3 026 000

APPENDIX C
QUESTIONNAIRE: OIL COMPONENT
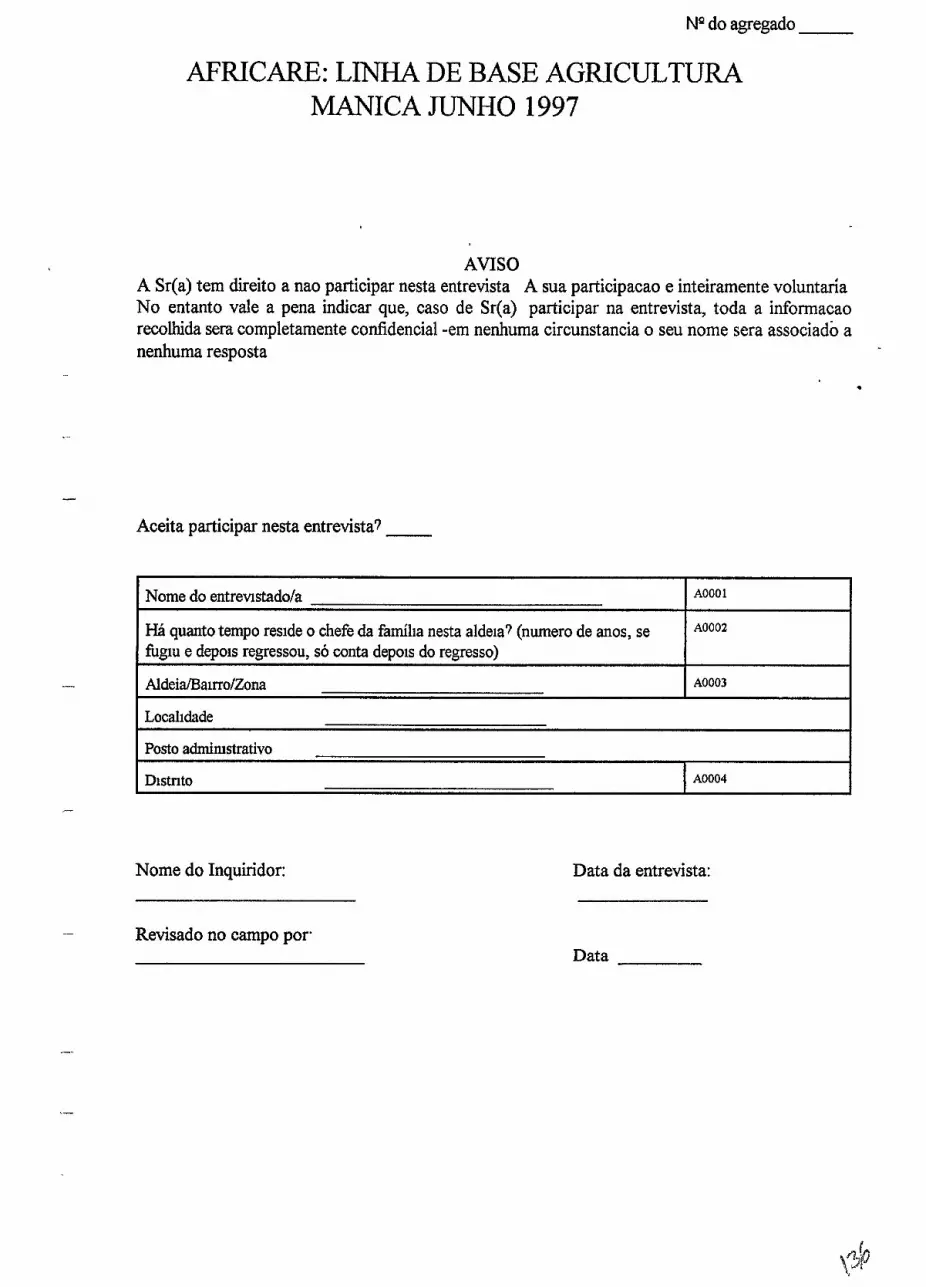
NQ do agregado
AFRICARE: LINHA DE BASE AGRICULTURA MANICA JUNHO 1997
AVISO A Sr(a) tem direito a nao participar nesta entrevista A sua participacao e inteiramente voluntaria No entanto vale a pena indicar que, caso de Sr(a) participar na entrevista, toda a informacao recolhida sera completamente confidential -em nenhuma circunstancia o seu nome sera associado a nenhuma resposta
Aceita participar nesta entrevista?
Nome do Inquiridor:
Nome do entrevlstadola
Hh quanto tempo reside o chefe da familla nesta aldeia? (nurnero de anos, se hgtu e depois regressou, so conta depots do regresso)
Aldeia/Bairro/Zona
Data da entrevista:
AOOO 1
*Ooo2
AOOO~
- Revisado no carnpo por. Data
Localidade
Posto admimstrativo
Dl~tnt0 A0004

kCOMPOSICA0 DO AG1 3ostanamos conhecer os mer
Quais siio as pessoas que normalmente comem nesta casa?
Durante 0s ultimos 12 meses, quantos meses estava nesta casa?
A0005
EGADO FAMILIAR bros resldentes na casa e conversar
I I
Relaw ao chefe
1 Chefe 2 Esposola 3 Fllhola 4 Padmae 5 Outro famllar 6 Outro
1 Mas- cullno 2 Fe- mmno
Idade
(anos, 0 para cnanqas com menos de um ano)
' Durante os ultimos 12 meses [NOME] tern contribuido para a renda familiar vendendo a sua milo de obra? (ganho-ganho)
e x . trabalhando na machamba do vmnho, ou da compadua, ou na fabnca, etc )
-escrever a actividade-
A0014
Durante os ultimos 12 meses [NOME] tern contribuido para a renda familiar fazendo alguma actividade economica a conta propria?
(Ex. venda de beb~da, carvgo, carpmntana, fabncaq50 de cestos, etc )
-escrever a activldade-
A00 13
Durante os ultimos 12 meses, [NOME] tem trabalhado como pastor de animais?
1 Slm 2 go
---P~
A00 12
obre as
Quantos anos comple- tou na escola?
A0009
I
I I I
1
1
actiwdades de cada urn
Durante os ultimos 12 meses,quantas vezes [NOME] tern trabalhado nas machambas da familia? 1 Sempre 2 Mutas vezes 3 As vezes 4 Nunca 5 So durante a campanha agncola
A001 1

lrpuS d E CONSTRUCAO DA CASA
A fa& tern q m t a s casas?
0 teto da casa pmapal 6 de que matenal? 1 Capim ou outro matenal natural 2 zmco 3 W o ( e s p )
Qua1 6 a mstru$40 da casa pnnapal? 1 Pau a pique 2 Bloco de Matope 3 Bloco de cunento ou trjolo (matope quemado)
Apotta da casa primpal 6 de que rnatenal? 1 Madeua
C:INSTRUMENTOS DE PRODUCAO E OUTROS BENS
hstrumentos de produ$io Outros bens I
-
- Catanas C0201 Mesas de madem C0202 I II I
-Instrumento Numero Ben
COlOl Maqumas de costura CO 102
I Madlados C030 1 I 11 Camas de madelra C0302 1 I
Nurnero
Pas C0401 Blncletas C0402 I
I Ancuhos C0501 Motonzadas C0502 I I
Lunas C0701
C0801 Charmas de trade anlmal
T a r r o p h a m C0901 I
I Veoda de culturas alimentares? (mlho, mapira, feijao, tomate, etc )
Coldlbes C0702
C0802 Reloglo
Panelas de Alummlo C0902 I I
:FONTES DE RENDIMENTOS
I Venda de girassollgergelim?
- - - - -
I
I
I
I ' 3
Venda de outras culturas de rendimento? (algod20, tabaco) ~0301
I
Venda de 61eo produzido em casa? (girassol ou gergelim) D O ~ O 1
A familia recebeu remessas durante os filtimos 12 meses? (I-Sim 2-NZo)
Venda de gadolanimais? DO501
DO701
Venda de alimentos feitos em casa? (pao, pastels, bebidas tra&cionals, etc ) Do601
Alguem de sua familia contribue a renda familiar fazendo alguma actividade como ... I 1.Sim 2.Ngo
Auto-emprego nao agricola? (como carpintana, alfaiataria, cestos, etc ) D O ~ O 1
I
I Compra e venda de roupas, comida, cigarros, f6sforos, e outras coisas? etc ( ~0801
Venda de recursos naturais? (como peixe, agua, lenha, mel, came de caGa, etc ) ~0901 I
Venda de produtos doados? ~1001
Aposentados/outros dinheiros do governo? Dl201 i I I
Saliirios regulares ou temporhrios? (inclusive ganho-ganho)
I DO001 Dl301 1 Outra actividade? -especlficar
~ 1 1 0 1

:TRABALHOU NAS MACHAMBAS DE GERGELIM/GIRASSOL DAS OUTRAS PESSOAS
/ Este ano? Ano passado?
I9 AlguiSm da sua familia trabalhou nas machambas de 13901 ~ 0 9 0 2
:COMPRAS 1- Sim 2- Ngo I I 1
I 1
10
gergelim/girassol das outras pessoas ... 1 Sim, gergelim 2 Sim, girassol 3 Sim, ambos 4 Nfio
Quantos membros da sua familia? (trabalham nas machambas de gergelim/~rassol das outras pessoas)
12
13
:CONSUMO DE OLEO I I 1
- 5 G:FALTA DE ALIMENTOS
I 15. Quantas vezes a sua familia cozinha a refeiqao principal com 61eo? 1. Nunca 4 Uma vez por semana 7 Depende da dpoca (esp) 2 Todos os &as 5 Algumas vezes por m&s
- 3 2 vezes ou mais por semana 6 De vez em quando (esp) I
~ 0 9 0 3
A familia comprou roupa nova (nil0 inclua roupa usada ou capulana) nos Gltimos 12 meses?
A familia comarou came durante os iiltimos 12 meses?
14 .-
I
16 Quantas vezes a sua familia nomalmente compra 61eo? - I
1 Nunca 4 Uma vez por semana 7 Depende da dpoca (esp) 2 Todos os Qas 5 Algumas vezes por mGs 3.2 vezes ou mals por semana 6. De vez em quando (esp)
- - - - - -
E0904
F1201
~ 1 3 0 1
' 17 A onde a sua familia costuma conseguir 61eo?
- 1. Dum pnvado 3 De outra aldeia 5 No Clumoio
t 2 No mercado ou loja de sua aldeia 4 Na sede do distnto 6 Outro sitlo
Durante o ano passado, em que meses teve maiores problemas com a alimentaqilo? 1-Slm ou 2- N ~ o Janeuo G1401
Fevereuo GI402 M q o G1403 Abtll G1404 Mato G1405 Junho G1406
Julho GI407 Agosto GI408 Setembro GI409 Outobro GI410 NovembroGl4 1 1 Dezembro G1412
18 Quantas vezes a sua familia utiliia 61eo de girassoYgergelim da prensa vizinha/pr6pria? - I
1. Nunca 4 Uma vez por semana 7 Depende da dpoca (esp) 2 Todos os &as 5 Algumas vezes por m&s 3 2 vezes ou mais por semana 6 De vez em quando(esp)
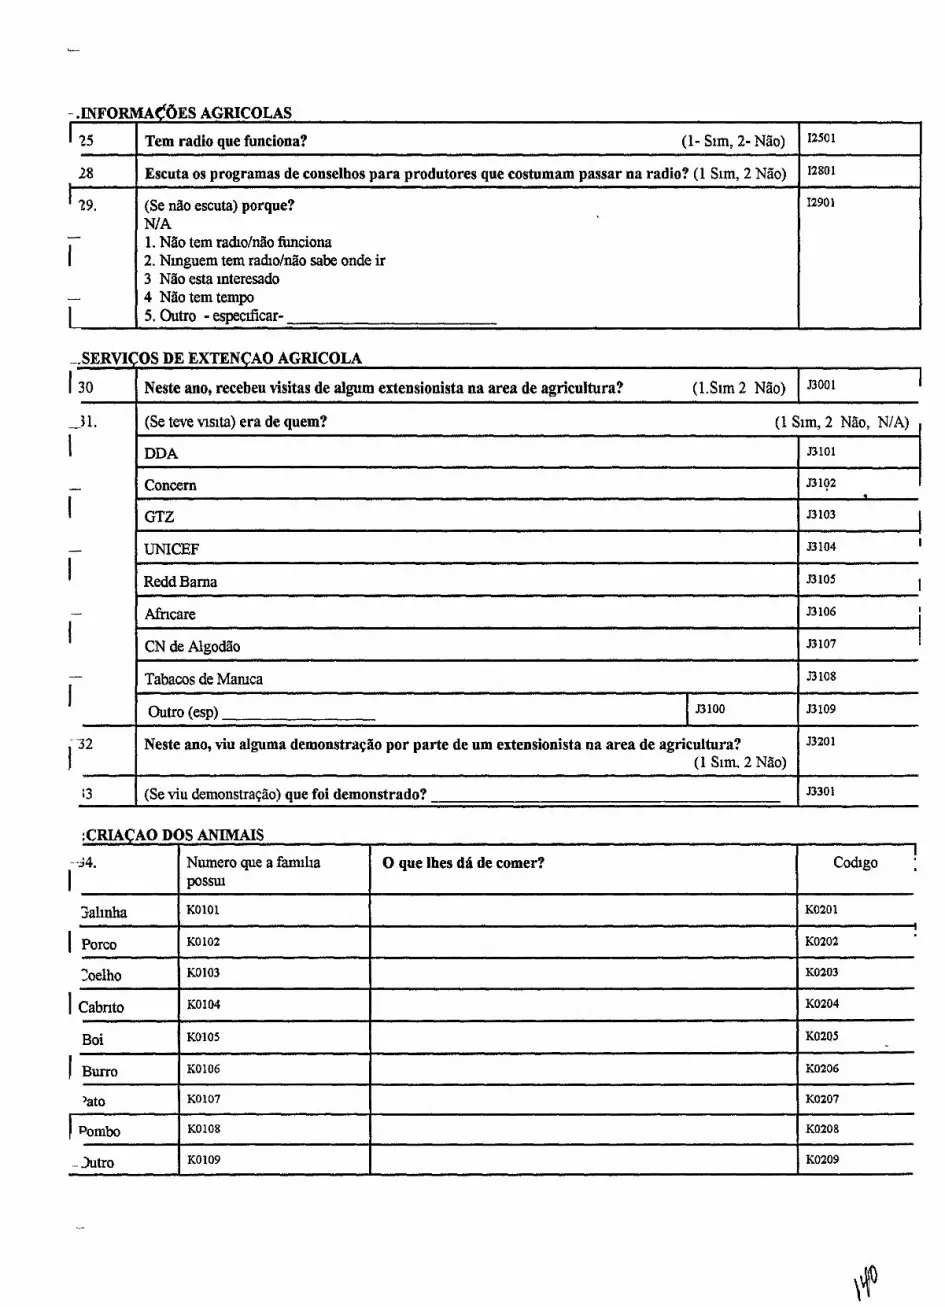
- .INFORMACOES AGRICOLAS
1 25 Tem radio que funciona? (1- Sim, 2- Nlo) '2501 I Escuta os programas de conselhos para produtores que costumam passar na radio? (1 Slm, 2 Ngo)
(Se niio escuta) porque? N/A 1. Niio tem ra&o/niio funciona 2. N~nguem tern radto/nSio sabe onde ir 3 Niio esta lnteresado 4 Niio tem tempo 5. Outro - especlticar-
OS DE EXTENCAO AGRICOLA
Neste ano, recebeu visitas de algum extensionista na area de agricultura? 1
(Se teve msita) era de quem? (1 Sim, 2 N ~ o , NIA) , DDA
Concern
1 Redd Barna 1 ni05 I
53101
n102
GTZ
UNICEF
53 103 I 53104 I
-
I
13 I (Se viu demonstrac50) que foi demonstrado? 53301
Neste ano, viu alguma demonstra~iio por parte de um extensionista na area de agricultura? (1 Sim. 2 Nlo)
:CRIACAO DOS ANJMAIS I I
Tabacos de Mamca
Outro (esp) 53100
53201
53108
53 109
1 Cabnto 1 ~ 0 1 0 4 I
"Jalinha
I Codlgo :
Boi I KO105 I 1 KO205
Numero que a fanulia possul
K O I O ~
1 Burro I KO106
0 que lhes dB de comer?
- h t r o ~ 0 1 0 9 I KO209


M:AGRICULTURA GERAL I I i I Quantas machambas a familia cultivou durante esta campanha? (# de machambas) 1 m 6 0 1 I / I
3 7 1 Utilizou adubo quimico em alguma machamba durante este ano? (1 Sun 2 NBo) I "701 I
I I A familia recebeu fomento de alguma empresa durante este m o para a produgPo de uma 1 M901 I Utilizou outro insumo (semente melhorada, insecticida, herbiclda) em alguma machamba este ano (1 Sim 2 NBo)
hug01
1 . I A empresa garante a compra desta cultura de rendimento? (1.Sim 2 N30, N/A) I M4001 I
cultura de rendimento? (1 Sim 2. Niio) Cultura
+I A familia vendeu milho alguma vez durante os Lltimos 12 meses? (1 Sim 2 NSlo) yJ. 7 ~ ~ ~ ~ ~ A ~ DE GERGELIM E GIRASSOL r I
M3902
- , cultit ou gergelim ou girassol? (1 Sim, 2 Nilo) ( Gergelim I I
.'"
43
I
Girassol
Porque nunca cultivou ou parou de cultivar esta cultura? 1 Falta de sementes 4 FaIta de colocaqao (mercado) N/A
2. Falta de terra 5 Problema de amazenamento 3 Falta de mSlo-de-obra 6 Outro -especficar
( Se J B cultivou gergehm/girassol) quantos anos produziu esta cultura? (# anos, 97- mais de 10 anos, N/A)
Quando foi a Lltima campanha que cultivou esta cultura? 1. Nunca 3 Ha 5-10 anos 5. No ano passado 2 Ha mais de 10 anos 4. Ha 2-5 anos 6. Neste ano
NMO 1
~ 4 4 0 3
I (# sementes, 98. N3o sabe, 99 Outro- esp 1 I I I
N4201
~ 4 3 0 1
- - -Se nunca cult~vou, acabar com a entrevista- (NIA)
45
i
' 5
Qual e o intervalo que costuma usar entre as linhas? I N4801
( # de crns, 98- N?lo sabe, 99 Outro- esp 1
47
Quem decide semear esta cultura? 1 Homen 3 Ambos 2 Mulher 4 Outro-especrficar
Quantas sementes costuma colocar em cada covacho?
Quantas plantas costuma deisar crescer em cada covacho? (# plantas, 98 NGo sabe, 99 Outro- esp )
a
. I Vendeu esse produto nos Lltimos 5 anos? ( 1-Lm. 2-N5o) I N5001 ~ 5 0 0 2 I
~ 4 5 0 1
~ 4 6 0 1
(1 Sim, 2 Niio) Com quais cuIturas? esp
~ 4 5 0 2
~ 4 6 0 2
~ 4 7 0 1
- - -
Qua1 e o interval0 que costuma deixar entre plantas? ( # de crns, 98- Niio sabe)
-pp
Costuma plantar em consorcio com outras plantas?
~ 4 7 0 2
- - - - - - - - - -
~ 4 9 0 1
~ 4 9 0 3
Ei;
"
~ 4 9 0 6 N4908
!
A quem vendeu a maior quantidade? 1 Mwambique Industrial 3 Agncom 5 Outro-esp. N/A 2 Corneraante 4 Girassol Mamca
-
Teve algum problema para vender este producto? 1 Nada 6 Falta de produqb N/ A 2 Falta de compradores 7. Problemas de preeo
N5lOl
3 Mercado fica &stante 8 Custo de transportaqb 4 Falta de qualidade de produto 9 Outro (esp) 5 Problema de annazenamento at6 venda
N5 102
~ 5 2 0 1
~ 5 2 0 3
~ 5 2 0 2
~ 5 2 0 4
~ 5 2 0 s N5206

3:PRODUCAO DE GIRASSOL OU GERGELIM DO AN0 PASSADO I I i
53 1 Cultivou no ano passado? (1-Sim, 2-N%o) I
Gergelim
N5301
N5401 (Se niio cultivou) Porque? NIA 3 Falta de miio-de-obra 6. Outro (esp) 1. Falta de semente 4 Falta de mercado 2. Falta de terra 5 Problema de armazenamento
Girassol
N5302
N5402
-Se niio cultivou no ano passado, passar a secc%o P- (N/ A)
No ano passado, qua1 foi a origem da maior parte das sementes? 1. Guardou do ano passado 5 Comprou do vlzinho/dum pnvado 2.Doa~iio da DDA 6 Comprou do mercadofioja 3 .Doaq%o de Moqambique Industnal 7 Outro-especlficar- 4 Trocou
No ano passado, quantos sementes semeou?
A machamba desta cultura sofreu de quC? 1 .Nada 3. Bichos 5 Roubos 7 Outro espec~ficar 2 Doenqas 4 Passannhos 6 Ratos
No armazenamento, perdeu sementes devido a quC? 1 Nada 4 Humdade 7. Outro -especificar- 2 Bichos 5 Passannhos NIA 3 Ratos 6 Roubos
I Quanto colheu? Quantidade
1 Umdade I
Qua1 foi o destino da cultura? -utlllze 20 feyoes- 1 ~ e n d a
I Produciio de Oleo para
1 venda
Produciio de Oleo para
1 Sementes
1 Perdeu
Guardou
Quanto vendeu? 1 Quantldade
1 Umdade - - - - - --
Qua1 era o p re~o? (S em meticats, 98- NHo sabe, NIA) ( Quantidade
1 Umdade

P: PRODUCAO DE GERGELLM OU GIRASSOL ESTE AN0
Girassol
N6402 Cultivou neste ano? (1-Srm, 2-NZo)
(Se n?lo cult~vou) Porque? N/ A 3. Falta de mZo de obra 6. Outro (esp) 1 FaIta de semente 4. Falta de mercado 2 Falta de terra 5. Problema de armazenamento
-Se nilo cult~vou neste ano, acabar com a entrevista- (NIA) I I I
Neste ano, qua1 foi a origem da maior parte das sementes? 1 Guardou do ano passado 5 Comprou do winho/dum pnvado 2.DoaqHo da DDA 6 Comprou do mercado/loja 3 D u a ~ b de Mwambique Industrial 7 Outro-especlficar-
I 4 Trocou I
I Neste ano, quantos sementes semeou? ~ 6 7 0 2
I I I Umdade h6703 ~ 6 7 0 4 I
Quantas pessoas empregou? (NIA; # de pessoas) ~ 7 0 0 2 ' I I
( Empregou mPo de obra para trabalhar na machamba? ( 1-Sim, 2- Nilo) 1 Ii6801 N6802
Se comparar ao ano passado, a produfiio deste ano foi como? N/ A 2 Menos 4 N5o sabe 1 .Ma~s 3 A mesma
Que quantidade espera vender? (98-Nilo sabe) Quantidade
Umdade
A machamba desta cultura sofreu de quC? 1 Nada 3 Ratos 5 Roubos 7 Outro espec~car 2 Bichos 4 Passannhos 6 Doen~as
-
Qual 6 o preqo neste ano? ($ em metlcais, 98- NSo sabe)
Umdade
Quanto colheu ou espera colher? (98-NZo sabe)
,:TERRA CUI
Quantldade
Umdade
Qualidade da terra?
WADA PARA GTRASSOLIGERGELIM ESTE AN0
1 Fdrtll 2 Regular 3 Cansada
Qua1 C a cultura?
1 Gergellm 2 Girassol
Qua1 iS a disthcia da casa?
nachamba #2
Qua1 iS a Area?
I 1 0-30 rmnutos 2 30-60 rmnutos 3 Mais de uma hora
iachamba #3
(Indtcar se a umdade C hectares ou m2)

-- ACKNOWLEDGEMENTS
- The baseline survey would not have been possible without the hard work and dedication of the following people:
Veronica Fletcher, a consultant, who designed the survey and planned and coordinated the execution of field work Bill Noble, the national Director, Collin A Elias, the Project Coordinator and Blll Messiter, the oil component Coordinator who provided general guidance and support
- Africare Staff *
Anuar A Lat~fo Abdula Angelo Mlguel Adriano Jose Almeida Manuel Mfirio Jose Almeida Eduardo C~prlano Faduco Pedro A M. Ginga Con~alves M. Margarida Santos
Data Entry
Manual Jo%o Madrlge Olga Maria Guimaroes do Rosfirlo Marta Ivone Pack Luisa Eurits Chin Pack W6
Fieldwork
Domingos Catique Franclso Lisboa Josi Antonio Manuel Geraldo Polinario Patrlck Muzarabani Ermelinda Fuleque Jo%o Almeida Jose Tegua Fernando Hortensil~o Afonso Luciana G ~ m o Domingos Thaimo Mhawenbe Antonio Dias Margarida Inacio Zingai Ernesto Dos Santos Adriano Daniel Victor Jose Abreu Susana Pedro Canote Eteluina Uasco Pascoal Guta Ern1110 Conrado Alusio Consaga Pio Antionio Joaquim da Rocha Aurora Arcenia Zandamela Michael Chihururu

AFRICAREIUSAXD MANICA OIL SEED FQOD SECURITY INlT1ATlVE
Prepared for AFRICARE Mozamb~que by Isabelle Schm~dt Research Consultancy Serv~ces, Be~ra September 1997
Data was entered by 4 persons with prior data entry experience They worked in teams of 2 to double check all entries One person dictated the codes while the other entered them into the computer Atter completing one set of questions, the person at the computer read the codes entered while the first person verified the codes w th those on the questionnaire This method was chosen instead of having each person enter data on their own for the following two reasons First there were only 2 computers available for data entry Second, there were many large tables of data to be entered and the data capturers were more likely to lose their place on the page while looking back and forth f'iom the computer screen to the questionnaire, thus increasing the odds of entering codes out of sequence As an additional precaution, records were spot-checked land the database was scrutinized for inconsistencies
Upon completion of data-entry, diskettes were given to a Research Statistician who completed the analysis and interpretation The agricultural survey data sets were given for analysis in early August, followed by the nutrition data-sets in mid-August
Recommendations For Future Household Surveys
1) At mid-term, it would be preferable to repeat the survey in the same communities that were surveyed at the baseline but not necessarily in the same households However, if Africare's activities have shfied significantly to new areas not part of the original target areas, another strategy may have to be developed If population estimates have to be revisited, the best source would be data fiom the population census of August 1997
2) An attempt could be made to compare communities participating in Africare's program with those who are not Carefbl attention however should be given to the analysis and comparison of characteristics of the two groups at baseline to determine any significant differences Also the sample sizes of the two groups (participating versus non- participating) are probably not large enough to make such a comparison
3) For the mid-term and final survey, questionnaires should be shortened to include the most useful indicators for evaluation of the program All questions included at baseline for program planmng purposes could probably be eliminated For example, in the agriculture questionnaire, Section H questions 16 and 17, all of Section I, Section K "0 que lhes da de comer? (what do you give them to eat?)", Section L "quantos anos produziu algodZo/tabaco (How many years have you grown cotton/tobacco?)" could be taken out Sections N, O& P could be significantly cut back Some of the general food security questions may also not be necessary In the nutrition questionnaire, Section E could be shortened to include only the best question (s) for determining diet and Section B could be cut back to 1 or 2 questions about vegetable growing. With shorter questionnaires, the sample of households intermewed could be increased
4) Once shortened, the 2 questionnaires could probably be combined into one Ths would make it possible to collect all measurements fiom the same household There would then be two options avalable to either conduct interviews only in households with children under five or to select any household but increase the sample size to ensure that an adequate number of children under five are sampled

New codes should be added for "other" answers identified during the baseline This should reduce time spent writing down answers and post-survey coding
The time period should always be specified (for example questions #15 and #18 for agriculture and #14 and #15 for nutrition should refer to the last 12 months)
It is not normally valuable to add any questions at mid-term for which there would be no baseline value However, the following questions may prove to be usehl
The experience in Barue and Guro districts of families consuming pig fat in significant quantities may warrant an additional question to find out if any type of animal fat is used instead of vegetable oil. This would provide a possible explanation if vegetable oil consumption does not increase as expected.
A few questions could be added to monitor Africare's outreach activities such as "Participam em alguma actividade de Micare? (Have you participated in Africare's activities?) Quais actividades? (Which Activities?) Quantas vezes a sua familia recebe informaqiio de um extensionlstafactivista de Micare na area de saude? (How often has your family received information from an Africare activist/extensionist about health?) Na area de agricultura? (About Agriculture?)"
During training, more time should be spent on 24 diet recalls and problem questions identified discussed above Translation into local dialects may be worthwhile
Dialogue should be maintained with MSU for accurate definitions of all terms used in questions relating to measurement of income, such as "house" and "family-owned businesses" versus "salaried work"
More time should be spent to prepare the sites for the arrival of interviewers and adequate accommodation are secured ahead of.time The role of the Iocal guides should be discussed and if their presence is needed, an agreement should be reached with local authorities about how they should be compensated
If the length of the questionnaires remains the same, the survey schedule could be accelerated since after the first week, interviewers were able to complete on average 3 5 interviews per day, instead of 2 5 as originally expected
If possible it is preferable to have fewer interviewers to be able to supervise more frequently in the field. The M & E coordinator w11 no longer need to spend a lot of time preparing the database and could spend more time in the field during the first few weeks of the survey observing the interviewing process
It is usually recommended to conduct subsequent surveys dunng the same months as in the baseline However, since harvesting of oilseed crops (sesame and sunflower) can extend into the month of August, it might be more useful to postpone the survey one month to collect more complete information about that year's total production

Documents Consulted
CARE'S baseline questionnaire for the OPEN project (March 1995) World Vision's Socio-Economic baseline questionnaire (July-August 1996) Model Knowledge, Practice and Coverage (KPC) s;rvey Questionnaire (1996) Food Security Baseline Survey Gorongosa and Cheringoma, I Schmidt PRRS-GTZ Beira (1996) Inquerito Demografico e de Saude (DHS), Modulo para agregado familiar, Institute Nacional de EstatisticaJMinisterio de Sabde (Setembro, 1996) Draft questiomaire'for income proxies module, Dave TschirleyMSU (May 2, 1997) The EPI coverage survey: Training for mid-level managers, WHO (1991) Inquerito Nutritional Rapido, Distrito de Guro, Provincia de Manica, MSF- CIS/ACNUR Maputo (Abril 1995) Rapid nutrition survey among populations in emergency situations, MSF/UNHCR/WFP (1 99 1) Smallholder cash cropping, food cropping, and food security in Northern Mozambique research methods, MAP/MSU Research Team/M.nistry of Agriculture, Working Paper No 22 (March 1996) Mozambique Trip Report of Eunyong Chung, USAID/G (September 1996) Monitoring and Evaluation Framework, Manica Oilseed Food Security Initiative (February 1997) Survey Trainer's Guide for PVO Child Survival Project Rapid KPC Coverage Surveys, John Hopkins University (May 1 994) Manual do Inquiridor, Inquerito Nacional aos Agregados Familiares sobre Condiq6es de Vida, Ministerio do Plano e Finanqas/Direcqiio Nacional de Estatistica (Novembro 1995) Manual do Inquiridor, MSF-CIS/AEDES (Abril 1997) Nutrition and Food Security Baseline. Tambara, Macossa districts and Dombe/Sussundenga, MARRP-GTZ (1996) Estudo sobre Economia Alimentar do Distrito de Barue, DPS, Chimoio (Outubro 1996) Estudo sobre Economia Alimentar do Distrito de Sussundenga, DPS, Chimoio (Julho 1996) Estudo sobre Economia Alimentar do Distrito de Manica, DPS, Chimoio (Novembro 1996) Estudo sobre Economia Alimentar do Distrito de Gondola, DPS, Chimoio (Abril 1997) Perfis de Desenvolvimento Distrital, Distrito de Barue, Provincia de Manica, ACNUR/PNUD, Maputo (Julho 1 996) Perfis de Desenvolvimento Distrital, Distrito de Sussundenga, Provincia de Manica, ACNURJPNUD, Maputo (Julho 1996) Perfis de Desenvolvimento Distrital, Distrito de Gondola, Provincia de Manica, ACNUWNUD, Maputo (Julho 1996) Perfis de Desenvolvimento Distrital, Distrito de Guro, Provtncia de Manica, ACNURIPNUD, Maputo (Julho 1996)

Population Estimates of Target Areas ** cornmunitics originally selected as clusters that lud to bc replaced due to inacccssability
- ( ) substitute comnlunilics
GONDOLA (Total of target area = 108,83 1) \
- - Posto adrninistr. I Localidade Populacao I Cumm I CIustcr C
Inchope C- -----. <-
Scdt:
Muds Serracao
Doeroi
I
-
Amatongas
I
I
I
Scdc
Nhambonda
Pihnganga
Pindanganga-Centro
hlussamba
h4ucomhcdzc
Mutcnga
Nhamazamba
Mussiquire
Nharunharo?
C'unlro JL: A~0111~dil(jit0 Doiroi
7 de Abril - - c-C- - ----L. >-<- 4-- __.-- -- _
-
Chifupe?
Mussequene?
446
372
334
68 1
3450 --. 4. ,.(
.-+< -
---__ -- -\A"-
16334
16706
17040
.
8752
12202 -.+ .-.
-&.
Chiyindaumue
Nhamakoa
Nhamazizi
4
2
--. rH .- :.A
7
1 ,
--
3107 115309
.- /- -./**/
0
547
*/-
3
17587

target area = 6:
I ,ocalidade
Cldrrdc: de Manica
Mavonde- acdo
Mavonde
1 Mavondc Chulunga
Mucono I 905 1 1105$1 I I
Mungura 402 112506 Vanduzi- sede
Marongorongo 11 89
Bolas 1 159 Munlrilrari
Belas 1 208 5
Ad. Charewsl 1427
Josinil Machcl 1729 1 19095 Macora
Almada 1870 120965 29
25 de Setembro 1027 121992
Vunlc . 2753 124745 30
25 de Junho 1183 131969
Cafungura 479 132448
Chd~arnacungo 130:' 132578
Chigodole

33
34
1613 6
2 19
27 1
368
2541
8 17
293
4 12')
345?
782
101
485
8 43'?
I172
Joay uirn Alberlo Ciussano
MudLidzi
Muzenga
blacorii
Clutundo
bluc;ombed/i
Wl~amundimo
blacadera'?
Nhamassana?
Nhamatiquid
Malrunde
Ccn tro
Lore?
Mavudzi
- .
134191
134410
13468 1 , 135049
137590
138407 1
138700
139112
139457
140239
140340
140825 ,
141668
142540
Machipanda
I-
I T Measica
I
I--
I
t 1
I
-1 -
t
Maridza
n/lachipanda- Sodr:
Muzongo
Messica- Sede
Vanduli ,
Hairro Vila Messica '. 2 B.Vilahlessica
3 I3,VilaMcssica
4 13. "
5 n. b'
6 13. " I3a11rro M ~ I I I L J - A. LIe Messicn
B. Chimoio
13 Ilandula
13.7 de Abril
Pungue-Sul
782
1227
1353
1060
1113
1500
1 0 1 1
2002
668
722
143322
144549
146002
147062
148175
149675
1 5 1280
153288
153956
154678
3 5
36
37

/ B.Machicanda
B.Mut.56
1LMutanda
Mcssica
38
-0 .XI';<'
940
857
1145
-\.( ,..- , Mcssica
Messicil
I 1 I
1
1 - ----- ---- -
155618
156475
1 57620
\
Nhaucaca P.- - .- - 4
Chinhambud zi
Dandula
-
;
1 13airroBandula
Ald. Garuzo
2 13nirroBandula
l<cpalriadou dc: Zimbabwe
Ald. Chican~ba Rcal
Ald. Nova Kc;vud
3 I3airroBandula
Raho Muiiunango
Bairroblatrabolo ---------
2292
2272
948
6 I
2241
2032
2047
1301
370
159912
162184
1631 32
163193
165434
167466
169513
170814
171 184 -
39
40
4 1

S U S S W E N G A
Tave
-
(Total of target area = 52,824)
-
/
Yosto administr.
Sussundcnga
L,ocalidadc
Suvhulldonga Scdo
1013
Sussendenga
186683
hdatira
C"lrmhus 437 103448 4 7 I
Munhinga 2
Nhaurom be
Aldcidl3airro
Nhame/,u a
Nl~amarenm
25 Junho 1
25 J u d ~ o 2
Muzoria
7 de Abril
Cl~iprmdeque
biunhinga-sede
C hingundo -. Nhamacomba
(.'umm.
175979
178091
1 8 1005
182605
Populacan
4795
-.-
301 2
201 4
-.A /'< -
1600
V Congrcsso
Chido Choparo
hlamacuio
I3loco 5
/------
---__ _ - - -.---
Cluster f f
42 '
43
44
604
165
120
./* /'
192726
19289 1
19301 1
363 ' 194456
249
132
-.-./-+ - -A/ = - - -
194705
194837

- I
/
Sussendcnga
-I- Kotanda
I
I
-1-
T
t I
r I-
Muoha
l-
L
I
bfuoha
I -
Maticir
Rotancia-Sedc
Munlunga 1
Mussapa
Phem
Muoha-Sedc
Mupandeia
---.~/---~ _ .- - . - -- --
Kotandii-scde
C hirodzo
Zuandi
Mussambudzi (tsctscra)
Clunhaca~a
blunllingo-sedc
e
.- ,x.. fl -..
410 ,'
270
750 t
1050
150
573
/-.\.. -
105247
195517
100207
207317
197467
198040
Mutoa
Nhagonlua
blapombcre-sede
Gudza
Mals i ;~
bfatova
I'lie~a-sedc
Nhaezi
Mnbate '.
Muoha-sedc
Vi~anci~%furorue
Chiwmil
-L
Mukuti
Mutore
Munhnd/,c:
- -- - ---2. / ___-- - -
,/\. ,--- 1- ..
48
2
-
(49)
+*
- L-. - . 44
/ Y<:
300
550
1010
000
300
y
/-/
.-.--/ ..A~-
497
41 5
5 1 5
y0 Y~
'?
1481
'---.- /' , -/--. -
198340
198890
139000
200500
200800
201 297
201712
202227
203708
- *
p-. _.* ---.
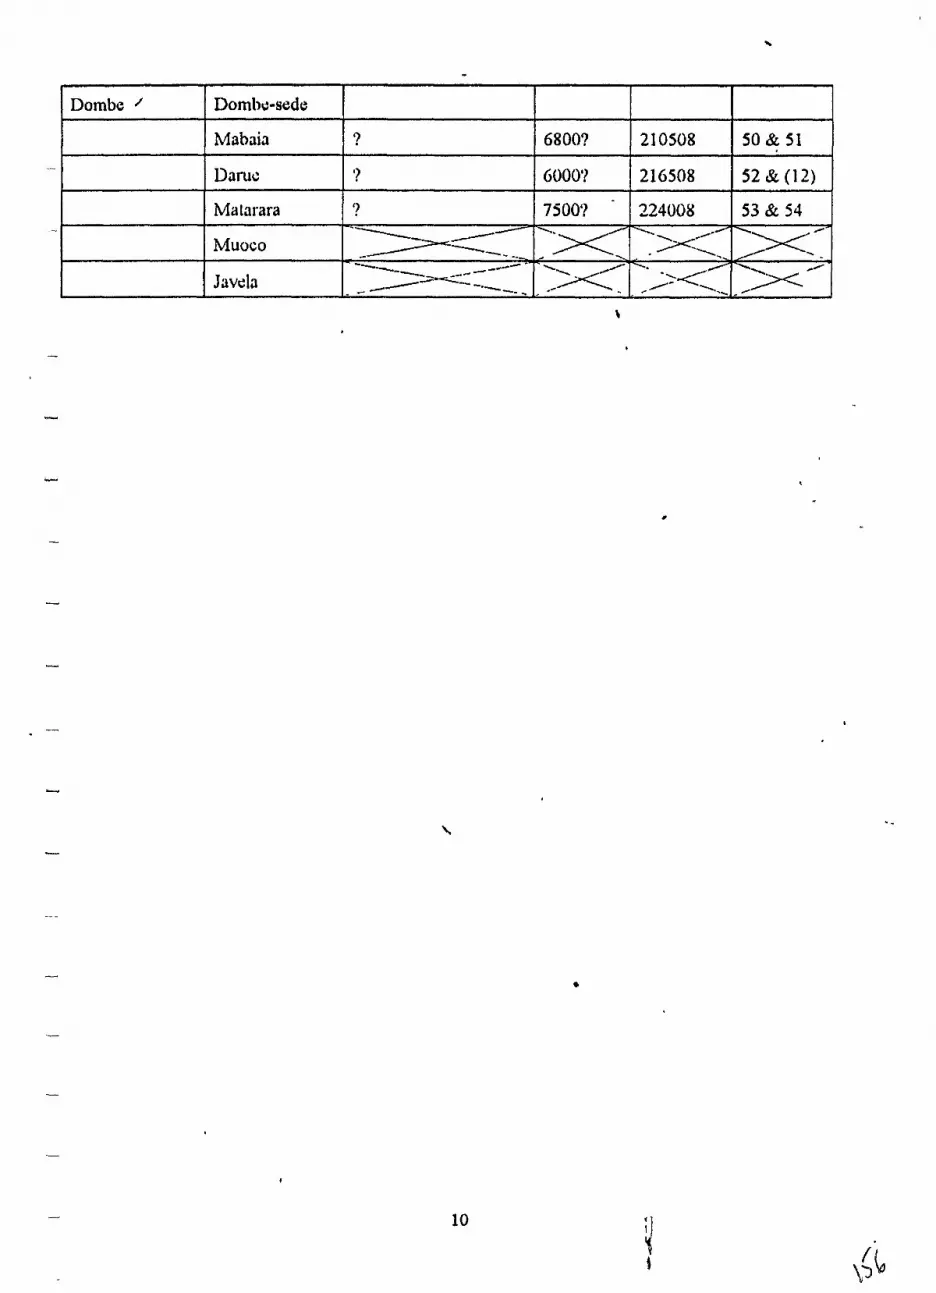
Dombc / Dombe-sede
Mabaia
Daruc
Ma tarara
Muoco
Javzla
?
I?
(? -
,----- ----_ ----- - - -----, -/---- --- - ----- _ .
6800?
GOOO'?
7500'1
21 0508
216508
224008
50 & 51
52 & ( 1 2)
53 & 54
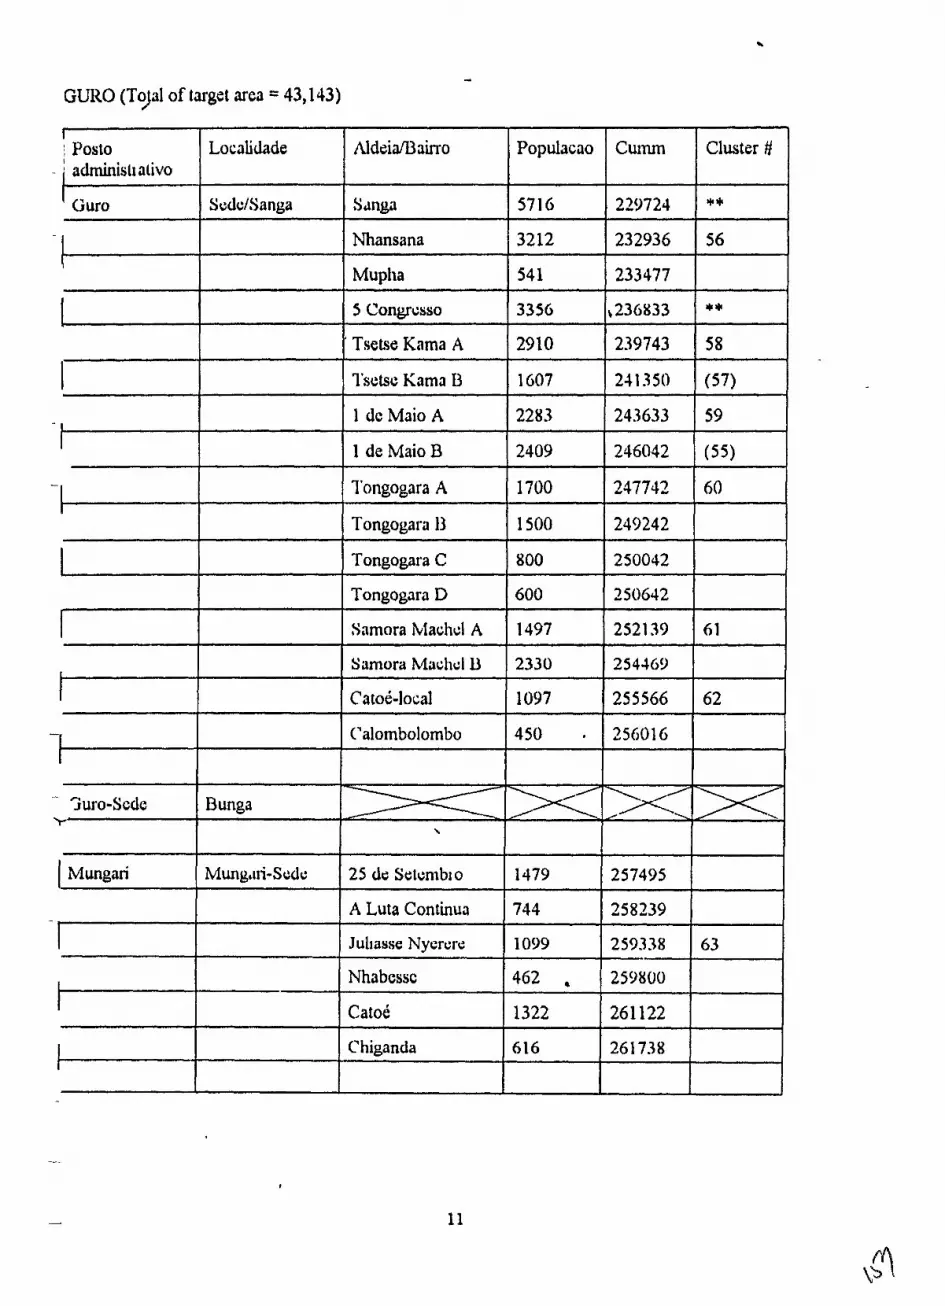
- GUKO ( T y l of target area = 43,143)
I i Yosto
I L
I
t -
I
1
.-
3uro-Scde
Localidade
SedoISanga
Runga
Ndeia/Baino
S~nga
Nhansana
Mupha
5 C o ~ : s s o
' Tsetse Kama A
l'sele Kama I3
1 dc Maio A
1 de Maio B
I'ongogara A
Tongogat-a 13
Tongogara C
Tongogara D
Snmora Machcl A
S emora Me~hol l3
Catol-local
C"1ombolombo
'r
Mungari
I I
Cutnrn
229724
232936
233477
,236833
239743
2-51350
243633
246042
247742
249242
250042
250612
252139
254469
255566
256016
Populacilo
5716
3212
54 1
3356
2910
1 G07
2283
2409
1700
1 500
800
600
1497
2330
1097
450
Cluster #
**
56
**
58
(57)
59
(55)
60
61
62
Mung,ui-Sode
\
25 dc Setumblo
A Luta Continua
Jullavse Nyerorr:
Nhabcsvc
CatoC
C higanda
1479
744
1099
462 . 1322
616
257495
258239
259338
259800
261 122
261 738
63

-
-
-
--
Mungari,
-
Mungui
Nhamassorige
Nhamassonge
Nhnmassongc
Mandi6
Cllivuli 7 dr: Abril-Sodr:
3 dc: Fcvcrciro
LolonguJ
Bamba (Chitondo)
692
732
952
\
.
262430
263162
264 104
449
907
5 12
347
48 1
35 1
Nlimassongc- Scds
64
Nhacasuangano
Nhamoa
blspangrua
Clabcrcmondc:
Chiruto'?
Nhamassonge-Scde "Pllumphwa"
Nl~acaduzuduzu - Thanda
L
264553
265460
265972
2603 19
266800 . 267151
blandid-sede
Massangano
I I~llla ufc
65
I--- /-----'. ---\ ----.. -----. /-'\ - ------& -
- - --- -- ---. . - -.. --- -- - --. -, - - - . - -
1.
. - - I _H-- >,c"
&*.-/ --
I - , .' /: - &

!ARUEj (Tqtal of
I Poslo ad minis^. Uhoa
Catandica
I
I
I - -
,
I
I
I
Catandica
1
r
1. .
target area=53,649)
Localidade
Choa-szdc
Nllauroa
S ede
Chiula
NdeialBairro Populacao Cumm Cluster #
1 de Maio
7 dc: Abril
3 Jt: Fevomiro
Sanhmtunzi
Nhamissundo
Uotone
5082 "
2163
868
2851
229
651
r(r*
69
70
7 1
272233
274397
275265
2781 16
278345
278996
Cagorc
kIutcua
Cllowa
M' panze
Siguma
Vulornite
Pique
Sabao
I Ionde
Nhomatcma
Mussianharo ,
Nharnidnga
Chiuala
Nhancang'irc
66
67
750
923
871
459
327
273
3831
2084
1605
605
978
68 8
1263
6
279746
2801jG9
28 1 540
28 1999
282326
282599
286430
288524
2901 19
290724
29 1 702
292390
203653

--
-
-
-
--
Posto ddminislr.
Ca tandica
Nhamyassa
L-----L Grand total of target
Localidade
Nhazania
Nhampassa- Scdc
Nllassacara
FudA (Cni7;lmento?)
areas in 5 d&cls
- Aldeia/bairro
Maputo
'I'irngiicl/j
blatundu
Macossa
(iuinlial'ulu
Clrindanguc
Mlangate
Nhamoca
Nliachan~uc
C'hozo
Nhatumbo
Sede
N hangagar0
29.1760
295530
296209
297076
297530
298544
300098 ,
30071 7
30 1 509
302745
305705
1107
776
G73
867
454
1014 b '
1554
619
792
1236 0*--
2960
- .-. .--- -- ,I
72
73
74
7 5
76
(68)
>
77 I
78 1
Nhamagiwa
Scdc
Nhantucllu
Patanguena a
\
Sude
Pandiera
Nhantucutira
Camaasl~enga = 320,800
6244
1224
1159
2135
1088
2330
31 1949
313173
314332
3 16467
317555
319885
919 p20800
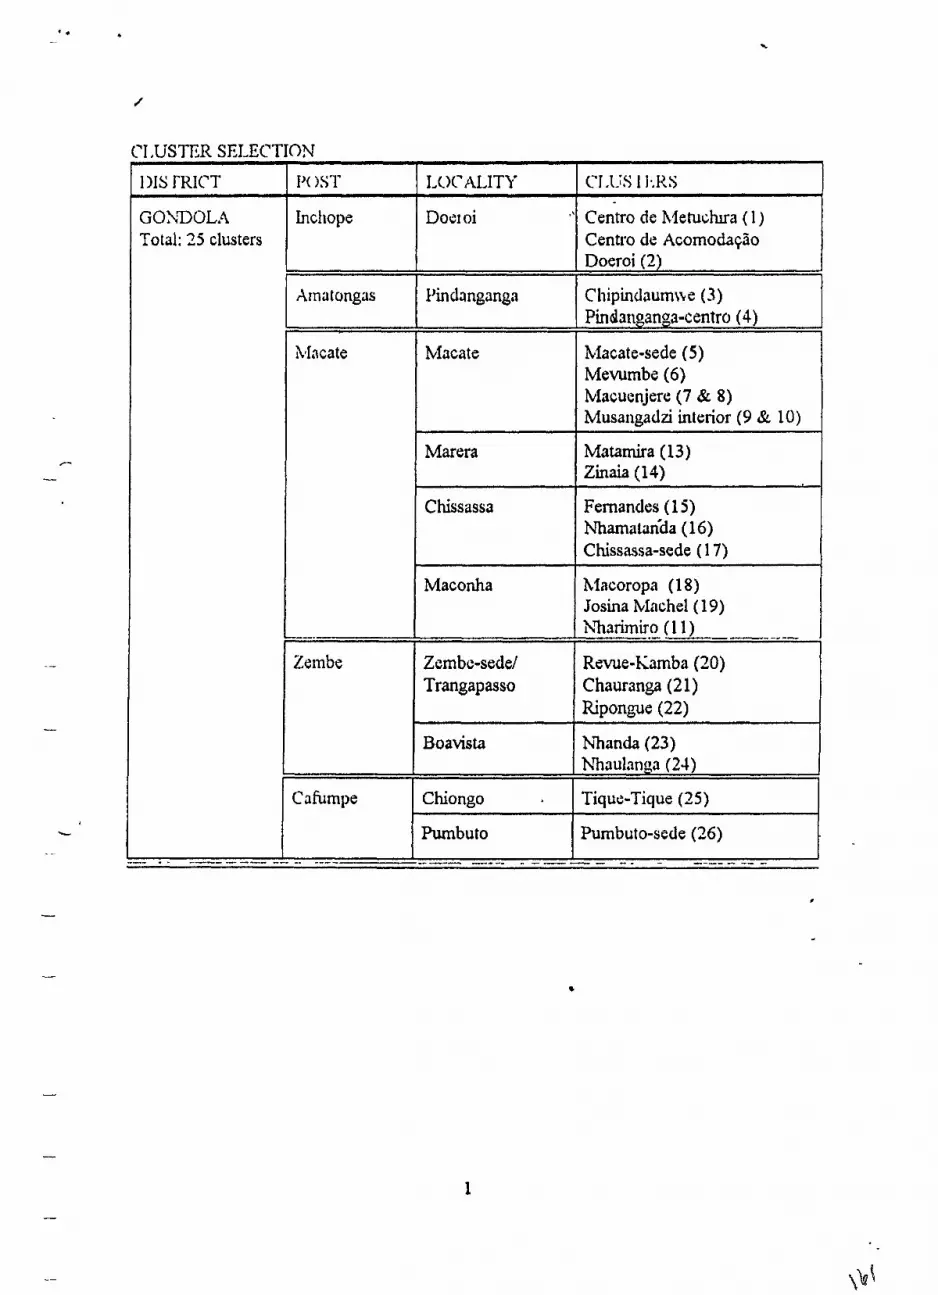
C'I .UST:R SELECTION
1 >IS JXICT I I'( )ST I LOCALITY I TI .IIS 1 J:RS
I 1 I I
I Doeroi (2)
GOhDOLA Total: 25 clusters
Inchope
klacate-sede (5) Mewmbz (6) blacuenjerc: (7 & 8) Musangadzi interior (9 gL 10)
Xrnatongas
Chissassa Fernandes (1 5 ) Nharnatan'da (1 6) Chissasa-sede ( 1 7)
Pin danganga
Marera
hlacoropa (1 8) Josina biachel( 1 9) Nharirniro (1 1 ) .- -- -- -- --
1
Chipindaumne (3) Pindanganga-centro (4)
Matamira (13) Zinaia (13)
Zcmbc-sedel Trangapasso
Chiongo
Pumbuto
I Revue-Kamba (20) Chauranga (21) Ripongue (22)
hihanda (23) h%aulanga(24)
Tiquz-Tique (25)
Pumbuto-sede (26)

I3ISTRICT
IZ1lAKICA Total: 15 clusters
-
SUS SLhiIENGA Total: 14 clusters
I'oST
h,I,~vonde
Vandud
I\ Icss~ca
-- - ---
Sus,endznga
Rotanda
Xluoha
Dombe
1,OC AL,ITY
Clu lunga
Vanduzi
Punguc-sd
Mesai~a
Bandula
Suscndznga-sede
Munhinga 2
Rotanda
Munhinga 1 ,
Mussapa
Muoha
Mabaia
Dame
Matarara
CLVSTEKS
Mucornbur: (27) \
Belas 1 (28) Alma& (29) Verde (30) Bairro Centro (3 1) 25 4e Junllo (32)
Chitundo (33) Nhamatiquiti (34)
2OI3ilirt.o Vila hlcasica (35) SVBaino Vila blessica (36) Bairro Chunoio (37) Bairro blutsd (38)
hldeia Garuzo (39) Clucamba Real (40) 3OBairro Bandula (4 1)
N h u n z ~ ~ ~ a (42) 25 Junllo 1 (43) 25 Junho 2 (44) Chicueu (45) Nhamawaia (46)
ChirnhGa (47)
Mussambudzi (tsetscra) (48)
(b
0
hla~ita-scde (49)
Moiana (50) Chigumete (5 1)
Ndongue (52) S anguene (1 2)
Tusscne (53) Macocue (54)

I DISTRICT 1 POST I LOCALITY I CLUSTERS I I
GURU Total : 11 clusters
Guro 1 de LMaio B (55) Nhansana (56) Tsetsehama B (57) Tsctsekama A (58) 1 de Maio A (59) Tongogara A (60)
h 1ungal.i Mungari Juliasse Nyerel-e (63)
Chivuli 3 cle Feverciro (64)
I I I I I ---- ---- --.- -..---- -------- . ----- -- -- -- --- - - - - --
I3 .U<LTE Total: 13 clusters
Chiwala
Nhazonia
Honde (70) Chiwala-centro (7 1)
Matundu (72) Nhangnzz (73) -
1 Nharnpmsa
Catandica
Nhampnssa
Fudzi
Catandica-sede
Nhampnssa-sccle (74)
Nhassacara
- Pandiera (77) Camamhenga (78) Fudzi-sede (68)
1" de: h?nio (66) Sanhantunzi (67) Sabao (69)
Nhassacnra-sede (75) Nhantuchu (76)

AfricarelMozarnbique Manica Oil Seed Food Securlty Initiative
Baseline Indicator And Annual Target Revision September 30,1997
P c - -c Note Baseltne Values Are Actual. Taken From Baseltne Survey and Secondary-Source Data-Gathenng, Conducted June - September 1997
Increases by 500 HA'slsesame and 5,700 HA'sl Sunflower Sesame
Sunflower Total Area Planted
6) 75% of vrllage-based presses wll have been opembng for more than two years Output level 7) A rnlnlmum of 400 field demonstrations of 011 seeds and pracesslng techniques are completed 8) Collaborafive partnerships established tn 100% of target communttes to promote 011 seed produrAon and sale 9) KG's of 011 Seed harvested per year In the target areas
Sunflower Sesame
Total 10) - farmers planfing 011 seed per year m the target areas 11)- KG'S of planting seed sold andlor planted In the target areas
Seed Sold Reta~ned Seed
Total Seed Planted
463 70
533
NIA % :+> **q; 'z
600 1 ,000 1,600
NIA : P ~ , , ~ \ A ;
700 3,000 3,700
19 - - * t **- c- g
750 4,500 5,250
64 .", tL . '
900 5.800 6,700
128 a ,;. ' \ ' ~ ' --j
65
0%
35,000 162,0!50 197,050
4,492
0 3,493 3,493
q, :$$-
110
20°h
500,000 210,000 710,000
6,219
12.000 8.000
20,000
+g.fe--$-%i $
100
40%
1,500,000 245,000
1,745,000
8.706
24,000 4.000
28,000
;':&i& ii- a
75
80%
2,250,000 262,500
2,512,500
10,448
40,000 6,000
46,000
: % k i s ~ *<-'y
50
1 OoOh
2,900,000 315,000
3,215,000
12,537
40,000 10,000 50,000

Page 2
I Oils Promotion Component Cont.
.s+ -+=--A Component And Indicator
12) 370 or1 seed presses sold In the target areas 13) 100% of retail sales of oil seeds, presses and spare parts made by commercial agents In the target areas 14) Commercial entlties are multiplying and selllng
parts sales 19) liters of oil produced by oil presses 20) Oil Seed Extension Services provided to % of Target
FY 1997 Baseline
0% . . -
100% of the planting seed 15) 70% of presses sold by Afrlcare are sold with credlt 16) Per Cent of Borrowers that pay off thew loans on tlme 17) 30 repair artisans trarned and offerrng repair services 18) 300 sales agents trained In oil seed, press and spare
Households I 0%
0%
under werght (WeighVAge) in participating commun~tles I 36% Monitoring Outputs [$iE$p&{ 4) ~ u t r i t i o ~ ~ c t r v ~ s t s are tra~ned/working In each drstrict 5) V~llage Food Securrty Cornmrttees are trained and using the "3A" approach to community problem-solving 6) Nutrrtion Volunteer Groups are supporting NA's 7) Use of IEC Materials In % of target communities
8) - minutes per month on local radio are transmitted about nutrition, health and food security 9) Nutrition methods are transmitted by non-formal comm- ation In % of target communities at mid-term, % at end
Note Baseline Values Are Actual, Taken From Baselrne Survey and Sea
lndica Impact
I I I -
ndary-Source Data-Gathering, Conducted June
FY 1998 Year 2
Mid-Term
,r Type x
End-Line
FY 1999 Year3
- Monitoring
FY 2000 Year 4
Mid-Term
0% NIA 40% NIA 80%
FY 1997 Baseline
FY 2001 Year 5
End-Line
20 NIA
0
0 15 30 40 NIA 0 15 30 40 NIA
0% NIA 40% NIA 80%
FY 2000 Year 4
0 5 5 5 5
0% NIA 40% N/A 80%
September 1997
FY 1998 Year 2
FY 2001 Year 5
- 42 70%
10
FY 1999 Year 3
60 85%
0
70 90%
10
70 90%
10

(page 2 I Indicator Type lm pact
FYI997 FYI998 FYI999 FY2000 FY2001 - cr;--~ Component And Indicator Baseline Year 2 Year 3 Year 4 Year 5 Narrative Descr~ption Mid-Term End-Line
NIA
parts sates 19) llters of or1 produced by 011 presses 20) 011 Seed Extension Servrces provrded to % of Target Households 0% 5% 12% 17% 20%
1) % reduct~on In stuntrng In the total population of I I I I under 5 chrldren In the target area I 5o%I NIA 1 47 50%I NIA Purpose Level (End Of Project Status) \tg@gz$$ sc 3s -I-$~T 'A a st:*vx i&&$&f;:@;;& 2%; ' ~ ; ~ ~ ~ $ & ~ "
2) Nutrlt~on Educat~on actrwtles establrshed m % of
4) Nutrrtlon Act~vists are tralnedhorklng In each dlstrtct I I I I 5) Vrllage F w d Security Committees are tra~ned and using the"3A" approach to cornmun~ty problem-solv~ng 6 ) Nutrrtron Volunteer Groups are supportrng NA's 7) Use of IEC Materrals In % of target commun~tres 8) - mrnutes per month on local radlo are transmrtted about nutrrtlon, health and food security. 9) Nutr~tron methods are transmitted by non-formal comm- atron In O h of target commun1tres at m~d-term, % at end
Monitoring FY 1998 1 FY 1999 I FY 2000
NIA
NIA I 40%1 NIA
- FY 2001 Year 5
End-Line
$&*&*&y NIA
NJA NIA
80%
I
Note Baselrne Values Are Actual, Taken From Baselrne Survey and Secondary-Source Data-Gathering, Conducted June - Septemb
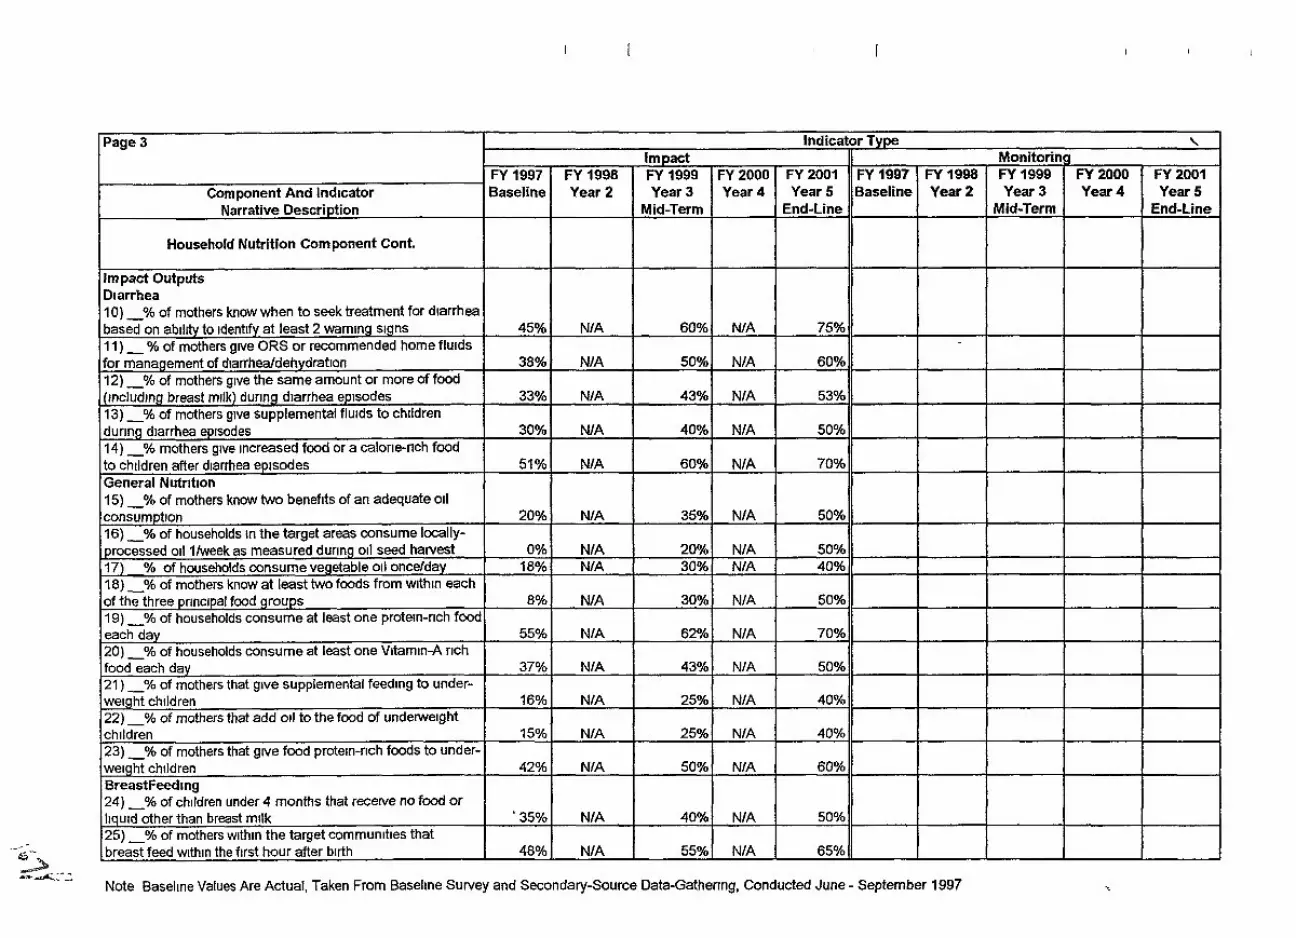
Page 3
Component And Indicator Narrative Description
Household Nutrition Component Cont.
lm pact Outputs Dlarrhea 10) % of mothers know when to seek treatment for diarrhea based on ability to identlfy at least 2 warning signs 11) - % of mothers give ORS or recommended home flulds for management of diarrhealdehydratron 12) % of mothers give the same amount or more of food (including breast rnrlk) during diarrhea episodes 13) % of mothers give supplemental fluids to children durrng diarrhea episodes 14) % mothers give increased food or a calorie-rlch food to children after diarrhea episodes General Nutr~t~on 15) % of mothers know two benefits of an adequate 011
consumption 16) % of households in the target areas consume locally- processed oil Itweek as measured during oll seed harvest 17) % of households consume vegetable oil oncelday 18) -YO of mothers know at least two foods from within each of the three prrncrpal food groups 19) % of households consume at least one protein-rlch food each day 20) -% of households consume at least one Vitamin-A rich food each day 21) -% of mothers that give supplemental feedlng to under- weight ch~ldren 22) -% of mothers that add 011 to the food of underwerght children 23) -YO of mothers that give food protein-rich foods to under- welght children BreastFeeding 24) -% of children under 4 months that recerve no food or llquid other than breast milk 25) -% of mothers w~thln the target communities that breast feed w~thin the first hour after birth --
& ? - 6 - 2
Note Baseline Values Are Actual, Taken From Baseline Survey and Secondary-Source Data-Gathering, Conducted June - September 1997
Type '. Monitoring
Indicator
FY 2001 Year 5
End-Line
75%
60%
53%
50%
70°h
50%
50% 40%
50%
70%
50%
40%
40%
60%
50%
65%
FY 1997 Baseline
45%
38%
33%
30%
51%
20°h
0% 18%
8%
55%
37%
16%
15%
42%
' 35%
48%
lm pact FY 1999 Year 3
Mid-Term
60%
50%
43%
40%
60%
35%
20% 30%
30%
62%
43%
25%
25%
50%
40%
55%
FY 1998 Year 2
NIA
NIA
NIA
NIA
NIA
NIA
NIA NIA
NIA
NIA
NIA
NIA
NIA
NIA
NIA
NIA
FY 1999 Year 3
Mid-Term
FY 2000 Year4
FY 1997 Baseline
FY 2000 Year 4
NIA
NIA
NIA
NIA
NIA
NIA
NIA NIA
NIA
NIA
NIA
NIA
NIA
NIA
NIA
NIA
FY 2001 Year 5
End-Line
FY 1998 Year2

Africare/Mozambique Manica Oil Seed Food Security Initiative
Narrative Description of Indicators
Oils Promotion Component (Baseline values derived from household survey analysis and direct field observations and research):
1) Average household income within the target areas increases -% as measured by income proxies '
Income data was collected during the household survey, including proxy information as defined by Michigan State University's Food Security Project A separate module designed by MSU was inserted into Afiricare's questionnaire The data from this module has been given to MSU for analysis Estimates of household income for 1997 for Africare's project area will be provided by MSU, determined by applying statistical variables developed from their research in other parts of Mozambique This information will be provided by MSU at the end of CY'97, and will be included in Afncare's FY'97 Annual Results Report, to be submitted in January 1998 Mid-term and End-line estimates of household income will be collected via proxy information included in the questionnaire During 1998, Africare will participate in a collaborative research activity with MSU and the other PVO's implementing Title I1 activities to - conduct a series of repeat household interviews that w~ll determine the statistical relationship between different proxies and household income, specific to Africare's implementation area This will be the basis for the measurement of household income in 1999 (mid-term) and 2001 (end-line) Baseline value will be presented in USD terms Mid-Term and End-Line targets will be presented in absolute terms, with a percentage target increase over the baseline for each target
2) Average cash income from oil seed production increases by $46 per HH for sesame and $97 per HH for sunflower
Baseline calculation 3,948 families (8% of total per survey) planted 463 HA's of sesame, harvested an average 350KgYs/HA and received an average $0 35KG 494 families (1% of total per survey) planted 70 HA's of sunflower, harvested an average 500 KG7s/HA and received an average $0 17fKG. At the end of the activity, it is assumed that at least 20% of the target population in the target area will be growing oil seed (10,000 HH's) The price of sunflower increases to $0 22/KG, sesame remains the same.
3) Per cent of participating households that receive cash income from the sale of oil seed.
An overall increase of 18% during the life of the activity, with the largest annual increase in years 2 and 3, dropping off due to saturation at the end of the implementation period paselme calculated from survey)

4) Average cash income (gross profit) from oil seed processing increases $2,228 per participating household.
Baseline value has been calculated from regular monitoring by Africare staff of the twenty-five presses that were in operation through the end of FY797 Each press produced an average 2 5 literslday for an average of 43 days pressing and received an average price of $1 60Jliter Annual targets are based on projected number of new press enterprises to be established, number of liters to be produced/press/year and assumes an improved efficiency of the operators (more liters produced per day and more oiVKG's of expressed seed) All oil that is produced is assumed sold Baseline value is presented in USD terms. Annual targets are presented in absolute terms
5) Oil seed production (HA's planted) within the target areas increases by 500 HA's for sesame and 5,700 HA's for sunflower.
Baseline value for hectares planted of sesame included in the data analysis (463 HA's) is feasible However, regular field reconnaissance by Afi-icare staff during FY'97 '
concluded that the number of HA's planted for sunflower included in the data analysis (2,193 HA's) is rrsf, accurate A more realistic estimate, based on field observations and the amount of oil seed that has been harvested in the target area, is included (No oil seed was planted during FY 1997 with Africare support) Significant increases in planting area in years two and three will be the result of intensive oil seed production outreach and extension supported by Africare
6) 75% of village-based presses will have been operating for more than two years.
It is expected that 75% of the presses sold during the first two years will be in minimal operating condition at the end of that period, given recent experience with other ram press projects in Mozambique and southern Africa However, as there is (expected) increased competition in the more accessible areas with the commercial refining sector, some of these village presses will close or greatly reduce their pressing The Yr 3 target is 75% of Yr 1 press sales, the Yr 4 target is 75% of Yrs 1&2 sales, the Yr 5 target is 75% of Yrs 1,2 & 3 sales
7) A minimum of 400 field demonstrations of oil seeds and processing techniques are completed.
Over time, the necessity for field demonstrations will decrease as the oil press becomes a recogntzed technology and receives unofficial promotion (including radlo) (Baseline taken from demonstrations completed)
8) Collaborative partnerships established in 100% of target communities to promote oil seed production and sale.
Partner organizations (private sector, government and other development agencies) will assume a larger responsibility for the promotion of oil seed husbandry, processing technology and other needed inputs and support services

KG's of oil seed harvested per year in the target areas.
Baseline value is calculated for sunflower (70 HA's x 500 KGys/HA, per field observations) and for sesame (463 HA's x 350 KG'sHA per survey and field observations). Annual targets correspond with expected increases in amount of land to be planted with oil seed.
farmers planting oil seed per year in the target areas.
Baseline value is calculated from number of households that planted (per survey) Annual targets are based on projected amount of seed and available hectares to be planted It is assumed that while the number of farmers that plant oil seed will increase during the life of the activity, more important will be the increase in the amount of land planted per farmer and the (expected) increased yield each farmer receives
KG's of planting seed sold and/or planted in the target areas.
Little seed was sold in FY 1997 other than what was sold from farmer to farmer No seed was distributed by any institution during this period Targets for seed sold and planted are separated because most farmers retain seed for future planting Baseline is calculated from the estimated hectares that were planted
370 oil seed presses sold in the target areas.
Baseline represents actual sales through the end of the FY 1997. Two presses that were sold by the end of FY'97 had not begun pressing operations. Annual targets are based on identified potential for increased planting and available crushing seed
100% of retail sales of oil seeds, presses and spare parts made by commercial agents in the target areas,
By the end of the activity, Africare will have completely withdrawn from facilitating the commercial supply of critical inputs for oil seed production and processing
Commercial entities are multiplying and selling 100% of the planting seed,
Preparations have begun to identify other agencies fiom the private sector and the government that will eventually assume all multiplication, maintenance and marketing of planting seed in the province
70% of presses sold by Africare are sold with credit.
Credit for press purchase will be given directly by Africare on a limited basis during years 1 and 2 (including a "lease-purchase" option) The objective wll be to have all press sales to take place by retailers starting in Yr 3 (who will receive the presses "on consignment" from Africare or will purchase them directly from local manufacturers) Credit could be offered by these retailers to potential press owners

16) Per cent of Borrowers that pay off their loans on time.
It is expected that most, if not all, press owners that receive a press on credit will pay off their loan Experience with similar projects indicates that most press owners are able to pay off their loans wthin three months Starting in Yr 3, all credit would be managed by the private sector
17) 30 repair artisans trained and offering repair services
If a thorough maintenance training is provided to the press owner, experience has shown that major repair needs are minimal The number of repair artisans to be trained during the five years will be sufficient to provide coverage throughout the five target districts
18) 300 sales agents trained in oil seed, press and spare parts sales.
An important activity will be to increase knowledge and understanding of this technology, so it will be disseminated throughout the target areas Potential sales agents include, press owners, repair artisans, rural store owners & employees and small-scale traders (both fixed and ambulatory)
19) liters of oil produced by oil presses.
Baseline value is derived fiom the number of presses in operation at the end of the fiscal year Annual targets are derived from the number of presses to be in operation, the expected increase in available crushing seed and the average number of liters produced by each press during each pressing season
20) Oil seed extension services provided to -% of target households.
Extension services about oil seed will be provided to at least 10,000 households (20% of targeted HH's) by the end of the activity These services will be provided by other agencies, in addition to Aficare's own outreach personnel
Household Nutrition Component (Baseline values derived from household survey analysis and field observation):
1) % reduction in stunting in children under 5 years of age
The <-2 Z-score cut-off point will be used for children 0-5 years of age for comparative reasons. The percentage of stunting for children 2-5 years ef age will also be measured slnce this age group is most affected and is typically monitored
2) Nutrition Education activities established in -% of target communities
The expansion strategy for the nutrition staff will be to 'Yollow" the establishment of oil promotion activities in target communities ApproximateIy eighty communities will

receive direct assistance during life of activity. Mid-term and End-line target include those communities that will have a regular Africare staff presence (Nutrition Monitor andlor Activist) Remaining communities would receive nutrition education from partner agencies
3) % reduction in children under 5 years that are underweight (based on weight for age)
This is the indicator used by Ministry of Health Because of its greater simplicity, weight for age is often used as a single indicator for Protein-Energy-Malnutrition However, this indicator does not allow for distinction between stunting and wasting For this reason height for age will also be measured
4) Nutrition Activists are trainedlworking in each district.
Annual targets are based on expected number of communities to receive direct support from within each district. Larger communities could have two activists It is expected that some activists will work in other communities in fbture years, in addition to the fielding and training of new activists
5 ) Village Food Security Committees are trained and using the "3A" Approach to community problem-solving.
These targets identify those communities that will receive direct support and participate in community food security activities It is expected that some of the communities to receive direct support will not form a VFSC, but still participate in some nutrition outreach A maximum of one VFSC would be formed per community
6 ) Nutrition Volunteer Groups are supporting Nutrition Activists
These targets reflect the establishment of VFSC's, and include individuals (both male and female) that directly support the activists.
7) Use of IEC materials in -% of target communities
The nutrition education curriculum being developed by Africare will be used by nutrition monitors and activists in the target communities and the outreach staff of other agencies (who will receive training in its use) The targets reflect the combination of those communities with a regular Africare presence and others that have another agency's regular presence
8) - Minutes per month on local radio are transmitted about nutrition, health and food security
Short announcements will be developed and transmitted in local languages about key nutritional concepts

Nutrition methods are transmitted by non-formal communication in -% of target communities a t mid-term; % a t end.
Africare wlll use non-formal techniques such as street theatre and story-telling to reinforce the nutritional messages and improved behavior promoted by outreach activities The targets reflect those communities that participate in these activities at least several times during the year.
% of mothers know when to seek treatment for diarrhea based on ability to identify a t least 2 warning signs of diarrhealdehydration
The purpose of this indicator is to assess the mother's ability to determine the seriousness of her child's diarrhea The women will be taught to recognize warning signs of dehydration and to seek treatment for their children when appropriate based on this assessment
% of mothers give ORS and/or recommended home fluids to treat diarrhea . % of mothers give the same amount of food to children during diarrheal episodes % of mothers give supplemental fluids to children during diarrheal episodes % of mothers give increased food and/or calorie-dense foods to children following diarrheal episodes
These indicators measure the mother's behavior rather than the child since the child's well-being greatly depend9 on the mother's actions It is UNICEF's recommendation that children receive additional fluids including ORS to replace all liquids lost In addition, children should continue to receive the same amount of food or more during a diarrheal episode and if the child is exclusively breastfed, she is breastfed the same amount or more frequently Immediately following the diarrheal episode, children should be given an extra meal every day to ensure a good recovery These indicators are used to measure if mothers put into practice program messages about proper management of diarrhea
% of mothers know a t least 2 benefits of adequate oil consumption % of households consume locally-processed oil a t least once per week as measured during the oil seed harvest % of households consume vegetable oil a t least once a day
It is assumed that d the Gother increases oil in their cooking the child will benefit Adequate oil consumptton allows for adequate utiltzatton of fat soluble vitamins and increases caloric intake for protein sparing effect.
% of mothers know a t least 2 items of food for each of 3 basic food groups (Energy, Construction, Protection)
If mothers know which types of foods give energy, help growth and protect their health, they will be more likely to include some of each basic food group in the family's diet

% of households consume at least 1 protein-rich food per day
If the mother includes protein foods, fruits and vegetables in her cooking, her children will also benefit. This indicator is based on a 7-day recall
% of households consume a vitamin A-rich food at least once a day
Vitamin A is necessary to prevent xerophthalmia and also improves children's resistence to other illnesses such as diarrhea and measles It should be a part of children's daily diet.'This indicator is measured using a 7-day recall for the entire family and is based on frequency of intake not quantity
% of mothers give supplemental feeding to underweight children % of mothers add oil to food of underweight children
All children, especially under 3 years of age, need a small amount of extra fat or oil added to their food to satisfy their high energy needs and for protein sparing It also ensures adequate intake of essential fatty acids This is even more important for underweight children who need to catch up on their growth
% of mothers give protein-rich foods to underweight children
An adequate supply of protein is necessary to ensure body growth and maintenance
% of children under 4 months that receive no food or liquid other than breast milk
The WHO recommendation is for infants to be exclusively breastfed from birth to six months However, Mozambique's national breastfeeding policy continues to encourage exclusive breastfeed~ng only up to 4 months Based on Africare's initla1 assessment, mothers tend to initiate supplementation early on, most often before 4 months This indicator is calculated based on 24 hour recall data
% mothers that breastfeed within the first hour after birth
The purpose of this indicator is to assess whether mothers initiate breastfeeding immediately after delivery Early initiation has many benefits both to mother and child because tt ensures that the baby receives colostrum, which contains high concentrat~ons of nutrients and antibod~es that protect the infant from infection It also is important for proper bonding, whch is esgential for growth Thts indicator is calculated based on currently breastfed chldren, to decrease recall bias for older children