planning malaysia
TRANSCRIPT


© 2021 by MIP
PLANNING MALAYSIA Journal of the Malaysian Institute of Planners
Advisor
TPr. Hj Ihsan Zainal Mokhtar
Editor-in-Chief
Professor Dato’ TPr. Dr. Mansor Ibrahim
International Islamic University Malaysia (IIUM)
Local Editorial Board Members
Professor Dato’ TPr. Dr. Alias Abdullah - International Islamic University Malaysia (IIUM)
Professor TPr. Dr. Ho Chin Siong - Universiti Teknologi Malaysia (UTM)
Dato’ Professor Dr. Ruslan Rainis - Universiti Sains Malaysia (USM)
Professor TPr. Dr. Ahmad Nazri Muhamad Ludin - Universiti Teknologi Malaysia (UTM)
Professor TPr. Dr. Dasimah Omar - Universiti Teknologi Mara (UiTM)
Professor TPr. Dr. Jamalunlaili Abdullah - Universiti Teknologi Mara (UiTM)
Assoc. Prof. TPr. Dr. M. Zainora Asmawi - International Islamic University Malaysia (IIUM)
Assoc. Prof. Dr. Nurwati Badarulzaman - Universiti Sains Malaysia (USM)
Professor TPr. Dr. Mariana Mohamed Osman - International Islamic University Malaysia (IIUM)
Assoc. Prof. TPr. Dr. Syahriah Bachok - International Islamic University Malaysia (IIUM)
Datin Paduka TPr. Dr. Halimaton Saadiah Hashim - Malaysia Institute of Planner (MIP)
Assoc. Prof. TPr. Dr. Oliver Ling Hoon Leh - Universiti Teknologi Mara (UiTM)
Dr. Chua Rhan See - Jabatan Perancang Bandar dan Desa (JPBD)
TPr. Khairiah Talha - Malaysia Institute of Planner (MIP)
TPr. Ishak Ariffin - Malaysia Institute of Planner (MIP)
Prof. Dr. Azizan Marzuki - Universiti Sains Malaysia (USM)
International Editorial Board
Professor Emeritus Dr. Richard E. Klosterman - University of Akron / Whatif? Inc., USA
Professor Dr. Stephen Hamnett - University of South Australia, Adelaide, Australia
Professor Dr. Kiyoshi Kobayashi - University of Kyoto, Japan
Assoc. Prof. Dr. Belinda Yuen - University of Singapore, Singapore
Dr. Davide Geneletti - University of Trento, Italy
Dr. Boy Kombaitan - Institut Teknologi Bandung, Indonesia

© 2021 by MIP ii
Editorial & Business Correspondence
PLANNING MALAYSIA
Journal of the Malaysian Institute of Planners
B-01-02, Jalan SS7/13B, Aman Seri, Kelana Jaya
47301, Petaling Jaya, Selangor Darul Ehsan, MALAYSIA
Tel: +603 78770637 Fax: +603 78779636 Email: [email protected]
www.planningmalaysia.org
Copyright © MIP, 2021
All rights reserved.
No part of this publication may be reproduced, stored in a retrieval system, or transmitted in any
form or by any means, electronic, mechanical, photocopying, or otherwise without the prior
permission of the publisher.
The views expressed in this publication are those of the author(s) and do not necessarily represent
the views of MIP.
This journal is a refereed journal.
All articles were reviewed by two or three unanimous referees identified by the Institute (MIP).
Published By
Malaysian Institute of Planners
ISSN Number
1675-6215
e-ISSN
0128-0945
Date Published: 18th October 2021
iii © 2021 by MIP
CONTENTS
1. Tangible and Intangible Factors Incorporated for Infrastructure Asset Valuation
Nur Farah Hanna Mohd Rohaizad, Ezdihar Hamzah, Hariati Abdullah Hashim and
Azizah Ismail
1 – 12
2. Exploring the Usage of Digital Technologies for Construction Project Management Tung, Yew-Hou, Chia, Fah-Choy, Felicia Yong, Yan-Yan
13 – 22
3. Investment Styles of REIT Property Portfolios Tan Chor Heng & Ting Kien Hwa
23 – 36
4. Identification of Factors Influencing Land Value for State's Assets Mass
Appraisal Purposes: Evidence from Indonesia Kristian Agung Prasetyo, Dhian Adhetiya Safitra, Adhipradana Prabu Swasito
37 – 47
5. Purchasing Decision of Property Buyers: The Housing Quality, Financial
Capabilities and Government Policies Studies Kenn Jhun Kam, Tze Shwan Lim, Danielle Li Ping Yoong, Fuey Lin Ang, Boon Tik Leong
48 – 60
6. The Methodological Structure for Legal Research: A Perspective from
the Malaysian Land Law and Islamic Law Noor Azimah Ghazali, Ibrahim Sipan, Farah Nadia Abas & Ahmad Che Yaacob
61 – 71
7. Residential Building Quality Measurement and the Relationship with House
Prices: A Study of Houses in Klang Muhamad Hilmi Mohamad @ Masri, Mohd Farid Sa’ad, Najma Azman, Mohd Hasrol
Haffiz Aliasak
72 – 83
8. First-Time Homebuyers’ Interests in Using Property Crowdfunding as an
Alternative Financing Option Hon-Choong Chin a, Sheelah Sivanathana, Goh Hong Lipa & Low Choon Weib
84 – 94
9. Assessing the Strata Housing Attributes for Elderly to Age in Place in Klang Valley Amalina binti Azmi, Peter Aning, Wan Nor Azriyati Wan Abd Aziz Nur Hafizah Juhari,
Nurhayati Khair, Puteri Ameera Mentaza Khan, Sheelah a/p Sivanathan
95 – 110
10. An Analysis on the Efficiency of Green Roof on Managing Urban Stormwater Runoff Shazmin Shareena Ab. Azis, Muhammad Najib Bin Mohamed Razali, Nurul Hana Adi Maimun,
Nurul Syakima Mohd Yusoff, Mohd Shahril Abdul Rahman, Nur Amira Aina Zulkifli
111 – 122
11. Factors Causing Failure in Completing Reassessment Work Among
Appointed Valuation Firms Nur Amira Aina Zulkifli, Shazmin Shareena Ab. Azis, Nor Syafiqah Syahirah Saliman,
Nurul Hana Adi Maimun
123 – 133
12. Housing Preferences: An Analysis of Malaysian Youths Suhana Ismail, Azima Abdul Manaf, Mohd Yusof Hussain, Noraliza Basrah, Fatin
Umaira Muhamad Azian
134 – 145
© 2021 by MIP iv
12. Housing Preferences: An Analysis of Malaysian Youths Suhana Ismail, Azima Abdul Manaf, Mohd Yusof Hussain, Noraliza Basrah, Fatin
Umaira Muhamad Azian
134 – 145
13. Revealing the Investment Value of Penang Heritage Properties Chin Tiong Cheng, Yan Bin Tan, Wai Fang Wong, Kong Seng Lai, Koh Yu Xuan
146 – 156
14. Alternative Numeraires for Measuring Welfare Changes: Review of Empirical
Environmental Valuation Studies Akhmad Solikin
157 – 168
15. Technical, Scale and Managerial Efficiencies in Malaysian Reits: A Non-
Parametric Approach Nor Nazihah Chuweni, Siti Nadiah Mohd Ali, Nurul Sahida Fauzi, Nur Baizura Mohd
Shukor
169 – 179
16. Valuation of Market Rental Value of a Planned Dormitory Using Hedonic
Pricing Method: A Case Study of Polytechnique of State Finance Stan,
Indonesia Doni Triono, Akhmad Solikin
180 – 189
17. Determination of Financial Feasibility of Indonesia's New Capital Road
Construction Project Using Scenario Analysis Muhammad Heru Akhmadi, Audra Rizki Himawan
190 – 201
18. The Legal Requirements of Appropriate Heritage Property Valuation Method Junainah Mohamad, Suriatini Ismail, Abdul Rahman Mohd Nasir
202 – 213
19. Determinants of Public Asset Value for Land Property: A Study in the City of
Tangerang, Indonesia Intan Puspitarini, Irfan Rachmat Devianto
214 – 225
20. Issues and Obstacles in the Development of Malay Reserve Land Siti Hasniza Rosman, Abdul Hadi Nawawi & Rohayu Ab Majid
226 – 236
21. The Importance of Sustainability Implementation for Business Corporations Nurul Sahida Fauzi, Noraini Johari, Ashrof Zainuddin, Nor Nazihah Chuweni
237 – 248
22. Enhancing the Accuracy of Malaysian House Price Forecasting: A
Comparative Analysis on the Forecasting Performance Between the Hedonic
Price Model and Artificial Neural Network Model Nurul Fazira Sa’at, Nurul Hana Adi Maimun & Nurul Hazrina Idris
249 – 259
23. A Proposal for Affordable Waqf Housing Projects in Malaysia: Public
Perception of House Characteristics Nor Azizan Che Embi, Salina Kassim, Roslily Ramlee, Wan Rohaida Wan Husain
260 – 269
24. An Integrated Approach Based on Artificial Intelligence Using ANFIS and
ANN for Multiple Criteria Real Estate Price Prediction A. A. Yakub, Hishamuddin, Mohd. Ali, Kamalahasan, Achu, Rohaya binti Abdul Jalil &
Salawu, A.O
270 – 282
v © 2021 by MIP
25. An Investigation of the Issues of Tenancy Management Practice: The Case of
Commercial Waqf Properties in Malaysia Ibrahim Sipan, Farah Nadia Abas, Noor Azimah Ghazali, Ahmad Che Yaacob
283 – 294
26. Agribusiness as the Solution for the Underutilized Waqf Lands: A Viewpoint
from the Waqf Administrators Norfaridah Ali Azizan, Amirul Afif Muhamat, Sharifah Faigah Syed Alwi, Husniyati Ali,
Mohamad Nizam Jaafar & Nur Hidayah Jusoh
295 – 306
27. Uncertainty in Business Valuation for Tax Purposes Kristian Agung Prasetyo, Adhipradana Prabu Swasito, Dhian Adhetiya Safitra
307 – 316
28. Waqf Land Development Approaches and Practices in the State Islamic
Religious Councils Mohd Arif Mat Hassan, Anuar Alias, Siti Mashitoh Mahamood & Feroz De Costa
317 – 325
29. Express Condition of Land, Usage of Property and Licensing of Short-Term
Accommodations Nuraisyah Chua Abdullah, Azni Mohd Dian, Ramzyzan Ramly
326 – 337
30. The Development of Penang Shop Price Index (PSPI) Using Laspeyres
Hedonic Price Model Mohamad Hafiz Jamaludin, Suriatini Ismail, Norziha Ismail
338 – 350
31. Gross Income Multiplier as a Fairness Indicator of Transaction Value on
Transfer of Rights on Land and Building in South Tangerang Nur Hendrastuti
351 – 362
32. Spatial Autocorrelation Analysis of Housing Distribution in Johor Bahru Nur Asyikin Mohd Sairi, Burhaida Burhan, Edie Ezwan Mohd Safian
363 – 374
33. Constructing Housing Price Index for Terraced Properties in Johor Bahru,
Malaysia Wendy Lim Wen Xin, Burhaida Burhan, Mohd Lizam Mohd Diah
375 – 386
34. The Gap Between Housing Affordability and Affordable House: A Challenge
for Policy Makers Najihah Azmi, Ahmad Ariffian Bujang
387 – 399
35. Value Of Buildings in Volcanic Vulnerability: A Calculation Concept Jerri Falson
400 – 410
36. Machine Learning for Property Price Prediction and Price Valuation: A
Systematic Literature Review Nur Shahirah Ja’afar, Junainah Mohamad, Suriatini Ismail
411 – 422
37. Big Data Analytics for Preventive Maintenance Management Muhammad Najib Razali, Siti Hajar Othman, Ain Farhana Jamaludin, Nurul
Hana Adi Maimun, Rohaya Abdul Jalil, Yasmin Mohd. Adnan, Siti Hafsah
Zulkarnain
423 – 437
38. A Review of Spatial Econometrics in Explicit Location Modelling of
Commercial Property Market
438 – 448
© 2021 by MIP vi
Hamza Usman, Mohd Lizam, Burhaida Bint Burhan
39. Innovations Of Village Asset Management: A Case of The Best Indonesian
Village Taufik Raharjo, Roby Syaiful Ubed, Ambang Aris Yudanto, Retno Yuliati
449 – 459
40. Significance And Performance of Property Markets in Malaysia Mohd Haris Yop
460 – 471
41. Preventif State Asset Management Vs Sultan Ground: A Study Case in Special
Region of Yogyakarta Aditya Wirawan, Taufik Raharjo, Roby Syaiful Ubed, Retno Yuliati
472 – 483
Notes to contributors and guidelines for manuscript submission 484
Ethics Statement 486

vii © 2021 by MIP
MIP Council Members
2019 - 2021 Session
President
Datin TPr. Hjh Noraida Saludin (468/02)
Immediate Past President
TPr. Hj Ihsan Zainal Mokhtar (305/94)
Vice President
TPr. Lee Lih Shyan (267/92)
Datin TPr. Hjh Mazrina Dato' Abdul Khalid (559/09)
Honorary Secretary
TPr. Hj. Abdul Hamid Akub (450/01)
Honorary Treasury
TPr. Wan Andery Wan Mahmood (572/10)
Council Members
TPr. Mohamad Fauzi Ahmad (418/99)
TPr. Saiful Azman Abdul Rashid (474/03)
TPr. Afzal Azhari (735/20)
Prof. TPr. Dr. Mariana Mohamed Osman (581/11)
TPr. Juwairiyah Ho Abdullah (453/02)
TPr. Hj Nik Mohd Ruiz Ahmad Fakhrul Razy (570/10)
TPr. Fu Swee Yun (553/99)
TPr. Abdul Halim Ali Hassan (407/98)
TPr. Dr. Marlyana Azyyati Marzukhi (582/11)
TPr. Annie Syazrin Ismail (670/17)

1 Student. Email: [email protected]
PLANNING MALAYSIA:
Journal of the Malaysian Institute of Planners
VOLUME 19 ISSUE 3 (2021), Page 1 – 12
TANGIBLE AND INTANGIBLE FACTORS INCORPORATED
FOR INFRASTRUCTURE ASSET VALUATION
Nur Farah Hanna Mohd Rohaizad1, Ezdihar Hamzah2, Hariati Abdullah
Hashim3 and Azizah Ismail4
1, 2, & 4Department of Real Estate, Faculty of Built Environment and Surveying. 3Centre for Real Estate Studies, Institute for Smart Infrastructure and
Innovative Construction
UNIVERSITI TEKNOLOGI MALAYSIA (UTM)
Abstract
Infrastructure asset requires high building capacity for its operations. Its functions
are also linked to other infrastructures. In this light, an asset’s uniqueness in its
design, operations, stakeholders’ interest, and business growth affects its overall
value. Therefore, valuation is a critical component of infrastructure assets. This
is because specific components incorporate the approaches for valuing assets.
This paper highlights the valuation method for infrastructure assets and identifies
the tangible and intangible perspectives incorporated in infrastructure asset
valuation. Thus, each tangible and intangible perspective were investigated and
critically detailed in this paper. Identifying the tangible and intangible
components in an asset is essential because it will affect the valuation methods
that will be used to value the asset. Then, it will also be affected on the final value
of the asset. The research findings are derived from a critical review of literature
on tangible and intangible assets. This study adopted the qualitative approach,
where a series of in-depth interviews were conducted with experts to get an
insight into how these tangible and intangible perspectives influence asset
valuation. This paper will enrich the current body of knowledge and benefit
practitioners who could apply the study’s output to real practice.
Keywords: Tangible assets, intangible assets, infrastructure asset valuation,
property valuation, Malaysia
Nur Farah Hanna Mohd Rohaizad, Ezdihar Hamzah, Hariati Abdullah Hashim and Azizah Ismail
Tangible and Intangible Factors Incorporated for Infrastructure Asset Valuation
© 2021 by MIP 2
INTRODUCTION
Infrastructure refers to the physical, interrelated systems and components that
provide essential commodities and services to enhance a society’s living
sustainability (Fulmer, 2009). Infrastructures include roads, bridges, water
supply, sewers, electrical grids, telecommunication, and transportation.
According to Government Asset Management Policy (2009), assets are
categorised into four categories: movable assets, immovable assets, live assets,
and intellectual assets. In this light, infrastructure assets comprise both
infrastructure and assets supporting each other commonly used by members of
the society. The main goal of infrastructure management is to optimise the
lifecycle value of infrastructure for its users, owners and other stakeholders.
In recent years, the concept of infrastructure assets valuation has been
expanding as the infrastructure industry shifts into a performance-based decision-
making paradigm and the innovation of smarter infrastructure. Subsequently, the
intentions in intangible assets, including information and communication
technology, continue to rise in their shares in advanced economics. The
expansion of the intangible’s economy reflects the importance of expanding asset
valuation methods to capture tangible and intangible more explicitly in the future.
On the other hand, the international valuation standard (2013) stated that only
real property interests, infrastructure assets and plant equipment could be
described as specialised public service assets as infrastructure assets possess
specialised features by design, specification or location, reliable comparisons can
rarely be made with the prices of similar assets in the market. Therefore, choosing
the right method for infrastructure asset valuation has become the responsibility
of real estate professionals. This has caused several problems to arise, particularly
about the design of the building, the function, operation, and business growth
within the assets, making it more challenging to determine the suitable valuation
approaches to value an infrastructure asset. Therefore, the valuation of
infrastructure assets should come under scrutiny. Valuers need to understand and
adopt the right and most suitable approach in valuing infrastructure assets.
Consequently, it is important to choose an approach that aligns with the goals and
objectives for managing the infrastructure and reflects the true value of the asset.
Junainah and Suriatini (2019) supported that the goal of the valuation process is
to estimate the best possible value for a specific property. For this reason, an asset
valuation methodology is needed to quantify the value of infrastructure assets by
considering the tangibles asset and the intangible elements, including overall
asset use.
PLANNING MALAYSIA
Journal of the Malaysia Institute of Planners (2021)
3 © 2021 by MIP
LITERATURE REVIEW
Valuation of Special Property The Malaysian Valuation Standards (MVS) 2019 defined specialised property as
a property with a specialised nature. These properties are rarely transacted to
continue their existing use, except as part of a business sale in occupation. The
property is categorised as a ‘special’ due to the construction, arrangement, size
or location of the property, or a combination of these factors, or maybe due to the
nature of the plant, machinery and equipment provided in the buildings. Thus, a
special property valuation is required by using specific valuation methods based
on the property’s specific functions, operations, and the purpose of valuation.
Moreover, MVS (2019) asserted that specialised properties are usually valued
based on the Depreciated Replacement Cost (DRC). As mentioned in MVS
(2019), DRC is defined as the current cost of replacing an asset with a modern
equivalent asset with fewer deductions for physical deterioration, functional
obsolescence and economic obsolescence. Therefore, it is subject to the cost of
replacing the new asset by considering the physical, functional and economic
obsolescence. Thus, this research further discusses the current valuation practice
for infrastructure assets and how intangible elements are considered in
conducting a valuation. In this light, the most suitable valuation method could be
determined based on data derived from published reading materials (Abdul
Halim, 2008).
A previous study by Michelle (2012) adopted the depreciation
replacement cost method in highway valuation. Other than that, Nick French
(2004) investigated the profit method and depreciation replacement cost method
for hotel valuation, where depreciation replacement cost was applied to leisure
properties, public hospitals, and public churches. Meanwhile, in a study on
transportation terminals, Ratmoko (1997) adopted the cost method and profit
method for airport terminal valuation; and Gutek (1990) also adopted the cost
method and profit method for terminal transit valuation. Besides, Hall (1990)
used the cost method, comparison method and profit method for an automatic car
wash centre, and Healy and Berquist (1994) adopted the comparison method for
tin mining valuation. Based on the studies reviewed, the preferable valuation
methods adopted are cost and profit-based methods. In general, all valuation
methods adopted for special properties would identify and categorise a different
component that could be taken out during the valuation of tangible and intangible
assets.
This study embarked on a case study of the Sultan Iskandar Custom,
Immigration and Quarantine Complex (CIQ Complex) in Johor. The CIQ
complex is a transportation terminal in Johor Bahru built to solve the traffic
congestion issue in the Johor-Singapore Causeway. This study focused on a 3-
storey office building located within the CQI Complex with a total area of
353,082.43 square feet. The building is located adjacent to the complex’s vehicle
Nur Farah Hanna Mohd Rohaizad, Ezdihar Hamzah, Hariati Abdullah Hashim and Azizah Ismail
Tangible and Intangible Factors Incorporated for Infrastructure Asset Valuation
© 2021 by MIP 4
deck of the complex. In this light, the vehicle decks in the complex are placed at
different levels to isolate traffic flow. Heavy vehicles will use the outermost part,
and the next level is for light vehicles such as cars and motorcycles, while the
highest level is reserved for buses. The CIQ Complex also houses government
offices. The development of the complex was listed under the National Key
Target Level 1, which means that CIQ Complex is considered an essential
infrastructure asset that serves an important function to the society and the
relationship between Malaysia and foreign countries, specifically Singapore.
Thus, in valuating this asset, all facilities and components of the building must
be identified to ensure a comprehensive assessment that involves all facilities and
components of the CIQ Complex. Issues related to intangible economic benefits
also need to be highlighted as they also influence the infrastructure asset value.
Overview of Profit Method and Cost Method The profit method is one of the five methods of valuation (Pagourtzi et al., 2003).
It aims to provide a comprehensive valuation of any property (land and
buildings), plant, equipment, machinery and movable asset. The profit method
considers the specialised nature of the property and is based on the income and
expenses relating to the business that includes tangible and intangible assets. It is
important to note that this method is not a business valuation; it does share
similarities to a discounted cash flow used to value a business and is based on the
income and expenses of the business. However, at a certain point, the cash flow
would be converted into a property rental split and capitalised after deducting
property expenses to arrive at the property value.
Meanwhile, the cost method is used when the transaction data for the
property is limited, or there is no transaction for the property. In theory, the cost
method evaluates the property by dividing it into land and buildings. Based on A.
F Millington (1975), the value of land should be added to the cost of the building
to obtain the value of the property. For the first component, which is land, the
value of this site will be determined by comparing the site’s value against the
value of other similar sites. If there is a difference between the comparison site
and the valuation site, adjustments need to be made (Azhari Husin, 1996). On the
other hand, to determine the second component, including building cost,
estimates can be made by assuming the cost for rebuilding or refurbishing the
building on the ground.
Tangible Factors of Infrastructure Asset Valuation When the valuation is made, the asset components will be carefully considered
to obtain the correct and accurate amount of value. The components of the asset
will usually take into account the so-called tangible assets. Tangible assets are
terms used in the valuation procedure for fixed assets, including machinery,
PLANNING MALAYSIA
Journal of the Malaysia Institute of Planners (2021)
5 © 2021 by MIP
buildings and land, and current assets, such as inventory (Falls & Hosang, 2001).
Other than identifying the methods adopted for infrastructure asset valuation, the
use-value approach mentioned by Weldemicael (2017) could also be used to
measure an asset’s intangible economic benefits. Thus, the tangible factors that
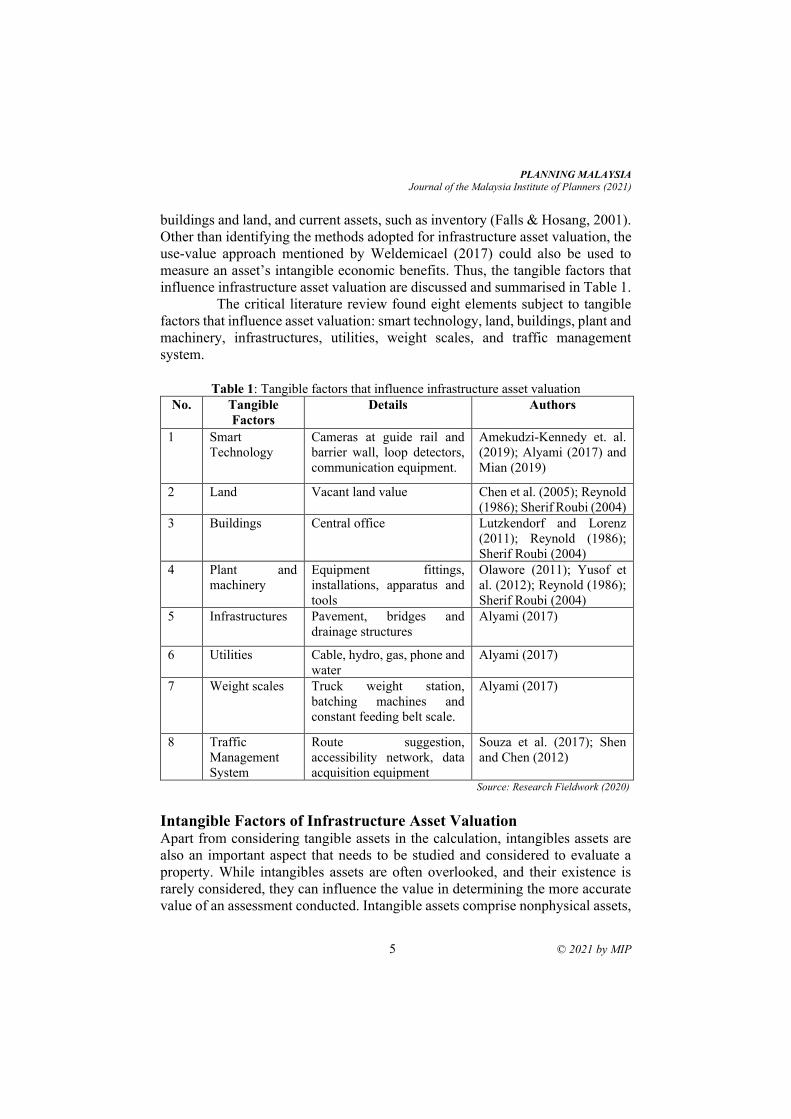
influence infrastructure asset valuation are discussed and summarised in Table 1.
The critical literature review found eight elements subject to tangible
factors that influence asset valuation: smart technology, land, buildings, plant and
machinery, infrastructures, utilities, weight scales, and traffic management
system.
Table 1: Tangible factors that influence infrastructure asset valuation
No. Tangible
Factors
Details Authors
1 Smart
Technology
Cameras at guide rail and
barrier wall, loop detectors,
communication equipment.
Amekudzi-Kennedy et. al.
(2019); Alyami (2017) and
Mian (2019)
2 Land Vacant land value Chen et al. (2005); Reynold
(1986); Sherif Roubi (2004)
3 Buildings Central office Lutzkendorf and Lorenz
(2011); Reynold (1986);
Sherif Roubi (2004)
4 Plant and
machinery
Equipment fittings,
installations, apparatus and
tools
Olawore (2011); Yusof et
al. (2012); Reynold (1986);
Sherif Roubi (2004)
5 Infrastructures Pavement, bridges and
drainage structures
Alyami (2017)
6 Utilities Cable, hydro, gas, phone and
water
Alyami (2017)
7 Weight scales Truck weight station,
batching machines and
constant feeding belt scale.
Alyami (2017)
8 Traffic
Management
System
Route suggestion,
accessibility network, data
acquisition equipment
Souza et al. (2017); Shen
and Chen (2012)
Source: Research Fieldwork (2020)
Intangible Factors of Infrastructure Asset Valuation Apart from considering tangible assets in the calculation, intangibles assets are
also an important aspect that needs to be studied and considered to evaluate a
property. While intangibles assets are often overlooked, and their existence is
rarely considered, they can influence the value in determining the more accurate
value of an assessment conducted. Intangible assets comprise nonphysical assets,
Nur Farah Hanna Mohd Rohaizad, Ezdihar Hamzah, Hariati Abdullah Hashim and Azizah Ismail
Tangible and Intangible Factors Incorporated for Infrastructure Asset Valuation
© 2021 by MIP 6
and the intangible asset components will vary across the properties being
assessed. Intangible assets are also monetary assets that manifest themselves
according to their economic properties. It does not have physical substances but
grants rights and economic benefits to its owner (Malaysian Valuation Standard,
2019). These assets derive their value from the rights inherent in their ownership.
In this sense, these assets are considered intangibles because they cannot be seen
or touched, yet they have the potential to possess value.
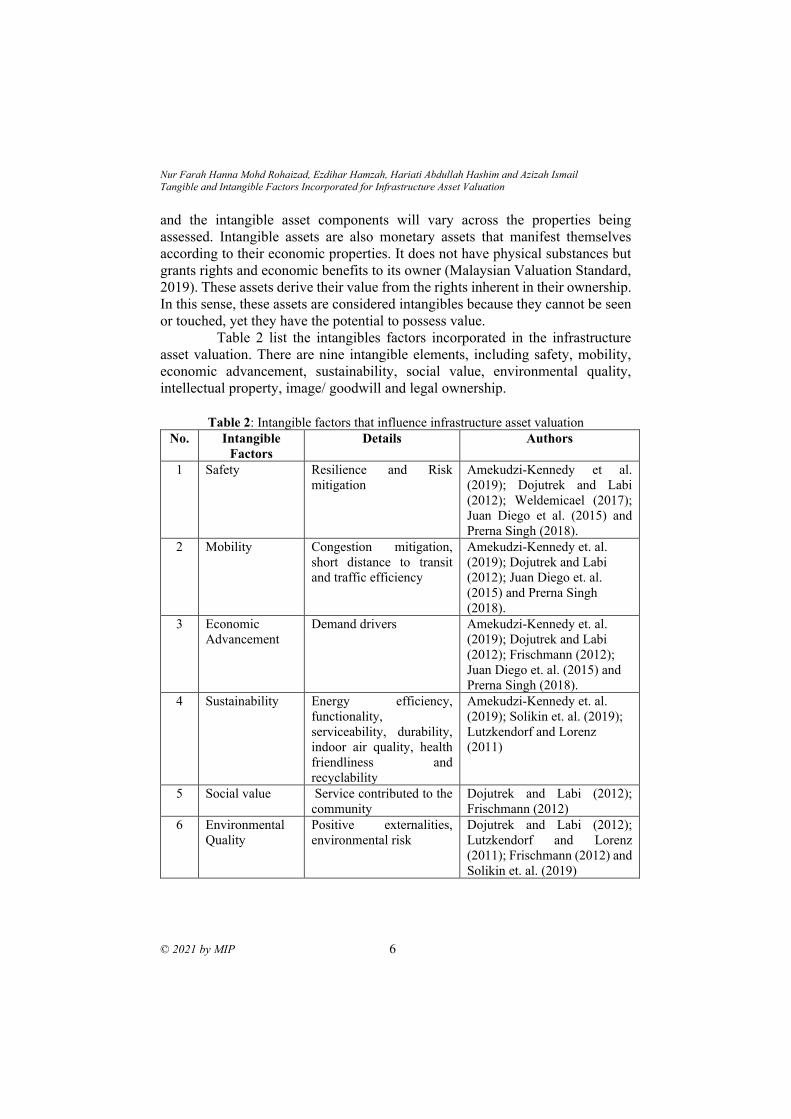
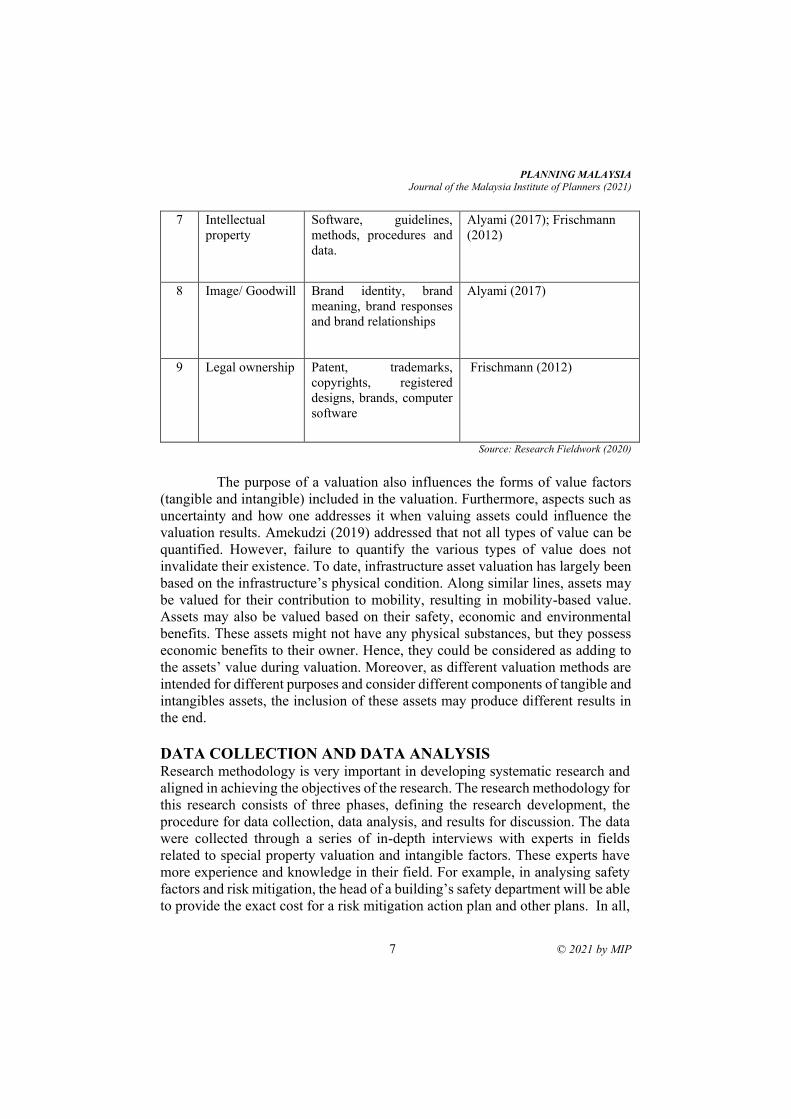
Table 2 list the intangibles factors incorporated in the infrastructure
asset valuation. There are nine intangible elements, including safety, mobility,
economic advancement, sustainability, social value, environmental quality,
intellectual property, image/ goodwill and legal ownership.
Table 2: Intangible factors that influence infrastructure asset valuation
No. Intangible
Factors
Details Authors
1 Safety Resilience and Risk
mitigation
Amekudzi-Kennedy et al.
(2019); Dojutrek and Labi
(2012); Weldemicael (2017);
Juan Diego et al. (2015) and
Prerna Singh (2018).
2 Mobility Congestion mitigation,
short distance to transit
and traffic efficiency
Amekudzi-Kennedy et. al.
(2019); Dojutrek and Labi
(2012); Juan Diego et. al.
(2015) and Prerna Singh
(2018).
3 Economic
Advancement
Demand drivers Amekudzi-Kennedy et. al.
(2019); Dojutrek and Labi
(2012); Frischmann (2012);
Juan Diego et. al. (2015) and
Prerna Singh (2018).
4 Sustainability Energy efficiency,
functionality,
serviceability, durability,
indoor air quality, health
friendliness and
recyclability
Amekudzi-Kennedy et. al.
(2019); Solikin et. al. (2019);
Lutzkendorf and Lorenz
(2011)
5 Social value Service contributed to the
community
Dojutrek and Labi (2012);
Frischmann (2012)
6 Environmental
Quality
Positive externalities,
environmental risk
Dojutrek and Labi (2012);
Lutzkendorf and Lorenz
(2011); Frischmann (2012) and
Solikin et. al. (2019)
PLANNING MALAYSIA
Journal of the Malaysia Institute of Planners (2021)
7 © 2021 by MIP
7 Intellectual
property
Software, guidelines,
methods, procedures and
data.
Alyami (2017); Frischmann
(2012)
8 Image/ Goodwill Brand identity, brand
meaning, brand responses
and brand relationships
Alyami (2017)
9 Legal ownership Patent, trademarks,
copyrights, registered
designs, brands, computer
software
Frischmann (2012)
Source: Research Fieldwork (2020)
The purpose of a valuation also influences the forms of value factors
(tangible and intangible) included in the valuation. Furthermore, aspects such as
uncertainty and how one addresses it when valuing assets could influence the
valuation results. Amekudzi (2019) addressed that not all types of value can be
quantified. However, failure to quantify the various types of value does not
invalidate their existence. To date, infrastructure asset valuation has largely been
based on the infrastructure’s physical condition. Along similar lines, assets may
be valued for their contribution to mobility, resulting in mobility-based value.
Assets may also be valued based on their safety, economic and environmental
benefits. These assets might not have any physical substances, but they possess
economic benefits to their owner. Hence, they could be considered as adding to
the assets’ value during valuation. Moreover, as different valuation methods are
intended for different purposes and consider different components of tangible and
intangibles assets, the inclusion of these assets may produce different results in
the end.
DATA COLLECTION AND DATA ANALYSIS Research methodology is very important in developing systematic research and
aligned in achieving the objectives of the research. The research methodology for
this research consists of three phases, defining the research development, the
procedure for data collection, data analysis, and results for discussion. The data
were collected through a series of in-depth interviews with experts in fields
related to special property valuation and intangible factors. These experts have
more experience and knowledge in their field. For example, in analysing safety
factors and risk mitigation, the head of a building’s safety department will be able
to provide the exact cost for a risk mitigation action plan and other plans. In all,
Nur Farah Hanna Mohd Rohaizad, Ezdihar Hamzah, Hariati Abdullah Hashim and Azizah Ismail
Tangible and Intangible Factors Incorporated for Infrastructure Asset Valuation
© 2021 by MIP 8
10 experts’ valuation field, cost-benefit analysis and officers in charge of
operations of the CIQ Complex were interviewed. The in-depth interviews with
the experts were conducted on either a face-to-face basis or online interview via
the Webex platform. All experts interviewed have successfully shared their
thoughts and insights on the tangible and intangible factors of infrastructure asset
valuation and how they influence the asset’s value. The data analysis stage
followed the data collection. Qualitative data analysis is the conceptual
interpretation of the data set as a whole, using a specific analytic strategy to
convert the raw data into a logical description and explanation of the
phenomenon under study. This research adopted qualitative data analysis to
analyse the data from the interview sessions with the experts.
RESEARCH FINDINGS AND DISCUSSIONS Based on the research findings, there are two sections for the questions asked to
the experts. The first section presents the expert’s background and opinions on
valuation methods adopted for infrastructure asset valuation. Based on the input
from the in-depth interview, all experts agreed that the cost method is the
preferred valuation method for infrastructure asset valuation. This is because the
cost method is suitable for valuing a public infrastructure asset as it considers the
land value by comparing the land value per square foot. Moreover, the method
allows valuators to consider the depreciation for cost in determining the cost for
building, plant, machinery and equipment.
The next part determined the most preferred methods for infrastructure
asset valuation. This includes the tangible and intangible factors incorporated that
enhance the infrastructure asset value. As infrastructure assets are considered
special properties, they are rarely transacted. Hence, it is hard to find comparable
data. All of the experts supported this notion during the interviews. In terms of
intangible elements included in infrastructure asset valuation, all of the experts
agreed that the cost method they adopted did not include the intangible elements.
However, experts 3 and 8 opined that the intangible elements are already included
in the price per square foot for the built-up area of the infrastructure asset. Thus,
they opined that the intangible elements already influence the value by
considering the building materials attached to the infrastructure asset. Two
experts, experts 3 and 8, disagreed that the valuation findings did not picture the
asset’s real value. This is because the price per square feet for the built-up area
of the infrastructure asset already includes the element of building materials,
which also influences intangible factors that are environmental quality and
sustainability. This is applicable especially for green buildings with sustainability
features. The study found that the main concept to highlight in intangible asset
valuation is an individual’s willingness to pay (Solikin et al., 2019). The findings
on tangible and intangible factors that should be incorporated into infrastructure
asset valuation are shown in Table 3.
PLANNING MALAYSIA
Journal of the Malaysia Institute of Planners (2021)
9 © 2021 by MIP
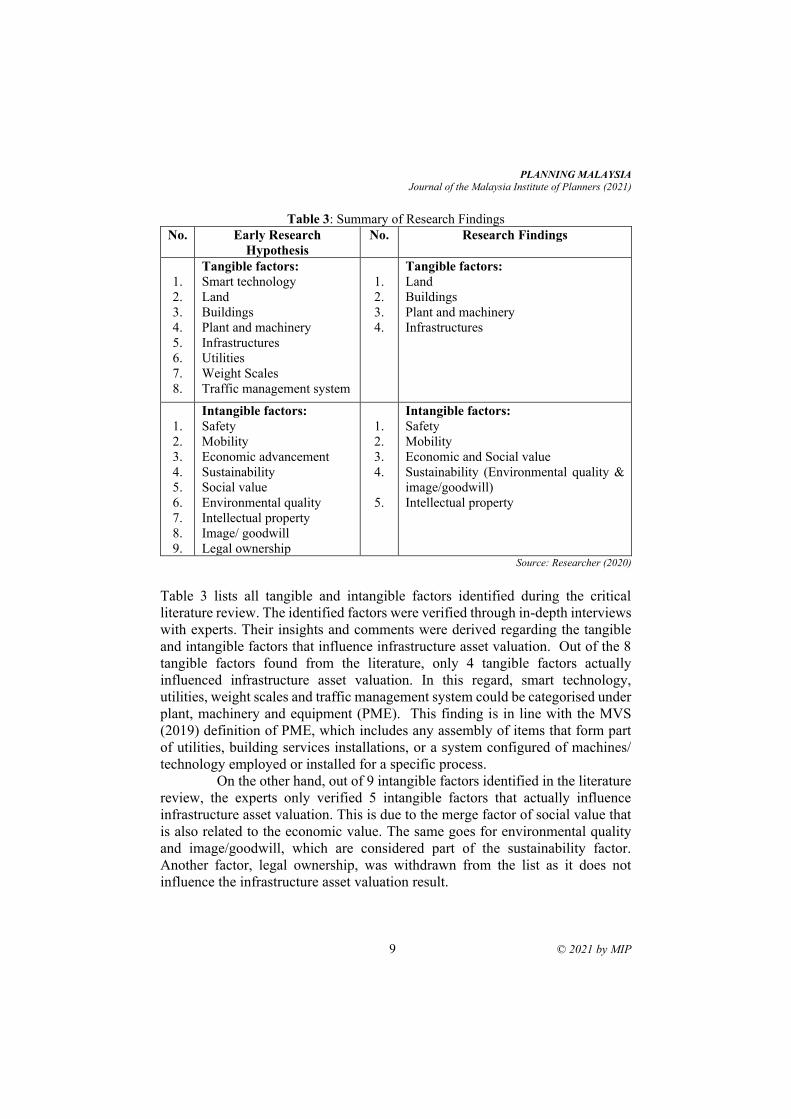
Table 3: Summary of Research Findings
No. Early Research
Hypothesis
No. Research Findings
1.
2.
3.
4.
5.
6.
7.
8.
Tangible factors:
Smart technology
Land
Buildings
Plant and machinery
Infrastructures
Utilities
Weight Scales
Traffic management system
1.
2.
3.
4.
Tangible factors:
Land
Buildings
Plant and machinery
Infrastructures
1.
2.
3.
4.
5.
6.
7.
8.
9.
Intangible factors:
Safety
Mobility
Economic advancement
Sustainability
Social value
Environmental quality
Intellectual property
Image/ goodwill
Legal ownership
1.
2.
3.
4.
5.
Intangible factors:
Safety
Mobility
Economic and Social value
Sustainability (Environmental quality &
image/goodwill)
Intellectual property
Source: Researcher (2020)
Table 3 lists all tangible and intangible factors identified during the critical
literature review. The identified factors were verified through in-depth interviews
with experts. Their insights and comments were derived regarding the tangible
and intangible factors that influence infrastructure asset valuation. Out of the 8
tangible factors found from the literature, only 4 tangible factors actually
influenced infrastructure asset valuation. In this regard, smart technology,
utilities, weight scales and traffic management system could be categorised under
plant, machinery and equipment (PME). This finding is in line with the MVS
(2019) definition of PME, which includes any assembly of items that form part
of utilities, building services installations, or a system configured of machines/
technology employed or installed for a specific process.
On the other hand, out of 9 intangible factors identified in the literature
review, the experts only verified 5 intangible factors that actually influence
infrastructure asset valuation. This is due to the merge factor of social value that
is also related to the economic value. The same goes for environmental quality
and image/goodwill, which are considered part of the sustainability factor.
Another factor, legal ownership, was withdrawn from the list as it does not
influence the infrastructure asset valuation result.
Nur Farah Hanna Mohd Rohaizad, Ezdihar Hamzah, Hariati Abdullah Hashim and Azizah Ismail
Tangible and Intangible Factors Incorporated for Infrastructure Asset Valuation
© 2021 by MIP 10
CONCLUSION In conclusion, the main research objectives have been achieved by identifying the
most suitable evaluation method. This study has identified and verified both
tangible and intangible factors influencing infrastructure asset valuation through
in-depth interviews with the experts and found the most significant factors
influencing infrastructure asset valuation. This paper will enrich the current body
of knowledge and benefit practitioners who could apply the study’s output to real
practice.
ACKNOWLEDGMENTS This research was supported by the research funders, namely the National
Institute of Valuation grant named The National Real Estate Research
Coordinator (NAPREC) with vote number R.J130000.7352.4B430.
REFERENCES Abdul Halim Abdul Raof (2008). Academic Report Writing (Second Edition). Petaling.
Alyami Z. (2017). Asset Valuation: A Performance Measure for Comprehensive
Infrastructure Asset Management. Doctor of Philosophy in Engineering
Dissertation. University of Waterloo, Canada.
Azhari Husin (1996). Harta Tanah: Kaedah Penilaian, Malaysia.
Amekudzi Kennedy (2019). Transportation Asset Valuation: Pre-Peri- and Post-Fourth
Industrial Revolution. Page: 1-10 at National Academy Science.
Chen Y., Lin X. and Liu Y. (2005). Impacts of Rail Transport Construction on
Land Value valuation Model and Empirical Study-case Study on Beijing Light Rail.
Journalof Beijing. Jiaotong University (Social Sciences Edition). Volume 4 (3).
Page 7-13.
Dojutrek, M. and Labi, S. (2012). Incorporating Asset Values in Investment Decision-
Making. Proc., 9th National Conference on Asset Management San Diego, Calif.
Falls, L.C., & Hosang, R. H (2001). Asset Valuation as a key Element Pavement
Management. 5th International Conference on Managing Pavement, Seattle:
Transportation Research Board.
Frischmann B. M. (2012). Infrastructure: The Social Value of Shared Resources. Oxford
University Press.
Fullmer J. E. (2009). “What in the World is Infrastructure?”Infrastructure investor. Page
30-32.
Government Asset Management Policy (2009). Malaysia.
Gutek J.P (1990). Transit Terminal Valuation, The Appraisal Journal, October.
Hall. J.G (1990). Valuation of Fully Automatic Carwash, The Appraisal Journal
October 1990.
Healy M.J and Berquist (1994). The sale comparison Approach and Timberland
Valuation. The Appraisal Journal, October 1994.
International Valuation Standard (2013) Framework and Requirements International
Valuation Standard Council. Valuation of Specialized Public services. London,
United Kingdom.
PLANNING MALAYSIA
Journal of the Malaysia Institute of Planners (2021)
11 © 2021 by MIP
Juan Diego Porras-Alvarado, Diniece Peter, Zhe Han and Zhanmin Zhang (2015) Novel
Utility-Based Methodological Framework for Valuation of Road Infrastructure.
Junainah M. and Suriatini I. (2019). Capabilities of Revealed Preference Method for
Heritage Property Valuation. Planning Malaysia. Journal of the Malaysian
Institute of Planners. Volume 17. Issue 1. Page 377-388.
Lutzkendorf T. and Lorenz D. (2011). Capturing Sustainability-related information for
Property Valuation. Building Research & Information.Volume 39 (3). Page 256 -
273.
Malaysian Valuation Standards, Sixth Edition (2019). Ramscott Academy. Board of
Valuer, Appraisers, Estate Agents and Property Managers.
Mian A. S. (2019). How ICT Implementations Impact on Managing Real Estate:
Directorate General State Asset Management, Ministry of Finance, Indonesia.
Planning Malaysia. Journal of the Malaysian Institute of Planners. Volume 17.
Issue 1. Page 350-364.
Millington A.F (1975). An Introduction to Property Valuation, London the Estate Gazette
Limited.
Michelle (2012). A Methodology for Highway Assets Valuation in Indiana Department
of Transportation and Purdue University).
Nick French (2004). The valuation of Specialized Property: A Review of Valuation
Method (Journal of Property Investment and Finance 22 (60:533-541).
Olawore A, Otegbulu A. and Babawale GK. (2011). Valuer’s Perception of Potential
Sources of Inaccuracy in Plant and Machinery Valuation in Nigeria. Property
Management.
Prena Singh (2018). Performance-Based Research Implementation Management.
Presented at 97thAnnual Meeting of the Transportation Research Board,
Washington DC.
Pagourtzi, et al., (2003). Real Estate Appraisal: A Review of Valuation Methods. Page
386.
Ratmoko, Setiawan Herman (1997). Valuation Methodology of Airport
Terminal. Master Dissertation. Universiti Teknologi Malaysia, Faculty
Geoinformation and Real Estate.
Renold (1986) Hotel Asset Allocation: Separating the Tangibles Personalty.
Roubi S. (2004). The Valuation of Intangibles for Hotel Investments. Property
Management. Volume 22. No.5. Page 410-423.
Shen D. and Chen S. (2012). Urban Traffic Management System Based on Ontology and
Multiagent System. Service Science, Management and Engineering.
Solikin A., Abdul Rahman R., Saefruden E., Suboh N., Zahari N. H. and Wahyudi E.
(2019). Forest Valuation Using Travel Cost Method (TCM): Cases of Pahang
National Park and Srengseng Jakarta Urban Forest. Planning Malaysia. Journal of
the Malaysian Institute of Planners.Volume 17. Issue 1. Page 365-376.
Souza A. M., Brennand C. and Yokoyama R. (2017). Traffic Management Systems: A
Classification, Review, Challenges, and Future Perspectives. International
Journal of Distributed Sensor Networks.
Weldemicael E. (2017). Asset Valuation of Transportation Infrastructure: Proof of
Concept in Colorado. Transportation Research Record. Washington.

Nur Farah Hanna Mohd Rohaizad, Ezdihar Hamzah, Hariati Abdullah Hashim and Azizah Ismail
Tangible and Intangible Factors Incorporated for Infrastructure Asset Valuation
© 2021 by MIP 12
Yusof Y., Eves C. and Mohd Nasir A. R. (2012). Space Management in Malaysian
Government Property: A Case Study. 18th Annual Pacific-Rim Real Estate Society
Conference. Adelaide, Australia.
Received: 12th July 2021. Accepted: 23rd Sept 2021
1 Student at University Tunku Abdul Rahman. Email: [email protected]
PLANNING MALAYSIA:
Journal of the Malaysian Institute of Planners
VOLUME 19 ISSUE 3 (2021), Page 13 – 22
EXPLORING THE USAGE OF DIGITAL TECHNOLOGIES FOR
CONSTRUCTION PROJECT MANAGEMENT
Tung, Yew-Hou1, Chia, Fah-Choy2, Felicia Yong, Yan-Yan3
Lee Kong Chian Faculty of Engineering and Science
UNIVERSITI TUNKU ABDUL RAHMAN, MALAYSIA
Abstract
Digital technologies have recently started to enter the construction industry,
gradually changing how infrastructure, real estate and other built assets are
designed, constructed, operated and maintained. Being among the least
digitalized sectors, it is predicted that digital technologies will substantially
increase the productivity, decrease the costs, and improve site safety of
construction projects. Thus, the primary objective of this pilot study is to explore
the usage of digital technologies for the 12 components of construction project
management. A total of 32 respondents participated in the online survey. The
results indicate that the usage of digital technologies was significantly higher in
the management of scheduling, documenting, designing, and assigning costs. The
aspects for digitalized safety, stakeholders, equipment, and materials are room
for further improvement.
Keywords: Digital Technologies, Construction Industry, Project Management
Tung Yew-Hou, Chia Fah-Choy, Felicia Yong Yan-Yan Exploring the Usage of Digital Technologies for Construction Project Management
© 2021 by MIP 14
INTRODUCTION
The construction industry is triggered by the world's megatrends such as the
growing population, or the increasing demand for infrastructure and housing
projects. The construction industry intends to improve the image of remarkably
poor productivity by pursuing the Fourth Industrial Revolution (4IR), which
involves the integration of digital technologies into all existing business areas.
The digital transformation in the construction industry involves the introduction
of Industrialised Building Systems (IBSs), Building Information Modelling
(BIM), Augmented Reality (AR) and Virtual Reality (VR), and Unmanned Aerial
Vehicles (UAVs), and has given a different elucidation of built environment to
the public (Abdullah, Rashid, Tahar & Osoman, 2021; Ramu, Taib & Aziz, 2020;
Chai, 2017).
Digitalisation has raised the production of the construction industry.
IBSs manufacture distinct components and are ready to erect modular units off
site. BIM is no longer restricted to dimensional modelling. Nevertheless, the BIM
model can be shown in different platforms that can be consolidated with various
digital devices. AR and VR are initially only beneficial for game design, but the
idea was executed for training purposes in the built environment. Digitalisation
will change nearly everything that allows the industry to improve to the newest,
recognised innovative methods (Chai, 2017).
The Malaysian construction industry is advancing, although at a laggy
pace. The idea of digitalisation has been highly acknowledged in the country. The
Malaysian construction industry is in a transformation stage, changing from
analog to digital. The preparedness of the stakeholders in connection with
business model, finance, planning, operation, and maintenance of organization,
together with the top management’s commitment, are improving digitalisation.
Nevertheless, the digital age progresses quickly, and the industry either accepts
the megatrend to advance forward, or risks being left behind (Chai, 2017).
LITERATURE REVIEW Digital Technologies: Barriers in Construction Project Management
The current practice of the construction industry makes digital evolution
remarkably difficult. Construction companies find it even harder to develop
digital solutions that can be applied to multiple projects. Often, the individual
departments of a company will develop their own digital solutions, without
coordinating with others (Koeleman, Ribeirinho, Rockhill, Sjodin & Strude,
2019).
Construction projects are usually fragmented throughout a project life
cycle. The specialists of consultants normally operate in a small number of
disciplines. Each stage of the project life cycle involves a different group of
contractors and subcontractors. Therefore, it is extremely hard to develop digital
PLANNING MALAYSIA
Journal of the Malaysia Institute of Planners (2021)
15 © 2021 by MIP
solutions across a construction project that requires coordinating changes among
project stakeholders (Koeleman et al., 2019).
Construction projects have distinctive requirements that involve
bespoke design and delivery approaches. These approaches are hardly repeated;
therefore, it is difficult to initiate changes across several projects, because it
involves thorough transformation. (Koeleman et al., 2019).
Typically, a new construction project engages a new arrangement of
organizations working together. Project stakeholders are hardly regular.
Contractors will have similar encounters at the company level, where workforce
turnover is high. Instability at the project and company levels makes it difficult
for construction companies and the involved parties to establish new working
approaches and competencies that seamlessly transfer from one project to the
next (Koeleman et al., 2019).
The large scale of construction companies is likely to be associated with
departments adhering to their own procedures in preference to specific standards,
especially since many have expanded by obtaining small-scale companies where
project sites located far away from the company’s headquarters. It is encouraging
for supervising workers to implement new working approaches or use advanced
technologies (Koeleman et al., 2019).
Digital Technologies: Trends in Construction Project Management
Experts foresee that construction programmes will be reduced persistently, as
clients expect more efficiency in project delivery. Also, the shortage of skilled
labour and raw materials will increasingly challenge those involved in
construction projects. Therefore, construction companies are expected to
integrate digital technologies into their processes in order to retain their
competitive edge (Smartsheet, 2018).
Construction projects usually involve several phases before completion.
It is normal to have changes due to project constraints, especially when waiting
for information or an approval for implementation. As the changes may affect the
scope of the project, the updated information must be instantly accessed by all
the affected parties through digital devices and platforms. With real-time
updating, project delivery performance and transparency will be improved as
project managers will be able to know actual happenings at site, to monitor and
make timely decisions if there are any site issues (Smartsheet, 2018).
Site safety is highly important for any construction project. Due to busy
workload, workers may be reluctant or forget to report any spotted site safety
issues. To reduce accident rates, contractors should make it convenient for
workers to report safety issues by using their mobile phones to scan the QR codes
on the on site safety signs. Alternatively, workers can take pictures attached to an
online form as well. Once the issues are reported, the relevant parties, namely,
site officers and construction managers, must conduct immediate inspection and
Tung Yew-Hou, Chia Fah-Choy, Felicia Yong Yan-Yan Exploring the Usage of Digital Technologies for Construction Project Management
© 2021 by MIP 16
resolve them without any delay, to create a highly safer work environment
(Smartsheet, 2018).
All project parties, regardless of whether they are based on site or at the
head office, can access real-time and comprehensive project information if
allowed by the company. There are many project documents such as contracts,
documents, drawings, specifications, progress reports, requests for information,
testing logs, inspection logs, master programmes, financial statements, progress
claims, and interim certificates that make documentation easy for the project
parties to access when needed by using cloud-based technology (Smartsheet,
2018).
There are many types of project deliverables in construction projects. It
is crucial to access and share the status of work done in real-time by using cloud-
based technology. All project parties are responsible for their outstanding work,
as the other parties can view the status of each item and who is accountable for
it. Many project documents require approval or sign-off before the work can be
executed in construction projects. However, it is hard to obtain all the key project
stakeholders to sit down and get the instructions signed by everyone physically.
This can be overcome and expedited by collecting electronic signatures through
circulation of the project documents (Smartsheet, 2018).
The shortage of skilled and knowledgeable workers is a common and
long-standing issue in the construction industry. But this would not be a reason
for construction companies to deliver a project with a longer lead time.
Conversely, the contractor especially must retain the same speed and efficiency
with a compact workforce, due to the competition getting increasingly fierce in
the industry. To sustain the construction business, automating repetitive tasks by
adopting reliable software is an option. For instance, BIM software would benefit
construction companies by coordinating trades and subcontractors, detecting any
clashes before construction begins, visualizing the entire project during
preconstruction, and improving onsite collaboration and communication (Hall,
2018).
RESEARCH METHODOLOGY Sampling Design and Research Procedure
This research was based on a pilot survey conducted using an online
questionnaire. It was achieved through the following processes:
1) Sample Definition. This pilot study aims to explore the usage of digital
technologies in construction-related companies. Therefore, the target
respondents included the following construction practitioners: consultancy,
construction businesses, property developments, construction materials,
manufacturer and merchants, and other related parties with certain working
experience in the industry and working in established construction-related
companies that involve different types of construction projects such as
PLANNING MALAYSIA
Journal of the Malaysia Institute of Planners (2021)
17 © 2021 by MIP
commercial, industrial, infrastructure, residential, renovation or
refurbishment.
2) Questionnaire Validation. In validating a survey, face validity was
established. First, experts who understand the topic read through the
questionnaire to ensure the questions effectively capture the topic under
investigation. Second an expert in construction checked the survey for
common errors like double-barrelled, confusing, or leading questions.
3) Questionnaire Design. The questionnaire was created by using Google
Forms. Google Forms provides a fast way to create an online survey. Once
the online questionnaire is created, an invitation was sent out by the
researcher to potential respondents for participation through email. The
survey instrument was divided into two sections. Section A consists of
questions about general responses on the usage of digital technologies when
managing different components of construction projects, while Section B
comprises questions concerning respondents’ demographic information.
4) Data collection. Data was collected from February to July 2019. The
duration was about six months.
5) Data analysis. Analysis of the data started in the month of August 2019. The
Statistical Package for the Social Sciences (SPSS) software was used to
check and analyze the data.
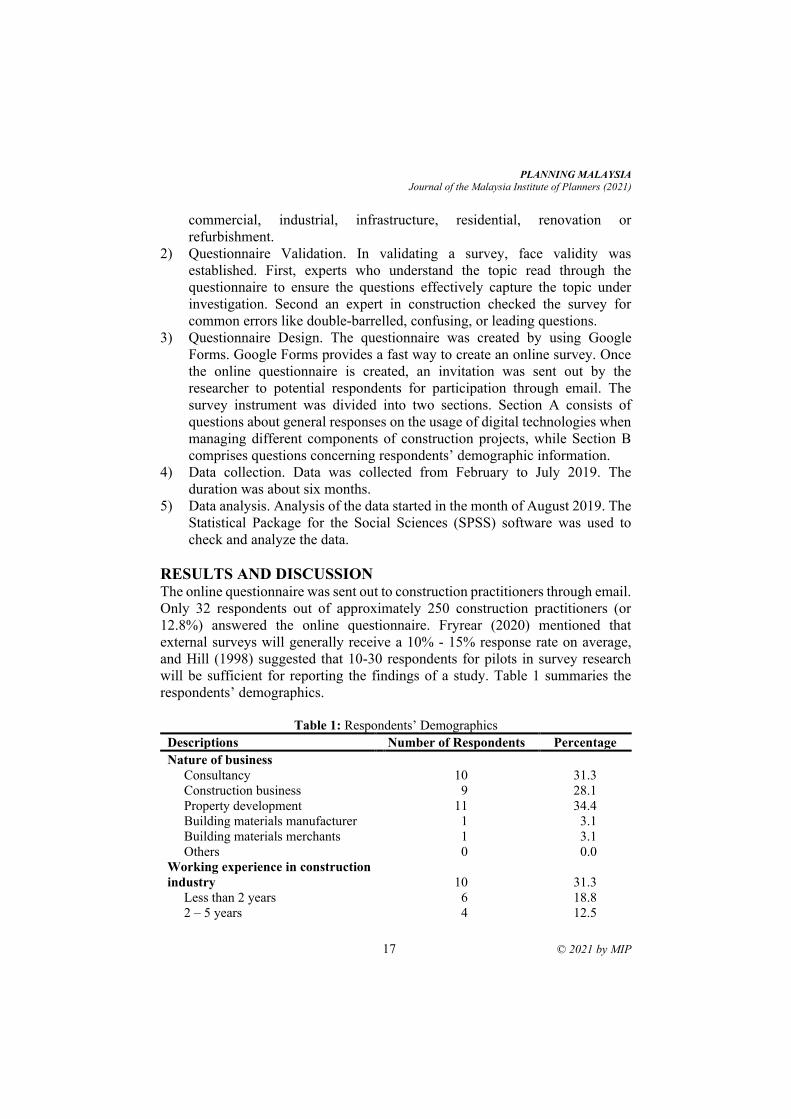
RESULTS AND DISCUSSION The online questionnaire was sent out to construction practitioners through email.
Only 32 respondents out of approximately 250 construction practitioners (or
12.8%) answered the online questionnaire. Fryrear (2020) mentioned that
external surveys will generally receive a 10% - 15% response rate on average,
and Hill (1998) suggested that 10-30 respondents for pilots in survey research
will be sufficient for reporting the findings of a study. Table 1 summaries the
respondents’ demographics.
Table 1: Respondents’ Demographics
Descriptions Number of Respondents Percentage
Nature of business
Consultancy
Construction business
Property development
Building materials manufacturer
Building materials merchants
Others
10
9
11
1
1
0
31.3
28.1
34.4
3.1
3.1
0.0
Working experience in construction
industry
Less than 2 years
2 – 5 years
10
6
4
31.3
18.8
12.5
Tung Yew-Hou, Chia Fah-Choy, Felicia Yong Yan-Yan Exploring the Usage of Digital Technologies for Construction Project Management
© 2021 by MIP 18
6 – 10 years
1 – 20 years
More than 20 years
7
5
21.9
15.6
Number of company employees
Less than 5
5 – 29
30 – 75
More than 75
4
13
6
9
12.5
40.6
18.8
28.1
Types of construction project
Commercial
Industrial
Infrastructure
Residential
Renovation or refurbishment works
Others
14
1
4
9
4
0
43.8
3.1
12.5
28.1
12.5
0.0
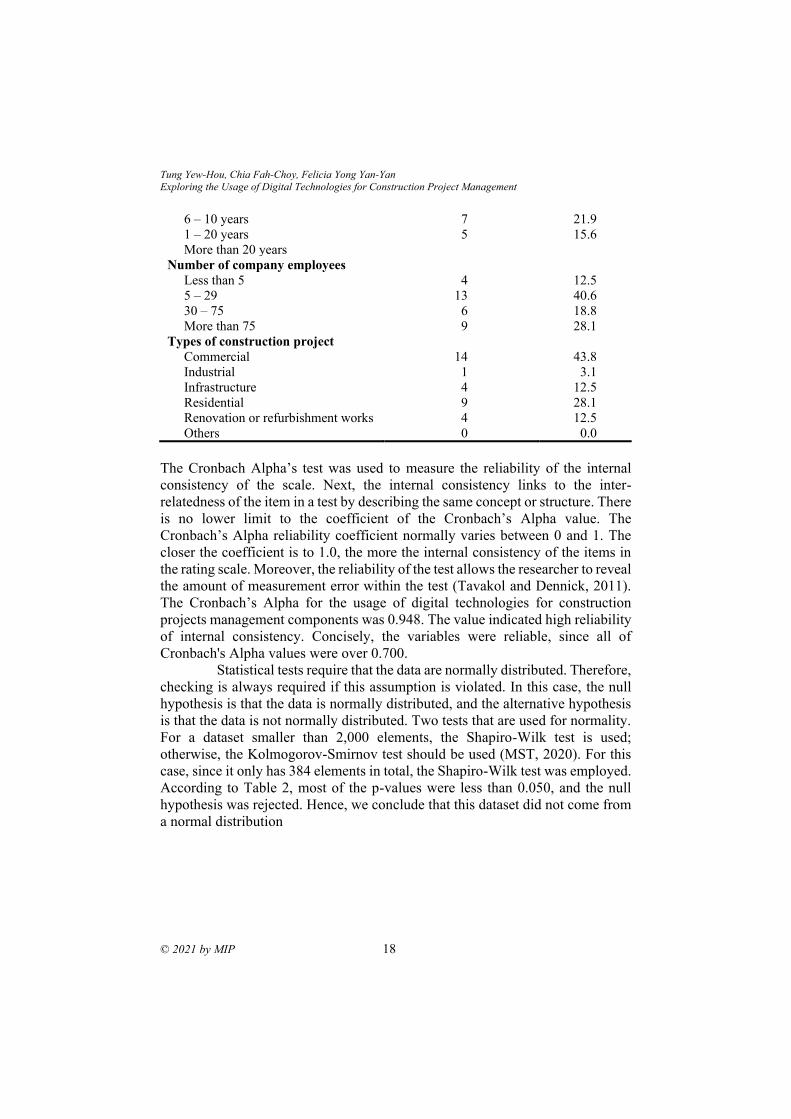
The Cronbach Alpha’s test was used to measure the reliability of the internal
consistency of the scale. Next, the internal consistency links to the inter-
relatedness of the item in a test by describing the same concept or structure. There
is no lower limit to the coefficient of the Cronbach’s Alpha value. The
Cronbach’s Alpha reliability coefficient normally varies between 0 and 1. The
closer the coefficient is to 1.0, the more the internal consistency of the items in
the rating scale. Moreover, the reliability of the test allows the researcher to reveal
the amount of measurement error within the test (Tavakol and Dennick, 2011).
The Cronbach’s Alpha for the usage of digital technologies for construction
projects management components was 0.948. The value indicated high reliability
of internal consistency. Concisely, the variables were reliable, since all of
Cronbach's Alpha values were over 0.700.
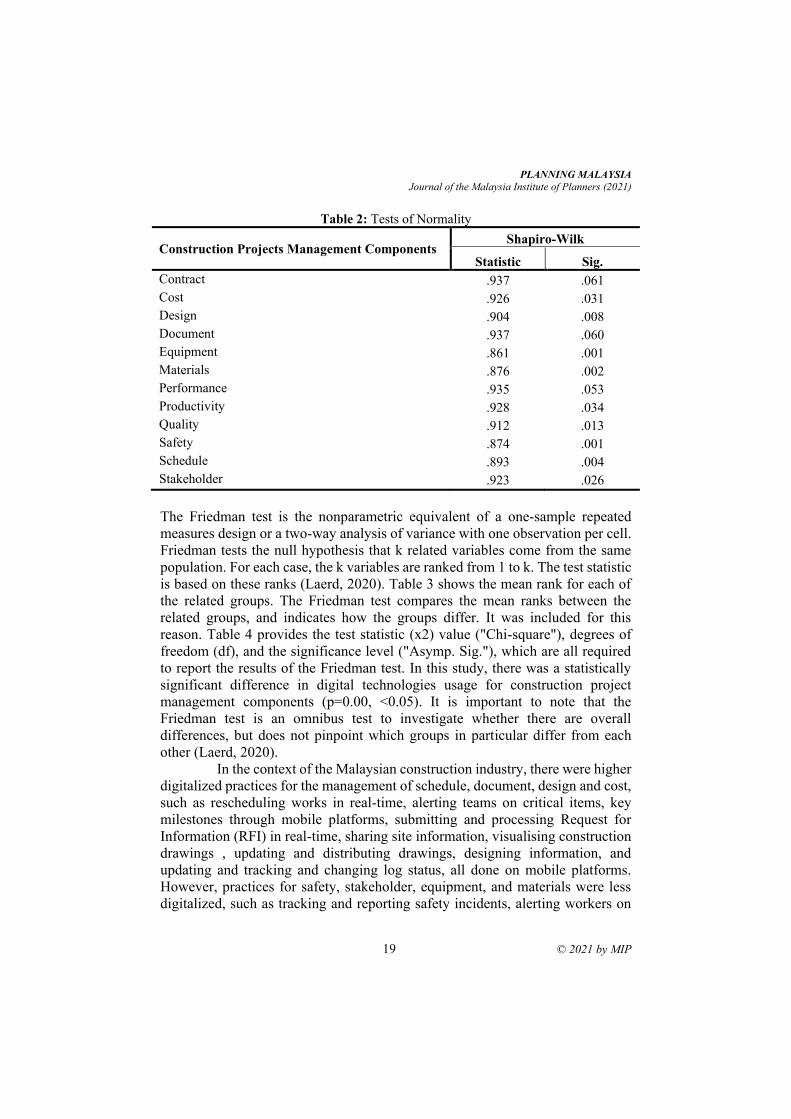
Statistical tests require that the data are normally distributed. Therefore,
checking is always required if this assumption is violated. In this case, the null
hypothesis is that the data is normally distributed, and the alternative hypothesis
is that the data is not normally distributed. Two tests that are used for normality.
For a dataset smaller than 2,000 elements, the Shapiro-Wilk test is used;
otherwise, the Kolmogorov-Smirnov test should be used (MST, 2020). For this
case, since it only has 384 elements in total, the Shapiro-Wilk test was employed.
According to Table 2, most of the p-values were less than 0.050, and the null
hypothesis was rejected. Hence, we conclude that this dataset did not come from
a normal distribution
PLANNING MALAYSIA
Journal of the Malaysia Institute of Planners (2021)
19 © 2021 by MIP
Table 2: Tests of Normality
Construction Projects Management Components Shapiro-Wilk
Statistic Sig.
Contract .937 .061
Cost .926 .031
Design .904 .008
Document .937 .060
Equipment .861 .001
Materials .876 .002
Performance .935 .053
Productivity .928 .034
Quality .912 .013
Safety .874 .001
Schedule .893 .004
Stakeholder .923 .026
The Friedman test is the nonparametric equivalent of a one-sample repeated
measures design or a two-way analysis of variance with one observation per cell.
Friedman tests the null hypothesis that k related variables come from the same
population. For each case, the k variables are ranked from 1 to k. The test statistic
is based on these ranks (Laerd, 2020). Table 3 shows the mean rank for each of
the related groups. The Friedman test compares the mean ranks between the
related groups, and indicates how the groups differ. It was included for this
reason. Table 4 provides the test statistic (x2) value ("Chi-square"), degrees of
freedom (df), and the significance level ("Asymp. Sig."), which are all required
to report the results of the Friedman test. In this study, there was a statistically
significant difference in digital technologies usage for construction project
management components (p=0.00, <0.05). It is important to note that the
Friedman test is an omnibus test to investigate whether there are overall
differences, but does not pinpoint which groups in particular differ from each
other (Laerd, 2020).
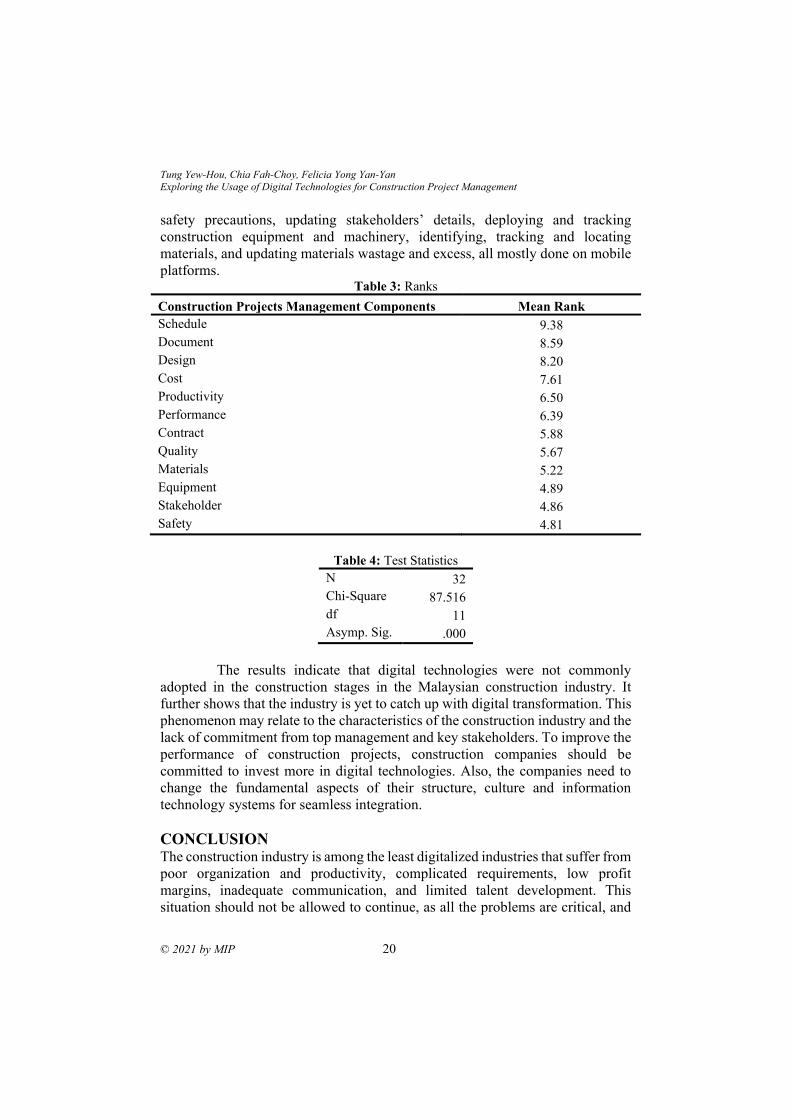
In the context of the Malaysian construction industry, there were higher
digitalized practices for the management of schedule, document, design and cost,
such as rescheduling works in real-time, alerting teams on critical items, key
milestones through mobile platforms, submitting and processing Request for
Information (RFI) in real-time, sharing site information, visualising construction
drawings , updating and distributing drawings, designing information, and
updating and tracking and changing log status, all done on mobile platforms.
However, practices for safety, stakeholder, equipment, and materials were less
digitalized, such as tracking and reporting safety incidents, alerting workers on
Tung Yew-Hou, Chia Fah-Choy, Felicia Yong Yan-Yan Exploring the Usage of Digital Technologies for Construction Project Management
© 2021 by MIP 20
safety precautions, updating stakeholders’ details, deploying and tracking
construction equipment and machinery, identifying, tracking and locating
materials, and updating materials wastage and excess, all mostly done on mobile
platforms. Table 3: Ranks
Construction Projects Management Components Mean Rank
Schedule 9.38
Document 8.59
Design 8.20
Cost 7.61
Productivity 6.50
Performance 6.39
Contract 5.88
Quality 5.67
Materials 5.22
Equipment 4.89
Stakeholder 4.86
Safety 4.81
Table 4: Test Statistics
N 32
Chi-Square 87.516
df 11
Asymp. Sig. .000
The results indicate that digital technologies were not commonly
adopted in the construction stages in the Malaysian construction industry. It
further shows that the industry is yet to catch up with digital transformation. This
phenomenon may relate to the characteristics of the construction industry and the
lack of commitment from top management and key stakeholders. To improve the
performance of construction projects, construction companies should be
committed to invest more in digital technologies. Also, the companies need to
change the fundamental aspects of their structure, culture and information
technology systems for seamless integration.
CONCLUSION The construction industry is among the least digitalized industries that suffer from
poor organization and productivity, complicated requirements, low profit
margins, inadequate communication, and limited talent development. This
situation should not be allowed to continue, as all the problems are critical, and
PLANNING MALAYSIA
Journal of the Malaysia Institute of Planners (2021)
21 © 2021 by MIP
population growth, urbanisation and economic expansion are predicted to
increase global demand for construction output by 85% by 2030 (Atom & CIOB,
2019). Therefore, the construction industry must embrace digital technologies
and adopt new approaches to manage and deliver the projects for better success.
This study has indicated that there was a statistically significant difference in
digital technologies usage for construction project management components in
the context of the Malaysian construction industry. The results show there were
higher digitalized practices for the management of schedule, document, design
and cost. However, practices for safety, stakeholder, equipment, and materials
were less digitalized. Thus, it is recommended that construction players invest in
more resources to enhance the digital technologies in a more holistic way, in order
to enhance construction project delivery.
REFERENCES Atom & CIOB. (2019). Reimagining construction: transformed by technology. Retrieved
from: https://www.constructionmanagermagazine.com/cpd-articles/reimagining-
construction-transformed-technology/
Abdullah, S., Rashid, M. F. A., Tahar, K. N., & Osoman, M. A. (2021). Tree Crown
Mapping based on unmanned aerial vehicle (UAV) towards a green-sustainable
residential. Planning Malaysia Journal of the Malaysian Institute of Planners,
19(2), 97–107. Chai, C.S. (2017). Digitalisation in built environment. Retrieved from:
https://ipm.my/digitalisation-built-environment/
Fryrear, A. (2020). What’s a good survey response rate? Retrieved from:
https://www.surveygizmo.com/resources/blog/survey-response-rates/
Hall, J. (2018). Top 10 benefits of BIM in construction. Retrieved from:
https://bim360resources.autodesk.com/connect-construct/top-10-benefits-of-bim-
in-construction
Hill, R. (1998). What sample size is “enough” in internet survey research. Interpersonal
Computing and Technology: An electronic journal for the 21st century, 6(3-4), 1-
12.
Koeleman, J., Ribeirinho, M.J., Rockhill, D., Sjodin, E. & Strude, G. (2019). Decoding
digital transformation in construction. Retrieved from:
https://www.mckinsey.com/industries/capital-projects-and-infrastructure/our-
insights/decoding-digital-transformation-in-construction
Laerd. (2020). Friedman test in SPSS statistics. Retrieved from:
https://statistics.laerd.com/spss-tutorials/friedman-test-using-spss-statistics.php
MST. (2020). Performing normality in PASW (SPSS). Retrieved from:
http://www.maths-statistics-tutor.com/normality_test_pasw_spss.php
Ramu, V., Taib, N., & Aziz, N. F. (2020). The attributes of future social learning built
environments towards 21st century education in tertiary education. Planning
Malaysia Journal of the Malaysian Institute of Planners, 18(3), 326–337. Smartsheet. (2018). A digital transformation report: five emerging trends in the
construction industry. Retrieved from:

Tung Yew-Hou, Chia Fah-Choy, Felicia Yong Yan-Yan Exploring the Usage of Digital Technologies for Construction Project Management
© 2021 by MIP 22
https://www.smartsheet.com/sites/default/files/13619-Report-Construction-
DIGITAL.pdf
Tavakol, M., & Dennick, R. (2011). Making sense of Cronbach's alpha. International
journal of medical education, 2, 53.
Received: 12th July 2021. Accepted: 23rd Sept 2021
1 Undergraduate Student at Tunku Abdul Rahman University College. Email: [email protected]
PLANNING MALAYSIA:
Journal of the Malaysian Institute of Planners
VOLUME 19 ISSUE 3 (2021), Page 23 – 36
INVESTMENT STYLES OF REIT PROPERTY PORTFOLIOS
Tan Chor Heng1 & Ting Kien Hwa2
1Faculty of Built Environment,
TUNKU ABDUL RAHMAN UNIVERSITY COLLEGE 2Faculty of Architecture, Planning & Surveying,
UNIVERSITI TEKNOLOGI MARA
Abstract
Investment style, comprising generic-style and specific-style, is the real estate
investment management approach adopted by REIT management in guiding the
construction of their portfolios. These portfolios would have distinctive return
and risk performance reflecting the stated risk and return underlying the
investment vision. Using quantitative and qualitative approaches, this study
identified the investment style of each M-REIT listed on Bursa Malaysia. Using
the generic-style criteria and analysis, M-REITs are found to have pursued
passive and value strategies aided by a top-down approach to their property
portfolio management. Whilst results of the specific style analysis show that core
portfolios have produced a lower risk-return ratio compared to value-added and
opportunistic portfolios. These findings will benefit investors by guiding their
investment decision making in constructing their investment portfolios and also
in deciding ways to achieve diversification.
Keywords: Property portfolios, investment style, risk and return
Tan Chor Heng & Ting Kien Hwa Investment Styles of REIT Property Portfolios
© 2021 by MIP 24
INTRODUCTION Investing in diversified portfolios involves consideration of risk tolerance and
style characteristics with an eye on systematic changes affecting investing
opportunities in the overall investment landscape (Baum and Hartzell, 2012,
Baum, 2015). Style is a statement of the approach adopted by a portfolio manager
to real estate investment management reflecting the stated risk tolerance.
According to Peyton (2008), style is usually expressed as a combination of:
a) generic style (active or passive, top down or bottom up, value or growth),
b) specific style (core, value-added or opportunistic)
This study focuses on the listed REIT sector in Bursa Malaysia. In
December 2019, there are 18 listed REITs and 1 unlisted REIT in Malaysia. There
are 5 Office REITs, 5 Retail REITs, 4 Mixed REITs, 2 Industrial REITs, 1
Healthcare REIT, 1 Hospitality REIT and 1 Education REIT in Malaysia.
The outcome of this research is particularly useful to retail and
institutional investors, where the investment styles identified can assist them in
making the right M-REIT investment decision making. Coupled with the
knowledge on fundamental, technical and sentimental analysis of a particular M-
REIT, investors will be able to benefit by developing the most suitable investment
portfolio. For retail investors, the style box helps the investors to construct a
diversified portfolio that reduces overall volatility and increase expected return.
The objectives of the study are:
a) To determine the investment style of each M-REIT
b) To determine the investment styles of M-REIT in general
c) To identify the effect of investment style on the performance of M-REIT
LITERATURE REVIEW
According to Parker (2011), investment style is a clear statement of approach to
property investment management to be selected by the REIT demonstrating the
stated risk tolerance underlying the vision or goals of the REIT. Generally,
investment style is articulated as a combination of generic style and specific style.
Typically, generic style is classified into three categories, namely Active or
Passive, Value or Growth, and Top-down or Bottom-up. On the other hand,
specific style is divided into Core, Value-Added, and Opportunistic. This
research has come up with a set of guidelines and criteria for the purpose of
identifying the investment styles adopted by M-REITs.

PLANNING MALAYSIA
Journal of the Malaysia Institute of Planners (2021)
25 © 2021 by MIP
Generic Style: Active or Passive Active Style
The REIT manager seeks to actively manage an asset or portfolio of assets so as
to add value and enhance returns above those achieved by a benchmark/index.
The characteristics include but are not limited to: -
a) The real estate e.g. shopping mall is occupied by tenants from various
retails, trades and services e.g. TGV Cinema, Jaya Grocer, H&M, Padini,
Haidilao, Tealive etc.
b) The manager needs to actively source tenants to occupy most spaces within
the real estate, say the occupancy rate is less than 90%. Thus, additional
effort is required to attract tenants into the real estate.
c) Tenant turnover is expected to be significant as there is a high likelihood a
tenant would move out from the real estate.
Passive Style
The REIT manager seeks to replicate or follow a benchmark in order to
approximate the risk-return of the benchmark. The characteristics include but are
not limited to: -
a) The real estate is occupied by single or multiple tenants which is from the
same parent company with a large company size. For example: Nestle, KPJ
Healthcare, DHL, Maxis and so forth. Generally, this applies to real estate
such as corporate office, factories, hospitals, universities and government
buildings.
b) The manager needs not to actively source tenants to occupy the spaces
within the real estate as the tenants are less likely to move out from the real
estate due to high investment capital for the plants and machinery.
c) The tenants have either long leases, usually more than 10 years, or a proven
track record of consistent and successful tenancy or lease renewal.
Generic Style: Value or Growth Value Style
The REIT manager focuses on real estate which are essentially mispriced, as well
as offering the potential for abnormal income, capital and total returns over a
predetermined future timeframe. The characteristics include but are not limited
to:
a) The real estate is generally located in emerging hotspots, non-prime or
secondary areas such as Shah Alam, Setapak and Subang Jaya.
b) It focuses on generating growth in rental income from its real estate.
c) Typically, it comes with an active style of management e.g., adjusting
tenant mix, repositioning, rebranding etc.

Tan Chor Heng & Ting Kien Hwa Investment Styles of REIT Property Portfolios
© 2021 by MIP 26
Growth Style
The REIT manager focuses on building a portfolio comprising real estate that
offer the potential for growing income, capital and total returns over an undefined
and usually longer future timeframe. The characteristics include but are not
limited to: -
a) The real estate is generally located in prime areas such as Central Business
District (CBD), Kuala Lumpur City Centre, Golden Triangle and Petaling
Jaya.
b) It focuses on generating stable rental income from its real estate.
c) Typically, it comes with a passive style of management i.e., buy and hold.
GENERIC STYLE: TOP-DOWN OR BOTTOM-UP Top-Down Approach
The REIT manager studies the global, national, regional and local real estate
markets to examine the optimal geographic areas and real estate sectors for
investment, then seeking assets within such areas and sectors for property
acquisitions. The characteristics include but are not limited to: -
a) Market/Sector/Industry analyses are reported in the annual report of the
REIT.
b) Market news or headlines can be found in the company website.
c) Specific style can be core, value-added or opportunistic.
Bottom-Up Approach
The REIT manager seeks to specifically consider the investment attributes of an
individual real estate and their acceptability as the basis of acquisition. The
characteristics include but are not limited to: -
a) Building attributes e.g., location, accessibility, building quality and design.
b) Surrounding neighborhood characteristics e.g., employment, amenities and
facilities.
c) Specific style is usually of opportunistic as it places more emphasis on
individual opportunities e.g., mispricing of property.
SPECIFIC STYLE: CORE, VALUE-ADDED AND
OPPORTUNISTIC Core Style
The REIT manager emphasizes on existing, well-leased and high-quality real
estate in established and matured markets. It generally reflects stable and
predictable income flows from strong credit and reputable tenants. Other
characteristics include but are not limited to: -
a) The real estate is generally situated in prime areas e.g. Central Business
Districts (CBD), Kuala Lumpur City Centre and Golden Triangle.
PLANNING MALAYSIA
Journal of the Malaysia Institute of Planners (2021)
27 © 2021 by MIP
b) It requires a relatively high proportion of total return from rental income
and cash flow.
c) Capital appreciation plays a lesser role.
d) The real estate has an excellent tenant mix and tenant quality in terms of
reputation, credit quality etc.
e) It records a comparatively low distribution yield due to lower risk. As a
rule of thumb, the yield is less than 5% per annum.
Value-Added Style
The REIT manager seeks to increase the value of the real estate investments.
Often these real estates will have sub-optimal occupancy rate, operational issues
or some physical obsolescence. Hence, significant expertise and experience in
retenanting and rehabilitating the assets are required (Shilling and Wurtzebach,
2012). Other characteristics include but are not limited to: -
a) The real estate is generally situated in non-prime areas such as Shah Alam,
Georgetown, Johor Bahru and so forth.
b) It focuses on capital appreciation of the real estate.
c) It involves assets that require refurbishment or major enhancement
resulting in repositioning.
d) The real estate has a good tenant mix and tenant quality in terms of
reputation, credit quality and so forth.
e) It records a moderate yield due to moderate risk. As a rule of thumb, the
yield is between 5% to 6% per annum.
Opportunistic Style
In this instance, the REIT manager is willing to take entrepreneurial risk in order
to achieve out-sized returns by investing into real estate from ground up
development, adaptive reuse, to emerging markets. Other characteristics include
but are not limited to: -
a) The real estate is generally situated in suburban or outskirt areas such as
Sepang, Kajang, Ipoh, Seremban and Malacca. Overseas properties are
also in this category.
b) The real estate has a fair tenant mix and tenant quality in terms of
reputation, credit quality and so forth.
c) It records a relatively high distribution yield due to higher risk. As a rule
of thumb, the yield is more than 6% per annum.
Tan Chor Heng & Ting Kien Hwa Investment Styles of REIT Property Portfolios
© 2021 by MIP 28
RESEARCH METHODOLOGY
Introduction This section highlights the research methodology to examine the investment style
of each individual Malaysia REIT, as well as the effect of specific investment
style on the REIT performance.
Research Process The total return of each REIT is calculated based on the average changes of
monthly closing price and the income distribution of the respective REIT, which
are annualised to arrive at its annual return.
Risk refers to the chance an outcome or investment's actual gains will
differ from an expected outcome or return. To quantify risk, the standard
deviation of the monthly returns is used to measure the volatility of a REIT and
are annualised to obtain its annual risk.
Property portfolio information and data of the M-REITs are collected
from 2018 annual reports. The information collected include name of property,
type of property, size, acquisition date, purchase price, latest valuation and date
of valuation, location, age etc. By combining the data collected with the sets of
criteria for each investment style, the investment style adopted to manage each
property is identified.
In addition, the monthly closing price since the IPO listings of each
REIT listed in Malaysia is obtained, without any adjustment to any capital
changes such as rights and bonus issues. Furthermore, any distribution by the
respective REIT is also recorded in the month of its ex-date.
ANALYSIS OF RESULTS
Investment Styles of REITs in Malaysia Generic Style: Active or Passive
Two-thirds of the properties owned by M-REITs are managed passively by the
managers. Most of these properties, regardless of their types, are located in
established areas such as Golden Triangle and Petaling Jaya. There are 145
properties being managed passively, as opposed to 73 properties being managed
actively by REIT managers.
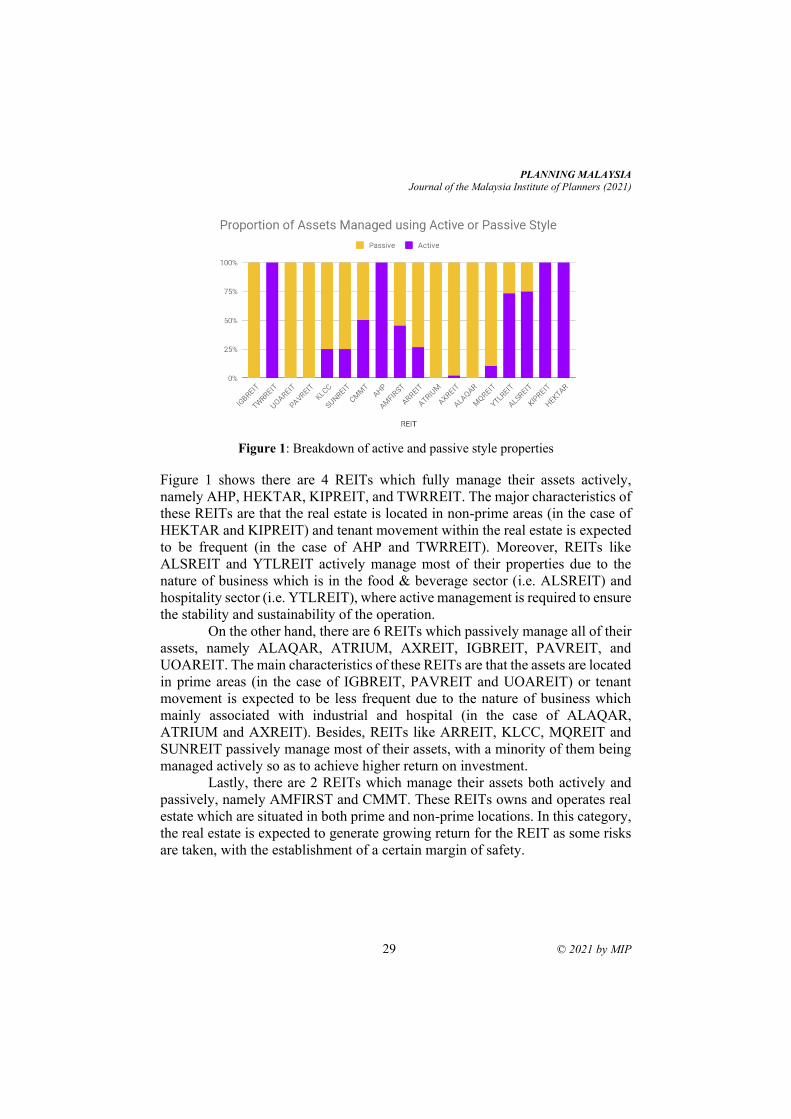
PLANNING MALAYSIA
Journal of the Malaysia Institute of Planners (2021)
29 © 2021 by MIP
Figure 1: Breakdown of active and passive style properties
Figure 1 shows there are 4 REITs which fully manage their assets actively,
namely AHP, HEKTAR, KIPREIT, and TWRREIT. The major characteristics of
these REITs are that the real estate is located in non-prime areas (in the case of
HEKTAR and KIPREIT) and tenant movement within the real estate is expected
to be frequent (in the case of AHP and TWRREIT). Moreover, REITs like
ALSREIT and YTLREIT actively manage most of their properties due to the
nature of business which is in the food & beverage sector (i.e. ALSREIT) and
hospitality sector (i.e. YTLREIT), where active management is required to ensure
the stability and sustainability of the operation.
On the other hand, there are 6 REITs which passively manage all of their
assets, namely ALAQAR, ATRIUM, AXREIT, IGBREIT, PAVREIT, and
UOAREIT. The main characteristics of these REITs are that the assets are located
in prime areas (in the case of IGBREIT, PAVREIT and UOAREIT) or tenant
movement is expected to be less frequent due to the nature of business which
mainly associated with industrial and hospital (in the case of ALAQAR,
ATRIUM and AXREIT). Besides, REITs like ARREIT, KLCC, MQREIT and
SUNREIT passively manage most of their assets, with a minority of them being
managed actively so as to achieve higher return on investment.
Lastly, there are 2 REITs which manage their assets both actively and
passively, namely AMFIRST and CMMT. These REITs owns and operates real
estate which are situated in both prime and non-prime locations. In this category,
the real estate is expected to generate growing return for the REIT as some risks
are taken, with the establishment of a certain margin of safety.
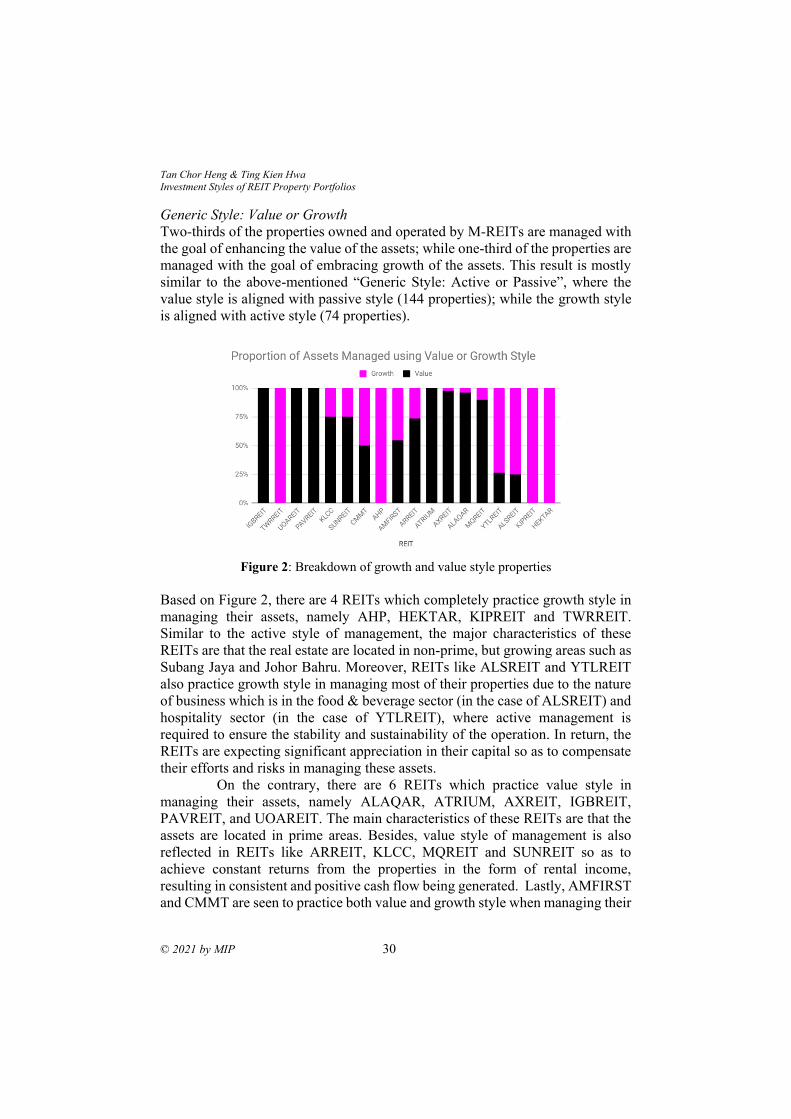
Tan Chor Heng & Ting Kien Hwa Investment Styles of REIT Property Portfolios
© 2021 by MIP 30
Generic Style: Value or Growth
Two-thirds of the properties owned and operated by M-REITs are managed with
the goal of enhancing the value of the assets; while one-third of the properties are
managed with the goal of embracing growth of the assets. This result is mostly
similar to the above-mentioned “Generic Style: Active or Passive”, where the
value style is aligned with passive style (144 properties); while the growth style
is aligned with active style (74 properties).
Figure 2: Breakdown of growth and value style properties
Based on Figure 2, there are 4 REITs which completely practice growth style in
managing their assets, namely AHP, HEKTAR, KIPREIT and TWRREIT.
Similar to the active style of management, the major characteristics of these
REITs are that the real estate are located in non-prime, but growing areas such as
Subang Jaya and Johor Bahru. Moreover, REITs like ALSREIT and YTLREIT
also practice growth style in managing most of their properties due to the nature
of business which is in the food & beverage sector (in the case of ALSREIT) and
hospitality sector (in the case of YTLREIT), where active management is
required to ensure the stability and sustainability of the operation. In return, the
REITs are expecting significant appreciation in their capital so as to compensate
their efforts and risks in managing these assets.
On the contrary, there are 6 REITs which practice value style in
managing their assets, namely ALAQAR, ATRIUM, AXREIT, IGBREIT,
PAVREIT, and UOAREIT. The main characteristics of these REITs are that the
assets are located in prime areas. Besides, value style of management is also
reflected in REITs like ARREIT, KLCC, MQREIT and SUNREIT so as to
achieve constant returns from the properties in the form of rental income,
resulting in consistent and positive cash flow being generated. Lastly, AMFIRST
and CMMT are seen to practice both value and growth style when managing their
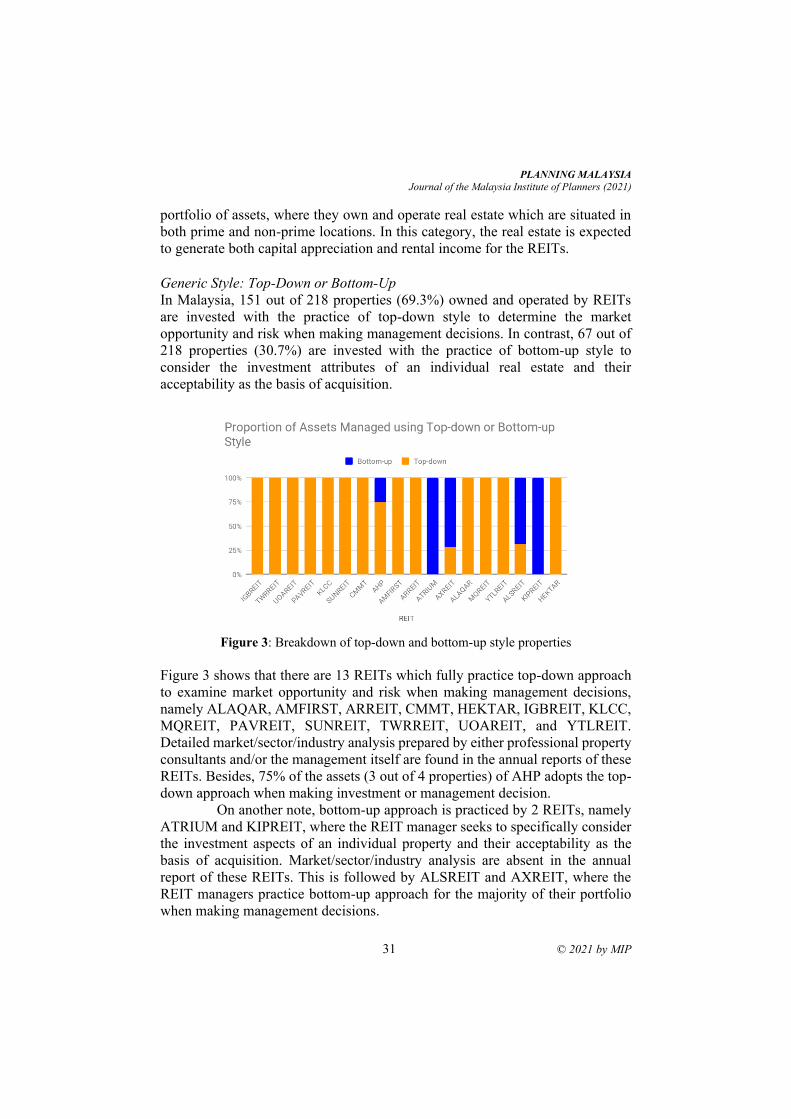
PLANNING MALAYSIA
Journal of the Malaysia Institute of Planners (2021)
31 © 2021 by MIP
portfolio of assets, where they own and operate real estate which are situated in
both prime and non-prime locations. In this category, the real estate is expected
to generate both capital appreciation and rental income for the REITs.
Generic Style: Top-Down or Bottom-Up
In Malaysia, 151 out of 218 properties (69.3%) owned and operated by REITs
are invested with the practice of top-down style to determine the market
opportunity and risk when making management decisions. In contrast, 67 out of
218 properties (30.7%) are invested with the practice of bottom-up style to
consider the investment attributes of an individual real estate and their
acceptability as the basis of acquisition.
Figure 3: Breakdown of top-down and bottom-up style properties
Figure 3 shows that there are 13 REITs which fully practice top-down approach
to examine market opportunity and risk when making management decisions,
namely ALAQAR, AMFIRST, ARREIT, CMMT, HEKTAR, IGBREIT, KLCC,
MQREIT, PAVREIT, SUNREIT, TWRREIT, UOAREIT, and YTLREIT.
Detailed market/sector/industry analysis prepared by either professional property
consultants and/or the management itself are found in the annual reports of these
REITs. Besides, 75% of the assets (3 out of 4 properties) of AHP adopts the top-
down approach when making investment or management decision.
On another note, bottom-up approach is practiced by 2 REITs, namely
ATRIUM and KIPREIT, where the REIT manager seeks to specifically consider
the investment aspects of an individual property and their acceptability as the
basis of acquisition. Market/sector/industry analysis are absent in the annual
report of these REITs. This is followed by ALSREIT and AXREIT, where the
REIT managers practice bottom-up approach for the majority of their portfolio
when making management decisions.
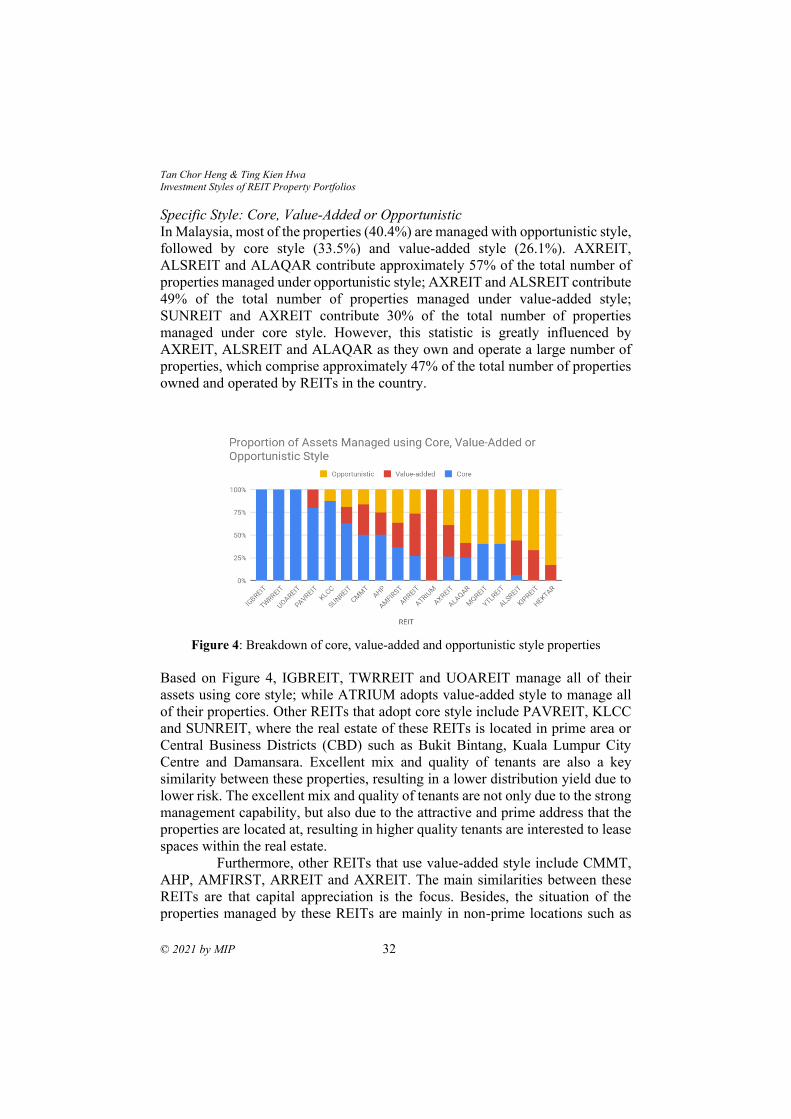
Tan Chor Heng & Ting Kien Hwa Investment Styles of REIT Property Portfolios
© 2021 by MIP 32
Specific Style: Core, Value-Added or Opportunistic
In Malaysia, most of the properties (40.4%) are managed with opportunistic style,
followed by core style (33.5%) and value-added style (26.1%). AXREIT,
ALSREIT and ALAQAR contribute approximately 57% of the total number of
properties managed under opportunistic style; AXREIT and ALSREIT contribute
49% of the total number of properties managed under value-added style;
SUNREIT and AXREIT contribute 30% of the total number of properties
managed under core style. However, this statistic is greatly influenced by
AXREIT, ALSREIT and ALAQAR as they own and operate a large number of
properties, which comprise approximately 47% of the total number of properties
owned and operated by REITs in the country.
Figure 4: Breakdown of core, value-added and opportunistic style properties
Based on Figure 4, IGBREIT, TWRREIT and UOAREIT manage all of their
assets using core style; while ATRIUM adopts value-added style to manage all
of their properties. Other REITs that adopt core style include PAVREIT, KLCC
and SUNREIT, where the real estate of these REITs is located in prime area or
Central Business Districts (CBD) such as Bukit Bintang, Kuala Lumpur City
Centre and Damansara. Excellent mix and quality of tenants are also a key
similarity between these properties, resulting in a lower distribution yield due to
lower risk. The excellent mix and quality of tenants are not only due to the strong
management capability, but also due to the attractive and prime address that the
properties are located at, resulting in higher quality tenants are interested to lease
spaces within the real estate.
Furthermore, other REITs that use value-added style include CMMT,
AHP, AMFIRST, ARREIT and AXREIT. The main similarities between these
REITs are that capital appreciation is the focus. Besides, the situation of the
properties managed by these REITs are mainly in non-prime locations such as
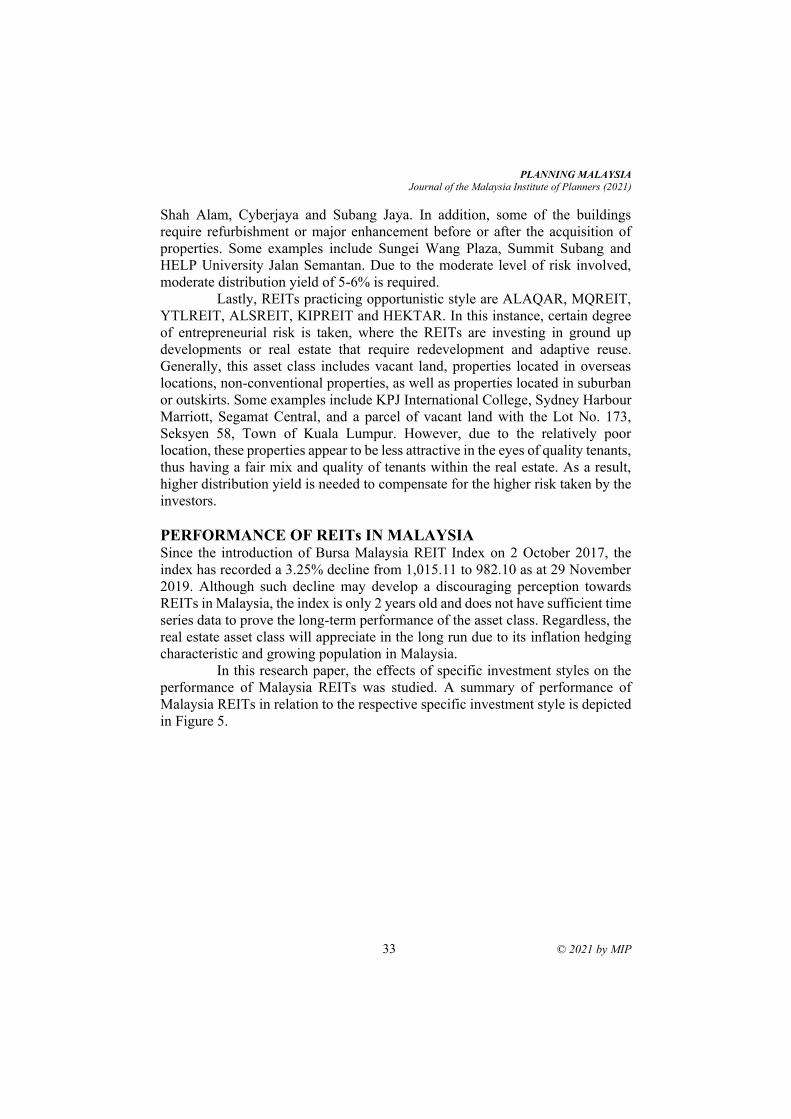
PLANNING MALAYSIA
Journal of the Malaysia Institute of Planners (2021)
33 © 2021 by MIP
Shah Alam, Cyberjaya and Subang Jaya. In addition, some of the buildings
require refurbishment or major enhancement before or after the acquisition of
properties. Some examples include Sungei Wang Plaza, Summit Subang and
HELP University Jalan Semantan. Due to the moderate level of risk involved,
moderate distribution yield of 5-6% is required.
Lastly, REITs practicing opportunistic style are ALAQAR, MQREIT,
YTLREIT, ALSREIT, KIPREIT and HEKTAR. In this instance, certain degree
of entrepreneurial risk is taken, where the REITs are investing in ground up
developments or real estate that require redevelopment and adaptive reuse.
Generally, this asset class includes vacant land, properties located in overseas
locations, non-conventional properties, as well as properties located in suburban
or outskirts. Some examples include KPJ International College, Sydney Harbour
Marriott, Segamat Central, and a parcel of vacant land with the Lot No. 173,
Seksyen 58, Town of Kuala Lumpur. However, due to the relatively poor
location, these properties appear to be less attractive in the eyes of quality tenants,
thus having a fair mix and quality of tenants within the real estate. As a result,
higher distribution yield is needed to compensate for the higher risk taken by the
investors.
PERFORMANCE OF REITs IN MALAYSIA Since the introduction of Bursa Malaysia REIT Index on 2 October 2017, the
index has recorded a 3.25% decline from 1,015.11 to 982.10 as at 29 November
2019. Although such decline may develop a discouraging perception towards
REITs in Malaysia, the index is only 2 years old and does not have sufficient time
series data to prove the long-term performance of the asset class. Regardless, the
real estate asset class will appreciate in the long run due to its inflation hedging
characteristic and growing population in Malaysia.
In this research paper, the effects of specific investment styles on the
performance of Malaysia REITs was studied. A summary of performance of
Malaysia REITs in relation to the respective specific investment style is depicted
in Figure 5.
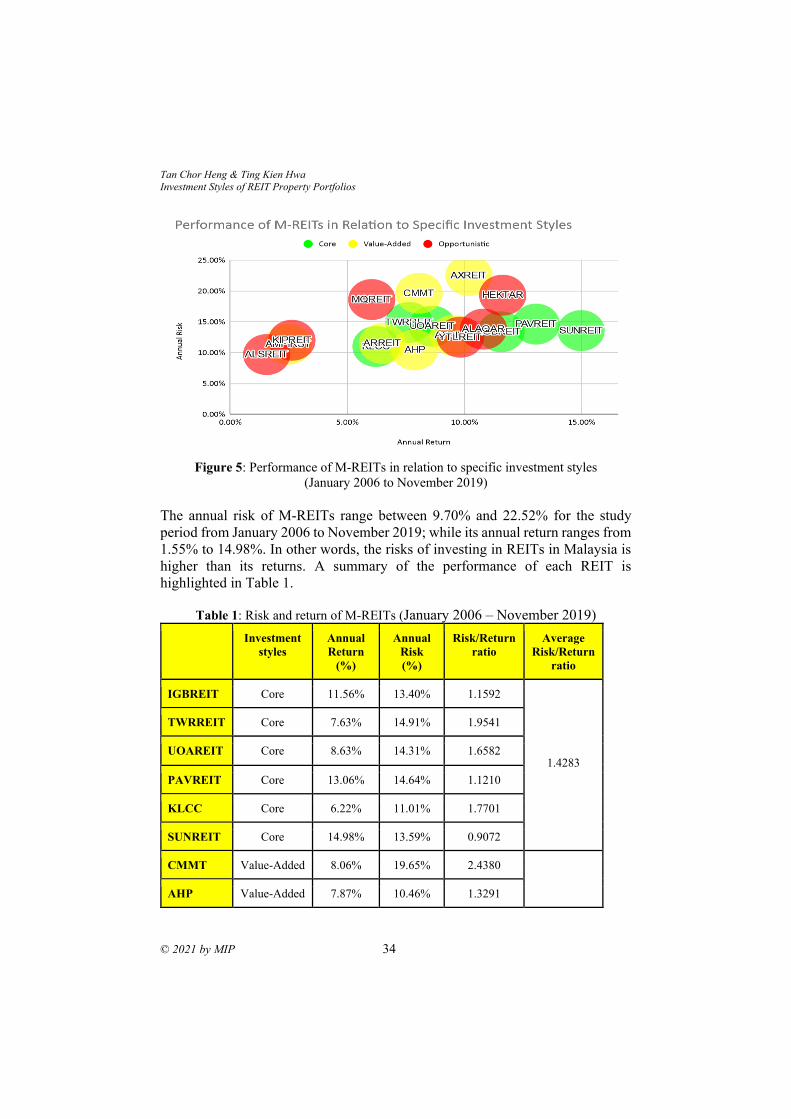
Tan Chor Heng & Ting Kien Hwa Investment Styles of REIT Property Portfolios
© 2021 by MIP 34
Figure 5: Performance of M-REITs in relation to specific investment styles
(January 2006 to November 2019)
The annual risk of M-REITs range between 9.70% and 22.52% for the study
period from January 2006 to November 2019; while its annual return ranges from
1.55% to 14.98%. In other words, the risks of investing in REITs in Malaysia is
higher than its returns. A summary of the performance of each REIT is
highlighted in Table 1.
Table 1: Risk and return of M-REITs (January 2006 – November 2019)
Investment
styles
Annual
Return
(%)
Annual
Risk
(%)
Risk/Return
ratio
Average
Risk/Return
ratio
IGBREIT Core 11.56% 13.40% 1.1592
1.4283
TWRREIT Core 7.63% 14.91% 1.9541
UOAREIT Core 8.63% 14.31% 1.6582
PAVREIT Core 13.06% 14.64% 1.1210
KLCC Core 6.22% 11.01% 1.7701
SUNREIT Core 14.98% 13.59% 0.9072
CMMT Value-Added 8.06% 19.65% 2.4380
AHP Value-Added 7.87% 10.46% 1.3291
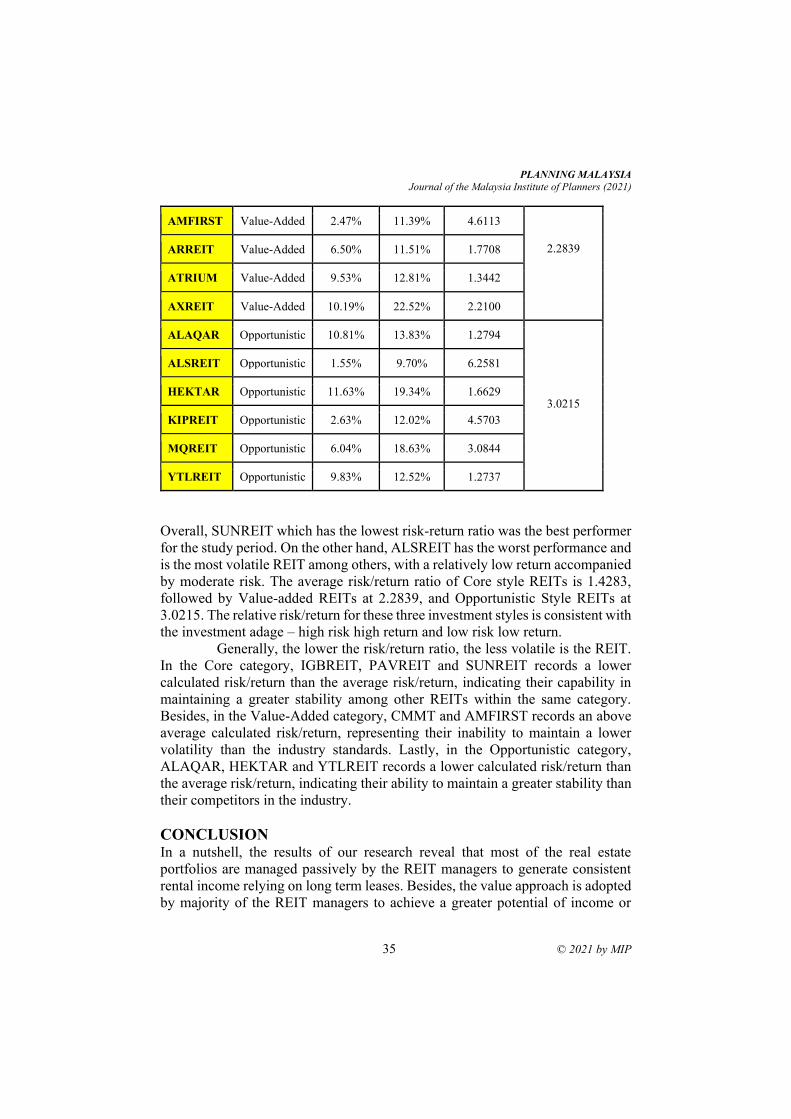
PLANNING MALAYSIA
Journal of the Malaysia Institute of Planners (2021)
35 © 2021 by MIP
AMFIRST Value-Added 2.47% 11.39% 4.6113
2.2839 ARREIT Value-Added 6.50% 11.51% 1.7708
ATRIUM Value-Added 9.53% 12.81% 1.3442
AXREIT Value-Added 10.19% 22.52% 2.2100
ALAQAR Opportunistic 10.81% 13.83% 1.2794
3.0215
ALSREIT Opportunistic 1.55% 9.70% 6.2581
HEKTAR Opportunistic 11.63% 19.34% 1.6629
KIPREIT Opportunistic 2.63% 12.02% 4.5703
MQREIT Opportunistic 6.04% 18.63% 3.0844
YTLREIT Opportunistic 9.83% 12.52% 1.2737
Overall, SUNREIT which has the lowest risk-return ratio was the best performer
for the study period. On the other hand, ALSREIT has the worst performance and
is the most volatile REIT among others, with a relatively low return accompanied
by moderate risk. The average risk/return ratio of Core style REITs is 1.4283,
followed by Value-added REITs at 2.2839, and Opportunistic Style REITs at
3.0215. The relative risk/return for these three investment styles is consistent with
the investment adage – high risk high return and low risk low return.
Generally, the lower the risk/return ratio, the less volatile is the REIT.
In the Core category, IGBREIT, PAVREIT and SUNREIT records a lower
calculated risk/return than the average risk/return, indicating their capability in
maintaining a greater stability among other REITs within the same category.
Besides, in the Value-Added category, CMMT and AMFIRST records an above
average calculated risk/return, representing their inability to maintain a lower
volatility than the industry standards. Lastly, in the Opportunistic category,
ALAQAR, HEKTAR and YTLREIT records a lower calculated risk/return than
the average risk/return, indicating their ability to maintain a greater stability than
their competitors in the industry.
CONCLUSION
In a nutshell, the results of our research reveal that most of the real estate
portfolios are managed passively by the REIT managers to generate consistent
rental income relying on long term leases. Besides, the value approach is adopted
by majority of the REIT managers to achieve a greater potential of income or
Tan Chor Heng & Ting Kien Hwa Investment Styles of REIT Property Portfolios
© 2021 by MIP 36
return. Furthermore, more than two-thirds of the REIT managers practice top-
down style to determine market opportunity and risk when making investment
management decisions. Moreover, most REIT managers apply core style in
managing their individual assets by focusing on existing, well-leased and high-
quality properties in established key property sectors and prime locations.
Last but not least, the results of our research have been aligned with our
hypothesis, where the Core style represents low risk, low return; while the
Opportunistic style represents high risk, high return. For retail and institutional
investors, the identified investment style portfolios of M-REITs give them the
flexibility to choose from an array of investment portfolios that meet their
investment mandates. If the investor is more conservative and risk averse, he
might want to invest into REITs which practice Core investment style such as
SUNREIT, PAVREIT, IGBREIT, TWRREIT, UOAREIT and KLCC. For an
investor who has moderate tolerance towards risk, REITs under the Value-added
category such as CMMT, AHP, AMFIRST, ARREIT, ATRIUM and AXREIT
would be a suitable choice. Lastly, aggressive investors who are willing to take
up more risk to bet for a better potential return can invest into REITs adopting
Opportunistic investment styles such as ALAQAR, ALSREIT, HEKTAR,
KIPREIT, MQREIT and YTLREIT.
REFERENCES Baum, A. E. (2015). Real estate investment: a strategic approach. London: Routledge
Taylor & Francis Group.
Baum, A. E. and Hartzell, D. (2012) Global Property Investment: Strategies, Structures,
Decisions, John Wiley & Sons
Chuweni, N. N., & Eves, C. (2019). Measuring Technical Efficiency of Malaysian Real
Estate Investment Trusts: A Data Envelopment Analysis Approach, Planning
Malaysia Journal of the Malaysian Institute of Planners, Vol. 17 Issue 1, 319-327
Garay, U. (2016) “Investment Styles, Portfolio Allocation, and Real Estate Derivatives.”
In Kazemi, H.; Black, K.; and D. Chambers (Editors), Alternative Investments:
CAIA Level II, Chapter 16, Wiley Finance, 3rd Edition, 2016, pp. 401-421.
Parker, D. (2011). Global real estate investment trusts: people, process and management.
Chichester, West Sussex: Wiley-Blackwell.
Peyton, M. S. (2008). Real Estate Investment Style and Style Purity, Journal of Real
Estate Portfolio Management, Vol. 14 No. 4, 325-334 Shilling, J. D. and Wurtzebach, Charles H. (2012). Is Value-Added and Opportunistic
Real Estate Investing Beneficial? If So, Why? Journal of Real Estate Research, Vol. 34 No. 4, 429-461
Received: 12th July 2021. Accepted: 17th Sept 2021
1 Lecturer at Polytechnic of State Finance STAN. Email: [email protected]
PLANNING MALAYSIA:
Journal of the Malaysian Institute of Planners
VOLUME 19 ISSUE 3 (2021), Page 37 – 47
IDENTIFICATION OF FACTORS INFLUENCING LAND VALUE
FOR STATE'S ASSETS MASS APPRAISAL PURPOSES:
EVIDENCE FROM INDONESIA
Kristian Agung Prasetyo1, Dhian Adhetiya Safitra2, Adhipradana Prabu
Swasito3
1,2,3 Diploma III Vocational Program (valuation major)
POLYTECHNIC OF STATE FINANCE STAN
Abstract
Land value is an important element in a decision making. The estimation of land
value conducted individually based on comparables. This approach often faces
difficulties due to the large quantities of such assets with limited capacity of
valuers. This research aimed to build a model to effectively identify the main
property attributes that shape property value and quantify the effect of
unobserved variables on value. We observed 628 property data in Jakarta
collected by the Directorate General of State Asset Management (DGSAM) as
part of their valuation activities in 2018. The results of this study provide an
evidence that structural equation model (SEM) can be effectively used to identify
property attributes that significantly affect property value, particularly for valuing
state-owned assets.
Keyword: Land Value, Land Market, Residential Land JEL Code: R330, R210
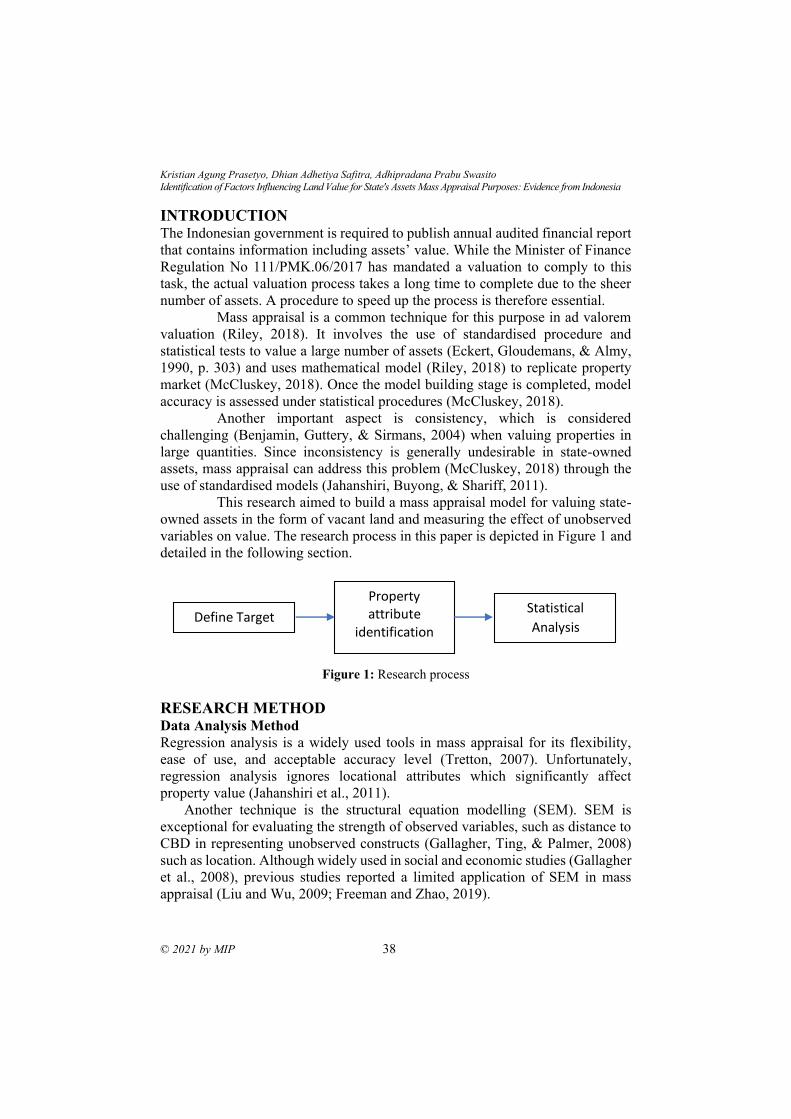
Kristian Agung Prasetyo, Dhian Adhetiya Safitra, Adhipradana Prabu Swasito
Identification of Factors Influencing Land Value for State's Assets Mass Appraisal Purposes: Evidence from Indonesia
© 2021 by MIP 38
INTRODUCTION The Indonesian government is required to publish annual audited financial report
that contains information including assets’ value. While the Minister of Finance
Regulation No 111/PMK.06/2017 has mandated a valuation to comply to this
task, the actual valuation process takes a long time to complete due to the sheer
number of assets. A procedure to speed up the process is therefore essential.
Mass appraisal is a common technique for this purpose in ad valorem
valuation (Riley, 2018). It involves the use of standardised procedure and
statistical tests to value a large number of assets (Eckert, Gloudemans, & Almy,
1990, p. 303) and uses mathematical model (Riley, 2018) to replicate property
market (McCluskey, 2018). Once the model building stage is completed, model
accuracy is assessed under statistical procedures (McCluskey, 2018).
Another important aspect is consistency, which is considered
challenging (Benjamin, Guttery, & Sirmans, 2004) when valuing properties in
large quantities. Since inconsistency is generally undesirable in state-owned
assets, mass appraisal can address this problem (McCluskey, 2018) through the
use of standardised models (Jahanshiri, Buyong, & Shariff, 2011).
This research aimed to build a mass appraisal model for valuing state-
owned assets in the form of vacant land and measuring the effect of unobserved
variables on value. The research process in this paper is depicted in Figure 1 and
detailed in the following section.
Figure 1: Research process
RESEARCH METHOD
Data Analysis Method
Regression analysis is a widely used tools in mass appraisal for its flexibility,
ease of use, and acceptable accuracy level (Tretton, 2007). Unfortunately,
regression analysis ignores locational attributes which significantly affect
property value (Jahanshiri et al., 2011).
Another technique is the structural equation modelling (SEM). SEM is
exceptional for evaluating the strength of observed variables, such as distance to
CBD in representing unobserved constructs (Gallagher, Ting, & Palmer, 2008)
such as location. Although widely used in social and economic studies (Gallagher
et al., 2008), previous studies reported a limited application of SEM in mass
appraisal (Liu and Wu, 2009; Freeman and Zhao, 2019).
Define Target
Property attribute
identification
Statistical
Analysis
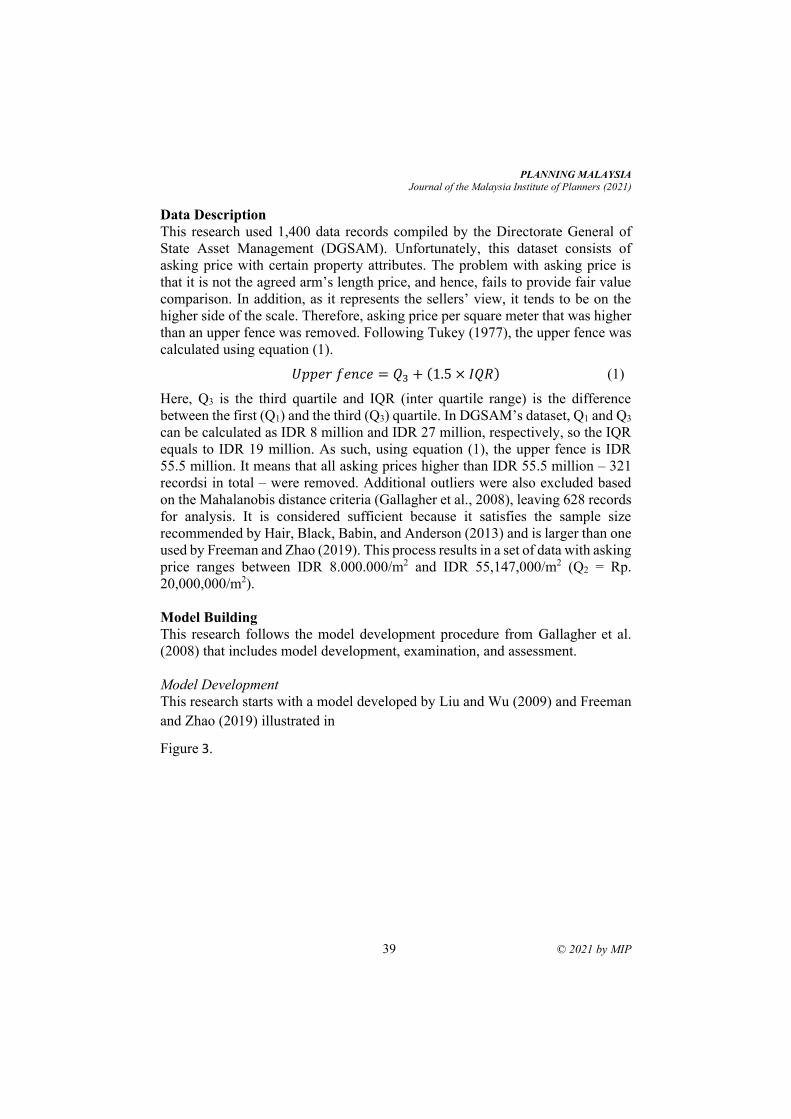
PLANNING MALAYSIA
Journal of the Malaysia Institute of Planners (2021)
39 © 2021 by MIP
Data Description
This research used 1,400 data records compiled by the Directorate General of
State Asset Management (DGSAM). Unfortunately, this dataset consists of
asking price with certain property attributes. The problem with asking price is
that it is not the agreed arm’s length price, and hence, fails to provide fair value
comparison. In addition, as it represents the sellers’ view, it tends to be on the
higher side of the scale. Therefore, asking price per square meter that was higher
than an upper fence was removed. Following Tukey (1977), the upper fence was
calculated using equation (1).
𝑈𝑝𝑝𝑒𝑟 𝑓𝑒𝑛𝑐𝑒 = 𝑄3 + (1.5 × 𝐼𝑄𝑅) (1)
Here, Q3 is the third quartile and IQR (inter quartile range) is the difference
between the first (Q1) and the third (Q3) quartile. In DGSAM’s dataset, Q1 and Q3
can be calculated as IDR 8 million and IDR 27 million, respectively, so the IQR
equals to IDR 19 million. As such, using equation (1), the upper fence is IDR
55.5 million. It means that all asking prices higher than IDR 55.5 million – 321
recordsi in total – were removed. Additional outliers were also excluded based
on the Mahalanobis distance criteria (Gallagher et al., 2008), leaving 628 records
for analysis. It is considered sufficient because it satisfies the sample size
recommended by Hair, Black, Babin, and Anderson (2013) and is larger than one
used by Freeman and Zhao (2019). This process results in a set of data with asking
price ranges between IDR 8.000.000/m2 and IDR 55,147,000/m2 (Q2 = Rp.
20,000,000/m2).
Model Building
This research follows the model development procedure from Gallagher et al.
(2008) that includes model development, examination, and assessment.
Model Development
This research starts with a model developed by Liu and Wu (2009) and Freeman
and Zhao (2019) illustrated in
Figure 3.
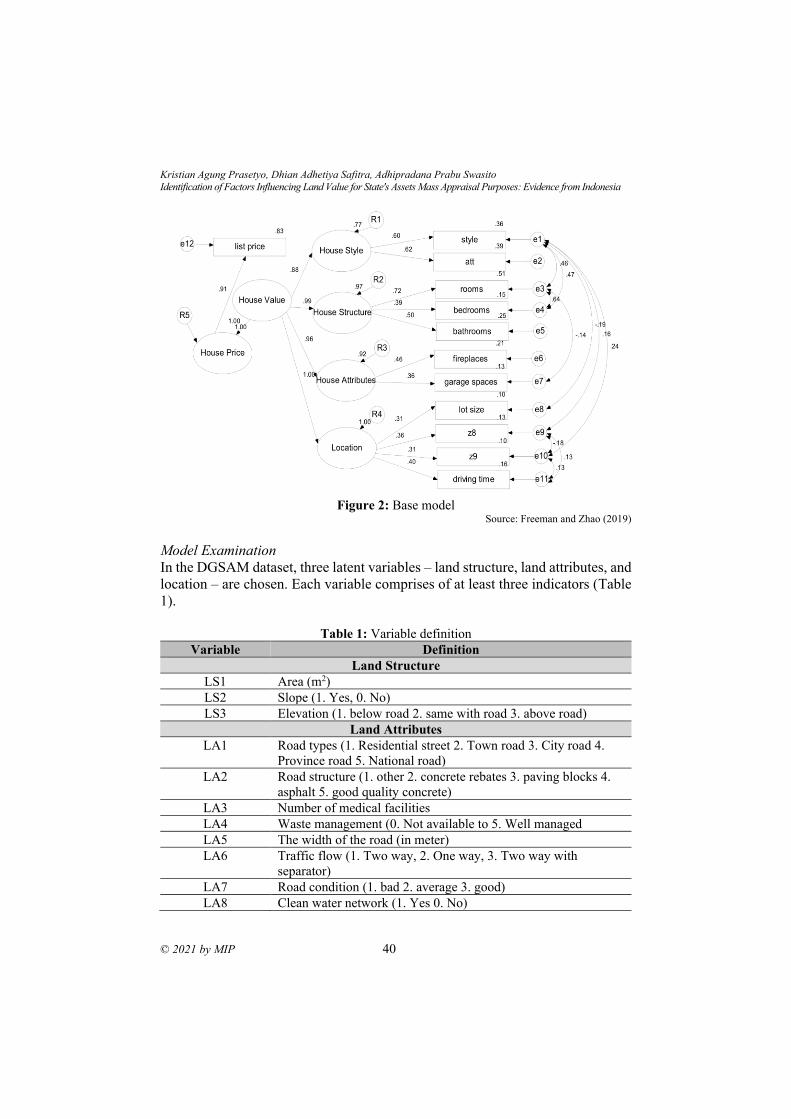
Kristian Agung Prasetyo, Dhian Adhetiya Safitra, Adhipradana Prabu Swasito
Identification of Factors Influencing Land Value for State's Assets Mass Appraisal Purposes: Evidence from Indonesia
© 2021 by MIP 40
Figure 2: Base model
Source: Freeman and Zhao (2019)
Model Examination
In the DGSAM dataset, three latent variables – land structure, land attributes, and
location – are chosen. Each variable comprises of at least three indicators (Table
1).
Table 1: Variable definition
Variable Definition
Land Structure
LS1 Area (m2)
LS2 Slope (1. Yes, 0. No)
LS3 Elevation (1. below road 2. same with road 3. above road)
Land Attributes
LA1 Road types (1. Residential street 2. Town road 3. City road 4.
Province road 5. National road)
LA2 Road structure (1. other 2. concrete rebates 3. paving blocks 4.
asphalt 5. good quality concrete)
LA3 Number of medical facilities
LA4 Waste management (0. Not available to 5. Well managed
LA5 The width of the road (in meter)
LA6 Traffic flow (1. Two way, 2. One way, 3. Two way with
separator)
LA7 Road condition (1. bad 2. average 3. good)
LA8 Clean water network (1. Yes 0. No)
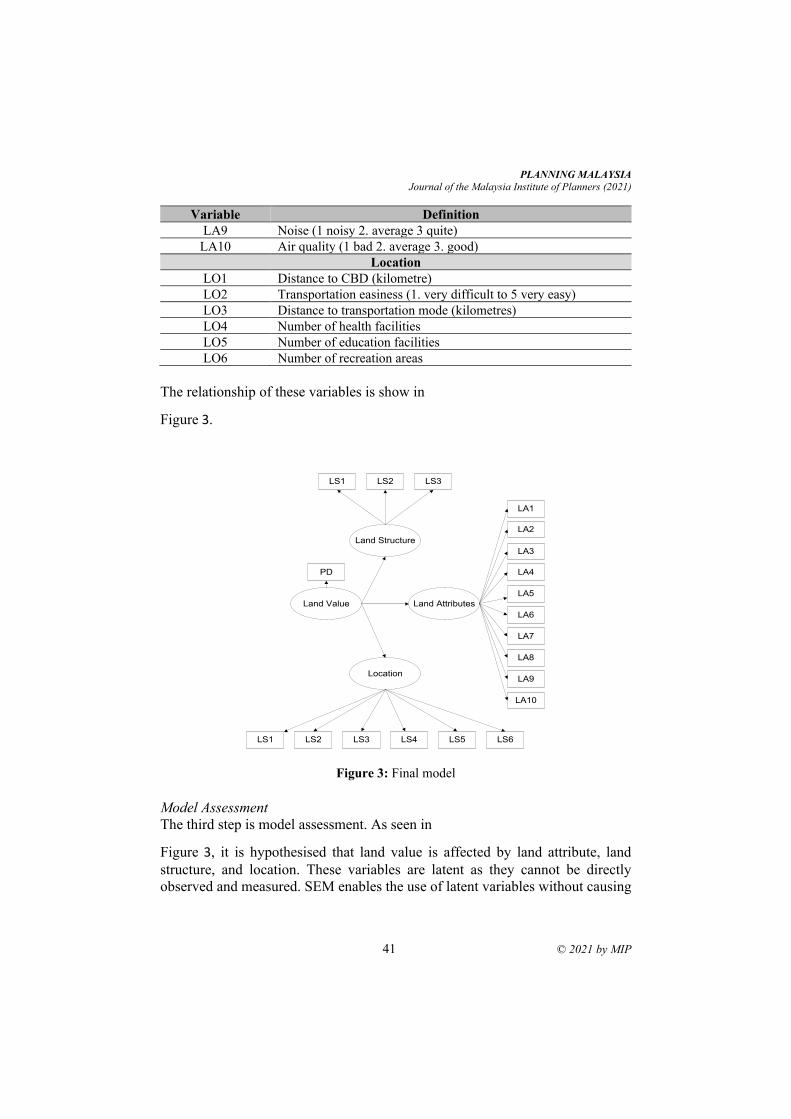
PLANNING MALAYSIA
Journal of the Malaysia Institute of Planners (2021)
41 © 2021 by MIP
Variable Definition
LA9 Noise (1 noisy 2. average 3 quite)
LA10 Air quality (1 bad 2. average 3. good)
Location
LO1 Distance to CBD (kilometre)
LO2 Transportation easiness (1. very difficult to 5 very easy)
LO3 Distance to transportation mode (kilometres)
LO4 Number of health facilities
LO5 Number of education facilities
LO6 Number of recreation areas
The relationship of these variables is show in
Figure 3.
Figure 3: Final model
Model Assessment
The third step is model assessment. As seen in
Figure 3, it is hypothesised that land value is affected by land attribute, land
structure, and location. These variables are latent as they cannot be directly
observed and measured. SEM enables the use of latent variables without causing
Land Value
Land Structure
Land Attributes
Location
PD
LS1 LS2 LS3
LA1
LA2
LA10
LA9
LA8
LA7
LA6
LA5
LA4
LA3
LS1 LS2 LS3 LS4 LS5 LS6
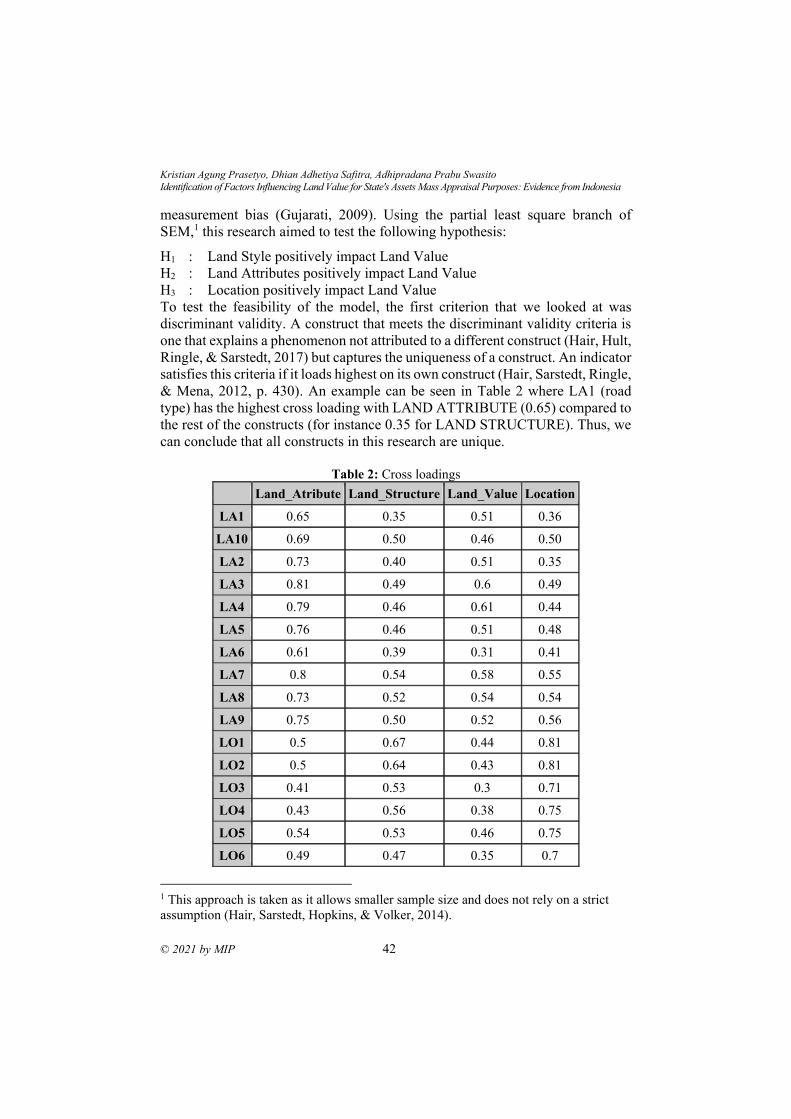
Kristian Agung Prasetyo, Dhian Adhetiya Safitra, Adhipradana Prabu Swasito
Identification of Factors Influencing Land Value for State's Assets Mass Appraisal Purposes: Evidence from Indonesia
© 2021 by MIP 42
measurement bias (Gujarati, 2009). Using the partial least square branch of
SEM,1 this research aimed to test the following hypothesis:
H1 : Land Style positively impact Land Value
H2 : Land Attributes positively impact Land Value
H3 : Location positively impact Land Value
To test the feasibility of the model, the first criterion that we looked at was
discriminant validity. A construct that meets the discriminant validity criteria is
one that explains a phenomenon not attributed to a different construct (Hair, Hult,
Ringle, & Sarstedt, 2017) but captures the uniqueness of a construct. An indicator
satisfies this criteria if it loads highest on its own construct (Hair, Sarstedt, Ringle,
& Mena, 2012, p. 430). An example can be seen in Table 2 where LA1 (road
type) has the highest cross loading with LAND ATTRIBUTE (0.65) compared to
the rest of the constructs (for instance 0.35 for LAND STRUCTURE). Thus, we
can conclude that all constructs in this research are unique.
Table 2: Cross loadings
Land_Atribute Land_Structure Land_Value Location
LA1 0.65 0.35 0.51 0.36
LA10 0.69 0.50 0.46 0.50
LA2 0.73 0.40 0.51 0.35
LA3 0.81 0.49 0.6 0.49
LA4 0.79 0.46 0.61 0.44
LA5 0.76 0.46 0.51 0.48
LA6 0.61 0.39 0.31 0.41
LA7 0.8 0.54 0.58 0.55
LA8 0.73 0.52 0.54 0.54
LA9 0.75 0.50 0.52 0.56
LO1 0.5 0.67 0.44 0.81
LO2 0.5 0.64 0.43 0.81
LO3 0.41 0.53 0.3 0.71
LO4 0.43 0.56 0.38 0.75
LO5 0.54 0.53 0.46 0.75
LO6 0.49 0.47 0.35 0.7
1 This approach is taken as it allows smaller sample size and does not rely on a strict
assumption (Hair, Sarstedt, Hopkins, & Volker, 2014).
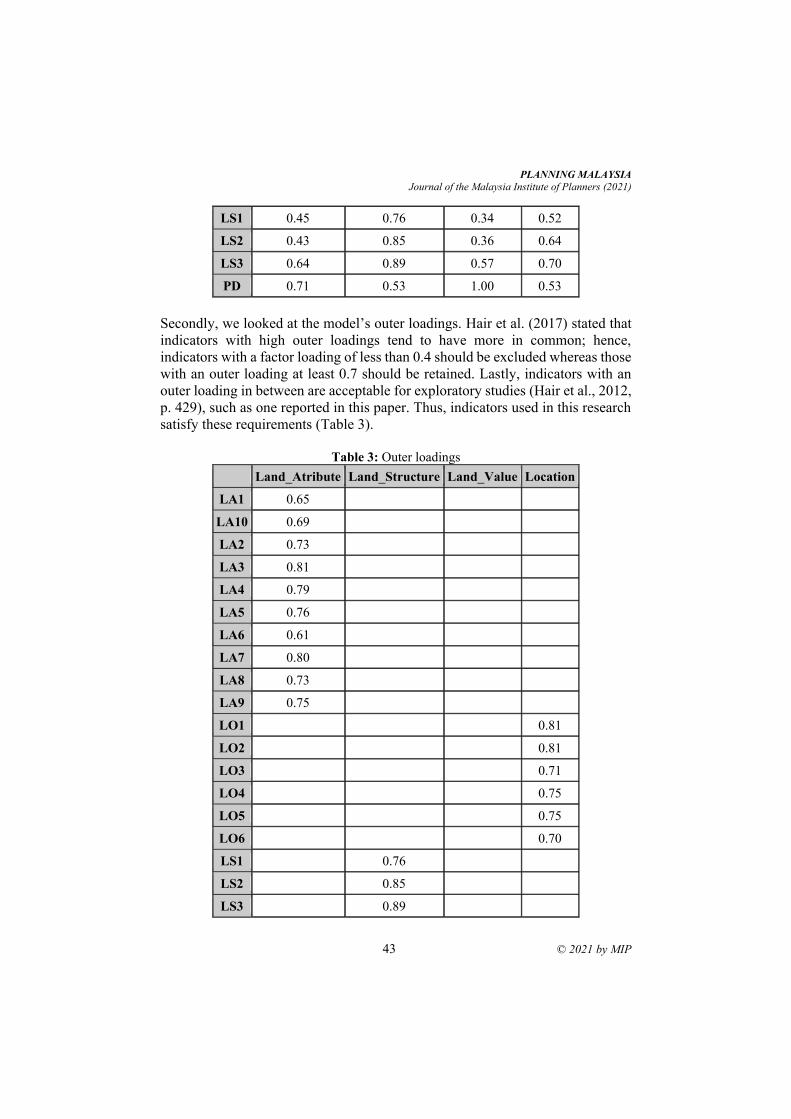
PLANNING MALAYSIA
Journal of the Malaysia Institute of Planners (2021)
43 © 2021 by MIP
LS1 0.45 0.76 0.34 0.52
LS2 0.43 0.85 0.36 0.64
LS3 0.64 0.89 0.57 0.70
PD 0.71 0.53 1.00 0.53
Secondly, we looked at the model’s outer loadings. Hair et al. (2017) stated that
indicators with high outer loadings tend to have more in common; hence,
indicators with a factor loading of less than 0.4 should be excluded whereas those
with an outer loading at least 0.7 should be retained. Lastly, indicators with an
outer loading in between are acceptable for exploratory studies (Hair et al., 2012,
p. 429), such as one reported in this paper. Thus, indicators used in this research
satisfy these requirements (Table 3).
Table 3: Outer loadings
Land_Atribute Land_Structure Land_Value Location
LA1 0.65
LA10 0.69
LA2 0.73
LA3 0.81
LA4 0.79
LA5 0.76
LA6 0.61
LA7 0.80
LA8 0.73
LA9 0.75
LO1 0.81
LO2 0.81
LO3 0.71
LO4 0.75
LO5 0.75
LO6 0.70
LS1 0.76
LS2 0.85
LS3 0.89
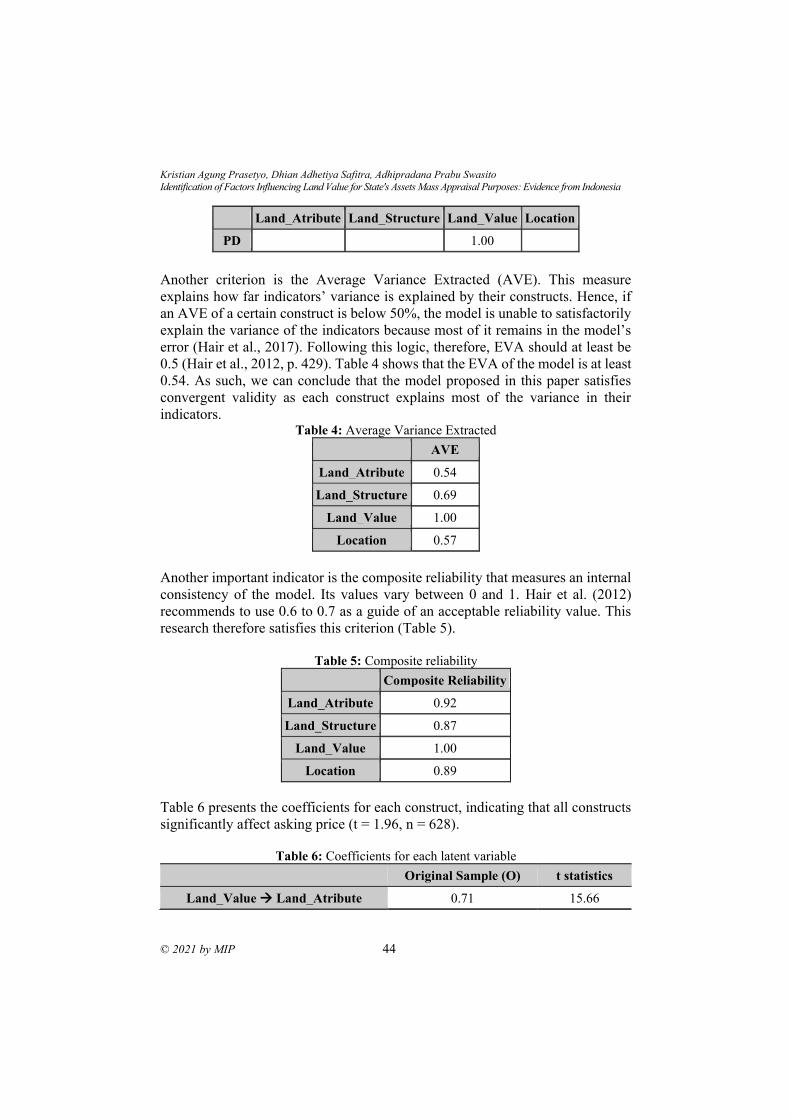
Kristian Agung Prasetyo, Dhian Adhetiya Safitra, Adhipradana Prabu Swasito
Identification of Factors Influencing Land Value for State's Assets Mass Appraisal Purposes: Evidence from Indonesia
© 2021 by MIP 44
Land_Atribute Land_Structure Land_Value Location
PD 1.00
Another criterion is the Average Variance Extracted (AVE). This measure
explains how far indicators’ variance is explained by their constructs. Hence, if
an AVE of a certain construct is below 50%, the model is unable to satisfactorily
explain the variance of the indicators because most of it remains in the model’s
error (Hair et al., 2017). Following this logic, therefore, EVA should at least be
0.5 (Hair et al., 2012, p. 429). Table 4 shows that the EVA of the model is at least
0.54. As such, we can conclude that the model proposed in this paper satisfies
convergent validity as each construct explains most of the variance in their
indicators. Table 4: Average Variance Extracted
AVE
Land_Atribute 0.54
Land_Structure 0.69
Land_Value 1.00
Location 0.57
Another important indicator is the composite reliability that measures an internal
consistency of the model. Its values vary between 0 and 1. Hair et al. (2012)
recommends to use 0.6 to 0.7 as a guide of an acceptable reliability value. This
research therefore satisfies this criterion (Table 5).
Table 5: Composite reliability
Composite Reliability
Land_Atribute 0.92
Land_Structure 0.87
Land_Value 1.00
Location 0.89
Table 6 presents the coefficients for each construct, indicating that all constructs
significantly affect asking price (t = 1.96, n = 628).
Table 6: Coefficients for each latent variable
Original Sample (O) t statistics
Land_Value → Land_Atribute 0.71 15.66
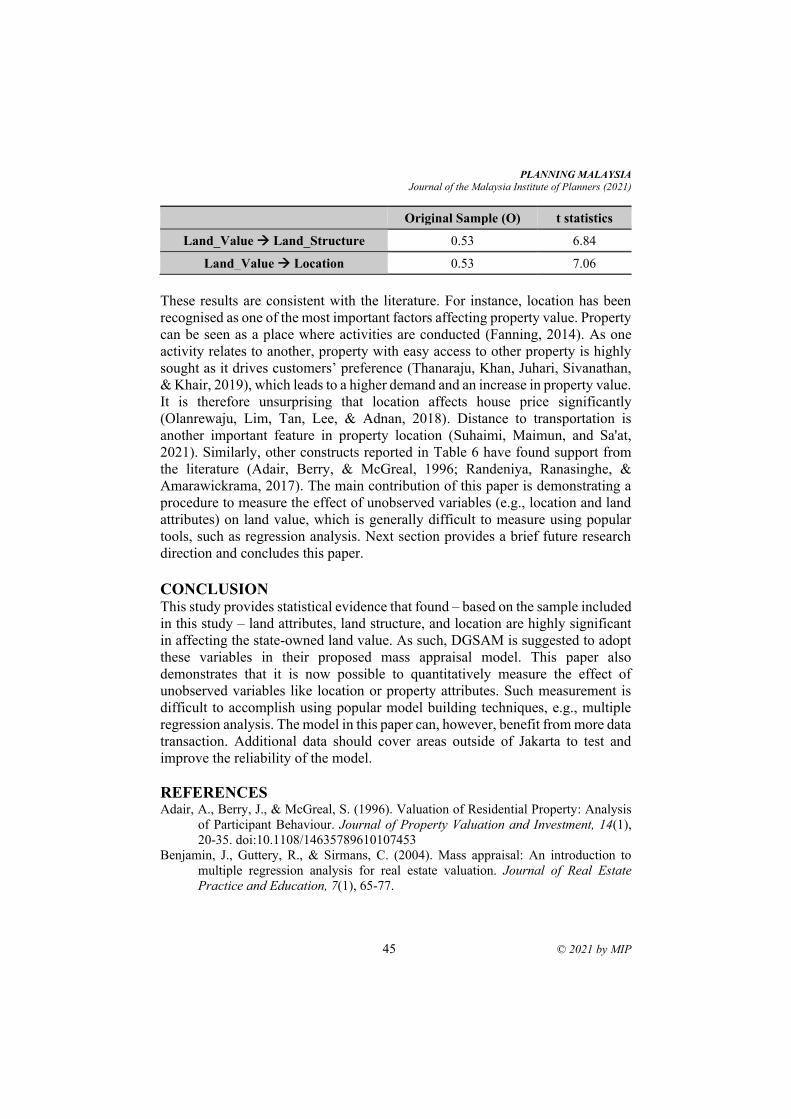
PLANNING MALAYSIA
Journal of the Malaysia Institute of Planners (2021)
45 © 2021 by MIP
Original Sample (O) t statistics
Land_Value → Land_Structure 0.53 6.84
Land_Value → Location 0.53 7.06
These results are consistent with the literature. For instance, location has been
recognised as one of the most important factors affecting property value. Property
can be seen as a place where activities are conducted (Fanning, 2014). As one
activity relates to another, property with easy access to other property is highly
sought as it drives customers’ preference (Thanaraju, Khan, Juhari, Sivanathan,
& Khair, 2019), which leads to a higher demand and an increase in property value.
It is therefore unsurprising that location affects house price significantly
(Olanrewaju, Lim, Tan, Lee, & Adnan, 2018). Distance to transportation is
another important feature in property location (Suhaimi, Maimun, and Sa'at,
2021). Similarly, other constructs reported in Table 6 have found support from
the literature (Adair, Berry, & McGreal, 1996; Randeniya, Ranasinghe, &
Amarawickrama, 2017). The main contribution of this paper is demonstrating a
procedure to measure the effect of unobserved variables (e.g., location and land
attributes) on land value, which is generally difficult to measure using popular
tools, such as regression analysis. Next section provides a brief future research
direction and concludes this paper.
CONCLUSION
This study provides statistical evidence that found – based on the sample included
in this study – land attributes, land structure, and location are highly significant
in affecting the state-owned land value. As such, DGSAM is suggested to adopt
these variables in their proposed mass appraisal model. This paper also
demonstrates that it is now possible to quantitatively measure the effect of
unobserved variables like location or property attributes. Such measurement is
difficult to accomplish using popular model building techniques, e.g., multiple
regression analysis. The model in this paper can, however, benefit from more data
transaction. Additional data should cover areas outside of Jakarta to test and
improve the reliability of the model.
REFERENCES Adair, A., Berry, J., & McGreal, S. (1996). Valuation of Residential Property: Analysis
of Participant Behaviour. Journal of Property Valuation and Investment, 14(1),
20-35. doi:10.1108/14635789610107453
Benjamin, J., Guttery, R., & Sirmans, C. (2004). Mass appraisal: An introduction to
multiple regression analysis for real estate valuation. Journal of Real Estate
Practice and Education, 7(1), 65-77.
Kristian Agung Prasetyo, Dhian Adhetiya Safitra, Adhipradana Prabu Swasito
Identification of Factors Influencing Land Value for State's Assets Mass Appraisal Purposes: Evidence from Indonesia
© 2021 by MIP 46
Eckert, J. K., Gloudemans, R. J., & Almy, R. R. (1990). Property Appraisal and
Assessment Administration. Chicago, Ill.: International Association of Assessing
Officers.
Fanning, S. F. (2014). Market Analysis for Real Estate: Concepts and Applications in
Valuation and Highest and Best Use (2nd ed.): Appraisal Institute.
Freeman, J., & Zhao, X. (2019). An SEM Approach to Modeling Housing Values. Data
Analysis and Applications 1: Clustering and Regression, Modeling‐estimating,
Forecasting and Data Mining, 2, 125-135.
Gallagher, D., Ting, L., & Palmer, A. (2008). A Journey into the Unknown; Taking the
Fear Out of Structural Equation Modeling with AMOS for the First-time User. The
Marketing Review, 8(3), 255-275.
Gujarati, D. N. (2009). Basic econometrics: Tata McGraw-Hill Education.
Hair, J. F., Black, W. C., Babin, B. J., & Anderson, R. E. (2013). Multivariate Data
Analysis: Pearson Education Limited.
Hair, J. F., Hult, G. T. M., Ringle, C. M., & Sarstedt, M. (2017). A Primer on Partial
Least Squares Structural Equation Modeling (PLS-SEM) (2nd ed.). Los Angeles:
SAGE Publications, Inc.
Hair, J. F., Sarstedt, M., Hopkins, L., & Volker, G. K. (2014). Partial Least Squares
Structural Equation Modeling (PLS-SEM): An Emerging Tool in Business
Research. European Business Review, 26(2), 106-121. doi:10.1108/EBR-10-
2013-0128
Hair, J. F., Sarstedt, M., Ringle, C. M., & Mena, J. A. (2012). An Assessment of the Use
of Partial Least Squares Structural Equation Modeling in Marketing Research.
Journal of the Academy of Marketing Science, 40(3), 414-433.
doi:10.1007/s11747-011-0261-6
Jahanshiri, E., Buyong, T., & Shariff, A. R. M. (2011). A review of property mass
valuation models. Pertanika Journal of Science & Technology, 19(1), 23-30.
Liu, Y., & Wu, Y. X. (2009). Analysis of Residential Product's Value Based On Structural
Equation Model and Hedonic Price Theory. Paper presented at the 2009
International Conference on Management Science and Engineering.
McCluskey, W. J. (2018). A Critical Review of Computer Assisted Mass Appraisal
Techniques. In W. J. McCluskey & A. Adair (Eds.), Computer Assisted Mass
Appraisal: An International Review: Taylor & Francis.
Olanrewaju, A. L., Lim, X. Y., Tan, S. Y., Lee, J. E., & Adnan, H. (2018). Factors
Affecting Housing Prices in Malaysia: Analysis of the Supply Side. Planning
Malaysia, 16(6).
Randeniya, T., Ranasinghe, G., & Amarawickrama, S. (2017). A Model to Estimate the
Implicit Values of Housing Attributes by Applying the Hedonic Pricing Method.
International Journal of Built Environment and Sustainability, 4(2).
Riley, W. (2018). Mass Appraisals of Condominiums. In W. J. McCluskey & A. Adair
(Eds.), Computer Assisted Mass Appraisal: An International Review: Taylor &
Francis.
Suhaimi, N. A., Maimun, N. H. A., & Sa'at, N. F. (2021). Does Rail Transport Impact
House Prices and Rents? Planning Malaysia, 19(16).

PLANNING MALAYSIA
Journal of the Malaysia Institute of Planners (2021)
47 © 2021 by MIP
Thanaraju, P., Khan, P. A. M., Juhari, N. H., Sivanathan, S., & Khair, N. M. (2019).
Factors Affecting the Housing Preferences of Homebuyers in Kuala Lumpur.
Planning Malaysia, 17(9).
Tretton, D. (2007). Where is the world of property valuation for taxation purposes going?
Journal of Property Investment & Finance, 25(5), 482-514.
Tukey, J. W. (1977). Exploratory Data Analysis: Addison-Wesley Publishing Company.
Received: 12th July 2021. Accepted: 17th Sept 2021
1 Senior Lecturer at Taylor’s University. Email: [email protected]
PLANNING MALAYSIA:
Journal of the Malaysian Institute of Planners
VOLUME 19 ISSUE 3 (2021), Page 48 – 60
PURCHASING DECISION OF PROPERTY BUYERS: THE
HOUSING QUALITY, FINANCIAL CAPABILITIES, AND
GOVERNMENT POLICIES STUDIES
Kenn Jhun Kam1, Tze Shwan Lim2, Danielle Li Ping Yoong3, Fuey Lin Ang4, Boon
Tik Leong5
1,2,3,4,5 School of Architecture, Building and Design TAYLOR’S UNIVERSITY
Abstract
There are generally three types of house buyers called owner-occupiers,
investors,and speculators. However, various factors that affect their decision to
purchase a house. The research aims to identify the main factors that will affect
the purchase decision of property buyers. Factors such as environmental factors,
financial factors, governmental factors, subjective norms, and physical design
factors will affect their decision to purchase. The research technique used is
quantitative research. Descriptive analysis and inferential analysis to analyse the
hypothesis. Based on the findings, the factors that showed to be statistically
significant are the environmental, governmental, and subjective norm factors.
Environmental factor has a positive influence towards the purchasing decision of
dwelling while governmental and subjective norm factor has a negative influence
onthe purchasing decision of residential properties. The regression model
findings from this research show not only governmentimposed regulation could
significantly affecting the purchasers’ decision, however, environmental and
subjective norm factors play a major role in this matter. This information is
beneficial to developers that have the intention to construct dwellings in the
future. Developers can take into consideration all the significant factors before
deciding on the location for their future development
Keywords: purchase decision, house buyers, environmental factors, financial
factors, government factors, residential properties, inferential analysis
PLANNING MALAYSIA
Journal of the Malaysia Institute of Planners (2021)
49 © 2021 by MIP
INTRODUCTION The Malaysian government has been putting effort into improving the housing
sectors in terms of quantity and quality by providing incentives to the public and
private developers. However recently, prices of houses have been shooting high
up due to inflation and weakening Ringgit Malaysia while the salary of the
household -is increasing at a slower pace. The existing gap between what the
developers sell and what the households or individuals can afford is getting
further as time goes on Atati (2014).
PROBLEM STATEMENT According to Bank Negara Malaysia, BNM (2015), from the last five years, there
is a shortfall in the supply of housing as shown from the mismatch between the
growth rate of the housing supply and the increasing number of potential
households. On average the total number of completed houses are 166,876, and
approximately a total of 117,250 household increases simultaneously. Thus, this
indicates that there will be a surplus of 49,626 units of houses annually. However,
in the year 2010 to 2015, the completion of the total number of housings has been
declining to approximately 80,089 units per year while the net increase of the
number of households is on average 166,000 per year. This implies that from the
year 2010 to 2015 there is a shortage of 85,911 units of houses (BNM, 2015). As
mentioned by Zainun and Ismail (2015, p.1037) ‘housing supply is not keeping
up with demand’.
According to Hong Leong Investment Bank Research (2016), the
National Property Information Centre (NAPIC) recorded that there was a drop of
5.7% in the transactions made in the year 2015. This decline is recorded to be the
second-largest drop since the year 2002 which is placed after the drop that took
place in 2009 of a percentage of 8.3. The surplus supply of houses is still on the
inclining slope. In the year 2015, the supply of housing stocks has reached a total
of 892,000 which is an increase of an additional 16% since 2004. This is the
highest amount which is overall 18% of the existing stocks in Malaysia.
RESEARCH AIM AND HYPOTHESIS The aim of this study is to understand which factors will affect the purchasing
decision of dwellings among property buyers. Hypothesis 1: Factors that affects the purchasing decision of residential properties
among property buyers
H1a: Environmental factors will have a positive relationship with the purchasing
decision of residential properties
H1b: Financial factors will have a negative relationship with the purchasing decision of
residential properties
K.J. Kam, T.S. Lim, D.L.P. Yoong, F.L. Ang, B.T. Leong
Purchasing Decision of Property Buyers: The Housing Quality, Financial Capabilities, and Government Policies Studies
© 2021 by MIP 50
H1c: Governmental factors will have a negative relationship with the purchasing
decision of residential properties
H1d: Subjective norm factors will have a positive relationship with the purchasing
decision of residential properties
H1e: Physical design factors will have a positive relationship with the purchasing
decision of residential properties
LITERATURE REVIEW The decision of purchasing a house is complex and must into consideration a
handful of factors as eventually will lead to long-term financial burdens such as
a mortgage, day-to-day activities as well as social interaction, security and safety,
and many more other factors (Litman, 2012).
Environmental Factor Anuar and Muhamadan (2018) emphasized that the three main factors that a
person should consider before purchasing a house are location, location, and
location, especially the demand on the complete neighborhood facilities. Past
researchers have identified the location as one of the main factors that will affect
the purchase decision of homebuyers in countries such as Australia, the UK, and
Ireland (Daly et al., 2003). Location factor can be commonly linked to the
distance and convenience to local amenities such as public transport, health care
center and etc (Tobi, Fathi & Amaratunga, 2018). Proximities will have a
significant influence on choosing whether which residential property (Saw &
Tan, 2014).
Neighborhood can be defined as a space whereby a community dwells
together with similar interest (Choguill, 2008). Households will prefer to incur
additional money for a dwelling that is in a good neighborhood with excellent
indoor and outdoor qualities (Aini et al., 2017). Some of neighboring
environment qualities such as the pollution level, crime, and safety level, and
cleanliness are vital and will eventually affect the purchasing decision of the
buyers (Tan, 2011a). Khalid et al. (2020) conducted research and proved that a
gated community lowers the chances of any unwanted crime.
Financial Factor Price can be defined as a type of payment where one party pays the other for their
services or transactions done. In real estate, the price is set bythe developers after
doing relevant research in the market. According to Shinde, Gawande (2018) the
price of residential properties is one of the factors to drive the demand of
investors. Lower price dwellings will encourage more prospective buyers to
purchase dwellings (Humphrey & Verdery, 2020). Fluctuation of the price of
these dwelling is also affected by a set of factors such as exterior and interior or
the dwell, location, facilities and many more (Rahadi et al., 2013).
PLANNING MALAYSIA
Journal of the Malaysia Institute of Planners (2021)
51 © 2021 by MIP
According to Paramesran (2013), the banking systems in Malaysia have
vied with one another to promote various types of loans that can be adjusted to
suit their preference and thus increasing the demand and eventually the price of
the houses. The financing sourcing from the housing sector is inclined by a
compound annual growth rate (CAGR) of 10.6% from the year 1997 to 2012. In
1997, there was a total of RM 20.5 billion loans and it has increased to RM 95.2
billion by 2012 which is four times the amount in 1997 (Zandi et al., 2015). Kam
et al. (2016) reported that the ability to widen the availability of these loans from
the financial institutions depends on the supply of new housing. However, in the
event when the government imposes stringent housing regulations, the demand
for houses will decline as people will be unable to take long-term loans to
purchase a house.
Interest rates are the cost of borrowing a loan or mortgage from a
financial institution (Fields, 2018). It is a vital factor to determine how much to
pay back with having a property or house. According to Chang et al. (2019), at
the time when interest rates decline, it is very tempting to purchase a house. This
is provided if the rates are reduced due to the weakened economic growth with
other factors remaining, the prices of the house would not incline. Pembina
Institute (2013) further supports that a low-interest rate for a mortgage would
drive the demand for houses but if the supply of new units does not keep up, the
price of the houses will eventually increase and would discourage people to
purchase a house. Governmental Factor Real Property Gain Tax (RPGT) is the type of payment or charge originating from
the disposal of the real properties and shares in those companies for real
properties located in Malaysia. It is computed based on the money that is to be
made by subtracting the disposal price and acquisition price (Geoffrey, 2014).
From the Ministry of Finance (MOF) Malaysia stated that the tax imposed is
based on the holding period of the property before selling it. The tax is associated
with other costs such as professional fees, stamp duty, etc. (Zainuddin, 2015)
Developer Interest Bearing Scheme (DIBS), whereby the interest rates
for the housing loan incurred during the construction phase will be absorbed by
the developers. The result of this scheme is that is not necessary for the purchasers
to cough out with other payment than the initial deposit during the period of
construction (Paramesran, 2013). Since purchasers are still required to pay for the
initial deposit, thus this is not a Build-Then-Sell (BTS) concept but a Sell-Then-
Build (STB) concept. The initial cost that is to be incurred by the purchaser could
be hefty as the cost comprises not only the down payment when the Sale and
Purchase Agreement (S&P) is signed but as well as other costs (REHDA, 2014).
The Malaysia Government has been implementing various housing
policies and housing programmes through various Malaysia Plans. The housing

K.J. Kam, T.S. Lim, D.L.P. Yoong, F.L. Ang, B.T. Leong
Purchasing Decision of Property Buyers: The Housing Quality, Financial Capabilities, and Government Policies Studies
© 2021 by MIP 52
policies introduced by the Malaysian Government was to provide more attention
to the production and transportation of the houses through the participation of the
private sectors.
Subjective Norm Factor Tonglet et al (2004) defined subjective norm as to how an individual would allow
or control the pressures put on him or her to do or not to do. Housing preferences
are determined by many other factors such as religion, social status and relation,
and many more (Jabareen, 2005). Social pressures such as influence from people
surrounding one’s everyday life, family members, friends, and acquaintance, or
sometimes agents will affect the property buyer’s perception on deciding what or
whether to buy or not (Kam et al. 2018). For example, the perception of an
individual may be affected by the persuasion from their family, or incentives
offered by the government and thus opt to purchase a certain type of house. One
of the most influential party is often to be one family members (Teoh, 2011).
Research in the United States shows that spouse and children carry the highest
influential level that will affect one’s purchase decision for a dwell (Livette,
2007). It was further elaborated that among these two parties, children carry a
high impact as adults would normally provide the best for their children.
Physical Design Factor The physical design includes design, physical conditions, and the quality of the
property. Based on Hurtubia et al. (2010), the features of a house such as the
number of rooms and bathrooms would be considered first before deciding on
purchasing, this is especially in western countries. The size of the living and
dining hall, usable area of the house, and number of rooms are all considered
under design factors (Tan, 2012). The purpose of purchasing residential
properties affects the type of house to purchase. For example, purchasing a
property to live in and purchasing as an investment has a significant difference.
Speculators prefer buying smaller units in high-rise buildings as they tend to sell
better later on (Kohler, 2013). Other design factors such as good ventilation and
good lighting also contribute to the purchase decision of an individual (Sew &
Chin, 2000).
RESEARCH METHODOLOGY A research framework is developed in this research study based on the objective
of this research study by having 5 factors and 28 items, as shown in Table 1
below.
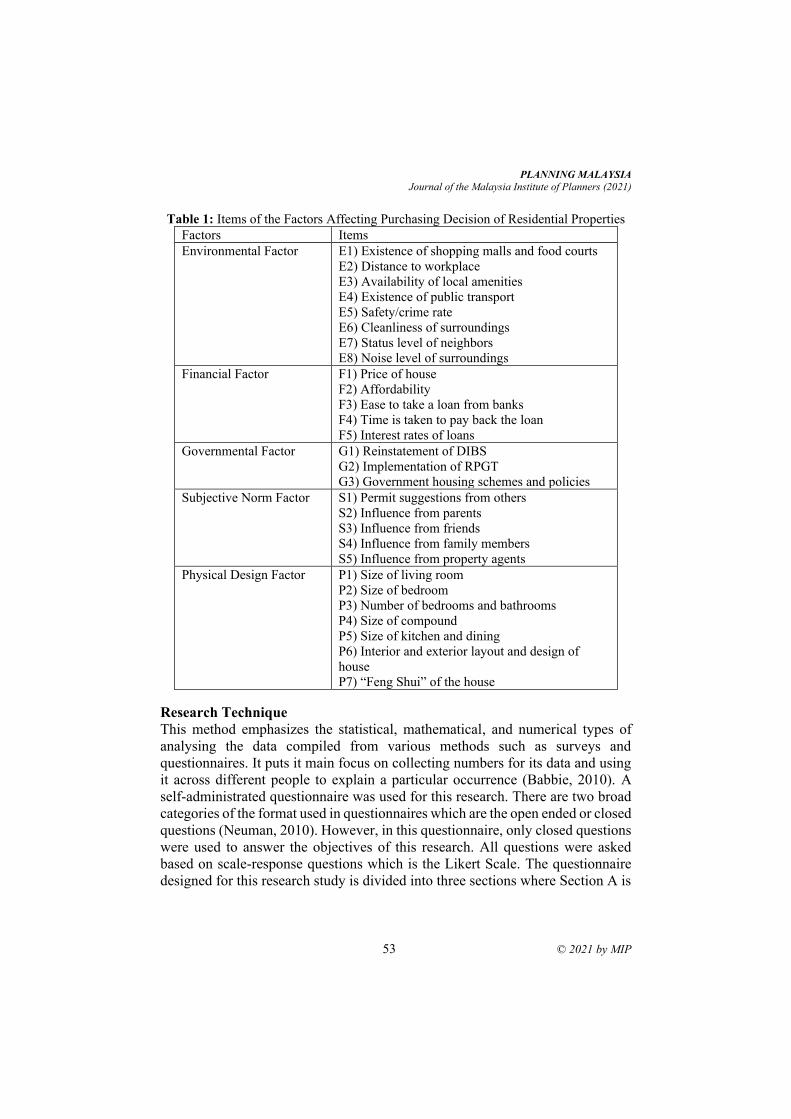
PLANNING MALAYSIA
Journal of the Malaysia Institute of Planners (2021)
53 © 2021 by MIP
Table 1: Items of the Factors Affecting Purchasing Decision of Residential Properties
Factors Items
Environmental Factor E1) Existence of shopping malls and food courts
E2) Distance to workplace
E3) Availability of local amenities
E4) Existence of public transport
E5) Safety/crime rate
E6) Cleanliness of surroundings
E7) Status level of neighbors
E8) Noise level of surroundings
Financial Factor F1) Price of house
F2) Affordability
F3) Ease to take a loan from banks
F4) Time is taken to pay back the loan
F5) Interest rates of loans
Governmental Factor G1) Reinstatement of DIBS
G2) Implementation of RPGT
G3) Government housing schemes and policies
Subjective Norm Factor S1) Permit suggestions from others
S2) Influence from parents
S3) Influence from friends
S4) Influence from family members
S5) Influence from property agents
Physical Design Factor P1) Size of living room
P2) Size of bedroom
P3) Number of bedrooms and bathrooms
P4) Size of compound
P5) Size of kitchen and dining
P6) Interior and exterior layout and design of
house
P7) “Feng Shui” of the house
Research Technique This method emphasizes the statistical, mathematical, and numerical types of
analysing the data compiled from various methods such as surveys and
questionnaires. It puts it main focus on collecting numbers for its data and using
it across different people to explain a particular occurrence (Babbie, 2010). A
self-administrated questionnaire was used for this research. There are two broad
categories of the format used in questionnaires which are the open ended or closed
questions (Neuman, 2010). However, in this questionnaire, only closed questions
were used to answer the objectives of this research. All questions were asked
based on scale-response questions which is the Likert Scale. The questionnaire
designed for this research study is divided into three sections where Section A is
K.J. Kam, T.S. Lim, D.L.P. Yoong, F.L. Ang, B.T. Leong
Purchasing Decision of Property Buyers: The Housing Quality, Financial Capabilities, and Government Policies Studies
© 2021 by MIP 54
the demographic profile of the respondents and Section B is the factors affecting
the purchasing decision of residential properties among the respondents.
The research topic is to study the factors affecting the purchasing
decision of residential property among property buyers. Since property buyers
can be anyone of legal age and can purchase a property, thus the scope of this
research will be on people living in Klang Valley which is one of the most
urbanized places located in Malaysia. To have an equal and fair chance for every
respondent of the population, a simple random sampling method is used in the
study. Further from that, the snowball sampling method which is one of the non-
probability sampling methods is also used to enhance the respondents’ rate to get
the statistic normality of the respondents achieve for a more significant statistic
analysis output.
Method of Analysis According to Zikmund et al. (2010), descriptive analysis is a method of
presenting the data in a method that describes the characteristics of a population
or sample. This type of analysis is commonly used to present the demographic
profile of the respondents. There are various ways to present the data, one of the
popular methods is by using the frequency charts either pie or bar. It is relatively
simple to understand the charts at a glance. Frequency can be defined as the total
number of respondents that answered for each category of choice. The frequency
can be converted into a percentage to suit the data collected.
The average index method is used to calculate the mean of an item by
multiplying the frequency by a weightage. This method of analysis is employed
to rank the factors that affect the purchasing decision based on the level of
importance that is measured using the Likert scale.
Logistic regression is used to test models to forecast the outcomes with
binary options. The dependent variable in the hypothesis is the purchasing
decision of residential property which is asked in the questionnaire as a binary
question “Have purchased” and “Have not purchased”. The independent variable
on the other hand could be either be categorical or continuous data (Pallant,
2002). The independent variables which are the factors in this research are
measured using Likert scales which are continuous.
DATA ANALYSIS A total of 5,000 emails with the survey web link attached were sent out and a total
of 386 surveys were filled in through google form. However, as this research only
focus on respondents living in Klang Valley, the response was filtered and hence
only an usable survey of 348 number of response is used for this research.
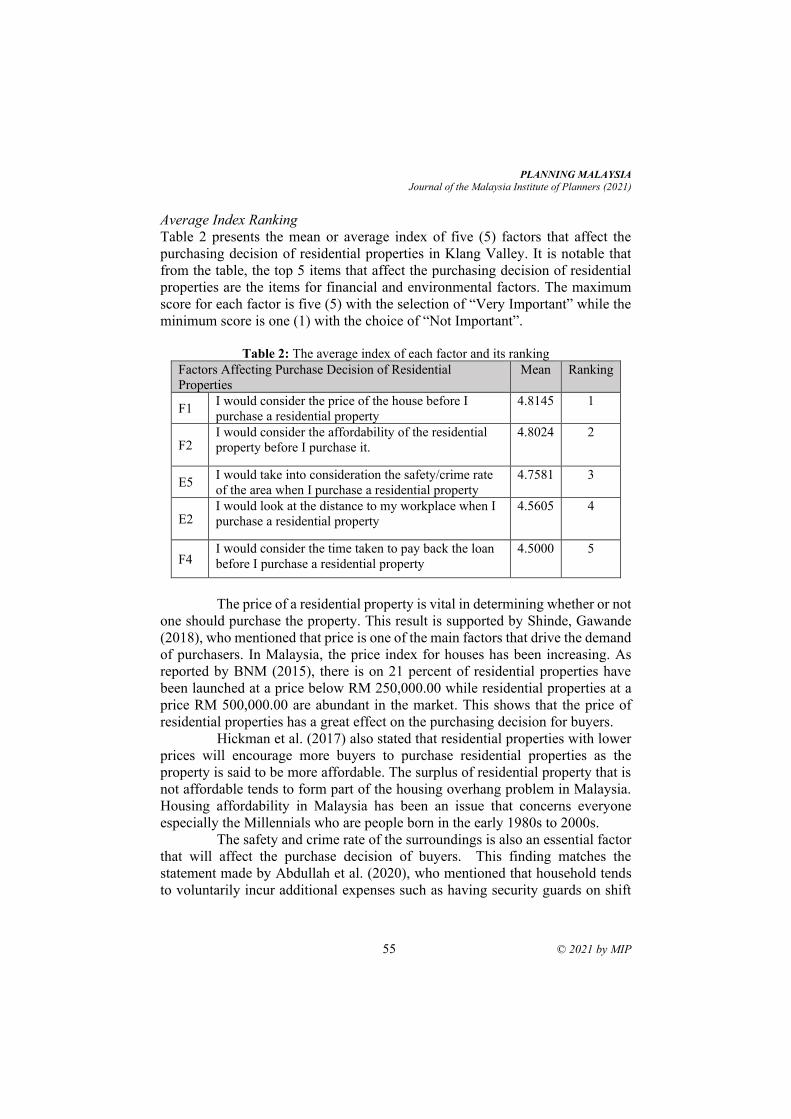
PLANNING MALAYSIA
Journal of the Malaysia Institute of Planners (2021)
55 © 2021 by MIP
Average Index Ranking Table 2 presents the mean or average index of five (5) factors that affect the
purchasing decision of residential properties in Klang Valley. It is notable that
from the table, the top 5 items that affect the purchasing decision of residential
properties are the items for financial and environmental factors. The maximum
score for each factor is five (5) with the selection of “Very Important” while the
minimum score is one (1) with the choice of “Not Important”.
Table 2: The average index of each factor and its ranking
Factors Affecting Purchase Decision of Residential
Properties
Mean Ranking
F1 I would consider the price of the house before I
purchase a residential property
4.8145 1
F2 I would consider the affordability of the residential
property before I purchase it.
4.8024 2
E5 I would take into consideration the safety/crime rate
of the area when I purchase a residential property
4.7581 3
E2 I would look at the distance to my workplace when I
purchase a residential property
4.5605 4
F4 I would consider the time taken to pay back the loan
before I purchase a residential property
4.5000 5
The price of a residential property is vital in determining whether or not
one should purchase the property. This result is supported by Shinde, Gawande
(2018), who mentioned that price is one of the main factors that drive the demand
of purchasers. In Malaysia, the price index for houses has been increasing. As
reported by BNM (2015), there is on 21 percent of residential properties have
been launched at a price below RM 250,000.00 while residential properties at a
price RM 500,000.00 are abundant in the market. This shows that the price of
residential properties has a great effect on the purchasing decision for buyers.
Hickman et al. (2017) also stated that residential properties with lower
prices will encourage more buyers to purchase residential properties as the
property is said to be more affordable. The surplus of residential property that is
not affordable tends to form part of the housing overhang problem in Malaysia.
Housing affordability in Malaysia has been an issue that concerns everyone
especially the Millennials who are people born in the early 1980s to 2000s.
The safety and crime rate of the surroundings is also an essential factor
that will affect the purchase decision of buyers. This finding matches the
statement made by Abdullah et al. (2020), who mentioned that household tends
to voluntarily incur additional expenses such as having security guards on shift
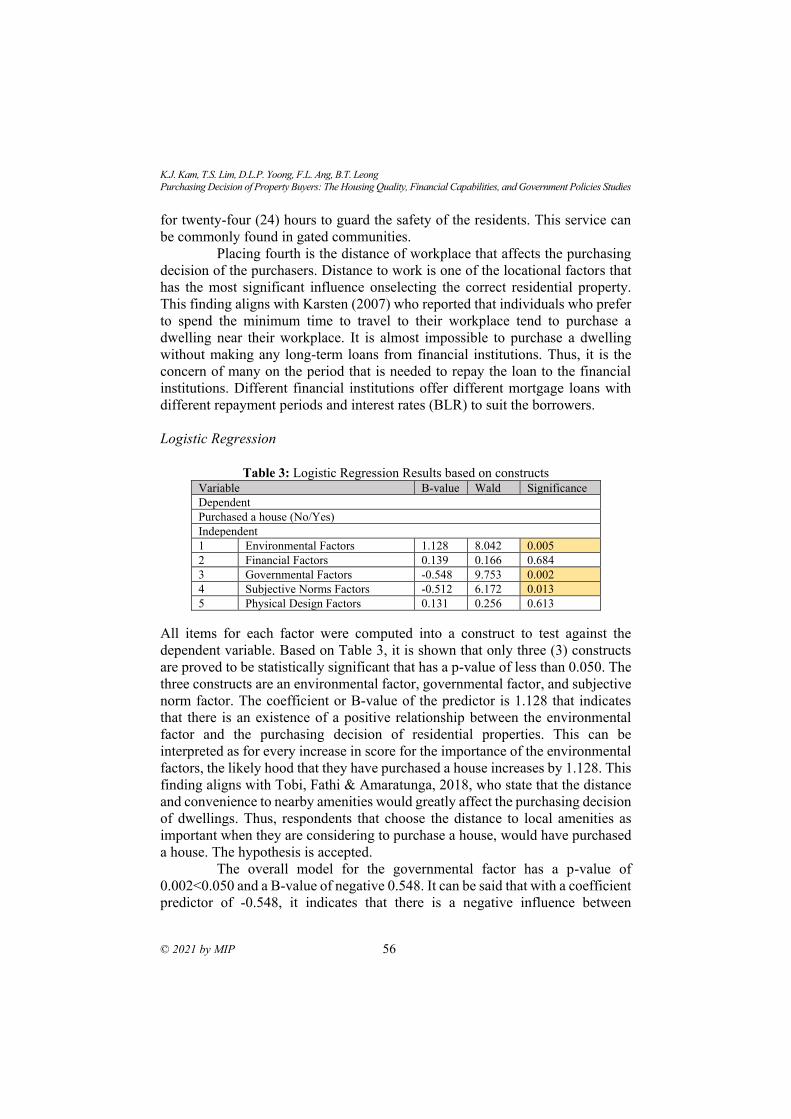
K.J. Kam, T.S. Lim, D.L.P. Yoong, F.L. Ang, B.T. Leong
Purchasing Decision of Property Buyers: The Housing Quality, Financial Capabilities, and Government Policies Studies
© 2021 by MIP 56
for twenty-four (24) hours to guard the safety of the residents. This service can
be commonly found in gated communities.
Placing fourth is the distance of workplace that affects the purchasing
decision of the purchasers. Distance to work is one of the locational factors that
has the most significant influence onselecting the correct residential property.
This finding aligns with Karsten (2007) who reported that individuals who prefer
to spend the minimum time to travel to their workplace tend to purchase a
dwelling near their workplace. It is almost impossible to purchase a dwelling
without making any long-term loans from financial institutions. Thus, it is the
concern of many on the period that is needed to repay the loan to the financial
institutions. Different financial institutions offer different mortgage loans with
different repayment periods and interest rates (BLR) to suit the borrowers.
Logistic Regression
Table 3: Logistic Regression Results based on constructs
Variable B-value Wald Significance
Dependent
Purchased a house (No/Yes)
Independent
1 Environmental Factors 1.128 8.042 0.005
2 Financial Factors 0.139 0.166 0.684
3 Governmental Factors -0.548 9.753 0.002
4 Subjective Norms Factors -0.512 6.172 0.013
5 Physical Design Factors 0.131 0.256 0.613
All items for each factor were computed into a construct to test against the
dependent variable. Based on Table 3, it is shown that only three (3) constructs
are proved to be statistically significant that has a p-value of less than 0.050. The
three constructs are an environmental factor, governmental factor, and subjective
norm factor. The coefficient or B-value of the predictor is 1.128 that indicates
that there is an existence of a positive relationship between the environmental
factor and the purchasing decision of residential properties. This can be
interpreted as for every increase in score for the importance of the environmental
factors, the likely hood that they have purchased a house increases by 1.128. This
finding aligns with Tobi, Fathi & Amaratunga, 2018, who state that the distance
and convenience to nearby amenities would greatly affect the purchasing decision
of dwellings. Thus, respondents that choose the distance to local amenities as
important when they are considering to purchase a house, would have purchased
a house. The hypothesis is accepted.
The overall model for the governmental factor has a p-value of
0.002<0.050 and a B-value of negative 0.548. It can be said that with a coefficient
predictor of -0.548, it indicates that there is a negative influence between
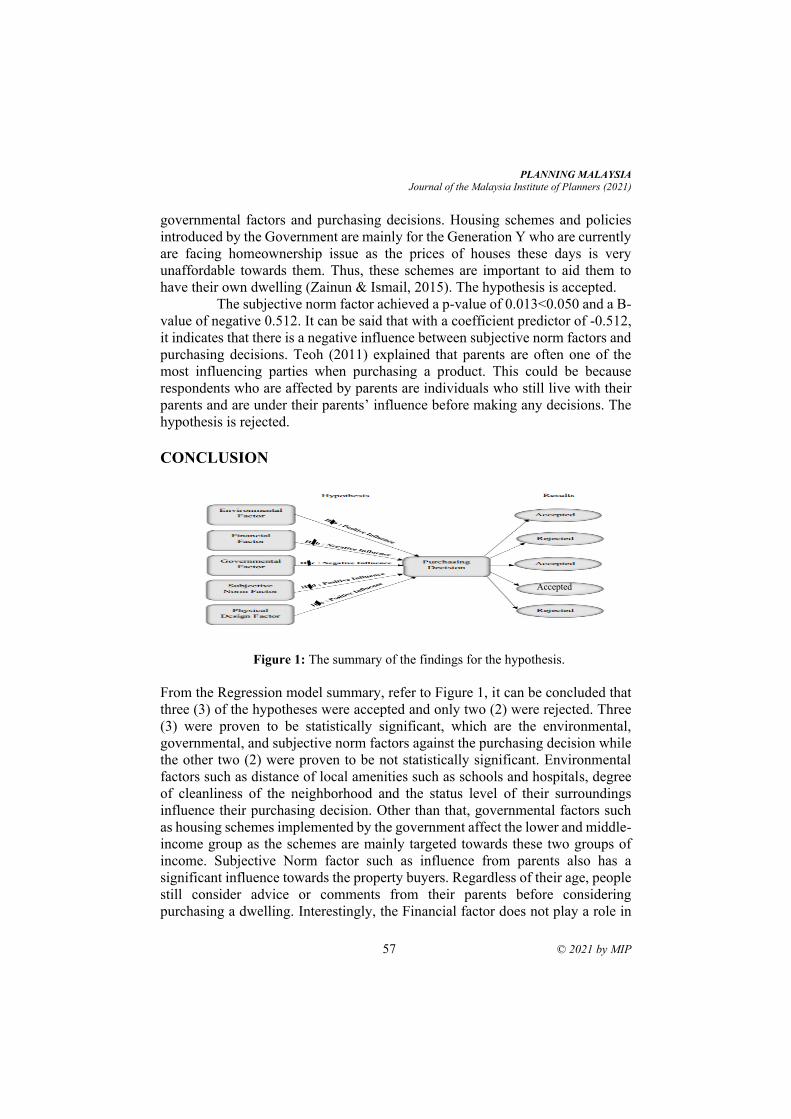
PLANNING MALAYSIA
Journal of the Malaysia Institute of Planners (2021)
57 © 2021 by MIP
governmental factors and purchasing decisions. Housing schemes and policies
introduced by the Government are mainly for the Generation Y who are currently
are facing homeownership issue as the prices of houses these days is very
unaffordable towards them. Thus, these schemes are important to aid them to
have their own dwelling (Zainun & Ismail, 2015). The hypothesis is accepted.
The subjective norm factor achieved a p-value of 0.013<0.050 and a B-
value of negative 0.512. It can be said that with a coefficient predictor of -0.512,
it indicates that there is a negative influence between subjective norm factors and
purchasing decisions. Teoh (2011) explained that parents are often one of the
most influencing parties when purchasing a product. This could be because
respondents who are affected by parents are individuals who still live with their
parents and are under their parents’ influence before making any decisions. The
hypothesis is rejected.
CONCLUSION
Figure 1: The summary of the findings for the hypothesis.
From the Regression model summary, refer to Figure 1, it can be concluded that
three (3) of the hypotheses were accepted and only two (2) were rejected. Three
(3) were proven to be statistically significant, which are the environmental,
governmental, and subjective norm factors against the purchasing decision while
the other two (2) were proven to be not statistically significant. Environmental
factors such as distance of local amenities such as schools and hospitals, degree
of cleanliness of the neighborhood and the status level of their surroundings
influence their purchasing decision. Other than that, governmental factors such
as housing schemes implemented by the government affect the lower and middle-
income group as the schemes are mainly targeted towards these two groups of
income. Subjective Norm factor such as influence from parents also has a
significant influence towards the property buyers. Regardless of their age, people
still consider advice or comments from their parents before considering
purchasing a dwelling. Interestingly, the Financial factor does not play a role in
Accepted
K.J. Kam, T.S. Lim, D.L.P. Yoong, F.L. Ang, B.T. Leong
Purchasing Decision of Property Buyers: The Housing Quality, Financial Capabilities, and Government Policies Studies
© 2021 by MIP 58
affecting the purchaser in their decision on buying a house because according to
Shinde, Gawande (2018), the Financial factor has a lesser relationship in the
purchaser decision because since the mortgage’s loan to Value (LTV) Ratio is up
to 70% for a borrower. Where in another word, a borrower can easily get a loan,
which this phenomenon causes the logistic regression of the Financial factors
tend to be non-significant in the hypothesis testing. The findings from this
research are beneficial to developers that have the intention to construct dwellings
in the future. Developers can take into consideration all the significant factors
before deciding on the location for their future development. Governmental
bodies shall take note of the importance of the housing schemes towards the low
and middle-income group as it greatly affects their purchasing decision and aid
in promoting homeownership.
REFERENCES Abdullah, J., Rashid, K. A., Shah, M. I. B., Leh, O. L. H., Majid, R. A., & Ngah, R.
(2020). Land use development and ridership at Kelana Jaya lrt line, Malaysia.
Planning Malaysia Journal of the Malaysian Institute of Planners, 18(4), 220– 238.
Aini, A. M., Azriyati, W. N., Aziz, W. A., & Zulkifli, N. F. (2017). Middle Adults’
Housing Expectations for Old-age: A Study of Urban Area of Greater Kuala
Lumpur. Journal of Design and Built Environment, 150-165.
Anuar, A. N. A., & Muhamadan, N. H. (2018). The demand of recreational facilities in
neighbourhood parks: Visitors’ perspectives. Planning Malaysia Journal of the
Malaysian Institute of Planners, 16(3), 197–207.
Atati, F.O. (2014). An investigation into the factors that influence housing finance in
developing countries: A case study of Kenya. Bachelor of Degree of Real Estate.
University of Nairobi, Kenya.
Babbie, Earl R. The Practice of Social Research. 12th ed. Belmont, CA: Wadsworth
Cengage, (2010). Muijs, Daniel. Doing Quantitative Research in Education with
SPSS. 2nd edition. London: SAGE Publications, 2010.
Bank Negara Malaysia (2015) Assessing demand-supply conditions in the Malaysian
property market. Available From:
http://www.bnm.gov.my/files/publication/ar/en/2015/cp01_002_box.pdf
[Accessed: 10 May 2016]
Bank Negara Malaysia (2016a). Monthly Statistical Bulletin Jan 2016. Available at:
http://www.bnm.gov.my/index.php?ch=en_publication_catalogue&pg=en_publi
cation_msb&eId=box1&mth=1&yr=2016&lang=en [Accessed 20 June 2016]
Chang, Y. F., Choong, W. C., Looi, S. Y., Pan, W. Y., & Goh, H. L. (2019). Analysis of
housing prices in Petaling district, Malaysia using functional relationship model.
International Journal of Housing Markets and Analysis.
Choguill, C.L. (2008). Developing sustainable neighbourhoods. Habitat International,
32, 41-8.
Daly, J., Gronow, S., Jenkins, D., & Plimmer, F. (2003). Consumer behaviour in the
valuation of residential property: A comparative study in the UK, Ireland and
Australia. Property Management, 21(5), 295-314.
PLANNING MALAYSIA
Journal of the Malaysia Institute of Planners (2021)
59 © 2021 by MIP
Fields, D. (2018). Constructing a new asset class: Property-led financial accumulation
after the crisis. Economic Geography, 94(2), 118-140.
Geoffrey (2014). Real Property Gain Tax (RPGT) in Malaysia. Available at:
http://www.nbc.com.my/blog/real-property-gain-tax-rpgt-in-malaysia/ [Accessed
on 26 June 2016]
Hickman, R., Cao, M., Mella Lira, B., Fillone, A., & Bienvenido Biona, J. (2017).
Understanding Capabilities, Functionings and Travel in High- and Low-Income
Neighbourhoods in Manila. Social Inclusion, 5(4), 161.
Hong Leong Investment Bank Research (2016) Malaysia’s 2015 property market records
decline in transaction value, volume. The Edge Property, Available From:
http://www.theedgeproperty.com.my/tags/bank-negara [Accessed: 4 May 2016].
Humphrey, C., & Verdery, K. (Eds.). (2020). Property in question: value transformation
in the global economy. Routledge.
Hurtubia, B., Gallay, O., & Bielaire, M. (2010). Attributes of household, locations and
real estate for land use modeling. Sustain City Working Paper, 2.7. Lausanne:
EPFL.
Jabareen, Y. (2005). Culture and Housing Preferences in a Developing City. Environment
and Behavior, 37(1), 134146. doi: 10.1177/0013916504267640
Jacobsen, D. H. and Naug, B. (2004). What drive house prices? Economic Bulletin, 4(4),
229- 235
Kam, K. J., Chuah, S. Y., Lim, T. S., & Lin Ang, F. (2016). Modelling of property market:
The structural and locational attributes towards Malaysian properties. Pacific Rim
Property Research Journal, 22(3), 203-216.
Kam, K. J., Lim, A. S. H., Al-Obaidi, K. M., & Lim, T. S. (2018). Evaluating housing
needs and preferences of generation Y in Malaysia. Planning Practice & Research,
33(2), 172-185.
Karsten, L. (2007). Housing as a way of life: Towards an understanding of middle-class
families’ preference for an urban residential location. Housing Studies, 22(1), 83-
98.
Khalid, H. A., Ling, O. H. L., Jalil, N. I. R., & Marzukhi, M. A. (2020). An analysis of
the needs of elderly-friendly neighbourhood in Malaysia: Perspectives of older
and younger groups. Planning Malaysia Journal of the Malaysian Institute of
Planners, 18(4), 144-157.
Kohler, M. J. (2013). Why you should be investing your money in real estate.
Entrepreneur. Available from: http://www.entrepreneur.com/article/228506.
[Accessed on 10 September 2016]
Livette, M. (2007). Influencer and other “buying” roles in the decision-making process
of retirement housing purchasers, Property management, 25(3), 242-256.
Litman, T. (2012). Victoria transport policy Institute. Home Location Preferences and
Their Implications for Smart Growth. Available from: www.vtpi.org [Accessed
on 12 September 2016].
Neuman, Lawrence. W. (2010). Social Research Methods, Qualitative and 219
Quantitative Approaches (7th ed.). USA: Pearson Education, Inc.
Pallant, J. 2002. SPSS SURVIVAL MANUAL-A step by step guide to data analysis using
SPSS for Windows (Version 12). Allen Unwin, New South Wales. p 121
K.J. Kam, T.S. Lim, D.L.P. Yoong, F.L. Ang, B.T. Leong
Purchasing Decision of Property Buyers: The Housing Quality, Financial Capabilities, and Government Policies Studies
© 2021 by MIP 60
Paramesran, R. (2013). The role of the banking system, Housing the Nation: Policies,
Issues and Prospects (p. 137), Malaysia, Cagamas
Pembina Institute (2013). Priced Out: Understanding the factors affecting home prices in
the GTA, Canada, Royal Bank of Canada
Rahadi, R. A., Sudarso, K. W., Deddy, P. K. & Indra, B.S. (2013). Attributes Influencing
Housing Product Value and Price in Jakarta Metropolitan Region. Procedia -
Social and Behavioural Sciences, 101(0), 368-378.
Real Estate and Housing Developers Association (REHDA) (2014). Property outlook
2014: Interview with REHDA president. REHDA, Selangor.
Sew, G. S., & Chin, T. Y. (2000). Hillside development - Planning, Design, Constrution
and Maintenace consideration. IEM Seminar on Geotechnical Engineering,
Penang, 1-22
Shinde, N., & Gawande, K. (2018). Survey on predicting property price. In 2018
International Conference on Automation and Computational Engineering
(ICACE) (pp. 1-7). IEEE.
Tan, T. H. (2012). Meeting first-time buyers’ housing needs and preferences in greater
Kuala Lumpur. Cities, 29(6), 389-396.
Teoh, W.L. (2011). Factors affecting the preferences of residential housing in gated
community.
The Edge Property (2016). Half of overhang units are homes priced at RM300,000 and
below. Available at: http://www.theedgeproperty.com.my/content/half-overhang-
units-are-homes-priced-rm300000-and-below. [Accessed on 15 September 2016]
Tobi, S., Fathi, M., & Amaratunga, D. (2018). Ageing in place framework as reference
guide for housing in Malaysia: Landed property. Planning Malaysia Journal of the
Malaysian Institute of Planners, 16(1), 130–143.
Tonglet, M., Phillips, P. S., & Read, A. D. (2004). Using the Theory of Planned Behaviour
to investigate the determinants of recycling behaviour: a case study from
Brixworth.
Zainuddin, N. (2015). Overview of Real Property Gain Tax in Malaysia. The Sixth IMF-
Japan High Level Tax Conference for Asian Countries
Zainun, N.Y. and Ismail, S.S. (2015). ‘Low Cost Housing Demand Factors In Malaysia’.
Applied Mechanic and Materials, 773, 1037-1041.
Zainun, N.Y., Rahman, I.A., & Eftekhari, M. (2010). Forcasting low cost housing demand
in Johor Bharu, Malaysia using Artificial Neural Networks (ANN). Journal of
Mathematic Research. 2(1). P. 16-19
Zandi¹, G., Mahadevan, A., Supramaniam, L., Aslam, A., & Theng, L. K. (2015). The
economical factors affecting residential property price: The case of Penang island.
International Journal of Economics and Finance, 7(12).
Zikmund, William G., Babin, Barry J., Carr, Jon C., & Griffin, Mitch. (2010). Business
Research methods (8th ed.). USA: South-Western, CenGage Learni
Received: 12th July 2021. Accepted: 23rd Sept 2021
1 Corresponding Author. Email: [email protected]
PLANNING MALAYSIA:
Journal of the Malaysian Institute of Planners
VOLUME 19 ISSUE 3 (2021), Page 61 – 71
THE METHODOLOGICAL STRUCTURE FOR LEGAL
RESEARCH: A PERSPECTIVE FROM THE MALAYSIAN LAND
LAW AND ISLAMIC LAW
Noor Azimah Ghazali1, Ibrahim Sipan2, Farah Nadia Abas3 & Ahmad Che
Yaacob4
1,2,3Center of Real Estate Studies, (CRES UTM),
Faculty of Built Environment and Surveying 4Faculty of Islamic Civilization,
UNIVERSITI TEKNOLOGI MALAYSIA
Abstract
A legal research shall be secured with the idea to facilitate a future change; either
in the law itself or in the manner of its administration from the production of
‘pure’ academic knowledge which is concerned legal doctrines. Therefore, this
paper purpose is to propose a methodological structure for legal research within
perspective Malaysian Land Law and Islamic Law to establish a regulation or
amendment in the existing foundation. This paper adopts method of content
analysis to understanding on the underlying reasons through expert opinions on
the legal issues. The finding of this research revealed that a legal methodological
framework is easily simplified in form of system theory approach. This type of
methodological structure is common amongst the legal researchers, lawyers and
legal scholars who embrace Pure and Applied Legal Research. The
methodological structure for legal research in form of system theory shall make
a better regulation proposal in the perspective of Malaysian Land Law and
Islamic Law. By adopt this methodological structure; researchers shall propose
new regulation or amendments as legal researchers, lawyers and legal scholars.
Keywords: framework, legal, research, land, methodology
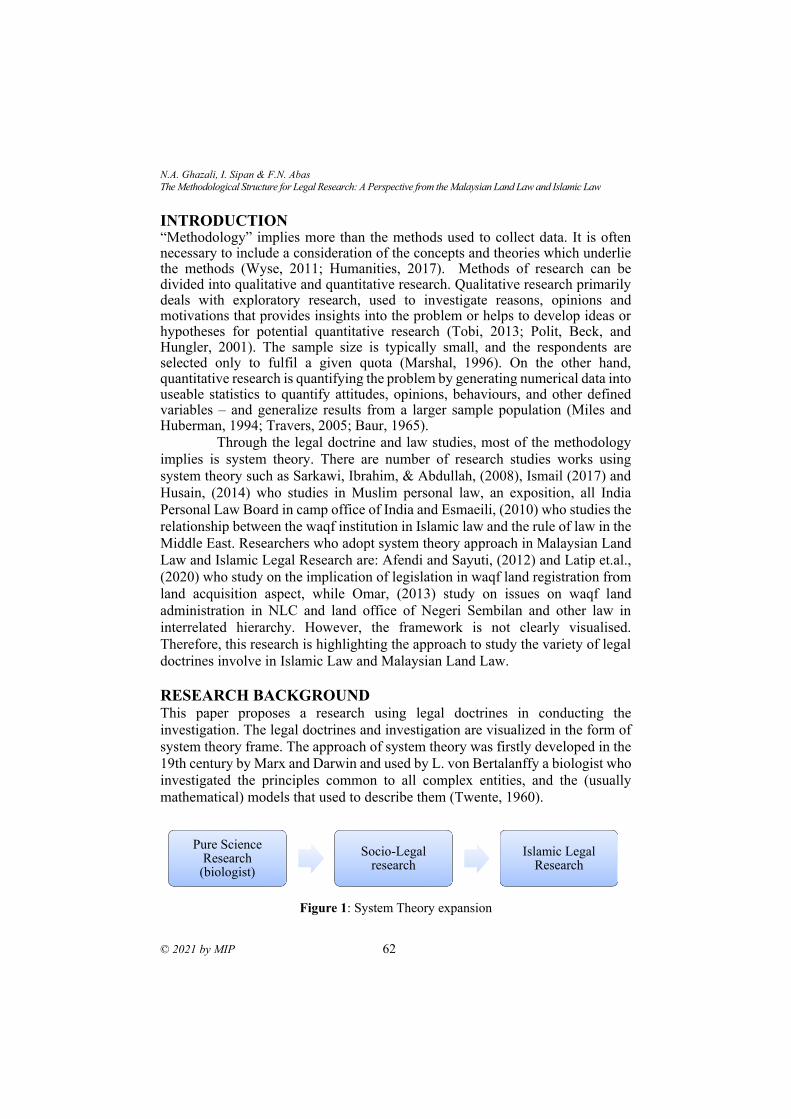
N.A. Ghazali, I. Sipan & F.N. Abas
The Methodological Structure for Legal Research: A Perspective from the Malaysian Land Law and Islamic Law
© 2021 by MIP 62
INTRODUCTION “Methodology” implies more than the methods used to collect data. It is often necessary to include a consideration of the concepts and theories which underlie the methods (Wyse, 2011; Humanities, 2017). Methods of research can be divided into qualitative and quantitative research. Qualitative research primarily deals with exploratory research, used to investigate reasons, opinions and motivations that provides insights into the problem or helps to develop ideas or hypotheses for potential quantitative research (Tobi, 2013; Polit, Beck, and Hungler, 2001). The sample size is typically small, and the respondents are selected only to fulfil a given quota (Marshal, 1996). On the other hand, quantitative research is quantifying the problem by generating numerical data into useable statistics to quantify attitudes, opinions, behaviours, and other defined variables – and generalize results from a larger sample population (Miles and Huberman, 1994; Travers, 2005; Baur, 1965).
Through the legal doctrine and law studies, most of the methodology
implies is system theory. There are number of research studies works using
system theory such as Sarkawi, Ibrahim, & Abdullah, (2008), Ismail (2017) and
Husain, (2014) who studies in Muslim personal law, an exposition, all India
Personal Law Board in camp office of India and Esmaeili, (2010) who studies the
relationship between the waqf institution in Islamic law and the rule of law in the
Middle East. Researchers who adopt system theory approach in Malaysian Land
Law and Islamic Legal Research are: Afendi and Sayuti, (2012) and Latip et.al.,
(2020) who study on the implication of legislation in waqf land registration from
land acquisition aspect, while Omar, (2013) study on issues on waqf land
administration in NLC and land office of Negeri Sembilan and other law in
interrelated hierarchy. However, the framework is not clearly visualised.
Therefore, this research is highlighting the approach to study the variety of legal
doctrines involve in Islamic Law and Malaysian Land Law.
RESEARCH BACKGROUND This paper proposes a research using legal doctrines in conducting the
investigation. The legal doctrines and investigation are visualized in the form of
system theory frame. The approach of system theory was firstly developed in the
19th century by Marx and Darwin and used by L. von Bertalanffy a biologist who
investigated the principles common to all complex entities, and the (usually
mathematical) models that used to describe them (Twente, 1960).
Figure 1: System Theory expansion
Pure Science Research
(biologist)
Socio-Legal research
Islamic Legal Research
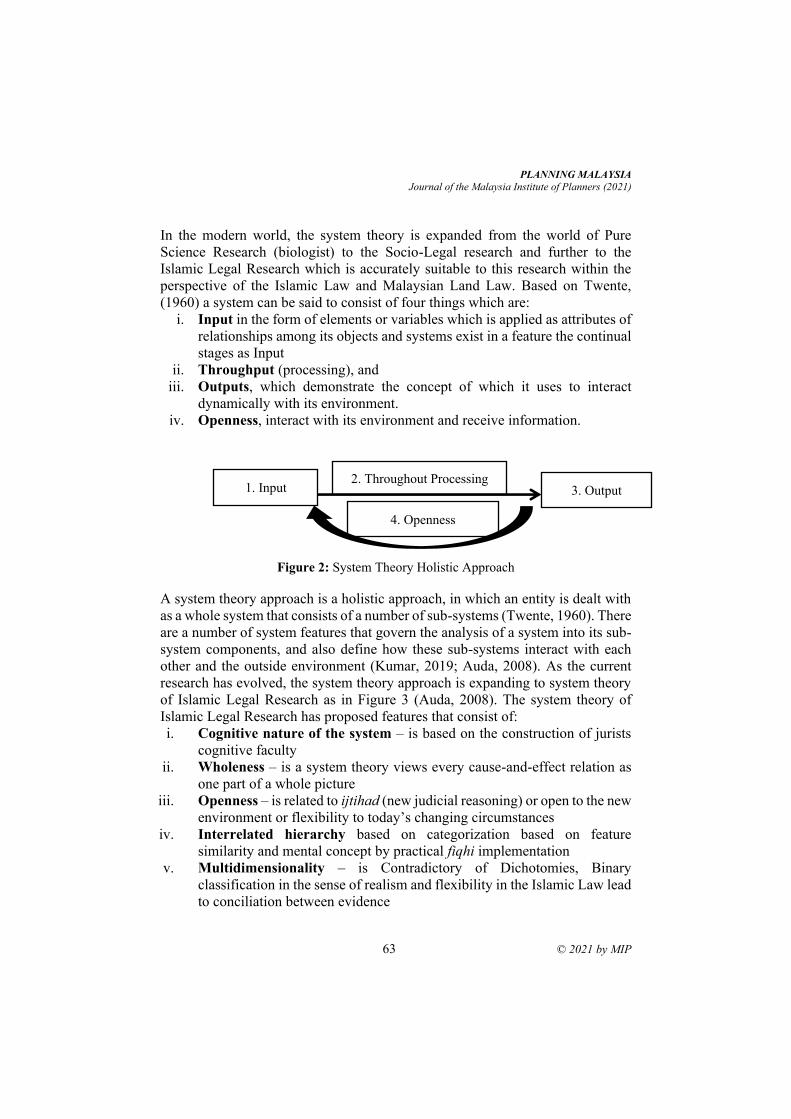
PLANNING MALAYSIA
Journal of the Malaysia Institute of Planners (2021)
63 © 2021 by MIP
In the modern world, the system theory is expanded from the world of Pure
Science Research (biologist) to the Socio-Legal research and further to the
Islamic Legal Research which is accurately suitable to this research within the
perspective of the Islamic Law and Malaysian Land Law. Based on Twente,
(1960) a system can be said to consist of four things which are:
i. Input in the form of elements or variables which is applied as attributes of
relationships among its objects and systems exist in a feature the continual
stages as Input
ii. Throughput (processing), and
iii. Outputs, which demonstrate the concept of which it uses to interact
dynamically with its environment.
iv. Openness, interact with its environment and receive information.
Figure 2: System Theory Holistic Approach
A system theory approach is a holistic approach, in which an entity is dealt with
as a whole system that consists of a number of sub-systems (Twente, 1960). There
are a number of system features that govern the analysis of a system into its sub-
system components, and also define how these sub-systems interact with each
other and the outside environment (Kumar, 2019; Auda, 2008). As the current
research has evolved, the system theory approach is expanding to system theory
of Islamic Legal Research as in Figure 3 (Auda, 2008). The system theory of
Islamic Legal Research has proposed features that consist of:
i. Cognitive nature of the system – is based on the construction of jurists
cognitive faculty
ii. Wholeness – is a system theory views every cause-and-effect relation as
one part of a whole picture
iii. Openness – is related to ijtihad (new judicial reasoning) or open to the new
environment or flexibility to today’s changing circumstances
iv. Interrelated hierarchy based on categorization based on feature
similarity and mental concept by practical fiqhi implementation
v. Multidimensionality – is Contradictory of Dichotomies, Binary
classification in the sense of realism and flexibility in the Islamic Law lead
to conciliation between evidence
1. Input 3. Output
4. Openness
2. Throughout Processing
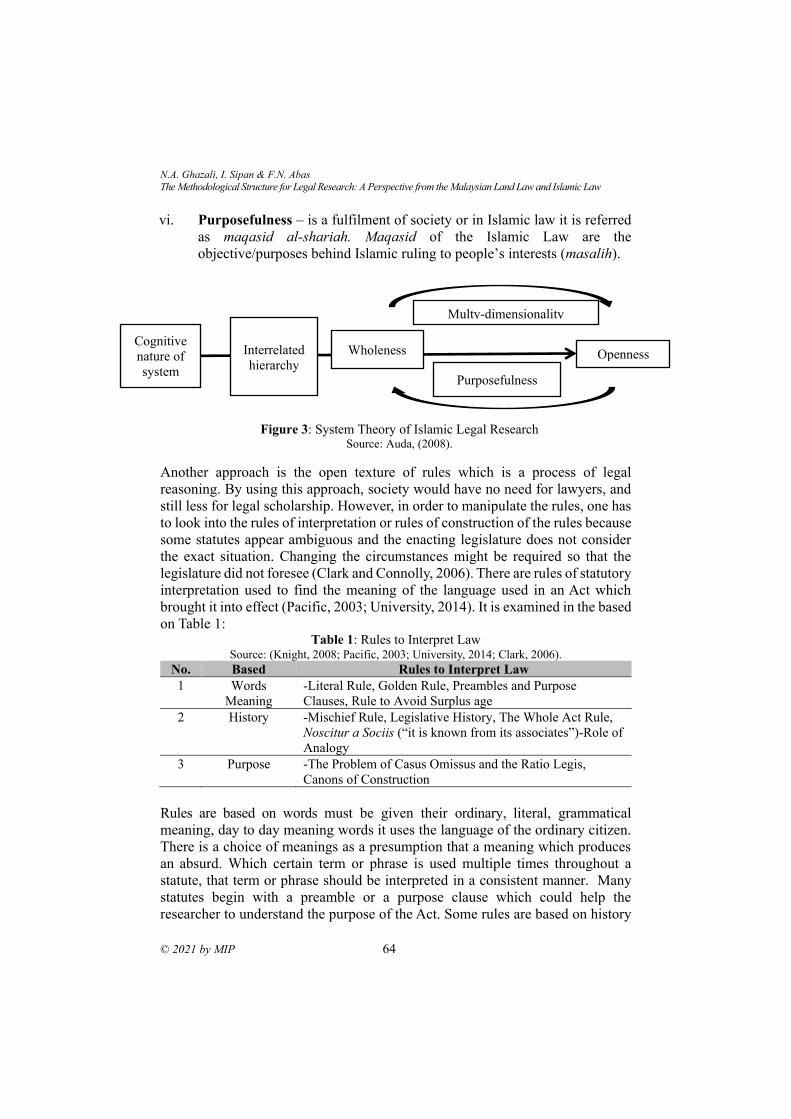
N.A. Ghazali, I. Sipan & F.N. Abas
The Methodological Structure for Legal Research: A Perspective from the Malaysian Land Law and Islamic Law
© 2021 by MIP 64
vi. Purposefulness – is a fulfilment of society or in Islamic law it is referred
as maqasid al-shariah. Maqasid of the Islamic Law are the
objective/purposes behind Islamic ruling to people’s interests (masalih).
Another approach is the open texture of rules which is a process of legal
reasoning. By using this approach, society would have no need for lawyers, and
still less for legal scholarship. However, in order to manipulate the rules, one has
to look into the rules of interpretation or rules of construction of the rules because
some statutes appear ambiguous and the enacting legislature does not consider
the exact situation. Changing the circumstances might be required so that the
legislature did not foresee (Clark and Connolly, 2006). There are rules of statutory
interpretation used to find the meaning of the language used in an Act which
brought it into effect (Pacific, 2003; University, 2014). It is examined in the based
on Table 1: Table 1: Rules to Interpret Law
Source: (Knight, 2008; Pacific, 2003; University, 2014; Clark, 2006).
No. Based Rules to Interpret Law
1 Words
Meaning
-Literal Rule, Golden Rule, Preambles and Purpose
Clauses, Rule to Avoid Surplus age
2 History -Mischief Rule, Legislative History, The Whole Act Rule,
Noscitur a Sociis (“it is known from its associates”)-Role of
Analogy
3 Purpose -The Problem of Casus Omissus and the Ratio Legis,
Canons of Construction
Rules are based on words must be given their ordinary, literal, grammatical
meaning, day to day meaning words it uses the language of the ordinary citizen.
There is a choice of meanings as a presumption that a meaning which produces
an absurd. Which certain term or phrase is used multiple times throughout a
statute, that term or phrase should be interpreted in a consistent manner. Many
statutes begin with a preamble or a purpose clause which could help the
researcher to understand the purpose of the Act. Some rules are based on history
Openness Wholeness Cognitive
nature of
system
Interrelated
hierarchy
Multy-dimensionality
Purposefulness
Figure 3: System Theory of Islamic Legal Research Source: Auda, (2008).
PLANNING MALAYSIA
Journal of the Malaysia Institute of Planners (2021)
65 © 2021 by MIP
which requires looking to what the law was before the statute was passed in order
to discover what gap or mischief the statute was intended to cover. The court is
then required to interpret the statute in such a way to ensure that the gap is
covered. What a statute’s history might suggest about the meaning of a word or
phrase. This method is involving the method of the legal reasoning of a general
rule to a specific case to another specific case.
Finally, there are rules based on purpose where the judges have to
establish what the purpose is of the Act and should promote that purpose. Certain
techniques of statutory construction have been used so often that they have
become “formalized” into “canons.” Unlike the tools provided in this handout,
the canons are not particularly useful for discerning the meaning of a statute. In
the end, the judge or researcher may use the method of open texture to manipulate
the rules as long as it is following the interpretation and construction rules. The
advantage of this method is the researcher may produce an efficient legal
structure by the flexibility to manipulate the rules.
METHODOLOGY
This research is to study both communication and interaction between Islamic Law
and Malaysian Land Law to formulate the methodology structure of legal research.
The communication within the Islamic Law is to answer the concept of maqasid
syariah in research. And the communication of the Federal Constitution, National
Land Code, State Enactment and law pertaining land administration, will answer
how the substantive law governing systems in Malaysia. All of the communication
in law and legislation is analyzed using the literature collection by using the method
of content analysis. In the content, the analysis contains several categories such as:
i. Syllogism-The method of syllogism comprised three items to formulate a rule
known as the major premise, the minor premise and the conclusion, (Farrar,
1997. p. 9, 30; Knight and Ruddox, 2008)
a. Major premise- identifies a general rule of law that requires a specified
legal outcome when particular facts are present in a situation.
b. Minor premise- describes a particular factual situation including the
current situation
c. Conclusion- states whether the rule in the major premise applied to the
facts in the minor premise, and whether the specified legal outcome has
any effect.
For example, within the Islamic Law, the syllogism goes as described in the
below explanation:
a. Major premise- Every legal research in Malaysia apply analysis of states
regulation
b. Minor premise- Enactments is a state regulation.
c. Conclusion- Analysis of legal research in Malaysia involves states
enactments.
N.A. Ghazali, I. Sipan & F.N. Abas
The Methodological Structure for Legal Research: A Perspective from the Malaysian Land Law and Islamic Law
© 2021 by MIP 66
As the historical research, will examine past events or combinations of events to
arrive at an account of what has happened in the past (Banakar and Travers,
2005). Just like the earlier system theory, system theory of Islamic Legal
Research also has a few elements to describe the complex entity within the
system. By using these methods, researchers are formulating the framework as in
Figure 5.
ANALYSIS AND FINDING; ADAPTING SYSTEM THEORY
APPROACH IN MALAYSIAN LAND LAW AND ISLAMIC LAW
The researcher scrutinizes each law, determine the regularities and formulate a
theory on abidingness and validity related to the concept of the law according to
academia writing, journal, article, government support documents and books.
System theory approach formulated based on rules of interpretation in broader
generalizations of theories of law. Later, it detects patterns and regularities,
formulate some tentative hypotheses (major and minor premises) to explore, and
finally ends up developing general conclusions or theories as in Figure 5
(Crossman, 2011). This is a method to evaluate the value of the law to achieve
the maqasid al-shariah. The rules of interpretation used in order to find the
meaning of the legal communication in an Act, which brought it into effect,
(Pacific, 2003; (Van and Hundley, 2001). In Islamic Law, the sources of
references are Quran and Sunnah as the guidance in life and it is a duty to believe
in these two. When Quran is silent, Sunnah is sought. However, when Sunnah is
silent, one shall refer to the cognitive natures of Islamic Law which are:
i. Ijma’- unanimous agreement of the Muslim community (Zahrah, 1959,
p.372; Ramli, 1938, p.370),
ii. Qiyas- comparison of the other original case (asl) toward proclaimed or
rule/hukm (Kamali, 1998).
iii. Istihsan- bringing the new case to another rule based on a stronger reason,
(Kamali 1998).
iv. Istislah is a rules based on public interest (Kamali 1998).
v. Urf is a custom of a community (al- Tarabulsi, 1908).
vi. Juristic Interpretation is the opinions of four scholars leading in four
schools of law; Hanafi, Maliki, Syafie and Hanbali.
vii. Fatwa- The Fatwa also is a point of Islamic law given by a recognized
religious authority (Osman, 1982).
viii. Judicial decisions which based on obiter dictum (purposive principal) and
ratio decindi (binding principal) and jurists opinion which is followed by
the judge (Islam, 1998, p. 336).
All the sources are known as interrelated hierarchy in system theory
approach. Within Malaysian Land Law, the interrelated hierarchy is stand of
Statutes the federal and states regulation which record in Act and Enactments
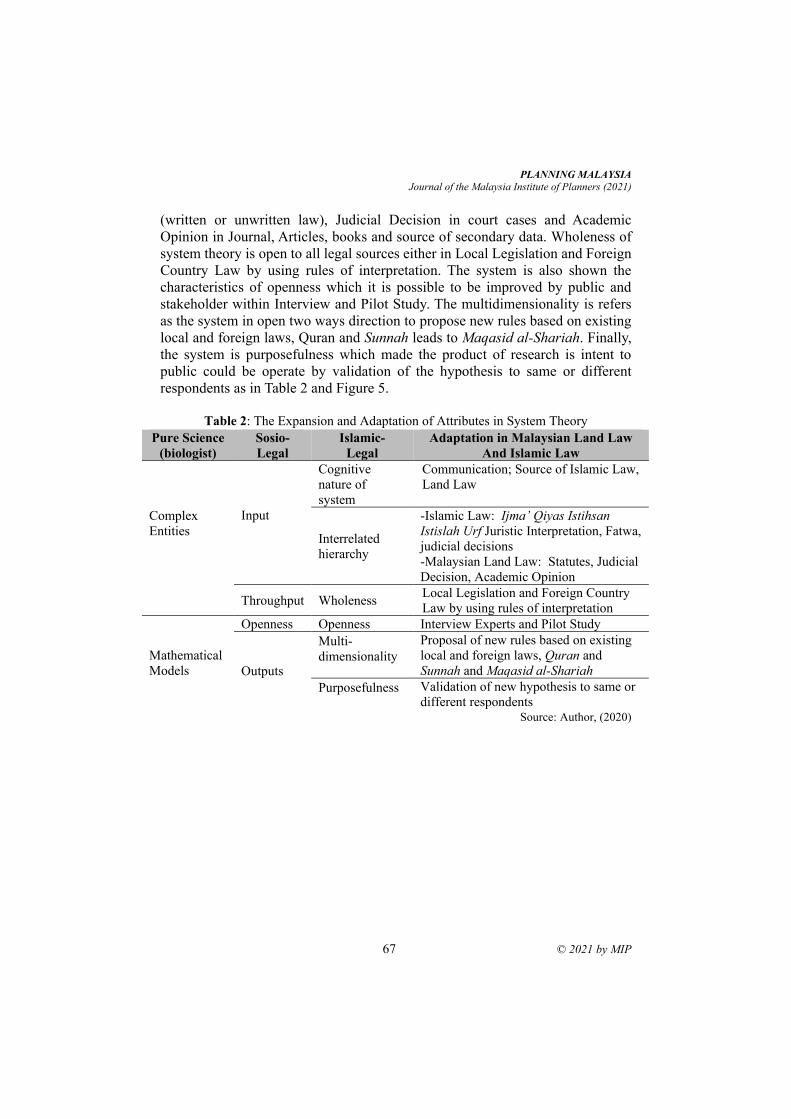
PLANNING MALAYSIA
Journal of the Malaysia Institute of Planners (2021)
67 © 2021 by MIP
(written or unwritten law), Judicial Decision in court cases and Academic
Opinion in Journal, Articles, books and source of secondary data. Wholeness of
system theory is open to all legal sources either in Local Legislation and Foreign
Country Law by using rules of interpretation. The system is also shown the
characteristics of openness which it is possible to be improved by public and
stakeholder within Interview and Pilot Study. The multidimensionality is refers
as the system in open two ways direction to propose new rules based on existing
local and foreign laws, Quran and Sunnah leads to Maqasid al-Shariah. Finally,
the system is purposefulness which made the product of research is intent to
public could be operate by validation of the hypothesis to same or different
respondents as in Table 2 and Figure 5.
Table 2: The Expansion and Adaptation of Attributes in System Theory
Source: Author, (2020)
Pure Science
(biologist)
Sosio-
Legal
Islamic-
Legal
Adaptation in Malaysian Land Law
And Islamic Law
Complex
Entities
Input
Cognitive
nature of
system
Communication; Source of Islamic Law,
Land Law
Interrelated
hierarchy
-Islamic Law: Ijma’ Qiyas Istihsan
Istislah Urf Juristic Interpretation, Fatwa,
judicial decisions
-Malaysian Land Law: Statutes, Judicial
Decision, Academic Opinion
Throughput Wholeness Local Legislation and Foreign Country
Law by using rules of interpretation
Mathematical
Models
Openness Openness Interview Experts and Pilot Study
Outputs
Multi-
dimensionality
Proposal of new rules based on existing
local and foreign laws, Quran and
Sunnah and Maqasid al-Shariah
Purposefulness Validation of new hypothesis to same or
different respondents
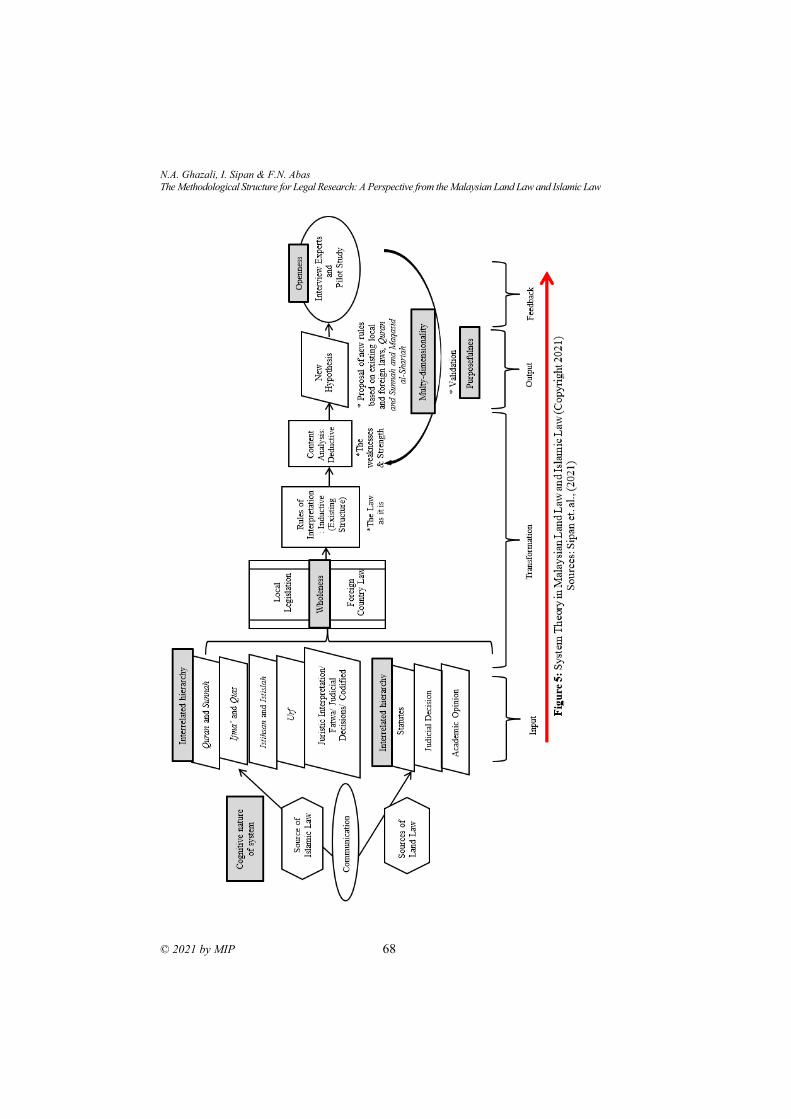
N.A. Ghazali, I. Sipan & F.N. Abas
The Methodological Structure for Legal Research: A Perspective from the Malaysian Land Law and Islamic Law
© 2021 by MIP 68
PLANNING MALAYSIA
Journal of the Malaysia Institute of Planners (2021)
69 © 2021 by MIP
CONCLUSION From all theories proposed by researchers in various field of social science,
Islamic studies, legislation and jurisdiction, and biology science, this paper is
proposing framework as in Figure 5 in order as guide to researchers who adopt
Islamic law and civil law in their research. By using the framework, all the
essential criteria in Islamic law are taken into consideration to proposed any
Syariah compliance model or fundamental theories in the academician studies
and practical industries of research and development (R&D). The limitation of
this research is the formulated framework is only verified among the stakeholder
and fiqh experts from academicians. This framework shall be taken further
research to be exposed among the ulama and Muslim scholars and the fatwa
community in order to become one of the best approaches to be adopt by the
worldwide ideas. Hopefully, the finding of this paper is managed to contribute in
the development planning of regulation which involved Muslim society and
multi-racial community in various country.
ACKNOWLEDGEMENT
This research was supported by Fundamental Research Grant Scheme (FRGS)
Phase 1/2019: FRGS/1/2019/SSI10/UTM/02/1, Ministry of Education, Malaysia.
We thank our colleagues from Universiti Teknologi Malaysia (vote number:
5F202) as the supporting institution that provided insight and expertise that
greatly assisted the research
REFERENCES Afendi, M., & Sayuti (2012). Implikasi Perundangan Terhadap Pendaftaran Tanah Wakaf
Malaysia. Satu Kajian Dari Aspek Akta Pengambilan Tanah. Retrieved from:
Http://Www.Scribd.Com/Doc/81330622/ Implikasi-Pendaftaran-Tanah-Wakaf
Auda, J. (2008). Maqasid Al-Shariah as Philosophy of Islamic Law. Herndon, USA: The
International Institute of Islamic Thought.
Baker, T.L. (1994). Doing Social Research (2nd Edn.). New York: McGraw-Hill Inc
Banakar, R., and Travers, M. (2005). Theory and Method in Sosio-Legal Research,
Portland. United State of America: Hart Publishing.
Baur, V. (1965). How to Look up Law and Write Legal Memoranda Revisited. Practical
Lawyer, 11, 5.
Campbell, E. et. al., (1979). Legal Research, Sherwood Court. Perth: the Law Book
Company Limited.
Clark, K., and Connolly, M. (2006). A Guide to Reading, Interpreting and Applying
Statutes. Notingham, England: Georgetown University Law Center. Retrieved
from:
Crankshaft, (2013). Validation (Social Science). What-when-how in Depth Tutorials and
Information. Retrieved from: http://what-when-how.com/ social-
sciences/validation-social-science
N.A. Ghazali, I. Sipan & F.N. Abas
The Methodological Structure for Legal Research: A Perspective from the Malaysian Land Law and Islamic Law
© 2021 by MIP 70
Crossman, A. (2017). An overview to Chaos Theory in Sociology. ThoughtCo. Dotdash
Press Publisher. Retrieved from: https://www.thoughtco.com/chaos-theory-
3026621
Esmaeili, H. (2010). The Relationship between the Waqf Institution in Islamic Law and
the Rule of Law in the Middle East. Flinders University, Australia
Farrar, J. H. (1997). Reasoning by Analogy in the Law. Australia: Bond University, p. 9,
30.
Husain, A. (2014). Muslim Personal Law. An Exposition. India, All India Personal Law
Board. Camp Office. Retrieved from: http://muslimcanada.org/ muspersonallaw.
html#about
Husain, A. (2014). Muslim Personal Law. An Exposition. India, All India Personal Law
Board. Camp Office. Retrieved from: http://muslimcanada.org/ muspersonallaw.
html#about
Ismail W.N.W., Et.Al. (2017) “The Establishment of Islamic Dwelling Principles for The
Malaysian Communities”. Planning Malaysia Journal: 15, (1).
Kamali, M.H. (1998). Principles of Islamic Jurisprudence. The Islamic Texts Society.
Kuala Lumpur, Malaysia: Ilmiah Pulishers Sdn. Bhd.
Knight, A., and Ruddox, L. (2008). Advance Research Methods In The Built Enviroment.
London, UK: Wiley-Blackwell.
Kumar, R. (2019). Research Methodology: A Step-by-Step Guide for Beginners. London,
UK: SAGE Publications.
Latip N.S.A., et.al. (2020). The Derivation of Urban Design Principles in Malay-Islamic
Town of Kuala Terengganu. Planning Malaysia Journal. 18(2).
Marshal, N.M. (1996). Sampling for qualitative research. Family Practice, 13, 6.
Miles, M.B., and Huberman, M. (1994). Qualitative Data Analysis: An Expanded
Sourcebook. 2nd ed. Sydney: SAGE Publication.
Ghazali, N.A., Sipan, I., Haji Mohammad, M.T.S. and Ab Aziz, M.A. (2021), New
framework for the management of waqf land registration system in Malaysia,
International Journal of Islamic and Middle Eastern Finance and Management,
Vol. 14 No. 3, pp. 625-640. DOI: doi.org/10.1108/IMEFM-04-2019-0172
Omar, M.M. (2013). Isu Pentadbiran Tanah Wakaf dalam Konteks KTN 1965 dan Pejabat
Tanah dan Galian Negeri Sembilan. Jurnal Pentadbiran Tanah, 25-37.
Osman, A. Z. (2012). Accountability in managing waqf properties: the case of two State
Religious Councils in Malaysia. London: School of Management, Royal Holloway
University. 348. Retrieved from: https://ethos.bl.uk/
OrderDetails.do?uin=uk.bl.ethos.553846
Pacific, U.O.S. (2003). Principles Relating to the Interpretation of Statutes and
Constitutions. Port Vila, Vanuatu: PacLII.
Polit, D.F., Beck, C.T., and Hungler, B.P. (2001). Essentials of Nursing Research:
Methods, Appraisal and Utilization. 5th Ed., Philadelphia: Lippincott Williams &
Wilkins
Ramli, M.I.A. (1938). Nihayat al-Muhtaj, Cairo: Open source. 368
Sarkawi, A.A., Ibrahim, A.B., & Abdullah, A. (2008). The Contribution of Fiqh Al-
Jinayat (Islamic Criminal Law) In the Planning of a Safe City, Planning Malaysia
Journal. 6 (1).

PLANNING MALAYSIA
Journal of the Malaysia Institute of Planners (2021)
71 © 2021 by MIP
Sipan, I., et.al., (2021). Johor: UTM Innovation and Commercialisation Centre (ICC).
Copyright 2021by Universiti Teknologi Malaysia. Reprinted [or adapted] with
permission.
Tobi, U. (2013). Research Methodological Cage. Kuala Lumpur, Malaysia: Aras
Publisher.
Twente, T.U.O. (1960). System Theory. Communication Theories. Netherlands:
University of Twente.
University, T.O. (2014). Judges and the law. United Kingdom: LabSpace.
Van Teijlingen, E. R., and Hundley, V. (2001). The importance of pilot studies. Social
Research Update, (35).
Wyse, S. E. (2011). Difference between Qualitative Research and Quantitative Research,
Research Gate.
Zahrah, A. (1959). Muhadarat fi-al-waqf (lectures on waqf). Cairo: Matba’ah Ahmad 'Ali
Mukhaimar. 48
Received: 12th July 2021. Accepted: 17th Sept 2021
1 Senior Lecturer at University Teknologi MARA Email: [email protected]
PLANNING MALAYSIA:
Journal of the Malaysian Institute of Planners
VOLUME 19 ISSUE 3 (2021), Page 72 – 83
RESIDENTIAL BUILDING QUALITY MEASUREMENT AND
THE RELATIONSHIP WITH HOUSE PRICES: A STUDY OF
HOUSES IN KLANG
Muhamad Hilmi Mohamad @ Masri1, Mohd Farid Sa’ad2, Najma Azman3,
Mohd Hasrol Haffiz Aliasak4
Department of Built Environment Studies and Technology,
Faculty of Architecture, Planning and Surveying
UNIVERSITI TEKNOLOGI MARA PERAK BRANCH,
32610 SERI ISKANDAR, PERAK
Abstract
This research focuses on the particular aspect of residential building quality and
aims to measure the relationship that affects houses prices in Klang. The
researcher through the problem statement and literature review has noted that
respondents have knowledge in measuring the quality of their own house, but
measurement must be conducted on an empirical basis with evidence. The main
research objectives were to identify residential building quality and to measure
the residential building quality effect on houses prices. The sampling of the
research was conducted on fifty houses, and the measurement was conducted with
the help of Regression Analysis. The results obtained show a significant
relationship between higher quality of residential buildings and higher prices that
can be commanded. The findings also could help to improve the estimation of
value for new and older houses in the sampled areas.
Keywords: quality measurement, residential house price, residential quality
PLANNING MALAYSIA
Journal of the Malaysia Institute of Planners (2021)
73 © 2021 by MIP
INTRODUCTION
In finding out the aspects of residential houses to be measured in the research,
first, the researcher has to outline the arguments addressed by other researchers
relating to residential buildings and the relationship with the prices. For the aspect
of houses bought by buyers, most of the respondents’ understanding was that
higher house prices equate to higher house quality. Nevertheless, in urban areas,
a high house prices sometimes did not correlate with the quality that the buyers
received in turn making the purchase to be perceived as unsatisfying. This
statement was also noted by Mohit, Ibrahim, & Rashid, (2010) stating that buyers
who purchased houses from property developers and other sub-sale house sellers
were not content with the qualities but proving it in an empirical way of low
quality was difficult. Fauzi, Yusof, & Abidin, (2012) noted also that low
residential building quality as was seen in Malaysia and buyers have no other
choice than to receive their bought house from the property developers.
Mu, (2016) also stated that residential building quality can be neglected
as developers usually did not measure properly their built houses before handing
them off to buyers. Emmanuel, (2012) through his research also noted developers
might enunciate their houses were of high quality but not being backed by any
empirical data or benchmarking guidelines. Amin, Zubaidah, Abdul, & Kassim,
(2015) also reported that residential building quality as was usually complained
by house buyers. However, little standardised action was taken by developers in
rectifying the issue. For these reasons, the researcher believes that there is a major
research gap that needs to be addressed for the benefit of house buyers.
Iwata & Yamaga, (2008) also addressed that house buyers were not
satisfied with the quality of their houses after moving in as the quality level was
found to be unsatisfactory. These were also supported by Shuid, (2015) that stated
that houses with sub-par quality were delivered to house buyers and eventually,
many repairs had to be conducted afterwards. Bø (2018) also noted that house
buyers often compare their residential buildings in other residential areas and it
leads to some understanding regarding the quality of houses that they received.
Based on the problems above, the researcher feels that the residential building
quality needs to be addressed, and their relationship with the prices paid needs to
be measured for the benefit of house buyers.
Muhamad Hilmi Mohamad @ Masri, Mohd Farid Sa’ad, Najma Azman, Mohd Hasrol Haffiz Aliasak
Residential Building Quality Measurement and The Relationship with House Prices: A Study of Houses in Klang
© 2021 by MIP 74
LITERATURE REVIEW Residential Building Qualities
The quality of residential building is needed as it will look into the material aspect
of the houses, and the buyers can ensure several elements to be available in their
houses. Physicality can be reviewed as their quality, physical elements and
functionality thus helping to develop a good quality residential area (Yazdanfar
& Nazari, 2015). Besides this, Fattah et al., (2020) also denoted that residential
dwelling features also contribute towards quality especially in the neighbourhood
and residential areas. The researchers addressed the importance of various
elements to be studied and measured thoroughly to achieve the outlined
objectives.
The physicality of houses must be explained in terms of elements of
functionality and housing quality correlations. House quality, thus, also needs to
be improved for the well-being of house buyers. (Behzadfar & Saneei, 2012).
Urban environments inclusion of residential buildings in Malaysia also needs to
be justified and included as part of the measurement. The physical housing
dimensions need to be placed where they become vital in dealing with the
livelihood of house buyers and their satisfactions in a residential development
(Elshater, 2012). Other than that, stakeholders also need to consider buyer’s needs
as stakeholders develop safety and accessibility regarding their housing
conditions (Gobster & Westphal, 2004).
Hassan et al., (2021) in their research also found that there is a
significant relationship between house prices and housing expenditure to
maintain the building. The researchers saw this as part of residential building
features that were also needed to become part of measurement indicators.
Knowing house buyers needs will then align with optimal housing physical
conditions and buyers can be satisfied with the residential building quality level
and this can increase their live quality (Hamzehnejad et al., 2015).
Amenities of housing need to be looked at as the measurement of
housing conditions such as external exterior, interior aspects, and community
features of housing (Ezgi & Kahraman, 2013). Other than that, elements of
amenities which include noise level, and transportation were built inside housing
areas but due to financial limitations of buyers, these sometimes need to be
sacrificed (Hui et al., 2007).
Literature Background of Residential Building Qualities relationship with
House Prices
Based on the previous discussions, several research have shown relevance
towards showing that residential building qualities that have relationships with
house prices. Adeoye, (2016) believed that buyers can perceive house quality
subjectively and houses with important qualities that need to be measured. Based
on the explanation given by the previous researcher, it can be perceived that
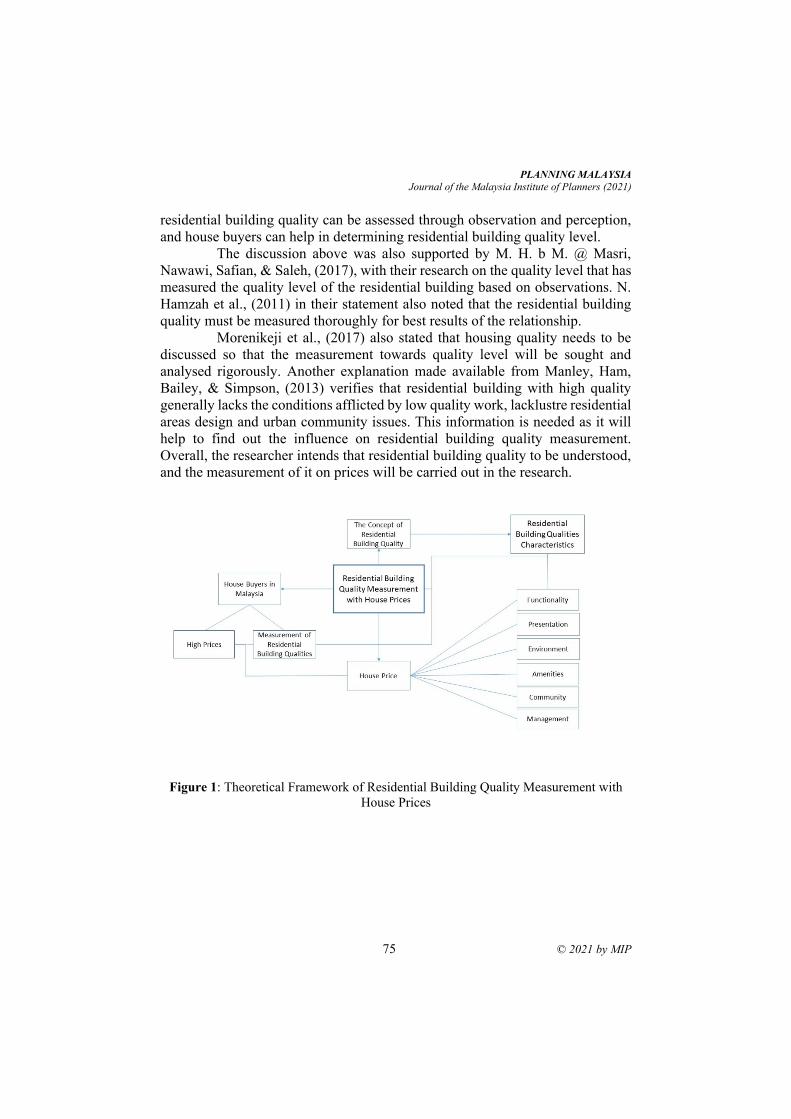
PLANNING MALAYSIA
Journal of the Malaysia Institute of Planners (2021)
75 © 2021 by MIP
residential building quality can be assessed through observation and perception,
and house buyers can help in determining residential building quality level.
The discussion above was also supported by M. H. b M. @ Masri,
Nawawi, Safian, & Saleh, (2017), with their research on the quality level that has
measured the quality level of the residential building based on observations. N.
Hamzah et al., (2011) in their statement also noted that the residential building
quality must be measured thoroughly for best results of the relationship.
Morenikeji et al., (2017) also stated that housing quality needs to be
discussed so that the measurement towards quality level will be sought and
analysed rigorously. Another explanation made available from Manley, Ham,
Bailey, & Simpson, (2013) verifies that residential building with high quality
generally lacks the conditions afflicted by low quality work, lacklustre residential
areas design and urban community issues. This information is needed as it will
help to find out the influence on residential building quality measurement.
Overall, the researcher intends that residential building quality to be understood,
and the measurement of it on prices will be carried out in the research.
Figure 1: Theoretical Framework of Residential Building Quality Measurement with
House Prices
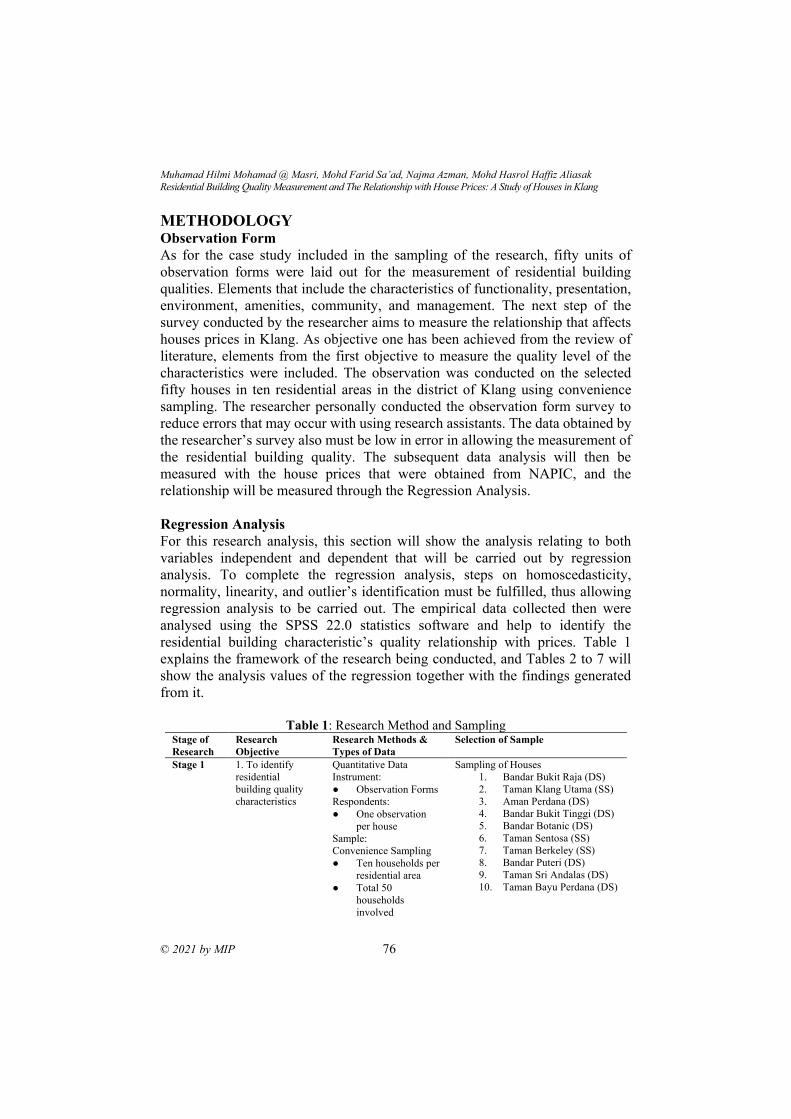
Muhamad Hilmi Mohamad @ Masri, Mohd Farid Sa’ad, Najma Azman, Mohd Hasrol Haffiz Aliasak
Residential Building Quality Measurement and The Relationship with House Prices: A Study of Houses in Klang
© 2021 by MIP 76
METHODOLOGY Observation Form
As for the case study included in the sampling of the research, fifty units of
observation forms were laid out for the measurement of residential building
qualities. Elements that include the characteristics of functionality, presentation,
environment, amenities, community, and management. The next step of the
survey conducted by the researcher aims to measure the relationship that affects
houses prices in Klang. As objective one has been achieved from the review of
literature, elements from the first objective to measure the quality level of the
characteristics were included. The observation was conducted on the selected
fifty houses in ten residential areas in the district of Klang using convenience
sampling. The researcher personally conducted the observation form survey to
reduce errors that may occur with using research assistants. The data obtained by
the researcher’s survey also must be low in error in allowing the measurement of
the residential building quality. The subsequent data analysis will then be
measured with the house prices that were obtained from NAPIC, and the
relationship will be measured through the Regression Analysis.
Regression Analysis
For this research analysis, this section will show the analysis relating to both
variables independent and dependent that will be carried out by regression
analysis. To complete the regression analysis, steps on homoscedasticity,
normality, linearity, and outlier’s identification must be fulfilled, thus allowing
regression analysis to be carried out. The empirical data collected then were
analysed using the SPSS 22.0 statistics software and help to identify the
residential building characteristic’s quality relationship with prices. Table 1
explains the framework of the research being conducted, and Tables 2 to 7 will
show the analysis values of the regression together with the findings generated
from it.
Table 1: Research Method and Sampling
Stage of
Research
Research
Objective
Research Methods &
Types of Data
Selection of Sample
Stage 1 1. To identify
residential
building quality
characteristics
Quantitative Data
Instrument:
● Observation Forms
Respondents:
● One observation
per house
Sample:
Convenience Sampling
● Ten households per
residential area
● Total 50
households
involved
Sampling of Houses
1. Bandar Bukit Raja (DS)
2. Taman Klang Utama (SS)
3. Aman Perdana (DS)
4. Bandar Bukit Tinggi (DS)
5. Bandar Botanic (DS)
6. Taman Sentosa (SS)
7. Taman Berkeley (SS)
8. Bandar Puteri (DS)
9. Taman Sri Andalas (DS)
10. Taman Bayu Perdana (DS)
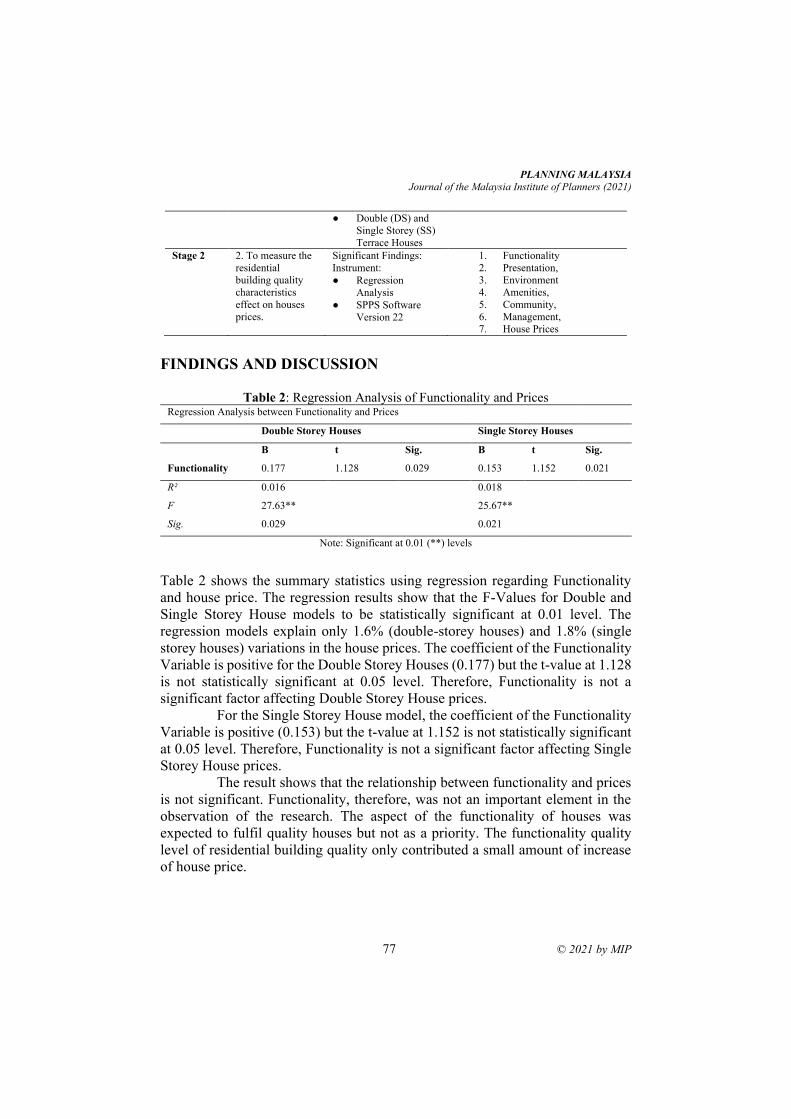
PLANNING MALAYSIA
Journal of the Malaysia Institute of Planners (2021)
77 © 2021 by MIP
● Double (DS) and
Single Storey (SS)
Terrace Houses
Stage 2 2. To measure the
residential
building quality
characteristics
effect on houses
prices.
Significant Findings:
Instrument:
● Regression
Analysis
● SPPS Software
Version 22
1. Functionality
2. Presentation,
3. Environment
4. Amenities,
5. Community,
6. Management,
7. House Prices
FINDINGS AND DISCUSSION
Table 2: Regression Analysis of Functionality and Prices Regression Analysis between Functionality and Prices
Double Storey Houses Single Storey Houses
B t Sig. B t Sig.
Functionality 0.177 1.128 0.029 0.153 1.152 0.021
R² 0.016 0.018
F 27.63** 25.67**
Sig. 0.029 0.021
Note: Significant at 0.01 (**) levels
Table 2 shows the summary statistics using regression regarding Functionality
and house price. The regression results show that the F-Values for Double and
Single Storey House models to be statistically significant at 0.01 level. The
regression models explain only 1.6% (double-storey houses) and 1.8% (single
storey houses) variations in the house prices. The coefficient of the Functionality
Variable is positive for the Double Storey Houses (0.177) but the t-value at 1.128
is not statistically significant at 0.05 level. Therefore, Functionality is not a
significant factor affecting Double Storey House prices.
For the Single Storey House model, the coefficient of the Functionality
Variable is positive (0.153) but the t-value at 1.152 is not statistically significant
at 0.05 level. Therefore, Functionality is not a significant factor affecting Single
Storey House prices.
The result shows that the relationship between functionality and prices
is not significant. Functionality, therefore, was not an important element in the
observation of the research. The aspect of the functionality of houses was
expected to fulfil quality houses but not as a priority. The functionality quality
level of residential building quality only contributed a small amount of increase
of house price.
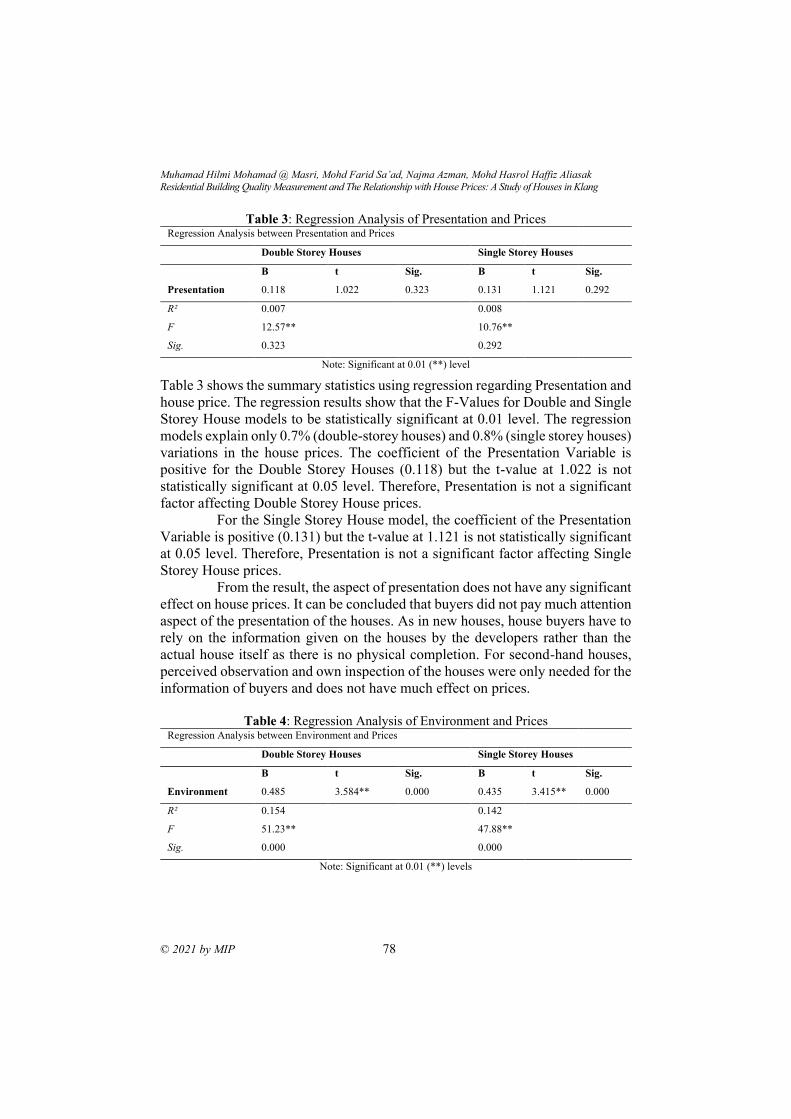
Muhamad Hilmi Mohamad @ Masri, Mohd Farid Sa’ad, Najma Azman, Mohd Hasrol Haffiz Aliasak
Residential Building Quality Measurement and The Relationship with House Prices: A Study of Houses in Klang
© 2021 by MIP 78
Table 3: Regression Analysis of Presentation and Prices Regression Analysis between Presentation and Prices
Double Storey Houses Single Storey Houses
B t Sig. B t Sig.
Presentation 0.118 1.022 0.323 0.131 1.121 0.292
R² 0.007 0.008
F 12.57** 10.76**
Sig. 0.323 0.292
Note: Significant at 0.01 (**) level
Table 3 shows the summary statistics using regression regarding Presentation and
house price. The regression results show that the F-Values for Double and Single
Storey House models to be statistically significant at 0.01 level. The regression
models explain only 0.7% (double-storey houses) and 0.8% (single storey houses)
variations in the house prices. The coefficient of the Presentation Variable is
positive for the Double Storey Houses (0.118) but the t-value at 1.022 is not
statistically significant at 0.05 level. Therefore, Presentation is not a significant
factor affecting Double Storey House prices.
For the Single Storey House model, the coefficient of the Presentation
Variable is positive (0.131) but the t-value at 1.121 is not statistically significant
at 0.05 level. Therefore, Presentation is not a significant factor affecting Single
Storey House prices.
From the result, the aspect of presentation does not have any significant
effect on house prices. It can be concluded that buyers did not pay much attention
aspect of the presentation of the houses. As in new houses, house buyers have to
rely on the information given on the houses by the developers rather than the
actual house itself as there is no physical completion. For second-hand houses,
perceived observation and own inspection of the houses were only needed for the
information of buyers and does not have much effect on prices.
Table 4: Regression Analysis of Environment and Prices
Regression Analysis between Environment and Prices
Double Storey Houses Single Storey Houses
B t Sig. B t Sig.
Environment 0.485 3.584** 0.000 0.435 3.415** 0.000
R² 0.154 0.142
F 51.23** 47.88**
Sig. 0.000 0.000
Note: Significant at 0.01 (**) levels
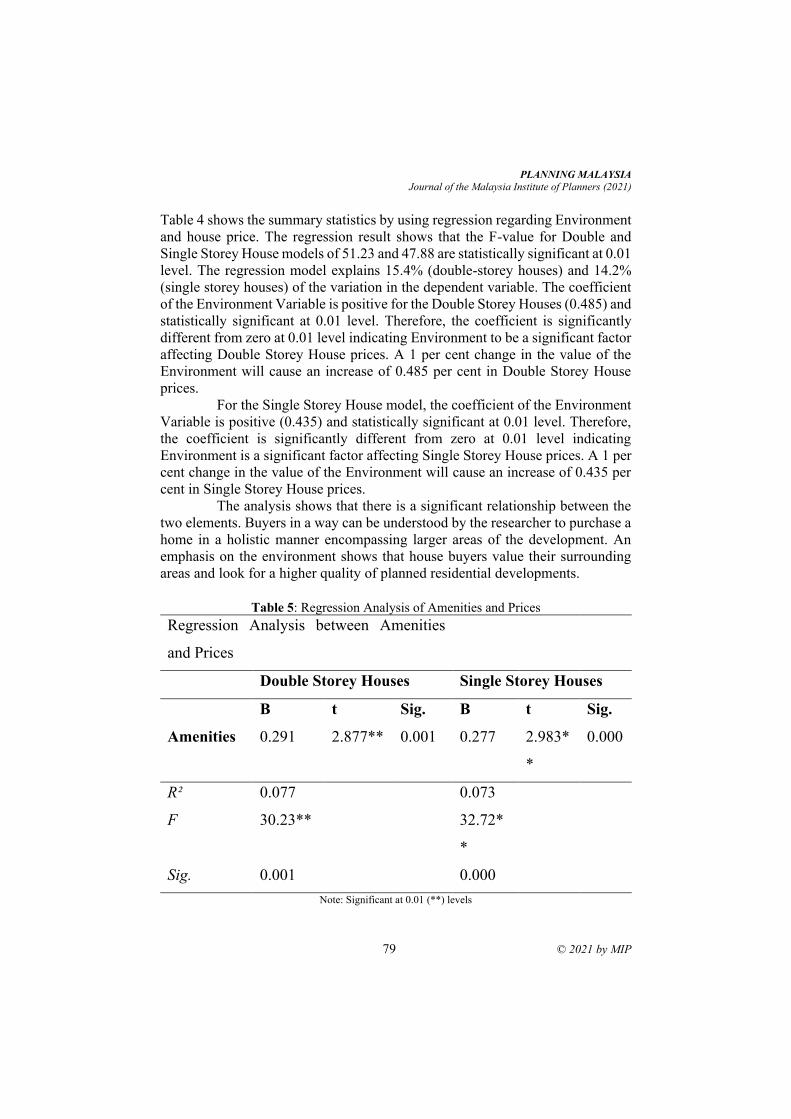
PLANNING MALAYSIA
Journal of the Malaysia Institute of Planners (2021)
79 © 2021 by MIP
Table 4 shows the summary statistics by using regression regarding Environment
and house price. The regression result shows that the F-value for Double and
Single Storey House models of 51.23 and 47.88 are statistically significant at 0.01
level. The regression model explains 15.4% (double-storey houses) and 14.2%
(single storey houses) of the variation in the dependent variable. The coefficient
of the Environment Variable is positive for the Double Storey Houses (0.485) and
statistically significant at 0.01 level. Therefore, the coefficient is significantly
different from zero at 0.01 level indicating Environment to be a significant factor
affecting Double Storey House prices. A 1 per cent change in the value of the
Environment will cause an increase of 0.485 per cent in Double Storey House
prices.
For the Single Storey House model, the coefficient of the Environment
Variable is positive (0.435) and statistically significant at 0.01 level. Therefore,
the coefficient is significantly different from zero at 0.01 level indicating
Environment is a significant factor affecting Single Storey House prices. A 1 per
cent change in the value of the Environment will cause an increase of 0.435 per
cent in Single Storey House prices.
The analysis shows that there is a significant relationship between the
two elements. Buyers in a way can be understood by the researcher to purchase a
home in a holistic manner encompassing larger areas of the development. An
emphasis on the environment shows that house buyers value their surrounding
areas and look for a higher quality of planned residential developments.
Table 5: Regression Analysis of Amenities and Prices
Regression Analysis between Amenities
and Prices
Double Storey Houses Single Storey Houses
B t Sig. B t Sig.
Amenities 0.291 2.877** 0.001 0.277 2.983*
*
0.000
R² 0.077 0.073
F 30.23** 32.72*
*
Sig. 0.001 0.000
Note: Significant at 0.01 (**) levels
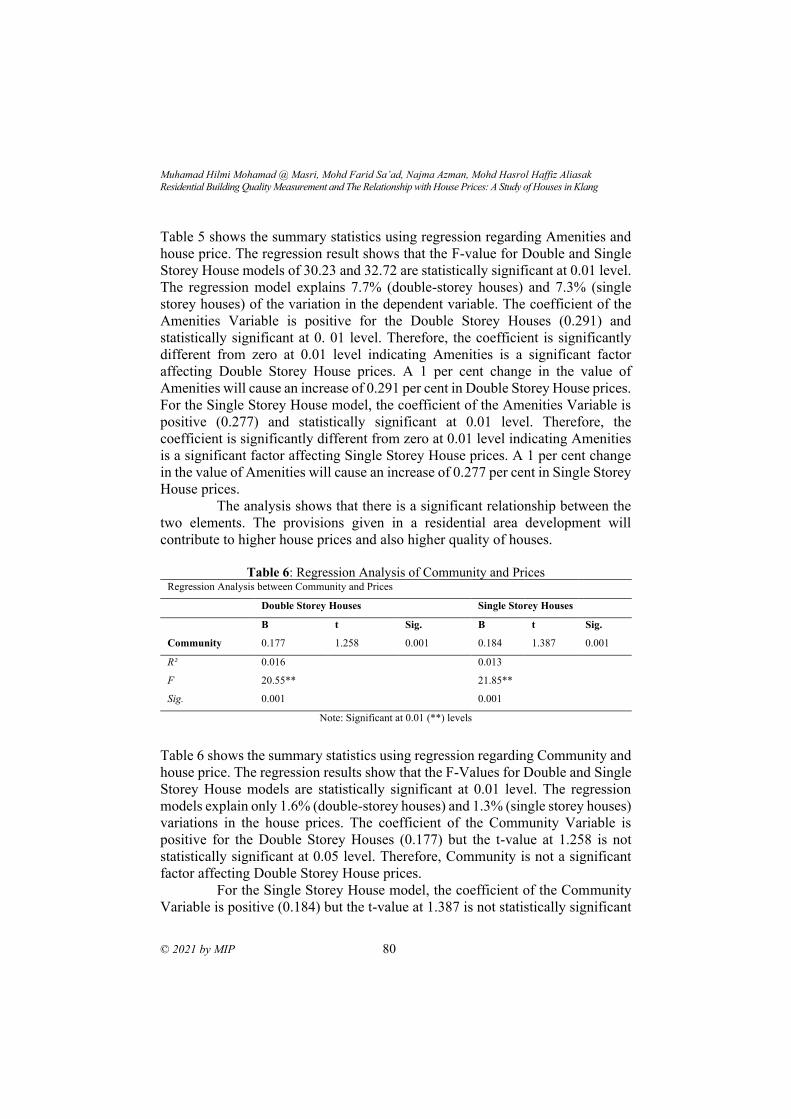
Muhamad Hilmi Mohamad @ Masri, Mohd Farid Sa’ad, Najma Azman, Mohd Hasrol Haffiz Aliasak
Residential Building Quality Measurement and The Relationship with House Prices: A Study of Houses in Klang
© 2021 by MIP 80
Table 5 shows the summary statistics using regression regarding Amenities and
house price. The regression result shows that the F-value for Double and Single
Storey House models of 30.23 and 32.72 are statistically significant at 0.01 level.
The regression model explains 7.7% (double-storey houses) and 7.3% (single
storey houses) of the variation in the dependent variable. The coefficient of the
Amenities Variable is positive for the Double Storey Houses (0.291) and
statistically significant at 0. 01 level. Therefore, the coefficient is significantly
different from zero at 0.01 level indicating Amenities is a significant factor
affecting Double Storey House prices. A 1 per cent change in the value of
Amenities will cause an increase of 0.291 per cent in Double Storey House prices.
For the Single Storey House model, the coefficient of the Amenities Variable is
positive (0.277) and statistically significant at 0.01 level. Therefore, the
coefficient is significantly different from zero at 0.01 level indicating Amenities
is a significant factor affecting Single Storey House prices. A 1 per cent change
in the value of Amenities will cause an increase of 0.277 per cent in Single Storey
House prices.
The analysis shows that there is a significant relationship between the
two elements. The provisions given in a residential area development will
contribute to higher house prices and also higher quality of houses.
Table 6: Regression Analysis of Community and Prices
Regression Analysis between Community and Prices
Double Storey Houses Single Storey Houses
B t Sig. B t Sig.
Community 0.177 1.258 0.001 0.184 1.387 0.001
R² 0.016 0.013
F 20.55** 21.85**
Sig. 0.001 0.001
Note: Significant at 0.01 (**) levels
Table 6 shows the summary statistics using regression regarding Community and
house price. The regression results show that the F-Values for Double and Single
Storey House models are statistically significant at 0.01 level. The regression
models explain only 1.6% (double-storey houses) and 1.3% (single storey houses)
variations in the house prices. The coefficient of the Community Variable is
positive for the Double Storey Houses (0.177) but the t-value at 1.258 is not
statistically significant at 0.05 level. Therefore, Community is not a significant
factor affecting Double Storey House prices.
For the Single Storey House model, the coefficient of the Community
Variable is positive (0.184) but the t-value at 1.387 is not statistically significant
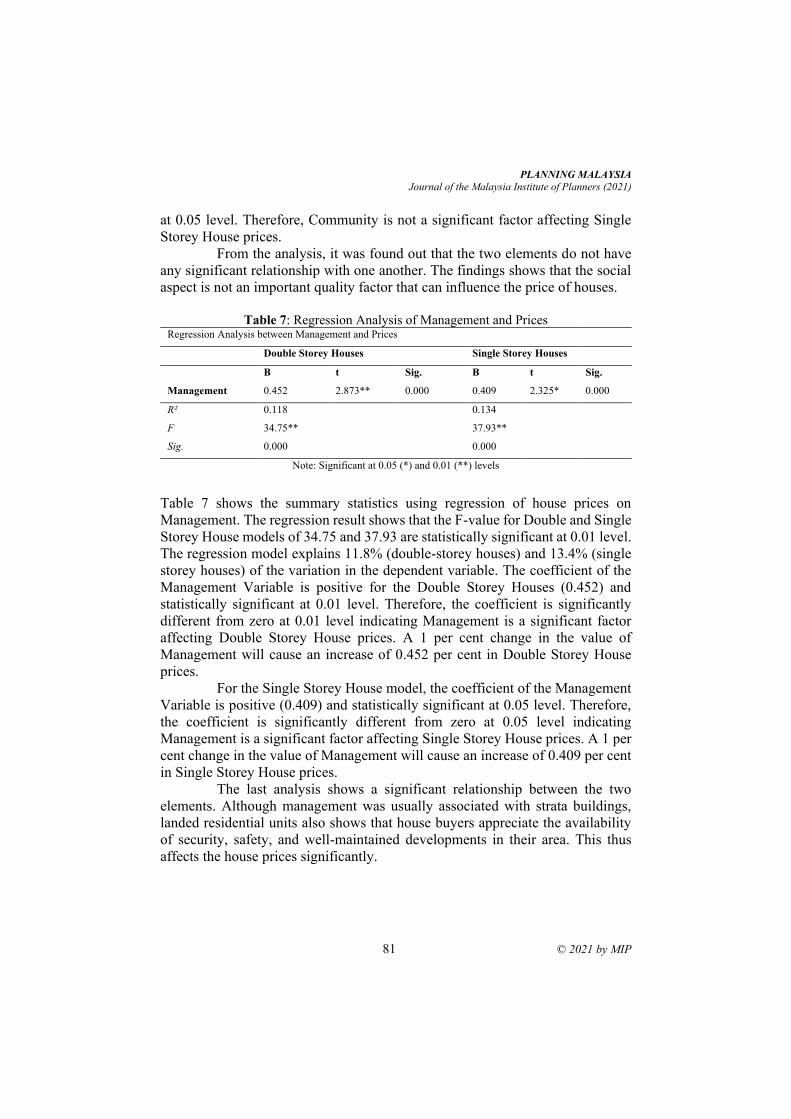
PLANNING MALAYSIA
Journal of the Malaysia Institute of Planners (2021)
81 © 2021 by MIP
at 0.05 level. Therefore, Community is not a significant factor affecting Single
Storey House prices.
From the analysis, it was found out that the two elements do not have
any significant relationship with one another. The findings shows that the social
aspect is not an important quality factor that can influence the price of houses.
Table 7: Regression Analysis of Management and Prices
Regression Analysis between Management and Prices
Double Storey Houses Single Storey Houses
B t Sig. B t Sig.
Management 0.452 2.873** 0.000 0.409 2.325* 0.000
R² 0.118 0.134
F 34.75** 37.93**
Sig. 0.000 0.000
Note: Significant at 0.05 (*) and 0.01 (**) levels
Table 7 shows the summary statistics using regression of house prices on
Management. The regression result shows that the F-value for Double and Single
Storey House models of 34.75 and 37.93 are statistically significant at 0.01 level.
The regression model explains 11.8% (double-storey houses) and 13.4% (single
storey houses) of the variation in the dependent variable. The coefficient of the
Management Variable is positive for the Double Storey Houses (0.452) and
statistically significant at 0.01 level. Therefore, the coefficient is significantly
different from zero at 0.01 level indicating Management is a significant factor
affecting Double Storey House prices. A 1 per cent change in the value of
Management will cause an increase of 0.452 per cent in Double Storey House
prices.
For the Single Storey House model, the coefficient of the Management
Variable is positive (0.409) and statistically significant at 0.05 level. Therefore,
the coefficient is significantly different from zero at 0.05 level indicating
Management is a significant factor affecting Single Storey House prices. A 1 per
cent change in the value of Management will cause an increase of 0.409 per cent
in Single Storey House prices.
The last analysis shows a significant relationship between the two
elements. Although management was usually associated with strata buildings,
landed residential units also shows that house buyers appreciate the availability
of security, safety, and well-maintained developments in their area. This thus
affects the house prices significantly.
Muhamad Hilmi Mohamad @ Masri, Mohd Farid Sa’ad, Najma Azman, Mohd Hasrol Haffiz Aliasak
Residential Building Quality Measurement and The Relationship with House Prices: A Study of Houses in Klang
© 2021 by MIP 82
CONCLUSION Based on the findings generated from this research, there are some elements that
were deemed as insignificant that can affect the house prices that were
functionality, presentation, and community. Whereas the significant elements
were the environment, amenities, and management. This shows that with proper
empirical research conducted, the relationship between residential building
qualities with their prices can be determined, thus helping the stakeholders.
House buyers can therefore generally expect much better in terms of the quality
level of their houses with the prices that they have paid.
REFERENCES Adeoye, D. O. (2016). Challenges of Urban Housing Quality: Insights and Experiences
of Akure, Nigeria. Procedia - Social and Behavioral Sciences, 216(October 2015),
260–268. https://doi.org/10.1016/j.sbspro.2015.12.036
Amin, N., Zubaidah, S., Abdul, S., & Kassim, S. (2015). Enforcement of Housing Law in
Malaysia: Issues and Challenges. 2, 230–243.
Behzadfar, M., & Saneei, M. (2012). Regenerating the historical axes of Isfahan, using
urban design dimensions to make places for people (The Case Study of Joibareh
Neighbourhood). Procedia - Social and Behavioral Sciences, 51, 728–735.
https://doi.org/10.1016/j.sbspro.2012.08.232
Bø, E. E. (2018). Housing match quality and demand: What can we learn from comparing
buyer characteristics? Journal of Housing Economics, 41(October 2017), 184–
199. https://doi.org/10.1016/j.jhe.2018.06.007
Elshater, A. (2012). New Urbanism Principles versus Urban Design Dimensions towards
Behavior Performance Efficiency in Egyptian Neighbourhood Unit. Procedia -
Social and Behavioral Sciences, 68, 826–843.
https://doi.org/10.1016/j.sbspro.2012.12.270
Emmanuel, J. B. (2012). “Housing Quality” To the Low-Income Housing Producers in
Ogbere, Ibadan, Nigeria. Procedia - Social and Behavioral Sciences,
35(December 2011), 483–494. https://doi.org/10.1016/j.sbspro.2012.02.114
Ezgi, Z., & Kahraman, H. (2013). Dimensions Of Housing Satisfaction: A Case Study
Based on Perceptions Of Rural Migrants Living In Dikmen. Metu Journal of the
Faculty of Architecture, 30(01), 1–27.
https://doi.org/10.4305/METU.JFA.2013.1.1
Fattah, H. A., Badarulzaman, N., & Ali, K. (2020). NEIGHBOURHOOD QUALITY
ASSESSMENT: A VIEW OF TENURE OWNERSHIP AND MOBILITY
DECISIONS IN PENANG, MALAYSIA. Planning Malaysia, 18(1), 92–101.
https://doi.org/http://dx.doi.org/10.21837/pm.v18i11.712
Fauzi, S. N. F. M., Yusof, N., & Abidin, N. Z. (2012). The Relationship of Housing
Defects, Occupants’ Satisfaction and Loyalty Behavior in Build-Then-Sell
Houses. Procedia - Social and Behavioral Sciences, 62, 75–86.
https://doi.org/10.1016/j.sbspro.2012.09.014
Gobster, P. H., & Westphal, L. M. (2004). The human dimensions of urban greenways:
planning for recreation and related experiences. Landscape and Urban Planning,
68(2–3), 147–165. https://doi.org/10.1016/S0169-2046(03)00162-2
PLANNING MALAYSIA
Journal of the Malaysia Institute of Planners (2021)
83 © 2021 by MIP
Hamzah, N., Ramly, A., Salleh, H., Tawil, N. M., Khoiry, M. A., & Che Ani, A. I. (2011).
The importance of design process in housing quality. Procedia Engineering, 20,
483–489. https://doi.org/10.1016/j.proeng.2011.11.191
Hamzehnejad, M., Dadras, F., & Yekta, N. H. (2015). ScienceDirect Houses’ Physical
Features based on Temperament Indicators. Procedia - Social and Behavioral
Sciences, 201(February), 317–324. https://doi.org/10.1016/j.sbspro.2015.08.180
Hassan, M. A., Abdullah, Y. A., Omar, D., & Danial, M. H. (2021). Location housing
affordability index: Analysing the relationships. Planning Malaysia, 19(15), 41–
52. https://doi.org/10.21837/PM.V19I15.923
Hui, E. C. M., Chau, C. K., Pun, L., & Law, M. Y. (2007). Measuring the neighboring
and environmental effects on residential property value: Using spatial weighting
matrix. Building and Environment, 42(6), 2333–2343.
https://doi.org/10.1016/j.buildenv.2006.05.004
Iwata, S., & Yamaga, H. (2008). Rental externality, tenure security, and housing quality.
Journal of Housing Economics, 17(3), 201–211.
https://doi.org/10.1016/j.jhe.2008.06.002
Manley, D., Ham, M. Van, Bailey, N., & Simpson, L. (2013). Neighbourhood Eff ects or
Neighbourhood Based Problems? Springer. https://doi.org/10.1007/978-94-007-
6695-2
Masri, M. H. b M. @, Nawawi, A. H., Safian, E. E., & Saleh, A. F. A. (2017).
Characteristic Qualities Impacting Landed House Prices: Better Homes, Better
Livelihood. Environment-Behaviour Procedings Journal, February, 25–27.
Mohit, M. A., Ibrahim, M., & Rashid, Y. R. (2010). Assessment of residential satisfaction
in newly designed public low-cost housing in Kuala Lumpur, Malaysia. Habitat
International, 34(1), 18–27. https://doi.org/10.1016/j.habitatint.2009.04.002
Morenikeji, W., Umaru, E., Pai, H., Jiya, S., Idowu, O., & Adeleye, B. M. (2017). Spatial
analysis of housing quality in Nigeria. International Journal of Sustainable Built
Environment, 6(2), 309–316. https://doi.org/10.1016/j.ijsbe.2017.03.008
Mu, S. (2016). Community Building in Social-mix Public Housing: Participatory
Planning of Ankang Redevelopment Plan. Procedia - Social and Behavioral
Sciences, 222, 755–762. https://doi.org/10.1016/j.sbspro.2016.05.155
Shuid, S. (2015). The housing provision system in Malaysia. Habitat International, 54,
210–223. https://doi.org/10.1016/j.habitatint.2015.11.021
Yazdanfar, S. A. A., & Nazari, N. (2015). Proposed Physical-environmental Factors
Influencing Personal and Social Security in Residential Areas. Procedia - Social
and Behavioral Sciences, 201(February), 224–233.
https://doi.org/10.1016/j.sbspro.2015.08.171
Received: 12th July 2021. Accepted: 23rd Sept 2021
1 Assistant Professor at Universiti Tunku Abdul Rahman Email: [email protected]
PLANNING MALAYSIA:
Journal of the Malaysian Institute of Planners
VOLUME 19 ISSUE 3 (2021), Page 84 – 94
FIRST-TIME HOMEBUYERS’ INTERESTS IN USING
PROPERTY CROWDFUNDING AS AN ALTERNATIVE
FINANCING OPTION
Hon-Choong Chin1, Sheelah Sivanathan2, Goh Hong Lip3 & Low Choon
Wei4
1Department of Building & Property Management, Faculty of Accountancy and
Management, UNIVERSITI TUNKU ABDUL RAHMAN 2Department of Economics, Faculty of Accountancy and Management,
UNIVERSITI TUNKU ABDUL RAHMAN
Abstract
Property crowdfunding as an alternative financing option for first-time
homebuyers was introduced by the Malaysian government during the
presentation of the National Budget 2019. This platform was the first of its kind,
and targeted fundraisers who were first-time homebuyers, i.e., those allowed to
raise financial support for their home purchase via the platform. As the
mechanism of the Malaysian property crowdfunding platform is new to
homebuyers, this study aims to explore homebuyers’ interests to use property
crowdfunding platform as an alternative financing option for the purchase of their
first home. First-time homebuyers’ opinions were collected through face-to-face
interviews, and content analysis was performed to analyse the obtained
qualitative data. Key themes were identified and organised into three sections: (i)
knowledge of the property crowdfunding; (ii) factors that motivated the use of
the property crowdfunding and (iii) barriers that hindered the use of the property
crowdfunding. These findings are expected to contribute toward the adoption of
the property crowdfunding in Malaysia.
Keywords: property crowdfunding, first-time homebuyer, affordable housing,
homeownership
PLANNING MALAYSIA
Journal of the Malaysia Institute of Planners (2021)
85 © 2021 by MIP
INTRODUCTION As an alternative financial scheme, crowdfunding has received increasing
attention worldwide. The concept of crowdfunding has been adopted as an
alternative financing option for new ventures, as well as cultural and social
projects (Mollick, 2014). In general, crowdfunding is a micro-finance concept
(Mollick, 2014) based on the fundraising strategy which collects an individual’s
small amount of capital from across a large group of people (Ordanini et al., 2011;
Sigar, 2012). It connects the investees (project or idea owners) with potential
supporters for the purpose of turning start-up ideas into reality (Ramsey, 2012).
Thus, it involves three main participants which are the fund seekers (project or
idea owners), investors, and the platform operators.
In terms of the business models, there are four types of crowdfunding
platforms, namely donation-based, reward-based, equity-based and loan-based
(Massolution, 2015). In general, the donation-based platform is used by non-
profit organisations for charity purposes, while the reward-based platform is
offered to the crowd funders as a token of appreciation in recognition of their
business ideas. In contrast, the equity-based and loan-based platforms are
investment oriented, in the sense that they fund providers who are looking toward
for a return from their investments. Similarly, in the real estate domain, property
crowdfunding is a fundraising process, whereby developers and project owners
raise an aggregated small amount of capital from a large group of individual
investors via the internet platform (Maarbani, 2015). The business model of
property crowdfunding platform is either equity-based, or loan-based. It allows
the investor and property developer (the project owners) to achieve a higher
interest by eliminating the involvement of intermediaries and transaction costs
(Miller, 2015). Although the crowdfunding concept has been widely adopted,
studies on the application of this concept in the real estate domain has remained
scarce (Lowies, Viljoen and McGreal, 2017). The application of the
crowdfunding concept in the real estate industry is worth being investigated, as
both the risk and the growth opportunity needed to be clarified (Cohen, 2016).
The importance of crowdfunding as an alternative financial platform
has been recognised in Malaysia for some time now. In fact, Malaysia is the first
country within the Asia-Pacific Region to legislate an equity-based and peer-to-
peer lending crowdfunding platform (Mokhtarrudin, Masrurah, and Muhamad,
2017). According to the Asian Institute of Finance (2017), there was a total of
RM15.8 million funds which were raised using equity-based platforms to support
24 projects, and the amount of funds were expected to increase to RM343.4
million by 2021. On the other hand, peer-to-peer crowdfunding platforms are
expected to secure RM1513.7 million in funding by 2021. Recently, the
application of crowdfunding had been further embraced by the Malaysian
government to support homeownership. As stated in the Malaysian 2019 national
budget, property crowdfunding had been introduced by the Malaysian
Hon-Choong Chin, Sheelah Sivanathan, Goh Hong Lip & Low Choon Wei
First-Time Homebuyers' Interest in Using Property Crowdfunding as An Alternative Financing Option
© 2021 by MIP 86
government as an alternative financing option for first time homebuyers (Ministry
of Finance, 2018). It is recognised that by promoting an innovative home
financing product will certainly offer benefits in term of promoting
homeownership in Malaysia (Mohd Yusof et al., 2019), as it provides an
alternative pathway that increases the possibilities for those who need access to
financial assistance (Yusof et al., 2019), as well as addressing the mismatch
between the existing financial system criteria and the homebuyer’s profile
(Kamal et al., 2018) . It is worth mentioning that difficulties in obtaining housing
loans have contributed to the failure of homeownership, especially those in low-
and medium-income groups (Hing and Singaravelloo, 2018; Osman et al.,
2020).
Unlike traditional property crowdfunding platforms which are
predominantly used to raise funds for property development projects, the recently
announced Malaysian property crowdfunding platform is meant to address
housing affordability issues, and facilitate homeownership among first time
homebuyers. Accordingly, under the Malaysia property crowdfunding
mechanism, first time homebuyers can secure a property by paying 20% of the
property selling price, as the remaining 80% will be funded by potential investors
who are keen to fund the property in exchange for the potential appreciation in
the future property value. Recently, the 20% deposit had been allowed to be
reduced to 10% by the Securities Commission of Malaysia. By doing so, the
financial burden of owning a house had been reduced, thus, making
homeownership an affordable option for homebuyers.
In recognising the potential of property crowdfunding platform as an
alternative financing option, studies have disclosed the associated advantages and
disadvantages (Vogel and Moll, 2014) as well as the risks and potential growth
associated with the property crowdfunding platform (Cohen, 2016), which
highlighted the concerns over information asymmetry pertaining to the
investment decision via property crowdfunding (Ahlers et al., 2015). It also
investigated the influence of the characteristics of property, financial and
crowdfunding platform characteristics on the return of the property platform
(Schweizer and Zhou, 2016), which identified investors as the key driving factor
for change (O’Roarty et al., 2016), and profiled the investor’s risk perceptions
(Lowies et al., 2017). Nonetheless, these studies have been focused on the
investment perspective whereby policy implication is now focused on promoting
investment decision-making using property crowdfunding platforms. Studies on
another domain, which is the user’s perspective has remained scare, and is worth
being investigated as the key to the success of the property crowdfunding
platform, which does not solely depend on the investor’s interest to invest, but,
also on the intention of the users (fundraisers) to adopt the platform as an
alternative financing option for them.
PLANNING MALAYSIA
Journal of the Malaysia Institute of Planners (2021)
87 © 2021 by MIP
Furthermore, the Malaysian property crowdfunding is novel compared to that of
the traditional property crowdfunding platforms, in such a way that fundraisers
are the homebuyers, instead of developers and project owners. This makes the
Malaysian property crowdfunding platform the first of its kind in the world,
whereby, it serves as a platform for homebuyers to seek financial capital to
purchase their homes. Following this, the motive of using the property
crowdfunding platform is very much different, as developers and project owners
(in the traditional property crowdfunding platform mechanism) intend to seek
funds to support their development projects for businesses and investment
purposes, while, homeowners (in the case of the Malaysian property
crowdfunding platform) intend to secure financial support for personal
homeownership purposes. In addition to that, the investment based crowdfunding
platform (such as the property crowdfunding platform in this study) is unique and
different from other forms of crowdfunding platforms, due to the differences in
term of its incentives and compensation (Hervé et al., 2017). This uniqueness
further points to the fact that the adoption of crowdfunding platforms can be case
specific, whereby the user’s motive for a crowdfunding platform can be
distinguished and differ from other crowdfunding platforms. In other words, the
Malaysian homebuyer’s intentions to use property crowdfunding platforms can
differ from that of users from other countries and regions, which use different
forms of crowdfunding platforms to facilitate homeownership. On top of that,
property crowdfunding is regarded as a potentially disruptive innovation which
may disrupt the traditional real estate finance market (Montgomery, Squires and
Syed, 2018). Thus, understanding the homebuyer’s intentions to use property
crowdfunding as an alternative financing vehicle can contribute toward the
preparation of the industry for facing the adoption challenges of this disruptive
innovation. In short, this study not only contributes toward the scarcity of
literature on property crowdfunding, but also prepares the Malaysian real estate
industry and financial industry for addressing the challenges pertaining to
property crowdfunding adoption, by providing an in-depth understanding of the
Malaysian homebuyer’s intentions to use the property crowdfunding platform as
an alternative financing option to secure their homeownership.
RESEARCH METHOD For the purpose of this study, the FundMyHome platform is referred to. This
platform is Malaysia's first and only property crowdfunding platform that serves
to support homeownership. The FundMyHome platform is a privately operated
property crowdfunding platform of which the operating mechanism is regulated
by the Securities Commission of Malaysia. At present, this platform has more
than 7,000 registered users, with about 20 successful applicants who are currently
using this property crowdfunding platform as an alternative financing scheme for
supporting their homeownership (Idris, 2019). Applicants who successfully
Hon-Choong Chin, Sheelah Sivanathan, Goh Hong Lip & Low Choon Wei
First-Time Homebuyers' Interest in Using Property Crowdfunding as An Alternative Financing Option
© 2021 by MIP 88
obtained the required financial support needed to only pay 20% of the house’s
price. The applicants are not be tied down to instalment repayments for a period
of five years. After five years, the applicants will be given two options, which are
(i) retain their ownership, or (ii) sell the property. For the first option, the
applicants are required to look for their own financial support to pay the 80%
house price in the platform, in order to secure their homeownership. For the
second option, applicants are required to bear costs involved in selling the
property, and can enjoy their portion of the gain from selling the property only
after paying back the associated costs of the property to the crowdfunding
platform.
This study is exploratory in nature, given the fact that utilising property
crowdfunding in supporting homeownership is a novel application. This study
employed a qualitative interview to probe the respondent’s understanding and
perceptions about property crowdfunding as an alternative financing option for
homebuyers. Using qualitative interviews in this study is expected to provide new
information and insights on the adoption of the property crowdfunding platform,
and will contribute to our knowledge pertaining to the topic.
A total of thirty-two (32) first-time homebuyers (coded with R1 to R32)
were identified during their visit to a local property fair and exhibition centre in
Kuala Lumpur. In order to ensure that the interviewees were qualified for our
study, the respondents were screened with three questions, (i) if they owned any
property; (ii) their income range and (iii) if they had the intention to purchase a
property over the next 5 years. The rationale of the first screening question was
to ensure the recruited respondents were first-time homebuyers. Subsequently,
the second question aimed to ensure that the targeted respondents were users of
the property crowdfunding based on their income levels, and lastly, the third
question implied if the respondents were rigorously looking for financial options
for their homeownership over the 5 year period.
The interviews were recorded and transcribed. The thematic content
analysis was used to identify, analyse, organise, describe, and report themes
derived from the transcripts (Braun & Clarke, 2006). The codes and themes had
been derived independently by two researchers, with line-by-line coding of the
interview transcripts. A rigorous discussion was conducted amongst the
researchers for reaching to an affirmative agreement on the identified codes and
themes.
FINDINGS
In total, 46.9% of the respondents were male. The majority of them ranged
between 24 to 30 (46.9%) years of age, and the remaining were above the age of
30. Furthermore, 87.5% had a household size of 5 or less. The majority of our
respondent’s profile were young and with a low household size. This was not
surprising, as our targeted respondents were first-time homebuyers who were just
PLANNING MALAYSIA
Journal of the Malaysia Institute of Planners (2021)
89 © 2021 by MIP
establishing their family, and looking forward to owning property. In terms of
income level, almost 84.4% of our respondents earned less than or equivalent to
RM5,000 and the remaining earned between RM5,001 - RM10,000.
In terms of house ownership, none of the interviewees owned any
property at the time of the interview. A total of 62.5% of the interviewees stayed
with their family members, and 31.3% were renting a house, and the remaining
6.3% are room tenants. The majority of the interviewees (68.8%) were seeking
to purchase the house for their own dwelling, meanwhile that 25.0% were looking
for an investment opportunity. The remaining 6.3% were seeking property for
personal dwelling or as an investment. Almost 53.1% of the interviewees were
willing to jointly own their property with their family members and spouse, while,
46.9% had a strong intention to become sole proprietors.
The following sub-sections are presented according to the findings of
this study. The findings have been arranged accordingly to correlate to the
identified themes, into three sub-sections, (i) prior knowledge of property
crowdfunding, (ii) factors which stimulate a homebuyer’s interest to use property
crowdfunding, and (iii) barriers which hinder homebuyers from using property
crowdfunding.
Knowledge on Property Crowdfunding Platform
In general, 66% of the respondents (n=21) acknowledged that they were not
aware of the term "property crowdfunding". Interestingly, 67% of the respondents
had heard about the FundMyHome platform. Furthermore, those who responded
with awareness about property crowdfunding seemed to associate property
crowdfunding with the FundMyHome platform. They tended to highlight the
mechanism of FundMyHome while explaining their interpretation of property
crowdfunding to the researchers. For instance, as noted by R10 "....it means that
they are people who invest in our property with a small pool of funds.....so that
we can own the house by paying only 20%. The anonymous investors will fund
the remaining 80%". None of the interviewees defined the term from its original
operating mechanism and definition. This implied that the public may have
misconceptions about property crowdfunding, as the FundMyHome platform
actually operates on the basics of property crowdfunding. A plausible explanation
is that the public awareness on property crowdfunding is low. The awareness of
property crowdfunding is due to the introduction of the FundMyHome platform.
Despite their awareness about property crowdfunding, we were
particularly interested in how the homebuyers perceived the FundMyHome
platform. Despite the operating mechanism of the platform, interviewees tended
to link the platform with government efforts in promoting affordable housing.
The statement "supported by government", "financial support from government",
"government to reduce financial burdens" and "a loan provided by government
to homebuyers" were frequently mentioned by the interviewees. The tendency of
Hon-Choong Chin, Sheelah Sivanathan, Goh Hong Lip & Low Choon Wei
First-Time Homebuyers' Interest in Using Property Crowdfunding as An Alternative Financing Option
© 2021 by MIP 90
interviewees to associate the FundMyHome platform with the government can be
attributed to the fact that the property crowdfunding had been highlighted in the
government’s Budget plan 2019. Additionally, the FundMyHome platform was
officially launched by the Prime Minister (Tan, 2018), and was supported by the
government by providing aid to first-time homebuyers to use the platform for
homeownership purposes (Idris, 2019). Thus, it is not surprising that our
respondents tended to perceive the platform as a government initiative and
strategy to support homeownership among first-time homebuyers.
Factors which contribute to the use of the platform
Only 21.9% (n=7) of interviewees acknowledged that they were considering
using property crowdfunding as an alternative financing option for supporting
their homeownership. The Government’s role in property crowdfunding is one of
the motivators which stimulate the homebuyer's interest to use property
crowdfunding. As highlighted by one of the interviewees, "...the government
supports this scheme...the risk can be lowered, and I think is worth to try..."
(R31). Also, "...Guaranteed by the government and there must be a fund
supported by the government for helping the homebuyers to purchase the
property after 5 years..." (R28). This indicated that the government's involvement
in property crowdfunding will further enhance the public’s confidence in property
crowdfunding, and stimulate the homebuyer’s interest to use property
crowdfunding as an alternative financing option.
Additionally, the advantage of delaying the monthly instalment period
is another attractive point for property crowdfunding. Interviewees tended to
perceive that the delay in paying the monthly instalment will likely reduce their
financial burden and prompt them to opt for this option to own their home over
the next 5 years. For instance, as revealed by one interviewee, "...buyers do not
need to worry about the monthly instalments, at least for the first five
years..."(R10).
Nonetheless, property crowdfunding has been perceived as a
replacement financial scheme to that of the traditional housing loan offered by
banks. As mentioned by R29, "...If I cannot get a loan from the bank, I may
consider it." This was supported by other interviewees, who considered property
crowdfunding as a replacement financial scheme for those who cannot meet bank
requirements (R31). As an alternative financial option, the public tended to
perceive it as a replacement financial scheme, or serve as the last option as
mentioned by R32, "...I will put this as the last option..."
Barriers that hinder the usage of the platform
On the other hand, interviewees who were concerned about the trustworthiness
of the platform could prevent them from using property crowdfunding as an
alternative financing option. For instance, as noted by R31, "...I would not use it.
PLANNING MALAYSIA
Journal of the Malaysia Institute of Planners (2021)
91 © 2021 by MIP
I do not really trust the platform...". It is also argued that the platform only
"benefits the investors and developers" (R13) and "...it seems to be speculative as
it will contribute to price escalation..." (R30). Along with this argument, the
interviewees highlighted the importance of a clear agreement in safeguarding
those using property crowdfunding to fund their homeownership. As stated by
the respondent, "...there needs to be a clear agreement that both parties (the
homeowner and the platform owners) will not only benefit but also share the
potential risks associated with the mechanism of the platform..." (R27)
The uncertainty and risks associated with the platform is another barrier
that hinders the usage of property crowdfunding in supporting homeownership.
Although homebuyers may enjoy a five (5) year period of time without
commitments toward the housing loan, however, homebuyers were still
concerned about what would happen to them after five years. As noted by R26,
"...I am not certain if I am able to save enough money for the balance or get
another institution to provide a financial scheme for supporting me to pay for the
ownership after five years...". In other words, homebuyers who opted for the
current property crowdfunding faced the risk of losing their homeownership. This
will definitely offset the benefits of using property crowdfunding. As mentioned
by R32, "Many uncertainties. I don't believe we can own a home for free. The
after five years scenario can be worse, as we may lose our house if we cannot get
the loan to support our purchase. What is the point of the five years’ timeframe,
when you have the risk of losing the ownership after five years" Alongside with
this concern, the term "insecure", "not guaranteed", "losing", "actual cost maybe
higher", and "jeopardise the interest of homebuyers" were mentioned by the
interviewees.
The third theme that emerged from the barriers that hindered the usage
of property crowdfunding was related to the housing product offered by the
platform. At present, the FundMyHome users have limited choices in term of
housing products, of which they are limited in terms of choices listed on the
platform. This further discourages interested and committed first-time
homebuyers from using the platform, as they are unable to refer to the current
platform for funding their preferred housing product, which is not listed on the
platform. As mentioned by R29, "...we need to subject to the product listed on the
platform, and there are limitations in terms of the product itself, especially at my
preferred location". Thus, it is not only the limited product availability but, the
location for the housing product which is also a concern for the interviewees.
CONCLUSION This study aimed to explore first-time homebuyer's interest to use property
crowdfunding as an alternative financing option. A series of interviews had been
conducted to probe first-time homebuyer’s knowledge and understanding of
property crowdfunding. Our finding indicated that the public had limited
Hon-Choong Chin, Sheelah Sivanathan, Goh Hong Lip & Low Choon Wei
First-Time Homebuyers' Interest in Using Property Crowdfunding as An Alternative Financing Option
© 2021 by MIP 92
knowledge of property crowdfunding. They had a better understanding of the
financing mechanism of the platform, whereby 20% was paid by the homebuyers,
and 80% was supported by the platform itself. They had a perceived
misunderstanding on the government’s role in the operating of the property
crowdfunding platform in Malaysia. Essentially, the public will likely opt for
property crowdfunding if it is supported by the government, as it may potentially
reduce the associated financial burden, which is the last financial option after
traditional housing loans offered by banks. On the other hand, homebuyers had
trust issues, uncertainties, and a high-risk avoidance factor, as well as highlighted
limited housing products provided by the property crowdfunding financing
scheme.
The results suggested that an additional educational campaign is
required, essentially, the concept of crowdfunding, and how it can be utilised and
incorporated in our daily activities, rather than employed as an alternative
financial solution for business activities. Moreover, although the platform is
supported by the government, nonetheless, the misunderstanding on the
government’s role needs to be clarified. In terms of the platform’s mechanism,
policy makers and platform operators need to focus on lowering the uncertainty
and risks associated with the platform’s operation. Initiatives such as a better risk-
sharing mechanisms between the investors and homebuyers, and the deposit
guarantee scheme that protects homebuyers from financial risks can contribute
toward lowering the uncertainty and risks faced by the homebuyers. To address
the limited choice of products, the variety of products need to diversified, and
should not be limited to those listed on the platform.
ACKNOWLEDGEMENTS
This study was funded by Universiti Tunku Abdul Rahman via its internal
funding scheme - UTAR Research Fund with the project number of
IPSR/RMC/UTARRF/2019-C1/02
REFERENCES
Ahlers, G. K., Cumming, D., Günther, C., & Schweizer, D. (2015). Signaling in equity
crowdfunding. Entrepreneurship Theory and Practice, 39(4), 955-980
Asian Institute of Finance (2017), Crowdfunding Malaysia’s Sharing Economy:
Alternative Financing for Micro, Small, and Medium Enterprises, Asian Institute
of Finance, Kuala Lumpur.
Braun, V. & Clarke, V. (2006). Using thematic analysis in psychology. Qualitative
Research in Psychology 3:2, 77-101.
Cohen, J. (2016). A Study on the History and Functionality of Real Estate
Crowdfunding, Joseph Wharton Research Scholars. Retrieved February, 1, 2019,
from http://repository.upenn.edu/joseph_whraton_ scholars/19
Hervé, F., Manthé, E., Sannajust, A. & Schwienbacher, A. (2017). Determinants of
Individual Investment Decisions in Investment-Based Crowdfunding, Retrieved
PLANNING MALAYSIA
Journal of the Malaysia Institute of Planners (2021)
93 © 2021 by MIP
February,1, 2019, from https://papers-ssrn-
com.access.library.unisa.edu.au/sol3/Delivery.cfm/SSRN_ID2746398_
code301672.pdf?1
Hing, Y. K., & Singaravelloo, K. (2018). Impediments to home ownership: perception of
low and middle-income tenants in Selangor. Planning Malaysia, 16(3), 357-368.
Idris, A.N. (21 Feb 2019). Housing ministry launches scheme to aid first-time
homebuyers. The Edge Financial Daily. Retrieved December 13, 2019, from
http://theedgemarkets.com/article/housing-ministry-launches-scheme-to-aid-
firsttime-homebuyers
Kamal, E. M., Lai, K. S., & Yusof, N. A. (2020). The low-middle income housing
challenges in Malaysia. Planning Malaysia, 18(1), 102-117.
Lowies, B., Viljoen, C. & McGreal, S. (2017). Investor perspectives on property
crowdfunding: evidence from Australia. Journal of Financial Management of
Property and Construction, Vol. 22 No. 3, pp. 303-321.
Maarbani, S. (2015). Real estate crowdfunding: the digital evolution of real estate
funding and investment. PricewaterhouseCoopers, Sydney.
Massolution (2015), 2015CF-Crowdfunding Industry Report, Massolution.
Mollick, E. (2014). The dynamics of crowdfunding: An exploratory study, Journal of
Business Venturing, 29(1) 1-16
Mokhtarrudin, A., Masrurah, I. M. K., & Muhamad, S. C. R. (2017). Crowdfunding as a
funding opportunity for youth start-ups in Malaysia. Pertanika Journal of Social
Sciences & Humanities, 25, 139–154.
Miller, D. (2015). Crowdfunding Commercial Real Estate — the New Disruptor?
Retrieved February,1, 2019, from http://knowledge.wharton.upenn.edu/article/i
scrowd-sourced-funding-for-commercial-real-estate-the-next-big-disruptor/.
Ministry of Finance (2018). Budget 2019. Retrieved February,1, 2019, from
http://www.treasury.gov.my/pdf/budget/speech/bs19.pdf
Mohd Yusof, R., Mohd Khan, S. J., M Yusuf, F., & Abdul Majid, N. H. (2019). Bridging
the supply and demand gap for affordable home ownership in Malaysia: the roles
of government and financial institutions. Planning Malaysia, 17(1), 160-175.
Montgomery, N., Squires, G., & Syed, I. (2018). Disruptive potential of real estate
crowdfunding in the real estate project finance industry: A literature review,
Property Management, 36(5), 597-619
Ordanini, A., Miceli, L., Pizzetti, M., & Parasuraman, A. (2011). Crowd‐funding:
transforming customers into investors through innovative service platforms,
Journal of Service Management, 22(4), 443-470.
Osman, M. M., Zainudin, F. E., Rabe, N. S., Hitam, M., & Ponrahono, Z. (2020).
Challenges and ownership issues facing by low (B40) and medium income group
(M40) in Selangor. Planning Malaysia, 18(3), 218-228.
O’ Roarty, B., McMahon, S., Martin, R., Marx, S. & Craddock, P. (2016). Real estate
crowdfunding: gimmick or game changer? Investment Property Forum, 27.
Schweizer, D. & Zhou, T. (2016). Do principles pay in real estate crowdfunding? The
Journal of Portfolio Management, 43 (6) 120-137
Sigar, K. (2012). Fret no more: inapplicability of crowdfunding concerns in the internet
age and the JOBS Act’s safeguards, Administrative Law Review, 64(2), 473 - 506.

Hon-Choong Chin, Sheelah Sivanathan, Goh Hong Lip & Low Choon Wei
First-Time Homebuyers' Interest in Using Property Crowdfunding as An Alternative Financing Option
© 2021 by MIP 94
Ramsey, Y.A., (2012). What the heck is crowdfunding Business people, November, pp.
54.
Tan, V. (04 Nov 2018). PM launches FundMyHome scheme to help first time home
owners. The Star. Retrieved December 13, 2019, from
http://thestar.com.my/news/nation/2018/11/04/pm-launches-fundmyhome-
scheme-to-help-first-time-home-owners
Vogel Jr, J. H., & Moll, B. S. (2014). Crowdfunding for real estate. The Real Estate
Finance Journal, Summer/Fall, 5-16.
Yusof, R. M., Aliyu, S., Khan, S. J. M., & Majid, N. H. A. (2019). Supply overhang of
affordable homes: a survival analysis on housing loans application. Planning
Malaysia, 17(1), 250-266.
Received: 12th July 2021. Accepted: 17th Sept 2021
1 Lecturer at University Tunku Abdul Rahman (UTAR). Email: [email protected]
PLANNING MALAYSIA:
Journal of the Malaysian Institute of Planners
VOLUME 19 ISSUE 3 (2021), Page 95 – 110
ASSESSING THE STRATA HOUSING ATTRIBUTES FOR
ELDERLY TO AGE IN PLACE IN KLANG VALLEY
Amalina binti Azmi1, Peter Aning2, Wan Nor Azriyati Wan Abd Aziz3, Nur
Hafizah Juhari4, Nurhayati Khair5, Puteri Ameera Mentaza Khan6, Sheelah a/p
Sivanathan7
1,4,5,6,7 Faculty of Accountancy and Management,
UNIVERSITI TUNKU ABDUL RAHMAN (UTAR) 2,3 Faculty of Built Environment,
UNIVERSITIY OF MALAYA
Abstract
As the elderly population is burgeoning globally, the number of elderlies in
Malaysia has also increased tremendously. Malaysia is expected to become an
aging nation by 2030. The elderly in Malaysia prefer to age in place. At the same
time, the trend of residing in landed property has shifted to strata housing due to
several factors. Therefore, the purpose of this study is to assess the strata housing
attributes for the elderly to age in place in Klang Valley. The list of housing
attributes is divided into three categories: housing features, housing environment
and technology. These attributive patterns emerge from various sources of
literature reviews. Eight experts were identified and selected to validate the
content based on their background as well as their area of specialization.
Keywords: Aging, Elderly, Strata Housing, Aging in Place, Housing Attributes
Amalina binti Azmi, Peter Aning, Wan Nor Azriyati Wan Abd Aziz, Nur Hafizah Juhari, Nurhayati Khair,
Puteri Ameera Mentaza Khan, Sheelah a/p Sivanathan,
Assessing the Strata Housing Attributes for Elderly to Age in Place in Klang Valley
© 2021 by MIP 96
INTRODUCTION
The aging population is burgeoning globally, including in Malaysia. Malaysia is
predicted to become an aging nation by the year 2030. The elderly population
increases are due to factors such as low birth rate, low fertility rate, low mortality
rate and increased life expectancy. However, as an elderly, they experienced
impairments such as primary functional impairment, chronic disease, diminishing
social network, and lower level of physical activities (Peek et al., 2014; Wilby &
Cathy Chambless, 2012).
However, previous research discovered that most elderly prefer to age
in place regardless of their impairments. Aging in place is defined as the ability
to live in one’s own home and community safely, independently, and
comfortably, regardless of age, income, and ability level (Lum et al., 2016). They
prefer to age in place to maintain control and autonomy in their lives to ensure
their wellbeing and quality of life (Coleman & Kearns, 2015). It is also revealed
that the elderly tend to choose a smaller house namely strata housing such as
apartments, townhouses, and condominiums (Guillory & Moschis, 2008; Judd et
al., 2012; Vasara, 2015). Thus, the elderly require an innovative housing design
for them to age in place safely and comfortably (Thompson, 2013).
In Malaysia, the increasing population and limited land offered have
forced high-rise buildings to become a lifestyle (Che Ani et al., 2010). However,
the homes and communities in Malaysia are not designed to meet people’s needs
as they grow older. Moreover, according to the mid-term review of the 11th
Malaysia Plan, one of the challenges of the increasing number of elderlies is the
lack of collaboration between agencies in implementing the universal design for
building and public facilities. Consequently, it has reduced the efforts to provide
a user-friendly physical environment, especially for the elderly (Ministry of
Economic Affairs, 2018). On top of that, under Strategy 4 of the 11th Malaysia
Plan, various measures need to be considered to enhance the elderly living
environment.
Initiatives such as age-friendly community, lifelong learning and
retirement village concept will be promoted as the independent living lifestyle.
The mid-term review also urged the private sector to embrace the creation of a
lively community, housing and local areas. It is also imperative that the location
is near public amenities and transit terminals. Environment-friendly facilities
such as parks and recreation spaces need to be provided (Ministry of Economic
Affairs, 2018). Many previous local scholars have studied the housing attributes
for the elderly to age in place in landed properties (Tobi et al., 2017; Zainab Ismail
et al., 2012), but there are limited studies on housing attributes for the elderly to
age in place in strata housing (Sitinur Athirah et al., 2016; Wai & Wei, 2016). In
addition, Tan & Lee (2018) claimed that the housing needs and preferences of the
PLANNING MALAYSIA
Journal of the Malaysia Institute of Planners (2021)
97 © 2021 by MIP
elderly are lacking in Malaysia. Thus, this study will assess the attributes of strata
housing needed by the elderly to age in place in Klang Valley.
RESEARCH BACKGROUND The Aging Population The aging population has increased tremendously worldwide. Most of the
developed countries have categorized 65-year-olds as elderly (Rosilawati &
Pettit, 2016). Meanwhile, in most of the developing countries, including
Malaysia, 60 years old are grouped as elderly (Siti Uzairah et al., 2018). In
Malaysia, Jariah, Husna, Aizan, & Ibrahim (2012) identified that the Ministry of
Women, Family, and Community Development of Malaysia affirmed that
someone who is above 60 years of age could be considered elderly. This follows
the guideline by the United Nations World Assembly on Ageing 1982 in Vienna.
According to the Malaysian Department of Statistics, there were about 2.7 million
senior citizens in 2014, forming 8.9% out of the 30.3 million Malaysian
population. Hence, Malaysia is expected to become an aging nation by the year
2030.
Yüksel, Kırkkanat, Yılmaz, & Sevim (2016) specified that the
characteristics of the elderly could be divided into psychological and
physiological aspects. The psychological aspect is indicated by the state of
emotion of the elderly. The positive emotions are when the elderly feel satisfied
with their lives and the negative emotions are when they feel unsatisfied with
their lives, feeling isolated and alienated (Pavalache-Ille, 2015). On the other
hand, the physiological aspect is related to physical illness (Abdul Manaf et al.,
2016). Frailty among the elderly is evident in the increase of weakness and
slowness that usually leads to a decline in daily activities, causing fatal accidents
(Yuki et al., 2016). In addition, Gonawala et al. (2013) mentioned that the elderly
also endanger themselves on the road caused by their decreasing vision, lack of
hearing ability, increased cognitive impairment, and confusion.
As the global population is aging, societies around the world are
struggling with the issues and problems related to providing care for the aging
population in their homes. Lipman, Lubell, & Salomon (2012) found increased
demands for home modification to enable the elderly to age in place. In addition,
Mohd, Senadjki, & Mansor (2017) highlighted that number of elderly living alone
across 43 countries, including Malaysia, is increasing to the extent that almost a
quarter of them live by themselves. Furthermore, most elderly wish to age in place
in a strata housing (Ainoriza et al., 2016). The trend to prefer living in a strata
housing is due to factors such as land scarcity, high price for landed property,
facilities in strata housing and many other factors (Ainoriza et al., 2017; Shuid,
2004; Siti Rashidah Hanum et al., 2016). Therefore, this study will assess the
strata housing attributes to cater to the elderly needs to age in place using the
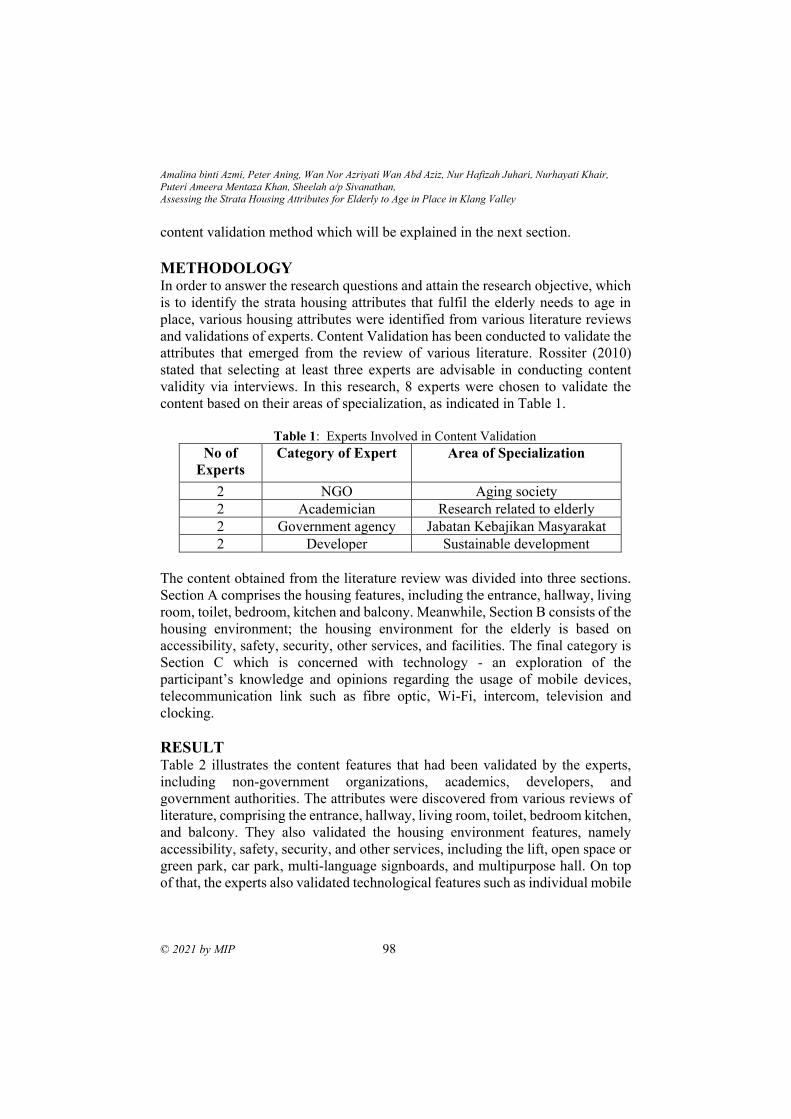
Amalina binti Azmi, Peter Aning, Wan Nor Azriyati Wan Abd Aziz, Nur Hafizah Juhari, Nurhayati Khair,
Puteri Ameera Mentaza Khan, Sheelah a/p Sivanathan,
Assessing the Strata Housing Attributes for Elderly to Age in Place in Klang Valley
© 2021 by MIP 98
content validation method which will be explained in the next section.
METHODOLOGY In order to answer the research questions and attain the research objective, which
is to identify the strata housing attributes that fulfil the elderly needs to age in
place, various housing attributes were identified from various literature reviews
and validations of experts. Content Validation has been conducted to validate the
attributes that emerged from the review of various literature. Rossiter (2010)
stated that selecting at least three experts are advisable in conducting content
validity via interviews. In this research, 8 experts were chosen to validate the
content based on their areas of specialization, as indicated in Table 1.
Table 1: Experts Involved in Content Validation
No of
Experts
Category of Expert Area of Specialization
2 NGO Aging society
2 Academician Research related to elderly
2 Government agency Jabatan Kebajikan Masyarakat
2 Developer Sustainable development
The content obtained from the literature review was divided into three sections.
Section A comprises the housing features, including the entrance, hallway, living
room, toilet, bedroom, kitchen and balcony. Meanwhile, Section B consists of the
housing environment; the housing environment for the elderly is based on
accessibility, safety, security, other services, and facilities. The final category is
Section C which is concerned with technology - an exploration of the
participant’s knowledge and opinions regarding the usage of mobile devices,
telecommunication link such as fibre optic, Wi-Fi, intercom, television and
clocking.
RESULT Table 2 illustrates the content features that had been validated by the experts,
including non-government organizations, academics, developers, and
government authorities. The attributes were discovered from various reviews of
literature, comprising the entrance, hallway, living room, toilet, bedroom kitchen,
and balcony. They also validated the housing environment features, namely
accessibility, safety, security, and other services, including the lift, open space or
green park, car park, multi-language signboards, and multipurpose hall. On top
of that, the experts also validated technological features such as individual mobile
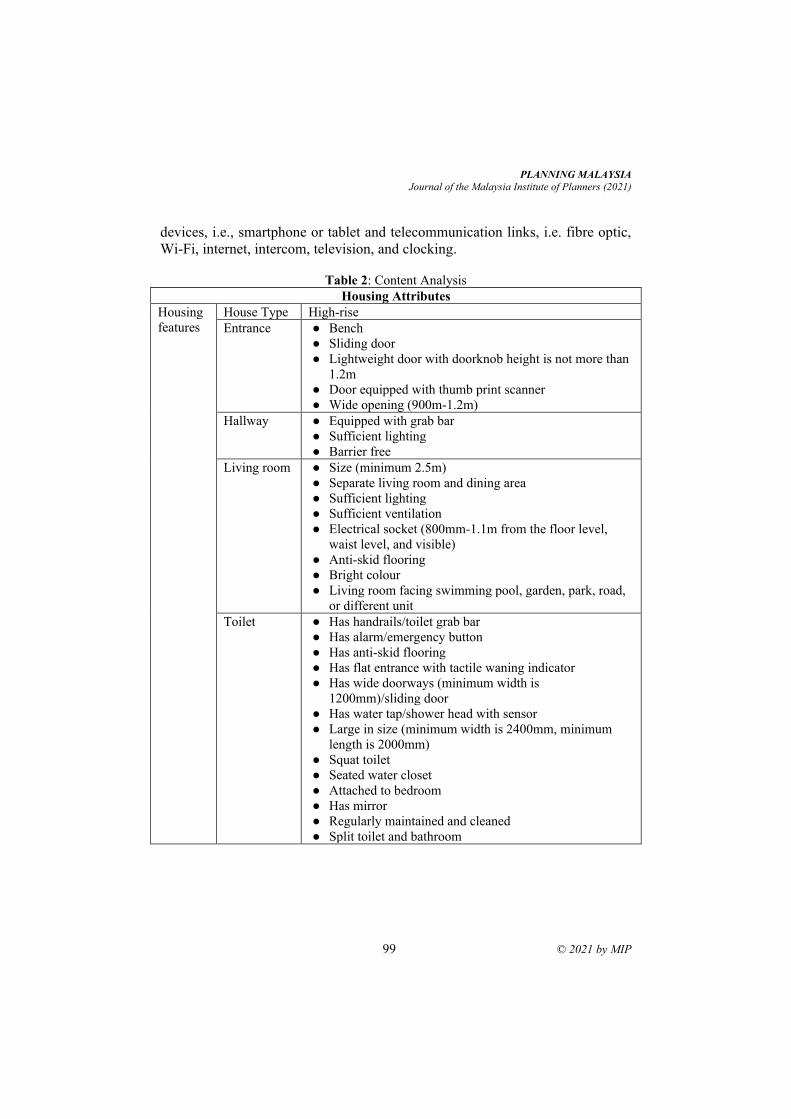
PLANNING MALAYSIA
Journal of the Malaysia Institute of Planners (2021)
99 © 2021 by MIP
devices, i.e., smartphone or tablet and telecommunication links, i.e. fibre optic,
Wi-Fi, internet, intercom, television, and clocking.
Table 2: Content Analysis
Housing Attributes
Housing
features
House Type High-rise
Entrance ● Bench
● Sliding door
● Lightweight door with doorknob height is not more than
1.2m
● Door equipped with thumb print scanner
● Wide opening (900m-1.2m)
Hallway ● Equipped with grab bar
● Sufficient lighting
● Barrier free
Living room ● Size (minimum 2.5m)
● Separate living room and dining area
● Sufficient lighting
● Sufficient ventilation
● Electrical socket (800mm-1.1m from the floor level,
waist level, and visible)
● Anti-skid flooring
● Bright colour
● Living room facing swimming pool, garden, park, road,
or different unit
Toilet ● Has handrails/toilet grab bar
● Has alarm/emergency button
● Has anti-skid flooring
● Has flat entrance with tactile waning indicator
● Has wide doorways (minimum width is
1200mm)/sliding door
● Has water tap/shower head with sensor
● Large in size (minimum width is 2400mm, minimum
length is 2000mm)
● Squat toilet
● Seated water closet
● Attached to bedroom
● Has mirror
● Regularly maintained and cleaned
● Split toilet and bathroom
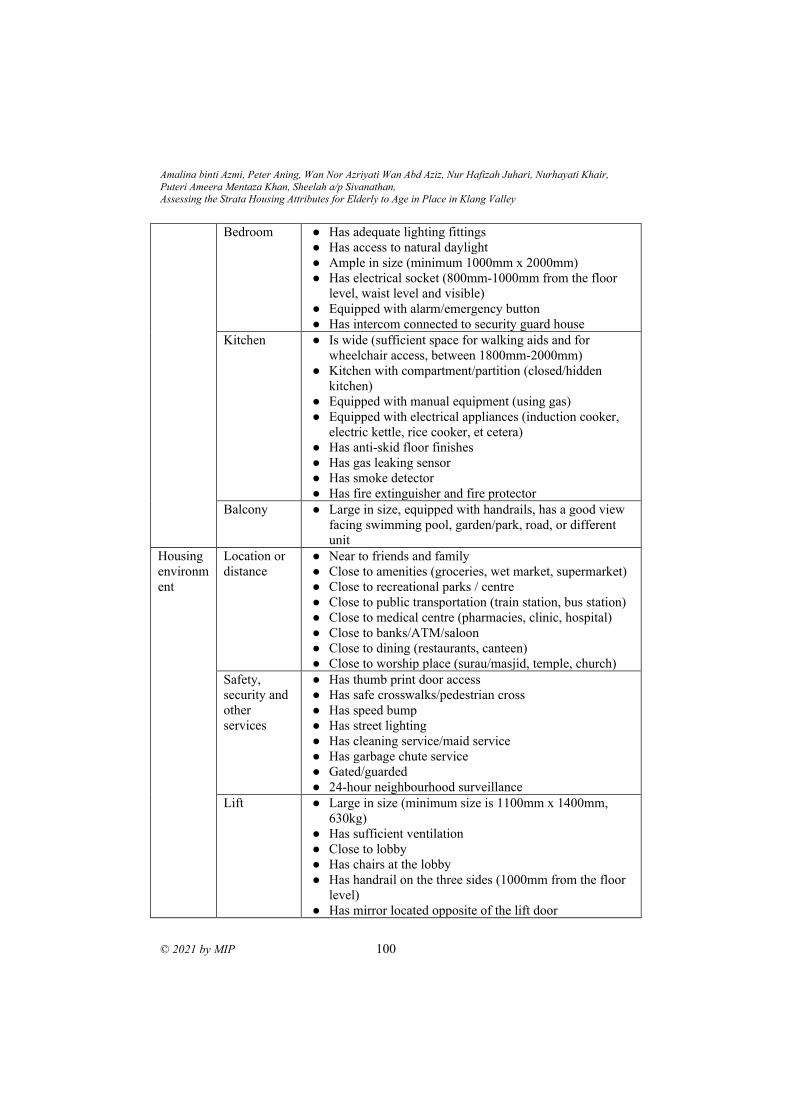
Amalina binti Azmi, Peter Aning, Wan Nor Azriyati Wan Abd Aziz, Nur Hafizah Juhari, Nurhayati Khair,
Puteri Ameera Mentaza Khan, Sheelah a/p Sivanathan,
Assessing the Strata Housing Attributes for Elderly to Age in Place in Klang Valley
© 2021 by MIP 100
Bedroom ● Has adequate lighting fittings
● Has access to natural daylight
● Ample in size (minimum 1000mm x 2000mm)
● Has electrical socket (800mm-1000mm from the floor
level, waist level and visible)
● Equipped with alarm/emergency button
● Has intercom connected to security guard house
Kitchen ● Is wide (sufficient space for walking aids and for
wheelchair access, between 1800mm-2000mm)
● Kitchen with compartment/partition (closed/hidden
kitchen)
● Equipped with manual equipment (using gas)
● Equipped with electrical appliances (induction cooker,
electric kettle, rice cooker, et cetera)
● Has anti-skid floor finishes
● Has gas leaking sensor
● Has smoke detector
● Has fire extinguisher and fire protector
Balcony ● Large in size, equipped with handrails, has a good view
facing swimming pool, garden/park, road, or different
unit
Housing
environm
ent
Location or
distance
● Near to friends and family
● Close to amenities (groceries, wet market, supermarket)
● Close to recreational parks / centre
● Close to public transportation (train station, bus station)
● Close to medical centre (pharmacies, clinic, hospital)
● Close to banks/ATM/saloon
● Close to dining (restaurants, canteen)
● Close to worship place (surau/masjid, temple, church)
Safety,
security and
other
services
● Has thumb print door access
● Has safe crosswalks/pedestrian cross
● Has speed bump
● Has street lighting
● Has cleaning service/maid service
● Has garbage chute service
● Gated/guarded
● 24-hour neighbourhood surveillance
Lift ● Large in size (minimum size is 1100mm x 1400mm,
630kg)
● Has sufficient ventilation
● Close to lobby
● Has chairs at the lobby
● Has handrail on the three sides (1000mm from the floor
level)
● Has mirror located opposite of the lift door
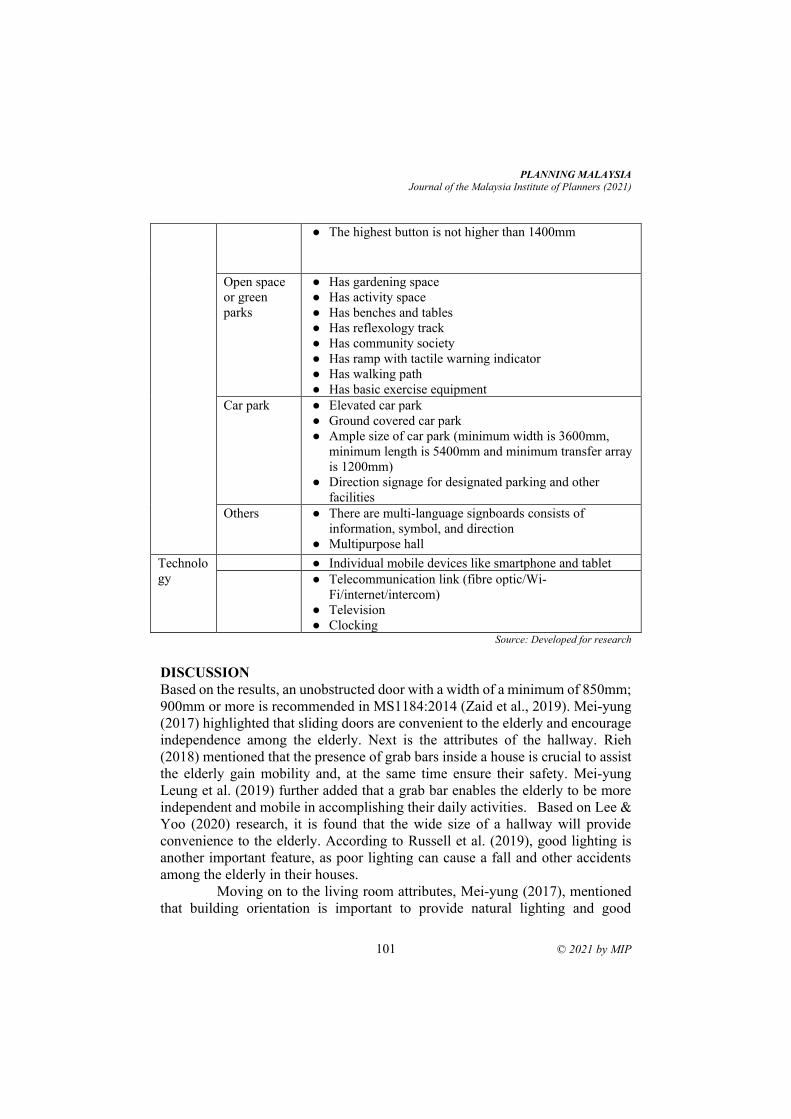
PLANNING MALAYSIA
Journal of the Malaysia Institute of Planners (2021)
101 © 2021 by MIP
● The highest button is not higher than 1400mm
Open space
or green
parks
● Has gardening space
● Has activity space
● Has benches and tables
● Has reflexology track
● Has community society
● Has ramp with tactile warning indicator
● Has walking path
● Has basic exercise equipment
Car park ● Elevated car park
● Ground covered car park
● Ample size of car park (minimum width is 3600mm,
minimum length is 5400mm and minimum transfer array
is 1200mm)
● Direction signage for designated parking and other
facilities
Others ● There are multi-language signboards consists of
information, symbol, and direction
● Multipurpose hall
Technolo
gy
● Individual mobile devices like smartphone and tablet
● Telecommunication link (fibre optic/Wi-
Fi/internet/intercom)
● Television
● Clocking Source: Developed for research
DISCUSSION
Based on the results, an unobstructed door with a width of a minimum of 850mm;
900mm or more is recommended in MS1184:2014 (Zaid et al., 2019). Mei-yung
(2017) highlighted that sliding doors are convenient to the elderly and encourage
independence among the elderly. Next is the attributes of the hallway. Rieh
(2018) mentioned that the presence of grab bars inside a house is crucial to assist
the elderly gain mobility and, at the same time ensure their safety. Mei-yung
Leung et al. (2019) further added that a grab bar enables the elderly to be more
independent and mobile in accomplishing their daily activities. Based on Lee &
Yoo (2020) research, it is found that the wide size of a hallway will provide
convenience to the elderly. According to Russell et al. (2019), good lighting is
another important feature, as poor lighting can cause a fall and other accidents
among the elderly in their houses.
Moving on to the living room attributes, Mei-yung (2017), mentioned
that building orientation is important to provide natural lighting and good
Amalina binti Azmi, Peter Aning, Wan Nor Azriyati Wan Abd Aziz, Nur Hafizah Juhari, Nurhayati Khair,
Puteri Ameera Mentaza Khan, Sheelah a/p Sivanathan,
Assessing the Strata Housing Attributes for Elderly to Age in Place in Klang Valley
© 2021 by MIP 102
ventilation, which will increase the quality of life of the elderly. According to
Rieh (2018), the living room is one of the important attributes for the elderly as
they spend most of their time watching TV, reading and doing activities
associated with their hobbies. Moreover, Chen, Zhu, & Xiong (2018) highlighted
that lighting provides a pleasant mood, increases alertness, and enables the
elderly to stay vigilant. In addition, Datta (2019) found that good ventilation in a
room or space is very important in determining a good quality of life for the
elderly. Mei-yung (2017) further added that good ventilation would ensure the
elderly’s health by maintaining the elderly’s body temperature. Mei-yung Leung,
Yu, & Chow (2016) also mentioned that a moderate height of electrical sockets
enables the elderly to be more independent.
Akbar, Ramadhani, & Putri (2018)’s research findings revealed that a
smoke detector is an assistive technology that can detect the presence of fire. A
heat detector in the kitchen provides additional protection against the risk of fires,
and it is exposed to fire when the temperature hit 62°C (Palumbo et al., 2014). It
is important for the elderly’s security and provides appropriate warning during
emergency situation as well as to avoid fire accidents and death (Akbar et al.,
2018; Feng et al., 2018). Feng et al. (2018), in their research, highlighted that
anti-skid flooring will prevent falling and accidents among the elderly.
Anti-skid flooring in a toilet is important for the elderly to protect them
from accidents and falling (Afifi et al., 2015; Clemson et al., 2019). In addition,
according to Abdel Salam & Shams El-din (2019), a grab bar in the toilet or
bathroom will enable the elderly to move around. Abdel Salam & Shams El-din
(2019) further added that the emergency button in the bathroom should be
waterproof and color contrasted, to increase the safety of the elderly. Katunský
& Brausch (2018) asserted that tactile features are essential to increase visual and
sensory cognition among the elderly. According to (Carr et al., 2013), sliding
doors will provide accessibility for the elderly to enter a space and reduce the
need for them to open a heavy door. Opening a heavy door can cause negative
feelings among the elderly as they have very limited energy (M. Y. Leung et al.,
2017). Moreover, the sliding door will also enable the elderly with a wheelchair
to access the toilet or bathroom (van Hoof & Boerenfijn, 2018).
According to Abdel Salam & Shams El-din (2019), water faucets with
sensors in the bathroom can assist the elderly who find it is difficult to turn the
manual faucet, and at the same time, they will reduce water usage. Based on Afifi
et al. (2015), a seated water closet will enable the elderly to stand with the support
of the installed grab bar in the toilet. Mirror located next to the washbasin also
promotes comfort and safety to the elderly (Paiva et al., 2015). According to
Feng et al. (2018), even flooring is also fundamental for the elderly to avoid
impediments, while cleanliness is also important to prevent contagious and skin
PLANNING MALAYSIA
Journal of the Malaysia Institute of Planners (2021)
103 © 2021 by MIP
diseases. Mei-yung (2017) highlighted that the use of contrasting colors in a
building could reduce confusion among the elderly.
According to Gardner (2011), a balcony is very important for the
elderly to feel connected to their neighbour. Al-Shaqi, Mourshed, & Rezgui
(2016); Gardner (2011); Verma (2019) mentioned that businesses and services
such as banks, groceries store, restaurants and others are important for the elderly
who wish to age in place as those businesses and services enable the elderly to
maintain their social network.
On the other hand, Lehmann, Syrdal, Dautenhahn, Gelderblom, &
Bedaf (2013); Weeks & LeBlanc (2010) highlighted the importance of a safe and
secured neighbourhood. Day, Boarnet, Alfonzo, & Forsyth (2006); Haselwandter
et al. (2015) stated that safety aspects include safety from crimes, the provision
of street lighting, neighbourhood surveillance, and protection from traffic like
safe crosswalks, bike lanes, and sidewalks. Gated and guarded communities and
the availability of 24-hour surveillance cameras are important for the elderly to
prevent snatch thefts, house break-ins, and rampant. Having a few street lightings
in the surrounding area to assist the elderly in walking and giving a comfortable
view at night is imperative
According to Loukaitou-Sideris, Wachs, & Pinski (2019), proper
lighting is an attribute to increase road safety for the elderly. Speed bumps are
important to slow down the approaching vehicles (Loukaitou-Sideris & Wachs,
2018). Pedestrian lanes are believed to reduce the risk of accidents and, at the
same time, increase safety (Verma, 2018). According to Nadine (2019), a garbage
chute will ease the elderly in managing waste from their house. Farzana &
Tanmoy (2019) added that maid service is important for the elderly to help them
manage their basic necessities while aging in place.
Lift is essential in strata housing. Based on the results, a mirror in a lift
is an attribute. The function of a mirror in the lift is to assist the elderly who are
in a wheelchair to observe any obstacles behind them when they are unable to
turn around and move backwards (Department of Standards Malaysia, 2014). Mei
Yung Leung & Liang (2019), in their research, stated that a lift is important for
the elderly to connect with their external environment when living in high-rise
buildings. They further added that the lift should be elderly sensitive by
providing benches for resting. Moreover, according to Yuen (2019), a grab bar is
important in a lift to assist the elderly to age in place.
Open space is important for the elderly to encourage social interaction
and, at the same time, ensure successful aging (Yung et al., 2016). Moreover,
according to Yung et al. (2016), WHO (2007) has identified 11 elements to
revitalize open spaces for the elderly, which include green spaces, walkways,
outdoor seating, pavements, roads, traffic, cycle paths, safety, services, buildings
and public toilets. According to Arnberger et al. (2017) and Paiva et al. (2015),
Amalina binti Azmi, Peter Aning, Wan Nor Azriyati Wan Abd Aziz, Nur Hafizah Juhari, Nurhayati Khair,
Puteri Ameera Mentaza Khan, Sheelah a/p Sivanathan,
Assessing the Strata Housing Attributes for Elderly to Age in Place in Klang Valley
© 2021 by MIP 104
benches in the garden and outside space are important for elderly as resting points
along the route. Darmawati (2019) asserted that open space or green space will
be able to reduce the elderly’s stress level, hence attractive open space or green
space is necessary to increase the elderly’s interaction. In addition, activities
suitable for the elderly are considered social therapy for them (Darmawati, 2019).
Besides, green space will be able to reduce the temperature by providing shading
for outside activities (Arnberger et al., 2017). Loukaitou-Sideris, Levy-Storms,
Chen, & Brozen (2016), further added, parks will increase the social interaction
among the elderly. Social and recreational activities are said to improve the
elderly’s health (Mei-yung, 2017).
On the other hand, proper signage can assist the elderly to be
independent (Mei-yung, 2017). Wei, Kiang, & Chye (2017) highlighted that a
multipurpose hall is a critical attribute for aging in place in order to encourage
and provide shared space for common use. Mei-yung (2017) further added that
facilities that can cater to multipurpose activities are essential in improving the
elderly’s quality of life.
In addition, technologies must also be anticipated in designing a house
for the elderly to help them overcome their weaknesses (Wright et al., 2014). According to Nordin et al. (2017), most elderly who live in an apartment usually
engage in recreational activities such as watching television or listening to the
radio. Hence, those attributes are important. At the same time, those attributes
provide a valuable link to the outside world and society. At the same time,
television will enable the elderly to live independently, remain active and stay
healthy (Peek et al., 2016). Smartphones allow the elderly to have social
interaction and social engagement to increase their quality of life (Wang et al.,
2019). In addition, in their research, Joe et al. (2018) mentioned that the elderly
could use their phones for health and wellness interventions, including
management of diabetes, symptom management, and fall detection. According to
Casado-Muñoz, Lezcano, & Rodríguez-Conde, (2015); Tatnall & Lepa (2003),
telecommunication or internet is important for the elderly to enable them to
communicate with their family and friends through email, to access information,
to perform e-commerce activities such as paying bills, purchase of goods and
services and electronic banking.
SUMMARY From the theoretical perspective, the implications of this study are manifolds.
First, the findings contribute to the growing body of knowledge in housing that
enables the elderly to age in place in Malaysia. The suggested attributes for all
the strata housing will enable the elderly to age in place gracefully, with less risk
of hazards and accidents. The discovered housing attributes can be developed as
a guideline for the elderly in Malaysia to age in place in strata housing. Moreover,
PLANNING MALAYSIA
Journal of the Malaysia Institute of Planners (2021)
105 © 2021 by MIP
it will contribute towards the formulation and monitoring of more effective
policies to promote aging in place.
ACKNOWLEDGEMENTS
This research has been accomplished with financial support from the Real Estate
Research and Development Grant Scheme (NAPREC) represented by the
National Institute of Valuation (INSPEN). Universiti Tunku Abdul Rahman
(UTAR) Sungai Long Campus gratefully acknowledges the financial and other
support it has received from the Government of Malaysia.
REFERENCES Abdel Salam, M., & Shams El-din, A. (2019). Developing Smarter Bathrooms for Elderly
and Disabled People. Journal of Al-Azhar University Engineering Sector, 14(52),
1024–1035. https://doi.org/10.21608/auej.2019.42295
Abdul Manaf, M. R., Mustafa, M., Abdul Rahman, M. R., Yusof, K. H., & Abd Aziz, N.
A. (2016). Factors influencing the prevalence of mental health problems among
Malay elderly residing in a rural community: A cross-sectional study. PLoS ONE,
11(6), 1–12. https://doi.org/10.1371/journal.pone.0156937
Afifi, M., Al-Hussein, M., & Bouferguene, A. (2015). Geriatric bathroom design to
minimize risk of falling for older adults- A systematic review. European Geriatric
Medicine, 6(6), 598–603. https://doi.org/10.1016/j.eurger.2015.05.004
Ainoriza, M. A., Nooraisyilah, M., & Wan Nor Azriyati, W. A. A. (2016). Housing
Aspirations of the Elderly in Malaysia : A Comparison of Urban and Rural Areas.
Journal of Design and Built Environment, 16(2).
Ainoriza, M. A., Wan Nor Azriyati, W. A. A., & Nurul Farahana, Z. (2017). Middle
Adults ’ Housing Expectations for Old -age : A Study of Urban Area of Greater
Kuala Lumpur. Journal of Design and Built Environment, 150–165.
Akbar, M. F., Ramadhani, N. A., & Putri, R. A. (2018). Assistive and wearable
technology for elderly. Bulletin of Social Informatics Theory and Application,
2(1), 8–14. https://doi.org/10.31763/businta.v2i1.101
Al-Shaqi, R., Mourshed, M., & Rezgui, Y. (2016). Progress in ambient assisted systems
for independent living by the elderly. SpringerPlus, 5(1), 624.
https://doi.org/10.1186/s40064-016-2272-8
Arnberger, A., Allex, B., Eder, R., Ebenberger, M., Wanka, A., Kolland, F., Wallner, P.,
& Hutter, H. P. (2017). Elderly resident’s uses of and preferences for urban green
spaces during heat periods. Urban Forestry and Urban Greening, 21, 102–115.
https://doi.org/10.1016/j.ufug.2016.11.012
Carr, K., Weir, P. L., Azar, D., & Azar, N. R. (2013). Universal Design : A Step toward
Successful Aging. Journal of Aging Research, 2013.
Casado-Muñoz, R., Lezcano, F., & Rodríguez-Conde, M. J. (2015). Active ageing and
access to technology: An evolving empirical study. Comunicar, 23(45), 37–46.
https://doi.org/10.3916/C45-2015-04
Che Ani, A. ., Tawil, N. ., Sairi, A., Abdullah, N. A. ., Tahir, M. ., & Surat, M. (2010).
Facility Management Indicators for High-Rise Residential Property in Malaysia.
Amalina binti Azmi, Peter Aning, Wan Nor Azriyati Wan Abd Aziz, Nur Hafizah Juhari, Nurhayati Khair,
Puteri Ameera Mentaza Khan, Sheelah a/p Sivanathan,
Assessing the Strata Housing Attributes for Elderly to Age in Place in Klang Valley
© 2021 by MIP 106
WSEAS Transactions on Environment and Development, 6(4), 255–264.
Clemson, L., Stark, S., Pighills, A. C., Torgerson, D. J., Sherrington, C., & Lamb, S. E.
(2019). Environmental interventions for preventing falls in older people living in
the community. Cochrane Database of Systematic Reviews, 2019(2).
https://doi.org/10.1002/14651858.CD013258
Coleman, T., & Kearns, R. (2015). The role of bluespaces in experiencing place, aging
and wellbeing: Insights from Waiheke Island, New Zealand. Health and Place,
35, 206–217. https://doi.org/10.1016/j.healthplace.2014.09.016
Darmawati, R. (2019). Perception of Green Open Space as Medium of Therapy for
Elderly. MATEC Web of Conferences, 280, 03018.
https://doi.org/10.1051/matecconf/201928003018
Datta, T. (2019). Living arrangements of the elderly in Fiji. Genus Homo, 3, 61–72.
Day, K., Boarnet, M., Alfonzo, M., & Forsyth, A. (2006). The Irvine-Minnesota inventory
to measure built environments: Development. American Journal of Preventive
Medicine, 30(2), 144–152. https://doi.org/10.1016/j.amepre.2005.09.017
Department of Standards Malaysia. (2014). MS1184: 2014 Universal design and
accessibility in the built environment- Code of practice (Second Revision).
Farzana, F., & Tanmoy, M. (2019). ‘ Aging in Place ’ in Bangladesh : Challenges and
Possibilities. International Journal of Multidiscplinary Research, 4(2), 23–42.
https://doi.org/10.5281/zenodo.3593329
Feng, I. M., Chen, J. H., Zhu, B. W., & Xiong, L. (2018). Assessment of and improvement
strategies for the housing of healthy elderly: Improving quality of life.
Sustainability (Switzerland), 10(3), 1–32. https://doi.org/10.3390/su10030722
Gardner, P. J. (2011). Natural neighborhood networks - Important social networks in the
lives of older adults aging in place. Journal of Aging Studies, 25(3), 263–271.
https://doi.org/10.1016/j.jaging.2011.03.007
Gonawala, R. J., Badami, N. B., Electicwala, F., & Kumar, R. (2013). Impact of Elderly
Road Users Characteristics at Intersection. Procedia - Social and Behavioral
Sciences, 104(0), 1088–1094. https://doi.org/10.1016/j.sbspro.2013.11.204
Guillory, M. D., & Moschis, G. (2008). Marketing Apartments , Townhouses , and
Condominiums to Seniors. Seniors Housing & Care Journal, 16(1), 39–52.
Haselwandter, E. M., Corcoran, M. P., Folta, S. C., Hyatt, R., Fenton, M., & Nelson, M.
E. (2015). The built environment, physical activity, and aging in the United States:
A state of the science review. Journal of Aging and Physical Activity, 23(2), 323–
329. https://doi.org/10.1123/japa.2013-0151
Jariah, M., Husna, S., Aizan, T., & Ibrahim, R. (2012). SOCIAL SCIENCES &
HUMANITIES Financial Practices and Problems amongst Elderly in Malaysia.
Pertanika J. Soc. Sci. & Hum, 20(4), 1065–1084.
http://www.myjurnal.my/filebank/published_article/26015/09_Page_1065_1084.
Judd, B., Bridge, C., Davy, L., Adams, T., & Liu, E. (2012). Downsizing amongst older
Australians. In AHURI Positioning Paper (Issue 150).
http://staging.beweb.fbe.unsw.edu.au/sites/default/files/upload/research/centres/c
f/publications/ahuriprojectreports/AHURI_Positioning_Paper_No150.pdf
Katunský, D., & Brausch, C. (2018). Environmental Issues Related to the Elderly and
PLANNING MALAYSIA
Journal of the Malaysia Institute of Planners (2021)
107 © 2021 by MIP
Physically Disabled People in Different Life Situations.
https://doi.org/10.20944/preprints201807.0282.v1
Lee, S. Y., & Yoo, S. E. (2020). WILLINGNESS TO PAY FOR ACCESSIBLE
ELDERLY HOUSING IN KOREA. International Journal of Strategic Property
Management, 24(1), 70–82.
Lehmann, H., Syrdal, D., Dautenhahn, K., Gelderblom, G. J., & Bedaf, S. (2013). What
Should a Robot do for you ? - Evaluating the Needs of the Elderly in the UK. Achi
2013, c, 83–88.
Leung, M. Y., Famakin, I. O., & Olomolaiye, P. (2017). Effect of facilities management
components on the quality of life of Chinese elderly in care and attention homes.
Facilities, 35(5–6), 270–285. https://doi.org/10.1108/F-03-2016-0032
Leung, Mei-yung, Famakin, I. O., & Wang, C. (2019). Developing an integrated indoor
built environment – quality of life model for the elderly in public and subsidized
housing. Engineering, Construction and Architectural Management.
https://doi.org/10.1108/ECAM-02-2018-0054
Leung, Mei-yung, Yu, J., & Chow, H. (2016). “Impact of indoor facilities management
on the quality of life of the elderly in public housing.” Facilities, 34(9/10), 564–
579.
Leung, Mei yung, & Liang, Q. (2019). Developing structural facilities management–
quality of life models for the elderly in the common areas of public and subsidized
housings. Habitat International, 94(October), 102067.
https://doi.org/10.1016/j.habitatint.2019.102067
Lipman, B., Lubell, J., & Salomon, E. (2012). Housing an aging population: are we
prepared? In Introduction to Housing.
Loukaitou-Sideris, A., Levy-Storms, L., Chen, L., & Brozen, M. (2016). Parks for an
Aging Population: Needs and Preferences of Low-Income Seniors in Los Angeles.
Journal of the American Planning Association, 82(3), 236–251.
https://doi.org/10.1080/01944363.2016.1163238
Loukaitou-Sideris, A., & Wachs, M. (2018). Transportation for an Aging Population:
Promoting Mobility and Equity for Low-Income Seniors. http://transweb.sjsu.edu
Loukaitou-Sideris, A., Wachs, M., & Pinski, M. (2019). Toward a Richer Picture of the
Mobility Needs of Older Americans. Journal of the American Planning
Association, 85(4), 482–500. https://doi.org/10.1080/01944363.2019.1630295
Lum, T. Y. S., Lou, V. W. Q., Chen, Y., Wong, G. H. Y., Luo, H., & Tong, T. L. W.
(2016). Neighborhood Support and Aging-in-Place Preference Among Low-
Income Elderly Chinese City-Dwellers. Journals of Gerontology Series B:
Psychological Sciences and Social Sciences, 71(1), 98–105.
https://doi.org/10.1093/geronb/gbu154
Mei-yung, L. (2017). Effect of facilities management components on the quality of life
of Chinese elderly in care and attention homes. Facilities, 35(5/6), 270–285.
https://doi.org/10.1108/F-03-2016-0032
Ministry of Economic Affairs. (2018). Mid-Term Review of the Eleventh Malaysia Plan,
2016-2020: New Priorities and Emphases. Percekan Nasional Malaysia Berhad.
Nadine, A. (2019). RETHINK Aging in Place : An Integrated Indoor Domestic Waste
Management System (Issue April).
Amalina binti Azmi, Peter Aning, Wan Nor Azriyati Wan Abd Aziz, Nur Hafizah Juhari, Nurhayati Khair,
Puteri Ameera Mentaza Khan, Sheelah a/p Sivanathan,
Assessing the Strata Housing Attributes for Elderly to Age in Place in Klang Valley
© 2021 by MIP 108
Nordin, S., McKee, K., Wallinder, M., von Koch, L., Wijk, H., & Elf, M. (2017). The
physical environment, activity and interaction in residential care facilities for older
people: a comparative case study. Scandinavian Journal of Caring Sciences,
31(4), 727–738. https://doi.org/10.1111/scs.12391
Paiva, M., Ferrer, N., & Villarouco, V. (2015). The process of aging: A case study
approach implementing an ergonomics evaluation of the built environment for the
elderly in Brazil. Work, 50(4), 595–606.
Palumbo, F., Ullberg, J., Stimec, A., Furfari, F., Karlsson, L., Coradeschi, S., &
Pontecorvo, L. B. (2014). Sensor Network Infrastructure for a Home Care
Monitoring System 4. 3833–3860. https://doi.org/10.3390/s140303833
Pavalache-Ille, M. (2015). Appropriation of space and well-being of institutionalized
elderly people. Journal Plus Education, 3(SI), 201–206.
Peek, S. T. M., Luijkx, K. G., Rijnaard, M. D., Nieboer, M. E., Van Der Voort, C. S.,
Aarts, S., Van Hoof, J., Vrijhoef, H. J. M., & Wouters, E. J. M. (2016). Older
Adults’ Reasons for Using Technology while Aging in Place. Gerontology, 62(2),
226–237. https://doi.org/10.1159/000430949
Peek, S. T. M., Wouters, E. J. M., van Hoof, J., Luijkx, K. G., Boeije, H. R., & Vrijhoef,
H. J. M. (2014). Factors influencing acceptance of technology for aging in place:
A systematic review. International Journal of Medical Informatics, 83(4), 235–
248. https://doi.org/10.1016/j.ijmedinf.2014.01.004
Rieh, S. Y. (2018). Post-occupancy evaluation of urban public housing in Korea: Focus
on experience of elderly females in the ageing society. Indoor and Built
Environment, 0(0), 1–17. https://doi.org/10.1177/1420326X18782578
Rosilawati, Z., & Pettit, C. J. (2016). Faculty of Built Environment. Malaysian Institute
of Planners, V, 49–64.
Rossiter, J. . (2010). Measurement for the social science: The C-OAR-SE method and why
it must replace psychometrics. Springer Science & Business Media.
Russell, D., Oberlink, M. R., Onorato, N., Feinberg, J. L., Bowles, K. H., & Szanton, S.
L. (2019). Identifying Barriers in the Home Environment among Urban
Community-Dwelling Older Adults with Functional Difficulty: A Multi-Method
Pilot Study. Activities, Adaptation and Aging, 43(4), 315–333.
https://doi.org/10.1080/01924788.2018.1542247
Saidatulakmal, M., Senadjki, A., & Norma, M. (2016). Living Arrangements of Elderly:
Evidence from Household Income Expenditure Survey. Journal of Population
Ageing, 10(4), 323–342.
Shuid, S. (2004). URBANIZATION AND HOUSING IN KUALA LUMPUR CITY
CENTRE : ISSUES AND FUTURE CHALLENGES. 19th Earoph World
Planning and Housing Congress, 1–14.
Siti Rashidah Hanum, A. W., Adi Irfan, C. A., Sairi, A., Norngainy, M. T., & Mohd
Zulhanif, A. R. (2016). Classification of High-Rise Residential Building
Facilities : A Descriptive Survey on 170 Housing Scheme in Klang Valley.
MATEC Web of Confrence, 66, 00103.
Siti Uzairah, M. T., Mohamad Syazli, F., & Amaratunga, D. (2018). Ageing In Place
Framework As Reference Guide For Housing In Malaysia : Landed Property.
Journal of the Malaysian Institute of Planners, 16(1), 130–143.
PLANNING MALAYSIA
Journal of the Malaysia Institute of Planners (2021)
109 © 2021 by MIP
Siti Uzairah, M. T., Mohd Syazli, F., & Amaratunga, D. (2017). Ageing in place , an
overview for the elderly in Malaysia. AIP Conference Proceedings, 1891(1),
020101. https://doi.org/10.1063/1.5005434
Sitinur Athirah, M., Mazuiyah, M. D., & Sabarinah Sh, A. (2016). Inclusion of Social
Realm within Elderly Facilities to Promote their Wellbeing. Procedia - Social and
Behavioral Sciences, 234, 114–124. https://doi.org/10.1016/j.sbspro.2016.10.226
Tan, T. H., & Lee, J. H. (2018). Assessing the determinants of retirement home ownership
among Malaysian young-old seniors. International Journal of Housing Markets
and Analysis, 11(4), 687–700. https://doi.org/10.1108/IJHMA-08-2017-0072
Tatnall, A., & Lepa, J. (2003). The Internet, e‐commerce and older people: an actor‐
network approach to researching reasons for adoption and use. Logistics
Information Management, 16(1), 56–63.
https://doi.org/10.1108/09576050310453741
Thompson, E. (2013). From Canada to Kircubbin: learning from America on housing an
ageing population. Housing, Care and Support, 16(3/4), 154–160.
van Hoof, J., & Boerenfijn, P. (2018). Re-inventing existing real estate of social housing
for older people: Building a new De Benring in Voorst, The Netherlands. In
Buildings (Vol. 8, Issue 7). https://doi.org/10.3390/buildings8070089
Vasara, P. (2015). Not ageing in place: Negotiating meanings of residency in age-related
housing. Journal of Aging Studies, 35, 55–64.
https://doi.org/10.1016/j.jaging.2015.07.004
Verma, I. (2018). Housing design for all. Universal Design in Higher Education in
Transformation Congress 2018, November. https://arrow.dit.ie/unides18pap/10/
Verma, I. (2019). Design for All?
Wai, C. W., & Wei, C. Q. (2016). Preferred Housing Attributes among Elderly in
Malaysia. http://www.prres.net/papers/Wai_Preferred_Housing_Attributes.pdf
Wang, J., Du, Y., Coleman, D., Peck, M., Myneni, S., Kang, H., & Gong, Y. (2019).
Mobile and connected health technology needs for older adults aging in place:
Cross-sectional survey study. Journal of Medical Internet Research, 21(5), 1–9.
https://doi.org/10.2196/13864
Weeks, L. E., & LeBlanc, K. (2010). Housing concerns of vulnerable older Canadians.
Canadian Journal on Aging, 29(3), 333–347.
Wei, Z., Kiang, H. C., & Chye, F. J. (2017). Community Planning Framework of
Community Care for the Elderly in Singapore. October.
https://www.researchgate.net/publication/320628307
Wilby, F., & Cathy Chambless. (2012). Older adults who seek care in the home. Quality
in Ageing and Older Adults, 13(2), 89–97.
Wright, D. L., Faculty, C. I., Buys, L., Faculty, C. I., Vine, D., Faculty, C. I., Xia, B.,
Faculty, E., Skitmore, M., Faculty, E., Drogemuller, R., Faculty, C. I., Kennedy,
R., Faculty, C. I., Li, M., & Faculty, C. I. (2014). EUTOPIA 75 + : Exploratory
Futures Scenarios for Baby Boomers ’ Preferred Living Spaces EU TOPIA 75 + :
Exploratory Futures Scenarios for Baby Boomers ’ Preferred Living Spaces
Abstract Introduction and Background : What the Numbers Say. 1–23.
Yuen, B. (2019). Moving towards age-inclusive public housing in Singapore. Urban
Research and Practice, 12(1), 84–98.
Amalina binti Azmi, Peter Aning, Wan Nor Azriyati Wan Abd Aziz, Nur Hafizah Juhari, Nurhayati Khair,
Puteri Ameera Mentaza Khan, Sheelah a/p Sivanathan,
Assessing the Strata Housing Attributes for Elderly to Age in Place in Klang Valley
© 2021 by MIP 110
https://doi.org/10.1080/17535069.2018.1451556
Yuki, A., Otsuka, R., Tange, C., Nishita, Y., Tomida, M., Ando, F., & Shimokata, H.
(2016). Epidemiology of frailty in elderly Japanese. The Journal of Physical
Fitness and Sports Medicine, 5(4), 301–307. https://doi.org/10.7600/jpfsm.5.301
Yüksel, M., Kırkkanat, B., Yılmaz, S. H., & Sevim, E. (2016). Investigation of life
satisfaction, meaning in life and loneliness levels of a group of older adults in
terms of some demographic variables. Toplum ve Sosyal Hizmet, 27(1), 65–76.
Yung, E. H. K., Conejos, S., & Chan, E. H. W. (2016). Social needs of the elderly and
active aging in public open spaces in urban renewal. Cities, 52(June 2018), 114–
122. https://doi.org/10.1016/j.cities.2015.11.022
Zaid, S. M., Yamin, A. A., & Yaacob, N. M. (2019). The environmental study on ageing
in place: the design practice compliance to accessibility legislation and standards
in Malaysia for elderly home environment. Ekoloji, 28(107), 601–613.
Zainab Ismail, Wan-Ibrahim Wan Ahmad, Zuria Mahmud, Salasiah Hanim Hamjah,
Rosidah Jemain, Elmi Baharuddin, Razaleigh Muhamat@Kawangit, Roziah
Sidek@Mat Sidek, & Zuli. (2012). An alternative living arrangement for older
Malaysian. Advances in Natural and Applied Sciences, 6(8), 1568–1572.
Received: 12th July 2021. Accepted: 17th Sept 2021
1 Senior Lecturer at University Teknologi Malaysia Email: [email protected]
PLANNING MALAYSIA:
Journal of the Malaysian Institute of Planners
VOLUME 19 ISSUE 3 (2021), Page 111 – 122
AN ANALYSIS ON THE EFFICIENCY OF GREEN ROOF IN
MANAGING URBAN STORMWATER RUNOFF
Shazmin Shareena Ab. Azis1, Muhammad Najib Bin Mohamed Razali2, Nurul
Hana Adi Maimun3, Nurul Syakima Mohd Yusoff4, Mohd Shahril Abdul
Rahman5, Nur Amira Aina Zulkifli6
Real Estate, Faculty of Built Environment and Surveying
UNIVERSITI TEKNOLOGI MALAYSIA
Abstract
Modernization has created new impervious urban landscape contributed to major
catastrophe. Urban drainage system incapable to convey the excess rainwater
resulting in flash flood due to heavy rainfall. The combination of green roof on
building have tremendously proved to control stormwater efficiently. This study
is conducted to review the efficiency of intensive and extensive green roof in
reducing urban storm water runoff. This study identifies characteristic of green
roof that contributes to lessening urban storm water runoff. Data was collected
based on rigorous literature reviews and analyzed using meta-analysis. Overall,
findings revealed intensive green roof performed better in reducing storm water
runoff compared to extensive green roof. Green roof performance increases as
the depth of substrate increased. Origanum and Sedum plants are both highly
effective for intensive and extensive green roofs. The performance of green roof
reduces as degree of roof slope increased.
Keywords: Flash flood, urban, green infrastructure, green roof, storm water
Shazmin Shareena Ab. Azis, Muhammad Najib Bin Mohamed Razali, Nurul Hana Adi Maimun, Nurul
Syakima Mohd Yusoff, Mohd Shahril Abdul Rahman, Nur Amira Aina Zulkifli
An Analysis on The Efficiency of Green Roof in Managing Urban Stormwater Runoff
© 2021 by MIP 112
INTRODUCTION New urban landscape surface of densely walled with tall buildings were the effect
from changes in economic development, population growth and mitigation from
rural to urban areas. This situation may serve as evidence of a mismatch between
land supply and brisk population growth in urban areas. Thus, new non-porous
or impervious surface has been created in urban landscape. Past research found
that conventional roofs consist of 40% to 50% of impervious area (Dunnett and
Kingsbury, 2004). Countries that received large amount of rainfall every year
viewed this new urban landscape as a catastrophic problem.
A non-porous surface creates elevated storm water runoff volumes and
flow rates and engulf the existing centralized drainage systems. Storm water
runoff created when rain falls on impervious surface and cannot be absorbed into
the ground. It makes stream impairment in urban areas which cause by high
volumes of water that rapidly transferred to local streams, lakes, wetlands, and
rivers which trigger flood phenomena. Report from 2012 till 2016 from
Department of Irrigation and Drainage Malaysia reported the major causes of
flash flood in the urban area are due to several contributing factors including non-
stop heavy rainfall, changes in land uses, and low water infiltration capacity. The
impervious surface has changed the hydrological response of natural catchment
areas which causes more frequent flooding episodes in the urban region.
Floods are natural disasters that have been affecting human lives ever
since the beginning of time. Floods has been recorded among 50% from all
natural disasters that cause deaths around the world (Du et. al., 2010). Tropical
climate countries such as Malaysia also suffers this natural disaster which
paralyse communities and cause destructions (Elias et. al., 2013). Malaysia has
experienced several events of flash floods in the urban area including in Johor
Bahru city centre and Kuala Lumpur city centre in 2007 and 2016 respectively.
Flash floods were produced when the existing drainage systems does not able to
withstand the excess rainwater from an intense burst of rainfall which often cause
from thunderstorms.
Hence, there is an urgency to introduced mitigation measures in
managing rainwater runoff as response to these disastrous events. Numerous
countries have implemented green infrastructure in urban landscape as this
solution is designed innovatively to restore environment and ecological damage.
Trees and scrubs are found to be vital in avoiding flood disaster as the roots are
naturally function as sponge to soak water that falls on the ground (Nagase &
Dunnett, 2012; Razzaghmanesh et. al., 2014).
Scarcity of urban greenery and plantation may be due to the limited
vacant land in urban areas. However, green initiatives such as green roof become
one of the promising solutions to this issue (Bakar et. al., 2021). The green roof
idea was constructed and created to encourage the development of numerous
PLANNING MALAYSIA
Journal of the Malaysia Institute of Planners (2021)
113 © 2021 by MIP
types of vegetation on the top of buildings and thus deliver aesthetical,
environmental and economic benefits (Vijayaraghavan & Raja, 2015). Besides,
green roof is able to provide annual electricity energy savings by RM139 for
residential buildings (Azis et. al., 2019).
Green roofs have been gradually implemented as part of urban
stormwater management plans in urban areas. According to Razzaghmanesh and
Beecham (2014), the appropriate designed of green roofs can function as storm
water source control devices. Henceforth, this study is conducted to review the
efficiency of green roof in managing storm water runoff in the urban area. This
is conducted through determining the physical characteristics of extensive and
intensive green roof that contributes in reducing storm water runoff. The data
were collected from literature reviews and analysed using meta-analysis.
GREEN ROOF CONCEPT Green roofs are comprised of five components which are water proofing
membrane, anti-root sheet, a drainage layer, a filter layer, growth substrate (soil),
and vegetation on the top of the structure. Waterproofing sheet is the individual
anti-root sheet and placed as a base. The function is to cover the roof by
redirecting water to the drainage ducts. Anti-root sheets are placed to avoid harm
to the roof waterproofing layers. The drainage layer acts to prevent extreme water
stagnation in the substrate that could be harmful to the vegetation. Filter is
positioned on top of the layer to prevent parts of the substrate from forming
sludge.
Besides, substrate is the layer that strengthens the vegetation and
comprises the roots and nutrient materials. The upper layer of the green roof
structure is the vegetation or plantation. This layer consists of resistant and
aesthetically pleasing vegetation. The most planted varieties on green roofs are
succulent’s plants such as Sedum. Succulents’ plants are best for endurance in
green roof systems due to its characteristics of shallow root system and
conservative water use strategy (VanWoert et al., 2005; Getter and Rowe, 2009).
Extensive green roof
Extensive green roofs typically have thin media and drought tolerant vegetation
(Berndtsson, 2010; Getter et. al., 2006). Substrate depth of extensive green roof
is constructed less than 150mm and can be installed on sloped roofs as high as 45
degrees (Renato and Sara, 2016; DeNardo et al., 2005; Mentens et al., 2006;
Moran et al., 2003). This type of green roof does not require a complicated
construction process (Sajedeh et al., 2015). These roofs are sown with smaller
plants such as sedum species which able to provide full coverage of the vegetated
roof.
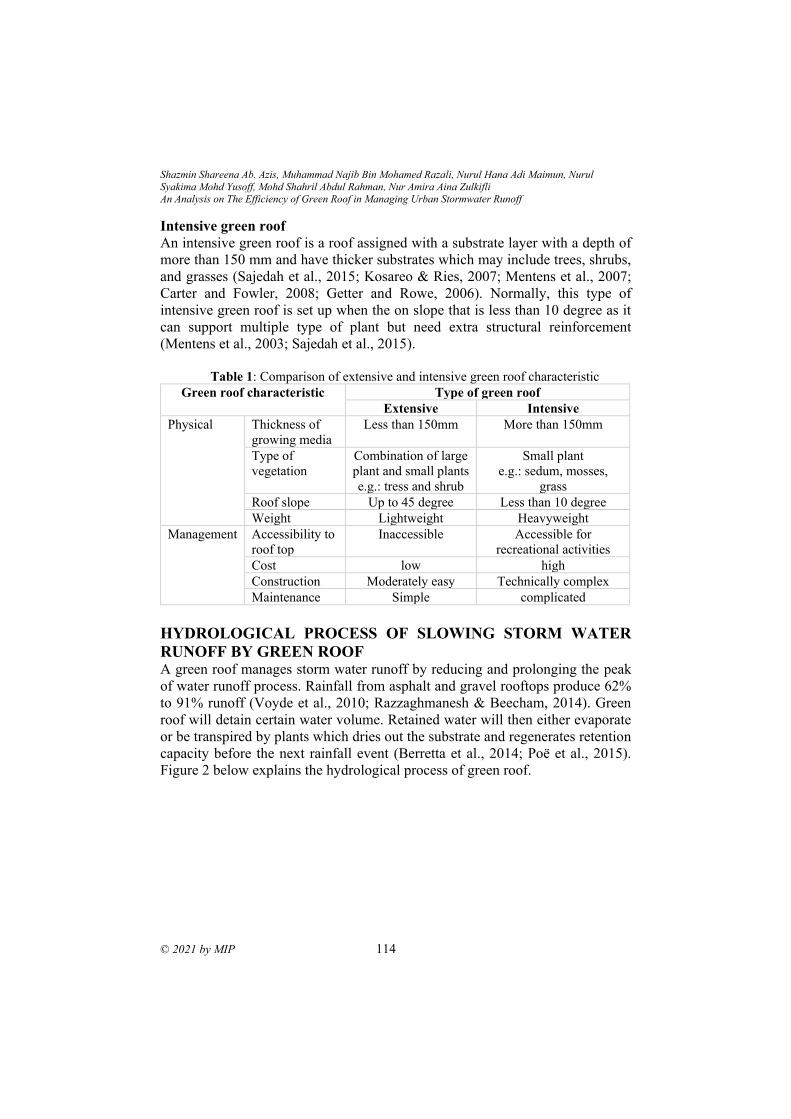
Shazmin Shareena Ab. Azis, Muhammad Najib Bin Mohamed Razali, Nurul Hana Adi Maimun, Nurul
Syakima Mohd Yusoff, Mohd Shahril Abdul Rahman, Nur Amira Aina Zulkifli
An Analysis on The Efficiency of Green Roof in Managing Urban Stormwater Runoff
© 2021 by MIP 114
Intensive green roof
An intensive green roof is a roof assigned with a substrate layer with a depth of
more than 150 mm and have thicker substrates which may include trees, shrubs,
and grasses (Sajedah et al., 2015; Kosareo & Ries, 2007; Mentens et al., 2007;
Carter and Fowler, 2008; Getter and Rowe, 2006). Normally, this type of
intensive green roof is set up when the on slope that is less than 10 degree as it
can support multiple type of plant but need extra structural reinforcement
(Mentens et al., 2003; Sajedah et al., 2015).
Table 1: Comparison of extensive and intensive green roof characteristic
Green roof characteristic Type of green roof
Extensive Intensive
Physical Thickness of
growing media
Less than 150mm More than 150mm
Type of
vegetation
Combination of large
plant and small plants
e.g.: tress and shrub
Small plant
e.g.: sedum, mosses,
grass
Roof slope Up to 45 degree Less than 10 degree
Weight Lightweight Heavyweight
Management Accessibility to
roof top
Inaccessible Accessible for
recreational activities
Cost low high
Construction Moderately easy Technically complex
Maintenance Simple complicated
HYDROLOGICAL PROCESS OF SLOWING STORM WATER
RUNOFF BY GREEN ROOF A green roof manages storm water runoff by reducing and prolonging the peak
of water runoff process. Rainfall from asphalt and gravel rooftops produce 62%
to 91% runoff (Voyde et al., 2010; Razzaghmanesh & Beecham, 2014). Green
roof will detain certain water volume. Retained water will then either evaporate
or be transpired by plants which dries out the substrate and regenerates retention
capacity before the next rainfall event (Berretta et al., 2014; Poë et al., 2015).
Figure 2 below explains the hydrological process of green roof.
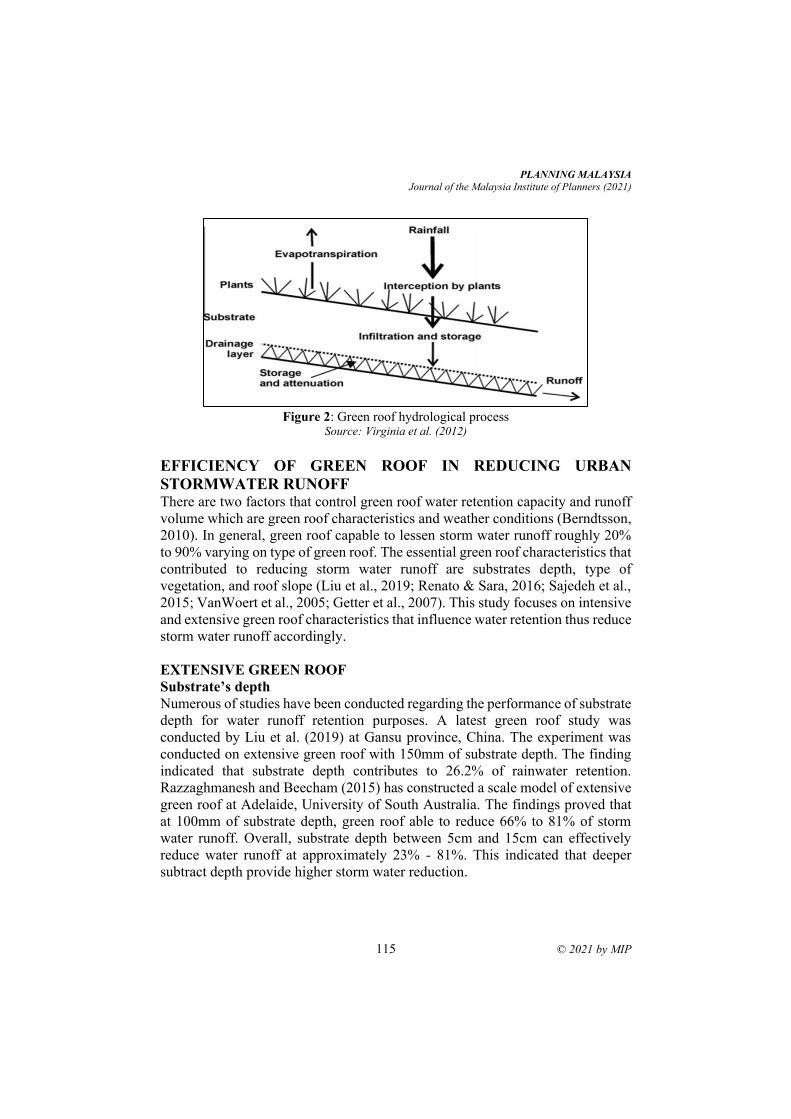
PLANNING MALAYSIA
Journal of the Malaysia Institute of Planners (2021)
115 © 2021 by MIP
Figure 2: Green roof hydrological process
Source: Virginia et al. (2012)
EFFICIENCY OF GREEN ROOF IN REDUCING URBAN
STORMWATER RUNOFF There are two factors that control green roof water retention capacity and runoff
volume which are green roof characteristics and weather conditions (Berndtsson,
2010). In general, green roof capable to lessen storm water runoff roughly 20%
to 90% varying on type of green roof. The essential green roof characteristics that
contributed to reducing storm water runoff are substrates depth, type of
vegetation, and roof slope (Liu et al., 2019; Renato & Sara, 2016; Sajedeh et al.,
2015; VanWoert et al., 2005; Getter et al., 2007). This study focuses on intensive
and extensive green roof characteristics that influence water retention thus reduce
storm water runoff accordingly.
EXTENSIVE GREEN ROOF
Substrate’s depth
Numerous of studies have been conducted regarding the performance of substrate
depth for water runoff retention purposes. A latest green roof study was
conducted by Liu et al. (2019) at Gansu province, China. The experiment was
conducted on extensive green roof with 150mm of substrate depth. The finding
indicated that substrate depth contributes to 26.2% of rainwater retention.
Razzaghmanesh and Beecham (2015) has constructed a scale model of extensive
green roof at Adelaide, University of South Australia. The findings proved that
at 100mm of substrate depth, green roof able to reduce 66% to 81% of storm
water runoff. Overall, substrate depth between 5cm and 15cm can effectively
reduce water runoff at approximately 23% - 81%. This indicated that deeper
subtract depth provide higher storm water reduction.
Shazmin Shareena Ab. Azis, Muhammad Najib Bin Mohamed Razali, Nurul Hana Adi Maimun, Nurul
Syakima Mohd Yusoff, Mohd Shahril Abdul Rahman, Nur Amira Aina Zulkifli
An Analysis on The Efficiency of Green Roof in Managing Urban Stormwater Runoff
© 2021 by MIP 116
Type of vegetation
Extensive green roof normally sown with smaller plants to provide
comprehensive coverage of the vegetated roof (Berndsston, 2010). There are
various types of vegetation for extensive green roof including sedum, vegetable,
mosses, and centipede grass. Overall, these plantations able to provide 30% to
89% reduction of storm water runoff. According to a study by Whittinghill et al.
(2015), the most effective type of plant for extensive green roof is Sedum plant.
Roof slope
Roof slopes affect the effectiveness of green roof in lessening storm water runoff.
According to Getter et al. (2007), extensive green roof slope at 25 degrees able
to retain water at 75%. Meanwhile at 2 degree of roof slope, it able to produce
larger water retention at 85%. Overall, elevated degree of roof slope can decrease
green roof performance in reducing storm water runoff.
INTENSIVE GREEN ROOF Substrate’s depth
Intensive green roof with deep substrate capable to deliver 60% of water retention
(Viola et al., 2017). Simulation research on intensive green roof by Renato and
Sara (2016) shows that intensive green roof able to reduce storm water runoff at
29%, 33%, 40%, and 54% at 200mm, 400mm, 800mm, and 1600mm of substrate
depth, respectively. Mentens et al. (2006) has proved in his study that intensive
green roof with 155mm substrate depth contributes to 65% to 85% of water
retention performance. Overall, substrate depth between 155mm and 1600mm
can effectively reduce water runoff at approximately 29% - 92%. This result has
proved that the deeper the substrate, the higher the water retention performance.
Type of vegetation
Size and structure of plants significantly influenced the amount of water runoff.
Plant species with taller height, larger diameter, and larger shoot and root were
more effective in reducing water runoff than plant species with shorter height,
smaller diameter, and smaller shoot and root biomass (Nagasea and Dunnett,
2012). It was found that Origanum (tall plant) able to reduce higher storm water
runoff that sedum (short plant). Origanum and sedum plant are able to reduce
storm water runoff at 79% and 76% respectively.
Roof slope Roof slopes influence the effectiveness of intensive green roof. According to
VanWoert et al. (2005), intensive green roof slope at 6.5 degree can retain 66%
water runoff while at 2 degrees, it retains water at 87%. Overall, higher degree of
roof slope reduces the performance of intensive green roof in reducing storm
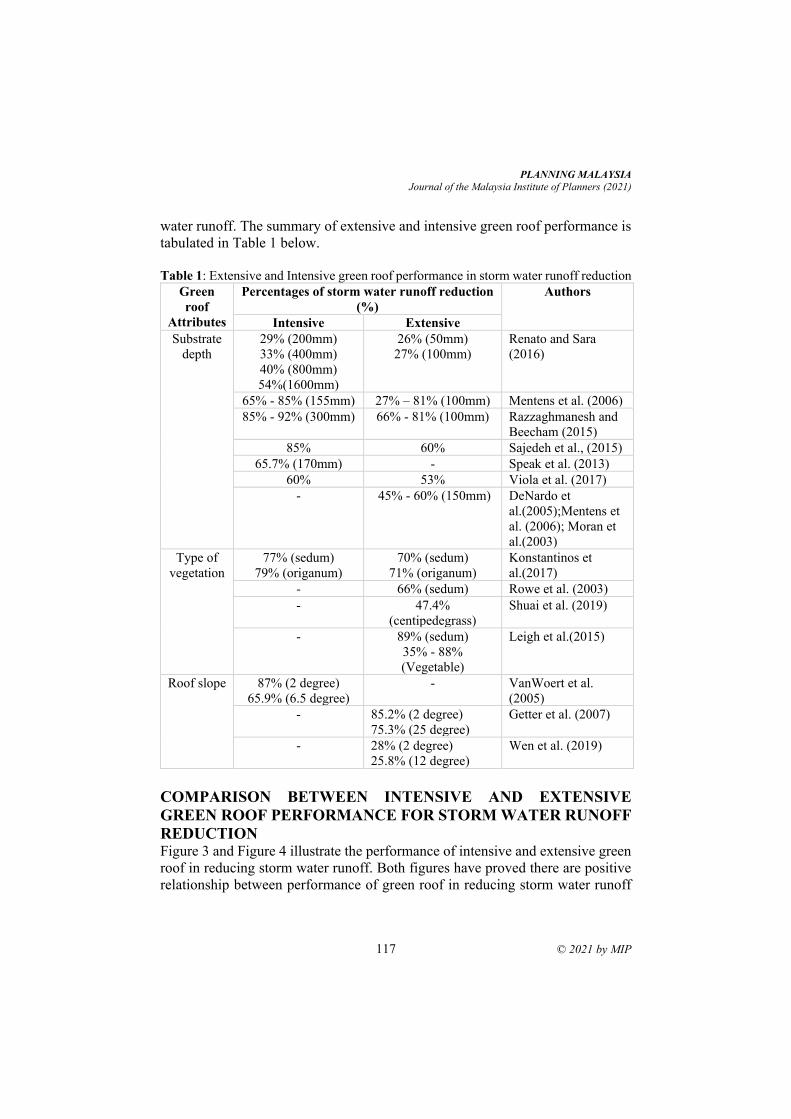
PLANNING MALAYSIA
Journal of the Malaysia Institute of Planners (2021)
117 © 2021 by MIP
water runoff. The summary of extensive and intensive green roof performance is
tabulated in Table 1 below.
Table 1: Extensive and Intensive green roof performance in storm water runoff reduction
Green
roof
Attributes
Percentages of storm water runoff reduction
(%)
Authors
Intensive Extensive
Substrate
depth
29% (200mm)
33% (400mm)
40% (800mm)
54%(1600mm)
26% (50mm)
27% (100mm)
Renato and Sara
(2016)
65% - 85% (155mm) 27% – 81% (100mm) Mentens et al. (2006)
85% - 92% (300mm) 66% - 81% (100mm) Razzaghmanesh and
Beecham (2015)
85% 60% Sajedeh et al., (2015)
65.7% (170mm) - Speak et al. (2013)
60% 53% Viola et al. (2017)
- 45% - 60% (150mm) DeNardo et
al.(2005);Mentens et
al. (2006); Moran et
al.(2003)
Type of
vegetation
77% (sedum)
79% (origanum)
70% (sedum)
71% (origanum)
Konstantinos et
al.(2017)
- 66% (sedum) Rowe et al. (2003)
- 47.4%
(centipedegrass)
Shuai et al. (2019)
- 89% (sedum)
35% - 88%
(Vegetable)
Leigh et al.(2015)
Roof slope 87% (2 degree)
65.9% (6.5 degree)
- VanWoert et al.
(2005)
- 85.2% (2 degree)
75.3% (25 degree)
Getter et al. (2007)
- 28% (2 degree)
25.8% (12 degree)
Wen et al. (2019)
COMPARISON BETWEEN INTENSIVE AND EXTENSIVE
GREEN ROOF PERFORMANCE FOR STORM WATER RUNOFF
REDUCTION Figure 3 and Figure 4 illustrate the performance of intensive and extensive green
roof in reducing storm water runoff. Both figures have proved there are positive
relationship between performance of green roof in reducing storm water runoff
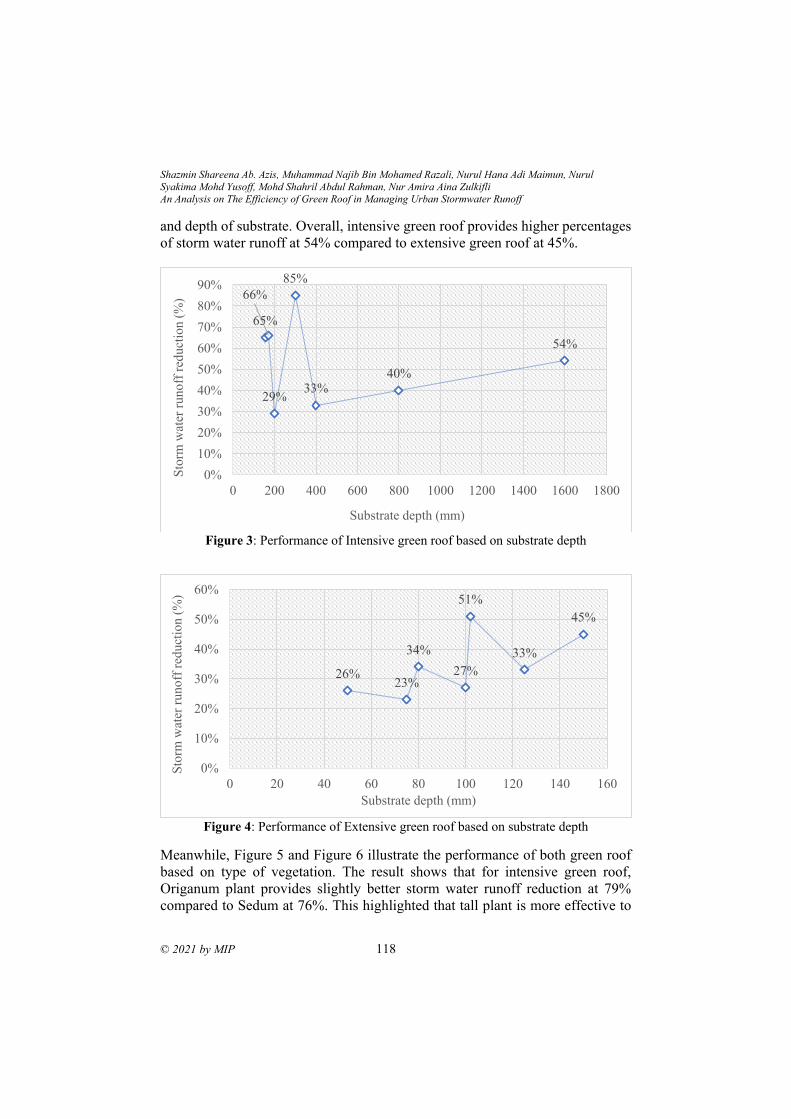
Shazmin Shareena Ab. Azis, Muhammad Najib Bin Mohamed Razali, Nurul Hana Adi Maimun, Nurul
Syakima Mohd Yusoff, Mohd Shahril Abdul Rahman, Nur Amira Aina Zulkifli
An Analysis on The Efficiency of Green Roof in Managing Urban Stormwater Runoff
© 2021 by MIP 118
and depth of substrate. Overall, intensive green roof provides higher percentages
of storm water runoff at 54% compared to extensive green roof at 45%.
Figure 3: Performance of Intensive green roof based on substrate depth
Figure 4: Performance of Extensive green roof based on substrate depth
Meanwhile, Figure 5 and Figure 6 illustrate the performance of both green roof
based on type of vegetation. The result shows that for intensive green roof,
Origanum plant provides slightly better storm water runoff reduction at 79%
compared to Sedum at 76%. This highlighted that tall plant is more effective to
65%
66%
29%
85%
33%40%
54%
0%
10%
20%
30%
40%
50%
60%
70%
80%
90%
0 200 400 600 800 1000 1200 1400 1600 1800
Sto
rm w
ater
ru
no
ff r
edu
ctio
n (
%)
Substrate depth (mm)
26%23%
34%
27%
51%
33%
45%
0%
10%
20%
30%
40%
50%
60%
0 20 40 60 80 100 120 140 160
Sto
rm w
ater
ru
no
ff r
edu
ctio
n (
%)
Substrate depth (mm)
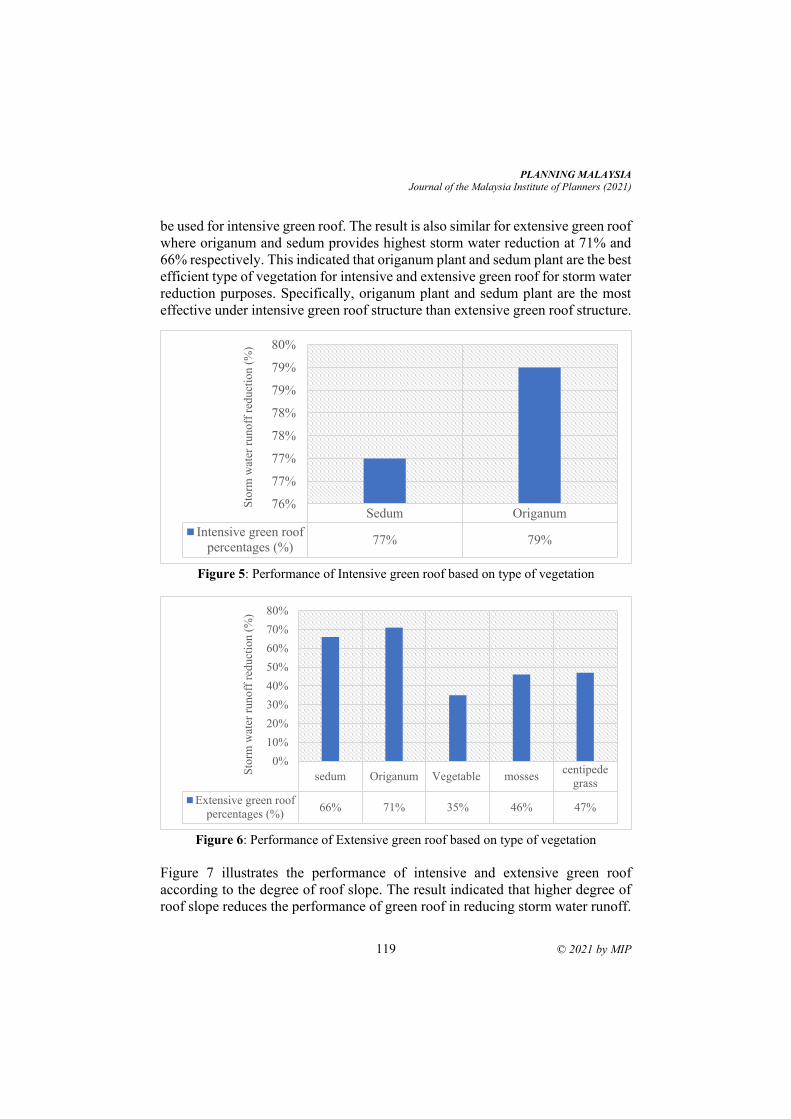
PLANNING MALAYSIA
Journal of the Malaysia Institute of Planners (2021)
119 © 2021 by MIP
be used for intensive green roof. The result is also similar for extensive green roof
where origanum and sedum provides highest storm water reduction at 71% and
66% respectively. This indicated that origanum plant and sedum plant are the best
efficient type of vegetation for intensive and extensive green roof for storm water
reduction purposes. Specifically, origanum plant and sedum plant are the most
effective under intensive green roof structure than extensive green roof structure.
Figure 5: Performance of Intensive green roof based on type of vegetation
Figure 6: Performance of Extensive green roof based on type of vegetation
Figure 7 illustrates the performance of intensive and extensive green roof
according to the degree of roof slope. The result indicated that higher degree of
roof slope reduces the performance of green roof in reducing storm water runoff.
Sedum Origanum
Intensive green roof
percentages (%)77% 79%
76%
77%
77%
78%
78%
79%
79%
80%
Sto
rm w
ater
runoff
red
uct
ion (
%)
sedum Origanum Vegetable mossescentipede
grass
Extensive green roof
percentages (%)66% 71% 35% 46% 47%
0%
10%
20%
30%
40%
50%
60%
70%
80%
Sto
rm w
ater
runoff
red
uct
ion (
%)
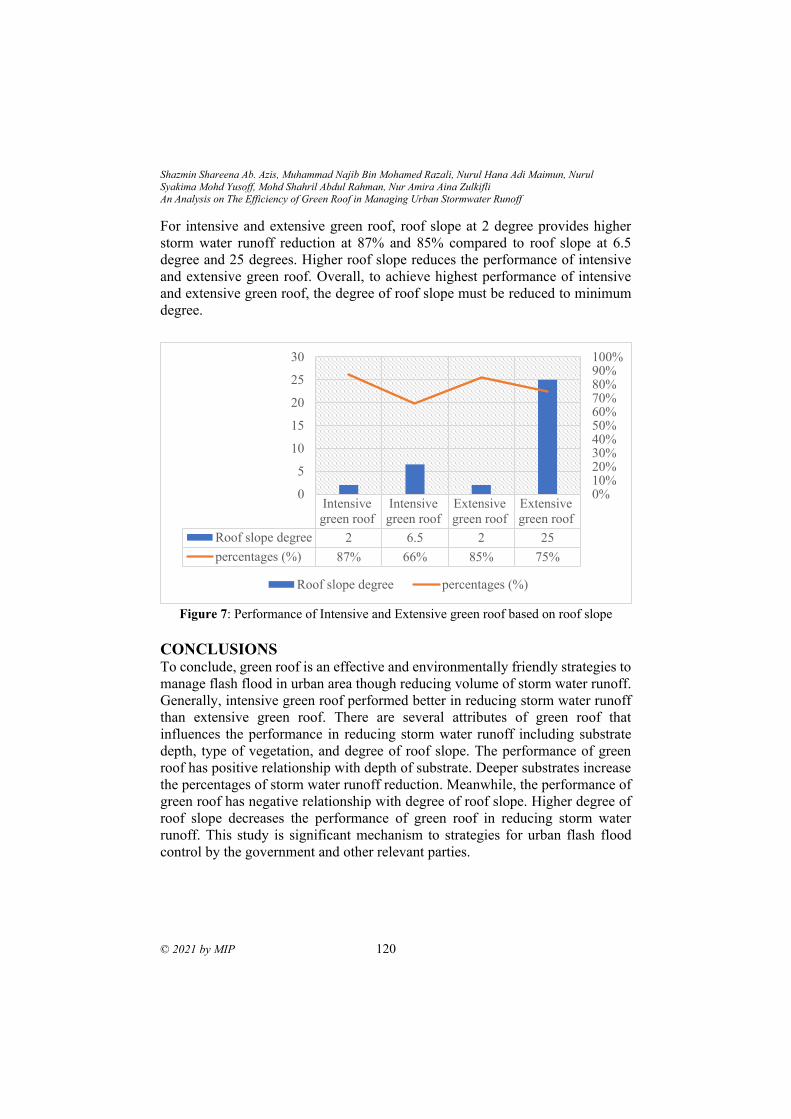
Shazmin Shareena Ab. Azis, Muhammad Najib Bin Mohamed Razali, Nurul Hana Adi Maimun, Nurul
Syakima Mohd Yusoff, Mohd Shahril Abdul Rahman, Nur Amira Aina Zulkifli
An Analysis on The Efficiency of Green Roof in Managing Urban Stormwater Runoff
© 2021 by MIP 120
For intensive and extensive green roof, roof slope at 2 degree provides higher
storm water runoff reduction at 87% and 85% compared to roof slope at 6.5
degree and 25 degrees. Higher roof slope reduces the performance of intensive
and extensive green roof. Overall, to achieve highest performance of intensive
and extensive green roof, the degree of roof slope must be reduced to minimum
degree.
Figure 7: Performance of Intensive and Extensive green roof based on roof slope
CONCLUSIONS
To conclude, green roof is an effective and environmentally friendly strategies to
manage flash flood in urban area though reducing volume of storm water runoff.
Generally, intensive green roof performed better in reducing storm water runoff
than extensive green roof. There are several attributes of green roof that
influences the performance in reducing storm water runoff including substrate
depth, type of vegetation, and degree of roof slope. The performance of green
roof has positive relationship with depth of substrate. Deeper substrates increase
the percentages of storm water runoff reduction. Meanwhile, the performance of
green roof has negative relationship with degree of roof slope. Higher degree of
roof slope decreases the performance of green roof in reducing storm water
runoff. This study is significant mechanism to strategies for urban flash flood
control by the government and other relevant parties.
Intensive
green roof
Intensive
green roof
Extensive
green roof
Extensive
green roof
Roof slope degree 2 6.5 2 25
percentages (%) 87% 66% 85% 75%
0%10%20%30%40%50%60%70%80%90%100%
0
5
10
15
20
25
30
Roof slope degree percentages (%)
PLANNING MALAYSIA
Journal of the Malaysia Institute of Planners (2021)
121 © 2021 by MIP
ACKNOWLEDGEMENTS The authors would like to thank the Fundamental Research Grant Scheme
(FRGS) for funding this study with cost center number: R.J130000.7852.5F201
and project reference number: PY/2019/01198.
REFERENCES Azis, S. S. A., Sipan, I., Sapri, M., Yusoff, N. S. M., & Hashim, H. A. (2019).
COMPARISON ON ENERGY SAVING: GREEN ROOF AND GREEN WALL.
PLANNING MALAYSIA, 17(9).
Bakar, A. A., Mustapa, S. I., & Mohammad, N. (2021). GREEN CITY INITIATIVES:
HUMAN-NATURE INTERACTION. PLANNING MALAYSIA, 19(15).
Berndtsson, J.C. (2010). Green roof performance towards management of runoff water
quantity and quality: a review. Ecol. Eng. 36 (4), 351–360.
Berretta, C., Po€e, S., Stovin, V. (2014). Moisture content behaviour in extensive green
roofs during dry periods: the influence of vegetation and substrate characteristics.
J. Hydrol. 511, 374e386.
Carter, T., & Jackson, C. R. (2007). Vegetated roofs for stormwater management at
multiple special scales. Landscape and Urban Planning, 80, 84–94.
Carter, T.L., Rasmussen, T.C., (2006). Hydrologic behavior of vegetated roofs. Journal
of the American Water Resources Association 42 (5), 1261–1274.
DeNardo, J.C., Jarrett, A.R., Manbeck, H.B., Beattie, D.J., Berghage, R.D. (2005).
Stormwater mitigation and surface temperature reduction by green roofs.
Transactions of the American Society of Agricultural Engineers 48 (4), 1491–
1496.
Getter, K. L., Rowe, D. B., & Andresen, J. A. (2007). Quantifying the effect of slope on
extensive green roof stormwater retention. Ecological Engineering, 31(4), 225–
231.
Kosareo, L., Ries, R., 2007. Comparative environmental life cycle assessment of green
roofs. Build. Environ. 42, 2606–2613.
Liu, K., Minor, J., 2005. Performance Evaluation of an Extensive Green Roof. Greening
Rooftops for Sustainable Communities Conference, Washington DC, 4–6 May.
M. Razzaghmanesh and S. Beecham (2014). The hydrological behaviour of extensive and
intensive green roofs in a dry climate. Science of the Total Environment 499
(2014) 284–296.
Mentens J, Raes D, Hermy M. (2003). Effect of Orientation on the Water Balance of
Green Roofs. Greening rooftops for Sustainable Communities Chicago; 2003. p.
363 71.
Mentens, J., Raes, D., Hermy, M., (2006). Green roofs as a tool for solving the
rainwaterrunoff problem in the urbanized 21st century? Landscape and Urban
Planning 77 (3), 217–226.
Moran A, Hunt B, Jennings G. A North Carolina field study to evaluate greenroof runoff
quality, runoff quantity, and plant growth (2003). ASAEPaper 032303Am. Soc. of
Agric. Eng.; 2003
Shazmin Shareena Ab. Azis, Muhammad Najib Bin Mohamed Razali, Nurul Hana Adi Maimun, Nurul
Syakima Mohd Yusoff, Mohd Shahril Abdul Rahman, Nur Amira Aina Zulkifli
An Analysis on The Efficiency of Green Roof in Managing Urban Stormwater Runoff
© 2021 by MIP 122
Nagase, A., Dunnett, N. (2012). Amount of water runoff from different vegetation types
on extensive green roofs: effects of plant species, diversity and plant structure.
Landsc. Urban Plan. 104 (3–4), 356–363.
Poe, S., Stovin, V., Berretta, C. (2015). Parameters influencing the regeneration of a green
roof's retention capacity via evapotranspiration. J. Hydrol. 523, 356e367.
Razzaghmanesh M, Beecham S, Kazemi F. (2014). The Growth and Survival of Plants in
Urban Green Roofs in a Dry Climate. Sci Total Environ 2014a; 476–477:288–97.
Renato Castiglia Feitosa and Sara Wilkinson (2016). Modelling green roof stormwater
response for different soil depths. Landscape and Urban Planning 153 (2016)
170–179.
Speak, A.F., Rothwell, J.J., Lindley, S.J., Smith, C.L. (2013). Rainwater runoff retention
on an aged intensive green roof. Sci. Total Environ. 461, 28–38.
Stovin V, Vesuviano G, Kasmin H. (2012). The hydrological performance of a green roof
test bed under UK climatic conditions. J Hydrol 2012; 414–415:148–61.
VanWoert N, Rowe B, Andresen J, Rugh C, Fernandez T, Xiao L. (2005). Green roof
stormwater retention: effects of roof surface, slope, andmedia depth. J Environ
Qual 2005; 34:1036–44.
VanWoert, N.D., Rowe, D.B., Andresen, J.A., Rugh, C.L., Xiao, L. (2005). Watering
regime and green roof substrate design affect sedum plant growth. HortScience 40
(3), 659–664.
Vijayaraghavan, K., & Raja, F. D. (2015). Pilot-scale evaluation of green roofs with
Sargassum biomass as an additive to improve runoff quality. Ecological
Engineering, 75, 70–78.
Voyde E, Fassman E, Simcock R. (2010). Hydrology of an extensive living roof under
sub-tropical climate conditions in Auckland, New Zealand. J Hdrol 2010;
394:384–95.
Dunnett, N., Kircher, W., & Kingsbury, N. (2004). Communicating naturalistic plantings:
plans and specifications. The Dynamic Landscape: Design, Ecology and
Management of Naturalistic Urban Planting, 348-368.
Du, W., FitzGerald, G. J., Clark, M., & Hou, X. Y. (2010). Health impacts of floods.
Prehospital and disaster medicine, 25(3), 265-272.
Elias, Z., Hamin, Z., & Othman, M. B. (2013). Sustainable management of flood risks in
Malaysia: Some lessons from the legislation in England and Wales. Procedia-
Social and Behavioral Sciences, 105, 491-497.
Liu, W., Wei, W., Chen, W., Deo, R. C., Si, J., Xi, H., ... & Feng, Q. (2019). The impacts
of substrate and vegetation on stormwater runoff quality from extensive green
roofs. Journal of Hydrology, 576, 575-582.
Whittinghill, L. J., Rowe, D. B., Andresen, J. A., & Cregg, B. M. (2015). Comparison of
stormwater runoff from sedum, native prairie, and vegetable producing green
roofs. Urban ecosystems, 18(1), 13-29.
Viola, F., Hellies, M., & Deidda, R. (2017). Retention performance of green roofs in
representative climates worldwide. Journal of Hydrology, 553, 763-772.
Received: 12th July 2021. Accepted: 23rd Sept 2021
2 Senior Lecturer at University Teknologi Malaysia Email: [email protected]
PLANNING MALAYSIA:
Journal of the Malaysian Institute of Planners
VOLUME 19 ISSUE 3 (2021), Page 123 – 133
FACTORS CAUSING FAILURE IN COMPLETING
REASSESSMENT WORK AMONG APPOINTED VALUATION
FIRMS
Nur Amira Aina Zulkifli1, Shazmin Shareena Ab. Azis2, Nor Syafiqah
Syahirah Saliman3, Nurul Hana Adi Maimun4
Department of Real Estate, Faculty of Built Environment and Surveying
UNIVERSITI TEKNOLOGI MALAYSIA
Abstract
Property tax is a main source of local authority and contributes to nation’s
development. Local Government Act 1976 (Act 171) has authorized local
authority as the responsible party in levying property tax. Based on pilot study,
there is an urgency in conducting property tax reassessment due to the lack of
manpower in valuation department. Besides, it was found that the outsource
solution by appointing private valuation firm also failed to complete the
reassessment within dateline. Hence, this study is conducted to scrutinize the
most significant factors that cause failure in completing reassessment work
among private valuation firm appointed by local authority. Questionnaires were
distributed among local authority within Iskandar region to rank the most
important factors that cause the failure. The results shows that workload increase,
and time constraint is the most prominent factors that cause failure in completing
the reassessment work. This paper is significant for local authority in handling
the problem regarding reassessment work among appointed valuation firm.
Keywords: Local authority, tax reassessment, valuation firm, failure
Nur Amira Aina Zulkifli, Shazmin Shareena Ab. Azis and Nor Syafiqah Syahirah Saliman
Factors Causing Failure in Completing Reassessment Work Among Appointed Valuation Firms
© 2021 by MIP 124
INTRODUCTION
The IAAO (2013) defines property tax assessment as property valuation officially
for the taxation purposes. Property tax assessment value is defined as the market
value of property on the date based on tone of the list which could derive from
the basis of annual value of improved value (Ibrahim, 2009). Property tax
assessment can also be referred to as tax collected by local authorities to cover
expenses for services and development (Ariffian and Hasmah, 2014). The
property tax assessment that was collected from the taxpayer and has become the
major source of income for local authorities (Pawi et al., 2011). According to
Local Government Act 1976 (Act 171), property tax reassessment must be
conducted once every five years and valuation list must be prepared before
conducting reassessment work. Valuation list is a complete record that consist of
information related to the holding such as the location of the property, district,
file number, lot number, house number, name of the owner, owner address, basis
of property tax assessment (annual value or improved value) and date of valuation
list. The valuation list is important to local authority as before it is gazette, it must
be advertised in two local newspaper and at least one of it is in national language
based on Local Government Act 1976 (Act 171). The purpose of the
advertisement is to ensure owner aware on the tax rate that are imposed on their
holding property. During the reassessment work, thousands of properties need to
be inspected and assessed by the local authority. However, property tax
reassessment work must be completed within 5 years to avoid issues in collecting
tax. Private valuation firm are then appointed to conduct the reassessment work
under local authority observations. However, several issues arise regarding
reassessment work in preparing valuation list which are limited space provided,
lack of manpower and expertise (Ariffian and Hasmah, 2014). Therefore, this
study is conducted to determine the cause of failure in completing reassessment
work among appointed valuation firm.
PROPERTY TAX Tax revenue is used to finance government expenditure for providing services to
public in defense, healthcare, education, law and internal or external effects on
the market (Ariffian and Hasmah, 2014). Taxation can be one of ways to
reallocate income for national growth and offset social benefits with production
costs. Every tax system has certain characteristics or criteria in order for it be
imposed efficiently.
The Great Recession during late 2000s and early 2010s certainly
affected the national economy and funds. Authority funds are affected in terms
of income and spending, monetary and spending, budgeting and public worker
benefits and recompense (Chernick, Langley and Reschovsky, 2011; Conant,
2010; Levine and Scorsone, 2011). According to Alm, Buschman and Sjoquist
PLANNING MALAYSIA
Journal of the Malaysia Institute of Planners (2021)
125 © 2021 by MIP
(2011) and Lutz, Molloy and Shan (2011), Great Recession causes the local
authority to depend on the assessment.
Property Tax Assessment
The purpose of enacting property tax is to accommodate local authority expenses
such as cost to manage drainage maintenance, roads, public utilities,
management, and other expenses. Tax assessment is considered to be the largest
contributor to local authorities fund to manage public finances and resources for
urban management and border development administration (Pawi et. al., 2011;
Lim et. al., 2017). Factors that determine property tax are type of holding usage,
land size, building size, type of construction materials and other influential
factors and is evaluated based on the market value.
There are four types of property that are subjected to assessment tax
which are building residential, commercial buildings, industrial buildings,
agricultural land including vacant land or undeveloped land. The amount of
assessment tax is based on the percentage rate on the value added which is
determined by the Valuation and Property Management Department (JPPH).
Property tax reassessment are performed every five years to update valuation list
of holding property. The purpose of reassessment is to marks any changes on the
building such as renovation or extension upon the land which will affect the
market value of holding property.
Basis of Property Tax Assessment
The basis of assessment is important as it is fundamentally used in taxation
process. Section 2 of Local Government Act 1976 states that there are two basis
in determining property tax assessment which are annual value and improved
value. Improved value is used as the basis in tax assessment in Johor and Melaka
state while annual value is used in the remaining states in Malaysia.
Annual Value
The annual value can be defined as a reasonable amount of gross rental value of
a holding without any implication of forced, restrictions or control over the rent
(Jaafar & Ismail, 2017). Annual value is the estimated gross annual rent that is
available or expected from year to year through such holding where the holding
owner shall pay expenses for repairs, insurance, maintenance, and public taxes.
Improved Value
Improved value is used as the basis of tax assessment in state of Johor. Section 2
of Act 171 defines improved value as: ‘The price that an owner willing, and not
obliged to sell might reasonably expect to obtain from a willing purchaser with
whom he was bargaining, for sale and purchase of the holding.’ In accordance
with the provisions under section 130 of Act 171, assessment tax may be levied
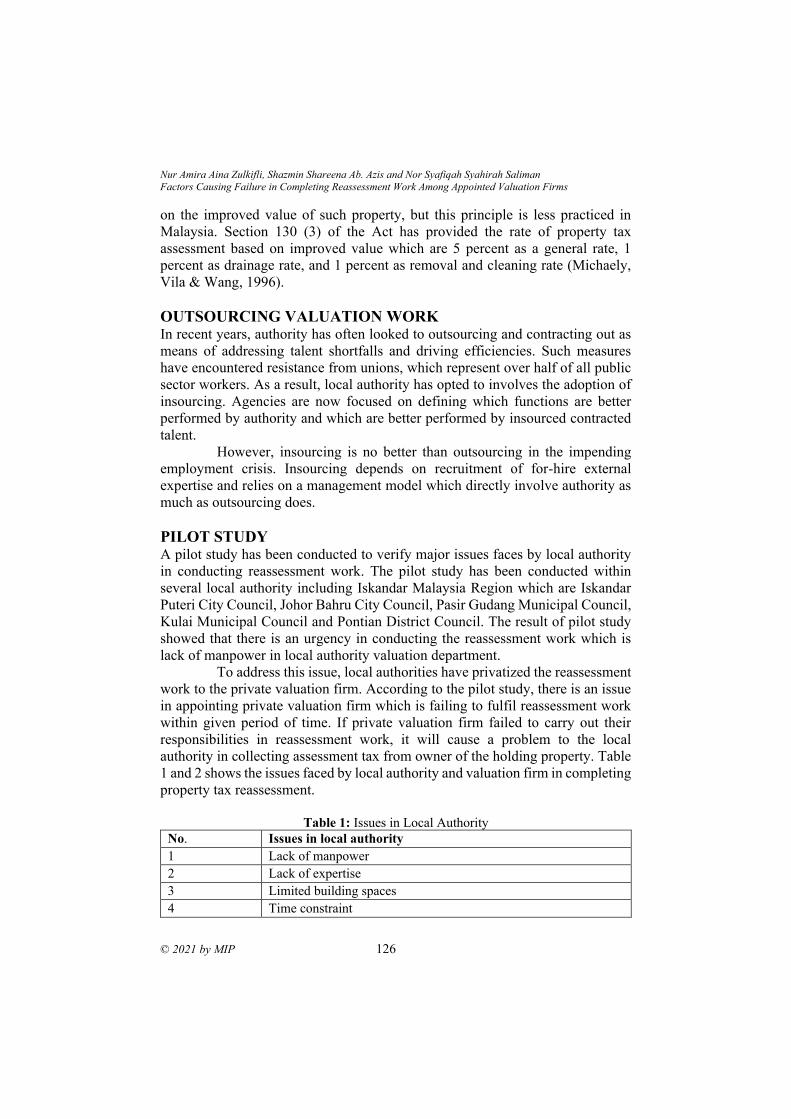
Nur Amira Aina Zulkifli, Shazmin Shareena Ab. Azis and Nor Syafiqah Syahirah Saliman
Factors Causing Failure in Completing Reassessment Work Among Appointed Valuation Firms
© 2021 by MIP 126
on the improved value of such property, but this principle is less practiced in
Malaysia. Section 130 (3) of the Act has provided the rate of property tax
assessment based on improved value which are 5 percent as a general rate, 1
percent as drainage rate, and 1 percent as removal and cleaning rate (Michaely,
Vila & Wang, 1996).
OUTSOURCING VALUATION WORK In recent years, authority has often looked to outsourcing and contracting out as
means of addressing talent shortfalls and driving efficiencies. Such measures
have encountered resistance from unions, which represent over half of all public
sector workers. As a result, local authority has opted to involves the adoption of
insourcing. Agencies are now focused on defining which functions are better
performed by authority and which are better performed by insourced contracted
talent.
However, insourcing is no better than outsourcing in the impending
employment crisis. Insourcing depends on recruitment of for-hire external
expertise and relies on a management model which directly involve authority as
much as outsourcing does.
PILOT STUDY A pilot study has been conducted to verify major issues faces by local authority
in conducting reassessment work. The pilot study has been conducted within
several local authority including Iskandar Malaysia Region which are Iskandar
Puteri City Council, Johor Bahru City Council, Pasir Gudang Municipal Council,
Kulai Municipal Council and Pontian District Council. The result of pilot study
showed that there is an urgency in conducting the reassessment work which is
lack of manpower in local authority valuation department.
To address this issue, local authorities have privatized the reassessment
work to the private valuation firm. According to the pilot study, there is an issue
in appointing private valuation firm which is failing to fulfil reassessment work
within given period of time. If private valuation firm failed to carry out their
responsibilities in reassessment work, it will cause a problem to the local
authority in collecting assessment tax from owner of the holding property. Table
1 and 2 shows the issues faced by local authority and valuation firm in completing
property tax reassessment.
Table 1: Issues in Local Authority
No. Issues in local authority
1 Lack of manpower
2 Lack of expertise
3 Limited building spaces
4 Time constraint
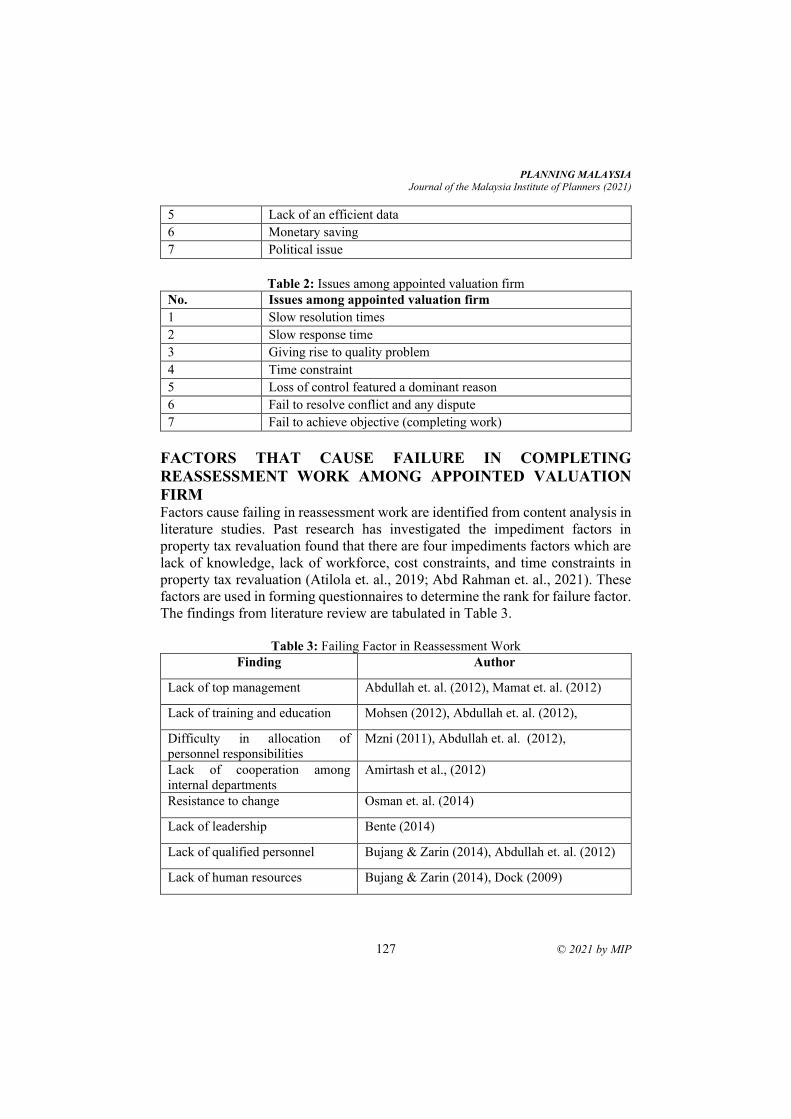
PLANNING MALAYSIA
Journal of the Malaysia Institute of Planners (2021)
127 © 2021 by MIP
5 Lack of an efficient data
6 Monetary saving
7 Political issue
Table 2: Issues among appointed valuation firm
No. Issues among appointed valuation firm
1 Slow resolution times
2 Slow response time
3 Giving rise to quality problem
4 Time constraint
5 Loss of control featured a dominant reason
6 Fail to resolve conflict and any dispute
7 Fail to achieve objective (completing work)
FACTORS THAT CAUSE FAILURE IN COMPLETING
REASSESSMENT WORK AMONG APPOINTED VALUATION
FIRM Factors cause failing in reassessment work are identified from content analysis in
literature studies. Past research has investigated the impediment factors in
property tax revaluation found that there are four impediments factors which are
lack of knowledge, lack of workforce, cost constraints, and time constraints in
property tax revaluation (Atilola et. al., 2019; Abd Rahman et. al., 2021). These
factors are used in forming questionnaires to determine the rank for failure factor.
The findings from literature review are tabulated in Table 3.
Table 3: Failing Factor in Reassessment Work
Finding Author
Lack of top management Abdullah et. al. (2012), Mamat et. al. (2012)
Lack of training and education Mohsen (2012), Abdullah et. al. (2012),
Difficulty in allocation of
personnel responsibilities
Mzni (2011), Abdullah et. al. (2012),
Lack of cooperation among
internal departments
Amirtash et al., (2012)
Resistance to change Osman et. al. (2014)
Lack of leadership Bente (2014)
Lack of qualified personnel Bujang & Zarin (2014), Abdullah et. al. (2012)
Lack of human resources Bujang & Zarin (2014), Dock (2009)
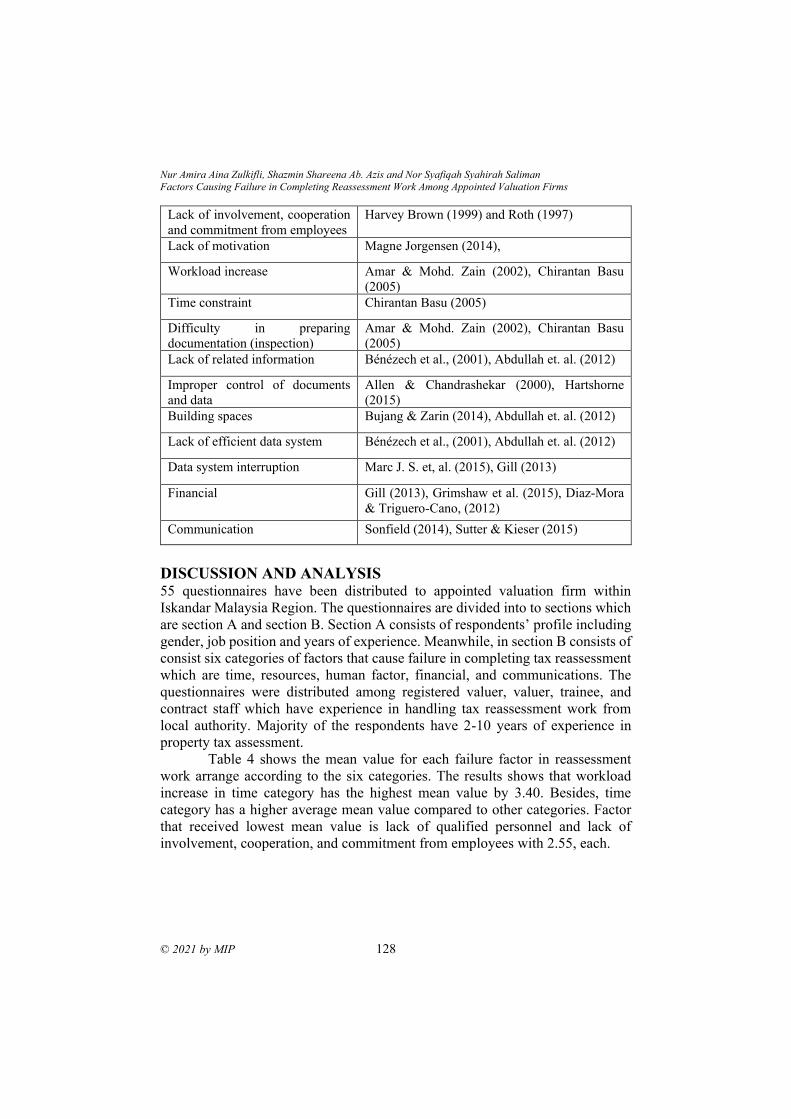
Nur Amira Aina Zulkifli, Shazmin Shareena Ab. Azis and Nor Syafiqah Syahirah Saliman
Factors Causing Failure in Completing Reassessment Work Among Appointed Valuation Firms
© 2021 by MIP 128
Lack of involvement, cooperation
and commitment from employees
Harvey Brown (1999) and Roth (1997)
Lack of motivation Magne Jorgensen (2014),
Workload increase Amar & Mohd. Zain (2002), Chirantan Basu
(2005)
Time constraint Chirantan Basu (2005)
Difficulty in preparing
documentation (inspection)
Amar & Mohd. Zain (2002), Chirantan Basu
(2005)
Lack of related information Bénézech et al., (2001), Abdullah et. al. (2012)
Improper control of documents
and data
Allen & Chandrashekar (2000), Hartshorne
(2015)
Building spaces Bujang & Zarin (2014), Abdullah et. al. (2012)
Lack of efficient data system Bénézech et al., (2001), Abdullah et. al. (2012)
Data system interruption Marc J. S. et, al. (2015), Gill (2013)
Financial Gill (2013), Grimshaw et al. (2015), Diaz-Mora
& Triguero-Cano, (2012)
Communication Sonfield (2014), Sutter & Kieser (2015)
DISCUSSION AND ANALYSIS 55 questionnaires have been distributed to appointed valuation firm within
Iskandar Malaysia Region. The questionnaires are divided into to sections which
are section A and section B. Section A consists of respondents’ profile including
gender, job position and years of experience. Meanwhile, in section B consists of
consist six categories of factors that cause failure in completing tax reassessment
which are time, resources, human factor, financial, and communications. The
questionnaires were distributed among registered valuer, valuer, trainee, and
contract staff which have experience in handling tax reassessment work from
local authority. Majority of the respondents have 2-10 years of experience in
property tax assessment.
Table 4 shows the mean value for each failure factor in reassessment
work arrange according to the six categories. The results shows that workload
increase in time category has the highest mean value by 3.40. Besides, time
category has a higher average mean value compared to other categories. Factor
that received lowest mean value is lack of qualified personnel and lack of
involvement, cooperation, and commitment from employees with 2.55, each.
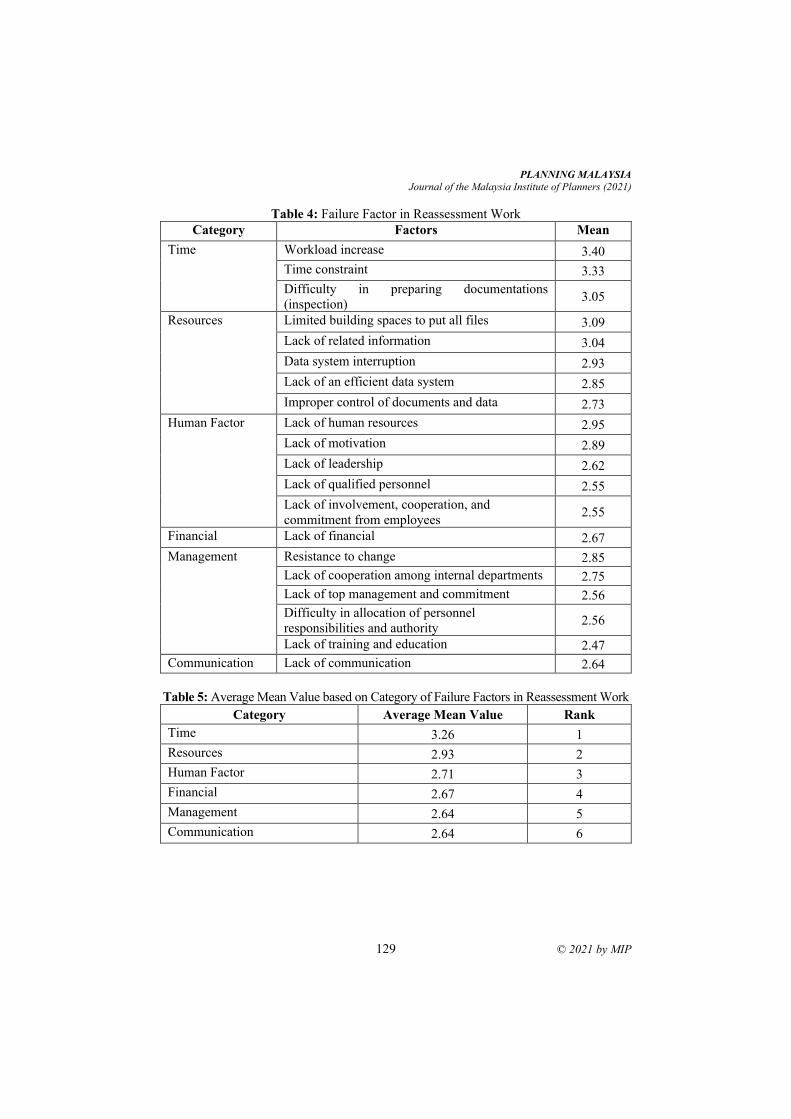
PLANNING MALAYSIA
Journal of the Malaysia Institute of Planners (2021)
129 © 2021 by MIP
Table 4: Failure Factor in Reassessment Work
Category Factors Mean
Time Workload increase 3.40
Time constraint 3.33
Difficulty in preparing documentations
(inspection) 3.05
Resources Limited building spaces to put all files 3.09
Lack of related information 3.04
Data system interruption 2.93
Lack of an efficient data system 2.85
Improper control of documents and data 2.73
Human Factor Lack of human resources 2.95
Lack of motivation 2.89
Lack of leadership 2.62
Lack of qualified personnel 2.55
Lack of involvement, cooperation, and
commitment from employees 2.55
Financial Lack of financial 2.67
Management Resistance to change 2.85
Lack of cooperation among internal departments 2.75
Lack of top management and commitment 2.56
Difficulty in allocation of personnel
responsibilities and authority 2.56
Lack of training and education 2.47
Communication Lack of communication 2.64
Table 5: Average Mean Value based on Category of Failure Factors in Reassessment Work
Category Average Mean Value Rank
Time 3.26 1
Resources 2.93 2
Human Factor 2.71 3
Financial 2.67 4
Management 2.64 5
Communication 2.64 6
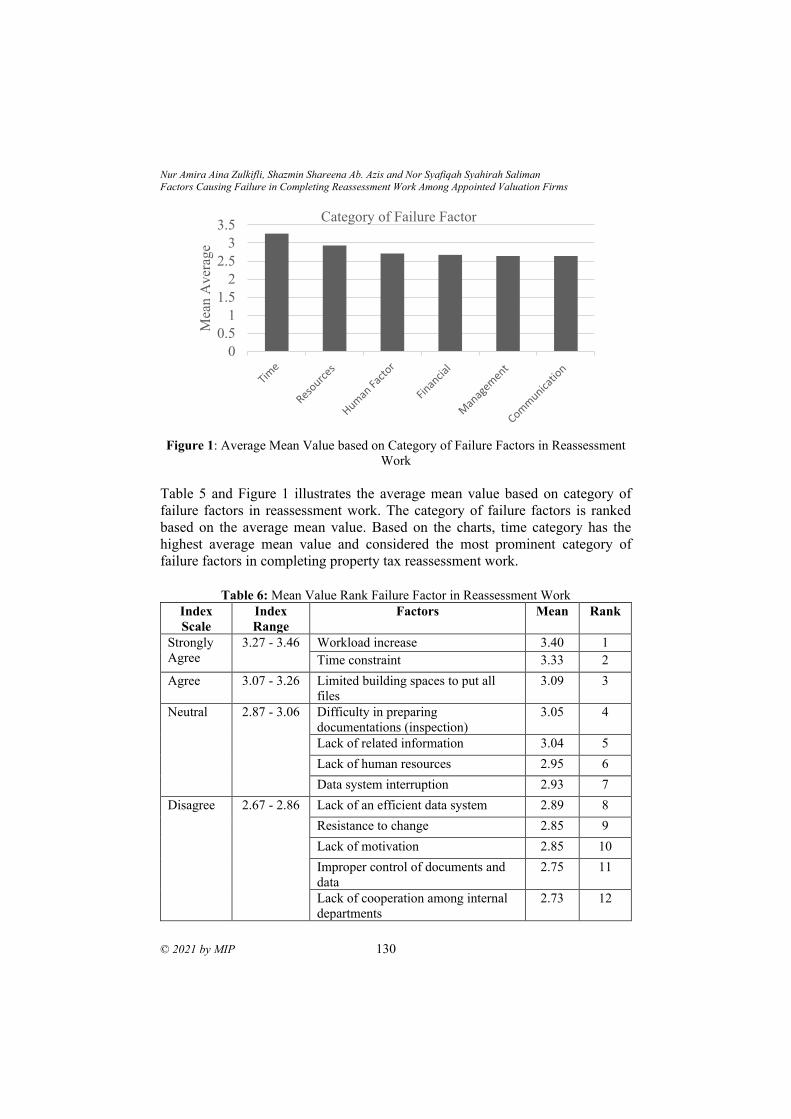
Nur Amira Aina Zulkifli, Shazmin Shareena Ab. Azis and Nor Syafiqah Syahirah Saliman
Factors Causing Failure in Completing Reassessment Work Among Appointed Valuation Firms
© 2021 by MIP 130
Figure 1: Average Mean Value based on Category of Failure Factors in Reassessment
Work
Table 5 and Figure 1 illustrates the average mean value based on category of
failure factors in reassessment work. The category of failure factors is ranked
based on the average mean value. Based on the charts, time category has the
highest average mean value and considered the most prominent category of
failure factors in completing property tax reassessment work.
Table 6: Mean Value Rank Failure Factor in Reassessment Work
Index
Scale
Index
Range
Factors Mean Rank
Strongly
Agree
3.27 - 3.46 Workload increase 3.40 1
Time constraint 3.33 2
Agree 3.07 - 3.26 Limited building spaces to put all
files
3.09 3
Neutral 2.87 - 3.06 Difficulty in preparing
documentations (inspection)
3.05 4
Lack of related information 3.04 5
Lack of human resources 2.95 6
Data system interruption 2.93 7
Disagree 2.67 - 2.86 Lack of an efficient data system 2.89 8
Resistance to change 2.85 9
Lack of motivation 2.85 10
Improper control of documents and
data
2.75 11
Lack of cooperation among internal
departments
2.73 12
0
0.5
1
1.5
2
2.5
3
3.5
Mea
n A
ver
age
Category of Failure Factor
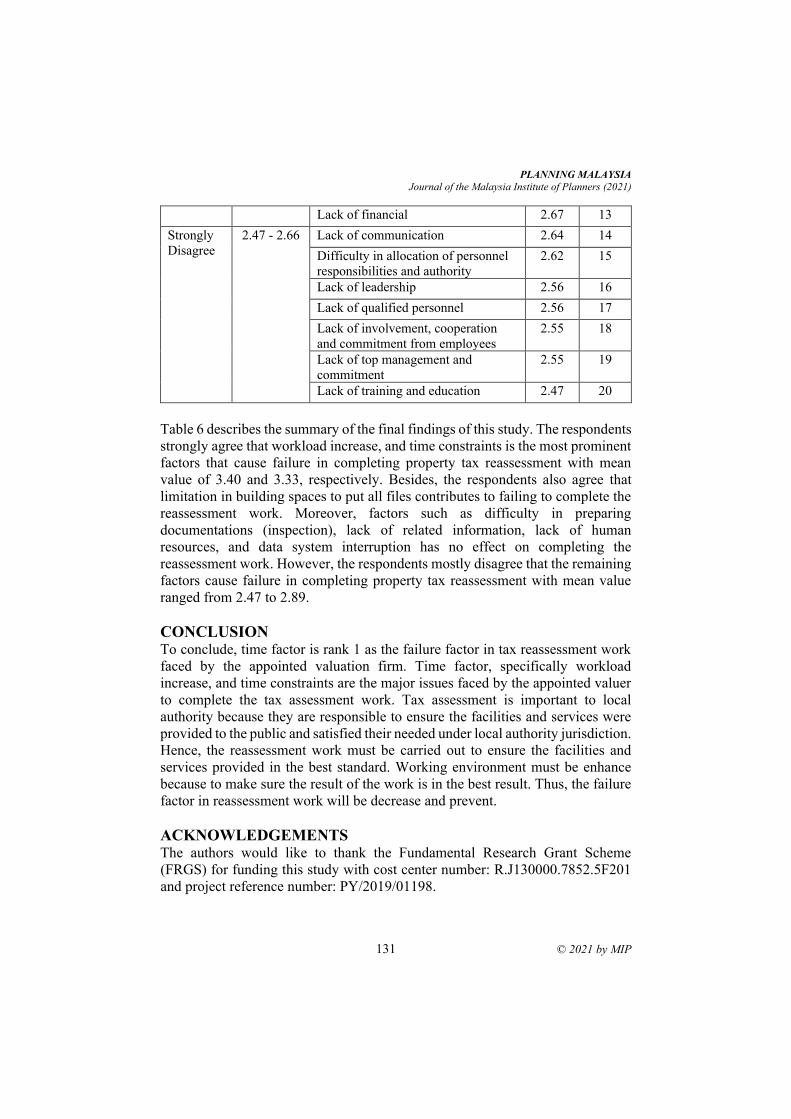
PLANNING MALAYSIA
Journal of the Malaysia Institute of Planners (2021)
131 © 2021 by MIP
Lack of financial 2.67 13
Strongly
Disagree
2.47 - 2.66 Lack of communication 2.64 14
Difficulty in allocation of personnel
responsibilities and authority
2.62 15
Lack of leadership 2.56 16
Lack of qualified personnel 2.56 17
Lack of involvement, cooperation
and commitment from employees
2.55 18
Lack of top management and
commitment
2.55 19
Lack of training and education 2.47 20
Table 6 describes the summary of the final findings of this study. The respondents
strongly agree that workload increase, and time constraints is the most prominent
factors that cause failure in completing property tax reassessment with mean
value of 3.40 and 3.33, respectively. Besides, the respondents also agree that
limitation in building spaces to put all files contributes to failing to complete the
reassessment work. Moreover, factors such as difficulty in preparing
documentations (inspection), lack of related information, lack of human
resources, and data system interruption has no effect on completing the
reassessment work. However, the respondents mostly disagree that the remaining
factors cause failure in completing property tax reassessment with mean value
ranged from 2.47 to 2.89.
CONCLUSION To conclude, time factor is rank 1 as the failure factor in tax reassessment work
faced by the appointed valuation firm. Time factor, specifically workload
increase, and time constraints are the major issues faced by the appointed valuer
to complete the tax assessment work. Tax assessment is important to local
authority because they are responsible to ensure the facilities and services were
provided to the public and satisfied their needed under local authority jurisdiction.
Hence, the reassessment work must be carried out to ensure the facilities and
services provided in the best standard. Working environment must be enhance
because to make sure the result of the work is in the best result. Thus, the failure
factor in reassessment work will be decrease and prevent.
ACKNOWLEDGEMENTS
The authors would like to thank the Fundamental Research Grant Scheme
(FRGS) for funding this study with cost center number: R.J130000.7852.5F201
and project reference number: PY/2019/01198.
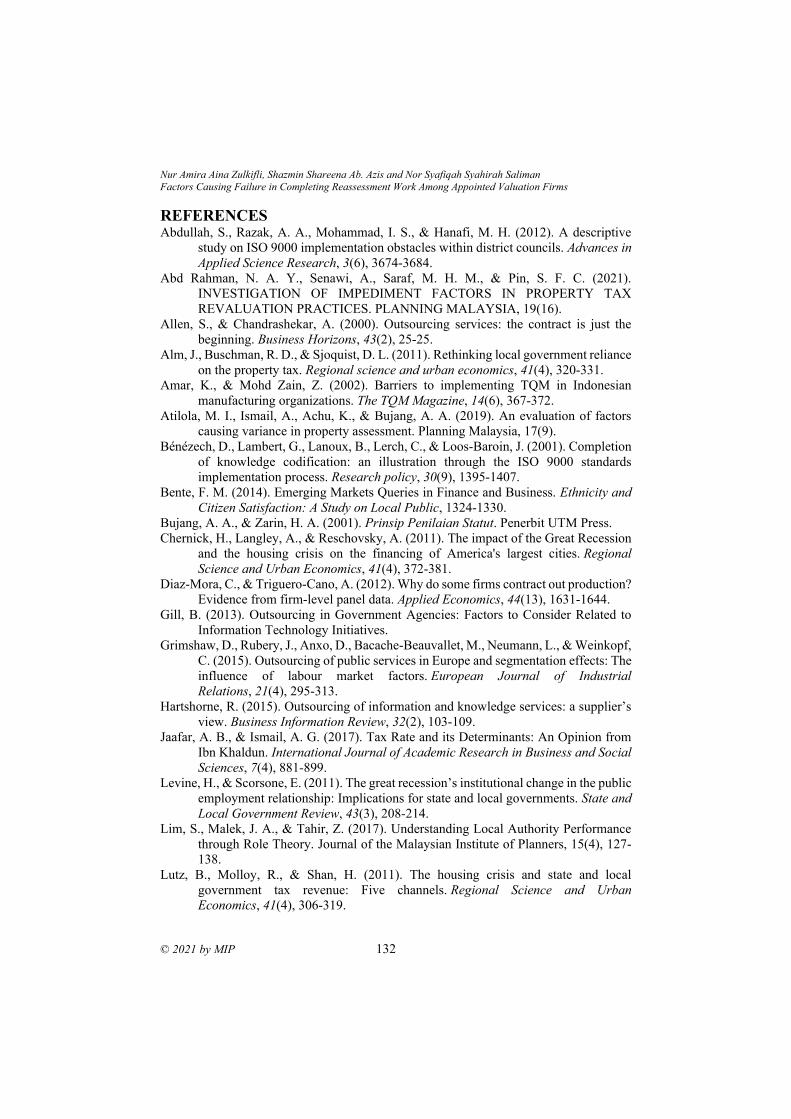
Nur Amira Aina Zulkifli, Shazmin Shareena Ab. Azis and Nor Syafiqah Syahirah Saliman
Factors Causing Failure in Completing Reassessment Work Among Appointed Valuation Firms
© 2021 by MIP 132
REFERENCES Abdullah, S., Razak, A. A., Mohammad, I. S., & Hanafi, M. H. (2012). A descriptive
study on ISO 9000 implementation obstacles within district councils. Advances in
Applied Science Research, 3(6), 3674-3684.
Abd Rahman, N. A. Y., Senawi, A., Saraf, M. H. M., & Pin, S. F. C. (2021).
INVESTIGATION OF IMPEDIMENT FACTORS IN PROPERTY TAX
REVALUATION PRACTICES. PLANNING MALAYSIA, 19(16).
Allen, S., & Chandrashekar, A. (2000). Outsourcing services: the contract is just the
beginning. Business Horizons, 43(2), 25-25.
Alm, J., Buschman, R. D., & Sjoquist, D. L. (2011). Rethinking local government reliance
on the property tax. Regional science and urban economics, 41(4), 320-331.
Amar, K., & Mohd Zain, Z. (2002). Barriers to implementing TQM in Indonesian
manufacturing organizations. The TQM Magazine, 14(6), 367-372.
Atilola, M. I., Ismail, A., Achu, K., & Bujang, A. A. (2019). An evaluation of factors
causing variance in property assessment. Planning Malaysia, 17(9).
Bénézech, D., Lambert, G., Lanoux, B., Lerch, C., & Loos-Baroin, J. (2001). Completion
of knowledge codification: an illustration through the ISO 9000 standards
implementation process. Research policy, 30(9), 1395-1407.
Bente, F. M. (2014). Emerging Markets Queries in Finance and Business. Ethnicity and
Citizen Satisfaction: A Study on Local Public, 1324-1330.
Bujang, A. A., & Zarin, H. A. (2001). Prinsip Penilaian Statut. Penerbit UTM Press.
Chernick, H., Langley, A., & Reschovsky, A. (2011). The impact of the Great Recession
and the housing crisis on the financing of America's largest cities. Regional
Science and Urban Economics, 41(4), 372-381.
Diaz-Mora, C., & Triguero-Cano, A. (2012). Why do some firms contract out production?
Evidence from firm-level panel data. Applied Economics, 44(13), 1631-1644.
Gill, B. (2013). Outsourcing in Government Agencies: Factors to Consider Related to
Information Technology Initiatives.
Grimshaw, D., Rubery, J., Anxo, D., Bacache-Beauvallet, M., Neumann, L., & Weinkopf,
C. (2015). Outsourcing of public services in Europe and segmentation effects: The
influence of labour market factors. European Journal of Industrial
Relations, 21(4), 295-313.
Hartshorne, R. (2015). Outsourcing of information and knowledge services: a supplier’s
view. Business Information Review, 32(2), 103-109.
Jaafar, A. B., & Ismail, A. G. (2017). Tax Rate and its Determinants: An Opinion from
Ibn Khaldun. International Journal of Academic Research in Business and Social
Sciences, 7(4), 881-899.
Levine, H., & Scorsone, E. (2011). The great recession’s institutional change in the public
employment relationship: Implications for state and local governments. State and
Local Government Review, 43(3), 208-214.
Lim, S., Malek, J. A., & Tahir, Z. (2017). Understanding Local Authority Performance
through Role Theory. Journal of the Malaysian Institute of Planners, 15(4), 127-
138.
Lutz, B., Molloy, R., & Shan, H. (2011). The housing crisis and state and local
government tax revenue: Five channels. Regional Science and Urban
Economics, 41(4), 306-319.
PLANNING MALAYSIA
Journal of the Malaysia Institute of Planners (2021)
133 © 2021 by MIP
Malaysia (1976) Local Government Act 197.
Mamat, M. N., Mahamood, S. F., & Ismail, I. (2012). Islamic philosophy on behaviour-
based environmental attitude. Procedia-Social and Behavioral Sciences, 49, 85-
92.Mzini, D. L. (2011). Improving the Quality of Public Services. The
Relationship between Accountability and Customer Satisfaction in Sedibeng
District Municipality, South Africa, 1-32.
Michaely, R., Vila, J. L., & Wang, J. (1996). A model of trading volume with tax-induced
heterogeneous valuation and transaction costs. Journal of Financial
Intermediation, 5(4), 340-371.
Osman, M. M., Bachok, S., Bakri, N. I. M., & Harun, N. Z. (2014). Government delivery
system: effectiveness of local authorities in Perak, Malaysia. Procedia-Social and
Behavioral Sciences, 153, 452-462.
Pawi, S., Juanil, D. M., Yusoff, W. Z. W., & Shafie, F. (2011). Property tax performance
of local authorities in Malaysia. Artificial Intelligence, 6(1), 42-46.
Sonfield, M. C. (2014). Outsourcing strategies for small businesses: Issues, theoretical
bases, and guidelines. Small Business Institute Journal, 10(2), 35-43.
Sutter, M., & Kieser, A. (2019). How consultants and their clients collaborate in spite of
massive communication barriers. International Journal of Business
Communication, 56(2), 249-277.
Received: 12th July 2021. Accepted: 23rd Sept 2021
1 Lecturer at Universiti Teknologi MARA. Email: [email protected]
PLANNING MALAYSIA:
Journal of the Malaysian Institute of Planners
VOLUME 19 ISSUE 3 (2021), Page 134 – 145
HOUSING PREFERENCES: AN ANALYSIS OF MALAYSIAN
YOUTHS
Suhana Ismail1, Azima Abdul Manaf2, Mohd Yusof Hussain3, Noraliza Basrah4,
Fatin Umaira Muhamad Azian5
1,2 Faculty of Architecture, Planning and Surveying,
UNIVERSITI TEKNOLOGI MARA
3,4,5Faculty of Social Sciences and Humanities,
UNIVERSITI KEBANGSAAN MALAYSIA
Abstract
Housing preferences among Malaysian youths are an important issue because the
housing unit prices nowadays are often unaffordable. Malaysian youths confront
various challenges nowadays, including marriage, relocating away from home
upon graduation, and finding new work opportunities. Youths have developed
into the primary section of the housing market who are constantly faced with
housing options and decisions. Besides, youths have different preferences for
housing characteristics throughout their particular stage of life, which will
significantly impact their future lives. Data was gathered from a survey
questionnaire answered by 174 Shah Alam youths aged from 18 to 35. This
research focuses on identifying the preferred types of houses chosen by youths,
involving features such as location, housing price and type of house to live in.
The results also showed that the highest-ranked preferred factors were the
financial factors, followed by the neighbourhood, location, and design factors.
Keywords: Housing preference, youth
PLANNING MALAYSIA
Journal of the Malaysia Institute of Planners (2021)
135 © 2021 by MIP
INTRODUCTION
Vision 2020 envisions a fully developed Malaysian society in all aspects, not only
economically but also socially, justly and politically stable. Malaysian should
enjoy a best quality of life, social wellbeing and spiritual values.
The younger generation has a hard time purchasing a property. House
purchasers are discovering that acquiring their ideal house has become
significantly more complicated. Unfortunately, the costs of potential properties
tend to be above their budget. Young adults seem unable to buy a decent,
adequate, and livable property that does not force them to take out a large bank
loan or relocate to a remote and unexciting housing development that requires
lengthy daily travels.
Wu (2010) indicated that because youths are undergoing a tough time
of life, such as leaving the family house for employment prospects and marriage,
they are likely to have different housing preferences. As a result, youths
frequently consider the environmental factors and services available in a
particular locality while acquiring a home. According to a study by Gateshead
Council on April 2009 survey determined that young people’s housing needs and
ambitions, the critical need of young people in terms of housing is for additional
housing alternatives since many young people feel constrained by their present
housing options.
Many researchers have endeavoured to clarify homebuyers’
preferences based on demographic and socio-economic characteristics. Based on
classic research conducted by Rossi and Weber (1980), housing choices might
vary by age, household capacity, income, and present housing situation.
Most studies on housing preferences are generally concerned with
demographic and socio-economic factors, such as different age groups and family
size (Berko, 2000). According to Al-Momani and Box (2000), the preference
factors are lifestyle, values and family patterns. Other factors are education, age,
family income and the nature of a buyer’s employment organisation (Wang and
Li, 2006).
RESEARCH BACKGROUND Youths, especially those living in metropolitan regions such as the Klang Valley,
are presently facing real challenges in purchasing a home as the cost of housing
continues to grow at an alarming rate. Youths can be considered the most active
population in terms of migration. According to Hoek J. (2016), young adults
represent the cohort or age group between 18 and 35 years old. People in this age
range can translate from their parents home to become independent and start to
build an individual household of their own. According to Heath (2008), youths
frequently take a ‘live for today’ approach toward financial planning, whereas
saving is viewed as an ‘adult’ behaviour. Youth have the lower-than-average
financial knowledge and limited access to financial services. Leaving the family
Suhana Ismail, Azima Abdul Manaf, Mohd Yusof Hussain, Noraliza Basrah, Fatin Umaira Muhamad Azian
Housing Preferences: An Analysis of Malaysian Youth
© 2021 by MIP 136
home frequently results in an increased awareness of one’s financial
responsibilities.
High housing costs have meant youths prefer to choose rental units
rather than purchasing a house. Youth are more likely than other age groups to
experience homelessness and rent housing. Additionally, the majority of people
acquire their first house in their late 20s or early 30s (Hong, 2011). This situation
shows that many youths, in particular, are unlikely to own or purchase a house.
For example, a survey conducted by Malaysian government workers Zaimah et
al. (2012) on 250 youths under 40 discovered that only 40% of respondents
owned their homes. Another study reported that the housing problem in Malaysia
is more related to accessibility issues for the low-income group (Junaidi et al.,
2012), including youths. This scenario because of the low supply of low-cost or
affordable housing, as well as the low-income level among locals.
According to the Star (2014), fifty (50) percent of Malaysia’s
population was forty (40) years old or younger. Thus, based on this scenario, half
of Malaysia’s population is expected to be youths who are disadvantaged in the
housing market.
Housing is a basic human need that maintains people’s quality of life.
Additionally, a house is a safe place that reflects cultural perceptions and
occurrences. It is a cultural unit of space that encompasses actions that occur and
vary in their significance and use as fundamental rituals (Al-Homoud, 2009).
Thus, housing should not have been built or given just for the purpose of
providing shelter but also to accommodate people’s preferences and other
requirements. Considering the housing issues and scenarios, this study aimed to
identify youth housing preferences and develop suggestions based on the research
findings.
LITERATURE REVIEW
Housing preferences are distinguished into two related terms, which are housing
expectation and housing aspiration. Housing aspiration refers to a future-oriented
desire for housing or standards, whereas expectation refers to a realistic
evaluation of future housing circumstances (Thanaraju et al., 2019).
The importance of investigating the relationship between housing
preferences and personal characteristics is due to the consequent ability to
identify variations in housing preferences between different population groups
(Shi, 2000). If it is established that different segments of the population have
distinct housing preferences, this will have a substantial impact on housing design
and research. For example, it is believed that older people like to live in areas
near open space but not too close to shopping centres. Thus, a housing designer
should consider this when building flats or buildings for senior citizens.
Housing affordability for the young generation has deteriorated to
precarious circumstances (Nor Suzylah Sohaimi, 2017). A household's housing
PLANNING MALAYSIA
Journal of the Malaysia Institute of Planners (2021)
137 © 2021 by MIP
choice or decision can be influenced by a variety of socio-demographic factors
(Kömürlü, 2013). To instance, household composition is a critical factor to
consider when determining housing choices. The size of households results in
varying housing demands, which results in distinct housing preferences.
Meanwhile, both single-family homes and suburban locations are favourably
associated with family size. Secondly, age is an essential factor to consider when
determining the composition of households, since as individuals go through their
lives, they may require a variety of living environments. Furthermore, marital
status probably has an effect on housing preferences.
Housing Preferences
Housing preferences can be classified into two broad modelling approaches
(Harold W. Elder, 1991). The first one is revealed models based on household
observational data and actual housing decisions in the proper market. Meanwhile,
stated models are predicated on the premise that observed choices would be
mirrored in the effect of preferences, market circumstances, and housing
availability (Karsten, Lia. 2007). Social-demographic descriptors do not only
influence house preferences, but equally important are buyers’ intentions and
their financial situations (Lim Poh Im, 2018). When no one choice offers a clear
benefit, housing preference indecision may lead to deferral. For a long time,
researchers have noted that there is no apparent distinction between preference
and choice; thus, they are frequently entwined. Ameera (2019) highlighted that
decision is frequently motivated by personal preferences.
Also, researchers have emphasised that because the choice is a mirror
of preferences, individuals may deduce their preferences just by witnessing their
own choices. According to a recent survey, about 60% of Lagos residents were
renters. Because most of the existing housing was provided by private landlords,
most of them had to pay rent that was 50-70 percent of their monthly income
(Olugbenga Taiwo, Yusoff, and Aziz 2018).
The majority of research that examine consumer housing choices
employ the hedonic pricing framework, which is predicated on the concept of
housing characteristics or house purchase considerations (Opoku & Abdul-
Muhmin 2010). The relevance of housing variables in housing research is
emphasised further by their inclusion in discrete choice models of housing, as
well as by the numerous empirical studies examining their relative importance in
consumers’ housing decisions across a variety of national settings. Numerous
studies have indicated that various unique housing characteristics and home
purchasing variables impact people’s housing choices (Ling, 2016).
These range from intrinsic housing attributes such as cost and size, to
extrinsic attributes such as exterior design and exterior space, to the
neighbourhood and other locational factors such as pollution (Chin, 2016). There
has been considerable discussion concerning the relative relevance of internal and
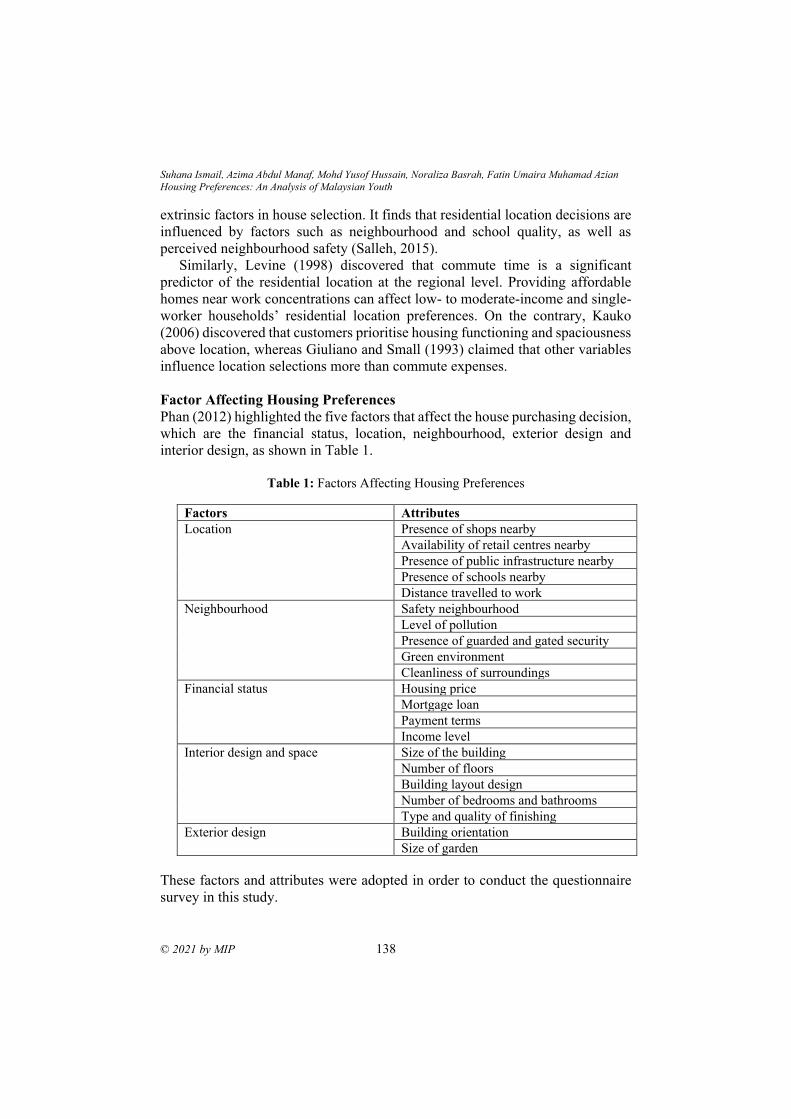
Suhana Ismail, Azima Abdul Manaf, Mohd Yusof Hussain, Noraliza Basrah, Fatin Umaira Muhamad Azian
Housing Preferences: An Analysis of Malaysian Youth
© 2021 by MIP 138
extrinsic factors in house selection. It finds that residential location decisions are
influenced by factors such as neighbourhood and school quality, as well as
perceived neighbourhood safety (Salleh, 2015).
Similarly, Levine (1998) discovered that commute time is a significant
predictor of the residential location at the regional level. Providing affordable
homes near work concentrations can affect low- to moderate-income and single-
worker households’ residential location preferences. On the contrary, Kauko
(2006) discovered that customers prioritise housing functioning and spaciousness
above location, whereas Giuliano and Small (1993) claimed that other variables
influence location selections more than commute expenses.
Factor Affecting Housing Preferences
Phan (2012) highlighted the five factors that affect the house purchasing decision,
which are the financial status, location, neighbourhood, exterior design and
interior design, as shown in Table 1.
Table 1: Factors Affecting Housing Preferences
These factors and attributes were adopted in order to conduct the questionnaire
survey in this study.
Factors Attributes
Location Presence of shops nearby
Availability of retail centres nearby
Presence of public infrastructure nearby
Presence of schools nearby
Distance travelled to work
Neighbourhood Safety neighbourhood
Level of pollution
Presence of guarded and gated security
Green environment
Cleanliness of surroundings
Financial status Housing price
Mortgage loan
Payment terms
Income level
Interior design and space Size of the building
Number of floors
Building layout design
Number of bedrooms and bathrooms
Type and quality of finishing
Exterior design Building orientation
Size of garden
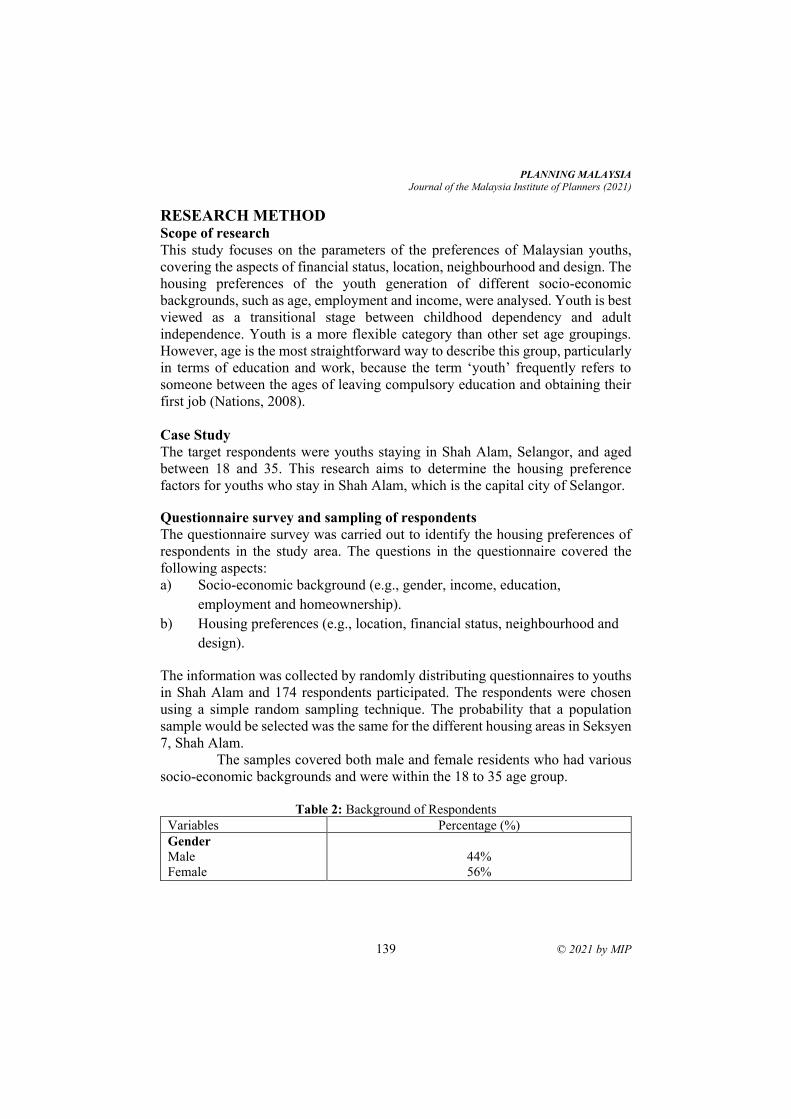
PLANNING MALAYSIA
Journal of the Malaysia Institute of Planners (2021)
139 © 2021 by MIP
RESEARCH METHOD
Scope of research
This study focuses on the parameters of the preferences of Malaysian youths,
covering the aspects of financial status, location, neighbourhood and design. The
housing preferences of the youth generation of different socio-economic
backgrounds, such as age, employment and income, were analysed. Youth is best
viewed as a transitional stage between childhood dependency and adult
independence. Youth is a more flexible category than other set age groupings.
However, age is the most straightforward way to describe this group, particularly
in terms of education and work, because the term ‘youth’ frequently refers to
someone between the ages of leaving compulsory education and obtaining their
first job (Nations, 2008).
Case Study
The target respondents were youths staying in Shah Alam, Selangor, and aged
between 18 and 35. This research aims to determine the housing preference
factors for youths who stay in Shah Alam, which is the capital city of Selangor.
Questionnaire survey and sampling of respondents
The questionnaire survey was carried out to identify the housing preferences of
respondents in the study area. The questions in the questionnaire covered the
following aspects:
a) Socio-economic background (e.g., gender, income, education,
employment and homeownership).
b) Housing preferences (e.g., location, financial status, neighbourhood and
design).
The information was collected by randomly distributing questionnaires to youths
in Shah Alam and 174 respondents participated. The respondents were chosen
using a simple random sampling technique. The probability that a population
sample would be selected was the same for the different housing areas in Seksyen
7, Shah Alam.
The samples covered both male and female residents who had various
socio-economic backgrounds and were within the 18 to 35 age group.
Table 2: Background of Respondents
Variables Percentage (%)
Gender
Male
Female
44%
56%
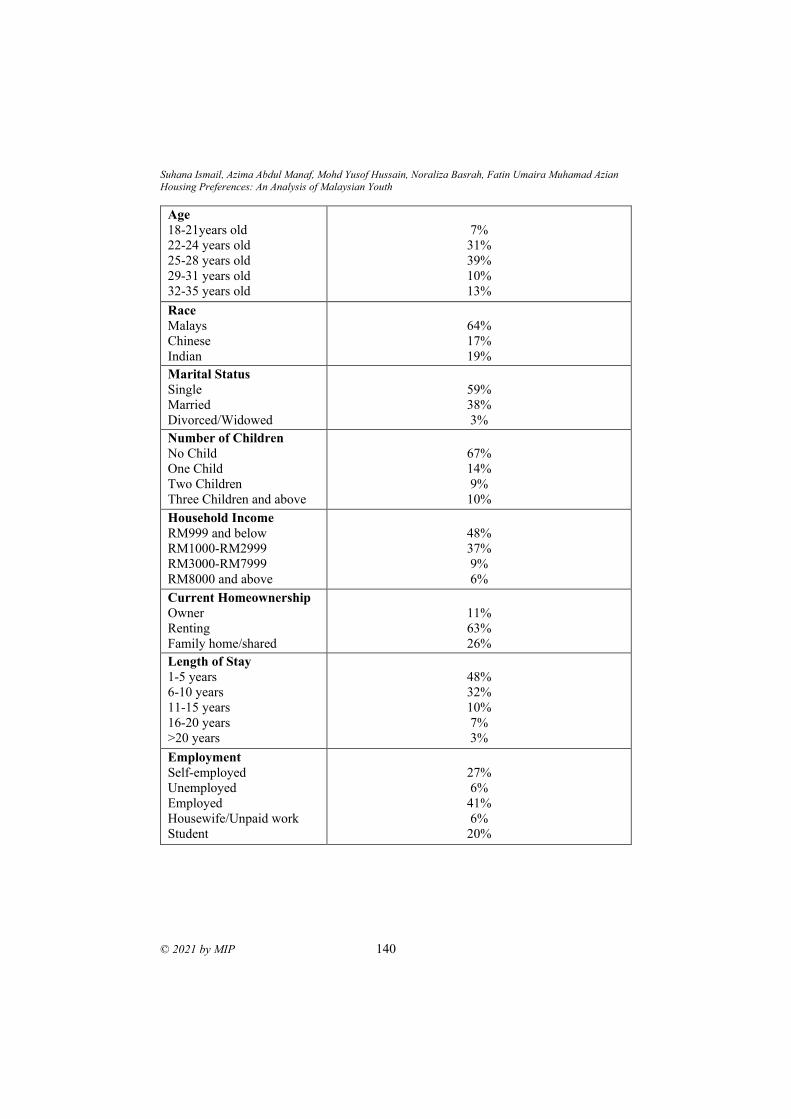
Suhana Ismail, Azima Abdul Manaf, Mohd Yusof Hussain, Noraliza Basrah, Fatin Umaira Muhamad Azian
Housing Preferences: An Analysis of Malaysian Youth
© 2021 by MIP 140
Age
18-21years old
22-24 years old
25-28 years old
29-31 years old
32-35 years old
7%
31%
39%
10%
13%
Race
Malays
Chinese
Indian
64%
17%
19%
Marital Status
Single
Married
Divorced/Widowed
59%
38%
3%
Number of Children
No Child
One Child
Two Children
Three Children and above
67%
14%
9%
10%
Household Income
RM999 and below
RM1000-RM2999
RM3000-RM7999
RM8000 and above
48%
37%
9%
6%
Current Homeownership
Owner
Renting
Family home/shared
11%
63%
26%
Length of Stay
1-5 years
6-10 years
11-15 years
16-20 years
>20 years
48%
32%
10%
7%
3%
Employment
Self-employed
Unemployed
Employed
Housewife/Unpaid work
Student
27%
6%
41%
6%
20%
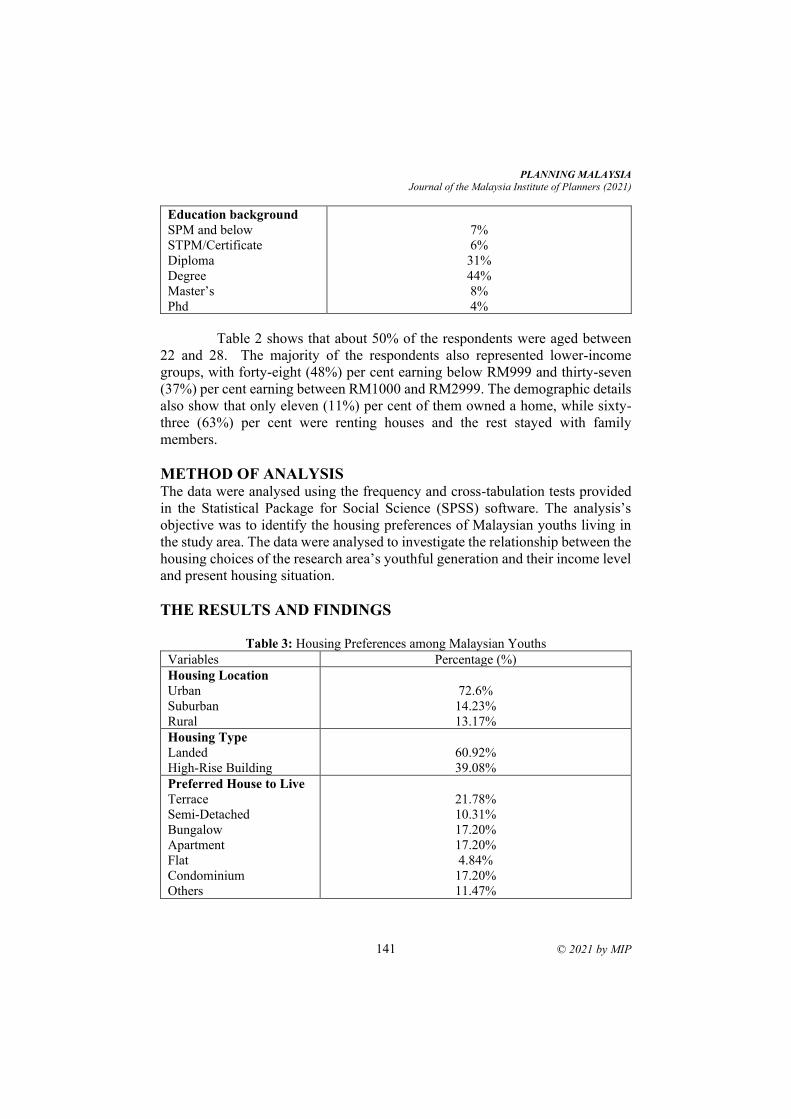
PLANNING MALAYSIA
Journal of the Malaysia Institute of Planners (2021)
141 © 2021 by MIP
Education background
SPM and below
STPM/Certificate
Diploma
Degree
Master’s
Phd
7%
6%
31%
44%
8%
4%
Table 2 shows that about 50% of the respondents were aged between
22 and 28. The majority of the respondents also represented lower-income
groups, with forty-eight (48%) per cent earning below RM999 and thirty-seven
(37%) per cent earning between RM1000 and RM2999. The demographic details
also show that only eleven (11%) per cent of them owned a home, while sixty-
three (63%) per cent were renting houses and the rest stayed with family
members.
METHOD OF ANALYSIS
The data were analysed using the frequency and cross-tabulation tests provided
in the Statistical Package for Social Science (SPSS) software. The analysis’s
objective was to identify the housing preferences of Malaysian youths living in
the study area. The data were analysed to investigate the relationship between the
housing choices of the research area’s youthful generation and their income level
and present housing situation.
THE RESULTS AND FINDINGS
Table 3: Housing Preferences among Malaysian Youths
Variables Percentage (%)
Housing Location
Urban
Suburban
Rural
72.6%
14.23%
13.17%
Housing Type
Landed
High-Rise Building
60.92%
39.08%
Preferred House to Live
Terrace
Semi-Detached
Bungalow
Apartment
Flat
Condominium
Others
21.78%
10.31%
17.20%
17.20%
4.84%
17.20%
11.47%
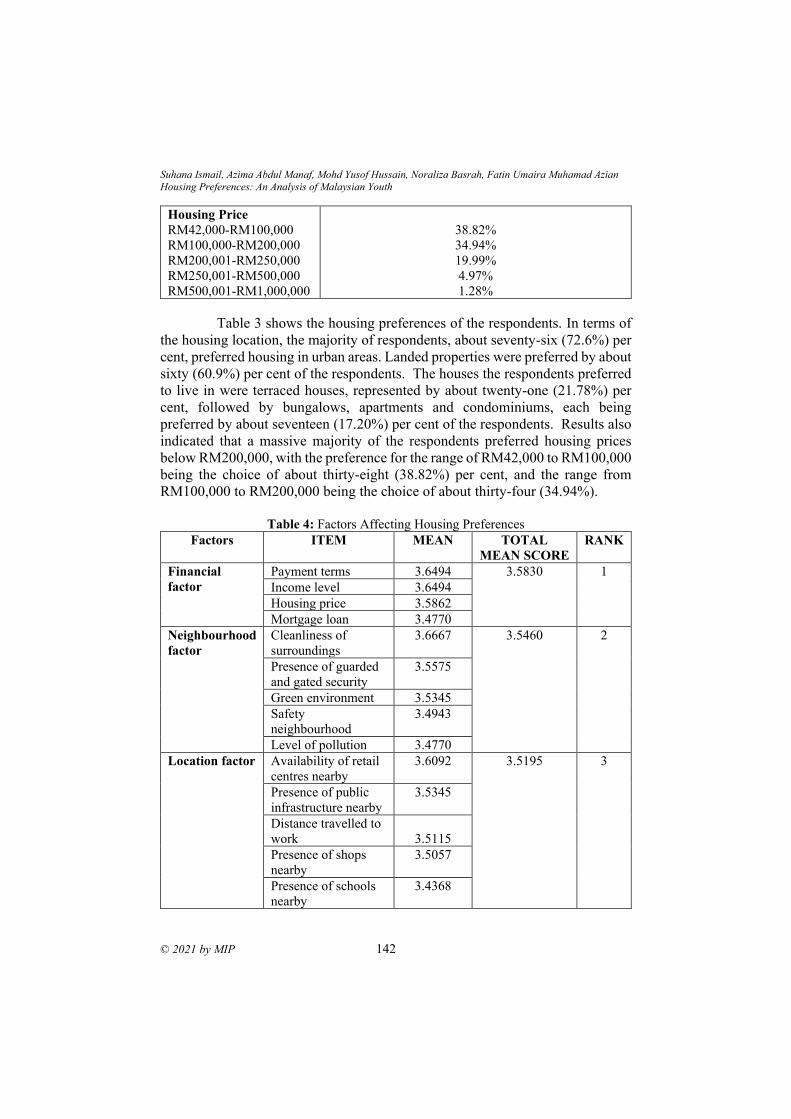
Suhana Ismail, Azima Abdul Manaf, Mohd Yusof Hussain, Noraliza Basrah, Fatin Umaira Muhamad Azian
Housing Preferences: An Analysis of Malaysian Youth
© 2021 by MIP 142
Housing Price
RM42,000-RM100,000
RM100,000-RM200,000
RM200,001-RM250,000
RM250,001-RM500,000
RM500,001-RM1,000,000
38.82%
34.94%
19.99%
4.97%
1.28%
Table 3 shows the housing preferences of the respondents. In terms of
the housing location, the majority of respondents, about seventy-six (72.6%) per
cent, preferred housing in urban areas. Landed properties were preferred by about
sixty (60.9%) per cent of the respondents. The houses the respondents preferred
to live in were terraced houses, represented by about twenty-one (21.78%) per
cent, followed by bungalows, apartments and condominiums, each being
preferred by about seventeen (17.20%) per cent of the respondents. Results also
indicated that a massive majority of the respondents preferred housing prices
below RM200,000, with the preference for the range of RM42,000 to RM100,000
being the choice of about thirty-eight (38.82%) per cent, and the range from
RM100,000 to RM200,000 being the choice of about thirty-four (34.94%).
Table 4: Factors Affecting Housing Preferences
Factors ITEM MEAN TOTAL
MEAN SCORE
RANK
Financial
factor
Payment terms 3.6494 3.5830 1
Income level 3.6494
Housing price 3.5862
Mortgage loan 3.4770
Neighbourhood
factor
Cleanliness of
surroundings
3.6667
3.5460 2
Presence of guarded
and gated security
3.5575
Green environment 3.5345
Safety
neighbourhood
3.4943
Level of pollution 3.4770
Location factor Availability of retail
centres nearby
3.6092
3.5195 3
Presence of public
infrastructure nearby
3.5345
Distance travelled to
work
3.5115
Presence of shops
nearby
3.5057
Presence of schools
nearby
3.4368
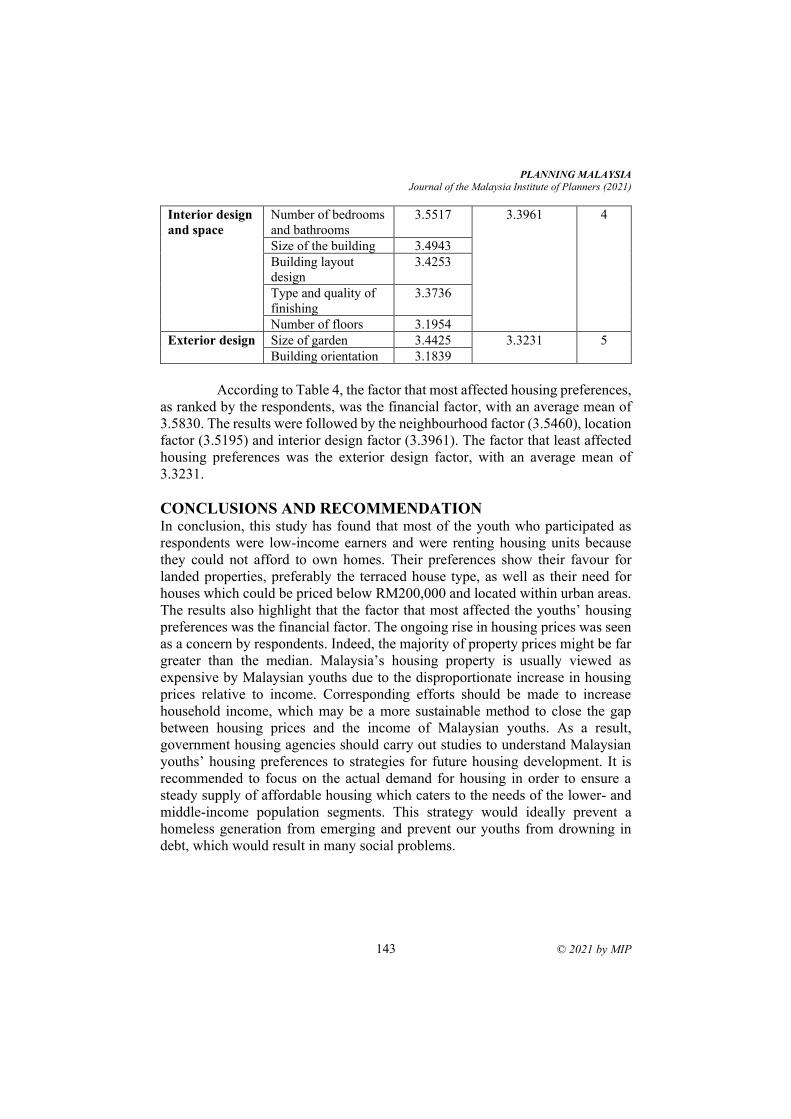
PLANNING MALAYSIA
Journal of the Malaysia Institute of Planners (2021)
143 © 2021 by MIP
Interior design
and space
Number of bedrooms
and bathrooms
3.5517 3.3961 4
Size of the building 3.4943
Building layout
design
3.4253
Type and quality of
finishing
3.3736
Number of floors 3.1954
Exterior design Size of garden 3.4425 3.3231 5
Building orientation 3.1839
According to Table 4, the factor that most affected housing preferences,
as ranked by the respondents, was the financial factor, with an average mean of
3.5830. The results were followed by the neighbourhood factor (3.5460), location
factor (3.5195) and interior design factor (3.3961). The factor that least affected
housing preferences was the exterior design factor, with an average mean of
3.3231.
CONCLUSIONS AND RECOMMENDATION
In conclusion, this study has found that most of the youth who participated as
respondents were low-income earners and were renting housing units because
they could not afford to own homes. Their preferences show their favour for
landed properties, preferably the terraced house type, as well as their need for
houses which could be priced below RM200,000 and located within urban areas.
The results also highlight that the factor that most affected the youths’ housing
preferences was the financial factor. The ongoing rise in housing prices was seen
as a concern by respondents. Indeed, the majority of property prices might be far
greater than the median. Malaysia’s housing property is usually viewed as
expensive by Malaysian youths due to the disproportionate increase in housing
prices relative to income. Corresponding efforts should be made to increase
household income, which may be a more sustainable method to close the gap
between housing prices and the income of Malaysian youths. As a result,
government housing agencies should carry out studies to understand Malaysian
youths’ housing preferences to strategies for future housing development. It is
recommended to focus on the actual demand for housing in order to ensure a
steady supply of affordable housing which caters to the needs of the lower- and
middle-income population segments. This strategy would ideally prevent a
homeless generation from emerging and prevent our youths from drowning in
debt, which would result in many social problems.
Suhana Ismail, Azima Abdul Manaf, Mohd Yusof Hussain, Noraliza Basrah, Fatin Umaira Muhamad Azian
Housing Preferences: An Analysis of Malaysian Youth
© 2021 by MIP 144
REFERENCES Al-Homoud, Majd. 2009. “Privacy Control as a Function of Personal Space in Single-
Family Homes in Jordan.” Journal of Design and the Built Environment 5 (1): 31–
48.
Al-Momani, Ayman H & P O Box. 2000. “Structuring Information on Residential
Building: A Model of Preference,” 179–90.
Berko, Lale. 2000. “Residential-Location Preferences According to Demographic
Characteristics in Istanbul” 48.
Chin, Kok San (2016) Attributes Influencing Home Buyers’ Purchase Decision: A Study
of Residential Property in Setia Alam. Master dissertation/thesis, UTAR.
D.Wang & S.-m.Li. 2006 “Socio-Economic Differentials and Stated Housing Preferences
in Guangzhou, China”. Habitat International 30 (2006) 305–326.
Giuliano, G., & Small, K. A. (1993). Is the journey to work explained by urbanstructure?
Urban Studies, 30(9), 1485–1500.
Harold W.Elder. 1991. “Tenure Choice, Housing Demand and Residential Location.”
Journal of Real Estate Research, American Real Estate Society.
Heath, Sue. 2008. “Housing Choices and Issues for Youth in the UK.” Joseph Rowntree
Foundation, York, no. November: 1–41.
Hoek J, Thrul J, Ling P. Qualitative analysis ofyoung adult ENDS users’expectations and
experiences.BMJOpen2017;7:e014990.doi:10.1136/bmjopen-2016-014990
Hong, Teck. 2011. “Munich Personal RePEc Archive Home Owning Motivation in
Malaysia,” no. 34906.
Junaidi AB, Rosmadi F, Amer SG (2012) Penilaian awal impak perlaksanaan Dasar
Perumahan Negara terhadap sektor perumahan di Kuala Lumpur. Geografia-
Malaysian Journal of Society and Space8(6), 90-108.
Karsten, Lia. 2007. “Housing as a Way of Life: Towards an Understanding of Middle-
Class Families’ Preference for an Urban Residential Location.” Housing Studies
22 (1): 83–98. https://doi.org/10.1080/02673030601024630.
Kauko, T. (2006). Expressions of housing consumer preferences: proposition fora
research agenda. Housing, Theory and Society, 23(2), 92–108.
Levine, J. (1998). Rethinking accessibility and jobs-housing balance. Journal of
theAmerican Planning Association, 64(2), 133–149.
Ling, Oliver, Hoon Leh, Nurul Amanina Mansor, Siti Nur Afiqah, and Mohamed
Musthafa. 2016. “The Housing Preference of Youth in Malaysian Urban Areas: A
Case Study Subang Jaya, Selangor.” http://journalarticle.ukm.my/10325/1/6x.full-
geo-mei16-oliver-edam.pdf.
NA Salleh, S Abd Zoher, SA Mahayuddin, Y Abdul, 2015. “Influencing Factors of
Property Buyer in Hillside Residential Development.” Procedia-Social and
Behavioral Sciences 170: 586–95.
Nations, The United. 2008. “Definition of Youth,” 2007–9.
Nor Suzylah Sohaimi, Alias Abdullah, Shuid S, Azila Ahmad Sarkawi (2017). Young
Professionals Housing Affordability Through Housing Preferences in Kuala
Lumpur And A Review on The Means-End Chain Model Vol 15: Planning
Malaysia Journal: Volume 15, Issue 1, 2017.
PLANNING MALAYSIA
Journal of the Malaysia Institute of Planners (2021)
145 © 2021 by MIP
Olugbenga Taiwo, David, 2018. “Housing Preferences and Choice in Emerging Cities of
Developing Countries.” Journal of Advanced Research in Applied Sciences and
Engineering Technology Journal Homepage 10: 48–58.
Opoku, Robert A., and Alhassan G. Abdul-Muhmin. 2010. “Housing Preferences and
Attribute Importance among Low-Income Consumers in Saudi Arabia.” Habitat
International 34 (2): 219–27. https://doi.org/10.1016/j.habitatint.2009.09.006.
P Thanaraju, PAM Khan, NH Juhari, S Sivanathan, NM Khair 2019. “Factors Affecting
the Housing Preferences of Homebuyers in Kuala Lumpur.” Planning Malaysia
17 (1): 138–48. https://doi.org/10.21837/pmjournal.v17.i9.593.
PAM Khan, A Azmi, NH Juhari, N Khair, SZ Daud 2017. “Housing Preference for First
Time Home Buyer in Malaysia.” International Journal of Real Estate Studies. Vol.
11. Number 2, 2017.
Phan Than Si. 2012. “Key Factors Affecting House Purchase Decision of Customers in
Vietnam” 2012 (8): 1–30.
Poh Im, Lim & Yun Fah, Chang, Preference of residential typologies for urban
Malaysians, Planning Malaysia Journal, Volume 16 Issue 3 (2018).
R Kömürlü, AP Gürgün, D Arditi 2013. “Drivers of Residential Developers’ Marketing
Strategies Based on Buyer Preferences: Konut Üreticilerinin Pazarlama
Stratejilerini Yönlendiren Konut Alicisi Tercihleri.” Metu Journal of the Faculty
of Architecture 30 (2): 1–16. https://doi.org/10.4305/METU.JFA.2013.2.1.
Rossi PH & Weber E (1980) The social benefits of homeownership: Empirical evidence
from national survey. Housing Policy Debates.
Shi, Lin. 2000. “Housing Preferences of Residents in Stellenbosch, Master In Consumer
Science (Housing).”
Star, The. n.d. “Minister: Study on ‘Youth City’ to Begin next Year | The Star Online.”
Accessed November 11, 2019.
Wu, Xiaogang. 2010. “Central Policy Unit the Government of the Hong Kong Special
Administrative Region Hong Kong” S Post-80S Generation: Profiles and
Predicaments the Hong Kong University of Science & Technology May 2010,”
no. May.
Zaimah, R, Sarmila Ms, Azima Am, Suhana Saad, Mohd Yusof Hussain, and N Lyndon.
2012. The Youth Well-Being: A Case Study of Malaysian Public Sector
Employees” 6 (6): 150–56.
Received: 12th July 2021. Accepted: 17th Sept 2021
1 Senior Lecturer at Tunku Abdul Rahman University College. Email: [email protected]
PLANNING MALAYSIA:
Journal of the Malaysian Institute of Planners
VOLUME 19 ISSUE 3 (2021), Page 146 – 156
REVEALING THE INVESTMENT VALUE OF PENANG
HERITAGE PROPERTIES
Chin Tiong Cheng1, Yan Bin Tan2, Wai Fang Wong3, Kong Seng Lai4, Koh
Yu Xuan5
1,3,4 Centre for Construction Research (CCR)
2 Centre for Data Science and Analytics 1,3,4Faculty of Built Environment
2Faculty of Computing and Information Technology
TUNKU ABDUL RAHMAN UNIVERSITY COLLEGE
Abstract
Heritage buildings are a representation of historic features and the Malaysian
culture. The intangible value of a heritage property comprises aesthetic quality,
spiritual aspects, social functions, and its own uniqueness. Therefore, heritage
properties have been seen to be moving away from traditional alternative
investments, which are not covered by conventional real estate schemes.
Additionally, the characteristics of heritage properties are expected to be seen as
‘art’, and they offer a highly beneficial diversification strategy with a relatively
low correlation towards traditional assets classes. The Penang (Island) Heritage
Property Price Index (PPHPPI) is estimated to be using a hedonic regression
method. Based on the index, the heritage property records the highest quarterly
returns and risk among the conventional assets considered in this study.
Keywords: Heritage property, investment, price index, diversification
PLANNING MALAYSIA
Journal of the Malaysia Institute of Planners (2021)
147 © 2021 by MIP
INTRODUCTION Real property is viewed as a conservative investment asset because it is more
resilient to short term volatility in economic conditions. Based on past studies,
property investment had been used to hedge against the inflation of a particular
country. The property types included residential (Li and Ge, 2008; Lee, 2014),
commercial (Limmack and Ward, 1988; Newell, 1996; Fraser, Leishman and
Tarbert, 2002; Leung, 2010) and industrial (Tarbert, 1996). Therefore, most of
the investors preferred to invest in such properties in order to diversify the risk of
investment. Tan and Ting (2004) found that Malaysia had allocated about 50%-
65% of the available capital for investing in residential property. According to
the National Property Information Centre (NAPIC) (2019), the total value of
property transactions were worth RM 68.30 billion in the first half of 2019. The
large amount of transaction value showed the significance of the property sector
towards Malaysia’s economy. Additionally, the three folds increase of pre-war
properties prices in Georgetown, Penang, has gained the attention of the
practitioners since its recognition as a UNESCO World Heritage in 2008 (The
Edge 2017).
RESEARCH BACKGROUND In year 2008, UNESCO World Heritage had recognised Georgetown as one of
the heritage cities in Malaysia. In order to manage the heritage buildings
effectively, the local government had subsequently divided the heritage area into
core zone and buffer zone. Besides, the landlords who intended to restore the
condition of the heritage buildings in these zones, they are required to obtain the
approval from the local authorities (Heritage Department of the Penang Island
City Council). Jasme et.al (2014) stated that the guidelines in preserving the pre-
war properties included forecourt, roof, external, and internal parts of the
building. According to Lum (2018) and Rahman (2018), some of the landlords of
these heritage properties transformed the old buildings into much more valuable
properties. For instance, cafés, boutique hotels, restaurants, and others. There are
only 4,665 units of heritage buildings in the core zone and buffer zones, with a
size of 109.38 hectares and 150.04 hectares respectively, in Penang (Jasme
et.al.,2014). Hence, the property value of heritage buildings have been rising
faster than unprotected or undefined buildings, due to the limited supply of
heritage buildings (Gilderbloom et.al.,2009).
The conventional property investment in terms of risk and returns have
been widely discussed in previous studies. However, the heritage properties have
been given less attention in the developing investment portfolio. For example,
there are some studies which explored the factors which influenced the price of
these heritage properties (Shipley, 2000; Ashworth, 2002; Kouwenberg and
Zwinkels, 2014; Lazrak et al., 2014). Some research was conducted on the
conservation of heritage properties in order to protect its value (Billington, 2004;
Chin Tiong Cheng, Yan Bin Tan, Wai Fang Wong, Kong Seng Lai, Koh Yu Xuan
Revealing The Investment Value of Penang Heritage Properties
© 2021 by MIP 148
Samadi and Yunus, 2012; Tokede, Udawatta and Luther, 2018). The conservation
of heritage properties is necessary because these buildings can produce aesthetic
and spiritual value which cannot be found in the conventional properties such as
terrace houses, apartments, etc (Cores, Assets and Development, 2012; Halim
and Tambi,2021). Moreover, Shipley (2000) claimed that the heritage properties
were able to outperform the general market trend in terms of sales rate and value,
especially during the economic downturns. This result was also supported by Mat
Zin et.al (2018), from which there was evidence of an increasing trend in the price
per square foot for the heritage shophouses in the long run. Hence, this study
hypothesised that the heritage buildings shared the characteristics of art, from
which the heritage property was embedded as an intangible value. Therefore, the
correlation between heritage property and traditional asset classes were expected
to be low.
Furthermore, it is important to construct a price index for measuring the
performance of the Penang heritage properties, but the construction of such
heritage property price indexes is indeed complicated due to the heterogeneous
characteristics of these properties in terms of location and land size. The property
price index should be effectively captured in the price change based on the supply
and demand forces, rather than the quality change in each transacted period
(Rosen, 1974). The quality change of the transacted properties must be controlled
in order to avoid the price index from being overstated or understated in the price
change across every period. Lazrak et al (2014) adopted the spatial autoregressive
model to investigate the impact of cultural heritage on the value of the real estate
in the cities. Both structural and spatial characteristics of the property were used
to construct the model. The study found that the structural characteristics (e.g.
number of rooms, floor space, and capacity) and spatial characteristics (e.g.
population density, percentage ethnic, and proportion of water areas) had a
significant impact on the property’s value. According to the study, it is crucial to
identify significant variables in the hedonic price index model in order to avoid
the model being mis specified, or overfitted.
According to NAPIC (2019), there are several published indices for the
housing sector, such as terraced, high-rise, detached, and semi-detached. Ting
et.al (2007) conducted a study on the real estate returns using the published
indices, and they found that the property market in Malaysia is relatively
homogeneous. The diversification effect in the portfolio is not established across
property type and geographical region. In terms of commercial properties,
Callender et.al (2007) claimed that the risk reduction in the commercial property
investment can be realised with a portfolio of 30-50 properties. Furthermore,
previous studies on the commercial property market in the United Kingdom
showed that the log returns and standard deviations of the transaction-based rental
series were estimated to be 15.60 percent and 35.64 percent, respectively (Patel
and Sing, 2000). Brown & Matysiak (1995) stressed that there was a correlation
PLANNING MALAYSIA
Journal of the Malaysia Institute of Planners (2021)
149 © 2021 by MIP
between a reliable property index, and the performance measurement. In other
words, a reliable price index is needed to yield precise measurements on the risk
and return of such a property. The study indicated that the price index is an
effective indicator in terms of making strategic decisions. However, the
investigation on the investment performance of such heritage properties were not
possible without the presence of heritage property price indexes.
The computation of risk and return for every asset is crucial in
developing an investment portfolio. The risk of an investment asset can be
measured based on its variance or standard deviation. Elton & Gruber (1997)
pointed out that the Markowitz Modern Portfolio Theory had considered the
trade-off between the mean and variance of the assets. The theory aimed to
maximise the expected return, and minimise the variance of the portfolio through
the formulation of an efficient frontier. Thereafter, it was adopted to improve
conventional investment portfolio that consists of shares, real estate security,
bonds, cash, commodity, real estate and etc. (Ghazali et.al., 2015; Hiang Liow
& Adair, 2009; Jin, Grissom, & Ziobrowski, 2007; Lee, 2007). Furthermore, a
few studies found that artwork could be included for reducing the risk in an
investment portfolio. It was mainly contributed by low correlation on return
between artwork and financial assets. (Worthington and Higgs, 2004; Campbell,
2009). Therefore, it would be interesting to assess the aesthetic value of heritage
properties from the aspect of investment. (de la Torre, 2013). Apart from that,
the conservation of a historic core can also distinguish the city from competing
locations (both national and international), in order to attract investment and
talented people.
RESEARCH METHODOLOGY This study listed 1084 transacted Georgetown pre-war properties from 2009Q1
until 2018Q4 (10 years or 40 quarters) for constructing a Penang (Island) Heritage
Property Price Index (PPHPPI). It was used to evaluate the performance of the
heritage property market in Penang’s Georgetown over the past 10 years. The raw
transaction data underwent data cleaning before the construction of a price index.
It is important to ensure that the transacted value qualified within the definition
of market value, and that the non-arm’s length transactions were removed from
the price index basket. In addition, this study only included the pre-war properties
that held a freehold status, because the transaction volume of the leasehold
properties were very low and not significant. Besides, the transacted value was
based on the individual share of the property. The land size, location, and
transacted months were collected from the raw transaction data, correlated
(positive or negative) with the heritage property prices based on the statistical
results.
The Hedonic Regression Method (HRM) is a fundamental approach in
developing a price index model for heritage properties, as it is useful in
Chin Tiong Cheng, Yan Bin Tan, Wai Fang Wong, Kong Seng Lai, Koh Yu Xuan
Revealing The Investment Value of Penang Heritage Properties
© 2021 by MIP 150
overcoming the quality change of the properties across the period. Moreover, this
technique had been widely used in determining the contribution of different
characteristics on house price, wage levels, and environmental quality (Palmquist
et.al., 2001). The approach can be further extended to a Hedonic Time-Dummy
Regression Method (HTDRM) for computing the Heritage Property Price Index
Model (HPPIM) (Haan and Diewert, 2013). The price index is computed by the
estimated pooled time dummy regression equation. The negative or positive value
of the time dummy parameter indicates the effect of “time” on the logarithm of
the price. The value of the price index is estimated from the model by
exponentiating the time dummy coefficient. It provides a quality adjusted price
change between the base period 0, and each comparison period, t. HTDRM can
then be integrated within the Spatial Longitudinal Hedonic Model (SLHM) for
capturing the variability of the property price due its location (Clapp, 2004). The
heritage property price index model to be adopted in this study is illustrated as
follows:
𝑙𝑛 𝑆𝑃𝑖𝑡 = 𝑄𝑈𝐴𝑅𝑇𝐸𝑅𝑖𝑡𝛾 + 𝑙𝑛𝐿𝐴𝑁𝐷𝑖𝑡𝛽 + 𝛾1𝑙𝑎𝑡𝑖𝑡 + 𝛾2𝑙𝑜𝑛𝑖𝑡 + 𝛾3𝑙𝑎𝑡𝑖𝑡2 + 𝛾4𝑙𝑜𝑛𝑖𝑡
2
+ 𝛾5𝑙𝑎𝑡𝑙𝑜𝑛𝑖𝑡 + 𝜀𝑖𝑡
The dependent variable in this model is the transacted price in the logarithmic
form (ln SP), and follows the independent variables such as the time parameter
(QUARTER), land area of the transacted property in the logarithmic form (ln
LAND), and the polynomial expansion of the locational variables (lat=latitude
and lon=longitude). The price index of each quarter is obtained by exponentiating
the coefficient of the time parameter.
The investment performance among several asset classes such as
REITs, Stocks (KLCI), the Penang (Island) Terrace House Price Index (PPTHPI),
Penang High Rise Unit Price Index (PPHRPI) and Penang (Island) Heritage
Property Price Index (PPHPPI) were investigated in this study. The comparison
study comprised of the expected risk and return of the respective assets.
Additionally, the quality of the investment asset was examined by using the
Sharpe ratio. The high value of the Sharpe ratio was preferred in the selection of
the investment asset. The Sharpe ratio (SP) was derived from the division of the
portfolio’s expected return (Rp ) in terms of the excess of risk-free rate (Rf
) by its
expected standard deviation (σP) . It can be represented through the formula
below (Best et.al., 2007).
SP =Rp − Rf
σP
The expected return of every asset was calculated based on its average quarterly
return over the 10-year price change. The standard deviation or risk of the
quarterly return for 5 different assets in this study were estimated. The average
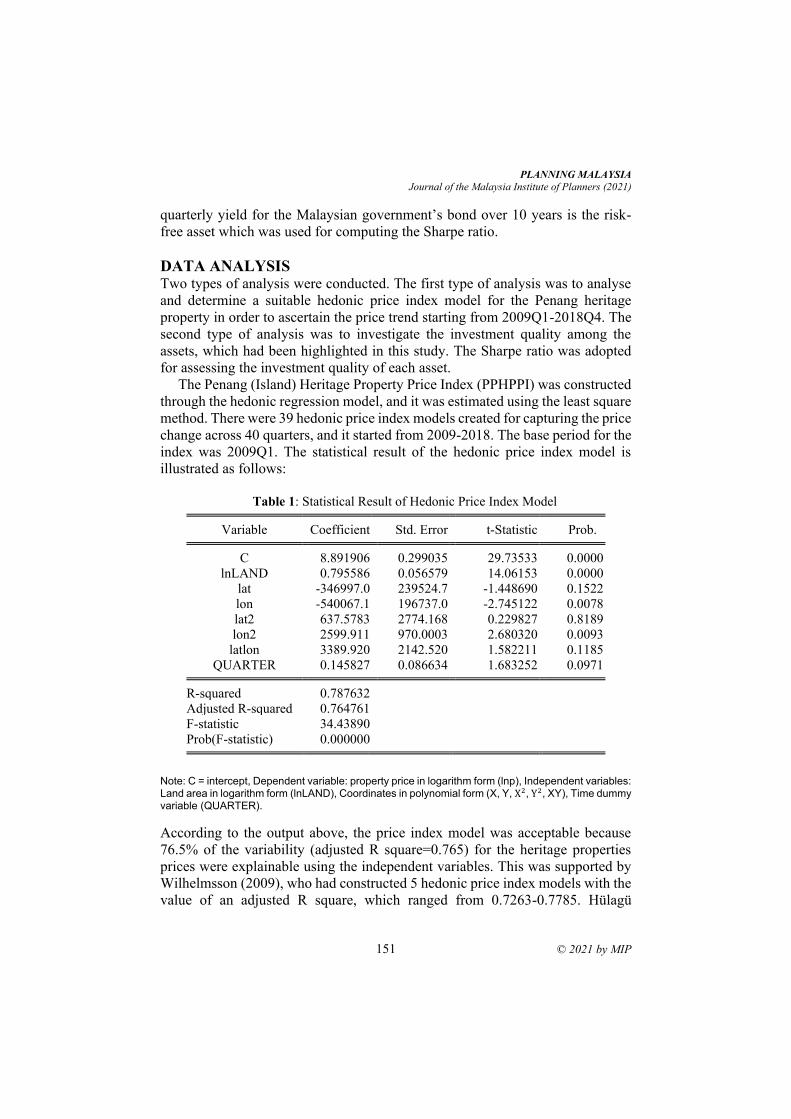
PLANNING MALAYSIA
Journal of the Malaysia Institute of Planners (2021)
151 © 2021 by MIP
quarterly yield for the Malaysian government’s bond over 10 years is the risk-
free asset which was used for computing the Sharpe ratio.
DATA ANALYSIS Two types of analysis were conducted. The first type of analysis was to analyse
and determine a suitable hedonic price index model for the Penang heritage
property in order to ascertain the price trend starting from 2009Q1-2018Q4. The
second type of analysis was to investigate the investment quality among the
assets, which had been highlighted in this study. The Sharpe ratio was adopted
for assessing the investment quality of each asset.
The Penang (Island) Heritage Property Price Index (PPHPPI) was constructed
through the hedonic regression model, and it was estimated using the least square
method. There were 39 hedonic price index models created for capturing the price
change across 40 quarters, and it started from 2009-2018. The base period for the
index was 2009Q1. The statistical result of the hedonic price index model is
illustrated as follows:
Table 1: Statistical Result of Hedonic Price Index Model
Variable Coefficient Std. Error t-Statistic Prob.
C 8.891906 0.299035 29.73533 0.0000
lnLAND 0.795586 0.056579 14.06153 0.0000
lat -346997.0 239524.7 -1.448690 0.1522
lon -540067.1 196737.0 -2.745122 0.0078
lat2 637.5783 2774.168 0.229827 0.8189
lon2 2599.911 970.0003 2.680320 0.0093
latlon 3389.920 2142.520 1.582211 0.1185
QUARTER 0.145827 0.086634 1.683252 0.0971
R-squared 0.787632
Adjusted R-squared 0.764761
F-statistic 34.43890
Prob(F-statistic) 0.000000
Note: C = intercept, Dependent variable: property price in logarithm form (lnp), Independent variables: Land area in logarithm form (lnLAND), Coordinates in polynomial form (X, Y, X2, Y2, XY), Time dummy variable (QUARTER).
According to the output above, the price index model was acceptable because
76.5% of the variability (adjusted R square=0.765) for the heritage properties
prices were explainable using the independent variables. This was supported by
Wilhelmsson (2009), who had constructed 5 hedonic price index models with the
value of an adjusted R square, which ranged from 0.7263-0.7785. Hülagü
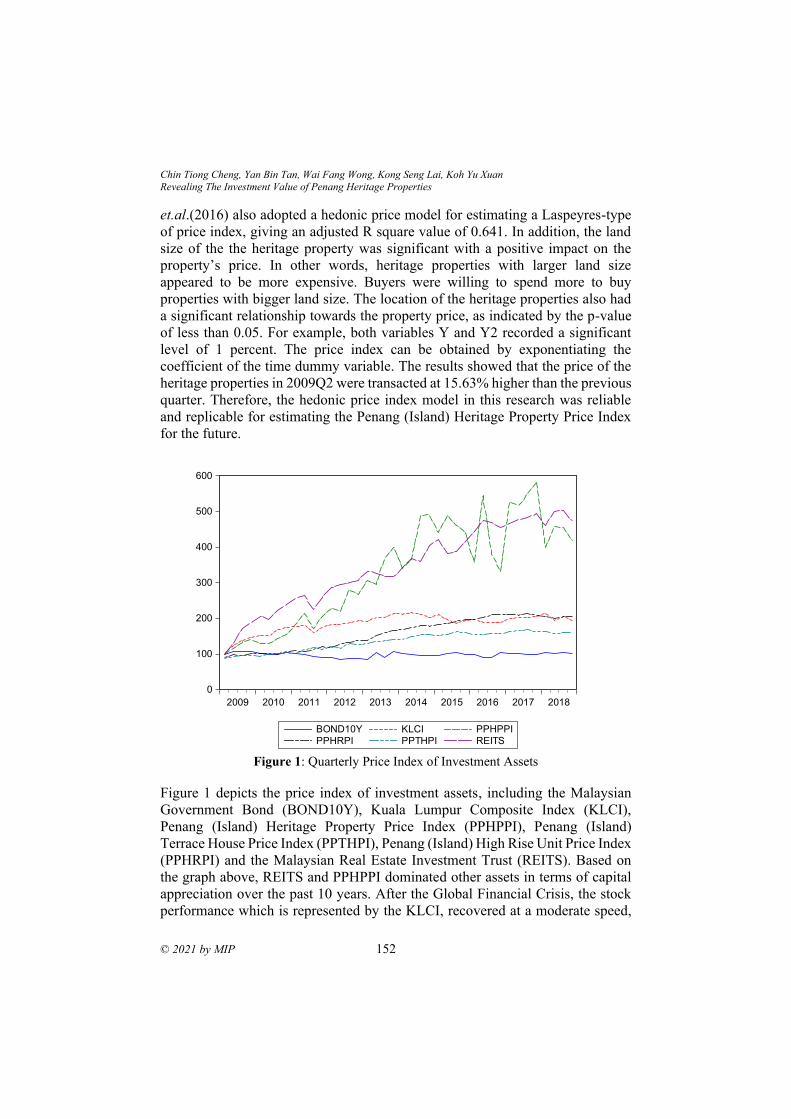
Chin Tiong Cheng, Yan Bin Tan, Wai Fang Wong, Kong Seng Lai, Koh Yu Xuan
Revealing The Investment Value of Penang Heritage Properties
© 2021 by MIP 152
et.al.(2016) also adopted a hedonic price model for estimating a Laspeyres-type
of price index, giving an adjusted R square value of 0.641. In addition, the land
size of the the heritage property was significant with a positive impact on the
property’s price. In other words, heritage properties with larger land size
appeared to be more expensive. Buyers were willing to spend more to buy
properties with bigger land size. The location of the heritage properties also had
a significant relationship towards the property price, as indicated by the p-value
of less than 0.05. For example, both variables Y and Y2 recorded a significant
level of 1 percent. The price index can be obtained by exponentiating the
coefficient of the time dummy variable. The results showed that the price of the
heritage properties in 2009Q2 were transacted at 15.63% higher than the previous
quarter. Therefore, the hedonic price index model in this research was reliable
and replicable for estimating the Penang (Island) Heritage Property Price Index
for the future.
Figure 1: Quarterly Price Index of Investment Assets
Figure 1 depicts the price index of investment assets, including the Malaysian
Government Bond (BOND10Y), Kuala Lumpur Composite Index (KLCI),
Penang (Island) Heritage Property Price Index (PPHPPI), Penang (Island)
Terrace House Price Index (PPTHPI), Penang (Island) High Rise Unit Price Index
(PPHRPI) and the Malaysian Real Estate Investment Trust (REITS). Based on
the graph above, REITS and PPHPPI dominated other assets in terms of capital
appreciation over the past 10 years. After the Global Financial Crisis, the stock
performance which is represented by the KLCI, recovered at a moderate speed,
0
100
200
300
400
500
600
2009 2010 2011 2012 2013 2014 2015 2016 2017 2018
BOND10Y KLCI PPHPPI
PPHRPI PPTHPI REITS
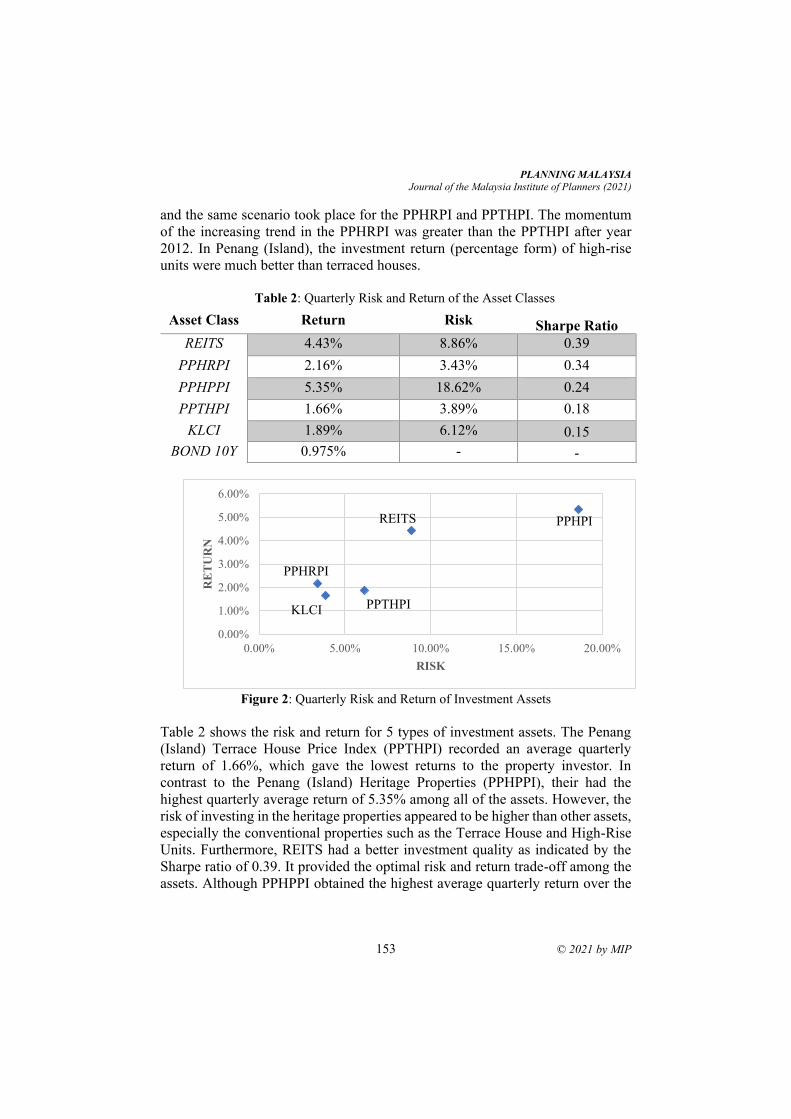
PLANNING MALAYSIA
Journal of the Malaysia Institute of Planners (2021)
153 © 2021 by MIP
and the same scenario took place for the PPHRPI and PPTHPI. The momentum
of the increasing trend in the PPHRPI was greater than the PPTHPI after year
2012. In Penang (Island), the investment return (percentage form) of high-rise
units were much better than terraced houses.
Table 2: Quarterly Risk and Return of the Asset Classes
Asset Class Return Risk Sharpe Ratio
REITS 4.43% 8.86% 0.39
PPHRPI 2.16% 3.43% 0.34
PPHPPI 5.35% 18.62% 0.24
PPTHPI 1.66% 3.89% 0.18
KLCI 1.89% 6.12% 0.15
BOND 10Y 0.975% - -
Figure 2: Quarterly Risk and Return of Investment Assets
Table 2 shows the risk and return for 5 types of investment assets. The Penang
(Island) Terrace House Price Index (PPTHPI) recorded an average quarterly
return of 1.66%, which gave the lowest returns to the property investor. In
contrast to the Penang (Island) Heritage Properties (PPHPPI), their had the
highest quarterly average return of 5.35% among all of the assets. However, the
risk of investing in the heritage properties appeared to be higher than other assets,
especially the conventional properties such as the Terrace House and High-Rise
Units. Furthermore, REITS had a better investment quality as indicated by the
Sharpe ratio of 0.39. It provided the optimal risk and return trade-off among the
assets. Although PPHPPI obtained the highest average quarterly return over the
0.00%
1.00%
2.00%
3.00%
4.00%
5.00%
6.00%
0.00% 5.00% 10.00% 15.00% 20.00%
RE
TU
RN
RISK
KLCI
PPHRPI
PPTHPI
REITS PPHPI
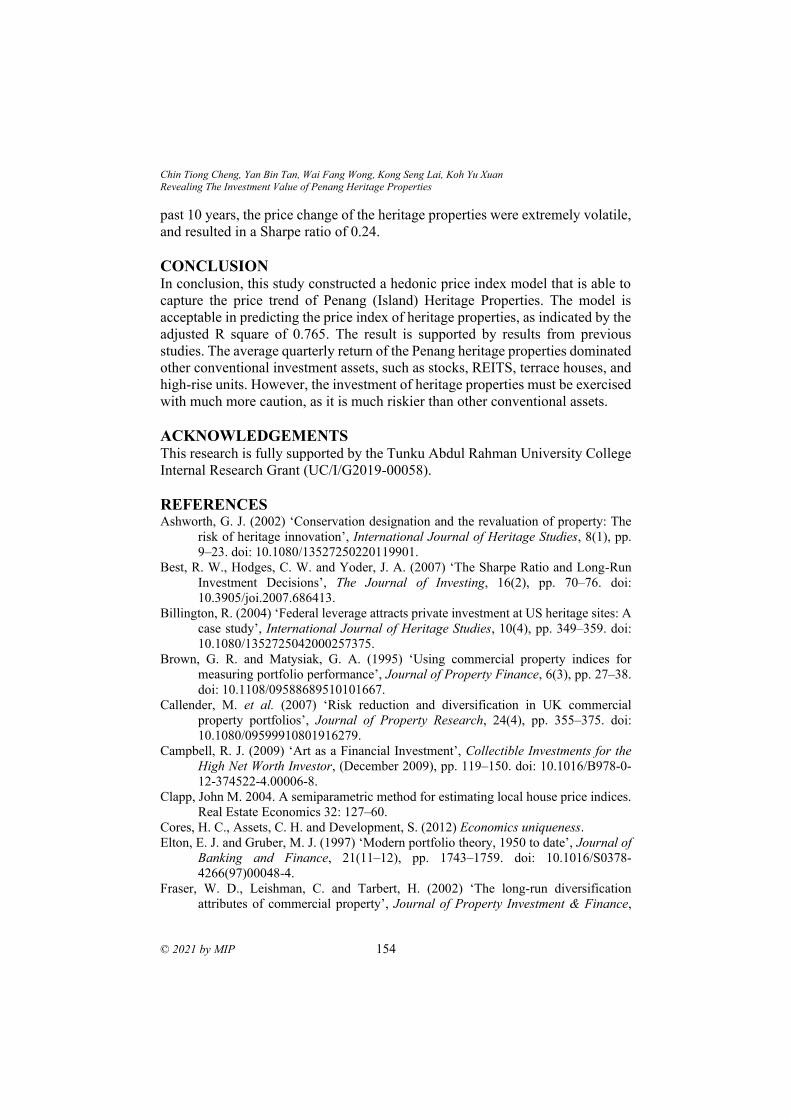
Chin Tiong Cheng, Yan Bin Tan, Wai Fang Wong, Kong Seng Lai, Koh Yu Xuan
Revealing The Investment Value of Penang Heritage Properties
© 2021 by MIP 154
past 10 years, the price change of the heritage properties were extremely volatile,
and resulted in a Sharpe ratio of 0.24.
CONCLUSION
In conclusion, this study constructed a hedonic price index model that is able to
capture the price trend of Penang (Island) Heritage Properties. The model is
acceptable in predicting the price index of heritage properties, as indicated by the
adjusted R square of 0.765. The result is supported by results from previous
studies. The average quarterly return of the Penang heritage properties dominated
other conventional investment assets, such as stocks, REITS, terrace houses, and
high-rise units. However, the investment of heritage properties must be exercised
with much more caution, as it is much riskier than other conventional assets.
ACKNOWLEDGEMENTS
This research is fully supported by the Tunku Abdul Rahman University College
Internal Research Grant (UC/I/G2019-00058).
REFERENCES Ashworth, G. J. (2002) ‘Conservation designation and the revaluation of property: The
risk of heritage innovation’, International Journal of Heritage Studies, 8(1), pp.
9–23. doi: 10.1080/13527250220119901.
Best, R. W., Hodges, C. W. and Yoder, J. A. (2007) ‘The Sharpe Ratio and Long-Run
Investment Decisions’, The Journal of Investing, 16(2), pp. 70–76. doi:
10.3905/joi.2007.686413.
Billington, R. (2004) ‘Federal leverage attracts private investment at US heritage sites: A
case study’, International Journal of Heritage Studies, 10(4), pp. 349–359. doi:
10.1080/1352725042000257375.
Brown, G. R. and Matysiak, G. A. (1995) ‘Using commercial property indices for
measuring portfolio performance’, Journal of Property Finance, 6(3), pp. 27–38.
doi: 10.1108/09588689510101667.
Callender, M. et al. (2007) ‘Risk reduction and diversification in UK commercial
property portfolios’, Journal of Property Research, 24(4), pp. 355–375. doi:
10.1080/09599910801916279.
Campbell, R. J. (2009) ‘Art as a Financial Investment’, Collectible Investments for the
High Net Worth Investor, (December 2009), pp. 119–150. doi: 10.1016/B978-0-
12-374522-4.00006-8.
Clapp, John M. 2004. A semiparametric method for estimating local house price indices.
Real Estate Economics 32: 127–60.
Cores, H. C., Assets, C. H. and Development, S. (2012) Economics uniqueness.
Elton, E. J. and Gruber, M. J. (1997) ‘Modern portfolio theory, 1950 to date’, Journal of
Banking and Finance, 21(11–12), pp. 1743–1759. doi: 10.1016/S0378-
4266(97)00048-4.
Fraser, W. D., Leishman, C. and Tarbert, H. (2002) ‘The long-run diversification
attributes of commercial property’, Journal of Property Investment & Finance,
PLANNING MALAYSIA
Journal of the Malaysia Institute of Planners (2021)
155 © 2021 by MIP
20(4), pp. 354–373. doi: 10.1108/14635780210435047.
Ghazali, M. F., Lean, H. H. and Bahari, Z. (2015) ‘Sharia compliant gold investment in
Malaysia: Hedge or safe haven?’, Pacific Basin Finance Journal.
Elsevier B.V., 34, pp. 192–204. doi: 10.1016/j.pacfin.2014.12.005.
Gilderbloom, J. I., Hanka, M. J. and Ambrosius, J. D. (2009) ‘Historic preservation’s
impact on job creation, property values, and environmental sustainability’,
Journal of Urbanism, 2(2), pp. 83–101. doi: 10.1080/17549170903056821.
‘Handbook on Residential Property Price Indices’ (2013) Handbook on Residential
Property Price Indices. doi: 10.1787/9789264197183-en.
Halim, U. L., & Tambi, N. (2021). Awareness Of Community On The Conservation Of
Heritage Buildings In George Town, Penang. Planning Malaysia, 19(1), pp. 114–
126. doi:10.21837/pm.v19i15.929
Hiang Liow, K. and Adair, A. (2009) ‘Do Asian real estate companies add value to
investment portfolio?’, Journal of Property Investment and Finance, 27(1), pp.
42–64. doi: 10.1108/14635780910926667.
Hülagü, T. et al. (2016) ‘A Hedonic House Price Index for Turkey’, (03), pp. 1–22.
Jasme, N., Othuman Mydin, M. A. and Sani, N. M. (2014) ‘Investigation of Adaptive
Reuse of Heritage Buildings in Penang’, SHS Web of Conferences, 11, p. 01007.
doi: 10.1051/shsconf/20141101007.
Jin, C., Grissom, T. V. and Ziobrowski, A. J. (2007) ‘The mixed asset portfolio for asia-
pacific markets’, Journal of Real Estate Portfolio Management, 13(3), pp. 249–
256.
Keng, T. A. N. Y. E. N. (no date) ‘THE ROLE OF RESIDENTIAL PROPERTY IN
PERSONAL INVESTMENT PORTFOLIOS : THE CASE OF MALAYSIA
University of Western Sydney University of Technology MARA’, 10(4).
Kouwenberg, R. and Zwinkels, R. (2014) ‘Forecasting the US housing market’,
International Journal of Forecasting. Elsevier B.V., 30(3), pp. 415–425. doi:
10.1016/j.ijforecast.2013.12.010.
de la Torre, M. (2013) ‘Values and Heritage Conservation’, Heritage & Society, 6(2), pp.
155–166. doi: 10.1179/2159032x13z.00000000011.
Lazrak, F. et al. (2014) ‘The market value of cultural heritage in urban areas: An
application of spatial hedonic pricing’, Journal of Geographical Systems, 16(1),
pp. 89–114. doi: 10.1007/s10109-013-0188-1.
Lee, C. L. (2007) ‘The role of Malaysian securitised real estate in a mixed-asset portfolio’,
(December). doi: 10.1108/13664380911000440.
Lee, C. L. (2014) ‘The inflation-hedging characteristics of Malaysian residential
property’, International Journal of Housing Markets and Analysis, 7(1), pp. 61–
75. doi: 10.1108/IJHMA-10-2012-0053.
Leung, A. (2010) ‘Commercial property as an inflation hedge: An Australian
perspective’, Pacific Rim Property Research Journal, 16(1), pp. 97–115. doi:
10.1080/14445921.2010.11104297.
Li, L. H. and Ge, C. L. (2008) ‘Inflation and housing market in Shanghai’, Property
Management, 26(4), pp. 273–288. doi: 10.1108/02637470810894902.
Limmack, R. J. and Ward, C. W. R. (1988) ‘Property returns and inflation’, (November
1987), pp. 47–55.
Mat Zin, N., Ismail, S. and Md. Azmi, F. A. (2018) ‘Ascertaining the Economic
Chin Tiong Cheng, Yan Bin Tan, Wai Fang Wong, Kong Seng Lai, Koh Yu Xuan
Revealing The Investment Value of Penang Heritage Properties
© 2021 by MIP 156
Sustainability of Heritage Property Market based on Sales Transaction Analysis’,
Environment-Behaviour Proceedings Journal, 3(7), pp. 0–7. doi: 10.21834/e-
bpj.v3i7.1299.
Newell, G. (1996) ‘The inflation-hedging characteristics of Australian commercial
property : 1984-1995’, 7(1), pp. 6–20.
Palmquist, Raymond B and Smith, V. K. (2001) ‘The Use of Hedonic Property Value
Techniques for Policy and Litigation’, International Yearbook of Envrionmental
and Resources Economics, 6, p. 78.
Patel, K. and Sing, T. F. (2000) ‘Implied volatility in the U.K. Commercial property
market: Empirical evidence based on transaction data’, Journal of Real Estate
Finance and Economics, 20(1), pp. 5–24. doi: 10.1023/A:1007824720502.
Rahman, S. (2018) ‘Emerging built heritage commodification of boutique hotels in world
heritage site: Evidence from George Town, Penang, Malaysia’, Planning
Malaysia, 16(4), pp. 104–116. doi: 10.21837/pmjournal.v16.i8.542.
Rosen, S. (2019) ‘Hedonic prices and implicit markets: Product differentiation in pure
competition’, Revealed Preference Approaches to Environmental Valuation
Volumes I and II, pp. 5–26.
Samadi, Z. and Yunus, R. M. (2012) ‘Conflict of Image and Identity in Heritage
Commercialization’, Procedia - Social and Behavioral Sciences, 50(July), pp.
675–684. doi: 10.1016/j.sbspro.2012.08.070.
Shipley, R. (2000) ‘Heritage designation and property values: Is there an effect?’,
International Journal of Heritage Studies, 6(1), pp. 83–100. doi:
10.1080/135272500363760.
Tarbert, H. (1996) ‘Is commercial property a hedge against inflation ? A cointegration
approach’, 7(1), pp. 77–98.
Ting, K. H., Zhou, S. Z. and Bao, H. X. H. (2007) ‘12th Asian Real Estate Society Annual
Conference Regional Variations of Residential Real Estate Returns in Malaysia
Regional Variations of Residential Real Estate Returns in Malaysia’, Policy,
(July).
Tokede, O., Udawatta, N. and Luther, M. (2018) ‘Retrofitting heritage office buildings in
the UK: a case study’, Built Environment Project and Asset Management, 8(1),
pp. 39–50. doi: 10.1108/BEPAM-11-2016-0068.
Wilhelmsson, M. (2009) ‘Construction and updating of property price index series: The
case of segmented markets in Stockholm’, Property Management, 27(2), pp. 119–
137. doi: 10.1108/02637470910946426.
Worthington, A. C. and Higgs, H. (2004) ‘Art as an investment: Risk, return and portfolio
diversification in major painting markets’, Accounting and Finance, 44(2), pp.
257–271. doi: 10.1111/j.1467-629X.2004.00108.x.
Received: 12th July 2021. Accepted: 17th Sept 2021
1 Associate Professor, Polytechnic of State Finance STAN, Ministry of Finance, Indonesia. Email: [email protected]
PLANNING MALAYSIA:
Journal of the Malaysian Institute of Planners
VOLUME 19 ISSUE 3 (2021), Page 157 – 168
ALTERNATIVE NUMERAIRES FOR MEASURING WELFARE
CHANGES: REVIEW OF EMPIRICAL ENVIRONMENTAL
VALUATION STUDIES
Akhmad Solikin1
Accounting Department
POLYTECHNIC OF STATE FINANCE STAN, INDONESIA
Abstract
This study examines numeraire or an account unit that measures household
welfare changes. Although money metric usually determines budget constraint,
textbook explanations of the alternative metrics are limited. Therefore, the study
aimed to fill the existing gap by systematically and qualitatively analysing
previously published articles on environmental valuation in developing countries.
The results showed the existence of alternative numeraires in working time,
commodities, and financing. The alternative metrics are useful in the valuation of
environmental goods and services in developing countries, especially those
involving poor respondents and underdeveloped monetary transactions. The non-
monetary payments reduce zero bids due to the inability of subsistence people to
pay in cash and help the poor express their true environmental values.
Keywords: numeraire, welfare change, willingness to work, willingness to pay
Akhmad Solikin
Alternative Numeraires for Measuring Welfare Changes: Review of Empirical Environmental Valuation Studies
© 2021 by MIP 158
INTRODUCTION Economic valuation of environmental goods and services is important in the
policy context when environmental change has economic impact (Söderqvist &
Soutukorva, 2009). Recently, there is a rise of governments’ interests to economic
value of environmental goods and services in order to measure state wealth (e.g.
Solikin et al., 2019). In the case of Indonesia, Ministry of Finance keens to value
natural resources in order to put the values in the environmental balance sheet in
particular and for optimal fiscal policy in general. In the valuation process, a
researcher should make decision on the valuation approach, since different
approach has its specific strengths, weaknesses, and challenges. One of
challenges in the use of contingent valuation method (CVM), an approach
capable of estimating nonmarket values (Sunoto et al., 2020), is to choose
appropriate valuation yardstick or numeraire. The yardstick is usually measured
in monetary, while other measures are increasingly popular among researchers.
RESEARCH BACKGROUND Standard introduction to economics and microeconomics textbooks describes
price and quantity in vertical and horizontal axes when depicting demand and
supply graphs. However, it least discusses the need to use alternatives other than
monetary to analyze demand and supply. There are discussions on numeraire in
the intermediate microeconomics textbook, such as Varian (2010). The numeraire
measures other prices or income and helps avoid redundancy. Varian (2010) also
illustrated the Robinson Crusoe's economic concept that uses a coconut as a
numeraire to measure wage rate. In general, it is essential to find alternative
numeraires to measure environmental goods and services in an empirical study.
The failure to include such alternative measures may induce bias in the estimated
valuation values in developing countries.
LITERATURE REVIEW The welfare impact of a proposed program or project could be illustrated in
indifference curve changes. Theoretically, the distance among indifference
curves illustrates the welfare, utility enhancement, or impairment measured in
money or alternative numeraires.
Money Metric
The money metric is usually used to denote underlying utility changes because
they are unobservable. Money is an appropriate welfare measure because it is
widely used by people to relate their preferences or utility changes. People buy
packages of goods and services using money in the transactions. Additionally,
money easily aggregates and is readily retransformed to goods and services as
sources of utilities (Ahlheim et al., 2010).
PLANNING MALAYSIA
Journal of the Malaysia Institute of Planners (2021)
159 © 2021 by MIP
Arguments for Alternative Numeraires
Researchers do not need to confine matching welfare change with monetary
measures (Carson and Louviere, 2011) for various reasons. First, the respondents
are poor so using monetary payment will limit the monetary payment (willingness
to pay, WTP) they offer (Nath et al., 2017). Since poor people in developing
countries (Whittington, 2010) have a limited budget, they elicit zero or near zero
WTPs when asked about money, though they value environmental goods and
services. In Lower Kinabatangan, Sabah, almost half of the respondents are
unwilling to pay for various reasons, with 7% stating they did not spare income
to pay (Latip et al., 2013).
Second, using non-monetary payment (willingness to work, WTW)
instead of WTP increases participation rate or decreases the zero bids. The
planned program may need local participation, which could be achieved by
creating an unpaid working day (Arbiol et al., 2013; Casiwan-Launio et al., 2011;
Schiappacasse et al., 2013). In this regard, further inquiry of valid zero bids due
to inabilities to pay showed that most respondents were willing to pay through
non-monetary transactions (Brouwer et al., 2008).
Third, the market in the region is not well developed, as shown by barter
transactions or partial subsidies (Saizan et al., 2019). There are pervasive in-kind
payments for community activities (Diafas et al., 2017). This is in line with
Gorkhali (2009) that stated the Nepal remote area is characterized by low ability
to pay, a barter economy, less cash in the market, and typical labor as a
community's input to a project; making non-monetary contributions appealing.
However, the imperfect market economy may produce a downward bias on
implementing the WTP. Fourth, the mean WTW is more stable than WTP (Jiang,
2018; Pondorfer & Rehdanz, 2018). Fifth, WTP may yield a lower estimate due
to institutional distrust in corruption-prone countries (Kassahun et al., 2020).
Disagreement exists in using non-monetary contributions because, as a
numeraire, the labour is not easily convertible to utility (Ahlheim et al., 2010).
The numeraire must have four characteristics: (1) to fulfil theoretical
requirements, it must be strictly monotonically increasing in individual utility,
(2) to satisfy the psychological criterion of relating the numeraire with utility, it
must be extensively used in everyday life, (3) it must be easily aggregated across
people, and (4) it must be easily converted to money (Ahlheim et al., 2010).
However, Vondolia et al. (2014) argue that the choice of numeraire does not
responsible for the results; rather respondents’ acquaintance with the numeraires
that matters. If respondents are familiar with the numeraires then the results
should be indifferent between money and other measures. Additionally, eliciting
cash WTP could be biased when the existing arrangement does not contain money
expenditures (Abramson et al., 2011).
Akhmad Solikin
Alternative Numeraires for Measuring Welfare Changes: Review of Empirical Environmental Valuation Studies
© 2021 by MIP 160
RESEARCH METHOD This study answers the research question using a literature review from the
internet, comprising articles that cite and appear in reference lists of non-
monetary vehicles as numeraire (van Houtven et al., 2017). It only reviews the
valuation of environmental goods and services. Additionally, articles written in
languages other than English, Bahasa Indonesia, and Malay are excluded due to
the language barrier.
Five topics are specifically sought after in the literature, including: (1)
whether the literature includes theoretical exposition; (2) the majority of payment
vehicles used in the studies; (3) determinants of WTW; (4) how to translate non-
monetary to monetary values; and (5) whether the non-monetary value
significantly differs from the monetary valuation. To compute mean WTW in
hours per month, this article assumes 8 hours per day, 30 days per month, four
weeks per month, and 365 days per year.
RESULTS AND DISCUSSION Theoretical Exposition
Most of the reviewed literature did not offer theoretical discussion but focused
on empirical estimation (Das and Mahanta, 2013; Girma and Beyene, 2012).
Jiang (2018), Saizan, et al. (2019) only discussed why the willingness to
contribute (WTC) or WTW is more suitable than WTP. Similarly, Ishiguro
(2019) did not discuss the theory but directed interested readers towards the
public goods model, proving that people could substitute money and time in
producing public goods.
Arbiol et al. (2013) follows Eom and Larson (2006), which used compensating
surplus measures of WTP, though modified to incorporate time budget. The
indirect utility function (V) could be represented as:
𝑉(𝑀 − 𝑊𝑇𝐶𝐿 , 𝑍, 𝑞1) = 𝑉(𝑀, 𝑍, 𝑞0) …………………………….. (1),
where M is time budget, WTCL is the willingness to contribute labor, Z is the
vector of socioeconomic variables, q0 is the condition before the intervention, and
q1 is the condition after the program. Therefore, WTCL represents WTW for
environmental improvements (q1- q0). The model could be further made empirical
by considering the formats used to elicit WTP or WTW. Susilo et al. (2017) also
used this framework to value mangrove restoration in Mahakam Delta, Indonesia.
Alternatively, the standard individual preference function (Haab &
McConnell, 2002) states that respondents gain utilities from the bundle of private
and public goods. To measure WTW, WTP is substituted with WTW and budget
constraint with time constraint (Arbiol et al., 2013; Gibson et al., 2016; Navrud
& Vondolia, 2020; Solikin, 2017).
PLANNING MALAYSIA
Journal of the Malaysia Institute of Planners (2021)
161 © 2021 by MIP
Alternative Payment Vehicles
Many authors empirically used non-monetary payments, the most popular choice
being labor time or WTW (Abramson et al., 2011; Alam, 2013; Arbiol et al.,
2013; Casiwan-Launio, Shinbo & Morooka, 2011; Das & Mahanta, 2013; Gibson
et al., 2016; Girma & Beyene, 2012; Gorkhali, 2009; Hung, Loomis & Thinh,
2007; Ishigu, 2019; Ninan & Sathyapalan, 2005; Notaro & Paletto, 2011; Saizan
et al., 2019; Saxena, Bisht, & Singh, 2008; Schiappacasse et al., 2013; Solikin,
2017; Tilahun et al., 2015; Vasquez, 2014; & Vondolia et al., 2014). In contrast,
the less popular alternatives include commodity or harvest, such as rice (Navrud
& Vondolia, 2020), providing meals (Diafas et al., 2017), borrowing (Abramson
et al., 2011), and income tax and reduction of government subsidy for groceries
(Hassan et al., 2018).
Several studies used voluntary working to predict WTP time, WTW, or
WTC. For instance, Hung, Loomis, and Thinh (2007) used unpaid work from 0
to 30 days per year to value a forest fire prevention program in Vietnam.
Furthermore, Saxena, Bisht, and Singh (2008) used WTW and WTP to low-
income groups in three villages in India to value gazelle habitat. Similarly,
Abramson et al. (2011) used WTP, WTW, and borrowing or interest-free loans
to potable water programs in Zambia. The results showed that WTW is the
highest, WTP is the lowest, while borrowing lies between labor and cash
amounts. Schiappacasse et al. (2013) used money and time variables to value a
forest restoration project in Chile. Similarly, Alam (2013) used the money and
time variables to value the restoration of a river ecosystem in Bangladesh. In
contrast, Arbiol et al. (2013) used labor as a numeraire to value leptospirosis
prevention in Metro Manila, Philippines. Solikin (2017) used the money and
unpaid working days variables to value Indonesia's deforestation and forest
degradation avoidance. Similarly, Vasquez (2014) used money and labor to value
improved water services in Guatemala. Moreover, Navrud and Vondolia (2020)
used money, labor time, and harvest contributions to value flood risk prevention
in Ghana.
Critics state that the elicited WTW depends on the tasks offered to the
respondents. Specifically, the measure of contribution in labor may not be
appropriate for all programs (Rai and Scarborough, 2015). According to the
critics, the tasks asked in WTW studies should be designed to suit the valuation
project. For instance, voluntary work could comprise tree planting, forest
management, or the number of days refraining from logging (Ishiguro, 2019).
Voluntary work could also encompass environmental clean-ups and health
advocacy activities (Saizan et al., 2019), labor-meal, or providing meals for
workers participating in the village development program (Diafas et al., 2017).
People could also voluntarily plant seedlings, monitor their growth, and protect
mangrove areas (Susilo et al., 2017).
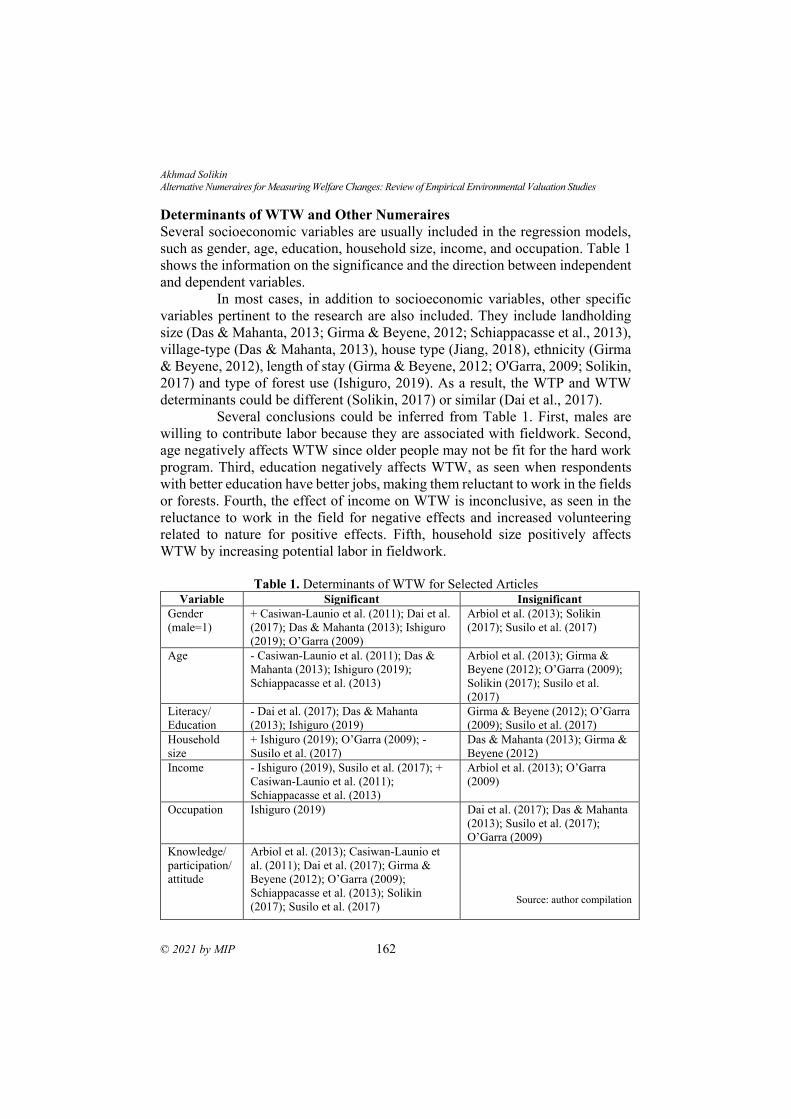
Akhmad Solikin
Alternative Numeraires for Measuring Welfare Changes: Review of Empirical Environmental Valuation Studies
© 2021 by MIP 162
Determinants of WTW and Other Numeraires
Several socioeconomic variables are usually included in the regression models,
such as gender, age, education, household size, income, and occupation. Table 1
shows the information on the significance and the direction between independent
and dependent variables.
In most cases, in addition to socioeconomic variables, other specific
variables pertinent to the research are also included. They include landholding
size (Das & Mahanta, 2013; Girma & Beyene, 2012; Schiappacasse et al., 2013),
village-type (Das & Mahanta, 2013), house type (Jiang, 2018), ethnicity (Girma
& Beyene, 2012), length of stay (Girma & Beyene, 2012; O'Garra, 2009; Solikin,
2017) and type of forest use (Ishiguro, 2019). As a result, the WTP and WTW
determinants could be different (Solikin, 2017) or similar (Dai et al., 2017).
Several conclusions could be inferred from Table 1. First, males are
willing to contribute labor because they are associated with fieldwork. Second,
age negatively affects WTW since older people may not be fit for the hard work
program. Third, education negatively affects WTW, as seen when respondents
with better education have better jobs, making them reluctant to work in the fields
or forests. Fourth, the effect of income on WTW is inconclusive, as seen in the
reluctance to work in the field for negative effects and increased volunteering
related to nature for positive effects. Fifth, household size positively affects
WTW by increasing potential labor in fieldwork.
Table 1. Determinants of WTW for Selected Articles
Variable Significant Insignificant
Gender
(male=1)
+ Casiwan-Launio et al. (2011); Dai et al.
(2017); Das & Mahanta (2013); Ishiguro
(2019); O’Garra (2009)
Arbiol et al. (2013); Solikin
(2017); Susilo et al. (2017)
Age - Casiwan-Launio et al. (2011); Das &
Mahanta (2013); Ishiguro (2019);
Schiappacasse et al. (2013)
Arbiol et al. (2013); Girma &
Beyene (2012); O’Garra (2009);
Solikin (2017); Susilo et al.
(2017)
Literacy/
Education
- Dai et al. (2017); Das & Mahanta
(2013); Ishiguro (2019)
Girma & Beyene (2012); O’Garra
(2009); Susilo et al. (2017)
Household
size
+ Ishiguro (2019); O’Garra (2009); -
Susilo et al. (2017)
Das & Mahanta (2013); Girma &
Beyene (2012)
Income - Ishiguro (2019), Susilo et al. (2017); +
Casiwan-Launio et al. (2011);
Schiappacasse et al. (2013)
Arbiol et al. (2013); O’Garra
(2009)
Occupation Ishiguro (2019) Dai et al. (2017); Das & Mahanta
(2013); Susilo et al. (2017);
O’Garra (2009)
Knowledge/
participation/
attitude
Arbiol et al. (2013); Casiwan-Launio et
al. (2011); Dai et al. (2017); Girma &
Beyene (2012); O’Garra (2009);
Schiappacasse et al. (2013); Solikin
(2017); Susilo et al. (2017)
Source: author compilation
PLANNING MALAYSIA
Journal of the Malaysia Institute of Planners (2021)
163 © 2021 by MIP
Translation to Monetary Value The WTW should be converted to monetary to be compared with WTP. When
translating WTW to monetary, it is compulsory to consider the working or leisure
time and the rate at which value is assigned to the time. When the WTP-labour is
assumed to be traded-off with working time, converting person-days to monetary
value involves multiplying the mean or median workday by the daily income
(Tilahun et al., 2015), official minimum wage (Saxena, Bisht, & Singh, 2008;
Susilo et al., 2017; Vondolia et al., 2014), market wage (Arbiol et al., 2013;
Vondolia et al., 2014), or respondents’ expected wage (Susilo et al., 2017).
Furthermore, estimating the total WTP from households’ WTW involves
multiplying the daily or minimum wage or other rates by the mean WTW. The
result is extrapolated to the number of households in the research area and
adjusted with the percentage of respondents willing to contribute.
When the time contribution is assumed to come from leisure time, one-
third of the wage is implemented (Arbiol et al., 2013; Casiwan-Launio et al.,
2011; O’Garra, 2009; Saizan et al., 2019; Saxena, Bisht, & Singh, 2008). In this
case, the wage rate represents the working contribution trade-off, while one-third
of the wage represents the leisure contribution trade-off. Similarly, Schiappacasse
et al. (2013) allocated different values of time to respondents that could take the
working time voluntarily (using wage rate) and respondents that could not choose
freely (using one-third of the wage rate).
Instead of using income or official wage, Gibson et al. (2016) and
Solikin (2017) used wage rates from job vacancies in the villages because an
official minimum wage for formal employment is substantially lower. However,
this is not always the case. For instance, Abramson et al. (2011) found that official
minimum wages were 4 to 12 times higher than local wage rates for unskilled
labor in Zambia. Recent study by Hagedoorn et al. (2020) suggest of using
individual conversion to accommodate heterogeneity in value of time. They argue
that using generic wage rate may yield downward bias of the WTP.
Sum of Money vs. Nonmonetary
Previous literature found that WTW is significantly greater than WTP. The reason
for a bigger WTP value may be due to low time value or hypothetical bias (Eom
and Larson, 2006). Casiwan-Launio et al. (2011) and Gibson et al. (2016)
suggested two reasons for the discrepancies. First, a missing or incomplete labor
market lowers opportunity costs of time, as previously mentioned by Eom ad
Larson (2006). For instance, transportation is very difficult in the Philippines in
the rainy season, hampering workers’ mobility to get jobs outside the area.
Second, sacrifice of potential income (as in case of WTW) is psychologically less
painful compared to surrendering hard earned income (as in case of WTP). The
second reason is reinforced by the social norms where labour contribution to
community program indicates being a good village resident. However, as
Akhmad Solikin
Alternative Numeraires for Measuring Welfare Changes: Review of Empirical Environmental Valuation Studies
© 2021 by MIP 164
previously mentioned, the difference between WTW and WTP diminishes when
respondents are familiar with the non-monetary payment (Vondolia et al., 2014).
For instance, Diafas et al. (2017) found no significant difference between WTP
and WTW in Kenya due to respondents’ familiarity with both payment vehicles.
Similarly, Gibson et al. (2016) found the same result due to the functioning labor
market in the villages surrounding Cambodia’s capital city.
Several studies showed higher WTW than WTP, including Gorkhali
(2009), which found that WTW was 2.6 to 4.8 times higher than WTP for quality
improvement of a hydropower project in Nepal. The discrepancy is more
considerable in the most remote areas, where the WTW is 9.4 times higher
compared to WTP. Furthermore, Saxena, Bisht, and Singh (2008) showed that
the WTW value was more than four times WTP in India. Schiappacasse et al.
(2013) found that WTW was almost seven times greater than the WTP in
reforestation in Chile. According to Solikin (2017), villagers in Berau District,
Indonesia elicited WTW 8.5 times higher than WTP in valuing deforestation and
forest degradation avoidance. Similarly, Casiwan-Launio et al. (2011) showed
that the WTW is 3 or 8 times greater than the WTP in a marine reserve in the
Philippines.
Exceptions for this general trend include Vondolia et al. (2014), which
found that mean WTP is 2.32 higher than mean WTW. This is possible when
WTW is converted to WTP using the minimum wage. Additionally, Navrud and
Vondolia (2020) found that the probability of farmers purchasing flood risk
insurance is higher when premium as monetary and harvest rather than as labor.
O'Garra (2009) also found higher WTP compared to WTC labor in Fiji probably
due to outlier data.
The percentage of respondents that answered “yes” to participate in
non-monetary contribution implies the suitability of the non-monetary measures.
Regarding this, Dai et al. (2017) found that 73.57% of respondents were willing
to contribute labor, while 55.65% were willing to contribute financially.
Moreover, Ishiguro (2019) showed percentages of respondents willing to
participate in voluntary works in several villages in Cambodia. The study showed
that 78% of respondents were willing to participate in forest preservation two
days per year, 44% in forest management one day every two years, and 57%
refraining from logging three days each month. Furthermore, Nath et al. (2017)
showed that 85% of respondents in Kuala Selangor, Malaysia are willing to
contribute non-monetary through an awareness program, (82%) tree planting,
75% patrolling, and fire protection, and 74% community-based forest
management. Ahlheim et al. (2010) valued a landslide protection program in
Vietnam and found that more than 85% of respondents stated their WTW and
WTP.
Recalculating mean WTW based on hours per month found that they
range from 3.83 (Navrud & Vondolia, 2019) to 31.40 (Dai et al., 2017). Saizan et
PLANNING MALAYSIA
Journal of the Malaysia Institute of Planners (2021)
165 © 2021 by MIP
al. (2019) found that respondents are willing to pay an average of 6.68 hours per
month for leptospirosis prevention in Malaysia. Moreover, Das and Mahanta
(2013) found that respondents living in forest villages were willing to contribute
12 to 16 hours for biodiversity conservation in Assam, India. According to
Solikin (2017), the mean number of days a respondent is willing to contribute to
the program is 13.50 hours. Saxena, Bisht, and Singh (2008) valued the habitat
function of planted forests in India and found that the WTW average is 11.18
hours. Furthermore, Arbiol et al. (2013) found that the WTW average was 10.66
hours per month in valuing leptospirosis prevention projects in Manila, The
Philippines. The results show that mean WTW varies with study location, goods
and services in questions, and the study design. Therefore, further research should
carefully design the study to suit the proposed program.
CONCLUSION In the valuation of environmental goods and services, especially when using the
contingent valuation method, the use of monetary or nonmonetary measures
determines the estimate of welfare change. When majority of local people are
very poor, the money market is underdeveloped, barter is prevalent, contribution
in kind is a social norm, and then using money to value WTP is inappropriate. An
alternative to monetary payment is voluntary working (WTW) or contributing
commodity.
This study reviewed the use of non-monetary contribution, resulting in
five conclusions. First, most WTW studies do not expose theoretical foundations.
Most studies use standard individual preference theory amended using time
constraint and bundles of public rather than budget constraint and all private
goods, respectively. Second, the most popular alternative measure is voluntary
working that suits the program evaluated, while the less common alternatives are
a commodity, providing a meal, or credit. Third, WTW determinants include age,
income, gender, household size, education, knowledge or attitude, and variables
suitable to the project designs evaluated. Fourth, in translating the WTW to WTP,
researchers usually use wage rate for trade-off between contribution-working or
one-third of the wage rate if assumed that trade-off is between contribution-
leisure. Recent study, however, calls for conversion rate which accommodate
individual heterogeneity. Fifth, the WTW is generally larger than WTP due to
low leisure time value in the villages or remote areas, as indicated by limited job
opportunities or difficult transportation.
Future studies should examine the theoretical basis for using WTW. In
addition, future empirical research on environmental valuation should seriously
consider using WTW in addition to standard WTP. Determinants of WTW
included in the empirical studies should also consider different nature of WTW
and WTP.
Akhmad Solikin
Alternative Numeraires for Measuring Welfare Changes: Review of Empirical Environmental Valuation Studies
© 2021 by MIP 166
REFERENCES Abramson, A., Becker, N., Garb, Y., & Lazarovitch, N. (2011). Willingness to pay,
borrow and work for rural water service improvements in developing countries.
Water Resources Research, 47, W11512.
Ahlheim, M., Frör, O., Heinke, A., Duc, N. M., & Dinh, P. V. (2010). Labour as a utility
measure in contingent valuation studies: How good is it really? FZID Discussion
Paper No. 13-2010. Stuttgart, Germany: Center for Research on Innovation and
Services, University of Hohenheim.
Alam, K. (2013). Factors affecting public participation in river ecosystem restoration:
Using the contingent valuation method. The Journal of Developing Areas, 47(1),
223-240.
Arbiol, J., Borja, M., Yabe, M., Nomura, H., Gloriani, N. & Yoshida, S. (2013). Valuing
human leptospirosis prevention using the opportunity cost of labor. International
Journal of Environmental Research and Public Health, 10, 1845-1860.
Brouwer, R., Akter, S., Brander, L., & Haque, E. (2008). Economic valuation of flood
risk exposure and reduction in a severely flood-prone developing country.
Environment and Development Economics, 14, 397-417.
Carson, R. T. & Louviere, J. L. (2011). A common nomenclature for stated preference
elicitation approaches. Environmental and Resource Economics, 49(4), 539-559.
Casiwan-Launio, C., Shinbo, T., & Morooka, Y. (2011). Island villagers' willingness to
pay for the sustainability of a marine fishery reserve: Case of San Miguel Island,
Philippines. Coastal Management, 39, 459-477.
Dai, H., Lee, C., Cheng, K. & Zong, C. (2017). Community residents’ willingness to
contribute to wetland ecosystem services in Sanjiang Plain Natural Reserves.
Journal of Natural Resources, 32(6), 977-987.
Das, D. & Mahanta, R. (2013). Willingness to spend labor hour for biodiversity
conservation: A case study with special reference to village forest dwellers and
encroachers in Assam. Journal of Biodiversity, 4(1), 45-51.
Diafas, I., Barkmann, J. & Mburu, J. (2017). Measurement of bequest value using a non-
monetary payment in a choice experiment- The case of improving forest
ecosystem services for the benefit of local communities in rural Kenya. Ecological
Economics, 140, 157-165.
Eom, Y-S. & Larson, D. M. (2006). Valuing housework time from the willingness to
spend time and money for environmental quality improvements. Review of
Economics of the Households, 4, 205-227.
Gibson, J. M., Rigby, D., Polya, D. A. & Russell, N. (2016). Discrete choice experiment
in developing countries: Willingness to pay versus willingness to work.
Environmental and Resource Economics, 65, 697-721.
Girma, W. & Beyene, F. (2012). Willingness to contribute to collective forest
management: Evidence from Godere in the Gambela Region of Ethiopia. The
Journal of Socio-Economics, 41, 79-86.
Gorkhali, S. P. (2009). Economic Analysis of Infrastructure Investments: National
Benefits and Local Costs- Case Study of a Hydropower Project in Nepal.
Göttingen, Germany: Cuvillier Verlag.
PLANNING MALAYSIA
Journal of the Malaysia Institute of Planners (2021)
167 © 2021 by MIP
Haab, T. C. & McConnell, K. E. (2002). Valuing Environmental and Natural Resources:
The Econometrics of Nonmarket Valuation. Cheltenham, UK & Northampton,
MA, USA: Edward Elgar.
Hagedoorn, L. C., Koetse, M. J., van Beukering, P. J. H. & Brander, L. M. (2020). Time
equals money? Valuing ecosystem-based adaptation in a developing country
context. Environment and Development Economics, 25, 482-508.
Hassan, S., Olsen, S. B. & Thorsen, B. J. (2018). Appropriate payment vehicles in stated
preference studies in developing economies. Environmental Resource Economics,
71, 1053-1075.
Hung, L. T., Loomis, J. B., & Thinh, V. T. (2007). Comparing money and labor payment
in contingent valuation: The case of forest fire prevention in the Vietnamese
context. Journal of International Development, 19, 173-185.
Ishiguro, K. (2019). Evaluation of forest preservation in Cambodian rural villages.
Journal of Sustainable Development, 12(1), 27-38.
Jiang, X. (2018). Analyzing the willingness to work and willingness to pay for RWH in
Japan. Jurnal Lanskap Indonesia, 10(2), 3-45.
Kassahun, H. T., Jacobsen, J. B. & Nicholson, C. F. (2020). Revisiting chut and land labor
for valuing environmental goods and services in developing countries. Ecological
Economics, 177, 106771.
Latip, N. A., Badarulzaman, N., Marzuki, A., & Umar, M. U. (2013). Sustainable forest
management in Lower Kinabatangan, Sabah: Issues and current practices.
Planning Malaysia, 11, 59-84.
Nath, T. K., Bin Dahalan, M. P., Parish, F., & Rengasamy, N. (2017). Local peoples’
appreciation on and contribution to the conservation of peatland swamp forests:
Experience from Peninsular Malaysia. Wetlands, 37, 1067-1077.
Ninan, K. N. & Sathyapalan, J. (2005). The economics of biodiversity conservation: A
study of the coffee-growing region in the Western Ghats of India. Ecological
Economics, 55, 61-72.
Notaro, S. & Paletto, A. (2011). Links between mountain communities and environmental
services in the Italian Alps. Sociologia Ruralis, 51(2), 137-157.
Navrud, S. & Vondolia, G. K. (2020). Farmers’ preferences for reductions in flood risk
under monetary and non-monetary payment modes. Water Resources and
Economics, 30, 100151.
O’Garra, T. (2009). Bequest values for marine resources: How important for indigenous
communities in less-developed economies? Environmental and Resource
Economics, 44, 179-202.
Pondorfer, A. & Rehdanz, K. (2018). Eliciting preferences for public goods in
nonmonetized communities: Accounting for preference uncertainty. Land
Economics, 94(1), 73-86.
Rai, R. K. & Scarborough, H. (2015). Nonmarket valuation in developing countries:
Incorporating labor contributions in environmental benefits estimates. Australian
Journal of Agricultural and Resource Economics, 59, 479-498.
Saizan, S., Sukeri, S., Zahiruddin, W. M., Shafei, M. N., Rukman, A. H., Malina, O.,
Jamaluddin, T. Z. M. T., & Aziah, D. (2019). Economic benefit of leptospirosis
prevention in Kelatan, Malaysia: Willingness-to-contribute approach.
International Journal of Health Planning Management, 34, e817-e823.
Akhmad Solikin
Alternative Numeraires for Measuring Welfare Changes: Review of Empirical Environmental Valuation Studies
© 2021 by MIP 168
Saxena, A. K., Bisht, N. S., & Singh, C. J. (2008). The value of the Indian gazelle (Gazella
gazelle): A case study in Haryana, India. The Indian Forester, 134(10), 1289-
1295.
Schiappacasse, I., Vasquez, F., Nahuelhual, L., & Echeverria, C. (2013). Labor as a
welfare measure in contingent valuation: The value of a forest restoration project.
Ciencia e Investigacion Agraria, 40(1), 69-84.
Söderqvist, T. & Soutukorva, A. (2009). On how to assess the quality of environmental
valuation studies. Journal of Forest Economics, 15, 15-36.
Solikin, A. (2017). Willingness to pay and willingness to work to avoid deforestation and
forest degradation. In Taufik, T. et al. (Eds.). ICoSI 2014: Proceeding of the 2nd
International Conference on Sustainable Innovation. Singapore: Springer Nature.
Solikin, A., Abdul Rahman, R., Saefrudin, E, Suboh, N., Zahari, N. A. & Wahyudi, E.
(2019). Using travel cost method (TCM) to value forests: Cases of Pahang
National Park and Srengseng Jakarta Urban Forests. Planning Malaysia, 17(1),
365-376.
Sunoto, Y. N., Fatiah, A. A., Ponrahono, Z., & Osman, M. M. (2020). Profiling the
perceived mangrove forest use-value and community’s willingness to pay for
mangrove conservation. Planning Malaysia, 18(3), 229-240.
Susilo, H., Takahashi, Y., & Yabe, M. (2017). The opportunity cost of labor for valuing
mangrove restoration in Mahakam Delta, Indonesia. Sustainability, 9, 2169.
Tilahun, M., Vranken, L., Muys, B., Deckers, J., Gebregziabher, K., Gebrehiwot, K.,
Bauer, H., & Mathijs, E. (2015). Rural households’ demand for frankincense forest
conservation in Tigray, Ethiopia: A contingent valuation analysis. Land
Degradation and Development, 26, 642-653.
van Houtven, G. L., Pattanayak, S. K., Usmani, F., & Yang, J.-C. (2017). What are
households' willingness to pay for improved water access? Results from a meta-
analysis. Ecological Economics, 136, 126-135.
Varian, H. A. (2010). Intermediate Microeconomics: A Modern Approach, 8th Ed. New
York: W.W. Norton.
Vasquez, W. F. (2014). Willingness to pay and willingness to work for improvements of
municipal and community-managed water services. Water Resources Research,
50, 8002-8014.
Vondolia, G. K., Eggert, H., Navrud, S., & Stage, J. (2014). What do respondents bring
to contingent valuation? A comparison of monetary and labor payment vehicles.
Journal of Environmental Economics and Policy, 3(3), 253-267.
Whittington, D. (2010). What have we learned from 20 years of stated preference research
in less-developed countries? Annual Review of Resource Economics, 2, 209-236.
Received: 12th July 2021. Accepted: 23rd Sept 2021
1 Senior lecturer at Universiti Teknologi MARA Perak. Email: [email protected]
PLANNING MALAYSIA:
Journal of the Malaysian Institute of Planners
VOLUME 19 ISSUE 3 (2021), Page 169 – 179
TECHNICAL, SCALE AND MANAGERIAL EFFICIENCIES IN
MALAYSIAN REITS: A NON-PARAMETRIC APPROACH
Nor Nazihah Chuweni1, Siti Nadiah Mohd Ali2, Nurul Sahida Fauzi3, Nur Baizura
Mohd Shukor4
Department of Built Environment Studies and Technology
Faculty of Architecture, Planning and Surveying
UNIVERSITI TEKNOLOGI MARA, PERAK BRANCH, SERI ISKANDAR
CAMPUS, 32610 SERI ISKANDAR, MALAYSIA
Abstract
The paper examined technical, managerial and scale efficiencies scores of
Malaysian Real Estate Investment Trust (M-REITs). A non-parametric approach
of VRS-DEA examined the input and output variables to determine REIT
efficiency. We examined their determinants using GLS regression in the second
stage. On average, the M-REIT industry has faced technical inefficiency, that
involves scale and managerial inefficiencies. This paper presents new estimates
through discussion on return as REIT output. The empirical results indicate
Islamic REITs exhibited higher efficiency scores than their counterparts. The
results from GLS regression analysis suggest that efficient REITs are smaller in
size with higher concentration in property sector and geographical area. Having
examined these values, there is still some catching-up for the inefficient REITs
in the sample to be more competitive to stay relevant in the global market.
Keywords: Technical, Scale; Efficiency; Malaysian REITs
Nor Nazihah Chuweni, Siti Nadiah Mohd Ali, Nurul Sahida Fauzi, Nur Baizura Mohd Shukor
Technical, Scale and Managerial Efficiencies in Malaysian REITs: A Non-Parametric Approach
© 2021 by MIP 170
INTRODUCTION Real estate investment trusts (REITs) are unit trust scheme which predominantly
invest or propose to invest in income-generating real estate (Securities
Commission Malaysia, 2019). The REIT market is now spread to 33 countries,
with nearly US$ 2 trillion market capitalisation (EPRA, 2019). The market
capitalisation of Malaysian REITs was approximately US$7.32 billion,
contributing 1.8% to the Asia Pacific REIT market (EPRA, 2019). If confidence
in the REIT industry is shaken, both local and global investors may leave the
industry as well as the country, increasing the vulnerability of the real estate
industry. To maximise profits, REIT investors must consider the operational
efficiency of the REIT in which they invest. Furthermore, more efficient REITs
can provide average stock gains of up to 3.88 percent greater than REITs that do
not practise effective efficiency (Beracha et al., 2019). REITs with an effective
strategy are often able to maintain higher-quality operating performance, lower
risk, and higher cross-sectional stock returns (Beracha et al., 2018).
From managerial perspective, efficiency improvement could be the
focus of REIT managers as inefficiency could likely lead to agency problems and
the corporate resources wastage. Therefore, it is important for the managers to
provide insights to ensure the dynamic performance to stay competitive in the
global market. Building on past research on REIT operating efficiencies and
recognising the growth in the industry over the past decade, we examine REIT
efficiencies performance over the period of 2007 to 2015 in Malaysia.
LITERATURE REVIEW Previous literature in the REIT industry focus on capital structure, diversification
benefits and corporate strategies (see for example Anderson, Benefield, & Hurst,
2015; Bauer, Eichholtz, & Kok, 2010; Brockman, French, & Tamm, 2014;
Newell & Marzuki, 2016). However, limited studies explore the issue related to
technical and scale efficiencies (see Table 1) particularly in the Malaysian
emerging market. Chuweni and Eves (2017) reviewed measurement for REIT
efficiency, particularly for Malaysian Islamic REITs. Table 1 summarises the
matrix for input and output variables in REIT efficiency.
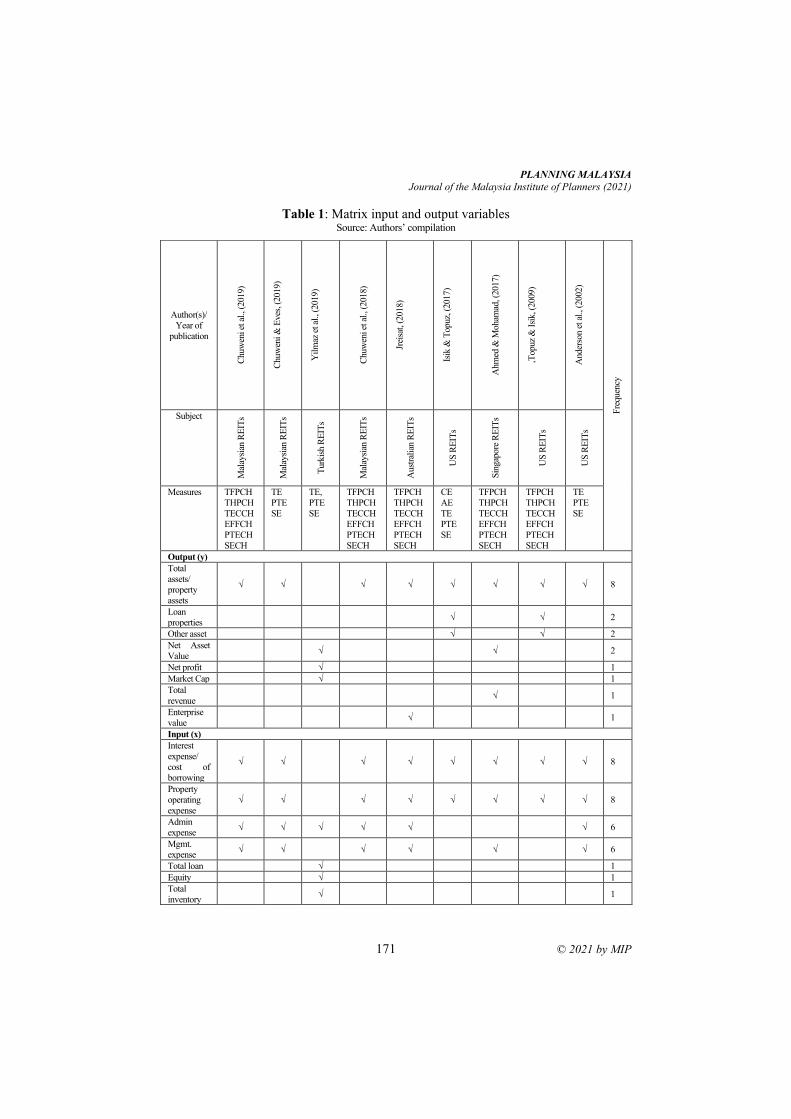
PLANNING MALAYSIA
Journal of the Malaysia Institute of Planners (2021)
171 © 2021 by MIP
Table 1: Matrix input and output variables Source: Authors’ compilation
Author(s)/
Year of
publication
Chuw
eni et
al., (
2019)
Chuw
eni &
Eves
, (2019)
Yilm
az e
t al
., (2
019)
Chuw
eni et
al., (
2018)
Jrei
sat, (
2018)
Isik
& T
opuz,
(2017)
Ahm
ed &
Moham
ad, (
2017)
,Topuz
& I
sik, (
2009)
Ander
son e
t al
., (2
002)
Fre
quen
cy
Subject
Mal
aysi
an R
EIT
s
Mal
aysi
an R
EIT
s
Turk
ish R
EIT
s
Mal
aysi
an R
EIT
s
Aust
rali
an R
EIT
s
US
RE
ITs
Sin
gap
ore
RE
ITs
US
RE
ITs
US
RE
ITs
Measures TFPCH
THPCH
TECCH
EFFCH
PTECH
SECH
TE
PTE
SE
TE,
PTE
SE
TFPCH
THPCH
TECCH
EFFCH
PTECH
SECH
TFPCH
THPCH
TECCH
EFFCH
PTECH
SECH
CE
AE
TE
PTE
SE
TFPCH
THPCH
TECCH
EFFCH
PTECH
SECH
TFPCH
THPCH
TECCH
EFFCH
PTECH
SECH
TE
PTE
SE
Output (y)
Total
assets/
property
assets
√ √ √ √ √ √ √ √ 8
Loan
properties √ √ 2
Other asset √ √ 2
Net Asset
Value √ √ 2
Net profit √ 1
Market Cap √ 1
Total
revenue
√ 1
Enterprise
value
√ 1
Input (x)
Interest
expense/
cost of
borrowing
√ √ √ √ √ √ √ √ 8
Property
operating
expense
√ √ √ √ √ √ √ √ 8
Admin
expense √ √ √ √ √ √ 6
Mgmt.
expense √ √ √ √ √ √ 6
Total loan √ 1
Equity √ 1
Total
inventory √ 1
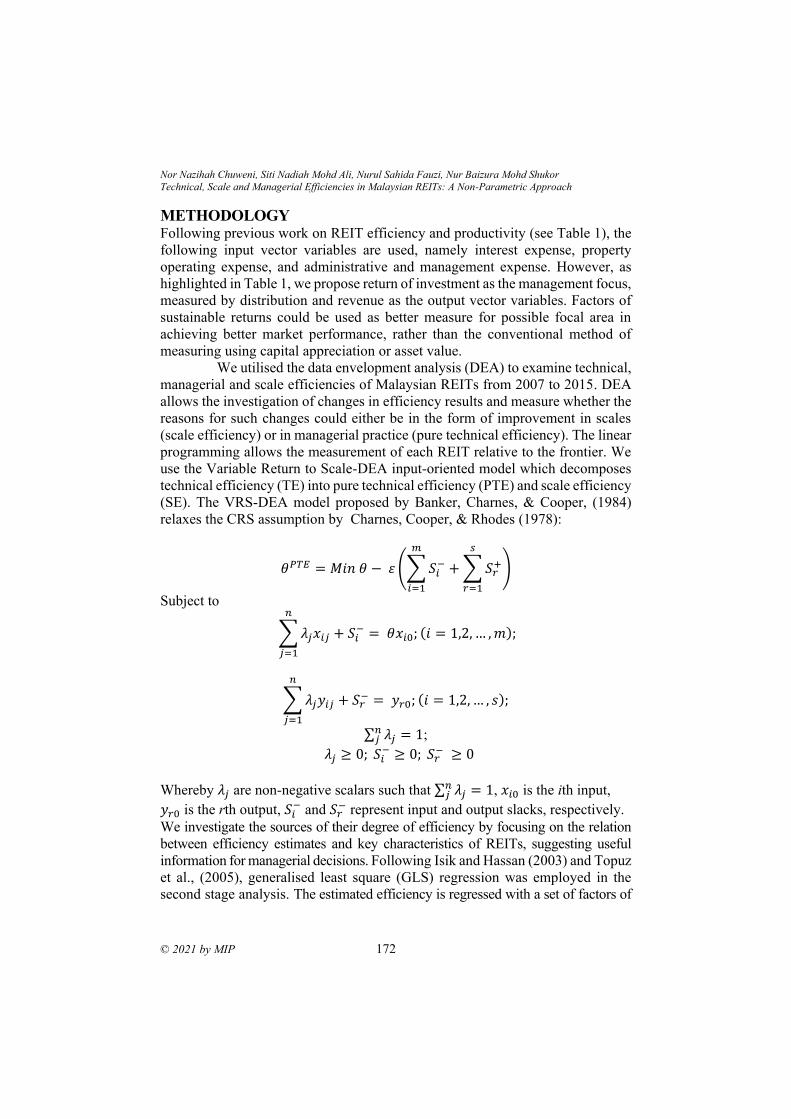
Nor Nazihah Chuweni, Siti Nadiah Mohd Ali, Nurul Sahida Fauzi, Nur Baizura Mohd Shukor
Technical, Scale and Managerial Efficiencies in Malaysian REITs: A Non-Parametric Approach
© 2021 by MIP 172
METHODOLOGY Following previous work on REIT efficiency and productivity (see Table 1), the
following input vector variables are used, namely interest expense, property
operating expense, and administrative and management expense. However, as
highlighted in Table 1, we propose return of investment as the management focus,
measured by distribution and revenue as the output vector variables. Factors of
sustainable returns could be used as better measure for possible focal area in
achieving better market performance, rather than the conventional method of
measuring using capital appreciation or asset value.
We utilised the data envelopment analysis (DEA) to examine technical,
managerial and scale efficiencies of Malaysian REITs from 2007 to 2015. DEA
allows the investigation of changes in efficiency results and measure whether the
reasons for such changes could either be in the form of improvement in scales
(scale efficiency) or in managerial practice (pure technical efficiency). The linear
programming allows the measurement of each REIT relative to the frontier. We
use the Variable Return to Scale-DEA input-oriented model which decomposes
technical efficiency (TE) into pure technical efficiency (PTE) and scale efficiency
(SE). The VRS-DEA model proposed by Banker, Charnes, & Cooper, (1984)
relaxes the CRS assumption by Charnes, Cooper, & Rhodes (1978):
𝜃𝑃𝑇𝐸 = 𝑀𝑖𝑛 𝜃 − 𝜀 (∑ 𝑆𝑖−
𝑚
𝑖=1
+ ∑ 𝑆𝑟+
𝑠
𝑟=1
)
Subject to
∑ 𝜆𝑗𝑥𝑖𝑗
𝑛
𝑗=1
+ 𝑆𝑖− = 𝜃𝑥𝑖0; (𝑖 = 1,2, … , 𝑚);
∑ 𝜆𝑗𝑦𝑖𝑗
𝑛
𝑗=1
+ 𝑆𝑟− = 𝑦𝑟0; (𝑖 = 1,2, … , 𝑠);
∑ 𝜆𝑗𝑛𝑗 = 1;
𝜆𝑗 ≥ 0; 𝑆𝑖− ≥ 0; 𝑆𝑟
− ≥ 0
Whereby 𝜆𝑗 are non-negative scalars such that ∑ 𝜆𝑗𝑛𝑗 = 1, 𝑥𝑖0 is the ith input,
𝑦𝑟0 is the rth output, 𝑆𝑖− and 𝑆𝑟
− represent input and output slacks, respectively.
We investigate the sources of their degree of efficiency by focusing on the relation
between efficiency estimates and key characteristics of REITs, suggesting useful
information for managerial decisions. Following Isik and Hassan (2003) and Topuz
et al., (2005), generalised least square (GLS) regression was employed in the
second stage analysis. The estimated efficiency is regressed with a set of factors of
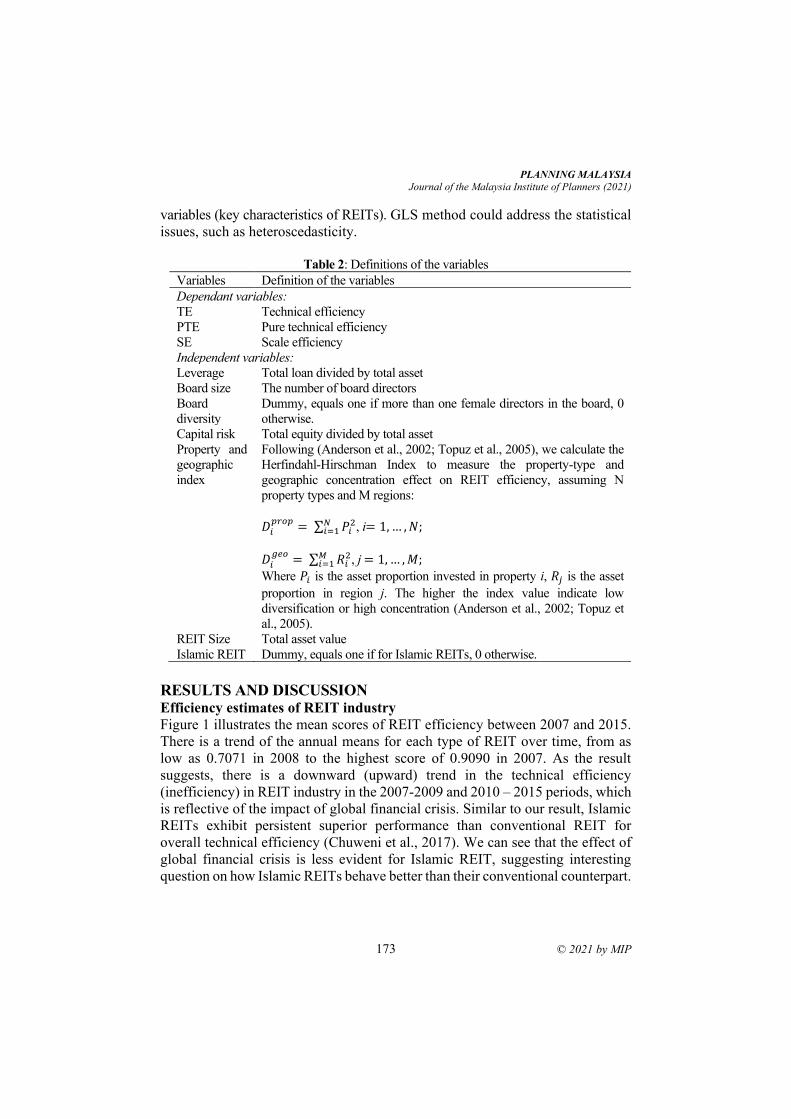
PLANNING MALAYSIA
Journal of the Malaysia Institute of Planners (2021)
173 © 2021 by MIP
variables (key characteristics of REITs). GLS method could address the statistical
issues, such as heteroscedasticity.
Table 2: Definitions of the variables
Variables Definition of the variables
Dependant variables:
TE Technical efficiency
PTE Pure technical efficiency
SE Scale efficiency
Independent variables:
Leverage Total loan divided by total asset
Board size The number of board directors
Board
diversity
Dummy, equals one if more than one female directors in the board, 0
otherwise.
Capital risk Total equity divided by total asset
Property and
geographic
index
Following (Anderson et al., 2002; Topuz et al., 2005), we calculate the
Herfindahl-Hirschman Index to measure the property-type and
geographic concentration effect on REIT efficiency, assuming N
property types and M regions:
𝐷𝑖𝑝𝑟𝑜𝑝
= ∑ 𝑃𝑖2𝑁
𝑖=1 , i= 1, … , 𝑁;
𝐷𝑖𝑔𝑒𝑜
= ∑ 𝑅𝑖2𝑀
𝑖=1 , j = 1, … , 𝑀;
Where 𝑃𝑖 is the asset proportion invested in property i, 𝑅𝑗 is the asset
proportion in region j. The higher the index value indicate low
diversification or high concentration (Anderson et al., 2002; Topuz et
al., 2005).
REIT Size Total asset value
Islamic REIT Dummy, equals one if for Islamic REITs, 0 otherwise.
RESULTS AND DISCUSSION Efficiency estimates of REIT industry
Figure 1 illustrates the mean scores of REIT efficiency between 2007 and 2015.
There is a trend of the annual means for each type of REIT over time, from as
low as 0.7071 in 2008 to the highest score of 0.9090 in 2007. As the result
suggests, there is a downward (upward) trend in the technical efficiency
(inefficiency) in REIT industry in the 2007-2009 and 2010 – 2015 periods, which
is reflective of the impact of global financial crisis. Similar to our result, Islamic
REITs exhibit persistent superior performance than conventional REIT for
overall technical efficiency (Chuweni et al., 2017). We can see that the effect of
global financial crisis is less evident for Islamic REIT, suggesting interesting
question on how Islamic REITs behave better than their conventional counterpart.
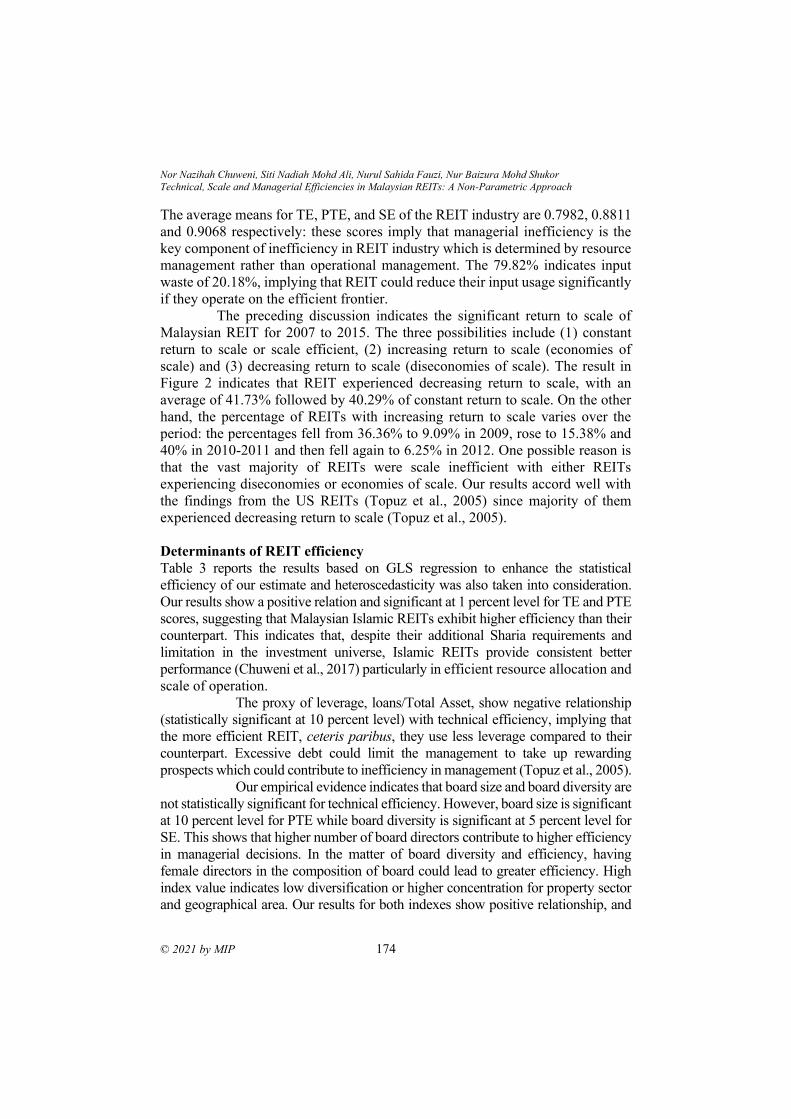
Nor Nazihah Chuweni, Siti Nadiah Mohd Ali, Nurul Sahida Fauzi, Nur Baizura Mohd Shukor
Technical, Scale and Managerial Efficiencies in Malaysian REITs: A Non-Parametric Approach
© 2021 by MIP 174
The average means for TE, PTE, and SE of the REIT industry are 0.7982, 0.8811
and 0.9068 respectively: these scores imply that managerial inefficiency is the
key component of inefficiency in REIT industry which is determined by resource
management rather than operational management. The 79.82% indicates input
waste of 20.18%, implying that REIT could reduce their input usage significantly
if they operate on the efficient frontier.
The preceding discussion indicates the significant return to scale of
Malaysian REIT for 2007 to 2015. The three possibilities include (1) constant
return to scale or scale efficient, (2) increasing return to scale (economies of
scale) and (3) decreasing return to scale (diseconomies of scale). The result in
Figure 2 indicates that REIT experienced decreasing return to scale, with an
average of 41.73% followed by 40.29% of constant return to scale. On the other
hand, the percentage of REITs with increasing return to scale varies over the
period: the percentages fell from 36.36% to 9.09% in 2009, rose to 15.38% and
40% in 2010-2011 and then fell again to 6.25% in 2012. One possible reason is
that the vast majority of REITs were scale inefficient with either REITs
experiencing diseconomies or economies of scale. Our results accord well with
the findings from the US REITs (Topuz et al., 2005) since majority of them
experienced decreasing return to scale (Topuz et al., 2005).
Determinants of REIT efficiency
Table 3 reports the results based on GLS regression to enhance the statistical
efficiency of our estimate and heteroscedasticity was also taken into consideration.
Our results show a positive relation and significant at 1 percent level for TE and PTE
scores, suggesting that Malaysian Islamic REITs exhibit higher efficiency than their
counterpart. This indicates that, despite their additional Sharia requirements and
limitation in the investment universe, Islamic REITs provide consistent better
performance (Chuweni et al., 2017) particularly in efficient resource allocation and
scale of operation.
The proxy of leverage, loans/Total Asset, show negative relationship
(statistically significant at 10 percent level) with technical efficiency, implying that
the more efficient REIT, ceteris paribus, they use less leverage compared to their
counterpart. Excessive debt could limit the management to take up rewarding
prospects which could contribute to inefficiency in management (Topuz et al., 2005).
Our empirical evidence indicates that board size and board diversity are
not statistically significant for technical efficiency. However, board size is significant
at 10 percent level for PTE while board diversity is significant at 5 percent level for
SE. This shows that higher number of board directors contribute to higher efficiency
in managerial decisions. In the matter of board diversity and efficiency, having
female directors in the composition of board could lead to greater efficiency. High
index value indicates low diversification or higher concentration for property sector
and geographical area. Our results for both indexes show positive relationship, and
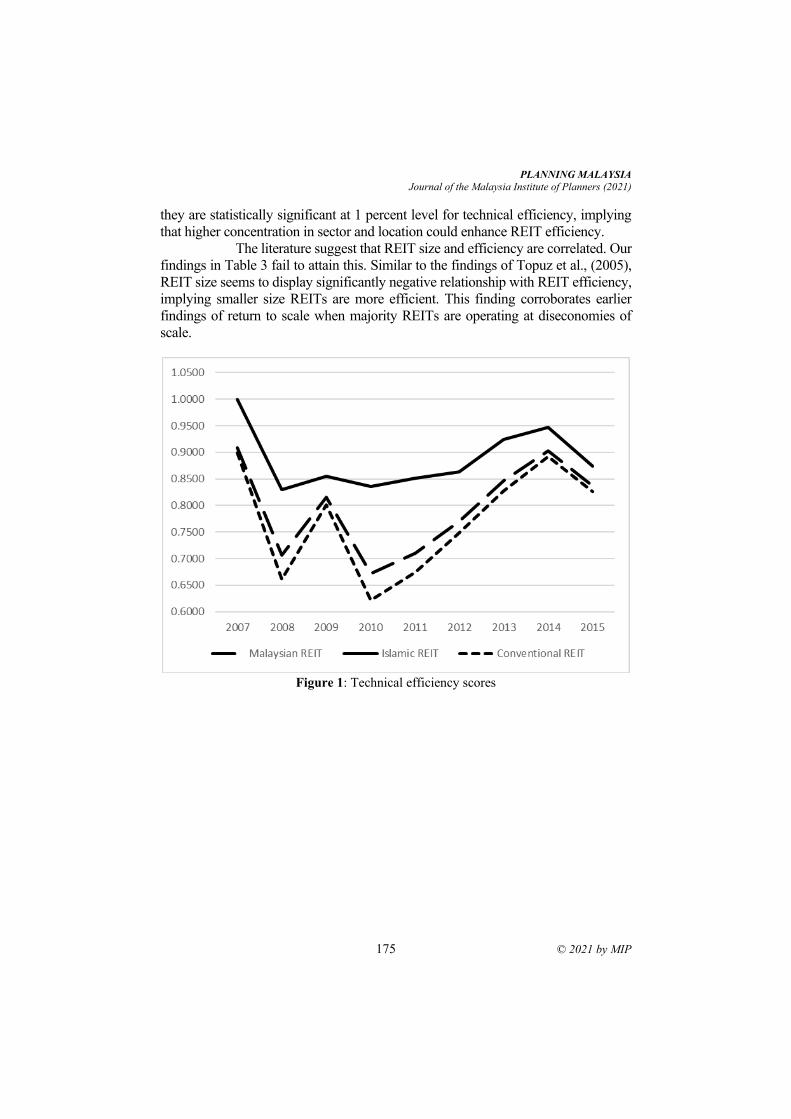
PLANNING MALAYSIA
Journal of the Malaysia Institute of Planners (2021)
175 © 2021 by MIP
they are statistically significant at 1 percent level for technical efficiency, implying
that higher concentration in sector and location could enhance REIT efficiency.
The literature suggest that REIT size and efficiency are correlated. Our
findings in Table 3 fail to attain this. Similar to the findings of Topuz et al., (2005),
REIT size seems to display significantly negative relationship with REIT efficiency,
implying smaller size REITs are more efficient. This finding corroborates earlier
findings of return to scale when majority REITs are operating at diseconomies of
scale.
Figure 1: Technical efficiency scores
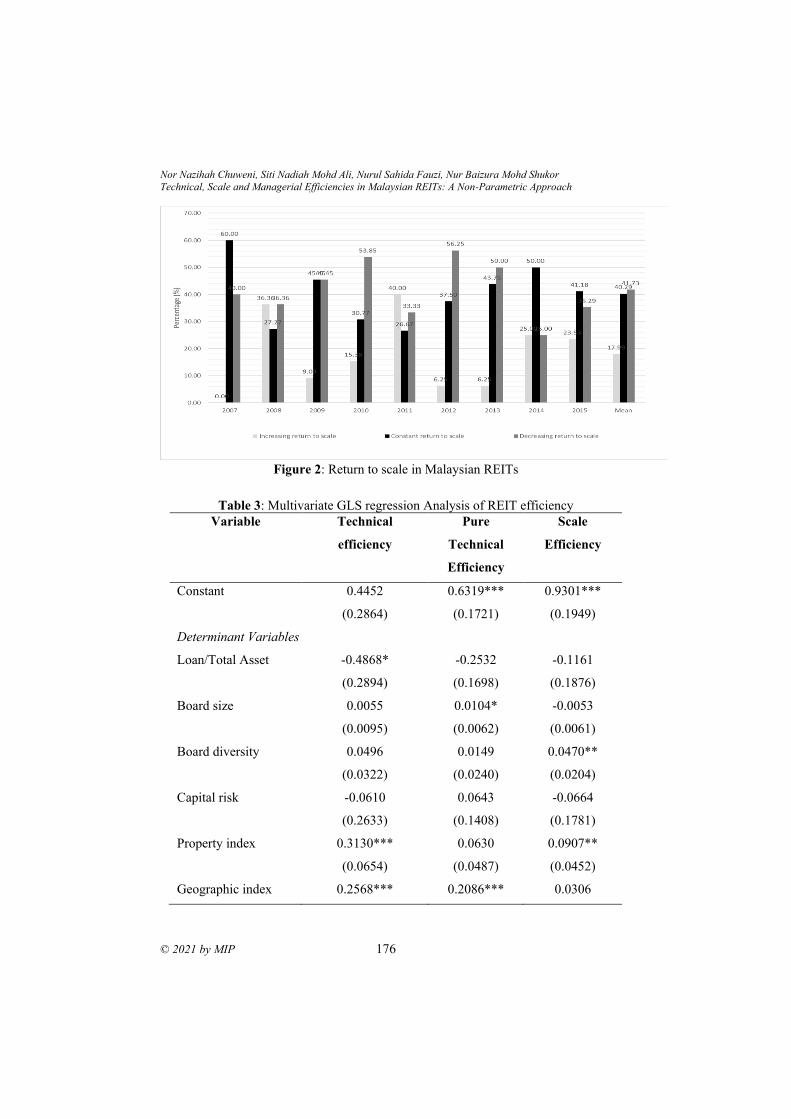
Nor Nazihah Chuweni, Siti Nadiah Mohd Ali, Nurul Sahida Fauzi, Nur Baizura Mohd Shukor
Technical, Scale and Managerial Efficiencies in Malaysian REITs: A Non-Parametric Approach
© 2021 by MIP 176
Figure 2: Return to scale in Malaysian REITs
Table 3: Multivariate GLS regression Analysis of REIT efficiency
Variable Technical
efficiency
Pure
Technical
Efficiency
Scale
Efficiency
Constant 0.4452
(0.2864)
0.6319***
(0.1721)
0.9301***
(0.1949)
Determinant Variables
Loan/Total Asset -0.4868*
(0.2894)
-0.2532
(0.1698)
-0.1161
(0.1876)
Board size 0.0055
(0.0095)
0.0104*
(0.0062)
-0.0053
(0.0061)
Board diversity 0.0496
(0.0322)
0.0149
(0.0240)
0.0470**
(0.0204)
Capital risk -0.0610
(0.2633)
0.0643
(0.1408)
-0.0664
(0.1781)
Property index 0.3130***
(0.0654)
0.0630
(0.0487)
0.0907**
(0.0452)
Geographic index 0.2568*** 0.2086*** 0.0306
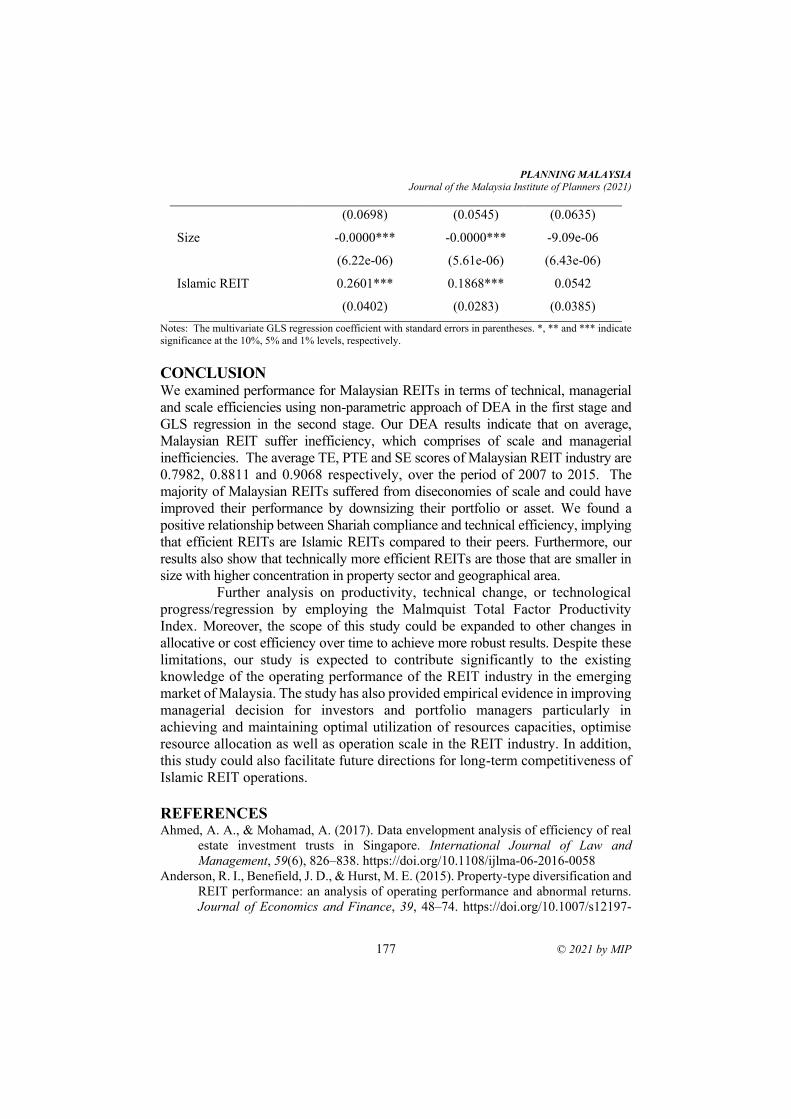
PLANNING MALAYSIA
Journal of the Malaysia Institute of Planners (2021)
177 © 2021 by MIP
(0.0698) (0.0545) (0.0635)
Size -0.0000***
(6.22e-06)
-0.0000***
(5.61e-06)
-9.09e-06
(6.43e-06)
Islamic REIT 0.2601***
(0.0402)
0.1868***
(0.0283)
0.0542
(0.0385)
Notes: The multivariate GLS regression coefficient with standard errors in parentheses. *, ** and *** indicate
significance at the 10%, 5% and 1% levels, respectively.
CONCLUSION We examined performance for Malaysian REITs in terms of technical, managerial
and scale efficiencies using non-parametric approach of DEA in the first stage and
GLS regression in the second stage. Our DEA results indicate that on average,
Malaysian REIT suffer inefficiency, which comprises of scale and managerial
inefficiencies. The average TE, PTE and SE scores of Malaysian REIT industry are
0.7982, 0.8811 and 0.9068 respectively, over the period of 2007 to 2015. The
majority of Malaysian REITs suffered from diseconomies of scale and could have
improved their performance by downsizing their portfolio or asset. We found a
positive relationship between Shariah compliance and technical efficiency, implying
that efficient REITs are Islamic REITs compared to their peers. Furthermore, our
results also show that technically more efficient REITs are those that are smaller in
size with higher concentration in property sector and geographical area.
Further analysis on productivity, technical change, or technological
progress/regression by employing the Malmquist Total Factor Productivity
Index. Moreover, the scope of this study could be expanded to other changes in
allocative or cost efficiency over time to achieve more robust results. Despite these
limitations, our study is expected to contribute significantly to the existing
knowledge of the operating performance of the REIT industry in the emerging
market of Malaysia. The study has also provided empirical evidence in improving
managerial decision for investors and portfolio managers particularly in
achieving and maintaining optimal utilization of resources capacities, optimise
resource allocation as well as operation scale in the REIT industry. In addition,
this study could also facilitate future directions for long-term competitiveness of
Islamic REIT operations.
REFERENCES Ahmed, A. A., & Mohamad, A. (2017). Data envelopment analysis of efficiency of real
estate investment trusts in Singapore. International Journal of Law and
Management, 59(6), 826–838. https://doi.org/10.1108/ijlma-06-2016-0058
Anderson, R. I., Benefield, J. D., & Hurst, M. E. (2015). Property-type diversification and
REIT performance: an analysis of operating performance and abnormal returns.
Journal of Economics and Finance, 39, 48–74. https://doi.org/10.1007/s12197-
Nor Nazihah Chuweni, Siti Nadiah Mohd Ali, Nurul Sahida Fauzi, Nur Baizura Mohd Shukor
Technical, Scale and Managerial Efficiencies in Malaysian REITs: A Non-Parametric Approach
© 2021 by MIP 178
012-9232-0
Anderson, R. I., Fok, R., Springer, T., & Webb, J. (2002). Technical efficiency and
economies of scale: A non-parametric analysis of REIT operating efficiency.
European Journal of Operational Research, 139, 598–612.
https://doi.org/10.1111/j.1540-6229.2005.00121.x
Banker, R. D., Charnes, A., & Cooper, W. W. (1984). Some models for estimating
technical and scale inefficiencies in data envelopment analysis. Management
Science, 30(9), 1078–1092.
Bauer, R., Eichholtz, P., & Kok, N. (2010). Corporate governance and performance: The
REIT effect. Real Estate Economics, 38(1), 1–29. https://doi.org/10.1111/j.1540-
6229.2009.00252.x
Beracha, E., Feng, Z., & Hardin, W. G. (2018). REIT Operational Efficiency :
Performance , Risk , and Return. Journal of Real Estate Finance and Economincs,
Feb, 1–30. https://doi.org/10.1007/s11146-018-9655-2
Beracha, E., Feng, Z., & Hardin, W. G. (2019). REIT Operational Efficiency and
Shareholder Value. The Journal of Real Estate Research, 41(4), 513–553.
https://doi.org/10.22300/0896-5803.41.4.513
Brockman, P., French, D. W., & Tamm, C. (2014). REIT Organizational Structure,
Institutional Ownership, and Stock Performance. Journal of Real Estate Portfolio
Management, 20(1), 21–36.
Charnes, A., Cooper, W. W., & Rhodes, E. (1978). Measuring the efficiency of decision
making units. European Journal of Operational Research, 2(6), 429–444.
https://doi.org/10.1016/0377-2217(78)90138-8
Chuweni, N. N., & Eves, C. (2017). A review of efficiency measures for REITS and their
specific application for Malaysian Islamic REITS. Journal of Islamic Accounting
and Business Research, 8(1), 41–53. https://doi.org/10.1108/JIABR-03-2015-
0007
Chuweni, N. N., & Eves, C. (2019). Measuring technical efficiency of Malaysian real
estate investment trusts: A data envelopment analysis approach. Planning
Malaysia: Journal of the Malaysian Institute of Planners, 17(1), 319–327.
https://doi.org/http://dx.doi.org/10.21837/pmjournal.v17.i9.608
Chuweni, N. N., Eves, C., Hoang, V.-N., Isik, I., & Hassan, M. K. (2017). How efficient
are alternative financial institutions? An empirical investigation of Islamic REITs
in Malaysia. Journal of Real Estate Literature, 25(1), 109–139.
Chuweni, N. N., Isik, I., & Blake, A. (2019). Total factor productivity change in the REIT
industry: The case of Malaysian REITs during and post global financial crisis.
Planning Malaysia: Journal of the Malaysian Institute of Planners, 17(1), 149–
159. https://doi.org/http://dx.doi.org/10.21837/pmjournal.v17.i9.594
Chuweni, N. N., Isik, I., & Mohamed Azmi, A. S. (2018). Productivity , Technology and
Efficiency Change of Islamic and Conventional Reits in Malaysia. The Journal of
Social Sciences Research, Special Is(6), 382–389.
https://doi.org/https://doi.org/10.32861/jssr.spi6.382.389
EPRA. (2019). Global Real Estate Total Markets Table (Issue October). www.epra.com
Isik, I., & Hassan, M. K. (2002). Technical, scale and allocative efficiencies of Turkish
banking industry. Journal of Banking and Finance, 26, 719–766.
https://doi.org/10.1016/S0378-4266(01)00167-4
PLANNING MALAYSIA
Journal of the Malaysia Institute of Planners (2021)
179 © 2021 by MIP
Isik, I., & Hassan, M. K. (2003). Efficiency, ownership and market structure, corporate
control and governance in the Turkish banking industry. Journal of Business
Finance and Accounting, 30(9), 1363–1421. https://doi.org/10.1111/j.0306-
686X.2003.05533.x
Isik, I., & Topuz, J. C. (2017). Meet the “born efficient” financial institutions: Evidence
from the boom years of US REITs. Quarterly Review of Economics and Finance,
66, 70–99. https://doi.org/10.1016/j.qref.2017.07.017
Jreisat, A. (2018). Productivity growth of the Australian real estate investment trusts.
Electronic Journal of Applied Statistical Analysis, 11(1), 58–73.
https://doi.org/10.1285/i20705948v11n1p58
Newell, G., & Marzuki, M. J. (2016). The significance and performance of UK-REITs in
a mixed-asset portfolio. Journal of European Real Estate Research, 9(2), 171–
182. https://doi.org/10.1108/JERER-08-2015-0032
Securities Commission Malaysia. (2019). Guidelines on Listed Real Estate Investment
Trusts (Vol. 2018, Issue June).
https://www.sc.com.my/api/documentms/download.ashx?id=afacc30c-060e-
4cc0-b40f-d4546db74724
Topuz, J. C., Darrat, A. F., & Shelor, R. M. (2005). Technical, Allocative and Scale
Efficiencies of REITs: An Empirical Inquiry. Journal of Business Finance &
Accounting, 32(9 & 10), 1961–1994. https://doi.org/10.1111/j.0306-
686X.2005.00653.x
Topuz, J. C., & Isik, I. (2009). Structural changes, market growth and productivity gains
of the US real estate investment trusts in the 1990s. Journal of Economics and
Finance, 33, 288–315. https://doi.org/10.1007/s12197-008-9026-6
Yilmaz, M. K., Kusakci, A. O., Tatoglu, E., Icten, O., & Yetgin, F. (2019). Performance
Evaluation of Real Estate Investment Trusts using a Hybridized Interval Type-2
Fuzzy AHP-DEA Approach: The Case of Borsa Istanbul. International Journal of
Information Technology and Decision Making, 18(6), 1785–1820.
https://doi.org/10.1142/S0219622019500354
Received: 12th July 2021. Accepted: 17th Sept 2021
1 Lecturrer at Polytechnique of State Finance STAN, Indonesia. Email : [email protected]
PLANNING MALAYSIA:
Journal of the Malaysian Institute of Planners
VOLUME 19 ISSUE 3 (2021), Page 180 – 189
VALUATION OF MARKET RENTAL VALUE OF A PLANNED
DORMITORY USING HEDONIC PRICING METHOD: A CASE STUDY
OF POLYTECHNIQUE OF STATE FINANCE STAN, INDONESIA
Doni Triono1, Akhmad Solikin2
1 Department of Financial Management
POLYTECHNIQUE OF STATE FINANCE STAN, INDONESIA 2 Department of Accounting
POLYTECHNIQUE OF STATE FINANCE STAN, INDONESIA
Abstract
This study determines the attributes that affect the market rental value of dormitories using the Hedonic Pricing Model. The proportional stratified random sampling technique was used to obtain data from 1,292 PKN STAN students in levels 1 to 3, which was analyzed using the SPSS statistical application. Based on the calculation, the dormitory value varies between IDR11,719,521 (RM3,424.82) to IDR15,482,242 (RM4524,41). The determinants that have a significant positive effect on dormitory value are bathroom location, average remittances per month, earnings per month, room size, gender, and origin, while the type of residence attribute has a negative correlation effect. The results of this study will be beneficial inputs for the PKN STAN in determining the market rental value, the quality of buildings and facilities are in accordance with the market preference.
Keywords: Market Rental Valuation, Hedonic Pricing Model, Willingness to Pay
PLANNING MALAYSIA
Journal of the Malaysia Institute of Planners (2021)
181 © 2021 by MIP
INTRODUCTION Polytechnic of State Finance STAN (PKN STAN) is a state campus under the Ministry of Finance, Indonesia. Graduates of this higher institution are directly recruited as government officials for the Ministry of Finance and state institutions in Indonesia. PKN STAN is among the favourite campuses in Indonesia, attracting more than 100,000 applicants every year with approximately 2,000 freshmen. The campus offers free tuition, while students bear accommodations and meals.
However, this polytechnic plan to build dormitories to improve discipline, safety, esprit de corps, and monitor students' activities in and around its surroundings. The planned dormitories are intended for students, and the occupants are required to pay rent. According to analysts, the planned dormitory would likely decrease the prices of rental houses or rooms in areas near the PKN STAN campus. The additional rooms supply will undoubtedly lead to an increase in empty rooms, thereby mandating the owners to reduce rental prices to attract new tenants. Therefore, this research also aims to analyze the new equilibrium of rental price.
This policy is likely to affect land asset utilization for PKN STAN to become more productive. It creates an avenue for the polytechnic to generate revenue as a public service agency (Badan Layanan Umum) which legally has the right to levy fees on its services. Students varying financial abilities need to be taken into account when setting the rental price. This study also aims to estimate rental prices based on students' preferences by revealing their preference for available facilities and services provided. Furthermore, this study applied the hedonic price model (HPM), which has been widely implemented to appraise the effect of respondents’ willingness to pay in accordance with residential property value. LITERATURE REVIEW According to Palmquist (1984) utility of a property is determined by its physical and external attributes. The HPM is suitable for this study due to its effect on the characteristics on the value of a property. The valuation approach is applied to dormitory property planned in the PKN STAN from 2020 to 2022.
HPM is a valuation model used to estimate someone's preferences in paying for the value of goods and services through its attributes. According to Orford (2000), this strategy has been used extensively in the property industry to evaluate peoples’ preferences. Hanley, Shogren, & White (1997) defined it as an economic valuation model based on respondents’ preferences to pay for goods or services in accordance with the attributes of the property.
Furthermore, Ready, Berger, and Blomquist (1997) stated that HPM can be implemented to calculate the value of agricultural land. Preliminary studies implement it to evaluate the monetary impact of environmental damage, such as air pollution, sedimentation, and landfills (Hite et al., 2001). In addition, Brendt (1990) used HPM to estimate prices in the car and computer industries.
Doni Triono & Akmad Solikin
Valuation Of Market Rental Value of a Planned Dormitory Using Hedonic Pricing Method: A Case Study of
Polytechnique of State Finance STAN, Indonesia
© 2021 by MIP 182
Therefore, information regarding the willingness to pay in accordance with HPM analysis is beneficial to stakeholders in the government and private sectors. This evaluation model also provides valuable information on the value of specific goods and services and informs policymakers.
The hedonic price model is one of the methods suitable for valuing and replacing special goods that do not have market values. HPM is commonly used in valuing property (Bolt et al., 2005). It assumes that physical property is an attribute that reflects community preferences for property and is used as a reference in determining its value.
The physical attributes of the hostel include location, room area, elevator, study
table, bed, wardrobe, and wifi. This is in addition to the property externalities
such as distance from campus. The frequent use of statistical analysis and
multiple regression models makes it possible to isolate the effects of the features
considered to be assessed.
METHODOLOGY Theoretically, property value is determined by its attributes which people then consume to fulfill its demand. Therefore, studies need to be carried out to construct regression functions with dependent variables, such as dormitory rental price and the independent variables. According to Cró and Martins (2017), several attributes affect dormitory prices, such as staff, facilities, atmosphere, cleanliness, location, and security. However, Santos (2016), Tsai, and Pan (2014) state that attributes such as location, daylighting, facilities, service quality, and security are the dominant factors affecting dormitory prices. The rental price of an apartment is determined by its physical and environmental attributes (Anselin, 1988; Dubin, 1992). The mathematical expression is shown in equation (1). R = f(P, E) ............................................................................................ (1) where R, P, and E denotes dormitory rent, physical conditions, and environmental attributes. Kong, Yin, and Nakagoshi (2007) and Bolt et al. (2005) reported that choosing attributes that affect property value is imperative because they are used in the multiple regression as independent variables. In addition to physical facilities and environmental attributes, this research also included some socioeconomic variables to capture the effect of socioeconomic status on willingness to pay (Mohit & Mustafa, 2010). Therefore, the attributes and socioeconomic variables include: 1. Physical attributes, such as type of current room (house, room, or apartment),
room size, location of shower/toilet (inside or shared), electricity bill, kitchen, and parlor.
2. External attributes, such as distance or time-traveled to the campus, transportation type, and food provider. We do not include open space
PLANNING MALAYSIA
Journal of the Malaysia Institute of Planners (2021)
183 © 2021 by MIP
(Asmawi et al., 2018) as an external attributes since we assume that the open space is not relevant for majority of students.
3. Socioeconomic attributes, such as income (from family or own revenue), department, semester, age, place of origin, gender, family member, and parents’ professions.
The empirical model of multiple linear regressions is shown in equation (2): 𝑌𝑖 = 𝛽 + 𝛽1TYPE𝑖 + 𝛽2ELEC𝑖 + 𝛽3SHARED𝑖 + 𝛽4KITCHEN𝑖 + 𝛽5SIZE𝑖
+ 𝛽6BATH𝑖 + 𝛽7REMIT𝑖 + 𝛽8INCOME𝑖 + 𝛽9DEPT𝑖 + 𝛽10SEM𝑖 + 𝛽11AGE𝑖 + 𝛽12ORI𝑖 + 𝛽13GENDER𝑖 + 𝛽14FAM𝑖 + 𝛽15JOB𝑖 + 𝛽16DIST𝑖 + 𝜀𝑖 ........................................................................................... (2)
where 𝑌𝑖 = Dormitory value, 𝛽 = intercept, 𝛽1...n = coeficient correlation, TYPE = type of place, ELEC = electricity cost, SHARED = shared space, KITCHEN = shared kitchen, SIZE = room size, BATH = the location of the bathroom, REMIT = Average remittances per month, INCOME = own income, DEPT = Departmen, SEM = semester, AGE = age, ORI = origin, GENDER = gender, FAM = family number, JOB = profession parents, DIST = distance to campus. The sample in this study was Campus PKN STAN students of all department levels, namely Accounting, Tax, Customs and Excise, and Financial Management. The sampling technique used was stratified random sampling by randomly select sample based on attendance numbers list. The data will be analyzed using the ordinary least square (OLS) method by a stepwise selection of variables. This method is the same as the research conducted by Majid et al. (2018). FINDING AND DISCUSSION Descriptive Statistics The sample population consists of 10,756 students grouped into 287 per class at all levels. Out of the 1289 respondents, 1236 (95.9%) agreed and strongly agreed with the construction of dormitories in the campus area. Meanwhile, 912 (70.7%) were aware of the planned construction of the dormitories. 1,064 (82.5%) lived with a distance of 0-500 meters and 167 (12.9%) at 501-1500 meters. The remaining 58 (4.5%) lived at a distance of 1.5-11 km. Therefore, it can be concluded that the current significant number of students mostly live around the campus. It is logical that our models do not include transportation choice, albeit previous literatures found it significant predictors of rents (Suhaimi et al., 2021).
Table 1: Composition of Respondents Based on Gender, Level and Department
No Department Male Female
I* III V VII I III V VII
1. Accounting 151 127 76 0 90 186 70 0
Doni Triono & Akmad Solikin
Valuation Of Market Rental Value of a Planned Dormitory Using Hedonic Pricing Method: A Case Study of
Polytechnique of State Finance STAN, Indonesia
© 2021 by MIP 184
2. Tax 80 53 29 0 28 79 21 0
3. Customs and
Excises
1 13 28 0 0 0 3 0
4. Financial
management
52 45 10 0 41 82 24 0
Total 284 238 143 0 159 347 118 0
Grand total 1289
* Level/semester
The composition of respondents by gender, level, and department is shown in Table 1. Based on gender, the number of respondents consists of 665 (51.6%) male and 624 (48.4%) female students. In terms of origin, 893 (69.3%) of the respondents come from Java, Bali, and Nusa Tenggara, while 335 (26%), 29 (2.3%), 29 (2.3%), and 3 (0.2%) are from Sumatra, Kalimantan, Sulawesi, and Papua, respectively. Furthermore, there are 700 (54.3%), 290 (22.4%), 45 (3.5%), and 254 (19.7%) Department of Accounting, Department of Tax, Department of Customs and Excise, and Department of Financial Management. Regression Analysis Parameter Estimation Parameter estimation in this regression uses the ordinary least square (OLS) method by a stepwise selection of variables. It is a combination of forward and backward methods, with the first variable consisting of the highest and significant correlation with the dependent variable. The second incoming variable with the highest value is still a significant and partial correlation. Furthermore, after certain variables enter the model, others are evaluated to eliminate those that are not significant (Draper & Smith, 1998).
From 7 possible models, the 7th model can explain the effect of variables used up to 7 variables. Therefore, model 7 will be used. As shown in Table 1, bathroom location, average monthly remittances, own earnings per month, room size, type of residence (others), gender (male), and place of origin (Kalimantan island), are all significant at 5%.
Table 2: Coefficients
Model B Std. Err. t Sig. Tol VIF
1 (Constant) 9909483 307905 32.184 .000
Bathroom location 3460185 446147 7.756 .000 1.000 1.000
2 (Constant) 8189247 484983 16.886 .000
Bathroom location 3240819 439284 7.378 .000 .988 1.012
Average remittances (month) 1.402 .310 4.527 .000 .988 1.012
3 (Constant) 6768582 593756 11.400 .000
Bathroom location 3316224 432331 7.671 .000 .986 1.014
Average remittances (month) 1.933 .332 5.823 .000 .831 1.203
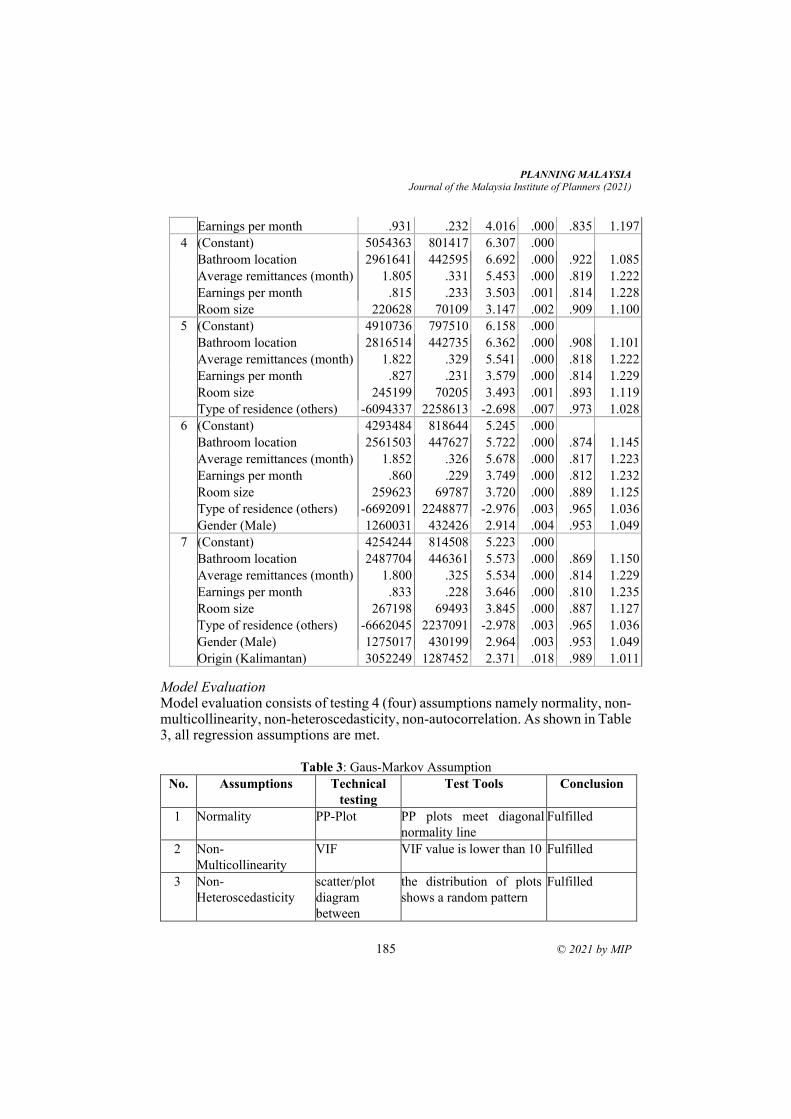
PLANNING MALAYSIA
Journal of the Malaysia Institute of Planners (2021)
185 © 2021 by MIP
Earnings per month .931 .232 4.016 .000 .835 1.197
4 (Constant) 5054363 801417 6.307 .000
Bathroom location 2961641 442595 6.692 .000 .922 1.085
Average remittances (month) 1.805 .331 5.453 .000 .819 1.222
Earnings per month .815 .233 3.503 .001 .814 1.228
Room size 220628 70109 3.147 .002 .909 1.100
5 (Constant) 4910736 797510 6.158 .000
Bathroom location 2816514 442735 6.362 .000 .908 1.101
Average remittances (month) 1.822 .329 5.541 .000 .818 1.222
Earnings per month .827 .231 3.579 .000 .814 1.229
Room size 245199 70205 3.493 .001 .893 1.119
Type of residence (others) -6094337 2258613 -2.698 .007 .973 1.028
6 (Constant) 4293484 818644 5.245 .000
Bathroom location 2561503 447627 5.722 .000 .874 1.145
Average remittances (month) 1.852 .326 5.678 .000 .817 1.223
Earnings per month .860 .229 3.749 .000 .812 1.232
Room size 259623 69787 3.720 .000 .889 1.125
Type of residence (others) -6692091 2248877 -2.976 .003 .965 1.036
Gender (Male) 1260031 432426 2.914 .004 .953 1.049
7 (Constant) 4254244 814508 5.223 .000
Bathroom location 2487704 446361 5.573 .000 .869 1.150
Average remittances (month) 1.800 .325 5.534 .000 .814 1.229
Earnings per month .833 .228 3.646 .000 .810 1.235
Room size 267198 69493 3.845 .000 .887 1.127
Type of residence (others) -6662045 2237091 -2.978 .003 .965 1.036
Gender (Male) 1275017 430199 2.964 .003 .953 1.049
Origin (Kalimantan) 3052249 1287452 2.371 .018 .989 1.011
Model Evaluation Model evaluation consists of testing 4 (four) assumptions namely normality, non-multicollinearity, non-heteroscedasticity, non-autocorrelation. As shown in Table 3, all regression assumptions are met.
Table 3: Gaus-Markov Assumption
No. Assumptions Technical
testing
Test Tools Conclusion
1 Normality PP-Plot PP plots meet diagonal
normality line
Fulfilled
2 Non-
Multicollinearity
VIF VIF value is lower than 10 Fulfilled
3 Non-
Heteroscedasticity
scatter/plot
diagram
between
the distribution of plots
shows a random pattern
Fulfilled
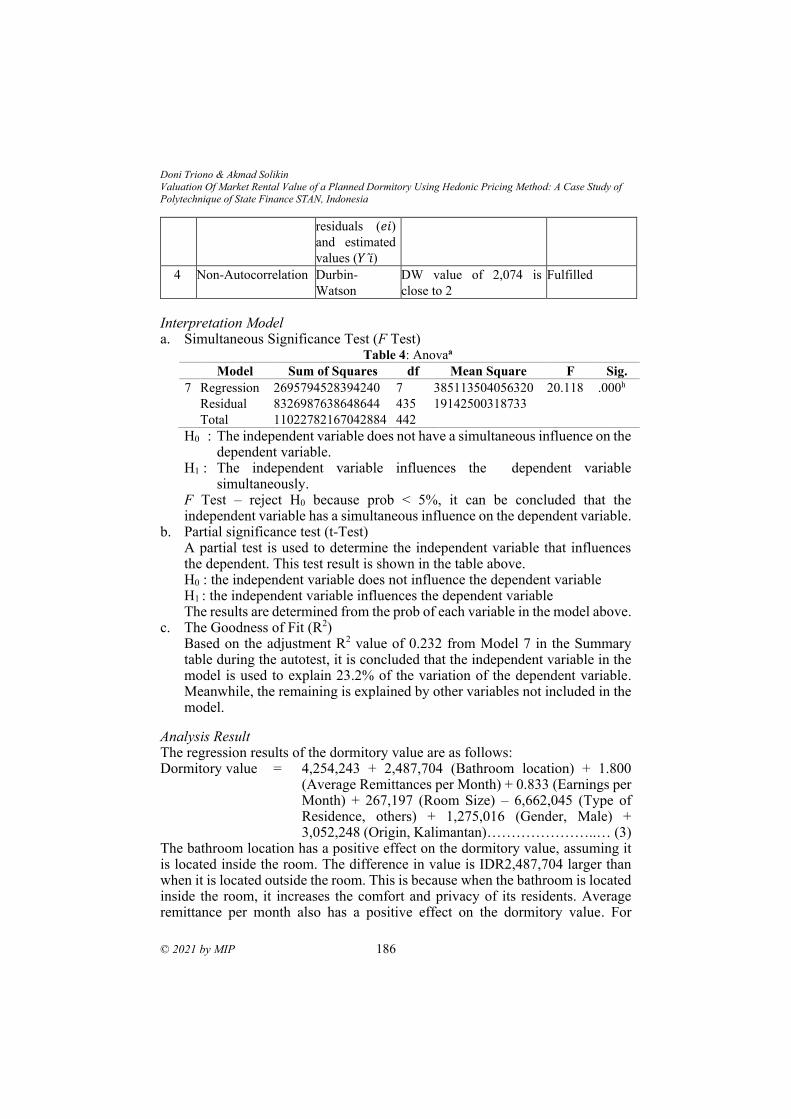
Doni Triono & Akmad Solikin
Valuation Of Market Rental Value of a Planned Dormitory Using Hedonic Pricing Method: A Case Study of
Polytechnique of State Finance STAN, Indonesia
© 2021 by MIP 186
residuals (𝑒𝑖) and estimated
values (𝑌 𝑖)
4 Non-Autocorrelation Durbin-
Watson
DW value of 2,074 is
close to 2
Fulfilled
Interpretation Model a. Simultaneous Significance Test (F Test)
Table 4: Anovaa
Model Sum of Squares df Mean Square F Sig.
7 Regression 2695794528394240 7 385113504056320 20.118 .000h
Residual 8326987638648644 435 19142500318733
Total 11022782167042884 442
H0 : The independent variable does not have a simultaneous influence on the dependent variable.
H1 : The independent variable influences the dependent variable simultaneously.
F Test – reject H0 because prob < 5%, it can be concluded that the independent variable has a simultaneous influence on the dependent variable.
b. Partial significance test (t-Test) A partial test is used to determine the independent variable that influences the dependent. This test result is shown in the table above. H0 : the independent variable does not influence the dependent variable H1 : the independent variable influences the dependent variable The results are determined from the prob of each variable in the model above.
c. The Goodness of Fit (R2) Based on the adjustment R2 value of 0.232 from Model 7 in the Summary table during the autotest, it is concluded that the independent variable in the model is used to explain 23.2% of the variation of the dependent variable. Meanwhile, the remaining is explained by other variables not included in the model.
Analysis Result The regression results of the dormitory value are as follows: Dormitory value = 4,254,243 + 2,487,704 (Bathroom location) + 1.800
(Average Remittances per Month) + 0.833 (Earnings per Month) + 267,197 (Room Size) – 6,662,045 (Type of Residence, others) + 1,275,016 (Gender, Male) + 3,052,248 (Origin, Kalimantan)…………………..… (3)
The bathroom location has a positive effect on the dormitory value, assuming it is located inside the room. The difference in value is IDR2,487,704 larger than when it is located outside the room. This is because when the bathroom is located inside the room, it increases the comfort and privacy of its residents. Average remittance per month also has a positive effect on the dormitory value. For
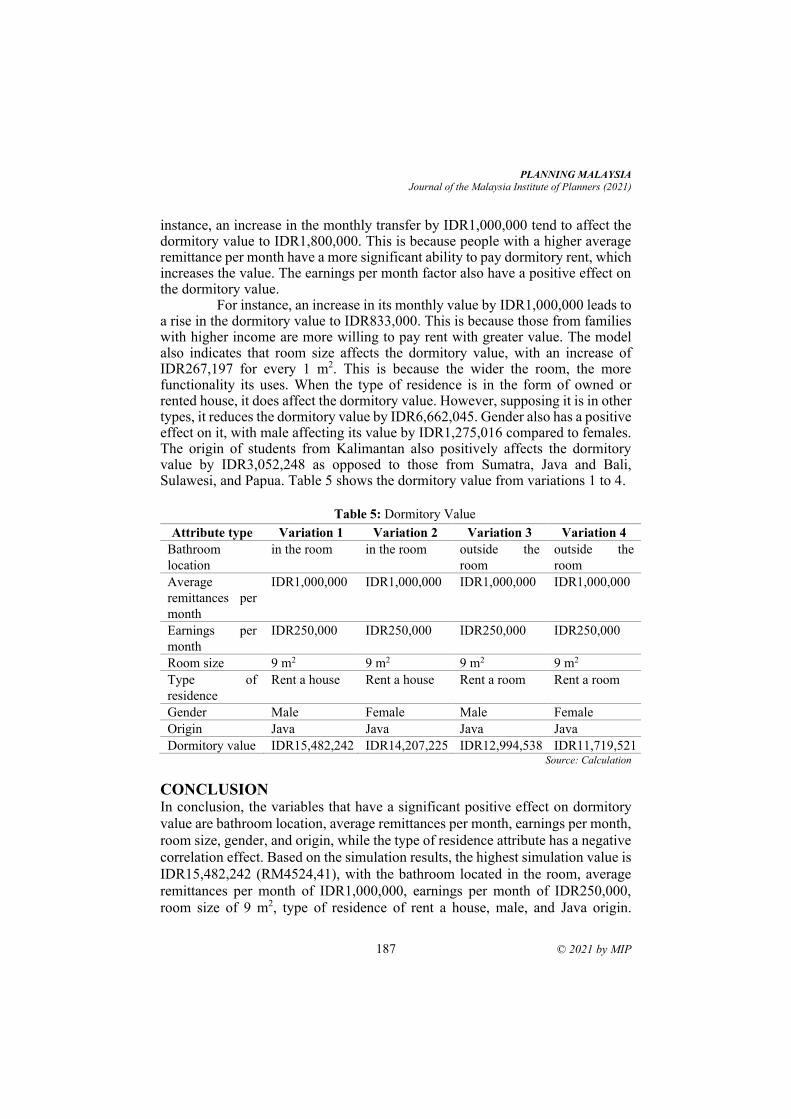
PLANNING MALAYSIA
Journal of the Malaysia Institute of Planners (2021)
187 © 2021 by MIP
instance, an increase in the monthly transfer by IDR1,000,000 tend to affect the dormitory value to IDR1,800,000. This is because people with a higher average remittance per month have a more significant ability to pay dormitory rent, which increases the value. The earnings per month factor also have a positive effect on the dormitory value.
For instance, an increase in its monthly value by IDR1,000,000 leads to a rise in the dormitory value to IDR833,000. This is because those from families with higher income are more willing to pay rent with greater value. The model also indicates that room size affects the dormitory value, with an increase of IDR267,197 for every 1 m2. This is because the wider the room, the more functionality its uses. When the type of residence is in the form of owned or rented house, it does affect the dormitory value. However, supposing it is in other types, it reduces the dormitory value by IDR6,662,045. Gender also has a positive effect on it, with male affecting its value by IDR1,275,016 compared to females. The origin of students from Kalimantan also positively affects the dormitory value by IDR3,052,248 as opposed to those from Sumatra, Java and Bali, Sulawesi, and Papua. Table 5 shows the dormitory value from variations 1 to 4.
Table 5: Dormitory Value
Attribute type Variation 1 Variation 2 Variation 3 Variation 4
Bathroom
location
in the room in the room outside the
room
outside the
room
Average
remittances per
month
IDR1,000,000 IDR1,000,000 IDR1,000,000 IDR1,000,000
Earnings per
month
IDR250,000 IDR250,000 IDR250,000 IDR250,000
Room size 9 m2 9 m2 9 m2 9 m2
Type of
residence
Rent a house Rent a house Rent a room Rent a room
Gender Male Female Male Female
Origin Java Java Java Java
Dormitory value IDR15,482,242 IDR14,207,225 IDR12,994,538 IDR11,719,521 Source: Calculation
CONCLUSION In conclusion, the variables that have a significant positive effect on dormitory
value are bathroom location, average remittances per month, earnings per month,
room size, gender, and origin, while the type of residence attribute has a negative
correlation effect. Based on the simulation results, the highest simulation value is
IDR15,482,242 (RM4524,41), with the bathroom located in the room, average
remittances per month of IDR1,000,000, earnings per month of IDR250,000,
room size of 9 m2, type of residence of rent a house, male, and Java origin.
Doni Triono & Akmad Solikin
Valuation Of Market Rental Value of a Planned Dormitory Using Hedonic Pricing Method: A Case Study of
Polytechnique of State Finance STAN, Indonesia
© 2021 by MIP 188
Meanwhile, the lowest simulation value is IDR11,719,521 (RM3,424.82), with
the bathroom located outside the room, average remittances per month
IDR1,000,000, earnings per month of IDR250,000, room size of 9 m2, type of
residence of rent a house, female, and of Java origin.
REFERENCES Anselin, L. (1988). Spatial econometrics: Methods and models. In Department of
Geography and Economics, University of California, Santa Barbara, USA.
Springer, Dordrecht. https://doi.org/https://doi.org/10.1007/978-94-015-7799-1
Asmawi, M. Z., Mohit, M. A., Noor, N. M., Abdullah, A., & Paiman, T. (2018). Factor
analysis on hedonic pricing model on open space affecting the housing price in
Melaka and Seremban. Planning Malaysia, 16(6), 119–130.
Berndt, E. R. (1990). The practice of econometrics: Classic and contemporary. Reading,
Mass.; Don Mills, Ont.: Addison-Wesley Publishing Company.
Bolt, K., Ruta, G., & Sarraf, M. (2005). Estimating the cost of environmental degradation.
In Report of the World Bank Environment Department (pp. 38–50). World Bank
Washington.
Cró, S., & Martins, A. M. (2017). The importance of security for hostel price premiums:
European empirical evidence. Tourism Management, 60, 159–165.
https://doi.org/10.1016/j.tourman.2016.11.021
Draper, N. R., & Smith, H. (1998). Applied Regression Analysis (3ed ed.). John Wiley &
Sons.
Dubin, R. A. (1992). Spatial autocorrelation and neighborhood quality. Regional Science
and Urban Economics, 22(3), 433–452.
Hite, D., Chern, W., Hitzhusen, F., & Randall, A. (2001). Property-value impacts of an
environmental disamenity: The case of landfills. Journal of Real Estate Finance
and Economics, 22(2–3), 185–203.
Kong, F., Yin, H., & Nakagoshi, N. (2007). Using GIS and landscape metrics in the
hedonic price modeling of the amenity value of urban green space: A case study
in Jinan City, China. Landscape and Urban Planning, 79(3–4), 240–252.
Majid, M. R., Zaman, M., & Halim, N. (2018). Gis-based regression analysis of the
relationship between ecological footprint and economic development of selected
countries. Planning Malaysia, 16(7), 221–232.
Mohit, M. A., & Mustafa, M. M. (2010). Analysis of commute charateristics and
residential location choice of IIUM Gombak Campus Employees of Malaysia.
Planning Malaysia, 8(1), 25–43.
Palmquist, R. B. (1984). Estimating the demand of characteristics of housing. Review of
Economics and Statistics, 64, 394–404.
Ready, R. C., Berger, M. C., & Blomquist, G. C. (1997). Measuring amenity benefits
from farmland: Hedonic pricing vs. contingent valuation. Growth and Change,
28(4), 438–459.
Santos, G. E. de O. (2016). Worldwide hedonic prices of subjective characteristics of
hostels. Tourism Management, 52, 451–454.
https://doi.org/10.1016/j.tourman.2015.07.001
Suhaimi, N. A., Maimun, N. H. A., & Sa’at, N. F. (2021). Does rail transport impact

PLANNING MALAYSIA
Journal of the Malaysia Institute of Planners (2021)
189 © 2021 by MIP
house prices and rents? Planning Malaysia, 19(16), 141–149.
Tsai, W.-P., & Pan, N.-H. (2014). The Application of the artificial neural network in
student dormitory rent – with Taiwan Sugar Corporation Hsianghe Dormitory as
an example. Journal of Statistics and Management Systems, 17(1), 23–46.
https://doi.org/10.1080/09720510.2013.857915
Received: 12th July 2021. Accepted: 23rd Sept 2021
1 Lecturer at Polytechnic of State Finance STAN, Email: [email protected]
PLANNING MALAYSIA:
Journal of the Malaysian Institute of Planners
VOLUME 19 ISSUE 3 (2021), Page 190 – 201
DETERMINATION OF FINANCIAL FEASIBILITY OF
INDONESIA'S NEW CAPITAL ROAD CONSTRUCTION
PROJECT USING SCENARIO ANALYSIS
Muhammad Heru Akhmadi1, Audra Rizki Himawan2
School of Financial Management
POLYTECHNIC OF STATE FINANCE STAN, INDONESIA
Abstract
The plan to relocate the Indonesian capital from Jakarta to East Kalimantan
Province in 2024 requires a significant amount of 442 trillion Rupiah to construct
various new capital infrastructure such as roads for transportation. This study
aims to analyze the funding scheme for new capital road construction projects in
Indonesia using two alternative financing, namely the National Budget and
Public-Private Partnership (PPP). This study used quantitative methods with a
scenario analysis approach to determine the best funding scheme based on
regional economic growth and financial viability. This study did not consider the
project management factors during the construction period and the quality factors
of the roads built during the concession period. The results showed that road
construction projects in the new capital city can be implemented using two
financing schemes. The National Budget financing scheme will increase the
percentage of the budget deficit to GDP in the first five years of development.
The financing scheme through PPP can help the government overcome the budget
deficit but requires the resilience of the government's budget during the project
concession period.
Keywords: infrastructure, scenario analysis, financing, new capital
PLANNING MALAYSIA
Journal of the Malaysia Institute of Planners (2021)
191 © 2021 by MIP
INTRODUCTION
The government has been planning to relocate the Indonesian national capital
from Jakarta to some other state even before it gained independence. Based on
data compiled by Kompas Research and Development (2019), Bandung in West
Java, Palangkaraya in Central Kalimantan, and Jonggol were being considered
during the Dutch East Indies era, and Presidents Soeharto and Soekarno’s times
in office. Finally, President Jokowi established the Kutai Kertanegara and North
Penajam Paser Regencies, East Kalimantan Province, as Indonesia's new capital.
The Ministry of National Development Planning has reported that an
estimated cost of IDR 466 trillion is needed to construct new capital. This is
expected to lead to an increase in APBN spending in the next few years. Given
the limited fiscal space, an alternative financing procedure, namely a partnership
scheme between the government and business entities or SOEs' assignment, was
adopted for this construction, thereby enabling APBN spending to be allocated to
other public sectors.
One factor that determines the readiness to develop the new capital is
road construction. Its provision is important because it is regarded as a basic
infrastructure that connects various economic aspects, including access both in
and out of the capital. Moreover, the planned capital Kutai Kertanegara and Pasir
Penajam Districts lack adequate road infrastructure. Although the Ministry of
PPN intends to execute its construction using the Public-Private Partnership
scheme, besides it is important to review the financing feasibility of capital roads.
The PPP is implemented supposing the road construction has economic
and financial feasibility, thereby providing added value to the companies to get
their investment returns. Therefore, this study ensures that the government's
choice of the PPP scheme is realistic compared to other alternative financing
initiatives, such as SOE special assignments and bilateral loans from international
institutions.
However, this study aims to determine the feasibility of road
construction using an economically sustainable financing scheme that benefits
the government and reduces fiscal risks in the long run. This led to the adoption
of a funding initiative that meets the 3 aforementioned criteria. Before
calculating the financing feasibility, a scenario analysis approach was adopted to
determine the road requirements based on the estimated number of existing and
migratory populations. Meanwhile, the government has yet to formalize the
design and technical drawings related to the construction of these roads.
RESEARCH METHODOLOGY This study uses quantitative methods to analyze the determination of financing
schemes for developing the new capital city of Indonesia. Furthermore, inference
statistics were used to calculate the average and standard deviations of road
requirements. Some data that serve as independent variables include population,
Muhammad Heru Akhmadi & Audra Rizki Himawan
Determination of Financial Feasibility of Indonesia's New Capital Road Construction Project Using Scenario Analysis
© 2021 by MIP 192
area size, and Gross Regional Domestic Product (GRDP) in the Kutai
Kertanegara and Penajam Pasir Utara districts were used to determine the
estimated length of the road. The results showed that the estimated length of road
and the yield data of Rupiah denominated government securities are used as
independent variables to determine the estimated project based on several
scenarios.
According to Kishita et al. (2016), the scenario analysis is a method
used to predict the possible occurrence of a situation and its consequences,
assuming that the phenomenon or a trend is continued in the future. The scenario
analysis is carried out through 4 stages. The first is estimating the road
construction requirements based on Minimum Service Standards using the
following variables, population, and GDRP per area. The second stage is to
estimate the average population parameters according to a small sample size to
ascertain the road construction project costs. Third, extrapolate Government
Bonds (SBN) Yield Curve in Rupiah Denominations as Discount Rate, and trend
compilation using scatter-plots and logarithmic natural (ln) to estimate the
interest rates for 50 years as an input in the NPV calculation.
The fourth stage involves analyzing the scenarios to determine the
changes in independent variables, determined by a set of values. Based on this,
the independent variables are projects and a range of estimated values determined
by an inferential statistical approach. Conversely, the dependent variable is a
primary balance and the ratio of deficits to GDP. Income expenditure is the
control variable in accordance with ceteris paribus. However, the addition of the
project value results in capital expenditure.
LITERATURE REVIEW Sumardjoko (2019) stated that the provision of infrastructure creates connectivity
and trade. Based on the managerial status of the authority, there are national,
provincial, district, city, and village roads. National roads are described as arterial
collectors in the primary road network system that strategically connects
provincial capitals, national and toll lanes. Provincial roads are collectors in the
primary road network system that strategically connects provincial, and district,
or city lanes. City roads are a secondary road network system connecting service
centers, parcels, and settlements within the city. Village roads are also
categorized as public lanes that connect the area or settlements within the
community and environmental roads.
However, technical inefficiency has a greater deviation in the efficient
frontier compared to the ineffective scale (Chuweni, 2019). In road construction,
technical requirements include the speed of the plan, width, capacity, driveways,
intersections of complementary buildings, equipment, usage according to their
functions, and the ability to meet the security, safety, and environmental needs.
To guarantee all these, Government Regulation No. 25 of 2000 stipulated a
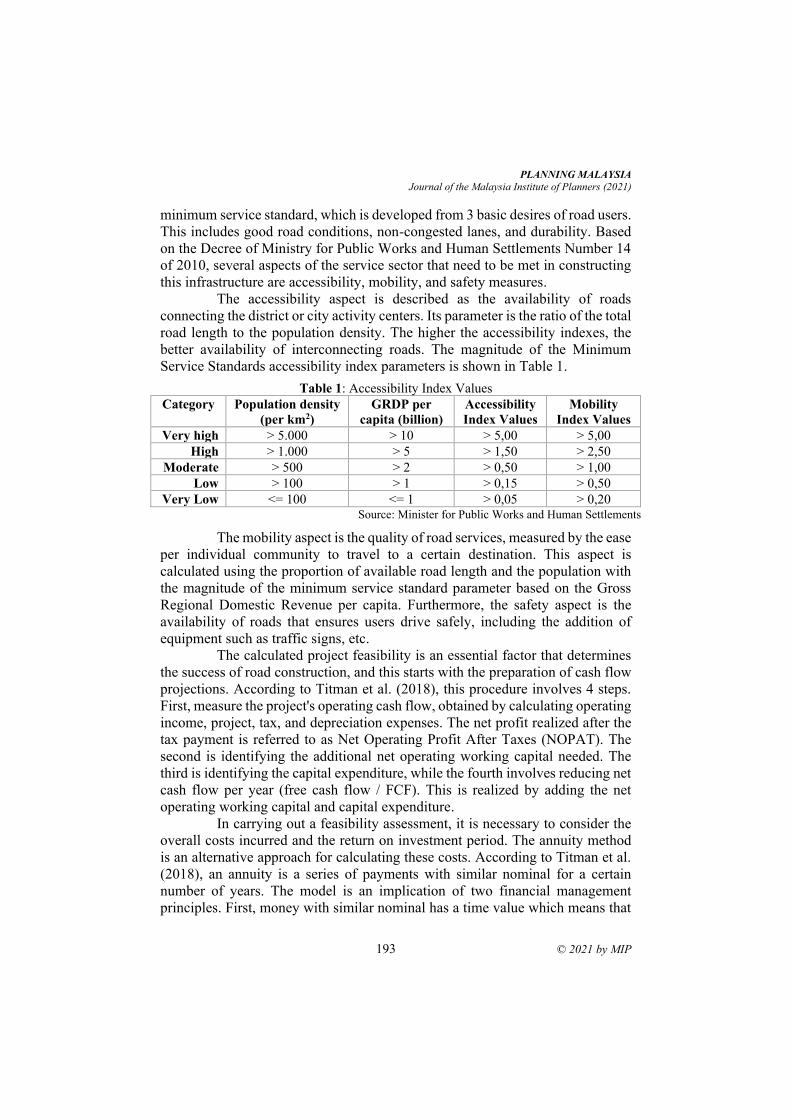
PLANNING MALAYSIA
Journal of the Malaysia Institute of Planners (2021)
193 © 2021 by MIP
minimum service standard, which is developed from 3 basic desires of road users.
This includes good road conditions, non-congested lanes, and durability. Based
on the Decree of Ministry for Public Works and Human Settlements Number 14
of 2010, several aspects of the service sector that need to be met in constructing
this infrastructure are accessibility, mobility, and safety measures.
The accessibility aspect is described as the availability of roads
connecting the district or city activity centers. Its parameter is the ratio of the total
road length to the population density. The higher the accessibility indexes, the
better availability of interconnecting roads. The magnitude of the Minimum
Service Standards accessibility index parameters is shown in Table 1.
Table 1: Accessibility Index Values
Category Population density
)2(per km
GRDP per
capita (billion)
Accessibility
Index Values
Mobility
Index Values
Very high > 5.000 > 10 > 5,00 > 5,00
High > 1.000 > 5 > 1,50 > 2,50
Moderate > 500 > 2 > 0,50 > 1,00
Low > 100 > 1 > 0,15 > 0,50
Very Low <= 100 <= 1 > 0,05 > 0,20 Source: Minister for Public Works and Human Settlements
The mobility aspect is the quality of road services, measured by the ease
per individual community to travel to a certain destination. This aspect is
calculated using the proportion of available road length and the population with
the magnitude of the minimum service standard parameter based on the Gross
Regional Domestic Revenue per capita. Furthermore, the safety aspect is the
availability of roads that ensures users drive safely, including the addition of
equipment such as traffic signs, etc.
The calculated project feasibility is an essential factor that determines
the success of road construction, and this starts with the preparation of cash flow
projections. According to Titman et al. (2018), this procedure involves 4 steps.
First, measure the project's operating cash flow, obtained by calculating operating
income, project, tax, and depreciation expenses. The net profit realized after the
tax payment is referred to as Net Operating Profit After Taxes (NOPAT). The
second is identifying the additional net operating working capital needed. The
third is identifying the capital expenditure, while the fourth involves reducing net
cash flow per year (free cash flow / FCF). This is realized by adding the net
operating working capital and capital expenditure.
In carrying out a feasibility assessment, it is necessary to consider the
overall costs incurred and the return on investment period. The annuity method
is an alternative approach for calculating these costs. According to Titman et al.
(2018), an annuity is a series of payments with similar nominal for a certain
number of years. The model is an implication of two financial management
principles. First, money with similar nominal has a time value which means that
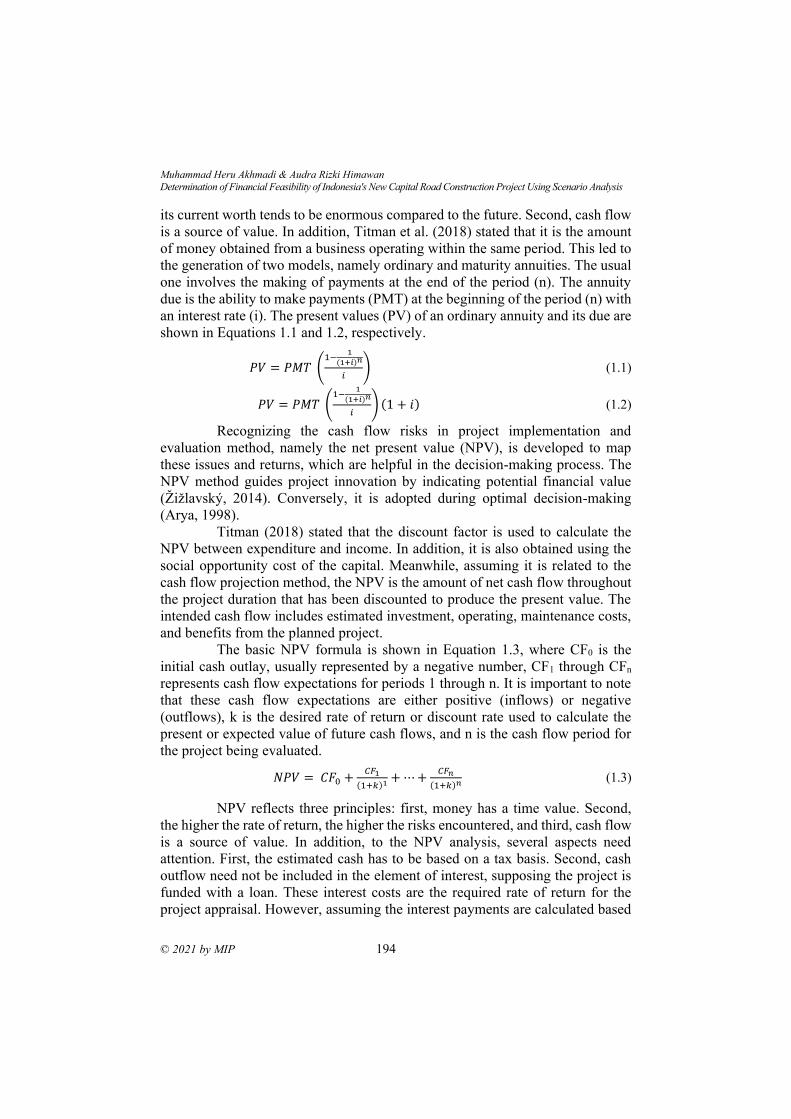
Muhammad Heru Akhmadi & Audra Rizki Himawan
Determination of Financial Feasibility of Indonesia's New Capital Road Construction Project Using Scenario Analysis
© 2021 by MIP 194
its current worth tends to be enormous compared to the future. Second, cash flow
is a source of value. In addition, Titman et al. (2018) stated that it is the amount
of money obtained from a business operating within the same period. This led to
the generation of two models, namely ordinary and maturity annuities. The usual
one involves the making of payments at the end of the period (n). The annuity
due is the ability to make payments (PMT) at the beginning of the period (n) with
an interest rate (i). The present values (PV) of an ordinary annuity and its due are
shown in Equations 1.1 and 1.2, respectively.
𝑃𝑉 = 𝑃𝑀𝑇 (1−
1
(1+𝑖)𝑛
𝑖) (1.1)
𝑃𝑉 = 𝑃𝑀𝑇 (1−
1
(1+𝑖)𝑛
𝑖) (1 + 𝑖) (1.2)
Recognizing the cash flow risks in project implementation and
evaluation method, namely the net present value (NPV), is developed to map
these issues and returns, which are helpful in the decision-making process. The
NPV method guides project innovation by indicating potential financial value
(Žižlavský, 2014). Conversely, it is adopted during optimal decision-making
(Arya, 1998).
Titman (2018) stated that the discount factor is used to calculate the
NPV between expenditure and income. In addition, it is also obtained using the
social opportunity cost of the capital. Meanwhile, assuming it is related to the
cash flow projection method, the NPV is the amount of net cash flow throughout
the project duration that has been discounted to produce the present value. The
intended cash flow includes estimated investment, operating, maintenance costs,
and benefits from the planned project.
The basic NPV formula is shown in Equation 1.3, where CF0 is the
initial cash outlay, usually represented by a negative number, CF1 through CFn
represents cash flow expectations for periods 1 through n. It is important to note
that these cash flow expectations are either positive (inflows) or negative
(outflows), k is the desired rate of return or discount rate used to calculate the
present or expected value of future cash flows, and n is the cash flow period for
the project being evaluated.
𝑁𝑃𝑉 = 𝐶𝐹0 +𝐶𝐹1
(1+𝑘)1 + ⋯ +𝐶𝐹𝑛
(1+𝑘)𝑛 (1.3)
NPV reflects three principles: first, money has a time value. Second,
the higher the rate of return, the higher the risks encountered, and third, cash flow
is a source of value. In addition, to the NPV analysis, several aspects need
attention. First, the estimated cash has to be based on a tax basis. Second, cash
outflow need not be included in the element of interest, supposing the project is
funded with a loan. These interest costs are the required rate of return for the
project appraisal. However, assuming the interest payments are calculated based
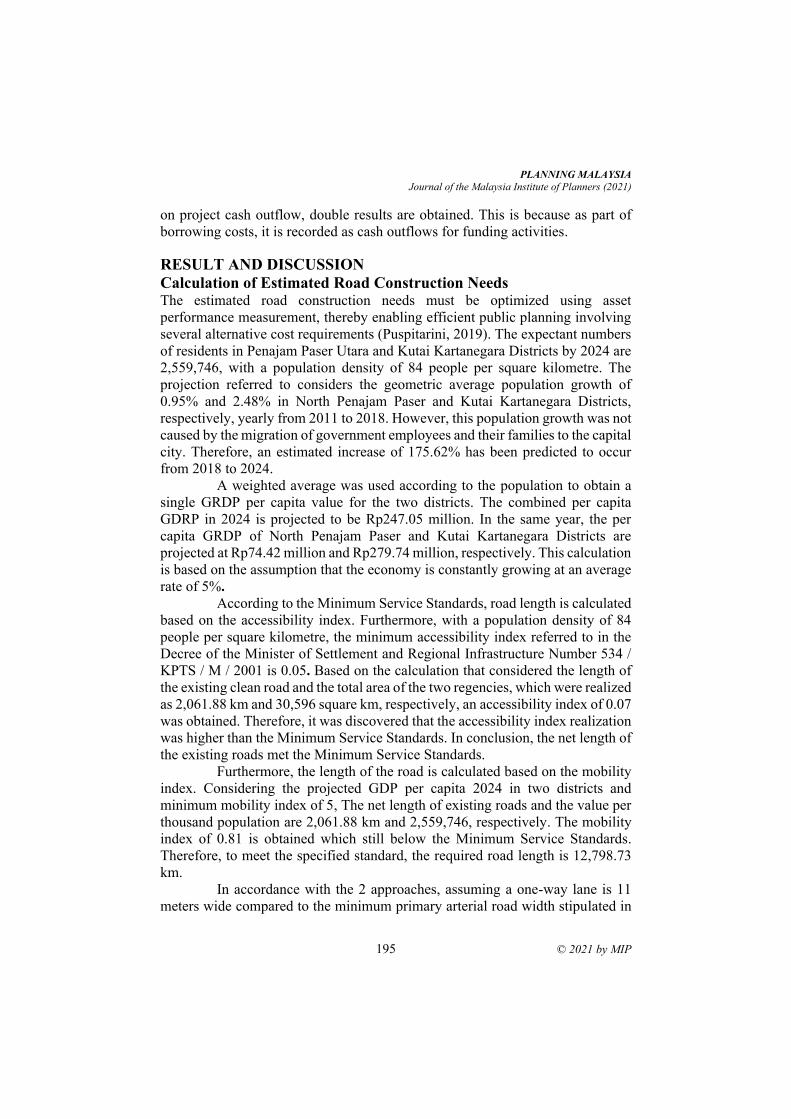
PLANNING MALAYSIA
Journal of the Malaysia Institute of Planners (2021)
195 © 2021 by MIP
on project cash outflow, double results are obtained. This is because as part of
borrowing costs, it is recorded as cash outflows for funding activities.
RESULT AND DISCUSSION
Calculation of Estimated Road Construction Needs The estimated road construction needs must be optimized using asset
performance measurement, thereby enabling efficient public planning involving
several alternative cost requirements (Puspitarini, 2019). The expectant numbers
of residents in Penajam Paser Utara and Kutai Kartanegara Districts by 2024 are
2,559,746, with a population density of 84 people per square kilometre. The
projection referred to considers the geometric average population growth of
0.95% and 2.48% in North Penajam Paser and Kutai Kartanegara Districts,
respectively, yearly from 2011 to 2018. However, this population growth was not
caused by the migration of government employees and their families to the capital
city. Therefore, an estimated increase of 175.62% has been predicted to occur
from 2018 to 2024.
A weighted average was used according to the population to obtain a
single GRDP per capita value for the two districts. The combined per capita
GDRP in 2024 is projected to be Rp247.05 million. In the same year, the per
capita GRDP of North Penajam Paser and Kutai Kartanegara Districts are
projected at Rp74.42 million and Rp279.74 million, respectively. This calculation
is based on the assumption that the economy is constantly growing at an average
rate of 5%.
According to the Minimum Service Standards, road length is calculated
based on the accessibility index. Furthermore, with a population density of 84
people per square kilometre, the minimum accessibility index referred to in the
Decree of the Minister of Settlement and Regional Infrastructure Number 534 /
KPTS / M / 2001 is 0.05. Based on the calculation that considered the length of
the existing clean road and the total area of the two regencies, which were realized
as 2,061.88 km and 30,596 square km, respectively, an accessibility index of 0.07
was obtained. Therefore, it was discovered that the accessibility index realization
was higher than the Minimum Service Standards. In conclusion, the net length of
the existing roads met the Minimum Service Standards.
Furthermore, the length of the road is calculated based on the mobility
index. Considering the projected GDP per capita 2024 in two districts and
minimum mobility index of 5, The net length of existing roads and the value per
thousand population are 2,061.88 km and 2,559,746, respectively. The mobility
index of 0.81 is obtained which still below the Minimum Service Standards.
Therefore, to meet the specified standard, the required road length is 12,798.73
km.
In accordance with the 2 approaches, assuming a one-way lane is 11
meters wide compared to the minimum primary arterial road width stipulated in
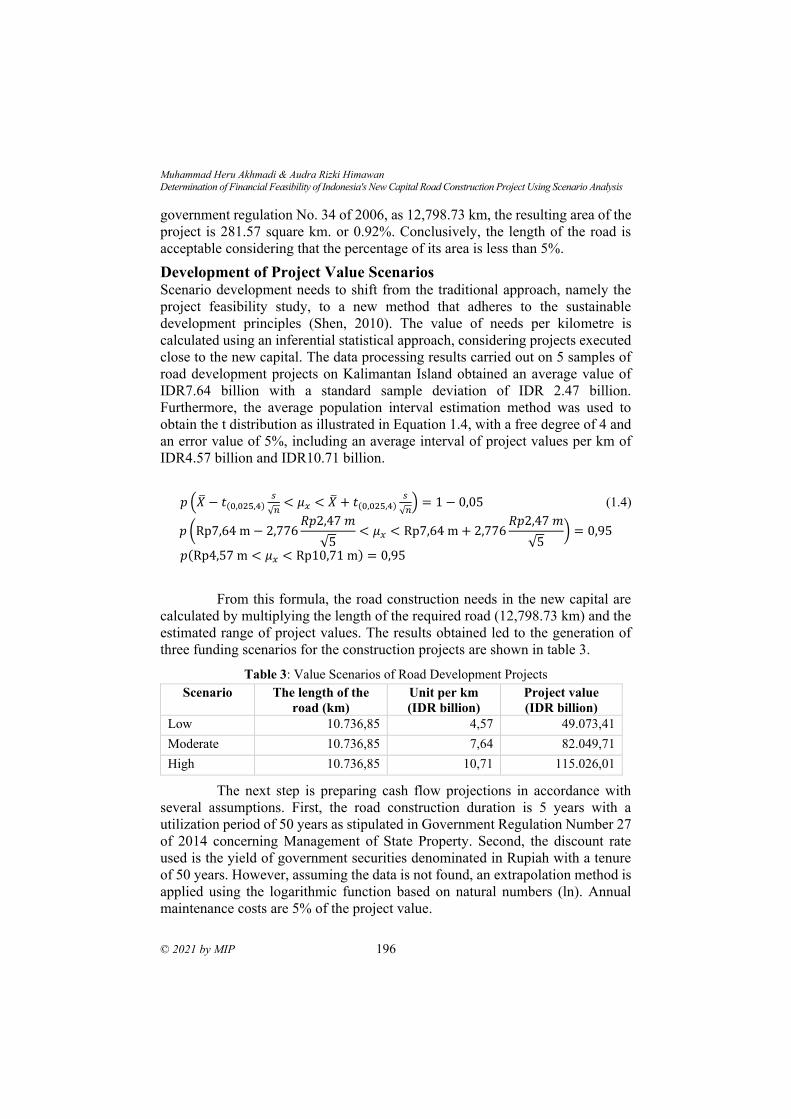
Muhammad Heru Akhmadi & Audra Rizki Himawan
Determination of Financial Feasibility of Indonesia's New Capital Road Construction Project Using Scenario Analysis
© 2021 by MIP 196
government regulation No. 34 of 2006, as 12,798.73 km, the resulting area of the
project is 281.57 square km. or 0.92%. Conclusively, the length of the road is
acceptable considering that the percentage of its area is less than 5%.
Development of Project Value Scenarios Scenario development needs to shift from the traditional approach, namely the
project feasibility study, to a new method that adheres to the sustainable
development principles (Shen, 2010). The value of needs per kilometre is
calculated using an inferential statistical approach, considering projects executed
close to the new capital. The data processing results carried out on 5 samples of
road development projects on Kalimantan Island obtained an average value of
IDR7.64 billion with a standard sample deviation of IDR 2.47 billion.
Furthermore, the average population interval estimation method was used to
obtain the t distribution as illustrated in Equation 1.4, with a free degree of 4 and
an error value of 5%, including an average interval of project values per km of
IDR4.57 billion and IDR10.71 billion.
𝑝 (�� − 𝑡(0,025,4)𝑠
√𝑛< 𝜇𝑥 < �� + 𝑡(0,025,4)
𝑠
√𝑛) = 1 − 0,05 (1.4)
𝑝 (Rp7,64 m − 2,776𝑅𝑝2,47 𝑚
√5< 𝜇𝑥 < Rp7,64 m + 2,776
𝑅𝑝2,47 𝑚
√5) = 0,95
𝑝(Rp4,57 m < 𝜇𝑥 < Rp10,71 m) = 0,95
From this formula, the road construction needs in the new capital are
calculated by multiplying the length of the required road (12,798.73 km) and the
estimated range of project values. The results obtained led to the generation of
three funding scenarios for the construction projects are shown in table 3.
Table 3: Value Scenarios of Road Development Projects
Scenario The length of the
road (km)
Unit per km
(IDR billion)
Project value
(IDR billion)
Low 10.736,85 4,57 49.073,41
Moderate 10.736,85 7,64 82.049,71
High 10.736,85 10,71 115.026,01
The next step is preparing cash flow projections in accordance with
several assumptions. First, the road construction duration is 5 years with a
utilization period of 50 years as stipulated in Government Regulation Number 27
of 2014 concerning Management of State Property. Second, the discount rate
used is the yield of government securities denominated in Rupiah with a tenure
of 50 years. However, assuming the data is not found, an extrapolation method is
applied using the logarithmic function based on natural numbers (ln). Annual
maintenance costs are 5% of the project value.
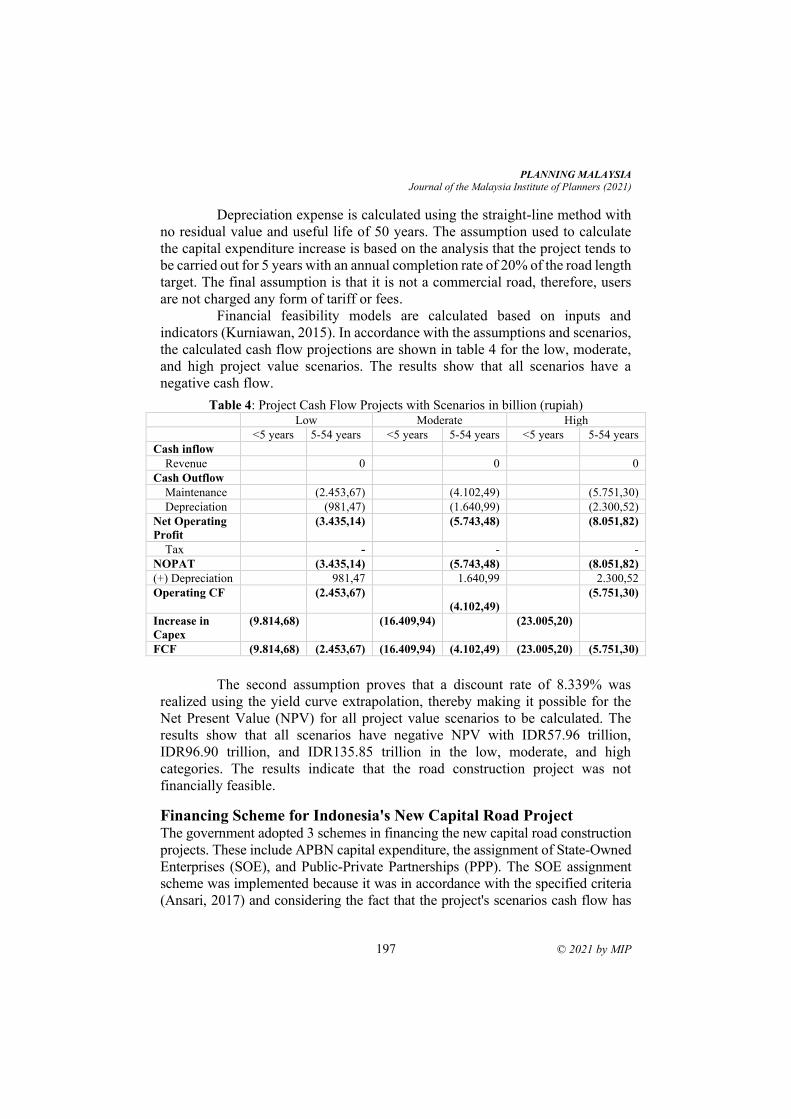
PLANNING MALAYSIA
Journal of the Malaysia Institute of Planners (2021)
197 © 2021 by MIP
Depreciation expense is calculated using the straight-line method with
no residual value and useful life of 50 years. The assumption used to calculate
the capital expenditure increase is based on the analysis that the project tends to
be carried out for 5 years with an annual completion rate of 20% of the road length
target. The final assumption is that it is not a commercial road, therefore, users
are not charged any form of tariff or fees.
Financial feasibility models are calculated based on inputs and
indicators (Kurniawan, 2015). In accordance with the assumptions and scenarios,
the calculated cash flow projections are shown in table 4 for the low, moderate,
and high project value scenarios. The results show that all scenarios have a
negative cash flow.
Table 4: Project Cash Flow Projects with Scenarios in billion (rupiah) Low Moderate High
<5 years 5-54 years <5 years 5-54 years <5 years 5-54 years
Cash inflow
Revenue 0 0 0
Cash Outflow
Maintenance (2.453,67) (4.102,49) (5.751,30)
Depreciation (981,47) (1.640,99) (2.300,52)
Net Operating
Profit
(3.435,14) (5.743,48) (8.051,82)
Tax - - -
NOPAT (3.435,14) (5.743,48) (8.051,82)
(+) Depreciation 981,47 1.640,99 2.300,52
Operating CF (2.453,67)
(4.102,49)
(5.751,30)
Increase in
Capex
(9.814,68) (16.409,94) (23.005,20)
FCF (9.814,68) (2.453,67) (16.409,94) (4.102,49) (23.005,20) (5.751,30)
The second assumption proves that a discount rate of 8.339% was
realized using the yield curve extrapolation, thereby making it possible for the
Net Present Value (NPV) for all project value scenarios to be calculated. The
results show that all scenarios have negative NPV with IDR57.96 trillion,
IDR96.90 trillion, and IDR135.85 trillion in the low, moderate, and high
categories. The results indicate that the road construction project was not
financially feasible.
Financing Scheme for Indonesia's New Capital Road Project The government adopted 3 schemes in financing the new capital road construction
projects. These include APBN capital expenditure, the assignment of State-Owned
Enterprises (SOE), and Public-Private Partnerships (PPP). The SOE assignment
scheme was implemented because it was in accordance with the specified criteria
(Ansari, 2017) and considering the fact that the project's scenarios cash flow has
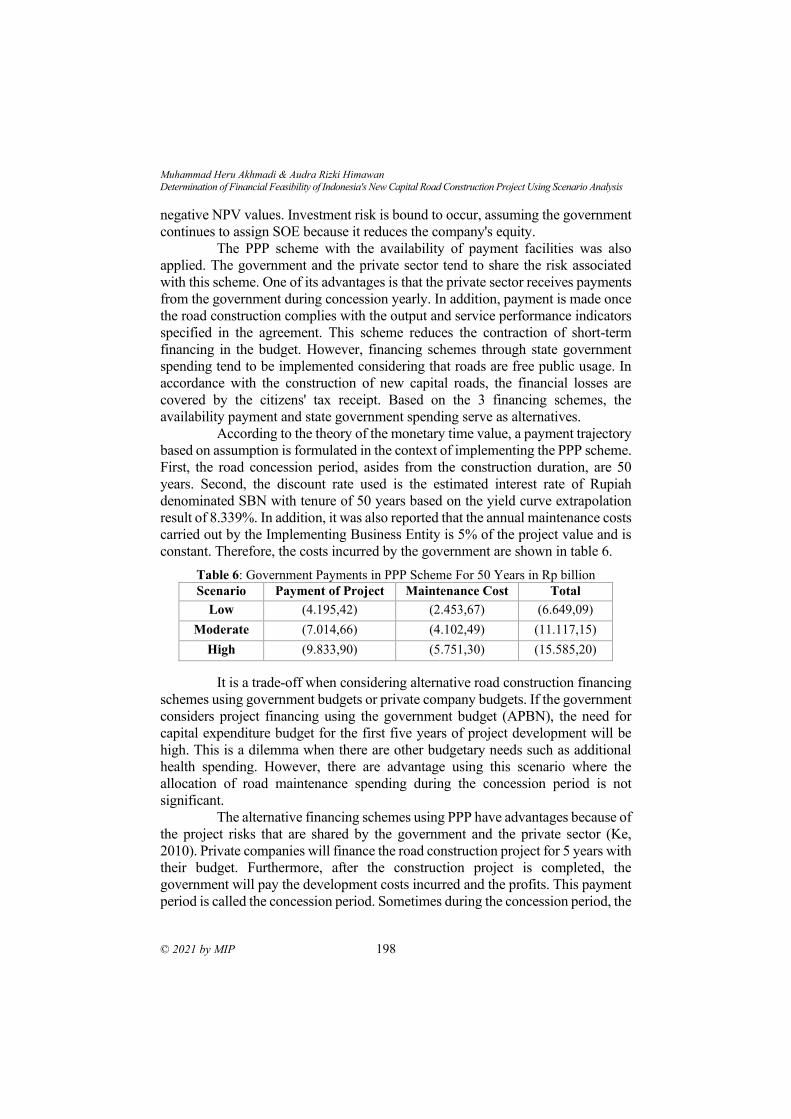
Muhammad Heru Akhmadi & Audra Rizki Himawan
Determination of Financial Feasibility of Indonesia's New Capital Road Construction Project Using Scenario Analysis
© 2021 by MIP 198
negative NPV values. Investment risk is bound to occur, assuming the government
continues to assign SOE because it reduces the company's equity.
The PPP scheme with the availability of payment facilities was also
applied. The government and the private sector tend to share the risk associated
with this scheme. One of its advantages is that the private sector receives payments
from the government during concession yearly. In addition, payment is made once
the road construction complies with the output and service performance indicators
specified in the agreement. This scheme reduces the contraction of short-term
financing in the budget. However, financing schemes through state government
spending tend to be implemented considering that roads are free public usage. In
accordance with the construction of new capital roads, the financial losses are
covered by the citizens' tax receipt. Based on the 3 financing schemes, the
availability payment and state government spending serve as alternatives.
According to the theory of the monetary time value, a payment trajectory
based on assumption is formulated in the context of implementing the PPP scheme.
First, the road concession period, asides from the construction duration, are 50
years. Second, the discount rate used is the estimated interest rate of Rupiah
denominated SBN with tenure of 50 years based on the yield curve extrapolation
result of 8.339%. In addition, it was also reported that the annual maintenance costs
carried out by the Implementing Business Entity is 5% of the project value and is
constant. Therefore, the costs incurred by the government are shown in table 6.
Table 6: Government Payments in PPP Scheme For 50 Years in Rp billion
Scenario Payment of Project Maintenance Cost Total
Low (4.195,42) (2.453,67) (6.649,09)
Moderate (7.014,66) (4.102,49) (11.117,15)
High (9.833,90) (5.751,30) (15.585,20)
It is a trade-off when considering alternative road construction financing
schemes using government budgets or private company budgets. If the government
considers project financing using the government budget (APBN), the need for
capital expenditure budget for the first five years of project development will be
high. This is a dilemma when there are other budgetary needs such as additional
health spending. However, there are advantage using this scenario where the
allocation of road maintenance spending during the concession period is not
significant.
The alternative financing schemes using PPP have advantages because of
the project risks that are shared by the government and the private sector (Ke,
2010). Private companies will finance the road construction project for 5 years with
their budget. Furthermore, after the construction project is completed, the
government will pay the development costs incurred and the profits. This payment
period is called the concession period. Sometimes during the concession period, the
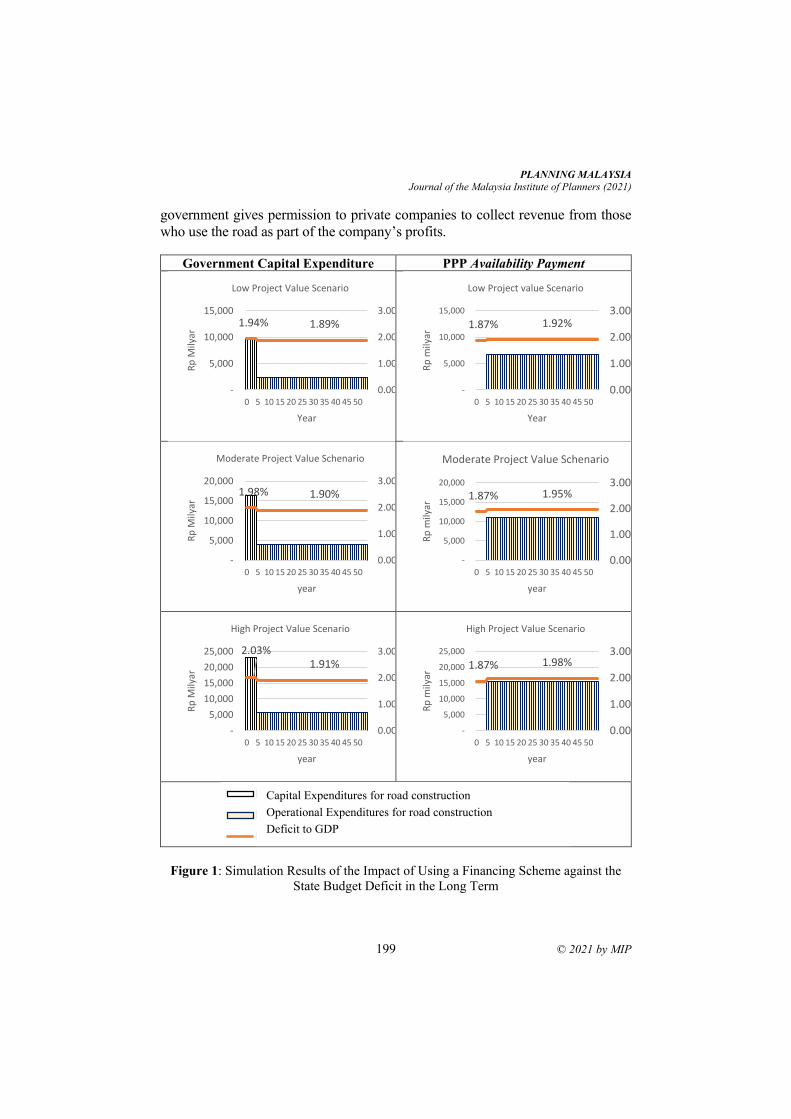
PLANNING MALAYSIA
Journal of the Malaysia Institute of Planners (2021)
199 © 2021 by MIP
government gives permission to private companies to collect revenue from those
who use the road as part of the company’s profits.
Government Capital Expenditure PPP Availability Payment
Figure 1: Simulation Results of the Impact of Using a Financing Scheme against the
State Budget Deficit in the Long Term
1.94% 1.89%
0.00%
1.00%
2.00%
3.00%
-
5,000
10,000
15,000
0 5 10 15 20 25 30 35 40 45 50
Rp
Mily
ar
Year
Low Project Value Scenario
1.87% 1.92%
0.00%
1.00%
2.00%
3.00%
-
5,000
10,000
15,000
0 5 10 15 20 25 30 35 40 45 50
Rp
mily
arYear
Low Project value Scenario
1.98% 1.90%
0.00%
1.00%
2.00%
3.00%
-
5,000
10,000
15,000
20,000
0 5 10 15 20 25 30 35 40 45 50
Rp
Mily
ar
year
Moderate Project Value Schenario
1.87% 1.95%
0.00%
1.00%
2.00%
3.00%
-
5,000
10,000
15,000
20,000
0 5 10 15 20 25 30 35 40 45 50
Rp
mily
ar
year
Moderate Project Value Schenario
2.03%1.91%
0.00%
1.00%
2.00%
3.00%
-
5,000
10,000
15,000
20,000
25,000
0 5 10 15 20 25 30 35 40 45 50
Rp
Mily
ar
year
High Project Value Scenario
1.87% 1.98%
0.00%
1.00%
2.00%
3.00%
-
5,000
10,000
15,000
20,000
25,000
0 5 10 15 20 25 30 35 40 45 50
Rp
mily
ar
year
High Project Value Scenario
1,94% 1,89%
0,00%
0,50%
1,00%
1,50%
2,00%
2,50%
3,00%
-
2.000
4.000
6.000
8.000
10.000
12.000
0 2 4 6 8 10 12 14 16 18 20 22 24 26 28 30 32 34 36 38 40 42 44 46 48 50 52 54
Rp
Mily
ar
tahun
Belanja Modal
Belanja Modal dalam Rangka Pembangunan Jalan (LHS)
Belanja Barang dalam Rangka Pembangunan Jalan (LHS)
Defisit terhadap PDB (RHS)
Capital Expenditures for road construction
Operational Expenditures for road construction
Deficit to GDP
Muhammad Heru Akhmadi & Audra Rizki Himawan
Determination of Financial Feasibility of Indonesia's New Capital Road Construction Project Using Scenario Analysis
© 2021 by MIP 200
CONCLUSION Road construction as a form of connectivity from one place to another is one of
the challenges facing the development of new capital. The use of scenario
analysis shows that the needs of the project are not financially feasible therefore,
the government has to adopt the APBN capital expenditure funding scheme and
PPP availability payment. However, the use of these methods encouraged the
government to provide a working budget for the next 50 years. The APBN capital
expenditure financing method is preferred to the PPP scheme, because it has less
impact on the budget allocated to finance road construction projects during the
first 5 years. Furthermore, the use of the PPP scheme is associated with numerous
risks. However, within 6 to 50 years, the government needs to provide a budget
allocation to pay for the return on investment of the business entity. The second
financing schemes are risky, the government needs to consider the best that does
not have an negative impact on the government budget. Finally, the results of this
study do not consider the project management factors during the construction
period and the quality factors of the roads built during the concession period. We
assume the project management and road quality using these two scenarios are
the same.
REFERENCES Ansari, M. I. (2017). Government Assignment in the State Owned Enterprise in the
Electricity Sector in the Corporate Law Perspective. Padjadjaran Journal of
Law, 4(3), 551-568.
Arya, A., Fellingham, J. C., & Glover, J. C. (1998). Capital budgeting: Some exceptions
to the net present value rule. Issues in Accounting Education, 13, 499-508.
Aulia, Mohamad Donie. 2011. Analysis of Road Requirements in the New City Area of
Tegalluar District of Bandung. Majalah Ilmiah UNIKOM, Vol. 11, No.1. Bandung:
UNIKOM.
Central Bureau of Statistics. 2015. Kutai Kartanegara Regency in Figures. Kutai
Kartanegara: Badan Pusat Statistik.
Chuweni, N. N. (2019). Measuring technical efficiency of Malaysian real estate
investment trusts: a data envelopment analysis approach. PLANNING
MALAYSIA, 17(9). Ke, Y., Wang, S., & Chan, A. P. (2010). Risk allocation in public-private partnership
infrastructure projects: comparative study. Journal of infrastructure
systems, 16(4), 343-351.
Kishita, Y., Hara, K., Uwasu, M., & Umeda, Y. (2016). Research needs and challenges
faced in supporting scenario design in sustainability science: a literature
review. Sustainability Science, 11(2), 331-347. Kurniawan, F., Mudjanarko, S. W., & Ogunlana, S. (2015). Best practice for financial
models of PPP projects. Procedia Engineering, 125, 124-132.
Puspitarini, I., & Akhmadi, M. H. (2019). Measuring Public Asset Performance Using
Outputbased Approach: Evidence from Indonesia. PLANNING
MALAYSIA, 17(9).
PLANNING MALAYSIA
Journal of the Malaysia Institute of Planners (2021)
201 © 2021 by MIP
Shen, L. Y., Tam, V. W., Tam, L., & Ji, Y. B. (2010). Project feasibility study: the key to
successful implementation of sustainable and socially responsible construction
management practice. Journal of cleaner production, 18(3), 254-259.
Sumardjoko, I., & Akhmadi, M. H. (2019). Development of Connectivity Infrastructure
as Economic Leveraging Power and Poverty Reduction in East Java. Jurnal
Manajemen Keuangan Publik, 3(1), 22-31.
Titman, Sheridan. Arthur J. Keown. John D. Martin. (2018). Financial Management:
Principles and Applications, Thirteenth Edition. Harlow: Pearson.
Qomarsono, Hilman. (2016, Edisi 1). Government Guarantee for Financing the Trans
Sumatra Toll Project by PT Hutama Karya (Persero). Info Risiko Fiskal. Jakarta:
Direktorat Pengelolaan Risiko Keuangan Negara, DJPPR.
Žižlavský, O. (2014). Net present value approach: method for economic assessment of
innovation projects. Procedia-Social and Behavioral Sciences, 156(26), 506-512.
Received: 12th July 2021. Accepted: 23rd Sept 2021
1 Lecturer at Universiti Teknologi MARA Perak, Seri Iskandar Campus. Email: [email protected]
PLANNING MALAYSIA:
Journal of the Malaysian Institute of Planners
VOLUME 19 ISSUE 3 (2021), Page 202 – 213
THE LEGAL REQUIREMENTS OF APPROPRIATE HERITAGE
PROPERTY VALUATION METHOD
Junainah Mohamad1, Suriatini Ismail2, Abdul Rahman Mohd Nasir3
1Faculty of Architecture, Planning and Surveying
UNIVERSITI TEKNOLOGI MARA PERAK, SERI ISKANDAR CAMPUS,
MALAYSIA 2Faculty of Architecture and Ekistics
UNIVERSITI MALAYSIA KELANTAN, MALAYSIA 3New Valuation Information System Project Team
VALUATION AND PROPERTY SERVICES DEPARTMENT, MALAYSIA
Abstract
Heritage property value is an important economic indicator to a country. Thus, it
is imperative that the value is derived from an accurate and reliable method of
valuation. However, in Malaysia, there are no specific standards that can be
referred to for conducting an assessment for heritage property valuation. Thus,
this paper fills the gap by reviewing five provisions of the Malaysian laws and
four provisions of the international laws that are related to heritage property
valuation. Thematic analysis of the documents is undertaken by using five
keywords that relate to heritage property valuation, namely: definition, factors,
method, procedure and type of values. Out of nine legal documents analysed,
Valuation of Specialised Public Service Assets has the most information needed
as a guidance for heritage property valuation.
Keywords: heritage property, valuation, law of property, Malaysian laws,
international laws
PLANNING MALAYSIA
Journal of the Malaysia Institute of Planners (2021)
203 © 2021 by MIP
INTRODUCTION Heritage is increasingly defined as an economic development tool. However, in
order to conclusively gauge heritage-related economic impacts, measurements,
tools and methodologies must be accordingly implemented and evaluated. This
paper conducts a thematic analysis on the legal documents that are related to
heritage property valuation in the effort to determine the procedure in conducting
an assessment for heritage buildings.
HERITAGE PROPERTY VALUATION Heritage property can be classified into two types of uses, i.e., for public use and
for private use. Interest in the valuation of heritage property has increased among
researchers, particularly in determining the best methods to value heritage
properties. Yet, the valuation of heritage property has been met with many
challenges over the time. The valuation of heritage property differs from the
valuation of other kinds of assets or property because heritage property is not
traded actively in the market. The uniqueness of heritage property makes it
difficult to be valued using the existing conventional methods. The theory,
methods, and practice of economic valuation are well established especially in
valuing Grade-I heritage property. However, no studies have attempted to
identify the most appropriate approach for valuing heritage property, especially
for Grade-II heritage property (for example, pre-war shop-houses and pre-war
housing buildings). Some of the difficulties in valuing heritage property have
already been discussed in the literature through various perspectives, and the
following critical issues have been identified: i) the complexity of the term is a
fundamental part of why heritage property becomes difficult to be assessed. First,
one needs to understand the classification of heritage property and types of
values; ii) heritage property value cannot be expressed only with statistics
because the heritage value is also influenced by other variables (non-use value),
including intrinsic value; iii) the current methods for assessing the impact and
outcomes of heritage property value are increasingly being questioned, both in
terms of methodologies and the results have illuminated our understanding. If the
methodology of measurement is not accurate, the results would be inconclusive;
and iv) the limited availability of data might not facilitate us in understanding the
valuable aspects of heritage value.
A previous study by Junainah et al. (2015) revealed that, the valuers
use a conventional method for heritage property valuation where comparison
approach is the main choice due to market conditions. Moreover, based on the
findings, most of the valuers admitted that they did not have enough knowledge
about valuation of heritage property. The valuers claimed that the comparison
approach is the best approach compared to the conventional methods, but there
are weaknesses that need to be dealt with in applying this approach. The main
weakness of this approach is the unavailability of comparison data. So, it could
Junainah Mohamad, Suriatini Ismail & Abdul Rahman Mohd Nasir
The Legal Requirements of Appropriate Heritage Property Valuation Method
© 2021 by MIP 204
be said that it is very important to establish an appropriate method for heritage
property valuation in order to produce reliable and accurate value of assessment.
The unavailability of a specific guidance for heritage property valuation is the
motivation for this paper.
RESEARCH METHODOLOGY This paper adopts a qualitative document study and analysis. A document study
approach is an analysis of any written material which contains information of the
phenomenon being studied (Henning et al., 2004). The documents which were
studied in this paper are five provisions of the Malaysian Laws and four
provisions of the International laws that are related to heritage property valuation.
Textual data presented in provisions of the Malaysian and International laws were
analysed using thematic analysis. Thematic analysis is a method for identifying,
analysing, and reporting patterns (themes) within data (Braun & Clarke, 2006).
Thematic analysis of the legal documents is undertaken based on five keywords,
which are, definition, factors, method, procedure and type of values.
LAWS RELATED TO HERITAGE PROPERTY This section reviews the related statutes for heritage property valuation by
looking into five keywords on heritage property valuation: definition of heritage
property, factors affecting the heritage property values, methods of valuation,
procedure taken for conducting valuation processes, and type of values that exist
in a heritage property. The discussion is based on the following Malaysian laws:
National Heritage Act 2005 (Act 645), Local Government Act 1976 (Act 171),
Town and Country Planning 1976 (Act 172), Malaysian Valuation Standard 2019
(6th Edition), and MPSAS 17-Property, Plant and Equipment. The following
international laws were also referred to: International Valuation Standard,
Valuation of Specialised Public Service Assets, Accounting Standards Board –
Heritage Assets (GRAP 103), and IPSAS 17-Property Plant and Equipment.
Malaysian Laws National Heritage Act 2005 (Act 645)
The legislation related to building conservation was introduced with the
inauguration of Antiquities Act 168, 1976, which was later replaced by the
National Heritage Act, 2005 (NHA 2005). NHA is empowered by the National
Heritage Department (NHD) under the Ministry of Cultural, Arts, and Heritage.
This act focuses more towards building conservation. According to five keywords
that have been assigned, it appears that only one important keyword is found in
the NHA 2005, which is the definition of heritage property. The definition
provided by NHA 2005 is diverse, which facilitates the understanding of the
meaning of heritage property. Referring to NHA 2005 Part I – Preliminary 2(1),
the listed definitions indicate significance definition towards Grade-II heritage
PLANNING MALAYSIA
Journal of the Malaysia Institute of Planners (2021)
205 © 2021 by MIP
property. The Grade-II heritage properties are considered ‘heritage property’
even though they are not registered in official registrar as long as the buildings
have significant historical or cultural value. They are regarded as having “cultural
heritage” because they represent the same meaning for heritage property and are
classified under tangible cultural heritage.
Local Government Act 1976 (Act 171)
Local Government Act 1976 (Act 171) is a Malaysian law enacted to revise and
consolidate the laws relating to local government and shall apply only to
Peninsular Malaysia. This act has 16 parts and is divided into 166 sections that
cover a variety of matters related to the functions and role of local government.
In the Local Government Act 1976, there are provisions that discuss heritage
property. Section 101 (1) (c) (iv) denotes further empowerment to local
authorities to maintain or contribute to the maintenance of historical buildings or
sites and acquire any land, with or without buildings. This is done for the purpose
of or in connection with the establishment of such public parks, gardens,
esplanades, recreation grounds, playing fields, children’s playgrounds, open
spaces, holiday sites, swimming pool, stadia, aquaria, gymnasia and community
centres, or for the purpose of or in connection with the maintenance of historical
buildings or sites. The purpose of Local Government Act 1976 is more towards
the power given to local authorities inducting the maintenance on heritage
property. However, no specific discussion on heritage property valuation is
available.
Town and Country Planning 1976 (Act 172)
Local authorities are responsible for managing, controlling, and monitoring Town
and Country Planning 1976 (Act 172). Following are the lists of the provisions
contained in the Town and Country Planning Act relating to heritage property in
obtaining planning permission.
The layout plans under paragraph 21A(1)(f) shall show the proposed
development and in particular— Section 21B (1) (b) where the development is in
respect of a building with special architecture or historical interest, particularly
to identify the building including its use and condition, and its special character,
appearance, make and feature and measures for its protection, preservation and
enhancement;
a) 22 (5) (j) where the development involves any addition or alteration to an
existing building with special architecture or historical interest, with the
conditions to ensure that the facade and other external characters of the
building are retained;
b) Section 22 (5) (k) where the development involves the re-erection of a
building with special architecture or historical interest or the demolition
thereof and the erection of a new building in its place, with the conditions
Junainah Mohamad, Suriatini Ismail & Abdul Rahman Mohd Nasir
The Legal Requirements of Appropriate Heritage Property Valuation Method
© 2021 by MIP 206
to ensure that the facade and other external character of the demolished
building is retained.
c) Section 58 (2) (f) the protection of ancient monuments and lands and
buildings of historical or architectural interest;
For valuation purposes, these conditions will affect the value of heritage
property; often they may decrease the value of the property. The conditions are
as follows:
a) The heritage property cannot be demolished and rebuilt with a new modern
building; the owner of the building needs to maintain the façade of the
building.
b) Any addition or alteration made to the heritage building must obtain
approval from the local authorities.
c) Overall, heritage properties are protected by law.
Malaysian Valuation Standards 2019 (6th Edition)
Malaysian Valuation Standards 2019 (6th Edition) (MVS) are the latest valuation
standards that come with 19 standards and 2 introductory chapters. The
introductory chapter commences with the definitions of terms and words used in
the standards. The second introductory chapter is on the general concepts and
principles normally used in the valuation profession. The review focuses on the
standards related to heritage property valuation. However, the findings show that
the MVS does not come with specific standards regarding heritage property
valuation.
MPSAS 17 – Property, Plant, and Equipment
The objective of the MPSAS 17 – Property, Plant and Equipment is to prescribe
the accounting treatment for property, plant and equipment so that users of
financial statements can discern information about an entity’s investment and the
changes in such investment. There are specific contents for heritage assets in
MPSAS 17 starting from Paragraph 9 until 12. MPSAS 17 provides the meaning
of heritage assets in Paragraph 10. Paragraph 10 states that some assets are
described as heritage assets because of their cultural, environmental, or historical
significance.
In MPSAS 17, there is a specific section that discusses heritage property
but the discussions are more on the preparation of financial statements.
Nevertheless, the information provided can be adopted in the valuation of
heritage property, for example, the factor affecting the value of heritage property
and determination of market value, among others.
PLANNING MALAYSIA
Journal of the Malaysia Institute of Planners (2021)
207 © 2021 by MIP
International Laws International Valuation Standards
The IVS 230 Annexe – Historic Property was removed from IVS 2017. The
reason is the Board did not consider that there were sufficient unique
requirements or considerations when valuing historic (real) property that warrant
the inclusion of this annexe in the standards. It also provides only guidance, which
under current IVSC protocols should be included in a TIP. The guidance provided
is similar to that in the TIP on Specialised Public Sector Assets 2012. Another
reason for the removal of this annexe is due, to the fact that it may be issued as a
standalone paper providing information and guidance on some of the valuation
criteria to be considered.
In addition, there have been recent changes after we completed the
analysis where the International Valuation Standards Council has issued an
updated version of the suite of International Valuation Standards titled IVS 2020
which took effect on 31st January 2020; the 2020 edition of IVS would be
replacing IVS 2017.
Valuation of Specialised Public Service Assets
Up to now, based on a review of what? in Malaysian laws, there are no specific
guidelines or standards for heritage property valuation. They need to refer to
several guidelines in order to conduct the assessments on heritage property. It is
interesting that in Valuation of Specialised Public Service Assets there is one
section for interests in undertaking valuation for historic real properties. The
section is under Asset Standards – Annexe - Historic Property. It contains
Annexes A1 until A17. The Annexe gives additional guidance on matters that
require consideration when valuations are undertaken for heritage assets. First,
the definition on heritage property where some people may use different terms to
refer to heritage property. Annexe A2 defines historic property as a real property
that is publicly recognised or officially designated by a government body as
having cultural or historic importance because of its association with a historic
event or period, with an architectural style or with a nation’s heritage. The
characteristics common to historic property include the following; its historic,
architectural and/or cultural importance, the statutory or legal protection to which
it may be subjected, restraints and limitations placed upon its use, alteration and
disposal and, a frequent obligation in some jurisdictions that it be made accessible
to the public.
Annexe A3 explains that the historic property is a broad term,
encompassing property types. For example; certain properties are restored to their
original condition and some are only partially restored, i.e building façade; it also
includes properties which are partially adapted to current standards, i.e interior
space and properties that have been extensively modernised
Junainah Mohamad, Suriatini Ismail & Abdul Rahman Mohd Nasir
The Legal Requirements of Appropriate Heritage Property Valuation Method
© 2021 by MIP 208
Annexe A4 – A6 explains on the need to protect heritage property. It
also provides the definition of cultural heritage and cultural property by
UNESCO Glossary of World Heritage. Lastly it also states that not all heritage
properties are necessarily recorded in registers. Certain properties having cultural
and historic importance also qualify as heritage property.
Annexe A7-A11 specifies the factors that affect heritage property
values. The valuation of heritage property requires consideration of a variety of
factors that are associated with the importance of these properties, including the
legal and statutory protections to which they are subjected, the various restraints
upon their use, alteration and disposal and possible financial grants, tax rate or
tax exemptions to the owners of such properties in some jurisdictions.
When undertaking a valuation of a heritage property, the following
matters should be considered depending upon the nature of the heritage property
and the purpose of the valuation:
a) Restrictive covenants that apply to the land regardless of the owner,
b) Preservation easements that prohibit certain physical changes, usually
based on the condition of the property at the time the easement was
acquired or immediately after proposed restoration of the property,
c) Conservation easements that limit the future use of a property so as to
protect open space, natural features or wildlife habitat.
The valuation of heritage property involves special considerations dealing with
the:
a) Nature of old approaches
b) The current efficiency and performance of the property in terms of modern
equivalent assets
c) The appropriateness of the methods used to repair, restore, refurbish or
rehabilitate the properties, and
d) Character and extent of legal and statutory protection
Annexe A12-17 states the valuation approaches that can be applied in
valuation of heritage property. The methods are market approach, income
approach, and cost approach. The conformity of those approaches depends on the
nature of the heritage property. In applying market approach, the first important
requirement that should be considered is availability of market evidence. If the
market evidence is available, then the market approach can be applied. The
market evidence should be similar with the subject property. Other criteria for
selection of comparable properties include architectural style, property size,
specific cultural or historic associations of the subject property, and similarity in
locations with regards to zoning, permissible use, legal protection and
concentration of historic properties. The adjustment may have to be made to the
comparable sale with regard to their differences in factors affecting the values.
Heritage properties fully utilised for commercial purposes may be valued by
means of the income approach. When applying the cost approach for heritage
PLANNING MALAYSIA
Journal of the Malaysia Institute of Planners (2021)
209 © 2021 by MIP
property, consideration is given to whether the features of the heritage building
would be of intrinsic value.
Accounting Standards Board – Heritage Assets (GRAP 103)
Accounting Standards Board – Heritage Property (GRAP 103) is set out in
Paragraphs .01 to .98. The objective of this standard is to prescribe the accounting
treatment for heritage assets and related disclosure requirements.
Paragraph .04 defines the terms used in the standard what? , and one of
the terms is related to heritage assets. The standard defines heritage assets as an
asset that has a cultural, environmental, historical, natural, scientific,
technological or artistic significance and are held indefinitely for the benefit of
present and future generations.
Paragraph .06, there are several characteristics often displayed by
heritage assets. Some of the characteristics may affect the value of this asset.
either they increase or increase the values. The characteristics are as follows:
a) Heritage property value may increase over time even though their physical
condition deteriorates (increase the value)
b) Heritage property value are protected, kept unencumbered, cared for and
preserved (decrease the value)
c) The value in cultural, environmental, educational and historical terms is
unlikely to be fully reflected in monetary terms (use value and non-use
value)
In this standard, Paragraph .13 states that the heritage assets can be recognised as
an “heritage asset if:
a) The future economic benefits or service potential associated with the asset
will flow to the entity, and
b) The cost or fair value of the asset can be measured reliably
With reference to the above underlined sentence “the cost or fair value
of the asset can be measured reliably” is parallel with the aim of this study in
identifying the appropriate approach for heritage property valuation in ensuring
its reliability, validity of the values.
Paragraph .35 to 0.45 discusses on determining fair value. The standard
defines fair value to be the same with the market value. The value of a heritage
asset is the price at which the heritage asset could be exchanged between
knowledgeable, willing parties in an arm’s length transaction. The willing buyer
and the willing seller are reasonably informed about the nature and characteristics
of the heritage asset, its actual and potential uses, and market conditions at the
date of the revaluation.
In Paragraph 0.43, we can find that this standard recognises a valuer as
a person who is qualified to undertake the valuation exercise for heritage assets.
The values of heritage property can be obtained from the active market and it is
the best evidence for fair value. However, there is a situation where the evidence
Junainah Mohamad, Suriatini Ismail & Abdul Rahman Mohd Nasir
The Legal Requirements of Appropriate Heritage Property Valuation Method
© 2021 by MIP 210
is not available and the valuation profession may use any valuation technique to
determine fair value. For man-made heritage structures such as monuments, the
fair values are usually determined by using a replacement cost approach.
There is one section discussing the inability to determine fair value
reliably. The discussion starts from Paragraphs .55 until .58. There is a
presumption that fair value can be measured reliably for heritage assets if the
market evidence is available. However, the presumption can be rebutted when
market evidence (heritage property prices) is not available. Besides, the
alternative method to estimate the fair value of heritage property is seen as clearly
unreliable.
IPSAS 17-Property, Plant and Equipment
IPSAS 17-Property, Plant and Equipment was developed by the International
Public Sector Accounting Standards Boards to converge public sector accounting
standards with private sectors standards.
Under Heritage Assets Standard in Paragraph 9, some assets are
described as “heritage assets” because of their cultural, environmental or
historical significance. Examples of heritage assets include historical buildings
and monuments, archaeological sites, conservation areas and nature reserves, and
works of art.
The standard also states that it is important to determine the fair value
based on recent market evidence. The discussion is similar with Accounting
Standards Board-Heritage Asset (GRAP 103) where market evidence is used to
determine the fair value, and the valuation process is undertaken by a person with
a relevant professional qualification. Under Paragraph 47, if no market evidence
is available to determine the market value in active market for heritage property,
the fair value of heritage property may be established by reference to other similar
properties (similarity in terms of characteristics, circumstances and location).
However, this is difficult to find.
RESULTS OF ANALYSIS Table 1 summarises the review on the related laws on heritage property valuation.
In Malaysia, there are no specific standards that can be referred to for conducting
an assessment for heritage property valuation. A valuer needs to refer to several
standards as follows:
a) Malaysian Valuation Standard 2019 (6th edition) is very important for the
valuation profession. MVS describes the procedure for conducting real
estate appraisal including methods of valuation, factors affecting the value,
several important concepts such as market value, highest and best use, and
others. MVS is very important in the valuation process because it will affect
the accuracy of value estimation. However, MVS provides general
PLANNING MALAYSIA
Journal of the Malaysia Institute of Planners (2021)
211 © 2021 by MIP
descriptions of property valuation. No specific explanation is available for
the interest in undertaking an assessment for heritage property.
b) National Heritage Act 2005 (Act 645) focuses more on heritage property
conservation and preservation. NHA 2005 provides the definition and the
classification of heritage property.
c) MPSAS 17-Property, Plant and Equipment. So far in Malaysia, this standard
is most related to heritage property valuation. However, the purpose of the
standard is for preparation of financial statements. MPSAS 17 provides the
information on the definition of heritage property and the historical factors
affecting the heritage property value, either increasing or decreasing the
value.
d) Town and Country Planning Act 1976 (Act 172) - Restriction on heritage
property. For each development, approval must be obtained from the local
authority and must comply with the listed conditions provided in Town and
Country Planning Act. For example, for any addition, alteration or re-
erection of heritage building, the owner must ensure that the building façade
is retained.
e) Local Government Act 1976 (Act 171). It enlists the power given to the local
authority regarding the heritage property matters related to maintenance
works.
At International level, the review suggests that the practice of heritage
property valuation is more guided compared to Malaysia. This is based on the
existence of several legal provisions as follows:
a) Valuation of Specialised Public Service Assets. This provision provides a
section for heritage property known as Annexe - Historic Real Property. It
provides detailed information for conducting heritage property valuation
including the definition of heritage property, factors that affect the value, the
valuation methods, procedures and types of value comprising in heritage
property.
b) Accounting Standards Board-Heritage Assets (GRAP 103). This provision
is specifically for financial statement preparation but we can still use this
standard for heritage property valuation. There is one section that
emphasises the determination of market value for heritage property. It is
important to take note that this requires the market value of heritage property
to be determined based on market evidence, but question arises as to what
will happen if the market evidence is not available. The GRAP 103 states
that there is no clear method to be used if the market evidence is not
available, which leads to the need to identify an appropriate approach that
considers the thin market issue.
c) IPSAS17-Property, Plant and Equipment. The explanation is similar to GRAP
103.
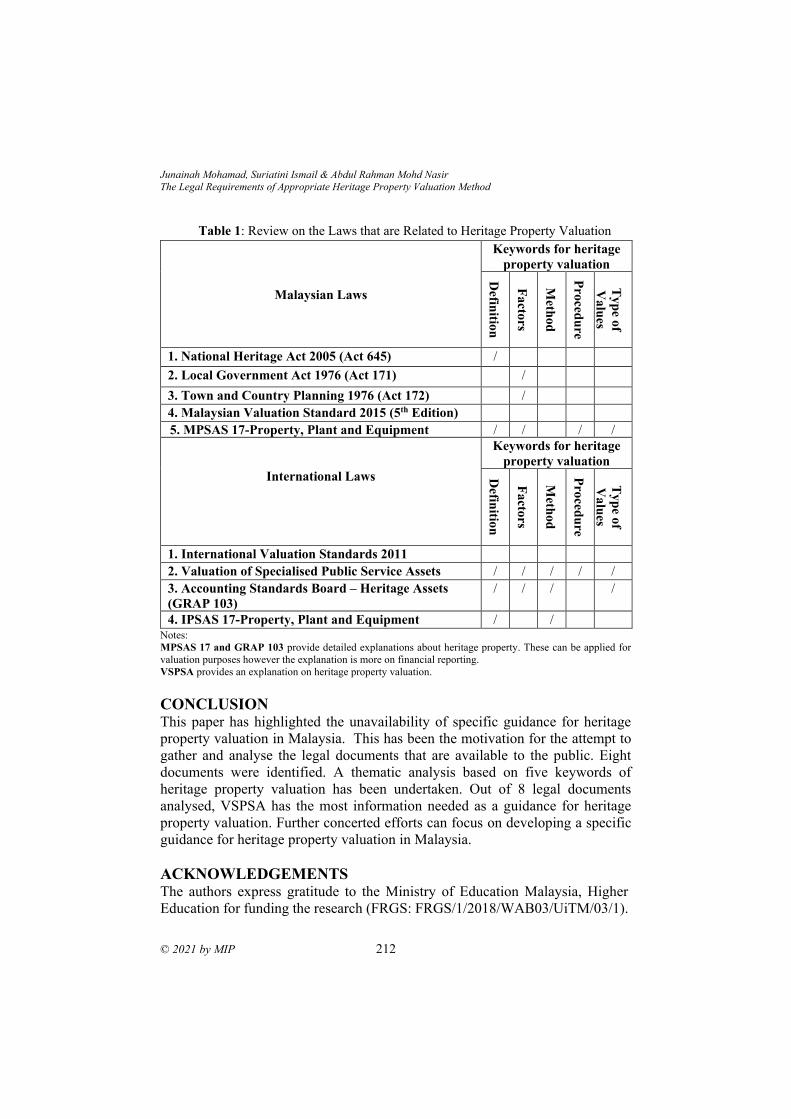
Junainah Mohamad, Suriatini Ismail & Abdul Rahman Mohd Nasir
The Legal Requirements of Appropriate Heritage Property Valuation Method
© 2021 by MIP 212
Table 1: Review on the Laws that are Related to Heritage Property Valuation
Malaysian Laws
Keywords for heritage
property valuation
Defin
ition
Fa
ctors
Meth
od
Pro
cedu
re
Ty
pe o
f
Va
lues
1. National Heritage Act 2005 (Act 645) /
2. Local Government Act 1976 (Act 171) /
3. Town and Country Planning 1976 (Act 172) /
4. Malaysian Valuation Standard 2015 (5th Edition)
5. MPSAS 17-Property, Plant and Equipment / / / /
International Laws
Keywords for heritage
property valuation
Defin
ition
Fa
ctors
Meth
od
Pro
cedu
re
Ty
pe o
f
Va
lues
1. International Valuation Standards 2011
2. Valuation of Specialised Public Service Assets / / / / /
3. Accounting Standards Board – Heritage Assets
(GRAP 103)
/ / / /
4. IPSAS 17-Property, Plant and Equipment / / Notes:
MPSAS 17 and GRAP 103 provide detailed explanations about heritage property. These can be applied for
valuation purposes however the explanation is more on financial reporting.
VSPSA provides an explanation on heritage property valuation.
CONCLUSION This paper has highlighted the unavailability of specific guidance for heritage
property valuation in Malaysia. This has been the motivation for the attempt to
gather and analyse the legal documents that are available to the public. Eight
documents were identified. A thematic analysis based on five keywords of
heritage property valuation has been undertaken. Out of 8 legal documents
analysed, VSPSA has the most information needed as a guidance for heritage
property valuation. Further concerted efforts can focus on developing a specific
guidance for heritage property valuation in Malaysia.
ACKNOWLEDGEMENTS
The authors express gratitude to the Ministry of Education Malaysia, Higher
Education for funding the research (FRGS: FRGS/1/2018/WAB03/UiTM/03/1).
PLANNING MALAYSIA
Journal of the Malaysia Institute of Planners (2021)
213 © 2021 by MIP
Our gratitude also goes to the anonymous for the suggestions on the early draft
of this paper.
REFERENCES Accounting Standards Board. Standard of Generally Recognised Accounting Practice
Heritage Assets (GRAP 103)
Braun, V. & Clarke, V. (2006) Using Thematic Analysis in Psychology. Qualitative
Research in Psychology, 3, 2, 77-101. Bulmer
Henning, E., Van Rensburg, W. & Smit, B. (2004) Finding your Way in Qualitative
Research. Pretoria: Van Schaick. http://www.ICT.org.zw/
International Public Sector Accounting Standard (IPSAS) 17: Property, Plant and
Equipment.
International Valuation Standard 2011. 5th edition
Junainah, M., Suriatini, I., & Rosdi, A. R. (2015). Valuers’ Perception on the Current
Practice of Heritage Property Valuation in Malaysia. In 21st Annual Pacific-Rim
Real Estate Society Conference.
Local Government Act 1976 (Act 171). Kuala Lumpur. International Laws Services
Malaysian Public Sector Accounting Standards (MPSAS) 17: Property, Plant and
Equipment.
Malaysian Valuation Standard 2019. 6th edition.
National Heritage Act 2005 (Act 645). Kuala Lumpur. International Laws Services
Town and Country Planning 1976 (Act 172). Kuala Lumpur. International Laws Services
Valuation of Specialised Public Service Assets
Received: 12th July 2021. Accepted: 23rd Sept 2021
1 Lecturer at Polytechnic of State Finance STAN. Indonesia Ministry of Finance. Email:
PLANNING MALAYSIA:
Journal of the Malaysian Institute of Planners
VOLUME 19 ISSUE 3 (2021), Page 214 – 225
DETERMINANTS OF PUBLIC ASSET VALUE FOR LAND
PROPERTY: A STUDY IN THE CITY OF TANGERANG,
INDONESIA
Intan Puspitarini1, Irfan Rachmat Devianto2
1Department of Financial Management,
POLYTECHNIC OF STATE FINANCE 2 State Asset Management,
MINISTRY OF FINANCE OF THE REPUBLIC OF INDONESIA
Abstract
Public lands take a huge portion of the government balance sheet in many
countries, necessitating the need to reevaluate public assets for accurate financial
reports, informed decisions, and optimized performance in strategic asset
management. This study aimed to determine how the land area, location, shape,
road width, and distance to the CBD affect the value of public land. A quantitative
method with multiple regression was used to analyze primary data collected from
the Public Asset Revaluation Report in the City of Tangerang from 2017 to 2018.
The subject was made of 62 plots of public land chosen through population
sampling. The results showed that land area and distance to the CBD significantly
and negatively affected the public property value, while the road width had a
positive effect. However, the location and shape of the public land did not affect
its value.
Keywords: Strategic Asset Management, public property fair value, City of
Tangerang, public asset revaluation
PLANNING MALAYSIA
Journal of the Malaysia Institute of Planners (2021)
215 © 2021 by MIP
INTRODUCTION Land property has similar characteristics to buildings, such as being immovable,
long-lasting, scarce, and dependant on other production factors (Whipple, 1995).
In general, land property continues to appreciate in value because it has fixed
supply and rising demand. The Indonesian Minister of Finance, also acts as a
public asset manager, controlling the Central Government's land property. This
authority is then delegated to the Directorate General of State Asset Management
(DGSAM). From 2017 to 2018, DGSAM held an Asset Revaluation Program for
public assets, including land, building, roads, and dams, to establish their true
value.
The government used a market data approach during the valuation
process. In this case, the property being valued is compared with similar recent
sales in the area. DGSAM provided public valuers with the Appraisal Guidelines
for compliance with the valuation requirements and consistency. The guideline
primarily focused on the object under relation. Potential factors that could affect
the property value were selected, analyzed, and made necessary adjustments to
account for the difference when estimating market value. According to previous
studies, road width and distance from the property to the Central Business District
(CBD) affect land value (Bintang et al., 2017; Aulia (2005); Olawande (2011);
Sutarmin (2012); Mariada et al. 2014). However, the Appraisal Guidelines did
not include them as adjustment factors in valuing the public land property. Most
previous studies examined private land property while ignoring public assets,
hence there is a need to examine factors affecting the public land property. This
study focused on Tangerang, Province of Banten in Indonesia. The findings were
expected to provide information to the government for revising The Appraisal
Guidelines policies.
Apart from the introduction, this paper has additional 5 Sections.
Section 1 presents a literature review, covering a discussion on land property
determinants and develops a framework. The methodology is described in
Section 2. Section 3 presents data analysis and results, while 4 and 5 present the
paper conclusion and the limitation of the study
LITERATURE REVIEW
Previous Research Various studies have examined land and real estate property valuation, each
proposing different valuation methods, determinants, and object’s location.
However, they all agree that location is one factor that affects land value. Some
studies define location as distance to CBD while others use it in general. Eckert
(1990) indicated that land property value is affected by the area of the land, front
width, its position on the road, and shape. Another study with a specific definition
of location reported that the distance and accessibility to the CBD via private or
public transportation affects property value (Hromada, 2018). Hasan et al. (2019)
Intan Puspitarini, Irfan Rachmat Devianto
Determinants Of Public Asset Value for Land Property: A Study in The City of Tangerang, Indonesia
© 2021 by MIP 216
also defined the location variable as the distance to residential neighborhoods and
employment centers. This is in line with another study conducted in Shanghai,
China (Chena et al., 2008), which showed that housing prices were impacted by
their distance to CBD and the availability of mass transportation (subway). The
further away the house is from the CBD, the lower its price. Easy access to the
subway was found to increase housing value sharply. A similar result was also
recorded in the city of Semarang by Rakhmatulloh et al. (2019), which concluded
that land prices were significantly affected by the proximity and the ease of access
to the city center of Semarang. Studies in Greater Jakarta show that proximity to
CBD affects property value.
A study conducted in Bekasi, Indonesia, to establish the relationship
between land value and distance to the CBD in urban structure in Bekasi
(Yowaldi, 2012) demonstrated that the distance to the CBD affects land value in
the area. Though Yowaldi’s study primarily focused on one part of Greater
Jakarta (Bekasi), a different study by Andrayani examined all parts of Greater
Jakarta (Andrayani et al., 2014) and found that population density and the
distance to the CBD area in Jakarta have impacted land value. Bintang et al.
(2017) claimed that the ability of the surrounding community also affects
property value since an increase in the surrounding community's purchasing
power will lead to an increase in property value around it. This study also
indicated a higher demand for a property close to the CBD and has wide road
access. A study by Sutarmin (2012) agrees with these findings, indicating that
location positively influences property values.
Though these studies give a different definition of location, they agree that it
affects land value. Nevertheless, the above studies were focused on private land
and private real estate property. No research has focused on factors affecting the
public land property, despite the Appraisal Guidelines stating that public land
value is affected by land area, location, and shape. This study aimed to determine
if two other factors (distance to CBD and road width) in the previous studies
affect the value of the public land property.
Framework The framework of the study is discussed below in Figure I.
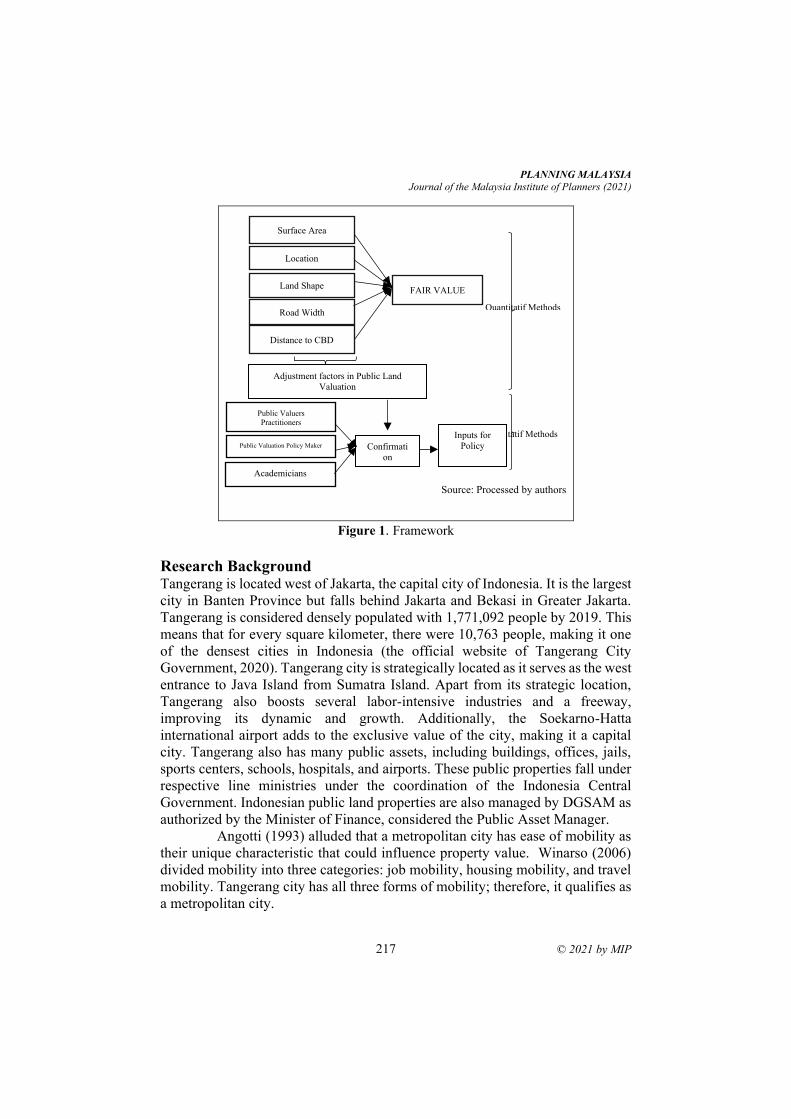
PLANNING MALAYSIA
Journal of the Malaysia Institute of Planners (2021)
217 © 2021 by MIP
Source: Processed by authors
Figure 1. Framework
Research Background Tangerang is located west of Jakarta, the capital city of Indonesia. It is the largest
city in Banten Province but falls behind Jakarta and Bekasi in Greater Jakarta.
Tangerang is considered densely populated with 1,771,092 people by 2019. This
means that for every square kilometer, there were 10,763 people, making it one
of the densest cities in Indonesia (the official website of Tangerang City
Government, 2020). Tangerang city is strategically located as it serves as the west
entrance to Java Island from Sumatra Island. Apart from its strategic location,
Tangerang also boosts several labor-intensive industries and a freeway,
improving its dynamic and growth. Additionally, the Soekarno-Hatta
international airport adds to the exclusive value of the city, making it a capital
city. Tangerang also has many public assets, including buildings, offices, jails,
sports centers, schools, hospitals, and airports. These public properties fall under
respective line ministries under the coordination of the Indonesia Central
Government. Indonesian public land properties are also managed by DGSAM as
authorized by the Minister of Finance, considered the Public Asset Manager.
Angotti (1993) alluded that a metropolitan city has ease of mobility as
their unique characteristic that could influence property value. Winarso (2006)
divided mobility into three categories: job mobility, housing mobility, and travel
mobility. Tangerang city has all three forms of mobility; therefore, it qualifies as
a metropolitan city.
Quantitatif Methods
Qualitatif Methods
Confirmati
on
Surface Area
Location
Land Shape
Distance to CBD
FAIR VALUE
Inputs for
Policy
Academicians
Public Valuation Policy Maker
Public Valuers
Practitioners
Road Width
Adjustment factors in Public Land
Valuation
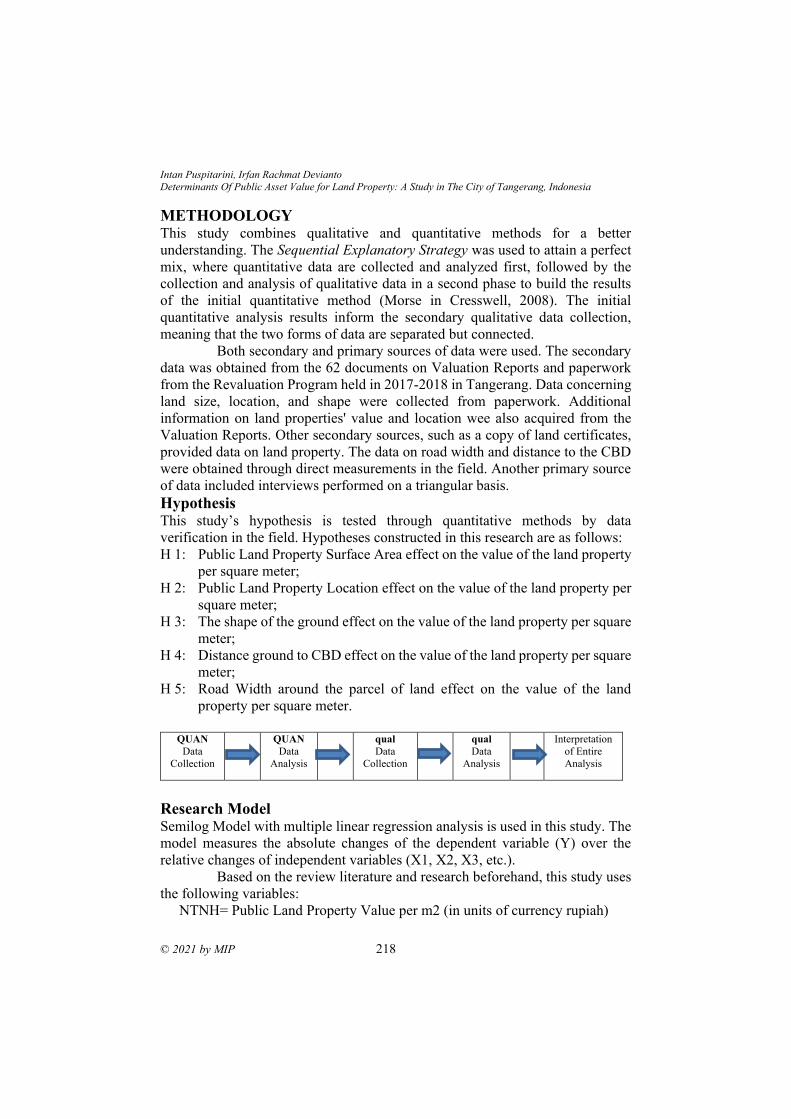
Intan Puspitarini, Irfan Rachmat Devianto
Determinants Of Public Asset Value for Land Property: A Study in The City of Tangerang, Indonesia
© 2021 by MIP 218
METHODOLOGY This study combines qualitative and quantitative methods for a better
understanding. The Sequential Explanatory Strategy was used to attain a perfect
mix, where quantitative data are collected and analyzed first, followed by the
collection and analysis of qualitative data in a second phase to build the results
of the initial quantitative method (Morse in Cresswell, 2008). The initial
quantitative analysis results inform the secondary qualitative data collection,
meaning that the two forms of data are separated but connected.
Both secondary and primary sources of data were used. The secondary
data was obtained from the 62 documents on Valuation Reports and paperwork
from the Revaluation Program held in 2017-2018 in Tangerang. Data concerning
land size, location, and shape were collected from paperwork. Additional
information on land properties' value and location wee also acquired from the
Valuation Reports. Other secondary sources, such as a copy of land certificates,
provided data on land property. The data on road width and distance to the CBD
were obtained through direct measurements in the field. Another primary source
of data included interviews performed on a triangular basis.
Hypothesis This study’s hypothesis is tested through quantitative methods by data
verification in the field. Hypotheses constructed in this research are as follows:
H 1: Public Land Property Surface Area effect on the value of the land property
per square meter;
H 2: Public Land Property Location effect on the value of the land property per
square meter;
H 3: The shape of the ground effect on the value of the land property per square
meter;
H 4: Distance ground to CBD effect on the value of the land property per square
meter;
H 5: Road Width around the parcel of land effect on the value of the land
property per square meter.
QUAN
Data
Collection
QUAN
Data
Analysis
qual
Data
Collection
qual
Data
Analysis
Interpretation
of Entire
Analysis
Research Model Semilog Model with multiple linear regression analysis is used in this study. The
model measures the absolute changes of the dependent variable (Y) over the
relative changes of independent variables (X1, X2, X3, etc.).
Based on the review literature and research beforehand, this study uses
the following variables:
NTNH= Public Land Property Value per m2 (in units of currency rupiah)
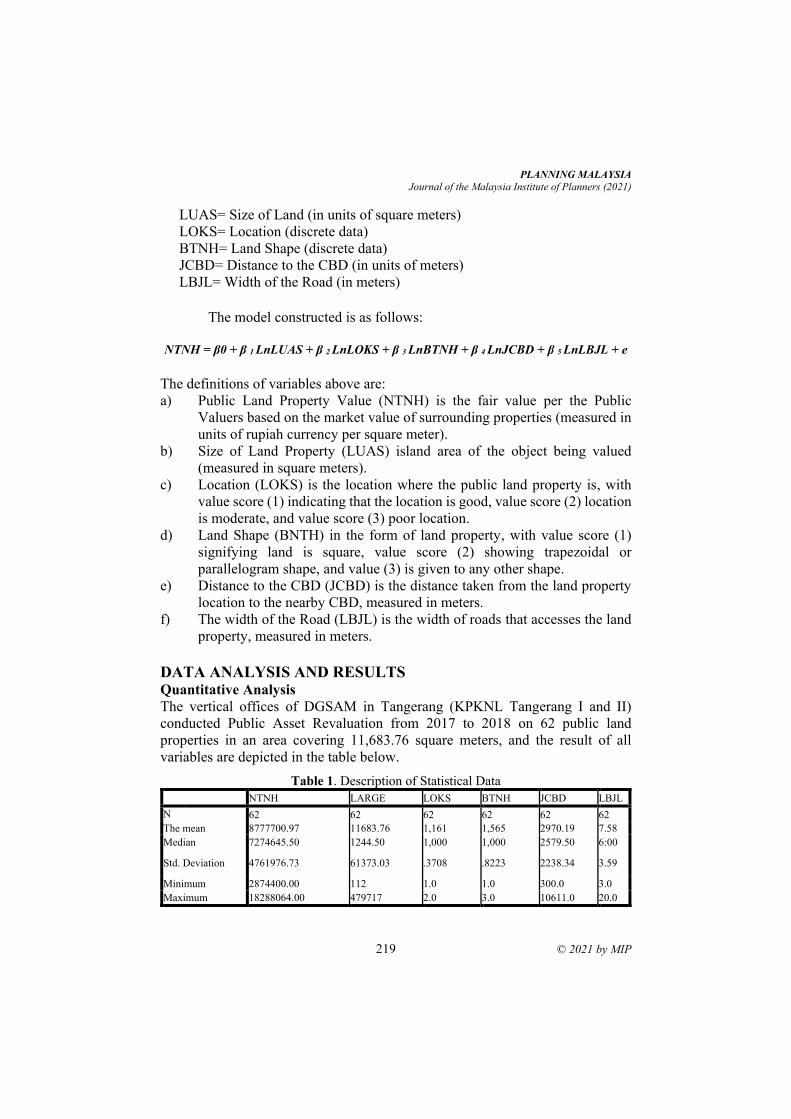
PLANNING MALAYSIA
Journal of the Malaysia Institute of Planners (2021)
219 © 2021 by MIP
LUAS= Size of Land (in units of square meters)
LOKS= Location (discrete data)
BTNH= Land Shape (discrete data)
JCBD= Distance to the CBD (in units of meters)
LBJL= Width of the Road (in meters)
The model constructed is as follows:
NTNH = β0 + β 1 LnLUAS + β 2 LnLOKS + β 3 LnBTNH + β 4 LnJCBD + β 5 LnLBJL + e
The definitions of variables above are:
a) Public Land Property Value (NTNH) is the fair value per the Public
Valuers based on the market value of surrounding properties (measured in
units of rupiah currency per square meter).
b) Size of Land Property (LUAS) island area of the object being valued
(measured in square meters).
c) Location (LOKS) is the location where the public land property is, with
value score (1) indicating that the location is good, value score (2) location
is moderate, and value score (3) poor location.
d) Land Shape (BNTH) in the form of land property, with value score (1)
signifying land is square, value score (2) showing trapezoidal or
parallelogram shape, and value (3) is given to any other shape.
e) Distance to the CBD (JCBD) is the distance taken from the land property
location to the nearby CBD, measured in meters.
f) The width of the Road (LBJL) is the width of roads that accesses the land
property, measured in meters.
DATA ANALYSIS AND RESULTS Quantitative Analysis
The vertical offices of DGSAM in Tangerang (KPKNL Tangerang I and II)
conducted Public Asset Revaluation from 2017 to 2018 on 62 public land
properties in an area covering 11,683.76 square meters, and the result of all
variables are depicted in the table below.
Table 1. Description of Statistical Data NTNH LARGE LOKS BTNH JCBD LBJL N 62 62 62 62 62 62 The mean 8777700.97 11683.76 1,161 1,565 2970.19 7.58 Median 7274645.50 1244.50 1,000 1,000 2579.50 6:00
Std. Deviation 4761976.73 61373.03 .3708 .8223 2238.34 3.59
Minimum 2874400.00 112 1.0 1.0 300.0 3.0 Maximum 18288064.00 479717 2.0 3.0 10611.0 20.0
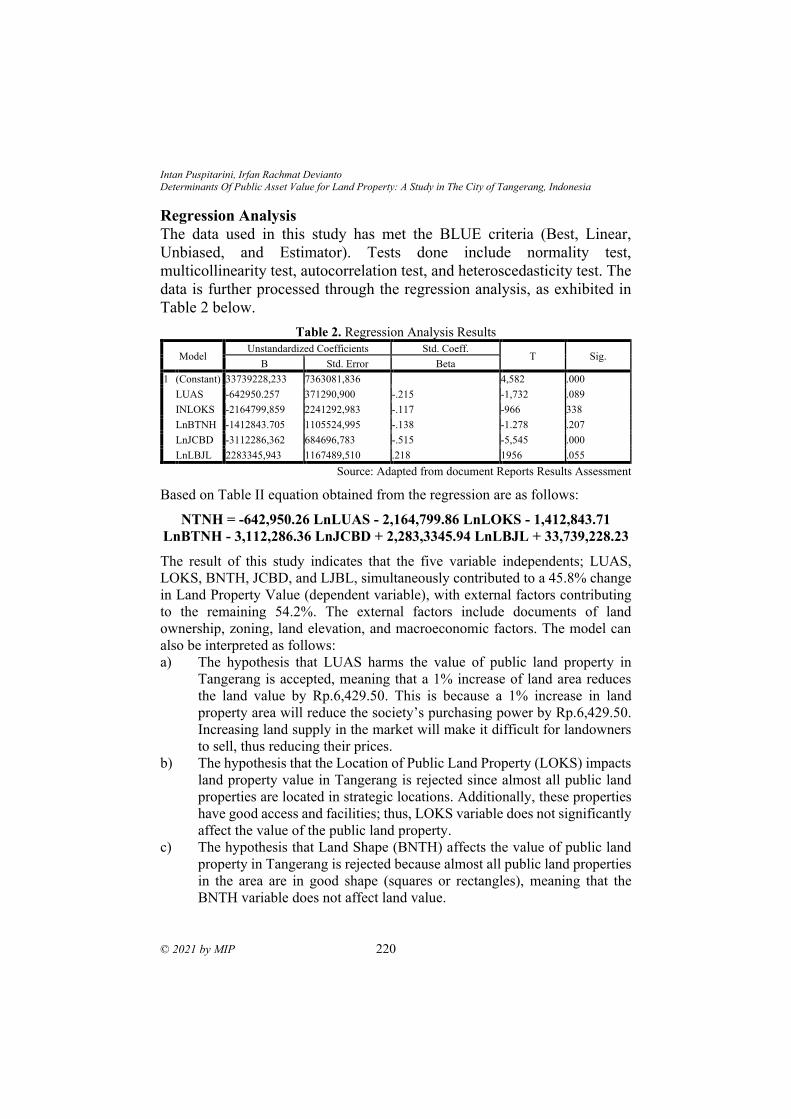
Intan Puspitarini, Irfan Rachmat Devianto
Determinants Of Public Asset Value for Land Property: A Study in The City of Tangerang, Indonesia
© 2021 by MIP 220
Regression Analysis
The data used in this study has met the BLUE criteria (Best, Linear,
Unbiased, and Estimator). Tests done include normality test,
multicollinearity test, autocorrelation test, and heteroscedasticity test. The
data is further processed through the regression analysis, as exhibited in
Table 2 below.
Table 2. Regression Analysis Results
Model Unstandardized Coefficients Std. Coeff.
T Sig. B Std. Error Beta
1 (Constant) 33739228,233 7363081,836 4,582 .000 LUAS -642950.257 371290,900 -.215 -1,732 .089 INLOKS -2164799,859 2241292,983 -.117 -966 338 LnBTNH -1412843.705 1105524,995 -.138 -1.278 .207 LnJCBD -3112286,362 684696,783 -.515 -5,545 .000 LnLBJL 2283345,943 1167489,510 .218 1956 .055
Source: Adapted from document Reports Results Assessment
Based on Table II equation obtained from the regression are as follows:
NTNH = -642,950.26 LnLUAS - 2,164,799.86 LnLOKS - 1,412,843.71
LnBTNH - 3,112,286.36 LnJCBD + 2,283,3345.94 LnLBJL + 33,739,228.23
The result of this study indicates that the five variable independents; LUAS,
LOKS, BNTH, JCBD, and LJBL, simultaneously contributed to a 45.8% change
in Land Property Value (dependent variable), with external factors contributing
to the remaining 54.2%. The external factors include documents of land
ownership, zoning, land elevation, and macroeconomic factors. The model can
also be interpreted as follows:
a) The hypothesis that LUAS harms the value of public land property in
Tangerang is accepted, meaning that a 1% increase of land area reduces
the land value by Rp.6,429.50. This is because a 1% increase in land
property area will reduce the society’s purchasing power by Rp.6,429.50.
Increasing land supply in the market will make it difficult for landowners
to sell, thus reducing their prices.
b) The hypothesis that the Location of Public Land Property (LOKS) impacts
land property value in Tangerang is rejected since almost all public land
properties are located in strategic locations. Additionally, these properties
have good access and facilities; thus, LOKS variable does not significantly
affect the value of the public land property.
c) The hypothesis that Land Shape (BNTH) affects the value of public land
property in Tangerang is rejected because almost all public land properties
in the area are in good shape (squares or rectangles), meaning that the
BNTH variable does not affect land value.
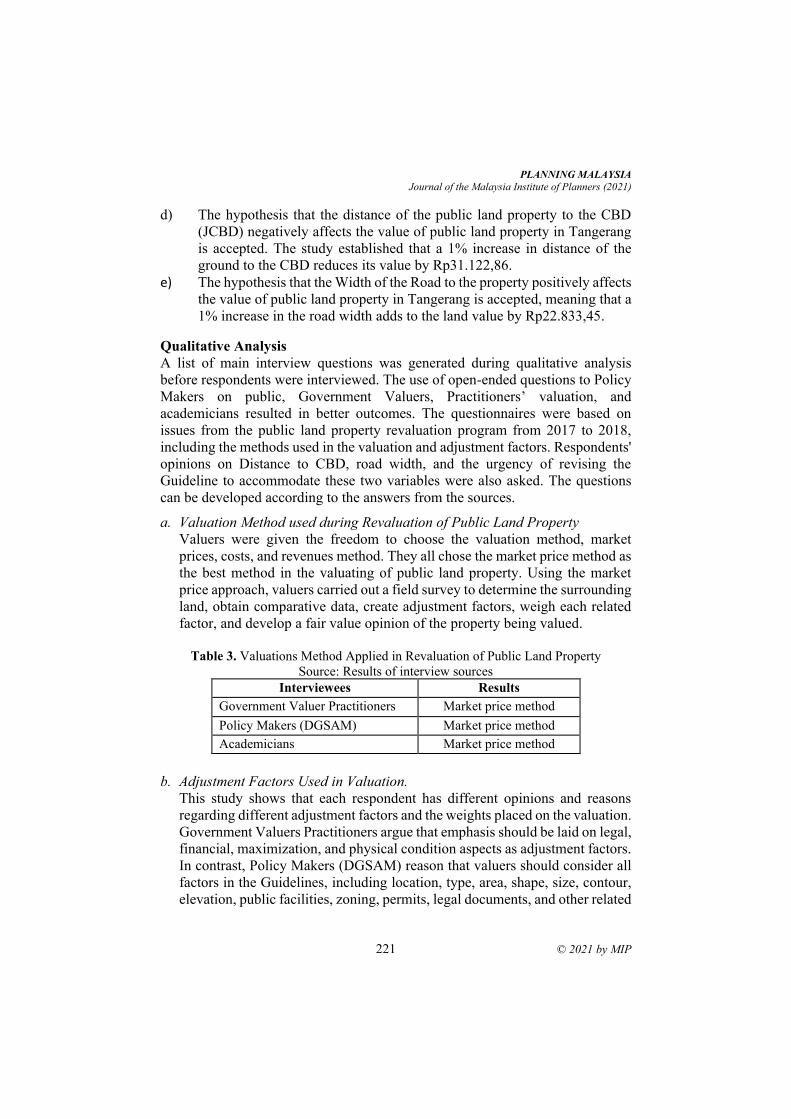
PLANNING MALAYSIA
Journal of the Malaysia Institute of Planners (2021)
221 © 2021 by MIP
d) The hypothesis that the distance of the public land property to the CBD
(JCBD) negatively affects the value of public land property in Tangerang
is accepted. The study established that a 1% increase in distance of the
ground to the CBD reduces its value by Rp31.122,86.
e) The hypothesis that the Width of the Road to the property positively affects
the value of public land property in Tangerang is accepted, meaning that a
1% increase in the road width adds to the land value by Rp22.833,45.
Qualitative Analysis
A list of main interview questions was generated during qualitative analysis
before respondents were interviewed. The use of open-ended questions to Policy
Makers on public, Government Valuers, Practitioners’ valuation, and
academicians resulted in better outcomes. The questionnaires were based on
issues from the public land property revaluation program from 2017 to 2018,
including the methods used in the valuation and adjustment factors. Respondents'
opinions on Distance to CBD, road width, and the urgency of revising the
Guideline to accommodate these two variables were also asked. The questions
can be developed according to the answers from the sources.
a. Valuation Method used during Revaluation of Public Land Property
Valuers were given the freedom to choose the valuation method, market
prices, costs, and revenues method. They all chose the market price method as
the best method in the valuating of public land property. Using the market
price approach, valuers carried out a field survey to determine the surrounding
land, obtain comparative data, create adjustment factors, weigh each related
factor, and develop a fair value opinion of the property being valued.
Table 3. Valuations Method Applied in Revaluation of Public Land Property
Source: Results of interview sources
Interviewees Results
Government Valuer Practitioners Market price method
Policy Makers (DGSAM) Market price method
Academicians Market price method
b. Adjustment Factors Used in Valuation.
This study shows that each respondent has different opinions and reasons
regarding different adjustment factors and the weights placed on the valuation.
Government Valuers Practitioners argue that emphasis should be laid on legal,
financial, maximization, and physical condition aspects as adjustment factors.
In contrast, Policy Makers (DGSAM) reason that valuers should consider all
factors in the Guidelines, including location, type, area, shape, size, contour,
elevation, public facilities, zoning, permits, legal documents, and other related
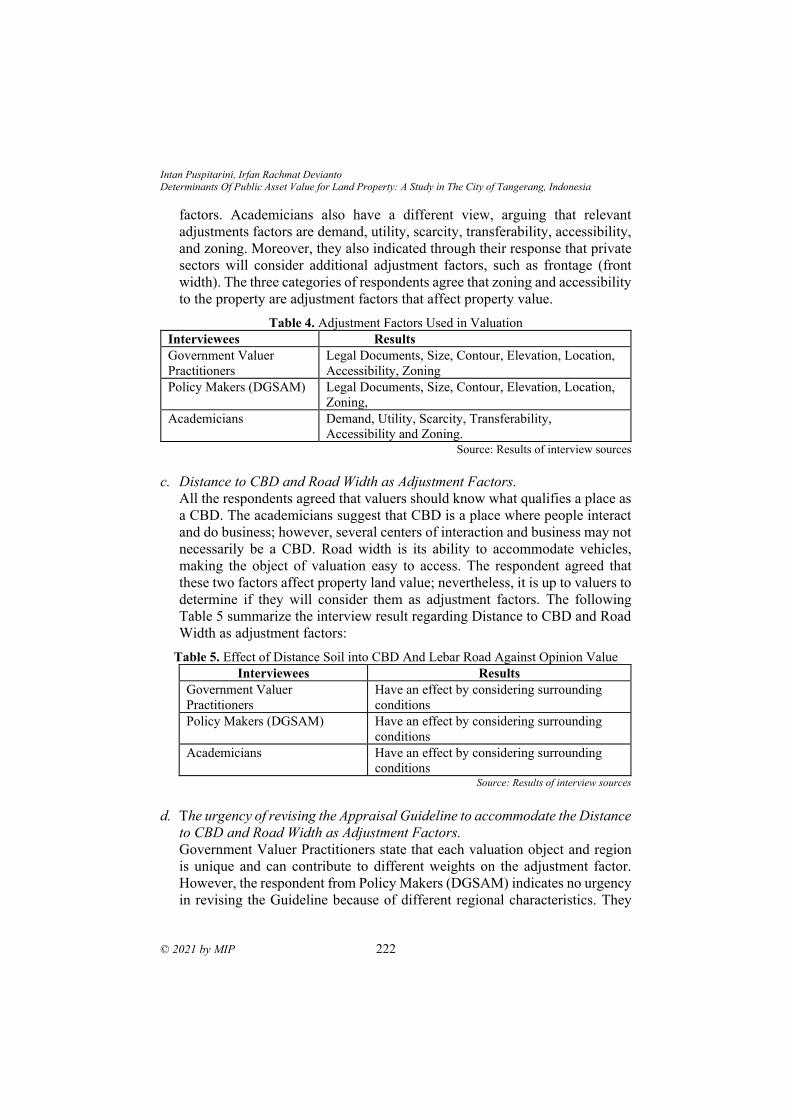
Intan Puspitarini, Irfan Rachmat Devianto
Determinants Of Public Asset Value for Land Property: A Study in The City of Tangerang, Indonesia
© 2021 by MIP 222
factors. Academicians also have a different view, arguing that relevant
adjustments factors are demand, utility, scarcity, transferability, accessibility,
and zoning. Moreover, they also indicated through their response that private
sectors will consider additional adjustment factors, such as frontage (front
width). The three categories of respondents agree that zoning and accessibility
to the property are adjustment factors that affect property value.
Table 4. Adjustment Factors Used in Valuation Interviewees Results
Government Valuer
Practitioners
Legal Documents, Size, Contour, Elevation, Location,
Accessibility, Zoning
Policy Makers (DGSAM) Legal Documents, Size, Contour, Elevation, Location,
Zoning,
Academicians Demand, Utility, Scarcity, Transferability,
Accessibility and Zoning. Source: Results of interview sources
c. Distance to CBD and Road Width as Adjustment Factors.
All the respondents agreed that valuers should know what qualifies a place as
a CBD. The academicians suggest that CBD is a place where people interact
and do business; however, several centers of interaction and business may not
necessarily be a CBD. Road width is its ability to accommodate vehicles,
making the object of valuation easy to access. The respondent agreed that
these two factors affect property land value; nevertheless, it is up to valuers to
determine if they will consider them as adjustment factors. The following
Table 5 summarize the interview result regarding Distance to CBD and Road
Width as adjustment factors:
Table 5. Effect of Distance Soil into CBD And Lebar Road Against Opinion Value
Interviewees Results
Government Valuer
Practitioners
Have an effect by considering surrounding
conditions
Policy Makers (DGSAM) Have an effect by considering surrounding
conditions
Academicians Have an effect by considering surrounding
conditions Source: Results of interview sources
d. The urgency of revising the Appraisal Guideline to accommodate the Distance
to CBD and Road Width as Adjustment Factors.
Government Valuer Practitioners state that each valuation object and region
is unique and can contribute to different weights on the adjustment factor.
However, the respondent from Policy Makers (DGSAM) indicates no urgency
in revising the Guideline because of different regional characteristics. They
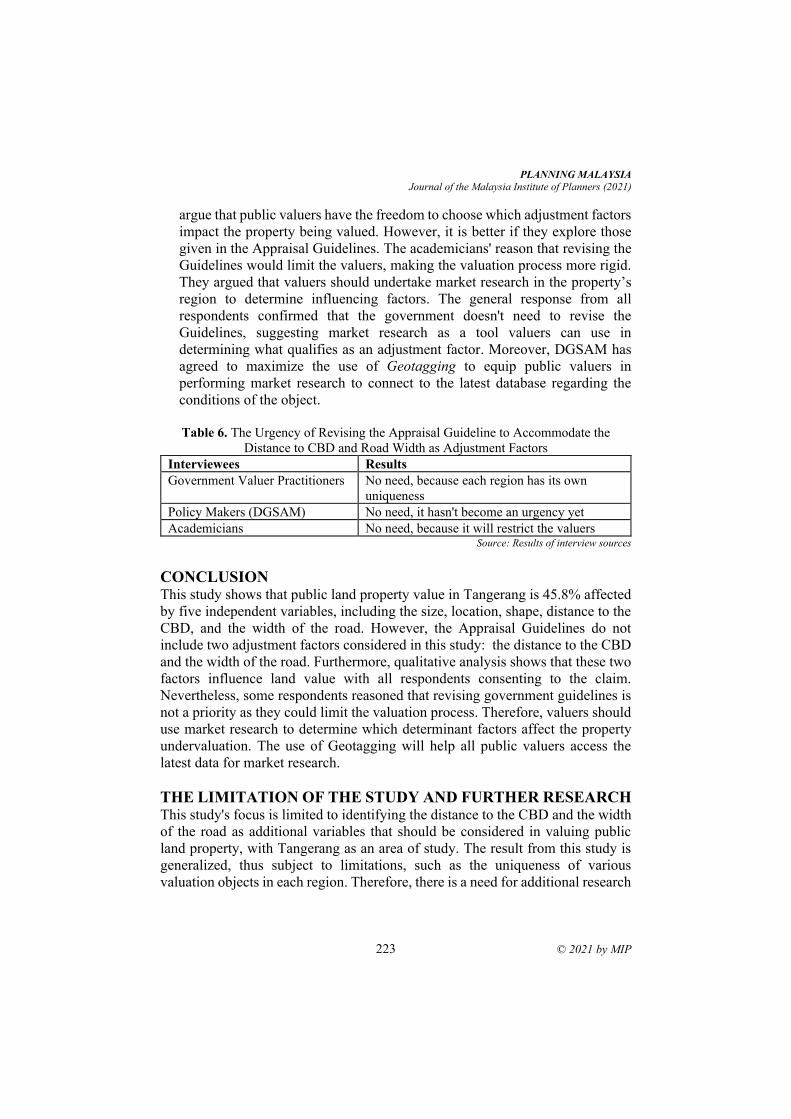
PLANNING MALAYSIA
Journal of the Malaysia Institute of Planners (2021)
223 © 2021 by MIP
argue that public valuers have the freedom to choose which adjustment factors
impact the property being valued. However, it is better if they explore those
given in the Appraisal Guidelines. The academicians' reason that revising the
Guidelines would limit the valuers, making the valuation process more rigid.
They argued that valuers should undertake market research in the property’s
region to determine influencing factors. The general response from all
respondents confirmed that the government doesn't need to revise the
Guidelines, suggesting market research as a tool valuers can use in
determining what qualifies as an adjustment factor. Moreover, DGSAM has
agreed to maximize the use of Geotagging to equip public valuers in
performing market research to connect to the latest database regarding the
conditions of the object.
Table 6. The Urgency of Revising the Appraisal Guideline to Accommodate the
Distance to CBD and Road Width as Adjustment Factors
Interviewees Results
Government Valuer Practitioners No need, because each region has its own
uniqueness
Policy Makers (DGSAM) No need, it hasn't become an urgency yet
Academicians No need, because it will restrict the valuers Source: Results of interview sources
CONCLUSION This study shows that public land property value in Tangerang is 45.8% affected
by five independent variables, including the size, location, shape, distance to the
CBD, and the width of the road. However, the Appraisal Guidelines do not
include two adjustment factors considered in this study: the distance to the CBD
and the width of the road. Furthermore, qualitative analysis shows that these two
factors influence land value with all respondents consenting to the claim.
Nevertheless, some respondents reasoned that revising government guidelines is
not a priority as they could limit the valuation process. Therefore, valuers should
use market research to determine which determinant factors affect the property
undervaluation. The use of Geotagging will help all public valuers access the
latest data for market research.
THE LIMITATION OF THE STUDY AND FURTHER RESEARCH This study's focus is limited to identifying the distance to the CBD and the width
of the road as additional variables that should be considered in valuing public
land property, with Tangerang as an area of study. The result from this study is
generalized, thus subject to limitations, such as the uniqueness of various
valuation objects in each region. Therefore, there is a need for additional research
Intan Puspitarini, Irfan Rachmat Devianto
Determinants Of Public Asset Value for Land Property: A Study in The City of Tangerang, Indonesia
© 2021 by MIP 224
covering various parts of Indonesia for more insight for policymakers, public
valuers, and academicians.
ACKNOWLEDGEMENT The authors wish to express sincere gratitude to the DGSAM, Ministry of
Finance, for making this study possible by providing the required data. The
authors are also grateful to Polytechnic of State Finance, Ministry of Finance of
the Republic of Indonesia for its support.
REFERENCES
Andrayani, Andrayani; Wihardi, Didi; and Susilowati, Yuliana. 2014. A Pattern of Land
Value in Bodetabek Area. Kuala Lumpur, Malaysia: FIG Congress.
Aulia, Nuril Fikri. 2005. Faktor-Faktor yang Mempengaruhi Nilai Tanah Kajian Nilai
Tanah Lingkungan Kampus dan di Sekitar Lingkungan Kampus (Studi di Kawasan
Jatinangor Sumedang Jawa Barat). Yogyakarta: Tesis Pasca Sarjana UGM.
Bintang, Andika Presley, Tri Oldy Rotinsulu, Daisy S.M. Engka. 2017. Analisis Faktor-
Faktor yang Mempengaruhi Nilai Tanah di Kota Manado. Manado: Fakultas
Ekonomi dan Bisnis Universitas Sam Ratulangi.
Chena, Jie and Hao, Qianjin. 2008. The Impacts Of Distance To CBD On Housing Prices
In Shanghai: A Hedonic Analysis. China: Journal of Chinese Economic and Business
Studies.
Creswell, John W. 2008. Research Design: Qualitative, Quantitative and Mixed Methods
Approach. California: SAGE Publications.
Dadi, Iwan Hindawan, Arik Hariyono, Darmawan Dwi Atmoko. 2006. Fundamental of
Valuation Teori dan Aplikasi Penilaian Properti. Jakarta: Lembaga Pengkajian
Keuangan Publik dan Akuntansi Pemerintah (LPKPAP).
Denhardt, Robert B., Janet Vinzant Denhardt. 2000. The New Public Service: Serving
Rather Than Steering. Public Administration Review Vol. 60, No.6 (Nov. - Dec.
2000), pp. 549-559.
Eckert, J.K. 1990. Property Appraisal and Assesment Administration. IAAO. Chicago.
Illinois.
Fahirah F, Amin Basong, Hermansyah H. Tagala. 2010. Identifikasi Faktor yang
Mempengaruhi Nilai Jual Lahan dan Bangunan Pada Perumahan Tipe Sederhana.
Palu: Universitas Tadulako.
Hassan, Mohd Azren; Abdullah, Yusfida Ayu; Omar, Dasimah; Danial, Muhammad
Hakim. 2019. Location Housing Affordability Index: Analysing the Relationships.
Journal of the Malaysian Institute of Planners, Vol. 19, Issue 1 (2021), pp 41-52. Hromada, Eduard. 2018. Analysis of Relationship Between Market Value of Property and
Its Distance from Center of Capital. Czech Technical University: Prague, Czech
Republic.
Oni, Ayotunde Olawande. 2011. Land Value Determinants and Rental Values of Office
Space in Ikeja. Mediterranean Journal of Social Sciences vol.2, No.2, May 2011.
Pemerintah Kota Tangerang. https://tangerangkota.go.id (diakses 11 Juni 2020).
PLANNING MALAYSIA
Journal of the Malaysia Institute of Planners (2021)
225 © 2021 by MIP
Rakhmatulloh, Anita Ratnasari; Buchori, Imam; Pradoto, Wisnu; Riyanto, Bambang. The
Power Of Accessibility To Land Price In Semarang Urban Corridors, Indonesia.
Journal of the Malaysian Institute of Planners, Vol. 16, Issue 1 (2018), pp 118-129. Rijasa, M. Mariada, M. Sukrawa, Mayun Nadiasa. 2014. Analisis Penilaian Bangunan
Rumah Tinggal Di Kota Denpasar. Jurnal Spektran Vol.2 No.2 Juli 2014. Badung:
Universitas Udayana.
Sutarmin, 2012, Determinan Nilai Likuidasi Real Property (Studi Eksekusi Lelang PUPN
Pada Kantor Pelayanan Kekayaan Negara dan Lelang Madiun Tahun 2008–2010),
Yogyakarta: Tesis Pascasarjana UGM.
Whipple, R.T.M. 1995. Property Valuation and Analysis. Sydney: Law Book Company
Winarso, Haryo. 2006. Metropolitan di Indonesia: Kenyataan dan Tantangan dalam
Penataan ruang. Direktorat Jenderal Penataan Ruang, Departemen Pekerjaan
Umum.
Yowaldi, Yowaldi. 2012. The Relation between Land Price and Distance to CBD in Bekasi.
Institute of Social Studies, The Netherlands: A Research Paper.
Received: 12th July 2021. Accepted: 23rd Sept 2021

1 Lecturer at Universiti Teknologi MARA. Email: [email protected]
PLANNING MALAYSIA:
Journal of the Malaysian Institute of Planners
VOLUME 19 ISSUE 3 (2021), Page 226 – 236
ISSUES AND OBSTACLES IN THE DEVELOPMENT OF
MALAY RESERVE LAND
Siti Hasniza Rosman1, Abdul Hadi Nawawi2 & Rohayu Ab Majid3
1,2Faculty of Architecture, Planning and Surveying
UNIVERSITI TEKNOLOGI MARA 3Institution of Malay Rulers Chair
UNIVERSITI TEKNOLOGI MARA
Abstract
Malay Reserve Land (MRL) is an heirloom belonging to the Malays to be
protected, preserved, and developed in line with the aspirations of sustainable
development. However, it has been found that land under the Malay Reserve
Land (MRL) category is still lagging in the development stream although it has
the potential to be developed in tandem with other Non-Malay Reserve Land.
This research paper aims to establish the issues and obstacles in developing the
Malay Reserve Land eventually to formulate a strategy for development of the
land in future. Focus Group Discussions (FGDs) were held involving experts
from various backgrounds namely academics, government officers, industry
players and non-governmental organizations (NGOs). Issues and the respective
obstacles mainly elicited from the FGDs are in the areas of data, information and
research, legislation, development, and financial.
Keywords: Development, Malay Reserve Land (MRL), Focus Group Discussions
(FGDs)
PLANNING MALAYSIA
Journal of the Malaysia Institute of Planners (2021)
227 © 2021 by MIP
INTRODUCTION
In Malaysia, it can be seen that the demand for land is increasing from time to
time for development purposes. There have been regular occurrences in the past
whereby decision for land development was initiated by the government
especially if it is recognised that development of certain land not necessarily idle
or under-developed, is essential in fulfilling certain urban planning policies of the
government (Nik Jaafar, 2009). However, it has been found that land under the
Malay Reserve Land (MRL) category is still lagging in the development stream
although it has the potential to be developed in tandem with other non-Malay land
(Ali, 1999).
The MRL has begun since its enactment of the Malay Reservation
Enactment in 1913. MRL is a very valuable heritage of the Malays. It is one
example of a category of land ownership reserved for the Malays only. The efforts
of the government in helping to develop the MRL should be praised, but it is
dependent on the potential and condition of a Malay reserve land such as size,
location, and may have overlapping claims on the land (Abdul Aziz, 2017). The
development of MRL can improve rural livelihoods, living environment and
narrows the life quality gaps between those living in urban and rural areas (Abdul
Rashid et al., 2021).
In order to achieve the high potential of Malay Reserve Land (MRL)
for development, strategic development is very important to guide the
development and efficiently fulfil the objectives of the government, developers
and land owners. However, some strategic development provisions tend to be
static and fail to consider the consequences of the changing economic demand
for development (Sivam, 2002).
According to Odongo and Datche (2015), strategic development if well
implemented in the organisation is effective towards growth and can be
instrumental in helping it to remain profitable, attain a competitive edge
(Olusanya and Oluwasanya, 2014) and face challenges in a highly competitive
and rapidly changing business environment (Al-Turki, 2011). The
implementation of strategic development is thus crucial to unlock the potential
for development of MRL.
Nevertheless, integral to the strategic development of the MRL is the
identification of the issues and obstacles in developing the land. This will help
the developers to enhance the opportunities in developing the MRL with the
valuable information serving as a benchmark to strategise the development
planning and eventually to produce a holistic and comprehensive strategic
development framework.
This research paper thus aims to establish the issues and obstacles in
developing the MRL with a view to formulate a strategy for development of the land
in future.
Siti Hasniza Rosman, Abdul Hadi Nawawi & Rohayu Ab Majid
Issues and Obstacles in the Development of Malay Reserve Land
© 2021 by MIP 228
LITERATURE REVIEW A number of issues and obstacles in developing the MRL highlighted by previous
work are as follows:
Availability of Data and Information Lack of data and information on the successful developments on MRL is one of
the issues that have prolonged the ignorance and led to negative mind-set of the
society about the status of MRL (Md. Ariffin, 2015).
There are data and information pertinent to MRL that have not been
recorded, updated, and reported by relevant authorities or parties for the benefits
of the society especially for Malays and Bumiputera. If the data and information
are made available and statistically analysed by a dedicated party, it can help
others to plan for a strategic and sustainable development of the MRL (Ali, 2008).
Legal Matters The legal obstacles in the development of MRL, can be inferred from previous
researchers who argued that the restriction by legislation under Article 89 of the
Federal Constitution involving the sale, mortgage, transfer, leasing and other
transactions from Malays to non-Malays are issues that affect the potential of
developing MRL (Shamsuddin, 2001).
Hussin and Abdul Rashid (2014) stated that although the provisions of
the law relating to MRL prevent the sale, lease, mortgage, transfer or any other
business on the land to non-Malays, the Ruler in Council is empowered to give
possession of state land including in Malay Reservation to any agency or
company as required.
The MRL status which mainly in certain areas are predominantly in
agricultural land use category may hinder its development. The small size of the
land and the low market price caused the landlord to have low negotiation power
to determine the landlord's interest in the land. In addition, any forms of
development that will be held on MRL can only be sold or transacted only among
the Malays. Thus, the market will be limited to the Malays only. This has led to
the real estate market being limited and consequently the prices offered low
(Abdullah and Omar, 2012). These are issues that need to be addressed and taken
into account in order to develop strategically the MRL.
Land Values and Development The value of MRL is directly linked to the potential land development activity in
view of accessibility, provision of infrastructures and potential demand and its
marketability (Omar and Raji, 2015). Land owners also need to act creatively in
ensuring MRL does not back down and can increase the economic position of the
Bumiputera through strategic development of the land development (Samsudin
PLANNING MALAYSIA
Journal of the Malaysia Institute of Planners (2021)
229 © 2021 by MIP
et al., 2021). The developer must have the edge when deciding to go ahead with
the development proposal in lieu of the underlying constraints on the MRL.
In addition, the normal consideration by developers of “choosing the
right location, building the right property types, for the right buyers and at the
right price” still applies in the case of development on MRL (Md. Ariffin, 2015).
The issue of perceived MRL value has the potential for generating
optimistic value (Omar, 2017) causing the MRL to decline slightly in terms of
development (Abdul Aziz, 2017). Notwithstanding the constraints in value, MRL
has good potential for development when it comes to location, land, size, and
availability to generate the marketability of land in the future (Omar and Raji,
2015).
Land Ownership Structure The issue of overlapping ownership of MRL is an obstacle that has long been a
challenge in its development. According to Omar (2015), when the land is owned
by more than one owner, the potential of developing the land is low.
Previous studies have found that overlapping ownership is one of the
factors that inhibits MRL development. Much of this form of shareholding comes
from land inheritance mechanisms. According to Siwar (1976), theoretically this
status of ownership is a form of land fragmentation that affects the efficiency of
land use in the long run. The studies by Hanif et al. (2015) and Maidin (2013)
found that the development of MRL was hindered as a result of shared ownership
status and legal restrictions on land dealings. This is not only happening in rural
areas but it is more alarming for MRL in urban areas (Md Ariffin, 2013).
Most MRL overlapping ownership situations occur as a result of the
process of inheritance or land alienation. Jusoh et al. (2013) found that the process
of dividing the land had led to the fragmentation of individual land lots making
them no longer economical to be developed. Land ownership status is an
important factor in land development efforts (Md. Ariffin, 2013). This is because
the sole ownership of land will facilitate its development activities (Omar, 2015).
In situations where land ownership overlaps, it requires more than one decision
maker (Md. Ariffin, 2015). Often misunderstandings and lack of co-operations
among co-owners will hinder any development activities to be undertaken.
Finance Issues related to the problem of obtaining finance from banks and financial
institutions often undermine efforts to develop the MRL especially in multiple
ownership situations. Most MRL owners stated that they failed to develop their
land for example into housing due to failure to obtain loans from banks and
financial institutions (Md. Ariffin, 2015). This is because the multiple ownership
status makes it difficult to get an agreement on the project to be implemented and
there is no guarantee of the validity of the agreement being created. As a financial
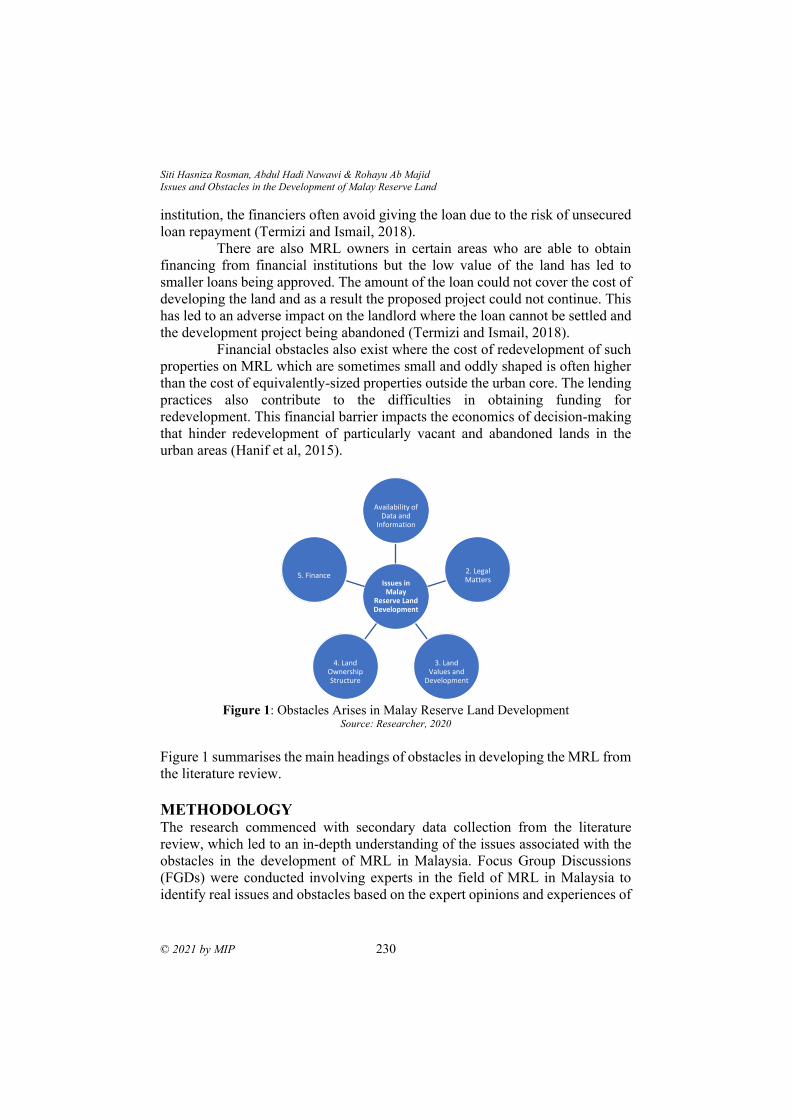
Siti Hasniza Rosman, Abdul Hadi Nawawi & Rohayu Ab Majid
Issues and Obstacles in the Development of Malay Reserve Land
© 2021 by MIP 230
institution, the financiers often avoid giving the loan due to the risk of unsecured
loan repayment (Termizi and Ismail, 2018).
There are also MRL owners in certain areas who are able to obtain
financing from financial institutions but the low value of the land has led to
smaller loans being approved. The amount of the loan could not cover the cost of
developing the land and as a result the proposed project could not continue. This
has led to an adverse impact on the landlord where the loan cannot be settled and
the development project being abandoned (Termizi and Ismail, 2018).
Financial obstacles also exist where the cost of redevelopment of such
properties on MRL which are sometimes small and oddly shaped is often higher
than the cost of equivalently-sized properties outside the urban core. The lending
practices also contribute to the difficulties in obtaining funding for
redevelopment. This financial barrier impacts the economics of decision-making
that hinder redevelopment of particularly vacant and abandoned lands in the
urban areas (Hanif et al, 2015).
Figure 1: Obstacles Arises in Malay Reserve Land Development
Source: Researcher, 2020
Figure 1 summarises the main headings of obstacles in developing the MRL from
the literature review.
METHODOLOGY The research commenced with secondary data collection from the literature
review, which led to an in-depth understanding of the issues associated with the
obstacles in the development of MRL in Malaysia. Focus Group Discussions
(FGDs) were conducted involving experts in the field of MRL in Malaysia to
identify real issues and obstacles based on the expert opinions and experiences of
Issues in Malay
Reserve Land Development
Availability of Data and
Information
2. Legal Matters
3. Land Values and
Development
4. Land Ownership Structure
5. Finance
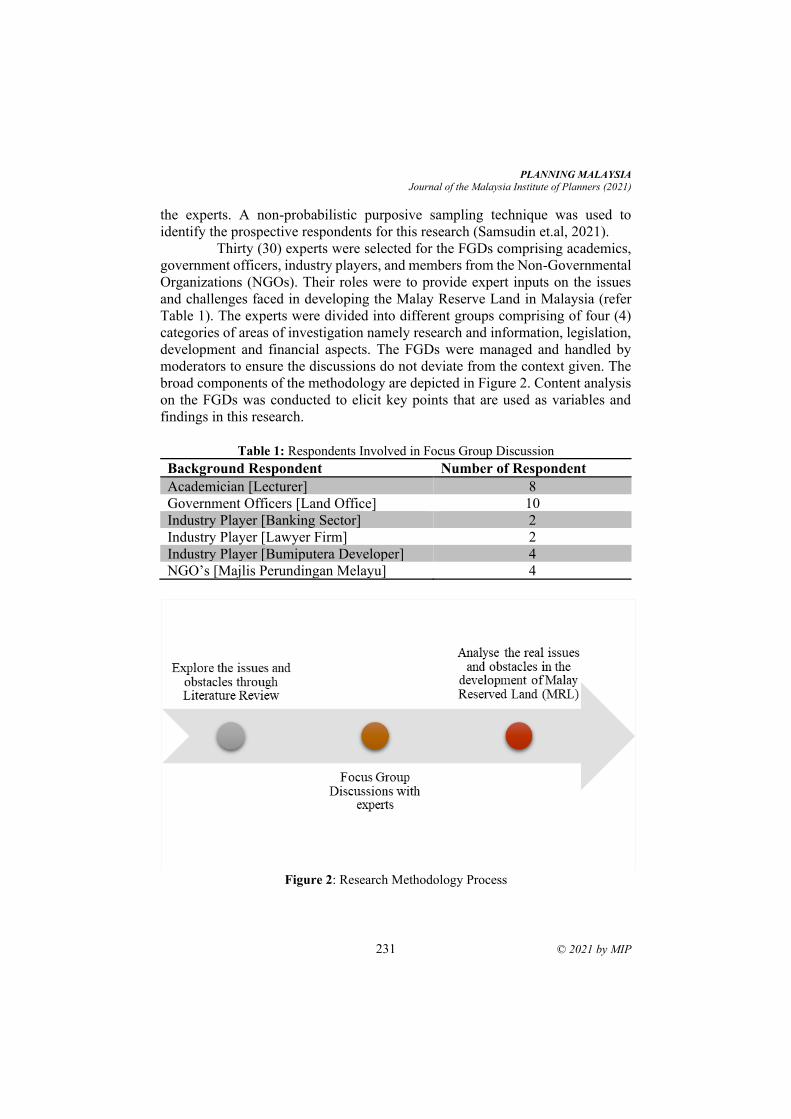
PLANNING MALAYSIA
Journal of the Malaysia Institute of Planners (2021)
231 © 2021 by MIP
the experts. A non-probabilistic purposive sampling technique was used to
identify the prospective respondents for this research (Samsudin et.al, 2021).
Thirty (30) experts were selected for the FGDs comprising academics,
government officers, industry players, and members from the Non-Governmental
Organizations (NGOs). Their roles were to provide expert inputs on the issues
and challenges faced in developing the Malay Reserve Land in Malaysia (refer
Table 1). The experts were divided into different groups comprising of four (4)
categories of areas of investigation namely research and information, legislation,
development and financial aspects. The FGDs were managed and handled by
moderators to ensure the discussions do not deviate from the context given. The
broad components of the methodology are depicted in Figure 2. Content analysis
on the FGDs was conducted to elicit key points that are used as variables and
findings in this research.
Table 1: Respondents Involved in Focus Group Discussion
Background Respondent Number of Respondent
Academician [Lecturer] 8
Government Officers [Land Office] 10
Industry Player [Banking Sector] 2
Industry Player [Lawyer Firm] 2
Industry Player [Bumiputera Developer] 4
NGO’s [Majlis Perundingan Melayu] 4
Figure 2: Research Methodology Process
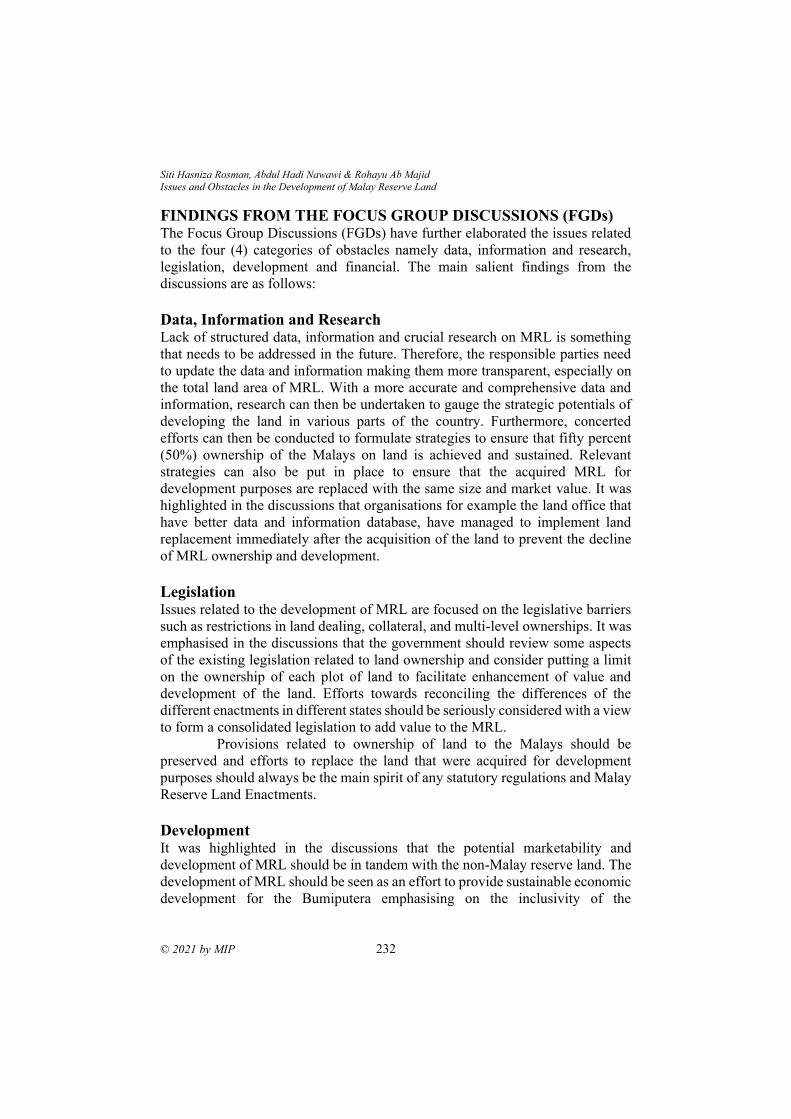
Siti Hasniza Rosman, Abdul Hadi Nawawi & Rohayu Ab Majid
Issues and Obstacles in the Development of Malay Reserve Land
© 2021 by MIP 232
FINDINGS FROM THE FOCUS GROUP DISCUSSIONS (FGDs) The Focus Group Discussions (FGDs) have further elaborated the issues related
to the four (4) categories of obstacles namely data, information and research,
legislation, development and financial. The main salient findings from the
discussions are as follows:
Data, Information and Research Lack of structured data, information and crucial research on MRL is something
that needs to be addressed in the future. Therefore, the responsible parties need
to update the data and information making them more transparent, especially on
the total land area of MRL. With a more accurate and comprehensive data and
information, research can then be undertaken to gauge the strategic potentials of
developing the land in various parts of the country. Furthermore, concerted
efforts can then be conducted to formulate strategies to ensure that fifty percent
(50%) ownership of the Malays on land is achieved and sustained. Relevant
strategies can also be put in place to ensure that the acquired MRL for
development purposes are replaced with the same size and market value. It was
highlighted in the discussions that organisations for example the land office that
have better data and information database, have managed to implement land
replacement immediately after the acquisition of the land to prevent the decline
of MRL ownership and development.
Legislation Issues related to the development of MRL are focused on the legislative barriers
such as restrictions in land dealing, collateral, and multi-level ownerships. It was
emphasised in the discussions that the government should review some aspects
of the existing legislation related to land ownership and consider putting a limit
on the ownership of each plot of land to facilitate enhancement of value and
development of the land. Efforts towards reconciling the differences of the
different enactments in different states should be seriously considered with a view
to form a consolidated legislation to add value to the MRL.
Provisions related to ownership of land to the Malays should be
preserved and efforts to replace the land that were acquired for development
purposes should always be the main spirit of any statutory regulations and Malay
Reserve Land Enactments.
Development It was highlighted in the discussions that the potential marketability and
development of MRL should be in tandem with the non-Malay reserve land. The
development of MRL should be seen as an effort to provide sustainable economic
development for the Bumiputera emphasising on the inclusivity of the
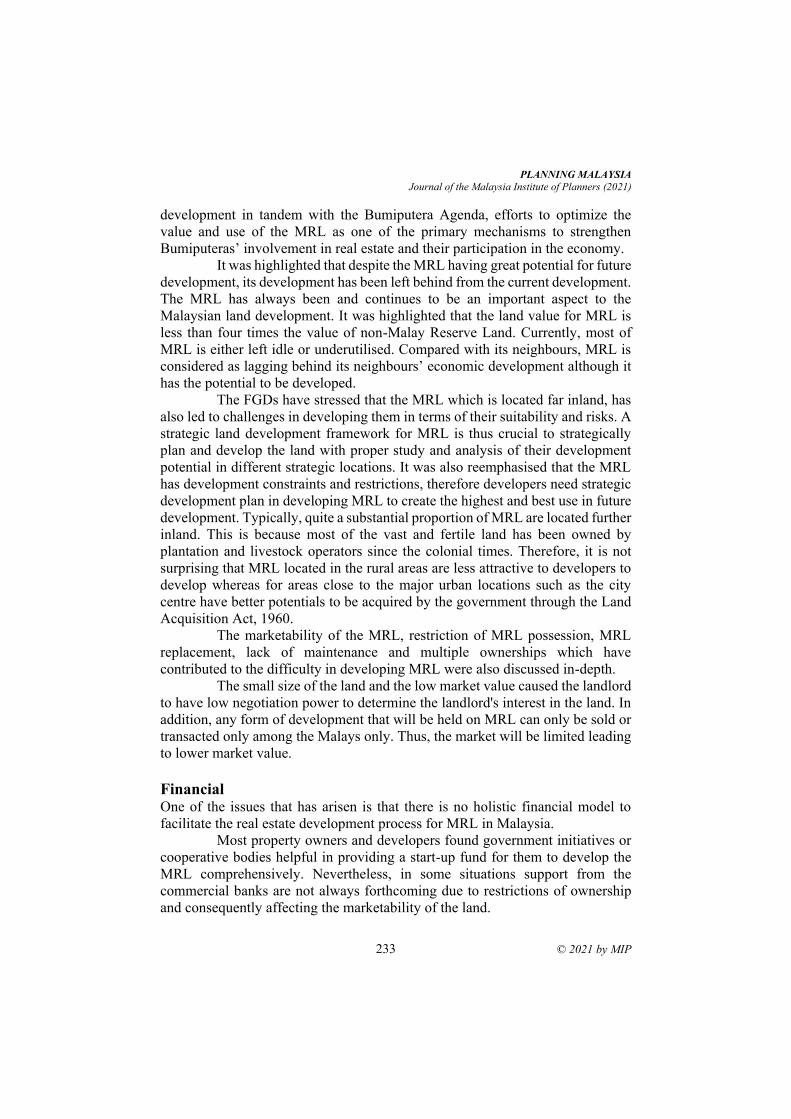
PLANNING MALAYSIA
Journal of the Malaysia Institute of Planners (2021)
233 © 2021 by MIP
development in tandem with the Bumiputera Agenda, efforts to optimize the
value and use of the MRL as one of the primary mechanisms to strengthen
Bumiputeras’ involvement in real estate and their participation in the economy.
It was highlighted that despite the MRL having great potential for future
development, its development has been left behind from the current development.
The MRL has always been and continues to be an important aspect to the
Malaysian land development. It was highlighted that the land value for MRL is
less than four times the value of non-Malay Reserve Land. Currently, most of
MRL is either left idle or underutilised. Compared with its neighbours, MRL is
considered as lagging behind its neighbours’ economic development although it
has the potential to be developed.
The FGDs have stressed that the MRL which is located far inland, has
also led to challenges in developing them in terms of their suitability and risks. A
strategic land development framework for MRL is thus crucial to strategically
plan and develop the land with proper study and analysis of their development
potential in different strategic locations. It was also reemphasised that the MRL
has development constraints and restrictions, therefore developers need strategic
development plan in developing MRL to create the highest and best use in future
development. Typically, quite a substantial proportion of MRL are located further
inland. This is because most of the vast and fertile land has been owned by
plantation and livestock operators since the colonial times. Therefore, it is not
surprising that MRL located in the rural areas are less attractive to developers to
develop whereas for areas close to the major urban locations such as the city
centre have better potentials to be acquired by the government through the Land
Acquisition Act, 1960.
The marketability of the MRL, restriction of MRL possession, MRL
replacement, lack of maintenance and multiple ownerships which have
contributed to the difficulty in developing MRL were also discussed in-depth.
The small size of the land and the low market value caused the landlord
to have low negotiation power to determine the landlord's interest in the land. In
addition, any form of development that will be held on MRL can only be sold or
transacted only among the Malays only. Thus, the market will be limited leading
to lower market value.
Financial One of the issues that has arisen is that there is no holistic financial model to
facilitate the real estate development process for MRL in Malaysia.
Most property owners and developers found government initiatives or
cooperative bodies helpful in providing a start-up fund for them to develop the
MRL comprehensively. Nevertheless, in some situations support from the
commercial banks are not always forthcoming due to restrictions of ownership
and consequently affecting the marketability of the land.
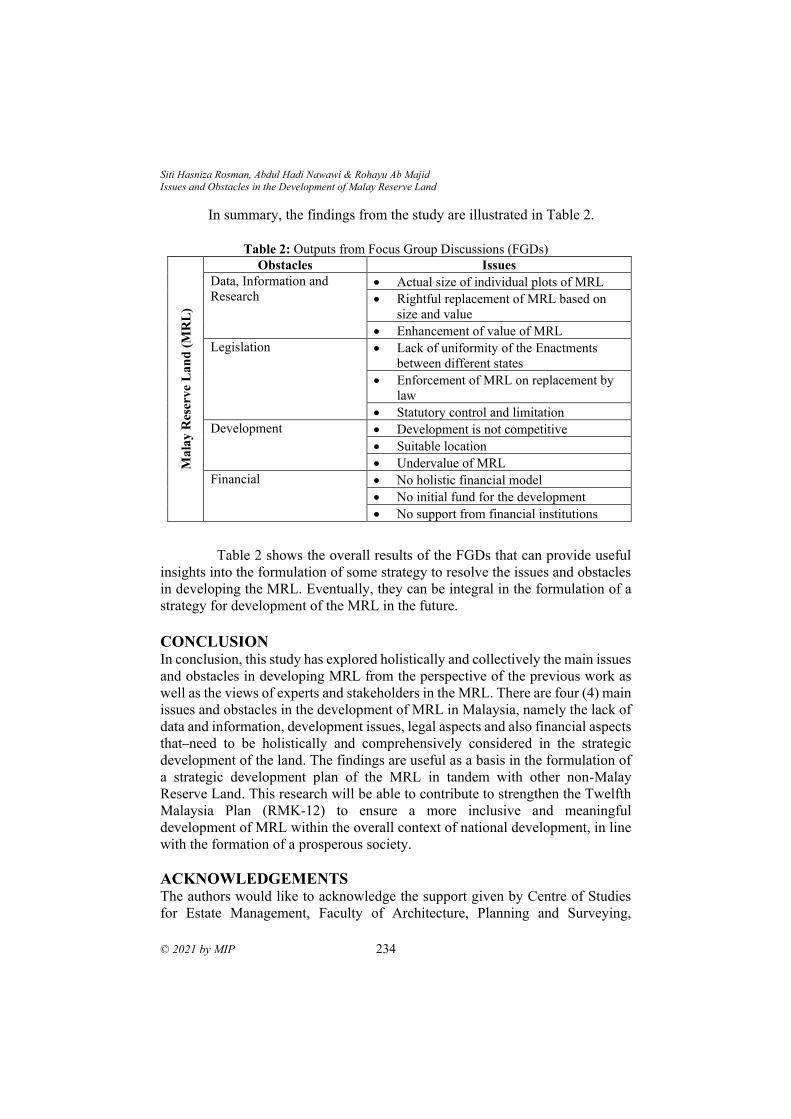
Siti Hasniza Rosman, Abdul Hadi Nawawi & Rohayu Ab Majid
Issues and Obstacles in the Development of Malay Reserve Land
© 2021 by MIP 234
In summary, the findings from the study are illustrated in Table 2.
Table 2: Outputs from Focus Group Discussions (FGDs)
Ma
lay R
eser
ve
La
nd
(M
RL
)
Obstacles Issues
Data, Information and
Research • Actual size of individual plots of MRL
• Rightful replacement of MRL based on
size and value
• Enhancement of value of MRL
Legislation • Lack of uniformity of the Enactments
between different states
• Enforcement of MRL on replacement by
law
• Statutory control and limitation
Development • Development is not competitive
• Suitable location
• Undervalue of MRL
Financial • No holistic financial model
• No initial fund for the development
• No support from financial institutions
Table 2 shows the overall results of the FGDs that can provide useful
insights into the formulation of some strategy to resolve the issues and obstacles
in developing the MRL. Eventually, they can be integral in the formulation of a
strategy for development of the MRL in the future.
CONCLUSION In conclusion, this study has explored holistically and collectively the main issues
and obstacles in developing MRL from the perspective of the previous work as
well as the views of experts and stakeholders in the MRL. There are four (4) main
issues and obstacles in the development of MRL in Malaysia, namely the lack of
data and information, development issues, legal aspects and also financial aspects
that need to be holistically and comprehensively considered in the strategic
development of the land. The findings are useful as a basis in the formulation of
a strategic development plan of the MRL in tandem with other non-Malay
Reserve Land. This research will be able to contribute to strengthen the Twelfth
Malaysia Plan (RMK-12) to ensure a more inclusive and meaningful
development of MRL within the overall context of national development, in line
with the formation of a prosperous society.
ACKNOWLEDGEMENTS
The authors would like to acknowledge the support given by Centre of Studies
for Estate Management, Faculty of Architecture, Planning and Surveying,
PLANNING MALAYSIA
Journal of the Malaysia Institute of Planners (2021)
235 © 2021 by MIP
Universiti Teknologi MARA, Shah Alam, Institution of Malay Rulers Chair,
Universiti Teknologi MARA, TERAJU and all participants in the Focus Group
Discussions.
REFERENCES Abdul Rashid, M.F. et al. (2021). Formulation of a Malaysia Modern Rural Development
Framework: Synergising Rural for Change. Journal of the Malaysian Institute of
Planners. Volume 19 Issue 2 (2021), Page 14 – 26.
Abdul Aziz, I.H. (2017). Tanah Rizab Melayu Seluruh Negara Seluas 4 Juta Hektar,
Retrieved August 9, 2017, from http://www.mstar.com.my/berita/berita
semasa/2017/03/29/tanah-rizab-melayu/#2eC1j6V1wHJfYz6G.99
Abdullah, M.Z. and Omar, I. (2012) Pembangunan tanah dan halangannya. Universiti
Teknologi Malaysia, Johor.
Ali, S.H. (1999) Kemiskinan dan kelaparan tanah di Kelantan. Percetakan Abadi Sdn.
Bhd., Petaling Jaya.
Ali, S.H. (2008). Orang Melayu: Masalah dan Masa Depan. Kuala Lumpur: Buku
Harakah.
Al-Turki, U.M. (2011). A framework for strategic planning in maintenance. Journal of
Quality in Maintenance Engineering, Vol. 17 Issue: 2, pp.150 162,
https://doi.org/10.1108/13552511111134583
Hanif et al. (2015). The challenge of rural life nostalgia: Barriers in redevelopment of
Malay Reserve Land (MRL) in Klang Valley City. Territory and Architecture, 2,3.
Hussin, R. and Abdul Rashid, R. (2014). Dilema Pembangunan Tanah Rizab Melayu:
Satu Warisan atau Satu Tangisan? TeSHHI 2014/ eProoceedings.
Jusoh, H. et al. (2013). Development process and its implication on the native land
ownership. Asian Social Science, 9, 14.
Maidin, A.J. (2013). Developing rural land for sustaining agricultural activities: A case
study of the customary land in the state of Negri Sembilan, Malaysia. Asia Pacific
Economic Corporation. Sustainable land management to enhance food production
of APEC Members Proceeding of Workshop Chiang Mai.
Md. Ariffin, S. (2013). Malay Reservation Land: Unleashing a century of trust.
International Surveying Research Journal, 3, (2), 6.
Md. Ariffin, S. (2015). Issues, Challenges and Prospects in Developing Malay
Reservation Land. Malay Reservation Land – The Way Forward. LAMBERT
Academic Publishing. ISBN: 978-3-659-75336-7.
Nik Jaafar, N.N. (2009). Land Development Process in Malaysia. Nilai Harta Consultant
Sdn Bhd. Research Department of NHCSB.
Odongo, M.S and Datche, O. (2015). Effects of Strategic Planning on Organizational
Growth. (A Case Study of Kenya Medical Research Institute, Kemri).
International Journal of Scientific and Research Publications, Volume 5, Issue 9,
September 2015 1 ISSN 2250-3153.
Olusanya, O.O and Oluwasanya, A, T. (2014). Effect of Strategic Planning on the Growth
and Survival of an Emerging Firm American Journal of Engineering Research
(AJER) e-ISSN: 2320-0847 p-ISSN: 2320-0936 Volume-03, Issue-02, pp-230-
239.
Siti Hasniza Rosman, Abdul Hadi Nawawi & Rohayu Ab Majid
Issues and Obstacles in the Development of Malay Reserve Land
© 2021 by MIP 236
Omar, A.W. (2017). Smart partnership can unlock value of Malay Reserve Land.
https://themalaysianreserve.com/2017/03/31/smart-partnership-can-unlock-
value-of-malay-reserve-land-says-wahid/, Friday, March 31st, 2017.
Omar, I. (2015). Enterprizing indigenous land in Kuala Lumpur: Constraining factors of
Malay Reservation Land. International Journal of Trade & Global Business
Perspectives, 4, 2.
Omar, I. and Raji, F. (2015). The Influence of Land Supply Constraints on the Value of
Indigenous Malay Reservation Land in Malaysia. Malay Reservation Land – The
Way Forward. LAMBERT Academic Publishing. ISBN: 978-3-659-75336-7.
Samsudin et al. (2021). Attachment and Values Among Youth to Paddy Field Activities
in Homestay Programmes. Journal of the Malaysian Institute of Planners Volume
19 Issue 2 (2021), Page 85 – 96.
Shamsuddin, K. (2001). Satu percubaan keatas pendekatan cooperative relloting dalam
membangunkan Tanah Rizab Melayu: Kajian persepsi dan arah tuju
pelaksanaannya di Tanah Rizab Melayu Kuang, Selangor Darul Ehsan.Universiti
Teknologi Malaysia.
Sivam, A. (2002). “Constraints affecting the efficiency of the urban residential land
market in developing countries: a case study of India”, Habitat International 26
(2002) 523–537, Pergamon.
Siwar, C. (1976). Kehendak dan bentuk reformasi tanah di Malaysia. Kuala Lumpur:
Dewan Bahasa dan Pustaka.
Termizi, M.K. and Ismail, M. (2018). Isu Pembangunan Tanah Rizab Melayu
Berpemilikan Bertindih. Malaysian Journal of Social Sciences and Humanities,
Volume 3, Issue 1, (page 91-99).
Received: 12th July 2021. Accepted: 23rd Sept 2021
1 Senior Lecturer at Universiti Teknologi MARA, Perak Branch, Email: [email protected]
PLANNING MALAYSIA:
Journal of the Malaysian Institute of Planners
VOLUME 19 ISSUE 3 (2021), Page 237 – 248
THE IMPORTANCE OF SUSTAINABILITY
IMPLEMENTATION FOR BUSINESS CORPORATIONS
Nurul Sahida Fauzi1, Noraini Johari2, Ashrof Zainuddin3, Nor Nazihah Chuweni4
1,2,3,4Department of Built Environment Studies and Technology,
Faculty of Architecture, Planning and Surveying,
UNIVERSITI TEKNOLOGI MARA, PERAK BRANCH
Abstract
Sustainability is the current trend adopted by major business corporations in
Malaysia. Abundant evidence reveals corporations are now recognizing that
aligning business operation with sustainable ways adds more value. Previous
literature shows sustainability has become a strategic imperative for all
businesses. Apart from that, having a sustainable building in their asset portfolio
contributes towards achieving the management strategic corporate goals.
Therefore, this research aims to discuss what are the corporate goals or corporate
expectations from going green. In conjunction with that, secondary data
collection was thoroughly reviewed from previous studies. Then, primary data
consolidates via questionnaire distribution on 117 persons directly involved in
green management. The data then analyzed via relative importance index (RII) to
identify the importance level for expected corporate goals. Derivation of deeper
conceptual findings uses the sustainable triple bottom line theory as a guide. The
result indicates four major goals of corporations including the environment,
maximization of economic value, and minimization of economic and social costs.
This research provides ample evidence for further research in green management.
Keywords: Corporate Goals; Corporate Sustainability; Triple Bottom Line
Nurul Sahida Fauzi, Noraini Johari, Ashrof Zainuddin, Nor Nazihah Chuweni
The Importance of Sustainability Implementation for Business Corporations
© 2021 by MIP 238
INTRODUCTION The corporate movement towards sustainable buildings in efforts to implement
sustainable practice successfully, also simultaneously contribute to the success of
business operations. Sustainable involvement is considered as a new strategic
planning approach which is employed worldwide (Rasoolimanesh et al., 2011).
Abundant evidence reveals corporations are now recognizing that aligning
business operations with sustainable ways adds more value. Corporations believe
that owning sustainable buildings in the asset portfolio contributes to achieving
the management strategic corporate goals. This research aims to discuss on the
corporate goals or corporate expectations from sustainable adoption.
LITERATURE REVIEW The main key for sustainable practice is to minimize environmental impact and
costs while maximizing occupant comfort and satisfaction. The need for
enhancing corporate and organizational image are also motivators for
management to go green (Fauzi et al., 2021; Rock et al., 2019). Hopkins et al.
(2017) acknowledge and divide the various benefits of sustainability into three
perspectives. These categories are to improve environmental performance, social
performance, and economic performance through revenue increase and cost
reduction. These are in line with the corporate sustainability concept that
integrates the environment, the economic, and the social aspects of triple-bottom
line to meet the needs of a firm’s direct and indirect stakeholders (Isaksson, 2019;
Masalskyte, Andelin, Sarasoja, & Ventovuori, 2014; Olawumi & Chan, 2019).
The following explains many more expectations from going sustainable
according to three major perspectives of sustainability namely environmental,
economic and social.
Environment Perspective
A sustainable environment seeks to improve human welfare by protecting the
sources of raw materials used for human needs and mitigating harm to humans
(Ajayi, Oyedele, & Jamiu, 2019; Ilhan & Banu Yobas, 2019; Razali, 2018; Zaid
& Zainon, 2019). The environment perspective or also known as the ecological
dimension is mostly illustrated as global warming prevention. Støre-Valen &
Buser (2019) concurrently find that the environment perspective aims to focus on
environmental sustainability particularly on lowering energy consumption and
reducing the carbon footprint. The findings echo Shurrab et al. (2019) where
environmental sustainability is beneficial in terms of improved air quality, higher
water quality, and reductions in energy and water consumption. Consistent with
Ohueri, Enegbuma, & Kenley (2018); and Shaikh et al. (2019), among the shared
benefits include minimizing adverse environmental effects, obliteration of the
risks of environmental disasters, contribution towards the development of natural
resources, reduction in the use of non-renewable materials, water, emissions,
PLANNING MALAYSIA
Journal of the Malaysia Institute of Planners (2021)
239 © 2021 by MIP
wastes, and pollutants. Conclusively, all the benefits discerned from previous
research relate to sustainable performance as per Lu & Taylor (2018) on the
environmental concerns normally related to the aims to achieve sustainability
performance.
Economic Perspective
In purely economic view, economics is defined as a target concept covering
performance targets, financial targets, and success targets (Glatte, 2012). These
parallels findings by Masalskyte, Andelin, Sarasoja, & Ventovuori (2014) that
corporations’ aims in green buildings include financial benefits, added value for
the customers, brand value, transparency, and trust. Hopkins et al. (2017; and
Robert (2010) reiterate that sustainability is able to increase revenue and reduce
cost. Cass (2018); Lamprinidi & Ringland (2006); Mansfield (2009) also find that
competent sustainable practices reduce cost. When relating to sustainable or
green CRE, corporations will experience significant economic impact towards
the market such as higher rent and lower vacancy rates. Subsequently, they enjoy
higher market price reflecting good long-term business opportunities (Rogerson,
2014). The veritable conclusion is that demand is increasing (Chang & Devine,
2019; Collins, Junghans, & Haugen, 2018; Hui, Yu, & Tse, 2016; Shurrab et al.,
2019). This is the scenario in Malaysia where the average green office rental
value is higher compared to non-green office buildings (Muniandy & Kasim,
2019). Razali (2018) adds that the sustainable building provides positive
incentives to the firms in the form of attractive rentals and high-profile tenants.
Ganda (2018) discovers that sustainable buildings generate increased financial
gains of up to 3.15 per cent and enjoying 0.76/m2 higher rent compared to
common buildings. Oyewole & Markson Opeyemi (2018) agree and further
discover increasing demand for sustainable offices in the market day by day.
Rameezdeen et al., (2019) concur that private buildings with green certification
have positive impact on investor decisions due to market demand and the
opportunity for branding. Not only that, Reichardt, Fuerst, Rottke, & Zietz (2012)
postulate that sustainable real estate contributes to positive economic
performance. They also exhibit higher returns on assets than their fewer green
counterparts that far outweigh the costs.
In addition, Bangwal & Tiwari (2018; Newsham et al. (2018) report
that sustainable buildings tend to have higher resale values and better market
values. Further, portfolio greenness was found to be positively related to
operating performance by Reichardt et al. (2012). Additionally, sustainable CRE
delivers value for marketing and branding purposes, innovations and creativity
improvements (Jylhä, Remøy, & Arkesteijn, 2019). This is a good sign for the
corporation. Prior research suggests that sustainable buildings improve
productivity (Christensen, Baldwin, & Ellis (2012); Cass (2018); Dwaikat & Ali,
2018; Jylhä et al. (2019). Meanwhile Hui et al. (2016) mention the benefits of
Nurul Sahida Fauzi, Noraini Johari, Ashrof Zainuddin, Nor Nazihah Chuweni
The Importance of Sustainability Implementation for Business Corporations
© 2021 by MIP 240
efficient building includes improving business image. Ledashcheva (2019);
Reichardt et al. (2012); Zaid & Zainon (2019) agree that the business gains and
improves its reputation and image through sustainable building. in concurrence,
Eichholtz et al. (2018) state that green commitment improves corporate
reputation and reflects more attractive employers than otherwise comparable
firms. If leasing green office space leads to a superior corporate reputation, this
may enable firms to attract investors more easily and at better market rates
(Eichholtz et al., 2018). Rameezdeen et al. (2019) discover tenants realize that
some sustainability features of the buildings are more cogent to their productivity
and hence are willing to pay more for these attributes. The overall life cycle of
the economic performance reflects optimization (Ohueri et al., 2018) like
increases in share prices (Ganda, 2018), and many more.
Recently, Fauzi et al. (2021) find several benefits of sustainable
practices associated with economics. These are minimizing costs, which include
reduced management, operational, renovation, and replacement costs. Cost
minimization is conceptually similar to cost effectiveness. Cost effectiveness
generally represents reasonable value for the money paid. In conjunction with
that, Lu & Taylor (2018) post that sustainable buildings establish cost
effectiveness for investment, construction, and operation costs. Oyewole &
Markson Opeyemi (2018) concur that the growing interest in green buildings is
due to its potential benefits in operating cost reduction, energy use reduction, and
savings in waste management costs. Meanwhile, Dwaikat & Ali (2018); Ohueri
et al. (2018); Shurrab et al. (2019); Zaid & Zainon (2019) address that being
sustainable reduces operation and maintenance costs.
Social Perspective
The next concern are social benefits. These are more concerned on the social
performance (Hopkins et al., 2017) and impacts on the organization including
labour practices, human rights and society (Ghazali, 2015). Masalskyte, Andelin,
Sarasoja, & Ventovuori (2014) recount that the social dimension of a sustainable
building includes a healthy and comfortable working environment, employee
engagement to sustainability-related activities, promotion of employee
satisfaction, and working efficiency. Other than that, most research reveals that
sustainable buildings manifest social benefits through improved safety and health
(Lu & Taylor, 2018) that directly enhance the quality of life (Ajayi et al., 2019)
and promotes a healthy life (Zhang, Kang, & Jin, 2018). Eichholtz & Kok (2018)
and Rogerson (2014) experience reduced number of employee sick leave days
and reduced staff turnover. Tenants report that employee skill intensity relates
positively to corporate use of green office space. Eichholtz et al. (2018) also
record one of the common social benefit aims by corporations is occupants’
healthy living. It has also been established that green buildings help in providing
important benefits to human health (Oyewole & Markson Opeyemi, 2018). These
PLANNING MALAYSIA
Journal of the Malaysia Institute of Planners (2021)
241 © 2021 by MIP
findings echo Zaid & Zainon (2019) results that sustainable buildings contribute
to occupant absenteeism minimization. Gou & Ma (2019) and Shurrab et al.
(2019) share the same thing that is community benefits that encompass health
enhancement, quality of life and wellbeing improvements, and occupant comfort.
Taylor (2013) also indicates occupant comfort and health are benefits of
sustainability.
Collins et al. (2019) view the benefit of sustainability in a different way
that is it promotes a sense of sustainable community. This is actually the root for
successful implementation of sustainable concern in the community. According
to Shaikh et al. (2019), sustainability contributes to increased awareness for
harmonization and also human health. Not only that, the role of sustainable
buildings is crucial to encourage technological innovation in society (Lu &
Taylor, 2018). In relation to the community, generally corporations embed
corporate social responsibility initiatives to ensure the community is able to gain
benefits from corporate sustainability. Ajayi et al. (2019) recap that sustainable
initiatives aim to support communities.
METHODOLOGY The analysis of data uses the descriptive analysis method in order to compare the
level of agreement and the level of importance of each element from the most
important to the least important. The descriptive analysis method used is relative
important index analysis (RII). RII analysis allows identifying most of the
important criteria based on the participants' replies. It is an appropriate tool to
prioritize indicators rated on Likert-type scales (Mohd Adnan, Aman, Razali, &
Daud, 2017; Rooshdia, Majid, Sahamir, & Ismail, 2018). This research adopted
five (5) point likert scales for the questionnaire instruments that start from
strongly disagree, disagree, neutral, agree and strongly agree. According to
Akadiri (2011) in (Rooshdia et al., 2018), five important levels are transformed
from importance values. They commence with high (H) (0.8 ≤ RI ≤ 1), high
medium (H–M) (0.6 ≤ RI ≤ 0.8), medium (M) (0.4 ≤ RI ≤ 0.6), medium-low (M-
L) (0.2 ≤ RI ≤ 0.4) and low (L) (0 ≤ RI ≤ 0.2). The highest ranking refers to the
highest RI value. Waidyasekara & Silva (2016) also mention a low RII indicates
that the factor is less applicable and less relevant, whereas a high index indicates
higher applicability, agreement and relevance. The distribution of feedback
involves 117 respondents that directly involved in the sustainable management
of corporate companies certified with green building index certification in
Peninsular Malaysia. There are 39 building chosen whereby three respondents
are selected from each of the buildings. Then, 100 responses are accepted for the
final analysis. The total 100 data used in the study meets the required sample
suggestion by Raosoft (90 sample) and G Power (98 sample).
Nurul Sahida Fauzi, Noraini Johari, Ashrof Zainuddin, Nor Nazihah Chuweni
The Importance of Sustainability Implementation for Business Corporations
© 2021 by MIP 242
RESULTS AND DISCUSSION There are four main elements of the results. These are 1) environment, 2) social
3) economic (maximizing value) and 4) economic (minimizing cost).
Table 1: Corporations’ Sustainability Goals
Sustainability Goal RII Rank Importance Level
Environment 0.881 1 High
Economic (Maximizing Value) 0.876 2 High
Social 0.815 3 High
Economic (Minimizing Cost) 0.808 4 High
Table 1 explains an overall ranking and important levels of sustainability goals.
In line with the results, environmental sustainability goal ranks first (RII=0.881),
economic sustainability goal (maximizing value) ranks second (RII=0.876),
social sustainability goal ranks third (RII = 0.815), and economic sustainability
goal (minimizing cost) was ranked the last (RII = 0.808). This revealed that the
main objective of the corporations involved in sustainability is to preserve the
environment as found in Rameezdeen et al. (2019), while at the same time
improving their economic sustainability and contributing to social sustainability.
Table 2: Environmental Sustainability Goals
Environment Mean RII Rank Importance Level
ENV_ HAZARDOUS 4.49 0.898 1 High
ENV_NATURAL_SOURCE 4.39 0.878 2 High
ENV_SUSTAINABILITY 4.38 0.876 3 High
ENV_INNOVATION 4.35 0.870 4 High
Table 2 shows that reducing hazardous gas emissions and pollution ranks first
(RII=0.898) while protecting, preserving, minimizing, and effective use of natural
resources ranks second (RII=0.878). These precede promoting sustainability in the
environment and attitude which ranks third (RII = 0.876). The least sustainability
goal ranking fourth is encouraging innovation to preserve and promote the
sustainable environment (RII = 0.870). It is evident that the corporations’ main goal
in environmental sustainability is to reduce pollution that contributes to the
environmental problems leading to environmental deterioration. This is line with
aim of most companies involved in sustainability as to reduce the co2 emission
(Razali & Hamid, 2018) and adverse impact on the environment (Shaikh et al.,
2019). Further the the aim of sustainability involvement includes of contributing to
the development of the natural resources (Shaikh et al., 2019). Then, Follows by
environment accountability demand (Rameezdeen et al., 2019).
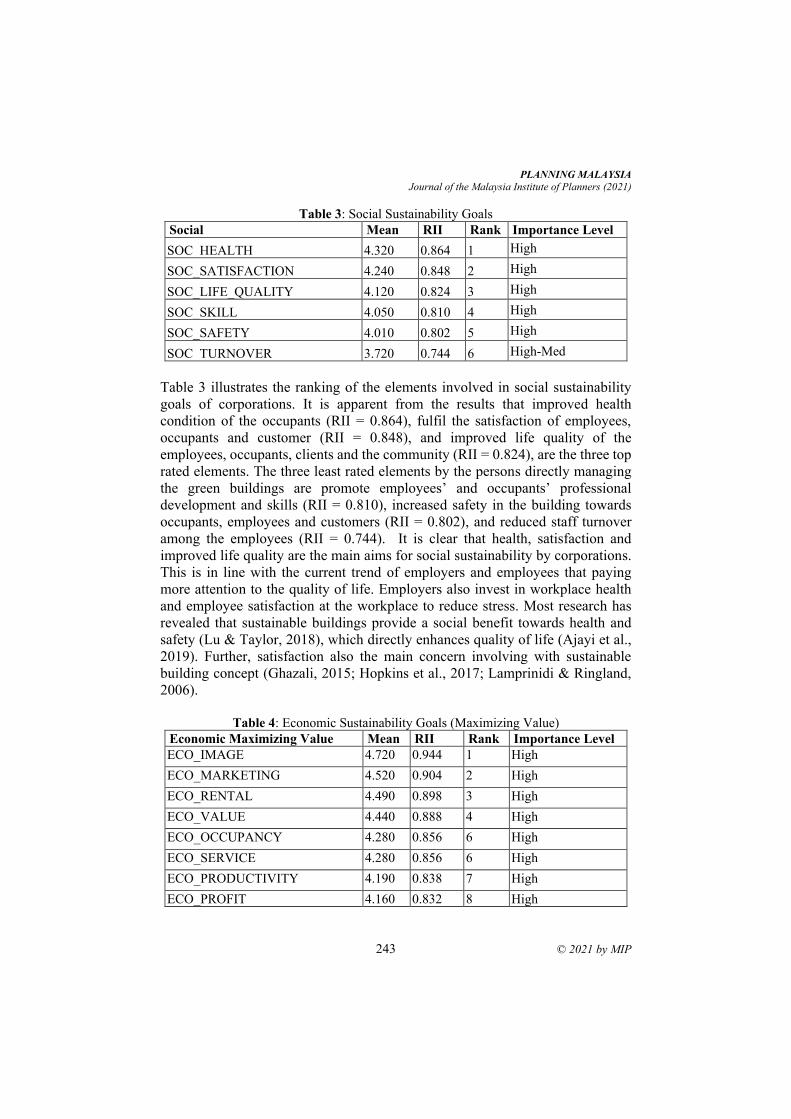
PLANNING MALAYSIA
Journal of the Malaysia Institute of Planners (2021)
243 © 2021 by MIP
Table 3: Social Sustainability Goals
Social Mean RII Rank Importance Level
SOC_HEALTH 4.320 0.864 1 High
SOC_SATISFACTION 4.240 0.848 2 High
SOC_LIFE_QUALITY 4.120 0.824 3 High
SOC_SKILL 4.050 0.810 4 High
SOC_SAFETY 4.010 0.802 5 High
SOC_TURNOVER 3.720 0.744 6 High-Med
Table 3 illustrates the ranking of the elements involved in social sustainability
goals of corporations. It is apparent from the results that improved health
condition of the occupants (RII = 0.864), fulfil the satisfaction of employees,
occupants and customer (RII = 0.848), and improved life quality of the
employees, occupants, clients and the community (RII = 0.824), are the three top
rated elements. The three least rated elements by the persons directly managing
the green buildings are promote employees’ and occupants’ professional
development and skills (RII = 0.810), increased safety in the building towards
occupants, employees and customers (RII = 0.802), and reduced staff turnover
among the employees (RII = 0.744). It is clear that health, satisfaction and
improved life quality are the main aims for social sustainability by corporations.
This is in line with the current trend of employers and employees that paying
more attention to the quality of life. Employers also invest in workplace health
and employee satisfaction at the workplace to reduce stress. Most research has
revealed that sustainable buildings provide a social benefit towards health and
safety (Lu & Taylor, 2018), which directly enhances quality of life (Ajayi et al.,
2019). Further, satisfaction also the main concern involving with sustainable
building concept (Ghazali, 2015; Hopkins et al., 2017; Lamprinidi & Ringland,
2006).
Table 4: Economic Sustainability Goals (Maximizing Value)
Economic Maximizing Value Mean RII Rank Importance Level
ECO_IMAGE 4.720 0.944 1 High
ECO_MARKETING 4.520 0.904 2 High
ECO_RENTAL 4.490 0.898 3 High
ECO_VALUE 4.440 0.888 4 High
ECO_OCCUPANCY 4.280 0.856 6 High
ECO_SERVICE 4.280 0.856 6 High
ECO_PRODUCTIVITY 4.190 0.838 7 High
ECO_PROFIT 4.160 0.832 8 High
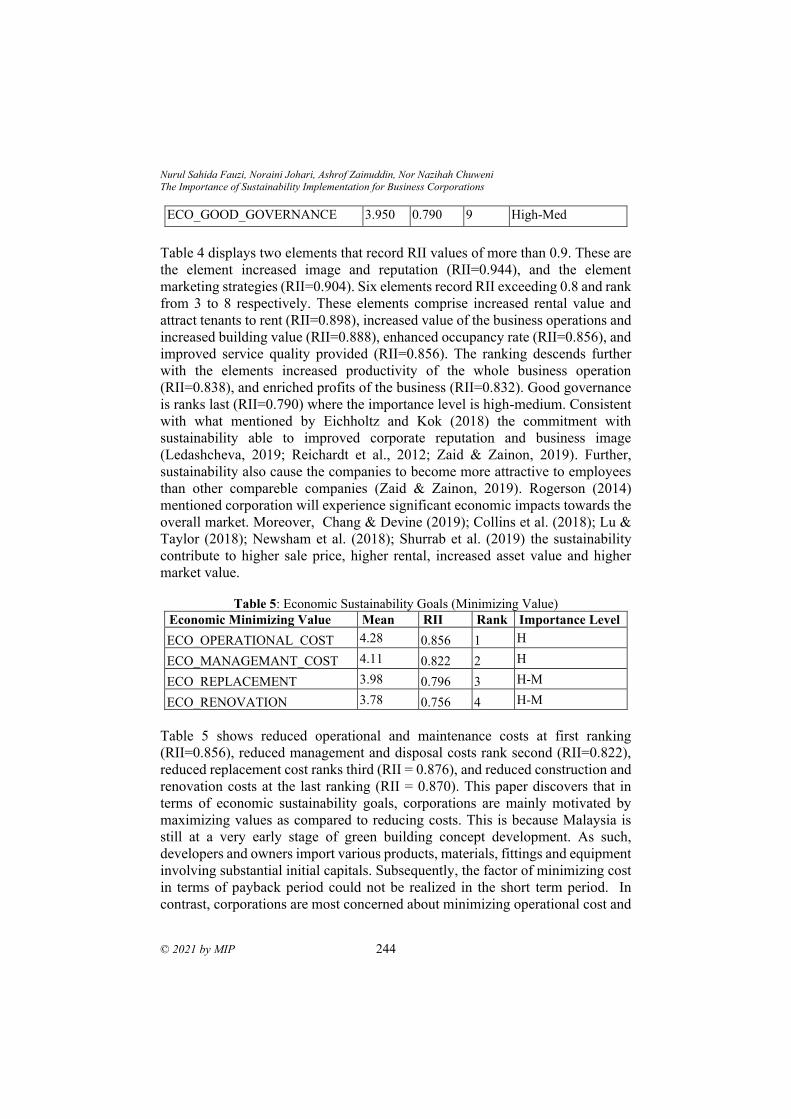
Nurul Sahida Fauzi, Noraini Johari, Ashrof Zainuddin, Nor Nazihah Chuweni
The Importance of Sustainability Implementation for Business Corporations
© 2021 by MIP 244
ECO_GOOD_GOVERNANCE 3.950 0.790 9 High-Med
Table 4 displays two elements that record RII values of more than 0.9. These are
the element increased image and reputation (RII=0.944), and the element
marketing strategies (RII=0.904). Six elements record RII exceeding 0.8 and rank
from 3 to 8 respectively. These elements comprise increased rental value and
attract tenants to rent (RII=0.898), increased value of the business operations and
increased building value (RII=0.888), enhanced occupancy rate (RII=0.856), and
improved service quality provided (RII=0.856). The ranking descends further
with the elements increased productivity of the whole business operation
(RII=0.838), and enriched profits of the business (RII=0.832). Good governance
is ranks last (RII=0.790) where the importance level is high-medium. Consistent
with what mentioned by Eichholtz and Kok (2018) the commitment with
sustainability able to improved corporate reputation and business image
(Ledashcheva, 2019; Reichardt et al., 2012; Zaid & Zainon, 2019). Further,
sustainability also cause the companies to become more attractive to employees
than other compareble companies (Zaid & Zainon, 2019). Rogerson (2014)
mentioned corporation will experience significant economic impacts towards the
overall market. Moreover, Chang & Devine (2019); Collins et al. (2018); Lu &
Taylor (2018); Newsham et al. (2018); Shurrab et al. (2019) the sustainability
contribute to higher sale price, higher rental, increased asset value and higher
market value.
Table 5: Economic Sustainability Goals (Minimizing Value)
Economic Minimizing Value Mean RII Rank Importance Level
ECO_OPERATIONAL_COST 4.28 0.856 1 H
ECO_MANAGEMANT_COST 4.11 0.822 2 H
ECO_REPLACEMENT 3.98 0.796 3 H-M
ECO_RENOVATION 3.78 0.756 4 H-M
Table 5 shows reduced operational and maintenance costs at first ranking
(RII=0.856), reduced management and disposal costs rank second (RII=0.822),
reduced replacement cost ranks third (RII = 0.876), and reduced construction and
renovation costs at the last ranking (RII = 0.870). This paper discovers that in
terms of economic sustainability goals, corporations are mainly motivated by
maximizing values as compared to reducing costs. This is because Malaysia is
still at a very early stage of green building concept development. As such,
developers and owners import various products, materials, fittings and equipment
involving substantial initial capitals. Subsequently, the factor of minimizing cost
in terms of payback period could not be realized in the short term period. In
contrast, corporations are most concerned about minimizing operational cost and
PLANNING MALAYSIA
Journal of the Malaysia Institute of Planners (2021)
245 © 2021 by MIP
management cost. In line with Tjenggoro & Khusnul Prasetyo (2018) that
mentioned lower operating costs is one of the top reasons some countries
triggering future green building activities.
CONCLUSION There are many benefits of implementing sustainability in business corporations.
They include environmental benefits; economic benefits that are manifest in two
perspectives of maximizing value and minimizing cost, and the last are social
benefits. From these four benefits, environmental benefits are the most influential
concern for corporations to go green. This indicates benchmark for the country
to focus more on green initiatives. However, the economic concern still strongly
relates to the corporation as the economic maximizing value ranks as the next
important benefit followed by social concerns and economic minimizing cost.
Corporations perceive sustainability as significant in economic development
particularly in maximizing the value and optimizing the utilization of limited
resources. The maximization of value helps the management to provide and
deliver the management objectives without comprising on the social and
environmental aspects. By addressing the importance of sustainability
implementation, this study establishes the need for the stakeholders and policy
makers to promote environmental practices while contributing to the economic
and social development cores of business operations.
REFERENCES Ajayi, S. O., Oyedele, L. O., & Jamiu A. Dauda. (2019). Dynamic relationship between
embodied and operational impacts of buildings: an evaluation of sustainable
design appraisal tools. World Journal of Science , Technology and Sustainable
Development Article Information. https://doi.org/10.1108/WJSTSD-05-2018-
0048
Bangwal, D., & Tiwari, P. (2018). Environmental design and awareness impact on
organization image. Engineering, Construction and Architectural Management.
https://doi.org/10.1108/ECAM-02-2017-0029
Cass, N. (2018). Energy-related standards and UK speculative office development.
Building Research & Information, 46(6), 615–635.
https://doi.org/10.1080/09613218.2017.1333351
Chang, Q., & Devine, A. (2019). Environmentally-certified space and retail revenues : A
study of US. Journal of Cleaner Production, 211, 1586–1599.
https://doi.org/10.1016/j.jclepro.2018.11.266
Christensen, P., Baldwin, E., & Ellis, C. (2012). Key strategies of sustainable real estate
decision-making in the United States: A Delphi study of the stakeholders.
ProQuest Dissertations and Theses, (December), 277. Retrieved from
http://search.proquest.com/docview/1287056962?accountid=41453
Collins, D., Haugen, T., Lindkvist, C., & Aamodt, C. (2019). Bridging the gap between
sustainable FM and sustainable buildings an exploratory study of six public
buildings in Norway. Facilities. https://doi.org/10.1108/F-01-2018-0007
Nurul Sahida Fauzi, Noraini Johari, Ashrof Zainuddin, Nor Nazihah Chuweni
The Importance of Sustainability Implementation for Business Corporations
© 2021 by MIP 246
Collins, D., Junghans, A., & Haugen, T. (2018). Green leasing in commercial real estate:
the drivers and barriers for owners and tenants of sustainable office buildings.
Journal of Corporate Real Estate, 20(4), 244–259. https://doi.org/10.1108/JCRE-
01-2017-0003
Dwaikat, L. N., & Ali, K. N. (2018). The economic benefits of a green building : evidence
from Malaysia. Journal of Building Engineering, 18(May), 448–453.
https://doi.org/10.1016/j.jobe.2018.04.017
Eichholtz, P. M. A., Kok, N., & Quigley, J. M. (2018). Ecological responsiveness and
corporate real estate. Business and Society, 1–31(March 2015).
https://doi.org/10.1177/0007650315575118
Fauzi, N. S., Johari, N., Chuweni, N. N., Ali, S. N. M., Arshad, H., &
NurulanisAhmad@Mohamed. (2021). The crossfire of corporate real estate
sustainable management with corporate sustainable objectives in Malaysia.
Journal of the Malaysian Institute of Planners, 19(2), 186–198.
Ganda, F. (2018). The effect of carbon performance on corporate financial performance
in a growing economy. Social Responsibility Journal.
https://doi.org/10.1108/SRJ-12-2016-0212
Ghazali, zahid zulkipli. (2015). Corporate sustainability practices among Malaysian
REITs and property listed companies. World Journal of Science , Technology and
Sustainable Development Article Information, 12(2), 100–118.
Glatte, T. (2012). The Importance of Corporate Real Estate Management in Overall
Corporate Strategies.
Gou, Z., & Ma, N. (2019). Human Factors in Green Building. Building, Special
Is(January 2019). https://doi.org/10.3390/books978-3-03897-567-0
Hopkins, E. A., Read, D. C., & Goss, R. C. (2017). Promoting sustainability in the United
States multifamily property management industry. Journal of Housing and the
Built Environment, 32(2), 361–376. https://doi.org/10.1007/s10901-016-9516-3
Hui, E. C. M., Yu, K., & Tse, C. (2016). The impact of environmental management
awards and certifications in property management on property price. Facilities,
34(5/6), 314–338. https://doi.org/http://dx.doi.org/10.1108/F-04-2013-0029
Downloaded
Ilhan, B., & Banu Yobas. (2019). Measuring construction for social , economic and
environmental assessment. Engineering, Construction and Architectural
Management. https://doi.org/10.1108/ECAM-03-2018-0112
Isaksson, R. (2019). Revisiting the triple bottom line. In WIT Transactions on Ecology
and the Environment. https://doi.org/10.2495/SDP180381
Jylhä, T., Remøy, H., & Arkesteijn, M. (2019). Identification of changed paradigms in
CRE research – a systematic literature review. Journal of Corporate Real Estate,
21(1), 2–18. https://doi.org/10.1108/JCRE-07-2017-0020
Lamprinidi, S., & Ringland, L. (2006). A Snapshot of Sustainability Reporting in the
Construction and Real Estate Sector. GRI Research and Development Series
Publication (Vol. Third Gene).
Ledashcheva, T. (2019). Prospects of implementation of the practice of “green office” or
“sustainable office” in Russia. In Green Design and Sustainable Architecture.
https://doi.org/10.5593/sgem2018V/6.4/S10.091
Lu, L. W., & Taylor, M. E. (2018). A study of the relationships among environmental
PLANNING MALAYSIA
Journal of the Malaysia Institute of Planners (2021)
247 © 2021 by MIP
performance, environmental disclosure, and financial performance. Asian Review
of Accounting, 26(1), 107–130. https://doi.org/10.1108/ARA-01-2016-0010
Mansfield, J. R. (2009). The valuation of sustainable freehold property: a CRE
perspective. Journal of Corporate Real Estate, 11(2), 91–105.
https://doi.org/10.1108/14630010910963133
Masalskyte, Rasita, Andelin, M., Sarasoja, A.-L., & Ventovuori, T. (2014). Modelling
sustainability maturity in corporate real estate management. Journal of Corporate
Real Estate, 16(2), 126–139. https://doi.org/10.1108/JCRE-09-2013-0023
Mohd Adnan, Y., Aman, N. U., Razali, M. N., & Daud, M. N. (2017). The
implementation of green lease practices for office buildings in Kuala Lumpur,
Malaysia. Property Management, 35(3). https://doi.org/10.1108/PM-12-2015-
0067
Muniandy, Y., & Kasim, R. (2019). Key green attributes affecting rental value of green
office buildings in klang valley, malaysia.
Newsham, G. R., Veitch, J. A., & Hu, Y. V. (2018). Effect of green building certification
on organizational productivity metrics. Building Research & Information, 46(7),
755–766. https://doi.org/10.1080/09613218.2017.1358032
Ohueri, C. C., Enegbuma, W. I., & Kenley, R. (2018). Energy efficiency practices for
Malaysian green office building occupants. Built Environment Project and Asset
Management, 8(2), 134–146. https://doi.org/10.1108/BEPAM-10-2017-0091
Olawumi, T. O., & Chan, D. W. M. (2019). An empirical survey of the perceived benefits
of executing BIM and sustainability practices in the built environment.
Contstruction Innovation, 10(May).
Oyewole, M. O., & Markson Opeyemi, K. (2018). Users ’ preference for green features
in office properties. Property Management. https://doi.org/10.1108/PM-03-2017-
0016
Rameezdeen, R., Zuo, J., Paniagua, J. O., Wood, A., & Do, P. (2019). Ensuring
environmental performance in green leases: the role of facilities managers.
Facilities.
Rasoolimanesh, S. M., Badrulzaman, N., & Jaafar, M. (2011). City development
strategies (CDS) contribution toward sustainable urban development in
developing countries. Journal of the Malaysian Institute of Planners, IX, 1–18.
Razali, M. N. (2018). Assessing green property management implementation among
commercial buildings in Malaysia. In WIT Transactions on Ecology and the
Environment. https://doi.org/10.2495/SDP170721
Reichardt, A., Fuerst, F., Rottke, N. B., & Zietz, J. (2012). Sustainable building
certification and the rent premium : a panel data approach. Journal of Real Estate
Research, 34(1), 99–126.
Robert T. Osgood, J. (2010). The Strategy Alignment Model : Defining Real Estate
Strategies in the Context of Organizational Outcomes. Site Selection Magazine,
(January 2002).
Rock, S., Hosseini, M. R., Nikmehr, B., Martek, I., Abrishami, S., & Durdyev, S. (2019).
Barriers to “ green operation ” of commercial office buildings perspectives of
Australian facilities managers. Facilities. https://doi.org/10.1108/F-08-2018-0101
Rogerson, J. M. (2014). Green commercial property development in urban South Africa :
emerging trends, emerging geographies. Bulletin of GeoGraphy. Socio–Economic
Nurul Sahida Fauzi, Noraini Johari, Ashrof Zainuddin, Nor Nazihah Chuweni
The Importance of Sustainability Implementation for Business Corporations
© 2021 by MIP 248
SerieS, 26(26), 233–246.
Rooshdia, R. R. R. M., Majid, M. Z. A., Sahamir, S. R., & Ismail, N. A. A. (2018).
Relative importance index of sustainable design and constructionactivities criteria
for green highway. Chemical Engineering Transaction, 63(2007), 151–156.
https://doi.org/10.3303/CET1863026
Shaikh, P. H., Shaikh, M. S., Kumar, M., Shaikh, F., Uqaili, M. A., & Bhatti, I. (2019).
Environmental assessment of green buildings, 1–6. https://doi.org/10.1016/B978-
0-12-803581-8.10402-3
Shurrab, A., Hussain, M., & Mehmood Khan. (2019). Green and sustainable practices in
the construction industry : a confirmatory factor analysis approach. Engineering,
Construction and Architectural Management. https://doi.org/10.1108/ECAM-02-
2018-0056
Støre-Valen, M., & Buser, M. (2019). Implementing sustainable facility management
challenges and barriers encountered by Scandinavian FM practicioners. Facilities.
https://doi.org/10.1108/F-01-2018-0013
Taylor, B. M. (2013). Sustainability and Performance Measurement: Corporate Real
Estate Perspectives. Performance Improvement, 52(6), 36–45.
https://doi.org/10.1002/pfi.21356
Tjenggoro, F. N., & Khusnul Prasetyo. (2018). The usage of green building concept to
reduce operating costs (study case of PT. Prodia Widyahusada). Journal of
Accounting Reaearch, 3(1), 72–81. https://doi.org/10.1108/AJAR-06-2018-0005
Waidyasekara, K. G. A. S., & Silva, L. De. (2016). Water use efficiency and conservation
during construction : drivers , barriers and practices, 6(5), 553–566.
https://doi.org/10.1108/BEPAM-09-2015-0052
Zaid, S., & Zainon, N. (2019). Are green offices better than conventional? Measuring
operational energy consumption and carbon impact of green office in Malaysia.
Facilities, (January). https://doi.org/10.1108/F-06-2016-0063
Zhang, Y., Kang, J., & Jin, H. (2018). A review of green building development in China
from the perspective of energy saving. Energies.
https://doi.org/10.3390/en11020334
Received: 12th July 2021. Accepted: 23rd Sept 2021
1 Research Assistant at Universiti Teknologi Malaysia. Email: [email protected]
PLANNING MALAYSIA:
Journal of the Malaysian Institute of Planners
VOLUME 19 ISSUE 3 (2021), Page 249 – 259
ENHANCING THE ACCURACY OF MALAYSIAN HOUSE PRICE
FORECASTING: A COMPARATIVE ANALYSIS ON THE
FORECASTING PERFORMANCE BETWEEN THE HEDONIC PRICE
MODEL AND ARTIFICIAL NEURAL NETWORK MODEL
Nurul Fazira Sa’at1, Nurul Hana Adi Maimun2 & Nurul Hazrina Idris3
1,2Centre for Real Estate Studies, Institute for Smart Infrastructure and
Innovative Construction,
UNIVERSITI TEKNOLOGI MALAYSIA 3Geoscience and Digital Earth Centre, Research Institute for Sustainable
Environment (RISE),
UNIVERSITI TEKNOLOGI MALAYSIA
Abstract
The Hedonic Price Model (HPM), a prominent model used in real estate appraisal
and economics, has been argued to be marred with nonlinearity, multicollinearity
and heteroscedasticity problems that affect the accuracy of price predictions. An
alternative method called Artificial Neural Network Model (ANN) was identified
as capable of addressing the shortcomings of HPM and produces superior
predictive performance. Hence, this study aims to evaluate the forecasting
performance between HPM and ANN using Malaysian housing transaction data
from the period between 2009 to 2018, sourced from the Valuation and Property
Service Department, Johor Bahru. The models’ performance was evaluated and
compared based on their statistical and predictive performance. Results showed
that ANN outperformed HPM in both statistical and predictive performance. This
study benefits the expansion of academic and practical knowledge in enhancing
the accuracy of house price forecasting.
Keywords: Property forecasting, property valuation, predictive accuracy, hedonic
price model, artificial neural network
Nurul Fazira Sa’at, Nurul Hana Adi Maimun & Nurul Hazrina Idris
Enhancing the Accuracy of Malaysian House Price Forecasting: A Comparative Analysis on the Forecasting
Performance between the Hedonic Price Model (HPM) and Artificial Neural Network Model (ANN)
© 2021 by MIP 250
INTRODUCTION The era of the fourth industrial revolution (IR 4.0) saw the explosion of new
technologies such as Artificial Intelligence (AI), biotechnology, collaborative
robots, internet of things, nanotechnology, quantum computing and 5G telecoms.
All industries, including the real estate industry, are increasingly investing in
advanced analytical tools to remain competitive and responsive to fast growing
market demands. For instance, the application of AI in property valuation is
crucial to cope with the fast changing and high demand for property valuation
services (Yalpir, 2014; Sa'at and Adi Maimun, 2019b). Although AI has been
explored since the 1990s, the adoption rate was slow. At present, the Hedonic
Pricing Model (HPM) still dominates both literature and applications due to its
flexibility and straightforwardness in estimation. Nonetheless, the nonlinearity,
multicollinearity and heteroscedasticity problems (Kilpatrick, 2011; Antipov &
Pokryshevskaya, 2012; Rahman et al., 2018) that plagued HPM may cause biased
estimates and specification errors that may reduce prediction accuracy (Adi
Maimun, 2011). Inaccurate predictions will negatively affect the decisions of
policy-makers, valuers and developers. Thus, an improved property forecasting
model is vital to enhance the efficiency and accuracy of forecasting.
An AI model, known as Artificial Neural Network Model (ANN), was
able to address the shortcomings of HPM (Tabales et al., 2013). Like humans, the
ANN has self-learning ability, permits analysis on a large dataset, identifies
relationships between variables, and predicts a future trend (Mohd Radzi et al.,
2012). Despite the advantages and good forecasting performance, ANN received
less attention than HPM (Mooya, 2015; Abidoye & Chan, 2016; 2017), including
its use in Malaysia. In response to the Malaysia Government's vision towards IR
4.0 through "Industry 4WRD: NATIONAL POLICY ON INDUSTRY 4.0" and
to improve the accuracy of house price forecasting, this paper aims to evaluate
the forecasting performance between HPM and ANN in the Malaysian context.
This paper offers two benefits. Firstly, it expands academic knowledge on AI-
based property forecasting. Secondly, it guides researchers, valuers and investors
on AI for property valuation, index and investment.
This paper is structured as follows. An overview of the literature on
house price forecasting models is provided, followed by an elaboration on the
theoretical framework of HPM and ANN. Based on previous studies findings, it
is hypothesised that ANN will outperform HPM in both statistical and predictive
performance. The following section explains and justifies the methodology used
in this study, followed by a discussion of findings.
THE HPM THEORETICAL BACKGROUND Theoretically, HPM is executed through regression analysis (Selim, 2009). It is
assumed that consumers are willing to purchase a commodity that consists of a
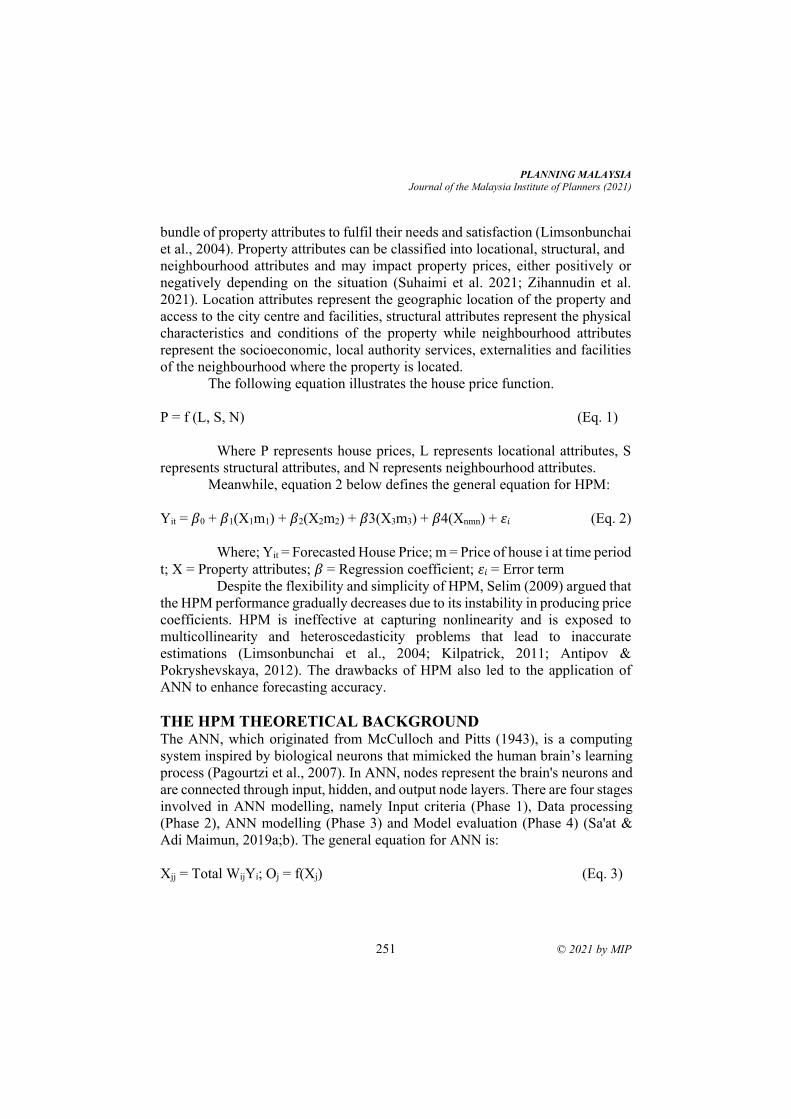
PLANNING MALAYSIA
Journal of the Malaysia Institute of Planners (2021)
251 © 2021 by MIP
bundle of property attributes to fulfil their needs and satisfaction (Limsonbunchai
et al., 2004). Property attributes can be classified into locational, structural, and
neighbourhood attributes and may impact property prices, either positively or
negatively depending on the situation (Suhaimi et al. 2021; Zihannudin et al.
2021). Location attributes represent the geographic location of the property and
access to the city centre and facilities, structural attributes represent the physical
characteristics and conditions of the property while neighbourhood attributes
represent the socioeconomic, local authority services, externalities and facilities
of the neighbourhood where the property is located.
The following equation illustrates the house price function.
P = f (L, S, N) (Eq. 1)
Where P represents house prices, L represents locational attributes, S
represents structural attributes, and N represents neighbourhood attributes.
Meanwhile, equation 2 below defines the general equation for HPM:
Yit = 𝛽0 + 𝛽1(X1m1) + 𝛽2(X2m2) + 𝛽3(X3m3) + 𝛽4(Xnmn) + 𝜀𝑖 (Eq. 2)
Where; Yit = Forecasted House Price; m = Price of house i at time period
t; X = Property attributes; 𝛽 = Regression coefficient; 𝜀𝑖 = Error term
Despite the flexibility and simplicity of HPM, Selim (2009) argued that
the HPM performance gradually decreases due to its instability in producing price
coefficients. HPM is ineffective at capturing nonlinearity and is exposed to
multicollinearity and heteroscedasticity problems that lead to inaccurate
estimations (Limsonbunchai et al., 2004; Kilpatrick, 2011; Antipov &
Pokryshevskaya, 2012). The drawbacks of HPM also led to the application of
ANN to enhance forecasting accuracy.
THE HPM THEORETICAL BACKGROUND The ANN, which originated from McCulloch and Pitts (1943), is a computing
system inspired by biological neurons that mimicked the human brain’s learning
process (Pagourtzi et al., 2007). In ANN, nodes represent the brain's neurons and
are connected through input, hidden, and output node layers. There are four stages
involved in ANN modelling, namely Input criteria (Phase 1), Data processing
(Phase 2), ANN modelling (Phase 3) and Model evaluation (Phase 4) (Sa'at &
Adi Maimun, 2019a;b). The general equation for ANN is:
Xjj = Total WijYi; Oj = f(Xj) (Eq. 3)
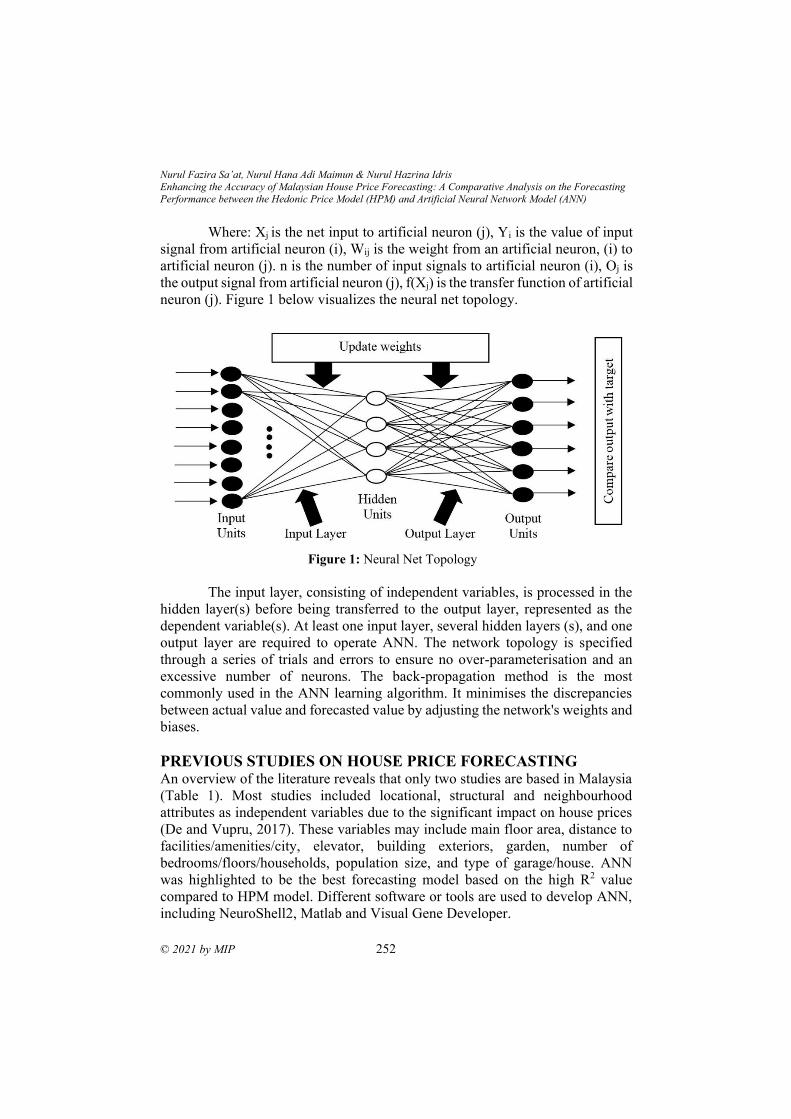
Nurul Fazira Sa’at, Nurul Hana Adi Maimun & Nurul Hazrina Idris
Enhancing the Accuracy of Malaysian House Price Forecasting: A Comparative Analysis on the Forecasting
Performance between the Hedonic Price Model (HPM) and Artificial Neural Network Model (ANN)
© 2021 by MIP 252
Where: Xj is the net input to artificial neuron (j), Yi is the value of input
signal from artificial neuron (i), Wij is the weight from an artificial neuron, (i) to
artificial neuron (j). n is the number of input signals to artificial neuron (i), Oj is
the output signal from artificial neuron (j), f(Xj) is the transfer function of artificial
neuron (j). Figure 1 below visualizes the neural net topology.
Figure 1: Neural Net Topology
The input layer, consisting of independent variables, is processed in the
hidden layer(s) before being transferred to the output layer, represented as the
dependent variable(s). At least one input layer, several hidden layers (s), and one
output layer are required to operate ANN. The network topology is specified
through a series of trials and errors to ensure no over-parameterisation and an
excessive number of neurons. The back-propagation method is the most
commonly used in the ANN learning algorithm. It minimises the discrepancies
between actual value and forecasted value by adjusting the network's weights and
biases.
PREVIOUS STUDIES ON HOUSE PRICE FORECASTING An overview of the literature reveals that only two studies are based in Malaysia
(Table 1). Most studies included locational, structural and neighbourhood
attributes as independent variables due to the significant impact on house prices
(De and Vupru, 2017). These variables may include main floor area, distance to
facilities/amenities/city, elevator, building exteriors, garden, number of
bedrooms/floors/households, population size, and type of garage/house. ANN
was highlighted to be the best forecasting model based on the high R2 value
compared to HPM model. Different software or tools are used to develop ANN,
including NeuroShell2, Matlab and Visual Gene Developer.
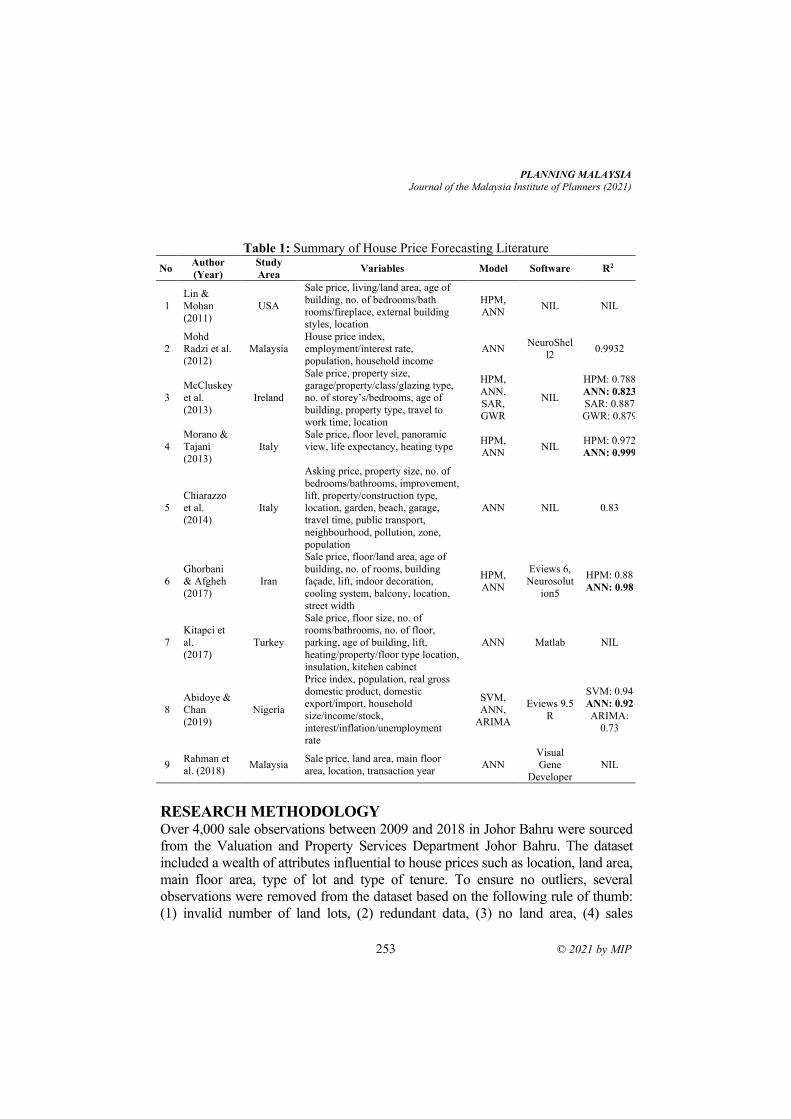
PLANNING MALAYSIA
Journal of the Malaysia Institute of Planners (2021)
253 © 2021 by MIP
Table 1: Summary of House Price Forecasting Literature
No Author
(Year)
Study
Area Variables Model Software R2
1
Lin &
Mohan
(2011)
USA
Sale price, living/land area, age of
building, no. of bedrooms/bath
rooms/fireplace, external building
styles, location
HPM,
ANN NIL NIL
2
Mohd
Radzi et al.
(2012)
Malaysia
House price index,
employment/interest rate,
population, household income
ANN NeuroShel
l2 0.9932
3
McCluskey
et al.
(2013)
Ireland
Sale price, property size,
garage/property/class/glazing type,
no. of storey’s/bedrooms, age of
building, property type, travel to
work time, location
HPM,
ANN,
SAR,
GWR
NIL
HPM: 0.788
ANN: 0.823
SAR: 0.887
GWR: 0.879
4
Morano &
Tajani
(2013)
Italy
Sale price, floor level, panoramic
view, life expectancy, heating type HPM,
ANN NIL
HPM: 0.972
ANN: 0.999
5
Chiarazzo
et al.
(2014)
Italy
Asking price, property size, no. of
bedrooms/bathrooms, improvement,
lift, property/construction type,
location, garden, beach, garage,
travel time, public transport,
neighbourhood, pollution, zone,
population
ANN NIL 0.83
6
Ghorbani
& Afgheh
(2017)
Iran
Sale price, floor/land area, age of
building, no. of rooms, building
façade, lift, indoor decoration,
cooling system, balcony, location,
street width
HPM,
ANN
Eviews 6,
Neurosolut
ion5
HPM: 0.88
ANN: 0.98
7
Kitapci et
al.
(2017)
Turkey
Sale price, floor size, no. of
rooms/bathrooms, no. of floor,
parking, age of building, lift,
heating/property/floor type location,
insulation, kitchen cabinet
ANN Matlab NIL
8
Abidoye &
Chan
(2019)
Nigeria
Price index, population, real gross
domestic product, domestic
export/import, household
size/income/stock,
interest/inflation/unemployment
rate
SVM,
ANN,
ARIMA
Eviews 9.5
R
SVM: 0.94
ANN: 0.92
ARIMA:
0.73
9 Rahman et
al. (2018) Malaysia
Sale price, land area, main floor
area, location, transaction year ANN
Visual
Gene
Developer
NIL
RESEARCH METHODOLOGY Over 4,000 sale observations between 2009 and 2018 in Johor Bahru were sourced
from the Valuation and Property Services Department Johor Bahru. The dataset
included a wealth of attributes influential to house prices such as location, land area,
main floor area, type of lot and type of tenure. To ensure no outliers, several
observations were removed from the dataset based on the following rule of thumb:
(1) invalid number of land lots, (2) redundant data, (3) no land area, (4) sales
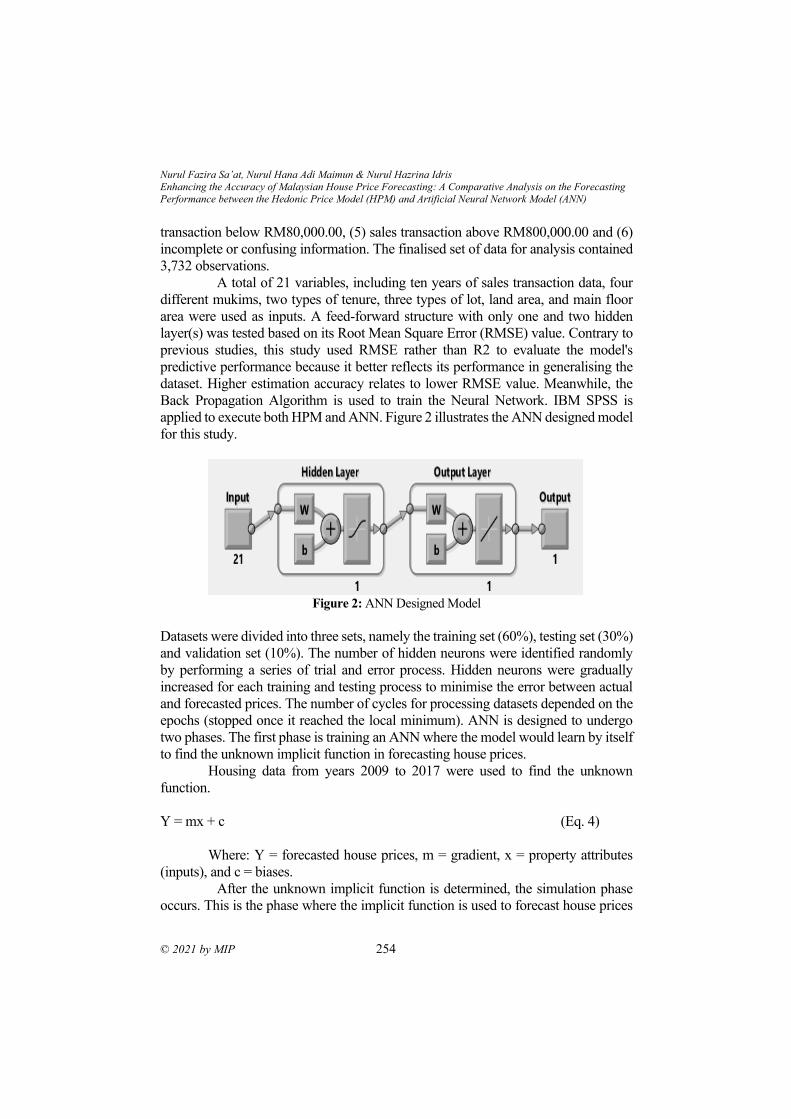
Nurul Fazira Sa’at, Nurul Hana Adi Maimun & Nurul Hazrina Idris
Enhancing the Accuracy of Malaysian House Price Forecasting: A Comparative Analysis on the Forecasting
Performance between the Hedonic Price Model (HPM) and Artificial Neural Network Model (ANN)
© 2021 by MIP 254
transaction below RM80,000.00, (5) sales transaction above RM800,000.00 and (6)
incomplete or confusing information. The finalised set of data for analysis contained
3,732 observations.
A total of 21 variables, including ten years of sales transaction data, four
different mukims, two types of tenure, three types of lot, land area, and main floor
area were used as inputs. A feed-forward structure with only one and two hidden
layer(s) was tested based on its Root Mean Square Error (RMSE) value. Contrary to
previous studies, this study used RMSE rather than R2 to evaluate the model's
predictive performance because it better reflects its performance in generalising the
dataset. Higher estimation accuracy relates to lower RMSE value. Meanwhile, the
Back Propagation Algorithm is used to train the Neural Network. IBM SPSS is
applied to execute both HPM and ANN. Figure 2 illustrates the ANN designed model
for this study.
Figure 2: ANN Designed Model
Datasets were divided into three sets, namely the training set (60%), testing set (30%)
and validation set (10%). The number of hidden neurons were identified randomly
by performing a series of trial and error process. Hidden neurons were gradually
increased for each training and testing process to minimise the error between actual
and forecasted prices. The number of cycles for processing datasets depended on the
epochs (stopped once it reached the local minimum). ANN is designed to undergo
two phases. The first phase is training an ANN where the model would learn by itself
to find the unknown implicit function in forecasting house prices.
Housing data from years 2009 to 2017 were used to find the unknown
function.
Y = mx + c (Eq. 4)
Where: Y = forecasted house prices, m = gradient, x = property attributes
(inputs), and c = biases.
After the unknown implicit function is determined, the simulation phase
occurs. This is the phase where the implicit function is used to forecast house prices
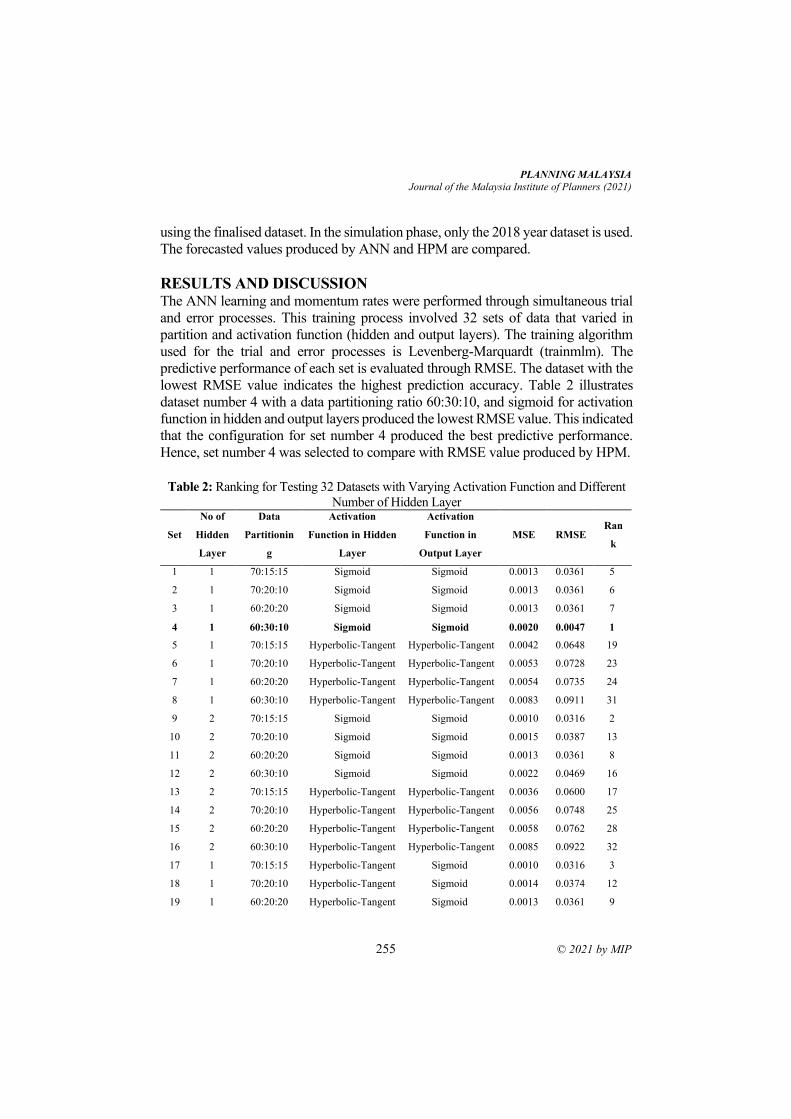
PLANNING MALAYSIA
Journal of the Malaysia Institute of Planners (2021)
255 © 2021 by MIP
using the finalised dataset. In the simulation phase, only the 2018 year dataset is used.
The forecasted values produced by ANN and HPM are compared.
RESULTS AND DISCUSSION The ANN learning and momentum rates were performed through simultaneous trial
and error processes. This training process involved 32 sets of data that varied in
partition and activation function (hidden and output layers). The training algorithm
used for the trial and error processes is Levenberg-Marquardt (trainmlm). The
predictive performance of each set is evaluated through RMSE. The dataset with the
lowest RMSE value indicates the highest prediction accuracy. Table 2 illustrates
dataset number 4 with a data partitioning ratio 60:30:10, and sigmoid for activation
function in hidden and output layers produced the lowest RMSE value. This indicated
that the configuration for set number 4 produced the best predictive performance.
Hence, set number 4 was selected to compare with RMSE value produced by HPM.
Table 2: Ranking for Testing 32 Datasets with Varying Activation Function and Different
Number of Hidden Layer
Set
No of
Hidden
Layer
Data
Partitionin
g
Activation
Function in Hidden
Layer
Activation
Function in
Output Layer
MSE RMSE Ran
k
1 1 70:15:15 Sigmoid Sigmoid 0.0013 0.0361 5
2 1 70:20:10 Sigmoid Sigmoid 0.0013 0.0361 6
3 1 60:20:20 Sigmoid Sigmoid 0.0013 0.0361 7
4 1 60:30:10 Sigmoid Sigmoid 0.0020 0.0047 1
5 1 70:15:15 Hyperbolic-Tangent Hyperbolic-Tangent 0.0042 0.0648 19
6 1 70:20:10 Hyperbolic-Tangent Hyperbolic-Tangent 0.0053 0.0728 23
7 1 60:20:20 Hyperbolic-Tangent Hyperbolic-Tangent 0.0054 0.0735 24
8 1 60:30:10 Hyperbolic-Tangent Hyperbolic-Tangent 0.0083 0.0911 31
9 2 70:15:15 Sigmoid Sigmoid 0.0010 0.0316 2
10 2 70:20:10 Sigmoid Sigmoid 0.0015 0.0387 13
11 2 60:20:20 Sigmoid Sigmoid 0.0013 0.0361 8
12 2 60:30:10 Sigmoid Sigmoid 0.0022 0.0469 16
13 2 70:15:15 Hyperbolic-Tangent Hyperbolic-Tangent 0.0036 0.0600 17
14 2 70:20:10 Hyperbolic-Tangent Hyperbolic-Tangent 0.0056 0.0748 25
15 2 60:20:20 Hyperbolic-Tangent Hyperbolic-Tangent 0.0058 0.0762 28
16 2 60:30:10 Hyperbolic-Tangent Hyperbolic-Tangent 0.0085 0.0922 32
17 1 70:15:15 Hyperbolic-Tangent Sigmoid 0.0010 0.0316 3
18 1 70:20:10 Hyperbolic-Tangent Sigmoid 0.0014 0.0374 12
19 1 60:20:20 Hyperbolic-Tangent Sigmoid 0.0013 0.0361 9
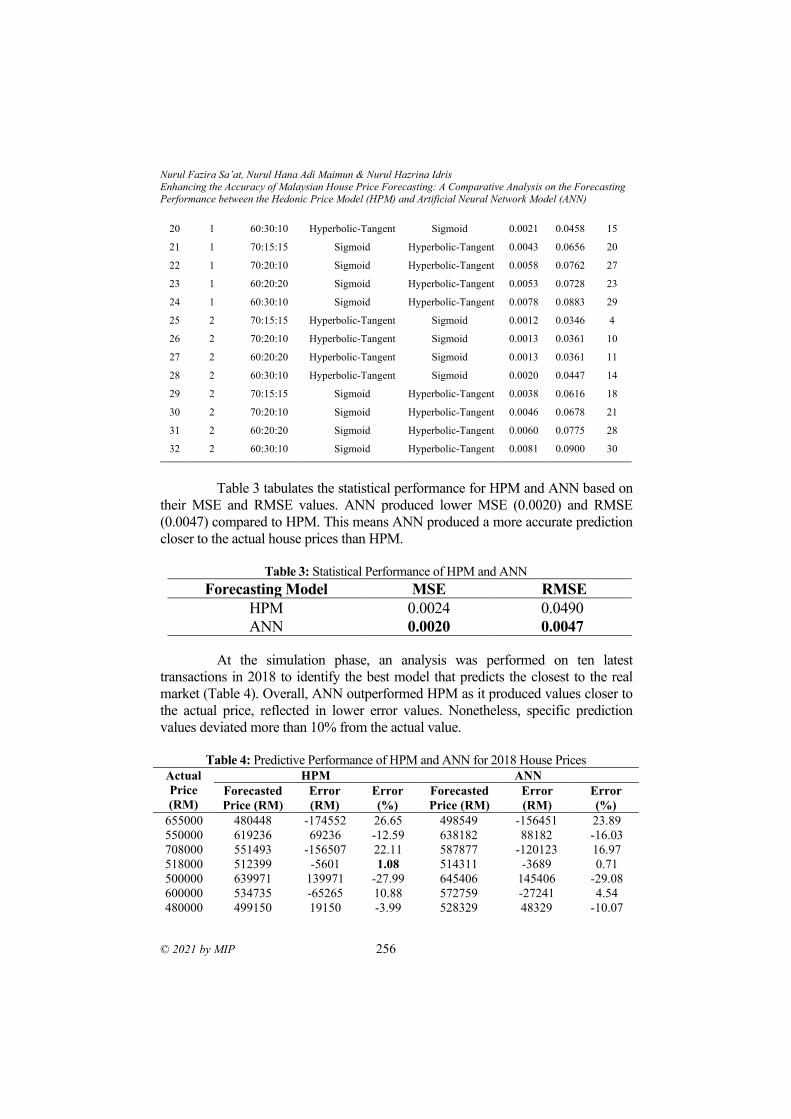
Nurul Fazira Sa’at, Nurul Hana Adi Maimun & Nurul Hazrina Idris
Enhancing the Accuracy of Malaysian House Price Forecasting: A Comparative Analysis on the Forecasting
Performance between the Hedonic Price Model (HPM) and Artificial Neural Network Model (ANN)
© 2021 by MIP 256
20 1 60:30:10 Hyperbolic-Tangent Sigmoid 0.0021 0.0458 15
21 1 70:15:15 Sigmoid Hyperbolic-Tangent 0.0043 0.0656 20
22 1 70:20:10 Sigmoid Hyperbolic-Tangent 0.0058 0.0762 27
23 1 60:20:20 Sigmoid Hyperbolic-Tangent 0.0053 0.0728 23
24 1 60:30:10 Sigmoid Hyperbolic-Tangent 0.0078 0.0883 29
25 2 70:15:15 Hyperbolic-Tangent Sigmoid 0.0012 0.0346 4
26 2 70:20:10 Hyperbolic-Tangent Sigmoid 0.0013 0.0361 10
27 2 60:20:20 Hyperbolic-Tangent Sigmoid 0.0013 0.0361 11
28 2 60:30:10 Hyperbolic-Tangent Sigmoid 0.0020 0.0447 14
29 2 70:15:15 Sigmoid Hyperbolic-Tangent 0.0038 0.0616 18
30 2 70:20:10 Sigmoid Hyperbolic-Tangent 0.0046 0.0678 21
31 2 60:20:20 Sigmoid Hyperbolic-Tangent 0.0060 0.0775 28
32 2 60:30:10 Sigmoid Hyperbolic-Tangent 0.0081 0.0900 30
Table 3 tabulates the statistical performance for HPM and ANN based on
their MSE and RMSE values. ANN produced lower MSE (0.0020) and RMSE
(0.0047) compared to HPM. This means ANN produced a more accurate prediction
closer to the actual house prices than HPM.
Table 3: Statistical Performance of HPM and ANN
Forecasting Model MSE RMSE
HPM 0.0024 0.0490
ANN 0.0020 0.0047
At the simulation phase, an analysis was performed on ten latest
transactions in 2018 to identify the best model that predicts the closest to the real
market (Table 4). Overall, ANN outperformed HPM as it produced values closer to
the actual price, reflected in lower error values. Nonetheless, specific prediction
values deviated more than 10% from the actual value.
Table 4: Predictive Performance of HPM and ANN for 2018 House Prices
Actual
Price
(RM)
HPM ANN
Forecasted
Price (RM)
Error
(RM)
Error
(%)
Forecasted
Price (RM)
Error
(RM)
Error
(%)
655000 480448 -174552 26.65 498549 -156451 23.89
550000 619236 69236 -12.59 638182 88182 -16.03
708000 551493 -156507 22.11 587877 -120123 16.97
518000 512399 -5601 1.08 514311 -3689 0.71
500000 639971 139971 -27.99 645406 145406 -29.08
600000 534735 -65265 10.88 572759 -27241 4.54
480000 499150 19150 -3.99 528329 48329 -10.07
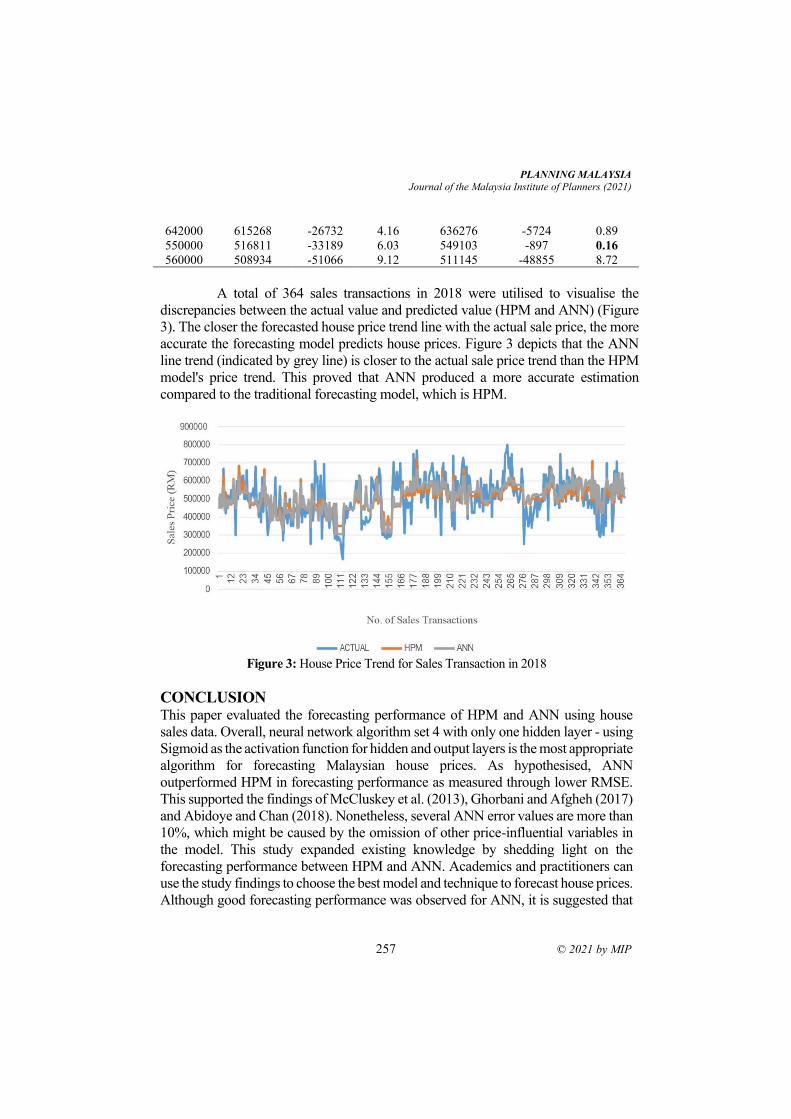
PLANNING MALAYSIA
Journal of the Malaysia Institute of Planners (2021)
257 © 2021 by MIP
642000 615268 -26732 4.16 636276 -5724 0.89
550000 516811 -33189 6.03 549103 -897 0.16
560000 508934 -51066 9.12 511145 -48855 8.72
A total of 364 sales transactions in 2018 were utilised to visualise the
discrepancies between the actual value and predicted value (HPM and ANN) (Figure
3). The closer the forecasted house price trend line with the actual sale price, the more
accurate the forecasting model predicts house prices. Figure 3 depicts that the ANN
line trend (indicated by grey line) is closer to the actual sale price trend than the HPM
model's price trend. This proved that ANN produced a more accurate estimation
compared to the traditional forecasting model, which is HPM.
Figure 3: House Price Trend for Sales Transaction in 2018
CONCLUSION This paper evaluated the forecasting performance of HPM and ANN using house
sales data. Overall, neural network algorithm set 4 with only one hidden layer - using
Sigmoid as the activation function for hidden and output layers is the most appropriate
algorithm for forecasting Malaysian house prices. As hypothesised, ANN
outperformed HPM in forecasting performance as measured through lower RMSE.
This supported the findings of McCluskey et al. (2013), Ghorbani and Afgheh (2017)
and Abidoye and Chan (2018). Nonetheless, several ANN error values are more than
10%, which might be caused by the omission of other price-influential variables in
the model. This study expanded existing knowledge by shedding light on the
forecasting performance between HPM and ANN. Academics and practitioners can
use the study findings to choose the best model and technique to forecast house prices.
Although good forecasting performance was observed for ANN, it is suggested that
Nurul Fazira Sa’at, Nurul Hana Adi Maimun & Nurul Hazrina Idris
Enhancing the Accuracy of Malaysian House Price Forecasting: A Comparative Analysis on the Forecasting
Performance between the Hedonic Price Model (HPM) and Artificial Neural Network Model (ANN)
© 2021 by MIP 258
future studies consider additional variables to improve forecasting accuracy. Future
research may also explore other AI models such as autoregression, autoregressive
integrated moving average, fuzzy logic, support vector machine and spatial-temporal
models to uncover the potential of AI in forecasting house prices in specific and real
estate as a whole.
ACKNOWLEDGEMENTS The Ministry of Higher Education Malaysia supported this work through the
Fundamental Research Grant Scheme (FRGS/1/2019/SS08/UTM/02/7). The authors
also appreciate the reviewers for their constructive comments.
REFERENCES Abd. Rahman, S.N., Adi Maimun, N.H., Razali, M.N. & Ismail, S. (2019). The artificial neural
network model (ANN) for Malaysian housing market analysis. Planning Malaysia,
17(1), 1-9.
Abidoye, R.B., & Chan, A.P.C. (2016). A survey of property valuation approaches in Nigeria.
Property Management, 34(5), 364-382.
Abidoye, R.B., & Chan, A.P.C. (2017). Artificial neural network in property valuation:
application framework and research trend. Property Management, 35(5), 554-571.
Adi Maimun, N.H. (2011). Spatiotemporal autoregressive model for Malaysian housing
market analysis (Master's Thesis). Universiti Teknologi Malaysia.
Adi Maimun, N.H., Ismail, S., Junainah, M., Razali, M.N., Tarmidi, M.Z., & Idris, N.H. An
integrated framework for affordable housing demand projection and site selection. IOP
Conference Series: Earth and Environmental Science, 169, 1-8.
Antipov, E.A., & Pokryshevskaya, E.B. (2012). Mass appraisal of residential apartments: an
application of random forest for valuation and a CART-based approach for model
diagnostics. Expert Systems with Applications, 39(2), 1772-1778.
Chiarazzo, V., Caggiani, L., Marinelli, M. & Ottomanelli, M. (2014). A neural network-based
model for real estate price estimation considering environmental quality of property
location. Transportation Research Procedia, 3(2014), 810-817.
De, U.K., & Vupru, V. (2017). Location and neighbourhood conditions for housing choice
and its rental value: empirical examination in an urban area of North-East India.
International Journal of Housing Markets and Analysis, 10(4), 519-538.
Ghorbani, S. and Afgheh, S.M. (2017). Forecasting the house price for Ahvaz City: the
comparison of the hedonic and artificial neural network models. Urban Economics and
Management, 5(3), 29-45.
Idris, N.H., & Masrol, N.S. (2018). Seamless transition of altimetric retracked sea levels using
neural network technique: case study using simulated data. IOP Conference Series:
Earth and Environmental Science, 169(1), 1-8.
Kilpatrick, J. (2011). Expert systems and mass appraisal. Journal of Property Investment &
Finance, 29(4/5), 529-550.
Kitapci, O., Tosun, Ö., Tuna, M.F. & Turk, T. (2017). The use of artificial neural networks
(ann) in forecasting housing prices in Ankara, Turkey. Journal of Marketing and
Consumer Behaviour in Emerging Markets, 1(5), 4-14.
PLANNING MALAYSIA
Journal of the Malaysia Institute of Planners (2021)
259 © 2021 by MIP
Limsombunchai, V., Gan, C., & Lee, M. (2004). House price prediction: hedonic price model
vs artificial neural network. American Journal of Applied Sciences, 1(3), 193- 201.
Lin, C.C., & Mohan, S.B. (2011). Effectiveness comparison of the residential property mass
appraisal methodologies in the USA. International Journal of Housing Markets and
Analysis, 4(3), 224-243.
McCluskey, W.J., McCord, M., Davis, P.T., Haran, M. & McIlhatton, D. (2013). Prediction
accuracy in mass appraisal: a comparison of modern approaches, Journal of Property
Research, 30(4), 239-265.
McCulloch, W.S. & Pitts, W. (1943): A logical calculus of the ideas immanent in nervous
activity. Bulletin of Mathematical Biophysics, 5, 115-133.
Mohd Radzi, M.S., Muthuveerappan, C., Kamarudin, N., & Mohammad, I.S. (2012).
Forecasting house price index using artificial neural network. International Journal of
Real Estate Studies, 7(1), 43-48.
Mooya, M.M. (2015). The education and professional practice of values in South Africa: a
critical review. Property Management, 33(3), 245-274.
Morano, P. & Tajani, F. (2013). Bare ownership evaluation. Hedonic price model vs. artificial
neural network. International Journal of Business Intelligence and Data Mining, 8(4),
340-362.
Pagourtzi, E., Metaxiotis, K., Nikolopoulos, K. Giannelos, K. & Assimakopoulos, V. (2007).
Real estate valuation with artificial intelligence approaches. International Journal of
Intelligent Systems Technologies and Applications, 2(1), 50–57.
Sa'at, N.F. & Adi Maimun, N.H. (2019a). Artificial neural network modelling framework for
forecasting malaysian property prices. International Graduate Conference of Built
Environment and Surveying Conference Proceedings (Volume 2), 325-332.
Sa'at, N.F. & Adi Maimun, N.H. (2019b). Does artificial intelligence enhance house price
forecasting accuracy? a literature review. International Journal of Real Estate Studies.
13(1), 74-78.
Suhaimi, N.A., Adi Maimun, N.H. & Sa’at, N.F. (2021). Does rail transport impact house
prices and rents? Planning Malaysia, 19(2), 141-149.
Selim, H. (2009). Determinants of house prices in Turkey: hedonic regression versus artificial
neural network. Expert Systems with Applications, 36(2), 2843-2852.
Tabales, J.M.N., Ocerin, J.M.C.Y., & Francisco, J.R.C. (2013). Artificial neural networks for
predicting real estate prices. Revista De Metodos Cuantitativos Para La Economia Y
La Empresa, 15, 29-44.
Tan, T.H. (2010). Neighborhood preferences of House buyers: the case of Klang Valley,
Malaysia. International Journal of Housing Markets & Analysis, 4(1), 58-69.
Yalpir, S. (2014). Forecasting residential real estate values with AHP method and integrated
GIS. People, Buildings and Environment Conference, An International Scientific
Conference. 15-17 October, Kromeríž, Czech Republic.
Zihannudin, N.Z., Adi Maimun, N.H. & Ibrahim, N.L. (2021). Brownfield sites and property
market sensitivity. Planning Malaysia, 19(2), 121-130.
Received: 12th July 2021. Accepted: 23rd Sept 2021
1 Assistant Professor Dr. Nor Azizan Che Embi, International Islamic University
Malaysia. Email: [email protected]
PLANNING MALAYSIA:
Journal of the Malaysian Institute of Planners
VOLUME 19 ISSUE 3 (2021), Page 260 – 269
A PROPOSAL FOR AFFORDABLE WAQF HOUSING PROJECTS IN
MALAYSIA: PUBLIC PERCEPTION OF HOUSE CHARACTERISTICS
Nor Azizan Che Embi1, Salina Kassim2, Roslily Ramlee3, Wan Rohaida
Wan Husain4
1,3,4 Kulliyyah of Economics and Management Sciences
2 IIUM Institute of Islamic Banking and Finance
INTERNATIONAL ISLAMIC UNIVERSITY MALAYSIA
Abstract
Housing affordability is important to ensure houses are affordable to everyone
across all income categories, whether they are in the low-income, middle-income
(M40), or high-income group. Building housing projects on waqf land will help
increase the supply of affordable houses, especially targeted at the M40 group,
while also addressing the shortage of affordable housing for the M40 cohort. This
study analyses public perceptions of house characteristics and relate these factors
to affordable housing prices. The independent variables are location,
infrastructure, facilities, size, design and quality. By applying a quantitative
research design, the study aims to understand the relationship between various
demanded housing characteristics vis-à-vis the price of the house. A sample of
261 usable responses was analysed using the Structural Equation Modelling
(SEM). The results show that house size is not statistically significant in
influencing the housing price, while location, infrastructure and design of the
house are positively significant factors. These findings are expected to provide
important inputs to the relevant authorities on factors that are critical in
influencing the prices of housing projects built on waqf land in Malaysia.
Keywords: Housing Affordability, Housing Price, Middle Income Group (M40),
Waqf
PLANNING MALAYSIA
Journal of the Malaysia Institute of Planners (2021)
261 © 2021 by MIP
INTRODUCTION
In Malaysia, efforts have been made by policymakers to understand and manage
affordable housing issues. This effort has led to several initiatives focusing on
providing affordable houses or financial resources to low-income households
who by nature, are incapacitated to house themselves. However, the gap left
unfilled by these initiatives is middle-income households (M40) who neither
qualify for social housing nor are capable of affording houses provided by private
sector suppliers (Baqutaya et al., 2016; Khazanah Research Institute, 2015). The
issue of a shortage of affordable housing requires immediate attention since most
of the conventional methods used in the property market lack the capacity to
supply affordable housing. While several houses are unsold, a sizeable number
of middle-income households are still looking for reasonably priced and
affordable houses to buy. The use of waqf land on which the affordable houses
will be constructed would help reduce the construction costs substantially. This
will lead to more reasonable pricing of the houses.
RESEARCH BACKGROUND
The Malaysian government has acknowledged that housing is a basic human need
and one of the important components in the urban economy (Suhaida, Norngainy,
Noraini, Adi Irfan, & Tahir, 2010). While Malaysia has made immense
contributions towards providing affordable housing, especially to low-income
households, affordable housing providers are faced with serious resistance over
their products because they are generally unaffordable for middle-income
households. Consequently, the housing contribution to the quality of life in urban
areas is deteriorating since housing providers cannot produce houses at prices that
middle-income households would be able to afford (Hong, 2013; Ernawati, Kong
Seng & Nor A’ini, 2020). However, it should be noted that house prices in
Malaysia are deeply dependent on location, with some states having more
affordable housing. For example, Melaka with median multiple of 3.0 times
compared to others; the house prices in other states, such as Kuala Lumpur (5.4
times) and Pulau Pinang (5.2 times) are strictly unaffordable (Khazanah Research
Institute, 2015). Location has influence towards housing affordability (M. Azren,
Hazlina, Jamalunlaili & Yusfida Ayu, 2018). Data in the Annual Property Market
Report 2016 and 2020 by the National Property Information Centre (NAPIC)
reveals that a considerable amount of completed and under construction
residential units are currently not demanded by Malaysian households.
Table 1 indicates more than 14,000 completed residential units are
unsold as of the third quarter of 2016 and in Table 2, the amount increases further
in fourth quarter of 2020. From Table 1, 4,646 completed residential units are
priced below RM250,000, 4,120 units are priced between RM250,001-
RM500,000, and 5,427 units are priced above RM500,001. In addition, 14,792
units of house under residential were overhang in 2016 and in 2020 it increases
Nor Azizan, Salina, Roslily & Wan Rohaida
A Proposal for Affordable Waqf Housing Projects in Malaysia: Public Perception of House Characteristics
© 2021 by MIP 262
to 29565 units. Surprisingly, an estimated one million Malaysian households in
the RM2,500 to RM10,000 monthly income group do not own a house as of
20161.
Table 1: Launched and Unsold Residential Properties
House Category Units
Launched
Units Unsold Value (RM
Mill)
Below RM250,000 23,849 4,646 624.7
RM250,001-RM500,000 13,730 4,120 1,512.1
Above RM500,001 25,233 5,427 6,130.7
Total 62,812 14,193 8,267.4 Source: The Edge Markets (2017) and NAPIC (2016)
Table 2: Residential Overhang Properties in 2020
House Category Units Unsold
Below RM100,000 1,209
RM100,001-RM300,000 7,549
RM300,001-RM500,000 7,116
RM500,001-RM700,000 6,607
Total 22,481 Source: NAPIC (2020)
Based on the data reported in Tables 1 and 2, we can deduce that most
low and middle-income households do not own a house because they cannot
afford to purchase the house due to the price being beyond their reach. The house
prices according to NAPIC (2020) still seriously unaffordable therefore the
quantities of unsold housing units remain huge. This is consistent with the study
by Liu and Ong (2021). Although there are a significant number of unsold houses,
a considerable number of middle-income households are still looking for
reasonably priced and affordable houses to buy. Bank Negara Malaysia2 reported
that Malaysian middle-income households with the household income brackets
of RM6,000 to RM7,999 are in need of houses priced less than RM408,300. The
price of RM408,300 is considered the affordability threshold. There is suggestion
that proposed selling price should be monitor by the Government (Ernawati, et
al., 2020)
In short, the houses available in the market currently are unaffordable
to middle-income groups, and with their current level of income, they may not be
1 Cindy Yeap (2017), state of the nation: unsold units reflect mismatch in supply and demand for affordable
housing, retrieved from http://www.theedgemarkets.com/my/article/state-nation-unsold-units-reflect-
mismatch-supply-and-demand-affordable-housing 2 Cheah S. Ling, Stefanie Almeida, Muhamad Shukri and Lim Le Sze, (2017) Imbalances in the Property
Market. Bank Negara Malaysia.
PLANNING MALAYSIA
Journal of the Malaysia Institute of Planners (2021)
263 © 2021 by MIP
able to secure a home loan or financing from financial institutions to finance the
purchase of a house. This issue requires immediate attention from the
government, government bodies or relevant authorities to find solutions or
mechanisms to provide more affordable homes for this cohort. This study
proposes using waqf as an alternative financing mechanism to provide affordable
houses to middle-income (M40) households. Due to the global financial crisis,
land mitigation, and global environmental issues, the country faces design
innovation and policy evolution (Lim, 2016 and Malaysia Productivity
Corporation, 2010). Thus, the Malaysian government has adopted a creative
design approach and various incentives to increase the number of affordable
houses.
In the Muslim world, many humanitarian projects are operated by waqf
institutions. Among their large scale waqf projects is building houses for the
needy. In the context of Malaysia, building housing projects on waqf land will
help increase the supply of affordable houses, especially targeted at the middle-
income (M40) group, thus addressing the issue of shortages of affordable houses
for the M40. In Malaysia, the prospects and demand from the public to rent the
waqf houses are high due to affordable rental rates. In view of this, the best option
by State Islamic Religious Councils (SIRCs) in managing their waqf land is to
develop affordable houses so that the waqf land is productively developed as well
as getting lump sum rental income. Currently, these initiatives are actively
undertaken by SIRCs in Kedah and Pulau Pinang (UDA Holdings Berhad, 2019).
RESEARCH METHODOLOGY
By applying a quantitative research design, the study aims to understand the
relationship between various housing demanded characteristics with the price of
the house. The definition of population in this study are middle-income Muslim
households in Malaysia. Due to limitations in gaining feedback from Sabah and
Sarawak, the study only focuses on middle-income Muslim groups in Peninsular
Malaysia. A sample of 261 usable responses was collected using the purposive
sampling method. The sample size between 200 to 300 respondents was
appropriate and fair according to the scale suggested by Comrey and Lee (1992)
and cited by Tabachnick & Fidell (1996). A set of questionnaires with four parts
was designed to collect various responses from the respondents. The first part
addresses the demographic profiles of respondents. The second part targets the
public knowledge of affordable housing projects built on waqf land in Malaysia.
Among the aims in part three of the questionnaire is to understand the relationship
between various housing characteristics vis-à-vis the price of the house. The last
part of the questionnaire covers the public perception of several aspects of the
proposed waqf financing model. This paper only reports part of the findings from
part three. The independent variables that reflect housing characteristics are
location, infrastructure, facilities/amenities, size, design, and quality, while price
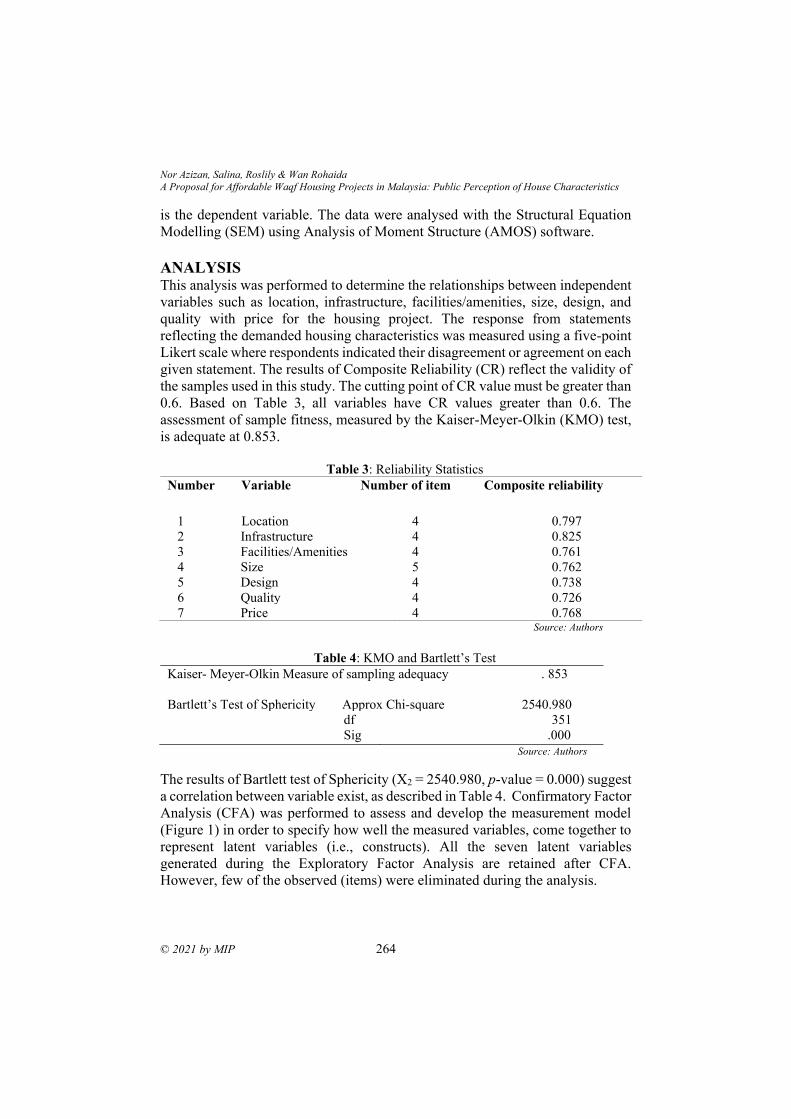
Nor Azizan, Salina, Roslily & Wan Rohaida
A Proposal for Affordable Waqf Housing Projects in Malaysia: Public Perception of House Characteristics
© 2021 by MIP 264
is the dependent variable. The data were analysed with the Structural Equation
Modelling (SEM) using Analysis of Moment Structure (AMOS) software.
ANALYSIS
This analysis was performed to determine the relationships between independent
variables such as location, infrastructure, facilities/amenities, size, design, and
quality with price for the housing project. The response from statements
reflecting the demanded housing characteristics was measured using a five-point
Likert scale where respondents indicated their disagreement or agreement on each
given statement. The results of Composite Reliability (CR) reflect the validity of
the samples used in this study. The cutting point of CR value must be greater than
0.6. Based on Table 3, all variables have CR values greater than 0.6. The
assessment of sample fitness, measured by the Kaiser-Meyer-Olkin (KMO) test,
is adequate at 0.853.
Table 3: Reliability Statistics
Number Variable Number of item Composite reliability
1 Location 4 0.797
2 Infrastructure 4 0.825
3 Facilities/Amenities 4 0.761
4 Size 5 0.762
5 Design 4 0.738
6 Quality 4 0.726
7 Price 4 0.768 Source: Authors
Table 4: KMO and Bartlett’s Test
Kaiser- Meyer-Olkin Measure of sampling adequacy . 853
Bartlett’s Test of Sphericity Approx Chi-square
2540.980
df 351
Sig .000
Source: Authors
The results of Bartlett test of Sphericity (X2 = 2540.980, p-value = 0.000) suggest
a correlation between variable exist, as described in Table 4. Confirmatory Factor
Analysis (CFA) was performed to assess and develop the measurement model
(Figure 1) in order to specify how well the measured variables, come together to
represent latent variables (i.e., constructs). All the seven latent variables
generated during the Exploratory Factor Analysis are retained after CFA.
However, few of the observed (items) were eliminated during the analysis.
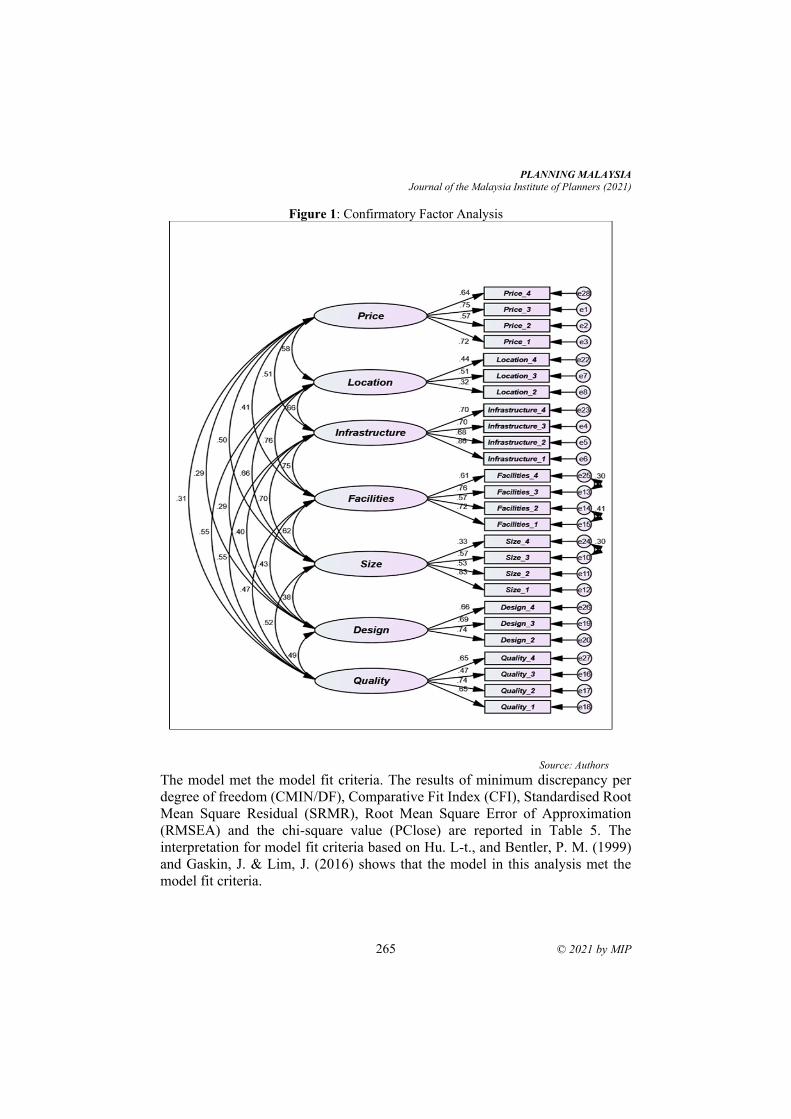
PLANNING MALAYSIA
Journal of the Malaysia Institute of Planners (2021)
265 © 2021 by MIP
Figure 1: Confirmatory Factor Analysis
Source: Authors
The model met the model fit criteria. The results of minimum discrepancy per
degree of freedom (CMIN/DF), Comparative Fit Index (CFI), Standardised Root
Mean Square Residual (SRMR), Root Mean Square Error of Approximation
(RMSEA) and the chi-square value (PClose) are reported in Table 5. The
interpretation for model fit criteria based on Hu. L-t., and Bentler, P. M. (1999)
and Gaskin, J. & Lim, J. (2016) shows that the model in this analysis met the
model fit criteria.
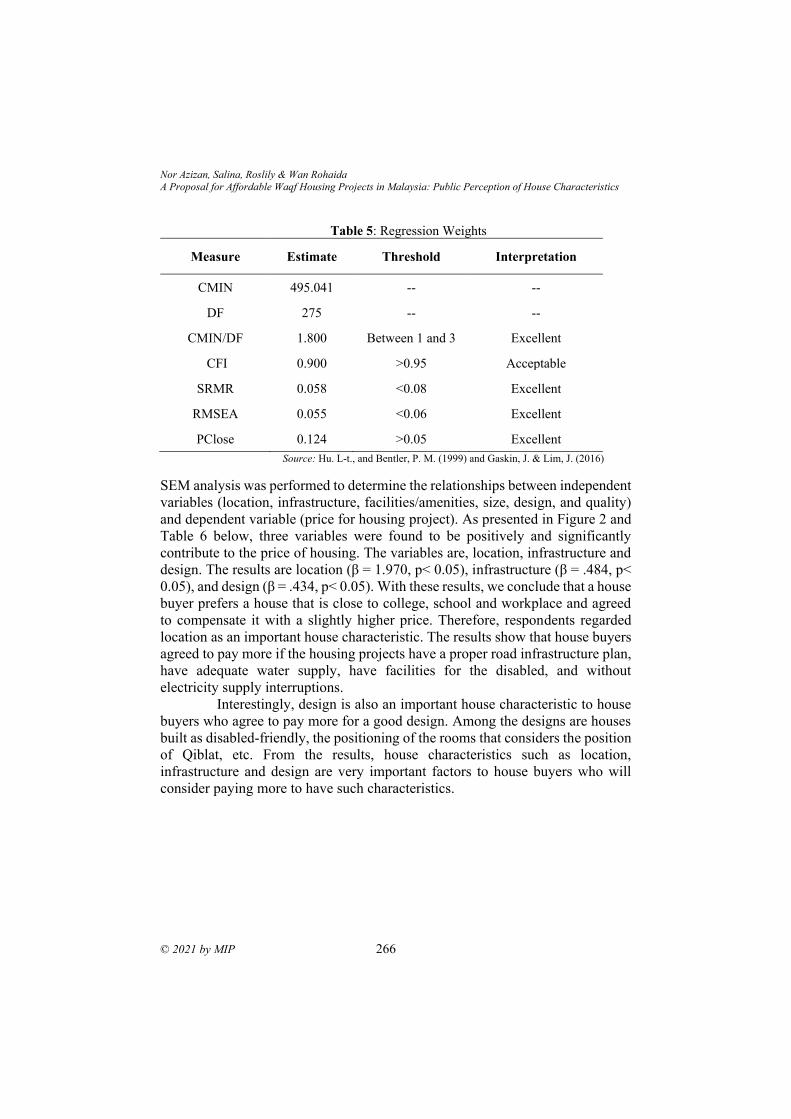
Nor Azizan, Salina, Roslily & Wan Rohaida
A Proposal for Affordable Waqf Housing Projects in Malaysia: Public Perception of House Characteristics
© 2021 by MIP 266
Table 5: Regression Weights
Measure Estimate Threshold Interpretation
CMIN 495.041 -- --
DF 275 -- --
CMIN/DF 1.800 Between 1 and 3 Excellent
CFI 0.900 >0.95 Acceptable
SRMR 0.058 <0.08 Excellent
RMSEA 0.055 <0.06 Excellent
PClose 0.124 >0.05 Excellent
Source: Hu. L-t., and Bentler, P. M. (1999) and Gaskin, J. & Lim, J. (2016)
SEM analysis was performed to determine the relationships between independent
variables (location, infrastructure, facilities/amenities, size, design, and quality)
and dependent variable (price for housing project). As presented in Figure 2 and
Table 6 below, three variables were found to be positively and significantly
contribute to the price of housing. The variables are, location, infrastructure and
design. The results are location (β = 1.970, p< 0.05), infrastructure (β = .484, p<
0.05), and design (β = .434, p< 0.05). With these results, we conclude that a house
buyer prefers a house that is close to college, school and workplace and agreed
to compensate it with a slightly higher price. Therefore, respondents regarded
location as an important house characteristic. The results show that house buyers
agreed to pay more if the housing projects have a proper road infrastructure plan,
have adequate water supply, have facilities for the disabled, and without
electricity supply interruptions.
Interestingly, design is also an important house characteristic to house
buyers who agree to pay more for a good design. Among the designs are houses
built as disabled-friendly, the positioning of the rooms that considers the position
of Qiblat, etc. From the results, house characteristics such as location,
infrastructure and design are very important factors to house buyers who will
consider paying more to have such characteristics.
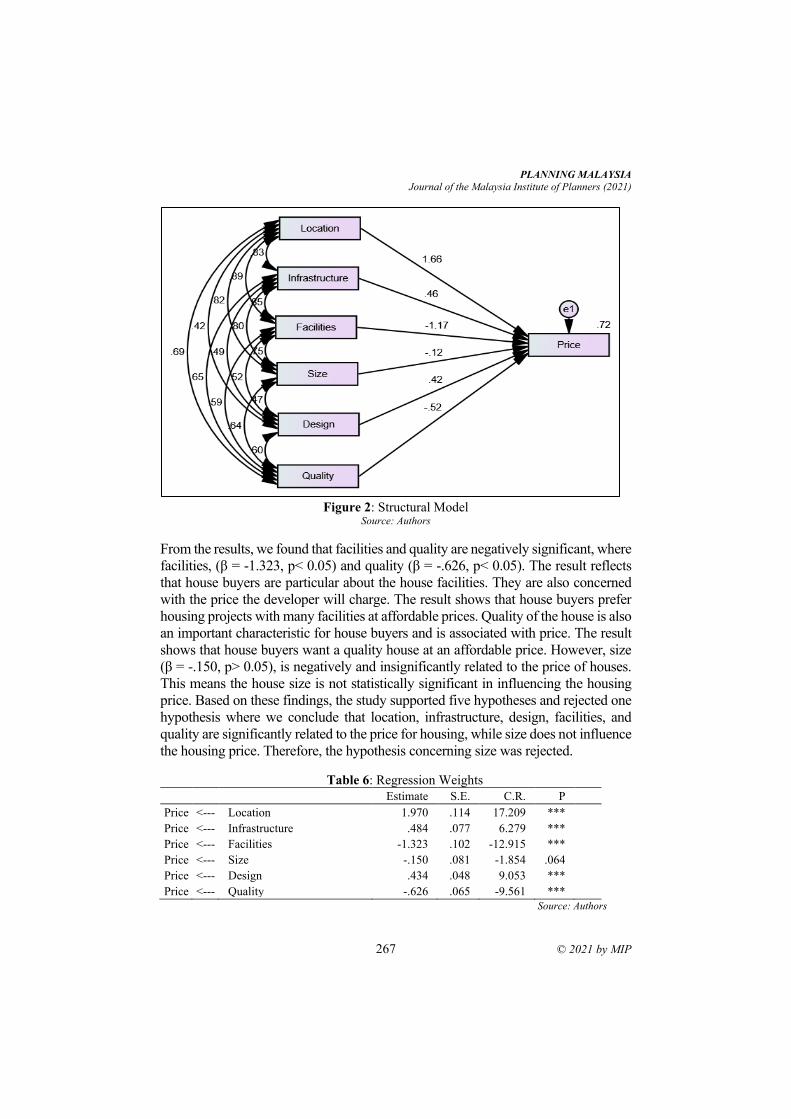
PLANNING MALAYSIA
Journal of the Malaysia Institute of Planners (2021)
267 © 2021 by MIP
Figure 2: Structural Model
Source: Authors
From the results, we found that facilities and quality are negatively significant, where
facilities, (β = -1.323, p< 0.05) and quality (β = -.626, p< 0.05). The result reflects
that house buyers are particular about the house facilities. They are also concerned
with the price the developer will charge. The result shows that house buyers prefer
housing projects with many facilities at affordable prices. Quality of the house is also
an important characteristic for house buyers and is associated with price. The result
shows that house buyers want a quality house at an affordable price. However, size
(β = -.150, p> 0.05), is negatively and insignificantly related to the price of houses.
This means the house size is not statistically significant in influencing the housing
price. Based on these findings, the study supported five hypotheses and rejected one
hypothesis where we conclude that location, infrastructure, design, facilities, and
quality are significantly related to the price for housing, while size does not influence
the housing price. Therefore, the hypothesis concerning size was rejected.
Table 6: Regression Weights Estimate S.E. C.R. P
Price <--- Location 1.970 .114 17.209 ***
Price <--- Infrastructure .484 .077 6.279 ***
Price <--- Facilities -1.323 .102 -12.915 ***
Price <--- Size -.150 .081 -1.854 .064
Price <--- Design .434 .048 9.053 ***
Price <--- Quality -.626 .065 -9.561 ***
Source: Authors
Nor Azizan, Salina, Roslily & Wan Rohaida
A Proposal for Affordable Waqf Housing Projects in Malaysia: Public Perception of House Characteristics
© 2021 by MIP 268
CONCLUSION The results show that house size is not statistically significant in influencing the
housing price, while location, infrastructure and design of the house are very
important factors. These findings are expected to provide important inputs to the
relevant authorities on factors that are critical in influencing the prices of
affordable housing projects built on waqf land in Malaysia. Therefore, in setting
the price for affordable waqf housing in Malaysia and increasing the demand for
such a housing project, waqf institutions must emphasise the house characteristics
demanded by house buyers.
ACKNOWLEDGEMENTS
This research was supported by the National Real Property Research Coordinator
(NAPREC), National Institute of Valuation (INSPEN), Valuation & Property
Services Department (JPPH Malaysia) and Ministry of Finance, Malaysia
through grant allocation under Project ID: SP18-152-0414
REFERENCES Annual Property Market Report (2016), National Property Information Centre.
https://napic.jpph.gov.my/portal/web/guest/main-page
Annual Property Market Report (2020), National Property Information Centre.
https://napic.jpph.gov.my/portal/web/guest/main-page
Baqutaya, S., Ariffin, a. S., & Raji, F. (2016). Affordable Housing Policy: Issues and
Challenges Among Middle-Income Groups. International Journal of Social
Science and Humanity, 6(6), 433–436.
https://doi.org/10.7763/IJSSH.2016.V6.686
Cheah S. L., Stefanie A., Muhamad S. & Lim L. S., (2017) Imbalances in the Property
Market. Bank Negara Malaysia.
Cindy Y. (2017), State of the Nation: Unsold Units Reflect Mismatch in Supply and
Demand for Affordable Housing, retrieved from
http://www.theedgemarkets.com/my/article/state-nation-unsold-units-reflect-
mismatch-supply-and-demand-affordable-housing
Comrey, A. L., & Lee, H. B. (1992). A First Course in Factor Analysis (2nd. ed.).
Lawrence Erlbaum Associates, Inc.
Ernawati M. K., Kong S. L. & Nor’Aini Y. (2020). The Low-Middle Income Housing
Challenges in Malaysia, Journal of the Malaysian Institute of Planners, Vol. 18
(1) 102-117.
Gaskin, J. & Lim, J. (2016), “Model Fit Measures”, AMOS Plugin. Gaskination’s
StatWiki.
Hong, T. T. (2013). Affordable Housing for First-Time Homebuyers: Issues and
Implications from the Malaysian Experience. Pacific Rim Property Research
Journal, 19(2), 199–210. https://doi.org/10.1080/14445921.2013.11104381
Hu. L-t., and Bentler, P.M. (1999). Cut-off Criteria for Fit Indexes in Covariance
Structure Analysis: Conventional Criteria Versus New Alternatives. Structural
Equation Modelling, 6(1), 1-55.
PLANNING MALAYSIA
Journal of the Malaysia Institute of Planners (2021)
269 © 2021 by MIP
Khazanah Research Institute. (2015). Making Housing Affordable. Retrieved from
www.KRInstitute.org
Lim, S. (2016). Affordable Housing and the Emergence of a New Norm. The Edge
Property. https://www.edgeprop.my/content/959872/affordable-housing-and-
emergence-new-norm
Liu J. & Ong H. Y. (2021). Can Malaysia’s National Affordable Housing Policy
Guarantee Housing Affordability of Low-Income Households? Journal of
Sustainability, Vol. 13 https://doi.org/10.3390/su13168841
Malaysia Productivity Corporation. (2010). Sustainable Development Initiatives in
Malaysia. http://www.mpc.gov.my/wp-content/uploads/2016/04/Sustainable-
Development-Initiatives-In-Malaysia.pdf
M. Azren H., Hazlina H., Jamalunlaili A. & Yusfida Ayu A. (2018). Housing and
Transportation Expenditure: An Assessment of Location Housing Affordability,
Journal of the Malaysian Institute of Planners, Vol. 16 (2) 99-108.
Suhaida, M. S., Norngainy M.T., Noraini H., Adi Irfan C.A.& Tahir, M. M. (2010). A
Conceptual Overview of Housing Affordability in Selangor, Malaysia. World
Academy of Science, Engineering and Technology, 72, 45-47.
https://doi.org/10.1016/j.proeng.2011.11.176
Tabachnick, B. G., & Fidell, L. S. (1996). Using multivariate statistics (3rd ed.). New
York: HarperCollins.
UDA Holdings Berhad (2019). UDA First Global Waqf Conference Recognition Awards.
https://prebiu.com/2019/11/21/uda-raih-anugerah-1st-global-waqf-conference-
recognition-awards/
Received: 12th July 2021. Accepted: 17th Sept 2021
1 A PhD candidate at Universiti Teknologi Malaysia Email: [email protected]
PLANNING MALAYSIA:
Journal of the Malaysian Institute of Planners
VOLUME 19 ISSUE 3 (2021), Page 270 – 282
AN INTEGRATED APPROACH BASED ON ARTIFICIAL
INTELLIGENCE USING ANFIS AND ANN FOR MULTIPLE
CRITERIA REAL ESTATE PRICE PREDICTION
A. A. Yakub1, Hishamuddin, Mohd. Ali2, Kamalahasan, Achu3, Rohaya
binti Abdul Jalil4 & Salawu, A.O5
1, 2, 3, 4 Centre for Real Estate Studies, Faculti of Built Environment & Surveying
UNIVERSITI TEKNOLOGI MALAYSIA 1&5Department of Estate Management, College of Built Environment,
HAFEDPOLY, KAZAURE, JIGAWA STATE, NIGERIA
Abstract
A relatively high level of precision is required in real estate valuation for
investment purposes. Such estimates of value which is carried out by real estate
professionals are relied upon by the end-users of such financial information
having paid a certain fee for consultation hence leaving little room for errors.
However, valuation reports are often criticised for their inability to be replicated
by two or more valuers. Hence, stirring to a keen interest within the academic
cycle leading to the need for exploring avenues to improve the price prediction
ability of the professional valuer. This study, therefore, focuses on overcoming
these challenges by introducing an integrated approach that combines ANFIS
with ANN termed ANFIS-AN, thereby having a reiteration in terms of ANN
application to fortify price predictability. Using 255 property data alongside 12
variables, the ANFIS-AN model was adopted and its outcome was compared with
that of ANN. Finally, the results were subjected to 3 different error testing models
using the same training and learning benchmarks. The proposed model’s RMSE
gave 1.413169, while that of ANN showed 9.942206. Similarly, using MAPE,
ANN recorded 0.256438 while ANFIS-AN had 0.208324. Hence, ANFIS-AN’s
performance is laudable, thus a better tool over ANN.
Keywords: AI, ANFIS, ANN, ANFIS-AN, price prediction, Real Estate, Valuation
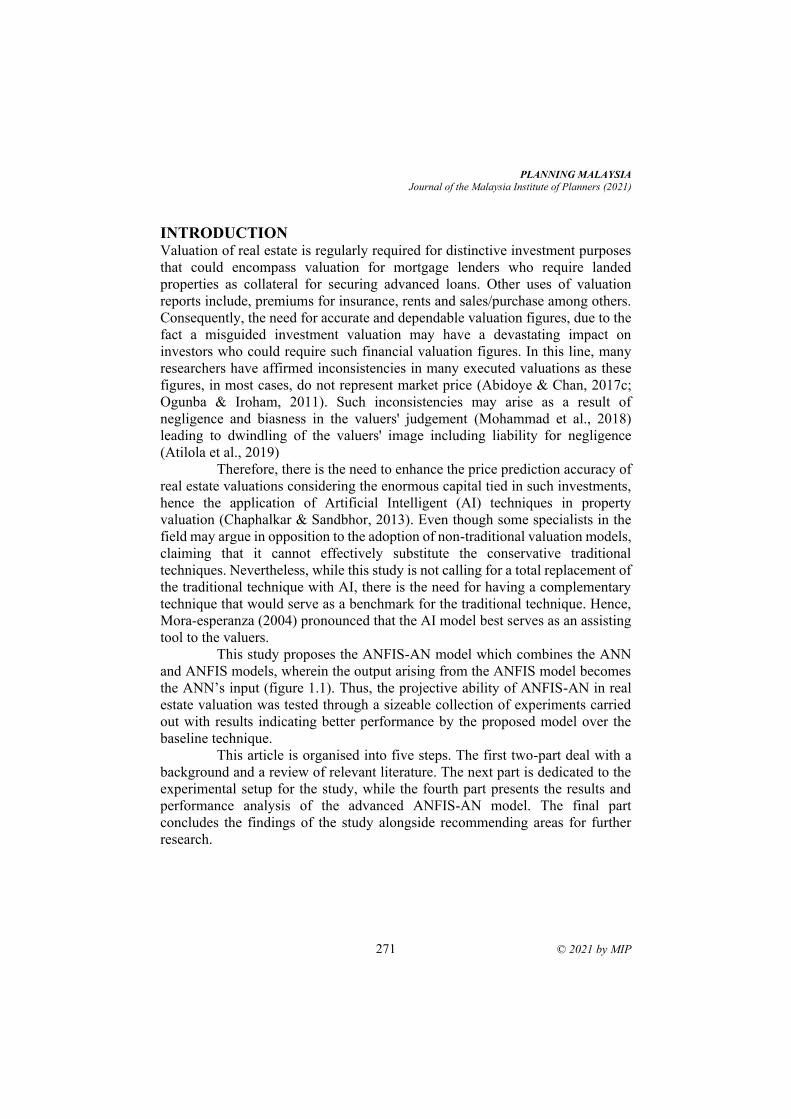
PLANNING MALAYSIA
Journal of the Malaysia Institute of Planners (2021)
271 © 2021 by MIP
INTRODUCTION Valuation of real estate is regularly required for distinctive investment purposes
that could encompass valuation for mortgage lenders who require landed
properties as collateral for securing advanced loans. Other uses of valuation
reports include, premiums for insurance, rents and sales/purchase among others.
Consequently, the need for accurate and dependable valuation figures, due to the
fact a misguided investment valuation may have a devastating impact on
investors who could require such financial valuation figures. In this line, many
researchers have affirmed inconsistencies in many executed valuations as these
figures, in most cases, do not represent market price (Abidoye & Chan, 2017c;
Ogunba & Iroham, 2011). Such inconsistencies may arise as a result of
negligence and biasness in the valuers' judgement (Mohammad et al., 2018)
leading to dwindling of the valuers' image including liability for negligence
(Atilola et al., 2019)
Therefore, there is the need to enhance the price prediction accuracy of
real estate valuations considering the enormous capital tied in such investments,
hence the application of Artificial Intelligent (AI) techniques in property
valuation (Chaphalkar & Sandbhor, 2013). Even though some specialists in the
field may argue in opposition to the adoption of non-traditional valuation models,
claiming that it cannot effectively substitute the conservative traditional
techniques. Nevertheless, while this study is not calling for a total replacement of
the traditional technique with AI, there is the need for having a complementary
technique that would serve as a benchmark for the traditional technique. Hence,
Mora-esperanza (2004) pronounced that the AI model best serves as an assisting
tool to the valuers.
This study proposes the ANFIS-AN model which combines the ANN
and ANFIS models, wherein the output arising from the ANFIS model becomes
the ANN’s input (figure 1.1). Thus, the projective ability of ANFIS-AN in real
estate valuation was tested through a sizeable collection of experiments carried
out with results indicating better performance by the proposed model over the
baseline technique.
This article is organised into five steps. The first two-part deal with a
background and a review of relevant literature. The next part is dedicated to the
experimental setup for the study, while the fourth part presents the results and
performance analysis of the advanced ANFIS-AN model. The final part
concludes the findings of the study alongside recommending areas for further
research.
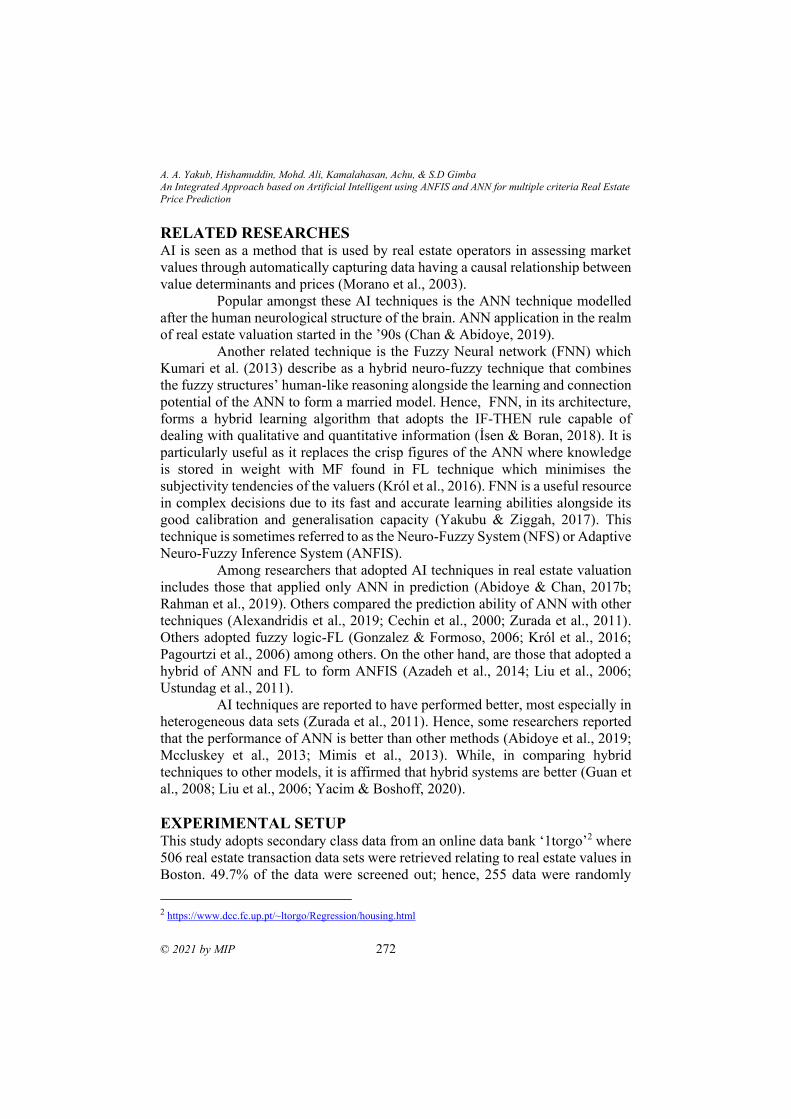
A. A. Yakub, Hishamuddin, Mohd. Ali, Kamalahasan, Achu, & S.D Gimba
An Integrated Approach based on Artificial Intelligent using ANFIS and ANN for multiple criteria Real Estate
Price Prediction
© 2021 by MIP 272
RELATED RESEARCHES AI is seen as a method that is used by real estate operators in assessing market
values through automatically capturing data having a causal relationship between
value determinants and prices (Morano et al., 2003).
Popular amongst these AI techniques is the ANN technique modelled
after the human neurological structure of the brain. ANN application in the realm
of real estate valuation started in the ’90s (Chan & Abidoye, 2019).
Another related technique is the Fuzzy Neural network (FNN) which
Kumari et al. (2013) describe as a hybrid neuro-fuzzy technique that combines
the fuzzy structures’ human-like reasoning alongside the learning and connection
potential of the ANN to form a married model. Hence, FNN, in its architecture,
forms a hybrid learning algorithm that adopts the IF-THEN rule capable of
dealing with qualitative and quantitative information (İsen & Boran, 2018). It is
particularly useful as it replaces the crisp figures of the ANN where knowledge
is stored in weight with MF found in FL technique which minimises the
subjectivity tendencies of the valuers (Król et al., 2016). FNN is a useful resource
in complex decisions due to its fast and accurate learning abilities alongside its
good calibration and generalisation capacity (Yakubu & Ziggah, 2017). This
technique is sometimes referred to as the Neuro-Fuzzy System (NFS) or Adaptive
Neuro-Fuzzy Inference System (ANFIS).
Among researchers that adopted AI techniques in real estate valuation
includes those that applied only ANN in prediction (Abidoye & Chan, 2017b;
Rahman et al., 2019). Others compared the prediction ability of ANN with other
techniques (Alexandridis et al., 2019; Cechin et al., 2000; Zurada et al., 2011).
Others adopted fuzzy logic-FL (Gonzalez & Formoso, 2006; Król et al., 2016;
Pagourtzi et al., 2006) among others. On the other hand, are those that adopted a
hybrid of ANN and FL to form ANFIS (Azadeh et al., 2014; Liu et al., 2006;
Ustundag et al., 2011).
AI techniques are reported to have performed better, most especially in
heterogeneous data sets (Zurada et al., 2011). Hence, some researchers reported
that the performance of ANN is better than other methods (Abidoye et al., 2019;
Mccluskey et al., 2013; Mimis et al., 2013). While, in comparing hybrid
techniques to other models, it is affirmed that hybrid systems are better (Guan et
al., 2008; Liu et al., 2006; Yacim & Boshoff, 2020).
EXPERIMENTAL SETUP
This study adopts secondary class data from an online data bank ‘1torgo’2 where
506 real estate transaction data sets were retrieved relating to real estate values in
Boston. 49.7% of the data were screened out; hence, 255 data were randomly
2 https://www.dcc.fc.up.pt/~ltorgo/Regression/housing.html
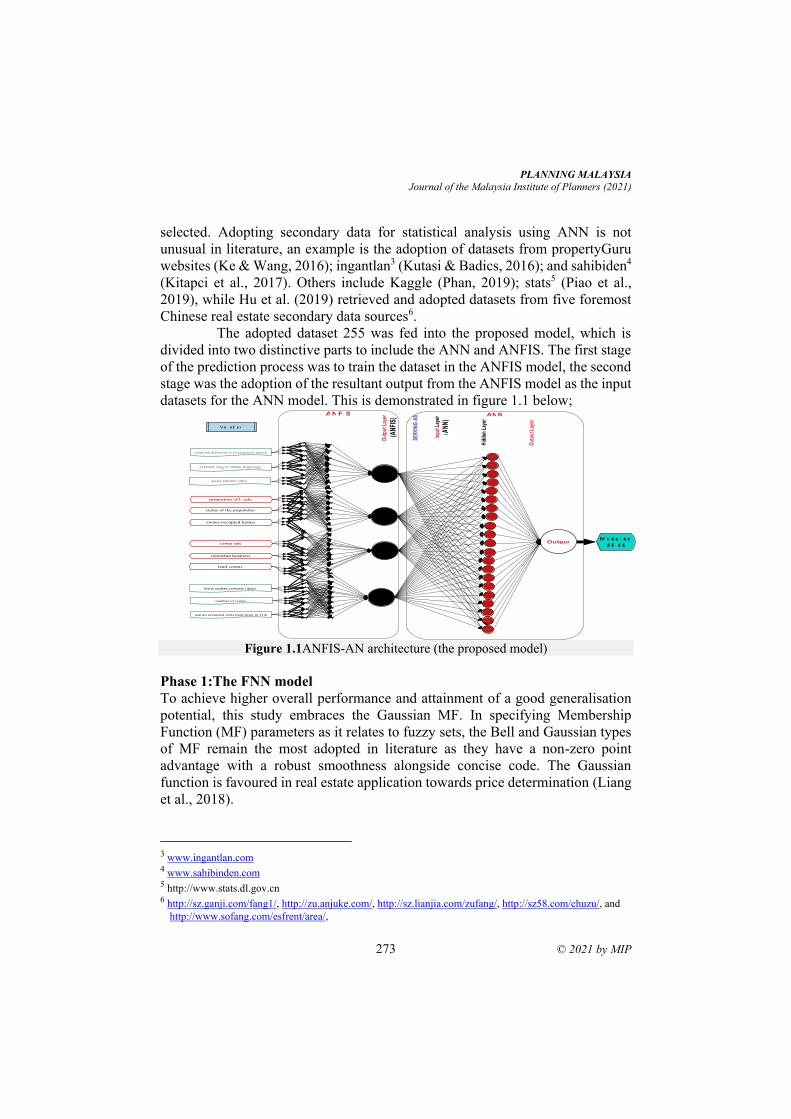
PLANNING MALAYSIA
Journal of the Malaysia Institute of Planners (2021)
273 © 2021 by MIP
selected. Adopting secondary data for statistical analysis using ANN is not
unusual in literature, an example is the adoption of datasets from propertyGuru
websites (Ke & Wang, 2016); ingantlan3 (Kutasi & Badics, 2016); and sahibiden4
(Kitapci et al., 2017). Others include Kaggle (Phan, 2019); stats5 (Piao et al.,
2019), while Hu et al. (2019) retrieved and adopted datasets from five foremost
Chinese real estate secondary data sources6.
The adopted dataset 255 was fed into the proposed model, which is
divided into two distinctive parts to include the ANN and ANFIS. The first stage
of the prediction process was to train the dataset in the ANFIS model, the second
stage was the adoption of the resultant output from the ANFIS model as the input
datasets for the ANN model. This is demonstrated in figure 1.1 below;
Figure 1.1ANFIS-AN architecture (the proposed model)
Phase 1:The FNN model
To achieve higher overall performance and attainment of a good generalisation
potential, this study embraces the Gaussian MF. In specifying Membership
Function (MF) parameters as it relates to fuzzy sets, the Bell and Gaussian types
of MF remain the most adopted in literature as they have a non-zero point
advantage with a robust smoothness alongside concise code. The Gaussian
function is favoured in real estate application towards price determination (Liang
et al., 2018).
3 www.ingantlan.com 4 www.sahibinden.com 5 http://www.stats.dl.gov.cn 6 http://sz.ganji.com/fang1/, http://zu.anjuke.com/, http://sz.lianjia.com/zufang/, http://sz58.com/chuzu/, and
http://www.sofang.com/esfrent/area/,
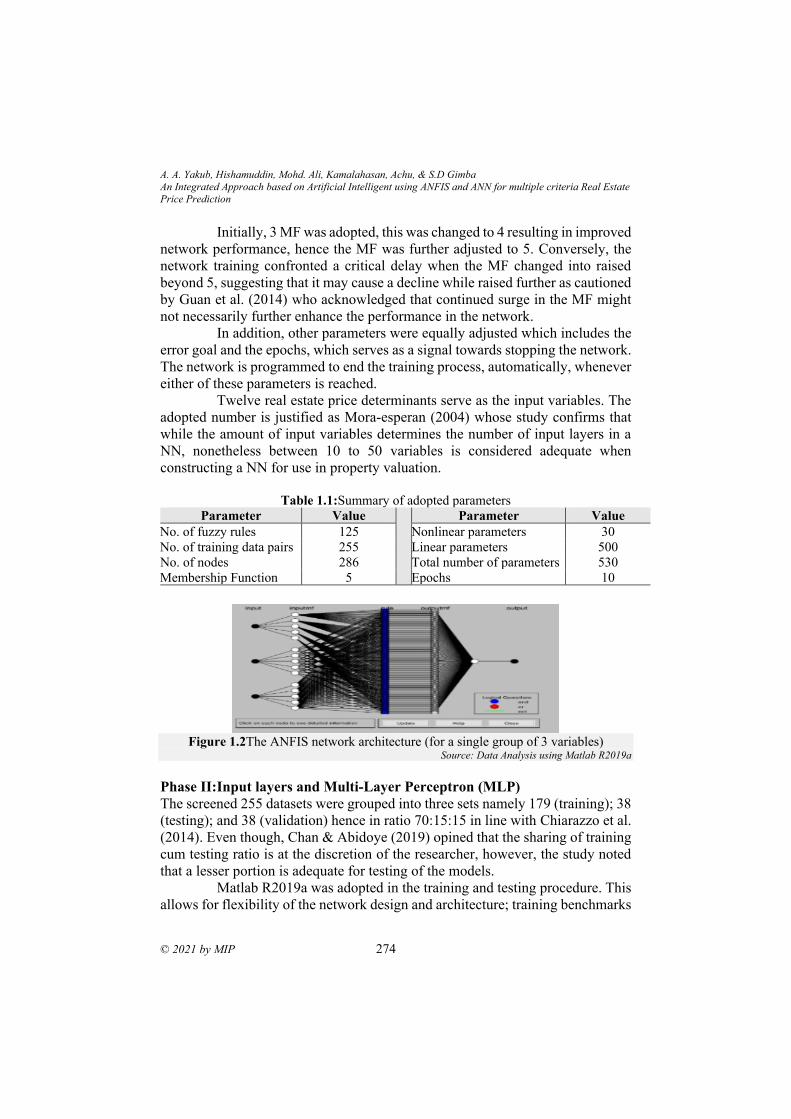
A. A. Yakub, Hishamuddin, Mohd. Ali, Kamalahasan, Achu, & S.D Gimba
An Integrated Approach based on Artificial Intelligent using ANFIS and ANN for multiple criteria Real Estate
Price Prediction
© 2021 by MIP 274
Initially, 3 MF was adopted, this was changed to 4 resulting in improved
network performance, hence the MF was further adjusted to 5. Conversely, the
network training confronted a critical delay when the MF changed into raised
beyond 5, suggesting that it may cause a decline while raised further as cautioned
by Guan et al. (2014) who acknowledged that continued surge in the MF might
not necessarily further enhance the performance in the network.
In addition, other parameters were equally adjusted which includes the
error goal and the epochs, which serves as a signal towards stopping the network.
The network is programmed to end the training process, automatically, whenever
either of these parameters is reached.
Twelve real estate price determinants serve as the input variables. The
adopted number is justified as Mora-esperan (2004) whose study confirms that
while the amount of input variables determines the number of input layers in a
NN, nonetheless between 10 to 50 variables is considered adequate when
constructing a NN for use in property valuation.
Table 1.1:Summary of adopted parameters
Parameter Value Parameter Value
No. of fuzzy rules 125 Nonlinear parameters 30
No. of training data pairs 255 Linear parameters 500
No. of nodes 286 Total number of parameters 530
Membership Function 5 Epochs 10
Figure 1.2The ANFIS network architecture (for a single group of 3 variables)
Source: Data Analysis using Matlab R2019a
Phase II:Input layers and Multi-Layer Perceptron (MLP)
The screened 255 datasets were grouped into three sets namely 179 (training); 38
(testing); and 38 (validation) hence in ratio 70:15:15 in line with Chiarazzo et al.
(2014). Even though, Chan & Abidoye (2019) opined that the sharing of training
cum testing ratio is at the discretion of the researcher, however, the study noted
that a lesser portion is adequate for testing of the models.
Matlab R2019a was adopted in the training and testing procedure. This
allows for flexibility of the network design and architecture; training benchmarks
PLANNING MALAYSIA
Journal of the Malaysia Institute of Planners (2021)
275 © 2021 by MIP
and simulation in design (Peterson & Flanagan-III, 2009). Matlab R2019a also
allows for a better and more efficient performing MLP (Al-Akhras & Saadeh,
2010). MathWorks (2004) further uphold that the rule in the MLP perceptron
learning is within the supervised learning classification.
Determination of the number of hidden layers and neurons
This study adopts a single hidden layered network. Lin & Mohan (2011)
recommend the adoption of a single hidden layer when modelling using MLP as
a solitary hidden layer is sufficient in modelling a NN towards realizing accurate
complex non-linear function. Hence, a single hidden layer node is considered
adequate in a NN design for most practical problems (MathWorks, 2004).
However, in determining the number of neurons, otherwise term nodes,
in a NN hidden layer, researchers including Limsombunchai (2004), Lin &
Mohan (2011) opine that experimentation, using trial and error, pending when a
satisfactory result is achieved is recommended. Contrarily, Ge & Runeson (2004)
and Kitapci et al. (2017) stressed that determining the number of hidden neurons
is crucial as it affects the convergence ability of the network, as insufficient
hidden nodes disallow the feeding of the full specifics of the pattern involved in
the NN leading to inability to converge. On the other hand, too many hidden
layers often result to delay in the network and/or overtraining cum overfitting.
The above observations by different researchers affirm that caution
needs to be taken in determining the number of neurons/nodes in a network’s
hidden layer. Thus, rather than the subjective random trial by error propounded
by some researchers, Lam et al. (2008) and Abidoye et al. (2017) respectively
explore the use of formula in their study as shown below;
1. 𝑁ℎ = 1
2 (Inputs + Outputs) + √𝑁𝑢𝑚𝑏𝑒𝑟 𝑜𝑓 𝑝𝑎𝑡𝑡𝑒𝑟𝑛𝑠 𝑖𝑛 𝑡ℎ𝑒 𝑡𝑟𝑎𝑖𝑛𝑖𝑛𝑔 𝑓𝑖𝑙𝑒eqn.2
2. 𝑁ℎ =𝑁𝑖𝑛+𝑁𝑜𝑢𝑡
2+ √𝑁𝑠eqn.3
Nh implies the number of neurons adaptable in a hidden layer. Nin
signifies the input while Nout indicates the output layer and Ns indicates the
training samples.
Therefore, this study adopt MLP using the supervised learning rule.
Hence, different NN topologies were applied, with adjustments, to the hidden
neurons during the network’s learning process ranging from 16-22 neurons while
seeking the most appropriate network. However, more concentration was centred
on having neurons within the group 20-24 because when the parameters were
applied to the formula, 𝑁ℎ indicated 22.9687. Nevertheless, when subjected to
several trials, the study’s best-performing architecture contains 22 hidden
neurons resulting in an architecture of 12:22:1. The results of these trials are given
in tables 1.2 and 1.3 below.

A. A. Yakub, Hishamuddin, Mohd. Ali, Kamalahasan, Achu, & S.D Gimba
An Integrated Approach based on Artificial Intelligent using ANFIS and ANN for multiple criteria Real Estate
Price Prediction
© 2021 by MIP 276
Table 1.2:Trained MSE results for both ANN and ANFIS-AN
Number of nodes ANFIS-AN ANN
16 2.91 5.07
19 3.25 1.74e-6
22 R
etrain
ing 1st 1.40 7.76e-7
2nd 1.35 6.38e-8
3rd 2.01 3.53e-11
4th 14.81 2.49e-9
5th 4.91 2.81e-8
Table 1.3:Tested MSE results for both ANN and ANFIS-AN
Number of nodes ANFIS-AN ANN
16 32.20 1482.72
19 12.94 314.26
22
Ret
est
ing
1st 7.96 519.51
2nd 5.66 781.86
3rd 114.47 663.31
4th 13.15 1014.18
5th 9.82 1617.22
Training of the network
The ANFIS model was adopted in the first segment in the ANFIS-AN model,
while the ANN was adopted in the second segment. In the 1st segment, the input
nodes were divided into 4 groups, hence each group had 3 nodes making 12 nodes
in total, generating 4 output neurons in total. This is consistent with past
researches such as Ustundag et al. (2011); Khoshnevisan et al. (2014); Gerami
Moghadam et al. (2019) among others. The best outcome was attained when 3
inputs were adopted at each stage; gaussmf was used for the input MF function
while linear was adopted for the output MF function; and adoption of a 5 number
MF at 10 epoch for the four groups.
These output neurons from the ANFIS were thereafter fed into the ANN
model serving as its inputs, which were yet again retrained using one single
hidden layer with 22 nodes to yield the final resultant output of the ANFIS-AN
model.
A feedforward backpropagation algorithm was implemented in training
each of the ANN and 2nd segment of the ANFIS-AN architectural structure to
model the relationship among the variables (input), and the target price (output).
The parameters involving the epochs and number of hidden neurons were
sufficiently adjusted using trial and error to reduce the prediction errors at the
training, testing and validation phases. This is consistent with past researchers as
Mora-esperanza (2004) opined that ANN does not provide the requisite number
of outputs during the first trial, rather until after undergoing adequate training, as
PLANNING MALAYSIA
Journal of the Malaysia Institute of Planners (2021)
277 © 2021 by MIP
they are required to learn, thus the need for subjecting the NN to successive trial
and error sessions. This viewpoint was further buttressed in Eriki & Udegbunam
(2008), the study stressed that modifications are required in NN parameters
involving model specification; training cycles and the number of hidden neurons
in realizing the best outcome in a NN. These adjustments in the learning rate and
momentum are attainable through trial and error.
This study further adopted trainlm (lavernberg-Marquardt) in training
the NN, although trainlm is the time taken, nevertheless, the algorithm is capable
of attaining good generalisation. On the other hand, this study adopts learngm as
the learning function for the NN, while the performance function adopted is the
Mean Squared Error (MSE), which is in line with Hegde (2018).
RESULTS AND PERFORMANCE EVALUATION
Training and Retraining sessions
Three different NN topologies were trained adopting 12 input variables in
addition to 1-output variables using several parameters for the hidden neurons.
The network architecture of 12:22:1 achieved the best performance; this same
structure was adopted for the proposed ANFIS-AN model for a simple
comparison of their final result.
The training of both models was carried out in three dynamic stages. 16
neurons were adopted in the first stage, and this stage produced the best outcome
for the proposed ANFIS-AN model over the ANN model. These numbers of
neurons were increased to 19 in the second stage. The results of the second stage
training session showed that ANN performed better, whereas the testing session
exhibited a better result for ANFIS-AN. Nevertheless, it should be noted that the
most crucial phase of a NN’s learning session is the testing stage as the trained
network becomes capable of adopting the learning parameters that it gained
during the training sessions towards predicting the prices of untrained variables.
In the third stage of the training and testing session, the number of
neurons was raised to 22 in line with the results of the formula for estimating the
number of the hidden neuron as shown in equations 2 and 3 above. The results
from this stage became the best of the three stages adopted, hence the best-
performing architecture for the ANFIS-AN model.
Thereafter, the network was subjected to retraining five different times
using the same parameter to further assess its efficiency ability. During each of
these retraining sessions, all training sessions in the ANN model demonstrated
good learning ability, hence a better training technique over the proposed model.
However, in terms of testing, the ANFIS-AN tests demonstrated better results
over that of ANN which indicates its ability to yield better results whenever it is
used in predicting new untrained datasets.
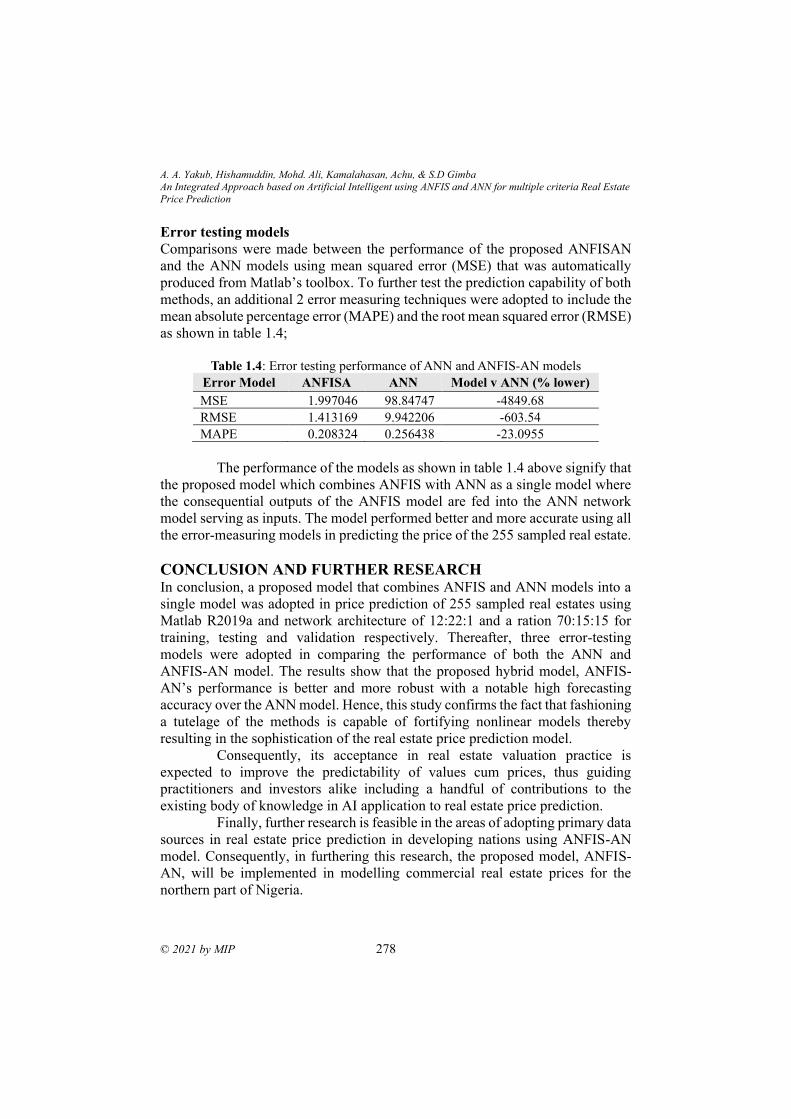
A. A. Yakub, Hishamuddin, Mohd. Ali, Kamalahasan, Achu, & S.D Gimba
An Integrated Approach based on Artificial Intelligent using ANFIS and ANN for multiple criteria Real Estate
Price Prediction
© 2021 by MIP 278
Error testing models
Comparisons were made between the performance of the proposed ANFISAN
and the ANN models using mean squared error (MSE) that was automatically
produced from Matlab’s toolbox. To further test the prediction capability of both
methods, an additional 2 error measuring techniques were adopted to include the
mean absolute percentage error (MAPE) and the root mean squared error (RMSE)
as shown in table 1.4;
Table 1.4: Error testing performance of ANN and ANFIS-AN models
Error Model ANFISA ANN Model v ANN (% lower)
MSE 1.997046 98.84747 -4849.68
RMSE 1.413169 9.942206 -603.54
MAPE 0.208324 0.256438 -23.0955
The performance of the models as shown in table 1.4 above signify that
the proposed model which combines ANFIS with ANN as a single model where
the consequential outputs of the ANFIS model are fed into the ANN network
model serving as inputs. The model performed better and more accurate using all
the error-measuring models in predicting the price of the 255 sampled real estate.
CONCLUSION AND FURTHER RESEARCH
In conclusion, a proposed model that combines ANFIS and ANN models into a
single model was adopted in price prediction of 255 sampled real estates using
Matlab R2019a and network architecture of 12:22:1 and a ration 70:15:15 for
training, testing and validation respectively. Thereafter, three error-testing
models were adopted in comparing the performance of both the ANN and
ANFIS-AN model. The results show that the proposed hybrid model, ANFIS-
AN’s performance is better and more robust with a notable high forecasting
accuracy over the ANN model. Hence, this study confirms the fact that fashioning
a tutelage of the methods is capable of fortifying nonlinear models thereby
resulting in the sophistication of the real estate price prediction model.
Consequently, its acceptance in real estate valuation practice is
expected to improve the predictability of values cum prices, thus guiding
practitioners and investors alike including a handful of contributions to the
existing body of knowledge in AI application to real estate price prediction.
Finally, further research is feasible in the areas of adopting primary data
sources in real estate price prediction in developing nations using ANFIS-AN
model. Consequently, in furthering this research, the proposed model, ANFIS-
AN, will be implemented in modelling commercial real estate prices for the
northern part of Nigeria.
PLANNING MALAYSIA
Journal of the Malaysia Institute of Planners (2021)
279 © 2021 by MIP
ACKNOWLEDGEMENT The authors acknowledge the efforts of the National Real Estate Research
Coordinator (NAPREC) Grant that sponsored this research.
REFERENCES Abidoye, R. B., & Chan, A. P. C. (2017a). Artificial neural network in property valuation:
application framework and research trend. Property Management, 35(5), 554–
571. https://doi.org/10.1108/PM-06-2016-0027
Abidoye, R. B., & Chan, A. P. C. (2017b). Modelling property values in Nigeria using
artificial neural network. Journal of Property Research, 9916, 0.
https://doi.org/10.1080/09599916.2017.1286366
Abidoye, R. B., & Chan, A. P. C. (2017c). Valuers’ receptiveness to the application of
artificial intelligence in property valuation. Pacific Rim Property Research
Journal, 23(2), 175–193. https://doi.org/10.1080/14445921.2017.1299453
Abidoye, R. B., Chan, A. P. C., Abidoye, F. A., & Oshodi, O. S. (2019). Predicting
property price index using artificial intelligence techniques: Evidence from Hong
Kong. International Journal of Housing Markets and Analysis, 12(6), 1072–1092.
https://doi.org/10.1108/IJHMA-11-2018-0095
Al-Akhras, M., & Saadeh, M. (2010). Automatic valuation of Jordanian estates using a
genetically-optimised Artificial Neural Network approach. WSEAS Transactions
on Systems, 9(8), 905–915.
Alexandridis, A. K., Karlis, D., Papastamos, D., & Andritsos, D. (2019). Real Estate
valuation and forecasting in non-homogeneous markets: A case study in Greece
during the financial crisis. Journal of the Operational Research Society, 70(10),
1769–1783. https://doi.org/10.1080/01605682.2018.1468864
Atilola, M. I., Ismail, A., Achu, K., & Bujang, A. A. (2019). An evaluation of factors
causing variance in property assessment. Planning Malaysia, 17(1), 82–93.
https://doi.org/10.21837/pmjournal.v17.i9.588
Azadeh, A., Sheikhalishahi, M., & Boostani, A. (2014). A flexible neuro-fuzzy approach
for improvement of seasonal housing price estimation in uncertain and non-linear
environments. South African Journal of Economics, 82(4), 567–582.
Cechin, A. L., Souto, A., & González, M. A. (2000). Real Estate Value at Porto Alegre
City Using Artificial Neural Networks. Vol.1., Sixth Brazilian Symposium on
Neural Networks, 237–242. https://doi.org/10.1109/SBRN.2000.889745
Chan, A. P. C., & Abidoye, B. R. (2019). Advanced Property Valuation Techniques and
Valuation Accuracy: Deciphering the Artificial Neural Network Technique.
International Journal of Real Estate and Land Planning, 2, 2623–4807.
Chaphalkar, N. B., & Sandbhor, S. (2013). Use of Artificial Intelligence in Real Property
Valuation. 5(3), 2334–2337.
Chiarazzo, V., Caggiani, L., Marinelli, M., & Ottomanelli, M. (2014). A neural network
based model for real estate price estimation considering environmental quality of
property location. Transportation Research Procedia, 3(July), 810–817.
Eriki, P. O., & Udegbunam, R. I. (2008). Application of Neural Network in evaluating
Prices of Housing units in Nigeria: a preliminary investigation. Journal of
A. A. Yakub, Hishamuddin, Mohd. Ali, Kamalahasan, Achu, & S.D Gimba
An Integrated Approach based on Artificial Intelligent using ANFIS and ANN for multiple criteria Real Estate
Price Prediction
© 2021 by MIP 280
Artificial Intelligence, 1(1), 21–27. https://doi.org/10.3923/jai.2008.21.27
Ge, X. J. (2004). Modeling Property Prices Using Neural Network Model for Hong Kong.
7(1), 121–138.
Gerami Moghadam, R., Yaghoubi, B., Izadbakhsh, M. A., & Shabanlou, S. (2019).
Prediction of the hydraulic jump length on sloping rough beds using meta-
heuristic neuro-fuzzy model and differential evolution algorithm. Journal of
Applied Research in Water and Wastewater, 6(1), 8–15.
https://doi.org/10.22126/arww.2019.1019
Gonzalez, M. A. S., & Formoso, C. T. (2006). Mass appraisal with genetic fuzzy rule-
based systems. Property Management, 24(1), 20–30.
https://doi.org/10.1108/02637470610643092
Guan, J., Shi, D., Zurada, J. M., & Levitan, A. S. (2014). Analyzing Massive Data Sets:
An Adaptive Fuzzy Neural Approach for Prediction, with a Real Estate
Illustration. Journal of Organizational Computing and Electronic Commerce,
24(1), 94–112. https://doi.org/10.1080/10919392.2014.866505
Guan, J., Zurada, J., & Levitan, A. S. (2008). An adaptive neuro-fuzzy inference system
based approach to real estate property assessment. Journal of Real Estate
Research, 30(4), 395–422.
Hegde, M. N. (2018). Comparison of Artificial Neural Networks and Fuzzy Logic
approaches for crack detection in a beam like structure. International Journal of
Artificial Intelligence and Applications (IJAIA), 9(1), 35–51. https://doi.org/DOI :
10.5121/ijaia.2018.9103
Hu, L., He, S., Han, Z., Xiao, H., Su, S., Weng, M., & Cai, Z. (2019). Monitoring housing
rental prices based on social media:An integrated approach of machine-learning
algorithms and hedonic modeling to inform equitable housing policies. Land Use
Policy, 82(129), 657–673. https://doi.org/10.1016/j.landusepol.2018.12.030
İsen, E., & Boran, S. (2018). A Novel Approach Based on Combining ANFIS, Genetic
Algorithm and Fuzzy c-Means Methods for Multiple Criteria Inventory
Classification. Arabian Journal for Science and Engineering, 43(6), 3229–3239.
Ke, Q., & Wang, W. (2016). The factors that determine shopping centre rent in Wuhan,
China. Journal of Property Investment and Finance, 34(2), 172–185.
https://doi.org/10.1108/JPIF-04-2015-0021
Khoshnevisan, B., Rafiee, S., Omid, M., & Mousazadeh, H. (2014). Development of an
intelligent system based on ANFIS for predicting wheat grain yield on the basis of
energy inputs. Information Processing in Agriculture, 1(1), 14–22.
https://doi.org/10.1016/j.inpa.2014.04.001
Kitapci, O., Tosun, Ö., Tuna, M. F., & Turk, T. (2017). The Use of Artificial Neural
Networks (ANN) in Forecasting Housing Prices in Ankara, Turkey. Journal of
Marketing and Consumer Behaviour in Emerging Markets, 2017(5), 4–14.
https://doi.org/10.7172/2449-6634.jmcbem.2017.1.1
Król, D., Lasota, T., Trawiński, B., & Trawiński, K. (2016). Investigation of evolutionary
optimization methods of TSK fuzzy model for real estate appraisal. International
Journal of Hybrid Intelligent Systems, 5(3), 111–128.
Kumari, N., Sunita, & Smita. (2013). Comparison of ANNs, Fuzzy Logic and Neuro-
Fuzzy Integrated Approach for Diagnosis of Coronary Heart Disease: A Survey.
PLANNING MALAYSIA
Journal of the Malaysia Institute of Planners (2021)
281 © 2021 by MIP
International Journal of Computer Science and Mobile Computing (IJCSMC),
2(6), 216–224.
Kutasi, D., & Badics, M. C. (2016). Valuation Methods for the Housing Market: evidence
from Budapest. Acta Oeconomica, 66(3), 527–546.
Lam, K. C., Yu, C. Y., & Lam, K. Y. (2008). An artificial neural network and entropy
model for residential property price forecasting in Hong Kong. Journal of
Property Research, 25(4), 321–342. https://doi.org/10.1080/09599910902837051
Liang, X., Liu, Y., Qiu, T., Jing, Y., & Fang, F. (2018). The effects of locational factors
on the housing prices of residential communities: The case of Ningbo, China.
Habitat International, 81(August), 1–11.
https://doi.org/10.1016/j.habitatint.2018.09.004
Limsombunchai, V., Gan, C., Lee, M., Box, P. O., & Zealand, N. (2004). House Price
Prediction: Hedonic Price Model vs Artificial Neural Network. American Journal
of Applied Sciences, 3(1), 193–201. https://doi.org/10.3844/ajassp.2004.193.201
Lin, C. C., & Mohan, S. B. (2011). Effectiveness comparison of the residential property
mass appraisal methodologies in the USA. International Journal of Housing
Markets and Analysis, 4(3), 224–243.
https://doi.org/10.1108/17538271111153013
Liu, J., Zhang, X., & Wu, W. (2006). Application of Fuzzy Neural Network for Real
Estate Prediction. International Symposium on Neural Networks; Advances in
Neural Networks, 1187–1191.
MathWorks, I. (2004). Neural network toolboxTM For Use with MATLAB. In H. Demuth,
M. Beale, & M. Hagan (Eds.), User’s guide (4th ed.).
Mccluskey, W. J., Mccord, M., Davis, P. T., Haran, M., Mcilhatton, D., Mccord, M.,
Davis, P. T., Haran, M., & Mcilhatton, D. (2013). Prediction accuracy in mass
appraisal : a comparison of modern approaches. Journal of Property Research
ISSN:, 30(4), 239–265. https://doi.org/10.1080/09599916.2013.781204
Mimis, A., Rovolis, A., & Stamou, M. (2013). Property valuation with artificial neural
network: The case of Athens. Journal of Property Research, 30(2), 128–143.
Mohammad, N. E., Ali, H. M., & Jasimin, T. H. (2018). Valuer’s behavioural
uncertainties in property valuation decision making. Planning Malaysia, 16(1),
239–250.
Mora-esperanza, J. G. (2004). Artificial Intelligence Applied to Real Estate Valuation; an
example for the appraisal of Madrid. CATASTRO, 1(April), 255–265.
Morano, P., Tajani, F., & Torre, C. M. (2003). Artificial intelligence in property
valuations An application of artificial neural networks to housing appraisal.
Advances in Environmental Science and Energy Planning, 2015, 23–29.
Ogunba, A. O., & Iroham, C. O. (2011). A search for an acceptable margin of valuation
error: A case study of valuers and their clients in Nigeria. Sri Lanka Journal of
Real Estate, 1(4), 54–73.
Pagourtzi, E., Nikolopoulos, K., & Assimakopoulos, V. (2006). Architecture for a real
estate analysis information system using GIS techniques integrated with fuzzy
theory. Journal of Property Investment and Finance, 24(1), 68–78.
Peterson, S., & Flanagan-III, A. B. (2009). Neural Network Hedonic Pricing Models in
Mass Real Estate Appraisal. Journal of Real Estate Research, American Real
A. A. Yakub, Hishamuddin, Mohd. Ali, Kamalahasan, Achu, & S.D Gimba
An Integrated Approach based on Artificial Intelligent using ANFIS and ANN for multiple criteria Real Estate
Price Prediction
© 2021 by MIP 282
Estate Society, 31(2), 147–164.
Phan, T. D. (2019). Housing price prediction using machine learning algorithms: The case
of Melbourne city, Australia. Proceedings - International Conference on Machine
Learning and Data Engineering, ICMLDE 2018, 8–13.
Piao, Y., Chen, A., & Shang, Z. (2019). Housing Price Prediction Based on CNN. 9th
International Conference on Information Science and Technology, ICIST 2019,
491–495. https://doi.org/10.1109/ICIST.2019.8836731
Rahman, S. N. A., Maimun, N. H. A., Razali, M. N., & Ismail, S. (2019). The artificial
neural network model (ANN) for Malaysian housing market analysis. Planning
Malaysia, 17(1), 1–9. https://doi.org/10.21837/pmjournal.v17.i9.581
Ustundag, A., Cevikcan, E., & Kilinc, M. S. (2011). A hybrid fuzzy risk evaluation model
for real estate investments. Journal of Multiple-Valued Logic and Soft Computing,
17(4), 339–362.
Yacim, J. A., & Boshoff, D. G. B. (2020). Neural networks support vector machine for
mass appraisal of properties. Property Management, 38(2), 241–272.
Yakubu, I., & Ziggah, Y. Y. (2017). Appraisal of ANN and ANFIS for Predicting Vertical
Total Electron Content (VTEC) in the Ionosphere for GPS Observations. Ghana
Mining Journal, 17(2), 12–16.
Zurada, J., Levitan, A. S., & Guan, J. (2011). A comparison of regression and artificial
intelligence methods in a mass appraisal context. Journal of Real Estate Research,
33(3), 349–387.
Received: 12th July 2021. Accepted: 23rd Sept 2021
1 Professor at University Technology Malaysia Email: [email protected]
PLANNING MALAYSIA:
Journal of the Malaysian Institute of Planners
VOLUME 19 ISSUE 3 (2021), Page 283 – 294
AN INVESTIGATION OF THE ISSUES OF TENANCY
MANAGEMENT PRACTICE: THE CASE OF COMMERCIAL
WAQF PROPERTIES IN MALAYSIA
Ibrahim Sipan1, Farah Nadia Abas2, Noor Azimah Ghazali3, Ahmad Che Yaacob4
1, 2, 3 Center of Real Estate Studies, (CRES UTM), Faculty of Built Environment
and Surveying, 4Faculty of Islamic Civilization,
UNIVERSITI TEKNOLOGI MALAYSIA
Abstract
This paper concerns the sustainability of the commercial waqf properties (CWP)
in regards to tenancy management (TM) since the waqf properties were
underperformed due to large rental arrears in some states. The objective of the
study is to investigate the issues of tenancy management that limit the
achievement of the financial sustainability of CWP. This research adopts the
qualitative approach which employing in-depth interviews at seven (7) CWP as
a case study that covered the state of Johor, Selangor, Penang and WPKL. Semi-
structured interviews were conducted with six (6) waqf property managers
(WPM) and twenty-one (21) tenants to get their perspective regarding the issues
of tenancy management according to TM attributes. From the findings, it was
found that the tenancy businesses attribute is the most issues voiced by the tenants
and WPMs followed by tenancy agreement, rental determination and
enforcement. Meanwhile, tenant selection and waqf property manager attributes
are less critical. Hence, the solutions have been proposed to improve the
sustainability of CWP while Shariah principles and waqf needs are being adhered
to in the full spectrum of waqf tenancy management.
Keywords: commercial waqf properties (CWP), rental arrears, tenancy
management, Shariah compliance, waqf needs
I. Sipan, F. N. Abas, N.A. Ghazali and A. C. Yaacob
An Investigation of The Issues of Tenancy Management Practice: The Case of Commercial Waqf Properties in Malaysia
© 2021 by MIP 284
INTRODUCTION In Malaysia, numerous commercial waqf properties (CWP) have been developed
by State Islamic Religious Council (SIRCs) in their vicinity respectively with the
cooperation of Department of Awqaf, Zakat and Hajj (JAWHAR) and Waqf
Foundation of Malaysia (WFM). CWP could be income generating to the SIRCs
through rent and encouraging better economic growth for Muslim society. By
having a good cash flow, it will allow the SIRCs to be financially sustainable to
cover all the costs and expenses of CWP and also profit distribution for waqf
philanthropy. Unfortunately, the statement fails to materialize because the waqf
properties were underperformed due to large rental arrears in some states (Mohsin
and Mohammad, 2011; Majid and Said, 2014; Ali et al., 2016). Series 3 of the
Auditor-General Report 2014 confirmed that some SIRC faced outstanding rental
issues; Kedah Islamic Religious Council (MAIK) (RM1,050,000), Penang
Islamic Religious Council (MAIPP) (RM4,560,000) and Melaka Islamic
Religious Council (MAIM) (RM420,083).
In regards to this issue, several researchers have made
recommendations on the improvement of tenancy management in waqf
properties. Ismail et al. (2015) suggested that (i) rental of waqf land should be
increased in tandem with the current rental value, (ii) more staff should be hired
to collect rental more efficiently and (iii) records system of waqf land and tenants
must be up to date. While, Osman et al. (2015) urged that tenancy management
should be well managed including leasing and renting existing land and buildings,
internal and external expertise, selecting and upgrading potential lots. However,
the disciplinary studies that deal with the management of waqf tenancy in the full
spectrum are scarce.
In another context, the literature also pointed the tenancy management
which complied with Shariah and waqf needs. Othman (1982) and Rani and Aziz
(2010) examined in depth the management of waqf properties based on the waqf
requirements and the Shariah laws embodied in them. They suggested the
solutions based on Shariah features which included terms of waqf tenancy,
duration, rental rate, the income of waqf properties, tenancy agreement and
mutawwali. However, some attributes such as tenant selection, default rent and
non-compliance penalties do not exclusively specify. Therefore, this study
bridges the gap highlighted in a prior study by interpreting the full spectrum of
tenancy management listed as (i) tenant selection, (ii) tenancy businesses, (iii)
rental determination, (iv) tenancy agreement, (v) enforcement and (vi) waqf
property manager from the Shariah perspective, investigating the current issues
from tenant’s and WPM perspectives, apart from offering a solution that meets
the needs of waqf and Shariah.
PLANNING MALAYSIA
Journal of the Malaysia Institute of Planners (2021)
285 © 2021 by MIP
TENANCY MANAGEMENT BASED ON SHARIAH COMPLIANT
PERSPECTIVES Tenancy management (TM) basically interpreted as tenant-landlord business
affairs to sustain the building, its system and business for a lasting period (Iman
and Mohamad, 2014). The scope of tenancy management may involve tenant
recruitment, tenancy agreement, rental determination, rent review, provision of
services including maintenance services to tenants, bill collection, marketing, etc.
The entire task should be carried out by the landlord itself or may appoint the
property manager on behalf of the landlord. However, property managers are
better versed in the legal rights of both the tenant and the owner.
Renting or tenancy in Arabic is termed as al-ijarah, which means
wages, rents, services or rewards. According to Islamic law terms, the people who
rent are called mu'ajir. While, renting person is called musta'jir (Mohamed,
2001). The rented property is termed ma'jur and rent or reward for the use of the
goods is called ujrah. From some of the meanings of the ijarah mentioned above,
it can be taken as the essence that ijarah or tenancy is an agreement on benefits
in return. As such, the tenant hired for a specified period, but actually they do not
own the property. They only enjoy the benefit from the property and by the time
rental is paid as a return for the enjoyment of benefit.
Since waqf is one of the Islamic philanthropy tools, adherence to
Shariah principles are necessitated for the accomplishment of waqf philosophy
Ghazali, et.al., (2021). Shariah primary sources, namely the Quran's injunctions
and the Prophet s.a.w directives and practices, usually called the Sunnah. While
it is possible to refer to the secondary sources of Shariah based on human
interpretation and reasoning, whether at the highest level of ijma' (consensus of
all jurists) or in the form of qiyas, istihsan, istislah, etc. (Engku Ali, 2013).
Shariah compliance generally means adherence to the Shariah principles and
conformity to them. In the context of tenant selection attributes, tenant and landlord
conditions are the same with seller and buyer conditions in Islamic law. Mansor
(1998) has listed the conditions which are; (i) from those who can be held
accountable – sound minded, age, and intelligence (rusyd), (ii) not blocked from
managing muamalat (not bankrupt and not safih), (iii) not being forced by any
party to carry out the contract. Besides, according to Paragraph (5/1/3) of SS9
stated that if the use to be made of usufructs of rented assets considered
permissible, an Ijarah contract could be grant even with a non-Muslim (AAOIFI,
2015). However, if the landlord knows or has reason to assume in advance that
the use of the asset to be rented is for an unacceptable purpose, and thus it will
not be allowable.
For tenancy businesses attributes, the factors to be considered in
businesses condition are permissibility of use according to Shariah law. The
permissibility to rent an asset is based on the permissibility of the tenant’s core
I. Sipan, F. N. Abas, N.A. Ghazali and A. C. Yaacob
An Investigation of The Issues of Tenancy Management Practice: The Case of Commercial Waqf Properties in Malaysia
© 2021 by MIP 286
activity, although it may involve certain activities that do not comply with
Shariah (No 63) of BNM (2009). The tenant shall comply with the terms and
conditions of use of the asset until the expiry of the tenancy or termination of the
tenancy as agreed by both parties, whichever is earlier (No 64) of BNM (2009).
Furthermore, the property shall not be rented to a person or entity if it is known
or if there is a very high potential to use the assets for non-conforming activities
(No 68) (BNM, 2009).
In discussing rental determination attributes, the rental amount shall be
determined when the tenancy contract is concluded as stated in Paragraph 76 of
(BNM, 2009). Once the tenancy agreement comes into effect, the amount of
rental specified and mutually agreed for the tenancy period shall not vary during
the period (Paragraph 77) of (BNM, 2009). Any variation such as rental
benchmarked to market rate or index is prohibited. Usmani (2000) asserted that
the landlord shall not increase the rent unilaterally because it would render the
agreement null and void. However, it’s only could permissible upon renewal of
the contract for subsequent tenancy periods that should reflect the market rate or
an agreed benchmark (Paragraph 5/2/5) of SS9 (AAOIFI, 2015). Paragraph
(5/2/4) of SS9 states that there are two specified parts of rental, (i) transferred to
the landlord and (ii) expenses or costs approved by the landlord, such as the cost
of major maintenance, insurance, etc (AAOIFI, 2015). The excess of the second
part of the rental shall be treated as an advance to the landlord on the account,
while the landlord shall bear any shortage.
Furthermore, in tenancy agreement attributes, legally enforceable
contract or al-‘aqd shall consist principles of offer, acceptance, obligations and
consideration (Mohamed, 2001). Once an offer is accepted, then a contract is
concluded. An offer can be made, either verbal, in writing or could be
communicated through messenger. Then, the obligation is an essential principle
could involve one relationship with Allah. According to Mohamed (2001), any
consideration which is forbidden by the Shariah, renders the contract to be
invalid. Therefore, to be a valid tenancy contract, all elements that prohibited by
Islamic Law in connection with the consideration of usufruct or manfaah shall
take into account. There are several conditions that are deemed as valid contract.
Firstly, the tenant and the landlord must be legally able to contract as contracting
parties. Secondly, the premises to be rented must be identified in terms of the
location, accessibility, facilities, size and quality of the premises. Besides, the
rental must be determined and the period of use the premises must be explicit at
the time of the contract. Therefore, SS9 of Ijarah under Paragraph (4/1/2) stated
that Ijarah's period should start on the date the contract is executed. If the two
parties agree on a specified future start date, which will result in a future Ijarah,
i.e., an Ijarah contract to be executed in the future (AAOIFI, 2015).
In regards to the rental payable, the tenant shall pay once he/ she has
taken delivery of the asset. However, the tenant is not liable for rental during the
PLANNING MALAYSIA
Journal of the Malaysia Institute of Planners (2021)
287 © 2021 by MIP
period of delay on the part of the owner in delivering the asset. If the contract
does not specify when rental is to be tendered then rental is payable on a daily
basis if so, demanded by the landlord. In addition, another condition has been
listed is the purpose of the tenant to use the premises. The tenant may not conduct
business which cause damage to the premises or if the landlord specifically
prohibits business or stipulates the type of business permitted. Simply put, the
tenant shall use the property only for the purpose specified in the tenancy
agreement. However, in the case whereby the agreement does not specify the
purpose of the tenancy, the tenant may use the property for whatever permissible
purpose according to the customary practice of the market which is in compliance
with sharia (BNM, 2009; Mohamed, 2001). The tenant cannot use the property
for any abnormal purpose unless the landlord agrees in express terms for such
abnormal use (Elias, 2001). Hence, the tenant shall obtain consent from the
landlord if the property is to be used for for non-specified use in the customary
practice of the market (No. 67) (BNM, 2009).
In respect to enforcement attributes, there are two situations which the
rental payment shall be deemed as a debt due from the tenant. First, the debt
results from the tenant failure or delay to pay the rental Paragraph (92) of (BNM,
2009) and second, tenant stops using the property or returns it to the owner
without the owner’s consent (Paragraph 7/1/7) of SS9 (AAOIFI, 2015).
According to Paragraph (7/2/2) of SS9, a termination of the tenancy shall be
undertaken resulting from the tenant failed or delay to pay the rental (AAOIFI,
2015). Hence, the tenant shall be subject to all the rules prescribed for defaults
and delinquencies in the payment of debt for the defined tenancy period.
However, the landlord shall not charge any additional amount as income in case
of delays in payment of the rental by tenant (Paragraph 6/3) of SS9 and Paragraph
92 of (BNM, 2009).
As far as the second situation is concerned, the rental will continue to
be due for the remaining Ijarah period. For this period, the landlord may not rent
the property to another tenant, but must keep it at the current tenant's disposal. It
should not, however, be carried out if the tenant gives the remaining time to the
landlord, in which case the tenancy expires. However, any compensation for
actual loss incurred as a result of default and debt payment delinquencies may be
claimed by the landlord rather than a rental increase (Paragraph 92) of (BNM,
2009). It also can be regarded as penalty imposed that will be channeled to
charity. However, if the tenant wants to be exempted from this penalty, the claim
of non-delinquent insolvency should be proven. To be summary, as result from
the default payment, the tenancy may not renew and the rental amount
outstanding including penalty charges becomes an outstanding debt.
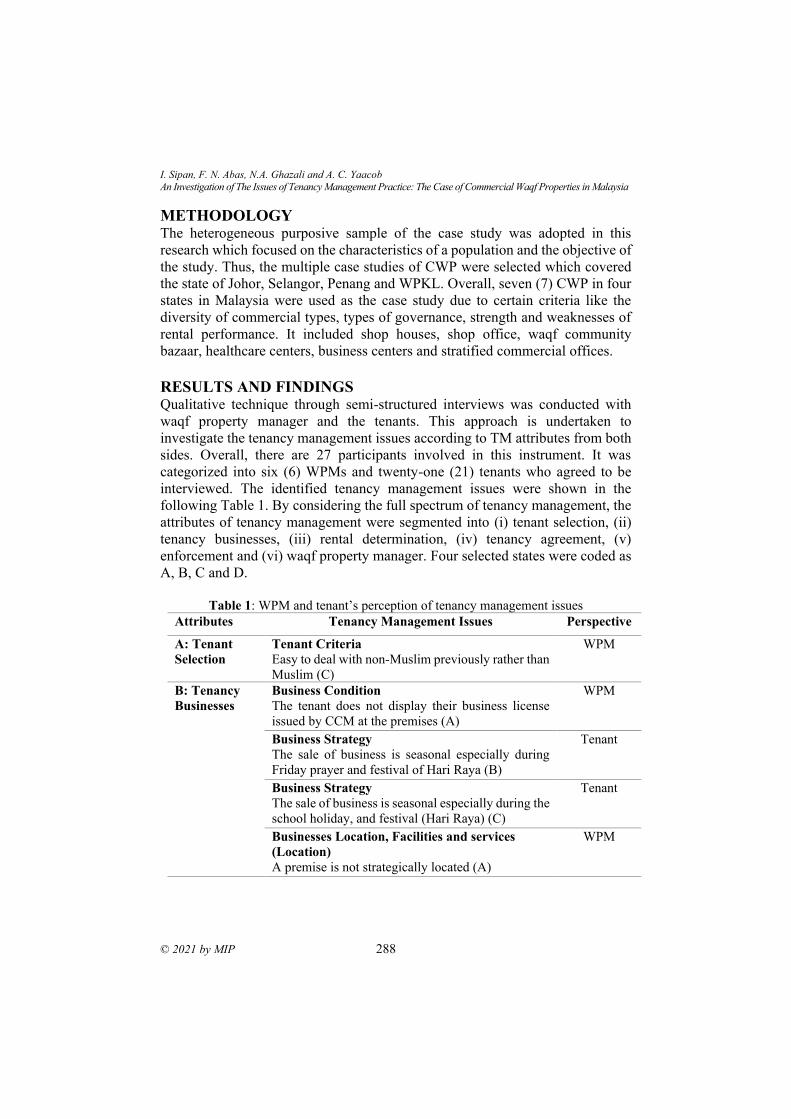
I. Sipan, F. N. Abas, N.A. Ghazali and A. C. Yaacob
An Investigation of The Issues of Tenancy Management Practice: The Case of Commercial Waqf Properties in Malaysia
© 2021 by MIP 288
METHODOLOGY The heterogeneous purposive sample of the case study was adopted in this
research which focused on the characteristics of a population and the objective of
the study. Thus, the multiple case studies of CWP were selected which covered
the state of Johor, Selangor, Penang and WPKL. Overall, seven (7) CWP in four
states in Malaysia were used as the case study due to certain criteria like the
diversity of commercial types, types of governance, strength and weaknesses of
rental performance. It included shop houses, shop office, waqf community
bazaar, healthcare centers, business centers and stratified commercial offices.
RESULTS AND FINDINGS Qualitative technique through semi-structured interviews was conducted with
waqf property manager and the tenants. This approach is undertaken to
investigate the tenancy management issues according to TM attributes from both
sides. Overall, there are 27 participants involved in this instrument. It was
categorized into six (6) WPMs and twenty-one (21) tenants who agreed to be
interviewed. The identified tenancy management issues were shown in the
following Table 1. By considering the full spectrum of tenancy management, the
attributes of tenancy management were segmented into (i) tenant selection, (ii)
tenancy businesses, (iii) rental determination, (iv) tenancy agreement, (v)
enforcement and (vi) waqf property manager. Four selected states were coded as
A, B, C and D.
Table 1: WPM and tenant’s perception of tenancy management issues
Attributes Tenancy Management Issues Perspective
A: Tenant
Selection
Tenant Criteria
Easy to deal with non-Muslim previously rather than
Muslim (C)
WPM
B: Tenancy
Businesses
Business Condition
The tenant does not display their business license
issued by CCM at the premises (A)
WPM
Business Strategy
The sale of business is seasonal especially during
Friday prayer and festival of Hari Raya (B)
Tenant
Business Strategy
The sale of business is seasonal especially during the
school holiday, and festival (Hari Raya) (C)
Tenant
Businesses Location, Facilities and services
(Location)
A premise is not strategically located (A)
WPM
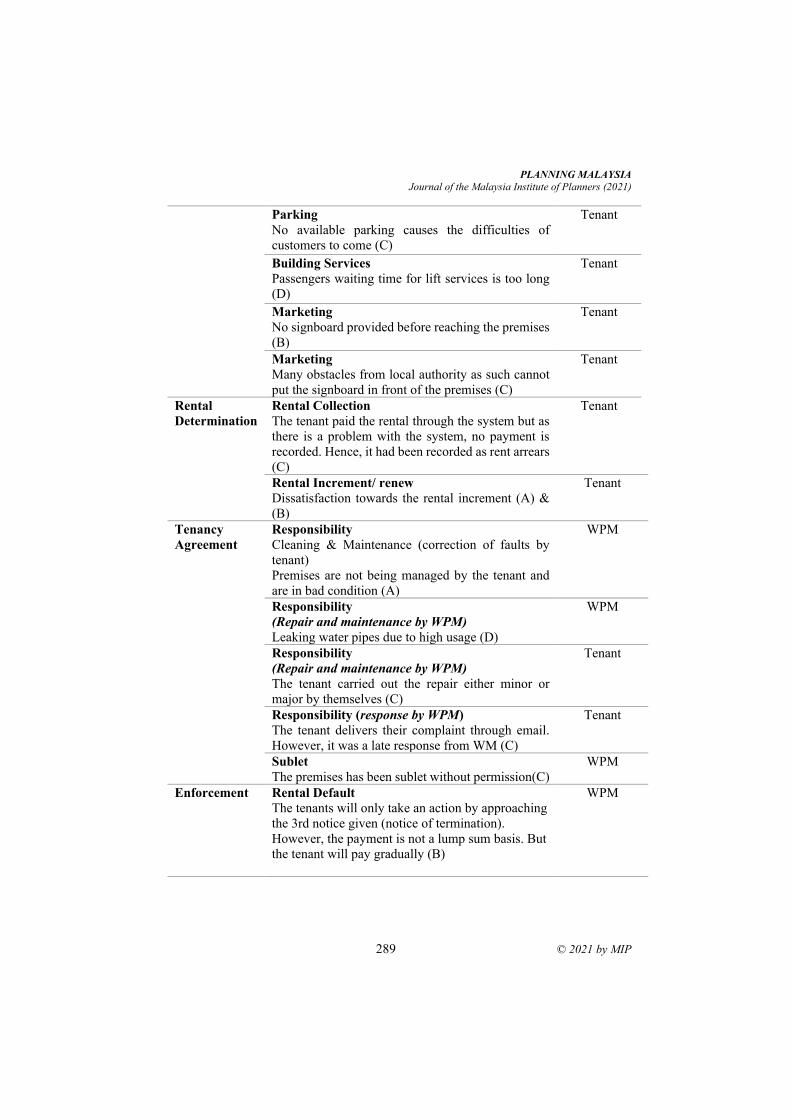
PLANNING MALAYSIA
Journal of the Malaysia Institute of Planners (2021)
289 © 2021 by MIP
Parking
No available parking causes the difficulties of
customers to come (C)
Tenant
Building Services
Passengers waiting time for lift services is too long
(D)
Tenant
Marketing
No signboard provided before reaching the premises
(B)
Tenant
Marketing
Many obstacles from local authority as such cannot
put the signboard in front of the premises (C)
Tenant
Rental
Determination
Rental Collection
The tenant paid the rental through the system but as
there is a problem with the system, no payment is
recorded. Hence, it had been recorded as rent arrears
(C)
Tenant
Rental Increment/ renew
Dissatisfaction towards the rental increment (A) &
(B)
Tenant
Tenancy
Agreement
Responsibility
Cleaning & Maintenance (correction of faults by
tenant)
Premises are not being managed by the tenant and
are in bad condition (A)
WPM
Responsibility
(Repair and maintenance by WPM)
Leaking water pipes due to high usage (D)
WPM
Responsibility
(Repair and maintenance by WPM)
The tenant carried out the repair either minor or
major by themselves (C)
Tenant
Responsibility (response by WPM)
The tenant delivers their complaint through email.
However, it was a late response from WM (C)
Tenant
Sublet
The premises has been sublet without permission(C)
WPM
Enforcement Rental Default
The tenants will only take an action by approaching
the 3rd notice given (notice of termination).
However, the payment is not a lump sum basis. But
the tenant will pay gradually (B)
WPM
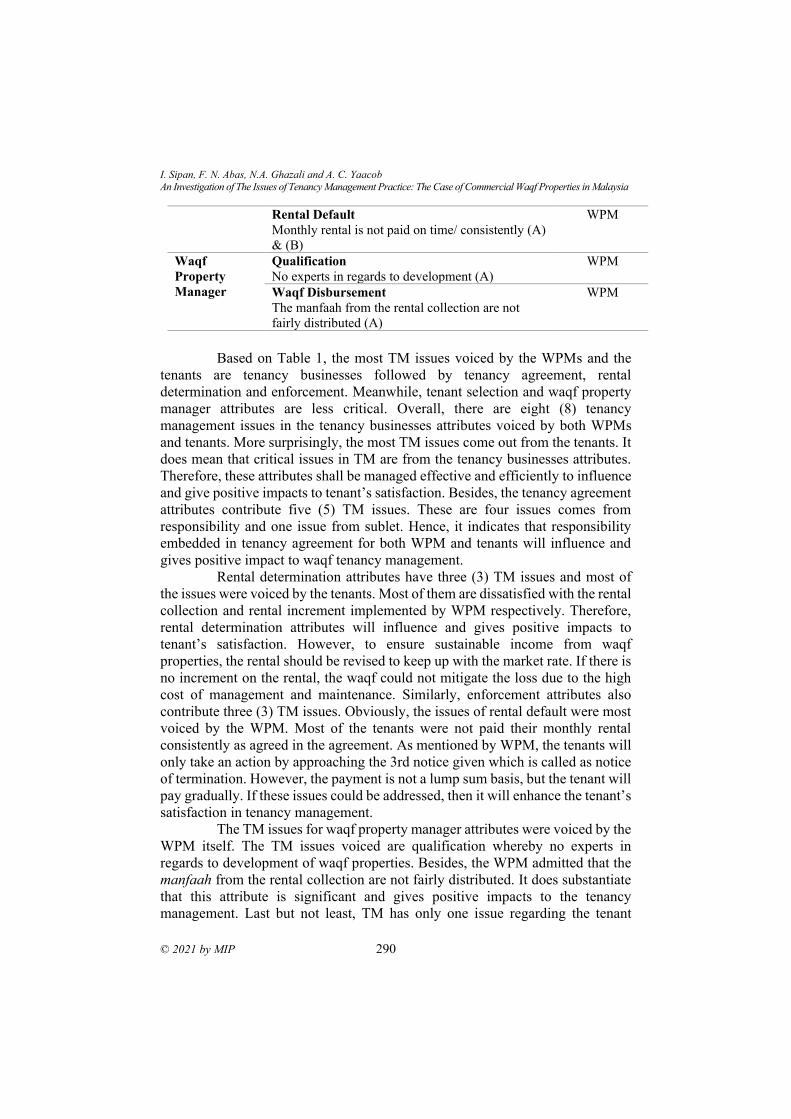
I. Sipan, F. N. Abas, N.A. Ghazali and A. C. Yaacob
An Investigation of The Issues of Tenancy Management Practice: The Case of Commercial Waqf Properties in Malaysia
© 2021 by MIP 290
Rental Default
Monthly rental is not paid on time/ consistently (A)
& (B)
WPM
Waqf
Property
Manager
Qualification
No experts in regards to development (A)
WPM
Waqf Disbursement
The manfaah from the rental collection are not
fairly distributed (A)
WPM
Based on Table 1, the most TM issues voiced by the WPMs and the
tenants are tenancy businesses followed by tenancy agreement, rental
determination and enforcement. Meanwhile, tenant selection and waqf property
manager attributes are less critical. Overall, there are eight (8) tenancy
management issues in the tenancy businesses attributes voiced by both WPMs
and tenants. More surprisingly, the most TM issues come out from the tenants. It
does mean that critical issues in TM are from the tenancy businesses attributes.
Therefore, these attributes shall be managed effective and efficiently to influence
and give positive impacts to tenant’s satisfaction. Besides, the tenancy agreement
attributes contribute five (5) TM issues. These are four issues comes from
responsibility and one issue from sublet. Hence, it indicates that responsibility
embedded in tenancy agreement for both WPM and tenants will influence and
gives positive impact to waqf tenancy management.
Rental determination attributes have three (3) TM issues and most of
the issues were voiced by the tenants. Most of them are dissatisfied with the rental
collection and rental increment implemented by WPM respectively. Therefore,
rental determination attributes will influence and gives positive impacts to
tenant’s satisfaction. However, to ensure sustainable income from waqf
properties, the rental should be revised to keep up with the market rate. If there is
no increment on the rental, the waqf could not mitigate the loss due to the high
cost of management and maintenance. Similarly, enforcement attributes also
contribute three (3) TM issues. Obviously, the issues of rental default were most
voiced by the WPM. Most of the tenants were not paid their monthly rental
consistently as agreed in the agreement. As mentioned by WPM, the tenants will
only take an action by approaching the 3rd notice given which is called as notice
of termination. However, the payment is not a lump sum basis, but the tenant will
pay gradually. If these issues could be addressed, then it will enhance the tenant’s
satisfaction in tenancy management.
The TM issues for waqf property manager attributes were voiced by the
WPM itself. The TM issues voiced are qualification whereby no experts in
regards to development of waqf properties. Besides, the WPM admitted that the
manfaah from the rental collection are not fairly distributed. It does substantiate
that this attribute is significant and gives positive impacts to the tenancy
management. Last but not least, TM has only one issue regarding the tenant
PLANNING MALAYSIA
Journal of the Malaysia Institute of Planners (2021)
291 © 2021 by MIP
selection attributes. The issue raised from the WPM claimed that it was easy to
deal with non-Muslim previously rather than Muslim. Thus, selective tenants
should be wisely considered to avoid tenant defaults in the future.
DISCUSSION AND SOLUTIONS The researchers have proposed the solutions based on the TM issues tabulated in
the previous section. Basically, the first step to select the tenants is by giving the
explanation about the nature of waqf philosophy in an understandable way. For
tenant selection’s attributes, the WPM shall provide clear information about the
tenant’s criteria and tenant screening needs to be done so that they know whether
they are qualified or otherwise. Hence, the market tenants are recommended for
the tenant’s criteria as the rental income must be sufficient to be distributed to
beneficiaries as well as to maintain and manage waqf properties. Non-Muslims
are also qualified to rent out since it is permitted by Islamic law. However,
priority is given to Muslim tenants.
In regards to tenancy businesses' attributes, all the conditions set forth
for waqf premises must conform to Shariah principles. It does imply that the
business conducted contradict to sharia principles are considered forbidden. As
such there should be no elements of forbidden uses include tobacco and alcohol,
pork, interest-based banking, gambling and weaponry. To strategized, this
framework suggested that they shall have a good tenant profile that could attract
more crowds and promote the waqf building. If possible, set up the main tenant
or anchor tenant to attract more people to the waqf building especially for a big
commercial centre such as a bank, GLC company, EPF, post office and others.
Besides, an interesting event should be organized to attract the crowd.
Importantly, the activities performed could reflect the waqf's good image and
expose the waqf's principles and benefits to society.
As previously suggested, the waqf istibdal could be carried out to
combat the less strategic location of waqf premises. However, istibdal issues must
refer to maslahah instead of the potential assets and the decision of the Fatwa
Committee by SIRC. Then, the researchers proposed that the services of the waqf
properties must be emphasized on the provision of ibadat purposes while adding
Shariah value such as the location of musolla. By right, putting the sign of
musolla could entice more patrons or customers to business premises. However,
every service to be equipped at waqf premises must in line with the intention of
waqif but depends on the manager to most potential services. Also, in order to
attract visitors and make large sales, the framework proposed that an attractive
signboard for the waqf property is essential. By doing this, visitors are aware of
the existing waqf properties and the product or services that the premise offered.
Moreover, colour scheme for waqf building as building identity could also be as
the strategy of marketing.
I. Sipan, F. N. Abas, N.A. Ghazali and A. C. Yaacob
An Investigation of The Issues of Tenancy Management Practice: The Case of Commercial Waqf Properties in Malaysia
© 2021 by MIP 292
Concerning rental determination’s attributes, rental collection for waqf
properties suggested that rental payments should be made through a bank transfer
(GIRO). A bank giro transfer is a method of transferring money by instructing a
bank to directly transfer funds from one bank account to another without the use
of physical checks. As the rental default was the most challenging issue faced by
WPM, the researchers propose that this type of payment appears capable of
disciplining tenants in fulfilling their obligations as waqf tenants. Indeed, their
monthly payment could make a huge contribution to the beneficiaries. Hopefully,
this alternative payment might decrease SIRC's default tenant figures. Then, the
rental increment should be implemented based on market rental. But the full
consideration must be given to the new facilities provided by the landlord that
based on the tenant’s needs and performances of businesses.
Basically, the tenancy agreement’s attributes concern for the sub-
attributes of responsibility suggested that the process of maintenance must be
sharia compliance such as using halal and good cleaning products. Lastly, for the
responsiveness dimension proposed by WPM, it shall be done in a shorter time.
For on-site WPM, it should be done within half an hour. Then, it would be two
hours of response time if in the case was off site but subjected to the terms and
condition. Thus, any complaints or request shall be voiced by any medium and
must be followed by filling up relevant form. Then, sublet not allowed to be
implemented since it is presumed risky.
Besides, rental default proposed as following; i) issuance of bill-
triggered to pay-(1st-7th of the month), (ii) after 7 days in rental arrears-(14th of
the month)- 1st notice, (iii) if fail to pay within 14 days from the 1st notice-(28th
of the month)-2nd notice, (iv) Notice of expiry (after 30 days)- LOD-letter of
demand. As waqf emphasizes the social welfare, thus there is no harsh approach
implemented in enforcement’s attributes.
For waqf property manager’s attributes, qualification suggested that the
tenants shall be a competent and professional, understanding of waqf and Shariah
(Islamic expertise/principle) and shall graduate in real estate and have an
experience in real estate. Since maintenance should be given priority for
distribution even if the waqif has stipulated it or not, this distribution is proposed.
The allocation should be channelled to; (i) management and maintenance, (ii)
outgoings (quit rent, assessment rate, property tax, fire insurance), (iii) sinking
fund (upgrading/ major repair) and (iv) beneficiaries.
CONCLUSION The arising issues of TM in the waqf practice have been featured prominently in
this research. Tenancy businesses are the most issues voiced by the tenants and
WPM followed by tenancy agreement, rental determination and enforcement.
Meanwhile, tenant selection and waqf property manager attributes are less
noticeable. Evidently, it can be perceived that waqf property is not sustainable
PLANNING MALAYSIA
Journal of the Malaysia Institute of Planners (2021)
293 © 2021 by MIP
yet since the performance of TM should be more improvised effectively and
efficiently. As far as Shariah law is concerned, this research proposed a possible
solution guided by Shariah principles. The findings have contributed to the
literature since there is a lack of studies on Shariah-compliant tenancy
management. Besides, by having a good TM could contribute a more income
generation will be and thus unlocking the potential of waqf properties to compete
with other conventional properties.
ACKNOWLEDGEMENTS
The research was funded by National Institute of Valuation (INSPEN) through
the research grant of The National Real Property Research Coordinator
(NAPREC). We thank our colleagues from Universiti Teknologi Malaysia
(UTM) with vote number RJ130000.7327.4B346, and by Fundamental Research
Grant Scheme (FRGS) Phase 1/2019: FRGS/1/2019/SSI10/UTM/02/1, Ministry
of Education, Malaysia. We thank our colleagues from Universiti Teknologi
Malaysia (vote number: 5F202) as the supporting institution that provided insight
and expertise that greatly assisted the research
REFERENCES
AAOIFI (2015). Sharia Standard (SS 33) on Waqf and (SS 9) on Ijarah, Shari'ah
Standards for Islamic Financial Institutions Accounting and Auditing
Organization For Islamic Financial Institutions.
Ali, S. N. M., Johari, N., Fauzi, N. S., Ahmad, N., Chuweni, N. N. and Noor, A. H. M.
(2016). Income Optimization From Waqf Properties: Sustaining The Acheen
Street Mosque. e-Proceeding of the Social Sciences Research ICSSR
BNM (2009). Draft Of Shariah Parameter Reference 2: Ijarah Contract (SPR2). (Bank
Negara Malaysia).
Elias, A. H. (2001). Business Laws. Transl of Muhammad Madani's Tahseelul Quduri Li
Masaail-ul-Quduri (1990). . (Benoni: Jet Printers).
Engku Ali, E. R. A. (2013). Shariah-compliant to Shariah-based financial innovation: a
question of semantics or progressive market differentiation. 4th SC-OCIS
Roundtable, 9 -10 March 2013, Ditchley Park, Oxford, United Kingdom.
Ghazali, N.A., Sipan, I., Haji Mohammad, M.T.S. and Ab Aziz, M.A. (2021), New
framework for the management of waqf land registration system in Malaysia,
International Journal of Islamic and Middle Eastern Finance and Management,
Vol. 14 No. 3, pp. 625-640. DOI: doi.org/10.1108/IMEFM-04-2019-0172Iman,
A. H. M. and Mohamad, M. T. S. (2014). Waqf property: Concept, management,
development, and financing. Penerbit UTM Press,
Ismail, C. Z., Salim, N. J. and Hanafiah, N. J. A. (2015). Administration and Management
of Waqf Land in Malaysia: Issues and Solutions. Mediterranean Journal of Social
Sciences. 6(4), 613.
Majid, R. A. and Said, R. (2014). Permasalahan Pengurusan Hartanah Wakaf Di
Malaysia. International Surveying Research Journal (ISrJ). Volume 4 Number 1
29-43.
I. Sipan, F. N. Abas, N.A. Ghazali and A. C. Yaacob
An Investigation of The Issues of Tenancy Management Practice: The Case of Commercial Waqf Properties in Malaysia
© 2021 by MIP 294
Mansor, M. B. H. (1998). Konsep Syariah Dalam Sistem Perbankan Islam. (BIMB
Institute of Research and Training Sdn. Bhd (BIRT)).
Mohamed, S. I. (2001). Rights and Obligations of Landlord and Tenant: A Study in the
Light of Shari'ah (Islamic Law) and the South African Rental Housing Act.
Citeseer,
Mohsin, A. and Mohammad, M. (2011). Weaknesses of current capital raising, financing,
and investment methods of awqaf (Islamic Trusts). International Conference on
Social Science and Humanity, Singapore, 2011-02-26, 5: 401-405.
Osman, S., Mat, I., Ahmad, J. and Othman, Y. (2015). Unlocking Value Of Waqf Property
Using Hibah Mudharabah: A Case Study Of Commercial Buildings In Kedah,
Malaysia. International Journal of Development Research. 5(5), 4294-4299.
Othman, M. Z. (1982). Islamic Law: With Special Reference to the Institution of Waqf.
Prime Minister's Department, Religious Affairs Division,
Rani, M. A. M. and Aziz, A. A. (2010). Waqf management and administration in
malaysia: its implementation from the perspective of Islamic law. Malaysian
Accounting Review. 9, 115-121.
Usmani, M. T. (2000). An Introduction to Islamic Finance. Karachi: Idaratul Ma'arif.
Received: 12th July 2021. Accepted: 17th Sept 2021
2 Associate Professor Dr Amirul Afif Muhamat ([email protected])
PLANNING MALAYSIA:
Journal of the Malaysian Institute of Planners
VOLUME 19 ISSUE 3 (2021), Page 295 – 306
AGRIBUSINESS AS THE SOLUTION FOR THE
UNDERUTILIZED WAQF LANDS: A VIEWPOINT FROM THE
WAQF ADMINISTRATORS
Norfaridah Ali Azizan1, Amirul Afif Muhamat2, Sharifah Faigah Syed Alwi3,
Husniyati Ali4, Mohamad Nizam Jaafar5 & Nur Hidayah Jusoh6
1,2,4Faculty of Business and Management,
UNIVERSITI TEKNOLOGI MARA 3,5Arshad Ayub Graduate Business School,
UNIVERSITI TEKNOLOGI MARA 6Consumer Operations Department No.80,
AFFIN BANK BERHAD
Abstract
Waqf land bank in Malaysia has huge potential to be developed but most of the
lands are underutilized due to the administrative and legal (conventional and
Shariah) issues that are plaguing them. The underutilized land size is estimated
to be around 87% from the 30,000 hectares waqf lands, as at 2018. This study
focuses on Selangor and Perak to explore on the same issue by interviewing the
relevant key informants to gather their feedback. In order to unlock the potential
of these waqf lands, pragmatic model or approach needs to be researched and
implemented – and this study suggests agribusiness. Therefore, this study
embarks on the preliminary field work that intends to assess the potential to
develop the waqf lands in Selangor and Perak for agribusiness activities.
Keywords: waqf, agribusiness, lands, agriculture, model, wakaf, wakap
Norfaridah Ali Azizan, Amirul Afif Muhamat, Sharifah Faigah Syed Alwi, Husniyati Ali, Mohamad Nizam
Jaafar & Nur Hidayah Jusoh
Agribusiness As the Solution for The Underutilized Waqf Lands: A Viewpoint from The Waqf Administrators
© 2021 by MIP 296
INTRODUCTION
The underutilized waqf lands is a continuous debatable issue that has been
discussed by several parties in various platforms such as seminars, workshops,
conferences and even in the parliament. We need to be fair when discussing on
this issue because over the years a lot of improvements in forms of projects and
activities being addressed towards the waqf lands. Nevertheless, the underutilised
land size which is estimated to be around 26,100 hectares as at 2018 or 87% from
the 30,000 hectares waqf lands (Kamarudin, 2019) requires immediate attention
from the stakeholders.
Therefore, this study discusses on this issue by exploring the
perspective of the waqf administrator, the trustees which is the state Islamic
religious council. This study believes agribusiness as the pragmatic solution that
can be considered for the underutilized waqf lands.
The structure of this article is as follows: literature review section to
discuss on the contemporary and important studies in the area, followed by
methodology (it is important to highlight that this article is an excerpt from a large
scale study, therefore, only several key informants who are being included in this
article as per the objective of the paper – to present the waqf administrators’ views
on agribusiness). The next section is findings from the key informants and last
but not least is conclusion.
LITERATURE REVIEW Waqf Land Issues
Waqf can be segregated into two categories: waqf am (general endowment) and
waqf khas (specific endowment) (Abdul Karim, 2010). These types of waqf are
based on the intention of endower when the person endowed a particular asset.
Likewise, these two waqf categories share similar problems which are
the waqf lands are not strategically located (Muhamat & Jaafar, 2012), lack of
funds to develop the waqf land (Azmi, Hanif, & Mahamood, 2017; Mahamood
& Ab Rahman, 2015), most of the waqf lands are small in term of size as per
bequest (A. Ibrahim & Ibrahim, 2018) and in Malaysia, the administrative of the
waqf lands are governed by various state religious councils (Ismail, Salim, &
Hanafiah, 2015; Rashid, Fauzi, & Hasan, 2018).
In the context of waqf lands, one of the pragmatic approach to develop
the waqf lands for productive purposes is by implementing istibdal. Despite this
approach, as reported in the previous section, 87% of waqf lands are still
underutilized all over Malaysia. It is not a surprise because Muhamat & Jaafar
(2012) have informed that most of the lands in the country are scattered and
predominantly at the remote area.
This situation suggests that for the waqf lands that are in the remote
area, most of the lands, in general, are suitable for agriculture. Furthermore, the
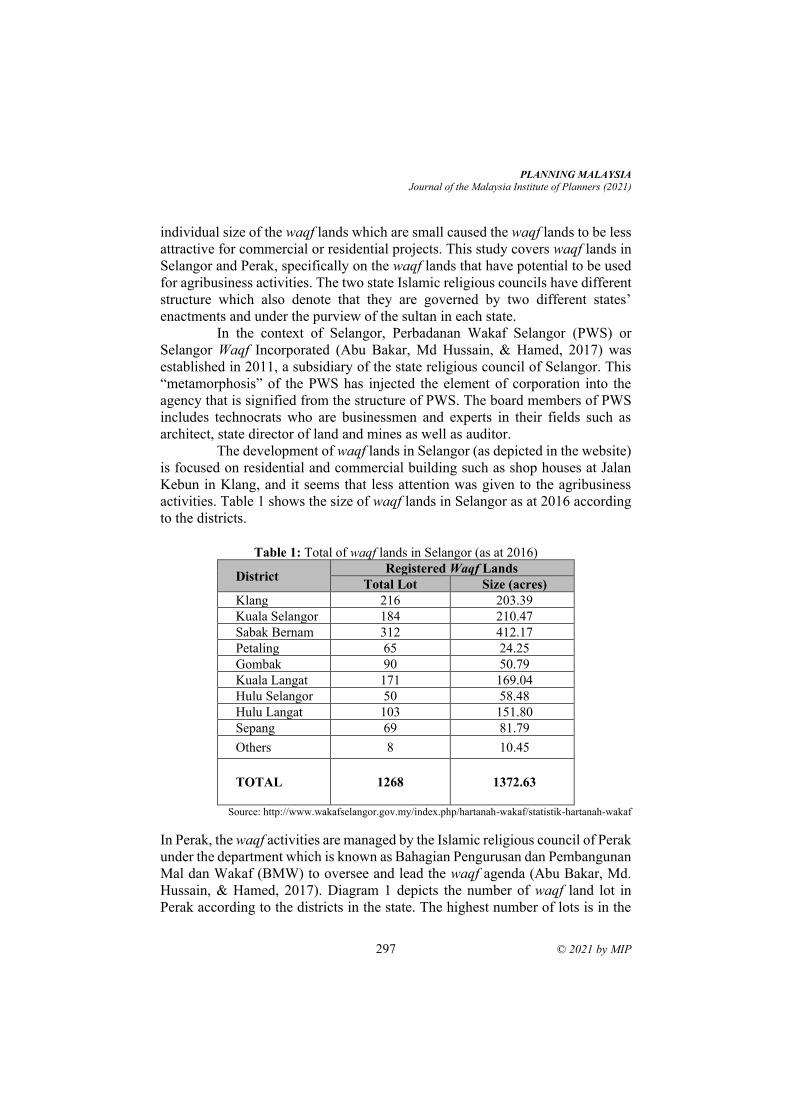
PLANNING MALAYSIA
Journal of the Malaysia Institute of Planners (2021)
297 © 2021 by MIP
individual size of the waqf lands which are small caused the waqf lands to be less
attractive for commercial or residential projects. This study covers waqf lands in
Selangor and Perak, specifically on the waqf lands that have potential to be used
for agribusiness activities. The two state Islamic religious councils have different
structure which also denote that they are governed by two different states’
enactments and under the purview of the sultan in each state.
In the context of Selangor, Perbadanan Wakaf Selangor (PWS) or
Selangor Waqf Incorporated (Abu Bakar, Md Hussain, & Hamed, 2017) was
established in 2011, a subsidiary of the state religious council of Selangor. This
“metamorphosis” of the PWS has injected the element of corporation into the
agency that is signified from the structure of PWS. The board members of PWS
includes technocrats who are businessmen and experts in their fields such as
architect, state director of land and mines as well as auditor.
The development of waqf lands in Selangor (as depicted in the website)
is focused on residential and commercial building such as shop houses at Jalan
Kebun in Klang, and it seems that less attention was given to the agribusiness
activities. Table 1 shows the size of waqf lands in Selangor as at 2016 according
to the districts.
Table 1: Total of waqf lands in Selangor (as at 2016)
District Registered Waqf Lands
Total Lot Size (acres)
Klang 216 203.39
Kuala Selangor 184 210.47
Sabak Bernam 312 412.17
Petaling 65 24.25
Gombak 90 50.79
Kuala Langat 171 169.04
Hulu Selangor 50 58.48
Hulu Langat 103 151.80
Sepang 69 81.79
Others 8 10.45
TOTAL 1268
1372.63
Source: http://www.wakafselangor.gov.my/index.php/hartanah-wakaf/statistik-hartanah-wakaf
In Perak, the waqf activities are managed by the Islamic religious council of Perak
under the department which is known as Bahagian Pengurusan dan Pembangunan
Mal dan Wakaf (BMW) to oversee and lead the waqf agenda (Abu Bakar, Md.
Hussain, & Hamed, 2017). Diagram 1 depicts the number of waqf land lot in
Perak according to the districts in the state. The highest number of lots is in the
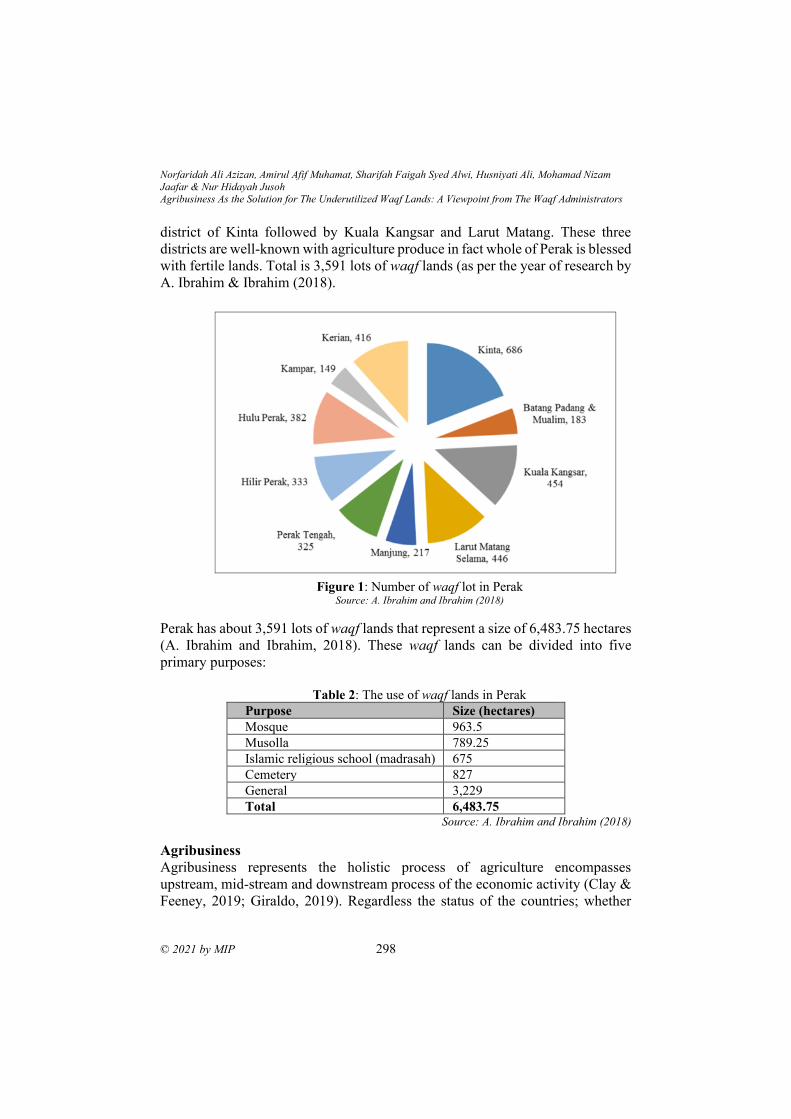
Norfaridah Ali Azizan, Amirul Afif Muhamat, Sharifah Faigah Syed Alwi, Husniyati Ali, Mohamad Nizam
Jaafar & Nur Hidayah Jusoh
Agribusiness As the Solution for The Underutilized Waqf Lands: A Viewpoint from The Waqf Administrators
© 2021 by MIP 298
district of Kinta followed by Kuala Kangsar and Larut Matang. These three
districts are well-known with agriculture produce in fact whole of Perak is blessed
with fertile lands. Total is 3,591 lots of waqf lands (as per the year of research by
A. Ibrahim & Ibrahim (2018).
Figure 1: Number of waqf lot in Perak
Source: A. Ibrahim and Ibrahim (2018)
Perak has about 3,591 lots of waqf lands that represent a size of 6,483.75 hectares
(A. Ibrahim and Ibrahim, 2018). These waqf lands can be divided into five
primary purposes:
Table 2: The use of waqf lands in Perak
Purpose Size (hectares)
Mosque 963.5
Musolla 789.25
Islamic religious school (madrasah) 675
Cemetery 827
General 3,229
Total 6,483.75 Source: A. Ibrahim and Ibrahim (2018)
Agribusiness
Agribusiness represents the holistic process of agriculture encompasses
upstream, mid-stream and downstream process of the economic activity (Clay &
Feeney, 2019; Giraldo, 2019). Regardless the status of the countries; whether
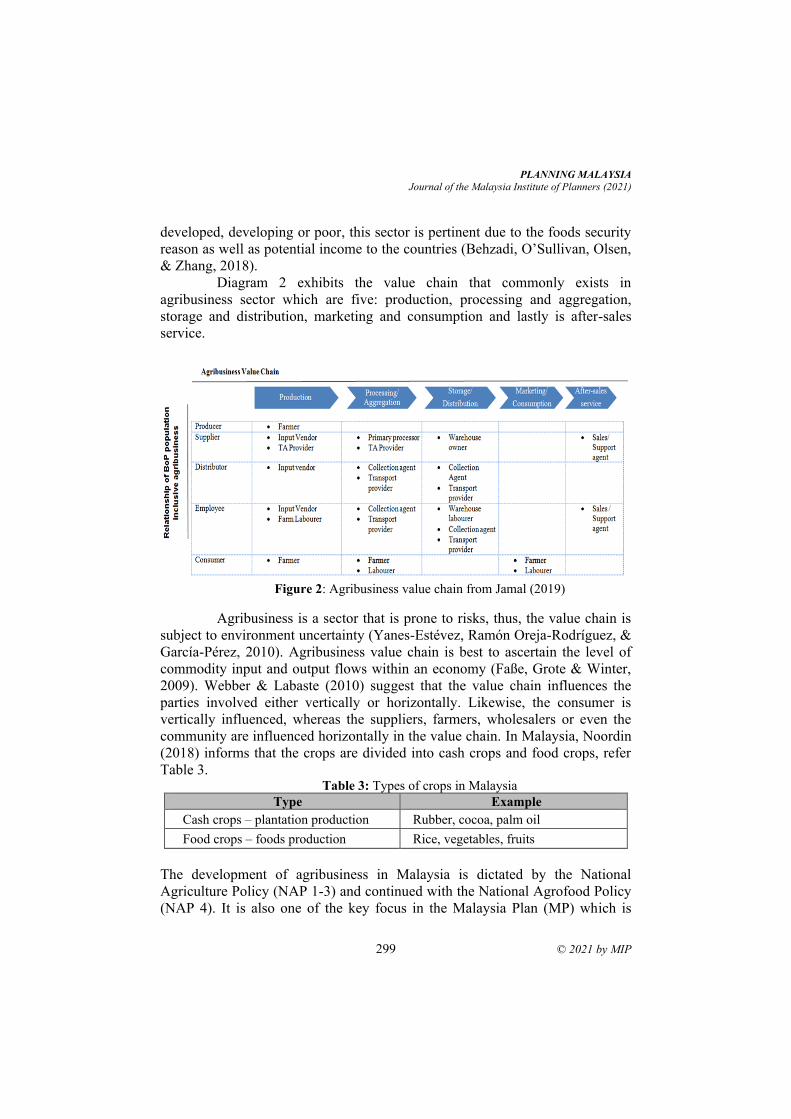
PLANNING MALAYSIA
Journal of the Malaysia Institute of Planners (2021)
299 © 2021 by MIP
developed, developing or poor, this sector is pertinent due to the foods security
reason as well as potential income to the countries (Behzadi, O’Sullivan, Olsen,
& Zhang, 2018).
Diagram 2 exhibits the value chain that commonly exists in
agribusiness sector which are five: production, processing and aggregation,
storage and distribution, marketing and consumption and lastly is after-sales
service.
Figure 2: Agribusiness value chain from Jamal (2019)
Agribusiness is a sector that is prone to risks, thus, the value chain is
subject to environment uncertainty (Yanes-Estévez, Ramón Oreja-Rodríguez, &
García-Pérez, 2010). Agribusiness value chain is best to ascertain the level of
commodity input and output flows within an economy (Faße, Grote & Winter,
2009). Webber & Labaste (2010) suggest that the value chain influences the
parties involved either vertically or horizontally. Likewise, the consumer is
vertically influenced, whereas the suppliers, farmers, wholesalers or even the
community are influenced horizontally in the value chain. In Malaysia, Noordin
(2018) informs that the crops are divided into cash crops and food crops, refer
Table 3. Table 3: Types of crops in Malaysia
Type Example
Cash crops – plantation production Rubber, cocoa, palm oil
Food crops – foods production Rice, vegetables, fruits
The development of agribusiness in Malaysia is dictated by the National
Agriculture Policy (NAP 1-3) and continued with the National Agrofood Policy
(NAP 4). It is also one of the key focus in the Malaysia Plan (MP) which is
Norfaridah Ali Azizan, Amirul Afif Muhamat, Sharifah Faigah Syed Alwi, Husniyati Ali, Mohamad Nizam
Jaafar & Nur Hidayah Jusoh
Agribusiness As the Solution for The Underutilized Waqf Lands: A Viewpoint from The Waqf Administrators
© 2021 by MIP 300
reviewed every five years. These plans have provided directions to the sector,
however the planning is somewhat lacking in term of foresighting input when
developing the plan because some of the gaps are widening such as the food
crops.
Currently, the government, through the Ministry of Agriculture and
Food Industries (MAFI) is focusing to increase the supply of foods production,
particularly rice to ensure the food security needs in Malaysia can be achieved.
This is consistent with Ramaloo, Siwar, Liong & Isahak (2018) recommendation
for urban agriculture development based on the Penang’s case study. The current
local production of rice for national consumption is 70% and the remaining is
imported from other countries (Abd Mutalib, 2019; Rosmiza et al., 2015; Tey,
2010). Nevertheless, the national food self-sufficiency is should be at 80% (Hadi,
2019).
RESEARCH METHOD It has been mentioned earlier that this article presents a focused discussion or an
excerpt from a bigger study. Thus, only a few key informants that are highlighted
in relation to the issue of discussed in this article. The qualitative method was
employed and semi-structured interview sessions were held with the key
informants (senior managers) from Islamic Religious Council of Selangor,
Islamic Religious Council of Perak (MAIPk), Islamic Religious Council of
Federal Territory, Northern Corridor Implementation Authority (NCIA) and
Wakaf Selangor Incorporated or PWS.
FINDINGS Some of the findings gathered in this study are consistent with previous studies
which signify that the issues are still exist and continuous action must be taken to
reduce the gap, at least, if to eliminate them are difficult.
Shariah requirements
In general, the use of waqf lands for agribusiness is permissible however for waqf
khas, there are specific requirements that need to be adhered. Firstly, the intention
of the endower must be executed, however, if the endower’s wishes might be
impossible to be executed at that time because there is no urgent need for it then
the waqf lands can be developed for other beneficial activities which are deemed
suitable by the waqf trustee.
Nevertheless, it cannot be perpetuity because the original intention of
the endower remains and must be executed when possible. For instance, there is
waqf land endowed for a mosque or cemetery but in that vicinity, such facilities
are available. Therefore, the land can be used for agribusiness (subject to the State
Islamic Religious Council approval) within the stipulated period.
PLANNING MALAYSIA
Journal of the Malaysia Institute of Planners (2021)
301 © 2021 by MIP
Islam is the official religion for federation of Malaysia and Muslims in
Malaysia follow the Sunni’s sect. In the context of religious madhhab or school
of thought, the Shafie madhhab opinions are being preferred before referring to
other interpretations in other Sunni’s madhhab such as Hanafi, Maliki and
Hanbali (Ahmad, 2017; Man, Ali, Abdullah, & Ramli, 2009). This is being
practiced when the fatwa or solution on certain issues are not suitable for
Malaysia as per the Shafie’s madhhab due to the social, culture or the current
situation.
According to the Hanbali madhhab, the waqf lands can be istibdal if the idle
lands can be used to bring benefits to the beneficiaries. I would say the Hanbali
madhhab is more flexible. For instance, even though the waqf land is doing well,
it can be istibdal if there is better plan that could give better benefits to the
beneficiaries. (Key informant 1)
There is no objection from the Shariah perspective since the agribusiness
activities are just for temporary and not permanent. (Key informant 2)
Importantly, to reiterate previous point, the waqf lands for agribusiness
is subject to the time consideration because the original intention of endower is
different. When the original needs (as per endower’s intention) arises, then the
lands must be used for it. Thus, when drafting the agreement to develop the waqf
lands for agribusiness, the agreement must reflect the situation, for instance the
type of crops must be crops that can produce yield in a short cycle, process or
clearing and cleaning the waqf lands before and after the agreement starts etc.
Financial constraints
Almost many corporations or government agencies face limitation with regard to
funding, however, the situation of PWS and MAIPk is more critical because these
are institutions that are being established for charitable causes but operating and
being treated like other commercial institutions. They are responsible to manage
among others; waqf lands that the proceeds from the waqf lands will be
distributed back to the Muslims communities such as to the local mosques,
madrasa, NGOs and others. Therefore, it is clear that the institutions are selling
and marketing the “charitable products” instead of commercial products.
Accordingly, this situation has limits the institutions from being
aggressive to develop and grow the waqf lands. It can be easily understood that
MAIPk and PWS do not have sufficient funds to plan and execute more economic
activities for the waqf lands because every project requires commitment of human
resource, overhead cost, land premium, legal and administrations etc.
Norfaridah Ali Azizan, Amirul Afif Muhamat, Sharifah Faigah Syed Alwi, Husniyati Ali, Mohamad Nizam
Jaafar & Nur Hidayah Jusoh
Agribusiness As the Solution for The Underutilized Waqf Lands: A Viewpoint from The Waqf Administrators
© 2021 by MIP 302
Interviewer: Does the state government provides MAIPk some funds to manage
the waqf land?
Key informant 3: No. We are self-funded.
Expertise to develop the waqf lands for agribusiness
PWS and MAIPk do not have in-house expertise to plan and develop the waqf
lands for agribusiness because that is not their forte; and this is expected.
Therefore, the institutions have to outsource the talents from other agencies or
companies so that they will have a committee of experts to advise them before
venturing into agribusiness.
I think, in terms of expertise, MAIS and PWS do not have enough expertise and
that must be outsourced. However, even though we outsourced, the committee
(representative from MAIS or PWS) must be in the committee or company to
ensure the interest of the stakeholders is taken care. Especially the intention of
the bequether. (Key informant 2)
In other words, consortium of panel of experts to advise the PWS or
MAIPk is possible, and this study believes that many Muslims experts are willing
to contribute to these agencies for the sake of Allah and recognition of their
expertise in forms of letters of appointment and certificates. This will not cost a
lot to PWS and MAIPk.
However, the concern is in term of the governance because it involves
audit process which is a continuous process in any agency that practices good
corporate governance, and the situation is more critical due to the involvement of
external parties with PWS and MAIPk. The agency issue is inherent in this
situation particularly if the conflict of interest arises when the appointed expert
or advisor leaks the information to his or her confidante or business associate with
regard to the development of the waqf lands.
Likewise, the appointed experts also need to consistently monitor the
agribusiness projects to ensure the objectives are met – this is time consuming.
The statement from another key informant, who is a senior manager oversees
agribusiness activities in the Northern region under Northern Corridor Economic
Region (NCER) authority advises as follows:
Agribusiness cannot afford a simple mistake because the period or cycle taken
before the mistake becomes visible is too long. Therefore, for this sector, better
replicate the successful model and implement it rather than trial and error. The
trial and error should be done at the university or research center level such as
MARDI. (Key informant 4)
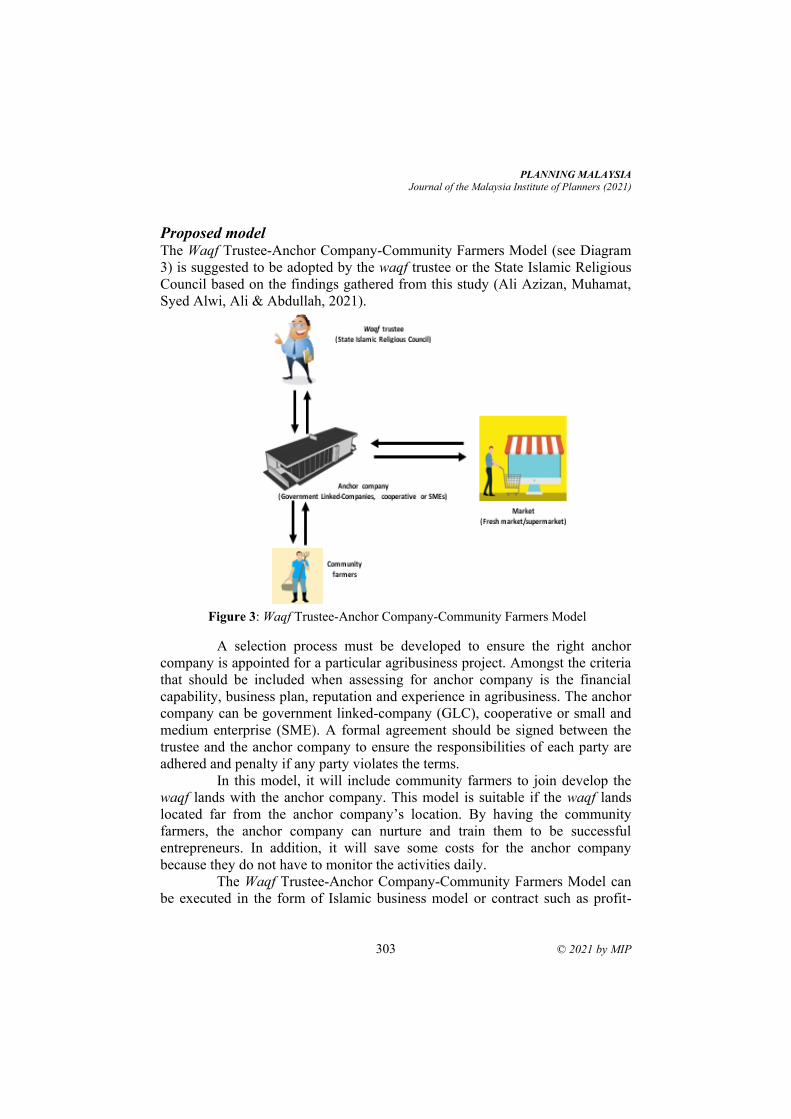
PLANNING MALAYSIA
Journal of the Malaysia Institute of Planners (2021)
303 © 2021 by MIP
Proposed model The Waqf Trustee-Anchor Company-Community Farmers Model (see Diagram
3) is suggested to be adopted by the waqf trustee or the State Islamic Religious
Council based on the findings gathered from this study (Ali Azizan, Muhamat,
Syed Alwi, Ali & Abdullah, 2021).
Figure 3: Waqf Trustee-Anchor Company-Community Farmers Model
A selection process must be developed to ensure the right anchor
company is appointed for a particular agribusiness project. Amongst the criteria
that should be included when assessing for anchor company is the financial
capability, business plan, reputation and experience in agribusiness. The anchor
company can be government linked-company (GLC), cooperative or small and
medium enterprise (SME). A formal agreement should be signed between the
trustee and the anchor company to ensure the responsibilities of each party are
adhered and penalty if any party violates the terms.
In this model, it will include community farmers to join develop the
waqf lands with the anchor company. This model is suitable if the waqf lands
located far from the anchor company’s location. By having the community
farmers, the anchor company can nurture and train them to be successful
entrepreneurs. In addition, it will save some costs for the anchor company
because they do not have to monitor the activities daily.
The Waqf Trustee-Anchor Company-Community Farmers Model can
be executed in the form of Islamic business model or contract such as profit-
Norfaridah Ali Azizan, Amirul Afif Muhamat, Sharifah Faigah Syed Alwi, Husniyati Ali, Mohamad Nizam
Jaafar & Nur Hidayah Jusoh
Agribusiness As the Solution for The Underutilized Waqf Lands: A Viewpoint from The Waqf Administrators
© 2021 by MIP 304
sharing (musharakah) or profit and loss sharing (mudharabah) models. The
musharakah or mudharabah models will offer higher return but begets higher risk
(this is the consideration that the waqf trustee needs to consider in term of risk).
The pertinent issue with agribusiness is the market place for the produce. Thus,
this is the role of the anchor company that is not only to develop but also to market
or sell the crops or livestock from the waqf lands.
CONCLUSION
This study informs that the issues or problems that were highlighted in previous
studies are still exist, and they required immediate attention from the relevant
stakeholders and authority to address them.
The waqf administrators or trustees do not against the use of waqf lands for
agribusiness but as mentioned in the discussion, the agreement is important
especially on the part of period to use the waqf lands for agribusiness because in
general, it cannot be for a long time due to the endower’s original intention on
the land which is endowed.
The Waqf Trustee-Anchor Company-Community Farmer model is
suggested based on the findings from this study. It can be executed in the form of
Islamic business contract that surely will pave way financing from Islamic banks,
that is compatible with the waqf institutions that is for the Muslims. Moreover,
through this model, the rural farmers can be assisted so that they can have source
of income and learn from the experienced and successful farmer – the anchor
company. In addition, this study highlights the importance of urban planning and
management on the waqf administrators and government agencies that because the waqf lands are scattered all over Malaysia, located in the urban and rural areas.
Proper planning and modern farming technique will ensure the urbanisation
process happen in order for the benefits of the waqf beneficiaries, endower as
well as the community.
ACKNOWLEDGEMENTS We would like to express our gratitude to the Ministry of Finance Malaysia and
INSPEN for the NAPREC research grant 2019/2020, file no: 100-IRMI/GOV
16/6/2 (019/2019) that has assisted us to complete this research.
REFERENCES Abdul Karim, S. (2010). Contemporary shari’a compliance structuring for the
development and management of waqf assets in Singapore. Kyoto Bulletin of
Islamic Area Studies, 3(2), 143-164.
Abd Mutalib, Z. (2019). Ministry: rice production to be increased to 75 per cent, New
Straits Times.
PLANNING MALAYSIA
Journal of the Malaysia Institute of Planners (2021)
305 © 2021 by MIP
Abu Bakar, N. A., Md Hussain, M. N., & Hamed, A. B. (2017). Scrutinizing the effects
of restructuring in Perbadanan Wakaf Selangor. International Journal of
Accounting, 2(4), 13-21.
Abu Bakar, N. A., Md. Hussain, M. N., & Hamed, A. B. (2017). Kaedah pembangunan
tanah wakaf oleh Majlis Agama Islam dan Adat Melayu Perak (MAIPK). Journal
of Islamic, Social, Economics and Development, 2(4), 2017.
Ali Azizan, N., Muhamat, A. A., Syed Alwi, S. F., Ali, H., & Abdullah, A. Q. C. (2021).
Revitalising Waqf (endowment) lands for agribusiness: potentials of the anchor
company models. Journal of Agribusiness in Developing and Emerging
Economies.
Azmi, A. S. M., Hanif, N. R., & Mahamood, S. M. (2017). Revitalising the development
of waqf properties: a way forward. International Journal of Real Estate Studies,
11(3), 1-11.
Behzadi, G., O’Sullivan, M. J., Olsen, T. L., & Zhang, A. (2018). Agribusiness supply
chain risk management: A review of quantitative decision models. Omega, 79, 21-
42.
Clay, P. M., & Feeney, R. (2019). Analyzing agribusiness value chains: a literature
review. International Food and Agribusiness Management Review, 22(1), 31-46.
Faße, A., Grote, U., & Winter, E. (2009). Value chain analysis methodologies in the
context of environment and trade research: Discussion papers//School of
Economics and Management
Giraldo, O. F. (2019). Territorial control and geographical expansion of agribusiness
Political Ecology of Agriculture (pp. 35-59): Springer.
Hadi, E. (2019). Food security in Malaysia: rice above all. Retrieved 20 September 2020,
2020, from https://www.emirresearch.com/food-security-in-malaysia-rice-above-
all/.
Ibrahim, A., & Ibrahim, A. (2018). Pelaksanaan istibdal dan pembangunan tanah wakaf
di Perak. Asian People Journal (APJ), 1(2), 287-297.
Ibrahim, T. A.-N. (1995). The Islamic personality (Vol. 2): Dar al-Ummah.
Ismail, C. Z., Salim, N. J., & Hanafiah, N. J. A. (2015). Administration and management
of waqf land in Malaysia: Issues and solutions. Mediterranean Journal of Social
Sciences, 6(4), 613.
Kamarudin, K. (2019). Tanah wakaf boleh dimanfaatkan untuk kumpulan B40,
Bernama.com. Retrieved from
http://www.bernama.com/bm/news.php?id=1738830
Lewis, R. B. (2004). NVivo 2.0 and ATLAS. ti 5.0: A comparative review of two popular
qualitative data-analysis programs. Field methods, 16(4), 439-464.
Mahamood, S. M., & Ab Rahman, A. (2015). Financing universities through waqf, pious
endowment: is it possible? Humanomics, 31(4), 430-453.
Muhamat, A. A., & Jaafar, M. N. (2012). A study on the prospect of waqaf (endowment)
lands for agricultural activities: an exploratory study on Kota Setar district, Kedah.
Jurnal Pengurusan Awam, 9(1).
Man, S., Ali, A.K., Abdullah, L.H. and Ramli, R. (2009), “Kesesuaian pemikiran dan
amalan mazhab selain Syafi'i dalam masyarakat Islam di Malaysia: satu analisis
awal”, Jurnal Fiqh, Vol. 6, pp. 21-40.
Norfaridah Ali Azizan, Amirul Afif Muhamat, Sharifah Faigah Syed Alwi, Husniyati Ali, Mohamad Nizam
Jaafar & Nur Hidayah Jusoh
Agribusiness As the Solution for The Underutilized Waqf Lands: A Viewpoint from The Waqf Administrators
© 2021 by MIP 306
Noordin, K.A. (2018), “Agriculture: addressing food security in Malaysia”, The Edge.
Ramaloo, P., Siwar, C., Liong, C. Y., & Isahak, A. (2018). Identification of strategies for
urban agriculture development: A SWOT analysis. Planning Malaysia, 16(7).
Rashid, K. A., Fauzi, P. N. F. N. M., & Hasan, S. F. (2018). Meeting housing needs of
the poor and needy Muslims through Zakat and Wakaf. Planning Malaysia, 16(7).
Rosmiza, M., Davies, W., Rosniza, A. C., Jabil, M., Mazdi, M., Toren, W. W., &
Rosmawati, C. C. (2015). Stagnation of rice straw agribusiness development in
Malaysia: the entrepreneurs’ perspectives. Mediterranean Journal of Social
Sciences, 6(4), 523-523.
Webber, C., & Labaste, P. (2010). Building competitiveness in Africa’s agriculture. A
guide to value chain concepts and applications. Washington DC: The World Bank.
Yanes-Estévez, V., Ramón Oreja-Rodríguez, J., & García-Pérez, A. M. (2010). Perceived
environmental uncertainty in the agrifood supply chain. British Food Journal,
112(7), 688-709.
Received: 12th July 2021. Accepted: 17th Sept 2021
1 Lecturer at Polytechnic of State Finance STAN. Email: [email protected]
PLANNING MALAYSIA:
Journal of the Malaysian Institute of Planners
VOLUME 19 ISSUE 3 (2021), Page 307 – 316
UNCERTAINTY IN BUSINESS VALUATION FOR TAX
PURPOSES
Kristian Agung Prasetyo1, Adhipradana Prabu Swasito2, Dhian Adhetiya Safitra3
1,2,3Valuer Diploma III Vocational Program in Tax Major
POLYTECHNIC OF STATE FINANCE STAN
Abstract
An important but often neglected aspect in business valuation for tax purposes is
uncertainty. It is known in the literature that changes in economic structure,
people’s behavior, business risk, or political leader are expected. Unfortunately,
these factors cannot be effectively measured and reported in business valuation
for tax purposes. As such, most business valuations for tax purposes are unable
to capture uncertainty adequately. Valuation reports under a tax investigation
process only present an estimated value in the form of a single value, which is
unable to represent uncertainty sufficiently. This paper aims to demonstrate a
method to quantify uncertain variables into the business valuation for tax
purposes. The research engaged scenario analysis to arrive in three different
possible value estimates, and Monte Carlo simulation to take uncertainties into
accountto produce a frequency distribution containing all possible values
between predetermined limits. Using the range of value produced in the
simulation, a taxpayer will have more complete information to decide whether
taxpayers submit an undervalue report or not.
Keyword: Business Valuation, Tax, Scenario Analysis, Monte Carlo
JEL Code: G170
Kristian Agung Prasetyo, Adhipradana Prabu Swasito, Dhian Adhetiya Safitra
Uncertainty In Business Valuation: The Monte Carlo Approach
© 2021 by MIP 308
INTRODUCTION In the business context, valuation is aims to work our the total market value of a
company (Sinem and Saad (2020) for various purposes, including commercial
transactions, financing, taxation, bankruptcy, and ownership transition. While the
value of physical assets is generally known, the overall market value of a business
is often unknown because market value is merely an estimate of sale price in the
open market between willing buyers and sellers (Sayce et al., 2009), and the
summary of the company’s net assets and goodwill (Fernandez, 2007). The
primary assumption is that this interaction occurs in an open market between
willing buyers and sellers. The current standard defines market value as the
predicted amount of an asset at the valuation date after proper marketing, which
each party has acted knowledgeably, prudently, and without compulsion (IVSC,
2010). Accordingly, an accurate estimation of market value is desirable as it leads
to a better decision making (Ja’afar & Muhammad, 2021).
These definitions generally say that the company’s value is the result of
estimation or prediction. the estimated value may be different from the actual
price when a transaction occurs. In fact, it is common to find discrepancies in
estimated market values reported by one appraiser from another, which
Mohammad, Mohd Ali, & Haryati Jasimin (2018) as the art of valuation.
Valuation is a mere attempt to predict prices that might occur in transactions., it
carries an element of risk or uncertainty inherent in its process.
In the context of Indonesia’s income taxation, business valuation has
become increasingly important. For instance, profits from selling shares in
corporate actions (e.g., mergers or acquisitions) or selling a company above the
fair value are subject to income tax. However, the integrity of income tax system
is undermined by taxpayers who defensively file an underreport in transaction
values (Allingham and Sandmo, 1972). Meanwhile, tax valuers (tax officers who
primarily performs valuation for tax purposes) strives for measuring as accurate
transaction values as possible.
The effect of risks faced by Indonesian tax valuers compounds as
taxpayers often do not provide an actual transaction amount. This situation makes
tax valuers are unable to produce adequate report of the market value for the given
transactions. As a result, the outcome of a valuation process contains a degree of
uncertainty. However, the uncertainty is not fully covered in business valuation
reports for tax purposes in Indonesia because the reports only provide a single
value estimate. Accordingly, this paper aims to fill this gap by demonstrating the
method of incorporating uncertainty in the business valuation process. For this
purpose, this paper is organized as follows. Section II describes a brief literature
review on valuation and the Monte Carlo approach. Section III demonstrates how
uncertainty is incorporated into the valuation. Finally, the fourth section identifies
several limitations with regard to the methods chosen in this paper. A brief
conclusion at the end concludes this paper.
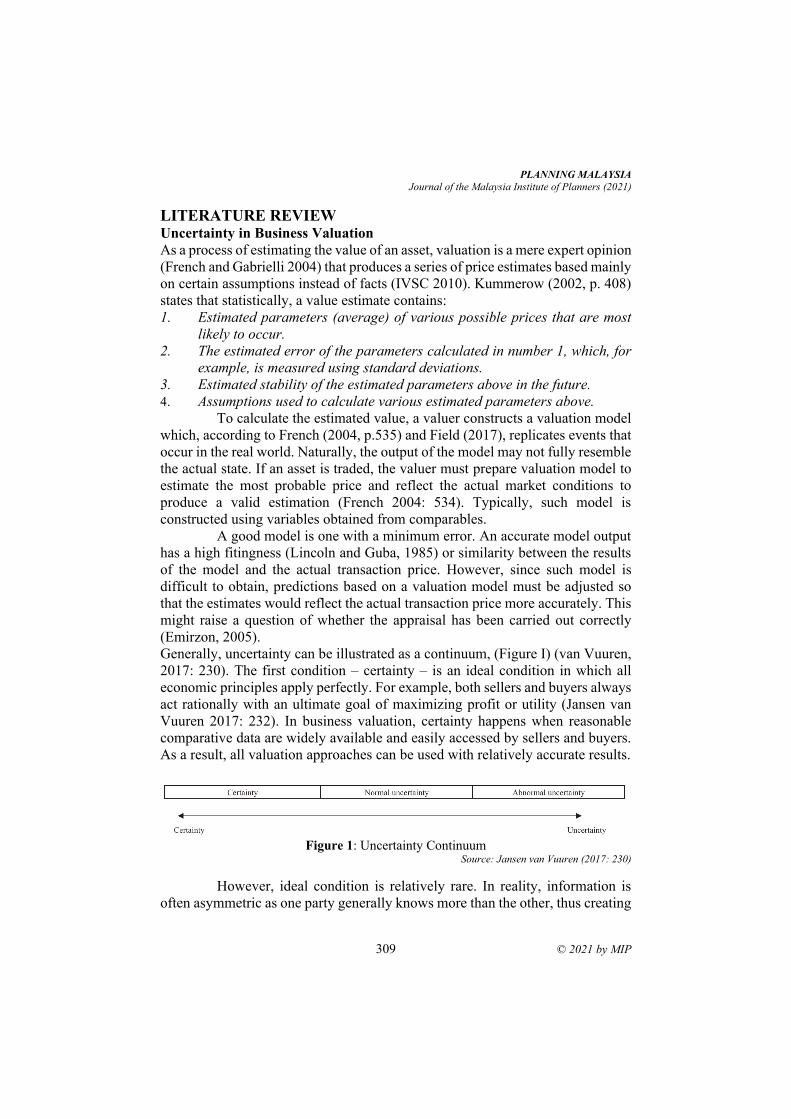
PLANNING MALAYSIA
Journal of the Malaysia Institute of Planners (2021)
309 © 2021 by MIP
LITERATURE REVIEW Uncertainty in Business Valuation
As a process of estimating the value of an asset, valuation is a mere expert opinion
(French and Gabrielli 2004) that produces a series of price estimates based mainly
on certain assumptions instead of facts (IVSC 2010). Kummerow (2002, p. 408)
states that statistically, a value estimate contains:
1. Estimated parameters (average) of various possible prices that are most
likely to occur.
2. The estimated error of the parameters calculated in number 1, which, for
example, is measured using standard deviations.
3. Estimated stability of the estimated parameters above in the future.
4. Assumptions used to calculate various estimated parameters above.
To calculate the estimated value, a valuer constructs a valuation model
which, according to French (2004, p.535) and Field (2017), replicates events that
occur in the real world. Naturally, the output of the model may not fully resemble
the actual state. If an asset is traded, the valuer must prepare valuation model to
estimate the most probable price and reflect the actual market conditions to
produce a valid estimation (French 2004: 534). Typically, such model is
constructed using variables obtained from comparables.
A good model is one with a minimum error. An accurate model output
has a high fitingness (Lincoln and Guba, 1985) or similarity between the results
of the model and the actual transaction price. However, since such model is
difficult to obtain, predictions based on a valuation model must be adjusted so
that the estimates would reflect the actual transaction price more accurately. This
might raise a question of whether the appraisal has been carried out correctly
(Emirzon, 2005).
Generally, uncertainty can be illustrated as a continuum, (Figure I) (van Vuuren,
2017: 230). The first condition – certainty – is an ideal condition in which all
economic principles apply perfectly. For example, both sellers and buyers always
act rationally with an ultimate goal of maximizing profit or utility (Jansen van
Vuuren 2017: 232). In business valuation, certainty happens when reasonable
comparative data are widely available and easily accessed by sellers and buyers.
As a result, all valuation approaches can be used with relatively accurate results.
Figure 1: Uncertainty Continuum
Source: Jansen van Vuuren (2017: 230)
However, ideal condition is relatively rare. In reality, information is
often asymmetric as one party generally knows more than the other, thus creating
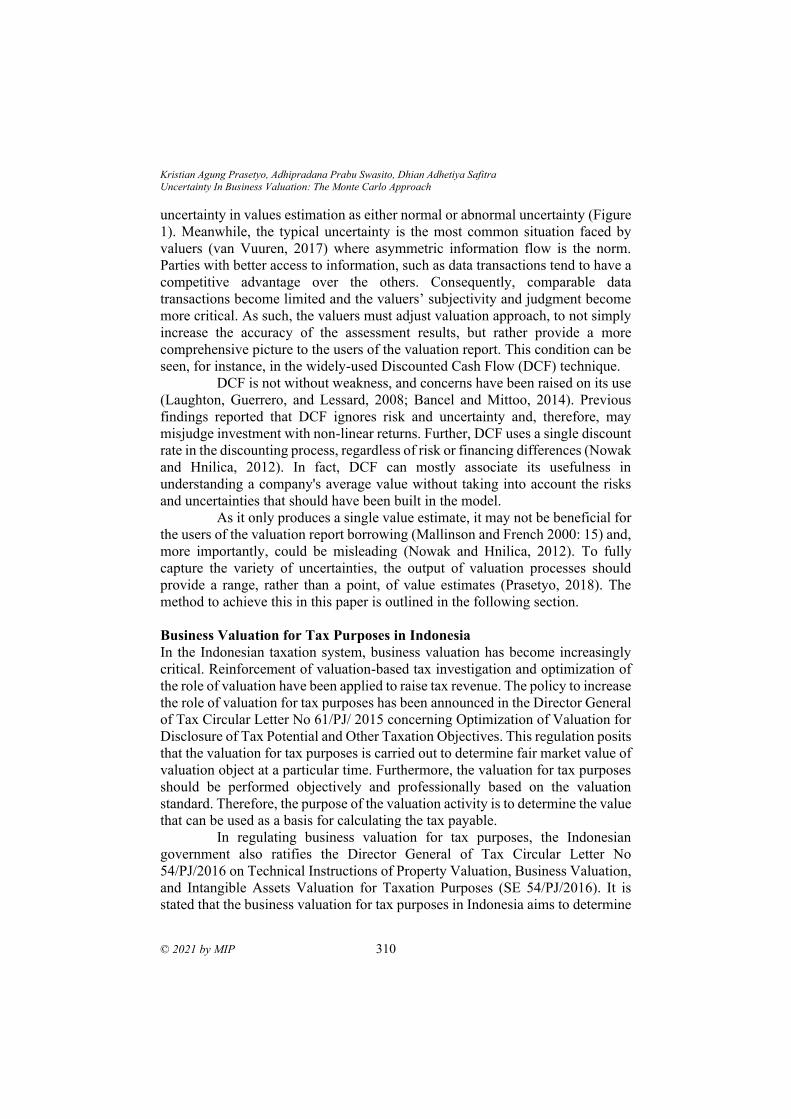
Kristian Agung Prasetyo, Adhipradana Prabu Swasito, Dhian Adhetiya Safitra
Uncertainty In Business Valuation: The Monte Carlo Approach
© 2021 by MIP 310
uncertainty in values estimation as either normal or abnormal uncertainty (Figure
1). Meanwhile, the typical uncertainty is the most common situation faced by
valuers (van Vuuren, 2017) where asymmetric information flow is the norm.
Parties with better access to information, such as data transactions tend to have a
competitive advantage over the others. Consequently, comparable data
transactions become limited and the valuers’ subjectivity and judgment become
more critical. As such, the valuers must adjust valuation approach, to not simply
increase the accuracy of the assessment results, but rather provide a more
comprehensive picture to the users of the valuation report. This condition can be
seen, for instance, in the widely-used Discounted Cash Flow (DCF) technique.
DCF is not without weakness, and concerns have been raised on its use
(Laughton, Guerrero, and Lessard, 2008; Bancel and Mittoo, 2014). Previous
findings reported that DCF ignores risk and uncertainty and, therefore, may
misjudge investment with non-linear returns. Further, DCF uses a single discount
rate in the discounting process, regardless of risk or financing differences (Nowak
and Hnilica, 2012). In fact, DCF can mostly associate its usefulness in
understanding a company's average value without taking into account the risks
and uncertainties that should have been built in the model.
As it only produces a single value estimate, it may not be beneficial for
the users of the valuation report borrowing (Mallinson and French 2000: 15) and,
more importantly, could be misleading (Nowak and Hnilica, 2012). To fully
capture the variety of uncertainties, the output of valuation processes should
provide a range, rather than a point, of value estimates (Prasetyo, 2018). The
method to achieve this in this paper is outlined in the following section.
Business Valuation for Tax Purposes in Indonesia
In the Indonesian taxation system, business valuation has become increasingly
critical. Reinforcement of valuation-based tax investigation and optimization of
the role of valuation have been applied to raise tax revenue. The policy to increase
the role of valuation for tax purposes has been announced in the Director General
of Tax Circular Letter No 61/PJ/ 2015 concerning Optimization of Valuation for
Disclosure of Tax Potential and Other Taxation Objectives. This regulation posits
that the valuation for tax purposes is carried out to determine fair market value of
valuation object at a particular time. Furthermore, the valuation for tax purposes
should be performed objectively and professionally based on the valuation
standard. Therefore, the purpose of the valuation activity is to determine the value
that can be used as a basis for calculating the tax payable.
In regulating business valuation for tax purposes, the Indonesian
government also ratifies the Director General of Tax Circular Letter No
54/PJ/2016 on Technical Instructions of Property Valuation, Business Valuation,
and Intangible Assets Valuation for Taxation Purposes (SE 54/PJ/2016). It is
stated that the business valuation for tax purposes in Indonesia aims to determine
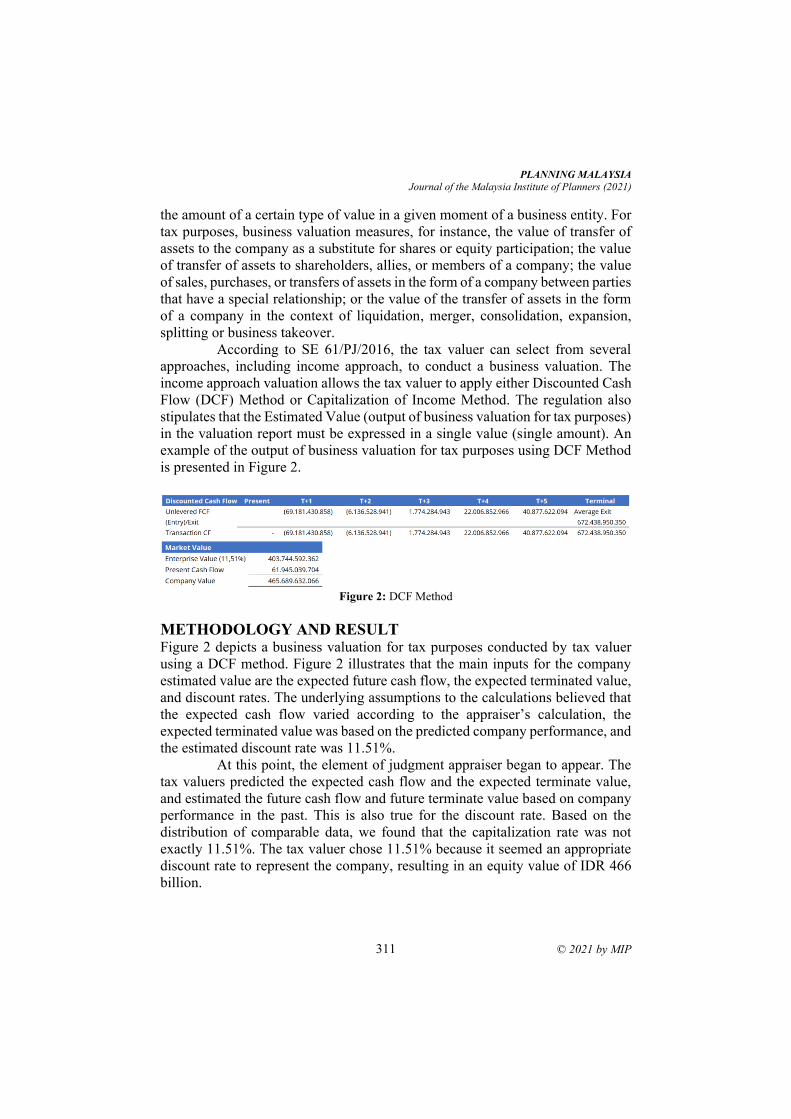
PLANNING MALAYSIA
Journal of the Malaysia Institute of Planners (2021)
311 © 2021 by MIP
the amount of a certain type of value in a given moment of a business entity. For
tax purposes, business valuation measures, for instance, the value of transfer of
assets to the company as a substitute for shares or equity participation; the value
of transfer of assets to shareholders, allies, or members of a company; the value
of sales, purchases, or transfers of assets in the form of a company between parties
that have a special relationship; or the value of the transfer of assets in the form
of a company in the context of liquidation, merger, consolidation, expansion,
splitting or business takeover.
According to SE 61/PJ/2016, the tax valuer can select from several
approaches, including income approach, to conduct a business valuation. The
income approach valuation allows the tax valuer to apply either Discounted Cash
Flow (DCF) Method or Capitalization of Income Method. The regulation also
stipulates that the Estimated Value (output of business valuation for tax purposes)
in the valuation report must be expressed in a single value (single amount). An
example of the output of business valuation for tax purposes using DCF Method
is presented in Figure 2.
Figure 2: DCF Method
METHODOLOGY AND RESULT Figure 2 depicts a business valuation for tax purposes conducted by tax valuer
using a DCF method. Figure 2 illustrates that the main inputs for the company
estimated value are the expected future cash flow, the expected terminated value,
and discount rates. The underlying assumptions to the calculations believed that
the expected cash flow varied according to the appraiser’s calculation, the
expected terminated value was based on the predicted company performance, and
the estimated discount rate was 11.51%.
At this point, the element of judgment appraiser began to appear. The
tax valuers predicted the expected cash flow and the expected terminate value,
and estimated the future cash flow and future terminate value based on company
performance in the past. This is also true for the discount rate. Based on the
distribution of comparable data, we found that the capitalization rate was not
exactly 11.51%. The tax valuer chose 11.51% because it seemed an appropriate
discount rate to represent the company, resulting in an equity value of IDR 466
billion.
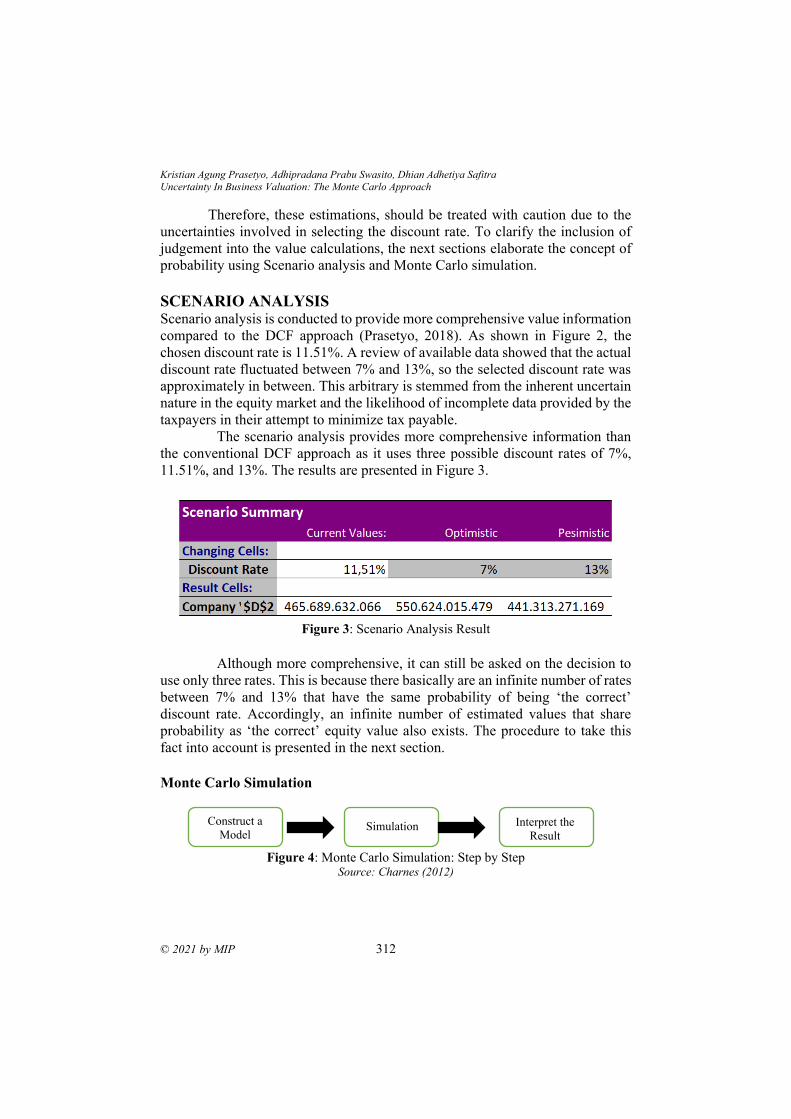
Kristian Agung Prasetyo, Adhipradana Prabu Swasito, Dhian Adhetiya Safitra
Uncertainty In Business Valuation: The Monte Carlo Approach
© 2021 by MIP 312
Therefore, these estimations, should be treated with caution due to the
uncertainties involved in selecting the discount rate. To clarify the inclusion of
judgement into the value calculations, the next sections elaborate the concept of
probability using Scenario analysis and Monte Carlo simulation.
SCENARIO ANALYSIS Scenario analysis is conducted to provide more comprehensive value information
compared to the DCF approach (Prasetyo, 2018). As shown in Figure 2, the
chosen discount rate is 11.51%. A review of available data showed that the actual
discount rate fluctuated between 7% and 13%, so the selected discount rate was
approximately in between. This arbitrary is stemmed from the inherent uncertain
nature in the equity market and the likelihood of incomplete data provided by the
taxpayers in their attempt to minimize tax payable.
The scenario analysis provides more comprehensive information than
the conventional DCF approach as it uses three possible discount rates of 7%,
11.51%, and 13%. The results are presented in Figure 3.
Figure 3: Scenario Analysis Result
Although more comprehensive, it can still be asked on the decision to
use only three rates. This is because there basically are an infinite number of rates
between 7% and 13% that have the same probability of being ‘the correct’
discount rate. Accordingly, an infinite number of estimated values that share
probability as ‘the correct’ equity value also exists. The procedure to take this
fact into account is presented in the next section.
Monte Carlo Simulation
Figure 4: Monte Carlo Simulation: Step by Step
Source: Charnes (2012)
Construct a
Model Interpret the
Result Simulation
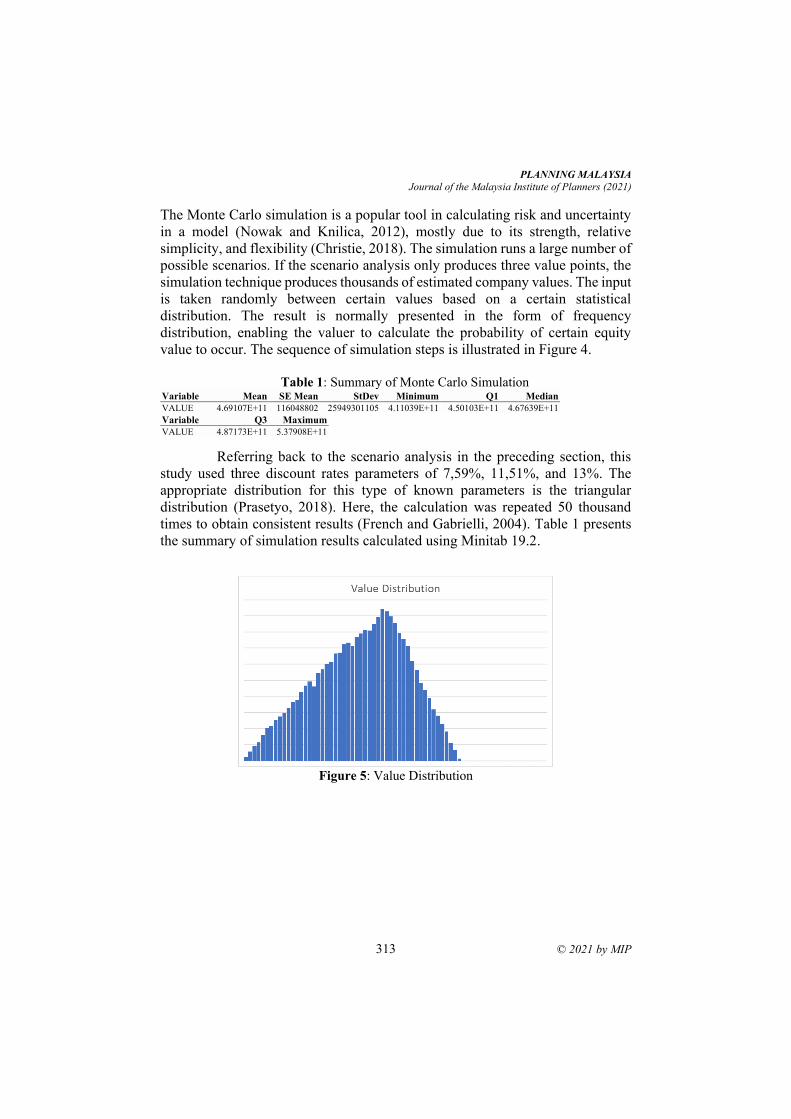
PLANNING MALAYSIA
Journal of the Malaysia Institute of Planners (2021)
313 © 2021 by MIP
The Monte Carlo simulation is a popular tool in calculating risk and uncertainty
in a model (Nowak and Knilica, 2012), mostly due to its strength, relative
simplicity, and flexibility (Christie, 2018). The simulation runs a large number of
possible scenarios. If the scenario analysis only produces three value points, the
simulation technique produces thousands of estimated company values. The input
is taken randomly between certain values based on a certain statistical
distribution. The result is normally presented in the form of frequency
distribution, enabling the valuer to calculate the probability of certain equity
value to occur. The sequence of simulation steps is illustrated in Figure 4.
Table 1: Summary of Monte Carlo Simulation
Variable Mean SE Mean StDev Minimum Q1 Median
VALUE 4.69107E+11 116048802 25949301105 4.11039E+11 4.50103E+11 4.67639E+11
Variable Q3 Maximum
VALUE 4.87173E+11 5.37908E+11
Referring back to the scenario analysis in the preceding section, this
study used three discount rates parameters of 7,59%, 11,51%, and 13%. The
appropriate distribution for this type of known parameters is the triangular
distribution (Prasetyo, 2018). Here, the calculation was repeated 50 thousand
times to obtain consistent results (French and Gabrielli, 2004). Table 1 presents
the summary of simulation results calculated using Minitab 19.2.
Figure 5: Value Distribution
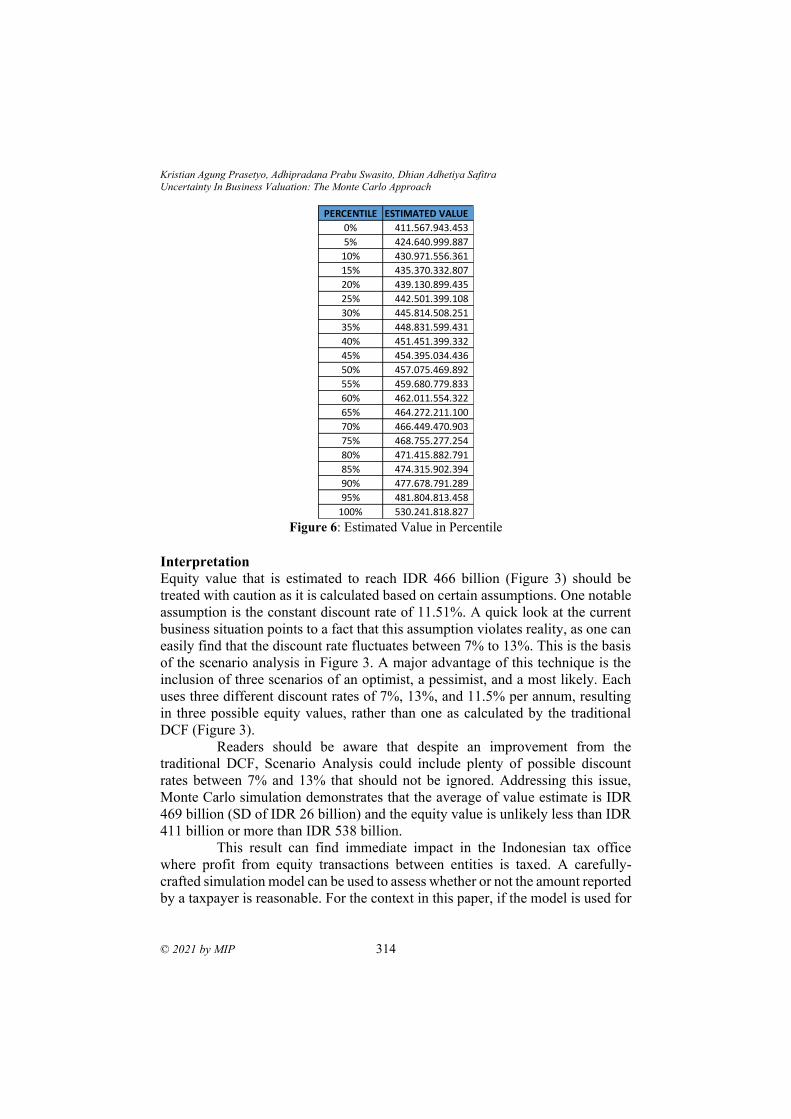
Kristian Agung Prasetyo, Adhipradana Prabu Swasito, Dhian Adhetiya Safitra
Uncertainty In Business Valuation: The Monte Carlo Approach
© 2021 by MIP 314
Figure 6: Estimated Value in Percentile
Interpretation
Equity value that is estimated to reach IDR 466 billion (Figure 3) should be
treated with caution as it is calculated based on certain assumptions. One notable
assumption is the constant discount rate of 11.51%. A quick look at the current
business situation points to a fact that this assumption violates reality, as one can
easily find that the discount rate fluctuates between 7% to 13%. This is the basis
of the scenario analysis in Figure 3. A major advantage of this technique is the
inclusion of three scenarios of an optimist, a pessimist, and a most likely. Each
uses three different discount rates of 7%, 13%, and 11.5% per annum, resulting
in three possible equity values, rather than one as calculated by the traditional
DCF (Figure 3).
Readers should be aware that despite an improvement from the
traditional DCF, Scenario Analysis could include plenty of possible discount
rates between 7% and 13% that should not be ignored. Addressing this issue,
Monte Carlo simulation demonstrates that the average of value estimate is IDR
469 billion (SD of IDR 26 billion) and the equity value is unlikely less than IDR
411 billion or more than IDR 538 billion.
This result can find immediate impact in the Indonesian tax office
where profit from equity transactions between entities is taxed. A carefully-
crafted simulation model can be used to assess whether or not the amount reported
by a taxpayer is reasonable. For the context in this paper, if the model is used for
PERCENTILE ESTIMATED VALUE
0% 411.567.943.453
5% 424.640.999.887
10% 430.971.556.361
15% 435.370.332.807
20% 439.130.899.435
25% 442.501.399.108
30% 445.814.508.251
35% 448.831.599.431
40% 451.451.399.332
45% 454.395.034.436
50% 457.075.469.892
55% 459.680.779.833
60% 462.011.554.322
65% 464.272.211.100
70% 466.449.470.903
75% 468.755.277.254
80% 471.415.882.791
85% 474.315.902.394
90% 477.678.791.289
95% 481.804.813.458
100% 530.241.818.827
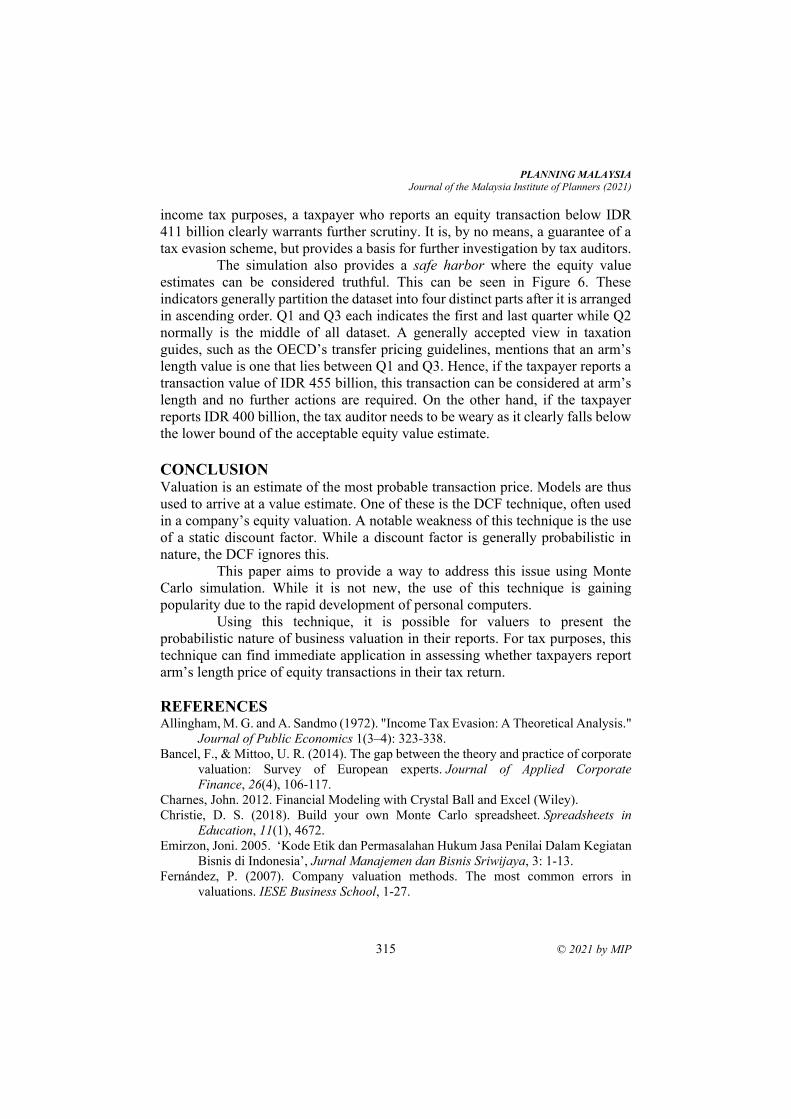
PLANNING MALAYSIA
Journal of the Malaysia Institute of Planners (2021)
315 © 2021 by MIP
income tax purposes, a taxpayer who reports an equity transaction below IDR
411 billion clearly warrants further scrutiny. It is, by no means, a guarantee of a
tax evasion scheme, but provides a basis for further investigation by tax auditors.
The simulation also provides a safe harbor where the equity value
estimates can be considered truthful. This can be seen in Figure 6. These
indicators generally partition the dataset into four distinct parts after it is arranged
in ascending order. Q1 and Q3 each indicates the first and last quarter while Q2
normally is the middle of all dataset. A generally accepted view in taxation
guides, such as the OECD’s transfer pricing guidelines, mentions that an arm’s
length value is one that lies between Q1 and Q3. Hence, if the taxpayer reports a
transaction value of IDR 455 billion, this transaction can be considered at arm’s
length and no further actions are required. On the other hand, if the taxpayer
reports IDR 400 billion, the tax auditor needs to be weary as it clearly falls below
the lower bound of the acceptable equity value estimate.
CONCLUSION Valuation is an estimate of the most probable transaction price. Models are thus
used to arrive at a value estimate. One of these is the DCF technique, often used
in a company’s equity valuation. A notable weakness of this technique is the use
of a static discount factor. While a discount factor is generally probabilistic in
nature, the DCF ignores this.
This paper aims to provide a way to address this issue using Monte
Carlo simulation. While it is not new, the use of this technique is gaining
popularity due to the rapid development of personal computers.
Using this technique, it is possible for valuers to present the
probabilistic nature of business valuation in their reports. For tax purposes, this
technique can find immediate application in assessing whether taxpayers report
arm’s length price of equity transactions in their tax return.
REFERENCES Allingham, M. G. and A. Sandmo (1972). "Income Tax Evasion: A Theoretical Analysis."
Journal of Public Economics 1(3–4): 323-338.
Bancel, F., & Mittoo, U. R. (2014). The gap between the theory and practice of corporate
valuation: Survey of European experts. Journal of Applied Corporate
Finance, 26(4), 106-117.
Charnes, John. 2012. Financial Modeling with Crystal Ball and Excel (Wiley).
Christie, D. S. (2018). Build your own Monte Carlo spreadsheet. Spreadsheets in
Education, 11(1), 4672.
Emirzon, Joni. 2005. ‘Kode Etik dan Permasalahan Hukum Jasa Penilai Dalam Kegiatan
Bisnis di Indonesia’, Jurnal Manajemen dan Bisnis Sriwijaya, 3: 1-13.
Fernández, P. (2007). Company valuation methods. The most common errors in
valuations. IESE Business School, 1-27.
Kristian Agung Prasetyo, Adhipradana Prabu Swasito, Dhian Adhetiya Safitra
Uncertainty In Business Valuation: The Monte Carlo Approach
© 2021 by MIP 316
French, Nick, dan Laura Gabrielli. 2004. 'The Uncertainty of Valuation’, Journal of
Property Investment & Finance, 22: 484-500.
French, Nick. 2004. 'The Valuation of Specialised Property: A Review of Valuation
Methods', Journal of Property Investment & Finance, 22: 533-41.
IVSC. 2010. 'Valuation Uncertainty', International Valuation Standards Council,
https://www.ivsc.org/files/file/download/id/296.
Ja’afar, N. S, Mohamad, J. (2021). Application of machine learning in analysing historical
and non-historical characteristics of heritage pre-war shophouses. Planning
Malaysia, 19(2), 72–84. http://dx.doi.org/10.21837/pm.v19i16.953
Jansen van Vuuren, David. 2017. 'Valuation Paradigm: A Rationality and (Un)Certainty
Spectrum', 35: 228-39.
Kahr, Joshua, dan Michael C. Thomsett. 2006. Real Estate Market Valuation and
Analysis (Wiley).
Köseoğlu, Sinem & Almeany, Saad. (2020). Introduction to Business Valuation.
10.4018/978-1-7998-1086-5.ch001.
Kummerow, Max. 2002. 'A Statistical Definition of Value', Appraisal Journal, 70: 407.
Laughton, D., Guerrero, R., & Lessard, D. (2008). Real Asset Valuation: A Back‐to‐
basics Approach. Journal of Applied Corporate Finance, 20(2), 46-65.
Lincoln, Yvonna S., dan Egon G. Guba. 1985. Naturalistic Inquiry (SAGE Publications).
Mallinson, Michael, dan Nick French. 2000. 'Uncertainty in Property Valuation–The
Nature and Relevance of Uncertainty and How It Might Be Measured and
Reported', Journal of Property Investment & Finance, 18: 13-32.
Mohammad, N. E, Mohd Ali, H, & Haryati Jasimin, T. (2018). Valuer’s behavioural
uncertainties in property valuation decision making. Planning Malaysia, 16(1),
239–250. https://doi.org/10.21837/pmjournal.v16.i5.428
Nowak, O. N. D. Ř. E. J., & Hnilica, J. I. Ř. Í. (2012). Business Valuation under
Uncertainty. In Proc. of the 5th WSEAS Int. Conf. on Business Administration (pp.
87-92).
Prasetyo, K. A. (2018). Penentuan Unsur Ketidakpastian Dalam Penghitungan Estimasi
Nilai Pasar Properti Dengan Menggunakan Pendekatan Pendapatan: Catatan
Praktisi. Simposium Nasional Keuangan Negara, 1(1), 58-78.
Sayce, Sarah, Judy Smith, Richard Cooper, dan Piers Venmore-Rowland. 2009. Real
Estate Appraisal: From Value to Worth (Wiley).
Received: 12th July 2021. Accepted: 17th Sept 2021
2 Associate Professor at Faculty of Built Environment, University ofMalaya. Email: [email protected].
PLANNING MALAYSIA:
Journal of the Malaysian Institute of Planners
VOLUME 19 ISSUE 3 (2021), Page 317 – 325
WAQF LAND DEVELOPMENT APPROACHES AND
PRACTICES IN THE STATE ISLAMIC RELIGIOUS COUNCILS
Mohd Arif Mat Hassan1, Anuar Alias2, Siti Mashitoh Mahamood3 & Feroz De
Costa4
1,2Faculty of Built Environment
UNIVERSITI MALAYA 3Academy of Islamic Studies
UNIVERSITI MALAYA 4Department of Communication, Faculty of Modern Languages and
Communication
UNIVERSITI PUTRA MALAYSIA
Abstract
Waqf land is a religious property that is provided as a charity act by a donor and
placed under the jurisdiction of the State Islamic Religious Councils (SIRCs).
The SIRCs are the sole trustees in charge of governing, managing, and developing
these properties. SIRCs have been working to develop waqf lands through a
variety of projects and ways that adhere to best practices and a sound management
system. However, the waqf's potential for greater outcomes is yet to be optimised.
This research has reviewed the literature of waqf land development approaches
and practices in Malaysia and it has tabled the significant development
approaches that can be implemented by the SIRC. These approaches and practices
may overcome the issues and challenges faced by the SIRCs in developing waqf
land.
Keyword: Waqf Land, Land Development, Development Approaches &
Practices, State Islamic Religious Councils (SIRCs)

Mohd Arif Mat Hassan, Anuar Alias, Siti Mashitoh Mahamood & Feroz De Costa
Waqf Land Development Approaches and Practices in The State Islamic Religious Councils
© 2021 by MIP 318
INTRODUCTION Land is a limited resource and it is one of the main factors of production. It plays
a large role in the economic growth of a country and also satisfies humans’
unlimited needs and wants. Rapid developments lead to high demand for land.
Hence, it should be managed effectively within the scarcity of land settings. This
will unlock the value of the land to its highest and best use. This study focuses on
the development of religious land known as waqf land by the State Islamic
Religious Councils (SIRCs).
SIRC is a sole trustee of waqf land in Malaysia according to The Federal
Constitution's Ninth Schedule, List II (State List). They are authorised to manage
the waqf land within their state jurisdiction with the best standard of practice and
suitable management system according to Islamic law. Previous literature has
raised several issues and challenges face by SIRCs in developing land under their
jurisdiction. Various efforts have been taken by the SIRCs and other recognised
institutions to overcome these challenges but not all of the states are able to
perform well in developing waqf lands.
Besides the SIRCs, there are also Federal Agencies involve in waqf land
development in Malaysia. The agencies under the Prime Minister’s Department
highly involved with SIRCs are Jabatan Wakaf, Zakat & Haji (JAWHAR), and
Yayasan Wakaf Malaysia (YWM). These agencies support the SIRCs in
accomplishing this potential in a more orderly and efficient way. It is noted that
these agencies are more of an active complementary agency and is not an actual
authority because land is a state matter. JAWHAR and YWM have embarked on
several projects in collaboration with the SIRCs to develop waqf land. According
to JAWHAR, there are a few high-impact waqf projects that have been
established in various states in Malaysia.
LITERATURE REVIEW
Waqf is a word in the Arabic language that means “stop, contain, or preserve”. It
is an act of philanthropy and it is a charitable endowment in Islamic law. A waqf
land is a piece of land voluntarily donated by the donor as a charitable act for the
social and economic development of Muslims and has strict principles such as
“perpetuity, inalienability, and irrevocability” (Khaf, 1998). Among the
contribution of waqf to social and economic development is that waqf has the
capacity to provide affordable homes for the underprivileged and needy (Rashid,
et al., 2018; Rashid, et al., 2019).
Waqf land is categorised into two, i.e “waqf am” and “waqf khas”
according to its purpose. Waqf am refers to waqf land that has been endowed
without any specific purpose and it is dedicated to the general welfare without
stipulating any condition or any particular beneficiary. In contrast, waqf khas has
a specific charitable purpose or special beneficiaries that have been precisely
declared by the donor. Normally, the donor dedicated “waqf khas” for the
PLANNING MALAYSIA
Journal of the Malaysia Institute of Planners (2021)
319 © 2021 by MIP
development of mosques, orphanage homes, religious schools, cemeteries, etc.
Meanwhile, waqf am or general waqf can be developed into any type of
development as long as it can benefit the ummah (Mahamood, 2006).
According to JAWHAR, the number of waqf lands recorded has been
increasing over the years. In 2013, there were 4,524 lots of waqf land with a total
area of 11,092 hectares worth RM99,329,171. In 2015, it had gradually increased
to 5,740 lots with a total area of 16,751 hectares worth RM111,413,890. Data
from JAWHAR tabled the staggering increase to 14,356 lots with a total area of
30,888.9 hectares (Mahmood, Mustaffha, Hameed & Johari, 2017). These huge
numbers however do not include the unrecorded Waqf land. There are
approximately 30 per cent of unrecorded Waqf lands and the actual size, location,
and ownership of the waqf land are still unknown (Siraj, 2012). According to the
former director of JAWHAR, there is 99.28 per cent of undeveloped and idle
waqf land (Thaker & Pitchay, 2018). The shortage of financial resources has led
to a huge percentage of waqf land remained undeveloped (Ismail, Salim &
Hanafiah, 2015; Jalil, Yaacob, Omar, Ridza & Fadzli, 2019).
The SIRCs hold the accountability to manage the waqf land. These
include the power to develop the said land. Waqf land development will improve
Muslims' socioeconomic conditions by allowing them to participate in and
benefit from economic development initiatives while remaining compliant with
Syariah.
METHODOLOGY
This research used content analysis as the qualitative approach. The systematic
literature review (SLR) method has been used in this study. Research through
literature review can be described as “a form of research that reviews, critiques,
and synthesizes representative literature on a topic in an integrated way such that
frameworks and perspectives on the topic are generated” (Torraco, 2005).
There are four (4) stages involved in conducting SLR. The process
started with the selection of databases in stage 1. Prominent databases such as
Scopus and Web of Science (WoS) were identified. These databases were chosen
because of their robustness and it covers many fields of studies related to this
research including social science, arts, and humanities, economics, finance,
business, management, Islamic studies, etc.
The 2nd stage is the keyword search configuration. Selecting the articles
involve the identification of keyword and develop the search configuration. The
search configuration for Scopus is TITLE-ABS-KEY (“Wakaf Land” OR “Waqf
Land” OR “Awqaf Land”). Meanwhile, the search configuration for WoS is TS
= (“Wakaf Land” OR “Waqf Land” OR “Awqaf Land”). In total, 51 articles were
retrieved from the Scopus and WoS in this 2nd stage.
Mohd Arif Mat Hassan, Anuar Alias, Siti Mashitoh Mahamood & Feroz De Costa
Waqf Land Development Approaches and Practices in The State Islamic Religious Councils
© 2021 by MIP 320
The 3rd Stage is filtering the articles. The articles were filtered for duplication. 13
duplicate articles were omitted. The process was further refined for the remaining
38 articles. There were then reviewed for the inclusion and exclusion criteria. The
review focused on the publication date, language, subject area, and specifically
on the articles written in the areas of land development under the SIRCs
jurisdiction.
After filtering, 16 articles remain and proceed to the 4th Stage. 16 full
articles were then carefully accessed. After reading the abstracts, the data were
obtained. Next, the themes and sub-themes were detected by exhaustively reading
the full articles. The qualitative analysis was then executed by the means of
content analysis to identify themes related to Waqf land development tools and
practices in Malaysia.
Articles were then further analysed through a coding process based on
common characteristics. Thematic analysis was conducted in developing the
appropriate themes and the sub-themes. The articles were analysed using a
sophisticated Qualitative Data Analysis software called ATLAS.ti. This software
finds all the keywords and phrases related to the subject matter. This approach is
looking for patterns, threads, constructs, and commonalities. This data analysis
technique enables the identification of key issues and challenges discussed in the
articles using coding, grouping, and networking.
FINDINGS
This research has been able to provide results from the Qualitative Data Analysis
using Systematic Literature Review (SLR) with the assistance of the ATLAS.ti.
software. The list of the 16 articles according to the titles are as in Table 1.
Further analysis of the publication year from 2009 to 2019 found that there is no
article related to this study indexed in Scopus and Web of Science in the years
2009, 2012, and 2014. The average number of articles published is less than 2
articles annually and the highest number of articles published is 4 for the year
2015 and 2018.

PLANNING MALAYSIA
Journal of the Malaysia Institute of Planners (2021)
321 © 2021 by MIP
Table 1: List of articles used in the SLR
No. Title
1. A Comparative Study of Waqf management in Malaysia
2. Acquisition of Waqf Lands by the State Authority: A Case Study of Land
Acquisition in Terengganu
3. Administration and Management of Waqf Land in Malaysia: Issues and
Solutions
4. Asopting Al-Hikr Long Term Lease Financing for Waqf and State Lands
in Malaysia to Provide Affordable Public Housing
5. Application of the Build, Operate, Transfer (BOT) Contract as a Means of
Financing Development of Waqf Land: Malaysian Experience
6. Classification and Prioritaztion of Waqf Lands: A Selangor Case
7. Compulsaru Acquisition of Waqf Land by the State Authorities:
Compensation Versus Substitution
8. Cooperative-Waqf Model: A Proposal to Develop Idle Waqf Lands in
Malaysia
9. Developing Waqf Land Through Crowdfunding-Waqf Model (CWM):
The Case of Malaysia
10. Factors Influencing the Adoption of the Crowdfunding-Waqf Model
(CWM) in the Waqf Land Development
11. Factors Influencing the Behavorial Intentions of Muslim Employees to
Contribute to Cash-Waqf Through Salary Deductions
12. Integrated Framework for Development on Waqf Land in Pulau Pinang
13. Maqasidic Approach in the Management of Waqf Property: A Study with
Reference to Malaysian Contemporary Issues
14.
Modeling Crowdfunders’ Behavorial Intention to Adopt the
Crowdfunding-Waqf Model (CWM) in Malaysia: The Theory of the
Technology Acceptance Model (TAM)
15. Substitution of Waqf Properties (Istibdal) in Malaysia: Statutory
Provisions and Implementations
16. Waqf Private Property Trust Fund as Property Unlock Initiative
Sixteen selected articles have been systematically analysed. This study has
identified four (4) themes related to the waqf development tools and practices in
Malaysia. The breakdown of these themes according to the number of articles is
as follows:
Table 2: Waqf land development approaches and practices discussed in the articles
No. Approaches & Practices Number of articles
1 Joint-venture & Partnership 2
2 Government Assistance 4
3 Public Participation 6
4 Internal Management (SIRCs) 4
Source: Authors’ ATLAS.ti Analysis
Mohd Arif Mat Hassan, Anuar Alias, Siti Mashitoh Mahamood & Feroz De Costa
Waqf Land Development Approaches and Practices in The State Islamic Religious Councils
© 2021 by MIP 322
Most of the articles used in this study discussed public participation in waqf land
development. Besides self-initiatives, the SIRCs also involved the government in
assisting them to develop waqf land. There are four (4) articles that discussed
these approaches. Only two (2) articles highlight joint-venture and partnership in
their article. Further details on the approaches and practices by the SIRCs are as
follows;
THEME 1. JOINT VENTURE AND PARTNERSHIP
The SIRCs have established smart partnerships or joint ventures in developing
land under their jurisdiction. This joint ventures and partnerships have been done
with interested parties such as individuals, federal departments, state agencies,
corporate institutions, financial institutions, and private firms in monetary forms
and sharing expertise. Joint ventures between the SIRCs and the interested parties
are based on the principles of mudharabah or musharakah. These principles
enable the parties involved to receive profit according to the agreed ratio
(Abdullah & Meera, 2018; Jalil et al., 2019).
This joint venture and partnership with an interested party can be
initiated because SIRCs don’t have to contribute huge capital because it acts as
the ‘owner’ of the land. There are two (2) local and one (1) overseas examples of
joint-venture projects highlighted. The first example is JV between SIRC of
Penang (MAINPP) with UDA Holding Berhad in developing housing schemes in
Seberang Jaya, Pulau Pinang (Pitchay, Thaker, Mydin, Azhar & Latiff, 2018).
The second example is JV between SIRC of Federal Territory (MAIWP) and
Lembaga Tabung Haji subsidiary (TH Technologies) in developing a purpose-
built office known as Menara Imarah Wakaf in Kuala Lumpur using a Built-
Operate-Transfer (BOT) contract (Mohd Noor & Yunus, 2012). The overseas
example given by Pitchay, Meera & Saleem (2015) is the joint venture between
King Abdel Aziz waqf (KAAW) with Bin Laden Group under a BOT contract in
developing ZamZam Tower in Mekkah which consists of a shopping complex, a
shopping mall, and hotels. These joint ventures involved financial institutions in
financing the projects.
THEME 2. GOVERNMENT ASSISTANCE
Government assistance can be through funding the capital and facilitating the
land development in terms of advice and expertise. The majority of the works of
literature point out that SIRCs are having a significant challenge in developing
land under their jurisdiction because of the insufficient fund and lack of expertise
(Abdullah & Meera, 2018; Awang, Hamid, Nazli & Lotpi, 2017; Salleh, Hamid,
Harun & Ghani, 2015; Thaker & Pitchay, 2018).
The federal government of Malaysia has established the Department of Awqaf,
Zakat, and Hajj (JAWHAR) and Yayasan Wakaf Malaysia (YWM) to coordinate
PLANNING MALAYSIA
Journal of the Malaysia Institute of Planners (2021)
323 © 2021 by MIP
the development of waqf properties by the SIRCs. It also aids, facilitates, and
complements SIRC initiatives to improve waqf administration, management, and
development efficiency and effectiveness. JAWHAR & YWM are also
responsible for observing and assisting SIRCs development projects if the project
is failed to complete due to a shortage of financial resources and expertise. These
organisations are in charge of administering and managing waqf-related affairs
(Thaker & Pitchay, 2018).
According to JAWHAR, their JV programs with the SIRCs called Waqf
Property Development Program has a total of 17 large scale and high impact
projects involves a total cost of RM290.25 million with a total land area of 23.771
hectares. These JVs is funded by the federal government from the Malaysia Plan
(RMK) allocation. The federal government becomes the main source of funding
to the SIRCs for developing waqf land through many projects and developments.
(Thanker & Pitchay 2018). JAWHAR also published several manuals for SIRCs
to improve their knowledge and practices. Six (6) manuals and guidelines have
been produced to streamline the process and procedure of land development by
SIRCs. The notable manual is ‘Waqf Lands Administration Manual 2010’
(Harun, Hamid, Salleh & Bidin, 2017). THEME 3. PUBLIC PARTICIPATION
Besides government assistance, public participation is equally important in waqf
land development. The Malaysian Plan allotted some funds to the SIRCs,
however, the sum allotted is insufficient to develop a large area of waqf land (Jalil
et al., 2019).
Participation from the public can be done through contribution in terms
of monetary (cash). Cash waqf is considered a crowdfunding method because it
pools money from the public to fund waqf land development (Isa, Ali & Harun,
2011; Jalil et al., 2019; Thaker & Pitchay, 2018). The cash waqf concept received
a soft reaction from the public but it was found to be more realistic to practise
since it can be done in any amount and it is low compared to endow property or
land as waqf (Jalil et al., 2019). Cash waqf can be done online and offline at
various SIRCs platforms.
The public can also participate through corporate waqf by buying shares
issued by corporate waqf entities. Johor Corporation (JCorp) launched the first
corporate waqf in Malaysia by issuing its company's shares as Waqf in 2006.
Meanwhile, SIRC of Selangor (MAIS) issued Selangor Share Scheme with the
same purpose which is to elevate public participation in cash waqf by purchasing
the share units (Isa et al., 2011; Jalil et al., 2019).
THEME 4. INTERNAL MANAGEMENT
SIRCs can self-develop lands under their jurisdiction using internal funds and
expertise. The development project can be managed internally. Normally the type of
Mohd Arif Mat Hassan, Anuar Alias, Siti Mashitoh Mahamood & Feroz De Costa
Waqf Land Development Approaches and Practices in The State Islamic Religious Councils
© 2021 by MIP 324
development involve is a small-scale project such as constructing single-storey shops
or bazaars for rental. The internal funds within SIRCs jurisdiction are money from
the rental of premises, cash waqf from the public, proceed from istibdal, zakat fund
allocation, etc. (Harun et al., 2017; Hisham, Jaseran & Jusoff, 2013; Salleh et al.,
2015)
Some SIRCs have established subsidiaries known as “Perbadanan” or
“Corporation” responsible for the administration and management of waqf-related
concerns. States that have established the entities are Selangor, Negeri Sembilan, and
Johor. In 2011, MAIS formed Perbadanan Wakaf Selangor (PWS), a subsidiary that
focuses on collecting cash waqf as an in-house financing source (Pitchay et al., 2015;
Thaker & Pitchay, 2018).
CONCLUSION The issue with underdeveloped land under SIRCs jurisdiction is mainly because of
insufficient funds (capital). Based on this study, there are four (4) themes of
approaches and practices that have been adopted by the SIRCs in developing
religious land in their state. Besides self-initiative, SIRC needs assistance from the
federal government, private companies, developers, and public participation to
improve its role as an effective sole trustee. There are a few rooms for improvement
for the SIRCs to overcome any challenges related to land development. More
continuous campaigns and promotion needed to be done to increase public awareness
and participation in waqf. SIRCs have to maintain the synergy and strategic
collaboration with the related parties including collaboration between SIRCs.
Internally, SIRCs can improve their management system using an updated database,
ICT upgrade, hiring professional experts, and strengthening the organizational
structure. With all the effective approaches and best practices, SIRCs may strengthen
and reform waqf administration in Malaysia and improve the economy of the
Ummah.
REFERENCES Abdullah, A., & Meera, A.K.M. (2018). Adopting Al-Hikr long term lease financing for waqf
and state lands in Malaysia to provide affordable public housing. Al-Shajarah: Journal
of the International Institute of Islamic Thought and Civilization (ISTAC), 1-42.
Awang, M.B., Hamid, N.A., Nazli, I., & Mohd Lotpi, M.Y. (2017). Maqasidic approach in
the management of waqf property: A study with reference to Malaysian contemporary
issues. Pertanika Journal of Social Sciences and Humanities, 25, 301-308.
Harun, N., Hamid, N.A., Salleh, K., & Bidin, A. (2017). Acquisition of waqf lands by the
State Authority: A case study of land acquisition in Terengganu. Pertanika Journal of
Social Sciences and Humanities, 25, 281-292.
Hisham, S.H.A.J., Jaseran, H.A., & Jusoff, K. (2013). Substitution of waqf properties (istibdal)
in Malaysia: Statutory provisions and implementations. Middle-East Journal of
Scientific Research, 13(13), 23-27.
PLANNING MALAYSIA
Journal of the Malaysia Institute of Planners (2021)
325 © 2021 by MIP
Isa, Z.M., Ali, N., & Harun, R. (2011). A comparative study of waqf management in Malaysia.
In International Conference on Sociality and Economics Development, 10, 561-565.
Ismail, C.Z., Salim, N.J., & Hanafiah, N.J.A. (2015). Administration and management of waqf
land in Malaysia: Issues and solutions. Mediterranean Journal of Social Sciences, 6(4),
613.
Jalil, R. A., Yaacob, A.C., Omar, I., Ridza, B. H. M., & Fadzli, S. Z. (2019). Waqf private
property trust fund as property unlock initiative. In IOP Conference Series: Materials
Science and Engineering, 620 (1).
Kahf, M. (1998). Financing development of awqaf properties. Paper presented at the Seminar
on Development of Awqaf by IRTI, Kuala Lumpur. Retrieved June 6, 2018
http://www.iefpedia.com/english/wp-content/uploads/2009/11/Financing-the-
Development-of-Awqaf-Property.pdf
Mahamood, S.M. (2006). Waqf in Malaysia, Legal and Administrative Perspective. Kuala
Lumpur: UM Press.
Mahmood, R.H., Mustaffha, N., Hameed, L.B.M., & Johari, N. (2017). Pengurusan wakaf di
Malaysia: Isu dan cabaran. In Proceeding of the 4th International Conference on
Management and Muamalah, 2017(9).
Mohd Noor, A., & Yunus, S.M. (2012). The application of Build, Operate, Transfer (BOT)
contract as a mode of financing in developing waqf land: Malaysian experience. Joint
Ventures in Construction 2: Contract, Governance, Performance and Risk. January
2012, 49-64
Pitchay, A.A., Meera, A.K.M, & Saleem, M.Y. (2015). Factors influencing the behavioral
intentions of Muslim employees to contribute to cash-waqf through salary deductions.
Journal of King Abdulaziz University: Islamic Economics, 28(1).
Pitchay, A.A., Thaker, M.A.M.T., Mydin, A.A., Azhar, Z., & Latiff, A.R.A. (2018).
Cooperative-waqf model: a proposal to develop idle waqf lands in Malaysia. ISRA
International Journal of Islamic Finance.
Rashid, K. A., Fauzi, P. N. F. N. M., & Hasan, S. F. (2018). Meeting housing needs of the
poor and needy Muslims through Zakat and Wakaf. Planning Malaysia, 16(7).
Rashid, K. A., Hasan, S. F., Fauzi, P. N. F. N. M., Aripin, S., & Sarkawi, A. A. (2019). Zakat
and wakaf funded housing for the poor and needy–an analysis of the zakat and wakaf
authorities roles from the authorities’ perspectives. Planning Malaysia, 17(9).
Salleh, K., Hamid, N.A., Harun, N., & Ghani, M.N. (2015). Compulsory acquisition of waqf
land by the state authorities: compensation versus substitution. Pertanika Journal of
Social Science and Humanities, 23, 39-50.
Siraj. S.A. (2012). An empirical investigation into the accounting, accountability and
effectiveness of waqf management in the State Islamic Religious Councils (SIRCS) in
Malaysia. (Doctoral dissertation, Cardiff University, 2012)
Thaker, M.A.M.T., & Pitchay, A.A. (2018). Developing waqf land through crowdfunding-
waqf model (CWM): the case of Malaysia. Journal of Islamic Accounting and
Business Research. 9 (3), 448-456.
Torraco, R.J. (2005). Writing Integrative Literature Reviews: Guidelines and Examples.
Human Resource Development Review, 4(3), 356–367.
https://doi.org/10.1177/1534484305278283
Received: 12th July 2021. Accepted: 17th Sept 2021
1 Corresponding Author: [email protected]
PLANNING MALAYSIA:
Journal of the Malaysian Institute of Planners
VOLUME 19 ISSUE 3 (2021), Page 326 – 337
EXPRESS CONDITION OF LAND, USAGE OF PROPERTY, AND
LICENSING OF SHORT-TERM ACCOMMODATIONS
Nuraisyah Chua Abdullah1, Azni Mohd Dian2,
Ramzyzan Ramly3
1,2 Faculty of Law
UNIVERSITI TEKNOLOGI MARA 3School of Mechanical Engineering, College of Engineering
UNIVERSITI TEKNOLOGI MARA
Abstract
Contrary to many short-term accommodation operators (STAs), short-term
accommodations in Malaysia are subjected to laws relating to land and town
planning. In the light of the ignorance of the STA operators about the legal aspects
of STAs and complaints received by both the industry players (registered
hoteliers) and the general community at large, this paper addresses the elements
of an express condition of the land, usage of the property and licensing of the
STAs in Malaysia. This paper uses the library-based approach, where the
analysis of relevant legislation, newspaper report, decided cases, and journal
articles are made. A comparative study with selected states in the U.S.A is made
concerning the legal status of the short-term rentals.
Keyword: short-term accommodation, governance, land office, local authorities
PLANNING MALAYSIA
Journal of the Malaysia Institute of Planners (2021)
327 © 2021 by MIP
INTRODUCTION Nowadays, many people are renting out entire houses or apartments to short-term
visitors and operate as short-term accommodation (from now on referred to as
STA) operators without having proper registration of the business. In worst-case
scenarios, entrepreneurs lease many apartments and operate them as STAs (which
is sometimes referred to as 'homestays' or 'guesthouses' with scant regard for
permanent residents living there. Housing developers could switch to more one-
room studio apartments with cheaper private residence utility rates, as
commercial charges apply to service apartments or small office home offices.
Buyers of such studio apartments are least likely to object if many units are used
for so-called homestays or guesthouses. Commercialized STAs have become a
trend and growing at breakneck speed in cities without specific regulations, as
perceived by many people. In the light of the ignorance of the STA operators
about the legal aspects of STAs and complaints received by both the industry
players (registered hoteliers) and the general community at large, by using a
library-based approach, where the analysis of relevant legislation, newspaper
report, decided cases and journal articles is made, this paper addresses the aspects
of the condition of the land, usage of the property and licensing of the STAs in
Malaysia, given the challenges endured in the governance of urban complexities
in the ethos of global intensities (Faizul Abdullah & Fatimah Yusof, 2016). A
comparative study with selected states in the U.S.A is made concerning the legal
status of the short-term rentals. The selected states in the U.S.A. are made since
the U.S.A. has a diverse framework in addressing the legal issues of STAs and
because of some features of similarity in the concept of federalism practiced in
the U.S.A and Malaysia.
The Federal Constitution of Malaysia 1957, the country's supreme law,
prescribes a two-tier governmental structure that is the Federal and State
Government. Federal intervention on the grounds of achieving uniformity of land
law and policy in Malaysia was initiated by the introduction of the National Land
Code 1965 (herein after referred to as NLC). Landed properties in Malaysia are
subjected to the governance of town planning in each district. After
independence, the town and country planning system were re-organized in line
with the new government system whereby the responsibilities between Federal
and State Governments are stipulated in the Federal Constitution. Under Article
74(1) of the Federal Constitution, read together with the Concurrent List in the
Ninth Schedule, matters related to town planning (and local government) are the
concurrent responsibility of both governments. This is, however, complicated by
the fact that land is under the constitutional jurisdiction of state governments.
One of the planning administrative bodies that play a significant role in
the planning system under the Town and Country Planning Act 1976 (Act 172)
is the Local Planning Authority, as provided under Section 5(1) of Act 172. The
powers and obligations of Act 172 in the town and country planning domain are

Nuraisyah Chua Abdullah, Azni Mohd Dian, Ramzyzan Ramly
Express Condition of Land, Usage of Property, And Licensing of Short-Term Accommodations
© 2021 by MIP 328
defined in Section 12(1) of Act 172, and this includes the responsibility to
immediately initiate the preparation of structure plans for the consideration of the
State Planning Committee even before the State Authority gives assent to a draft
structure plan that has been prepared (Izuandi Yin & Jamalunlaili Abdullah,
2020). As regulated under Act 172, powers of Act 172 in matters concerning
land development are constrained as they cannot approve developments that are
contrary to the approved development plans (i.e., structure and local plans).
Hence, statutory development plans play an essential role in the development
control system (Faizah Ahmad, 2001-2011). All Local Planning Authorities are
entirely within the purview of the State Government, and the Federal Government
has no direct power to intervene in their affairs.
Administratively, town and country planning in Malaysia is carried out
at three levels; at the federal level, the Ministry of Housing and Local
Government via Federal Town and Country Planning Department, which is
responsible for formulating and administering all national policies relating to
town and country planning. At the state level, the State Department of Town and
Country Planning through the State Planning Committee acts as an advisory body
to the state government. While at the ground level, local authorities have the task
to carry out town and country planning functions as prescribed in the local plan
(Abdul Aziz, Zakaria, & Hamzah, 2011) (Alden & Awang, 1985).
Beyond the legal structure prescribed in Act 172, planning
administration encompasses three levels of town planning departments which
provide the technical and administrative support for the respective levels of
government. The Federal Town and Country Planning Department (FTCPD)
under the Ministry of Housing and Local Government operates within Peninsular
Malaysia, while Sabah and Sarawak each have their equivalent State-level
ministries.
GOVERNANCE OF LAND OFFICE IN STA OPERATION Can an owner of STA who operates STA use land other than what is stated in the
condition? Application for land use conversion can be made under the NLC.
Section 52(1)(a) of the NLC provides that all alienated lands are divided into
three (3) categories of land use, i.e., "Agriculture," "Building," and "Industry."
Section 52 (1) (b) of the NLC states that the State Authority may specify the
conditions that attached to the alienated land to include (a) the express conditions;
Section 121 for Agriculture land; and Section 122 for Building and Industry (b)
the implied conditions: Section 115 for Agriculture; Section 116 for Building;
and Section 117 for Industry. Section 104 of the NCL provides conditions to be
complied with not only by the proprietor but also every person/body claiming an
interest in the land. e.g., chargee (bank), tenant and lessee. Failure to do so will
lead to a breach of the condition under Section 125 of the NLC, and the State
PLANNING MALAYSIA
Journal of the Malaysia Institute of Planners (2021)
329 © 2021 by MIP
Authority can forfeit the land under Section 127 as illustrated in the case of Lam
Eng Rubber Factory (M) Sdn Bhd v State Director, Kedah (1994) 1 CLJ 179.
In 2014, the Penang state government decided to regulate the
conversion of residential premises by allowing limited commercial activities.
With amendments to Petaling Jaya Local Plan 1 and 2, 19 areas in the city were
rezoned from residential to limited commercial status (Brenda Ch'ng, 2016).
Under Section 124 of the NLC, variation of a condition of the land use
can be made. Section 124 (1) State Authority is empowered to vary conditions on
the application of proprietor of any category of land use: Section 124(5) Approval
made by the State Authority may be conditional upon all or any of the following
matters-
(a) the payment of a further premium;
(aa) the payment of any other charges as may be prescribed;
(b) the reservation of a new rent;
(c) compliance with such other requirements as the State Authority may think
fit.
In the case, Pengarah Tanah dan Galian, Wilayah Persekutuan v Sri Lempah
Enterprise Sdn Bhd [1979] 1 MLJ 135, the state authority imposed a condition to
approving conversion that the applicant has to surrender the land in perpetuity
and would get back the land for a term of 99 years. The Federal Court held that
the State Authority has no power to compel the proprietor to surrender its freehold
title. The State Authority should act reasonably and not arbitrarily even though it
may impose any other requirement State Authority thinks fit.
Section 124(8) of the NLC provides that the new rent and premium
under this section shall become due to the State Authority at the time when it
approved the application for the conversion of land use and served on the
proprietor a notice in Form 7G requiring him to pay such sum within the specified
time and if any such sum is not paid within such time the approval of the State
Authority shall thereupon lapse.
For the purpose of determining the premium, the Land Administrator
will request the Valuation and Property Services Department of Malaysia (JPPH
Malaysia) to carry out the valuation. It is noted that the premium of commercial
lands is the most expensive, followed by limited commercial and then residential.
Factors such as the leasehold expiry term would also determine the valuation
process. The valuation is always done on the value of the land and not on the size
of the building (Brenda Ch'ng, 2016). In Penang, although the State authority
allowed for the conversion from residential to limited commercial, the residents
claim their land was over-valued by the Valuation and Property Services
Department. Hence, although 633 lot owners were entitled to the conversion, only
110 owners applied for and received planning approval from 2014-August 2016.
However, of those who have planning approval, 59 applied for a change of land
use, and only 40 of them received approval. Out of the 40, only 14 owners paid
Nuraisyah Chua Abdullah, Azni Mohd Dian, Ramzyzan Ramly
Express Condition of Land, Usage of Property, And Licensing of Short-Term Accommodations
© 2021 by MIP 330
the premium (98% yet to accept land conversion in Petaling Jaya). The difference
in land valuation was up to RM1mil in some cases. The land premium was
between RM300,000 and RM500,000 per lot to be settled within six months, after
a discount given by the state government (Brenda Ch'ng, 2016).
In Selangor, the premium rate is as follows: agriculture to residential
(15%), agriculture to commercial (30%), agriculture to industry (20-30%),
residential to commercial (15%), and industry to commercial (10%). The
calculation of the additional premium is based on the State Land Rules. The basis
and rates of premium differ between the respective states in Malaysia. Almost in
all cases, a market value has to be determined. JPPH Malaysia will report the
valuation to the Land Office/Land and Mines Office within ten working days
upon receipt of the application. Where a valuation is required, the valuation
would be the market value for the new use and the market value for the existing
use. The percentage rate and the basis for the computation of additional premiums
are provided in the respective State Land Rules.
Among the factors that are taken into consideration in the valuation are the
condition of the land as at the date of valuation, the type of development that can
be approved, location, shape, and size of the subject land. Information required
from the proprietor is a copy of the title; address of the property (if any); site plan;
location plan; development proposal; feasibility study (if any), and valuation
report (if any).
STRUCTURE AND LOCAL PLAN VS FOREIGN ZONING LAWS The Malaysian town planning system consists of two types of development plans:
structure plans and local plans. While the former provides general policies of the
state governments, the latter are statutory and detailed plans of the local
authorities. The formulation of the development plans is fundamental and
relevant to the growth of STAs in Malaysia. In the preparation process of both
the structure and local plans, Section 7 of Act 172 requires the State Director to
consider all matters expected to affect the development, such as the principal
physical, economic, environmental, and social characteristics, including the
primary land uses, of the State and, those of the neighboring areas. Section 8(3)
of the Act 172 defines a structured plan for a state as a written statement
formulating the policy and general proposals of the State Authority in respect of
the development and use of land in that State, including measures for the
improvement of the physical living environment, the improvement of the socio-
economic well-being and the promotion of economic growth and for facilitating
sustainable development. The state structural plans serve as the framework for
spatial planning at the local level in the form of a local plan. Section 12(3) of the
Act 172 defines a local plan as a detailed land-use plan (map) supported by
written statements explaining proposals for the development and use of land in
the area. The local plans can be prepared by the local planning authorities or the
PLANNING MALAYSIA
Journal of the Malaysia Institute of Planners (2021)
331 © 2021 by MIP
state planning department at any time during the preparation of or upon the
coming into effect of a structural plan.
Unfortunately, it is silent on specific matters concerning the
permissibility and non-permissibility of STAs. Lack of concerns on this issue
during the preparation of the structure and local plans will continue to lead to the
vagueness as to the permissibility of the STA operation. It would appear that
reference to the NLC about the express condition on the land and the Act 172 will
continue to govern the STAs.
In foreign jurisdictions, for example, in the U.S.A, there are Zoning
Ordinances which generally provide for sub-categories and statutory definitions.
Residential districts are separated into single-family and multi-family. In Belle
Terre, the city may go so far as to restrict a single-family dwelling use to only
members of the same family unit with no more than two unrelated persons (Vill.
of Belle Terre v. Boraas, 1974), whereas the Austin Ordinance limits the
occupancy to six-unrelated-person rule (Austin, 2016). A foreign court had
concluded that Zoning Ordinances must specify the non-permissible rule of STAs
expressly to enable the local authorities to take action against illegal STAs, and
in the absence of a definition of types of STAs in the Zoning Ordinances, there
should be no restriction to the activities allowed in residential premises (Slice of
Life, LLC v. Hamilton Twp. Zoning Hearing Board). On the contrary, there is no
specific law on zoning except under Act 172. There is the development plan
(Structure Plan and Local Plan) as mentioned earlier.
GOVERNANCE OF LOCAL AUTHORITIES IN USAGE OF
PREMISE FOR STAs Under Act 172, the local authorities have the right to allow or prohibit owners of
properties from carrying out commercial business such as STA in their properties.
Various local authorities use different approaches in addressing this issue, and
this is influenced by the fact that every community's needs are different,
changing, and the increasing demand of pursuit of quality life and influence of
human rights (Meng Lee Lik et al., 2006). For example, the Penang Municipal
Council stressed that landlords need to verify the allowed uses for their properties
in Penang from the local Planning Department before they engage in a short-term
rental.
On 16 October 2017, the Kota Kinabalu City Hall (DBKK) confirmed
it was illegal for Sabah residents to lease their properties through Airbnb. Hence,
the scrutiny behind the approval of operation of STA as a type of "property
development" where planning permission needs to be obtained must be
addressed.
Act 172 defines property development as “the carrying out of any
building, engineering, mining, industrial or other similar operations in on, over
or under land, or the making of any material change in the use of any buildings
Nuraisyah Chua Abdullah, Azni Mohd Dian, Ramzyzan Ramly
Express Condition of Land, Usage of Property, And Licensing of Short-Term Accommodations
© 2021 by MIP 332
or other land, or the subdivision or amalgamation of lands” where planning
permission needs to be obtained. In broad terms, development can be divided into
two categories;
i. the carrying out of physical operations such as building or engineering
works, and
ii. the making of a material change of use
A change of use of land or buildings requires planning permission if it constitutes
a material change of use. There is no statutory definition of ‘material change of
use’; however, it is linked to the significance of a change and the resulting impact
on the use of land and buildings (Mohammad Yusup et al., 2018). Whether a
‘material change of use’ has taken place is a matter of fact and degree, and this
will be determined on the individual merits of a case. Planning permission will
not normally be required to homework or run a business from home, provided
that a dwelling house remains a private residence first and business second (or in
planning terms, provided that a business does not result in a material change of
use of a property so that it is no longer a single dwelling house). In the United
Kingdom, a local planning authority is responsible for deciding whether planning
permission is required and will determine this on the basis of individual facts.
Issues which they may consider, whether home working or a business, leads to
notable increases in traffic, disturbance to neighbors, abnormal noise or smells,
or the need for any major structural changes or major renovations. This is in line
with the idea that the happiness of residence is very much dependent on the
neighborhood (Oliver Ling Hoon Leh et al., 2015). Hence, it may be concluded
that normally planning permission is needed when (1) whether there has been
a material change of use will depend on whether a space is used in a significantly
different way as compared to the original position of the premise and (2) whether
there are any other relevant planning considerations, such as planning conditions,
which impose restrictions on the operation of the premise being opened for public
accommodation (Ministry of Housing, 2014). It could also be argued that the
“use” allowed is based around "A one-family dwelling on each building site." A
home may be built as a one-family dwelling, but when it is converted to STA use,
it may be argued that it loses that character and contributes to unauthorized
changes in neighborhood character by intensifying the use both in terms of the
number of people who typically use the property at any given time and by the
negative impacts associated with frequent turnover. It would appear that some
considerations are: if the premise is not used for a whole year period (i.e., limited
operation days in a year) or where the owner stays in the same house, then
planning permission is not needed. One possible way to address the ‘change of
character’ issue is by differentiating the types of short-term accommodation
businesses.
In Austin, Texas, STRs can essentially be characterized by: (1) home-
sharing, (2) home rental, or (3) transient rental. Under the “Home sharing” model,
PLANNING MALAYSIA
Journal of the Malaysia Institute of Planners (2021)
333 © 2021 by MIP
the guest and the host are co-occupants of the premises during the guest’s stay.
Home-sharing maximizes the accountability of the host because if the guest
causes any nuisance to surround neighbors, the host is right there to deal with the
problem.
Under the “Home rental” model, the host uses her primary residence for
the STA, but instead of restricting the guest to one room or STA unit, the guest
has rented the entire dwelling, and the host does not occupy the home during the
guest’s stay. A host under the home rental model is less accountable than under
the home-sharing model.
Under the “Transient rental” model, the host is essentially operating an
income property that does not serve as the host’s primary residence but is for the
sole purpose of STAs. Hosts utilizing the transient rental model are the least
accountable of the three models. On the other hand, in the City of New Orleans,
U.S. state of Louisiana, three different categorizations are provided. Under the
category of Accessory Short-Term Rentals. The portion of the dwelling licensed
as an Accessory Short-Term Rental is limited to three (3) bedrooms, and
occupancy is limited to six (6) guests. (There must be at least one bedroom in the
dwelling for the owner-occupant.) The owner-occupant shall occupy the dwelling
and be present during any Short-Term Rental occupancy. Proof of owner-
occupancy will be established by verification of a Homestead Exemption in the
name of the applicant. However, Short-Term Accessory Rentals are prohibited in
the French Quarter. Under the Temporary Short -Term Rentals category, an in-
town property manager is available at all times. Temporary Short-Term Rental
licenses allow a maximum of 90-rental nights per license year. Occupancy is
limited to two (2) guests per bedroom or a total of ten (10) guests, whichever is
less. The entire dwelling may be rented, and the owner/occupant of the dwelling
does not need to be present. No signs advertising the presence of a Short-Term
Rental are allowed. Temporary Short-Term Rentals are prohibited in the French
Quarter.
Under the Commercial Short-Term Rentals category, rental of an entire
dwelling is allowed, where occupancy is limited to five (5) bedrooms and ten (10)
guests. The owner/occupant does not need to be present during the rental period,
and there is no limitation on the number of rental nights per license year. This
type of business must be in a non-residential zoning district. Commercial Short-
Term Rentals are prohibited in non-VCE portions of the French Quarter. In the
City of Charleston, South Carolina, Short-Term Rental regulations now have four
Residential Short-Term Rental Permit Categories based on location. Category I
refers to all properties located within the City’s Old and Historic District. Within
that area, the property must be individually listed on the National Register of
Historic Places to be eligible for short-term renting. Category II refers to all other
properties located on the Charleston peninsula, as long as they are outside the
Short-Term Rental Overlay Zone. Category III refers to all other properties in the
Nuraisyah Chua Abdullah, Azni Mohd Dian, Ramzyzan Ramly
Express Condition of Land, Usage of Property, And Licensing of Short-Term Accommodations
© 2021 by MIP 334
City of Charleston. This includes incorporated areas of West Ashley, James
Island, Johns Island, Cainhoy, and Daniel Island. Under the past regulations,
these areas are not eligible for any short-term legal rentals, but the ordinance
allows short-term renting in these areas, subject to specific requirements. The
STR Overlay Zone refers to a pre-existing area in Cannonborough-Elliotborough.
Commercial Short-Term Rental Permit, which follows the same rules as the past
ordinances. Properties within the Short-Term Rental Overlay are still eligible for
a Bed & Breakfast Permit as defined under past ordinances. No changes to this
area have been made, except that an annual Permit renewal will be required.
Limiting the character of use in the property can be an option to
maintain the character of the STA premise. In the City of Charleston, to ensure
that the STA does not change the character of the property, a maximum guests
rule is applied where up to four adults, regardless of relationship, can stay
overnight in an STA according to the City of Charleston Short Term Rental
Ordinance, 2018, whereas studio apartments and dwelling units shall be limited
to have one (1) guest bedroom and allowed a maximum of two (2) guests in the
City of New Orleans, the U.S. state of Louisiana under Article 20 of
Comprehensive Zoning Ordinance, 2016 (20.3.LLL.1). In the City of Charleston
also, a host must sleep overnight at the property whenever it is being rented. The
Austin, Texas, Code of Ordinances 2015, § 25-2-795(E), reads: “A licensee or
guest may not use or allow another to use a short-term rental for an outside
assembly of more than six adults between 7:00 a.m. and 10:00 p.m.” Furthermore,
"assembly" was defined in the statute to encompass any activity “other than
sleeping.” Hence, if an STR guest wanted to host a barbeque at his rental, he
would be capped at five friends or family members, no matter the scale of the
rental. When read along with subsection(D) ("[a] . . . guest may not use or allow
another to use a short-term rental for an assembly between 10:00 p.m. and 7:00
a.m."), there is a strong term of "a bedtime for tenants."
LICENSING OF STAs IN THE PURVIEW OF LOCAL
AUTHORITIES Under the Local Government Act 1976, section 107, a local authority in the
granting of any license or permit may prescribe the fees for such license or permit
and the charges for the inspection or supervision of any trade, occupation, or
premises in respect of which the license is granted. Under clause (1A), any license
or permit granted under this Act may be issued jointly with any other license or
permit. Under clause (2), every license or permit granted shall be subject to such
conditions and restrictions as the local authority may think fit and shall be
revocable by the local authority at any time without assigning any reason therefor.
Under clause (2A), the revocation of any particular license or permit issued
jointly with any other license or permit under subsection (1A) shall not affect the
validity of any other license or permit with which it had been jointly issued. Under
PLANNING MALAYSIA
Journal of the Malaysia Institute of Planners (2021)
335 © 2021 by MIP
clauses (3) and (4), respectively, the local authority may at its discretion refuse
to grant or renew any license without assigning any reason; therefore and a license
shall be valid for a period not exceeding three years.
Under clause (6), any person who fails to exhibit or to produce such
license under subsection (5) shall be guilty of an offense and shall on conviction
be liable to a fine not exceeding five hundred ringgit or to imprisonment for a
term not exceeding six months or to both. In order words, violation of the
licensing requirement of short-term accommodation by respective local
authorities would lead to a maximum penalty of fine not exceeding RM 500,
where quite unlikely the imprisonment provision is being imposed. Hence, the
small amount of RM 500 would unlikely lead to deterrence, especially when the
local authorities are not given the power to stop the business physically, for
example, by way of eviction.
Under section 110, an officer of a local authority duly authorized in
writing may at all reasonable times enter any premises (including that of STAs)
within the local authority area for the purpose of exercising any power of
inspection, inquiry, or execution of works which is given to a local authority.
Under section 111, the Officer of the local government may demand names and
addresses. Under clause (1), the occupier of any premises within the local
authority area shall, if required by any officer of a local authority, give his name
and identity card number and the name and address of the owner of the premises,
if known. Under clause (2), any person who refuses to give or wilfully misstates
his name and identity card number or the name and address of the owner of the
premises shall be guilty of an offense and shall on conviction be liable to a fine
not exceeding five hundred ringgit or to a term of imprisonment not exceeding
six months or to both.
Currently, different states have different treatments on STAs, but Penang has set
a good path to protect and preserve the property market and hotel industry.
Penang prohibits illegal short-term accommodation to support and protect their
tourism industry in line with the long-known promotion of medium-cost hotels
in Malaysia (Badaruddin Mohamed & Abdul Aziz Hussin, 2003) as well as to
preserve the property market. Last July 2017, the Penang Island City Council
issued summons to landlords after receiving complaints that they were leasing
their premises for STAs purposes. The Environment Health and Licensing
Department of Penang regarded short-term rental operators who operate without
a legal license as operating an illegal lodging house.
Most local authorities have by-laws that govern guests' houses; for
example, Hotel Act (Wilayah Persekutuan Kuala Lumpur) 2003 and Hotel
Bylaws (Seberang Perai) 2017 require all accommodation providers who render
accommodation as a guest house to be registered and to operate under a valid
operating license. It is reported that landlords or property owners in the Penang
Island City Council who ignore notices from the Penang Island City Council for
Nuraisyah Chua Abdullah, Azni Mohd Dian, Ramzyzan Ramly
Express Condition of Land, Usage of Property, And Licensing of Short-Term Accommodations
© 2021 by MIP 336
them to cease their unlicensed short-term rental activity were issued the summons
as the property owners violated the Trade, Businesses and Industries Bylaws of
1991 by the Municipal Council of Penang Island. Hotels Malacca (Historic City
Council) By-Laws 2011, Hotels (Alor Gajah Municipal Council) By-Laws 2011,
Hotels (Jasin Municipal Council) By-Laws 2011, and Hotels (Hang Tuah Jaya
Municipal Council) By-Laws 2011 are examples of a by-law which had
attempted to cover STAs through its application of hotel which includes STAs,
where rooms or any premise (terrace house and homes) including kampung stay,
homestays and town stays are included in the definition of the hotel under the By-
laws. The scale of accommodation of rooms in hotels (including STAs), fire and
noise prevention are covered. Basic documents are required in the registration of
the STAs by local authorities in Melaka, i.e., copy of identity card, prove of
ownership/tenancy agreement, prove of business registration, visual
advertisement (if available), and proof of exit signage in the premise and fire
extinguisher. If there is a renovation, an approval letter from the local authority
and Fire and Rescue Department Malaysia is required.
CONCLUSION Although there is the absence of federal legislation which has been enacted in
direct response to the rise of STAs, there are existing specific laws that relate to
the restriction of activities in ones’ properties under the federal land law (NLC)
and the restriction on the use of the property by local authorities. Although STAs
issue has been a complex one to resolve, the fact remains that the current NLC is
still binding in the general governance of the STAs, and the enactment of some
specific by-laws by local authorities are seen as proactive actions by local
authorities to govern the operation of STAs in the locality.
ACKNOWLEDGEMENT The authors would like to thank Institut Penilaian Negara (INSPEN) for
sponsoring this conference under the National Real Estate Research Grant
(NAPREC) and Research Management Centre (RMC), Universiti Teknologi
MARA for managing the fund.
REFERENCES Abdul Aziz , A., Zakaria , H., & Hamzah, A. (2011). The planning process of
development project in the Malaysian context: A crucial brief overview.
International Journal of Applied Science and Technology, 1(2), 74-81.
Alden, J., & Awang, A. (1985). Regional development planning in Malaysia. Regional
Studies, 19(6), 495-508.
Apallonia C. Wilhelm. (2018). Sharing is Caring: Regulating Rather than Prohibiting
Home Sharing in Wisconsin. 101 Marq. L. Rev. 821.
Austin, T. (2016). Code of Ordinances. 25-2-795(G).
PLANNING MALAYSIA
Journal of the Malaysia Institute of Planners (2021)
337 © 2021 by MIP
Badaruddin Mohamed, & Abdul Aziz Hussin. (2003). Journal of the Malaysian Institute
of Planners Vol. 1 (2003), 35-46.
Brenda Ch'ng. (20 September 2016). Show how valuation is done, say landowners.
Retrieved from The Star:
https://www.thestar.com.my/metro/community/2016/09/20/show-how-valuation-
is-done-say-landowners-premium-amount-still-too-high-even-after-50-discount/
Cory Scanlon. (2017). Rezoning the Sharing Economy: Municipal Authority to Regulate
Short-Term Rentals of Real Property. SMU Law Review, Vol 70, Issue 2.
Faizah Ahmad. (2001-2011). Malaysian Development Plan System: Issues and Problems,
One Decade after its Reform. Journal of the Malaysian Institute of Planners,
VOLUME XIV (2016), 107 – 126.
Faizul Abdullah, & Fatimah Yusof. (2016). Overview of Governance Of Land And
Landed Properties In Malaysia. Journal Of The Malaysian Institute Of Planners,
107 – 126.
Izuandi Yin, & Jamalunlaili Abdullah. (2020). The Development Control of Urban Centre
in Kuala Lumpur. Journal of the Malaysian Institute of Planners Vol. 18, ISSUE
3, 313 – 325.
Meng Lee Lik, et al. (2006). How We Failed To Plan for Habitability. Journal o.f the
Malaysian Institute of Planners, 1-21.
Ministry of Housing, C. &. (20 March 2014). When is permission required? Retrieved
from www.gov.uk: https://www.gov.uk/guidance/when-is-permission-
required#changesofuse
Mohammad Yusup et al. (2018). Temporary Planning Permission In Development
Control System For Urban Development. Journal of the Malaysian Institute of
Planners Vol. 16 ISSUE 3, 143 – 155.
Nicole Gurran, & Peter Phibbs. (2017). When Tourists Move In: How Should Urban
Planners Respond to Airbnb? Journal of the American Planning Association, 83:1,
80-92.
Oliver Ling Hoon Leh, et al. (2015). The Relationship of Human Happiness and
Neighbourhood Planning: Case Study Puchong Indah Housing Estate, Selangor.
Journal of the Malaysian Institute of Planners, 51 – 64.
Slice of Life, LLC v. Hamilton Twp. Zoning Hearing Board. (n.d.). 180 A.3d 687.
Toronto City Planning Division. (2017). Zoning By-law and Zoning By-law Amendments
to Permit Short-term Rentals. Report for Action.
Vill. of Belle Terre v. Boraas. (1974). 416 U.S. 1, 9 .
Received: 12th July 2021. Accepted: 23rd Sept 2021
1 Corresponding Author. Email: [email protected]
PLANNING MALAYSIA:
Journal of the Malaysian Institute of Planners
VOLUME 19 ISSUE 3 (2021), Page 338 – 350
THE DEVELOPMENT OF PENANG SHOP PRICE INDEX (PSPI)
USING LASPEYRES HEDONIC PRICE MODEL
Mohamad Hafiz Jamaludin1, Suriatini Ismail2, Norziha Ismail3
1Faculty of Creative Technology and Heritage,
UNIVERSITI MALAYSIA KELANTAN, MALAYSIA 2Faculty of Architecture and Ekistics,
UNIVERSITI MALAYSIA KELANTAN, MALAYSIA 3Valuation and Property Services Department
MINISTRY OF FINANCE
Abstract
The index is considered an important benchmark and is a decision-making tool
in the financial and capital markets, as well as in the property market. In Malaysia,
continuous monitoring of property price movements is important as almost half
of banking exposure is on property. Further, NAPIC has published indicators
displaying the performance of property such as MHPI and PBO-RI. However,
indicators regarding the price of commercial property are still less widely
published in Malaysia. This study was conducted to develop indicators related to
the price of commercial property, especially to shop property. This study has
focused on the state of Penang as a study area. The literature review methodology
is used to identify existing methods and practices used in developing the index of
commercial property both in Malaysia and internationally. In determining the
appropriate form of hedonic functions for the development of PSPI, analysis of
dependent and independent variables was performed. Meanwhile, the
development of the index is based on the Laspeyres hedonic model which is the
same as the development of MHPI and PBO-RI. The development of PSPI will
be able to help the industry and investors to make decisions and benchmark the
performance of shop. This is also one of the pilot studies in Malaysia to form an
indicator of commercial property.
Keyword: Property Indicator, Shop Property, Penang, Laspeyres, PSPI, Investor
PLANNING MALAYSIA
Journal of the Malaysia Institute of Planners (2021)
339 © 2021 by MIP
INTRODUCTION Index are considered important benchmarks and are decision-making tools in the
financial and capital markets, as well as in the property market (Farragher et al,
2008). In economic maturity, its importance has led to the development of
internationally renowned indexes especially in the United States such as the
National Council of Real Estate Investment Fiduciaries (NCREIF) Property
Index (NPI), Moody's / REAL Commercial Property Index, Massachusetts
Institute of Technology and Centre for Real Estate (MIT-CRE) Transaction-
Based Index. Apart from the United States, there is also an index published by
Investment Property Databank (IPD) in the United Kingdom known as the IPD
Index. This index shows the performance of commercial and industrial properties
which are owned by investment institutions and property companies. Indexes can
also help investors in managing, formulating strategies, and making decisions for
their investment portfolios.
In Malaysia, the Malaysian House Price Index (MHPI) was first
developed in 1997. MHPI is develop using the Laspeyres Hedonic Price Model,
where the index is calculated by using the Laspeyres weighted formula (NAPIC,
2018). MHPI is considered one of the important macroeconomic indicators for
Bank Negara Malaysia (BNM) and the Ministry of Finance Malaysia (MOF)
(BNM, 2017). Following on the introduction of MHPI, NAPIC has published
another index known as the Purpose-built Office Rental Index (PBO-RI) Wilayah
Persekutuan Kuala Lumpur. The index was first published in 2011 with quarterly
publications and uses the Laspeyres Hedonic Price Model. PBO-RI is a
commercial property rental indicator focusing on Purpose-built Office in the
Federal Territory of Kuala Lumpur. Starting in 2016, this index has been
expanded to 3 states namely Selangor, Johor, and Penang known as the PBO-RI
Klang Valley (WPKL and Selangor), Johor Bahru, and George Town.
Overall, PBORI is the only index published by NAPIC that shows the
performance of commercial property in Malaysia, but it is related on rental. There
is also a study conducted by Aina Edayu (2015) on the development of office
price index in the Kuala Lumpur, but it is involves of office price. Thus, this study
is a pioneer in the development of a commercial property index that specializes
in shop property.
LITERATURE REVIEW There are two methodologies used in the development of property indices related
to commercial property there are appraisal and transaction method. NPI is a
commercial property index developed using an appraisal method. NPI has been a
key benchmark for measuring property performance to investment institutions
since its introduction in 1978 (Fisher, 2003). According to Fisher (2003) and
Chegut et al. (2013), Junainah et al. (2019) and Tuti Haryati (2018), the lack of
Mohamad Hafiz Jamaludin, Suriatini Ismail, Norziha Ismail
The Development of Penang Shop Price Index (Pspi) Using Laspeyres Hedonic Price Model
© 2021 by MIP 340
data record and the less of sales data at that time have led to the development of
the index using this approach. However, this approach is not sensitive to current
property market and having problem in the valuing processs that is lack of
property transaction (Geltner et al., 2003 & Chau et al., 2005).
The development of property indices using a transaction method has
long been used over the past decade by using evidence of transaction (Bailey et
al., 1963; Rosen, 1974; Quigley, 1995; Francke, 2010). This method can be
separate into three there are the Repeat Sales Model, Hedonic Price Model, and
Hybrid Model. The Repeat Sales model was developed by Bailey et al. (1963), in
which the transaction of the same property is studied in two or more periods.
Bailey et al. (1963) and Case and Shiller (1987) are pioneers who use the Repeat
Sales method in developing index in the residential sector because of the frequent
transaction. However, its use in the development of commercial property index
is less suitable because it is difficult to obtain commercial property transaction in
a short period. Commercial property prices are more volatile which results in
them being less transferable than residential property (Hasliza et al., 2018). Yet
in Florida, USA a study by Gatzlaff and Haurin (1998) found that indices
developed using this model is more realistic than NCREIF indices developed
using the appraisal basis.
The hedonic price model is one of the methods developed using the
transaction method and has been used more than 70 years ago (Aina Edayu,
2015). This model is developed by considering the characteristics of a property
and there is no need for repeat sales model (Haurin, 2003). In principle, this
technique can be implemented if all the characteristics that affect the value of the
property can be obtained to control the differences in quality of the characteristics
of the property transferred at a time (Fisher et al., 2007). The implementation of
this method is more relevant if the quality of all hedonic variables is obtainable
and complete information is available. The hedonic model has a strong theoretical
basis (Griliches 1971; Rosen 1974) because it uses regression techniques to
control changes in composition and quality. The use of hedonic price models has
been used in the development of MHPI and PBO-RI which have become
important benchmarks in Malaysia.
Another model in developing index using transaction-based method is
hybrid. The hybrid model essentially combines the repeat sales model and the
hedonic price model developed by Quigley (1995). Even so, Quigley (1995) did
not see any advantage in developing an index using a hybrid model over a hedonic
price model. Tables 1 and 2 show the indexes related to property internationally
and in Malaysia along with the methods used in its development.
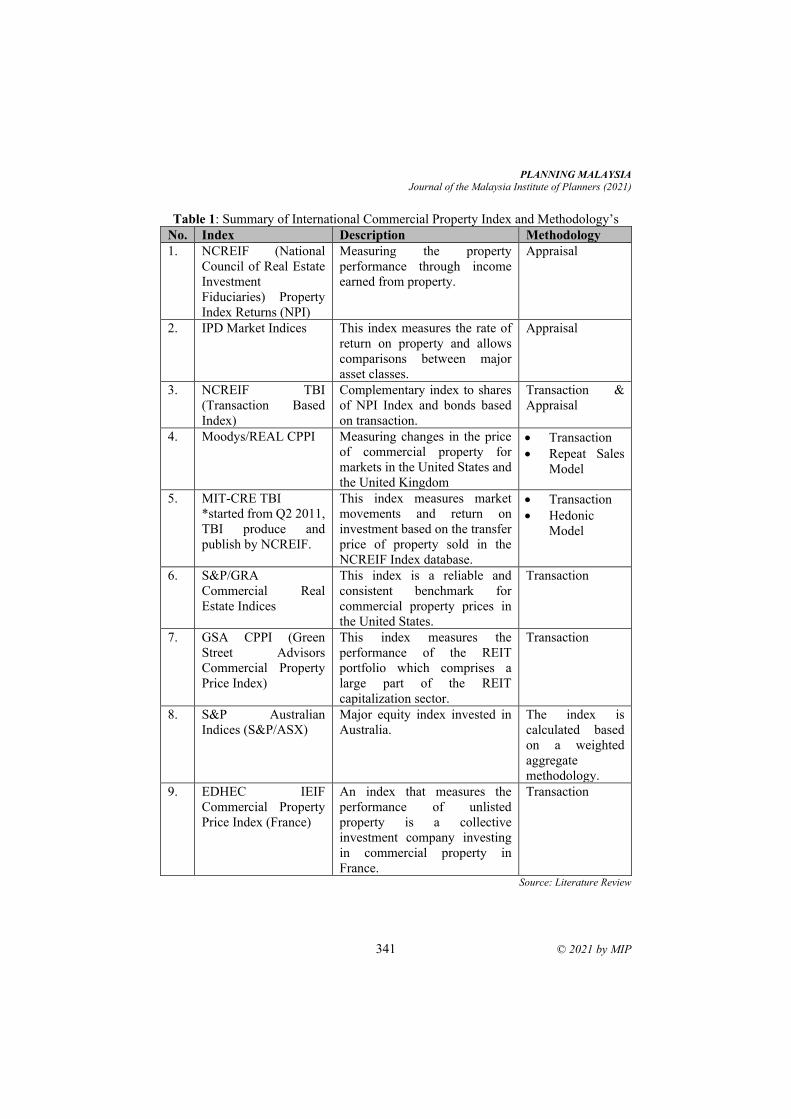
PLANNING MALAYSIA
Journal of the Malaysia Institute of Planners (2021)
341 © 2021 by MIP
Table 1: Summary of International Commercial Property Index and Methodology’s
No. Index Description Methodology
1. NCREIF (National
Council of Real Estate
Investment
Fiduciaries) Property
Index Returns (NPI)
Measuring the property
performance through income
earned from property.
Appraisal
2. IPD Market Indices This index measures the rate of
return on property and allows
comparisons between major
asset classes.
Appraisal
3. NCREIF TBI
(Transaction Based
Index)
Complementary index to shares
of NPI Index and bonds based
on transaction.
Transaction &
Appraisal
4. Moodys/REAL CPPI
Measuring changes in the price
of commercial property for
markets in the United States and
the United Kingdom
• Transaction
• Repeat Sales
Model
5. MIT-CRE TBI
*started from Q2 2011,
TBI produce and
publish by NCREIF.
This index measures market
movements and return on
investment based on the transfer
price of property sold in the
NCREIF Index database.
• Transaction
• Hedonic
Model
6. S&P/GRA
Commercial Real
Estate Indices
This index is a reliable and
consistent benchmark for
commercial property prices in
the United States.
Transaction
7. GSA CPPI (Green
Street Advisors
Commercial Property
Price Index)
This index measures the
performance of the REIT
portfolio which comprises a
large part of the REIT
capitalization sector.
Transaction
8. S&P Australian
Indices (S&P/ASX)
Major equity index invested in
Australia.
The index is
calculated based
on a weighted
aggregate
methodology.
9. EDHEC IEIF
Commercial Property
Price Index (France)
An index that measures the
performance of unlisted
property is a collective
investment company investing
in commercial property in
France.
Transaction
Source: Literature Review
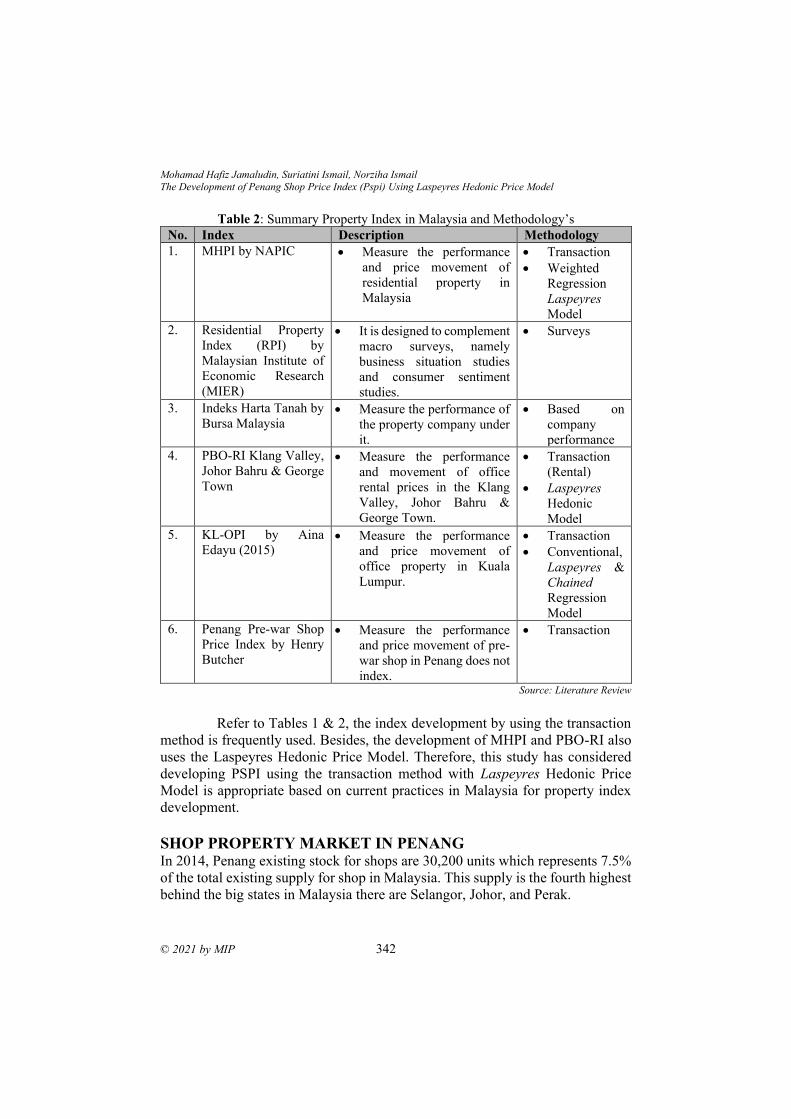
Mohamad Hafiz Jamaludin, Suriatini Ismail, Norziha Ismail
The Development of Penang Shop Price Index (Pspi) Using Laspeyres Hedonic Price Model
© 2021 by MIP 342
Table 2: Summary Property Index in Malaysia and Methodology’s
No. Index Description Methodology
1. MHPI by NAPIC
• Measure the performance
and price movement of
residential property in
Malaysia
• Transaction
• Weighted
Regression
Laspeyres
Model
2. Residential Property
Index (RPI) by
Malaysian Institute of
Economic Research
(MIER)
• It is designed to complement
macro surveys, namely
business situation studies
and consumer sentiment
studies.
• Surveys
3. Indeks Harta Tanah by
Bursa Malaysia
• Measure the performance of
the property company under
it.
• Based on
company
performance
4. PBO-RI Klang Valley,
Johor Bahru & George
Town
• Measure the performance
and movement of office
rental prices in the Klang
Valley, Johor Bahru &
George Town.
• Transaction
(Rental)
• Laspeyres
Hedonic
Model
5. KL-OPI by Aina
Edayu (2015) • Measure the performance
and price movement of
office property in Kuala
Lumpur.
• Transaction
• Conventional,
Laspeyres &
Chained
Regression
Model
6. Penang Pre-war Shop
Price Index by Henry
Butcher
• Measure the performance
and price movement of pre-
war shop in Penang does not
index.
• Transaction
Source: Literature Review
Refer to Tables 1 & 2, the index development by using the transaction
method is frequently used. Besides, the development of MHPI and PBO-RI also
uses the Laspeyres Hedonic Price Model. Therefore, this study has considered
developing PSPI using the transaction method with Laspeyres Hedonic Price
Model is appropriate based on current practices in Malaysia for property index
development.
SHOP PROPERTY MARKET IN PENANG In 2014, Penang existing stock for shops are 30,200 units which represents 7.5%
of the total existing supply for shop in Malaysia. This supply is the fourth highest
behind the big states in Malaysia there are Selangor, Johor, and Perak.
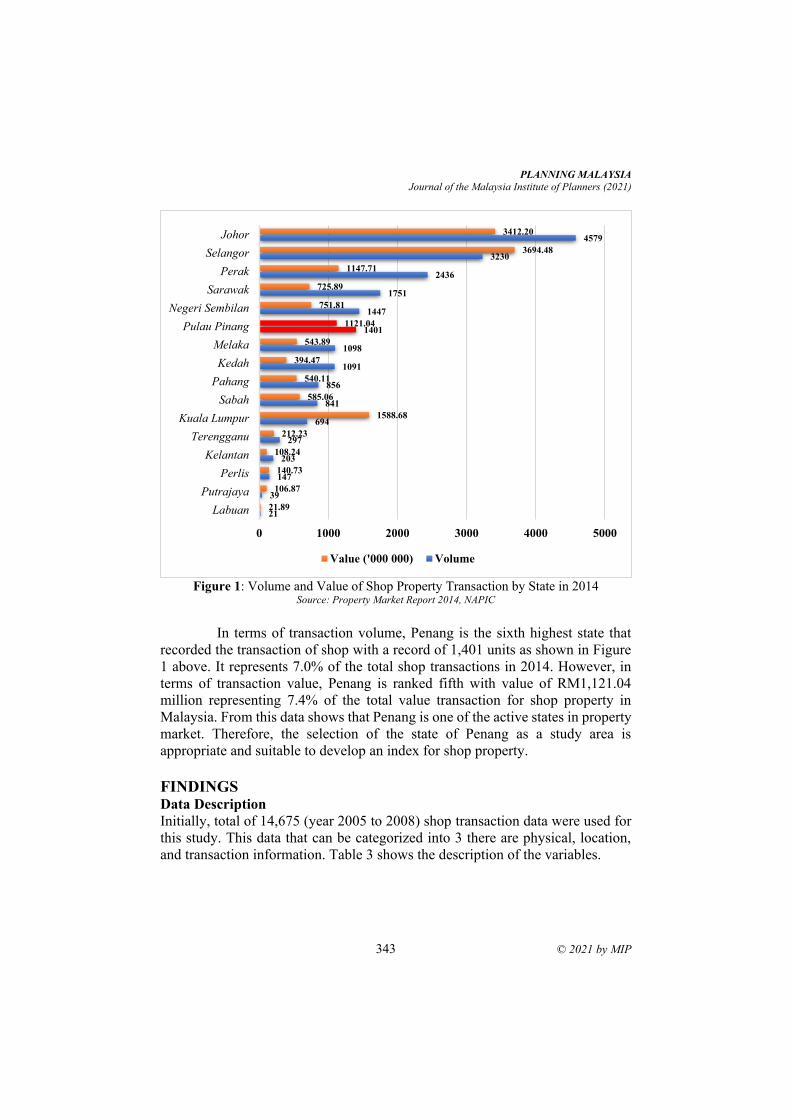
PLANNING MALAYSIA
Journal of the Malaysia Institute of Planners (2021)
343 © 2021 by MIP
Figure 1: Volume and Value of Shop Property Transaction by State in 2014
Source: Property Market Report 2014, NAPIC
In terms of transaction volume, Penang is the sixth highest state that
recorded the transaction of shop with a record of 1,401 units as shown in Figure
1 above. It represents 7.0% of the total shop transactions in 2014. However, in
terms of transaction value, Penang is ranked fifth with value of RM1,121.04
million representing 7.4% of the total value transaction for shop property in
Malaysia. From this data shows that Penang is one of the active states in property
market. Therefore, the selection of the state of Penang as a study area is
appropriate and suitable to develop an index for shop property.
FINDINGS Data Description
Initially, total of 14,675 (year 2005 to 2008) shop transaction data were used for
this study. This data that can be categorized into 3 there are physical, location,
and transaction information. Table 3 shows the description of the variables.
21
39
147
203
297
694
841
856
1091
1098
1401
1447
1751
2436
3230
4579
21.89
106.87
140.73
108.24
212.23
1588.68
585.06
540.11
394.47
543.89
1121.04
751.81
725.89
1147.71
3694.48
3412.20
0 1000 2000 3000 4000 5000
Labuan
Putrajaya
Perlis
Kelantan
Terengganu
Kuala Lumpur
Sabah
Pahang
Kedah
Melaka
Pulau Pinang
Negeri Sembilan
Sarawak
Perak
Selangor
Johor
Value ('000 000) Volume
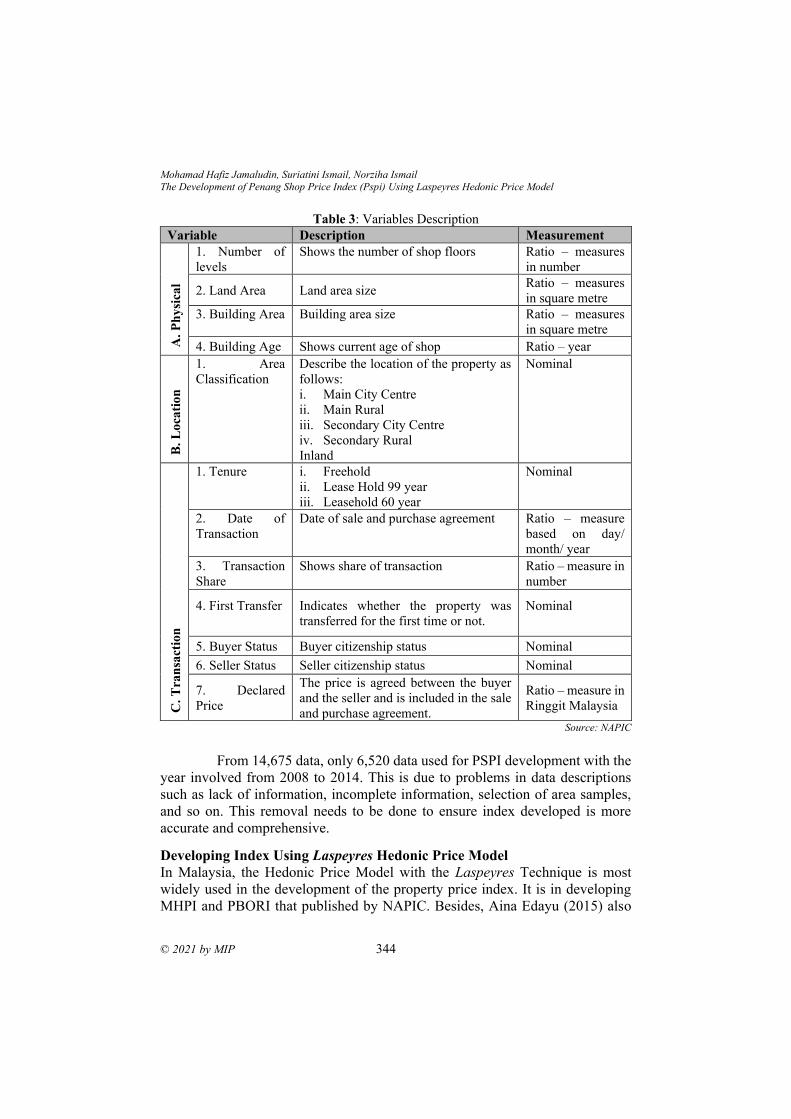
Mohamad Hafiz Jamaludin, Suriatini Ismail, Norziha Ismail
The Development of Penang Shop Price Index (Pspi) Using Laspeyres Hedonic Price Model
© 2021 by MIP 344
Table 3: Variables Description
Variable Description Measurement
A. P
hy
sica
l
1. Number of
levels
Shows the number of shop floors
Ratio – measures
in number
2. Land Area Land area size Ratio – measures
in square metre
3. Building Area
Building area size
Ratio – measures
in square metre
4. Building Age Shows current age of shop Ratio – year
B.
Lo
cati
on
1. Area
Classification
Describe the location of the property as
follows:
i. Main City Centre
ii. Main Rural
iii. Secondary City Centre
iv. Secondary Rural
Inland
Nominal
C.
Tra
nsa
ctio
n
1. Tenure
i. Freehold
ii. Lease Hold 99 year
iii. Leasehold 60 year
Nominal
2. Date of
Transaction
Date of sale and purchase agreement
Ratio – measure
based on day/
month/ year
3. Transaction
Share
Shows share of transaction
Ratio – measure in
number
4. First Transfer
Indicates whether the property was
transferred for the first time or not.
Nominal
5. Buyer Status Buyer citizenship status Nominal
6. Seller Status Seller citizenship status Nominal
7. Declared
Price
The price is agreed between the buyer
and the seller and is included in the sale
and purchase agreement.
Ratio – measure in
Ringgit Malaysia
Source: NAPIC
From 14,675 data, only 6,520 data used for PSPI development with the
year involved from 2008 to 2014. This is due to problems in data descriptions
such as lack of information, incomplete information, selection of area samples,
and so on. This removal needs to be done to ensure index developed is more
accurate and comprehensive.
Developing Index Using Laspeyres Hedonic Price Model
In Malaysia, the Hedonic Price Model with the Laspeyres Technique is most
widely used in the development of the property price index. It is in developing
MHPI and PBORI that published by NAPIC. Besides, Aina Edayu (2015) also
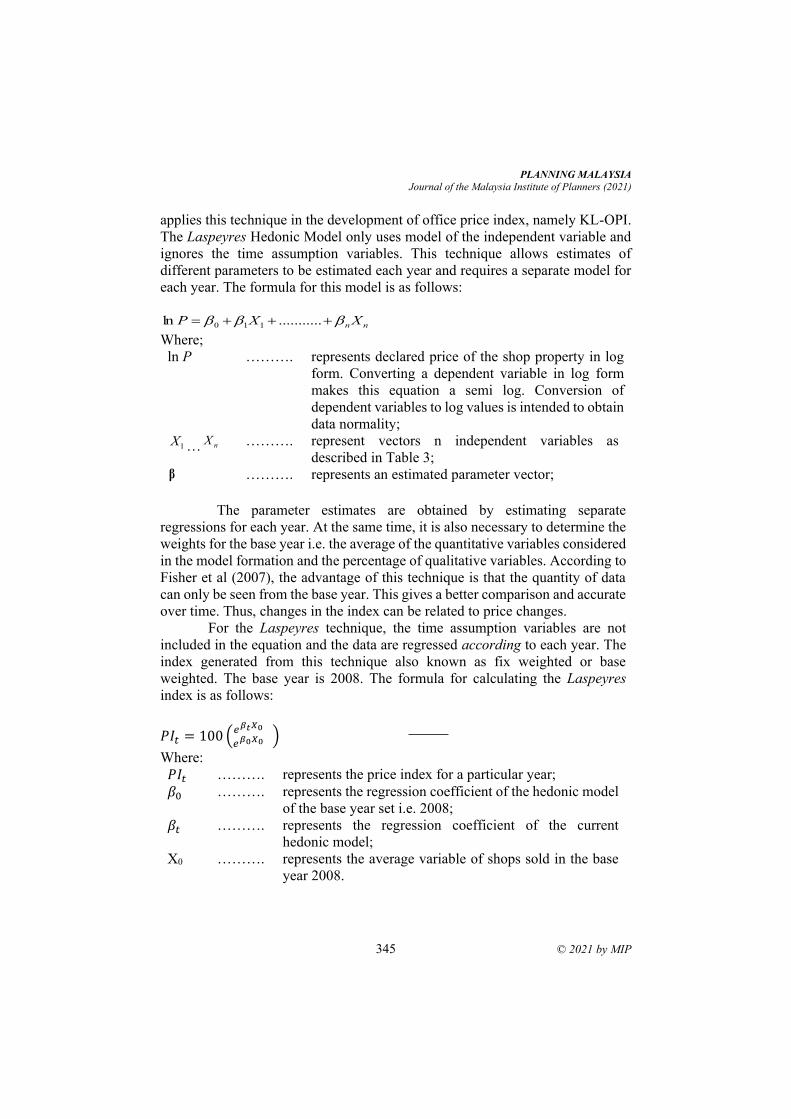
PLANNING MALAYSIA
Journal of the Malaysia Institute of Planners (2021)
345 © 2021 by MIP
applies this technique in the development of office price index, namely KL-OPI.
The Laspeyres Hedonic Model only uses model of the independent variable and
ignores the time assumption variables. This technique allows estimates of
different parameters to be estimated each year and requires a separate model for
each year. The formula for this model is as follows:
nn XXP +++= ...........ln 110
Where;
ln P ………. represents declared price of the shop property in log
form. Converting a dependent variable in log form
makes this equation a semi log. Conversion of
dependent variables to log values is intended to obtain
data normality;
1X … nX ………. represent vectors n independent variables as
described in Table 3; β ………. represents an estimated parameter vector;
The parameter estimates are obtained by estimating separate
regressions for each year. At the same time, it is also necessary to determine the
weights for the base year i.e. the average of the quantitative variables considered
in the model formation and the percentage of qualitative variables. According to
Fisher et al (2007), the advantage of this technique is that the quantity of data
can only be seen from the base year. This gives a better comparison and accurate
over time. Thus, changes in the index can be related to price changes.
For the Laspeyres technique, the time assumption variables are not
included in the equation and the data are regressed according to each year. The
index generated from this technique also known as fix weighted or base
weighted. The base year is 2008. The formula for calculating the Laspeyres
index is as follows:
𝑃𝐼𝑡 = 100 (𝑒𝛽𝑡𝑋0
𝑒𝛽0𝑋0 )
Where:
𝑃𝐼𝑡 ………. represents the price index for a particular year;
𝛽0 ………. represents the regression coefficient of the hedonic model
of the base year set i.e. 2008;
𝛽𝑡 ………. represents the regression coefficient of the current
hedonic model;
X0 ………. represents the average variable of shops sold in the base
year 2008.
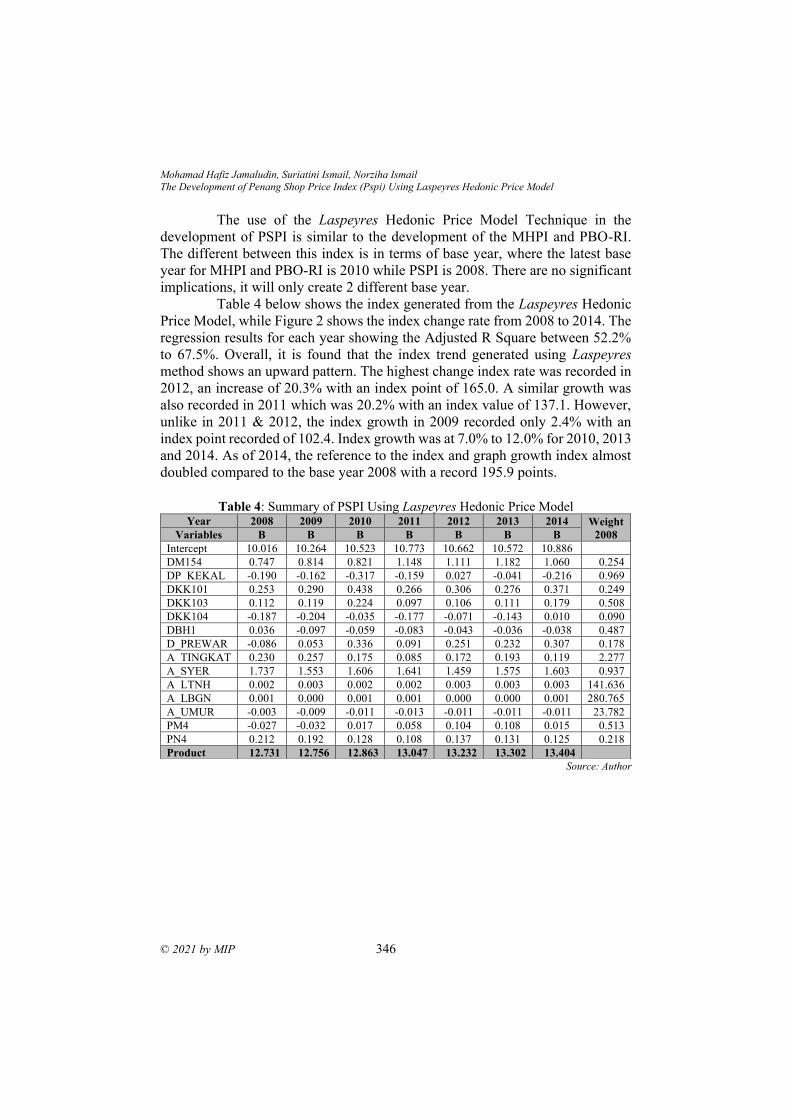
Mohamad Hafiz Jamaludin, Suriatini Ismail, Norziha Ismail
The Development of Penang Shop Price Index (Pspi) Using Laspeyres Hedonic Price Model
© 2021 by MIP 346
The use of the Laspeyres Hedonic Price Model Technique in the
development of PSPI is similar to the development of the MHPI and PBO-RI.
The different between this index is in terms of base year, where the latest base
year for MHPI and PBO-RI is 2010 while PSPI is 2008. There are no significant
implications, it will only create 2 different base year.
Table 4 below shows the index generated from the Laspeyres Hedonic
Price Model, while Figure 2 shows the index change rate from 2008 to 2014. The
regression results for each year showing the Adjusted R Square between 52.2%
to 67.5%. Overall, it is found that the index trend generated using Laspeyres
method shows an upward pattern. The highest change index rate was recorded in
2012, an increase of 20.3% with an index point of 165.0. A similar growth was
also recorded in 2011 which was 20.2% with an index value of 137.1. However,
unlike in 2011 & 2012, the index growth in 2009 recorded only 2.4% with an
index point recorded of 102.4. Index growth was at 7.0% to 12.0% for 2010, 2013
and 2014. As of 2014, the reference to the index and graph growth index almost
doubled compared to the base year 2008 with a record 195.9 points.
Table 4: Summary of PSPI Using Laspeyres Hedonic Price Model
Source: Author
Year 2008 2009 2010 2011 2012 2013 2014 Weight
2008 Variables B B B B B B B
Intercept 10.016 10.264 10.523 10.773 10.662 10.572 10.886
DM154 0.747 0.814 0.821 1.148 1.111 1.182 1.060 0.254
DP_KEKAL -0.190 -0.162 -0.317 -0.159 0.027 -0.041 -0.216 0.969
DKK101 0.253 0.290 0.438 0.266 0.306 0.276 0.371 0.249
DKK103 0.112 0.119 0.224 0.097 0.106 0.111 0.179 0.508
DKK104 -0.187 -0.204 -0.035 -0.177 -0.071 -0.143 0.010 0.090
DBH1 0.036 -0.097 -0.059 -0.083 -0.043 -0.036 -0.038 0.487
D_PREWAR -0.086 0.053 0.336 0.091 0.251 0.232 0.307 0.178
A_TINGKAT 0.230 0.257 0.175 0.085 0.172 0.193 0.119 2.277
A_SYER 1.737 1.553 1.606 1.641 1.459 1.575 1.603 0.937
A_LTNH 0.002 0.003 0.002 0.002 0.003 0.003 0.003 141.636
A_LBGN 0.001 0.000 0.001 0.001 0.000 0.000 0.001 280.765
A_UMUR -0.003 -0.009 -0.011 -0.013 -0.011 -0.011 -0.011 23.782
PM4 -0.027 -0.032 0.017 0.058 0.104 0.108 0.015 0.513
PN4 0.212 0.192 0.128 0.108 0.137 0.131 0.125 0.218
Product 12.731 12.756 12.863 13.047 13.232 13.302 13.404
Index 100.0 102.4 114.1 137.1 165.0 176.8 195.9
Changes 2.4% 11.4% 20.2% 20.3% 7.2% 10.8%
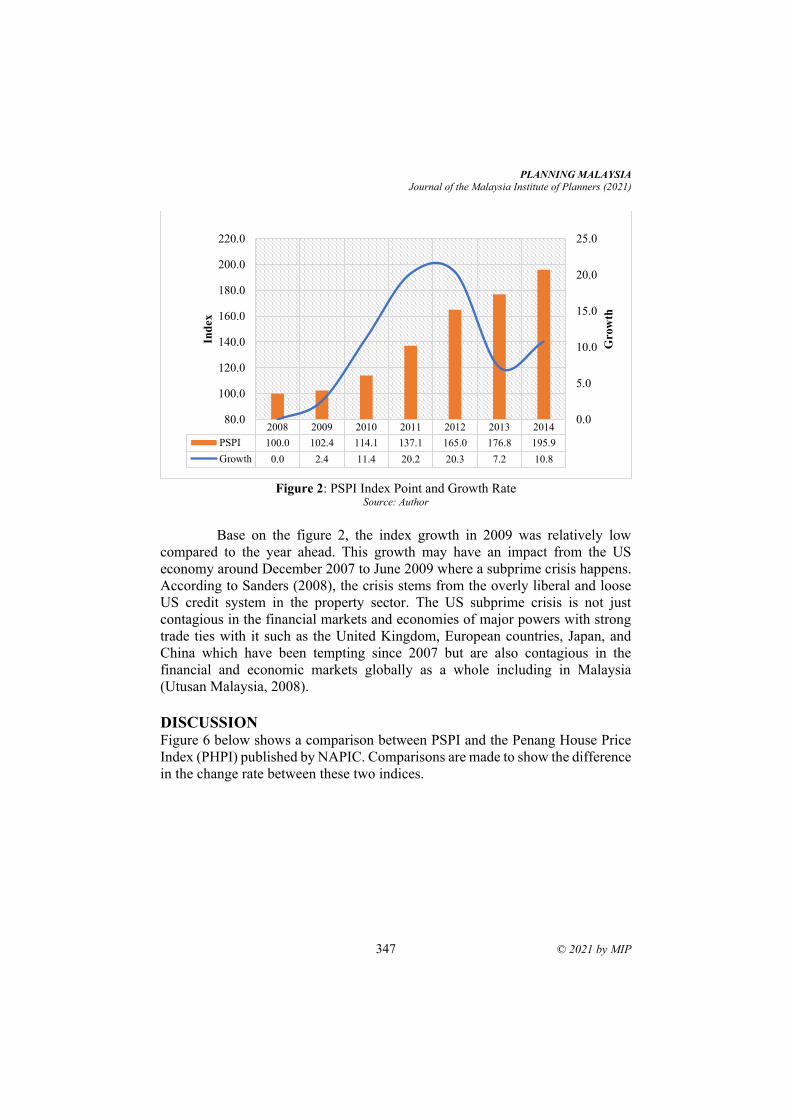
PLANNING MALAYSIA
Journal of the Malaysia Institute of Planners (2021)
347 © 2021 by MIP
Figure 2: PSPI Index Point and Growth Rate
Source: Author
Base on the figure 2, the index growth in 2009 was relatively low
compared to the year ahead. This growth may have an impact from the US
economy around December 2007 to June 2009 where a subprime crisis happens.
According to Sanders (2008), the crisis stems from the overly liberal and loose
US credit system in the property sector. The US subprime crisis is not just
contagious in the financial markets and economies of major powers with strong
trade ties with it such as the United Kingdom, European countries, Japan, and
China which have been tempting since 2007 but are also contagious in the
financial and economic markets globally as a whole including in Malaysia
(Utusan Malaysia, 2008).
DISCUSSION Figure 6 below shows a comparison between PSPI and the Penang House Price
Index (PHPI) published by NAPIC. Comparisons are made to show the difference
in the change rate between these two indices.
2008 2009 2010 2011 2012 2013 2014
PSPI 100.0 102.4 114.1 137.1 165.0 176.8 195.9
Growth 0.0 2.4 11.4 20.2 20.3 7.2 10.8
0.0
5.0
10.0
15.0
20.0
25.0
80.0
100.0
120.0
140.0
160.0
180.0
200.0
220.0
Grow
th
Ind
ex
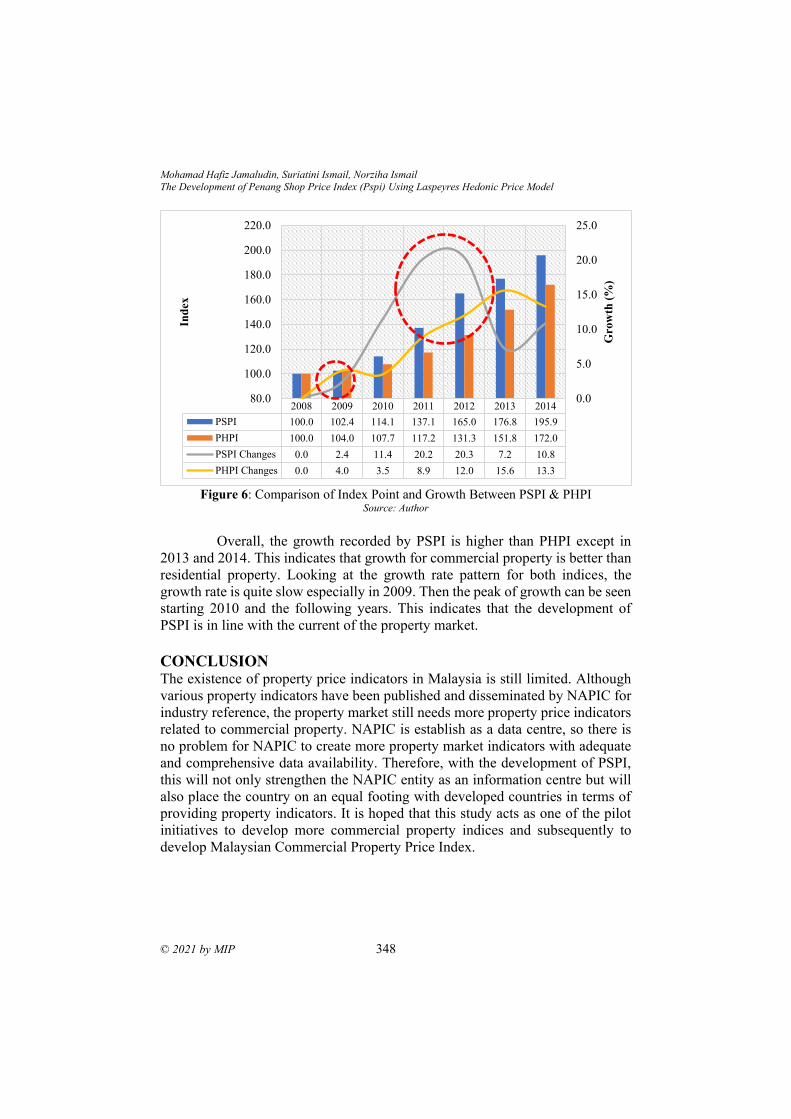
Mohamad Hafiz Jamaludin, Suriatini Ismail, Norziha Ismail
The Development of Penang Shop Price Index (Pspi) Using Laspeyres Hedonic Price Model
© 2021 by MIP 348
Figure 6: Comparison of Index Point and Growth Between PSPI & PHPI
Source: Author
Overall, the growth recorded by PSPI is higher than PHPI except in
2013 and 2014. This indicates that growth for commercial property is better than
residential property. Looking at the growth rate pattern for both indices, the
growth rate is quite slow especially in 2009. Then the peak of growth can be seen
starting 2010 and the following years. This indicates that the development of
PSPI is in line with the current of the property market.
CONCLUSION The existence of property price indicators in Malaysia is still limited. Although
various property indicators have been published and disseminated by NAPIC for
industry reference, the property market still needs more property price indicators
related to commercial property. NAPIC is establish as a data centre, so there is
no problem for NAPIC to create more property market indicators with adequate
and comprehensive data availability. Therefore, with the development of PSPI,
this will not only strengthen the NAPIC entity as an information centre but will
also place the country on an equal footing with developed countries in terms of
providing property indicators. It is hoped that this study acts as one of the pilot
initiatives to develop more commercial property indices and subsequently to
develop Malaysian Commercial Property Price Index.
2008 2009 2010 2011 2012 2013 2014
PSPI 100.0 102.4 114.1 137.1 165.0 176.8 195.9
PHPI 100.0 104.0 107.7 117.2 131.3 151.8 172.0
PSPI Changes 0.0 2.4 11.4 20.2 20.3 7.2 10.8
PHPI Changes 0.0 4.0 3.5 8.9 12.0 15.6 13.3
0.0
5.0
10.0
15.0
20.0
25.0
80.0
100.0
120.0
140.0
160.0
180.0
200.0
220.0
Grow
th (
%)
Ind
ex
PLANNING MALAYSIA
Journal of the Malaysia Institute of Planners (2021)
349 © 2021 by MIP
REFERENCES Aina Edayu, A., Md Nasir D. & Zulkifli E. (2014). Commercial Property Index
Construction Methodology: A Review on Literature and Practice. Journal of
Design and Built Environment, 14 (2), 1-11.
Aina Edayu, A. (2015). Development of Kuala Lumpur Office Price Index (KL-OPI): An
Application of Hedonic Price Model. (Master Thesis) Fakulti Alam Bina,
Universiti Malaya.
Bailey, M. J., Muth, R. F., and Nourse, H. O. (1963). A regression method for real estate
price index construction. Journal of the American Statistical Association, 58, 933-
942.
Bank Negara Malaysia (BNM) (2009). Buletin Suku Tahunan, Suku Pertama 2009.
Diperolehi daripada http://www.bnm.gov.my/ files/publication/qb/2009/Q1/
bm_p3.pdf
Case, K. E. and Shiller, R. J. (1987). Prices of single-family homes since 1970: New
indexes for four cities. National Bureau of Economic Research Cambridge,
Massachusetts, USA.
Chau, K., Wong, S., Yiu, C. and Leung, H. (2005). Real estate price indices in Hong
Kong. Journal of Real Estate Literature, 13, 337-356.
Chegut, A. M., Eichholtz P. M. A. and Rodrigues, P. J. M. (2013). The London
commercial property price index. The Journal of Real Estate Finance and
Economics, November 2013, 47(4), 588-616.
Farragher, E.J. and Savage, A. (2008). An investigation of real estate investment decision-
making practices. Journal of Real Estate Practice and Education, 11(1), 29-40.
Fisher, J. D. (2003). US commercial real estate indices: the NCREIF property index. BIS
Paper No. 21, 359-367.
Fisher, J. D., Geltner, D. and Pollakowski, H. (2007). A quarterly transactions-based
index (TBI) of institutional real estate investment performance and movements in
supply and demand. Journal Real Estate Finance and Economics, 34, 5–33.
Francke, M. K. (2010). Repeat Sales Index for Thin Markets. Journal of Real Estate
Finance and Economics, July 2010, 41(1), 24–52.
Gatzlaff, D. H. and Haurin, D. R. (1998). Sample selection and biases in local house value
indices. Journal of Urban Economics, 43(2), 199-222.
Geltner, D., MacGregor, B. and Schwann, G. (2003). Appraisal smoothing & price
discovery in real estate markets. Urban Studies, 40(5-6), 1047-1064.
Griliches, Z. (1971). Hedonic price indexes of automobiles: an econometric analysis of
quality change. Cambridge University Press.
Hasliza, J., Norngainy, M. T., Md Nasir, D. & Aina Edayu, A. (2018). House Price
Movement for Primary and Secondary Markets: Evidence from Selangor,
Malaysia. Journal of the Malaysian Institute of Planners, 16(1), 334 – 347.
Haurin, D. R. (2003). US commercial real estate indices: transaction-based and constant-
liquidity indices. BIS Paper No. 21, 232-242.
IPD Index Guide (2011). Edition Six – January 2011.
Junainah, M. and Suriatini, I. (2019). Capabilities f Revealed Preference Method for
Heritage Property Valuation. Journal of the Malaysian Institute of Planners,
17(1), 377 – 388.
Kementerian Kewangan Malaysia (MOF) (2017). Laporan Ekonomi 2017.
Mohamad Hafiz Jamaludin, Suriatini Ismail, Norziha Ismail
The Development of Penang Shop Price Index (Pspi) Using Laspeyres Hedonic Price Model
© 2021 by MIP 350
National Council of Real Estate Investment Fiduciaries (NCREIF) (2014). NCREIF
Transaction Based Index (TBI) Overview. Obtained from
https://www.ncreif.org/data-products/tbi/
National Council of Real Estate Investment Fiduciaries (NCREIF) (2014). Property
Index Returns (NPI) Overview. Obtained from https://www.ncreif.org/data-
products/property/
Pusat Maklumat Harta Tanah Negara (NAPIC) (2012). Laporan Indeks Sewaan Pejabat
Binaan Khas Wilayah Persekutuan Kuala Lumpur (WPKL). Jabatan Penilaian dan
Perkhidmatan Harta, Kementerian Kewangan Malaysia.
Pusat Maklumat Harta Tanah Negara (NAPIC) (2018). Laporan Indeks Sewaan Pejabat
Binaan Khas Lembah Klang, Johor Bahru & George Town, Suku 1 dan 2 2018.
Jabatan Penilaian dan Perkhidmatan Harta, Kementerian Kewangan Malaysia.
Pusat Maklumat Harta Tanah Negara (NAPIC) (2018). Laporan Indeks Harga Rumah
Malaysia, Suku 1 dan 2 2018. Jabatan Penilaian dan Perkhidmatan Harta,
Kementerian Kewangan Malaysia.
Pusat Maklumat Harta Tanah Negara (NAPIC) (2014). Laporan Pasaran Harta 2005-
2014. Jabatan Penilaian dan Perkhidmatan Harta, Kementerian Kewangan
Malaysia.
Quigley, J. M. (1995). A simple hybrid model for estimating real estate price indexes.
Journal of Housing Economics, 4, 1-12.
Real Capytal Analytic (RCA) (2014). Moody’s/REAL Commercial Property Price Indices
(CPPI). Obtained from https://www.rcanalytics.com/our-data/rca_cppi/
Rosen, S. (1974). Hedonic prices and implicit markets: product differentiation in pure
competition. The Journal of Political Economy, 82(1), 34-55.
Tuti Haryati, J. (2018). Mediation Effect of Social Aspect in The Relationship Between
Environmental and Economic Aspects: Their Influence on The Value of Green
Commercial Office Property. Journal of the Malaysian Institute of Planners,
16(1), 251 – 264.
Received: 12th July 2021. Accepted: 23rd Sept 2021
1 Trainer at State Asset and Fiscal Balance Training Center, Ministry of Finance Republic of Indonesia Email:
PLANNING MALAYSIA:
Journal of the Malaysian Institute of Planners
VOLUME 19 ISSUE 3 (2021), Page 351 – 362
GROSS INCOME MULTIPLIER AS A FAIRNESS INDICATOR OF
TRANSACTION VALUE ON TRANSFER OF RIGHTS ON LAND AND
BUILDING IN SOUTH TANGERANG
Nur Hendrastuti1
1State Asset and Fiscal Balance Training Center
FINANCIAL EDUCATION AND TRAINING AGENCY INDONESIA
Abstract
As the government of Indonesia targets income tax to contribute 50,1% of the
overall tax revenue target in Indonesia, the Directorate General of Taxes (DGT)
is compelled to maximize the excavation of tax potential. Among others,
excavation of income tax potential may apply for income tax upon the transfer of
rights on land and/or building. For this final income tax, tax extraction is
performed by evaluating the transfer transaction value stated in the Land Deed
Officer Monthly Report which should be based on the value received or obtained
by the seller based on market price. Unfortunately, there is no means to ensure
that the value stated by taxpayer is the actual transaction value. Also, since data
on property in Indonesia is not publicly available, the real value of the transfer
remains elusive. Therefore, Tax Office requires a method or technique to
determine whether the stated value is a reasonable and compliant one. This
research aims to examine the feasibility of Gross Income Multiplier to determine
the fairness indication of transaction value stated by the taxpayer in the transfer
of rights on land and/or building. By understanding the fairness of the stated value
as reported in the Land Deed Officer monthly report, DGT is expected to
accurately determine the fair transaction value.
Keyword: transaction value, Gross Income Multiplier, fairness indication
Nur Hendrastuti
Gross Income Multiplier as A Fairness Indicator of Transaction Value on Transfer of Rights on Land and
Building in South Tangerang
© 2021 by MIP 352
INTRODUCTION Tax revenue is the current focus of state revenue in Indonesia that accounts for
82.5% of the total revenues in the Indonesian State Budget of 2019 (Directorate
General of Budget , 2019) generated from taxation sectors including value added
tax, income tax, land and building tax, import duty, customs clearance, excise,
and other taxes. In the Indonesian State Budget of 2019, income tax and value
added tax are targeted to provide the highest contribution of 50.1% and 36.7%,
respectively. Despite the increasing target year to year, the past 6 years has never
seen a fulfilment.
Addressing this missed target, the government, in this case the
Directorate General of Taxes (DGT) needs to make various efforts that include
excavating the potential taxation. Excavation of potential tax is an attempt to
equalize a tax payment with the potential of theoretical tax owned, or an attempt
to make taxpayers fulfill their potential theoretical taxes (Aribowo &
Rinaningsih, 2013). DGT, an institution primarily tasked with collecting tax
revenue, analyzes the difference between tax potential and data obtained from
taxpayers. The largest source of national tax revenue is non-oil income tax at
52.18% contribution (Directorate General of Taxes , 2019), which is also the
largest taxes managed by central government.
Excavation of income tax potential applies to income tax upon the
transfer of rights on land and/or building. For this final income tax, alternative
tax extraction is feasible by evaluating the value of the transfer transaction stated
in the Tax Payment Slip, a compulsory document presented to a Land Deed
Officer prior to sign the deed of transfer of rights on land and/or building. The
Government Regulation No. 34 of 2016 regarding Income Tax on Income from
The Transfer of Rights on Land and/or Buildings and Sale and Purchase Binding
Agreements on Land and/or Building (GR-34) stated that if the transfer of rights
on land and/or building (L&B) made through a sale is not influenced by
associated enterprises, the value of the transfer should be reported as the tax basis
and reflects the real value that the taxpayer receives. As of transfer made through
exchange, waiver, submission of rights, grants, heirs, or other means that do not
involve value of money, the tax basis is a value that should be received or
obtained based on market price. After the deed is made, Land Deed Officer
reported all acts signed in a Land Deed Officer’s Monthly Report to be submitted
to the head of the Tax Office of the area where the L&B object is located. Tax
Payment Slip examination and Land Deed Officer’s Monthly Report submitted
to the head of Tax Office shall be preliminary data in the examination of taxation
obligations.
The stated value of the taxpayer's transaction needs to be examined by
Tax Office because there is currently no means to ensure that the value stated by
taxpayer is the actual transaction value of the transaction. Although the
PLANNING MALAYSIA
Journal of the Malaysia Institute of Planners (2021)
353 © 2021 by MIP
examination procedure requires an attached proof of transfer, there is no
procedure to cross check the transaction value with data from the third parties,
such as the beneficiary bank. Also, since data on property in Indonesia is not
publicly available, the real value of the transfer remains elusive. It is different
from the systems in other countries, such as the UK Residential Yield Index data
in England or data on lease at the Ministry of Housing in New Zealand
(Hargreaves, 2005). Any indication of misaligned or unnatural values between
the stated and the provision ones, the Tax Office will clarify to taxpayers or audit
the tax against the applicable provisions. Therefore, Tax Office needs a method
or technique to determine whether the stated value is reasonable and compliant.
This research aims to determine whether Gross Income Multiplier
(GIM) can be an alternative valuation technique to be used by the Tax Office.
GIM is a method in valuation under the market data approach, and the multiplier
is obtained by dividing sales price with rental price. This study used GIM because
the reasonable rental price is generally easier to obtain than the reasonable selling
price. This can be understood because psychologically, property owners tend to
set rental price similar to the market price to boost sale. Also, tax officers,
probably not an expert in valuation, need a simple method to determine the
market value. Hence, it is vital to engage a simple and informative method, which
expected can be achieved by using GIM.
THEORETICAL AND CONCEPTUAL FRAMEWORKS Final Income Tax on The Transfer of Rights on Land and/or Building and Land
Deed Officer Obligation to Submit the Monthly Report
Under the provisions of Article 4 Paragraph (l) of Law No. 7 of 1983 concerning
Income Tax as amended by Law No. 36 year 2008 (Income Tax Law), income
received or obtained from sale or transfer of property is an object of income tax.
Therefore, in the event a person or a corporate receives or earns income from the
transfer of property in form of land and/or building, the income is included as an
object of income tax. In GR-34 is stated that the transfer of rights on L&B is
subject to a final income tax. Revenue refers to income received or acquired by
the party who transferred the right through the sale, exchange, waiver, submission
of rights, auction, grant, heir, or other means. Furthermore, the laws stipulated that the final income tax tariff is 2.5% of the gross amount of transfer value,
except for taxpayers whose main business is to sale L&B the tariff is 1%, and for
the transfer of rights to the Government is 0%. The transfer value used as the
basis for calculating the outstanding income tax are the value that should be
received (actual value).
The person or entity who receives or earns income from the transfer of
rights on L&B shall be obliged to deposit his or her own income tax owed to the
bank or postal collecting agent before the deed, decision, agreement, or the
Nur Hendrastuti
Gross Income Multiplier as A Fairness Indicator of Transaction Value on Transfer of Rights on Land and
Building in South Tangerang
© 2021 by MIP 354
treatise of the auction on the transfer rights is signed by an authorized officer.
The payment made for any transfer of rights on L&B uses the tax payment slip
or other administrative means on behalf of the receiver (person or entity) of the
payment, then the slip will be examined by the Tax Office. While both formal
and material obligations are subjected to tax examination by Tax Office, the
former will receive a certificate of formal examination as a proof of fulfillment
of formal obligations. Meanwhile, material examination is conducted after formal
examination to ensure the correctness of the tax amount owed.
Transaction of transfer of rights that has been ratified by the authorized
officer shall then be reported to the Director General of Taxes in the form of
monthly report on the issuance of the deed on the transfer of L&B rights. The
Land Deed Officer monthly report must be submitted for a period of 20 (twenty)
days after the month of rights transfer to the Tax Office where the relevant office
is registered.
Fairness of Value Concept
Fair value as the basis of income tax imposition cannot be waived from an
understanding of the fairness of value in the Income Tax Law. Some regulations
govern the transaction with associated enterprises, such as Article 4 Paragraph
(1) Letter d, it is stated that if there is profit due to sale or because of property
transfer higher or lower than market price, then market price will be used to
calculate taxation obligation. This market price is considered to reflect the
reasonable value of the income tax object, so it is used as the basis of tax
imposition.
According to Indonesian Valuation Standard (SPI), the fair value of a
fixed asset is usually the market value (Indonesian Society of Appraiser, 2018)
that corresponds to the fair value used in financial accounting. SPI defines market
value as an estimated amount of money earned from or paid for converting an
asset or liabilities on the valuation date between buyers who intend to buy with
sellers interested in selling in a transaction-free bond, reasonable marketing, and
each party act prudently and without undue duress. Therefore, market value is
expressed in a currency and measured as the most possible price obtained
reasonably in the market. It is the best, sensible price for the seller and the most
profitable price for the buyer. Meanwhile, Appraisal Institute (2013) defines
market value as the most probable price, as of a specified date, in cash, or in terms
equivalent to cash, or in other precisely revealed terms, for which the specified
property rights should sell after reasonable exposure in a competitive market
under all conditions exquisite to a fair sale, with the buyer and seller each acting
prudently, knowledgeably, and for self-interest, and assuming that neither is
under undue duress.
PLANNING MALAYSIA
Journal of the Malaysia Institute of Planners (2021)
355 © 2021 by MIP
In the sale of L&B property, the sales value for the seller is the actual
value received or based on the actual transaction. If the taxpayer does not use the
market price as stipulated, DGT is authorized to redefine the magnitude of
income and deduction and determine the debt as the capital to calculate the
amount of taxable income for the taxpayer having associated enterprises with
other taxpayers in accordance with the fairness and the dignity of the business
that is not influenced by the associated enterprises. If the sale of property of L&B
is influenced by associated enterprises, the sales value for the seller is the value
that should be received based on reasonable market price or based on assessment
by independent appraiser. Accordingly, the expertise of a valuer is necessary to
determine the reasonable market price.
Gross Income Multiplier Technique
There are three common approaches in valuation: market data approach, cost
approach, and income approach. One of the simple and widely used methods in
market data approach is the Gross Income Multiplier (GIM) method. GIM are
used to compare the income producing characteristic of properties, most often
small residential income properties (Appraisal Institute, 2013). GIM measures
the relationship between a property's gross income and its selling price and is a
combination of an income approach and a market data approach (Lusht, 1997).
Therefore, in order to use the GIM technique, sales and rental data of the property
must be available. The general Formula of GIM is as follows:
𝐺𝐼𝑀 =𝑆𝑒𝑙𝑙𝑖𝑛𝑔 𝑃𝑟𝑖𝑐𝑒
𝐺𝑟𝑜𝑠𝑠 𝐼𝑛𝑐𝑜𝑚𝑒
Gross income used to calculate GIM is an annual gross income from
the property being valued. Perceived as a simple but informative measure in
property cycles (Bjorklund & Soderberg, 1999), GIM is utilized in valuation
mechanism to multiply the gross income that the property can obtain with the
GIM extracted from the comparison property. For example, if GIM is 8, the
property with gross income per year Rp 40 million will be worth Rp 320 million
(Rp 40M x 8). However, two conditions should be taken into account when
utilizing this method (AIREA, 1978), namely consistency in net income ratio
against gross income and enough sales data on the market to acquire a clear GIM
pattern. According to Lusht (1997), the similarity of property with the
comparable to which the GIM will be determined includes the ratio of operating
costs, prospects of profit and changes in future value, and risk. It is in accordance
with Appraisal Institute (2013) that the property being analyzed should be a
property that is comparable to the subject property in terms of physical, location
and investment. Similarly, Zainuddin & Yusof (2020) stated that the rental price
Nur Hendrastuti
Gross Income Multiplier as A Fairness Indicator of Transaction Value on Transfer of Rights on Land and
Building in South Tangerang
© 2021 by MIP 356
is driven by the current rents for nearby houses (location) and the amount of
mortgage that the owner has to pay.
Lusht argues that because of its simplicity, GIM is often perceived too
harsh to use as a value estimating technique. However, this assumption is
questionable because this technique is, in fact, common, especially for simple
properties. WF Smith (in Hargreaves, 2005), stated that for some relatively
homogeneous groups of residential property, gross income is a more reliable
value gauge than traditional valuation methods. Confirming this, Wendt (in
Hargreaves, 2005) stated that GIM is easily understood by investors, property
sales agents, and lenders.
RESEARCH METHODS
This research is an exploratory descriptive study. The purpose of the descriptive
research is to create a systematic, factual, and accurate adjective about the facts and
properties of a specific population or region (Suryabrata, 2013). Also, exploratory
study investigates a problem that has never been explored or examined and attempts
to unravel the issues despite the poor circumstances and scarce research information
(Bungin, 2009). This study expected to obtain a simply and feasible alternative
method to evaluate the fairness of transaction value of rights transfer on L&B and
to determine the follow-up of the transfer transaction reporting.
Research Area
The study was undertaken in South Tangerang City, Banten Province, a satellite city
of Jakarta that experiences rapid growth and is predicted to be the center of emerging
economic growth in greater Jakarta (Sulaiman, 2017). This region has the most
complete urban facilities, especially with the presence of major developers, such as
Bumi Serpong Damai (BSD) City, Alam Sutera, and Bintaro Jaya. Also, South
Tangerang City is an area in Banten province that is directly adjacent to Jakarta and
West Java provinces.
In order to obtain proof of entitlement, the transfer of rights to L&B must
be ratified by the Land Deed Officer who is in charge with the district/city working
area where the L&B is located. The published data of the Ministry of Agrarian
Affairs and Spatial Planning/National Land Agency revealed as many as 355 Land
Deed Officers in South Tangerang who are to validate the transfer of rights.
Data
For this study, the monthly report data of the Land Deed Officer was taken from
Serpong Tax Office between January and October 2019. Data on the rental and sale
of land and building offers to determine the GIM in the research area were obtained
from the online property offering listings in South Tangerang city. Data on property
for sale and rent on the internet were obtained from the site www.olx.co.id and
PLANNING MALAYSIA
Journal of the Malaysia Institute of Planners (2021)
357 © 2021 by MIP
www.rumah123.com, while the price data referred to the asking price. One of the
main advantages of indices constructed from asking price is their timelines
(Eurostat, 2013). However, indices based on initial asking prices have a major
drawback; houses can be withdrawn from market and the agreed selling price may
not equal the seller's asking price. However, given the availability and accessibility
of this type of data, we had them as an optional source.
The GIM was determined for the chosen housing estates: Alam Sutera and
Bumi Serpong Damai (BSD). The two housing areas were selected to ensure
similarities in age, size, and location characteristics of the properties from which the
GIM would be measured (AIREA, 1978). Aiming to establish more thorough
results, we only analyzed particular type of property in the obtained data, namely
property with a land area below 500 m2. Property larger than 500 m2 was opted out
because the wide variation of land and building would made it difficult to obtain
comparable data. The analysis was conducted by categorizing the property based on
the land area: small property (<100 m2), medium property (100 m2 - 200 m2), and
large property (200 m2 - 500 m2).
Stages of data analysis
Data of rental and property sale offers were analyzed to determine the GIM in an
area. Before the GIM was applied to examine the fairness of the transaction value,
it was first tested whether the gross income (annual rent) could explain the variation
that occurred in the value of property in the research area. Testing was conducted
with regression analysis – the process of constructing a mathematical model or
function to predict or determine one variable by another variable or other variables
(Black, 2011). The independent variable in this analysis was the rental value, and
the dependent variable was selling value. Given the lease value was proven to affect
the value of property, the GIM and rental value would be utilized to analyze the
fairness of the value of transactions reported in the monthly report of the Land Deed
Officer.
RESULTS OF RESEARCH The transaction data of the sales and rent used in the study were the offers for house
sale and rental in two housing estates Alam Sutera and BSD which, according to
Ririh (2011) were the large ones in South Tangerang. While BSD has a higher
average rent value in BSD, the average selling value is only slightly higher
compared to Alam Sutera (Table 1). The significantly higher median of the selling
point in Alam Sutera than in BSD suggests a more dynamic trend of buying and
selling transactions. Also, the standard deviation in Table 1 shows a greater variation
in selling value and rent value in BSD than in Alam Sutera.
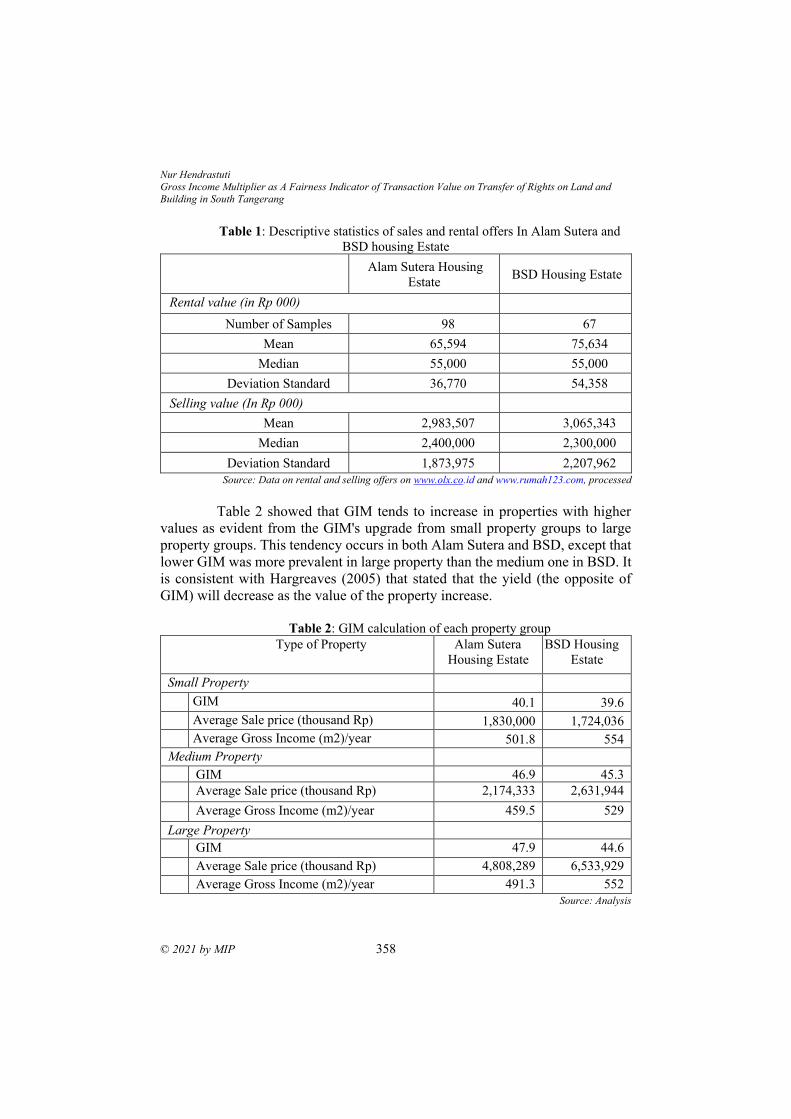
Nur Hendrastuti
Gross Income Multiplier as A Fairness Indicator of Transaction Value on Transfer of Rights on Land and
Building in South Tangerang
© 2021 by MIP 358
Table 1: Descriptive statistics of sales and rental offers In Alam Sutera and
BSD housing Estate
Alam Sutera Housing
Estate BSD Housing Estate
Rental value (in Rp 000)
Number of Samples 98 67
Mean 65,594 75,634
Median 55,000 55,000
Deviation Standard 36,770 54,358
Selling value (In Rp 000)
Mean 2,983,507 3,065,343
Median 2,400,000 2,300,000
Deviation Standard 1,873,975 2,207,962
Source: Data on rental and selling offers on www.olx.co.id and www.rumah123.com, processed
Table 2 showed that GIM tends to increase in properties with higher
values as evident from the GIM's upgrade from small property groups to large
property groups. This tendency occurs in both Alam Sutera and BSD, except that
lower GIM was more prevalent in large property than the medium one in BSD. It
is consistent with Hargreaves (2005) that stated that the yield (the opposite of
GIM) will decrease as the value of the property increase.
Table 2: GIM calculation of each property group
Type of Property Alam Sutera
Housing Estate
BSD Housing
Estate
Small Property
GIM 40.1 39.6 Average Sale price (thousand Rp) 1,830,000 1,724,036 Average Gross Income (m2)/year 501.8 554
Medium Property
GIM 46.9 45.3 Average Sale price (thousand Rp) 2,174,333 2,631,944
Average Gross Income (m2)/year 459.5 529
Large Property
GIM 47.9 44.6 Average Sale price (thousand Rp) 4,808,289 6,533,929 Average Gross Income (m2)/year 491.3 552
Source: Analysis
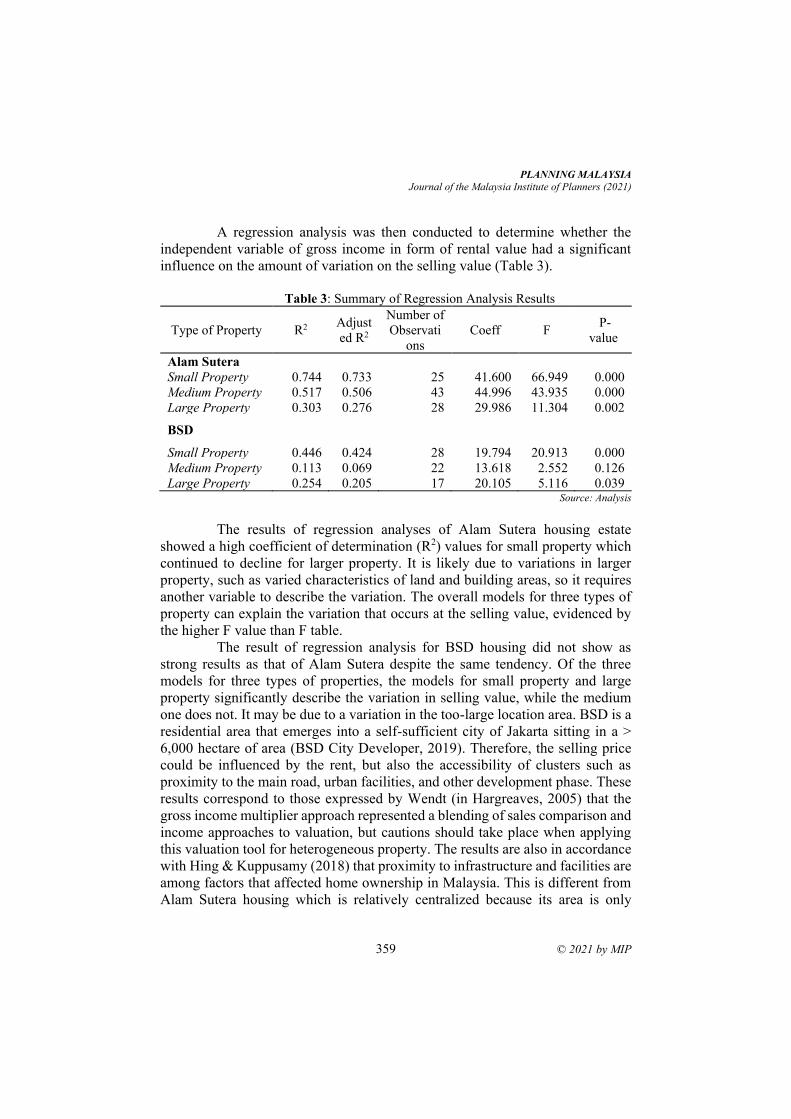
PLANNING MALAYSIA
Journal of the Malaysia Institute of Planners (2021)
359 © 2021 by MIP
A regression analysis was then conducted to determine whether the
independent variable of gross income in form of rental value had a significant
influence on the amount of variation on the selling value (Table 3).
Table 3: Summary of Regression Analysis Results
Type of Property R2 Adjust
ed R2
Number of
Observati
ons
Coeff F P-
value
Alam Sutera Small Property 0.744 0.733 25 41.600 66.949 0.000
Medium Property 0.517 0.506 43 44.996 43.935 0.000
Large Property 0.303 0.276 28 29.986 11.304 0.002
BSD
Small Property 0.446 0.424 28 19.794 20.913 0.000
Medium Property 0.113 0.069 22 13.618 2.552 0.126
Large Property 0.254 0.205 17 20.105 5.116 0.039 Source: Analysis
The results of regression analyses of Alam Sutera housing estate
showed a high coefficient of determination (R2) values for small property which
continued to decline for larger property. It is likely due to variations in larger
property, such as varied characteristics of land and building areas, so it requires
another variable to describe the variation. The overall models for three types of
property can explain the variation that occurs at the selling value, evidenced by
the higher F value than F table.
The result of regression analysis for BSD housing did not show as
strong results as that of Alam Sutera despite the same tendency. Of the three
models for three types of properties, the models for small property and large
property significantly describe the variation in selling value, while the medium
one does not. It may be due to a variation in the too-large location area. BSD is a
residential area that emerges into a self-sufficient city of Jakarta sitting in a >
6,000 hectare of area (BSD City Developer, 2019). Therefore, the selling price
could be influenced by the rent, but also the accessibility of clusters such as
proximity to the main road, urban facilities, and other development phase. These
results correspond to those expressed by Wendt (in Hargreaves, 2005) that the
gross income multiplier approach represented a blending of sales comparison and
income approaches to valuation, but cautions should take place when applying
this valuation tool for heterogeneous property. The results are also in accordance
with Hing & Kuppusamy (2018) that proximity to infrastructure and facilities are
among factors that affected home ownership in Malaysia. This is different from
Alam Sutera housing which is relatively centralized because its area is only
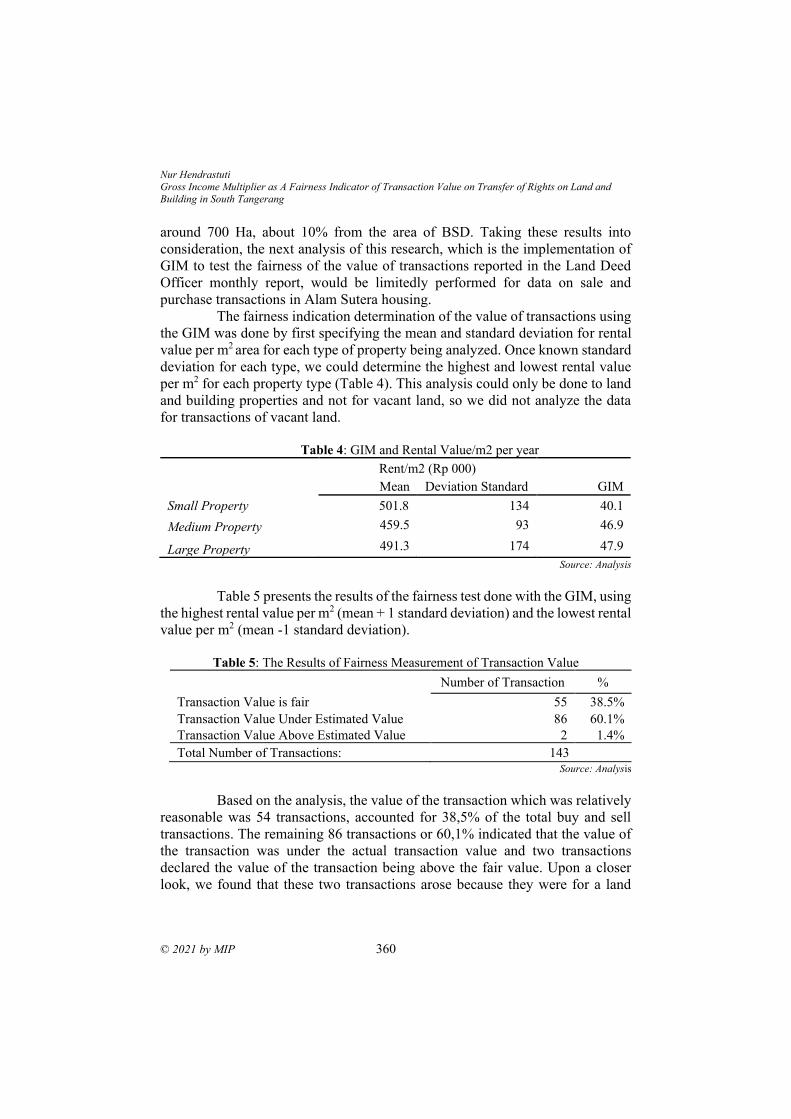
Nur Hendrastuti
Gross Income Multiplier as A Fairness Indicator of Transaction Value on Transfer of Rights on Land and
Building in South Tangerang
© 2021 by MIP 360
around 700 Ha, about 10% from the area of BSD. Taking these results into
consideration, the next analysis of this research, which is the implementation of
GIM to test the fairness of the value of transactions reported in the Land Deed
Officer monthly report, would be limitedly performed for data on sale and
purchase transactions in Alam Sutera housing.
The fairness indication determination of the value of transactions using
the GIM was done by first specifying the mean and standard deviation for rental
value per m2 area for each type of property being analyzed. Once known standard
deviation for each type, we could determine the highest and lowest rental value
per m2 for each property type (Table 4). This analysis could only be done to land
and building properties and not for vacant land, so we did not analyze the data
for transactions of vacant land.
Table 4: GIM and Rental Value/m2 per year
Rent/m2 (Rp 000)
Mean Deviation Standard GIM
Small Property 501.8 134 40.1
Medium Property 459.5 93 46.9
Large Property 491.3 174 47.9
Source: Analysis
Table 5 presents the results of the fairness test done with the GIM, using
the highest rental value per m2 (mean + 1 standard deviation) and the lowest rental
value per m2 (mean -1 standard deviation).
Table 5: The Results of Fairness Measurement of Transaction Value
Number of Transaction %
Transaction Value is fair 55 38.5%
Transaction Value Under Estimated Value 86 60.1%
Transaction Value Above Estimated Value 2 1.4%
Total Number of Transactions: 143 Source: Analysis
Based on the analysis, the value of the transaction which was relatively
reasonable was 54 transactions, accounted for 38,5% of the total buy and sell
transactions. The remaining 86 transactions or 60,1% indicated that the value of
the transaction was under the actual transaction value and two transactions
declared the value of the transaction being above the fair value. Upon a closer
look, we found that these two transactions arose because they were for a land
PLANNING MALAYSIA
Journal of the Malaysia Institute of Planners (2021)
361 © 2021 by MIP
larger than the property analyzed (500 m2), so we considered it inappropriate to
include them in the analysis.
CONCLUSION
Although GIM is often perceived as a very simple method, it is undeniably
informative and easy to understand, even for those unfamiliar with valuation.
This study shows that GIM is an alternative method to estimate market value as
the basis of income tax for transaction of transfer right of land and/or building
(L&B). Most of the transaction values reported in the monthly report of the Land
Deed Officer were under estimated market value, indicative of failure to meet the
stipulated regulation.
ACKNOWLEDGEMENT
The authors would like to thank Tax Office of Serpong, South Tangerang City
for data support and interviews.
REFERENCES AIREA. (1978). The Appraisal of Real Estate 7th Edition. Chicago: American Institute
of Real Esate Appraisers of the National Association of Realtors. Appraisal Institute. (2013). The Appraisal of Real Estate 14th Edition. Illinois: The
Appraisal Institute.
Aribowo, I., & Rinaningsih. (2013). Modul Metode Penggalian Potensi Diklat Account
Representative. Jakarta: Pusat Pendidikan dan Pelatihan Pajak.
Bjorklund, K., & Soderberg, B. (1999). Property Cycles, Speculative Bubbles, and Gross
Income Multiplier. Journal of Real Estate Research, 151-174.
Black, K. (2011). Applied Business Statistics: Making Better Business Decisions 6th
Edition International Student Version. John Wiley and Sons.
BSD City Developer. (2019). About BSD City. Retrieved from www.BSDCity:
https://www.bsdcity-development.com/
Bungin, B. (2009). Metodologi Penelitian Kuantitatif Komunikasi, Ekonomi, dan
Kebijakan Publik serta Ilmu-ilmu Sosial Lainnya. Jakarta: Kencana.
Directorate General of Budget Ministry of Finance, Republic of Indonesia. (2019). APBN
to Encourage Investment and Competitiveness Through Development of Human
Resources. Jakarta: Directorate General of Budget Ministry of Finance, Republic
of Indonesia.
Directorate General of Taxes . (2019). Directorate General of Taxes Annual report Year
2018. Retrieved from www.pajak.go.id: https:// www.pajak.go.id/id/laporan-
tahunan-2018
Eurostat. (2013). Handbook on Residential Property Prices Indices (RPPIs).
Methodologies & Working Papers. Retrieved from
http://epp.eurostat.ec.europa.eu/cache/ity_offpub/ks-ra-12-022/en/ks-ra-12-022-
en.pdf.

Nur Hendrastuti
Gross Income Multiplier as A Fairness Indicator of Transaction Value on Transfer of Rights on Land and
Building in South Tangerang
© 2021 by MIP 362
Hargreaves, B. (2005). Exploring the Yields on Residential Investment Property. Pacific
Rims Real Estate Society (PRRES) Conference. Melborne.
Hing, Y. K., & Kuppusamy, S. (2018). Impediments to Home Ownership: Perception of
Low- and Middle-Income Tenants in Selangor. Planning Malaysia: Journal of the
Malaysian Institute Of Planners Volume 16 Issue 3, 357 – 368.
Indonesian Society of Appraiser. (2018). Standar Penilaian Indonesia Edisi VII (SPI).
Jakarta: Indonesian Society of Appraiser.
Lusht, K. M. (1997). Real Estate Valuation: Principles and Applications. Chicago: Irwin.
Republic of Indonesia. (1983). Law No. 7 regarding Income Tax.
Republic of Indonesia. (2016). Government Regulation No. 34 of 2016 regarding Income
Tax On Income From The Transfer Of Rights on Land And/Or Buildings And Sale
and Purchase Binding Agreements on Land and/or Building.
Ririh, N. (2011, March 03). 13 Kota Baru Tumbuh di Tangerang, Bekasi, dan Bogor.
Retrieved from Kompas.com:
https://properti.kompas.com/read/2011/05/03/20204260/13.kota.baru.tumbuh.di.t
angerang.bekasi.dan.bogor
Sulaiman, F. (2017, March 31). Tangsel Diprediksi Jadi Pusat Pertumbuhan Ekonomi
Baru. Retrieved from wartaekonomi.co.id:
https://www.wartaekonomi.co.id/read136051/tangsel-diprediksi-jadi-pusat-
pertumbuhan-ekonomi-baru.htm
Suryabrata, S. (2013). Metodologi Penelitian. Jakarta: PT Raja Grafindo Perkasa.
Zainuddin, Z., & Yusof, R. M. (2020). Do Inflation, Interest Rate and Cost of Renting
Affect the Price of Terrace Houses in Penang. Planning Malaysia: Journal of the
Malaysian Institute of Planners Volume 18 Issue 3, 338-347.
www.olx.co.id
www.rumah123.com
Received: 12th July 2021. Accepted: 17th Sept 2021
2 Senior Lecturer at Universiti Tun Hussein Onn Malaysia. Email: [email protected]
PLANNING MALAYSIA:
Journal of the Malaysian Institute of Planners
VOLUME 19 ISSUE 3 (2021), Page 363 – 374
SPATIAL AUTOCORRELATION ANALYSIS OF HOUSING
DISTRIBUTION IN JOHOR BAHRU
Nur Asyikin Mohd Sairi1, Burhaida Burhan2, Edie Ezwan Mohd Safian3
1,2,3Faculty of Technology Management and Business
UNIVERSITI TUN HUSSEIN ONN MALAYSIA
Abstract
Geographic location naturally generates spatial patterns that are either clustered,
dispersed, or random. Moreover, Tobler’s First Law of Geography is essentially
a testable assumption in the concept where geographic location matters and one
method for quantifying Tobler’s law of geography is through measures of spatial
autocorrelation. Therefore, the purpose of this study is to identify the spatial
patterns of housing distribution in Johor Bahru through the spatial autocorrelation
method. The result of the global spatial autocorrelation analysis demonstrates a
high degree of clustering within the housing distribution, as well as the
identification of a clustered pattern with a highly positive Moran’s I value of
0.995207. Following that, the LISA cluster map successfully identified individual
clusters of each housing unit with their neighbours through the red and blue
colours displayed on the map, as well as revealing home buyers’ preferences for
a property in each location.
Keyword: Tobler’s First Law of Geography, housing distribution, spatial
patterns, spatial autocorrelation
Nur Asyikin Mohd Sairi, Burhaida Burhan, Edie Ezwan Mohd Safian Spatial Autocorrelation Analysis of Housing Distribution in Johor Bahru
© 2021 by MIP 364
INTRODUCTION Housing is seen as a unique commodity with a variety of characteristics such as
design, neighbourhood condition, location, accessibility and other attributes that
influence customer decision-making in order to achieve maximum use (Tam et
al., 2019). Numerous factors influence home ownership, including housing
characteristics, employment and income trends, and socio-cultural and
demographic descriptors (Lim & Chang, 2018). In addition, housing continues to
be one of the primary growth engines for developing economies, as it contributes
to urbanization and infrastructure development (Nor et al., 2019). Apart from
that, real estate is one of the most important economic activities in the world,
influencing settlement patterns and shaping built environments (Cecchini et al.,
2019). Moreover, three qualities of a house that are frequently emphasized by
home buyers are the building quality, location of the property, and neighbourhood
conditions, all of which can affect housing prices (Mohamad et al., 2016).
According to Scott (2015), data associated with locations can be
mapped, and mapping geographic data is an important first step in analyzing
spatial patterns. The following steps entail identifying, describing, and measuring
data’s spatial characteristics (Scott, 2015). Bivand (1998) agreed, emphasizing
that in cases where data are located at geographical coordinates, mapping the data
alone is insufficient because it appears imprudent not to investigate the possibility
of dependence. Thus, in the context of this study, the housing distribution data
containing location information can be visually mapped, allowing for further
spatial analysis research.
Naturally, everything that has a geographic location will create or
contribute a spatial pattern that is either clustered, dispersed, or random (Klippel
et al., 2011). Furthermore, spatial distributions or patterns are of interest in many
fields of geographic research because they can identify and quantify patterns of
features in space, allowing the underlying cause of the distribution to be
determined (Er et al., 2010). Besides, Laohasiriwong et al. (2018) affirmed that
spatial pattern detection could be an effective tool for understanding geographical
distribution. These statements demonstrate that identifying the spatial patterns of
housing distribution can lead to a better understanding of the housing distribution.
As a matter of fact, a testable assumption in the concept where
geographic location matters are Tobler’s First Law of Geography (TFL). In
addition, TFL stated that: “everything is related to everything else, but near things
are more related than distant things”, which has become central to the core of
spatial analytical techniques as well as geographic conceptions of space (Miller,
2004). The concept of TFL is implied in spatial analysis practice because near
and related are useful concepts at the heart of spatial analysis and modelling
(Miller, 2004). TFL also claims that spatial data are defined by their spatial
dependence or spatial autocorrelation (Waters, 2018). Similarly, Miller (2004)
emphasized that TFL is at the heart of spatial autocorrelation statistics, which are
PLANNING MALAYSIA
Journal of the Malaysia Institute of Planners (2021)
365 © 2021 by MIP
quantitative techniques for analyzing correlation in relation to distance or
connectivity. Spatial autocorrelation refers to the pattern in which observations
from nearby locations are more likely to have a similar magnitude compared to
those from distant locations (Nunung & Pasaribu, 2006).
Therefore, according to TFL, it is possible to conclude that spatial
association existed in geographic data, with proximity playing a significant role.
Because the housing distribution in Johor Bahru has a geographical location, the
existence of spatial association and spatial pattern can be measured by taking TFL
into account. Miller (2004) emphasised that one method of quantifying TFL is
through measures of spatial autocorrelation. Hence, the purpose of this research
is to identify the spatial patterns of housing distribution in the Johor Bahru area
through a spatial autocorrelation analysis.
This paper is divided into four sections. The first section is dedicated to
the introduction. The methodology section, which is the second part of the paper,
goes into great detail about the two types of spatial autocorrelation analyses used
in this research. Following that, the results and discussions section includes an
in-depth discussion of the findings from both spatial autocorrelation analyses.
The conclusions section, which comes last, wraps up all the findings and makes
recommendations for further research.
METHODOLOGY Spatial Autocorrelation Analysis
The spatial autocorrelation method was used in this study to identify the patterns
of housing distribution in the entire Johor Bahru area, including the Kulai district.
The Department of Town and Country Planning Johor provided the 2018 housing
data used in this analysis. The global spatial autocorrelation was computed first
to demonstrate the presence of clustering within the data set. The individual
clusters of the housing distribution were then visualized using local spatial
autocorrelation.
Spatial autocorrelation primarily exists because geography is important
(Griffith & Chun, 2018). Tsai et al. (2009) defined spatial autocorrelation as the
relationship between the values of a single variable caused by the geographic
arrangement of areal units on a map. In fact, spatial autocorrelation is a pattern
component limited to object clustering or dispersion rather than measuring
geometric aspects of the pattern (Boots, 2003). Furthermore, the spatial
autocorrelation concept aids in pattern analysis by measuring the relationship
between values of a variable based on their spatial arrangements and determining
whether the data is clustered, random, or dispersed based on the similarity of the
values and their spatial proximity (Bandyopadhyay et al., 2012).
Clusters form in a geographic distribution when features are found close
to one another or when groups of features with similarly high or low values are
discovered together (Aghajani et al., 2017). According to Griffith and Chun
Nur Asyikin Mohd Sairi, Burhaida Burhan, Edie Ezwan Mohd Safian Spatial Autocorrelation Analysis of Housing Distribution in Johor Bahru
© 2021 by MIP 366
(2018), the spatial autocorrelation perspective focuses on clustering similar or
dissimilar phenomena in geographic space to form map patterns typified by TFL
rather than random mixtures of phenomena. Furthermore, the indicators used to
calculate spatial autocorrelation can be divided into two types which are global
spatial autocorrelation indicators and local spatial autocorrelation indicators
(Wang et al., 2019).
Global Spatial Autocorrelation Analysis
Moran's I, developed by P. A. P. Moran in 1948, is a significant indication of
spatial autocorrelation (Wang et al., 2019). It is a measure of global spatial
autocorrelation, which indicates whether similar values of a particular variable
are closer together in space, detecting the presence of similar value clustering
(Bandyopadhyay et al., 2012). Moran’s I measures spatial autocorrelation based
on both feature location and feature values simultaneously (Er et al., 2010). The
value of Moran’s I ranges from -1 to +1. The Moran’s I is positive when the
observed values of locations within a certain distance or their contiguous
locations are similar (Ma et al., 2008). It is negative when they are dissimilar
(checkered pattern), and it is close to zero when the observed values are
distributed randomly and independently across space (Musakwa & Niekerk,
2014).
However, global autocorrelation tests are unable to distinguish between
high and low clustering within the data set (Wang et al., 2019). As Boots (2003)
emphasizes, global approaches produce a single value for the entire data set,
whereas local approaches produce a local value for each data site in the data set.
Aside from that, Zhang et al. (2010) suggested that it is important to remember
that the spatial autocorrelation level of different census areas is not exactly the
same, which prompted the need for a local indicator. Therefore, local Moran’s I
statistics must be performed in order to identify the individual locations of the
clustering within the entire data set.
Local Spatial Autocorrelation Analysis
Local Moran’s I, in contrast to global Moran’s I, which assumes homogeneity of
the entire dataset, is a local indicator of spatial association and shows the level of
spatial autocorrelation at various individual locations within the data set
(Musakwa & Niekerk, 2014). Local Moran statistics, also known as Local
Indicator of Spatial Association (LISA), are more commonly used to quantify
local spatial concentration or clustering (Ayadi & Amara, 2009). According to
Zhang et al. (2008), local Moran’s I does not range between -1 and +1. However,
a positive value still implies positive spatial autocorrelation (clusters), and a
negative value indicates negative spatial autocorrelation (outliers). The LISA
cluster map basically categorises those locations based on the type of association
either high values with high values (HH), low values with low values (LL), high
PLANNING MALAYSIA
Journal of the Malaysia Institute of Planners (2021)
367 © 2021 by MIP
values with low values (HL), or low values with high values (LH) (Anselin et al.,
2006).
Moran’s I, both global and local, sought to quantify spatial
autocorrelation. The most notable difference between the two measures, as most
scholars pointed out, was the method by which the spatial autocorrelation was
computed. Since global Moran’s I refers to the dataset as a whole while implying
homogeneity, it fails to identify individual clustering, necessitating the use of
local measures, which can identify spatial autocorrelation at the local level as well
as identifying high and low clustering and spatial outliers. Moreover, Anselin et
al. (2006) distinguished between the two measures by stating that global Moran’s
I is used to test for clustering in the data set, whereas local Moran’s I is used to
identify the location of the cluster. Therefore, to overcome the limitation of global
Moran’s I, additional analysis of local Moran’s I must be performed in order to
obtain deeper and more thorough results.
RESULTS AND DISCUSSIONS The housing distribution in Johor Bahru was used to measure the degree of spatial
autocorrelation in this study. The data entry contains a total of 403 606 housing
locations for the year 2018. In fact, TFL can be used to further investigate housing
distribution, which is the arrangement of housing in space. It can be deduced from
TFL that things that are closer together are more related than things that are
farther apart. Moreover, spatial autocorrelation is a technical term that refers to
the measure of similarity or correlation between nearby observations. Since both
TFL and spatial autocorrelation place a premium on the nearest distance, this
study employs the spatial autocorrelation method to identify the spatial patterns
in the studied area.
Global Moran’s I Scatter Plot
First, a global autocorrelation measure based on global Moran’s I was used to test
for homogeneity and the presence of clustering across the entire housing data set.
Figure 1 depicts the results of the analysis using a Moran’s I scatter plot.
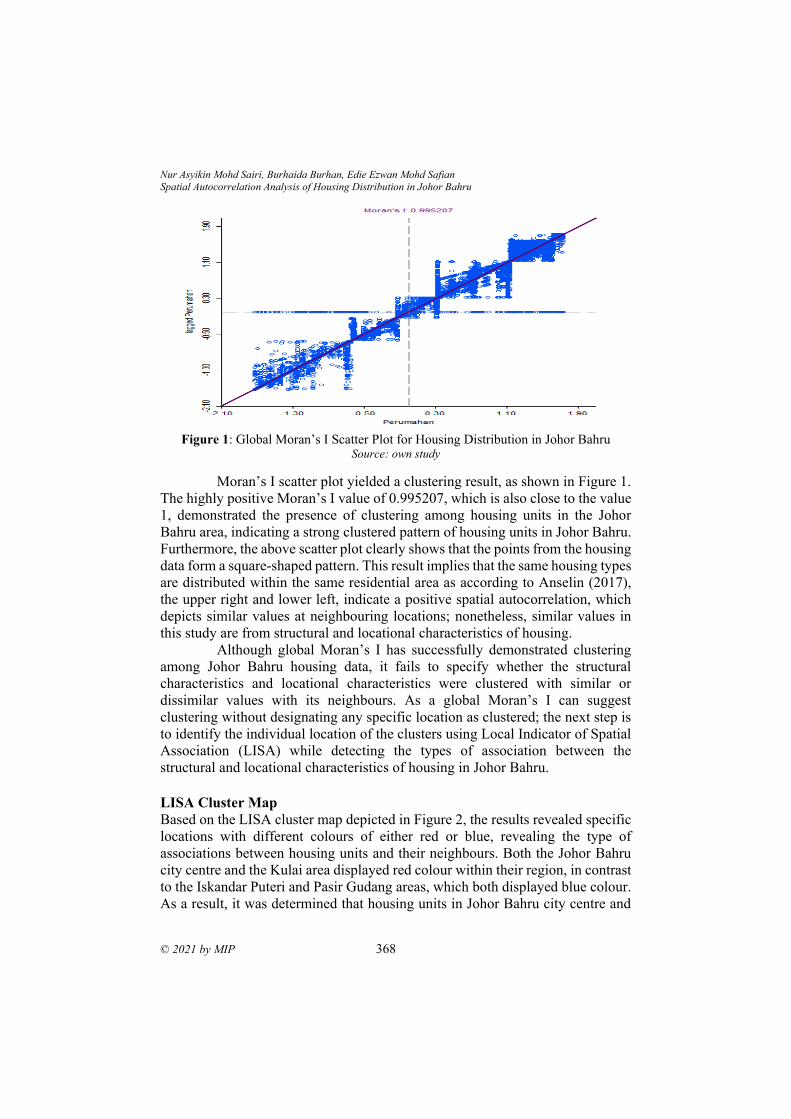
Nur Asyikin Mohd Sairi, Burhaida Burhan, Edie Ezwan Mohd Safian Spatial Autocorrelation Analysis of Housing Distribution in Johor Bahru
© 2021 by MIP 368
Figure 1: Global Moran’s I Scatter Plot for Housing Distribution in Johor Bahru
Source: own study
Moran’s I scatter plot yielded a clustering result, as shown in Figure 1.
The highly positive Moran’s I value of 0.995207, which is also close to the value
1, demonstrated the presence of clustering among housing units in the Johor
Bahru area, indicating a strong clustered pattern of housing units in Johor Bahru.
Furthermore, the above scatter plot clearly shows that the points from the housing
data form a square-shaped pattern. This result implies that the same housing types
are distributed within the same residential area as according to Anselin (2017),
the upper right and lower left, indicate a positive spatial autocorrelation, which
depicts similar values at neighbouring locations; nonetheless, similar values in
this study are from structural and locational characteristics of housing.
Although global Moran’s I has successfully demonstrated clustering
among Johor Bahru housing data, it fails to specify whether the structural
characteristics and locational characteristics were clustered with similar or
dissimilar values with its neighbours. As a global Moran’s I can suggest
clustering without designating any specific location as clustered; the next step is
to identify the individual location of the clusters using Local Indicator of Spatial
Association (LISA) while detecting the types of association between the
structural and locational characteristics of housing in Johor Bahru.
LISA Cluster Map
Based on the LISA cluster map depicted in Figure 2, the results revealed specific
locations with different colours of either red or blue, revealing the type of
associations between housing units and their neighbours. Both the Johor Bahru
city centre and the Kulai area displayed red colour within their region, in contrast
to the Iskandar Puteri and Pasir Gudang areas, which both displayed blue colour.
As a result, it was determined that housing units in Johor Bahru city centre and
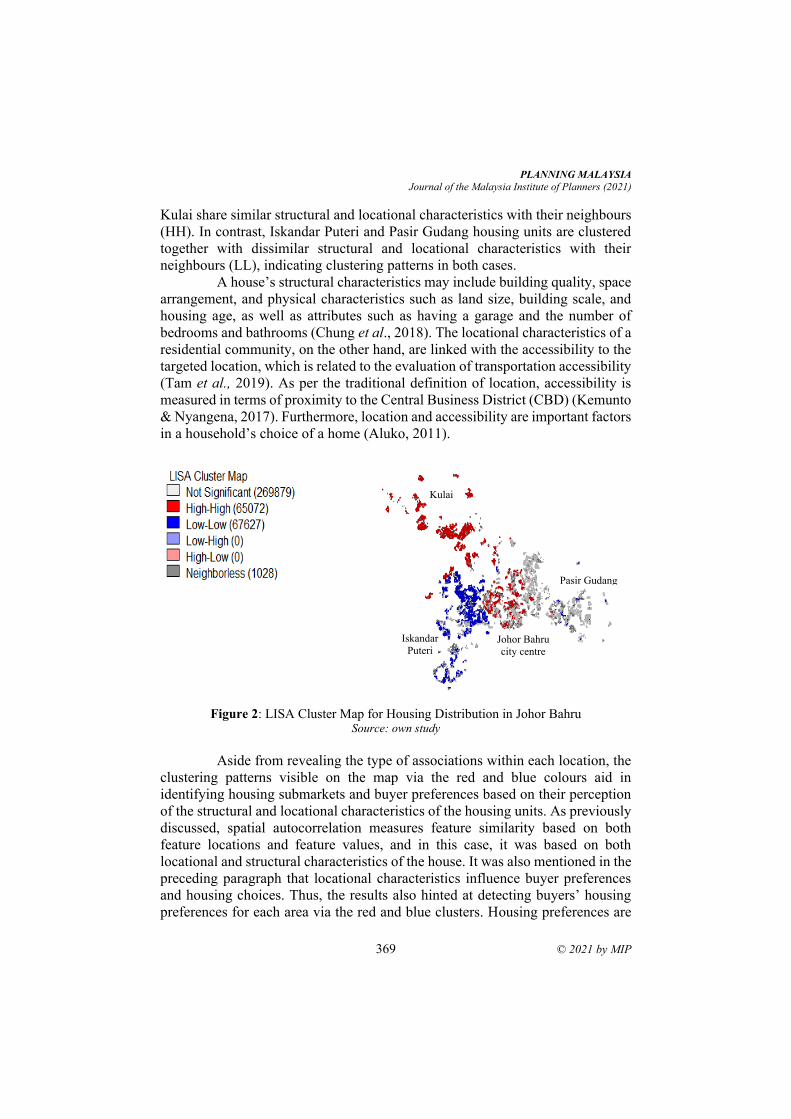
PLANNING MALAYSIA
Journal of the Malaysia Institute of Planners (2021)
369 © 2021 by MIP
Kulai share similar structural and locational characteristics with their neighbours
(HH). In contrast, Iskandar Puteri and Pasir Gudang housing units are clustered
together with dissimilar structural and locational characteristics with their
neighbours (LL), indicating clustering patterns in both cases.
A house’s structural characteristics may include building quality, space
arrangement, and physical characteristics such as land size, building scale, and
housing age, as well as attributes such as having a garage and the number of
bedrooms and bathrooms (Chung et al., 2018). The locational characteristics of a
residential community, on the other hand, are linked with the accessibility to the
targeted location, which is related to the evaluation of transportation accessibility
(Tam et al., 2019). As per the traditional definition of location, accessibility is
measured in terms of proximity to the Central Business District (CBD) (Kemunto
& Nyangena, 2017). Furthermore, location and accessibility are important factors
in a household’s choice of a home (Aluko, 2011).
Figure 2: LISA Cluster Map for Housing Distribution in Johor Bahru
Source: own study
Aside from revealing the type of associations within each location, the
clustering patterns visible on the map via the red and blue colours aid in
identifying housing submarkets and buyer preferences based on their perception
of the structural and locational characteristics of the housing units. As previously
discussed, spatial autocorrelation measures feature similarity based on both
feature locations and feature values, and in this case, it was based on both
locational and structural characteristics of the house. It was also mentioned in the
preceding paragraph that locational characteristics influence buyer preferences
and housing choices. Thus, the results also hinted at detecting buyers’ housing
preferences for each area via the red and blue clusters. Housing preferences are
Johor Bahru
city centre
Pasir Gudang
Iskandar
Puteri
Kulai
Nur Asyikin Mohd Sairi, Burhaida Burhan, Edie Ezwan Mohd Safian Spatial Autocorrelation Analysis of Housing Distribution in Johor Bahru
© 2021 by MIP 370
verbal expressions for the quantitative and qualitative housing characteristics that
residents would prefer to have in their homes (Thanaraju et al., 2019).
Johor Bahru city centre serves as the CBD in the Johor Bahru area. The
decision to buy property near the CBD is typically motivated by the fact that the
CBD provides more job opportunities, enticing buyers to relocate closer to their
workplace (Taubenbock et al., 2013). The red colour that appeared in the Johor
Bahru city centre area indicated that the housing units in the city centre shared
similar locational characteristics with their neighbours, explaining the role of
CBD as a factor influencing buyers to purchase properties in that area. However,
due to the high residential prices in the CBD, not all buyers are able to purchase
properties there. This fact also aids in determining the economic background of
property buyers in the Johor Bahru city centre area, as only households with
higher incomes can afford to purchase expensive housing in the city centre. In
fact, among 140 other administrative districts, Johor Bahru had the six highest
income groups (Department of Statistics Malaysia, 2017). This statistic manages
to back up the findings of the LISA cluster map.
The existence of Kulai Highway, which is part of Federal Route 1, in
the Kulai district may have contributed to the similarity of locational
characteristics within that area. The Kulai Highway connects to other highways
such as the Skudai-Pontian Highway 5, Senai Airport Highway 16, Jalan Kulai-
Kota Tinggi 94, and Diamond Interchange, which connect to Bandar Putra and
Indahpura. As previously discussed, although properties closer to Johor Bahru
are more expensive, buyers benefit from lower transportation costs and less time
on the road. Residents living in Kulai but working in the CBD, on the other hand,
can enjoy affordable properties but must pay more for transportation. Senai
airport and Kulai railway station are also located in Kulai. Therefore, it can be
concluded that the Kulai district provides a reasonable level of accessibility to the
area’s residents while attracting a group of buyers with similar locational
preferences. According to Kaur (2019), an efficient transportation system would
not only help to reduce congestion, but it would also help to increase demand for
residential units in the area.
Iskandar Puteri, a rapidly developing area that is currently serving as
the new administrative centre for Johor state, demonstrated a clustering of
dissimilar values. This reveals that before purchasing a property in Iskandar
Puteri, each home-owner has different locational preferences. It is reasonable to
suggest that Iskandar Puteri has it all. Apart from Kota Iskandar, which serves as
the administrative centre for the state government of Johor, Iskandar Puteri is
home to a number of prestigious educational institutions, including Marlborough
College Malaysia and the well-known University of Technology Malaysia.
Iskandar Puteri also draws visitors with its well-known Legoland Malaysia and
Puteri Harbour. Since Iskandar Puteri is home to a diverse range of key economic
activities such as education and medical tourism, entertainment and recreation,
PLANNING MALAYSIA
Journal of the Malaysia Institute of Planners (2021)
371 © 2021 by MIP
and state administration, each buyer is expected to have distinct purchasing
objectives. Fewer households may purchase the property because it is closer to
their place of employment. Because Iskandar Puteri is home to a plethora of
important economic activities, their working place may vary. Furthermore, the
presence of higher education institutes attracts buyers to purchase residential
properties for the purpose of renting to students. Nasongkhla and Sintusingha
(2013) found that the economic transformation of Iskandar Malaysia benefits
upper-middle-income groups while encouraging cultural diversity and
community participation in development.
Pasir Gudang is well-known for various industrial activities, including
transportation and logistics, shipbuilding, petrochemicals, and other heavy
industries. Despite being Johor’s most well-known industrial city, the results
revealed a clustering of dissimilar values. According to Gasper (2013), Pasir
Gudang has grown well over the years due to the development of an education
hub, shopping complexes, and several private hospitals. Furthermore, the
presence of high education institutes such as Politeknik Ibrahim Sultan, Kolej
Komuniti Pasir Gudang, and UiTM Pasir Gudang influenced a wide range of
buyer preferences. Apart from that, infrastructural improvements such as the
construction of the second bridge in Permas Jaya that connects directly to the
Eastern Dispersal Link, which leads to the city centre, serve to make the area
more accessible (Gasper, 2013). As a result, the residents of Pasir Gudang have
different reasons and preferences for purchasing properties there, resulting in the
clustering of dissimilar locational characteristics.
Aside from that, both spatial and structural factors were revealed to aid
in determining the dimensions of housing submarkets (Watkins, 2001). Thus, the
clustering patterns and spatial factors identified by the LISA cluster map also
revealed the submarkets for each area. For example, higher property prices in
Johor Bahru city centre due to its role as the CBD indicate that the households in
that area are from a higher income group. On the other hand, householders in
Kulai form a submarket with similar locational preferences as Kulai provides
easy access to other regions in addition to being home to the Kulai railway station
and Senai airport.
CONCLUSIONS In a nutshell, the results of both spatial autocorrelation analyses confirm the
existence of clustering in the housing distribution in Johor Bahru while also
identifying a clustered pattern of the housing distribution. The significantly
positive Moran’s I value of 0.995207 from global measures of spatial
autocorrelation revealed the presence of clustering within the housing distribution
in Johor Bahru. Then, the local measures of spatial autocorrelation through the
LISA cluster map were able to identify the type of clustering within the study
area specifically. The red color seen in Johor Bahru’s city centre and Kulai area
Nur Asyikin Mohd Sairi, Burhaida Burhan, Edie Ezwan Mohd Safian Spatial Autocorrelation Analysis of Housing Distribution in Johor Bahru
© 2021 by MIP 372
represents the clustering of similar structural and locational characteristics with
their neighbour (HH). In contrast, the blue color seen in Pasir Gudang and
Iskandar Puteri area represents the clustering of dissimilar structural and
locational characteristics with their neighbour (LL).
The LISA cluster map results provide valuable information not only on
the clustering of structural and locational characteristics but also on buyer
preferences, household incomes, and the actual housing scenario in Johor Bahru.
As previously stated, each of the areas included in this study, namely Johor Bahru
city centre, Kulai, Iskandar Puteri, and Pasir Gudang, has its own set of locational
factors that entice home buyers and even investors to purchase property there.
Among the locational factors influencing buyers’ housing choices in the study
areas are the presence of higher education institutes, job opportunities, the city
center, and accessibility. However, it is important to note, that the spatial
autocorrelation analysis was carried out using a simple housing location data
without knowledge of the specific housing characteristics that cause the
clustering. As a result of the LISA cluster map findings, additional research into
the structural and locational characteristics of housing units that cause red and
blue clustering in the Johor Bahru area is recommended.
ACKNOWLEDGEMENTS
This research was supported by the Ministry of Higher Education (MOHE)
through the Fundamental Research Grant Scheme
(FRGS/1/2019/SS08/UTHM/02/1). In addition, the authors would like to thank
the Department of Town and Country Planning Johor (JPBDJ) for providing the
data used in this research. REFERENCES Aghajani, M. A., Dezfoulian, R. S., Arjroody, A. R. & Rezaei, M. (2017). Applying GIS
to identify the spatial and temporal patterns of road accidents using spatial
statistics (case study: Ilam Province, Iran). Transportation Research Procedia, 25,
2126–2138.
Aluko, O. (2011). The effects of location and neighbourhood attributes on housing values
in metropolitan Lagos. Ethiopian Journal of Environmental Studies and
Management, 4(2), 69-82.
Anselin, L. (2017). Global Spatial Autocorrelation. The Center for Spatial Data Science:
The University of Chicago, 1-69.
Anselin, L., Syabri, I. & Kho, Y. (2006). GeoDa: An introduction to spatial data analysis.
Geographical Analysis, 38(1), 5-22.
Ayadi, M. & Amara, M. (2009). Spatial patterns and geographic determinants of welfare
and poverty in Tunisia. Economic Research Forum Working Paper, 478, 1-23.
Bandyopadhyay, M., Singh, M. P. & Singh, V. (2012). Spatial pattern analysis for finding
weighted candidate set for p-median problem in locating emergency facilities.
PLANNING MALAYSIA
Journal of the Malaysia Institute of Planners (2021)
373 © 2021 by MIP
International Journal of Advanced Research in Computer Science and Software
Engineering, 2(5), 69-74.
Bivand, R. (1998). A review of spatial statistical techniques for location studies. CEPR
Symposium on New Issues in Trade and Location (2277): Lund,Sweden, 1-21.
Boots, B. (2003). Developing local measures of spatial association for categorical data.
Journal of Geographical Systems, 5(2), 139-160.
Cecchini, M., Zambon, I. & Salvati, L. (2019). Housing and the city: A spatial analysis
of residential building activity and the socio-demographic background in a
Mediterranean City, 1990–2017. Sustainability, 11(2), 1-23.
Chung, Y. S., Seo, D. & Kim, J. (2018). Price determinants and GIS analysis of the
housing market in Vietnam: the cases of Ho Chi Minh City and Hanoi.
Sustainability, 10(4720), 1-18.
Department of Statistics Malaysia. (2017). Report of Household Income and Basic
Amenities Survey 2016. Putrajaya: Department of Statistics Malaysia.
Er, A.C., Rosli, M. H., Asmahani, A., Mohamad Naim, M. R., Harsuzilawati M. (2010).
Spatial mapping of dengue incidence: A case study in Hulu Langat district,
Selangor, Malaysia. International Journal of Geological and Environmental
Engineering, 4(7), 251-255.
Gasper, D. T. (2013, February 20). Pasir Gudang a thriving township. The Star. Retrieved
from https://www.thestar.com.my/news/community/2013/02/20/pasir-gudang-a-
thriving-township
Griffith, D. A. & Chun, Y. (2018). GIS and spatial statistics/econometrics: An overview.
Reference Module in Earth Systems and Environmental Sciences, 75, 25-37.
Kaur, S. (2019, April 5). EDTP & mdash; A game changer for Johor. New Straits Times.
Retrieved from https://www.nst.com.my/property/2019/04/476538/edtp-
%E2%80%94-game-changer-johor
Kemunto, M. G. & Nyangena, W. (2017). Residential housing demand in Nairobi; A
hedonic pricing approach. American Journal of Economics,1(2), 64 -85.
Klippel, A., Hardisty, F. & Li, R. (2011). Interpreting spatial patterns: An inquiry into
formal and cognitive aspects of Tobler’s First Law of Geography. Annals of the
Association of American Geographers, 101(5), 1011-1031.
Laohasiriwong, W., Puttanapong, N. & Singsalasang, A. (2018). Prevalence of
hypertension in Thailand: Hotspot clustering detected by spatial analysis.
Geospatial Health, 13(1), 20-27.
Lim, P. I. & Chang, Y. F. (2018). Preference of residential typologies of urban
Malaysians. Journal of the Malaysian Institute of Planners, 16(3), 171-181.
Ma, R., Gu, C., Pu, Y. & Ma, X. (2008). Mining the urban sprawl pattern: A case study
on Sunan, China. Sensors, 8(10), 6371-6395.
Miller, H. J. (2004). Tobler’s first law and spatial analysis. Annals of the Association of
American Geographers, 94(2), 284-289.
Mohamad, M. H., Nawawi, A. H. & Sipan, I. (2016). Review of building, locational,
neighbourhood qualities affecting house prices in Malaysia. Procedia - Social and
Behavioral Sciences, 234, 452 – 460.
Musakwa, W. & Niekerk, A. V. (2014). Monitoring urban sprawl and sustainable urban
development using the Moran Index: A case study of Stellenbosch, South Africa.
International Journal of Applied Geospatial Research, 5(3), 1-20.
Nur Asyikin Mohd Sairi, Burhaida Burhan, Edie Ezwan Mohd Safian Spatial Autocorrelation Analysis of Housing Distribution in Johor Bahru
© 2021 by MIP 374
Nasongkhla, S. & Sintusingha, S. (2013). Social production of space in Johor Bahru.
Urban Studies, 50(9), 1836-1853.
Nor, M. I., Masron, T. A. & Gedi, S. Y. (2019). Modeling of residential property rents in
Somalia using two-stage modelling: Hedonic regression and artificial neural
network. International Journal of Housing Markets and Analysis, 13(2), 331-356.
Nunung, N. & Pasaribu, U. S. (2006). Identifying spatial pattern using spatial
autocorrelation. International Conference on Mathematics and Natural Sciences
(ICMNS). Bandung-Indonesia. 760-764.
Scott, L. M. (2015). Spatial pattern, analysis of. International Encyclopedia of the Social
& Behavioral Sciences, 23(2), 178-184.
Tam, V. W. Y., Fung, I. W. H., Wang, J & Ma, M. (2019). Effects of locations, structures
and neighbourhoods to housing price: An empirical study in Shanghai, China.
International Journal of Construction Management, 1-20.
Taubenbock, H., Klotz, M., Wurm, M., Schmieder, J., Wagner, B., Wooster, M., Esch, T.
& Dech, S. (2013). Delineation of central business districts in mega city regions
using remotely sensed data. Remote Sensing of Environment, 136, 386-401.
Thanaraju, P., Khan, P. A. M., Juhari, N. H., Sivanathan, S. & Md Khair, N. (2019).
Factors affecting the housing preferences of home buyers in Kuala Lumpur.
Journal of the Malaysian Institute of Planners, 17(1), 138-148.
Tsai, P. J., Lin, M. L., Chu, C. M. & Perng, C. H. (2009). Spatial autocorrelation analysis
of health care hotspots in Taiwan in 2006. BMC Public Health, 9(464), 1-13.
Wang, W. C., Chang, Y. J. & Wang, H. C. (2019). An application of the spatial
autocorrelation method on the change of real estate prices in Taitung City.
International Journal of Geo-Information, 8(6), 1-20.
Waters, N. (2018). Tobler’s First Law of Geography. In The International Encyclopedia
of Geography. Hoboken, NJ, USA: John Wiley & Sons, Ltd.
Watkins, C. A. (2001). The definition and identification of housing submarkets.
Environment and Planning A, 33(12), 2235-2253.
Zhang, C., Luo, L., Xu, W. & Ledwith, V. (2008). Use of local Morans I and GIS to
identify pollution hotspots of Pb in urban soils of Galway, Ireland. Science of the
Total Environment, 398(1-3), 212–221.
Zhang, D., Mao, X. & Meng, L. (2010). A method using ESDA to analyze the spatial
distribution patterns of cultural resource. The International Archives of the
Photogrammetry, Remote Sensing and Spatial Information Sciences, 38(2), 273-
278.
Received: 12th July 2021. Accepted: 23rd Sept 2021
2 Senior lecturer at Universiti Tun Hussein Onn Malaysia, Johor. Email: [email protected]
PLANNING MALAYSIA:
Journal of the Malaysian Institute of Planners
VOLUME 19 ISSUE 3 (2021), Page 375 – 386
CONSTRUCTING HOUSING PRICE INDEX FOR
TERRACED PROPERTIES IN JOHOR BAHRU, MALAYSIA
Wendy Lim Wen Xin1, Burhaida Burhan2, Mohd Lizam Mohd Diah3
1,2,3Department of Real Estate Management
Faculty of Technology Management and Business
UNIVERSITI TUN HUSSEIN ONN MALAYSIA
Abstract
Housing is a country’s biggest asset. Hence, the pattern of the housing price index
(HPI) is an important topic to gain insight into the housing market while
identifying the prevailing housing issues. The determinants of housing price vary
for each city and state based on the different characteristics in each location.
Accordingly, HPI should consider the property’s quality differences. Besides,
national HPI is insufficient and restricted to the housing price at the state level.
Thus, the study focused on constructing a specified HPI model for different cities,
districts, and states. Effective HPI can give parties a better idea of the current
property market situation and act as an analytical tool in managing the sector.
Specifically, the study aims to examine the relationship between the
heterogeneity housing attributes and housing prices of the terraced properties in
Johor Bahru, Malaysia. Additionally, the study provides detailed information on
the key determinants of the housing price variation in Johor Bahru. Hedonic price
analysis is useful in constructing HPI, expressing housing price as a function of
vector property characteristics. Furthermore, HPI is constructed based on the
yearly indices and by pooling the data into certain periods. The results show the
percentage of variance explained by the factors of HPI for the terraced properties
in Johor Bahru. Correspondingly, the underlying correlation between the tested
housing attributes with the housing price is explained through the analysis results.
Keyword: Housing market, housing price index, hedonic analysis, residential
property
Wendy Lim Wen Xin, Burhaida Burhan, Mohd Lizam Mohd Diah
Constructing Housing Price Index for Terraced Properties in Johor Bahru, Malaysia
© 2021 by MIP 376
HOUSING PRICE INDEX (HPI) As no two properties are identical due to heterogeneity, housing prices vary based
on numerous attributes, such as locational and structural features (Lim et al.,
2018). The attributes significantly contribute to the formation of housing prices
(Tan, 2010). Essentially, property transaction prices are reflected through
structural and locational attributes, such as lot area size, tenure, property age,
proximity to the central business district (CBD), neighbourhood, facilities, transit
stations, and others (Dziauddin, Ismail and Othman, 2015; Wilhelmsson, 2000;
Laakso and Loikkanen, 1995). Summarily, regressing the property locational and
structural attributes against the transaction price enables estimating the
significant effects of these traits on the property price.
The HPI is a widely used indicator in the real estate property market
that portrays the general fluctuation of housing prices across the period. Besides,
HPI is a broad indicator of the operation and transaction of the property market
(Kassim, Redzuan and Harun, 2017). Rosen (1974) stated that HPI is computed
based on the hedonic regression model with the working hypothesis that housing
price encloses significant determinants by considering the property’s locational
and structural attributes.
Issues of Housing Price Index The HPI is more challenging to measure than other goods and assets due to three
key distinguishing characteristics. Firstly, properties are heterogeneous, meaning
that every property has a different housing price summed up by different
combinations of structural and locational attributes. Abdul Rahman et al. (2019)
suggested that the sampled HPI could be a weak indicator of all housing prices,
and predicting the sales prices of a given property from the price of another is
unfair. Additionally, simple HPI conducted based on mean and median excludes
all the property attributes of the dwellings (Burhan, 2014). Thus, no exact single
HPI works as the best measure of central tendency for the properties based on the
various attributes.
Secondly, past studies express that the housing price of a given property
cannot be simply observed without being sold or transacted. Generally, properties
are commonly transacted at an agreed price upon the consensus of both parties
through negotiation or auction, making the advertised housing price a poor
substitute for the eventual selling price (Burhan, 2014; Wood, 2005). Thirdly,
properties are generally sold infrequently (Chandler and Disney, 2014; Wood,
2005). Hence, the illiquidity of the property market is explained through the
infrequently transacted dwellings, as the types of property sold at different times
may vary.
Consequently, changes in the reported HPI between years may be
influenced by the different composition of property sold rather than reflecting on
the actual changes in the property market (Nagaraja, Brown and Wachter, 2014).
PLANNING MALAYSIA
Journal of the Malaysia Institute of Planners (2021)
377 © 2021 by MIP
Thus, the property market cycle is unpredictable, leading to volatility in the real
estate market (Rosmera, Mohd Diah and Omar, 2012). Based on past studies,
many determinants or property attributes are included to examine its relationship
with the housing price. Nevertheless, Sutton (2002) and Chen and Patel (1998)
argued that the housing price model in the market failed to clarify the correlation
between housing price and the determinants due to confusion and uncertainty.
Chen and Patel (1998) supported the argument, indicating possible
reasons for the failure resulting from misunderstanding the interrelation between
housing price and the tested determinants. As the nature of the property market
is complex and always fluctuating, substantial uncertainty exists. Maclennan
(1994) cited that “the housing market is a large sector of the economy and it is
highly possible that the housing market and the economy interact. Although the
feedback mechanism is possible, it is not very clear. It is not only important to
determine a timing relationship, but also a direct relationship between house
price and its aggregate determinant series”.
Presently, the relationship between property attributes and housing
price is still a debatable issue in the property market. Every property has a
different housing price summed up by the various combinations of property
characteristics and attributes. Moreover, housing price factors vary for each city
and state due to its different characteristics in every location. Therefore, the
national housing price is insufficient and limited to the housing price at the state
level. Thus, the study emphasises the importance of constructing different models
for different cities or states in the country.
The study evaluates the time-series aggregation effects on the HPI in
Johor Bahru by using a comprehensive transaction-based data set from 2009 to
2018. The hedonic approach enables a full appraisal and estimation of the
property attributes on the housing price. Besides, the analysis results focus on the
R-squared (R2) value for each selected period. The R2 value is the coefficient of
determination, the proportion of variance in the dependent variable explained by
the independent variables (Cameron and Windmeijer, 1997). Hence, the analysis
results measure the percentage of variance explained by the property attributes of
the HPI.
HEDONIC PRICE ANALYSIS
Basically, the hedonic method is a widely used analysis for constructing HPI
(Burhan, 2014; Rosmera, Mohd Diah and Omar, 2012). Many researchers apply
the hedonic price model to examine the relationship between property attributes
and housing price. Previously, the hedonic pricing model was implemented
expansively into the housing market research and explored the link between the
housing price and the housing characteristics. The model also examines housing
demand for attributes and guides housing price (Fenwick, 2013). The hedonic
Wendy Lim Wen Xin, Burhaida Burhan, Mohd Lizam Mohd Diah
Constructing Housing Price Index for Terraced Properties in Johor Bahru, Malaysia
© 2021 by MIP 378
price analysis is performed by referring to the multiple regression technique
based on the correlation method (Md Yusof and Ismail, 2012).
Two main types of variables are identified for the analysis, i.e.,
independent variables and dependent variable. It is important to carefully
determine the variables that contribute to the housing price. Subsequent effect, if
the essential variables are not being identified, it will lead to omitted variables
bias (Rosmera, Mohd Diah and Omar, 2012).
Two main types of variables are identified for the analysis: independent
variables and dependent variables. Significantly, the variables that contribute to
the housing price must be identified, failing which lead to omitted variables bias
(Rosmera, Mohd Diah and Omar, 2012). Property housing price is commonly
used to model the dependent variable to determine the correlation or contribution
of each independent variable in price variation (Haron and Ibrahim, 2019; Md
Yusof and Ismail, 2012). Meanwhile, independent variables are related to two
categories: locational attributes of property (distance to CBD, area category) and
structural attributes of property (lot area size, building size, property type)
(Owusu-Ansah and Abdulai, 2014; Watkins, 1999).
Nonetheless, no specific or compulsory variables are included when
constructing HPI for the property market (Dorsey et al., 2010; Osland, 2010). The
common variables mainly used to describe the physical characteristics are listed
as follows. The locational and structural attributes often incorporated in the
regression model are lot area size (specifically for landed property, such as
terraced, detached); the number of storeys for strata property (specifically for
high rise units only, such as flat, condominium and apartment); building size;
building age; distance to the nearest town centre; property type; building
condition; type of tenure (freehold or leasehold); and neighbourhood
classification.
Generally, housing is heterogeneous goods, with each unit comprising
a group of unique attributes and characteristics. Each attribute included could
have its implicit price. Hedonic price analysis enables further identification of a
substantial relationship between housing price and its characteristics with the
following simplified equation (Ebru and Eban, 2009):
HP = xi + i
where HP = housing price, xi = set of independent variables, = coefficient matrix
and i = error term.
Aggregating hedonic price analysis enables the researchers to identify the
extent of selected attributes or characteristics in the housing price variation. The
hedonic analysis could also provide significant evidence and detailed assumption
on the impact of each attribute on the housing prices. Studies propose that the
hedonic analysis of each housing attribute is governed by its supply and demand,

PLANNING MALAYSIA
Journal of the Malaysia Institute of Planners (2021)
379 © 2021 by MIP
with its own ‘market’. As housing is heterogeneous, each housing attribute would
have its own ‘hedonic price’ (Burhan, 2014). Thus, one can create HPI based on
hedonic price analysis, and this analysis could aid in examining the volatility of
the overall housing market condition. Ultimately, the analysis enables researchers
and relevant authorities to gain better insight into a particular property market.
ANALYSIS AND RESULTS
Model 1: Regression Analysis for Terraced Property from the Year 2009-
2018
In order to construct Model 1, multiple regression analysis was conducted based
on the property transaction dataset obtained from the Department of Valuation
and Property Services (JPPH). The regression analysis included all the transacted
terraced properties in Johor Bahru for the past ten years, 2009 to 2018.
Table 1: Regression Analysis Summary for Model 1 Before Data Cleaning
Model R R Square Adjusted R Square Std. Error of the Estimate
1 .534a .285 .285 188083.770 a. Predictors: (Constant), Year (Y), Building Size (BS), Type of Construction (TC), Lot Area Size
(LS), Area Category (ACT), No. Bedroom (NB), Property Condition (PC), Tenure (T), No.
Storey (NS), Subdistrict (S), Area Classification (ACL), Completion Date (CD), Property Type
(PT), Valuation Date (VD)
b. Dependent Variable: Housing Price (HP) Source: Researcher’s study, 2020
Table 2: Regression Analysis Summary for Model 1 After Data Cleaning Model R R Square Adjusted R Square Std. Error of the Estimate
1 .773a .598 .598 131051.651 a. Predictors: (Constant), Y, BS, TC, LS, ACT, NB, PC, T, NS, S, ACL, CD, PT, VD
b. Dependent Variable: HP
Source: Researcher’s study, 2020
Based on Table 2, the R2 value was approximately 0.598, which could
evaluate the overall goodness of fit for Model 1. The results showed that 59.8%
of the variation of housing prices could be explained by the 14 independent
variables. Referring to Table 1, the model before data cleaning yielded an R2
value of approximately 0.285 or 28.5%. Thus, the R2 value for Model 1 achieved
a marked improvement of 31.3% by removing missing values and unwanted
observations from the dataset.
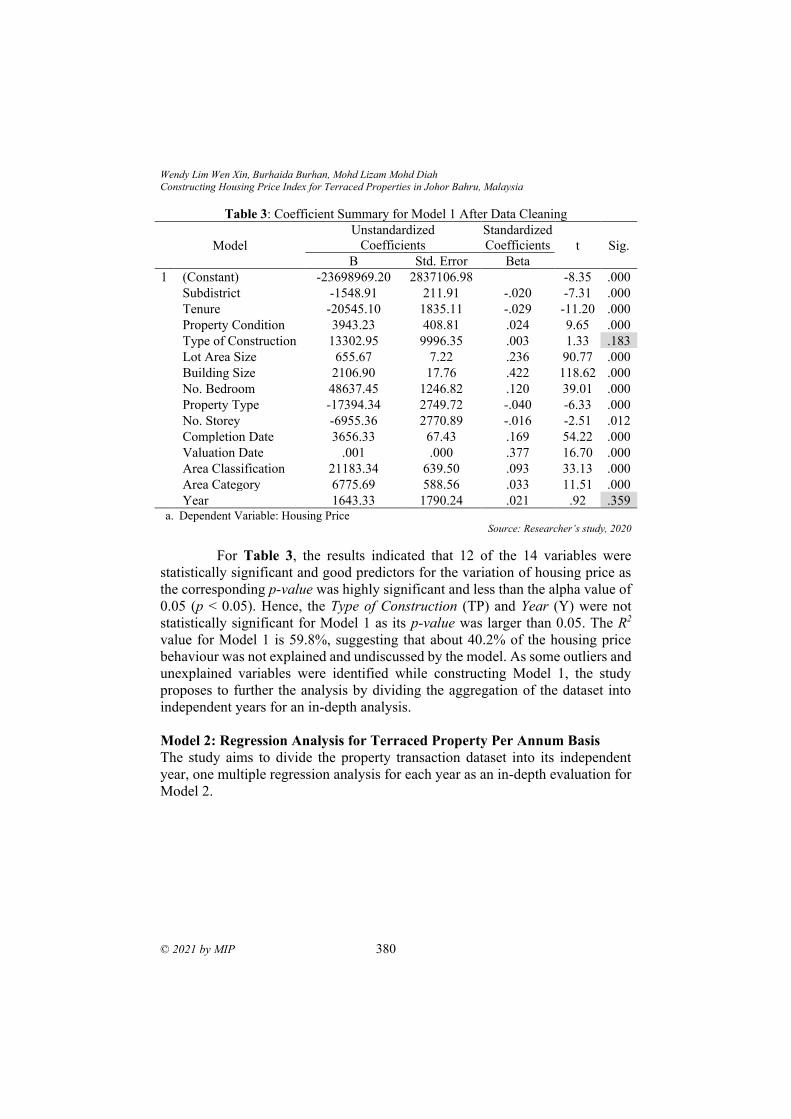
Wendy Lim Wen Xin, Burhaida Burhan, Mohd Lizam Mohd Diah
Constructing Housing Price Index for Terraced Properties in Johor Bahru, Malaysia
© 2021 by MIP 380
Table 3: Coefficient Summary for Model 1 After Data Cleaning
Model
Unstandardized
Coefficients
Standardized
Coefficients t Sig.
B Std. Error Beta
1 (Constant) -23698969.20 2837106.98 -8.35 .000
Subdistrict -1548.91 211.91 -.020 -7.31 .000
Tenure -20545.10 1835.11 -.029 -11.20 .000
Property Condition 3943.23 408.81 .024 9.65 .000
Type of Construction 13302.95 9996.35 .003 1.33 .183
Lot Area Size 655.67 7.22 .236 90.77 .000
Building Size 2106.90 17.76 .422 118.62 .000
No. Bedroom 48637.45 1246.82 .120 39.01 .000
Property Type -17394.34 2749.72 -.040 -6.33 .000
No. Storey -6955.36 2770.89 -.016 -2.51 .012
Completion Date 3656.33 67.43 .169 54.22 .000
Valuation Date .001 .000 .377 16.70 .000
Area Classification 21183.34 639.50 .093 33.13 .000
Area Category 6775.69 588.56 .033 11.51 .000
Year 1643.33 1790.24 .021 .92 .359 a. Dependent Variable: Housing Price
Source: Researcher’s study, 2020
For Table 3, the results indicated that 12 of the 14 variables were
statistically significant and good predictors for the variation of housing price as
the corresponding p-value was highly significant and less than the alpha value of
0.05 (p < 0.05). Hence, the Type of Construction (TP) and Year (Y) were not
statistically significant for Model 1 as its p-value was larger than 0.05. The R2
value for Model 1 is 59.8%, suggesting that about 40.2% of the housing price
behaviour was not explained and undiscussed by the model. As some outliers and
unexplained variables were identified while constructing Model 1, the study
proposes to further the analysis by dividing the aggregation of the dataset into
independent years for an in-depth analysis.
Model 2: Regression Analysis for Terraced Property Per Annum Basis
The study aims to divide the property transaction dataset into its independent
year, one multiple regression analysis for each year as an in-depth evaluation for
Model 2.
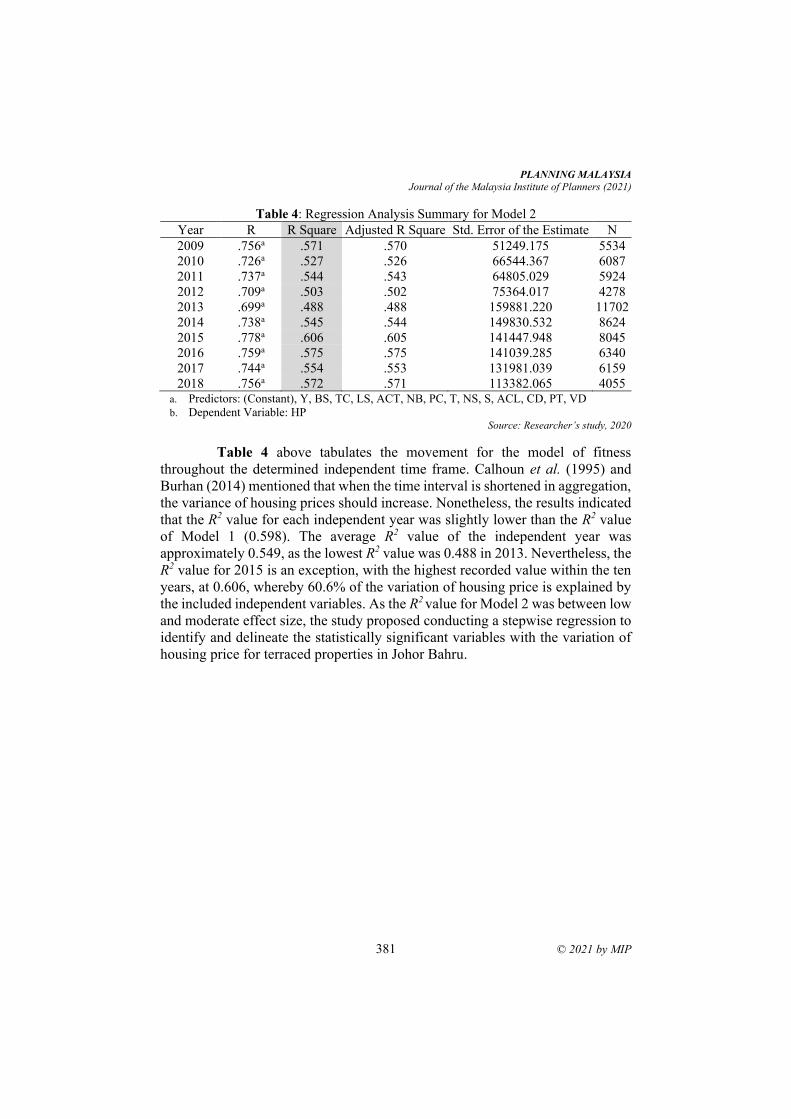
PLANNING MALAYSIA
Journal of the Malaysia Institute of Planners (2021)
381 © 2021 by MIP
Table 4: Regression Analysis Summary for Model 2 Year R R Square Adjusted R Square Std. Error of the Estimate N
2009 .756a .571 .570 51249.175 5534
2010 .726a .527 .526 66544.367 6087
2011 .737a .544 .543 64805.029 5924
2012 .709a .503 .502 75364.017 4278
2013 .699a .488 .488 159881.220 11702
2014 .738a .545 .544 149830.532 8624
2015 .778a .606 .605 141447.948 8045
2016 .759a .575 .575 141039.285 6340
2017 .744a .554 .553 131981.039 6159
2018 .756a .572 .571 113382.065 4055 a. Predictors: (Constant), Y, BS, TC, LS, ACT, NB, PC, T, NS, S, ACL, CD, PT, VD
b. Dependent Variable: HP Source: Researcher’s study, 2020
Table 4 above tabulates the movement for the model of fitness
throughout the determined independent time frame. Calhoun et al. (1995) and
Burhan (2014) mentioned that when the time interval is shortened in aggregation,
the variance of housing prices should increase. Nonetheless, the results indicated
that the R2 value for each independent year was slightly lower than the R2 value
of Model 1 (0.598). The average R2 value of the independent year was
approximately 0.549, as the lowest R2 value was 0.488 in 2013. Nevertheless, the
R2 value for 2015 is an exception, with the highest recorded value within the ten
years, at 0.606, whereby 60.6% of the variation of housing price is explained by
the included independent variables. As the R2 value for Model 2 was between low
and moderate effect size, the study proposed conducting a stepwise regression to
identify and delineate the statistically significant variables with the variation of
housing price for terraced properties in Johor Bahru.
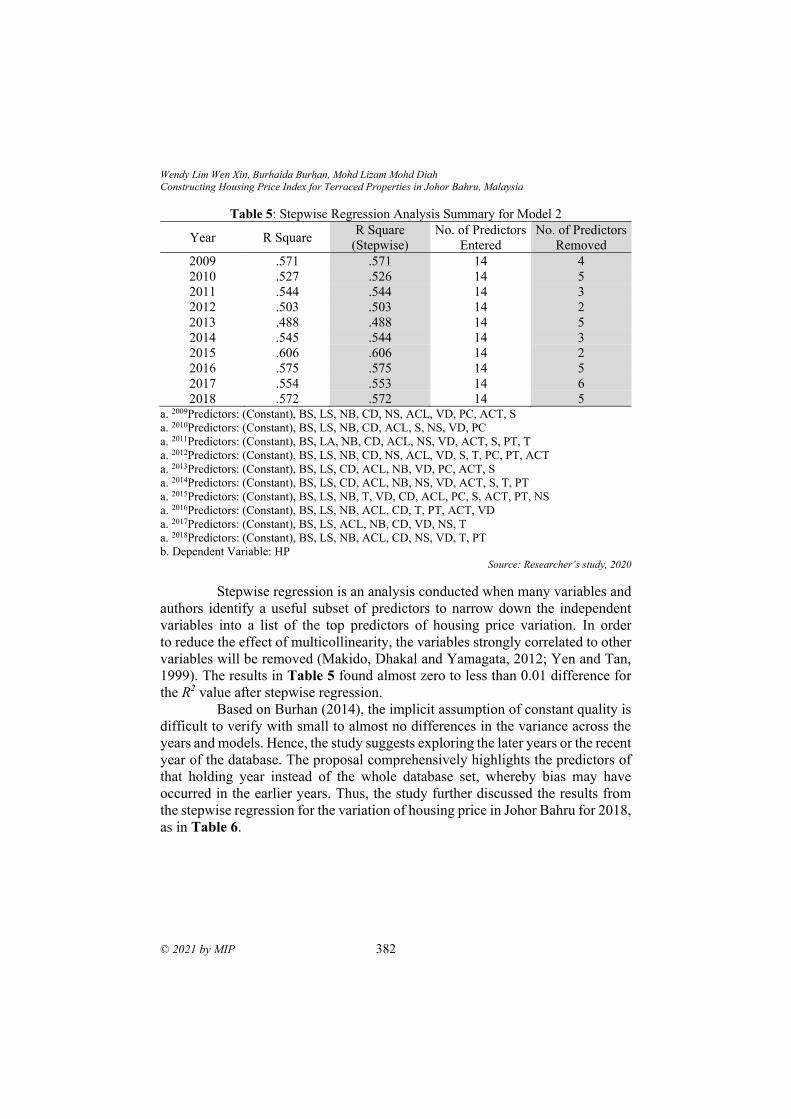
Wendy Lim Wen Xin, Burhaida Burhan, Mohd Lizam Mohd Diah
Constructing Housing Price Index for Terraced Properties in Johor Bahru, Malaysia
© 2021 by MIP 382
Table 5: Stepwise Regression Analysis Summary for Model 2
Year R Square R Square
(Stepwise)
No. of Predictors
Entered
No. of Predictors
Removed
2009 .571 .571 14 4
2010 .527 .526 14 5
2011 .544 .544 14 3
2012 .503 .503 14 2
2013 .488 .488 14 5
2014 .545 .544 14 3
2015 .606 .606 14 2
2016 .575 .575 14 5
2017 .554 .553 14 6
2018 .572 .572 14 5 a. 2009Predictors: (Constant), BS, LS, NB, CD, NS, ACL, VD, PC, ACT, S
a. 2010Predictors: (Constant), BS, LS, NB, CD, ACL, S, NS, VD, PC
a. 2011Predictors: (Constant), BS, LA, NB, CD, ACL, NS, VD, ACT, S, PT, T
a. 2012Predictors: (Constant), BS, LS, NB, CD, NS, ACL, VD, S, T, PC, PT, ACT
a. 2013Predictors: (Constant), BS, LS, CD, ACL, NB, VD, PC, ACT, S
a. 2014Predictors: (Constant), BS, LS, CD, ACL, NB, NS, VD, ACT, S, T, PT
a. 2015Predictors: (Constant), BS, LS, NB, T, VD, CD, ACL, PC, S, ACT, PT, NS
a. 2016Predictors: (Constant), BS, LS, NB, ACL, CD, T, PT, ACT, VD
a. 2017Predictors: (Constant), BS, LS, ACL, NB, CD, VD, NS, T
a. 2018Predictors: (Constant), BS, LS, NB, ACL, CD, NS, VD, T, PT
b. Dependent Variable: HP Source: Researcher’s study, 2020
Stepwise regression is an analysis conducted when many variables and
authors identify a useful subset of predictors to narrow down the independent
variables into a list of the top predictors of housing price variation. In order
to reduce the effect of multicollinearity, the variables strongly correlated to other
variables will be removed (Makido, Dhakal and Yamagata, 2012; Yen and Tan,
1999). The results in Table 5 found almost zero to less than 0.01 difference for
the R2 value after stepwise regression.
Based on Burhan (2014), the implicit assumption of constant quality is
difficult to verify with small to almost no differences in the variance across the
years and models. Hence, the study suggests exploring the later years or the recent
year of the database. The proposal comprehensively highlights the predictors of
that holding year instead of the whole database set, whereby bias may have
occurred in the earlier years. Thus, the study further discussed the results from
the stepwise regression for the variation of housing price in Johor Bahru for 2018,
as in Table 6.
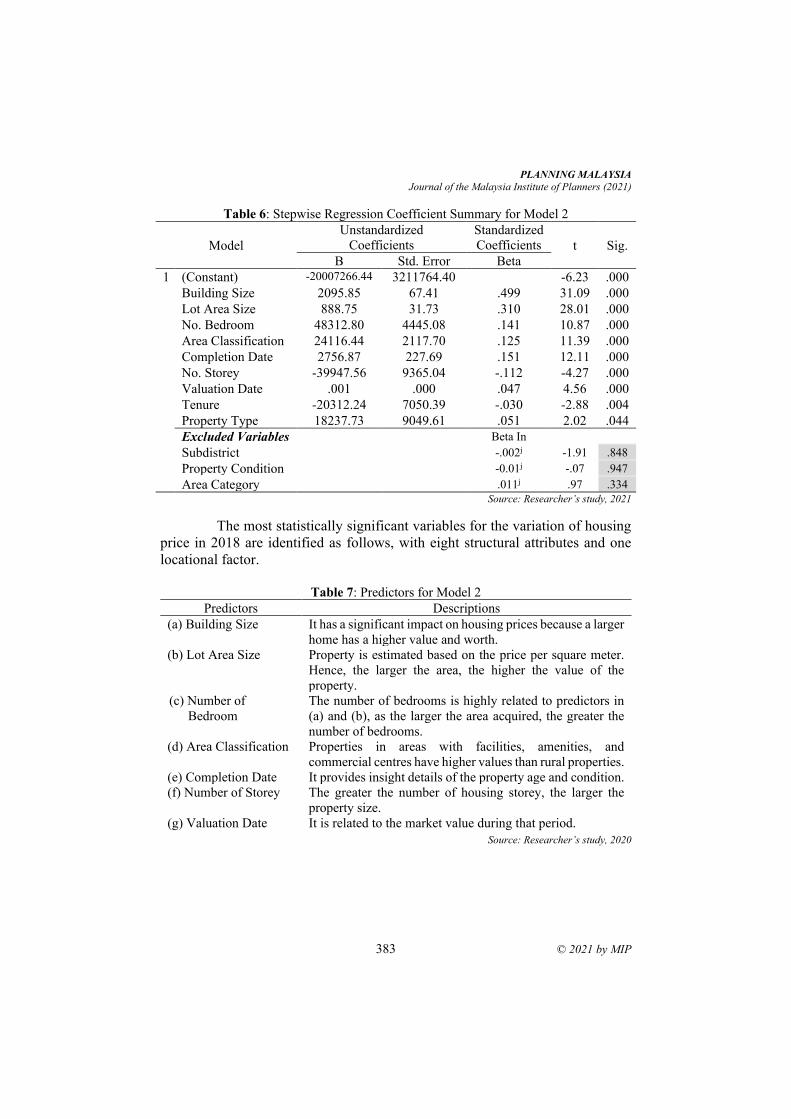
PLANNING MALAYSIA
Journal of the Malaysia Institute of Planners (2021)
383 © 2021 by MIP
Table 6: Stepwise Regression Coefficient Summary for Model 2
Model
Unstandardized
Coefficients
Standardized
Coefficients t Sig.
B Std. Error Beta
1 (Constant) -20007266.44 3211764.40 -6.23 .000
Building Size 2095.85 67.41 .499 31.09 .000
Lot Area Size 888.75 31.73 .310 28.01 .000
No. Bedroom 48312.80 4445.08 .141 10.87 .000
Area Classification 24116.44 2117.70 .125 11.39 .000
Completion Date 2756.87 227.69 .151 12.11 .000
No. Storey -39947.56 9365.04 -.112 -4.27 .000
Valuation Date .001 .000 .047 4.56 .000
Tenure -20312.24 7050.39 -.030 -2.88 .004
Property Type 18237.73 9049.61 .051 2.02 .044
Excluded Variables Beta In
Subdistrict -.002j -1.91 .848
Property Condition -0.01j -.07 .947
Area Category .011j .97 .334
Source: Researcher’s study, 2021
The most statistically significant variables for the variation of housing
price in 2018 are identified as follows, with eight structural attributes and one
locational factor.
Table 7: Predictors for Model 2
Predictors Descriptions
(a) Building Size It has a significant impact on housing prices because a larger
home has a higher value and worth.
(b) Lot Area Size Property is estimated based on the price per square meter.
Hence, the larger the area, the higher the value of the
property.
(c) Number of
Bedroom
The number of bedrooms is highly related to predictors in
(a) and (b), as the larger the area acquired, the greater the
number of bedrooms.
(d) Area Classification Properties in areas with facilities, amenities, and
commercial centres have higher values than rural properties.
(e) Completion Date It provides insight details of the property age and condition.
(f) Number of Storey The greater the number of housing storey, the larger the
property size.
(g) Valuation Date It is related to the market value during that period.
Source: Researcher’s study, 2020
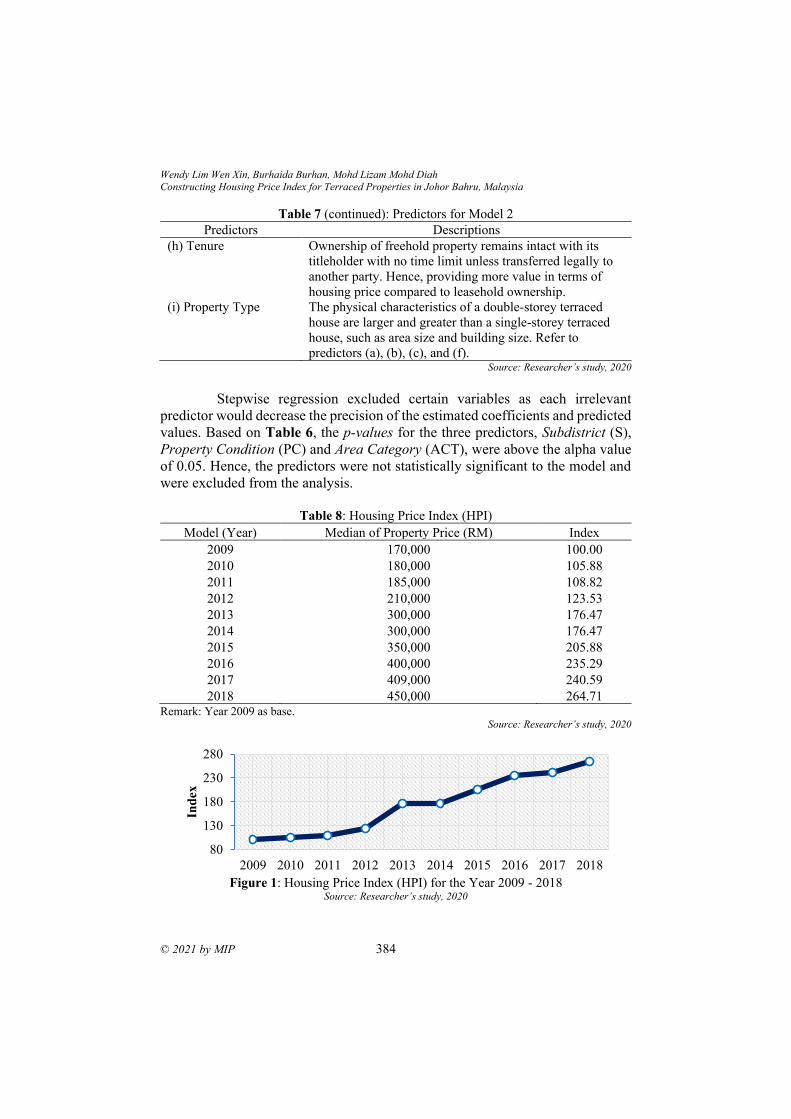
Wendy Lim Wen Xin, Burhaida Burhan, Mohd Lizam Mohd Diah
Constructing Housing Price Index for Terraced Properties in Johor Bahru, Malaysia
© 2021 by MIP 384
Table 7 (continued): Predictors for Model 2 Predictors Descriptions
(h) Tenure Ownership of freehold property remains intact with its
titleholder with no time limit unless transferred legally to
another party. Hence, providing more value in terms of
housing price compared to leasehold ownership.
(i) Property Type The physical characteristics of a double-storey terraced
house are larger and greater than a single-storey terraced
house, such as area size and building size. Refer to
predictors (a), (b), (c), and (f). Source: Researcher’s study, 2020
Stepwise regression excluded certain variables as each irrelevant
predictor would decrease the precision of the estimated coefficients and predicted
values. Based on Table 6, the p-values for the three predictors, Subdistrict (S),
Property Condition (PC) and Area Category (ACT), were above the alpha value
of 0.05. Hence, the predictors were not statistically significant to the model and
were excluded from the analysis.
Table 8: Housing Price Index (HPI)
Model (Year) Median of Property Price (RM) Index
2009 170,000 100.00
2010 180,000 105.88
2011 185,000 108.82
2012 210,000 123.53
2013 300,000 176.47
2014 300,000 176.47
2015 350,000 205.88
2016 400,000 235.29
2017 409,000 240.59
2018 450,000 264.71 Remark: Year 2009 as base.
Source: Researcher’s study, 2020
Figure 1: Housing Price Index (HPI) for the Year 2009 - 2018
Source: Researcher’s study, 2020
80
130
180
230
280
2009 2010 2011 2012 2013 2014 2015 2016 2017 2018
Ind
ex
PLANNING MALAYSIA
Journal of the Malaysia Institute of Planners (2021)
385 © 2021 by MIP
Based on the two analyses conducted, the R2 value for both models was
generally in between low and moderate effect size. As the tabulated R2 value was
weak and less convincing, further tests should be considered and applied to increase
the efficiency of the overall goodness of fit. Besides, extended future research should
be conducted by considering other omitted variables to discover more about the
underlying relationship of the variables towards housing prices.
CONCLUSION
The results signify that the most significant variables identified for the variation of
housing price are structural characteristics, such as lot area size, building size and
the number of storeys. The results also show that only approximately 50% of the
variation in housing price were explained by the model with the current list of
independent variables. Hence, about 50% of the behaviour of housing prices was
not explored nor explained by the model. Past studies mentioned that structural and
locational attributes of the property are the two crucial predictors for the housing
price. Thus, the study strongly suggests performing other extended analyses by
including the omitted variables, such as environmental and neighbourhood
attributes, in the analysis model. As locational characteristics from the current
dataset were inadequate for the analysis, the study aims to obtain and include another
necessary dataset. The omitted variables from the new dataset could provide useful
insights and discuss its extent on the variation of housing price.
ACKNOWLEDGEMENTS
The authors would like to thank the Ministry of Higher Education Malaysia for
supporting this research under Fundamental Research Grant Scheme Vot No.
FRGS/1/2019/SS08/UTHM/02/1 and partially sponsored by Universiti Tun Hussein
Onn Malaysia. In addition, the authors gratefully acknowledge NAPIC and JPPH
for providing the data used in this research.
REFERENCES Abdul Rahman, S.N. et al. (2019). The Artificial Neural Network Model (ANN) for
Malaysian Housing Market Analysis. Journal of the Malaysian Institute of Planners,
17(1), pp. 1-9.
Burhan, B. (2014). Spatial Mechanism of Hedonic Price Functions for Housing Submarket
Analysis. Saga University: Ph.D Thesis.
Chandler, D. & Disney, R. (2014). Measuring House Prices: A Comparison of Different
Indices. London: The Institute for Fiscal Studies.
Chen, M.C. & Patel, K. (1998). House Price Dynamics and Granger Causality: An Analysis
of Taipei New Dwelling Market. Journal of The Asian Real Estate Society, 1(1), pp.
101-126.
Dorsey, R.E. et al. (2010). Hedonic Versus Repeat-Sales Housing Price Indexes For
Measuring The Recent Boom-Bust Cycle. Journal of Housing Economics, 19(2), pp.
75-93.
Wendy Lim Wen Xin, Burhaida Burhan, Mohd Lizam Mohd Diah
Constructing Housing Price Index for Terraced Properties in Johor Bahru, Malaysia
© 2021 by MIP 386
Dziauddin, M.F., Ismail, K., & Othman, Z. (2015). Analysing The Local Geography Of The
Relationship Between Residential Property Prices And Its Determinants. Bulletin of
Geography: Socio–economic Series, 28, pp. 21-35.
Ebru, C. & Eban, A. (2009). Determinants of House Prices in Istanbul: A Quartile Regression
Approach. Quality and Quantity, 45(2), pp. 305-317.
Fenwick, D. (2013). Uses of Residential Property Price Indices. in OECD, et al., Handbook
on Residential Property Price Indices. Eurostat, Luxembourg. pp. 15-20.
Haron, R. & Ibrahim, K. (2019). Residential Property Price Hike and Speculation. Journal
of the Malaysian Institute of Planners, 17(1), pp. 328-337.
Kassim, S., Redzuan, N.H. & Harun, N.Z. (2017). What Drives House Price in Malaysia? In
Search of An Alternative Pricing Benchmark for Islamic Home Financing. Planning
Malaysia: Journal of The Malaysian Institute of Planners, 15(4), pp. 21-34.
Laakso, S. & Loikkanen, H.A. (1995). Finnish Homes – Through Passages or Traps. Real
Estate Economics, 23(4), pp. 475-495.
Lim, X.Y. et al. (2018). Factors Determining the Demand for Affordable Housing. Journal
of the Malaysian Institute of Planners, 16(2), pp. 109-118.
Maclennan, D. (1994). A Competitive UK Economy: Challenges for Housing Policy. United
Kingdom: Joseph Rowntree Foundation.
Md Yusof, A. & Ismail, S. (2012). Multiple Regressions in Analysing House Price
Variations. Communicatios of the IBIMA.
Nagaraja, C.H., Brown, L.D. & Wachter, S.M. (2014). Repeat Sales House Price Index
Methodology. Journal of Real Estate Literature, 22.
Osland, L. (2010). An Application of Spatial Econometrics in Relation to Hedonic House
Price Modelling. Journal of Real Estate Research, 32(3), pp. 289-320.
Owusu-Ansah, A. & Abdulai, R.T. (2014). Producing Hedonic Price Indices for Developing
Markets. Explicit Time Variable Versus Strictly Cross-Sectional Models.
International Journal of Housing Markets and Analysis, 7(4), pp. 444-458.
Rosmera, N.A., Mohd Diah, M.L. & Omar, A.J. (2012). The Revisited of Malaysian House
Price Index. Proceedings International Conference of Technology Management,
Business and Entrepreneurship 2012. Melaka: Faculty of Technology Management,
Business and Entrepreneurship. pp. 656-667.
Sutton, G.D. (2002). Explaining Changes in House Prices. BIS Quarterly Review September
2002, pp. 46-55.
Tan, T.H. (2010). The Impact of Neighborhood Types on The Prices of Residential
Properties. Sunway Academic Journal, 7, pp. 77-88.
Watkins, C. (1999). Property Valuation and the Structure of Urban Housing Markets.
Journal of Property Investment and Finance, 17(2), pp. 157-173.
Wilhelmsson, M. (2000). The Impact of Traffic Noise on The Values of Single-Family
Houses. Journal of Environmental Planning and Management, 43(6), pp. 799-815.
Wood, R. (2005). A Comparison of UK Residential House Price Indices. in Bank for
International Settlements (ed.). Real Estate Indicators and Financial Stability. Bank
for International Settlements. pp. 212-227.
Received: 12th July 2021. Accepted: 23rd Sept 2021

2 Associate Professor at Universiti Teknologi Malaysia. Email: [email protected]
PLANNING MALAYSIA:
Journal of the Malaysian Institute of Planners
VOLUME 19 ISSUE 3 (2021), Page 387 – 399
THE GAP BETWEEN HOUSING AFFORDABILITY AND
AFFORDABLE HOUSE: A CHALLENGE FOR POLICY
MAKERS
Najihah Azmi1, Ahmad Ariffian Bujang2
Faculty of Built Environment and Surveying,
UNIVERSITI TEKNOLOGI MALAYSIA
Abstract
Much of the literature defines housing affordability as the relationship between
household income and housing expenditure (housing costs). Affordable housing
refers to the affordability of the household to own or rent the housing. Housing
becomes unaffordable if the housing costs exceed the income of the household.
Thus, the objective of this paper is to define the difference between housing
affordability and an affordable house and to identify the factors influencing the
gap between housing affordability and an affordable house. To achieve the
objectives of this paper, 28 variables or factors have been identified. These
variables or factors are then analysed by using the descriptive method of analysis.
After analysing 28 identified variables or factors, the findings show that a high
house price, a high monthly repayment, the type of property ownership and the
land area either extremely or moderately influenced the gap between housing
affordability and an affordable house.
Keyword: Housing Affordability, Affordable House, Mortgage, Housing Policy
Najihah Azmi, Ahmad Ariffian Bujang
The Gap Between Housing Affordability and Affordable House: A Challenge for Policy Makers
© 2021 by MIP 388
INTRODUCTION Public concern over housing affordability arises from housing being the single
largest expenditure item in a household budget and the increases in housing and
rental prices (Quigley and Raphael, 2004). This situation creates problems for the
medium- and low-income groups. Devenport (2003) found that low and medium
income families found it increasingly difficult to access adequate affordable
housing. The existing housing policy restricts the maximum income level for
affordable housing without explaining the exact affordable amount. Thus, this
condition will create a gap between affordable housing and housing affordability.
According to Yates (2008), the rising issues of housing affordability are due to
the increment of house prices compared to household income. In addition, the
current trend of housing development focuses more on high-cost housing than
affordable housing. The property market report in the first half of year 2019
(NAPIC, 2019) revealed that only 20% of the launched residential units in Johor
are priced at RM300,000 and below in the first quarter of year 2019. The new
stocks of housing supply in Johor are unaffordable for the majority of the
community with a median income of RM5,197. The mismatch between demand
and supply has led to a large number of unsold properties.
There is evidence of discrimination in the affordable housing schemes
launched by the government such as PR1MA, which has a price range of RM
400,000.00 and below. The price tag is beyond the affordability of the population.
As a result, there is the excess of unsold properties including the ones under the
affordable housing scheme. According to the property market report in the first
half of 2019 (NAPIC, 2019), there were 6,195 units of unsold properties worth
RM4.46 billion in Johor. Hence, policymakers should be aware of the new
paradigm for the concept of affordable housing and housing affordability. The
objectives of this study are to analyse the gap between affordable housing and
housing affordability and identify factors that increase the gap between affordable
housing and housing affordability.
HOUSING AFFORDABILITY VS AFFORDABLE HOUSING Housing affordability is linked to the relationship between household income and
housing costs (Kutty, 2010; Hancock, 1993; Crowley, 2003). Ndubueze (2007)
defined housing affordability as the ability to own a house. There are various
interpretations of the relationship between housing costs and income. For
example, the United States targeted 30% of the income (Linneman &
Megbolugbe, 1992) while Canada set 20 to 25% of the income for housing
expenditure (Hulchanski, 1995). Gan and Hill (2009) and Bujang, Zarin, and
Jumaidi (2010) proposed the concept of housing affordability according to three
matters:
PLANNING MALAYSIA
Journal of the Malaysia Institute of Planners (2021)
389 © 2021 by MIP
i) Purchasing Affordability
Purchasing ability refers to the ability to obtain sufficient loan for home purchase
(Gan & Hill, 2009; Bujang, Abu Zarin & Jumaidi, 2010). Bourassa (1996)
mentions that the main restrictions on homeownership are obtaining housing
loan, the ability to pay housing deposits, and the housing costs in homeownership.
Bourassa (1996) also highlights the importance of financial stability in obtaining
a mortgage loan. This statement is similar to Trimbath and Montoya (2002) who
highlight the three dimensions for housing affordability, namely house price,
household income, and mortgage or end financing interest rates. In addition, the
purchasing ability depends on house prices and interest rates that affect the
overall cost of homeownership financing (Yates, 2008; Osman et al, 2016).
i) Mortgage repayment Affordability
Mortgage repayment ability refers to the burden experienced by the household
members in repaying the mortgage loan. The household members have the
repayment ability if they could afford to repay the mortgage loan after deducting
other non-housing related costs (Yang & Wang, 2011). It is the act of setting aside
fixed payments for housing costs on a monthly or yearly basis without facing
other costs of living pressures. Besides that, they should also consider other
housing costs in ensuring homeownership security. In Malaysia, property owners
have to deal with monthly and annual costs such as land tax, assessment tax, and
management fees as stated in the National Land Code 1965, Local Government
Act 1976 and Strata Management Act 2013.
ii) Income affordability
Income affordability refers to the purchasing power of the household. Besides
that, income affordability refers to the ratio of house price to the annual income
median which affects the type or price of the house that can be owned or rented
by owners. Income affordability can also influence the ability to buy and repay
mortgage loans. When the ratio of house price to household income is high, the
household’s ability to own a house becomes low.
There is no specific definition of affordable housing. Gabriel, Jacob,
Arthurson, Burke, and Yates (2005) defined affordable housing as the housing
project provided by the government or private sector to meet the benchmark level
of affordability (house price or income). In Australia, Urban Research Centre
(2008) defined affordable housing as a suitable home for low and medium-
income households due to the low and medium house prices that allow them to
afford other basic living expenses without any pressure. Stone (2006) affirms that
affordable housing is not only the provision of affordable housing but also a
scheme or financial assistance for low and medium-income groups that are
experiencing difficulties in the housing market. Some houses are affordable to
some people despite their exorbitant price (Stone, 2006). On the other hand, some
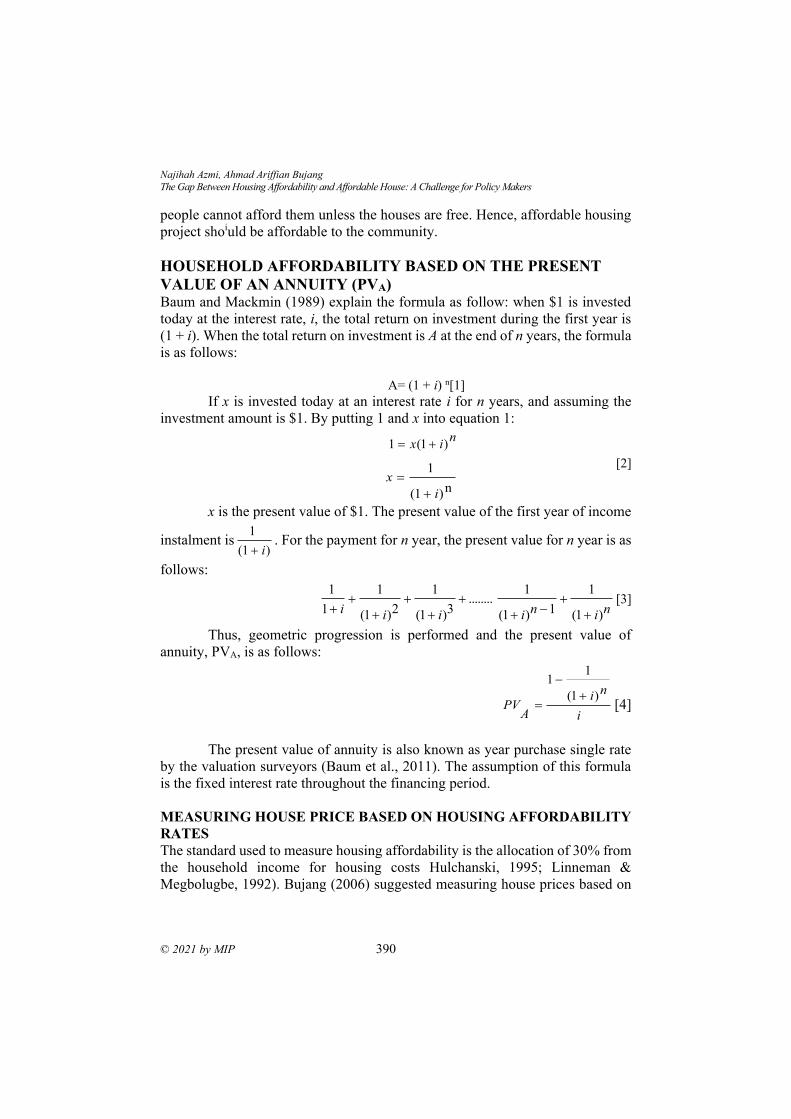
Najihah Azmi, Ahmad Ariffian Bujang
The Gap Between Housing Affordability and Affordable House: A Challenge for Policy Makers
© 2021 by MIP 390
n)(1
1
i
x
+
=
people cannot afford them unless the houses are free. Hence, affordable housing
project shoiuld be affordable to the community.
HOUSEHOLD AFFORDABILITY BASED ON THE PRESENT
VALUE OF AN ANNUITY (PVA) Baum and Mackmin (1989) explain the formula as follow: when $1 is invested
today at the interest rate, i, the total return on investment during the first year is
(1 + i). When the total return on investment is A at the end of n years, the formula
is as follows:
A= (1 + i) n[1]
If x is invested today at an interest rate i for n years, and assuming the
investment amount is $1. By putting 1 and x into equation 1:
[2]
x is the present value of $1. The present value of the first year of income
instalment is . For the payment for n year, the present value for n year is as
follows:
[3]
Thus, geometric progression is performed and the present value of
annuity, PVA, is as follows:
[4]
The present value of annuity is also known as year purchase single rate
by the valuation surveyors (Baum et al., 2011). The assumption of this formula
is the fixed interest rate throughout the financing period.
MEASURING HOUSE PRICE BASED ON HOUSING AFFORDABILITY
RATES
The standard used to measure housing affordability is the allocation of 30% from
the household income for housing costs Hulchanski, 1995; Linneman &
Megbolugbe, 1992). Bujang (2006) suggested measuring house prices based on
nix )1(1 +=
)(1
1
i+
niniiii )1(
1
1)1(
1........
3)1(
1
2)1(
1
1
1
+
+−+
+
+
+
+
++
i
ni
APV
)1(
11
+
−
=
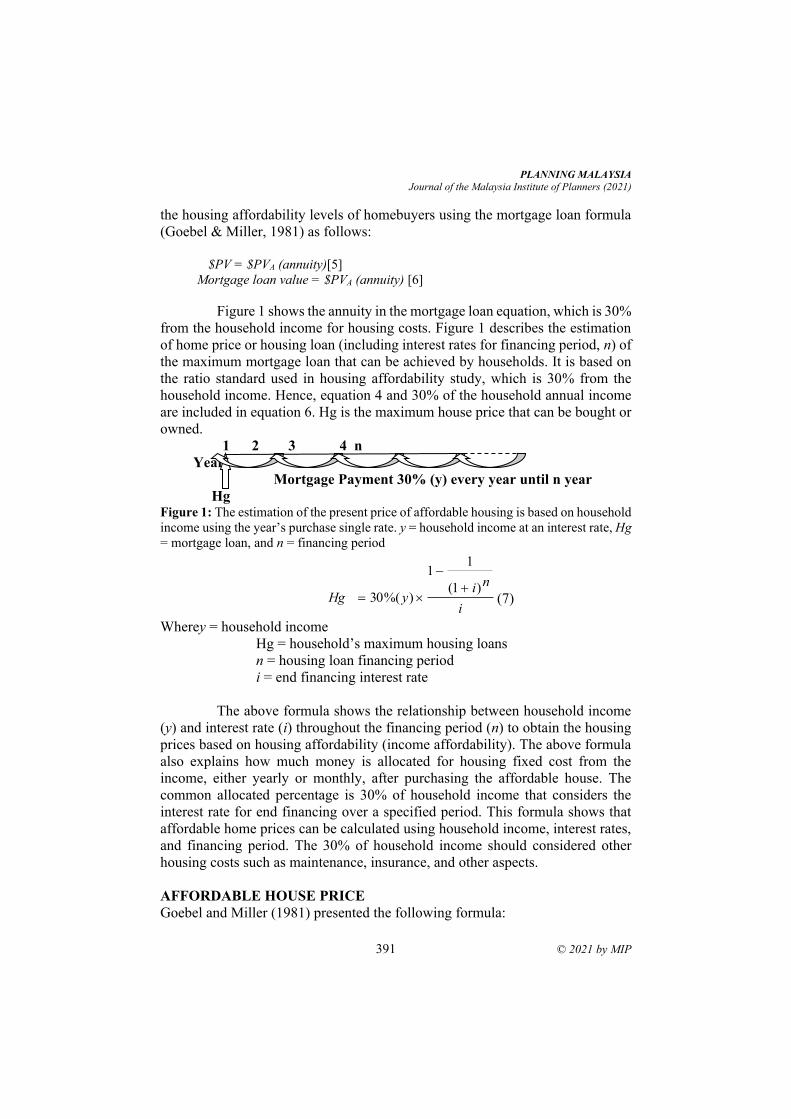
PLANNING MALAYSIA
Journal of the Malaysia Institute of Planners (2021)
391 © 2021 by MIP
the housing affordability levels of homebuyers using the mortgage loan formula
(Goebel & Miller, 1981) as follows:
$PV = $PVA (annuity)[5]
Mortgage loan value = $PVA (annuity) [6]
Figure 1 shows the annuity in the mortgage loan equation, which is 30%
from the household income for housing costs. Figure 1 describes the estimation
of home price or housing loan (including interest rates for financing period, n) of
the maximum mortgage loan that can be achieved by households. It is based on
the ratio standard used in housing affordability study, which is 30% from the
household income. Hence, equation 4 and 30% of the household annual income
are included in equation 6. Hg is the maximum house price that can be bought or
owned.
1 2 3 4 n
Year
Mortgage Payment 30% (y) every year until n year
Hg Figure 1: The estimation of the present price of affordable housing is based on household
income using the year’s purchase single rate. y = household income at an interest rate, Hg
= mortgage loan, and n = financing period
(7)
Where y = household income
Hg = household’s maximum housing loans
n = housing loan financing period
i = end financing interest rate
The above formula shows the relationship between household income
(y) and interest rate (i) throughout the financing period (n) to obtain the housing
prices based on housing affordability (income affordability). The above formula
also explains how much money is allocated for housing fixed cost from the
income, either yearly or monthly, after purchasing the affordable house. The
common allocated percentage is 30% of household income that considers the
interest rate for end financing over a specified period. This formula shows that
affordable home prices can be calculated using household income, interest rates,
and financing period. The 30% of household income should considered other
housing costs such as maintenance, insurance, and other aspects.
AFFORDABLE HOUSE PRICE
Goebel and Miller (1981) presented the following formula:
i
niyHg
)1(
11
)%(30+
−
=
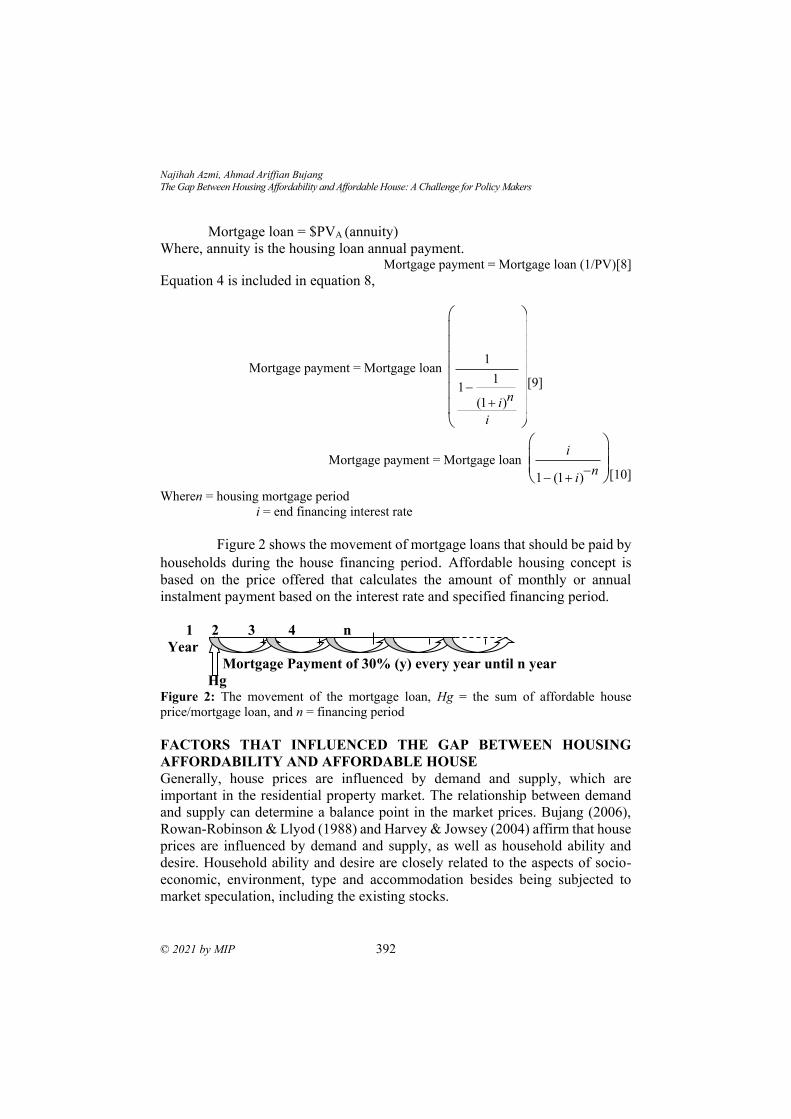
Najihah Azmi, Ahmad Ariffian Bujang
The Gap Between Housing Affordability and Affordable House: A Challenge for Policy Makers
© 2021 by MIP 392
Mortgage loan = $PVA (annuity)
Where, annuity is the housing loan annual payment. Mortgage payment = Mortgage loan (1/PV)[8]
Equation 4 is included in equation 8,
Mortgage payment = Mortgage loan
[9]
Mortgage payment = Mortgage loan
[10]
Wheren = housing mortgage period
i = end financing interest rate
Figure 2 shows the movement of mortgage loans that should be paid by
households during the house financing period. Affordable housing concept is
based on the price offered that calculates the amount of monthly or annual
instalment payment based on the interest rate and specified financing period.
1 2 3 4 n
Year
Mortgage Payment of 30% (y) every year until n year
Hg Figure 2: The movement of the mortgage loan, Hg = the sum of affordable house
price/mortgage loan, and n = financing period
FACTORS THAT INFLUENCED THE GAP BETWEEN HOUSING
AFFORDABILITY AND AFFORDABLE HOUSE
Generally, house prices are influenced by demand and supply, which are
important in the residential property market. The relationship between demand
and supply can determine a balance point in the market prices. Bujang (2006),
Rowan-Robinson & Llyod (1988) and Harvey & Jowsey (2004) affirm that house
prices are influenced by demand and supply, as well as household ability and
desire. Household ability and desire are closely related to the aspects of socio-
economic, environment, type and accommodation besides being subjected to
market speculation, including the existing stocks.
BayaranTahunanPinjaman = PinjamanPerumahan1
1-1
(1+ i)n
i
æ
è
çççççç
ö
ø
÷÷÷÷÷÷
BayaranTahunanPinjaman = PinjamanPerumahani
1- (1+ i)-n
æ
è
çç
ö
ø
÷÷
PLANNING MALAYSIA
Journal of the Malaysia Institute of Planners (2021)
393 © 2021 by MIP
Economists debated that the rise in commodity prices is due to the
macroeconomic and socio-demographic of the population. Positive economic and
socio-demographic growth of the population, such as gross domestic product
(GDP) growth (Clark & Coggin, 2011; Dreger & Zhang, 2013; Ren, 2012),
household income growth (Clark & Coggin, 2011; Garcia & Hernandez, 2008),
population (Ren & Xion, 2012), household size (Garcia & Hernandez, 2008), and
interest rates (Dreger & Zhang, 2013; Himmelberg, Mayer & Sinai, 2005; Mayer
& Quigley, 2003) can influence changes in the commodity demand. In addition,
the government policy on housing, either fiscal or non-fiscal policy, can influence
the demand in the housing market. When the fundamental economic factors
cannot justify price growth, the market bubble will occur as investors are
confident in obtaining profit returns. The bubble in the market happens if there is
an increase in commodity price when investors are engaged in speculative
activities and manipulative prices for profit. This situation will increase the
demands in the market (Mill, 1885). ). Stiglits (1990) (cited by Himmelberg,
Mayer & Sinai, 2005) define a bubble as, “If the reason that the price is high
today is only because investors believe that the selling price is high tomorrow --
when ‘fundamental’ factors do not seem to justify such a price -- then a bubble
exists. At least in the short run, the high price of the asset is merited, because it
yields a return (capital gain plus dividend) equal to that on alternative assets”
The market bubble occurs when there is a financial liberalisation by the
central bank, which focuses on the credit growth that can increase housing
demand and asset prices (Malpezzi & Wacther, 2005). This situation happens
because the end financing for buying or investing the residential property sector
is readily available by the speculative investors. A market bubble occurs when
there is a rapid rise in the demand in the market at a given time (Melpezzi &
Wachter, 2005; Glaeser, Gyourko & Saiz, 2008; Huang & Tang, 2012; Capozza,
Hendreshott & Mack, 2004). At the same time, the supply rate remains constant
with the inelastic demand. This situation has led to a rapid rise in the commodity
market price. In Johor, the housing market experienced a bubble from year 2012
to 2014 before the downturn in year 2015 due to the introduction of developer
interest bearing scheme (DIBS) by Bank Negara Malaysia in resolving the excess
amount of unsold properties since the global economic decline in year 2009. The
DIBS scheme is similar to an adjustable mortgage, which is one of the major
causes of the subprime mortgage crisis. The scheme encourages the speculative
activity as the end financing is readily available to homebuyers. The scheme also
causes a 30 per cent increase in the DIBS house prices. Homebuyers are generally
unaware of the additional costs due to the lack of transparency concerning
important information. The scheme has resulted in a median increase in house
price although there has been a decline in the excess of real estate as a result of
the global economic downturn in year 2009. According to Khazanah Research
Institute (2019), the value of compound annual growth rate (CAGR) from year
Najihah Azmi, Ahmad Ariffian Bujang
The Gap Between Housing Affordability and Affordable House: A Challenge for Policy Makers
© 2021 by MIP 394
2012 to 2014 for median house prices was 23.5 per cent compared to the 11.17
per cent increase in household income for the same period. The system was
discontinued in year 2014 to control the high house prices in the market (Bank
Negara Malaysia, 2017).
The supply reaction increases due to the excess supply of unsold or
overhang market (Pirounaski, 2013). Gross (2007) stated that the bubble in the
real estate market causes the excess of unsold properties due to the rise of
excessive properties during the market bubble. Barras (2007) mentioned that the
demand for new development in the real estate sector is decreasing after the
bubble bursts that produce excessive properties. The residential property
condition is undervalued due to the high supply and surplus as there is a lack of
demand for certain types and prices of properties. The lack of demand is due to
high costs, undesirable location and accessibility, less attractive design, less
attractive neighbourhoods, and failure to attract the target group. The difficulty
of obtaining end financing loan has also affected the number of unsold residential
properties.
Beside that, location and microeconomic factors in housing market
should be considered because it also gives impact to houses price. Harvey and
Jowsey (2004) provided the three main determinants of residential location
valuation, namely accessibility, environmental features, and rentals. Location is
the most important factor in the housing market. The features of an attractive
location are as follows: (1) the physical features of the neighbourhood; (2)
neighbourhood social characteristics; (3) public services and facilities in the
neighbourhood; (4) environmental quality in the neighbourhood; and (5)
accessibility. Hassan et al (2018) & Hassan et al (2021) found that location factor
give impact on housing affordability. The micro-economic factor in the housing
market can influence house prices. Previous studies revealed that housing
characteristics, such as land area, lot location, and lot size have a big impact on
house prices (Nashan, 2010; DiPasquale & Wheaton, 1995; Yang & Shen, 2008;
Tiwari & Parikh, 1998).
METHODOLOGY The results from previous studies and questionnaire survey were gathered to
achieve the research objectives. This study used random sampling method.
Besides that, the researcher used the formula by Israel (1992) to determine the
population size and the number of respondents in this study. The chosen
confidence level is 95 per cent with the assumption of 5 per cent probability in
which the actual percentage is not within the selected confidence interval (Israel,
1992). The researcher referred to the number of households in Johor Bahru and
determined that the number of respondents for this study should be at least 400.
This study used the calculation of sample size as follows:
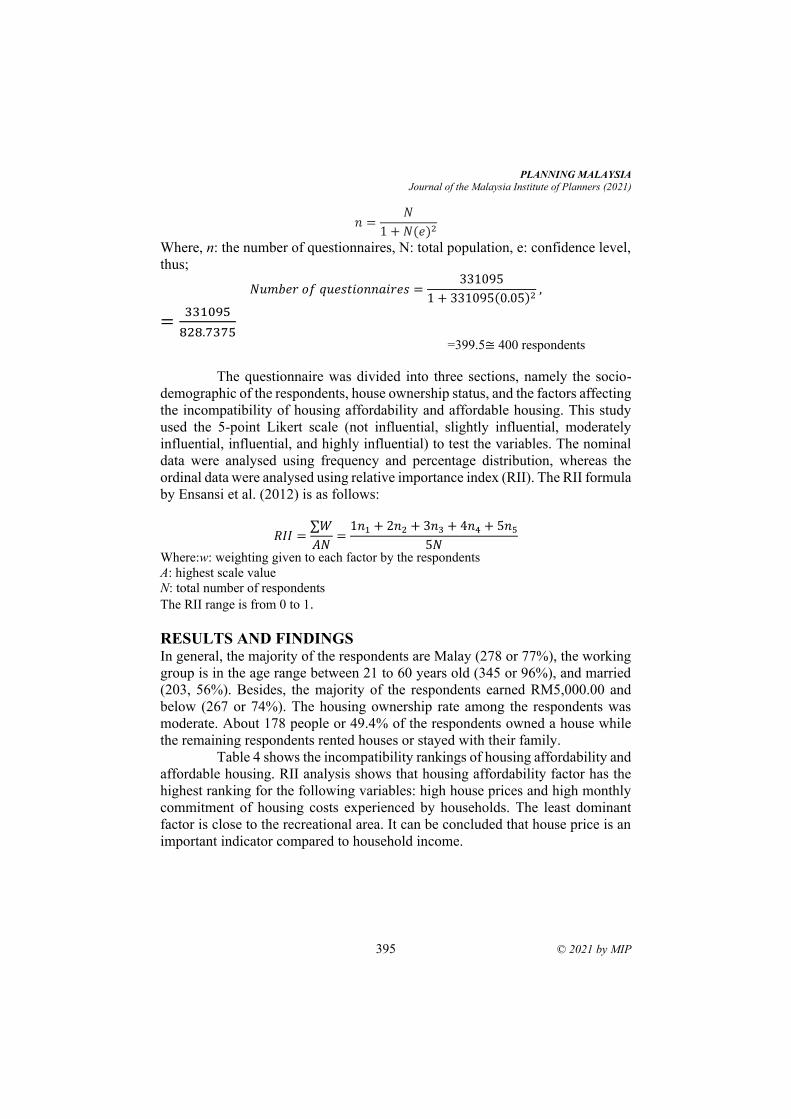
PLANNING MALAYSIA
Journal of the Malaysia Institute of Planners (2021)
395 © 2021 by MIP
𝑛 =𝑁
1 + 𝑁(𝑒)2
Where, n: the number of questionnaires, N: total population, e: confidence level,
thus;
𝑁𝑢𝑚𝑏𝑒𝑟 𝑜𝑓 𝑞𝑢𝑒𝑠𝑡𝑖𝑜𝑛𝑛𝑎𝑖𝑟𝑒𝑠 =331095
1 + 331095(0.05)2 ,
=331095
828.7375
=399.5≅ 400 respondents
The questionnaire was divided into three sections, namely the socio-
demographic of the respondents, house ownership status, and the factors affecting
the incompatibility of housing affordability and affordable housing. This study
used the 5-point Likert scale (not influential, slightly influential, moderately
influential, influential, and highly influential) to test the variables. The nominal
data were analysed using frequency and percentage distribution, whereas the
ordinal data were analysed using relative importance index (RII). The RII formula
by Ensansi et al. (2012) is as follows:
𝑅𝐼𝐼 =∑𝑊
𝐴𝑁=
1𝑛1 + 2𝑛2 + 3𝑛3 + 4𝑛4 + 5𝑛5
5𝑁
Where:w: weighting given to each factor by the respondents
A: highest scale value
N: total number of respondents
The RII range is from 0 to 1.
RESULTS AND FINDINGS
In general, the majority of the respondents are Malay (278 or 77%), the working
group is in the age range between 21 to 60 years old (345 or 96%), and married
(203, 56%). Besides, the majority of the respondents earned RM5,000.00 and
below (267 or 74%). The housing ownership rate among the respondents was
moderate. About 178 people or 49.4% of the respondents owned a house while
the remaining respondents rented houses or stayed with their family.
Table 4 shows the incompatibility rankings of housing affordability and
affordable housing. RII analysis shows that housing affordability factor has the
highest ranking for the following variables: high house prices and high monthly
commitment of housing costs experienced by households. The least dominant
factor is close to the recreational area. It can be concluded that house price is an
important indicator compared to household income.
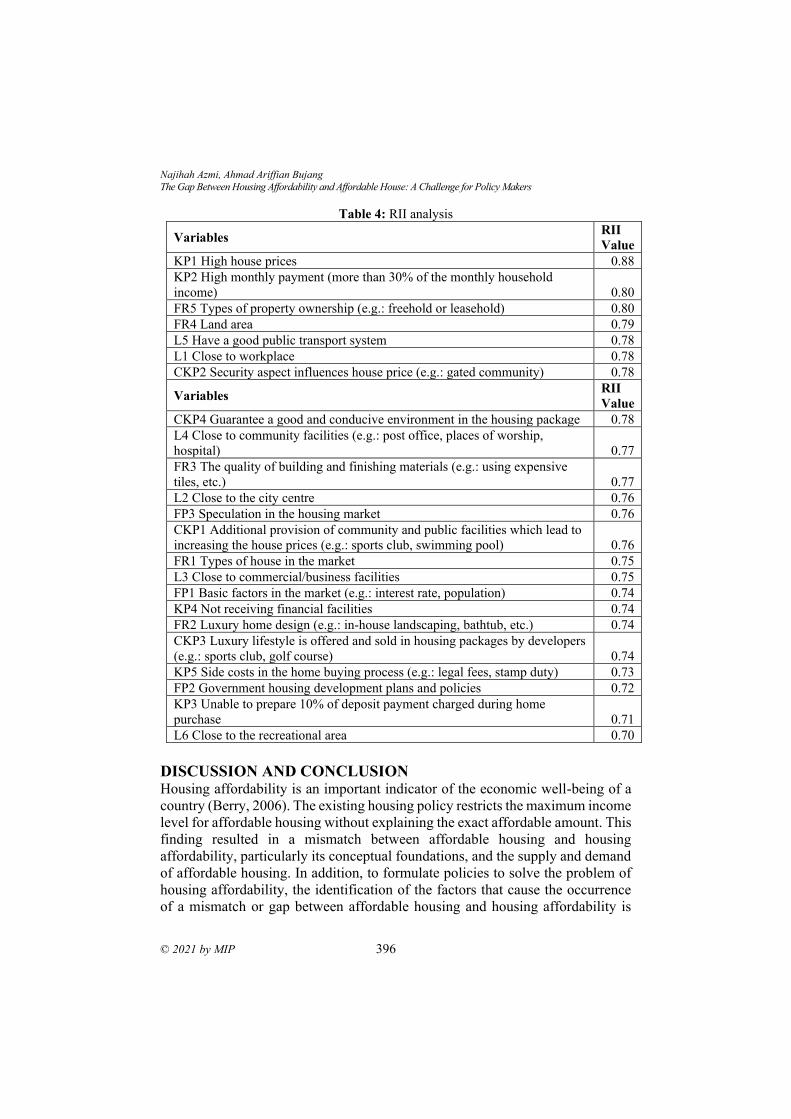
Najihah Azmi, Ahmad Ariffian Bujang
The Gap Between Housing Affordability and Affordable House: A Challenge for Policy Makers
© 2021 by MIP 396
Table 4: RII analysis
Variables RII
Value
KP1 High house prices 0.88
KP2 High monthly payment (more than 30% of the monthly household
income) 0.80
FR5 Types of property ownership (e.g.: freehold or leasehold) 0.80
FR4 Land area 0.79
L5 Have a good public transport system 0.78
L1 Close to workplace 0.78
CKP2 Security aspect influences house price (e.g.: gated community) 0.78
Variables RII
Value
CKP4 Guarantee a good and conducive environment in the housing package 0.78
L4 Close to community facilities (e.g.: post office, places of worship,
hospital) 0.77
FR3 The quality of building and finishing materials (e.g.: using expensive
tiles, etc.) 0.77
L2 Close to the city centre 0.76
FP3 Speculation in the housing market 0.76
CKP1 Additional provision of community and public facilities which lead to
increasing the house prices (e.g.: sports club, swimming pool) 0.76
FR1 Types of house in the market 0.75
L3 Close to commercial/business facilities 0.75
FP1 Basic factors in the market (e.g.: interest rate, population) 0.74
KP4 Not receiving financial facilities 0.74
FR2 Luxury home design (e.g.: in-house landscaping, bathtub, etc.) 0.74
CKP3 Luxury lifestyle is offered and sold in housing packages by developers
(e.g.: sports club, golf course) 0.74
KP5 Side costs in the home buying process (e.g.: legal fees, stamp duty) 0.73
FP2 Government housing development plans and policies 0.72
KP3 Unable to prepare 10% of deposit payment charged during home
purchase 0.71
L6 Close to the recreational area 0.70
DISCUSSION AND CONCLUSION Housing affordability is an important indicator of the economic well-being of a
country (Berry, 2006). The existing housing policy restricts the maximum income
level for affordable housing without explaining the exact affordable amount. This
finding resulted in a mismatch between affordable housing and housing
affordability, particularly its conceptual foundations, and the supply and demand
of affordable housing. In addition, to formulate policies to solve the problem of
housing affordability, the identification of the factors that cause the occurrence
of a mismatch or gap between affordable housing and housing affordability is
PLANNING MALAYSIA
Journal of the Malaysia Institute of Planners (2021)
397 © 2021 by MIP
important; this will also bridge the mismatch that occurs. This formulation can
indirectly control house prices and reduce the excess property.
Housing affordability has emerged as the key challenge confronting
housing policy makers. Therefore, addressing affordability problems is currently
a priority for governments in many countries, and a broad variety of strategies are
being enacted to improve the efficiency of housing markets, to increase supplies
of affordable housing, to respond to housing-related financial pressures on
individual households and to promote housing finance options for those
households being excluded from the housing market. Changes to the social
housing system are required to ensure the viability of this existing source of low-
cost housing and to better integrate existing service providers and assets into an
expanding sector of affordable housing. In particular, reform should be oriented
towards overcoming the current residualisation of this sector and towards
increasing housing and other options and, where needed, the mobility of those
lower-income households who rely most on social housing. In conclusion, a joint,
strongly coordinated national framework is important to address Malaysia's
housing affordability catastrophe and to mitigate the broader risks that the
systemic decline in housing affordability poses to future generations. Addressing
this crisis requires leadership from all sectors of government and a long-term
commitment to a whole-government approach that uses housing and non-housing
public policy levers.
REFERENCES Bank Negara Malaysia. (2017). Debunking the Myth: Property Measures Have Led To
Higher Loan Rejection Rate. Kuala Lumpur: Bank Negara Malaysia.
Baum, A., & Mackmin, D. (1989). Valuation Mathematic. In A. Baum, & D. Mackmin,
The Income Approach to Property Valuation (pp. 3-52). London: Routledge &
Kegan Paul.
Baum, A., Mackmin, D., & Nunnington, N. (2011). The Income Approach to Property
Valuation. New York, USA: Routledge.
Bourassa, S. C. (1996). Measuring the Affordability of Home-ownership. Urban Studies,
1867-877.
Bujang, A. A. (2006). Pemilikan Harta Tanah Kediaman: Satu Kajian Penilaian Ke Atas
Peraturan Kuota Lot Bumiputera Di Daerah Johor Bharu. Kuala Lumpur:
Universiti Malaya.
Bujang, A. A., Zarin, H. A., & Jumadi, N. (2010). The Relationship Between
Demographic Factor and Housing Affordability. Malaysian Journal of Real
Estate, 49-58.
Capozza, D. R., Hendershott, P. H., & Mack, C. (2004). An Anatomy of Price Dynamics
in Illiquid Markets: Analysis and Evidence from Local Housing Markets. Real
Estate Economics, 1–32..
Clark, S. P., & Coggin, T. D. (2011). Was there a U.S. house price bubble? An
econometric analysis using national and regional panel data. The Quarterly Review
of Economics and Finance , 189–200.
Najihah Azmi, Ahmad Ariffian Bujang
The Gap Between Housing Affordability and Affordable House: A Challenge for Policy Makers
© 2021 by MIP 398
Crowley, S. (2003). The Affordable Housing Crisis: Residential Mobility of Poor
Families and School Mobility of Poor Children. The Journal of Negro Education,
22-38.
Davenport, J. L. (2003). The Effect of Supply and Demand Factors on the Affordability
of Rental Housing. Bloomington, USA: Illinois Wesleyan University.
DiPasquale, D., & Wheaton, W. C. (1996). Chapter 2 The Operation of the Property
Market: A Macro and Micro Approach. In D. DiPasquale, & W. C. Wheaton,
Urban Economics and Real Estate Market (pp. 22-32). Englewood Cliffs, N. J.:
Prentice Hall.
Dreger, C., & Zhang, Y. (2013). Is there a Bubble in the Chinese Housing Market? .
Urban Policy and Research , 27-39.
Enshassi, A., Arain, F., & Tayeh, B. (2012). Major causes of problems between
contractors and subcontractors in the Gaza Strip. Journal of Financial
Management of Property and Construction, 92-112.
Gabriel, M., Jacobs, K., Arthurson, K., Burke, T., & Yates, J. (2005). Conceptualising
and measuring the housing affordability problem. Sydney: Australian Housing
and Urban Research Institute (AHURI).
Gan, Q., & Hill, R. J. (2009). Measuring housing affordability: Looking beyond the
median . Journal of Housing Economics , 115-125.
García, J. A., & Hernández, J. E. (2008). Housing demand in Spain according to dwelling
type: Microeconometric evidence . Regional Science and Urban Economics , 363-
377.
Glaeser, E. L., Gyourko, J., & Saiz, A. (2008). Housing supply and housing bubbles .
Journal of Urban Economics , 198-217.
Goebel, P. R., & Miller, N. G. (1981). Handbook of Mortgage Mathematics and Financial
Tables . Englewood Cliffs, NJ: Prentice-Hall.
Hancock, K. E. (1993). 'Can Pay ? Won't Pay? or Economic Principle of Affordability.
Urban Studies, 127-145.
Harvey, J., & Jowsey, E. (2004). Urban Land Economics. Basingstoke: Palgrave
MacMillan.
Hassan, M. A., Hamdan, H., Abdullah, J., & Abdullah, Y. A. (2018). Housing and
Transport Expenditure: An Assessment of Location Housing Affordability. .
Planning Malaysia: Journal of the Malaysian Institute of Planners, 99-108.
Hassan, M. A., Abdullah, Y. A., Omar, D., & Danial, M. H. (2021). Location Housing
Affordability Index: Analysing The Relationships. Planning Malaysia: Journal
of the Malaysian Institute of Planners, 218-228., 41-52.
Himmelberg, C., Mayer, C., & Sinai, T. (n.d.). Assessing High House Price: Bubble,
Fundamental and Misperceptions. NBER Working Paper (pp. 1-21). 2005.
Huang, H., & Tang, Y. (2012). Residential land use regulation and the US housing price
cycle between 2000 and 2009. Journal of Urban Economics, 93–99.
Hulchanski, J. D. (1995). The concept of housing affordability: Six contemporary uses of
the housing expenditure‐to‐income ratio. Housing Studies, 471-491.
Khazanah Research Institute. (2019). Rethinking Housing: Between State, Market and
Society. Kuala Lumpur: Khazanah Research Institute.
Kutty, N. K. (2010). A new measure of housing affordability: Estimates and analytical
results. Housing Policy Debate , 113-142.
PLANNING MALAYSIA
Journal of the Malaysia Institute of Planners (2021)
399 © 2021 by MIP
Israel, G. D. (1992). Determining Sample Size. Florida: University of Florida.
Linneman, P., & Megbolugbe, I. (1992). Housing Affordability: Myth or Reality? Urban
Studies, 369-392.
Malpezzi, S., & Wachter, S. M. (2005). The Role of Speculation in Real Estate Cycles .
Journal of Real Estate Literature, 141-164.
Mayer, C., & Quigley, J. M. (2003). [Is There a Bubble in the Housing Market?].
Comments and Discussion . Brookings Papers on Economic Activity , 343-362
Mill, J. S. (1885). The Project Gutenberg EBook of Principles Of Political Economy .
New York: D. Appleton And Company, .
Nashan, A. M. (2010). Penentuan Harga Rumah Berdasarkan Faktor-Faktor Mikro.
Johor Bharu: Universiti Teknologi Malaysia.
Ndubueze, O. (2007). Measuring Housing Affordability: A Composite Approach. ENHR
2007 International Conference ‘Sustainable Urban Areas’, (pp. 1-43). Rotterdam.
Pirounakis, N. G. (2013). Real Estate Economics. London & New York: Routledge.
National Property Information Centre (NAPIC). (2005-2019). Property Market Report
2005-2019. Kuala Lumpur: Pusat Maklumat Harta Tanah Negara (NAPIC).
Osman, M. M., Zainudin, F. E., Rabe, N. S., Hitam, M., & Ponrahono, Z. (2020).
Challenges and Ownership Issues Facing By Low (B40) and Medium Income
Group (M40) In Selangor. Planning Malaysia: Journal of the Malaysian Institute
of Planners, 218-228.
Quigley, J. M., & Raphael, S. (2004). Is Housing Unaffordable? Why Isn't It More
Affordable. Journal of Economic Perspectives, 191-214.
Ren, Y., Xiong, C., & Yuan, Y. (2012). House price bubbles in China . China Economic
Review , 786-800..
Rowan‐Robinson, J., & Lloyd, M. (1988). The infrastructure lottery and the land
development process. Land Development Studies, 17-30.
Stone, M. E. (2006). What Is Housing Affordability? The Case for the Residual Income
Approach . Housing Policy Debate, 151-184.
Tiwari, P., & Parikh, J. (1998). Affordability, Housing Demand and Housing Policy in
Urban India . Urban Studies, 2111-2129.
Trimbath, S., & Montoya, J. (2002, Disember 13). Housing Affordability in Three
Dimensions: Price, Income and Interest Rates. Retrieved from Milken Institute
Policy Brief No. 31: https://ssrn.com/abstract=349681 or
http://dx.doi.org/10.2139/ssrn.349681.
Urban Research Centre. (2008). Housing Affordability Literature Review and Affordable
Housing Program Audit. Sydney: University of Western Sydney.
Yang, Z., & Shen, Y. (2008). The affordability of owner occupied housing in Beijing . J
Hous and the Built Environ , 317-335.
Yang, Z., & Wang, S. (2011). The impact of privatization of public housing on housing
affordability in Beijing: An assessment using household survey data . Local
Economy, 384-400.
Yates, J. (2008). Australia’s Housing Affordability Crisis . The Australian Economic
Review , 200-214
Received: 12th July 2021. Accepted: 17th Sept 2021
1 Employee at Indonesian Ministry of Finance Email: [email protected]
PLANNING MALAYSIA:
Journal of the Malaysian Institute of Planners
VOLUME 19 ISSUE 3 (2021), Page 400 – 410
VALUE OF BUILDINGS IN VOLCANIC VULNERABILITY:
A CALCULATION CONCEPT
Jerri Falson1
MINISTRY OF FINANCE – REPUBLIC OF INDONESIA
Abstract
Indonesia has diverse geographical conditions in each region that causes different
impact in assessing real estate value, one of which is the active mountains
especially in Ternate, North Maluku. This research discusses the experience of
volcanic hazards that influences the model of cost valuation method in building.
Drawing on technical calculation, the paper first examines the historical volcanic
hazard at Mt. Gamalama, Ternate, Province North Maluku. This work also
introduces in how volcanic vulnerability requires a specific approach to play
complementary roles in appraising the real value of a building. Following cost
approach method, by computing the specific formula to determine the
characteristic of a building which directly related to its depreciation, this model
predicts the implications of the expected value of a building which is typically
located in the volcanic vulnerability.
Keyword: volcanic vulnerability, building, cost approach method
PLANNING MALAYSIA
Journal of the Malaysia Institute of Planners (2021)
401 © 2021 by MIP
INTRODUCTION Called as “Pacific Ring of Fire”, the natural disasters such as earthquakes, floods,
tsunamis, and volcanic eruptions are common threats to many countries, in the
Asia-Pacific region including Indonesia (Primanti et al 2018). For the last decades
in Indonesia,a volcanic hazard has been assessed at the regional scale and the
assessment of volcanic vulnerability is a particular step within the real estate
analysis at the specific region. Precisely, in order to conduct a valuation,
specifically in the location of the volcanic eruption recorded, an appraiser needs
to determine the effect, in terms of possible damage to buildings and other built
facilities due to volcanic eruption (Spence et al 2005).
Characterized with four thematic areas as physical, social, economic
and environmental, (Birkman and Wisner, 2006) the vulnerability which related
to the physical aspects is usually described as the ‘degree of losses’ of an element
or set of elements at risk resulting from the occurrence of a natural phenomenon.
In this context, particularly for the structure of a building, an appraiser is expected
to express a judgement in terms of volcanic vulnerability for the building
constructions.
Indonesia has public appraisers that is officially appointed by the
Minister of Finance through The Directorate General of State Asset Management
(DGSAM)- with specific duty to conduct state asset valuation. Established at
2006, DGSAM answered the need of public asset management practice issues,
one of its positive agenda is to identify the accuracy and reliability of existing
value of Indonesian asset with up-to-date database. Written down in its mission
to realize a fair value of the State Asset that can be used for various purposes,
moreover, to achieve the target, then DGSAM need a new set of rules and
regulations in valuation.
Several regulations as guidance for public appraisers in conducting
valuation have been made, one of which is related to building valuation. Thus,
the regulation must meet the necessity of a particular asset to be identified.
Specifically in this research objective for assets located in a volcanic hazard,
within the context of the impact of volcanic vulnerability towards building.
Several indicators have set up to be considered in building valuation such as: (1)
age of buildings; (2) construction materials; (3) building function; (4) number of
floors. All of the indicators henceforth will be useful to assess building New
Reproduction Cost when appraisers conduct a Cost Method approach.
In view of the lack of research in how to assess the fair value of a
building at the potential hazardous location and its significance, based on
technical calculation, this study analyses each volcanic action and describe their
effects on the fair value of building at a regional scale, in the municipality of
Ternate, located in the North of Maluku. The example is given by applying the
model to part of the potentially affected area based on calculation output.
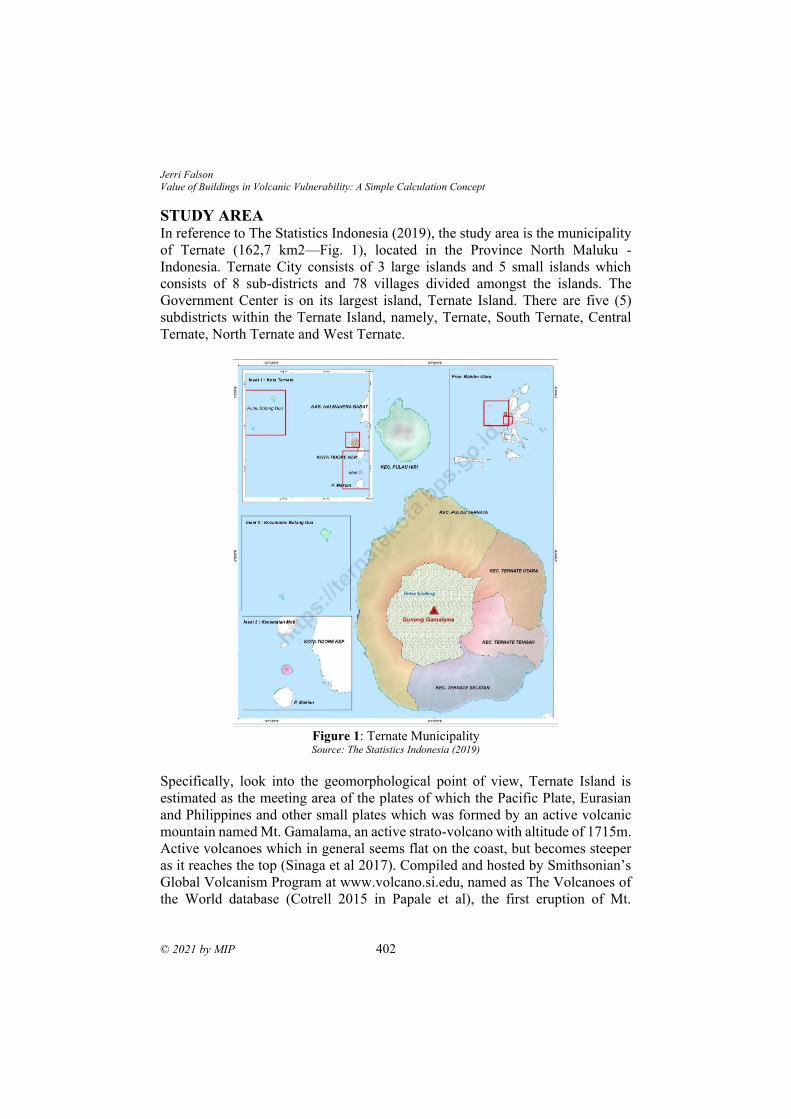
Jerri Falson
Value of Buildings in Volcanic Vulnerability: A Simple Calculation Concept
© 2021 by MIP 402
STUDY AREA In reference to The Statistics Indonesia (2019), the study area is the municipality
of Ternate (162,7 km2—Fig. 1), located in the Province North Maluku -
Indonesia. Ternate City consists of 3 large islands and 5 small islands which
consists of 8 sub-districts and 78 villages divided amongst the islands. The
Government Center is on its largest island, Ternate Island. There are five (5)
subdistricts within the Ternate Island, namely, Ternate, South Ternate, Central
Ternate, North Ternate and West Ternate.
Figure 1: Ternate Municipality Source: The Statistics Indonesia (2019)
Specifically, look into the geomorphological point of view, Ternate Island is
estimated as the meeting area of the plates of which the Pacific Plate, Eurasian
and Philippines and other small plates which was formed by an active volcanic
mountain named Mt. Gamalama, an active strato-volcano with altitude of 1715m.
Active volcanoes which in general seems flat on the coast, but becomes steeper
as it reaches the top (Sinaga et al 2017). Compiled and hosted by Smithsonian’s
Global Volcanism Program at www.volcano.si.edu, named as The Volcanoes of
the World database (Cotrell 2015 in Papale et al), the first eruption of Mt.
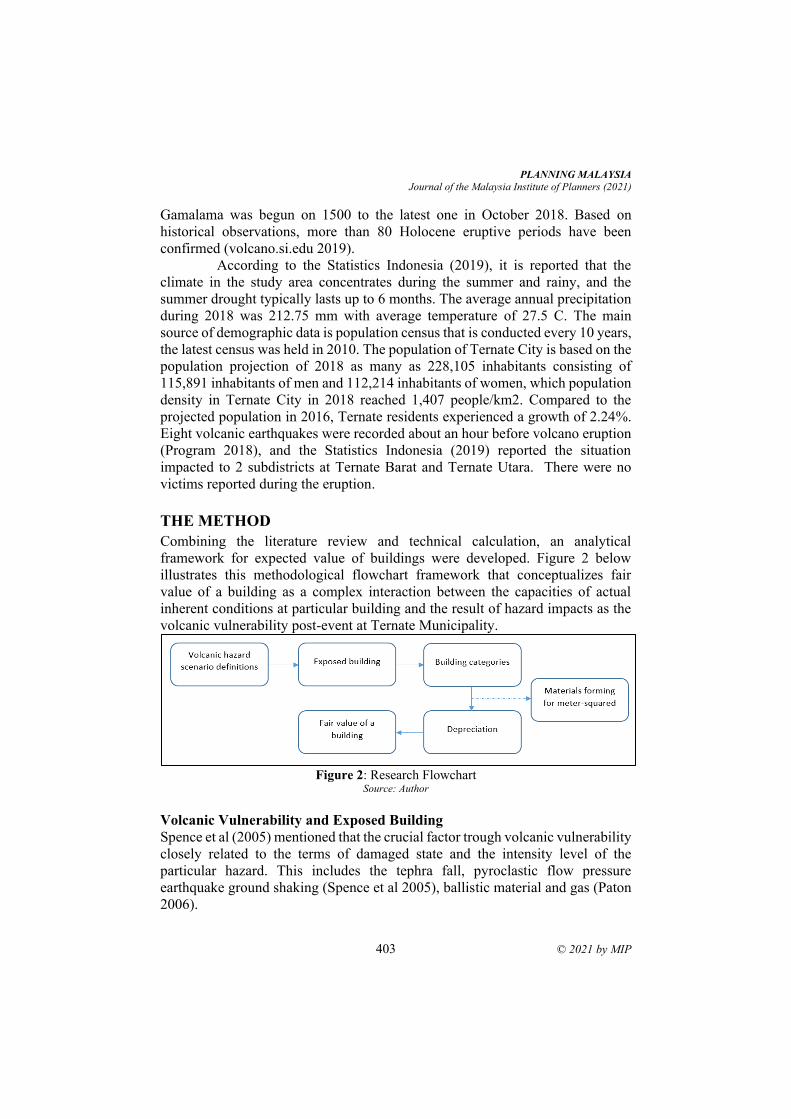
PLANNING MALAYSIA
Journal of the Malaysia Institute of Planners (2021)
403 © 2021 by MIP
Gamalama was begun on 1500 to the latest one in October 2018. Based on
historical observations, more than 80 Holocene eruptive periods have been
confirmed (volcano.si.edu 2019).
According to the Statistics Indonesia (2019), it is reported that the
climate in the study area concentrates during the summer and rainy, and the
summer drought typically lasts up to 6 months. The average annual precipitation
during 2018 was 212.75 mm with average temperature of 27.5 C. The main
source of demographic data is population census that is conducted every 10 years,
the latest census was held in 2010. The population of Ternate City is based on the
population projection of 2018 as many as 228,105 inhabitants consisting of
115,891 inhabitants of men and 112,214 inhabitants of women, which population
density in Ternate City in 2018 reached 1,407 people/km2. Compared to the
projected population in 2016, Ternate residents experienced a growth of 2.24%.
Eight volcanic earthquakes were recorded about an hour before volcano eruption
(Program 2018), and the Statistics Indonesia (2019) reported the situation
impacted to 2 subdistricts at Ternate Barat and Ternate Utara. There were no
victims reported during the eruption.
THE METHOD
Combining the literature review and technical calculation, an analytical
framework for expected value of buildings were developed. Figure 2 below
illustrates this methodological flowchart framework that conceptualizes fair
value of a building as a complex interaction between the capacities of actual
inherent conditions at particular building and the result of hazard impacts as the
volcanic vulnerability post-event at Ternate Municipality.
Figure 2: Research Flowchart
Source: Author
Volcanic Vulnerability and Exposed Building
Spence et al (2005) mentioned that the crucial factor trough volcanic vulnerability
closely related to the terms of damaged state and the intensity level of the
particular hazard. This includes the tephra fall, pyroclastic flow pressure
earthquake ground shaking (Spence et al 2005), ballistic material and gas (Paton
2006).
Jerri Falson
Value of Buildings in Volcanic Vulnerability: A Simple Calculation Concept
© 2021 by MIP 404
Moreover, Spence et al (2005) defined the tephra fall as the damage state
of collapse, meaning “the failure of a major structural element” such that “the
roof covering and the structural members supporting it will fall inwards along
with the thick tephra layer above”. The focus is on this damage state because it is
only roof collapse which leads to significant casualties. Related to pyroclastic
flow pressure, Spence et al (2005) notices four specific variables started from the
occurrence of first damage state when glazed openings start to fail, allowing
pyroclastic flow materials to invade building interiors. A second damage state
occurs when shuttered openings and solid doors fail. As pressure further
increases, wall panels without opening may begin to fail, third damage state. As
pressure increases further, roofs and whole buildings may fail, which is the fourth
damage state. And taking into account to the hazard concerned in volcanogenic
earthquake, categorized by two types as collapse and partial collapse of a
building.
Thus, even though the hazard contributes to building resilience both in
times of quiescence, during a disaster, and after a disaster (De Terte et al 2009),
this study focusses on the post disaster impact on the buildings which is related
to the Perceived risk and adaptability to hazards that are especially significant in
measuring local resilience.
Building categories and meter-squared material forming
In the way due to lack of comparable market transaction information, many
instances of buildings opinion about its value are required even though no market
activity took place (Scarrett 2008). To solve this situation, the replacement cost
method seeks to estimate the usual costs associated with the constructing of a
building rather than exchange price (Wyatt 2007). In details, the DGSAM, based
on the Director General Decree 12/2019, stated, in order to find the new
replacement or reproduction cost, appraisers must multiply the identified total
area of building with meter-squared cost of building. Specifically, there are 4
categories of meter-squared cost of a building such:
a. 1st Category is a building that is generally known and well-functioned as a
residential building. Buildings of this category usually consist of many rooms
separated by permanent walls for residential activities such as bedrooms,
living rooms, family rooms, kitchens and bathrooms. To be more specific, the
1st category can be divided into three sub-categories with characteristics
below:
1) Char 1.1
Building functioned as a place for housing activities which has simple
structure with dimensions of columns are no more than 18 cm squared or
flattened with walls, and more than 50% of distance between columns
that is less than 6 m in which the overall construction does not require
special construction/structural design.
PLANNING MALAYSIA
Journal of the Malaysia Institute of Planners (2021)
405 © 2021 by MIP
2) Char 1.2
Building that is built as a place for housing which has medium structure
with several dimensions of columns are 18cm2, more than 50% of
distance between columns that more than 6 m and there are several rooms
with special construction.
3) Char 1.3
Building functioned as a place for housing activities which has complex
structure or has multi-storey structures with or without shear wall/core
wall. This building specification requires more than 50% of distance
between columns are more than 6 m and there are several rooms with
special construction.
b. 2nd Category is a well-known as business (commercial) building. Building of
this category is functioned as a place of business or a combination between
place of business and residence. Generally, buildings of this category only
have a few spaces that separated by permanent walls. However, the separation
between spaces sometimes can be insulated with non-permanent walls or
consist of a collection of small spaces of common size area and these spaces
are corridors-connected. To be more specific, the 2nd category could divide
into three sub-categories with characteristic below:
1) Char 2.1
A rectangular less-space simple building structure with smaller width
than the length. This building specification requires more than 50% of
distance between columns that less than 6 m with overall no require
special construction.
2) Char 2.2
Building functioned as a commercial place with multi-storey structures
without shear wall and core wall. This building specification requires
more than 50% of distance between columns maximum 6 m with no
rooms with special construction.
3) Char 2.3
Building functioned as a commercial place with complex structure and
had two-tiered portal which combined with shear wall and core wall
structures. This building specification requires more than 50% of distance
between columns that more than 6 m with no rooms with special
construction.
c. 3rd Category are buildings that are generally used for industrial activities such
as warehouses, workshops, and factories. These buildings has a saddle-roof
construction and has a single space that covers at least 80% of the building
area. To be more specific, the 3rd category could divide into two sub-
categories with characteristic below:
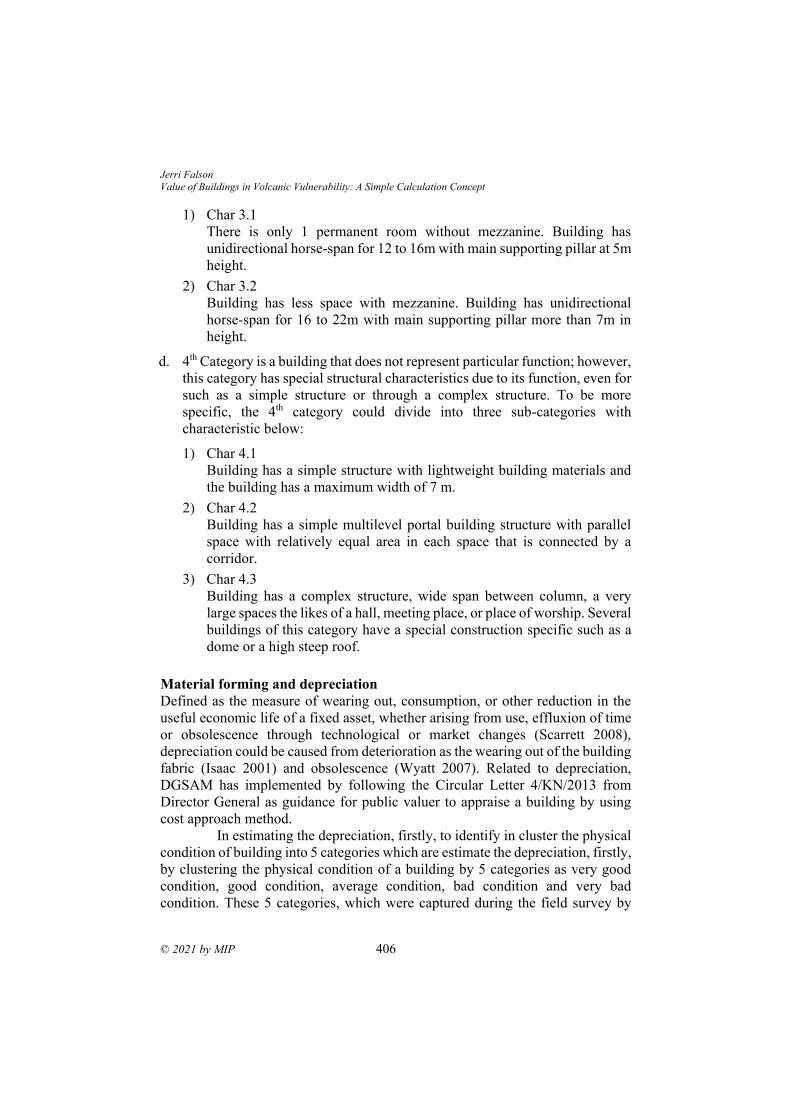
Jerri Falson
Value of Buildings in Volcanic Vulnerability: A Simple Calculation Concept
© 2021 by MIP 406
1) Char 3.1
There is only 1 permanent room without mezzanine. Building has
unidirectional horse-span for 12 to 16m with main supporting pillar at 5m
height.
2) Char 3.2
Building has less space with mezzanine. Building has unidirectional
horse-span for 16 to 22m with main supporting pillar more than 7m in
height.
d. 4th Category is a building that does not represent particular function; however,
this category has special structural characteristics due to its function, even for
such as a simple structure or through a complex structure. To be more
specific, the 4th category could divide into three sub-categories with
characteristic below:
1) Char 4.1
Building has a simple structure with lightweight building materials and
the building has a maximum width of 7 m.
2) Char 4.2
Building has a simple multilevel portal building structure with parallel
space with relatively equal area in each space that is connected by a
corridor.
3) Char 4.3
Building has a complex structure, wide span between column, a very
large spaces the likes of a hall, meeting place, or place of worship. Several
buildings of this category have a special construction specific such as a
dome or a high steep roof.
Material forming and depreciation
Defined as the measure of wearing out, consumption, or other reduction in the
useful economic life of a fixed asset, whether arising from use, effluxion of time
or obsolescence through technological or market changes (Scarrett 2008),
depreciation could be caused from deterioration as the wearing out of the building
fabric (Isaac 2001) and obsolescence (Wyatt 2007). Related to depreciation,
DGSAM has implemented by following the Circular Letter 4/KN/2013 from
Director General as guidance for public valuer to appraise a building by using
cost approach method.
In estimating the depreciation, firstly, to identify in cluster the physical
condition of building into 5 categories which are estimate the depreciation, firstly,
by clustering the physical condition of a building by 5 categories as very good
condition, good condition, average condition, bad condition and very bad
condition. These 5 categories, which were captured during the field survey by
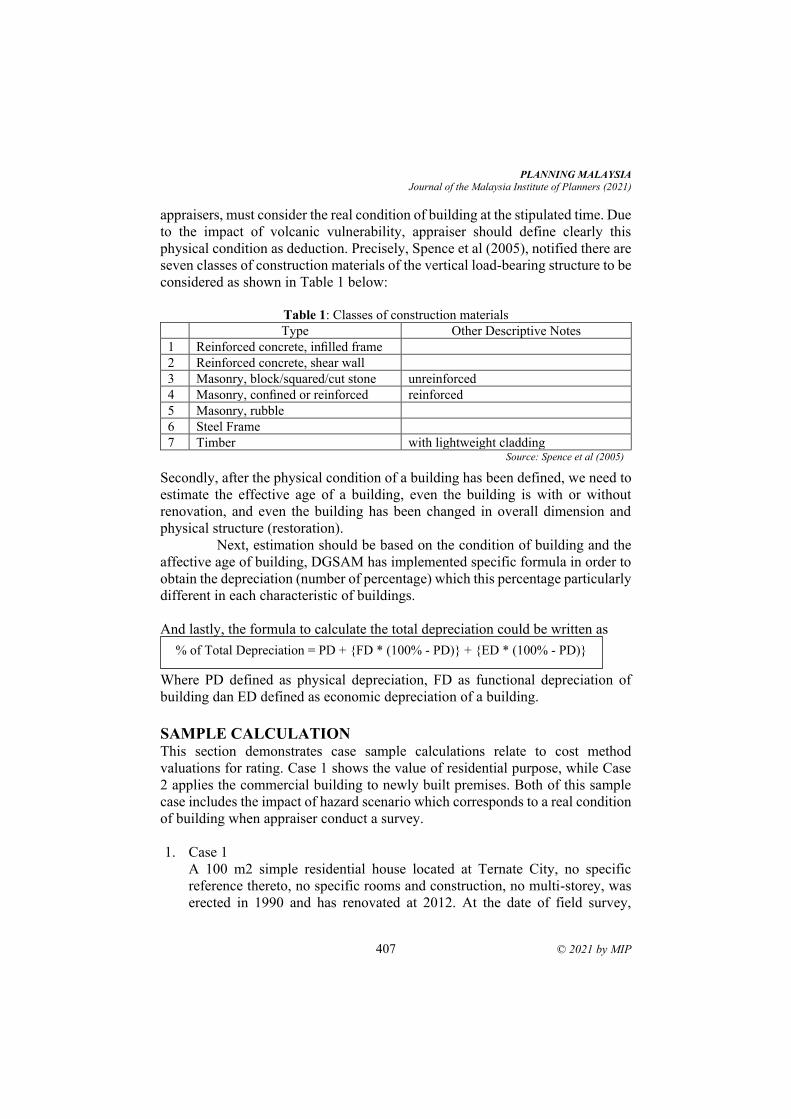
PLANNING MALAYSIA
Journal of the Malaysia Institute of Planners (2021)
407 © 2021 by MIP
appraisers, must consider the real condition of building at the stipulated time. Due
to the impact of volcanic vulnerability, appraiser should define clearly this
physical condition as deduction. Precisely, Spence et al (2005), notified there are
seven classes of construction materials of the vertical load-bearing structure to be
considered as shown in Table 1 below:
Table 1: Classes of construction materials
Type Other Descriptive Notes
1 Reinforced concrete, infilled frame
2 Reinforced concrete, shear wall
3 Masonry, block/squared/cut stone unreinforced
4 Masonry, confined or reinforced reinforced
5 Masonry, rubble
6 Steel Frame
7 Timber with lightweight cladding
Source: Spence et al (2005)
Secondly, after the physical condition of a building has been defined, we need to
estimate the effective age of a building, even the building is with or without
renovation, and even the building has been changed in overall dimension and
physical structure (restoration).
Next, estimation should be based on the condition of building and the
affective age of building, DGSAM has implemented specific formula in order to
obtain the depreciation (number of percentage) which this percentage particularly
different in each characteristic of buildings.
And lastly, the formula to calculate the total depreciation could be written as
Where PD defined as physical depreciation, FD as functional depreciation of
building dan ED defined as economic depreciation of a building.
SAMPLE CALCULATION This section demonstrates case sample calculations relate to cost method
valuations for rating. Case 1 shows the value of residential purpose, while Case
2 applies the commercial building to newly built premises. Both of this sample
case includes the impact of hazard scenario which corresponds to a real condition
of building when appraiser conduct a survey.
1. Case 1
A 100 m2 simple residential house located at Ternate City, no specific
reference thereto, no specific rooms and construction, no multi-storey, was
erected in 1990 and has renovated at 2012. At the date of field survey,
% of Total Depreciation = PD + {FD * (100% - PD)} + {ED * (100% - PD)}
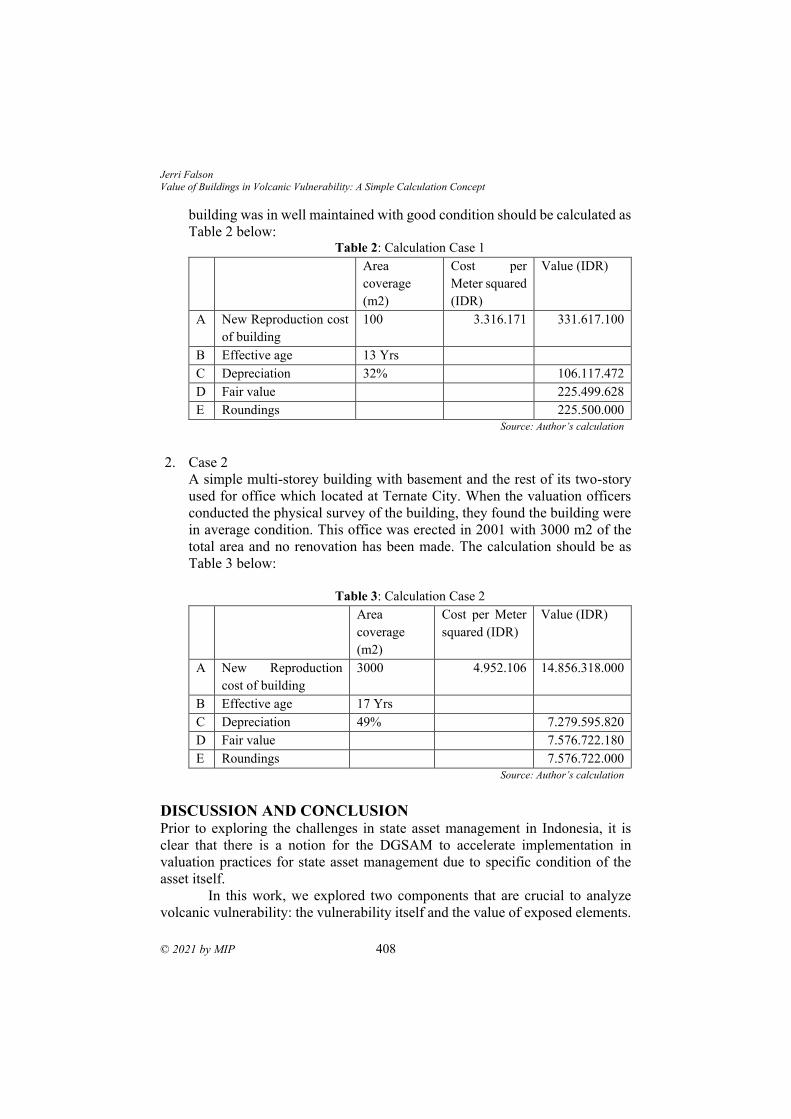
Jerri Falson
Value of Buildings in Volcanic Vulnerability: A Simple Calculation Concept
© 2021 by MIP 408
building was in well maintained with good condition should be calculated as
Table 2 below: Table 2: Calculation Case 1
Area
coverage
(m2)
Cost per
Meter squared
(IDR)
Value (IDR)
A New Reproduction cost
of building
100 3.316.171 331.617.100
B Effective age 13 Yrs
C Depreciation 32% 106.117.472
D Fair value 225.499.628
E Roundings 225.500.000
Source: Author’s calculation
2. Case 2
A simple multi-storey building with basement and the rest of its two-story
used for office which located at Ternate City. When the valuation officers
conducted the physical survey of the building, they found the building were
in average condition. This office was erected in 2001 with 3000 m2 of the
total area and no renovation has been made. The calculation should be as
Table 3 below:
Table 3: Calculation Case 2
Area
coverage
(m2)
Cost per Meter
squared (IDR)
Value (IDR)
A New Reproduction
cost of building
3000 4.952.106 14.856.318.000
B Effective age 17 Yrs
C Depreciation 49% 7.279.595.820
D Fair value 7.576.722.180
E Roundings 7.576.722.000
Source: Author’s calculation
DISCUSSION AND CONCLUSION Prior to exploring the challenges in state asset management in Indonesia, it is
clear that there is a notion for the DGSAM to accelerate implementation in
valuation practices for state asset management due to specific condition of the
asset itself.
In this work, we explored two components that are crucial to analyze
volcanic vulnerability: the vulnerability itself and the value of exposed elements.
PLANNING MALAYSIA
Journal of the Malaysia Institute of Planners (2021)
409 © 2021 by MIP
However, this contribution only focuses on the single type of exposed elements:
buildings. One of the innovative contributes of this study was supported by very
detailed component materials in order to develop the precise cost per meter
squared that allowed the appraisers to calculate the reproduction cost for each
single building within the study area. Such information was used to evaluate the
buildings condition bases on physical survey conducted based on empirical data
which supported by expert opinion.
In this study, we assume a unique value for every single of building in
the municipality. Value of a building was obtained for each single building taking
into consideration the construction cost, the area, the building characteristic,
location and its age.
The complete information regarding buildings in the volcanic hazard
was aggregated into a geodatabase that may be explored in future work in order
to improve the estimation of magnitude values for other types of volcanic
vulnerability in the study area. We believe that this methodology may be exported
to other areas with similar building characteristics. However, the application of
this method to large cities appears to be very difficult because it implies the data
collection for each individual building.
REFERENCES Birkmann, J. & Wisner, B. (2006). Measuring the un-measurable. The challenge of
vulnerability. Studies of the University: Research, Counsel, Education—
Publication Series of UNU-EHS, No. 5/2006.
Cotrell, E. (2015). Global Distribution of Active Volcanoes. In: Papale, P. Volcanic
Hazards, Risks, and Disasters. Elsevier.
De Terte, I., Becker, J., & Stephens, C. (2009). An Integrated Model for Understanding
and Developing Resilience in the Face of Adverse Events. Journal of Pacific Rim
Psychology, 3(1), 20-26. doi:10.1375/prp.3.1.20.
Directorate General of State Asset Management (2013). Surat Edaran Nomor SE-
4/KN/2013 tentang Penyusutan/Depresiasi pada Penilaian Bangunan
Directorate General of State Asset Management (2019). Keputusan Direktur Jenderal
Kekayaan Negara Nomor 12/KN/2019 tentang Perubahan Kedua atas Keputusan
Direktur Jenderal Kekayaan Negara Nomor 246/KN/2017 tentang Petunjuk
Teknis Penilaian Tanah, Gedung dan Bangunan, Jalan, Jembatan, Bangunan Air,
dan Penyusunan Laporan Penilaian Dalam Rangka Penilaian Kembali Barang
Milik Negara.
Global Volcanism Program. (2018). Report on Gamalama (Indonesia). In: Venzke, E.
(ed.). Bulletin of the Global Volcanism Network, 43:11. Smithsonian Institution.
https://doi.org/10.5479/si.GVP.BGVN201811-268060.
https://volcano.si.edu/volcano.cfm?vn=268060, accessed on 18 Oct 2019
Isaac, D. (2002). Property Valuation Principles. Palgrave-McMillan.
Paton, D. (2006). Disaster resilience: Building capacity to co-exist with natural hazards
and their consequences. In D. Paton & D. Johnston (Eds.), Disaster resilience: An
integrated approach (pp. 3–10). Springfield, IL: Charles C Thomas.

Jerri Falson
Value of Buildings in Volcanic Vulnerability: A Simple Calculation Concept
© 2021 by MIP 410
Primanti, IN., Roeslan, F. & Hastiadi, FF. (2018). The Economic Development Impact of
Natural Disasters in APEC Countries (1999-2013). Journal of Economic
Cooperation and Development, 39(2) pp. 1-28.
Scarrett, D. (2008). Property Valuation-The Five Methods. 2nd Edition. Routledge.
Sinaga, GHD., Zarlis, M., Sitepu, M., Prasetyo, RA. & Simanullang, A. (2017). Coulomb
stress analysis of West Halmahera earthquake mw=7.2 to mount Soputan and
Gamalama volcanic activities. IOP Conference Series: Earth and Environmental
Science, 56-012005.
Spence, RJS., Kelman, I., Calogero, E., Toyos, G., Baxter, PJ., et al. (2005). Modelling
expected physical impacts and human casualties from explosive volcanic
eruptions. Natural Hazards and Earth System Science, Copernicus Publications
on behalf of the European Geosciences Union, 5(6), pp.10031015.
The Statistics Indonesia. (2009). Ternate Municipality in Figures.
Wyatt, P. (2007). Property Valuation. 2nd Edition. Wiley-Blackwell.
Received: 12th July 2021. Accepted: 17th Sept 2021
2 Lecturer at Universiti Teknologi MARA, Seri Iskandar Campus. Email: [email protected]
PLANNING MALAYSIA:
Journal of the Malaysian Institute of Planners
VOLUME 19 ISSUE 3 (2021), Page 411 – 422
MACHINE LEARNING FOR PROPERTY PRICE PREDICTION AND
PRICE VALUATION: A SYSTEMATIC LITERATURE REVIEW
Nur Shahirah Ja’afar1, Junainah Mohamad2, Suriatini Ismail3
1 Faculty of Architecture, Planning and Surveying
UNIVERSITI TEKNOLOGI MARA SHAH ALAM MALAYSIA 2 Department of Built Environment Studies & Technology,
Faculty of Architecture, Planning and Surveying
UNIVERSITI TEKNOLOGI MARA PERAK BRANCH, MALAYSIA 3 Faculty of Architecture and Ekistics
UNIVERSITI MALAYSIA KELANTAN, MALAYSIA
Abstract
Machine learning is a branch of artificial intelligence that allows software
applications to be more accurate in its data predicting, as well as to predict current
performance and improve for future data. This study reviews published articles
with the application of machine learning techniques for price prediction and
valuation. Authors seek to explore optimal solutions in predicting the property
price indices, that will be beneficial to the policymakers in assessing the overall
economic situation. This study also looks into the use of machine learning in
property valuation towards identifying the best model in predicting property
values based on its characteristics such as location, land size, number of rooms
and others. A systematic review was conducted to review previous studies that
imposed machine learning as statistical tool in predicting and valuing property
prices. Articles on real estate price prediction and price valuation using machine
learning techniques were observed using electronics database. The finding shows
the increasing use of this method in the real estate field. The most successful
machine learning algorithms used is the Random Forest that has better
compatibility to the data situation.
Keyword: machine learning, real estate, property price prediction, valuation
Nur Shahirah Ja’afar, Junainah Mohamad & Suriatini Ismail
Machine Learning for Property Price Prediction and Price Valuation: A Systematic Literature Review
© 2021 by MIP 412
INTRODUCTION Machine learning (ML) was first found in the early years and has since been
further developed and vastly applied to date. ML technologies have grown and
raised its capabilities across a suited of application (Ja’afar & Mohamad, 2021).
ML is a computer program and a branch of artificial intelligence which is applied
to identity, acquire and improve data performance carrying out its roles as a
prediction model (Kamalov & Gurrib, 2021). In other words, ML learns from
previous experiences to predict current performance and improve for future data.
In ML, there are several categories learning such as supervised and unsupervised.
Every learning category has several algorithms that studies different patterns.
How ML works is done by studying previous pattersn using selected algorithms
and predicts future result upon observations (Oladunni, 2016).
The benefits of ML includes to improve the performance of iterative
algorithms by caching the previous accessed datasets Park & Kwon (2015) that
avoids the overfitting on datasets which contain noise or many other features,
able to predict unstable and unpredictable market with reasonable accuracy Sarip
(2015), manufacturing, education, financial modelling, policing Jordan (2015),
medicine (Christodoulou, 2019), transport system (Maalel, 2011), healthcare
Ghassemi (2018) and engineering (Begel, 2019). This proved ML has a wide
application and is being used in many sectors in addressing various issues.
METHODOLOGY Based to the Preferred Reporting Items for Systematic Review (PRISMA) and
Meta-Analyses, there are four steps involved in reviewing methodology e.g.
starting with identification, screening, eligibility and finally, the inclusion (Lalu,
Li, & Loder, 2021). In identification step, authors conduct literature searches by
using electronic databases with variety of keywords to identify related articles.
The objective of PRISMA is to ease the identification of the literature review.
Authors studies several previous journals in producing a comprehensive literature
review. Referring to the checklist studied by Lalu et al. (2021), it comprises items
to be analysed such as defining clear research questions, identifies inclusion and
exclusion criteria, besides examine a few database for scientific literature. In
addition, in conducting literature review, researchers used two databases of peer-
reviewed publication database which is Scopus and Web Science, it is the most
profound database, used by many, to be the primary competitor database for
citation analysis and journal ranking statistics. This subsection is classified as
phase one in identification of literature review.
The first phase is to identify the related journal article relating to ML in
real estate price prediction which leads to the search for systematic literature
review based on the topic from two licensed database which is the Scopus and
Web of Science. Through the advanced search, using the query string, the
database has disclosed over 2,254 articles available. In identifying related
PLANNING MALAYSIA
Journal of the Malaysia Institute of Planners (2021)
413 © 2021 by MIP
literature, the keywords and queries string information strategy were used during
penetrating keywords. The query string search done by authors from Scopus
includes TITLE-ABS-KEY (“machine learning”) AND “real estate” AND
“price” AND “price prediction” AND “predict” AND “real estate” OR “price
predict” OR “property” OR “house” OR “ housing”), (“Machine Learning” AND
“Real Estate” AND “price AND predict”). Meanwhile for the query string search
for Web of Science are TITLE-ABS-KEY “machine learning” AND “real estate”
AND “price” AND “price prediction” OR “property” OR “house” OR
“housing”), (“Machine learning” AND “Real Estate” AND “price AND predict”.
The second phase is via screening identified literature; this is to choose
the suitable article that is associated to this topic of study. Based on 135 literatures
found, only 47 literatures are used for this study.
The third phase is the eligibility and exclusion, there are several
eligibility and exclusion criterions that were decided by authors. First and
foremost, will be based on the literature type, authors selected articles from
journals with empirical data and theoretical data which means, non-research
articles, book chapters and book series are excluded. Secondly, authors only
focused on English publication and excluded non-English publication in order to
avoid difficulty and confusing in translating. Third, authors only considered
publications between 1999 until 2021, but emphasised more on articles published
from the year 2009 and above, this is to observe the published articles
development areas. This process only focused on the application of ML on real
estate prediction and articles will be selected if it was social science indexed.
Lastly, authors also focused the objectives of the studies that is the ML in real
estate prediction in general, so that articles studies are compatible to any region.
Table 1: Criteria Selection
Criteria Eligibility Exclusion
Article Type Research article and conference
proceeding
Non-research article and
book sections
Language English Non-English
Timeline 1999 until 2021 <2009
Indexes Social Science and Web of
Science None
Countries Any countries None
The fourth phase is on the data abstraction and analysis. This phase
consists significant information, whereby the data from the articles were assessed
and analysed, this is to concentrate on specific studies to respond to this study’s
questions and objective. Through the collected data, the classification types of
ML on the real estate price prediction are found and proceeded to analysis.
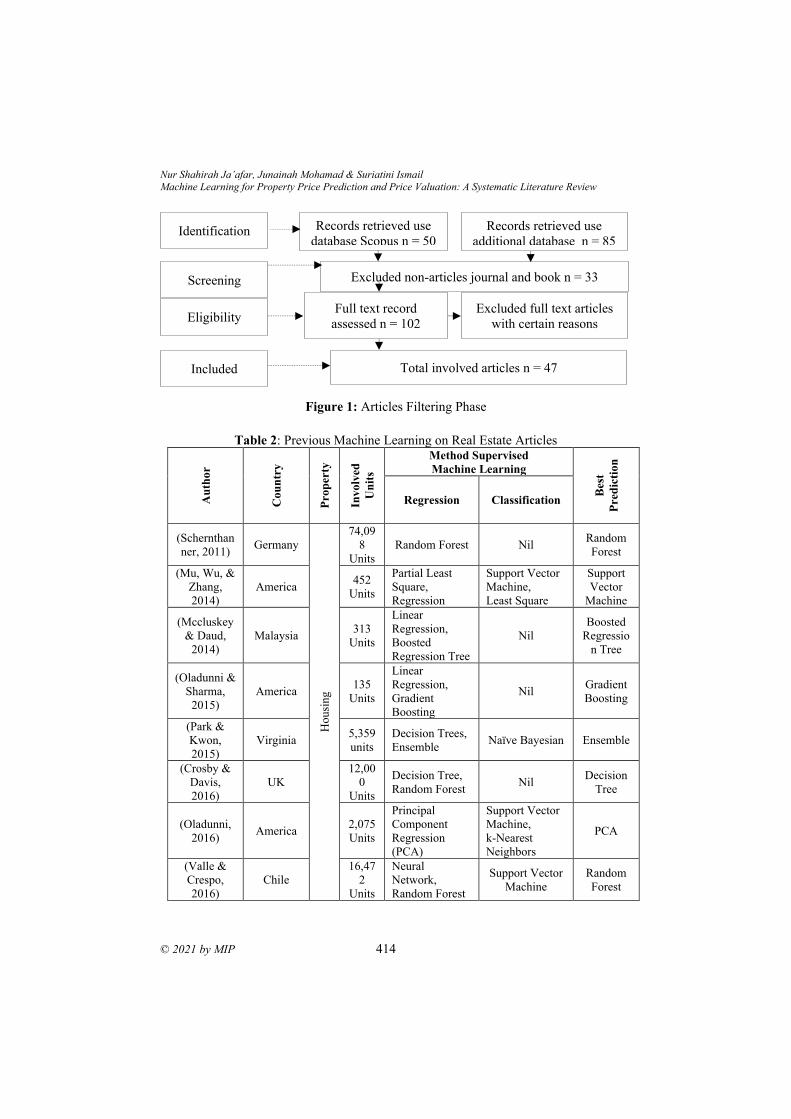
Nur Shahirah Ja’afar, Junainah Mohamad & Suriatini Ismail
Machine Learning for Property Price Prediction and Price Valuation: A Systematic Literature Review
© 2021 by MIP 414
Figure 1: Articles Filtering Phase
Table 2: Previous Machine Learning on Real Estate Articles
Au
thor
Cou
ntr
y
Prop
erty
Involv
ed
Un
its
Method Supervised
Machine Learning
Bes
t
Pred
icti
on
Regression Classification
(Schernthan
ner, 2011) Germany
Housi
ng
74,09
8
Units
Random Forest Nil Random
Forest
(Mu, Wu, &
Zhang,
2014)
America 452
Units
Partial Least
Square,
Regression
Support Vector
Machine,
Least Square
Support
Vector
Machine
(Mccluskey
& Daud,
2014)
Malaysia 313
Units
Linear
Regression,
Boosted
Regression Tree
Nil
Boosted
Regressio
n Tree
(Oladunni &
Sharma,
2015)
America 135
Units
Linear
Regression,
Gradient
Boosting
Nil Gradient
Boosting
(Park &
Kwon,
2015)
Virginia 5,359
units
Decision Trees,
Ensemble Naïve Bayesian Ensemble
(Crosby &
Davis,
2016)
UK
12,00
0
Units
Decision Tree,
Random Forest Nil
Decision
Tree
(Oladunni,
2016) America
2,075
Units
Principal
Component
Regression
(PCA)
Support Vector
Machine,
k-Nearest
Neighbors
PCA
(Valle &
Crespo,
2016)
Chile
16,47
2
Units
Neural
Network,
Random Forest
Support Vector
Machine
Random
Forest
Identification
Screening
Eligibility
Included
Records retrieved use
database Scopus n = 50
Records retrieved use
additional database n = 85
Excluded non-articles journal and book n = 33
Full text record
assessed n = 102
Excluded full text articles
with certain reasons
Total involved articles n = 47
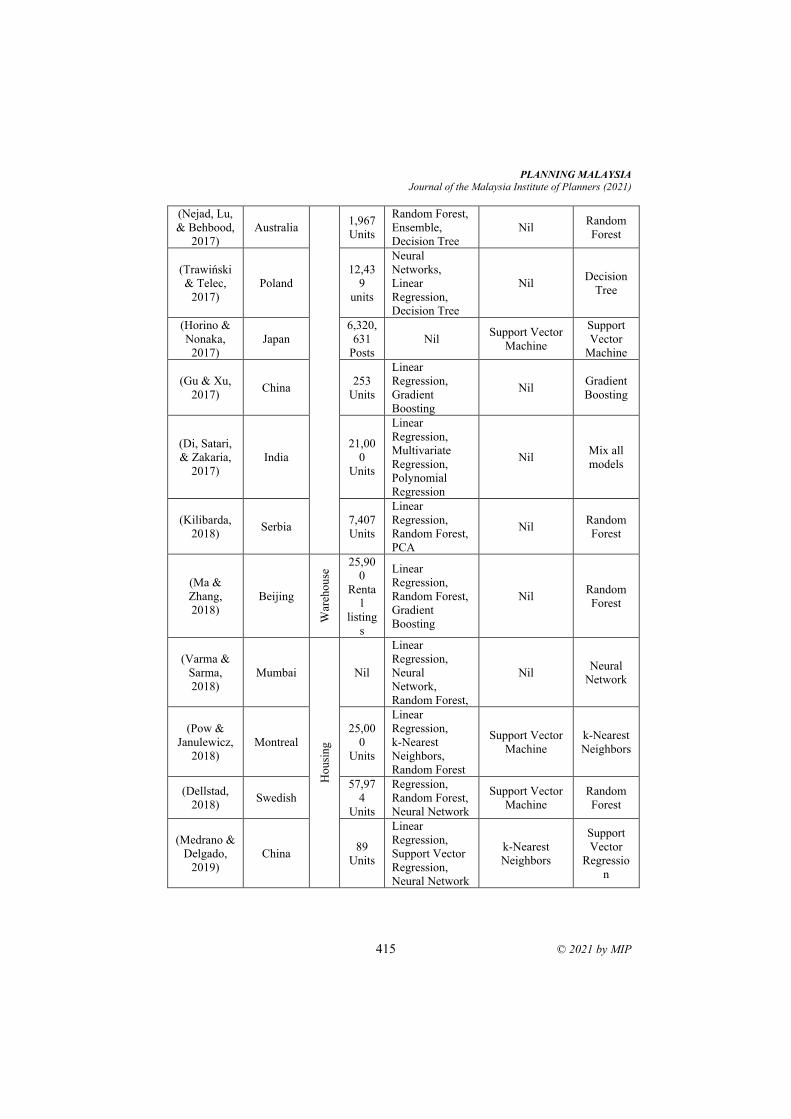
PLANNING MALAYSIA
Journal of the Malaysia Institute of Planners (2021)
415 © 2021 by MIP
(Nejad, Lu,
& Behbood,
2017)
Australia 1,967
Units
Random Forest,
Ensemble,
Decision Tree
Nil Random
Forest
(Trawiński
& Telec,
2017)
Poland
12,43
9
units
Neural
Networks,
Linear
Regression,
Decision Tree
Nil Decision
Tree
(Horino &
Nonaka,
2017)
Japan
6,320,
631
Posts
Nil Support Vector
Machine
Support
Vector
Machine
(Gu & Xu,
2017) China
253
Units
Linear
Regression,
Gradient
Boosting
Nil Gradient
Boosting
(Di, Satari,
& Zakaria,
2017)
India
21,00
0
Units
Linear
Regression,
Multivariate
Regression,
Polynomial
Regression
Nil Mix all
models
(Kilibarda,
2018) Serbia
7,407
Units
Linear
Regression,
Random Forest,
PCA
Nil Random
Forest
(Ma &
Zhang,
2018)
Beijing
War
ehouse
25,90
0
Renta
l
listing
s
Linear
Regression,
Random Forest,
Gradient
Boosting
Nil Random
Forest
(Varma &
Sarma,
2018)
Mumbai
Housi
ng
Nil
Linear
Regression,
Neural
Network,
Random Forest,
Nil Neural
Network
(Pow &
Janulewicz,
2018)
Montreal
25,00
0
Units
Linear
Regression,
k-Nearest
Neighbors,
Random Forest
Support Vector
Machine
k-Nearest
Neighbors
(Dellstad,
2018) Swedish
57,97
4
Units
Regression,
Random Forest,
Neural Network
Support Vector
Machine
Random
Forest
(Medrano &
Delgado,
2019)
China 89
Units
Linear
Regression,
Support Vector
Regression,
Neural Network
k-Nearest
Neighbors
Support
Vector
Regressio
n
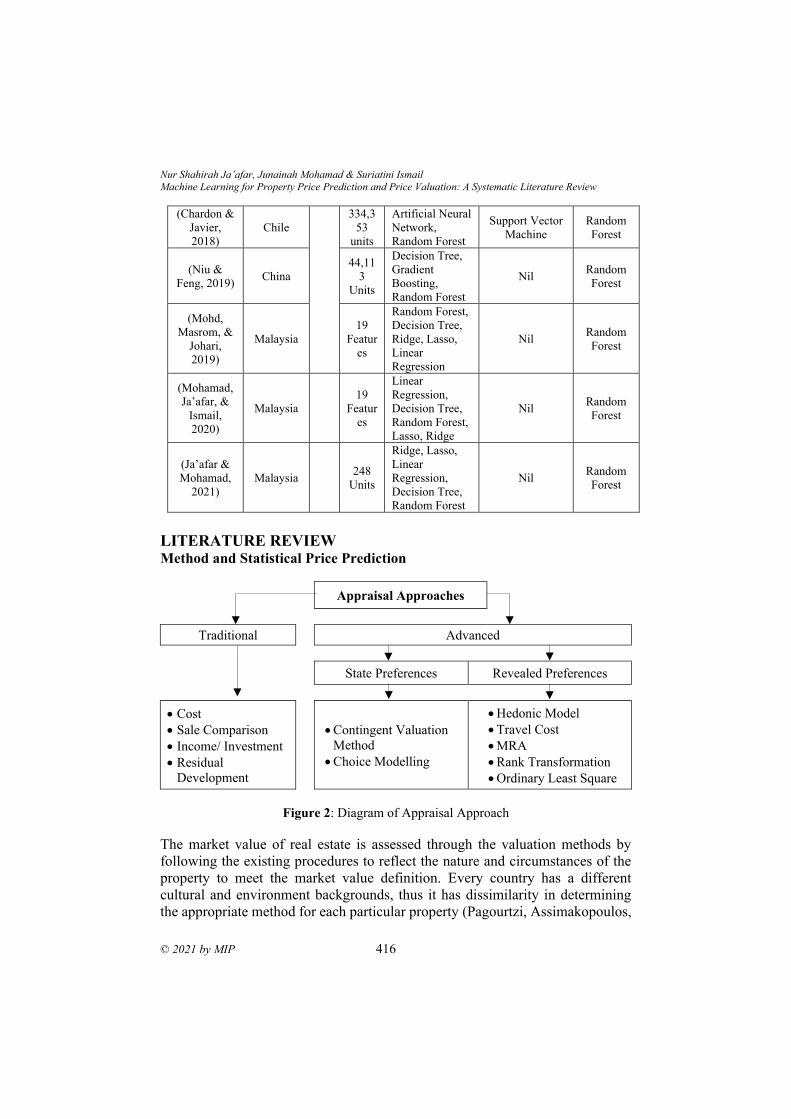
Nur Shahirah Ja’afar, Junainah Mohamad & Suriatini Ismail
Machine Learning for Property Price Prediction and Price Valuation: A Systematic Literature Review
© 2021 by MIP 416
(Chardon &
Javier,
2018)
Chile
334,3
53
units
Artificial Neural
Network,
Random Forest
Support Vector
Machine
Random
Forest
(Niu &
Feng, 2019) China
44,11
3
Units
Decision Tree,
Gradient
Boosting,
Random Forest
Nil Random
Forest
(Mohd,
Masrom, &
Johari,
2019)
Malaysia
19
Featur
es
Random Forest,
Decision Tree,
Ridge, Lasso,
Linear
Regression
Nil Random
Forest
(Mohamad,
Ja’afar, &
Ismail,
2020)
Malaysia
19
Featur
es
Linear
Regression,
Decision Tree,
Random Forest,
Lasso, Ridge
Nil Random
Forest
(Ja’afar &
Mohamad,
2021)
Malaysia 248
Units
Ridge, Lasso,
Linear
Regression,
Decision Tree,
Random Forest
Nil Random
Forest
LITERATURE REVIEW
Method and Statistical Price Prediction
Appraisal Approaches
Traditional Advanced
State Preferences Revealed Preferences
• Cost
• Sale Comparison
• Income/ Investment
• Residual
Development
• Contingent Valuation
Method
• Choice Modelling
• Hedonic Model
• Travel Cost
• MRA
• Rank Transformation
• Ordinary Least Square
Figure 2: Diagram of Appraisal Approach
The market value of real estate is assessed through the valuation methods by
following the existing procedures to reflect the nature and circumstances of the
property to meet the market value definition. Every country has a different
cultural and environment backgrounds, thus it has dissimilarity in determining
the appropriate method for each particular property (Pagourtzi, Assimakopoulos,
PLANNING MALAYSIA
Journal of the Malaysia Institute of Planners (2021)
417 © 2021 by MIP
& Thomas, 2003). In the valuation process, there are several methods used such
as traditional and advanced method (Mohamad & Ismail, 2019). Traditional
valuation method has been practiced in Malaysia and it has several methods as
stated in the diagram. Due to the nature of the method which has several
limitations and restrictions to produce accurate value, the advance method has
been adopted in carrying out valuation prediction (Olanrewaju & Lim, 2018).
Advanced method is better than traditional method in terms of the availability
and amount of data to run which is less time consuming. In addition, in
determining the price of real estates, valuation also have a different purpose in
valuing market transaction to compulsory purchase, the purposes of this valuation
are for sale report, accounting purpose, loan security, auction, insurance, taxation
and investment (Pagourtzi et al., 2003).
In reference to the study by Nejad et al., (2017), authors indicated the
accurate sale price of property transaction process is significant in price
prediction. It is important to achieve fair value during transactions of valuable
property for home sellers and buyers, similar to the price assessment which is
also important for investors to learn better decision making in obtaining
investment opportunities and as well as to avoid risk. However, there are also
difficulties in producing accurate value because the prices of residential property
are affected by various factors including the property location, neighbourhood,
market condition and many other internal and external factors that should be
considered in value real estate property.
The current ML is found to be a practical application in various fields
(Jordan, 2015). As stated by Park & Kwon (2015), ML is a statistical learning of
predictive analysis which is a subset of artificial intelligence used in various task
such as modelling, designing, programming and recognition. Besides that, ML is
about extracting knowledge from data input to deliver output. A study from
Kilibarda (2018) stated that researchers have concluded in this twentieth century,
ML is known as an alternative in model predicting.
Based on Figure 3 of ML, it shows ML has two types of learning
algorithms. These two learnings process has different algorithms due to dissimilar
method learn datasets condition. From the previous studies, the most common
learning being used is supervised machine learning, this learning dataset is
structured by human then this learning will learn and train the dataset
automatically in producing result based from the previous data experiences. This
learning consists of two types of problem such as regression and classification.
In short, regression was used to identify or learn the value output of “distance”
and “kilogram”, while classification was used for output e.g., “colour”, “talking”
and “thinking”.
The application of ML must provide complete dataset for further
prediction, ML will learn the given dataset in the entire system from start until
the produced result. Previous study has applied ML techniques to predict various
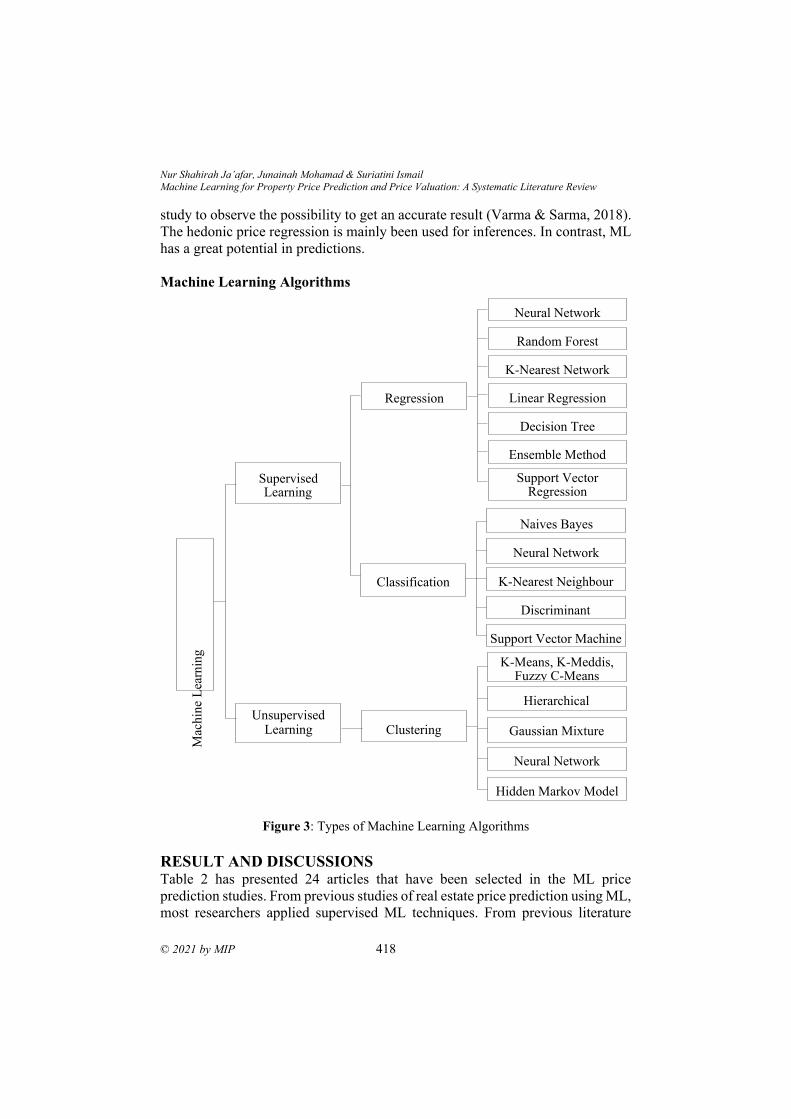
Nur Shahirah Ja’afar, Junainah Mohamad & Suriatini Ismail
Machine Learning for Property Price Prediction and Price Valuation: A Systematic Literature Review
© 2021 by MIP 418
Unsupervised Learning
study to observe the possibility to get an accurate result (Varma & Sarma, 2018).
The hedonic price regression is mainly been used for inferences. In contrast, ML
has a great potential in predictions.
Machine Learning Algorithms
Figure 3: Types of Machine Learning Algorithms
RESULT AND DISCUSSIONS
Table 2 has presented 24 articles that have been selected in the ML price
prediction studies. From previous studies of real estate price prediction using ML,
most researchers applied supervised ML techniques. From previous literature
Support Vector Regression
Ensemble Method
Decision Tree
Linear Regression
K-Nearest Network
Random Forest
Neural Network
Support Vector Machine
Discriminant
K-Nearest Neighbour Classification
Neural Network
Naives Bayes
Hidden Markov Model
Neural Network
Gaussian Mixture Clustering
Hierarchical
K-Means, K-Meddis, Fuzzy C-Means
Supervised Learning
Regression
Mac
hin
e L
earn
ing
PLANNING MALAYSIA
Journal of the Malaysia Institute of Planners (2021)
419 © 2021 by MIP
studies, authors have concluded that the ML techniques have been discovered in
the real estate field in the past 5 years as property price prediction. The most
popular learning used are supervised learning which is refer to regression and
classification. Furthermore, from all the studies, there are few algorithms that has
always been selected as the most popular model in prediction which is the
algorithm of Random Forest, Decision Tree, Gradient Boosting, Neural Network
and Linear Regression. The best model in prediction is the Random Forest, this
algorithm can adapt well with dataset situation and produce accurate and effective
results, it is also recommended by previous researchers to consider in study
prediction.
The decision made by ML algorithm is based on its previous data
experiences. The application of ML has been applied in many fields as predicting
analysis. However, the use of ML in real estate industry in Malaysia is not often
been discovered. Thus, authors have considered to use ML in real estate as a tool
in predicting price of property to observe the significant improvement that can be
achieved in price prediction. However, there may be some restrictions when
exploring the ML algorithms in achieving accuracy.
There are several suggestions when it comes to ML algorithms for real
estate price predictions. The first would be the most selected algorithm which is
Random Forest (RF). This algorithm is known as one of ensemble method used
in supervised, it is usually used as prediction in analysing the price of property
and decision making in real estate (Shinde & Gawande, 2018). Random Forest
has the same concept like Decision Tree by reproducing a large number of trees
in forest then this algorithm will restart training sample and randomly choose
features and observe to build decision tree and choose in improving the accuracy
(Ja’afar & Mohamad, 2021). Besides that, Random Forest has less error than the
other algorithms when it comes as property price prediction, this algorithm are
among popular ML algorithm (Shinde & Gawande, 2018).
The second most used algorithm is the gradient boosting (GB)
algorithm, it also known as another ensemble method created in ML. GB
algorithm were built to construct new base learners to be optimal and relevant in
learning the data. This algorithm used as prediction by convert weak learners to
strong learner, usually in decision tree. From previous studies, GB generate
accurate result as prediction of house price and it also shows good performance
than LR algorithm, but RF is the best in estimating rental (Borde & Rane, 2017).
The third algorithm is the Support Vector Machine (SVM). This
algorithm been applied in regression and classification learning, however it
mainly used in classification. SVM were imposed to plot each data item or
variable as a point in two dimensional spaces with the value of each feature of
particular coordinate, besides that it also can reduce the bias problem during
forecast and deliver a better simplification after consider the item of DV and IV
Nur Shahirah Ja’afar, Junainah Mohamad & Suriatini Ismail
Machine Learning for Property Price Prediction and Price Valuation: A Systematic Literature Review
© 2021 by MIP 420
(Phan, 2019; Sarip, 2015). For the summary, SVM is among the best algorithm
in supervised ML and mostly been used as recognition in classification learning.
Here, the fourth algorithm is Decision Tree (DT), this algorithm is a
supervised learning that covered in both regression and classification. DT
algorithm are used in visualise the decision, decision tree was drawn from root,
branches and bottom. Commonly, DT used for variable selection, assess the
significant connection of variables, monitor the missing value, prediction and
data management (Song & Lu, 2015).
Lastly but not least, the fifth algorithm is Linear Regression (LR), this
algorithm is one of the most frequent algorithms been used in predicting. This
algorithm also known as Ordinary Least Square (OLS), Simple Linear Regression
(SLR) and Multiple Linear Regression (MLR). The one independent in predicting
will be SLR, while more than two independents will use MLR in predicting the
linear between Y and X. From previous studies, LR is popular in house price
prediction (Mayer, Bourassa, & Hoesli, 2019). Basically LR is used for
prediction, forecasting and seeking to study plus to analyses the straight line
relationship between variables (Borde & Rane, 2017).
CONCLUSION This study has reviewed the application of machine learning techniques in real
estate prediction analysis studied by previous researchers, from the result studied
there are several existing machine learning algorithm techniques that have been
applied. The types of real estate forecasting in appraisal approach and statistical
learning been discussed in above sections. Besides that, the overview types of
machine learning algorithms, number of transactions involved and result of
several previous studies are also reported in this study. This study summaries few
suggestions of potential machine learning algorithm for future studies. Authors
strongly believe that this study is desirable, because of the outlined basic
information of previous studies especially in discovering methods price
prediction using machine learning techniques.
ACKNOWLEDGEMENTS
This study was supported by the grant of “FRGS” project: Automated Machine
Learning Pipelines in Predicting the Price of Heritage Property. Project number:
FRGS/1/2018/WAB03/UITM/03/1.
REFERENCES Begel, A. (2019). Software Engineering for Machine Learning : A Case Study. Microsoft
Research, 1–10.
Borde, S., & Rane, A. (2017). Real Estate Investment Advising Using Machine Learning.
Journal of Engineering and Technology (IRJET), 04(03), 1821–1825.
Chardon, I., & Javier, F. (2018). Housing Prices: Testing Machines Learning Methods.
PLANNING MALAYSIA
Journal of the Malaysia Institute of Planners (2021)
421 © 2021 by MIP
2–15.
Christodoulou, E. (2019). A Systematic Review shows no Performance Benefit of
Machine Learning over Logistics Regression for Clinical Prediction Models.
Journal of Clinical Epidemiology, 110, 12–22.
Crosby, H., & Davis, P. (2016). A Spatio-Temporal , Gaussian Process Regression , Real-
Estate Price Predictor. 3–6.
Dellstad, M. (2018). Comparing Three Machine Learning Algorithms in the task of
Appraising Commercial Real Estate. KTH Royal Institute of Technology.
Di, N. F. M., Satari, S. Z., & Zakaria, R. (2017). Real estate value prediction using
multivariate regression models
Ghassemi, M. (2018). A Review of Challenges and Opportunities in Machine Learning
for Health.
Gu, G., & Xu, B. (2017). Housing Market Hedonic Price Study Based on Boosting
Regression Tree. Advanced Computational Intelligence and Informatics, 21(6).
Horino, H., & Nonaka, H. (2017). Development of an Entropy-Based Feature Selection
Method on Real Estate. Industrial & Engineering Management, 2351–2355.
Ja’afar, N. S., & Mohamad, J. (2021). Application of Machine Learning in Analysing
Historical and Non-Historical Characteristics of Heritage Pre-War Shophouses.
Journal of the Malaysian Institute of Planners, 19(2), 72–84.
Jordan, M. I. (2015). Machine learning: Trends, Perspectives and Prospects. Journal of
Electrical Engineering and Computer, 349(6245), 255–260.
Kamalov, F., & Gurrib, I. (2021). Financial Forecasting with Machine Learning: Price Vs
Return. Journal of Computer Science, 17(3), 251–264.
Kilibarda, M. (2018). Estimating the Performance of Random Forest versus Multiple
Regression for Predicting Prices of the Apartments. Geo-Information, 1–16.
Lalu, M. M., Li, T., & Loder, E. W. (2021). The PRISMA 2020 statement: An updated
guideline for reporting systematic reviews. Journal of Surgery, 88, 1–11.
Ma, Y., & Zhang, Z. (2018). Estimating Warehouse Rental Price using Machine Learning
Techniques. Journal of Computers Communications and Control, 13(April), 235–
250.
Maalel, A. (2011). The Contribution of Machine Learning to Analyze and Evaluate the
Safety of Automated Transport Systems. (May 2016), 1–7.
Mayer, M., Bourassa, S. C., & Hoesli, M. (2019). Estimation and Updating Methods for
Hedonic Valuation. Journal of European Real Estate Research.
Mccluskey, W. J., & Daud, D. (2014). Boosted Regression Trees an Application for the
Mass Appraisal of Residential Property in Malaysia. Journal of Financial
Management of Property and Construction, 19(2), 152–167.
Medrano, C., & Delgado, J. (2019). Estimation of missing prices in real-estate market
agent-based simulations with machine learning and dimensionality reduction. 7.
Mohamad, J., & Ismail, S. (2019). Capabilities of Revealed Preference Method for
Heritage Property Valuation. Journal of the Malaysia Institute of Planners, 17(1),
377–379.
Mohamad, J., Ja’afar, S., & Ismail, S. (2020). Heritage Property Valuation using Machine
Learning Algorithms. Annual Pacific Rim Real Estate Society, 1–12.
Mohd, T., Masrom, S., & Johari, N. (2019). Machine Learning Housing Price Prediction
in Selangor, Malaysia. Recent Technology and Engineering (RTE), 8(2), 542–546.
Nur Shahirah Ja’afar, Junainah Mohamad & Suriatini Ismail
Machine Learning for Property Price Prediction and Price Valuation: A Systematic Literature Review
© 2021 by MIP 422
Mu, J., Wu, F., & Zhang, A. (2014). Housing Value Forecasting Based on Machine
Learning Methods. Abstract and Applied Analysis, 2014, 1–7.
Nejad, M. Z., Lu, J., & Behbood, V. (2017). Applying Dynamic Bayesian Tree in Property
Sales Price Estimation.
Niu, W., & Feng, Z. (2019). Neural Network, Extreme Learning Machine and Support
Vector Machine in Deriving Operation Rule of Hydropower Reservoir. Journal of
Water, 11(88). https://doi.org/10.3390/w11010088
Oladunni, T. (2016). Hedonic Housing Theory A Machine Learning Investigation.
Journal of Machine Learning and Application, (December).
Oladunni, T., & Sharma, S. (2015). Predictive Real Estate Multiple Listing System Using
MVC Architecture and Linear Regression 1 Introduction.
Olanrewaju, A. L., & Lim, X. Y. (2018). Factors Affecting Housing Prices in Malaysia:
Analysis of the Supply Side. Journal of the Malaysian Institute of Planners, 16(2),
225–235.
Pagourtzi, E., Assimakopoulos, V., & Thomas, H. (2003). Real Estate Appraisal : A
review of Valuation Methods. Property Investment & Finance, 21(4), 383–401.
Park, B., & Kwon, J. (2015). Using Machine Learning Algorithms for Housing Price
Prediction Fairfax. Journal of Expert System with Applications, 42(6), 2928–2934.
Phan, T. D. (2019). Housing Price Prediction using Machine Learning Algorithms : The
Case of Melbourne, Australia. Machine Learning and Data Engineering, 35–42.
Pow, N., & Janulewicz, E. (2018). Applied Machine Learning Project 4 Prediction of
Real Estate Property Prices in Montreal.
Sarip, A. G. (2015). Fuzzy Logic Application for House Price Prediction. Journal of
Property Sciences, 5(1), 24–30.
Schernthanner, H. (2011). Spatial modeling and geovisualization of rental prices for real
estate portals.
Shinde, N., & Gawande, K. (2018). Valuation of House Prices using Predictive
Techniques. Journal of Advances in Electronics Computer Science, 5(6), 34–40.
Song, Y., & Lu, Y. (2015). Decision Tree Methods : Applications for Classification and
Prediction. Journal of Biostatistics in Psychiatry, 27(2), 130–136.
Trawiński, B., & Telec, Z. (2017). Comparison of Expert Algorithms with Machine
Learning Models for Real Estate Appraisal. Journal of Science and Technology.
Valle, M. A., & Crespo, R. (2016). Property Valuation using Machine Learning
Algorithms. Journal of Modelling and Simulation, 97–105.
Varma, A., & Sarma, A. (2018). House Price Prediction Using Machine Learning And
Neural Networks. Journal of Inventive Communication and Computational
Technologies (ICICCT), 1936–1939.
Received: 12th July 2021. Accepted: 7th Sept 2021
1 Associate Professor at Universtiti Teknologi Malaysia. Email: [email protected]
PLANNING MALAYSIA:
Journal of the Malaysian Institute of Planners
VOLUME 19 ISSUE 3 (2021), Page 423 – 437
BIG DATA ANALYTICS FOR PREVENTIVE MAINTENANCE
MANAGEMENT
Muhammad Najib Razali1, Siti Hajar Othman2, Ain Farhana Jamaludin3, Nurul
Hana Adi Maimun4, Rohaya Abdul Jalil5, Yasmin Mohd. Adnan6, Siti Hafsah
Zulkarnain7
1,2,3,4,5 Faculty of Built Environment and Surveying
UNIVERSITI TEKNOLOGI MALAYSIA 6 Faculty of Built Environment
UNIVERSITI MALAYA 7 Faculty of Architecture Planning and Surveying
UNIVERSITI TEKNOLOGI MARA
Abstract
Maintenance data for government buildings in Putrajaya, Malaysia, consists of a
vast volume of data that is divided into different classes based on the functions
of the maintenance tasks. As a result, multiple interactions from stakeholders and
customers are required. This necessitates the collection of data that is specific to
the stakeholders and customers. Big data can also forecast for predictive
maintenance purposes in maintenance management. The current data practise
relies solely on well-structured statistical data, resulting in static analysis and
findings. Predictive maintenance under the Big Data idea will also use non-visible
data such as social media and web search queries, which is a novel way to use
Big Data analytics. The metamodel technique will be used in this study to
evaluate the predictive maintenance model and faulty events in order to verify
that the asset, facilities, and buildings are in excellent working order utilising
systematic maintenance analytics. The metamodel method proposed a predictive
maintenance procedure in Putrajaya by utilising the big data idea for maintenance
management data.
Keyword: Big data, analytics, maintenance, forecasting, Malaysia
Muhammad Najib Razali, Siti Hajar Othman, Ain Farhana Jamaluddin, Nurul Hana Adi Maimun, Rohaya
Abdul Jalil, Yasmin Mohd. Adnan, Siti Hafsah Zulkarnain
Big Data Analytics for Preventive Maintenance Management
© 2021 by MIP 424
INTRODUCTION Building maintenance management is an issue that must be handled at every stage
of the construction process. Buildings must be maintained on a regular basis, and
in most nations, building maintenance is a substantial undertaking (Horner et al.
1997). In reality, it plays a role in the company's long-term success. Because of
the consequences of a building without facilities and maintenance, maintenance
management and asset management work closely together. Human intervention
has recently resulted in the production of a large amount of data. This data,
especially for the government, must be treated with extreme caution, since it is a
critical component for top management in making successful and informed
decisions based on true data and information. Big data refers to the phenomena
of massive amounts of data growing at a rapid rate and in a variety of formats,
both structured and unstructured.
Preventive maintenance is crucial in maintenance management because
it protects the good state of facilities before they fail. Once the method is
implemented, a considerable amount of data about operation and maintenance
will be generated. JKR is responsible for the preservation of government and
asset maintenance data in Malaysia; nevertheless, this is a problem because the
stored data is vast and underutilised. The analysis of this data is critical for better
decision-making. Furthermore, although much Big Data (BD) has been
undertaken in Malaysian business, particularly the government, it is not used in
the maintenance management of government facilities. Aside from that,
numerous Information and Communications Technologies (ICTs) are suggested
for use in the industrial realm; however, this does not provide a comprehensive
picture of the BD method. Most organisations nowadays rely on computer-
assisted services, including maintenance management. Normally, this assistance
comes in the form of a decision-making mechanism. Eventually, this will
contribute to the organization's overall efficiency. Poorly maintained resources
can cause a company's operations to come to a halt and result in a loss of revenue.
Maintenance management actors must re-orient themselves as globalisation and
shifts in information and communication technology increase (Dixon 2007).
(Razali & Juanil 2011).
Despite the fact that mySPATA was created to make data collection of
government building assets and maintenance data easier, it is currently
unavailable due to system integration involving a large amount of data. The
system is attempting to adopt Business Intelligence (BI), but so far it has been
unsuccessful. According to JPAK (2014), there has been poor record
management, non-centralized information that has not been updated to
mySPATA, and hence there are concerns that need to be addressed. Furthermore,
whether CMMS and mySPATA are useful in assisting senior management in
making decisions about the assets and maintenance of government buildings in
PLANNING MALAYSIA
Journal of the Malaysia Institute of Planners (2021)
425 © 2021 by MIP
Putrajaya is a significant question. The data contained in the Computerised
Maintenance Management System (CMMS) is still incomplete for analysis and
projection to aid or support strategic decisions in the management of facilities,
according to the research and monitoring done. Although it is capable of
producing dynamic dashboards for decision-making, it does not use BI to provide
real-time analysis or an interactive dashboard to the user, making the system
easier to grasp for beginners. With the rise of BD and the advancement of smart
technology, an organisation can use 'business intelligence' to modify its daily
operations in a more intelligent manner (BI). Property players can benefit from
BI because it keeps them more informed, which helps them make better decisions.
People's high expectations for real-time analysis are critical. It enables
governments to make choices more quickly and to monitor them in real time.
With the usage of smart technologies, BD plays a larger role in acquiring and
analysing data, while BI assists the maintenance department in making educated
decisions. Due to issues occurring in the administration of government building
maintenance, particularly during the decision-making stage, the research to be
conducted is critical. Maintenance data that is scattered, insufficient, and
inaccurate has become a burden for the maintenance department, making
modelling the process or managing maintenance activities extremely difficult and
complex.
LITERATURE REVIEW
BD has evolved into a new field that necessitates the collection of data and the
integration of data systems. Academic and professional professionals have been
drawn to the evolution of BD. This area highlights the most recent advancements
in the world of electronic commerce today. The industry's top buzzword is BD
(Waller & Fawcett 2013). The application of BD in corporate decision-making
and enhancing efficiency has also been demonstrated in Malaysia's commercial
industry. Companies, academia, and the business press have been drawn to a
quantitative information explosion caused by human behaviour on the internet
and social media. Roger Mouglas of O'Reilly Media coined this term in 2005
(Beebe 2019), a year after the business coined the term Web 2.0. The term BD
was coined by Mouglas to describe reference datasets that are too vast to be
analysed and handled using typical BI techniques. Traditional data-processing
systems can no longer handle massive volumes of data, necessitating the
development of new technology (Provost & Fawcett 2013). This is referred to as
BD. BD has become a buzzword that has been used in a variety of industries
around the world. Despite the fact that the genuine benefit of BD is unknown
(Boyd & Crawford 2012; Desouza & Jacob 2017), analysts have noticed that BD
solutions have been marketed as a means of focusing on public issues (Desouza
& Jacob 2017).
Muhammad Najib Razali, Siti Hajar Othman, Ain Farhana Jamaluddin, Nurul Hana Adi Maimun, Rohaya
Abdul Jalil, Yasmin Mohd. Adnan, Siti Hafsah Zulkarnain
Big Data Analytics for Preventive Maintenance Management
© 2021 by MIP 426
Governments can benefit from BD in a variety of ways, including cost
savings, improved services, and occupancy insights. The real estate data can be
utilised to provide valuable recommendations to top officials, administrators, and
the general public about how facilities are used, how efficiently assets are
operated, and how to anticipate possible liabilities and possibilities ahead of time.
A complicated portfolio of different sites, construction kinds, and oversights
might also benefit from centralised information. Because buildings may be
centrally owned and operated or leased by different agencies and departments,
viewing the big picture can be difficult for many governments. A centralised data
management system can provide cost-saving insights and innovative methods to
serve constituents, as well as inform typical buy, sell, lease, and occupancy
decisions. The effort will make it easier to put land to its best and greatest use,
opening up new development possibilities (CBRE 2018).
Predictive analytics can be used to forecast future events, such as real
estate requirements and expected staff growth or reductions as a result of public
policy efforts. Another major problem is determining where different
departments and individuals will be most productive and collaborative. The
potential benefit of co-locating agencies that serve the same constituents or
operations can be shown via BD insights. According to CBRE (2018), combining
counter-parties with BD analytics allows for more efficient resource allocation,
resulting in savings for homeowners who have more options. The impact of BD
on supply networks will be enormous. BD will support a change from production-
led supply chain management to consumer-centric demand chain management by
improving visibility of end-customer demand or offering insight into future
demand. This is more than a semantic shift; it will shift the focus away from the
supply of items pushed out to markets and toward the demand for products, better
connecting producers and customers. One method to get around this is to use
open-source software. Essentially, organisations can start to rely on open-
sourcing by exposing the source code of their software, allowing users and staff
to change programmes and apps to improve connection inside their processes. It
is believed that BD will be able to provide data management solutions that range
from a simple repository to an open-source solution. BD has the potential to be
used in the future to manage knowledge, particularly for governments handling
building maintenance data. Governments have begun to use BD to assist in
making real-time choices and expanding in-motion, according to Kim et al.
(2014). He went on to say that government decision-making typically takes
longer and involves a variety of stakeholders, including officials, interest groups,
and individuals. As a result, BD seeks to make quick judgments with a small
number of players. According to the findings of the investigation, BD will create
extremely relevant data that will assist management in making better decisions.
PLANNING MALAYSIA
Journal of the Malaysia Institute of Planners (2021)
427 © 2021 by MIP
METHODOLOGY
Putrajaya was chosen as the research region since it is the seat of Malaysia's new
federal government. It's in the middle of a multimedia corridor. Many
government buildings and ministries are located in Putrajaya, Malaysia. Putrajaya
is an excellent location for performing this study because it focuses on
government buildings.
This study employed a metamodeling approach to collect maintenance
data in order to give it more structure and to make it more complete. It would be
fascinating to learn how a BI application in the form of a metamodeling approach
may make Malaysian building maintenance management methods more realistic
without requiring a large crew. It also allows maintenance managers to make
quick judgments based on more structured data in a short amount of time.
According to Thompson (2004), BI enables for faster and more accurate reporting
by as much as 81 percent, with 78 percent enhanced decision-making, 56 percent
improved customer service, and 49 percent more income. As a result, a large
number of BI applications have been implemented in a range of fields, and the
field is considered to be rapidly evolving (Aruldoss et al. 2014).
Metamodeling is a technique for generating properties for a model of a
model (Sprinkle et al. 2010). A domain metamodel will be created using the
metamodeling approach. The metamodeling technique is effective in situations
when there is a lot of information that isn't properly organised, such as in
emerging fields like maintenance management. Metamodeling, according to
Othman (2013), is an artefact that can represent the modelling language that
describes all of the constituents in a model. A metamodeling approach might
combine different domain models to create a metamodel for the domain that
generates the abstraction. It includes a list of themes (issues) as well as a diagram
illustrating the relationships between the concepts. The data in this situation
pertains to maintenance management.
Some refer to the metamodel as a model of model, whereas it is actually
the model's explanation. When the model is the subject's representation, or, in
other words, the real-world problem, the metamodel is the explanation of the
subject's model (Völter et al. 2013). According to Susi et al. (2005), a metamodel
is a set of possible instantiations in some modelling languages that are all and
only syntactically correct models. It is possible to change and reuse the
metamodel for specialised needs. Metamodel is also known as a domain model
glossary since it collects all of the properties from multiple sources to serve as a
language for domain metamodels. As a result, the model is easy to grasp and is
developed by domain experts, which may aid in the development of a system that
is not reliant on technology expertise. As demonstrated in Figure 1, this will result
in a viable and efficient system as well as encourage information sharing among
domain experts. The subject of a real-world problem is to manage maintenance
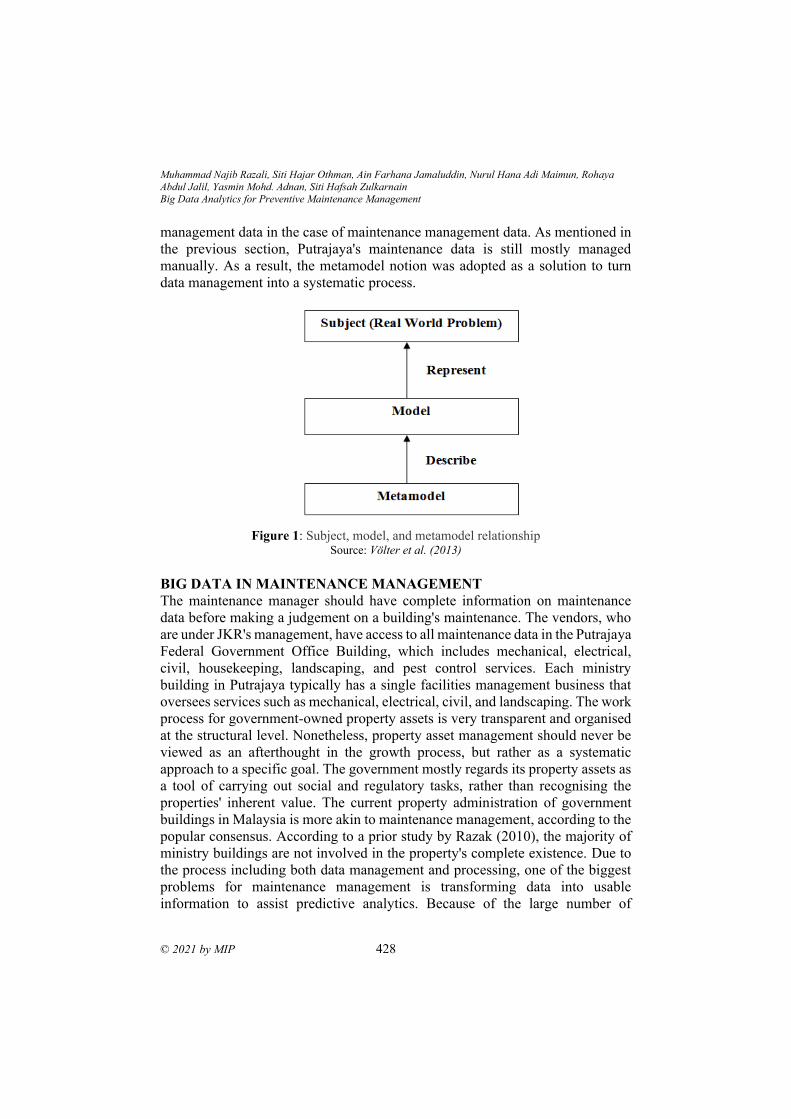
Muhammad Najib Razali, Siti Hajar Othman, Ain Farhana Jamaluddin, Nurul Hana Adi Maimun, Rohaya
Abdul Jalil, Yasmin Mohd. Adnan, Siti Hafsah Zulkarnain
Big Data Analytics for Preventive Maintenance Management
© 2021 by MIP 428
management data in the case of maintenance management data. As mentioned in
the previous section, Putrajaya's maintenance data is still mostly managed
manually. As a result, the metamodel notion was adopted as a solution to turn
data management into a systematic process.
Figure 1: Subject, model, and metamodel relationship
Source: Völter et al. (2013) BIG DATA IN MAINTENANCE MANAGEMENT
The maintenance manager should have complete information on maintenance
data before making a judgement on a building's maintenance. The vendors, who
are under JKR's management, have access to all maintenance data in the Putrajaya
Federal Government Office Building, which includes mechanical, electrical,
civil, housekeeping, landscaping, and pest control services. Each ministry
building in Putrajaya typically has a single facilities management business that
oversees services such as mechanical, electrical, civil, and landscaping. The work
process for government-owned property assets is very transparent and organised
at the structural level. Nonetheless, property asset management should never be
viewed as an afterthought in the growth process, but rather as a systematic
approach to a specific goal. The government mostly regards its property assets as
a tool of carrying out social and regulatory tasks, rather than recognising the
properties' inherent value. The current property administration of government
buildings in Malaysia is more akin to maintenance management, according to the
popular consensus. According to a prior study by Razak (2010), the majority of
ministry buildings are not involved in the property's complete existence. Due to
the process including both data management and processing, one of the biggest
problems for maintenance management is transforming data into usable
information to assist predictive analytics. Because of the large number of
PLANNING MALAYSIA
Journal of the Malaysia Institute of Planners (2021)
429 © 2021 by MIP
buildings and job tasks in maintenance, there is a difficulty in terms of data
expansion, processing analytics, and decision tree analysis. Few scholars have
looked at big data from the perspective of maintenance management since its
inception. As a result, when complex interactions and nonlinearities are present
in dataset models in maintenance management systems, it is influenced in terms
of practical constraints in developing statistical methodologies. The goal of
predictive maintenance is to infer all duties related to civil works based on the
technician's inspection and data records, which are then validated by the superior.
As a result, understanding how to predict civil works is crucial. For example,
understanding the asset condition lifespan, also known as lifecycle assessment
(LCA), for each asset in a building is critical. A predictive model, such as
regression analysis, can usually anticipate the assets' lifespan state. In order to
anticipate future failures, the model can examine the variables and conditions that
contributed to previous failures. Predictive analytics technology was utilised to
create data-driven models of specific assets using machine-learning algorithms.
As a result, maintenance staff must be well-versed in statistics, modelling,
machine learning, and data mining in order for the big data system in maintenance
management to function at its best.
BIG DATA PREDICTIVE MAINTENANCE SYSTEM BY USING THE
METAMODEL METHOD
Before the construction of the Building Metamodel (BMM) metamodel began,
the data for BMM was acquired by analysing prior studies of BMM variables and
performing research into the concerns and obstacles that affect BMM
performance. The methods listed below were carried out in order to establish the
Building Maintenance Metamodel (BMM) framework.
a) Identifying the major factors
Building maintenance management factors were gathered before the
development in order to discover the source, issue, and challenges that
produced the problem in the existing domain.
b) Candidate shortlisting definition
Following the extraction of the BMM factor from the acquired data, the
definition of each of the factors will be presented in order to group the
factors into a common meaning for BMM.
c) Definitions must be reconciled
Following the determination of the BMM determinant, the procedure for
maintaining the common definition specified earlier in order to create the
metamodel will be followed.
Muhammad Najib Razali, Siti Hajar Othman, Ain Farhana Jamaluddin, Nurul Hana Adi Maimun, Rohaya
Abdul Jalil, Yasmin Mohd. Adnan, Siti Hafsah Zulkarnain
Big Data Analytics for Preventive Maintenance Management
© 2021 by MIP 430
d) Factor designation
The group of factors for BMM can be split into distinct sets of views
when the various groupings of the factor are completed.
e) Identifying Relationships
After determining the BMM factor, the relationship between the factor
and the sub-factors will be examined and validated in order to establish
a link or connection between the factors.
f) Metamodel Creation
The building of a BMM metamodel will begin after recognising the
factors of BMM and their relationships. The model will be drawn using
tools such as Microsoft Visio. During this procedure, the metamodel's
class, entity, attributes, and operation will be incorporated.
g) The Metamodel's Validation
This stage will be completed after the factor and its connection have been
developed in the metamodel. This stage is critical in the BMM
metamodel design process because it determines whether the component
is consistent, well-presented, and coherent in relation to the listed
objectives. is that the relic provided by DSR must be fully described,
formally talked to, aware, and consistent on the inside (von Alan et al.,
2004). As a result, the model necessitates metamodel validation. In this
phase, two strategies will be used:
i. Frequency-based Selection is a technique for confirming
the accuracy of inferred ideas' beginnings and examining
any missing concepts from the domain models being
studied in the early stages of the first BMM's
development.
ii. Face Validity is a research method in which the
developer interviews experts in the topic.
The development will begin with the extraction of generic BMM factors
such as BMM determinants; next, from the materials obtained prior to the start of
this research, the candidate for definition will be shortlisted and designated. The
relationships between the factors will be determined after all of the factors have
been defined. All of the phases will be detailed as illustrated in Figure 2 utilising
the 8-Steps of Metamodeling Creation Process developed by Othman and
Beydoun (2010a). The metamodel phases are described in the following method,
which is based on a large data approach to BMM generation.
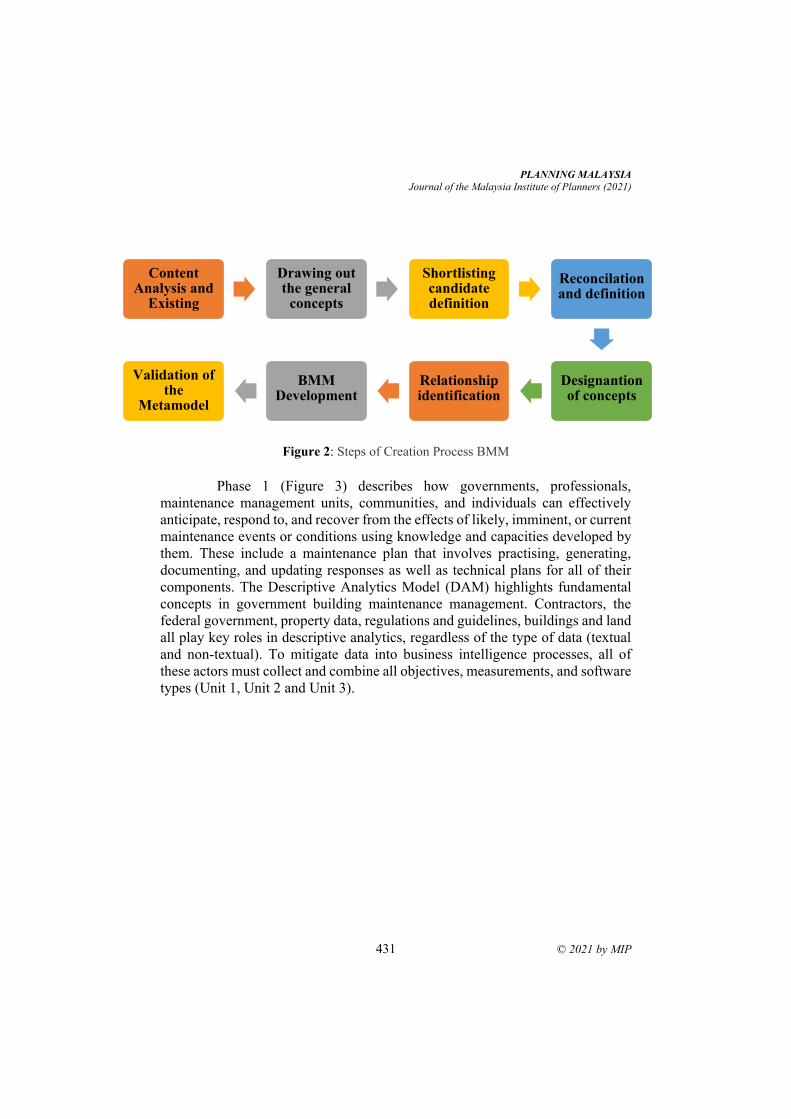
PLANNING MALAYSIA
Journal of the Malaysia Institute of Planners (2021)
431 © 2021 by MIP
Figure 2: Steps of Creation Process BMM
Phase 1 (Figure 3) describes how governments, professionals,
maintenance management units, communities, and individuals can effectively
anticipate, respond to, and recover from the effects of likely, imminent, or current
maintenance events or conditions using knowledge and capacities developed by
them. These include a maintenance plan that involves practising, generating,
documenting, and updating responses as well as technical plans for all of their
components. The Descriptive Analytics Model (DAM) highlights fundamental
concepts in government building maintenance management. Contractors, the
federal government, property data, regulations and guidelines, buildings and land
all play key roles in descriptive analytics, regardless of the type of data (textual
and non-textual). To mitigate data into business intelligence processes, all of
these actors must collect and combine all objectives, measurements, and software
types (Unit 1, Unit 2 and Unit 3).
Content Analysis and
Existing BMM
Drawing out the general
concepts
Shortlisting candidate definition
Reconcilation and definition
Designantion of concepts
Relationship identification
BMM Development
Validation of the
Metamodel
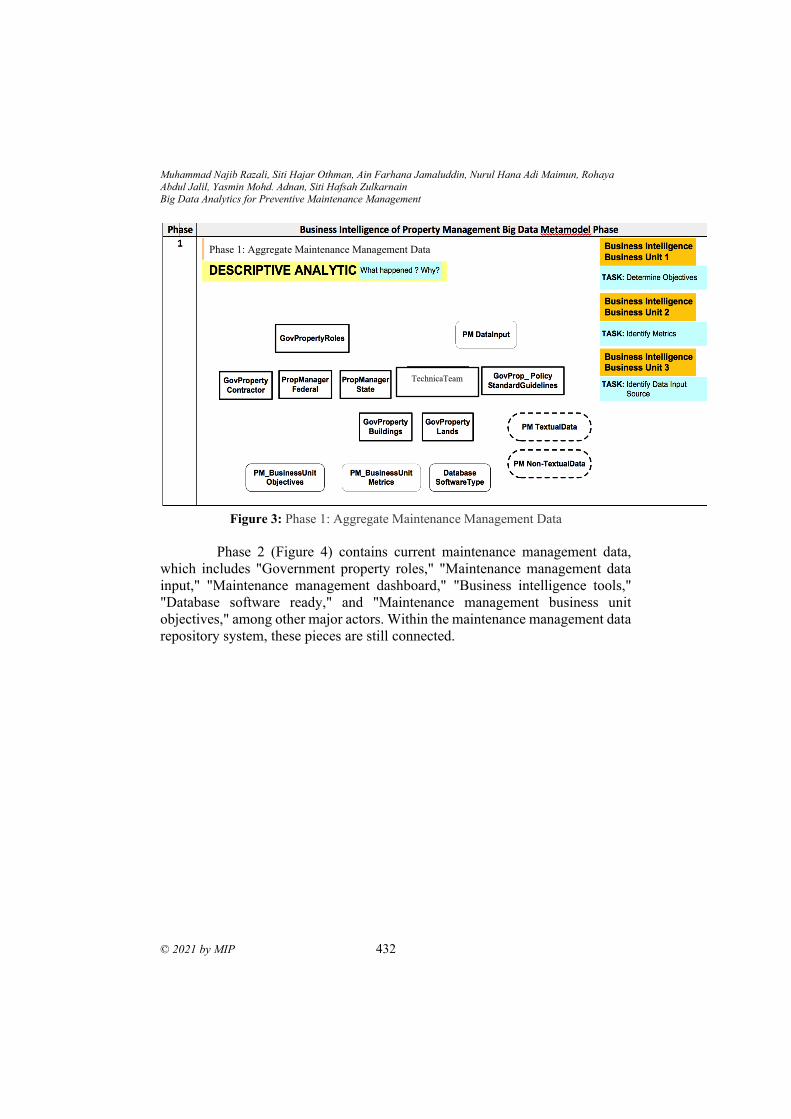
Muhammad Najib Razali, Siti Hajar Othman, Ain Farhana Jamaluddin, Nurul Hana Adi Maimun, Rohaya
Abdul Jalil, Yasmin Mohd. Adnan, Siti Hafsah Zulkarnain
Big Data Analytics for Preventive Maintenance Management
© 2021 by MIP 432
Figure 3: Phase 1: Aggregate Maintenance Management Data
Phase 2 (Figure 4) contains current maintenance management data,
which includes "Government property roles," "Maintenance management data
input," "Maintenance management dashboard," "Business intelligence tools,"
"Database software ready," and "Maintenance management business unit
objectives," among other major actors. Within the maintenance management data
repository system, these pieces are still connected.
Phase 1: Aggregate Maintenance Management Data
TechnicaTeam
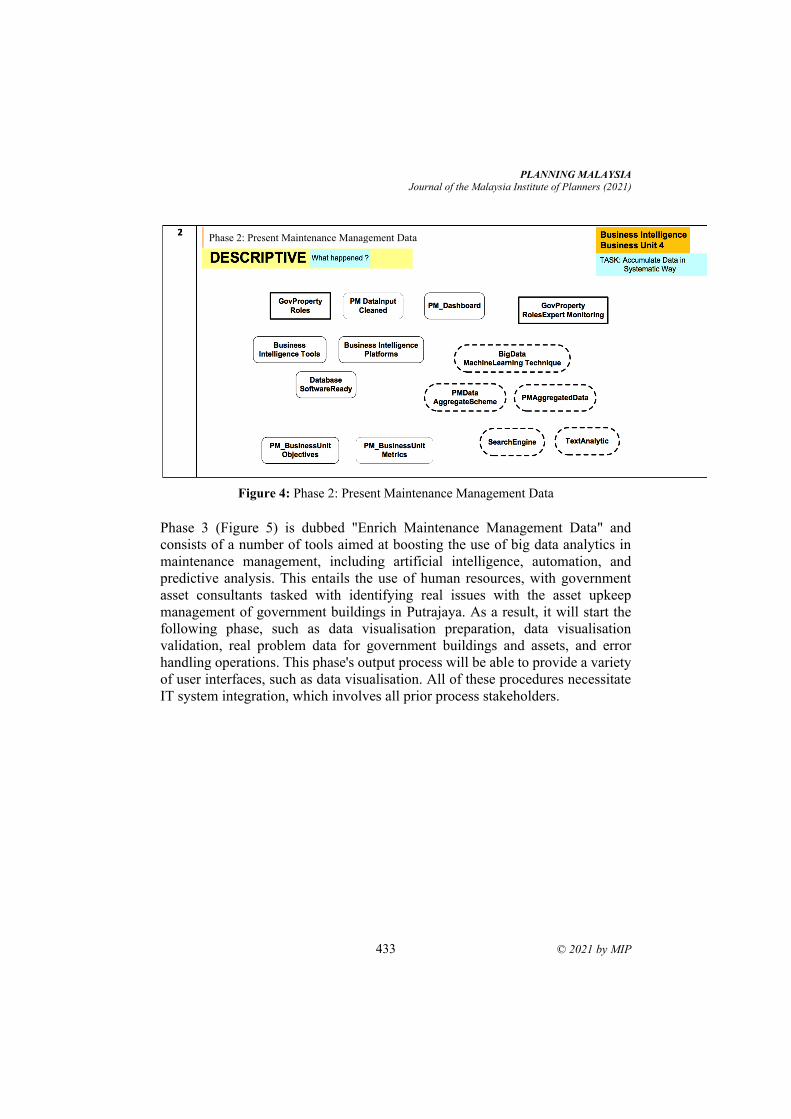
PLANNING MALAYSIA
Journal of the Malaysia Institute of Planners (2021)
433 © 2021 by MIP
Figure 4: Phase 2: Present Maintenance Management Data
Phase 3 (Figure 5) is dubbed "Enrich Maintenance Management Data" and
consists of a number of tools aimed at boosting the use of big data analytics in
maintenance management, including artificial intelligence, automation, and
predictive analysis. This entails the use of human resources, with government
asset consultants tasked with identifying real issues with the asset upkeep
management of government buildings in Putrajaya. As a result, it will start the
following phase, such as data visualisation preparation, data visualisation
validation, real problem data for government buildings and assets, and error
handling operations. This phase's output process will be able to provide a variety
of user interfaces, such as data visualisation. All of these procedures necessitate
IT system integration, which involves all prior process stakeholders.
Phase 2: Present Maintenance Management Data
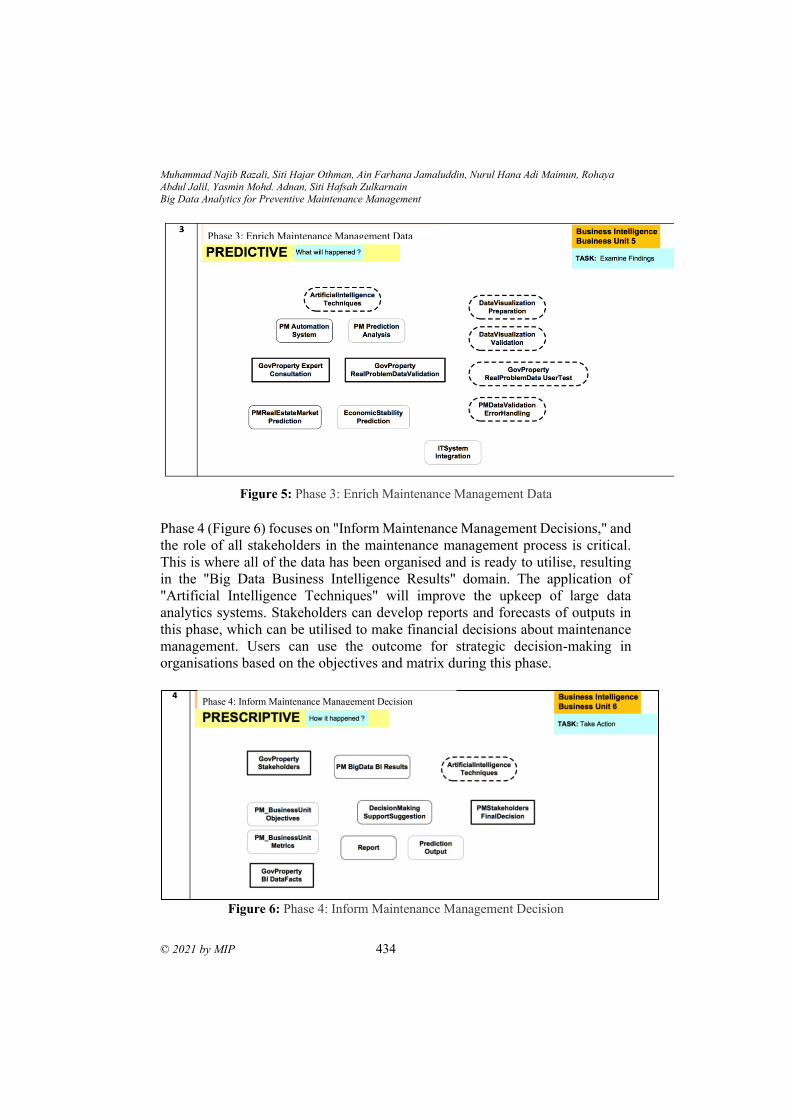
Muhammad Najib Razali, Siti Hajar Othman, Ain Farhana Jamaluddin, Nurul Hana Adi Maimun, Rohaya
Abdul Jalil, Yasmin Mohd. Adnan, Siti Hafsah Zulkarnain
Big Data Analytics for Preventive Maintenance Management
© 2021 by MIP 434
Figure 5: Phase 3: Enrich Maintenance Management Data
Phase 4 (Figure 6) focuses on "Inform Maintenance Management Decisions," and
the role of all stakeholders in the maintenance management process is critical.
This is where all of the data has been organised and is ready to utilise, resulting
in the "Big Data Business Intelligence Results" domain. The application of
"Artificial Intelligence Techniques" will improve the upkeep of large data
analytics systems. Stakeholders can develop reports and forecasts of outputs in
this phase, which can be utilised to make financial decisions about maintenance
management. Users can use the outcome for strategic decision-making in
organisations based on the objectives and matrix during this phase.
Figure 6: Phase 4: Inform Maintenance Management Decision
Phase 3: Enrich Maintenance Management Data
Phase 4: Inform Maintenance Management Decision
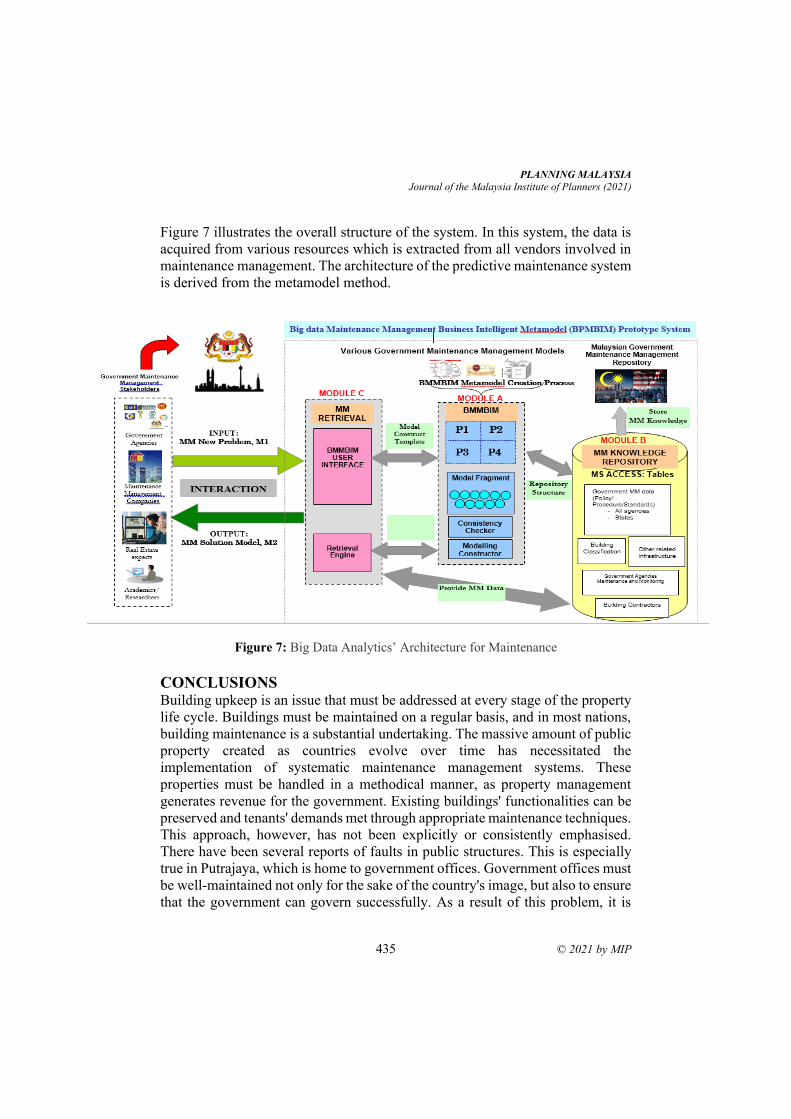
PLANNING MALAYSIA
Journal of the Malaysia Institute of Planners (2021)
435 © 2021 by MIP
Figure 7 illustrates the overall structure of the system. In this system, the data is
acquired from various resources which is extracted from all vendors involved in
maintenance management. The architecture of the predictive maintenance system
is derived from the metamodel method.
Figure 7: Big Data Analytics’ Architecture for Maintenance
CONCLUSIONS
Building upkeep is an issue that must be addressed at every stage of the property
life cycle. Buildings must be maintained on a regular basis, and in most nations,
building maintenance is a substantial undertaking. The massive amount of public
property created as countries evolve over time has necessitated the
implementation of systematic maintenance management systems. These
properties must be handled in a methodical manner, as property management
generates revenue for the government. Existing buildings' functionalities can be
preserved and tenants' demands met through appropriate maintenance techniques.
This approach, however, has not been explicitly or consistently emphasised.
There have been several reports of faults in public structures. This is especially
true in Putrajaya, which is home to government offices. Government offices must
be well-maintained not only for the sake of the country's image, but also to ensure
that the government can govern successfully. As a result of this problem, it is
Muhammad Najib Razali, Siti Hajar Othman, Ain Farhana Jamaluddin, Nurul Hana Adi Maimun, Rohaya
Abdul Jalil, Yasmin Mohd. Adnan, Siti Hafsah Zulkarnain
Big Data Analytics for Preventive Maintenance Management
© 2021 by MIP 436
necessary to manage government properties in a methodical manner, with proper
databases of maintenance data. This information may be easily transmitted to
users for decision-making, resulting in well-structured knowledge. As a result,
the goal of this research is to discover characteristics in BD apps that can be used
to produce maintenance management data for federal government buildings.
Using Business Intelligence (BI) methodologies in the form of a metamodel
framework, this study seeks to offer a novel strategy to managing a fragmented
and complicated domain structure. The metamodeling technique can help
stakeholders in the maintenance management domain (government, Public
Works Department, facilities manager) comprehend and guide them through the
decision-making process in the future. Importantly, the metamodel provides a
comprehensive structure of general principles and best practises for distinct
collections of maintenance management improvement models. If the metamodel-
based repository system is established and disseminated, the study will be
valuable to the government, particularly policymakers and auditors for decision–
making. As a result, maintenance management metamodels promote information
sharing and, more crucially, maintenance management in federal government
facilities. Systematic management of infrastructure and properties, particularly
those under government control, will benefit governments.
ACKNOWLEDGEMENT
The authors would like to express gratitude and appreciation for the research
grant funding under National Property Research Coordinator (NAPREC) Vot
17H05 Number and UTM for the financial support in this research.
REFERENCES Aruldoss, M., Lakshmi Travis, M., & Prasanna Venkatesan, V. (2014). A survey on
recent research in business intelligence. Journal of Enterprise Information
Management, 27(6), 831-866.
Beebe, N. H. (2019). A Bibliography of O ’Reilly & Associates and O’Reilly Media. Inc.
Publishers.
Boyd, D., & Crawford, K. (2012). Critical questions for big data:
Provocations for a cultural, technological, and scholarly phenomenon. Information,
communication & society, 15(5), 662-679.
CBRE (2018) Global Viewpoint: Urban Big Data and Real Estate, retrieved from
https://www.cbre.com/research-and-reports/Global-Viewpoint-Urban-Big-Data-
and-Real-Estate-Markets
Desouza, K. C., & Jacob, B. (2017). Big data in the public sector: Lessons for
practitioners and scholars. Administration & Society, 49(7), 1043-1064.
Dixon, R. (2007). The management task. Routledge.
PLANNING MALAYSIA
Journal of the Malaysia Institute of Planners (2021)
437 © 2021 by MIP
Horner, R. M. W., El-Haram, M. A., & Munns, A. K. (1997). Building maintenance
strategy: a new management approach. Journal of quality in maintenance
engineering, 3(4), 273-280.
Jawatankuasa Pengurusan Aset Kerajaan (JPAK) (2014), Mesyuarat JP PATA,Jabatan
Perdana Menteri
Kim, G. (2014). Why BIG DATA for the Smart City? CIO of Seoul Secretary General of
WeGO, Seoul, Korea
Othman, S. H. (2013). Supporting domain ontology through a metamodel: A disaster
management case study. In Ontology-Based Applications for Enterprise Systems
and Knowledge Management (pp. 191-209). IGI Global.
Provost, F., & Fawcett, T. (2013). Data Science for Business: What you need to know
about data mining and data-analytic thinking. " O'Reilly Media, Inc.".
Razak Bin Ibrahim, A., Roy, M. H., Ahmed, Z., & Imtiaz, G. (2010). An investigation of
the status of the Malaysian construction industry. Benchmarking: An International
Journal, 17(2), 294-308.
Razali, M,N. , M., & Juanil, D. M. (2011). A study on knowledge management
implementation in property management companies in
Malaysia. Facilities, 29(9/10), 368-390.
Sprinkle, J., Rossi, M., Gray, J., & Tolvanen, J. P. (2014, October). DSM'14: the 14th
workshop on domain-specific modeling. In Proceedings of the companion
publication of the 2014 ACM
Susi, A., Perini, A., Mylopoulos, J., & Gi, P. (2005). The tropos metamodel and its
use. Informatica, 29(4).
Thompson, O., Business Intelligence Success, Lessons Learned, 2004, Retrieved from
www.technologyevaluation.com
Völter, M., Stahl, T., Bettin, J., Haase, A., & Helsen, S. (2013). Model-driven software
development:technology, engineering, management. John Wiley & Sons.
Von Alan, R. H., March, S. T., Park, J., & Ram, S. (2004). Design science in information
systems research. MIS quarterly, 28(1), 75-105.
Waller, M. A., & Fawcett, S. E. (2013). Click here for a data scientist:
Big data, predictive analytics, and theory development in the era of a maker movement
supply chain. Journal of Business Logistics, 34(4), 249-252.
Received: 12th July 2021. Accepted: 7th Sept 2021
1 PhD Graduand at Universiti Tun Hussein Onn Malaysia (UTHM); Email: [email protected]
PLANNING MALAYSIA:
Journal of the Malaysian Institute of Planners
VOLUME 19 ISSUE 3 (2021), Page 438 – 448
A REVIEW OF SPATIAL ECONOMETRICS IN EXPLICIT
LOCATION MODELLING OF COMMERCIAL PROPERTY
MARKET
Hamza Usman1, Mohd Lizam2, Burhaida Bint Burhan3
1,2,3Faculty of Technology Management and Business
UNIVERSITI TUN HUSSEIN ONN MALAYSIA 1Department of Estate Management & Valuation
ABUBAKAR TAFAWA BALEWA UNIVERSITY, BAUCH, NIGERIA
Abstract
‘Location, location, location’ is a real property parlance mostly used to describe
the influence of location in the property market. Location is mainly considered as
the most significant influencer of commercial property prices. Location is
modelled traditionally using hedonic pricing model by either proxy location
dummies or distances relative to other neighbourhood features. This was shown
to be inadequate due to spatial autocorrelation and heterogeneity inherent in
spatial data, which jeopardises the estimates' consistency. Consequently, spatial
econometrics is used to explicitly model location into property pricing by
controlling spatial effects of autocorrelation and heterogeneity. Housing studies
dominate the use of this approach with limited application in the commercial
property market. This paper reviewed spatial econometrics and found that the
commercial property market exhibits significant spatial dependence and
heterogeneity. Accounting for such effects improves model accuracy
significantly. It, therefore, recommends increase use of spatial econometrics in
commercial property market modelling.
Keyword: Location, Spatial Econometrics, Commercial Property Market,
Hedonic Pricing Modelling, Spatial dependence
PLANNING MALAYSIA
Journal of the Malaysia Institute of Planners (2021)
439 © 2021 by MIP
INTRODUCTION The strategic prominence of the commercial property to the world market has
been noted in the literature (Usman & Lizam, 2020; Jeong & Kim, 2011; Raposo
& Evangelista, 2017). The commercial property market, like the residential
counterpart, is imperfect. Commercial properties have high information
asymmetry, high cost of transactions, highly heterogeneous, relative low liquidity
and are rarely traded (Beracha, Hardin III, & Skiba, 2018; Chegut, Eichholtz, &
Rodrigues, 2015; Hardin III, Jiang, & Wu, 2017; Wiley, 2017). These features of
the commercial property make it relatively volatile. Similarly, besides
heterogeneity and thinness, a different characteristic of commercial property is
the distinctiveness of each commercial property’s location (Chegut, Eichholtz, &
Rodrigues, 2013; Chiang, 2016). This characteristic makes the location an
influential factor in modelling the commercial property market. It is also the
reason why location is considered as one of the most critical determinants of
commercial property prices (Bhattacharya, Lamond, Proverbs, & Hammond,
2013; Li, He, Xu, Wang, & He, 2013; Droj & Droj, 2015; Hayunga & Pace, 2010;
Özyurt, 2013, 2014). This, therefore, underscore the necessity for modelling the
commercial property market such that the state of the market and performance of
the property market is reflected in the pricing (Corgel, Liu, & White, 2015).
Traditionally, the hedonic pricing model is used to model commercial
property market. The composites of properties – location characteristics,
neighbourhood attributes, and physical characteristics – constitute the property
price (Noh, 2019; Usman, Lizam, & Adekunle, 2020; Usman, Lizam, & Burhan,
2021; Zhang, Zheng, Sun, & Dai, 2019). While the neighbourhood attributes and
physical characteristics are relatively straightforward to model in HPM, the
location is more challenging to model objectively and objectively (Özyurt, 2014).
The traditional location modelling using the hedonic has not explicitly accounted
for location impact on commercial property prices even though spatial dispersion
of commercial property prices is imminent in the market (Droj & Droj, 2015;
Özyurt, 2014). Alternatively, spatial analytical techniques are developed to
account for location effect in real estate market modelling explicitly and are
shown to improve the accuracy of price prediction (Aliyu, Sani, Usman, &
Muhammad, 2018; Noh, 2019; Seo, Salon, Kuby, & Golub, 2019; Usman, Lizam,
& Adekunle, 2020). However, the application of explicit spatial treatment of
location is skewed towards the residential market with relatively scarcer research
works on the commercial property market (Montero-Lorenzo, Larraz-Iribas, &
Paez, 2009; Özyurt, 2014). Consequently, this paper reviewed the application of
spatial econometric approaches in explicit location modelling of the commercial
property market.
Hamza Usman, Mohd Lizam, Burhaida Bint Burhan
A Review of Spatial Econometrics in Explicit Location Modelling of Commercial Property Market
© 2021 by MIP 440
LOCATION AND COMMERCIAL PROPERTY MARKET The phrase ‘location, location, location’ is widely held parlance among real estate
professionals to symbolise location's influence on property prices (Orford, 2017;
Özyurt, 2014). Locations are immobile, fixed, and distinctive. Spatially, no
property is identically the same as others (Wyatt, 2010). Such distinctiveness of
location exerts a substantial effect on property prices with the consequent
concerns to all stakeholders in the property market (Orford, 2017). Location is
interrelated to local amenities, social ties, and environmental factors. These form
positive and negative externalities and affect commercial property prices
differently.
The mid-20th-century urban economic theories underpin the modelling
property market location. The theories emphasised the trade-off between space
relating to Central Business District (CBD) and accessibility (Alonso, 1964;
Ibeas, Cordera, Dell’Olio, Coppola, & Dominguez, 2012). High accessibility
attracts higher property prices due to accessibility premium (Chiarazzo, dell’
Olio, Ibeas, & Ottomanelli, 2014; Muth, 1969). The commercial property market
is more sensitive to the influence of location on prices than other property types
markets. This is partly because location factors such as access to customers,
traffic, market access, employment centres and other location factors determine
the acquisition of commercial properties.
Consequently, valuers consider location factors seriously when
modelling the property market. In such consideration, the main concern is how to
incorporate location into the commercial property market modelling.
COMMERCIAL PROPERTY MARKET LOCATION MODELLING Commercial properties are modelled traditionally using the conventional hedonic
pricing model. This is a quantitative concept and requires a quantitative analysis
technique (Bawuro, Shamsuddin, Wahab, & Usman, 2019). Property prices in
HPM are treated as the function of the properties’ neighbourhood characteristics,
location factors and physical attributes (Usman, Lizam, & Burhan, 2020b).
Several previous studies have modelled property markets empirically (Abdullahi,
Usman, & Ibrahim, 2018; Montero-Lorenzo et al., 2009; Özyurt, 2014). The
traditional HPM model location implicitly in two ways. Firstly, neighbourhood
effects are modelled using location dummies to control their effects on prices
(Raposo & Evangelista, 2017). This method, however, does not explicitly account
for the specific individual locations in the model and therefore the uniqueness
and distinctiveness of each property’s spatial identity is not sufficiently accounted
for.
Secondly, the HPM implicitly models location by controlling for the
relative distance of major spatial landmarks such as CBDs, highways, bus
terminals, rail stations, airports, and other externalities to the subject property
(Abdullahi et al., 2018; Bujanda & Fullerton Jr., 2018; Usman, Lizam, & Burhan,
PLANNING MALAYSIA
Journal of the Malaysia Institute of Planners (2021)
441 © 2021 by MIP
2020a). These implicit location modelling methods have some limitations when
dealing with spatial data such as commercial properties. The methods do not
capture spatial interactions, which affect the resultant predicted prices (Özyurt,
2014). This spatial interaction makes the model’s residuals spatially correlated
and not random, violating the assumption of uncorrelated error and constant
variance of the Ordinary Least Squares (OLS) (Can, 1992; Özyurt, 2014; Pace,
Barry, & Sirmans, 1998). The traditional hedonic models do not explicitly control
the effect of spatial autocorrelation, spatial dependence, and spatial heterogeneity
inherent in real estate data, making the model estimates biased and inconsistent
(Chegut, Eichholtz, & Rodrigues, 2015; Pace et al., 1998). With the
sophistication of Geographic Information System (GIS) technology to determine
exact property location, spatial econometric models are developed to model such
location effects explicitly. This made the commercial property location modelling
more efficient, reliable and have better predictions (Droj & Droj, 2015; Özyurt,
2014).
MODELLING SPATIAL DEPENDENCE AND HETEROGENEITY IN
COMMERCIAL PROPERTY MARKET The characteristics of the commercial property market include infrequent and thin
transactions, heterogeneity, and high information asymmetry (Özyurt, 2014; Tu,
Yu, & Sun, 2004). The commercial property market value depends on a
comparable transaction within the neighbourhood called the adjacency effect.
The adjacency effect may be because property agents or sellers use comparable
information of a particular property in arriving at the price of the subject property,
thereby leading the price obtained in the property influencing the price of a nearer
property in the neighbourhood (Kim et al., 2003; Yu, Pang, et al., 2017). The
presence of statutory homogeneous building codes tends to make properties
homogenous in a particular neighbourhood (Chegut, Eichholtz, & Rodrigues,
2015). The presence of these property characteristics leads to a correlation in
space among property characteristics. Such correlation is called spatial
autocorrelation or dependence (Meen, 2016; Noh, 2019).
Based on Tobler’s first law of geography, properties that are located
closer together are more expected to be interrelated than with farther properties
(Liang, Reed, & Crabb, 2017; Tobler, 1970). When a property attribute in a
particular location is correlated spatially with similar attributes closeby, spatial
autocorrelation occurs (Dziauddin, Powe, & Alvanides, 2014). Spatial
dependence, therefore, is the situation where property price is correlated spatially
with the prices of closeby properties. On the other hand, spatial heterogeneity is
when the association between property attributes and price vary spatially. It
happens when estimates for the property feature in the regression vary over a
spatial area (Dziauddin et al., 2014).
Hamza Usman, Mohd Lizam, Burhaida Bint Burhan
A Review of Spatial Econometrics in Explicit Location Modelling of Commercial Property Market
© 2021 by MIP 442
The existence of spatial autocorrelation, dependence, and heterogeneity
in the property market severely affects property pricing estimation. Failure to
account for it in modelling the property prices leads to spurious, distorted, biased
and inconsistent parameter estimates (Anselin, 2010; Noh, 2019; Pace et al.,
1998; Yu, Pang, et al., 2017). Spatial econometrics models are developed to solve
the concern of spatial dependence and heterogeneity in spatial data such as
property market. Although various studies were conducted to control the
influence of spatial dependence in property pricing, the bulk of these studies are
on housing markets (Dziauddin et al., 2014; Montero-Lorenzo et al., 2009;
Osland, 2010; Özyurt, 2013). To date, fewer studies have been conducted to
explicitly control the influence of spatial dependence in commercial property
pricing with divergent findings (Chegut et al., 2015; Ke et al., 2017; Kim &
Zhang, 2005; Liang et al., 2017; Nappi-Choulet & Maury, 2009; Seo, Salon,
Kuby, et al., 2018; Tu et al., 2004; Xu et al., 2016; Zhang et al., 2015).
The study of Tu et al. (2004) appears to be the first study to control the
spatial and temporal dependences in the commercial property market using
spatial econometrics. Using the Spatio-temporal Autoregressive (STAR) model,
adopted from the housing study of Pace, Barry, Gilley, & Sirmans (2000), they
found significant and substantial spatial and temporal dependence in Singapore
office market price. Nappi-Choulet & Maury (2009), using a similar
methodology, also found significant spatial and temporal dependence in Paris
office prices. Ke et al. (2017) also found significant spatial dependence in Central
London office market prices. Zhang et al. (2015) estimated commercial property
prices for mass appraisal in Shenzhen, China using Spatial Error Model (SEM)
and found significant spatial heterogeneity in the commercial property market
associated with omitted neighbourhood variables as indicated by significant
lambda (λ) value of 0.0850. Liang et al. (2017) also found significant spatial
dependence affecting Melbourne office prices.
The study of Chegut et al. (2015) provided a broader coverage of the
commercial property market by accounting for spatial and temporal dependence
in six established global commercial property markets (Los Angeles, London,
Hong Kong, Tokyo, Paris, and New York). The result shows divergent findings
across the markets. While spatial dependence was significant in New York,
London, Tokyo and Paris commercial property markets, no significant spatial
dependence was found in Hong Kong and Los Angeles markets. The lack of
spatial dependence in the Hong Kong and Los Angeles markets may be due to
the homogenous commercial property market. However, Ke et al. (2017) found
significant spatial dependence in commercial property prices even after
accounting for market segmentation using submarkets dummy.
PLANNING MALAYSIA
Journal of the Malaysia Institute of Planners (2021)
443 © 2021 by MIP
SPATIAL ECONOMETRIC MODELS IN COMMERCIAL PROPERTY
LOCATION MODELLING Spatial econometrics is an improved econometric model that is developed to
address the issues and failure of Ordinary Least Squares regression hedonic price
modelling when dealing with spatial data to adequately account for spatial
location effect (Yang, Wang, Zhou, & Wang, 2018). The HPM provides the basis
for the application of spatial econometrics. Spatial data are characterised by
spatial heterogeneity and autocorrelation (Meen, 2016; Noh, 2019). The major
spatial econometric models are the Spatial Lag Model (SLM), Spatial Error
Model (SEM) and Spatial Durbin Model (SDM). The choice of a particular model
depends on the nature of spatial autocorrelation. These methods have been
applied to model the commercial property market spatially and explicitly.
The spatial lag model is used to model the influence of neighbouring
commercial property prices on the price of subject commercial property (Droj &
Droj, 2015; Özyurt, 2014). The SLM lags the dependent variable by adding a
spatially weighted matrix to the spatially lagged variable to modulate the spatial
correlation between the property variables and their neighbours. The studies that
model location explicitly using spatial lag model include that of Özyurt (2013,
2014), who modelled the commercial property market including retail, office and
industrial properties in Netherland, found significant spatial dependence. The
respective studies found that the spatial lag model improves modelling accuracy
above the traditional hedonic price model. Other studies that utilised the spatial
lag model in modelling commercial property market spatially include Chegut et
al. (2015, 2013), Ke et al. (2017), Liang et al. (2017), Nappi-Choulet & Maury
(2009) and Tu et al. (2004). The studies found significant spatial dependence in
office market accounting for which significantly improved accuracy of
commercial property price prediction.
The Spatial Error Model (SEM), on the other hand, is used to control
the influence of spatial autocorrelation in modelling regional data. SEM models
how the residuals are spatially correlated. The spatial error model is also based
on the premise that spatial autocorrelation is generated by omitting key
neighbourhood variables that are not observed (Yu, Zhang, et al., 2017). Thus,
instead of lagging the dependent variable, the model incorporates the spatial
effects in the error terms (Yang et al., 2018). The spatial error model has been
used to model the commercial property market. The study of Seo et al. (2019)
found a significant correlation in the error terms. Another study that used a spatial
error model is Zhang, Du, Geng, Liu, & Huang (2015) who modelled the
commercial property market for mass appraisal in Shenzhen, China, and found
significant spatial heterogeneity. Accounting for the spatial effect in these models
significantly improved the commercial property market modelling.
The Spatial Durbin Model (SDM), adds a spatial lag to the property
price to control the dependence of property prices on the neighbouring property
Hamza Usman, Mohd Lizam, Burhaida Bint Burhan
A Review of Spatial Econometrics in Explicit Location Modelling of Commercial Property Market
© 2021 by MIP 444
prices and another spatial lag to the error term to control the spatial
autocorrelation in the error terms (Li et al., 2015; Noh, 2019). Although the SDM
has been applied in the residential property market and was found to significantly
improve property price prediction accuracy (Li et al., 2015; Osland, 2010), there
appears to be no evidence of its usage in modelling commercial property market.
CONCLUSION
Location is regarded as one of the most critical influencers of property prices.
The popularised real estate parlance – Location, Location, Location – is a pointer
of importance attached to the location in property pricing. The influence of
location is more in the commercial property market. It is modelled traditionally
using the conventional HPM by either controlling the neighbourhood effect using
location dummies and by a relative distance of the subject property relative to
other important landmarks. This implicit modelling of property location do not
account for the spatial interactions inherent in the commercial property market.
Such spatial interactions lead to spatial autocorrelation and heterogeneity. The
error terms are spatially correlated against the Ordinary Least Squares (OLS)
assumption of uncorrelated error terms and constant variance. The deficiency of
the traditional method to account for the spatial effect leads to the estimated
coefficients being bias, inconsistent and distorted. The spatial econometric
techniques are developed to explicitly account for the location effect in property
modelling by controlling spatial autocorrelation. Empirical researches show a
superior performance of the spatial econometric models over the conventional
hedonic pricing modelling in modelling location. However, despite this improved
performance, the spatial econometric approach in modelling commercial property
is rather minimal. This may not be unconnected with the general nature of the
commercial property market lack of transaction data relative to other property
classes. Accordingly, this paper reviewed the application of the spatial
econometric models used in modelling the commercial property market. The
review found that the spatial lag model has been applied in the commercial
property market and found significant spatial dependence accounting, which
improved the model's performance. The spatial error model was also found to
enhance the performance of commercial property market modelling. However,
the review does not found evidence of the application of SDM in the commercial
property market even though the model was found very effective in housing
market modelling. The review also found most of the studies that used spatial
econometrics to be limited to the office submarket of the commercial property
market. Thus, the paper recommends the application of spatial econometric
models in modelling the commercial property market more especially the retail
submarket. Similarly, the paper recommends the exploration of SDM in the
commercial property market in future studies.
PLANNING MALAYSIA
Journal of the Malaysia Institute of Planners (2021)
445 © 2021 by MIP
ACKNOWLEDGEMENTS
The authors would like to thank the Ministry of Education Malaysia for
supporting this research under the Fundamental Research Grant Scheme Vot No.
FRGS/1/2018/SS08/UTHM/02/1 and partially sponsored by Universiti Tun
Hussein Onn Malaysia.
REFERENCES Abdullahi, A., Usman, H., & Ibrahim, I. (2018). Determining house price for mass appraisal
using multiple regression analysis modeling in Kaduna North, Nigeria. ATBU
Journal of Environmental Technology, 11(1), 26–40.
Aliyu, B. A., Sani, H., Usman, H., & Muhammad, H. (2018). Ranking the Causative Factors
of Mortgage Valuation Inaccuracy in Kaduna Metroplois. Real Estate Management
and Valuation, 26(3). https://doi.org/10.2478/remav-2018-0026
Alonso, W. (1964). Location and Land Use. Toward a General Theory of Land Rent.
Cambridge: Harward University Press.
https://doi.org/http://dx.doi.org/10.4159/harvard.9780674730854
Anselin, L. (2010). Thirty years of spatial econometrics. Papers in Regional Science, 89(1).
https://doi.org/10.1111/j.1435-5957.2010.00279.x
Bawuro, F. A., Shamsuddin, A., Wahab, E., & Usman, H. (2019). Mediating role of
meaningful work in the relationship between intrinsic motivation and innovative
work behaviour. International Journal of Scientific and Technology Research, 8(9),
2076–2084.
Beracha, E., Hardin III, W. G., & Skiba, H. M. (2018). Real Estate Market Segmentation :
Hotels as Exemplar. Real Estate Finance Economics, 56, 252–273.
https://doi.org/10.1007/s11146-017-9598-z
Bhattacharya, N., Lamond, J., Proverbs, D., & Hammond, F. (2013). Development of
conceptual framework for understanding vulnerability of commercial property
values towards flooding. International Journal of Disaster Resilience in the Built
Environment, 4(3), 334–351.
Bujanda, A., & Fullerton Jr., T. M. (2018). Infrastructure Impacts on Commercial Property
Values Across El Paso in 2013. Border Region Modeling Project, 55.
Can, A. (1992). Specification and estimation of hedonic housing price models. Regional
Science and Urban Economics, 22, 453–474.
Chegut, A. M., Eichholtz, P. M. A., & Rodrigues, P. J. M. (2015). Spatial Dependence in
International Office Markets. Journal of Real Estate Finance and Economics, 51(2),
317–350. https://doi.org/10.1007/s11146-014-9484-x
Chegut, A. M., Eichholtz, P., & Rodrigues, P. (2013). Transaction Based London
Commercial Property Indices. The Journal of Real Estate Finance and Economics,
47(4), 588-616, 47(4), 588–616.
Chiang, S. H. (2016). Interaction among real estate properties in China using three
submarket panels. Habitat International, 53, 243–253.
https://doi.org/10.1016/j.habitatint.2015.11.038
Chiarazzo, V., dell’Olio, L., Ibeas, Á., & Ottomanelli, M. (2014). Modeling the Effects of
Environmental Impacts and Accessibility on Real Estate Prices in Industrial Cities.
Procedia - Social and Behavioral Sciences, 111(February), 460–469.
Hamza Usman, Mohd Lizam, Burhaida Bint Burhan
A Review of Spatial Econometrics in Explicit Location Modelling of Commercial Property Market
© 2021 by MIP 446
https://doi.org/10.1016/j.sbspro.2014.01.079
Corgel, J. B., Liu, C. H., & White, R. M. (2015). Determinants of Hotel Property Prices.
Retrieved May 17, 2019, from http://scholarship.sha.cornell.edu/articles/1012
Droj, L., & Droj, G. (2015). Usage of location analysis software in the evaluation of
commercial real estate properties. In Procedia Economics and Finance 32, 826–832.
https://doi.org/10.1016/S2212-5671(15)01525-7
Dziauddin, M. F., Powe, N. A., & Alvanides, S. (2014). Estimating the Effects of Light Rail
Transit (LRT) System on Residential Property Values Using Geographically
Weighted Regression ( GWR ). Applied Spatial Analysis.
https://doi.org/10.1007/s12061-014-9117-z
Hardin III, W. G., Jiang, X., & Wu, Z. (2017). Inflation Illusion, Expertise and Commercial
Real Estate. Journal of Real Estate Finance and Economics, 55(3), 345–369.
Hayunga, D. K., & Pace, R. K. (2010). Spatial statistics applied to commercial real estate.
Journal of Real Estate Finance and Economics, 41(2), 103–125.
https://doi.org/10.1007/s11146-009-9190-2
Ibeas, Á., Cordera, R., Dell’Olio, L., Coppola, P., & Dominguez, A. (2012). Modelling
transport and real-estate values interactions in urban systems. Journal of Transport
Geography, 24, 370–382. https://doi.org/10.1016/j.jtrangeo.2012.04.012
Jeong, S., & Kim, J. (2011). A Study of Retail Property Prices in Seoul. In ERES Conference
2011.
Ke, Q., Sieracki, K., & White, M. (2017). A Spatial Analysis of the Central London Office
Market. In 24th Annual European Real Estate Society Conference. (pp. 1–16).
Netherlands.
Kim, C. W., Phipps, T. T., & Anselin, L. (2003). Measuring the benefits of air quality
improvement : a spatial hedonic approach. Journal of Environmental Economics and
Management 45, 45, 24–39.
Kim, J., & Zhang, M. (2005). Determining transit’s impact on Seoul commercial land
values: an application of spatial econometrics. International Real Estate Review,
8(1), 1–26.
Li, W., Joh, K., Lee, C., Kim, J., Park, H., & Woo, A. (2015). Assessing Benefits of
Neighborhood Walkability to Single-Family Property Values : A Spatial Hedonic
Study in Austin , Texas. Journal of Planning Education and Research.
https://doi.org/10.1177/0739456X15591055
Li, Y., He, L., Xu, W., Wang, H., & He, Z. (2013). Using GIS and hedonic in the modelling
of spatial variation of housing price in Xiamen city. International Review for Spatial
Planning and Sustainable Development, 1(4), 29–42.
https://doi.org/10.14246/irspsd.1.4_29
Liang, J., Reed, R., & Crabb, T. (2017). The contribution of spatial dependency to office
building price index: A melbourne case study. Journal of Property Investment &
Finance.
Meen, G. (2016). Spatial housing economics : A survey. Urban Studies, 53(10), 1987–2003.
https://doi.org/10.1177/0042098016642962
Montero-Lorenzo, J.-M., Larraz-Iribas, B., & Paez, A. (2009). Estimating commercial
property prices : an application of cokriging with housing prices as ancillary
information. J Geogr Syst, 11, 407–425. https://doi.org/10.1007/s10109-009-0095-
7
PLANNING MALAYSIA
Journal of the Malaysia Institute of Planners (2021)
447 © 2021 by MIP
Muth, R. F. (1969). Cities and Housing: The Spatial Pattern of Urban Residential Land
Use. Chicago & London: The University of Chicago Press.
Nappi-Choulet, I., & Maury, T.-P. (2009). A Spatiotemporal Autoregressive Price Index for
the Paris Office Property Market. Real Estate Economics, 37(2), 305–340.
Noh, Y. (2019). Landscape and Urban Planning Does converting abandoned railways to
greenways impact neighboring housing prices ? Landscape and Urban Planning,
183(September 2017), 157–166. https://doi.org/10.1016/j.landurbplan.2018.11.002
Orford, S. (2017). Valuing the Built Environment: GIS and House Price Analysis. New
York: Routledge Taylor & Francis group.
Osland, L. (2010). An Application of Spatial Econometrics in Relation to Hedonic House
Price. JRER, 32(3).
Özyurt, S. (2013). Does the spatially augmented transaction-based commercial property
price indicator perform better than the standard one ? Evidence from micro data
(Graduate Programme Research Paper 2012-2013 No. Graduate Programme
Research Paper 2012-2013).
Özyurt, S. (2014). Spatial dependence in commercial property prices: micro evidence from
the Netherlands (ECB Working Paper No. 1627). Frankfurt.
Pace, R. K., Barry, R., Gilley, O. W., & Sirmans, C. F. (2000). A method for spatial –
temporal forecasting with an application to real estate prices. International Journal
of Forecasting, 16(2), 229-246.
Pace, R. K., Barry, R., & Sirmans, C. F. (1998). Spatial Statistics and Real Estate. Journal
of Real Estate Finance and Economics, 17(1), 5–13.
Raposo, I. G., & Evangelista, R. (2017). A transactions-based commercial property price
index for Portugal. Financial Stability Papers, 3(March), 1–25.
Seo, K., Salon, D., Kuby, M., & Golub, A. (2018). Hedonic modeling of commercial
property values : distance decay from the links and nodes of rail and highway
infrastructure Hedonic modeling of commercial property values : distance decay
from the links and nodes of rail. Transportation, (March).
https://doi.org/10.1007/s11116-018-9861-z
Seo, K., Salon, D., Kuby, M., & Golub, A. (2019). Hedonic modeling of commercial
property values : distance decay from the links and nodes of rail and highway
infrastructure. Transportation, 46(3), 859–882. https://doi.org/10.1007/s11116-018-
9861-z
Tobler, W. R. (1970). A Computer Movie Simulating Urban Growth in the Detroit Region.
Economic Geography, 46(sup1), 234–240. https://doi.org/10.1126/science.ns-
13.332.462
Tu, Y., Yu, S., & Sun, H. (2004a). Transaction-Based Office Price Indexes : A
Spatiotemporal Modeling Approach. Real Estate Economics, 32(2), 297–328.
Tu, Y., Yu, S., & Sun, H. (2004b). Transaction‐based office price indexes: a spatiotemporal
modeling approach. Real Estate Economics, 32(2), 297–328.
Usman, H., & Lizam, M. (2020). Empirical Modelling of Commercial Property Market
Location Submarket using Hedonic Price Model in Malaysia. In Proceedings of the
5th NA International Conference on Industrial Engineering and Operations
Management. Detroit, Michigan, USA, August 10 - 14, 2020.
Usman, H., Lizam, M., & Adekunle, M. U. (2020). Property price modelling, market
segmentation and submarket classifications: A review. Real Estate Management and
Hamza Usman, Mohd Lizam, Burhaida Bint Burhan
A Review of Spatial Econometrics in Explicit Location Modelling of Commercial Property Market
© 2021 by MIP 448
Valuation, 28(3), 24–35.
Usman, H., Lizam, M., & Burhan, B. (2020a). A Review of Property Attributes Influence
in Hedonic Pricing Model. In Proceedings of the 2nd African International
Conference on Industrial Engineering and Operations Management (pp. 2795–
2805). Harare.
Usman, H., Lizam, M., & Burhan, B. (2020b). Review of Issues in the Conventional
Hedonic Property Pricing Model. In Proceedings of the 2nd African International
Conference on Industrial Engineering and Operations Management (pp. 2806–
2816). Harare.
Usman, H., Lizam, M., & Burhan, B. (2021). A priori spatial segmentation of commercial
property market using hedonic price modelling. Real Estate Management and
Valuation, 29(2), 16–28.
Wiley, J. A. (2017). Leverage, liquidity and information in commercial property prices.
Journal of Property Research, 34(2), 77–107.
https://doi.org/10.1080/09599916.2017.1320683
Wyatt, P. J. (2010). The development of a GIS- based property information system for real
estate valuation. International Journal of Geographical Information Science, 11(5),
37–41. https://doi.org/10.1080/136588197242248
Xu, T., Zhang, M., & Aditjandra, P. T. (2016). The impact of urban rail transit on
commercial property value: New evidence from Wuhan , China. Trasportation
Research Part A, 91, 223–235.
Yang, L., Wang, B., Zhou, J., & Wang, X. (2018). Transportation Research Part D Walking
accessibility and property prices. Transportation Research Part D, 62, 551–562.
https://doi.org/10.1016/j.trd.2018.04.001
Yu, H., Pang, H., & Zhang, M. (2017). Value-added effects of transit-oriented
development : The impact of urban rail on commercial property values with
consideration of spatial heterogeneity : Rail transit and commercial ... Value-added
effects of transit-oriented development : The impact of. Papers in Regional Science,
1–23. https://doi.org/10.1111/pirs.12304
Yu, H., Zhang, M., & Pang, H. (2017). Evaluation of transit proximity effects on residential
land prices : an empirical study in Austin , Texas. Transportation Planning and
Technology, (8), 1–14. https://doi.org/10.1080/03081060.2017.1355880
Zhang, R., Du, Q., Geng, J., Liu, B., & Huang, Y. (2015a). An improved spatial error model
for the mass appraisal of commercial real estate based on spatial analysis : Shenzhen
as a case study. Habitat International, 46, 196–205.
https://doi.org/10.1016/j.habitatint.2014.12.001
Zhang, R., Du, Q., Geng, J., Liu, B., & Huang, Y. (2015b). An improved spatial error model
for the mass appraisal of commercial real estate based on spatial analysis : Shenzhen
as a case study, 46, 196–205.
Zhang, X., Zheng, Y., Sun, L., & Dai, Q. (2019). Urban Structure , Subway Systemand
Housing Price : Evidence from Beijing and Hangzhou , China, 11–13.
https://doi.org/10.3390/su11030669.
Received: 12th July 2021. Accepted: 7th Sept 2021

1 Lecturer at Polytechnic of State Finance STAN, INDONESIA. Email: [email protected]
PLANNING MALAYSIA:
Journal of the Malaysian Institute of Planners
VOLUME 19 ISSUE 3 (2021), Page 449 – 459
INNOVATIONS OF VILLAGE ASSET MANAGEMENT: A CASE
OF THE BEST INDONESIAN VILLAGE
Taufik Raharjo1, Roby Syaiful Ubed2, Ambang Aris Yudanto3, Retno Yuliati4
1,2,3Department of Financial Management,
POLITEKNIK KEUANGAN NEGARA STAN, INDONESIA; 4 Department of Accounting,
UNIVERSITAS PRASETIYA MULYA, INDONESIA
Abstract
The purpose of this paper is to analyze Innovation Patterns in Utilizing Village
Assets. The data collections were conducted by interviewing three village asset
managers and implementing field observation on the research object. The study
suggested that innovative asset management implemented in Panggungharjo
successfully provided fundamental contributions to its community. The village
assets have been successfully managed to increase the community’s earnings by
creating innovative businesses such as technology-based business innovations
and using exceptional business processes. This study was conducted in the
Indonesian background. Nonetheless, the study results may not apply to village
asset management in other countries, particularly the Western ones. At last, these
findings are likely to have substantial implications for village asset managers
from other villages in designing and implementing how to maximize village asset
utilization for the benefit of the village community.
Keyword: Village, Asset Management, Innovation, Community
Taufik Raharjo, Roby Syaiful Ubed, Ambang Aris Yudanto, Retno Yuliati
Innovations of Village Asset Management: A Case of Indonesian Village
© 2021 by MIP 450
INTRODUCTION Policymakers, public sector managers, and employees agreed to increase innovation
in their public services. That addresses the challenges of public service delivery in
terms of efficiency and budget savings (de Vries, Bekkers, and Tummers 2016;
Lindsay, 2018) as well as maintaining high levels of welfare services and helping to
address economic and social challenges facing the public sector (Borin, 2001; Koch
and Hauknes, 2005; Eggres and Singh, 2009). Successful innovation is the creation
and implementation of new processes, products, services, and delivery methods,
resulting in significant improvements in outcomes, efficiency, effectiveness, or
quality (Albury, 2005).
One form of policy makers' support for village innovation in Indonesia is
the issuance of Law Number 6 of 2014 regarding Village that gives the village
authority to regulate and manage government affairs and the interests of its people
independently. One of the objectives of village governance is to encourage village
communities' initiatives, movements, and participation to develop village assets for
the common welfare (Law 6/2014). Optimizing the use of village assets is one of
the priorities of development and empowerment of rural communities, increasing
original village income (Natalia, 2017) and playing a role in sustaining and
mobilizing community livelihoods (Anwar, 2018). Optimizing the use of village
assets is necessary to have good village asset management.
Village asset management practices have been carried out according to
applicable regulations, but the implementation of its utilization has not been going
well (Sutaryo, 2016; Risnawati, 2017). Village treasury land management is used
more for the interests of the village head and village apparatus instead of the village
apparatus income and less for the interests of the village community (Permatasari,
2013).
Unlike the condition of village asset land use in general, the utilization of
village asset land in Panggungharjo village, Sewon District, Bantul Regency,
Yogyakarta can be considered innovative. As one of the best villages in Indonesia,
Panggungharjo utilizes village assets land in developing the economy with a
community asset-based development concept approach (Nurjaman, 2018). This
innovation in the use of village assets land has led Panggungharjo to get an
international award from the 2019 ASEAN Leadership Award in Myanmar for
contributing to rural development and poverty alleviation. Innovations made by the
village government of Panggungharjo can be a benchmark for optimizing the
utilization of village assets.
The village assets land of Panggungharjo are utilized for domestic waste
management processes, the production of diesel fuel substitutes from used oil, the
production of tamanu oils/nyamplung oil – a vegetable oil from nyamplung fruit
seeds, the development of village tourism services, and the production of rice
commodities as complementary products for the village’s tourism business service.
Innovations related to the use of village assets have become the domain of research
PLANNING MALAYSIA
Journal of the Malaysia Institute of Planners (2021)
451 © 2021 by MIP
conducted. Previous research had been carried out by Nurjaman (2018) regarding
the opportunities provided by the village law, village leadership, the strategy of the
Village Owned Enterprises (VOEs) as an instrument of driving the village economy.
However, this research has not identified innovation patterns related to the use of
village assets. Therefore, we aim to fill in the gap to identify patterns of innovation
related to the utilization of village assets, particularly in Panggungharjo. The results
of this study can contribute practically to other village governments and
policymakers in the use of village assets. The rest of this paper is organized as follows; the second section reviews
the literature addressing the definition of innovation and asset management. The
third section explains the research methodology used and how the data were
collected. The result of the research is presented in the fourth section. The fifth
section explains the conclusion and the implications of the finding. The final section
provides the limitation of this research and a suggestion for future research.
LITERATURE REVIEW Innovation is a concept that Joseph Schumpeter introduced in 1934. Innovation is a
final element of organizational change (Robbins, 2012; Griffin, 2012). It is the
synergized effort of an organization to develop new products or services or new uses
for existing products or services. Innovation started from creativity. Creativity refers
to uniquely combining ideas or making unusual associations between ideas. A
creative organization develops unique ways of working or novel solutions to
problems. Hence, creativity by itself is not enough. The outcomes of the creative
process need to be turned into valuable products or work methods, which is defined
as innovation (Robbins, 2012). Innovation is crucial because, without new products
or services, any organization will fall behind its competition or create customer
satisfaction. Innovation is the key to sustainable success.
Governments around the world promote innovation as a critical tool to
improve public services. Financial pressures and bureaucratic controls, along with
the demands for better services, make innovation difficult but also necessary as the
only practical way to approach citizens and respond to their requests (Robertson and
Ball, 2002). Finally, encouraging innovation in public service delivery can create
innovative governance (Tahir, 2016).
As the smallest government, the village government must also promote
innovation in their every activity. One of the much-needed innovations is innovation
in managing village assets. The Village law (Law 6/2014) stated that village assets
belong to the village that originates from the village's original wealth are bought or
obtained at the expense of the Village Budget and other legal rights. Village assets
can be in the form of village treasury land, customary land, village markets, animal
markets, boat moorings, village buildings, fish auctions, agricultural product
auctions, village forests, village springs, public baths, and other village assets.
Regarding the management of village assets, it is further regulated in Regulation of
Taufik Raharjo, Roby Syaiful Ubed, Ambang Aris Yudanto, Retno Yuliati
Innovations of Village Asset Management: A Case of Indonesian Village
© 2021 by MIP 452
the Minister of Internal Affairs No. 1 of 2016. Village asset management is a series
of planning, procurement, use, utilization, security, maintenance, deletion,
alienation, administration, reporting, appraisal, guidance, supervision, and control
of village assets. Village asset management is based on functional principles, legal
certainty, transparency and openness, efficiency, accountability, and value certainty.
Village assets can be utilized as long as they are not utilized directly to
support village governance. Forms of use include rent, borrow and use, cooperation
in utilization, built-operate-transfer, or built-transfer-operate. Utilization of village
assets is stipulated in Village Regulation.
Utilization of assets in a lease does not change ownership status, and the
maximum term is three years but can be extended. Utilization of assets in the form
of loan-use/lease is carried out between the village government and other village
governments and village community organizations. Leasing is excluded for land,
buildings, and movable assets in the form of motorized vehicles. Collaborative use
of land or buildings with other parties is carried out to optimize the effectiveness
and effectiveness and increase village income. Collaboration on the use of village
assets in land and buildings with other parties can be carried out if there are not
enough funds available in the Village Revenue and Expenditure Budget. That
collaboration covers the operational, maintenance, and repair costs needed for the
land and building. However, other parties are prohibited from lending or mortgaging
village assets which is the object of the utilization cooperation.
RESEARCH METHODS The data collections were conducted by interviewing three village asset managers
and implementing field observation on the research object. All the participants are
the key person of asset management in Panggungharjo village. Interviews were
conducted with the village head of Panggungharjo, the Manager of the Village-
Owned Enterprises, and the treasurer of the Village-Owned Enterprises. In addition,
observations were made to elaborate on more exciting findings.
FINDING AND DISCUSSIONS A. Profile of Desa Panggungharjo
The Village of Panggungharjo consists of 14 hamlets divided into 118 household
units that inhabit 560,966.5 hectares. Panggungharjo Village combines three
villages, namely Cabeyan Village, Prancak Village, and Krapyak Village.
Panggungharjo Village is one of the villages in Bantul Regency, directly bordered
by the city of Yogyakarta, the capital city of the Special Region of Yogyakarta.
Yogyakarta City borders the northern part of Panggungharjo village; the eastern part
is Bangunharjo Village, Sewon District; the southern part is Timbulharjo Village,
Sewon District; the western part is Pendowoharjo Village Sewon District and
Tirtonirmolo Village Kasihan District.
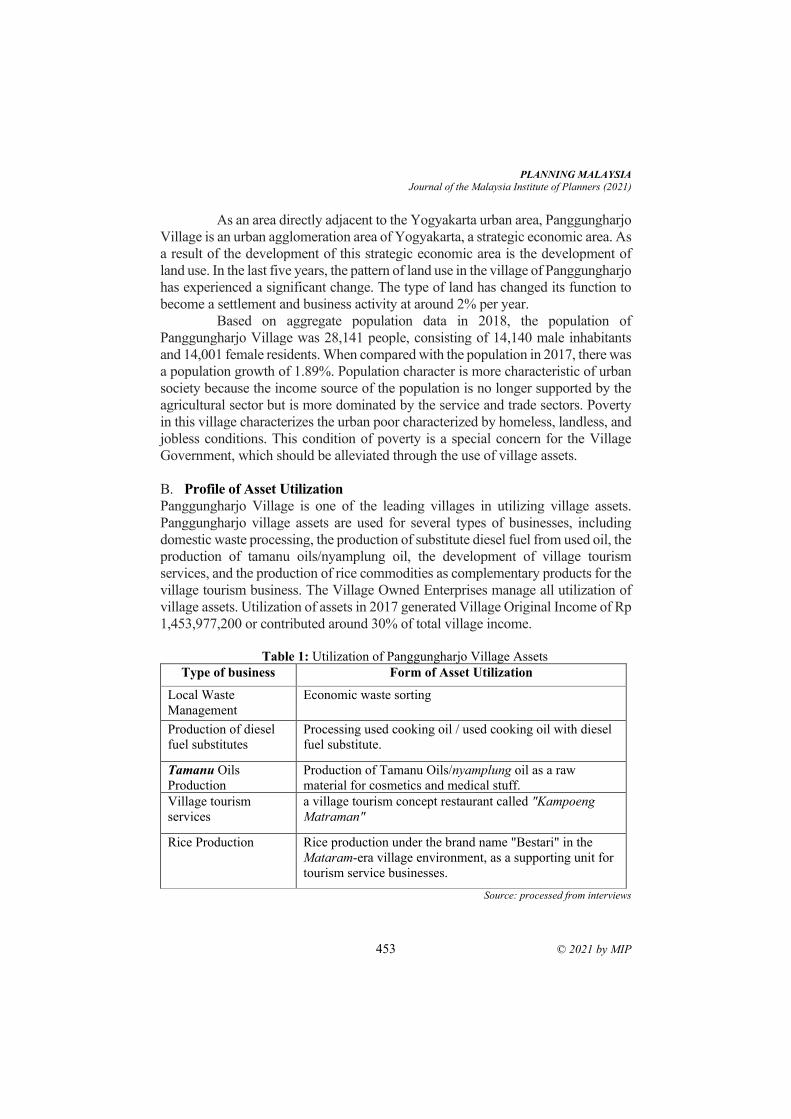
PLANNING MALAYSIA
Journal of the Malaysia Institute of Planners (2021)
453 © 2021 by MIP
As an area directly adjacent to the Yogyakarta urban area, Panggungharjo
Village is an urban agglomeration area of Yogyakarta, a strategic economic area. As
a result of the development of this strategic economic area is the development of
land use. In the last five years, the pattern of land use in the village of Panggungharjo
has experienced a significant change. The type of land has changed its function to
become a settlement and business activity at around 2% per year. Based on aggregate population data in 2018, the population of
Panggungharjo Village was 28,141 people, consisting of 14,140 male inhabitants
and 14,001 female residents. When compared with the population in 2017, there was
a population growth of 1.89%. Population character is more characteristic of urban
society because the income source of the population is no longer supported by the
agricultural sector but is more dominated by the service and trade sectors. Poverty
in this village characterizes the urban poor characterized by homeless, landless, and
jobless conditions. This condition of poverty is a special concern for the Village
Government, which should be alleviated through the use of village assets.
B. Profile of Asset Utilization
Panggungharjo Village is one of the leading villages in utilizing village assets.
Panggungharjo village assets are used for several types of businesses, including
domestic waste processing, the production of substitute diesel fuel from used oil, the
production of tamanu oils/nyamplung oil, the development of village tourism
services, and the production of rice commodities as complementary products for the
village tourism business. The Village Owned Enterprises manage all utilization of
village assets. Utilization of assets in 2017 generated Village Original Income of Rp
1,453,977,200 or contributed around 30% of total village income.
Table 1: Utilization of Panggungharjo Village Assets
Type of business Form of Asset Utilization
Local Waste
Management
Economic waste sorting
Production of diesel
fuel substitutes
Processing used cooking oil / used cooking oil with diesel
fuel substitute.
Tamanu Oils
Production
Production of Tamanu Oils/nyamplung oil as a raw
material for cosmetics and medical stuff.
Village tourism
services
a village tourism concept restaurant called "Kampoeng
Matraman"
Rice Production Rice production under the brand name "Bestari" in the
Mataram-era village environment, as a supporting unit for
tourism service businesses.
Source: processed from interviews
Taufik Raharjo, Roby Syaiful Ubed, Ambang Aris Yudanto, Retno Yuliati
Innovations of Village Asset Management: A Case of Indonesian Village
© 2021 by MIP 454
C. Analysis of Innovation Patterns in Utilizing Village Assets
The land assets of the village of Panggungharjo are not coming from natural
resources. Unlike other villages that have village assets with abundant natural
resources. The lack of value of village assets is not a reason to discourage steps from
exploring the potential of these assets for the welfare of village communities.
Informant 1, Head of the village of Panggungharjo said:
"If we do not have a landscape, then (we have to focus on) the life-scape. The
social-scape, about culture, about economics, about technology, merely needs
to be highly-utilized."
The statement of the village head is a motivation for village asset
managers to be creative in producing innovative products or services. Not only
relying on the natural wealth contained in village assets but also how to do
innovative businesses to benefit through existing village assets by paying attention
to what business is appropriate to run. The initial form of innovation is to determine
good business in utilizing village assets. Informant 2, as the manager of village
assets, said:
“What needs to be considered is how to start the Village-owned enterprise
business focus; when we decided to build the wrong business unit, the business
will be finished. Therefore, it must be very observant on how to choose a
business unit. Therefore it needs to conduct a study before the establishment of
the business. Next, we have to make a business plan, complete the business
analysis.”
Regarding the community's characteristics in Pangungharjo village that
resembles the character of urban communities, asset utilization businesses tend to
provide services. Informant 3 said:
“The business is more into services-based because there are five campuses
around here, mostly for its citizens who set up boarding houses and restaurants.
Laundry business too, so many services that can be explored.”
Next, we will identify the forms of innovation found in each business unit
that effectively utilizes village assets.
1. Domestic Waste Management
Waste management was established in 2013, starting with concern over increasingly
worrisome environmental conditions. This domestic waste management is managed
by the "KUPAS", a business unit that stands for Waste Management Business
Group. The establishment of KUPAS by carrying the slogan "Caring Waste for the
Future of Our Children and Grandchildren" means bringing together the strengths
PLANNING MALAYSIA
Journal of the Malaysia Institute of Planners (2021)
455 © 2021 by MIP
of the village community with a caring orientation to the future of children. That is
an affirmation of the commitment of the Panggungharjo Village Government to the
community of Panggungharjo Village with its great potential through waste
management which has become a classic problem in the Panggungharjo Village
area.
This asset utilization innovation captures business opportunities that meet
the livelihoods of the people. As long as the community needs it, we can take
advantage of the effort. Informant 2 stated that:
“The business unit that controls the basic human life, garbage, as long as
humans (it is unclear) how much additional human will produce waste, he will
need forever related to waste management and processing, it becomes a basic
human need.”
The revenue generated from waste management consists of three sources,
firstly the income from retribution, secondly, the income from the sale of waste that
still has economic value, and thirdly from making organic fertilizer. Village assets
are used as a waste sorting process that still has economic value, such as plastic
bottles. In addition, village assets are also used to process organic waste that can
produce organic fertilizer. These organic fertilizers are marketed to plant traders and
primarily to help healthy rice production business units.
When viewed from the perspective of the Habitability concept, the
domestic waste management program is included in the elements of social-cultural
and psychological aspects, which relate to people and their activities that affect the
quality of a living environment. In socio-cultural aspects, the social needs of the
people are a prerequisite in habitability (Meng, 2006). Finally, it can be said that this
innovation is beneficial for public services.
2. Production of Solar Substitute Fuels
The processing of used cooking oil / used cooking oil with diesel fuel results is an
innovation from Informant 1 that has been researching for two years. Informant 3
said that:
“The business of managing used cooking oil is also coming from Wahyudi’s
contribution himself, who researched for years. The used cooking oil is only
filtered, and the results are sent to the AQUA factory to fuel the factory as much
as 10 tons per month. The results of this used fried oil processing are used as a
substitute for fuel, 20% using used cooking oil, 80% is diesel fuel. Moreover,
those who did the research were Wahyudi. The equipment in the box is all the
initial bottles used by Wahyudi to conduct research. Suppose he researches
returning to college. So, he likes to do research.”
Taufik Raharjo, Roby Syaiful Ubed, Ambang Aris Yudanto, Retno Yuliati
Innovations of Village Asset Management: A Case of Indonesian Village
© 2021 by MIP 456
The source of used cooking oil comes from collectors who have
collaborated with the manager of this business unit. Informant 3 said that:
“So, we have collectors who deposit to us. Because if we look for it from the
household, it will be difficult and time-consuming to collect. We work with
collectors, and collectors usually take it in catering, large restaurants, hotels,
something like that. Sometimes there are VOEs around Jogja that we always
offer cooperation as collectors of used cooking oil.”
3. Tamanu Oils production
Village assets are used as a production location for Tamanu Oils / nyamplung
oil. Tamanu Oils is a raw material for making cosmetics and medical drugs. The
production process of Tamanu oils uses appropriate technology to utilize the fruit
called Nyamplung waste that is on the southern coast of Java.
4. Village Tourism Services
Village tourism services in the village of Panggungharjo take advantage of the
village's assets by establishing "Mataram village", a restaurant with a village tourism
concept. The innovation presented in the Mataraman village presents the atmosphere
of the life of the people of the Mataram Islamic era. Description of innovation
explained by Informant 2:
"All forms of creativity are there, but when creativity is formed, no innovation
will die. There is not the natural landscape that we are prioritizing, but
education, so we have the Mataram village by the concept. We want to turn on,
bring back the life of the era of the 19th time, the triumph of Islamic Mataram.
We present an agrarian society that still uses buffalo for plowing.
It became exciting and became a business opportunity. Jogja is a tourist
destination, and tourists are returning, wanting to remember back to the life of
his grandfather or his childhood, that is what they will tell his grandchildren,
long time ago we were like this, seeing the shape of his house just remembered,
the shape of the limasan house, seeing people wearing traditional clothes, using
trousers to go to rice fields, to the market, using a headband. So that when we
get there, already, that is innovation, we are aware, creativity if there is no
innovation will die, so the innovations that we are doing now are adjusted to
the desires of tourists or the community towards village life, again need a selfie,
yes we prepare, there is a bridge from bamboo yes there is no connection. It
cannot be bent, it becomes a question, the curved shape is confused, yes the
bamboo is curved without a connection, we can see there is no connection, the
archway is also curved, it can bend, the curved bridge is unbroken, it is an
innovation that makes something, people Yes, we provide selfies, the culture of
eating alone is different now, before eating it was praying. However, it is

PLANNING MALAYSIA
Journal of the Malaysia Institute of Planners (2021)
457 © 2021 by MIP
innovation before eating, taking a picture, and uploading, so the Mataraman
village is different from other food stalls because there is a concept. In
Mataraman Village, non-MSG, non-MSG food is sold there, and the rice is also
healthy, so that makes a difference. Because we are different from the others,
the segments are different, right. The prices are affordable, the food served is
healthy. In the past, Mataram was free from MSG.”
The initial idea for establishing of the Mataraman village began with a
problem that had arisen since Panggungharjo village became a pilot village for other
village governments. The consequence of becoming a pilot village is that it often
receives visits from other village governments nationwide. Informant 3 said:
“If there are visiting guests at the village hall, because our schedule is indeed
a lot, I only receive three visits a day. Many visitors from outside the area cause
the village hall filled by traders who sell like the incidental market.”
Due to being overwhelmed by visits, it will be transferred to mataraman
village when there is a visit from outsiders. There was also a team there that
facilitated the visit. The effect is that if the visit would interfere with services to
residents and drain the Panggungharjo village budget, now the citizens' service is
prioritized, and guests will bring income to the village of Panggungharjo, because
guests will spend money to get the facilities. Informant 3 says:
"Because it is we who take care of guest visits like that. At first, the one
managing it was a village, but there were so many requests for a visit.
Moreover, Pak Yudi is like, "This village takes care of guests, not taking care of
citizens". Then finally at VOEs, right? We also contribute, especially if there
are many like that. We provide snacks, consumption, and hospitality. So, after
that, we make it a business opportunity."
5. Rice Production
The use of village assets is then the usage of land to produce healthy rice. In addition,
healthy rice production in the mataram village environment, as a supporting unit for
the Mataraman village tourism service business. Informant 3 said:
"We used to have healthy rice. That is the rice field in Matraman village. That
is the village treasury and crooked. We rent crooked land per year of 20 million.
In total, there are 6 hectares we use about 3 hectares we plant."
The innovation in utilizing village assets is the production of healthy rice.
Rice produced is rice with quality and price that is more attractive than conventional
rice. Informant 2 said:
Taufik Raharjo, Roby Syaiful Ubed, Ambang Aris Yudanto, Retno Yuliati
Innovations of Village Asset Management: A Case of Indonesian Village
© 2021 by MIP 458
"We do not call this organic rice, but we call it healthy because if it is organic,
we have to go through water management. If in Panggungharjo it is wastewater,
it requires quite expensive costs when we do water management, so this is 0%
contamination of pesticides. We only call it healthy. The price is only Rp 12,000,
almost the same as the hope that the lower-middle-class people can still access
it because we serve not only the upper-middle class, there are middle-lower-
class villagers, and some are upper-middle class."
CONCLUSION This study is a qualitative study that identifies the patterns of innovative asset
management in Panggungharjo, a village located in Yogyakarta, Indonesia. The
village assets have been successfully managed to increase the community’s
earnings by creating innovative businesses such as technology-based business
innovations and using exceptional business processes.
There is a pattern in the innovation of the use of village assets to provide
income to the original village income and provide benefits to the community. First,
the utilization of village assets must be directed to businesses that can provide
profits and benefits, so it needs to be managed by a notable profit-oriented Village
Institution (VOEs). Second, innovation in utilizing village assets must be posted on
businesses that can meet the community's needs so that the market share is evident.
Third, innovation in utilizing village assets needs to be combined with appropriate
technology.
LIMITATION AND FUTURE RESEARCH This study was conducted in the Indonesian settings. Nonetheless, the study results
may not apply to village asset management in other countries, particularly the
Western ones. At last, these findings are likely to have substantial implications for
village asset managers from other villages in designing and implementing how to
maximize village asset utilization for the benefit of the village community.
ACKNOWLEDGEMENTS
Authors thank to Politeknik Keuangan Negara STAN and Universitas Prasetiya
Mulya for the support during the research process. We also thank all respondents
from several village governments for cooperation in the survey.
REFERENCES Albury, D. (2005). Fostering innovation in public services. Public money and management,
25(1), 51-56.
Anwar, M. Z., & Angga, R. D. (2018). Perempuan, Aset Desa, Dan Sumber Penghidupan:
Studi Kasus Desa Gadungan, Blitar, Jawa Timur. Musãwa Jurnal Studi Gender dan
Islam, 16(1), 81-96.
PLANNING MALAYSIA
Journal of the Malaysia Institute of Planners (2021)
459 © 2021 by MIP
Borins, S., (2001). Encouraging innovation in the public sector. Journal of Intellectual
Capital 2, 310–319.
de Vries, Hanna, Victor Bekkers, and Lars Tummers. 2016. Innovation in the Public Sector:
A Systematic Review and Future Research Agenda. Public Administration 94(1):
146–66.
Eggers, B., Singh, S., (2009). The Public Innovators Playbook. Harvard Kennedy School of
Government, Washington, DC.
Hartanto, D. A. (2016). Kedudukan Tanah Bengkok Sebagai Hak Asal Usul Pasca Undang-
Undang Nomor 6 Tahun 2014 Tentang Desa. Jurnal Mahkamah: Kajian Ilmu
Hukum Dan Hukum Islam, 1(2), 461-487.
Koch, P., Hauknes, J., (2005). Innovation in the public sector. NIFU STEP, Oslo.
Lindsay, C., Findlay, P., McQuarrie, J., Bennie, M., Corcoran, E. D., & Van Der Meer, R.
(2018). Collaborative innovation, new technologies, and work redesign. Public
Administration Review, 78(2), 251-260.
Meng, L. L., Abdullah, A., Fern, T. S., Badarulzaman, N., & Hassan, A. S. (2006). How we
failed to plan for habitability. PLANNING MALAYSIA, 4(1).
Natalia, Y.S., Sulindawati, N.L.G.E., Atmadja, A.T. (2017). Pengaruh Profesionalisme
Pengelolaan Aset Desa, Optimalisasi Pemanfaatan Aset Desa, Dan Pemberdayaan
Masyarakat Terhadap Pendapatan Asli Daerah. Jurnal Akuntansi Program S1, 7(1)
Nurjaman, R. (2018). Desa Sebagai Penggerak Ekonomi Lokal: Potret Transformasi
Ekonomi Tiga Desa Di Jawa. Jurnal Analis Kebijakan, 2(1)
Tahir, Z., & Malek, J. A. (2016). Main criteria in the development of smart cities determined
using analytical method. Planning Malaysia, 14(5).
Ricky W. Griffin Management, (2012), 11th ed South-Western Natorp Boulevard Mason
Robbins, Stephen P. Management / Stephen P. Robbins, Mary Coulter. (2012) , 11th ed.
Pearson Education, Inc., publishing as Prentice Hall, One Lake Street, Upper Saddle
River, New Jersey
Robertson, R., & Ball, R. (2002). Innovation and improvement in the delivery of public
services: The use of quality management within local government in Canada. Public
Organization Review. A Global Journal, 2(4), 387–405.
Sutaryo, S. (2016). Praktik Pengelolaan Aset Desa Di Pemerintahan Desa Provinsi Jawa
Tengah. AKRUAL: Jurnal Akuntansi, 7(2), 153-175
Received: 12th July 2021. Accepted: 7th Sept 2021
1 Senior Officer at Valuation and Property Services Department, INSPEN. Email: [email protected]
PLANNING MALAYSIA:
Journal of the Malaysian Institute of Planners
VOLUME 19 ISSUE 3 (2021), Page 460 – 471
SIGNIFICANCE AND PERFORMANCE OF PROPERTY
MARKETS IN MALAYSIA
Mohd Haris Yop1
Valuation and Property Services Department
MINISTRY OF FINANCE MALAYSIA
Abstract
The importance of the global real estate market has been widely debated over the
last decade. Prior discussion has focused on various aspects of analysis used to
evaluate the performance of the property market, such as statistical analysis,
surveys, academic or industrial literature. As a result, it is also necessary to
examine the global and Asian property markets while also evaluating the
significance and performance of the Malaysian property market in comparison to
other Asian markets to determine Malaysia's international contribution to the
global property market. The performance of Malaysia's property market from
2015 to 2018 was examined in this study. Data was gathered using Thomson
Router Data Stream from Real Capital Analytic, Asia Pacific Real Estate
Association (APREA), World Economic Forum, and Transparency International,
among others. The study's findings will extend knowledge not only of the
performance and significance of the Malaysian property market, but also of GDP
growth, inflation rate, market ranking global, competitiveness business
environment index, corruption perception, and risk and transparency index in
Malaysia and across Asian countries. The overall results indicate that the
performance and signs of the Malaysian real estate market were better compared
to other Asian and developing markets.
Keyword: significance, performance of property market
PLANNING MALAYSIA
Journal of the Malaysia Institute of Planners (2021)
461 © 2021 by MIP
RESEARCH BACKGROUND The importance of the global real estate market has been widely debated over the
last decade. Prior discussion has focused on various aspects of analysis used to
evaluate the performance of the property market, such as statistical analysis,
surveys, academic or industrial literature. As a result, it is also necessary to
examine the global and Asian property markets while also assessing the
significance and performance of the Malaysian property market in comparison to
other Asian property markets. To strengthen the findings of this study, a
comparison with other countries will be made to determine the international
contribution of the Malaysian property market in global portfolios. The study
included perspectives from Malaysians, Asians, and selected developed countries
as a benchmark for the home nation. It begins by addressing the global countries,
Asian countries, and previous studies that have influenced this research.
LITERETURE REVIEW There have only been a few studies that focused on Malaysian property market
performance. As an example, Ting and Tan (2008) expressed an interest in the
Malaysian real estate market, but only for residential properties. Ting (2002)
investigated the comprehensive comparative analysis of Malaysian listed
property companies; however, the research was limited to shares of property
market significance and performance.
Global real estate has been going to look for real estate investment
opportunities in emerging real estate markets, particularly in Asia, in recent years.
This trend reflects research highlighting the benefits of including international
real estate in mixed-asset portfolios for portfolio diversification (Wilson and
Okunev, 1996; Steinert and Crowe, 2001; Bond, Karolyi, and Sanders, 2003;
Conover, Friday, and Sirmans, 2003; and Hoesli, Lekander, and Wit-kiewicz,
2005). This has contributed in recent emphasis on the dynamics of specific Asian
real estate markets (e.g., Hong Kong) (Newell and Chau, 1996; Chau,
MacGregor, and Schwann, 2001; Chau, Wong, and Newell, 2003; Schwann and
Chau, 2003; and Newell, Chau, and Wong, 2004), the development of Asian
REITs (UBS, 2005; and Ooi, Newell, and Sing, 2006), and the rapidly growing
real estate (Tse, Chiang, and Raftery, 1998; Webb and Tse, 2000; Chu and Sing,
2004; and Newell, Chau, Wong, and Mc-Kinnell, 2005). In summary, recent
research of the Malaysian property market is still limited when compared to other
countries; thus, there are several opportunities to explore Malaysia property
market research. Nevertheless, no evident study has been undertaken on the
significance and performance of the Malaysian property market.
Mohd Haris Yop
Significance and Performance of Property Markets in Malaysia
© 2021 by MIP 462
Global Economy Context The first quarter of 2018 saw a big decline in real estate investment activity that
was globally closely linked. Confidence has since improved, but after five years
of growth in investment turnaround, investors are starting to wonder if the cycle's
end is near. Most likely not, for two reasons: The first is strong economic growth.
Property investment does not exist in a vacuum; it is part of a larger economic
integration process. According to economists, GDP growth is the most important
single driver of total capital flows and real estate flows. GDP growth generates
occupier demand for space and thus supports rent values, but it also generates
market confidence and banks’ lending confidence. Surprisingly, the global
economy has been growing in both real and nominal terms over the last seven
years. Overall, it has grown much faster than real estate investment flows, so real
estate investment remains well below its recent peak as a percentage of global
GDP. As a result of previous nominal growth and future real growth, global
economic support for real estate investment remains strong.
The Malaysian Performance Economy Malaysia's economy grew by 4.3 % in the third quarter of 2016 (2Q 2016: 4.0 %),
primarily driven by continued growth in private sector spending and additional
support from net exports. On the supply side, the major economic sectors
continued to drive growth. On a seasonally adjusted quarterly basis, the economy
grew by 1.5 % from one quarter to the next (2Q 2016: 0.7 %). The Malaysian
economy weathered through significant headwinds in 2014 and 2015, such as the
fall in commodities prices, a dismal global trade environment, and a weakened
Ringgit to emerge relatively unscathed. Nominal GDP grew 22 times from 1980
to 2015, while nominal GDP per person grew 9.9 times in the same period.
Malaysia’s GDP per person remains higher than the average for upper-middle-
income countries. In absolute terms, this meant that average monthly household
incomes grew by RM1,141, while median household incomes grew by RM959
per month. Progress in household income, in turn, drove a decrease in the poverty
rate, which stood at 0.6 % in 2014, down from 1.7 % in 2012.
Services grew 6.1 % backed by wholesale & retail trade, information &
communication, and food & beverage and accommodation. Manufacturing sector
increased to 4.3 % contributed by electrical, electronic & optical products and
petroleum, chemical, rubber & plastic products. Meanwhile, the mining and
quarrying sector rebounded to 2.9 % driven by the recovery in natural gas
production. The agriculture sector posted a growth of 4.2 % following a
moderation in Oil palm and contraction in Fishing and Forestry & logging. The
construction sector grew marginally at 0.5 % contributed by Civil engineering
and Specialised construction activities. Businesses are more confident for the
second quarter of 2019, with the overall confidence indicator rising to +2.8 %
from -2.2 % in the first quarter of 2019.
PLANNING MALAYSIA
Journal of the Malaysia Institute of Planners (2021)
463 © 2021 by MIP
Global Real Estate Transparency Index The ninth edition of the Global Real Estate Transparency Index (GRETI) contains
the most comprehensive country comparisons of data availability, governance,
transaction processes, property rights, and the regulatory and legal environment
around the world. The Index is updated every two years and has been charting
the evolution of real estate transparency across the globe for 17 years. The 2018
Index includes 109 markets. The 2018 Index has increased granularity in response
to the real estate industry's need for more detailed data to inform decisions.
Additional elements include the availability of disaggregated datasets; data on
alternative sectors (such as student housing and self-storage); and aggregate data
on debt and financing conditions. This has resulted in a 21% increase in the
number of individual factors covered to 139. Although the survey's consistency
is not compromised, increased scrutiny and the explicit inclusion of more factors
account for some of the changes in score between 2016 and 2018. Since the
index's inception in 1999, its components have evolved and been refined to reflect
the changing needs of global investors and corporate occupiers. As a result, in
order to allow for cross-temporal comparisons, the index has recreated a historic
Transparency Index based on current weights and questions, emphasising that the
recalibrated historic Indices differ from those published at the time of each
survey.
METHODOLOGY In order to provide convincing results, the three research objectives will be
examined using a variety of scientific methodologies. The primary source for this
research is secondary data. Secondary data was gathered at Western Sydney
University using Thomson Router Data Stream. Secondary data sources included
journals and annual reports from Real Capital Analytic, Asia Pacific Real Estate
Association (APREA), World Economic Forum, and Transparency International,
among others.
DATA ANALYSIS Malaysia GDP
GDP at purchaser's prices equals the sum of the gross value added by all resident
producers in the economy plus any product taxes and minus any subsidies not
included in the product value. It is calculated without accounting for the
depreciation of manufactured assets or the depletion and degradation of natural
resources. The figures are in current US dollars. Dollar GDP figures are
calculated by converting domestic currencies to US dollars using one-year
official exchange rates. An alternative conversion factor is used in a few countries
where the official exchange rate does not accurately represent the rate effectively
applied to actual foreign transactions.
Mohd Haris Yop
Significance and Performance of Property Markets in Malaysia
© 2021 by MIP 464
Table 1: Malaysia GDP vs Asian GDP
Country 2015 2016 2017 2018 Brunei Darussalam 16953505122 16110693734 17104656669 15492035784 Cambodia 14038383450 15449630419 16777820333 18049954289 Indonesia 9.1787E+11 9.12524E+11 8.90487E+11 8.61934E+11 Lao PDR 9359185244 11192471435 11715619756 12327488341 Malaysia 3.14443E+11 3.23343E+11 3.38104E+11 4.96218E+11 Myanmar 74690222131 58652652371 64330041773 64865515159 Philippines 2.50092E+11 2.71927E+11 2.84777E+11 2.91965E+11 Singapore 2.89269E+11 3.00288E+11 3.06344E+11 2.92739E+11 Thailand 3.97291E+11 4.19889E+11 4.0432E+11 3.95282E+11 Vietnam 1.5582E+11 1.71222E+11 1.86205E+11 1.93599E+11
Source: Author’s Compilation
Malaysia GDP Growth vs Asian GDP Growth
The annual percentage growth rate of GDP at market prices is based on constant
local currency. Aggregates are based on constant 2010 U.S. dollars. GDP is the
sum of gross value added by all resident producers in the economy plus any
product taxes and minus any subsidies not included in the value of the products.
It is calculated without making deductions for depreciation of fabricated assets or
depletion and degradation of natural resources.
Table 2: Malaysia GDP Growth vs Asian GDP Growth
Country 2010 2014 2015 2016 2017 2018 Brunei Darussalam 2.60 3.43 0.95 -1.75 -2.34 -0.50 Cambodia 5.96 7.07 7.26 7.48 7.07 7.04 Indonesia 6.22 6.17 6.03 5.56 5.02 4.79 Lao PDR 8.53 8.04 8.02 8.47 7.52 7.00 Malaysia 7.43 5.29 4.47 4.71 4.50 4.95 Myanmar .. .. .. 8.52 8.50 6.99 Philippines 7.63 3.66 6.68 7.06 6.13 5.81 Singapore 15.24 6.21 3.67 4.68 3.26 2.01 Thailand 7.51 0.83 7.23 2.70 0.82 2.82 Vietnam 6.42 6.24 5.25 5.42 5.98 6.68
Source: Author’s Compilation
The World’s Top 5 Economies Country & Asian Inflation Rate:
Inflation, as measured by the annual growth rate of the GDP implicit deflator,
shows the rate of price change in the economy as a whole. The GDP implicit
deflator is the ratio of GDP in current local currency to GDP in constant local
currency.
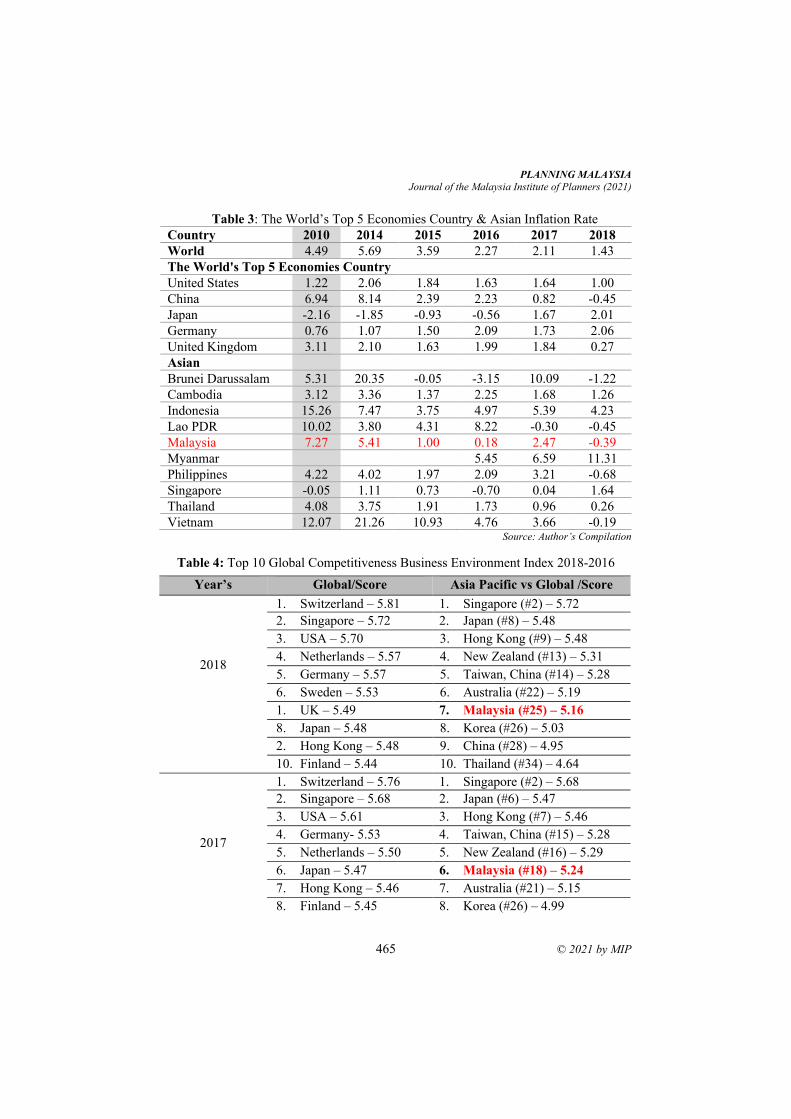
PLANNING MALAYSIA
Journal of the Malaysia Institute of Planners (2021)
465 © 2021 by MIP
Table 3: The World’s Top 5 Economies Country & Asian Inflation Rate
Country 2010 2014 2015 2016 2017 2018
World 4.49 5.69 3.59 2.27 2.11 1.43
The World's Top 5 Economies Country
United States 1.22 2.06 1.84 1.63 1.64 1.00
China 6.94 8.14 2.39 2.23 0.82 -0.45
Japan -2.16 -1.85 -0.93 -0.56 1.67 2.01
Germany 0.76 1.07 1.50 2.09 1.73 2.06
United Kingdom 3.11 2.10 1.63 1.99 1.84 0.27
Asian
Brunei Darussalam 5.31 20.35 -0.05 -3.15 10.09 -1.22
Cambodia 3.12 3.36 1.37 2.25 1.68 1.26
Indonesia 15.26 7.47 3.75 4.97 5.39 4.23
Lao PDR 10.02 3.80 4.31 8.22 -0.30 -0.45
Malaysia 7.27 5.41 1.00 0.18 2.47 -0.39
Myanmar 5.45 6.59 11.31
Philippines 4.22 4.02 1.97 2.09 3.21 -0.68
Singapore -0.05 1.11 0.73 -0.70 0.04 1.64
Thailand 4.08 3.75 1.91 1.73 0.96 0.26
Vietnam 12.07 21.26 10.93 4.76 3.66 -0.19 Source: Author’s Compilation
Table 4: Top 10 Global Competitiveness Business Environment Index 2018-2016
Year’s Global/Score Asia Pacific vs Global /Score
2018
1. Switzerland – 5.81 1. Singapore (#2) – 5.72
2. Singapore – 5.72 2. Japan (#8) – 5.48
3. USA – 5.70 3. Hong Kong (#9) – 5.48
4. Netherlands – 5.57 4. New Zealand (#13) – 5.31
5. Germany – 5.57 5. Taiwan, China (#14) – 5.28
6. Sweden – 5.53 6. Australia (#22) – 5.19
1. UK – 5.49 7. Malaysia (#25) – 5.16
8. Japan – 5.48 8. Korea (#26) – 5.03
2. Hong Kong – 5.48 9. China (#28) – 4.95
10. Finland – 5.44 10. Thailand (#34) – 4.64
2017
1. Switzerland – 5.76 1. Singapore (#2) – 5.68
2. Singapore – 5.68 2. Japan (#6) – 5.47
3. USA – 5.61 3. Hong Kong (#7) – 5.46
4. Germany- 5.53 4. Taiwan, China (#15) – 5.28
5. Netherlands – 5.50 5. New Zealand (#16) – 5.29
6. Japan – 5.47 6. Malaysia (#18) – 5.24
7. Hong Kong – 5.46 7. Australia (#21) – 5.15
8. Finland – 5.45 8. Korea (#26) – 4.99
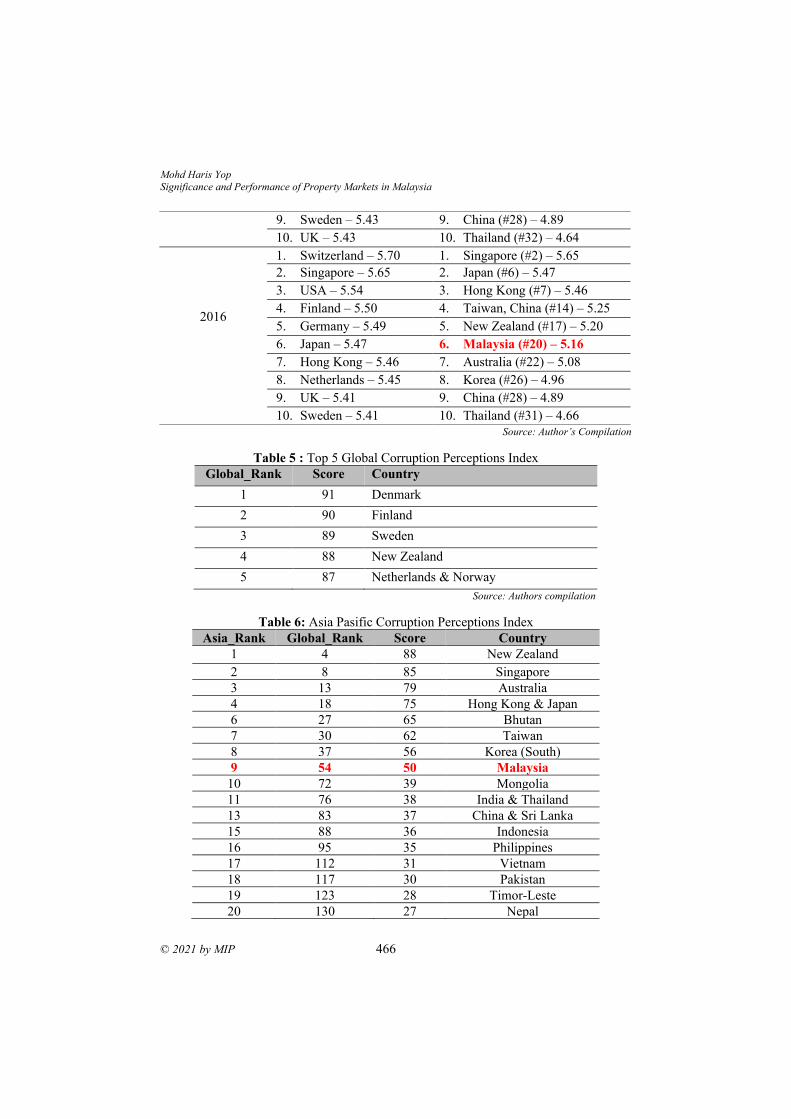
Mohd Haris Yop
Significance and Performance of Property Markets in Malaysia
© 2021 by MIP 466
Source: Author’s Compilation
Table 5 : Top 5 Global Corruption Perceptions Index
Global_Rank Score Country
1 91 Denmark
2 90 Finland
3 89 Sweden
4 88 New Zealand
5 87 Netherlands & Norway
Source: Authors compilation
Table 6: Asia Pasific Corruption Perceptions Index
Asia_Rank Global_Rank Score Country
1 4 88 New Zealand
2 8 85 Singapore
3 13 79 Australia
4 18 75 Hong Kong & Japan
6 27 65 Bhutan
7 30 62 Taiwan
8 37 56 Korea (South)
9 54 50 Malaysia
10 72 39 Mongolia
11 76 38 India & Thailand
13 83 37 China & Sri Lanka
15 88 36 Indonesia
16 95 35 Philippines
17 112 31 Vietnam
18 117 30 Pakistan
19 123 28 Timor-Leste
20 130 27 Nepal
9. Sweden – 5.43 9. China (#28) – 4.89
10. UK – 5.43 10. Thailand (#32) – 4.64
2016
1. Switzerland – 5.70 1. Singapore (#2) – 5.65
2. Singapore – 5.65 2. Japan (#6) – 5.47
3. USA – 5.54 3. Hong Kong (#7) – 5.46
4. Finland – 5.50 4. Taiwan, China (#14) – 5.25
5. Germany – 5.49 5. New Zealand (#17) – 5.20
6. Japan – 5.47 6. Malaysia (#20) – 5.16
7. Hong Kong – 5.46 7. Australia (#22) – 5.08
8. Netherlands – 5.45 8. Korea (#26) – 4.96
9. UK – 5.41 9. China (#28) – 4.89
10. Sweden – 5.41 10. Thailand (#31) – 4.66
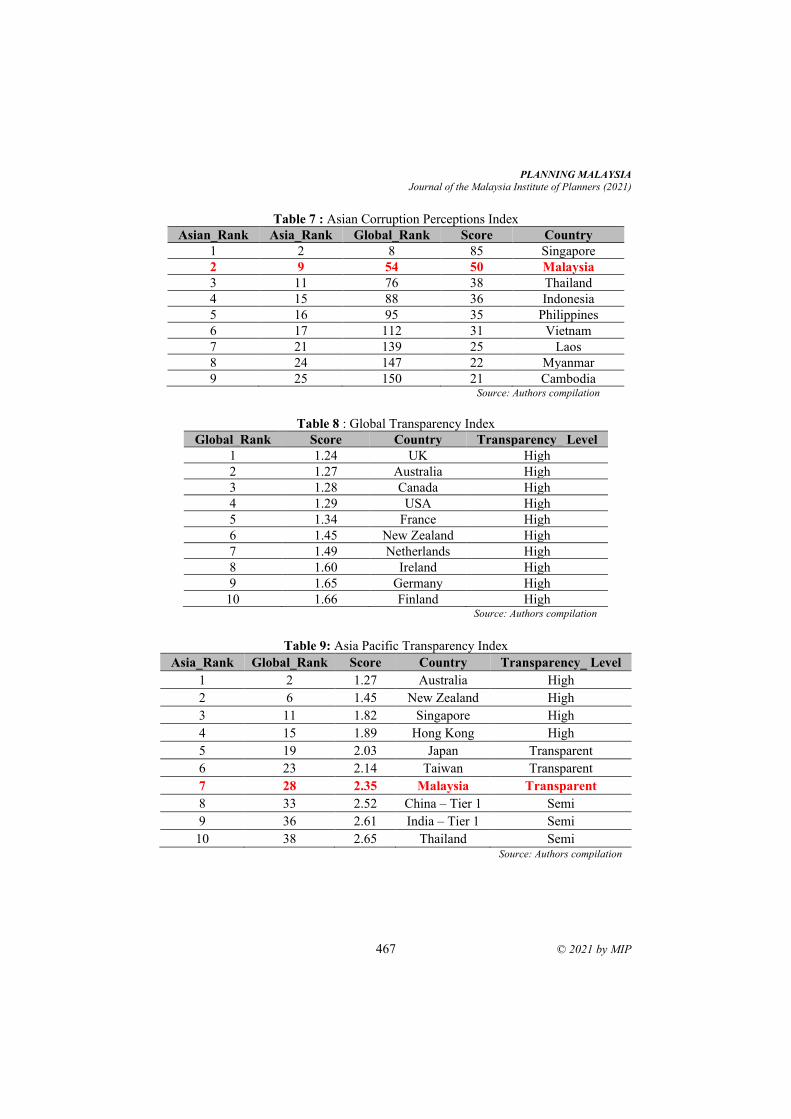
PLANNING MALAYSIA
Journal of the Malaysia Institute of Planners (2021)
467 © 2021 by MIP
Table 7 : Asian Corruption Perceptions Index Asian_Rank Asia_Rank Global_Rank Score Country
1 2 8 85 Singapore
2 9 54 50 Malaysia
3 11 76 38 Thailand
4 15 88 36 Indonesia
5 16 95 35 Philippines
6 17 112 31 Vietnam
7 21 139 25 Laos
8 24 147 22 Myanmar
9 25 150 21 Cambodia Source: Authors compilation
Table 8 : Global Transparency Index
Global_Rank Score Country Transparency_ Level
1 1.24 UK High
2 1.27 Australia High
3 1.28 Canada High
4 1.29 USA High
5 1.34 France High
6 1.45 New Zealand High
7 1.49 Netherlands High
8 1.60 Ireland High
9 1.65 Germany High
10 1.66 Finland High Source: Authors compilation
Table 9: Asia Pacific Transparency Index
Asia_Rank Global_Rank Score Country Transparency_ Level
1 2 1.27 Australia High
2 6 1.45 New Zealand High
3 11 1.82 Singapore High
4 15 1.89 Hong Kong High
5 19 2.03 Japan Transparent
6 23 2.14 Taiwan Transparent
7 28 2.35 Malaysia Transparent
8 33 2.52 China – Tier 1 Semi
9 36 2.61 India – Tier 1 Semi
10 38 2.65 Thailand Semi Source: Authors compilation
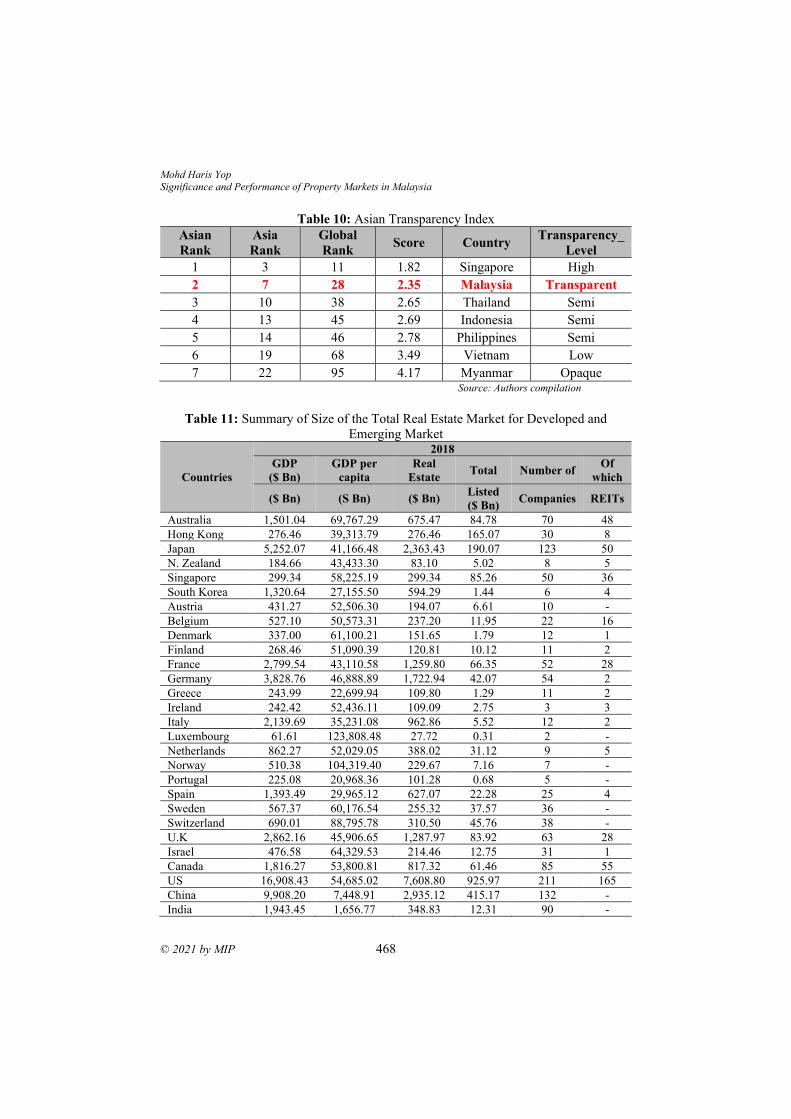
Mohd Haris Yop
Significance and Performance of Property Markets in Malaysia
© 2021 by MIP 468
Table 10: Asian Transparency Index
Asian
Rank
Asia
Rank
Global
Rank Score Country
Transparency_
Level
1 3 11 1.82 Singapore High
2 7 28 2.35 Malaysia Transparent
3 10 38 2.65 Thailand Semi
4 13 45 2.69 Indonesia Semi
5 14 46 2.78 Philippines Semi
6 19 68 3.49 Vietnam Low
7 22 95 4.17 Myanmar Opaque Source: Authors compilation
Table 11: Summary of Size of the Total Real Estate Market for Developed and
Emerging Market
Countries
2018
GDP
($ Bn)
GDP per
capita
Real
Estate Total Number of
Of
which
($ Bn) (S Bn) ($ Bn) Listed
($ Bn) Companies REITs
Australia 1,501.04 69,767.29 675.47 84.78 70 48
Hong Kong 276.46 39,313.79 276.46 165.07 30 8
Japan 5,252.07 41,166.48 2,363.43 190.07 123 50
N. Zealand 184.66 43,433.30 83.10 5.02 8 5
Singapore 299.34 58,225.19 299.34 85.26 50 36
South Korea 1,320.64 27,155.50 594.29 1.44 6 4
Austria 431.27 52,506.30 194.07 6.61 10 -
Belgium 527.10 50,573.31 237.20 11.95 22 16
Denmark 337.00 61,100.21 151.65 1.79 12 1
Finland 268.46 51,090.39 120.81 10.12 11 2
France 2,799.54 43,110.58 1,259.80 66.35 52 28
Germany 3,828.76 46,888.89 1,722.94 42.07 54 2
Greece 243.99 22,699.94 109.80 1.29 11 2
Ireland 242.42 52,436.11 109.09 2.75 3 3
Italy 2,139.69 35,231.08 962.86 5.52 12 2
Luxembourg 61.61 123,808.48 27.72 0.31 2 -
Netherlands 862.27 52,029.05 388.02 31.12 9 5
Norway 510.38 104,319.40 229.67 7.16 7 -
Portugal 225.08 20,968.36 101.28 0.68 5 -
Spain 1,393.49 29,965.12 627.07 22.28 25 4
Sweden 567.37 60,176.54 255.32 37.57 36 -
Switzerland 690.01 88,795.78 310.50 45.76 38 -
U.K 2,862.16 45,906.65 1,287.97 83.92 63 28
Israel 476.58 64,329.53 214.46 12.75 31 1
Canada 1,816.27 53,800.81 817.32 61.46 85 55
US 16,908.43 54,685.02 7,608.80 925.97 211 165
China 9,908.20 7,448.91 2,935.12 415.17 132 -
India 1,943.45 1,656.77 348.83 12.31 90 -
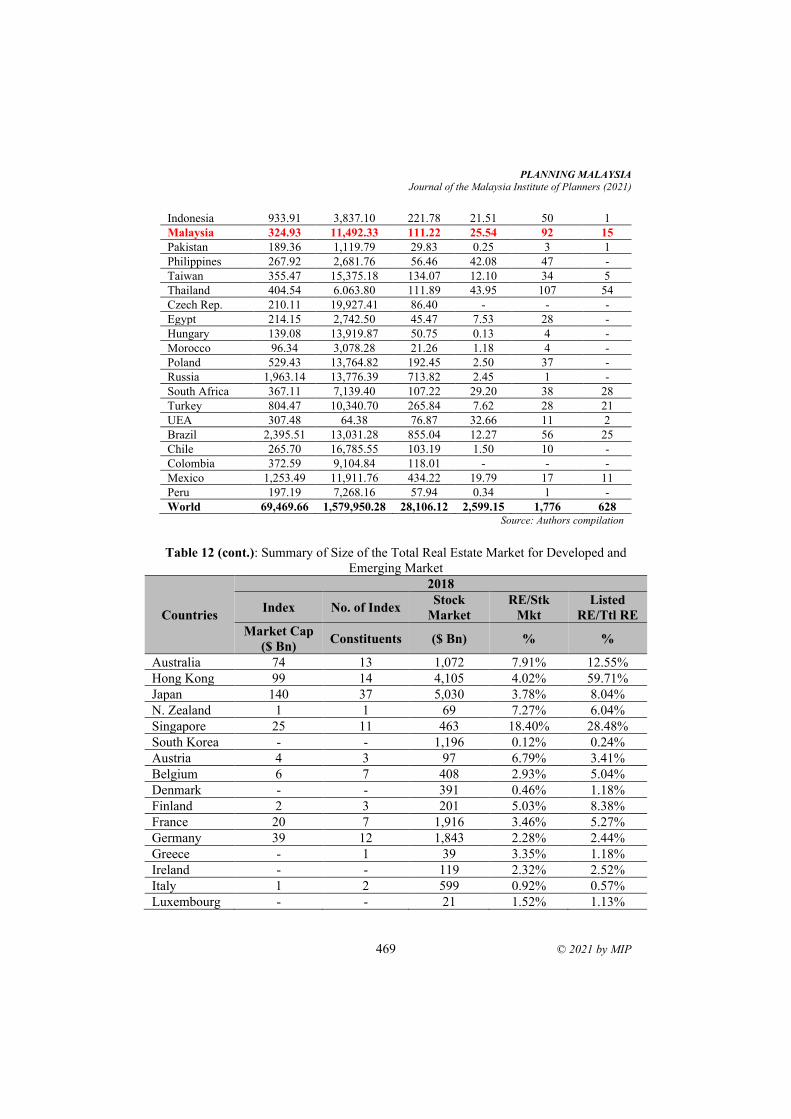
PLANNING MALAYSIA
Journal of the Malaysia Institute of Planners (2021)
469 © 2021 by MIP
Indonesia 933.91 3,837.10 221.78 21.51 50 1
Malaysia 324.93 11,492.33 111.22 25.54 92 15
Pakistan 189.36 1,119.79 29.83 0.25 3 1
Philippines 267.92 2,681.76 56.46 42.08 47 -
Taiwan 355.47 15,375.18 134.07 12.10 34 5
Thailand 404.54 6.063.80 111.89 43.95 107 54
Czech Rep. 210.11 19,927.41 86.40 - - -
Egypt 214.15 2,742.50 45.47 7.53 28 -
Hungary 139.08 13,919.87 50.75 0.13 4 -
Morocco 96.34 3,078.28 21.26 1.18 4 -
Poland 529.43 13,764.82 192.45 2.50 37 -
Russia 1,963.14 13,776.39 713.82 2.45 1 -
South Africa 367.11 7,139.40 107.22 29.20 38 28
Turkey 804.47 10,340.70 265.84 7.62 28 21
UEA 307.48 64.38 76.87 32.66 11 2
Brazil 2,395.51 13,031.28 855.04 12.27 56 25
Chile 265.70 16,785.55 103.19 1.50 10 -
Colombia 372.59 9,104.84 118.01 - - -
Mexico 1,253.49 11,911.76 434.22 19.79 17 11
Peru 197.19 7,268.16 57.94 0.34 1 -
World 69,469.66 1,579,950.28 28,106.12 2,599.15 1,776 628 Source: Authors compilation
Table 12 (cont.): Summary of Size of the Total Real Estate Market for Developed and
Emerging Market
Countries
2018
Index No. of Index Stock
Market
RE/Stk
Mkt
Listed
RE/Ttl RE
Market Cap
($ Bn) Constituents ($ Bn) % %
Australia 74 13 1,072 7.91% 12.55%
Hong Kong 99 14 4,105 4.02% 59.71%
Japan 140 37 5,030 3.78% 8.04%
N. Zealand 1 1 69 7.27% 6.04%
Singapore 25 11 463 18.40% 28.48%
South Korea - - 1,196 0.12% 0.24%
Austria 4 3 97 6.79% 3.41%
Belgium 6 7 408 2.93% 5.04%
Denmark - - 391 0.46% 1.18%
Finland 2 3 201 5.03% 8.38%
France 20 7 1,916 3.46% 5.27%
Germany 39 12 1,843 2.28% 2.44%
Greece - 1 39 3.35% 1.18%
Ireland - - 119 2.32% 2.52%
Italy 1 2 599 0.92% 0.57%
Luxembourg - - 21 1.52% 1.13%
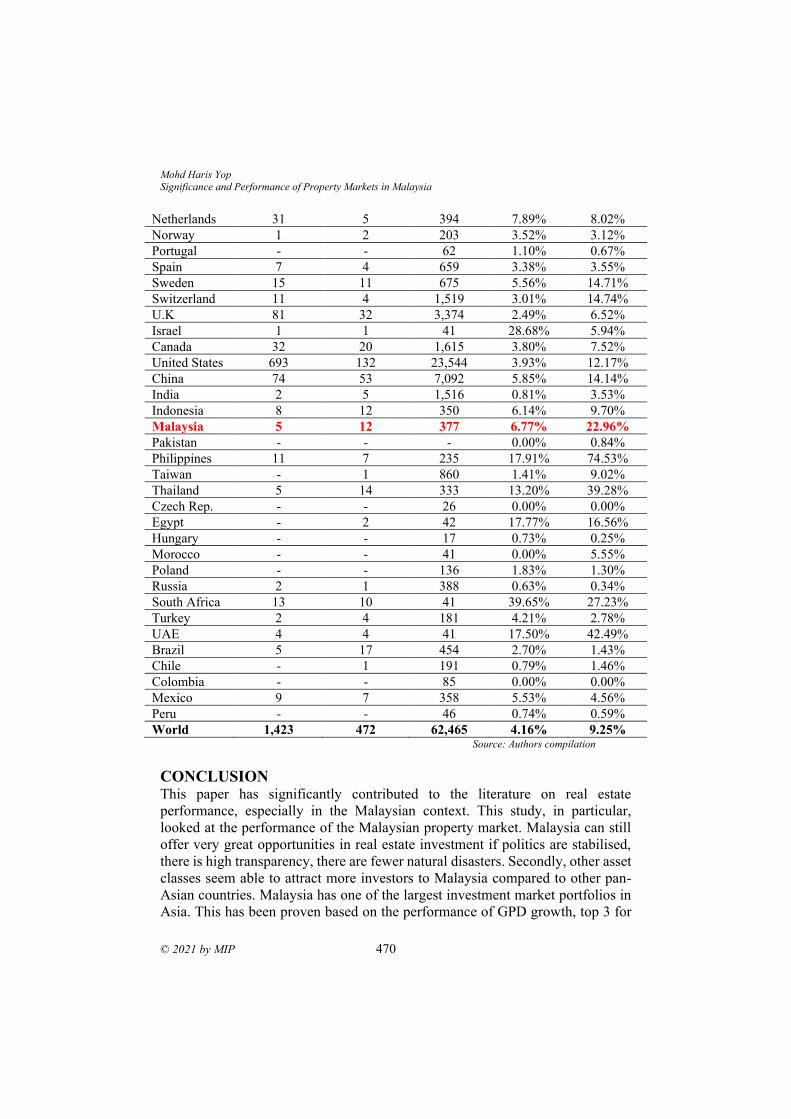
Mohd Haris Yop
Significance and Performance of Property Markets in Malaysia
© 2021 by MIP 470
Netherlands 31 5 394 7.89% 8.02%
Norway 1 2 203 3.52% 3.12%
Portugal - - 62 1.10% 0.67%
Spain 7 4 659 3.38% 3.55%
Sweden 15 11 675 5.56% 14.71%
Switzerland 11 4 1,519 3.01% 14.74%
U.K 81 32 3,374 2.49% 6.52%
Israel 1 1 41 28.68% 5.94%
Canada 32 20 1,615 3.80% 7.52%
United States 693 132 23,544 3.93% 12.17%
China 74 53 7,092 5.85% 14.14%
India 2 5 1,516 0.81% 3.53%
Indonesia 8 12 350 6.14% 9.70%
Malaysia 5 12 377 6.77% 22.96%
Pakistan - - - 0.00% 0.84%
Philippines 11 7 235 17.91% 74.53%
Taiwan - 1 860 1.41% 9.02%
Thailand 5 14 333 13.20% 39.28%
Czech Rep. - - 26 0.00% 0.00%
Egypt - 2 42 17.77% 16.56%
Hungary - - 17 0.73% 0.25%
Morocco - - 41 0.00% 5.55%
Poland - - 136 1.83% 1.30%
Russia 2 1 388 0.63% 0.34%
South Africa 13 10 41 39.65% 27.23%
Turkey 2 4 181 4.21% 2.78%
UAE 4 4 41 17.50% 42.49%
Brazil 5 17 454 2.70% 1.43%
Chile - 1 191 0.79% 1.46%
Colombia - - 85 0.00% 0.00%
Mexico 9 7 358 5.53% 4.56%
Peru - - 46 0.74% 0.59%
World 1,423 472 62,465 4.16% 9.25% Source: Authors compilation
CONCLUSION
This paper has significantly contributed to the literature on real estate
performance, especially in the Malaysian context. This study, in particular,
looked at the performance of the Malaysian property market. Malaysia can still
offer very great opportunities in real estate investment if politics are stabilised,
there is high transparency, there are fewer natural disasters. Secondly, other asset
classes seem able to attract more investors to Malaysia compared to other pan-
Asian countries. Malaysia has one of the largest investment market portfolios in
Asia. This has been proven based on the performance of GPD growth, top 3 for
PLANNING MALAYSIA
Journal of the Malaysia Institute of Planners (2021)
471 © 2021 by MIP
Asian market ranking, top 10 for global competitive business environment index
in the Asia Pacific and transparent country. The opportunity to gain more profits
from investments may come from property investment portfolios, as this
investment type has had an outstanding previous performance record.
REFERENCES Asia Property Market Sentiment Report H1 (2016) and H2 (2015)
Newell, G. and K.W. Chau. Linkages between Direct and Indirect Property Performance
in Hong Kong. Journal of Property Finance
Newell, G., K.W. Chau, and S.K. Wong. The Level of Direct Property in Hong Kong
Property Company Performance. Journal of Property Investment and Finance,
2004
Newell, G., K.W. Chau, S.K. Wong, and K. Mc Kinnell. Dynamics of the Direct and
Indirect Real Estate Markets in China. Journal of Real Estate Portfolio
Management, 2005
Newell, G. Acheampong, P and Karantonis, A. (2002). The Accuracy of Property
Forecasting Pacific Rim Real Estate Society. Christchurch, New Zealand, January
2002. Sydney: PRESS
Nguyen, T.K. (2011) The Significance and Performance of Listed Property Companies
in Asian Developed and Emerging Markets. Pacific Rim Property Research
Journal
Ooi, J., G. Newell, and T.F. Sing. The Growth of REIT Markets in Asia. Journal of Real
Estate Literature, 2006
Schwann, G. and K.W. Chau. News Effects and Structural Shifts in Price Discovery in
Hong Kong. Journal of Real Estate Finance and Economics, 2003
Steinert, M. and S. Crowe. Global Real Estate Investment: Characteristics, Portfolio
Allocation and Future Trends. Pacific Rim Property Research Journal, 2001
Real Capital Analytics (2008). Global Capital Trends: Jan 2008. London: RCA.
Real Capital Analytics (2009). Global Capital Trends: Jan 2009. London: RCA
Tse, R., Y.H. Chiang, and J. Raftery. Office Property Returns in Shanghai, Guangzhou
and Shenzhen. Journal of Real Estate Literature, 1999, 7, 197-208
14th Edition World Bank Group Flagship Report – Doing Business Equal Opportunity to
All (2017)
26th Edition World Bank Group Flagship Report – Global Economic - Prospect
Divergences and Risks
Received: 12th July 2021. Accepted: 17th Sept 2021
1 Lecturer at Polytechnic of State Finance STAN, INDONESIA. Email: [email protected]
PLANNING MALAYSIA:
Journal of the Malaysian Institute of Planners
VOLUME 19 ISSUE 3 (2021), Page 472 – 483
PREVENTIF STATE ASSET MANAGEMENT VS SULTAN
GROUND: A STUDY CASE IN SPECIAL REGION OF
YOGYAKARTA
Aditya Wirawan1, Taufik Raharjo2, Roby Syaiful Ubed3, Retno Yuliati4
1,2,3Department of Financial Management,
POLITEKNIK KEUANGAN NEGARA STAN, INDONESIA 4 Department of Accounting,
UNIVERSITAS PRASETIYA MULYA, INDONESIA
Abstract
This research uses principal negotiation theory to identify further a dispute
emerging between the state asset manager, the central government, and the
special local government, the sultanate government. This study examines the
dispute resolution and the implementation of the dispute resolution between
applying the Yogyakarta Privileges Act to the management of State Property.
This research uses study literature, secondary data and then is analyzed
qualitatively. This study explains that dispute resolution outside the court is more
effective and efficient in managing state property. The costs incurred are
enormous, and the time required is extensive. Therefore, it is better to
immediately design policies, breakthroughs, and arrangements for resolving
disputes between state property and sultanate ground. This study was conducted
in the Indonesian context. However, the study's findings may not be generalizable
to State Asset Management in other countries, especially the Western ones. These
findings are likely to have significant implications for State Asset Management
in designing and implementing how to resolve dispute problems in asset
management in the unique region of Yogyakarta.
Keyword: State Asset Management, Sultanate Ground, Dispute Resolution, State
Asset Management policy
PLANNING MALAYSIA
Journal of the Malaysia Institute of Planners (2021)
473 © 2021 by MIP
INTRODUCTION The authority of the Special Region of Yogyakarta, referred to like DIY, as an
autonomous region encompasses authority in the affairs of Regional Government
and the affairs of Privileges. Privileged affairs have the authority to include rules
for stuffing commissions, standpoints, and authority of the Governor and Deputy
Governor, DIY Regional Government institutions, culture, land, and spatial
planning. It provides a broader understanding of terms that are commonly known
without making new definitions. The Special Region of Yogyakarta has a more
comprehensive specialty stated in Act Number 13 of 2012.
The Land Special Privileges of the Special Region of Yogyakarta are
very broad and connected with regulations regarding the Management of State
Property. Land disputes are protracted and expensive. Management of state
property is the smallest part of State Finance Management. From the point of
view of the State Finance, only court decisions that have permanent legal force
are recognized and implemented. On the other hand, there are procedures outside
the court line regulated in Law Number 30 of 1999 relating Arbitration and
Alternative Dispute Resolution. Although there is a legal basis for resolving cases
in the land sector through Law Number 30 of 1999 relating Arbitration and
Alternative Dispute Resolution, it does not provide legal certainty for the
executor of the agreement on arbitration and alternative dispute resolution. In the
context of DIY Specialties in terms of land, it connects to state property. In the
context of resolving disputes that are fast, simple, inexpensive, providing legal
certainty, maintaining the authority of the state and the legal entity Privileges of
the Special Region of Yogyakarta, alternative disputes settlement in the land
sector is needed.
LITERATURE BACKGROUND A. Pure Theory of Law according to Hans Kelsen
The Pure Law Theory is a theory that aims to notice and explain its goal. This
theory seeks to answer what law is and how it exists, not how it should exist. It is
named pure legal theory since it merely describes the law and investigates to
refine the object of its explanation of everything that has less linked with the law.
The purpose is to clear jurisprudence from unknown elements (Kelsen, 1967:1).
Hans Kelsen also stated that in the process of legislation formation, the
theory of the level of law (Stufentheorie). In this theory, Hans Kelsen says that
legal regulations are layered in a hierarchy. Higher regulations are applied,
originate, and are based on higher regulations, and arrive at regulations that
cannot be traced further are hypothetical and fictitious, called the basic regulation
(Grundnorm). Basic Norms are the paramount regulations in a system of
regulations no longer formed by higher regulations, but the basic regulations are
determined in advance by the society as the basic norms, which are the source of
Aditya Wirawan, Taufik Raharjo, Roby Syaiful Ubed, Retno Yuliati
Preventif State Asset Management Vs Sultan Ground: A Study Case in Special Region of Yogyakarta
© 2021 by MIP 474
the following norms. Therefore, a Basic Norm is said to be pre-supposed (Farida,
2010).
Hans Nawiasky, a colleague of Hans Kelsen, developed the theory of
the level of law. Regulations that are leveled and at several levels, the legal
regulations of a country are also organized, and the organization of legal
regulations in a country consists of four main groups, among others:
a) First association: Staatsfundamentalnorm (Basic Regulations of the State);
b) Second association: Staatsgrundgesetz (Basic Rules / Basic Rules of the
State);
c) Third association: Formell Gesetz ("formal" law);
d) Fourth association: Verordnung & Autonome Satzung (Implementation of
norms/autonomous norms).
Staatsfundamentalnorm is norms that underlie the formation of a
constitution or a country's constitution (Staatsverfassung), including the norms
for its changes. The legal nature of a Staatsfundamentalnorm is a condition for
the validity of a constitution. It was available before the constitution (Farida,
ibid). Furthermore, Hans Nawiasky argues that the highest norm, which Kelsen
calls the fundamental norm in a country, should not be called staatsgrundnorm
but staatsfundamentalnorm or the state's fundamental norm. Grundnorm tends
not to change or be permanent, whereas, in a country, the country's fundamental
norms can change at any time due to rebellions, coups, and so on (Sihombing,
2016).
Law Number 12, 2011, concerning Formation of Regulations (Law on
the Establishment of Regulations). In Article 7 paragraph (1) of the Law,
Establishment of Law regulates the hierarchy of laws and regulations as follows:
1. The 1945 State Constitution.
2. Decree of the People's Consultative Assembly;
3. Government Act / Regulation in Lieu of Law;
4. Government Regulations;
5. Presidential Regulation;
6. Provincial Regulations; and
7. Regency / City Regional Regulations.
In addition to Article 7 paragraph (1) of the Law on the Establishment
of Laws, also regulated in Article 8 paragraph (1) includes regulations stipulated
by the People's Consultative Assembly, the House of Representatives, the
Regional Representative Council, the Supreme Court, the Constitutional Court,
the Supreme Audit Board Judicial Commission, Central Bank, Ministers,
agencies, institutions, or commissions of the same level formed by Law or
Government by order of the Law, Provincial Regional Representative Council,
Governor, Regency / City Regional Representative Council, Regent / Mayor
Village head or equivalent. The provisions mentioned above are recognized and
PLANNING MALAYSIA
Journal of the Malaysia Institute of Planners (2021)
475 © 2021 by MIP
have binding legal force insofar as they are ordered by higher Regulations or are
formed based on authority.
The contents of the lower material must be following the content of the
laws upper degree. Otherwise, the legislation does not have binding legal force.
B. Previous Researches
No Author Theme Research Gap
1. M Syamsudin Procedural and
Substantive Justice in
Magersari Land
Dispute Decisions
In the study done by M
Syamsudin, the object of
research is a court decision
regarding the Magersari land
dispute, while the object of this
study is the substance of the
regulation itself.
2. Diaswati
Mardiasmo and
Paul Barnes
A Pandora Box Effect
to State Asset
Management in DIY
Yogyakarta
In the research conducted by
Diaswati Mardiasmo and Paul
Barnes, the emphasis is more on
the process of managing state
asset management, while this
research emphasizes alternative
dispute resolution beyond those
previously set.
RESEARCH METHOD The main issues in this study are reviewed in a juridical-normative manner,
namely by studying or analyzing primary data in the form of primary legal
materials by understanding the law as a set of rules or positive norms in the
legislative system governing the issues in this study. Hence, this research is
understood as library research, namely research on secondary data. The paradigm
used in this study is the legal positivism paradigm based on Guba and Lincoln
(1994).
This study using the legal meaning is interpreted as a product of the
ruling. Law is defined as a set of written regulations made by the government
under its authority. In addition, the legal approach used in this study is that law is
assumed to be natural moral values of justice and universal (law as what ought to
be). The approach used in this study is the statutory approach and the historical
approach.
This study carried out a literature search with secondary data as
information, both in the form of primary legal materials and secondary legal
materials. Primary legal material consists of the 1945 Constitution, which has
been fourth amended. Law Number 1 of 2004 concerning the State Treasury, Law
Number 13 of 2012 concerning Privileges of the Special Region of Yogyakarta,
Aditya Wirawan, Taufik Raharjo, Roby Syaiful Ubed, Retno Yuliati
Preventif State Asset Management Vs Sultan Ground: A Study Case in Special Region of Yogyakarta
© 2021 by MIP 476
Law Number 12 of 2011 concerning Formation of Legislation, HIR
(Het Herziene Indonesisch Reglement) / Indonesian Regulations that are
renewed: S. 1848 no. 16, S. 1941 no. 44, Rbg (Rechtsreglement Buitengewesten)
/ Regional regulation opposite: S. 1927 no. 227, Rv
(Reglement op de Burgerlijke rechtsvordering): S. 1847 no. 52, S. 1849 no. 63,
RO (Reglement op de Rechterlijke Organisatie in hed beleid der Justitie in
Indonesie) / Regulations on Judicial Organizations: S. 1847 no. 23, Law Number
30 of 1999 concerning Arbitration and Alternative Dispute Resolution, Law
Number 20 of 1947 of the Trial Court, Law Number 14 of 1970 concerning Basic
Provisions of Judicial Power joucto Law Number 48 of 2009 concerning Judicial
Power, Law Number 14 of 1985 concerning the Supreme Court joucto Law
Number 3 of 2009, Law Number 2 of 1986 concerning General Judgment joucto
Law Number 49 of 2009.
FINDINGS AND DISCUSSION
A. Outstanding Land Location of the Special Region of Yogyakarta Yogyakarta has been a special region since its establishment in 1950 and
since its recognition was in 1945. In the law on DIY formation, DIY has a legal
status as a provincial-level special area. The specialty lies in appointing special
regional heads and deputy heads of special regions for Sultan and Paku Alam,
who are on the throne. However, the specialties of DIY are not included in the
training law but only in local government laws that govern the entire territory of
Indonesia in general. In 1965, the legal status of do-it-yourself was reduced to an
ordinary provincial territory, and finally, in 1999 and 2004, the right of do-it-
yourself entered the territory without law.
After the issuance of Law Number 13 of 2012, DIY functions consist
of (a) the techniques for filling the positions, positions, responsibilities, and
government of the Governor and Deputy Governor; (b) DIY Local Government
institutions; (c) culture; (d) land; and (e) spatial. Privileges with inside techniques
for filling positions, positions, responsibilities, and government of the Governor
and Deputy Governor consist of unique situations for the possible governor of
DIY, particularly Sultan Hamengkubuwana, who has enthroned, and the deputy
governor is the Duke of Paku Alam, who has enthroned. The Governor and
Deputy Governor have equal position, responsibilities, and government as
different Governors and Deputy Governors, plus privileged affairs. The unique
functions withinside the institutional region of the Regional Government of DIY
are the association and resolution of institutions, with unique nearby regulations,
to acquire the effectiveness and performance of governance and public carrier
primarily based totally on the ideas of responsibility, accountability,
transparency, and participation through contemplating the shape and composition
of the authentic government.
PLANNING MALAYSIA
Journal of the Malaysia Institute of Planners (2021)
477 © 2021 by MIP
The specialty in culture is the care and development of creations, tastes,
initiatives and works in the form of values, knowledge, norms, customs, objects,
arts and noble traditions that are rooted in the DIY society and regulated by
regional regulations. Privileges in the land sector, namely the Sultanate and the
District, have authority to manage and utilize the land of the Sultanate and the
District land intended to use the most incredible opportunity to develop culture,
social interests, and community welfare. The specialty in the spatial layout is the
authority of the Sultanate and District on the management and utilization of the
Sultanate's land and the District's land. The form of this privilege is the Sultan Ground (SG) which is the land
owned by the Ngayogyakarta Hadiningrat Sultanate and managed to benefit the
people's welfare. The Sultanate provides a sign of permission to use SG land with
a letter of concern, which is the "Consequence of the Signing of the Cooperation
Agreement to anyone occupying land that is categorized as the Sultan Ground as
the basis for issuing building construction permits and occupying permits."
Based on Article 32 paragraph 2, Law Number 13 the Year 2012 concerning the
Privileges of the Special Region of Yogyakarta, the Sultanate as a legal entity is
the subject of rights that have ownership rights to the Sultanate's land. Kasultanan
Land includes Keprabon land and non-Keprabon land found in all regencies/cities
in the DIY region. The Sultanate and the District are authorized to manage and
utilize land of the Sultanate and the District intended for the maximum possible
development of culture, social interests, and welfare of the community.
Based on Article 33, it is explained that the title to the Sultanate land
and the Duchy land is registered with the land agency. Registration for the
Sultanate's land and the Duchy's land, which another party carries out, must
obtain written approval from the Sultanate for the Sultanate's land and written
approval from the Duchy for the Duchy's land. The Sultanate in the period before
independence was contained in Rijksblad Kasultanan Number 16 Year 1918
and Rijksblad of Pakualaman Number 18 Year 1918 which stated that
"Sakabehing bumi kang ora ana tanda yektine kadarbe ing liyan mawa
wewenang eigendom, dadi bumi kagungane keraton ingsun". That sentence
means that all the illegal land without any proof of belongings (land ownership
letter called eigendom) belongs to the Sultanate. Conflicts over land tenure
arrangements also occur between the laws of the former governor of the swapraja
government and the Basic Agrarian Law. This evidence in the Special Region of
Yogyakarta has caused conflicts between individuals and government agencies
related to the existence of the palace land.
It is known that in the fourth Dictum of the Second Book in letter (A)
the Provisions for the Conversion of the Basic Agrarian Law which states that the
rights and authorities over land and water from the swapraja or ex-swapraja
regions that were still in existence at the time this Law came into effect were this
Law is abolished and transferred to the State. Then, it will be further regulated in
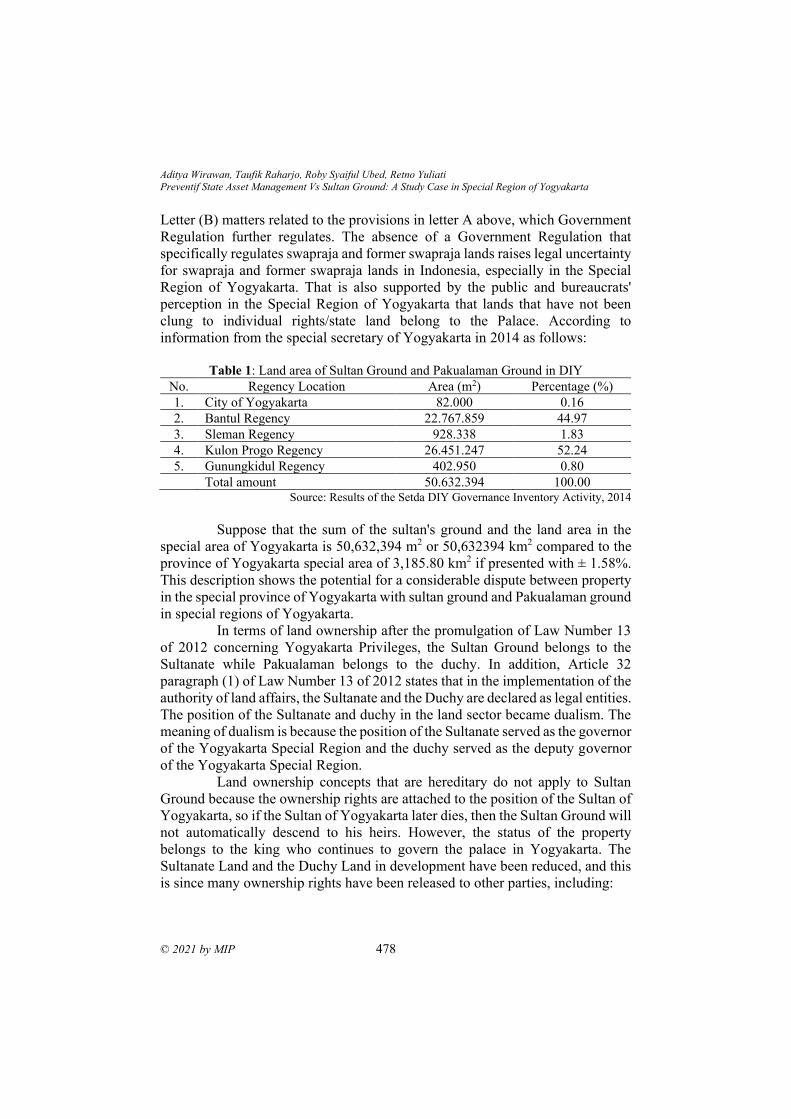
Aditya Wirawan, Taufik Raharjo, Roby Syaiful Ubed, Retno Yuliati
Preventif State Asset Management Vs Sultan Ground: A Study Case in Special Region of Yogyakarta
© 2021 by MIP 478
Letter (B) matters related to the provisions in letter A above, which Government
Regulation further regulates. The absence of a Government Regulation that
specifically regulates swapraja and former swapraja lands raises legal uncertainty
for swapraja and former swapraja lands in Indonesia, especially in the Special
Region of Yogyakarta. That is also supported by the public and bureaucrats'
perception in the Special Region of Yogyakarta that lands that have not been
clung to individual rights/state land belong to the Palace. According to
information from the special secretary of Yogyakarta in 2014 as follows:
Table 1: Land area of Sultan Ground and Pakualaman Ground in DIY
No. Regency Location Area (m2) Percentage (%)
1. City of Yogyakarta 82.000 0.16
2. Bantul Regency 22.767.859 44.97
3. Sleman Regency 928.338 1.83
4. Kulon Progo Regency 26.451.247 52.24
5. Gunungkidul Regency 402.950 0.80
Total amount 50.632.394 100.00 Source: Results of the Setda DIY Governance Inventory Activity, 2014
Suppose that the sum of the sultan's ground and the land area in the
special area of Yogyakarta is 50,632,394 m2 or 50,632394 km2 compared to the
province of Yogyakarta special area of 3,185.80 km2 if presented with ± 1.58%.
This description shows the potential for a considerable dispute between property
in the special province of Yogyakarta with sultan ground and Pakualaman ground
in special regions of Yogyakarta.
In terms of land ownership after the promulgation of Law Number 13
of 2012 concerning Yogyakarta Privileges, the Sultan Ground belongs to the
Sultanate while Pakualaman belongs to the duchy. In addition, Article 32
paragraph (1) of Law Number 13 of 2012 states that in the implementation of the
authority of land affairs, the Sultanate and the Duchy are declared as legal entities.
The position of the Sultanate and duchy in the land sector became dualism. The
meaning of dualism is because the position of the Sultanate served as the governor
of the Yogyakarta Special Region and the duchy served as the deputy governor
of the Yogyakarta Special Region.
Land ownership concepts that are hereditary do not apply to Sultan
Ground because the ownership rights are attached to the position of the Sultan of
Yogyakarta, so if the Sultan of Yogyakarta later dies, then the Sultan Ground will
not automatically descend to his heirs. However, the status of the property
belongs to the king who continues to govern the palace in Yogyakarta. The
Sultanate Land and the Duchy Land in development have been reduced, and this
is since many ownership rights have been released to other parties, including:
PLANNING MALAYSIA
Journal of the Malaysia Institute of Planners (2021)
479 © 2021 by MIP
1. According to domein, as stated in Article 1 Rijksblad Kasultanan
Number 16 of 1918, and Duchy Rijksblad Number 18 of 1918, it appears
that there have been lands that have been given to foreigners with
ownership rights under western law called eigendom rights.
2. There is also the Sultanate land and the Duchy land, given to indigenous
citizens, for example, those in the Township. They have been utilized by
indigenous people based on the Rijksblad Kasultanan Number 23 of
1925 and the Rijksblad of the Duchy of the Republic of Indonesia
Number 25 of 1925, in which they were granted the rights of andarbe or
property rights under customary law.
B. Legal Perspective of State Finance In the perspective of state finance law, it has been regulated in Law
Number 1 of 2004 concerning State Treasury. The main focus of this research is
related to securing state land so that the ownership is not transferred to third
parties. The General Explanation of the State Treasury Law states that the point
of view adopted in the regulation of state property is a view to preventing the
transfer of ownership of state property, including land, to other parties.
In line with the development of state financial management needs, the
importance of the treasury function is related to the context of efficiently
managing limited government financial resources. The treasury function
includes, in particular, good cash planning, prevention so as not to leak and
deviate, finding the cheapest source of financing, and utilizing idle cash to
increase the added value of financial resources. In line with the security point of
view, Article 49 paragraph (1) of the State Treasury Law also regulates that any
state / regional property in the form of land controlled by the Central / Regional
Government must be notarized on behalf of the Government of the Republic of
Indonesia / the relevant regional government. Of course, the regulation in the
Article also explains that the paradigm of securing state property adhered to in
the State Treasury Law is technically realized by certification, an example of asset
performance is part of an asset management strategy intended to align with the
expenditure strategy in achieving organizational goals (Brown and Humphrey,
2005). The regulation of State Property appears in Government Regulation
Number 27 of 2014 concerning Management of State / Regional Property as an
implementing regulation for the State Treasury Law. The Government Regulation
in Article 3 paragraph (2) regulates that the obligation to certify State land falls
within one of the stages of the scope of management of state / regional property,
namely at the security and maintenance stage. Meanwhile, Article 43 paragraph
(1) of this regulation is also reaffirmed by certifying state-owned land in the
security stages.
Aditya Wirawan, Taufik Raharjo, Roby Syaiful Ubed, Retno Yuliati
Preventif State Asset Management Vs Sultan Ground: A Study Case in Special Region of Yogyakarta
© 2021 by MIP 480
Using the point of view to prevent the transfer of ownership of state
property, including land, to other parties, it removes state property from the list
of goods by issuing a decision from an authorized official to free the Property
Manager, Property User, and or Authorization of the User of Goods from
administrative and physical responsibility for the goods under their control.
However, then enacted Law Number 13 of 2012 concerning the Privileges of the
Special Region of Yogyakarta has the potential to come that many disputes will
occur between court-owned land, either Sultanate or duchy by Law Number 13
of 2012 with State Property in the Special Province of Yogyakarta. In a broader
scope, the management of state assets has never been separated from Strategic
Asset Management (SAM). The SAM approach encompasses asset management
throughout the entire lifecycle, from planning to disposal (Puspitarini and
Akhmadi, 2019). The disharmony between the State Treasury Law and the
Yogyakarta Special Region Privilege Law on the Management of State Property
does not interfere with SAM. From the considerations above, it is deemed
necessary to seek the resolution of disputes in the land sector.
C. Land Dispute Resolution
Dispute resolution is a case settlement that is conducted between one
party and another party. Dispute resolution consists of two ways, namely through
litigation (court) and non-litigation (outside court). In the process of dispute
resolution through litigation is the last option (ultimum remidium) for the parties
to the dispute after settlement through non-litigation to no avail.
According to Article 1 number 10 of Law Number 30 of 1999 relating
to Arbitration and Alternative Dispute Resolution, conflict resolution through
non-litigation (out of court) consists of 5 ways, namely:
1. Consultation: an action taken between one party and another party
called a consultant.
2. Negotiations: a settlement outside the court to reach a mutual agreement
based on more harmonious cooperation.
3. Mediation: settlement through negotiations to achieve an agreement
between the parties with the aid of the mediator
4. Conciliation: A conciliator assists dispute resolution, whose function is
to mediate between parties to find solutions and reach an agreement.
5. Expert Assessment: expert opinions on matters of a technical nature and
under their area of expertise.
Another form of settlement outside the court that turned out to be one of the
settlement processes carried out in court (litigation) is mediation. From this
article, we know that mediation is an out-of-court settlement, but mediation
is carried out in court in its development. Article 1 number 1 of Law Number
30 the Year 1999 relating Arbitration and Alternative Dispute Resolution

PLANNING MALAYSIA
Journal of the Malaysia Institute of Planners (2021)
481 © 2021 by MIP
explains that the settlement of disputes outside the court recognizes the
existence of an arbitration method, namely the settlement of a civil conflict
outside the court based on an arbitration agreement created in writing by the
parties disputing party.
The advantages of conflict resolution outside the court, namely
1. Provide a final decision.
2. Measurable and more cost-effective than arbitration or court.
3. Flexibility in the process can help resolve disputes.
However, on the other hand, there is a lack of dispute resolution outside the
court, i.e.
1. Have no tools to carry out executions of decisions.
2. It does not contribute to legal confidence for the management of state
property.
On the other hand, dispute resolution through a court of law, i.e., is
submitted to a general court in civil if the dispute is about settling land ownership
rights or settling a dispute through a state administrative court. However, based
on Law Number 51 / PRP / 1960 regarding Prohibition of Use of Land without a
Right of Permit or Proxy, the central government has a stronger position than
other parties. The regulation weakness is that a dispute arises between the central
government and the palace or duchy as the owner of the sultan ground and
Pakualaman Ground.
The drawback is that the land disputes that are resolved through the courts are
less effective since these require a relatively long time and immeasurable costs.
However, the advantages of dispute resolution through the court, namely
1. Provide a final solution.
2. Having the tools to carry out executions of decisions.
3. Provide legal certainty for the manager of state property.
Both of weaknesses and strengths resolved through court and non-court,
it is necessary to resolve disputes outside of the two systems above, namely to
draw up a draft Government Regulation or the same level that regulates
agreements between the regional government and the palace or duchy. In
addition, the matters that need to be regulated include procedures for settlement,
compensation process according to the agreement, taking legal actions in good
faith without involving other parties.
Aditya Wirawan, Taufik Raharjo, Roby Syaiful Ubed, Retno Yuliati
Preventif State Asset Management Vs Sultan Ground: A Study Case in Special Region of Yogyakarta
© 2021 by MIP 482
CONCLUSION Dispute resolution both inside and outside the court has consequences, both
strengths, and weaknesses. State property managers have fears of disputes and
dealing with the law for an extended period.
ACKNOWLEDGEMENTS Authors thank to Politeknik Keuangan Negara STAN and Universitas Prasetiya
Mulya for the support during the research process.
REFERENCES Brown, R., & Humphrey, B. (2005). Asset Management for Transmission and
Distribution. Amerika: IEEE Power & energy Magazine.
Farida, Maria Indrat Soeprapto. (2010). Ilmu Perundang-undangan,Yogyakarta:
Kanisius.
Guba, E. G., & Lincoln, Y. S. (1994). Competing paradigms in qualitative research. In
N.K. Denzin & Y. S. Lincoln (Eds.), Handbook of qualitative research (pp. 105-
117). Thousand Oaks, CA: Sage.
HIR (Het Herziene Indonesisch Reglement) / Reglemen Indonesia yg diperbaharui : S.
1848 no. 16, S. 1941 no. 44,
Kelsen, Hans. (2008). Teori Hukum Murni : Dasar-Dasar Ilmu Hukum Normatif.
Bandung PT. Rineke Cipta
Puspitarini, I & Heru Akhmadi, M. (2019). Measuring Public Asset Performance Using
Output-Based Approach: Evidence From Indonesia. Journal of the Malaysian
Institute of Planners Volume 17 Issue 1 (2019), Page 292 – 304
Rbg (Rechtsreglement Buitengewesten) / Reglemen daerah seberang : S. 1927 no. 227,
RO (Reglement op de Rechterlijke Organisatie in hed beleid der Justitie in
Indonesie) / Reglemen tentang Organisasi Kehakiman : S. 1847 no. 23, Rv
(Reglement op de Burgerlijke rechtsvordering) : S. 1847 no. 52, S. 1849 no. 63,
Sihombing, Eka N.A.M. (2016). Menyoal Ketentuan Usul Pindah Pegawai Negeri Sipil
di Lingkungan Pemerintah Daerah Kabupaten Nias Barat. Badan Penelitian dan
Pengembangan Hukum dan HAM Kementerian Hukum dan HAM RI dan Ikatan
Peneliti Hukum Indonesia (IPHI).
Translated by B.L. Paulson and S.L. Paulson as Introduction to the Problems of Legal
Theory (Oxford, Clarendon P., 1992); the German subtitle is used as the English
title, to distinguish this book from the second edition of Reine Rechtslehre,
translated by Max Knight as Pure Theory of Law (Berkeley, U. California P.,
1967)
Undang-Undang Dasar 1945 yang telah diamandemen keempat.
Undang-Undang Nomor 1 Tahun 2004 tentang Perbendaharaan Negara
Undang-Undang Nomor 13 Tahun 2012 tentang Keistimewaan Daerah Istimewa
Yogyakarta,
Undang-Undang Nomor 12 Tahun 2011 tentang Pembentukan Peraturan Perundang-
undangan.
Undang-Undang Nomor 30 Tahun 1999 tentang Arbitrase Dan Alternatif Penyelesaian
Sengketa.

PLANNING MALAYSIA
Journal of the Malaysia Institute of Planners (2021)
483 © 2021 by MIP
Undang-Undang Nomor 20 tahun 1947 Pengadilan Peradilan Ulangan,
Undang-Undang Nomor 14 tahun 1970 tentang Ketentuan-ketentuan Pokok Kekuasaan
Kehakiman joucto Undang-Undang Nomor 48 tahun 2009 tentang perubahan
kedua atas Undang-Undang Nomor 14 tahun 1970 tentang Kekuasaan Kehakiman,
Undang-Undang Nomor 14 tahun 1985 tentang Mahkamah Agung joucto Undang-
Undang Nomor 3 tahun 2009 tentang perubahan kedua atas Undang-Undang
Nomor 14 tahun 1985 tentang Mahkamah Agung,
Undang-Undang Nomor 2 tahun 1986 tentang Peradilan Umum joucto Undang-Undang
Nomor 49 tahun 2009 tentang perubahan kedua atas Undang-Undang Nomor 2
tahun 1986 tentang Peradilan Umum
Received: 12th July 2021. Accepted: 7th Sept 2021
PLANNING MALAYSIA
Journal of the Malaysia Institute of Planners (2021)
© 2021 by MIP 484
NOTES TO CONTRIBUTORS AND GUIDELINES FOR MANUSCRIPT
SUBMISSION
INTRODUCTION
The Journal of the Malaysian Institute of Planners or PLANNING MALAYSIA is a
multidisciplinary journal related to theory, experiments, research, development,
applications of ICT, and practice of planning and development in Malaysia and
elsewhere.
The objective of the journal is to promote the activity of town planning through dialogue
and exchange of views concerning professional town planning practice. PLANNING
MALAYSIA will welcome any news, feature articles, or peer reviewed (including book
reviews, software review, etc.) articles for publication. All articles should be original
work by the authors. Articles, views and features will not be taken to be the official
view of the Malaysian Institute of Planners (MIP) unless it carries the name of MIP
as the author. This is to encourage open discussion on diverse issues and opinion for the
advancement of town planning practice. Articles and contributions will be accepted from
MIP members and non-members worldwide.
In year 2010, PLANNING MALAYSIA Journal has been indexed in SCOPUS. Previous
issues of PLANNING MALAYSIA Journal can be viewed on the MIP website.
SUBMISSION OF MANUSCRIPTS
Manuscript should be emailed to [email protected]. Manuscript should ideally be
in the range of 8-10 pages long. Each manuscript should have a title page and an abstract
of about 150 words. The title page should contain the title, full name(s), designation(s),
organizational affiliation(s), a contact address, and an email address. All manuscripts are
received on the understanding that they are not under concurrent consideration at another
journal. One copy of the current Journal will be provided for each article. Additional
reprints of article can be ordered, at cost, by the author(s). PDF format of the article (if
available) can be obtained from the Publisher.
LAYOUT
Manuscript should be typed in single spacing (including footnotes, endnotes and
references) on one side of the paper only (preferably A4) with the following margins:
right and left - 4.25 cm, top - 5.5 cm and bottom - 5.2 cm (including header – 4.5 cm and
footer – 4.3 cm) in 11 point Times New Roman font. Footnotes should be numbered
consecutively and placed at the end of the manuscript. Footnotes should be kept to a
minimum. Tables and diagrams should be provided in the text. References should follow
the APA (6th Edition) referencing format. All foreign words must be typed and
transliterated. The Editorial Board reserves the right to change the transliteration of all
historical names, titles and non-English terminology to bring them into conformity with
its own style.

PLANNING MALAYSIA
Journal of the Malaysia Institute of Planners (2021)
485 © 2021 by MIP
USE OF FORMULA, FIGURES AND TABLES
Formula (mathematical formula) should be used only when necessary and the
CONCLUSION derived must be explained and made intelligible to a non-mathematical
reader. Wherever possible, authors are encouraged to place the mathematical parts of the
article in an appendix. In cases of empirical articles, authors are expected to make readily
available a complete set of data and any specialized computer programs to interested
readers.
All illustrations, figures and/or tables in the manuscript must be captioned, in clear black
and white (grayscale) and ready for reproduction.
REFEREEING PROCEDURE
Manuscripts will be acknowledged upon receipt. Only selected (preferred) manuscripts
will be reviewed by two (or three) referees in addition to the editors. Editorial decision
will normally be made within two to six months, but circumstances beyond control
occasionally dictate a longer cycle. If authors are invited to prepare a revision for further
consideration, the major issues to be resolved will be outlined and will be forwarded to
them as quickly as possible.
ACCEPTED ARTICLES
Authors of accepted articles will be requested to provide a digital copy of the manuscript,
preferably in Microsoft Word to the MIP (the Publisher) via email at
[email protected]. MIP will not be responsible for the loss or damage of the digital
copy.
COPYRIGHT
Copyright & Creative Commons Licence
eISSN: 0128-0945 © Year. The Authors. Published for Malaysia insititute of planner.
This is an open-access article under the CC BY-NC-ND license.
The authors hold the copyright without restrictions and also retain publishing rights
without restrictions.
Contact:
Editor-in-Chief
PLANNING MALAYSIA
Journal of the Malaysian Institute of Planners
B-01-02, Jalan SS7/13B, Aman Seri, Kelana Jaya,
47301, Petaling Jaya, Selangor Darul Ehsan, MALAYSIA
Tel: +603 78770637 Fax: +603 78779636
Email: [email protected]
Homepage: www.planningmalaysia.org

Ethic Statement
© 2021 by MIP 486
ETHIC STATEMENT
The Journal of the Malaysia Institute of Planners or PLANNING MALAYSIA is a peer-
reviewed journal. This statement spells out ethical behaviour of all parties involved in the
act of publishing an article for this journal, i.e. the author, the peer-reviewer, the chief
editor and editors, and the publisher. This statement is based on COPE’s Best Practice
Guidelines for Journal Editors. URL: http://publicationethics.org/files/u2
/Best_Practice.pdf
DUTIES OF AUTHORS
Reporting Standards
Authors of original research should present an accurate account of the work done as well
as an objective discussion of its significance. Data of the research should be represented
accurately in the article. An article should contain sufficient detail and references to
permit others to replicate the work. Fraudulent or knowingly inaccurate statements
constitute unethical behaviour and are unacceptable.
Data Access and Retention
Authors may be asked to provide the raw data in connection with an article submitted for
editorial review, and should be prepared to provide public access to such, if practicable,
and should in any event be prepared to retain such data for a reasonable time after
publication.
Originality and Plagiarism
Authors should ensure that they have written entirely original works, and if the authors
have used the work and/or words of others this must be appropriately cited or quoted.
Such quotations and citations must be listed in the Reference at the end of the article.
Multiple Publication
An author should not in general publish manuscripts describing essentially the same
research in more than one journal or primary publication. Submitting the same manuscript
to more than one journal concurrently constitutes unethical publishing behaviour and is
unacceptable.
Acknowledgment of Sources
Proper acknowledgment of the work of others must always be given. Authors should cite
publications that have been influential in determining the nature of the reported work.
Authorship of the Paper
Authorship should be limited to those who have made a significant contribution to the
conception, design, execution, or interpretation of the study, and should be listed as co-
authors. Others who have participated in certain substantive aspects of the research
project, they should be acknowledged or listed as contributors.

PLANNING MALAYSIA
Journal of the Malaysia Institute of Planners (2021)
487 © 2021 by MIP
Corresponding Author
Corresponding author is the author responsible for communicating with the journal for
publication. The corresponding author should ensure that all appropriate co-authors and
no inappropriate co-authors are included on the paper. All co-authors have seen and
approved the final version of the paper and have agreed to its submission for publication.
Acknowledgment of Funding Sources
Sources of funding for the research reported in the article should be duly acknowledged
at the end of the article.
Disclosure and Conflicts of Interest
All authors should disclose in their manuscript any financial or other substantive conflict
of interest that might be construed to influence the results or interpretation of their
manuscript.
Fundamental Errors in Published Works
When an author discovers a significant error or inaccuracy in his/her own published work,
it is the author’s obligation to promptly notify the journal editor or publisher and
cooperate with the editor to retract or correct the paper.
DUTIES OF REVIEWERS
Contribution of Peer Review
Peer review assists the chief editor and the editorial board in making editorial decisions
while editorial communications with the author may also assist the author in improving
the paper.
Unqualified to Review or Promptness
Any reviewer who feels unqualified to review the assigned manuscript or unable to
provide a prompt review should notify the editor and excuse himself/herself from the
review process.
Confidentiality
Manuscripts received for review must be treated as confidential documents. They must
not be shown to, or discussed with, others except as authorized by the chief editor.
Privileged information or ideas obtained through peer review must be kept confidential
and not used for personal advantage.
Standards of Objectivity
Reviews should be conducted objectively. There shall be no personal criticism of the
author. Reviewers should express their views clearly with supporting arguments.
Acknowledgment of Sources
Reviewers should identify relevant published work that has not been cited by the authors.
Any statement that had been previously reported elsewhere should be accompanied by
the relevant citation. A reviewer should also call to the chief editor's attention any

Ethic Statement
© 2021 by MIP 488
substantial similarity or overlap between the manuscript under consideration and any
other published paper of which they have personal knowledge.
Conflict of Interest
Reviewers should decline to review manuscripts in which they have conflicts of interest
resulting from competitive, collaborative, or other relationships or connections with any
of the authors.
DUTIES OF EDITORS
Decision on the Publication of Articles
The chief editor of the PLANNING MALAYSIA is responsible for deciding which of the
articles submitted to the journal should be published. The chief editor may be guided by
the policies of the journal's editorial board subjected to such legal requirements regarding
libel, copyright infringement and plagiarism. The chief editor may confer with other
editors or reviewers in making this decision.
Fair play
Manuscripts shall be evaluated solely on their intellectual merit.
Confidentiality
The chief editor/editors and any editorial staff must not disclose any information about a
submitted manuscript to anyone other than the corresponding author, reviewers, potential
reviewers, other editorial advisers, and the publisher.
Disclosure and Conflicts of Interest
Unpublished materials disclosed in a submitted manuscript must not be used by anyone
who has a view of the manuscript while handling it in his or her own research without the
express written consent of the author