pimpri-chinchwad municipal corporation (pcmc) - pcmcindia
TRANSCRIPT
Pimpri-Chinchwad Municipal Corporation (PCMC)
Comprehensive Mobility Plan (CMP) for PCMC
November 2008
CMP for PCMC
-2-
PREFACE
The Ministry of Urban Development has issued instructions to the effect that each city proposing an urban transport project through JNNURM shall develop a Comprehensive Mobility Plan (CMP). The CMP should be compliant with National Urban Transport Policy, indicating the plan for satiating the current service need as well the future service need. Finally the CMP should focus on the mobility of people rather than on movement of vehicles.
The Comprehensive Mobility Plan aims at overall improvement in the movement of people within the city as well as into and out of it. Therefore the proposals in this plan have to consist of a wide range of interventions targeted at various segments of travel demand, public transport being one of them, albeit the most important. The present report is a Comprehensive Mobility Plan for the city of Pimpri-Chinchwad.
Pimpri Chinchwad is one of the most vibrant industrial and urban settlements in Maharashtra. Its developed industrial sector, proximity to Pune and the growing IT sector draws a large group of people and businesses to settle in the city, temporarily or permanently. This creates a growing demand for urban infrastructure, especially for urban transport infrastructure and public transport.
Pimpri Chinchwad Municipal Corporation (PCMC) has undertaken an exercise of identifying the service need for urban transport by preparing a Comprehensive Mobility Plan (CMP). As part of this exercise, PCMC has profiled the current transportation network and patterns in the city and has projected them for the future. Based on these, the needs for urban transport solutions along various corridors of the city have been identified.
Road network improvement measures such as road-widening, construction of fly-over and bridges have been recommended. A bus-based rapid transit system (BRTS) has been chosen as the solution to the public transport service needs of PCMC.
The report has been structured to profile the city and the current transportation system to start with, followed by the projected traffic patterns and a forward looking comprehensive mobility plan which tries to integrate land-use planning with the proposed transportation system.
CMP for PCMC
-3-
EXECUTIVE SUMMARY
The city of Pimpri-Chinchwad is situated northeast of Pune and is 160 km from Mumbai, the capital of state of Maharashtra. It is predominantly an industrial area, which has developed during the last four decades. Industrialisation in Pimpri area commenced with the establishment of Hindustan Antibiotics Limited in 1956. The establishment of the Maharashtra Industrial Development Corporation (MIDC) in 1961-62 considerably facilitated industrial development in the area. The establishment of large-scale core industries has led to the growth of ancillary and small-scale industries in and around this industrial belt. With a current population estimated at 13.35 lakhs in Pimpri-Chinchwad, it is expected to reach about 15.07 lakhs by 2011. As the city continues to grow, the Pimpri-Chinchwad Municipal Corporation (PCMC), which is responsible for provision of all municipal services to the citizens, is preparing itself to provide quality services to its citizens. Many projects have been taken up towards this objective.
To address most of the urban transport problems being faced by PCMC currently and those anticipated in the future, a Comprehensive Mobility Plan (CMP) study has been undertaken. The study captures both the traffic as well as the land-use scenario of the city. As a recommendation of this study, a Bus-based rapid transit system has to be implemented by PCMC to improve the public transportation system in Pimpri-Chinchwad. Improvement of network of existing roads in order to provide good quality of service to commuters has also been proposed with fly-overs and bridges at important locations. As part of the Traffic study, primary surveys were conducted to capture the travel characteristics of the citizens of PCMC. This data was used to develop a transportation model and forecast the future demand for a public transportation system in the city. The land-use study was conducted to capture the current level of development in the city, future growth prospects and the impact it will have on the transportation system. The concept of transit-oriented development with integration of land-use and transportation has been addressed in the study.
Growth of Pimpri - Chinchwad
The city of Pimpri-Chinchwad has seen a high rate of population growth and development in the recent past. Due to its proximity to Pune and its significance as an industrial hub of the region, the city is expected to continue its growth in the future.
There has been an increase of 84% in area under development in the region in the period between 2000 and 2007, most of it within PCMC limits. Considerable portion of the development in the last decade has occurred towards Pune city in the south and Hinjewadi IT Park in the south-western direction. Further impetus to development has been given by the westerly by-pass connecting Mumbai to Pune and the improvements of the Aundh-Ravet road. Talwade IT Park in the north-western corner of the city is another pull factor in PCMC area. Improvements to the Dehu-Alandi road and the NH50 will bring about development in the northern and the north-western region. The new international airport at Chakan to the north will further enhance growth in these directions.
Besides major developments outside the city, transformations have been seen extensively along the NH4 with industrial and residential uses getting converted to commercial uses. Therefore some intensification of development is also expected.
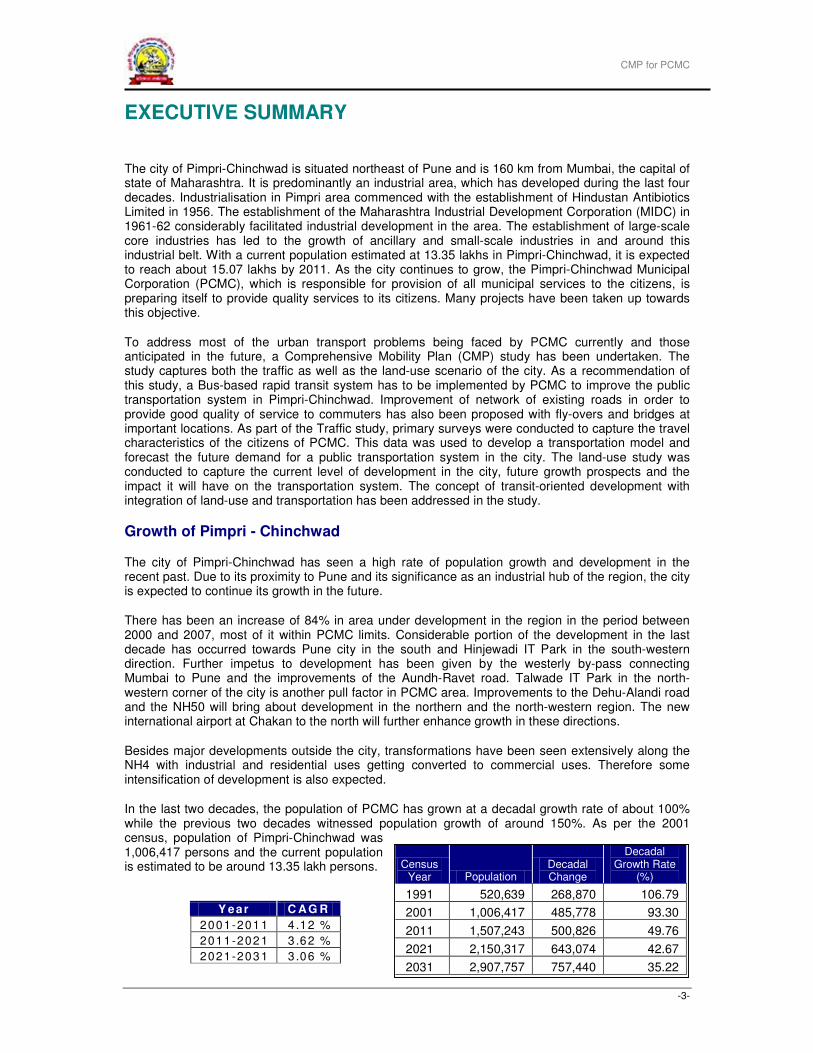
In the last two decades, the population of PCMC has grown at a decadal growth rate of about 100% while the previous two decades witnessed population growth of around 150%. As per the 2001 census, population of Pimpri-Chinchwad was 1,006,417 persons and the current population is estimated to be around 13.35 lakh persons.
Y ear C AG R
2001-2011 4 .12 %
2011-2021 3 .62 %
2021-2031 3 .06 %
Census Year Population
Decadal Change
Decadal Growth Rate
(%)
1991 520,639 268,870 106.79
2001 1,006,417 485,778 93.30
2011 1,507,243 500,826 49.76
2021 2,150,317 643,074 42.67
2031 2,907,757 757,440 35.22
CMP for PCMC
-4-
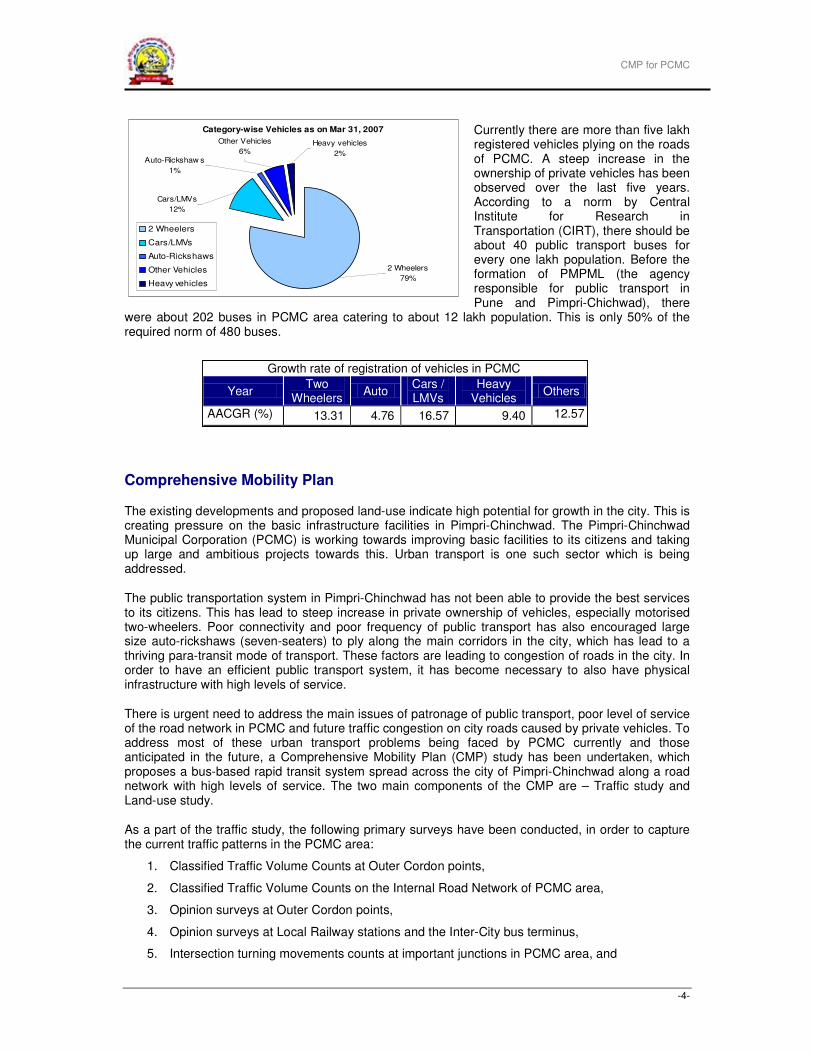
Currently there are more than five lakh registered vehicles plying on the roads of PCMC. A steep increase in the ownership of private vehicles has been observed over the last five years. According to a norm by Central Institute for Research in Transportation (CIRT), there should be about 40 public transport buses for every one lakh population. Before the formation of PMPML (the agency responsible for public transport in Pune and Pimpri-Chichwad), there
were about 202 buses in PCMC area catering to about 12 lakh population. This is only 50% of the required norm of 480 buses.
Comprehensive Mobility Plan
The existing developments and proposed land-use indicate high potential for growth in the city. This is creating pressure on the basic infrastructure facilities in Pimpri-Chinchwad. The Pimpri-Chinchwad Municipal Corporation (PCMC) is working towards improving basic facilities to its citizens and taking up large and ambitious projects towards this. Urban transport is one such sector which is being addressed.
The public transportation system in Pimpri-Chinchwad has not been able to provide the best services to its citizens. This has lead to steep increase in private ownership of vehicles, especially motorised two-wheelers. Poor connectivity and poor frequency of public transport has also encouraged large size auto-rickshaws (seven-seaters) to ply along the main corridors in the city, which has lead to a thriving para-transit mode of transport. These factors are leading to congestion of roads in the city. In order to have an efficient public transport system, it has become necessary to also have physical infrastructure with high levels of service.
There is urgent need to address the main issues of patronage of public transport, poor level of service of the road network in PCMC and future traffic congestion on city roads caused by private vehicles. To address most of these urban transport problems being faced by PCMC currently and those anticipated in the future, a Comprehensive Mobility Plan (CMP) study has been undertaken, which proposes a bus-based rapid transit system spread across the city of Pimpri-Chinchwad along a road network with high levels of service. The two main components of the CMP are – Traffic study and Land-use study.
As a part of the traffic study, the following primary surveys have been conducted, in order to capture the current traffic patterns in the PCMC area:
1. Classified Traffic Volume Counts at Outer Cordon points,
2. Classified Traffic Volume Counts on the Internal Road Network of PCMC area,
3. Opinion surveys at Outer Cordon points,
4. Opinion surveys at Local Railway stations and the Inter-City bus terminus,
5. Intersection turning movements counts at important junctions in PCMC area, and
Growth rate of registration of vehicles in PCMC
Year Two
Wheelers Auto
Cars / LMVs
Heavy Vehicles
Others
AACGR (%) 13.31 4.76 16.57 9.40 12.57
Category-wise Vehicles as on Mar 31, 2007
2 Wheelers
79%
Heavy vehicles
2%
Cars/LMVs
12%
Auto-Rickshaw s
1%
Other Vehicles
6%
2 Wheelers
Cars/LMVs
Auto-Rickshaws
Other Vehicles
Heavy vehicles
CMP for PCMC
-5-
6. Speed and Delay surveys along important corridors in the city.
House-hold surveys with a sample size of 5,000, spread uniformly across all the election wards in PCMC area, were conducted to capture the current travel characteristics of the citizens.
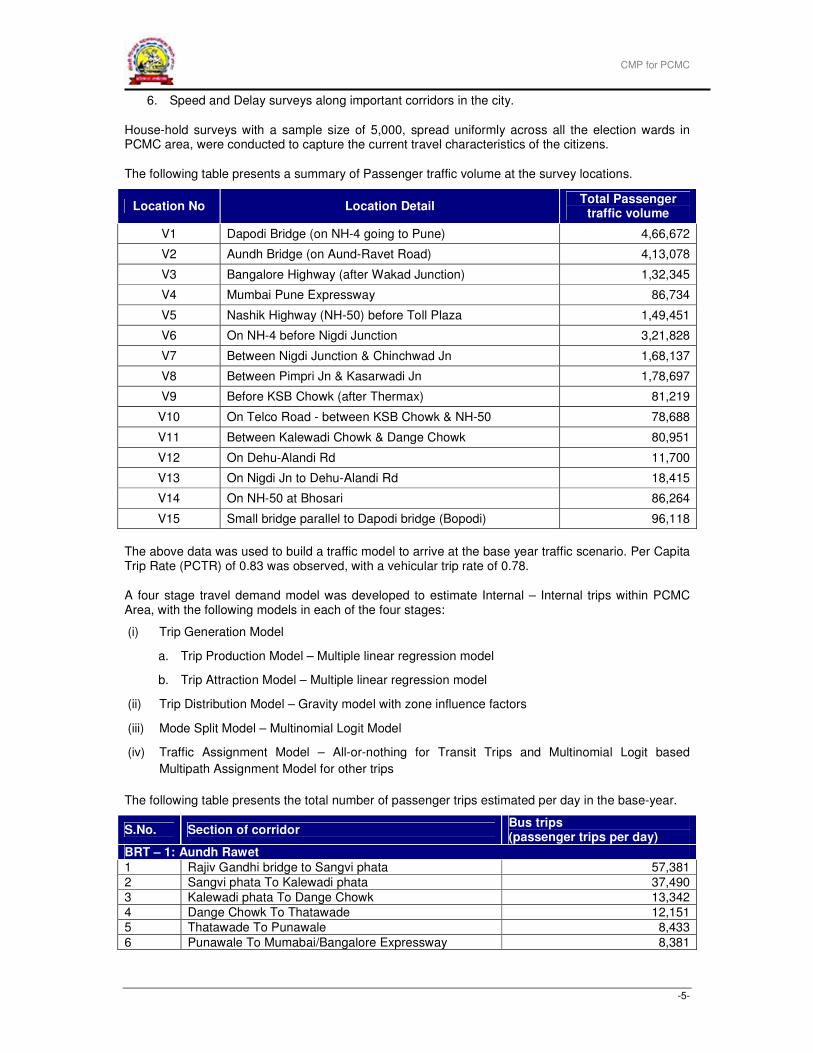
The following table presents a summary of Passenger traffic volume at the survey locations.
Location No Location Detail Total Passenger
traffic volume
V1 Dapodi Bridge (on NH-4 going to Pune) 4,66,672
V2 Aundh Bridge (on Aund-Ravet Road) 4,13,078
V3 Bangalore Highway (after Wakad Junction) 1,32,345
V4 Mumbai Pune Expressway 86,734
V5 Nashik Highway (NH-50) before Toll Plaza 1,49,451
V6 On NH-4 before Nigdi Junction 3,21,828
V7 Between Nigdi Junction & Chinchwad Jn 1,68,137
V8 Between Pimpri Jn & Kasarwadi Jn 1,78,697
V9 Before KSB Chowk (after Thermax) 81,219
V10 On Telco Road - between KSB Chowk & NH-50 78,688
V11 Between Kalewadi Chowk & Dange Chowk 80,951
V12 On Dehu-Alandi Rd 11,700
V13 On Nigdi Jn to Dehu-Alandi Rd 18,415
V14 On NH-50 at Bhosari 86,264
V15 Small bridge parallel to Dapodi bridge (Bopodi) 96,118
The above data was used to build a traffic model to arrive at the base year traffic scenario. Per Capita Trip Rate (PCTR) of 0.83 was observed, with a vehicular trip rate of 0.78.
A four stage travel demand model was developed to estimate Internal – Internal trips within PCMC Area, with the following models in each of the four stages:
(i) Trip Generation Model
a. Trip Production Model – Multiple linear regression model
b. Trip Attraction Model – Multiple linear regression model
(ii) Trip Distribution Model – Gravity model with zone influence factors
(iii) Mode Split Model – Multinomial Logit Model
(iv) Traffic Assignment Model – All-or-nothing for Transit Trips and Multinomial Logit based
Multipath Assignment Model for other trips
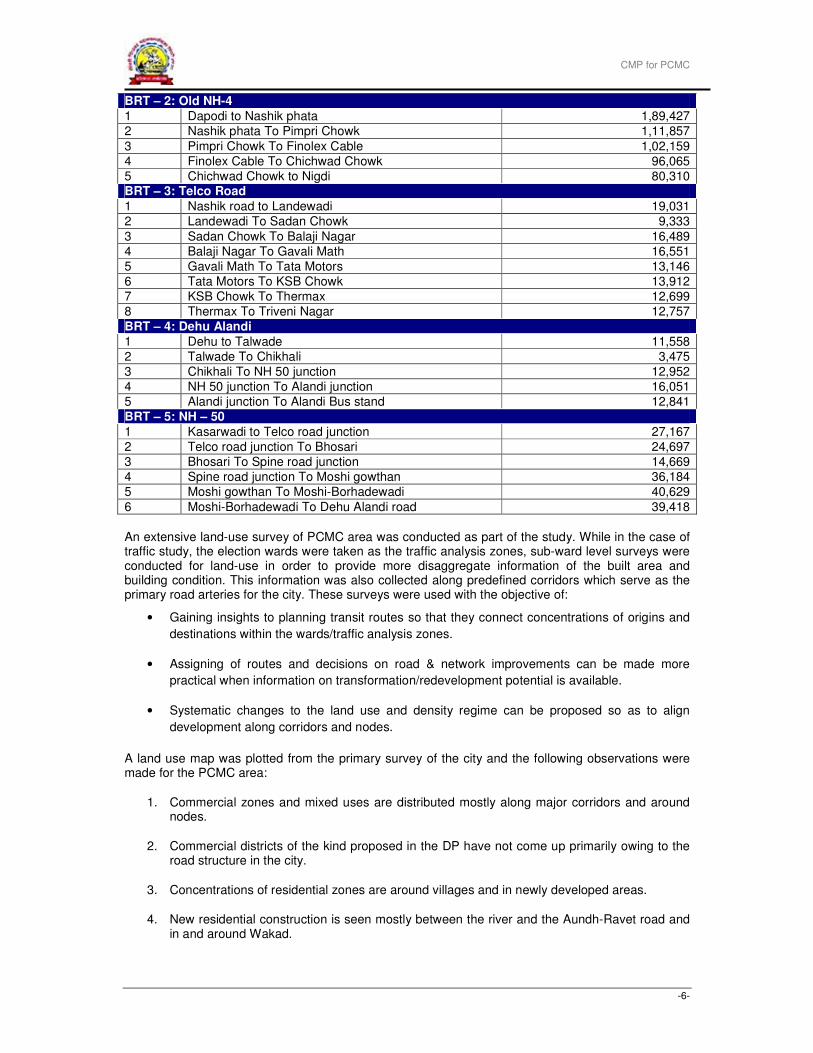
The following table presents the total number of passenger trips estimated per day in the base-year.
S.No. Section of corridor Bus trips (passenger trips per day)
BRT – 1: Aundh Rawet
1 Rajiv Gandhi bridge to Sangvi phata 57,381
2 Sangvi phata To Kalewadi phata 37,490
3 Kalewadi phata To Dange Chowk 13,342
4 Dange Chowk To Thatawade 12,151
5 Thatawade To Punawale 8,433
6 Punawale To Mumabai/Bangalore Expressway 8,381
CMP for PCMC
-6-
BRT – 2: Old NH-4
1 Dapodi to Nashik phata 1,89,427
2 Nashik phata To Pimpri Chowk 1,11,857
3 Pimpri Chowk To Finolex Cable 1,02,159
4 Finolex Cable To Chichwad Chowk 96,065
5 Chichwad Chowk to Nigdi 80,310 BRT – 3: Telco Road
1 Nashik road to Landewadi 19,031
2 Landewadi To Sadan Chowk 9,333
3 Sadan Chowk To Balaji Nagar 16,489
4 Balaji Nagar To Gavali Math 16,551
5 Gavali Math To Tata Motors 13,146
6 Tata Motors To KSB Chowk 13,912
7 KSB Chowk To Thermax 12,699
8 Thermax To Triveni Nagar 12,757
BRT – 4: Dehu Alandi
1 Dehu to Talwade 11,558
2 Talwade To Chikhali 3,475
3 Chikhali To NH 50 junction 12,952
4 NH 50 junction To Alandi junction 16,051
5 Alandi junction To Alandi Bus stand 12,841
BRT – 5: NH – 50
1 Kasarwadi to Telco road junction 27,167
2 Telco road junction To Bhosari 24,697
3 Bhosari To Spine road junction 14,669
4 Spine road junction To Moshi gowthan 36,184
5 Moshi gowthan To Moshi-Borhadewadi 40,629
6 Moshi-Borhadewadi To Dehu Alandi road 39,418
An extensive land-use survey of PCMC area was conducted as part of the study. While in the case of traffic study, the election wards were taken as the traffic analysis zones, sub-ward level surveys were conducted for land-use in order to provide more disaggregate information of the built area and building condition. This information was also collected along predefined corridors which serve as the primary road arteries for the city. These surveys were used with the objective of:
• Gaining insights to planning transit routes so that they connect concentrations of origins and
destinations within the wards/traffic analysis zones.
• Assigning of routes and decisions on road & network improvements can be made more
practical when information on transformation/redevelopment potential is available.
• Systematic changes to the land use and density regime can be proposed so as to align
development along corridors and nodes.
A land use map was plotted from the primary survey of the city and the following observations were made for the PCMC area:
1. Commercial zones and mixed uses are distributed mostly along major corridors and around nodes.
2. Commercial districts of the kind proposed in the DP have not come up primarily owing to the road structure in the city.
3. Concentrations of residential zones are around villages and in newly developed areas.
4. New residential construction is seen mostly between the river and the Aundh-Ravet road and in and around Wakad.
CMP for PCMC
-7-
5. Location decisions of high order institutional zones such as hospitals, colleges, etc seem to have been based on a function of market values and connectivity rather than zonation as specified in the DP.
6. Industries have come up in the MIDC area. Some transformations from industrial to commercial are seen along major spines like the NH4.
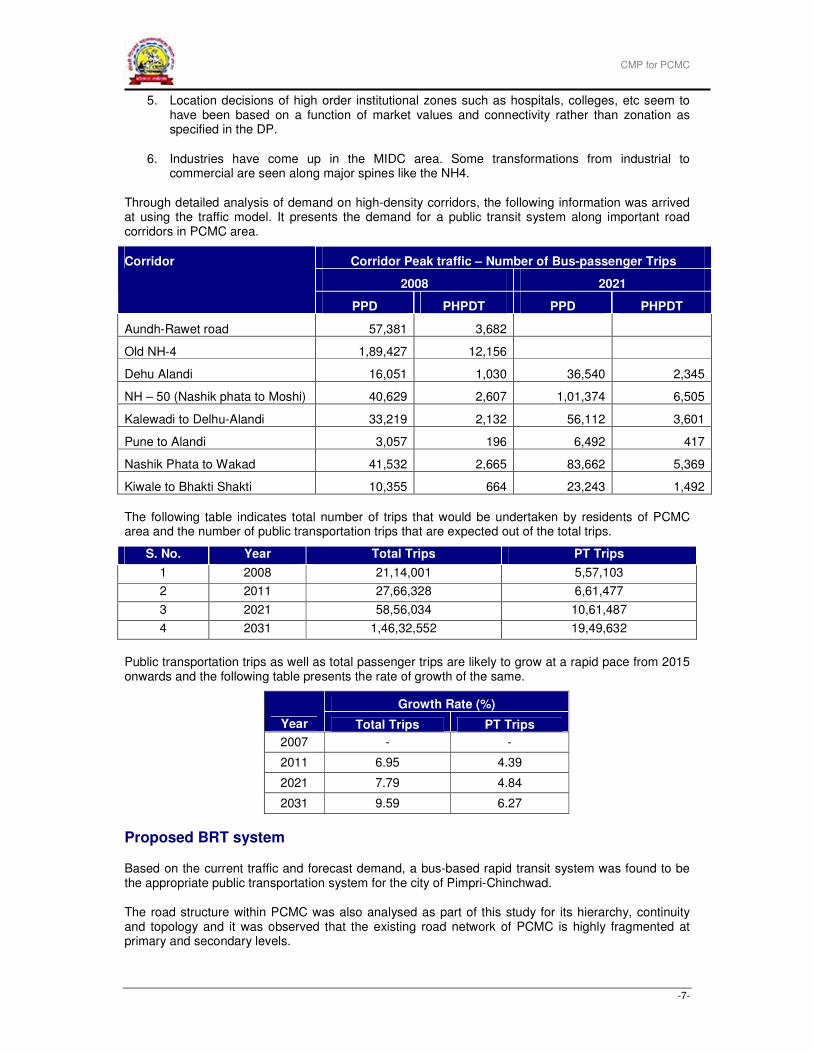
Through detailed analysis of demand on high-density corridors, the following information was arrived at using the traffic model. It presents the demand for a public transit system along important road corridors in PCMC area.
Corridor Peak traffic – Number of Bus-passenger Trips
2008 2021
Corridor
PPD PHPDT PPD PHPDT
Aundh-Rawet road 57,381 3,682
Old NH-4 1,89,427 12,156
Dehu Alandi 16,051 1,030 36,540 2,345
NH – 50 (Nashik phata to Moshi) 40,629 2,607 1,01,374 6,505
Kalewadi to Delhu-Alandi 33,219 2,132 56,112 3,601
Pune to Alandi 3,057 196 6,492 417
Nashik Phata to Wakad 41,532 2,665 83,662 5,369
Kiwale to Bhakti Shakti 10,355 664 23,243 1,492
The following table indicates total number of trips that would be undertaken by residents of PCMC area and the number of public transportation trips that are expected out of the total trips.
S. No. Year Total Trips PT Trips
1 2008 21,14,001 5,57,103
2 2011 27,66,328 6,61,477
3 2021 58,56,034 10,61,487
4 2031 1,46,32,552 19,49,632
Public transportation trips as well as total passenger trips are likely to grow at a rapid pace from 2015 onwards and the following table presents the rate of growth of the same.
Growth Rate (%)
Year Total Trips PT Trips
2007 - -
2011 6.95 4.39
2021 7.79 4.84
2031 9.59 6.27
Proposed BRT system
Based on the current traffic and forecast demand, a bus-based rapid transit system was found to be the appropriate public transportation system for the city of Pimpri-Chinchwad.
The road structure within PCMC was also analysed as part of this study for its hierarchy, continuity and topology and it was observed that the existing road network of PCMC is highly fragmented at primary and secondary levels.
CMP for PCMC
-8-
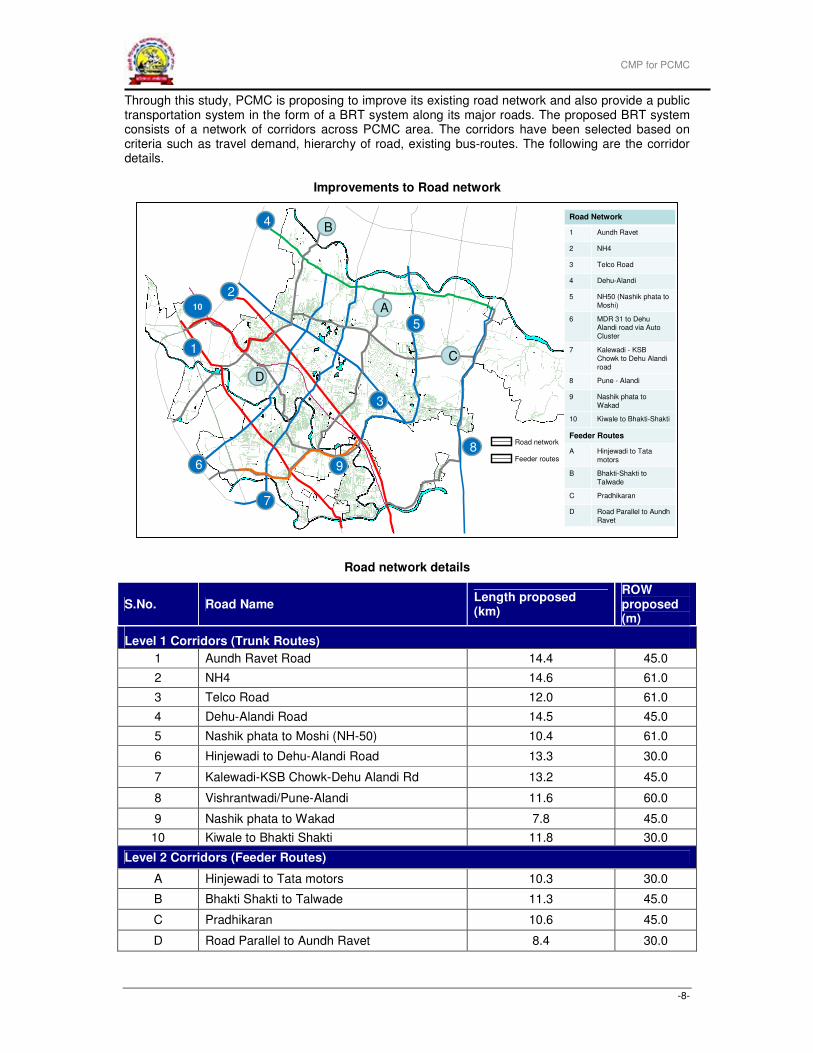
Through this study, PCMC is proposing to improve its existing road network and also provide a public transportation system in the form of a BRT system along its major roads. The proposed BRT system consists of a network of corridors across PCMC area. The corridors have been selected based on criteria such as travel demand, hierarchy of road, existing bus-routes. The following are the corridor details.
Improvements to Road network
Road network details
S.No. Road Name Length proposed (km)
ROW proposed (m)
Level 1 Corridors (Trunk Routes)
1 Aundh Ravet Road 14.4 45.0
2 NH4 14.6 61.0
3 Telco Road 12.0 61.0
4 Dehu-Alandi Road 14.5 45.0
5 Nashik phata to Moshi (NH-50) 10.4 61.0
6 Hinjewadi to Dehu-Alandi Road 13.3 30.0
7 Kalewadi-KSB Chowk-Dehu Alandi Rd 13.2 45.0
8 Vishrantwadi/Pune-Alandi 11.6 60.0
9 Nashik phata to Wakad 7.8 45.0
10 Kiwale to Bhakti Shakti 11.8 30.0
Level 2 Corridors (Feeder Routes)
A Hinjewadi to Tata motors 10.3 30.0
B Bhakti Shakti to Talwade 11.3 45.0
C Pradhikaran 10.6 45.0
D Road Parallel to Aundh Ravet 8.4 30.0
`
Feeder routes
Road network
Nashik phata to
Wakad
9
Kiwale to Bhakti-Shakti10
Pune - Alandi8
Kalewadi - KSB
Chowk to Dehu Alandi
road
7
Road Network
1 Aundh Ravet
2 NH4
3 Telco Road
4 Dehu-Alandi
5 NH50 (Nashik phata to
Moshi)
6 MDR 31 to DehuAlandi road via Auto
Cluster
Feeder Routes
A Hinjewadi to Tata
motors
B Bhakti-Shakti to
Talwade
C Pradhikaran
D Road Parallel to Aundh
Ravet
1
2
3
4
5
6
7
A
B
C
8
9
10
D
CMP for PCMC
-9-
As a part of re-development of land along corridors, with the objective of having a transit-oriented development along the BRT corridors, it has been proposed to modify certain land-use policies prevalent in PCMC. PCMC has initiated the process by presenting to its General Body for allowing a maximum FSI of 1.8 within the influence zone of the BRT corridors. Once approved, developers will be able to utilise more FSI along the BRT corridors. It is also planned by PCMC that transfer of development rights (TDR) from other existing zones in the area would be allowed in the buffer zones along BRT corridors. This is expected to drive the more development along the public transport corridors in future years. Developers will have to pay a premium for tranfering the development rights onto the new zone.
Proposed design of corridors
In terms of the configuration of road and BRT corridors, the following recommendations have been made in the study:
1. Dedicated bus-lanes have been located in the middle of the carriageway, on either sides of the median,
2. Bus-stops are located at a distance of about 250 m on either side of junctions and at mid-block locations at distances of 500-700 m beyond junctions,
3. In order to have least hindrances for pedestrians to cross roads to reach bus-stops, it has been recommended that the bus-stops be located at grade with the pedestrian lanes provided at the edge of RoW. The through traffic lanes on either sides of BRT lanes would be elevated to a minimum height of the buses. This would enable pedestrians to reach bus-stops with minimum impedance.
4. Provision of separate lanes for pedestrians and non-motorised vehicles on either ends of RoW,
Based on the width of RoW of the corridors, the above components have varying widths. A number of alternate designs were studied and discussed with PCMC officials. The detailed designs have been presented in the report.
Project Phasing and cost estimates
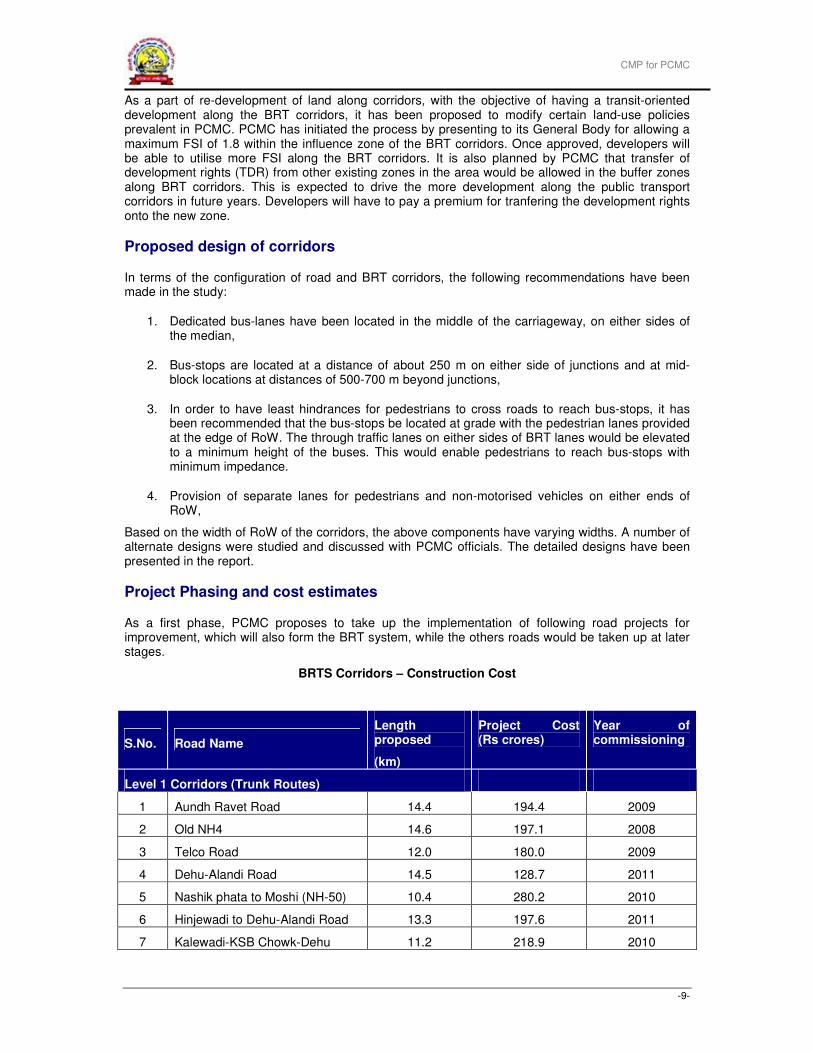
As a first phase, PCMC proposes to take up the implementation of following road projects for improvement, which will also form the BRT system, while the others roads would be taken up at later stages.
BRTS Corridors – Construction Cost
S.No. Road Name
Length proposed
(km)
Project Cost (Rs crores)
Year of commissioning
Level 1 Corridors (Trunk Routes)
1 Aundh Ravet Road 14.4 194.4 2009
2 Old NH4 14.6 197.1 2008
3 Telco Road 12.0 180.0 2009
4 Dehu-Alandi Road 14.5 128.7 2011
5 Nashik phata to Moshi (NH-50) 10.4 280.2 2010
6 Hinjewadi to Dehu-Alandi Road 13.3 197.6 2011
7 Kalewadi-KSB Chowk-Dehu 11.2 218.9 2010
CMP for PCMC
-10-
S.No. Road Name
Length proposed
(km)
Project Cost (Rs crores)
Year of commissioning
Alandi Rd
8 Vishrantwadi/Pune-Alandi 11.6 187.4 2011
9 Nashik phata to Wakad 8.04 205.6 2010
10 Kiwale to Bhakti Shakti 11.8 144.9 2011
Level 2 Corridors (Feeder Routes)
A Hinjewadi to Tata motors 10.3 92.7 2013
B Bhakti Shakti to Talwade 11.3 101.7 2013
C Pradhikaran 10.6 95.4 2012
D Road Parallel to Aundh Ravet 8.4 75.6 2014
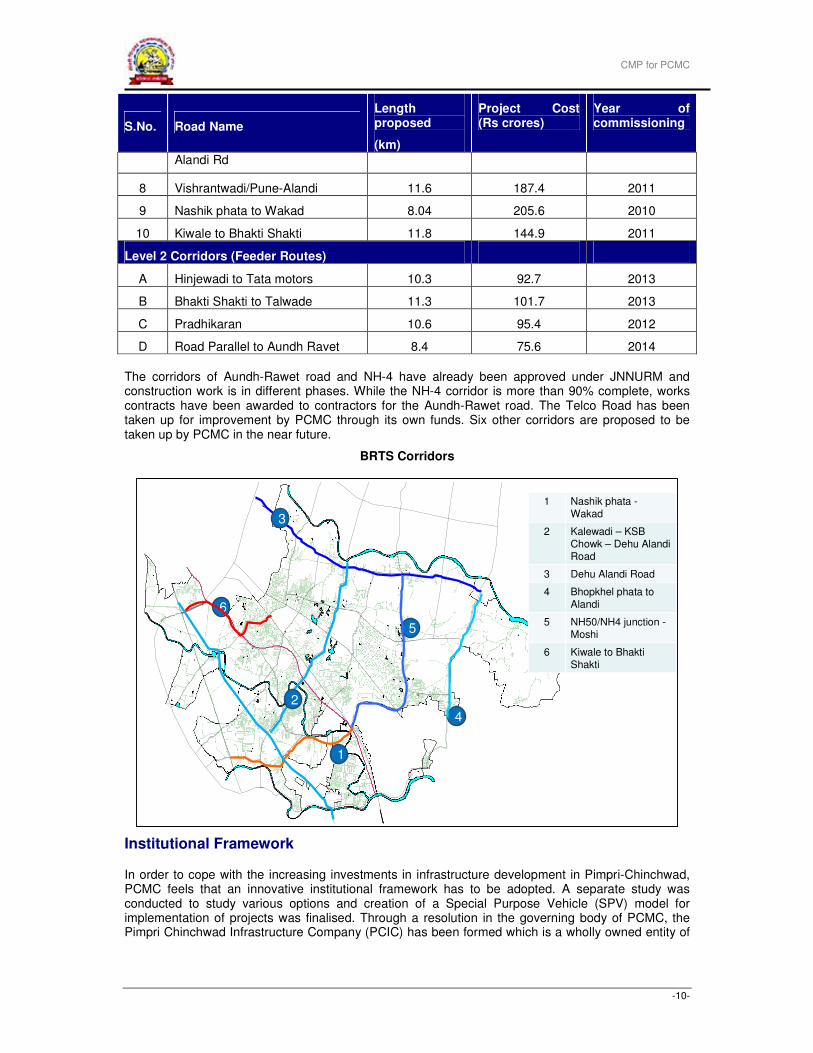
The corridors of Aundh-Rawet road and NH-4 have already been approved under JNNURM and construction work is in different phases. While the NH-4 corridor is more than 90% complete, works contracts have been awarded to contractors for the Aundh-Rawet road. The Telco Road has been taken up for improvement by PCMC through its own funds. Six other corridors are proposed to be taken up by PCMC in the near future.
BRTS Corridors
Institutional Framework
In order to cope with the increasing investments in infrastructure development in Pimpri-Chinchwad, PCMC feels that an innovative institutional framework has to be adopted. A separate study was conducted to study various options and creation of a Special Purpose Vehicle (SPV) model for implementation of projects was finalised. Through a resolution in the governing body of PCMC, the Pimpri Chinchwad Infrastructure Company (PCIC) has been formed which is a wholly owned entity of
`
6
3
5
2
4
1 Nashik phata -Wakad
2 Kalewadi – KSB Chowk – Dehu AlandiRoad
3 Dehu Alandi Road
4 Bhopkhel phata to Alandi
5 NH50/NH4 junction -Moshi
6 Kiwale to BhaktiShakti
1 Nashik phata -Wakad
2 Kalewadi – KSB Chowk – Dehu AlandiRoad
3 Dehu Alandi Road
4 Bhopkhel phata to Alandi
5 NH50/NH4 junction -Moshi
6 Kiwale to BhaktiShakti
1
CMP for PCMC
-11-
PCMC. This company will be responsible for implementation of the first phase of the CMP, which involves 8 main corridors of the road network.
To ensure long term sustainability of the BRTS project, PCMC has created an Urban Transport Fund (UTF), which will be managed by the SPV. This Urban Transport Fund has been created to capture the benefits of the BRTS projects for long term sustainability and as a means of self financing for the future. The UTF has identified 100 m on either side of the BRTS corridors as BRTS influence zone which will be densified as per Ministry of Urban Development’s policy of corridor densification. PCMC has already approved grant of higher FSI on all BRTS corridors. The UTF has been assigned revenues that include building permission development charges, incremental property tax, advertisement rights, lease on utilities ducts etc. In addition, PPP revenues viz. premium charges for loading of Transfer of Development Rights and sale of incremental FSI emerging from real estate development and corridor densification have also been assigned to the UTF.
PCIC will manage the UTF as well as project development, construction and management of BRTS corridors. PCIC will be a company under the Companies Act of 1956. This company will be managed by a board of Directors comprising of elected representatives and key officials of PCMC. Professional staff either nominated from PCMC or appointed from external sources will manage the day to day operations of the company related to construction of BRTS corridors, financial management and management of UTF. For the balance funds for project corridors, PCMC will approach ADB, IFC, IIFCL and other banks through PCIC with BRTS influence zone earnings as collateral to funding agencies. A substantial portion of the project funding will be provided by PCMC in the form of equity into this company. This will be generated by commercializing key parcels of land on PPP basis along the project corridor.
Pune Mahanagar Parivahan Mandal Limited, a company jointly owned by Pune Municipal Corporation and Pimpri Chinchwad Municipal Corporation will operate the BRTS system that will be common for both the cities.
Financial Planning
To support the capital expenditure to be incurred for the projects, the following revenue streams would be considered by the SPV which would be through the Urban Transport Fund (UTF). These charges would be collected from developments along a buffer area of 100 m width on either sides of the corridors.
� Development Charges;
� Revenue through incremental FSI – TDR loading;
� Incremental Property Tax;
� Advertisements, and
� Lease Rentals of Utility Ducts
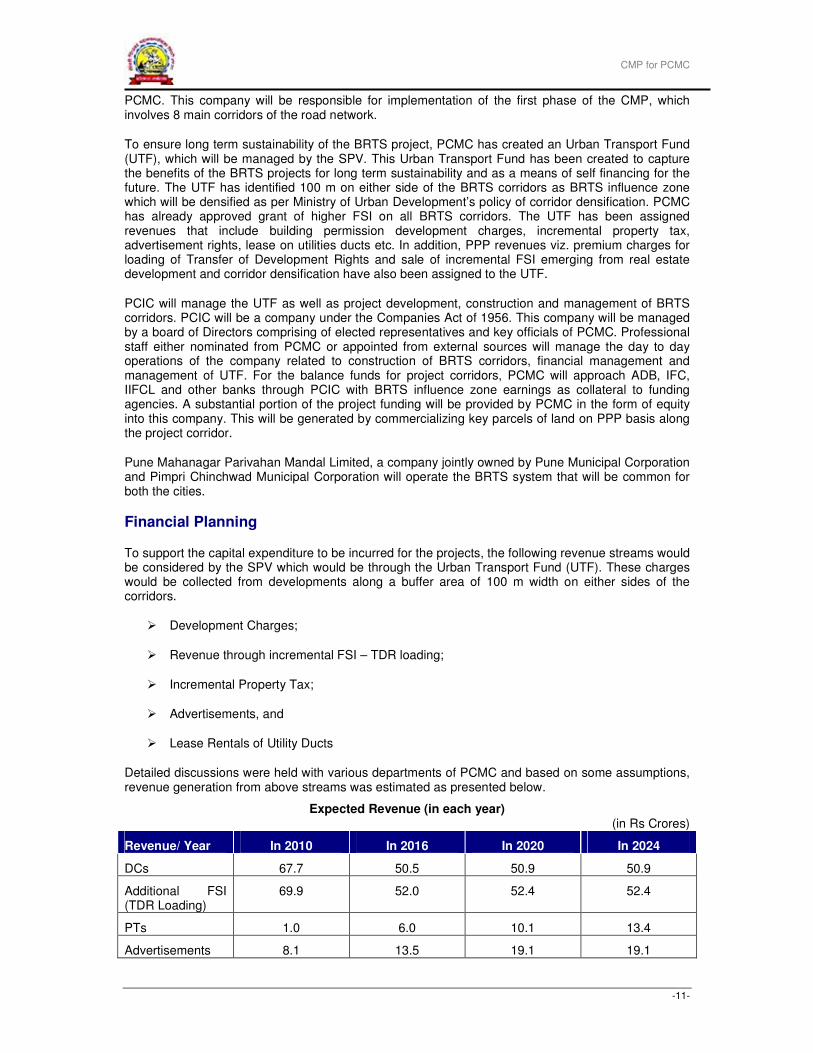
Detailed discussions were held with various departments of PCMC and based on some assumptions, revenue generation from above streams was estimated as presented below.
Expected Revenue (in each year) (in Rs Crores)
Revenue/ Year In 2010 In 2016 In 2020 In 2024
DCs 67.7 50.5 50.9 50.9
Additional FSI (TDR Loading)
69.9 52.0 52.4 52.4
PTs 1.0 6.0 10.1 13.4
Advertisements 8.1 13.5 19.1 19.1

CMP for PCMC
-12-
Revenue/ Year In 2010 In 2016 In 2020 In 2024
Utility Charges 8.5 6.1 6.1 6.1
Total Revenue 155.2 128.1 138.6 141.9
PCMC is working on strategies for procuring funding for the projects from various sources such as multi-lateral agencies, financial institutions and banks.
CMP for PCMC
-13-
CONTENTS
1 INTRODUCTION..................................................................................................... 25
1.1 Profile of the City ......................................................................................................................... 25
1.2 Urban Land Use Structure/Activity Distribution ....................................................................... 34
2 EXISTING TRANSPORTATION SYSTEM IN THE CITY........................................ 55
2.1 Introduction .................................................................................................................................. 55
2.2 Vehicular growth and composition ............................................................................................ 55
2.3 Road network Characteristics .................................................................................................... 57
2.4 Analyzing Road Structure ........................................................................................................... 58
2.5 Major Transportation Nodes ....................................................................................................... 61
2.6 Pedestrian and NMV Facilities.................................................................................................... 62
2.7 Traffic Management Including Parking Management............................................................... 63
2.8 Traffic Safety ................................................................................................................................ 63
2.9 Intermediate Public Transit System........................................................................................... 64
2.10 Public Transportation System .................................................................................................... 65
2.11 Issues and Prospects .................................................................................................................. 66
3 TRAVEL CHARACTERISTICS............................................................................... 68
3.1 Introduction .................................................................................................................................. 68
3.2 Approach ...................................................................................................................................... 68
3.3 Outline of the Proposed Methodology....................................................................................... 69
3.4 Details of traffic and transportation studies undertaken for PCMC ....................................... 71
3.5 Travel Characteristics.................................................................................................................. 89
3.6 Intersection Turning Movements ............................................................................................... 96
3.7 Travel Demand Analysis............................................................................................................ 109
4 TRAVEL DEMAND MODELLING......................................................................... 118
4.2 Future Travel Demand Scenarios – Business as Usual......................................................... 119
4.3 Future Travel Demand Scenario – Integrated Land Use and Transportation...................... 122
CMP for PCMC
-14-
4.4 Proposed Land Use and Density Zoning................................................................................. 123
4.5 Challenges and opportunities, goals and objectives............................................................. 124
4.6 Alternative Analysis................................................................................................................... 125
4.7 Stake holder consultations ....................................................................................................... 125
5 TRANSPORT MASTER PLAN ............................................................................. 127
5.1 Strategy for Proposed Transportation System....................................................................... 127
5.2 Integration of Master Transport Plan into the Master Plan of the city ................................. 133
5.3 Integration of the system with Pune ........................................................................................ 140
6 BRT SYSTEM DESIGN – NETWORK AND ROADWAY ..................................... 142
6.1 Network/Corridor Assessment & Selection............................................................................. 142
6.2 Land Ownership of the Corridor ROW..................................................................................... 143
6.3 Corridor design .......................................................................................................................... 143
6.4 Pavement design........................................................................................................................ 160
6.5 Street Lighting, Furniture .......................................................................................................... 160
6.6 Relocation of existing services/utilities................................................................................... 160
6.7 Block Cost Estimates for Roadway Development.................................................................. 160
6.8 Integration of BRT with Other Transit Services...................................................................... 161
6.9 Setting up of Common Utility Offices ...................................................................................... 162
6.10 Fare Fixation and Collection System....................................................................................... 162
6.11 Parking For Para Transit Facilities........................................................................................... 162
6.12 Hawkers & Vendors Reorganization ........................................................................................ 163
7 INTEGRATING LAND USE & TRANSPORTATION AND USING LAND AS A RESOURCE................................................................................................................ 164
7.1 Concepts in Land Use and Transportation Integration.......................................................... 164
7.2 Analysis of 500 m buffer of the corridors................................................................................ 165
7.3 Implementation Mechanisms.................................................................................................... 168
7.4 Development of government land ............................................................................................ 168
8 TERMINALS AND PARKING ............................................................................... 169
8.1 Proposed Parking Policy........................................................................................................... 169
CMP for PCMC
-15-
8.2 Rolling Stock of the BRT system ............................................................................................. 169
8.3 Other vehicles on BRTS Corridors........................................................................................... 169
8.4 Other Streets .............................................................................................................................. 170
8.5 Locations & Area of Terminals ................................................................................................. 170
8.6 Block Cost Estimates ................................................................................................................ 170
8.7 PPP Potential .............................................................................................................................. 171
9 PROPOSED PHASING OF PROJECTS .............................................................. 172
10 FINANCIAL PLANNING AND COST ESTIMATES .............................................. 176
10.1 Project Cost ................................................................................................................................ 176
10.2 Financial Status of PCMC.......................................................................................................... 177
10.3 Revenue Model........................................................................................................................... 179
10.4 Funding Options ........................................................................................................................ 185
PCMC Road SPV – Profit & Loss Account, Balance Sheet, Cash Flow Statement and Ratio Analysis.................................................................................................................................................... 189
11 AGENCY/AGENCIES FOR IMPLEMENTATION, OPERATION AND MAINTENANCE.......................................................................................................... 193
11.1 Need for an institutional framework......................................................................................... 193
11.2 Proposed structure of SPV ....................................................................................................... 194
12 CONCLUSIONS.................................................................................................... 204
RESOLUTION OF GENERAL BODY MEETING........................................................ 210
CMP for PCMC
-16-
LIST OF TABLES
Table 1 Analysis of spatial growth over time......................................................................................... 27
Table 2: Population Growth in PCMC ................................................................................................... 28
Table 3 Proposed Land Use Areas....................................................................................................... 34
Table 4 FSI Corresponding to Use as Prescribed in the DCR in force................................................. 35
Table 5 Extent of developed area in PCMC based on Land Use sub-category .................................. 42
Table 6 FSI consumed by land area ..................................................................................................... 42
Table 7 Existing road hierarchy ............................................................................................................ 43
Table 8 Registered Vehicles in PCMC.................................................................................................. 55
Table 9 New Registrations of Vehicles in PCMC ............................................................................. 57
Table 10: Details of accidents in PCMC area ....................................................................................... 63
Table 11: Auto-rickshaws in PCMC ..................................................................................................... 65
Table 12: Fleet size and Passenger base of PCMT ............................................................................. 65
Table 13: Locations and Schedule of Outer Cordon Counts ................................................................ 73
Table 14: Locations and Schedule of Counts on major arterial network of PCMC............................... 73
Table 15: Locations, Sample Size and Schedule of Opinion Surveys.................................................. 74
Table 16: Origin-Destination Surveys conducted at Railway Stations.................................................. 75
Table 17: Origin-Destination Surveys conducted at Inter-City Bus Terminus ...................................... 75
Table 18: Locations of Turning Movement Surveys ............................................................................. 75
Table 19: Distribution of HIS Sample by Gender .................................................................................. 80
Table 20: Distribution of Vehicle Ownership as per HIS Survey........................................................... 80
Table 21: Trip Rates Distribution .......................................................................................................... 81
Table 22: Modal Split ............................................................................................................................ 81
Table 23: Trip Generation (Productions and Attractions) in the Study Area ................................ 82
Table 24: Summary of Traffic Counts at Outer Cordon Points ............................................................. 86
Table 25: Passenger Traffic Volume (in Vehicles and PCUs) at Outer Cordon Points ........................ 86
Table 26 Summary of Mid-block Counts on Major Arterials ........................................................... 87
Table 27 Passenger Traffic Volume (in Vehicles and PCUs) at Mid-block Count Locations ............... 88
CMP for PCMC
-17-
Table 28 Journey Speeds on Major Arterials in PCMC Area................................................................ 88
Table 29 Average Occupancies of Vehicles at Outer Cordon Points and in PCMC Area.................... 89
Table 30 Total number of passenger trips in PCMC Area .................................................................... 89
Table 31 Summary of Regression Analysis for Trip Production Model .............................................. 109
Table 32 Summary of Regression Analysis for Trip Attraction Model ................................................ 111
Table 33 Traffic Volume on Various Major Arterials in PCMC............................................................ 116
Table 34 Number of Lanes Required for General Traffic.................................................................... 116
Table 35: Total and PT Trips in PCMC Area under BAU Scenario .................................................... 120
Table 36: Growth rates for traffic forecast under BAU Scenario......................................................... 121
Table 37: Peak traffic derived for important corridords in PCMC area ............................................... 121
Table 38: Total and PT Trips in PCMC Area under Integrated Land-Use scenario .................... 122
Table 39: Growth rates for traffic forecast under Land-use integration Scenario ............................... 123
Table 40 Land consolidation requirements for improving road structure .................................. 128
Table 41 Main Road Corridors and Feeder Routes............................................................................ 129
Table 42: Peak traffic derived for important corridors in PCMC area ................................................. 130
Table 43 Locations of fly-overs ........................................................................................................... 132
Table 44 Locations of major-bridges................................................................................................... 132
Table 45 Locations of Rail-over-bridges ............................................................................................. 132
Table 46 Details of meetings held with PMC ...................................................................................... 140
Table 47: Peak traffic derived for important corridors in PCMC area ................................................. 142
Table 48 Block cost estimates of road development .......................................................................... 161
Table 49 Estimated area along corridors (in 500m) - Public real estate assets ................................. 165
Table 50 Estimated Built-up area development along BRT corridors – 500 m ........................... 167
Table 51 Estimated land development along BRT corridors – 500 m ................................................ 168
Table 52 Estimated value capture through Impact Fees along BRT corridors – 500m...................... 168
Table 53 Proposed locations for bus terminals................................................................................... 170
Table 54 Estimated cost of bus terminals ........................................................................................... 170
Table 55 Potential for PPP for bus-terminals...................................................................................... 171
Table 56 Road Corridors – Phasing................................................................................................... 173
Table 57 Road Corridors – Estimated costs ...................................................................................... 176

CMP for PCMC
-18-
Table 58 Fly-overs – Estimated Construction Cost ........................................................................... 177
Table 59 Major Bridges – Construction Cost ..................................................................................... 177
Table 60 ROBs – Construction Cost.................................................................................................. 177
Table 61 Development along Road Corridors..................................................................................... 180
Table 62 Development Charges....................................................................................................... 182
Table 63 Revenue from TDR Loading ............................................................................................. 182
Table 64 Revenue from Property Tax.............................................................................................. 184
Table 65: Expected Revenue (per annum)...................................................................................... 184
Table 66 Funding Options ................................................................................................................ 185
Table 67 SPV Key activities ............................................................................................................. 195
CMP for PCMC
-19-
LIST OF FIGURES
Figure 1 Ward wise distribution of employment .................................................................................... 47
Figure 2: Trend in Growth of Two-wheelers and Cars in PCMC .......................................................... 56
Figure 3: Trend in Growth of Two-wheelers and Cars in PCMC .......................................................... 57
Figure 4: Important roads in PCMC area .......................................................................................... 58
Figure 5 Existing Road Network by Hierarchy ...................................................................................... 59
Figure 6 Proposed Road Network by Hierarchy ................................................................................... 59
Figure 7 Proposed Network highlighting roads with ROW 24 m or more ............................................. 60
Figure 8 Proposed Road Network highlighting roads with ROW 24 m or more & loose ends removed....................................................................................................................................................... 60
Figure 9 Major Trip Generators around PCMC Area ............................................................................ 61
Figure 10 Fatal Accidents details in PCMC Area.................................................................................. 64
Figure 11 Major Accidents details in PCMC Area................................................................................. 64
Figure 12 Methodology of Traffic study................................................................................................. 69
Figure 13: Study of Existing Scenario at PCMC Area .......................................................................... 70
Figure 14 Stages of Base Year Travel Demand Model Development.................................................. 71
Figure 15: Survey Locations ................................................................................................................. 76
Figure 16: Locations of Origin-Destination Surveys at Railway and Bus Stations ............................... 76
Figure 17: Distribution of Residences at PCMC Area by Type of Ownership ...................................... 79
Figure 18: Distribution of Residences at PCMC Area by Area ............................................................. 79
Figure 19: Distribution of Residences at PCMC Area by Type of the Building..................................... 80
Figure 20: Vehicle Composition as Observed in HIS............................................................................ 81
Figure 21: Distribution of Trip Generation in MCPC Area..................................................................... 85
Figure 22: Variation of Traffic Volume across Cordon and Mid-block Locations.................................. 87
Figure 23: Desire Lines for car Traffic................................................................................................... 91
Figure 24 Desire Lines for Two Wheeler Traffic ................................................................................... 92
Figure 25 Desire Lines for Three Wheeler Traffic................................................................................. 93
Figure 26: Desire Lines for Bus Traffic ................................................................................................. 94
Figure 27 Desire Lines for Local Train Traffic....................................................................................... 95
CMP for PCMC
-20-
Figure 28 Desire Lines for Total Traffic................................................................................................. 96
Figure 29 Peak Hour Turning Movements at Nigdi Junction in Vehicles per Hour...................... 97
Figure 30 Peak Hour Turning Movements at Nigdi Junction in PCUs per Hour........................... 98
Figure 31 Peak Hour Turning Movements at Chinchwad Junction in Vehicless per Hour ......... 99
Figure 32 Peak Hour Turning Movements at Chinchwad Junction in PCUs per Hour .............. 100
Figure 33 Peak Hour Turning Movements at Morewadi Junction in Vehicles per Hour ............ 101
Figure 34 Peak Hour Turning Movements at Morewadi Junction in PCUs per Hour ................. 102
Figure 35 Peak Hour Turning Movements at KSB Junction in Vehicles per Hour ..................... 103
Figure 36 Peak Hour Turning Movements at KSB Junction in PCUs per Hour .......................... 104
Figure 37 Peak Hour Turning Movements at Dange Chowk in Vehicles per Hour..................... 105
Figure 38 Peak Hour Turning Movements at Dange Chowk in PCUs per Hour.......................... 106
Figure 39 Peak Hour Turning Movements at Nashik Phata in Vehicles per Hour ...................... 107
Figure 40 Peak Hour Turning Movements at Nashik Phata in PCUs per Hour .......................... 107
Figure 41 Peak Hour Turning Movements at Kalewadi Chowk in Vehicles per Hour ................ 108
Figure 42 Peak Hour Turning Movements at Kalewadi Chowk in PCUs per Hour ..................... 108
Figure 43 Correlation between Observed and Estimated Trip Productions ....................................... 111
Figure 44 Correlation between Observed and Estimated Trip Attractions ......................................... 113
Figure 45 Correlation between Observed and Estimated Trip Distribution ........................................ 114
Figure 46 Growths of Total and Transit Trips in PCMC AREA under BAU Scenario ......................... 121
Figure 47 Growth of Total and Transit Trips in PCMC AREA under Integrated Land-Use Scenario .123
Figure 48 Road network by traffic density........................................................................................... 127
Figure 49 Map showing road network................................................................................................. 131
Figure 50 Map showing proposed fly-overs, briges and ROBs .......................................................... 133
Figure 51 Street light lamp posts at 30 m centre to centre ................................................................. 160
Figure 52 Inter-modal transfer points in PCMC .................................................................................. 162
Figure 53 Parking for auto rickshaws near sub way bus stops........................................................... 163
Figure 54 Parking for auto rickshaws near at graded bus stops......................................................... 163
Figure 55 Location of vendor kiosks near bus stop ............................................................................ 163
Figure 56 Transit oriented development......................................................................................... 164
Figure 57 Potential for development/re-development along BRT corridors........................................ 166
CMP for PCMC
-21-
Figure 58 Schematic designs of land-use and FSI loading on Aundh Ravet corridor ........................ 167
Figure 59 PCMC – Revenue Trend .................................................................................................... 177
Figure 60 PCMC’s liquidity position .................................................................................................... 178
Figure 61: Borrowing for Road Corridors – Impact on PCMC’s Liquidity Position.............................. 179
Figure 62 SPV – Funding options.................................................................................................... 187
Figure 63 Debt Repayment – Water Flow Arrangement ................................................................ 199
Figure 64 Organisation Structure .................................................................................................... 202
Figure 65 BRTS corridors ................................................................................................................... 205
CMP for PCMC
-22-
LIST OF MAPS
Map 1-1 Ward wise population distribution 29
Map 1-2 Ward wise population density 30
Map 1-3 Urban Sprawl 31
Map 1-4 Directions of growth 32
Map 1-5 Base scenario for 2021 & 2031 33
Map 1-6 Combined land use map of Old PCMC, PCNTDA & New PCMC areas 36
Map 1-7 Proposed FSI pattern (as per DCR) 37
Map 1-8 Proposed road network pattern 38
Map 1-9 Existing land use pattern 44
Map 1-10 Existing pattern of FSI consumption 45
Map 1-11 Existing road network pattern 46
Map 1-12 Distribution of jobs by survey block 49
Map 1-13 Distribution of Activity Areas 50
Map 1-14 Distribution of Residential Population By Survey Block 51
Map 1-15 Distribution of Floating Population/Visitors by Survey Block 52
Map 1-16 Trip Generation Potential by Survey Block 53
Map 3-1 The following map shows 106 zones (including Tathwade) considered in PCMC Area. 78
Map 3-2 Network Diagram 115
Map 5-1 Proposed road network for PCMC region 135
Map 5-2 Proposed Road Network with BRT Corridors & Feeder Routes 136
Map 5-3 Bicycle & Pedestrian Master Plan 137
Map 5-4 Proposed Schematic Land Use Plan 138
Map 5-5 Proposed Schematic Density Plan 139
Map 5-6 Integration of BRT corridors with Pune area 141
Map 6-1 Proposed BRT Corridors 148
Map 6-2 Bus-stop locations 149
Map 6-3 61 m RoW Configuration 150
Map 6-4 RoW configuration – 45 m 151
CMP for PCMC
-23-
Map 6-5 RoW configuration – 45 m 152
Map 6-6 At-grade Bus Stops Placed On The Median Between Bus Lanes And Accessed Through Foot Over-bridges 153
Map 6-7 At-grade Bus Stops Placed On The Median Between Bus Lanes And Accessed Through Sub-ways 154
Map 6-8 Bus Stops Placed Under At-grade Carriageway Of Mixed Traffic, Accessed Directly From Footpath 155
Map 6-9 At-grade Bus Stops Placed On The Median Between Bus Lanes And Accessed Through Foot Over-bridges 156
Map 6-10 At-grade Bus Stops Placed Under elevated Carriageway Of Mixed Traffic, Accessed Directly From Footpath 157
Map 6-11 At-grade Bus Stops Placed Under At-grade Carriageway Of Mixed Traffic, Accessed Directly From Footpath 158
Map 6-12 At-grade Bus Stops Placed Under At-grade Carriageway Of Mixed Traffic, Accessed Directly From Footpath 159
Map 9-1 BRTS Corridors in Phase I 175
CMP for PCMC
-24-
ABBREVIATIONS
AACGR Annual Average Cumulative Growth Rate
BRTS Bus Rapid Transit System
IPT Intermediate Para Transit
MoUD Ministry of Urban Development
NH National Highway
NUTP National Urban Trasnport Policy
PCMC Pimpri-Chinchwad Municipal Corporation
PCMT Pimpri-chinchwad Municipal Trasnport
PMC Pune Municipal Corporation
PMT Pune Municipal Transport
PMPML Pune Mahanagar Parivahan Mandal Ltd
PPP Public Private Partnership
PT Public Transport
CMP for PCMC
-25-
1 INTRODUCTION
Pimpri-Chinchwad is a major industrial centre of the Pune region and also of the entire country. It has witnessed a high population growth rate of around 100% in the last two decades. The population is estimated to reach about 15.07 lakhs by 2011 from the current level of 12.8 lakhs. As the city continues to grow, the Pimpri-Chinchwad Municipal Corporation (PCMC), which is responsible for provision of infrastructure services, needs to prepare itself for providing quality services to its citizens in all areas of infrastructure, including provision of a reliable public transport system.
As part of the JnNURM, PCMC is committed to implement various reforms as part of a tripartite Memorandum of Agreement. These reforms include e-Governance set-up, shifting to accrual-based Double-entry accounting system, Property Tax reforms, recovery of user-charges, dedicated fund allocation for provision of basic service to urban poor, etc. PCMC has also taken up a number of infrastructure projects in water-supply, sewerage systems, municipal solid-waste management, urban transport, integrated housing infrastructure provision for urban poor, etc. It has already received approvals to the tune of Rs 1,761 crores for the implementation of above project.
Urban transport forms an important part of development projects. It is the means of providing transportation facilities to the residents in developing cities. Given the current status of public transport services and unplanned road networks, the mobility needs of the people are seldom met. This has led to the unprecedented increase in the number of private vehicles plying on roads. In order to provide effective and efficient transport facilities to the public, the transport authorities are looking at alternative systems which can meet the mobility needs of the people. Increasingly, such alternative systems like Mass Rapid Transit Systems (MRTS) are being planned in the major cities of the country.
PCMC, through a Comprehensive Mobility Plan, has tried to explore and identify various steps that have to be taken towards improvement of its transportation systems with the objective of providing better quality of service to its citizens through better quality of infrastructure. As large quantum of funds would be required to create the network, PCMC is exploring the possibility of accessing funds through the Jawaharlal Nehru Urban Renewal Mission (JNNURM) in addition to assessing ways and means of increasing its own revenue streams to contribute towards this project.
The present study is aimed at developing a comprehensive mobility plan for the city and at the same time proposing a mass rapid transit system in the city of Pimpri-Chinchwad along with an integrated land-use development of the city. For this purpose traffic surveys were conducted to capture the present scenario in Pimpri-Chinchwad. A transportation model was developed for the city, which was used to identify the traffic flows in the road network of the city and used for estimating future traffic. A comprehensive land-use study of the city was also conducted and using the concept of Transit-Oriented-Development, proposals have been made for undertaking re-development of existing land-use patterns as well as encouraging new development in the city. These proposals have been made keeping in mind the growing nature of the city of Pimpri-Chinchwad, which needs to have an integrated land-use and transportation system as part of its planned growth.
This report presents the results obtained from the traffic and land-use study conducted and proposes the corridors along which a BRT system can be taken up by PCMC for implementation. It provides a financial feasibility for the system as well as the institutional framework required for the implementation and operations and management of the new system.
1.1 Profile of the City
The city of Pimpri-Chinchwad is situated northeast of Pune and is 160 km from Mumbai, the capital city of Maharashtra. It is predominantly an industrial area, which has developed during the last four decades.
CMP for PCMC
-26-
1.1.1 Historical Background
Pimpri was basically established as a centre for refugees from Pakistan. Industrialisation in Pimpri area commenced with the establishment of Hindustan Antibiotics Limited in 1956. The establishment of the Maharashtra Industrial Development Corporation (MIDC) in 1961-62 considerably facilitated industrial development in the area. The establishment of large-scale core industries has led to the growth of ancillary and small-scale industries in and around this industrial belt. The landscape in the region has seen significant changes over the years with agricultural land giving way to enclosed factory campuses. Today, Pimpri-Chinchwad is a major industrial centre of the Pune region and of the entire country.
1.1.2 Physical Characteristics of the City
Pimpri-Chinchwad is situated near the western margin of the Deccan Plateau on the leeward side of the Sahyadri ranges and Western Ghats, 560 m above sea level. The rivers Mula, Pawana and Indrayani form boundaries on three sides of the city. The city lies in the seismically active zone of Koyna Region, which is about 100 km. south of Pune.
Pimpri-Chinchwad being an extension of Pune, enjoys the excellent connectivity that Pune has. The city is well connected by road, rail and air to almost all important cities in India. Pimpri-Chinchwad is along the National Highway, NH-4 leading to Mumbai.
Pimpri-Chinchwad experiences three distinct seasons of summer, monsoon and winter. Typical summer months are from March to May, with maximum temperatures ranging from 35 to 39°C. The city often receives locally developed heavy thundershowers with sharp downpours in May. The nights however, are significantly cooler compared to most other parts in this region owing to its high altitude. The cities of Pune and Pimpri-Chinchwad receive moderate rainfall with an annual average of 722 mm, mainly between June and September as the result of southwest monsoon. July is the wettest month of the year. The weather is very pleasant in the city with average temperatures ranging from 20 to 28°C. The city experiences winter from November to February. The day temperature hovers around 29°C while night temperature is below 10°C for most of December and January, often dropping to 5 or 6°C.
1.1.3 Demographic and Socio-Economic Profile
Development of the Pimpri-Chinchwad Municipal Corporation dates back to the establishment of industries such as Bajaj Auto and Telco, in the middle of the 20th century. The establishment of the Pimpri-Chinchwad New Town Development Authority (PCNTDA) in the 1980s helped the development of residential colonies in the 1990s to an extent. With the booming IT and ITeS sector in neighbouring Pune in the 1990’s, Pimpri-Chinchwad has seen large scale development of residential areas.
Pimpri-Chinchwad has a literacy rate of 74% as per the 2001 Census. More than 60% of the population growth in Pimpri-Chinchwad has been on account of migration largely due to the employment opportunities prevailing in the region. Pimpri-Chinchwad has a sex ratio of 916 females for every 1000 males as per Census 2001.
1.1.3.1 Population growth
Pimpri-Chinchwad provides employment to industrial workers and of late has emerged as an affordable urban destination for residential purposes. The increasing demand for industrial and residential areas led to continuous addition of areas and upgradation of the erstwhile Municipal Council to a Municipal Corporation. For the last two decades, the decadal growth rate of population has been in the range of 100% while the previous two decades witnessed population growth of around 150%. As per the 2001 census, population of Pimpri-Chinchwad was 1,006,417 persons and the current population is estimated to be around 13.35 lakh persons.
CMP for PCMC
-27-
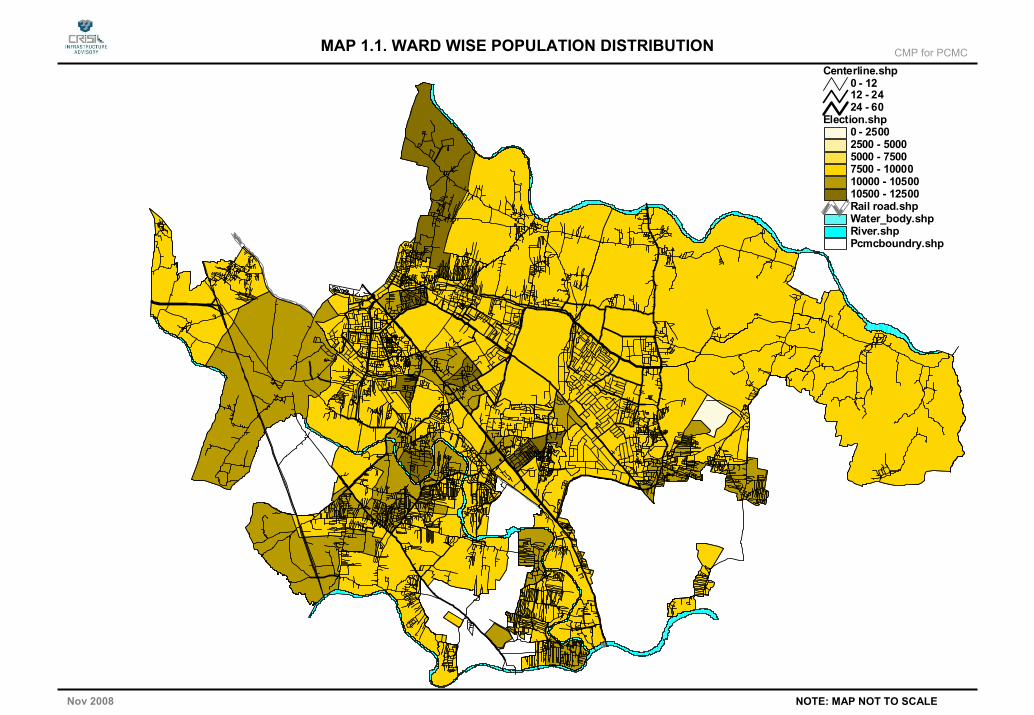
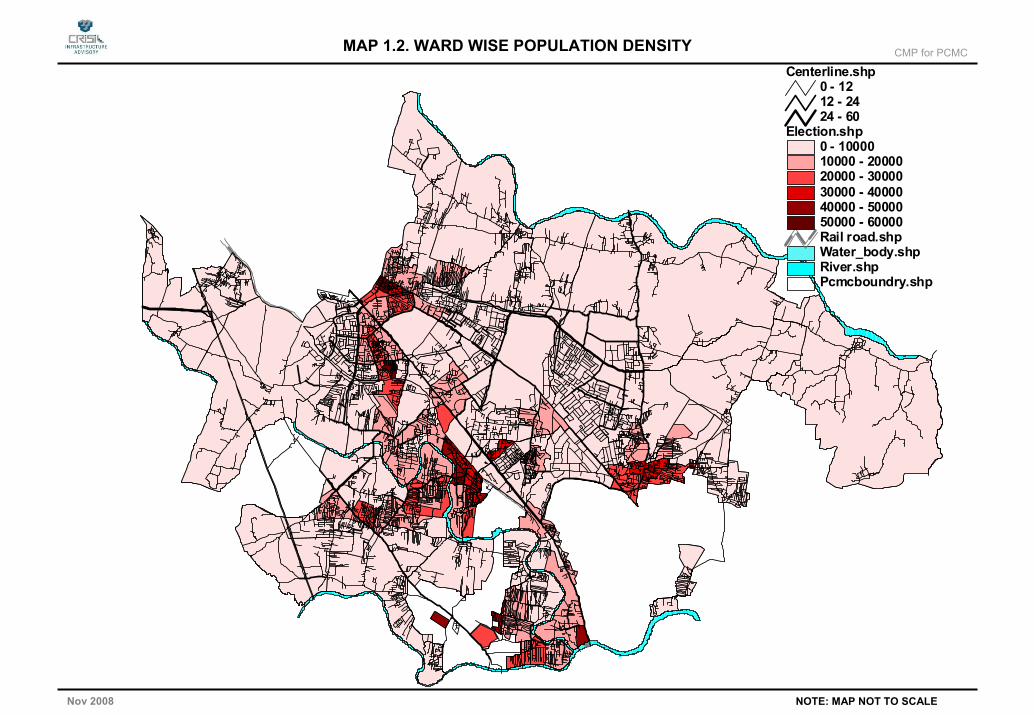
1.1.3.2 Existing population distribution
The existing population in the 105 wards of PCMC as per the Census of 2001 is attached in Annexure 1. Based on details of area of wards collected, the population density in these wards has also been calculated.
Refer Map 1.1 for Ward wise population distribution and Map 1.2 for Ward wise population density.
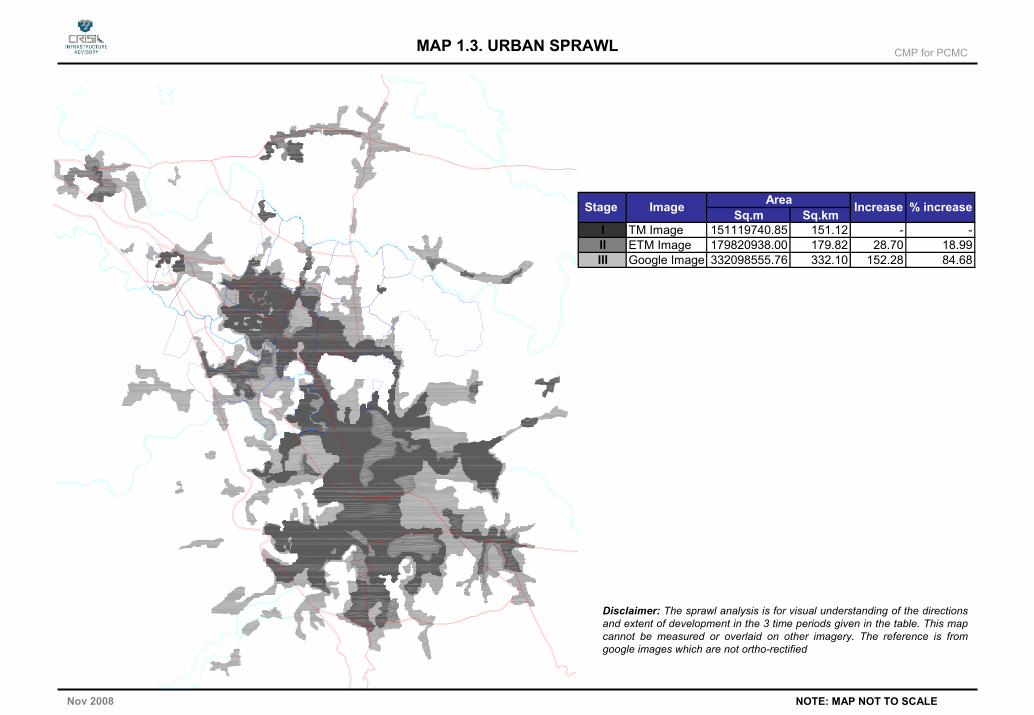
1.1.3.3 Spatial Patterns of Growth
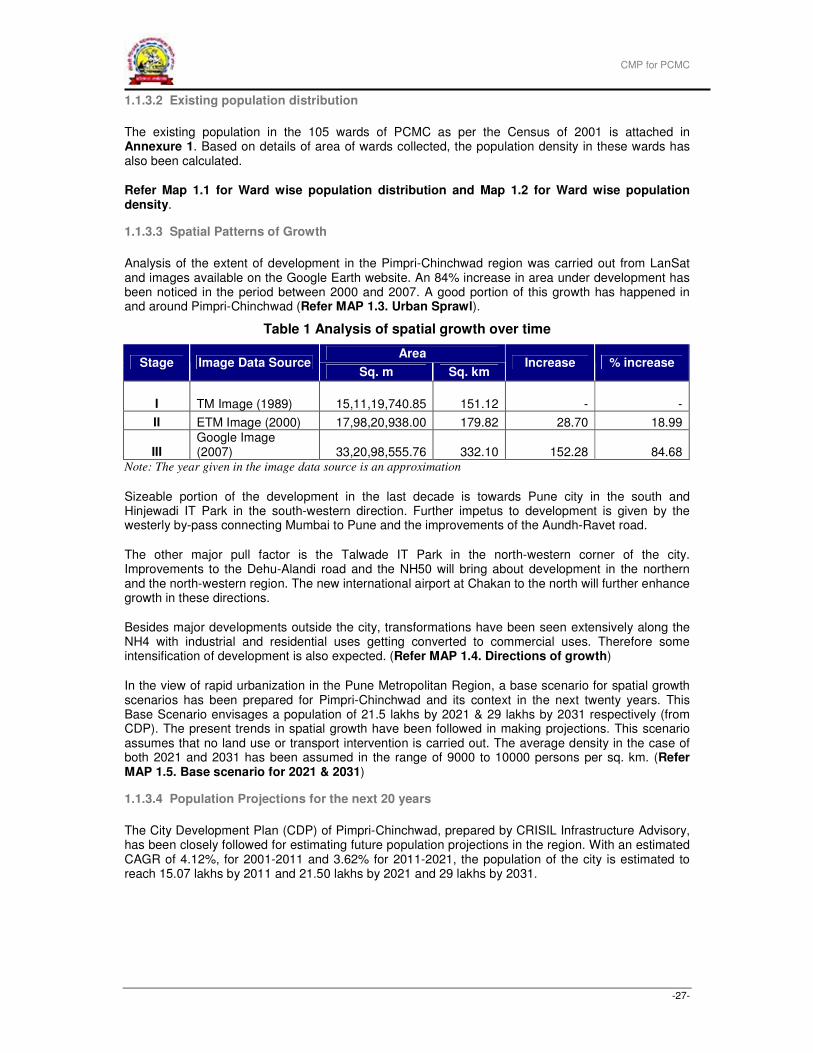
Analysis of the extent of development in the Pimpri-Chinchwad region was carried out from LanSat and images available on the Google Earth website. An 84% increase in area under development has been noticed in the period between 2000 and 2007. A good portion of this growth has happened in and around Pimpri-Chinchwad (Refer MAP 1.3. Urban Sprawl).
Table 1 Analysis of spatial growth over time
Area Stage Image Data Source
Sq. m Sq. km Increase % increase
I TM Image (1989) 15,11,19,740.85 151.12 - -
II ETM Image (2000) 17,98,20,938.00 179.82 28.70 18.99
III Google Image (2007) 33,20,98,555.76 332.10 152.28 84.68
Note: The year given in the image data source is an approximation
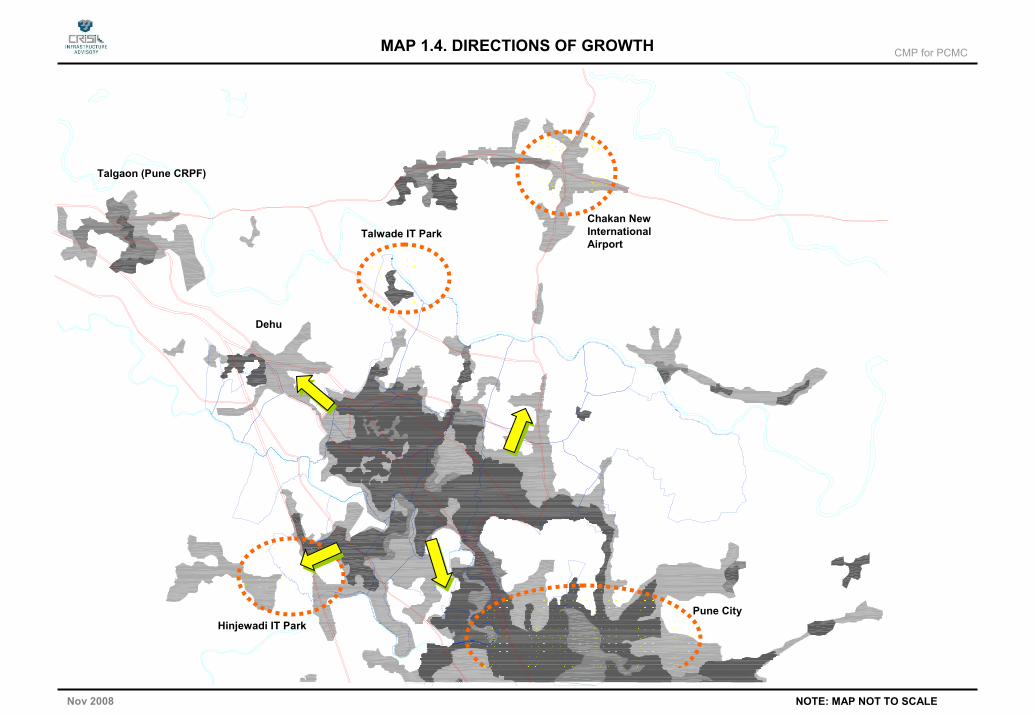
Sizeable portion of the development in the last decade is towards Pune city in the south and Hinjewadi IT Park in the south-western direction. Further impetus to development is given by the westerly by-pass connecting Mumbai to Pune and the improvements of the Aundh-Ravet road.
The other major pull factor is the Talwade IT Park in the north-western corner of the city. Improvements to the Dehu-Alandi road and the NH50 will bring about development in the northern and the north-western region. The new international airport at Chakan to the north will further enhance growth in these directions.
Besides major developments outside the city, transformations have been seen extensively along the NH4 with industrial and residential uses getting converted to commercial uses. Therefore some intensification of development is also expected. (Refer MAP 1.4. Directions of growth)
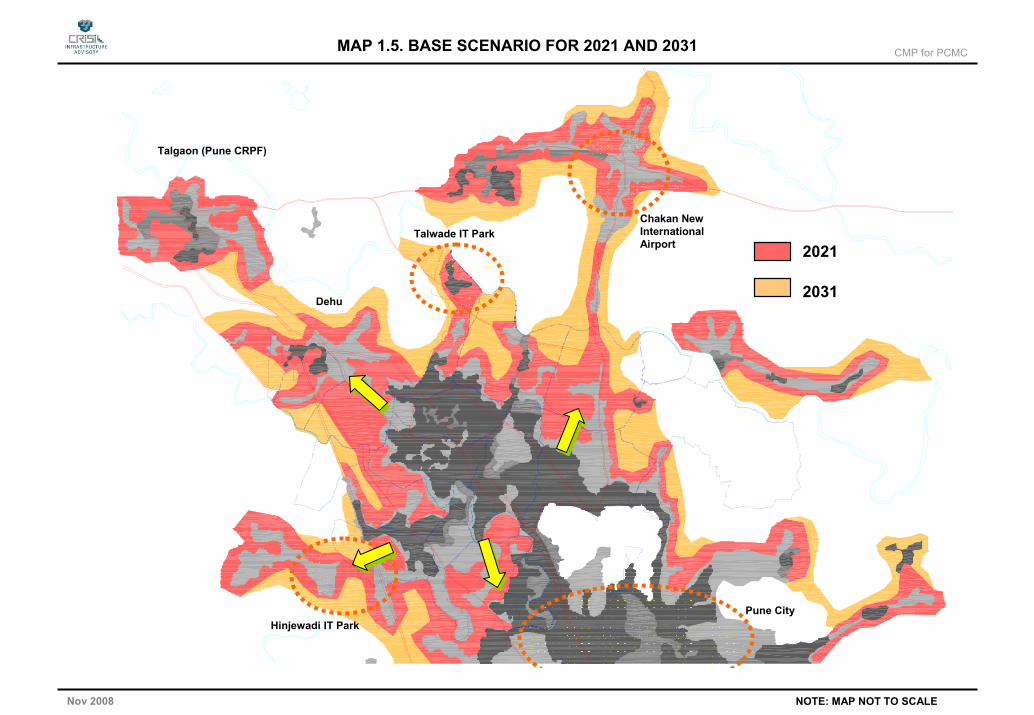
In the view of rapid urbanization in the Pune Metropolitan Region, a base scenario for spatial growth scenarios has been prepared for Pimpri-Chinchwad and its context in the next twenty years. This Base Scenario envisages a population of 21.5 lakhs by 2021 & 29 lakhs by 2031 respectively (from CDP). The present trends in spatial growth have been followed in making projections. This scenario assumes that no land use or transport intervention is carried out. The average density in the case of both 2021 and 2031 has been assumed in the range of 9000 to 10000 persons per sq. km. (Refer MAP 1.5. Base scenario for 2021 & 2031)
1.1.3.4 Population Projections for the next 20 years
The City Development Plan (CDP) of Pimpri-Chinchwad, prepared by CRISIL Infrastructure Advisory, has been closely followed for estimating future population projections in the region. With an estimated CAGR of 4.12%, for 2001-2011 and 3.62% for 2011-2021, the population of the city is estimated to reach 15.07 lakhs by 2011 and 21.50 lakhs by 2021 and 29 lakhs by 2031.
CMP for PCMC
-28-
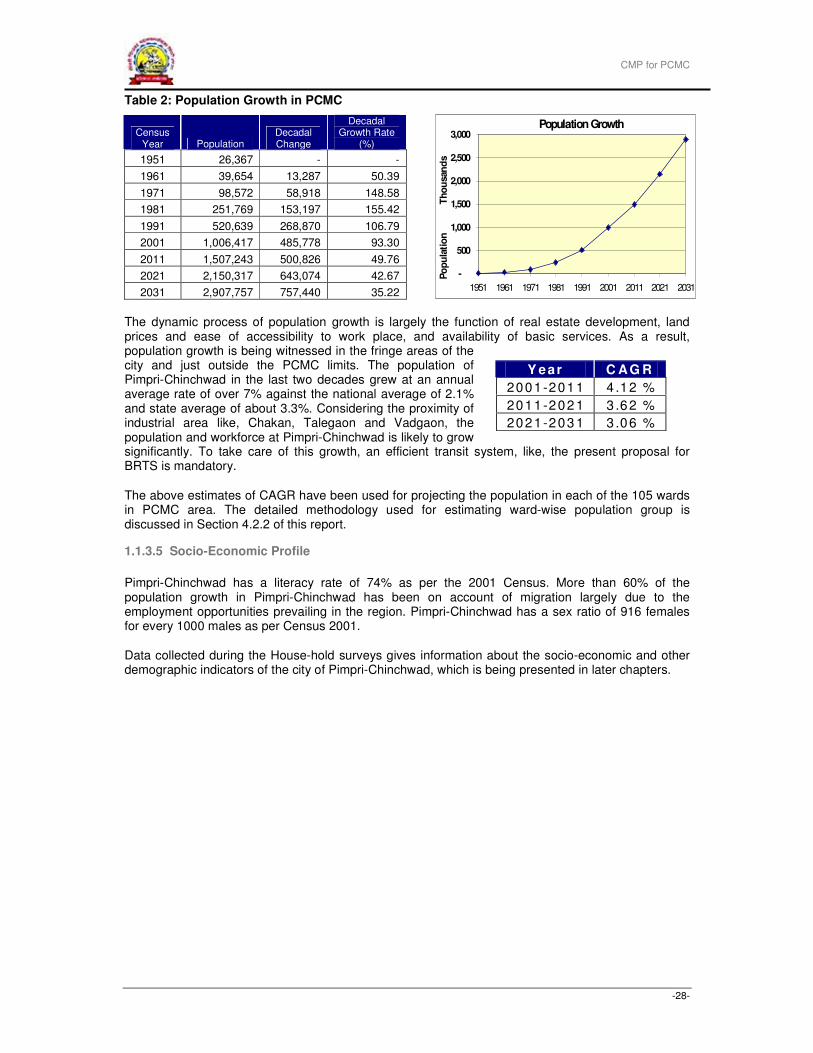
Table 2: Population Growth in PCMC
Census Year Population
Decadal Change
Decadal Growth Rate
(%)
1951 26,367 - -
1961 39,654 13,287 50.39
1971 98,572 58,918 148.58
1981 251,769 153,197 155.42
1991 520,639 268,870 106.79
2001 1,006,417 485,778 93.30
2011 1,507,243 500,826 49.76
2021 2,150,317 643,074 42.67
2031 2,907,757 757,440 35.22
The dynamic process of population growth is largely the function of real estate development, land prices and ease of accessibility to work place, and availability of basic services. As a result, population growth is being witnessed in the fringe areas of the city and just outside the PCMC limits. The population of Pimpri-Chinchwad in the last two decades grew at an annual average rate of over 7% against the national average of 2.1% and state average of about 3.3%. Considering the proximity of industrial area like, Chakan, Talegaon and Vadgaon, the population and workforce at Pimpri-Chinchwad is likely to grow significantly. To take care of this growth, an efficient transit system, like, the present proposal for BRTS is mandatory.
The above estimates of CAGR have been used for projecting the population in each of the 105 wards in PCMC area. The detailed methodology used for estimating ward-wise population group is discussed in Section 4.2.2 of this report.
1.1.3.5 Socio-Economic Profile
Pimpri-Chinchwad has a literacy rate of 74% as per the 2001 Census. More than 60% of the population growth in Pimpri-Chinchwad has been on account of migration largely due to the employment opportunities prevailing in the region. Pimpri-Chinchwad has a sex ratio of 916 females for every 1000 males as per Census 2001.
Data collected during the House-hold surveys gives information about the socio-economic and other demographic indicators of the city of Pimpri-Chinchwad, which is being presented in later chapters.
Population Growth
-
500
1,000
1,500
2,000
2,500
3,000
1951 1961 1971 1981 1991 2001 2011 2021 2031
Th
ou
san
ds
Po
pu
lati
on
Y ear C AG R
2001-201 1 4 .12 %
2011-202 1 3 .62 %
2021-203 1 3 .06 %
CMP for PCMC
Nov 2008 NOTE: MAP NOT TO SCALE
MAP 1.1. WARD WISE POPULATION DISTRIBUTION
Pcmcboundry.shpRiver.shpWater_body.shpRail road.shp
Election.shp0 - 25002500 - 50005000 - 75007500 - 1000010000 - 1050010500 - 12500
Centerline.shp0 - 1212 - 2424 - 60
CMP for PCMC
Nov 2008 NOTE: MAP NOT TO SCALE
MAP 1.2. WARD WISE POPULATION DENSITY
Pcmcboundry.shpRiver.shpWater_body.shpRail road.shp
Election.shp0 - 1000010000 - 2000020000 - 3000030000 - 4000040000 - 5000050000 - 60000
Centerline.shp0 - 1212 - 2424 - 60
CMP for PCMC
Nov 2008 NOTE: MAP NOT TO SCALE
Sq.m Sq.kmI TM Image 151119740.85 151.12 - -II ETM Image 179820938.00 179.82 28.70 18.99III Google Image 332098555.76 332.10 152.28 84.68
% increaseAreaStage Image Increase
MAP 1.3. URBAN SPRAWL
Disclaimer: The sprawl analysis is for visual understanding of the directions and extent of development in the 3 time periods given in the table. This map cannot be measured or overlaid on other imagery. The reference is from google images which are not ortho-rectified
CMP for PCMC
Nov 2008 NOTE: MAP NOT TO SCALE
Chakan New International Airport
Talwade IT Park
Hinjewadi IT ParkPune City
Talgaon (Pune CRPF)
Dehu
MAP 1.4. DIRECTIONS OF GROWTH
CMP for PCMC
Nov 2008 NOTE: MAP NOT TO SCALE
Chakan New International Airport
Talwade IT Park
Hinjewadi IT ParkPune City
Talgaon (Pune CRPF)
Dehu
2021
2031
MAP 1.5. BASE SCENARIO FOR 2021 AND 2031
CMP for PCMC
-34-
1.2 Urban Land Use Structure/Activity Distribution
1.2.1 Development Plans in force
The first development plan for the erstwhile Municipal Council had been prepared and sanctioned by the State Government in the year 1978. Following the constitution of the planning authority, the Pimpri-Chinchwad Municipal Corporation in 1982, a Development Plan was prepared for the then PCMC area of 86.01 sq km and sanctioned by the Government on 18th September 1995. The Plan came into force with effect from 2nd November 1995. In 1997, certain areas, which were under the planning control of PCNTDA, were merged with PCMC. Different surveys have been carried out for the purpose of the preparation of the development plan for these newly added areas, such as housing, traffic and transportation, industrial trade and commerce, water supply, sewage and waste disposal, slums, environment, health and medical, education and recreation.
The area under the Municipal Corporation was further increased through the addition of 18 new villages in part or full, constituting an extended area of 84.51 sq km in the year 1982. Thus, the total area under the jurisdiction of PCMC measured 170.51 sq km. The draft DP for these newly merged areas has been submitted to the state government and approval for the same is awaited. Revision of the Development Plan for the old PCMC area of 86.01 sq km. is due in 2007. It is considered necessary that a comprehensive Development Plan for the entire area of 170.51 sq km be drawn up. Hence, the draft DP for the newly added areas has to be merged into the revised DP to ensure a comprehensive plan for the PCMC area.
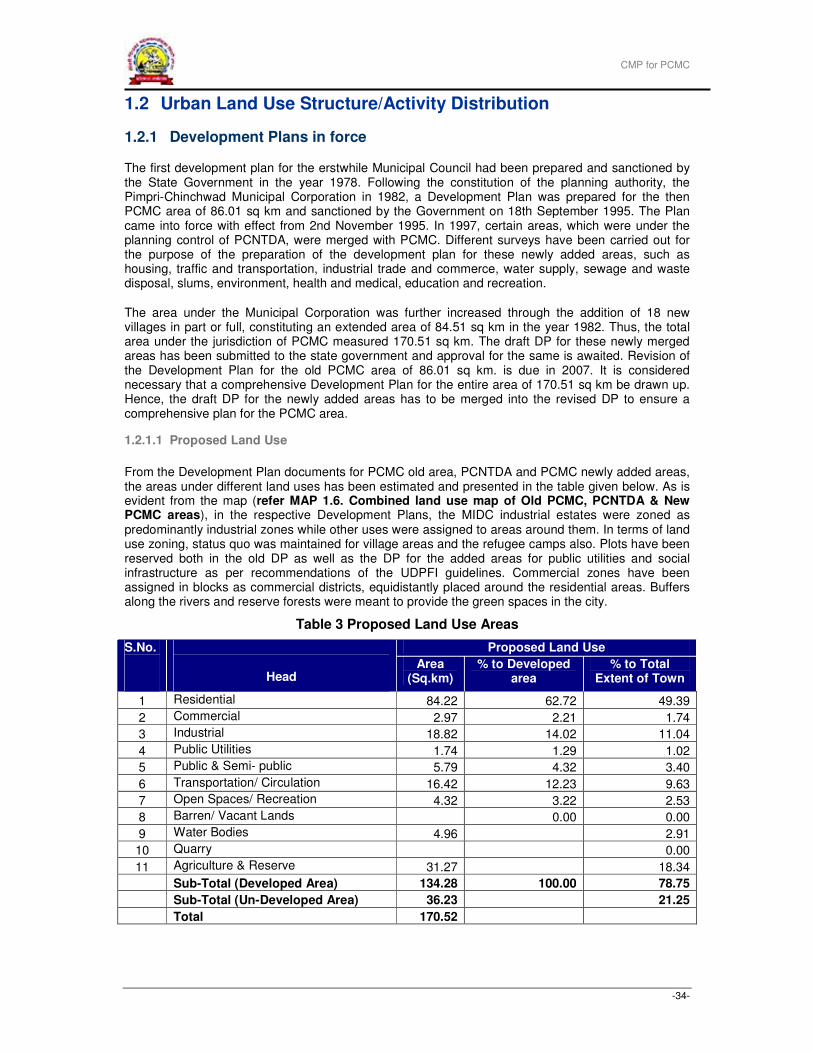
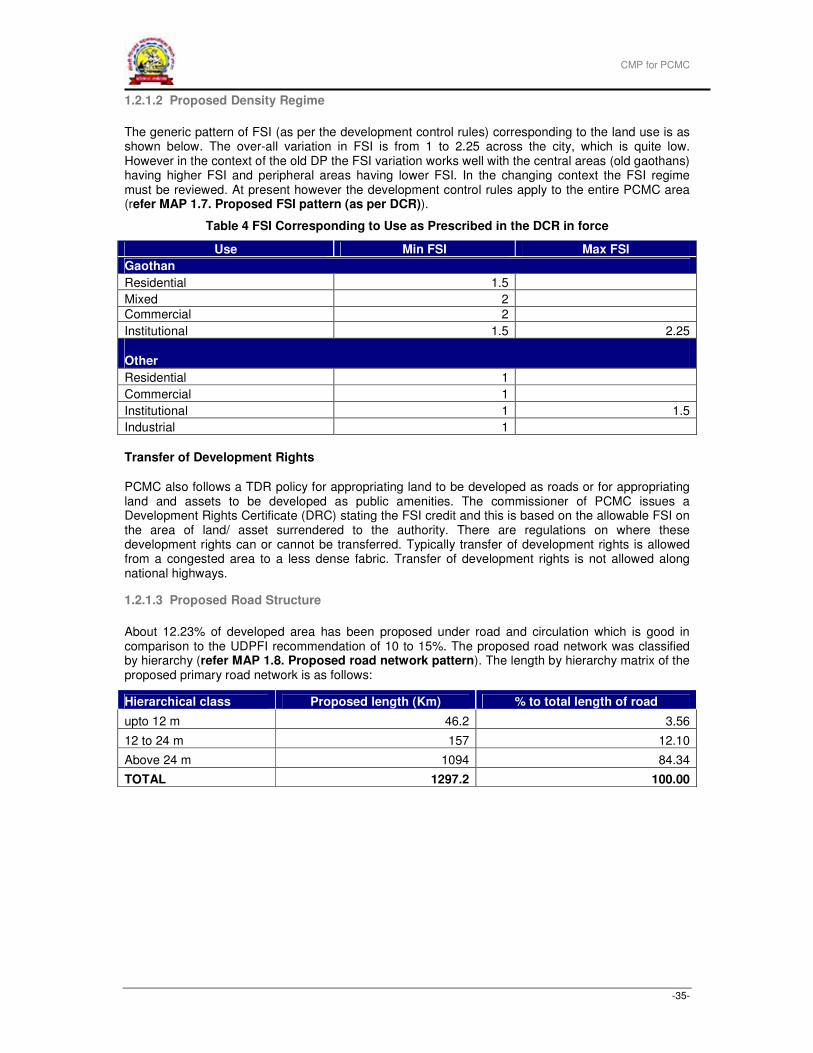
1.2.1.1 Proposed Land Use
From the Development Plan documents for PCMC old area, PCNTDA and PCMC newly added areas, the areas under different land uses has been estimated and presented in the table given below. As is evident from the map (refer MAP 1.6. Combined land use map of Old PCMC, PCNTDA & New PCMC areas), in the respective Development Plans, the MIDC industrial estates were zoned as predominantly industrial zones while other uses were assigned to areas around them. In terms of land use zoning, status quo was maintained for village areas and the refugee camps also. Plots have been reserved both in the old DP as well as the DP for the added areas for public utilities and social infrastructure as per recommendations of the UDPFI guidelines. Commercial zones have been assigned in blocks as commercial districts, equidistantly placed around the residential areas. Buffers along the rivers and reserve forests were meant to provide the green spaces in the city.
Table 3 Proposed Land Use Areas
Proposed Land Use S.No.
Head Area
(Sq.km) % to Developed
area % to Total
Extent of Town
1 Residential 84.22 62.72 49.39
2 Commercial 2.97 2.21 1.74
3 Industrial 18.82 14.02 11.04
4 Public Utilities 1.74 1.29 1.02
5 Public & Semi- public 5.79 4.32 3.40
6 Transportation/ Circulation 16.42 12.23 9.63
7 Open Spaces/ Recreation 4.32 3.22 2.53
8 Barren/ Vacant Lands 0.00 0.00
9 Water Bodies 4.96 2.91
10 Quarry 0.00
11 Agriculture & Reserve 31.27 18.34
Sub-Total (Developed Area) 134.28 100.00 78.75
Sub-Total (Un-Developed Area) 36.23 21.25
Total 170.52
CMP for PCMC
-35-
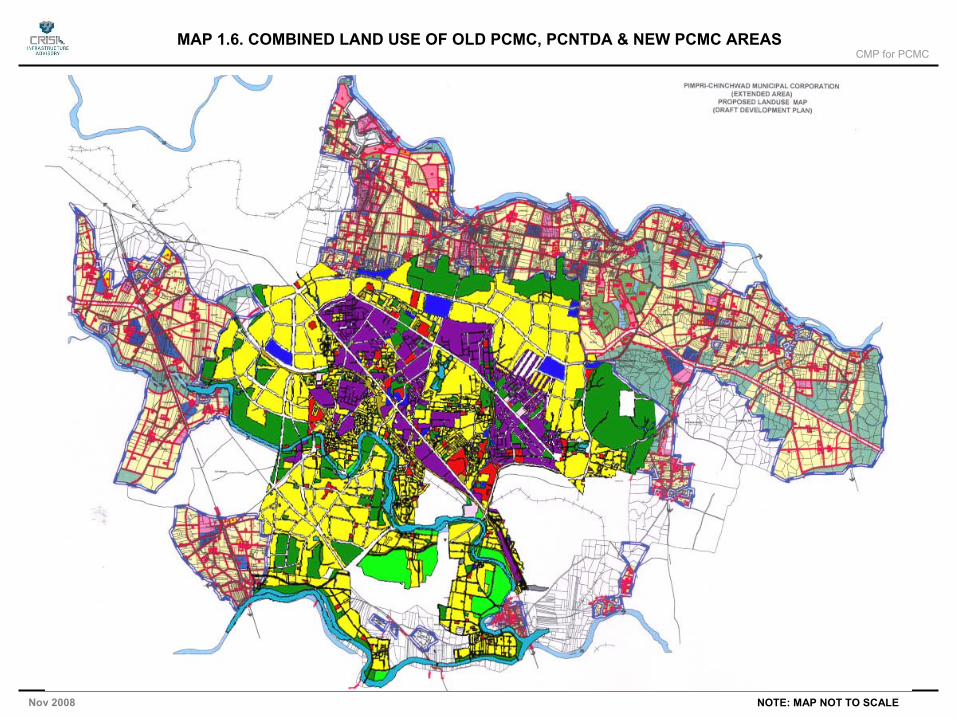
1.2.1.2 Proposed Density Regime
The generic pattern of FSI (as per the development control rules) corresponding to the land use is as shown below. The over-all variation in FSI is from 1 to 2.25 across the city, which is quite low. However in the context of the old DP the FSI variation works well with the central areas (old gaothans) having higher FSI and peripheral areas having lower FSI. In the changing context the FSI regime must be reviewed. At present however the development control rules apply to the entire PCMC area (refer MAP 1.7. Proposed FSI pattern (as per DCR)).
Table 4 FSI Corresponding to Use as Prescribed in the DCR in force
Use Min FSI Max FSI
Gaothan
Residential 1.5
Mixed 2
Commercial 2
Institutional 1.5 2.25
Other
Residential 1
Commercial 1
Institutional 1 1.5
Industrial 1
Transfer of Development Rights
PCMC also follows a TDR policy for appropriating land to be developed as roads or for appropriating land and assets to be developed as public amenities. The commissioner of PCMC issues a Development Rights Certificate (DRC) stating the FSI credit and this is based on the allowable FSI on the area of land/ asset surrendered to the authority. There are regulations on where these development rights can or cannot be transferred. Typically transfer of development rights is allowed from a congested area to a less dense fabric. Transfer of development rights is not allowed along national highways.
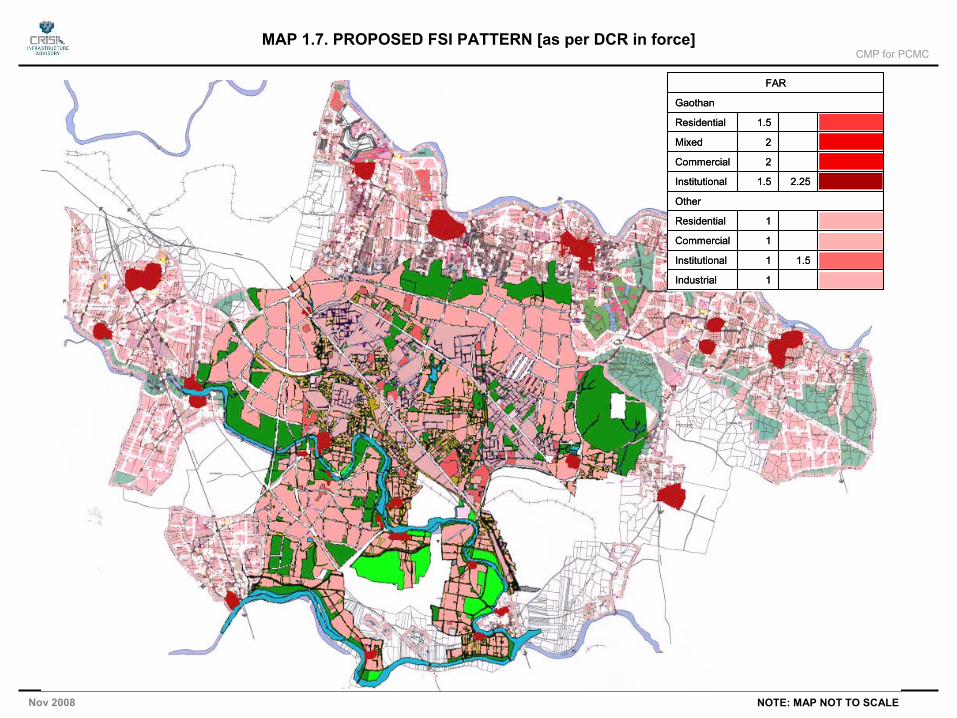
1.2.1.3 Proposed Road Structure
About 12.23% of developed area has been proposed under road and circulation which is good in comparison to the UDPFI recommendation of 10 to 15%. The proposed road network was classified by hierarchy (refer MAP 1.8. Proposed road network pattern). The length by hierarchy matrix of the proposed primary road network is as follows:
Hierarchical class Proposed length (Km) % to total length of road
upto 12 m 46.2 3.56
12 to 24 m 157 12.10
Above 24 m 1094 84.34
TOTAL 1297.2 100.00
CMP for PCMC
Nov 2008 NOTE: MAP NOT TO SCALE
MAP 1.6. COMBINED LAND USE OF OLD PCMC, PCNTDA & NEW PCMC AREAS
CMP for PCMC
Nov 2008 NOTE: MAP NOT TO SCALE
MAP 1.7. PROPOSED FSI PATTERN [as per DCR in force]
1Industrial
1.51Institutional
1Commercial
1Residential
Other
2.251.5Institutional
2Commercial
2Mixed
1.5Residential
Gaothan
FAR
1Industrial
1.51Institutional
1Commercial
1Residential
Other
2.251.5Institutional
2Commercial
2Mixed
1.5Residential
Gaothan
FAR
CMP for PCMC
Nov 2008 NOTE: MAP NOT TO SCALE
Pcmcboundry.shpRiver.shpWater_body.shp
Centerline.shp1 - 1212 - 2424 - 60
Rail road.shp
MAP 1.8. PROPOSED ROAD NETWORK PATTERN [as per DP]
CMP for PCMC
-39-
1.2.2 Existing City Structure
For the preparation of a Comprehensive Mobility Plan and designing a BRT system, the election wards were taken as the traffic analysis zones. However, modal distribution and assignment of trips to roads at the ward level does not reveal the real concentration of origins and destinations within the ward, as development is not homogenous throughout the ward. In order to provide more disaggregate information, two types of land use surveys, built area and building condition surveys were undertaken – at the sub ward level and along predefined corridors which serve as the primary road arteries for the city. These surveys were used to arrive at information to enable and informed decision making in the following ways:
• While the trip generation from the traffic & household analysis will assign trips on existing
roads, the land-use survey may give further insights to planning transit routes so that they
connect concentrations of origins and destinations within the wards/traffic analysis zones.
• Assigning of routes and decisions on road & network improvements can be made more
practical when information on transformation/redevelopment potential is available.
• Systematic changes to the land use and density regime can be proposed so as to align
development along corridors and nodes.
The following sections describe in detail, the steps carried out for modelling the existing land-use patterns in Pimpri-Chinchwad.
1.2.2.1 Methodology for identifying current land use
Step 1 – Primary Survey of Existing Land Use, No. of Floors & Building Condition
The layers of information provided by the Growth Lab1 have been utilized to prepare a base map for
this exercise. Each election ward/traffic zone was sub-divided into survey blocks. (Survey block boundaries mostly followed road alignments. In one or more places a survey block may have been demarcated so as to have portions of more than one ward.) A primary survey of these survey blocks was carried out and each of these blocks was assessed for their use (commercial, residential, industrial, etc), no. of floors (of buildings) (G, G+1, G+2…) and the general condition of buildings (good, bad, poor) in the survey block. Contiguous built forms of similar use, number of floors and condition were demarcated within each survey block.
Step 2 – Calculating Built-up Area and Applying Factor of Correction
The data from the primary survey was overlaid on the available layers of information on a GIS platform. Polygons were created within each survey block where the characteristics of the built form were more or less homogenous. The area of building footprint layer falling within each polygon has been calculated to obtain the ground cover and this was multiplied by number of floors to obtain the built-up area under each type of use.
Step 3 – Determining Space Utilization Factor
The objective is to determine the residential population, number of jobs and visitors and hence the trip generation potential of each survey block. The space utilization factor for different uses needs to be determined. However within a use there may be more than one typology of built-form or there may be sub-categories in the use. For example; residential use may include the following typologies –
1 Science and Technology park of Pune has a facility called Growth Lab which has been awarded the work of preparing
detailed basemaps for Pimpri-Chinchwad based on Satellite Image interpretation and ground truthing. Quickbird (April 2006) was used for this purpose and several layers of information have been provided to us through PCMC. These include – administrative boundaries, road networks, natural features, building foot prints, etc.
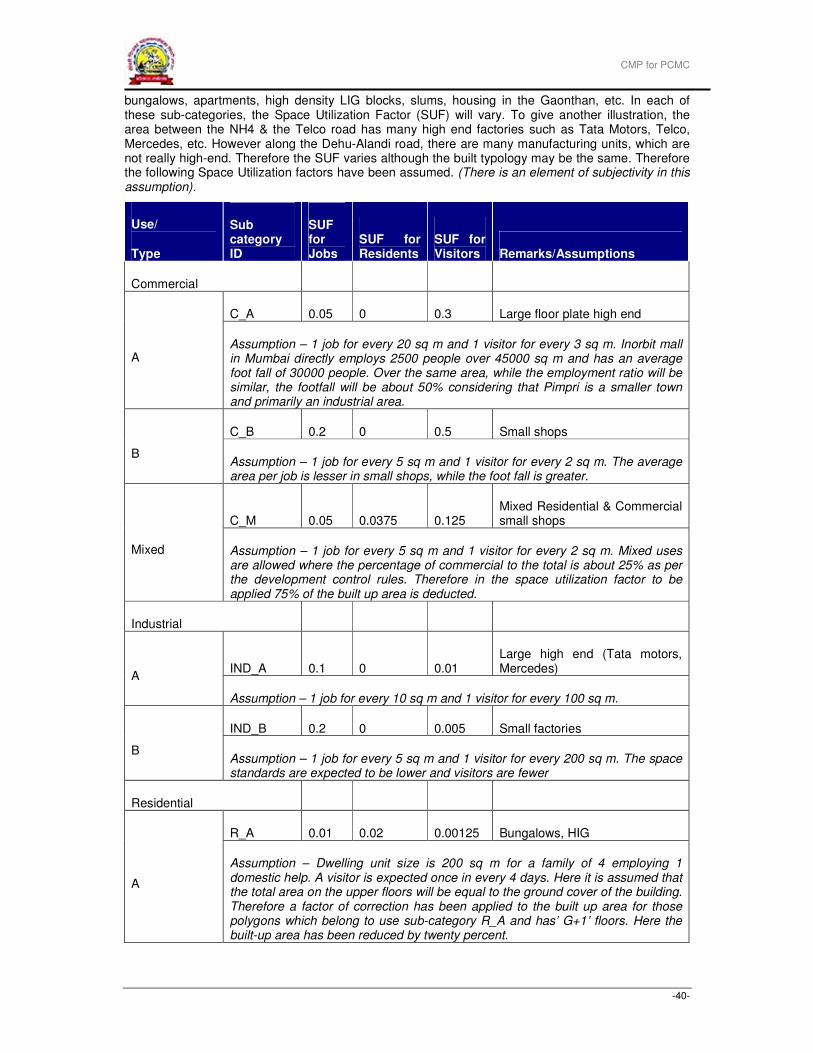
CMP for PCMC
-40-
bungalows, apartments, high density LIG blocks, slums, housing in the Gaonthan, etc. In each of these sub-categories, the Space Utilization Factor (SUF) will vary. To give another illustration, the area between the NH4 & the Telco road has many high end factories such as Tata Motors, Telco, Mercedes, etc. However along the Dehu-Alandi road, there are many manufacturing units, which are not really high-end. Therefore the SUF varies although the built typology may be the same. Therefore the following Space Utilization factors have been assumed. (There is an element of subjectivity in this assumption).
Use/
Type
Sub category ID
SUF for Jobs
SUF for Residents
SUF for Visitors Remarks/Assumptions
Commercial
C_A 0.05 0 0.3 Large floor plate high end
A Assumption – 1 job for every 20 sq m and 1 visitor for every 3 sq m. Inorbit mall in Mumbai directly employs 2500 people over 45000 sq m and has an average foot fall of 30000 people. Over the same area, while the employment ratio will be similar, the footfall will be about 50% considering that Pimpri is a smaller town and primarily an industrial area.
C_B 0.2 0 0.5 Small shops
B Assumption – 1 job for every 5 sq m and 1 visitor for every 2 sq m. The average area per job is lesser in small shops, while the foot fall is greater.
C_M 0.05 0.0375 0.125 Mixed Residential & Commercial small shops
Mixed Assumption – 1 job for every 5 sq m and 1 visitor for every 2 sq m. Mixed uses are allowed where the percentage of commercial to the total is about 25% as per the development control rules. Therefore in the space utilization factor to be applied 75% of the built up area is deducted.
Industrial
IND_A 0.1 0 0.01 Large high end (Tata motors, Mercedes)
A
Assumption – 1 job for every 10 sq m and 1 visitor for every 100 sq m.
IND_B 0.2 0 0.005 Small factories
B Assumption – 1 job for every 5 sq m and 1 visitor for every 200 sq m. The space standards are expected to be lower and visitors are fewer
Residential
R_A 0.01 0.02 0.00125 Bungalows, HIG
A
Assumption – Dwelling unit size is 200 sq m for a family of 4 employing 1 domestic help. A visitor is expected once in every 4 days. Here it is assumed that the total area on the upper floors will be equal to the ground cover of the building. Therefore a factor of correction has been applied to the built up area for those polygons which belong to use sub-category R_A and has’ G+1’ floors. Here the built-up area has been reduced by twenty percent.

CMP for PCMC
-41-
Use/
Type
Sub category ID
SUF for Jobs
SUF for Residents
SUF for Visitors Remarks/Assumptions
R_B 0.01 0.033 0.00208 Apartments - MIG
B Assumption - Dwelling unit size is 120 sq m for a family of 4 employing 1 domestic help. A visitor is expected once in every 4 days
R_C 0 0.06 0.00357 LIG housing
C Assumption - Dwelling unit size is 70 sq m for a family of 4. A visitor is expected once in every 4 days
R_D 0 0.15 0.00833 Slums
D Assumption - Dwelling unit size is 30 sq m for a family of 4.5. A visitor is expected once in every 4 days. It is assumed that 80 percent of the land area demarcated as slums is built and all buildings have only 1 floor. The net FSI is taken as 1.
CINEMA C_CIN 0.01 0 0.4
HOSPITALS INS_HOS 0.03 0 0.1
COLLEGES INS_COL 0.03 0 0.2
Other Inst INS_OT 0.02 0 0.125 Here again the built up area has been reduced by 10 percent
Step 4 – Calculating Jobs, Residents, Visitors & Trip Generation Potential
Utilizing the SUF as stated above, the jobs, residents & visitors will be calculated for the city. However there are various other factors to be considered. The above does not factor in the interdependency of Pune and Pimpri-Chinchwad. Many people live in Pune and travel to Pimpri-Chinchwad for work and vice-versa.
1.2.2.2 Land Use
A land use map was plotted from the primary survey of the city (refer MAP 1.9. - Existing land use pattern). The following observations were made:
7. Commercial zones and mixed uses are distributed mostly along major corridors and around nodes.
8. Commercial districts of the kind proposed in the DP have not come up primarily owing to the road structure in the city.
9. Concentrations of residential zones are around village and in newly developed areas.
10. New residential construction is seen mostly between the river and the Aundh-Ravet road and in and around Wakad.
11. Location decisions of high order institutional zones such as hospitals, colleges, etc seem to have been based on a function of market values and connectivity rather than zonation as specified in the DP.
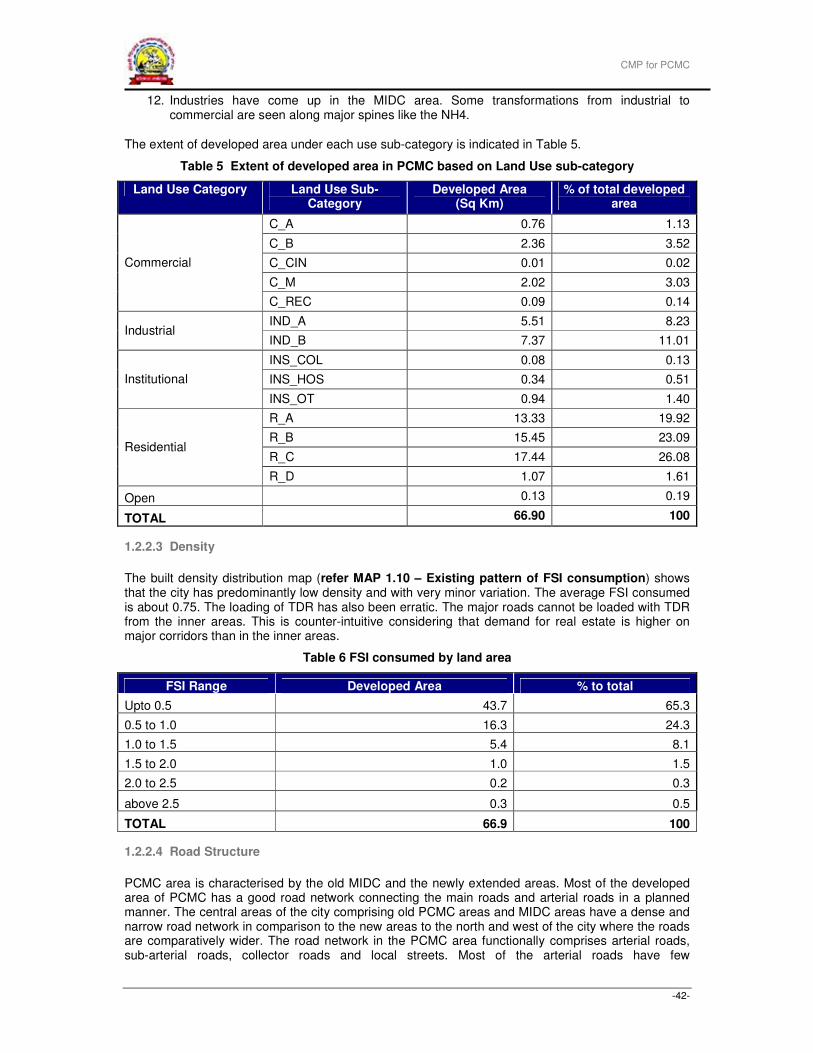
CMP for PCMC
-42-
12. Industries have come up in the MIDC area. Some transformations from industrial to commercial are seen along major spines like the NH4.
The extent of developed area under each use sub-category is indicated in Table 5.
Table 5 Extent of developed area in PCMC based on Land Use sub-category
Land Use Category Land Use Sub-Category
Developed Area (Sq Km)
% of total developed area
C_A 0.76 1.13
C_B 2.36 3.52
C_CIN 0.01 0.02
C_M 2.02 3.03
Commercial
C_REC 0.09 0.14
IND_A 5.51 8.23 Industrial
IND_B 7.37 11.01
INS_COL 0.08 0.13
INS_HOS 0.34 0.51 Institutional
INS_OT 0.94 1.40
R_A 13.33 19.92
R_B 15.45 23.09
R_C 17.44 26.08 Residential
R_D 1.07 1.61
Open 0.13 0.19
TOTAL 66.90 100
1.2.2.3 Density
The built density distribution map (refer MAP 1.10 – Existing pattern of FSI consumption) shows that the city has predominantly low density and with very minor variation. The average FSI consumed is about 0.75. The loading of TDR has also been erratic. The major roads cannot be loaded with TDR from the inner areas. This is counter-intuitive considering that demand for real estate is higher on major corridors than in the inner areas.
Table 6 FSI consumed by land area
FSI Range Developed Area % to total
Upto 0.5 43.7 65.3
0.5 to 1.0 16.3 24.3
1.0 to 1.5 5.4 8.1
1.5 to 2.0 1.0 1.5
2.0 to 2.5 0.2 0.3
above 2.5 0.3 0.5
TOTAL 66.9 100
1.2.2.4 Road Structure
PCMC area is characterised by the old MIDC and the newly extended areas. Most of the developed area of PCMC has a good road network connecting the main roads and arterial roads in a planned manner. The central areas of the city comprising old PCMC areas and MIDC areas have a dense and narrow road network in comparison to the new areas to the north and west of the city where the roads are comparatively wider. The road network in the PCMC area functionally comprises arterial roads, sub-arterial roads, collector roads and local streets. Most of the arterial roads have few
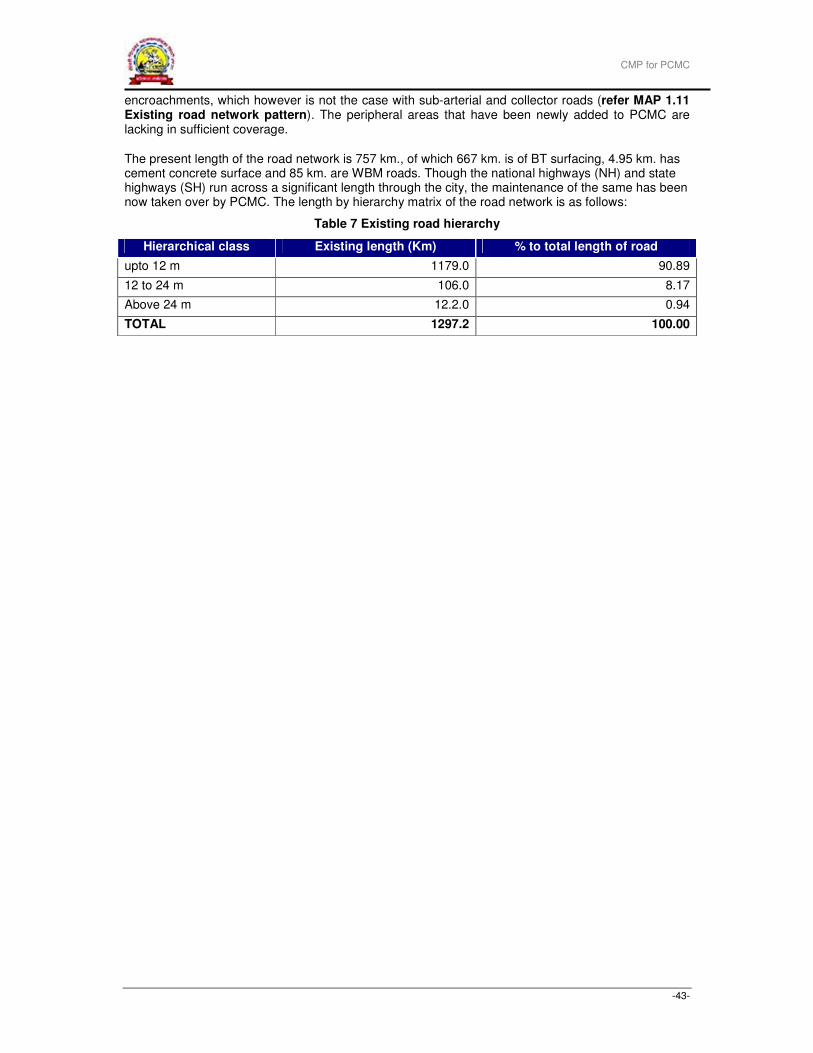
CMP for PCMC
-43-
encroachments, which however is not the case with sub-arterial and collector roads (refer MAP 1.11 Existing road network pattern). The peripheral areas that have been newly added to PCMC are lacking in sufficient coverage.
The present length of the road network is 757 km., of which 667 km. is of BT surfacing, 4.95 km. has cement concrete surface and 85 km. are WBM roads. Though the national highways (NH) and state highways (SH) run across a significant length through the city, the maintenance of the same has been now taken over by PCMC. The length by hierarchy matrix of the road network is as follows:
Table 7 Existing road hierarchy
Hierarchical class Existing length (Km) % to total length of road
upto 12 m 1179.0 90.89
12 to 24 m 106.0 8.17
Above 24 m 12.2.0 0.94
TOTAL 1297.2 100.00
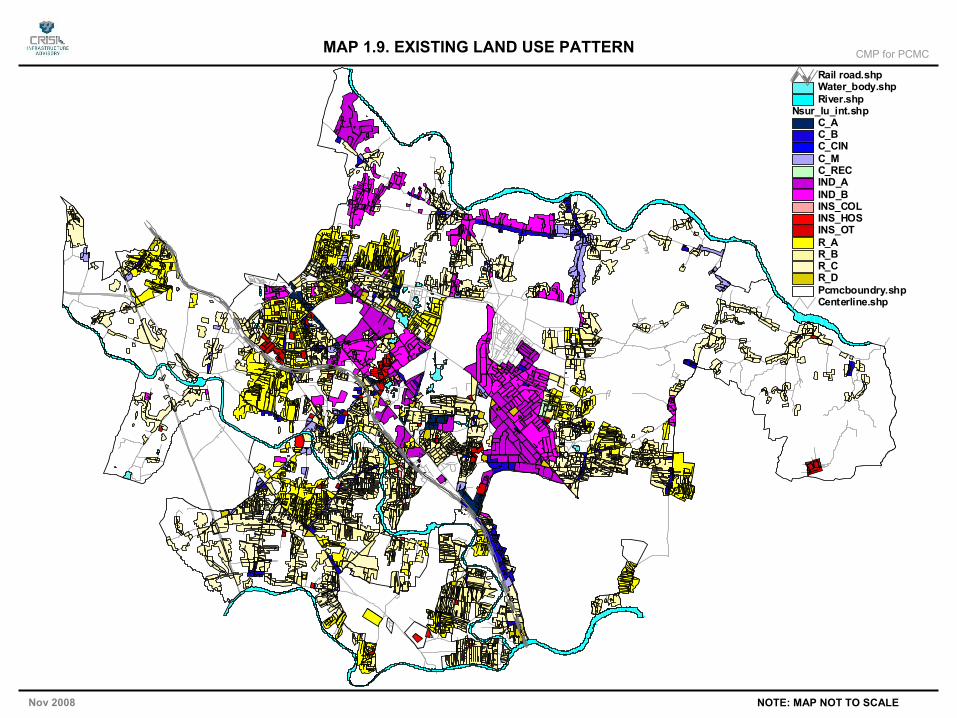
CMP for PCMC
Nov 2008 NOTE: MAP NOT TO SCALE
MAP 1.9. EXISTING LAND USE PATTERN
Centerline.shpPcmcboundry.shp
Nsur_lu_int.shpC_AC_BC_CINC_MC_RECIND_AIND_BINS_COLINS_HOSINS_OTR_AR_BR_CR_D
River.shpWater_body.shpRail road.shp
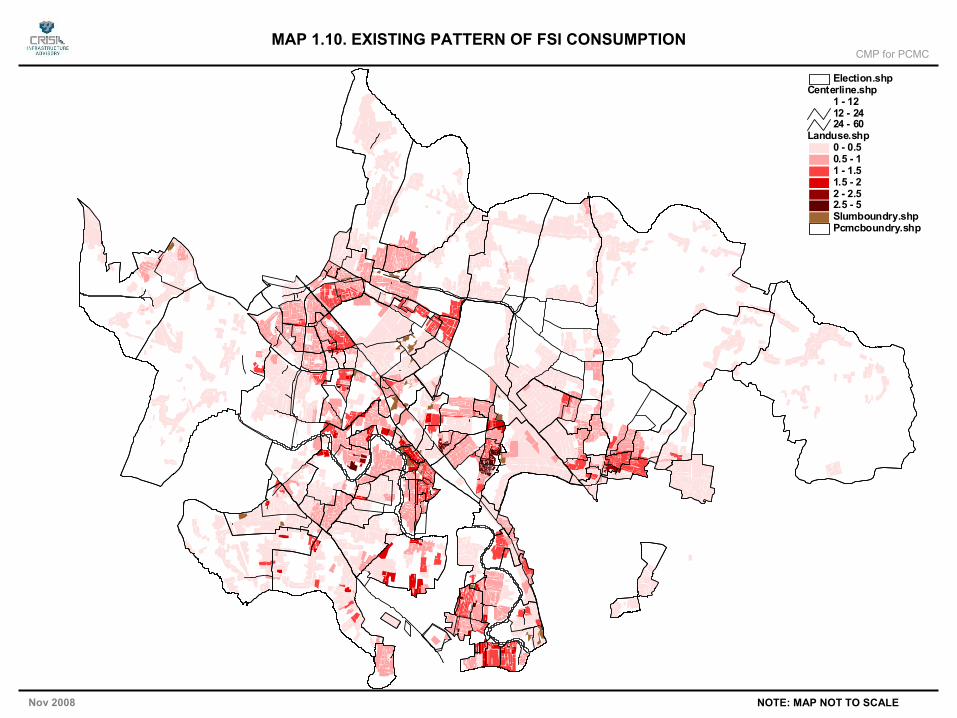
CMP for PCMC
Nov 2008 NOTE: MAP NOT TO SCALE
MAP 1.10. EXISTING PATTERN OF FSI CONSUMPTION
Pcmcboundry.shpSlumboundry.shp
Landuse.shp0 - 0.50.5 - 11 - 1.51.5 - 22 - 2.52.5 - 5
Centerline.shp1 - 1212 - 2424 - 60
Election.shp
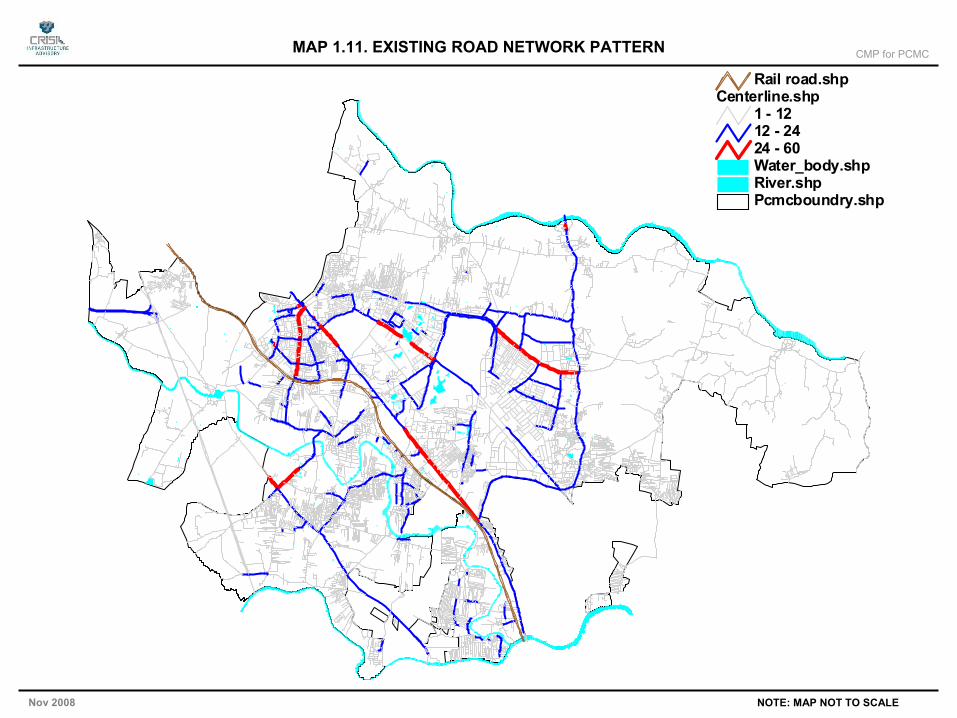
CMP for PCMC
Nov 2008 NOTE: MAP NOT TO SCALE
MAP 1.11. EXISTING ROAD NETWORK PATTERN
Pcmcboundry.shpRiver.shpWater_body.shp
Centerline.shp1 - 1212 - 2424 - 60
Rail road.shp
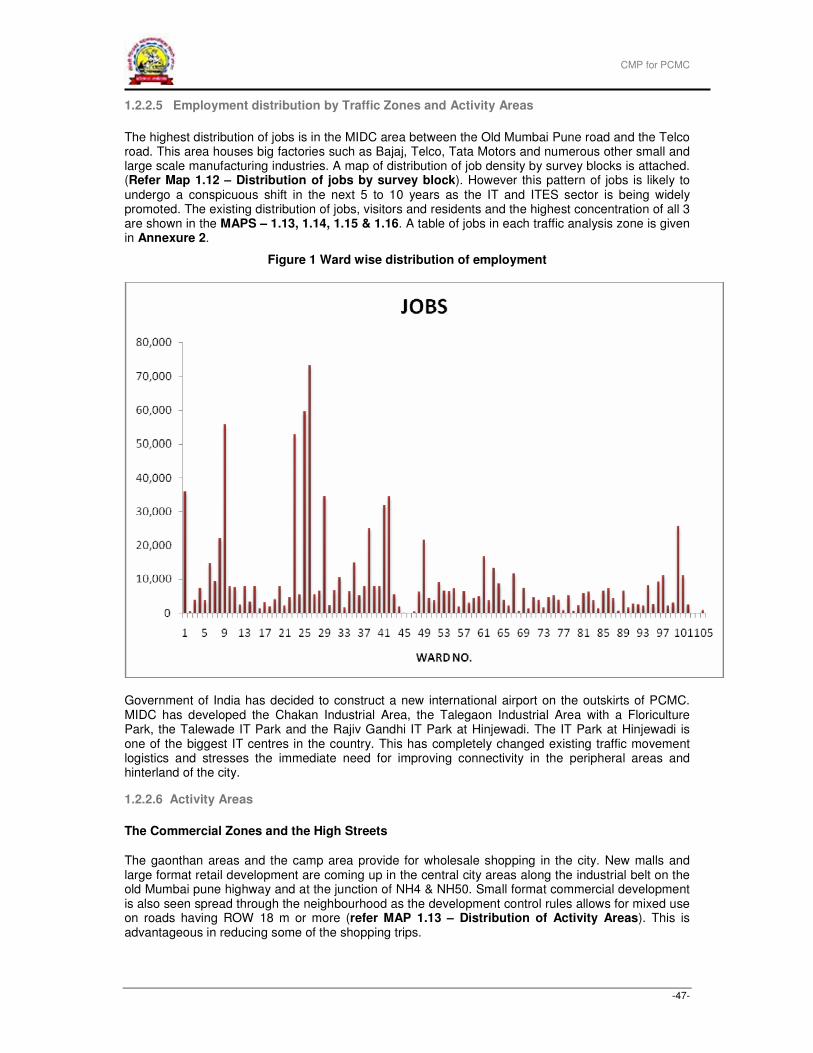
CMP for PCMC
-47-
1.2.2.5 Employment distribution by Traffic Zones and Activity Areas
The highest distribution of jobs is in the MIDC area between the Old Mumbai Pune road and the Telco road. This area houses big factories such as Bajaj, Telco, Tata Motors and numerous other small and large scale manufacturing industries. A map of distribution of job density by survey blocks is attached. (Refer Map 1.12 – Distribution of jobs by survey block). However this pattern of jobs is likely to undergo a conspicuous shift in the next 5 to 10 years as the IT and ITES sector is being widely promoted. The existing distribution of jobs, visitors and residents and the highest concentration of all 3 are shown in the MAPS – 1.13, 1.14, 1.15 & 1.16. A table of jobs in each traffic analysis zone is given in Annexure 2.
Figure 1 Ward wise distribution of employment
Government of India has decided to construct a new international airport on the outskirts of PCMC. MIDC has developed the Chakan Industrial Area, the Talegaon Industrial Area with a Floriculture Park, the Talewade IT Park and the Rajiv Gandhi IT Park at Hinjewadi. The IT Park at Hinjewadi is one of the biggest IT centres in the country. This has completely changed existing traffic movement logistics and stresses the immediate need for improving connectivity in the peripheral areas and hinterland of the city.
1.2.2.6 Activity Areas
The Commercial Zones and the High Streets
The gaonthan areas and the camp area provide for wholesale shopping in the city. New malls and large format retail development are coming up in the central city areas along the industrial belt on the old Mumbai pune highway and at the junction of NH4 & NH50. Small format commercial development is also seen spread through the neighbourhood as the development control rules allows for mixed use on roads having ROW 18 m or more (refer MAP 1.13 – Distribution of Activity Areas). This is advantageous in reducing some of the shopping trips.
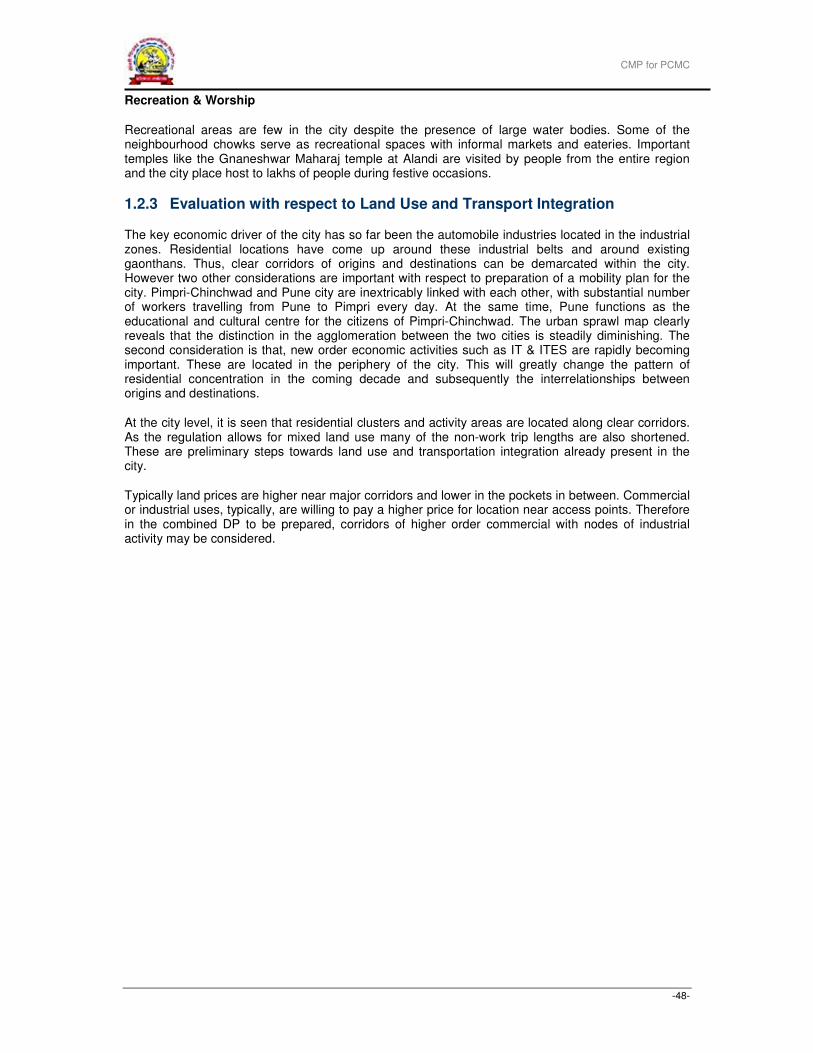
CMP for PCMC
-48-
Recreation & Worship
Recreational areas are few in the city despite the presence of large water bodies. Some of the neighbourhood chowks serve as recreational spaces with informal markets and eateries. Important temples like the Gnaneshwar Maharaj temple at Alandi are visited by people from the entire region and the city place host to lakhs of people during festive occasions.
1.2.3 Evaluation with respect to Land Use and Transport Integration
The key economic driver of the city has so far been the automobile industries located in the industrial zones. Residential locations have come up around these industrial belts and around existing gaonthans. Thus, clear corridors of origins and destinations can be demarcated within the city. However two other considerations are important with respect to preparation of a mobility plan for the city. Pimpri-Chinchwad and Pune city are inextricably linked with each other, with substantial number of workers travelling from Pune to Pimpri every day. At the same time, Pune functions as the educational and cultural centre for the citizens of Pimpri-Chinchwad. The urban sprawl map clearly reveals that the distinction in the agglomeration between the two cities is steadily diminishing. The second consideration is that, new order economic activities such as IT & ITES are rapidly becoming important. These are located in the periphery of the city. This will greatly change the pattern of residential concentration in the coming decade and subsequently the interrelationships between origins and destinations.
At the city level, it is seen that residential clusters and activity areas are located along clear corridors. As the regulation allows for mixed land use many of the non-work trip lengths are also shortened. These are preliminary steps towards land use and transportation integration already present in the city.
Typically land prices are higher near major corridors and lower in the pockets in between. Commercial or industrial uses, typically, are willing to pay a higher price for location near access points. Therefore in the combined DP to be prepared, corridors of higher order commercial with nodes of industrial activity may be considered.
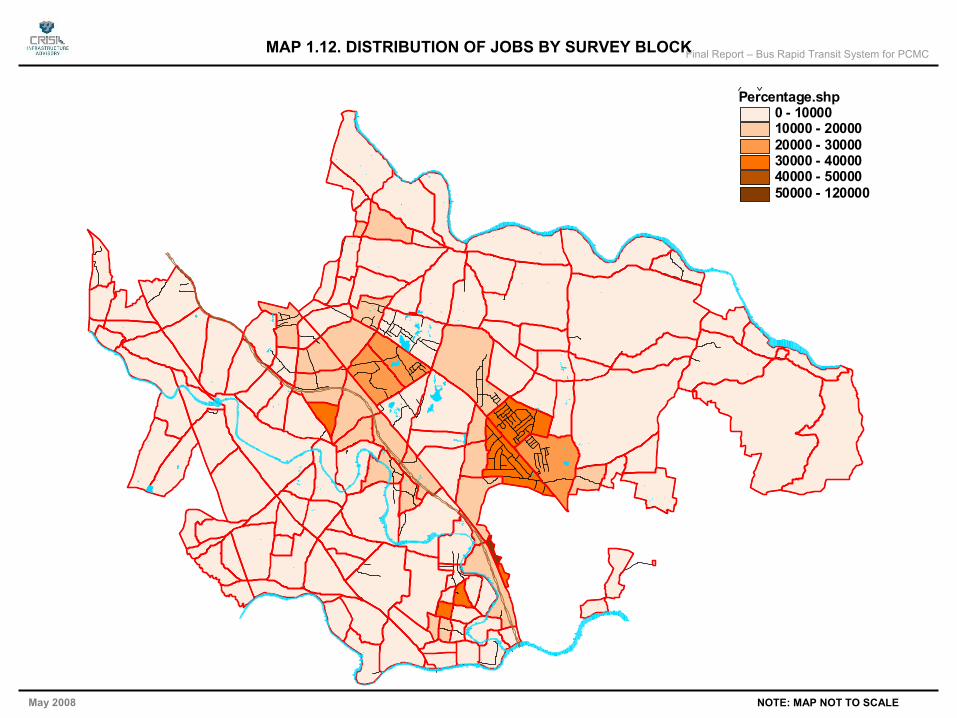
Final Report – Bus Rapid Transit System for PCMC
May 2008 NOTE: MAP NOT TO SCALE
Percentage.shp0 - 1000010000 - 2000020000 - 3000030000 - 4000040000 - 5000050000 - 120000
MAP 1.12. DISTRIBUTION OF JOBS BY SURVEY BLOCK
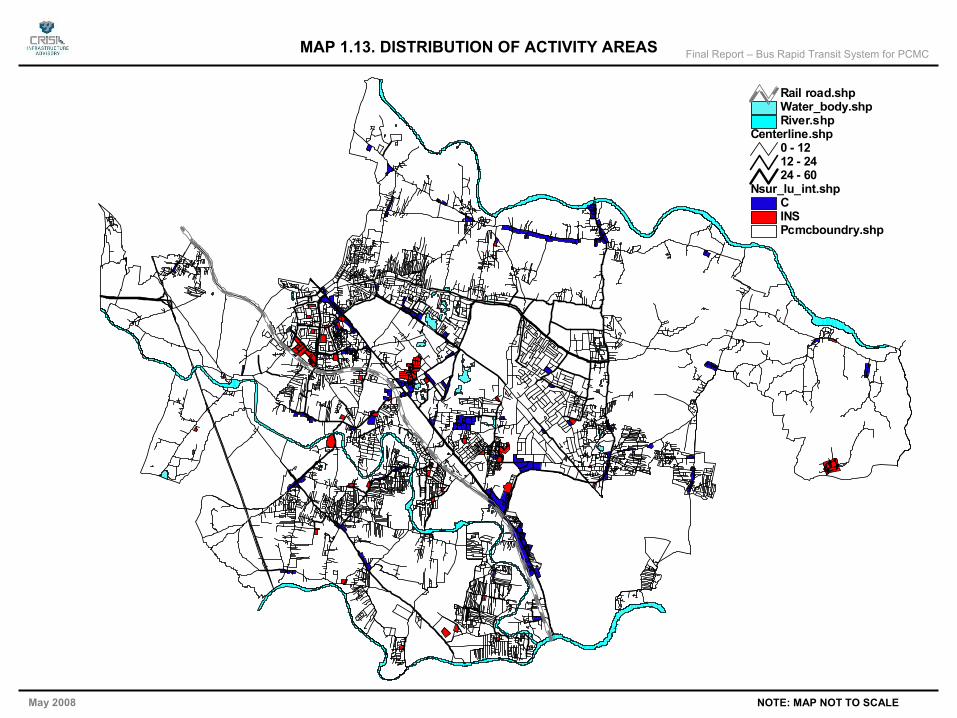
Final Report – Bus Rapid Transit System for PCMC
May 2008 NOTE: MAP NOT TO SCALE
Pcmcboundry.shp
Nsur_lu_int.shpCINS
Centerline.shp0 - 1212 - 2424 - 60
River.shpWater_body.shpRail road.shp
MAP 1.13. DISTRIBUTION OF ACTIVITY AREAS
Final Report – Bus Rapid Transit System for PCMC
May 2008 NOTE: MAP NOT TO SCALE
Resi.shp0 - 50005000 - 1000010000 - 1500015000 - 2000020000 - 2500025000 - 3000030000 - 60000
Rail road.shpRiver.shpWater_body.shp
Centerline.shp1 - 47 - 604 - 7
g p
MAP 1.14. DISTRIBUTION OF RESIDENTIAL POPULATION BY SURVEY BLOCK
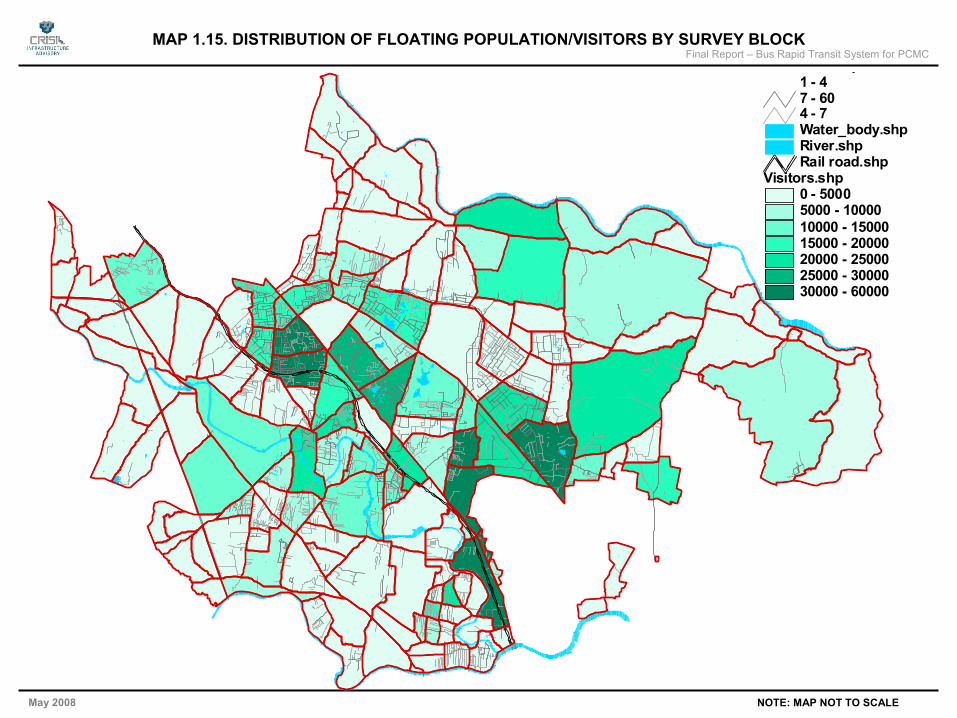
Final Report – Bus Rapid Transit System for PCMC
May 2008 NOTE: MAP NOT TO SCALE
Visitors.shp0 - 50005000 - 1000010000 - 1500015000 - 2000020000 - 2500025000 - 3000030000 - 60000
Rail road.shpRiver.shpWater_body.shp
p1 - 47 - 604 - 7
MAP 1.15. DISTRIBUTION OF FLOATING POPULATION/VISITORS BY SURVEY BLOCK
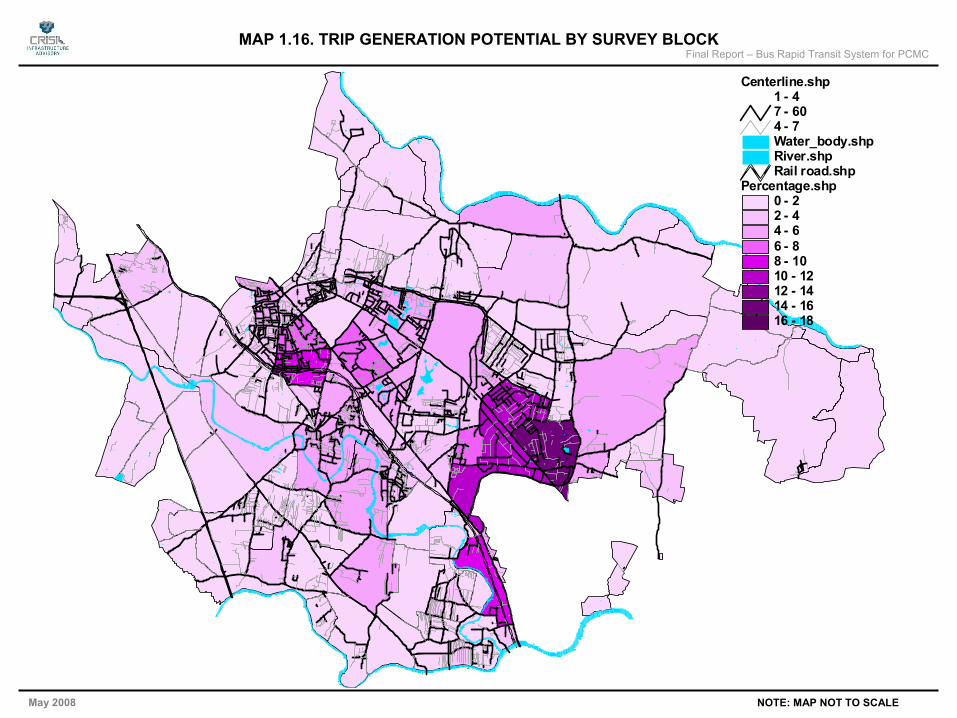
Final Report – Bus Rapid Transit System for PCMC
May 2008 NOTE: MAP NOT TO SCALE
MAP 1.16. TRIP GENERATION POTENTIAL BY SURVEY BLOCK
Percentage.shp0 - 22 - 44 - 66 - 88 - 1010 - 1212 - 1414 - 1616 - 18
Rail road.shpRiver.shpWater_body.shp
Centerline.shp1 - 47 - 604 - 7
CMP for PCMC
-54-
Providing substantial opportunities for employment, PCMC attracts a large migrant populatiom. This coupled with the natural growth in the city leads to a high rate of population growth in the city putting pressure on the existing road network and transport infrastructure. Additionally the growing incomes of the residents have led to an increase in the ownership of personal vehicles, leading to greater load on the existing infrastructure.
Currently the use of roads in PCMC is driven by the industrial clusters in the area. This might change with the development of IT sector in the overall region, along with the Pune area. It has also been observed that some industries are moving out of the city limits leading to a change of the land-use of their estates from industrial to residential or commercial. All these factors impact the transportation profile of PCMC. The following chapter profiles the existing transportation systems and traffic characteristics.
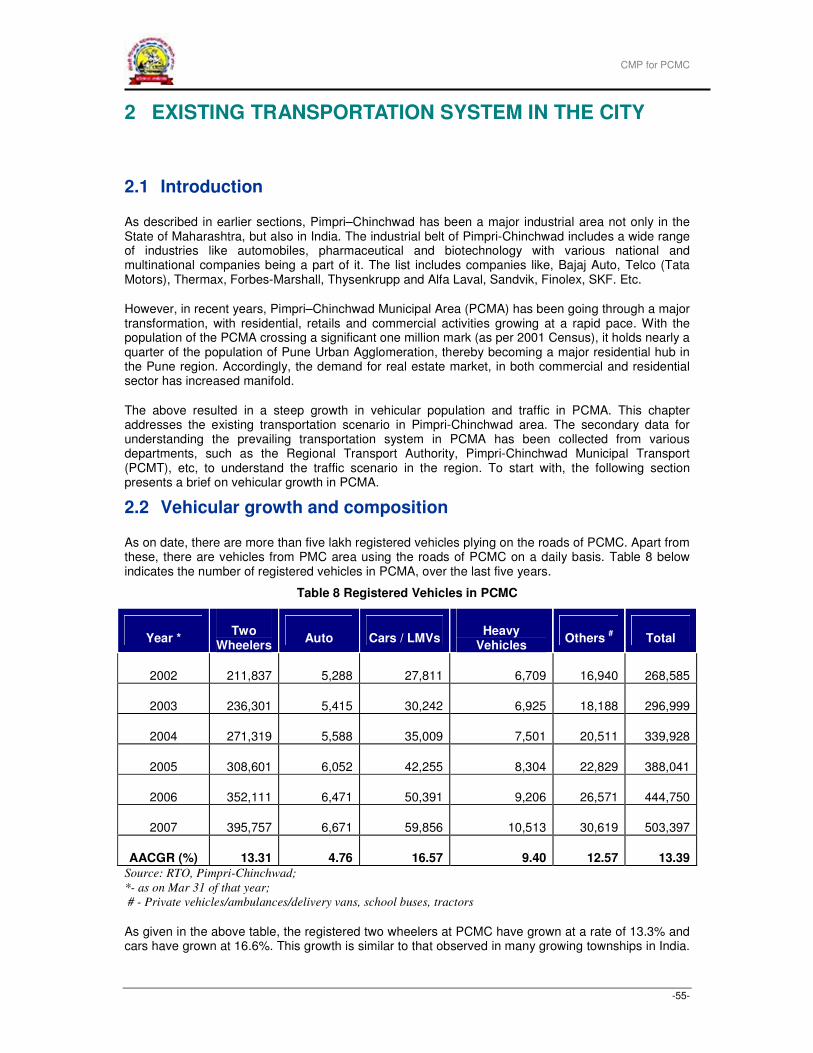
CMP for PCMC
-55-
2 EXISTING TRANSPORTATION SYSTEM IN THE CITY
2.1 Introduction
As described in earlier sections, Pimpri–Chinchwad has been a major industrial area not only in the State of Maharashtra, but also in India. The industrial belt of Pimpri-Chinchwad includes a wide range of industries like automobiles, pharmaceutical and biotechnology with various national and multinational companies being a part of it. The list includes companies like, Bajaj Auto, Telco (Tata Motors), Thermax, Forbes-Marshall, Thysenkrupp and Alfa Laval, Sandvik, Finolex, SKF. Etc.
However, in recent years, Pimpri–Chinchwad Municipal Area (PCMA) has been going through a major transformation, with residential, retails and commercial activities growing at a rapid pace. With the population of the PCMA crossing a significant one million mark (as per 2001 Census), it holds nearly a quarter of the population of Pune Urban Agglomeration, thereby becoming a major residential hub in the Pune region. Accordingly, the demand for real estate market, in both commercial and residential sector has increased manifold.
The above resulted in a steep growth in vehicular population and traffic in PCMA. This chapter addresses the existing transportation scenario in Pimpri-Chinchwad area. The secondary data for understanding the prevailing transportation system in PCMA has been collected from various departments, such as the Regional Transport Authority, Pimpri-Chinchwad Municipal Transport (PCMT), etc, to understand the traffic scenario in the region. To start with, the following section presents a brief on vehicular growth in PCMA.
2.2 Vehicular growth and composition
As on date, there are more than five lakh registered vehicles plying on the roads of PCMC. Apart from these, there are vehicles from PMC area using the roads of PCMC on a daily basis. Table 8 below indicates the number of registered vehicles in PCMA, over the last five years.
Table 8 Registered Vehicles in PCMC
Year * Two
Wheelers Auto Cars / LMVs
Heavy Vehicles
Others # Total
2002 211,837 5,288 27,811 6,709 16,940 268,585
2003 236,301 5,415 30,242 6,925 18,188 296,999
2004 271,319 5,588 35,009 7,501 20,511 339,928
2005 308,601 6,052 42,255 8,304 22,829 388,041
2006 352,111 6,471 50,391 9,206 26,571 444,750
2007 395,757 6,671 59,856 10,513 30,619 503,397
AACGR (%) 13.31 4.76 16.57 9.40 12.57 13.39
Source: RTO, Pimpri-Chinchwad;
*- as on Mar 31 of that year;
# - Private vehicles/ambulances/delivery vans, school buses, tractors
As given in the above table, the registered two wheelers at PCMC have grown at a rate of 13.3% and cars have grown at 16.6%. This growth is similar to that observed in many growing townships in India.
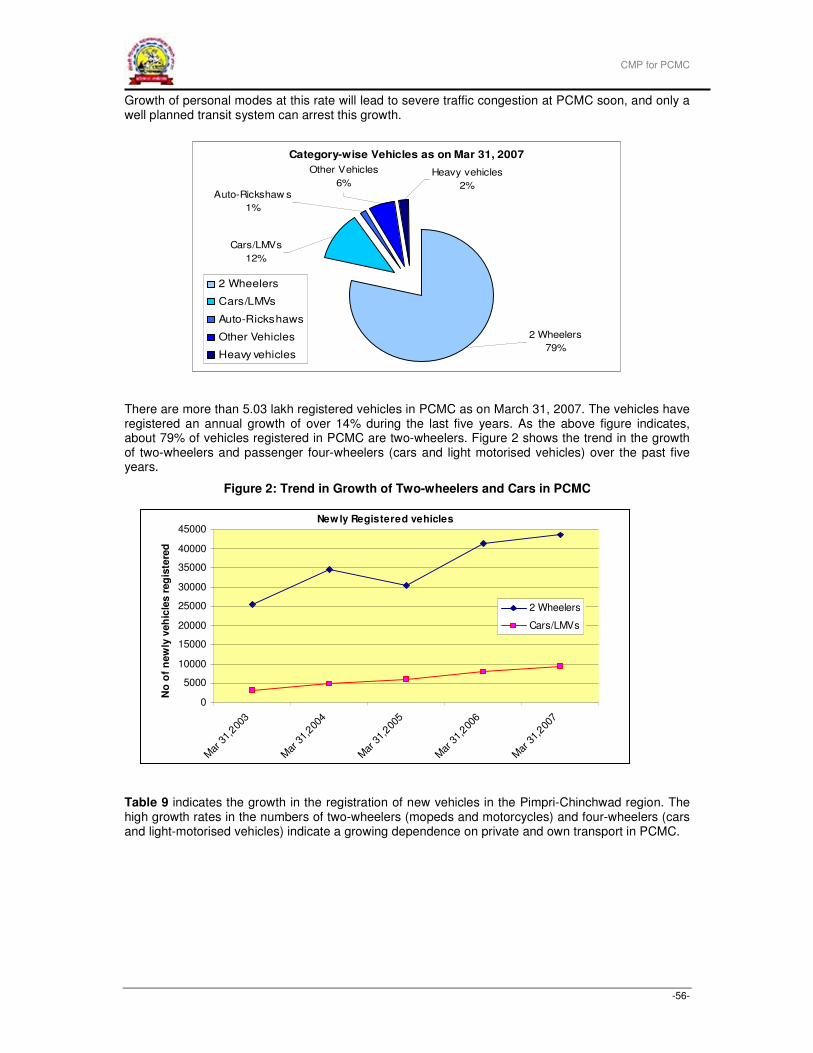
CMP for PCMC
-56-
Growth of personal modes at this rate will lead to severe traffic congestion at PCMC soon, and only a well planned transit system can arrest this growth.
There are more than 5.03 lakh registered vehicles in PCMC as on March 31, 2007. The vehicles have registered an annual growth of over 14% during the last five years. As the above figure indicates, about 79% of vehicles registered in PCMC are two-wheelers. Figure 2 shows the trend in the growth of two-wheelers and passenger four-wheelers (cars and light motorised vehicles) over the past five years.
Figure 2: Trend in Growth of Two-wheelers and Cars in PCMC
Table 9 indicates the growth in the registration of new vehicles in the Pimpri-Chinchwad region. The high growth rates in the numbers of two-wheelers (mopeds and motorcycles) and four-wheelers (cars and light-motorised vehicles) indicate a growing dependence on private and own transport in PCMC.
Newly Registered vehicles
0
5000
10000
15000
20000
25000
30000
35000
40000
45000
Mar
31,
2003
Mar
31,
2004
Mar
31,
2005
Mar
31,
2006
Mar
31,
2007
No
of
new
ly v
eh
icle
s r
eg
iste
red
2 Wheelers
Cars/LMVs
Category-wise Vehicles as on Mar 31, 2007
2 Wheelers
79%
Heavy vehicles
2%
Cars/LMVs
12%
Auto-Rickshaw s
1%
Other Vehicles
6%
2 Wheelers
Cars/LMVs
Auto-Rickshaws
Other Vehicles
Heavy vehicles
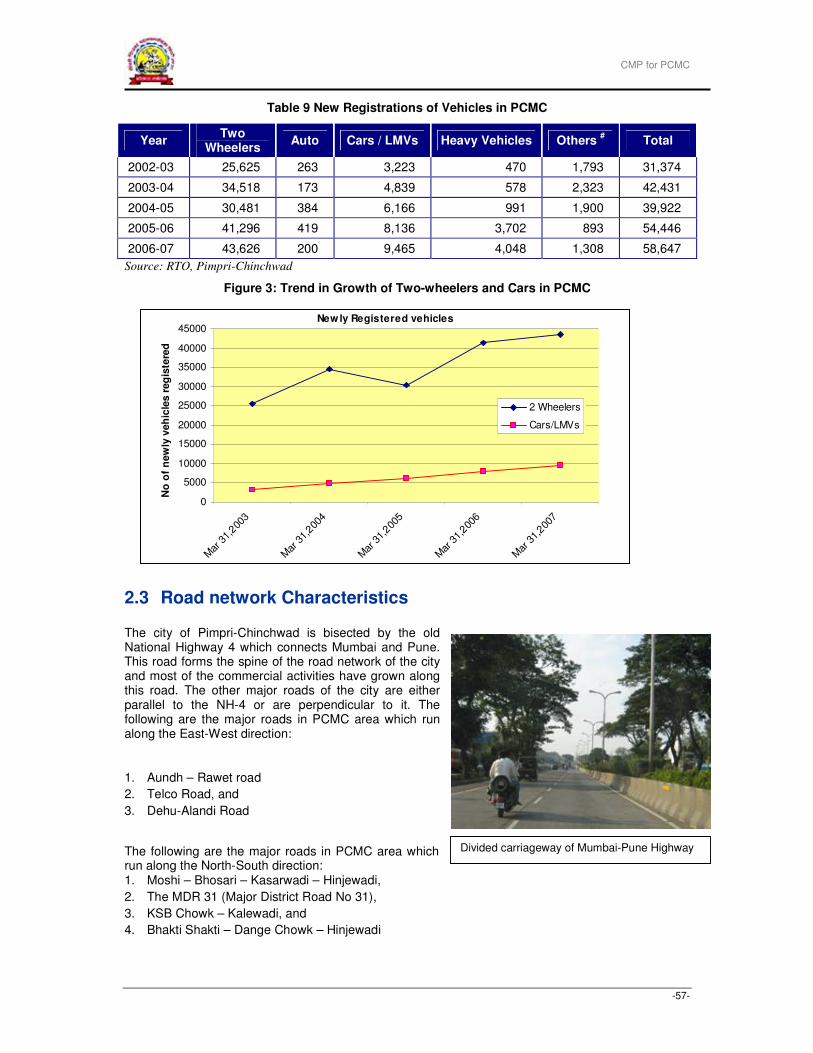
CMP for PCMC
-57-
Table 9 New Registrations of Vehicles in PCMC
Year Two
Wheelers Auto Cars / LMVs Heavy Vehicles Others
# Total
2002-03 25,625 263 3,223 470 1,793 31,374
2003-04 34,518 173 4,839 578 2,323 42,431
2004-05 30,481 384 6,166 991 1,900 39,922
2005-06 41,296 419 8,136 3,702 893 54,446
2006-07 43,626 200 9,465 4,048 1,308 58,647
Source: RTO, Pimpri-Chinchwad
Figure 3: Trend in Growth of Two-wheelers and Cars in PCMC
2.3 Road network Characteristics
The city of Pimpri-Chinchwad is bisected by the old National Highway 4 which connects Mumbai and Pune. This road forms the spine of the road network of the city and most of the commercial activities have grown along this road. The other major roads of the city are either parallel to the NH-4 or are perpendicular to it. The following are the major roads in PCMC area which run along the East-West direction:
1. Aundh – Rawet road
2. Telco Road, and
3. Dehu-Alandi Road
The following are the major roads in PCMC area which run along the North-South direction: 1. Moshi – Bhosari – Kasarwadi – Hinjewadi,
2. The MDR 31 (Major District Road No 31),
3. KSB Chowk – Kalewadi, and
4. Bhakti Shakti – Dange Chowk – Hinjewadi
Divided carriageway of Mumbai-Pune Highway
Newly Registered vehicles
0
5000
10000
15000
20000
25000
30000
35000
40000
45000
Mar
31,
2003
Mar
31,
2004
Mar
31,
2005
Mar
31,
2006
Mar
31,
2007
No
of
new
ly v
eh
icle
s r
eg
iste
red
2 Wheelers
Cars/LMVs
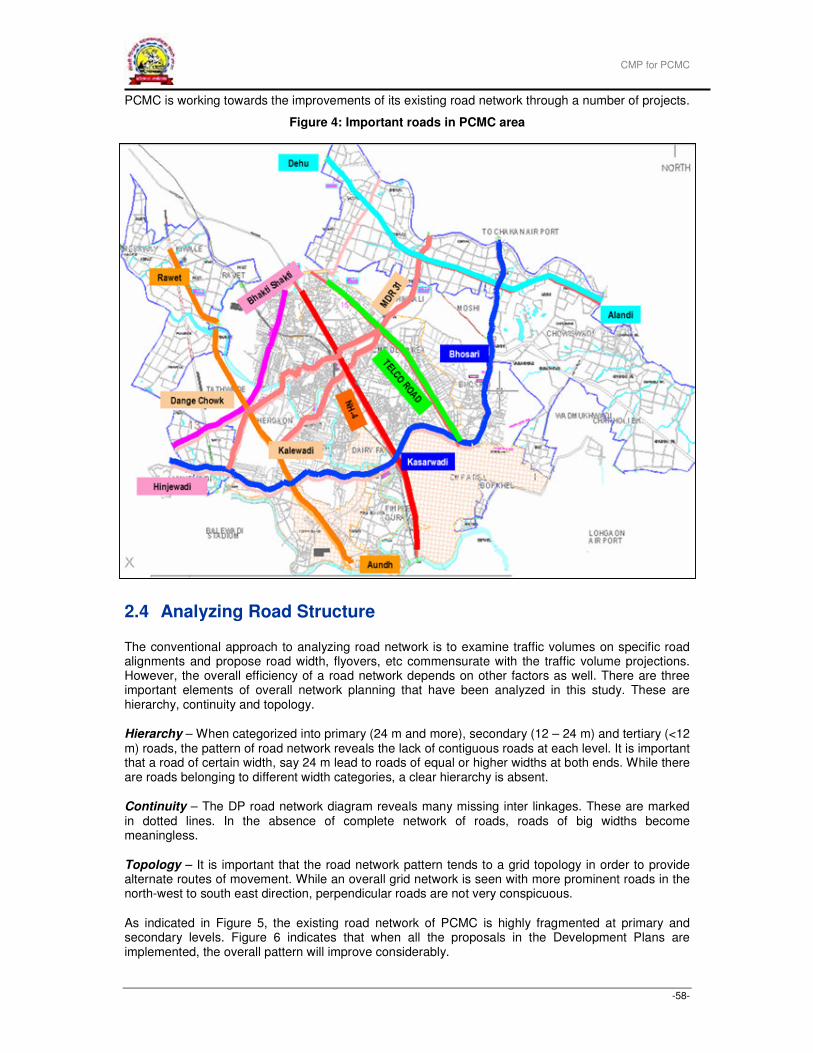
CMP for PCMC
-58-
PCMC is working towards the improvements of its existing road network through a number of projects.
Figure 4: Important roads in PCMC area
2.4 Analyzing Road Structure
The conventional approach to analyzing road network is to examine traffic volumes on specific road alignments and propose road width, flyovers, etc commensurate with the traffic volume projections. However, the overall efficiency of a road network depends on other factors as well. There are three important elements of overall network planning that have been analyzed in this study. These are hierarchy, continuity and topology.
Hierarchy – When categorized into primary (24 m and more), secondary (12 – 24 m) and tertiary (<12 m) roads, the pattern of road network reveals the lack of contiguous roads at each level. It is important that a road of certain width, say 24 m lead to roads of equal or higher widths at both ends. While there are roads belonging to different width categories, a clear hierarchy is absent.
Continuity – The DP road network diagram reveals many missing inter linkages. These are marked in dotted lines. In the absence of complete network of roads, roads of big widths become meaningless.
Topology – It is important that the road network pattern tends to a grid topology in order to provide alternate routes of movement. While an overall grid network is seen with more prominent roads in the north-west to south east direction, perpendicular roads are not very conspicuous.
As indicated in Figure 5, the existing road network of PCMC is highly fragmented at primary and secondary levels. Figure 6 indicates that when all the proposals in the Development Plans are implemented, the overall pattern will improve considerably.
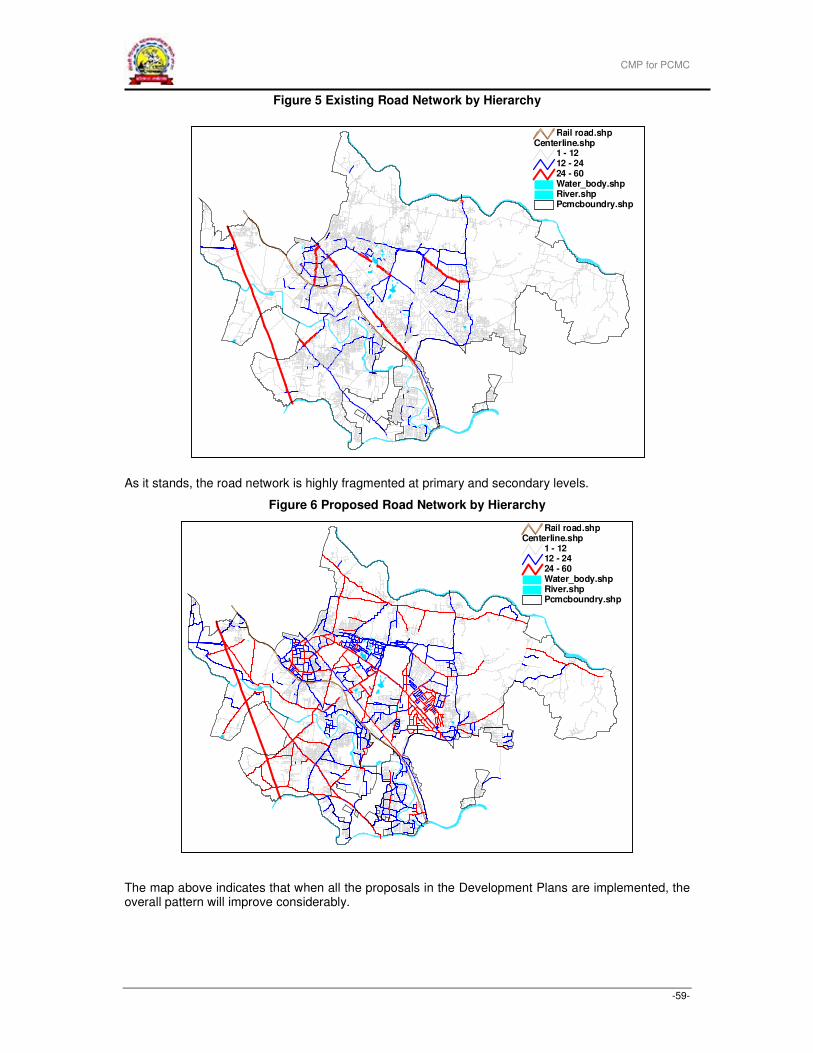
CMP for PCMC
-59-
Figure 5 Existing Road Network by Hierarchy
As it stands, the road network is highly fragmented at primary and secondary levels.
Figure 6 Proposed Road Network by Hierarchy
The map above indicates that when all the proposals in the Development Plans are implemented, the overall pattern will improve considerably.
Pcmcboundry.shpRiver.shpWater_body.shp
Centerline.shp1 - 1212 - 2424 - 60
Rail road.shp
Pcmcboundry.shpRiver.shpWater_body.shp
Centerline.shp1 - 1212 - 2424 - 60
Rail road.shp
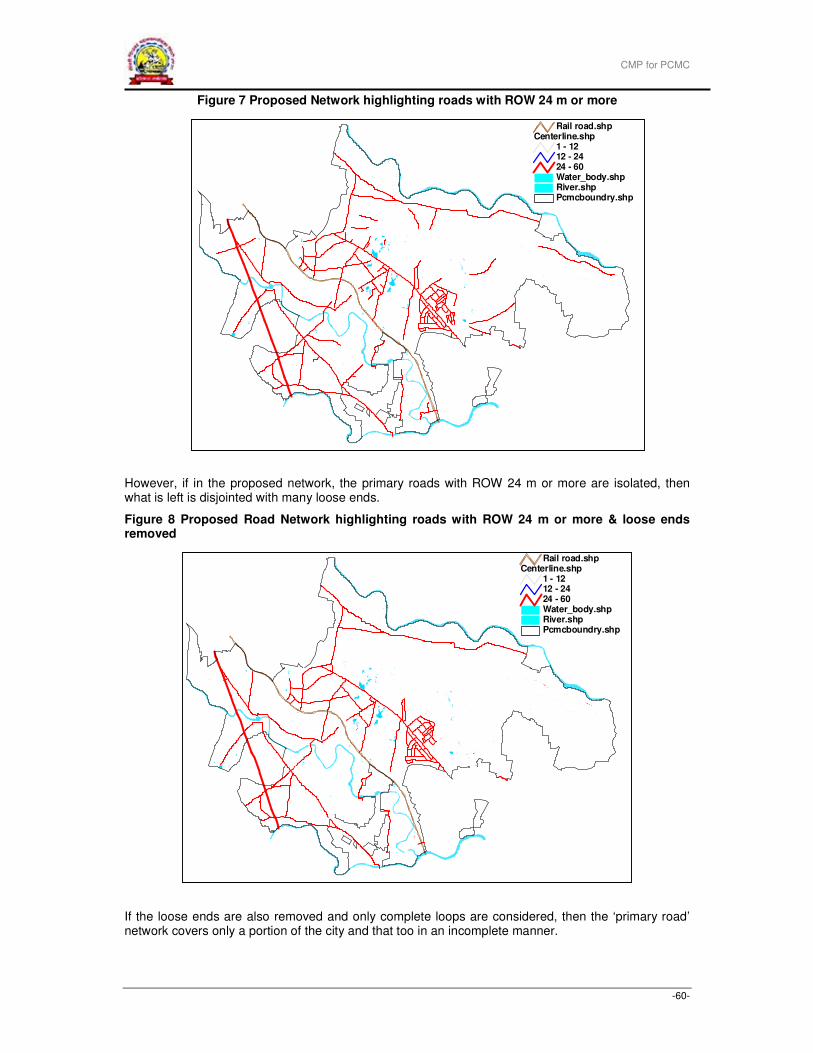
CMP for PCMC
-60-
Figure 7 Proposed Network highlighting roads with ROW 24 m or more
However, if in the proposed network, the primary roads with ROW 24 m or more are isolated, then what is left is disjointed with many loose ends.
Figure 8 Proposed Road Network highlighting roads with ROW 24 m or more & loose ends removed
If the loose ends are also removed and only complete loops are considered, then the ‘primary road’ network covers only a portion of the city and that too in an incomplete manner.
Pcmcboundry.shpRiver.shpWater_body.shp
Centerline.shp1 - 1212 - 2424 - 60
Rail road.shp
Pcmcboundry.shpRiver.shpWater_body.shp
Centerline.shp1 - 1212 - 2424 - 60
Rail road.shp
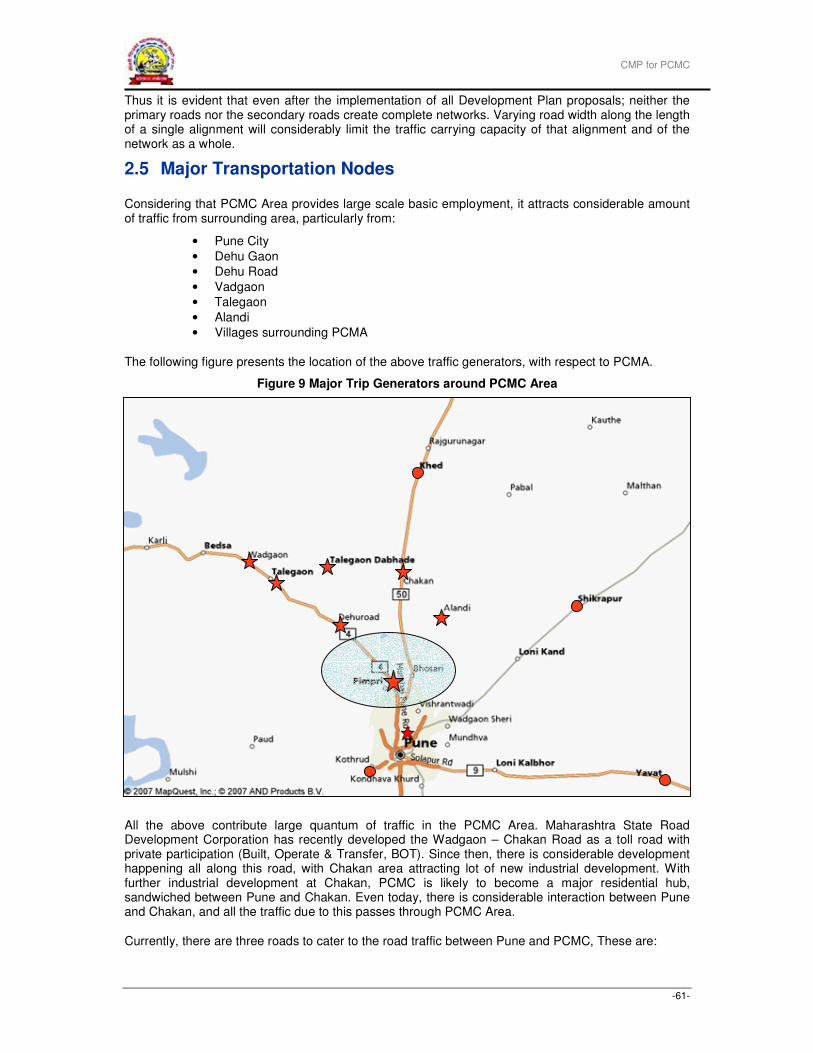
CMP for PCMC
-61-
Thus it is evident that even after the implementation of all Development Plan proposals; neither the primary roads nor the secondary roads create complete networks. Varying road width along the length of a single alignment will considerably limit the traffic carrying capacity of that alignment and of the network as a whole.
2.5 Major Transportation Nodes
Considering that PCMC Area provides large scale basic employment, it attracts considerable amount of traffic from surrounding area, particularly from:
• Pune City
• Dehu Gaon
• Dehu Road
• Vadgaon
• Talegaon
• Alandi
• Villages surrounding PCMA
The following figure presents the location of the above traffic generators, with respect to PCMA.
Figure 9 Major Trip Generators around PCMC Area
All the above contribute large quantum of traffic in the PCMC Area. Maharashtra State Road Development Corporation has recently developed the Wadgaon – Chakan Road as a toll road with private participation (Built, Operate & Transfer, BOT). Since then, there is considerable development happening all along this road, with Chakan area attracting lot of new industrial development. With further industrial development at Chakan, PCMC is likely to become a major residential hub, sandwiched between Pune and Chakan. Even today, there is considerable interaction between Pune and Chakan, and all the traffic due to this passes through PCMC Area.
Currently, there are three roads to cater to the road traffic between Pune and PCMC, These are:
CMP for PCMC
-62-
• Old NH4 (Old Mumbai – Pune Road)
• Aundh – Ravet Road
• NH4 Bypass
In addition to the above, a sub-urban/local train service exists between Pune and Lonavala, which passes through PCMC limts. This forms a part of the services being provided by the Central Railways. Along this route, there are five railway stations within PCMC. These are:
• Dapodi
• Kasarwadi
• Pimpri
• Chinchwad, and
• Akurdi The railway service provides an important means of transportation to daily commuters of Pimpri-Chinchwad to Pune and nearby areas. However, as presented in later chapter (desire-line diagrams), it can be seen that the influence area of this service is limited.
NH50 (Pune – Nashik Road) which originates at Nashik Phata in PCMC Area caters to most of the current traffic between Pune and Chakan, and PCMC Area and Chakan. With the sort of growth happening at and around Chakan, this road (NH50) will become a bottleneck to traffic flow in PCMC Area, and necessitates development of North-South Corridors parallel to NH50.
The Inter-City Bus Station of the city is located in Sant Tukaram Nagar and caters to the State Transport bus services to various cities and towns across the state of Maharashtra.
Currently, there is no separate airport for the city of Pimpri-Chinchwad. The airport in Pune is situated in Lohegaon, and is used by all commuters in the region including Pimpri-Chinchwad. Connectivity to the airport is along routes which pass through the Military Cantonement area of Pune. Apart from the daily traffic in Pune limits, there is no major bottle-neck in terms of connectivity to the airport.
There is a proposal for construction of an international airport at Chackan. Connectivity to the new airport would be along the existing NH-50 from PCMC limits.
Within PCMC, as of now, the following are major traffic attractors:
• Bajaj Auto,
• Tata Motors (formerly Telco), and Bhosri Industrial Area,
• Kinetic Engineering,
• Force Motors (formerly Bajaj Tempo),
• DaimlerChrysler,
• Mercedes Benz India ltd. (at MIDC Bhosari),
• Hindustan Antibiotics Limited (HAL)
• Forbes-Marshall,
• Alfa Laval,
• Sandvik,
• Finolex,
• SKF, and
• Birla Hospital
Old Pimpri and Chinchwad, Nigdi, and Sant Tukaram Nagar contain most of the current residential area, which is growing rapidly. Pimpri-Chinchwad has today become the most sought after residential location for middle income as well as higher income groups in Pune Region, and future will make it one of the most coveted residential zones in the state.
2.6 Pedestrian and NMV Facilities
No dedicated facilities are available for the non motorized vehicles and pedestrian, though they form a significant mode of travel, especially for non-work trips. However attempts are being made as part of
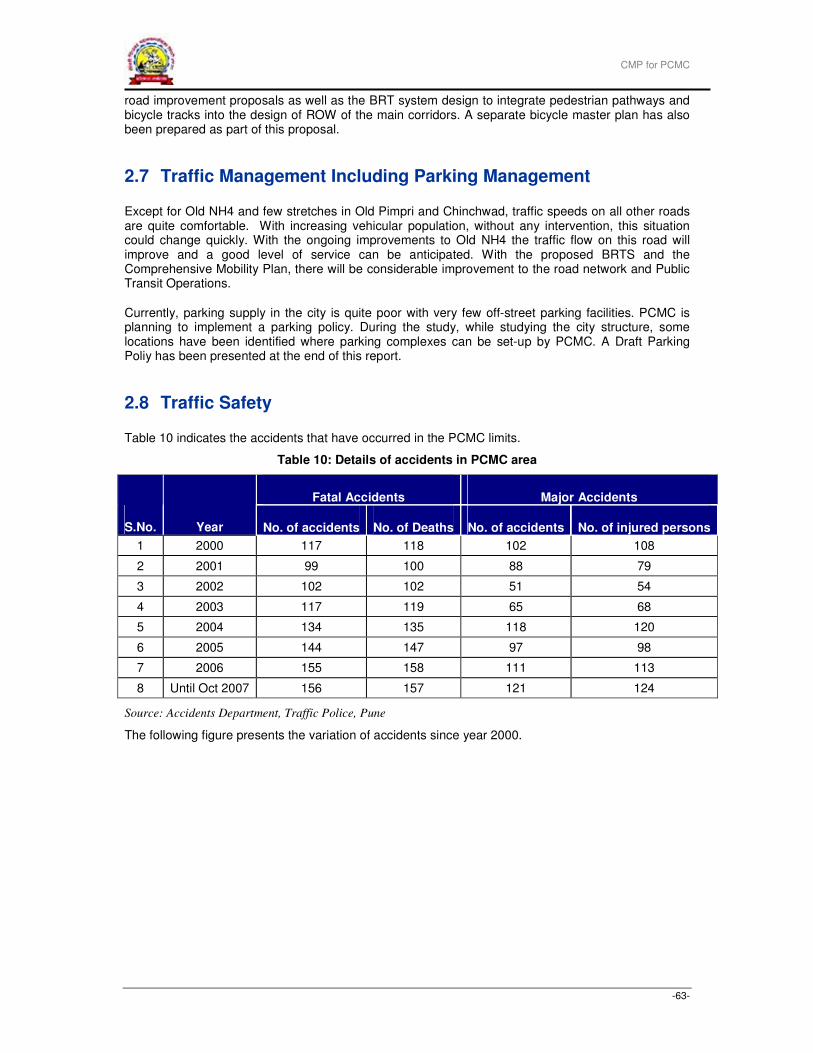
CMP for PCMC
-63-
road improvement proposals as well as the BRT system design to integrate pedestrian pathways and bicycle tracks into the design of ROW of the main corridors. A separate bicycle master plan has also been prepared as part of this proposal.
2.7 Traffic Management Including Parking Management
Except for Old NH4 and few stretches in Old Pimpri and Chinchwad, traffic speeds on all other roads are quite comfortable. With increasing vehicular population, without any intervention, this situation could change quickly. With the ongoing improvements to Old NH4 the traffic flow on this road will improve and a good level of service can be anticipated. With the proposed BRTS and the Comprehensive Mobility Plan, there will be considerable improvement to the road network and Public Transit Operations.
Currently, parking supply in the city is quite poor with very few off-street parking facilities. PCMC is planning to implement a parking policy. During the study, while studying the city structure, some locations have been identified where parking complexes can be set-up by PCMC. A Draft Parking Poliy has been presented at the end of this report.
2.8 Traffic Safety
Table 10 indicates the accidents that have occurred in the PCMC limits.
Table 10: Details of accidents in PCMC area
Fatal Accidents Major Accidents
S.No. Year No. of accidents No. of Deaths No. of accidents No. of injured persons
1 2000 117 118 102 108
2 2001 99 100 88 79
3 2002 102 102 51 54
4 2003 117 119 65 68
5 2004 134 135 118 120
6 2005 144 147 97 98
7 2006 155 158 111 113
8 Until Oct 2007 156 157 121 124
Source: Accidents Department, Traffic Police, Pune
The following figure presents the variation of accidents since year 2000.
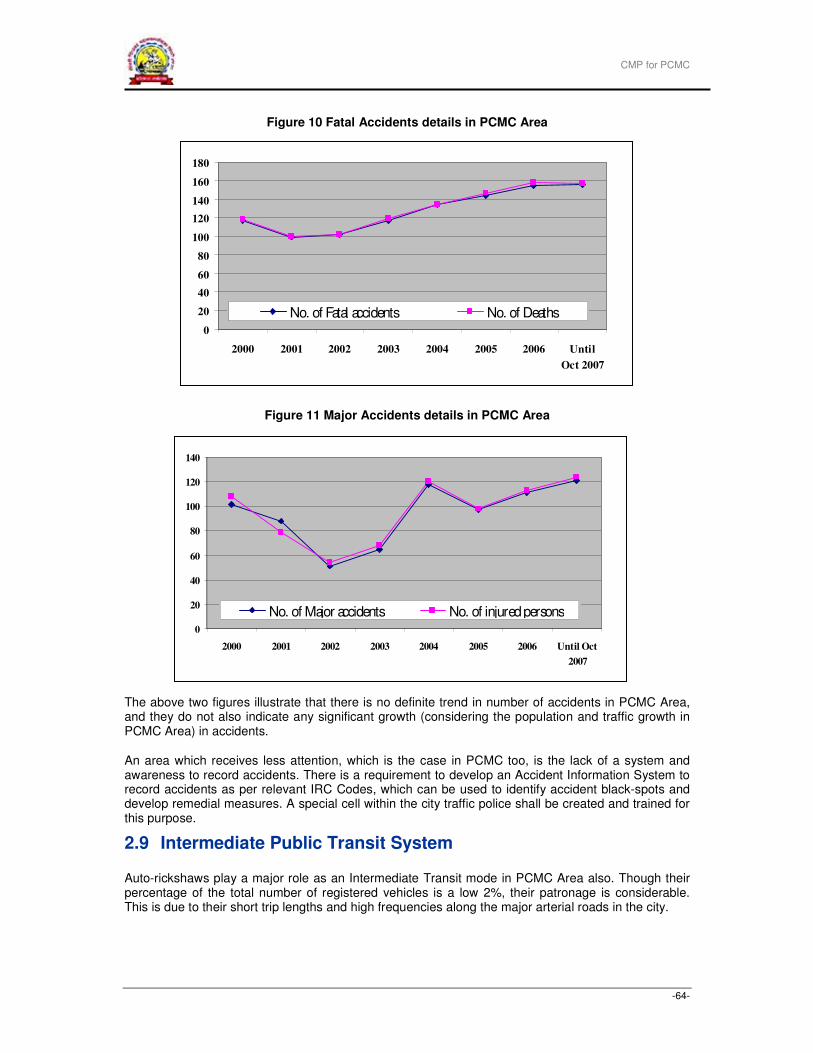
CMP for PCMC
-64-
Figure 10 Fatal Accidents details in PCMC Area
Figure 11 Major Accidents details in PCMC Area
The above two figures illustrate that there is no definite trend in number of accidents in PCMC Area, and they do not also indicate any significant growth (considering the population and traffic growth in PCMC Area) in accidents.
An area which receives less attention, which is the case in PCMC too, is the lack of a system and awareness to record accidents. There is a requirement to develop an Accident Information System to record accidents as per relevant IRC Codes, which can be used to identify accident black-spots and develop remedial measures. A special cell within the city traffic police shall be created and trained for this purpose.
2.9 Intermediate Public Transit System
Auto-rickshaws play a major role as an Intermediate Transit mode in PCMC Area also. Though their percentage of the total number of registered vehicles is a low 2%, their patronage is considerable. This is due to their short trip lengths and high frequencies along the major arterial roads in the city.
0
20
40
60
80
100
120
140
160
180
2000 2001 2002 2003 2004 2005 2006 Until
Oct 2007
No. of Fatal accidents No. of Deaths
0
20
40
60
80
100
120
140
2000 2001 2002 2003 2004 2005 2006 Until Oct
2007
No. of Major accidents No. of injured persons
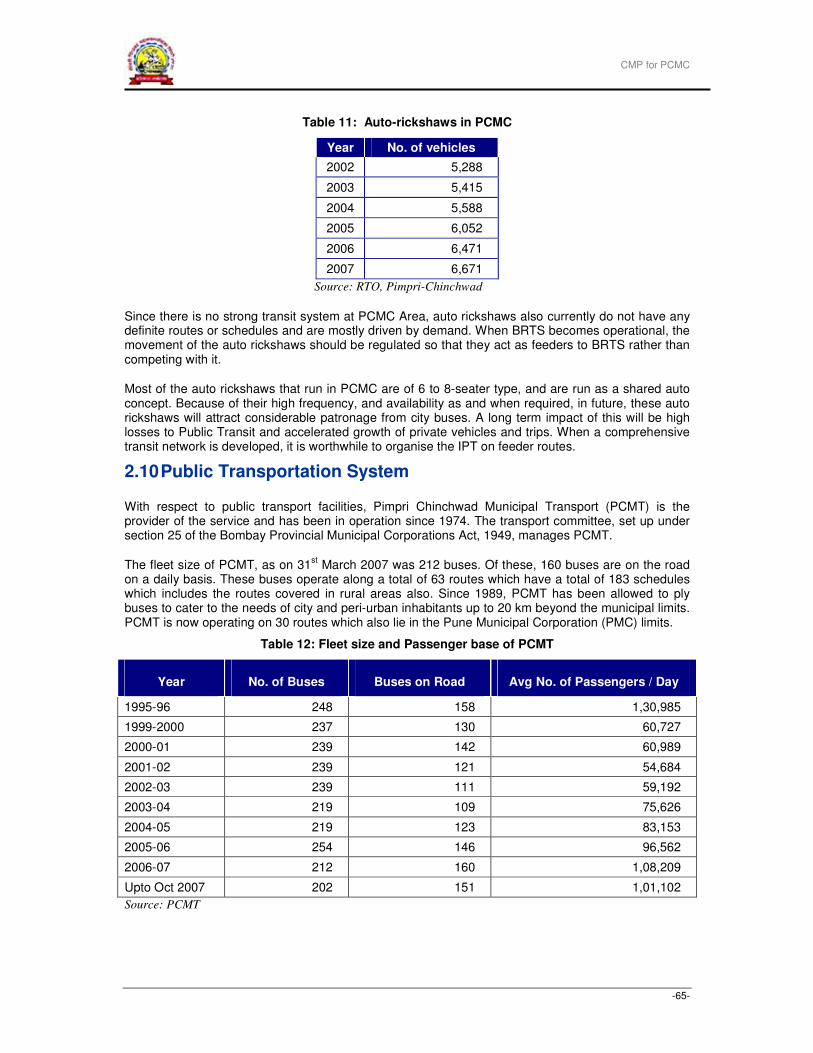
CMP for PCMC
-65-
Table 11: Auto-rickshaws in PCMC
Year No. of vehicles
2002 5,288
2003 5,415
2004 5,588
2005 6,052
2006 6,471
2007 6,671
Source: RTO, Pimpri-Chinchwad
Since there is no strong transit system at PCMC Area, auto rickshaws also currently do not have any definite routes or schedules and are mostly driven by demand. When BRTS becomes operational, the movement of the auto rickshaws should be regulated so that they act as feeders to BRTS rather than competing with it.
Most of the auto rickshaws that run in PCMC are of 6 to 8-seater type, and are run as a shared auto concept. Because of their high frequency, and availability as and when required, in future, these auto rickshaws will attract considerable patronage from city buses. A long term impact of this will be high losses to Public Transit and accelerated growth of private vehicles and trips. When a comprehensive transit network is developed, it is worthwhile to organise the IPT on feeder routes.
2.10 Public Transportation System
With respect to public transport facilities, Pimpri Chinchwad Municipal Transport (PCMT) is the provider of the service and has been in operation since 1974. The transport committee, set up under section 25 of the Bombay Provincial Municipal Corporations Act, 1949, manages PCMT.
The fleet size of PCMT, as on 31st March 2007 was 212 buses. Of these, 160 buses are on the road
on a daily basis. These buses operate along a total of 63 routes which have a total of 183 schedules which includes the routes covered in rural areas also. Since 1989, PCMT has been allowed to ply buses to cater to the needs of city and peri-urban inhabitants up to 20 km beyond the municipal limits. PCMT is now operating on 30 routes which also lie in the Pune Municipal Corporation (PMC) limits.
Table 12: Fleet size and Passenger base of PCMT
Year No. of Buses Buses on Road Avg No. of Passengers / Day
1995-96 248 158 1,30,985
1999-2000 237 130 60,727
2000-01 239 142 60,989
2001-02 239 121 54,684
2002-03 239 111 59,192
2003-04 219 109 75,626
2004-05 219 123 83,153
2005-06 254 146 96,562
2006-07 212 160 1,08,209
Upto Oct 2007 202 151 1,01,102
Source: PCMT
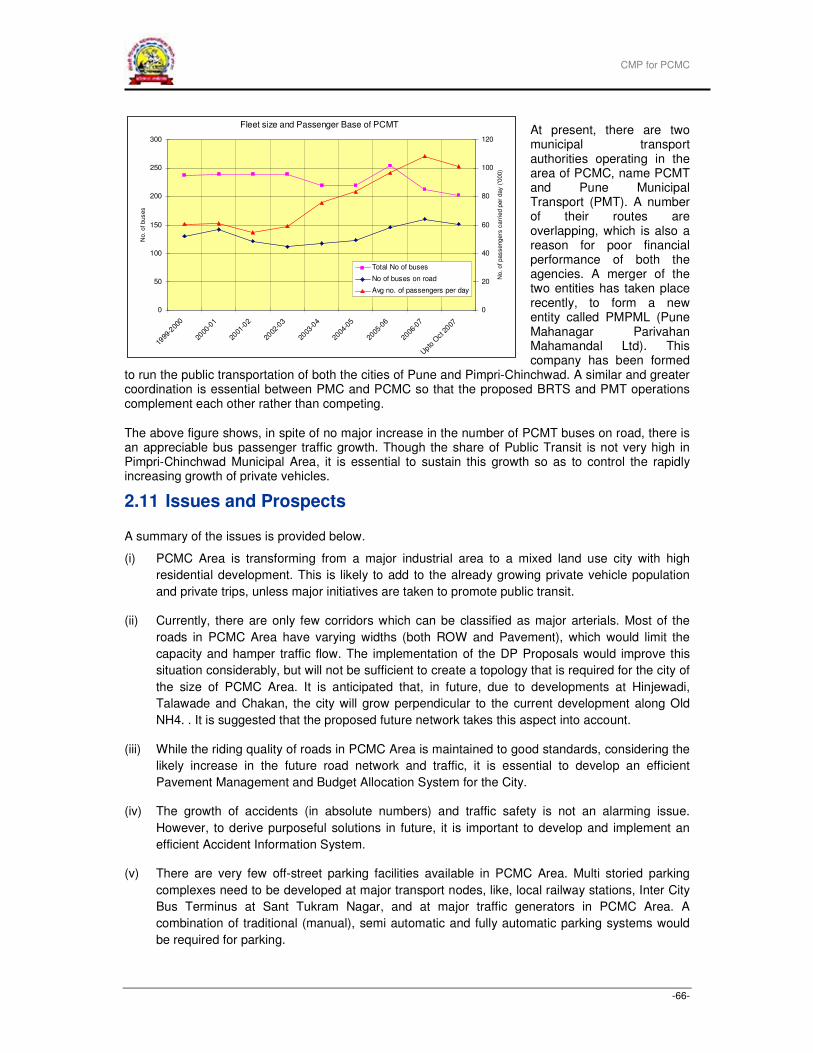
CMP for PCMC
-66-
At present, there are two municipal transport authorities operating in the area of PCMC, name PCMT and Pune Municipal Transport (PMT). A number of their routes are overlapping, which is also a reason for poor financial performance of both the agencies. A merger of the two entities has taken place recently, to form a new entity called PMPML (Pune Mahanagar Parivahan Mahamandal Ltd). This company has been formed
to run the public transportation of both the cities of Pune and Pimpri-Chinchwad. A similar and greater coordination is essential between PMC and PCMC so that the proposed BRTS and PMT operations complement each other rather than competing.
The above figure shows, in spite of no major increase in the number of PCMT buses on road, there is an appreciable bus passenger traffic growth. Though the share of Public Transit is not very high in Pimpri-Chinchwad Municipal Area, it is essential to sustain this growth so as to control the rapidly increasing growth of private vehicles.
2.11 Issues and Prospects
A summary of the issues is provided below.
(i) PCMC Area is transforming from a major industrial area to a mixed land use city with high
residential development. This is likely to add to the already growing private vehicle population
and private trips, unless major initiatives are taken to promote public transit.
(ii) Currently, there are only few corridors which can be classified as major arterials. Most of the
roads in PCMC Area have varying widths (both ROW and Pavement), which would limit the
capacity and hamper traffic flow. The implementation of the DP Proposals would improve this
situation considerably, but will not be sufficient to create a topology that is required for the city of
the size of PCMC Area. It is anticipated that, in future, due to developments at Hinjewadi,
Talawade and Chakan, the city will grow perpendicular to the current development along Old
NH4. . It is suggested that the proposed future network takes this aspect into account.
(iii) While the riding quality of roads in PCMC Area is maintained to good standards, considering the
likely increase in the future road network and traffic, it is essential to develop an efficient
Pavement Management and Budget Allocation System for the City.
(iv) The growth of accidents (in absolute numbers) and traffic safety is not an alarming issue.
However, to derive purposeful solutions in future, it is important to develop and implement an
efficient Accident Information System.
(v) There are very few off-street parking facilities available in PCMC Area. Multi storied parking
complexes need to be developed at major transport nodes, like, local railway stations, Inter City
Bus Terminus at Sant Tukram Nagar, and at major traffic generators in PCMC Area. A
combination of traditional (manual), semi automatic and fully automatic parking systems would
be required for parking.
Fleet size and Passenger Base of PCMT
0
50
100
150
200
250
300
1999
-200
0
2000
-01
2001
-02
2002
-03
2003
-04
2004
-05
2005
-06
2006
-07
Upto
Oct 2
007
No. of buses
0
20
40
60
80
100
120
No. of passengers
carr
ied p
er
day (
'000)
Total No of buses
No of buses on road
Avg no. of passengers per day

CMP for PCMC
-67-
(vi) No NMV facilities are available at present. As part of the road improvements projects being
taken up by PCMC, separate lanes for non-motorised vehicles and pedestrians are being
proposed in the RoW design.
(vii) Public Transit services of PCMT and PMT, and IPT (particularly 6/8-seater Auto Rickshaws)
presently compete with each other on major corridors in PCMC Area. While PMT and PCMT
services are being clubbed together in PMPML, PT and IPT would need to be organised so that
each mode complements the other.
CMP for PCMC
-68-
3 TRAVEL CHARACTERISTICS
3.1 Introduction
In the past, a number of studies have been conducted in the Pune Metropolitan Region. The important ones have been listed below:
1. Mass Rapid Transit System for Pune Metropolitan Area, January 2001
2. Comprehensive Traffic & Transportation Study, 2003
3. Detailed Project Report - Sky bus, July 2004
4. Comprehensive Study of Integrated Traffic Dispersal System for PCMC & PMC, July 2004
5. Common Wealth Youth Games Report
6. DPR on Tramways, Consult Team Bremen, 2007
7. Master Plan for Bus Rapid Transit System, CIRT, March 2008
8. DPR for Metro Rail in Pune Metropolitan Area, DMRC, February 2008
It has been observed that in all the studies, PCMC area has not been covered extensively. The PCMC area figures in the form of a few survey points in these studies. Therefore, most of the studies do not present recommendations in terms of improvements to be taken up in the PCMC area. Therefore, as part of the Comprehensive Mobility Plan, extensive primary surveys were conducted covering the entire PCMC area. This Chapter presents details of these surveys and some preliminary analysis. It also presents detailed methodology used for determining the existing traffic and travel characteristics of citizens in Pimpri-Chinchwad. Based on the field data collected from various primary surveys conducted across the PCMC area and the house-hold survey, a traffic model was developed to mathematically represent the current traffic scenario in the city. A travel demand model was developed to forecast traffic patterns in future years. A gravity-based trip distribution model was developed to distribute total future traffic estimated across the zones of PCMC area. The trips were then assigned onto the road network of PCMC to determine traffic along each road.
3.2 Approach
In order to estimate travel demand for the present and the future, the following procedure has been considered:
Step 1: In addition to the secondary data collected and presented in Chapter 2, extensive primary traffic surveys have been carried out to obtain data on baseline traffic and travel characteristics
Step2: Travel demand model has been calibrated and validated to mimic the prevailing traffic and travel pattern in PCMC Area
Step3: Future travel demand has been estimated based on anticipated growth in the city (population and land use)
In the following sections, an out line of the proposed methodology for travel demand estimation has been presented, followed by details on travel demand estimation carried out.
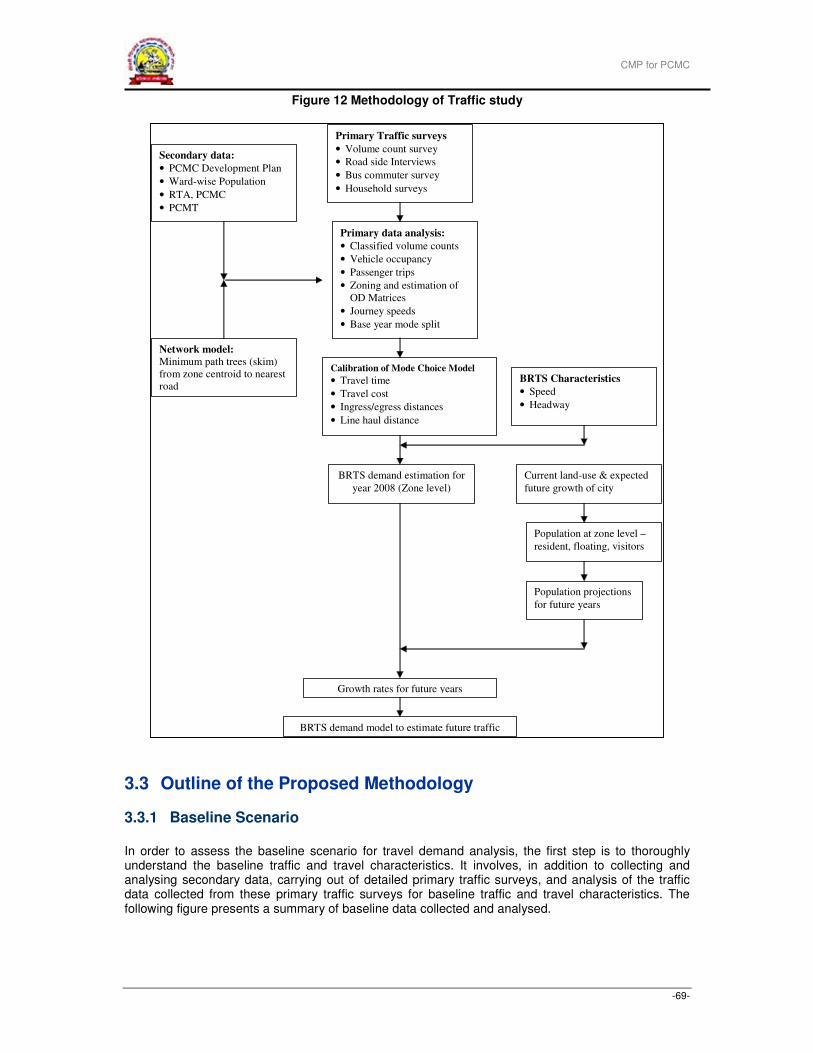
CMP for PCMC
-69-
Figure 12 Methodology of Traffic study
3.3 Outline of the Proposed Methodology
3.3.1 Baseline Scenario
In order to assess the baseline scenario for travel demand analysis, the first step is to thoroughly understand the baseline traffic and travel characteristics. It involves, in addition to collecting and analysing secondary data, carrying out of detailed primary traffic surveys, and analysis of the traffic data collected from these primary traffic surveys for baseline traffic and travel characteristics. The following figure presents a summary of baseline data collected and analysed.
Primary Traffic surveys
• Volume count survey
• Road side Interviews
• Bus commuter survey
• Household surveys
Primary data analysis:
• Classified volume counts
• Vehicle occupancy
• Passenger trips
• Zoning and estimation of
OD Matrices
• Journey speeds
• Base year mode split
Secondary data:
• PCMC Development Plan
• Ward-wise Population
• RTA, PCMC
• PCMT
Calibration of Mode Choice Model
• Travel time
• Travel cost
• Ingress/egress distances
• Line haul distance
BRTS demand estimation for
year 2008 (Zone level)
Network model:
Minimum path trees (skim)
from zone centroid to nearest
road
Growth rates for future years
BRTS demand model to estimate future traffic
BRTS Characteristics
• Speed
• Headway
Current land-use & expected
future growth of city
Population at zone level –
resident, floating, visitors
Population projections
for future years
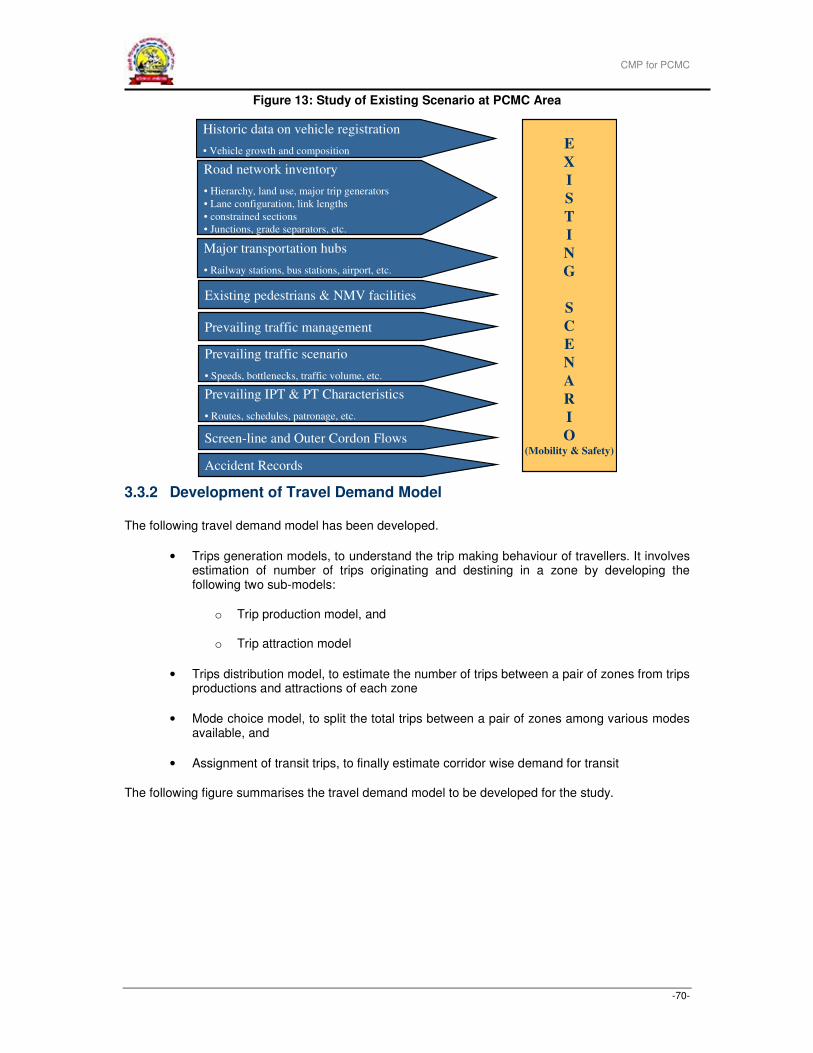
CMP for PCMC
-70-
Figure 13: Study of Existing Scenario at PCMC Area
3.3.2 Development of Travel Demand Model
The following travel demand model has been developed.
• Trips generation models, to understand the trip making behaviour of travellers. It involves estimation of number of trips originating and destining in a zone by developing the following two sub-models:
o Trip production model, and
o Trip attraction model
• Trips distribution model, to estimate the number of trips between a pair of zones from trips productions and attractions of each zone
• Mode choice model, to split the total trips between a pair of zones among various modes available, and
• Assignment of transit trips, to finally estimate corridor wise demand for transit
The following figure summarises the travel demand model to be developed for the study.
Historic data on vehicle registration
• Vehicle growth and composition
Road network inventory
• Hierarchy, land use, major trip generators
• Lane configuration, link lengths
• constrained sections
• Junctions, grade separators, etc.
Major transportation hubs
• Railway stations, bus stations, airport, etc.
Existing pedestrians & NMV facilities
Prevailing traffic management
Prevailing traffic scenario
• Speeds, bottlenecks, traffic volume, etc.
Prevailing IPT & PT Characteristics
• Routes, schedules, patronage, etc.
Screen-line and Outer Cordon Flows
E
X
I
S
T
I
N
G
S
C
E
N
A
R
I
O(Mobility & Safety)
Accident Records
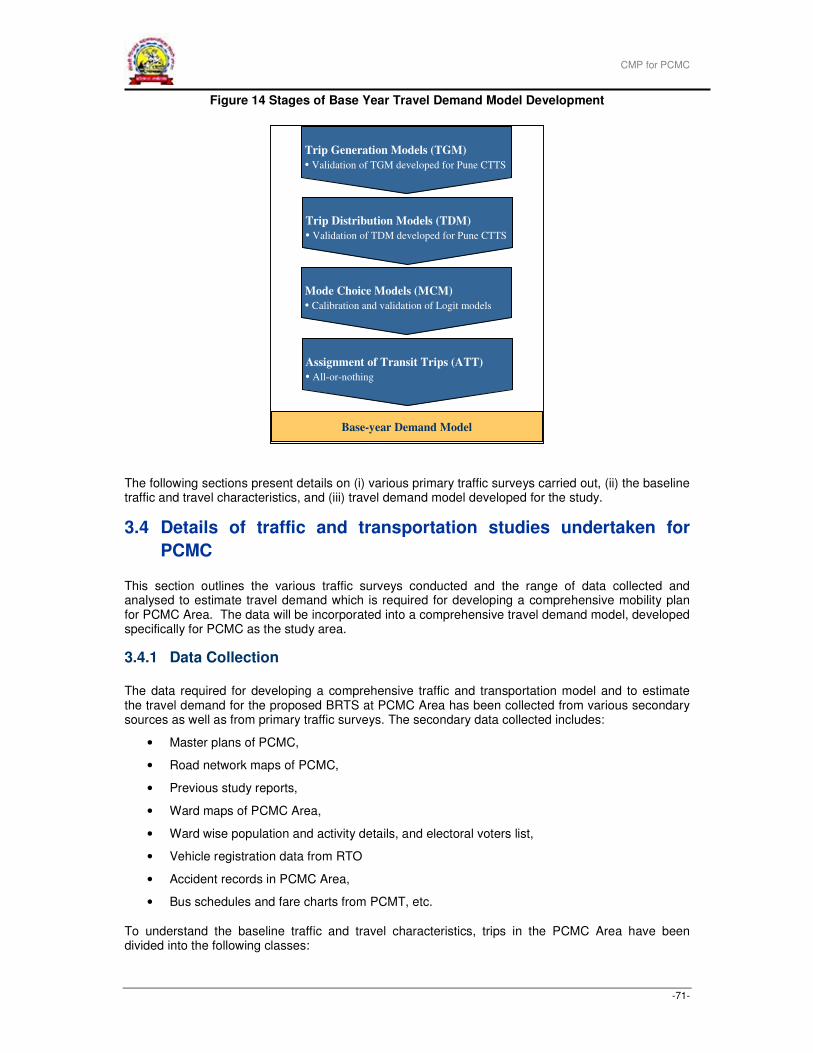
CMP for PCMC
-71-
Figure 14 Stages of Base Year Travel Demand Model Development
The following sections present details on (i) various primary traffic surveys carried out, (ii) the baseline traffic and travel characteristics, and (iii) travel demand model developed for the study.
3.4 Details of traffic and transportation studies undertaken for
PCMC
This section outlines the various traffic surveys conducted and the range of data collected and analysed to estimate travel demand which is required for developing a comprehensive mobility plan for PCMC Area. The data will be incorporated into a comprehensive travel demand model, developed specifically for PCMC as the study area.
3.4.1 Data Collection
The data required for developing a comprehensive traffic and transportation model and to estimate the travel demand for the proposed BRTS at PCMC Area has been collected from various secondary sources as well as from primary traffic surveys. The secondary data collected includes:
• Master plans of PCMC,
• Road network maps of PCMC,
• Previous study reports,
• Ward maps of PCMC Area,
• Ward wise population and activity details, and electoral voters list,
• Vehicle registration data from RTO
• Accident records in PCMC Area,
• Bus schedules and fare charts from PCMT, etc.
To understand the baseline traffic and travel characteristics, trips in the PCMC Area have been divided into the following classes:
Base-year Demand Model
Trip Generation Models (TGM)
• Validation of TGM developed for Pune CTTS
Trip Distribution Models (TDM)
• Validation of TDM developed for Pune CTTS
Mode Choice Models (MCM)
• Calibration and validation of Logit models
Assignment of Transit Trips (ATT)
• All-or-nothing
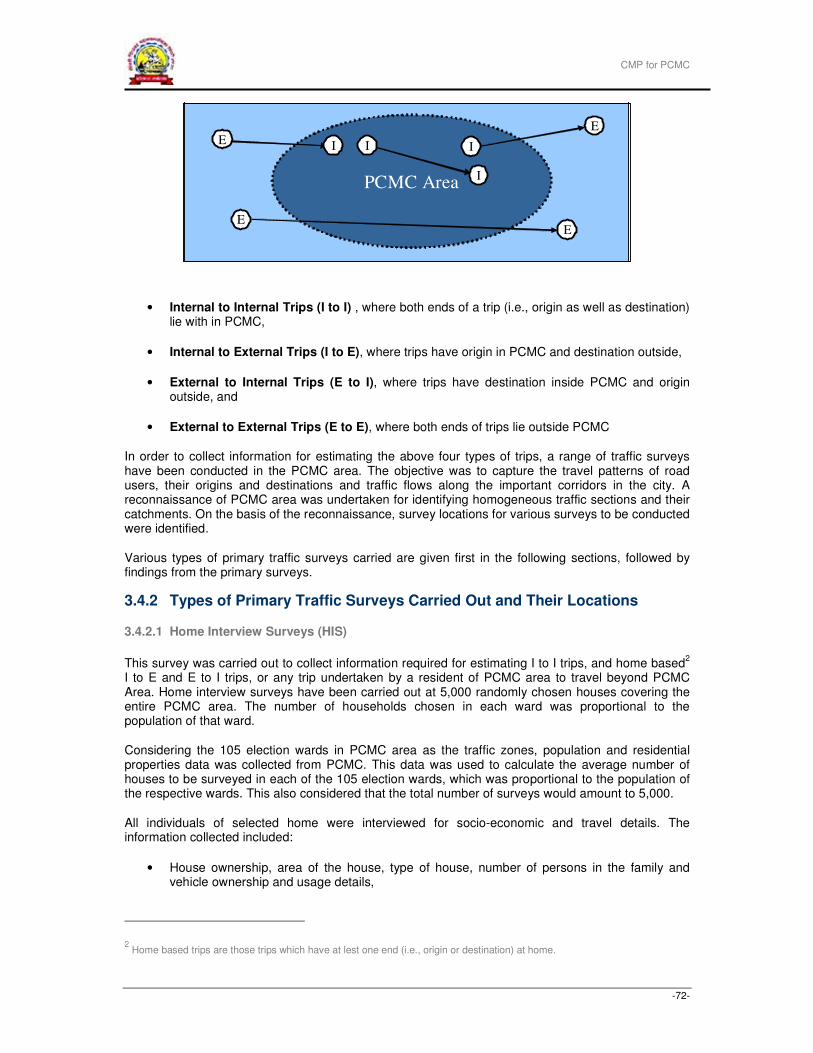
CMP for PCMC
-72-
• Internal to Internal Trips (I to I) , where both ends of a trip (i.e., origin as well as destination) lie with in PCMC,
• Internal to External Trips (I to E), where trips have origin in PCMC and destination outside,
• External to Internal Trips (E to I), where trips have destination inside PCMC and origin outside, and
• External to External Trips (E to E), where both ends of trips lie outside PCMC
In order to collect information for estimating the above four types of trips, a range of traffic surveys have been conducted in the PCMC area. The objective was to capture the travel patterns of road users, their origins and destinations and traffic flows along the important corridors in the city. A reconnaissance of PCMC area was undertaken for identifying homogeneous traffic sections and their catchments. On the basis of the reconnaissance, survey locations for various surveys to be conducted were identified.
Various types of primary traffic surveys carried are given first in the following sections, followed by findings from the primary surveys.
3.4.2 Types of Primary Traffic Surveys Carried Out and Their Locations
3.4.2.1 Home Interview Surveys (HIS)
This survey was carried out to collect information required for estimating I to I trips, and home based2
I to E and E to I trips, or any trip undertaken by a resident of PCMC area to travel beyond PCMC Area. Home interview surveys have been carried out at 5,000 randomly chosen houses covering the entire PCMC area. The number of households chosen in each ward was proportional to the population of that ward.
Considering the 105 election wards in PCMC area as the traffic zones, population and residential properties data was collected from PCMC. This data was used to calculate the average number of houses to be surveyed in each of the 105 election wards, which was proportional to the population of the respective wards. This also considered that the total number of surveys would amount to 5,000.
All individuals of selected home were interviewed for socio-economic and travel details. The information collected included:
• House ownership, area of the house, type of house, number of persons in the family and vehicle ownership and usage details,
2 Home based trips are those trips which have at lest one end (i.e., origin or destination) at home.
PCMC Area
I
I
I
EE I
EE
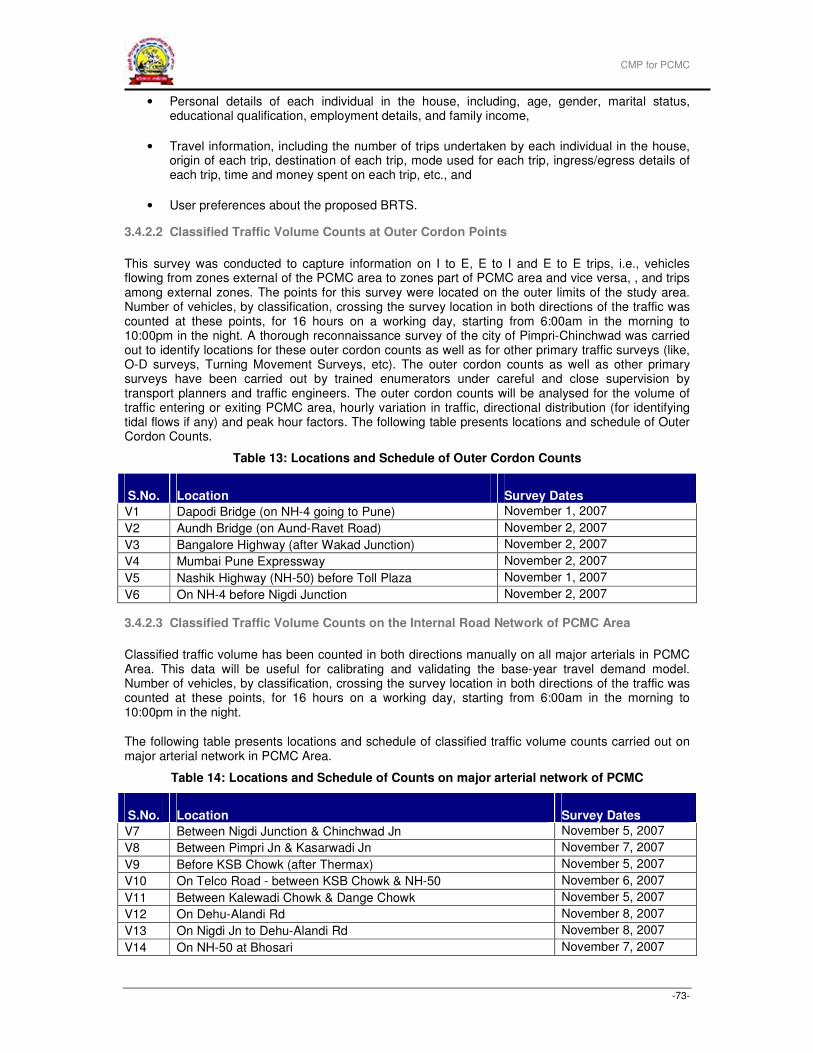
CMP for PCMC
-73-
• Personal details of each individual in the house, including, age, gender, marital status, educational qualification, employment details, and family income,
• Travel information, including the number of trips undertaken by each individual in the house, origin of each trip, destination of each trip, mode used for each trip, ingress/egress details of each trip, time and money spent on each trip, etc., and
• User preferences about the proposed BRTS.
3.4.2.2 Classified Traffic Volume Counts at Outer Cordon Points
This survey was conducted to capture information on I to E, E to I and E to E trips, i.e., vehicles flowing from zones external of the PCMC area to zones part of PCMC area and vice versa, , and trips among external zones. The points for this survey were located on the outer limits of the study area. Number of vehicles, by classification, crossing the survey location in both directions of the traffic was counted at these points, for 16 hours on a working day, starting from 6:00am in the morning to 10:00pm in the night. A thorough reconnaissance survey of the city of Pimpri-Chinchwad was carried out to identify locations for these outer cordon counts as well as for other primary traffic surveys (like, O-D surveys, Turning Movement Surveys, etc). The outer cordon counts as well as other primary surveys have been carried out by trained enumerators under careful and close supervision by transport planners and traffic engineers. The outer cordon counts will be analysed for the volume of traffic entering or exiting PCMC area, hourly variation in traffic, directional distribution (for identifying tidal flows if any) and peak hour factors. The following table presents locations and schedule of Outer Cordon Counts.
Table 13: Locations and Schedule of Outer Cordon Counts
S.No. Location Survey Dates
V1 Dapodi Bridge (on NH-4 going to Pune) November 1, 2007
V2 Aundh Bridge (on Aund-Ravet Road) November 2, 2007
V3 Bangalore Highway (after Wakad Junction) November 2, 2007
V4 Mumbai Pune Expressway November 2, 2007
V5 Nashik Highway (NH-50) before Toll Plaza November 1, 2007
V6 On NH-4 before Nigdi Junction November 2, 2007
3.4.2.3 Classified Traffic Volume Counts on the Internal Road Network of PCMC Area
Classified traffic volume has been counted in both directions manually on all major arterials in PCMC Area. This data will be useful for calibrating and validating the base-year travel demand model. Number of vehicles, by classification, crossing the survey location in both directions of the traffic was counted at these points, for 16 hours on a working day, starting from 6:00am in the morning to 10:00pm in the night.
The following table presents locations and schedule of classified traffic volume counts carried out on major arterial network in PCMC Area.
Table 14: Locations and Schedule of Counts on major arterial network of PCMC
S.No. Location Survey Dates
V7 Between Nigdi Junction & Chinchwad Jn November 5, 2007
V8 Between Pimpri Jn & Kasarwadi Jn November 7, 2007
V9 Before KSB Chowk (after Thermax) November 5, 2007
V10 On Telco Road - between KSB Chowk & NH-50 November 6, 2007
V11 Between Kalewadi Chowk & Dange Chowk November 5, 2007
V12 On Dehu-Alandi Rd November 8, 2007
V13 On Nigdi Jn to Dehu-Alandi Rd November 8, 2007
V14 On NH-50 at Bhosari November 7, 2007
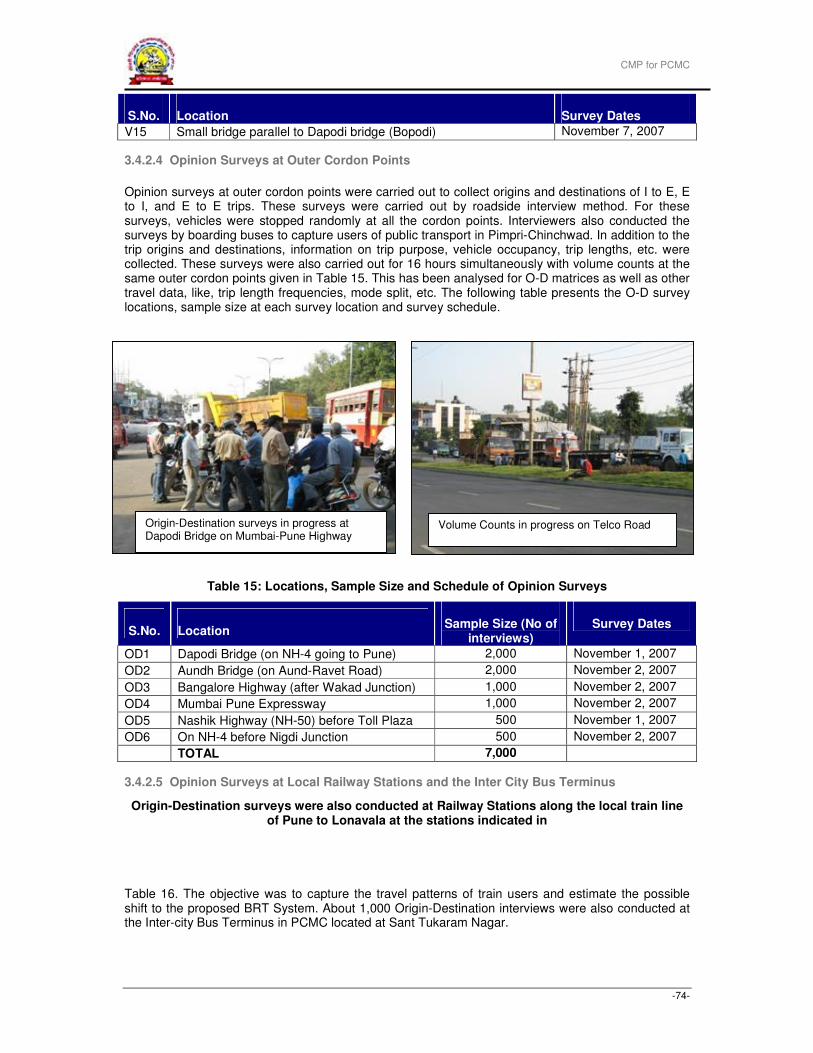
CMP for PCMC
-74-
S.No. Location Survey Dates
V15 Small bridge parallel to Dapodi bridge (Bopodi) November 7, 2007
3.4.2.4 Opinion Surveys at Outer Cordon Points
Opinion surveys at outer cordon points were carried out to collect origins and destinations of I to E, E to I, and E to E trips. These surveys were carried out by roadside interview method. For these surveys, vehicles were stopped randomly at all the cordon points. Interviewers also conducted the surveys by boarding buses to capture users of public transport in Pimpri-Chinchwad. In addition to the trip origins and destinations, information on trip purpose, vehicle occupancy, trip lengths, etc. were collected. These surveys were also carried out for 16 hours simultaneously with volume counts at the same outer cordon points given in Table 15. This has been analysed for O-D matrices as well as other travel data, like, trip length frequencies, mode split, etc. The following table presents the O-D survey locations, sample size at each survey location and survey schedule.
Table 15: Locations, Sample Size and Schedule of Opinion Surveys
S.No. Location Sample Size (No of
interviews) Survey Dates
OD1 Dapodi Bridge (on NH-4 going to Pune) 2,000 November 1, 2007
OD2 Aundh Bridge (on Aund-Ravet Road) 2,000 November 2, 2007
OD3 Bangalore Highway (after Wakad Junction) 1,000 November 2, 2007
OD4 Mumbai Pune Expressway 1,000 November 2, 2007
OD5 Nashik Highway (NH-50) before Toll Plaza 500 November 1, 2007
OD6 On NH-4 before Nigdi Junction 500 November 2, 2007
TOTAL 7,000
3.4.2.5 Opinion Surveys at Local Railway Stations and the Inter City Bus Terminus
Origin-Destination surveys were also conducted at Railway Stations along the local train line of Pune to Lonavala at the stations indicated in
Table 16. The objective was to capture the travel patterns of train users and estimate the possible shift to the proposed BRT System. About 1,000 Origin-Destination interviews were also conducted at the Inter-city Bus Terminus in PCMC located at Sant Tukaram Nagar.
Volume Counts in progress on Telco Road Origin-Destination surveys in progress at Dapodi Bridge on Mumbai-Pune Highway
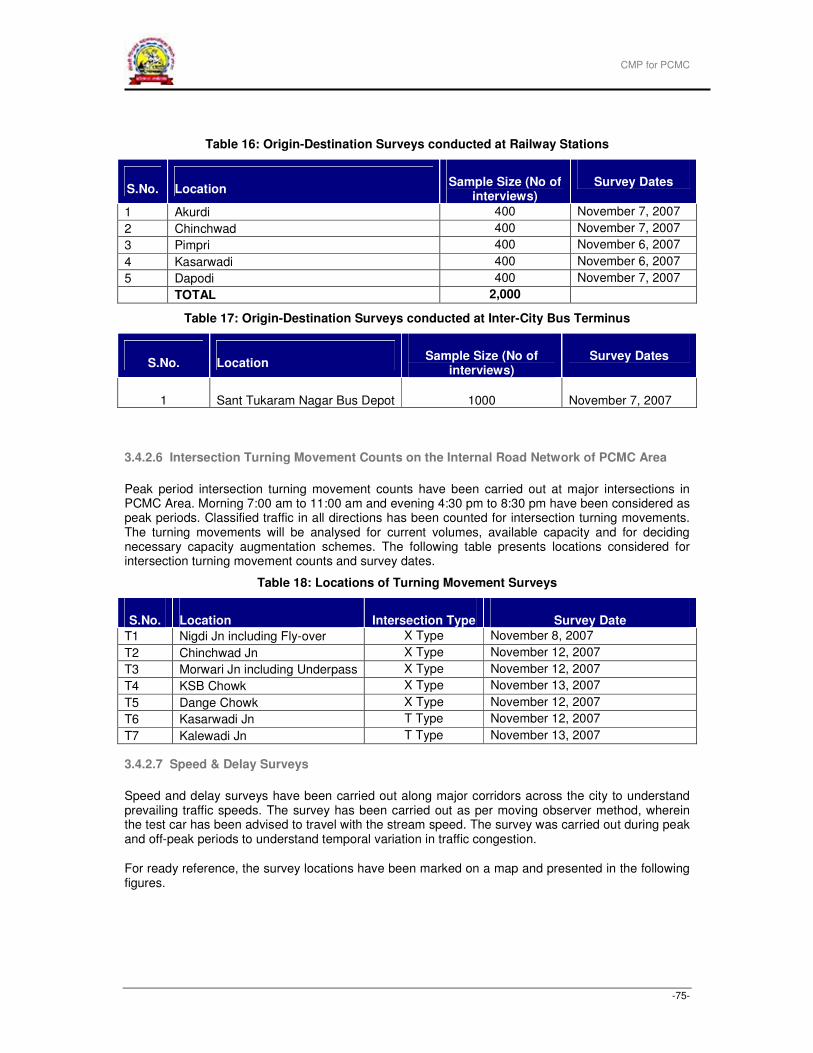
CMP for PCMC
-75-
Table 16: Origin-Destination Surveys conducted at Railway Stations
S.No. Location Sample Size (No of
interviews) Survey Dates
1 Akurdi 400 November 7, 2007
2 Chinchwad 400 November 7, 2007
3 Pimpri 400 November 6, 2007
4 Kasarwadi 400 November 6, 2007
5 Dapodi 400 November 7, 2007
TOTAL 2,000
Table 17: Origin-Destination Surveys conducted at Inter-City Bus Terminus
S.No. Location Sample Size (No of
interviews) Survey Dates
1 Sant Tukaram Nagar Bus Depot 1000 November 7, 2007
3.4.2.6 Intersection Turning Movement Counts on the Internal Road Network of PCMC Area
Peak period intersection turning movement counts have been carried out at major intersections in PCMC Area. Morning 7:00 am to 11:00 am and evening 4:30 pm to 8:30 pm have been considered as peak periods. Classified traffic in all directions has been counted for intersection turning movements. The turning movements will be analysed for current volumes, available capacity and for deciding necessary capacity augmentation schemes. The following table presents locations considered for intersection turning movement counts and survey dates.
Table 18: Locations of Turning Movement Surveys
S.No. Location Intersection Type Survey Date
T1 Nigdi Jn including Fly-over X Type November 8, 2007
T2 Chinchwad Jn X Type November 12, 2007
T3 Morwari Jn including Underpass X Type November 12, 2007
T4 KSB Chowk X Type November 13, 2007
T5 Dange Chowk X Type November 12, 2007
T6 Kasarwadi Jn T Type November 12, 2007
T7 Kalewadi Jn T Type November 13, 2007
3.4.2.7 Speed & Delay Surveys
Speed and delay surveys have been carried out along major corridors across the city to understand prevailing traffic speeds. The survey has been carried out as per moving observer method, wherein the test car has been advised to travel with the stream speed. The survey was carried out during peak and off-peak periods to understand temporal variation in traffic congestion.
For ready reference, the survey locations have been marked on a map and presented in the following figures.
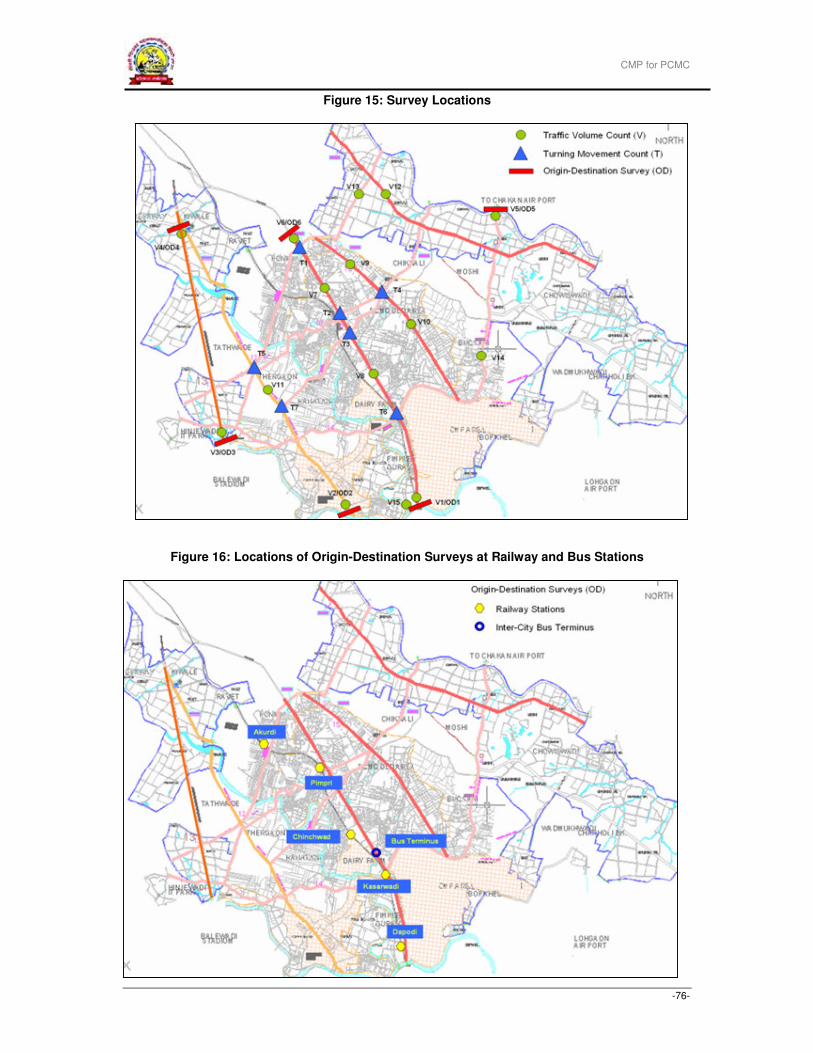
CMP for PCMC
-76-
Figure 15: Survey Locations
Figure 16: Locations of Origin-Destination Surveys at Railway and Bus Stations
CMP for PCMC
-77-
3.4.3 Data Analysis for Baseline Traffic & Travel Characteristics
3.4.3.1 Traffic Zones
To understand the distribution of trips in PCMC Area, the area in PCMC and around has been divided into 134 traffic zones. Out of these, 106 zones have been defined in PCMC Area itself, and remaining 28 zones outside PCMC Area. While defining the zone boundaries, the following have been considered:
� Elections ward boundaries in PCMC Area. As of now, there are 105 election wards in PCMC
Area, and each of these wards are considered as traffic zones. In addition, Tathwade area has
been added to PCMC Area recently. Accordingly, Tathwade has been considered as a zone
(Zone 106).
� MES Area has been considered as Zone 108.
� Major roads in Pune have been considered for defining zone boundaries in PMC Area. In PMC
Area 10 Zones (Zone 107, and Zones 109 to 117) have been defined.
� Rest of Maharashtra State and Rest of India constitute remaining zones from 118 to 134.
The traffic zones considered for the study are given in Annexure 3.
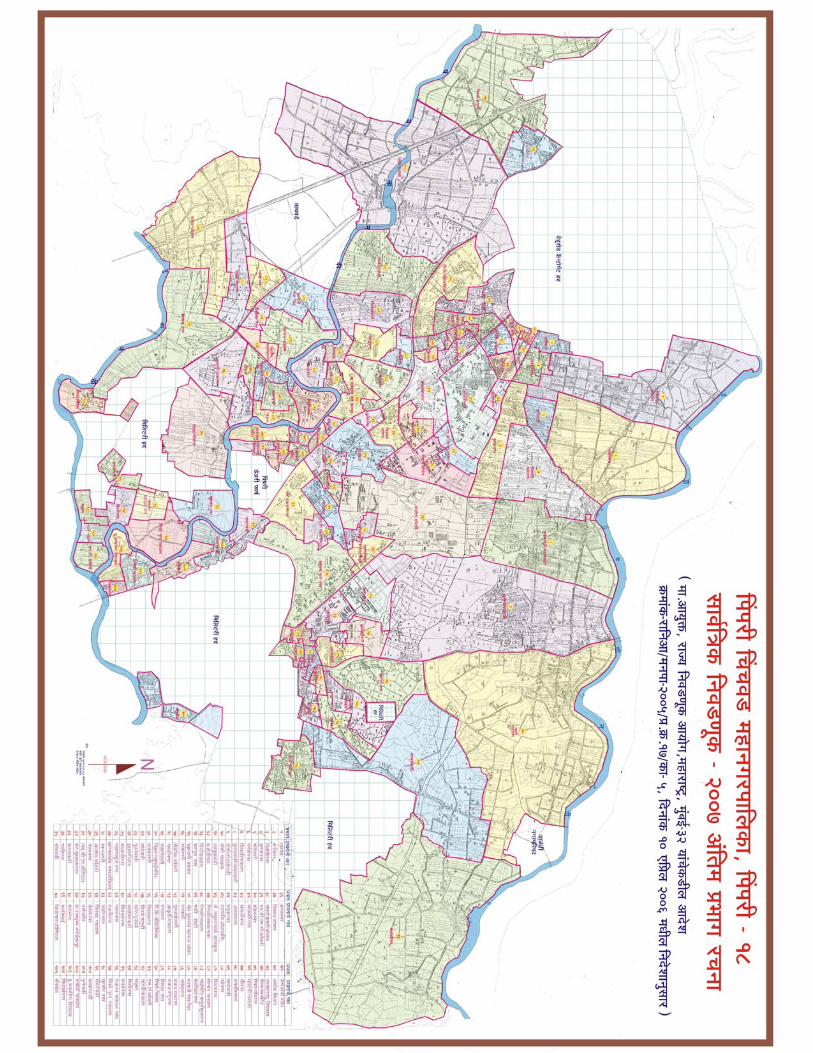
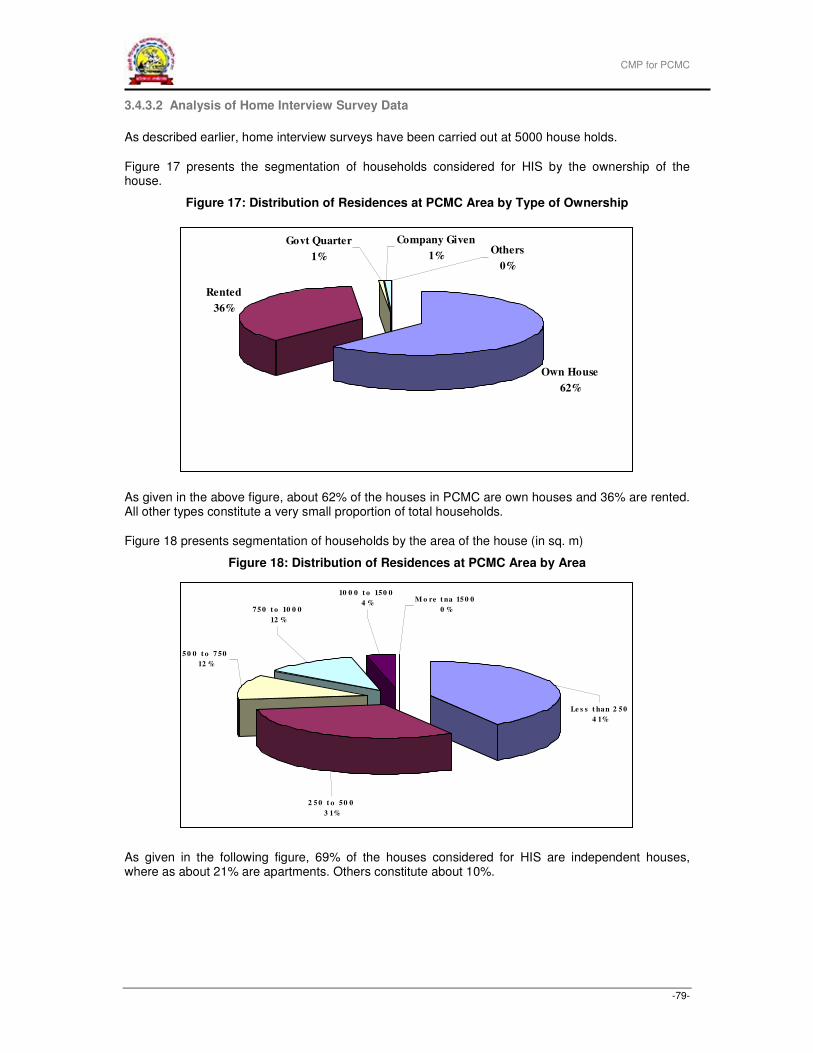
CMP for PCMC
-79-
3.4.3.2 Analysis of Home Interview Survey Data
As described earlier, home interview surveys have been carried out at 5000 house holds.
Figure 17 presents the segmentation of households considered for HIS by the ownership of the house.
Figure 17: Distribution of Residences at PCMC Area by Type of Ownership
As given in the above figure, about 62% of the houses in PCMC are own houses and 36% are rented. All other types constitute a very small proportion of total households.
Figure 18 presents segmentation of households by the area of the house (in sq. m)
Figure 18: Distribution of Residences at PCMC Area by Area
As given in the following figure, 69% of the houses considered for HIS are independent houses, where as about 21% are apartments. Others constitute about 10%.
Rented
36%
Others
0%
Govt Quarter
1%
Company Given
1%
Own House
62%
2 5 0 t o 50 0
3 1%
M o re t na 15 0 0
0 %
Le s s t han 2 50
4 1%
75 0 t o 10 0 0
12 %
5 0 0 t o 7 50
12 %
10 0 0 t o 150 0
4 %
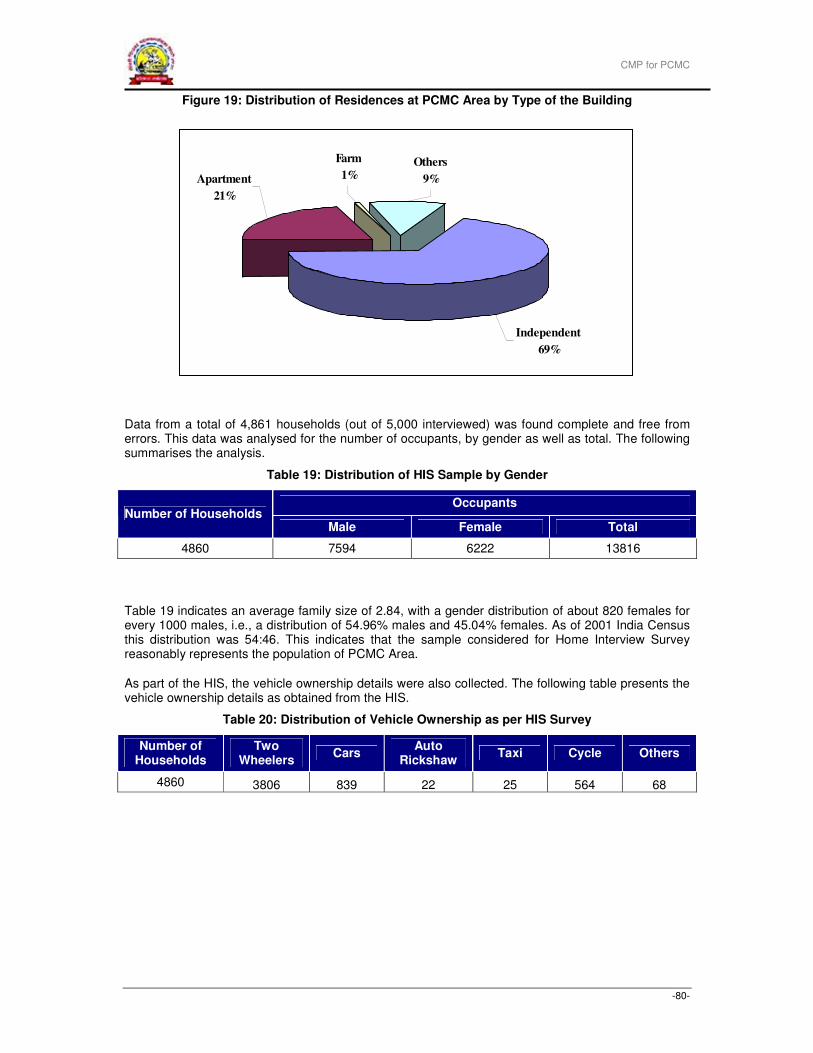
CMP for PCMC
-80-
Figure 19: Distribution of Residences at PCMC Area by Type of the Building
Data from a total of 4,861 households (out of 5,000 interviewed) was found complete and free from errors. This data was analysed for the number of occupants, by gender as well as total. The following summarises the analysis.
Table 19: Distribution of HIS Sample by Gender
Occupants Number of Households
Male Female Total
4860 7594 6222 13816
Table 19 indicates an average family size of 2.84, with a gender distribution of about 820 females for every 1000 males, i.e., a distribution of 54.96% males and 45.04% females. As of 2001 India Census this distribution was 54:46. This indicates that the sample considered for Home Interview Survey reasonably represents the population of PCMC Area.
As part of the HIS, the vehicle ownership details were also collected. The following table presents the vehicle ownership details as obtained from the HIS.
Table 20: Distribution of Vehicle Ownership as per HIS Survey
Number of Households
Two Wheelers
Cars Auto
Rickshaw Taxi Cycle Others
4860 3806 839 22 25 564 68
Farm
1%Others
9%
Independent
69%
Apartment
21%
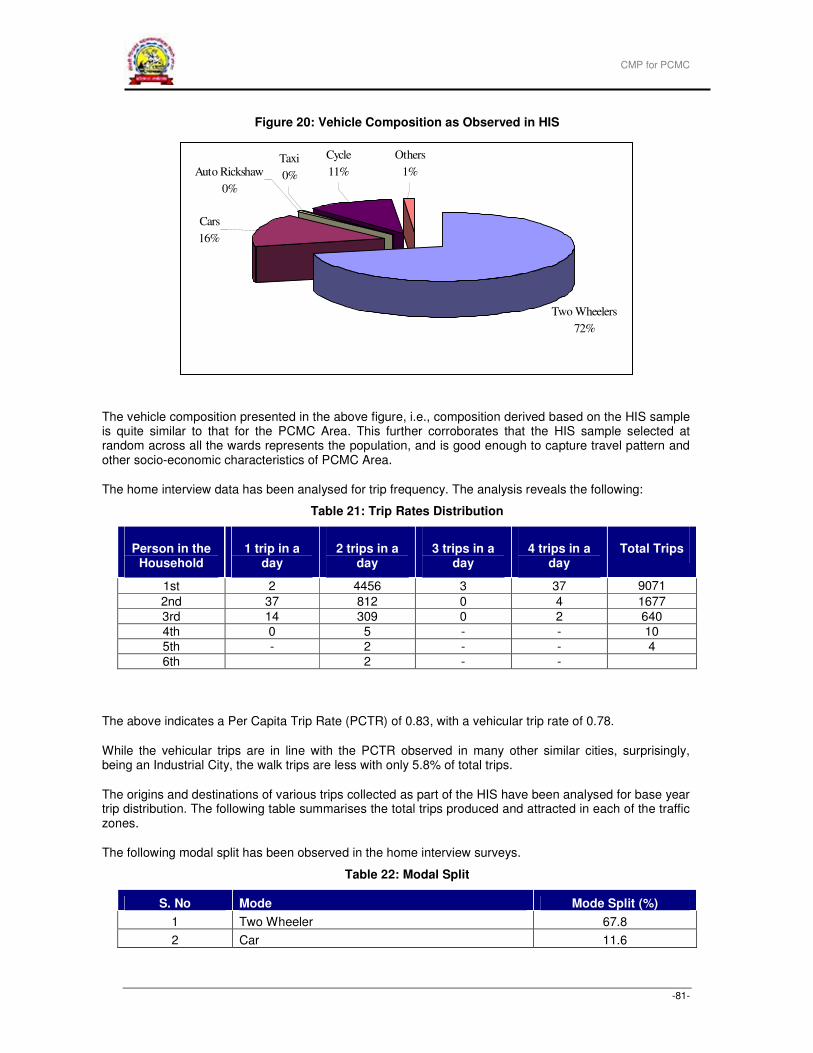
CMP for PCMC
-81-
Figure 20: Vehicle Composition as Observed in HIS
The vehicle composition presented in the above figure, i.e., composition derived based on the HIS sample is quite similar to that for the PCMC Area. This further corroborates that the HIS sample selected at random across all the wards represents the population, and is good enough to capture travel pattern and other socio-economic characteristics of PCMC Area.
The home interview data has been analysed for trip frequency. The analysis reveals the following:
Table 21: Trip Rates Distribution
Person in the Household
1 trip in a day
2 trips in a day
3 trips in a day
4 trips in a day
Total Trips
1st 2 4456 3 37 9071
2nd 37 812 0 4 1677
3rd 14 309 0 2 640
4th 0 5 - - 10
5th - 2 - - 4
6th 2 - -
The above indicates a Per Capita Trip Rate (PCTR) of 0.83, with a vehicular trip rate of 0.78.
While the vehicular trips are in line with the PCTR observed in many other similar cities, surprisingly, being an Industrial City, the walk trips are less with only 5.8% of total trips.
The origins and destinations of various trips collected as part of the HIS have been analysed for base year trip distribution. The following table summarises the total trips produced and attracted in each of the traffic zones.
The following modal split has been observed in the home interview surveys.
Table 22: Modal Split
S. No Mode Mode Split (%)
1 Two Wheeler 67.8
2 Car 11.6
Two Wheelers
72%
Others
1%
Cars
16%
Cycle
11%Auto Rickshaw
0%
Taxi
0%
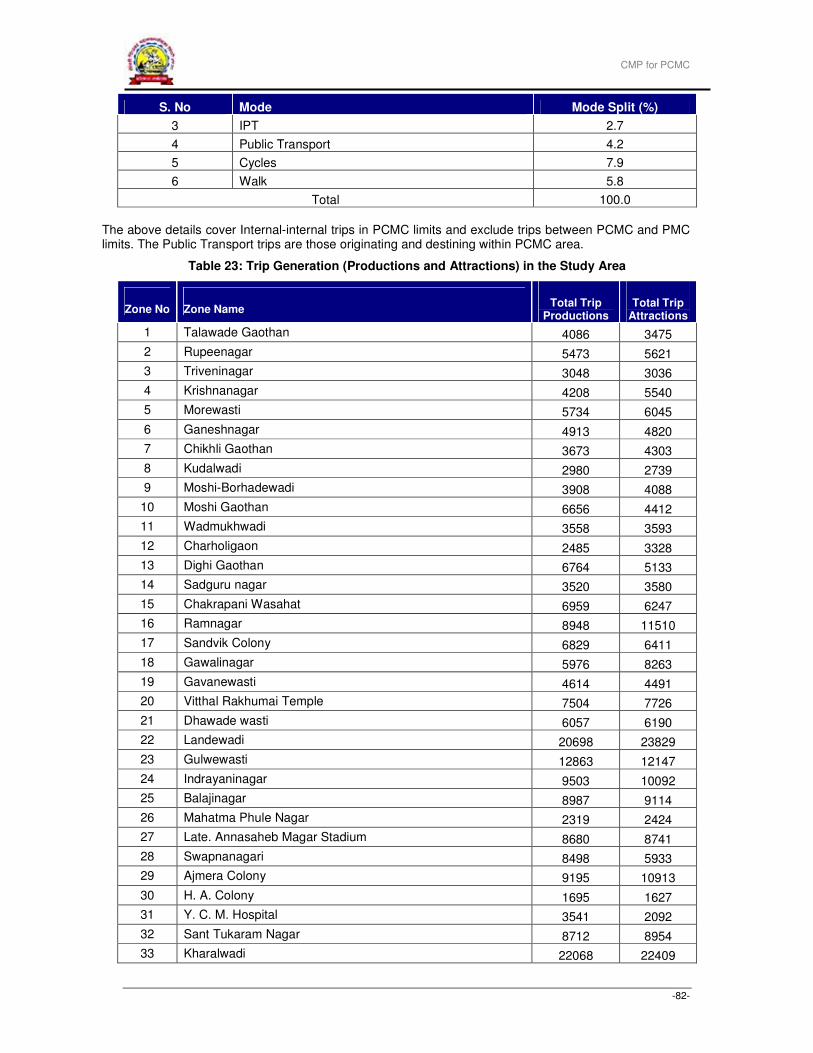
CMP for PCMC
-82-
S. No Mode Mode Split (%)
3 IPT 2.7
4 Public Transport 4.2
5 Cycles 7.9
6 Walk 5.8
Total 100.0
The above details cover Internal-internal trips in PCMC limits and exclude trips between PCMC and PMC limits. The Public Transport trips are those originating and destining within PCMC area.
Table 23: Trip Generation (Productions and Attractions) in the Study Area
Zone No Zone Name Total Trip
Productions Total Trip
Attractions
1 Talawade Gaothan 4086 3475
2 Rupeenagar 5473 5621
3 Triveninagar 3048 3036
4 Krishnanagar 4208 5540
5 Morewasti 5734 6045
6 Ganeshnagar 4913 4820
7 Chikhli Gaothan 3673 4303
8 Kudalwadi 2980 2739
9 Moshi-Borhadewadi 3908 4088
10 Moshi Gaothan 6656 4412
11 Wadmukhwadi 3558 3593
12 Charholigaon 2485 3328
13 Dighi Gaothan 6764 5133
14 Sadguru nagar 3520 3580
15 Chakrapani Wasahat 6959 6247
16 Ramnagar 8948 11510
17 Sandvik Colony 6829 6411
18 Gawalinagar 5976 8263
19 Gavanewasti 4614 4491
20 Vitthal Rakhumai Temple 7504 7726
21 Dhawade wasti 6057 6190
22 Landewadi 20698 23829
23 Gulwewasti 12863 12147
24 Indrayaninagar 9503 10092
25 Balajinagar 8987 9114
26 Mahatma Phule Nagar 2319 2424
27 Late. Annasaheb Magar Stadium 8680 8741
28 Swapnanagari 8498 5933
29 Ajmera Colony 9195 10913
30 H. A. Colony 1695 1627
31 Y. C. M. Hospital 3541 2092
32 Sant Tukaram Nagar 8712 8954
33 Kharalwadi 22068 22409
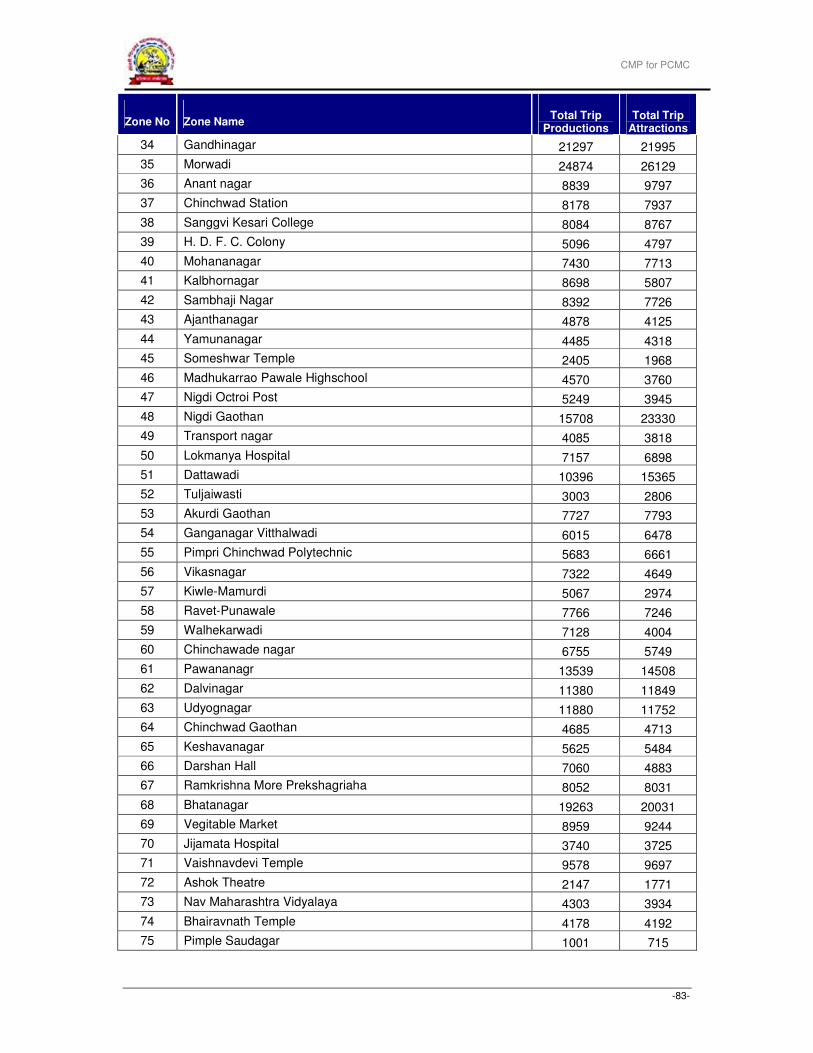
CMP for PCMC
-83-
Zone No Zone Name Total Trip
Productions Total Trip
Attractions
34 Gandhinagar 21297 21995
35 Morwadi 24874 26129
36 Anant nagar 8839 9797
37 Chinchwad Station 8178 7937
38 Sanggvi Kesari College 8084 8767
39 H. D. F. C. Colony 5096 4797
40 Mohananagar 7430 7713
41 Kalbhornagar 8698 5807
42 Sambhaji Nagar 8392 7726
43 Ajanthanagar 4878 4125
44 Yamunanagar 4485 4318
45 Someshwar Temple 2405 1968
46 Madhukarrao Pawale Highschool 4570 3760
47 Nigdi Octroi Post 5249 3945
48 Nigdi Gaothan 15708 23330
49 Transport nagar 4085 3818
50 Lokmanya Hospital 7157 6898
51 Dattawadi 10396 15365
52 Tuljaiwasti 3003 2806
53 Akurdi Gaothan 7727 7793
54 Ganganagar Vitthalwadi 6015 6478
55 Pimpri Chinchwad Polytechnic 5683 6661
56 Vikasnagar 7322 4649
57 Kiwle-Mamurdi 5067 2974
58 Ravet-Punawale 7766 7246
59 Walhekarwadi 7128 4004
60 Chinchawade nagar 6755 5749
61 Pawananagr 13539 14508
62 Dalvinagar 11380 11849
63 Udyognagar 11880 11752
64 Chinchwad Gaothan 4685 4713
65 Keshavanagar 5625 5484
66 Darshan Hall 7060 4883
67 Ramkrishna More Prekshagriaha 8052 8031
68 Bhatanagar 19263 20031
69 Vegitable Market 8959 9244
70 Jijamata Hospital 3740 3725
71 Vaishnavdevi Temple 9578 9697
72 Ashok Theatre 2147 1771
73 Nav Maharashtra Vidyalaya 4303 3934
74 Bhairavnath Temple 4178 4192
75 Pimple Saudagar 1001 715
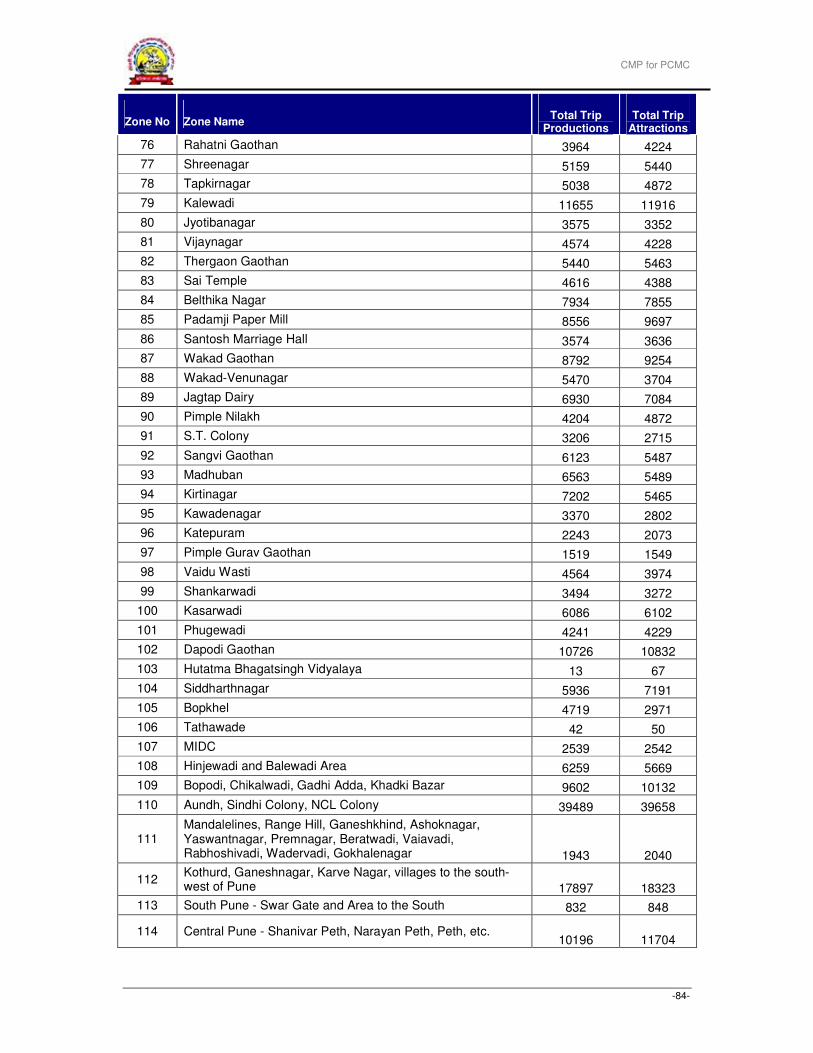
CMP for PCMC
-84-
Zone No Zone Name Total Trip
Productions Total Trip
Attractions
76 Rahatni Gaothan 3964 4224
77 Shreenagar 5159 5440
78 Tapkirnagar 5038 4872
79 Kalewadi 11655 11916
80 Jyotibanagar 3575 3352
81 Vijaynagar 4574 4228
82 Thergaon Gaothan 5440 5463
83 Sai Temple 4616 4388
84 Belthika Nagar 7934 7855
85 Padamji Paper Mill 8556 9697
86 Santosh Marriage Hall 3574 3636
87 Wakad Gaothan 8792 9254
88 Wakad-Venunagar 5470 3704
89 Jagtap Dairy 6930 7084
90 Pimple Nilakh 4204 4872
91 S.T. Colony 3206 2715
92 Sangvi Gaothan 6123 5487
93 Madhuban 6563 5489
94 Kirtinagar 7202 5465
95 Kawadenagar 3370 2802
96 Katepuram 2243 2073
97 Pimple Gurav Gaothan 1519 1549
98 Vaidu Wasti 4564 3974
99 Shankarwadi 3494 3272
100 Kasarwadi 6086 6102
101 Phugewadi 4241 4229
102 Dapodi Gaothan 10726 10832
103 Hutatma Bhagatsingh Vidyalaya 13 67
104 Siddharthnagar 5936 7191
105 Bopkhel 4719 2971
106 Tathawade 42 50
107 MIDC 2539 2542
108 Hinjewadi and Balewadi Area 6259 5669
109 Bopodi, Chikalwadi, Gadhi Adda, Khadki Bazar 9602 10132
110 Aundh, Sindhi Colony, NCL Colony 39489 39658
111 Mandalelines, Range Hill, Ganeshkhind, Ashoknagar, Yaswantnagar, Premnagar, Beratwadi, Vaiavadi, Rabhoshivadi, Wadervadi, Gokhalenagar 1943 2040
112 Kothurd, Ganeshnagar, Karve Nagar, villages to the south-west of Pune 17897 18323
113 South Pune - Swar Gate and Area to the South 832 848
114 Central Pune - Shanivar Peth, Narayan Peth, Peth, etc. 10196 11704
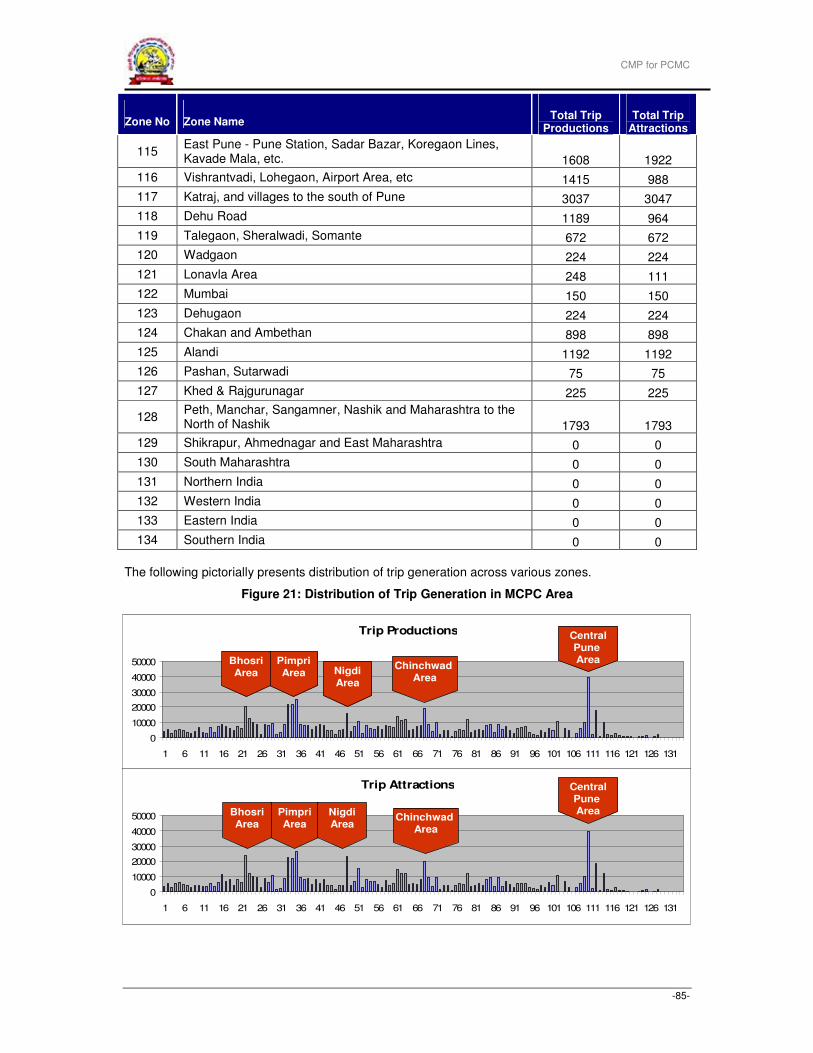
CMP for PCMC
-85-
Zone No Zone Name Total Trip
Productions Total Trip
Attractions
115 East Pune - Pune Station, Sadar Bazar, Koregaon Lines, Kavade Mala, etc. 1608 1922
116 Vishrantvadi, Lohegaon, Airport Area, etc 1415 988
117 Katraj, and villages to the south of Pune 3037 3047
118 Dehu Road 1189 964
119 Talegaon, Sheralwadi, Somante 672 672
120 Wadgaon 224 224
121 Lonavla Area 248 111
122 Mumbai 150 150
123 Dehugaon 224 224
124 Chakan and Ambethan 898 898
125 Alandi 1192 1192
126 Pashan, Sutarwadi 75 75
127 Khed & Rajgurunagar 225 225
128 Peth, Manchar, Sangamner, Nashik and Maharashtra to the North of Nashik 1793 1793
129 Shikrapur, Ahmednagar and East Maharashtra 0 0
130 South Maharashtra 0 0
131 Northern India 0 0
132 Western India 0 0
133 Eastern India 0 0
134 Southern India 0 0
The following pictorially presents distribution of trip generation across various zones.
Figure 21: Distribution of Trip Generation in MCPC Area
Trip Productions
0
10000
20000
30000
40000
50000
1 6 11 16 21 26 31 36 41 46 51 56 61 66 71 76 81 86 91 96 101 106 111 116 121 126 131
Trip Attractions
0
10000
20000
30000
40000
50000
1 6 11 16 21 26 31 36 41 46 51 56 61 66 71 76 81 86 91 96 101 106 111 116 121 126 131
Central
PuneArea
Chinchwad
Area
Central
PuneArea
Chinchwad
Area
Pimpri
Area
Bhosri
Area
Pimpri
Area
Bhosri
Area
Nigdi
Area
Nigdi
Area
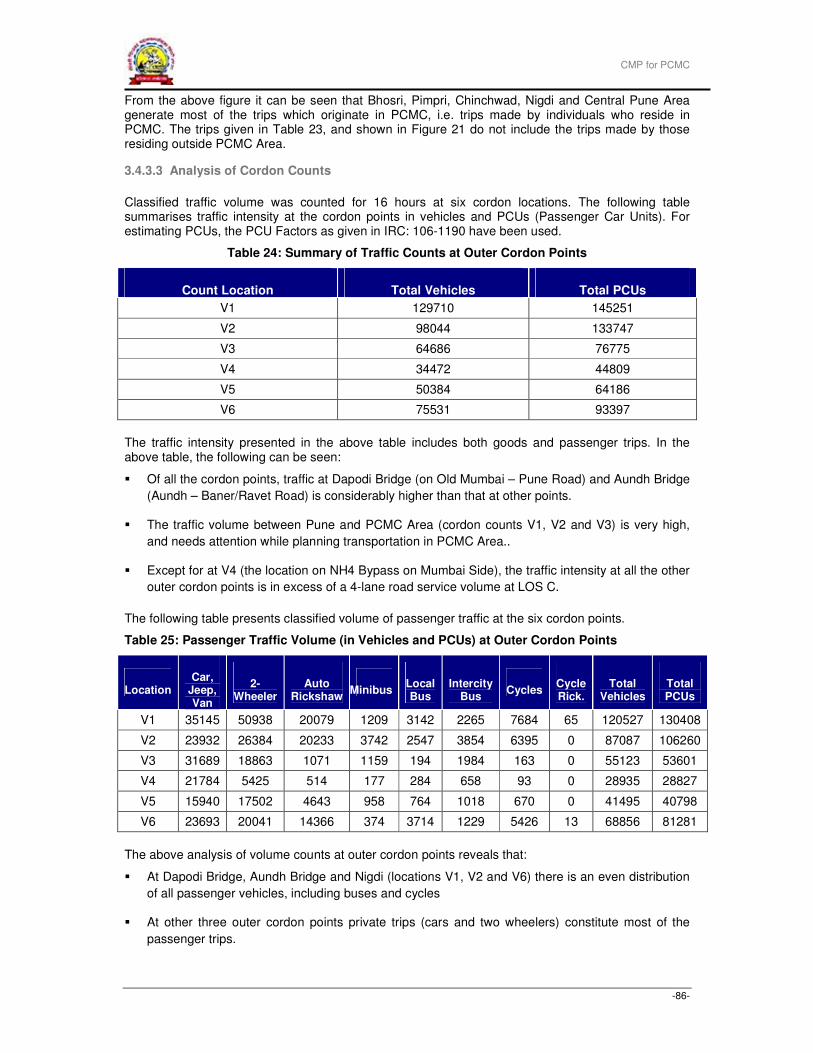
CMP for PCMC
-86-
From the above figure it can be seen that Bhosri, Pimpri, Chinchwad, Nigdi and Central Pune Area generate most of the trips which originate in PCMC, i.e. trips made by individuals who reside in PCMC. The trips given in Table 23, and shown in Figure 21 do not include the trips made by those residing outside PCMC Area.
3.4.3.3 Analysis of Cordon Counts
Classified traffic volume was counted for 16 hours at six cordon locations. The following table summarises traffic intensity at the cordon points in vehicles and PCUs (Passenger Car Units). For estimating PCUs, the PCU Factors as given in IRC: 106-1190 have been used.
Table 24: Summary of Traffic Counts at Outer Cordon Points
Count Location Total Vehicles Total PCUs
V1 129710 145251
V2 98044 133747
V3 64686 76775
V4 34472 44809
V5 50384 64186
V6 75531 93397
The traffic intensity presented in the above table includes both goods and passenger trips. In the above table, the following can be seen:
� Of all the cordon points, traffic at Dapodi Bridge (on Old Mumbai – Pune Road) and Aundh Bridge
(Aundh – Baner/Ravet Road) is considerably higher than that at other points.
� The traffic volume between Pune and PCMC Area (cordon counts V1, V2 and V3) is very high,
and needs attention while planning transportation in PCMC Area..
� Except for at V4 (the location on NH4 Bypass on Mumbai Side), the traffic intensity at all the other
outer cordon points is in excess of a 4-lane road service volume at LOS C.
The following table presents classified volume of passenger traffic at the six cordon points.
Table 25: Passenger Traffic Volume (in Vehicles and PCUs) at Outer Cordon Points
Location Car,
Jeep, Van
2-Wheeler
Auto Rickshaw
Minibus Local Bus
Intercity Bus
Cycles Cycle Rick.
Total Vehicles
Total PCUs
V1 35145 50938 20079 1209 3142 2265 7684 65 120527 130408
V2 23932 26384 20233 3742 2547 3854 6395 0 87087 106260
V3 31689 18863 1071 1159 194 1984 163 0 55123 53601
V4 21784 5425 514 177 284 658 93 0 28935 28827
V5 15940 17502 4643 958 764 1018 670 0 41495 40798
V6 23693 20041 14366 374 3714 1229 5426 13 68856 81281
The above analysis of volume counts at outer cordon points reveals that:
� At Dapodi Bridge, Aundh Bridge and Nigdi (locations V1, V2 and V6) there is an even distribution
of all passenger vehicles, including buses and cycles
� At other three outer cordon points private trips (cars and two wheelers) constitute most of the
passenger trips.
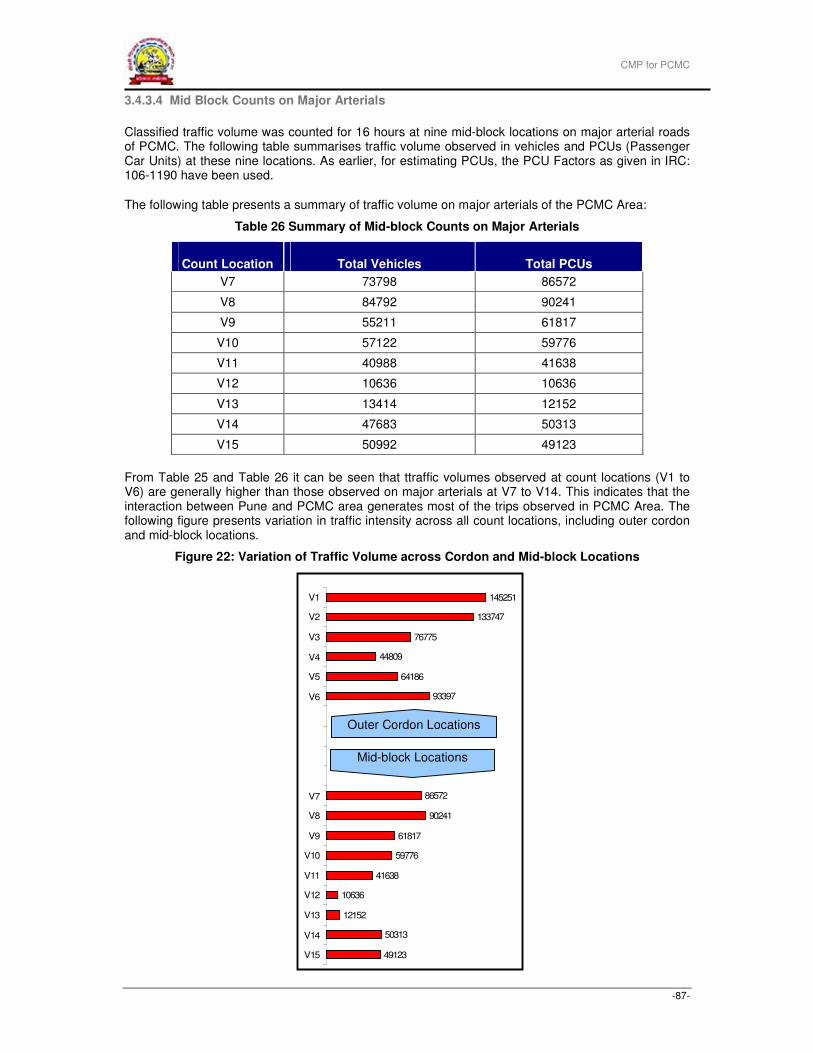
CMP for PCMC
-87-
3.4.3.4 Mid Block Counts on Major Arterials
Classified traffic volume was counted for 16 hours at nine mid-block locations on major arterial roads of PCMC. The following table summarises traffic volume observed in vehicles and PCUs (Passenger Car Units) at these nine locations. As earlier, for estimating PCUs, the PCU Factors as given in IRC: 106-1190 have been used.
The following table presents a summary of traffic volume on major arterials of the PCMC Area:
Table 26 Summary of Mid-block Counts on Major Arterials
Count Location Total Vehicles Total PCUs
V7 73798 86572
V8 84792 90241
V9 55211 61817
V10 57122 59776
V11 40988 41638
V12 10636 10636
V13 13414 12152
V14 47683 50313
V15 50992 49123
From Table 25 and Table 26 it can be seen that ttraffic volumes observed at count locations (V1 to V6) are generally higher than those observed on major arterials at V7 to V14. This indicates that the interaction between Pune and PCMC area generates most of the trips observed in PCMC Area. The following figure presents variation in traffic intensity across all count locations, including outer cordon and mid-block locations.
Figure 22: Variation of Traffic Volume across Cordon and Mid-block Locations
145251
133747
76775
44809
64186
93397
86572
90241
61817
59776
41638
10636
12152
50313
49123
V1
V2
V3
V4
V5
V6
V7
V8
V9
V10
V11
V12
V13
V14
V15
Outer Cordon Locations
Mid-block Locations
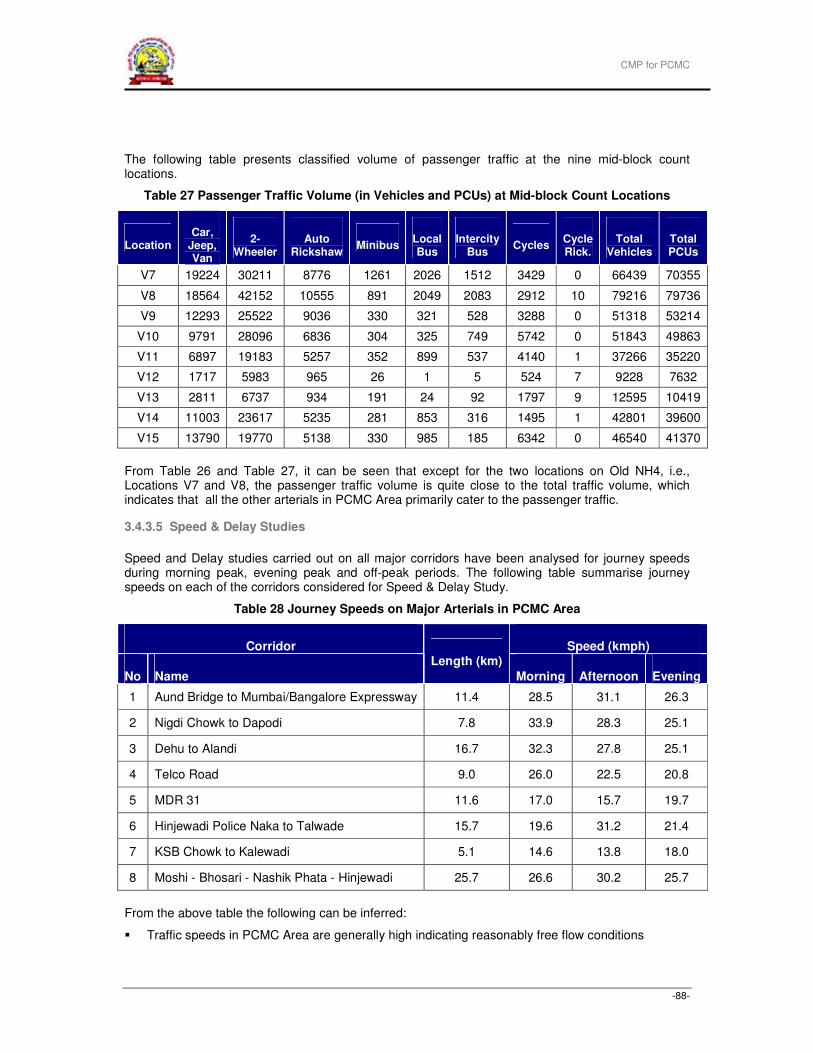
CMP for PCMC
-88-
The following table presents classified volume of passenger traffic at the nine mid-block count locations.
Table 27 Passenger Traffic Volume (in Vehicles and PCUs) at Mid-block Count Locations
Location Car,
Jeep, Van
2-Wheeler
Auto Rickshaw
Minibus Local Bus
Intercity Bus
Cycles Cycle Rick.
Total Vehicles
Total PCUs
V7 19224 30211 8776 1261 2026 1512 3429 0 66439 70355
V8 18564 42152 10555 891 2049 2083 2912 10 79216 79736
V9 12293 25522 9036 330 321 528 3288 0 51318 53214
V10 9791 28096 6836 304 325 749 5742 0 51843 49863
V11 6897 19183 5257 352 899 537 4140 1 37266 35220
V12 1717 5983 965 26 1 5 524 7 9228 7632
V13 2811 6737 934 191 24 92 1797 9 12595 10419
V14 11003 23617 5235 281 853 316 1495 1 42801 39600
V15 13790 19770 5138 330 985 185 6342 0 46540 41370
From Table 26 and Table 27, it can be seen that except for the two locations on Old NH4, i.e., Locations V7 and V8, the passenger traffic volume is quite close to the total traffic volume, which indicates that all the other arterials in PCMC Area primarily cater to the passenger traffic.
3.4.3.5 Speed & Delay Studies
Speed and Delay studies carried out on all major corridors have been analysed for journey speeds during morning peak, evening peak and off-peak periods. The following table summarise journey speeds on each of the corridors considered for Speed & Delay Study.
Table 28 Journey Speeds on Major Arterials in PCMC Area
Corridor Speed (kmph)
No Name
Length (km)
Morning Afternoon Evening
1 Aund Bridge to Mumbai/Bangalore Expressway 11.4 28.5 31.1 26.3
2 Nigdi Chowk to Dapodi 7.8 33.9 28.3 25.1
3 Dehu to Alandi 16.7 32.3 27.8 25.1
4 Telco Road 9.0 26.0 22.5 20.8
5 MDR 31 11.6 17.0 15.7 19.7
6 Hinjewadi Police Naka to Talwade 15.7 19.6 31.2 21.4
7 KSB Chowk to Kalewadi 5.1 14.6 13.8 18.0
8 Moshi - Bhosari - Nashik Phata - Hinjewadi 25.7 26.6 30.2 25.7
From the above table the following can be inferred:
� Traffic speeds in PCMC Area are generally high indicating reasonably free flow conditions
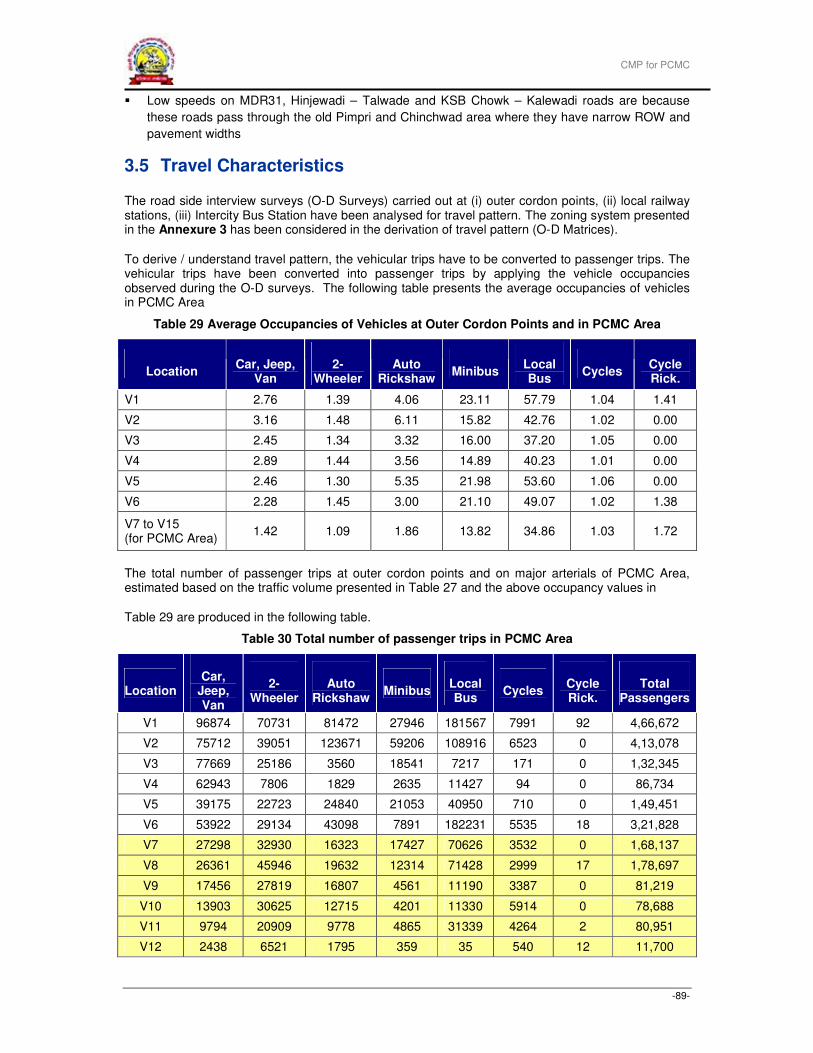
CMP for PCMC
-89-
� Low speeds on MDR31, Hinjewadi – Talwade and KSB Chowk – Kalewadi roads are because
these roads pass through the old Pimpri and Chinchwad area where they have narrow ROW and
pavement widths
3.5 Travel Characteristics
The road side interview surveys (O-D Surveys) carried out at (i) outer cordon points, (ii) local railway stations, (iii) Intercity Bus Station have been analysed for travel pattern. The zoning system presented in the Annexure 3 has been considered in the derivation of travel pattern (O-D Matrices).
To derive / understand travel pattern, the vehicular trips have to be converted to passenger trips. The vehicular trips have been converted into passenger trips by applying the vehicle occupancies observed during the O-D surveys. The following table presents the average occupancies of vehicles in PCMC Area
Table 29 Average Occupancies of Vehicles at Outer Cordon Points and in PCMC Area
Location Car, Jeep,
Van 2-
Wheeler Auto
Rickshaw Minibus
Local Bus
Cycles Cycle Rick.
V1 2.76 1.39 4.06 23.11 57.79 1.04 1.41
V2 3.16 1.48 6.11 15.82 42.76 1.02 0.00
V3 2.45 1.34 3.32 16.00 37.20 1.05 0.00
V4 2.89 1.44 3.56 14.89 40.23 1.01 0.00
V5 2.46 1.30 5.35 21.98 53.60 1.06 0.00
V6 2.28 1.45 3.00 21.10 49.07 1.02 1.38
V7 to V15 (for PCMC Area)
1.42 1.09 1.86 13.82 34.86 1.03 1.72
The total number of passenger trips at outer cordon points and on major arterials of PCMC Area, estimated based on the traffic volume presented in Table 27 and the above occupancy values in
Table 29 are produced in the following table.
Table 30 Total number of passenger trips in PCMC Area
Location Car,
Jeep, Van
2-Wheeler
Auto Rickshaw
Minibus Local Bus
Cycles Cycle Rick.
Total Passengers
V1 96874 70731 81472 27946 181567 7991 92 4,66,672
V2 75712 39051 123671 59206 108916 6523 0 4,13,078
V3 77669 25186 3560 18541 7217 171 0 1,32,345
V4 62943 7806 1829 2635 11427 94 0 86,734
V5 39175 22723 24840 21053 40950 710 0 1,49,451
V6 53922 29134 43098 7891 182231 5535 18 3,21,828
V7 27298 32930 16323 17427 70626 3532 0 1,68,137
V8 26361 45946 19632 12314 71428 2999 17 1,78,697
V9 17456 27819 16807 4561 11190 3387 0 81,219
V10 13903 30625 12715 4201 11330 5914 0 78,688
V11 9794 20909 9778 4865 31339 4264 2 80,951
V12 2438 6521 1795 359 35 540 12 11,700
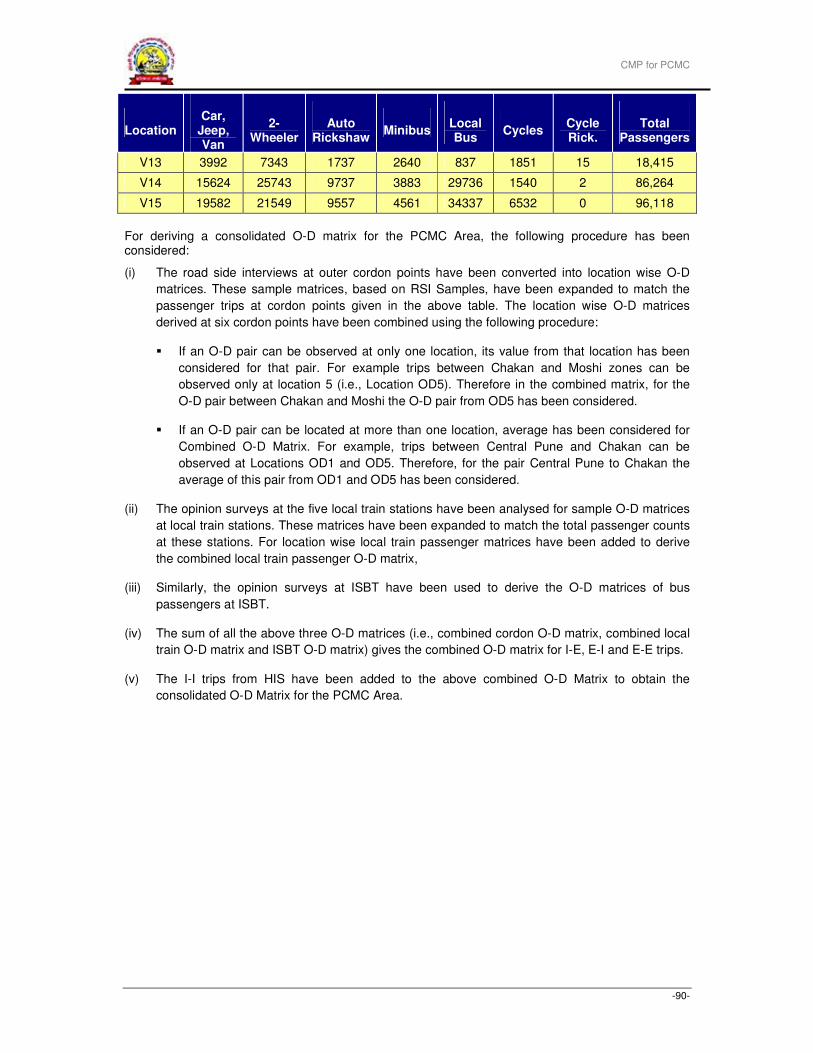
CMP for PCMC
-90-
Location Car,
Jeep, Van
2-Wheeler
Auto Rickshaw
Minibus Local Bus
Cycles Cycle Rick.
Total Passengers
V13 3992 7343 1737 2640 837 1851 15 18,415
V14 15624 25743 9737 3883 29736 1540 2 86,264
V15 19582 21549 9557 4561 34337 6532 0 96,118
For deriving a consolidated O-D matrix for the PCMC Area, the following procedure has been considered:
(i) The road side interviews at outer cordon points have been converted into location wise O-D
matrices. These sample matrices, based on RSI Samples, have been expanded to match the
passenger trips at cordon points given in the above table. The location wise O-D matrices
derived at six cordon points have been combined using the following procedure:
� If an O-D pair can be observed at only one location, its value from that location has been
considered for that pair. For example trips between Chakan and Moshi zones can be
observed only at location 5 (i.e., Location OD5). Therefore in the combined matrix, for the
O-D pair between Chakan and Moshi the O-D pair from OD5 has been considered.
� If an O-D pair can be located at more than one location, average has been considered for
Combined O-D Matrix. For example, trips between Central Pune and Chakan can be
observed at Locations OD1 and OD5. Therefore, for the pair Central Pune to Chakan the
average of this pair from OD1 and OD5 has been considered.
(ii) The opinion surveys at the five local train stations have been analysed for sample O-D matrices
at local train stations. These matrices have been expanded to match the total passenger counts
at these stations. For location wise local train passenger matrices have been added to derive
the combined local train passenger O-D matrix,
(iii) Similarly, the opinion surveys at ISBT have been used to derive the O-D matrices of bus
passengers at ISBT.
(iv) The sum of all the above three O-D matrices (i.e., combined cordon O-D matrix, combined local
train O-D matrix and ISBT O-D matrix) gives the combined O-D matrix for I-E, E-I and E-E trips.
(v) The I-I trips from HIS have been added to the above combined O-D Matrix to obtain the
consolidated O-D Matrix for the PCMC Area.
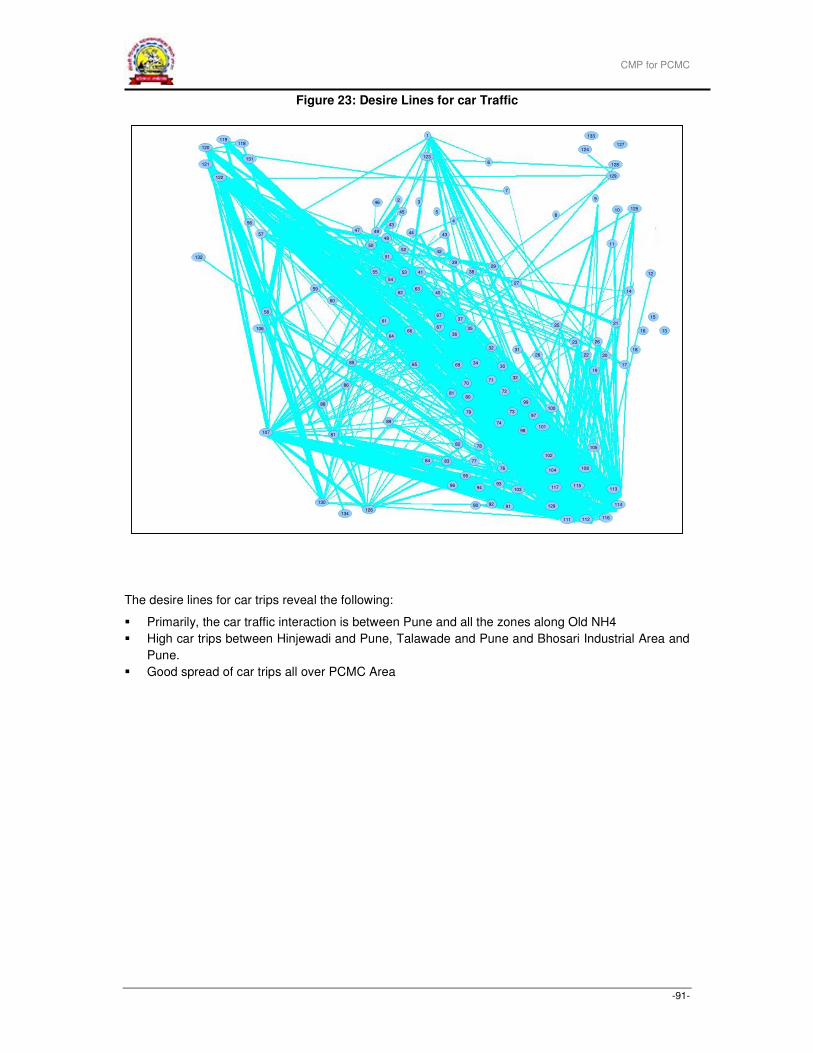
CMP for PCMC
-91-
Figure 23: Desire Lines for car Traffic
The desire lines for car trips reveal the following:
� Primarily, the car traffic interaction is between Pune and all the zones along Old NH4
� High car trips between Hinjewadi and Pune, Talawade and Pune and Bhosari Industrial Area and
Pune.
� Good spread of car trips all over PCMC Area
1
45
3246
5
52
48
47
43
44 43
50
51
56
57
131
120
119118
121
122
58
106
59
6664
61
40
42
4
39
384153
63
54
62
37
35
36
67
55
10781
126134
130
96
95
84 83
89
86
85
88
82 78
77
91
103
93
74
104
102
108
105
117
129
111 112 116
114
113
100
97
101
99
73
98
30
32
72
2631
23
22
19
25
26
21
17
18
27
14
11
12
10 125
9
129
133
127
128
124
6
7
8
60
123
67
29
3469
80
79
81
65
32
115
71
20
16
15
13
70
94
92
76
132
49
90
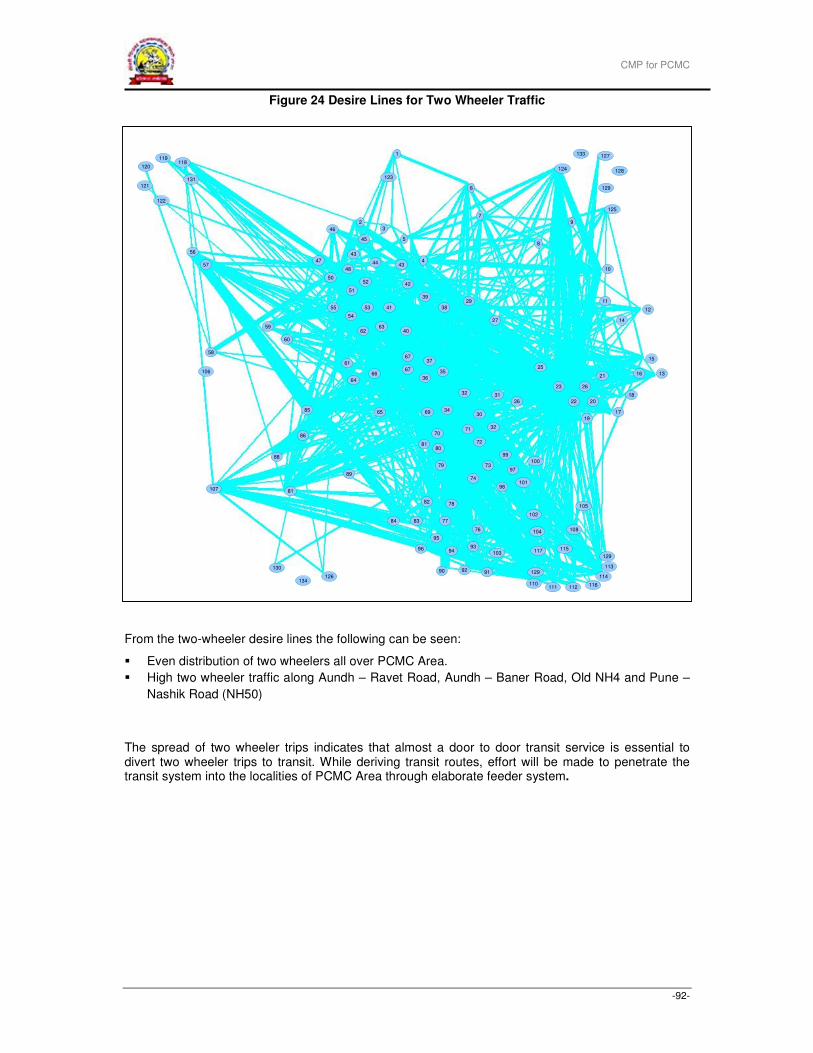
CMP for PCMC
-92-
Figure 24 Desire Lines for Two Wheeler Traffic
From the two-wheeler desire lines the following can be seen:
� Even distribution of two wheelers all over PCMC Area.
� High two wheeler traffic along Aundh – Ravet Road, Aundh – Baner Road, Old NH4 and Pune –
Nashik Road (NH50)
The spread of two wheeler trips indicates that almost a door to door transit service is essential to divert two wheeler trips to transit. While deriving transit routes, effort will be made to penetrate the transit system into the localities of PCMC Area through elaborate feeder system.
1
45
3
2
46
5
52
48
47
43
44 43
50
51
56
57
131
120
119118
121
122
58
106
59
66
64
61
40
42
4
39
384153
63
54
62
37
35
36
67
55
107 81
126134
130
96
95
84 83
89
86
85
88
82 78
77
91
103
93
74
104
102
108
105
117
129
111 112 116
113
129
100
97
101
99
73
98
30
32
72
26
31
23
22
19
25
26
21
17
18
27 14
11
12
10
125
9
129
133 127
128124
6
7
8
60
123
67
29
3469
80
79
81
65
32
115
71
20
16
15
13
70
94
92
76
90
110
114
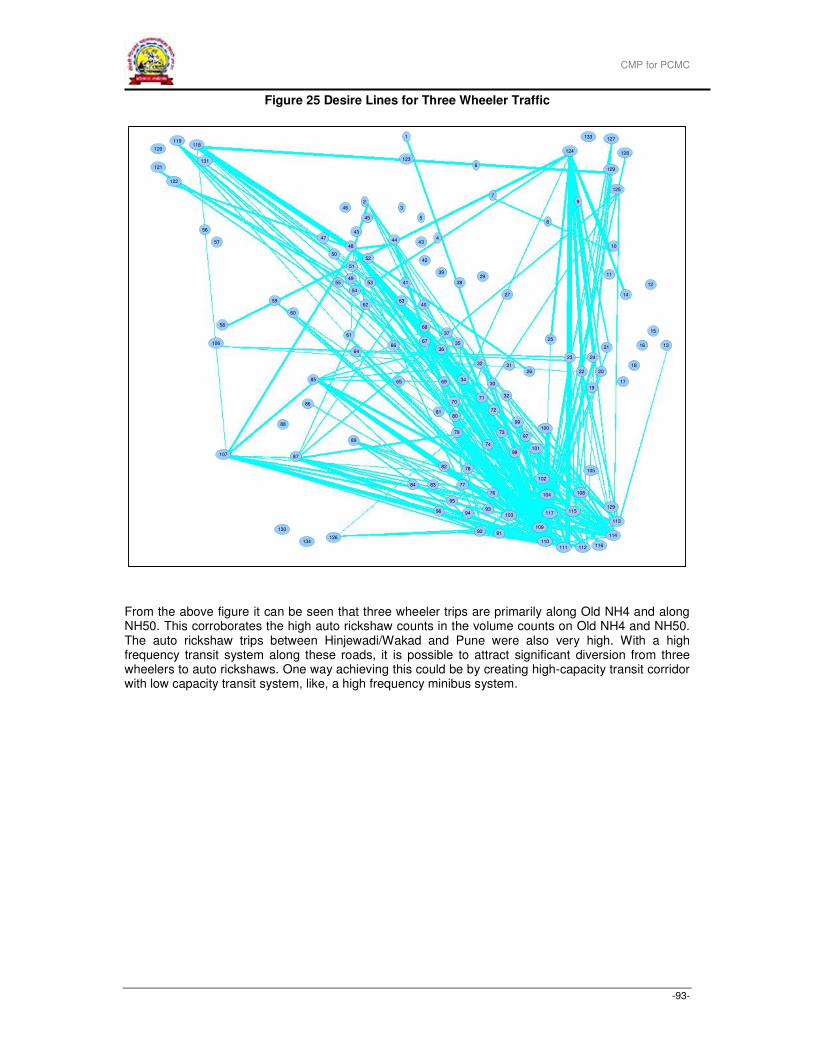
CMP for PCMC
-93-
Figure 25 Desire Lines for Three Wheeler Traffic
From the above figure it can be seen that three wheeler trips are primarily along Old NH4 and along NH50. This corroborates the high auto rickshaw counts in the volume counts on Old NH4 and NH50. The auto rickshaw trips between Hinjewadi/Wakad and Pune were also very high. With a high frequency transit system along these roads, it is possible to attract significant diversion from three wheelers to auto rickshaws. One way achieving this could be by creating high-capacity transit corridor with low capacity transit system, like, a high frequency minibus system.
1
45
3
2
46
5
52
48
47
43
44 43
50
51
56
57
131
120
119118
121
122
58
106
59
66
64
61
40
42
4
39
384153
63
54
62
37
35
36
67
55
107 87
126134
130
96
95
84 83
89
86
85
88
82 78
77
91
103
93
74
104
102
108
105
117
129
111 112 116
114
113
100
97
101
99
73
98
30
32
72
26
31
23
22
19
25
24
21
17
18
27 14
11
12
10
125
9
129
133 127
128124
6
7
8
60
123
68
29
3469
80
79
81
65
32
115
71
20
16
15
13
70
94
92
76
110
109
49
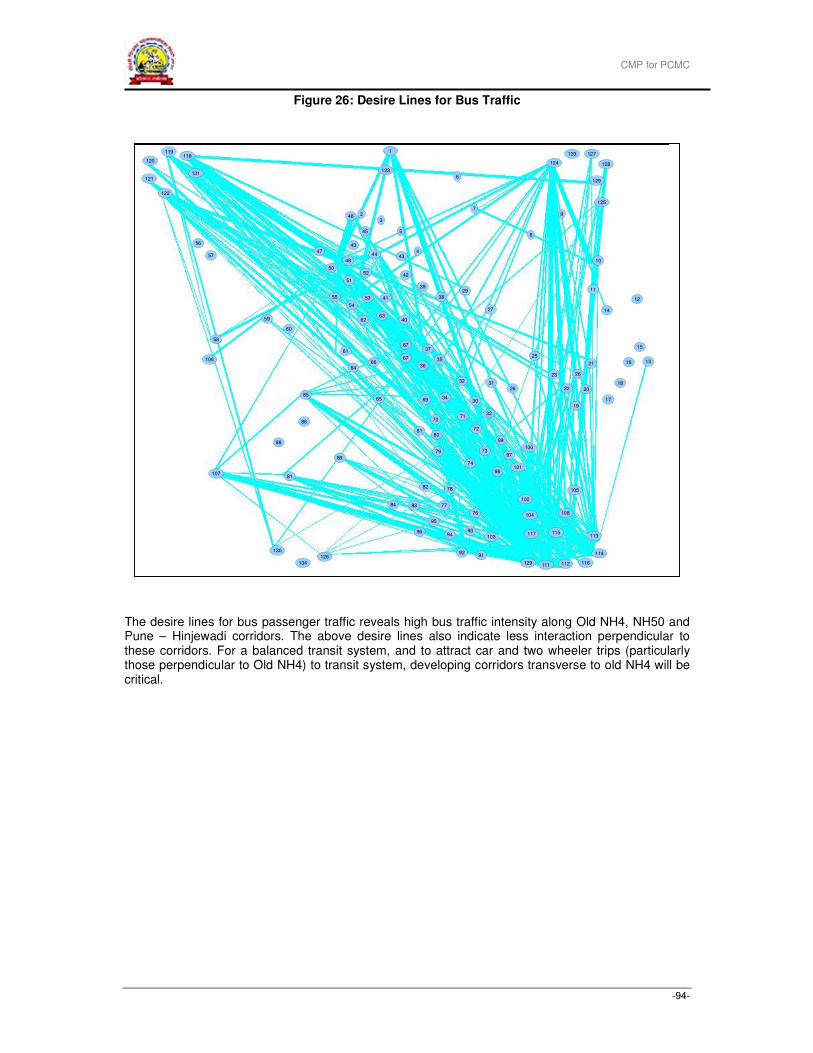
CMP for PCMC
-94-
Figure 26: Desire Lines for Bus Traffic
The desire lines for bus passenger traffic reveals high bus traffic intensity along Old NH4, NH50 and Pune – Hinjewadi corridors. The above desire lines also indicate less interaction perpendicular to these corridors. For a balanced transit system, and to attract car and two wheeler trips (particularly those perpendicular to Old NH4) to transit system, developing corridors transverse to old NH4 will be critical.
10
1
45
3
246
5
52
48
47
43
44 43
50
51
56
57
131
120
119118
121
122
58
106
59
6664
61
40
42
4
39
384153
63
54
62
37
35
36
67
55
10781
126
134
130
96
95
84 83
89
86
85
88
82 78
77
91
103
93
74
104
102
108
105
117
129 111 112 116
114
113
100
97
101
99
73
98
30
32
72
2631
23
22
19
25
26
21
17
18
27 14
11
12
10
125
9
129
133 127
128124
6
7
8
60
123
67
29
3469
80
79
81
65
32
115
71
20
16
15
13
70
94
92
76
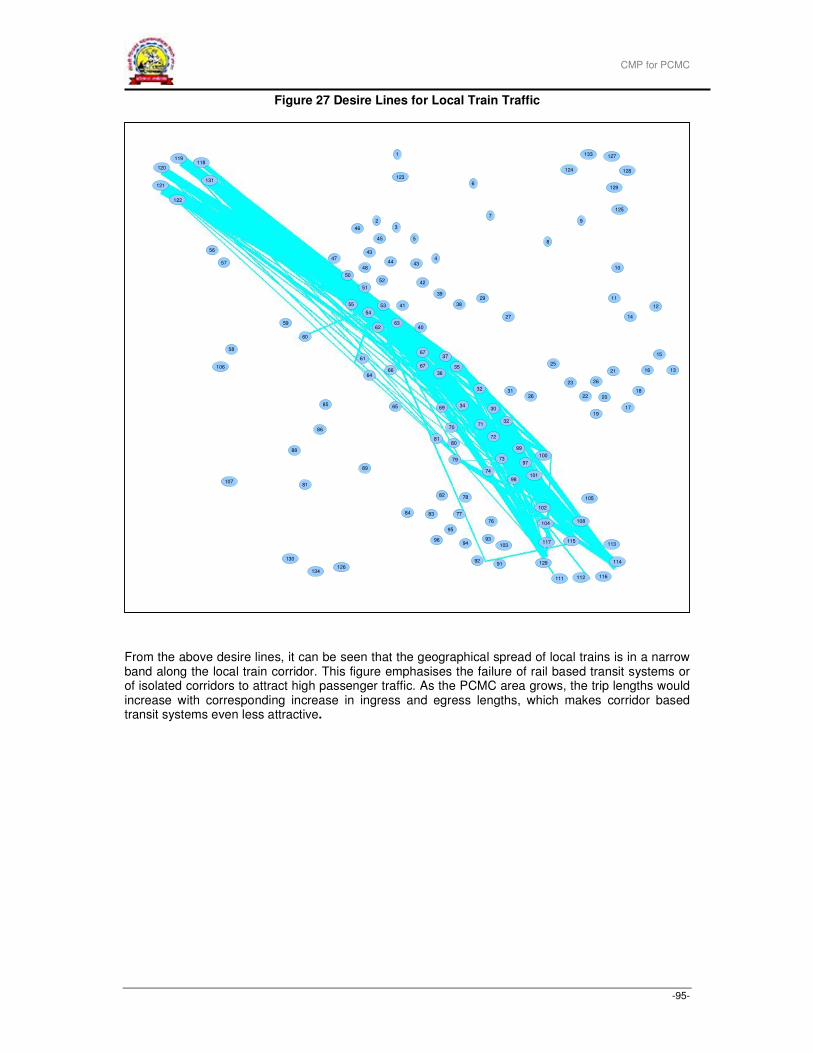
CMP for PCMC
-95-
Figure 27 Desire Lines for Local Train Traffic
From the above desire lines, it can be seen that the geographical spread of local trains is in a narrow band along the local train corridor. This figure emphasises the failure of rail based transit systems or of isolated corridors to attract high passenger traffic. As the PCMC area grows, the trip lengths would increase with corresponding increase in ingress and egress lengths, which makes corridor based transit systems even less attractive.
c
10
1
45
3
2
46
5
52
48
47
43
44 43
50
51
56
57
131
120
119118
121
122
58
106
59
6664
61
40
42
4
39
384153
63
54
62
37
35
36
67
55
10781
126134
130
96
95
84 83
89
86
85
88
82 78
77
91
103
93
74
104
102
108
105
117
129
111 112 116
114
113
100
97
101
99
73
98
30
32
72
2631
23
22
19
25
26
21
17
18
27 14
11
12
10
125
9
129
133 127
128124
6
7
8
60
123
67
29
3469
80
79
81
65
32
115
71
20
16
15
13
70
94
92
76
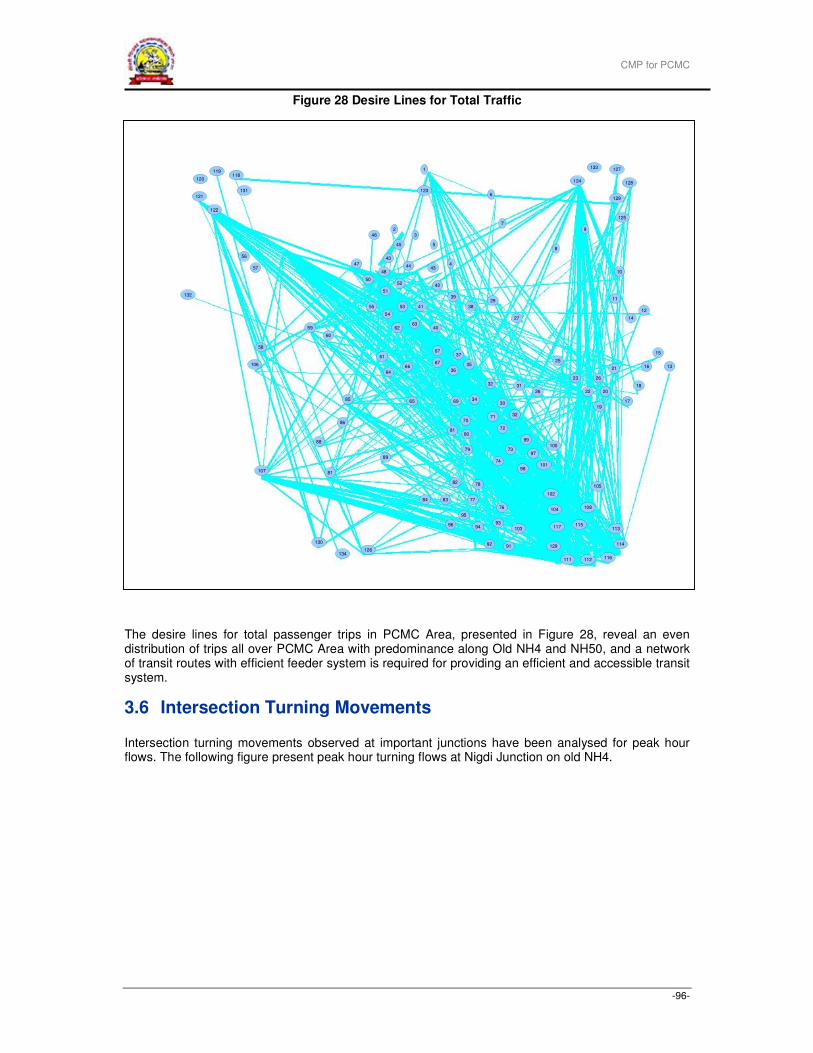
CMP for PCMC
-96-
Figure 28 Desire Lines for Total Traffic
The desire lines for total passenger trips in PCMC Area, presented in Figure 28, reveal an even distribution of trips all over PCMC Area with predominance along Old NH4 and NH50, and a network of transit routes with efficient feeder system is required for providing an efficient and accessible transit system.
3.6 Intersection Turning Movements
Intersection turning movements observed at important junctions have been analysed for peak hour flows. The following figure present peak hour turning flows at Nigdi Junction on old NH4.
1
45
3
2
46
5
52
48
47
43
44 43
50
51
56
57
131
120
119118
121
122
58
106
59
66
64
61
40
42
4
39
384153
63
54
62
37
35
36
67
55
107 81
126134
130
96
95
84 83
89
86
85
88
82 78
77
91
103
93
74
104
102
108
105
117
129
111 112 116
114
113
100
97
101
99
73
98
30
32
72
26
31
23
22
19
25
26
21
17
18
27 14
11
10
125
9
129
133 127
128124
6
7
8
60
123
67
29
3469
80
79
81
65
32
115
71
20
16
15
13
70
94
92
76
132
12
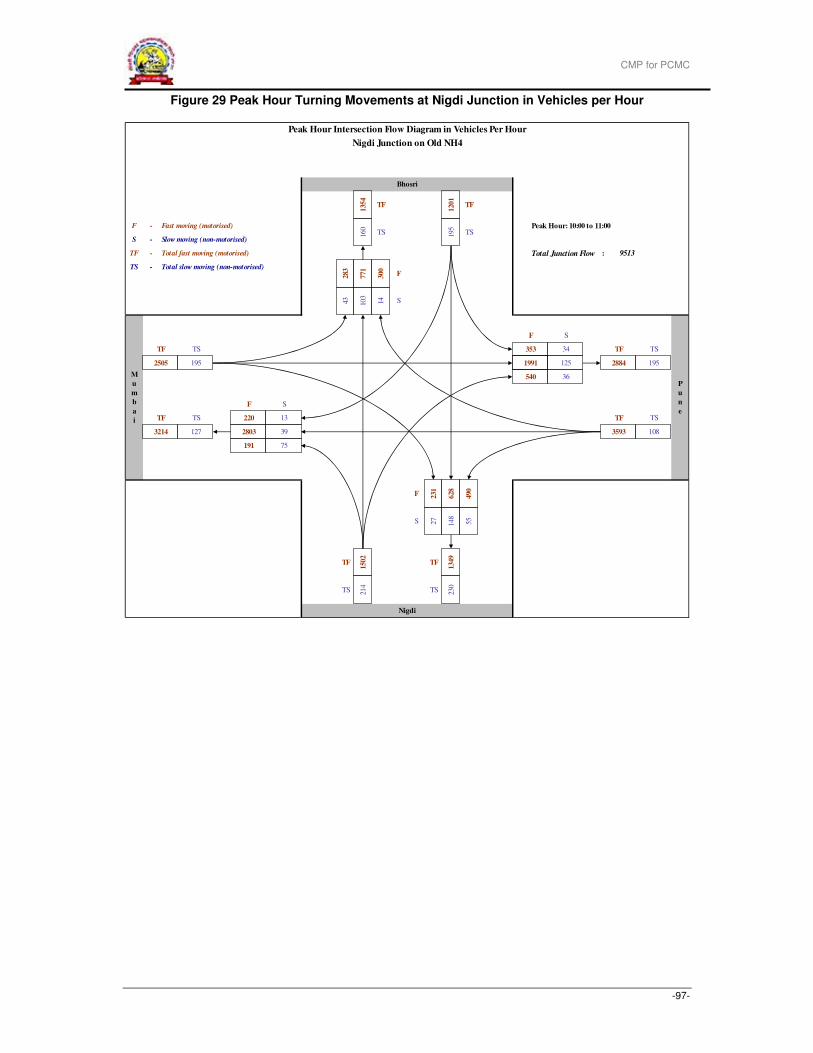
CMP for PCMC
-97-
Figure 29 Peak Hour Turning Movements at Nigdi Junction in Vehicles per Hour
F - Fast moving (motorised) Peak Hour: 10:00 to 11:00
S - Slow moving (non-motorised)
TF - Total fast moving (motorised) Total Junction Flow :
TS - Total slow moving (non-motorised)
9513
Peak Hour Intersection Flow Diagram in Vehicles Per Hour
Nigdi Junction on Old NH4
Bhosri
135
4
TF
120
1
TF
160
TS 195
TS
283
771
300 F
43 103
14 S
F S
M
u
m
b
a
i
TF TS 353 34
36
F S
P
u
n
e
2505 195 1991 125 2884 195
540
220 13
TF TS
TF TS
3593 108
TF TS
3214 127 2803 39
191 75
F 231
628
490
S 27
148
55
TF
150
2
TF
134
9
Nigdi
TS 214
TS 230
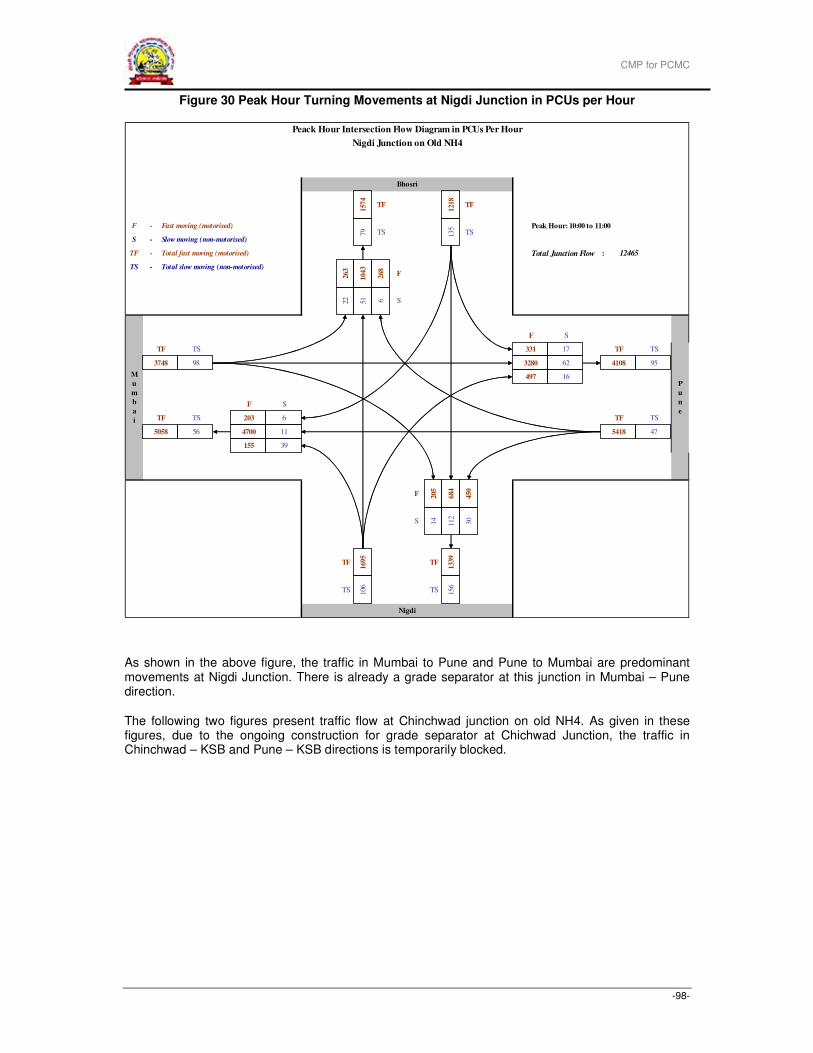
CMP for PCMC
-98-
Figure 30 Peak Hour Turning Movements at Nigdi Junction in PCUs per Hour
As shown in the above figure, the traffic in Mumbai to Pune and Pune to Mumbai are predominant movements at Nigdi Junction. There is already a grade separator at this junction in Mumbai – Pune direction.
The following two figures present traffic flow at Chinchwad junction on old NH4. As given in these figures, due to the ongoing construction for grade separator at Chichwad Junction, the traffic in Chinchwad – KSB and Pune – KSB directions is temporarily blocked.
F - Fast moving (motorised) Peak Hour: 10:00 to 11:00
S - Slow moving (non-motorised)
TF - Total fast moving (motorised) Total Junction Flow :
TS - Total slow moving (non-motorised)
12465
TF
TS
Peack Hour Intersection Flow Diagram in PCUs Per Hour
Nigdi Junction on Old NH4
F
S
TF
TS
TF
TS
TF
TS
169
510
6
F
S
TF TS
TF TS
F S
155 39
TF TS
TF TS
F S
Bhosri
P
u
n
e
5122331 17
62
16
Nigdi
M
u
m
b
a
i
121
813
5
157
479
104
3
263
268
6497
3280 4108 95
475418
3748 98
5058 56
203 6
4700 11
156
133
9684
450
205
14
112
30
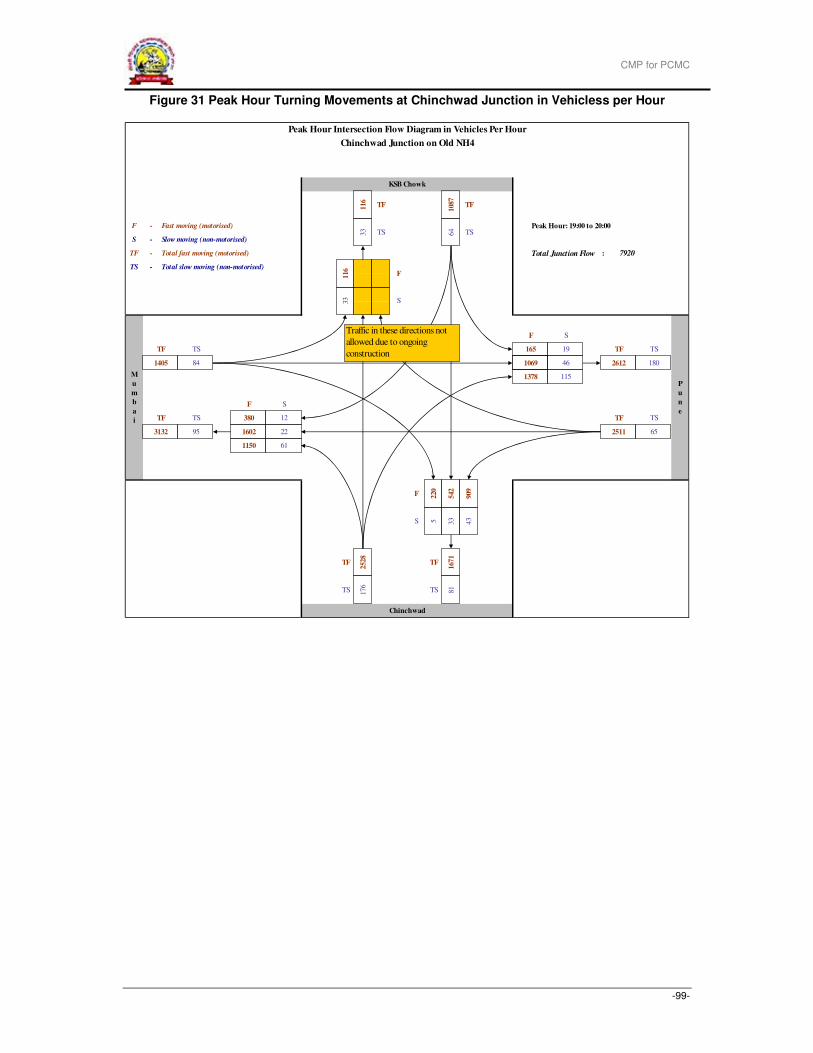
CMP for PCMC
-99-
Figure 31 Peak Hour Turning Movements at Chinchwad Junction in Vehicless per Hour
F - Fast moving (motorised) Peak Hour: 19:00 to 20:00
S - Slow moving (non-motorised)
TF - Total fast moving (motorised) Total Junction Flow :
TS - Total slow moving (non-motorised)
Chinchwad
TS 176
TS 81
TF
252
8
TF
167
1542
909
S 5 33
43
1150 61
F 220
2511 65
TF TS
3132 95 1602 22
TF TS
TF TS
P
u
n
e
1405 84 1069 46 2612 180
1378
380 12
F S
M
u
m
b
a
i
TF TS 165 19
115
F S
33 S
64 TS
116 F
7920
Peak Hour Intersection Flow Diagram in Vehicles Per Hour
Chinchwad Junction on Old NH4
KSB Chowk
116 TF
108
7
TF
33 TS
Traffic in these directions not
allowed due to ongoing
construction
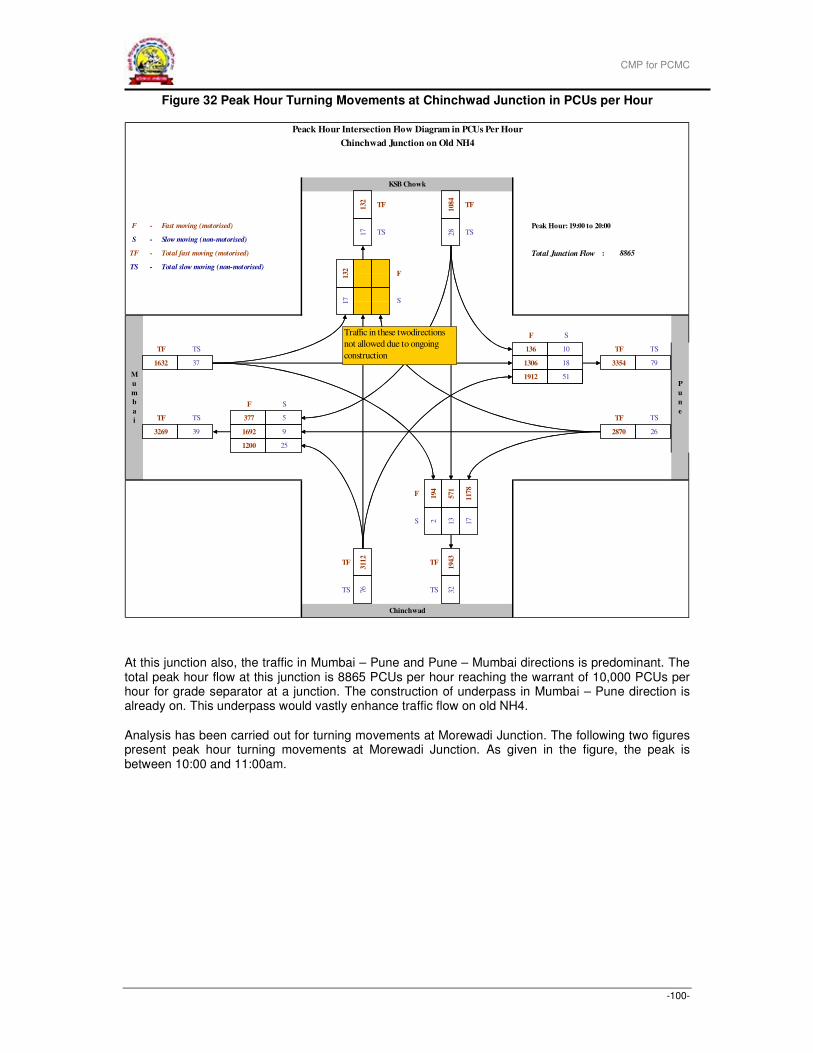
CMP for PCMC
-100-
Figure 32 Peak Hour Turning Movements at Chinchwad Junction in PCUs per Hour
At this junction also, the traffic in Mumbai – Pune and Pune – Mumbai directions is predominant. The total peak hour flow at this junction is 8865 PCUs per hour reaching the warrant of 10,000 PCUs per hour for grade separator at a junction. The construction of underpass in Mumbai – Pune direction is already on. This underpass would vastly enhance traffic flow on old NH4.
Analysis has been carried out for turning movements at Morewadi Junction. The following two figures present peak hour turning movements at Morewadi Junction. As given in the figure, the peak is between 10:00 and 11:00am.
F - Fast moving (motorised) Peak Hour: 19:00 to 20:00
S - Slow moving (non-motorised)
TF - Total fast moving (motorised) Total Junction Flow :
TS - Total slow moving (non-motorised)
194
2 13
17
32194
3571
117
8
262870
1632 37
3269 39
377 5
1692 9
1912
1306 3354 79
Chinchwad
M
u
m
b
a
i
108
428
132
17
132
F S
KSB Chowk
P
u
n
e
17136 10
18
51
TF TS
TF TS
F
S
TF TS
TF TS
F S
1200 25
TF
TS
TF
TS
311
276
F
S
TF
TS
8865
TF
TS
Peack Hour Intersection Flow Diagram in PCUs Per Hour
Chinchwad Junction on Old NH4
Traffic in these twodirections
not allowed due to ongoing
construction
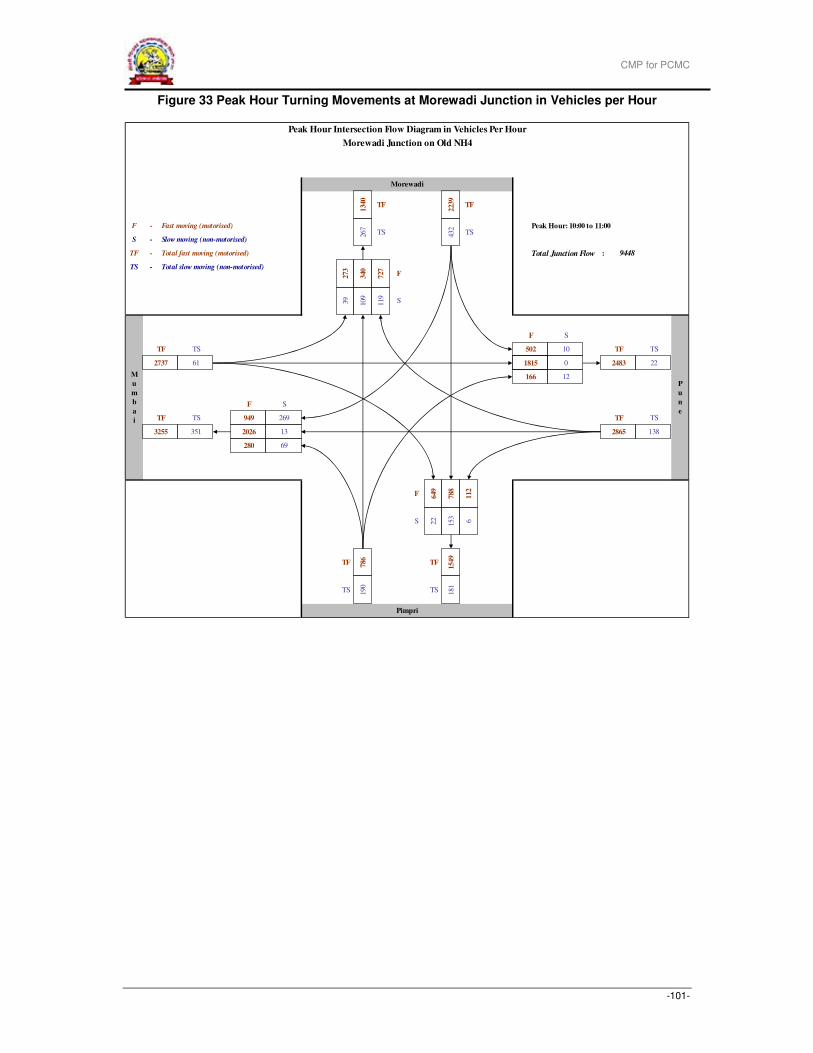
CMP for PCMC
-101-
Figure 33 Peak Hour Turning Movements at Morewadi Junction in Vehicles per Hour
F - Fast moving (motorised) Peak Hour: 10:00 to 11:00
S - Slow moving (non-motorised)
TF - Total fast moving (motorised) Total Junction Flow :
TS - Total slow moving (non-motorised)
Pimpri
TS 190
TS 181
TF 786 TF
154
9788
112
S 22
153
6
280 69
F 649
2865 138
TF TS
3255 351 2026 13
TF TS
TF TS
P
u
n
e
2737 61 1815 0 2483 22
166
949 269
F S
M
u
m
b
a
i
TF TS 502 10
12
F S
39 109
119
S
432
TS
273
340
727 F
9448
Peak Hour Intersection Flow Diagram in Vehicles Per Hour
Morewadi Junction on Old NH4
Morewadi
134
0
TF
223
9
TF
267
TS
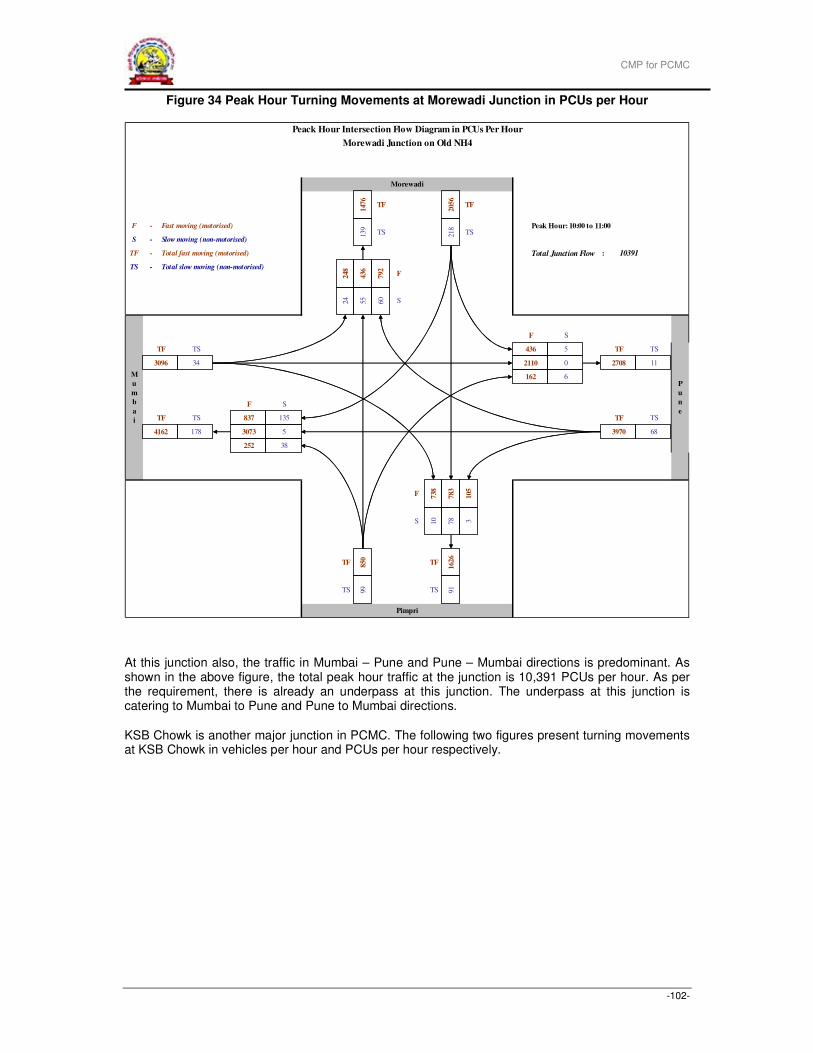
CMP for PCMC
-102-
Figure 34 Peak Hour Turning Movements at Morewadi Junction in PCUs per Hour
At this junction also, the traffic in Mumbai – Pune and Pune – Mumbai directions is predominant. As shown in the above figure, the total peak hour traffic at the junction is 10,391 PCUs per hour. As per the requirement, there is already an underpass at this junction. The underpass at this junction is catering to Mumbai to Pune and Pune to Mumbai directions.
KSB Chowk is another major junction in PCMC. The following two figures present turning movements at KSB Chowk in vehicles per hour and PCUs per hour respectively.
F - Fast moving (motorised) Peak Hour: 10:00 to 11:00
S - Slow moving (non-motorised)
TF - Total fast moving (motorised) Total Junction Flow :
TS - Total slow moving (non-motorised)
738
10
78 3
91162
6783
105
683970
3096 34
4162 178
837 135
3073 5
162
2110 2708 11
Pimpri
M
u
m
b
a
i
205
621
8
147
613
9436
248
792
60
F S
Morewadi
P
u
n
e
5524436 5
0
6
TF TS
TF TS
F
S
TF TS
TF TS
F S
252 38
TF
TS
TF
TS
850
99
F
S
TF
TS
10391
TF
TS
Peack Hour Intersection Flow Diagram in PCUs Per Hour
Morewadi Junction on Old NH4
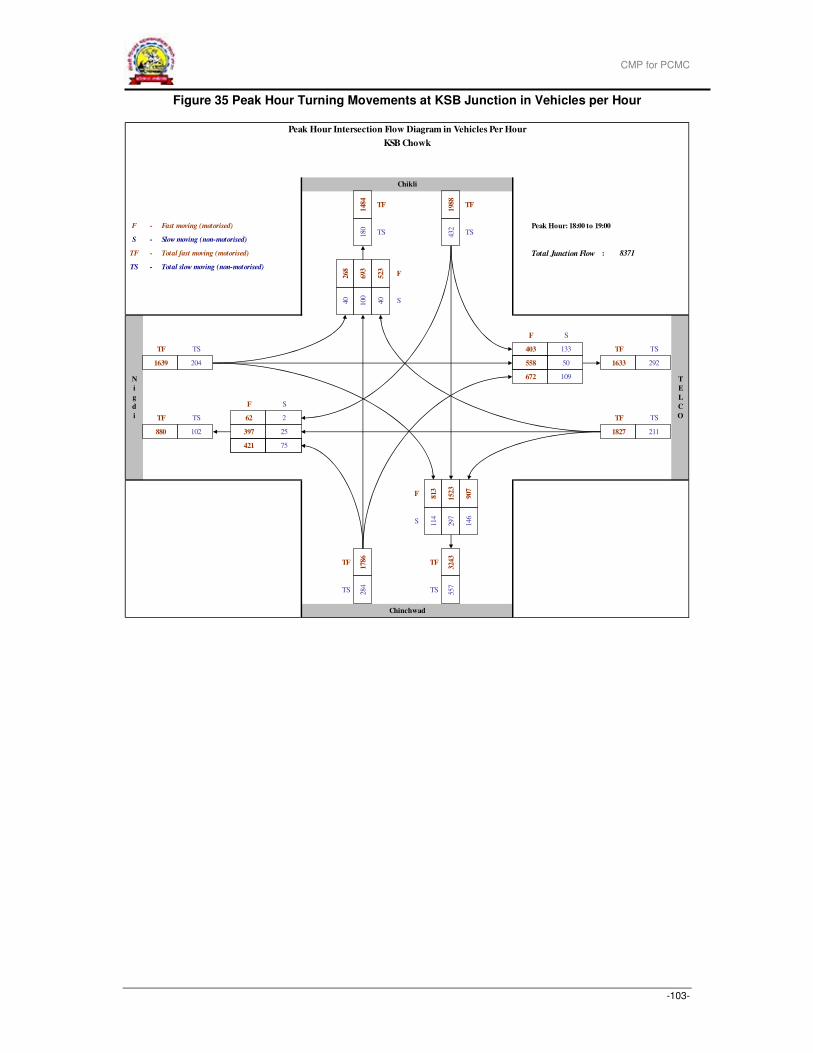
CMP for PCMC
-103-
Figure 35 Peak Hour Turning Movements at KSB Junction in Vehicles per Hour
F - Fast moving (motorised) Peak Hour: 18:00 to 19:00
S - Slow moving (non-motorised)
TF - Total fast moving (motorised) Total Junction Flow :
TS - Total slow moving (non-motorised)
8371
Peak Hour Intersection Flow Diagram in Vehicles Per Hour
KSB Chowk
Chikli
148
4
TF
198
8
TF
180
TS 432
TS
268
693
523 F
40 100
40 S
F S
N
i
g
d
i
TF TS 403 133
109
F S
T
E
L
C
O
1639 204 558 50 1633 292
672
62 2
TF TS
TF TS
1827 211
TF TS
880 102 397 25
421 75
F 813
152
3
907
S 114
297
146
TF
178
6
TF
324
3
Chinchwad
TS 284
TS 557
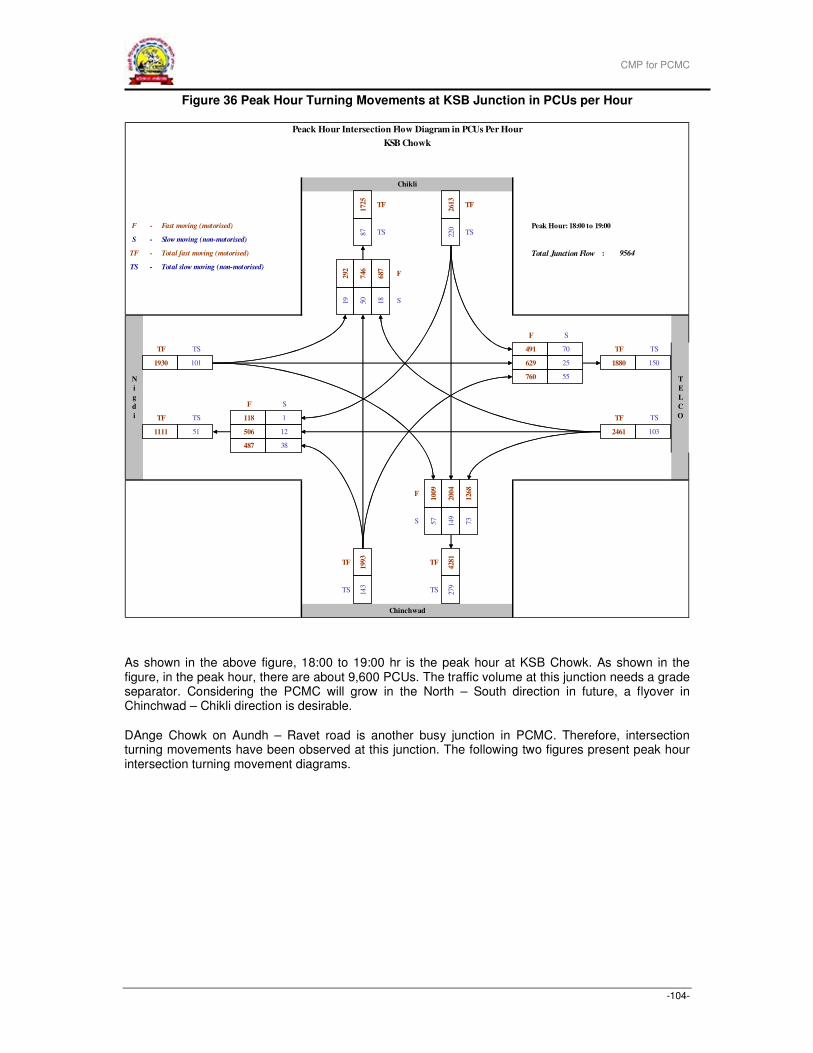
CMP for PCMC
-104-
Figure 36 Peak Hour Turning Movements at KSB Junction in PCUs per Hour
As shown in the above figure, 18:00 to 19:00 hr is the peak hour at KSB Chowk. As shown in the figure, in the peak hour, there are about 9,600 PCUs. The traffic volume at this junction needs a grade separator. Considering the PCMC will grow in the North – South direction in future, a flyover in Chinchwad – Chikli direction is desirable.
DAnge Chowk on Aundh – Ravet road is another busy junction in PCMC. Therefore, intersection turning movements have been observed at this junction. The following two figures present peak hour intersection turning movement diagrams.
F - Fast moving (motorised) Peak Hour: 18:00 to 19:00
S - Slow moving (non-motorised)
TF - Total fast moving (motorised) Total Junction Flow :
TS - Total slow moving (non-motorised)
9564
TF
TS
Peack Hour Intersection Flow Diagram in PCUs Per Hour
KSB Chowk
F
S
TF
TS
TF
TS
TF
TS
199
314
3
F
S
TF TS
TF TS
F S
487 38
TF TS
TF TS
F S
Chikli
T
E
L
C
O
5019491 70
25
55
Chinchwad
N
i
g
d
i
261
322
0
172
587
746
292
687
18760
629 1880 150
1032461
1930 101
1111 51
118 1
506 12
279
428
1200
4
126
8
100
957
149
73
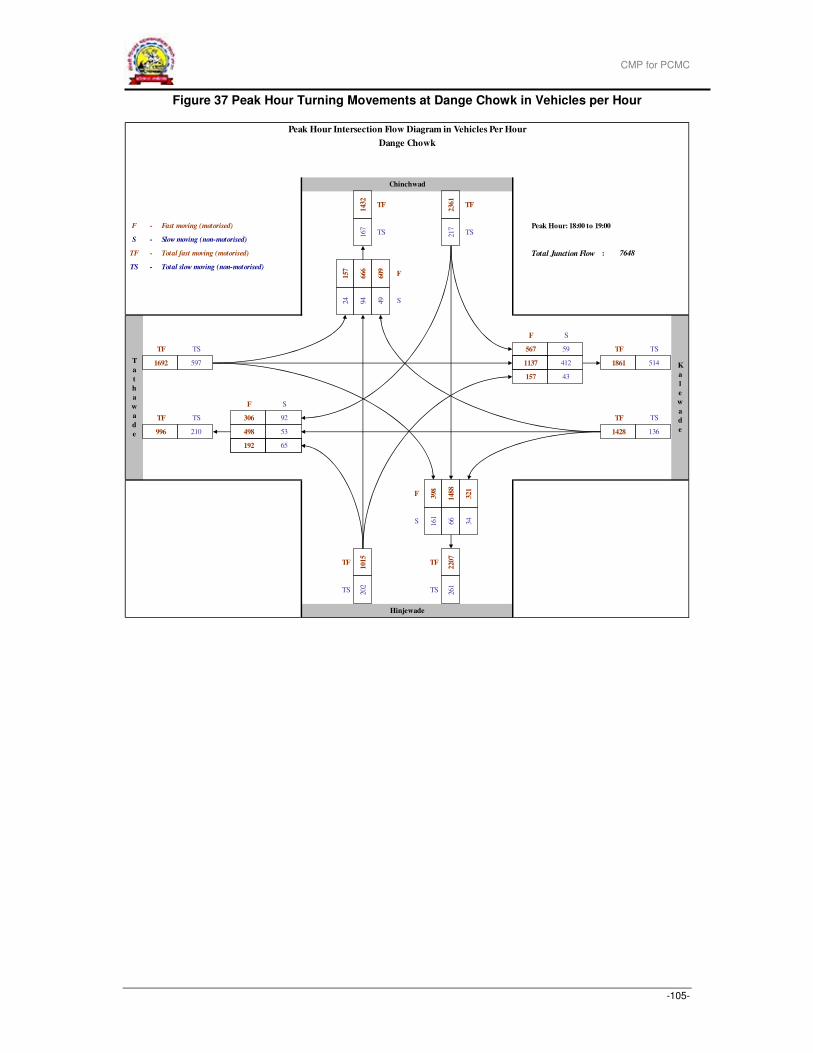
CMP for PCMC
-105-
Figure 37 Peak Hour Turning Movements at Dange Chowk in Vehicles per Hour
F - Fast moving (motorised) Peak Hour: 18:00 to 19:00
S - Slow moving (non-motorised)
TF - Total fast moving (motorised) Total Junction Flow :
TS - Total slow moving (non-motorised)
7648
Peak Hour Intersection Flow Diagram in Vehicles Per Hour
Dange Chowk
Chinchwad
143
2
TF
236
1
TF
167
TS 217
TS
157
666
609 F
24 94 49 S
F S
T
a
t
h
a
w
a
d
e
TF TS 567 59
43
F S
K
a
l
e
w
a
d
e
1692 597 1137 412 1861 514
157
306 92
TF TS
TF TS
1428 136
TF TS
996 210 498 53
192 65
F 398
148
8
321
S 161
66
34
TF
101
5
TF
220
7
Hinjewade
TS 202
TS 261
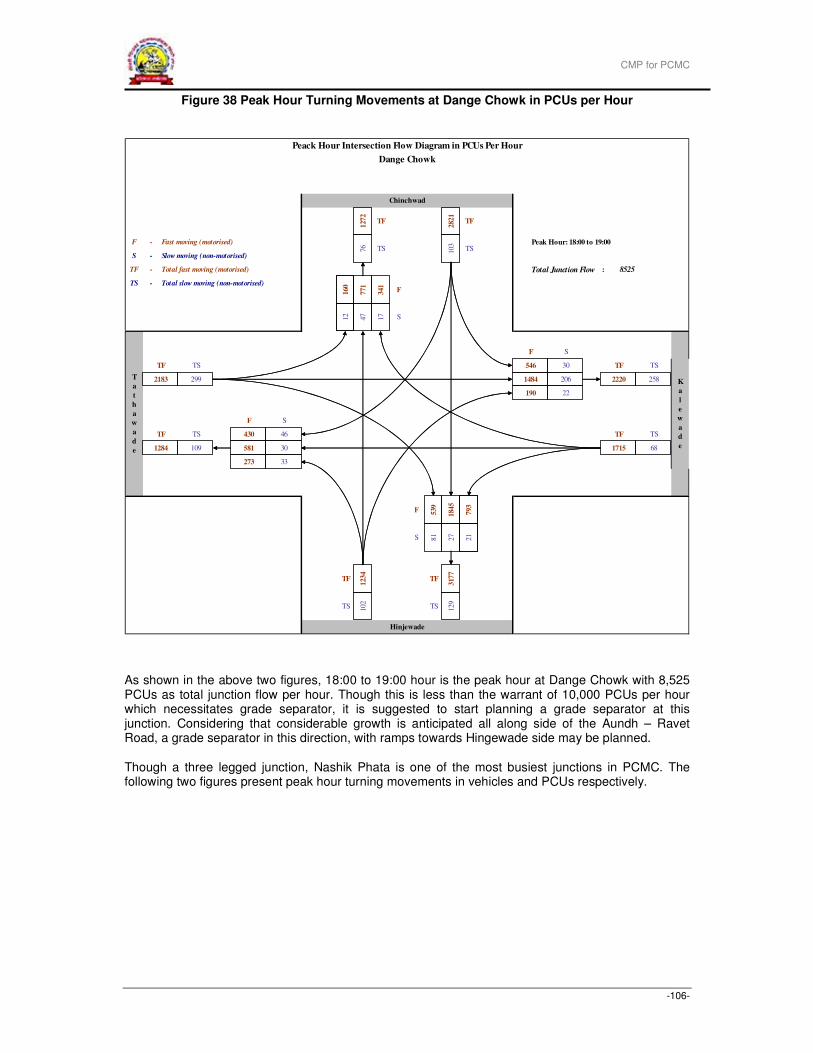
CMP for PCMC
-106-
Figure 38 Peak Hour Turning Movements at Dange Chowk in PCUs per Hour
As shown in the above two figures, 18:00 to 19:00 hour is the peak hour at Dange Chowk with 8,525 PCUs as total junction flow per hour. Though this is less than the warrant of 10,000 PCUs per hour which necessitates grade separator, it is suggested to start planning a grade separator at this junction. Considering that considerable growth is anticipated all along side of the Aundh – Ravet Road, a grade separator in this direction, with ramps towards Hingewade side may be planned.
Though a three legged junction, Nashik Phata is one of the most busiest junctions in PCMC. The following two figures present peak hour turning movements in vehicles and PCUs respectively.
F - Fast moving (motorised) Peak Hour: 18:00 to 19:00
S - Slow moving (non-motorised)
TF - Total fast moving (motorised) Total Junction Flow :
TS - Total slow moving (non-motorised)
8525
TF
TS
Peack Hour Intersection Flow Diagram in PCUs Per Hour
Dange Chowk
F
S
TF
TS
TF
TS
TF
TS
123
410
2
F
S
TF TS
TF TS
F S
273 33
TF TS
TF TS
F S
Chinchwad
K
a
l
e
w
a
d
e
4712
546 30
206
22
Hinjewade
T
a
t
h
a
w
a
d
e282
110
3
127
276
771
160
341
17
190
1484 2220 258
681715
2183 299
1284 109
430 46
581 3012
9317
7184
5
793
539
81
27
21
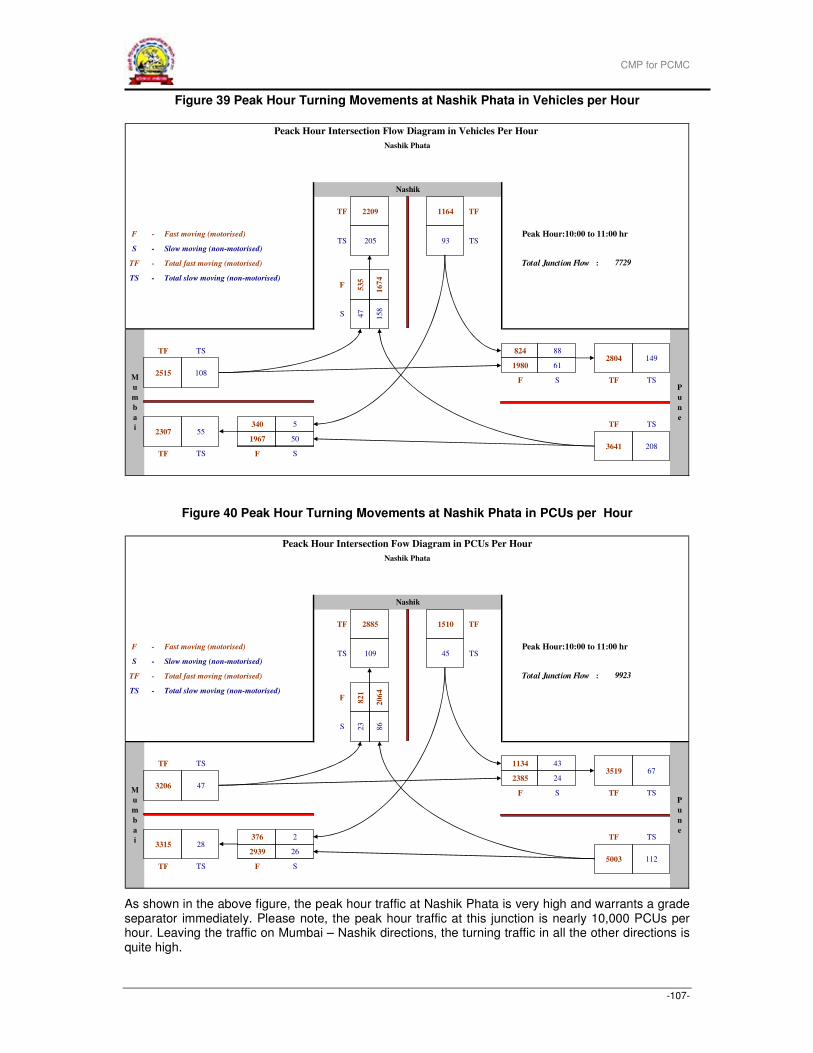
CMP for PCMC
-107-
Figure 39 Peak Hour Turning Movements at Nashik Phata in Vehicles per Hour
Figure 40 Peak Hour Turning Movements at Nashik Phata in PCUs per Hour
As shown in the above figure, the peak hour traffic at Nashik Phata is very high and warrants a grade separator immediately. Please note, the peak hour traffic at this junction is nearly 10,000 PCUs per hour. Leaving the traffic on Mumbai – Nashik directions, the turning traffic in all the other directions is quite high.
F - Fast moving (motorised) Peak Hour:10:00 to 11:00 hr
S - Slow moving (non-motorised)
TF - Total fast moving (motorised) Total Junction Flow :
TS - Total slow moving (non-motorised)
535
167
4
F
TF TS
2307 55
1164
93205
2209
208
2804 149
Peack Hour Intersection Flow Diagram in Vehicles Per Hour
Nashik Phata
Nashik
TF TF
TS TS
47
158
S
3641
824
M
u
m
b
a
i
61
50
TF TS
10825151980
1967
88
F S
7729
F S
P
u
n
e340 5
TF TS
TF TS
F - Fast moving (motorised) Peak Hour:10:00 to 11:00 hr
S - Slow moving (non-motorised)
TF - Total fast moving (motorised) Total Junction Flow :
TS - Total slow moving (non-motorised)
TF TS F S
TF TS
5003 1122939 26
P
u
n
e
F S TF TS
3519 6724
1134 43
M
u
m
b
a
i
3206 472385
3315 28376 2
S 23
86
TF TS
45 TS
F 821
206
4
9923
Peack Hour Intersection Fow Diagram in PCUs Per Hour
Nashik Phata
Nashik
TF 2885 1510 TF
TS 109
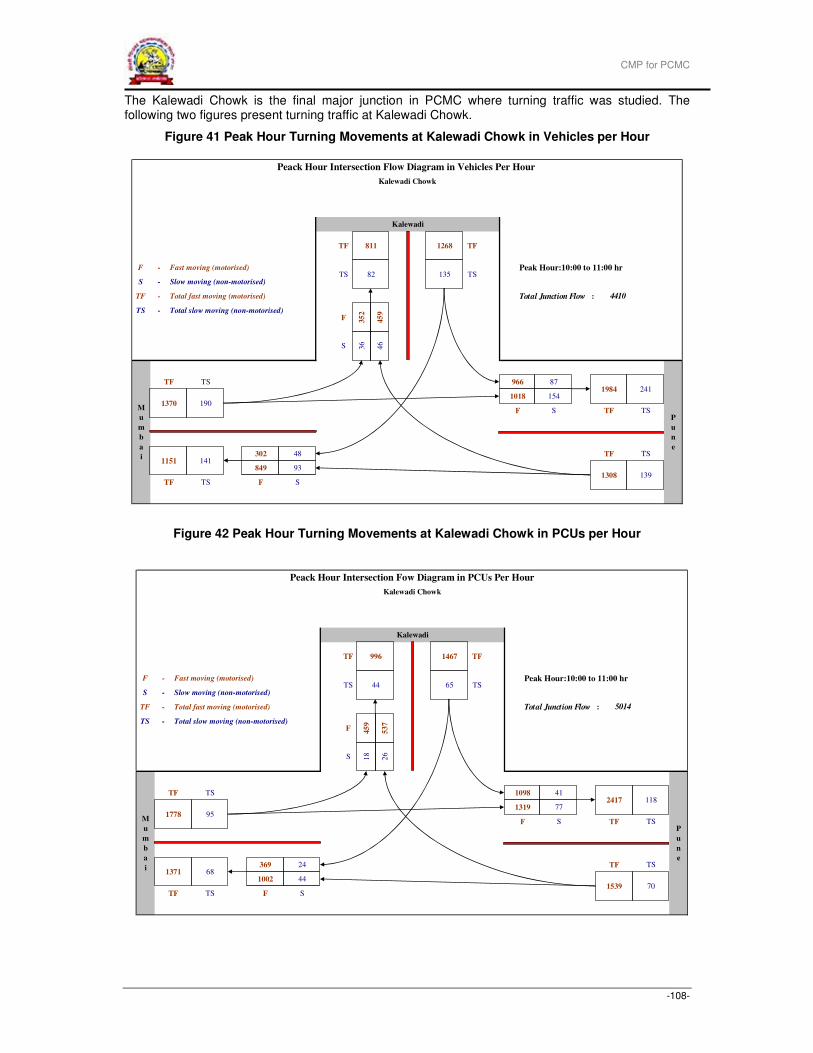
CMP for PCMC
-108-
The Kalewadi Chowk is the final major junction in PCMC where turning traffic was studied. The following two figures present turning traffic at Kalewadi Chowk.
Figure 41 Peak Hour Turning Movements at Kalewadi Chowk in Vehicles per Hour
Figure 42 Peak Hour Turning Movements at Kalewadi Chowk in PCUs per Hour
F - Fast moving (motorised) Peak Hour:10:00 to 11:00 hr
S - Slow moving (non-motorised)
TF - Total fast moving (motorised) Total Junction Flow :
TS - Total slow moving (non-motorised)
4410
F S
P
u
n
e302 48
TF TS
TF TS
849
87
F S
1308
966
M
u
m
b
a
i
154
93
TF TS
19013701018
139
1984 241
Peack Hour Intersection Flow Diagram in Vehicles Per Hour
Kalewadi Chowk
Kalewadi
TF TF
TS TS
1268
13582
811
35
2
45
9
F
TF TS
1151 141
36
46S
F - Fast moving (motorised) Peak Hour:10:00 to 11:00 hr
S - Slow moving (non-motorised)
TF - Total fast moving (motorised) Total Junction Flow :
TS - Total slow moving (non-motorised)
5014
Peack Hour Intersection Fow Diagram in PCUs Per Hour
Kalewadi Chowk
Kalewadi
TF 996 1467 TF
TS 44 65 TS
F 45
9
53
7
S 18
26
TF TS 1098 41
M
u
m
b
a
i
1778 951319
1371 68369 24
1002 44
P
u
n
e
F S TF TS
2417 11877
TF TS
1539 70TF TS F S
CMP for PCMC
-109-
The peak hour turning traffic at this junction, i.e., at Kalewadi Chowk is moderate and does not warrant a flyover immediately. However, considering the growth prospects in the influence area of this junction, it is recommended to acquire land for a flyover in near future.
3.7 Travel Demand Analysis
3.7.1 Introduction
As explained in Section 3.3, a four stage travel demand model has been developed to estimate Internal – Internal trips within PCMC Area, with the following models in each of the four stages:
(i) Trip Generation Model
a. Trip Production Model – Multiple linear regression model
b. Trip Attraction Model – Multiple linear regression model
(ii) Trip Distribution Model – Gravity model with zone influence factors
(iii) Mode Split Model – Multinomial Logit Model
(iv) Traffic Assignment Model – All-or-nothing for Transit Trips and Multinomial Logit based
Multipath Assignment Model for other trips
For trips with one end outside PCMC Area (i.e., I-E, E-I and E-E trips) elasticity of travel demand approach has been used for trip generation/distribution. The following sections present details on the travel demand model.
3.7.2 Trip Generation Models
To model trip generation, two sets of models, namely, trip production and trip attraction models have been calibrated. While trip production models are for estimating the number of trips produced in a zone, trip attraction models are for deriving the number of trips that come to a zone.
3.7.2.1 Trip Production Models
The number of trips produced in a zone generally depends upon a number of factors, important among them being:
� Population of the zone
� Accessibility of the zone
� Income level of people
� Vehicle ownership,
� Age, gender, etc.
In this study, population and accessibility of a zone have been considered for modelling trip productions. The distance of a zone from the nearest commercial zone has been considered as proxy for the accessibility of zone.
A stepwise linear regression modelling approach has been considered. Models have been calibrated both with and without intercepts. The following table summarises results from regression analysis.
Table 31 Summary of Regression Analysis for Trip Production Model
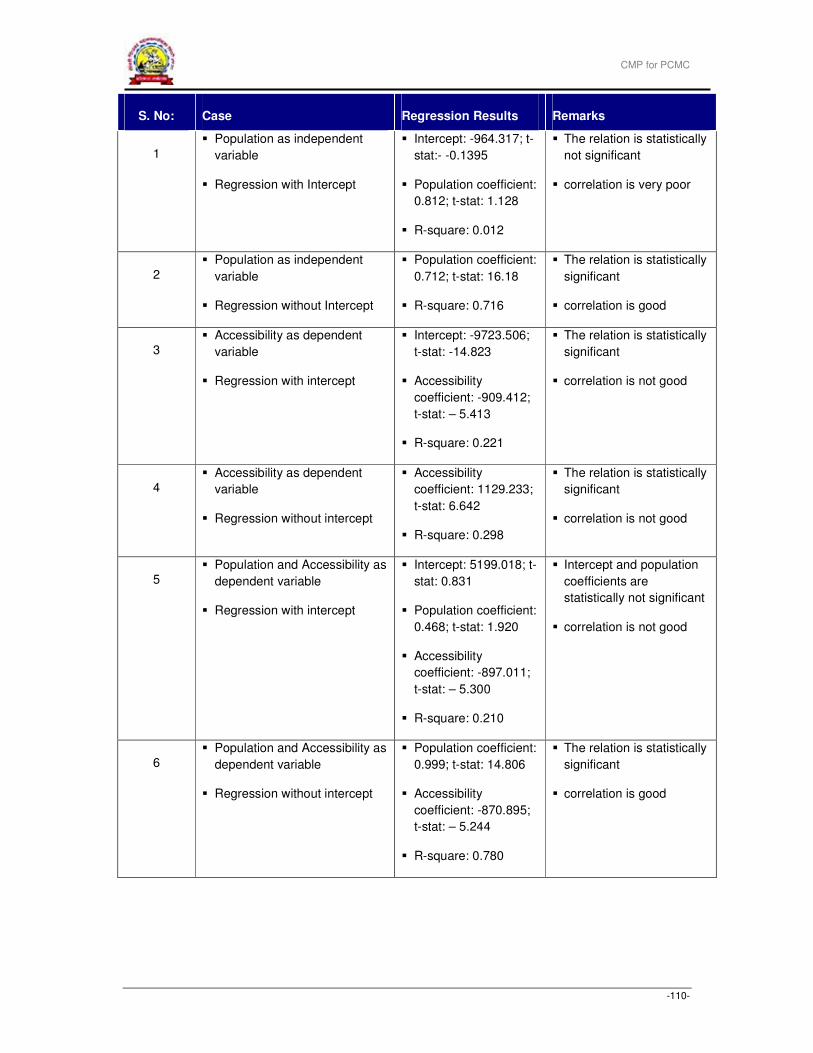
CMP for PCMC
-110-
S. No: Case Regression Results Remarks
1
� Population as independent
variable
� Regression with Intercept
� Intercept: -964.317; t-
stat:- -0.1395
� Population coefficient:
0.812; t-stat: 1.128
� R-square: 0.012
� The relation is statistically
not significant
� correlation is very poor
2
� Population as independent
variable
� Regression without Intercept
� Population coefficient:
0.712; t-stat: 16.18
� R-square: 0.716
� The relation is statistically
significant
� correlation is good
3 � Accessibility as dependent
variable
� Regression with intercept
� Intercept: -9723.506;
t-stat: -14.823
� Accessibility
coefficient: -909.412;
t-stat: – 5.413
� R-square: 0.221
� The relation is statistically
significant
� correlation is not good
4 � Accessibility as dependent
variable
� Regression without intercept
� Accessibility
coefficient: 1129.233;
t-stat: 6.642
� R-square: 0.298
� The relation is statistically
significant
� correlation is not good
5 � Population and Accessibility as
dependent variable
� Regression with intercept
� Intercept: 5199.018; t-
stat: 0.831
� Population coefficient:
0.468; t-stat: 1.920
� Accessibility
coefficient: -897.011;
t-stat: – 5.300
� R-square: 0.210
� Intercept and population
coefficients are
statistically not significant
� correlation is not good
6 � Population and Accessibility as
dependent variable
� Regression without intercept
� Population coefficient:
0.999; t-stat: 14.806
� Accessibility
coefficient: -870.895;
t-stat: – 5.244
� R-square: 0.780
� The relation is statistically
significant
� correlation is good
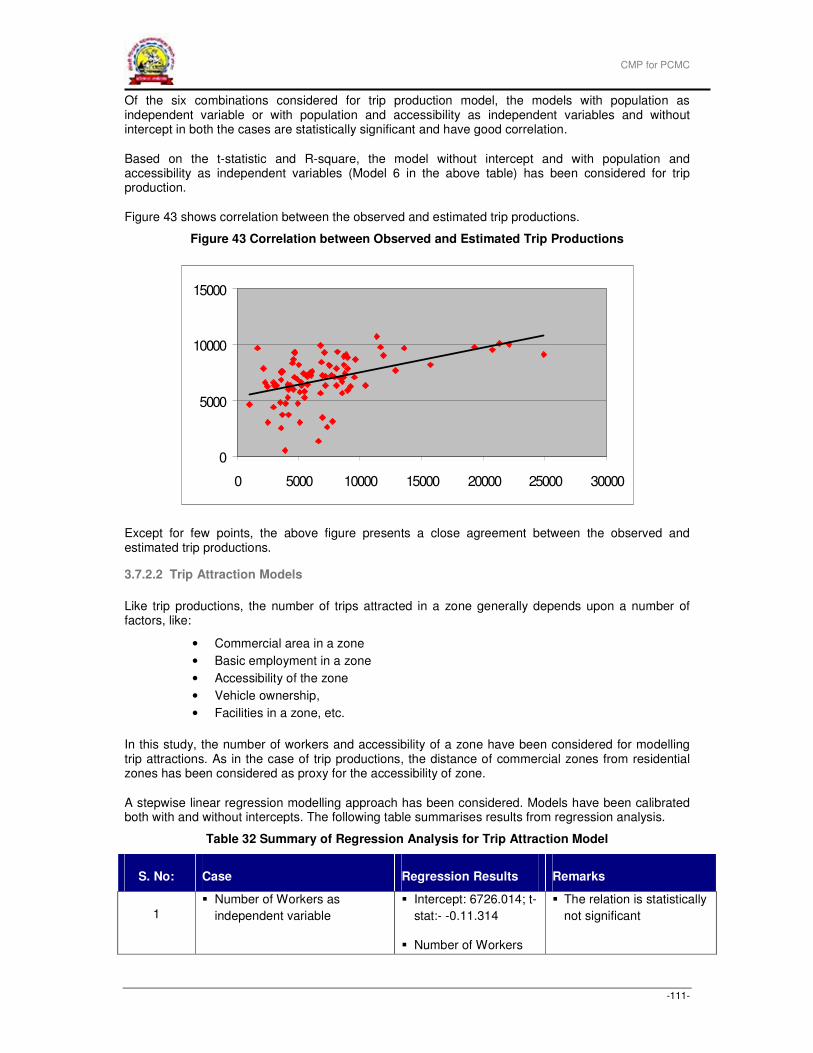
CMP for PCMC
-111-
Of the six combinations considered for trip production model, the models with population as independent variable or with population and accessibility as independent variables and without intercept in both the cases are statistically significant and have good correlation.
Based on the t-statistic and R-square, the model without intercept and with population and accessibility as independent variables (Model 6 in the above table) has been considered for trip production.
Figure 43 shows correlation between the observed and estimated trip productions.
Figure 43 Correlation between Observed and Estimated Trip Productions
Except for few points, the above figure presents a close agreement between the observed and estimated trip productions.
3.7.2.2 Trip Attraction Models
Like trip productions, the number of trips attracted in a zone generally depends upon a number of factors, like:
• Commercial area in a zone
• Basic employment in a zone
• Accessibility of the zone
• Vehicle ownership,
• Facilities in a zone, etc.
In this study, the number of workers and accessibility of a zone have been considered for modelling trip attractions. As in the case of trip productions, the distance of commercial zones from residential zones has been considered as proxy for the accessibility of zone.
A stepwise linear regression modelling approach has been considered. Models have been calibrated both with and without intercepts. The following table summarises results from regression analysis.
Table 32 Summary of Regression Analysis for Trip Attraction Model
S. No: Case Regression Results Remarks
1 � Number of Workers as
independent variable
� Intercept: 6726.014; t-
stat:- -0.11.314
� Number of Workers
� The relation is statistically
not significant
0
5000
10000
15000
0 5000 10000 15000 20000 25000 30000
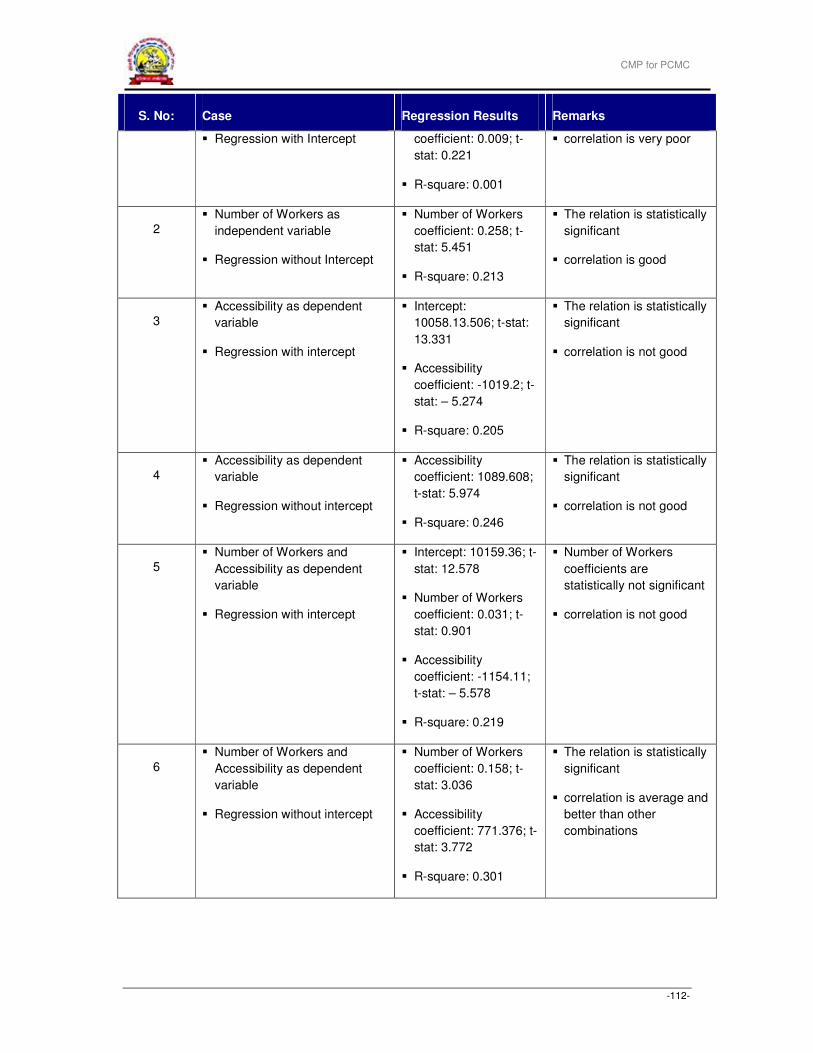
CMP for PCMC
-112-
S. No: Case Regression Results Remarks
� Regression with Intercept coefficient: 0.009; t-
stat: 0.221
� R-square: 0.001
� correlation is very poor
2 � Number of Workers as
independent variable
� Regression without Intercept
� Number of Workers
coefficient: 0.258; t-
stat: 5.451
� R-square: 0.213
� The relation is statistically
significant
� correlation is good
3 � Accessibility as dependent
variable
� Regression with intercept
� Intercept:
10058.13.506; t-stat:
13.331
� Accessibility
coefficient: -1019.2; t-
stat: – 5.274
� R-square: 0.205
� The relation is statistically
significant
� correlation is not good
4 � Accessibility as dependent
variable
� Regression without intercept
� Accessibility
coefficient: 1089.608;
t-stat: 5.974
� R-square: 0.246
� The relation is statistically
significant
� correlation is not good
5 � Number of Workers and
Accessibility as dependent
variable
� Regression with intercept
� Intercept: 10159.36; t-
stat: 12.578
� Number of Workers
coefficient: 0.031; t-
stat: 0.901
� Accessibility
coefficient: -1154.11;
t-stat: – 5.578
� R-square: 0.219
� Number of Workers
coefficients are
statistically not significant
� correlation is not good
6
� Number of Workers and
Accessibility as dependent
variable
� Regression without intercept
� Number of Workers
coefficient: 0.158; t-
stat: 3.036
� Accessibility
coefficient: 771.376; t-
stat: 3.772
� R-square: 0.301
� The relation is statistically
significant
� correlation is average and
better than other
combinations
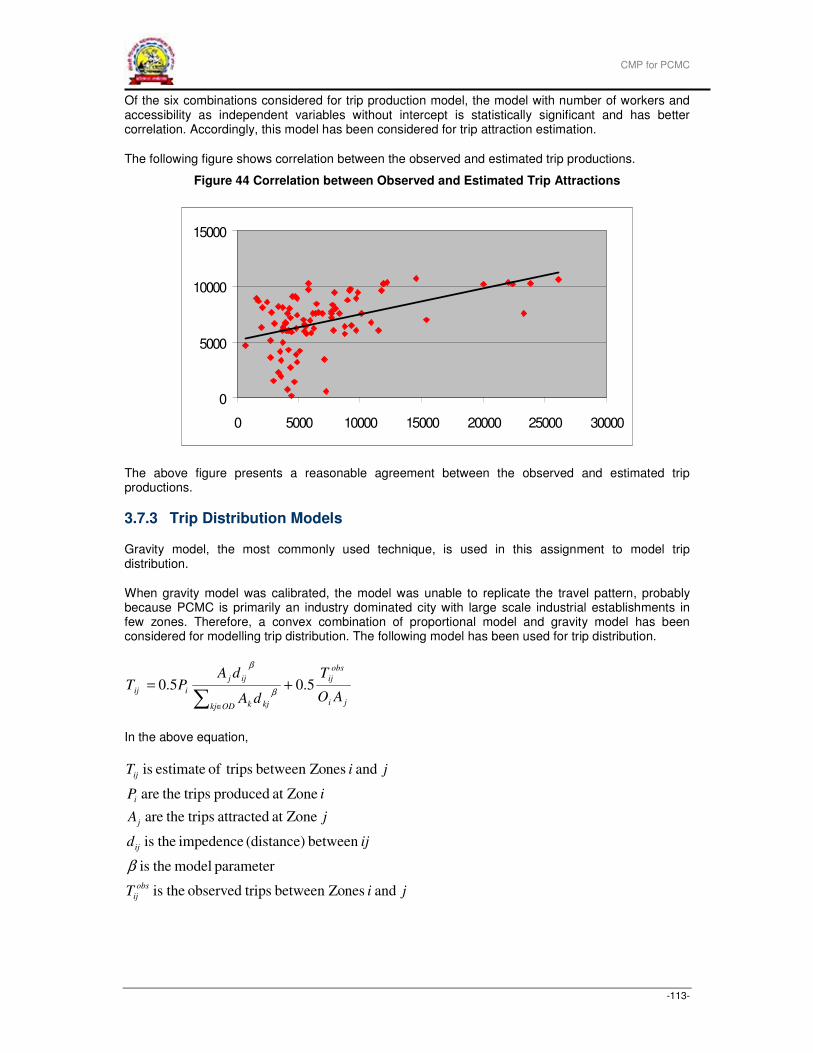
CMP for PCMC
-113-
Of the six combinations considered for trip production model, the model with number of workers and accessibility as independent variables without intercept is statistically significant and has better correlation. Accordingly, this model has been considered for trip attraction estimation.
The following figure shows correlation between the observed and estimated trip productions.
Figure 44 Correlation between Observed and Estimated Trip Attractions
0
5000
10000
15000
0 5000 10000 15000 20000 25000 30000
The above figure presents a reasonable agreement between the observed and estimated trip productions.
3.7.3 Trip Distribution Models
Gravity model, the most commonly used technique, is used in this assignment to model trip distribution.
When gravity model was calibrated, the model was unable to replicate the travel pattern, probably because PCMC is primarily an industry dominated city with large scale industrial establishments in few zones. Therefore, a convex combination of proportional model and gravity model has been considered for modelling trip distribution. The following model has been used for trip distribution.
ji
obs
ij
ODkj kjk
ijj
iijAO
T
dA
dAPT 5.05.0 +=
∑∈
β
β
In the above equation,
jiT
ijd
jA
iP
jiT
obs
ij
ij
j
i
ij
and nesbetween Zo tripsobserved theis
parameter model theis
between (distance) impedence theis
at Zone attracted trips theare
at Zone produced trips theare
and nesbetween Zo tripsof estimate is
β
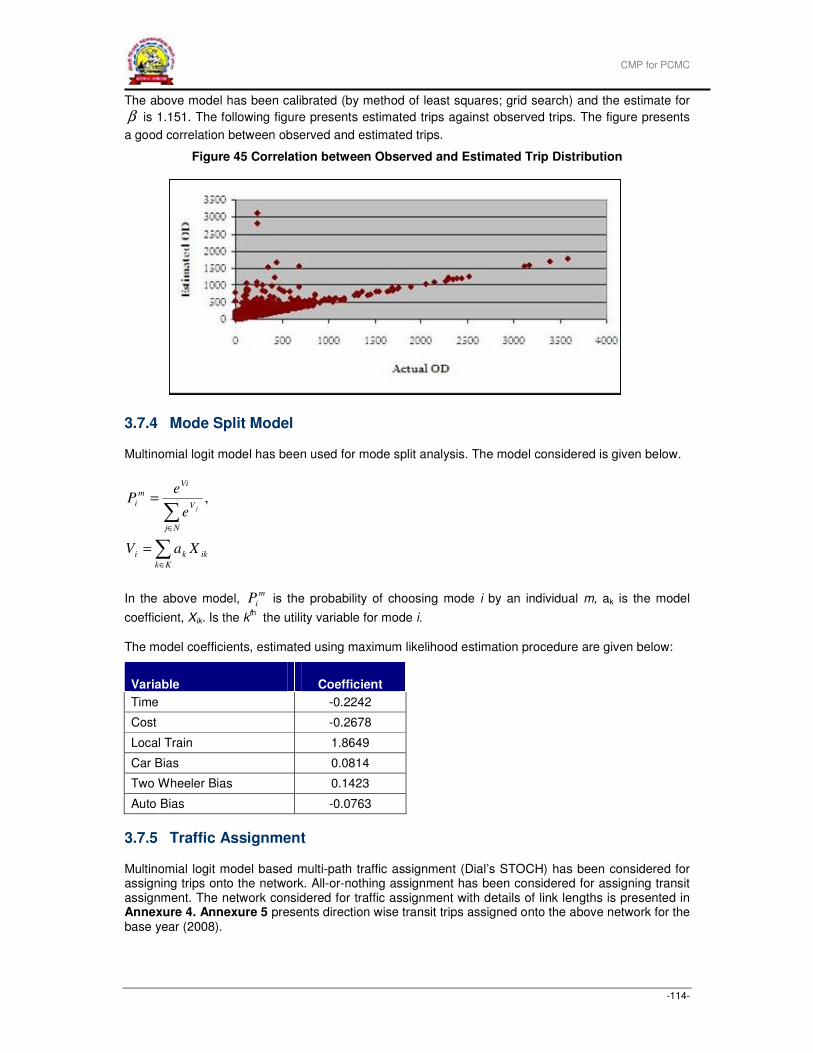
CMP for PCMC
-114-
The above model has been calibrated (by method of least squares; grid search) and the estimate for
β is 1.151. The following figure presents estimated trips against observed trips. The figure presents
a good correlation between observed and estimated trips.
Figure 45 Correlation between Observed and Estimated Trip Distribution
3.7.4 Mode Split Model
Multinomial logit model has been used for mode split analysis. The model considered is given below.
∑
∑
∈
∈
=
=
Kk
ikki
Nj
V
Vim
i
XaV
e
eP
j
,
In the above model, m
iP is the probability of choosing mode i by an individual m, ak is the model
coefficient, Xik. Is the kth the utility variable for mode i.
The model coefficients, estimated using maximum likelihood estimation procedure are given below:
Variable Coefficient
Time -0.2242
Cost -0.2678
Local Train 1.8649
Car Bias 0.0814
Two Wheeler Bias 0.1423
Auto Bias -0.0763
3.7.5 Traffic Assignment
Multinomial logit model based multi-path traffic assignment (Dial’s STOCH) has been considered for assigning trips onto the network. All-or-nothing assignment has been considered for assigning transit assignment. The network considered for traffic assignment with details of link lengths is presented in Annexure 4. Annexure 5 presents direction wise transit trips assigned onto the above network for the base year (2008).
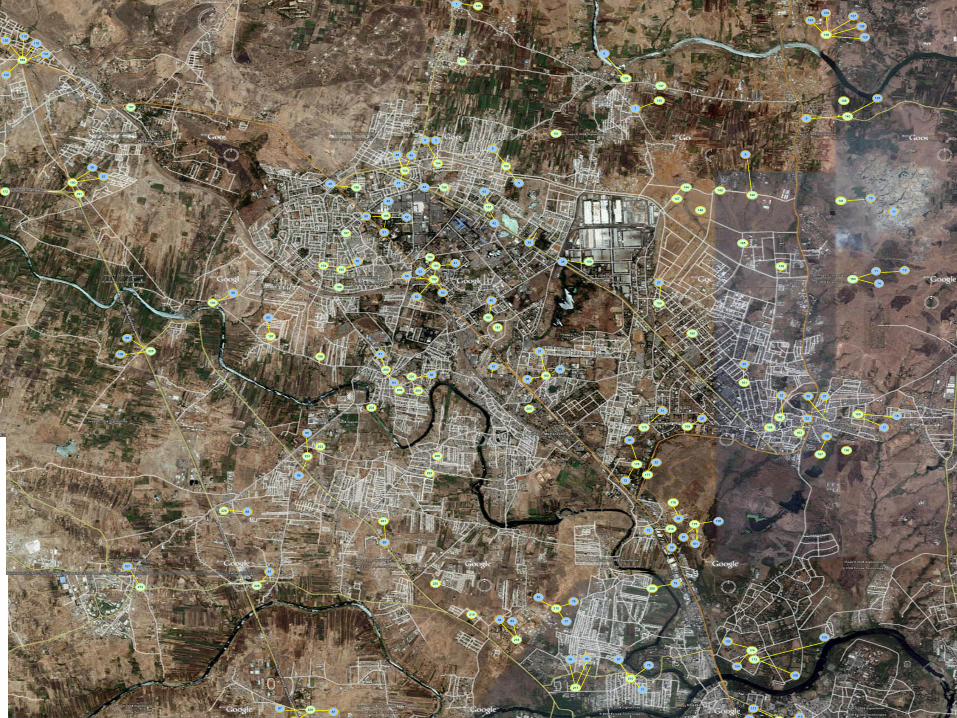
1.
Travel Demand Estimation - Network Considered1
135
45
153
3
154
2
155
46
152
5
184
156
185
186
183
197
181
182
52
48
49 4744
43
50
51
191
190
56
57
172
189
131
120119
118
132
187
197
225
193
198
58
106
59
201
200
66
64
61
40
157
158
42
5
39
38
199
41
53
63
54
62
180
37
35
36
67
195194
196
55
205
202 204
206
222
223
203
224
226
273
107
228
87
22987
87
96 95
218
217
84 83
219
220
221
89
86
85
88
210
8278
77
210
209
77
78
87
79
176
104
102
108
105
174
173
117
109113
100
97
101
175
99
21472
98
177
178
30
32
72
170 169
26
31
168
162
22
22
163
167166
19
161
25
26 21
165
17
18
160
159
27150
14
11 12
14110
125
11
140
138
9
139129
133127
128
124
137
136
6
7
145
151
142
8
144143
146
147
148
149
60
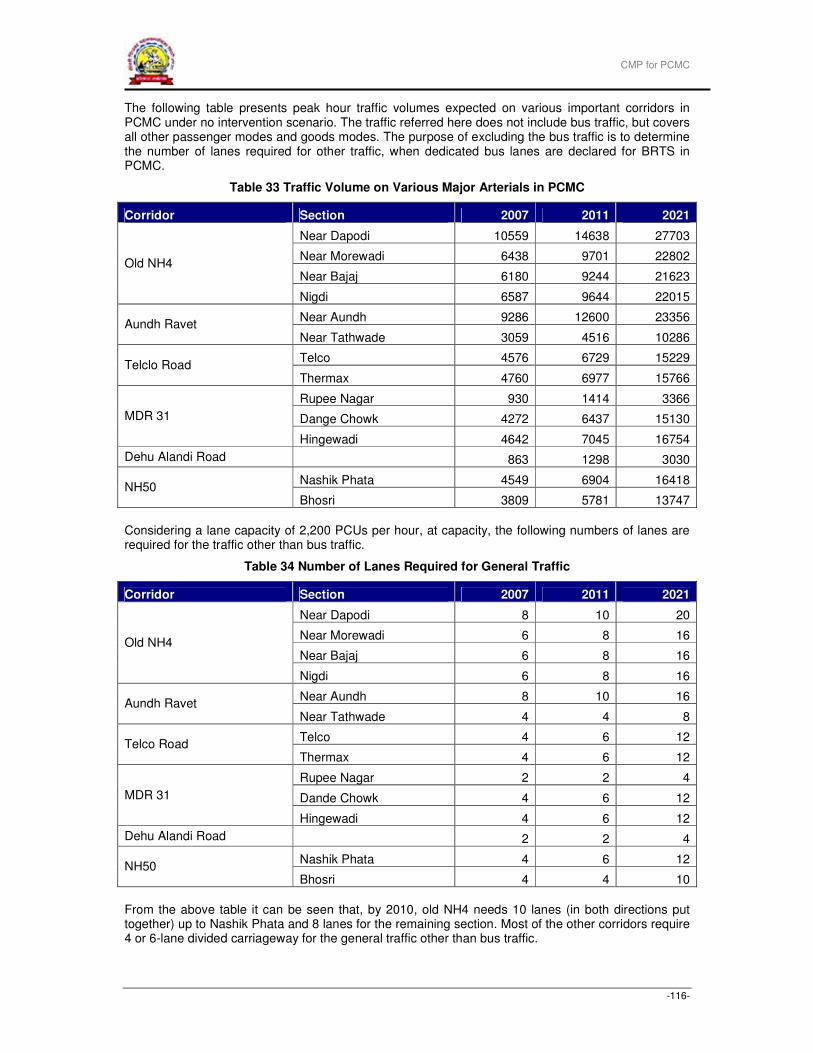
CMP for PCMC
-116-
The following table presents peak hour traffic volumes expected on various important corridors in PCMC under no intervention scenario. The traffic referred here does not include bus traffic, but covers all other passenger modes and goods modes. The purpose of excluding the bus traffic is to determine the number of lanes required for other traffic, when dedicated bus lanes are declared for BRTS in PCMC.
Table 33 Traffic Volume on Various Major Arterials in PCMC
Corridor Section 2007 2011 2021
Near Dapodi 10559 14638 27703
Near Morewadi 6438 9701 22802
Near Bajaj 6180 9244 21623 Old NH4
Nigdi 6587 9644 22015
Near Aundh 9286 12600 23356 Aundh Ravet
Near Tathwade 3059 4516 10286
Telco 4576 6729 15229 Telclo Road
Thermax 4760 6977 15766
Rupee Nagar 930 1414 3366
Dange Chowk 4272 6437 15130 MDR 31
Hingewadi 4642 7045 16754
Dehu Alandi Road 863 1298 3030
Nashik Phata 4549 6904 16418 NH50
Bhosri 3809 5781 13747
Considering a lane capacity of 2,200 PCUs per hour, at capacity, the following numbers of lanes are required for the traffic other than bus traffic.
Table 34 Number of Lanes Required for General Traffic
Corridor Section 2007 2011 2021
Near Dapodi 8 10 20
Near Morewadi 6 8 16
Near Bajaj 6 8 16 Old NH4
Nigdi 6 8 16
Near Aundh 8 10 16 Aundh Ravet
Near Tathwade 4 4 8
Telco 4 6 12 Telco Road
Thermax 4 6 12
Rupee Nagar 2 2 4
Dande Chowk 4 6 12 MDR 31
Hingewadi 4 6 12
Dehu Alandi Road 2 2 4
Nashik Phata 4 6 12 NH50
Bhosri 4 4 10
From the above table it can be seen that, by 2010, old NH4 needs 10 lanes (in both directions put together) up to Nashik Phata and 8 lanes for the remaining section. Most of the other corridors require 4 or 6-lane divided carriageway for the general traffic other than bus traffic.
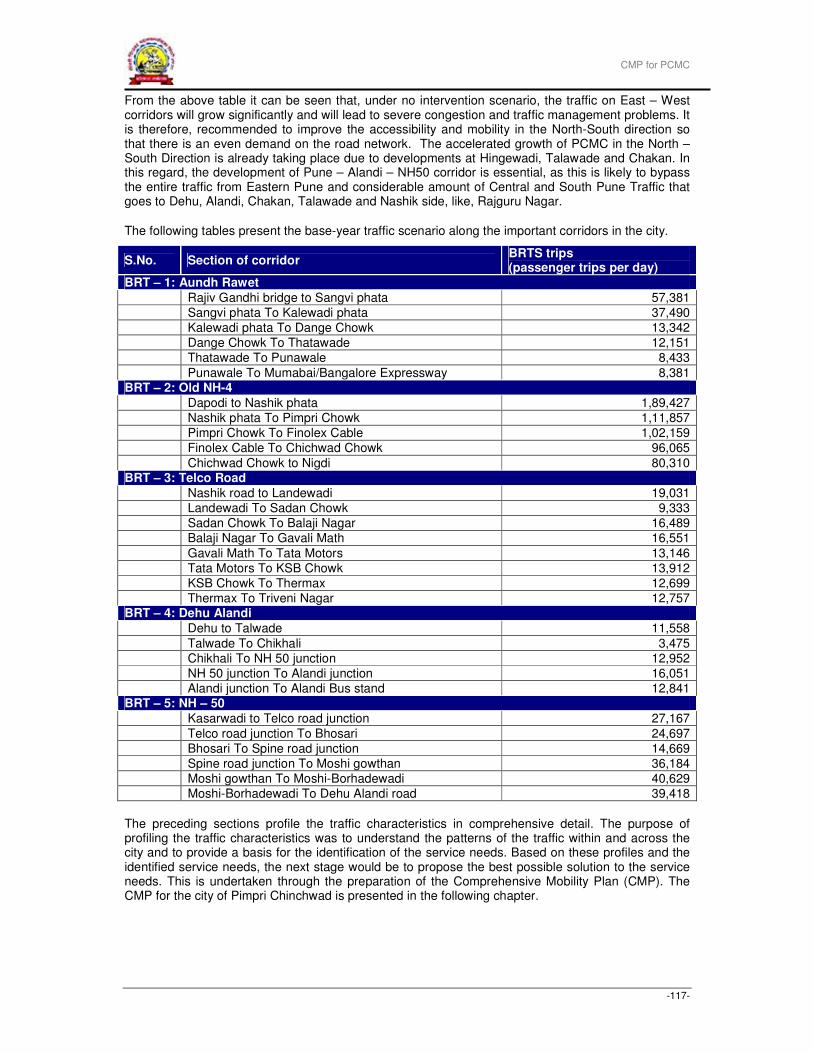
CMP for PCMC
-117-
From the above table it can be seen that, under no intervention scenario, the traffic on East – West corridors will grow significantly and will lead to severe congestion and traffic management problems. It is therefore, recommended to improve the accessibility and mobility in the North-South direction so that there is an even demand on the road network. The accelerated growth of PCMC in the North – South Direction is already taking place due to developments at Hingewadi, Talawade and Chakan. In this regard, the development of Pune – Alandi – NH50 corridor is essential, as this is likely to bypass the entire traffic from Eastern Pune and considerable amount of Central and South Pune Traffic that goes to Dehu, Alandi, Chakan, Talawade and Nashik side, like, Rajguru Nagar.
The following tables present the base-year traffic scenario along the important corridors in the city.
S.No. Section of corridor BRTS trips (passenger trips per day)
BRT – 1: Aundh Rawet
Rajiv Gandhi bridge to Sangvi phata 57,381
Sangvi phata To Kalewadi phata 37,490
Kalewadi phata To Dange Chowk 13,342
Dange Chowk To Thatawade 12,151
Thatawade To Punawale 8,433
Punawale To Mumabai/Bangalore Expressway 8,381 BRT – 2: Old NH-4
Dapodi to Nashik phata 1,89,427
Nashik phata To Pimpri Chowk 1,11,857
Pimpri Chowk To Finolex Cable 1,02,159
Finolex Cable To Chichwad Chowk 96,065
Chichwad Chowk to Nigdi 80,310 BRT – 3: Telco Road
Nashik road to Landewadi 19,031
Landewadi To Sadan Chowk 9,333
Sadan Chowk To Balaji Nagar 16,489
Balaji Nagar To Gavali Math 16,551
Gavali Math To Tata Motors 13,146
Tata Motors To KSB Chowk 13,912
KSB Chowk To Thermax 12,699
Thermax To Triveni Nagar 12,757 BRT – 4: Dehu Alandi
Dehu to Talwade 11,558
Talwade To Chikhali 3,475
Chikhali To NH 50 junction 12,952
NH 50 junction To Alandi junction 16,051
Alandi junction To Alandi Bus stand 12,841 BRT – 5: NH – 50
Kasarwadi to Telco road junction 27,167
Telco road junction To Bhosari 24,697
Bhosari To Spine road junction 14,669
Spine road junction To Moshi gowthan 36,184
Moshi gowthan To Moshi-Borhadewadi 40,629
Moshi-Borhadewadi To Dehu Alandi road 39,418
The preceding sections profile the traffic characteristics in comprehensive detail. The purpose of profiling the traffic characteristics was to understand the patterns of the traffic within and across the city and to provide a basis for the identification of the service needs. Based on these profiles and the identified service needs, the next stage would be to propose the best possible solution to the service needs. This is undertaken through the preparation of the Comprehensive Mobility Plan (CMP). The CMP for the city of Pimpri Chinchwad is presented in the following chapter.
CMP for PCMC
-118-
4 TRAVEL DEMAND MODELLING
Once the traffic and transportation characteristics of the city have been profiled, the next step is to identify the interventions and solutions to satisfy the current and the future service needs. While doing so, it is very important that the solutions to satisfy the service needs in different corridors are integrated with each other and all such solutions are integrated at the city level. Such a city level identification of service needs and the consequent strategy of integrated corridor level solutions and interventions are known as the Comprehensive Mobility Plan.
This Chapter is organized to present the pattern of travel demand is projected over a two decade period in a Business As Usual Scenario – assuming that the Development Plans and regulations currently in force remain as they are and current development trends continue. Having laid out this scenario, the objectives for a planned transformation were set out. The options available were then analyzed. The following section lays out all the key elements of a strategy for rational reorganization of both transportation systems and land use in the city of Pimpri-Chinchwad. While planning for transportation systems (from road network to mass transport) constitutes the supply management side of the intervention, the modulation of land use constitutes demand management. The effect of the Integrated Land Use – Transportation Plan on projected travel demand has then been assessed. The changes proposed in land use and density can only be realized through statutory processes leading to change in the Development Plan and Development Control Regulations. This is dealt with in the last section.
In the transportation planning exercise of this study, two broad scenarios have been considered for making population forecasts and their subsequent use in predicting travel patterns:
1. Business As Usual Scenario: the Land Use Zoning and Development Control Regulations continue to remain as they are today
2. Integrated Land Use – Transport Scenario: the Land Use Zoning and Development Control Regulations are modified to encourage higher density of built up area and location of higher order uses/ activities along proposed transport corridors and at nodes on such corridors.
4.1.1.1 Business-As-Usual (BAU) Scenario
In this scenario, the notional/ implied ‘Carrying Capacity’ of resident population in each ward has been estimated on the basis of the following factors:
1. Observed population density in wards that appear to be ‘fully developed’
2. Observed population density in built areas of wards that are partly developed
3. Land use and built form typology in all the wards
4. Prevalent Development Control Regulations
The urban planners have relied substantially on their experience and intuitive understanding of urban development processes while interpreting the observations and arriving at notional carrying capacities for each ward.
A simple Excel Worksheet based model was developed for distributing the city level increment in population (as estimated in the City Development Plan) for each time period. The increment in city level population is distributed in direct proportion to the available ‘spare capacity’ in each ward.
CMP for PCMC
-119-
4.1.1.2 Integrated Land Use – Transport (ILUT) Scenario
Based on various considerations elaborated in the relevant chapters of this report, the main transportation corridors have been identified. A proposed land use and density zoning plan has been prepared to complement and strengthen these corridors. Higher density (Higher Floor Space Index - FSI) and higher order land uses (such as commercial) have been proposed along the proposed transportation corridors, with emphasis on nodes on these corridors. It is anticipated that these zones will be provided with higher level of services.
In a simplistic sense, the impact of this proposed land use and density zoning on the estimated population distribution is that it will increase the notional carrying capacity of wards in which these zones fall. The increased capacity in each ward has been calculated on the basis of (1) proposed Development Control Regulations and (2) an intuitive understanding of the nature of development likely along the corridors. The rest of the methodology remains the same as in the BAU Scenario.
The estimated population distribution in the ILUT Scenario is presented in Section 4.3.1.
4.2 Future Travel Demand Scenarios – Business as Usual
The current travel demand scenario has been described in detail in Chapter 3. The model developed on the basis of historic and current data has been used to simulate the changing travel demand pattern over 5-year intervals up to 2031.
4.2.1 Methodology for Population Projections
The electoral ward is the spatial unit used for population forecast as it is also the spatial unit used as Traffic Analysis Zone. 2001 has been taken as the base year with census population for the 105 wards as the base population. Population has been estimated for the years 2006 and projected for the years 2011, 2016, 2021, 2026, and 2031 (five year intervals from Census year 2001) using the methodology described below.
4.2.1.1 City level population projection
At the city level, the components of population change are as follows:
1. Natural growth of resident population
2. In-migration
3. Out-migration
4. Incorporation of peripheral/ new areas into the city’s jurisdiction
5. Removal of any areas from the city’s jurisdiction
Typically, the largest components are natural growth and in-migration. A multitude of factors affect these two components, such as socio-economic characteristics, economic growth in the city, availability of land for development and the push factors in the hinterland (for example, rural poverty). While it is not realistically possible to model the effects of all such factors, it has been observed that a trend based projection usually suffices for most planning purposes. Such a trend based projection has already been carried out for Pimpri-Chinchwad Municipal Corporation during the preparation of the City Development Plan. This projection has been used for estimating the city’s infrastructure requirements. The same projections have been used for the transportation planning exercise also.
4.2.1.2 Ward level population projection
At ward level, however, a trend based projection proves inadequate as the growth trends are different in different parts of the city. It has generally been observed that the growth rate of population decreases in an area as it approaches a notional/ implied carrying capacity. ‘Modified exponential’ is the statistical method that comes closest to describing such a growth pattern.
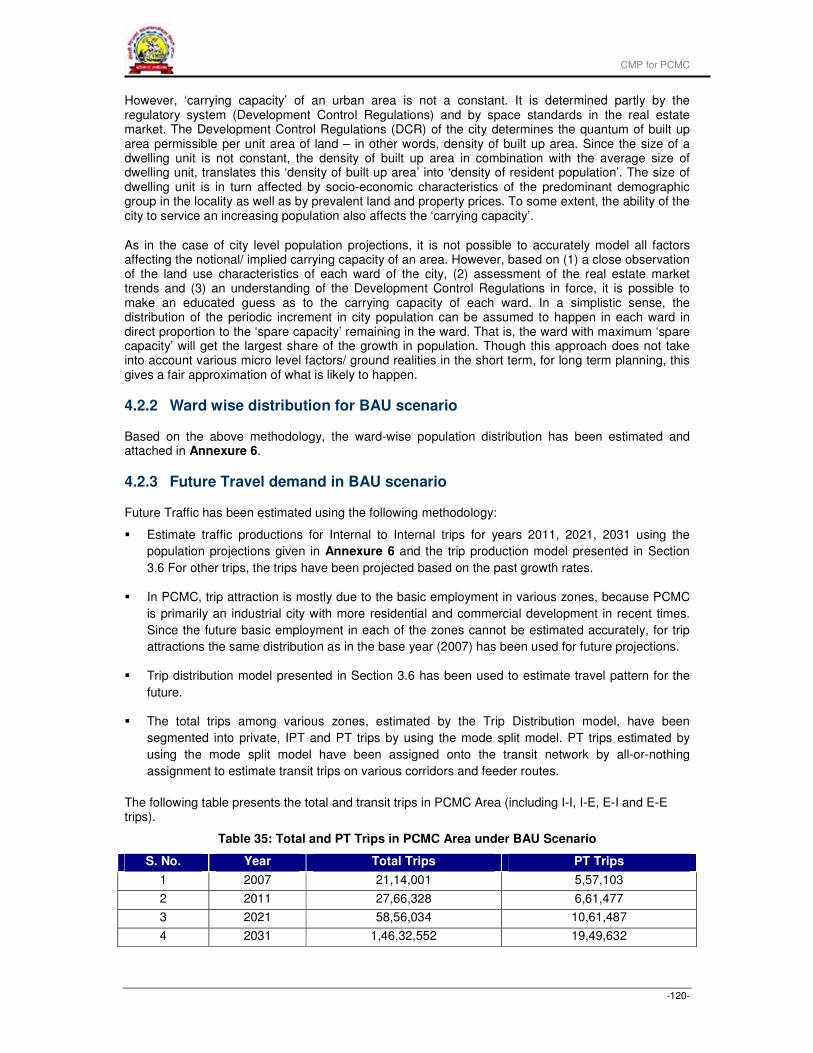
CMP for PCMC
-120-
However, ‘carrying capacity’ of an urban area is not a constant. It is determined partly by the regulatory system (Development Control Regulations) and by space standards in the real estate market. The Development Control Regulations (DCR) of the city determines the quantum of built up area permissible per unit area of land – in other words, density of built up area. Since the size of a dwelling unit is not constant, the density of built up area in combination with the average size of dwelling unit, translates this ‘density of built up area’ into ‘density of resident population’. The size of dwelling unit is in turn affected by socio-economic characteristics of the predominant demographic group in the locality as well as by prevalent land and property prices. To some extent, the ability of the city to service an increasing population also affects the ‘carrying capacity’.
As in the case of city level population projections, it is not possible to accurately model all factors affecting the notional/ implied carrying capacity of an area. However, based on (1) a close observation of the land use characteristics of each ward of the city, (2) assessment of the real estate market trends and (3) an understanding of the Development Control Regulations in force, it is possible to make an educated guess as to the carrying capacity of each ward. In a simplistic sense, the distribution of the periodic increment in city population can be assumed to happen in each ward in direct proportion to the ‘spare capacity’ remaining in the ward. That is, the ward with maximum ‘spare capacity’ will get the largest share of the growth in population. Though this approach does not take into account various micro level factors/ ground realities in the short term, for long term planning, this gives a fair approximation of what is likely to happen.
4.2.2 Ward wise distribution for BAU scenario
Based on the above methodology, the ward-wise population distribution has been estimated and attached in Annexure 6.
4.2.3 Future Travel demand in BAU scenario
Future Traffic has been estimated using the following methodology:
� Estimate traffic productions for Internal to Internal trips for years 2011, 2021, 2031 using the
population projections given in Annexure 6 and the trip production model presented in Section
3.6 For other trips, the trips have been projected based on the past growth rates.
� In PCMC, trip attraction is mostly due to the basic employment in various zones, because PCMC
is primarily an industrial city with more residential and commercial development in recent times.
Since the future basic employment in each of the zones cannot be estimated accurately, for trip
attractions the same distribution as in the base year (2007) has been used for future projections.
� Trip distribution model presented in Section 3.6 has been used to estimate travel pattern for the
future.
� The total trips among various zones, estimated by the Trip Distribution model, have been
segmented into private, IPT and PT trips by using the mode split model. PT trips estimated by
using the mode split model have been assigned onto the transit network by all-or-nothing
assignment to estimate transit trips on various corridors and feeder routes.
The following table presents the total and transit trips in PCMC Area (including I-I, I-E, E-I and E-E trips).
Table 35: Total and PT Trips in PCMC Area under BAU Scenario
S. No. Year Total Trips PT Trips
1 2007 21,14,001 5,57,103
2 2011 27,66,328 6,61,477
3 2021 58,56,034 10,61,487
4 2031 1,46,32,552 19,49,632
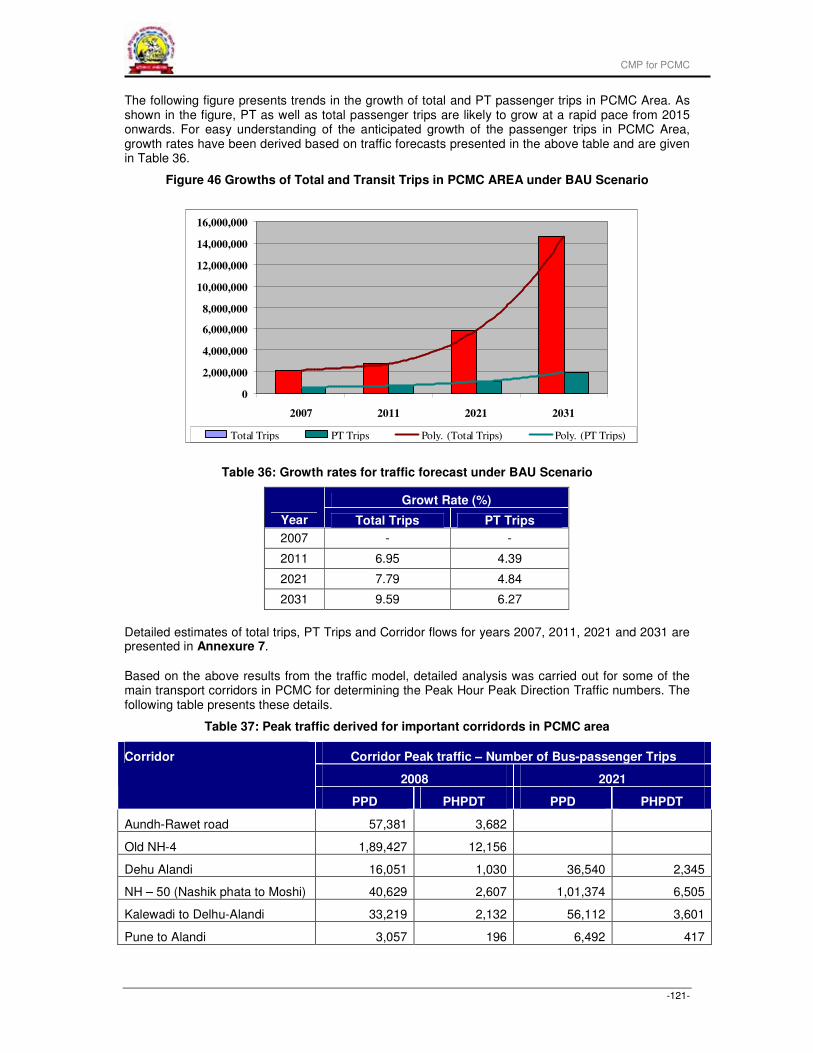
CMP for PCMC
-121-
The following figure presents trends in the growth of total and PT passenger trips in PCMC Area. As shown in the figure, PT as well as total passenger trips are likely to grow at a rapid pace from 2015 onwards. For easy understanding of the anticipated growth of the passenger trips in PCMC Area, growth rates have been derived based on traffic forecasts presented in the above table and are given in Table 36.
Figure 46 Growths of Total and Transit Trips in PCMC AREA under BAU Scenario
Table 36: Growth rates for traffic forecast under BAU Scenario
Growt Rate (%)
Year Total Trips PT Trips
2007 - -
2011 6.95 4.39
2021 7.79 4.84
2031 9.59 6.27
Detailed estimates of total trips, PT Trips and Corridor flows for years 2007, 2011, 2021 and 2031 are presented in Annexure 7.
Based on the above results from the traffic model, detailed analysis was carried out for some of the main transport corridors in PCMC for determining the Peak Hour Peak Direction Traffic numbers. The following table presents these details.
Table 37: Peak traffic derived for important corridords in PCMC area
Corridor Peak traffic – Number of Bus-passenger Trips
2008 2021
Corridor
PPD PHPDT PPD PHPDT
Aundh-Rawet road 57,381 3,682
Old NH-4 1,89,427 12,156
Dehu Alandi 16,051 1,030 36,540 2,345
NH – 50 (Nashik phata to Moshi) 40,629 2,607 1,01,374 6,505
Kalewadi to Delhu-Alandi 33,219 2,132 56,112 3,601
Pune to Alandi 3,057 196 6,492 417
0
2,000,000
4,000,000
6,000,000
8,000,000
10,000,000
12,000,000
14,000,000
16,000,000
2007 2011 2021 2031
Total Trips PT Trips Poly. (Total Trips) Poly. (PT Trips)
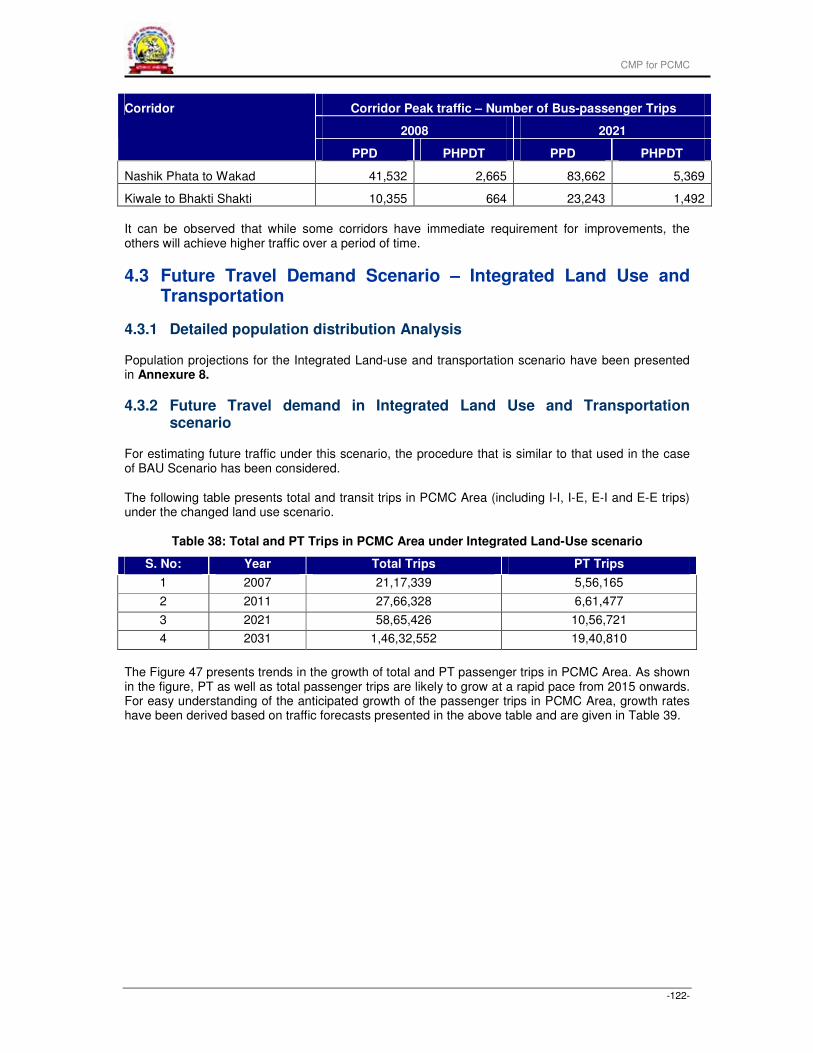
CMP for PCMC
-122-
Corridor Peak traffic – Number of Bus-passenger Trips
2008 2021
Corridor
PPD PHPDT PPD PHPDT
Nashik Phata to Wakad 41,532 2,665 83,662 5,369
Kiwale to Bhakti Shakti 10,355 664 23,243 1,492
It can be observed that while some corridors have immediate requirement for improvements, the others will achieve higher traffic over a period of time.
4.3 Future Travel Demand Scenario – Integrated Land Use and Transportation
4.3.1 Detailed population distribution Analysis
Population projections for the Integrated Land-use and transportation scenario have been presented in Annexure 8.
4.3.2 Future Travel demand in Integrated Land Use and Transportation scenario
For estimating future traffic under this scenario, the procedure that is similar to that used in the case of BAU Scenario has been considered.
The following table presents total and transit trips in PCMC Area (including I-I, I-E, E-I and E-E trips) under the changed land use scenario.
Table 38: Total and PT Trips in PCMC Area under Integrated Land-Use scenario
S. No: Year Total Trips PT Trips
1 2007 21,17,339 5,56,165
2 2011 27,66,328 6,61,477
3 2021 58,65,426 10,56,721
4 2031 1,46,32,552 19,40,810
The Figure 47 presents trends in the growth of total and PT passenger trips in PCMC Area. As shown in the figure, PT as well as total passenger trips are likely to grow at a rapid pace from 2015 onwards. For easy understanding of the anticipated growth of the passenger trips in PCMC Area, growth rates have been derived based on traffic forecasts presented in the above table and are given in Table 39.
CMP for PCMC
-123-
Figure 47 Growth of Total and Transit Trips in PCMC AREA under Integrated Land-Use Scenario
Note: Poly – polygon curve corresponding to the peaks of trips
Table 39: Growth rates for traffic forecast under Land-use integration Scenario
Growth Rate (%)
Year Total Trips PT Trips
2007 - -
2011 6.91 4.43
2021 7.81 4.80
2031 9.57 6.27
Traffic forecasts under the BAU and Changed Land Use Scenario are quite similar except for re-distribution of trips. It may be noted that, while estimating transit trips a wide network of transit routes with feeder network covering almost entire PCMC Area has been considered. Therefore, even in the case of transit trips there is no appreciable difference in traffic forecasts under the two scenarios considered. Detailed estimates of total trips, PT Trips and Corridor flows for years 2007, 2011, 2021 and 2031 are given in Annexure 9.
4.4 Proposed Land Use and Density Zoning
The basic premise of aligning land use and density is to load higher order uses and higher density on corridors with higher investment in infrastructure, in other words; ‘corridors with higher carrying capacity will have higher intensity of uses’. The trunk routes as mentioned in Section 5.1.1.1 will have commercial uses of greater FSI while the feeder corridors may have lower order commercial and residential uses in comparison. Residential and other uses of decreasing density will be aligned with increasing distance from these corridors. A schematic land use and density maps is shown in MAPS 5.4 and 5.5 - Proposed Land Use Plan, Proposed Density Plan. These plans are only schematic and are intended to give inputs to the preparation of a Development Plan for the city.
It is proposed that a variable FSI regime be applied on the corridors. A base FSI of one will be given as a matter of right to all and additional development rights may be bought to be used on predefined pockets along the corridor.
0
2,000,000
4,000,000
6,000,000
8,000,000
10,000,000
12,000,000
14,000,000
16,000,000
2007 2011 2021 2031
Total Trips PT Trips Poly. (Total Trips) Poly. (PT Trips)
CMP for PCMC
-124-
4.5 Challenges and opportunities, goals and objectives
With the goal of achieving a coherent relationship between land use and transportation systems, this section sets forth the agenda for improving various components of mobility in the city.
4.5.1 Improving road network structure
In Section2.1, the inadequacies of the road network as it stands presently and as proposed in the Development Plans have been discussed. The Development Plans have been prepared at three points in time for three different parts of the city. The challenge is to articulate a holistic approach to road network, building on the strength of the existing network. Currently, there is a paradoxical situation wherein the north-south arterial roads function both as the spine of the city with its major activities aligned along their length and as the principal regional traffic routes. A long term vision for the city has to consider the transformation of these arterials into high capacity traffic carriers for the city and its main connections to Pune. This requires the creation of alternate routes for regional through traffic on the periphery. The road network in Pimpri-Chinchwad has a grid structure. The simplest approach would be to extend the grid outwards, the outermost grid roads taking the regional traffic. The internal grid is however, incomplete and needs to be strengthened in terms of hierarchy, continuity and topology.
4.5.2 Diversifying and integrating transportation systems
Currently PCMC is served by bus transport being provided by PCMT, PMT (both these mow merged in PMPML) and Local Trains. IPT is also a predominant mode, but on few corridors in Pune – Mumbai direction. However, there is no coordination among these modes and therefore some of these modes are under utilised.
The local trains running between Pune and Lonavla currently cater to only about 80,000 passengers per day. Its share is likely to go down further as PCMC City grows further away from the local train corridor, particularly the growth of the City transverse to Mumbai – Pune direction. The capacity available on this corridor can be utilised better, if sufficient feeder network is provided both in PCMC and Pune and better parking facilities at stations. High frequency local trains, with integrated ticketing (for local trains and bus transit) would greatly enhance the utilisation of local trains and relieve congestion on Old NH4 in Dapodi Area.
Currently buses run on few major arterials and important streets. An efficient feeder system needs to be provided for enhancing the reach public transit into whole of PCMC Area.
4.5.3 Integration of Land Use and Transportation at City Level
The land use zoning proposed in the three Development Plans in the city have also been configured on a need basis at different points in time and do not take a holistic view for the city in totality. The Comprehensive Mobility Plan provides an opportunity to reorganize land use and density in coordination with the proposed road network and transportation systems proposed.
4.5.4 Development of East-West Corridors
It was shown earlier that, at present, the movement of traffic in PCMC area is predominantly in North – South direction, parallel to Old NH4. There are five corridors in PCMC to cater to this traffic, namely,
1. Old NH4
2. Aundh – Ravet Road
3. NH4 Bypass
4. Telco Road
5. Spine Road
CMP for PCMC
-125-
In addition to the above, Dehu – Alandi road is also available for North – South Traffic. However, due to following reasons, the travel pattern in the East-West direction is expected to grow significantly.
(i) growth of Chakan as another industrial hub in the region,
(ii) large number of SEZs and industrial estates that are being planned on Vadgaon –
Chakan Road, and
(iii) growth of Hingewadi and Talawade area
To organise this growth from the beginning, it is essential to develop East – West corridors in PCMC area including transit operations.
4.6 Alternative Analysis
To manage mobility in PCMC area, the following options have been considered:
(i) Plan the land use in such a way that the overall necessity for travel goes down. This will
require mixed land use in all zones. Further, as described earlier, plan major
developments close to Public Transit Corridors so that one can access transit without
much difficulty and without using a feeder system. In this assignment, proposals have
been made to this effect.
(ii) Provide high capacity transit, like, metro system on Old NH4 and a feeder system in Pune
and PCMC Area. While this may address the traffic between Pune and PCMC, for the
network spread of PCMC, considering the failure of metro rail systems at other places, one
or few metro lines may not suffice.
(iii) Provide high frequency high capacity bus transit on all important corridors and develop
new corridors between Pune and PCMC. Right now, Old NH4 and Aundh – Ravet road
carry most of the traffic between Pune and PCMC Area. With the growth of PCMC towards
Chakan these two corridors will not be effective to handle the future traffic between Pune
and PCMC. The extension of the road network grid proposed in this study into Pune will
reduce congestion on Old NH4 significantly.
4.7 Stake holder consultations
The present study involved a comprehensive study of the PCMC area. The various organisations/departments with whom consultations were held are:
1. The Commissioner, PCMC
2. The Additional Commissioner, PCMC
3. The City Engineer, PCMC
4. The Deputy Engineer, PCMC
5. Election Department at PCMC
6. Town Planning Department at PCMC
7. Property Tax Department at PCMC
8. General Manager, Pimpri-Chinchwad Municipal Transport (PCMT)
9. Dy. Managing Director, PMPML
CMP for PCMC
-126-
10. Asst Commissioner Office, Regional Transport Authority, Pimpri-Chinchwad
11. Asst Commissioners Office, Traffic Police, Pune
12. Team working on GISDA, Science & Technology Park
Secondary data was also collected from most of the above departments in order to complement primary traffic surveys.
Meetings were also held with officials in Pune Municipal Corporation to understand their plans for mass transit systems. Interactions were also held with the consultants of PMC which are working on these projects. They were appraised about the current study.
A meeting was also held with members of the builder association in the region to get their inputs on future growth of Pimpri-Chinchwad.
A number of meetings were held with technical consultants of PCMC who are working on various infrastructure projects in the city.
At various stages of the study, members of the General Body of PCMC, which is the decision making authority with all Corporators of the city as its members, were apprised about the concept and approach towards the projects. Their concurrence was taken for finalising city-level issues related to the road improvement projects and the BRT system.
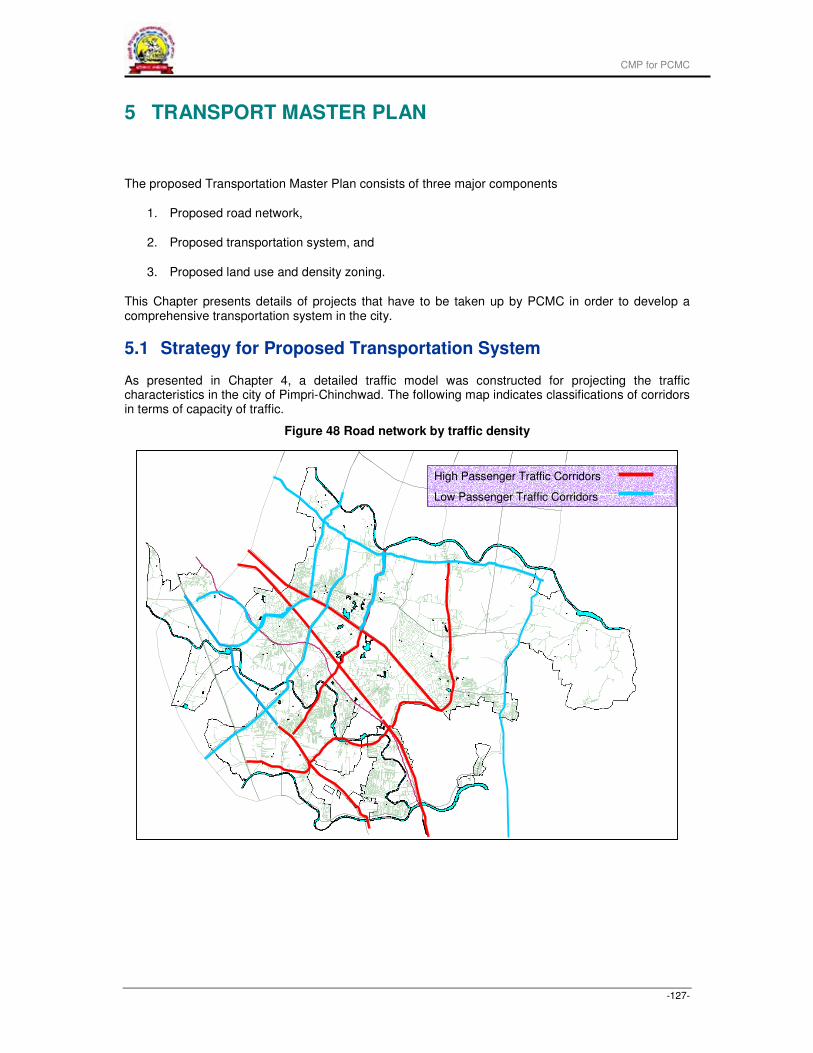
CMP for PCMC
-127-
5 TRANSPORT MASTER PLAN
The proposed Transportation Master Plan consists of three major components
1. Proposed road network,
2. Proposed transportation system, and
3. Proposed land use and density zoning.
This Chapter presents details of projects that have to be taken up by PCMC in order to develop a comprehensive transportation system in the city.
5.1 Strategy for Proposed Transportation System
As presented in Chapter 4, a detailed traffic model was constructed for projecting the traffic characteristics in the city of Pimpri-Chinchwad. The following map indicates classifications of corridors in terms of capacity of traffic.
Figure 48 Road network by traffic density
High Passenger Traffic Corridors
Low Passenger Traffic Corridors
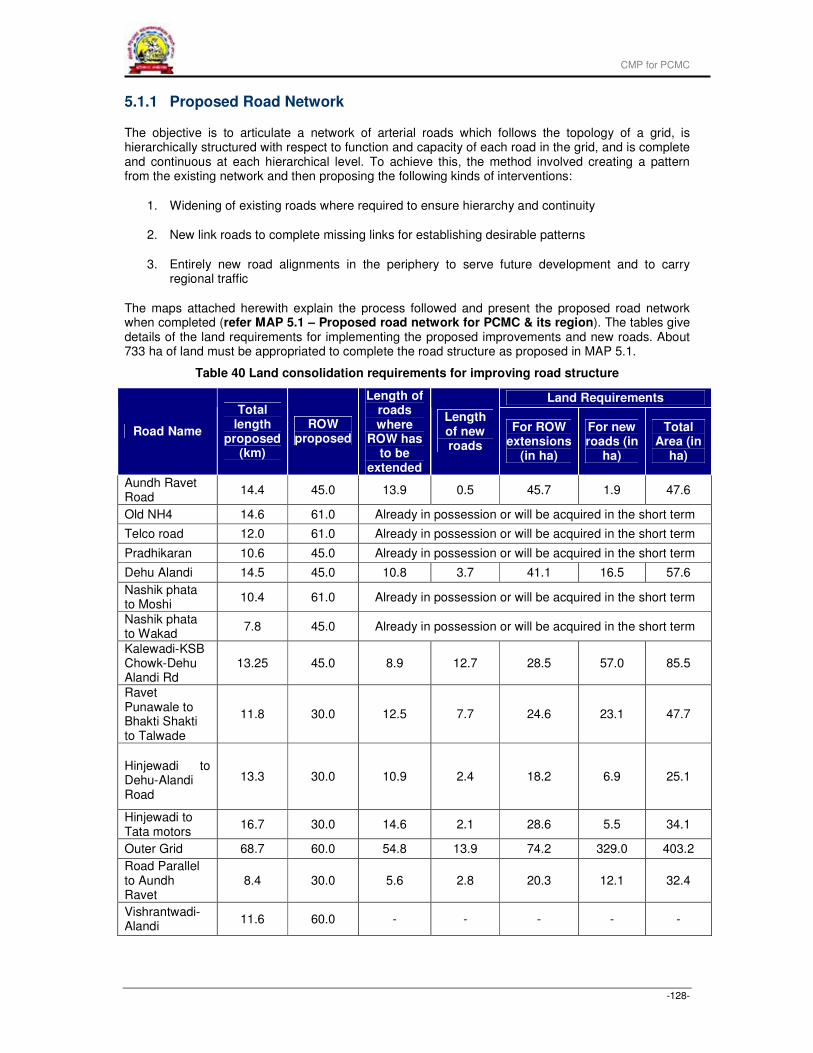
CMP for PCMC
-128-
5.1.1 Proposed Road Network
The objective is to articulate a network of arterial roads which follows the topology of a grid, is hierarchically structured with respect to function and capacity of each road in the grid, and is complete and continuous at each hierarchical level. To achieve this, the method involved creating a pattern from the existing network and then proposing the following kinds of interventions:
1. Widening of existing roads where required to ensure hierarchy and continuity
2. New link roads to complete missing links for establishing desirable patterns
3. Entirely new road alignments in the periphery to serve future development and to carry regional traffic
The maps attached herewith explain the process followed and present the proposed road network when completed (refer MAP 5.1 – Proposed road network for PCMC & its region). The tables give details of the land requirements for implementing the proposed improvements and new roads. About 733 ha of land must be appropriated to complete the road structure as proposed in MAP 5.1.
Table 40 Land consolidation requirements for improving road structure
Land Requirements
Road Name
Total length
proposed (km)
ROW proposed
Length of roads where
ROW has to be
extended
Length of new roads
For ROW extensions
(in ha)
For new roads (in
ha)
Total Area (in
ha)
Aundh Ravet Road
14.4 45.0 13.9 0.5 45.7 1.9 47.6
Old NH4 14.6 61.0 Already in possession or will be acquired in the short term
Telco road 12.0 61.0 Already in possession or will be acquired in the short term
Pradhikaran 10.6 45.0 Already in possession or will be acquired in the short term
Dehu Alandi 14.5 45.0 10.8 3.7 41.1 16.5 57.6
Nashik phata to Moshi
10.4 61.0 Already in possession or will be acquired in the short term
Nashik phata to Wakad
7.8 45.0 Already in possession or will be acquired in the short term
Kalewadi-KSB Chowk-Dehu Alandi Rd
13.25 45.0 8.9 12.7 28.5 57.0 85.5
Ravet Punawale to Bhakti Shakti to Talwade
11.8 30.0 12.5 7.7 24.6 23.1 47.7
Hinjewadi to Dehu-Alandi Road
13.3 30.0 10.9 2.4 18.2 6.9 25.1
Hinjewadi to Tata motors
16.7 30.0 14.6 2.1 28.6 5.5 34.1
Outer Grid 68.7 60.0 54.8 13.9 74.2 329.0 403.2
Road Parallel to Aundh Ravet
8.4 30.0 5.6 2.8 20.3 12.1 32.4
Vishrantwadi-Alandi
11.6 60.0 - - - - -
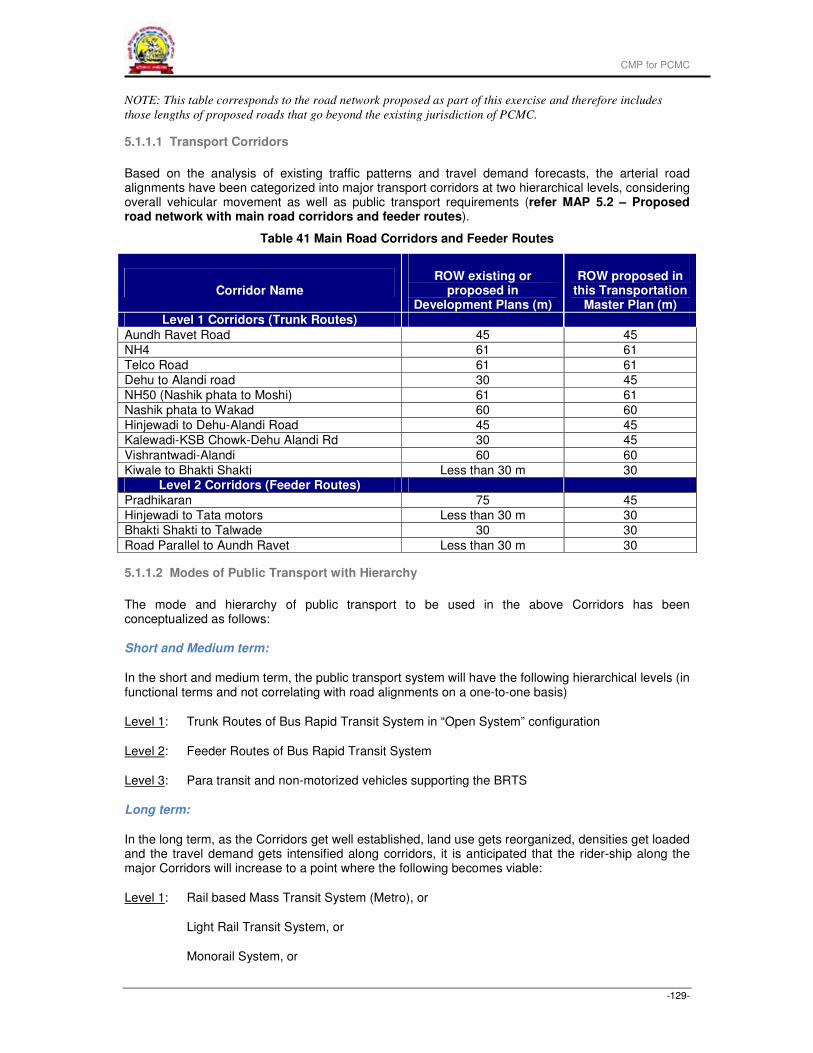
CMP for PCMC
-129-
NOTE: This table corresponds to the road network proposed as part of this exercise and therefore includes
those lengths of proposed roads that go beyond the existing jurisdiction of PCMC.
5.1.1.1 Transport Corridors
Based on the analysis of existing traffic patterns and travel demand forecasts, the arterial road alignments have been categorized into major transport corridors at two hierarchical levels, considering overall vehicular movement as well as public transport requirements (refer MAP 5.2 – Proposed road network with main road corridors and feeder routes).
Table 41 Main Road Corridors and Feeder Routes
Corridor Name ROW existing or
proposed in Development Plans (m)
ROW proposed in this Transportation
Master Plan (m)
Level 1 Corridors (Trunk Routes)
Aundh Ravet Road 45 45
NH4 61 61
Telco Road 61 61
Dehu to Alandi road 30 45
NH50 (Nashik phata to Moshi) 61 61
Nashik phata to Wakad 60 60
Hinjewadi to Dehu-Alandi Road 45 45
Kalewadi-KSB Chowk-Dehu Alandi Rd 30 45
Vishrantwadi-Alandi 60 60
Kiwale to Bhakti Shakti Less than 30 m 30 Level 2 Corridors (Feeder Routes)
Pradhikaran 75 45
Hinjewadi to Tata motors Less than 30 m 30
Bhakti Shakti to Talwade 30 30
Road Parallel to Aundh Ravet Less than 30 m 30
5.1.1.2 Modes of Public Transport with Hierarchy
The mode and hierarchy of public transport to be used in the above Corridors has been conceptualized as follows:
Short and Medium term:
In the short and medium term, the public transport system will have the following hierarchical levels (in functional terms and not correlating with road alignments on a one-to-one basis)
Level 1: Trunk Routes of Bus Rapid Transit System in “Open System” configuration
Level 2: Feeder Routes of Bus Rapid Transit System
Level 3: Para transit and non-motorized vehicles supporting the BRTS
Long term:
In the long term, as the Corridors get well established, land use gets reorganized, densities get loaded and the travel demand gets intensified along corridors, it is anticipated that the rider-ship along the major Corridors will increase to a point where the following becomes viable:
Level 1: Rail based Mass Transit System (Metro), or
Light Rail Transit System, or
Monorail System, or
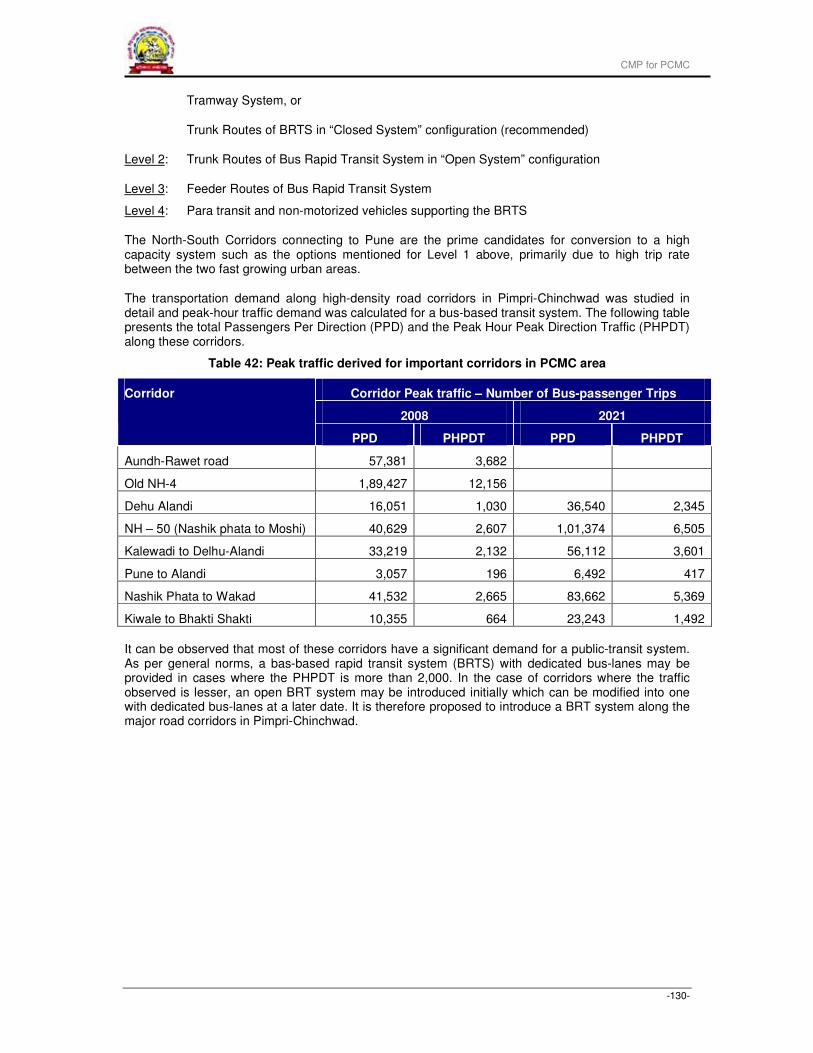
CMP for PCMC
-130-
Tramway System, or
Trunk Routes of BRTS in “Closed System” configuration (recommended)
Level 2: Trunk Routes of Bus Rapid Transit System in “Open System” configuration
Level 3: Feeder Routes of Bus Rapid Transit System
Level 4: Para transit and non-motorized vehicles supporting the BRTS
The North-South Corridors connecting to Pune are the prime candidates for conversion to a high capacity system such as the options mentioned for Level 1 above, primarily due to high trip rate between the two fast growing urban areas.
The transportation demand along high-density road corridors in Pimpri-Chinchwad was studied in detail and peak-hour traffic demand was calculated for a bus-based transit system. The following table presents the total Passengers Per Direction (PPD) and the Peak Hour Peak Direction Traffic (PHPDT) along these corridors.
Table 42: Peak traffic derived for important corridors in PCMC area
Corridor Peak traffic – Number of Bus-passenger Trips
2008 2021
Corridor
PPD PHPDT PPD PHPDT
Aundh-Rawet road 57,381 3,682
Old NH-4 1,89,427 12,156
Dehu Alandi 16,051 1,030 36,540 2,345
NH – 50 (Nashik phata to Moshi) 40,629 2,607 1,01,374 6,505
Kalewadi to Delhu-Alandi 33,219 2,132 56,112 3,601
Pune to Alandi 3,057 196 6,492 417
Nashik Phata to Wakad 41,532 2,665 83,662 5,369
Kiwale to Bhakti Shakti 10,355 664 23,243 1,492
It can be observed that most of these corridors have a significant demand for a public-transit system. As per general norms, a bas-based rapid transit system (BRTS) with dedicated bus-lanes may be provided in cases where the PHPDT is more than 2,000. In the case of corridors where the traffic observed is lesser, an open BRT system may be introduced initially which can be modified into one with dedicated bus-lanes at a later date. It is therefore proposed to introduce a BRT system along the major road corridors in Pimpri-Chinchwad.
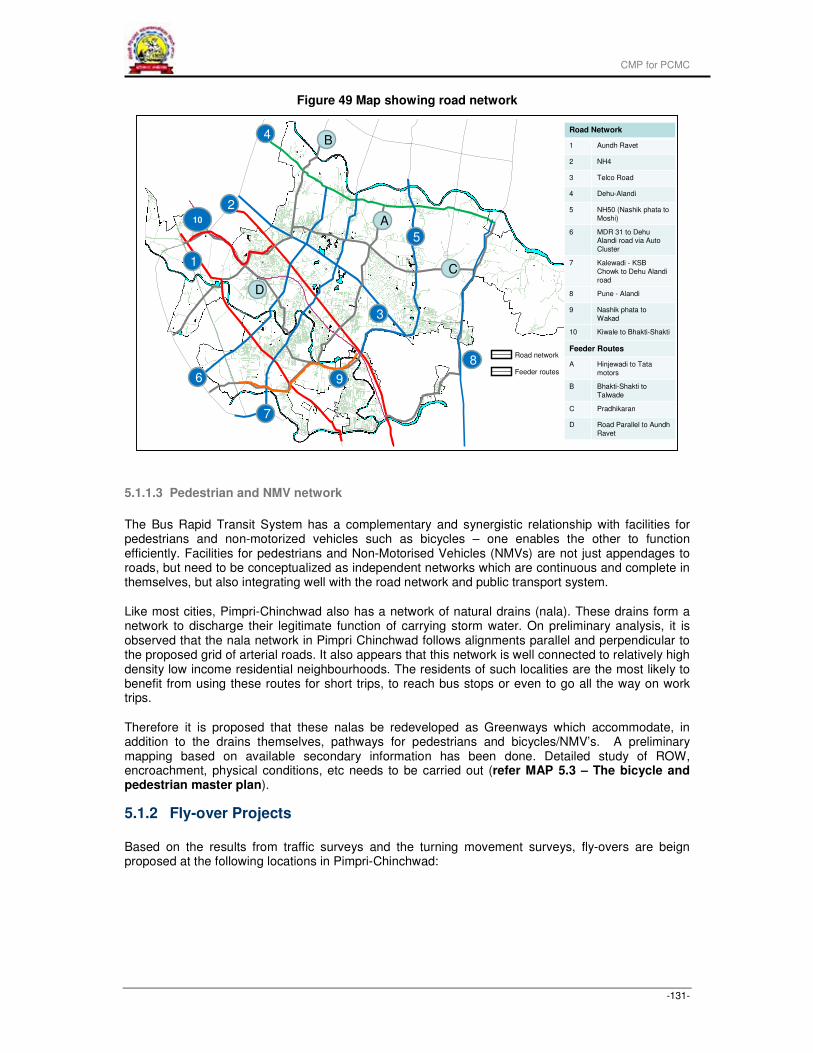
CMP for PCMC
-131-
Figure 49 Map showing road network
5.1.1.3 Pedestrian and NMV network
The Bus Rapid Transit System has a complementary and synergistic relationship with facilities for pedestrians and non-motorized vehicles such as bicycles – one enables the other to function efficiently. Facilities for pedestrians and Non-Motorised Vehicles (NMVs) are not just appendages to roads, but need to be conceptualized as independent networks which are continuous and complete in themselves, but also integrating well with the road network and public transport system.
Like most cities, Pimpri-Chinchwad also has a network of natural drains (nala). These drains form a network to discharge their legitimate function of carrying storm water. On preliminary analysis, it is observed that the nala network in Pimpri Chinchwad follows alignments parallel and perpendicular to the proposed grid of arterial roads. It also appears that this network is well connected to relatively high density low income residential neighbourhoods. The residents of such localities are the most likely to benefit from using these routes for short trips, to reach bus stops or even to go all the way on work trips.
Therefore it is proposed that these nalas be redeveloped as Greenways which accommodate, in addition to the drains themselves, pathways for pedestrians and bicycles/NMV’s. A preliminary mapping based on available secondary information has been done. Detailed study of ROW, encroachment, physical conditions, etc needs to be carried out (refer MAP 5.3 – The bicycle and pedestrian master plan).
5.1.2 Fly-over Projects
Based on the results from traffic surveys and the turning movement surveys, fly-overs are beign proposed at the following locations in Pimpri-Chinchwad:
`
Feeder routes
Road network
Nashik phata to
Wakad
9
Kiwale to Bhakti-Shakti10
Pune - Alandi8
Kalewadi - KSB
Chowk to Dehu Alandi
road
7
Road Network
1 Aundh Ravet
2 NH4
3 Telco Road
4 Dehu-Alandi
5 NH50 (Nashik phata to
Moshi)
6 MDR 31 to DehuAlandi road via Auto
Cluster
Feeder Routes
A Hinjewadi to Tata
motors
B Bhakti-Shakti to
Talwade
C Pradhikaran
D Road Parallel to Aundh
Ravet
Nashik phata to
Wakad
9
Kiwale to Bhakti-Shakti10
Pune - Alandi8
Kalewadi - KSB
Chowk to Dehu Alandi
road
7
Road Network
1 Aundh Ravet
2 NH4
3 Telco Road
4 Dehu-Alandi
5 NH50 (Nashik phata to
Moshi)
6 MDR 31 to DehuAlandi road via Auto
Cluster
Feeder Routes
A Hinjewadi to Tata
motors
B Bhakti-Shakti to
Talwade
C Pradhikaran
D Road Parallel to Aundh
Ravet
1
2
3
4
5
6
7
A
B
C
8
9
10
D
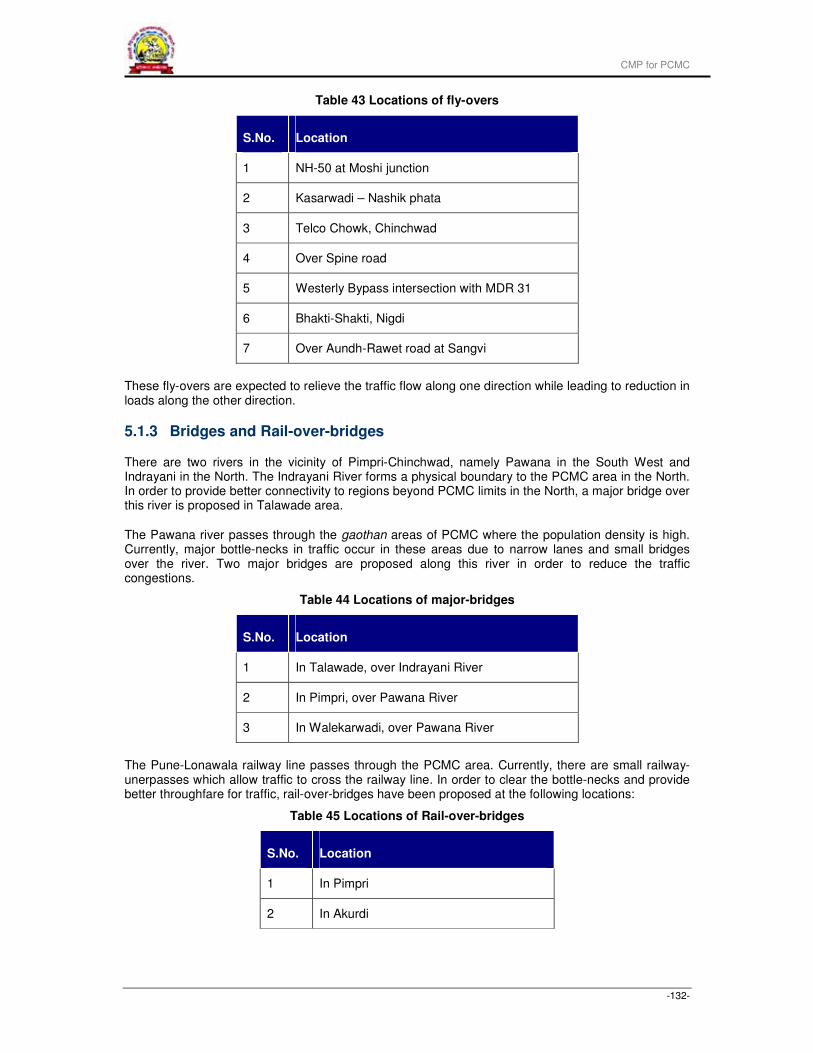
CMP for PCMC
-132-
Table 43 Locations of fly-overs
S.No. Location
1 NH-50 at Moshi junction
2 Kasarwadi – Nashik phata
3 Telco Chowk, Chinchwad
4 Over Spine road
5 Westerly Bypass intersection with MDR 31
6 Bhakti-Shakti, Nigdi
7 Over Aundh-Rawet road at Sangvi
These fly-overs are expected to relieve the traffic flow along one direction while leading to reduction in loads along the other direction.
5.1.3 Bridges and Rail-over-bridges
There are two rivers in the vicinity of Pimpri-Chinchwad, namely Pawana in the South West and Indrayani in the North. The Indrayani River forms a physical boundary to the PCMC area in the North. In order to provide better connectivity to regions beyond PCMC limits in the North, a major bridge over this river is proposed in Talawade area.
The Pawana river passes through the gaothan areas of PCMC where the population density is high. Currently, major bottle-necks in traffic occur in these areas due to narrow lanes and small bridges over the river. Two major bridges are proposed along this river in order to reduce the traffic congestions.
Table 44 Locations of major-bridges
S.No. Location
1 In Talawade, over Indrayani River
2 In Pimpri, over Pawana River
3 In Walekarwadi, over Pawana River
The Pune-Lonawala railway line passes through the PCMC area. Currently, there are small railway-unerpasses which allow traffic to cross the railway line. In order to clear the bottle-necks and provide better throughfare for traffic, rail-over-bridges have been proposed at the following locations:
Table 45 Locations of Rail-over-bridges
S.No. Location
1 In Pimpri
2 In Akurdi
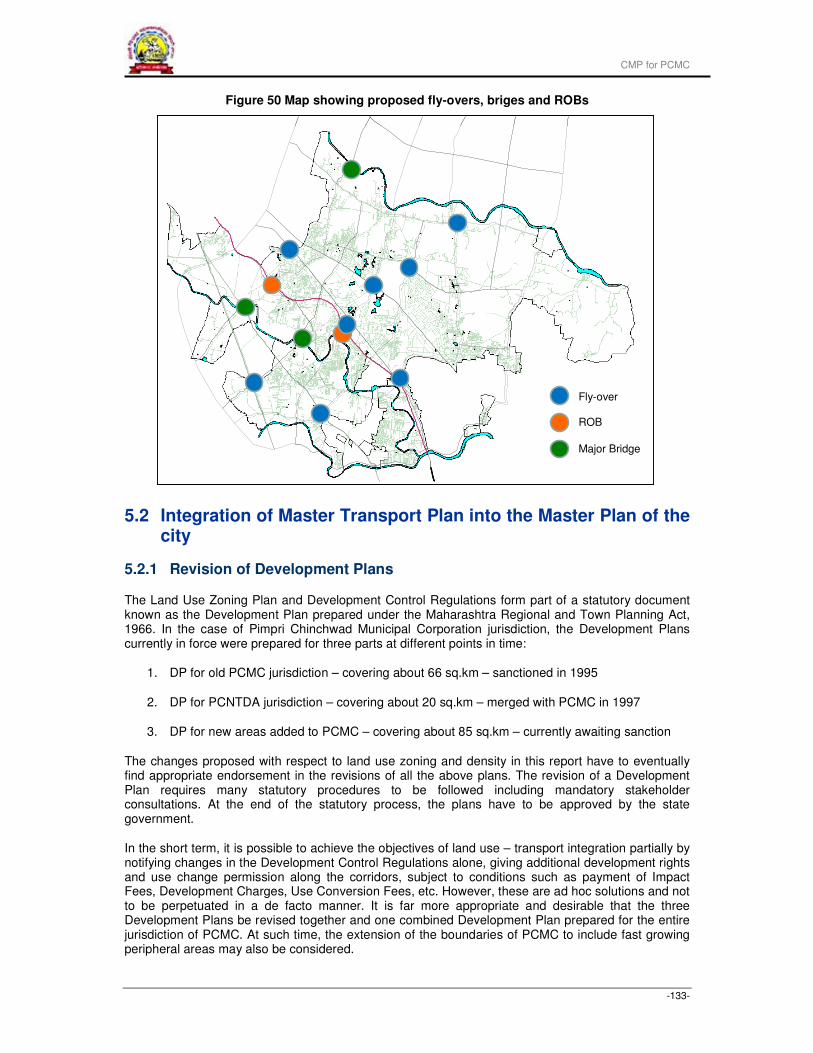
CMP for PCMC
-133-
Figure 50 Map showing proposed fly-overs, briges and ROBs
5.2 Integration of Master Transport Plan into the Master Plan of the city
5.2.1 Revision of Development Plans
The Land Use Zoning Plan and Development Control Regulations form part of a statutory document known as the Development Plan prepared under the Maharashtra Regional and Town Planning Act, 1966. In the case of Pimpri Chinchwad Municipal Corporation jurisdiction, the Development Plans currently in force were prepared for three parts at different points in time:
1. DP for old PCMC jurisdiction – covering about 66 sq.km – sanctioned in 1995
2. DP for PCNTDA jurisdiction – covering about 20 sq.km – merged with PCMC in 1997
3. DP for new areas added to PCMC – covering about 85 sq.km – currently awaiting sanction
The changes proposed with respect to land use zoning and density in this report have to eventually find appropriate endorsement in the revisions of all the above plans. The revision of a Development Plan requires many statutory procedures to be followed including mandatory stakeholder consultations. At the end of the statutory process, the plans have to be approved by the state government.
In the short term, it is possible to achieve the objectives of land use – transport integration partially by notifying changes in the Development Control Regulations alone, giving additional development rights and use change permission along the corridors, subject to conditions such as payment of Impact Fees, Development Charges, Use Conversion Fees, etc. However, these are ad hoc solutions and not to be perpetuated in a de facto manner. It is far more appropriate and desirable that the three Development Plans be revised together and one combined Development Plan prepared for the entire jurisdiction of PCMC. At such time, the extension of the boundaries of PCMC to include fast growing peripheral areas may also be considered.
Fly-over
ROB
Major Bridge
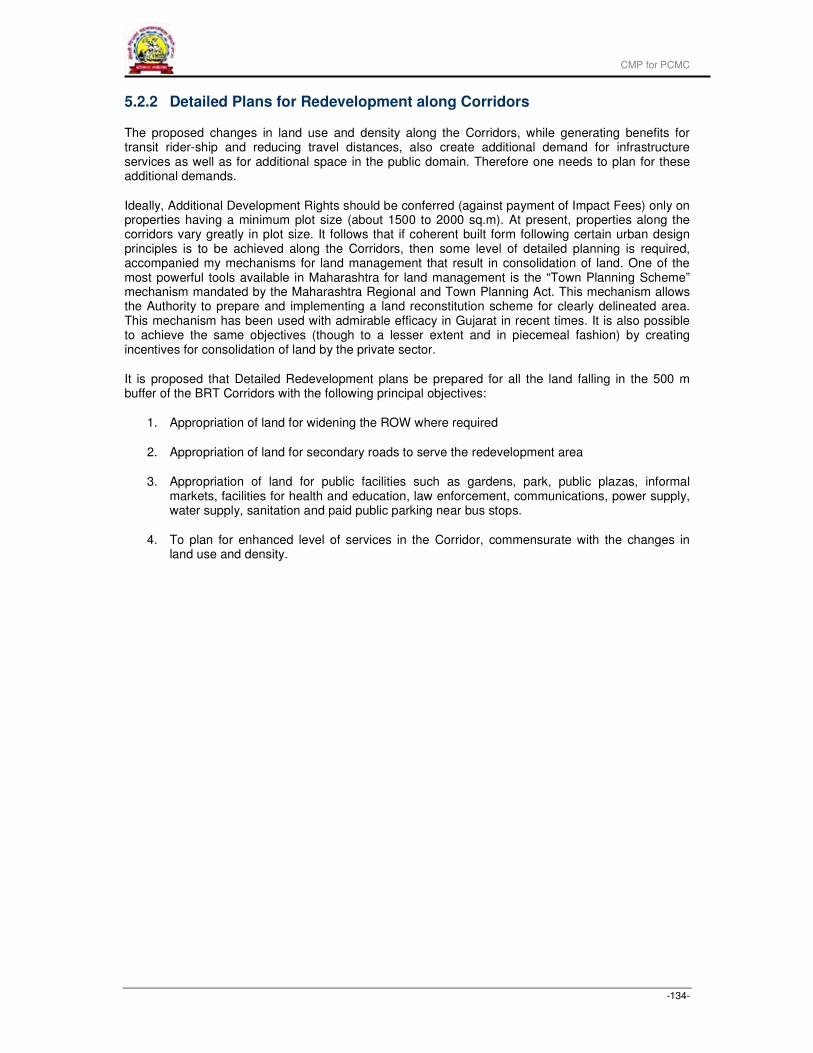
CMP for PCMC
-134-
5.2.2 Detailed Plans for Redevelopment along Corridors
The proposed changes in land use and density along the Corridors, while generating benefits for transit rider-ship and reducing travel distances, also create additional demand for infrastructure services as well as for additional space in the public domain. Therefore one needs to plan for these additional demands.
Ideally, Additional Development Rights should be conferred (against payment of Impact Fees) only on properties having a minimum plot size (about 1500 to 2000 sq.m). At present, properties along the corridors vary greatly in plot size. It follows that if coherent built form following certain urban design principles is to be achieved along the Corridors, then some level of detailed planning is required, accompanied my mechanisms for land management that result in consolidation of land. One of the most powerful tools available in Maharashtra for land management is the “Town Planning Scheme” mechanism mandated by the Maharashtra Regional and Town Planning Act. This mechanism allows the Authority to prepare and implementing a land reconstitution scheme for clearly delineated area. This mechanism has been used with admirable efficacy in Gujarat in recent times. It is also possible to achieve the same objectives (though to a lesser extent and in piecemeal fashion) by creating incentives for consolidation of land by the private sector.
It is proposed that Detailed Redevelopment plans be prepared for all the land falling in the 500 m buffer of the BRT Corridors with the following principal objectives:
1. Appropriation of land for widening the ROW where required
2. Appropriation of land for secondary roads to serve the redevelopment area
3. Appropriation of land for public facilities such as gardens, park, public plazas, informal markets, facilities for health and education, law enforcement, communications, power supply, water supply, sanitation and paid public parking near bus stops.
4. To plan for enhanced level of services in the Corridor, commensurate with the changes in land use and density.
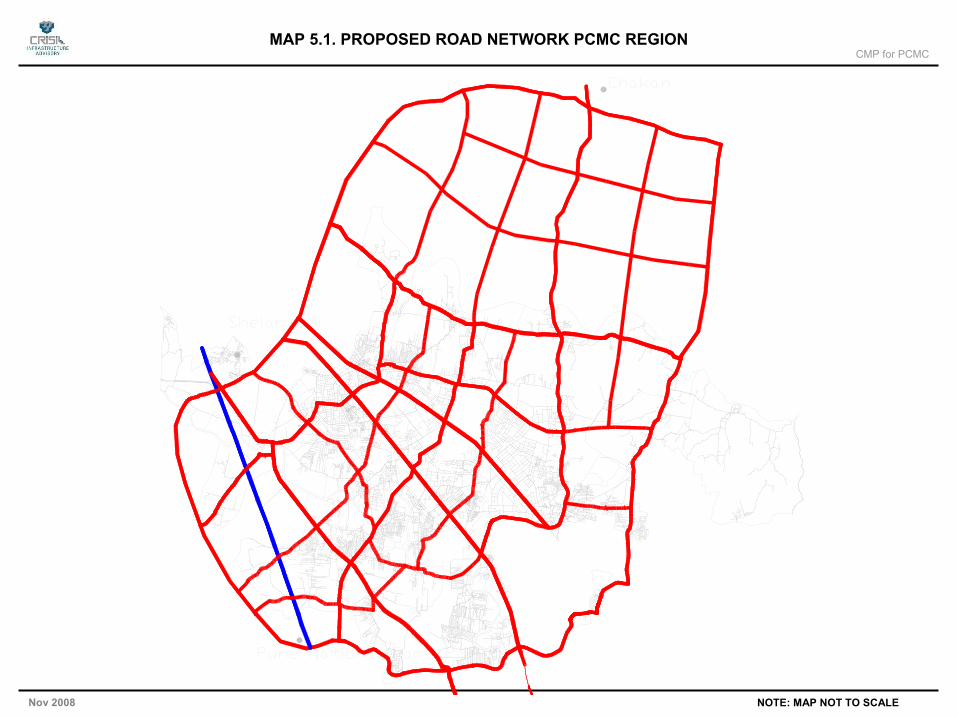
CMP for PCMC
Nov 2008 NOTE: MAP NOT TO SCALE
MAP 5.1. PROPOSED ROAD NETWORK PCMC REGION
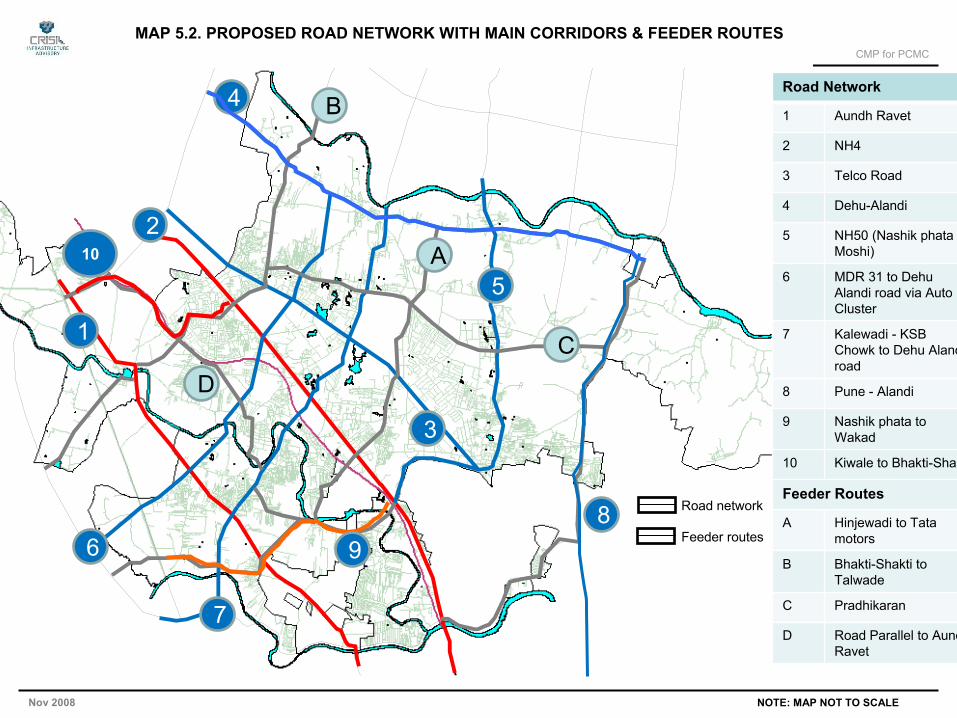
CMP for PCMC
Nov 2008 NOTE: MAP NOT TO SCALE
MAP 5.2. PROPOSED ROAD NETWORK WITH MAIN CORRIDORS & FEEDER ROUTES
`
Feeder routes
Road network
1
2
3
4
5
6
7
A
B
C
89
10
DNashik phata to Wakad
9
Kiwale to Bhakti-Shakti10
Pune - Alandi8
Kalewadi - KSB Chowk to Dehu Alandiroad
7
Road Network
1 Aundh Ravet
2 NH4
3 Telco Road
4 Dehu-Alandi
5 NH50 (Nashik phata to Moshi)
6 MDR 31 to DehuAlandi road via Auto Cluster
Feeder Routes
A Hinjewadi to Tatamotors
B Bhakti-Shakti to Talwade
C Pradhikaran
D Road Parallel to AundhRavet
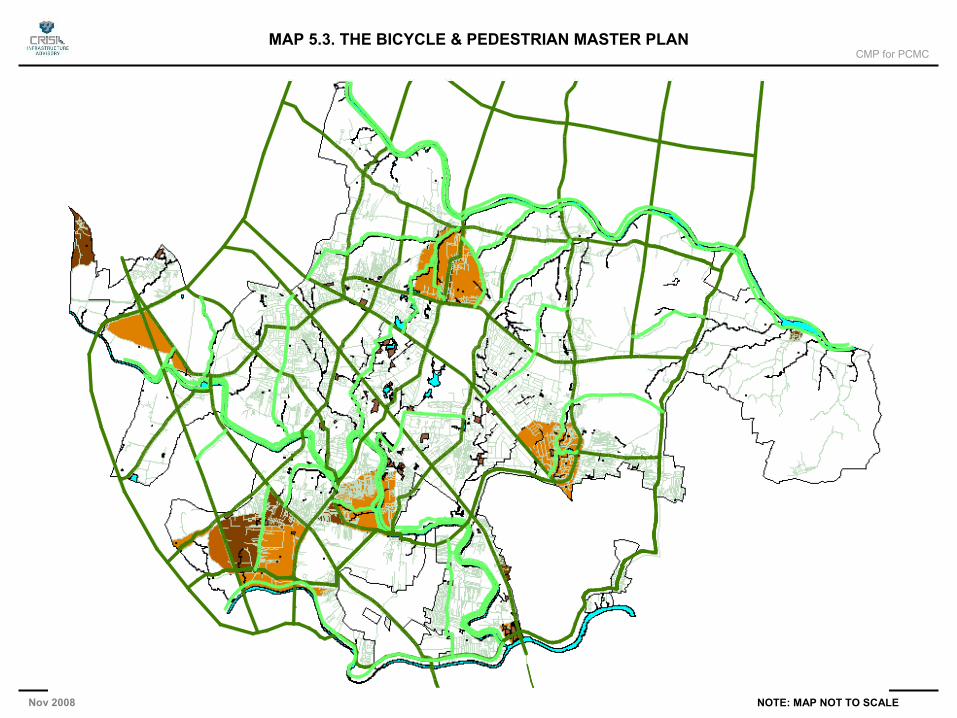
CMP for PCMC
Nov 2008 NOTE: MAP NOT TO SCALE
MAP 5.3. THE BICYCLE & PEDESTRIAN MASTER PLAN
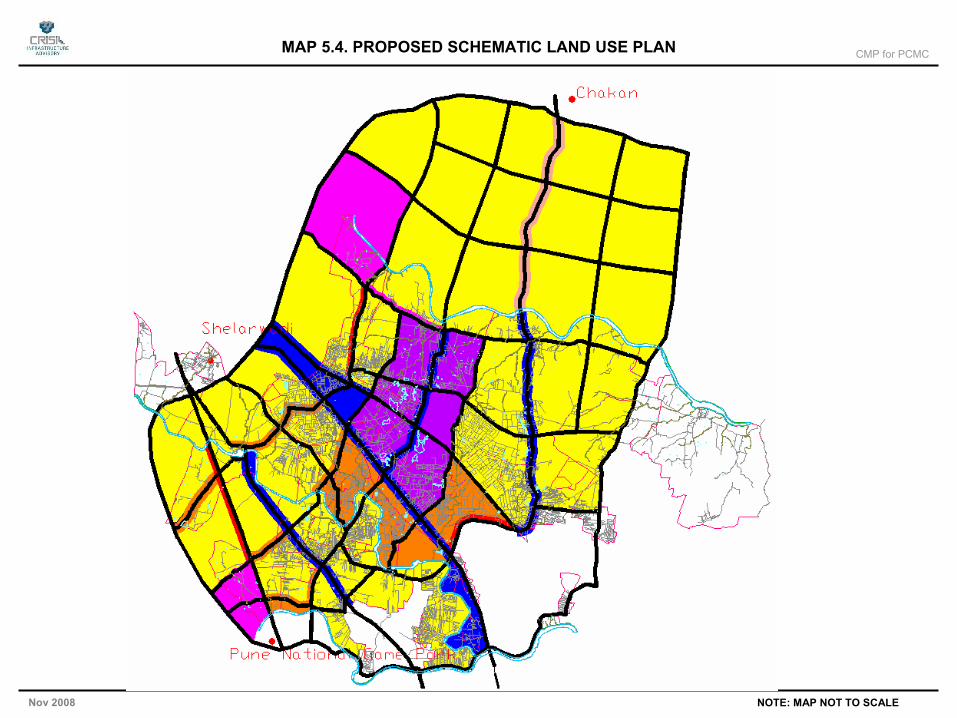
CMP for PCMC
Nov 2008 NOTE: MAP NOT TO SCALE
MAP 5.4. PROPOSED SCHEMATIC LAND USE PLAN

CMP for PCMC
Nov 2008 NOTE: MAP NOT TO SCALE
MAP 5.5. PROPOSED SCHEMATIC DENSITY PLAN
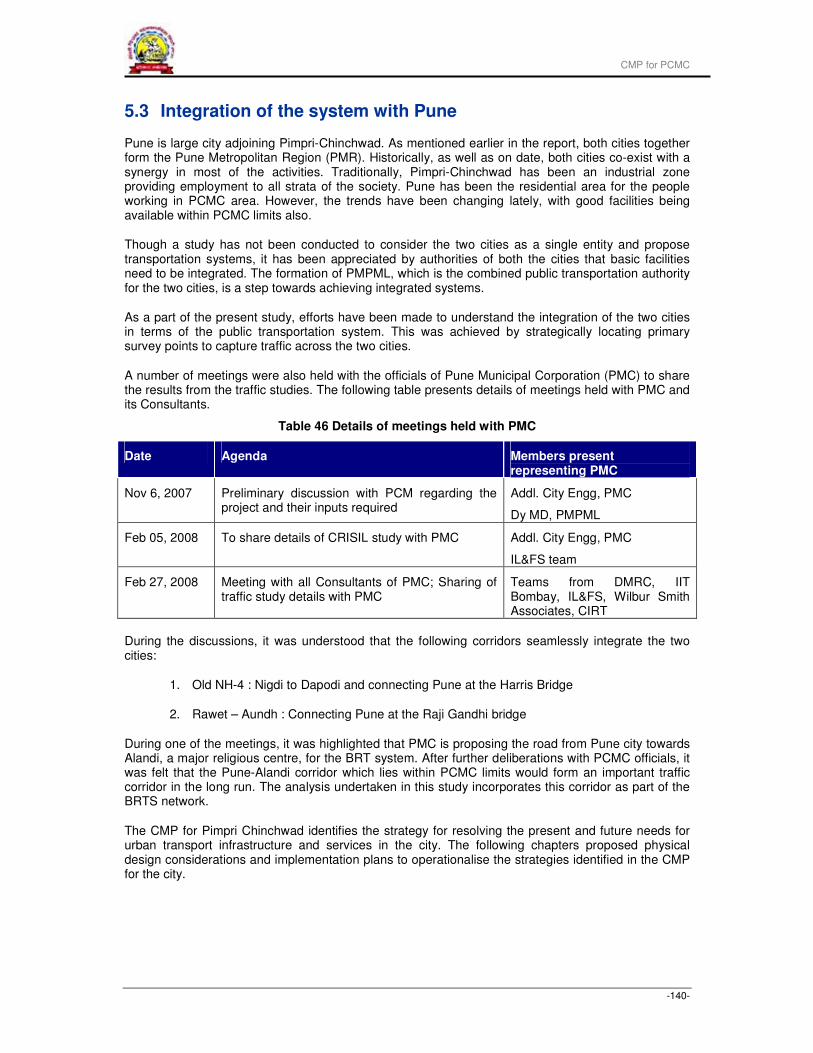
CMP for PCMC
-140-
5.3 Integration of the system with Pune
Pune is large city adjoining Pimpri-Chinchwad. As mentioned earlier in the report, both cities together form the Pune Metropolitan Region (PMR). Historically, as well as on date, both cities co-exist with a synergy in most of the activities. Traditionally, Pimpri-Chinchwad has been an industrial zone providing employment to all strata of the society. Pune has been the residential area for the people working in PCMC area. However, the trends have been changing lately, with good facilities being available within PCMC limits also.
Though a study has not been conducted to consider the two cities as a single entity and propose transportation systems, it has been appreciated by authorities of both the cities that basic facilities need to be integrated. The formation of PMPML, which is the combined public transportation authority for the two cities, is a step towards achieving integrated systems.
As a part of the present study, efforts have been made to understand the integration of the two cities in terms of the public transportation system. This was achieved by strategically locating primary survey points to capture traffic across the two cities.
A number of meetings were also held with the officials of Pune Municipal Corporation (PMC) to share the results from the traffic studies. The following table presents details of meetings held with PMC and its Consultants.
Table 46 Details of meetings held with PMC
Date Agenda Members present representing PMC
Nov 6, 2007 Preliminary discussion with PCM regarding the project and their inputs required
Addl. City Engg, PMC
Dy MD, PMPML
Feb 05, 2008 To share details of CRISIL study with PMC Addl. City Engg, PMC
IL&FS team
Feb 27, 2008 Meeting with all Consultants of PMC; Sharing of traffic study details with PMC
Teams from DMRC, IIT Bombay, IL&FS, Wilbur Smith Associates, CIRT
During the discussions, it was understood that the following corridors seamlessly integrate the two cities:
1. Old NH-4 : Nigdi to Dapodi and connecting Pune at the Harris Bridge
2. Rawet – Aundh : Connecting Pune at the Raji Gandhi bridge
During one of the meetings, it was highlighted that PMC is proposing the road from Pune city towards Alandi, a major religious centre, for the BRT system. After further deliberations with PCMC officials, it was felt that the Pune-Alandi corridor which lies within PCMC limits would form an important traffic corridor in the long run. The analysis undertaken in this study incorporates this corridor as part of the BRTS network.
The CMP for Pimpri Chinchwad identifies the strategy for resolving the present and future needs for urban transport infrastructure and services in the city. The following chapters proposed physical design considerations and implementation plans to operationalise the strategies identified in the CMP for the city.
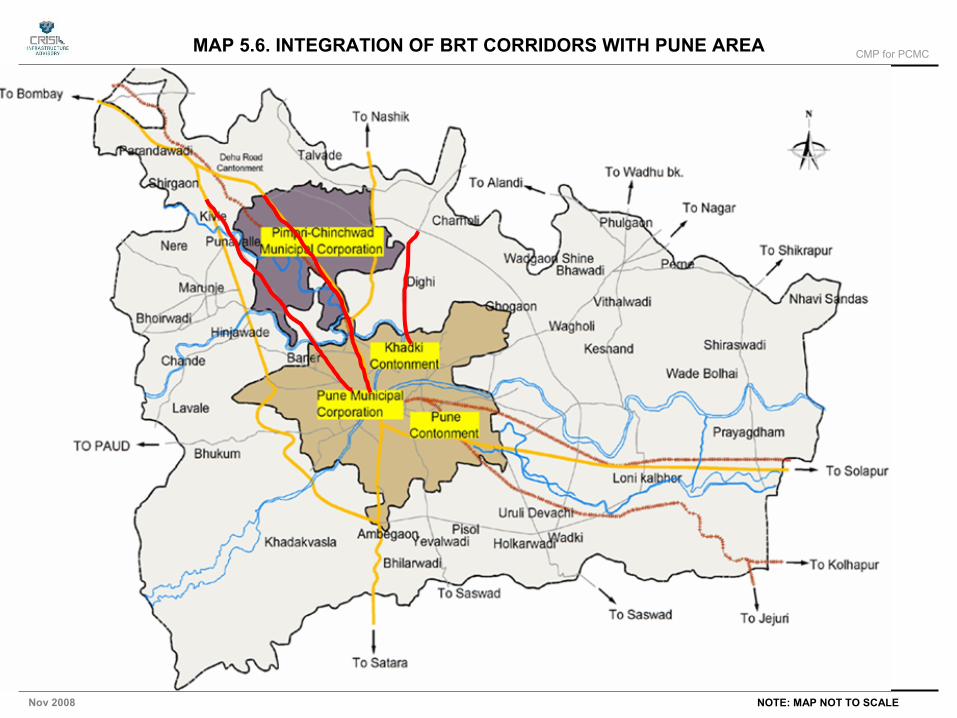
CMP for PCMC
Nov 2008 NOTE: MAP NOT TO SCALE
MAP 5.6. INTEGRATION OF BRT CORRIDORS WITH PUNE AREA
CMP for PCMC
-142-
6 BRT SYSTEM DESIGN – NETWORK AND ROADWAY
The major intervention identified in the CMP is the development of a Bus based Rapid Transit System (BRTS) in Pimpri Chinchwad. There are several components in the physical form of the BRTS, grouped as either BRTS infrastructure or rolling stock. The primary component of BRTS infrastructure is the BRTS network and roadway. The following sections discuss the various policy and implementation issues related to roadway design and the conceptual design framework to operationalise BRTS in the city.
6.1 Network/Corridor Assessment & Selection
6.1.1 Criteria for corridor selection
The selection of corridors from among the road network of PCMC was undertaken using the following parameters.
1. Travel Demand
2. Hierarchy of Roads
3. Availability of Right of Way
4. Ownership of the Right of Way
5. Existing Bus Routes
6. Integration with Pune’s system
7. Ongoing projects for road development
8. Other Mass Transit System Proposals
Elaborate discussions were held with PCMC and its technical consultants involved in road improvement projects. Based on these discussions and the traffic and land-use analysis undertaken as a part of this study the BRT corridors have been suggested.
6.1.2 Corridor Assessment
As observed in the traffic model, the transportation demand along high-density road corridors in Pimpri-Chinchwad was studied in detail and peak-hour traffic demand was calculated for a bus-based transit system. The following table presents the total Passengers Per Direction (PPD) and the Peak Hour Peak Direction Traffic (PHPDT) along these corridors.
Table 47: Peak traffic derived for important corridors in PCMC area
Corridor Peak traffic – Number of Bus-passenger Trips 2008 2021
Corridor
PPD PHPDT PPD PHPDT
Aundh-Rawet road 57,381 3,682
Old NH-4 1,89,427 12,156
Nashik Phata to Wakad 41,532 2,665 83,662 5,369
CMP for PCMC
-143-
Corridor Peak traffic – Number of Bus-passenger Trips
2008 2021
Corridor
PPD PHPDT PPD PHPDT
Kalewadi to Delhu-Alandi 33,219 2,132 56,112 3,601
Dehu Alandi 16,051 1,030 36,540 2,345
Pune to Alandi 3,057 196 6,492 417
NH – 50 (Nashik phata to Moshi) 40,629 2,607 1,01,374 6,505
Expressway to Bhakti Shakti 10,355 664 23,243 1,492
Of the above corridors, the following have high-density passenger traffic and can be taken up for implementation of a BRT system immediately:
1. Aundh-Rawet road,
2. Old NH-4,
3. Nashik Phata to Wakad,
4. Kalewadi to Dehu-Alandi road,
5. Nashik phata to Moshi (NH-50), and
6. Dehu-Alandi road.
The other corridors, though with a comparitvely lesser traffic, have very high seasonal patronage. The corridors from Dehu to Alandi and Pune to Alandi connect very important local pilgrimage centers. The corridor Pune to Alandi has been taken up by Pune Municipal Corporation for the implementation of a BRT system. It would serve the purpose of connecting the city of Pune with the pilgrim center of Alandi better if the same corridor is taken up in PCMC limits also. Map 6.1 presents the BRT corridors to be taken up for implementation.
6.2 Land Ownership of the Corridor ROW
Except for NH 50, the existing ROW of all other BRT Corridors are under the possession of PCMC. NH 50 is currently with the National Highways Authority, but is expected to be handed over to PCMC. Dehu-Alandi Road and Kalewadi - KSB Chowk to Dehu Alandi road are at present 30 m ROW. They are proposed to be widened to 45 m in this plan.
6.3 Corridor design
This section presents various options for RoW configuration to incorporate the BRT system within the RoW widths available. All the options were discussed in detail and the final selected set of RoW configurations have been presented at the end of this section.
6.3.1 Location of Bus Stops
To avoid traffic management complications at the junction, to improve efficiency of the bus system and to ensure passenger safety, it is proposed to have mid-block bus stops. The bus stops are placed about 250 m away from the junction and at a distance of 500 to 700 m on all the trunk corridors. The bus stops are mid-block and away from road junctions. The distance of the nearest bus stop from any road junction is not more than 250 m (refer MAP 6.2 – Location of bus stops and bus terminals). The location of a bus stop in each corridor and its size is determined by the ROW of the corridor and the ROW design. Land uses and density are also aligned similarly with higher FSI around bus stops.
CMP for PCMC
-144-
Three kinds of bus stops have been conceptualized – (1) At-grade bus stops placed under elevated carriageway of mixed traffic, accessed directly from footpath, (2) Underground bus stops placed under at-grade carriageway of mixed traffic, accessed directly from footpath and (3) At-grade bus stops placed on the median between bus lanes and accessed through Foot Over-Bridges. Of the above, with detailed discussions with the Authorities in PCMC, the At-grade bus stops placed under elevated carriageway of mixed traffic has been finalised for all roads except NH4 and NH50.
6.3.2 Typical street sections and bus stop design
As mentioned earlier, the design options of Corridors are primarily based on ROW, functional character (through traffic) and whether bus lanes are dedicated or not. The design considerations are as follows:
1. Efficient movement of buses in the bus lanes
2. Safety and comfort of bus passengers while boarding, alighting and transferring
3. Safety and comfort of pedestrians
4. Efficient flow of mixed traffic
As mentioned above, three kinds of bus stops have been conceptualized;
1. At-grade bus stops placed on the median between bus lanes and accessed through Foot Over-Bridges,
2. Underground bus stops placed under at-grade carriageway of mixed traffic, accessed directly from footpath,
3. At-grade bus stops placed under elevated carriageway of mixed traffic, accessed directly from footpath.
A number of options have been considered in this study and after elaborate discussions, some configurations have been finalised for implementation, which were used for estimating the project costs.
6.3.3 61m ROW Design
ROW: 61 m
Refer Map No. 6.3
Salient features:
• Central lanes currently exist for through traffic, with flyovers and underpasses at critical junctions (more are under construction or proposed).
• Dedicated bus lanes are provided on either sides of the through traffic lanes, segregated by a landscaped area between them.
• Beyond the Bus lanes is a two-way service lane.
• Cycle track and footpath have been provided on the sides of the service lane.
Advantages:
• Dedicated and unhindered through traffic lanes.
Disadvantages:
• The efficiency of the bus services on these corridors will be much lower than those with dedicated bus lanes.
CMP for PCMC
-145-
6.3.4 45m ROW Design
ROW: 45 m
Refer Map No. 6.4 and 6.5
Salient features:
• Central dedicated bus lanes, separated by a median.
• Mixed traffic lanes provided on either side of bus lanes – four lanes on either side.
• At bus stops two mixed traffic lanes are elevated while two remain at-grade to function as service lanes.
• Buses which have to stop at the bus stop shall move under the flyover, hence mixed lanes are elevated.
• Median bus stops are at-grade and positioned below the elevated mixed traffic lanes.
• Cycle track, footpath and a landscaped area has been provided adjoining the mixed traffic lanes.
• At the bus stops, the bus shelter has been provided in the landscaped area between the through traffic lane and dedicated bus lane.
This would provide easy access for vehicles from perpendicular roads.
6.3.5 At-grade bus stops placed on the median between bus lanes and accessed through Foot Over-Bridges
ROW: 61m, 45m
Refer Map No. 6.6 and 6.7
Salient features:
• Central dedicated bus lanes, separated by a median.
• Dedicated bus lanes flare up at the median at-grade bus stop.
• Mixed traffic lanes provided on either side of bus lanes.
• Cycle track and footpath provided adjoining the mixed traffic lanes.
• The median bus stops can be accessed by a foot over-bridge from the footpath to the central median.
Advantages:
• All bus stops will be at-grade and hence no subways or flyovers need to be constructed.
• FOB’s will ensure that pedestrians will not have to cross any traffic lanes – high safety for pedestrians.
Disadvantages:
• Passengers have to climb the foot over bridge, which may be a deterrent for usage of the system
• The flaring of bus lanes and concomitant flaring of the mixed traffic lanes at the bus stops would cause some turbulence in the flow of mixed traffic and also reduces the width of the footpath on the sides.
Recommendation:
• This option is to be used only where sub-way bus stops and at-grade (elevated carriageway) options are not feasible
• Elaborately designed FOB’s with escalators and vending spaces on the FOB may be considered at a later stage
CMP for PCMC
-146-
6.3.6 Underground bus stops placed under at-grade carriageway of mixed traffic, accessed directly from footpath
ROW: 61m, 45m Refer Map No. 6.8 and 6.9
Salient features:
• Central dedicated bus lanes, separated by a median.
• Median to be removed for overtaking lane at sub-way bus stops provided under carriageway for mixed traffic.
• The bus lanes will go down by about 3.5 m at sub-way bus stops.
• Mixed traffic lanes provided on either side of bus lanes.
• Cycle track and footpath provided adjoining the mixed traffic lanes.
• Cycle track and foot path merge into a “Pedestrian-NMV Priority Zone” at bus stops. This zone will have provision for cycle parking, seating, kiosks and space for informal activities and staircases, escalators or lifts for sub-way bus stops.
• The service lines are to be shifted to the shoulders of the road, under the footpath and cycle track
Advantages:
• All bus stops will have direct access from footpath – high safety for pedestrians.
• Widening of mixed traffic lanes in future will be possible.
• Commercial space can be created in the bus stop to recover capital and recurring costs
Disadvantages:
• The bus lanes will have a gentle roller coaster feel as they will go down by about 3.5 m at bus stops
• The operating costs of the bus stops will be higher as they are underground.
6.3.7 At-grade bus stops placed under elevated carriageway of mixed traffic, accessed directly from footpath
ROW: 61m, 45m
Refer Map No. 6.10, 6.11 and 6.12
Salient features:
• Central dedicated bus lanes, separated by a median.
• Median to be removed for overtaking lane for at-grade bus stops under mixed traffic carriageway.
• Mixed traffic lanes provided on either side of bus lanes.
• At-grade bus stops under elevated carriageway for mixed traffic.
• Cycle track and footpath provided adjoining the mixed traffic lanes.
• Cycle track and foot path merge into a “Pedestrian-NMV Priority Zone” at bus stops. This zone also provides access to by-lanes if any for mixed traffic.
Advantages:
• All bus stops will have direct access from footpath – highest safety for pedestrians.
Disadvantages:
• The mixed traffic lanes will have a gentle roller coaster feel as they will rise by about 3.5 m at bus stops.
• Widening of mixed traffic lanes in future will be difficult.

CMP for PCMC
-147-
Of the above options, with detailed discussion with the Authorities at PCMC, the ‘at-grade bus stops placed under elevated carriageway of mixed traffic, accessed directly from footpath’, has been selected for implementation for all roads. The details of the design for each ROW shall be illustrated below.

CMP for PCMC
Nov 2008 NOTE: MAP NOT TO SCALE
MAP 6.1. PROPOSED ROAD NETWORK WITH MAIN CORRIDORS & FEEDER ROUTES
`
Feeder routes
Road network
Nashik phata to Wakad
9
Kiwale to Bhakti-Shakti10
Pune - Alandi8
KSB Chowk to Kalewadi
7
Road Network
1 Aundh Ravet
2 NH4
3 Telco Road
4 Dehu-Alandi
5 NH50 (Nashik phata to Moshi)
6 MDR 31 to DehuAlandi road via Auto Cluster
Feeder Routes
A Hinjewadi to Tatamotors
B Bhakti-Shakti to Talwade
C Pradhikaran
D Road Parallel to AundhRavet
1
2
3
4
5
6
7
A
B
C
89
10
D
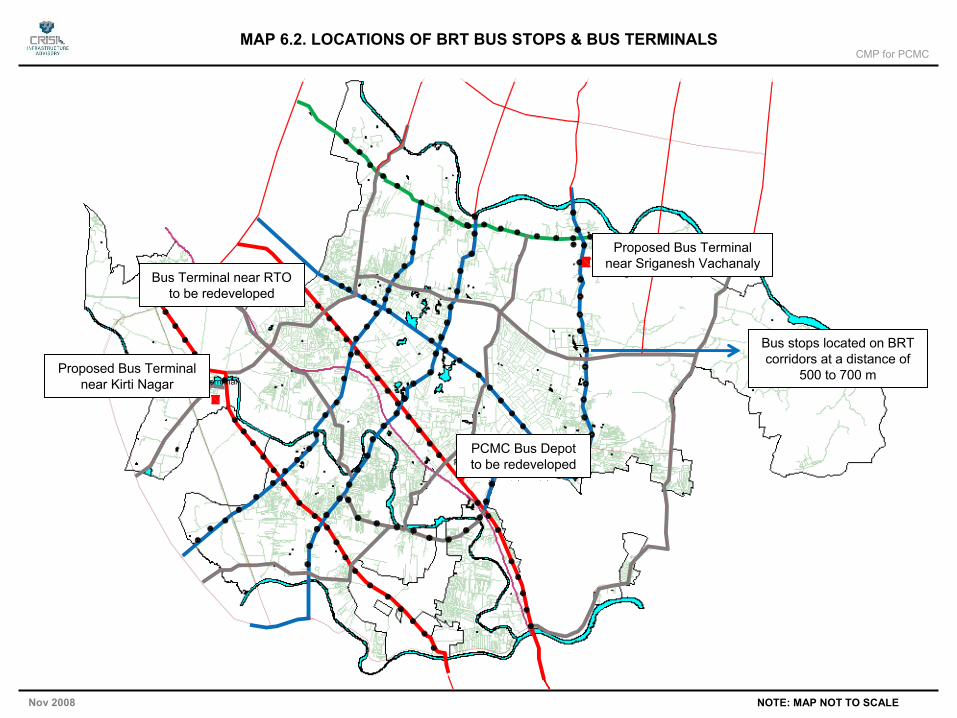
CMP for PCMC
Nov 2008 NOTE: MAP NOT TO SCALE
MAP 6.2. LOCATIONS OF BRT BUS STOPS & BUS TERMINALS
`
PCMC Bus Depot
Proposed Bus Terminal near Sriganesh Vachanaly
opposite RTOBus Terminal
to be redeveloped
Proposed Bus Terminal near Kirti Nagar
Proposed Bus Terminal near Sriganesh Vachanaly
Proposed Bus Terminal near Sriganesh Vachanaly
Bus Terminal near RTO to be redeveloped
Bus Terminal near RTO to be redeveloped
Proposed Bus Terminal near Kirti Nagar
Proposed Bus Terminal near Kirti Nagar
PCMC Bus Depot to be redevelopedPCMC Bus Depot to be redeveloped
Bus stops located on BRT corridors at a distance of
500 to 700 m
Bus stops located on BRT corridors at a distance of
500 to 700 m

CMP for PCMC
Nov 2008 NOTE: MAP NOT TO SCALE
Map No. 6.3: Approved RoW Design - 61m
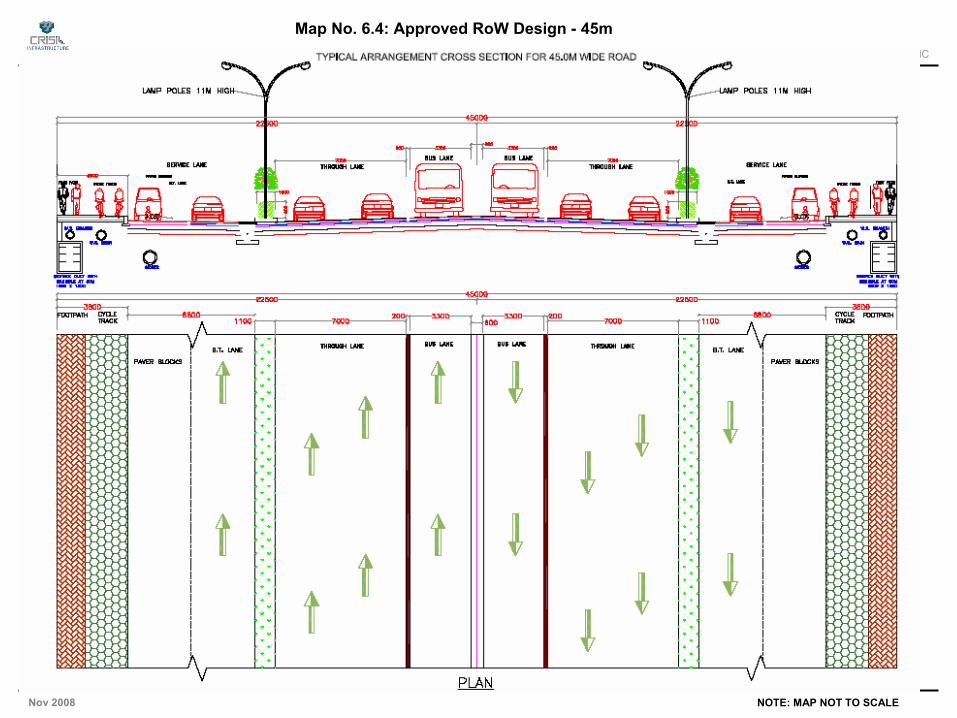
CMP for PCMC
Nov 2008 NOTE: MAP NOT TO SCALE
Map No. 6.4: Approved RoW Design - 45m
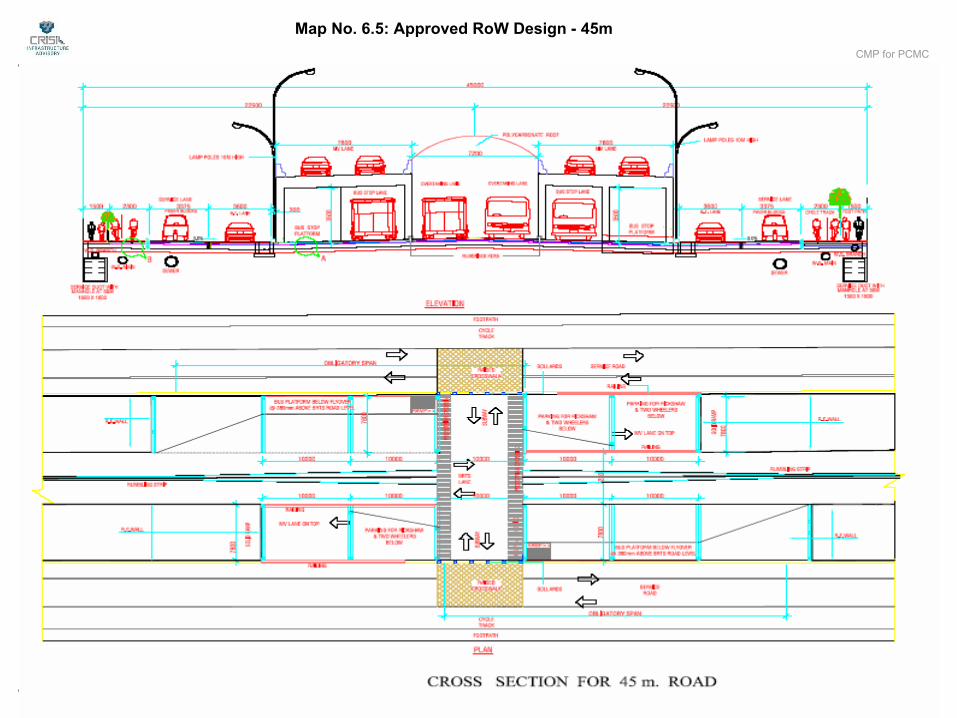
CMP for PCMC
Nov 2008 NOTE: MAP NOT TO SCALE
Map No. 6.5: Approved RoW Design - 45m
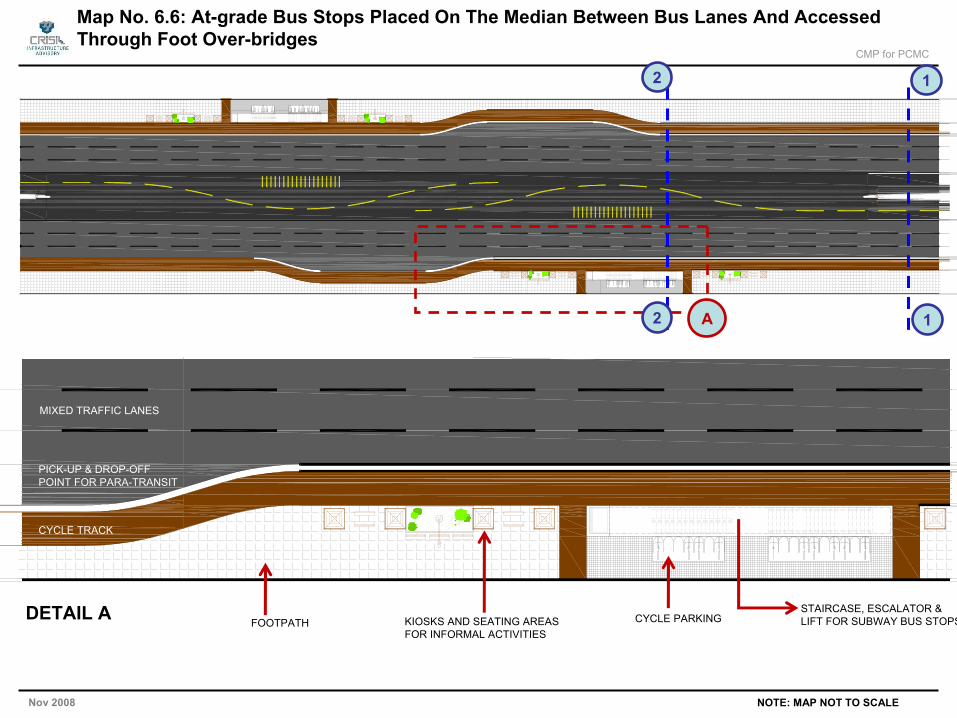
CMP for PCMC
Nov 2008 NOTE: MAP NOT TO SCALE
KIOSKS AND SEATING AREAS FOR INFORMAL ACTIVITIES
MIXED TRAFFIC LANES
Map No. 6.6: At-grade Bus Stops Placed On The Median Between Bus Lanes And Accessed Through Foot Over-bridges
A
PICK-UP & DROP-OFF POINT FOR PARA-TRANSIT
CYCLE PARKINGSTAIRCASE, ESCALATOR & LIFT FOR SUBWAY BUS STOPSDETAIL A
CYCLE TRACK
FOOTPATH
1
1
2
2
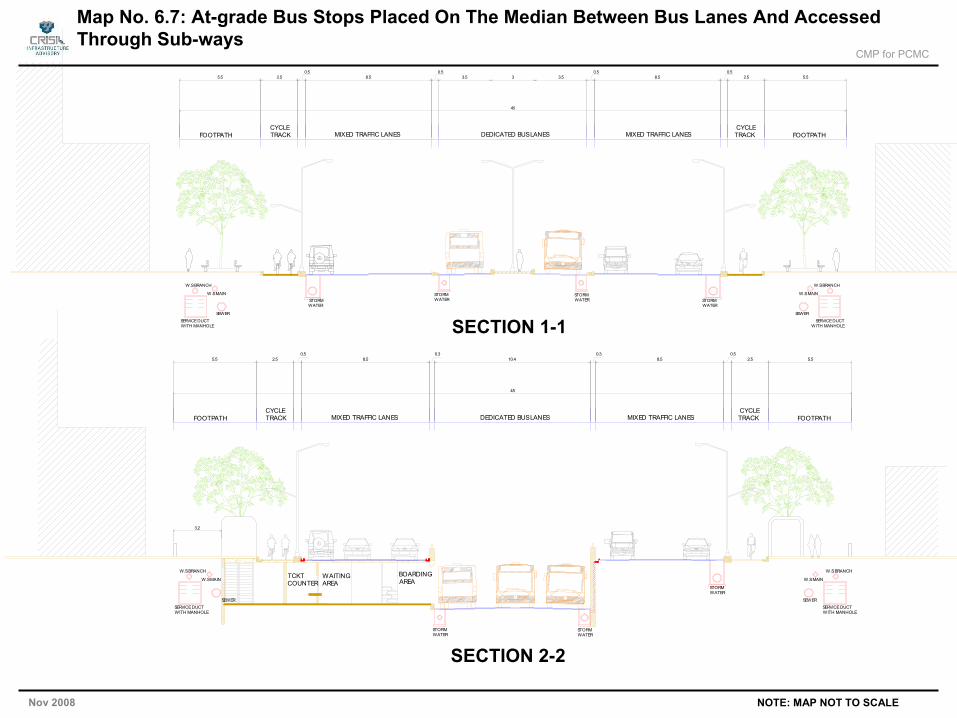
CMP for PCMC
Nov 2008 NOTE: MAP NOT TO SCALE
5.5 2.50.5
8.50.5 0.5
8.50.5
45
FOOTPATHCYCLE TRACK MIXED TRAFFIC LANES DEDICATED BUS LANES FOOTPATH
CYCLE TRACKMIXED TRAFFIC LANES
5.52.53.5 3 3.5
STORM WATER
SERVICE DUCTWITH MANHOLE
W.S MAIN
W.S BRANCH
SEWER
SERVICE DUCTWITH MANHOLE
W.S MAIN
W.S BRANCH
SEWER
STORM WATER
STORM WATERSTORM
WATER
WAITING AREA
BOARDING AREA
STORM WATER
STORM WATER
STORM WATER
TCKT COUNTER
SEWERSERVICE DUCTWITH MANHOLE
W.S MAIN
W.S BRANCH
SEWERSERVICE DUCTWITH MANHOLE
W.S MAIN
W.S BRANCH
5.5 2.50.5
8.50.3
10.40.3
8.50.5
45
FOOTPATHCYCLE TRACK MIXED TRAFFIC LANES DEDICATED BUS LANES FOOTPATH
CYCLE TRACKMIXED TRAFFIC LANES
5.52.5
3.2
SECTION 1-1
SECTION 2-2
Map No. 6.7: At-grade Bus Stops Placed On The Median Between Bus Lanes And Accessed Through Sub-ways
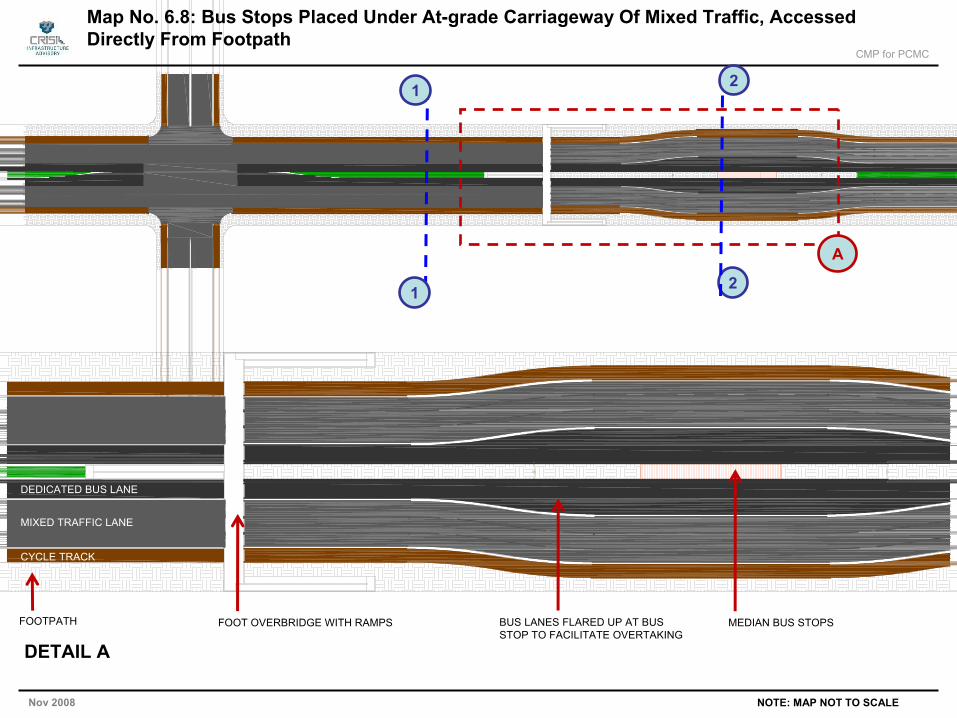
CMP for PCMC
Nov 2008 NOTE: MAP NOT TO SCALE
CYCLE TRACK
MIXED TRAFFIC LANE
DEDICATED BUS LANE
Map No. 6.8: Bus Stops Placed Under At-grade Carriageway Of Mixed Traffic, Accessed Directly From Footpath
BUS LANES FLARED UP AT BUS STOP TO FACILITATE OVERTAKING
MEDIAN BUS STOPSFOOT OVERBRIDGE WITH RAMPS
A
FOOTPATH
DETAIL A
2
21
1
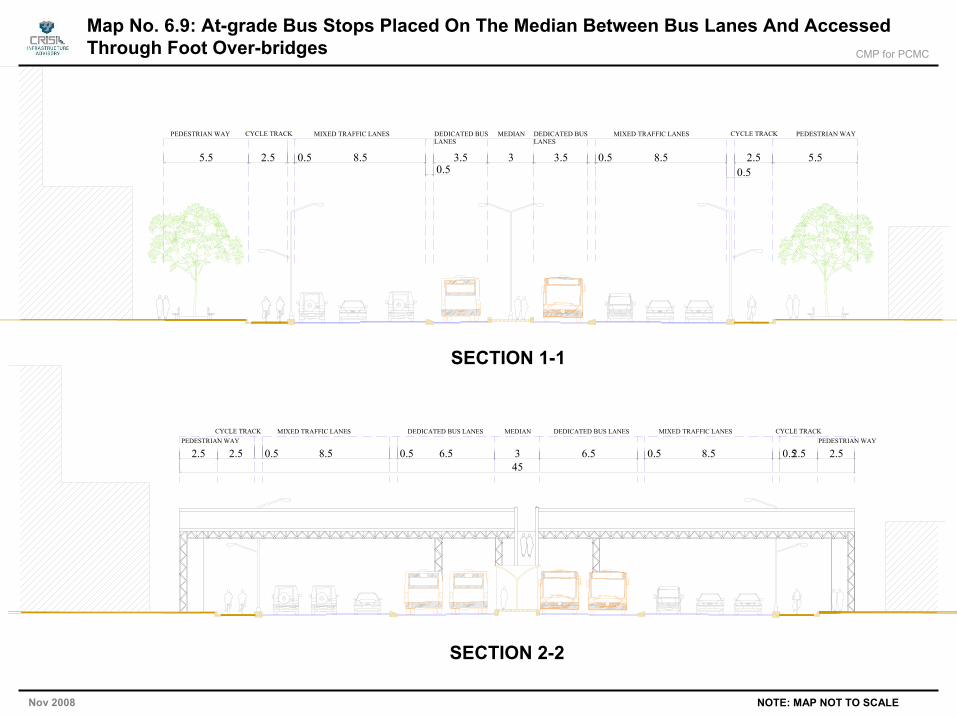
CMP for PCMC
Nov 2008 NOTE: MAP NOT TO SCALE
5.5 0.5 8.50.5
3.5 3 3.5 0.5 8.50.5
2.5 5.5
CYCLE TRACK MIXED TRAFFIC LANES DEDICATED BUS LANES
PEDESTRIAN WAYCYCLE TRACKMIXED TRAFFIC LANESPEDESTRIAN WAY MEDIAN DEDICATED BUS LANES
2.5
CYCLE TRACK MIXED TRAFFIC LANES DEDICATED BUS LANES CYCLE TRACKMIXED TRAFFIC LANESMEDIAN DEDICATED BUS LANES
2.5 2.5 0.5 8.5 6.5 3 6.5 0.5 8.5 0.52.5 2.545
PEDESTRIAN WAY PEDESTRIAN WAY
0.5
SECTION 1-1
SECTION 2-2
Map No. 6.9: At-grade Bus Stops Placed On The Median Between Bus Lanes And Accessed Through Foot Over-bridges
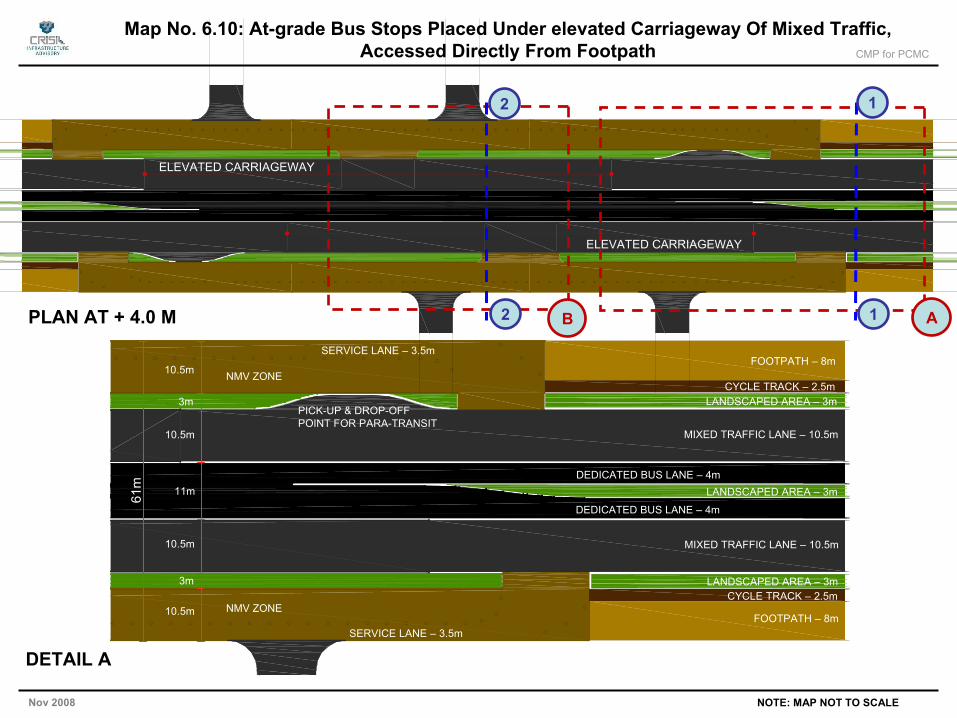
CMP for PCMC
Nov 2008 NOTE: MAP NOT TO SCALE
FOOTPATH – 8m
CYCLE TRACK – 2.5mLANDSCAPED AREA – 3m
MIXED TRAFFIC LANE – 10.5m
DEDICATED BUS LANE – 4m
PICK-UP & DROP-OFF POINT FOR PARA-TRANSIT
LANDSCAPED AREA – 3m
MIXED TRAFFIC LANE – 10.5m
LANDSCAPED AREA – 3mCYCLE TRACK – 2.5m
FOOTPATH – 8m
61m 11m
3m
10.5m
SERVICE LANE – 3.5m
NMV ZONE
10.5m
10.5m
3m
10.5m NMV ZONE
SERVICE LANE – 3.5m
DEDICATED BUS LANE – 4m
DETAIL A
ELEVATED CARRIAGEWAY
PLAN AT + 4.0 M B A
ELEVATED CARRIAGEWAY
2
2
1
1
Map No. 6.10: At-grade Bus Stops Placed Under elevated Carriageway Of Mixed Traffic, Accessed Directly From Footpath
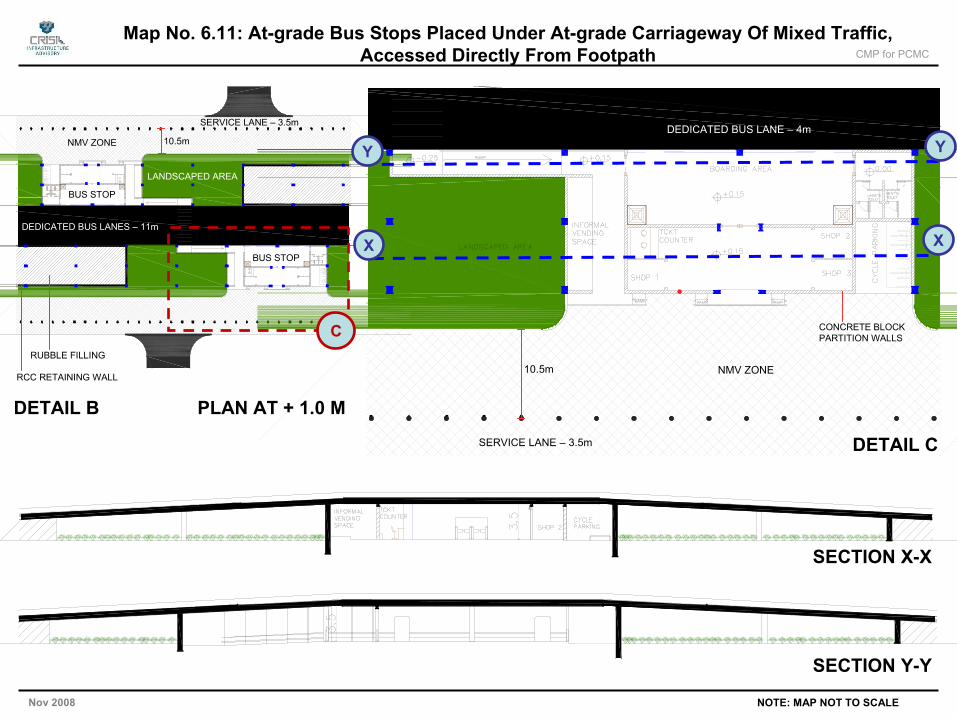
CMP for PCMC
Nov 2008 NOTE: MAP NOT TO SCALE
NMV ZONE
SERVICE LANE – 3.5m
DEDICATED BUS LANES – 11m
LANDSCAPED AREA
RUBBLE FILLING
RCC RETAINING WALL
BUS STOP
BUS STOP
10.5m
DETAIL B PLAN AT + 1.0 M
DEDICATED BUS LANE – 4m
C
NMV ZONE
CONCRETE BLOCK PARTITION WALLS
10.5m
SERVICE LANE – 3.5m DETAIL C
SECTION X-X
SECTION Y-Y
X X
Y Y
Map No. 6.11: At-grade Bus Stops Placed Under At-grade Carriageway Of Mixed Traffic, Accessed Directly From Footpath
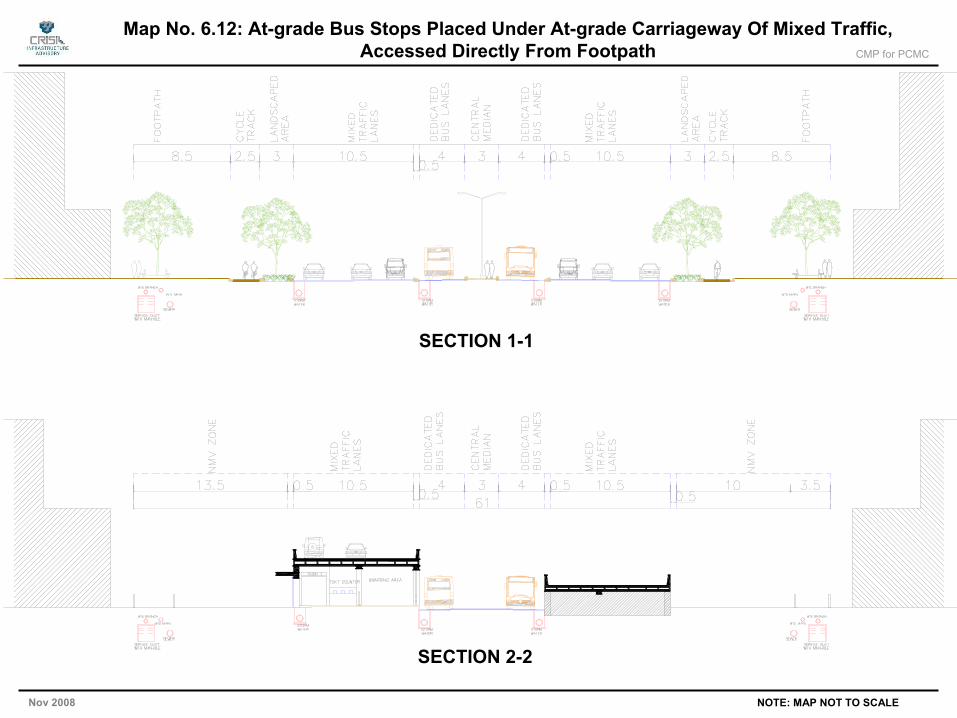
CMP for PCMC
Nov 2008 NOTE: MAP NOT TO SCALE
SECTION 1-1
SECTION 2-2
Map No. 6.12: At-grade Bus Stops Placed Under At-grade Carriageway Of Mixed Traffic, Accessed Directly From Footpath
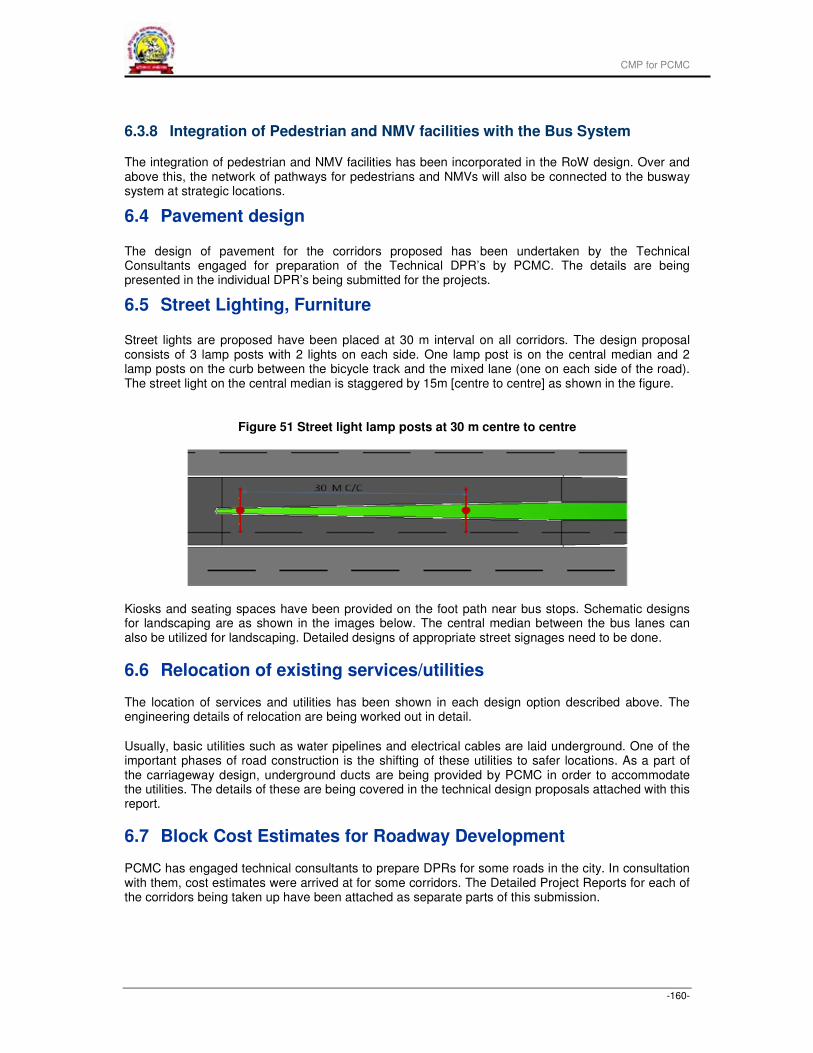
CMP for PCMC
-160-
6.3.8 Integration of Pedestrian and NMV facilities with the Bus System
The integration of pedestrian and NMV facilities has been incorporated in the RoW design. Over and above this, the network of pathways for pedestrians and NMVs will also be connected to the busway system at strategic locations.
6.4 Pavement design
The design of pavement for the corridors proposed has been undertaken by the Technical Consultants engaged for preparation of the Technical DPR’s by PCMC. The details are being presented in the individual DPR’s being submitted for the projects.
6.5 Street Lighting, Furniture
Street lights are proposed have been placed at 30 m interval on all corridors. The design proposal consists of 3 lamp posts with 2 lights on each side. One lamp post is on the central median and 2 lamp posts on the curb between the bicycle track and the mixed lane (one on each side of the road). The street light on the central median is staggered by 15m [centre to centre] as shown in the figure.
Figure 51 Street light lamp posts at 30 m centre to centre
Kiosks and seating spaces have been provided on the foot path near bus stops. Schematic designs for landscaping are as shown in the images below. The central median between the bus lanes can also be utilized for landscaping. Detailed designs of appropriate street signages need to be done.
6.6 Relocation of existing services/utilities
The location of services and utilities has been shown in each design option described above. The engineering details of relocation are being worked out in detail.
Usually, basic utilities such as water pipelines and electrical cables are laid underground. One of the important phases of road construction is the shifting of these utilities to safer locations. As a part of the carriageway design, underground ducts are being provided by PCMC in order to accommodate the utilities. The details of these are being covered in the technical design proposals attached with this report.
6.7 Block Cost Estimates for Roadway Development
PCMC has engaged technical consultants to prepare DPRs for some roads in the city. In consultation with them, cost estimates were arrived at for some corridors. The Detailed Project Reports for each of the corridors being taken up have been attached as separate parts of this submission.
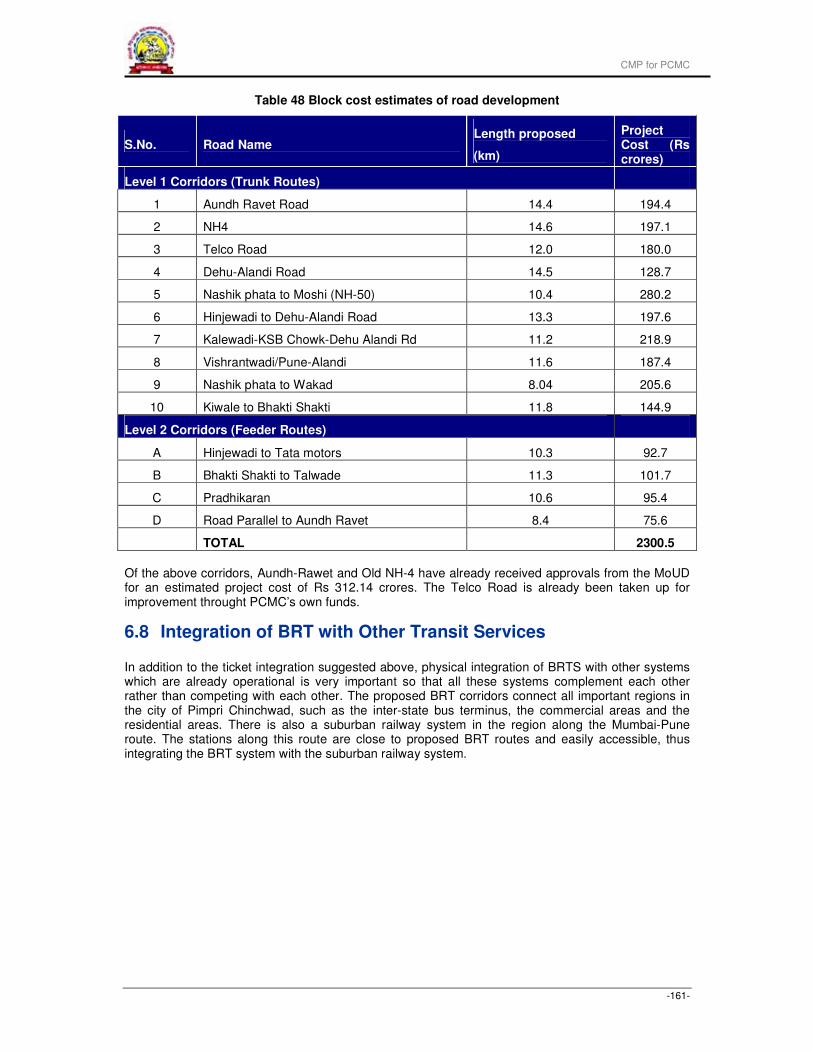
CMP for PCMC
-161-
Table 48 Block cost estimates of road development
S.No. Road Name Length proposed
(km)
Project Cost (Rs crores)
Level 1 Corridors (Trunk Routes)
1 Aundh Ravet Road 14.4 194.4
2 NH4 14.6 197.1
3 Telco Road 12.0 180.0
4 Dehu-Alandi Road 14.5 128.7
5 Nashik phata to Moshi (NH-50) 10.4 280.2
6 Hinjewadi to Dehu-Alandi Road 13.3 197.6
7 Kalewadi-KSB Chowk-Dehu Alandi Rd 11.2 218.9
8 Vishrantwadi/Pune-Alandi 11.6 187.4
9 Nashik phata to Wakad 8.04 205.6
10 Kiwale to Bhakti Shakti 11.8 144.9
Level 2 Corridors (Feeder Routes)
A Hinjewadi to Tata motors 10.3 92.7
B Bhakti Shakti to Talwade 11.3 101.7
C Pradhikaran 10.6 95.4
D Road Parallel to Aundh Ravet 8.4 75.6
TOTAL 2300.5
Of the above corridors, Aundh-Rawet and Old NH-4 have already received approvals from the MoUD for an estimated project cost of Rs 312.14 crores. The Telco Road is already been taken up for improvement throught PCMC’s own funds.
6.8 Integration of BRT with Other Transit Services
In addition to the ticket integration suggested above, physical integration of BRTS with other systems which are already operational is very important so that all these systems complement each other rather than competing with each other. The proposed BRT corridors connect all important regions in the city of Pimpri Chinchwad, such as the inter-state bus terminus, the commercial areas and the residential areas. There is also a suburban railway system in the region along the Mumbai-Pune route. The stations along this route are close to proposed BRT routes and easily accessible, thus integrating the BRT system with the suburban railway system.
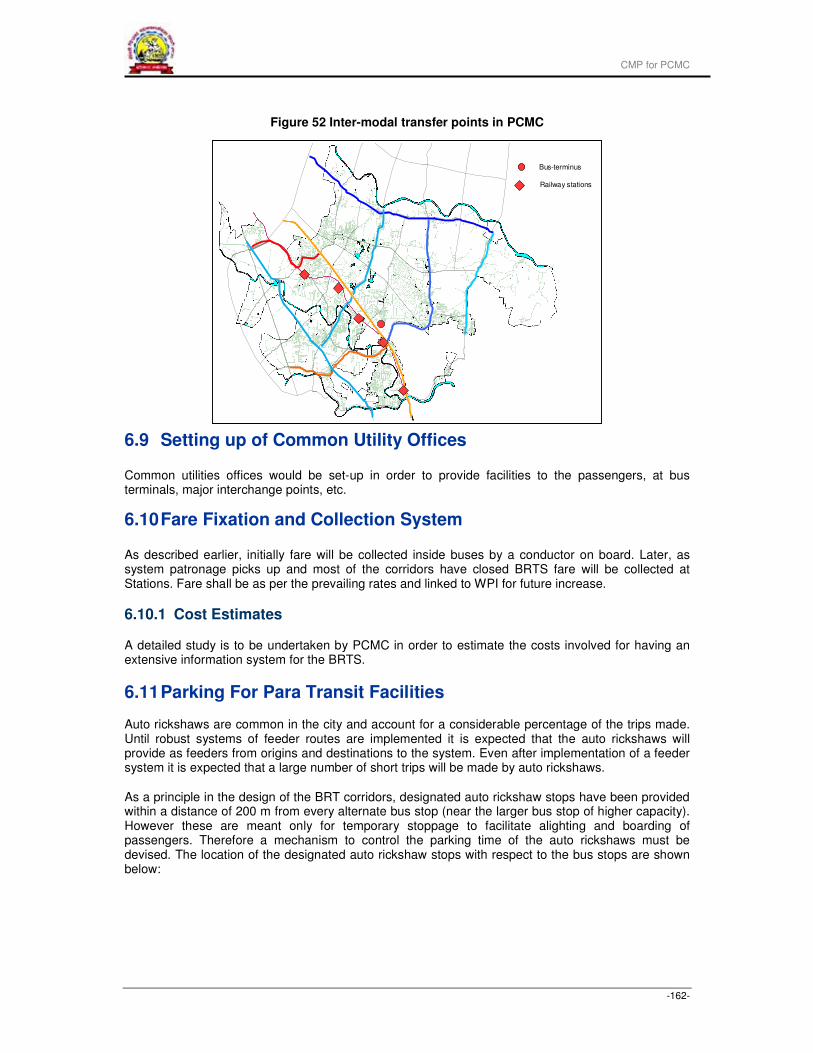
CMP for PCMC
-162-
Figure 52 Inter-modal transfer points in PCMC
6.9 Setting up of Common Utility Offices
Common utilities offices would be set-up in order to provide facilities to the passengers, at bus terminals, major interchange points, etc.
6.10 Fare Fixation and Collection System
As described earlier, initially fare will be collected inside buses by a conductor on board. Later, as system patronage picks up and most of the corridors have closed BRTS fare will be collected at Stations. Fare shall be as per the prevailing rates and linked to WPI for future increase.
6.10.1 Cost Estimates
A detailed study is to be undertaken by PCMC in order to estimate the costs involved for having an extensive information system for the BRTS.
6.11 Parking For Para Transit Facilities
Auto rickshaws are common in the city and account for a considerable percentage of the trips made. Until robust systems of feeder routes are implemented it is expected that the auto rickshaws will provide as feeders from origins and destinations to the system. Even after implementation of a feeder system it is expected that a large number of short trips will be made by auto rickshaws.
As a principle in the design of the BRT corridors, designated auto rickshaw stops have been provided within a distance of 200 m from every alternate bus stop (near the larger bus stop of higher capacity). However these are meant only for temporary stoppage to facilitate alighting and boarding of passengers. Therefore a mechanism to control the parking time of the auto rickshaws must be devised. The location of the designated auto rickshaw stops with respect to the bus stops are shown below:
` Bus-terminus
Railway stations
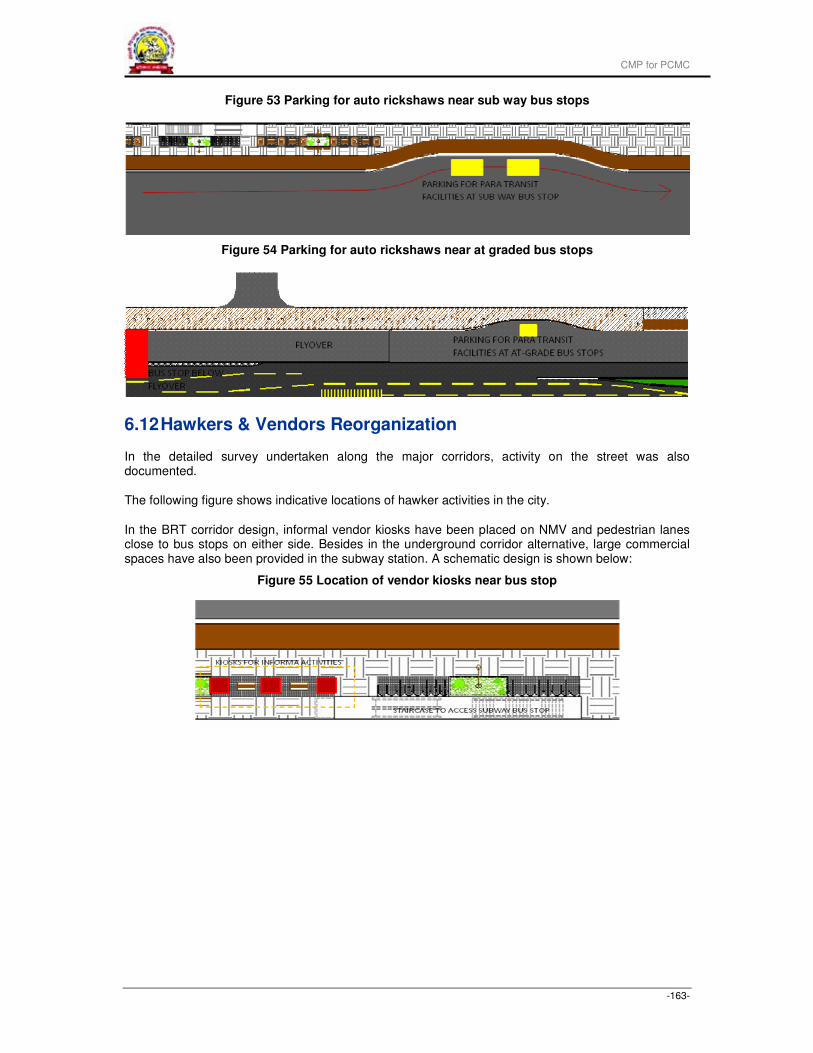
CMP for PCMC
-163-
Figure 53 Parking for auto rickshaws near sub way bus stops
Figure 54 Parking for auto rickshaws near at graded bus stops
6.12 Hawkers & Vendors Reorganization
In the detailed survey undertaken along the major corridors, activity on the street was also documented.
The following figure shows indicative locations of hawker activities in the city.
In the BRT corridor design, informal vendor kiosks have been placed on NMV and pedestrian lanes close to bus stops on either side. Besides in the underground corridor alternative, large commercial spaces have also been provided in the subway station. A schematic design is shown below:
Figure 55 Location of vendor kiosks near bus stop
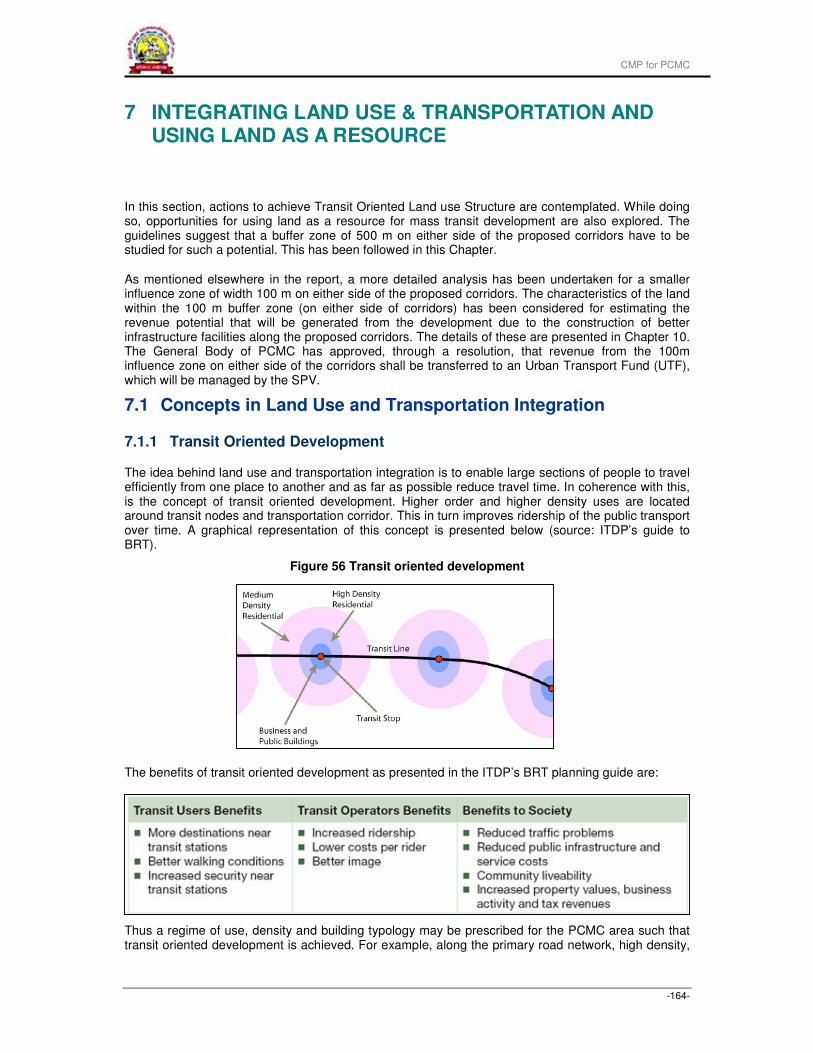
CMP for PCMC
-164-
7 INTEGRATING LAND USE & TRANSPORTATION AND USING LAND AS A RESOURCE
In this section, actions to achieve Transit Oriented Land use Structure are contemplated. While doing so, opportunities for using land as a resource for mass transit development are also explored. The guidelines suggest that a buffer zone of 500 m on either side of the proposed corridors have to be studied for such a potential. This has been followed in this Chapter.
As mentioned elsewhere in the report, a more detailed analysis has been undertaken for a smaller influence zone of width 100 m on either side of the proposed corridors. The characteristics of the land within the 100 m buffer zone (on either side of corridors) has been considered for estimating the revenue potential that will be generated from the development due to the construction of better infrastructure facilities along the proposed corridors. The details of these are presented in Chapter 10. The General Body of PCMC has approved, through a resolution, that revenue from the 100m influence zone on either side of the corridors shall be transferred to an Urban Transport Fund (UTF), which will be managed by the SPV.
7.1 Concepts in Land Use and Transportation Integration
7.1.1 Transit Oriented Development
The idea behind land use and transportation integration is to enable large sections of people to travel efficiently from one place to another and as far as possible reduce travel time. In coherence with this, is the concept of transit oriented development. Higher order and higher density uses are located around transit nodes and transportation corridor. This in turn improves ridership of the public transport over time. A graphical representation of this concept is presented below (source: ITDP’s guide to BRT).
Figure 56 Transit oriented development
The benefits of transit oriented development as presented in the ITDP’s BRT planning guide are:
Thus a regime of use, density and building typology may be prescribed for the PCMC area such that transit oriented development is achieved. For example, along the primary road network, high density,
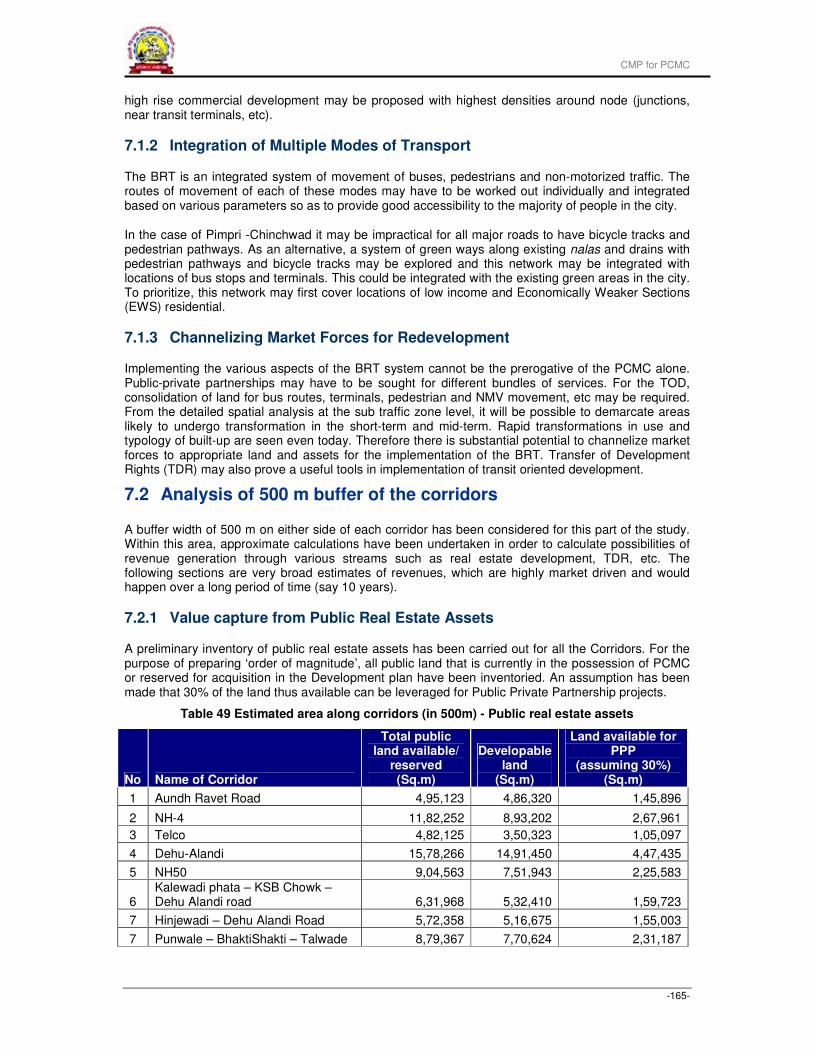
CMP for PCMC
-165-
high rise commercial development may be proposed with highest densities around node (junctions, near transit terminals, etc).
7.1.2 Integration of Multiple Modes of Transport
The BRT is an integrated system of movement of buses, pedestrians and non-motorized traffic. The routes of movement of each of these modes may have to be worked out individually and integrated based on various parameters so as to provide good accessibility to the majority of people in the city.
In the case of Pimpri -Chinchwad it may be impractical for all major roads to have bicycle tracks and pedestrian pathways. As an alternative, a system of green ways along existing nalas and drains with pedestrian pathways and bicycle tracks may be explored and this network may be integrated with locations of bus stops and terminals. This could be integrated with the existing green areas in the city. To prioritize, this network may first cover locations of low income and Economically Weaker Sections (EWS) residential.
7.1.3 Channelizing Market Forces for Redevelopment
Implementing the various aspects of the BRT system cannot be the prerogative of the PCMC alone. Public-private partnerships may have to be sought for different bundles of services. For the TOD, consolidation of land for bus routes, terminals, pedestrian and NMV movement, etc may be required. From the detailed spatial analysis at the sub traffic zone level, it will be possible to demarcate areas likely to undergo transformation in the short-term and mid-term. Rapid transformations in use and typology of built-up are seen even today. Therefore there is substantial potential to channelize market forces to appropriate land and assets for the implementation of the BRT. Transfer of Development Rights (TDR) may also prove a useful tools in implementation of transit oriented development.
7.2 Analysis of 500 m buffer of the corridors
A buffer width of 500 m on either side of each corridor has been considered for this part of the study. Within this area, approximate calculations have been undertaken in order to calculate possibilities of revenue generation through various streams such as real estate development, TDR, etc. The following sections are very broad estimates of revenues, which are highly market driven and would happen over a long period of time (say 10 years).
7.2.1 Value capture from Public Real Estate Assets
A preliminary inventory of public real estate assets has been carried out for all the Corridors. For the purpose of preparing ‘order of magnitude’, all public land that is currently in the possession of PCMC or reserved for acquisition in the Development plan have been inventoried. An assumption has been made that 30% of the land thus available can be leveraged for Public Private Partnership projects.
Table 49 Estimated area along corridors (in 500m) - Public real estate assets
No Name of Corridor
Total public land available/
reserved (Sq.m)
Developable land
(Sq.m)
Land available for PPP
(assuming 30%) (Sq.m)
1 Aundh Ravet Road 4,95,123 4,86,320 1,45,896
2 NH-4 11,82,252 8,93,202 2,67,961
3 Telco 4,82,125 3,50,323 1,05,097
4 Dehu-Alandi 15,78,266 14,91,450 4,47,435
5 NH50 9,04,563 7,51,943 2,25,583
6 Kalewadi phata – KSB Chowk – Dehu Alandi road 6,31,968 5,32,410 1,59,723
7 Hinjewadi – Dehu Alandi Road 5,72,358 5,16,675 1,55,003
7 Punwale – BhaktiShakti – Talwade 8,79,367 7,70,624 2,31,187
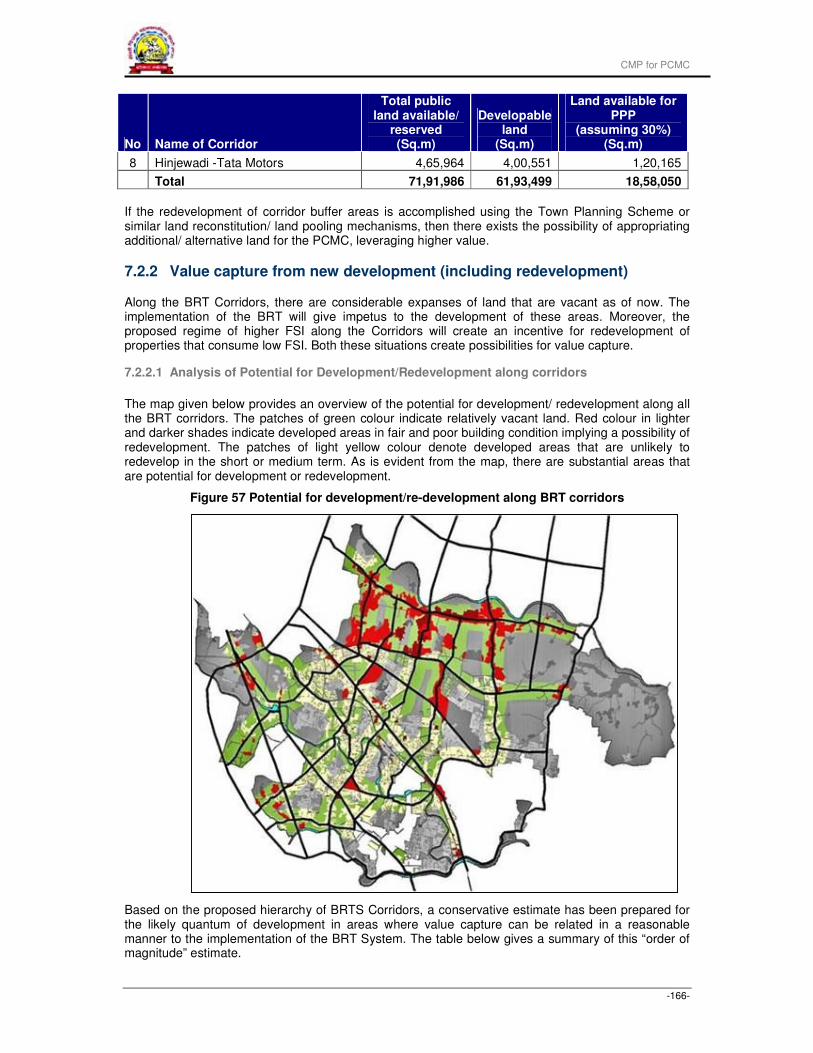
CMP for PCMC
-166-
No Name of Corridor
Total public land available/
reserved (Sq.m)
Developable land
(Sq.m)
Land available for PPP
(assuming 30%) (Sq.m)
8 Hinjewadi -Tata Motors 4,65,964 4,00,551 1,20,165
Total 71,91,986 61,93,499 18,58,050
If the redevelopment of corridor buffer areas is accomplished using the Town Planning Scheme or similar land reconstitution/ land pooling mechanisms, then there exists the possibility of appropriating additional/ alternative land for the PCMC, leveraging higher value.
7.2.2 Value capture from new development (including redevelopment)
Along the BRT Corridors, there are considerable expanses of land that are vacant as of now. The implementation of the BRT will give impetus to the development of these areas. Moreover, the proposed regime of higher FSI along the Corridors will create an incentive for redevelopment of properties that consume low FSI. Both these situations create possibilities for value capture.
7.2.2.1 Analysis of Potential for Development/Redevelopment along corridors
The map given below provides an overview of the potential for development/ redevelopment along all the BRT corridors. The patches of green colour indicate relatively vacant land. Red colour in lighter and darker shades indicate developed areas in fair and poor building condition implying a possibility of redevelopment. The patches of light yellow colour denote developed areas that are unlikely to redevelop in the short or medium term. As is evident from the map, there are substantial areas that are potential for development or redevelopment.
Figure 57 Potential for development/re-development along BRT corridors
Based on the proposed hierarchy of BRTS Corridors, a conservative estimate has been prepared for the likely quantum of development in areas where value capture can be related in a reasonable manner to the implementation of the BRT System. The table below gives a summary of this “order of magnitude” estimate.
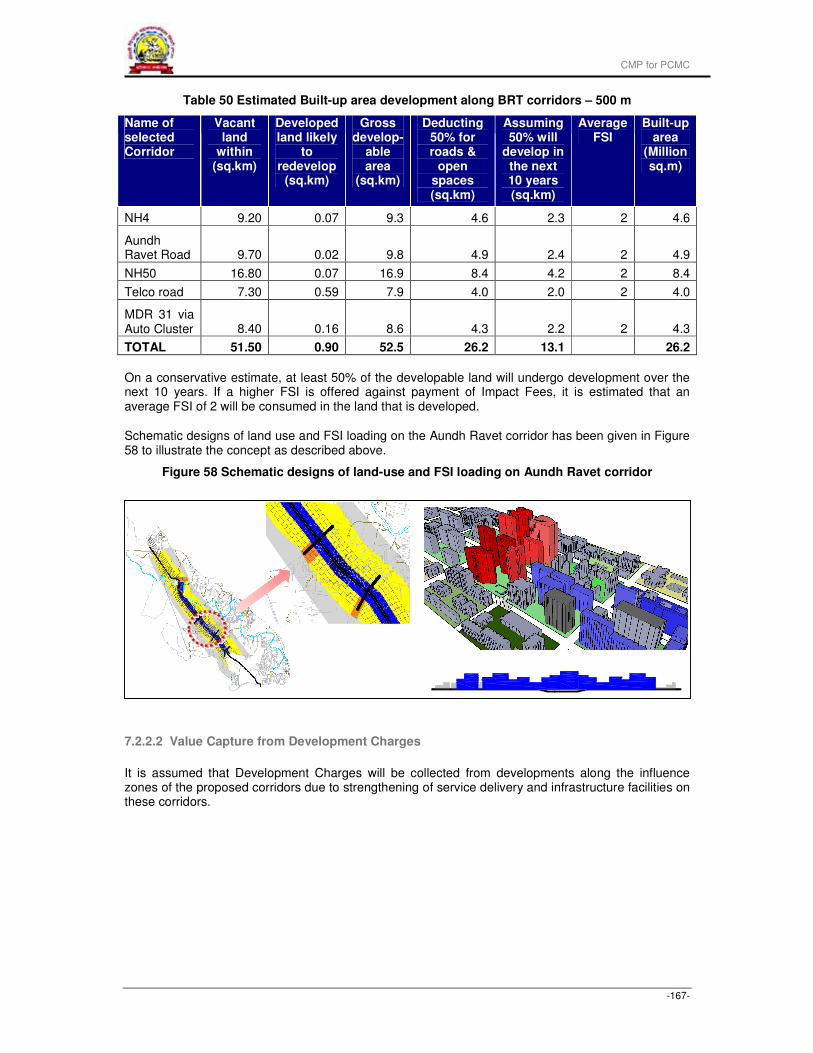
CMP for PCMC
-167-
Table 50 Estimated Built-up area development along BRT corridors – 500 m
Name of selected Corridor
Vacant land
within (sq.km)
Developed land likely
to redevelop
(sq.km)
Gross develop-
able area
(sq.km)
Deducting 50% for roads &
open spaces (sq.km)
Assuming 50% will
develop in the next 10 years (sq.km)
Average FSI
Built-up area
(Million sq.m)
NH4 9.20 0.07 9.3 4.6 2.3 2 4.6
Aundh Ravet Road 9.70 0.02 9.8 4.9 2.4 2 4.9
NH50 16.80 0.07 16.9 8.4 4.2 2 8.4
Telco road 7.30 0.59 7.9 4.0 2.0 2 4.0
MDR 31 via Auto Cluster 8.40 0.16 8.6 4.3 2.2 2 4.3
TOTAL 51.50 0.90 52.5 26.2 13.1 26.2
On a conservative estimate, at least 50% of the developable land will undergo development over the next 10 years. If a higher FSI is offered against payment of Impact Fees, it is estimated that an average FSI of 2 will be consumed in the land that is developed.
Schematic designs of land use and FSI loading on the Aundh Ravet corridor has been given in Figure 58 to illustrate the concept as described above.
Figure 58 Schematic designs of land-use and FSI loading on Aundh Ravet corridor
7.2.2.2 Value Capture from Development Charges
It is assumed that Development Charges will be collected from developments along the influence zones of the proposed corridors due to strengthening of service delivery and infrastructure facilities on these corridors.
CMP for PCMC
-168-
Table 51 Estimated land development along BRT corridors – 500 m
Name of selected Corridor
Estimated land development (million sq.m) FSI
Built-up Area (million sq.m)
NH4 2.3 2 4.6
Aundh Ravet road 2.4 2 4.9
NH50 4.2 2 8.4
Telco road 2.0 2 4.0
MDR 31 via Auto Cluster 2.2 2 4.3
TOTAL 13.1 26.2
7.2.2.3 Value Capture from Sale of Additional Development Rights (Impact Fee)
Of the total built-up area estimated above, it can be conservatively assumed that about 50% will be through the purchase of Additional Development Rights on payment of Impact Fees. This is a major source of value capture for the implementation of the BRT System. The revenue generated from such collections will for the enhanced infrastructure to support the proposed changes in land use and density along the corridor to make the redevelopment sustainable.
Table 52 Estimated value capture through Impact Fees along BRT corridors – 500m
Name of selected Corridor
Estimated land development along Corridors (million
sq.m)
FSI Built-up Area (million sq.m)
ADR area (million sq.m)
NH4 2.3 2 4.6 1.5
Aundh Ravet road 2.4 2 4.9 1.6
NH50 4.2 2 8.4 2.8
Telco road 2.0 2 4.0 1.3
MDR 31 via Auto Cluster 2.2 2 4.3 1.4 TOTAL 13.1 26.2 8.7
7.3 Implementation Mechanisms
PCMC has initiated the process to modify the FSI regime along an influence zone of 100m on either side of proposed corridors. A maximum FSI of 1.8 is to be allowed within these zones, through the approval of its General Body. Transfer of Development Rights shall also be allowed to a maximum extent of 1.8 along these zones. The TDR can occur from other existing zones in PCMC limits onto the new buffer zones along the BRT corridors. Developers will have to pay a premium for tranfering the development rights onto the new zone.
7.4 Development of government land
PCMC owns some parcels of land along proposed BRT corridors. It has initiated the process of developing some prime land parcels through a PPP model. These would be a source of one-time as well as annual income.
One such example is the Pimpri-Chinchwad City Centre, spread over an area of 33 acres at a prime location on Pune - Mumbai highway near PCMC Office Complex. This facility lies along one of the major BRT corridor of the city. Some of the facilities that are proposed in this complex include an Amphitheatre, a hotel, Laser and Aqua Show, Children’s zone, Conference zone, Exhibition Centre, Butterfly zone, a Velodrome, etc. PCMC plans to market this development as a major commercial hub in most prime areas of the city. This would also encourage use of the BRT system.
CMP for PCMC
-169-
8 TERMINALS AND PARKING
8.1 Proposed Parking Policy
The objective of PCMC, as stated by the National Urban Transport Policy (NUTP) would be to persuade people to use public transport access busy areas in the city instead of using personal vehicles. The NUTP suggests limiting the availability of parking space and the levy of high parking fee in order to curb the use of personal motor vehicles. Park and ride facilities can be provided in order to encourage use of public transport. Private sector participation can play an active role in having efficient systems in place for undertaking development of parking areas.
PCMC has taken an initiative to modify some of its Development Control Rules (DCR’s) in order to make provisions for increase in parking spaces in future developments, especially along the BRT corridors. The developers would be asked to share a part of the parking spaces for public purposes. PPP based models are being worked out to encourage investments from the private sector.
At a larger scale, provision of parking space for BRT rolling stock also has to be considered. It is expected that PCMC, PMPML and the proposed SPV shall hold discussions to use available spaces efficiently and generate additional revenues.
Number of fully automatic parking complexes are being implemented in various cities across India on a PPP format. Fully automatic perking complexes require very little area, and are very efficient when parking has to be done at multiple levels. Fully automatic parking systems can be considered at:
� ISBTs - at Nigdi and Sant Tukaram Nagar
� Local Railway Stations – Dapodi, Pimpri, Chinchwad and Akurdi
� Bhosari Industrial Area
� PCMC Office
� Chinchwad
� Nigdi
� Hinjewadi
Fully automated parking systems can be above or below ground and can also be below the existing roads. It may be noted that in a plot of size 2000 sqm, a fully automatic parking system with approximately 1200 ECS can be developed with a worst case retrieval time of 3 minutes.
8.2 Rolling Stock of the BRT system
The terminals at the proposed locations will act as parking places for the rolling stock of the BRT system. The routine maintenance, cleaning, re-fuelling, etc of the vehicles will be undertaken at these locations.
8.3 Other vehicles on BRTS Corridors
It is proposed that no on-street parking will be allowed on the BRTS Corridors. The reasons for this being that when dedicated bus lanes are created, the ROW becomes constrained to accommodate on-street parking and on-street parking encourages the use of private cars, which goes against the objective of creating a BRTS and also reduces its viability.
However, paid parking lots or parking complexes are meaningful at strategic locations on the BRTS corridors to facilitate ‘park-and-ride’ behaviour, which is in keeping with the philosophy of the BRTS. It is proposed to create incentives for private investment in such paid-parking complexes. The parking
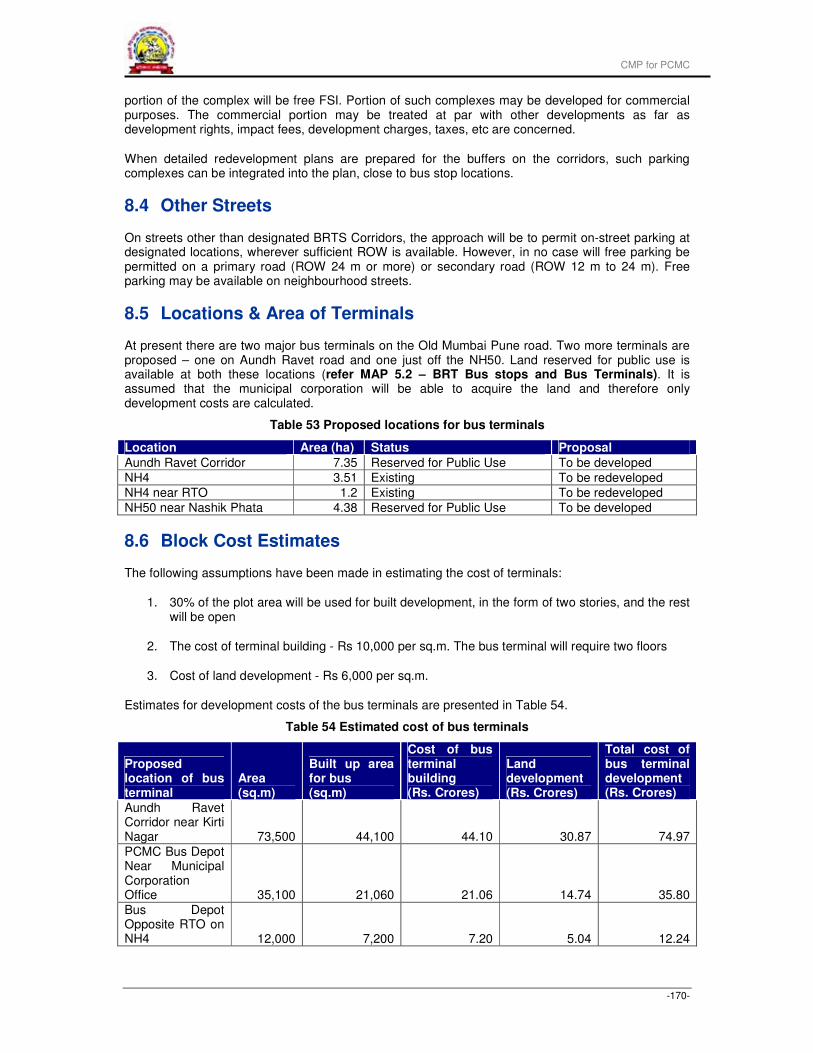
CMP for PCMC
-170-
portion of the complex will be free FSI. Portion of such complexes may be developed for commercial purposes. The commercial portion may be treated at par with other developments as far as development rights, impact fees, development charges, taxes, etc are concerned.
When detailed redevelopment plans are prepared for the buffers on the corridors, such parking complexes can be integrated into the plan, close to bus stop locations.
8.4 Other Streets
On streets other than designated BRTS Corridors, the approach will be to permit on-street parking at designated locations, wherever sufficient ROW is available. However, in no case will free parking be permitted on a primary road (ROW 24 m or more) or secondary road (ROW 12 m to 24 m). Free parking may be available on neighbourhood streets.
8.5 Locations & Area of Terminals
At present there are two major bus terminals on the Old Mumbai Pune road. Two more terminals are proposed – one on Aundh Ravet road and one just off the NH50. Land reserved for public use is available at both these locations (refer MAP 5.2 – BRT Bus stops and Bus Terminals). It is assumed that the municipal corporation will be able to acquire the land and therefore only development costs are calculated.
Table 53 Proposed locations for bus terminals
Location Area (ha) Status Proposal
Aundh Ravet Corridor 7.35 Reserved for Public Use To be developed
NH4 3.51 Existing To be redeveloped
NH4 near RTO 1.2 Existing To be redeveloped
NH50 near Nashik Phata 4.38 Reserved for Public Use To be developed
8.6 Block Cost Estimates
The following assumptions have been made in estimating the cost of terminals:
1. 30% of the plot area will be used for built development, in the form of two stories, and the rest will be open
2. The cost of terminal building - Rs 10,000 per sq.m. The bus terminal will require two floors
3. Cost of land development - Rs 6,000 per sq.m.
Estimates for development costs of the bus terminals are presented in Table 54.
Table 54 Estimated cost of bus terminals
Proposed location of bus terminal
Area (sq.m)
Built up area for bus (sq.m)
Cost of bus terminal building (Rs. Crores)
Land development (Rs. Crores)
Total cost of bus terminal development (Rs. Crores)
Aundh Ravet Corridor near Kirti Nagar 73,500 44,100 44.10 30.87 74.97
PCMC Bus Depot Near Municipal Corporation Office 35,100 21,060 21.06 14.74 35.80
Bus Depot Opposite RTO on NH4 12,000 7,200 7.20 5.04 12.24
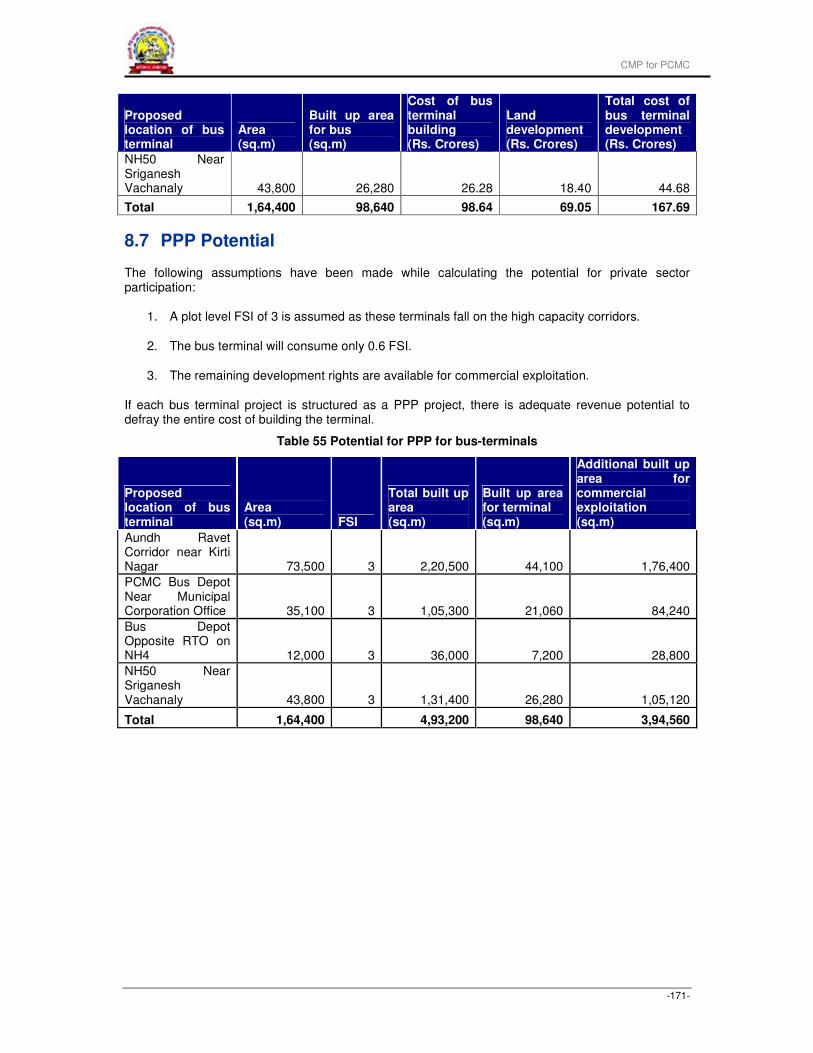
CMP for PCMC
-171-
Proposed location of bus terminal
Area (sq.m)
Built up area for bus (sq.m)
Cost of bus terminal building (Rs. Crores)
Land development (Rs. Crores)
Total cost of bus terminal development (Rs. Crores)
NH50 Near Sriganesh Vachanaly 43,800 26,280 26.28 18.40 44.68
Total 1,64,400 98,640 98.64 69.05 167.69
8.7 PPP Potential
The following assumptions have been made while calculating the potential for private sector participation:
1. A plot level FSI of 3 is assumed as these terminals fall on the high capacity corridors.
2. The bus terminal will consume only 0.6 FSI.
3. The remaining development rights are available for commercial exploitation.
If each bus terminal project is structured as a PPP project, there is adequate revenue potential to defray the entire cost of building the terminal.
Table 55 Potential for PPP for bus-terminals
Proposed location of bus terminal
Area (sq.m) FSI
Total built up area (sq.m)
Built up area for terminal (sq.m)
Additional built up area for commercial exploitation (sq.m)
Aundh Ravet Corridor near Kirti Nagar 73,500 3 2,20,500 44,100 1,76,400
PCMC Bus Depot Near Municipal Corporation Office 35,100 3 1,05,300 21,060 84,240
Bus Depot Opposite RTO on NH4 12,000 3 36,000 7,200 28,800
NH50 Near Sriganesh Vachanaly 43,800 3 1,31,400 26,280 1,05,120
Total 1,64,400 4,93,200 98,640 3,94,560
CMP for PCMC
-172-
9 PROPOSED PHASING OF PROJECTS
The selection of corridors from among the road network of PCMC was undertaken using the following parameters.
1. Travel Demand
2. Hierarchy of Roads
3. Availability of Right of Way
4. Ownership of the Right of Way
5. Existing Bus Routes
6. Integration with Pune’s system
7. Ongoing projects for road development
8. Other Mass Transit System Proposals
Elaborate discussions were held with PCMC and its technical consultants involved in road improvement projects. Based on these discussions and the traffic and land-use analysis undertaken as a part of this study the BRT corridors have been suggested.
The main roads in the city of Pimpri-Chinchwad are:
1. Old Mumbai-Pune highway (NH-4)
2. Aundh – Rawet road
3. Nashik phata to Moshi (NH-50)
4. Nashik phata to Wakad (new road alignment)
5. Telco Road,
6. Dehu-Alandi Road
7. Hinjewadi to Dehu Alandi road
8. Kalewadi Phata - KSB Chowk – Dehu Alandi road
9. Kiwale to Bhakti Shakti
10. Vishrantwadi - Alandi
Apart from the above, there are some other roads which play an important role while connecting the above roads. These are:
1. Pradhikaran/Spine road
2. Hinjewadi to Tata Motors
3. Road parallel to Aundh-Rawet corridor
4. Bhakti Shakti to Talawade
There are three corridors in Pimpri-Chinchwad which continue into the limits of Pune city. These are the Aundh-Rawet corridor the Old NH-4 and the Vishrantwadi-Alandi road. The Vishrantwadi -Alandi road starts from Pune city leading to the religious centre of Alandi. It passes through PCMC area limits and is being considered by PMC as one of its BRT corridors. In order to continue this corridor
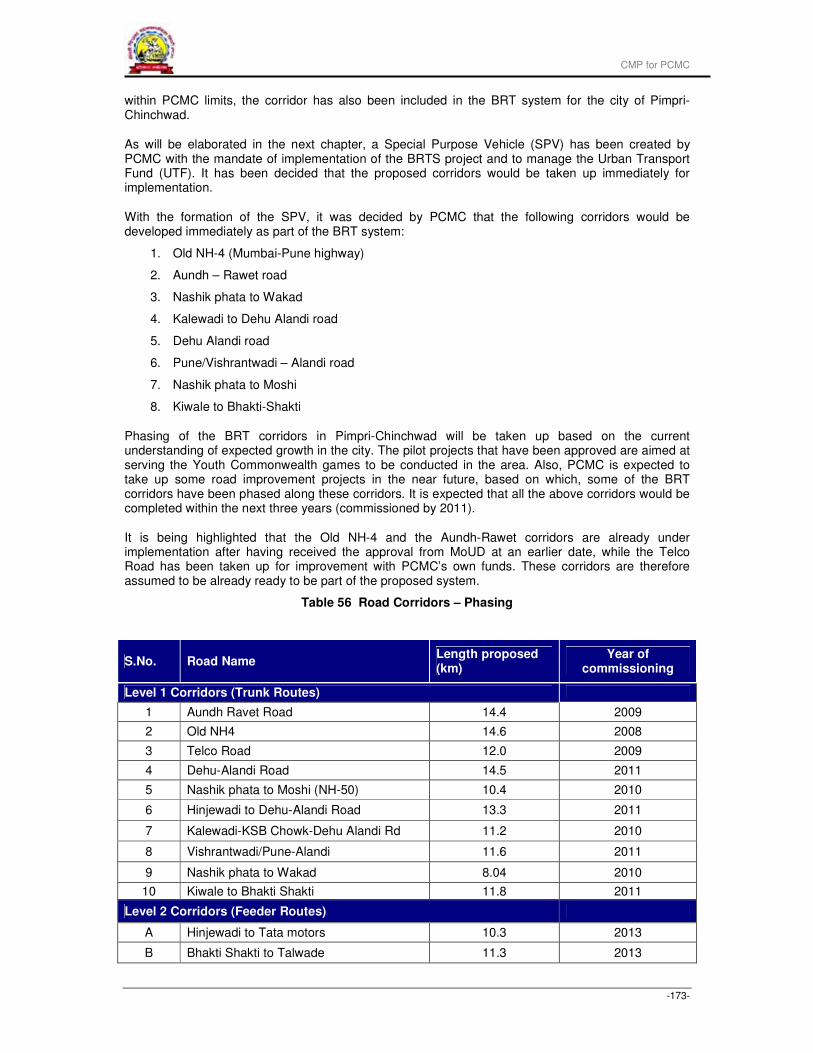
CMP for PCMC
-173-
within PCMC limits, the corridor has also been included in the BRT system for the city of Pimpri-Chinchwad.
As will be elaborated in the next chapter, a Special Purpose Vehicle (SPV) has been created by PCMC with the mandate of implementation of the BRTS project and to manage the Urban Transport Fund (UTF). It has been decided that the proposed corridors would be taken up immediately for implementation.
With the formation of the SPV, it was decided by PCMC that the following corridors would be developed immediately as part of the BRT system:
1. Old NH-4 (Mumbai-Pune highway)
2. Aundh – Rawet road
3. Nashik phata to Wakad
4. Kalewadi to Dehu Alandi road
5. Dehu Alandi road
6. Pune/Vishrantwadi – Alandi road
7. Nashik phata to Moshi
8. Kiwale to Bhakti-Shakti
Phasing of the BRT corridors in Pimpri-Chinchwad will be taken up based on the current understanding of expected growth in the city. The pilot projects that have been approved are aimed at serving the Youth Commonwealth games to be conducted in the area. Also, PCMC is expected to take up some road improvement projects in the near future, based on which, some of the BRT corridors have been phased along these corridors. It is expected that all the above corridors would be completed within the next three years (commissioned by 2011).
It is being highlighted that the Old NH-4 and the Aundh-Rawet corridors are already under implementation after having received the approval from MoUD at an earlier date, while the Telco Road has been taken up for improvement with PCMC’s own funds. These corridors are therefore assumed to be already ready to be part of the proposed system.
Table 56 Road Corridors – Phasing
S.No. Road Name Length proposed (km)
Year of commissioning
Level 1 Corridors (Trunk Routes)
1 Aundh Ravet Road 14.4 2009
2 Old NH4 14.6 2008
3 Telco Road 12.0 2009
4 Dehu-Alandi Road 14.5 2011
5 Nashik phata to Moshi (NH-50) 10.4 2010
6 Hinjewadi to Dehu-Alandi Road 13.3 2011
7 Kalewadi-KSB Chowk-Dehu Alandi Rd 11.2 2010
8 Vishrantwadi/Pune-Alandi 11.6 2011
9 Nashik phata to Wakad 8.04 2010
10 Kiwale to Bhakti Shakti 11.8 2011
Level 2 Corridors (Feeder Routes)
A Hinjewadi to Tata motors 10.3 2013
B Bhakti Shakti to Talwade 11.3 2013
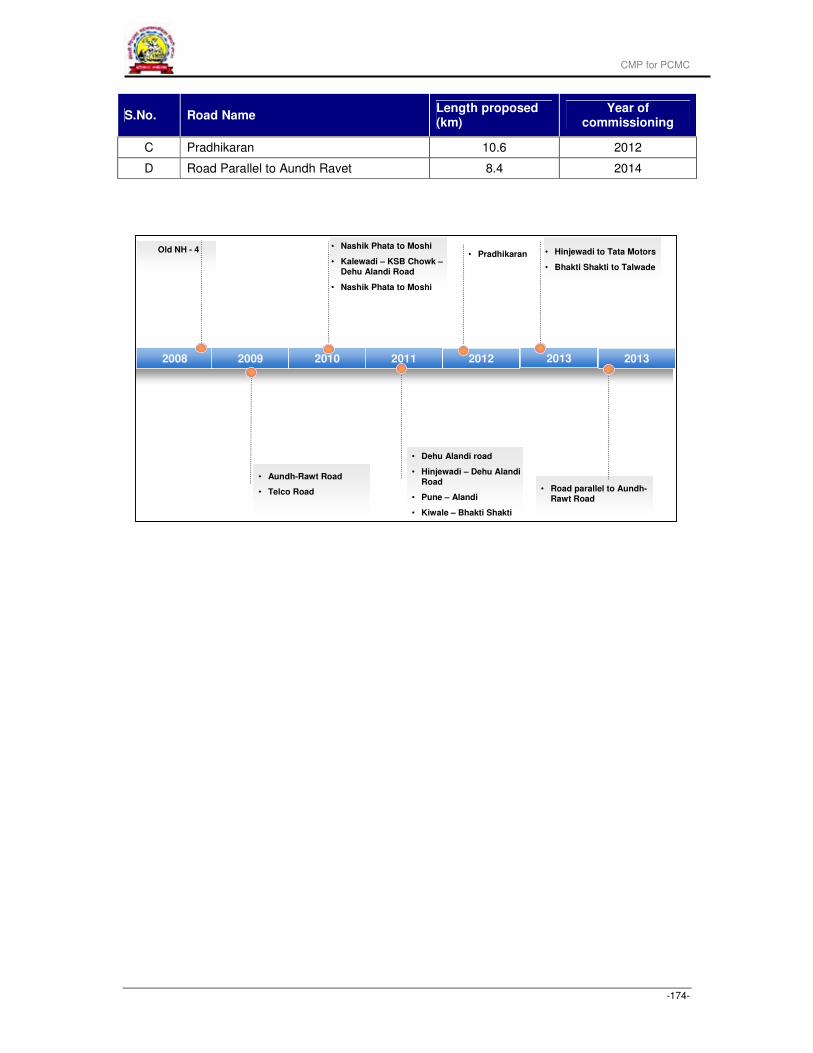
CMP for PCMC
-174-
S.No. Road Name Length proposed (km)
Year of commissioning
C Pradhikaran 10.6 2012
D Road Parallel to Aundh Ravet 8.4 2014
2008 2009 2010 2011
Old NH - 4 • Nashik Phata to Moshi
• Kalewadi – KSB Chowk –Dehu Alandi Road
• Nashik Phata to Moshi
• Aundh-Rawt Road
• Telco Road
20132012
• Dehu Alandi road
• Hinjewadi – Dehu AlandiRoad
• Pune – Alandi
• Kiwale – Bhakti Shakti
• Pradhikaran • Hinjewadi to Tata Motors
• Bhakti Shakti to Talwade
• Road parallel to Aundh-Rawt Road
2013

CMP for PCMC
-175-
Map 9-1 BRTS Corridors in Phase I
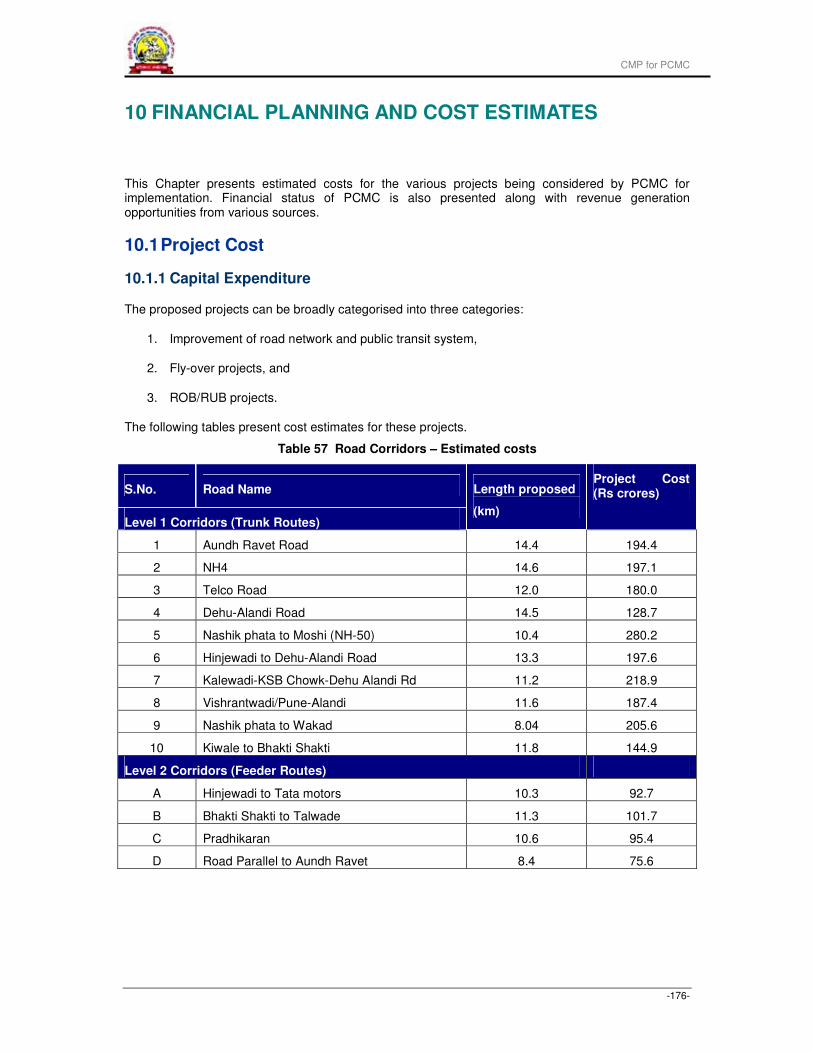
CMP for PCMC
-176-
10 FINANCIAL PLANNING AND COST ESTIMATES
This Chapter presents estimated costs for the various projects being considered by PCMC for implementation. Financial status of PCMC is also presented along with revenue generation opportunities from various sources.
10.1 Project Cost
10.1.1 Capital Expenditure
The proposed projects can be broadly categorised into three categories:
1. Improvement of road network and public transit system,
2. Fly-over projects, and
3. ROB/RUB projects.
The following tables present cost estimates for these projects.
Table 57 Road Corridors – Estimated costs
S.No. Road Name
Level 1 Corridors (Trunk Routes)
Length proposed
(km)
Project Cost (Rs crores)
1 Aundh Ravet Road 14.4 194.4
2 NH4 14.6 197.1
3 Telco Road 12.0 180.0
4 Dehu-Alandi Road 14.5 128.7
5 Nashik phata to Moshi (NH-50) 10.4 280.2
6 Hinjewadi to Dehu-Alandi Road 13.3 197.6
7 Kalewadi-KSB Chowk-Dehu Alandi Rd 11.2 218.9
8 Vishrantwadi/Pune-Alandi 11.6 187.4
9 Nashik phata to Wakad 8.04 205.6
10 Kiwale to Bhakti Shakti 11.8 144.9
Level 2 Corridors (Feeder Routes)
A Hinjewadi to Tata motors 10.3 92.7
B Bhakti Shakti to Talwade 11.3 101.7
C Pradhikaran 10.6 95.4
D Road Parallel to Aundh Ravet 8.4 75.6
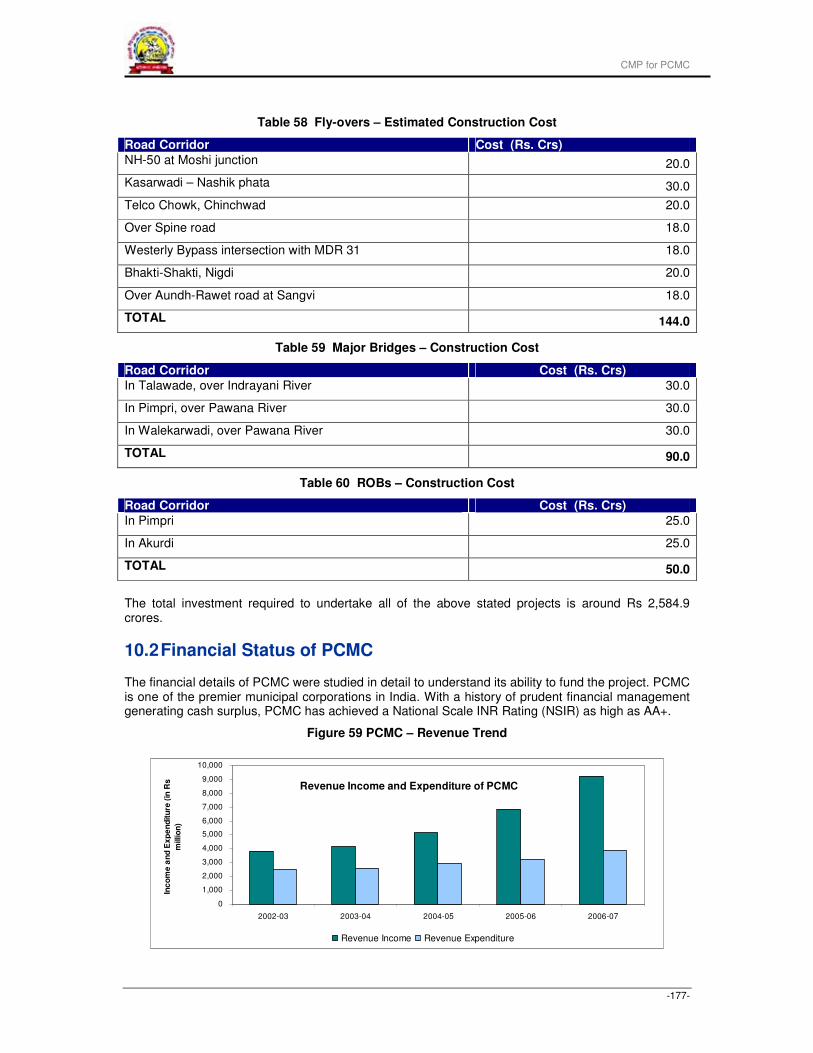
CMP for PCMC
-177-
Table 58 Fly-overs – Estimated Construction Cost
Road Corridor Cost (Rs. Crs)
NH-50 at Moshi junction 20.0
Kasarwadi – Nashik phata 30.0
Telco Chowk, Chinchwad 20.0
Over Spine road 18.0
Westerly Bypass intersection with MDR 31 18.0
Bhakti-Shakti, Nigdi 20.0
Over Aundh-Rawet road at Sangvi 18.0
TOTAL 144.0
Table 59 Major Bridges – Construction Cost
Road Corridor Cost (Rs. Crs)
In Talawade, over Indrayani River 30.0
In Pimpri, over Pawana River 30.0
In Walekarwadi, over Pawana River 30.0
TOTAL 90.0
Table 60 ROBs – Construction Cost
Road Corridor Cost (Rs. Crs)
In Pimpri 25.0
In Akurdi 25.0
TOTAL 50.0
The total investment required to undertake all of the above stated projects is around Rs 2,584.9 crores.
10.2 Financial Status of PCMC
The financial details of PCMC were studied in detail to understand its ability to fund the project. PCMC is one of the premier municipal corporations in India. With a history of prudent financial management generating cash surplus, PCMC has achieved a National Scale INR Rating (NSIR) as high as AA+.
Figure 59 PCMC – Revenue Trend
Revenue Income and Expenditure of PCMC
0
1,000
2,000
3,000
4,000
5,000
6,000
7,000
8,000
9,000
10,000
2002-03 2003-04 2004-05 2005-06 2006-07
Inc
om
e a
nd
Ex
pe
nd
itu
re (
in R
s
millio
n)
Revenue Income Revenue Expenditure
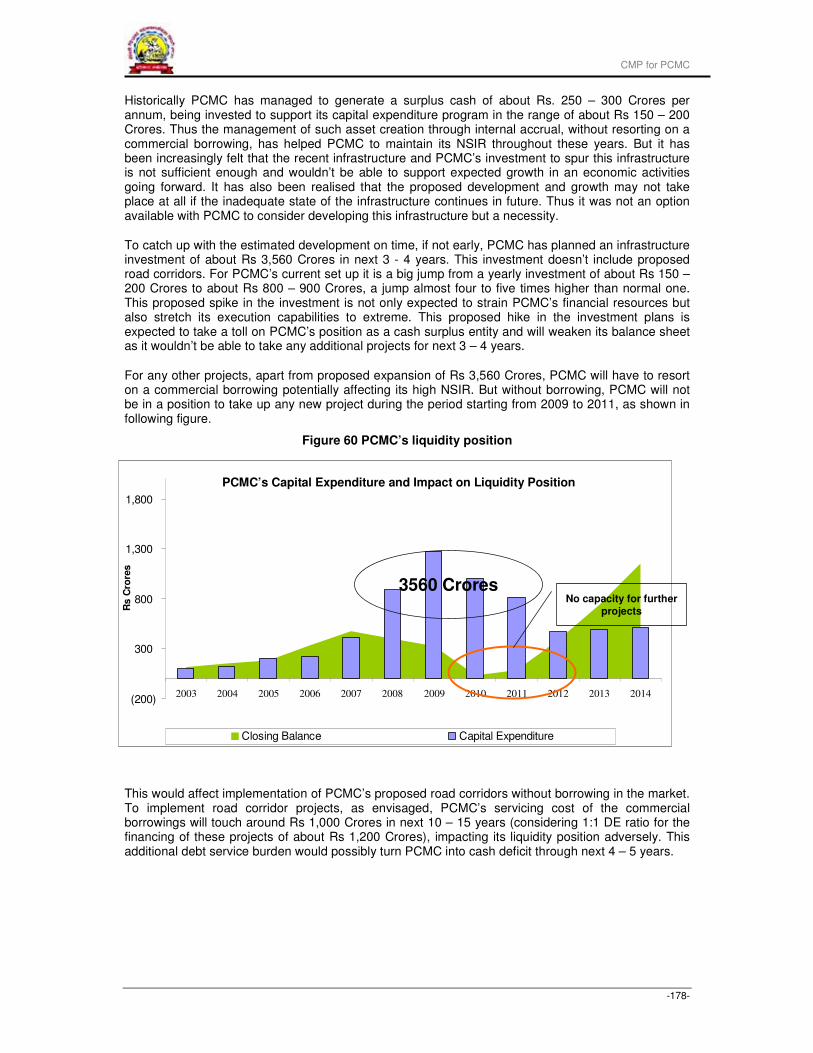
CMP for PCMC
-178-
Historically PCMC has managed to generate a surplus cash of about Rs. 250 – 300 Crores per annum, being invested to support its capital expenditure program in the range of about Rs 150 – 200 Crores. Thus the management of such asset creation through internal accrual, without resorting on a commercial borrowing, has helped PCMC to maintain its NSIR throughout these years. But it has been increasingly felt that the recent infrastructure and PCMC’s investment to spur this infrastructure is not sufficient enough and wouldn’t be able to support expected growth in an economic activities going forward. It has also been realised that the proposed development and growth may not take place at all if the inadequate state of the infrastructure continues in future. Thus it was not an option available with PCMC to consider developing this infrastructure but a necessity.
To catch up with the estimated development on time, if not early, PCMC has planned an infrastructure investment of about Rs 3,560 Crores in next 3 - 4 years. This investment doesn’t include proposed road corridors. For PCMC’s current set up it is a big jump from a yearly investment of about Rs 150 – 200 Crores to about Rs 800 – 900 Crores, a jump almost four to five times higher than normal one. This proposed spike in the investment is not only expected to strain PCMC’s financial resources but also stretch its execution capabilities to extreme. This proposed hike in the investment plans is expected to take a toll on PCMC’s position as a cash surplus entity and will weaken its balance sheet as it wouldn’t be able to take any additional projects for next 3 – 4 years.
For any other projects, apart from proposed expansion of Rs 3,560 Crores, PCMC will have to resort on a commercial borrowing potentially affecting its high NSIR. But without borrowing, PCMC will not be in a position to take up any new project during the period starting from 2009 to 2011, as shown in following figure.
Figure 60 PCMC’s liquidity position
This would affect implementation of PCMC’s proposed road corridors without borrowing in the market. To implement road corridor projects, as envisaged, PCMC’s servicing cost of the commercial borrowings will touch around Rs 1,000 Crores in next 10 – 15 years (considering 1:1 DE ratio for the financing of these projects of about Rs 1,200 Crores), impacting its liquidity position adversely. This additional debt service burden would possibly turn PCMC into cash deficit through next 4 – 5 years.
(200)
300
800
1,300
1,800
2003 2004 2005 2006 2007 2008 2009 2010 2011 2012 2013 2014
Rs C
rore
s
Closing Balance Capital Expenditure
3560 CroresNo capacity for further
projects
PCMC’s Capital Expenditure and Impact on Liquidity Position
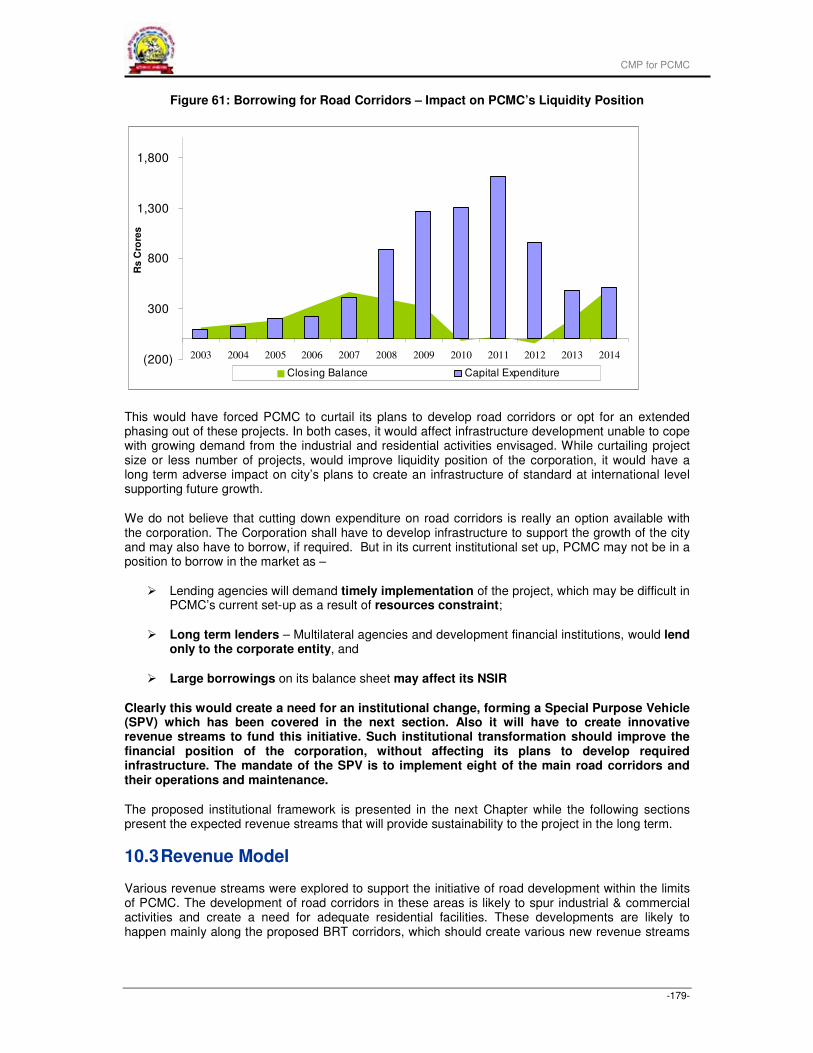
CMP for PCMC
-179-
Figure 61: Borrowing for Road Corridors – Impact on PCMC’s Liquidity Position
(200)
300
800
1,300
1,800
2003 2004 2005 2006 2007 2008 2009 2010 2011 2012 2013 2014
Rs C
rore
s
Closing Balance Capital Expenditure
This would have forced PCMC to curtail its plans to develop road corridors or opt for an extended phasing out of these projects. In both cases, it would affect infrastructure development unable to cope with growing demand from the industrial and residential activities envisaged. While curtailing project size or less number of projects, would improve liquidity position of the corporation, it would have a long term adverse impact on city’s plans to create an infrastructure of standard at international level supporting future growth.
We do not believe that cutting down expenditure on road corridors is really an option available with the corporation. The Corporation shall have to develop infrastructure to support the growth of the city and may also have to borrow, if required. But in its current institutional set up, PCMC may not be in a position to borrow in the market as –
� Lending agencies will demand timely implementation of the project, which may be difficult in PCMC’s current set-up as a result of resources constraint;
� Long term lenders – Multilateral agencies and development financial institutions, would lend only to the corporate entity, and
� Large borrowings on its balance sheet may affect its NSIR
Clearly this would create a need for an institutional change, forming a Special Purpose Vehicle (SPV) which has been covered in the next section. Also it will have to create innovative revenue streams to fund this initiative. Such institutional transformation should improve the financial position of the corporation, without affecting its plans to develop required infrastructure. The mandate of the SPV is to implement eight of the main road corridors and their operations and maintenance.
The proposed institutional framework is presented in the next Chapter while the following sections present the expected revenue streams that will provide sustainability to the project in the long term.
10.3 Revenue Model
Various revenue streams were explored to support the initiative of road development within the limits of PCMC. The development of road corridors in these areas is likely to spur industrial & commercial activities and create a need for adequate residential facilities. These developments are likely to happen mainly along the proposed BRT corridors, which should create various new revenue streams
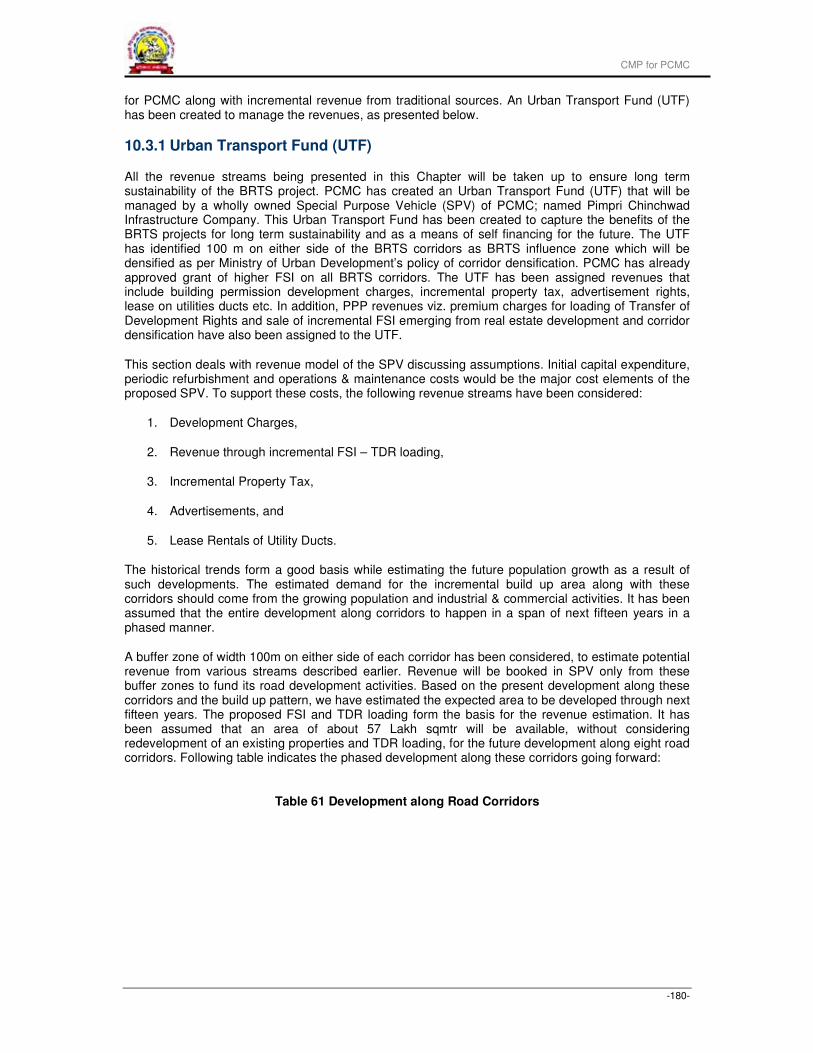
CMP for PCMC
-180-
for PCMC along with incremental revenue from traditional sources. An Urban Transport Fund (UTF) has been created to manage the revenues, as presented below.
10.3.1 Urban Transport Fund (UTF)
All the revenue streams being presented in this Chapter will be taken up to ensure long term sustainability of the BRTS project. PCMC has created an Urban Transport Fund (UTF) that will be managed by a wholly owned Special Purpose Vehicle (SPV) of PCMC; named Pimpri Chinchwad Infrastructure Company. This Urban Transport Fund has been created to capture the benefits of the BRTS projects for long term sustainability and as a means of self financing for the future. The UTF has identified 100 m on either side of the BRTS corridors as BRTS influence zone which will be densified as per Ministry of Urban Development’s policy of corridor densification. PCMC has already approved grant of higher FSI on all BRTS corridors. The UTF has been assigned revenues that include building permission development charges, incremental property tax, advertisement rights, lease on utilities ducts etc. In addition, PPP revenues viz. premium charges for loading of Transfer of Development Rights and sale of incremental FSI emerging from real estate development and corridor densification have also been assigned to the UTF.
This section deals with revenue model of the SPV discussing assumptions. Initial capital expenditure, periodic refurbishment and operations & maintenance costs would be the major cost elements of the proposed SPV. To support these costs, the following revenue streams have been considered:
1. Development Charges,
2. Revenue through incremental FSI – TDR loading,
3. Incremental Property Tax,
4. Advertisements, and
5. Lease Rentals of Utility Ducts.
The historical trends form a good basis while estimating the future population growth as a result of such developments. The estimated demand for the incremental build up area along with these corridors should come from the growing population and industrial & commercial activities. It has been assumed that the entire development along corridors to happen in a span of next fifteen years in a phased manner.
A buffer zone of width 100m on either side of each corridor has been considered, to estimate potential revenue from various streams described earlier. Revenue will be booked in SPV only from these buffer zones to fund its road development activities. Based on the present development along these corridors and the build up pattern, we have estimated the expected area to be developed through next fifteen years. The proposed FSI and TDR loading form the basis for the revenue estimation. It has been assumed that an area of about 57 Lakh sqmtr will be available, without considering redevelopment of an existing properties and TDR loading, for the future development along eight road corridors. Following table indicates the phased development along these corridors going forward:
Table 61 Development along Road Corridors
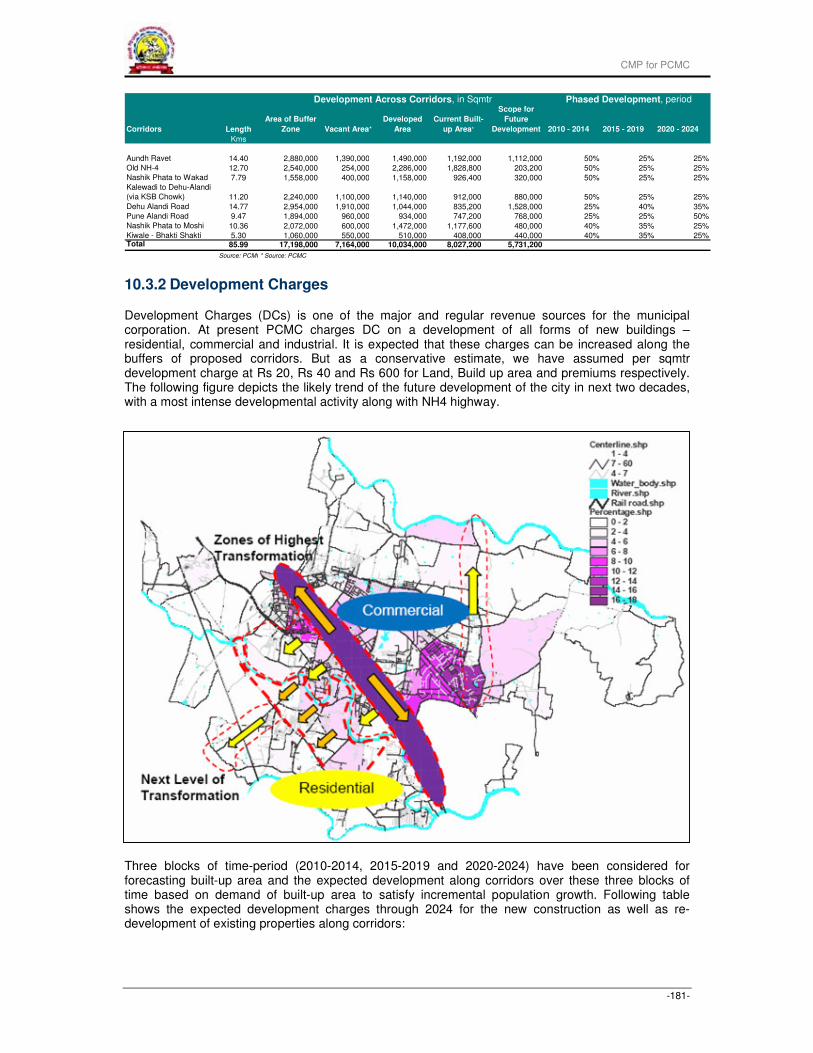
CMP for PCMC
-181-
Corridors Length
Area of Buffer
Zone Vacant Area*
Developed
Area
Current Built-
up Area*
Scope for
Future
Development 2010 - 2014 2015 - 2019 2020 - 2024
Kms
Aundh Ravet 14.40 2,880,000 1,390,000 1,490,000 1,192,000 1,112,000 50% 25% 25%
Old NH-4 12.70 2,540,000 254,000 2,286,000 1,828,800 203,200 50% 25% 25%
Nashik Phata to Wakad 7.79 1,558,000 400,000 1,158,000 926,400 320,000 50% 25% 25%
Kalewadi to Dehu-Alandi
(via KSB Chowk) 11.20 2,240,000 1,100,000 1,140,000 912,000 880,000 50% 25% 25%
Dehu Alandi Road 14.77 2,954,000 1,910,000 1,044,000 835,200 1,528,000 25% 40% 35%
Pune Alandi Road 9.47 1,894,000 960,000 934,000 747,200 768,000 25% 25% 50%
Nashik Phata to Moshi 10.36 2,072,000 600,000 1,472,000 1,177,600 480,000 40% 35% 25%
Kiwale - Bhakti Shakti 5.30 1,060,000 550,000 510,000 408,000 440,000 40% 35% 25%Total 85.99 17,198,000 7,164,000 10,034,000 8,027,200 5,731,200
Source: PCMC* Source: PCMC
Development Across Corridors, in Sqmtr Phased Development, period
10.3.2 Development Charges
Development Charges (DCs) is one of the major and regular revenue sources for the municipal corporation. At present PCMC charges DC on a development of all forms of new buildings – residential, commercial and industrial. It is expected that these charges can be increased along the buffers of proposed corridors. But as a conservative estimate, we have assumed per sqmtr development charge at Rs 20, Rs 40 and Rs 600 for Land, Build up area and premiums respectively. The following figure depicts the likely trend of the future development of the city in next two decades, with a most intense developmental activity along with NH4 highway.
Three blocks of time-period (2010-2014, 2015-2019 and 2020-2024) have been considered for forecasting built-up area and the expected development along corridors over these three blocks of time based on demand of built-up area to satisfy incremental population growth. Following table shows the expected development charges through 2024 for the new construction as well as re-development of existing properties along corridors:
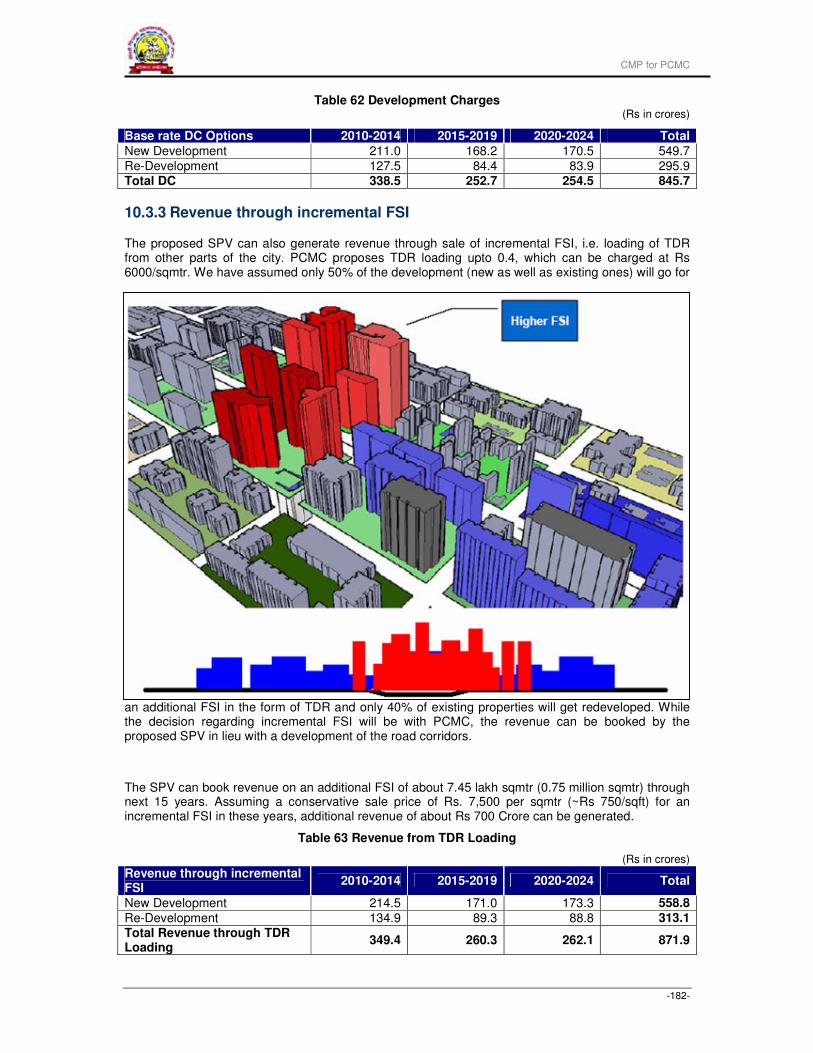
CMP for PCMC
-182-
Table 62 Development Charges (Rs in crores)
Base rate DC Options 2010-2014 2015-2019 2020-2024 Total
New Development 211.0 168.2 170.5 549.7
Re-Development 127.5 84.4 83.9 295.9 Total DC 338.5 252.7 254.5 845.7
10.3.3 Revenue through incremental FSI
The proposed SPV can also generate revenue through sale of incremental FSI, i.e. loading of TDR from other parts of the city. PCMC proposes TDR loading upto 0.4, which can be charged at Rs 6000/sqmtr. We have assumed only 50% of the development (new as well as existing ones) will go for
an additional FSI in the form of TDR and only 40% of existing properties will get redeveloped. While the decision regarding incremental FSI will be with PCMC, the revenue can be booked by the proposed SPV in lieu with a development of the road corridors.
The SPV can book revenue on an additional FSI of about 7.45 lakh sqmtr (0.75 million sqmtr) through next 15 years. Assuming a conservative sale price of Rs. 7,500 per sqmtr (~Rs 750/sqft) for an incremental FSI in these years, additional revenue of about Rs 700 Crore can be generated.
Table 63 Revenue from TDR Loading
(Rs in crores)
Revenue through incremental FSI
2010-2014 2015-2019 2020-2024 Total
New Development 214.5 171.0 173.3 558.8
Re-Development 134.9 89.3 88.8 313.1
Total Revenue through TDR Loading
349.4 260.3 262.1 871.9
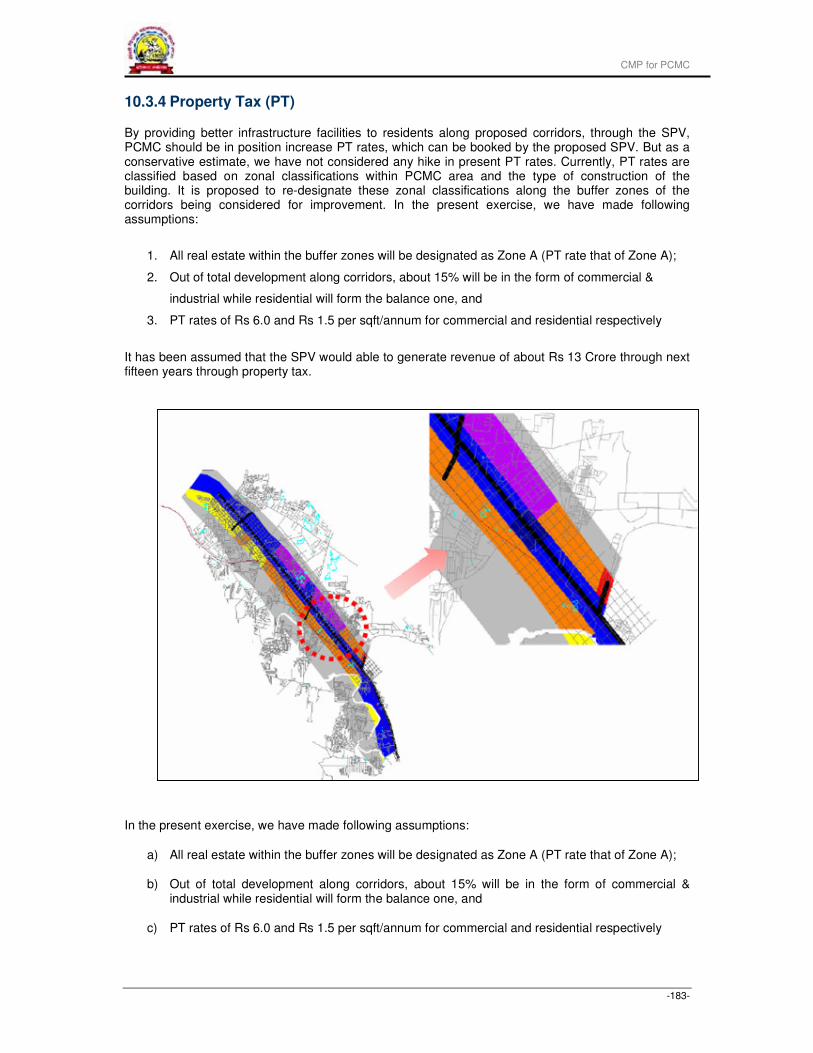
CMP for PCMC
-183-
10.3.4 Property Tax (PT)
By providing better infrastructure facilities to residents along proposed corridors, through the SPV, PCMC should be in position increase PT rates, which can be booked by the proposed SPV. But as a conservative estimate, we have not considered any hike in present PT rates. Currently, PT rates are classified based on zonal classifications within PCMC area and the type of construction of the building. It is proposed to re-designate these zonal classifications along the buffer zones of the corridors being considered for improvement. In the present exercise, we have made following assumptions:
1. All real estate within the buffer zones will be designated as Zone A (PT rate that of Zone A);
2. Out of total development along corridors, about 15% will be in the form of commercial &
industrial while residential will form the balance one, and
3. PT rates of Rs 6.0 and Rs 1.5 per sqft/annum for commercial and residential respectively
It has been assumed that the SPV would able to generate revenue of about Rs 13 Crore through next fifteen years through property tax.
In the present exercise, we have made following assumptions:
a) All real estate within the buffer zones will be designated as Zone A (PT rate that of Zone A);
b) Out of total development along corridors, about 15% will be in the form of commercial & industrial while residential will form the balance one, and
c) PT rates of Rs 6.0 and Rs 1.5 per sqft/annum for commercial and residential respectively
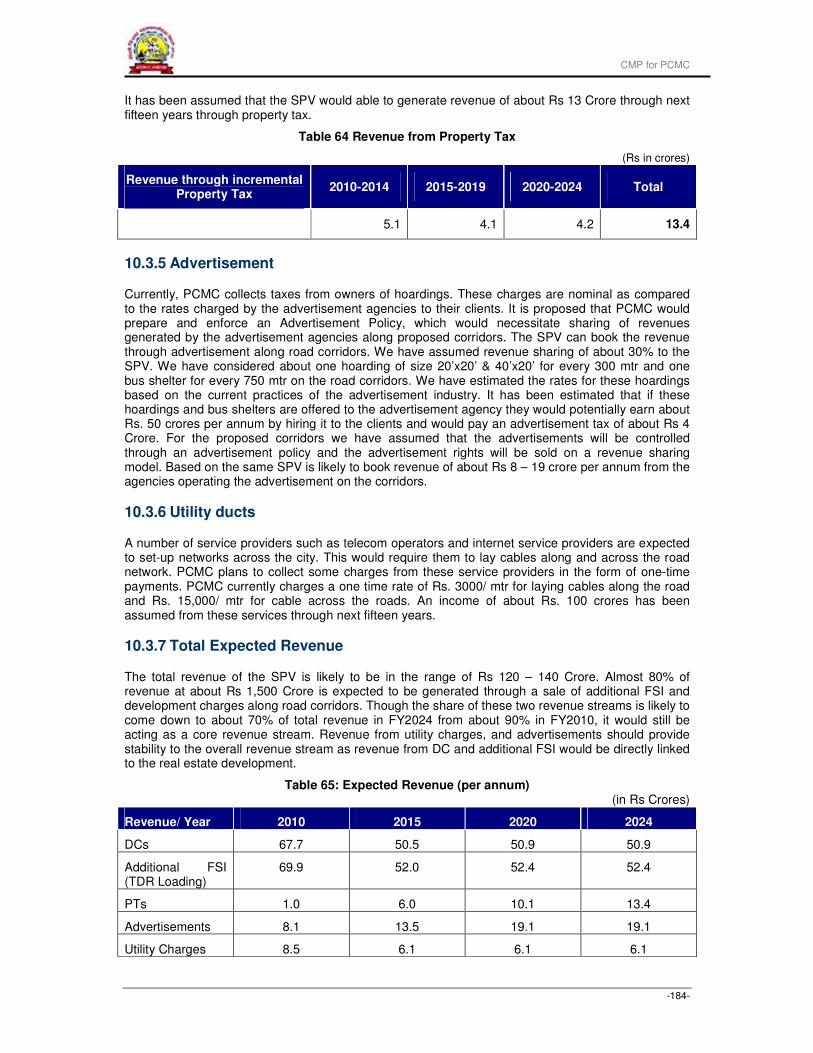
CMP for PCMC
-184-
It has been assumed that the SPV would able to generate revenue of about Rs 13 Crore through next fifteen years through property tax.
Table 64 Revenue from Property Tax
(Rs in crores)
Revenue through incremental Property Tax
2010-2014 2015-2019 2020-2024 Total
5.1 4.1 4.2 13.4
10.3.5 Advertisement
Currently, PCMC collects taxes from owners of hoardings. These charges are nominal as compared to the rates charged by the advertisement agencies to their clients. It is proposed that PCMC would prepare and enforce an Advertisement Policy, which would necessitate sharing of revenues generated by the advertisement agencies along proposed corridors. The SPV can book the revenue through advertisement along road corridors. We have assumed revenue sharing of about 30% to the SPV. We have considered about one hoarding of size 20’x20’ & 40’x20’ for every 300 mtr and one bus shelter for every 750 mtr on the road corridors. We have estimated the rates for these hoardings based on the current practices of the advertisement industry. It has been estimated that if these hoardings and bus shelters are offered to the advertisement agency they would potentially earn about Rs. 50 crores per annum by hiring it to the clients and would pay an advertisement tax of about Rs 4 Crore. For the proposed corridors we have assumed that the advertisements will be controlled through an advertisement policy and the advertisement rights will be sold on a revenue sharing model. Based on the same SPV is likely to book revenue of about Rs 8 – 19 crore per annum from the agencies operating the advertisement on the corridors.
10.3.6 Utility ducts
A number of service providers such as telecom operators and internet service providers are expected to set-up networks across the city. This would require them to lay cables along and across the road network. PCMC plans to collect some charges from these service providers in the form of one-time payments. PCMC currently charges a one time rate of Rs. 3000/ mtr for laying cables along the road and Rs. 15,000/ mtr for cable across the roads. An income of about Rs. 100 crores has been assumed from these services through next fifteen years.
10.3.7 Total Expected Revenue
The total revenue of the SPV is likely to be in the range of Rs 120 – 140 Crore. Almost 80% of revenue at about Rs 1,500 Crore is expected to be generated through a sale of additional FSI and development charges along road corridors. Though the share of these two revenue streams is likely to come down to about 70% of total revenue in FY2024 from about 90% in FY2010, it would still be acting as a core revenue stream. Revenue from utility charges, and advertisements should provide stability to the overall revenue stream as revenue from DC and additional FSI would be directly linked to the real estate development.
Table 65: Expected Revenue (per annum) (in Rs Crores)
Revenue/ Year 2010 2015 2020 2024
DCs 67.7 50.5 50.9 50.9
Additional FSI (TDR Loading)
69.9 52.0 52.4 52.4
PTs 1.0 6.0 10.1 13.4
Advertisements 8.1 13.5 19.1 19.1
Utility Charges 8.5 6.1 6.1 6.1
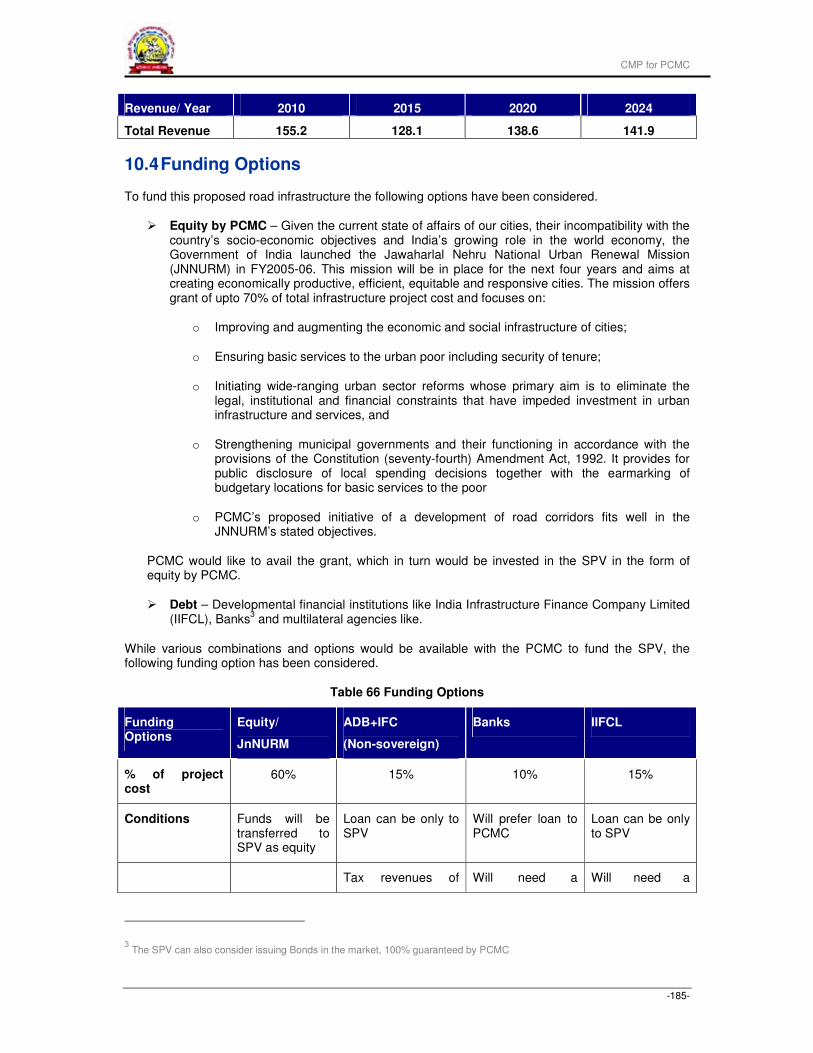
CMP for PCMC
-185-
Revenue/ Year 2010 2015 2020 2024
Total Revenue 155.2 128.1 138.6 141.9
10.4 Funding Options
To fund this proposed road infrastructure the following options have been considered.
� Equity by PCMC – Given the current state of affairs of our cities, their incompatibility with the country’s socio-economic objectives and India’s growing role in the world economy, the Government of India launched the Jawaharlal Nehru National Urban Renewal Mission (JNNURM) in FY2005-06. This mission will be in place for the next four years and aims at creating economically productive, efficient, equitable and responsive cities. The mission offers grant of upto 70% of total infrastructure project cost and focuses on:
o Improving and augmenting the economic and social infrastructure of cities;
o Ensuring basic services to the urban poor including security of tenure;
o Initiating wide-ranging urban sector reforms whose primary aim is to eliminate the legal, institutional and financial constraints that have impeded investment in urban infrastructure and services, and
o Strengthening municipal governments and their functioning in accordance with the provisions of the Constitution (seventy-fourth) Amendment Act, 1992. It provides for public disclosure of local spending decisions together with the earmarking of budgetary locations for basic services to the poor
o PCMC’s proposed initiative of a development of road corridors fits well in the JNNURM’s stated objectives.
PCMC would like to avail the grant, which in turn would be invested in the SPV in the form of equity by PCMC.
� Debt – Developmental financial institutions like India Infrastructure Finance Company Limited (IIFCL), Banks
3 and multilateral agencies like.
While various combinations and options would be available with the PCMC to fund the SPV, the following funding option has been considered.
Table 66 Funding Options
Funding Options
Equity/
JnNURM
ADB+IFC
(Non-sovereign)
Banks IIFCL
% of project cost
60% 15% 10% 15%
Conditions Funds will be transferred to SPV as equity
Loan can be only to SPV
Will prefer loan to PCMC
Loan can be only to SPV
Tax revenues of Will need a Will need a
3 The SPV can also consider issuing Bonds in the market, 100% guaranteed by PCMC
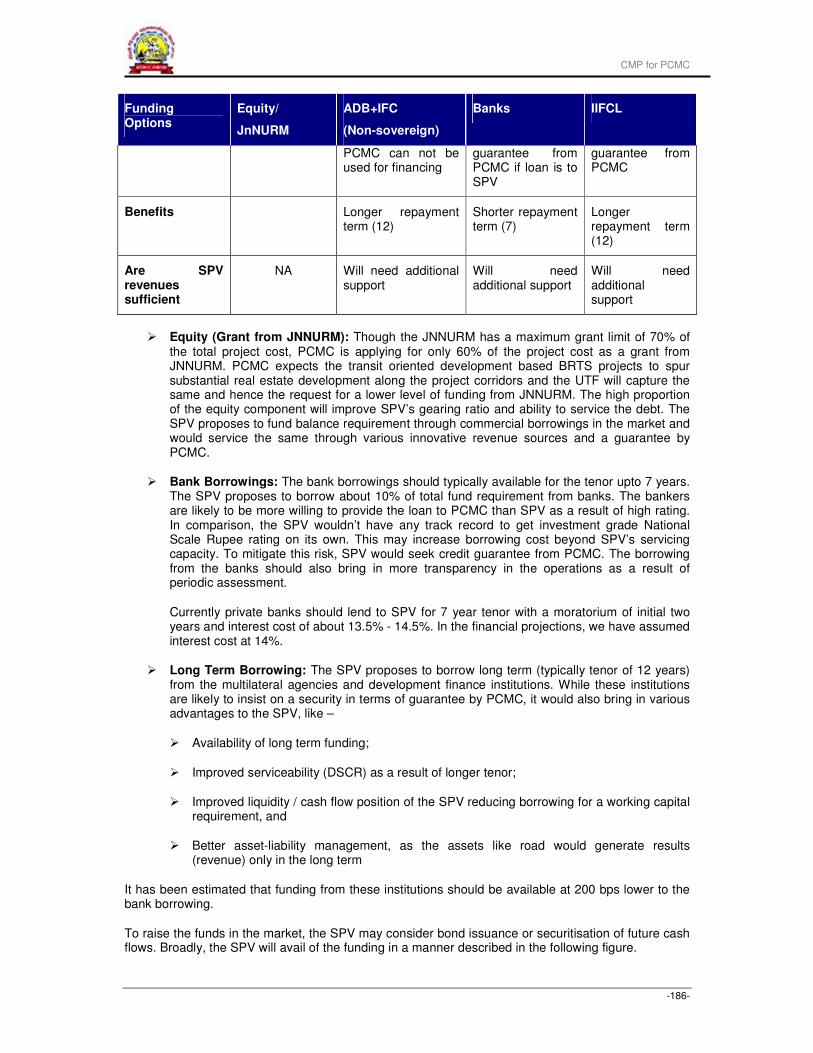
CMP for PCMC
-186-
Funding Options
Equity/
JnNURM
ADB+IFC
(Non-sovereign)
Banks IIFCL
PCMC can not be used for financing
guarantee from PCMC if loan is to SPV
guarantee from PCMC
Benefits Longer repayment term (12)
Shorter repayment term (7)
Longer repayment term (12)
Are SPV revenues sufficient
NA Will need additional support
Will need additional support
Will need additional support
� Equity (Grant from JNNURM): Though the JNNURM has a maximum grant limit of 70% of the total project cost, PCMC is applying for only 60% of the project cost as a grant from JNNURM. PCMC expects the transit oriented development based BRTS projects to spur substantial real estate development along the project corridors and the UTF will capture the same and hence the request for a lower level of funding from JNNURM. The high proportion of the equity component will improve SPV’s gearing ratio and ability to service the debt. The SPV proposes to fund balance requirement through commercial borrowings in the market and would service the same through various innovative revenue sources and a guarantee by PCMC.
� Bank Borrowings: The bank borrowings should typically available for the tenor upto 7 years. The SPV proposes to borrow about 10% of total fund requirement from banks. The bankers are likely to be more willing to provide the loan to PCMC than SPV as a result of high rating. In comparison, the SPV wouldn’t have any track record to get investment grade National Scale Rupee rating on its own. This may increase borrowing cost beyond SPV’s servicing capacity. To mitigate this risk, SPV would seek credit guarantee from PCMC. The borrowing from the banks should also bring in more transparency in the operations as a result of periodic assessment.
Currently private banks should lend to SPV for 7 year tenor with a moratorium of initial two years and interest cost of about 13.5% - 14.5%. In the financial projections, we have assumed interest cost at 14%.
� Long Term Borrowing: The SPV proposes to borrow long term (typically tenor of 12 years) from the multilateral agencies and development finance institutions. While these institutions are likely to insist on a security in terms of guarantee by PCMC, it would also bring in various advantages to the SPV, like –
� Availability of long term funding;
� Improved serviceability (DSCR) as a result of longer tenor;
� Improved liquidity / cash flow position of the SPV reducing borrowing for a working capital requirement, and
� Better asset-liability management, as the assets like road would generate results (revenue) only in the long term
It has been estimated that funding from these institutions should be available at 200 bps lower to the bank borrowing.
To raise the funds in the market, the SPV may consider bond issuance or securitisation of future cash flows. Broadly, the SPV will avail of the funding in a manner described in the following figure.
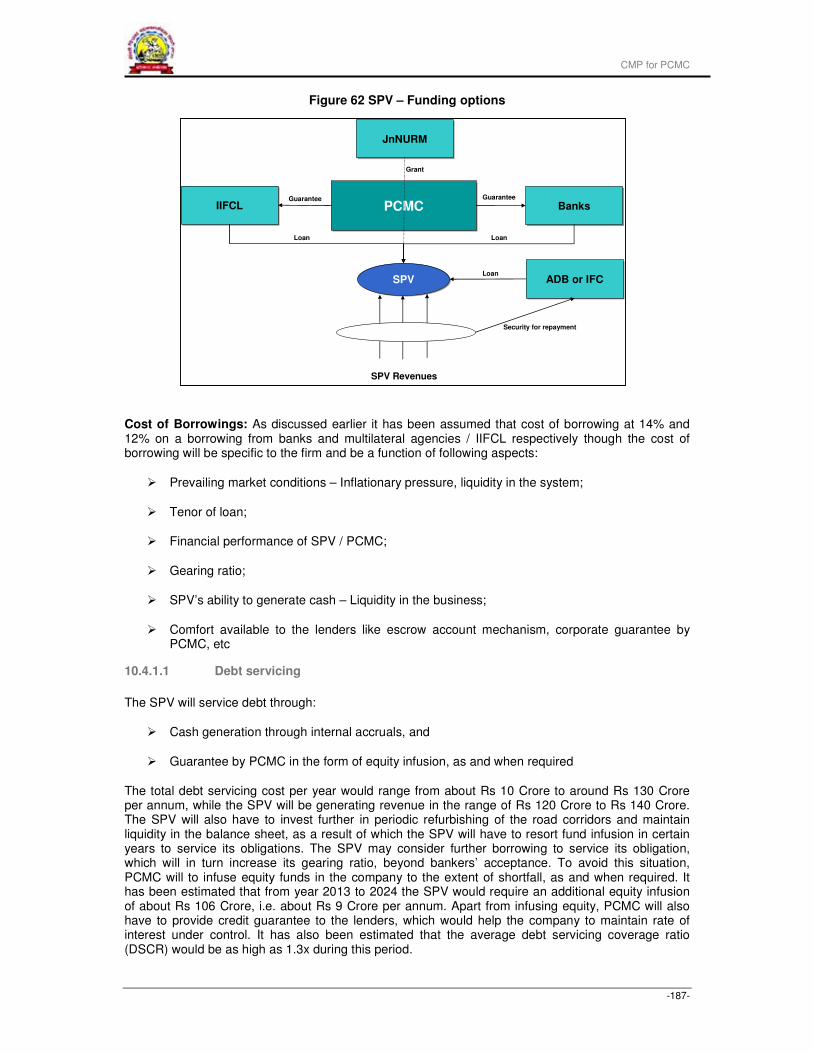
CMP for PCMC
-187-
Figure 62 SPV – Funding options
Cost of Borrowings: As discussed earlier it has been assumed that cost of borrowing at 14% and 12% on a borrowing from banks and multilateral agencies / IIFCL respectively though the cost of borrowing will be specific to the firm and be a function of following aspects:
� Prevailing market conditions – Inflationary pressure, liquidity in the system;
� Tenor of loan;
� Financial performance of SPV / PCMC;
� Gearing ratio;
� SPV’s ability to generate cash – Liquidity in the business;
� Comfort available to the lenders like escrow account mechanism, corporate guarantee by PCMC, etc
10.4.1.1 Debt servicing
The SPV will service debt through:
� Cash generation through internal accruals, and
� Guarantee by PCMC in the form of equity infusion, as and when required
The total debt servicing cost per year would range from about Rs 10 Crore to around Rs 130 Crore per annum, while the SPV will be generating revenue in the range of Rs 120 Crore to Rs 140 Crore. The SPV will also have to invest further in periodic refurbishing of the road corridors and maintain liquidity in the balance sheet, as a result of which the SPV will have to resort fund infusion in certain years to service its obligations. The SPV may consider further borrowing to service its obligation, which will in turn increase its gearing ratio, beyond bankers’ acceptance. To avoid this situation, PCMC will to infuse equity funds in the company to the extent of shortfall, as and when required. It has been estimated that from year 2013 to 2024 the SPV would require an additional equity infusion of about Rs 106 Crore, i.e. about Rs 9 Crore per annum. Apart from infusing equity, PCMC will also have to provide credit guarantee to the lenders, which would help the company to maintain rate of interest under control. It has also been estimated that the average debt servicing coverage ratio (DSCR) would be as high as 1.3x during this period.
PCMCPCMC
SPVSPV
JnNURMJnNURM
ADB or IFCADB or IFC
IIFCLIIFCL BanksBanks
Grant
Guarantee Guarantee
Loan Loan
Loan
SPV Revenues
Security for repayment
CMP for PCMC
-188-
10.4.1.2 Operations and Maintenance (O&M) Costs
The following assumptions have been made to estimate the O&M costs for the proposed road corridors:
� O&M of roads – To start from a year after commissioning;
� Annual O&M cost - About 1% of project cost;
� Periodic O&M cost - 10% of project cost, to be incurred once in every six years, and
� Annual escalation in O&M costs by 5%
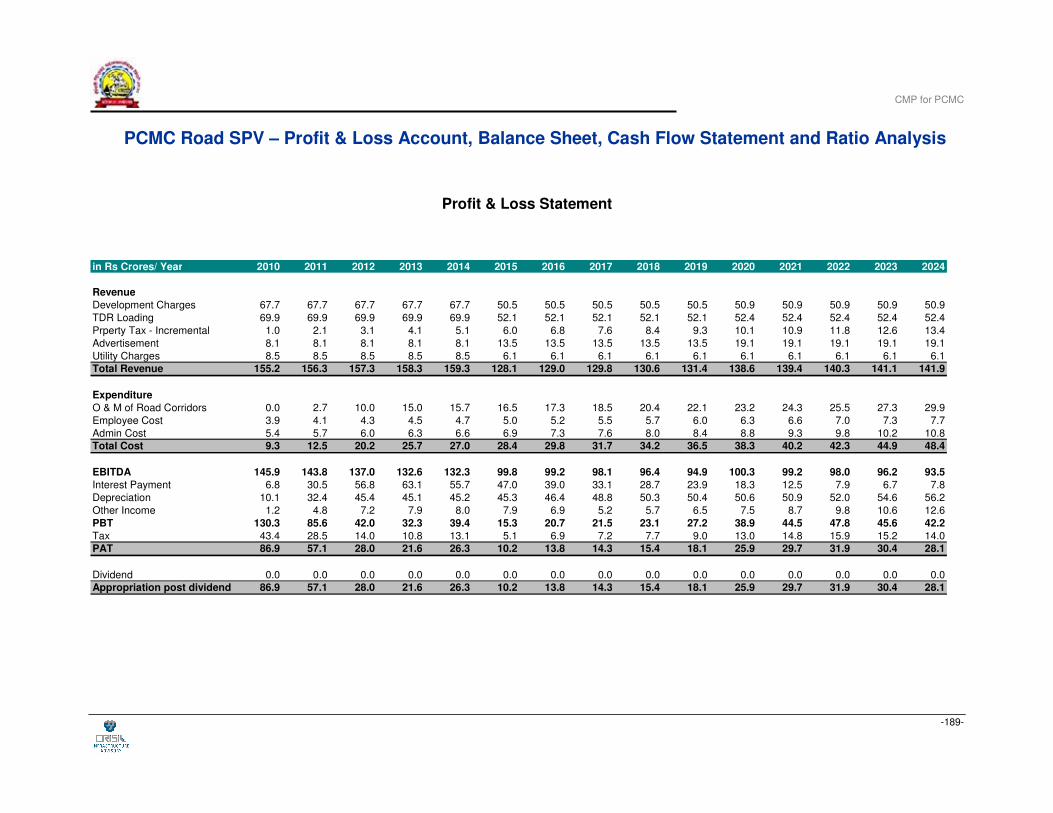
CMP for PCMC
-189-
PCMC Road SPV – Profit & Loss Account, Balance Sheet, Cash Flow Statement and Ratio Analysis
Profit & Loss Statement
in Rs Crores/ Year 2010 2011 2012 2013 2014 2015 2016 2017 2018 2019 2020 2021 2022 2023 2024
Revenue
Development Charges 67.7 67.7 67.7 67.7 67.7 50.5 50.5 50.5 50.5 50.5 50.9 50.9 50.9 50.9 50.9
TDR Loading 69.9 69.9 69.9 69.9 69.9 52.1 52.1 52.1 52.1 52.1 52.4 52.4 52.4 52.4 52.4
Prperty Tax - Incremental 1.0 2.1 3.1 4.1 5.1 6.0 6.8 7.6 8.4 9.3 10.1 10.9 11.8 12.6 13.4
Advertisement 8.1 8.1 8.1 8.1 8.1 13.5 13.5 13.5 13.5 13.5 19.1 19.1 19.1 19.1 19.1
Utility Charges 8.5 8.5 8.5 8.5 8.5 6.1 6.1 6.1 6.1 6.1 6.1 6.1 6.1 6.1 6.1
Total Revenue 155.2 156.3 157.3 158.3 159.3 128.1 129.0 129.8 130.6 131.4 138.6 139.4 140.3 141.1 141.9
Expenditure
O & M of Road Corridors 0.0 2.7 10.0 15.0 15.7 16.5 17.3 18.5 20.4 22.1 23.2 24.3 25.5 27.3 29.9
Employee Cost 3.9 4.1 4.3 4.5 4.7 5.0 5.2 5.5 5.7 6.0 6.3 6.6 7.0 7.3 7.7
Admin Cost 5.4 5.7 6.0 6.3 6.6 6.9 7.3 7.6 8.0 8.4 8.8 9.3 9.8 10.2 10.8
Total Cost 9.3 12.5 20.2 25.7 27.0 28.4 29.8 31.7 34.2 36.5 38.3 40.2 42.3 44.9 48.4
EBITDA 145.9 143.8 137.0 132.6 132.3 99.8 99.2 98.1 96.4 94.9 100.3 99.2 98.0 96.2 93.5
Interest Payment 6.8 30.5 56.8 63.1 55.7 47.0 39.0 33.1 28.7 23.9 18.3 12.5 7.9 6.7 7.8
Depreciation 10.1 32.4 45.4 45.1 45.2 45.3 46.4 48.8 50.3 50.4 50.6 50.9 52.0 54.6 56.2
Other Income 1.2 4.8 7.2 7.9 8.0 7.9 6.9 5.2 5.7 6.5 7.5 8.7 9.8 10.6 12.6
PBT 130.3 85.6 42.0 32.3 39.4 15.3 20.7 21.5 23.1 27.2 38.9 44.5 47.8 45.6 42.2
Tax 43.4 28.5 14.0 10.8 13.1 5.1 6.9 7.2 7.7 9.0 13.0 14.8 15.9 15.2 14.0
PAT 86.9 57.1 28.0 21.6 26.3 10.2 13.8 14.3 15.4 18.1 25.9 29.7 31.9 30.4 28.1
Dividend 0.0 0.0 0.0 0.0 0.0 0.0 0.0 0.0 0.0 0.0 0.0 0.0 0.0 0.0 0.0
Appropriation post dividend 86.9 57.1 28.0 21.6 26.3 10.2 13.8 14.3 15.4 18.1 25.9 29.7 31.9 30.4 28.1
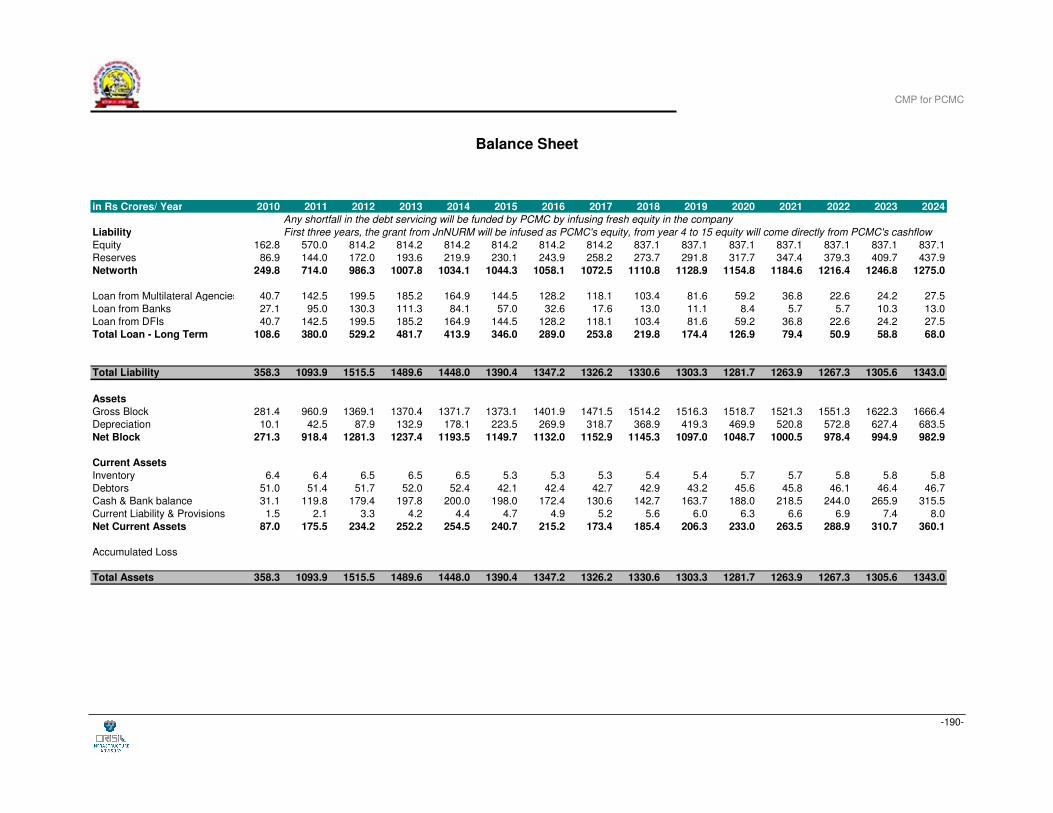
CMP for PCMC
-190-
Balance Sheet
in Rs Crores/ Year 2010 2011 2012 2013 2014 2015 2016 2017 2018 2019 2020 2021 2022 2023 2024
Any shortfall in the debt servicing will be funded by PCMC by infusing fresh equity in the company
Liability First three years, the grant from JnNURM will be infused as PCMC's equity, from year 4 to 15 equity will come directly from PCMC's cashflow
Equity 162.8 570.0 814.2 814.2 814.2 814.2 814.2 814.2 837.1 837.1 837.1 837.1 837.1 837.1 837.1
Reserves 86.9 144.0 172.0 193.6 219.9 230.1 243.9 258.2 273.7 291.8 317.7 347.4 379.3 409.7 437.9
Networth 249.8 714.0 986.3 1007.8 1034.1 1044.3 1058.1 1072.5 1110.8 1128.9 1154.8 1184.6 1216.4 1246.8 1275.0
Loan from Multilateral Agencies 40.7 142.5 199.5 185.2 164.9 144.5 128.2 118.1 103.4 81.6 59.2 36.8 22.6 24.2 27.5
Loan from Banks 27.1 95.0 130.3 111.3 84.1 57.0 32.6 17.6 13.0 11.1 8.4 5.7 5.7 10.3 13.0
Loan from DFIs 40.7 142.5 199.5 185.2 164.9 144.5 128.2 118.1 103.4 81.6 59.2 36.8 22.6 24.2 27.5
Total Loan - Long Term 108.6 380.0 529.2 481.7 413.9 346.0 289.0 253.8 219.8 174.4 126.9 79.4 50.9 58.8 68.0
Total Liability 358.3 1093.9 1515.5 1489.6 1448.0 1390.4 1347.2 1326.2 1330.6 1303.3 1281.7 1263.9 1267.3 1305.6 1343.0
Assets
Gross Block 281.4 960.9 1369.1 1370.4 1371.7 1373.1 1401.9 1471.5 1514.2 1516.3 1518.7 1521.3 1551.3 1622.3 1666.4
Depreciation 10.1 42.5 87.9 132.9 178.1 223.5 269.9 318.7 368.9 419.3 469.9 520.8 572.8 627.4 683.5
Net Block 271.3 918.4 1281.3 1237.4 1193.5 1149.7 1132.0 1152.9 1145.3 1097.0 1048.7 1000.5 978.4 994.9 982.9
Current Assets
Inventory 6.4 6.4 6.5 6.5 6.5 5.3 5.3 5.3 5.4 5.4 5.7 5.7 5.8 5.8 5.8
Debtors 51.0 51.4 51.7 52.0 52.4 42.1 42.4 42.7 42.9 43.2 45.6 45.8 46.1 46.4 46.7
Cash & Bank balance 31.1 119.8 179.4 197.8 200.0 198.0 172.4 130.6 142.7 163.7 188.0 218.5 244.0 265.9 315.5
Current Liability & Provisions 1.5 2.1 3.3 4.2 4.4 4.7 4.9 5.2 5.6 6.0 6.3 6.6 6.9 7.4 8.0
Net Current Assets 87.0 175.5 234.2 252.2 254.5 240.7 215.2 173.4 185.4 206.3 233.0 263.5 288.9 310.7 360.1
Accumulated Loss
Total Assets 358.3 1093.9 1515.5 1489.6 1448.0 1390.4 1347.2 1326.2 1330.6 1303.3 1281.7 1263.9 1267.3 1305.6 1343.0
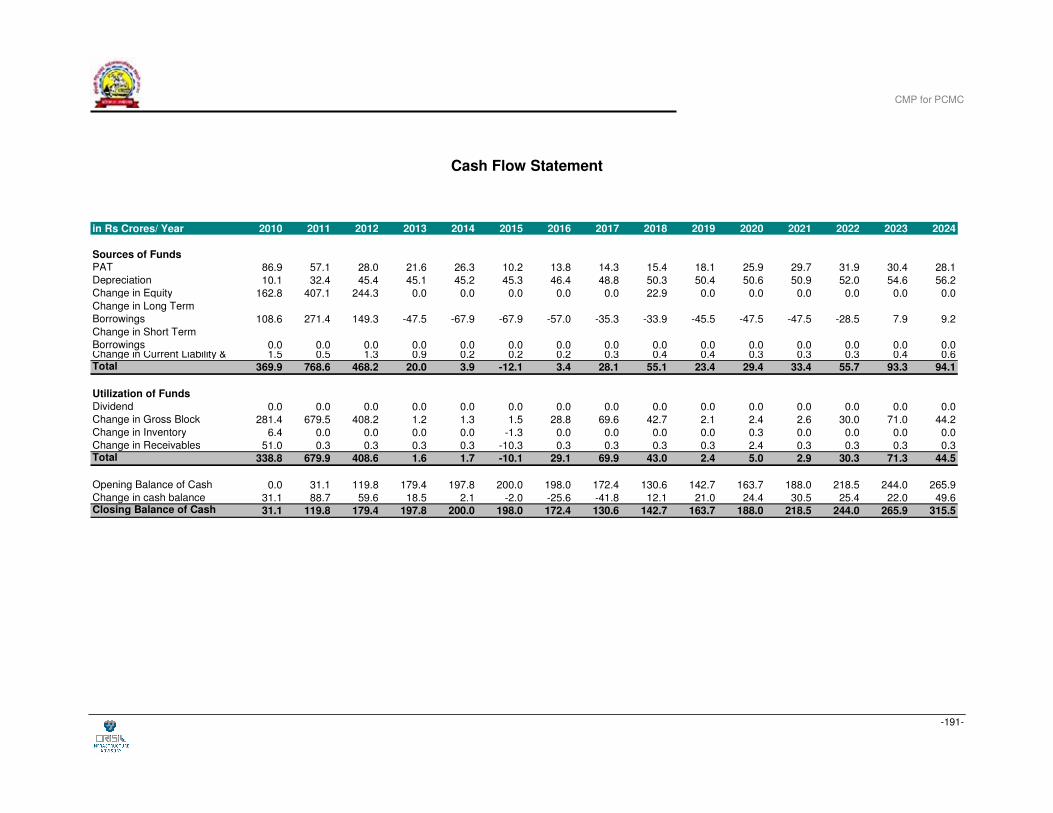
CMP for PCMC
-191-
Cash Flow Statement
in Rs Crores/ Year 2010 2011 2012 2013 2014 2015 2016 2017 2018 2019 2020 2021 2022 2023 2024
Sources of Funds
PAT 86.9 57.1 28.0 21.6 26.3 10.2 13.8 14.3 15.4 18.1 25.9 29.7 31.9 30.4 28.1
Depreciation 10.1 32.4 45.4 45.1 45.2 45.3 46.4 48.8 50.3 50.4 50.6 50.9 52.0 54.6 56.2
Change in Equity 162.8 407.1 244.3 0.0 0.0 0.0 0.0 0.0 22.9 0.0 0.0 0.0 0.0 0.0 0.0
Change in Long Term
Borrowings 108.6 271.4 149.3 -47.5 -67.9 -67.9 -57.0 -35.3 -33.9 -45.5 -47.5 -47.5 -28.5 7.9 9.2
Change in Short Term
Borrowings 0.0 0.0 0.0 0.0 0.0 0.0 0.0 0.0 0.0 0.0 0.0 0.0 0.0 0.0 0.0Change in Current Liability & 1.5 0.5 1.3 0.9 0.2 0.2 0.2 0.3 0.4 0.4 0.3 0.3 0.3 0.4 0.6Total 369.9 768.6 468.2 20.0 3.9 -12.1 3.4 28.1 55.1 23.4 29.4 33.4 55.7 93.3 94.1
Utilization of Funds
Dividend 0.0 0.0 0.0 0.0 0.0 0.0 0.0 0.0 0.0 0.0 0.0 0.0 0.0 0.0 0.0
Change in Gross Block 281.4 679.5 408.2 1.2 1.3 1.5 28.8 69.6 42.7 2.1 2.4 2.6 30.0 71.0 44.2
Change in Inventory 6.4 0.0 0.0 0.0 0.0 -1.3 0.0 0.0 0.0 0.0 0.3 0.0 0.0 0.0 0.0
Change in Receivables 51.0 0.3 0.3 0.3 0.3 -10.3 0.3 0.3 0.3 0.3 2.4 0.3 0.3 0.3 0.3Total 338.8 679.9 408.6 1.6 1.7 -10.1 29.1 69.9 43.0 2.4 5.0 2.9 30.3 71.3 44.5
Opening Balance of Cash 0.0 31.1 119.8 179.4 197.8 200.0 198.0 172.4 130.6 142.7 163.7 188.0 218.5 244.0 265.9
Change in cash balance 31.1 88.7 59.6 18.5 2.1 -2.0 -25.6 -41.8 12.1 21.0 24.4 30.5 25.4 22.0 49.6Closing Balance of Cash 31.1 119.8 179.4 197.8 200.0 198.0 172.4 130.6 142.7 163.7 188.0 218.5 244.0 265.9 315.5
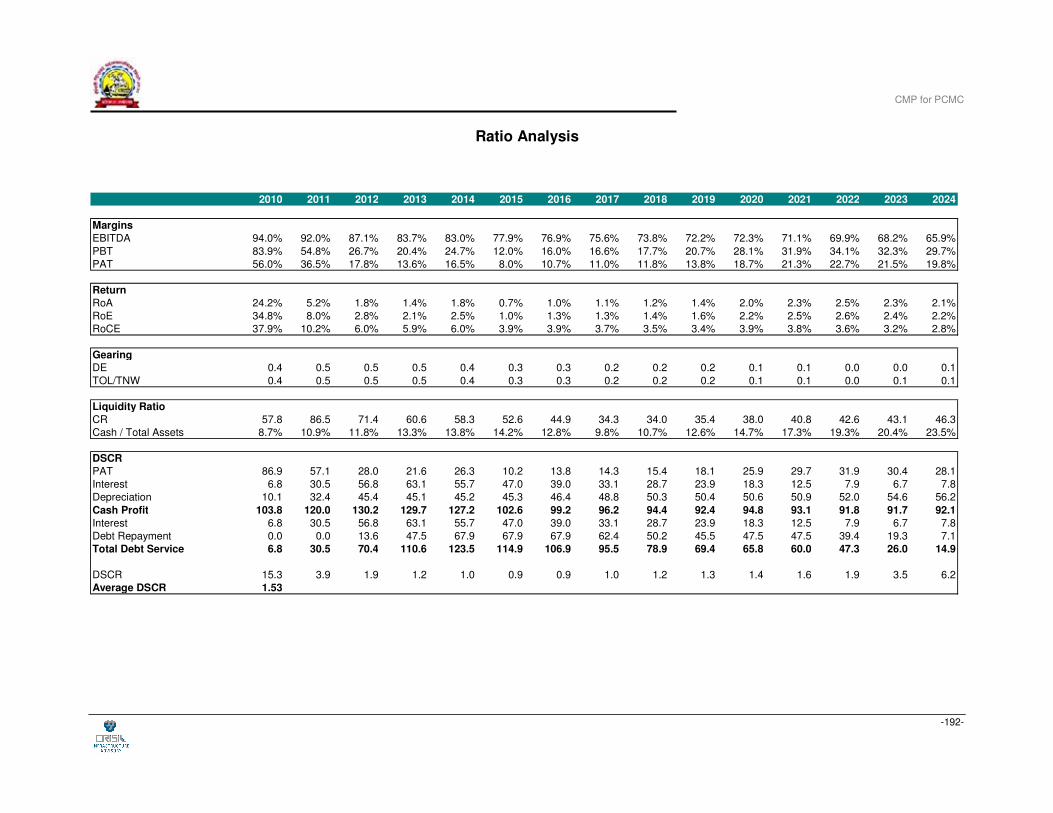
CMP for PCMC
-192-
Ratio Analysis
2010 2011 2012 2013 2014 2015 2016 2017 2018 2019 2020 2021 2022 2023 2024
Margins
EBITDA 94.0% 92.0% 87.1% 83.7% 83.0% 77.9% 76.9% 75.6% 73.8% 72.2% 72.3% 71.1% 69.9% 68.2% 65.9%
PBT 83.9% 54.8% 26.7% 20.4% 24.7% 12.0% 16.0% 16.6% 17.7% 20.7% 28.1% 31.9% 34.1% 32.3% 29.7%
PAT 56.0% 36.5% 17.8% 13.6% 16.5% 8.0% 10.7% 11.0% 11.8% 13.8% 18.7% 21.3% 22.7% 21.5% 19.8%
Return
RoA 24.2% 5.2% 1.8% 1.4% 1.8% 0.7% 1.0% 1.1% 1.2% 1.4% 2.0% 2.3% 2.5% 2.3% 2.1%
RoE 34.8% 8.0% 2.8% 2.1% 2.5% 1.0% 1.3% 1.3% 1.4% 1.6% 2.2% 2.5% 2.6% 2.4% 2.2%
RoCE 37.9% 10.2% 6.0% 5.9% 6.0% 3.9% 3.9% 3.7% 3.5% 3.4% 3.9% 3.8% 3.6% 3.2% 2.8%
Gearing
DE 0.4 0.5 0.5 0.5 0.4 0.3 0.3 0.2 0.2 0.2 0.1 0.1 0.0 0.0 0.1
TOL/TNW 0.4 0.5 0.5 0.5 0.4 0.3 0.3 0.2 0.2 0.2 0.1 0.1 0.0 0.1 0.1
Liquidity Ratio
CR 57.8 86.5 71.4 60.6 58.3 52.6 44.9 34.3 34.0 35.4 38.0 40.8 42.6 43.1 46.3
Cash / Total Assets 8.7% 10.9% 11.8% 13.3% 13.8% 14.2% 12.8% 9.8% 10.7% 12.6% 14.7% 17.3% 19.3% 20.4% 23.5%
DSCR
PAT 86.9 57.1 28.0 21.6 26.3 10.2 13.8 14.3 15.4 18.1 25.9 29.7 31.9 30.4 28.1
Interest 6.8 30.5 56.8 63.1 55.7 47.0 39.0 33.1 28.7 23.9 18.3 12.5 7.9 6.7 7.8
Depreciation 10.1 32.4 45.4 45.1 45.2 45.3 46.4 48.8 50.3 50.4 50.6 50.9 52.0 54.6 56.2
Cash Profit 103.8 120.0 130.2 129.7 127.2 102.6 99.2 96.2 94.4 92.4 94.8 93.1 91.8 91.7 92.1
Interest 6.8 30.5 56.8 63.1 55.7 47.0 39.0 33.1 28.7 23.9 18.3 12.5 7.9 6.7 7.8
Debt Repayment 0.0 0.0 13.6 47.5 67.9 67.9 67.9 62.4 50.2 45.5 47.5 47.5 39.4 19.3 7.1
Total Debt Service 6.8 30.5 70.4 110.6 123.5 114.9 106.9 95.5 78.9 69.4 65.8 60.0 47.3 26.0 14.9
DSCR 15.3 3.9 1.9 1.2 1.0 0.9 0.9 1.0 1.2 1.3 1.4 1.6 1.9 3.5 6.2
Average DSCR 1.53
CMP for PCMC
-193-
11 AGENCY/AGENCIES FOR IMPLEMENTATION, OPERATION AND MAINTENANCE
The objectives of institutional structure set-up for the implementation and operations and maintenance (O&M) of the all transportation projects should be to maximise the quality of service provided to commuters, minimise the cost of service and maximise the involvement of private sector. This chapter outlines the need for an institutional change in PCMC for implementing the projects in a professional and efficient manner. An elaborate study has been conducted to study the various options that PCMC can consider for the institutional framework for this project.
11.1 Need for an institutional framework
PCMC is planning to invest about Rs 800 – 900 Crores per annum for next 3 - 4 years for infrastructure development in the city. This is an increase from about Rs 150 – 200 Crores per annum. The management of projects of this scale is expected to be achieved by PCMC through an adoption of innovative procedures and an introduction of new processes including appointment of consultants for preparation of business plans and detailed project reports, utilisation of special equipment for construction of projects, dedicated teams in a few departments focussed on specific projects and third party quality assurance. These changes have helped PCMC to multiply its project execution capacity in FY08 to about Rs 800 Crores. Additional investment of about Rs 400 Crores per annum for next three years, in the proposed road corridors, pegging total projects execution at about Rs 1,200 Crores per annum, would affect PCMC’s ability to implement these projects efficiently. At the same time, PCMC doesn’t have an option of not implementing these road corridors considering the demand push in future. As a result, to further stretch its annual projects implementation capability, PCMC shall need to undergo an institutional change.
It is felt that PCMC will have to focus on the following issues in order to cope with the increasing demand for execution of project:
1. Dedicated to focus on project planning and implementation since the civil department is able to currently focus only on day-to-day activities,
2. Delegation of power and quick decision-making: Currently, there is a hierarchy in designations for approving of tenders. This acts as a constraint in quick decision-making,
3. Capacity building of resources, and
4. Simple and quick procedures.
Thus, it can be observed that in the current structure it will be difficult for the PCMC, given its current organisational structure and process to implement projects of this magnitude in an efficient manner. As an effort towards identifying the institutional changes that can to be undertaken so that the projects can be implemented in a professional manner, alternative options have been studied. Pros and cons of various options were studied as a part of a separate study, and it was found that creation of a Special Purpose Vehicle (SPV) with 100% holding by PCMC is the most favourable option.
This option fulfils all the objectives of institutional change and provides the necessary resources that are needed for implementing the road projects in a professional manner. It ensures that the team is focussed and dedicated for the high value road projects and at the same time PCMC has control over the same. Also, the liability of PCMC shall be limited to it’s equity in the SPV and guarantees that it would have offered to any creditors.
Through a resolution in the General Body of PCMC, an SPV called the Pimpri-Chinchwad Infrastructure Company (PCIC), a wholly owned subsidiary of PCMC has been formed. The SPV will
CMP for PCMC
-194-
also manage the Urban Transport Fund (UTF) that has been formed by PCMC to capture the benefits of the BRTS projects for long term sustainability and as a means of self financing for the future.
To start off with, the SPV has been given the mandate for eight corridors as presented below. The other development projects suggested in the CMP shall be taken up by PCMC.
1. Old NH-4 (Mumbai-Pune highway)
2. Aundh – Rawet road
3. Nashik phata to Wakad
4. Kalewadi to Dehu Alandi road
5. Dehu Alandi road
6. Pune/Vishrantwadi – Alandi road
7. Nashik phata to Moshi
8. Kiwale to Bhakti-Shakti
The following sections present details of its basic structure and its activities.
11.2 Proposed structure of SPV
This chapter details the structure of the SPV that has been formed, key objectives of the SPV, main activities that will be undertaken by the SPV, its legal feasibility, the relationship that the SPV will share with PCMC, its detailed functioning and its organisational structure.
11.2.1 Objectives
The SPV has been formed for the effective implementation of the road corridors and will cater to the following objectives:
� Ensure development of high quality road corridors in PCMC in a cost-efficient and professional manner within the specified time frame.
� Improve the access to and within the PCMC area resulting in efficient traffic management.
� Maximise revenue potential for the road corridors.
� Prepare long-term holistic plan for the development of the road network, making PCMC a highly connected city.
In order to achieve the above objectives, the SPV will undertake a certain set of activities related to project development and implementation, project monitoring and revenue generation. The next section broadly outlines these activities.
11.2.2 Key Activities and Skills Needed
11.2.2.1 Activities
In line with the objectives, the SPV will undertake certain key activities in order to ensure successful implementation of the road corridors (the Project). These activities will ensure that the three important parameters of time, cost and quality are met during project implementation. The key activities identified for the SPV are as follows:
� Plan, design, finance, construct, operate and maintain road projects,
� Enter into contracts for works related to the SPV,
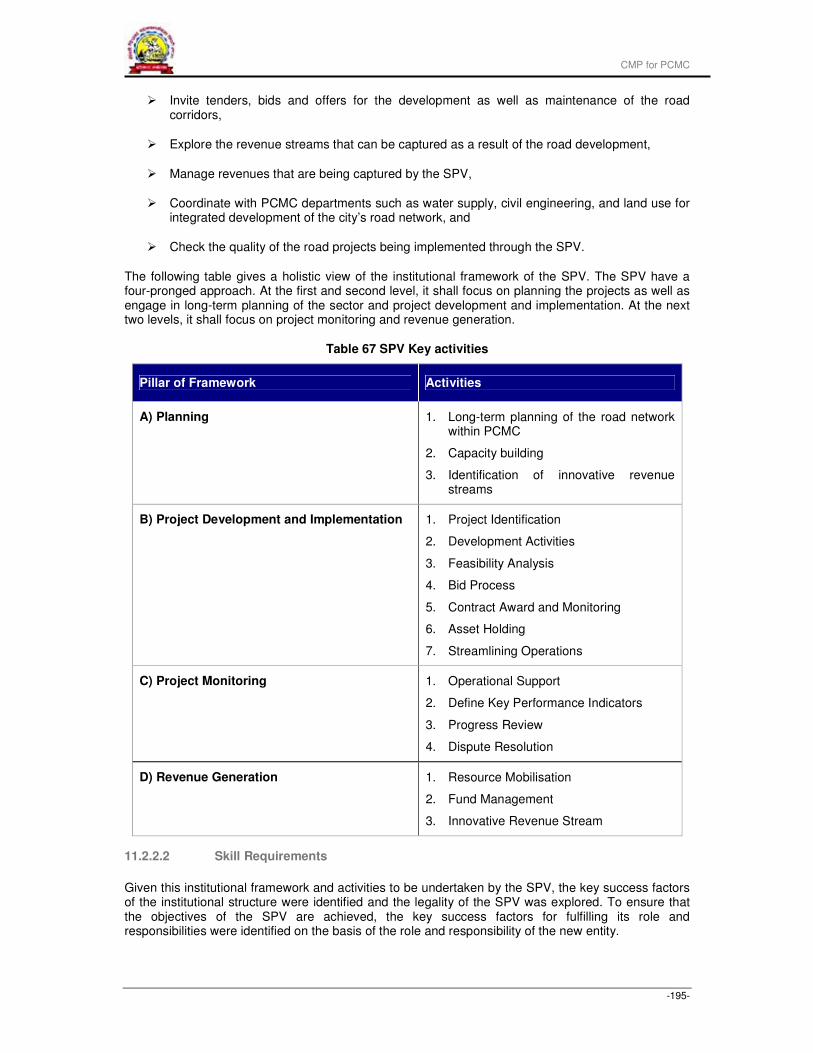
CMP for PCMC
-195-
� Invite tenders, bids and offers for the development as well as maintenance of the road corridors,
� Explore the revenue streams that can be captured as a result of the road development,
� Manage revenues that are being captured by the SPV,
� Coordinate with PCMC departments such as water supply, civil engineering, and land use for integrated development of the city’s road network, and
� Check the quality of the road projects being implemented through the SPV.
The following table gives a holistic view of the institutional framework of the SPV. The SPV have a four-pronged approach. At the first and second level, it shall focus on planning the projects as well as engage in long-term planning of the sector and project development and implementation. At the next two levels, it shall focus on project monitoring and revenue generation.
Table 67 SPV Key activities
Pillar of Framework Activities
A) Planning 1. Long-term planning of the road network within PCMC
2. Capacity building
3. Identification of innovative revenue streams
B) Project Development and Implementation 1. Project Identification
2. Development Activities
3. Feasibility Analysis
4. Bid Process
5. Contract Award and Monitoring
6. Asset Holding
7. Streamlining Operations
C) Project Monitoring 1. Operational Support
2. Define Key Performance Indicators
3. Progress Review
4. Dispute Resolution
D) Revenue Generation 1. Resource Mobilisation
2. Fund Management
3. Innovative Revenue Stream
11.2.2.2 Skill Requirements
Given this institutional framework and activities to be undertaken by the SPV, the key success factors of the institutional structure were identified and the legality of the SPV was explored. To ensure that the objectives of the SPV are achieved, the key success factors for fulfilling its role and responsibilities were identified on the basis of the role and responsibility of the new entity.
CMP for PCMC
-196-
11.2.2.3 Professionalism
The SPV will have to be professional in its functioning. The teams will have to be well-defined, trained and well-informed before the implementation of any project. The SPV will have to strive to achieve high ethical, technical as well as quality standards in their activities.
11.2.2.4 Prompt and informed decision-making
The SPV professionals will have to ensure quick decision-making. At the same time, they will have to ensure that they are well-informed about the situation. Clarity on the problem, evaluation of various alternative options, identification of the benefits and risks of each option and then the right choice will ensure informed decision-making. Often, road projects get delayed as decisions are not taken on time. If the decisions get delayed, then the project will also exceed the timelines and this will result in a cost overrun.
11.2.2.5 Project Management
Most of the time, the road projects get delayed since land acquisition takes time and the project may not be well co-ordinated. Thus, in such kinds of projects, planning and managing the project plays a crucial part. Project management shall primarily involve the following tasks:
� Planning the work according to the objectives,
� Assessing and controlling risk and identifying, managing and controlling changes,
� Estimating human and material resources, acquiring them and allocating the same on time,
� Organising the work optimally,
� Assigning tasks to employees, directing the activities and controlling project execution,
� Instituting a well-laid tracking and reporting system (Management information system),
� Analysing the results based on the facts, and
� Ensuring Quality and Issues Management.
11.2.2.6 Cost Efficiency
The SPV will have to ensure cost efficiency with regard to two aspects. One, the SPV will ensure that its material as well as human resources are optimally utilised such that the costs of operating the SPV are managed efficiently. Also, the SPV will have to ensure that the project is properly monitored with a tab on the costs of the project. Monthly budgets will need to be prepared and the actual cost incurred will have to be measured against the same. The SPV will then analyse the reasons of a cost overrun/cost savings, if any. It will constantly monitor the budgeted costs against the actual and accordingly re-define its processes and reallocate its resources.
11.2.2.7 Transparency
The entity will provide support for project development and project implementation. It will design projects, ensure their feasibility and select developers to implement the project. This will call for transparency in documentation, database management, selection of the developer and monitoring of the project.
11.2.2.8 Long-term focus
The entity will have to retain a long-term focus on developing the road network within PCMC. Currently, the Civil Engineering Department in PCMC is inadequately equipped to manage this task, as the focus is more on solving day-to-day maintenance issues than on holistic planning.
CMP for PCMC
-197-
It is envisaged that these key success factors will reflect on the decisions made by the new entity. Since these factors are crucial to the success of the SPV, they have been built into the entity’s foundation, i.e., its legal structure and organisational structure. With the above-mentioned objectives and skill requirements, the SPV will benefit PCMC in the execution of the road projects and in the capture of innovative revenue streams. However, it is necessary to explore whether it is legally possible for PCMC to form a SPV and have a shareholding in the same. The next sub-section elaborates the legal feasibility of the SPV.
11.2.3 Legal Feasibility of SPV
This sub-section primarily presents the possibility that was explored for the formation of a SPV by PCMC and whether the necessary rights for the functioning of the SPV can be transferred to the SPV. For the formation of an SPV and its successful functioning, the following points were explored from the legal point of view.
� Can PCMC create and subscribe to the share capital of a company?
� Can PCMC assign municipal functions to a SPV?
� Can PCMC transfer the road assets to a SPV?
The Pimpri Chinchwad Municipal Corporation is a body corporate, established under the provisions of The Bombay Provincial Municipal Corporation Act’1949 (BPMC Act) and the rules and byelaws made there under. Thus, the BPMC Act was studied to explore the legal issues to be addressed. The following sub-sections detail the possibility of the formation of the SPV.
11.2.3.1 Power to subscribe to the share capital of a Company (SPV)
Section 66(41 A) of the BPMC Act provides that subject to such terms and conditions as the State Government may impose, PCMC after obtaining the approval of the State Government may subscribe to the share capital of any company or a co-operative society which is either established or is providing any of the services in the city of Pimpri Chinchwad on behalf of the PCMC.
Section 66 (41A) of the BPMC Act reads as:
“66. Matters which may be provided for by the Corporation at its discretion
The Corporation may, in its discretion, provide from time to time, either wholly or partly, for all or any of the following matters, namely:
…………………………………
(41A) With the previous sanction of the State Government and subject to such terms and conditions as the State Government may impose, subscribing to the share capital of any company or cooperative society, with a limited liability, established or to be established for maintaining or setting up a slaughter house, or for providing any other services in the City, useful to the Corporation in carrying out any of the duties imposed upon it by or under this Act or any other law for the time being in force;
……………”
Even though the BPMC Act only stipulates that the PCMC may subscribe to share capital, and there is nothing in the BPMC Act which prohibits PCMC, a legal and juristic person, to incorporate a company (by subscribing to the share capital of the same), it can be reasonably concluded that PCMC is vested with legal authority and empowered in this regard to incorporate an SPV.
11.2.3.2 Power of PCMC to assign Municipal functions to SPV
It is important to ascertain whether the legal framework, as applicable to PCMC, authorises PCMC to assign, transfer or entrust any other entity to or legal pursuant to the creation of the SPV, the
CMP for PCMC
-198-
delegation of all essential functions which are required for the implementation of the road corridors project.
PCMC is authorised to make any provision, by any means or measures which it may lawfully use or take for the purpose of the construction, maintenance, alteration and improvement of public streets, sub-ways, culverts, cause-ways and the like. PCMC can delegate any or all of its functions in this regard to the SPV within its juridical powers under BPMC Act.
Section 66A of the BPMC Act, 1949 in this regard reads as below:
“66A. Performance of functions by agencies
When any duty has been imposed on, or any function has been assigned to, a Corporation under this Act or any other law for the time being in force, or a Corporation has been entrusted witty the implementation of a scheme, by the State Government or any other authority, -
(i ) the Corporation may, either discharge such duties or perform such function or implement such schemes by itself; or
(ii) subject to such directions as may be issued and the terms and conditions as may be determined by the State Government, cause them to be discharged, performed or implemented by any agency;
Provided that, the Corporation may also specify terms and conditions, not inconsistent with the terms and conditions determined by the State Government for such agency arrangement.”
From the perusal of the provisions of the BPMC Act, it is evident that PCMC can subscribe to the share capital of any company, and it can further assign its functions to any such agency (SPV). Thus, it can be interpreted that any SPV may implement a road project pursuant to the delegation/assignment of necessary functions by PCMC to the SPV. Provided that the scheme of incorporating such a SPV has been accorded previous approval of the State Government and is in accordance with other terms and conditions, if any, as prescribed by the State Government, and assigning such function to such SPV is approved by the Corporation, and is in accordance with any terms and conditions prescribed by the State Government, if any.
11.2.3.3 Power of PCMC to transfer road assets to SPV
Under the project, the SPV will be in a position to effectively perform its part only when PCMC transfers its road assets (including land, road assets, both movable and immovable, including right of way etc. which are required by the SPV to implement the Project) to the SPV. As all assets are under the control of the PCMC, they can only be transferred by PCMC in accordance with the provisions of the BPMC Act.
As per Section 79 of the BPMC Act:
Section 79: Provisions governing the disposal of municipal property
“ With respect to the disposal of property belonging to the Corporation, other than property vesting in the Corporation exclusively for the purposes of the Transport Undertaking the following provisions shall have effect, namely:-
(a) the Commissioner, may, in his discretion, dispose of by sale, letting out on hire or otherwise, any movable property belonging to the Corporation not exceeding in value of each instance five hundred rupees or such higher amount as the Corporation may, with the approval of the State Government, from time to time determine, or grant a lease of any immovable property belonging to the Corporation including any right of fishing or of gathering and taking fruit, and the like, for any period not exceeding twelve months at a time :
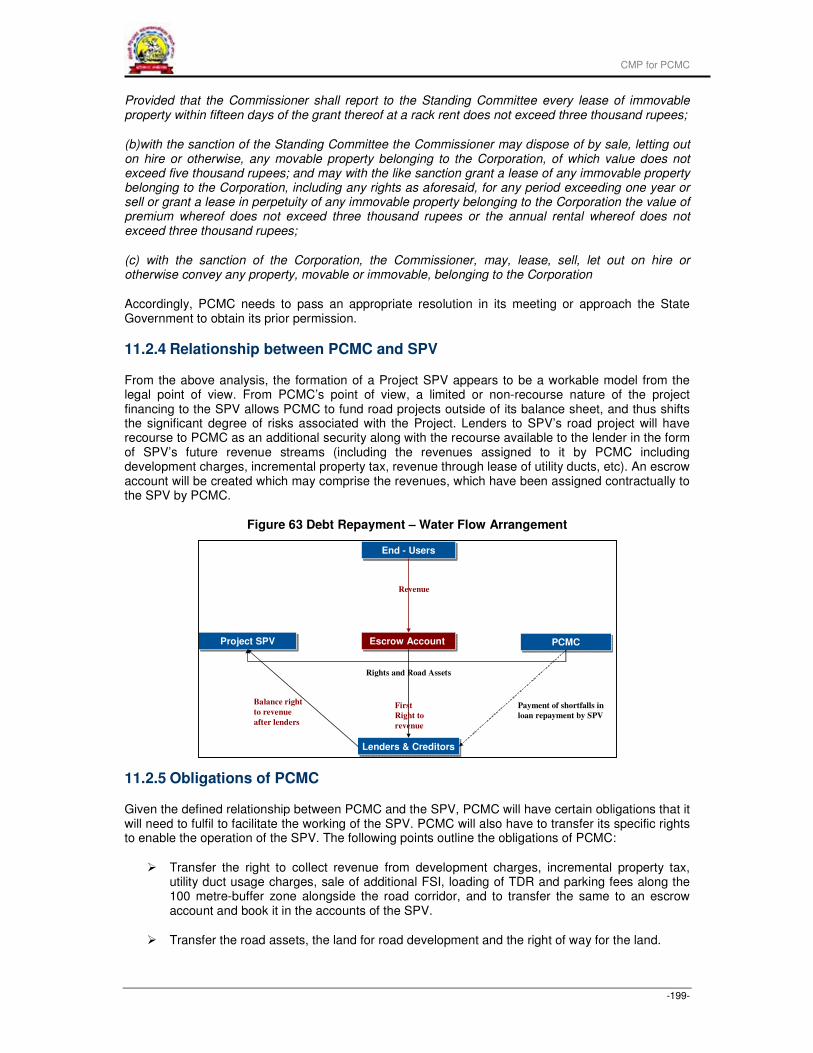
CMP for PCMC
-199-
Provided that the Commissioner shall report to the Standing Committee every lease of immovable property within fifteen days of the grant thereof at a rack rent does not exceed three thousand rupees;
(b)with the sanction of the Standing Committee the Commissioner may dispose of by sale, letting out on hire or otherwise, any movable property belonging to the Corporation, of which value does not exceed five thousand rupees; and may with the like sanction grant a lease of any immovable property belonging to the Corporation, including any rights as aforesaid, for any period exceeding one year or sell or grant a lease in perpetuity of any immovable property belonging to the Corporation the value of premium whereof does not exceed three thousand rupees or the annual rental whereof does not exceed three thousand rupees;
(c) with the sanction of the Corporation, the Commissioner, may, lease, sell, let out on hire or otherwise convey any property, movable or immovable, belonging to the Corporation
Accordingly, PCMC needs to pass an appropriate resolution in its meeting or approach the State Government to obtain its prior permission.
11.2.4 Relationship between PCMC and SPV
From the above analysis, the formation of a Project SPV appears to be a workable model from the legal point of view. From PCMC’s point of view, a limited or non-recourse nature of the project financing to the SPV allows PCMC to fund road projects outside of its balance sheet, and thus shifts the significant degree of risks associated with the Project. Lenders to SPV’s road project will have recourse to PCMC as an additional security along with the recourse available to the lender in the form of SPV’s future revenue streams (including the revenues assigned to it by PCMC including development charges, incremental property tax, revenue through lease of utility ducts, etc). An escrow account will be created which may comprise the revenues, which have been assigned contractually to the SPV by PCMC.
Figure 63 Debt Repayment – Water Flow Arrangement
11.2.5 Obligations of PCMC
Given the defined relationship between PCMC and the SPV, PCMC will have certain obligations that it will need to fulfil to facilitate the working of the SPV. PCMC will also have to transfer its specific rights to enable the operation of the SPV. The following points outline the obligations of PCMC:
� Transfer the right to collect revenue from development charges, incremental property tax, utility duct usage charges, sale of additional FSI, loading of TDR and parking fees along the 100 metre-buffer zone alongside the road corridor, and to transfer the same to an escrow account and book it in the accounts of the SPV.
� Transfer the road assets, the land for road development and the right of way for the land.
Project SPVProject SPV
End - UsersEnd - Users
PCMCPCMCEscrow Account Escrow Account
Lenders & CreditorsLenders & Creditors
Revenue
Rights and Road Assets
First
Right to
revenue
Payment of shortfalls in
loan repayment by SPV
Balance right
to revenue
after lenders
CMP for PCMC
-200-
� Provide a credit guarantee for the loan taken by the SPV, if need be.
� Subscribe to 100% of SPV’s equity.
11.2.6 Obligations of Project SPV
The SPV will be transferred the function of road development, specific to the road corridor projects undertaken by PCMC. Thus, the SPV will have to perform certain obligatory functions. The same have been listed below.
� Design, finance, construct, operate and maintain the road corridors,
� Explore innovative sources of revenue including incremental property tax, revenue from sale of additional FSI, revenue from TDR loading, revenue from utility ducts, etc. and capture these sources of revenue for funding of the project,
� Service debt,
� Monitor execution of the projects by the contractors - the quality of implementation, timelines, and the nature of equipment and technology. It may appoint a third party to undertake the monitoring, and
� Undertake quality maintenance.
11.2.7 Functions of SPV
The various activities that shall be undertaken by the SPV have been detailed below.
11.2.7.1 Long-term planning for the road network within PCMC
In a sector like roads and transportation, the majority of the projects lasts for a period of more than 20 years; hence, long-term planning is necessary. The SPV shall prepare a long-term plan for the road network within the city in line with its objective to improve connectivity in the PCMC’s jurisdiction area.
11.2.7.2 Monitoring
The SPV will also monitor the execution of the projects by developers/contractors, the quality of implementation, timelines, and nature of equipment and technology. It may appoint a third party to undertake the monitoring. It will ensure that the materials are of good quality, the necessary tests are conducted, and the construction as well as maintenance of the roads is up to quality.
11.2.7.3 Project Implementation
The SPV will ensure the timely construction of the road projects. Once the project is identified, the entity will undertake developmental activities such as identifying the amount of investment needed, the availability of land, the status of available technology, and the availability of resources such as contractors, land, power, etc. The major development activities that will be undertaken shall include:
� Assessing the market potential of the project if it is to be implemented on a PPP basis;
� Estimating the requirement of land, plant machinery and other utilities and facilities;
� Entering into tie-ups with technical consultants for sharing of innovative and the latest technologies;
� Estimating the cost of construction and revenue potential; and
� Estimating the debt–equity ratio for the project and identifying means of finances.
CMP for PCMC
-201-
11.2.7.4 Innovative revenue streams
With the implementation of the road corridors, the SPV will be able to generate innovative revenue streams as a result of the development that will take place along the corridors. The SPV will also explore the innovative revenue streams that the SPV can capture and also focus on the management of revenue. This should improve the project’s bankability.
11.2.7.5 Feasibility Analysis
The SPV will conduct a detailed financial feasibility analysis of a road project before its implementation to assess its commercial viability. The detailed cost of the project will be worked out for its economic life. Also, the various avenues of revenue generation will be identified and the total revenue calculated. Project cash flows, working capital requirements and a profit and loss account will be prepared. An in-depth analysis will be carried out to understand the project’s viability. Also, other risks such as political risks, social cost, and willingness to pay will be studied while gauging the feasibility of the project.
11.2.7.6 Structuring
The SPV will also explore whether the road projects need to be undertaken on a PPP basis. Various forms of project structure such as Design Build Operate (DBO), Build Own Operate Transfer (BOOT), Build Operate Transfer (BOT), and Operation and Maintenance (O&M) will be explored. Also, the contract structure including the terms of payment, the mode of payment, the roles, rights and responsibilities of each party, the transfer of property if any, etc. will be detailed.
11.2.7.7 Contract Award and Monitoring
The contract will be awarded to the successful bidder. He will be issued a letter of award and asked to sign the Agreement. Once the contract is signed, the SPV will monitor the progress of the construction of the project as well as its operation and maintenance. It will ensure that the project is constructed as per the quality norms and standards and that the necessary environment approvals have been obtained and there is no deviation from the technical plan. It will also ensure that the contractor maintains all the records and meets MIS requirements.
11.2.7.8 Organisational Structure
To ensure the successful implementation of the road corridor project, there needs to be a sound operating strategy. Human resources and functional expertise would be the backbone of SPV. Hence, the organisation structure has been designed such that it can provide adequate support to SPV’s primary activities, while maintaining a focus on the key success factors. The SPV has been designed to be a lean and focussed organisation, capable of attracting expertise from the industry and ensuring their independence from undesirable political or business pressures.
The SPV has been incorporated by PCMC under Section 66 of the BPMC Act, 1969, whereby 100% shareholding will be with PCMC. The SPV is a limited liability company incorporated under the Companies Act, 1956. If the SPV is a private company, then it shall need to have a minimum of two subscribers and a minimum of two directors. If the SPV is a public limited company then it shall need to have minimum seven subscribers and minimum three directors. The structure of the SPV has thus been designed to comprise a Board of Directors, the Chairman and the Managing Director. The Board of Directors would comprise the elected members of PCMC. The Board of Directors would then elect the Chairman of the Board. The Managing Director would be the Municipal Commissioner of PCMC and would be appointed by the Board of Directors. The Managing Director (MD), heading the top management team, would report to the Board of Directors. The MD would be responsible for the day-to-day operations of the company. The functional heads in the organisation – Engineering, Commercial, Accounts & Finance and Administrative/Systems & HR Department – would report to the MD. The functional cells have been suggested in line with the major roles and objectives of the SPV.
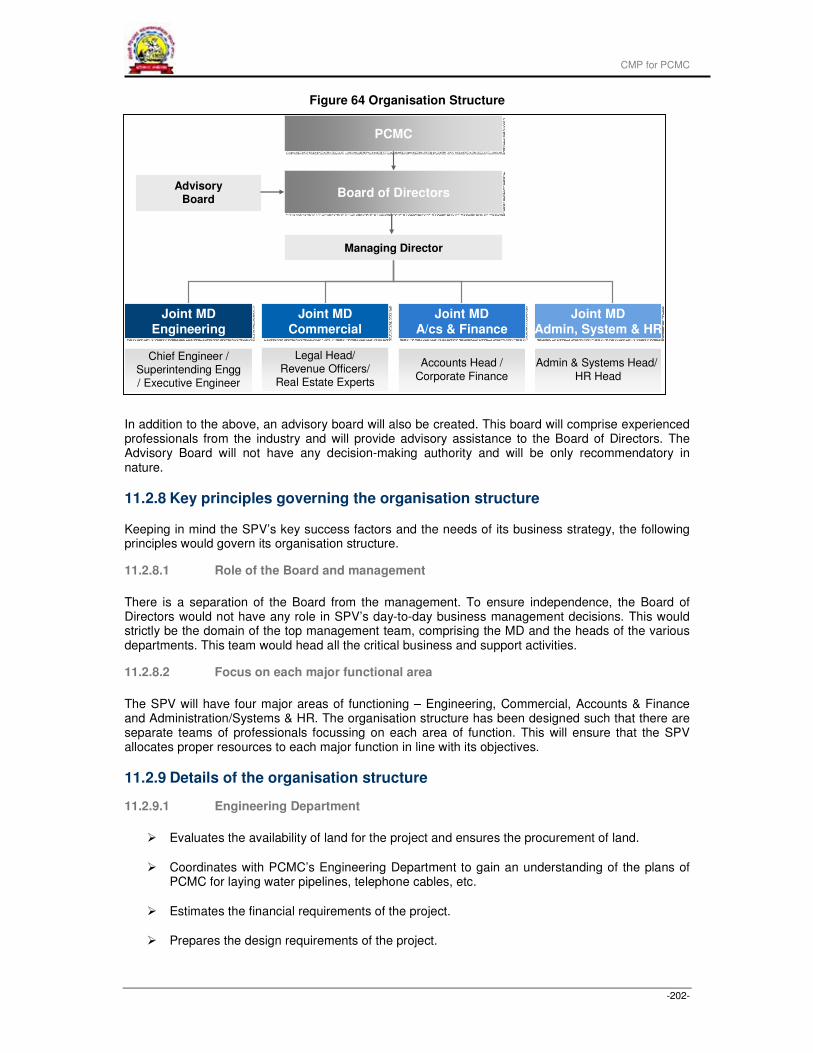
CMP for PCMC
-202-
Figure 64 Organisation Structure
In addition to the above, an advisory board will also be created. This board will comprise experienced professionals from the industry and will provide advisory assistance to the Board of Directors. The Advisory Board will not have any decision-making authority and will be only recommendatory in nature.
11.2.8 Key principles governing the organisation structure
Keeping in mind the SPV’s key success factors and the needs of its business strategy, the following principles would govern its organisation structure.
11.2.8.1 Role of the Board and management
There is a separation of the Board from the management. To ensure independence, the Board of Directors would not have any role in SPV’s day-to-day business management decisions. This would strictly be the domain of the top management team, comprising the MD and the heads of the various departments. This team would head all the critical business and support activities.
11.2.8.2 Focus on each major functional area
The SPV will have four major areas of functioning – Engineering, Commercial, Accounts & Finance and Administration/Systems & HR. The organisation structure has been designed such that there are separate teams of professionals focussing on each area of function. This will ensure that the SPV allocates proper resources to each major function in line with its objectives.
11.2.9 Details of the organisation structure
11.2.9.1 Engineering Department
� Evaluates the availability of land for the project and ensures the procurement of land.
� Coordinates with PCMC’s Engineering Department to gain an understanding of the plans of PCMC for laying water pipelines, telephone cables, etc.
� Estimates the financial requirements of the project.
� Prepares the design requirements of the project.
Board of DirectorsBoard of Directors
Managing Director
PCMCPCMC
Accounts Head /
Corporate Finance
Legal Head/Revenue Officers/
Real Estate Experts
Chief Engineer /Superintending Engg/ Executive Engineer
Admin & Systems Head/
HR Head
Joint MD
A/cs & Finance
Joint MDA/cs & Finance
Joint MD
Commercial
Joint MDCommercial
Joint MD
Engineering
Joint MDEngineering
Joint MD
Admin, System & HR
Joint MDAdmin, System & HR
AdvisoryBoard

CMP for PCMC
-203-
� Undertakes a quality check of the project.
� Undertakes maintenance activities for the road projects.
11.2.9.2 Commercial Department
� Identifies the alternative revenue resources that can be captured by the SPV.
� Markets the project to investors.
� Co-ordinates with the state as well as the Central Government on disbursal of funds.
� Manages legal matters related to the company and its projects.
� Manages the tendering process.
11.2.9.3 Accounts & Finance Department
� Maintains proper books of accounts.
� Prepares the financial structure of the project, explores new innovative structures and selects a structure that maximises returns to the investors.
� Manages the funds of the company as well as that of each identified project.
� Estimates the capital as well as the operating costs for the development as well as operation and maintenance of the project.
� Handles the treasury operations.
11.2.9.4 Administration, Systems & HR Department
� Deals with recruitment, promotions, transfers, leaves and other service matters of the core staff as well as the persons who are appointed on a contract basis.
� Deals with salary estimation, allowances, Income Tax and its deductions as TDS.
� Undertakes resolution of disputes.
� Handles housekeeping matters including maintenance of SPV’s vehicles, their contract work, security, telephones, scrutiny and passing of bills of staff benefits, bills for hired cars, etc.
� Prepares the budget and conducts performance evaluation.
� Handles the day-to-day operations of the SPV including payment of salary, recruitment, performance appraisal, office management, etc.
CMP for PCMC
-204-
12 CONCLUSIONS
Pimpri-Chinchwad is a high growth city within the Pune Metropolitan region with a population of approximately 13.5 lakhs. It is home to India’s finest corporates such as Tata Motors, Bajaj Auto, Bajaj Tempo, Mercedes Benz, Finolex, Thermax, Phillips, Forbes-Marshall, Thyssen Krupp, Alfa Laval and Sandvik Asia. Pimpri-Chinchwad Municipal Corporation (PCMC) is responsible for urban infrastructure services to the city. It is implementing an ambitious city development programme, which was finalized through a comprehensive and participative long term planning exercise in the year 2006. In line with this plan, PCMC is already implementing infrastructure projects worth Rs 1760 crores. The national urban development programme – The Jawaharlal Nehru National Urban Renewal Mission (JnNURM), has approved these projects and has provided partial grant funding. These projects are in the areas of water supply, sewerage, solid waste management, housing and BRTS road corridors.
To address most of the urban transport problems being faced by PCMC currently and those anticipated in the future, a Comprehensive Mobility Plan (CMP) study has been undertaken. An elaborate study on the traffic and land-use scenario has been conducted as part of this study. Based on a comprehensive traffic and land-use study, the need for a BRT system has been appreciated. Based on the urban land-use study future growth patterns in the city, its impact on traffic and the use of land as a resource for the Municipal Corporation, have been presented in the report. As a recommendation of this study, a Bus-based rapid transit system has to be implemented by PCMC to improve the public transportation system in Pimpri-Chinchwad. Improvement of network of existing roads in order to provide good quality of service to commuters has also been proposed.
A network of corridors for a BRT system has been arrived at by considering the following parameters for evaluation. These are recommended to be taken up by PCMC for the implementation.
1. Estimated traffic load along the corridor,
2. Estimated revenues that can be generated along the corridor by using land as a resource,
3. Availability of land for implementation of the project, and
4. The corridors aligned such that they provide a good road-network in PCMC area.
A Special Purpose Vehicle (SPV), as a wholly owned subsidiary of PCMC, has been formed for taking up the implementation of the road improvement as well as BRTS project. The SPV will also manage the Urban Transport Fund (UTF). The SPV would take up the following corridors immediately on its formation:
1. Old NH-4 (Mumbai-Pune highway)
2. Aundh – Rawet road
3. Nashik phata to Wakad
4. Kalewadi to Dehu Alandi road
5. Dehu Alandi road
6. Pune/Vishrantwadi – Alandi road
7. Nashik phata to Moshi
8. Kiwale to Bhakti-Shakti
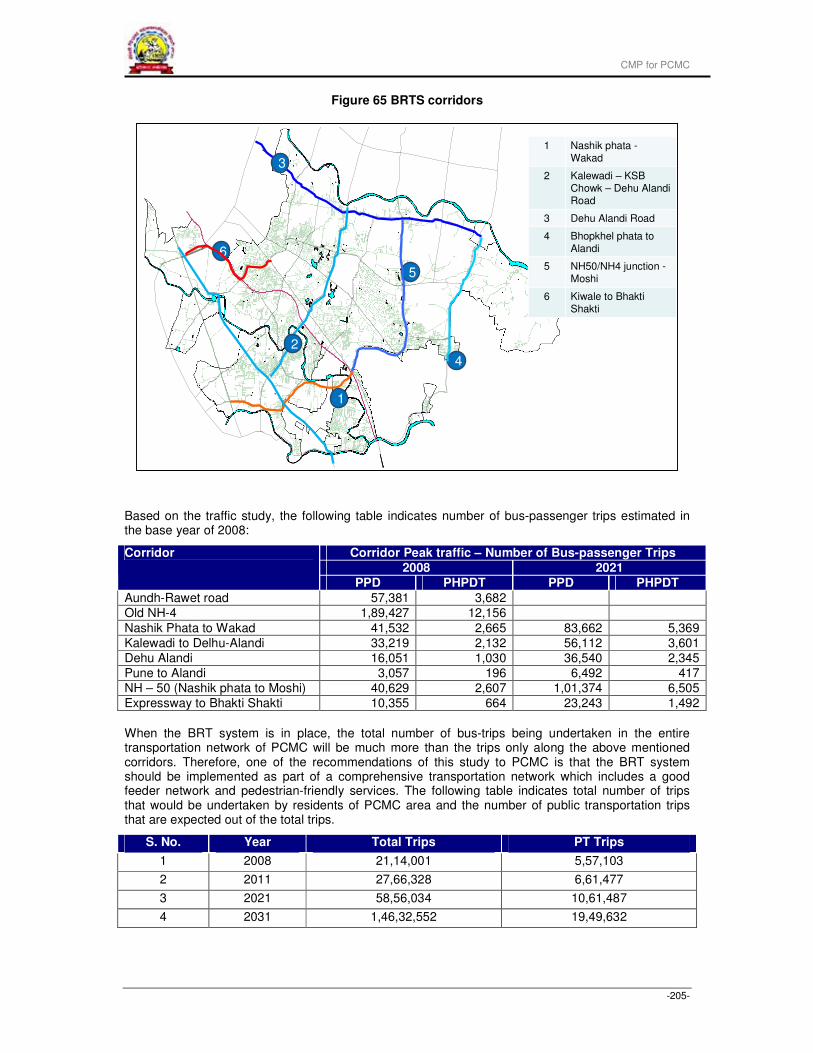
CMP for PCMC
-205-
Figure 65 BRTS corridors
Based on the traffic study, the following table indicates number of bus-passenger trips estimated in the base year of 2008:
Corridor Peak traffic – Number of Bus-passenger Trips
2008 2021
Corridor
PPD PHPDT PPD PHPDT
Aundh-Rawet road 57,381 3,682
Old NH-4 1,89,427 12,156
Nashik Phata to Wakad 41,532 2,665 83,662 5,369
Kalewadi to Delhu-Alandi 33,219 2,132 56,112 3,601
Dehu Alandi 16,051 1,030 36,540 2,345
Pune to Alandi 3,057 196 6,492 417
NH – 50 (Nashik phata to Moshi) 40,629 2,607 1,01,374 6,505
Expressway to Bhakti Shakti 10,355 664 23,243 1,492
When the BRT system is in place, the total number of bus-trips being undertaken in the entire transportation network of PCMC will be much more than the trips only along the above mentioned corridors. Therefore, one of the recommendations of this study to PCMC is that the BRT system should be implemented as part of a comprehensive transportation network which includes a good feeder network and pedestrian-friendly services. The following table indicates total number of trips that would be undertaken by residents of PCMC area and the number of public transportation trips that are expected out of the total trips.
S. No. Year Total Trips PT Trips
1 2008 21,14,001 5,57,103
2 2011 27,66,328 6,61,477
3 2021 58,56,034 10,61,487
4 2031 1,46,32,552 19,49,632
`
6
3
5
2
4
1 Nashik phata -Wakad
2 Kalewadi – KSB Chowk – Dehu AlandiRoad
3 Dehu Alandi Road
4 Bhopkhel phata to Alandi
5 NH50/NH4 junction -Moshi
6 Kiwale to BhaktiShakti
1 Nashik phata -Wakad
2 Kalewadi – KSB Chowk – Dehu AlandiRoad
3 Dehu Alandi Road
4 Bhopkhel phata to Alandi
5 NH50/NH4 junction -Moshi
6 Kiwale to BhaktiShakti
1
CMP for PCMC
-206-
Public transportation trips as well as total passenger trips are likely to grow at a rapid pace from 2015 onwards and the following table presents the rate of growth of the same.
Growth Rate (%)
Year Total Trips PT Trips
2007 - -
2011 6.95 4.39
2021 7.79 4.84
2031 9.59 6.27
Based on the land-use study, it has been observed that by using the concept of Transit Oriented land-use structure and developing transport infrastructure, land along BRT corridors can be used as a resource by PCMC. In the long term, considerable amounts of revenues can be generated from the land along proposed BRT corridors. Estimates of these revenues have been presented in the report.
Options for technology and specifications of rolling stock has been presented in the report. However, since the transportation systems in both the cities of Pimpri-Chinchwad and Pune are being managed by a single organization (PMPML), it is recommended that the rolling stock that would be procured shall conform to the requirements of both the cities. This is an important factor to be considered especially for the corridors which connect the two cities, namely Aundh-Rawet, the old NH4 and the Pune-Alandi road. Selection of rolling-stock needs to be coordinated with Pune Municipal Corporation/PMPML.
In terms of the configuration of road and BRT corridors, the following recommendations have been made in the study:
1. Dedicated bus-lanes have been located in the middle of the carriageway, on either sides of the median,
2. Bus-stops are located at a distance of about 250 m on either side of junctions and at mid-block locations at distances of 500-700 m beyond junctions,
3. In order to have least hindrances for pedestrians to cross roads to reach bus-stops, it has been recommended that the bus-stops be located at grade with the pedestrian lanes provided at the edge of RoW. The through traffic lanes on either sides of BRT lanes would be elevated to a minimum height of the buses. This would enable pedestrians to reach bus-stops with minimum impedance.
4. Provision of separate lanes for pedestrians and non-motorised vehicles on either ends of RoW,
As a part of re-development of land along corridors, with the objective of having a transit-oriented development along the BRT corridors, it has been proposed to modify certain land-use policies prevalent in PCMC. PCMC has initiated the process by presenting to its General Body for allowing a maximum FSI of 1.8 within the influence zone of the BRT corridors. TDR may be allowed from existing other zones in PCMC limits to the new zones along BRT corridors. Developers will have to pay a premium for tranfering the development rights onto the new zone.
As one of the innovative steps towards implementation of this project, PCMC has created a wholly owned subsidiary in the form of a Special Purpose Vehicle (SPV) which shall have the mandate of planning, implementing and O&M of the road projects and the BRT system. It is expected that through the SPV, PCMC will have a dedicated team of professionals who will ensure timely and effective implementation of these projects. The SPV will aim at capturing various revenues that can be generated along the corridors as some of PCMC’s functions would be delegated to it. It will also explore various financing options for project implementation.
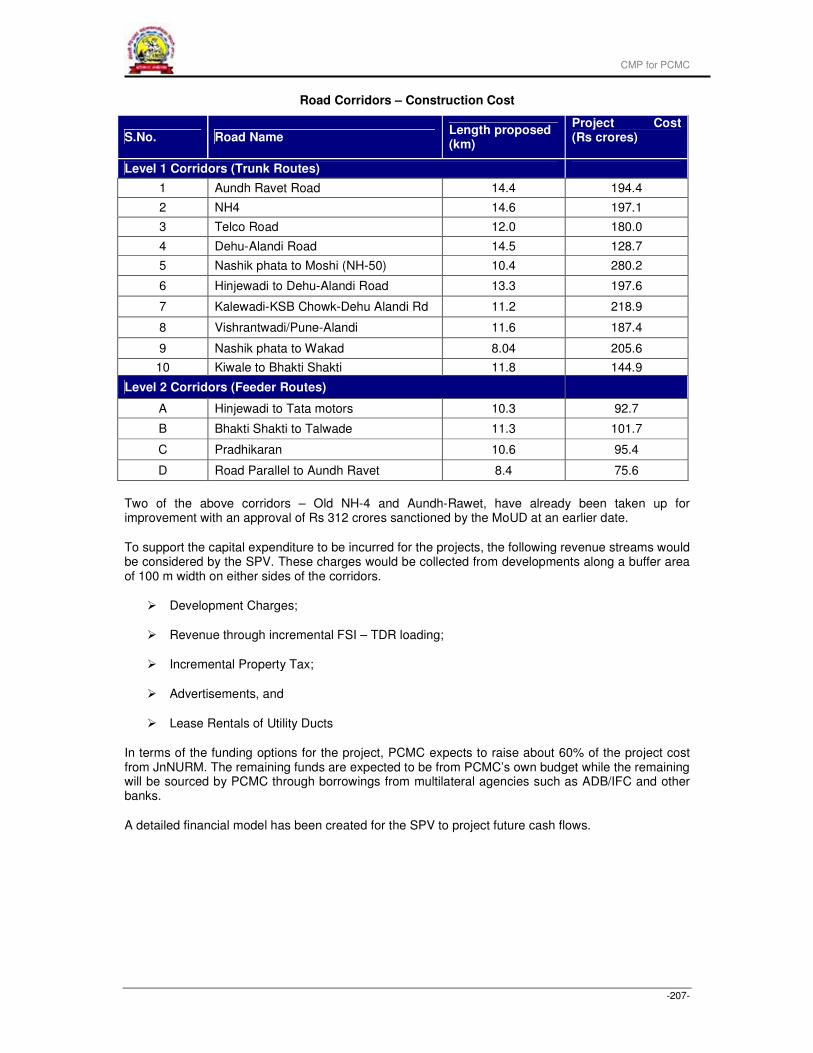
CMP for PCMC
-207-
Road Corridors – Construction Cost
S.No. Road Name Length proposed (km)
Project Cost (Rs crores)
Level 1 Corridors (Trunk Routes)
1 Aundh Ravet Road 14.4 194.4
2 NH4 14.6 197.1
3 Telco Road 12.0 180.0
4 Dehu-Alandi Road 14.5 128.7
5 Nashik phata to Moshi (NH-50) 10.4 280.2
6 Hinjewadi to Dehu-Alandi Road 13.3 197.6
7 Kalewadi-KSB Chowk-Dehu Alandi Rd 11.2 218.9
8 Vishrantwadi/Pune-Alandi 11.6 187.4
9 Nashik phata to Wakad 8.04 205.6
10 Kiwale to Bhakti Shakti 11.8 144.9
Level 2 Corridors (Feeder Routes)
A Hinjewadi to Tata motors 10.3 92.7
B Bhakti Shakti to Talwade 11.3 101.7
C Pradhikaran 10.6 95.4
D Road Parallel to Aundh Ravet 8.4 75.6
Two of the above corridors – Old NH-4 and Aundh-Rawet, have already been taken up for improvement with an approval of Rs 312 crores sanctioned by the MoUD at an earlier date.
To support the capital expenditure to be incurred for the projects, the following revenue streams would be considered by the SPV. These charges would be collected from developments along a buffer area of 100 m width on either sides of the corridors.
� Development Charges;
� Revenue through incremental FSI – TDR loading;
� Incremental Property Tax;
� Advertisements, and
� Lease Rentals of Utility Ducts
In terms of the funding options for the project, PCMC expects to raise about 60% of the project cost from JnNURM. The remaining funds are expected to be from PCMC’s own budget while the remaining will be sourced by PCMC through borrowings from multilateral agencies such as ADB/IFC and other banks.
A detailed financial model has been created for the SPV to project future cash flows.
CMP for PCMC
-208-
DRAFT POLICIES
PARKING POLICY
PCMC has decided to adopt the Parking Policy on the lines of the one being enforced by PMC. The principles of the policy could be aligned together. Broadly, the policy covers the following:
The growth in private vehicles, as observed from data obtained from local RTA, has been at a very high rate over the past few years. As the number of private vehicles increases, the need for parking space at various locations across the city increases. These places include commercial areas, residential areas as well as market places. This leads to the reduction in the space available for commuters on the roads. It is also a serious safety hazard to the road users. With these points in mind, a Parking Policy is being proposed by PCMC.
The objective of this policy is to reduce the dependence of people on private modes of transport and increase the capacity of the public transportation system. It is also being aimed at encouraging the use of bicycles in the city for covering short distances.
The policy will consider enforcing control measures along the various routes in the city based on the traffic characteristics. This would include control measures on the following two types routes:
• Those routes where stopping or parking would be dangerous or would impede traffic flow at any time, such as roads in the congested area of city, and
• Those routes where vehicles will want to stop, park, load or unload to meet the needs of local people, business and other activities
These controls can be achieved by having parking restrictions. An important step towards and effective policy would be to designate roads based on their functionalities. The roads in the city have to be categorized into a hierarchy based on their functionalities.
Some important strategies that will be looked into for this policy are:
• Vehicle Free Zones, • Multi-level Parking on BOT basis, • Enforcement, • Parking norms for private buildings to be incorporated in the local Development Control
Rules.
PCMC has initiated the process of modifying some of its Development Control Rules (DCR) in order to incorporate provisions for larger parking facilities in new developments that will happen henceforth. PCMC plans to enfore such rules by ensuring that developers make such provisions at the time of applying for Building Permission. Also, the developers would be asked to share a part of the parking space for public purposes.
CMP for PCMC
-209-
ADVERTISEMENT POLICY
Advertisements are an important source of revenue for the municipal corporation. It is important to have a policy in place for advertising activities. PCMC is working on developing an advertisement policy on the following lines:
The objective of this policy would be to:
• Regulate the erection, location, exhibition, fixation, size, shape, retention or display of advertisement in any manner in non-prohibited areas,
• Promote safety of the public, proper erection or hoardings and signages, • Improve the visual aesthetics of the city, • Encourage the innovative use of design to achieve aesthetic and commercial balance, • Ensure equitable treatment under the law through accurate records and consistent
enforcement.
The rates charged for advertising also need to be regulated and subjected to a maximum and a minimum as determined by PCMC. The policy will define the various categories of hoardings based on various parameters, types of advertisements, the corresponding rates to be charged, the security measures to be taken while erecting them and the norms for erecting them and their display.
As an activity towards implementing an innovative approach for generating revenues through advertisements, PCMC is planning to engage private sector participation for the construction of assets and their operation and maintenance, along one of the main corridors in the city. The private agency would make regular payments to PCMC in exchange of the advertisement rights on the assets created.
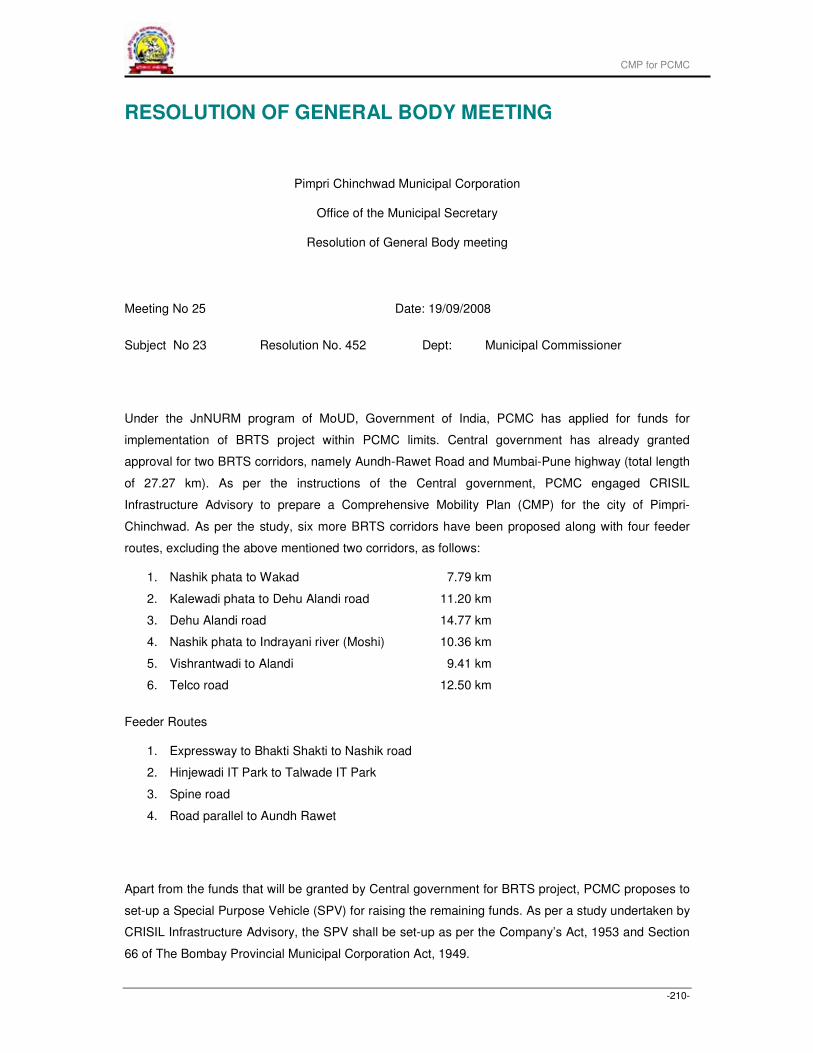
CMP for PCMC
-210-
RESOLUTION OF GENERAL BODY MEETING
Pimpri Chinchwad Municipal Corporation
Office of the Municipal Secretary
Resolution of General Body meeting
Meeting No 25 Date: 19/09/2008
Subject No 23 Resolution No. 452 Dept: Municipal Commissioner
Under the JnNURM program of MoUD, Government of India, PCMC has applied for funds for
implementation of BRTS project within PCMC limits. Central government has already granted
approval for two BRTS corridors, namely Aundh-Rawet Road and Mumbai-Pune highway (total length
of 27.27 km). As per the instructions of the Central government, PCMC engaged CRISIL
Infrastructure Advisory to prepare a Comprehensive Mobility Plan (CMP) for the city of Pimpri-
Chinchwad. As per the study, six more BRTS corridors have been proposed along with four feeder
routes, excluding the above mentioned two corridors, as follows:
1. Nashik phata to Wakad 7.79 km
2. Kalewadi phata to Dehu Alandi road 11.20 km
3. Dehu Alandi road 14.77 km
4. Nashik phata to Indrayani river (Moshi) 10.36 km
5. Vishrantwadi to Alandi 9.41 km
6. Telco road 12.50 km
Feeder Routes
1. Expressway to Bhakti Shakti to Nashik road
2. Hinjewadi IT Park to Talwade IT Park
3. Spine road
4. Road parallel to Aundh Rawet
Apart from the funds that will be granted by Central government for BRTS project, PCMC proposes to
set-up a Special Purpose Vehicle (SPV) for raising the remaining funds. As per a study undertaken by
CRISIL Infrastructure Advisory, the SPV shall be set-up as per the Company’s Act, 1953 and Section
66 of The Bombay Provincial Municipal Corporation Act, 1949.
CMP for PCMC
-211-
Accordingly, for the formation and operations of the SPV, the following persons shall be Directors on
its Board:
a) Honorable Mayor,
b) Honorable Chairman of Standing Committee,
c) Leader of the Ruling Party,
d) Honorable Municipal Commissioner,
e) Chief City Engineer,
f) Executive Engineer (Civil)/JnNURM Coordinator
Also,
1. A buffer zone of width 100 m on both sides of proposed BRTS corridors shall be created. This
zone shall be named – “BRT corridor”. The Floor Space Index (FSI) in this zone shall be allowed
to be increased up to a maximum limit of 1.80.
Also,
2. The proposed FSI of 1.80 shall constitute the following:
a. Based on the plot area - 1.00 FSI
b. Based on Transfer of Development Rights (TDR) - 0.80 FSI
or land acquisition as per reservations (in case of
land acquisition, a maximum of 0.4 is allowed)
Also,
3. Development Rights can be transferred to the “BRT corridors” from any existing as well as
proposed zones in the city.
Also,
4. In order to load TDR along “BRT corridors”, the following Premium Charges have to be paid
a. From zones in the new-villages area - Rs 12,000 per sq.m.
b. From Zone – C - Rs 9,000 per sq.m.
c. From Zone – B - Rs 6,000 per sq.m.
d. From Zone – A - Rs 3,000 per sq.m.
And,
5. On formation of the SPV as mentioned above, various streams of revenues that have been
identified by PCMC along the “BRTS Corridors” shall be transferred to the SPV, namely, building
permissions Development Charges (DCs), Property Tax, Impact Fees due to incremental FSI,
Premium Charges from Transfer of Development Rights (TDR), Advertisement revenues, and all
CMP for PCMC
-212-
other taxes, rents, etc. Revenues from vacant lands or other fixed assets owned by PCMC shall
also be transferred to the SPV.
6. The Municipal Commissioner has been given the authority to transfer various revenues collected
along the “BRTS Corridors”, such as Development Charges (DCs), TDR scrutiny charges,
utilization charges, revenues from parking facilities. Also, the Municipal Commissioner is being
given the authority to introduce modifications in the Development Control Rules (DCR), present
them to State Government as per Section 37 of Maharashtra Regional and Town Planning Act
and approve the Development Plan of new areas/villages added to PCMC limits. Through a public
notice, the objections and comments of people towards any above modifications shall be
considered. Also, the leader of the Opposition Party has also been added to the Board of
Directors of the SPV. It is proposed that maximum FSI of 1.80 will be allowed and as per the
DCR, developments such as four and five star hotels, educational institutions, hospitals, etc shall
give necessary permission as per existing DCR previously sanctioned by the Government. The
Municipal Commissioner shall be given the authority to modify rules related to parking, utilization
of set-backs, vacant lands, etc. The SPV is being named as “PCMC Infrastructure Company”.
Sd / -
Municipal Secretary
Pimpri Chichwad Municipal Corporation
Pimpri -18
Note: This document is a translation of the original Resolution passed by the General Body of PCMC. In case of any discrepancies, the original document in Marathi shall precede.