piecewise linear time series estimation with grasp
TRANSCRIPT
PIECEWISE LINEAR TIME SERIES ESTIMATION WITH GRASP
MARCELO C. MEDEIROS,MAURICIO G.C. RESENDE,AND ALVARO VEIGA
ABSTRACT. This paperdescribesa heuristicto build piecewise linear statisticalmodelswith multivariatethresholds,basedon a GreedyRandomizedAdaptive SearchProcedure(GRASP).GRASPis aniterative randomizedsamplingtechniquethathasbeenshown toquickly producegoodqualitysolutionsfor awidevarietyof optimizationproblems.In thispaperwedescribea GRASPto sequentiallysplit ann-dimensionalspacein orderto builda piecewiselineartimeseriesmodel.
1. INTRODUCTION AND PROBLEM DESCRIPTION
A time seriesis a sequenceof observationsof a certainphenomenonover time. Themain goal of moststatisticalforecastingtechniquesis to analyzethe pastoutcomesof agivenseriesin orderto predictits futurebehavior.
Historically, themostfrequentlyusedapproachesto timeseriesmodelbuilding assumethatthedataunderstudyaregeneratedfrom alinearGaussianstochasticprocess[4]. How-ever, it is well known thatreal-lifesystemsareusuallynonlinear, andcertainfeatures,suchaslimit-cycles,asymmetry, amplitude-dependentfrequency responses,jump phenomena,andchaoscannotbe correctlycapturedby linear statisticalmodels. Over the last years,severalnonlineartime seriesmodelshave beenproposedin theclassicaltechnicallitera-ture(see[9] and[5] for acomprehensivereview). Onemodelthathasfoundalargenumberof successfulapplicationsis thethresholdautoregressivemodel(TAR), proposedby Tong[7] andTong andLim [10]. TheTAR modelis a piecewise linearprocesswhosecentralideais to changethe parametersof a linear autoregressive modelaccordingto the valueof a known variable,calledthe thresholdvariable. If this variableis a laggedvalueof thetimeseries,themodelis calleda self-exciting thresholdautoregressive(SETAR) model.
In this paper, we proposea heuristic to estimateSETAR modelswith multivariatethresholds.This is a generalizationof the proceduresdescribedin [10] and[11], wherethe thresholdsaremonovariate. The proposedmethodis basedon a semi-greedyalgo-rithm, calledGreedyRandomizedSearchAdaptiveProcedure(GRASP),proposedby FeoandResende[2, 3, 6].
The paperis organizedasfollows. Section2 givesa generaldescriptionof thresholdmodels.Section3 presentstheproposedprocedure.Section4 describesbriefly theGRASPmethodologyandpresentsits applicationto our particularproblem. Section5 presentssomenumericalexamplesillustratingtheperformanceof theproposedmodel.Concludingremarksaremadein Section6.
Date: February26,1999.Key wordsandphrases.Nonlineartimeseriesanalysis,piecewiselinearmodels,combinatorialoptimization,
searchheuristic,GRASP.AT&T LabsResearchTechnicalReport:99.3.1.
1
2 M. C. MEDEIROS,M. G. C. RESENDE,AND A. VEIGA
2. THRESHOLD AUTOREGRESSIVE MODELS
The thresholdautoregressive modelwasfirst proposedby Tong [7] andfurtherdevel-opedby TongandLim [10] andTong[8]. Themainideaof theTAR modelis to describea givenstochasticprocessby a piecewiselinearautoregressivemodel,wherethedetermi-nationof whethereachof the modelsis active or not dependson the valueof a knownvariable.
A timeseriesyt is a thresholdprocessif it followsthemodel
yt l
∑j 1
φj
0 p
∑i 1
φj
i yt i εj
t Ij qt (1)
whereεj
t is a whitenoiseprocesswith zeromeanandfinite varianceσ2j , andtheterms
φj
0 φ j 1 φ j p arerealcoefficients.Ij is anindicatorfunction,definedby
Ij qt 1 if qt j ;
0 otherwise,(2)
where j r j 1 r j is a partitionof thereal line , definedby a linearly orderedsubset
of therealnumbers, r0 r l , suchthatr0 r1 r l , wherer0 ∞ andr l
∞.Model (1) is composedby l autoregressive linearmodels,eachof which will beactive ornot dependingon the valueof qt . The choiceof the thresholdvariable,qt , which deter-minesthedynamicsof theprocess,allows a numberof possiblesituations.An importantcaseis whenqt is replacedby yt d, wherethemodelbecomestheself exciting thresholdautoregressivemodel
yt l
∑j 1
φj
0 p
∑i 1
φj
i yt i εj
t Ij yt d (3)
denotedby theacronym SETAR l ; p1 pl . Thescalard is known asthedelayparam-eteror thelengthof thethreshold.
In [10], a grid searchto estimateSETAR models,basedon the Akaike’s informationcriterion [1], wasproposed.In [11], Tsaydevelopeda graphicalprocedureanda statis-tical test for nonlinearityto estimatethe thresholds.Both methodologiesconsideronlythresholdscontrolledby asinglelaggedobservationof thetimeseries.
3. THE MULTIPLE THRESHOLD AUTOREGRESSIVE MODEL
3.1. Model Presentation. As statedin Section2, the dynamicsof a SETAR modelarecontrolledby a partition of the real line inducedby the parametersr j . However, in amoregeneralsituation,it will be interestingto considera partition of an n-dimensionalspace,say n. Thispaperproposesaprocedureto estimateSETAR modelswith evolutioncontrolledby apartitionof amultidimensionalspaceinducedby h separatinghyperplanes.Theproposedmethodcanbeimmediatelygeneralizedto adynamicregressionframework.
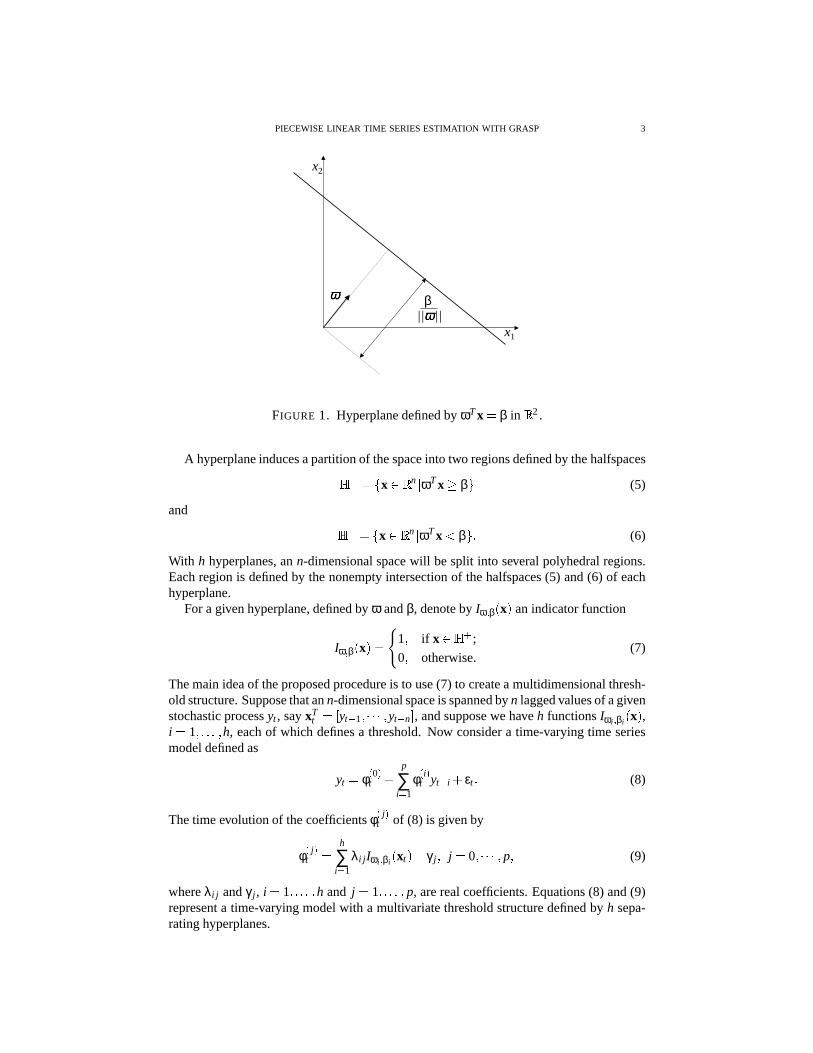
Considerann-dimensionalEuclideanspaceanda point x in thatspace.A hyperplaneis definedby x n ωTx β (4)
whereω is ann-dimensionalparametervectorandβ is a scalarparameter. Figure1 showsanexamplein 2. Thedirectionof ω determinestheorientationof thehyperplaneandthescalarterm β determinesthe positionof the hyperplanein termsof its distancefrom theorigin.
PIECEWISELINEAR TIME SERIESESTIMATION WITH GRASP 3
x1
x2
β||ωω ||
ωω
FIGURE 1. Hyperplanedefinedby ωTx β in 2.
A hyperplaneinducesapartitionof thespaceinto two regionsdefinedby thehalfspaces x n ωTx β (5)
and x n ωTx β (6)
With h hyperplanes,ann-dimensionalspacewill besplit into severalpolyhedralregions.Eachregion is definedby thenonemptyintersectionof thehalfspaces(5) and(6) of eachhyperplane.
For a givenhyperplane,definedby ω andβ, denoteby Iω ! β x anindicatorfunction
Iω ! β x 1 if x
;
0 otherwise.(7)
Themainideaof theproposedprocedureis to use(7) to createa multidimensionalthresh-oldstructure.Supposethatann-dimensionalspaceis spannedbyn laggedvaluesof agivenstochasticprocessyt , sayxT
t" yt 1 yt n , andsupposewehave h functionsIωi ! βi
x ,i 1 h, eachof which definesa threshold.Now considera time-varyingtime seriesmodeldefinedas
yt φ
0
t p
∑i 1
φi
t yt i εt (8)
Thetimeevolutionof thecoefficientsφj
t of (8) is givenby
φj
t h
∑i 1
λi j Iωi ! βi xt γ j j 0 p (9)
whereλi j andγ j , i 1 h and j 1 # p, arerealcoefficients.Equations(8) and(9)representa time-varyingmodelwith a multivariatethresholdstructuredefinedby h sepa-ratinghyperplanes.
4 M. C. MEDEIROS,M. G. C. RESENDE,AND A. VEIGA
24
68
1012
14
24
68
1012
14
0
0.5
1
1.5
2
yt−1
yt−2
Thr
esho
lds
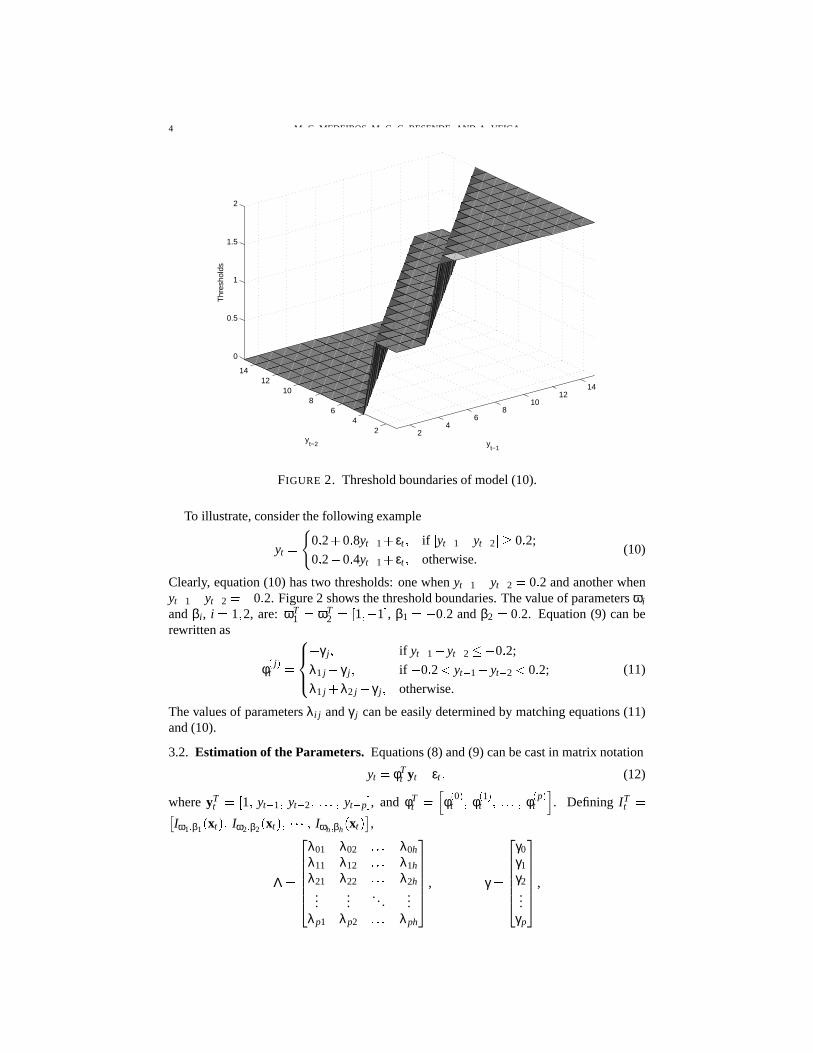
FIGURE 2. Thresholdboundariesof model(10).
To illustrate,considerthefollowing example
yt 0 2 0 8yt 1 εt if yt 1
yt 2 0 2;
0 2 0 4yt 1 εt otherwise.(10)
Clearly, equation(10) hastwo thresholds:onewhenyt 1 yt 2
0 2 andanotherwhenyt 1
yt 2 0 2. Figure2 shows thethresholdboundaries.Thevalueof parametersωi
andβi , i 1 2, are: ωT1 ωT
2$" 1 1 , β1
$ 0 2 andβ2 0 2. Equation(9) canbe
rewrittenas
φj
t γ j if yt 1
yt 2 % 0 2;
λ1 j γ j if 0 2 yt 1
yt 2 0 2;
λ1 j λ2 j γ j otherwise.
(11)
Thevaluesof parametersλi j andγ j canbeeasilydeterminedby matchingequations(11)and(10).
3.2. Estimation of the Parameters. Equations(8) and(9) canbecastin matrixnotation
yt φT
t yt εt (12)
whereyTt&" 1 yt 1 yt 2 ' yt p , and φT
t φ
0
t φ1
t ( φp
t . Defining ITt
Iω1 ! β1 xt Iω2 ! β2
xt Iωh ! βh xt ,
Λ λ01 λ02 λ0h
λ11 λ12 λ1h
λ21 λ22 λ2h...
......
...λp1 λp2 λph
, γ γ0
γ1
γ2...
γp
,
PIECEWISELINEAR TIME SERIESESTIMATION WITH GRASP 5
equation(9) canberewrittenas
φt ΛI t
γ (13)
DenotingΘ )" Λ γ andΩTt*" I t 1 , where1T +" 1 1 1 1
h
, equation(12)
becomes
yt ΘΩt T yt εt
ΩTt ΘTyt εt (14)
Applying the vec1 operatorto both sidesof equation(14), andusing the property2 thatvec ABC CT , A vec B , weobtain
yt yT
t, ΩT
t vec ΘT εt (15)
Equation(15) is a linearregressionmodelto which theordinaryleastsquaresestimatorcanbeapplied,obtaining
vec Θ N
∑i 1
yTt, ΩT
tT
yTt, ΩT
t
1 N
∑i 1
yTt, ΩT
tT
yt (16)
Sometimesin practice,thematrix ∑Ni 1 yT
t, ΩT
tT
yTt, ΩT
t doesnot have an in-
verseanda pseudo-inverseshouldbecalculatedby a singular-valuedecompositionalgo-rithm.
Theproblemnow is to estimateparametersωi andβi , i 1 h. As statedearlierinthissection,theseparametersdefineahyperplanein ann-dimensionalspace.If wehaveNobservationsof xt , wemustconsiderhyperplanesthatseparatetheobservedpoints.In fact,weonlyneedto considerthehyperplanesdefinedby combinationsof thosepoints.Sinceinann-dimensionalspace,weneedn distinctpointsto defineahyperplane.Hence,if wehaveN points,thereare N!
n!N n ! possiblehyperplanesto search.Oneway would be to search
all thepossiblecombinationsof hyperplanesandchoosethecombinationthatminimizesthesumof squarederrors.Of course,for mostpracticalproblemsthis is infeasible.In thenext sectionwe proposea procedurebasedon GRASPto choosethesetof h hyperplaneswith smallsumof squarederrors.
4. A GRASP FOR PIECEWISE L INEAR MODELS
A GRASPis a multi-startiterative randomizedsamplingtechnique,with eachGRASPiterationconsistingof two phases,a constructionphaseanda local searchphase.Thebestoverallsolutionis keptastheresult.
Theconstructionphaseof GRASPis essentiallya randomizedgreedyalgorithm,whereafeasiblesolutionis iteratively constructed,oneelementatatime. At eachconstructionit-eration,thechoiceof thenext elementto beaddedto thesolutionis determinedby orderingall candidateelementsin a candidatelist with respectto a greedyfunction. This functionmeasuresthe(myopic)benefitof selectingeachelement.Theheuristicis adaptivebecausethebenefitsassociatedwith everyelementareupdatedateachiterationof theconstruction
1Let A bea - m . n/ matrix with - m . 1/ columnsai . Thevec operatortransformsA into an - mn . 1/ vectorby stackingthecolumnsof A.
20 denotestheKronecker product.Let A 12- ai j / andB 13- bi j / be - m . n/ and - p . q/ matrices,respectively.
The - mp . nq/ matrixA 0 B 14556 a11B 78787 a1nB
......
...am1B 78787 amnB
9 ::; is theKronecker productof A andB.
6 M. C. MEDEIROS,M. G. C. RESENDE,AND A. VEIGA
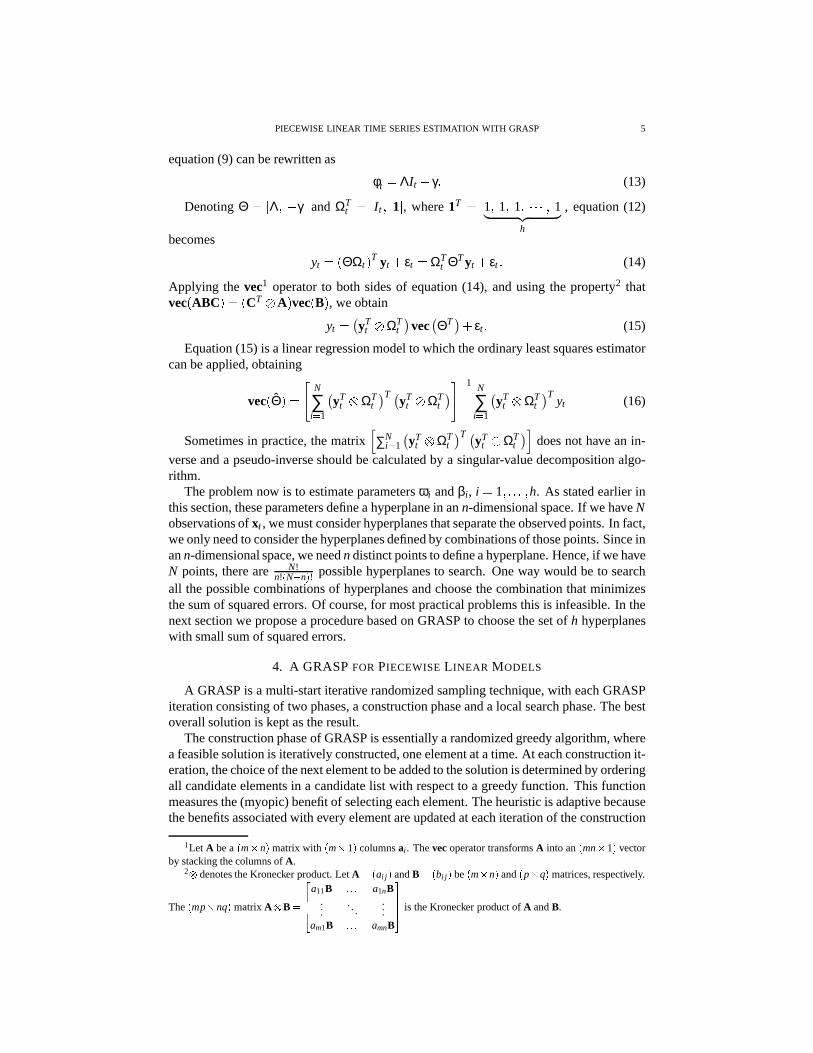
procedure grasp( )1 do k 1 MaxIter <2 ConstructGreedyRandomizedSolution( );3 LocalSearch();4 UpdateSolution();5 end do;6 return(BestSolutionFound);end grasp;
FIGURE 3. GRASPconstructionprocedure.
phaseto reflectthechangesbroughtonby theselectionof thepreviouselement.Theprob-abilistic componentof a GRASPis characterizedby randomlychoosingoneof the bestcandidatesin the list, but not necessarilythe top candidate.The list of bestcandidatesiscalledthe restrictedcandidatelist (RCL). This choicetechniqueallows for differentso-lutionsto beobtainedat eachGRASPiteration,but doesnot necessarilycompromisethepowerof theadaptivegreedycomponentof themethod.
As is the casefor many deterministicmethods,the solutionsgeneratedby a GRASPconstructionare not guaranteedto be locally optimal with respectto simple neighbor-hooddefinitions. Hence,it is almostalwaysbeneficialto applya local searchto attemptto improve eachconstructedsolution. Normally, a local optimizationproceduresuchasa two-exchangeis employed. While suchprocedurescanrequireexponentialtime fromanarbitrarystartingpoint, empiricallytheir efficiency significantlyimprovesastheinitialsolutionimproves. Throughtheuseof customizeddatastructuresandcarefulimplemen-tation,anefficientconstructionphasecanbecreatedwhichproducesgoodinitial solutionsfor efficient local search.Theresultis thatoftenmany GRASPsolutionsaregeneratedinthesameamountof time requiredfor thelocal optimizationprocedureto convergefrom asinglerandomstart. Furthermore,thebestof theseGRASPsolutionsis generallysignifi-cantlybetterthanthesolutionobtainedby a local searchfrom a randomstartingpoint.
Figure3 illustratesa genericGRASPin pseudo-code.TheGRASPtakesasinput pa-rametersfor settingthemaximumnumberof GRASPiterationsandtheseedfor theran-domnumbergenerator. TheGRASPiterationsarecarriedout in lines1–5. EachGRASPiterationconsistsof theconstructionphase(line 2), the local searchphase(line 3) and,ifnecessary, theincumbentsolutionupdate(line 4).
Whenappliedto the piecewise linear time seriesmodelingproblem,the constructionphaseconsistsof sequentiallychoosinghyperplanesuntil the maximumnumberof hy-perplanesis reached.Thegreedyfunctionproposedordersthepossiblehyperplaneswithrespectto the sumof squarederrorsof the fitted data. The local searchimplementedinthisGRASPis a two-exchangeheuristic,wherea hyperplanethatis in thesolutionis sub-stitutedby anotherthatis not in thesolution.Becausethenumberof possiblehyperplanescangrow very fastasa functionof thenumberof observedpoints,we build anouterloopwherein eachouteriterationweconsideronly arandomsubsetof thepossiblehyperplanes.Figure4 illustratestheprocedurein pseudo-code.
Themainproceduretakesasinputparametersfor settingthemaximumnumberof outerloop andGRASPiterations,themaximumnumberof hyperplanesat eachouterloop iter-ationandthenumberof hyperplanesin the solutionset. It is importantto stressthat thealgorithmsupposesthatthenumberof separatinghyperplanes,thevariablesthatcompose
PIECEWISELINEAR TIME SERIESESTIMATION WITH GRASP 7
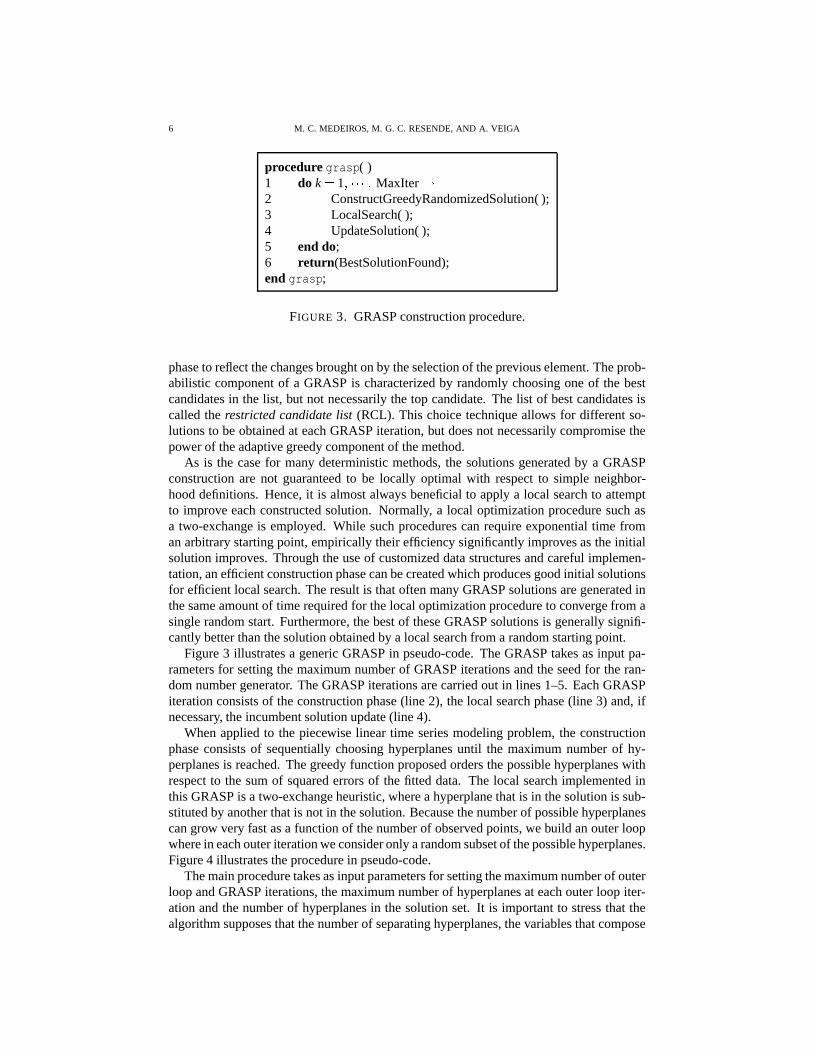
procedure gplts( )1 BestSolutionFound=OLS;2 do k 1 MaxOuterIter<3 PermuteData();4 RandomSelectHyperplanes();5 Grasp();6 UpdateSolution();7 end do;8 return(BestSolutionFound);end gptls;
FIGURE 4. Main loopprocedure.
procedure Grasp( )1 do k 1 MaxInnerIter<2 SelectαAtRandom();3 ConstructGreedyRandomizedSolution( );4 LocalSearch();5 UpdateSolution();6 end do;7 return(BestSolutionFound);end Grasp;
FIGURE 5. GRASPprocedure.
thevectorxt in (9) andtheorderp of theautoregressivemodel(8)areknown. After settingthebestsolutionto theordinaryleastsquaressolution(OLS)(line1),ateachouteriteration(lines2–7),theprocedurepermutesthedatasetsto avoid any biasin therandomnumbergeneratorandrandomlyselectsa subsetC of MaxHyperpossiblehyperplanesto beusedin theGRASPprocedure.In line 6, if it is necessary, thesolutionis updated.Figure(5)showsthepseudo-codefor theGRASPprocedureto thepiecewiselinearmodelbuilding.
We next describetheeachoneof thecomponentsin detail.
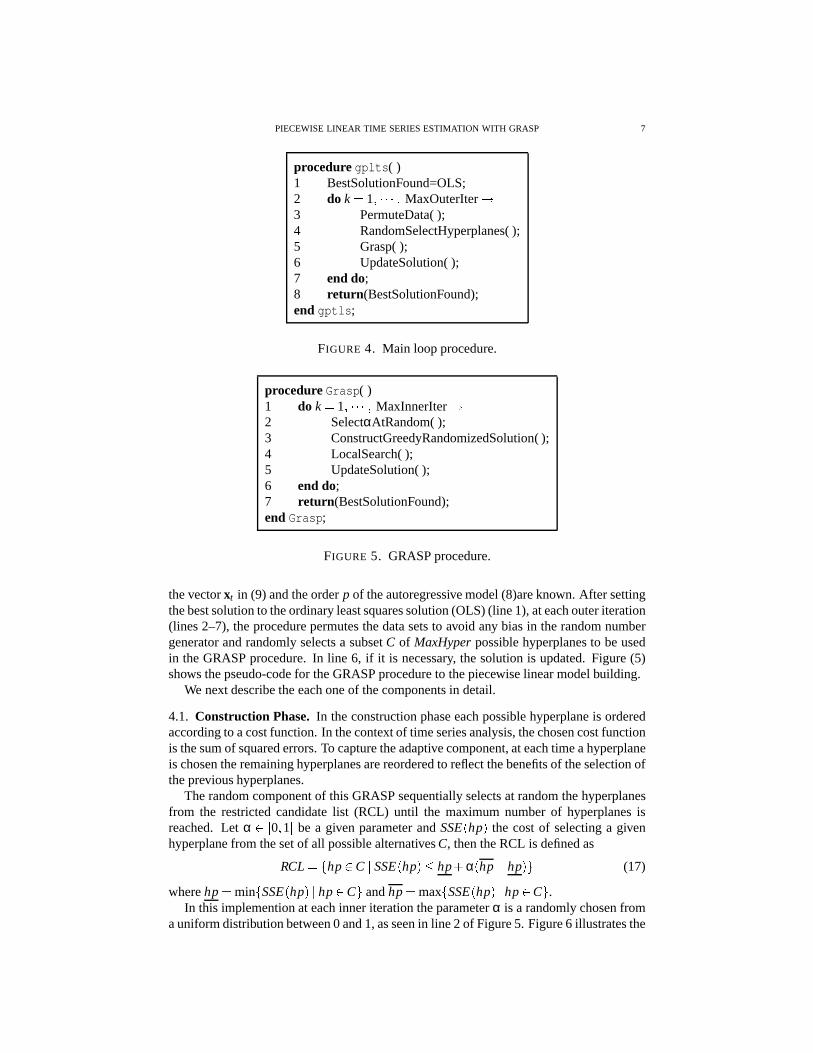
4.1. Construction Phase. In theconstructionphaseeachpossiblehyperplaneis orderedaccordingto acostfunction.In thecontext of timeseriesanalysis,thechosencostfunctionis thesumof squarederrors.To capturetheadaptivecomponent,ateachtimeahyperplaneis chosentheremaininghyperplanesarereorderedto reflectthebenefitsof theselectionoftheprevioushyperplanes.
Therandomcomponentof this GRASPsequentiallyselectsat randomthehyperplanesfrom the restrictedcandidatelist (RCL) until the maximumnumberof hyperplanesisreached.Let α " 0 1 be a given parameterandSSE hp the costof selectinga givenhyperplanefrom thesetof all possiblealternativesC, thentheRCL is definedas
RCL hp C SSE hp =% hp α hp hp (17)
wherehp min SSE hp hp C andhp max SSE hp hp C .In this implementionateachinneriterationtheparameterα is a randomlychosenfrom
auniformdistributionbetween0 and1,asseenin line 2 of Figure5. Figure6 illustratesthe
8 M. C. MEDEIROS,M. G. C. RESENDE,AND A. VEIGA
procedure ConstructGreedyRandomizedSolution( )1 s /0;3 do k 1 MaxHyperSolution<4 hp max SSE hp hp C ;5 hp min SSE hp hp C ;6 RCL hp C SSE hp =% hp α hp hp ;7 SelectHyperAtRandom(RCL);8 s s hp ;9 AdaptCost();9 end do;end ConstructGreedyRandomizedSolution;
FIGURE 6. Constructionphase.
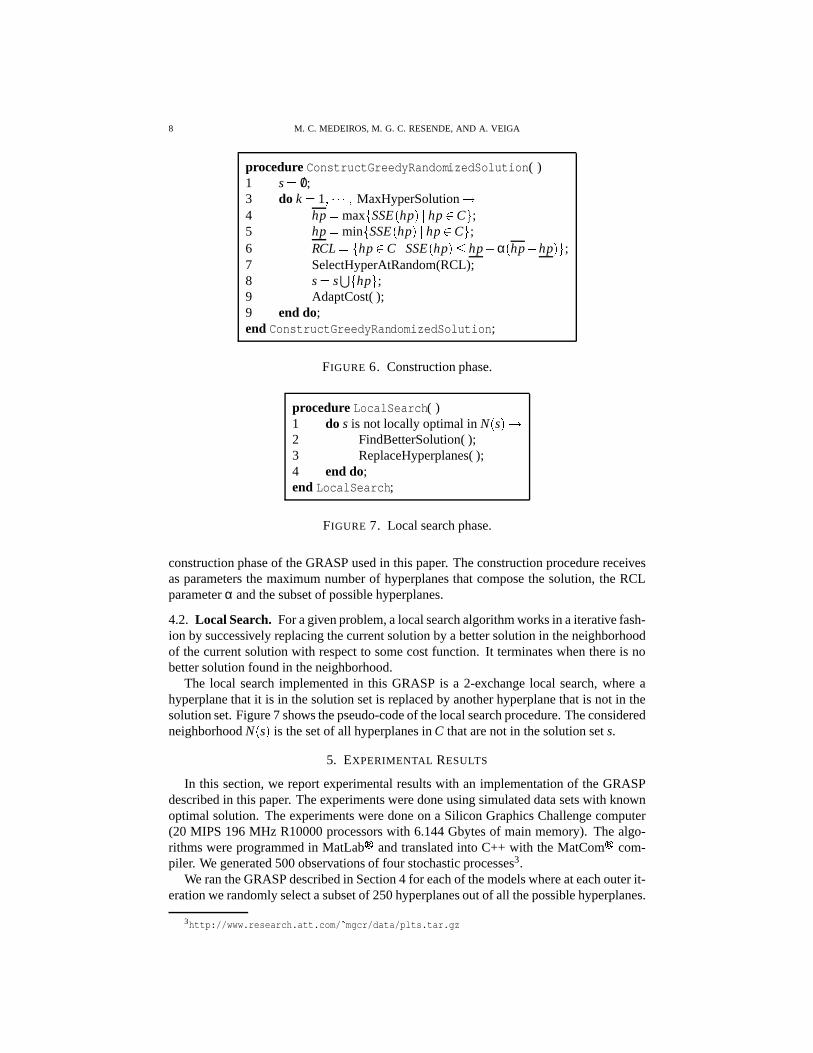
procedure LocalSearch( )1 do s is not locally optimalin N s <2 FindBetterSolution();3 ReplaceHyperplanes();4 end do;end LocalSearch;
FIGURE 7. Localsearchphase.
constructionphaseof theGRASPusedin this paper. Theconstructionprocedurereceivesasparametersthe maximumnumberof hyperplanesthat composethe solution,the RCLparameterα andthesubsetof possiblehyperplanes.
4.2. Local Search. For agivenproblem,alocalsearchalgorithmworksin aiterativefash-ion by successively replacingthecurrentsolutionby a bettersolutionin theneighborhoodof thecurrentsolutionwith respectto somecostfunction. It terminateswhenthereis nobettersolutionfoundin theneighborhood.
The local searchimplementedin this GRASPis a 2-exchangelocal search,whereahyperplanethat it is in thesolutionsetis replacedby anotherhyperplanethat is not in thesolutionset.Figure7 showsthepseudo-codeof thelocalsearchprocedure.TheconsideredneighborhoodN s is thesetof all hyperplanesin C thatarenot in thesolutionsets.
5. EXPERIMENTAL RESULTS
In this section,we reportexperimentalresultswith an implementationof the GRASPdescribedin this paper. Theexperimentsweredoneusingsimulateddatasetswith knownoptimalsolution. Theexperimentsweredoneon a Silicon GraphicsChallengecomputer(20 MIPS 196MHz R10000processorswith 6.144Gbytesof mainmemory). Thealgo-rithmswereprogrammedin MatLab> andtranslatedinto C++ with theMatCom> com-piler. We generated500observationsof four stochasticprocesses3.
WerantheGRASPdescribedin Section4 for eachof themodelswhereateachouterit-erationwerandomlyselectasubsetof 250hyperplanesoutof all thepossiblehyperplanes.
3http://www.research.att.com/ ? mgcr/data/plts.tar.gz
PIECEWISELINEAR TIME SERIESESTIMATION WITH GRASP 9
0 50 100 150 200 250 300 350 400 450 500−2.5
−2
−1.5
−1
−0.5
0
0.5
1
1.5
2
2.5
t
y t
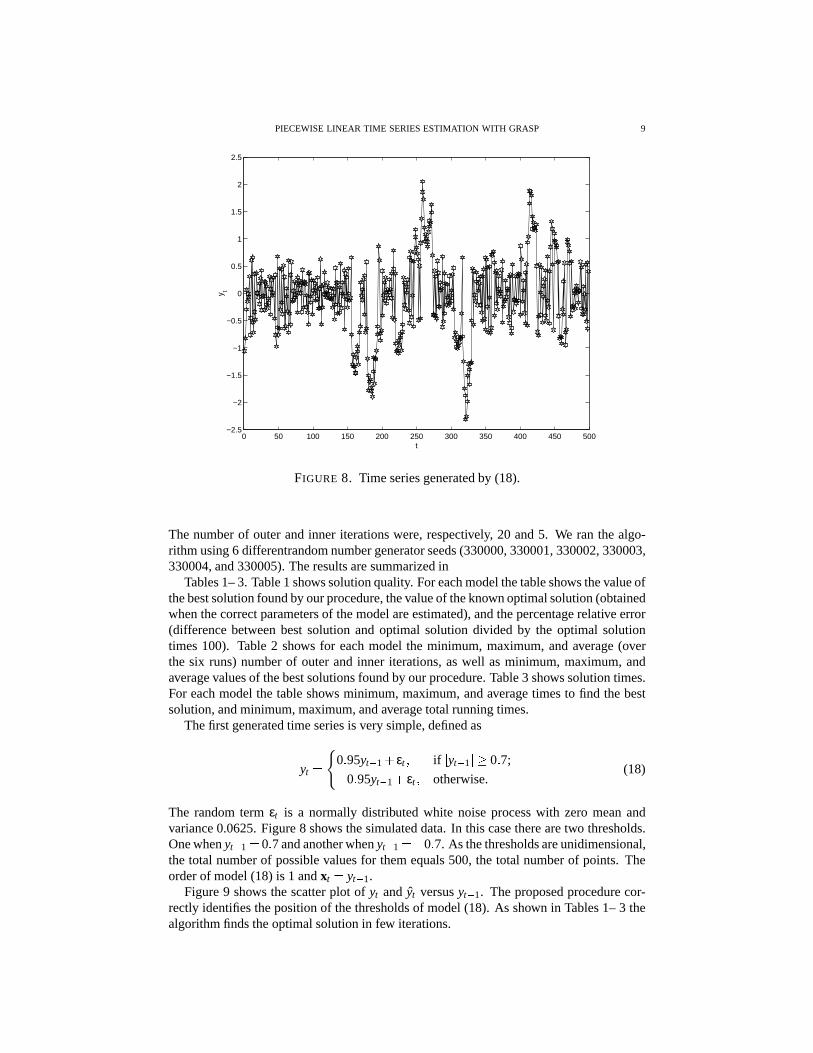
FIGURE 8. Timeseriesgeneratedby (18).
Thenumberof outerandinner iterationswere,respectively, 20 and5. We ran the algo-rithm using6 differentrandomnumbergeneratorseeds(330000,330001,330002,330003,330004,and330005).Theresultsaresummarizedin
Tables1–3. Table1 showssolutionquality. For eachmodelthetableshowsthevalueofthebestsolutionfoundby ourprocedure,thevalueof theknownoptimalsolution(obtainedwhenthecorrectparametersof themodelareestimated),andthepercentagerelativeerror(differencebetweenbestsolution and optimal solution divided by the optimal solutiontimes100). Table2 shows for eachmodel the minimum, maximum,andaverage(overthe six runs)numberof outerandinner iterations,aswell asminimum, maximum,andaveragevaluesof thebestsolutionsfoundby ourprocedure.Table3 showssolutiontimes.For eachmodelthe tableshows minimum,maximum,andaveragetimesto find thebestsolution,andminimum,maximum,andaveragetotal runningtimes.
Thefirst generatedtimeseriesis verysimple,definedas
yt 0 95yt 1 εt if yt 1
0 7; 0 95yt 1 εt otherwise.(18)
The randomterm εt is a normally distributed white noiseprocesswith zero meanandvariance0.0625.Figure8 shows thesimulateddata.In this casetherearetwo thresholds.Onewhenyt 1
0 7andanotherwhenyt 1@ 0 7. As thethresholdsareunidimensional,
the total numberof possiblevaluesfor themequals500, the total numberof points. Theorderof model(18) is 1 andxt
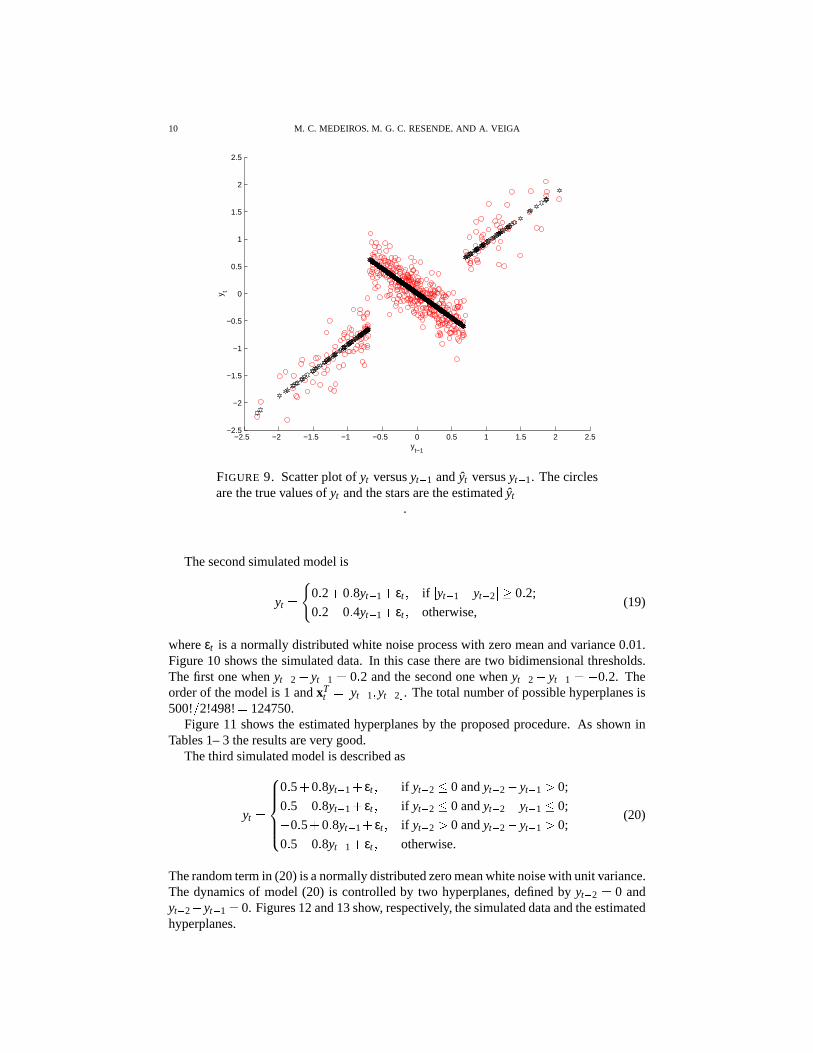
yt 1.Figure9 shows thescatterplot of yt and yt versusyt 1. Theproposedprocedurecor-
rectly identifiesthepositionof thethresholdsof model(18). As shown in Tables1– 3 thealgorithmfindstheoptimalsolutionin few iterations.
10 M. C. MEDEIROS,M. G. C. RESENDE,AND A. VEIGA
−2.5 −2 −1.5 −1 −0.5 0 0.5 1 1.5 2 2.5−2.5
−2
−1.5
−1
−0.5
0
0.5
1
1.5
2
2.5
yt−1
y t
FIGURE 9. Scatterplot of yt versusyt 1 andyt versusyt 1. Thecirclesarethetruevaluesof yt andthestarsaretheestimatedyt
.
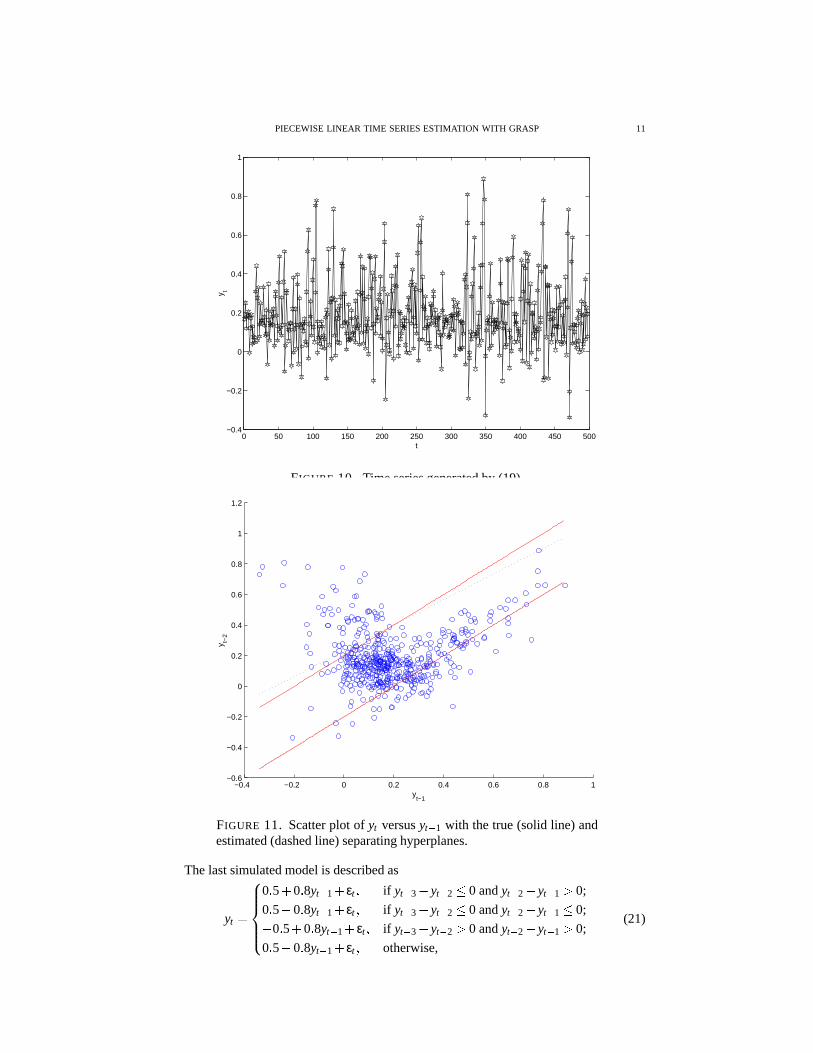
Thesecondsimulatedmodelis
yt 0 2 0 8yt 1 εt if yt 1
yt 2 0 2;
0 2 0 4yt 1 εt otherwise,(19)
whereεt is a normallydistributedwhite noiseprocesswith zeromeanandvariance0.01.Figure10 shows thesimulateddata. In this casetherearetwo bidimensionalthresholds.Thefirst onewhenyt 2
yt 1 0 2 andthe secondonewhenyt 2
yt 1$ 0 2. The
orderof themodelis 1 andxTtA" yt 1 yt 2 . Thetotal numberof possiblehyperplanesis
500!B 2!498! 124750.Figure11 shows the estimatedhyperplanesby the proposedprocedure.As shown in
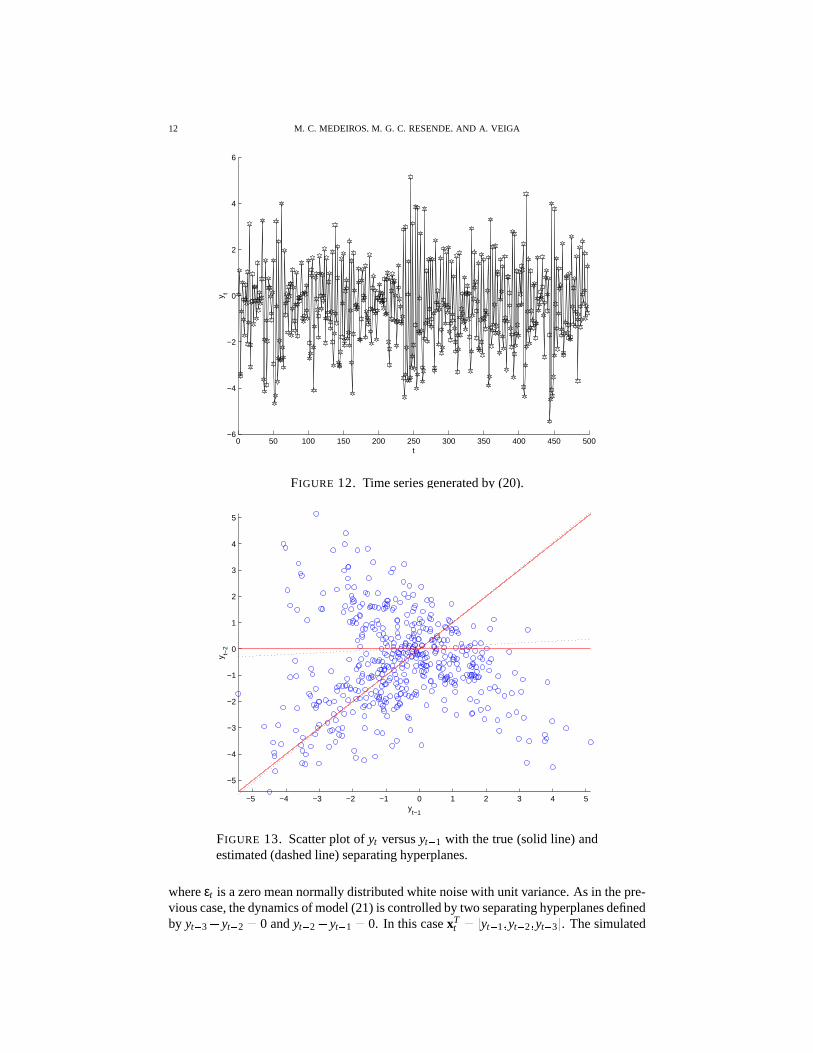
Tables1–3 theresultsareverygood.Thethird simulatedmodelis describedas
yt
0 5 0 8yt 1 εt if yt 2 % 0 andyt 2 yt 1 C 0;
0 5 0 8yt 1 εt if yt 2 % 0 andyt 2 yt 1 % 0; 0 5 0 8yt 1 εt if yt 2 C 0 andyt 2 yt 1 C 0;
0 5 0 8yt 1 εt otherwise.
(20)
Therandomtermin (20)isanormallydistributedzeromeanwhitenoisewith unit variance.The dynamicsof model(20) is controlledby two hyperplanes,definedby yt 2
0 andyt 2
yt 1 0. Figures12and13show, respectively, thesimulateddataandtheestimated
hyperplanes.
PIECEWISELINEAR TIME SERIESESTIMATION WITH GRASP 11
0 50 100 150 200 250 300 350 400 450 500−0.4
−0.2
0
0.2
0.4
0.6
0.8
1
t
y t
FIGURE 10. Timeseriesgeneratedby (19).
−0.4 −0.2 0 0.2 0.4 0.6 0.8 1−0.6
−0.4
−0.2
0
0.2
0.4
0.6
0.8
1
1.2
yt−1
y t−2
FIGURE 11. Scatterplot of yt versusyt 1 with thetrue(solid line) andestimated(dashedline) separatinghyperplanes.
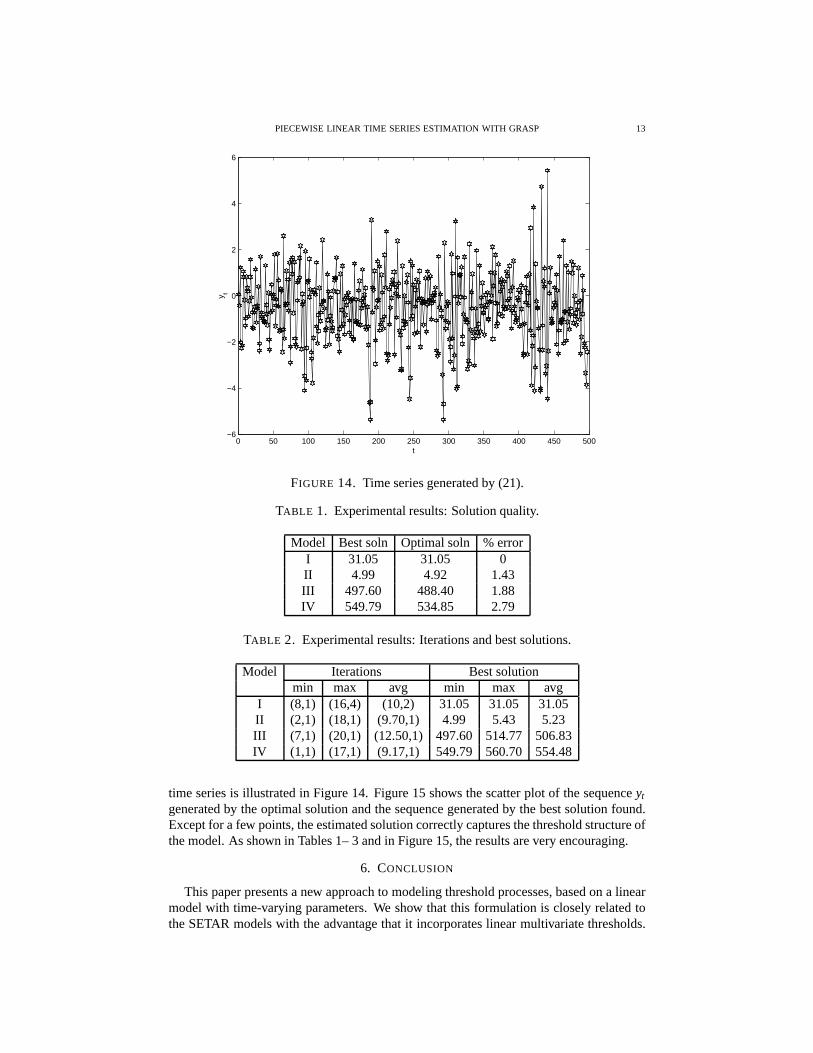
Thelastsimulatedmodelis describedas
yt
0 5 0 8yt 1 εt if yt 3 yt 2 % 0 andyt 2
yt 1 C 0;
0 5 0 8yt 1 εt if yt 3 yt 2 % 0 andyt 2
yt 1 % 0; 0 5 0 8yt 1 εt if yt 3 yt 2 C 0 andyt 2
yt 1 C 0;
0 5 0 8yt 1 εt otherwise,
(21)
12 M. C. MEDEIROS,M. G. C. RESENDE,AND A. VEIGA
0 50 100 150 200 250 300 350 400 450 500−6
−4
−2
0
2
4
6
t
y t
FIGURE 12. Timeseriesgeneratedby (20).
−5 −4 −3 −2 −1 0 1 2 3 4 5
−5
−4
−3
−2
−1
0
1
2
3
4
5
yt−1
y t−2
FIGURE 13. Scatterplot of yt versusyt 1 with thetrue(solid line) andestimated(dashedline) separatinghyperplanes.
whereεt is azeromeannormallydistributedwhitenoisewith unit variance.As in thepre-viouscase,thedynamicsof model(21)is controlledby two separatinghyperplanesdefinedby yt 3
yt 2 0 andyt 2
yt 1 0. In this casexT
tA" yt 1 yt 2 yt 3 . Thesimulated
PIECEWISELINEAR TIME SERIESESTIMATION WITH GRASP 13
0 50 100 150 200 250 300 350 400 450 500−6
−4
−2
0
2
4
6
t
y t
FIGURE 14. Timeseriesgeneratedby (21).
TABLE 1. Experimentalresults:Solutionquality.
Model Bestsoln Optimalsoln % errorI 31.05 31.05 0II 4.99 4.92 1.43III 497.60 488.40 1.88IV 549.79 534.85 2.79
TABLE 2. Experimentalresults:Iterationsandbestsolutions.
Model Iterations Bestsolutionmin max avg min max avg
I (8,1) (16,4) (10,2) 31.05 31.05 31.05II (2,1) (18,1) (9.70,1) 4.99 5.43 5.23III (7,1) (20,1) (12.50,1) 497.60 514.77 506.83IV (1,1) (17,1) (9.17,1) 549.79 560.70 554.48
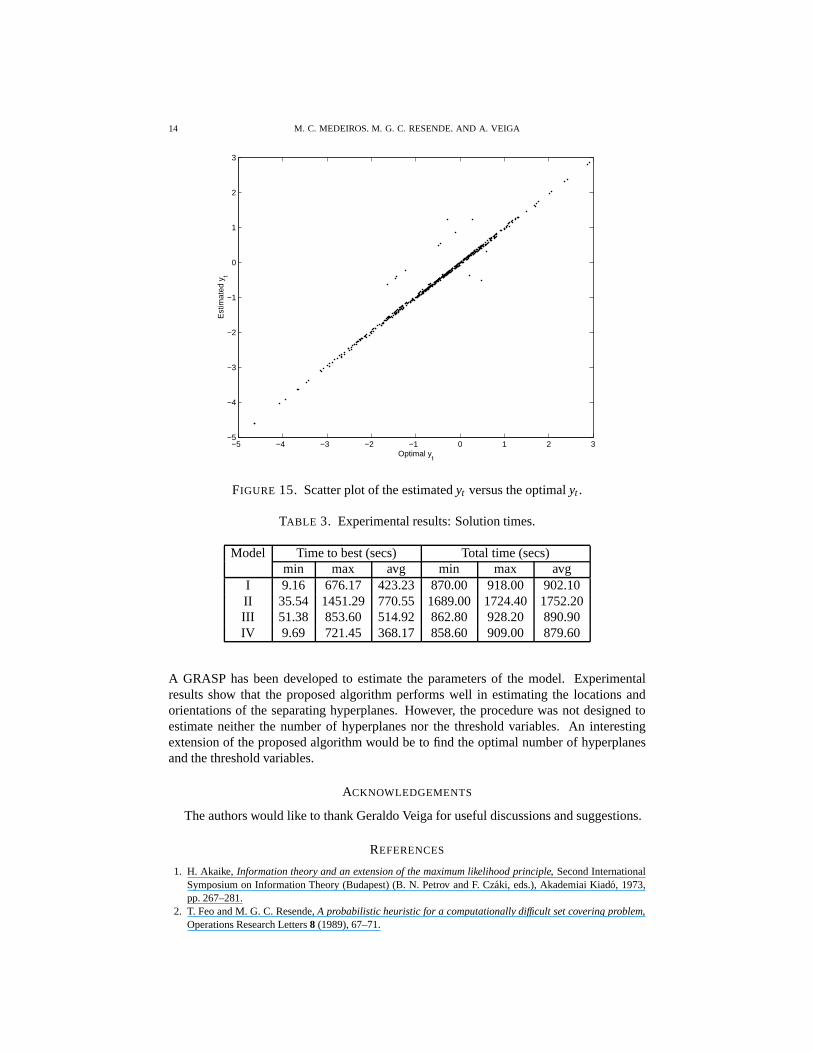
time seriesis illustratedin Figure14. Figure15 shows thescatterplot of thesequenceyt
generatedby theoptimalsolutionandthesequencegeneratedby thebestsolutionfound.Exceptfor a few points,theestimatedsolutioncorrectlycapturesthethresholdstructureofthemodel.As shown in Tables1–3 andin Figure15,theresultsareveryencouraging.
6. CONCLUSION
This paperpresentsa new approachto modelingthresholdprocesses,basedon a linearmodelwith time-varyingparameters.We show that this formulationis closelyrelatedtotheSETAR modelswith theadvantagethat it incorporateslinearmultivariatethresholds.
14 M. C. MEDEIROS,M. G. C. RESENDE,AND A. VEIGA
−5 −4 −3 −2 −1 0 1 2 3−5
−4
−3
−2
−1
0
1
2
3
Optimal yt
Est
imat
ed y
t
FIGURE 15. Scatterplot of theestimatedyt versustheoptimalyt .
TABLE 3. Experimentalresults:Solutiontimes.
Model Time to best(secs) Total time(secs)min max avg min max avg
I 9.16 676.17 423.23 870.00 918.00 902.10II 35.54 1451.29 770.55 1689.00 1724.40 1752.20III 51.38 853.60 514.92 862.80 928.20 890.90IV 9.69 721.45 368.17 858.60 909.00 879.60
A GRASPhasbeendevelopedto estimatethe parametersof the model. Experimentalresultsshow that the proposedalgorithmperformswell in estimatingthe locationsandorientationsof the separatinghyperplanes.However, the procedurewasnot designedtoestimateneitherthe numberof hyperplanesnor the thresholdvariables. An interestingextensionof theproposedalgorithmwould be to find theoptimalnumberof hyperplanesandthethresholdvariables.
ACKNOWLEDGEMENTS
Theauthorswould like to thankGeraldoVeigafor usefuldiscussionsandsuggestions.
REFERENCES
1. H. Akaike, Informationtheoryandan extensionof themaximumlikelihoodprinciple, SecondInternationalSymposiumon InformationTheory(Budapest)(B. N. Petrov andF. Czaki, eds.),AkademiaiKiado, 1973,pp.267–281.
2. T. FeoandM. G. C. Resende,A probabilisticheuristicfor a computationallydifficult setcoveringproblem,OperationsResearchLetters8 (1989),67–71.
PIECEWISELINEAR TIME SERIESESTIMATION WITH GRASP 15
3. T.A. FeoandM.G.C.Resende,Greedyrandomizedadaptivesearch procedures, Journalof GlobalOptimiza-tion 6 (1995),109–133.
4. G. M. JenkinsG.E. P.BoxandG.C.Reinsel,Timeseriesanalysis,forecastingandcontrol, third ed.,PrenticeHall, SanFrancisco,1994.
5. C. W. J. GrangerandT. Terasvirta,Modellingnonlineareconomicrelationships, Oxford University Press,Oxford,1990.
6. M.G.C. Resende,Greedyrandomizedadaptivesearch procedures(GRASP), Encyclopediaof Optimization(C. FloudasandP.M. Pardalos,eds.),Kluwer AcademicPublishers,1999,To appear.
7. H. Tong,On a thresholdmodel, PatternRecognitionandSignalProcessing(Amsterdam)(C. H. Chen,ed.),Sijthoff andNoordhoff, 1978.
8. , Thresholdmodelsin non-lineartimeseriesanalysis, LectureNotesin Statistics,vol. 21, Springer-Verlag,Heidelberg, 1983.
9. , Non-lineartimeseries: A dynamicalsystemsapproach, Oxford StatisticalScienceSeries,vol. 6,OxfordUniversityPress,Oxford,1990.
10. H. TongandK. S.Lim, Thresholdautoregression,limit cyclesandcyclicaldata(with discussion), JournaloftheRoyal StatisticalSocietyB 42 (1980),245–292.
11. R. S. Tsay, Testingand modelingthresholdautoregressiveprocesses, Journalof the AmericanStatisticalSociety84 (1989),431–452.
(M. C. Medeiros)DEPARTMENT OF ELECTRICAL ENGINEERING, CATHOLIC UNIVERSITY OF RIO DE
JANEIRO, RIO DE JANEIRO, RJ, BRAZIL .E-mail address: [email protected]
(M. G. C. Resende)INFORMATION SCIENCES RESEARCH, AT& T LABS RESEARCH, FLORHAM PARK ,NJ 07932 USA.
E-mail address: [email protected]
(A. Veiga)DEPARTMENT OF ELECTRICAL ENGINEERING, CATHOLIC UNIVERSITY OF RIO DE JANEIRO,RIO DE JANEIRO, RJ, BRAZIL .
E-mail address: [email protected]