physiological responses of goldfish and naked mole-rats to
TRANSCRIPT
Physiological responses of goldfish and naked mole-rats to
chronic hypoxia: Membrane, mitochondrial and molecular
mechanisms for metabolic suppression
Elie Farhat
Thesis submitted to the University of Ottawa
in partial Fulfillment of the requirements for the Doctorate in Philosophy
degree in Biology
Department of Biology
Faculty of Science
University of Ottawa
© Elie Farhat, Ottawa, Canada, 2021

ii
Table of Content
Acknowledgements……………………………………………………………………………………..v
Abstract………………………………………………………………………………………………….vii
Resume………………………………………………………………………………………………….viii
List of Figures………………………………………………………………………………………........x
List of Tables…………………………………………………………………………………………….xii
List of Abbreviations………………………………………………………………………………….xiv
Chapter 1: Introduction………………………..………………………………………………………1
1.1. Hypoxia……………………………………..……..………………………………………………..2
1.2. Membranes………………..……………………………………………………………………….2
1.2.1. Membrane lipids: response to environmental stress and how they affect metabolism,
ion pumps and channels………………..………………………………………………………………5
1.2.1.1. Temperature and toxins……………………………………………………...…5
1.2.1.2. Diet………………………………………………………………………………....6
1.2.2. Membrane pacemaker theory of metabolism….………………………………………….7
1.2.3. Membrane lipids affect enzymes involved in ATP production and utilization…………..7
1.2.4. Membrane lipids and ion channels……………………………………………………….9
1.3. Effects of chronic hypoxia on key enzymes regulating ATP supply and demand……………10
1.3.1. Na+/K+-ATPase..……………………………………………………………………………11
1.3.2. Glycolysis……...……………………………………………………………………………12
1.3.3. TCA cycle……………………………………………………………………………………18
1.3.4. β-oxidation……………………..……………………………………………………………20
1.4. Effects of chronic hypoxia on mitochondria…………………………………………………….21
1.4.1. Endotherms…..…………………………………………………………………………….22
1.4.2. Ectotherms…...……………………………………………………………………………..23
1.5. Overview of molecular mechanisms involved in metabolic suppression………………….…24
1.6. Thesis objectives…………………………………………………………..……………………….25
Chapter 2: Hypoxia-induced remodelling of goldfish membranes……………………………28
2.1. Introduction…………………………………………………………………………………………29
2.2. Methods…………………..…………………………………………………………………………31
2.2.1. Animals…………….………………………………………………………………………..31
2.2.2. Hypoxia acclimation and respirometry experiments…………………………………...32
2.2.3. Membrane composition experiments………………….…………………………………33
2.2.4. Lipid analyses…..…………………………………………………………………………..34
2.2.5. Ethanol analysis…………………………………………………………………………….35
2.2.6. Calculation and statistics………………………………………………………………….36
2.3. Results……………………………………………………………………..……………………….37
2.3.1. Respirometry……………………………………………………………………………….37
2.3.2. Membrane cholesterol…………………………………………………………………….38
2.3.3. Double bond index and fatty acid chain length…………………………………………40
2.3.4. Membrane fatty acids………………………………………………………………….…..42
2.4. Discussion…………………………………………………………………………………………46
2.4.1. Membrane cholesterol responds to hypoxia at low temperature………………………46
2.4.2. Membrane fatty acids respond to hypoxia at low temperature…………………………49
2.4.3. Homeoviscous responses of membrane lipids to temperature………………………..50
2.4.4. Lowering metabolic rate to save energy………………………………………………….51

iii
2.5. Conclusions…………………………………………………………………………………………52
Chapter 3: Naked mole-rats suppress energy metabolism and modulate membrane
cholesterol in chronic hypoxia………..……………………………………………………………..54
3.1. Introduction……………………………………………………………………………….…………55
3.2. Methods…………………………………………………………………………………..…………56
3.2.1. Animals…………….………………………………………………………………………..56
3.2.2. Experimental design………………………………………………………………..……..57
3.2.3. Whole-body respirometry……………….…………………………………………………57
3.2.4. Enzyme assays……………………………………………..………………………………58
3.2.5. Membrane lipid analyses……………………………..……………………………………60
3.2.6. Calculations and statistics………………………………………………………………....62
3.3. Results……………………………………………………...……………………………………….63
3.3.1. Metabolic rate……………………….………………………………………………………63
3.3.2. Enzyme activities…….……………………………………………………………………..64
3.3.3. Membrane lipids…...…………………………………………………………...…………..68
3.4. Discussion………………………………………………………………………………………......70
3.4.1. Metabolic suppression in hypoxia …………….………………………………………….71
3.4.2. Downregulation of glycolysis ……………………………………………………….…….71
3.4.3. Effects of chronic hypoxia on citrate synthase…………………………………………...72
3.4.4. Tissue-specific downregulation of β-oxidation…………………………………………..74
3.4.5. Na+/K+-ATPase activity is downregulated in NMR brains.……………………………...74
3.4.6. Changes in membrane composition caused by chronic hypoxia………………………75
3.5. Perspectives and significance…………………………………………………………………….76
Chapter 4: Goldfish response to chronic hypoxia: Mitochondrial respiration, fuel
preference and energy metabolism…………………………………………………………………78
4.1. Introduction…………………………………….……………………………………………………79
4.2. Methods………………………………………………..……………………………………………80
4.2.1. Animals…………….………………………………………………………………………..80
4.2.2. Mitochondrial respiration…………………………………………………………………..81
4.2.3. Enzyme assays………………………………………………………..……………………84
4.2.4. Calculations and statistics……………………………………………………………..…..86
4.3. Results……………………………………….…………..………………………………………….87
4.3.1. Mitochondrial respiration……………………..……………………………………………87
4.3.1.1. LEAK………………..………………………….....………………………………87
4.3.1.2. OXPHOS……………………………………….…………………………………90
4.3.1.3. CCCP-uncoupled state……………………………………………………….…93
4.3.1.4. Cytochrome oxidase……………………………………………………..………96
4.3.2. Energy metabolism enzymes..……………………………………………………..……..98
4.3.3. Na+/K+-ATPase……………………………………………………………………………..99
4.4. Discussion…………………………………………………………………………………………..99
4.4.1. Effects of hypoxia on mitochondrial respiration………………………………….……100
4.4.2. Tissue-specific fuel preference of goldfish mitochondria……………………………...103
4.4.3. Chronic hypoxia and glycolysis…………….……………………………………………105
4.4.4. β-oxidation and TCA cycle…………………...……………………………………..……106
4.4.5. Downregulation of Na+/K+-ATPase in goldfish brain….……………………….………106
4.5. Conclusions……………………………………………………………………………………….107

iv
Chapter 5: Transcriptional and epigenetic repression supports metabolic suppression in
chronically hypoxic goldfish......…………………………………………………………………...109
5.1. Introduction…………………………………….………………………………………….………110
5.2. Methods………………………………………….……..……………………………….…………113
5.2.1. Animals…………….………………………………………………………………….…..113
5.2.2. Real-time RT-PCR assays for mRNA quantification.………………………...………..114
5.2.3. Global DNA methylation…………………………………………..…………………...…117
5.2.4. Western blotting…………………………………………………………………………..118
5.2.5. Statistics…………………………………………………………………………….…..…120
5.3. Results……………………………………….…………..…………………….………………….121
5.3.1. Hypoxia sensing in goldfish...………………..……………………………………..……121
5.3.2. DNA methylation..…………………………………………………………...……..……..122
5.3.3. miRNA biogenesis pathway……………………………………………………………...124
5.3.4. m-TOR signaling pathway………………………………………………………………..126
5.3.5. Lipid transcripts……………………………………………………………………………128
5.4. Discussion…………………………………………………………………………………………130
5.4.1. Chronic hypoxia induces the oxygen sensing machinery across tissues.………...…131
5.4.2. A role for transcription/translation silencing in hypoxic goldfish brain.……..………...133
5.4.3. Chronic hypoxia does not repress m-TOR in liver and muscle …………….…………136
5.4.4. Molecular regulation of cholesterol biosynthesis in hypoxia……………………..……136
5.5. Conclusion..……………………………………………………………………………………….138
Chapter 6: General conclusions and future directions……………………………….………..140
6.1. Evidence for hypoxia-induced membrane remodeling..……………………………….………141
6.2. Hypoxia-driven changes in major enzymes..………………………..…………………….……145
6.2.1. Na+/K+-ATPase…....………………………………………………………………….…..145
6.2.2. Glycolysis………………………………………………………………………...………..146
6.2.3. β-oxidation………………………………………………………....…………………...…149
6.2.4. TCA cycle……...…………………………………………………………………………..151
6.3. Mitochondrial membranes and metabolic rate…………..…………………….……………….152
6.4. Epigenetic and molecular responses of hypoxic goldfish.……………………..…...…………154
6.5. Final remarks……..……………………………………………………………………………….156
Appendix A…...………………………………………………………………………………………..162
Appendix B...…………………………………………………………………………………………..170
Appendix C...…………………………………………………………………………………………..176
References…..……………...……………………………….………………………………………..180

v
Acknowledgements
I want to first and foremost thank my supervisor, Dr. Jean-Michel Weber, for his
exceptional guidance and mentorship during my 5 years in his lab. Your constructive
criticism and your faith in my abilities inspired me to become a better biologist. I want to
thank you for always being there for a chat, whether it was science-related or not. I
enjoyed our talks on science, football, music, movies, travel and food. I want to also
thank you for opening the door for me to travel and collaborate with some fantastic
researchers during my PhD.
I would also like to thank my committee members, Dr. Matthew Pamenter and Dr.
Kenneth Storey for their continued support and availability. It has been a privilege to
collaborate with Dr. Pamenter on two chapters of my thesis in addition to other projects
that are not included here.
Special thanks also go to Dr. Jan Mennigen, Dr. Caroline Romestaing and Dr.
Loic Teullier for their support during my time collaborating with them. Thank you Loic for
your generous hospitality in Lyon. Your whole group at the Unviersité de Lyon made my
3-months stay in France extremely fun, productive and memorable.
I want to also thank all my lab members that I have had the pleasure of sharing
space with since joining in May, 2016 as well as the biograds. In particular, I want to
thank Eric Turenne, Johnathon Forbes, Daniel Kostyniuk, Rawan Merhi, Hang Cheng,
Mais Jubbouri, Giancarlo Talarico and Liam Eaton who all remain good friends.
Furthermore, I want to thank Bill Fletcher and all the animal care personnel for
ensuring the animals were well taken care of.

vi
I want to thank some of my closest friends in Canada, Lebanon, The
Netherlands, USA, Italy and France. Your constant support and love despite the
distance between some of us has always kept me in good spirits. You were always
there to help pick me up if I was feeling down and I am extremely grateful for that. I am
proud to say that I am blessed to have you all in my life.
I am also thankful for my family members in Montreal, Gatineau, Ottawa and
Lebanon for their love and support. To my family in Montreal, thank you for helping me
settle in when I returned to Canada. I will always be grateful for your generous
hospitality that made the start of this phase of my life easier. To my family in Gatineau
and Ottawa, thank you for making me feel at home. To my family in Lebanon, thank you
for your love and support. I will always keep your kind words of encouragement in my
heart.
Last, but certainly not least, I want to thank my father and best friend, Farhat
“Frank” Farhat for always being there for me. You have always been my idol and the
closest person to my heart. You have always inspired me to be confident and
persevering in accomplishing my goals. Words will never be enough to explain my
gratitude to you. I am incredibly lucky and blessed to have you as my dad.

vii
Abstract
Chronic hypoxia is a state of oxygen limitation that is common in many aquatic
and terrestrial environments. Metabolic suppression is an essential strategy that is used
by hypoxia-tolerant champions such as goldfish and naked mole-rats to cope with
prolonged low oxygen. This thesis examines the physiological processes used by
goldfish and naked mole-rats to survive in low oxygen environments. It proposes a
novel mechanism - the remodeling of membrane lipids - to reduce ATP use and
production. Temperature (homeoviscous adaptation), diet (natural doping in migrant
birds) and body mass (membrane pacemaker of metabolism) have an impact on the
lipid composition of membranes that, in turn, modulates metabolism. In chapters 2 and
3 of this thesis, I demonstrate that vertebrate champions of hypoxia tolerance undergo
extensive changes in membrane lipid composition upon in vivo exposure to low oxygen.
These changes and those observed in hibernating mammals can promote the
downregulation of Na+/K+-ATPase (major ATP consumers), mitochondrial respiration
capacity [OXPHOS (phosphorylating conditions), proton leak (non-phosphorylating
conditions), cytochrome c oxidase], and energy metabolism (β-oxidation and glycolysis)
as discussed in chapters 3 and 4. A common membrane signal regulating the joint
inhibition of ion pumps and channels could be an exquisite way to preserve the balance
between ATP supply and demand in hypometabolic states. In chapter 5, I show that the
reduction in ATP turnover is also orchestrated by mechanisms that involve post-
translational and post-transcriptional modifications and epigenetic changes. Membrane
remodeling, together with these more traditional molecular mechanisms, could work in
concert to cause metabolic suppression.

viii
Résumé
L'hypoxie chronique est un état de manque en oxygène commun dans de
nombreux environnements aquatiques et terrestres. La suppression métabolique est
une stratégie essentielle utilisée par les champions de la tolérance à l'hypoxie tels que
les poissons rouges et les rats-taupes nus pour faire face à un manque d'oxygène
prolongé. Cette thèse examine les processus physiologiques utilisés par les poissons
rouges et les rats-taupes nus pour survivre dans des environnements à faible teneur en
oxygène. Elle propose un nouveau mécanisme - le remodelage des lipides
membranaires - pour réduire l'utilisation et la production d'ATP. La température
(adaptation homéovisqueuse), le régime alimentaire (dopage naturel chez les oiseaux
migrateurs) et la masse corporelle (théorie du pacemaker membranaire du
métabolisme) ont un impact sur la composition lipidique des membranes qui, à son tour,
module le métabolisme. Dans les chapitres 2 et 3 de cette thèse, je démontre que les
vertébrés champions de la tolérance à l'hypoxie subissent des changements importants
dans la composition de leurs lipides membranaires lors d'une exposition in vivo à un
manque d’oxygène. Ces changements et ceux observés chez les mammifères
hibernateurs peuvent favoriser l’inhibition de la Na+/K+-ATPase (un consommateur
important d'ATP), de la capacité respiratoire mitochondriale [OXPHOS (conditions de
phosphorylation), de la fuite de protons (conditions non phosphorylantes), de la
cytochrome c oxydase] et du métabolisme énergétique (β-oxydation et glycolyse)
comme discuté dans les chapitres 3 et 4. Un signal membranaire commun régulant
l'inhibition conjointe des pompes et des canaux ioniques pourrait être un excellent
moyen de préserver l'équilibre entre l'offre et la demande d'ATP dans les états
hypométaboliques. Au chapitre 5, je montre que la réduction du taux de renouvellement

ix
de l'ATP est aussi orchestrée par des mécanismes impliquant des modifications post-
traductionnelles et post-transcriptionnelles et des changements épigénétiques. Le
remodelage membranaire, de concert avec ces mécanismes moléculaires plus
traditionnels, pourraient fonctionner ensemble pour causer la suppression métabolique.

x
List of Figures
Figure 2.1. Metabolic rates of normoxic controls and hypoxia-acclimated goldfish at 13oC or
20oC………………………………………………………………………………………………………38
Figure 2.2. Relative membrane cholesterol levels in the tissues of normoxic controls and hypoxia-
acclimated goldfish at 13oC (A) or 20oC (B)………………………………………………...…………39
Figure 2.3. Membrane double bond index in the tissues of normoxic controls and hypoxia-
acclimated goldfish at 13oC (A) or 20oC (B)……………………………...……………………………41
Figure 2.4. Mean fatty acid chain length in the membrane phospholipids for the tissues of
normoxic controls and hypoxia-acclimated goldfish at 13oC (A) or 20oC (B)………......................42
Figure 2.5. Hypoxia-mediated changes in the relative abundance of individual membrane fatty
acids in goldfish gill (A) and liver (B) at 13oC………………………………………………………..…44
Figure 3.1. Metabolic rates of normoxic controls and hypoxia-acclimated naked mole-
rats……...………………………………………………………………………………………..……….64
Figure 3.2. Maximal enzymatic activity per gram tissue of (A) pyruvate kinase (PK), (B) lactate
dehydrogenase (LDH), (C) citrate synthase (CS), (D) carnitine palmitoyl transferase (CPT) and
(E) 3-hydroxyacyl CoA dehydrogenase (HOAD) in the tissues of normoxic controls and hypoxia-
acclimated naked mole-rats……………………………………………………………………..……..66
Figure 3.3. Na+/K+-ATPase activity per gram tissue in the tissues of normoxic controls and
hypoxia-acclimated naked mole-rats…………………………..……………………………………...68
Figure 3.4. Relative membrane cholesterol levels in the tissues of normoxic controls and hypoxia-
acclimated naked mole-rats…………………………………………………………….……………...69
Figure 4.1. Mitochondrial oxidative fuel preference during nonphosphorylating respiration (LEAK)
(pmol O2 sec−1 mg−1) normalized to cytochrome c oxidase (COX) respiration in the tissues of
normoxic controls (N = 12) and hypoxia-acclimated goldfish (N = 11)…………………………...…89
Figure 4.2. Mitochondrial oxidative fuel preference during oxidative phosphorylation (OXPHOS)
respiration (pmol O2 sec−1 mg−1) normalized to COX respiration in the tissues of normoxic controls
(N = 12) and hypoxia-acclimated goldfish (N = 11)……………………………………………...……92
Figure 4.3. Respiratory control ratio (RCR) in the tissues of normoxic controls (N = 12) and
hypoxia-acclimated goldfish (N = 11)………………………………………….………………………93
Figure 4.4. Mitochondrial oxidative fuel preference during the CCCP-uncoupled state (pmol O2
sec−1 mg–1) normalized to COX respiration in the tissues of normoxic controls (N = 12) and
hypoxia-acclimated goldfish (N = 11)………………………………………………………………….95
Figure 4.5. Mitochondrial oxidative fuel preference of COX in brain, liver, and white muscle of
normoxic controls (N = 12) and hypoxia-acclimated goldfish (N = 11)………................................97
Figure 4.6. Effects of chronic hypoxia on Na+/K+-ATPase activity in the brain, liver, and white
muscle of normoxic controls (N = 10) and hypoxia-acclimated goldfish (N = 10)………………….99

xi
Figure 5.1. Relative abundance of mRNA targets involved in the oxygen sensing machinery in
tissues of normoxic controls (N), 1 week hypoxic (1H) and 4 weeks hypoxic (4H) goldfish
presented in panel A (egln3) and B (egln1)…………………………………………………….......122
Figure 5.2. DNA methylation in tissues of normoxic controls (N), 1 week hypoxic (1H) and 4 weeks
hypoxic (4H) goldfish…………………………………………………………………………………..124
Figure 5.3. The miRNA biogenesis pathway (ago2a, panel A; dicer, panel B; dgcr8, panel C;
exportin5, panel D) in tissues of normoxic controls (N), 1 week hypoxic (1H) and 4 weeks hypoxic
(4H) goldfish……………………………………………………………………………………………126
Figure 5.4. Expression of targets involved in the m-TOR signalling pathway…………………….127
Figure 5.5. Expression of mRNA targets involved in cholesterol biosynthesis (A: hmgcs1; B: lxr;
C: cyp7a) in tissues of normoxic controls (N), 1 week hypoxic (1H) and 4 weeks hypoxic (4H)
goldfish………………………………………………………………………………………………….129
Figure 5.6. Expression of the β-oxidation mRNA, cpt1a, in tissues of normoxic controls (N), 1
week hypoxic (1H) and 4 weeks hypoxic (4H) goldfish……………………………………………130
Figure 6.1. Relative membrane cholesterol in the tissues of normoxic controls and hypoxia-
acclimated animals for two hypoxia-tolerant vertebrates: the goldfish (Chapter 2) and the naked-
mole rat (Chapter 3)………………………………………………………………………………….143
Figure 6.2. Percent docosahexaenoic acid (22:6) in membrane phospholipids in the tissues of
normoxic controls and hypoxia-acclimated animals for two hypoxia-tolerant vertebrates: the
goldfish (Chapter 2) and the naked-mole rat (Chapter 3)…………………………………………144
Figure 6.3. Effects of chronic hypoxia on the expression of mRNA involved in cholesterol
synthesis [hydroxymethylglutaryl-CoA synthase (hmgcs1)] and degradation/efflux [liver X
receptor (lxr) and cholesterol 7alpha-hydroxylase (cyp7a)] in goldfish white muscle (WM) and
brain (Chapter 5)……………………………………………………………………………………..156
Figure 6.4. Remodeling of membrane lipids is a proposed new mechanism to promote metabolic
suppression in chronic hypoxia……………………………………………………………………….160

xii
List of Tables
Table 1.1. Effects of chronic hypoxia (minimum 1 week) on the maximal activity of Na+/K+-ATPase in various animals……………………………………………………………….…………………….…12
Table 1.2. Effects of chronic hypoxia (minimum 1 week) on the maximal activity of hexokinase (HK) in various animals………………………………………………………….………………………14
Table 1.3. Effects of chronic hypoxia (minimum 1 week) on the maximal activity of phosphofructokinase (PFK) in various animals……………………………………………………….15
Table 1.4. Effects of chronic hypoxia (minimum 1 week) on the maximal activity of pyruvate kinase (PK) in various animals………………………………………………………………………………….16
Table 1.5. Effects of chronic hypoxia (minimum 1 week) on the maximal activity of lactate dehydrogenase (LDH) in various animals……………………………………………………….…….17
Table 1.6. Effects of chronic hypoxia (minimum 1 week) on the maximal activity of citrate synthase (CS) in various animals…………………………………………………………………………….……19
Table 1.7. Effects of chronic hypoxia (minimum 1 week) on the maximal activity of carnitine palmitoyl transferase (CPT) in various animals……………………………………………………….20
Table 1.8. Effects of chronic hypoxia (minimum 1 week) on the maximal activity of 3-hydroxyacyl-CoA dehydrogenase (HOAD) in various animals………………………………………………….…21
Table 2.1. Fatty acid composition of membrane phospholipids in tissues of goldfish acclimated to normoxia or hypoxia at two temperatures……………………………………………………………..45
Table 3.1. Effects of chronic hypoxia on the activities of key enzymes of energy metabolism (standardized either per gram tissue or per gram protein) in various tissues of naked mole-rats (N=12 in normoxia and N=9 in hypoxia)……………………..…………………………………….…..67
Table 3.2. Relative effects of chronic hypoxia on the membrane phospholipids of naked mole-rat tissues……………………………...…………………………………………………………...………..70
Table 4.1. Effects of chronic hypoxia on the activities of key enzymes of glycolysis, β-oxidation and tricarboxylic acid (TCA) cycle in goldfish brain, liver, and white muscle (N = 10 for each treatment group)…………………………………………………………………………………………98
Table 5.1. Real-time RT-PCR primer sequences and reaction parameters of gene targets involved in hypoxia sensing……………………………………………………………………………………..115
Table 5.2. Real-time RT-PCR primer sequences and reaction parameters of gene targets involved in DNA methylation dynamics (tet2, tet3 and Dnmt3) and miRNA biogenesis pathway (dgcr8, dicer, exportin5 and ago2a)……..…………………………………………………………………….116
Table 5.3. Real-time RT-PCR primer sequences and reaction parameters of gene targets involved in cholesterol biosynthesis (hmgcs1, lxr and cyp7a) and β-oxidation (CPT1a)……………….….117
Table 6.1. Effects of chronic hypoxia on the maximal activity of Na+/K+-ATPase in goldfish and naked mole-rats compared to other animals………………………………………………………...146
Table 6.2. Effects of chronic hypoxia (minimum 1 week) on the maximal activity of hexokinase (HK) in various animals………………………………………………………………………………..147

xiii
Table 6.3. Effects of chronic hypoxia (minimum 1 week) on the maximal activity of pyruvate kinase (PK) in various animals………………………………………………………………………………..148
Table 6.4. Effects of chronic hypoxia (minimum 1 week) on the maximal activity of lactate dehydrogenase (LDH) in various animals……………………………………………………………149
Table 6.5. Effects of chronic hypoxia (minimum 1 week) on the maximal activity of carnitine palmitoyl transferase (CPT) in various animals……………………………………………………..150
Table 6.6. Effects of chronic hypoxia (minimum 1 week) on the maximal activity of 3-hydroxyacyl-CoA dehydrogenase (HOAD) in various animals…………………………………………………...151
Table 6.7. Effects of chronic hypoxia (minimum 1 week) on the maximal activity of citrate synthase (CS) in various animals………………………………………………………………………………..152

xiv
List of Abbreviations
14:0 Myristic acid
16:0 Palmitic acid
16:1 Palmitoleic acid
18:0 Stearic acid
18:1 Oleic acid
18:2 Linoleic acid
18:3 α-Linolenic acid
20:0 Arachidic acid
20:2 Eicosadienoic acid
20:4 Arachidonic acid
20:5 Eicosapentaenoic acid
22:0 Behenic acid
22:3 Docosatrienoic acid
22:5 Docosapentaenoic acid
22:6 Docosahexaenoic acid
24:0 Lignoceric acid
ago2a argonaute-2
AMPK 5’-AMP-activated protein kinase
ANOVA Analysis of variance
ATP Adenosine triphosphate
β-oxidation Beta-oxidation
BSA Bovine serum albumin
Ca2+-ATPase Calcium adenosine triposphatase
Ca2+-dependent K+ channel Calcium-dependent potassium channel
(Ca2+, Mg2+)-ATPase (Calcium, magnesium)-adenosine triposphatase
CCCP Carbonyl cyanide m-chlorophenyl hydrazine
COX Cytochrome c oxidase
CPT Carnitine palmitoyltransferase
CS Citrate synthase
cyp7a cholesterol 7alpha-hydroxylase gene
DBI Double Bond Index

xv
DHA Docosahexaenoic acid
egln Egl nine gene
ETC Electron Transport Chain
FA Fatty acid
GABA Gamma aminobutyric acid
HIF Hypoxia Inducible Factor
HK Hexokinase
hmgcs1 hydroxymethylglutaryl-CoA synthase gene
HOAD 3-hydroxyacyl CoA dehydrogenase
LDH Lactate dehydrogenase
LEAK Nonphosphorylating respiration
lxr liver X receptor gene
miRNA micro ribonucleic acid
mRNA Mature ribonucleic acid
MUFA Monounsaturated fatty acid
Na+/K+-ATPase Sodium/potassium-adenosine triposphatase
NMR Naked mole-rat
OXPHOS Oxidative phosphorylation
PCM Palmitoylcarnitine/malate
PEP Phosphoenolpyruvate
PFK Phosphofructokinase
PK Pyruvate kinase
PL Phospholipid
PM Pyruvate/malate
PUFA Polyunsaturated fatty acid
RCR Respiratory control ratio
RM-ANOVA: repeated-measures two-way analysis of variance
ROS Reactive oxygen species
s.e.m: Standard error of the mean
SERCA Sarcoplasmic reticulum Ca2+-adenosine triposphatase
SFA Saturated fatty acid
State 3 OXPHOS in the presence of substrates and ADP

xvi
State 4 LEAK after ADP depletion
TCA Tricarboxylic acid cycle
tet ten-eleven translocation
VCO2 Carbon dioxide production
VO2 Oxygen consumption

1
Chapter 1
General Introduction
This chapter and chapter 6 are based on a manuscript titled “Hypometabolic responses
to chronic hypoxia: a potential role for membrane lipids”
Written by
Elie Farhat and Jean-Michel Weber
And published in
Metabolites
https://doi.org/10.3390/metabo11080503
Statement of contribution: I performed the literature search and wrote the manuscript.
Dr. Weber edited the manuscript with me.

2
1.1. Hypoxia
Hypoxia is a ubiquitous state of low oxygen (O2) common to many aquatic and
terrestrial environments. It occurs in warm waters where O2 solubility is low, in ice-
covered lakes and streams where exchange through the surface is restricted, at high
altitude, and in deep underground burrows (Diaz and Rosenberg, 2008; Lutz and
Storey, 2010; Richards et al., 2009). Global warming is exacerbating the problem,
particularly in oceans, where oxygen minimum “dead” zones are expanding rapidly
(Stramma et al., 2008). Except for a few unusually tolerant species, hypoxia is lethal to
most animals as they eventually fail to match ATP supply with demand (Hochachka,
1986). Champions of hypoxia tolerance like some cyprinid fish, freshwater turtles and
African mole rats can easily withstand several weeks of low O2 by suppressing their
metabolic rate (Bickler and Buck, 2007; Pamenter et al., 2018). This critical response
can only be achieved through the parallel downregulation of ATP-consuming processes
(Hochachka, 1986) and energy metabolism (Martínez et al., 2006; Solaini et al., 2010;
Storey, 1997). The simultaneous reduction in ATP supply and demand is realized via
post-translational and post-transcriptional modifications involving
phosphorylation/dephosphorylation reactions, association of enzymes with subcellular
structures (Storey and Storey, 1990), activation of 5’-AMP-activated protein kinase
(AMPK), an inhibitor of protein synthesis (Pamenter, 2014), and epigenetic mechanisms
(Storey, 2015).
1.2. Membranes
Membranes are essential structures that define cellular boundaries. Membranes
of eukaryotic cells are present externally (plasma membrane surrounding the cell) and

3
internally (membranes surrounding cellular organelles such as mitochondria).
Membranes are indispensable for life because they isolate and protect cellular
organelles from the environment, and they organize selective intracellular pathways.
Biological membranes are fluid in nature and are primarily composed of phospholipids,
cholesterol and proteins (Spector and Yorek, 1985). Together they form the fluid mosaic
model where the phospholipid polar head groups face the outside surfaces of the
bilayer and the hydrophobic fatty acid tails face each other (Singer and Nicolson, 1972).
The fatty acid tails can be saturated (no double bonds), monounsaturated (one double
bond) or polyunsaturated (two or more double bonds) hydrocarbon chains of lengths
varying from 14 to 22 carbons (Hulbert, 2003). Eukaryotic membranes have a
desaturase enzyme system that introduces double bonds to the acyl chains. Most
vertebrates can obtain these desaturases from their diets because they lack the
enzymes needed to produce the omega-3 (n-3) and omega-6 (n-6) desaturases (Tocher
et al., 1998). The double bonds of polyunsaturated fatty acids cause the fatty acids to
kink. This means that the saturated fatty acids are packed up closely together in
contrast to unsaturated fatty acids that are more loosely packed (Hazel, 1995; Raynard
and Cossins, 1991). Cholesterol intercalates between phospholipids in the bilayer
causing a change in the membrane permeability depending on the temperature.
Moreover, cholesterol disrupts fatty acid interactions causing an increase in membrane
fluidity depending on the temperature (Crockett and Hazel, 1995; Crockett, 1998;
Robertson and Hazel, 1995). Membrane proteins can be present anywhere on the
bilayer, and they are essential for selectively controlling the transport of molecules
between compartments (Cockburn et al., 2004). Examples of membrane proteins

4
include ion channels (Katz et al., 1982), enzymes like ATP synthase and carnitine
palmitoyltransferase (CPT) (Guo et al., 2005; Yoshida et al., 2001) as well as ion pumps
like Na+/K+ - ATPase that establish gradients (Glitsch, 2001). The activity of these
membrane proteins contribute to the bulk of the cellular-generated metabolic rate
(Hulbert and Else, 2000). Membrane protein activity can be modulated by changes in
the lipid composition of membranes (Murphy, 1990). Compositional changes which can
affect protein activity include changes in fatty acid composition and cholesterol
(Seebacher et al., 2010). This can include changes in the degree of unsaturation, the
ratio of n-3 to n-6 polyunsaturated fatty acids (Murphy, 1990), the chain lengths of
membrane phospholipids (Lee, 2004) as well as cholesterol content that modulates the
activity of Na+/K+ - ATPase (Crockett and Hazel, 1997; Garcia et al., 2019; Yeagle,
1989; Yeagle et al., 1988). The interactions between membrane proteins and
cholesterol can form lipid rafts whereby the function of some proteins is affected (Turk
and Chapkin, 2013). The lipid rafts increase the thickness of the lipid bilayer, leading to
an increase in the fatty acid chain length of the phospholipids. Lipid rafts also recruit
proteins with long transmembrane domains resulting in the activation of signaling
cascades (Simons and Toomre, 2000). Specialized membranes can be differentiated
from each other by the presence of certain lipids. For example, cardiolipin is a
phospholipid that is commonly found in inner mitochondrial membranes (Fernandez et
al., 2004).

5
1.2.1. Membrane lipids: response to environmental stress and how they affect
metabolism, ion pumps and channels
1.2.1.1. Temperature and toxins
Membrane fluidity varies with temperature (Hulbert and Else, 1999), but most
animals manage to maintain it constant by altering their lipid constituents -
phospholipids and cholesterol - through a mechanism known as homeoviscous
adaptation (Cossins et al., 1981; Hazel, 1995). This response is most common in
ectotherms (Crockett, 1998; Hazel, 1995; Seebacher et al., 2009), but has also been
reported in isolated mammalian cells (Anderson et al., 1981). Animals counteract the
effects of increasing temperature on membrane fluidity by decreasing the degree of
unsaturation and/or increasing the fatty acid chain length of phospholipids (Hulbert and
Else, 1999). Because cholesterol affects the interactions between phospholipids,
changes in its abundance can be used to stabilize membrane fluidity and cope with a
variety of environmental stresses. Cholesterol promotes an “intermediate state” in
phospholipids that causes an increase in fluidity below and a decrease in fluidity above
the liquid-gel phase transition temperature (Lewis and McElhaney, 1992). It also
interacts with the polar head groups of phospholipids to decrease membrane
permeability (Crockett, 1998; Demel and De Kruyff, 1976). Interestingly, homeoviscous
adaptation can even occur in response to environmental pollutants. For example,
goldfish chronically exposed to a membrane fluidizer like PCB-153 can use changes in
cholesterol abundance to counteract the effects of the toxin and maintain constant
fluidity (Gonzalez et al., 2013).

6
1.2.1.2. Diet
Membranes are known to be affected by the lipid composition of the diet in
various animal groups including fish (Martin et al., 2013), birds (Nagahuedi et al., 2009;
Pierce et al., 2005) and mammals (Abbott et al., 2010). Some species use this
mechanism strategically to prepare for hibernation (Ruf and Arnold, 2008) or long-
distance migration (Weber, 2009). The likelihood of golden-mantled ground squirrels to
enter and survive hibernation is greatly increased when they switch from a high
polyunsaturated fatty acid (PUFA) diet in the summer to a low PUFA diet in the fall
before entering torpor (Frank, 2002). Specific fatty acids such as the omega 6 (n-6)
PUFA linoleic acid (n-6 18:2) have been shown to enhance hibernation capacity (Giroud
et al., 2018; Ruf and Arnold, 2008). Similarly, some birds drastically improve their ability
for aerobic metabolism by feeding on diets high in long-chain n-3 PUFAs.
Semipalmated sandpipers double their body mass just before migrating across the
Atlantic Ocean between Canada and Brazil by eating large amounts of n-3 PUFA (mud
shrimps loaded with eicosapentaenoic acid (n-3 20:5) and docosahexaenoic acid (n-3
22:6)). This “natural doping” strategy greatly improves the aerobic capacity of the long-
distance migrant (Maillet and Weber, 2006; Maillet and Weber, 2007), and has been
further demonstrated experimentally in sedentary quails (Nagahuedi et al., 2009).
Therefore, animals can manipulate the lipid composition of their membranes by
selecting particular diets to prime basal metabolism or aerobic capacity for successful
hibernation or long-distance migration.

7
1.2.2. Membrane pacemaker theory of metabolism
The membrane pacemaker theory of metabolism stipulates that the fatty acid
composition of membrane phospholipids sets the basal metabolic rate of organisms
(Hulbert and Else, 2005). Its original formulation was based on
the combined observations that: (i) the mass-specific metabolic rate of
animals decreases with body size, (ii) the average number of double bonds in
membrane fatty acids also decreases with size, and (iii) integral proteins are activated
when membrane unsaturation increases (Hulbert and Else, 2005). This theory was
inferred from the correlation between the lipid composition of membranes and body size
discovered in mammals (Hulbert and Else, 1999), and was subsequently supported by
multiple other studies (Calhoon et al., 2015; Hulbert, 2007). The validity of the
pacemaker theory has been questioned, however, because the relationship between
body size and membrane composition first characterized in mammals disappears
when the effects of phylogeny are taken into account (Valencak and Ruf, 2007). More
recently, analyses using orchid bees (Rodriguez et al., 2015) and cypriniform fish
(Gonzalez et al., 2015) provide support for the theory, even after correction for
phylogeny. If the metabolic rate of organisms can be set by membrane composition on
an evolutionary time scale, the same mechanism could be used to suppress metabolism
in hypoxia within an animal’s lifespan.
1.2.3. Membrane lipids affect enzymes involved in ATP production and utilization
The main pitfall faced by organisms exposed to prolonged hypoxia is their
ultimate failure to match ATP supply with demand (Hochachka, 1986). Thus, it is
imperative to downregulate ATP-consuming and ATP-supplying processes to survive in

8
low O2 environments. This can be achieved by modulating enzymes that play essential
roles in regulating ATP use (ATPases) and ATP production (energy metabolism).
Current evidence shows that the activities of several such enzymes are affected by their
local lipid environment, in particular by the relative abundance of specific fatty acids and
cholesterol. Multi-species comparisons for birds and mammals show that Na+/K+-
ATPase activity is positively correlated with membrane 22:6 abundance (Turner et al.,
2003), and a clear functional link between these parameters has been demonstrated
with cross-species experiments. Na+/K+-ATPase taken from an ectotherm is activated
when reconstituted in a mammalian membrane that is richer in 22:6, and the reverse
experiment has confirmed that 22:6 is an activator of this essential pump (Else and Wu,
1999; Wu et al., 2004). N-3 PUFAs are also known to downregulate sarcoplasmic
reticulum Ca2+-ATPase (SERCA), and n-6 PUFA such as 18:2 upregulate the calcium
pump (Arnold et al., 2015). ATPases are also sensitive to the presence of cholesterol.
Changing intrinsic cholesterol abundance downregulates Na+/K+-ATPase in humans,
rabbits, guinea pigs and rats (Crockett and Hazel, 1997; Garcia et al., 2019; Yeagle,
1989; Yeagle et al., 1988), while high levels of the sterol downregulate rabbit (Ca2+,
Mg2+)-ATPase (Bastiaanse et al., 1997).
Specific membrane fatty acids influence the activities of many enzymes of energy
metabolism. N-3 PUFA levels are positively correlated with the activities of tricarboxylic
acid (TCA) cycle and β-oxidation enzymes (Arnold et al., 2015). This is evident in
sedentary quails (Nagahuedi et al., 2009) and migrant sandpipers (Maillet and Weber,
2007) that activate citrate synthase (CS), 3-hydroxyacyl-CoA dehydrogenase (HOAD)
and carnitine palmitoyl transferase (CPT) after eating long-chain n-3 PUFA for a few

9
weeks. The activity of CPT also increases in the presence of more n-3 20:5 in the
membranes of adipocytes (Guo et al., 2005). Fast glycolytic muscles contain more
palmitic acid (16:0) and n-6 18:2, but less long-chain PUFA (Alasnier et al., 1996) than
slow oxidative muscles, suggesting that glycolytic enzymes are downregulated by long-
chain PUFA. No information is currently available about whether modulating membrane
cholesterol has similar repercussions on energy metabolism pathways as it does on
ATPases. Overall, however, there is strong evidence that altering membrane
phospholipids and cholesterol affects ATP supply and demand by activating or inhibiting
key enzymes in these processes.
1.2.4. Membrane lipids and ion channels
Reducing ion pump activity in hypoxia is only possible with a matching decrease
in ion leak so that vital transmembrane ion gradients are preserved. Therefore, it is
essential to examine whether ion channels can also be downregulated by changing the
lipid composition of membranes. Ion channels are integral membrane proteins
surrounded by lipids and they contain a transmembrane domain that moves within the
bilayer (Poveda et al., 2014). Membrane lipids are known to modulate ion channels
directly or indirectly via specific lipid-protein interactions. This section reviews known
mechanisms whereby changes in membrane PUFAs and cholesterol alter the function
of Ca2+, K+ and Na+ channels as well as nicotinicoid receptors (Poveda et al., 2014;
Tillman and Cascio, 2003). Depleting cholesterol experimentally causes an increase in
Ca2+ uptake through the Ca2+ channel and the Na+/Ca2+ exchanger of the sarcolemma,
whereas cholesterol enrichment decreases conductance of the Ca2+-dependent K+
channel (Bastiaanse et al., 1997; Poveda et al., 2014). Negatively charged long chain

10
fatty acids upregulate Ca2+-activated K+ channels with the strongest effect observed for
cis unsaturated fatty acids (Tillman and Cascio, 2003). Modifying membrane cholesterol
from normal levels inhibits K+ channels (Levitan et al., 2010; Tillman and Cascio, 2003).
Moreover, voltage-gated Na+ channels are inhibited by PUFAs (D'Avanzo, 2016; Kang
and Leaf, 1996) and cholesterol (Levitan et al., 2010). This occurs by shifting the
steady-state inactivation kinetics of this voltage-gated ion channel in the direction of
hyperpolarization, possibly via selective binding to the inactive site of the channel (Kang
and Leaf, 1996).
Membrane lipids also impact the function of ligand-gated ion channels such as
nicotinicoid receptors. They include the excitatory acetylcholine and serotonin receptors
as well as the inhibitory gamma-aminobutyric acid (GABA) receptors that are required to
propagate neuronal signals. Functional acetylcholine receptors depend on the presence
of both cholesterol and negatively charged phospholipids to support ion flux. On its own,
cholesterol also alters the function of GABA, serotonin and acetylcholine receptors
because this sterol is necessary for maintaining their optimal activity (Poveda et al.,
2014; Tillman and Cascio, 2003). It has also been suggested that a decrease in
hippocampal cholesterol levels could reduce N-methyl-D-aspartate receptor signaling
(Palomer et al., 2016). Overall, current information clearly shows that membrane lipids
do not only modulate ion pumps, but also ion channels.
1.3. Effects of chronic hypoxia on key enzymes regulating ATP supply and
demand
Continuing to match ATP supply with demand during hypoxia can be achieved by
(i) downregulating aerobic pathways and/or (ii) activating anaerobic metabolism.
11
Animals that tolerate long-term hypoxia favor selecting the first option because
anaerobic glycolysis relies entirely on small carbohydrate stores and has very low
efficiency. These two important limitations mean that glycolysis can only proceed for a
very short time (Weber, 2011). Reducing overall ATP turnover by downregulating
multiple enzymes is therefore essential for survival. This section deals with how chronic
hypoxia affects Na+/K+-ATPase and key enzymes of energy metabolism.
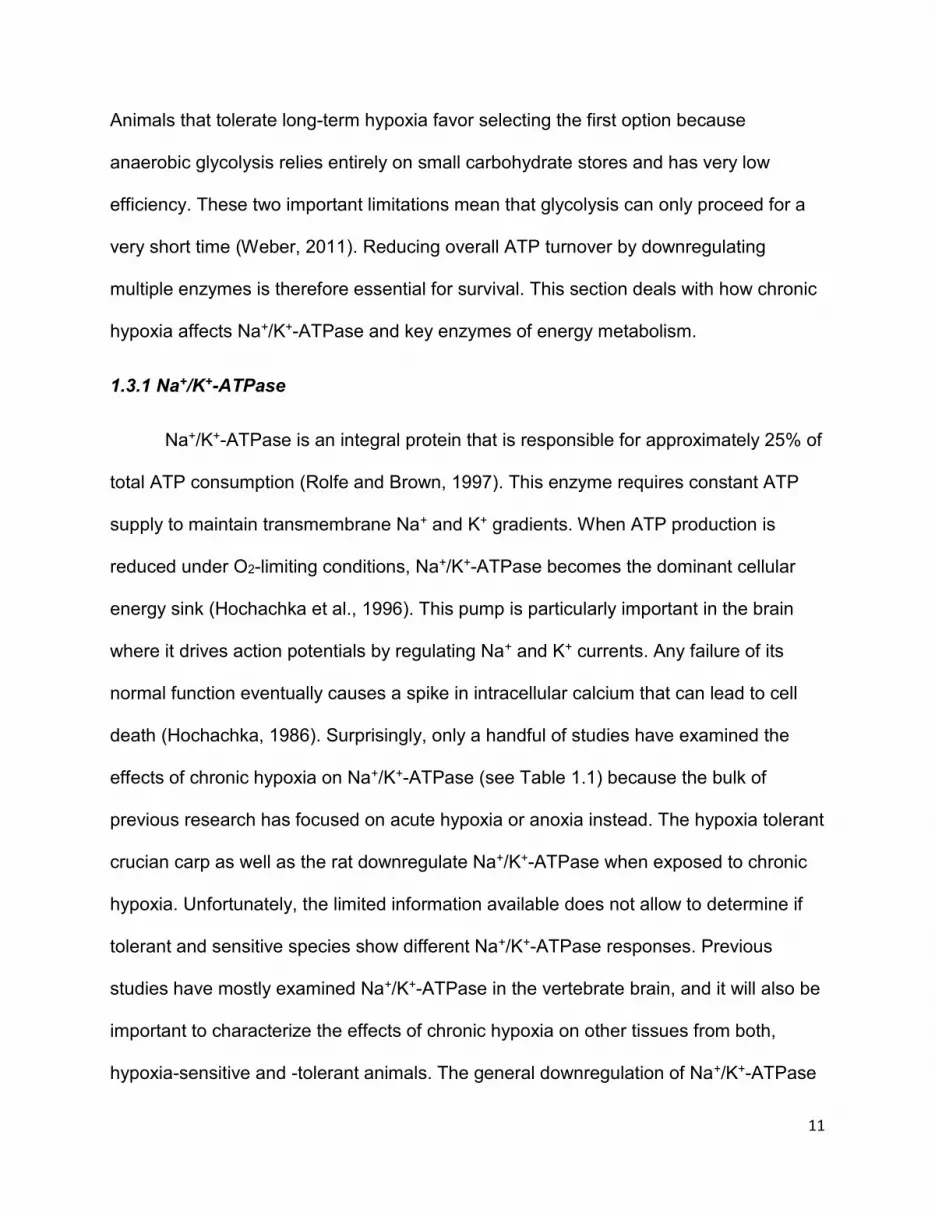
1.3.1 Na+/K+-ATPase
Na+/K+-ATPase is an integral protein that is responsible for approximately 25% of
total ATP consumption (Rolfe and Brown, 1997). This enzyme requires constant ATP
supply to maintain transmembrane Na+ and K+ gradients. When ATP production is
reduced under O2-limiting conditions, Na+/K+-ATPase becomes the dominant cellular
energy sink (Hochachka et al., 1996). This pump is particularly important in the brain
where it drives action potentials by regulating Na+ and K+ currents. Any failure of its
normal function eventually causes a spike in intracellular calcium that can lead to cell
death (Hochachka, 1986). Surprisingly, only a handful of studies have examined the
effects of chronic hypoxia on Na+/K+-ATPase (see Table 1.1) because the bulk of
previous research has focused on acute hypoxia or anoxia instead. The hypoxia tolerant
crucian carp as well as the rat downregulate Na+/K+-ATPase when exposed to chronic
hypoxia. Unfortunately, the limited information available does not allow to determine if
tolerant and sensitive species show different Na+/K+-ATPase responses. Previous
studies have mostly examined Na+/K+-ATPase in the vertebrate brain, and it will also be
important to characterize the effects of chronic hypoxia on other tissues from both,
hypoxia-sensitive and -tolerant animals. The general downregulation of Na+/K+-ATPase

12
observed to date (see Table 1.1) suggests that ion channels are also inhibited by
prolonged hypoxia to prevent a harmful increase in intracellular calcium.
Table 1.1. Effects of chronic hypoxia (minimum 1 week) on the maximal activity of
Na+/K+-ATPase in various animals.
1.3.2. Glycolysis
The overall effects of chronic hypoxia on all glycolytic enzymes are variable, but
some trends can be observed in endotherms (Tables 1.2-1.4). No pattern can be found
for the glycolytic response of ectotherms, and it is presently unclear whether a general
response to chronic hypoxia exists for this group of animals. However, endotherms
generally upregulate hexokinase (HK; Table 1.2), maintain phosphofructokinase (PFK;
Table 1.3), and downregulate pyruvate kinase (PK; Table 1.4). Because PFK plays a
dominant role in the regulation of glycolytic flux (Berg et al., 2007) and is not affected, it
appears that endotherms do not modulate glycolysis to cope with chronic hypoxia. The
opposite responses shown by HK (activation) and PK (inhibition) also support the notion
that hypoxic endotherms simply maintain normal glycolytic supply of ATP. As the last
Species Tissue
Na+/K+-
ATPase
response
Reference
Mouse
(Mus musculus) Brain -
(Cáceda et al.,
2001)
Rat
(Rattus norvegicus) Brain ~30-40% ↓ (Benzi et al., 1994)
Crucian carp
(Carassius carassius) Heart 33% ↓
(Paajanen and
Vornanen, 2003)

13
enzyme of the glycolytic pathway, lactate dehydrogenase (LDH) activity is often used as
an indicator of tissue capacity for anaerobic ATP production. The lack of a clear
activation or downregulation of LDH by chronic hypoxia in ecto- and endotherms
measured to date (Table 1.5) indicates that animals do not generally rely on anaerobic
metabolism to survive in hypoxic environments. Moreover, there is no indication that the
glycolytic supply of pyruvate to the TCA cycle is reduced to help metabolic suppression
in chronic hypoxia.

14
Table 1.2. Effects of chronic hypoxia (minimum 1 week) on the maximal activity of
hexokinase (HK) in various animals.
Species Tissue HK response Reference
Deer mouse
(Peromyscus maniculatus) Gastrocnemius 35% ↑ (Lau et al., 2017)
Gastrocnemius - (Lau et al., 2017)
Mouse
(Mus musculus) Brain - (Cáceda et al., 2001)
Rat
(Rattus norvegicus)
Gastrocnemius, soleus,
heart, brain 8-105% ↑
(Daneshrad et al.,
2000; Low et al.,
1986; Pastoris et al.,
1995; Waskova-
Arnostova et al.,
2014)
Gulf killifish
(Fundulus grandis) Heart, brain 16-28% ↑
(Martínez et al.,
2006)
Liver - (Martínez et al.,
2006)
White muscle, red muscle,
liver -
(van den Thillart and
Smit, 1984)
Tench
(Tinca tinca) White muscle 67% ↓
(Johnston and
Bernard, 1982)
Red muscle, liver - (Johnston and
Bernard, 1982)
Chinese shrimp
(Fenneropenaeus chinensis)
pancreas, pleopod,
abdominal 24-26% ↓ (Li et al., 2018)

15
Table 1.3. Effects of chronic hypoxia (minimum 1 week) on the maximal activity of
phosphofructokinase (PFK) in various animals.
Species Tissue PFK response Reference
Deer mouse
(Peromyscus maniculatus) Gastrocnemius - (Lau et al., 2017)
Rat
(Rattus norvegicus)
Heart, soleus,
gastrocnemius, caudal nerve -
(Daneshrad et al.,
2000; Low et al.,
1986; Pastoris et al.,
1995)
Gulf killifish
(Fundulus grandis) White muscle 25% ↓
(Martínez et al.,
2006)
Liver 63% ↑ (Martínez et al.,
2006)
Heart, brain - (Martínez et al.,
2006)
Nile tilapia
(Oreochromis niloticus) Liver, white muscle 59-123 ↑
(Mahfouz et al.,
2015)
Tench
(Tinca tinca) White muscle -
(Johnston and
Bernard, 1982)
Red muscle, liver 98-120% ↑ (Johnston and
Bernard, 1982)
Chinese shrimp
(Fenneropenaeus chinensis)
hepatopancreas, pleopod,
abdomen 16-31% ↓ (Li et al., 2018)

16
Table 1.4. Effects of chronic hypoxia (minimum 1 week) on the maximal activity of
pyruvate kinase (PK) in various animals.
Species Tissue PK response Reference
Deer mouse
(Peromyscus maniculatus) Gastrocnemius - (Lau et al., 2017)
Rat
(Rattus norvegicus) Heart, soleus -
(Daneshrad et al.,
2000)
Gastrocnemius - (Pastoris et al.,
1995)
Mouse
(Mus musculus) Liver 65% ↓
(Dukhande et al.,
2011)
Northern shrimp
(Pandalus borealis) White muscle - (Pillet et al., 2016)
Greenland halibut
(Reinhardtius hippoglossoides) White muscle 46% ↓ (Pillet et al., 2016)
Common carp
(Cyprinus carpio) White muscle - (Zhou et al., 2000)
Nile tilapia
(Oreochromis niloticus) Liver 61-96% ↑
(Mahfouz et al.,
2015)
White muscle - (Mahfouz et al.,
2015)
Gulf killifish
(Fundulus grandis) White muscle 23% ↓
(Martínez et al.,
2006)
Heart 24% ↑ (Martínez et al.,
2006)
Liver, brain - (Martínez et al.,
2006)
Goldfish
(Carassius auratus) White and red muscle, liver -
(van den Thillart
and Smit, 1984)
Tench
(Tinca tinca) White and red muscle -
(Johnston and
Bernard, 1982)
Liver 86% ↑ (Johnston and
Bernard, 1982)
Chinese shrimp
(Fenneropenaeus chinensis)
hepatopancreas, pleopod, abdominal
muscle 14-39% ↓ (Li et al., 2018)

17
Table 1.5. Effects of chronic hypoxia (minimum 1 week) on the maximal activity of
lactate dehydrogenase (LDH) in various animals.
Species Tissue LDH response Reference
Deer mouse
(Peromyscus maniculatus) Gastrocnemius, diaphragm -
(Lui et al., 2015; Nikel et
al., 2018)
Mouse
(Mus musculus) Hindlimb muscles 28% ↓ (le Moine et al., 2011)
Brain, liver - (Cáceda et al., 2001;
Dukhande et al., 2011)
Rat
(Rattus norvegicus) Soleus - (Daneshrad et al., 2000)
Gastrocnemius,
heart, gastrocnemius and liver mitochondria 25-54% ↑
(Daneshrad et al., 2000;
Dutta et al., 2009;
Pastoris et al., 1995)
Northern Shrimp
(Pandalus borealis) White muscle 45-88% ↓ (Pillet et al., 2016)
Greenland halibut
(Reinhardtius hippoglossoides) White muscle 58% ↓ (Pillet et al., 2016)
Common carp
(Cyprinus carpio) White muscle - (Zhou et al., 2000)
Liver ~60% ↑ (Zhou et al., 2000)
Nile tilapia
(Oreochromis niloticus) Liver, white muscle 80-176% ↑ (Mahfouz et al., 2015)
Gulf killifish
(Fundulus grandis) White muscle 30% ↓ (Martínez et al., 2006)
Liver 30% ↑ (Martínez et al., 2006)
Heart, brain - (Martínez et al., 2006)
Goldfish
(Carassius auratus) White and red muscle, liver, -
(van den Thillart and
Smit, 1984)
Tench
(Tinca tinca) White and red muscle -
(Johnston and Bernard,
1982)
Liver 116% ↑ (Johnston and Bernard,
1982)
Chinese shrimp
(Fenneropenaeus chinensis) hepatopancreas, pleopod, abdominal 26-33% ↓ (Li et al., 2018)

18
1.3.3. TCA cycle
The TCA cycle is an aerobic pathway generating NADH and FADH2 that feed into
the mitochondria to yield high amounts of ATP. Reliance on this pathway becomes
difficult when O2 availability is reduced. Most animals respond to chronic hypoxia by
downregulating CS in various tissues (Table 1.6). The only study showing CS activation
is for the heart in sablefish (Gerber et al., 2019). Accelerating the TCA cycle in the heart
of these species may be a strategy to increase cardiac output and maintain adequate
oxygen supply to other organs in hypoxia. Overall, however, flux capacity through the
TCA cycle is lowered in animals exposed to chronic hypoxia. The general decrease in
CS activity also indicates a reduction in mitochondrial density across tissues (DiMauro
and Moraes, 1993).

19
Table 1.6. Effects of chronic hypoxia (minimum 1 week) on the maximal activity of
citrate synthase (CS) in various animals.
Species Tissue CS response Reference
Deer mouse
(Peromyscus maniculatus) Liver, gastrocnemius, diaphragm -
(Lau et al., 2017; Lui
et al., 2015; Nikel et
al., 2018)
Mouse
(Mus musculus) Liver mitochondria 34% ↓ (Dutta et al., 2009)
Hindlimb muscles, heart -
(le Moine et al., 2011;
Templeman et al.,
2010)
Gastrocnemius mitochondria - (Dutta et al., 2009)
Brain, liver -
(Cáceda et al., 2001;
Dukhande et al.,
2011)
Rat
(Rattus norvegicus) Gastrocnemius 34-39% ↓ (Pastoris et al., 1995)
Gastrocnemius, heart, liver -
(Daneshrad et al.,
2000; Galbes et al.,
2008; Kennedy et al.,
2001)
Common carp
(Cyprinus carpio) White muscle ~25% ↓ (Zhou et al., 2000)
Liver - (Zhou et al., 2000)
Northern shrimp
(Pandalus borealis) White muscle 40% ↓ (Pillet et al., 2016)
Greenland halibut
(Reinhardtius hippoglossoides) White muscle 33% ↓ (Pillet et al., 2016)
Chinese shrimp
(Fenneropenaeus chinensis) pancreas, pleopod, abdominal 31-70% ↓ (Li et al., 2018)
Sablefish
(Anoplopoma fimbria) Heart 20% ↑ (Gerber et al., 2019)

20
1.3.4. β-oxidation
β-oxidation is a mitochondrial pathway that breaks down fatty acids to acetyl-CoA
and fuel the TCA cycle. The transmembrane enzyme CPT exerts the strongest control
on flux through β-oxidation (Drynan et al., 1996), and can therefore be modulated by
changes in membrane composition. Chronic hypoxia causes a general decrease in CPT
(Table 1.7) and HOAD activity (another enzyme that regulates β-oxidation; Table 1.8).
The only exception to this pattern is CPT activation in tench liver and red muscle
(Johnston and Bernard, 1982). Otherwise, general downregulation of β-oxidation
appears to be a common way to adjust ATP supply to the lower ATP demand afforded
by hypometabolism.
Table 1.7. Effects of chronic hypoxia (minimum 1 week) on the maximal activity of
carnitine palmitoyl transferase (CPT) in various animals.
Species Tissue CPT response Reference
Rat
(Rattus norvegicus) Muscle, heart 16-34% ↓
(Galbes et al., 2008;
Kennedy et al., 2001)
Liver, gastrocnemius mitochondria - (Dutta et al., 2009;
Kennedy et al., 2001)
Mouse
(Mus musculus) Skeletal muscle 65% ↓ (Morash et al., 2013)
Heart - (Morash et al., 2013)
Tench
(Tinca tinca) Red muscle, liver 162-236% ↑
(Johnston and Bernard,
1982)
White muscle - (Johnston and Bernard,
1982)

21
Table 1.8. Effects of chronic hypoxia (minimum 1 week) on the maximal activity of 3-
hydroxyacyl-CoA dehydrogenase (HOAD) in various animals.
1.4. Effects of chronic hypoxia on mitochondria
Mitochondria are major O2 consumers that produce ATP through oxidative
phosphorylation: a process that couples the electron transport chain (ETC = enzyme
complexes I to IV) with ATP synthase (complex V). The ETC pumps protons across the
inner mitochondrial membrane to establish an electrochemical gradient that is used to
phosphorylate ADP (McElroy and Chandel, 2017). Oxygen is consumed at complex IV
(cytochrome c oxidase, COX): the final electron acceptor that reduces O2 to water and
contributes to generating the proton gradient (Schmidt-Rohr, 2020). All these protein
complexes are transmembrane enzymes whose activities are modulated by changes in
the phospholipid composition of the bilayer. Mitochondria also produce significant
amounts of reactive oxygen species (ROS), particularly at complexes I and III (Quinlan
Species Tissue HOAD
response Reference
Deer mouse
(Peromyscus maniculatus) Gastrocnemius, liver - (Lau et al., 2017)
Mouse
(Mus musculus) Left ventricle 36% ↓ (Templeman et al., 2010)
Rat
(Rattus norvegicus)
Heart, skeletal, liver and liver
mitochondria 20-71% ↓
(Daneshrad et al., 2000;
Dutta et al., 2009; Galbes
et al., 2008; Kennedy et
al., 2001)
Soleus, gastrocnemius
mitochondria -
(Daneshrad et al., 2000;
Dutta et al., 2009)
Mouse
(Mus musculus) Heart, skeletal - (Morash et al., 2013)

22
et al., 2013). These organelles are strategically placed to sense any changes in O2 and
initiate organism-specific responses to hypoxia. Oxygen sensing can be done through a
ROS-induced response that may cause rapid accumulation of Ca2+ and/or activation of
hypoxia inducible factor (HIF) (McElroy and Chandel, 2017). ROS can cause the
formation of disulfide bonds, which may change the structure and function of proteins
such as phosphatases, transcription factors and those involved in epigenetic
modifications (Pamenter, 2014). Severe hypoxia causes the depolarization of
mitochondria that leads complex V to switch from ATP production to ATP consumption
(St-Pierre et al., 2000a). This exacerbates the existing ATP shortfall already induced by
hypoxia and can eventually result in tissue failure. This section deals with the effects of
hypoxia on the functional capacity of mitochondria by examining specific responses for
the different respiration states and ETC complexes.
1.4.1. Endotherms
The effects of chronic hypoxia on the mitochondria of endotherms have only
been investigated in rats and deer mice. After acclimation to hypoxia, rats decrease
respiration capacity through ETC complexes I, II and IV in the heart (Heather et al.,
2012) as well as state 3 (OXPHOS in the presence of substrates and ADP) and 4
(LEAK after ADP depletion) in the brain (Chávez et al., 1995). However, this response is
not always consistent because another study shows no change in rat liver and heart
(Costa et al., 1988). Hypoxia-tolerant species like deer mice have different
mitochondrial responses than rats to low O2. They increase mitochondrial respiration
(CI, CII and CIV) in the diaphragm (Dawson et al., 2018), but maintain it in the
gastrocnemius. In addition, mitochondrial respiration capacity is elevated in high-altitude

23
vs lowland deer mice (Mahalingam et al., 2017). While not the focus of this review,
acute hypoxia causes a decrease in mitochondrial respiration of naked mole-rat (NMR)
brain (Pamenter et al., 2018) and human pulmonary arterial endothelial cells (Chan et
al., 2009). It is not surprising to find differences between tissues and between species.
For endotherms, tissue differences are related to local O2 demand and species
responses depend on the environmental O2 availability of the whole organism: normoxia
(rat), life-long hypoxia (high-altitude deer mouse), intermittent hypoxia (NMR).
1.4.2. Ectotherms
Exposing ectotherms to prolonged hypoxia results in a wide-range of
mitochondrial responses that do not follow a general trend. For instance, mitochondrial
respiration for various states and tissues is lowered in frogs (St-Pierre et al., 2000b) and
eastern oysters (Sokolova, 2018), but remains unchanged in killifish liver (Du et al.,
2016) and snapper heart (Cook et al., 2013) after acclimation to hypoxia. Similarly,
acute hypoxia causes a wide range of responses in shark mitochondria (Hickey et al.,
2012), pacific oysters and hard-shell clams (Sokolova, 2018). However, turtles exposed
to anoxia lower mitochondrial respiration in several states and tissues (Bundgaard et al.,
2019; Gomez and Richards, 2018; Pamenter et al., 2016). Overall, it is impossible to
predict how ectotherm mitochondria respond to chronic hypoxia because some animals
maintain respiration capacity while many others prefer to: (i) regulate specific respiration
states that impact ATP turnover, (ii) change mitochondrial efficiency, (iii) change
mitochondrial abundance, or (iv) use a combination of the above.

24
1.5. Overview of molecular mechanisms involved in metabolic suppression
Much of the previously detailed responses to hypoxia are mostly controlled by
post-transcriptional and post-translational mechanisms via reversible phosphorylation of
proteins, DNA methylation as well as changes in relative mRNA and/or microRNA
(miRNA) expression. Reversible protein phosphorylation is a post-translational
mechanism that is catalyzed by kinases and phosphatases to regulate ATP-demanding
processes when animals enter a hypometabolic state (Storey, 2015). This is
demonstrated by the phosphorylation-mediated downregulation of ATP-producing
catabolic pathways such as glycolysis (Storey and Storey, 2007) and ATP-consuming
processes such as protein synthesis when entering a hypometabolic state (Storey and
Storey, 2004). DNA methylation is a post-translational mechanism that allows animals
to suppress their metabolic rate by repressing transcription (Storey, 2015). Most of the
hypoxia-induced molecular responses are controlled by HIF. This transcription factor is
composed of an O2-sensitive α subunit and an O2-stable β subunit, each consisting of
several different forms. HIF can be expressed in many different cells and is responsible
for the hypoxic regulation of various genes (Nikinmaa and Rees, 2005) and miRNAs
such as miR-210 (Hadj-Moussa and Storey, 2020). MicroRNAs are short, noncoding
RNA molecules that are produced canonically (He and Hannon, 2004). miRNA
biogenesis begins in the nucleus where primary miRNA genes are transcribed by
polymerase II. Primary miRNAs are then processed by DROSHA-dgcr8 complex to yield
precursor miRNA that are transported to the cytoplasm by exportin 5. The precursor
miRNAs are then cleaved by the Dicer RNAase III endonuclease in the cytoplasm to
produce mature 21-23 nucleotide miRNA (Han et al., 2006). Argonaute 2 then mediates

25
the binding of mature miRNA to the 3’UTR of mRNA as part of the RNA-induced
silencing complex. This is done through complementary base-pairing interactions
between nucleotides 2 and 8 of the miRNA at the 5’ end (Bartel, 2009). Because
miRNAs reduce protein output from existing transcripts, they serve as perfect controllers
of hypoxia-mediated HIF expression (Nikinmaa and Rees, 2005).
1.6. Thesis objectives
The effects of several environmental stressors on membrane lipid composition
are well-documented. Additionally, there is plenty of evidence supporting a link between
membrane lipids, maximal enzymatic activity and metabolic rate. The main goal of this
thesis is to establish a new mechanism for achieving metabolic suppression during
chronic hypoxia that involves altering membrane lipid composition. To test my
hypothesis, I will examine the effects of chronic hypoxia on membrane lipids and ATP
consuming and producing processes in the goldfish and the naked mole-rat. These
champions are known for their exceptional tolerance to chronic hypoxia, which is crucial
for performing the required prolonged low O2 acclimation. This thesis is divided into 4
data chapters, of which the first three are published, and a conclusion chapter.
(1) Surprisingly, no prior studies have been done to examine the effects of chronic
hypoxia on membrane lipids. In my first data chapter, I investigate the effects of chronic
hypoxia on the lipid composition of goldfish membranes and on metabolic rate at two
temperatures. Two different temperatures are chosen because of (i) the known
association between high temperature and O2 solubility and (ii) the known impact of
temperature changes on membrane lipids. I hypothesize that goldfish remodel their
membrane lipids in ways that promote metabolic suppression.

26
(2) After finding that goldfish remodel their membrane lipid composition in chronic
hypoxia, I sought out to determine if this response is specific to ectotherms or common
to other hypoxia-tolerant champions. Therefore, I collaborate with Dr. Matthew
Pamenter to study the effects of chronic hypoxia on the naked mole-rat (NMR) for my
second data chapter. In this chapter, I examine the effects of chronic hypoxia on
membrane lipid composition, metabolic rate and maximal enzymatic activity in the NMR.
I hypothesize that NMRs would remodel their membranes in ways that are similar to
goldfish and downregulate maximal enzymatic activities while suppressing their
metabolic rate.
(3) For my third data chapter, I aimed to quantify the effects of chronic hypoxia on
goldfish enzymes involved in ATP supply and demand. Moreover, I sought to
investigate the effects of long-term acclimation to hypoxia on goldfish mitochondria
because they are (i) excellent oxygen sensors, (ii) major producers of cellular ATP and
(iii) known to impact metabolic rate. I hypothesize that goldfish downregulate the
activities of key enzymes and lower mitochondrial respiration following hypoxia
acclimation.
(4) Because plenty of research confirms a role of molecular mechanisms in controlling
all the endpoints I study in my first 3 data chapters, I aimed to investigate how this
happens in hypoxic goldfish. In a collaboration with Dr. Jan Mennigen, I rely on the
recently published goldfish genome to examine the effects of chronic hypoxia on (i)
hypoxia sensing, (ii) post-transcriptional and post-translational as well as epigenetic
processes (DNA methylation, miRNA biogenesis) and (iii) lipid transcripts (cholesterol

27
biosynthesis and β-oxidation). I hypothesize that hypoxic goldfish suppress transcription
and translation to support metabolic suppression.
(5) In my conclusion chapter, I revisit the results of my four data chapters and discuss
how they promote metabolic suppression. I conclude by addressing the main question
of this thesis: Do membrane lipids contribute to achieving metabolic suppression in
chronic hypoxia?

28
Chapter 2
Hypoxia-induced remodelling of goldfish membranes
Based on a manuscript by the same title
Written by
Elie Farhat, Eric D. Turenne, Kevin Choi and Jean-Michel Weber
And published in
Comparative Biochemistry and Physiology Part B: Biochemistry and Molecular Biology
https://doi.org/10.1016/j.cbpb.2019.110326
Statement of contribution: This work was performed alongside Eric Turenne and Kevin Choi. Kevin acclimated the goldfish at 13oC and measured fatty acid composition of membrane phospholipids in brain. Eric measured cholesterol abundance in all tissues at 13oC. I measured the fatty acid composition of goldfish membranes at 13oC (liver, white muscle and gill) and 20oC (all tissues). Moreover, I measured cholesterol abundance of all tissues at 20oC, performed the metabolic rate measurements of all animals (at both 13oC and 20oC) and measured whole-body ethanol. Finally, I wrote the paper as first author and edited it with Dr. Weber.

29
2.1. Introduction
Hypoxia commonly occurs in aquatic environments through eutrophication and
thermal stratification, but the widespread use of fertilizers and global warming are
exacerbating the problem (Diaz and Rosenberg, 2008). Species particularly tolerant to
hypoxia use metabolic suppression as their key strategy to cope with a lack of oxygen
that normally kills most animals (Bickler and Buck, 2007; Richards, 2011; Seibel, 2011).
Among teleosts, goldfish are renowned for their outstanding capacity to endure
prolonged hypoxia (Nilsson, 2010). They can survive low O2 stress for months
(Richards, 2011), but their ability for metabolic suppression (a 42 to 56 % decrease in
metabolic rate) has only been investigated for the first few hours of hypoxia (van
Ginneken et al., 2004; Van Waversveld et al., 1989). It is unclear whether longer
exposure lasting several weeks would cause further suppression. Known mechanisms
to slow metabolism include downregulating ion pumps such as Na+/K+-ATPase
(Hochachka, 1986), reducing flux through anabolic pathways such as protein synthesis,
and inhibiting key enzymes of energy metabolism (Richards, 2009; Storey and Storey,
2004). Cold-acclimated goldfish can also tolerate very long periods of complete anoxia
by producing ethanol (Shoubridge and Hochachka, 1980; Weber, 2016).
Ectotherms modulate the lipid composition of membranes to deal with changes in
temperature (Hazel, 1995) or when they are exposed to membrane-fluidizing pollutants
(Gonzalez et al., 2013). These homeoviscous responses mitigate the changes in
membrane fluidity caused by environmental stress that would otherwise jeopardize
normal membrane function (Hazel, 1995). Fluidity and permeability are modulated by
changing both the fatty acid (FA) composition of phospholipids (PL) and the relative

30
abundance of cholesterol (Bell et al., 1986). Hypoxia has also been shown to alter the
FA composition of membranes, but only in isolated mammalian cells (Block et al., 1989;
Ježková et al., 2002). In fish, van Raaij et al (van Raaij et al., 1994) have shown that
low oxygen affects the FA composition of total tissue lipids, but their study does not
provide specific information about membrane lipids. Therefore, it is unclear whether
chronic hypoxia could cause the restructuring of fish membranes.
The activity of key integral proteins like ion pumps is modulated by changes in
the lipid composition of membranes (Harayama and Riezman, 2018). These proteins
include Na+/K+-ATPase and Ca2+-ATPase that can account for a large fraction of resting
metabolic rate (Rolfe and Brown, 1997). Their activity depends on bulk properties like
membrane order and permeability, or on direct interactions with specific FAs or with
cholesterol (Bastiaanse et al., 1997; Calhoon et al., 2015; Yeagle, 2012). In particular,
docosahexanoic acid (n-3 22:6) is a well characterized activator of Na+/K+-ATPase
(Calhoon et al., 2015; Turner et al., 2005), and cholesterol is an inhibitor of both Ca2+-
ATPase (Li et al., 2004) and Na+/K+-ATPase (Crockett and Hazel, 1997; Kimelberg and
Papahadjopoulos, 1974). Diverse approaches have been used to demonstrate the
stimulating effect of 22:6 on Na+/K+-ATPase. They include the manipulation of 22:6
abundance in artificial membranes (Calhoon et al., 2015), feeding experiments with
dietary 22:6 supplementation (Kumosani and Moselhy, 2010), and membrane crossover
experiments involving phospholipid exchange between toads (low %22:6) and rats (high
%22:6)(Wu et al., 2001). Limiting ion pump activity during hypoxia would significantly
reduce ATP turnover, but it is currently unknown whether the remodelling of membrane
lipids could be used as a mechanism to suppress metabolism. The goal of this study

31
was to characterize a potential link between membrane remodelling and metabolic
suppression in goldfish exposed to prolonged hypoxia. I have measured the effects of 4
weeks of hypoxia at 10% air saturation (~2.1 kPa) on metabolic rate and membrane
lipid composition. This hypoxic stress was selected because it induces significant
suppression of goldfish aerobic metabolism, but without initiating any ATP contribution
from anaerobic ethanol production (Regan et al., 2017). Because temperature-driven
homeoviscous adjustments could impact the response to hypoxia, measurements were
carried out in animals acclimated to two temperatures. This experimental design was
selected because hypoxic remodelling could be incompatible with the homeoviscous
remodelling necessary for acclimation to some temperatures. The aim was to test the
hypothesis that goldfish restructure membrane lipids while suppressing metabolism to
cope with prolonged hypoxia.
2.2. Methods
2.2.1. Animals
Adult common goldfish (Carassius auratus, Linnaeus 1758; N=88) were
purchased from AQUAlity Tropical Fish Wholesale (Mississauga, Ontario, Canada) and
held in a 1200 L flow-through holding tank in dechloraminated, well-oxygenated water,
under a 12h:12h light:dark photoperiod, and were fed 3 mm floating fish pellets
(Profishent; Martin Mills; Elmira, Ontario, Canada) once a day. They were randomly
allocated to respirometry experiments (N=16, body mass 26.2 ± 1.4 g), membrane
composition experiments (N=58, body mass 33.1 ± 1.4 g, liver mass 0.8 ± 0.04 g;
hepatosomatic index 2.0 ± 0.1) or ethanol experiments (N=14, body mass 17.9 ± 1.6 g).
All measurements were performed at 13oC (mean 13.12 ± 0.03oC; range 12.9-13.2oC

32
(hypoxia); mean 13.17 ± 0.04oC; range 12.8-13.3oC (normoxia)) and 20oC (20.2 ±
0.01oC; range 19.6-20.5oC (hypoxia); 20.17 ± 0.02oC; range 19.4-20.6oC (normoxia)).
The fish were acclimated to these temperatures for at least 2 weeks in the 1200 L
holding tank before starting experiments. All procedures were approved by the Animal
Care Committee of the University of Ottawa and adhered to the guidelines established
by the Canadian Council on Animal Care for the use of animals in research.
2.2.2. Hypoxia acclimation and respirometry experiments
Each temperature group (13 and 20oC; N=8 per group) was placed in a normoxic
40L flow-through tank before the transition to hypoxia, and the tanks were covered by
plexiglass lids to prevent air-water gas exchange. Water was then made progressively
hypoxic over 7 days by bubbling increasing amounts of N2 through a column filled with
glass beads. Water PO2 was measured using galvanic oxygen probes (Loligo Systems,
Tjele, Denmark). The probes were calibrated before each measurement using air-
saturated water (20.9% O2). Oxygen availability went from 100% air saturation on day 1
to 50, 40, 30, 20, 15, and finally 10% (or 2.1 kPa) on day 7. PO2 was maintained at that
low level for a period of 4 weeks. The effects of hypoxia on MO2 were measured in a
Loligo Systems respirometer (DAQ-PAC-G1 instrument controlled with AutoResp
software version 2). The same temperature ranges (given in the “Animals” section
above) apply to respirometer water. Preliminary measurements of MO2 were carried out
continuously for 24 hours on animals that had been fasted for 24 h (N=5) to determine
how much time they needed to reach resting metabolic rate. Their MO2 only decreased
during the first hour (as they were settling down from transfer stress), but subsequently
stayed constant for the following 23 h. For the different treatment groups, 24 h-fasted

33
individuals were transferred from their holding tank to a 2 L respirometry chamber: (1) at
the start of the experiment (normoxia), and (2) after 30 days in hypoxia. Each fish was
used as its own normoxic control. Individuals were identified by unique fin
morphologies, pigment patterns, fork length and/or body mass. After 1 h habituation to
the respirometry chamber, each fish was measured for 3 periods of 1 h and the most
reliable value among them was used in calculations (the 1 h period having a decline in
pO2 with the highest r2). Oxygen partial pressure decreased from 20.9 to 13.8 kPa for
normoxic trials and from 2.3 to 1.2 kPa for hypoxic trials. Control 24 h-measurements of
MO2 in the empty respirometer showed that bacterial respiration was negligible.
2.2.3. Membrane composition experiments
Experiments were designed as a 2x2 matrix simultaneously testing the effects of
temperature (13 vs. 20oC) and chronic hypoxia (normoxic controls vs. hypoxia). Fish
were randomly assigned to one of four groups: normoxia at 13oC (N=14), hypoxia at
13oC (N=13), normoxia at 20oC (N=15) and hypoxia at 20oC (N=16). A plexiglass lid
was used to prevent surface access. Hypoxic conditions were progressively achieved
as in the respirometry experiments. The fish were maintained in normoxia or hypoxia
(10% air saturation) for 4 weeks. This duration was selected to leave enough time for
membrane restructuring, knowing that homeoviscous changes to temperature take 2-3
weeks (Cossins et al., 1977; Sellner and Hazel, 1982; Smith and Kemp, 1971). To
ensure that there was no effect of diet on membrane composition, the hypoxic group
was fed first to satiation before providing the same amount of food to the normoxic
group. At the end of the experiments, the goldfish were euthanized by cervical

34
dislocation. The brain, gills, white muscle and liver were sampled and stored at -20oC
until analyses.
2.2.4. Lipid analyses
Total lipids were extracted from ~30 mg of each tissue as described previously
(Maillet and Weber, 2006). Total lipids dissolved in chloroform were loaded on solid-
phase extraction columns (Supelclean 3 mL 500 mg LC-NH2; Sigma-Aldrich; St. Louis,
MO, USA). Neutral lipids, non-esterified FAs and PLs were separated by sequential
elution using solvents of increasing polarity: chloroform:isopropanol (3:2 v/v), isopropyl
ether:acetic acid (98:2 v/v), and methanol (Maillet and Weber, 2006). Total PL
concentration was determined by gas chromatography as a measure of tissue
membrane abundance by adding a PL internal standard before solid-phase column
separation (40 mg/100 mL phosphatidyl choline 17:0/17:0; Avanti Polar Lipids;
Alabaster, AL, USA). Total PL concentration was calculated as total fatty acids in the PL
fraction divided by 2. The FA composition of membrane PL was measured after acid
transesterification in acetyl chloride and methanol (90°C for 2 h). FA methyl esters were
analyzed on an Agilent Technologies 6890N gas chromatograph (Mississauga, Ontario,
Canada) equipped with a flame-ionization detector and a fused silica capillary column
(Supelco DB-23, 60m, 0.25 mm i.d., 0.25 μm film thickness; Sigma-Aldrich) using
hydrogen as carrier gas (Magnoni and Weber, 2007). Individual FAs were identified by
determining exact retention times with pure standards (Supelco, Bellefonte, PA, USA).
Only the FAs accounting for >1% of total FAs in PLs are reported. The following FAs
were measured as more than 1% of total membrane FAs: 16:0, 16:1, 18:0, 18:1, 18:2,
18:3, 20:0, 20:2, 20:4, 20:5, 22:0, 22:3, 22:5, 22:6, and 24:0 (although not all of them

35
were detected in all tissues). Membrane cholesterol was measured as non-esterified
(free) cholesterol in ~30 mg of tissue. Each tissue was homogenized in
chloroform:methanol (2:1 v/v). Separation of aqueous and organic phases was achieved
by adding 2 M KCl / 5 mM EDTA before centrifugation (10 min at 3000 g). The organic
phase was dried under N2, resuspended in 2-methoxyethanol, and cholesterol was
measured by fluorometry (SpectraMax Gemini XS, Molecular Devices, Sunnyvale,
California, USA) using a commercial assay kit (Cayman Chemical, Ann Arbor, Michigan,
USA). This kit was selected because it allows the measurement of membrane (free,
non-esterified) cholesterol separately from cholesterol esters that are only found outside
membranes.
2.2.5. Ethanol analysis
Whole-body ethanol and water analyses were performed to confirm that no
anaerobic metabolism was occurring at 10% air saturation. Goldfish were randomly
allocated to either normoxia (N=7) or hypoxia (N=7) and kept for 4 weeks at normoxia
(20.9 kPa) or at 10% air saturation (~2.1 kPa) at 13oC. The experiment was terminated
by rapid euthanasia (cervical dislocation). The fish were cut into pieces and frozen in
liquid nitrogen. Four water samples were taken at 4 different time points to measure
whether ethanol was released through the gills. All parts from each fish were then
homogenized using a commercial blender (Magic bullet express blender, Homeland
Housewares, CA, USA). Whole-body and water ethanol was measured as described in
(Regan et al., 2017), using a commercial assay kit (Diagnostic Chemical Ltd., PEI,
Canada).

36
2.2.6. Calculation and statistics
Metabolic rate was calculated as follows: 𝑀𝑂2 = ([𝑂2]𝑡0 − [𝑂2]𝑡1) .𝑣
𝑡 .
1
𝑀𝑏 where
MO2 = rate of oxygen consumption (in mg O2 kg -1 h -1)
[O2]t0 and [O2]t1 = oxygen concentration at times to and t1 (in mg O2 L-1)
v = respirometer volume – animal volume (in L)
t = t1 – t0 (in h), and Mb = body mass of the animal (in kg).
The double bond index (DBI) of membranes was calculated as the average number of
double bonds in PL divided by the fraction of saturated FAs. Absolute concentration of
membrane cholesterol in a tissue (expressed in µmol g-1) is not a good indicator of the
relative abundance of cholesterol in membranes if the amount of membranes per gram
tissue varies with treatment. To address this problem, relative cholesterol concentration
was calculated as moles of cholesterol per mole of PL and expressed as a unitless
ratio. Statistical analyses were performed using SigmaPlot 12.5 (Systat, San Jose, CA,
USA). Data were analyzed using two-way repeated measure ANOVA for the
respirometry analysis, a two-way ANOVA for membrane lipid analyses with temperature
and oxygen as main factors followed by the Holm-Sidak post-hoc test and a one-way
ANOVA for the ethanol analysis. Normality was assessed using the Shapiro-Wilk test.
When the assumptions of normality or equality of variances were not met, the data were
normalized by log10 transformation. If transformation was unsuccessful, non-parametric
two-way ANOVA on ranks was performed. All percentages were transformed to the
arcsine of their square root before analyses. To account for multiple testing, the false
discovery rate test was used to compute an adjusted level of significance of 0.042
(Benjamini and Hochberg, 1995). All values presented are means ± s.e.m.

37
2.3. Results
2.3.1. Respirometry
Metabolic rate was higher at 20oC than at 13oC for both, normoxic controls
(P<0.05) and hypoxia-acclimated fish (P<0.001) (Fig. 2.1). At 20oC, prolonged hypoxia
caused a decrease in MO2 from 106.2 to 39.8 µmol O2 kg-1 min-1 (P<0.01) (Fig. 2.1). At
13oC, MO2 was suppressed from 45.8 to 11.8 µmol O2 kg-1 min-1 (P<0.01) (Fig. 2.1).
There was no interaction between oxygen availability and temperature (P>0.05). No
ethanol could be detected in any fish from the control and the hypoxic group (0 µmol
ethanol g-1, N=7 for each treatment group), or in their tank water (0 µmol ethanol mL-1,
N=4 for each group).

38
13 C 20 C
Meta
bolic
rate
(µm
ol O
2 k
g-1
min
-1)
0
40
80
120
Normoxia
Hypoxia
HH
TTT HH
T
o o
Figure 2.1. Metabolic rates of normoxic controls and hypoxia-acclimated goldfish at
13oC or 20oC. Values are means ± s.e.m. (N=8 per temperature). The effects of hypoxia
within each temperature group are indicated as HH (P < 0.01). The effects of
temperature within the normoxic or hypoxic treatments are indicated as T (P < 0.05) and
TTT (P < .001).
2.3.2. Membrane cholesterol
At 13oC (Fig. 2.2A), hypoxia affected relative membrane cholesterol (expressed
as a unitless ratio of µmoles of cholesterol per µmoles of membrane PL) in all tissues
except the brain. It increased in gills (P=0.032) and muscle (P=0.001), but decreased in
liver (P<0.042). At 20oC (Fig. 2.2B), hypoxia caused no change in relative membrane
cholesterol (P>0.05). Relative cholesterol levels were higher at 20oC than 13oC in gill
and liver, but lower in hypoxic muscle (P<0.001; Fig. 2.2B). There was an antagonistic
interaction between oxygen availability and temperature for cholesterol content in gills
(P=0.009), as well as in muscle and liver (P=0.003). Changes in absolute cholesterol
levels (in µmol/g tissue) mirror the results described above for relative cholesterol

39
because no significant effects of hypoxia were detected on total membrane PL
concentration (P>0.05).
Brain Gill Muscle Liver
0.00
0.02
0.04
0.06
0.08
0.10
Cho
leste
rol /
Pho
spho
lipid
(m
ole
:mo
le)
0.00
0.02
0.04
0.06
0.08
0.10 Normoxia
Hypoxia A
B
TTT
TTT
TTT T TTT
HH
TTT
H
H
13oC
20oC
Figure 2.2. Relative membrane cholesterol levels in the tissues of normoxic controls and
hypoxia-acclimated goldfish at 13oC (A) or 20oC (B). Values are means ± s.e.m. (N=13
to 16 per treatment). The effects of hypoxia within each temperature group are indicated
as H (P < 0.042) and HH (P < 0.01). The effects of temperature within the normoxic or
hypoxic treatments are indicated in the bottom panel as TTT (P < 0.001).

40
2.3.3. Double bond index and fatty acid chain length
At 13oC (Fig. 2.3A), hypoxia caused a decrease in DBI in the gill (P=0.009) and
liver (P<0.042). At 20oC (Fig. 2.3B), hypoxia had no effect on the membrane DBI of any
tissue (P>0.042). DBI was lower at 20oC than at 13oC in all tissues except the liver
(P<0.042; Fig. 2.3B). There were no interactions between oxygen and temperature
(P>0.042). At 13oC (Fig. 2.4A), hypoxia caused a decrease in average chain length in
gill and liver (P<0.01), but had no impact in brain and muscle. At 20oC (Fig. 2.4B),
hypoxia had no effect on chain length for any tissue (P>0.042). Average chain length
was higher at 20oC than at 13oC in all tissues except the brain (P<0.01; Fig. 2.4B).
There was an interaction between oxygen and temperature for gills (antagonistic)
(P=0.007) and liver (synergistic) (P=0.035).

41
Double
bond index
0
2
4
6
8
Brain Gill Muscle Liver
0
2
4
6
8
Normoxia
Hypoxia
A
B
TTT
TTT
TTT
T
HH
H
T
H
TTT
13oC
20oC
Figure 2.3. Membrane double bond index in the tissues of normoxic controls and
hypoxia-acclimated goldfish at 13oC (A) or 20oC (B). Values are means ± s.e.m. (N=13
to 16 per treatment). The effects of hypoxia within each temperature group are indicated
as H (P < 0.042) and HH (P < 0.01). The effects of temperature within the normoxic or
hypoxic treatments are indicated in the bottom panel as T (P < 0.042) and TTT (P <
0.001).

42
Acyl c
hain
length
(# o
f carb
ons)
17.5
18.0
18.5
19.0
Brain Gill Muscle Liver
17.5
18.0
18.5
19.0
Normoxia
Hypoxia
A
B
TTT
TTT TTTTT
TTT
TTT
HH
H
HH
TTT
13oC
20oC
Figure 2.4. Mean fatty acid chain length in the membrane phospholipids for the tissues
of normoxic controls and hypoxia-acclimated goldfish at 13oC (A) or 20oC (B). Values
are means ± s.e.m. (N=13 to 16 per treatment). The effects of hypoxia within each
temperature group are indicated as HH (P < 0.01). The effects of temperature within the
normoxic or hypoxic treatments are indicated in the bottom panel as TT (P < 0.01) and
TTT (P < 0.001).
2.3.4. Membrane fatty acids
Hypoxia only caused changes in PL composition at 13oC in gills, where %
saturated fatty acids (SFA) was increased (P<0.042), and % polyunsaturated fatty acids

43
(PUFA) was decreased (P<0.01) (Table 2.1). At 20oC, hypoxia had no effect on any
tissue (P>0.042). Higher %SFA (P<0.01), but lower % monounsaturated fatty acids
(MUFA) (P<0.042) and %PUFA (P<0.001) were observed at 20oC than at 13oC for most
tissues (Table 2.1). There was a synergistic interaction between oxygen and
temperature for %PUFA in gills only (P=0.023). Figure 2.5 shows changes in the relative
abundance of individual FAs in gill and liver membranes at 13oC. They were selected
because hypoxia only caused changes in these two tissues and at this temperature. In
gill (Fig. 2.5A), hypoxia caused decreases in %eicosapentaenoate (20:5; P<0.01),
%docosapentaenoate (22:5; P=0.022) and %docosahexaenoate (22:6; P<0.01). In liver
(Fig. 2.5B), hypoxia caused an increase in %linoleate (18:2; P=0.015), but decreases in
%arachidonate (20:4; P<0.01) and %docosahexaenoate (22:6; P=0.024).

44
18:2 20:4 22:6
0
5
10
15
20:5 22:5 22:6
% T
ota
l me
mb
rane
fa
tty
acid
s
0
2
4
6
8
10
Normoxia
Hypoxia
A
HH
B
HH
HH
H
H
H
Gill
Liver
Figure 2.5. Hypoxia-mediated changes in the relative abundance of individual
membrane fatty acids in goldfish gill (A) and liver (B) at 13oC. They were selected
because hypoxia only caused significant changes in these two tissues and at this
temperature. Values are means ± s.e.m. (N=14 for normoxia and N=13 for hypoxia).
The effects of hypoxia are indicated as H (P < 0.042) and HH (P < 0.01).

45
Table 2.1. Fatty acid composition of membrane phospholipids in tissues of goldfish
acclimated to normoxia or hypoxia at two temperatures. Values are mean percentages
of total membrane fatty acids ± s.e.m. (N=13-16). Saturated fatty acids (SFA),
monounsaturated fatty acids (MUFA) and polyunsaturated fatty acids (PUFA) are
indicated separately. Significant effects of hypoxia and temperature are indicated in
bold; P < 0.042 (H, T), P < 0.01 (HH, TT), P < 0.001 (TTT).
13oC 20oC
Normoxia Hypoxia Normoxia Hypoxia
Brain SFA 37.15 ± 0.29 37.08 ± 0.81 40.94 ± 0.36 TTT 40.45 ± 0.61 TTT
MUFA 35.81 ± 0.79 35.30 ± 0.87 35.15 ± 1.02 36.18 ± 0.63
PUFA 27.04 ± 0.74 27.62 ± 0.39 23.91 ± 0.77 TTT 23.36 ± 0.64 TTT
Gills SFA 33.90 ± 0.45 35.89 ± 0.75 H 42.95 ± 0.91 TTT 43.09 ± 0.77 TTT
MUFA 32.62 ± 0.53 33.65 ± 0.43 31.22 ± 0.83 T 31.58 ± 0.77
PUFA 33.48 ± 0.52 30.46 ± 0.85 HH 25.83 ± 0.42 TTT 25.83 ± 0.34 TTT
Muscle SFA 27.21 ± 0.90 29.74 ± 0.67 41.47 ± 0.71 TTT 40.89 ± 1.23 TTT
MUFA 35.55 ± 1.12 35.38 ± 0.96 21.34 ± 0.77 TTT 22.48 ± 0.78 TTT
PUFA 37.23 ± 1.74 34.88 ± 0.89 37.19 ± 1.13 36.63 ± 0.96
Liver
SFA 30.42 ± 0.99 31.83 ± 1.01 35.79 ± 0.93 TTT 35.85 ± 0.91 TT
MUFA 33.47 ± 1.86 34.72 ± 1.22 28.93 ± 1.38 30.77 ± 1.82
PUFA 36.10 ± 1.17 33.45 ± 1.15 35.28 ± 0.69 33.38 ± 1.07

46
2.4. Discussion
Goldfish exposed to several weeks of severe hypoxia suppress metabolic rate by
74% (at 13oC) and 63% (at 20oC) (Fig. 2.1). This study is the first to show that
prolonged in vivo exposure to low oxygen can cause membrane remodelling. At low
temperature, chronic hypoxia triggers extensive restructuring of membrane lipids in all
tissues measured except the brain. These membrane responses involve changes in
cholesterol and fatty acid composition. The observed hypoxia-driven increases in
cholesterol (in white muscle and gills) and increases in fatty acid saturation (in gills and
liver, mainly due to lower %22:6) are consistent with well characterized inhibition
mechanisms of key ATPases. By contrast, hypoxia does not affect the lipid composition
of membranes in warm-acclimated animals.
2.4.1. Membrane cholesterol responds to hypoxia at low temperature
At 13oC, hypoxia causes large tissue-specific changes in membrane cholesterol
that increases in white muscle (+92%) and in the gills (+81%) (Fig. 2.2A). These
responses are intriguing because boosting relative membrane cholesterol generally
inhibits integral proteins. The activities of [Ca2+, Mg2+]-ATPase (Ortega and Mas-Oliva,
1984), Ca2+-ATPase (Li et al., 2004; Madden et al., 1981) and Na+/K+-ATPase (Crockett
and Hazel, 1997; Kimelberg and Papahadjopoulos, 1974; Yeagle, 1983) are all
downregulated by incorporating more cholesterol in the membrane. Adding cholesterol
may inhibit ATPases by modifying bulk membrane properties and/or through direct
molecular interaction with the proteins. For example, it could decrease overall
membrane fluidity, thereby hindering the conformational changes necessary for ion
pumping (Li et al., 2004; Madden et al., 1981; Mas-Oliva and Santiago-Garcia, 1990).

47
Cholesterol could also interact directly with the hydrophobic domains of ATPases to
lower their activity (Bastiaanse et al., 1997; Madden et al., 1981). The exact mechanism
of cholesterol action is presently unknown, but any inhibition of ion pumps reduces
overall energy expenditure and could therefore contribute to metabolic suppression. It is
also possible that some hypoxia-induced increases in cholesterol abundance observed
here are associated with the formation of lipid rafts (Dietrich et al., 2001; Simons and
Sampaio, 2011). Lipid rafts can include proteins such as glycosylphosphatidylinositol-
anchored proteins, palmitoylated transmembrane proteins (Brown and London, 1998)
as well as Ca2+-ATPase (Sepúlveda et al., 2006), but not Na+/K+-ATPase (Eckert et al.,
2003; Martens et al., 2000). Raft proteins could be bound to cholesterol which might
impact protein conformation and function (Simons and Sampaio, 2011). This could
possibly cause a decrease in protein activity and, subsequently, a reduction in MO2. It
has also been shown that increasing cholesterol decreases membrane permeability to
oxygen in some mammalian cells (Dotson et al., 2017; Subczynski et al., 1991). If
goldfish membranes were to behave similarly, the cholesterol increase seen in muscle
and gill could potentially assist metabolic suppression.
Unlike muscle and gill, the liver shows a decrease in membrane cholesterol
during hypoxia (-46%) that could activate some hepatic ATPases (Bastiaanse et al.,
1997). However, it is also conceivable that this tissue uses a different strategy to
suppress metabolism in hypoxia. Protein synthesis is another energy-costly process
(Rolfe and Brown, 1997) that is downregulated in the liver of hypoxic goldfish by
stimulating AMP- activated protein kinase (AMPK) (Jibb and Richards, 2008). This
stimulation of AMPK is associated with the phosphorylation and, thus, inactivation of

48
eukaryotic elongation factor-2 that inhibits protein synthesis. In goldfish, this AMPK
response is only observed in the liver (not in muscle, brain or gill), and it suppresses
other ATP-consuming processes such as cholesterol synthesis (Hardie et al., 2003).
Therefore, AMPK modulation could explain why cholesterol abundance is decreased in
the hepatic membranes of hypoxic goldfish (Fig. 2.2A). It should also be noted here that
the effects of cholesterol are rather complex and that, in some cases, optimal levels of
the sterol can yield maximal Na+/K+-ATPase activity. However, this was mostly
observed in artificial lipid bilayers that may not reflect the behavior of real biological
membranes. In such reconstituted systems, increasing or decreasing cholesterol from
the optimum can cause inhibition of Na+/K+-ATPase (Cornelius, 1995; Garcia et al.,
2019).
Finally, membrane cholesterol did not respond to chronic hypoxia in goldfish
brain. This could be because membrane lipids do not generally seem to respond as
strongly to a variety of stresses in the brain as in other tissues. Seasonal changes did
not have any effect on membrane cholesterol and phospholipid composition in frog
brains (Reynolds et al., 2014). Furthermore, (Buda et al., 1994) tested several fish
species and showed that brain phospholipids do not respond to temperature. (Hulbert
and Else, 1999) also suggested that slowing membrane processes down in the brain via
changes in membrane lipids could be disadvantageous as it might decrease overall
behavioural responsiveness. This could be important for goldfish because they stay
active during hypoxia rather than becoming comatose like turtles.

49
2.4.2. Membrane fatty acids respond to hypoxia at low temperature
At 13oC, prolonged hypoxia increases membrane saturation (decreases DBI) and
mean acyl chain length in gill and liver (Figs. 2.3 and 2.4). The changes in DBI should
affect membrane fluidity (Hazel, 1995; Raynard and Cossins, 1991) and may reduce the
activity of membrane proteins (Harayama and Riezman, 2018). This decrease in DBI,
coupled with the increase in cholesterol, also strengthens the possibility of lipid raft
formation in the gills (Dietrich et al., 2001; Simons and Ikonen, 1997). More specifically,
results show that gill membranes alter their bulk properties through decreases in several
PUFAs: 20:5 (-16.5%), 22:5 (-31%) and 22:6 (-17%) (Fig. 2.5A). Liver membranes
achieve the same overall decrease in DBI through large reductions in 20:4 (-35%) and
22:6 (-23%) that overturn the smaller effect of an increase in 18:2 (+21%) (Fig. 2.5B).
The observed reductions in gill and liver 22:6 are particularly interesting because this
acid is a known activator of Na+/K+-ATPase, even though its exact mechanism of action
is presently unclear (Calhoon et al., 2015; Turner et al., 2005). The hypoxia-induced
decrease in liver 22:6 (Fig. 2.5B) could inhibit Na+/K+-ATPase particularly strongly
because: (1) this mechanism is amplified in membranes that lack cholesterol (Cornelius,
2008), and (2) liver membranes have a particularly low intrinsic cholesterol abundance
that is further reduced by hypoxia (Fig. 2.2A). Prolonged hypoxia also decreases mean
fatty acid chain length in gill and liver (Fig. 2.4A). Such a change can affect protein
activity by altering membrane thickness, thereby altering how well the width of the lipid
bilayer matches the size of integral proteins (Lee, 2004; Lee, 2011). For instance, the
activity of sarcoplasmic reticulum calcium-ATPase (SERCA) can be modulated by
manipulating the length of acyl carbon chains in artificial membranes (Gustavsson et al.,

50
2011). Therefore, the decrease in chain length observed here in hypoxia could inhibit
ATPases and further reduce energy use.
2.4.3. Homeoviscous responses of membrane lipids to temperature
Thermal acclimation is known to elicit a homeoviscous response (Crockett, 1998;
Hazel, 1995) and differences between the 2 temperature groups reported here are
generally consistent with the maintenance of normal membrane fluidity. The exact
remodelling mechanism is tissue specific and involves changes in fatty acid
composition, cholesterol abundance, or both. Overall, the transition from 13oC to 20oC
causes changes in cholesterol (Fig. 2.2), a decrease in DBI (Fig. 2.3), and an increase
in mean acyl chain length (Fig. 2.4). Cholesterol stabilizes membranes by protecting
them from sudden phase transitions (Zehmer and Hazel, 2004) and it plays an
important role in preserving lipid raft integrity (Zehmer and Hazel, 2005). This is why the
effects of changes in cholesterol on fluidity are difficult to predict because they depend
on temperature and on the intrinsic abundance of the sterol in each tissue. This may
explain why acclimation to higher temperature causes a cholesterol increase in gill and
liver, but a decrease in muscle. The restructuring of membrane PL observed here in
goldfish causes a decrease in fluidity to counteract the fluidizing effects of high
temperature as previously reported for a variety of ectotherms (Harayama and
Riezman, 2018). As expected, goldfish decrease DBI (in brain, gill and muscle; Fig. 2.3)
and increase mean acyl chain length (in gill, muscle and liver; Fig. 2.4) during warm
acclimation.

51
2.4.4. Lowering metabolic rate to save energy
Metabolic suppression occurs in response to low environmental oxygen (Boutilier
and St-Pierre, 2000; Buck et al., 1993), low temperature (Campbell et al., 2008) and
fasting (Young and Landsberg, 1977). This important strategy to cope with hypoxia is
therefore routinely used by animals such as goldfish (Van Waversveld et al., 1989),
turtles (Buck et al., 1993), pelagic crabs (Seibel et al., 2017), naked mole-rats
(Pamenter et al., 2015) and squids (Seibel et al., 2014). I show that acclimation to
hypoxia elicits deep metabolic suppression in the goldfish (Fig. 2.1). Four weeks of
severe hypoxia reduce metabolic rate by 63% in 20oC animals and 74% in 13oC fish.
These results are consistent with the decreases previously reported for short term
hypoxic stress (53 to 59% at 20oC) (van Ginneken et al., 2004; Van Waversveld et al.,
1989).
In these experiments, normoxic fish ate the same amount as the hypoxic fish fed
ad libitum. Because caloric requirements of the normoxic fish were higher (no metabolic
suppression), it could be argued that they were underfed, leading to lower metabolic
rates due to food restriction. If this was the case, measured metabolic suppression of
63% (20oC) and 74% (13oC) may be underestimates of true values. This study reveals
that goldfish undergo the strongest metabolic suppression at low temperature and after
prolonged hypoxia, when they decrease MO2 by 94% compared to normoxic fish
acclimated to the higher temperature (Fig. 2.1). It could be argued that this extremely
low metabolic rate can only be achieved through the combined effects of multiple
mechanisms that may include ATPase inhibition through membrane remodelling.
Interestingly, membrane lipids only respond to hypoxia at 13oC, but only show little

52
change at 20oC. This could be explained if the homeoviscous adjustments needed to
survive at 20oC were to make the membrane response to hypoxia difficult or impossible.
Such a scenario appears unlikely because I could not identify any specific cholesterol or
FA responses where temperature and hypoxia acclimation would interfere with each
other.
2.5. Conclusions
When exposed to prolonged hypoxia, goldfish have the capacity for deep metabolic
suppression (Fig. 2.1). This study shows that cold-acclimated animals undergo
extensive, tissue-specific restructuring of membrane lipids (Figs. 2.2-2.5) as they reach
minimal metabolic rates. The experiments carried out here only provide general
information on total membrane composition of each tissue. The evidence found about
the effects of chronic hypoxia averaged over all membranes suggests that more
detailed analyses of individual membrane types within each tissue and of specific
membrane regions like lipid rafts will be productive avenues for future work. Hypoxia-
driven membrane remodelling involves changes in cholesterol abundance and fatty acid
composition of phospholipids as classically observed during homeoviscous adjustments
to temperature. By contrast, hypoxia fails to modify the membranes of warm-acclimated
fish, and this could make survival more challenging in a warmer future. At low
temperature, the most prominent changes caused by chronic hypoxia are increases in
cholesterol (an inhibitor of ATPases) and decreases in 22:6 (a well characterized
activator of ATPases). Because ion pumping by membrane-bound ATPases accounts
for a large fraction of total energy use in resting tissues, I propose that the membrane

53
responses reported here in cold-acclimated animals could be a novel mechanism to
promote metabolic suppression.

54
Chapter 3
Naked mole-rats suppress energy metabolism and
modulate membrane cholesterol in chronic hypoxia
Based on a manuscript by the same title
Written by
Elie Farhat, Maiah Devereaux, Matthew Pamenter and Jean-Michel Weber
And published in
American Journal of Physiology-Regulatory, Integrative and Comparative Physiology
https://doi.org/10.1152/ajpregu.00057.2020
Statement of contribution: This work was performed alongside Maiah Devereaux. Maiah acclimated the naked mole-rats to their conditions and measured their metabolic rate, while I performed all the other measurements. These measurements include maximal enzymatic activities (PK, LDH, CS, CPT, HOAD and Na+/K+-ATPase) and the membrane lipid composition (cholesterol abundance and fatty acid composition of phospholipids). I also wrote the paper as first author and edited it with Dr. Weber.

55
3.1. Introduction
Hypoxia-tolerant organisms use metabolic suppression as a key strategy to cope
with reduced oxygen levels, which are otherwise deleterious to most animals (Bickler
and Buck, 2007; Richards, 2011; Seibel, 2011). The primary physiological mechanisms
that promote suppression include downregulating energy metabolism [tricarboxylic acid
(TCA) cycle, glycolysis, β-oxidation (Martínez et al., 2006; Solaini et al., 2010; Storey,
1997)] as well as major cellular consumers of ATP such as ion pumps (Hochachka,
1986). It has recently been suggested that membrane remodelling may play a role in the
overall inhibition of energy metabolism in hypoxic goldfish (Chapter 2). The lipid
composition of membranes affects the activity of integral proteins and could therefore
play a role in mediating metabolic suppression. For example, changes in cholesterol (a
modulator of Na+/K+-ATPase) and %docosahexaenoic acid (22:6 or DHA; an activator
of Na+/K+-ATPase) could be involved in reducing metabolic rate (Bastiaanse et al.,
1997; Harayama and Riezman, 2018). It has been recently shown that chronic hypoxia
causes extensive changes in the membrane lipid composition of goldfish (Chapter 2): a
hypoxia-tolerant vertebrate that utilizes significant metabolic rate depression to tolerate
severe hypoxia and anoxia (Regan et al., 2017). However, the plasticity of membrane
lipids in response to hypoxia has never been investigated in mammals.
Naked mole-rats (NMRs; Heterocephalus glaber, Linnaeus 1758), are fossorial
and hypoxia-tolerant mammals that live in poorly ventilated underground burrows where
temperatures are high (25-49oC) and oxygen levels are putatively hypoxic (Holtze et al.,
2018; Park et al., 2017). In laboratory conditions, acute exposure to a few hours of 3%
O2 causes an 85% decrease in metabolic rate (Pamenter et al., 2018): the strongest

56
suppression of metabolism among hypoxia-tolerant mole-rat species (Ivy et al., 2019).
However, it is unclear how NMRs cope with more chronic hypoxia.
Whereas the impact of hypoxia on membrane lipid composition is largely
unexplored in mammals, the effects of hypoxia acclimation on the activities of key
enzymes of energy metabolism have received more attention. For example, in rats,
mice, and high-altitude deer mice, hypoxia generally stimulates glycolysis (Daneshrad
et al., 2000; Dutta et al., 2009; Malthankar-Phatak et al., 2008; Pastoris et al., 1995),
and, apart from deer mice, downregulates β-oxidation (Cheviron et al., 2014; Dutta et
al., 2009; Galbes et al., 2008). Most investigations of TCA cycle enzymes suggest that
their activity is not modified by low oxygen (Cáceda et al., 2001; Cheviron et al., 2012;
Daneshrad et al., 2000; Galbes et al., 2008), although inhibition was observed in one
study (Solaini et al., 2010). Several reports also show that Na+/K+-ATPase activity is
decreased in the lungs of hypoxic rats (Carpenter et al., 2003; Mairbaurl et al., 1997;
Wodopia et al., 2000). However, none of these enzymes have been explored in the
hypoxia-tolerant NMR. Therefore, the goals of this study were to test the hypotheses
that during chronic hypoxia, NMRs: (i) downregulate key enzymes of TCA cycle,
glycolysis, and β-oxidation, (ii) inhibit Na+/K+-ATPase, and (iii) alter the composition of
membrane lipids concomitantly with metabolic suppression.
3.2. Methods
3.2.1. Animals
Adult NMRs (n = 37, body mass 45 ± 3.1 g; 2-5 years old) were group-housed in
interconnected multi-cage systems (30°C; 70% humidity; 12L:12D light cycle) and were
fed fresh tubers, vegetables, fruit and Pronutro cereal supplement ad libitum. All

57
experimental procedures were approved by the University of Ottawa’s Animal Care
Committee (protocol # 2535) in accordance with the Animals for Research Act and the
Canadian Council on Animal Care.
3.2.2. Experimental design
Subordinate animals were randomly allocated to respirometry experiments or
enzyme/membrane experiments. For each set of experiments, the animals were
randomly divided into normoxic controls and a hypoxic treatment group. Both groups
were placed in separate chambers with controlled, continuous air flow either normoxic
(21% O2; 0.04% CO2; balance N2) or hypoxic (11% O2; 0.04% CO2; balance N2) and
were kept under these conditions for 4-6 weeks. This duration was selected to provide
enough time for potential membrane restructuring, given that homeoviscous
adjustments to changes in environmental temperature can take 3 weeks in ectotherms
(Sellner and Hazel, 1982).
3.2.3. Whole-body respirometry
After normoxic or hypoxic acclimation, animals were individually placed
unrestrained into a 450 mL plexiglass respirometer, which was held inside a larger
environmental chamber held at 30°C. Animals were provided a thin layer of corn cob
bedding. The respirometer was continuously ventilated with gas mixtures set to the
desired fractional gas composition by calibrated rotameters (Krohne, Duisburg,
Germany). Inflowing gas was set at a flow rate of 100 mL min-1, determined using a
calibrated mass flow meter (Alicat Scientific, Tuscon, AZ, USA). The excurrent gas was
passed through a desiccant (Drierite, W.A. Hammond Drierite Co. Ltd., Xenia, OH)

58
before entering the cells of the CO2 and O2 analyzers (FC-10 O2 and CA-10 CO2
Analyzers, Sable Systems), which were used to determine the gas concentrations of
inspired and expired air. Before each trial the CO2 and O2 analyzers were calibrated
using 100% N2, compressed air (20.95% O2), and a span gas (1.5% CO2; balance N2).
The animals were placed in the respirometer for 1 h before measurements to familiarize
them with their new surroundings. Oxygen consumption (VO2) and carbon dioxide
production (VCO2) were then recorded for the next hour. VO2 and VCO2 measured
during the last 30 min (three 10-min intervals) of the recording period were averaged to
determine baseline values for each animal. For 5 min at the end of the recording period,
incurrent gas concentrations were measured by bypassing the experimental chamber
and diverting air flow directly to the CO2 and O2 analyzers. Body temperature was
recorded non-invasively every 10 min using an RFID microchip reader (Allflex USA Inc.,
Dallas, TX) to scan previously implanted RFID microchips (Destron Fearing, Langeskov,
Denmark). Normoxic controls (33.1 ± 0.13oC) and hypoxic animals (33 ± 0.12oC) had
the same body temperature. Chamber temperature was recorded every 2 seconds
using a custom designed thermocouple (range 29.8oC-30.2oC).
3.2.4. Enzyme assays
At the end of the experiments, NMRs were quickly euthanized by cervical
dislocation. Because different tissues do not always respond similarly to physiological
stresses, the brain, heart, liver, skeletal (temporalis) muscle and kidney were sampled
in < 2 min, immediately frozen in liquid N2 and stored at -80oC until analysis. All enzyme
activities were measured using a Spectra Max Plus384 Absorbance Microplate Reader
(Molecular Devices, Sunnyvale, CA). To measure the activities of key enzymes involved

59
in (i) glycolysis (pyruvate kinase (PK) and lactate dehydrogenase (LDH)), (ii) the
tricarboxylic acid cycle (citrate synthase (CS)) and (iii) β-oxidation (carnitine palmitoyl
transferase (CPT) and 3-hydroxyacyl CoA dehydrogenase (HOAD)), 50 mg of each
frozen tissue was weighed and homogenized on ice in 19 volumes of extraction medium
(25 mM Tris/HCl + 1 mM EDTA as well as 5 mM dithiothreitol (DTT), 0.05%
(volume/volume) Triton X-100 that were added on the day of the experiment to
complete the enzyme extraction). Homogenates were then centrifuged at 4oC at 2400g
for 5 min and the resulting supernatant was stored at -80oC until analysis. All assay
conditions were first optimized to give maximal rates with the skeletal muscle and, thus,
may not yield the maximal rate in all tissues. All homogenates were subjected to a
freeze/thaw cycle. Preliminary experiments were carried out to ensure that all substrate
and cofactor concentrations were saturating but not inhibitory. Control reactions
(containing no substrate) were run simultaneously for each enzyme to measure
background activity if present. All assays were run in triplicate at 32oC.
Assay conditions were as follows: PK: (A340; pH 7.35; (Zammit et al., 1978)): 0.17
mM NADH, 5 mM ADP, 80 mM KCl, 10 mM MgCl2, 5 mM phospho(enol)pyruvate (PEP)
(omitted from the control), excess coupling enzyme (LDH) in 160 mM
triethanolamine/HCl. LDH: (A340; pH 7.3; (Zammit and Newsholme, 1976)): 0.17 mM
NADH, 1 mM KCN, 2 mM pyruvate (omitted from the control) in 50 mM Tris/HCl. CS:
(A412; pH 8.1; (Alp et al., 1976)): 0.2 mM 5,5'-dithiobis-(2-nitrobenzoic acid) (DTNB), 0.1
mM acetyl-CoA, and 0.5 mM oxaloacetate (omitted from the control) in 50 mM Tris-HCl.
CPT: (A412; pH 8; (Guglielmo et al., 2002)): 0.15 mM DTNB, 0.035 mM palmitoyl CoA,
carnitine (omitted from the control) in 50 mM Tris. HOAD: (A340; pH 7.4; (Guglielmo et

60
al., 2002)): 0.2 mM NADH, 0.1 mM acetoacetyl-CoA (omitted from the control) in 50 mM
Imidazole + 1 mM EDTA. The measurements of CPT activity here most likely reflect the
behaviour of CPT2 because CPT1 is inactivated by freezing (McClelland et al., 2005).
The activity of Na+/K+-ATPase (A340) was measured by using a modified protocol
from (McCormick, 1993). Frozen tissue was weighed (~100 mg) and homogenized on
ice with a sonicator (Fisher Scientific Sonic Dismembrator model 100, San Diego, CA)
in a 4:1 SEI:SEID buffer (SEI: 250 mM sucrose, 10 mM EDTA, 42 mM imidazole, pH
7.3; SEID: 100 mL SEI + 0.5 g sodium deoxycholate). Homogenates were then
centrifuged at 10,000g for 5 min at 4oC and the resulting supernatant was directly used
in the assay. The assay was performed in quadruplicate (2 replicates contained 10 µL of
homogenate + 200 µL of assay solution A (50 mM imidazole, 2.8 mM PEP, 0.7 mM
ATP, 0.22 mM NADH, 5 mM PK and 4 mM LDH, pH 7.5) and 2 replicates contained 10
µL of homogenate + 200 µL of assay solution B (Solution A + 0.5 mM ouabain).
Ouabain was added to block Na+/K+-ATPase and measure any detectable ATP use not
associated with this enzyme. All enzyme measurements performed in this study provide
information on capacity for flux in different key pathways. Because enzyme Vmax was
measured under optimal in vitro conditions, the observed changes may not necessarily
reflect the effects of chronic hypoxia on in vivo fluxes.
3.2.5. Membrane lipid analyses
Total lipids were extracted from ~30 mg of each frozen tissue sample as
described previously (Maillet and Weber, 2006). Briefly, tissues were homogenized with
a Polytron (Kinematica AG, Luzern, Switzerland) and total lipids were extracted
twice in chloroform-methanol (2:1 v/v). After filtration, 0.25% KCl was added and the

61
mixture centrifuged to separate aqueous and organic phases. The aqueous phase
was discarded and the organic phase containing the lipids was dried on a rotating
evaporator (Büchi Rotavapor, Flawil,Switzerland). Following extraction and drying,
total lipids were resuspended in chloroform before being loaded on solid-phase
extraction columns (Supelclean 3 mL 500 mg LC-NH2; Sigma-Aldrich; St. Louis, MO,
USA). Neutral lipids, non-esterified fatty acids (FAs) and phospholipids (PLs) were
separated by sequential elution using solvents of increasing polarity:
chloroform:isopropanol (3:2 v/v), isopropyl ether:acetic acid (98:2 v/v), and methanol
(Maillet and Weber, 2006). Total PL concentration was determined by gas
chromatography as a measure of tissue membrane abundance by adding a PL internal
standard before solid-phase column separation (40 mg/100 mL phosphatidyl choline
17:0/17:0; Avanti Polar Lipids; Alabaster, AL, USA). The PL fraction was then used for
analysis of its FA composition, which was measured after acid transesterification in
acetyl chloride and methanol (90°C for 2 h). FA methyl esters were analyzed on an
Agilent Technologies 6890N gas chromatograph (Mississauga, Ontario, Canada)
equipped with a flame-ionization detector and a fused silica capillary column (Supelco
DB-23, 60m, 0.25 mm i.d., 0.25 μm film thickness; Sigma Aldrich), using hydrogen as
carrier gas. The following conditions were used during analysis: (i) oven temperature
was programmed for 1 min at 130°C and raised up to 170°C at a rate of 6.5°C min-1,
then up to 215°C at 2.75°C min-1, and maintained at 215°C for 12 min, then up to 230°C
at 40°C min-1, and maintained at 230°C for 3 min, (ii) injector temperature was 270°C
using a 50:1 split ratio, and (iii) detector temperature was 280°C. Individual FAs were

62
identified by determining exact retention times with pure standards (Supelco, Bellefonte,
PA, USA). Only the FAs accounting for >1% of total FAs in total PLs are reported.
Membrane cholesterol was measured as non-esterified (free) cholesterol in ~30
mg of tissue. Each tissue was homogenized in chloroform:methanol (2:1 v/v).
Separation of aqueous and organic phases was achieved by adding 2 M KCl / 5 mM
EDTA before centrifugation (10 min at 3,000g). The organic phase was dried under N2,
resuspended in 2-methoxyethanol, and cholesterol was measured by fluorometry
(SpectraMax Gemini XS, Molecular Devices, Sunnyvale, California, USA) using a
commercial assay kit (Cayman Chemical, Ann Arbor, Michigan, USA). This kit was
selected because it allows the measurement of membrane (free, non-esterified)
cholesterol separately from cholesterol esters that are only found outside membranes.
3.2.6. Calculations and statistics
Respirometry data were collected using LabChart software and analyzed in
PowerLab (AD Instruments, Colorado Springs, CO). Using these measurements, VO2
was then calculated using equation 10.6 in (Lighton, 2018): VO2 = FRi [(FiO2 – FeO2) –
FeO2 (FeCO2 – FiCO2)]/(1 – FeO2). Also, VCO2 was calculated using equation 10.7 in
(Lighton, 2018): VCO2 = FRi [(FeCO2 – FiCO2) – FeO2 (FiO2 – FeO2)]/(1 – FeCO2). In
both equations FRi is the incurrent flow rate (mL min-1), FiO2 and FiCO2 are the
fractional concentrations of incurrent O2 and CO2 of dry gas, and FeO2 and FeCO2 are
the fractional concentrations of excurrent O2 and CO2 from the experimental chamber.
Total PL concentration was calculated as follows: [PL] = [Σ ((area under the curve of
individual FA) * (PL 17:0/17:0 internal standard concentration)) / (individual FA molar
weight)] / 2. The double bond index (DBI) of membranes was calculated as the average

63
number of double bonds in PLs divided by percent saturated fatty acids. Absolute
concentration of membrane cholesterol in a tissue (expressed in µmol g-1) is not
indicative of the relative amount of cholesterol in membranes if treatment causes
changes in membrane abundance. To address this problem, relative cholesterol
concentration was calculated as moles of cholesterol per mole of PL and expressed as
a unitless ratio (Yeagle et al., 1988). Statistical analyses were performed using
SigmaPlot 12.5 (Systat, San Jose, CA, USA). Normoxic and hypoxic animals were
compared using a two-tailed t-test. Normality was assessed using the Shapiro-Wilk test
and homoscedasticity by the Levene test. When the assumptions of normality or
equality of variances were not met, the data were normalized by log10 or square root
transformation. If transformation was unsuccessful, non-parametric Mann-Whitney U
test was performed. Values presented are means ± SE, and a level of significance of
P<0.05 was used in all tests.
3.3. Results
3.3.1. Metabolic rate
Chronic hypoxia decreased VO2 by 34% and VCO2 by 33% (P<0.01) (Fig. 3.1).

64
Me
tabo
lic r
ate
(m
l O
2 o
r C
O2 m
in-1
kg
-1)
0
10
20
30
Normoxia
Hypoxia
.
.
****
VO2
.VCO2
.
Figure 3.1. Metabolic rates of normoxic controls and hypoxia-acclimated naked mole-
rats. Oxygen consumption (VO2) and carbon dioxide production (VCO2) are presented.
Values are means ± SE (N=9 in normoxia and N=7 in hypoxia). Significant effects of
hypoxia are indicated as ** (P<0.01).
3.3.2. Enzyme activities
Glycolysis
Observed changes in PK and LDH activities suggest that glycolytic capacity was
reduced by hypoxia (Figs. 3.2A and 3.2B). PK activity was strongly downregulated by
chronic hypoxia and this response was observed in all tissues (Fig. 3.2A; P<0.01). LDH
activity decreased in liver and muscle (P<0.001), increased in kidney (P<0.01), and was
unchanged in brain and heart (P>0.05) (Fig. 3.2B). Overall, enzyme activities calculated

65
per gram tissue or per gram protein were affected very similarly and lead to the same
conclusions apart from LDH in brain and kidney (see Table 3.1).
TCA cycle
CS activity was decreased in brain (P<0.01), liver (P<0.01) and muscle
(P<0.001). It was almost doubled in heart (P<0.001), but remained unchanged in kidney
(P>0.05) (Fig. 3.2C). Results were relatively similar when correcting per gram protein
except for a decrease in kidney CS activity per gram protein (Table 3.1).
Beta oxidation
β-oxidation capacity was reduced in liver and muscle where the activities of CPT
(Fig 3.2D) and HOAD (Fig. 3.2E) were downregulated by hypoxia (P<0.01 or P<0.001).
These same enzymes were not affected in brain, heart and kidney (P>0.05).
Standardizations per g tissue and per g protein showed the same effects of hypoxia on
CPT and HOAD (Table 3.1).

66
0
500
1000
1500
*** ***
**
**
***
Ma
xim
al a
ctivity (
mo
l min
-1 g
-1)
0
400
800
1200
***
*** **
0
16
32
48
Normoxia
Hypoxia
******
Brain Heart Liver Muscle Kidney
0
120
240
360
***
**
Brain Heart Liver Muscle Kidney
0
80
160
240
** ***
**
***
PK
CPT
HOADLDH
CS
A
EB
D
C
Figure 3.2. Maximal enzymatic activity per gram tissue of (A) pyruvate kinase (PK), (B)
lactate dehydrogenase (LDH), (C) citrate synthase (CS), (D) carnitine palmitoyl
transferase (CPT) and (E) 3-hydroxyacyl CoA dehydrogenase (HOAD) in the tissues of
normoxic controls and hypoxia-acclimated naked mole-rats. Values are means ± SE
(N=12 in normoxia and N=9 in hypoxia). Significant effects of hypoxia are indicated as
** (P<0.01) and *** (P<0.001).

67
Table 3.1. Effects of chronic hypoxia on the activities of key enzymes of energy
metabolism (standardized either per gram tissue or per gram protein) in various tissues
of naked mole-rats (N=12 in normoxia and N=9 in hypoxia). Significant effects of
hypoxia are indicated as * (P<0.05), ** (P<0.01) and *** (P<0.001), and presented as
percent differences between treatments. No effect of hypoxia is indicated by NS
(P>0.05).
PK
LDH CS CPT HOAD
/gtissue /µgprotein /gtissue /µgprotein /gtissue /µgprotein /gtissue /µgprotein /gtissue /µgprotein
Brain -89%***
-97%*** NS -73%*** -25%** -76%*** NS NS NS NS
Heart -93%***
-90%*** NS NS +94%*** +115%*** NS NS NS NS
Liver -99%***
-99%*** -73%***
-82%*** -36%** -57%** -89%** -98%** -69%***
-80%***
Muscle -61%** -79%** -62%***
-80%*** -59%*** -78%*** -96%***
-98%** -86%** -93%***
Kidney -90%** -96%** +81%** NS NS -56%*** NS NS NS NS

68
Na+/K+-ATPase
Hypoxia downregulated Na+/K+-ATPase in the brain, but upregulated it in liver
(P<0.05) without affecting muscle and heart (P>0.05) (Fig. 3.3).
Brain Heart Liver Muscle
Na
+/K
+ A
TP
ase
activity (
nm
ol A
DP
h-1
g-1
)
0
300
600
900
1200 Normoxia
Hypoxia
*
*
6
9
9 9
9
10
10
10
Figure 3.3. Na+/K+-ATPase activity per gram tissue in the tissues of normoxic controls
and hypoxia-acclimated naked mole-rats. Values are means ± SE Sample sizes are
indicated on the figure. Significant effects of hypoxia are indicated as * (P<0.05).
3.3.3. Membrane lipids
Hypoxia caused large changes in cholesterol abundance in all tissues. Relative
cholesterol increased in heart, muscle (P<0.05) and kidney (P<0.01), it decreased in
brain (P<0.05) and liver (P<0.001) (Fig. 3.4). The effects of hypoxia acclimation on the
total PL content per gram tissue (an index of membrane abundance in [PL]/g), the DBI,

69
and the absolute concentration of saturated (SFA), monounsaturated (MUFA), and
polyunsaturated fatty acids (PUFA) of NMR membranes are shown in Table 3.2.
Hypoxia elicited a decrease in DBI in liver, but an increase in muscle without affecting
the other tissues. There was an increase in [PL] in brain and liver, but a decrease in
muscle. Chronic hypoxia had no effect on the PL concentration of heart and kidney.
%SFA increased in liver, decreased in muscle, but did not change in the other tissues.
%MUFA did not change in all tissues except liver where it decreased. %PUFA
decreased in liver and kidney, increased in muscle, but did not change in the other
tissues (Table 3.2). Surprisingly, NMR membranes of all tissues only contained trace
amounts of 22:6 in both normoxic and hypoxic animals (see Figs. 1-5 in appendix B).
Brain Heart Liver Muscle Kidney
Cho
leste
rol / p
ho
sp
ho
lipid
(m
ole
:mo
le)
0.00
0.01
0.02
0.03
0.04 Normoxia
Hypoxia
*
**
***
*
*
Figure 3.4. Relative membrane cholesterol levels in the tissues of normoxic controls and
hypoxia-acclimated naked mole-rats. Values are means ± SE (N=12 in normoxia and
N=9 in hypoxia). Significant effects of hypoxia are indicated as * (P<0.05), ** (P<0.01)
and *** (P<0.001).

70
Table 3.2. Relative effects of chronic hypoxia on the membrane phospholipids of naked
mole-rat tissues. Double bond index (DBI), phospholipid/gtissue (PL/g), saturated fatty
acids (SFA), monounsaturated fatty acids (MUFA) and polyunsaturated fatty acids
(PUFA) are indicated separately. Absolute concentrations of PL and FAs in moles per
gram tissue (see Table 1 in appendix B) were used to calculate the percent changes
presented. Values are means ± SE (N=12 in normoxia and N=9 in hypoxia). Significant
effects of hypoxia are indicated as * (P<0.05), ** (P<0.01) and *** (P<0.001). No effect
of hypoxia is indicated by NS (P>0.05).
3.4. Discussion
Several weeks of hypoxia cause a 34% decrease in the metabolic rate of NMRs
(Fig. 3.1). I show that this suppression occurs simultaneously with a major decrease in
the capacity for energy metabolism, the downregulation of brain Na+/K+-ATPase, and
widespread changes in membrane lipids. Chronic hypoxia decreases the activities of
key enzymes in glycolysis, the TCA cycle and the β-oxidation pathway, but also induces
important changes in the relative abundance of membrane cholesterol in all tissues.
Together, these changes in protein activities and membrane composition may reflect a
coordinated physiological response to hypoxia, although a clear functional link between
membrane changes and enzyme downregulation could not be established in this study.
DBI PL/g SFA MUFA PUFA
Brain NS +18%** NS NS NS
Heart NS NS NS NS NS
Liver -23%* +50%** +24%* -43%*** -12%*
Muscle +22%* -28%*** -27%* NS +11%*
Kidney NS NS NS NS -5%*

71
Nevertheless, this is the first demonstration that hypometabolic NMRs alter the lipid
composition of their membranes in response to chronic in vivo exposure to hypoxia.
3.4.1. Metabolic suppression in hypoxia
The degree of metabolic rate suppression observed after 4 weeks at 11% O2 is
consistent with the only previous report of NMR metabolic rate measured during chronic
hypoxia (25-33% reduction after 10 days at 8% O2) (Chung et al., 2016). More
information is available for acute exposure of a few hours only. NMRs rapidly exposed
to progressive hypoxia from 9 to 3% O2 experience a stepwise decrease in metabolic
rate, with the strongest suppression occurring at the lowest oxygen level (55% decrease
in MO2 at 9% O2, but a more than 80% decline at 3% O2) (Pamenter et al., 2019). In
addition to tolerating extremely low oxygen, NMRs have the capacity to survive in
complete anoxia for up to 18 min (Park et al., 2017). However, the goal of this study
was not to examine the effects of anoxia (when reliance on anaerobic glycolysis
becomes essential for survival), but to characterize those of chronic hypoxia on aerobic
metabolism.
3.4.2. Downregulation of glycolysis
Chronic hypoxia causes large tissue-specific changes in the activities of the
glycolytic enzymes PK and LDH (Table 3.1; Figs. 3.2A and 3.2B). The general
downregulation of PK suggests that glycolytic capacity is reduced, but this enzyme
shares flux control with phosphofructokinase and hexokinase that were not measured
here. If PK behaviour is indicative of overall changes in pathway capacity, NMRs
respond very differently than hypoxic rats (Daneshrad et al., 2000; Dutta et al., 2009;

72
Malthankar-Phatak et al., 2008; Pastoris et al., 1995), mice (Cáceda et al., 2001) and
deer mice (Cheviron et al., 2012; Lau et al., 2017), who either activate or do not
modulate glycolysis in hypoxia. Conversely, NMRs respond by downregulating the
glycolytic supply of pyruvate to the TCA cycle. In NMRs, the strong downregulation of
PK observed in all tissues (61-99% decrease in activity; Fig. 3.2A) would concomitantly
slow the aerobic production of ATP. The 62-73% downregulation of LDH observed in
liver and muscle also shows that NMRs do not rely on anaerobic metabolism at this
level of hypoxia (Fig. 3.2B). This is perhaps not surprising because the anaerobic use of
total carbohydrate reserves could only last minutes to hours, not several weeks. A
recent study reported that NMRs store more cardiac glycogen than mice (Faulkes et al.,
2019), and this observation was interpreted as an indication that cardiac glycolysis is
activated in hypoxia. The results presented here do not support this idea because heart
PK activity is strongly decreased (Fig. 3.2A), suggesting that glycolysis is
downregulated rather than upregulated, at least in chronic hypoxia. Hypoxic NMRs can
afford to slow down glycolysis because they rely on the suppression of aerobic
metabolism that likely spares small carbohydrate stores and minimizes the
accumulation of anaerobic end-products.
3.4.3. Effects of chronic hypoxia on citrate synthase
In concert with the downregulation of glycolysis, the activity of CS is decreased in
NMR brain, liver and muscle (25-59%) (Fig. 3.2C). These responses were not observed
in chronically hypoxic rats (Daneshrad et al., 2000; Galbes et al., 2008), mice (Cáceda
et al., 2001) or deer mice (Cheviron et al., 2012; Lau et al., 2017), which instead
maintain normoxic CS activity. Sustaining aerobic ATP supply from the TCA cycle

73
becomes problematic when oxygen is scarce, and NMRs can afford to downregulate
this pathway because ATP demand is lowered by metabolic suppression. Tissue CS
activity can be modulated by changing mitochondrial density to adjust enzyme
abundance (DiMauro and Moraes, 1993). This is supported here because acute hypoxia
has no effect on CS activity in NMR brains (Pamenter et al., 2018), whereas chronic
hypoxia downregulates the enzyme (this study; Fig. 3.2C); and a few hours of acute
hypoxia does not provide sufficient time to alter mitochondrial density.
In contrast to other tissues, activity is upregulated by chronic hypoxia in NMR
heart (94%; Fig. 3.2C), indicating that the TCA cycle is stimulated in this organ. The
utility of this response is not intuitively obvious; however, similar responses have been
observed in the hearts of other animals such as high-altitude Andean mice (Schippers
et al., 2012) and sablefish (Gerber et al., 2019). It is possible that activating the TCA
cycle in this key organ is necessary because cardiac output must be increased to
compensate for the decreased arterial O2 saturation caused by hypoxia. However, such
a scenario is not consistent with lower heart rate during acute hypoxia (Pamenter et al.,
2019), although it is unclear whether more chronic hypoxia could have the opposite
effect on heart rate. Taken together, CS upregulation and PK downregulation suggest
that the chronically hypoxic NMR heart switches to using more lipids and less
carbohydrates, thus increasing its reliance on acetyl-CoA from β-oxidation rather than
glycolysis. Such a change in fuel selection precludes NMR hearts from taking
advantage of the 10-25% higher ATP yield per mole O2 provided by carbohydrates over
lipids (Hochachka et al., 1991; Hutter et al., 1985; McClelland et al., 1998) and it has
also been reported for various cardiac pathologies (Kolwicz and Tian, 2011). Here, this

74
response is consistent with the idea that the higher cardiac glycogen reserves of NMR
(Faulkes et al., 2019) are used for acute and severe hypoxia, rather than for coping with
chronic low oxygen stress. These observations suggest that metabolically-suppressed
NMRs can survive at 11% O2 without harnessing all the oxygen-saving mechanisms
available to them.
3.4.4. Tissue-specific downregulation of β-oxidation
Chronic hypoxia causes the downregulation of the β-oxidation enzymes CPT
(Fig. 3.2D) and HOAD (Fig. 3.2E) in most tissues except the heart and kidney. These
findings agree with previous studies in rats (Daneshrad et al., 2000; Dutta et al., 2009;
Galbes et al., 2008) and mice (Morash et al., 2013), but not high altitude deer mice in
which either increased (Cheviron et al., 2012; Cheviron et al., 2014) or sustained HOAD
activity has been reported (Lau et al., 2017). Reducing flux through β-oxidation logically
follows the downregulation of: (i) the other main pathways of energy metabolism
(glycolysis and TCA cycle), and (ii) multiple ATP-utilizing processes (overall metabolic
suppression) observed in most NMR tissues. The absence of a change in the β-
oxidation pathway in brain, kidney and heart may be related to the potentially higher
energy demands of these critical organs. More research will be needed to examine the
underlying physiological reasons why some tissues maintain β-oxidation and others do
not.
3.4.5. Na+/K+-ATPase activity is downregulated in NMR brains
Chronic hypoxia reduces Na+/K+-ATPase activity in NMR brain (77%), but not in
muscle, liver or heart (Fig. 3.3). This localized response may be a conserved adaptation

75
shared by hypoxia-tolerant organisms because similar changes also occur in anoxic
turtle brain (Hylland et al., 1997), but not in chronically hypoxic mice (Cáceda et al.,
2001). The brain is highly metabolically active (accounting for ~20% of whole-body
metabolic rate in NMRs (Gesser et al., 1977)), and uses ~60% of its total ATP supply for
pumping ions to ensure normal electric activity. The brain relies on Na+/K+-ATPase to
maintain Na+ and K+ gradients and, indirectly, to regulate the transport of Ca2+ and
neurotransmitters (Erecińska and Silver, 1994). Any failure of this pump in hypoxia-
sensitive neurons leads to a spike in intracellular calcium concentration that can
eventually cause cell death (Hochachka, 1986). The robust reduction of Na+/K+-ATPase
activity observed here in NMR brains must occur together with a decrease in ion
channel leak, so that ATP supply and demand can remain in balance (Bickler and Buck,
1998; Boutilier and St-Pierre, 2000). However, the potential inhibition of ion channels in
the hypoxic NMR brain has not been explored.
3.4.6. Changes in membrane composition caused by chronic hypoxia
This study is the first to demonstrate that in vivo exposure to chronic hypoxia can
alter the composition of membrane lipids in mammals. It is unclear whether such
changes only occur in hypoxia-tolerant species or if it is a general mammalian
response. In NMRs, chronic hypoxia caused widespread changes in the membrane
cholesterol abundance of all tissues. This result is intriguing because studies on artificial
membranes (Garcia et al., 2019; Yeagle et al., 1988) and on manipulated fish
membranes (Crockett and Hazel, 1997) show that changes in intrinsic, baseline
cholesterol generally downregulates Na+/K+-ATPase: possibly contributing to metabolic
suppression. NMR brains may use this mechanism because a large decrease in
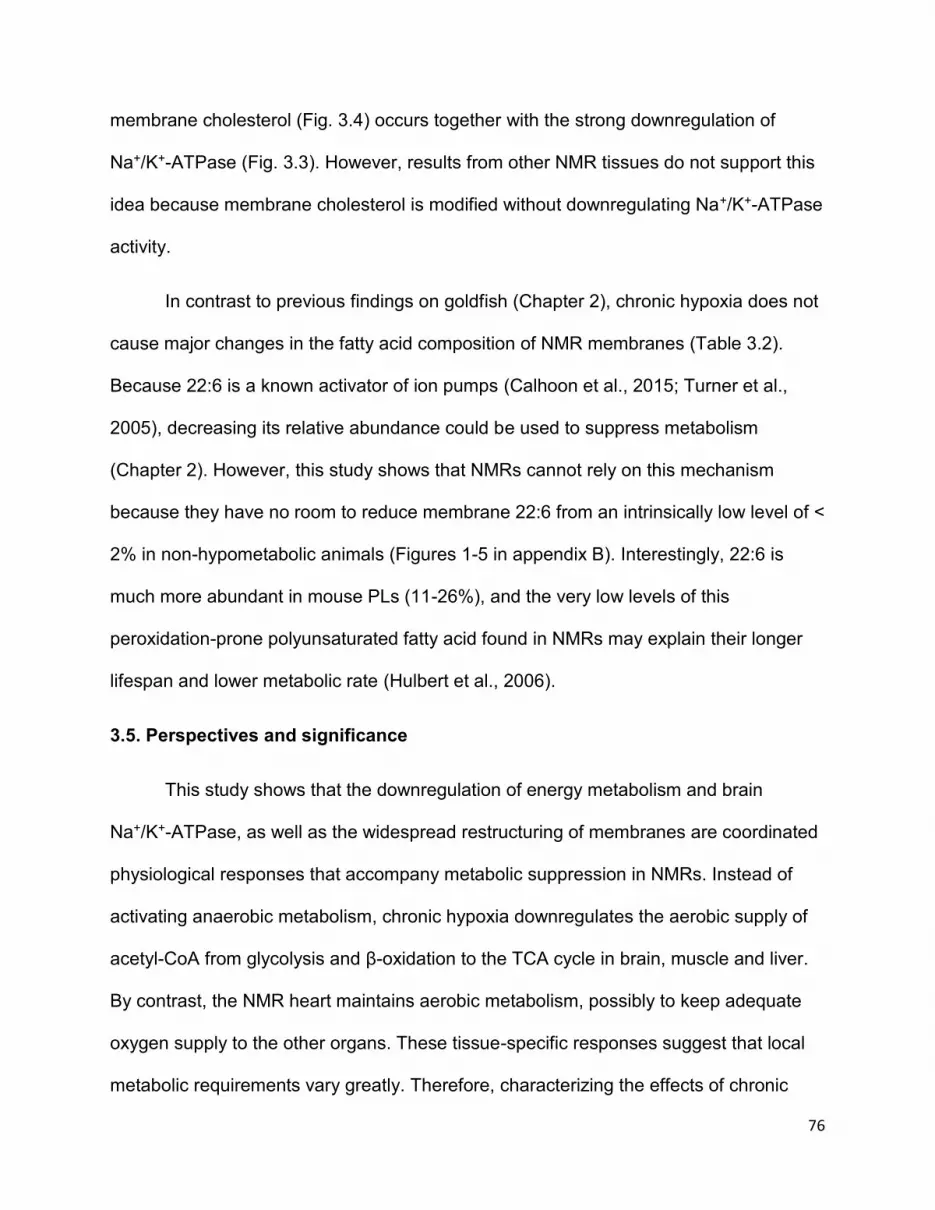
76
membrane cholesterol (Fig. 3.4) occurs together with the strong downregulation of
Na+/K+-ATPase (Fig. 3.3). However, results from other NMR tissues do not support this
idea because membrane cholesterol is modified without downregulating Na+/K+-ATPase
activity.
In contrast to previous findings on goldfish (Chapter 2), chronic hypoxia does not
cause major changes in the fatty acid composition of NMR membranes (Table 3.2).
Because 22:6 is a known activator of ion pumps (Calhoon et al., 2015; Turner et al.,
2005), decreasing its relative abundance could be used to suppress metabolism
(Chapter 2). However, this study shows that NMRs cannot rely on this mechanism
because they have no room to reduce membrane 22:6 from an intrinsically low level of <
2% in non-hypometabolic animals (Figures 1-5 in appendix B). Interestingly, 22:6 is
much more abundant in mouse PLs (11-26%), and the very low levels of this
peroxidation-prone polyunsaturated fatty acid found in NMRs may explain their longer
lifespan and lower metabolic rate (Hulbert et al., 2006).
3.5. Perspectives and significance
This study shows that the downregulation of energy metabolism and brain
Na+/K+-ATPase, as well as the widespread restructuring of membranes are coordinated
physiological responses that accompany metabolic suppression in NMRs. Instead of
activating anaerobic metabolism, chronic hypoxia downregulates the aerobic supply of
acetyl-CoA from glycolysis and β-oxidation to the TCA cycle in brain, muscle and liver.
By contrast, the NMR heart maintains aerobic metabolism, possibly to keep adequate
oxygen supply to the other organs. These tissue-specific responses suggest that local
metabolic requirements vary greatly. Therefore, characterizing the effects of chronic

77
hypoxia on the metabolic capacity and fuel preference of isolated mitochondria from
different tissues may be a productive avenue for future research. Hypoxia-induced
changes in membrane lipids occur in NMRs (Fig. 3.4) and goldfish (Chapter 2), but the
physiological significance of this response is still unclear. Do the observed changes in
NMR membrane cholesterol play a role in promoting metabolic suppression? A common
membrane signal regulating the joint inhibition of ion pumps and ion channels could be
an exquisite way to preserve the balance between ATP supply and demand in the
hypometabolic state, and it could serve as a neuroprotective mechanism in NMR brain.
To determine whether membrane restructuring and metabolic suppression are
physiologically linked, it may be useful to mimic the membrane changes observed in
vivo on artificial membranes to characterize how ion pumps and channels are affected.

78
Chapter 4
Goldfish response to chronic hypoxia: Mitochondrial
respiration, fuel preference and energy metabolism
Based on a manuscript by the same title
Written by
Elie Farhat, Hang Cheng, Caroline Romestaing, Matthew Pamenter and Jean-Michel
Weber
And published in
Metabolites
https://doi.org/10.3390/metabo11030187
Statement of contribution: This work was performed alongside Hang Cheng and Dr. Caroline Romestaing. I acclimated the fish and measured all enzymatic activities. Moreover, I isolated the red muscle fibres and measured mitochondrial respiration rates in all tissues alongside both Hang and Dr. Romestaing. Finally, I wrote the paper as first author and edited it along with Dr. Jean-Michel Weber.

79
4.1. Introduction
Hypoxia is a state of oxygen limitation commonly found in many environments. It
presents a dangerous challenge requiring animals to enter a hypometabolic state for
survival (Bickler and Buck, 2007). Under normoxic conditions, adenosine triphosphate
(ATP) is mainly produced by oxidative phosphorylation (OXPHOS) in the mitochondria
through the electron transport chain (ETC) (Semenza, 2007; Solaini et al., 2010). In
hypoxia-sensitive species, this critical pathway of energy metabolism is inhibited when
O2 is scarce, causing an imbalance between the now lower supply of ATP and normal
energetic demand (Boutilier, 2001). By contrast, hypoxia-tolerant animals can maintain
this balance by regulating the activity of key enzymes of energy metabolism (e.g.,
slowing the tricarboxylic acid (TCA) cycle and stimulating glycolysis) (Martínez et al.,
2006; Solaini et al., 2010), and by downregulating ion pumps such as Na+/K+-ATPase
(Hochachka, 1986). Mitochondria are thought to play a key role in coordinating these
responses because of their ability to detect changes in O2 (Pamenter, 2014).
Mitochondrial respiration can be affected by hypoxia acclimation differently, depending
on metabolic fuel, species, and tissue. For instance, respiration capacity is decreased in
the tissues of shovelnose ray sharks (Hickey et al., 2012), oysters (Sokolova, 2018),
and frogs (St-Pierre et al., 2000b), but maintained in epaulette sharks (Hickey et al.,
2012), killifish (Du et al., 2016), and snappers (Cook et al., 2013). Goldfish are among
the champions of hypoxia tolerance (Bickler and Buck, 2007), particularly at low water
temperatures, but how their mitochondria respond to prolonged hypoxia is presently
unknown.

80
Goldfish can suppress metabolic rate by 42–74% to cope with a lack of O2
(Chapter 2) (van Ginneken et al., 2004; Van Waversveld et al., 1989) and they have
larger glycogen stores than hypoxia-sensitive species (Richards, 2009). This indicates a
potentially higher capacity for glycolysis and increased reliance on carbohydrates during
prolonged hypoxia (Jibb and Richards, 2008). It would be useful to establish whether
hypoxic goldfish favor carbohydrates over lipids by quantifying the activities of key
enzymes involved in glycolysis and β-oxidation, and by testing the metabolic fuel
preference of individual tissues. Therefore, the main goal of this study was to determine
how prolonged hypoxia affects the respiration capacity and fuel selection of
mitochondria in different goldfish tissues. To complement this investigation of fuel
preference and to help identify potential mechanisms of metabolic suppression, I have
also measured key enzymes of energy metabolism involved in glycolysis, β-oxidation
and the TCA cycle, as well as Na+/K+-ATPase in brain, liver, and white muscle. I
hypothesized that hypoxia-acclimated goldfish will (i) favor carbohydrates over lipids,
and (ii) decrease overall flux capacity for energy metabolism to promote metabolic
suppression. I anticipated that changes both in mitochondrial respiration and in enzyme
activities would reflect these responses, but more strongly so in a critical tissue like the
brain.
4.2. Methods
4.2.1. Animals
Adult common goldfish (Carassius auratus (Linnaeus 1758)) (N = 43, body mass
20.9 ± 0.2 g) were purchased from AQUAlity Tropical Fish Wholesale (Mississauga,
Ontario, Canada) and held in a 1200 L flow-through holding tank in dechloraminated,

81
well-oxygenated water, under a 12 h:12 h light:dark photoperiod, and were fed 3 mm
floating fish pellets (Profishent; Martin Mills; Elmira, Ontario, Canada) once a day. They
were randomly allocated to normoxia or hypoxia. All measurements were performed at
13oC, and the fish were acclimated to this temperature for at least 2 weeks in the
holding tank before starting experiments. Water was then made progressively hypoxic
over 7 days by bubbling increasing amounts of N2 through a column filled with glass
beads. Water PO2 was measured using galvanic oxygen probes (Loligo Systems, Tjele,
Denmark). The probes were calibrated before each measurement using air-saturated
water (20.9% O2). Oxygen availability went from 100% saturation on day 1 to 50, 40, 30,
20, 15, and finally 10% (or 2.1 kPa) on day 7. PO2 was maintained at that low level for a
period of at least 4 weeks. This level of hypoxia was selected because it induces
significant suppression of goldfish aerobic metabolism, but without causing any ATP
synthesis from anaerobic ethanol production (Chapter 2). All procedures were approved
by the Animal Care Committee of the University of Ottawa (protocol BL-1625) and
adhered to the guidelines established by the Canadian Council on Animal Care for the
use of animals in research.
4.2.2. Mitochondrial respiration
After at least 4 weeks of acclimation to either normoxia or hypoxia, goldfish were
quickly euthanized by cervical dislocation and brain, liver, white muscle, heart, and red
muscle were carefully dissected. At least 150 mg of freshly collected brain, liver, and
white muscle were quickly frozen in liquid N2 and stored at −80°C for enzyme analyses.
Approximately 30–50 mg of fresh brain, liver, white muscle, heart, and red muscle were
placed in ice-cold BIOPS buffer (10 mM Ca-ethylene glycol-bis(β-aminoethyl ether)-

82
N,N,N′,N′-tetraacetic acid (EGTA) buffer, 0.1 µM free calcium, 20 mM imidazole, 20 mM
taurine, 50 mM 2-(N-Morpholino) ethanesulfonic acid potassium salt (K-MES), 0.5 mM
1,4-dithiothreitol (DTT), 6.56 mM MgCl2, 5.77 mM ATP, and 15 mM phosphocreatine,
pH 7.1) for mitochondrial respiratory capacity measurements.
Tissues were prepared for mitochondrial respiration in two different ways. Brain,
liver, and white muscle were prepared by relying on a shredding technique adapted
from (Kuznetsov et al., 2002; Kuznetsov et al., 2008; Larsen et al., 2014; Salin et al.,
2016; Velasco et al., 2012). Briefly, tissues were cut in ice-cold MiR05 (0.5 mM EGTA, 3
mM MgCl2.6 H2O, 60 mM lactobionic acid, 20 mM taurine, 10 mM KH2PO4, 20 mM 4-(2-
Hydroxyethyl)piperazine-1-ethanesulfonic acid (HEPES), 110 mM D-sucrose, and 1 g
L−1 fatty acid-free bovine serum albumin (BSA), pH 7.3) respirometry buffer using
microdissecting scissors to obtain a small particulate solution (liver/white muscle) or by
using a pestle for brain. The homogenization was completed by pipetting several times
to obtain very small tissue pieces (tested by pipetting through a 1 mL tip for white
muscle or 0.2 mL tip for brain and liver). The shredded homogenates were then diluted
in MiR05 to obtain the desired final concentration (100 mg mL−1 for the liver, 60 mg
mL–1 for the white muscle, and 5 mg mL−1 for brain). The entire procedure was carried
out at 4°C and completed within 20 min of the fish being euthanized. Red muscle and
heart were used to prepare permeabilized muscle fiber bundles as previously described
(Bourguignon et al., 2017; Pesta and Gnaiger, 2012). Briefly, a small piece of red
muscle immersed in BIOPS was dissected to separate muscle fibers. Fiber bundles
were transferred to BIOPS solution supplemented with saponin (50 μg mL−1) and mixed
gently at 4°C for 30 min. The permeabilized fibers were then gently washed once by

83
mixing for 10 min at 4°C in the Mir05 solution. Muscle fibers were then weighed, and
their respiration was monitored with an Oroboros oxymeter at 13°C in a
hyperoxygenated respiratory buffer Mir05.
Mitochondrial respiration of all samples was measured at 13°C using two
Oxygraph-2k high-resolution respirometers (Oroboros Instruments, Innsbruck, Austria)
running in parallel, each with a specific substrate protocol (carbohydrates or lipids).
Oxygen concentration (pmol mL−1) was recorded using DatLab software (Oroboros
Instruments). A two-point calibration of the oxygen electrodes was done daily: air
saturation with the addition of oxygen and zero oxygen saturation with the addition of
sodium dithionite. For the shredded preparation, homogenates were placed into the
calibrated chamber with saponin (50 μg mL−1) for 15 min before starting any
measurement. To avoid any limitation of oxygen diffusion to the cell, measurements
were run under hyperoxygenated conditions (350–450 μmol L−1). Oxygen was added to
the respirometry chambers at the beginning of the protocol. Mass-specific O2
consumption was expressed as pmol O2 s−1 mg−1 wet tissue. Two sequential substrate–
uncoupler–inhibitor–titration (SUIT) protocols were run simultaneously for each tissue
as follows:
For the carbohydrate protocol, substrates were added in the following order: 5
mM/2.5 mM pyruvate/malate (PM) to ensure electron entry to complex I of the ETC
(nonphosphorylating/LEAK), followed by saturating concentrations of ADP (1 mM for
brain and 0.5 mM for liver/white muscle) to obtain the phosphorylating respiration rate/to
activate ATP synthesis (OXPHOS), 10 mM glutamate to estimate amino acid utilization,
10 mM succinate to fully activate the ETC and obtain the real OXPHOS state by

84
supporting electron entry to complex I + II, and 10 µM cytochrome C to test for the
integrity of the outer mitochondrial membrane (rate below 15% was considered
acceptable) (Kuznetsov et al., 2002). A titration of 2 µM carbonyl cyanide m-
chlorophenyl hydrazone (CCCP) was used to obtain the CCCP-uncoupled respiration
rate, 2.5 µM antimycin A to inhibit complex III and obtain a residual oxygen consumption
that is not linked to mitochondria. Finally, 2.5 µM ascorbate and a titration of N,N,N′,N′-
tetramethyl-p-phenylenediamine (TMPD; final concentration = 2–2.5 mM TMPD) to
measure complex IV state 3 respiration and obtain the maximal activity of cytochrome c
oxidase (COX) as an estimate of mitochondrial density (Larsen et al., 2012).
For the lipid protocol, substrates were added in the following order: 0.04 mM/2.5
mM palmitoylcarnitine/malate (PCM) to measure complex I + II respiration
(nonphosphorylating/LEAK). At this concentration of malate, note that the exact
contribution of complex II to the respiration rates measured is unclear. This is followed
by the addition of a saturating concentration of ADP (as in the carbohydrate protocol),
10 µM cytochrome C, 2–4 µM CCCP, 2.5 µM antimycin A, 2.5 µM ascorbate, and finally,
a titration of TMPD (final concentration = 2–2.5 mM; brain, liver, and white muscle only).
Note that “carbohydrate protocol” and “lipid protocol” are so named to express what
starting substrate is used in each procedure. COX activity was measured in both
protocols in the presence of multiple substrates at the time antimycin A was added to
the respirometer chamber.
4.2.3. Enzyme assays
All enzyme activities were measured using a Spectra Max Plus384 Absorbance
Microplate Reader (Molecular Devices, Sunnyvale, CA). To measure the activities of

85
key enzymes involved in (i) glycolysis (hexokinase (HK), pyruvate kinase (PK), and
lactate dehydrogenase (LDH)), (ii) β-oxidation (carnitine palmitoyl transferase (CPT)
and 3-hydroxyacyl CoA dehydrogenase (HOAD)), and (iii) the tricarboxylic acid cycle
(citrate synthase (CS)), ~50 mg of each frozen tissue was weighed and homogenized
on ice in 19 volumes of extraction medium (25 mM Tris/HCl + 1 mM EDTA as well as 5
mM dithiothreitol and 0.05% (vol/vol) Triton X-100 that were added on the day of the
experiment to complete the enzyme extraction). Homogenates were then centrifuged at
4°C at 2400× g for 5 min, and the resulting supernatant was stored at −80°C until
analyses. All homogenates were subjected to one freeze/thaw cycle. Preliminary
experiments were carried out to ensure that all substrate and cofactor concentrations
were saturating but not inhibitory. Control reactions (containing no substrate) were run
simultaneously for each enzyme to measure background activity, if present. All assays
were run in triplicate.
Assay conditions were as follows: HK (A340; EC 2.7.1.1; (Best et al., 2014)): 1
mM glucose, 5 mM MgCl2, 0.24 mM NADH, 2 mM phosphoenolpyruvate (PEP), 5 U/mL
PK, 20 U/mL LDH, and 4 mM ATP (omitted from the control). PK: (A340; EC 2.7.1.40;
(Zammit et al., 1978)): 0.17 mM NADH, 5 mM ADP, 80 mM KCl, 10 mM MgCl2, 5 mM
PEP (omitted from the control), and excess coupling enzyme (LDH) in 160 mM
triethanolamine/HCl. LDH: (A340; EC; 1.1.1.27; (Zammit and Newsholme, 1976)): 0.17
mM NADH, 1 mM KCN, and 2 mM pyruvate (omitted from the control) in 50 mM
Tris/HCl. CS: (A412; EC 2.3.3.1; (Alp et al., 1976)): 0.2 mM 5,5′dithiobis(2-nitrobenzoic
acid) (DTNB), 0.1 mM acetyl-CoA, and 0.5 mM oxaloacetate (omitted from the control)
in 50 mM Tris-HCl. CPT: (A412; EC 2.3.1.21; (Guglielmo et al., 2002)): 0.15 mM DTNB,

86
0.035 mM palmitoyl CoA, carnitine (omitted from the control) in 50 mM Tris. HOAD:
(A340; EC 1.1.1.35; (Guglielmo et al., 2002)): 0.2 mM NADH, and 0.1 mM acetoacetyl-
CoA (omitted from the control) in 50 mM Imidazole + 1 mM EDTA.
The activity of Na+/K+-ATPase (A340) was measured by using a modified
protocol from (McCormick, 1993). Frozen tissue was weighed (~100 mg) and
homogenized on ice with a sonicator (Fisher Scientific Sonic Dismembrator model 100,
San Diego, CA) in a 4:1 SEI:SEID buffer (SEI: 250 mM sucrose, 10 mM EDTA, and 42
mM imidazole; SEID: 100 mL SEI + 0.5 g sodium deoxycholate). Homogenates were
then centrifuged at 10,000× g for 5 min at 4°C, and the resulting supernatant was
directly used in the assay. The assay was performed as previously described
(McCormick, 1993) in quadruplicate (2 replicates contained 10 µL of homogenate + 200
µL of assay solution A (50 mM imidazole, 2.8 mM PEP, 0.7 mM ATP, 0.22 mM NADH, 5
mM PK, and 4 mM LDH) and 2 replicates contained 10 µL of homogenate + 200 µL of
assay solution B (Solution A + 0.5 mM ouabain)). Ouabain was added to block Na+/K+-
ATPase and measure any detectable ATP use not associated with this enzyme.
4.2.4. Calculations and statistics
Antimycin A values were subtracted from PM/PCM, ADP, glutamate, succinate,
and CCCP values to obtain all desired states (LEAK, OXPHOS, and CCCP-uncoupled).
Ascorbate values were subtracted from TMPD values to calculate COX activity.
Mitochondrial respiratory control ratio (RCR), an indicator of mitochondrial coupling, was
calculated as a ratio between OXPHOS and LEAK (OXPHOS/LEAK). All respiratory
states were normalized to COX activity to avoid any intrinsic variation in mitochondrial
density/content. Statistical analyses were performed using SigmaPlot 12.5 (Systat, San

87
Jose, CA, USA). Data were analyzed using a repeated-measures two-way analysis of
variance (RM-ANOVA) for the mitochondrial respiration experiments to test for
significant interactions between the two independent variables: (i) oxygen level
(normoxia vs. hypoxia) and (ii) type of fuel (lipids vs. carbohydrates), followed by the
Holm–Sidak post hoc test. A two-tailed t-test was used to analyze the effects of hypoxia
on all enzyme activities. Normality was assessed using the Shapiro–Wilk test, and
homoscedasticity by the Levene’s test. When the assumptions of normality or equality
of variances were not met, the data were normalized by log10. If transformation was
unsuccessful, nonparametric Mann–Whitney U test was performed. All values
presented are means ± standard error of the mean (s.e.m), and a level of significance of
p < 0.05 was used in all tests.
4.3. Results
4.3.1. Mitochondrial Respiration
4.3.1.1. LEAK
Nonphosphorylating respiration (LEAK) represents mitochondrial respiration in
the presence of pyruvate/malate for the carbohydrate protocol and
palmitoylcarnitine/malate for the lipid protocol. There was no effect of either O2 or fuel
type on the heart or red muscle (p > 0.05) (Figure 4.1). In normoxia, the liver consumed
less O2 when using carbohydrates rather than lipids (p < 0.05). White muscle had higher
O2 consumption when using carbohydrates than when using lipids for both normoxia (p
< 0.001) and hypoxia (p < 0.05). Acclimation to hypoxia caused an increase in LEAK
respiration of brain when using lipids and of liver when using carbohydrates (p < 0.05).

88
Moreover, there was a significant interaction between the type of fuel used and chronic
hypoxia acclimation in the brain (p < 0.05).

89
0.00
0.01
0.02
0.03
0.04
0.05Brain
HH
IF
Normoxia
Hypoxia
0.00
0.05
0.10
0.15
0.20
Liver
F
H
0.000
0.005
0.010
0.015
Heart
Lipids Carbohydrates
0.00
0.05
0.10
0.15
0.20
0.25White muscle
FFFF
Carbohydrates
0.00
0.01
0.02
0.03
0.04 Red muscle
Re
sp
ira
tio
n r
ate
(L
EA
K/C
OX
)
Figure 4.1. Mitochondrial oxidative fuel preference during nonphosphorylating
respiration (LEAK) (pmol O2 sec−1 mg−1) normalized to cytochrome c oxidase (COX)
respiration in the tissues of normoxic controls (N = 12) and hypoxia-acclimated goldfish
(N = 11). LEAK represents mitochondrial respiration in the presence of pyruvate/malate
for the carbohydrate protocol and palmitoylcarnitine/malate for the lipid protocol. Values
are means ± standard error of the mean (s.e.m). Dots represent individual data points.
Differences between fuels are indicated as F (p < 0.05) and FFF (p < 0.001).
Differences between oxygen levels are indicated as H (p < 0.05) and HH (p < 0.01).
Significant interaction between type of fuel and oxygen is indicated as I (p < 0.05).

90
4.3.1.2. OXPHOS
OXPHOS represents mitochondrial respiration following the addition of saturating
concentrations of ADP in the presence of pyruvate/malate for the carbohydrate protocol
and palmitoylcarnitine/malate for the lipid protocol. The type of fuel used had a
significant effect on the OXPHOS respiration rates of goldfish mitochondria in various
tissues (Fig 4.2). Specifically, respiration rates of normoxic brain as well as normoxic
and hypoxic white muscle mitochondria were higher when using carbohydrates rather
than lipids (p < 0.01). However, mitochondrial respiration rate of hypoxic liver was lower
when using carbohydrates rather than lipids (p < 0.05). Neither heart nor red muscle
OXPHOS respiration rates differed between oxygen levels (p > 0.05). Chronic hypoxia
acclimation caused an increase in brain respiration rate when using lipids (p < 0.01)
without affecting other tissues (p > 0.05). Additionally, there was an interaction between
the two factors in both brain and white muscle that was only observed when normalizing
to COX activity (p < 0.05). Mitochondrial respiratory control ratio (RCR), an index of
mitochondrial coupling that was calculated as a ratio between OXPHOS and LEAK
respiration, was higher in normoxic liver as well as hypoxic white muscle when using
carbohydrates rather than lipids (p < 0.01). Chronic hypoxia caused a decrease in liver
RCR when using carbohydrates (p < 0.05) without affecting other tissues (p > 0.05)
(Figure 4.3). There was also a significant interaction between type of fuel and oxygen in
liver and white muscle (p < 0.05). Finally, neither type of fuel nor hypoxia acclimation
influenced brain or red muscle RCR (p > 0.05). OXPHOS respiration ranked in this
order for lipids (heart > red muscle = brain > liver > white muscle) and this slightly
different order for carbohydrates (heart > red muscle = brain > white muscle > liver) (p <

91
0.001) when not normalizing by COX (data not shown). For OXPHOS respiration
normalized with COX (Figure 4.2), rates ranked in this order for lipids (brain > liver =
white muscle) and for carbohydrates (heart = brain = white muscle > red muscle = liver)
(p < 0.05).

92
0.0
0.1
0.2
0.3
0.4 Brain
HH II
Normoxia
HypoxiaFFF
0.00
0.05
0.10
0.15
0.20
Liver
F
0.0
0.2
0.4
0.6 Heart
Lipids Carbohydrates
0.00
0.05
0.10
0.15
0.20
0.25White muscle
FFF
IFFF
Carbohydrates
0.0
0.1
0.2
Red muscle
Re
sp
ira
tio
n r
ate
(O
XP
HO
S/C
OX
)
Figure 4.2. Mitochondrial oxidative fuel preference during oxidative phosphorylation
(OXPHOS) respiration (pmol O2 sec−1 mg−1) normalized to COX respiration in the
tissues of normoxic controls (N = 12) and hypoxia-acclimated goldfish (N = 11).
OXPHOS represents mitochondrial respiration following the addition of saturating
concentrations of ADP in the presence of pyruvate/malate for the carbohydrate protocol
and palmitoylcarnitine/malate for the lipid protocol. Values are means ± s.e.m. Dots
represent individual data points. Differences between fuels are indicated as F (p < 0.05)
and FFF (p < 0.001). Difference between oxygen levels is indicated as HH (p < 0.01).
Significant interactions between type of fuel and oxygen are indicated as I (p < 0.05)
and II (p < 0.01).

93
0
50
100
150
200Brain
0
2
4
6
8White muscle
IF
Normoxia
Hypoxia
Lipids Carbohydrates
0
1
2
3
Liver
FF
IH
Lipids Carbohydrates
0
50
100 Red muscle
Respirato
ry c
ontr
ol ra
tio (
OX
PH
OS
/LE
AK
)
Figure 4.3. Respiratory control ratio (RCR) in the tissues of normoxic controls (N = 12)
and hypoxia-acclimated goldfish (N = 11). RCR was calculated as the ratio between
OXPHOS respiration and LEAK respiration (OXPHOS/LEAK). Values are means ±
s.e.m. Dots represent individual data points. Differences between fuels are indicated as
F (p < 0.05) and FF (p < 0.01). Difference between oxygen levels is indicated as H (p <
0.05). Significant interaction between type of fuel and oxygen is indicated as I (p <
0.05).
4.3.1.3. CCCP-uncoupled state
The carbonyl cyanide m-chlorophenyl hydrazone (CCCP)-uncoupled state
represents mitochondrial respiration following titration of carbonyl cyanide m-
chlorophenyl hydrazone (CCCP) in the presence of pyruvate/malate + ADP + glutamate
+ succinate + cytochrome C for the carbohydrate protocol and palmitoylcarnitine/malate

94
+ ADP + cytochrome C for the lipid protocol. Respiration rate was higher when using
carbohydrates rather than lipids in normoxic brain as well as in normoxic and hypoxic
liver and white muscle (p < 0.05). Chronic acclimation to hypoxia caused a decrease in
CCCP-uncoupled respiration rates of brain and white muscle, but an increase in heart,
when using carbohydrates (p < 0.05) (Fig 4.4). Finally, CCCP-uncoupled red muscle
mitochondria were not affected by O2 (p > 0.05).

95
0.0
0.2
0.4
0.6
0.8 Brain
H
Normoxia
HypoxiaFFF
0.0
0.1
0.2
0.3 Liver FF
0.0
0.2
0.4
0.6
0.8Heart
HH
Lipids Carbohydrates
0.0
0.1
0.2
0.3
0.4 White muscle
FFF
HFFF
Carbohydrates
0.0
0.1
0.2
0.3
0.4 Red muscleRe
sp
ira
tio
n r
ate
(C
CC
P-u
nco
up
led
/CO
X)
Figure 4.4. Mitochondrial oxidative fuel preference during the CCCP-uncoupled state
(pmol O2 sec−1 mg–1) normalized to COX respiration in the tissues of normoxic controls
(N = 12) and hypoxia-acclimated goldfish (N = 11). The CCCP-uncoupled state
represents mitochondrial respiration following titration of carbonyl cyanide m-
chlorophenyl hydrazone (CCCP) in the presence of pyruvate/malate + ADP + glutamate
+ succinate + cytochrome C for the carbohydrate protocol and palmitoylcarnitine/malate
+ ADP + cytochrome C for the lipid protocol. Values are means ± s.e.m. Dots represent
individual data points. Differences between fuels are indicated as F (p < 0.05) and FFF
(p < 0.001). Differences between oxygen levels are indicated as H (p < 0.05) and HH (p
< 0.01).

96
4.3.1.4. Cytochrome oxidase
Cytochrome c oxidase (COX) represents mitochondrial respiration following
addition of ascorbate and a titration of N,N,N′,N′-tetramethyl-p-phenylenediamine
(TMPD) in the presence of pyruvate/malate + ADP + glutamate + succinate +
cytochrome c + CCCP + antimycin A for the carbohydrate protocol and
palmitoylcarnitine/malate + ADP + cytochrome c + CCCP + antimycin A for the lipid
protocol. Both the type of fuel and O2 affected maximal COX respiration in goldfish brain
and white muscle, but only O2 impacted the liver (Figure 4.5). Chronic hypoxia caused a
decrease in COX respiration rate when using lipids in brain, liver, and white muscle (p <
0.05) as well as in red muscle (p < 0.05) when using carbohydrates, without affecting
heart (p > 0.05). Moreover, COX respiration decreased in normoxic and hypoxic brain (p
< 0.001) as well as normoxic white muscle (p < 0.01) when using carbohydrates rather
than lipids (Figure 4.5). There were interactions between type of fuel and O2 in brain
and white muscle COX.

97
0
20
40
60
80Brain
HHH
Normoxia
Hypoxia
FFF IIIFFF
0
10
20
30
Liver
HH
0
50
100
150
Heart
Lipids Carbohydrates
0
10
20
30
White muscle
FF II
H
Carbohydrates
0
50
100
150
Red muscle
H
Re
sp
ira
tio
n r
ate
(p
mo
l O
2 s
ec
-1 m
g-1)
Figure 4.5. Mitochondrial oxidative fuel preference of COX in brain, liver, and white
muscle of normoxic controls (N = 12) and hypoxia-acclimated goldfish (N = 11). COX
respiration represents mitochondrial respiration following addition of ascorbate and a
titration of N,N,N′,N′-tetramethyl-p-phenylenediamine (TMPD) in the presence of
pyruvate/malate + ADP + glutamate + succinate + cytochrome c + CCCP + antimycin A
for the carbohydrate protocol and palmitoylcarnitine/malate + ADP + cytochrome c +
CCCP + antimycin A for the lipid protocol. Values are means ± s.e.m. Dots represent
individual data points. Differences between fuels are indicated as FF (p < 0.01) and FFF
(p < 0.001). Differences between oxygen levels are indicated as H (p < 0.05), HH (p <
0.01), and HHH (p < 0.001). Significant interactions between type of fuel and oxygen
are indicated as II (p < 0.01) and III (p < 0.001).

98
4.3.2. Energy metabolism enzymes
The activity of hexokinase (HK) increased in white muscle (82%; p < 0.01),
decreased in brain (12%; p < 0.05), and was maintained in liver (p > 0.05). Moreover,
chronic hypoxia caused a 47% decrease in liver pyruvate kinase (PK) activity (p < 0.05)
as well as an 18% decrease in carnitine palmitoyl transferase (CPT) and 70% increase
in 3-hydroxyacyl CoA dehydrogenase (HOAD) activity of brain (p < 0.05). Chronic
hypoxia did not change the activities of lactate dehydrogenase (LDH) and citrate
synthase (CS) in any measured tissue (p > 0.05) (Table 4.1).
Table 4.1. Effects of chronic hypoxia on the activities of key enzymes of glycolysis, β-
oxidation and tricarboxylic acid (TCA) cycle in goldfish brain, liver, and white muscle (N
= 10 for each treatment group). All values are given in µmol g−1 min−1 and presented as
means ± s.e.m. Differences between oxygen levels are indicated as * (p < 0.05) and **
(p < 0.01). Values in color show how hypoxia affects enzyme activity: green for
activation and red for inhibition.
Hexokinase Pyruvate Kinase Lactate
Dehydrogenase Carnitine Palmitoyl
Transferase 3-Hydroxyacyl CoA
Dehydrogenase Citrate Synthase
Normoxia
Hypoxia Normoxia Hypoxia Normoxia Hypoxia Normoxia Hypoxia Normoxia Hypoxia Normoxi
a Hypoxi
a
Brain 16.64 ±
0.68 14.58 * ±
0.37 39.42 ±
3.06 37.75 ±
3.65 212.5 ± 13.23
204.12 ± 14.15
0.17 ± 0.01 0.14 * ±
0.04 0.1 ± 0.01
0.17 * ± 0.03
0.81 ± 0.24
0.57 ± 0.35
Liver 2.19 ± 0.23
1.89 ± 0.17
124.03 ± 20.95
65.15 * ± 14.38
344.89 ± 45.04
388.96 ± 43.38
10.34 ± 1.05
10.35 ± 1.04
0.29 ± 0.029 0.3 ± 0.03 2.09 ± 0.19
2.83 ± 0.42
White muscle
1.48 ± 0.11
2.69 ** ± 0.29
109.53 ± 5.2
96.63 ± 6.58
96.86 ± 13.51
118.53 ± 20.51
14.31 ± 1.67
11.73 ± 1.39
0.29 ± 0.05 0.46 ± 0.13 5.06 ± 0.31
4.71 ± 0.34

99
4.3.3. Na+/K+-ATPase
Chronic hypoxia caused a 40% decrease in the activity of Na+/K+-ATPase in
goldfish brains (p < 0.001) but did not affect liver or white muscle (p > 0.05) (Figure 4.6).
Brain Liver White muscle
0
1000
2000
3000
4000 Normoxia
Hypoxia
Na
+/K
+ A
TP
ase a
ctivity
(μ
mol A
DP
g-1 h
r-1)
HHH
Figure 4.6. Effects of chronic hypoxia on Na+/K+-ATPase activity in the brain, liver, and
white muscle of normoxic controls (N = 10) and hypoxia-acclimated goldfish (N = 10).
Values are means ± s.e.m. Dots represent individual data points. Significant effect of
hypoxia is indicated as HHH (p < 0.001).
4.4. Discussion
This study is the first to investigate the effects of hypoxia acclimation on
mitochondrial metabolism and Na+/K+-ATPase activity of the goldfish. It shows that the
capacity for mitochondrial respiration of these champions of hypoxia tolerance depends
on prevalent oxygen availability in the environment and on the type of metabolic fuel
oxidized in a tissue-specific manner. OXPHOS respiration is higher for carbohydrates in
brain and white muscle, whereas liver mitochondria reach higher maximal rates with
lipids. Respiration rates are higher in brain when using lipids (LEAK and OXPHOS) and
in liver when using carbohydrates (LEAK). Hypoxia acclimation causes significant

100
tissue-specific changes in respiration rates of most tissues that differ with type of fuel
and/or respiration state of mitochondria. COX respiration is lowered by chronic hypoxia
acclimation in most tissues. In brain, hypoxia increases LEAK and OXPHOS respiration
when using lipids, but decreases CCCP-uncoupled respiration when using
carbohydrates. Therefore, hypoxia does not cause a consistent decrease in
mitochondrial respiration capacity. Results also reveal that chronic hypoxia has
widespread, tissue-specific effects on maximal flux capacity for glycolysis and β-
oxidation, and causes strong downregulation of Na+/K+-ATPase in the brain. Hypoxia
does not lead to universal tissue preference for carbohydrates over lipids. Instead, fuel
selection strategies of individual tissues vary greatly. Overall, this study shows that
hypoxia-acclimated goldfish mainly promote metabolic suppression by modulating
glycolytic capacity and Na+/K+-ATPase, rather than by consistently downregulating
mitochondrial respiration in all tissues.
4.4.1. Effects of hypoxia on mitochondrial respiration
Hypoxia has virtually no effects on LEAK, OXPHOS, and CCCP-uncoupled
respiration when no normalization to COX is performed (results not shown). However,
some significant changes in mitochondrial respiration capacity caused by acclimation to
hypoxia become apparent when these respiration states are standardized per COX
respiration (Figures 4.1–4.4). This means that mitochondrial density is probably
decreased by hypoxia in most tissues (see further discussion of COX respiration below).
The effects of hypoxia acclimation differ depending on fuel type and mitochondrial
respiration state. For example, brain respiration rates are increased by hypoxia during
LEAK (substrates without ADP; complex I only; Figure 4.1) and OXPHOS (substrates

101
with ADP; complexes I+II; Figure 4.2) (lipids; 39–91%) (Figures 4.1, 4.2), but lowered in
the CCCP-uncoupled state (carbohydrates; 23%). Moreover, low O2 causes an increase
in respiration rates of liver (carbohydrates; LEAK; 36%) and heart (carbohydrates;
CCCP-uncoupled; 57%), but a decrease in liver (carbohydrates; RCR; 18%) and white
muscle (carbohydrates; CCCP-uncoupled; 28%). RCR values of liver and white muscle
were still low even after careful optimization of the homogenates of both tissues,
indicating that preparation quality was lower. Reasons why this was the case are
unknown, but respiration rates for these two tissues should be interpreted with caution.
The decrease in liver RCR could mean that the mitochondria of this tissue are more
uncoupled and less efficient because of the increase in LEAK and the lack of change in
OXPHOS respiration. Results in muscle (white and red) and heart LEAK and OXPHOS
are consistent with two previous studies on mitochondria from killifish liver (Du et al.,
2016) and snapper heart (Cook et al., 2013) that also maintain respiration capacity after
acclimation. However, most ectotherms normally show a clear downregulation of
mitochondrial performance when exposed to chronic hypoxia. They include shovelnose
ray sharks (Hickey et al., 2012), some mollusks (Sokolova, 2018), and frogs (St-Pierre
et al., 2000b). The absence of a clear downregulatory response of goldfish
mitochondrial respiration in this study is unexpected because goldfish suppress whole-
animal metabolic rate by 74% after 4 weeks at 10% air saturation (Chapter 2). General
across-tissue changes in mitochondrial respiration capacity are unlikely to be involved in
supporting such a deep hypometabolic state. It could be argued that selective pressure
for mitochondrial plasticity to support hypoxia tolerance is lacking because the goldfish
has evolved the capacity to survive in complete anoxia (Weber, 2016). However, this

102
reasoning can only be invoked at low temperatures because anoxic survival remains
limited to less than a day at 20oC and above (Van den Thillart et al., 1983). As primary
generator of cell power, mitochondria pump protons through their inner membrane via
several enzyme complexes to establish an electrochemical gradient that eventually
leads to the production of ATP at complex V (McElroy and Chandel, 2017). Severe
hypoxia depolarizes mitochondria, making complex V switch from producing ATP to
consuming ATP (St-Pierre et al., 2000a). This causes a mismatch between ATP supply
and demand that affects tissue function. Complex IV (cytochrome c oxidase, COX) is a
major contributor to the proton gradient as it uses O2, the final electron acceptor that is
eventually reduced to water (Schmidt-Rohr, 2020). It is interesting to note that COX
activity is reduced by hypoxia in most tissues. This enzyme complex is downregulated
in brain, liver, white muscle, and red muscle following acclimation (Figure 4.5). It could
indicate a possible regulation of the proton gradient in ways that decrease complex V
activity, as observed in anoxic turtles that are also known for their extreme tolerance to
hypoxia (in brain; (Pamenter et al., 2016), in heart, and liver; (Gomez and Richards,
2018)). Reduced COX respiration could also mean that mitochondrial density is
decreased by hypoxia acclimation in all these tissues (although the lack of change in
CS activity does not support this notion; see Table 4.1). It is therefore possible that a
reduction in COX activity could help metabolic suppression. This study does not
address the potential contribution of reactive oxygen species (ROS) to the hypoxia
acclimation response. Investigating this contribution could be productive because the
mitochondrion is a major producer of ROS, with the vast majority coming from
complexes I and III (Quinlan et al., 2013). This organelle is well positioned to sense any

103
changes in O2 levels and initiate organism-specific adaptations. This sensing can be
done acutely or chronically through an ROS-induced response that may cause rapid
accumulation of Ca2+ and/or activation of hypoxia inducible factor (HIF) (McElroy and
Chandel, 2017). ROS can cause the formation of disulfide bonds, which may change
the structure and function of proteins such as phosphatases, transcription factors, and
those involved in epigenetic modifications (Pamenter, 2014). Overall, the present results
demonstrate that goldfish mitochondria respond in a tissue-specific manner to chronic
hypoxia. Their response can differ between respiration states and is dependent on the
type of fuel oxidized. Because goldfish mitochondria show no consistent decrease in
respiration capacity, they appear to mainly support metabolic suppression by
decreasing their number.
4.4.2. Tissue-specific fuel preference of goldfish mitochondria
Metabolic fuel preference of different goldfish tissues has not been investigated
previously. Even for more thoroughly studied fish species like rainbow trout, quantitative
information about substrate preference is scarce. Nevertheless, it is known that white
muscle is mostly geared to use carbohydrates, whereas red muscle favors lipid
oxidation (Weber and Haman, 2004). Major indices of mitochondrial respiration (LEAK,
OXPHOS, CCCP-uncoupled state, and RCR) are mostly dependent on the type of
metabolic fuel oxidized. Furthermore, substrate preference shows great tissue
specificity (Figures 4.1–4.4). Respiration capacity is higher for carbohydrates than for
lipids in the brain (normoxia; OXPHOS; 53%) and white muscle (normoxia and hypoxia;
LEAK and OXPHOS; 39–154%), whereas it is the opposite in the brain (hypoxia; LEAK;
51%), and liver (normoxia and hypoxia; LEAK and OXPHOS; 12–36%; Figures 4.1 and

104
4.2). Heart and red muscle of normoxic and hypoxic goldfish do not show preference for
a particular fuel as they oxidize carbohydrates and lipids equally well. Overall results
show interesting inter-tissue differences in fuel selection that are not affected by chronic
hypoxia.
In the CCCP-uncoupled state, mitochondrial respiration capacity is also higher in
brain (normoxia and hypoxia; 28–96%), white muscle (normoxia and hypoxia; 111–
184%), and liver (normoxia and hypoxia; 23–29%) when using carbohydrates rather
than lipids (Figure 4.4). In normoxia and hypoxia, it is intriguing to see that the liver
shows opposite fuel selection strategies between the CCCP-uncoupled state (Figure
4.4; carbohydrates > lipids) and LEAK and OXPHOS respiration (Figure 4.1 and 4.2;
lipids > carbohydrates). CCCP-uncoupled respiration only reflects substrate oxidation,
independent of complex V, whereas OXPHOS is further constrained by ATP turnover
(Bundgaard et al., 2019). The contrasting fuel preferences between CCCP-uncoupled
and OXPHOS respiration of the liver indicate that mitochondrial capacity for
carbohydrate oxidation is limited by maximal complex V activity in this tissue. The
higher reliance of white muscle on carbohydrates (Figures 4.1 and 4.2) is further
supported by the higher mitochondrial RCR of this tissue when oxidizing carbohydrates
(Figure 4.3). Overall, mitochondria favor the use of carbohydrates in brain and white
muscle, prefer lipids in liver, and rely equally on both fuels in heart and red muscle.
These tissue-specific patterns of fuel selection are largely independent of environmental
oxygen availability.

105
4.4.3. Chronic hypoxia and glycolysis
Acclimation to low oxygen downregulates liver PK and brain HK, but upregulates
white muscle HK (Table 4.1). Therefore, glycolytic capacity may be decreased in liver
and brain, but increased in white muscle of hypoxia-acclimated goldfish. These tissue-
specific responses show that aerobic supply of pyruvate from glycolysis to the TCA
cycle varies between tissues. This indicates an increased reliance of white muscle on
carbohydrates during chronic hypoxia and is also supported by (i) higher mitochondrial
OXPHOS respiration (Figure 4.2), and (ii) higher glycogen stores in white muscle (but
not liver) of goldfish acclimated to hypoxia (van den Thillart et al., 1980). The lack of
change in LDH activity in hypoxia-acclimated goldfish suggests that anaerobic supply of
ATP is not enhanced. This makes sense because goldfish do not rely on anaerobic ATP
production at this level of hypoxia that does not cause the conversion of lactate to
ethanol (Chapter 2) (Regan et al., 2017).
The variable glycolytic responses observed in different goldfish tissues do not
allow to characterize a consistent pattern and echo the wide range of effects previously
reported for ectotherms. For example, chronic hypoxia downregulates HK in tench white
muscle (Johnston and Bernard, 1982), upregulates it in killifish brain (Martínez et al.,
2006), but maintains it in goldfish white muscle (van den Thillart and Smit, 1984).
Variable responses have also been reported for liver PK, which is upregulated in Nile
tilapia (Mahfouz et al., 2015), but maintained in killifish (Martínez et al., 2006) and in
goldfish (van den Thillart and Smit, 1984). These different responses may be associated
with various experimental conditions (e.g., temperature and diet) used in specific
experiments on these different fish species. Under standardized conditions, it would be

106
useful to explore whether glycolysis responds differently in hypoxia-tolerant vs. hypoxia-
sensitive species, but no comparable data can be obtained for sensitive species
because they cannot survive equivalent levels of hypoxia. Unfortunately, a common
glycolytic response of hypoxia-tolerant ectotherms cannot be inferred from the current
information. Like other species examined to date, the goldfish regulates the aerobic
supply of ATP through glycolysis in a tissue-specific manner to cope with chronic
hypoxia.
4.4.4. β-oxidation and TCA cycle
Acclimation to low O2 causes no major changes in the capacity for β-oxidation
and TCA cycle of goldfish tissues (Table 4.1). Aerobic supply of acetyl-CoA through
these pathways is maintained during chronic hypoxia, even though demand is lowered
by metabolic suppression (Chapter 2). This contrasts with previous studies on
ectotherms that either downregulate (Li et al., 2018; Pillet et al., 2016; Zhou et al., 2000)
or upregulate (Gerber et al., 2019; Johnston and Bernard, 1982) lipid catabolism and
the TCA cycle. The only effects of chronic hypoxia on goldfish β-oxidation detected here
were the downregulation of CPT and upregulation of HOAD in the brain (Table 4.1). The
physiological implications of this contrasting brain response remain unclear, but results
from brain mitochondria OXPHOS respiration (Figure 4.2) suggest an overall increase in
β-oxidation capacity in this tissue during chronic hypoxia.
4.4.5. Downregulation of Na+/K+-ATPase in goldfish brain
The most striking physiological response to chronic hypoxia characterized here is
a drastic downregulation of Na+/K+-ATPase in goldfish brain. The activity of this

107
essential ion pump is decreased by 40% in the central nervous system, but remains
unaffected in white muscle and liver (Figure 4.6). The same brain-specific response was
previously reported in hypoxic naked mole-rats (Chapter 3) and anoxic pond slider
turtles (Hylland et al., 1997). However, it cannot be concluded that this physiological
strategy is a required feature of the champions of hypoxia tolerance because crucian
carp exposed to complete anoxia do not use it (Hylland et al., 1997). Most of the ATP
consumed by the brain is used to maintain electrical activity by pumping ions (Soengas
and Aldegunde, 2002). Na+/K+-ATPase is arguably responsible for the majority of the
brain ATP consumption and it is essential to maintain Na+ and K+ gradients, as well as
to regulate Ca2+ and neurotransmitter transport (Erecińska and Silver, 1994).
Downregulating this pump will inevitably result in a decrease in O2 consumption.
However, reducing Na+/K+-ATPase must occur concomitantly with a decrease in ion
channel leak to maintain membrane gradients (Bickler and Buck, 1998; Boutilier and St-
Pierre, 2000) and to protect against intracellular Ca2+ buildup that can lead to neuronal
death (Hochachka, 1986). A previous study shows that the anoxic goldfish brain
downregulates Ca2+ channel activity together with Na+/K+-ATPase (Wilkie et al., 2008).
This suggests that channel arrest occurs when oxygen is absent, and determining
whether it is also the case in chronic hypoxia will be a productive avenue for future
research.
4.5. Conclusions
This study shows that acclimation to hypoxia causes significant changes in
mitochondrial respiration of all goldfish tissues. However, these mitochondrial
responses vary greatly between tissues and often depend on the substrate being

108
oxidized. All the respiration parameters measured here are stimulated or reduced by
hypoxia, at least for one of the metabolic fuels tested: LEAK (brain and liver), OXPHOS
(brain), RCR (liver), CCP-uncoupled (brain, white muscle and heart), and COX (all
tissues except heart). Therefore, hypoxia acclimation causes a rather complex array of
mitochondrial responses because no consistent across-tissue pattern could be
established except for a general decrease in COX respiration. This observed change in
COX activity suggests that hypoxia causes an organism-wide reduction in mitochondrial
density. Downregulating COX could aid in achieving hypometabolism by indirectly
inhibiting complex V via a reduction in the proton gradient. Regardless of environmental
oxygen conditions, goldfish mitochondria favor the use of carbohydrates in brain and
white muscle, prefer lipids in liver, and rely equally on both in heart and red muscle.
Hypoxia causes the goldfish brain to switch to oxidizing lipids rather than carbohydrates
with no clear preference observed in other tissues. Results also demonstrate a strong
hypoxia-driven downregulation of brain Na+/K+-ATPase that supports whole-animal
metabolic suppression and suggests concomitant channel arrest. The brain is the organ
most affected by chronically low oxygen because it shows important responses in
mitochondrial respiration (increase in LEAK and OXPHOS when using lipids, decrease
in CCCP-uncoupled respiration when using carbohydrates, and decrease in COX when
using lipids), as well as changes in the activities of key enzymes (HK, CPT, HOAD, and
Na+/K+-ATPase). Overall, hypoxia-acclimated goldfish mainly promote metabolic
suppression by regulating the glycolytic supply of pyruvate, downregulating brain
Na+/K+-ATPase, and most likely decreasing mitochondrial abundance.

109
Chapter 5
Transcriptional and epigenetic repression
supports metabolic suppression in chronically
hypoxic goldfish
Based on a manuscript to be submitted by the same title
Written by
Elie Farhat, Giancarlo Talarico, Mélissa Gregoire, Jean-Michel Weber and Jan A.
Mennigen
Statement of contribution: This work was performed alongside Mélissa Gregoire, Giancarlo Talarico and Dr. Mennigen. I (i) acclimated the fish, (ii) extracted the RNA and DNA, (iii) measured mRNA relative abundance and (iv) performed an ELISA to measure global DNA methylation. Mélissa and Giancarlo did the western blots. Dr. Mennigen and Giancarlo visualized the membranes. Dr. Mennigen helped me perform the ELISA. Finally, I wrote the paper with some input from Dr. Mennigen. We will be submitting this work for publication soon.

110
5.1. Introduction
Environmental hypoxia is a widely occurring environmental phenomenon that can
be lethal to most animals. This state of O2 limitation requires animals to suppress their
metabolic rate to survive (Bickler and Buck, 2007). Metabolic suppression can be
achieved through post-transcriptional and post-translational modifications as well as
epigenetics (Storey, 2015; Storey and Storey, 1990). These mechanisms allow for the
downregulation of energetically costly processes such as (i) Na+/K+-ATPase, (ii) the
hypoxia sensing machinery (Palmer and Clegg, 2014), (iii) transcription and translation
(Storey and Storey, 2004) and (iv) protein synthesis by repressing mechanisms such as
the mammalian target of rapamycin (m-TOR) signaling pathway (Liu et al., 2006). I
previously discussed the downregulation of Na+/K+-ATPase during chronic hypoxia in
chapters 3 and 4. This chapter will place more emphasis on the effects of low O2 on
hypoxia sensing, transcription/translation dynamics and protein synthesis via the m-
TOR pathway.
The hypoxia sensing machinery functions via enzymes, such as the Egl Nine
(egln) Family, that immediately respond to intracellular decreases in O2 (Ivan and Kaelin
Jr, 2017; Semenza, 2001a; Semenza, 2001b). Eglns are prolyl hydroxylases that target
hypoxia induced factors (both HIF-1 and HIF-2), key transcription factors involved in the
molecular orchestration of physiological responses to hypoxia (Ivan and Kaelin Jr,
2017). Additionally, noncoding transcripts such as miRNAs have emerged as
transcriptional markers of hypoxia and indeed important mediators of physiological
responses to hypoxia (Chan et al., 2012; Hadj-Moussa et al., 2018; Hadj‐Moussa et al.,
2020; Serocki et al., 2018). As such, miRNA-210 has emerged as the master hypoxia-

111
miR (Chan et al., 2012; Hadj-Moussa and Storey, 2020), complementing classical HIF-
mediated physiological responses to hypoxia via post-transcriptional regulation (Pocock,
2011).
Transcription and translation are molecular level energy sinks that are up or
downregulated by hypoxia (Casey et al., 2002; Chee et al., 2019). Indeed,
consequences of hypoxia exposure on global DNA methylation levels, as well as gene
expression of DNA enzymes involved in DNA methylation dynamics/turnover [the DNA
methylation de novo writer, methyltransferase (dnmt) and eraser ten-eleven
translocation (tet)] have been well described in cancer research, where both global
hyper- and hypo-methylation have been described (Wang et al., 2017). Moreover,
hypoxia regulates components of the canonical microRNA biogenesis machinery
(Bandara et al., 2017; Nallamshetty et al., 2013), supporting the notion that hypoxia may
globally affect post-transcriptional regulation of gene expression and translation of
transcripts.
Goldfish are champions of hypoxia tolerance that suppress their metabolic rate
by up to 74% to cope with prolonged exposure to low O2 (van Ginneken et al., 2004;
Van Waversveld et al., 1989)(Chapter 2). This hypometabolic state occurs together with
tissue-specific downregulation of Na+/K+-ATPase. Results from chapter 4 show that
goldfish brains increase reliance on lipid oxidation during chronic hypoxia based on
mitochondrial fuel selection. Moreover, hypoxia-exposed goldfish stimulate AMP-
activated protein kinase and increase eukaryotic elongation factor 2 phosphorylation to
support the necessary downregulation of liver protein synthesis (Jibb and Richards,
2008). Chapters 2 and 3 also show that changes in membrane lipid composition,

112
particularly cholesterol abundance, could promote hypometabolism in goldfish during
chronic hypoxia via lipid-enzyme interactions (Chapter 2). It is currently unclear how
goldfish adjust cholesterol abundance in their membranes when responding to chronic
hypoxia. Thus, it is imperative to probe transcripts of protein coding genes and miRNAs
involved in cholesterol biosynthesis and degradation during chronic hypoxia.
The four goals of this chapter are as follows: For the first goal, I investigate the
responses of egln genes orchestrating the oxygen sensing machinery in goldfish
exposed to chronic hypoxia. The second goal is to assess whether gene expression of
epigenetic pathways and global epigenetic markers are responsive to chronic hypoxia in
patterns suggesting transcriptional and post-transcriptional silencing at the genome
level [DNA methylation dynamics, global DNA methylation, miRNA biogenesis pathway].
The third goal is to assess if the protein synthesis pathway is downregulated by
reducing translation-dependent energy expenditure via the m-TOR pathway
[phosphorylated ribosomal protein S6 (p-S6), phosphorylated eukaryotic translation
initiation factor 4E binding protein 1 (p-4EBP1) and phosphorylated protein kinase B (p-
AKT)]. The fourth goal is to investigate the molecular targets that regulate changes in
cholesterol and lipid oxidation. I hypothesize that epigenetic regulation in the form of
global DNA methylation and miRNA-dependent post-transcriptional control may reduce
overall genome transcription and translation in chronically hypoxic goldfish. To test this
hypothesis, I examine the effects of chronic hypoxia at two time points (1 and 4 weeks
exposure) on all parameters in the goldfish.

113
5.2. Methods:
5.2.1. Animals
Adult common goldfish (Carassius auratus, Linnaeus 1758; N=36) were
purchased from AQUAlity Tropical Fish Wholesale (Mississauga, Ontario, Canada) and
held in a 1200 L flow-through holding tank in dechloraminated, well-oxygenated water,
under a 12 h:12 h light:dark photoperiod, and were fed 3mm floating fish pellets
(Profishent; Martin Mills; Elmira, Ontario, Canada) once a day. They were randomly
allocated to normoxia or hypoxia. All measurements were performed at 13°C, and the
fish were acclimated to this temperature for at least 2 weeks in the holding tank before
starting experiments. Water was then made progressively hypoxic over 7 days by
bubbling increasing amounts of N2 through a column filled with glass beads. Water PO2
was measured using galvanic oxygen probes (Loligo Systems, Tjele, Denmark). The
probes were calibrated before each measurement using air-saturated water (20.9% O2).
Fish were randomly allocated to either normoxia, 1 week hypoxia (1H) or 4 weeks
hypoxia (4H) (N = 12 per group). Oxygen availability for the hypoxic groups (1H and 4H)
went from 100% saturation on day 1 to 50, 40, 30, 20, 15, and finally 10% (or 2.1 kPa)
on day 7. PO2 was maintained at that low level for a period of 1 week or 4 weeks. This
level of hypoxia was selected because it induces significant suppression of goldfish
aerobic metabolism, but without causing any ATP synthesis from anaerobic ethanol
production (Chapter 2). All procedures were approved by the Animal Care Committee of
the University of Ottawa (protocol BL-1625) and adhered to the guidelines established
by the Canadian Council on Animal Care for the use of animals in research.

114
5.2.2. Real-time RT-PCR assays for mRNA quantification
Total RNA from brain, liver, white muscle and heart was extracted by
homogenizing 50 mg of tissue in TRIzol reagent (Invitrogen, Burlington, ON, Canada)
using a sonicator (Fisher Scientific Sonic Dismembrator model 100, San Diego, CA,
USA). Extracted RNA was quantified using a NanoDrop 2000c UV-Vis
Spectrophotometer (Thermo-Fisher Scientific, Mississauga, ON, Canada). Next, cDNA
was generated using a QuantiTech Reverse Transcription Kit (Qiagen, Toronto, ON,
Canada) following the manufacturer’s protocol which includes a DNA wipeout step
before reverse transcription occurs. Two-step relative abundance real-time RT-PCR
assays were performed on a BioRad CFX96 instrument (Bio-Rad, Mississauga, ON,
Canada) to quantify fold-changes in relative hepatic mRNA abundances of key
transcripts involved in canonical miRNA biogenesis [argonaute-2 (ago2a), dgcr8, dicer,
exportin5], DNA methylation dynamics (tet2, tet3, dnmt3), hypoxia sensing (egln1,
egln3) and lipids [hydroxymethylglutaryl-CoA synthase (hmgcs1), cholesterol 7alpha-
hydroxylase (cyp7a), liver X receptor (lxr) and carnitine palmitoyltransferase 1a (cpt1a)].
A standard curve consisting of serial dilutions of pooled cDNA and individual samples
were run in duplicate for each experiment. The total volume was 20 μL, which consisted
of 1 μL of diluted cDNA template, 1 μL of 10 nM specific forward and 1 μL of 10 nM
specific reverse primer (Tables 5.1-5.3), 10 μL of SsoAdvanced Universal Inhibitor-
Tolerant SYBR Green Supermix (Bio-Rad), and 7 μL of H2O for each individual reaction.
Real-time RT-PCR cycling parameters were a 5 min activation step at 95°C, followed by
40 cycles consisting of a 20 s denaturation step at 95°C and a 30 s annealing and
extension step at a primer-specific temperature (Tables 5.1-5.3). After each run, melting

115
curves were produced and monitored for single peaks to confirm the specificity of the
reaction and the absence of primer dimers. All amplification efficiencies calculated from
serially diluted 7-point standard curves were between 86.8–110%, with R2 values > 0.91
(Tables 5.1-5.3). Relative transcript abundance derived from standard curves was
normalized using the NORMA-Gene approach as described by Heckman et al.
(Heckmann et al., 2011).
Table 5.1. Real-time RT-PCR primer sequences and reaction parameters of gene
targets involved in hypoxia sensing.
Gene target Primer pair (5’ to 3’) Tissue Annealing
temperature (oC)
Efficiency (%)
R2
egln1 XM_026223343.1
F: ACAATAAACCACGCCCACTC R: GCCTCGACAACTGAACACAA
Heart 62 86.8 0.95
egln3
XM_026286524.1 F: CCGCCGAGAGGATTTATTTT R: ACGTTAGCAGCGGGTTATTC
Liver 62 114 0.98
White muscle 62 106.2 0.91
Heart 64 94.7 0.99 Brain 64 107 0.99

116
Table 5.2. Real-time RT-PCR primer sequences and reaction parameters of gene
targets involved in DNA methylation dynamics (tet2, tet3 and Dnmt3) and miRNA
biogenesis pathway (dgcr8, dicer, exportin5 and ago2a).
Gene target Primer pair (5’ to 3’) Tissue Annealing
temperature (oC)
Efficiency (%)
R2
tet2 XM_026204431.1
F: TTCCTTGACCCTGAAATTGG R: CTTTCTCTCGGGCCTTCTCT
Liver 61 89.1 0.99
White muscle 62 94.7 0.99
Heart 62 97.8 0.99 Brain 62 93.6 0.99
tet3 XM_026244985.1
F: CCCACCAGCCTAATGAAAAA R: GGTGATCTCTCAGGGCAAAA
Liver 64 106 0.99
White muscle 64 92.6 0.98
Heart 62 105.5 0.99 Brain 62 107.7 0.98
dnmt3 XM_026244444.1
F: CCTGTGCTTGTTGATGCTGT R: GGTGATGGTGCGAACTTTTT
Liver 62
108.5 0.97
White muscle 62 90 0.96
Heart 62 110 0.99 dgcr8
XM_026256969.1 F: TAAAGCACCTCCACCACCTC R: GTTTGTCCCTGTCCACTGCT
Liver 62 99.9 0.99
White muscle 62 108.8 0.93
Heart 62 108.3 0.94 Brain 63 106 0.91
dicer XM_026285621.1
F: CGCTGACGAGTTCGATTACA R: TGGACTGCTTCCCAATATCC
Liver 62 106.2 0.91
White muscle 64 102.7 0.98
Heart 62 95.2 0.99 Brain 64 95.6 0.99
exportin5 XM_026224889.1
F: GGCTGTGAATGTGATGATGG R: CAGGCCCATAGTGCTGTTTT
Liver 62 87.5 0.99
White muscle 62 89.7 0.97
Heart 62 87.7 0.98 Brain 62 92.2 0.98
ago2a
XM_026231597.1 F: CGTTGTTGGCAGTATGGATG R: TAGTAGATGATGCGCGTTGG
Liver 62 102.4 0.97
White muscle 62 92.4 0.99
Heart 62 92.6 0.98 Brain 62 106.7 0.93

117
Table 5.3. Real-time RT-PCR primer sequences and reaction parameters of gene
targets involved in cholesterol biosynthesis (hmgcs1, lxr and cyp7a) and β-oxidation
(cpt1a).
5.2.3. Global DNA methylation
Relative levels of global DNA methylation (%) was assessed using the
MethylFlash Global DNA Methylation (5-mC) ELISA Easy Kit, Colorimetric (Source:
Epigentek, Cat # P-1030), according to manufacturer’s instructions. This kit quantifies
global DNA methylation levels by measuring levels of 5-methylcytosine (5-mC)
colorimetrically in an ELISA assay using genomic DNA. Briefly, genomic DNA extracted
from brain liver, white muscle and heart tissues of normoxic, 1 week hypoxic (1H) and 4
weeks hypoxic (4H) goldfish were incubated with 100 μL of binding solution in a 96-well
Gene target Primer pair (5’ to 3’) Tissue Annealing
temperature (oC)
Efficiency (%)
R2
hmgcs1 (non-paralogue specific)
XM_026219183.1 XM_026273158.1
F: GACTTCGGCTTCATGGTGTT R: GACGCCTTGGTCTTGTTCTC
Liver 62 106.3 0.99
White muscle 62 106.9 0.95
Heart 64 95.8 0.98 Brain 64 108.4 0.98
lxr XM_026215287.1
F: GGCAGTGAAGCAGACAACAA R: GAGTCCCCATGACCAACATC
Liver 64 108.4 0.99
White muscle 62 107.3 0.99
Heart 63 93.7 0.96 Brain 64 99.4 0.90
cyp7a (non-paralogue specific)
XM_026206536.1 XM_026198858.1
F: GAACCTGCATCAGACCTTCC R: CTCCATCCAATTCCTTTCCA
Liver 64 96.3 0.98
Heart 62 93.5 0.97 Brain 62 106.8 0.98
cpt1a XM_026267939.1
F: GCAGATGGAGAGGATTCTGG R: GTTCTTGCCGTGTCTGAGGT
Liver 62 107.8 0.99
Heart 64 100.9 0.97 Brain 62 109.5 0.99

118
microplate for 60 min at 37oC. A negative control representing unmethylated
polynucleotide containing 50 % of cytosine, and positive controls representing
methylated polynucleotide containing 50 % 5-methylcytosine were also loaded into
independent wells on the same microplate. The wells were then incubated for 60 min at
room temperature with a capture antibody (1 ng mL-1). Following the incubation period,
the binding solution was removed and each well was washed 3 times with diluted
washing buffer. Subsequently, a 50 μL aliquot of 5-mC detection complex antibody
solution cocktail (1 μL of mC antibody + 1 μL of signial indicator + 1 μL of enhancer
solution in 1 mL of diluted washing buffer) was added and incubated at room
temperature for 50 min. This solution complex was then removed before washing each
well with diluted washing buffer 5 times. Following that, 100 μL of developer solution
was added to each well simultaneously and incubated at room temperature for 3 min
until the developer solution turned blue. Finally, 100 μL stop solution was added to each
well to halt the reaction and then absorbance values were read using a Spectra Max
Plus384 Absorbance Microplate Reader (Molecular Devices, Sunnyvale, CA) at 450 nm.
5.2.4. Western blotting
Frozen liver and white muscle from the normoxic and 1H and 4H goldfish groups
(N = 4 per group) were homogenized on ice with a sonicator (Fisher Scientific Sonic
Dismembrator model 100, San Diego, CA) in 400 μL of buffer per 100 mg of tissue.
During homogenization, samples were kept in a buffer containing 150 mmol/L NaCl, 10
mmol/L Tris, 1 mmol/L EGTA, 1 mmol/L EDTA (pH 7.4), 100 mmol/L sodium fluoride, 4
mmol/L sodium pyrophosphate, 2 mmol/L sodium orthovanadate, 1% (vol/vol) Triton X-
100, 0.5% (vol/vol) NP40-IGEPAL, and a protease inhibitor cocktail (Roche, Basel,

119
Switzerland). Homogenates were centrifuged at 15000 g for 5 min at 4°C, and the
resulting supernatants were recovered and stored at -80°C. Protein concentrations were
determined using a Bio-Rad protein assay kit (Bio-Rad Laboratories, Munich, Germany)
with BSA as standard. A denaturing, nonreducing SDS-PAGE was used to separate
proteins. Lysates were diluted in the previously described buffer containing protease
inhibitor for a total of 30 μg of total protein for liver and 50 μg of total protein for white
muscle in 15 μL before 15 μL of 2x Laemmli buffer were added for a total loading
volume of 30 μL. The prepared samples were denatured at 95°C for 2 min and quick
chilled on ice before loading on the gel. Gels were cast as 10% resolving gel consisting
of 5 mL ddH20, 2.5 mL buffer B pH 8.8 (1.5 M Tris base, 0.04% SDS at pH 8.8; both
BioShop, Burlington, ON Canada) dissolved in dH2O, 2.5 mL 40% acryl/Bis (Bio-Rad,
Mississauga, ON, Canada) and polymerized with 50 μL 10% APS (Sigma-Aldrich
Oakville, ON, Canada) and 20 μL TEMED (Life Technologies Burlington, ON, Canada),
and a 4% stacking gel [consisting of 3.25 mL ddH2O, 1.25 mL buffer C pH 6.8 (0.5 M
Tris, 0.04% SDS dissolved (BioShop) in dH2O], 0.5 mL 40% acryl/bis polymerized with
25 μL 10% APS, and 10 μL TEMED. Gels were immersed in 1x Tris glycine SDS (TGS)
running buffer, consisting of Tris base 2.5 mM, glycine 0.192 M, and 0.1% SDS (all
BioShop Canada) dissolved in dH2O, and samples were loaded with 5 μL of Page Ruler
prestained protein ladder (Thermo Fisher, Ottawa, ON, Canada).
Proteins were migrated in the gel at 100 V. After migration, they were blotted
onto nitrocellulose 0.45-mm pore size membrane paper (Millipore, Etobicoke, ON,
Canada) by wet transfer using the Mini TransBlot system (Bio-Rad) with blotting buffer
(250 mM Tris base, 1920 mM glycine; all BioShop Canada) dissolved in dH2O, by

120
applying 100 V for 2 h. Membranes were incubated with Odyssey blocking buffer (LI-
COR Biosciences Lincoln, NE) for 1 h at room temperature using an orbital shaker.
After the blocking step was completed, membranes were cut based on the molecular
weight marker to allow separate development of post-translationally modified p-Akt
(Ser473), p-S6 (Ser235/236) and p-4EBP1(Thr37/46) proteins with specific primary
antibodies validated in fish (Forbes et al., 2019; Mennigen et al., 2014). Partial
membranes containing the relevant molecular weight range of proteins were incubated
with rabbit raised primary p-Akt (no. 9271), p-S6 (no.2211) or p-4EBP1(no.9459)
antibodies (Cell Signaling Technology Ozyme, Saint Quentin Yvelines, France),
respectively, at a concentration of 1:10000 on an orbital shaker at 4°C overnight.
Membranes were washed four times for 5 min with PBS + 0.1% Tween 20 (Sigma-
Aldrich) then incubated with an IRDye Infrared dye (680 nm coupled) secondary goat
anti-rabbit IgG antibody (LI-COR Biosciences). Bands were visualized by infrared
fluorescence using the Odyssey Imaging System (LI-COR Biosciences) and quantified
by Odyssey Infrared imaging system software (v.3.0; LI COR Biosciences). p-Akt, p-S6
and p-4EBP1 protein intensity were normalized to rabbit β-tubulin (no. 2146; Cell
Signaling Technologies) intensity and expressed as relative-fold change compared with
control groups for liver and white muscle.
5.2.5. Statistics
Statistical analyses were performed using SigmaPlot 12.5 (Systat, San Jose, CA,
USA). Data were analyzed using a one-way analysis of variance (ANOVA) for all
experiments to test for the significant effects of hypoxia, followed by the Holm-Sidak
post-hoc test for multiple comparisons. Normality was assessed using the Shapiro-Wilk

121
test and homoscedasticity by the Levene’s test. When the assumptions of normality or
equality of variances were not met, the data were normalized by log10 or square root
transformation. If transformation was unsuccessful, non-parametric Kruskal-Wallis one-
way ANOVA on ranks test was performed. All values presented are means ± s.e.m, and
a level of significance of P<0.05 was used in all tests.
5.3. Results
5.3.1. Hypoxia sensing in goldfish
The expression of egln3 was higher in the 1H and 4H groups of all tissues (vs
normoxia; P<0.001) except in brain where it was only higher in the 1H group (P<0.001)
(Fig. 5.1A). There were no differences between 1H and 4H in any tissue (P>0.05).
Moreover, expression of egln1 in the heart remained unchanged in the 1H and 4H
groups (P>0.05) (Fig. 5.1B).

122
Brain Liver White muscle Heart
04×104
8×10⁴
5×10⁶
1×10⁷
1.5×10⁷
2×10⁷R
ela
tive
eg
ln3
mR
NA
ab
un
dan
ce
A
****
****** ***
***
***
***
Heart
0
1×10⁶
2×10⁶
3×10⁶
Rela
tive
eg
ln1
mR
NA
ab
un
dan
ce
B N
1H
4H
Figure 5.1. Relative abundance of mRNA targets involved in the oxygen sensing
machinery in tissues of normoxic controls (N), 1 week hypoxic (1H) and 4 weeks
hypoxic (4H) goldfish presented in panel A (egln3) and B (egln1). Values are means ±
standard error of the mean (s.e.m); sample size = 10-12 per group. Dots represent
individual data points. Differences between normoxia and hypoxia are indicated as ***
(p < 0.001).
5.3.2. DNA methylation
The expression of tet2 was higher in the 4H group in brain (vs normoxia and 1H;
P<0.001), liver (vs normoxia; P<0.05) and heart (vs 1H; P<0.05), but lower in white
muscle (vs 1H; P<0.001). Moreover, expression in the 1H group was increased in brain
(P<0.05), liver (P<0.05) and white muscle (P<0.001) when compared to the normoxic
group, without changing in heart (P>0.05) (Fig. 5.2A). Expression of tet3 was higher in
the 4H group in brain (vs normoxia and 1H; P<0.01), white muscle and heart (both vs
normoxia; P<0.01). Expression of tet3 was also higher in the 1H group in white muscle
and heart (P<0.05) when compared to normoxia. There was no effect of either 1H or 4H
on tet3 expression in the liver (P>0.05) (Fig. 5.2B). Finally, expression of dnmt3 was

123
only increased in 4H heart (vs normoxia and 1H; P<0.001), without changing in the
other tissues (P>0.05) (Fig. 5.2C). Global DNA methylation was increased in the 4H
group in brain (vs normoxia and 1H; P<0.01) and in heart (vs 1H; P<0.05) without
changing in this group in other tissues (P>0.05). However, methylation was decreased
in the 1H group in brain (vs normoxia; P<0.05), without changing in the other tissues
(P>0.05). There were no effects of hypoxia (1H or 4H) on DNA methylation in either liver
or white muscle (P>0.05) (Fig. 5.2D).

124
0
1×10⁵
2×10⁵
2×10⁶
4×10⁶
Rela
tive
tet2
mR
NA
ab
un
dan
ce
A
*
****
***###
#
***
###
Brain Liver White muscle Heart
0
1×10⁵
2×10⁵
2×10⁶
4×10⁶
Rela
tive
tet3
mR
NA
ab
un
dan
ce
B*
**
**
**
##
***
Liver White muscle Heart
0
1×10⁵
2×10⁵
3×10⁵
4×10⁵
5×10⁵
Rela
tive
dn
mt3
mR
NA
ab
un
dan
ce
C
***###
N
1H
4H
Brain Liver White muscle Heart
02468
10
20
40
Glo
bal D
NA
meth
yla
tio
n ###
**
*
#
D
Figure 5.2. DNA methylation in tissues of normoxic controls (N), 1 week hypoxic (1H)
and 4 weeks hypoxic (4H) goldfish. Expression of mRNA targets involved in DNA
methylation dynamics are presented in panels A (tet2), B (tet3) and C (dnmt3). Global
DNA methylation is presented in panel D. Values are means ± standard error of the
mean (s.e.m); sample size = 10-12 per group. Dots represent individual data points.
Differences between normoxia and hypoxia are indicated as * (p < 0.05), ** (p < 0.01)
and *** (p < 0.001). Differences between 1H and 4H are indicated as # (p < 0.05), ## (p
< 0.01) and ### (p < 0.001).
5.3.3. miRNA biogenesis pathway
The expression of ago2a was higher in the 4H group in brain (vs normoxia) and
heart (vs normoxia and 1H) (P<0.05), but it remained constant in the other tissues

125
(P>0.05) (Fig. 5.3A). Dicer expression was only increased in the 4H group of white
muscle (vs 1H; P<0.05), without being affected in other tissues (P>0.05) (Fig. 5.3B).
Moreover, the expression of dgcr8 was only higher in 4H brain (vs 1H; P<0.01) without
changing in other tissues (P>0.05) (Fig. 5.3C). Finally, the expression of exportin5 was
increased in the 4H group of brain (vs 1H; P<0.001) and in liver (vs normoxia; P<0.05)
without changing in white muscle and heart (P>0.05) (Fig. 5.3D).

126
0
5×10⁴
1×10⁵
1.5×10⁵
2×10⁵
2.5×10⁵R
ela
tive
ag
o2a
mR
NA
ab
un
dan
ce
A
*
#*
0
2×10⁵
2×10⁶
4×10⁶
6×10⁶
Rela
tive
dg
cr8
mR
NA
ab
un
dan
ce
C
##
N
1H
4H
Brain Liver White muscle Heart
0
1×10⁵
2×10⁶
4×10⁶
Rela
tive
dic
er
mR
NA
ab
un
dan
ce
B
#
Brain Liver White muscle Heart
0
2×10⁵
4×10⁵
1×10⁶
2×10⁶
3×10⁶
Rela
tive
ex
po
rtin
5m
RN
A
ab
un
dan
ce
D
###
*
Figure 5.3. The miRNA biogenesis pathway (ago2a, panel A; dicer, panel B; dgcr8,
panel C; exportin5, panel D) in tissues of normoxic controls (N), 1 week hypoxic (1H)
and 4 weeks hypoxic (4H) goldfish. Values are means ± standard error of the mean
(s.e.m); sample size = 10-12 per group. Dots represent individual data points.
Differences between normoxia and hypoxia are indicated as * (p < 0.05). Differences
between 1H and 4H are indicated as # (p < 0.05), ## (p < 0.01) and ### (p < 0.001).
5.3.4. m-TOR signalling pathway
Chronic hypoxia did not elicit any changes in the expression of the measured
target proteins p-S6 (liver and white muscle), p-4EBP1 (liver and white muscle) and p-
AKT (liver) (P>0.05) (Fig. 5.4).

127
0
40
80
120L
iver
pro
tein
[m
g/m
L]
A
0
20
40
60
80
WM
pro
tein
[m
g/m
L]
E
N 1H 4H0
200
400
600
Liv
er
p-A
kt
/ β
-tu
bu
lin
D
0
200
400
600
800
Liv
er
p-S
6 /
β-t
ub
uli
n
B
0
500
1000
1500
2000
WM
p-S
6 / β
-tu
bu
lin
F
0
500
1000
1500
Liv
er
p-4
EB
P1
/ β
-tu
bu
lin
C
N 1H 4H0
200
400
600
WM
p-4
EB
P1
/ β
-tu
bu
lin
G
Figure 5.4. Expression of targets involved in the m-TOR signalling pathway
[phosphorylated ribosomal protein S6 (p-S6; panels B and F), phosphorylated
eukaryotic translation initiation factor 4E binding protein 1 (p-4EBP1; panels C and G)
and phosphorylated protein kinase B (p-AKT; panel D) and total protein concentrations
(panels A and E) in liver and white muscle (WM) of normoxic controls (N; open circles,
dashed lines), 1 week hypoxic (1H; black circles, solid black lines) and 4 weeks hypoxic

128
(4H; red circles, solid red lines) goldfish. All targets are normalized to β-tubulin. Values
are means ± standard error of the mean (s.e.m); sample size = 4 per group. Dots
represent individual data points. Individual western blots are placed above each
corresponding panel. There were no significant effects of hypoxia found (p > 0.05).
5.3.5. Lipid transcripts
The expression of hmgcs1 was higher in the 4H group in brain (vs normoxia and
1H; P<0.05) and in white muscle (vs normoxia; P<0.05), but lower in the heart (vs
normoxia; P<0.05) without changing in liver (P>0.05) (Fig. 5.5A). Moreover, lxr
expression was increased in the 4H group in brain (vs normoxia and 1H; P<0.001),
white muscle (vs 1H; P<0.05) and heart (vs normoxia; P<0.001), but expression was
lower in liver (vs normoxia; P<0.01) and heart (vs 1H; P<0.001). Expression of lxr in the
1H group only decreased in liver (vs normoxia; P<0.05) without changing in the other
tissues (P>0.05) (Fig. 5.5B). Additionally, the expression of cyp7a was increased in the
4H group in brain (vs 1H; P<0.05), lowered in both the 1H and 4H groups in liver (vs
normoxia; P<0.01), but remained constant in heart (P>0.05) (Fig.5.5C).
The expression of cpt1a was only increased in the 4H group in brain (vs
normoxia and 1H; P<0.001), without changing in liver and heart (P>0.05) (Fig. 5.6).

129
Brain Liver Heart
0
5×10⁴
1×10⁵
2×10⁶
4×10⁶
Rela
tive
cyp
7a
mR
NA
ab
un
dan
ce
C
*****
#N
1H
4H
0
1×10⁵
2×10⁵
3×10⁵R
ela
tive
hm
gcs1
mR
NA
ab
un
dan
ce
A
*
*
**#
Brain Liver White muscle Heart
0
1×10⁵
2×10⁵
2×10⁶
4×10⁶
Rela
tive
lxr
mR
NA
ab
un
dan
ce
B
***
#
***
###
***
###
Figure 5.5. Expression of mRNA targets involved in cholesterol biosynthesis (A:
hmgcs1; B: lxr; C: cyp7a) in tissues of normoxic controls (N), 1 week hypoxic (1H) and 4
weeks hypoxic (4H) goldfish. Values are means ± standard error of the mean (s.e.m);
sample size = 10-12 per group. Dots represent individual data points. Differences
between normoxia and hypoxia are indicated as * (p < 0.05), ** (p < 0.01) and *** (p <
0.001). Differences between 1H and 4H are indicated as # (p < 0.05) and ### (p <
0.001).

130
Brain Liver Heart
0
5×10⁴
1×10⁵
1.5×10⁵
2×10⁵
2.5×10⁵R
ela
tive
cp
t1a
mR
NA
ab
un
dan
ce
###
***
N
1H
4H
Figure 5.6. Expression of the β-oxidation mRNA, cpt1a, in tissues of normoxic controls
(N), 1 week hypoxic (1H) and 4 weeks hypoxic (4H) goldfish. Values are means ±
standard error of the mean (s.e.m); sample size = 10-12 per group. Dots represent
individual data points. Differences between normoxia and hypoxia are indicated as ***
(p < 0.001). Differences between 1H and 4H are indicated as ### (p < 0.001).
5.4. Discussion
This study is the first to investigate the effects of chronic hypoxia on (i) genes
involved in the oxygen sensing machinery, (ii) transcription/translation via DNA
methylation dynamics and miRNA biogenesis pathways, (iii) mTOR-dependent
translational machinery involved in protein synthesis and (iv) changes in the expression
of transcripts involved in cholesterol biosynthesis and β-oxidation in the hypoxia tolerant
goldfish. It shows that components of hypoxia sensing are robustly activated across
tissues irrespective of hypoxia duration. In some tissues, I also report the induction of
gene expression for enzymes involved in global DNA methylation turnover and DNA
hypermethylation along with the activation of the miRNA biogenesis pathway. These
responses suggest a global role for epigenetic posttranscriptional repression of
transcription especially in the hypoxic brain, that probably support the downregulation of

131
Na+/K+-ATPase in this critical tissue (see chapter 4). Chronic hypoxia does not suppress
the m-TOR protein-signalling pathway in white muscle or liver, which suggests that
these tissues do not utilize hypermethylation to lower cellular energy expenditure.
Finally, molecular evidence from enzymes involved in cholesterol metabolism-related
transcripts support the membrane results from chapter 2 that show an increase in
membrane cholesterol of white muscle but no change in the brain. Overall, this study
reveals that hypoxia-acclimated goldfish promote metabolic suppression via multiple
posttranscriptional and epigenetic modifications.
5.4.1. Chronic hypoxia induces the oxygen sensing machinery across tissues
Long-term acclimation to hypoxia greatly influences the hypoxia sensing
machinery in goldfish tissues (Fig. 5.1). Hypoxia sensing is highly evolutionary
conserved at the molecular level (Bunn and Poyton, 1996) and relies on eglns to sense
changes in O2. Several egln isoforms exist (egln1-3) that allow for the extension of O2
sensing capacity across large ranges of O2 levels (Ivan and Kaelin Jr, 2017). Under
normoxic conditions, egln-mediated hydroxylation of HIF promotes von Hippel Lindau
factor-mediated ubiquitination resulting in protein degradation. Under hypoxic
conditions, lack of substrates results in decreased hydroxylation levels in HIF, thus
stabilizing the transcription factor and promoting transcriptional responses to hypoxia
via hypoxia response elements (HREs) in nuclear DNA (Ivan and Kaelin Jr, 2017).
While HIF activity is therefore principally regulated at the protein level, egln1 and egln3
have been shown to be part of a feedback loop, as their genes’ promotor region exhibit
HREs through which they are potently induced, possibly to compensate for reduced
enzyme activity under hypoxic conditions (Ivan and Kaelin Jr, 2017). This transcriptional

132
regulation loop makes eglns good transcriptional markers of the molecular oxygen
sensing machinery (Pescador et al., 2005).
Comparative investigation of hypoxia tolerant organisms such as the naked
mole-rat and crucian carp has provided evidence for a role of differential regulation of
the molecular hypoxia sensing machinery (Pamenter, 2014). The higher HIF expression
in naked mole-rats has been linked to mutations in the HIF amino acid sequence that is
believed to alter protein half-life by limiting von Lippel Lindau factor-dependent
ubiquitination and proteasomal degradation (Kim et al., 2011). In hypoxia tolerant
crucian carp and goldfish, these mutations are not present from genome derived amino
acid sequences (data not shown), suggesting different molecular mechanisms.
Interestingly, the goldfish genome has undergone a complex evolutionary history,
resulting in the presence of several paralogues of the molecular oxygen sensing
machinery. While the abundance of oxygen sensing machinery paralogues complicates
the detailed functional analysis in fish species (Pelster and Egg, 2018), it is possible that
the particular high retention of HIF-1α in the goldfish genome may be responsible for a
high baseline HIF-1 abundance, although the validation of this hypothesis is difficult
experimentally. Here, taking advantage of the recently published goldfish genome
(Chen et al., 2019), I provide a detailed description of investigated components of the
goldfish molecular hypoxia sensing repertoire using basic phylogenetic approaches.
Goldfish possess 5 egln1 (including 2 egln1b), 2 egln2 and 3 egln3 genes. As expected,
promotor regions up to 2000bp upstream of the transcription start sites (TSS) of
quantified transcripts of the egln1 and egln3 genes contain HREs, in line with

133
characterized HREs in mammalian egln1 and egln3 (Metzen et al., 2005; Pescador et
al., 2005).
Transcript levels of the specific egln1 paralogue (XP206079128.1) were only
quantifiable in the heart (Fig. 5.1B), supporting tissue-specific expression patterns of
goldfish Egln paralogues. Conversely, egln3 paralogue (XP026142309.1) transcripts
were ubiquitously expressed. Both paralogues were potently induced by both 1 week
and 4 weeks hypoxia across tissues (Fig. 5.1A), confirming activation of molecular
hypoxia sensing pathways across tissues. A notable exception is the transient induction
observed in the 1 week hypoxic goldfish brain, as egln3 transcript abundance in the 4
week hypoxic brain are indistinguishable from baseline egln3 transcript levels under
normoxic conditions. Interestingly, this brain-specific reduction in 4 weeks hypoxia is
mirrored by DNA hypermethylation (Fig. 5.2D), raising the possibility that global
hypermethylation may include a locus specific methylation in CpG elements found in the
HRE promotor region of the profiled Egln3 transcript, a regulatory mechanism described
for egln3 gene expression (D’Anna et al., 2020; Hatzimichael et al., 2010). However,
promotor specific DNA methylation profiling, for example via bisulfite sequencing
approaches, would be necessary to confirm this possibility.
5.4.2. A role for transcription/translation silencing in hypoxic goldfish brain
The reduction of energy demands in the form of metabolic suppression under
chronic hypoxia is well documented in the goldfish (Chapter 2) (Richards, 2009; van
Ginneken et al., 2004; Van Waversveld et al., 1989). While tissues have different
energetic demands and thus contribute differentially to the organismal MO2 (Chapter 4),
transcription and translation are molecular level energy sinks that are responsive to

134
hypoxia (Casey et al., 2002). Here I hypothesized that epigenetic regulation in the form
of global DNA methylation and miRNA dependent posttranscriptional control may
reduce overall genome transcription and affect transcript translation.
I report a general increase in expression of the demethylases tet2 (Fig. 5.2A) and
tet3 (Fig. 5.2B) in brain, liver and white muscle after 1 and 4 weeks hypoxia. In contrast,
the DNA methyltransferase transcript dnmt3 is only induced in the 4 weeks hypoxic
heart (Fig. 5.2C). This indicates a general demethylation occurring across goldfish
tissues, except for the heart that increases de novo methylation in chronic hypoxia.
Demethylation via the tet family may not be promoting overall metabolic suppression
because tets require oxygen for catalytic function (Matuleviciute et al., 2021). However,
results from global DNA methylation do not support the general demethylation in liver,
white muscle and heart (Fig. 5.2D). Only brain is globally hypermethylated after 4 weeks
hypoxia, following an initial hypomethylation occurring after 1 week exposure to hypoxia
(Fig. 5.2D). The role of global DNA hypermethylation in the hypoxic goldfish brain in
silencing transcription and translation is supported by induction of the epigenetic
machinery expression. Indeed, the expression of several transcripts involved in the
miRNA biogenesis pathway were induced in the brain (upregulation of ago2a, dgcr8 and
exportin5) following 4 weeks hypoxia (Fig. 5.3).
The highly aerobic brain is considered to be a disproportionately large contributor
to organismal energy demands in mammals and fish (Soengas and Aldegunde, 2002).
Indeed, larger brain size in weakly electric African fish has been linked to higher
energetic demands and reduced hypoxia tolerance, underlining the important role of
brain energy metabolism (Sukhum et al., 2016). Interestingly, several responses to

135
chronic hypoxia in the goldfish brain promote energy savings. For example, the activity
of Na+/K+-ATPase, a major consumer of cellular ATP, is downregulated in goldfish brain
but not other tissues (Chapter 4). Na+/K+-ATPase is crucially involved in maintaining
neuronal membrane potential, and neuronal ‘channel arrest’ has been linked to a
reduction in brain energy demands as well as hypoxia tolerance. Moreover, GABAergic
signalling supresses neuronal signalling and is necessary for the suppression of
neuronal excitotoxicity, a consequence of channel arrest in hypoxia (Hossein-Javaheri
and Buck, 2021). The observed DNA hypermethylation and the induction of transcripts
involved in miRNA biogenesis in 4 weeks hypoxic brain are indicative of
transcription/translation suppression at the DNA and posttranscriptional level. This
supports a pattern of lowered brain activity and, consequentially, a decrease in energy
demand that supports hypometabolism. Future studies investigating differentially
methylated regions at the DNA level or small RNAseq-based confirmation of general
induction of miRNAs are warranted to provide more evidence for
transcription/translation silencing in 4 weeks hypoxic brain. Finally, roles for an
additional epigenetic factor, histone modifications in molecular hypoxia responses are
emerging, as several histone-modifying enzymes possess oxygen sensitive domains.
Thus, the potential role of histone modification in different hypoxia-tolerant species
represents a potentially fruitful avenue, although detailed characterization of epigenetic
modifications in the context of hypoxia tolerance in goldfish will suffer from the
drawbacks of a complex genome.

136
5.4.3. Chronic hypoxia does not repress m-TOR in liver and muscle
Protein synthesis is a major consumer of ATP (Bickler and Buck, 2007; Rolfe and
Brown, 1997) and downregulating it in chronic hypoxia greatly promotes metabolic
suppression (Hochachka et al., 1996). Here, the effects of hypoxia on key mTOR-
dependent translational machinery such as S6, 4EBP1 and AKT were examined in liver
and white muscle (Fig. 5.4). There was no suppression in the active (phosphorylated)
forms of S6, 4EBP1 and AKT in either liver or white muscle. This does not support the
previously reported decreases in protein synthesis rates of hypoxic goldfish liver that
are mediated by activation of AMPK (Jibb and Richards, 2008), an inhibitor of m-TOR
(Liu et al., 2006). This different response could be due to the different hypoxia-exposure
time between the two studies, which would indicate a transient response of AMPK in
hypoxic goldfish. The lack of suppression in protein synthesis via the m-TOR pathway
suggests that the translation machinery via this pathway is not involved in reducing ATP
demand in chronically hypoxic goldfish liver and white muscle.
5.4.4. Molecular regulation of cholesterol biosynthesis in hypoxia
Chronic hypoxia influences the lipid composition of goldfish membranes in ways
that support metabolic suppression (Chapter 2). Here, I examine the effects of chronic
hypoxia on the expression of hmgcs1 (Fig. 5.5A), lxr (Fig. 5.5B) and cyp7a (Fig. 5.5C).
Hmgcs1 encodes the first of 2 rate-limiting enzymes in the cholesterol biosynthesis
pathway by catalyzing the condensation of acetyl-CoA with acetoacetyl-CoA towards 3-
hydroxy-3-methylglutaryl (HMG)-CoA (Vock et al., 2008). Inversely, lxr plays a critical
role in cholesterol efflux by regulating the expression of several genes and it activates a
negative feedback mechanism that limits cholesterol uptake (Lee and Tontonoz, 2015).

137
Likewise, cyp7a is an indicator of cholesterol efflux because it is the first and rate-
limiting enzyme in synthesizing bile acids from cholesterol (Chiang and Ferrell, 2020).
All the transcripts measured here are induced in the 4 weeks hypoxic brain. This
suggests that both cholesterol synthesis and efflux are increased, which supports the
overall maintenance of membrane cholesterol content in chronic hypoxia previously
observed in this critical tissue (Chapter 2). This may mean that cholesterol turnover is
stimulated even though membrane cholesterol levels remain constant. A different
strategy is observed in 4 weeks hypoxic white muscle that increases hmgcs1
expression without changing lxr and cyp7a. This suggests an increase in cholesterol
synthesis, but not efflux, and supports the increase in cholesterol content of white
muscle membranes (Chapter 2). The responses of 4 weeks hypoxic liver do not echo
the previously observed decrease observed in overall membrane cholesterol of this
tissue (Chapter 2). Briefly, 4 weeks hypoxic liver decreases lxr and cyp7a expression
without changing hmgcs1. This suggests a decrease in cholesterol efflux without
changing cholesterol synthesis. This indicates a buildup of cholesterol in this tissue in
chronic hypoxia, which contradicts the decrease in membrane cholesterol content
(Chap. 2). Finally, the decrease in hmgcs1 and increase in lxr expression of 4 week
shypoxic heart suggest an overall decrease in cholesterol content in this aerobic tissue
by lowering synthesis rates and improving efflux. Taken together, the changes observed
here support a role for the modulation of cholesterol metabolism in promoting
hypometabolism during chronic hypoxia because of the known downregulatory effects
this sterol has on several ATPases (Bastiaanse et al., 1997; Crockett and Hazel, 1997;
Garcia et al., 2019; Yeagle, 1989; Yeagle et al., 1988).

138
Additionally, goldfish mitochondrial responses reported in chapter 4 suggest that
lipid oxidation becomes dominant in the brain during chronic hypoxia. This suggestion is
supported by the fact that cpt1a expression is only increased in the brain, but not in the
other tissues. However, this contradicts the previously observed downregulation of this
enzyme in the same tissue (Chapter 4). This could possibly indicate an increase in CPT
expression, but a decrease in overall abundance of this enzyme. Overall, the increase
in cpt1a expression observed here supports a hypoxia-specific lipid preference of
goldfish brain.
5. Conclusion
This study investigates the effects of 1 and 4 weeks of acclimation to hypoxia on
transcriptional/translational mechanisms in the goldfish. Chronic hypoxia robustly
activates the oxygen sensing machinery in all tissues except 4 weeks hypoxic brain,
irrespectively of acclimation duration. Goldfish also rely on transcriptional and
translational silencing of hypoxic brain via hypermethylation after being transiently
hypomethylated after 1 week hypoxia. This suggests that post-transcriptional
modifications support metabolic suppression in this critical tissue, but require a long
exposure to occur. However, there does not appear to be any support for metabolic
suppression via the translational machinery in liver or white muscle because of the lack
of repression in the m-TOR signalling pathway. However, other mechanisms such as
AMPK-mediated signalling could be playing a role in coordinating a possible
translational response that was not measured here. Thus, it could be beneficial to
examine the effects of chronic hypoxia on AMPK in these tissues. Finally, this study
supports to the observed changes in membrane cholesterol content and brain lipid

139
metabolism of hypoxic goldfish (see chapters 2 and 4). Specifically, hmgcs1 is
upregulated in both white muscle and brain which indicates an increase in cholesterol
synthesis. Moreover, lxr and cyp7a are both upregulated in the 4 weeks hypoxic brain
which indicates an increase in cholesterol efflux/degradation. Taken together, these
changes in cholesterol biosynthesis support the observed increase in white muscle and
the lack of change in brain cholesterol content of goldfish membranes after 4 weeks
acclimation to hypoxia (Chapter 2). Overall, this study shows that chronic hypoxia
robustly activates hypoxia sensing, suppresses transcription/translation and
epigenetically supports a role for membrane remodeling in promoting metabolic
suppression.

140
Chapter 6
General conclusions and future directions
This chapter and chapter 1 are based on a manuscript titled “Hypometabolic responses
to chronic hypoxia: a potential role for membrane lipids”
Written by
Elie Farhat and Jean-Michel Weber
And published in
Metabolites
https://doi.org/10.3390/metabo11080503
Statement of contribution: I performed the literature search and wrote the manuscript.
Dr. Weber edited the manuscript with me.

141
6.1. Evidence for hypoxia-induced membrane remodeling
The membrane restructuring effects of temperature, toxins and diet introduced in
chapter 1 suggest that other environmental factors like hypoxia could also influence
membrane lipid composition. This led to my first hypothesis that goldfish (Chapter 2)
and naked mole-rats (NMR; chapter 3) remodel their membrane lipids in ways that
promote metabolic suppression in chronic hypoxia. My results support this hypothesis
because they show that goldfish (Chapter 2) and NMRs (Chapter 3) enter a
hypometabolic state and undergo widespread remodeling of their membrane lipids in
response to prolonged in vivo exposure to low O2. Both species modulate cholesterol
extensively (Fig. 6.1), but the effects of chronic hypoxia on membrane phospholipids are
more pronounced in goldfish (Chapter 2) than NMRs (Chapter 3) (Fig. 6.2). Changing
cholesterol abundance strongly affects the activity of membrane proteins (Bastiaanse et
al., 1997; Crockett and Hazel, 1997; Garcia et al., 2019; Harayama and Riezman, 2018;
Yeagle et al., 1988). Goldfish and NMRs increase cholesterol in muscle and decrease it
in liver, but only NMRs lower cholesterol in the brain. These responses are intriguing
because multiple studies on artificial membranes (Garcia et al., 2019; Yeagle et al.,
1988) and manipulated fish membranes (Crockett and Hazel, 1997) show that changing
cholesterol levels generally downregulates Na+/K+-ATPase. Therefore, this hypoxia-
driven membrane response could contribute to metabolic suppression. Another way to
downregulate Na+/K+-ATPase is by decreasing n-3 22:6 abundance in membrane
phospholipids because this fatty acid is a known activator of the ion pump (Calhoon et
al., 2015; Turner et al., 2005). Such a strategy seems to be used by the goldfish that
reduces % n-3 22:6 of liver (Fig. 6.2) and gill membranes (Chapter 2). However, this

142
mechanism is not available to NMRs because of their intrinsically low levels of 22:6
(only 0-4% of total membrane fatty acids in normoxic animals) that leaves little to no
room for a decrease in hypoxia (Chapter 3). Overall, I propose that the hypoxia-driven
changes in membrane lipids observed to date could represent a novel mechanism to
reduce organismal metabolic rate in stressful environments.

143
0.00
0.02
0.04
0.06Normoxia
Hypoxia
Brain
0.00
0.05
0.10
Muscle
Goldfish Naked mole-rat
0.000
0.005
0.010
0.015
0.020
Cho
leste
rol /
pho
spho
lipid
(m
ole
:mo
le)
Liver
*
***
*
**
*
Figure 6.1. Relative membrane cholesterol in the tissues of normoxic controls and
hypoxia-acclimated animals for two hypoxia-tolerant vertebrates: the goldfish (Chapter
2) and the naked-mole rat (Chapter 3). Values are means ± SEM (n = 9-16 per
treatment). *P < 0.05, **P < 0.01, **P < 0.001 indicate significant effects of hypoxia.

144
Goldfish Naked mole-rat
0
5
10
15
20
25
Normoxia
Hypoxia
Brain
Goldfish Naked mole-rat
0
5
10
Col 8
Col 10
Muscle
Goldfish Naked mole-rat
0
5
10
15
Liver
***
***
Pe
rce
nt
me
mbra
ne
22
:6
*
Figure 6.2. Percent docosahexaenoic acid (22:6) in membrane phospholipids in the
tissues of normoxic controls and hypoxia-acclimated animals for two hypoxia-tolerant
vertebrates: the goldfish (Chapter 2) and the naked-mole rat (Chapter 3). Values are
means ± SEM (n = 9-14 per treatment). *P < 0.05, ***P < 0.001 indicate significant
effects of hypoxia.

145
6.2. Hypoxia-driven changes in major enzymes
Because matching ATP supply and demand is critical to maintain energetic
balance and survive low O2 conditions, I tested the hypothesis that chronic hypoxia
causes the downregulation of key enzymes involved in ATP turnover in chapters 3
(naked mole-rats) and 4 (goldfish). Summarized below are my main conclusions
regarding the effects of chronic hypoxia on (i) Na+/K+-ATPase, (ii) glycolysis, (iii) β-
oxidation and (iv) the tricarboxylic acid (TCA) cycle.
6.2.1. Na+/K+-ATPase
Both the goldfish (Chapter 4) and the NMR (Chapter 3) respond to chronic
hypoxia by downregulating Na+/K+-ATPase in their brains by 40% and 77% respectively.
This downregulation is echoed by a few studies performed on this ion pump at chronic
hypoxia (Table 6.1). As explained in chapter 1, Na+/K+-ATPase is a major consumer of
cellular ATP and downregulating it in a highly active organ such as the brain
significantly promotes metabolic suppression. However, any decrease in ion pump
activity should be matched by a similar decrease in ion channel activity so that ATP
supply and demand can remain in balance. Therefore, quantifying the effects of chronic
hypoxia on ion channels such as Na+ and K+ channels could provide support for any
possible channel arrest happening in the brains of these hypoxia-tolerant champions.

146
Table 6.1. Effects of chronic hypoxia on the maximal activity of Na+/K+-ATPase in
goldfish and naked mole-rats compared to other animals.
6.2.2. Glycolysis
Glycolytic flux capacity is tissue-specific in the goldfish (Chapter 4) unlike in
NMRs where the response is consistent across all tissues when exposed to chronic
hypoxia (Chapter 3). Hypoxic goldfish increase glycolytic flux capacity in white muscle
(by upregulating HK; Table 6.2), but decrease it in brain (by downregulating HK; Table
6.2) and in liver (by downregulating PK, Table 6.3). This unsystematic response is
similar to the general tissue-specific trend observed in chronically hypoxic ectotherms
(Tables 6.2 and 6.3). Naked mole-rats decrease glycolytic flux capacity in all measured
tissues by downregulating PK, and this response is echoed in most chronically hypoxic
endotherms (Table 6.3). However, any conclusion about NMRs downregulating
glycolytic flux capacity should be taken with caution because I did not measure HK or
Species Tissue
Na+/K+-
ATPase
response
Reference
Naked mole rat
(Heterocephalus glaber) Brain 77% ↓ Chapter 3
Liver 41% ↑ Chapter 3
Temporalis, heart -
Goldfish
(Carassius auratus) Brain 40% ↓ Chapter 4
Liver, white muscle -
General trend
(endotherms and ectotherms) Brain, heart ↓ Table 1.1

147
phosphofructokinase (PFK) activity in this animal. Moreover, Table 6.2 shows a general
upregulation of HK in endotherms (opposite to PK; Table 6.3) which adds more
uncertainty to my final verdict regarding the effects of chronic hypoxia on the glycolytic
supply of pyruvate in the NMR (Chapter 3). Finally, apart from upregulation of LDH in
NMR kidney, neither animal appears to rely on anaerobic metabolism during chronic
hypoxia. Overall, chronic hypoxia generally downregulates glycolytic flux capacities in
goldfish and NMRs.
Table 6.2. Effects of chronic hypoxia (minimum 1 week) on the maximal activity of
hexokinase (HK) in various animals.
Species Tissue HK
response Reference
Goldfish
(Carassius auratus) Brain 12% ↓ Chapter 4
White muscle 82% ↑ Chapter 4
liver - Chapter 4
General trend
(endotherms)
Gastrocnemius, soleus,
heart, brain, ↑ Table 1.2
General trend
(ectotherms)
Heart, brain, liver, white and
red muscle, pancreas,
pleopod, abdominal
↑ ↓ - Table 1.2

148
Table 6.3. Effects of chronic hypoxia (minimum 1 week) on the maximal activity of
pyruvate kinase (PK) in various animals.
Species Tissue PK response Reference
Naked mole-rat
(Heterocephalus glaber)
Liver, temporalis muscle,
brain, heart, kidney 61-99% ↓ Chapter 3
Goldfish
(Carassius auratus) Liver 47% ↓
Chapter 4
White muscle, brain - Chapter 4
General trend
(endotherms)
Gastrocnemius, soleus,
heart, brain ↓ - Table 1.4
General trend
(ectotherms)
White and red muscle, liver,
heart, brain,
hepatopancreas, pleopod,
abdominal
↑ ↓ - Table 1.4

149
Table 6.4. Effects of chronic hypoxia (minimum 1 week) on the maximal activity of
lactate dehydrogenase (LDH) in various animals.
6.2.3. β-oxidation
The response of β-oxidation presented in chapters 3 and 4 suggests a species-
specific fuel strategy in chronic hypoxia. Naked mole-rats (Chapter 3) prefer to
downregulate β-oxidation capacity in two tissues (Tables 6.5 and 6.7), which suggests a
potential decrease in lipid oxidation. However, there does not appear to be an overall
change in fuel preference in these animals mainly because they also decrease
glycolytic flux capacity (Tables 6.2 and 6.3). This suggests that NMRs decrease overall
aerobic supply of pyruvate from both glycolysis and β-oxidation in chronic hypoxia
without favoring any particular type of fuel. In contrast, goldfish do not show a clear
trend to regulating β-oxidation in chronic hypoxia because of two opposite responses
seen in brain (Tables 6.5 and 6.6). However, when taking mitochondrial respiration into
Species Tissue LDH response Reference
Naked mole-rat
(Heterocephalus glaber) Brain, liver, temporalis 62-82% ↓ Chapter 3
Kidney 81% ↑ Chapter 3
Heart - Chapter 3
Goldfish
(Carassius auratus)
White muscle, red muscle,
liver, brain - Chapter 4
General trend
(endotherms and ectotherms)
Gastrocnemius, heart,
soleus, liver, white and red
muscle, brain,
hepatopancreas, pleopod,
abdominal
↑ ↓ - Table 1.5

150
account (Chapter 4), it appears that goldfish are in fact increasing reliance on lipid
oxidation, in contrast to most animals that downregulate β-oxidation in chronic hypoxia
(Tables 6.5 and 6.6).
Table 6.5. Effects of chronic hypoxia (minimum 1 week) on the maximal activity of
carnitine palmitoyl transferase (CPT) in various animals.
Species Tissue CPT response Reference
Naked mole-rat
(Heterocephalus glaber) Liver, temporalis muscle 89-98% ↓ Chapter 3
Heart, kidney - Chapter 3
Goldfish
(Carassius auratus) Brain 18% ↓ Chapter 4
Liver, white muscle - Chapter 4
General trend
(endotherms and
ectotherms)
Muscle, heart, skeletal ↓ Table 1.7

151
Table 6.6. Effects of chronic hypoxia (minimum 1 week) on the maximal activity of 3-
hydroxyacyl-CoA dehydrogenase (HOAD) in various animals.
6.2.4. TCA cycle
Goldfish and NMRs rely on different strategies to regulate flux through the TCA
cycle in chronic hypoxia. Goldfish prefer to maintain CS in contrast to the general trends
found in the literature (Table 6.5). However, NMRs generally downregulate CS in their
tissues except in the heart where they upregulate it to possibly increase cardiac output
(Chapter 3; Table 6.5). Regulating CS provides insight regarding ATP supply, fuel
preference (acetyl-CoA can be supplied from glycolysis and β-oxidation) and
mitochondrial abundance. This could indicate that goldfish, unlike NMRs, utilize other
ways to regulate ATP supply (glycolysis and β-oxidation) and mitochondrial density
during chronic hypoxia (Chapter 3).
Species Tissue HOAD
response Reference
Naked mole-rat
(Heterocephalus glaber) Liver, temporalis musc 69-93% ↓ Chapter 3
Brain, heart, kidney - Chapter 3
Goldfish
(Carassius auratus) Brain 70% ↑ Chapter 4
Liver, White muscle - Chapter 4
General trend
(endotherms and
ectotherms)
Heart, skeletal, liver ↓ Table 1.8

152
Table 6.7. Effects of chronic hypoxia (minimum 1 week) on the maximal activity of
citrate synthase (CS) in various animals.
6.3. Mitochondrial membranes and metabolic rate
In the fourth chapter of my thesis, I tested the hypothesis that mitochondrial
respiration rates are lowered after acclimation to chronic hypoxia. I predicted the
downregulation of mitochondrial respiration rates to occur in tissues that underwent
extensive membrane remodeling (Chapter 2), but I did not observe a clear trend. The
effects of chronic hypoxia on the lipid composition of the bilayer known to date do not
deal specifically with mitochondria, but with total tissue membranes (Chapters 2 and 3).
Because mitochondrial membranes often respond to stress differently than other
membrane types (plasma, sarcolemma, endoplasmic reticulum), it would be interesting
to investigate whether/how hypoxia affects isolated mitochondrial membranes. Diet-
induced changes in membrane lipids are known to alter mitochondrial function in fish
(Guderley et al., 2008; Martin et al., 2013) and in hibernating mammals (Staples and
Brown, 2008). For instance, rainbow trout fed a n-3 22:6-rich diet increase state 3
Species Tissue CS response Reference
Naked mole-rat
(Heterocephalus glaber) Brain, liver, temporalis, kidney 25-78% ↓ Chapter 3
Heart 94-115% ↑ Chapter 3
Goldfish
(Carassius auratus) Brain, liver, white muscle - Chapter 4
General trend
(endotherms and
ectotherms)
Gastrocnemius, liver, white
muscle, pleopod, pancreas,
abdominal
↓ Table 1.6

153
(OXPHOS/phosphorylating respiration in the presence of substrates and ADP)
(Guderley et al., 2008) and state 4 respiration (LEAK/nonphosphorylating respiration
after ADP depletion) (Martin et al., 2013). Early studies show that the fatty acid
composition of the diet has an impact on the hibernation capacity of golden-mantled
ground squirrels (Frank, 1992; Frank and Storey, 1995). This interesting observation
was further explored more recently in an attempt to characterize physiological
mechanisms linking mitochondrial function, membrane composition, hibernation
capacity, and metabolic suppression. For instance, ground squirrels and 13-mantled
ground squirrels suppress mitochondrial OXPHOS respiration during torpor, especially
when using succinate as a substrate (Staples, 2014). Changing the levels of n-6 18:2 in
the diet of 13-lined ground squirrels can also markedly reduce OXPHOS respiration or
proton leak (Gerson et al., 2008), and the authors argue that these reductions could be
used to conserve energy in hibernation (Staples and Brown, 2008). They suggest that
changing membrane lipid composition may be involved in reducing mitochondrial
respiration capacity during torpor, although other mechanisms are also clearly involved
(Chung et al., 2011). Also, cardiolipin is a major constituent of the inner mitochondrial
membrane and plays a role in regulating the activities of complexes I (Paradies et al.,
2002), IV (COX) (Frick et al., 2010) and V (Kraffe et al., 2007). Thus, it would be
particularly interesting to find out whether chronic hypoxia affects cardiolipin abundance
in mitochondrial membranes. The remodeling of membrane lipids can clearly modulate
mitochondrial capacity and this mechanism could be used to promote metabolic
suppression. It would thus be useful to quantify the effects of chronic hypoxia on

154
goldfish mitochondrial membranes, knowing that these animals decrease LEAK and
OXPHOS respiration in some of their tissues (Chapter 4).
6.4. Epigenetic and molecular responses of hypoxic goldfish
Having examined the effects of chronic hypoxia on various levels, an
understanding of the molecular underpinnings of hypoxia tolerance in the goldfish with
lacking. Moreover, and quite surprisingly, not a lot of information currently exists on the
effects of chronic hypoxia on goldfish at the transcriptional and translational level. This
lead to my hypothesis that chronically hypoxic goldfish reduce overall genome
transcription and translation to support metabolic suppression (Chapter 5). Indeed,
goldfish respond to chronic hypoxia by robustly activating genes involved in hypoxia-
sensing in all tissues except brain after 4 weeks of acclimation. Moreover, the 4 week
shypoxic brain exhibits an increase in induction of transcripts involved in global DNA
methylation turnover and DNA hypermethylation along with induction of the miRNA
biogenesis pathway. These responses suggest a role of epigenetic posttranscriptional
repression of transcription especially in hypoxic brain, supporting known neuronal ATP-
saving mechanisms such as Na+/K+-ATPase downregulation (Chapter 4). I also
investigated the effects of chronic hypoxia on mRNA targets involved in cholesterol
biosynthesis and lipid metabolism to compliment my findings in chapters 2 and 4. The
results support some of the responses observed in both goldfish chapters (Fig. 6.3).
Briefly, the increase in white muscle membrane cholesterol abundance (Chapter 2) is
complimented by an increase in expression of the mRNA hmgcs1 that is involved in
cholesterol synthesis (Chapter 5; Fig. 6.3). Moreover, the lack of change in brain
membrane cholesterol abundance (Chapter 2) can be explained by the increased

155
expression of transcripts involved in both cholesterol synthesis and degradation/efflux
(lxr and cyp7a) during chronic hypoxia (Chapter 5; Fig. 6.3). Additionally, mRNA
expression of the β-oxidation enzyme cpt1a is increased in 4 weeks hypoxic brain
(Chapter 5), supporting lipid oxidation preference of this critical tissue during similar
conditions (Chapter 4). Overall, goldfish show a tissue-specific molecular response by
repressing transcription/translation to promote metabolic suppression.

156
Figure 6.3. Effects of chronic hypoxia on the expression of mRNA involved in
cholesterol synthesis [hydroxymethylglutaryl-CoA synthase (hmgcs1)] and
degradation/efflux [liver X receptor (lxr) and cholesterol 7alpha-hydroxylase (cyp7a)] in
goldfish white muscle (WM) and brain (Chapter 5). Cholesterol synthesis is increased in
WM via an increase in HMGCS1 expression, while both cholesterol synthesis and
degradation/efflux are increased in brain via an increase in hmgcs1, lxr and cyp7a
expression of 4 weeks hypoxic goldfish. These responses support the increase in WM,
but maintenance in brain, membrane cholesterol abundance of 4 weeks hypoxic
goldfish (Chapter 2).
6.5. Final remarks
Current understanding of the mechanisms that cause metabolic suppression in
chronic hypoxia are summarized in Fig. 6.4. The lipid composition of membranes plays

157
a fundamental role in setting the metabolic capacity of cells, tissues and organisms. In
chapters 2 and 3 of this thesis, I tested the hypotheses that (i) goldfish and (ii) naked
mole-rats remodel their membrane lipids in ways that promote metabolic suppression in
chronic hypoxia. This versatile mechanism is maybe best exemplified by birds that
boost aerobic capacity before long-distance migration (natural doping in sandpipers),
scaling of mass-specific metabolic rate (membrane pacemaker theory of metabolism),
and various studies of metabolic suppression (hibernator mitochondria and
downregulation of Na+/K+- ATPase in artificial membranes).
A successful hypometabolic response relies primarily on reducing ATP use
whereas lowering ATP production is arguably easier to achieve and can be done
secondarily. Therefore, mechanisms that downregulate ion pumps, ion channels, proton
leak and transcription/translation play a strategic role in setting the tolerance of
organisms for hypoxia. Therefore, I hypothesized that chronic hypoxia causes the
downregulation of (i) enzymes involved in ATP turnover (Chapters 3 and 4), (ii)
mitochondrial respiration (Chapter 4) and (iii) transcription/translation (Chapter 5). The
results presented and discussed in this thesis suggest that hypoxia-induced
suppression of metabolism is partly mediated by membrane plasticity through multiple
mechanisms. Briefly, organismal acclimation to low oxygen causes widespread changes
in the lipid composition of membranes in two champions of hypoxia tolerance: the
goldfish and the naked mole-rat (Chapters 2 and 3). To cope with this environmental
stress, these resilient animals modify their membranes in ways that support the
downregulation of key enzymes directly involved in ATP turnover (Chapters 3 and 4). In
hypoxia tolerant species, entering the hypometabolic state occurs together with

158
extensive changes in membrane cholesterol (Chapters 2 and 3), a decrease in
mitochondrial density (Chapter 4), as well as the downregulation of brain Na+/K+-
ATPase and acetyl-CoA supply from β-oxidation and/or glycolysis (Chapters 3 and 4).
Moreover, the goldfish suppresses transcription/translation by inducing transcripts
involved in DNA methylation and miRNA biogenesis (Chapter 5). However, a direct
functional link between changes in membrane lipids and the downregulation of major
ATP consuming processes remains to be clearly established. A common membrane
signal regulating the joint inhibition of ion pumps and channels could be an exquisite
way to preserve the balance between ATP supply and demand in the hypometabolic
state. To further investigate how membrane restructuring and metabolic suppression
could be mechanistically linked, it will be useful to mimic the membrane changes
observed in vivo on artificial membranes to characterize how ion pumps and channels
are affected by hypoxia.
Hibernators seem to rely on changes in mitochondrial membrane lipids to reduce
proton leak and state 3 respiration as they enter torpor, and the same mechanism could
be used in hypoxia (see section 6.3). Examining the effects of chronic hypoxia on the
lipid composition of mitochondrial membranes is therefore an important avenue for
future research. Do the hypoxia-driven changes already characterized for total tissue
membranes echo those of mitochondrial membranes specifically? The membrane
remodeling mechanisms presently linked to metabolic suppression include changes in
cholesterol, fatty acid composition of phospholipids, and mitochondrial cardiolipin, but
their relative importance is unknown.

159
While not as critical as reducing ATP use, lowering the rate of ATP synthesis is
also required to keep matching ATP supply with demand in hypometabolic states.
Maximal flux capacities of key metabolic pathways such as glycolysis, β-oxidation and
the TCA cycle are affected by both chronic hypoxia and changes in membrane lipids. To
what extent the downregulation of energy metabolism caused by hypoxia depends on
membrane remodeling is currently unclear. To conclude, I propose that membrane
restructuring is a novel physiological mechanism used by animals to suppress ATP
turnover during prolonged hypoxia.

160
Figure 6.4. Remodeling of membrane lipids is a proposed new mechanism to promote
metabolic suppression in chronic hypoxia. Prolonged in vivo exposure to low oxygen
alters the relative abundance of membrane cholesterol, n-3 polyunsaturated fatty acids
(PUFA), and possibly mitochondrial cardiolipin in ways that downregulate ion pumps
such as Na+/K+-ATPase (a major ATP consumer), ion channels, and possibly
mitochondrial respiration capacity [state 3 (OXPHOS in the presence of substrates and
ADP) and LEAK (proton leak)]. Chronic hypoxia also causes a general reduction in
cytochrome c oxidase (COX) indicating a decrease in mitochondrial density. The
observed changes in membrane composition are known to modulate metabolic
pathways of energy metabolism such as β-oxidation (downregulation) and glycolysis (up
or downregulation). Reduction of flux through the ATP-ADP cycle can also be induced
by molecular mechanisms that involve post-translational/post-transcriptional

161
modifications (Storey and Storey, 1990), 5’-AMP-activated protein kinase (AMPK)
(Pamenter, 2014) or epigenetic changes (Storey, 2015). Membrane remodeling and
molecular mechanisms work in concert to cause metabolic suppression.

162
Appendix A
The following appendix includes 8 tables related to chapter 2 of my thesis.
Table 1. Fatty acid composition of membrane phospholipids in brain of goldfish
acclimated to normoxia or hypoxia at 13oC. Values are mean percentages ± s.e.m.
(N=13-14). Significant effects of hypoxia are indicated in bold as * (P < 0.05) and ** (P <
0.01).
Normoxia Hypoxia
16:0 24.8±0.22 25.2±0.24
16:1 10.7±0.41 9.4±0.62
18:0 10.0±0.19 9.5±0.80
18:1 25.2±0.39 25.9±0.86
18:2 1.5±0.13 1.2±0.16
18:3 0.5±0.35 0.0±0.0
20:2 1.9±0.06 1.8±0.05
20:4 3.0±0.07 3.2±0.05
20:5 2.0±0.05 2.0±0.06
22:6 18.0±0.7 19.4±0.53
24:0 2.4±0.15 2.4±0.11

163
Table 2. Fatty acid composition of membrane phospholipids in gills of goldfish
acclimated to normoxia or hypoxia at 13oC. Values are mean percentages ± s.e.m.
(N=13-14). Significant effects of hypoxia are indicated in bold as * (P < 0.05) and ** (P <
0.01).
Normoxia Hypoxia
14:0 0.0±0.0 1.0±0.25
16:0 24±0.38 25.1±0.57
16:1 5.9±0.26 6.4±0.11
18:0 8.1±0.24 8.2±0.26
18:1 26.5±0.41 27.2±0.44
18:2 10.9±0.28 10.7±0.26
20:0 1.2±0.1 1.3±0.04
20:2 4.3±0.08 4.1±0.07
20:4 3.4±0.25 3.2±0.15
20:5 3.6±0.09 3.1±0.16 **
22:3 0.0±0.0 0.4±0.4
22:5 1.7±0.06 0.9±0.15 *
22:6 9.9±0.39 8.2±0.51 **
24:0 0.5±0.13 0.2±0.11
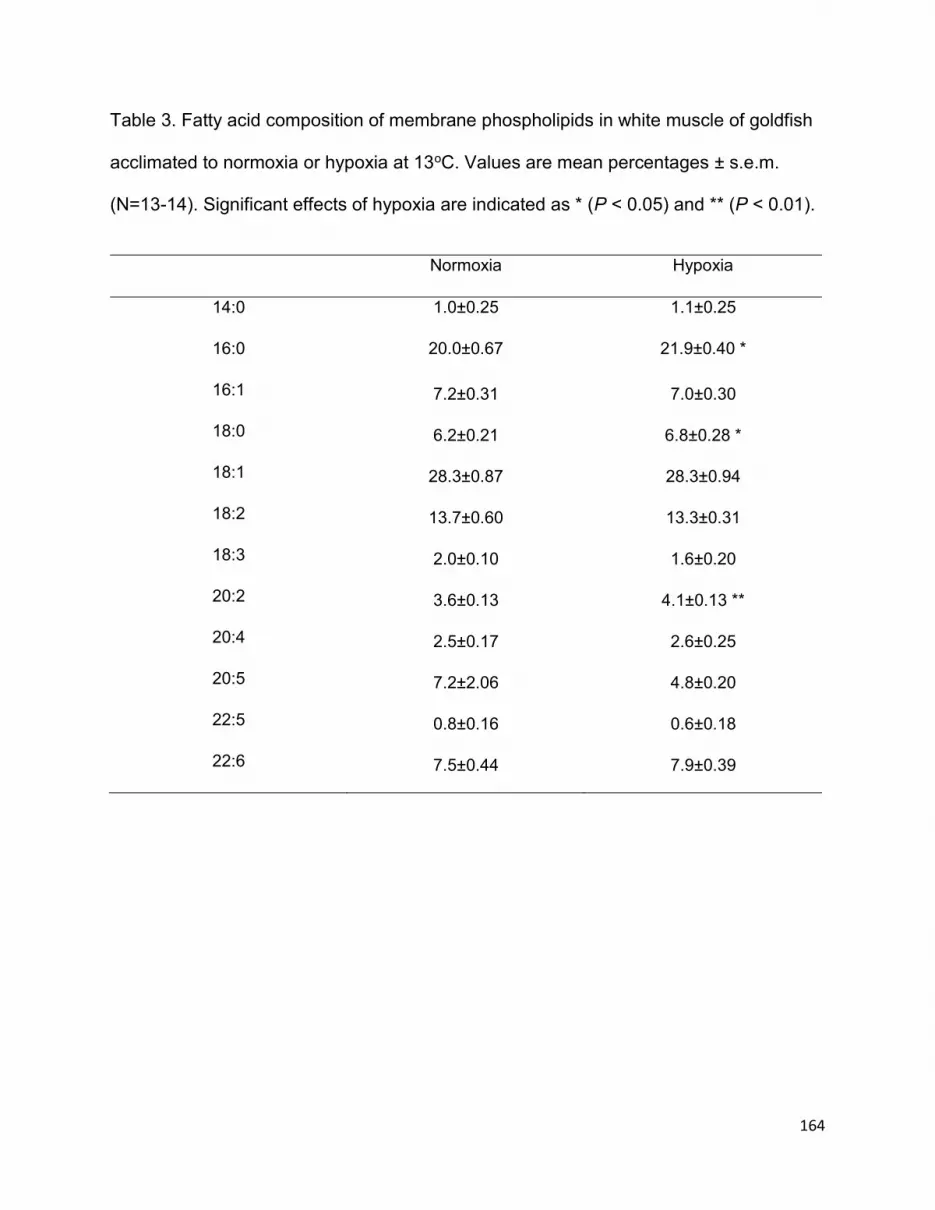
164
Table 3. Fatty acid composition of membrane phospholipids in white muscle of goldfish
acclimated to normoxia or hypoxia at 13oC. Values are mean percentages ± s.e.m.
(N=13-14). Significant effects of hypoxia are indicated as * (P < 0.05) and ** (P < 0.01).
Normoxia Hypoxia
14:0 1.0±0.25 1.1±0.25
16:0 20.0±0.67 21.9±0.40 *
16:1 7.2±0.31 7.0±0.30
18:0 6.2±0.21 6.8±0.28 *
18:1 28.3±0.87 28.3±0.94
18:2 13.7±0.60 13.3±0.31
18:3 2.0±0.10 1.6±0.20
20:2 3.6±0.13 4.1±0.13 **
20:4 2.5±0.17 2.6±0.25
20:5 7.2±2.06 4.8±0.20
22:5 0.8±0.16 0.6±0.18
22:6 7.5±0.44 7.9±0.39

165
Table 4. Fatty acid composition of membrane phospholipids in liver of goldfish
acclimated to normoxia or hypoxia at 13oC. Values are mean percentages ± s.e.m.
(N=13-14). Significant effects of hypoxia are indicated in bold as * (P < 0.05) and ** (P <
0.01).
Normoxia Hypoxia
14:0 0.5±0.22 1.4±0.24
16:0 22.2±0.55 22.8±0.65
16:1 5.6±0.54 6.7±0.35 *
18:0 7.3±0.55 6.8±0.40
18:1 27.7±1.45 28.1±0.97
18:2 8.6±0.66 10.4±0.40 *
18:3 0.4±0.17 1.1±0.23
20:0 0.4±0.18 0.4±0.18
20:2 3.7±0.13 3.8±0.12
20:4 3.7±0.35 2.4±0.25 **
20:5 3.1±0.26 3.1±0.15
22:5 1.2±0.14 0.8±0.16
22:6 15.5±1.38 12.0±0.97 *
24:0 0.1±0.07 0.2±0.11

166
Table 5. Fatty acid composition of membrane phospholipids in brain of goldfish
acclimated to normoxia or hypoxia at 20oC. Values are mean percentages ± s.e.m.
(N=15-16). There were no significant effects of hypoxia detected (P > 0.05).
Normoxia Hypoxia
16:0 26.7±0.36 25.9±0.54
16:1 8.3±0.49 8.4±0.38 *
18:0 11.6±0.27 11.5±0.43
18:1 25.3±0.5 25.9±0.33
18:2 1.9±0.19 2.8±1.11
20:1 1.7±0.06 2.0±0.36
20:4 2.6±0.08 2.5±0.11
20:5 1.4±0.11 1.6±0.2
22:6 17.9±0.74 16.5±0.98
24:0 2.6±0.27 2.9±0.18

167
Table 6. Fatty acid composition of membrane phospholipids in gills of goldfish
acclimated to normoxia or hypoxia at 20oC. Values are mean percentages ± s.e.m.
(N=15-16). Significant effects of hypoxia are indicated in bold as * (P < 0.05).
Normoxia Hypoxia
16:0 31.2±0.67 30.5±0.77
16:1 3.5±0.19 3.5±0.15
18:0 9.1±0.28 8.8±0.3
18:1 21.7±0.6 21.5±0.55
18:2 6.2±0.27 6.6±0.34
20:0 0.0±0.0 0.3±0.2
20:1 6.0±0.27 6.7±0.31 *
20:4 3.2±0.2 2.8±0.12
20:5 2.7±0.09 2.7±0.09
22:0 2.0±0.2 2.6±0.23
22:5 1.1±0.12 0.8±0.15
22:6 12.6±0.34 12.4±0.36
24:0 0.7±0.15 0.8±0.15

168
Table 7. Fatty acid composition of membrane phospholipids in white muscle of goldfish
acclimated to normoxia or hypoxia at 20oC. Values are mean percentages ± s.e.m.
(N=15-16). There were no significant effects of hypoxia detected (P > 0.05).
Normoxia Hypoxia
16:0 31.0±0.51 30.7±0.96
16:1 1.2±0.27 1.6±0.22
18:0 10.0±0.33 10.1±0.51
18:1 14.8±0.63 14.4±0.48
18:2 7.4±0.38 7.8±0.33
20:0 0.1±0.08 0±0
20:1 5.3±0.42 6.4±0.31
20:4 3.2±0.14 2.9±0.13
20:5 6.8±0.2 6.6±0.17
22:0 0.3±0.14 0.2±0.11
22:3 0.2±0.17 0±0
22:5 1.2±0.17 1.6±0.65
22:6 18.4±0.69 17.7±0.73
24:0 0.1±0.1 0±0

169
Table 8. Fatty acid composition of membrane phospholipids in liver of goldfish
acclimated to normoxia or hypoxia at 20oC. Values are mean percentages ± s.e.m.
(N=15-16). Significant effects of hypoxia are indicated as * (P < 0.05) and ** (P < 0.01).
Normoxia Hypoxia
16:0 27.5±0.75 28.3±0.96
16:1 3.0±0.25 3.5±0.34
18:0 7.2±0.51 5.7±0.38 *
18:1 21.0±0.97 21.4±1.22
18:2 5.4±0.4 6.1±0.44
20:0 0.2±0.11 0.3±0.14
20:1 4.9±0.38 5.9±0.46 *
20:2 0.4±0.16 0.0±0.0 *
20:4 2.5±0.32 1.5±0.36 *
20:5 3.7±0.17 3.3±0.22
22:0 0.6±0.22 1.4±0.18
22:5 1.8±0.13 1.2±0.14 **
22:6 21.5±1.0 21.2±1.33
24:0 0.3±0.18 0.2±0.15

170
Appendix B
The following appendix includes 5 figures and a table related to chapter 3 of my thesis.
16:0 18:0 18:1 18:2 20:2 20:4 22:0 22:3 22:5 22:6 24:0
% T
ota
l me
mb
rane
fa
tty
acid
s
0
10
20
30
Normoxia
Hypoxia
**
Figure 1. Fatty acid composition of membrane phospholipids in the brain of normoxic
controls and hypoxia-acclimated NMRs expressed in % of total fatty acids. Values are
means ± s.e.m. (N=12 in normoxia and N=9 in hypoxia). Significant effects of hypoxia
are indicated as * (P < 0.05).

171
16:0 18:0 18:1 18:2 20:4 22:0 22:3 22:5 22:6 24:0
% T
ota
l me
mb
rane
fa
tty
acid
s
0
6
12
18
24
Normoxia
Hypoxia
*****
**
*
***
Figure 2. Fatty acid composition of membrane phospholipids in the heart of normoxic
controls and hypoxia-acclimated NMRs expressed in % of total fatty acids. Values are
means ± s.e.m. (N=12 in normoxia and N=9 in hypoxia). Significant effects of hypoxia
are indicated as * (P < 0.05), ** (P < 0.01) and *** (P < 0.001).

172
16:0 18:0 18:1 18:2 20:2 20:4 22:0 22:3 22:5 22:6 24:0
% T
ota
l me
mb
rane
fa
tty
acid
s
0
6
12
18
24
Normoxia
Hypoxia
***
**
*** ***
***
***
**
***
Figure 3. Fatty acid composition of membrane phospholipids in the liver of normoxic
controls and hypoxia-acclimated NMRs expressed in % of total fatty acids. Values are
means ± s.e.m. (N=12 in normoxia and N=9 in hypoxia). Significant effects of hypoxia
are indicated as ** (P < 0.01) and *** (P < 0.001).

173
16:0 18:0 18:1 18:2 20:2 20:4 22:0 22:3 22:5 22:6 24:0
% T
ota
l me
mb
rane
fa
tty
acid
s
0
7
14
21
28
Normoxia
Hypoxia
*****
**
**
*
Figure 4. Fatty acid composition of membrane phospholipids in the muscle of normoxic
controls and hypoxia-acclimated NMRs expressed in % of total fatty acids. Values are
means ± s.e.m. (N=12 in normoxia and N=9 in hypoxia). Significant effects of hypoxia
are indicated as * (P < 0.05), ** (P < 0.01) and *** (P < 0.001).

174
16:0 18:0 18:1 18:2 20:2 20:4 22:0 22:3 22:5 22:6 24:0
% T
ota
l me
mb
rane
fa
tty
acid
s
0
6
12
18
24
Normoxia
Hypoxia
***
***
**
Figure 5. Fatty acid composition of membrane phospholipids in the kidney of normoxic
controls and hypoxia-acclimated NMRs expressed in % of total fatty acids. Values are
means ± s.e.m. (N=12 in normoxia and N=9 in hypoxia). Significant effects of hypoxia
are indicated as ** (P < 0.01) and *** (P < 0.001).

175
Table 1. Effects of chronic hypoxia on the membrane phospholipids of naked mole-rat
tissues. Double bond index (DBI), phospholipid/gtissue (PL/g), saturated fatty acids
(SFA), monounsaturated fatty acids (MUFA) and polyunsaturated fatty acids (PUFA) are
indicated separately. Values are means ± SE (N=12 in normoxia (N) and N=9 in hypoxia
(H)). Significant effects of hypoxia are indicated as * (P<0.05), ** (P<0.01) and ***
(P<0.001).
DBI PL/g SFA MUFA PUFA
N H N H N H N H N H
Brain 2.8 ± 0.1 2.9 ± 0.1 37.2 ±
1.7
43.9** ±
1.8
0.49 ±
0.01
0.48 ±
0.01
0.23 ±
0.01
0.24 ±
0.01
0.28 ±
0.01
0.29 ±
0.01
Heart 3.5 ± 0.3 3.2 ± 0.2 25.2 ±
4.5
22.0 ±
1.2 0.6 ± 0.1
0.5 ±
0.02
0.2 ±
0.06
0.1 ±
0.01
0.5 ±
0.04
0.4 ±
0.04
Liver 3.4 ± 0.1 2.65* ±
0.3
64.7 ±
3.2 97.2** ±
12.4
0.44 ±
0.01 0.55* ±
0.03
0.13 ±
0.01 0.07*** ±
0.01
0.43 ±
0.01 0.38* ±
0.02
Muscle 2.92 ±
0.16 3.57* ±
0.17
17.2 ±
0.44
12.3*** ±
0.54
0.44 ±
0.02
0.32* ±
0.01
0.074 ±
0.01
0.073 ±
0.01
0.42 ±
0.01 0.47* ±
0.01
Kidney 3.14 ±
0.08
3.4 ±
0.48
22.6 ±
0.5
25.0 ±
1.72
0.47 ±
0.01
0.47 ±
0.02
0.12 ±
0.01
0.14 ±
0.02
0.42 ±
0.02 0.39* ±
0.02

176
Appendix C
The following appendix includes 4 figures related to chapter 4 of my thesis.
0
1
2
0
1
2
Lipids Carbohydrates
0
1
2
Re
spir
atio
n r
ate
(pm
ol O
2 s
ec
-1 m
g-1
)
FFF F
FF
Brain
Liver
White muscle
0.0
0.5
1.0
Normoxia
Hypoxia
Lipids Carbohydrates
0
1
2
Heart
Red muscle
Figure 1. Mitochondrial oxidative fuel preference during LEAK respiration (non-
phosphorylating) in the tissues of normoxic controls (N = 12) and hypoxia-acclimated
goldfish (N = 11). Values are means ± s.e.m. Differences between fuels are indicated as
F (P<0.05), FF (P<0.01) and FFF (P<0.001). There were no significant effects of
hypoxia (P>0.05).

177
0
5
10
0
1
2
Lipids Carbohydrates
0
1
2
3
4
Re
spir
atio
n r
ate
(pm
ol O
2 s
ec
-1 m
g-1
)
Brain
Liver
White muscle
FF
F
FFFFFF
0
5
10
15
20
Normoxia
Hypoxia
Lipids Carbohydrates
0
5
10
Heart
Red muscle
Figure 2. Mitochondrial oxidative fuel preference during state 3 respiration (OXPHOS) in
the tissues of normoxic controls (N = 12) and hypoxia-acclimated (N = 11) goldfish.
Values are means ± s.e.m. Differences between fuels are indicated as F (P<0.05), FF
(P<0.01) and FFF (P<0.001). There were no significant effects of hypoxia (P>0.05).

178
Re
spir
atio
n r
ate
(pm
ol O
2 s
ec
-1m
g-1
)
0
5
10
Normoxia
Hypoxia
Lipids Carbohydrates
0.0
0.5
1.0
1.5
Brain
White muscle
FF
FFF
FF
Figure 3. Mitochondrial oxidative fuel preference of aerobic scope (Calculated as
OXPHOS – LEAK) in the brain and white muscle of normoxic controls (N = 12) and
hypoxia-acclimated (N = 11) goldfish. Values are means ± s.e.m. Differences between
fuels are indicated as FF (P<0.01) and FFF (P<0.001). There were no significant effects
of hypoxia (P>0.05).

179
0
5
10
15
0
1
2
3
4
Lipids Carbohydrates
0
1
2
3
4
Re
spir
atio
n r
ate
(pm
ol O
2 s
ec
-1 m
g-1
)
Brain
Liver
White muscle
FF
F
FFF
FF
FF
FF
0
15
30
45
Normoxia
Hypoxia
Lipids Carbohydrates
0
5
10
15
20
Heart
Red muscle
HHHFF
FFF
III
Figure 4. Mitochondrial oxidative fuel preference during the CCCP-uncoupled state in
the tissues of normoxic controls (N = 12) and hypoxia-acclimated (N = 11) goldfish.
Values are means ± s.e.m. Differences between fuels are indicated as F (P<0.05), FF
(P<0.01) and FFF (P<0.001). Difference between oxygen levels of hypoxia is indicated
as HHH (P<0.001). Significant interaction between type of fuel and oxygen is indicated
as III (P<0.001).

180
References
Abbott, S. K., Else, P. L. and Hulbert, A. J. (2010). Membrane fatty acid composition of rat skeletal muscle is most responsive to the balance of dietary n-3 and n-6 PUFA. British Journal of Nutrition 103, 522-529.
Alasnier, C., Rémignon, H. and Gandemer, G. (1996). Lipid characteristics associated with oxidative and glycolytic fibres in rabbit muscles. Meat Science 43, 213-224.
Alp, P. R., Newsholme, E. A. and Zammit, V. A. (1976). Activities of citrate synthase and NAD+-linked and NADP+-linked isocitrate dehydrogenase in muscle from vertebrates and invertebrates. Biochemical Journal 154, 689.
Anderson, R. L., Minton, K. W., Li, G. C. and Hahn, G. M. (1981). Temperature-induced homeoviscous adaptation of Chinese hamster ovary cells. Biochimica et Biophysica Acta (BBA)-Biomembranes 641, 334-348.
Arnold, W., Giroud, S., Valencak, T. G. and Ruf, T. (2015). Ecophysiology of omega fatty acids: a lid for every jar. Physiology 30, 232-240.
Bandara, K. V., Michael, M. Z. and Gleadle, J. M. (2017). MicroRNA biogenesis in hypoxia. MicroRNA 6, 80-96.
Bartel, D. P. (2009). MicroRNAs: target recognition and regulatory functions. Cell 136, 215-233. Bastiaanse, E. M. L., Höld, K. M. and Van der Laarse, A. (1997). The effect of membrane
cholesterol content on ion transport processes in plasma membranes. Cardiovascular Research 33, 272-283.
Bell, M., Henderson, R. and Sargent, J. (1986). The role of polyunsaturated fatty acids in fish. Comparative Biochemistry and Physiology Part B: Comparative Biochemistry 83, 711-719.
Benjamini, Y. and Hochberg, Y. (1995). Controlling the false discovery rate: a practical and powerful approach to multiple testing. Journal of the Royal Statistical Society: Series B (Methodological) 57, 289-300.
Benzi, G., Gorini, A., Arnaboldi, R., Ghigini, B. and Villa, R. (1994). Synaptosomal non-mitochondrial ATPase activities: age-related alterations by chronic normobaric intermittent hypoxia. Neurochemistry International 25, 61-67.
Berg, J., Tymoczko, J. and Stryer, L. (2007). Glycolysis and gluconeogenesis. In Biochemistry, pp. 433-474: Freeman WH Co. Ltd.
Best, C., Melnyk-Lamont, N., Gesto, M. and Vijayan, M. M. (2014). Environmental levels of the antidepressant venlafaxine impact the metabolic capacity of rainbow trout. Aquatic Toxicology 155, 190-198.
Bickler, P. E. and Buck, L. T. (1998). Adaptations of vertebrate neurons to hypoxia and anoxia: maintaining critical Ca2+ concentrations. Journal of Experimental Biology 201, 1141-1152.
Bickler, P. E. and Buck, L. T. (2007). Hypoxia tolerance in reptiles, amphibians, and fishes: life with variable oxygen availability. Annual Review of Physiology 69, 145-170.
Block, E. R., Patel, J. M. and Edwards, D. (1989). Mechanism of hypoxic injury to pulmonary artery endothelial cell plasma membranes. American Journal of Physiology-Cell Physiology 257, C223-C231.
Bourguignon, A., Rameau, A., Toullec, G., Romestaing, C. and Roussel, D. (2017). Increased mitochondrial energy efficiency in skeletal muscle after long-term fasting: its relevance to animal performance. Journal of Experimental Biology 220, 2445-2451.
Boutilier, R. and St-Pierre, J. (2000). Surviving hypoxia without really dying. Comparative Biochemistry and Physiology Part A: Molecular & Integrative Physiology 126, 481-490.
Boutilier, R. G. (2001). Mechanisms of cell survival in hypoxia and hypothermia. Journal of Experimental Biology 204, 3171-3181.
Brown, D. and London, E. (1998). Functions of lipid rafts in biological membranes. Annual Review of Cell and Developmental Biology 14, 111-136.

181
Buck, L. T., Land, S. C. and Hochachka, P. W. (1993). Anoxia-tolerant hepatocytes: model system for study of reversible metabolic suppression. American Journal of Physiology-Regulatory, Integrative and Comparative Physiology 265, R49-R56.
Buda, C., Dey, I., Balogh, N., L.I., H., Maderspach, K., Juhasz, M., Yeo, Y. K. and Farkas, T. (1994). Structural order of membranes and composition of phospholipids in fish brain cells during thermal acclimatization. Proceedings of the National Academy of Sciences 91, 8234-8238.
Bundgaard, A., Qvortrup, K., Rasmussen, L. J. and Fago, A. (2019). Turtles maintain mitochondrial integrity but reduce mitochondrial respiratory capacity in the heart after cold acclimation and anoxia. Journal of Experimental Biology 222.
Bunn, H. F. and Poyton, R. O. (1996). Oxygen sensing and molecular adaptation to hypoxia. Physiological Reviews 76, 839-885.
Cáceda, R., Gamboa, J. L., Boero, J. A., Monge-C, C. and Arregui, A. (2001). Energetic metabolism in mouse cerebral cortex during chronic hypoxia. Neuroscience Letters 301, 171-174.
Calhoon, E. A., Ro, J. and Williams, J. B. (2015). Perspectives on the membrane fatty acid unsaturation/pacemaker hypotheses of metabolism and aging. Chemistry and Physics of Lipids 191, 48-60.
Campbell, H. A., Fraser, K. P., Bishop, C. M., Peck, L. S. and Egginton, S. (2008). Hibernation in an Antarctic fish: on ice for winter. PLoS One 3, e1743.
Carpenter, T. C., Schomberg, S., Nichols, C., Stenmark, K. R. and Weil, J. V. (2003). Hypoxia reversibly inhibits epithelial sodium transport but does not inhibit lung ENaC or Na-K-ATPase expression. American Journal of Physiology-Lung Cellular and Molecular Physiology 284, L77-L83.
Casey, T. M., Pakay, J. L., Guppy, M. and Arthur, P. G. (2002). Hypoxia causes downregulation of protein and RNA synthesis in noncontracting mammalian cardiomyocytes. Circulation Research 90, 777-783.
Chan, S. Y., Zhang, Y.-Y., Hemann, C., Mahoney, C. E., Zweier, J. L. and Loscalzo, J. (2009). MicroRNA-210 controls mitochondrial metabolism during hypoxia by repressing the iron-sulfur cluster assembly proteins ISCU1/2. Cell Metabolism 10, 273-284.
Chan, Y. C., Banerjee, J., Choi, S. Y. and Sen, C. K. (2012). miR‐210: The master hypoxamir. Microcirculation 19, 215-223.
Chávez, J. C., Pichiule, P., Boero, J. and Arregui, A. (1995). Reduced mitochondrial respiration in mouse cerebral cortex during chronic hypoxia. Neuroscience Letters 193, 169-172.
Chee, N. T., Lohse, I. and Brothers, S. P. (2019). mRNA-to-protein translation in hypoxia. Molecular Cancer 18, 49.
Chen, Z., Omori, Y., Koren, S., Shirokiya, T., Kuroda, T., Miyamoto, A., Wada, H., Fujiyama, A., Toyoda, A. and Zhang, S. (2019). De novo assembly of the goldfish (Carassius auratus) genome and the evolution of genes after whole-genome duplication. Science Advances 5, eaav0547.
Cheviron, Z. A., Bachman, G. C., Connaty, A. D., McClelland, G. B. and Storz, J. F. (2012). Regulatory changes contribute to the adaptive enhancement of thermogenic capacity in high-altitude deer mice. Proceedings of the National Academy of Sciences 109, 8635-8640.
Cheviron, Z. A., Connaty, A. D., McClelland, G. B. and Storz, J. F. (2014). Functional
genomics of adaptation to hypoxic cold‐stress in high‐altitude deer mice: transcriptomic plasticity and thermogenic performance. Evolution 68, 48-62.
Chiang, J. Y. and Ferrell, J. M. (2020). Up to date on cholesterol 7α-hydroxylase (CYP7A1) in bile acid synthesis. Liver Research.

182
Chung, D., Dzal, Y. A., Seow, A., Milsom, W. K. and Pamenter, M. E. (2016). Naked mole rats exhibit metabolic but not ventilatory plasticity following chronic sustained hypoxia. Proceedings of the Royal Society B: Biological Sciences 283, 20160216.
Chung, D., Lloyd, G. P., Thomas, R. H., Guglielmo, C. G. and Staples, J. F. (2011). Mitochondrial respiration and succinate dehydrogenase are suppressed early during entrance into a hibernation bout, but membrane remodeling is only transient. Journal of Comparative Physiology B: Biochemical, Systemic, and Environmental Physiology 181, 699-711.
Cockburn, J. J. B., Abrescia, N. G. A., Grimes, J. M., Sutton, G. C., Diprose, J. M., Benevides, J. M., Thomas, G. J., Bamford, J. K. H., Bamford, D. H. and Stuart, D. I. (2004). Membrane structure and interactions with protein and DNA in bacteriophage PRD1. Nature 432, 122-125.
Cook, D. G., Iftikar, F. I., Baker, D. W., Hickey, A. J. and Herbert, N. A. (2013). Low-O2 acclimation shifts the hypoxia avoidance behaviour of snapper (Pagrus auratus) with only subtle changes in aerobic and anaerobic function. Journal of Experimental Biology 216, 369-378.
Cornelius, F. (1995). Cholesterol modulation of molecular activity of reconstituted shark Na+,K+-ATPase. BBA - Biomembranes 1235, 205-212.
Cornelius, F. (2008). Cholesterol-dependent interaction of polyunsaturated phospholipids with Na, K-ATPase. Biochemistry 47, 1652-1658.
Cossins, A., Bowler, K. and Prosser, C. (1981). Homeoviscous adaptation and its effect upon membrane-bound proteins. Journal of Thermal Biology 6, 183-187.
Cossins, A. R., Friedlander, M. J. and Prosser, C. L. (1977). Correlations between behavioral temperature adaptations of goldfish and the viscosity and fatty acid composition of their synaptic membranes. Journal of Comparative Physiology A: Neuroethology, Sensory, Neural, and Behavioral Physiology 120, 109-121.
Costa, L. E., Boveris, A., Koch, O. R. and Taquini, A. C. (1988). Liver and heart mitochondria in rats submitted to chronic hypobaric hypoxia. American Journal of Physiology-Cell Physiology 255, C123-C129.
Crockett, E. and Hazel, J. (1995). Cholesterol levels explain inverse compensation of membrane order in brush border but not homeoviscous adaptation in basolateral membranes from the intestinal epithelia of rainbow trout. Journal of Experimental Biology 198, 1105-1113.
Crockett, E. L. (1998). Cholesterol function in plasma membranes from ectotherms: membrane-specific roles in adaptation to temperature. American Zoologist 38, 291-304.
Crockett, E. L. and Hazel, J. R. (1997). Cholesterol affects physical properties and (Na+, K+)-ATPase in basolateral membranes of renal and intestinal epithelia from thermally acclimated rainbow trout. Journal of Comparative Physiology B 167, 344-351.
D'Avanzo, N. (2016). Lipid regulation of sodium channels. In Current Topics in Membranes, vol. 78, pp. 353-407. Amsterdam, Netherlands: Elsevier.
D’Anna, F., Van Dyck, L., Xiong, J., Zhao, H., Berrens, R. V., Qian, J., Bieniasz-Krzywiec, P., Chandra, V., Schoonjans, L. and Matthews, J. (2020). DNA methylation repels binding of hypoxia-inducible transcription factors to maintain tumor immunotolerance. Genome Biology 21, 1-36.
Daneshrad, Z., Garcia-Riera, M., Verdys, M. and Rossi, A. (2000). Differential responses to chronic hypoxia and dietary restriction of aerobic capacity and enzyme levels in the rat myocardium. Molecular and Cellular Biochemistry 210, 159-166.
Dawson, N. J., Lyons, S. A., Henry, D. A. and Scott, G. R. (2018). Effects of chronic hypoxia on diaphragm function in deer mice native to high altitude. Acta Physiologica 223.
Demel, R. A. and De Kruyff, B. (1976). The function of sterols in membranes. Biochimica et Biophysica Acta (BBA)-Reviews on Biomembranes 457, 109-132.

183
Diaz, R. J. and Rosenberg, R. (2008). Spreading dead zones and consequences for marine ecosystems. Science 321, 926-929.
Dietrich, C., Bagatolli, L., Volovyk, Z., Thompson, N., Levi, M., Jacobson, K. and Gratton, E. (2001). Lipid rafts reconstituted in model membranes. Biophysical Journal 80, 1417-1428.
DiMauro, S. and Moraes, C. T. (1993). Mitochondrial encephalomyopathies. Archives of Neurology 50, 1197-1208.
Dotson, R. J., Smith, C. R., Bueche, K., Angles, G. and Pias, S. C. (2017). Influence of cholesterol on the oxygen permeability of membranes: insight from atomistic simulations. Biophysical Journal 112, 2336-2347.
Drynan, L., Quant, P. A. and Zammit, V. A. (1996). Flux control exerted by mitochondrial outer membrane carnitine palmitoyltransferase over β-oxidation, ketogenesis and tricarboxylic acid cycle activity in hepatocytes isolated from rats in different metabolic states. Biochemical Journal 317, 791-795.
Du, S. N., Mahalingam, S., Borowiec, B. G. and Scott, G. R. (2016). Mitochondrial physiology and reactive oxygen species production are altered by hypoxia acclimation in killifish (Fundulus heteroclitus). Journal of Experimental Biology 219, 1130-1138.
Dukhande, V. V., Sharma, G. C., Lai, J. C. K. and Farahani, R. (2011). Chronic hypoxia-induced alterations of key enzymes of glucose oxidative metabolism in developing mouse liver are mTOR dependent. Molecular and Cellular Biochemistry 357, 189-197.
Dutta, A., Vats, P., Singh, V. K., Sharma, Y. K., Singh, S. N. and Singh, S. B. (2009). Impairment of mitochondrial β-oxidation in rats under cold-hypoxic environment. International Journal of Biometeorology 53, 397.
Eckert, G. P., Igbavboa, U., Müller, W. E. and Wood, W. G. (2003). Lipid rafts of purified mouse brain synaptosomes prepared with or without detergent reveal different lipid and protein domains. Brain Research 962, 144-150.
Else, P. and Wu, B. (1999). What role for membranes in determining the higher sodium pump molecular activity of mammals compared to ectotherms? Journal of Comparative Physiology B 169, 296-302.
Erecińska, M. and Silver, I. A. (1994). Ions and energy in mammalian brain. Progress in Neurobiology 43, 37-71.
Faulkes, C. G., Eykyn, T. R. and Aksentijevic, D. (2019). Cardiac metabolomic profile of the naked mole-rat—glycogen to the rescue. Biology Letters 15, 20190710.
Fernandez, M. I. G., Ceccarelli, D. and Muscatello, U. (2004). Use of the fluorescent dye 10-N-nonyl acridine orange in quantitative and location assays of cardiolipin: a study on different experimental models. Analytical Biochemistry 328, 174-180.
Forbes, J. L., Kostyniuk, D. J., Mennigen, J. A. and Weber, J.-M. (2019). Unexpected effect of insulin on glucose disposal explains glucose intolerance of rainbow trout. American Journal of Physiology-Regulatory, Integrative and Comparative Physiology 316, R387-R394.
Frank, C. L. (1992). The influence of dietary fatty acids on hibernation by golden-mantled ground squirrels (Spermophilus lateralis). Physiological Zoology. 65, 906-920.
Frank, C. L. (2002). Short-term variations in diet fatty acid composition and torpor by ground squirrels. Journal of Mammalogy 83, 1013-1019.
Frank, C. L. and Storey, K. B. (1995). The optimal depot fat composition for hibernation by golden-mantled ground squirrels (Spermophilus lateralis). Journal of Comparative Physiology B. 164, 536-542.
Frick, N. T., Bystriansky, J. S., Ip, Y. K., Chew, S. F. and Ballantyne, J. S. (2010). Cytochrome c oxidase is regulated by modulations in protein expression and mitochondrial membrane phospholipid composition in estivating African lungfish. American Journal of Physiology-Regulatory, Integrative and Comparative Physiology 298, R608-R616.

184
Galbes, O., Goret, L., Caillaud, C., Mercier, J., Obert, P., Candau, R. and Py, G. (2008). Combined effects of hypoxia and endurance training on lipid metabolism in rat skeletal muscle. Acta Physiologica 193, 163-173.
Garcia, A., Lev, B., Hossain, K. R., Gorman, A., Pham, T. H. N., Cornelius, F., Allen, T. W. and Clarke, R. J. (2019). Cholesterol depletion inhibits Na+, K+-ATPase activity in a near-native membrane environment. Journal of Biological Chemistry 294, 5956-5969.
Gerber, L., Clow, K. A., Katan, T., Emam, M., Leeuwis, R. H., Parrish, C. C. and Gamperl, A. K. (2019). Cardiac mitochondrial function, nitric oxide sensitivity and lipid composition following hypoxia acclimation in sablefish. Journal of Experimental Biology 222.
Gerson, A. R., Brown, J. C. L., Thomas, R., Bernards, M. A. and Staples, J. F. (2008). Effects of dietary polyunsaturated fatty acids on mitochondrial metabolism in mammalian hibernation Journal of Experimental Biology 211, 2689-2699.
Gesser, H., Johansen, K. and Maloiy, G. (1977). Tissue metabolism and enzyme activities in the rodent Heterocephalus glaber, a poor temperature regulator. Comparative Biochemistry and Physiology. B, Comparative Biochemistry 57, 293-296.
Giroud, S., Stalder, G., Gerritsmann, H., Kübber-Heiss, A., Kwak, J., Arnold, W. and Ruf, T. (2018). Dietary lipids affect the onset of hibernation in the garden dormouse (Eliomys quercinus): implications for cardiac function. Frontiers in Physiology 9, 1235.
Glitsch, H. G. (2001). Electrophysiology of the sodium-potassium-ATPase in cardiac cells. Physiological Reviews 81 (4), 1791-1826.
Gomez, C. R. and Richards, J. G. (2018). Mitochondrial responses to anoxia exposure in red eared sliders (Trachemys Scripta). Comparative Biochemistry and Physiology Part - B: Biochemistry and Molecular Biology 224, 71-78.
Gonzalez, A., Odjélé, A. and Weber, J.-M. (2013). PCB-153 and temperature cause restructuring of goldfish membranes: Homeoviscous response to a chemical fluidiser. Aquatic Toxicology 144-145, 11-18.
Gonzalez, A., Pagé, B. and Weber, J.-M. (2015). Membranes as a possible pacemaker of metabolism in cypriniform fish: does phylogeny matter? Journal of Experimental Biology. 218, 2563-2572.
Guderley, H., Kraffe, E., Bureau, W. and Bureau, D. P. (2008). Dietary fatty acid composition changes mitochondrial phospholipids and oxidative capacities in rainbow trout red muscle. Journal of Comparative Physiology B 178, 385-399.
Guglielmo, C. G., Haunerland, N. H., Hochachka, P. W. and Williams, T. D. (2002). Seasonal dynamics of flight muscle fatty acid binding protein and catabolic enzymes in a migratory shorebird. American Journal of Physiology-Regulatory, Integrative and Comparative physiology. 282, R1405-R1413.
Guo, W., Xie, W., Lei, T. and Hamilton, J. A. (2005). Eicosapentaenoic acid, but not oleic acid, stimulates β‐oxidation in adipocytes. Lipids 40, 815-821.
Gustavsson, M., Traaseth, N. J. and Veglia, G. (2011). Activating and deactivating roles of lipid bilayers on the Ca2+-ATPase/phospholamban complex. Biochemistry 50, 10367-10374.
Hadj-Moussa, H., Logan, S. M., Seibel, B. A. and Storey, K. B. (2018). Potential role for microRNA in regulating hypoxia-induced metabolic suppression in jumbo squids. Biochimica et Biophysica Acta (BBA)-Gene Regulatory Mechanisms 1861, 586-593.
Hadj-Moussa, H. and Storey, K. B. (2020). The OxymiR response to oxygen limitation: a comparative microRNA perspective. Journal of Experimental Biology 223.
Hadj‐Moussa, H., Pamenter, M. E. and Storey, K. B. (2020). Hypoxic naked mole–rat brains use microRNA to coordinate hypometabolic fuels and neuroprotective defenses. Journal of Cellular Physiology.
Han, J., Lee, Y., Yeom, K.-H., Nam, J.-W., Heo, I., Rhee, J.-K., Sohn, S. Y., Cho, Y., Zhang, B.-T. and Kim, V. N. (2006). Molecular basis for the recognition of primary microRNAs by the Drosha-DGCR8 complex. Cell 125, 887-901.

185
Harayama, T. and Riezman, H. (2018). Understanding the diversity of membrane lipid composition. Nature Reviews Molecular Cell Biology.
Hardie, D. G., Scott, J. W., Pan, D. A. and Hudson, E. R. (2003). Management of cellular energy by the AMP‐activated protein kinase system. FEBS Letters 546, 113-120.
Hatzimichael, E., Dasoula, A., Shah, R., Syed, N., Papoudou‐Bai, A., Coley, H. M., Dranitsaris, G., Bourantas, K. L., Stebbing, J. and Crook, T. (2010). The prolyl‐hydroxylase EGLN3 and not EGLN1 is inactivated by methylation in plasma cell neoplasia. European Journal of Haematology 84, 47-51.
Hazel, J. R. (1995). Thermal adaptation in biological membranes: Is homeoviscous adaptation the explanation? Annual Review of Physiology 57, 19-42.
He, L. and Hannon, G. J. (2004). MicroRNAs: small RNAs with a big role in gene regulation. Nature Reviews Genetics 5, 522-531.
Heather, L. C., Cole, M. A., Tan, J.-J., Ambrose, L. J., Pope, S., Abd-Jamil, A. H., Carter, E. E., Dodd, M. S., Yeoh, K. K. and Schofield, C. J. (2012). Metabolic adaptation to chronic hypoxia in cardiac mitochondria. Basic Research in Cardiology 107, 268.
Heckmann, L.-H., Sørensen, P. B., Krogh, P. H. and Sørensen, J. G. (2011). NORMA-Gene: A simple and robust method for qPCR normalization based on target gene data. BMC Bioinformatics 12, 250.
Hickey, A. J. R., Renshaw, G. M. C., Speers-Roesch, B., Richards, J. G., Wang, Y., Farrell, A. P. and Brauner, C. J. (2012). A radical approach to beating hypoxia: depressed free radical release from heart fibres of the hypoxia-tolerant epaulette shark (Hemiscyllum ocellatum). Journal of Comparative Physiology B 182, 91-100.
Hochachka, P., Stanley, C., Matheson, G., McKenzie, D., Allen, P. and Parkhouse, W. (1991). Metabolic and work efficiencies during exercise in Andean natives. Journal of Applied Physiology 70, 1720-1730.
Hochachka, P. W. (1986). Defense strategies against hypoxia and hypothermia. Science 231, 234-241.
Hochachka, P. W., Buck, L. T., Doll, C. J. and Land, S. C. (1996). Unifying theory of hypoxia tolerance: Molecular/metabolic defense and rescue mechanisms for surviving oxygen lack. Proceedings of the National Academy of Sciences 93, 9493-9498.
Holtze, S., Braude, S., Lemma, A., Koch, R., Morhart, M., Szafranski, K., Platzer, M., Alemayehu, F., Goeritz, F. and Hildebrandt, T. B. (2018). The microenvironment of naked mole-rat burrows in East Africa. African Journal of Ecology 56, 279-289.
Hossein-Javaheri, N. and Buck, L. T. (2021). GABA receptor inhibition and severe hypoxia induce a paroxysmal depolarization shift in goldfish neurons. Journal of Neurophysiology 125, 321-330.
Hulbert, A. J. (2003). Life, death and membrane bilayers. Journal of Experimental Biology 206, 2303-2311.
Hulbert, A. J. (2007). Membrane fatty acids as pacemakers of animal metabolism. Lipids 42, 811-819.
Hulbert, A. J. and Else, P. L. (1999). Membranes as possible pacemakers of metabolism. Journal of Theoretical Biology 199, 257-274.
Hulbert, A. J. and Else, P. L. (2000). Mechanisms underlying the cost of living in animals. Annual Review of Physiology 62, 207-235.
Hulbert, A. J. and Else, P. L. (2005). Membranes and the setting of energy demand. Journal of Experimental Biology 208, 1593-1599.
Hulbert, A. J., Faulks, S. C. and Buffenstein, R. (2006). Oxidation-resistant membrane phospholipids can explain longevity differences among the longest-living rodents and similarly-sized mice. The Journals of Gerontology Series A: Biological Sciences and Medical Sciences 61, 1009-1018.

186
Hutter, J., Piper, H. and Spieckerman, P. (1985). Effect of fatty acid oxidation on efficiency of energy production in rat heart. American Journal of Physiology-Heart and Circulatory Physiology 249, H723-H728.
Hylland, P., Milton, S., Pek, M., Nilsson, G. E. and Lutz, P. L. (1997). Brain Na+/K+-ATPase activity in two anoxia tolerant vertebrates: crucian carp and freshwater turtle. Neuroscience Letters 235, 89-92.
Ivan, M. and Kaelin Jr, W. G. (2017). The EGLN-HIF O2-sensing system: multiple inputs and feedbacks. Molecular Cell 66, 772-779.
Ivy, C. M., Sprenger, R. J., Bennett, N. C., van Jaarsveld, B., Hart, D. W., Kirby, A. M., Yaghoubi, D., Storey, K. B., Milsom, W. K. and Pamenter, M. E. (2019). The hypoxia
tolerance of 8 related African mole‐rat species rivals that of naked mole‐rats, despite divergent ventilatory and metabolic strategies in severe hypoxia. Acta Physiologica, e13436.
Ježková, J., Nováková, O., Kolář, F., Tvrzická, E., Neckář, J. and Novák, F. (2002). Chronic hypoxia alters fatty acid composition of phospholipids in right and left ventricular myocardium. Molecular and Cellular Biochemistry 232, 49-56.
Jibb, L. A. and Richards, J. G. (2008). AMP-activated protein kinase activity during metabolic rate depression in the hypoxic goldfish, Carassius auratus. Journal of Experimental Biology 211, 3111-3122.
Johnston, I. A. and Bernard, L. M. (1982). Ultrastructure and metabolism of skeletal muscle fibres in the tench: Effects of long-term acclimation to hypoxia. Cell and Tissue Research 227, 179-199.
Kang, J. X. and Leaf, A. (1996). Evidence that free polyunsaturated fatty acids modify Na+ channels by directly binding to the channel proteins. Proceedings of the National Academy of Sciences 93, 3542-3546.
Katz, A. M., Messineo, F. C. and Herbette, L. (1982). Ion channels in membranes. Circulation 65 (1 Pt 2), I2-10.
Kennedy, S. L., Stanley, W. C., Panchal, A. R. and Mazzeo, R. S. (2001). Alterations in enzymes involved in fat metabolism after acute and chronic altitude exposure. Journal of Applied Physiology 90, 17-22.
Kim, E. B., Fang, X., Fushan, A. A., Huang, Z., Lobanov, A. V., Han, L., Marino, S. M., Sun, X., Turanov, A. A., Yang, P. et al. (2011). Genome sequencing reveals insights into physiology and longevity of the naked mole rat. Nature 479, 223-227.
Kimelberg, H. K. and Papahadjopoulos, D. (1974). Effects of phospholipid acyl chain fluidity, phase transitions, and cholesterol on (Na++ K+)-stimulated adenosine triphosphatase. Journal of Biological Chemistry 249, 1071-1080.
Kolwicz, S. C., Jr and Tian, R. (2011). Glucose metabolism and cardiac hypertrophy. Cardiovascular Research 90, 194-201.
Kraffe, E., Marty, Y. and Guderley, H. (2007). Changes in mitochondrial oxidative capacities during thermal acclimation of rainbow trout Oncorhynchus mykiss: roles of membrane proteins, phospholipids and their fatty acid compositions. Journal of Experimental Biology 210, 149-165.
Kumosani, T. A. and Moselhy, S. S. (2010). Modulatory effect of cod-liver oil on Na+-K+ ATPase in rats’ brain. Human & Experimental Toxicology 30, 267-274.
Kuznetsov, A. V., Strobl, D., Ruttmann, E., Königsrainer, A., Margreiter, R. and Gnaiger, E. (2002). Evaluation of mitochondrial respiratory function in small biopsies of liver. Analytical Biochemistry 305, 186-194.
Kuznetsov, A. V., Veksler, V., Gellerich, F. N., Saks, V., Margreiter, R. and Kunz, W. S. (2008). Analysis of mitochondrial function in situ in permeabilized muscle fibers, tissues and cells. Nature Protocols 3, 965.

187
Larsen, S., Kraunsøe, R., Gram, M., Gnaiger, E., Helge, J. W. and Dela, F. (2014). The best approach: homogenization or manual permeabilization of human skeletal muscle fibers for respirometry? Analytical Biochemistry 446, 64-68.
Larsen, S., Nielsen, J., Hansen, C. N., Nielsen, L. B., Wibrand, F., Stride, N., Schroder, H. D., Boushel, R., Helge, J. W., Dela, F. et al. (2012). Biomarkers of mitochondrial content in skeletal muscle of healthy young human subjects. The Journal of Physiology 590, 3349-3360.
Lau, D. S., Connaty, A. D., Mahalingam, S., Wall, N., Cheviron, Z. A., Storz, J. F., Scott, G. R. and McClelland, G. B. (2017). Acclimation to hypoxia increases carbohydrate use during exercise in high-altitude deer mice. American Journal of Physiology-Regulatory, Integrative and Comparative Physiology 312, R400-R411.
le Moine, C. M. R., Morash, A. J. and McClelland, G. B. (2011). Changes in HIF-1α protein, pyruvate dehydrogenase phosphorylation, and activity with exercise in acute and chronic hypoxia. American Journal of Physiology-Regulatory Integrative and Comparative Physiology 301, R1098-R1104.
Lee, A. G. (2004). How lipids affect the activities of integral membrane proteins. Biochimica et Biophysica Acta (BBA) - Biomembranes 1666, 62-87.
Lee, A. G. (2011). Biological membranes: the importance of molecular detail. Trends in Biochemical Sciences 36, 493-500.
Lee, S. D. and Tontonoz, P. (2015). Liver X receptors at the intersection of lipid metabolism and atherogenesis. Atherosclerosis 242, 29-36.
Levitan, I., Fang, Y., Rosenhouse-Dantsker, A. and Romanenko, V. (2010). Cholesterol and ion channels. In Cholesterol Binding and Cholesterol Transport Proteins:, pp. 509-549. New York, USA: Springer.
Lewis, R. and McElhaney, R. N. (1992). The mesomorphic phase behavior of lipid bilayers. The Structure of Biological Membranes 2.
Li, J., Xu, X., Li, W. and Zhang, X. (2018). Effects of acute and chronic hypoxia on the locomotion and enzyme of energy metabolism in Chinese shrimp Fenneropenaeus chinensis. Marine and Freshwater Behaviour and Physiology 51, 275-291.
Li, Y., Ge, M., Ciani, L., Kuriakose, G., Westover, E. J., Dura, M., Covey, D. F., Freed, J. H., Maxfield, F. R. and Lytton, J. (2004). Enrichment of endoplasmic reticulum with cholesterol inhibits sarcoplasmic-endoplasmic reticulum calcium ATPase-2b activity in parallel with increased order of membrane lipids. Journal of Biological Chemistry 279, 37030-37039.
Lighton, J. R. (2018). Measuring metabolic rates: a manual for scientists: Oxford University Press.
Liu, L., Cash, T. P., Jones, R. G., Keith, B., Thompson, C. B. and Simon, M. C. (2006). Hypoxia-induced energy stress regulates mRNA translation and cell growth. Molecular Cell 21, 521-531.
Low, P. A., Schmelzer, J., Ward, K. and Yao, J. (1986). Experimental chronic hypoxic neuropathy: relevance to diabetic neuropathy. American Journal of Physiology-Endocrinology And Metabolism 250, E94-E99.
Lui, M. A., Mahalingam, S., Patel, P., Connaty, A. D., Ivy, C. M., Cheviron, Z. A., Storz, J. F., McClelland, G. B. and Scott, G. R. (2015). High-altitude ancestry and hypoxia acclimation have distinct effects on exercise capacity and muscle phenotype in deer mice. American Journal of Physiology-Regulatory, Integrative and Comparative Physiology 308, R779-R791.
Lutz, P. L. and Storey, K. B. (2010). Adaptations to variations in oxygen tension by Vertebrates and Invertebrates. In Comprehensive Physiology, pp. 1479-1522. New Jersey, USA: John Wiley & Sons, Inc.
Madden, T. D., King, M. D. and Quinn, P. J. (1981). The modulation of Ca2+-ATPase activity of sarcoplasmic reticulum by membrane cholesterol. The effect of enzyme coupling. Biochimica et Biophysica Acta (BBA) - Biomembranes 641, 265-269.

188
Magnoni, L. and Weber, J. M. (2007). Endurance swimming activates trout lipoprotein lipase: plasma lipids as a fuel for muscle. Journal of Experimental Biology 210, 4016-4023.
Mahalingam, S., McClelland, G. B. and Scott, G. R. (2017). Evolved changes in the intracellular
distribution and physiology of muscle mitochondria in high‐altitude native deer mice. The Journal of Physiology 595, 4785-4801.
Mahfouz, M. E., Hegazi, M. M., El-Magd, M. A. and Kasem, E. A. (2015). Metabolic and molecular responses in Nile tilapia, Oreochromis niloticus during short and prolonged hypoxia. Marine and Freshwater Behaviour and Physiology 48, 319-340.
Maillet, D. and Weber, J.-M. (2006). Performance-enhancing role of dietary fatty acids in a long-distance migrant: The semipalmated sandpiper. Journal of Experimental Biology 209, 2686-2695.
Maillet, D. and Weber, J.-M. (2007). Relationship between n-3 PUFA content and energy metabolism in the flight muscles of a migrating shorebird: evidence for natural doping. Journal of Experimental Biology 210, 413-420.
Mairbaurl, H., Wodopia, R., Eckes, S., Schulz, S. and Bartsch, P. (1997). Impairment of cation transport in A549 cells and rat alveolar epithelial cells by hypoxia. American Journal of Physiology-Lung Cellular and Molecular Physiology 273, L797-L806.
Malthankar-Phatak, G. H., Patel, A. B., Xia, Y., Hong, S., Chowdhury, G. M., Behar, K. L., Orina, I. A. and Lai, J. C. (2008). Effects of continuous hypoxia on energy metabolism in cultured cerebro-cortical neurons. Brain Research 1229, 147-154.
Martens, J. R., Navarro-Polanco, R., Coppock, E. A., Nishiyama, A., Parshley, L., Grobaski, T. D. and Tamkun, M. M. (2000). Differential targeting of Shaker-like potassium channels to lipid rafts. Journal of Biological Chemistry 275, 7443-7446.
Martin, N., Bureau, D. P., Marty, Y., Kraffe, E. and Guderley, H. (2013). Dietary lipid quality and mitochondrial membrane composition in trout: responses of membrane enzymes and oxidative capacities. Journal of Comparative Physiology B 183, 393-408.
Martínez, M. L., Landry, C., Boehm, R., Manning, S., Cheek, A. O. and Rees, B. B. (2006). Effects of long-term hypoxia on enzymes of carbohydrate metabolism in the Gulf killifish, Fundulus grandis. Journal of Experimental Biology 209, 3851-3861.
Mas-Oliva, J. and Santiago-Garcia, J. (1990). Cholesterol effect on thermostability of the (Ca2+, Mg2+)-ATPase from cardiac muscle sarcolemma. Biochemistry International 21, 233-241.
Matuleviciute, R., Cunha, P. P., Johnson, R. S. and Foskolou, I. P. (2021). Oxygen regulation of TET enzymes. The FEBS Journal n/a.
McClelland, G., Dalziel, A., Fragoso, N. and Moyes, C. (2005). Muscle remodeling in relation to blood supply: implications for seasonal changes in mitochondrial enzymes. Journal of Experimental Biology 208, 515-522.
McClelland, G. B., Hochachka, P. W. and Weber, J.-M. (1998). Carbohydrate utilization during exercise after high-altitude acclimation: A new perspective. Proceedings of the National Academy of Sciences 95, 10288-10293.
McCormick, S. D. (1993). Methods for Nonlethal Gill Biopsy and Measurement of Na+, K+-ATPase Activity. Canadian Journal of Fisheries and Aquatic Sciences 50, 656-658.
McElroy, G. S. and Chandel, N. S. (2017). Mitochondria control acute and chronic responses to hypoxia. Experimental Cell Research 356, 217-222.
Mennigen, J. A., Martyniuk, C. J., Seiliez, I., Panserat, S. and Skiba-Cassy, S. (2014). Metabolic consequences of microRNA-122 inhibition in rainbow trout, Oncorhynchus mykiss. BMC Genomics 15, 1-20.
Metzen, E., Stiehl, D. P., Doege, K., Marxsen, J. H., Hellwig-Bürgel, T. and Jelkmann, W. (2005). Regulation of the prolyl hydroxylase domain protein 2 (phd2/egln-1) gene: identification of a functional hypoxia-responsive element. Biochemical Journal 387, 711-717.

189
Morash, A. J., Kotwica, A. O. and Murray, A. J. (2013). Tissue-specific changes in fatty acid oxidation in hypoxic heart and skeletal muscle. American Journal of Physiology-Regulatory, Integrative and Comparative Physiology 305, R534-R541.
Murphy, M. G. (1990). Dietary Fatty Acids and Membrane Protein Function. The Journal of Nutritional Biochemistry 1, 68-79.
Nagahuedi, S., Popesku, J. T., Trudeau, V. L. and Weber, J.-M. (2009). Mimicking the natural doping of migrant sandpipers in sedentary quails: effects of dietary n-3 fatty acids on muscle membranes and PPAR expression. Journal of Experimental Biology 212, 1106-1114.
Nallamshetty, S., Chan, S. Y. and Loscalzo, J. (2013). Hypoxia: a master regulator of microRNA biogenesis and activity. Free Radical Biology and Medicine 64, 20-30.
Nikel, K. E., Shanishchara, N. K., Ivy, C. M., Dawson, N. J. and Scott, G. R. (2018). Effects of hypoxia at different life stages on locomotory muscle phenotype in deer mice native to high altitudes. Comparative Biochemistry and Physiology Part - B: Biochemistry and Molecular Biology 224, 98-104.
Nikinmaa, M. and Rees, B. B. (2005). Oxygen-dependent gene expression in fishes. American Journal of Physiology-Regulatory, Integrative and Comparative Physiology 288, R1079-R1090.
Nilsson, G. E. (2010). Surviving without any oxygen. In Respiratory Physiology of Vertebrates: Life with and without oxygen, (ed. G. E. Nilsson), pp. 300-328. Cambridge UK: Cambridge University Press.
Ortega, A. and Mas-Oliva, J. (1984). Cholesterol effect on enzyme activity of the sarcolemmal (Ca2++ Mg2+)-ATPase from cardiac muscle. Biochimica et Biophysica Acta (BBA)-Biomembranes 773, 231-236.
Paajanen, V. and Vornanen, M. (2003). Effects of chronic hypoxia on inward rectifier K+ current (IK1) in ventricular myocytes of crucian carp (Carassius carassius) heart. Journal of Membrane Biology 194, 119-127.
Palmer, B. F. and Clegg, D. J. (2014). Oxygen sensing and metabolic homeostasis. Molecular and Cellular Endocrinology 397, 51-58.
Palomer, E., Martín-Segura, A., Baliyan, S., Ahmed, T., Balschun, D., Venero, C., Martin, M. G. and Dotti, C. G. (2016). Aging triggers a repressive chromatin state at Bdnf promoters in hippocampal neurons. Cell Reports 16, 2889-2900.
Pamenter, M. E. (2014). Mitochondria: a multimodal hub of hypoxia tolerance. Canadian Journal of Zoology 92, 569-589.
Pamenter, M. E., Dzal, Y. A. and Milsom, W. K. (2015). Adenosine receptors mediate the hypoxic ventilatory response but not the hypoxic metabolic response in the naked mole rat during acute hypoxia. Proceedings of the Royal Society of London B: Biological Sciences 282, 20141722.
Pamenter, M. E., Dzal, Y. A., Thompson, W. A. and Milsom, W. K. (2019). Do naked mole rats accumulate a metabolic acidosis or an oxygen debt in severe hypoxia? Journal of Experimental Biology 222, jeb191197.
Pamenter, M. E., Gomez, C. R., Richards, J. G. and Milsom, W. K. (2016). Mitochondrial responses to prolonged anoxia in brain of red-eared slider turtles. Biology Letters 12, 20150797.
Pamenter, M. E., Lau, G. Y., Richards, J. G. and Milsom, W. K. (2018). Naked mole rat brain mitochondria electron transport system flux and H+ leak are reduced during acute hypoxia. Journal of Experimental Biology 221.
Paradies, G., Petrosillo, G., Pistolese, M. and Ruggiero, F. M. (2002). Reactive oxygen species affect mitochondrial electron transport complex I activity through oxidative cardiolipin damage. Gene 286, 135-141.

190
Park, T. J., Reznick, J., Peterson, B. L., Blass, G., Omerbašić, D., Bennett, N. C., Kuich, P. H. J. L., Zasada, C., Browe, B. M., Hamann, W. et al. (2017). Fructose-driven glycolysis supports anoxia resistance in the naked mole-rat. Science 356, 307-311.
Pastoris, O., Dossena, M., Foppa, P., Arnaboldi, R., Gorini, A., Villa, R. and Benzi, G. (1995). Modifications by chronic intermittent hypoxia and drug treatment on skeletal muscle metabolism. Neurochemical Research 20, 143-150.
Pelster, B. and Egg, M. (2018). Hypoxia-inducible transcription factors in fish: expression, function and interconnection with the circadian clock. Journal of Experimental Biology 221.
Pescador, N., Cuevas, Y., Naranjo, S., Alcaide, M., Villar, D., Landázuri, M. O. and Del Peso, L. (2005). Identification of a functional hypoxia-responsive element that regulates the expression of the egl nine homologue 3 (egln3/phd3) gene. Biochemical Journal 390, 189-197.
Pesta, D. and Gnaiger, E. (2012). High-resolution respirometry: OXPHOS protocols for human cells and permeabilized fibers from small biopsies of human muscle. In Mitochondrial Bioenergetics, pp. 25-58: Springer.
Pierce, B. J., McWilliams, S. R., O'Connor, T. P., Place, A. R. and Guglielmo, C. G. (2005). Effect of dietary fatty acid composition on depot fat and exercise performance in a migrating songbird, the red-eyed vireo. Journal of Experimental Biology 208, 1277-1285.
Pillet, M., Dupont-Prinet, A., Chabot, D., Tremblay, R. and Audet, C. (2016). Effects of exposure to hypoxia on metabolic pathways in northern shrimp (Pandalus borealis) and Greenland halibut (Reinhardtius hippoglossoides). Journal of Experimental Marine Biology and Ecology 483, 88-96.
Pocock, R. (2011). Invited review: decoding the microRNA response to hypoxia. Pflügers Archiv-European Journal of Physiology 461, 307-315.
Poveda, J. A., Giudici, A. M., Renart, M. L., Molina, M. L., Montoya, E., Fernández-Carvajal, A., Fernández-Ballester, G., Encinar, J. A. and González-Ros, J. M. (2014). Lipid modulation of ion channels through specific binding sites. Biochimica et Biophysica Acta (BBA) - Biomembranes 1838, 1560-1567.
Quinlan, C. L., Perevoschikova, I. V., Goncalves, R. L., Hey-Mogensen, M. and Brand, M. D. (2013). The determination and analysis of site-specific rates of mitochondrial reactive oxygen species production. In Methods in Enzymology, vol. 526, pp. 189-217. Amsterdam, Netherlands: Elsevier.
Raynard, R. and Cossins, A. (1991). Homeoviscous adaptation and thermal compensation of sodium pump of trout erythrocytes. American Journal of Physiology-Regulatory, Integrative and Comparative Physiology 260, R916-R924.
Regan, M. D., Gill, I. S. and Richards, J. G. (2017). Calorespirometry reveals that goldfish prioritize aerobic metabolism over metabolic rate depression in all but near-anoxic environments. Journal of Experimental Biology 220, 564-572.
Reynolds, A. M., Lee, R. E. and Costanzo, J. P. (2014). Membrane adaptation in phospholipids and cholesterol in the widely distributed, freeze-tolerant wood frog, Rana sylvatica. Journal of Comparative Physiology B 184, 371-383.
Richards, J. G. (2009). Metabolic and molecular responses of fish to hypoxia. In Fish Physiology, vol. 27 eds. J. G. Richards A. P. Farrell and C. J. Brauner), pp. 443-485: Academic Press.
Richards, J. G. (2011). Hypoxia | Metabolic rate suppression as a mechanism for surviving hypoxia. In Encyclopedia of Fish Physiology, (ed. A. P. Farrell), pp. 1764-1770. San Diego: Academic Press.
Richards, J. G., Farrell, A. P. and Brauner, C. J. (2009). Hypoxia. In Fish Physiology, vol. 27 eds. A. P. Farrell and C. J. Brauner), pp. 528. London: Academic Press.
Robertson, J. C. and Hazel, J. R. (1995). Cholesterol content of trout plasma membranes varies with acclimation temperature. American Journal of Physiology - Regulatory, Integrative and Comparative Physiology 269, R1113-R1119.

191
Rodriguez, E., Weber, J.-M., Pagé, B., Roubik, D. W., Suarez, R. K. and Darveau, C.-A. (2015). Setting the pace of life: Membrane composition of flight muscle varies with metabolic rate of hovering orchid bees. Proceedings of the Royal Society B: Biological Sciences 282, 20142232.
Rolfe, D. F. S. and Brown, G. C. (1997). Cellular energy utilization and molecular origin of standard metabolic rate in mammals. Physiological Reviews 77, 731-758.
Ruf, T. and Arnold, W. (2008). Effects of polyunsaturated fatty acids on hibernation and torpor: a review and hypothesis. American Journal of Physiology-Regulatory, Integrative and Comparative Physiology 294, R1044-1052.
Salin, K., Auer, S. K., Rudolf, A. M., Anderson, G. J., Selman, C. and Metcalfe, N. B. (2016). Variation in metabolic rate among individuals is related to tissue-specific differences in mitochondrial leak respiration. Physiological and Biochemical Zoology 89, 511-523.
Schippers, M.-P., Ramirez, O., Arana, M., Pinedo-Bernal, P. and McClelland, Grant B. (2012). Increase in carbohydrate utilization in high-altitude Andean mice. Current Biology 22, 2350-2354.
Schmidt-Rohr, K. (2020). Oxygen Is the high-energy molecule powering complex multicellular life: Fundamental corrections to traditional bioenergetics. ACS Omega 5, 2221-2233.
Seebacher, F., Brand, M. D., Else, P. L., Guderley, H., Hulbert, A. J. and Moyes, C. D. (2010). Plasticity of oxidative metabolism in variable climates: Molecular mechanisms. Physiological and Biochemical Zoology 83, 721-732.
Seebacher, F., Murray, S. and Else, P. (2009). Thermal acclimation and regulation of metabolism in a reptile (Crocodylus porosus): the importance of transcriptional mechanisms and membrane composition. Physiological and Biochemical Zoology 82, 766-775.
Seibel, B. A. (2011). Critical oxygen levels and metabolic suppression in oceanic oxygen minimum zones. Journal of Experimental Biology 214, 326-336.
Seibel, B. A., Häfker, N. S., Trübenbach, K., Zhang, J., Tessier, S. N., Pörtner, H.-O., Rosa, R. and Storey, K. B. (2014). Metabolic suppression during protracted exposure to hypoxia in the jumbo squid, Dosidicus gigas, living in an oxygen minimum zone. Journal of Experimental Biology 217, 2555-2568.
Seibel, B. A., Luu, B. E., Tessier, S. N., Towanda, T. and Storey, K. B. (2017). Metabolic suppression in the pelagic crab, Pleuroncodes planipes, in oxygen minimum zones. Comparative Biochemistry and Physiology Part B: Biochemistry and Molecular Biology.
Sellner, P. A. and Hazel, J. R. (1982). Time course of changes in fatty acid composition of gills and liver from rainbow trout (Salmo gairdneri) during thermal acclimation. Journal of Experimental Zoology Part A: Ecological Genetics and Physiology 221, 159-168.
Semenza, G. L. (2001a). HIF-1 and mechanisms of hypoxia sensing. Current Opinion in Cell Biology 13, 167-171.
Semenza, G. L. (2001b). HIF-1, O2, and the 3 PHDs: how animal cells signal hypoxia to the nucleus. Cell 107, 1-3.
Semenza, G. L. (2007). Life with oxygen. Science 318, 62-64. Sepúlveda, M. R., Berrocal-Carrillo, M., Gasset, M. and Mata, A. M. (2006). The plasma
membrane Ca2+-ATPase isoform 4 is localized in lipid rafts of cerebellum synaptic plasma membranes. Journal of Biological Chemistry 281, 447-453.
Serocki, M., Bartoszewska, S., Janaszak-Jasiecka, A., Ochocka, R. J., Collawn, J. F. and Bartoszewski, R. (2018). miRNAs regulate the HIF switch during hypoxia: a novel therapeutic target. Angiogenesis 21, 183-202.
Shoubridge, E. and Hochachka, P. (1980). Ethanol: novel end product of vertebrate anaerobic metabolism. Science 209, 308-309.
Simons, K. and Ikonen, E. (1997). Functional rafts in cell membranes. Nature 387, 569. Simons, K. and Sampaio, J. L. (2011). Membrane organization and lipid rafts. Cold Spring
Harbor Perspectives in Biology 3, a004697.

192
Simons, K. and Toomre, D. (2000). Lipid rafts and signal transduction. Nature Reviews Molecular Cell Biology 1, 31-39.
Singer, S. J. and Nicolson, G. L. (1972). The fluid mosaic model of the structure of cell membranes. Science 175, 720-731.
Smith, M. and Kemp, P. (1971). Parallel temperature-induced changes in membrane fatty acids and in the transport of amino acids by the intestine of goldfish (Carassius auratus L. Comparative Biochemistry and Physiology Part B: Comparative Biochemistry 39, 357-365.
Soengas, J. L. and Aldegunde, M. (2002). Energy metabolism of fish brain. Comparative Biochemistry and Physiology Part B: Biochemistry and Molecular Biology 131, 271-296.
Sokolova, I. (2018). Mitochondrial adaptations to variable environments and their role in animals’ stress tolerance. Integrative and Comparative Biology 58, 519-531.
Solaini, G., Baracca, A., Lenaz, G. and Sgarbi, G. (2010). Hypoxia and mitochondrial oxidative metabolism. Biochimica et Biophysica Acta (BBA) - Bioenergetics 1797, 1171-1177.
Spector, A. A. and Yorek, M. A. (1985). Membrane lipid composition and cellular function. Journal of Lipid Research 26 (9), 1015-1035.
St-Pierre, J., Brand, M. D. and Boutilier, R. G. (2000a). Mitochondria as ATP consumers: cellular treason in anoxia. Proceedings of the National Academy of Sciences 97, 8670-8674.
St-Pierre, J., Tattersall, G. J. and Boutilier, R. G. (2000b). Metabolic depression and enhanced O2 affinity of mitochondria in hypoxic hypometabolism. American Journal of Physiology-Regulatory, Integrative and Comparative Physiology 279, R1205-R1214.
Staples, J. F. (2014). Metabolic suppression in mammalian hibernation: The role of mitochondria. Journal of Experimental Biology 217, 2032-2036.
Staples, J. F. and Brown, J. C. L. (2008). Mitochondrial metabolism in hibernation and daily torpor: a review. Journal of Comparative Physiology B 178, 811-827.
Storey, K. B. (1997). Metabolic regulation in mammalian hibernation: enzyme and protein adaptations. Comparative Biochemistry and Physiology Part A: Physiology 118, 1115-1124.
Storey, K. B. (2015). Regulation of hypometabolism: insights into epigenetic controls. Journal of Experimental Biology 218, 150-159.
Storey, K. B. and Storey, J. M. (1990). Metabolic rate depression and biochemical adaptation in anaerobiosis, hibernation and estivation. The Quarterly Review of Biology 65, 145-174.
Storey, K. B. and Storey, J. M. (2004). Metabolic rate depression in animals: transcriptional and translational controls. Biological Reviews 79, 207-233.
Storey, K. B. and Storey, J. M. (2007). Tribute to PL Lutz: putting life onpause'–molecular regulation of hypometabolism. Journal of Experimental Biology 210, 1700-1714.
Stramma, L., Johnson, G. C., Sprintall, J. and Mohrholz, V. (2008). Expanding oxygen-minimum zones in the tropical oceans. Science 320, 655-658.
Subczynski, W. K., Hyde, J. S. and Kusumi, A. (1991). Effect of alkyl chain unsaturation and cholesterol intercalation on oxygen transport in membranes: a pulse ESR spin labeling study. Biochemistry 30, 8578-8590.
Sukhum, K. V., Freiler, M. K., Wang, R. and Carlson, B. A. (2016). The costs of a big brain: extreme encephalization results in higher energetic demand and reduced hypoxia tolerance in weakly electric African fishes. Proceedings of the Royal Society B: Biological Sciences 283, 20162157.
Templeman, N. M., Beaudry, J. L., Le Moine, C. M. R. and McClelland, G. B. (2010). Chronic hypoxia- and cold-induced changes in cardiac enzyme and gene expression in CD-1 mice. Biochimica et Biophysica Acta (BBA) - General Subjects 1800, 1248-1255.
Tillman, T. S. and Cascio, M. (2003). Effects of membrane lipids on ion channel structure and function. Cell Biochemistry and Biophysics 38, 161-190.
Tocher, D. R., Leaver, M. J. and Hodgson, P. (1998). Recent advances in the biochemistry and molecular biology of fatty acyl desaturases. Progress in Lipid Research 37, 73-117.

193
Turk, H. F. and Chapkin, R. S. (2013). Membrane lipid raft organization is uniquely modified by n-3 polyunsaturated fatty acids. Prostaglandins, Leukotrienes and Essential Fatty Acids (PLEFA) 88, 43-47.
Turner, N., Else, P. L. and Hulbert, A. (2003). Docosahexaenoic acid (DHA) content of membranes determines molecular activity of the sodium pump: implications for disease states and metabolism. Naturwissenschaften 90, 521-523.
Turner, N., Haga, K. L., Hulbert, A. J. and Else, P. L. (2005). Relationship between body size, Na+-K+-ATPase activity, and membrane lipid composition in mammal and bird kidney. American Journal of Physiology-Regulatory, Integrative and Comparative Physiology 288, R301-R310.
Valencak, T. G. and Ruf, T. (2007). N−3 polyunsaturated fatty acids impair lifespan but have no role for metabolism. Aging Cell 6, 15-25.
Van den Thillart, G., Berge-Henegouwen, M. and Kesbeke, F. (1983). Anaerobic metabolism of goldfish, Carassius auratus (L.): ethanol and CO2 excretion rates and anoxia tolerance at 20, 10, and 5 oC. Comparative Biochemistry and Physiology Part A: Physiology 76, 295-300.
van den Thillart, G., Kesbeke, F. and van Waarde, A. (1980). Anaerobic energy-metabolism of goldfish,Carassius auratus (L.). Journal of Comparative Physiology 136, 45-52.
van den Thillart, G. and Smit, H. (1984). Carbohydrate metabolism of goldfish (Carassius auratus L.) - Effects of long-term hypoxia-acclimation on enzyme patterns of red muscle, white muscle and liver. Journal of Comparative Physiology B 154, 477-486.
van Ginneken, V. J., Snelderwaard, P., van der Linden, R., van der Reijden, N., van den Thillart, G. E. and Kramer, K. (2004). Coupling of heart rate with metabolic depression in fish: a radiotelemetric and calorimetric study. Thermochimica acta 414, 1-10.
van Raaij, M. T. M., Bakker, E., Nieveen, M. C., Zirkzee, H. and van den Thillart, G. E. E. J. M. (1994). Energy status and free fatty acid patterns in tissues of common carp (Cyprinus carpio, L.) and rainbow trout (Oncorhynchus mykiss, L.) during severe oxygen restriction. Comparative Biochemistry and Physiology Part A: Physiology 109, 755-767.
Van Waversveld, J., Addink, A. and van den Thillart, G. (1989). The anaerobic energy metabolism of goldfish determined by simultaneous direct and indirect calorimetry during anoxia and hypoxia. Journal of Comparative Physiology B 159, 263-268.
Velasco, C., Draxl, A., Wiethuchter, A., Eigentler, A. and Gnaiger, E. (2012). Mitochondrial respiration in permeabilized fibres versus homogenate from trout heart and liver. Mitochondrial Physiology Network 17, 1-12.
Vock, C., Döring, F. and Nitz, I. (2008). Transcriptional regulation of HMG-CoA synthase and HMG-CoA reductase genes by human ACBP. Cellular Physiology and Biochemistry 22, 515-524.
Wang, J., Zhang, D., Du, J., Zhou, C., Li, Z., Liu, X., Ouyang, G. and Xiao, W. (2017). Tet1 facilitates hypoxia tolerance by stabilizing the HIF-α proteins independent of its methylcytosine dioxygenase activity. Nucleic Acids Research 45, 12700-12714.
Waskova-Arnostova, P., Kasparova, D., Elsnicova, B., Novotny, J., Neckar, J., Kolar, F. and Zurmanova, J. (2014). Chronic hypoxia enhances expression and activity of mitochondrial creatine kinase and hexokinase in the rat ventricular myocardium. Cellular Physiology and Biochemistry 33, 310-320.
Weber, J.-M. (2009). The physiology of long-distance migration: extending the limits of endurance metabolism. Journal of Experimental Biology 212, 593-597.
Weber, J.-M. (2011). Metabolic fuels: regulating fluxes to select mix. Journal of Experimental Biology 214, 286-294.
Weber, J.-M. (2016). Revealing how goldfish defy anoxia. Journal of Experimental Biology 219, 1422-1423.

194
Weber, J.-M. and Haman, F. (2004). Oxidative fuel selection: adjusting mix and flux to stay alive. In Animals and Environments, vol. International Congress Series 1275 eds. S. Morris and A. Vosloo), pp. 22-31. Amsterdam: Elsevier.
Wilkie, M. P., Pamenter, M. E., Alkabie, S., Carapic, D., Shin, D. S. H. and Buck, L. T. (2008). Evidence of anoxia-induced channel arrest in the brain of the goldfish (Carassius auratus). Comparative Biochemistry and Physiology Part C: Toxicology & Pharmacology 148, 355-362.
Wodopia, R., Ko, H. S., Billian, J., Wiesner, R., Bartsch, P. and Mairbaurl, H. (2000). Hypoxia decreases proteins involved in epithelial electrolyte transport in A549 cells and rat lung. American Journal of Physiology-Lung Cellular and Molecular Physiology 279, L1110-L1119.
Wu, B. J., Else, P. L., Storlien, L. H. and Hulbert, A. J. (2001). Molecular activity of Na+/K+-ATPase from different sources is related to the packing of membrane lipids. Journal of Experimental Biology 204, 4271-4280.
Wu, B. J., Hulbert, A. J., Storlien, L. H. and Else, P. L. (2004). Membrane lipids and sodium pumps of cattle and crocodiles: an experimental test of the membrane pacemaker theory of metabolism. American Journal of Physiology-Regulatory, Integrative and Comparative Physiology. 287, R633-R641.
Yeagle, P. L. (1983). Cholesterol modulation of (Na+ + K+)-ATPase ATP hydrolyzing activity in the human erythrocyte. Biochimica et Biophysica Acta (BBA) - Biomembranes 727, 39-44.
Yeagle, P. L. (1989). Lipid regulation of cell membrane structure and function. The FASEB journal 3, 1833-1842.
Yeagle, P. L. (2012). The structure of biological membranes. Boca Raton, FL: CRC Press. Yeagle, P. L., Young, J. and Rice, D. (1988). Effects of cholesterol on sodium-potassium
ATPase ATP hydrolyzing activity in bovine kidney. Biochemistry 27, 6449-6452. Yoshida, M., Muneyuki, E. and Hisabori, T. (2001). ATP synthase — a marvellous rotary
engine of the cell. Nature Reviews Molecular Cell Biology 2, 669-677. Young, J. B. and Landsberg, L. (1977). Suppression of sympathetic nervous system during
fasting. Science 196, 1473-1475. Zammit, V. A., Beis, I. and Newsholme, E. A. (1978). Maximum activities and effects of fructose
bisphosphate on pyruvate kinase from muscles of vertebrates and invertebrates in relation to the control of glycolysis. Biochemical Journal 174, 989.
Zammit, V. A. and Newsholme, E. A. (1976). The maximum activities of hexokinase, phosphorylase, phosphofructokinase, glycerol phosphate dehydrogenases, lactate dehydrogenase, octopine dehydrogenase, phosphoenolpyruvate carboxykinase, nucleoside diphosphatekinase, glutamate-oxaloacetate transaminase and arginine kinase in relation to carbohydrate utilization in muscles from marine invertebrates. Biochemical Journal 160, 447.
Zehmer, J. K. and Hazel, J. R. (2004). Membrane order conservation in raft and non-raft regions of hepatocyte plasma membranes from thermally acclimated rainbow trout. Biochimica et Biophysica Acta (BBA)-Biomembranes 1664, 108-116.
Zehmer, J. K. and Hazel, J. R. (2005). Thermally induced changes in lipid composition of raft and non-raft regions of hepatocyte plasma membranes of rainbow trout. Journal of Experimental Biology 208, 4283-4290.
Zhou, B., Wu, R., Randall, D., Lam, P., Ip, Y. and Chew, S. (2000). Metabolic adjustments in the common carp during prolonged hypoxia. Journal of Fish Biology 57, 1160-1171.