physical chemistry lab manual
TRANSCRIPT
School of Medical Sciences
Pharmaceutical and Chemical Engineering Department
Laboratory Manual
For
Edition: 2021
PHYSICAL CHEMISTRY LAB
MANUAL
PCE272
Contents
Experiment 1 ......................................................................................................... 1
Partial Molar Volume ............................................................................................ 1
Experiment 2 ......................................................................................................... 6
Boiling Point Elevation .......................................................................................... 6
Experiment 3 ....................................................................................................... 11
Salt Effect On Solubility And Dissociation ........................................................ 11
Experiment 4 ....................................................................................................... 15
Reaction Rate and Activation Energy of the Acid Hydrolysis of Ethyl Acetate
................................................................................................................................ 15
Experiment 5 ....................................................................................................... 20
Adsorption Isotherm ............................................................................................ 20
Experiment 6 ....................................................................................................... 25
Binary water - phenol mixture ............................................................................ 25
Experiment 7 ....................................................................................................... 31
Ternary systems ................................................................................................... 31
Experiment 8 ....................................................................................................... 39
Determination of Distribution Coefficient of I2 and Stability Constant of I3-
Complex ................................................................................................................ 39
Experiment 9 ....................................................................................................... 43
Transfer of salicylic acid across polymeric membrane .................................... 43
Experiment 10 ..................................................................................................... 47
Critical Micelle Concentration ........................................................................... 47
Preface and Safety
I
Preface and safety
*Make-up exams will be offered for valid reasons only with consent of the Dean. Make-up
exams may be different from regular exams in content and format.
Course Objectives and Learning Outcomes
The practical part is designed to achieve a working knowledge through examination of some of the basic
physicochemical principles covered in the lectures of CPE2282 in the delivery of drug and the design of
pharmaceutical dosage forms.
Teaching and Learning Methods
Teaching Methods:
Demonstration and general explanation
Course Content
Topic No. of
Lab.sessions
Syllabus –Introduction, Safety regulations 1
Partial Molar volume 1
Boiling Point Elevation 1
Salt effect on solubility and dissociation effect 1
Reaction Rate and Activation Energy of the Acid Hydrolysis of Ethyl Acetate 1
Adsorption isotherm 1
Binary and ternary systems 3
Transfer of salicylic acid across polymeric membrane: Diffusion phenomenon 1
Determination of Distribution Coefficient of I2 and Stability Constant of I3-
Complex 1
Critical Micelle Concentration 1
Assessment Policy*
Type Weight (%)
Reports and quizzes 60%
Final Exam(practical-theoretical) 40 %
Preface and Safety
II
Regulations Attendance
Laboratory
notebook:
Safety
measures:
There is one laboratory session per week (3 hours).
Laboratory attendance is MANDATORY (NOT optional), unless special
arrangements are made with your instructor (no more than two sessions),
accompanied by a valid excused absence. There will be no make-up laboratories.
The student will lose 5 marks of the total course grade for each missed laboratory
session.
Students are not allowed to leave the laboratory during the session without obtaining
permission, to minimize their absence.
The week’s experimental procedure will be sent periodically by e-mail.
Students are required to read carefully the experimental procedure before coming to
the lab.
The lab report with completed lab work should be submitted to the lab TA at the end
of each lab session in order to be signed and graded.
-Lab Safety Lecture
A mandatory introductory safety lecture FOR ALL GROUPS will be held on first
session
Each student must wear a clean, white laboratory coat at all times while in the
laboratory.
Each student must have a clean towel on hand at all times to keep his place or tools
clean.
All equipment and bottles should be returned to the proper place after use.
Assume all chemicals used in the experiment are dangerous.
Eating or drinking in the laboratory is prohibited.
Do not pipette by mouth or carry reagents around the lab.
Wash your hands thoroughly before leaving the lab.
Take time to review the laboratory safety section and locate the following safety
equipment in the laboratory.
Safety Equipment Location
Fire Extinguishers
Fire Alarm
Eye Wash Fountains
Safety Shower
First Aid Box
Chemical Disposal
Preface and Safety
III
Laboratory
structure
There are large red buckets (or otherwise indicated by the TA) available for broken
glassware in the lab. Please use them instead of the garbage, to respect the safety of
the cleaning staff.
There will be designated waste jars for hazardous waste and organic solvents in the
fume hoods for each lab. Chemically inert waste (e.g. petrolatum) will gum up the
drains, and are properly disposed of in the garbage.
If you are unsure how to properly dispose something, ask your TA or instructor.
Dress Code
For your protection, you are required to wear the following protective gear, at all
times during the lab:
A lab coat
Safety Goggles (even if you wear glasses)
Closed-Toed Shoes (no sandals or open-toed shoes)
Clothing that covers your legs
Do not wear contact lenses
Lab Check-Out Procedure
Clean your lab bench and any dirty glassware;
Throw out any remaining formulations or garbage;
Return any extra glassware to the laboratory back shelves;
Be assigned a special area in the lab to clean.
Students will work independently or in group according to the lab schedule.
Students are required to read the theory and procedures of each experiment before
coming to the lab.
There will be a brief lecture-discussion on the theory and procedure before each new
experiment
After the completion of each experiment, a full report must be submitted individually
to the TA.
The laboratories start on times. You should expect a quiz at the beginning of each
laboratory session.
Assignment of Grades
This laboratory has been assigned a 100% weight of the course grade. Performance in
the laboratory will be evaluated from a combination of activities. In order to receive a
grade for this laboratory, students have to submit work for each of the graded areas
noted. The following are approximate percentages (% of total).
Guidelines for Writing a Formal Laboratory Report
Preface and Safety
IV
A formal individual laboratory report consisting of individual identified sections will
be submitted according to the TA instructions after completion of the lab or one week
after performing the lab.
Rationale of Laboratory Reports
The purpose of writing a scientific report is to communicate your findings with the
outside world. Enough detail should be conveyed so that someone who did not do the
experiment could repeat it and replicate your results. Writing laboratory reports (and
technical writing in general) is an extremely useful and valuable skill to develop.
Avoid providing one word answers and bullet points. Use sentence form, and
summarize where appropriate. The ability to condense
the purpose, observations, and results into an abstract will help the reader connect
with the material, and will put your results in perspective for the reader. This process
will help prepare you for writing scientific publications.
Typical Components of a Laboratory Report
1. Title Page (1%)
Please include lab number and title, Student name, date submitted,
Course code.
2. Abstract (10%)
No more than 200 words, an abstract is a mini-version of the entire lab report. It
provides a brief introduction, purpose, a summary of results (not the raw data itself
but parameters estimated), conclusions, and the relevance of the conclusions to the
field of study. It is usually the last section that you will write, although it comes first
in the report.
3. Introduction (5%)
This section should be 1-2 paragraphs long, and include the purpose of the experiment
and a brief overview.
What is the main purpose of the lab? Which scientific principles are being
investigated? What is the value of the results to the field of study? A good
introduction will spark the interest of the reader and explain the purpose of the work.
4. Experimental part (10%): Mainly set up and speciality glassware(s) and devices.
This section should be no more than one pages long, but depending on the experiment,
may only be a few paragraphs. Do not copy and paste the methods section from the
lab manual – this is a protocol. The purpose of the methods section is to summarize
what you did with sufficient detail for someone to repeat the experiment, without
getting into step-by-step instructions. Provide details of the chemicals you used. Key
equipment (e.g. a UV spectrophotometer) should be mentioned; however, glassware
(e.g. 100 mL graduated cylinder) should not unless it was integral to the method.
Document what you actually did, not what you were supposed to do. If there was a
change or deviation from the lab manual, describe it. Explain what you did in
chronological order (the order that you did things in the lab).
Preface and Safety
V
5. Results and discussion (70%): Not more than two pages long (words excluding
graphs and or the recorded readings; avoid blank pages)
-The length of your results section will depend on the experiment.
-All of your data and observations go into this section, in table form. Attach any
graphs printed out in the lab. This should be the easiest section to write.
-Provide sample calculations for key elements of the lab: dilutions, standard curve
use, etc.
-Make sure you:
1.Properly label all graph axes;
2-Always report the units with each measurement;
3-Report your parameters with the appropriate number of significant
Digits.
Then discuss your results:
a) Summarize the key scientific idea(s) behind the lab. If there was a key equation ,
report it here and describe its significance.
b) Did the results confirm or refute the scientific principles involved? Discuss the
precision of your data (e.g. how good the r2 was of a fitted linear regression). Were
the results obtained what you expected? Sometimes in the lab you may observe a
trend opposite to what you were expecting. It is up to you to either re-evaluate your
understanding of the phenomena, or try to identify the sources of error
6. Conclusions (4%)
Conclusions are relatively short compared to the discussion. They are typically 1-2
paragraphs, and serve as the bottom line of the lab. In sentence form, report the final
estimated values of parameters, and summarize the results/discussions with a closing
thought. Recommendations for future work or how the lab could change may also be
included here.
7. References
Include literature references you referred to in this section. If you did not refer to the
references, you do not need to include them here.
8. Appendices
You may include extra calculations, additional information, and supplementary
analyses attached as appendices.
Make sure you staple your lab report together, and that you present your work neatly.
Cheating is defined as conduct (whether successful or not) aimed at deceiving the
University into acknowledging a false level of attainment by a student. Cheating
including assisting someone else to cheat (including attempting to assist someone else
to cheat) may be subject to disciplinary action in accordance with the University's
Disciplinary Procedure.
Any form of cheating is strictly forbidden under this regulation but, in order to assist
understanding, a number of specific forms of cheating are described. These include
but are not limited to the following examples:

Preface and Safety
VI
References
1. Basic physical pharmacy, Josepha Ma and Boka Hadzija, Jones and Bartlett learning, USA.2013.
2. Martin’s Physical Pharmacy and Pharmaceutical sciences, Edited by Patrick Sinko, Lippincott
Williams & Wilkins. 6th Edition (2006,2011).
Cheating
regulations
Submitting other people's work as your own - either with or without their knowledge.
This includes copying reports; using notes or unauthorized materials in examinations;
submitting work you have paid for as your own; impersonation - taking an assessment
on behalf of or pretending to be another student, or allowing another person to take an
assessment on your behalf or pretend to be you.
Plagiarism - taking or using another person's thoughts, writings or inventions as your
own. To avoid plagiarism you must make sure that quotations from whatever source
are clearly identified and attributed at the point where they occur in the text of your
work by using one of the standard conventions for referencing.
Collusion - except where written instructions specify that work for assessment may be
produced jointly and submitted as the work of more than one student, you must not
collude with others to produce a piece of work jointly, copy or share another student's
work or lend your work to another student when it is likely that some or all of it will
be copied.
Duplication - submitting work for assessment that is the same as, or broadly similar
to, work submitted earlier for academic credit, without acknowledgement of the
previous submission.
Falsification - the invention of data, its alteration, its copying from any other source,
or otherwise obtaining it by unfair means, or inventing quotations and/or references.
Custom Writing Services - this includes the use of any service which produces custom
materials. The University may consider any request placed with any form of custom
writing service to be a form of cheating, whatever use is then made of the material
produced, and therefore to be an offence under the University Regulations.
Assisting Others to Cheat - The University considers assisting others to cheat
(including attempting to assist someone else to cheat) as a form of cheating.
Experiment 1
1
EXPERIMENT 1
PARTIAL MOLAR VOLUME
Objectives
Measure the densities of different Ethanol-Water mixtures of specified composition at
room temperature with pyknometer.
Calculate the real volumes and the mean molar mixing volumes of the investigated
Ethanol-Water mixtures and also the partial molar volumes of each liquid for selected
compositions. Compare them with the molar volumes of the pure substances at room
temperature.
Theory
Due to the intermolecular interactions, the total volume measured when two real liquids
(e.g. ethanol and water) are mixed deviates from the total volume calculated from the
individual volumes of the two liquids (Volume contraction). To describe this non-ideal
behavior in the mixing phase, one defines partial molar quantities which are dependent on
the composition of the system. The values of these can be experimentally determined.
The volume vid and the mean molar volume Vid of an ideal mixture of the components A
and B can be calculated if the quantitative composition is known.
𝑥𝐴 =𝑛𝐴
𝑛𝐴 + 𝑛𝐵 (1.1)
𝑥𝐵 =𝑛𝐵
𝑛𝐴 + 𝑛𝐵 (1.2)
xA, xB :mole fraction of the components A and B, respectively
nA,nB : amounts of A and B respectively
VA , VB : molar volume of pure components which are independent of the composition.
𝑉𝑖𝑑 = 𝑣𝑖𝑑
𝑛𝐴 + 𝑛𝐵 = 𝑉𝐴𝑥𝐴 + 𝑉𝐵𝑥𝐵 (2)
However, the assumed additively in equation (2) loses its validity in cases of real mixtures
(e.g. ethanol/water). The real volumes vr and Vr deviate more or less strongly from the ideal
Experiment 1
2
volumes due to volume contraction but can still be calculated if the molar volumes of the
pure components A and B are replaced by the partial molar volumes, 𝑉𝐴 and 𝑉𝐵 which are
dependent of the composition.
𝑉𝐴 = (𝜕𝑣𝑟𝜕𝑛𝐴
)𝑇,𝑃,𝑛𝐵
(3.1)
𝑉𝐵 = (𝜕𝑣𝑟𝜕𝑛𝐵
)𝑇,𝑃,𝑛𝐴
(3.2)
𝑉𝑟 = 𝑣𝑟
𝑛𝐴 + 𝑛𝐵 = 𝑉𝐴𝑥𝐴 + 𝑉𝐵𝑥𝐵 (4)
The difference between the mean molar volumes defined according to equations (2) and
(4) is designated as the mean molar mixing volumes ∆𝑀𝑉 and is an intensive measure of
the deviation of the mixture from the ideal behavior.
∆𝑀𝑉 = 𝑉𝑟 − 𝑉𝑖𝑑
= [(𝑉𝐴 − 𝑉𝐵) − (𝑉𝐴 − 𝑉𝐵) ]𝑥𝐴 + (𝑉𝐵 − 𝑉𝐵) (5)
The dependence of it on the composition is described by the following relationship:
𝑑(∆𝑀𝑉)
𝑑𝑥𝐴=
𝑑𝑉𝑟
𝑑𝑥𝐴=𝑑𝑉𝑖𝑑
𝑑𝑥𝐴= (𝑉𝐴 − 𝑉𝐵) − (𝑉𝐴 − 𝑉𝐵) (6)
Analogous correlations can be formulated for xB due to the fact that xA=1-xB.
After substituting (6) in (5), the following relationships are obtained:
𝑉𝐵 = ∆𝑀𝑉 −𝑑(∆𝑀𝑉)
𝑑𝑥𝐴𝑥𝐴 + 𝑉𝐵 (7.1)
𝑉𝐴 = ∆𝑀𝑉 −𝑑(∆𝑀𝑉)
𝑑𝑥𝐴𝑥𝐵 + 𝑉𝐴 (7.2)
According to this, the partial molar volumes of the components A and B for the specific
compositions (xA, xB) can be determined if the molar volumes of the pure substances (VA,
VB) and their differential quotients 𝑑∆𝑀𝑉/𝑑𝑥𝐴 are known. These can be obtained as the
tangent to the graphical plot of ∆𝑀𝑉 versus xA (Fig.2). This is, however, better calculated
by deriving the functional correlation ∆𝑀𝑉 = 𝑓(𝑥𝐴) for selected values of xA.
The following procedure is recommended for this: First, calculate the exact mole fractional
compositions from the weighed-out masses of ethanol (A) and water (B) using equation
(1.1) or (1.2). Using pyknometer (small container whose volume is known accurately) and
Experiment 1
3
the following data (m= mass of the liquid in the pyknometer; v=25 ml=pyknometer
volume, the densities (𝜌=m/v) of the mixtures) the volumes vr corresponding to the total
masses (mA+ mB) can be determined. These values can be converted into the mean molar
volume vr using equation (4) and then into the mean molar mixing volume ∆𝑀𝑉 in
accordance with equations (2) and (5).
The molar volumes of the pure liquids required for these conversions are VA = 58.277
ml.mol-1 (ethanol) and VB= 18.073 ml.mol-1 (water) at T=293.15K. Plot the dependence of
the mean molar mixing volume ∆𝑀𝑉 on the composition xA and determine the differential
quotients 𝑑∆𝑀𝑉/𝑑𝑥𝐴 from the slope of the tangents for selected mole fractions xB and the
corresponding estimated values for ∆𝑀𝑉 from the curve itself.
[Note: the correlation between the variables can also be approximated by a polynomial of
the second or higher degree using a computer-assisted method. By substituting arbitrary
mole fractions xA in the polynomial or its first derivative, the corresponding estimated
value for ∆𝑀𝑉 and the differential quotients 𝑑(∆𝑀𝑉)/𝑑𝑥𝐴 can be calculated.]
The partial molar volumes of both components are now accessible via equations (7.1) and
(7.2).
Finally, calculate the mean molar volume Vr for a selected mixture which corresponds well
to the experimental conditions from the partial molar volumes determined according to
equation (4) and compare it with your experimental results.
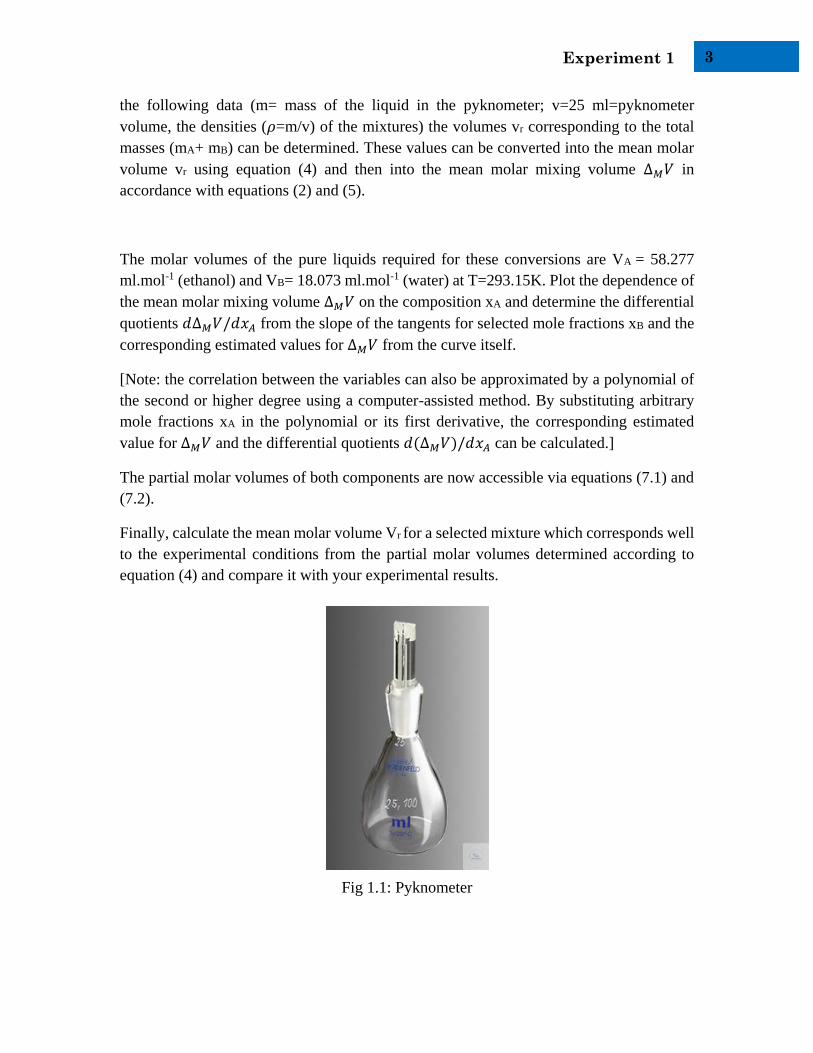
Fig 1.1: Pyknometer
Experiment 1
4
Apparatus / Reagents Needed
-Absolute Ethanol
- Distilled water
- 100 ml Beakers
- Volumetric Pipettes (5ml, 10ml, 25ml)
-5 Pyknometers with known volumes
-5 Reagent bottles with plastic stopper
- Analytical Balance
-Temperature controlled water bath
-Hot air gun
Procedure
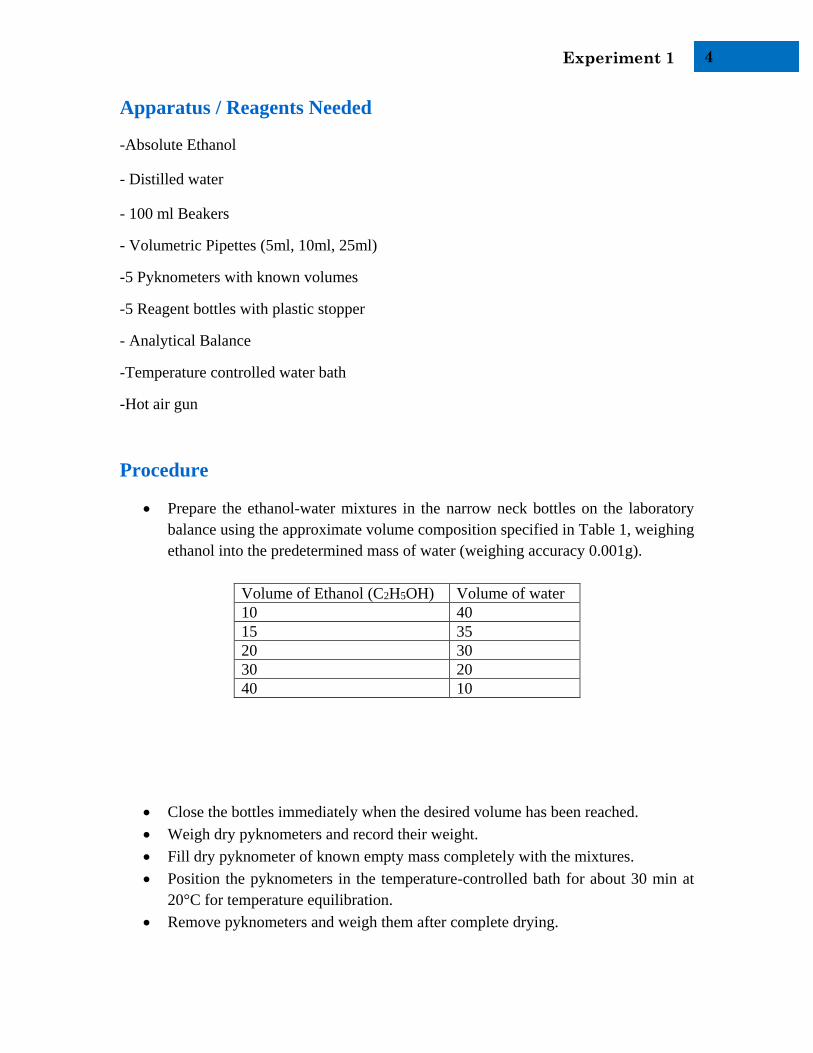
Prepare the ethanol-water mixtures in the narrow neck bottles on the laboratory
balance using the approximate volume composition specified in Table 1, weighing
ethanol into the predetermined mass of water (weighing accuracy 0.001g).
Volume of Ethanol (C2H5OH) Volume of water
10 40
15 35
20 30
30 20
40 10
Close the bottles immediately when the desired volume has been reached.
Weigh dry pyknometers and record their weight.
Fill dry pyknometer of known empty mass completely with the mixtures.
Position the pyknometers in the temperature-controlled bath for about 30 min at
20°C for temperature equilibration.
Remove pyknometers and weigh them after complete drying.
Experiment 1
5
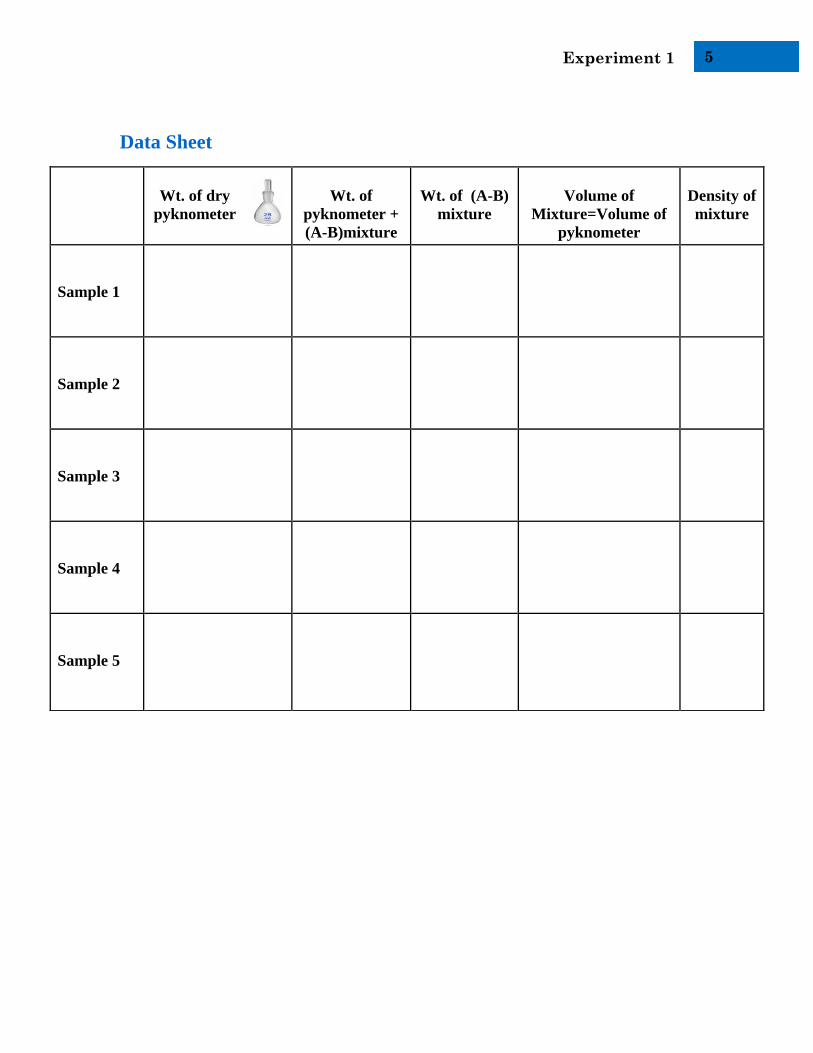
Data Sheet
Wt. of dry
pyknometer
Wt. of
pyknometer +
(A-B)mixture
Wt. of (A-B)
mixture
Volume of
Mixture=Volume of
pyknometer
Density of
mixture
Sample 1
Sample 2
Sample 3
Sample 4
Sample 5
Experiment 2
6
EXPERIMENT 2
BOILING POINT ELEVATION
Objective
Measure the increase in boiling point of water as a function of the concentration of table
salt, urea and hydroquinone.
Investigate the relationship between the increase in boiling point and the number of
pellets.
Determine the molar mass of the solute from the relationship between the increase in
boiling point and the concentration.
Theory
The boiling point of a solution is always higher than that of the pure solvent. The dependence
of the temperature difference (elevated boiling point) on the concentration of the solute can be
determined using a suitable apparatus.
A solution is a mixed-phase liquid which consists of a dissolved substance and a solvent. Only
the solvent is capable of vaporization, the vapour pressure of a solute is partially zero. When a
substance dissolves in solvent, additional forces results and these must be overcome by solvent
molecules before they can pass into the gas phase. Less solvent molecules can therefore
vaporize from a solution than from the pure solvent. In 1886, F.M. Raoult postulated the law
that is named after him: The vapour pressure of a solution is given by the product of the vapour
pressure of the pure solvent and the mole fraction of the solute.
𝑃𝑠 =𝑛2
𝑛1+𝑛2. 𝑃 𝑜 (1)
Where:
Ps: Vapour pressure of the solution.
Po: Vapour pressure of the pure solvent
n1: Amount of the pure solvent
n2: Amount of dissolved substance
A liquid boils when its vapour pressure is the same as the ambient pressure. The vapour pressure
of water reaches an ambient pressure of 1013 hPa at a temperature of 100oC. When a substance
Experiment 2
7
is dissolved in water, the vapour pressure is reduced, and is so less than 1013 hPa at 100oC.
Heat must now be supplied to increase the kinetic energy of the molecules, and so to raise the
temperature so that the solution comes to boiling. The reason for the higher energy requirement
for the solution than for the pure solvent is because additional forces, mutual attractive forces
between solute and solvent, must be overcome in the solution. The solution does not boil at T0,
but at the higher temperature Ts. The difference between these two temperatures is the boiling
point elevation ∆𝑇𝑠
∆𝑇𝑠 = 𝑇𝑠 − 𝑇𝑜 (2) From a quantitative point of view, the boiling point elevation is dependent on the amount to
which the vapour pressure is lowered, and so on the concentration of the solute. Molality is used
here as dimension, i.e. the number of moles of solute dissolved in 1 liter of solvent.
∆𝑇 = 𝑖 . 𝐾𝑏. 𝑚
= 𝐾𝑏. 𝑚2. 1000
𝑀2𝑚1 𝑖 (3)
m1: Mass of the pure solvent
m2: Mass of the dissolved substance
M2: Molar mass of the dissolved substance
Kb : Ebullioscopic constant (for water Kb = 0.512 (°C·kg·mol-1) )
i: depends on the number of particles in the solution (for non-electrolyte i=1)
Apparatus / Reagents Needed
-NaCl Compressed as pellets
- Distilled water
- Analytical balance
- 50 ml graduated cylinder
-250 ml graduated cylinder
- 50 ml beakers
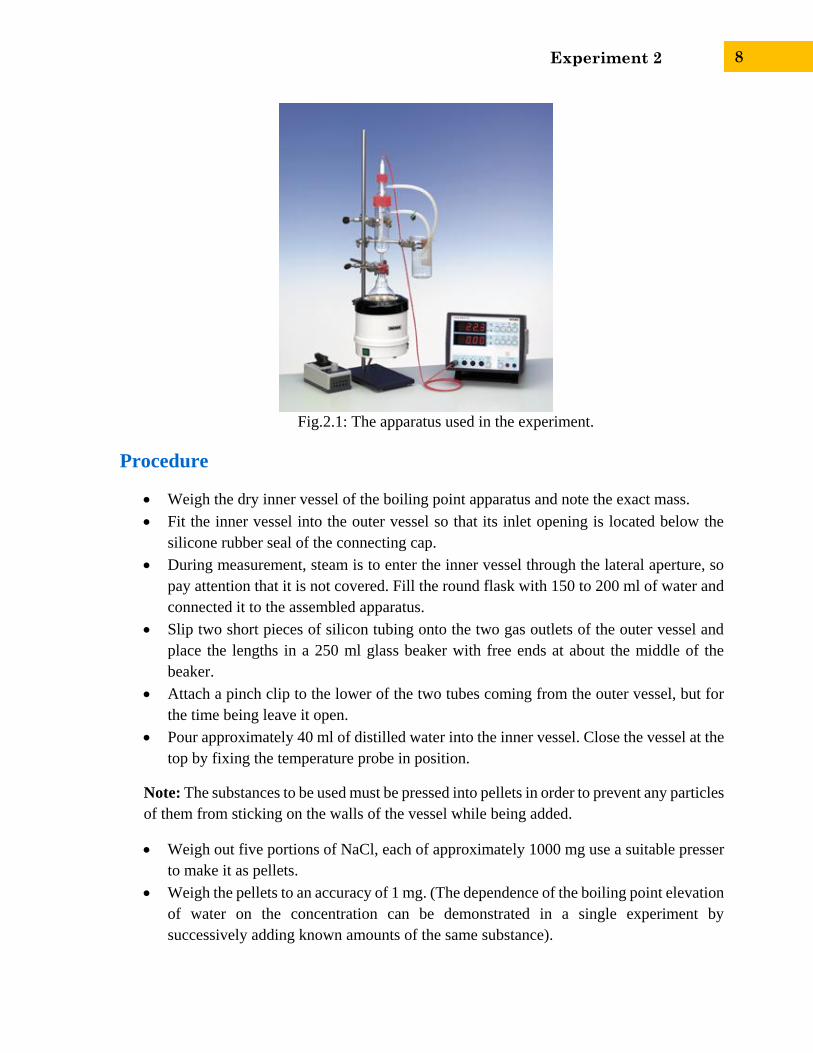
-Boiling point elevation apparatus (Fig.2.1 shows the apparatus used in the experiment.)
Experiment 2
8
Fig.2.1: The apparatus used in the experiment.
Procedure
Weigh the dry inner vessel of the boiling point apparatus and note the exact mass.
Fit the inner vessel into the outer vessel so that its inlet opening is located below the
silicone rubber seal of the connecting cap.
During measurement, steam is to enter the inner vessel through the lateral aperture, so
pay attention that it is not covered. Fill the round flask with 150 to 200 ml of water and
connected it to the assembled apparatus.
Slip two short pieces of silicon tubing onto the two gas outlets of the outer vessel and
place the lengths in a 250 ml glass beaker with free ends at about the middle of the
beaker.
Attach a pinch clip to the lower of the two tubes coming from the outer vessel, but for
the time being leave it open.
Pour approximately 40 ml of distilled water into the inner vessel. Close the vessel at the
top by fixing the temperature probe in position.
Note: The substances to be used must be pressed into pellets in order to prevent any particles
of them from sticking on the walls of the vessel while being added.
Weigh out five portions of NaCl, each of approximately 1000 mg use a suitable presser
to make it as pellets.
Weigh the pellets to an accuracy of 1 mg. (The dependence of the boiling point elevation
of water on the concentration can be demonstrated in a single experiment by
successively adding known amounts of the same substance).
Experiment 2
9
Heat the solvent in the flask to boiling. The vapour evolved rises up into the outer vessel
and heats up the inner vessel.
Control the heating rate with the power control. The temperature in the inner vessel is
displayed on the digital temperature meter in degrees Celsius.
After some minutes, when the temperature in the inner vessel has nearly reached the
boiling point and no longer increases, lower the heating hood for few seconds until
boiling stops and the condensate on the outer vessel returns to the round flask. Then
raise the heating hood again.
When boiling recommences, close the pinchcock. The (slightly superheated) steam now
flows through the water in the inner vessels. Set the digital temperature meter to measure
the change in temperature ∆𝑇 over time with the tare function< 𝑆𝐸𝑇 0.00 > . In this
mode of operation, the resolution is tenfold better (0.01K).
Wait until the value displayed remains constant. Now carefully open the inner vessel
(screw cap), add the first substance pellet, and close the opening immediately. The
temperature first drops slightly and then rises again while the pellet dissolves.
When the value has again become constant, record it and repeat this procedure for the
next portion of the substance.
After five concentration steps have been measured, first open the pinchcock and then
switch off the heating. This is important to avoid solution being sucked from the inner
vessel into the flask containing water while cooling down.
Remove the inner vessel, dry its outer surface, remove the temperature probe and re-
weigh it. The mass of the water is now equal to the last measured value less the mass of
the empty vessel and the masses of the five substances pellets.
Plot the increase in boiling point against the quotient of the mass of the dissolved NaCl
and the mass of water for each substance.
Experiment 2
10
Data Sheet
Boiling point of pure water (OC)
Mass of NaCl (g)
Boiling point of NaCl solution(OC)
Boiling point elevation (OC) =(TS-
TO)
Experiment 3
11
EXPERIMENT 3
SALT EFFECT ON SOLUBILITY AND DISSOCIATION
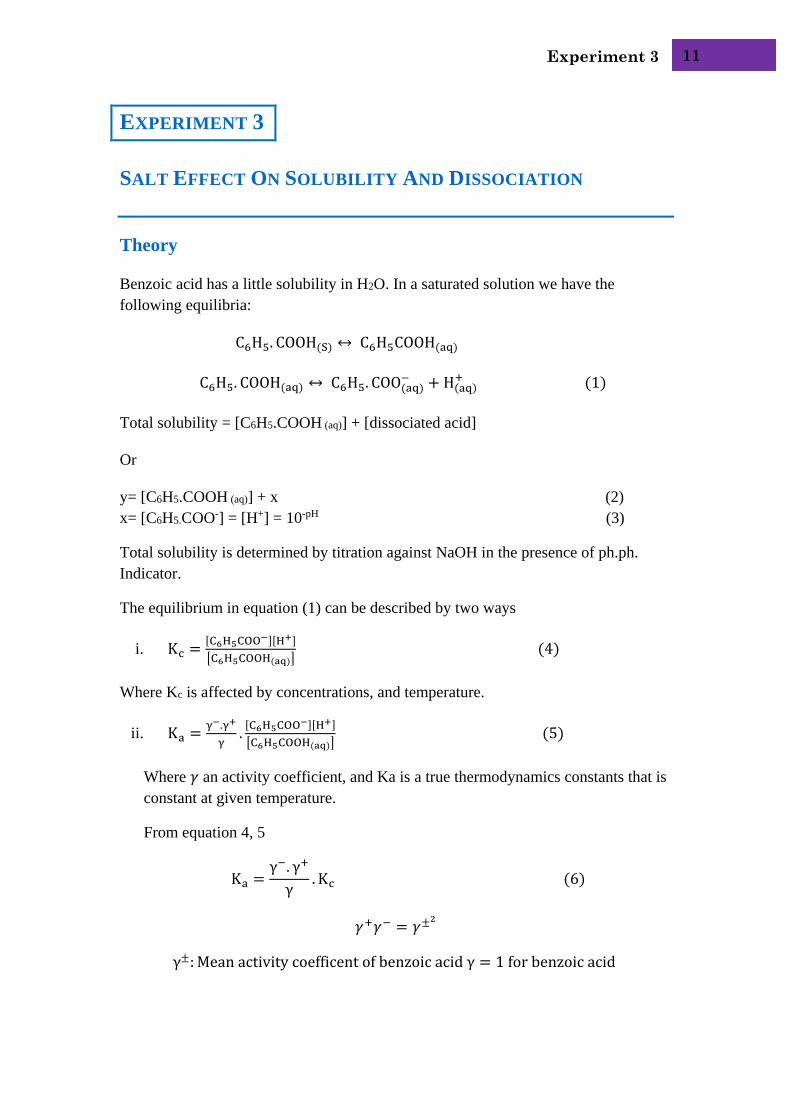
Theory
Benzoic acid has a little solubility in H2O. In a saturated solution we have the
following equilibria:
C6H5. COOH(S) ↔ C6H5COOH(aq)
C6H5. COOH(aq) ↔ C6H5. COO(aq)− + H(aq)
+ (1)
Total solubility = [C6H5.COOH (aq)] + [dissociated acid]
Or
y= [C6H5.COOH (aq)] + x (2)
x= [C6H5.COO-] = [H+] = 10-pH (3)
Total solubility is determined by titration against NaOH in the presence of ph.ph.
Indicator.
The equilibrium in equation (1) can be described by two ways
i. Kc =[C6H5COO
−][H+]
[C6H5COOH(aq)] (4)
Where Kc is affected by concentrations, and temperature.
ii. Ka =γ−.γ+
γ.[C6H5COO
−][H+]
[C6H5COOH(aq)] (5)
Where 𝛾 an activity coefficient, and Ka is a true thermodynamics constants that is
constant at given temperature.
From equation 4, 5
Ka =γ−. γ+
γ. Kc (6)
𝛾+𝛾− = 𝛾±2
γ±: Mean activity coefficent of benzoic acid γ = 1 for benzoic acid
Experiment 3
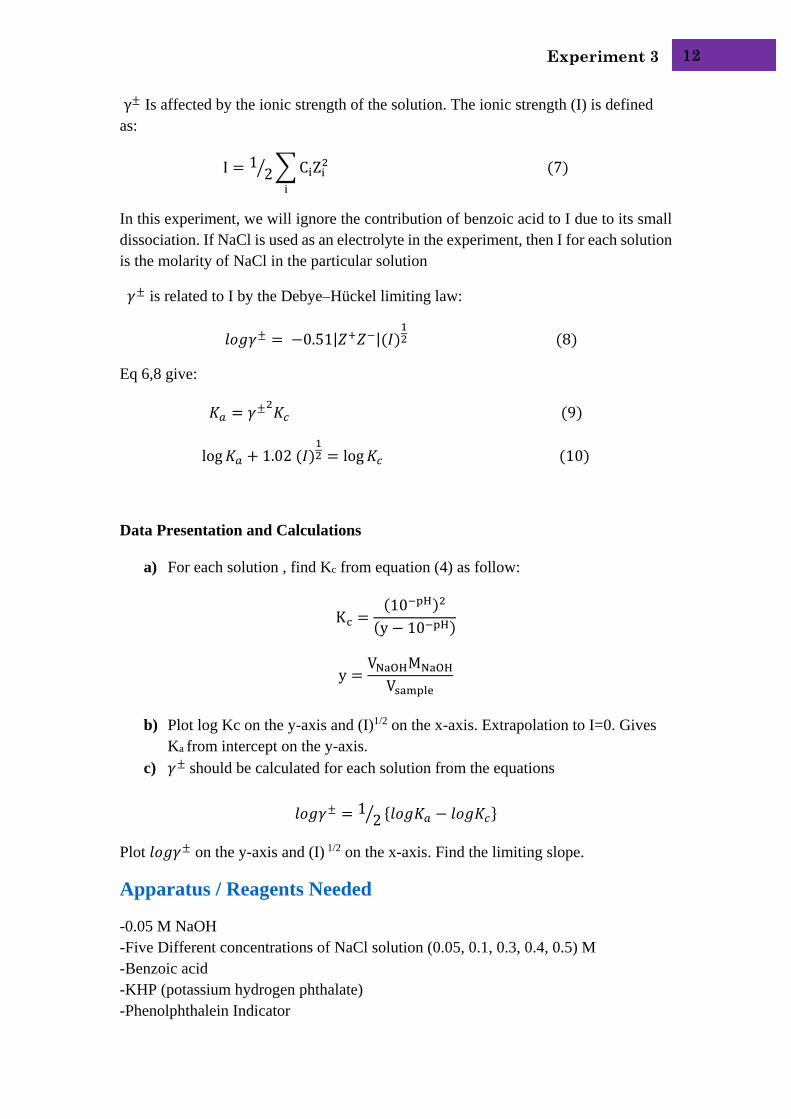
12
γ± Is affected by the ionic strength of the solution. The ionic strength (I) is defined
as:
I = 1 2⁄ ∑CiZi2 (7)
i
In this experiment, we will ignore the contribution of benzoic acid to I due to its small
dissociation. If NaCl is used as an electrolyte in the experiment, then I for each solution
is the molarity of NaCl in the particular solution
𝛾± is related to I by the Debye–Hückel limiting law:
𝑙𝑜𝑔𝛾± = −0.51|𝑍+𝑍−|(𝐼)12 (8)
Eq 6,8 give:
𝐾𝑎 = 𝛾±2𝐾𝑐 (9)
log𝐾𝑎 + 1.02 (𝐼)12 = log𝐾𝑐 (10)
Data Presentation and Calculations
a) For each solution , find Kc from equation (4) as follow:
Kc =(10−pH)2
(y − 10−pH)
y =VNaOHMNaOHVsample
b) Plot log Kc on the y-axis and (I)1/2 on the x-axis. Extrapolation to I=0. Gives
Ka from intercept on the y-axis.
c) 𝛾± should be calculated for each solution from the equations
𝑙𝑜𝑔𝛾± = 1 2⁄ {𝑙𝑜𝑔𝐾𝑎 − 𝑙𝑜𝑔𝐾𝑐}
Plot 𝑙𝑜𝑔𝛾± on the y-axis and (I) 1/2 on the x-axis. Find the limiting slope.
Apparatus / Reagents Needed
-0.05 M NaOH
-Five Different concentrations of NaCl solution (0.05, 0.1, 0.3, 0.4, 0.5) M
-Benzoic acid
-KHP (potassium hydrogen phthalate)
-Phenolphthalein Indicator
Experiment 3
13
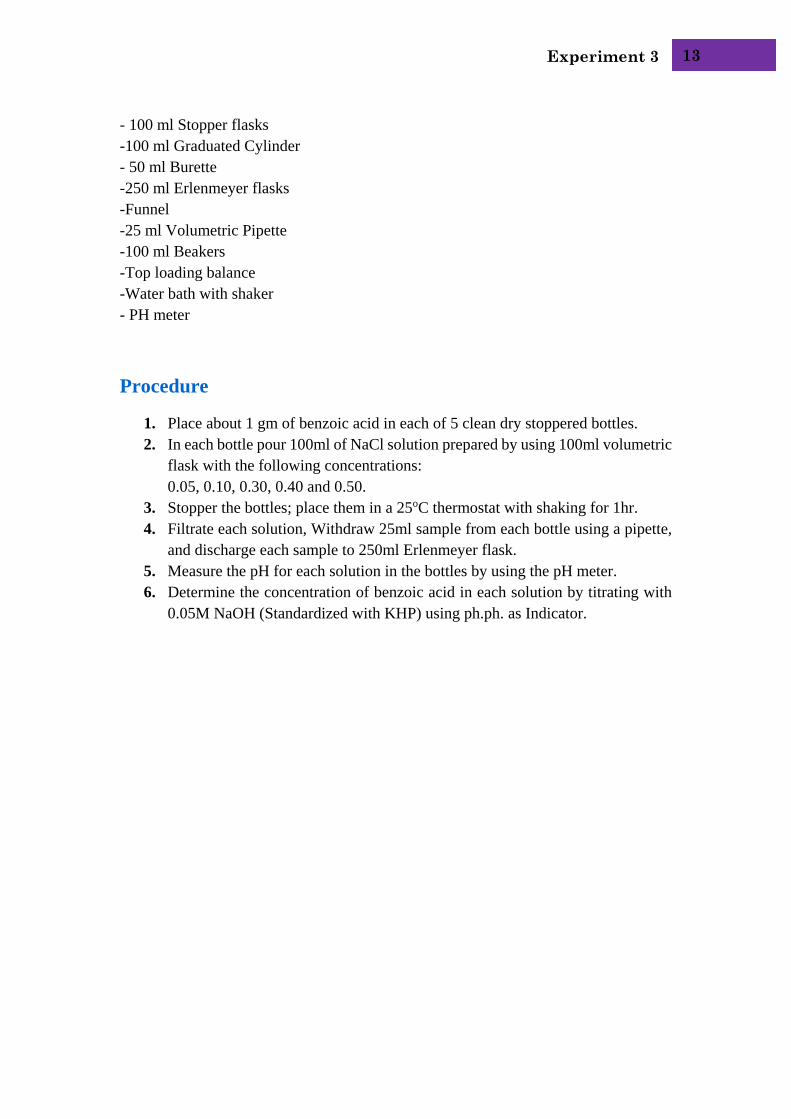
- 100 ml Stopper flasks
-100 ml Graduated Cylinder
- 50 ml Burette
-250 ml Erlenmeyer flasks
-Funnel
-25 ml Volumetric Pipette
-100 ml Beakers
-Top loading balance
-Water bath with shaker
- PH meter
Procedure
1. Place about 1 gm of benzoic acid in each of 5 clean dry stoppered bottles.
2. In each bottle pour 100ml of NaCl solution prepared by using 100ml volumetric
flask with the following concentrations:
0.05, 0.10, 0.30, 0.40 and 0.50.
3. Stopper the bottles; place them in a 25oC thermostat with shaking for 1hr.
4. Filtrate each solution, Withdraw 25ml sample from each bottle using a pipette,
and discharge each sample to 250ml Erlenmeyer flask.
5. Measure the pH for each solution in the bottles by using the pH meter.
6. Determine the concentration of benzoic acid in each solution by titrating with
0.05M NaOH (Standardized with KHP) using ph.ph. as Indicator.
Experiment 3
14
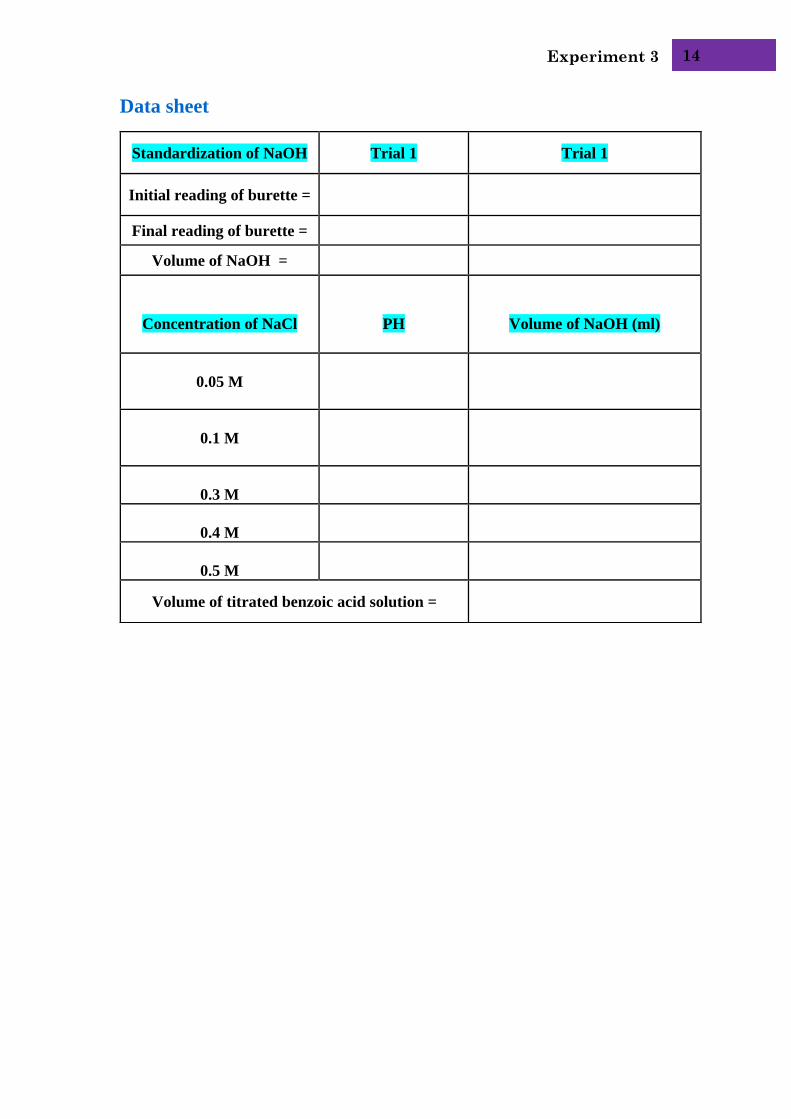
Data sheet
Standardization of NaOH Trial 1 Trial 1
Initial reading of burette =
Final reading of burette =
Volume of NaOH =
Concentration of NaCl
PH
Volume of NaOH (ml)
0.05 M
0.1 M
0.3 M
0.4 M
0.5 M
Volume of titrated benzoic acid solution =
Experiment 4
15
EXPERIMENT 4
REACTION RATE AND ACTIVATION ENERGY OF THE ACID
HYDROLYSIS OF ETHYL ACETATE
Objective
Determine the reaction rate constant for the hydrolysis of ethyl acetate at two (or
more) temperatures.
Calculate the activation energy of the reaction from the temperature dependence of
the measured rate constants.
Theory
In acid solution, ethyl acetate is hydrolyzed to equivalent quantities of ethanol and
acetic acid according to pseudo-first order rate law. The alkali metric determination of
the acetic acid formed enables conclusions to be drawn on the temporal concentration
of ester.
The acid ester hydrolysis is described by the equilibrium
𝐶𝐻3𝐶𝑂𝑂𝐶2𝐻5 + 𝐻2𝑂 [𝐻3𝑂
+]↔ 𝐶𝐻3𝐶𝑂𝑂𝐻 + 𝐶2𝐻5𝑂𝐻
Under the given experimental conditions, equilibrium is shift quantitatively towards
the reaction products. The reaction velocity (rate) vR of this reaction is given by the rate
law:
𝑣𝑅 = −𝑑𝑐𝐸
𝑑𝑡= 𝑘𝑐𝐸𝑐𝑊𝑐𝐾 (1)
Where:
k: Reaction rate constant
cE, cW, cK: Concentration of ester, water and catalyst at time t
The rate of the reaction investigated is a function of the acid concentration and can be
controlled by it.
Experiment 4
16
As a result of the practical constancy of the concentrations of H2O (Stoichiometric
excess) and H3O+ (Catalyst), this reduces to
−𝑑𝑐𝐸𝑑𝑡= 𝑘′𝑐𝐸 (1.1)
The rate of hydrolysis thus conforms to a pseudo-first-order time rule whose integration
results in the following:
𝑙𝑛𝑐𝐸,0𝑐𝐸= 𝑘′𝑡 (1.2)
The ester concentration cE;0 and cE at time t0 and t can be replaced by the volumes of
NaOH required for neutralization of the samples at the start ( vNaOH;0) during the
reaction (VNaOH) and after the complete conversion (VNaOH; ∞):
𝑙𝑛𝑉𝑁𝑎𝑂𝐻,∞ − 𝑉𝑁𝑎𝑂𝐻,0𝑉𝑁𝑎𝑂𝐻,∞ − 𝑉𝑁𝑎𝑂𝐻
= 𝑙𝑛𝑄 = 𝑘′𝑡 (1.3)
The volumes VNaOH;0 and VNaOH;∞ can be experimentally determined ( see ‘set-up and
procedure’) or can be calculated using relationships (2.1) and (2.2):
𝑉𝑁𝑎𝑂𝐻,0 =𝑐𝐻𝐶𝑙𝑉1𝑐𝑁𝑎𝑂𝐻
.100
105 (2.1)
Where:
CHCl: Concentration of the HCl solution (=1.0 mol/l)
CNaOH: Concentration of the NaOH solution (=0.2 mol/l)
V1: Sample volumes (=5 ml)
𝑉𝑁𝑎𝑂𝐻,∞ =𝜌𝐸𝑉𝐸𝑉1
𝑀𝐸𝑉𝑆𝑐𝑁𝑎𝑂𝐻+ 𝑉𝑁𝑎𝑂𝐻,0 (2.2)
Where:
𝜌𝐸: Density of ethyl acetate at T=298K (=0.895 g/ml)
ME: Molar mass of ethyl acetate (=88.12 g/mol)
VE: Volumes of ethyl acetate contained in the volume of the total system VS=105 ml
at time t0 (= 5ml)
In accordance with equation (1.3), the plot of the expression 𝑙𝑛 [𝑉𝑁𝑎𝑂𝐻;∞−𝑉𝑁𝑎𝑂𝐻;0
𝑉𝑁𝑎𝑂𝐻;∞−𝑉𝑁𝑎𝑂𝐻] as a
function of time results in a rising straight line with a slope of k’. The constant k includes
the dependence of the reaction velocity on the binding conditions of the participating
Experiment 4
17
molecules, the type of the reaction and the temperature. For two molecules to react,
they must not only collide, but also have sufficient energy content.
The activation energy EA is the difference between the average energy content prior to
reaction and the energy required for reaction. The molecules obtain the energy that is
needed for activation from heat supplied, from light and form the exchange of energy
when collisions occur. Such take-up of energy activates the molecules (loosens bonds,
polarization etc.) so that they can react. The portion of molecules with this increased
energy content increases with increasing temperature. The greater the portion of the
molecules capable of reaction, the more molecules that will react, and so the higher the
activation energy velocity.
The activation energy can be determined using the empirical Arrhenius equation:
k′ = kmax. e−EART (3)
Where:
R: Universal gas constant (=8.31441 J.K-1.mol-1)
kmax: Maximum rate constant at infinite temperature (frequency factor)
kmax is the velocity constant which would be given when every collision resulted in
reaction, i.e. when the activation energy was 0. For two known pairs of values having
the rate constant k’1 and k’
2 and the temperatures T1 and T2, using
lnk′ = −EART+ ln kmax (3.1)
The following concrete relationships result:
lnk1′ = −
EART1
+ ln kmax (3.11)
lnk2′ = −
EART2
+ ln kmax (3.12)
From which, by subtraction
EA = R.T1T2T2 − T1
. lnk2′
k1′ (3.2)
If further regarding k’ and T are available (i.e., measurements at a number of
temperatures), then the activation energy can alternatively be determined from the slope
of the linear relation between ln k’ and 1/T according to equation (3.1)
Experiment 4
18
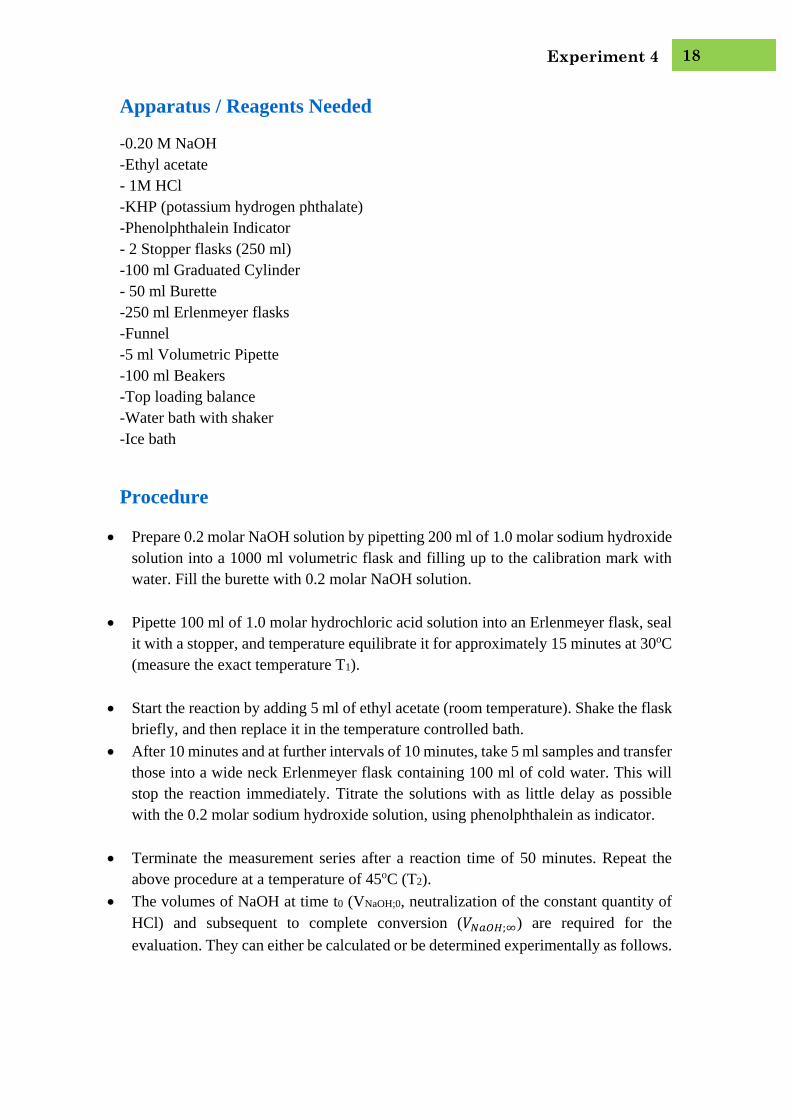
Apparatus / Reagents Needed
-0.20 M NaOH
-Ethyl acetate
- 1M HCl
-KHP (potassium hydrogen phthalate)
-Phenolphthalein Indicator
- 2 Stopper flasks (250 ml)
-100 ml Graduated Cylinder
- 50 ml Burette
-250 ml Erlenmeyer flasks
-Funnel
-5 ml Volumetric Pipette
-100 ml Beakers
-Top loading balance
-Water bath with shaker
-Ice bath
Procedure
Prepare 0.2 molar NaOH solution by pipetting 200 ml of 1.0 molar sodium hydroxide
solution into a 1000 ml volumetric flask and filling up to the calibration mark with
water. Fill the burette with 0.2 molar NaOH solution.
Pipette 100 ml of 1.0 molar hydrochloric acid solution into an Erlenmeyer flask, seal
it with a stopper, and temperature equilibrate it for approximately 15 minutes at 30oC
(measure the exact temperature T1).
Start the reaction by adding 5 ml of ethyl acetate (room temperature). Shake the flask
briefly, and then replace it in the temperature controlled bath.
After 10 minutes and at further intervals of 10 minutes, take 5 ml samples and transfer
those into a wide neck Erlenmeyer flask containing 100 ml of cold water. This will
stop the reaction immediately. Titrate the solutions with as little delay as possible
with the 0.2 molar sodium hydroxide solution, using phenolphthalein as indicator.
Terminate the measurement series after a reaction time of 50 minutes. Repeat the
above procedure at a temperature of 45oC (T2).
The volumes of NaOH at time t0 (VNaOH;0, neutralization of the constant quantity of
HCl) and subsequent to complete conversion (𝑉𝑁𝑎𝑂𝐻;∞) are required for the
evaluation. They can either be calculated or be determined experimentally as follows.
Experiment 4
19
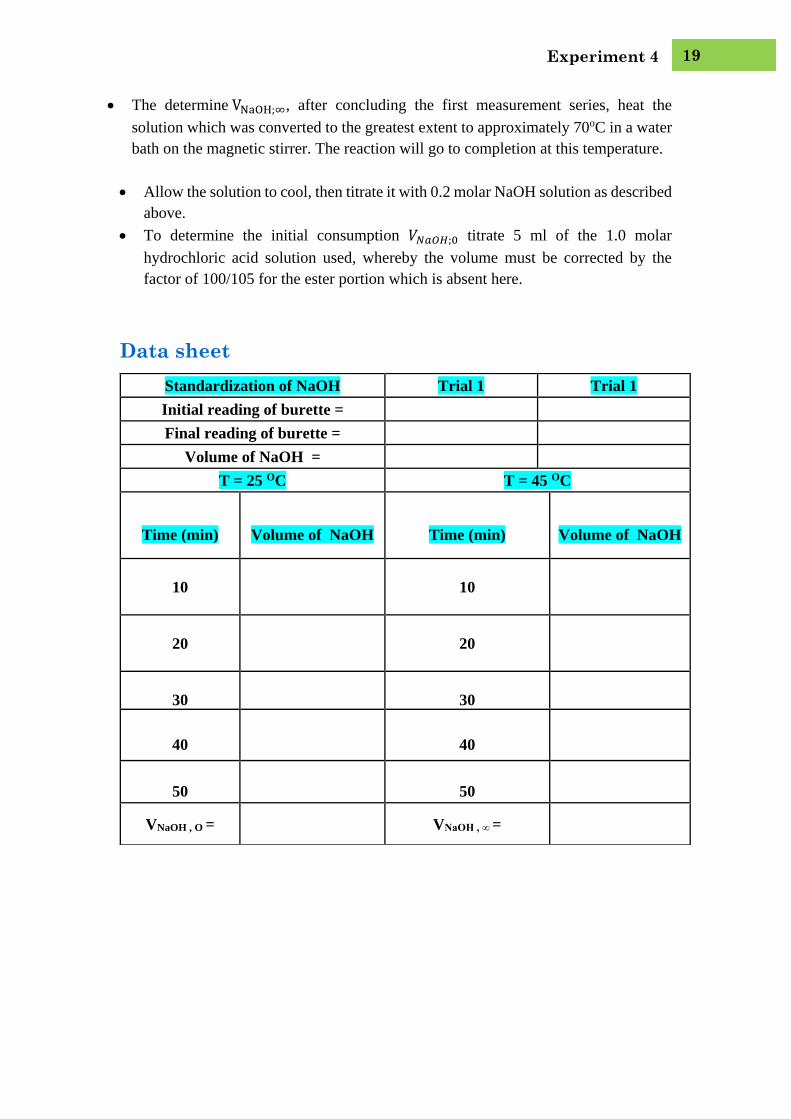
The determine VNaOH;∞, after concluding the first measurement series, heat the
solution which was converted to the greatest extent to approximately 70oC in a water
bath on the magnetic stirrer. The reaction will go to completion at this temperature.
Allow the solution to cool, then titrate it with 0.2 molar NaOH solution as described
above.
To determine the initial consumption 𝑉𝑁𝑎𝑂𝐻;0 titrate 5 ml of the 1.0 molar
hydrochloric acid solution used, whereby the volume must be corrected by the
factor of 100/105 for the ester portion which is absent here.
Data sheet
Standardization of NaOH Trial 1 Trial 1
Initial reading of burette =
Final reading of burette =
Volume of NaOH =
T = 25 OC T = 45 OC
Time (min)
Volume of NaOH
Time (min)
Volume of NaOH
10
10
20
20
30
30
40
40
50
50
VNaOH , O = VNaOH , ∞ =
Experiment 5
20
EXPERIMENT 5
ADSORPTION ISOTHERM
Objective:
Determine the residual equilibrium concentrations of acetic acid after stirring solutions
of differing initial concentrations with a constant mass of active carbon. Using the
measured results, determining the adsorption isotherm, which is valid for the given
system.
Theory:
Phenomenon whereby molecules or ions are adhered to surface of a solid due to forces
of attraction is called adsorption. The solid phase is called the adsorbent and the
molecules that are adsorbed on the adsorbent are called the adsorbed phase or adsorbate.
The adsorbate can be either a gas (molecules) or a solute (molecules or ions) in solution.
There are two types of adsorption i.e. physical adsorption in which the particles are held
by physical forces such as dipole and Van der Waals forces and chemical adsorption
(or chemisorption) where chemical bonds are formed between the particles and the
surface.
Adsorption is different from absorption, a process in which the material transferred
from one phase to another interpenetrates the second phase to form a “solution”. The
term ‘sorption’ is a general expression encompassing both adsorption and absorption.
The adsorption of acetic acid on charcoal is studied using both the Freundlich isotherm
and the Langmuir isotherm. This is an example of physical adsorption, where dipole
and van de Waals forces are the predominant sources of attraction, and the heat of
adsorption is typically less than 50 kJ/mol.
The amount of acetic acid (adsorbate) adsorbed per gram of charcoal (adsorbent) will
depend on the surface area of the charcoal, the temperature of the solution, and the
adsorbate concentration in solution. The adsorption will be followed by titrating the
acetic acid not adsorbed by the charcoal, then determining the amount adsorbed by
difference. Isotherms (plots of moles of adsorbate adsorbed per gram of adsorbent
versus solution concentration) will be constructed, then compared with two models:
The Freundlich isotherm and the Langmuir isotherm.
Experiment 5
21
In general, the term adsorption is used to describe the attachment of gasses or dissolved
substances to the surface of a solid (or liquid interfaces). At a constant temperature the
quantity of absorbed substances is a function of the type of system investigated and the
partial pressure and/or the concentration of the substance in question. This correlation
is described by great numbers of adsorption isotherms: their validity is to be
investigated experimentally.
As a result of the action of attractive forces between the exposed particles, gases or
dissolved substances B attach themselves (adsorbate) reversibly to the surfaces of solid
phases A (adsorbing agents) (adsorption).
A + B ↔ ABads
The extent of adsorption is normally expressed by the quantity of adsorbed substance
(adsorbate) nB,ads referred to the surface area of or the mass mA of the absorbing agent:
𝛾 =𝑛𝐵,𝑎𝑑𝑠𝑚𝐴
(1)
In cases of monolayer formation, the quotient of the real 𝛾 and the maximum 𝛾𝑚𝑎𝑥
adsorption molality is defined as the degree of coverageθ.
𝜃 =𝛾
𝛾𝑚𝑎𝑥 (2)
The type and degree of adsorption (𝛾, 𝜃) are function of the chemical nature of the
investigated system (adsorbing agent and adsorbate), among other things, as well as of
the temperature and partial pressure (gasses) or the concentration (dissolved
substances) of the adsorbate.
The correlation between the adsorption molality and the free equilibrium concentration
of B at constant temperature is described by great numbers of adsorption isotherms of
limited validity.
From kinetic consideration of the adsorption rate−𝑑𝑐𝐵
𝑑𝑡 :
−dcBdt= KadscB(1 − θ) − Kdesθ (3)
Where:
cB: concentration of B in the solution.
Kads and Kdes: rate constants of the adsorption and desorption, respectively.
For the case of an established adsorption (−𝑑𝑐𝐵
𝑑𝑡= 0) with the function (2), Langmuir’s
adsorption isotherm follows:
Experiment 5
22
𝛾 =(𝛾𝑚𝑎𝑥)(𝑐𝐵,𝑒𝑞)𝐾
1 + (𝑐𝐵,𝑒𝑞)𝐾 (4)
Where:
cB,eq: equilibrium concentration of B in solution.
K=Kads/Kdes= constants.
This simplifies for very low equilibrium concentration (KcB,eq<1) to:
γ = γmaxKcB,eq = K′cB,eq (4.1)
Thus, the adsorption molality γshould be linearly correlated with cB,eq (Henry’s
isotherm).
In contrast, the adsorption molality tends toward a concentration independent limiting
value 𝛾𝑚𝑎𝑥 at very high equilibrium concentrations (KcB,eq<1):
γ = γmax (4.2)
In the region of validity of the isotherm (4) the correlation between adsorption molality
and equilibrium concentration can be linearized by simple rearranging:
1
γ=
1
γmaxK.1
cB,eq+
1
γmax (4.3)
Consequently, the graphic plot 1/𝛾 as a function of the reciprocal equilibrium
concentration 1/cB,eq gives a straight line with a slope of 1
𝛾𝑚𝑎𝑥𝐾 and the ordinate segment
1/𝛾𝑚𝑎𝑥. The initial region of the adsorption isotherm is described by the Freundlich’s
empirically determined adsorption isotherm for many systems:
𝛾 = 𝛼𝑐𝐵,𝑒𝑞𝛽 (5)
Where:
𝛼, 𝛽= system-dependent constants,
Whose logarithmic expression is as follow:
logγ = βlogcB,eq + logα (5.1)
This form allows a simple graphic evaluation and thus the determination of the
constants 𝛼 and 𝛽. Plot logγ Vs 𝑙𝑜𝑔𝑐𝐵,𝑒𝑞 , the slope will be 𝛽 and the intercept will
be logα.
Experiment 5
23
Apparatus / Reagents Needed
-0.10 M NaOH
-Five different concentrations of acetic acid solutions 0.03, 0.05, 0.09, 0.15, 0.2 M
-KHP (potassium hydrogen phthalate)
-Phenolphthalein Indicator
-100 ml Graduated Cylinder
- 50 ml Burette
-250 ml Erlenmeyer flasks
-Funnel
-25 ml Volumetric Pipette
-100 ml Beakers
-Top loading balance
-Hot plate with stirrer
-5 magnetic bars
Procedure
1. Prepare the following solutions of acetic acid 0.20, 0.15, 0.09, 0.05, 0.03 M.
2. Transfer 100 ml of each of the above solutions to a 250 ml Erlenmeyer flask, and
then add about 1.0g of activated charcoal to each flask (record exact weight).
Stopper the flasks, shake the contents.
3. Place the flasks on a hot plate with intermitted shaking for about one hour to reach
equilibrium state. (*)
4. Separate the acetic acid solution in each flask from charcoal by using a filter paper
into another flask (discard the first 5-10 ml of each filtrate sample).
5. Take two 25.0 ml samples of each filtrate and titrate with standard 0.10M NaOH
using ph.ph. as an indicator, record the volume of NaOH for each trial.
(*) During this time prepare 0.10M NaOH in 500ml volumetric flask and standardize
with KHP to calculate the exact concentration of NaOH.
Experiment 5
24
Data and Calculations:
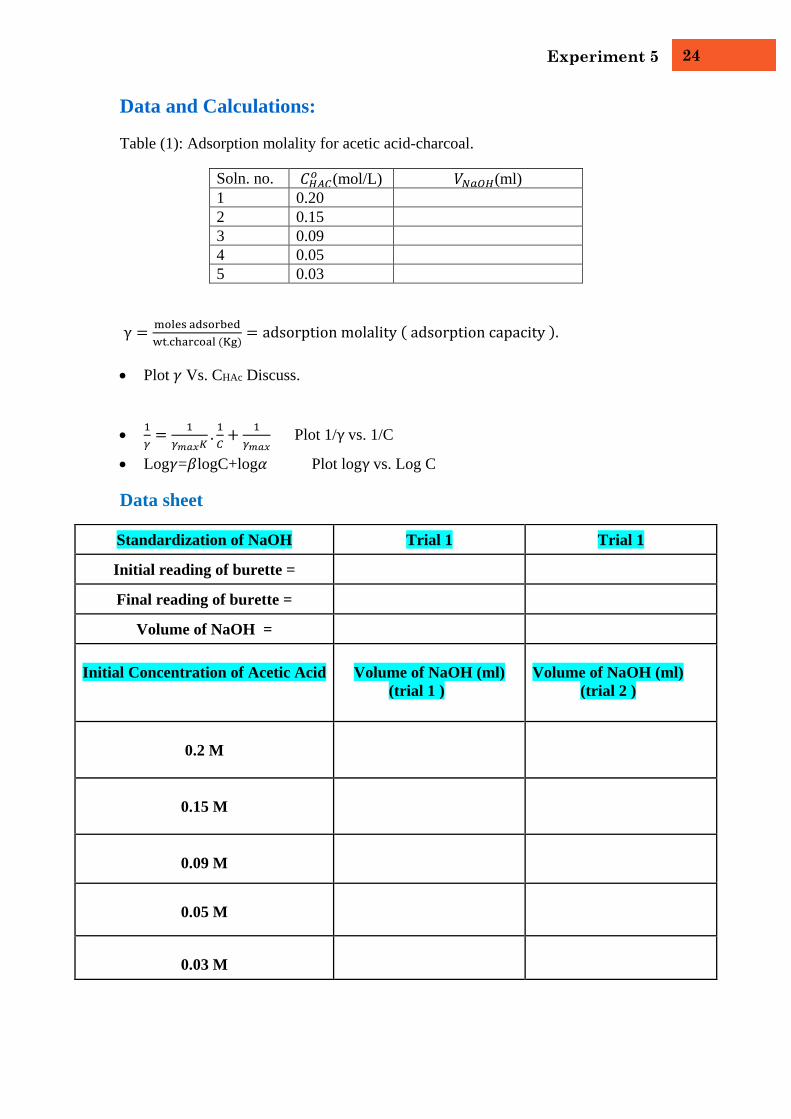
Table (1): Adsorption molality for acetic acid-charcoal.
Soln. no. 𝐶𝐻𝐴𝐶𝑜 (mol/L) 𝑉𝑁𝑎𝑂𝐻(ml)
1 0.20
2 0.15
3 0.09
4 0.05
5 0.03
γ =moles adsorbed
wt.charcoal (Kg)= adsorption molality ( adsorption capacity ).
Plot 𝛾 Vs. CHAc Discuss.
1
𝛾=
1
𝛾𝑚𝑎𝑥𝐾.1
𝐶+
1
𝛾𝑚𝑎𝑥 Plot 1/γ vs. 1/C
Log𝛾=𝛽logC+log𝛼 Plot logγ vs. Log C
Data sheet
Standardization of NaOH Trial 1 Trial 1
Initial reading of burette =
Final reading of burette =
Volume of NaOH =
Initial Concentration of Acetic Acid
Volume of NaOH (ml)
(trial 1 )
Volume of NaOH (ml)
(trial 2 )
0.2 M
0.15 M
0.09 M
0.05 M
0.03 M
Experiment 6
25
EXPERIMENT 6
BINARY WATER - PHENOL MIXTURE
Objectives
Determination of the Critical Solution Temperature, CST of Phenol-Water system.
Measuring the miscibility temperatures of several water-phenol mixtures of known
composition will be measured.
Theory
The study of the possible ways in which various materials can exist by themselves or in contact
with others, as a function of temperature, pressure, and time, is a very important part of Materials
Science. The reason is that we have to be able to tell what the stability of materials will be in all
sorts of environments, since the mechanical performance of these materials depends very much
on this. These changes in phase, called phase transformations, can be recorded in diagrams called
PHASE DIAGRAMS. The phase diagram is a type of map that allows us to predict what will
happen when we change the temperature or the overall composition of the material.
Binary systems are two-component systems. There are three types of liquid pairs:
A) Those which are completely soluble in each other in all proportions. (Alcohol and
Water).
B) Those which are soluble in each other in definite proportions. (Phenol and Water)
C) Those which are not soluble in any proportion. (Castor oil and Water)
At low and high percentages of phenol, water and phenol mix completely, forming a single
liquid phase. However, at intermediate compositions (and below the critical temperature)
mixtures of phenol and water separate into two liquid phases. Above the critical temperature,
phenol and water are completely miscible. The independent variable in the phase diagram is
composition. Composition is sometimes given as mass percent (w/w%).
Binary phase Diagram:
Knowledge of the phase diagrams of binary systems is necessary for an understanding of the
nature of the interaction of the components and the practical use of such systems.
Experiment 6
26
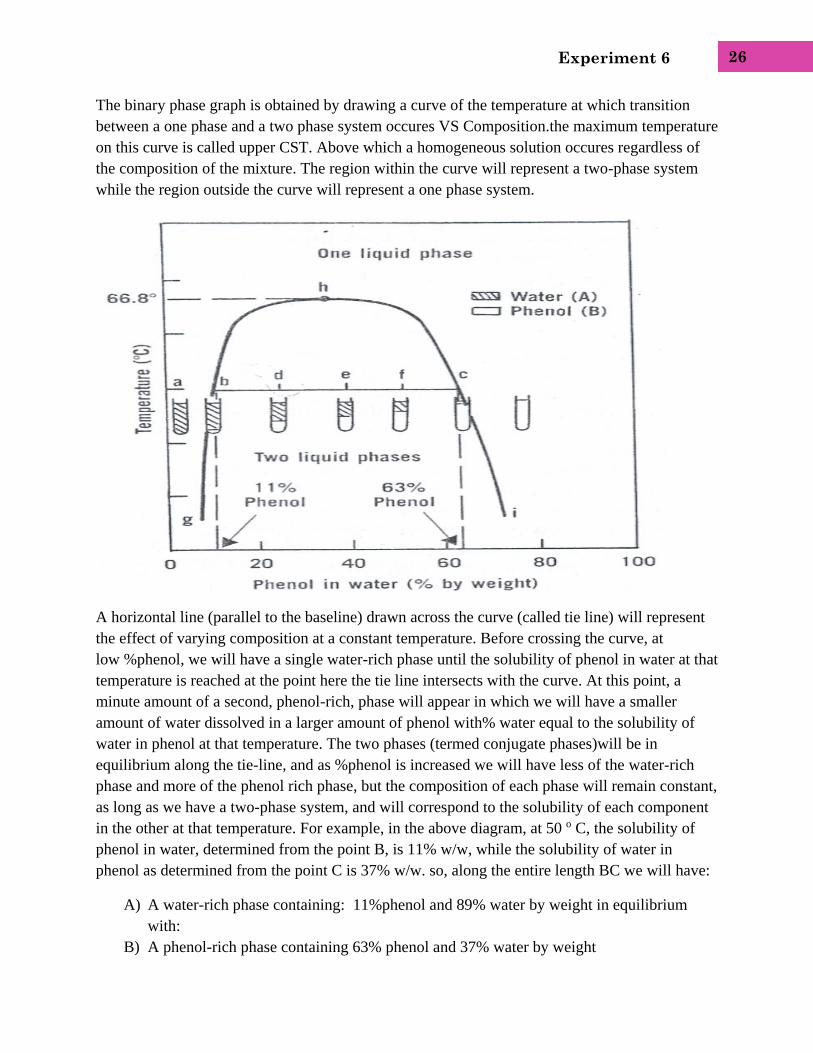
The binary phase graph is obtained by drawing a curve of the temperature at which transition
between a one phase and a two phase system occures VS Composition.the maximum temperature
on this curve is called upper CST. Above which a homogeneous solution occures regardless of
the composition of the mixture. The region within the curve will represent a two-phase system
while the region outside the curve will represent a one phase system.
A horizontal line (parallel to the baseline) drawn across the curve (called tie line) will represent
the effect of varying composition at a constant temperature. Before crossing the curve, at
low %phenol, we will have a single water-rich phase until the solubility of phenol in water at that
temperature is reached at the point here the tie line intersects with the curve. At this point, a
minute amount of a second, phenol-rich, phase will appear in which we will have a smaller
amount of water dissolved in a larger amount of phenol with% water equal to the solubility of
water in phenol at that temperature. The two phases (termed conjugate phases)will be in
equilibrium along the tie-line, and as %phenol is increased we will have less of the water-rich
phase and more of the phenol rich phase, but the composition of each phase will remain constant,
as long as we have a two-phase system, and will correspond to the solubility of each component
in the other at that temperature. For example, in the above diagram, at 50 o C, the solubility of
phenol in water, determined from the point B, is 11% w/w, while the solubility of water in
phenol as determined from the point C is 37% w/w. so, along the entire length BC we will have:
A) A water-rich phase containing: 11%phenol and 89% water by weight in equilibrium
with:
B) A phenol-rich phase containing 63% phenol and 37% water by weight
Experiment 6
27
After the tie line intersects with the curve again, we will get a one-phase system consisting of a
single phenol-rich phase.
Now, how can you determine the weight of each phase at any point on the tie-line? By taking
point F, for example:
Weight of Phase A (water-rich phase) / Weight of Phase B (phenol-rich phase) = Length
FC/Length of BF
Then we can calculate the weight of each component in each phase by simply multiplying the
weight of each phase by the %w/w of each component in it.
Some systems show a decrease in miscibility with increasing temperatures and their curves show
a lower CST appearing as a minimum point on the curve which will, compared to the phenol-
water system phase diagram, look inverted like in case of the triethylamine-water system. Other
systems will show both upper and lower CST’s and their phase diagrams will give a closed loop
like in the case of the nicotine-water system. However, there are solutions that do not exhibit
CST’s
Experiment 6
28
EXPERIMENTAL PART:
Materials
76% wt/wt Phenol solution, Distilled water.
Apparatus:
11Test Tubes, Test Tube Holder, Burette, Beakers, Funnel, Water Bath, Thermometer.
Procedure:
Note:
Phenol is poisonous; the phenol-water mixtures used in this lab are concentrated and dangerous
by contact or ingestion.
Phase diagram construction:
1-Prepare the following Concentrations of phenol in water mixtures (5ml each):
2- Heat each concentration separately on a water bath until you have a homogenous solution of
phenol in water while gently stirring with the thermometer
3- Keep the thermometer inserted in the mixture; observe the temperature of the complete
miscibility, indicated by the complete disappearance of any turbidity and the formation of one
phase system.
4- Take the test tube outside the water bath, while gently stirring; observe the solubility
temperature again, but this time by the first appearance of turbidity or two-phase system. Record
Volume (ml)
phenol Water
0.3 4.7
0.4 4.6
0.5 4.5
1.0 4.0
1.5 3.5
2.0 3.0
2.5 2.5
3.0 2.0
3.5 1.5
4.0 1.0
4.5 0.5
Experiment 6
29
the solubility temperature in the table. If you missed the exact temperature, you can repeat the
observation using the same mixture.
Experiment 6
30
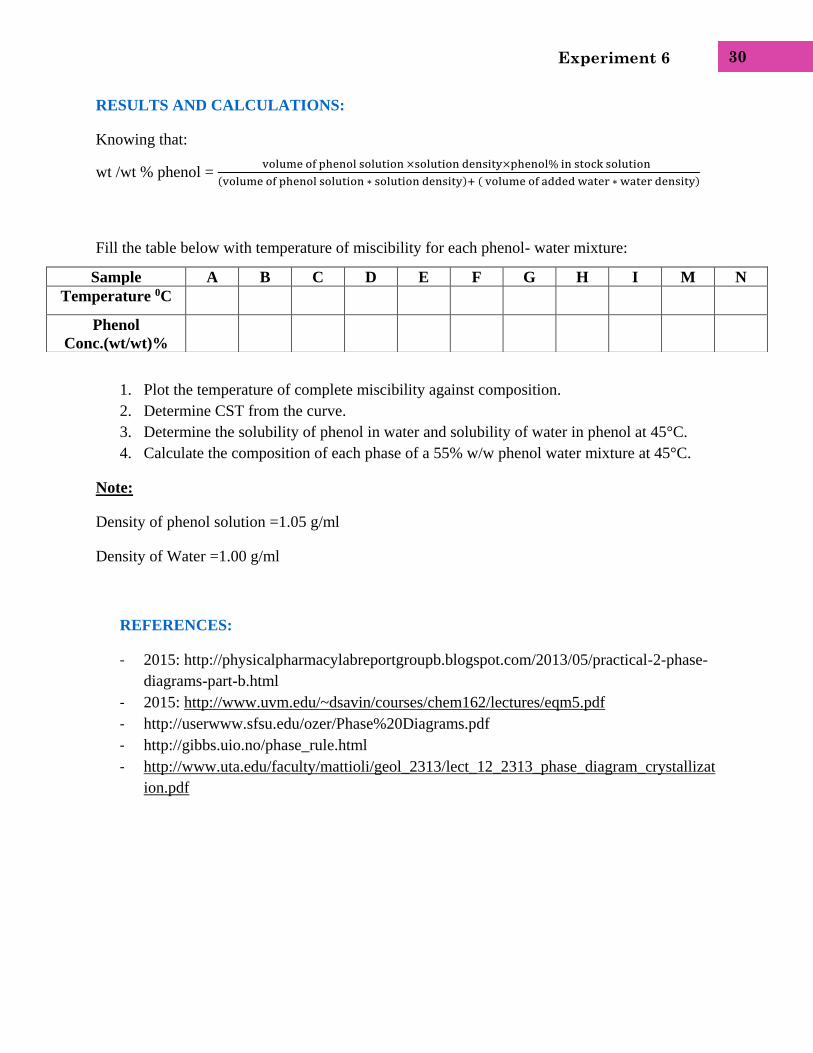
RESULTS AND CALCULATIONS:
Knowing that:
wt /wt % phenol = volume of phenol solution ×solution density×phenol% in stock solution
(volume of phenol solution ∗ solution density)+ ( volume of added water ∗ water density)
Fill the table below with temperature of miscibility for each phenol- water mixture:
1. Plot the temperature of complete miscibility against composition.
2. Determine CST from the curve.
3. Determine the solubility of phenol in water and solubility of water in phenol at 45°C.
4. Calculate the composition of each phase of a 55% w/w phenol water mixture at 45°C.
Note:
Density of phenol solution =1.05 g/ml
Density of Water =1.00 g/ml
REFERENCES:
- 2015: http://physicalpharmacylabreportgroupb.blogspot.com/2013/05/practical-2-phase-
diagrams-part-b.html
- 2015: http://www.uvm.edu/~dsavin/courses/chem162/lectures/eqm5.pdf
- http://userwww.sfsu.edu/ozer/Phase%20Diagrams.pdf
- http://gibbs.uio.no/phase_rule.html
- http://www.uta.edu/faculty/mattioli/geol_2313/lect_12_2313_phase_diagram_crystallizat
ion.pdf
Sample A B C D E F G H I M N
Temperature 0C
Phenol
Conc.(wt/wt)%
Experiment 7
31
EXPERIMENT 7
TERNARY SYSTEMS
Objectives
To construct the phase diagram of a ternary system.
To illustrate the effect of solvent composition on the solubility of a third substance.
Theory
A ternary system is defined as a physicochemical system consisting of three components.
Examples of ternary systems with practical importance are metal alloys, molten salts, oxides
(slags), and sulfides (mattes), and systems of water and two salts with a common ion.
According to the phase rule, the variance, or number of thermodynamic degrees of freedom, of
condensed ternary systems (those not containing a gaseous phase) at constant pressure is
determined from the formula F = C – P+2, where P is the number of phases in the system, and C
is the number of components in the system.
Degrees of freedom are defined as: the least number of independent (intensive) variables that
must be fixed to completely describe the system.
Example: for a system containing 3 components (ternary system) but only one phase:
F = 3 – 1 +2 = 4
These four intensive variables are pressure, temperature and concentration of two of the three
components.
Like in the previously mentioned example, we need four intensive variables to describe such a
system. However, it is not practically possible to deal with four different variables at the same
time. Therefore, in this experiment, we will work under constant pressure (condensed system)
and constant temperature. In this case, we will deal only with the effects of the two remaining
variables, which are the concentration of two of the three components.
Experiment 7
32
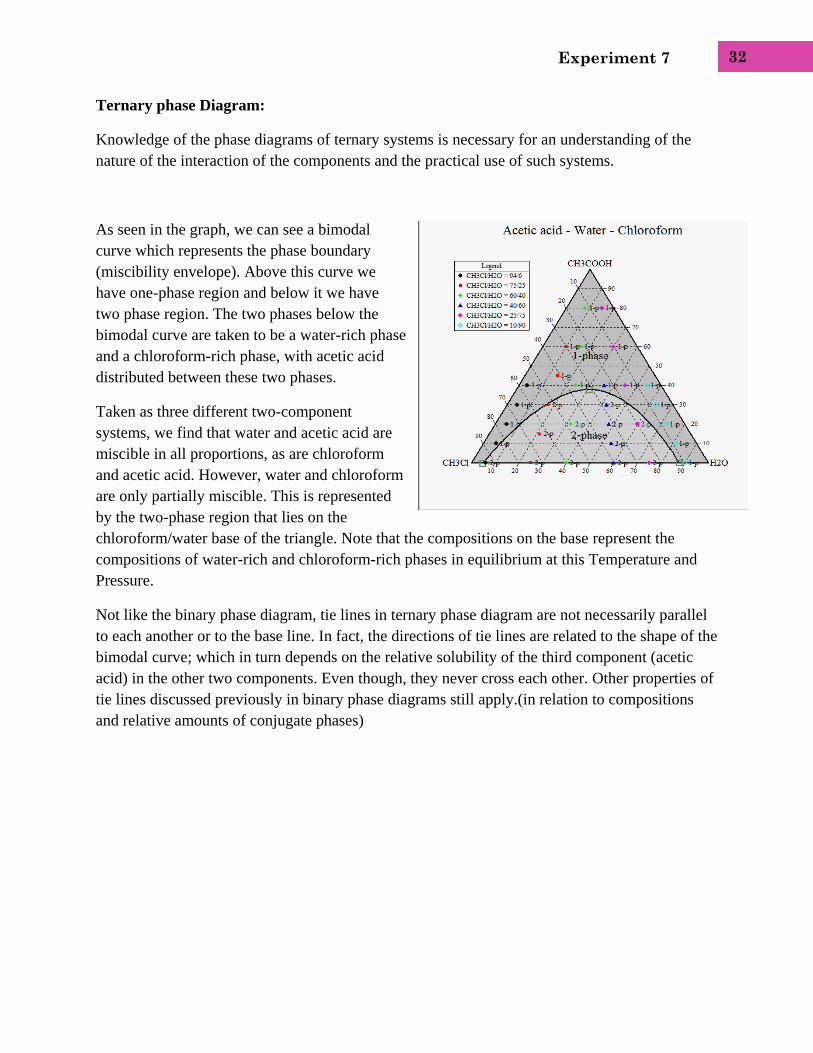
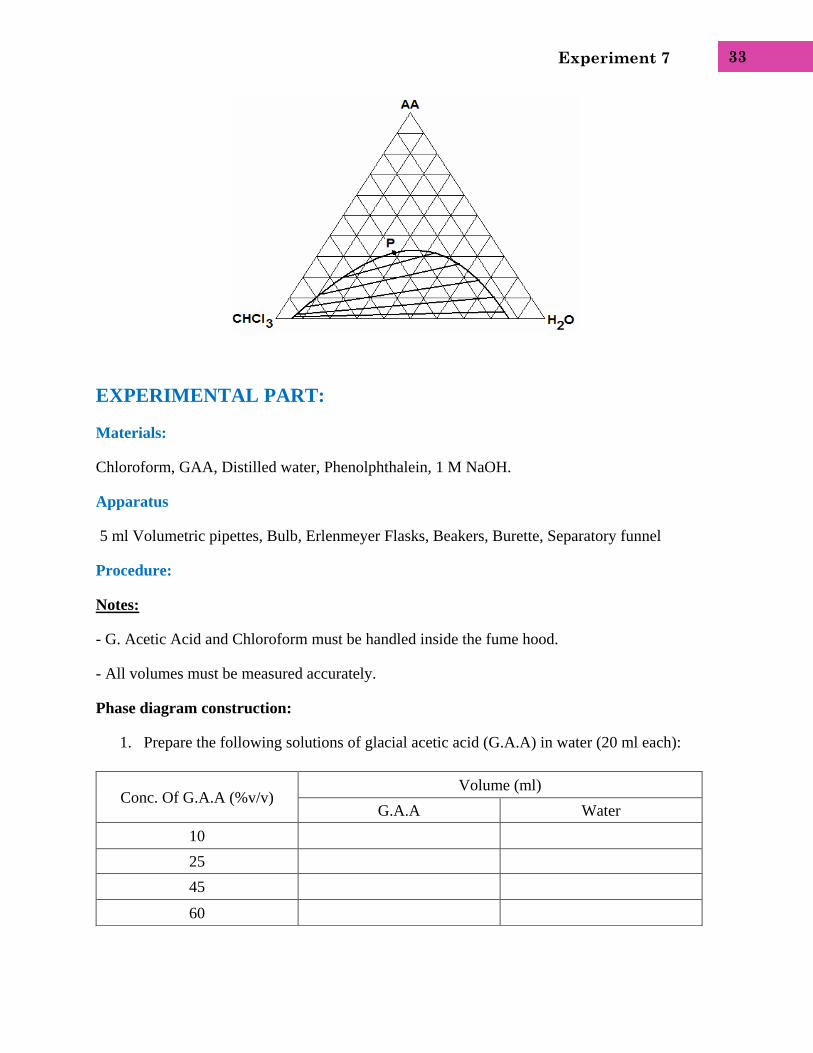
Ternary phase Diagram:
Knowledge of the phase diagrams of ternary systems is necessary for an understanding of the
nature of the interaction of the components and the practical use of such systems.
As seen in the graph, we can see a bimodal
curve which represents the phase boundary
(miscibility envelope). Above this curve we
have one-phase region and below it we have
two phase region. The two phases below the
bimodal curve are taken to be a water-rich phase
and a chloroform-rich phase, with acetic acid
distributed between these two phases.
Taken as three different two-component
systems, we find that water and acetic acid are
miscible in all proportions, as are chloroform
and acetic acid. However, water and chloroform
are only partially miscible. This is represented
by the two-phase region that lies on the
chloroform/water base of the triangle. Note that the compositions on the base represent the
compositions of water-rich and chloroform-rich phases in equilibrium at this Temperature and
Pressure.
Not like the binary phase diagram, tie lines in ternary phase diagram are not necessarily parallel
to each another or to the base line. In fact, the directions of tie lines are related to the shape of the
bimodal curve; which in turn depends on the relative solubility of the third component (acetic
acid) in the other two components. Even though, they never cross each other. Other properties of
tie lines discussed previously in binary phase diagrams still apply.(in relation to compositions
and relative amounts of conjugate phases)
Experiment 7
33
EXPERIMENTAL PART:
Materials:
Chloroform, GAA, Distilled water, Phenolphthalein, 1 M NaOH.
Apparatus
5 ml Volumetric pipettes, Bulb, Erlenmeyer Flasks, Beakers, Burette, Separatory funnel
Procedure:
Notes:
- G. Acetic Acid and Chloroform must be handled inside the fume hood.
- All volumes must be measured accurately.
Phase diagram construction:
1. Prepare the following solutions of glacial acetic acid (G.A.A) in water (20 ml each):
Conc. Of G.A.A (%v/v) Volume (ml)
G.A.A Water
10
25
45
60
Experiment 7
34
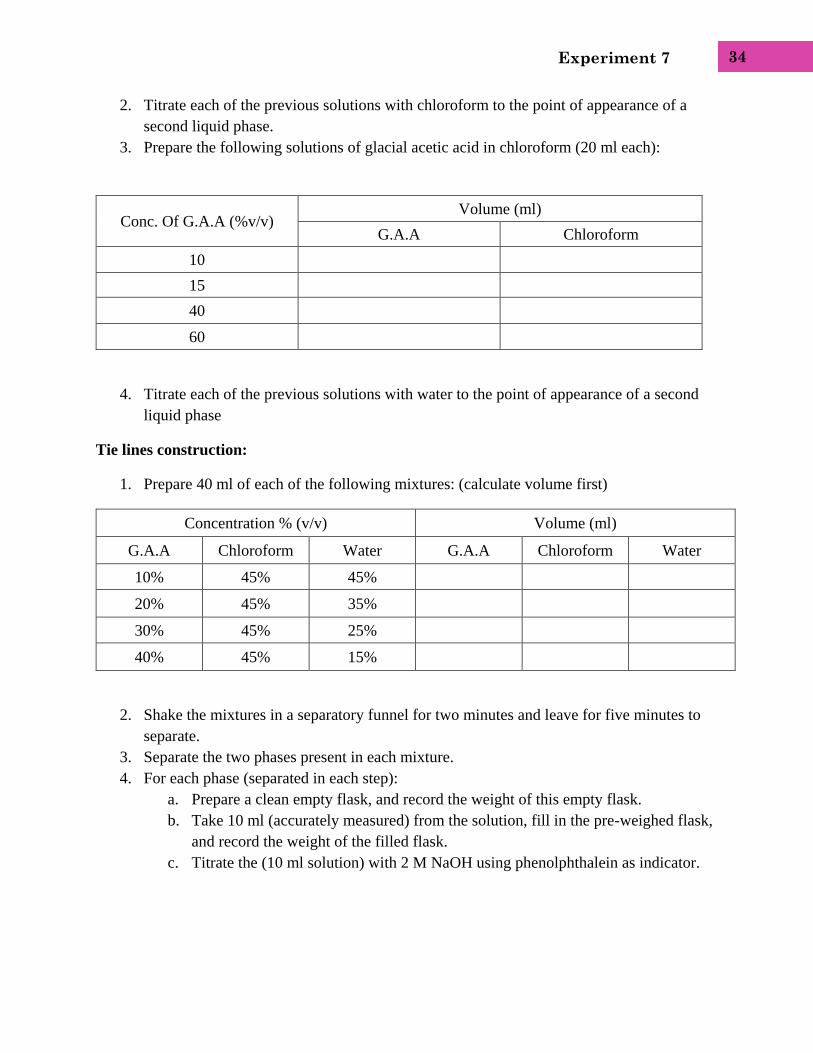
2. Titrate each of the previous solutions with chloroform to the point of appearance of a
second liquid phase.
3. Prepare the following solutions of glacial acetic acid in chloroform (20 ml each):
4. Titrate each of the previous solutions with water to the point of appearance of a second
liquid phase
Tie lines construction:
1. Prepare 40 ml of each of the following mixtures: (calculate volume first)
Concentration % (v/v) Volume (ml)
G.A.A Chloroform Water G.A.A Chloroform Water
10% 45% 45%
20% 45% 35%
30% 45% 25%
40% 45% 15%
2. Shake the mixtures in a separatory funnel for two minutes and leave for five minutes to
separate.
3. Separate the two phases present in each mixture.
4. For each phase (separated in each step):
a. Prepare a clean empty flask, and record the weight of this empty flask.
b. Take 10 ml (accurately measured) from the solution, fill in the pre-weighed flask,
and record the weight of the filled flask.
c. Titrate the (10 ml solution) with 2 M NaOH using phenolphthalein as indicator.
Conc. Of G.A.A (%v/v) Volume (ml)
G.A.A Chloroform
10
15
40
60
Experiment 7
35
RESULTS AND CALCULATIONS:
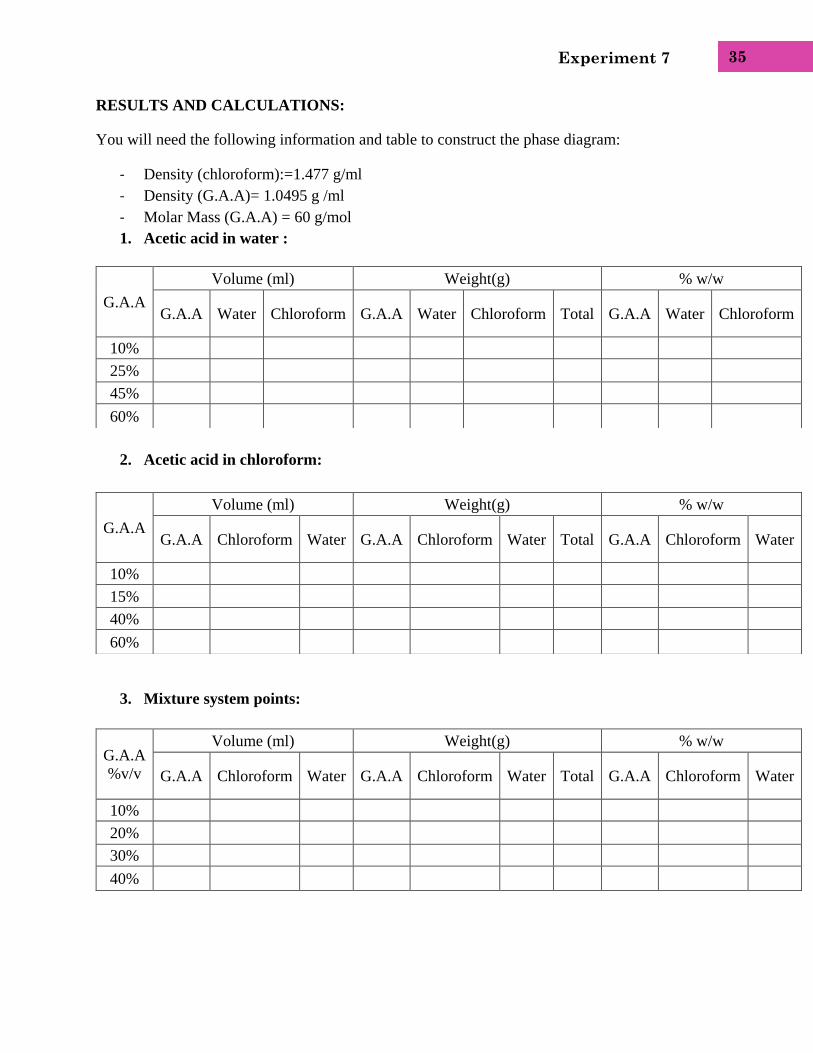
You will need the following information and table to construct the phase diagram:
- Density (chloroform):=1.477 g/ml
- Density (G.A.A)= 1.0495 g /ml
- Molar Mass (G.A.A) = 60 g/mol
1. Acetic acid in water :
2. Acetic acid in chloroform:
3. Mixture system points:
G.A.A
Volume (ml) Weight(g) % w/w
G.A.A Water Chloroform G.A.A Water Chloroform Total G.A.A Water Chloroform
10%
25%
45%
60%
G.A.A
Volume (ml) Weight(g) % w/w
G.A.A Chloroform Water G.A.A Chloroform Water Total G.A.A Chloroform Water
10%
15%
40%
60%
G.A.A
%v/v
Volume (ml) Weight(g) % w/w
G.A.A Chloroform Water G.A.A Chloroform Water Total G.A.A Chloroform Water
10%
20%
30%
40%
Experiment 7
36
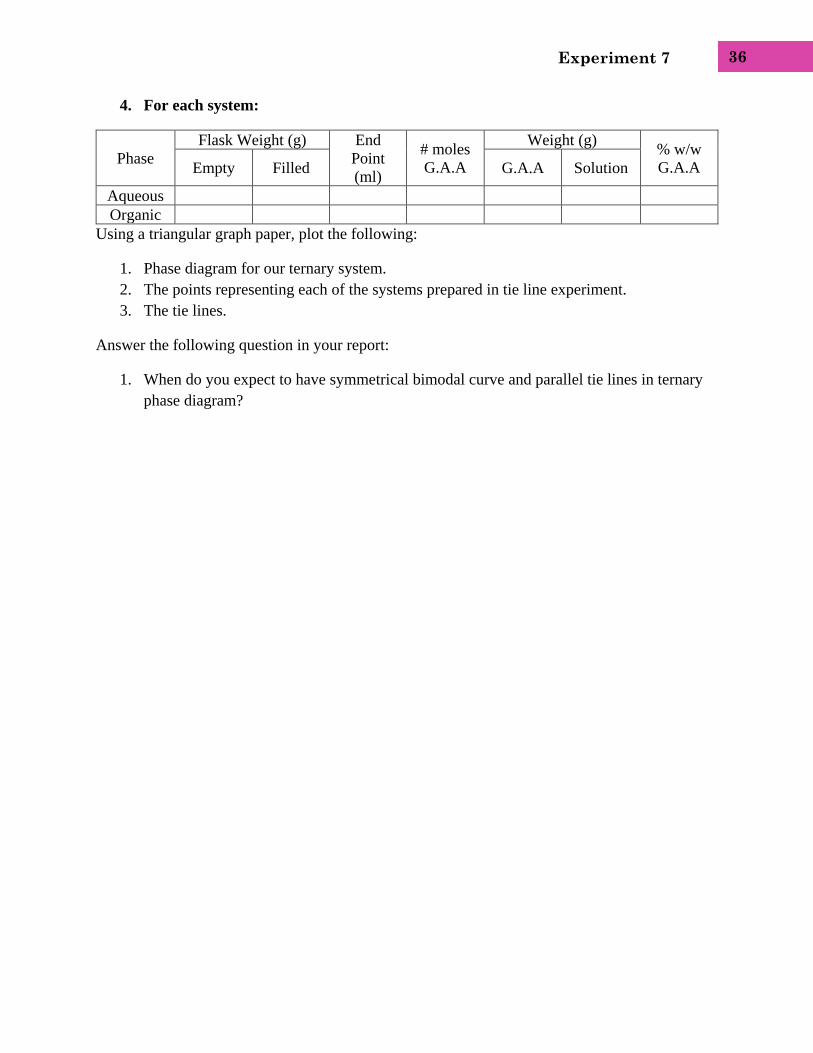
4. For each system:
Phase
Flask Weight (g) End
Point
(ml)
# moles
G.A.A
Weight (g) % w/w
G.A.A Empty Filled G.A.A Solution
Aqueous
Organic
Using a triangular graph paper, plot the following:
1. Phase diagram for our ternary system.
2. The points representing each of the systems prepared in tie line experiment.
3. The tie lines.
Answer the following question in your report:
1. When do you expect to have symmetrical bimodal curve and parallel tie lines in ternary
phase diagram?
Experiment 7
37
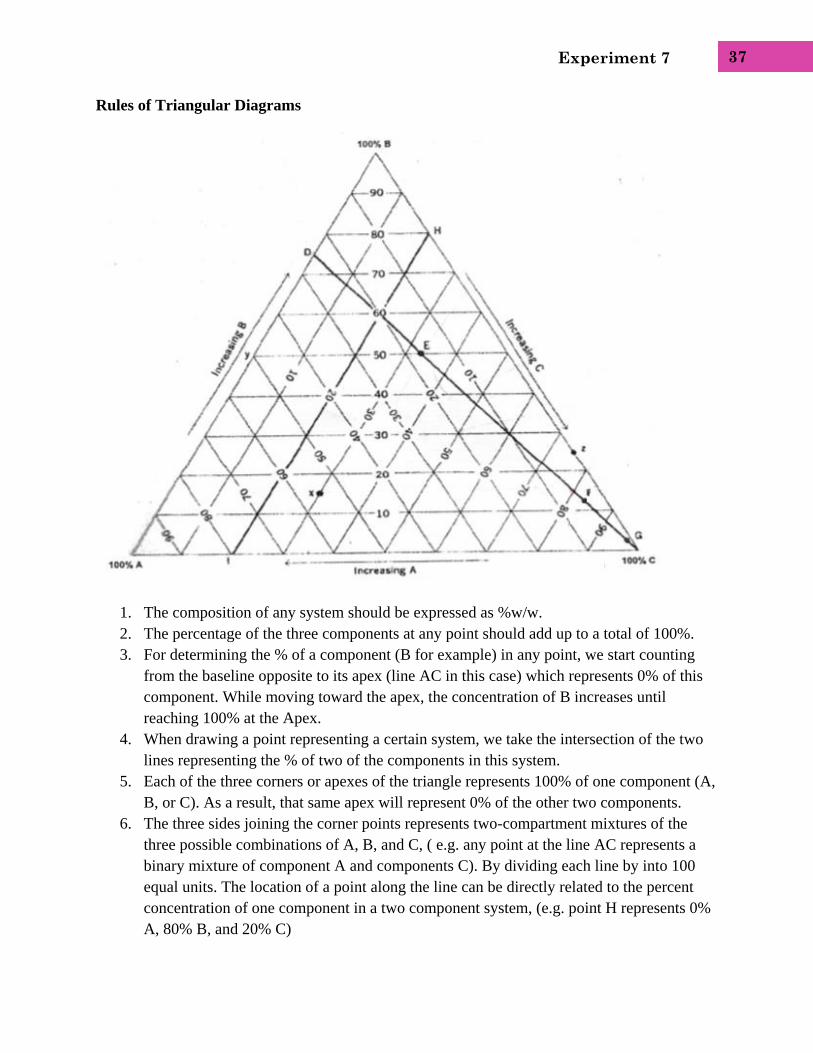
Rules of Triangular Diagrams
1. The composition of any system should be expressed as %w/w.
2. The percentage of the three components at any point should add up to a total of 100%.
3. For determining the % of a component (B for example) in any point, we start counting
from the baseline opposite to its apex (line AC in this case) which represents 0% of this
component. While moving toward the apex, the concentration of B increases until
reaching 100% at the Apex.
4. When drawing a point representing a certain system, we take the intersection of the two
lines representing the % of two of the components in this system.
5. Each of the three corners or apexes of the triangle represents 100% of one component (A,
B, or C). As a result, that same apex will represent 0% of the other two components.
6. The three sides joining the corner points represents two-compartment mixtures of the
three possible combinations of A, B, and C, ( e.g. any point at the line AC represents a
binary mixture of component A and components C). By dividing each line by into 100
equal units. The location of a point along the line can be directly related to the percent
concentration of one component in a two component system, (e.g. point H represents 0%
A, 80% B, and 20% C)
Experiment 7
38
7. We divide the triangle from base to apex by equal parallel lines (100 lines >> from each
base to the corresponding apex).
8. The area within the triangle represents all possible combinations of A, B, and C to give
three-component systems, (e.g. point X represents 55% A, 15% B, and 30% C).
9. Any line drawn parallel to a side of the triangle represents systems containing a
constant % of one of the three components, (e.g. any system at line HI will contain 20%
of component C).
10. Any line drawn from an apex toward a baseline represents systems containing a constant
ratio of two components, (e.g. any system at line DC will contain a constant ratio of A to
B, i.e. %A/%B in any system at this line is 1 to 3)
REFERENCES
- 2014: http://www.brocku.ca/earthsciences/people/gfinn/petrology/ternary5.gif
- 2014: http://encyclopedia2.thefreedictionary.com/ternary+system
- 2014:http://www.sv.vt.edu/classes/MSE2094_NoteBook/96ClassProj/experimental/ternar
y2.html
- 2014: http://www.uvm.edu/~dsavin/courses/chem162/lectures/eqm5.pdf
Experiment 8
39
EXPERIMENT 8
DETERMINATION OF DISTRIBUTION COEFFICIENT OF I2 AND STABILITY
CONSTANT OF I3- COMPLEX
Objectives
Determine the Distribution Coefficient (Kd) of molecular iodine between water and Ethyl
Acetate.
Determine the Stability Constant (Ks) of Iodine-Iodide complex.
Theory
The distribution Coefficient:
If an excess amount of a certain substance, is added to a mixture of two immiscible phases (i.e.
liquids), it will distribute itself between the two phases so that each of them becomes saturated;
provided that the substance is soluble in both phases.
If the substance is added in an amount insufficient to saturate each of the two phases, it will still
become distributed between the two phases in a definite concentration ratio. This ratio is called
Distribution (or Partition) Coefficient.
Distribution Coefficient (Kd) = Concentration in the first phase/ concentration in the second
phase= C1/C2
For instance; if a substance is added to ethyl acetate/water mixture, then Kd of this substance is:
Kd= Cethyl acetate/ Cwater
Distribution coefficient is a function of:
1. Nature of the solute.
2. Type of the two immiscible phases.
3. Temperature of the system. (Why?)
Distribution coefficient governs the concentration ratio of the solute species common to both
phases (i.e. in the same molecular condition). To better understand this idea, suppose that we
have benzoic acid added to octanol/water mixture. This weak acid will be present in the aqueous
phase in two different forms, which are dissociated form [A-]w and un-dissociated [HA]w . On
Experiment 8
40
the other hand, it can be present in the organic phase in the un-dissociated form [HA]0 and in the
dimer form[2HA]0.
In this case: Kd = [HA]0 / [HA]w
Distribution phenomenon is involved in several areas of pharmaceutical interest, which includes:
1) Preservation of oil-water systems (i.e. emulsions).
2) Drug actions at nonspecific sites.
3) The absorption and distribution of drugs throughout the body.
4) Chromatographic separation technique.
5) Extraction purposes.
6) Determination of complex stability constant.
The stability constant:
Complexes are structures that result from a donor-receptor interaction between two or more
different chemical constituents.
Intermolecular forces involved in the formation of these complexes are:
1. Covalent bonds.
2. Van der Waal forces.
3. Dipole or induced Dipole bonds.
4. Hydrogen bonds.
5. Charge transfer and hydrophobic interactions.
Complexes can be divided into three broad classes, which are:
1. Metal Ion Complexes.
In which a central metal ion is bonded to one or more ligands by a coordinate bond, for example:
chelate complexes.
2. Organic Molecular Complexes.
Molecular complexes consist of constituents held together by weak forces. For example:
Caffeine with acidic drugs.
3. Inclusion/Occlusion Compounds.
In which one of the constituents is trapped in the open lattice or cage-like structure of the other to
yield a stable arrangement. For example: Cyclodextrins with hydrophobic drugs.
Determination of the stoichiometric ratio of ligand-to-metal or donor-to-acceptor, and of a
quantitative expression of the stability constant (Ks) for complex formation are important in the
study and application of complexes.
Experiment 8
41
In this experiment, we are going to use the ‘Distribution Method’ to determine the stability
constant (Ks) of iodine-iodide complex.
I2 + I- I3-
The complex stability constant determined at equilibrium is given by:
Ks= [I3-] complex / ([I2] free × [I-] free)
The concentrations of the above species can be determined from the initial concentrations, the
distribution coefficient (Kd) of molecular iodine between two immiscible solvents, and from the
fact that only molecular iodine will be present in the organic phase, while both ionized and
molecular iodine will be present in the aqueous phase.
Experimental Part
Materials and apparatus:
0.04 M I2/Ethyl Acetate, 0.1 M NaI, Distilled water, pure Heptane, 0.1 M Na2S2O3, 0.01 M
Na2S2O3, conical flasks, burets, volumetric pipets(10 ml and 25 ml), beakers, separatory funnel,
measuring cylinder, pipette filler.
Procedure
Important Note: during the titration of organic phase, very good shaking is required after each
addition of Na2S2O3 in order to extract I2 from the organic phase; because the interaction between
them takes place in the aqueous medium.
Kd Determination:
1. Take 20 ml of 0.04 M I2/Ethyl Acetate solution (organic phase), place in separatory
funnel, add 100 ml distilled water (aqueous phase).
2. Shake at intervals for about 10 min.
3. Allow the equilibrium to establish in the system at room temperature.
4. Separate the two layers.
Titration of organic layer:
1. Using a pipet transfer 10 ml of the organic layer to a conical flask containing 10 ml of
0.1M NaI.
2. Titrate with 0.1 M Na2S2O3 until the disappearance of color.
3. Note that the chemical reaction that occurs is : 2Na2S2O3 + I2 2 NaI + Na2S4O6
Experiment 8
42
Titration of aqueous layer:
1. Transfer 25 ml of aqueous layer to an Erlenmeyer flask containing 10 ml of 0.1M NaI.
2. Add 1 ml of Heptane, which will act as an indicator, and shake the solution (heptane will
extract I2 and appear as pink droplets).
3. Titrate with 0.01 M Na2S2O3 until the disappearance of pink color (of heptane droplets).
Ks Determination:
Repeat the previous procedures using 0.1 M NaI instead of distilled water as an aqueous phase
and 0.04 M I2/ ethyl acetate as an organic phase.
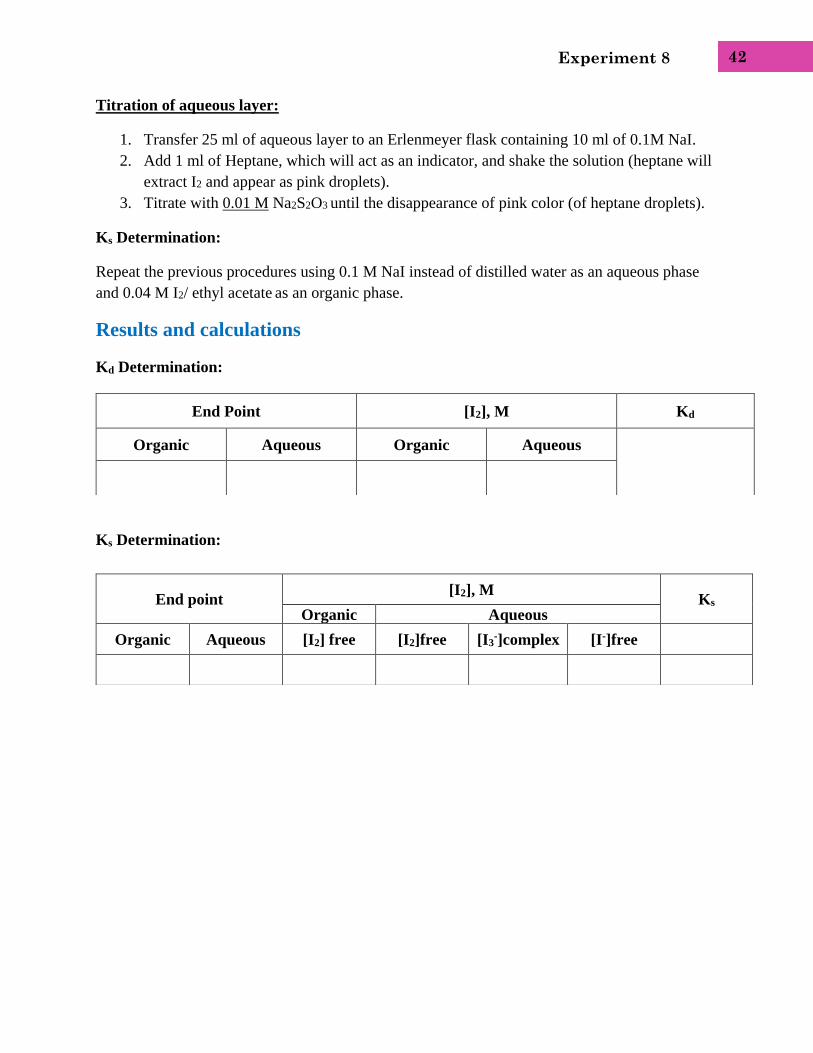
Results and calculations
Kd Determination:
Ks Determination:
End Point [I2], M Kd
Organic Aqueous Organic Aqueous
End point [I2], M
Ks
Organic Aqueous
Organic Aqueous [I2] free [I2]free [I3-]complex [I-]free
Experiment 9
43
EXPERIMENT 9
TRANSFER OF SALICYLIC ACID ACROSS POLYMERIC MEMBRANE
Objectives
To demonstrate the diffusion characteristics of salicylic acid across polymeric membrane.
Theory
Diffusion can be defined as the spontaneous flow of molecules from a region of high
concentration to a region of lower concentration as a result of the solute molecules’ Brownian
movement. The flow of molecules is described by Fick’s law:
J = dM / S.dt
Where J is the solute flux. The flux J, is the amount of material, M, flow through barrier unit
cross section area, S, in unit time, t.
If a drug of a concentration Cd is placed in a donor compartment and separated from a receptor
compartment by a membrane of thickness, h , then the flux of the drug from the donor to the
receptor compartment, when steady state sink condition ( in in vivo absorption, sink conditions
are brought about by the movement of drug molecules away from the absorption site in the blood
stream, thus, in in vitro diffusion experiments, there should be a way of maintaining sink
conditions) are assumed, is given by:
dM/ Sdt= DK Cd/h dM = (SDK Cd/ h) dt
If the membrane permeability coefficient, P is given by:
P= DK/h then dM= PS Cd dt or M= P S Cd t
Where D= the diffusion coefficient of the drug
K= partition coefficient of the drug between the membrane and the solvent.
Experiment 9
44
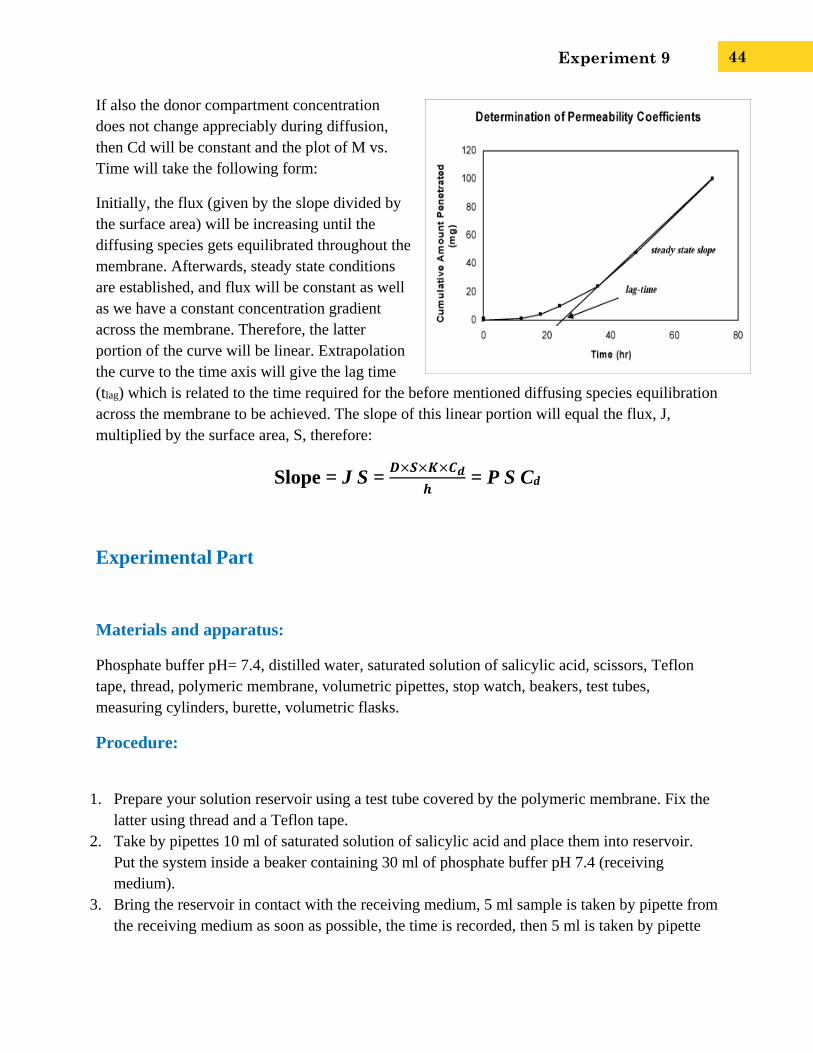
If also the donor compartment concentration
does not change appreciably during diffusion,
then Cd will be constant and the plot of M vs.
Time will take the following form:
Initially, the flux (given by the slope divided by
the surface area) will be increasing until the
diffusing species gets equilibrated throughout the
membrane. Afterwards, steady state conditions
are established, and flux will be constant as well
as we have a constant concentration gradient
across the membrane. Therefore, the latter
portion of the curve will be linear. Extrapolation
the curve to the time axis will give the lag time
(tlag) which is related to the time required for the before mentioned diffusing species equilibration
across the membrane to be achieved. The slope of this linear portion will equal the flux, J,
multiplied by the surface area, S, therefore:
Slope = J S = 𝑫×𝑺×𝑲×𝑪𝒅
𝒉 = P S Cd
Experimental Part
Materials and apparatus:
Phosphate buffer pH= 7.4, distilled water, saturated solution of salicylic acid, scissors, Teflon
tape, thread, polymeric membrane, volumetric pipettes, stop watch, beakers, test tubes,
measuring cylinders, burette, volumetric flasks.
Procedure:
1. Prepare your solution reservoir using a test tube covered by the polymeric membrane. Fix the
latter using thread and a Teflon tape.
2. Take by pipettes 10 ml of saturated solution of salicylic acid and place them into reservoir.
Put the system inside a beaker containing 30 ml of phosphate buffer pH 7.4 (receiving
medium).
3. Bring the reservoir in contact with the receiving medium, 5 ml sample is taken by pipette from
the receiving medium as soon as possible, the time is recorded, then 5 ml is taken by pipette
Experiment 9
45
after 3,5,10,15,30,45,60,75,90 minutes. 5 ml phosphate buffer pH 7.4 should be added to the
receiving medium after each sampling to keep the volume of the later constant.
4. Stirring should be carried out at all the time of the experiment since it is very important
factor in diffusion process, start stirring in a very slow, vertical and continuous movement, to
prevent the formation of air bubbles and to ensure good mixing.
5. Measure the absorbance of each sample using the spectrophotometer at 296 nm wavelength.
Dilute if necessary
6. Calculate the drug concentration in each sample using the calibration equation.
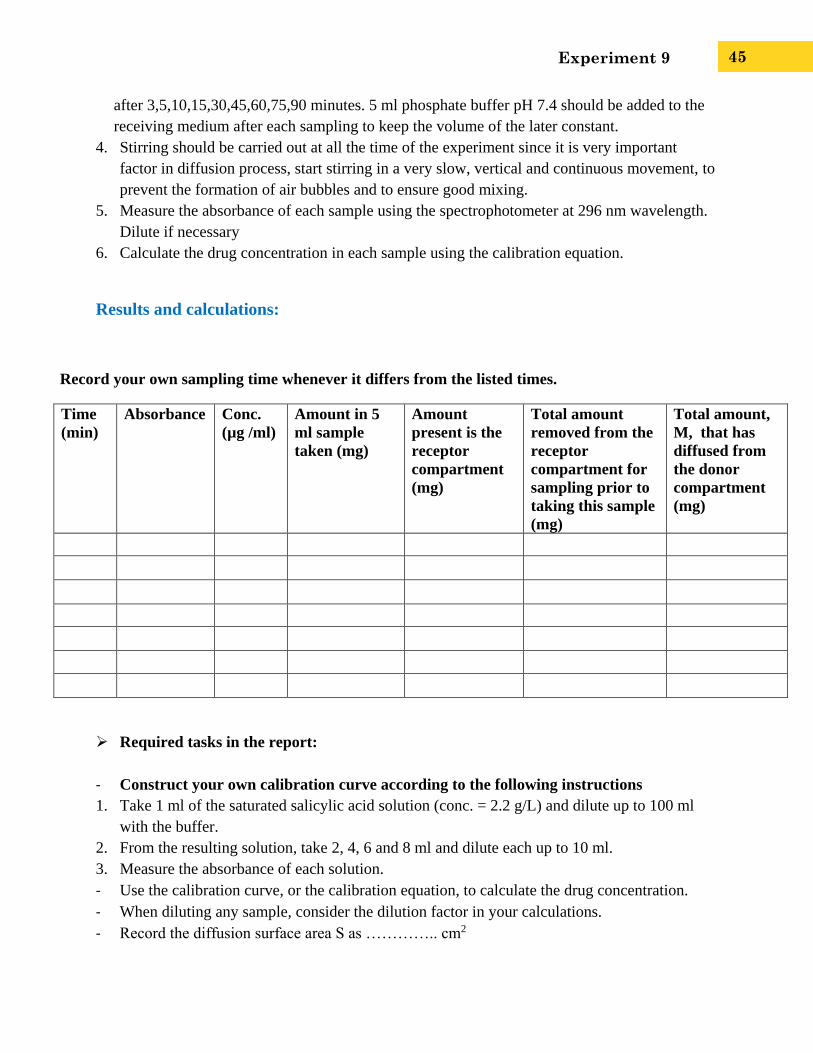
Results and calculations:
Record your own sampling time whenever it differs from the listed times.
Time
(min)
Absorbance Conc.
(µg /ml)
Amount in 5
ml sample
taken (mg)
Amount
present is the
receptor
compartment
(mg)
Total amount
removed from the
receptor
compartment for
sampling prior to
taking this sample
(mg)
Total amount,
M, that has
diffused from
the donor
compartment
(mg)
Required tasks in the report:
- Construct your own calibration curve according to the following instructions
1. Take 1 ml of the saturated salicylic acid solution (conc. = 2.2 g/L) and dilute up to 100 ml
with the buffer.
2. From the resulting solution, take 2, 4, 6 and 8 ml and dilute each up to 10 ml.
3. Measure the absorbance of each solution.
- Use the calibration curve, or the calibration equation, to calculate the drug concentration.
- When diluting any sample, consider the dilution factor in your calculations.
- Record the diffusion surface area S as ………….. cm2
Experiment 9
46
- Plot the amount, M, of salicylic acid versus time using regular graph paper.
- From the plot calculate the value of P.
- The time taken for the equilibrium concentration of the drug to be established in the
membrane is known as the lag time, if you were able to detect this time, use the equations:
Tlag = h2 / 6D and tlag= h/6p to calculate approximate values for h and D.
Tlag = h= D=
Questions:
1. Sink conditions are assumed when Cd>> Cr, according to the results of your
experiment can you consider it as sink condition? Why?
2. What factors contribute to creating sink conditions in our experiment?
3. What would be the factors affecting the diffusion rate and the lag time?
References:
2015:https://www.google.jo/search?q=concentration+vs+time+flux&safe=active&biw=1680&b
ih=955&source=lnms&tbm=isch&sa=X&ei=vufiVKfZDpGLaIOcgtAK&ved=0CAYQ_AUoA
Q#safe=active&tbm=isch&q=concentration+vs+time+flux+lag+time&imgdii=_&imgrc=myNd
3Z-
Fg83btM%253A%3Bxlwo5LSgzjqVIM%3Bhttp%253A%252F%252Fwww2.mst.dk%252Fudg
iv%252Fpublications%252F2009%252F978-87-7052-980-
8%252Fhtml%252Fimages%252Fs21.gif%3Bhttp%253A%252F%252Fwww2.mst.dk%252Fud
giv%252Fpublications%252F2009%252F978-87-7052-980-
8%252Fhtml%252Fhelepubl_eng.htm%3B432%3B314
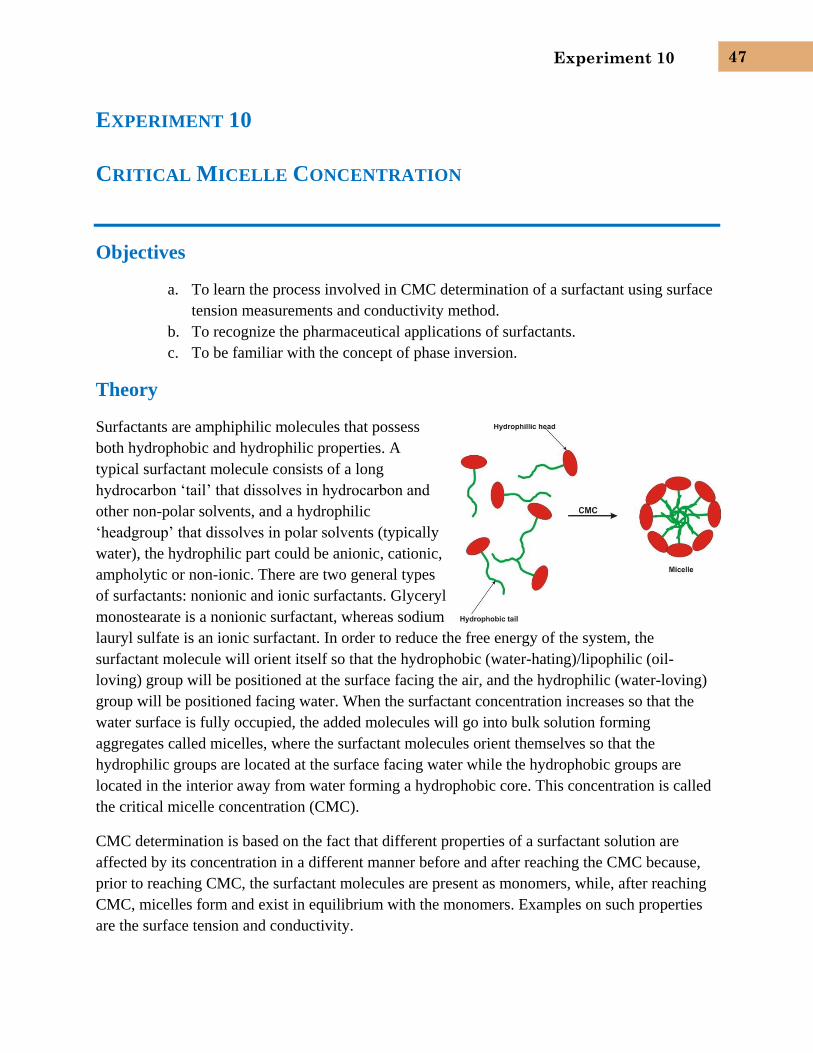
Experiment 10
47
EXPERIMENT 10
CRITICAL MICELLE CONCENTRATION
Objectives
a. To learn the process involved in CMC determination of a surfactant using surface
tension measurements and conductivity method.
b. To recognize the pharmaceutical applications of surfactants.
c. To be familiar with the concept of phase inversion.
Theory
Surfactants are amphiphilic molecules that possess
both hydrophobic and hydrophilic properties. A
typical surfactant molecule consists of a long
hydrocarbon ‘tail’ that dissolves in hydrocarbon and
other non-polar solvents, and a hydrophilic
‘headgroup’ that dissolves in polar solvents (typically
water), the hydrophilic part could be anionic, cationic,
ampholytic or non-ionic. There are two general types
of surfactants: nonionic and ionic surfactants. Glyceryl
monostearate is a nonionic surfactant, whereas sodium
lauryl sulfate is an ionic surfactant. In order to reduce the free energy of the system, the
surfactant molecule will orient itself so that the hydrophobic (water-hating)/lipophilic (oil-
loving) group will be positioned at the surface facing the air, and the hydrophilic (water-loving)
group will be positioned facing water. When the surfactant concentration increases so that the
water surface is fully occupied, the added molecules will go into bulk solution forming
aggregates called micelles, where the surfactant molecules orient themselves so that the
hydrophilic groups are located at the surface facing water while the hydrophobic groups are
located in the interior away from water forming a hydrophobic core. This concentration is called
the critical micelle concentration (CMC).
CMC determination is based on the fact that different properties of a surfactant solution are
affected by its concentration in a different manner before and after reaching the CMC because,
prior to reaching CMC, the surfactant molecules are present as monomers, while, after reaching
CMC, micelles form and exist in equilibrium with the monomers. Examples on such properties
are the surface tension and conductivity.
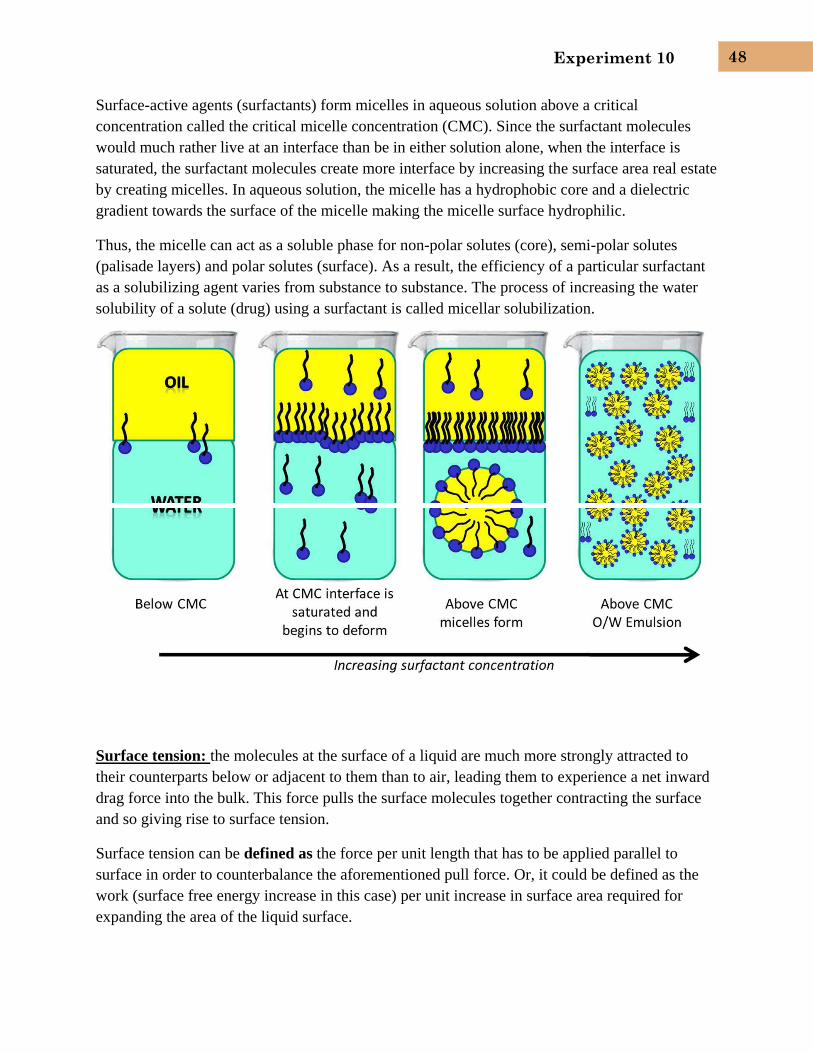
Experiment 10
48
Surface-active agents (surfactants) form micelles in aqueous solution above a critical
concentration called the critical micelle concentration (CMC). Since the surfactant molecules
would much rather live at an interface than be in either solution alone, when the interface is
saturated, the surfactant molecules create more interface by increasing the surface area real estate
by creating micelles. In aqueous solution, the micelle has a hydrophobic core and a dielectric
gradient towards the surface of the micelle making the micelle surface hydrophilic.
Thus, the micelle can act as a soluble phase for non-polar solutes (core), semi-polar solutes
(palisade layers) and polar solutes (surface). As a result, the efficiency of a particular surfactant
as a solubilizing agent varies from substance to substance. The process of increasing the water
solubility of a solute (drug) using a surfactant is called micellar solubilization.
Surface tension: the molecules at the surface of a liquid are much more strongly attracted to
their counterparts below or adjacent to them than to air, leading them to experience a net inward
drag force into the bulk. This force pulls the surface molecules together contracting the surface
and so giving rise to surface tension.
Surface tension can be defined as the force per unit length that has to be applied parallel to
surface in order to counterbalance the aforementioned pull force. Or, it could be defined as the
work (surface free energy increase in this case) per unit increase in surface area required for
expanding the area of the liquid surface.
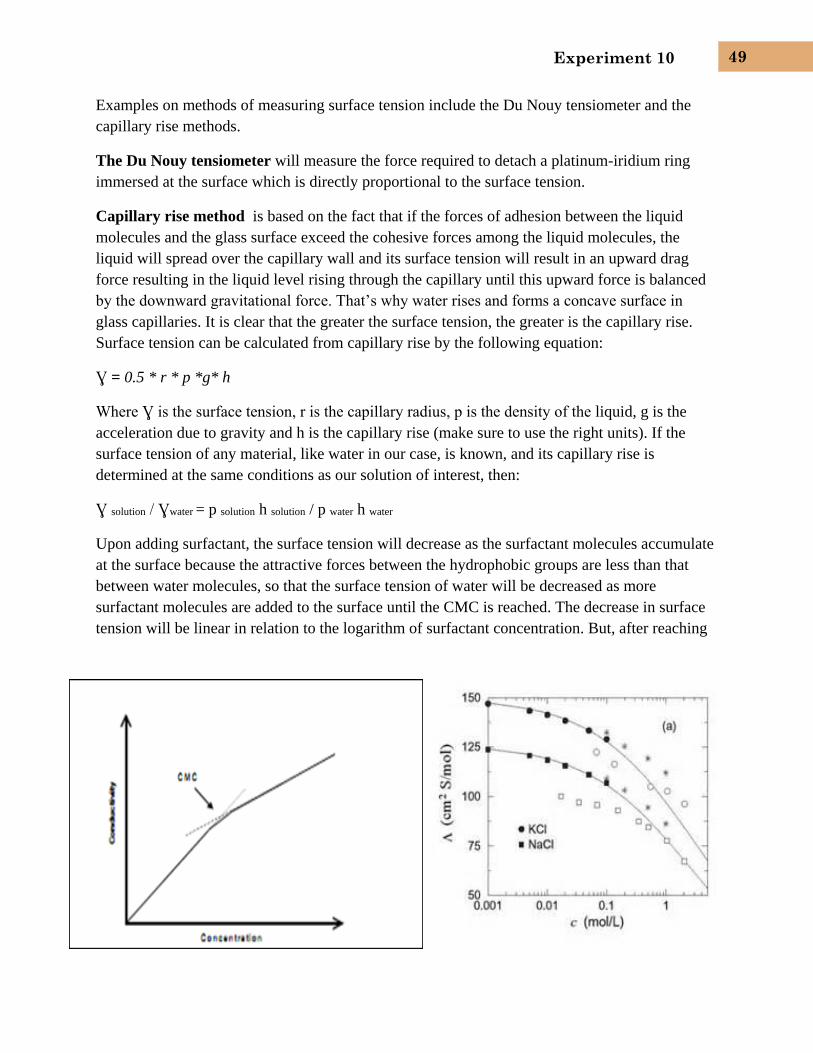
Experiment 10
49
Examples on methods of measuring surface tension include the Du Nouy tensiometer and the
capillary rise methods.
The Du Nouy tensiometer will measure the force required to detach a platinum-iridium ring
immersed at the surface which is directly proportional to the surface tension.
Capillary rise method is based on the fact that if the forces of adhesion between the liquid
molecules and the glass surface exceed the cohesive forces among the liquid molecules, the
liquid will spread over the capillary wall and its surface tension will result in an upward drag
force resulting in the liquid level rising through the capillary until this upward force is balanced
by the downward gravitational force. That’s why water rises and forms a concave surface in
glass capillaries. It is clear that the greater the surface tension, the greater is the capillary rise.
Surface tension can be calculated from capillary rise by the following equation:
Ɣ = 0.5 * r * p *g* h
Where Ɣ is the surface tension, r is the capillary radius, p is the density of the liquid, g is the
acceleration due to gravity and h is the capillary rise (make sure to use the right units). If the
surface tension of any material, like water in our case, is known, and its capillary rise is
determined at the same conditions as our solution of interest, then:
Ɣ solution / Ɣwater = p solution h solution / p water h water
Upon adding surfactant, the surface tension will decrease as the surfactant molecules accumulate
at the surface because the attractive forces between the hydrophobic groups are less than that
between water molecules, so that the surface tension of water will be decreased as more
surfactant molecules are added to the surface until the CMC is reached. The decrease in surface
tension will be linear in relation to the logarithm of surfactant concentration. But, after reaching
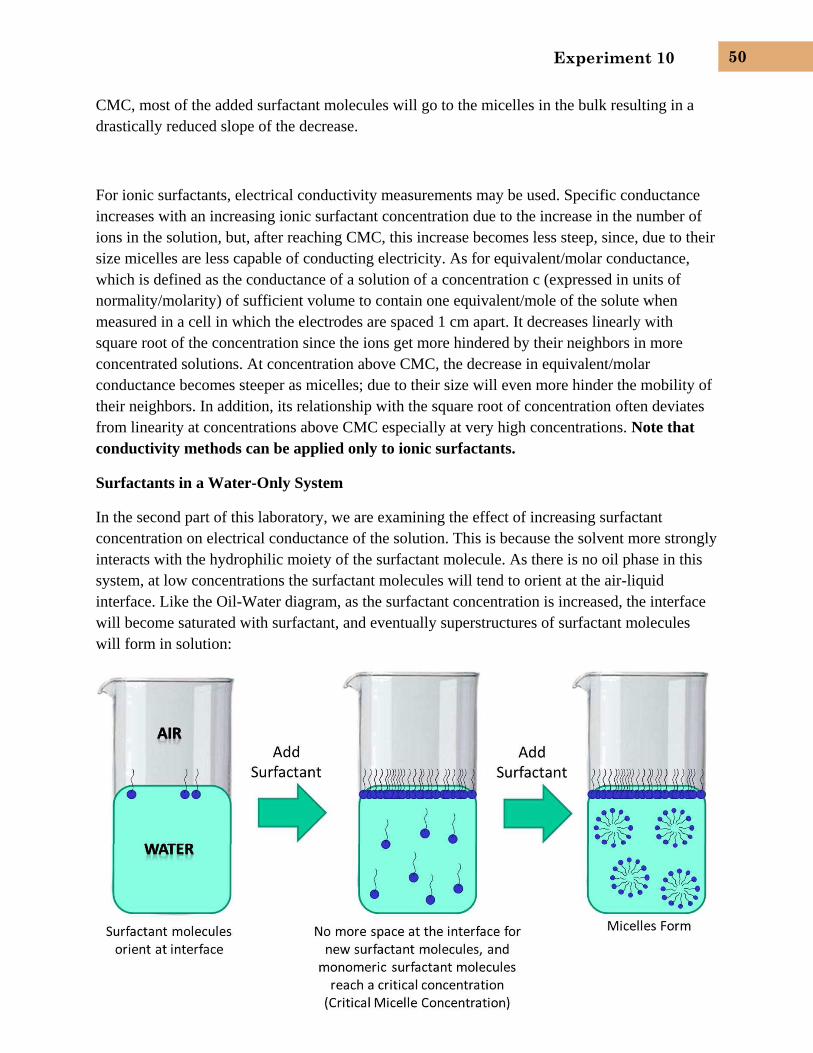
Experiment 10
50
CMC, most of the added surfactant molecules will go to the micelles in the bulk resulting in a
drastically reduced slope of the decrease.
For ionic surfactants, electrical conductivity measurements may be used. Specific conductance
increases with an increasing ionic surfactant concentration due to the increase in the number of
ions in the solution, but, after reaching CMC, this increase becomes less steep, since, due to their
size micelles are less capable of conducting electricity. As for equivalent/molar conductance,
which is defined as the conductance of a solution of a concentration c (expressed in units of
normality/molarity) of sufficient volume to contain one equivalent/mole of the solute when
measured in a cell in which the electrodes are spaced 1 cm apart. It decreases linearly with
square root of the concentration since the ions get more hindered by their neighbors in more
concentrated solutions. At concentration above CMC, the decrease in equivalent/molar
conductance becomes steeper as micelles; due to their size will even more hinder the mobility of
their neighbors. In addition, its relationship with the square root of concentration often deviates
from linearity at concentrations above CMC especially at very high concentrations. Note that
conductivity methods can be applied only to ionic surfactants.
Surfactants in a Water-Only System
In the second part of this laboratory, we are examining the effect of increasing surfactant
concentration on electrical conductance of the solution. This is because the solvent more strongly
interacts with the hydrophilic moiety of the surfactant molecule. As there is no oil phase in this
system, at low concentrations the surfactant molecules will tend to orient at the air-liquid
interface. Like the Oil-Water diagram, as the surfactant concentration is increased, the interface
will become saturated with surfactant, and eventually superstructures of surfactant molecules
will form in solution:
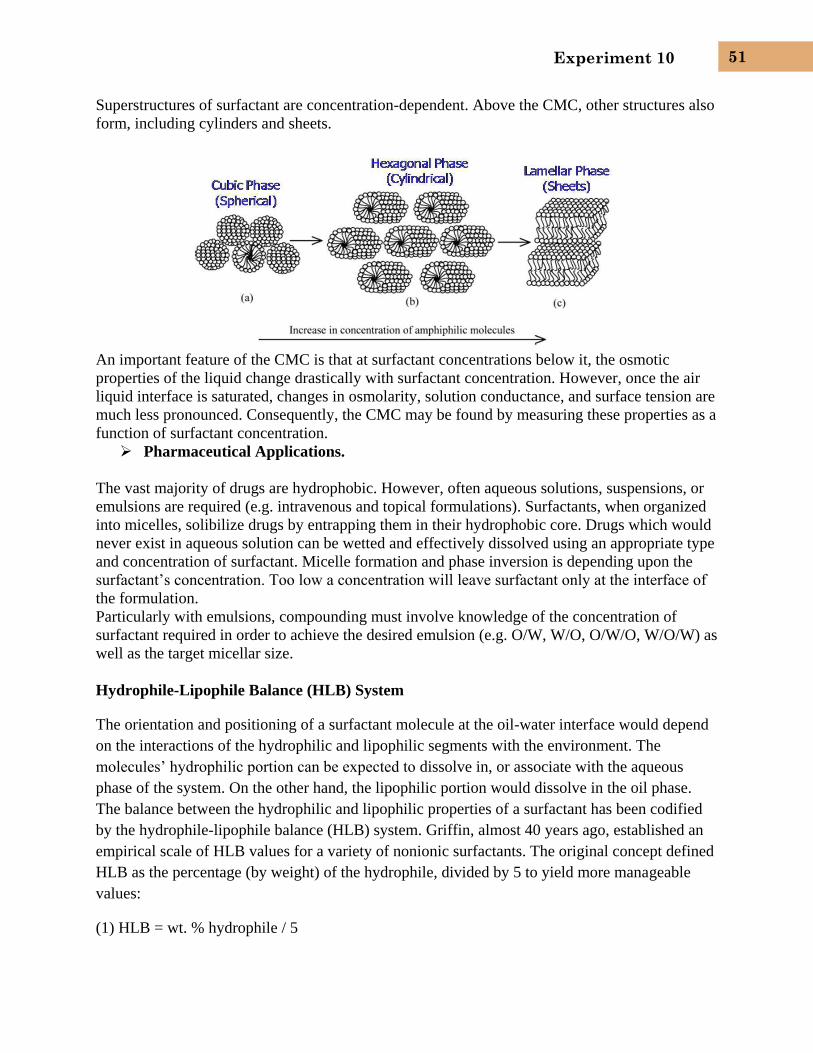
Experiment 10
51
Superstructures of surfactant are concentration-dependent. Above the CMC, other structures also
form, including cylinders and sheets.
An important feature of the CMC is that at surfactant concentrations below it, the osmotic
properties of the liquid change drastically with surfactant concentration. However, once the air
liquid interface is saturated, changes in osmolarity, solution conductance, and surface tension are
much less pronounced. Consequently, the CMC may be found by measuring these properties as a
function of surfactant concentration.
Pharmaceutical Applications.
The vast majority of drugs are hydrophobic. However, often aqueous solutions, suspensions, or
emulsions are required (e.g. intravenous and topical formulations). Surfactants, when organized
into micelles, solibilize drugs by entrapping them in their hydrophobic core. Drugs which would
never exist in aqueous solution can be wetted and effectively dissolved using an appropriate type
and concentration of surfactant. Micelle formation and phase inversion is depending upon the
surfactant’s concentration. Too low a concentration will leave surfactant only at the interface of
the formulation.
Particularly with emulsions, compounding must involve knowledge of the concentration of
surfactant required in order to achieve the desired emulsion (e.g. O/W, W/O, O/W/O, W/O/W) as
well as the target micellar size.
Hydrophile-Lipophile Balance (HLB) System
The orientation and positioning of a surfactant molecule at the oil-water interface would depend
on the interactions of the hydrophilic and lipophilic segments with the environment. The
molecules’ hydrophilic portion can be expected to dissolve in, or associate with the aqueous
phase of the system. On the other hand, the lipophilic portion would dissolve in the oil phase.
The balance between the hydrophilic and lipophilic properties of a surfactant has been codified
by the hydrophile-lipophile balance (HLB) system. Griffin, almost 40 years ago, established an
empirical scale of HLB values for a variety of nonionic surfactants. The original concept defined
HLB as the percentage (by weight) of the hydrophile, divided by 5 to yield more manageable
values:
(1) HLB = wt. % hydrophile / 5
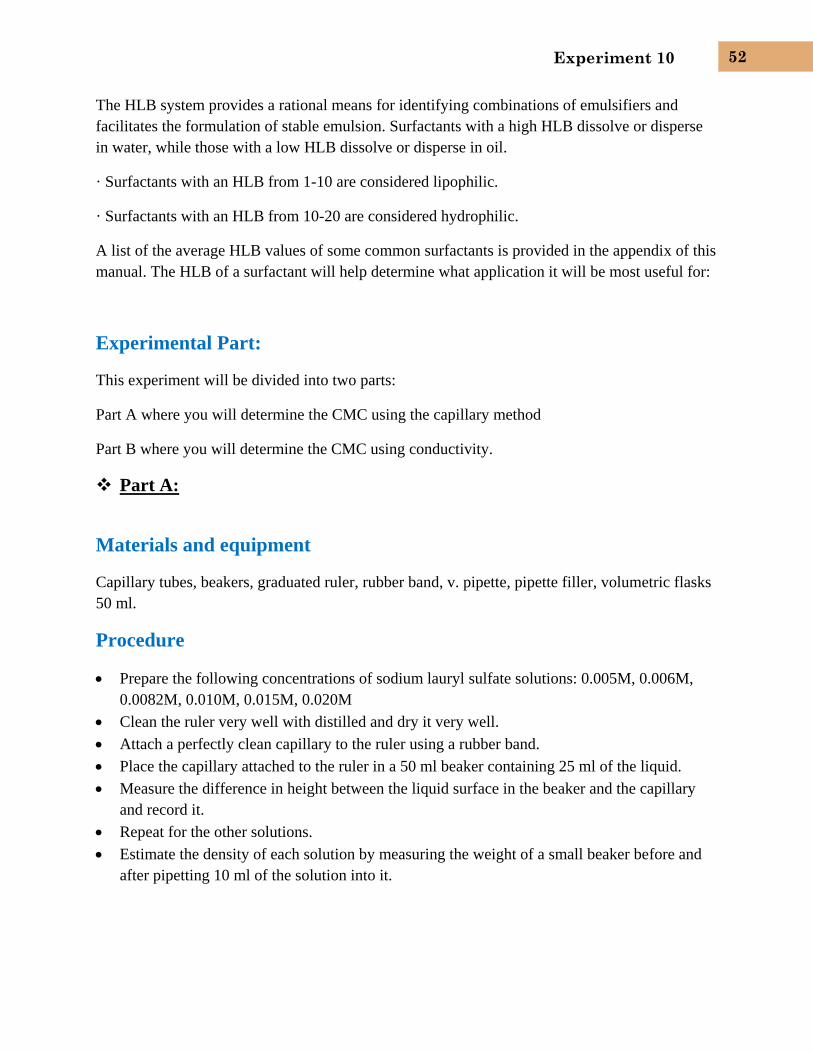
Experiment 10
52
The HLB system provides a rational means for identifying combinations of emulsifiers and
facilitates the formulation of stable emulsion. Surfactants with a high HLB dissolve or disperse
in water, while those with a low HLB dissolve or disperse in oil.
· Surfactants with an HLB from 1-10 are considered lipophilic.
· Surfactants with an HLB from 10-20 are considered hydrophilic.
A list of the average HLB values of some common surfactants is provided in the appendix of this
manual. The HLB of a surfactant will help determine what application it will be most useful for:
Experimental Part:
This experiment will be divided into two parts:
Part A where you will determine the CMC using the capillary method
Part B where you will determine the CMC using conductivity.
Part A:
Materials and equipment
Capillary tubes, beakers, graduated ruler, rubber band, v. pipette, pipette filler, volumetric flasks
50 ml.
Procedure
Prepare the following concentrations of sodium lauryl sulfate solutions: 0.005M, 0.006M,
0.0082M, 0.010M, 0.015M, 0.020M
Clean the ruler very well with distilled and dry it very well.
Attach a perfectly clean capillary to the ruler using a rubber band.
Place the capillary attached to the ruler in a 50 ml beaker containing 25 ml of the liquid.
Measure the difference in height between the liquid surface in the beaker and the capillary
and record it.
Repeat for the other solutions.
Estimate the density of each solution by measuring the weight of a small beaker before and
after pipetting 10 ml of the solution into it.
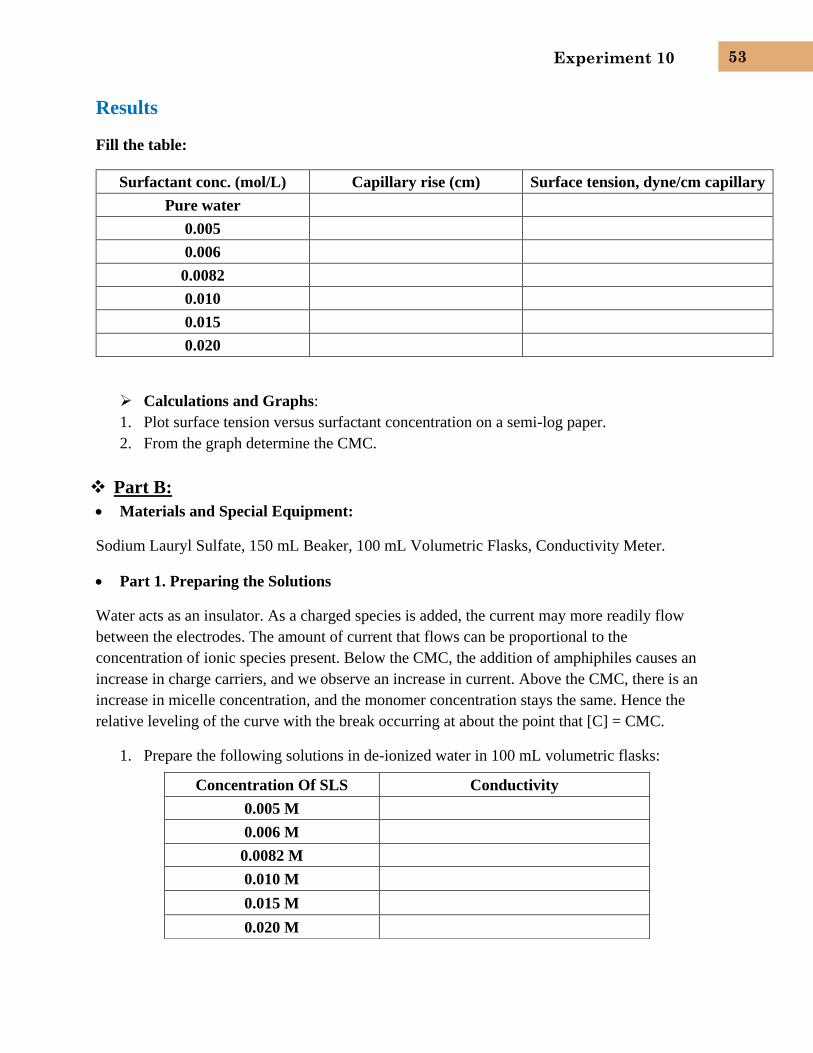
Experiment 10
53
Results
Fill the table:
Surfactant conc. (mol/L) Capillary rise (cm) Surface tension, dyne/cm capillary
Pure water
0.005
0.006
0.0082
0.010
0.015
0.020
Calculations and Graphs:
1. Plot surface tension versus surfactant concentration on a semi-log paper.
2. From the graph determine the CMC.
Part B:
Materials and Special Equipment:
Sodium Lauryl Sulfate, 150 mL Beaker, 100 mL Volumetric Flasks, Conductivity Meter.
Part 1. Preparing the Solutions
Water acts as an insulator. As a charged species is added, the current may more readily flow
between the electrodes. The amount of current that flows can be proportional to the
concentration of ionic species present. Below the CMC, the addition of amphiphiles causes an
increase in charge carriers, and we observe an increase in current. Above the CMC, there is an
increase in micelle concentration, and the monomer concentration stays the same. Hence the
relative leveling of the curve with the break occurring at about the point that [C] = CMC.
1. Prepare the following solutions in de-ionized water in 100 mL volumetric flasks:
Concentration Of SLS Conductivity
0.005 M
0.006 M
0.0082 M
0.010 M
0.015 M
0.020 M
Experiment 10
54
NOTE: When you are working with SDS solutions, avoid shaking them. Agitate gently, in order
to minimize bubble formation. Pour slowly and on an angle. When diluting to the mark, do not
use the top of the bubbles as a guide. Wait for a clear liquid meniscus to form, and add fluid until
the etched line at the neck of the volumetric mark.
2. Using the conductivity meter, measure the conductivity of each of the solutions prepared.
3. Plot conductivity vs. concentration of the surfactant
Questions
1. If a non-ionic surfactant were used in Part B of this experiment, would the experimental
design have to change? If so, how?
References:
- 2015:http://www.bing.com/images/search?adlt=strict&q=specific+conductance+vs+concentr
ation+surfactant&go=Submit+Query&qs=ds&form=QBIR#a
- 2015: http://chemwiki.ucdavis.edu/Physical_Chemistry/Kinetics/Rate_Laws/The_Rate_Law
- 2015: http://en.wikipedia.org/wiki/Critical_micelle_concentration