the journal of physical chemistry 1970 volume 74 no.14 july
TRANSCRIPT
T H E J O U R N A L O F
P H Y S I C A L C H E M I S T R YVolume 71+, Number 11+ July 9,1970
Infrared Spectroscopic Investigation of Zeolites and Adsorbed Molecules. V I . Interaction w ith n-Propyl Chloride. . . C. L. Angell and Maria V. Howell 2737
Optical Studies of Th in Films on Surfaces of Fused Q u a r tz .....................................................................................A. C. Hall 2742
The Reversible Hydration of Formaldehyde. Thermodynamic Parameters. . . Andreas A. Zavitsas, Mark Coffiner, Thomas Wiseman, and Lourdes R. Zavitsas 2746
Determ ination to 5 kbars of the X Transition Temperature in Sodium N itra te ....................................W . Klement, Jr. 2751
A Macroscopic Description for the X Transition in Sodium N i t r a t e ..................................................... W . Klement, Jr. 2753
A Reinvestigation of the Crystal Structure of the Zeolite Hydrated N a X .............................................David H. Olson 2758
Carbon-13 Nuclear Magnetic Resonance Spectra of Some Monosubstituted Thiophenes. . . Kensuke Takahashi, Tyo Sone, and Kunimi Fujieda 2765
Isothermal Diffusion in the System W ater-M agnesium Chloride-Sodium Chloride As Studied w ith the RotatingDiaphragm C e l l .....................................................................................Richard P. Wendt and Mohammed Shamim 2770
Diffusion Coefficients of Paraffin-Chain Salts and the Formation Energetics of Micelles. . . S. P. Wasik and Nina Matheny Roscher 2784
The Temperature Dependence of the Transmission Coefficient (T ,) for Carbon Dioxide Transport across a Series ofLong-Chain Alcohol M o n o la y e rs ............................................. ........................................ J. G. Hawke and I. White 2788
Pyrolysis of N itromethane-d.?................................................................................ C. G. Crawforth and D. J. Waddington 2793
The Kinetics of the U ra n iu m (IH )-U ra n iu m (V I) and the N e p tu n iu m (III)-N e p tu n iu m (V I) Reactions inAqueous Perchlorate Solutions.....................................................................................T. W . Newton and R. B. Fulton 2797
Reactions of Trifluorom ethyl Radicals in the Photolysis of Hexafluoroacetone and Hexafluoroazomethane. . . Shuang-Ling Chong and Sidney Toby 2801
The y Radiolysis of Cyclohexane-Perfluorocyclohexane Solutions. . . Michael B. Fallgatter and Robert J. Hanrahan 2806
The Study of Second Coordination Sphere of Complex Ions by Nuclear Magnetic Resonance . . . Amos J. Leffler 2810
Nuclear Magnetic Resonance Spectral Parameters and Ring Interconversion of a Series of Piperazines. . . R. G. Lett, L. Petrakis, A. F. Ellis, and R. K. Jensen 2816
Adsorbed Residues from Formic Acid and Formate Ion Generated under Steady-State Potentiostatic Conditions. . . Sigmund Schuldiner and Bernard J. Piersma 2823
3A
Keep pace with the new...through these basic research journals of the American Chemical Society
The Journal of the American Chemical SocietyThe premier American chemistry journal publishing original research papers in every field. Biweekly. *ACS members: U.S. $22 Canada, PUAS $26.50 Other nations $27.50Nonmembers: U.S. $44 Canada, PUAS $48.50 Other nations $49.50
The Journal of Organic ChemistryEmbraces the field, from synthesis to structure to behavior. Monthly publication.
*ACS members: U.S. $16 Canada, PUAS $20.50 Other nations $21.50Nonmembers: U.S. $32 Canada, PUAS $36.50 Other nations $37.50
The Journal of Physical ChemistryMaintains a balance between classical areas of chemistry and modern structural quantum oriented areas. Biweekly.
*ACS members: U.S. $20 Canada, PUAS $24 Other nations $25Nonmembers: U.S. $40 Canada, PUAS $44 Other nations $45
BiochemistryCovers enzymes, proteins, carbohydrates, lipids, nucleic acids and their metabolism, genetics, biosynthesis. Biweekly.
’ACS members: U.S. $20 Canada, PUAS $23 Other nations $23.50Nonmembers: U.S. $40 Canada, PUAS $43 Other nations $43.50
The Journal of Agricultural and Food ChemistryPlaces special emphasis on the chemical aspects of agricultural and food chemistry. Bimonthly.
’'ACS members: U.S. $10 Canada, PUAS $13 Other nations $13.50Nonmembers: U.S. $20 Canada, PUAS $23 Other nations $23.50
The Journal of Medicinal ChemistryEmphasis is on synthesis, mode of action and pharmacology of medicinal agents. Bimonthly.
’’ACS members: U.S. $10 Canada, PUAS $13 Other nations $13,50Nonmembers: U.S. $20 Canada, PUAS $23 Other nations $23.50
The Journal of Chemical and Engineering DataQuarterly journal presenting data oh properties and behavior of both new and known chemical systems.
''‘ACS members: U.S. $15 Canada, PUAS $18 Other nations $18.50Nonmembers: U.S. $30 Canada, PUAS $33 Other nations $33.50
Inorganic ChemistryPublishes original research, both experimental and theoretical, in all phases of inorganic chemistry. Monthly.
ACS members: U.S. $14 Canada, PUAS $17 Other nations $17.50Nonmembers: U.S. $28 Canada, PUAS $31 Other nations $31.50
MacromoleculesPresents original research on all fundamental aspects of polymer chemistry. Bimonthly publication. ACS members: U.S. $12 Canada, PUAS $15 Other nations $15.50Nonmembers: U.S. $24 Canada, PUAS $27 Other nations $27.50
American Chemical Society / 1155 Sixteenth Street, N.W., Washington, D.C. 20036 Please enter a one year subscription for the following journals:1 2 3
4 5 6
7 8 9
name position
address
city state/country zip
your company nature o f company’s business
♦ NOTE: Subscriptions at ACS member rates are for personal use only.□ I am an ACS member □ la m not an ACS member □ Bill me for $ ____________________________________________________________________
□ Payment enclosed (payable to American Chemical Society) in the amount of $____________. Payment must be made inU.S. currency, by international money order, UNESCO coupons, or U.S. bank draft; or order through your book dealer.
70A
4A • The Journal of Physical Chemistry, Voi. 74, No. 14, 1970
Association Theory. The Discontinuous Case and the Structure of Liquids and Solids. . . Robert Ginell and Albert S. Kirsch 2835
Hydrophobic Bonding in Alternating Copolymers of M aleic Acid and A lky l V iny l Ethers. . . Paul L. Dubin and Ulrich P. Strauss 2842
NOTES
Energy-Loss Rates of Slow Electrons in H ydrocarbo ns...........................Cornelius E. Klots and P. W . Reinhardt 2848
Infrared Evidence for the Association of Vanadium P o rp h y rin s ....................................F. E. Dickson and L. Petrakis 2850
Phosphorus-Proton Spin-Spin Coupling Constants in Acyclic P h osphates............................... Masatsune Kainosho 2853
Application of Microwave C avity Perturbation Techniques to a Study of the Kinetics of Reactions inthe Liquid P h a s e ................................................................................................................................................A . L . R a v im o h a n 2855
COMMUNICATIONS TO THE EDITOR
The Static Dielectric Perm ittivities of Solutions of W ater in Alcohols. . . T. H. Tjia, P. Bordewijk, and C. J. F. Bottcher 2857
Statistical Thermodynamics of Adsorption from Liquid Mixtures on Solids. I. Ideal Adsorbed Phase. . . S. Sircar and A. L. Myers 2828
The Journal of Physical Chemistry, Vol. 74, No. H, 1970 » 5A
AUTHOR INDEX
Angeli, C. L ., 2737
Bordewijk, P ., 2857 Böttcher, C. J. F ., 2857
Chong, S .-L., 2801 Coffiner, M ., 2746 Crawforth, C. G ., 2793
Dickson, F . E ., 2850 Dubin , P . L ., 2842
Ellis, A. F ., 2816
Fallgatter, M . B., 2806 Fujieda, K ., 2765 Fulton, R . B ., 2797
Ginell, R „ 2835
H a ll, A. C., 2742 Hanrahan, R . J., 2806 Hawke, J. G., 2788 Howell, M . V ., 2737
Jensen, R . K ., 2816
Kainosho, M ., 2853 Kirsch, A. S., 2835 Klem ent, W ., Jr., 2751,
2753Klots, C. E ., 2848
Leffler, A. J., 2810 L ett, R . G ., 2816
M yers, A. L ., 2828
Newton, T . W ., 2797
Olson, D . H ., 2758
Petrakis, L ., 2816, 2850 Piersma, B. J., 2823
Ravimohan, A. L ., 2855 Reinhardt, P . W ., 2848 Roscher, N . M ., 2784
Schuldiner, S., 2823 Shamim, M ., 2770 Sircar, S., 2828 Sone, T ., 2765 Strauss, U . P ., 2842
Takahashi, K ., 2765 T jia , T . H ., 2857 Toby, S., 2801
W addington, D . J., 2793
W asik, S. P ., 2784 W endt, R . P ., 2770 W hite, I . , 2788 Wiseman, T ., 2746
Zavitsas, A. A ., 2746 Zavitsas, L . R ., 2746
6A» The Journal of Physical Chemistry, Voi. 7Jt, No. 14, 1970
T H E J O U R N A L O F
P H Y S I C A L C H E M I S T R YRegistered in U. S. Patent Office © Copyright, 1970, by the American Chemical Society
VOLUME 74, NUMBER 14 JULY 9, 1970
Infrared Spectroscopic Investigation of Zeolites and Adsorbed
Molecules. VI. Interaction with n-Propyl Chloride
by C. L. Angell and Maria V. HowellUnion Carbide Research Institute, Tarrytown Technical Center, Tarrytown, New York 10591 (Received February 9, 1970)
A number of different uni-, bi-, and tervalent cation-containing Y zeolites were exposed to n-propyl chloride or n-propyl bromide at room temperature. I t was observed that two O H groups were formed on the zeolite samples. There were very few O H groups formed with N a Y but significant reaction occurred on bivalent cation-containing Y zeolites or on AgY. The two bands characteristic of decationized zeolites were formed in each case, but the sizes and relative ratios of the two bands varied greatly w ith the cations present. This indicates that the reaction of the zeolite w ith the n-propyl chloride mainly depends on the polarizing ability of the cations. An inference that the chloride of the n-propyl chloride molecule is associated w ith the cation is drawn from experiments observing the cation-specific carbon monoxide adsorption. The thermal stability of these newly created O H groups is considerably less than those observed in decationized zeolites, suggesting that the removal of O H groups on heating occurs not by the removing of water but by the removal of an HC1 molecule. The possibility of making zeolites that contain both cations and hydroxyl groups by this method is discussed, as well as creation of zeolites in which the proportion of the two hydroxyl groups can be varied.
IntroductionIn part I of this series1 it has been shown that when
a fully activated zeolite sample is exposed to dry HC1 or DC1 gas, a very fast reaction occurs with the formation of the two hydroxyl groups characteristic of decationized zeolites. This observation was now extended to the interaction of a number of different uni-, bi-, and tervalent cation-containing Y zeolites with n-propyl chloride or n-propyl bromide at room temperature. It was observed that the same two OH groups were formed on the zeolite samples as on exposure to HC1— these were the two bands characteristic of decationized zeolites. The presence or absence of surface cations after propyl chloride treatment was established by observing the cation-specific2 carbon monoxide adsorption. From these observations it was possible to come to a conclusion about the mechanism of the interaction between zeolites and propyl chloride. This method presents the possibility, besides the partial back-exchange of NH4 exchanged zeolites, of making zeolites that contain both
cations and hydroxyl groups. Actually, this way all the cations present remain in the structure, while in addition surface hydroxyl groups are created.
Experimental SectionThe compositions of the zeolite samples used in this
work have been given previously (part I, Table I; for LaY see ref 3). The short path length infrared cells, the preparation of the pellets, and the activation techniques have also been described in part I . 1 Activations at 700° were carried out with cells the lower halves of which were made of quartz. Infrared spectra were obtained on a Perkin-Elmer Model 225 double beam grating spectrophotometer. The hydroxyl region in
(1) Part I : C. L. Angell and P. C. Schaffer, J. Phys. Chem., 69, 3463 (1965).(2) Part II : C. L, Angell and P. C. Schaeffer, ibid., 70, 1413 (1966).(3) J. A. Rabo, C. L. Angell, and V. Schomaker, presented at the 4th International Congress on Catalysis, Moscow, June 1968.
2737
some cases was also run on a Perkin-Elmer Model 112 single beam spectrometer converted into grating operation. The n-propyl chloride and the n-propyl bromide were obtained from Fisher. Perdeuterated n- propyl bromide was obtained from Mallinckrodt Chemicals and was specified to be of 98% isotopic purity. These compounds were used without any further purification but were degassed by the freeze-pump-thaw technique. Carbon monoxide was obtained in lecture bottle sizes from the Matheson Co. and contained approximately 0.2% carbon dioxide impurity. No attempt was made to remove this impurity; actually its presence was convenient, since when CO gas was added to the zeolite samples to check on the presence of the cation-specific CO band, the cation-specific C02 band4 could also be observed (see Figure 4). The zeolite samples used in the experiments were all flash vacuum activated. The vacuum system was capable of pumping down to approximately 10_6 Torr. Deuterium exchange of the decationized Y zeolite has been described previously.6
ResultsThe following samples were exposed to n-propyl
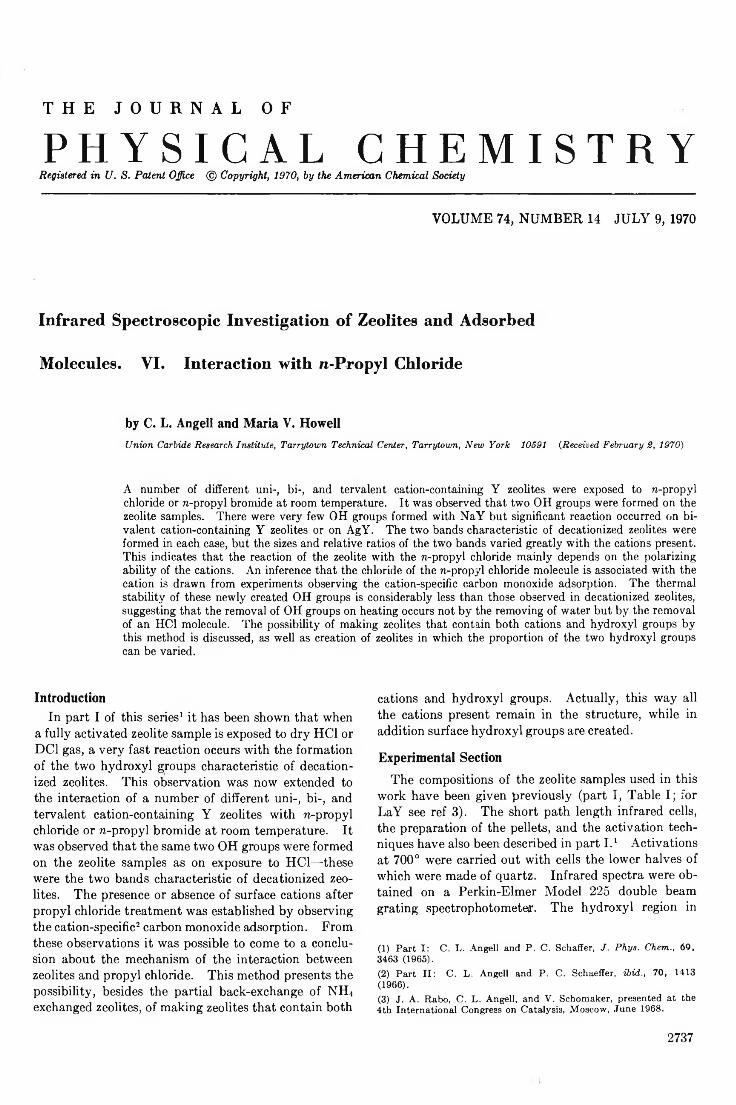
chloride: NaY, NaX, MgY, CaY, SrY, BaY, CoY, NiY, ZnY, AgY, LaY, and decationized Y ;6 CaY and decationized Y were exposed to n-propyl bromide also. When a CaY sample activated under vacuum at 500° and showing very small hydroxyl bands at 3744 and 3640 cm- 1 was exposed to 100 Torr pressure of n-propyl chloride at room temperature, a broad band appeared at 3200 cm- 1 in addition to the characteristic CH stretching bands of n-propyl chloride in the 3000-2800- cm_ 1 region (see Figure 1). On evacuation at room temperature for approximately 2 hr most of the n- propyl chloride was removed, as could be seen by the decrease of the CH stretching bands. The 3200-cm-1 broad band decreased considerably while at the same time a strong sharp band appeared at 3640 cm-1. In addition to this, a small band appeared at 3540 cm-1. The region near 1640 cm- 1 where the OH bending frequency of water occurs was carefully observed, but the presence of water could not be detected during any stage of the reaction.
When a NaY sample activated at 500° under vacuum was exposed to 100 Torr of n-propyl chloride at room temperature, a very much smaller band appeared at 3200 cm-1, while the CH stretching bands of n-propyl chloride were approximately the same size as in the case of CaY, indicating that approximately the same amount of n-propyl chloride was adsorbed on the two samples. When the sample was evacuated at room temperature, the formation of an OH band at 3640 cm- 1 could be observed. However, this band was considerably smaller than the one formed on CaY.
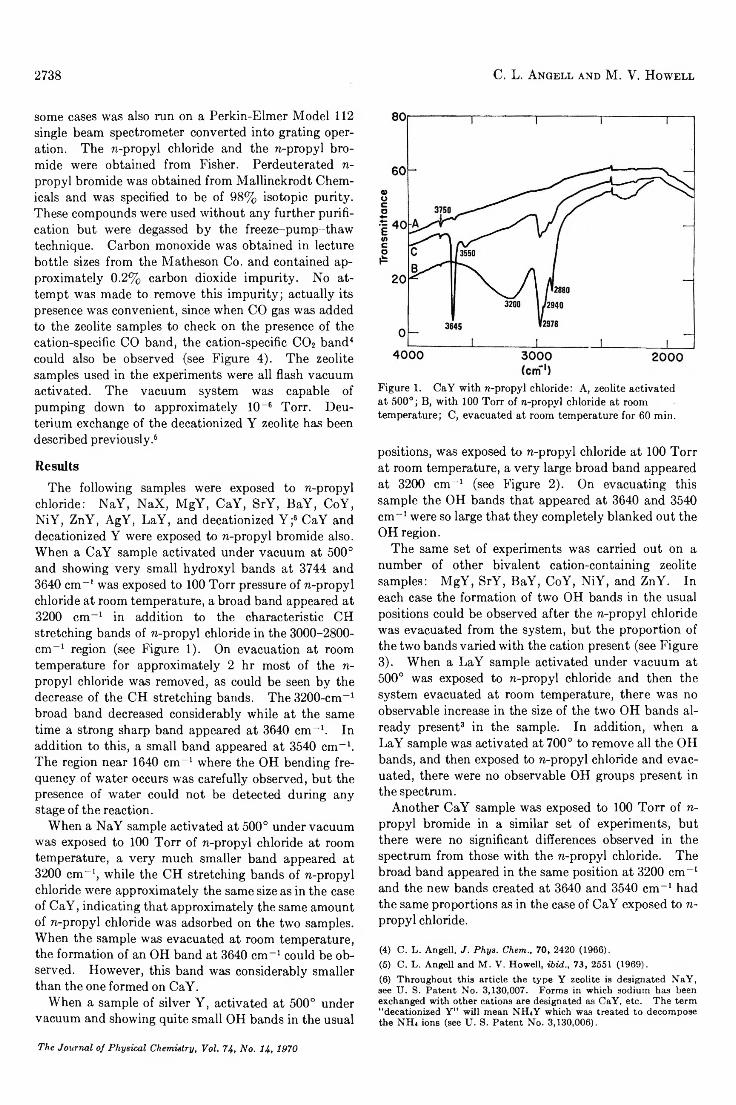
When a sample of silver Y, activated at 500° under vacuum and showing quite small OH bands in the usual
2738 C. L. Angell and M. V. Howell
Figure 1. CaY with n-propyl chloride: A, zeolite activated at 500°; B, with 100 Torr of n-propyl chloride at room temperature; C, evacuated at room temperature for 60 min.
positions, was exposed to n-propyl chloride at 100 Torr at room temperature, a very large broad band appeared at 3200 cm- 1 (see Figure 2). On evacuating this sample the OH bands that appeared at 3640 and 3540 cm- 1 were so large that they completely blanked out the OH region.
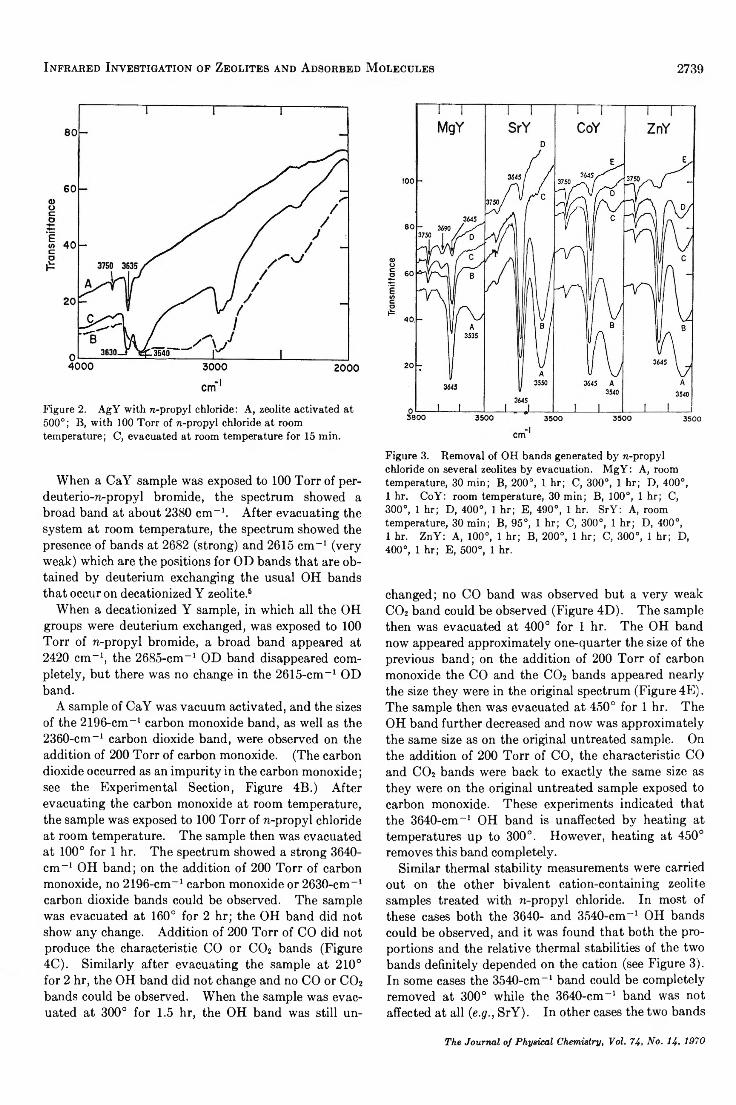
The same set of experiments was carried out on a number of other bivalent cation-containing zeolite samples: MgY, SrY, BaY, CoY, NiY, and ZnY. In each case the formation of two OH bands in the usual positions could be observed after the n-propyl chloride was evacuated from the system, but the proportion of the two bands varied with the cation present (see Figure3). When a LaY sample activated under vacuum at 500° was exposed to n-propyl chloride and then the system evacuated at room temperature, there was no observable increase in the size of the two OH bands already present3 in the sample. In addition, when a LaY sample was activated at 700° to remove all the OH bands, and then exposed to n-propyl chloride and evacuated, there were no observable OH groups present in the spectrum.
Another CaY sample was exposed to 100 Torr of n- propyl bromide in a similar set of experiments, but there were no significant differences observed in the spectrum from those with the n-propyl chloride. The broad band appeared in the same position at 3200 cm- 1 and the new bands created at 3640 and 3540 cm- 1 had the same proportions as in the case of CaY exposed to n- propyl chloride.
(4) C. L. Angell, J. Phys. Chem., 70, 2420 (1966).(5) C. L. Angell and M. V. Howell, ibid., 73, 2551 (1969).(6 ) Throughout this article the type Y zeolite is designated NaY, see U. S. Patent No. 3,130,007. Forms in which sodium has been exchanged with other cations are designated as CaY, etc. The term “ decationized Y ” will mean NHiY which was treated to decompose the NH 4 ions (see U. S. Patent No. 3,130,006).
The Journal of Physical Chemistry, Vol. 74, No. 14, 1970
Infrared Investigation of Zeolites and Adsorbed M olecules 2739
Figure 2. AgY with n-propyl chloride: A, zeolite activated at 500°; B, with 100 Torr of n-propyl chloride at room temperature; C, evacuated at room temperature for 15 min.
When a CaY sample was exposed to 100 Torr of per- deuterio-n-propyl bromide, the spectrum showed a broad band at about 2380 cm-1. After evacuating the system at room temperature, the spectrum showed the presence of bands at 2682 (strong) and 2615 cm- 1 (very weak) which are the positions for OD bands that are obtained by deuterium exchanging the usual OH bands that occur on decationized Y zeolite.5
When a decationized Y sample, in which all the OH groups were deuterium exchanged, was exposed to 100 Torr of n-propyl bromide, a broad band appeared at 2420 cm-1, the 2685-cm-1 OD band disappeared completely, but there was no change in the 2615-cm-1 OD band.
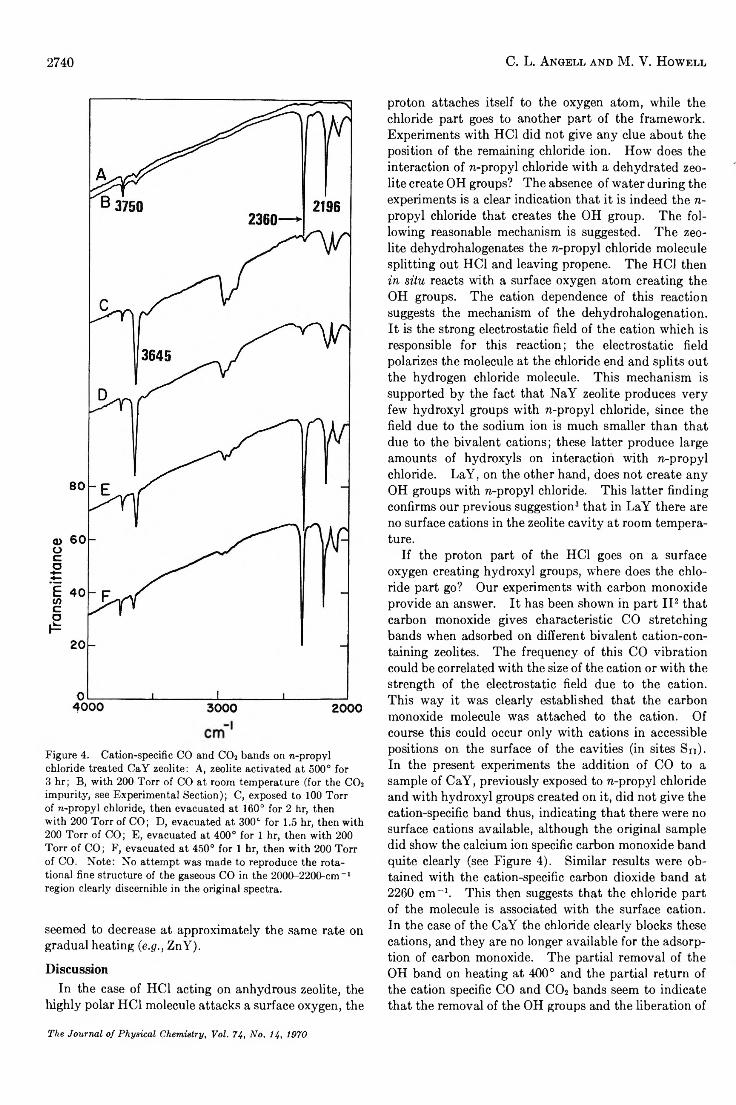
A sample of CaY was vacuum activated, and the sizes of the 2196-cm-1 carbon monoxide band, as well as the 2360-cm“ 1 carbon dioxide band, were observed on the addition of 200 Torr of carbon monoxide. (The carbon dioxide occurred as an impurity in the carbon monoxide; see the Experimental Section, Figure 4B.) After evacuating the carbon monoxide at room temperature, the sample was exposed to 100 Torr of n-propyl chloride at room temperature. The sample then was evacuated at 100° for 1 hr. The spectrum showed a strong 3640- cm- 1 OH band; on the addition of 200 Torr of carbon monoxide, no 2196-cm-1 carbon monoxide or 2630-cm-1 carbon dioxide bands could be observed. The sample was evacuated at 160° for 2 hr; the OH band did not show any change. Addition of 200 Torr of CO did not produce the characteristic CO or CO2 bands (Figure 4C). Similarly after evacuating the sample at 210° for 2 hr, the OH band did not change and no CO or CO2 bands could be observed. When the sample was evacuated at 300° for 1.5 hr, the OH band was still un
Figure 3. Removal of OH bands generated by n-propyl chloride on several zeolites by evacuation. MgY: A, room temperature, 30 min; B, 200°, 1 hr; C, 300°, 1 hr; D, 400°,1 hr. CoY: room temperature, 30 min; B, 100°, 1 hr; C,300°, 1 hr; D, 400°, 1 hr; E, 490°, 1 hr. SrY: A, room temperature, 30 min; B, 95°, 1 hr; C, 300°, 1 hr; D, 400°,1 hr. ZnY: A, 100°, 1 hr; B, 200°, 1 hr; C, 300°, 1 hr; D, 400°, 1 hr; E, 500°, 1 hr.
changed; no CO band was observed but a very weak C02 band could be observed (Figure 4D). The sample then was evacuated at 400° for 1 hr. The OH band now appeared approximately one-quarter the size of the previous band; on the addition of 200 Torr of carbon monoxide the CO and the C02 bands appeared nearly the size they were in the original spectrum (Figure 4E). The sample then was evacuated at 450° for 1 hr. The OH band further decreased and now was approximately the same size as on the original untreated sample. On the addition of 200 Torr of CO, the characteristic CO and CO2 bands were back to exactly the same size as they were on the original untreated sample exposed to carbon monoxide. These experiments indicated that the 3640-cm-1 OH band is unaffected by heating at temperatures up to 300°. However, heating at 450° removes this band completely.
Similar thermal stability measurements were carried out on the other bivalent cation-containing zeolite samples treated with n-propyl chloride. In most of these cases both the 3640- and 3540-cm-1 OH bands could be observed, and it was found that both the proportions and the relative thermal stabilities of the two bands definitely depended on the cation (see Figure 3). In some cases the 3540-cm-1 band could be completely removed at 300° while the 3640-cm-1 band was not affected at all (e.g ., SrY). In other cases the two bands
The Journal of Physical Chemistry, Vol. 74, No. 14, 1970
2740 C. L. Angell and M. V. Howell
Figure 4. Cation-specific CO and CO2 bands on re-propyl chloride treated CaY zeolite: A, zeolite activated at 500° for 3 hr; B, with 200 Torr of CO at room temperature (for the CO2 impurity, see Experimental Section); C, exposed to 100 Torr of re-propyl chloride, then evacuated at 160° for 2 hr, then with 200 Torr of CO; D, evacuated at 300° for 1.5 hr, then with 200 Torr of CO; E, evacuated at 400° for 1 hr, then with 200 Torr of CO; F, evacuated at 450° for 1 hr, then with 200 Torr of CO. Note: No attempt was made to reproduce the rotational fine structure of the gaseous CO in the 2000-2200-cm_I region clearly discernible in the original spectra.
seemed to decrease at approximately the same rate on gradual heating (e.g ., ZnY).
DiscussionIn the case of HC1 acting on anhydrous zeolite, the
highly polar HC1 molecule attacks a surface oxygen, the
proton attaches itself to the oxygen atom, while the chloride part goes to another part of the framework. Experiments with HC1 did not give any clue about the position of the remaining chloride ion. How does the interaction of n-propyl chloride with a dehydrated zeolite create OH groups? The absence of water during the experiments is a clear indication that it is indeed the n- propyl chloride that creates the OH group. The following reasonable mechanism is suggested. The zeolite dehydrohalogenates the n-propyl chloride molecule splitting out HC1 and leaving propene. The HC1 then in situ reacts with a surface oxygen atom creating the OH groups. The cation dependence of this reaction suggests the mechanism of the dehydrohalogenation. It is the strong electrostatic field of the cation which is responsible for this reaction; the electrostatic field polarizes the molecule at the chloride end and splits out the hydrogen chloride molecule. This mechanism is supported by the fact that NaY zeolite produces very few hydroxyl groups with n-propyl chloride, since the field due to the sodium ion is much smaller than that due to the bivalent cations; these latter produce large amounts of hydroxyls on interaction with n-propyl chloride. LaY, on the other hand, does not create any OH groups with n-propyl chloride. This latter finding confirms our previous suggestion3 that in LaY there are no surface cations in the zeolite cavity at room temperature.
If the proton part of the HC1 goes on a surface oxygen creating hydroxyl groups, where does the chloride part go? Our experiments with carbon monoxide provide an answer. It has been shown in part II2 that carbon monoxide gives characteristic CO stretching bands when adsorbed on different bivalent cation-containing zeolites. The frequency of this CO vibration could be correlated with the size of the cation or with the strength of the electrostatic field due to the cation. This way it was clearly established that the carbon monoxide molecule was attached to the cation. Of course this could occur only with cations in accessible positions on the surface of the cavities (in sites Sn). In the present experiments the addition of CO to a sample of CaY, previously exposed to n-propyl chloride and with hydroxyl groups created on it, did not give the cation-specific band thus, indicating that there were no surface cations available, although the original sample did show the calcium ion specific carbon monoxide band quite clearly (see Figure 4). Similar results were obtained with the cation-specific carbon dioxide band at 2260 cm-1. This then suggests that the chloride part of the molecule is associated with the surface cation. In the case of the CaY the chloride clearly blocks these cations, and they are no longer available for the adsorption of carbon monoxide. The partial removal of the OH band on heating at 400° and the partial return of the cation specific CO and C 02 bands seem to indicate that the removal of the OH groups and the liberation of
The Journal of Physical Chemistry, Vol. 74, No. lJt, 1970
Infrared Investigation of Zeolites and Adsorbed M olecules 2741
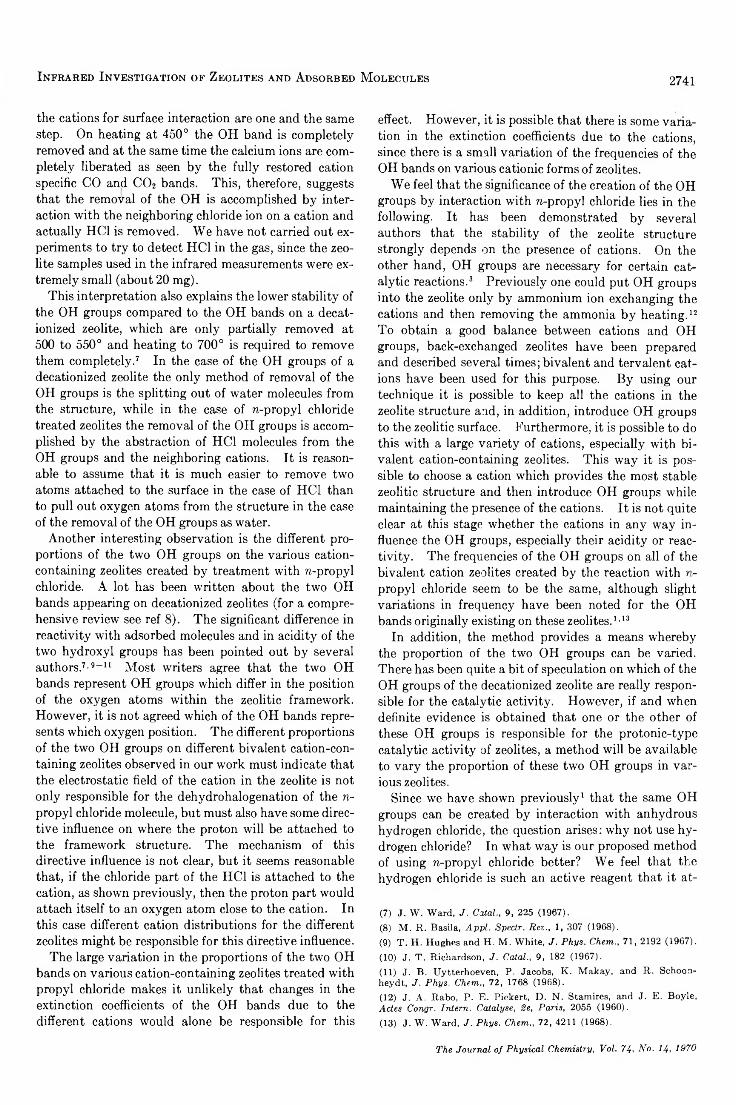
the cations for surface interaction are one and the same step. On heating at 450° the OH band is completely removed and at the same time the calcium ions are completely liberated as seen by the fully restored cation specific CO and C 02 bands. This, therefore, suggests that the removal of the OH is accomplished by interaction with the neighboring chloride ion on a cation and actually HC1 is removed. We have not carried out experiments to try to detect HC1 in the gas, since the zeolite samples used in the infrared measurements were extremely small (about 20 mg).
This interpretation also explains the lower stability of the OH groups compared to the OH bands on a decat- ionized zeolite, which are only partially removed at 500 to 550° and heating to 700° is required to remove them completely.7 In the case of the OH groups of a decationized zeolite the only method of removal of the OH groups is the splitting out of water molecules from the structure, while in the case of n-propyl chloride treated zeolites the removal of the OH groups is accomplished by the abstraction of HC1 molecules from the OH groups and the neighboring cations. It is reasonable to assume that it is much easier to remove two atoms attached to the surface in the case of HC1 than to pull out oxygen atoms from the structure in the case of the removal of the OH groups as water.
Another interesting observation is the different proportions of the two OH groups on the various cation- containing zeolites created by treatment with n-propyl chloride. A lot has been written about the two OH bands appearing on decationized zeolites (for a comprehensive review see ref 8). The significant difference in reactivity with adsorbed molecules and in acidity of the two hydroxyl groups has been pointed out by several authors.7'9 -1 1 Most writers agree that the two OH bands represent OH groups which differ in the position of the oxygen atoms within the zeolitic framework. However, it is not agreed which of the OH bands represents which oxygen position. The different proportions of the two OH groups on different bivalent cation-containing zeolites observed in our work must indicate that the electrostatic field of the cation in the zeolite is not only responsible for the dehydrohalogenation of the n- propyl chloride molecule, but must also have some directive influence on where the proton will be attached to the framework structure. The mechanism of this directive influence is not clear, but it seems reasonable that, if the chloride part of the HC1 is attached to the cation, as shown previously, then the proton part would attach itself to an oxygen atom close to the cation. In this case different cation distributions for the different zeolites might be responsible for this directive influence.
The large variation in the proportions of the two OH bands on various cation-containing zeolites treated with propyl chloride makes it unlikely that changes in the extinction coefficients of the OH bands due to the different cations would alone be responsible for this
effect. However, it is possible that there is some variation in the extinction coefficients due to the cations, since there is a small variation of the frequencies of the OH bands on various cationic forms of zeolites.
We feel that the significance of the creation of the OH groups by interaction with n-propyl chloride lies in the following. It has been demonstrated by several authors that the stability of the zeolite structure strongly depends on the presence of cations. On the other hand, OH groups are necessary for certain catalytic reactions.3 Previously one could put OH groups into the zeolite only by ammonium ion exchanging the cations and then removing the ammonia by heating. 12 To obtain a good balance between cations and OH groups, back-exchanged zeolites have been prepared and described several times; bivalent and tervalent cations have been used for this purpose. By using our technique it is possible to keep all the cations in the zeolite structure and, in addition, introduce OH groups to the zeolitic surface. Furthermore, it is possible to do this with a large variety of cations, especially with bivalent cation-containing zeolites. This way it is possible to choose a cation which provides the most stable zeolitic structure and then introduce OH groups while maintaining the presence of the cations. It is not quite clear at this stage whether the cations in any way influence the OH groups, especially their acidity or reactivity. The frequencies of the OH groups on all of the bivalent cation zeolites created by the reaction with n- propyl chloride seem to be the same, although slight variations in frequency have been noted for the OH bands originally existing on these zeolites. 1 '13
In addition, the method provides a means whereby the proportion of the two OH groups can be varied. There has been quite a bit of speculation on which of the OH groups of the decationized zeolite are really responsible for the catalytic activity. However, if and when definite evidence is obtained that one or the other of these OH groups is responsible for the protonic-type catalytic activity of zeolites, a method will be available to vary the proportion of these two OH groups in various zeolites.
Since we have shown previously1 that the same OH groups can be created by interaction with anhydrous hydrogen chloride, the question arises: why not use hydrogen chloride? In what way is our proposed method of using n-propyl chloride better? We feel that the hydrogen chloride is such an active reagent that it at-
(7) J. W. Ward, J. Catal., 9, 225 (1967).(8) M . R. Basila, Appl. Spectr. Rev., 1, 307 (1968).(9) T. H. Hughes and H. M . White, J. Phys. Chem., 71, 2192 (1967).(10) J. T. Richardson, J. Catcd., 9, 182 (1967).(11) J. B. Uytterhoeven, P. Jacobs, K. Makay, and R. Schoon- heydt, J. Phys. Chem., 72, 1768 (1968).(12) J. A. Rabo, P. E. Pickert, D. N. Stamires, and J. E. Boyle, Actes Congr. Intern. Catalyse, 2e, Paris, 2055 (1960).(13) J. W . Ward, J. Phys. Chem., 72, 4211 (1968).
The Journal of Physical Chemistry, Vol. 74, Aro. 14, 1970
2742 A. C. Hall
tacks the external surface immediately on contact. This means that all of the OH groups will be formed on the external surface or very close to the surface of the zeolite crystallites. In the case of interaction with n- propyl chloride, we have demonstrated that the reaction occurs only at sites where there are cations present. Therefore, the n-propyl chloride actually has to enter the zeolitic cavities before a dehydrohalogenation reaction and formation of hydroxyl groups can occur. In this way a more even distribution of OH groups will be
achieved than through interaction with hydrogen chloride. Since it is clear that catalytic reactions occurring on zeolites happen on the internal surfaces of the cavities, an even distribution of the OH groups all over the zeolitic surface is of significance in determining the catalytic properties of the zeolite used.
Acknow ledgm ent. The authors wish to express their thanks to Dr. J. A. Rabo and Professor Verner Scho- maker for helpful discussions.
Optical Studies of Thin Films on Surfaces of Fused Quartz
by A. C. HallMobil Research and Development Corporation, Field Research Laboratory, Dallas, Texas 75221 (.Received November 12, 1969)
Examination of deposited Langmuir-Blodgett monolayers indicates that fused quartz is a suitable substrate for ellipsometric studies. Thin films of adsorbed water on fused quartz surfaces do not exhibit the highest refractive indices reported for anomalous water condensed in quartz capillaries.
IntroductionThe analysis of reflected polarized light is in principle
one of the simplest and most versatile techniques for examining surfaces. Given a clean surface it is possible to infer its optical constants from experimental data. If the surface carries a plane, parallel-sided dielectric film, then the experimental data constitute a qualitative and quantitative analysis of the film. 1 That is, its refractive index and thickness are determined provided the nature of the bounding media is known, and subject to assumptions regarding the variation of refractive index between the boundaries of the film. In the Drude approximate formula (below), the film is taken to be an optically uniform layer for the sake of simplicity.
According to Drude, 2 if the substrate is transparent, and if the film thickness, d, is very small compared with X, the wavelength of light, then for plane polarized light incident at Brewster’s angle and at 45° azimuth
d ir f ( l + w2)’/! (ft2 — 1 ) ( n 2 — n 2)\
P ~ T V t t ~ O X ft2 )
where n, ft are the refractive indices of substrate and film, respectively, and p is the so-called ellipticity coefficient. Clearly, p is always a small quantity and will be positive, zero, or negative according to whether ft < n, ft = n, or ft > n .3
It has been shown by Buff4 that the given equation is
not strictly valid, even as an approximation, and that allowance should be made for the inherent birefringence of the surface film. In practice, however, it is found that results obtained from the Drude equation are accurate. Only in the case of the transition zone at a vapor-liquid interface does film anisotropy appear to have produced considerable errors.5
Because ellipsometry applies to specularly reflecting surfaces, it has certain inherent advantages as a tool for the study of adsorption, by contrast with techniques that require high-area adsorbents. But ellipsometry is not always easily applicable, and one of the major difficulties is that uncontaminated surfaces are hard to find. Metals except, perhaps, gold are covered by an oxide layer unless great care is taken in preparation and handling. Dielectrics, although frequently less reactive, pose similar problems.6'7 Fortunately, fused
(1) E. Passaglia, R . R. Stromberg, and J. Kruger, Ed., “ Ellipsometry in the Measurement of Surfaces and Thin Films,” National Bureau of Standards, Miscellaneous Publication 256, 1956.(2) P. Drude, “ The Theory of Optics,” Longmans, Green and Co., New York, N. Y., 1920, p 292.(3) R. W. Wood, “ Physical Optics,” Macmillan, New York, N. Y., 1934, p 360.(4) F. P. Buff, 1966 Saline Water Conversion Report, U. S. Government Printing Office, Washington, D. C., p 26.(5) K . Kinosita and H. Yokota, J. Phys. Soc. Jap., 20, 1086 (1965).(6) L. Holland, “ The Properties of Glass Surfaces,” Wiley, New York, N. Y „ 1964, p 122.
The Journal of Physical Chemistry, Voi. 74, No. 14, 1970
Optical Studies of T hin Films on Surfaces of Fused Quartz 2743
quartz is well suited to serve as an optical substrate: it is available in high purity, and relatively free from strains, striae, and bubbles. These properties are shared by crystalline quartz which, because of them, was long ago proposed as a reflectance standard.8
The potential technological importance of anomalous water has induced a number of laboratories, in this country and abroad, to initiate experimental programs aimed at discovering whether, in fact, it exists. While there is little doubt that the aqueous fluid condensed from water vapor in narrow capillaries of glass or quartz can have physical properties quite different from those of ordinary water, it is at least possible that these originate in causes other than a hitherto unknown structural modification of water. The clearest indication of true allotropy is in recently published9 vibrational spectra, which are compatible with the existence of polymerized H20.
There is evidence that anomolous water, once formed, can persist outside of capillaries9,10 but, with a single exception, 11 it appears never to have been prepared in other surroundings. For this reason it has not yet been available in quantities large enough to permit definitive characterization. The hypotheses of its formation generally involve an ordering interaction of the hydroxyl groups or oxygen atoms at the silica surface with H20 adsorbed from the vapor phase. 12 It might be supposed, therefore, that water adsorbed near the silica surface should be at least as anomalous as water held in the capillaries (diameter ~10-50 p) generally used. Thus, it would be convenient to use ellipsometry to observe whether the refractive index of the adsorbate has anomalous properties. Deryagin, Zorin, and Churaev13 measured the refractive index of anomalous water contained, as usual, in capillaries. They found values, in white light, between 1.3 (ordinary water) and 1.5, depending upon the degree of “structural modification.” Since the refractive index of fused quartz is 1.46 at 5461 A, reflection from its surface should exhibit positive or negative ellipticity, or no effect, according to whether the surface film refractive index is less than 1.46, greater, or the same.
Experimental SectionFollowing alignment of the ellipsometer, 14 the pro
cedures followed were essentially those of Rayleigh. 15 The analyzer was set at ±45°, and fine adjustment made with the polarizer in either quadrant. The quarter-wave compensators were alternately set with fast and slow axes in the plane of incidence.
Two ellipsometers were used. Observations of clean quartz surfaces and of barium stearate monolayers on quartz surfaces were made with a Gaertner LI 19 ellip- someter. The light source was a University Laboratories Model 240 He-Ne laser, and a specially constructed quarterwave plate was used for the 6238-A wavelength. The adsorption of water vapor on fused
quartz was observed with a Rudolph and Sons, Inc., Model 437-200E ellipso meter, previously described. 16
All specimens were of Spectrosil A fused quartz furnished by Thermal American Fused Quartz Co. The barium stearate films were deposited from a Langmuir trough on slabs thick enough so that reflections from the front and back could be separated. The water vapor was adsorbed on the hypotenuse of a 90° prism, contained in a Pyrex cell. The arms of the cell were arranged so that the incident and reflected beams should strike the quartz surface at Brewster’s angle and the cell windows within 2° of the perpendicular. The cell windows were microscope cover glasses, selected for freedom from birefringence and attached by Torr Seal low-vapor pressure resin, cured at room temperature. Degassed water was contained in a side arm reservoir frozen in liquid nitrogen. The cell was evacuated to 1 X 10~ 5 Torr, then repeatedly filled with helium and outgassed, during which process the specimen was exposed to gentle glow discharge while shielded from electron bombardment. The relative pressure of water vapor was fixed by maintaining the reservoir at temperatures controlled by a thermostat, the vacuum cell being heavily insulated, and the temperature difference measured by a Hewlett Packard 2801A quartz thermometer. In order to eliminate strains in the windows, the cell was brought to atmospheric pressure by purified He.
ResultsOn the fused quartz surface as received eight different
areas on a given prism gave p values between —0.00066 and —0.00026, with a mean of —0.00048. However, large positive p were also encountered; e.g., 0.00131, 0.00113, 0.00113 on a given surface. Fused quartz has alow refractive index, and it is plausible that an adventitious layer could have a higher one. This might occur in the polishing process, either by production of a dense surface film or by contamination of the surface with material of high refractive index. The former possibility has been advanced already, 17 and the latter seems
(7) A. Vasicek, J. Opt. Soc. Amer., 37, 979 (1947).(8) J. Koenigsberger, Phys. Z., 4, 494 (1903).(9) E. R. Lippincott, R. R. Stromberg, W. H. Grant, and G. L. Cessac, Science, 164, 1482 (1969).(10) B. V. Deryagin, D. S. Liehnikov, K . M . Merzhanov, Va. I. Rabinovitch, and N. V. Churaev, Dokl. Akad. Nauk SSSR, 181, 823 (1968).(11) B. V. Deryagin, Z. M. Zorin, and N. V. Churaev, Kolloid Z., 30, 308 (1968).(12) R. W. Bolander, J. L. Kassner, and J. T. Zung, Nature, 221, 1233 (1969).(13) B. V. Deryagin, Z. M. Zorin, and N. V. Churaev, Dokl. Akad. Nauk SSSR, 182, 811 (1968).(14) F. L. McCraekin, E. Passaglia, R. R. Stromberg, and H. L. Steinberg, J. Res. Nat. Bur. Stand., 67A, 363 (1963).(15) Rayleigh, Phil. Mag., 33, 1 (1892).(16) A. C. Hall, J. Phys. Chem., 69, 1654 (1965).(17) H. Yokota, K. Kinosita, and H. Sakata, Jap. J. Appl. Phys., 3, 805 (1964).
The Journal of Physical Chemistry, Vol. 74, No. 14, 1970
2744 A. C. Hall
by no means improbable, since it is known that the specimens at hand were polished with Barnesite, a substance of very high refractive index. 18
The positive ellipticities are less easily accounted for. The minimum possible thickness of the layer, i.e ., assuming ñ = V n , is about 7 A. If we suppose the layer in question to be quartz, but porous, and assign a value found by Vasicek19 for a layer on glass, n —1.36, then a thickness of 11 A would be sufficient. Whatever their nature, these layers are undesirable, since their optical effect is comparable in magnitude to that expected to be produced by the deposited mono- layer.
First efforts to reduce ellipticity by careful cleaning were unsuccessful. Each specimen was treated ultra- sonically in boiling ethanol and exposed to vapor degreasing in Baker Analyzed spectrophotometric acetone. Following such treatment small changes in ellipticity were noted, but in no case was it reduced to the level sought. Rayleigh20 had shown that even in the case of glass it was possible to bring ellipticity to zero by polishing, but such treatment tends to be irrepro- ducible. Etching with HF appears to be a more promising way of removing a surface layer with minimum damage to the optical properties of the substrate. Among the first to advocate this technique were the Rayleighs, 21,22 who used 0.5% “commercial acid,” and 8% and 2% “commercial acid,” respectively. In these experiments the more concentrated solutions, although faster, seemed to develop more obvious latent scratches which, while not conspicuously harmful to observation, were avoided by using 0.5% solution. In every case the etching solutions were constantly stirred.
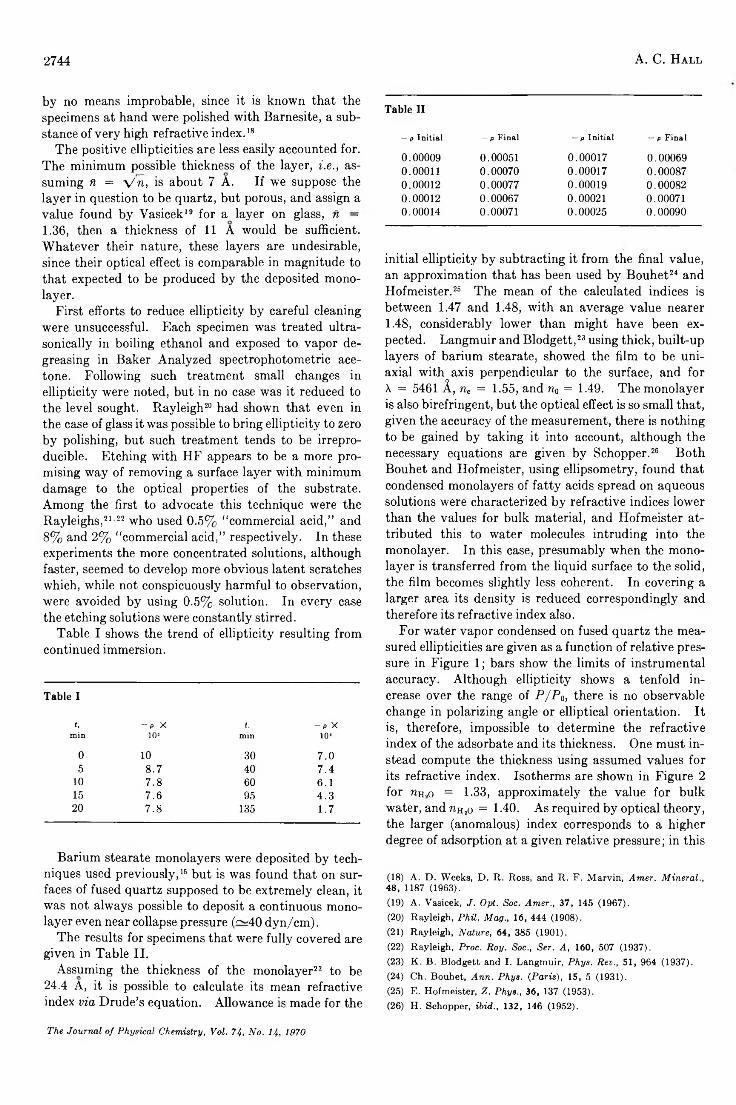
Table I shows the trend of ellipticity resulting from continued immersion.
Table I
t, -P X t, -P Xmin 104 min 104
0 10 30 7 .05 8 .7 40 7 .4
10 7 .8 60 6.115 7 .6 95 4 .320 7 .8 135 1.7
Barium stearate monolayers were deposited by techniques used previously, 16 but is was found that on surfaces of fused quartz supposed to be extremely clean, it was not always possible to deposit a continuous mono- layer even near collapse pressure (~40 dyn/cm).
The results for specimens that were fully covered are given in Table II.
Assuming the thickness of the monolayer23 to be24.4 A, it is possible to calculate its mean refractive index via Drude’s equation. Allowance is made for the
Table II
— p Initial — p Final — p Initial — p Final
0.00009 0.00051 0.00017 0.000690.00011 0.00070 0.00017 0.000870.00012 0.00077 0.00019 0.000820.00012 0.00067 0.00021 0.000710.00014 0.00071 0.00025 0.00090
initial ellipticity by subtracting it from the final value, an approximation that has been used by Bouhet24 and Hofmeister.26 The mean of the calculated indices is between 1.47 and 1.48, with an average value nearer 1.48, considerably lower than might have been expected. Langmuir and Blodgett, 23 using thick, built-up layers of barium stearate, showed the film to be uniaxial with axis perpendicular to the surface, and for X = 5461 Â, n„ = 1.55, and na = 1.49. The monolayer is also biréfringent, but the optical effect is so small that, given the accuracy of the measurement, there is nothing to be gained by taking it into account, although the necessary equations are given by Schopper.26 Both Bouhet and Hofmeister, using ellipsometry, found that condensed monolayers of fatty acids spread on aqueous solutions were characterized by refractive indices lower than the values for bulk material, and Hofmeister attributed this to water molecules intruding into the monolayer. In this case, presumably when the mono- layer is transferred from the liquid surface to the solid, the film becomes slightly less coherent. In covering a larger area its density is reduced correspondingly and therefore its refractive index also.
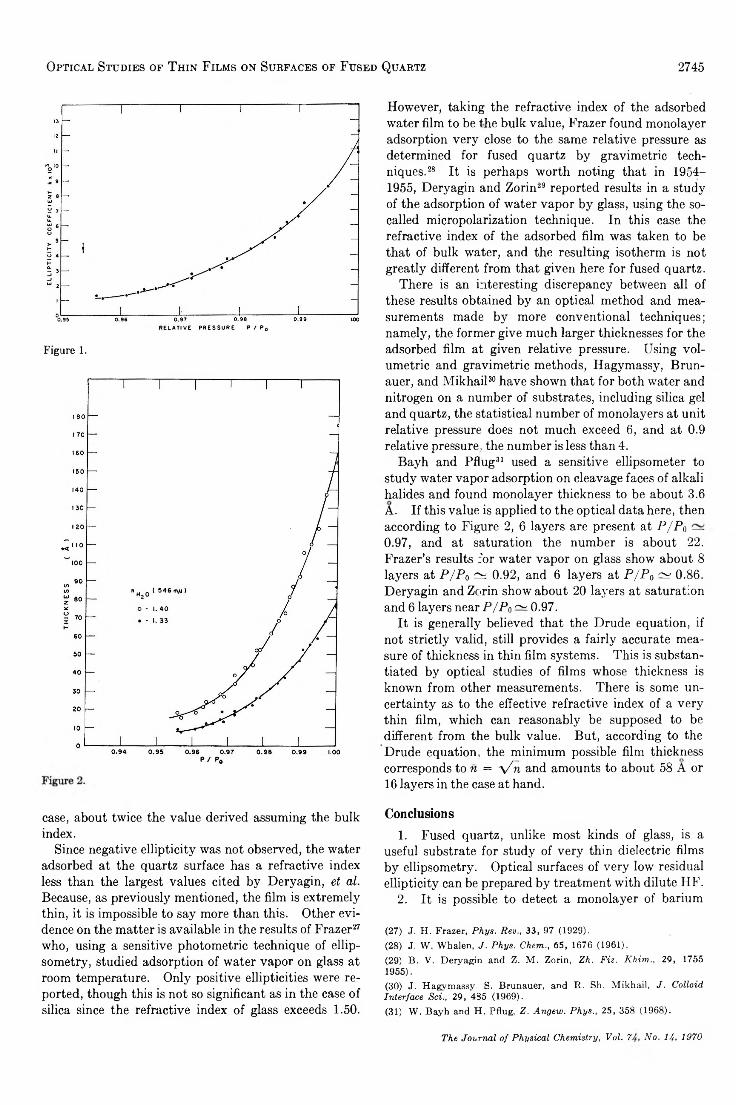
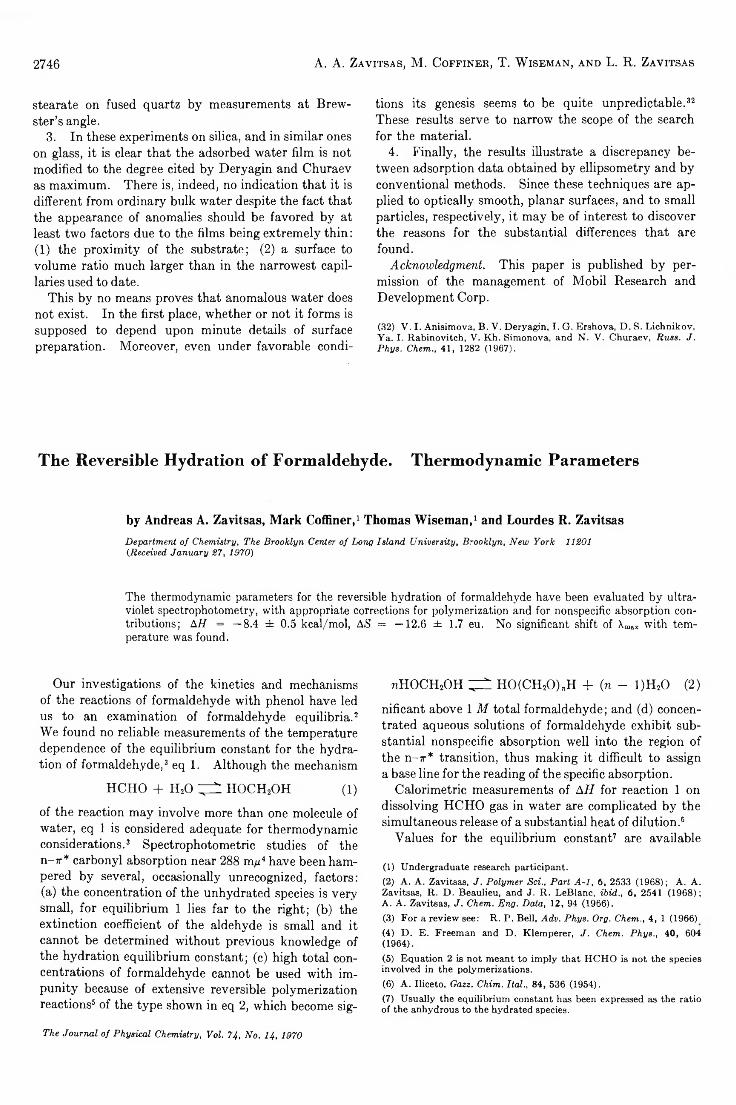
For water vapor condensed on fused quartz the measured ellipticities are given as a function of relative pressure in Figure 1; bars show the limits of instrumental accuracy. Although ellipticity shows a tenfold increase over the range of P/Pa, there is no observable change in polarizing angle or elliptical orientation. It is, therefore, impossible to determine the refractive index of the adsorbate and its thickness. One must instead compute the thickness using assumed values for its refractive index. Isotherms are shown in Figure 2 for wh2o = 1.33, approximately the value for bulk water, and nHîo = 1-40. As required by optical theory, the larger (anomalous) index corresponds to a higher degree of adsorption at a given relative pressure; in this
(18) A. D. Weeks, D. R. Ross, and R. F. Marvin, Amer. Mineral., 48, 1187 (1963).(19) A. Vasicek, J. Opt. Soc. Amer., 37, 145 (1967).(20) Rayleigh, Phil. Mag., 16, 444 (1908).(21) Rayleigh, Nature, 64, 385 (1901).(22) Rayleigh, Proc. Roy. Soc., Ser. A, 160, 507 (1937).(23) K. B. Blodgett and I. Langmuir, Phys. Rev., 51, 964 (1937).(24) Ch. Bouhet, Ann. Phys. (Paris), 15, 5 (1931).(25) E. Hofmeister, Z. Phys., 36, 137 (1953).(26) H. Schopper, ibid., 132, 146 (1952).
The Journal of Physical Chemistry, Vol. 74, No. 14, 1970
Optical Studies of Thin Films on Surfaces of Fused Quartz 2745
Figure 1.
case, about twice the value derived assuming the bulk index.
Since negative ellipticity was not observed, the water adsorbed at the quartz surface has a refractive index less than the largest values cited by Deryagin, et al. Because, as previously mentioned, the film is extremely thin, it is impossible to say more than this. Other evidence on the matter is available in the results of Frazer27 who, using a sensitive photometric technique of ellip- sometry, studied adsorption of water vapor on glass at room temperature. Only positive ellipticities were reported, though this is not so significant as in the case of silica since the refractive index of glass exceeds 1.50.
However, taking the refractive index of the adsorbed water film to be the bulk value, Frazer found monolayer adsorption very close to the same relative pressure as determined for fused quartz by gravimetric techniques.28 It is perhaps worth noting that in 1954- 1955, Deryagin and Zorin29 reported results in a study of the adsorption of water vapor by glass, using the so- called micropolarization technique. In this case the refractive index of the adsorbed film was taken to be that of bulk water, and the resulting isotherm is not greatly different from that given here for fused quartz.
There is an interesting discrepancy between all of these results obtained by an optical method and measurements made by more conventional techniques; namely, the former give much larger thicknesses for the adsorbed film at given relative pressure. Using volumetric and gravimetric methods, Hagymassy, Brun- auer, and Mikhail30 have shown that for both water and nitrogen on a number of substrates, including silica gel and quartz, the statistical number of monolayers at unit relative pressure does not much exceed 6 , and at 0.9 relative pressure, the number is less than 4.
Bayh and Pflug31 used a sensitive ellipsometer to study water vapor adsorption on cleavage faces of alkali halides and found monolayer thickness to be about 3.6A. If this value is applied to the optical data here, then according to Figure 2 , 6 layers are present at P /P o — 0.97, and at saturation the number is about 22. Frazer’s results for water vapor on glass show about 8
layers at P /P o ca 0.92, and 6 layers at P / P 0 ^ 0 .8 6 . Deryagin and Zorin show about 20 layers at saturation and 6 layers near P /Po ~ 0.97.
It is generally believed that the Drude equation, if not strictly valid, still provides a fairly accurate measure of thickness in thin film systems. This is substantiated by optical studies of films whose thickness is known from other measurements. There is some uncertainty as to the effective refractive index of a very thin film, which can reasonably be supposed to be different from the bulk value. But, according to the Drude equation, the minimum possible film thickness corresponds t o n = \/n and amounts to about 58 A or 16 layers in the case at hand.
Conclusions1. Fused quartz, unlike most kinds of glass, is a
useful substrate for study of very thin dielectric films by ellipsometry. Optical surfaces of very low residual ellipticity can be prepared by treatment with dilute HF.
2 . It is possible to detect a monolayer of barium
(27) J. H. Frazer, Phys. Rev., 33, 97 (1929).(28) J. W. Whalen, J. Phys. Chem., 65, 1676 (1961).(29) B. V. Deryagin and Z. M. Zorin, Zh. Fiz. Khim,., 29, 1755 1955).(30) J. Hagymassy. S. Brunauer, and R. Sh. Mikhail, J. Colloid Interface Sci., 29, 485 (1969).(31) W . Bayh and H. Pflug, Z. Angew. Phys., 25, 358 (1968).
The Journal of Physical Chemistry, Vol. 7 No. 14, 1970
2746 A. A. Za Vits as, M. Coffiner, T. W iseman, and L. R. Zavitsas
stearate on fused quartz by measurements at Brewster’s angle.
3. In these experiments on silica, and in similar ones on glass, it is clear that the adsorbed water film is not modified to the degree cited by Deryagin and Churaev as maximum. There is, indeed, no indication that it is different from ordinary bulk water despite the fact that the appearance of anomalies should be favored by at least two factors due to the films being extremely thin:(1 ) the proximity of the substrate; (2 ) a surface to volume ratio much larger than in the narrowest capillaries used to date.
This by no means proves that anomalous water does not exist. In the first place, whether or not it forms is supposed to depend upon minute details of surface preparation. Moreover, even under favorable condi
tions its genesis seems to be quite unpredictable.32 These results serve to narrow the scope of the search for the material.
4. Finally, the results illustrate a discrepancy between adsorption data obtained by ellipsometry and by conventional methods. Since these techniques are applied to optically smooth, planar surfaces, and to small particles, respectively, it may be of interest to discover the reasons for the substantial differences that are found.
Acknow ledgm ent. This paper is published by permission of the management of Mobil Research and Development Corp.
(32) V. I. Anisimova, B. V. Deryagin, I. G. Ershova, D . S. Lichnikov, Ya. I. Rabinovitch, V. Kh. Simonova, and N. V. Churaev, Russ. J. Phys. Chem., 41, 1282 (1967).
The Reversible Hydration of Formaldehyde. Thermodynamic Parameters
by Andreas A. Zavitsas, Mark Coffiner,1 Thomas Wiseman,1 and Lourdes R. ZavitsasDepartment of Chemistry, The Brooklyn Center of Long Island University, Brooklyn, New York 11201 {Received January 27, 1970)
The thermodynamic parameters for the reversible hydration of formaldehyde have been evaluated by ultraviolet spectrophotometry, with appropriate corrections for polymerization and for nonspecific absorption contributions; AH = —8.4 ± 0.5 kcal/mol, AS = —12.6 ± 1.7 eu. No significant shift of Xma* with temperature was found.
Our investigations of the kinetics and mechanisms of the reactions of formaldehyde with phenol have led us to an examination of formaldehyde equilibria.2 We found no reliable measurements of the temperature dependence of the equilibrium constant for the hydration of formaldehyde, 3 eq 1. Although the mechanism
HCHO + H20 ^ HOCH2OH (1 )
of the reaction may involve more than one molecule of water, eq 1 is considered adequate for thermodynamic considerations.3 Spectrophotometric studies of the n-r* carbonyl absorption near 288 m^ 4 have been hampered by several, occasionally unrecognized, factors:(a) the concentration of the unhydrated species is very small, for equilibrium 1 lies far to the right; (b) the extinction coefficient of the aldehyde is small and it cannot be determined without previous knowledge of the hydration equilibrium constant; (c) high total concentrations of formaldehyde cannot be used with impunity because of extensive reversible polymerization reactions5 of the type shown in eq 2 , which become sig-
The Journal of Physical Chemistry, Vol. 74, No. H, 1970
wHOCH2OH ^ H0(CH20)„H + (n - 1)H,0 (2)
nificant above 1 M total formaldehyde; and (d) concentrated aqueous solutions of formaldehyde exhibit substantial nonspecific absorption well into the region of the n-7r* transition, thus making it difficult to assign a base line for the reading of the specific absorption.
Calorimetric measurements of A H for reaction 1 on dissolving HCHO gas in water are complicated by the simultaneous release of a substantial heat of dilution.6
Values for the equilibrium constant7 are available
(1) Undergraduate research participant.(2) A. A. Zavitsas, J. Polymer Sci., Part A -l, 6, 2533 (1968); A. A. Zavitsas, R. D. Beaulieu, and J. R . LeBlanc, ibid., 6, 2541 (1968); A. A. Zavitsas, J. Chem. Eng. Data, 12, 94 (1966).(3) For a review see: R. P. Bell, Adv. Phys. Org. Chem., 4, 1 (1966)(4) D. E. Freeman and D. Klemperer, J. Chem. Phys., 40, 604 (1964).(5) Equation 2 is not meant to imply that HCHO is not the species involved in the polymerizations.(6) A. Iliceto, Gaze. Chim. Ital., 84, 536 (1954).(7) Usually the equilibrium constant has been expressed as the ratio of the anhydrous to the hydrated species.
or can be calculated from some existing data at various temperatures and concentrations of formaldehyde in aqueous solutions;8-10 there is rather poor agreement among the various values of the equilibrium constant and particularly among the slopes of plots of the points from each investigation vs. 1 / T °K . An excellent critical review of available data has been published.3 An apparently reliable value for the equilibrium constant is that of Valenta, 11 obtained by pulse polarography in dilute phosphate buffer of pH 7, reported as [HCHO]/ [HOCH2OH] = 4.37 X 10⁻⁴ at 20°; the method is based on the fact that HCHO is reducible whereas the hydrates are not, 12 and on the assumption that dehydration is slow relative to the duration of the polaro- graphic pulse.
To be better applicable to systems containing appreciable amounts of formaldehyde, the equilibrium content should be defined as in eq 3, in which A h2o indi-
K = [HOCH2OH]/([HCHO]Ah2o) (3)
cates molar fraction of free water. Thus defined the polarographic value becomes K = 2.33 X 10³.
Experimental Section
Reagents. Formaldehyde solutions were prepared by mixing 20 g of paraformaldehyde powder (Mallin- ckrodt), 100 ml of distilledH20 and0.5 g of reagent grade magnesium oxide powder and distilling at a very rapid rate with a short head and a condenser cooled by lukewarm water; the first 25% of the distillate was discarded and the next 50% was collected. The pH of the solutions was usually between 3.8 and 4.6; batches of lower pH were discarded. Magnesium oxide greatly facilitates the solution of paraformaldehyde. The formaldehyde content of the collected distillate was approximately 17%, as HCHO, by the hydroxyl- amine hydrochloride titration method. 13 Solutions above 2 2 wt % were found to develop a haze on standing at room temperature. The pH was adjusted with 0.5 M sodium hydroxide immediately before use; it was rechecked at the end of the measurements and it was found to have remained unchanged within the accuracy of the pH meter.
M easurem ents. Uv measurements were obtained on freshly prepared formaldehyde solutions in thermo- stated cell compartments, either with 1 0 .00-cm cells in a Bausch and Lomb Spectronic 505 operated in the absorbance mode, or with 5.00-cm cells in a Perkin- Elmer 450 operated in the transmittance mode with subsequent conversion of the readings to absorbance. We employed concentrations between 14 and 18 wt % over the pH range of 5.60-8.90. An average of ten observations at various temperatures were taken per sample with the highest temperature reading taken first, the following six readings at progressively lower temperatures, and the last three readings at progressively higher temperatures again. In this manner, any ther
The Reversible Hydration of Formaldehyde
mally irreversible changes that might have occurred during the measurements would have become apparent; this procedure also verified that the equilibria were established at each temperature.
We found it imperative to limit the time of exposure of the samples to heat and to the uv beam of the instrument. The samples were removed from the thermo- stated compartments during most of the substantial time required for the attainment of a steady new temperature at the circulating bath; prolonged exposure led to an increase in the nonspecific absorbance (see below) and to the appearance of a new absorption at 326 myu.
ResultsIn principle the concentration of HOCH2OH can be
calculated if the polymerization equilibrium constants for each value of n in eq 2 are known; such calculations, using the same value of equilibrium constant for all values of n greater than 2 , have been performed with the appropriate computer programs. 14 We employed a different and simpler approximation which describes the polymerization equilibria quite accurately; the generalized eq 2 was found to be equivalent, on the average and over a wide range, to eq 4. The average
K = 262.6[HOCH2OH] ^
[H0(CH20 )2.6H] + 1.6 [H20] (4)
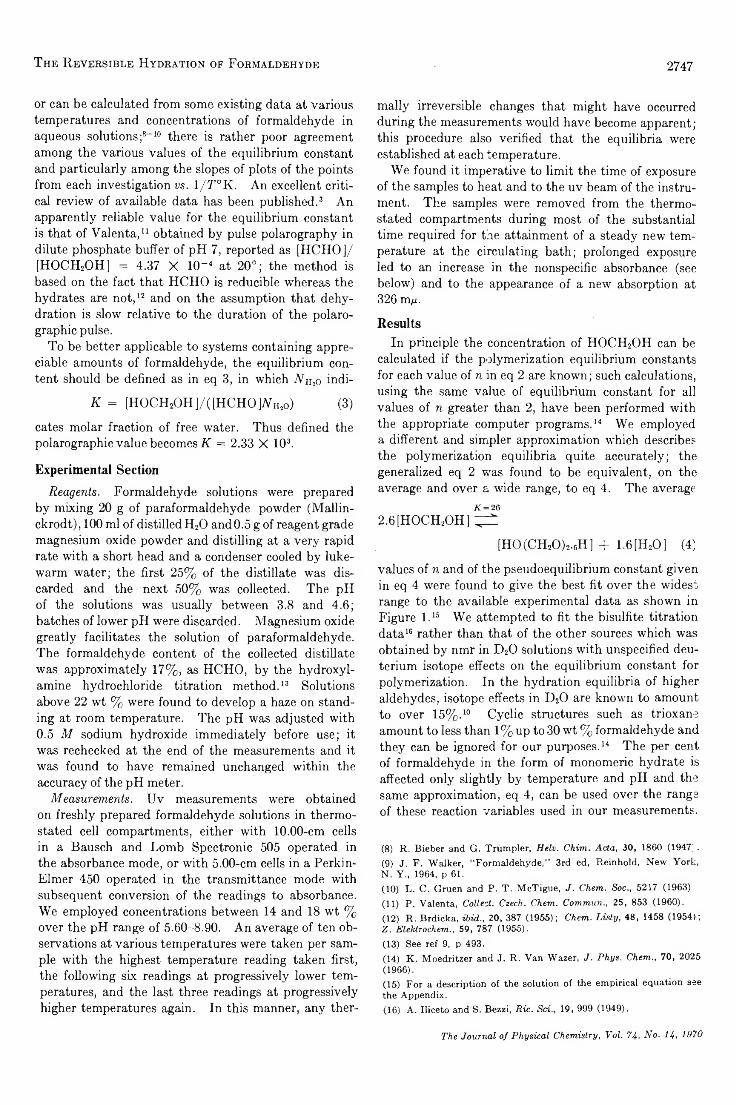
values of n and of the pseudoequilibrium constant given in eq 4 were found to give the best fit over the widest range to the available experimental data as shown in Figure l . 15 We attempted to fit the bisulfite titration data16 rather than that of the other sources which was obtained by nmr in D20 solutions with unspecified deuterium isotope effects on the equilibrium constant for polymerization. In the hydration equilibria of higher aldehydes, isotope effects in D20 are known to amount to over 15%.10 Cyclic structures such as trioxane amount to less than 1% up to 30 wt % formaldehyde and they can be ignored for our purposes. 14 The per cent of formaldehyde in the form of monomeric hydrate is affected only slightly by temperature and pH and the same approximation, eq 4, can be used over the range of these reaction variables used in our measurements.
(8) R. Bieber and G. Trumpler, Helv. Chim. Acta, 30, 1860 (1947',.(9) J. F . Walker, “ Formaldehyde,” 3rd ed, Reinhold, New York, N . Y., 1964, p 61.(10) L. C. Gruen and P. T. McTigue, J. Chem. Soc., 5217 (1963)(11) P. Valenta, Collect. Czech. Chem. Commun., 25, 853 (1960).(12) R. Brdicka, ibid., 20, 387 (1955); Chem. Listy, 48, 1458 (1954); Z. Elektrochem., 59, 787 (1955).(13) See ref 9, p 493.(14) K. Moedritzer and J. R . Van Wazer, J. Phys. Chem., 70, 2025 (1966).(15) For a description of the solution of the empirical equation see the Appendix.(16) A. Iliceto and S. Bezzi, Ric. Sci., 19, 999 (1949).
2747
The Journal of Physical Chemistry, Vol. 74, No. 14, 1970
2748 A. A. Zavitsas, M. Coffiner, T. W iseman, and L. R. Zavitsas
Figure 1. Fraction of formaldehyde in the form of HOCH2OH vs. total weight per cent formaldehyde: O, by bisulfite titration at 35°, ref 16; A, by nmr in D20 at 34°, ref 17;V, by nmr in D20 at 60°, ref 17; 0 , by nmr in D20 at ambient, ref 18; □, calculated for D20 solution at 30°, ref 14. The line indicates values obtained by solving eq 4.
The small temperature dependence is evident from the data in Figure 1, and from reported values for the average degree of polymerization, P n, excluding monomer; at 13.76 wt % formaldehyde in D20, P n = 2.28 at 34°, 2.27 at 60°, and 2.25 at 90°; at 22.61 wt % , P n = 2.42 at 34°, 2.44 at 60°, and 2.43 at 90°.17 These concentrations bracket our range. In agreement with the above, the enthalpy change for the polymerization has been reported to be very small. 14,18 The negligible effect of pH has been demonstrated by cryo- scopic measurements of the average molecular weight of a 25.52 wt % solution; the value increased by 0.4% in going from a neutral solution to pH 10.7. 19
The extinction coefficient of the n-x* absorption of HCHO was assumed to remain constant over our temperature range, by analogy from similar reports on acetone10 confirmed by us.
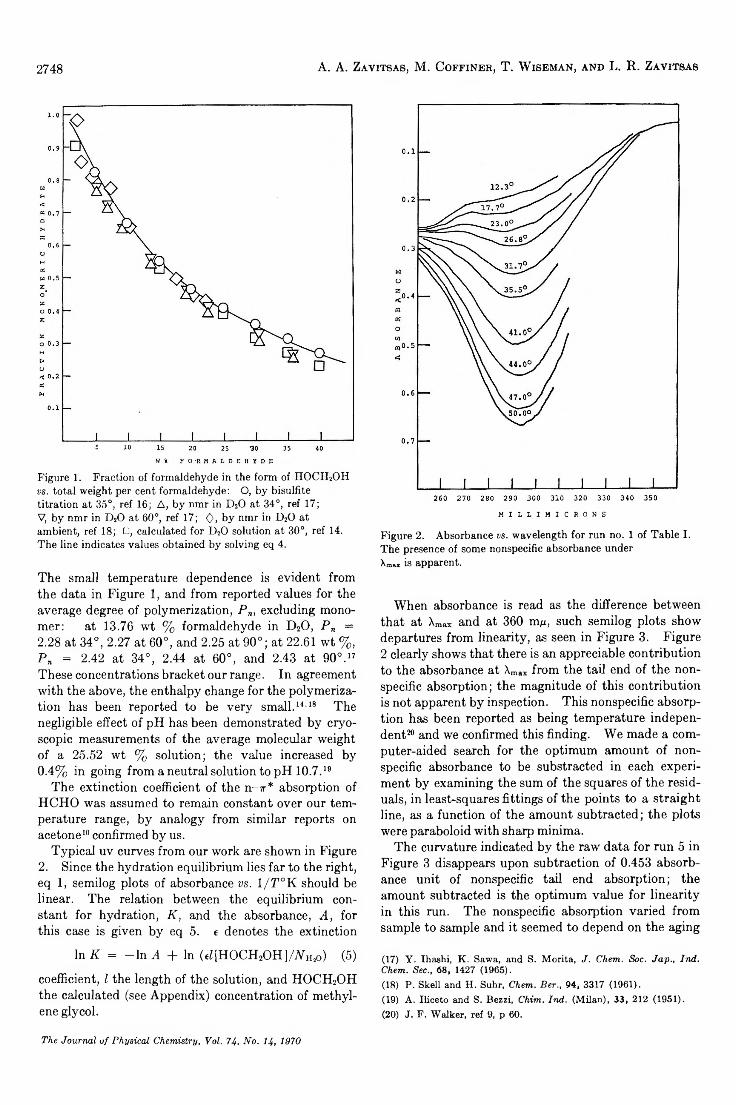
Typical uv curves from our work are shown in Figure2. Since the hydration equilibrium lies far to the right, eq 1, semilog plots of absorbance vs. 1 / T °K should be linear. The relation between the equilibrium constant for hydration, K , and the absorbance, A , for this case is given by eq 5. e denotes the extinction
In K = -In A + In (eZ[HOCH2OH]/AH!o) (5)
coefficient, l the length of the solution, and HOCH2OH the calculated (see Appendix) concentration of methylene glycol.
M I L L I M I C R O N S
Figure 2. Absorbance vs. wavelength for run no. 1 of Table I. The presence of some nonspecific absorbance under Xmai is apparent.
When absorbance is read as the difference between that at Xmax and at 360 m , such semilog plots show departures from linearity, as seen in Figure 3. Figure 2 clearly shows that there is an appreciable contribution to the absorbance at Xmax from the tail end of the nonspecific absorption; the magnitude of this contribution is not apparent by inspection. This nonspecific absorption has been reported as being temperature independent20 and we confirmed this finding. We made a computer-aided search for the optimum amount of nonspecific absorbance to be substracted in each experiment by examining the sum of the squares of the residuals, in least-squares fittings of the points to a straight line, as a function of the amount subtracted; the plots were paraboloid with sharp minima.
The curvature indicated by the raw data for run 5 in Figure 3 disappears upon subtraction of 0.453 absorbance unit of nonspecific tail end absorption; the amount subtracted is the optimum value for linearity in this run. The nonspecific absorption varied from sample to sample and it seemed to depend on the aging
(17) Y. Ihashi, K. Sawa, and S. Morita, J. Chem. Soc. Jap., Ind. Chem. Sec., 68, 1427 (1965).(18) P. Skell and H . Suhr, Chem. Ber., 9 4 , 3317 (1961).(19) A. Uiceto and S. Bezzi, Chim. Ind. (Milan), 33, 212 (1951).(20) J. F. Walker, ref 9, p 60.
The Journal of Physical Chemistry, Vol. 74, No. 14, 1970
T he Reversible Hydration of Formaldehyde
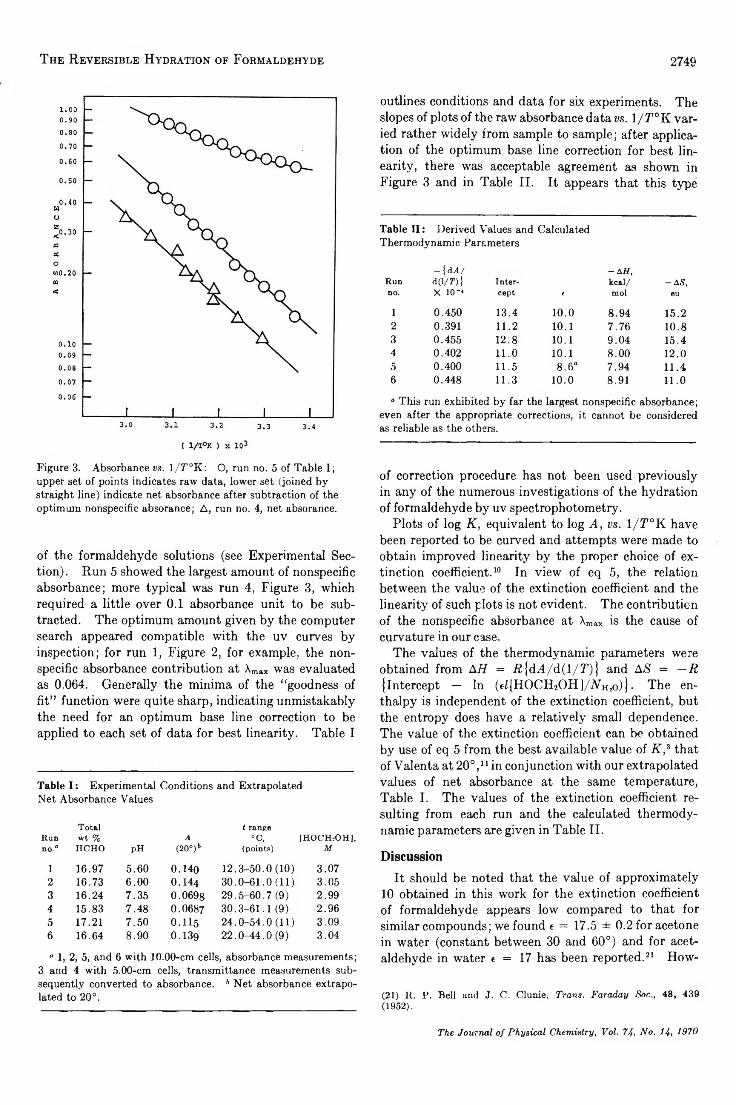
Figure 3. Absorbance vs. 1/T°K: O, run no. 5 of Table I; upper set of points indicates raw data, lower set (joined by straight line) indicate net absorbance after subtraction of the optimum nonspecific absorance; A, run no. 4, net absorance.
of the formaldehyde solutions (see Experimental Section). Run 5 showed the largest amount of nonspecific absorbance; more typical was run 4, Figure 3, which required a little over 0 .1 absorbance unit to be subtracted. The optimum amount given by the computer search appeared compatible with the uv curves by inspection; for run 1, Figure 2, for example, the nonspecific absorbance contribution at Xmax was evaluated as 0.064. Generally the minima of the “goodness of fit” function were quite sharp, indicating unmistakably the need for an optimum base line correction to be applied to each set of data for best linearity. Table I
Table I : Experimental Conditions and Extrapolated Net Absorbance Values
Runno.°
Total wt % HCHO pH
A(20° )b
t range°C,
(points)[H O C m O H ],
M
i 16.97 5.60 0.140 12.3-50.0(10) 3.072 16.73 6.00 0.144 30.0-61.0(11) 3.053 16.24 7.35 0.0698 29.5-60.7(9) 2.994 15.83 7.48 0.0687 30.3-61.1(9) 2.965 17.21 7.50 0.115 24.0-54.0(11) 3.096 16.64 8.90 0.139 22.0^4.0(9) 3.04
<* 1, 2, 5, and 6 with 10.00-cm cells, absorbance measurements; 3 and 4 with 5.00-cm cells, transmittance measurements subsequently converted to absorbance. 6 Net absorbance extrapolated to 20°.
outlines conditions and data for six experiments. The slopes of plots of the raw absorbance data vs. 1 / T °K varied rather widely from sample to sample; after application of the optimum base line correction for best linearity, there was acceptable agreement as shown in Figure 3 and in Table II. It appears that this type
2749
Table II : Derived Values and Calculated Thermodynamic Parameters
Run- | d A/do/nl Inter
- A H, kcal/ — AS,
no. x io-« cept € mol eu
1 0.450 13.4 10.0 8.94 15.22 0.391 11.2 10.1 7.76 10.83 0.455 12.8 10.1 9.04 15.44 0.402 11.0 10.1 8.00 12.05 0.400 11.5 8.6“ 7.94 11.46 0.448 11.3 10.0 8.91 11.0° This run exhibited by far the largest nonspecific absorbance;
even after the appropriate corrections, it cannot be considered as reliable as the others.
of correction procedure has not been used previously in any of the numerous investigations of the hydration of formaldehyde by uv spectrophotometry.
Plots of log K , equivalent to log A , vs. 1/T°K have been reported to be curved and attempts were made to obtain improved linearity by the proper choice of extinction coefficient. 10 In view of eq 5, the relation between the value of the extinction coefficient and the linearity of such plots is not evident. The contribution of the nonspecific absorbance at Xmax is the cause of curvature in our case.
The values of the thermodynamic parameters were obtained from A H = R {dT/d(l/T)} and AS = — R {intercept — In (€Z[HOCH2OH]/1V’h!o)}- The enthalpy is independent of the extinction coefficient, but the entropy does have a relatively small dependence. The value of the extinction coefficient can be obtained by use of eq 5 from the best available value of K ,3 that of Valenta at 20° , 11 in conjunction with our extrapolated values of net absorbance at the same temperature, Table I. The values of the extinction coefficient resulting from each run and the calculated thermodynamic parameters are given in Table II.
DiscussionIt should be noted that the value of approximately
10 obtained in this work for the extinction coefficient of formaldehyde appears low compared to that for similar compounds; we found e = 17.5 ± 0.2 for acetone in water (constant between 30 and 60°) and for acetaldehyde in water e = 17 has been reported.21 How-
(21) R. P. Bell and J. C. Clunie, Trans. Faraday Soc., 48, 439 (1952).
The Journal of Physical Chemistry, Voi. 74, No. 14, 1970
2750 A. A. Zavitsas, M. Coffiner, T. W iseman, and L. R. Zavitsas
ever, variations in emax with structure for small aldehydes are not uncommon. 22 For formaldehyde e =1 2 .5 has been assumed previously by extrapolation from higher aldehydes;8 e = 7 also has been used as a rough estimate. 10
Our value of A H = — 8.4 ± 0.5 kcal/mol can be compared with previous rough estimates of 8- 1 0 ;3 it is a reasonable value since the sum of the heats of solution and hydration of gaseous formaldehyde in water is 14.6 kcal/mol23 and the latent heat of the monomeric gas is 5.57 kcal/mol, 24 setting an upper limit of approximately 9 kcal/mol. A recent statistical analysis of available thermodynamic data for the reactions of formaldehyde with water and with its own polymers gave a “best” value of A H = —9.3 as part of an overall consistent set.26
The entropy change found, AS = —12.6 ± 1.7 eu, is in the expected direction for this kind of reaction but no meaningful comparisons can be made with other aldehydes since entropy changes for carbonyl hydrations vary rather widely.3,22,26
Increasing temperature appears to lead to a small red shift in Xmax for formaldehyde, Figure 2. A general property of n -7r* bands is a red shift in going from a polar to a nonpolar medium; the dipole moment decreases in going from the ground to the excited state.4 In this case it should be noted that the dielectric constant of water decreases substantially with increasing temperature. Such small red shifts for formaldehyde have been reported previously.20 The shift can be attributed to decreased hydrogen bonding of the ground state at higher temperature. However, we find no comparable shift with acetone in water over the same temperature range. We have concluded that this apparent shift probably is not real; it is the result that would be expected from the algebraic addition of an increasing and broad signal to a steeply sloping base line (the tail-end of the nonspecific absorption).
Acknowledgm ent. We wish to thank the Brooklyn
Center Committee on Research of Long Island University for support of part of this work.
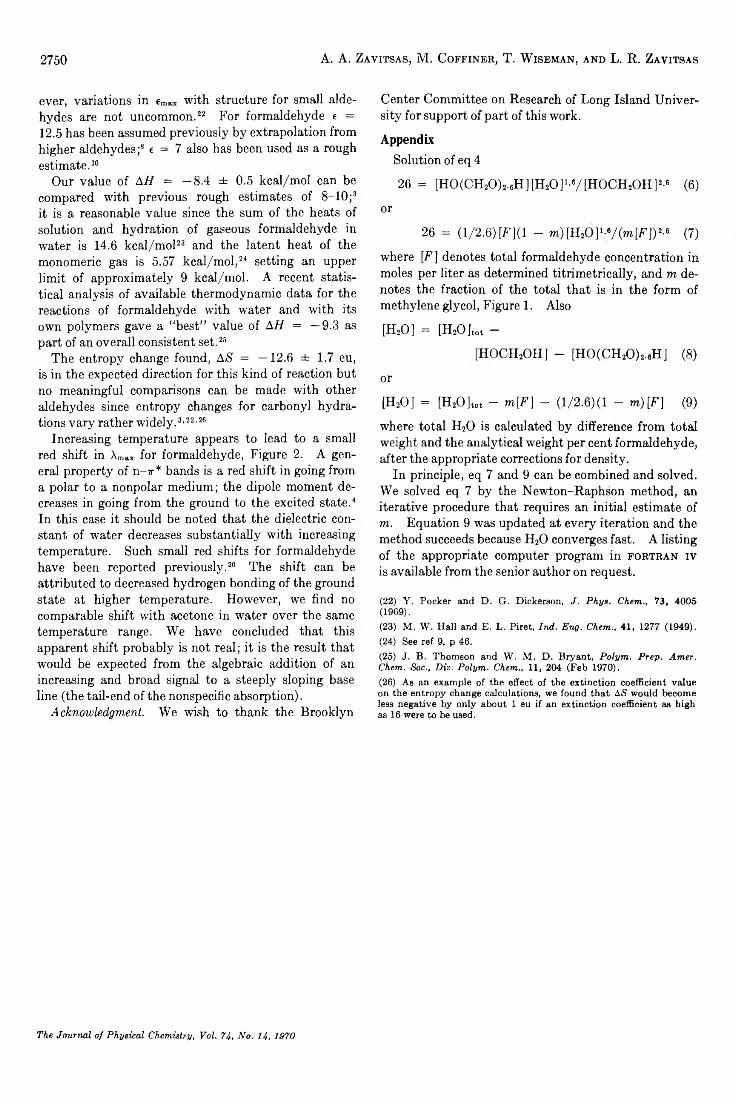
AppendixSolution of eq 4
26 = [HOCCH^i.eHltHiOI^VtHOC^OH]2-6 (6)
or
26 = (1/2.6)[F](l - m M HsO^VM F ] ) 2-6 (7)
where [F] denotes total formaldehyde concentration in moles per liter as determined titrimetrically, and m denotes the fraction of the total that is in the form of methylene glycol, Figure 1. Also
[H20] = [H20 ]tot -
[HOCH2OH] - [H0(CH20 )2.6H] (8)
or
[H20] = [H20]tot - m [ F ] - (1 / 2 .6 ) (1 - m ) [ F ] (9)
where total H20 is calculated by difference from total weight and the analytical weight per cent formaldehyde, after the appropriate corrections for density.
In principle, eq 7 and 9 can be combined and solved. We solved eq 7 by the Newton-Raphson method, an iterative procedure that requires an initial estimate of m. Equation 9 was updated at every iteration and the method succeeds because H20 converges fast. A listing of the appropriate computer program in fortran iv is available from the senior author on request.
(22) Y. Pocker and D. G. Dickerson, J. Phys. Chern., 73, 4005 (1969).(23) M. W. Hall and E. L. Piret, Ind. Eng. Chem., 41, 1277 (1949).(24) See ref 9, p 46.(25) J. B. Thomson and W. M. D. Bryant, Polym. Prep. Amer. Chem. Soc., Div. Polym. Chem., 11, 204 (Feb 1970).(26) As an example of the effect of the extinction coefficient value on the entropy change calculations, we found that AS would become less negative by only about 1 eu if an extinction coefficient as high as 16 were to be used.
The Journal of Physical Chemistry, Vol. 7A, No. 1A, 1970
X T r a n s it io n T e m p e r a t u r e in S o d iu m N it r a t e 2751
Determination to 5 kbars of the X Transition Temperature
in Sodium Nitrate
by W. Element, Jr.1Department of Geophysics and Geochemistry, Australian National University, Canberra, A.C.T., Australia (Received September 23, 1969)
Differential thermal analysis signals for the X transition in sodium nitrate have been obtained in experiments to 5 kbars in hydrostatic apparatus with heating-cooling rates of ~10-30° min-1. If the equilibrium transition temperature is taken as midway between the temperatures of the heating and cooling signals (which differed by ~5°), the best linear fit suggests dT\/dp ~ 7.2° kbar-1; if the curvature, d2T\/dp2 < 0, is allowed, the initial slope is ~8° kbar-1.
Rapoport2 suggested that the temperature, 7\, of the X transition in sodium nitrate increased with pressure at the rate of 6.3 ± 0.2°3 kbar-1 at zero pressure; this suggestion was based on an investigation over the range of ~ 5 -4 0 kbars in apparatus using solid pressure-transmitting media with differential thermal analysis (dta) in which, unfortunately, only a weak signal on cooling thru the transition could be detected. By correlating various zero-pressure thermodynamic data, Klement4 proposed instead that dl\/dp ~ 8-6° kbar-1. This note describes an investigation by dta of the X transition to 5 kbar in hydrostatic apparatus.
Analar sodium nitrate of “ analytical reagent” grade (<0.015% specified impurities) was compacted into pellets 1.50 cm long by 10.7 mm diam under a nominal pressure of 3 kbars. A blind hole of 1.20-mm diameter1.14 cm deep was drilled into a molybdenum “ thermocouple well” of 2.46-mm diameter which was pressed into a hole drilled along the pellet axis. In Paterson’s apparatus5 (which was designed for deformation work), argon is used as the pressure-transmitting medium and the cylindrical sample and adjacent steel end pieces are encased in a 0.25 mm thick annealed copper sheath. Heating is accomplished by passing current through nichrome windings concentric with the specimen. By means of an axial hole, an assembly comprised of three chromel-alumel thermocouples (with sheaths ~0.5- mm diameter) was introduced into the molybdenum well; the junctions were spaced ~ 9 mm apart and from the end. Pressure is measured by a manganin cell5 calibrated against a Heise gage and is known to an accuracy of at least ±50 bars.
The molybdenum well represents a compromise between the desired factors: (a) of high thermal conductivity and good thermal contact between specimen and thermocouple and (b) of strength sufficient to prevent extrusion of the sample into the axial hole or collapse about the thermocouple. In one run, a stainless steel well was used but the signals observed were inferior to those obtained with the design herein described.
In order to obtain sufficiently distinct and reproducible dta signals (even after amplification with a dc amplifier), it was necessary to abruptly alter the furnace current so that temperature varied at rates of ~ 10-30° min-1. The variation in temperature among the thermocouples in the sample was, however, almost always within 1 ° . Thus all of the useful data were obtained by varying temperature isobarically; some attempts to achieve better precision by isothermally varying pressure were unsuccessful because pumping on-bleeding off the gas caused excessive variations in temperature.
Upon commencing a run, the specimen was pressurized to a few hundred bars and annealed for 5-10 min a few degrees below the transition. Sufficiently distinct and reproducible signals could not be obtained initially at the lowest pressures; it seemed that a number of cycles through the transition, as well as going to slightly higher pressures and temperatures, were necessary. Shown in Figure 1 are the temperatures of the heating and cooling signals accepted for the transition for the several runs, for both increasing and decreasing pressure. The upper pressure here was dictated by the rate at which the pump could maintain the pressure against leakage. The absence of data at the lowest pressures is mostly due to the progressive indistinctness of the signals there. Cooling signals in the range of ~ 3 -4 kbars were difficult to recognize because of the much larger signals due to freezing of small amounts of sodium nitrate which had seeped into the thermocouple well.
The signals were reproducible to ± 1 ° and the uncertainty in the recorder calibration was ± 1 ° . Hence,
(1) G uggenheim F ellow , on leave from S ch oo l o f E ngineering and A p p lied Science, U niversity o f C alifornia , L os A ngeles, C alif. 90024.(2) E . R ap oport, J. Phys. Chem. Solids, 27 , 1349 (1966).(3) C . W . F . T . Pistorius, E . R a p op ort, and J. B . C lark, Z. Phys. Chem. (F rankfurt am M a in ), 59 , 200 (1968).(4) W . K lem ent, J. Phys. Chem., 72, 1294 (1968).(5) M . S . Paterson , to be published.
T he Journal o f P h ysica l Chem istry, V oi. 74, N o. 14, 1970
2752 W. K l e m e n t , Jr.
320 ----- 1---- 1----- 1-----1----- 1----- 1-----1----- 1-----1----- 1tj> A A 4
-S ' * heating v V* A V2 300 - A **3 A »o - A vr® A Vc 280 - ** cooling» -C T Aa>*♦- ___ i___i___ i___i----- 1----- 1-----1----- 1-----1-----
0 1 2 3 4 5pressure, k b a r
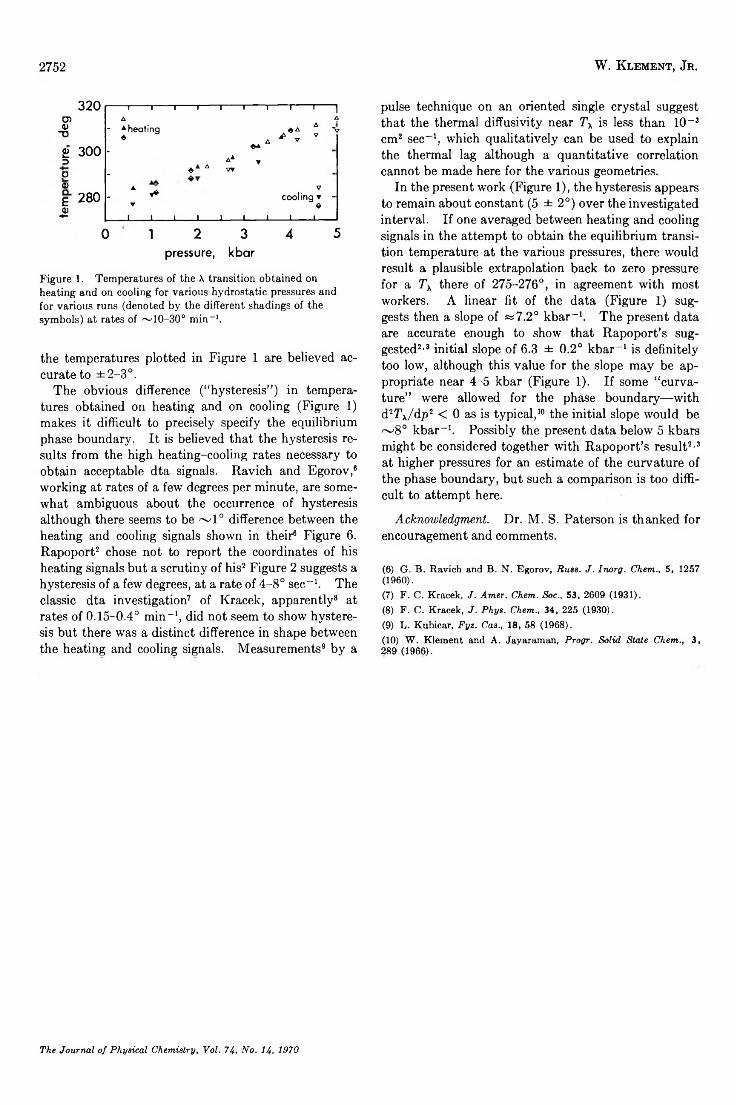
Figure 1. Temperatures of the X transition obtained on heating and on cooling for various hydrostatic pressures and for various runs (denoted by the different shadings of the symbols) at rates of ~ 10-30° min-1.
-----1-----1-----A
-----1-----1-----1 ' 1 1 |A- A heating ♦ .4* * *V
A * v "O*»♦ A ° V»
A »♦ cooling» -___ 1___ 1___
❖___ 1___ 1___ 1___ 1-----1----- 1-----
the temperatures plotted in Figure 1 are believed accurate to ±2 -3°.
The obvious difference (“ hysteresis” ) in temperatures obtained on heating and on cooling (Figure 1) makes it difficult to precisely specify the equilibrium phase boundary. It is believed that the hysteresis results from the high heating-cooling rates necessary to obtain acceptable dta signals. Ravich and Egorov,6 working at rates of a few degrees per minute, are somewhat ambiguous about the occurrence of hysteresis although there seems to be ~ 1 ° difference between the heating and cooling signals shown in their6 Figure 6. Rapoport2 chose not to report the coordinates of his heating signals but a scrutiny of his2 Figure 2 suggests a hysteresis of a few degrees, at a rate of 4-8° sec-1. The classic dta investigation7 of Kracek, apparently8 at rates of 0.15-0.4° min-1, did not seem to show hysteresis but there was a distinct difference in shape between the heating and cooling signals. Measurements9 by a
pulse technique on an oriented single crystal suggest that the thermal diffusivity near 7\ is less than 10-3 cm2 sec-1, which qualitatively can be used to explain the thermal lag although a quantitative correlation cannot be made here for the various geometries.
In the present work (Figure 1), the hysteresis appears to remain about constant (5 ± 2°) over the investigated interval. If one averaged between heating and cooling signals in the attempt to obtain the equilibrium transition temperature at the various pressures, there would result a plausible extrapolation back to zero pressure for a Tx there of 275-276°, in agreement with most workers. A linear fit of the data (Figure 1) suggests then a slope of «7 .2 ° kbar-1. The present data are accurate enough to show that Rapoport’s suggested2'3 initial slope of 6.3 ± 0.2° kbar-1 is definitely too low, although this value for the slope may be appropriate near 4-5 kbar (Figure 1). If some “ curvature” were allowed for the phase boundary— with d27\/dp2 < 0 as is typical,10 the initial slope would be ~ 8 ° kbar-1. Possibly the present data below 5 kbars might be considered together with Rapoport’s result2'3 at higher pressures for an estimate of the curvature of the phase boundary, but such a comparison is too difficult to attempt here.
Acknowledgment. Dr. M. S. Paterson is thanked for encouragement and comments.
(6) G . B . R av ich and B . N . E g orov , Russ. J. Inorg. Chem.., S, 1257 (1960).(7) F . C . K racek , J. Amer. Chem. Soc., 53, 2609 (1931).(8) F . C . K racek , J. Phys. Chem., 34, 225 (1930).(9) L . K u b ica r, Fyz. Cas., 18, 58 (1 968 ).(10) W . K lem en t and A . Jayaram an, Progr. Solid State Chem., 3 , 289 (1966).
The Journal o f P hysica l Chem istry, Vol. 74, N o. 14, 1970
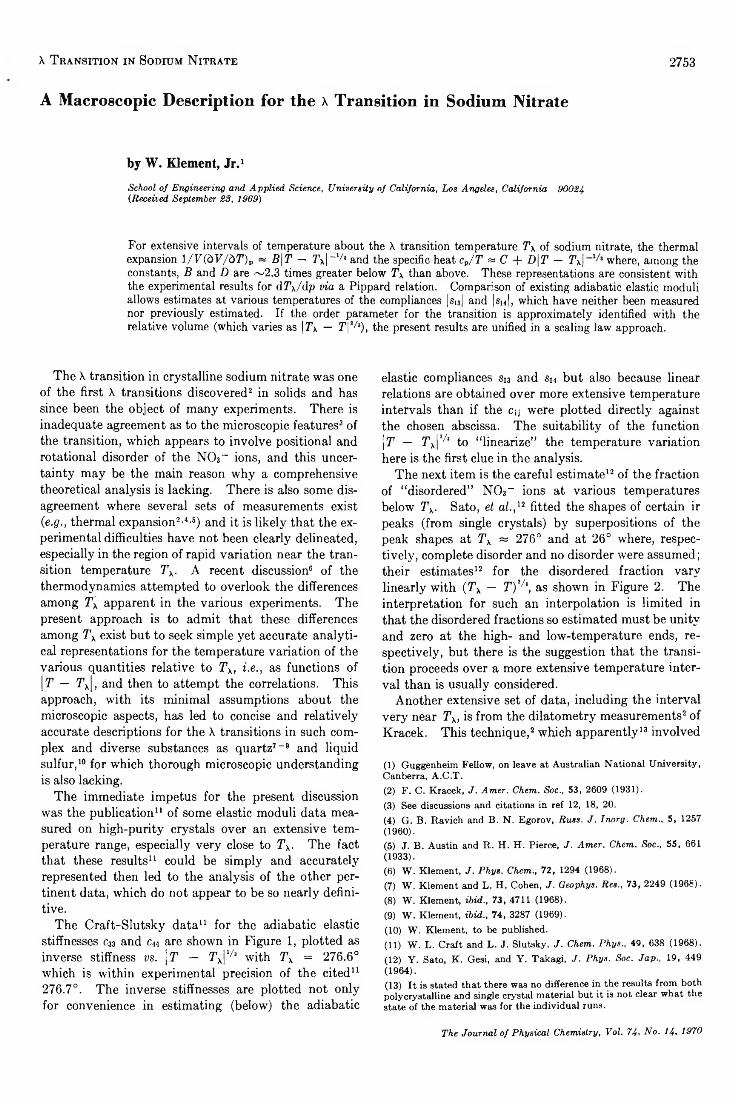
X T r a n s it io n in So d iu m N it r a t e 2753
A Macroscopic Description for the x Transition in Sodium Nitrate
by W. Element, Jr.1School o f Engineering and Applied Science, University of California, Los Angeles, California 90024 (.Received September 28, 1969)
For extensive intervals of temperature about the X transition temperature T\ of sodium nitrate, the thermal expansion l/V(bV/dT)p ~ B\T — Tx|-1/l and the specific heat cJT « C + D\T — T\\ where, among the constants, B and D are ~2.3 times greater below T\ than above. These representations are consistent with the experimental results for dT\/dp via a Pippard relation. Comparison of existing adiabatic elastic moduli allows estimates at various temperatures of the compliances |su| and |si4|, which have neither been measured nor previously estimated. If the order parameter for the transition is approximately identified with the relative volume (which varies as |!TX — T\2/z), the present results are unified in a scaling law approach.
The X transition in crystalline sodium nitrate was one of the first X transitions discovered2 in solids and has since been the object of many experiments. There is inadequate agreement as to the microscopic features3 of the transition, which appears to involve positional and rotational disorder of the NO3" ions, and this uncertainty may be the main reason why a comprehensive theoretical analysis is lacking. There is also some disagreement where several sets of measurements exist (e.g., thermal expansion2-4’6) and it is likely that the experimental difficulties have not been clearly delineated, especially in the region of rapid variation near the transition temperature Tx. A recent discussion6 of the thermodynamics attempted to overlook the differences among Tx apparent in the various experiments. The present approach is to admit that these differences among 7\ exist but to seek simple yet accurate analytical representations for the temperature variation of the various quantities relative to Tx, i.e., as functions of IT — Tx|, and then to attempt the correlations. This approach, with its minimal assumptions about the microscopic aspects, has led to concise and relatively accurate descriptions for the X transitions in such complex and diverse substances as quartz7-9 and liquid sulfur,10 for which thorough microscopic understanding is also lacking.
The immediate impetus for the present discussion was the publication11 of some elastic moduli data measured on high-purity crystals over an extensive temperature range, especially very close to Tx. The fact that these results11 could be simply and accurately represented then led to the analysis of the other pertinent data, which do not appear to be so nearly definitive.
The Craft-Slutsky data11 for the adiabatic elastic stiffnesses C33 and c44 are shown in Figure 1, plotted as inverse stiffness vs. \T — Tx\1/z with Tx = 276.6° which is within experimental precision of the cited11 276.7°. The inverse stiffnesses are plotted not only for convenience in estimating (below) the adiabatic
elastic compliances Sj3 and s44 but also because linear relations are obtained over more extensive temperature intervals than if the Cjj were plotted directly against the chosen abscissa. The suitability of the function |T — Tx|‘/a to “ linearize” the temperature variation here is the first clue in the analysis.
The next item is the careful estimate12 of the fraction of “ disordered” NO3 - ions at various temperatures below Tx. Sato, et al.,u fitted the shapes of certain ir peaks (from single crystals) by superpositions of the peak shapes at Tx « 276° and at 26° where, respectively, complete disorder and no disorder were assumed; their estimates12 for the disordered fraction vary linearly with (Tx — T),/% as shown in Figure 2. The interpretation for such an interpolation is limited in that the disordered fractions so estimated must be unity and zero at the high- and low-temperature ends, respectively, but there is the suggestion that the transition proceeds over a more extensive temperature interval than is usually considered.
Another extensive set of data, including the interval very near Tx, is from the dilatometry measurements2 of Kracek. This technique,2 which apparently13 involved
(1) G uggenheim F ellow , on leave at A ustralian N a tion a l U n iversity , Canberra , A .C .T .(2) F . C . K racek , J. Amer. Chem. Soc., 53, 2609 (1931).(3) See discussions and cita tion s in ref 12, 18, 20.(4) G . B . R a v ich and B . N . E g orov , Russ. J. Inorg. Chem., 5 , 1257 (1960).(5) J . B . A ustin and R . H . H . P ierce, J. Amer. Chem. Soc., 55 , 661 (1933).(6) W . E lem en t, J. Phys. Chem., 72 , 1294 (1968).(7) W . E lem en t and L . H . C ohen , J. Geophys. Res., 73 , 2249 (1968).
(8) W . E lem en t, ibid., 73 , 4711 (1968).(9) W . E lem en t, ibid., 74 , 3287 (1969).(10) W . E lem en t, to be published.(11) W . L . C ra ft and L . J . S lutsky, J. Chem. Phys., 49 , 638 (1 968).(12) Y . Sato, K . Gesi, and Y . T ak ag i, J. Phys. Soc. Jap., 19, 449 (1964).(13) I t is stated th at there w as n o d ifference in the results from b o th polycrysta lline and single crystal m aterial bu t it is n o t clear w h at the state o f the m ateria l was for the ind iv idu al runs.
The Journal o f P h ysical Chem istry, Vol. 74, N o . 14, 1970
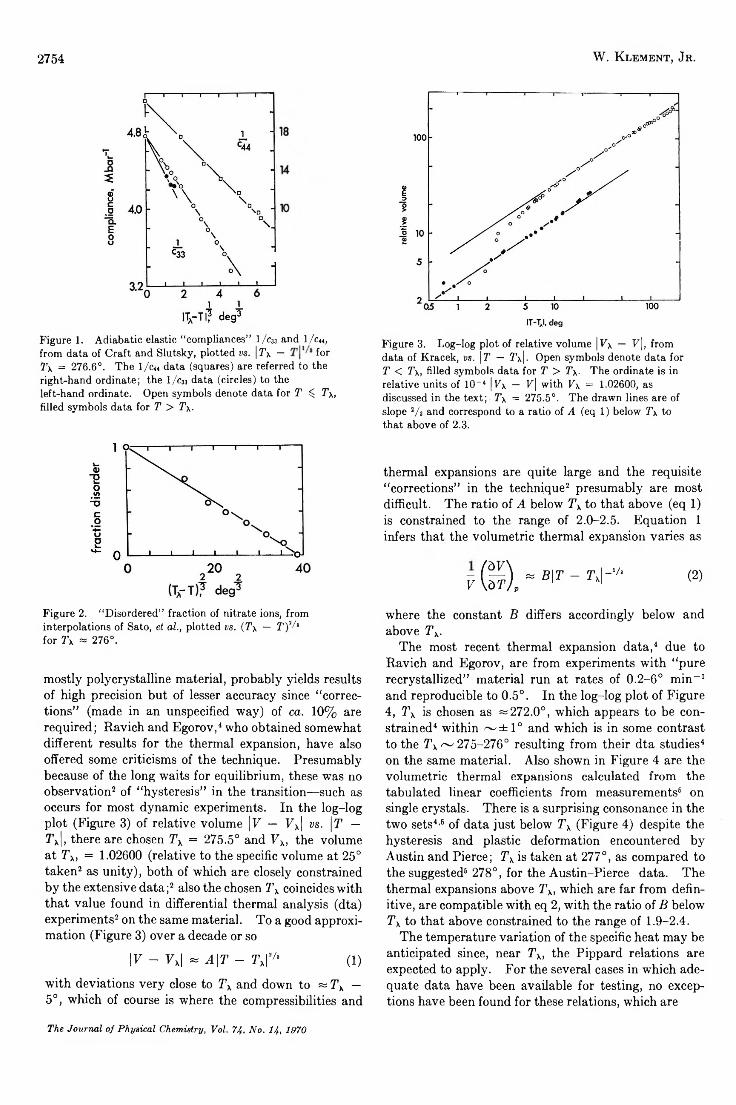
2754 W. K l e m e n t , Jr.
Figure 1. Adiabatic elastic “compliances” l /c 33 and 1/c«, from data of Craft and Slutsky, plotted vs. |7 \ — for T\ = 276.6°. The 1/c« data (squares) are referred to the right-hand ordinate; the l/c 33 data (circles) to the left-hand ordinate. Open symbols denote data for T S$ T\, filled symbols data for T > T\.
Figure 2. “Disordered” fraction of nitrate ions, from interpolations of Sato, et a l., plotted vs. (T \ — T)F* for 3 \ = 276°.
mostly polycrystalline material, probably yields results of high precision but of lesser accuracy since “ corrections” (made in an unspecified way) of ca. 10% are required; Ravich and Egorov,4 who obtained somewhat different results for the thermal expansion, have also offered some criticisms of the technique. Presumably because of the long waits for equilibrium, these was no observation2 of “ hysteresis” in the transition—such as occurs for most dynamic experiments. In the log-log plot (Figure 3) of relative volume |F — Fx| vs. \ T — Tx|, there are chosen Tx = 275.5° and Fx, the volume at r x> = 1.02600 (relative to the specific volume at 25° taken2 as unity), both of which are closely constrained by the extensive data;2 also the chosen Tx coincides with that value found in differential thermal analysis (dta) experiments2 on the same material. To a good approximation (Figure 3) over a decade or so
IF - F x| « A\T - r x|v* (1)
with deviations very close to 7\ and down to « Tx — 5°, which of course is where the compressibilities and
Figure 3. Log-log plot of relative volume |F X — V\, from data of Kracek, vs. [ T — Tx|. Open symbols denote data for T < T\, filled symbols data for T > T\. The ordinate is in relative units of 10-4 |F X — V\ with F x = 1.02600, as discussed in the text; T\ = 275.5°. The drawn lines are of slope 2/ 3 and correspond to a ratio of A (eq 1 ) below Tx to that above of 2.3.
thermal expansions are quite large and the requisite “ corrections” in the technique2 presumably are most difficult. The ratio of A below Tx to that above (eq 1) is constrained to the range of 2.0-2.5. Equation 1 infers that the volumetric thermal expansion varies as
f © , “ B <T - r F v' ®
where the constant B differs accordingly below and above Tx.
The most recent thermal expansion data,4 due to Ravich and Egorov, are from experiments with “ pure recrystallized” material run at rates of 0.2-6° min-1 and reproducible to 0.5°. In the log-log plot of Figure 4, Tx is chosen as «272.0°, which appears to be constrained4 within ~ ± 1° and which is in some contrast to the Tx ~ 275-276° resulting from their dta studies4 on the same material. Also shown in Figure 4 are the volumetric thermal expansions calculated from the tabulated linear coefficients from measurements6 on single crystals. There is a surprising consonance in the two sets4'6 of data just below Tx (Figure 4) despite the hysteresis and plastic deformation encountered by Austin and Pierce; Tx is taken at 277°, as compared to the suggested6 278°, for the Austin-Pierce data. The thermal expansions above 7\, which are far from definitive, are compatible with eq 2, with the ratio of B below Tx to that above constrained to the range of 1.9-2.4.
The temperature variation of the specific heat may be anticipated since, near Tx, the Pippard relations are expected to apply. For the several cases in which adequate data have been available for testing, no exceptions have been found for these relations, which are
The Journal o f P hysica l Chem istry, Vol. 74, N o . 14, 1970
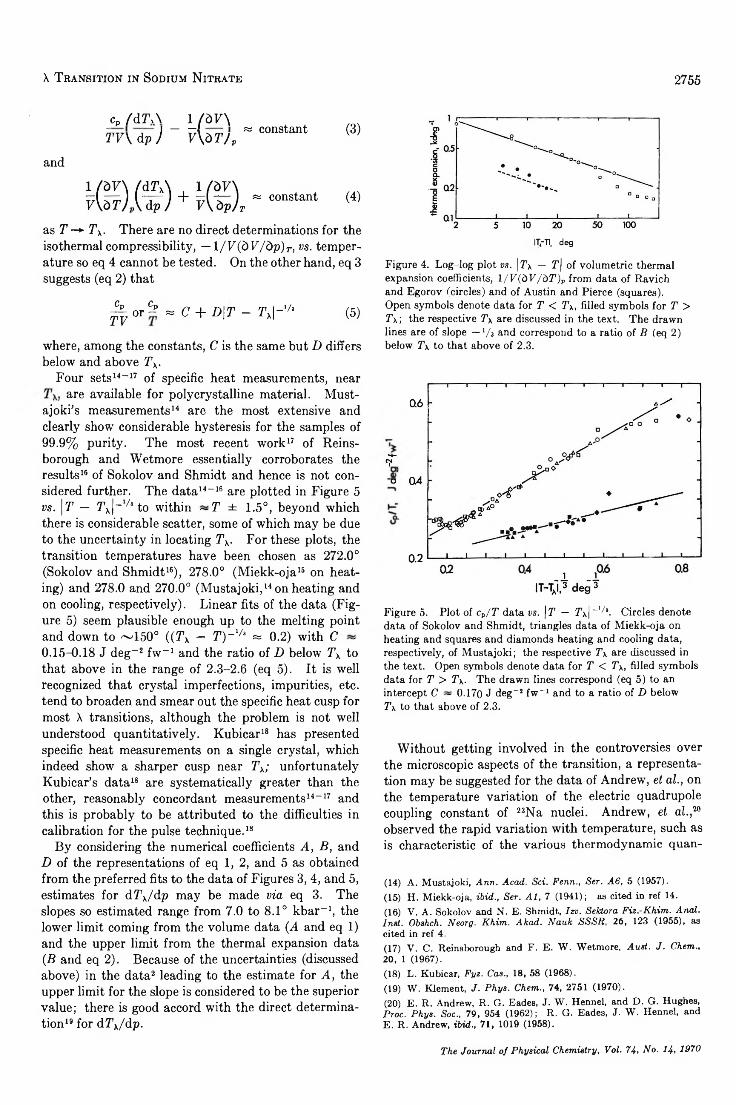
X T r a n s it io n in S o d iu m N it r a t e 2755
and
_Cp/dTA _ l (à V \TF\ dp ) V\0T/p
« constant (3)
« constant (4)
as T -+ T\. There are no direct determinations for the isothermal compressibility, — l/V(òV/òp)r, vs. temperature so eq 4 cannot be tested. On the other hand, eq 3 suggests (eq 2) that
^ o r C-p ~ C + D | T -T x | - l / ’ (5)
where, among the constants, C is the same but D differs below and above Tx.
Four sets14-17 of specific heat measurements, near are available for poly crystalline material. Must-
ajoki’s measurements14 are the most extensive and clearly show considerable hysteresis for the samples of 99.9% purity. The most recent work17 of Reins- borough and Wetmore essentially corroborates the results16 of Sokolov and Shmidt and hence is not considered further. The data14“ 16 are plotted in Figure 5 vs. | T — Tx|~1/sto within ~ T ± 1.5°, beyond which there is considerable scatter, some of which may be due to the uncertainty in locating Tx. For these plots, the transition temperatures have been chosen as 272.0° (Sokolov and Shmidt16), 278.0° (Miekk-oja16 on heating) and 278.0 and 270.0° (Mustajoki,14 on heating and on cooling, respectively). Linear fits of the data (Figure 5) seem plausible enough up to the melting point and down to ~150° ((Tx — T )-1/s « 0.2) with C ~ 0.15-0.18 J deg-2 fw-1 and the ratio of D below Tx to that above in the range of 2.3-2.6 (eq 5). It is well recognized that crystal imperfections, impurities, etc. tend to broaden and smear out the specific heat cusp for most X transitions, although the problem is not well understood quantitatively. Kubicar18 has presented specific heat measurements on a single crystal, which indeed show a sharper cusp near Tx; unfortunately Kubicar’s data18 are systematically greater than the other, reasonably concordant measurements14-17 and this is probably to be attributed to the difficulties in calibration for the pulse technique.18
By considering the numerical coefficients A, B, and D of the representations of eq 1, 2, and 5 as obtained from the preferred fits to the data of Figures 3, 4, and 5, estimates for dTx/dp may be made via eq 3. The slopes so estimated range from 7.0 to 8.1° kbar-1, the lower limit coming from the volume data (A and eq 1) and the upper limit from the thermal expansion data (.B and eq 2). Because of the uncertainties (discussed above) in the data2 leading to the estimate for A, the upper limit for the slope is considered to be the superior value; there is good accord with the direct determination19 for dTx/dp.
IT Ti, deg
Figure 4. Log-log plot vs. \T\ — T\ of volumetric thermal expansion coefficients, l / V { b V / b T ) v from data of Ravich and Egorov (circles) and of Austin and Pierce (squares).Open symbols denote data for T < T\, filled symbols for T > T y , the respective T\ are discussed in the text. The drawn lines are of slope — l/ t and correspond to a ratio of B (eq 2) below T\ to that above of 2.3.
Û6
*4-
7-o’ 04
0.2
Figure 5. Plot of cv/ T data vs. \T — 7 \ | " 'A Circles denote data of Sokolov and Shmidt, triangles data of Miekk-oja on heating and squares and diamonds heating and cooling data, respectively, of Mustajoki; the respective T\ are discussed in the text. Open symbols denote data for T < T\, filled symbols data for T > T\. The drawn lines correspond (eq 5) to an intercept C ~ 0.170 J deg-2 fw -1 and to a ratio of D below T\ to that above of 2.3.
Without getting involved in the controversies over the microscopic aspects of the transition, a representation may be suggested for the data of Andrew, et al., on the temperature variation of the electric quadrupole coupling constant of 23Na nuclei. Andrew, et al.,20 observed the rapid variation with temperature, such as is characteristic of the various thermodynamic quan-
(14) A . M usta jok i, Ann. Acad. Sci. Fenn., Ser. A6, 5 (1957).(15) H . M iek k -o ja , ibid., Ser. A l, 7 (1941); as cited in ref 14.(16) V . A . S ok o lov and N . E . Shm idt, Jot. Sektora Fiz.-Khim. Anal. Inst. Obshch. Neorg. Khim. Akad. Nauk SSSR, 26 , 123 (1955), as c ited in ref 4.(17) V . C . R einsborou gh and F . E . W . W etm ore, Aust. J. Chem., 20, 1 (1967).(18) L . K u bicar, Fyz. Cas., 18, 58 (1968).(19) W . K lem ent, J. Phys. Chem., 74, 2751 (1 970 ).(20) E . R . A ndrew , R . G . E ades, J . W . H ennel, and D . G . H ughes, Proc. Phys. Soc., 79 , 954 (1 962); R . G . E ades, J. W . H ennel, and E . R . A ndrew , ibid., 71 , 1019 (1958).
The Journal o f P h ysica l Chem istry, Voi. 74, N o. 14, 1970
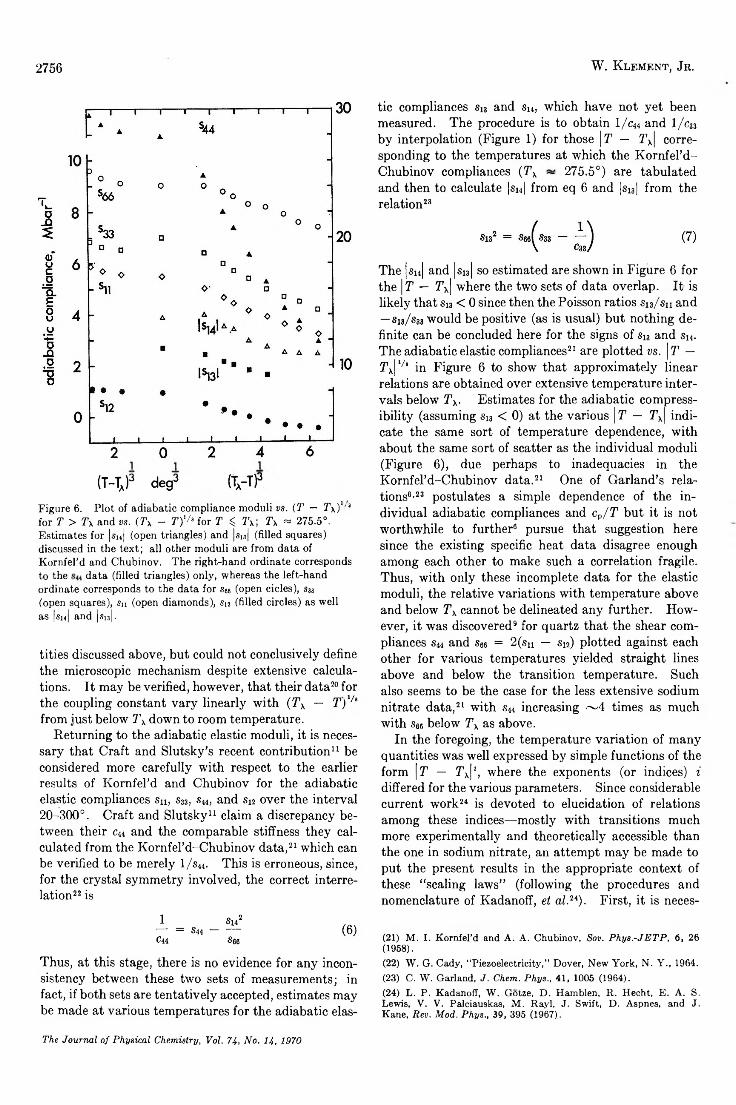
2756 W. E l e m e n t , Jr.
(T -T / deg (TA-TPFigure 6. Plot of adiabatic compliance moduli vs. (T — Tx)1' 3 for T > T-k and vs. (7\ - T)'/> for T ^ rI\; Tx « 275.5°. Estimates for |sn| (open triangles) and |su| (filled squares) discussed in the text; all other moduli are from data of Kornfel’d and Chubinov. The right-hand ordinate corresponds to the data (filled triangles) only, whereas the left-hand ordinate corresponds to the data for s®« (open cicles), S33
(open squares), su (open diamonds), si2 (filled circles) as well as |sn| and |si3|.
tities discussed above, but could not conclusively define the microscopic mechanism despite extensive calculations. It may be verified, however, that their data20 for the coupling constant vary linearly with (7\ — T) 1/1 from just below 7\ down to room temperature.
Returning to the adiabatic elastic moduli, it is necessary that Craft and Slutsky’s recent contribution11 be considered more carefully with respect to the earlier results of Kornfel’d and Chubinov for the adiabatic elastic compliances Su, s33, «44, and S12 over the interval 20-300°. Craft and Slutsky11 claim a discrepancy between their C44 and the comparable stiffness they calculated from the Kornfel’d-Chubinov data,21 which can be verified to be merely l /s 44. This is erroneous, since, for the crystal symmetry involved, the correct interrelation22 is
1 SX42— = S44 - — (6)C44 «66
Thus, at this stage, there is no evidence for any inconsistency between these two sets of measurements; in fact, if both sets are tentatively accepted, estimates may be made at various temperatures for the adiabatic elas
tic compliances Si3 and S14, which have not yet been measured. The procedure is to obtain l / c 44 and l / c 33 by interpolation (Figure 1) for those \T — 2\| corresponding to the temperatures at which the Kornfel’d - Chubinov compliances (Tx ~ 275.5°) are tabulated and then to calculate |si4| from eq 6 and |s«| from the relation23
The |«i4| and |si3| so estimated are shown in Figure 6 for the | T — Tx| where the two sets of data overlap. It is likely that Si3 < 0 since then the Poisson ratios Sis/sn and —S13/S33 would be positive (as is usual) but nothing definite can be concluded here for the signs of S13 and Si4. The adiabatic elastic compliances21 are plotted vs. | T — Tx|‘/! in Figure 6 to show that approximately linear relations are obtained over extensive temperature intervals below Tx. Estimates for the adiabatic compressibility (assuming su < 0) at the various | T — Tx| indicate the same sort of temperature dependence, with about the same sort of scatter as the individual moduli (Figure 6), due perhaps to inadequacies in the Kornfel’d-Chubinov data.21 One of Garland’s relations6’23 postulates a simple dependence of the individual adiabatic compliances and cp/T but it is not worthwhile to further6 pursue that suggestion here since the existing specific heat data disagree enough among each other to make such a correlation fragile. Thus, with only these incomplete data for the elastic moduli, the relative variations with temperature above and below Tx cannot be delineated any further. However, it was discovered9 for quartz that the shear compliances S44 and «66 = 2(sn — sH) plotted against each other for various temperatures yielded straight lines above and below the transition temperature. Such also seems to be the case for the less extensive sodium nitrate data,21 with S44 increasing ~ 4 times as much with «66 below Tx as above.
In the foregoing, the temperature variation of many quantities was well expressed by simple functions of the form | T — 71x|i, where the exponents (or indices) i differed for the various parameters. Since considerable current work24 is devoted to elucidation of relations among these indices—mostly with transitions much more experimentally and theoretically accessible than the one in sodium nitrate, an attempt may be made to put the present results in the appropriate context of these “ scaling laws” (following the procedures and nomenclature of Kadanoff, et al.2i). First, it is neces-
(21) M . I . K orn fe l’d and A . A . C h u binov , Sov. Phys.-JETP, 6, 26 (1958).(22) W . G . C ady, “ P iezoe lectr ic ity ,” D over, N ew Y ork , N . Y . , 1964.(23) C . W . G arland, J. Chem. Phys., 41, 1005 (1964).(24) L . P . K ad an off, W . G otze, D . H am blen , R . H ech t, E . A . S . Lew is, V . V . Palciauskas, M . R a y l, J . Sw ift, D . A spnes, and J. K ane, Rev. Mod. Phys., 39 , 395 (1967).
The Journal o f P hysica l Chem istry, Vol. 74, N o . 14 , 1970
X T r a n s it io n in S o d iu m N it r a t e 2757
sary to choose an “ order parameter” ; as with the description8 for the quartz inversion, it is convenient to take |FX — V\ as the approximate order parameter, which then yields the index «= 2/ 3 (eq 1) and which is microscopically plausible in view of the results12 of Sato, et al. (Figure 2). The temperature variation of the specific heat below and above Tx (Figure 5; eq 5) yields the indices —a and — a', respectively, ~ — W Requisite knowledge for the isothermal compressibility is lacking; however, since
and the adiabatic compressibility apparently varies only as strongly as | T — Tx| ‘/!, it may be assumed that the second term on the right-hand side of eq 8 dominates26 near Tx and that the indices —7 and —7 ' below and above, respectively, 1/i. Thus the conditions24 that a = a', 7 = 7 ' and
2 — a = 7 + 2d = KS + 1) (9)
are completely satisfied if S = 3/ 2. The definition here for 5 is via the relation
|FX - V\° = \p — px| (10)
at the temperature Tx corresponding to the X transition pressure px. There are no data for the equation of state for which eq 10 might be examined. Equation 9 and the scaling law approach,24 with the numerical values for the indices, then yield explicit predictions for the indices (e.g., rj, v,v'u) which describe the behavior
due to fluctuations near the transition; there do not appear to be any data presently available to test such predictions.
These macroscopic theories have very little to say concerning the range of temperatures (and pressures) about Tx over which the correlations and analytical representations are expected to be valid. Empirically, the Cp/T representations (eq 5) appear to be useful from ~150° up to the melting point (Figure 5). The representations for the thermal expansion may be useful over a similar temperature range but this cannot be inferred yet because the best of the data (of Ravich and Egorov4) only extend down to 200° (Figure 4). Similarly, a specification of the temperature ranges for the validity of the representations for the other quantities would seem to require a suitable microscopic model. The macroscopic approach also does not offer any insight into the origin of either the approximate factor 2.3, which is required so “ symmetrize” the temperature variation of the several thermodynamic quantities about Tx, or the approximate exponents */3, 2/ 3, etc., required to “ linearize” the variation; better measurements of course can refine these numerical factors.
Nevertheless, for all of these shortcomings, the present approach to the X transition in sodium nitrate results in a more quantitative and concise description than hitherto, with avenues suggested for estimates of quantities not yet adequately measured. It is perhaps surprising that such simple representations seem to suffice for a physical situation in which there appears to be positional and vibrational disordering, libration, hindered rotation, etc. of the constituent ions of enough complexity to have frustrated a comprehensive interpretation of so many investigations3 so far.
(25) E qu ation 4 is thus satisfied also.
The Journal o f P hysica l Chem istry, Vol. 74, N o. 14, 1970
2758 D a v id H. O l s o n
A Reinvestigation of the Crystal Structure of the Zeolite Hydrated NaX
by David H. OlsonMobil Research and Development Corporation, Central Research Division Laboratories, Princeton, New Jersey 08640 (Received December 11, 1969)
The crystal structure of hydrated NaX has been reinvestigated using single crystal X-ray techniques. Although the basic structural features agree with the earlier powder X-ray study of Broussard and Shoemaker, several, more detailed, features of the structure have been found. The probable space group and lattice parameter of the crystal studied are Fd3 and 25.028 A, respectively. The space group and the two average tetrahedral atom (Si, Al)-oxygen bond distances, 1.619 (4) and 1.729 (4) A, indicate that the Si and A1 atoms are ordered to a considerable extent. The nonframework atom site occupancies and assignments are as follows: site I, 9 Na+; site 1', 8 Na+ and 12 H20; near site IF, 26 H20; site II, 24 Na+ and 8 H20. In addition, seven low occupancy supercage scattering sites due to H20 and/or Na were found. The occupancy of site II gives direct evidence for the influence of aluminum content on cation siting in hydrated faujasites;i.e., a supercage six-ring of tetrahedra must contain three A1 ions before ion siting is energetically favorable. This rule appears to apply to hydrated mono and polyvalent cation faujasites.
IntroductionHydrated NaX is the parent material for all zeolite X
derivatives, i.e., catalysts, drying agents, etc. The crystal structure of this commercially important zeolite was reported nearly a decade ago by Broussard and Shoemaker,1 and elucidation of its crystal chemistry (primarily ion-exchange properties) has relied heavily upon the results of their powder diffraction study.
The availability of large crystals of hydrated NaX and our preliminary observation of diffraction symmetry lower than that assumed in the early study prompted us to reinvestigate the structure of the material. The lower diffraction symmetry suggested the possibility of obtaining information on the ordering of Si and A1 ions; this information was subsequently obtained. The cation distribution found differs in many respects from that found earlier,1 although many of the differences found can be attributed to the higher accuracy obtained in our study. Evidence for an effect of A1 content on the siting of cations in supercage six-rings also was found.
Experimental SectionThe NaX single crystal used in this study was grown
by Charnell.2 The crystal, which was a well-formed octahedron 60 n on an edge, was mounted in an open capillary tube for X-ray examination. The preliminary diffraction photographs exhibited m3 Laue symmetry, and the extinctions were consistent with the space group Fd3. The lattice parameter, a0 = 25.028 (5) A, was determined by double-scanning diffractom- etry3 on a Siemens goniometer equipped with a General Electric Eulerian Cradle. The intensity data were collected using the moving-crystal, moving- counter technique with nickel-filtered copper radiation. One-minute background counts were taken at each end of a three-degree, three-minute scan. The intensities
of the 1014 unique reflections contained in V3 octant (120° 28 cutoff) were measured. The standard deviations of the structure factors were computed as described earlier.4 Only those structure factors (694) having values greater than twice their standard deviations were used in solving and refining the structure.
The unit cell composition of the zeolite
Na8s [AlssSiio-iO 384 ] • 220H2O
was determined from the relation between the lattice parameter and aluminum content.6 The sodium content represented by this composition agrees with the value found for the parent preparation, i.e., 15.0 wt % on a dry basis.
Determination and Refinement of the StructureLeast-squares6 and Fourier techniques were combined
with trial faujasite framework parameters and estimated cation parameters to solve the structure. The structure factors were computed using scattering factors for Si2+, A1+, 0~, and Na+, based upon the HFS ionic scattering factors of Hanson and Pohler.7 In the last two least-squares cycles, the scattering factors were adjusted in accordance with the assumption that T1 is a pure Si site, and T2 is a site having 0.08 Si plus 0.92 Al. For this compositional assignment, the average T l -0
(1) L . B roussard and D . P . Shoem aker, J. Amer. Chem. Soc., 82 , 1041 (1960).(2) J . Charnell, M o b il R esearch and D evelop m en t C orp ., P auls- boro , N . J. 08066, to be published.(3) H . W . K in g and L . F . Vassm illet, “ A d va n ces in X -R a y A n a lysis 5 ,” W . M . M ueller, G . R . M alle tt , and M . J. F ox , E d ., P lenum P ublish ing C o., N ew Y ork , N . Y ., 1961, p p 78 -7 9 .(4) D . H . Olson, J. Phys. Chem., 72 , 4366 (1968).(5) E . D em psey, G . H . K u ehl, and D . H . O lson, ibid., 7 3 , 387 (1969).(6) W . R . B using, K . O . M artin , and H . A . L ev y , “ O R F L S ,” O ak R id g e N ational L aboratory , O ak R idge, T en n ., 1962.(7) H . P . H anson and R . F . P ohler, Acta Crystallogr., 21 , 435 (1966).
The Journal o f P hysica l Chem istry, Voi. 74, N o. 14, 1970
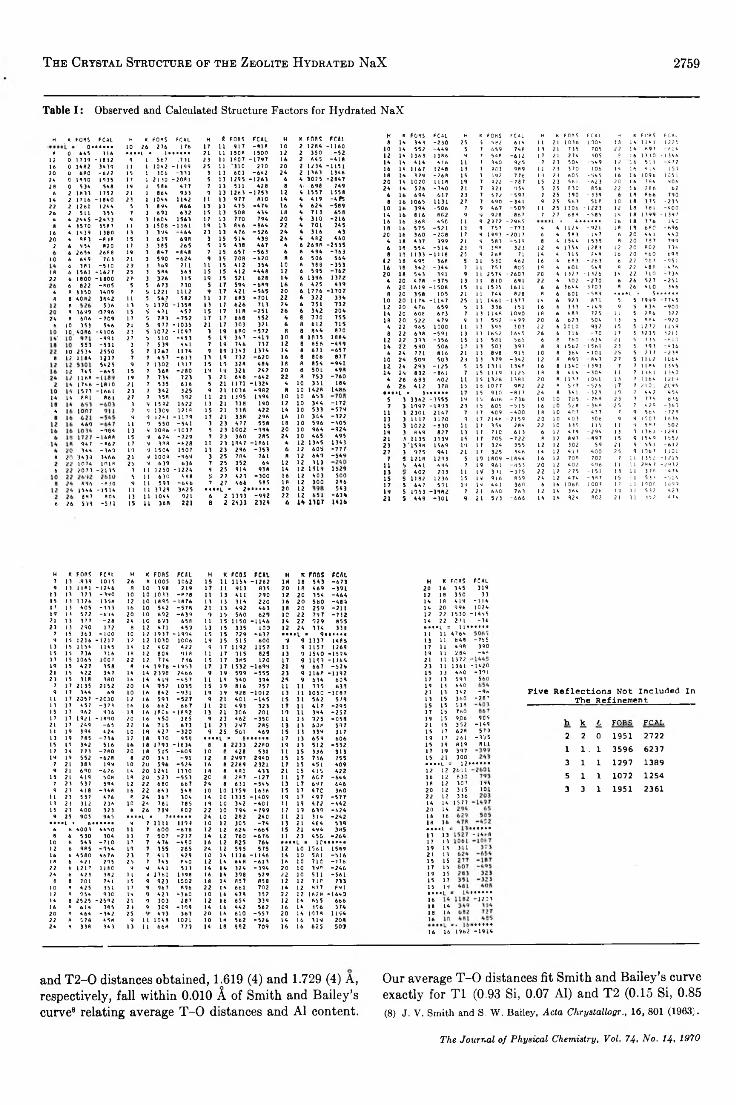
T h e C r y s t a l St r u c t u r e o f t h e Z e o l it e H y d r a t e d NaX 2759
Table I : Observed and Calculated Structure Factors for Hydrated N aX
H K FOBS F CAL H K FORS FCAL H ft FOBS FCAL H K FORS FCAL0» 10 26 276 176 17 u 917 - 9 1 R 10 2 12B4 - 1 1 6 0
S 0 645 316 ••••L » 1» 21 u 1508 1500 12 2 350 - 5 212 0 1739 - 1 8 3 2 9 1 567 .731 23 11 1807 - 1 7 9 7 16 2 645 - 4 1 816 0 34fl2 3839 l l 1 1062 - 1 1 9 9 25 n ' 3 1 0 270 20 2 1234 - 1 1 5 120 0 6B0 - 6 2 2 15 1 306 - 3 3 1 3 13 603 - 6 4 2 24 2 1363 134624 0 1890 1935 17 1 2 n o - 2 0 8 1 5 13 1295 - 1 2 6 3 6 4 3 025 - 2 8 4 728 0 538 588 19 1 586 677 7 13 511 428 8 4- 698 749
6- 2 1H 33 1752 21 l 866 933 9 13 1263 - 1 2 5 3 12 4 1557 15581* 2 1716 - 1 8 6 0 23 1 1066 1162 l l 13 977 BI O 14 4 419 - 4 P 522 2 1261 1266 5 3 896 866 13 13 475 - 4 7 4 16 4 624 - 5 8 926 2 511 355 7 3 691 632 15 13 508 434 18 4 713 658
4 4 2885 - 2 6 3 3 9 3 1606 1563 17 13 770 794 20 4 310 - 2 1 68 4 3570 3587 11 3 1508 - 1 3 6 1 19 13 846 - 8 6 4 22 4 701 745
16 4 1639 1380 13 3 396 - 6 6 6 23 13 476 - 5 2 6 2 4 4 316 4320 4 883 - 8 38 15 3 639 69R 3 15 514 433 26 4 482 460
2 6 958 820 17 3 .3 85 265 5 15 438 467 4 6 2 698 - 2 5 3 56 2658 2688 19 3 867 - 8 4 8 7 I S 657 - 5 6 3 6 6 494 - 7 6 3
10 6 689 ' 763 21 3 590 - 6 2 4 9 15 70B - 6 2 0 a 6 506 5646 3BI . - 5 1 0 2 3- 3 369 21 L 11 15 412 354 10 6 386 - 3 5 3
I B 6 1561 - 1 6 2 7 25 3 586 563 15 15 412 - 4 4 8 12 6 595 - 7 6 222 6 1800 - 1 8 0 0 27- 3 326 315 19 15 521 628 14 6 1396 1372
6 022 - 8 0 5 5 5 673 730 5 17 594 - 6 R 9 16 6 425 4394 8 3350 3609 7 $ 1221 1112 9 17 421 - 5 6 5 20 6 1776 - 1 7 0 7B 8 8082 3862 11 5 567 582 11 17 683 - 7 0 1 22 6 322 334
B 536 13 6 1370 - 1 3 5 8 13 17 626 713 24 6 751 7328 3699 (3796 15 5' 671 457 15 17 n a - 2 5 1 26 6 342 204
24 B 606 - 7 0 9 17 5 783 - 7 5 2 17 17 668 552 4 8 770 7556 •10 353 566 21 5 977 - 1 0 3 5 21 17 303 321 6 8 612 7 1 5
10 40R6 - 8 1 0 6 23 5 1072 - 1 0 9 7 3 19 6B0 - 5 7 2 8 8 8 4 4 870- 9 9 1 27 5 510 - 8 5 3 5 19 34 7 - 4 1 9 10 8 1835 1884
553 - 5 3 1 3 7 539 441 7 19 746 737 12 8 656 - 4 9 910 2538 2550 5 7 1267 1174 9 19 1347 1374 14 8 671 - 6 5 7
8 12 1188 1J37 7 7 657 - 6 1 3 13 19 732 - 6 2 0 16 8 806 8775825 9 7 1302 1317 15 19 32R 484 18 a 854 - 9 4 1
12 785 - 6 6 5 15 7 368 - 2 8 0 19 19 321 242 20 8 501 4981168 19 7 736 723 3 21 646 - 6 4 2 22 8 753 - 7 6 01786 - 1 8 1 0 21 7 535 616 5 21 1171 - 1 3 2 4 4 10 331 1841573 - 1 6 6 1 23 7 362 325 9 21 1036 - 9 8 2 a 10 1428 1486
14 14 881 861 27 7 35R 392 l l 21 1395 1394 10 10 6533 9 1592 1622 13 21 318 190 12 10 344 - 1 7 2
4 1007 7 9 1309 1218 15 21 33ft 422 14 10 533 - 5 7 99 9 1261 - 1 1 7 9 17 21 33ft 296 16 10 364 - 3 2 2
869 11 9 550 - 5 4 1 3 23 477 558 18 10 596 - 4 0 5- 9 0 6 13 9 1086 - 1 0 3 7 5 23 1002 - 9 9 4 20 10 964 - 9 2 4
- 1 6 8 8 15 9 676 - 7 2 9 7 23 360 285 24 10 465 495987 - 8 6 2 17 9 388 - 6 2 a l l 23 1847 - 1 8 6 1 4 12 1365 1343366 - 3 6 0 19 9 1506 1507 13 23 296 - 3 5 3 6 12 605 - 7 7 7
B 20 '36 39 3666 21 9 1009 - 9 6 9 3 25 7R4 761 a 12 649 - 5 4 910 7.6 1018 26 9 6 39 636 7 25 352 64 12 12 313
6 2 073 - 2 1 3 5 3 1 1 1250 - 1 2 2 4 9 25 914 938 14 12 1519 15295 11 6 30 588 5 27 429 - 3 0 0 16 12 403 500
896 - 8 3 0 9 1 l 593 - 6 4 6 7 27 466 585 I B 12 300 2R61566 - 1 5 1 6 11 l l 3729 3625 • 1**1. i5 2 > i n * t 20 12 543
307 806 13 11 1066 921 6 2 1393 - 9 9 2 22 12 651 - 6 3 46 26 599 - 5 7 1 15 u 36ft 221 a 2 243 3 2 324 6 1 4 1307 1416
H K FOBS FCAL H K FORS FCAL H K FOBS FCAL n K F CBS FCAi8 16 343 - 2 3 0 25 5 582 614 l l 21 1036 1004 13 14 114 1 - 1 2 2 5
10 14 552 - 4 4 9 5 7 659 746 13 21 735 705 22 14 697 - 0 1 412 14 1363 1386 9 7 54 R - 6 1 2 1 7 21 274 305 P 16 13 30 - 1 3 4 614 14 414 416 l l 1 340 925 7 23 504 - 54 9 12 16 511 - 4 7 216 14 1167 1248 13 7 903 9R9 1 1 23 370 106 14 16 414 15918 14 329 - 2 6 8 15 7 692 776 1 3 23 605 - 5 4 5 16 16 1096 105 l20 14 1020 1118 19 7 922 - 7 8 7 15 23 . 561 - 6 2 3 2 0 16 784 90624 14 526 - 7 4 0 21 7 921 954 5 25 030 856 22 16 206 62
6 16 694 617 23 7 672 - 5 9 7 7 25 390 - 3 3 9 6 18 066 7908 16 1065 1131 27 7 490 - 3 4 1 9 25 563 518 10 18 375 - 2 3 5
10 16 394 - 5 0 6 7 9 467 - 5 0 9 1 1 25 1306 - 1 2 2 3 12 18 381 - 4 0 014 16 8 16 882 9 9 928 867 7 27 688 - 5 8 5 14 1 8 1399 - 1 3 9 716 16 368 450 1 1 9 2972 - 2 9 6 5 •L * 4* 16 18 376 14 C18 16 575 - 5 2 1 13 9 757 - 7 7 3 4 4 1124 - 9 2 1 18 18 680 - 6 9 620 16 360 - 2 0 8 17 9 1993 - 2 0 1 7 6 4 583 - 1 4 7 6 20 441 440
4 18 437 399 21 9 583 - 5 1 9 8 4 1544 1 538 8 20 787 7996 18 554 - 5 1 4 23 9 3 8R 323 12 4 1354 1283 12 20 802 7948 19 1133 - 1 1 1 8 25 9 26R 71 14 4 315 248 16 20 660 698
12 18 495 368 5 11 530 462 16 4 683 - 2 6 3 6 22 987 - 95116 18 342 - 3 4 4 7 1 1 753 805 18 4 601 548 8 22 488 - 4 7 620 18 543 391 9 11 2574 - 2 6 0 3 20 4 1327 - 1 3 2 6 14 22 710 - 7 3 6
4 20 478 - 3 7 5 13 1 1 810 691 22 4 302 - 2 7 0 6 26 527 - 2516 20 1619 - 1 5 0 8 15 11 1595 1611 6 6 3644 - 3 703 8 26 4 10 346B 20 358 105 21 1 1 744 828 a 6 601 - 5 8 9 • * * • L = 5 ■
10 20 1174 - 1 1 4 7 25 M 1461 - 1 3 7 7 14 6 923 871 5 5 7999 - 7 7 4 512 20 4 76 659 5 13 336 151 16 6 333 - 149 9 5 R 3 6 r 90014 20 608 673 7 13 1 14R 1090 18 6 688 725 1 l 5 286 32218 20 522 479 9 1 3 552 - 4 9 9 20 6 623 504 1 3 8 RR4 - 9 2 0
4 22 965 1000 11 13 395 303 22 6 1010 - 9 3 2 15 5 1272 - 1 1 5 9ft 22 638 - 5 9 1 13 13 1652 1645 26 6 316 - 7 0 17 5 32 35 3211
12 22 393 - 3 5 6 15 l 3 581 565 6 0 760 - 6 3 4 21 5 7 35 - 8 1 014 22 590 506 17 13 503 397 8 B 1562 - 1 5 6 1 23 5 393 - 4 3 6
6 24 771 816 21 13 898 915 10 8 364 - 1 0 1 25 5 277 - 2 3 010 24 509 503 23 13 379 - 3 4 2 12 8 899 - 8 4 7 2 7 5 1 1 12 106412 24 293 - 1 2 5 5 15 1311 1348 16 8 1340 - 1 393 7 7 1 184 1 34 514 24 832 - 8 6 1 7 15 1 1 19 1125 18 8 414 - 3 0 6 1 1 7 1 181 - 1 3 4 0
4 26 693 602 l l 15 1326 1381 20 8 1137 1 061 1.3 7 1 164 12196 26 412 378 15 16 1077 982 22 8 5/7 - 5 2 6 17 7 2101 2096
••••L »‘ 3' 17 15 910 - 8 1 7 24 8 341 - 3 2 8 19 7 44 2 4545 3 3362 - 3 5 5 5 19 15 686 - 7 3 6 10 10 785 - 768 23 7 776 8367 3 1997 - 1 8 9 3 23 15 605 - 5 1 5 16 10 528 - 3 6 8 25 7 4 29 - 3 6 0
11 3 2301 2147 7 17 409 - 4 0 0 18 10 407 - 4 3 7 7 9 564 - 7 2 813 3 1117 1170 9 17 2148 - 2 1 5 9 20 10 403 306 9 9 150 7 163615 3 1022 - 8 3 0 I t 17 354 284 22 10 335 115 1 1 9 587 50219 3 849 827 13 1 7 71C 613 6 12 479 - 2 9 4 1 3 9 1361 - 128121 .3 1135 1139 15 17 705 - 7 2 2 8 12 897 - 8 9 7 15 9 1549 - 1 5 5 223 3 ' 1598 1569 19 1 7 324 355 12 12 302 59 21 9 551 - 6 1 227 3 975 941 21 1 7 325 346 14 12 413 400 25 9 1967 1101
7 5 1218 1293 5 19 1809 - 1 8 4 4 16 12 708 - 7 0 2 7 1 1 1352 - 1 2 1 511 6 441 4H4 7 19 961 - 8 5 3 20 12 402 496 1 l 1 1 2« 4 7 - 2 9 3 213 402 203 11 19' 3>i - 3 7 5 22 12 275 - 1 5 1 1 3 1 1 378 - 4 7 4
15 5 1182 1236 15 19 916 - 8 5 9 24 12 474 - 3 8 7 15 1 l 533 - 5 1 417 5 647 591 19 19 441 360 6 14 1068 1007 Ï 7 1 1 1900 - 1 09919 5 1953 - 1 9 8 2 7 21 660 763 12 14 364 22H 1 9 1 1 5 32 423
21 5 449 - 3 0 1 9 21 573 - 6 6 6 14 14 824 802 2 l l l 3 5 2 - 4 74
H K F o n s FCAL H K FOBS FCAL H K FOBS F CAL H K FOBS F CAL7 13 .9 39 1015 26 K 1005 1062 15 11 1164 - 1 2 6 2 1ft 18 5 4 3 - 6 7 3 H K FOBS FCAL9 l 3 1 1PI - 1 2 4 6 a 10 398 219 17 11 913 835 2 0 18 469 - 3 9 1 20 16 345 319
13 13 173 - 3 9 0 10 10 1033 - 8 78 11 13 411 290 12 20 354 - 4 6 4 12 18 350 3315 1 3 1326 1358 12 10 1895 - 1 8 7 6 13 13 314 220 16 2 0 580 - 4 8 4 14 18 419 - 1 1 417 1 3 405 - 3 3 3 16 10 542 - 57f t 21 13 492 463 18 20 259 - 2 1 1 14 20 996 102419- 1 3 572 - 6 3 4 20 10 692 - 6 3 9 9 15 560 629 1C 22 79 7 - 7 3 2 12 22 1530 •- 149521 13 377 - 2 8 24 10 693 658 11 15 1150 - 1 1 4 6 14 22 9 2 9 855 14 22 271 - 3 623 13 290 172 8 12 471 457 13 15 335 100 12 24 374 333 • * » » L = l l "
7 15 363 - 1 0 0 10 12 1937 - 1994 15 15 729 - 6 3 2 •••*L •i 9* * * *■* 11 11 47649 15 1216 - 1 2 1 7 12 12 1030 1006 19 15 515 600 *# 9 1337 I 4 8 6 13 11 848 - 7 5 5
13 15 1154 1145 14 12 4C2 422 9 17 1192 1157 11 9 1157 1263 17 11 488 39015 15 7 36 716 18 12 804 9 i a l l 17 915 825 13 9 1540 - 1 5 9 4 19 l l 284 - 4 417 15 1065 1007 22 12 774 7 16 15 17 385 120 17 9 1104 - 1 1 6 5 21 11 1372 •19 15 427 358 8 14 1976 - 1 9 5 3 17 17 1532 - 1 6 9 9 21 9 667 - 5 7 4 23 11 1361 ■- 1 4 2 021 15 422 347 14 14 2398 2466 9 19 599 - 5 5 5 23 9 116P - 1 1 9 2 15 13 460 - 3 9 123 15 318 380 16 14 4 19 - 4 5 7 l l 19 340 394 25 9 634 60ft 17 13 593 560
7 17 2135 2152 20 14 95? 1035 15 19 816 757 11 11 335 639 19 13 6409 17 344 69 10 16 842 - 9 3 1 19 19 928 - 1 0 1 2 13 l l 105C - I C 0 7 21 13 342 - 9 6
11 17 2057 - 2 C 3 0 12 16 593 - 5 2 7 9 21 401 - 1 4 5 15 l l 562 578 13 15 360 - 2 8 ' ’11 17 457 - 3 7 3 16 16 662 667 11 21 493 323 17 n 417 - 2 9 5 15 15 51815 17 962 936 10 16 1806 - 1 8 0 2 13 21 306 201 19 u 3H4 - 2 5 7 17 15 76017 17 1921 - 1 8 9 0 20 16 450 385 9 23 462 - 3 5 0 11 13 925 - 0 5 8 19 15 9,06 90521 17 249 - 6 5 22 16 715 673 11 23 297 285 13 13 608 597 21 15 352 - 1 4 91 1 19 384 424 10 1ft 427 - 3 2 0 9 25 561 469 15 13 339 317 15 17 62ft 5 T >13 19 785 - 7 3 6 12 18 970 958 • * t * L «! B****** 17 13 659 606 19 17 261 - 3 3 515 n 342 516 16 18 1793 - 1 8 3 4 8 8 2233 22P0 19 13 512 - 5 3 2 15 19 fi 19 n i l17 19 773 - 7 8 0 20 18 515 - 6 0 9 10 0 428 531 l l 15 336 313 17 19 39719 19 552 - 6 2 8 8 20 343 - 9 1 12 8 2997 2940 15 15 756 755 15 21 300
7 21 383 199 10 20 596 - 5 2 4 16 8 2269 2321 17 15 451 409 • • * * L - 12*<****9 21 690 - 6 2 6 14 20 1241 1330 18 8 481 433 21 15 4 15 422 12 12 2611
15 21 419 608 18 20 623 - 5 5 3 20 8 207 - 1 2 7 11 17 6C7 - 6 4 4 16 12 8307 23 537 594 12 22 680 667 24 8 631 - 5 4 5 13 17 697 646 lfl 12 307 1949 23 418 - 3 4 8 16 22 643 548 10 10 1759 1636 15 17 47C 360 20 12 315 101
11 23 537 476 P. 24 367 304 14 10 1315 - 1 4 0 9 19 17 497 - 5 7 7 22 12 33613 23 312 236 10 24 761 785 1ft 10 342 - 4 0 1 11 19 47? - 4 4 2 14 14. 157715 23 400 323 8 26 789 802 22 10 794 - 7 9 9 17 19 639 - 6 2 4 20 14
9 25 905 945 •a**L * 7 » ■•••• 24 10 282 240 11 21 314 - 2 4 2 16 16•••» L • 6••••»• 9 7 m i 1199 10 12 305 - 7 4 13 21 4e4 63ft 18 16
6 6 40 0 3 4450 11 7 600 - 6 7 8 12 12 624 - 6 6 5 15 21 494 385 « ••*L =- 14fc88 6 5 30 304 13 7 507 - 2 1 7 14 12 760 - 6 7 6 11 23 4 5 0 - 2 6 4 13 13
10 6 543 - 7 1 0 17 7 4 76 - 4 8 0 16 12 825 764 ••••L a 1 C * * » * » « 17 1312 6 985 - 9 54. 19 7 355 265 24 12 595 575 12 10 1561 1589 19 13 31116 6 4580 4676 23 7 413 429 10 14 1116 - 1 1 4 6 14 10 581 - 5 1 6 21 1318 6 421 295 25 7 745 840 12 14 64 H - 6 1 3 16 10 7 1 C - 7 7 6 15 1522 6 1217 1190 9 9 441 513 14 14 324 - 394 20 10 3 4 « - 2 4 6 17 1524 6 423 382 1 l 9 1361 1398 16 14 398 529 22 10 511 - 5 6 1 19 15
8 8 701 74 1 15 9 923 1002 18 14 857 858 12 12 7 l P 733 15 1710 8 425 351 I T 9 967 « 9 6 22 14 661 702 14 12 H77 891 15 1912 0 954 930 19 9 423 - 3 6 0 10 16 47ft 35? 22 12 162 8 - 1 6 4 0 * * « * L
- 1 2 0 314 8 2525 - 2 5 9 2 21 9 303 287 12 16 654 339 12 14 655 666 1616 8 614 385 21 9 309 - 3 0 0 14 16 442 562 16 14 596 374 18 1420 8 464 - 3 4 2 25 493 363 20 16 610 - 5 5 7 20 14 1078 1154 18 1622 0 578 458 9 1 1 104 0 1021 10 18 562 - 5 2 6 14 16 314 20H 1624 8 338 34 3 13 11 668 779 14 18 082 709 16 16 625 5 0 9
16 16 1962 - 1 9 1 4
Five Reflections Not Included In ________The Refinement______
h k l FOBS FCAL2 2 0 1951 27221 1 . 1 3596 62373 1 1 1297 13895 1 1 1072 12543 3 1 1951 2361
and T 2 -0 distances obtained, 1.619 (4) and 1.729 (4) A, respectively, fall within 0.010 A of Smith and Bailey’s curve8 relating average T -0 distances and A1 content.
Our average T -0 distances fit Smith and Bailey’s curve exactly for T1 (0,93 Si, 0.07 Al) and T2 (0.15 Si, 0.85(8) J . V . Sm ith and S, W . B ailey, Acta Chryslallogr., 16, 801 (1963).
The J outtmI o f P hysical Chem istry, V ol. 74, N o. 14, 1970
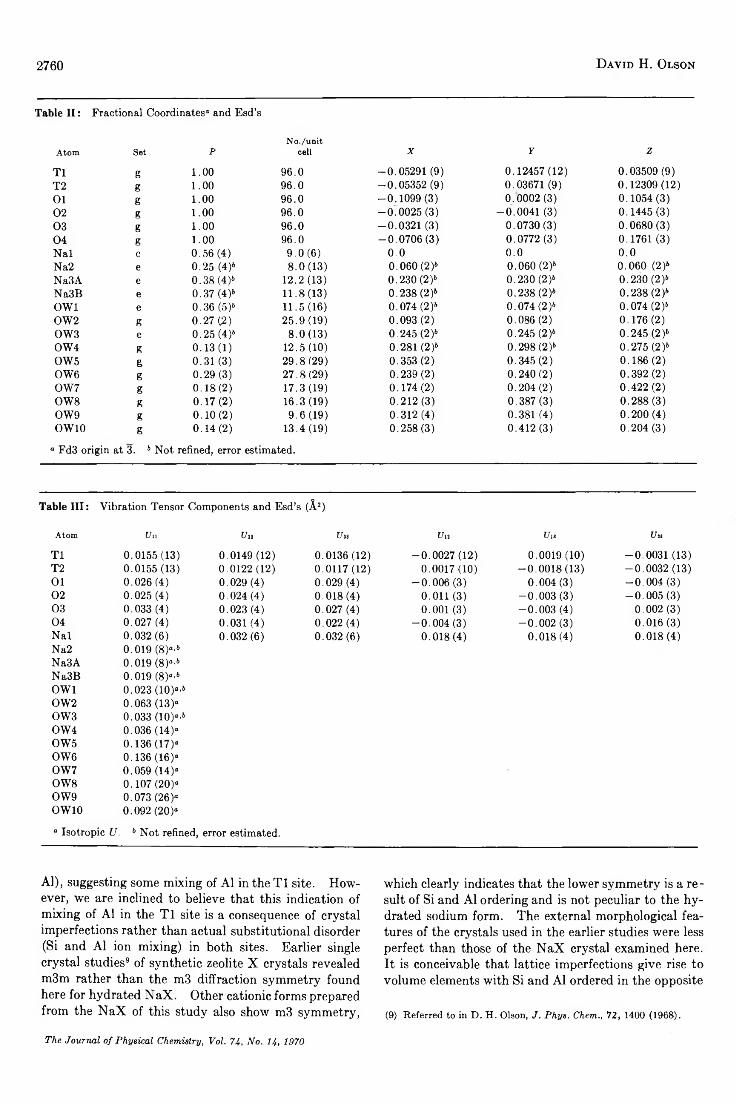
2760 D a v id H. O l s o n
Table I I : Fractional Coordinates“ and Esd’s
N o./unitAtom Set P oeil X Y Z
T1 g 1.00 96.0 -0.05291 (9) 0.12457(12) 0.03509(9)T2 g 1.00 96.0 -0.05352 (9) 0.03671(9) 0.12309(12)01 g 1.00 96.0 -0.1099 (3) 0.0002 (3) 0.1054 (3)02 g 1.00 96.0 -0.0025 (3) -0.0041 (3) 0.1445(3)03 g 1.00 96.0 -0.0321 (3) 0.0730(3) 0.0680(3)04 g 1.00 96.0 -0.0706 (3) 0.0772 (3) 0.1761 (3)Nal c 0.56(4) 9.0(6) 0.0 0.0 0.0Na2 e 0.25 (4)> 8.0(13) 0.060 (2)» 0.060 (2)» 0.060 (2)»Na3A e 0.38(4)» 12.2(13) 0.230 (2)» 0.230 (2)» 0.230 (2)»Na3B e 0.37 (4)» 11.8(13) 0.238(2)» 0.238(2)» 0.238(2)»OW1 e 0.36 (5)» 11.5(16) 0.074(2)» 0.074(2)» 0.074 (2)»OW2 g 0.27(2) 25.9(19) 0.093(2) 0.086(2) 0.176 (2)OW3 e 0.25 (4)» 8.0(13) 0.245(2)» 0.245(2)» 0.245(2)»OW4 g 0.13(1) 12.5(10) 0.281 (2)» 0.298 (2)» 0.275(2)»OW5 g 0.31(3) 29.8(29) 0.353(2) 0.345(2) 0.186(2)OW6 g 0.29 (3) 27.8(29) 0.239(2) 0.240 (2) 0.392 (2)OW7 g 0.18(2) 17.3(19) 0.174(2) 0.204(2) 0.422(2)OW8 g 0.17 (2) 16.3(19) 0.212 (3) 0.387(3) 0.288 (3)OW9 g 0.10 (2) 9.6(19) 0.312(4) 0.381(4) 0.200 (4)OWIO g 0.14 (2) 13.4(19) 0.258 (3) 0.412 (3) 0.204 (3)
“ Fd3 origin at 3. 6 Not refined, error estimated.
Table III : Vibration Tensor Components and Esd’s (Â2)
Atom Un U», Um Ult Ui, Uu
Tl 0.0155(13) 0.0149 (12) 0.0136(12) -0.0027 (12) 0.0019(10) -0.0031 (13)T2 0.0155 (13) 0.0122(12) 0.0117 (12) 0.0017 (10) -0.0018(13) -0.0032 (13)01 0.026 (4) 0.029 (4) 0.029 (4) -0.006(3) 0.004 (3) -0 .004(3)02 0.025 (4) 0.024(4) 0.018 (4) 0.011(3) -0 .003 (3) -0 .005 (3)03 0.033 (4) 0.023 (4) 0.027 (4) 0.001 (3) -0 .003 (4) 0.002(3)04 0.027(4) 0.031(4) 0.022 (4) -0.004(3) -0.002(3) 0.016 (3)Nal 0.032 (6) 0.032(6) 0.032 (6) 0.018(4) 0.018(4) 0.018(4)Na2 0.019 (8)“'»Na3A 0.019 (8)“'»Na3B 0.019 (8)“'»OW1 0.023 (10)“'»OW2 0.063 (13)“OW3 0.033 (10)“.»OW4 0.036 (14)“OW5 0.136(17)“OW6 0.136 (16)*OW7 0.059 (14)“OW8 0.107(20)“OW9 0.073(26)“OWIO 0.092 (20)“
“ Isotropie U, » Not refined, error estimated.
Al), suggesting some mixing of A1 in the T1 site. However, we are inclined to believe that this indication of mixing of Al in the T1 site is a consequence of crystal imperfections rather than actual substitutional disorder (Si and Al ion mixing) in both sites. Earlier single crystal studies9 of synthetic zeolite X crystals revealed m3m rather than the m3 diffraction symmetry found here for hydrated NaX. Other cationic forms prepared from the NaX of this study also show m3 symmetry,
which clearly indicates that the lower symmetry is a result of Si and Al ordering and is not peculiar to the hydrated sodium form. The external morphological features of the crystals used in the earlier studies were less perfect than those of the NaX crystal examined here. It is conceivable that lattice imperfections give rise to volume elements with Si and Al ordered in the opposite
(9) R eferred to in D . H . O lson, J. Phys. Chem., 72 , 1400 (1968).
The Journal o f P hysica l Chem istry, Voi. 7-í, N o. I 4, 1970
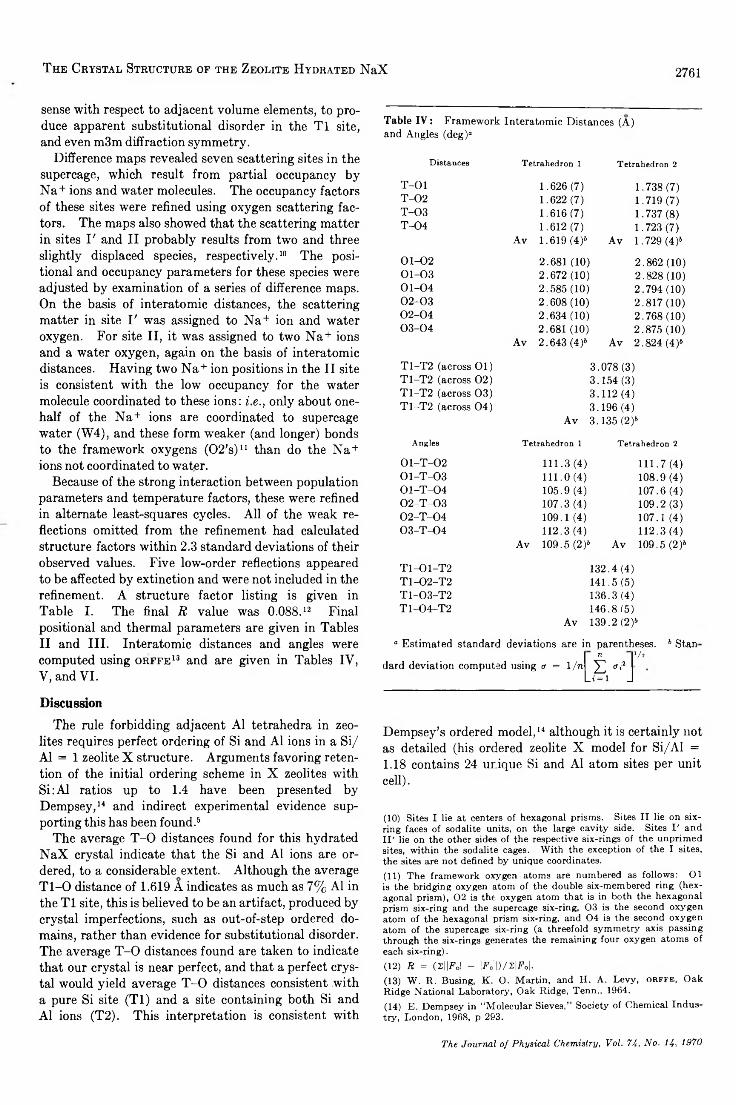
T h e C r y s t a l St r u c t u r e o f t h e Z e o l it e H y d r a t e d N a X 2761
sense with respect to adjacent volume elements, to produce apparent substitutional disorder in the T1 site, and even m3m diffraction symmetry.
Difference maps revealed seven scattering sites in the supercage, which result from partial occupancy by Na+ ions and water molecules. The occupancy factors of these sites were refined using oxygen scattering factors. The maps also showed that the scattering matter in sites I ' and II probably results from two and three slightly displaced species, respectively.10 The positional and occupancy parameters for these species were adjusted by examination of a series of difference maps. On the basis of interatomic distances, the scattering matter in site I ' was assigned to Na+ ion and water oxygen. For site II, it was assigned to two Na+ ions and a water oxygen, again on the basis of interatomic distances. Having two Na+ ion positions in the II site is consistent with the low occupancy for the water molecule coordinated to these ions: i.e., only about one- half of the N a+ ions are coordinated to supercage water (W4), and these form weaker (and longer) bonds to the framework oxygens (02 ’s)n than do the N a+ ions not coordinated to water.
Because of the strong interaction between population parameters and temperature factors, these were refined in alternate least-squares cycles. All of the weak reflections omitted from the refinement had calculated structure factors within 2.3 standard deviations of their observed values. Five low-order reflections appeared to be affected by extinction and were not included in the refinement. A structure factor listing is given in Table I. The final R value was 0.088.12 Final positional and thermal parameters are given in Tables II and III. Interatomic distances and angles were computed using o r f f e 13 and are given in Tables IV, V, and VI.
DiscussionThe rule forbidding adjacent A1 tetrahedra in zeo
lites requires perfect ordering of Si and A1 ions in a Si/ A1 = 1 zeolite X structure. Arguments favoring retention of the initial ordering scheme in X zeolites with Si:Al ratios up to 1.4 have been presented by Dempsey,14 and indirect experimental evidence supporting this has been found.5
The average T -0 distances found for this hydrated N aX crystal indicate that the Si and A1 ions are ordered, to a considerable extent. Although the average T l -0 distance of 1.619 A indicates as much as 7% A1 in the T1 site, this is believed to be an artifact, produced by crystal imperfections, such as out-of-step ordered domains, rather than evidence for substitutional disorder. The average T -0 distances found are taken to indicate that our crystal is near perfect, and that a perfect crystal would yield average T -0 distances consistent with a pure Si site (T l) and a site containing both Si and A1 ions (T2). This interpretation is consistent with
T a b le I V : Framework Interatomic Distances (A) and Angles (deg)“
Distances Tetrahedron 1 Tetrahedron 2
T -O l 1.626 (7) 1.738(7)T -0 2 1.622(7) 1.719 (7)T -0 3 1.616(7) 1.737 (8)T -0 4 1.612 (7) 1.723(7)
Av 1.619(4)» Av 1.729 (4)»
0 1 -0 2 2.681(10) 2.862(10)0 1 -0 3 2.672 (10) 2.828(10)0 1 -0 4 2.585(10) 2.794(10)0 2 -0 3 2.608(10) 2.817(10)0 2 -0 4 2.634(10) 2.768(10)0 3 -0 4 2.681(10) 2.875(10)
Av 2.643 (4)6 Av 2.824(4)»
T 1-T 2 (across 01) 3.078 (3)T1-T 2 (across 02) 3.154(3)T 1 -T 2 (across 03) 3.112(4)T1-T 2 (across 04) 3.196(4)
Av 3.135 (2)»
Angles Tetrahedron 1 Tetrahedron 2
0 1 -T -0 2 111.3(4) 111.7(4)0 1 -T -0 3 111.0(4) 108.9(4)O l-T -0 4 105.9 (4) 107.6(4)0 2 -T -0 3 107.3(4) 109.2(3)0 2 -T -0 4 109.1(4) 107.1(4)0 3 -T -0 4 112.3(4) 112.3(4)
Av 109.5(2)*- Av 109.5(2)»
T 1 -01 -T 2 132.4(4)T 1 -0 2 -T 2 141.5(5)T 1 -0 3 -T 2 136.3(4)T 1 -04 -T 2 146.8(5)
Av 139.2 (2)*-
° Estimated standard deviations are in parentheses. b Stann V»
dard deviation computed using cr = 1/n E - 2L » - i J
Dempsey's ordered model,14 although it is certainly not as detailed (his ordered zeolite X model for Si/Al = 1.18 contains 24 unique Si and A1 atom sites per unit cell).
(10) Sites I lie a t centers o f hexagonal prism s. Sites I I lie on six - ring faces o f sodalite units, on the large ca v ity side. Sites I ' an d I I ' lie on the other sides o f th e respective six-rings o f th e u n prim ed sites, w ithin the sodalite cages. W ith the exception o f th e I sites, the sites are n o t defined b y un ique coord inates.(11) T h e fram ew ork oxygen atom s are num bered as fo llo w s : 0 1is the bridging oxygen a tom o f the d ou b le six -m em bered ring (h ex agonal prism ), 0 2 is th e oxygen atom th at is in b o th th e h exagon al prism six-ring and the supercage six-ring, 0 3 is th e secon d o x y g e n atom o f the hexagonal prism six-ring, and 0 4 is the secon d o x y g e n atom o f the supercage 3ix-ring (a th reefo ld sym m etry axis p assing throu gh the six-rings generates the rem ain ing fou r oxygen atom s o f each six -ring).(12) R = (ZllFol - IFo’D/zW .(13) W . R . B using, K . O . M artin , and H . A . L ev y , o r f f e , O ak R id g e N ational L aboratory , O ak R idge, T en n ., 1964.(14) E . D em psey in “ M olecu lar S ieves,” S ociety o f C hem ica l In d u s - t iy , L o n d o n , 1968, p 293.
The Journal o f P h ysica l Chem istry, Voi. 74, N o. 14, 1970
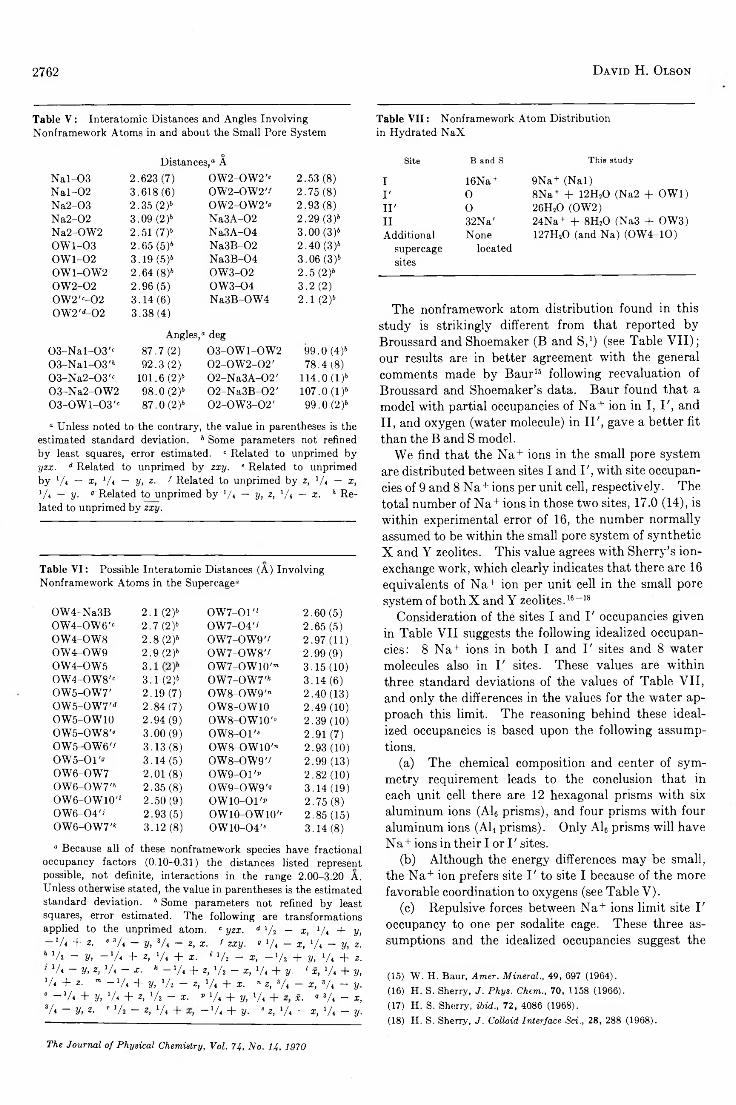
2762 D a v id H . O l s o n
Table V : Interatomic Distances and Angles InvolvingNonframework Atoms in and about the Small Pore System
Distances,0 ÂN a l-0 3 2.623 (7) OW2-OW2'* 2.53 (8)N a l-0 2 3.618(6) OW 2-OW 2'/ 2 .75(8 )Na2-03 2.35 (2)6 OW2-OW2'» 2 .93(8 )N a2-02 3.09 (2)6 Na3A -02 2.29 (3)sNa2-OW2 2.51 (7 )b Na3A -04 3.00 (3)6OW 1-03 2.65 (5 )b Na3B-02 2.40 (3)6OW 1-02 3.19 (5 )b Na3B -04 3.06 (3)*OW1-OW2 2.64 (8)6 0W 3-0 2 2 .5 (2)00W 2-0 2 2.96 (5) 0 W 3 -0 4 3.2 (2)0 W 2 'c-0 2 3.14 (6) Na3B-OW 4 2.1 (2)60 W 2 'i -0 2 3.38 (4)
Angles,0 deg0 3 -N a l-0 3 'c 87.7(2) 0 3 -0 W 1 -0 W 2 99.0 (4)60 3 -N a l-0 3 '* 92 .3 (2 ) 0 2 -0 W 2 -0 2 ' 78.4(8)0 3 -N a 2 -0 3 'c 101.6 (2 )*> 02 -N a3A -02 ' 114.0 ( l ) 603 -N a2-0W 2 98.0 (2)6 02 -N a3B -02 ' 107.0 ( l ) 60 3 -0 W 1 -0 3 '0 87.0 (2)s 0 2 -0 W 3 -0 2 ' 99.0 (2 )b
° Unless noted to the contrary, the value in parentheses is the estimated standard deviation. b Some parameters not refined by least squares, error estimated. c Related to unprimed by y z x . d Related to unprimed by zx y . e Related to unprimed by V< — x, Vi — y , z. 1 Related to unprimed by z, Vi — x , 'A — V- 0 Related to unprimed by Vi — y , z, Vi — x . h Related to unprimed by zx y .
Table VI: Possible Interatomic Distances (A) Involving Nonframework Atoms in the Supercage“
OW4-Na3B 2.1 (2 )4 O W 7-01" 2.60 (5)OW 4-OW 6'0 2.7 (2)6 0W 7-04'» 2.65 (5)OW4-OW8 2.8 (2)b O W 7-OW 9'/ 2.97 (11)OW4-OW9 2.9 (2 f OW 7-OW 8'/ 2.99 (9)OW4-OW5
<NCO OW 7-OW 10'“ 3.15(10)OW 4-OW 8'c 3.1 (2)b OW 7-OW 7'4 3.14 (6)OW5-OW7' 2.19 (7) OW8-OW9'» 2.40(13)OW 5-OW 7'd 2.84(7 ) OW8-OW10 2.49 (10)OW5-OW10 2.94 (9) OW 8-OW 10'“ 2.39 (10)OW5-OW8'« 3.00(9 ) O W 8-01" 2.91 (7)O W 5-OW 6'i 3 .13(8 ) OW8-OW10'" 2.93 (10)OW5-01'» 3.14 (5) OW 8-OW 9'/ 2 .99(13)OW6-OW7 2.01 (8) OW 9-01'» 2.82(10)OW 6-OW 7'4 2.35 (8) OW9-OW9'« 3.14(19)OW 6-OW 10'4 2.50(9 ) O W IO -01'î» 2.75 (8)0W 6-04O 2.93 (5) OW IO-OW IO'’- 2.85 (15)OW6-OW7'* 3.12 (8) OW10-O4'* 3 .14(8 )
° Because all of these nonframework species have fractional occupancy factors (0.10-0.31) the distances listed represent possible, not definite, interactions in the range 2.00-3.20 A. Unless otherwise stated, the value in parentheses is the estimated standard deviation. b Some parameters not refined by least squares, error estimated. The following are transformations applied to the unprimed atom. c y zx . d Vs — x , 1 / 4 + y ,
— ‘A + z. e 3A - y, V< — z, x. ' zxy. a :Vi - x, ‘Al — y, Z.h *A - y, -- ‘A + z, V* + X . ' Vi — x, --V i + y, Vi + z.’ *A - y, z, V* - x. 4 - Vi + z, Vi - X , Vi + V- 1 X, Vi + y,V< + z. m - V 4 + y, V:2 - 2, Vi + X . n i5 Vi — X , Vi — y■° - ‘A + y, Vi + z, Va -- X. p Vi + y, Vi + X. QVi — X,3A - y, z. r ’A - z, 'A + - Vi + V- 8
Z, Vi — X , Vi — y■
Table VII: Nonframework Atom Distribution in Hydrated N aX
Site B and S This study
I 16Na+ 9Na+ (N a l)I ' O 8Na+ + 12H20 (Na2 + OW1)I I ' O 26H20 (OW2)I I 32Na' 24Na+ + 8H20 (Na3 + OW3)Additional None 127H20 (and Na) (O W 4-10)
supercage locatedsites
The nonframework atom distribution found in this study is strikingly different from that reported by Broussard and Shoemaker (B and S,1) (see Table V II); our results are in better agreement with the general comments made by Baur16 following réévaluation of Broussard and Shoemaker’s data. Baur found that a model with partial occupancies of N a+ ion in I, I ', and II, and oxygen (water molecule) in II ', gave a better fit than the B and S model.
We find that the Na+ ions in the small pore system are distributed between sites I and I', with site occupancies of 9 and 8 Na+ ions per unit cell, respectively. The total number of Na+ ions in those two sites, 17.0 (14), is within experimental error of 16, the number normally assumed to be within the small pore system of synthetic X and Y zeolites. This value agrees with Sherry’s ion- exchange work, which clearly indicates that there are 16 equivalents of Na+ ion per unit cell in the small pore system of both X and Y zeolites.16-18
Consideration of the sites I and I ' occupancies given in Table VII suggests the following idealized occupancies: 8 Na+ ions in both I and I ' sites and 8 water molecules also in I ' sites. These values are within three standard deviations of the values of Table VII, and only the differences in the values for the water approach this limit. The reasoning behind these idealized occupancies is based upon the following assumptions.
(a) The chemical composition and center of symmetry requirement leads to the conclusion that in each unit cell there are 12 hexagonal prisms with six aluminum ions (AU prisms), and four prisms with four aluminum ions (AU prisms). Only AU prisms will have Na+ ions in their I or I ' sites.
(b) Although the energy differences may be small, the Na+ ion prefers site I ' to site I because of the more favorable coordination to oxygens (see Table V).
(c) Repulsive forces between Na+ ions limit site I ' occupancy to one per sodalite cage. These three assumptions and the idealized occupancies suggest the
(15) W . H . B aur, Amer. Mineral., 49 , 697 (1964).(16) H . S . Sherry, J. Phys. Chem., 70, 1158 (1966).(17) H . S. Sherry, ibid., 72 , 4086 (1968).(18) H . S . Sherry, j . Colloid Interface Sci., 28 , 288 (1968).
The Journal o f P hysica l Chem istry, Vol. 7If., N o . Ilf, 1970
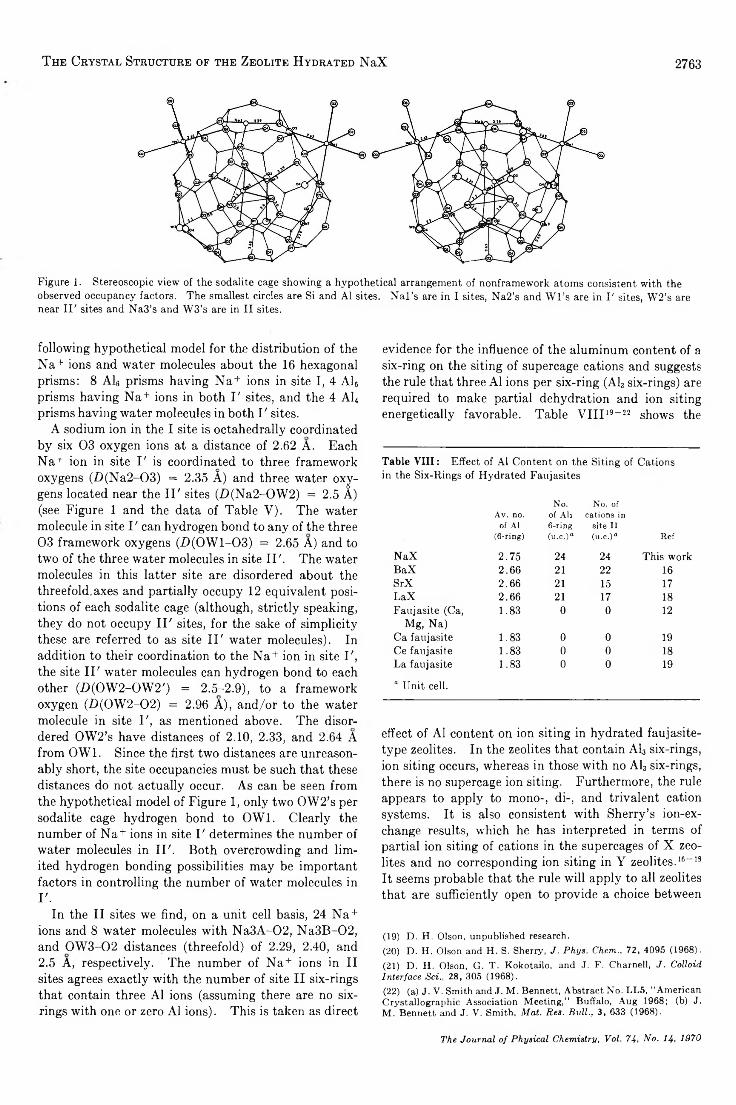
T h e C r y s t a l St r u c t u r e of t h e Z e o l it e H y d r a t e d NaX 2763
Figure 1. Stereoscopic view of the sodalite cage showing a hypothetical arrangement of nonframework atoms consistent with the observed occupancy factors. The smallest circles are Si and A1 sites. N a l’s are in I sites, Na2’s and W l’s are in I ' sites, W2’s are near I I ' sites and N a3’s and W3’s are in I I sites.
following hypothetical model for the distribution of the Na+ ions and water molecules about the 16 hexagonal prisms: 8 Ale prisms having Na+ ions in site I, 4 Al6 prisms having Na+ ions in both I ' sites, and the 4 Al4 prisms having water molecules in both I ' sites.
A sodium ion in the I site is octahedrally coordinated by six 03 oxygen ions at a distance of 2.62 A. Each N a+ ion in site I ' is coordinated to three frameworkooxygens (D(Na2-03) = 2.35 A) and three water oxygens located near the II ' sites (Z)(Na2-OW2) = 2.5 A) (see Figure 1 and the data of Table V). The water molecule in site I ' can hydrogen bond to any of the three 03 framework oxygens (D (0W l-03 ) = 2.65 A) and to two of the three water molecules in site II '. The water molecules in this latter site are disordered about the threefold, axes and partially occupy 12 equivalent positions of each sodalite cage (although, strictly speaking, they do not occupy II ' sites, for the sake of simplicity these are referred to as site II ' water molecules). In addition to their coordination to the Na+ ion in site I', the site II ' water molecules can hydrogen bond to each other (D(OW2-OW2') = 2.5-2.9), to a framework oxygen (Z)(0W 2-02) = 2.96 A), and/or to the water molecule in site I ', as mentioned above. The disordered 0W 2’s have distances of 2.10, 2.33, and 2.64 A from OW1. Since the first two distances are unreasonably short, the site occupancies must be such that these distances do not actually occur. As can be seen from the hypothetical model of Figure 1, only two OW2’s per sodalite cage hydrogen bond to OW1. Clearly the number of Na+ ions in site I ' determines the number of water molecules in II '. Both overcrowding and limited hydrogen bonding possibilities may be important factors in controlling the number of water molecules in I'.
In the II sites we find, on a unit cell basis, 24 Na + ions and 8 water molecules with Na3A-02, Na3B-02, and 0W 3-02 distances (threefold) of 2.29, 2.40, and2.5 A, respectively. The number of Na+ ions in II sites agrees exactly with the number of site II six-rings that contain three A1 ions (assuming there are no six- rings with one or zero A1 ions). This is taken as direct
evidence for the influence of the aluminum content of a six-ring on the siting of supercage cations and suggests the rule that three A1 ions per six-ring (Al3 six-rings) are required to make partial dehydration and ion siting energetically favorable. Table V III19-22 shows the
T a b le V I I I : Effect of A1 Content on the Siting of Cations in the Six-Rings of Hydrated Faujasites
N o. N o. ofA v . no. of A h cations in
o f A1 6-ring site 11(6-ring) (u .c .)° (u .c .)a R ef
N aX 2.75 24 24 This workB aX 2.66 21 22 16SrX 2.66 21 15 17LaX 2.66 21 17 18Faujasite (Ca, 1.8 3 0 0 12
Mg, Na) Ca faujasite 1.8 3 0 0 19Ce faujasite 1.8 3 0 0 18La faujasite 1.8 3 0 0 19
“ Unit cell.
effect of A1 content on ion siting in hydrated faujasite- type zeolites. In the zeolites that contain Ah six-rings, ion siting occurs, whereas in those with no Al3 six-rings, there is no supercage ion siting. Furthermore, the rule appears to apply to mono-, di-, and trivalent cation systems. It is also consistent with Sherry’s ion-exchange results, which he has interpreted in terms of partial ion siting of cations in the supercages of X zeolites and no corresponding ion siting in Y zeolites.16-13 It seems probable that the rule will apply to all zeolites that are sufficiently open to provide a choice between
(19) D . H . O lson, unpublished research.(20) D . H . O lson and H . S. Sherry, J. Phys. Chem., 72 , 4095 (1968).(21) D . H , Olson, G . T . K ok ota ilo , and J. F . C harnell, J. Colloid Interface Sci., 28 , 305 (1968).(22) (a) J . V . Sm ith and J. M . B ennett, A b stra ct N o . L L 5 , “ A m erican C rysta llogra p h ic A ssociation M eetin g ,” B uffa lo , A u g 1968; (b ) J. M . B en n ett and J. V . Sm ith, Mat. Res. Bull., 3 , 633 (1968).
The Journal o f P h ysica l Chem istry, Vol. 74, N o. 14, 1970
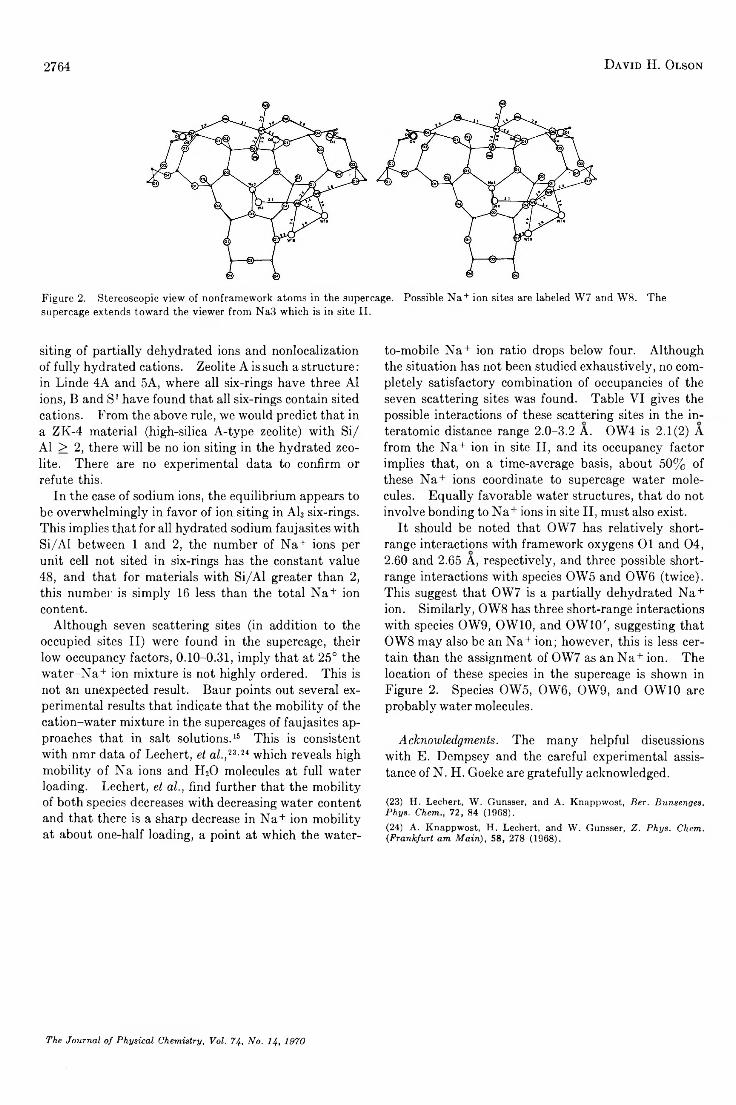
2764 D a v id H. O l s o n
Figure 2. Stereoscopic view of nonframework atoms in the supercage. Possible N a + ion sites are labeled W7 and W8. The supercage extends toward the viewer from Na3 which is in site I I .
siting of partially dehydrated ions and nonlocalization of fully hydrated cations. Zeolite A is such a structure: in Linde 4A and 5A, where all six-rings have three A1 ions, B and S1 have found that all six-rings contain sited cations. From the above rule, we would predict that in a ZK-4 material (high-silica A-type zeolite) with Si/ A1 > 2, there will be no ion siting in the hydrated zeolite. There are no experimental data to confirm or refute this.
In the case of sodium ions, the equilibrium appears to be overwhelmingly in favor of ion siting in Al3 six-rings. This implies that for all hydrated sodium faujasites with Si/Al between 1 and 2, the number of Na+ ions per unit cell not sited in six-rings has the constant value 48, and that for materials with Si/Al greater than 2, this number is simply 16 less than the total Na+ ion content.
Although seven scattering sites (in addition to the occupied sites II) were found in the supercage, their low occupancy factors, 0.10-0.31, imply that at 25° the water-Na+ ion mixture is not highly ordered. This is not an unexpected result. Baur points out several experimental results that indicate that the mobility of the cation-water mixture in the supercages of faujasites approaches that in salt solutions.15 This is consistent with nmr data of Lechert, et al.,2d'u which reveals high mobility of Na ions and H20 molecules at full water loading. Lechert, et al., find further that the mobility of both species decreases with decreasing water content and that there is a sharp decrease in Na+ ion mobility at about one-half loading, a point at which the water-
to-mobile Na+ ion ratio drops below four. Although the situation has not been studied exhaustively, no completely satisfactory combination of occupancies of the seven scattering sites was found. Table VI gives the possible interactions of these scattering sites in the interatomic distance range 2.0-3.2 A. OW4 is 2.1(2) A from the N a+ ion in site II, and its occupancy factor implies that, on a time-average basis, about 50% of these Na+ ions coordinate to supercage water molecules. Equally favorable water structures, that do not involve bonding to Na+ ions in site II, must also exist.
It should be noted that OW7 has relatively short- range interactions with framework oxygens 01 and 04,2.60 and 2.65 A, respectively, and three possible short- range interactions with species OW5 and OW6 (twice). This suggest that OW7 is a partially dehydrated Na+ ion. Similarly, OW8 has three short-range interactions with species OW9, OWIO, and OWIO', suggesting that OW8 may also be an Na+ ion; however, this is less certain than the assignment of OW7 as an Na+ ion. The location of these species in the supercage is shown in Figure 2. Species OW5, OW6, OW9, and OWIO are probably water molecules.
Acknowledgments. The many helpful discussions with E. Dempsey and the careful experimental assistance of N. H. Goeke are gratefully acknowledged.
(23) H . L echert, W . G unsser, and A . K n a p p w ost, Ber. Buns eng es. Phys. C h e m 72, 84 (1968).
(24) A . K n app w ost, H . L ech ert, and W . Gunsser, Z. Phys. Chem. (Frankfurt am Main), 58 , 278 (1968).
The Journal o f P hysical Chem istry, Vol. 74, N o. 14, 1970
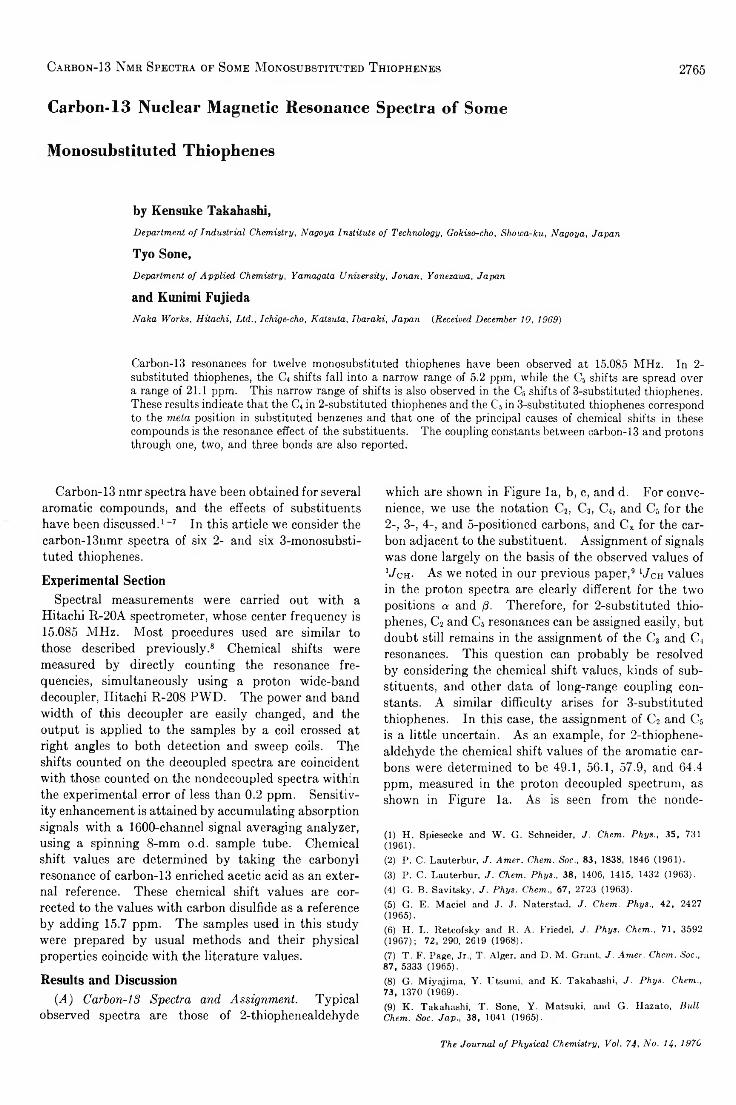
Carbon-13 Nmr Spectra of Some M onostjbstituted T hiophenes 2765
Carbon-13 Nuclear Magnetic Resonance Spectra of Some
Monosubstituted Thiophenes
by Kensuke Takahashi,Department of Industrial Chemistry, Nagoya Institute of Technology, Gokiso-cho, Showa-ku, Nagoya, Japan
Tyo Sone,Department of Applied Chemistry, Yamagata University, Jonan, Yonezawa, Japan
and Kunimi FujiedaNaka Works, Hitachi, Ltd., Ichige-cho, Katsuta, Ibaraki, Japan (Received December 10, 1969)
Carbon-13 resonances for twelve monosubstituted thiophenes have been observed at 15.085 MHz. In 2- substituted thiophenes, the C4 shifts fall into a narrow range of 5.2 ppm, while the C5 shifts are spread over a range of 21.1 ppm. This narrow range of shifts is also observed in the C6 shifts of 3-substituted thiophenes. These results indicate that the C4 in 2-substituted thiophenes and the C5 in 3-substituted thiophenes correspond to the meta position in substituted benzenes and that one of the principal causes of chemical shifts in these compounds is the resonance effect of the substituents. The coupling constants between carbon-13 and protons through one, two, and three bonds are also reported.
Carbon-13 nmr spectra have been obtained for several aromatic compounds, and the effects of substituents have been discussed.1-7 In this article we consider the carbon-13nmr spectra of six 2- and six 3-monosubsti- tuted thiophenes.
Experimental SectionSpectral measurements were carried out with a
Hitachi R-20A spectrometer, whose center frequency is15.085 MHz. Most procedures used are similar to those described previously.8 Chemical shifts were measured by directly counting the resonance frequencies, simultaneously using a proton wide-band decoupler, Hitachi R-208 PWD. The power and band width of this decoupler are easily changed, and the output is applied to the samples by a coil crossed at right angles to both detection and sweep coils. The shifts counted on the decoupled spectra are coincident with those counted on the nondecoupled spectra within the experimental error of less than 0.2 ppm. Sensitivity enhancement is attained by accumulating absorption signals with a 1600-channel signal averaging analyzer, using a spinning 8-mm o.d. sample tube. Chemical shift values are determined by taking the carbonyl resonance of carbon-13 enriched acetic acid as an external reference. These chemical shift values are corrected to the values with carbon disulfide as a reference by adding 15.7 ppm. The samples used in this study were prepared by usual methods and their physical properties coincide with the literature values.
Results and Discussion(A) Carbon-18 Spectra and Assignment. Typical
observed spectra are those of 2-thiophenealdehyde
which are shown in Figure la, b, c, and d. For convenience, we use the notation C2, C3, C4, and C5 for the2-, 3-, 4-, and 5-positioned carbons, and Cx for the carbon adjacent to the substituent. Assignment of signals was done largely on the basis of the observed values of V c h - As we noted in our previous paper,9 lJcm values in the proton spectra are clearly different for the two positions a and ¡3. Therefore, for 2-substituted thiophenes, C2 and C5 resonances can be assigned easily, but doubt still remains in the assignment of the C3 and C4 resonances. This question can probably be resolved by considering the chemical shift values, kinds of substituents, and other data of long-range coupling constants. A similar difficulty arises for 3-substituted thiophenes. In this case, the assignment of C2 and C5 is a little uncertain. As an example, for 2-thiophenealdehyde the chemical shift values of the aromatic carbons were determined to be 49.1, 56.1, 57.9, and 64.4 ppm, measured in the proton decoupled spectrum, as shown in Figure la. As is seen from the nonde-
(1) H . Spiesecke and W . G . Schneider, J. Chem. Phys., 35 , 731 (1961).(2) P . C . Lauterbur, J. Amer. Chem. Soc., 83 , 1838, 1846 (1961).(3) P . C . Lauterbur, J. Chem. Phys., 38 , 1406, 1415, 1432 (1963).(4) G . B . Savitsky , J. Phys. Chem., 67 , 2723 (1963).(5) G . E . M acie l and J. J . N aterstad, J. Chem. Phys., 42 , 2427 (1965).(6) H . L . R e tco fsk y and R . A . Friedel, J. Phys. Chem., 71 , 3592 (1 9 6 7 ); 7 2 ,2 9 0 ,2 6 1 9 (1968).(7) T . F . Page, Jr., T . A lger, and D . M . G rant, J. Amer. Chem. Soc., 87 , 5333 (1965).(8) G . M iya jim a , Y . U tsum i, and K . Takahash i, J. Phys. Chem., 73, 1370 (1969).(9) K . T akahashi, T . Sone, Y . M atsuki, and G . H a zato , Pull. Chem. Soc. Jap., 38 , 1041 (1965).
The Journal o f P hysical Chem istry, Vol. 74, H o . 14, 1970
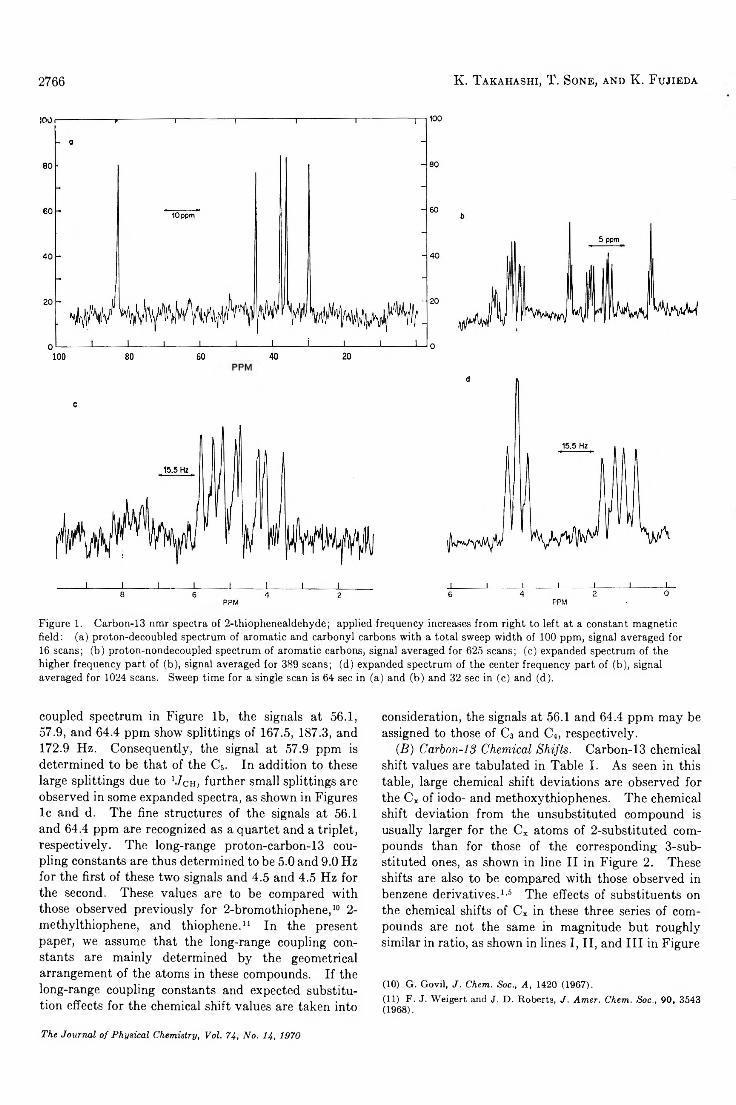
2766 K. T a k a h a s h i , T . S o n e , a n d K. F u j ie d a
c
Figure 1. Carbon-13 nmr spectra of 2-thiophenealdehyde; applied frequency increases from right to left at a constant magnetic field: (a) proton-decoubled spectrum of aromatic and carbonyl carbons with a total sweep width of 100 ppm, signal averaged for16 scans; (b) proton-nondecoupled spectrum of aromatic carbons, signal averaged for 625 scans; (c) expanded spectrum of the higher frequency part of (b), signal averaged for 389 scans; (d) expanded spectrum of the center frequency part of (b), signal averaged for 1024 scans. Sweep time for a single scan is 64 sec in (a) and (b) and 32 sec in (c) and (d).
coupled spectrum in Figure lb, the signals at 56.1,57.9, and 64.4 ppm show splittings of 167.5, 187.3, and172.9 Hz. Consequently, the signal at 57.9 ppm is determined to be that of the C5. In addition to these large splittings due to lJCu, further small splittings are observed in some expanded spectra, as shown in Figures lc and d. The fine structures of the signals at 56.1 and 64.4 ppm are recognized as a quartet and a triplet, respectively. The long-range proton-carbon-13 coupling constants are thus determined to be 5.0 and 9.0 Hz for the first of these two signals and 4.5 and 4.5 Hz for the second. These values are to be compared with those observed previously for 2-bromothiophene,10 2- methylthiophene, and thiophene.11 In the present paper, we assume that the long-range coupling constants are mainly determined by the geometrical arrangement of the atoms in these compounds. If the long-range coupling constants and expected substitution effects for the chemical shift values are taken into
consideration, the signals at 56.1 and 64.4 ppm may be assigned to those of C3 and C4, respectively.
(.B) Carbon-13 Chemical Shifts. Carbon-13 chemical shift values are tabulated in Table I. As seen in this table, large chemical shift deviations are observed for the Cx of iodo- and methoxythiophenes. The chemical shift deviation from the unsubstituted compound is usually larger for the Cx atoms of 2-substituted compounds than for those of the corresponding 3-sub- stituted ones, as shown in line II in Figure 2. These shifts are also to be compared with those observed in benzene derivatives.1'5 The effects of substituents on the chemical shifts of Cx in these three series of compounds are not the same in magnitude but roughly similar in ratio, as shown in lines I, II, and III in Figure
(10) G . G ov il, J. Chem. Soc., A, 1420 (1967).(11) F . J. W eigert and J. D . R oberts , J. Amer. Chem. Soc., 9 0 , 3543 (1968).
The Journal o f P hysica l Chem istry, Vol. 74, N o . 14, 1970
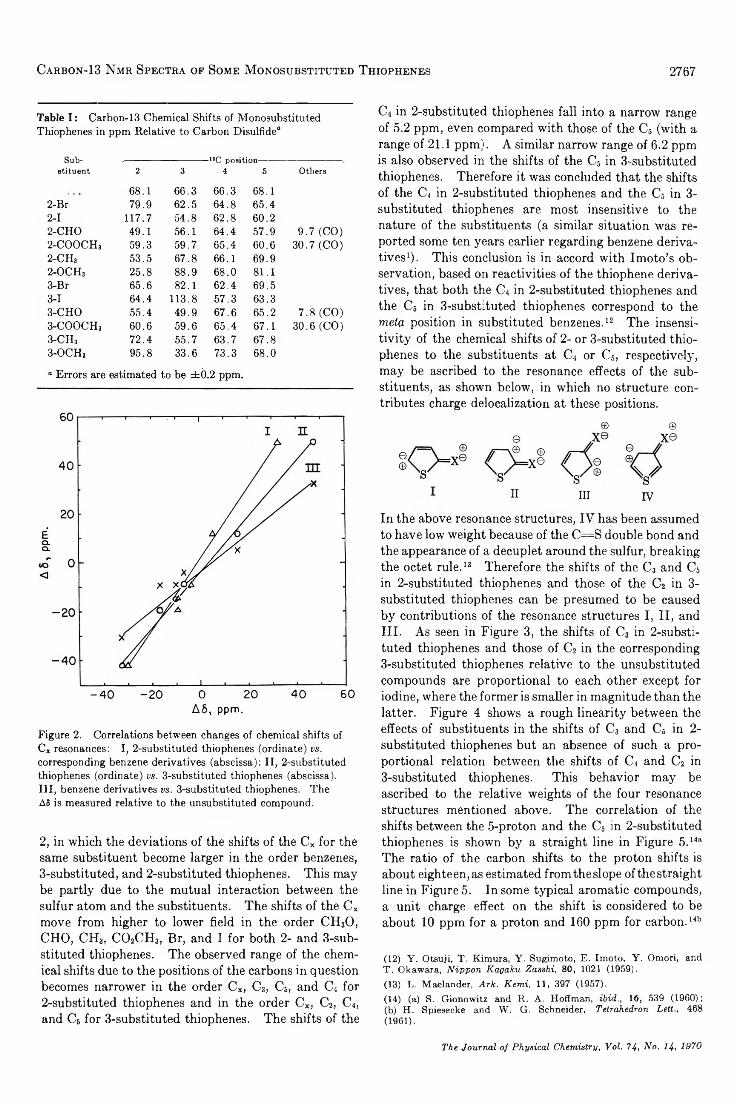
Carbon-13 Nmr Spectra o f Some M onosubstituted Thiophenes 2767
Table I : Carbon-13 Chemical Shifts of Monosubstituted Thiophenes in ppm Relative to Carbon Disulfide“
Sub- ,----------------------------- 18C position----------------------stituent 2 3 4 5 Others
68.1 66.3 66.3 68.12-Br 79.9 62.5 64.8 65.42-1 117.7 54.8 62.8 60.22-CHO 49.1 56.1 64.4 57.9 9.7 (CO)2-COOCH3 59.3 59.7 65.4 60.6 30.7 (CO)2-C H 3 53.5 67.8 66.1 69.92-OCH, 25.8 88.9 68.0 81.13-Br 65.6 82.1 62.4 69.53-1 64.4 113.8 57.3 63.33-CHO 55.4 49.9 67.6 65.2 7.8 (CO)3-COOCH3 60.6 59.6 65.4 67.1 30.6 (CO)3-C H 3 72.4 55.7 63.7 67.83-OCH3 95.8 33.6 73.3 68.0
- 4 0 - 2 0 0 20 40 60A6, ppm.
Figure 2. Correlations between changes of chemical shifts of Cx resonances: I, 2-substituted thiophenes (ordinate) vs. corresponding benzene derivatives (abscissa): II, 2-substituted thiophenes (ordinate) vs. 3-substituted thiophenes (abscissa).Ill, benzene derivatives vs. 3-substituted thiophenes. The AS is measured relative to the unsubstituted compound.
2, in which the deviations of the shifts of the Cx for the same substituent become larger in the order benzenes,3-substituted, and 2-substituted thiophenes. This maybe partly due to the mutual interaction between the sulfur atom and the substituents. The shifts of the Cx move from higher to lower field in the order CH30, CHO, CH3, C 02CH3, Br, and I for both 2- and 3-sub- stituted thiophenes. The observed range of the chemical shifts due to the positions of the carbons in question becomes narrower in the order Cx, C3, C5, and C4 for 2-substituted thiophenes and in the order Cx, C2, C4, and C5 for 3-substituted thiophenes. The shifts of the
C4 in 2-substituted thiophenes fall into a narrow range of 5.2 ppm, even compared with those of the C5 (with a range of 21.1 ppm). A similar narrow range of 6.2 ppm is also observed in the shifts of the C5 in 3-substituted thiophenes. Therefore it was concluded that the shifts of the C4 in 2-substituted thiophenes and the C6 in 3- substituted thiophenes are most insensitive to the nature of the substituents (a similar situation was reported some ten years earlier regarding benzene derivatives1). This conclusion is in accord with Imoto’s observation, based on reactivities of the thiophene derivatives, that both the C4 in 2-substituted thiophenes and the C6 in 3-substituted thiophenes correspond to the meta position in substituted benzenes.12 The insensitivity of the chemical shifts of 2- or 3-substituted thiophenes to the substituents at C4 or C 5 , respectively, may be ascribed to the resonance effects of the substituents, as shown below, in which no structure contributes charge delocalization at these positions.
© ©
II HI IV
In the above resonance structures, IY has been assumed to have low weight because of the C = S double bond and the appearance of a decuplet around the sulfur, breaking the octet rule.13 Therefore the shifts of the C3 and C6 in 2-substituted thiophenes and those of the C2 in 3- substituted thiophenes can be presumed to be caused by contributions of the resonance structures I, II, andIII. As seen in Figure 3, the shifts of C3 in 2-substituted thiophenes and those of C2 in the corresponding3-substituted thiophenes relative to the unsubstituted compounds are proportional to each other except for iodine, where the former is smaller in magnitude than the latter. Figure 4 shows a rough linearity between the effects of substituents in the shifts of C3 and C5 in 2- substituted thiophenes but an absence of such a proportional relation between the shifts of C4 and C2 in3-substituted thiophenes. This behavior may be ascribed to the relative weights of the four resonance structures mentioned above. The correlation of the shifts between the 5-proton and the C5 in 2-substituted thiophenes is shown by a straight line in Figure 5.14a The ratio of the carbon shifts to the proton shifts is about eighteen, as estimated from the slope of the straight line in Figure 5. In some typical aromatic compounds, a unit charge effect on the shift is considered to be about 10 ppm for a proton and 160 ppm for carbon.14b
(12) Y . O tsu ji, T . K im ura, Y . S ugim oto, E . Im o to , Y . O m ori, and T . O kaw ara, Nippon Kagaku Zasshi, 80 , 1021 (1959).(13) L . M aelander, Ark. Kemi, 11, 397 (1957).(14) (a) S . G ion ow itz and R . A . H offm an , ibid., 16, 539 (1960); (b ) H . Spiesecke and W . G . Schneider, Tetrahedron Lett., 468 (1961).
T he Journal o f P hysica l Chem istry, V oi. 74, N o . 14, 1970
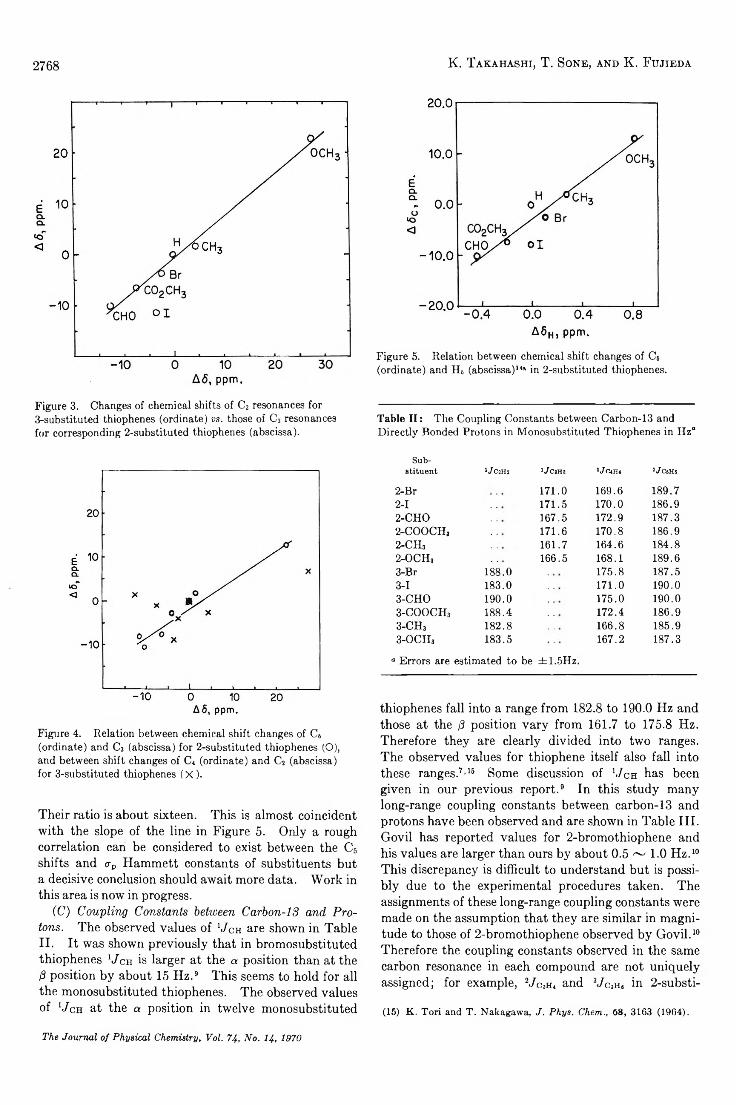
2768 K. T a k a h a s h i , T . S o n e , a n d K. F u j ie d a
Figure 3. Changes of chemical shifts of C2 resonances for 3-substituted thiophenes (ordinate) vs. those of C3 resonances for corresponding 2-substituted thiophenes (abscissa).
Figure 4. Relation between chemical shift changes of Cs (ordinate) and C3 (abscissa) for 2-substituted thiophenes (O), and between shift changes of Ci (ordinate) and C2 (abscissa) for 3-substituted thiophenes ( X ).
Their ratio is about sixteen. This is almost coincident with the slope of the line in Figure 5. Only a rough correlation can be considered to exist between the C5 shifts and <rp Hammett constants of substituents but a decisive conclusion should await more data. Work in this area is now in progress.
(C) Coupling Constants between Carbon-13 and Protons. The observed values of 1Jcr are shown in TableII. It was shown previously that in bromosubstituted thiophenes 1Jch is larger at the a position than at the /8 position by about 15 Hz.9 This seems to hold for all the monosubstituted thiophenes. The observed values of b/cH at the a position in twelve monosubstituted
Figure 5. Relation between chemical shift changes of Cc (ordinate) and H i (abscissa)14“ in 2-substituted thiophenes.
Table I I : The Coupling Constants between Carbon-13 and Directly Bonded Protons in Monosubstituted Thiophenes in Hz°
Sub-stituent lJ C2HJ lJ C!H3 1J C4H4 lJ CeHs
2-Br 171.0 169.6 189.72-1 171.5 170.0 186.92-CHO 167.5 172.9 187.32-COOCH3 171.6 170.8 186.92-CHs 161.7 164.6 184.82-OCHs 166.5 168.1 189.63-Br 188.0 175.8 187.53-1 183.0 171.0 190.03-CHO 190.0 175.0 190.03-COOCH3 188.4 172.4 186.93-C H 3 182.8 166.8 185.93-OCH3 183.5 167.2 187.3
0 Errors are estimated to be ±1.5Hz.
thiophenes fall into a range from 182.8 to 190.0 Hz and those at the /S position vary from 161.7 to 175.8 Hz. Therefore they are clearly divided into two ranges. The observed values for thiophene itself also fall into these ranges.7’15 Some discussion of h/cn has been given in our previous report.9 In this study many long-range coupling constants between carbon-13 and protons have been observed and are shown in Table III. Govil has reported values for 2-bromothiophene and his values are larger than ours by about 0.5 ~ 1.0 Hz.10 This discrepancy is difficult to understand but is possibly due to the experimental procedures taken. The assignments of these long-range coupling constants were made on the assumption that they are similar in magnitude to those of 2-bromothiophene observed by Govil.10 Therefore the coupling constants observed in the same carbon resonance in each compound are not uniquely assigned; for example, 2. /Cjh( and 3J c,h, in 2-substi-
(15) K . T o r i and T . N akagaw a, J. Phys. Chem., 68 , 3163 (1 964 ).
The Journal o f P hysica l Chem istry, Vol. 74, N o. 14, 1970
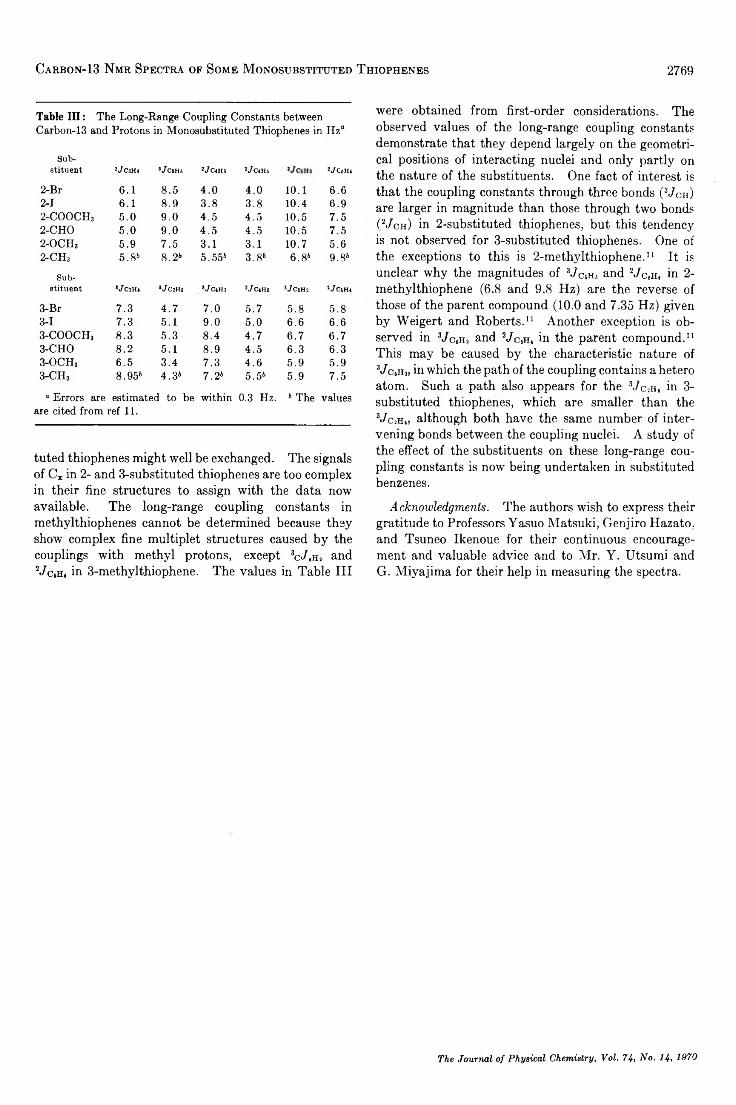
Carbon-13 Nmr Spectra of Some M onosubstittjted T hiophenes 2769
Table I I I : The Long-Range Coupling Constants between Carbon-13 and Protons in Monosubstituted Thiophenes in H z“
Sub-stituent iJcmi * J C8H6 V C(H3 V cois 2JC6H4
2-Br 6.1 8.5 4 .0 4.0 10.1 6.62-1 6.1 8.9 3.8 3.8 10.4 6.92-COOCH3 5.0 9.0 4.5 4.5 10.5 7.52-CHO 5.0 9.0 4.5 4.5 10.5 7.52-OCHs 5.9 7.5 3.1 3.1 10.7 5.62-CH3 5.86 8 .2 b 5.55» 3.8* 6.8* 9.8“
Sub-stituent *Jcait ’Jems VC(H! 2 J CilTS SJ CSH2 !JC5H1
3-Br 7.3 4 .7 7.0 5.7 5.8 5.83-1 7.3 5.1 9.0 5.0 6.6 6.63-COOCH3 8.3 5.3 8.4 4.7 6.7 6.73-CHO 8.2 5.1 8.9 4.5 6.3 6.33-OCHs 6.5 3.4 7.3 4.6 5.9 5.93-C H 3 8.95* 4 .36 7,2* 5 .56 5.9 7.5
“ Errors are estimated to be within 0.3 Hz. * The valuesare cited from ref 11.
tuted thiophenes might well be exchanged. The signals of Cx in 2- and 3-substituted thiophenes are too complex in their fine structures to assign with the data now available. The long-range coupling constants in methylthiophenes cannot be determined because they show complex fine multiplet structures caused by the couplings with methyl protons, except 3c / , h 2 and 2/ c sh , in 3-methylthiophene. The values in Table III
were obtained from first-order considerations. The observed values of the long-range coupling constants demonstrate that they depend largely on the geometrical positions of interacting nuclei and only partly on the nature of the substituents. One fact of interest is that the coupling constants through three bonds ( 3/ Ch )
are larger in magnitude than those through two bonds ( V c h ) in 2-substituted thiophenes, but this tendency is not observed for 3-substituted thiophenes. One of the exceptions to this is 2-methylthiophene.11 It is unclear why the magnitudes of 3/ c sh , and 2JctH4 in 2- methylthiophene (6.8 and 9.8 Hz) are the reverse of those of the parent compound (10.0 and 7.35 Hz) given by Weigert and Roberts.11 Another exception is observed in 3t7CfiHa and 2J Csh , in the parent compound.11 This may be caused by the characteristic nature of :<JCiiij, in which the path of the coupling contains a hetero atom. Such a path also appears for the 3J c 2h , in 3- substituted thiophenes, which are smaller than the 3Jcm„ although both have the same number of intervening bonds between the coupling nuclei. A study of the effect of the substituents on these long-range coupling constants is now being undertaken in substituted benzenes.
Acknowledgments. The authors wish to express their gratitude to Professors Yasuo Matsuki, Genjiro Hazato, and Tsuneo Ikenoue for their continuous encouragement and valuable advice and to Mr. Y. Utsumi andG. Miyajima for their help in measuring the spectra.
The Journal o f P h ysical Chem istry, V ol. 74, N o . 14, 1970
2770 R ic h a r d P. W e n d t a n d M o h a m m e d S h a m im
Isothermal Diffusion in the System Water-Magnesium Chloride-Sodium
Chloride As Studied with the Rotating Diaphragm Cell1
by Richard P. Wendt and Mohammed Shamim2Department of Chemistry, Loyola University, New Orleans, Louisiana 70118 (Received January 19, 1970)
The set of four diffusion coefficients sufficient for a complete description of isothermal diffusion has been measured at 25° for the system H20-MgCl2-NaCl at three compositions. A modified version of the Stokes diaphragm cell was used for the measurements, which resulted in an accuracy of ±0.03 X 10“ 5 cm2/sec in each diffusion coefficient. The diffusion data were combined with activity coefficient data in the literature to calculate the phenomenological transport coefficients and test the Onsager relation at each composition. Measured values for the diffusion and phenomenological coefficients were compared with values predicted by an approximate Nernst-type theory. It was found that the relatively large cross-term diffusion coefficients were well predicted by the approximate theory.
IntroductionSince 1955 when Dunlop and Gosting3 first measured
the set of four diffusion coefficients sufficient for a complete description of isothermal diffusion in a ternary system, several other workers4 have published results for a number of ternary systems containing electrolytes and nonelectrolytes. Of the electrolyte systems, only one,6 namely, H20-NaiS04-H2SC>4, contained divalent ions, and none contained the solute MgCl2. The work described here for the system H20-M gC l2-NaCl helps fill this data void of special interest to scientists working with systems similar to sea water, provides measured values for diffusion coefficients that can be compared with values predicted from Nernst-type equations6 for multiion systems containing a divalent ion, and introduces an inexpensive method of moderate accuracy for determining diffusion coefficients.
TheoryDiffusion in Ternary Systems. In this work we use
the formalism developed by Hooyman7 to describe reference frames, diffusion coefficients, and phenomenological coefficients that are consistent with Onsager’s theory of irreversible thermodynamics.8
According to this theory, for ternary systems the flows (Ji)0 of each solute i, measured with respect to a local reference frame moving with the velocity of the solvent 0, are linearly related to gradients of chemical potentials, bfij/bx, thereby defining the solvent-fixed phenomenological coefficients, (Ay)0
(JÎ)o = — 2 (Ay)o ~ i = 1 ,2 (1)3- 1 OX
The Onsager relation is
(Ln)o = (Ln)0 (2)
Solvent-fixed diffusion coefficients (Dy)0 are defined by the equations
2 ¿v(Ji)0 = - £ (Dy)0 —' i = 1, 2 (3)
1-1 ox
where bcffbx is the concentration gradient (in one dimension, x) of solute j.
Finally, volume-fixed diffusion coefficients Dy are defined by9
2 deJi = - E Dy —1 i = 1, 2 (4)
l - l ox
Hooyman, et al.,10 have shown that for systems in which partial molal volumes Vt are independent of concentration, and in which one surface of the solution is constrained to have zero velocity, then the volume- fixed reference frame becomes identical with the cell- fixed (or apparatus-fixed) reference frame with respect to which the solute flows are measured in the actual diffusion experiments. Since those conditions approximately prevail in our experiments, where the concentration differences were never greater than ca. 0.5 M and
(1) T h is w ork was supported b y G rant N o . 14 -01-0001-1303 from the O ffice o f Saline W ater, TJ. S . D ep artm en t o f th e Interior, W ash in gton , D . C .
(2) Institu te o f C hem istry, U niversity o f Islam abad, R aw a lp in d i, Pakistan.
(3) P . J. D u n lop and L . J . G osting, J. Amer. Chem. Soc., 77 , 5238 (1955).
(4) F o r sum m aries o f d iffusion data fo r ternary system s see: D . G . M iller, J. Phys. Chem., 71 , 616 (1 9 6 7 ); E . L . Cussler, Jr., an d P . J . D u n lop , ibid., 70 , 1880 (1 966); H . K im , ibid., 70 , 563 (1966).(5) R . P . W en d t, ibid., 66, 1279 (1962).(6) R . P . W en d t, ibid., 69, 1227 (1965).(7) G . J . H ooym a n , Physica, 22, 751 (1956).(8) L . Onsager, Phys. Rev., 37, 405 (1 931 ); 38 , 2265 (1931).(9) W e om it the subscript, V , fo r con venience.(10) G . J . H ooy m a n , et al., Physica, 19, 1095 (1 953 ); S . R . d e G ro o t and P . M azur, “ N on -E qu ilibrium T h erm od y n a m ics ,” In terscien ce , N ew Y o rk , N . Y ., 1962, p 256.
The Journal o f P hysical Chem istry, Voi. 74-, N o. 14, 1970
I s o t h e r m a l D if f u s io n in t h e S y s t e m H20-MgCl2-NaCl 2771
bulk flow was insignificant, we used volume-fixed flow equations to define the diffusion coefficients.
To calculate the solvent-fixed diffusion and phenomenological coefficients and test the Onsager relation we used transformation equations adapted by Dunlop and Gosting11 from Hooyman’s theory. For these calculations we must know (a) the four diffusion coefficients D{j, (b) the variation of the mean ionic activity coefficient of each solute with respect to the concentration of each solute, and (c) the partial molai volume of each component.
Diaphragm Cell Method. Probably the simplest and most inexpensive (but not necessarily fastest nor accurate) method for studying isothermal diffusion is the diaphragm cell method, described in great detail by Gordon12 and more recently by Robinson and Stokes.13
For binary systems the diaphragm cell equation is
Here t is the time at the end of the experiment; AC° = CB — CA at time t — 0, i.e., the initial concentration difference between the solution B in the bottom compartment of the cell and solution A in the top compartment; AC is the concentration difference at the end of the experiment; ¡3 is the cell constant; and D is the integral diffusion coefficient, a complicated function of the differential diffusion coefficient, D.
For ternary systems the assumptions used to obtain explicit expressions for the time dependence of the two solute concentration differences are the same as for binary systems, i.e., the pseudo-steady state is assumed for each solute flux density, and the solutions in each compartment are assumed to be uniform. Because of their complexity we present only the general form of the equations; the details of the derivation are given in the literature.14 The expressions found for the solute concentration differences, AC\ and AC2, at time t are
ACi = Pie~ßirit + Qie~ß°d (6)
AC2 = P * -* 9* + Q,e~ß,r2t (7)
In these equations Pi, P2, Qi, and Q2 are nonlinear functions of the diffusion coefficients Dtj and the initial concentration differences AC °, or and <r2 are functions of Di} only, and the cell constant /3 is the same as defined for binary systems. Equations 6 and 7 cannot be solved explicitly for the Dtj, but values for Di} can be calculated from measured values for A C °, A Cit fi, and t by using (a) an iteration method16’16 or (b) approximate methods17 which require restrictive assumptions about the experimental conditions and relative magnitudes of the Du. The former method places no restrictions on the experiments or on the magnitude of the Du, and this method was adapted with some modification for our work.
Special Theory for Ternary Systems. Instead of analyzing for each solute to find each AC, and then calculate the D(j by using the iteration method, we decided to determine overall physical properties of the solutions A and B at the end of the diffusion experiment and use a least-squares iteration method on one equation formed by combining eq 6 and 7.
This procedure is quite similar to that used by Cussler and Dunlop,16 differing only in the detail that we used values of AC ° determined directly by preparation of the initial solutions instead of determining overall physical properties of the initial solutions. Cussler and Dunlop compared the measured values for Dtj from their diaphragm cell experiments with Di} measured for the system H20-sucrose-KCl with the Gouy diffusi- ometer. Agreement within experimental error of the two methods established confidence in the diaphragm cell method in general and in their special procedure in particular.
Each overall physical property measured according to this procedure is a differential property, z, between solutions A and B which must vary linearly with the solute concentration differences, AC\ and AC2
z = TFxACi + W2AC2 (8)
In this work we measured An, the refractive index difference between solutions A and B, and the specific conductance difference, AK, between the same two solutions. Equations for these properties with the form of eq 8 are
A n = / i iA l ' i -|- R 2AC2 (9)
A K = KiACi + K,AC2 (10)
Si and E2 are called refractive index increments, and Ki and K?. are called conductometric increments. Linearity of these equations and values for the increments W{ were determined for this work by using solutions with known values for AC,.
The working equation for determining the Dtj is formed by multiplying both sides of eq 6 by Wi/(ACC
(11) P . J. D u n lop and L . J . G osting, J. Phys. Chem., 63, 86 (1959).(12) A . R . G ordon , Ann. N. F . Acad. Sci., 46 , 285 (1945).(13) R . A . R ob in son and R . H . Stokes, “ E lectro ly te S o lu tion s ,” A ca d em ic Press, N ew Y ork , N . Y ., 1959, C hapter 10; see also J. L . R ichardson , et at., O S W R esearch and D evelop m en t R ep ort , N o . 211, S ept 1966.(14) E . R . G illiland, R . F . B addou r, and D . J . G old stein , Can. J . Chem. Eng., 35 , 10 (1957); E . N . L igh tfoo t and E . L . Cussler, Jr., Chem. Eng. Progr. Symp. Sci., 61 , 66 (1 965 ); H . K im , J. Phys. Chem., 70, 1880 (1966).(15) E . L . Cussler, Jr., and P . J. D u n lop , ibid., 70 , 1880 (1966).(16) P . R . P atel, E . C . M oren o , and T . M . G regory , J. Res. Nat. Bur. Stand., Sect. A, 73 , 43 (1969).(17) F . J. K e lly and R . H . Stokes, “ E lectro ly tes ,” B . P esce, E d ., P ergam on Press, O xford , 1962, p p 9 6 -1 0 0 ; J . K . B u rch ard and H . L . T o o r , J. Phys. Chem., 66 , 2015 (1962).
The Journal o f P hysica l Chem istry, V oi. 74, N o . 14, 1970
2772 R ic h a r d P. W e n d t a n d M o h a m m e d S h a m im
+ AC20) and both sides of eq 7 by W2/(ACi° + AC2°) , and then adding the two resultant equations
y = e~l>nt[Wi{\ - S)X/\2 + W2B2( 1 - X) +
W2( 1 + 5)(1 - X)/2 - W2B\X] +
e - pnl[Wi( 1 + S)X / 2 - W i S 2( l - X ) +
W2R1X + W2(l - S )(l - X)/2] (11)
Here y = z/jACS + AC2° ) ,X = ACj0/ ^ 0 + AC2°), S = V" 1 + iB>iB2, and the four parameters arlt cr2, Blt and B2 are functions of the four diffusion coefficients Di} (i,j = 1, 2) only. A Newton-Rhapson least-squares iteration method is used to calculate the four parameters from the experimental data; the calculation of the D a is then straightforward, since the D t] are related to the parameters by
D2l = B\((T2 — (Tl)
D n — B 2 ( < n — cr2)
Dn — V2(ot+ <r2)
V (<JT + C2) 2 — 4(<Tl<72 + D12D21) (12)
Dll = 01 + c2 — D 22
At least four different data points are required to calculate the four diffusion coefficients. Each data point consists of values for the initial concentration differences AC\° and AC2° ; the differential increments Wi and W2 for the particular differential property measured; the cell constant /3; the time t; and the differential physical property, z, measured for solutions A and B at time t.
We did not develop a rigorous procedure for calculating probable errors in the diffusion coefficients calculated according to this method, primarily because of the extreme complexity of the least-squares iteration program derived from eq 11. A rigorous error analysis based on a least-squares treatment of eq 6 and 7 has been accomplished by Patel, Moreno, and Gregory,16 but their analysis was not directly applicable to our procedure.
Theories for Predicting Diffusion Coefficients. One of the purposes of this work was to obtain measured values for the D tj in eq 4 for comparison with theoretically predicted values. The most successful theory for predicting diffusion coefficients for ternary systems was derived by Miller.18 He combined a rigorous application of irreversible thermodynamics with judicious methods of estimating ternary transport coefficients and activity coefficient derivatives from binary data and he obtained predictions of diffusion coefficients for several ternary systems containing 1-1 electrolytes that agreed with measured values within the experimental error of the diffusion measurements. It would be very interesting to test his theory against data from the system studied in this work containing a divalent
ion, but unfortunately (and surprisingly) there are no precise data for transference numbers and diffusion coefficients for the binary system H20-M gC l2 in the literature. Instead of testing Miller’s theory we must turn to the author’s (RPW) theory6 which is an extension of Gosting's approximate theory.19 This method was shown to predict the coefficients Ltj and Di} within about 10-20% for several strong electrolyte systems, even though it contained the rather drastic assumption that the individual ion mobilities were the same at appreciable concentrations as they were at infinite dilution.
According to this relatively inexact theory, the phenomenological coefficients (Ly)0 (i, j = 1, 2) in eq 1 can be estimated for the system under discussion, H20-M gCl2-NaCl, by using the equations20
Ln = Ly2 (L44 -j- L55)/ (45)
Li2 = Z/21 - — L^Lu/ (2S)
¿22 = Z/4t(4L,i3 + L55)/ (45)
5 = L 33 + V 4E 44 + V 4T 55
La = XAq/d^FHO7) i = 3, 4, 5 (13)
In these equations, and in all subsequent equations in this paper, the subscript 1 designates MgCl2, 2 is NaCl, 3 is M g2+, 4 is Na+, and 5 is Cl- ; \t° is the limiting equivalent conductivity of ion i, in cm2/(ohm equiv); Ci is the concentration of ion i, in mol/cc; |z(| is the absolute value of the valence of ion i; and F is the Faraday constant with dimensions C/equiv.
From the estimates of Ltj, estimated values for the (By)0 are then calculated using the equations7 defining Dtj
2Da = (By)0 = (14)
k = 1Mtj = {d k/dCj)Tip i, j — 1 ,2 (15)
where g* is the chemical potential of neutral solute k.If the partial molal volumes F4 were known for the
ternary system, then the measured diffusion coefficients B y could be calculated from estimates of (By)0 by solving eq 2, ref 11; but since the differences between B y and (By)0 are only 1 or 2% in solutions of ca. 0.5 M total solute concentration, the transformation is hardly worthwhile compared with the overall error introduced by the assumptions of the theory. Note that according to this approximate theory the activity data needed to calculate the chemical potential derivatives are used to help estimate the By. If such data are not available, assumptions must be made concerning the variation of the activity coefficients with solute concentra-
(18) D. G. Miller, J. Phys. Chem., 71, 616 (1967).(19) L. J. Gosting, Advan. Protein Chem,., 11, 535 (1956).(20) Equations 27-30, ref 6.
The Journal o f P hysica l Chem istry, V oi. 7^, N o. 14, 1970
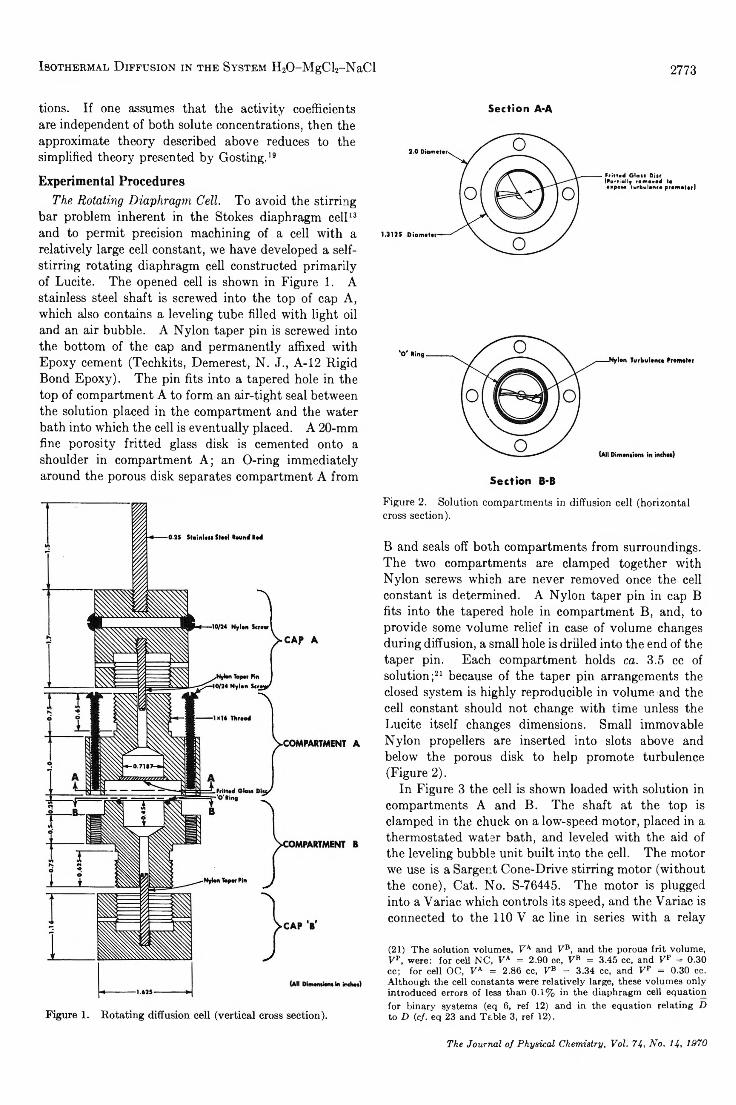
I s o t h e r m a l D if f u s io n in t h e S y s t e m H20-MgCl2-NaCl 2773
tions. If one assumes that the activity coefficients are independent of both solute concentrations, then the approximate theory described above reduces to the simplified theory presented by Gosting.19
Experimental ProceduresThe Rotating Diaphragm Cell. To avoid the stirring
bar problem inherent in the Stokes diaphragm cell13 and to permit precision machining of a cell with a relatively large cell constant, we have developed a selfstirring rotating diaphragm cell constructed primarily of Lucite. The opened cell is shown in Figure 1. A stainless steel shaft is screwed into the top of cap A, which also contains a leveling tube filled with light oil and an air bubble. A Nylon taper pin is screwed into the bottom of the cap and permanently affixed with Epoxy cement (Techkits, Demerest, N. J., A-12 Rigid Bond Epoxy). The pin fits into a tapered hole in the top of compartment A to form an air-tight seal between the solution placed in the compartment and the water bath into which the cell is eventually placed. A 20-mm fine porosity fritted glass disk is cemented onto a shoulder in compartment A; an O-ring immediately around the porous disk separates compartment A from
Section A-A
Fritted Glatt Disc (Partially removed to expote turbulence promoter)
Section B-BFigure 2. Solution compartments in diffusion cell (horizontal cross section).
B and seals off both compartments from surroundings. The two compartments are clamped together with Nylon screws which are never removed once the cell constant is determined. A Nylon taper pin in cap B fits into the tapered hole in compartment B, and, to provide some volume relief in case of volume changes during diffusion, a small hole is drilled into the end of the taper pin. Each compartment holds ca. 3.5 cc of solution;21 because of the taper pin arrangements the closed system is highly reproducible in volume and the cell constant should not change with time unless the Lucite itself changes dimensions. Small immovable Nylon propellers are inserted into slots above and below the porous disk to help promote turbulence (Figure 2).
In Figure 3 the cell is shown loaded with solution in compartments A and B. The shaft at the top is clamped in the chuck on a low-speed motor, placed in a thermostated water bath, and leveled with the aid of the leveling bubble unit built into the cell. The motor we use is a Sargent Cone-Drive stirring motor (without the cone), Cat. No. S-76445. The motor is plugged into a Variac which controls its speed, and the Variac is connected to the 110 V ac line in series with a relay
(21) T h e solu tion volum es, V A and V E, and the porou s frit volum e, V p, w ere: for cell N C , VA = 2 .90 ce, F B = 3.45 cc, and Vp = 0 .30 c c ; for cell O C , VA = 2 .86 cc, VB = 3 .34 cc, and Vp = 0.30 cc. A lth ou gh the cell constan ts w ere re latively large, these volu m es on ly in trodu ced errors o f less than 0 .1 % in the d iaphragm cell equ ation fo r b inary system s (eq 6, ref 12) and in th e equ ation relating D to D (cf. eq 23 and T a b le 3, ref 12).
The Journal o f P hysical Chem istry, V oi. 74, N o . 14, 1970
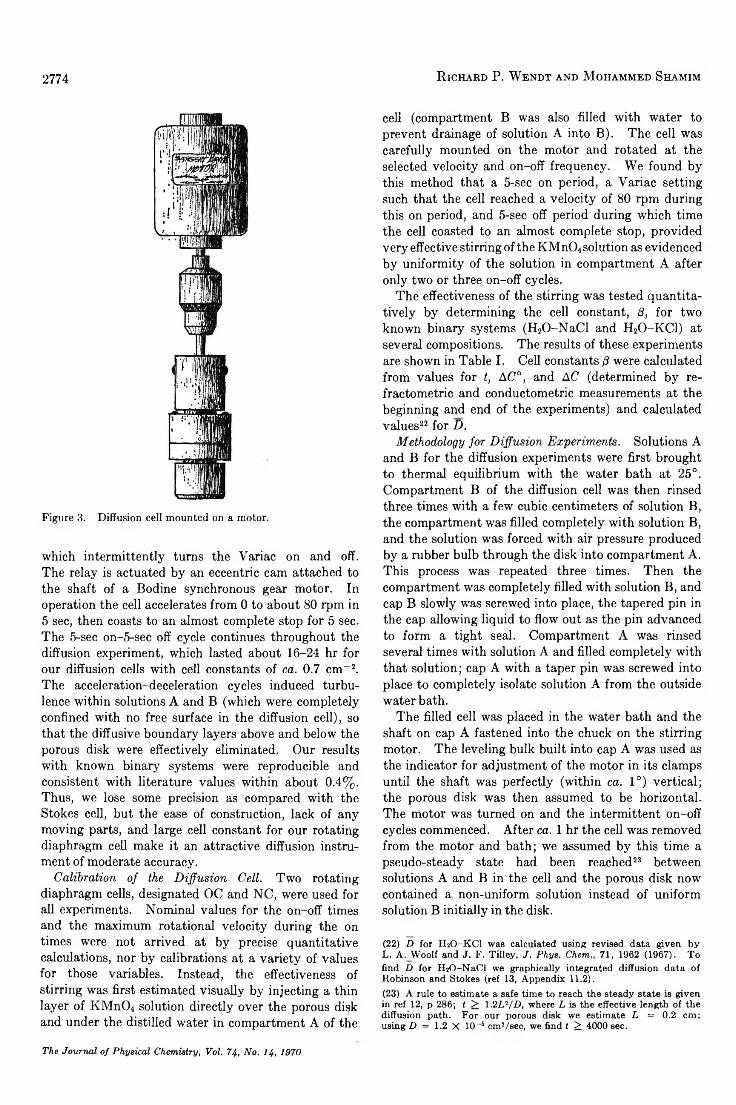
2774 R ic h a r d P. W e n d t a n d M o h a m m e d S h a m im
Figure 3. Diffusion cell mounted on a motor.
which intermittently turns the Yariac on and off. The relay is actuated by an eccentric cam attached to the shaft of a Bodine synchronous gear motor. In operation the cell accelerates from 0 to about 80 rpm in 5 sec, then coasts to an almost complete stop for 5 sec. The 5-sec on-5-sec off cycle continues throughout the diffusion experiment, which lasted about 16-24 hr for our diffusion cells with cell constants of ca. 0.7 cm-2. The acceleration-deceleration cycles induced turbulence within solutions A and B (which were completely confined with no free surface in the diffusion cell), so that the diffusive boundary layers above and below the porous disk were effectively eliminated. Our results with known binary systems were reproducible and consistent with literature values within about 0.4%. Thus, we lose some precision as compared with the Stokes cell, but the ease of construction, lack of any moving parts, and large cell constant for our rotating diaphragm cell make it an attractive diffusion instrument of moderate accuracy.
Calibration of the Diffusion Cell. Two rotating diaphragm cells, designated OC and NC, were used for all experiments. Nominal values for the on-off times and the maximum rotational velocity during the on times were not arrived at by precise quantitative calculations, nor by calibrations at a variety of values for those variables. Instead, the effectiveness of stirring was first estimated visually by injecting a thin layer of K M n04 solution directly over the porous disk and under the distilled water in compartment A of the
cell (compartment B was also filled with water to prevent drainage of solution A into B). The cell was carefully mounted on the motor and rotated at the selected velocity and on-off frequency. We found by this method that a 5-sec on period, a Variac setting such that the cell reached a velocity of 80 rpm during this on period, and 5-sec off period during which time the cell coasted to an almost complete stop, provided very effective stirring of the KM n04 solution as evidenced by uniformity of the solution in compartment A after only two or three on-off cycles.
The effectiveness of the stirring was tested quantitatively by determining the cell constant, /3, for two known binary systems (H20-N aCl and H20-KC1) at several compositions. The results of these experiments are shown in Table I. Cell constants /3 were calculated from values for t, AC°, and AC (determined by re- fractometric and conductometric measurements at the beginning and end of the experiments) and calculated values22 for D.
Methodology for Diffusion Experiments. Solutions A and B for the diffusion experiments were first brought to thermal equilibrium with the water bath at 25°. Compartment B of the diffusion cell was then rinsed three times with a few cubic centimeters of solution B, the compartment was filled completely with solution B, and the solution was forced with air pressure produced by a rubber bulb through the disk into compartment A. This process was repeated three times. Then the compartment was completely filled with solution B, and cap B slowly was screwed into place, the tapered pin in the cap allowing liquid to flow out as the pin advanced to form a tight seal. Compartment A was rinsed several times with solution A and filled completely with that solution; cap A with a taper pin was screwed into place to completely isolate solution A from the outside water bath.
The filled cell was placed in the water bath and the shaft on cap A fastened into the chuck on the stirring motor. The leveling bulk built into cap A was used as the indicator for adjustment of the motor in its clamps until the shaft was perfectly (within ca. 1°) vertical; the porous disk was then assumed to be horizontal. The motor was turned on and the intermittent on-off cycles commenced. After ca. 1 hr the cell was removed from the motor and bath; we assumed by this time a pseudo-steady state had been reached23 between solutions A and B in the cell and the porous disk now contained a non-uniform solution instead of uniform solution B initially in the disk.
(22) D for H 2O -K C I w as calcu lated using revised d ata g iven b y L . A .W o o l f and J. F . T illey , J. Phys. Chem., 71 , 1962 (1 967 ). T o find D fo r H 2 0 -N a C l w e graph ically integrated d iffu sion d ata o f R ob in son and Stokes (ref 13, A p pen d ix 11.2).(23) A rule to estim ate a safe tim e to reach the steady state is g iven in ref 12, p 286; t > 1.2L2/D, w here L is th e e ffective length o f the d iffusion path . F or our porou s disk w e estim ate L = 0 .2 cm ; using D = 1.2 X 10 ~6 cm 2/se c , w e find t > 4000 sec.
The Journal o f P hysical Chem istry, Voi. 74, N o . 14, 1970
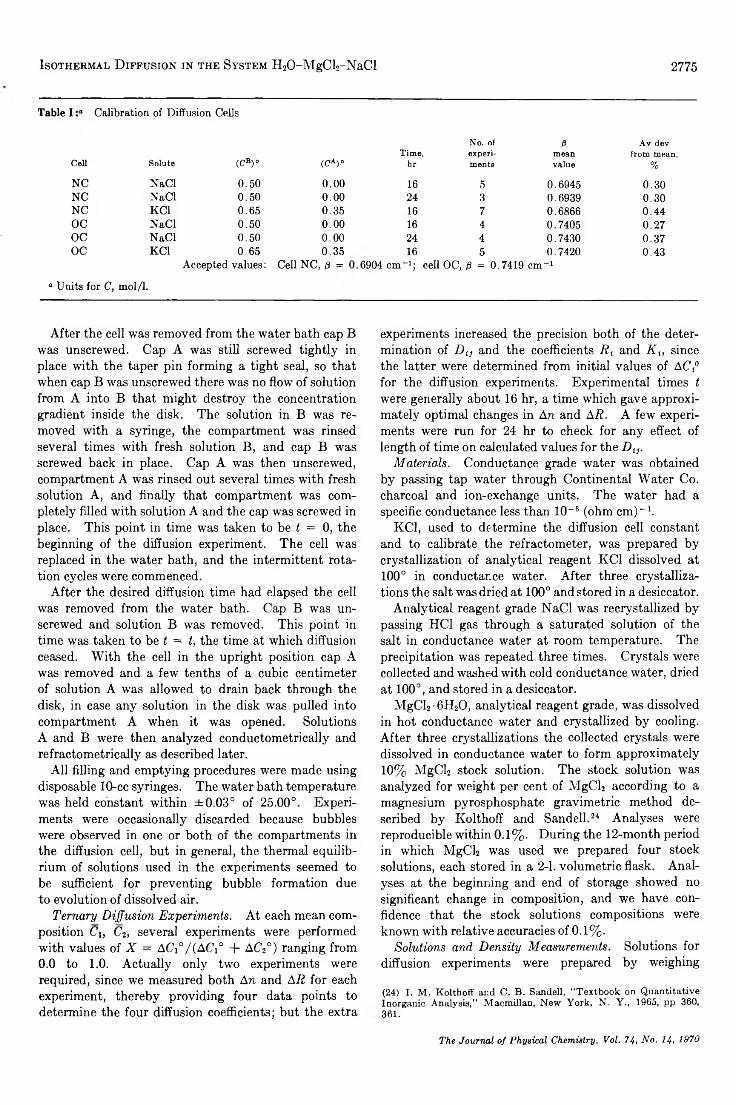
I s o t h e r m a l D if f u s io n in t h e Sy s t e m H20-MgCl2-NaCl 2775
Table IC a l ib r a t io n of Diffusion Cells
Cell Solute (CB)° (CA)°
NC NaCl 0.50 0.00NC NaCl 0.50 0.00NC K C l 0.65 0.35OC NaCl 0.50 0.00OC NaCl 0.50 0.00OC K C l 0.65 0.35
Accepted values: Cell NC, ß =
No. of ß A v devTime, experi mean from mean,
hr ments value %
16 5 0.6945 0.3024 3 0.6939 0.3016 7 0.6866 0.4416 4 0.7405 0.2724 4 0.7430 0.3716 5 0.7420 0.43
6904 cm-1; cell OC, ß = 0.7419 cm-1
“ Units for C , mol/1.
After the cell was removed from the water bath cap B was unscrewed. Cap A was still screwed tightly in place with the taper pin forming a tight seal, so that when cap B was unscrewed there was no flow of solution from A into B that might destroy the concentration gradient inside the disk. The solution in B was removed with a syringe, the compartment was rinsed several times with fresh solution B, and cap B was screwed back in place. Cap A was then unscrewed, compartment A was rinsed out several times with fresh solution A, and finally that compartment was completely filled with solution A and the cap was screwed in place. This point in time was taken to be t = 0, the beginning of the diffusion experiment. The cell was replaced in the water bath, and the intermittent rotation cycles were commenced.
After the desired diffusion time had elapsed the cell was removed from the water bath. Cap B was unscrewed and solution B was removed. This point in time was taken to be t = t, the time at which diffusion ceased. With the cell in the upright position cap A was removed and a few tenths of a cubic centimeter of solution A was allowed to drain back through the disk, in case any solution in the disk was pulled into compartment A when it was opened. Solutions A and B were then analyzed conductometrically and refractometrically as described later.
All filling and emptying procedures were made using disposable 10-cc syringes. The water bath temperature was held constant within ±0.03° of 25.00°. Experiments were occasionally discarded because bubbles were observed in one or both of the compartments in the diffusion cell, but in general, the thermal equilibrium of solutions used in the experiments seemed to be sufficient for preventing bubble formation due to evolution of dissolved air.
Ternary Diffusion Experiments. At each mean composition Ci, C2, several experiments were performed with values of X = ACi°/(ACi° + AC2°) ranging from 0.0 to 1.0. Actually only two experiments were required, since we measured both An and AR for each experiment, thereby providing four data points to determine the four diffusion coefficients; but the extra
experiments increased the precision both of the determination of Du and the coefficients Rt and K (, since the latter were determined from initial values of AC,0 for the diffusion experiments. Experimental times t were generally about 16 hr, a time which gave approximately optimal changes in An and AR. A few experiments were run for 24 hr to check for any effect of length of time on calculated values for the Dti.
Materials. Conductance grade water was obtained by passing tap water through Continental Water Co. charcoal and ion-exchange units. The water had a specific conductance less than 10-6 (ohm cm)-1.
KC1, used to determine the diffusion cell constant and to calibrate the refractometer, was prepared by crystallization of analytical reagent KC1 dissolved at 100° in conductance water. After three crystallizations the salt was dried at 100° and stored in a desiccator.
Analytical reagent grade NaCl was recrystallized by passing HC1 gas through a saturated solution of the salt in conductance water at room temperature. The precipitation was repeated three times. Crystals were collected and washed with cold conductance water, dried at 100°, and stored in a desiccator.
MgCl2 • 6H20, analytical reagent grade, was dissolved in hot conductance water and crystallized by cooling. After three crystallizations the collected crystals were dissolved in conductance water to form approximately 10% MgCl2 stock solution. The stock solution was analyzed for weight per cent of MgCl2 according to a magnesium pyrosphosphate gravimetric method described by Kolthoff and Sandell.24 Analyses were reproducible within 0.1%. During the 12-month period in which MgCl2 was used we prepared four stock solutions, each stored in a 2-1. volumetric flask. Analyses at the beginning and end of storage showed no significant change in composition, and we have confidence that the stock solutions compositions were known with relative accuracies of 0.1%.
Solutions and Density Measurements. Solutions for diffusion experiments were prepared by weighing
(24) I . M . K o lth o ff and C . B . Sandell, “ T e x tb o o k on Q u antita tive Inorgan ic A na lysis ,” M acm illan , N ew Y o rk , N . Y ., 1965, p p 360, 361.
The Journal o f P h ysical Chem istry, Voi. 74, No. 14, 1970
2776 R ic h a r d P. W e n d t a n d M o h a m m e d S h a m im
solute (or stock solution, in the case of MgCl2) into a 100-ml volumetric flask and filling the flask almost to the fiducial mark with conductance water. The flasks were then suspended in a water bath at 25.00°, allowed to thermally equilibrate, and filled with water to the fiducial mark with the aid of a magnifying eyepiece. The volume of each flask had been determined this way by weighing water required to fill to the mark, and reproducibilities of about ±0.02% in the volume were obtained for each flask. We could therefore determine solution densities to within about 0.0002 g /cc by weighing the solutions after they had been prepared to volume. All weights were corrected to vacuum in the usual way. The density information was used to calculate concentration in moles per liter for each solute and to determine with moderate accuracy solution properties such as partial molal volumes.
Conductometry. Conductance measurements were made with a Beckman Instruments, Inc., Model RC-18 conductivity bridge operated at 3 kc in the resistance mode. The conductance cell, a Beckman Instruments, Inc., Model CEL-G100Y184J, had a cell constant of approximately 100 cm-1, held about 0.1 cc of solution, and had a glass jacket through which transformer oil from a thermostated bath was circulated. The temperature of the circulating oil immediately at the outflow of the cell jacket was measured within 0.01° by a short-range mercury thermometer. For some conductance measurements the temperature slowly fluctuated by as much as ±0.05° around the desired temperature, 25°, but the bridge was balanced as the temperature rose and fell past 25° to obtain best values for the resistance that were reproducible within about 0.1%.
To try and determine Jc, the conductance cell constant, the resistance was measured for three solutions of NaCl in water, with concentrations C = 0.5, 0.3, and 0.13 M. Using literature values25 for the equivalent conductance of each solution, we found significantly different values for J0: at C — 0.5, Jc = 105.86 cm-1 ; at C = 0.3m, J c = 103.52; and at C = 0.13, J0 = 98.78. The design of the cell, being severely restricted by requirements of small solution volume and high cell constant, apparently resulted in this anomalous behavior which prohibits the use of this particular cell for absolute determinations of solution conductances. However, for our analytical needs the cell was adequate when calibrated over the range of concentrations expected for either the binary or ternary solutions used in the diffusion experiments.
For the binary systems KC1 in water and NaCl in water the conductance cell was calibrated by measuring the resistance of several solutions of KC1 in water and NaCl in water and then preparing deviation graphs similar to those used in ref 25.
For the ternary systems nominal values for the specific conductance, K, were calculated by using ./„ =
100. As indicated by eq 10, we expected AK, the difference between K for solution B and K for solution A, to be linearly dependent on ACi and AC2 over the small values used for the ACf. The sum of ACi° + AC2° (the known initial concentration differences) was held constant for each set of calibration experiments and the data were fit by the method of least squares to determine K1 and K2 in eq 10.
Refradometry. For each set of solutions the refractive index difference, An, was measured with a Brice- Phoenix Differential Refractometer, Model BP-2000-Y. The green line (546 mu) from a type AH-3 mercury vapor lamp illuminated the object slit of the apparatus. Oil from a thermostated oil bath passed through the jacket surrounding the quartz cell in the refractometer, and all measurements were made at 25 ± 0.05°. The cell constant was determined by calibration with several KCl-water and NaCl-water solutions, using literature data26 for accurate values of An. A single value for the cell constant, 0.92565 X 10“ ®, was found to reproduce An within about ± 3 X 10⁻⁶ refractive index units for several values of AC, thereby giving us confidence in the accuracy of our refractometric data.
For the ternary systems the refractometric increments Ri and F2 were determined from solutions of known ACi° and AC2° by applying the method of least squares to eq 9.
CalculationsThe Iteration Process. For each composition point
the following data were fed into the computer, according to the iterative least-squares program used to calculate the diffusion coefficients: (a) M, the number of experiments; (b) the first guesses for the parameters Si, S2, Bh and B2, which are functions only of four initial guessed values for the Dtj; (c) the initial solute concentration differences, ACC and AC'2° ; (d) the differential increments Ri and R2 (for the case of refractometric data points) or K, and K2 (for the case of conductometric data points); (e) the differential physical property An (for refractometric data points) or AK (for conductometric data points) measured at time t; and (f) the product (it of the cell constant and the diffusion time.
Item b, the initial estimates of the parameters, caused some difficulty. In general, the problem of convergence of iteration procedures such as the Newton- Rhapson method we used cannot be rigorously stated in terms of how close the initial guesses must be. We simply performed computer experiments with our program, using data for item e listed above generated by assuming some model values for Du (and hence the
(25) J . F . C ham bers, J. M . Stokes, and R . H . S tokes, J. Phys. Chem., 60, 985 (1956).
(26) T a b les 1 and 2, M anual B P -200 0 -V , P h oen ix P recis ion In stru m ent C o . [their d ata taken from A . K ruis, Z. Phys. Chem. (L e ip zig ), 343, 13 (1 9 3 6 )].
The Journal o f P hysica l Chem istry, V oi. 74, N o. 14, 1970
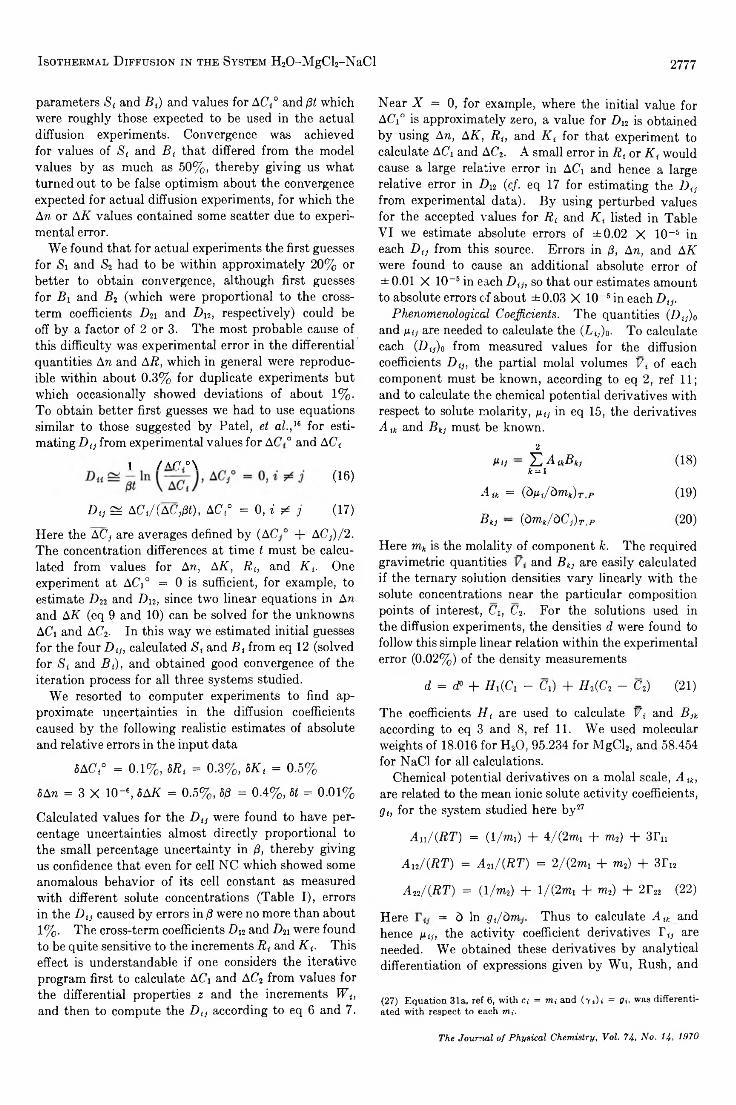
I s o t h e r m a l D if f u s io n in t h e S y s t e m H20-M gC l2-NaCl 2777
parameters S( and Bt) and values for AC ° and (3t which were roughly those expected to be used in the actual diffusion experiments. Convergence was achieved for values of St and B{ that differed from the model values by as much as 50%, thereby giving us what turned out to be false optimism about the convergence expected for actual diffusion experiments, for which the An or AK values contained some scatter due to experimental error.
We found that for actual experiments the first guesses for Si and S2 had to be within approximately 20% or better to obtain convergence, although first guesses for Bi and B2 (which were proportional to the crossterm coefficients Dn and Dn, respectively) could be off by a factor of 2 or 3. The most probable cause of this difficulty was experimental error in the differential quantities An and AR, which in general were reproducible within about 0.3% for duplicate experiments but which occasionally showed deviations of about 1%. To obtain better first guesses we had to use equations similar to those suggested by Patel, et a/.,16 for estimating D(j from experimental values for AC ° and ACt
1 / aC °\(16)
D „ S A C ,/(A C #), AC," - 0 , i * j (17)
Here the AC} are averages defined by (AC° + AC))/2. The concentration differences at time t must be calculated from values for An, AK, Rit and Ki. One experiment at AC)0 = 0 is sufficient, for example, to estimate D22 and T)n, since two linear equations in An and AK (eq 9 and 10) can be solved for the unknowns A % and A C2. In this way we estimated initial guesses for the four Dijt calculated St and Bf from eq 12 (solved for Si and Bt), and obtained good convergence of the iteration process for all three systems studied.
We resorted to computer experiments to find approximate uncertainties in the diffusion coefficients caused by the following realistic estimates of absolute and relative errors in the input data
5AC4° = 0.1%, 5Rt = 0.3%, 8Kt = 0.5%
8An = 3 X 10⁻⁶, 8AK = 0.5%, 8/3 = 0.4%, St = 0.01%
Calculated values for the Di} were found to have percentage uncertainties almost directly proportional to the small percentage uncertainty in /3, thereby giving us confidence that even for cell NC which showed some anomalous behavior of its cell constant as measured with different solute concentrations (Table I), errors in the Da caused by errors in /3 were no more than about 1%. The cross-term coefficients A 2 and A i were found to be quite sensitive to the increments R{ and K t. This effect is understandable if one considers the iterative program first to calculate AC) and AC) from values for the differential properties z and the increments Wu and then to compute the Dtj according to eq 6 and 7.
Near X = 0, for example, where the initial value for A O 0 is approximately zero, a value for Dn is obtained by using An, AK, R{, and K f for that experiment to calculate AC) and AC). A small error in R{ or K t would cause a large relative error in AC) and hence a large relative error in D12 (cf. eq 17 for estimating the Dtj from experimental data). By using perturbed values for the accepted values for Rt and K, listed in Table VI we estimate absolute errors of ±0.02 X 10 ~6 in each Dtj from this source. Errors in (3, An, and AK were found to cause an additional absolute error of ± 0.01 X 10~5 in each Dtj, so that our estimates amount to absolute errors of about ± 0.03 X 10⁻⁶ in each Dtj.
Phenomenological Coefficients. The quantities (Dy)0 and nn are needed to calculate the (Li;)0. To calculate each (Dy)0 from measured values for the diffusion coefficients D w, the partial molal volumes V, of each component must be known, according to eq 2, ref 11; and to calculate the chemical potential derivatives with respect to solute molarity, mu in eq 15, the derivatives A ik and Bkj must be known.
2Pii — X] A ikBkj (18)
k=lA oc = {òpi/òmk)TìP (19)
Bkj — (àmk/òCj)Tip (20)
Here mk is the molality of component k. The required gravimetric quantities and Bkj are easily calculated if the ternary solution densities vary linearly with the solute concentrations near the particular composition points of interest, O , C). For the solutions used in the diffusion experiments, the densities d were found to follow this simple linear relation within the experimental error (0.02%) of the density measurements
d = dP + 7/1(0 - O) + H2(C2 - O) (21)
The coefficients Ht are used to calculate V, and B]k according to eq 3 and 8, ref 11. We used molecular weights of 18.016 for H20 , 95.234 for MgCl2, and 58.454 for NaCl for all calculations.
Chemical potential derivatives on a molal scale, A « , are related to the mean ionic solute activity coefficients, g i, for the system studied here by27
An/(RT) = (l/wii) + 4/(2mi + m2) + 3I)i
Au/(RT) = An/(BT) = 2 /(2 mx + m,) + 3I)2
Ai2/(RT) = (l/m 2) + l/(2m i + m2) + 2r22 (22)
Here = d In gt/ d m Thus to calculate A ik and hence ntj, the activity coefficient derivatives Ttj are needed. We obtained these derivatives by analytical differentiation of expressions given by Wu, Rush, and
(27) Equation 31a, ref 6, with a = m,- and ( y ±) i = g i , was different ated with respect to each rrn.
The Journal o f P hysical C hem istry, Vol. 74, N o . 14, 1970
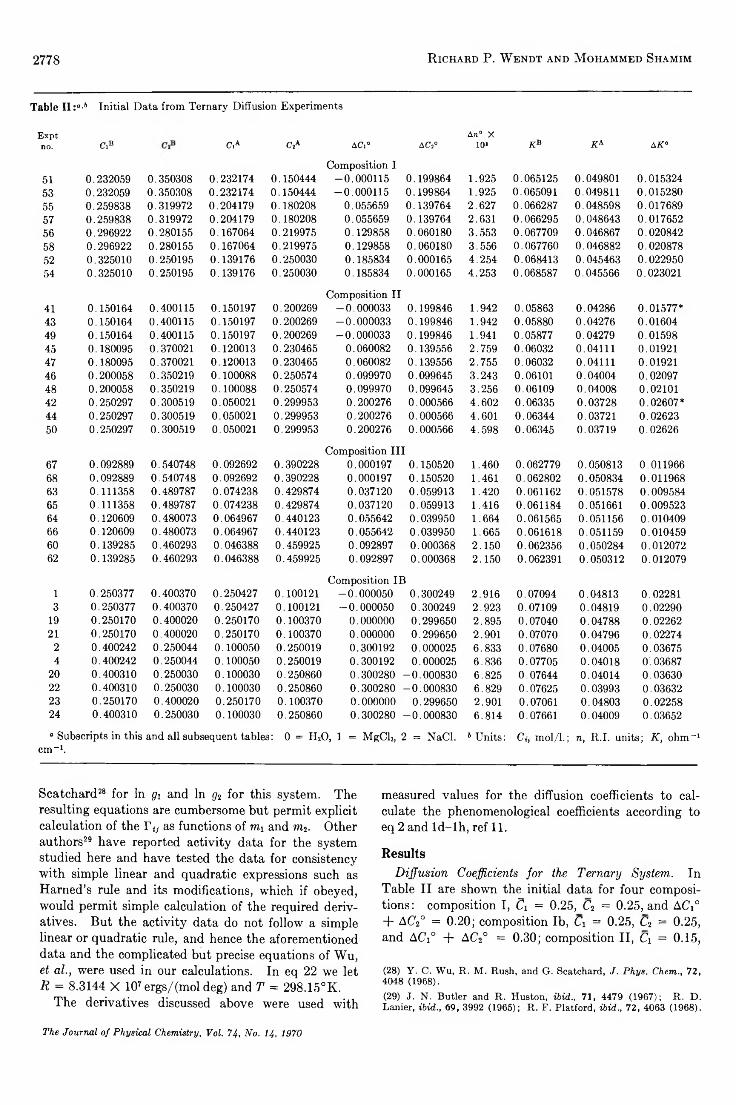
2778 R ic h a r d P. W e n d t a n d M o h a m m e d Sh a m im
Table II:“'6 Initial Data from Ternary Diffusion Experiments
E x p tno. C.B CiA c2A ACi° A C2°
A » ° X 10* k b E a ak°
51 0.232059 0.350308 0.232174 0.150444Composition I
-0 .000115 0.199864 1.925 0.065125 0.049801 0.01532453 0.232059 0.350308 0.232174 0.150444 -0.000115 0.199864 1.925 0.065091 0.049811 0.01528055 0.259838 0.319972 0.204179 0.180208 0.055659 0.139764 2.627 0.066287 0.048598 0.01768957 0.259838 0.319972 0.204179 0.180208 0.055659 0.139764 2.631 0.066295 0.048643 0.01765256 0.296922 0.280155 0.167064 0.219975 0.129858 0.060180 3.553 0.067709 0.046867 0.02084258 0.296922 0.280155 0.167064 0.219975 0.129858 0.060180 3.556 0.067760 0.046882 0.02087852 0.325010 0.250195 0.139176 0.250030 0.185834 0.000165 4.254 0.068413 0.045463 0.02295054 0.325010 0.250195 0.139176 0.250030 0.185834 0.000165 4.253 0.068587 0.045566 0.023021
41 0.150164 0.400115 0.150197 0.200269Composition I I
-0 .000033 0.199846 1.942 0.05863 0.04286 0.01577*43 0.150164 0.400115 0.150197 0.200269 -0 .000033 0.199846 1.942 0.05880 0.04276 0.0160449 0.150164 0.400115 0.150197 0.200269 -0.000033 0.199846 1.941 0.05877 0.04279 0.0159845 0.180095 0.370021 0.120013 0.230465 0.060082 0.139556 2.759 0.06032 0.04111 0.0192147 0.180095 0.370021 0.120013 0.230465 0.060082 0.139556 2.755 0.06032 0.04111 0.0192146 0.200058 0.350219 0.100088 0.250574 0.099970 0.099645 3.243 0.06101 0.04004 0.0209748 0.200058 0.350219 0.100088 0.250574 0.099970 0.099645 3.256 0.06109 0.04008 0.0210142 0.250297 0.300519 0.050021 0.299953 0.200276 0.000566 4.602 0.06335 0.03728 0.02607*44 0.250297 0.300519 0.050021 0.299953 0.200276 0.000566 4.601 0.06344 0.03721 0.0262350 0.250297 0.300519 0.050021 0.299953 0.200276 0.000566 4.598 0.06345 0.03719 0.02626
67 0.092889 0.540748 0.092692 0.390228Composition I I I
0.000197 0.150520 1.460 0.062779 0.050813 0.01196668 0.092889 0.540748 0.092692 0.390228 0.000197 0.150520 1.461 0.062802 0.050834 0.01196863 0.111358 0.489787 0.074238 0.429874 0.037120 0.059913 1.420 0.061162 0.051578 0.00958465 0.111358 0.489787 0.074238 0.429874 0.037120 0.059913 1.416 0.061184 0.051661 0.00952364 0.120609 0.480073 0.064967 0.440123 0.055642 0.039950 1.664 0.061565 0.051156 0.01040966 0.120609 0.480073 0.064967 0.440123 0.055642 0.039950 1.665 0.061618 0.051159 0.01045960 0.139285 0.460293 0.046388 0.459925 0.092897 0.000368 2.150 0.062356 0.050284 0.01207262 0.139285 0.460293 0.046388 0.459925 0.092897 0.000368 2.150 0.062391 0.050312 0.012079
1 0.250377 0.400370 0.250427 0.100121Composition IB
-0 .000050 0.300249 2.916 0.07094 0.04813 0.022813 0.250377 0.400370 0.250427 0.100121 -0.000050 0.300249 2.923 0.07109 0.04819 0.02290
19 0.250170 0.400020 0.250170 0.100370 0.000000 0.299650 2.895 0.07040 0.04788 0.0226221 0.250170 0.400020 0.250170 0.100370 0.000000 0.299650 2.901 0.07070 0.04796 0.02274
2 0.400242 0.250044 0.100050 0.250019 0.300192 0.000025 6.833 0.07680 0.04005 0.036754 0.400242 0.250044 0.100050 0.250019 0.300192 0.000025 6.836 0.07705 0.04018 0.03687
20 0.400310 0.250030 0.100030 0.250860 0.300280 -0.000830 6.825 0.07644 0.04014 0.0363022 0.400310 0.250030 0.100030 0.250860 0.300280 -0.000830 6.829 0.07625 0.03993 0.0363223 0.250170 0.400020 0.250170 0.100370 0.000000 0.299650 2.901 0.07061 0.04803 0.0225824 0.400310 0.250030 0.100030 0.250860 0.300280 -0.000830 6.814 0.07661 0.04009 0.03652
“ Subscripts in this and all subsequent tables: 0 = H 20, 1 = MgCl2, 2 = NaCl. 6 Units: C<, mol/1.; n , R .I. units; K , ohm-1 cm-1.
Scatchard28 for In gx and In g2 for this system. The resulting equations are cumbersome but permit explicit calculation of the Ttj as functions of mi and m2. Other authors29 have reported activity data for the system studied here and have tested the data for consistency with simple linear and quadratic expressions such as Hamed’s rule and its modifications, which if obeyed, would permit simple calculation of the required derivatives. But the activity data do not follow a simple linear or quadratic rule, and hence the aforementioned data and the complicated but precise equations of Wu, et al, were used in our calculations. In eq 22 we let R = 8.3144 X 10⁷ ergs/(mol deg) and T = 298.15°K.
The derivatives discussed above were used with
measured values for the diffusion coefficients to calculate the phenomenological coefficients according to eq 2 and ld -lh , ref 11.
ResultsDiffusion Coefficients for the Ternary System. In
Table II are shown the initial data for four compositions: composition I, Ci = 0.25, C2 = 0.25, and AC/° + AC2° = 0.20; composition lb, Ci = 0.25, C2 = 0.25, and AC/0 + AC’2° = 0.30; composition II, C\ = 0.15,
(28) Y . C . W u , R . M . R ush , and G . S catchard, J. Phys. Chem., 72 , 4048 (1968).
(29) J . N . B u tler and R . H u ston , ibid., 71 , 4479 (1 9 6 7 ); R . D . L anier, ibid., 69 , 3992 (1965); R . F . P la tford , ibid., 72 , 4063 (1 968).
The Journal o f P h ysical Chem istry, Voi. 74, N o. 14, 1970
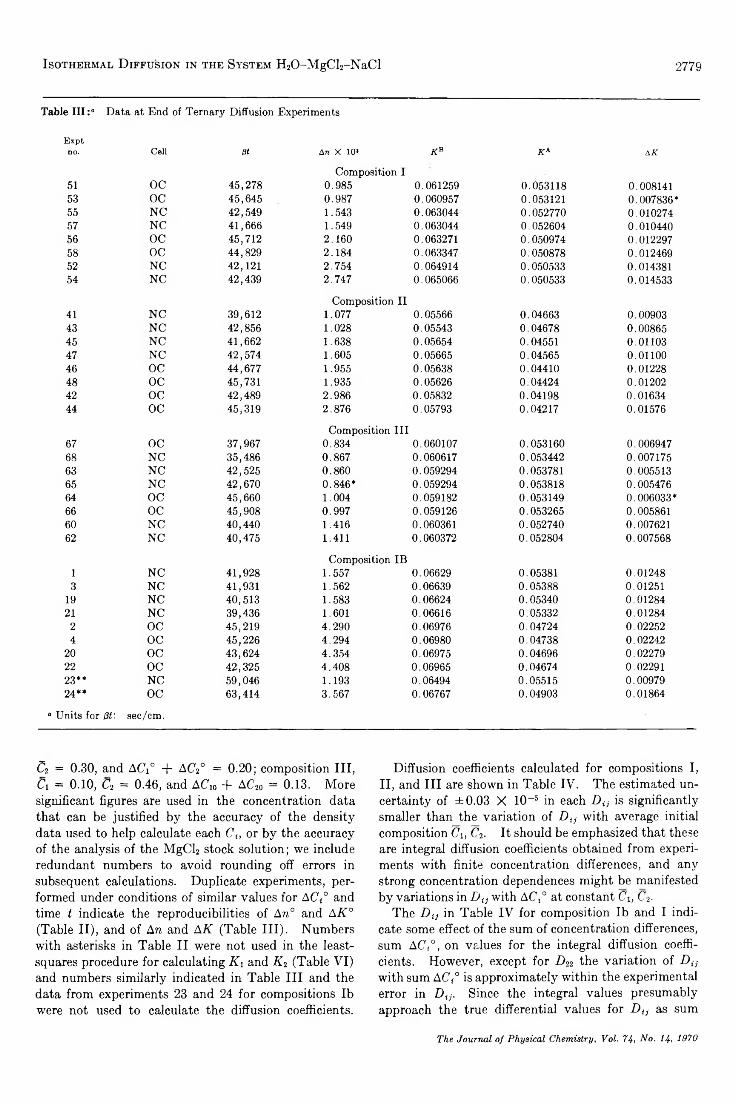
I s o t h e r m a l D if f u s io n in t h e Sy s t e m H20-MgCl2-NaCl 2779
Table III :® Data at End of Ternary Diffusion Experiments
Exptno. Cell ßt An X 10* X® X a AX
Composition I51 OC 45,278 0.985 0.061259 0.053118 0.00814153 OC 45,645 0.987 0.060957 0.053121 0.007836*55 NC 42,549 1.543 0.063044 0.052770 0.01027457 NC 41,666 1.549 0.063044 0.052604 0.01044056 OC 45,712 2.160 0.063271 0.050974 0.01229758 o c 44,829 2.184 0.063347 0.050878 0.01246952 NC 42,121 2.754 0.064914 0.050533 0.01438154 NC 42,439 2.747 0.065066 0.050533 0.014533
Composition I I41 NC 39,612 1.077 0.05566 0.04663 0.0090343 NC 42,856 1.028 0.05543 0.04678 0.0086545 NC 41,662 1.638 0.05654 0.04551 0.0110347 NC 42,574 1.605 0.05665 0.04565 0.0110046 OC 44,677 1.955 0.05638 0.04410 0.0122848 o c 45,731 1.935 0.05626 0.04424 0.0120242 o c 42,489 2.986 0.05832 0.04198 0.0163444 o c 45,319 2.876 0.05793 0.04217 0.01576
Composition I I I67 o c 37,967 0.834 0.060107 0.053160 0.00694768 NC 35,486 0.867 0.060617 0.053442 0.00717563 NC 42,525 0.860 0.059294 0.053781 0.00551365 NC 42,670 0.846* 0.059294 0.053818 0.00547664 OC 45,660 1.004 0.059182 0.053149 0.006033*66 o c 45,908 0.997 0.059126 0.053265 0.00586160 NC 40,440 1.416 0.060361 0.052740 0.00762162 NC 40,475 1.411 0.060372 0.052804 0.007568
Composition IB1 NC 41,928 1.557 0.06629 0.05381 0.012483 NC 41,931 1.562 0.06639 0.05388 0.01251
19 NC 40,513 1.583 0.06624 0.05340 0.0128421 NC 39,436 1.601 0.06616 0.05332 0.012842 OC 45,219 4.290 0.06976 0.04724 0.022524 o c 45,226 4.294 0.06980 0.04738 0.02242
20 o c 43,624 4.354 0.06975 0.04696 0.0227922 o c 42,325 4.408 0.06965 0.04674 0.0229123** NC 59,046 1.193 0.06494 0.05515 0.0097924** OC 63,414 3.567 0.06767 0.04903 0.01864
° Units for ß t : sec/cm.
Ci = 0.30, and ACi° + AC20 = 0.20; composition III, Ci = 0.10, Ci = 0.46, and AC10 + AC20 = 0.13. More significant figures are used in the concentration data that can be justified by the accuracy of the density data used to help calculate each Ct, or by the accuracy of the analysis of the MgCl2 stock solution; we include redundant numbers to avoid rounding off errors in subsequent calculations. Duplicate experiments, performed under conditions of similar values for ACt° and time t indicate the reproducibilities of An° and AK° (Table II), and of An and AK (Table III). Numbers with asterisks in Table II were not used in the least- squares procedure for calculating K\ and K2 (Table VI) and numbers similarly indicated in Table III and the data from experiments 23 and 24 for compositions lb were not used to calculate the diffusion coefficients.
Diffusion coefficients calculated for compositions I, II, and III are shown in Table IV. The estimated uncertainty of ±0.03 X 10~5 in each Dtj is significantly smaller than the variation of Du with average initial composition C\, C2. It should be emphasized that these are integral diffusion coefficients obtained from experiments with finite concentration differences, and any strong concentration dependences might be manifested by variations in Du with AC’,0 at constant C\, C2.
The Du in Table IV for composition lb and I indicate some effect of the sum of concentration differences, sum ACt° , on values for the integral diffusion coefficients. However, except for Z)22 the variation of Dtj with sum ACC is approximately within the experimental error in D(j. Since the integral values presumably approach the true differential values for Dtj as sum
The Journal o f P h ysica l Chem istry, Vol. 74, N o. 14 , 1970
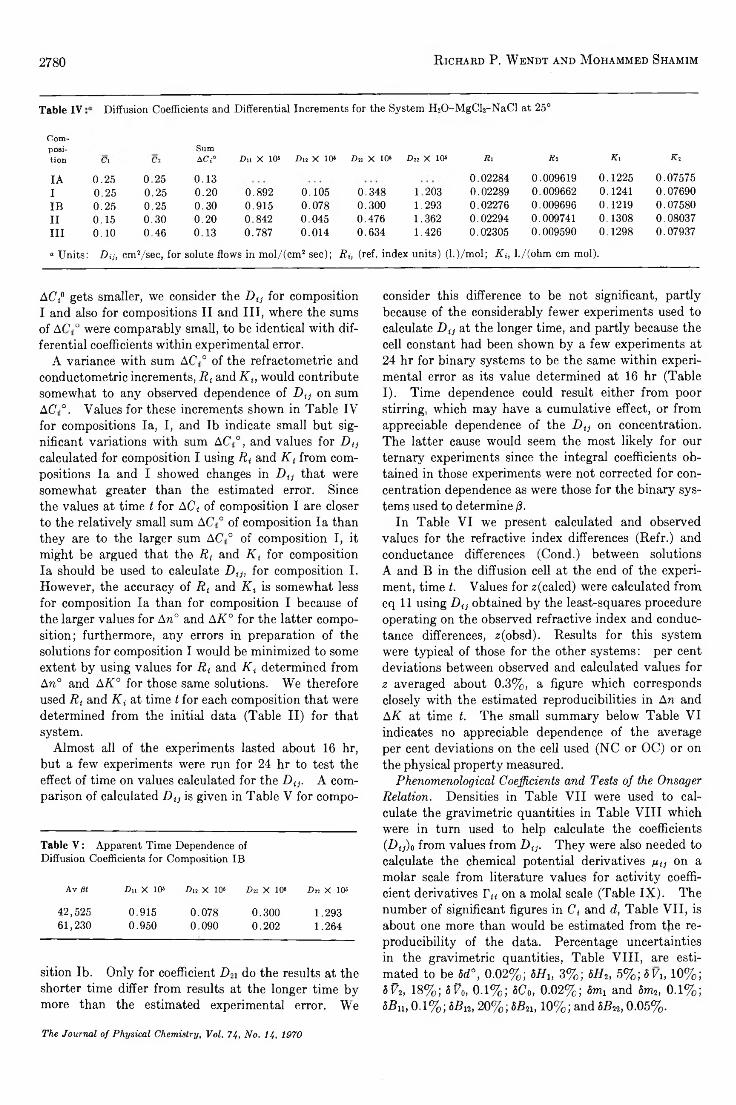
2780 R ic h a r d P. W e n d t a n d M o h a m m e d S h a m im
Table IV Diffusion Coefficients and Differential Increments for the System H 20 -M g C l2-N aC l at 25°
Com-position Ci Cl
Sum A Ci° Du X 10® Du X 10® Da X 10« Du x 10® Ai Ri A i A i
IA 0.25 0.25 0.13 0.02284 0.009619 0.1225 0.07575I 0.25 0.25 0.20 0.892 0.105 0.348 1.203 0.02289 0.009662 0.1241 0.07690IB 0.25 0.25 0.30 0.915 0.078 0.300 1.293 0.02276 0.009696 0.1219 0.07580I I 0.15 0.30 0.20 0.842 0.045 0.476 1.362 0.02294 0.009741 0.1308 0.08037I I I 0.10 0.46 0.13 0.787 0.014 0.634 1.426 0.02305 0.009590 0.1298 0.07937
« Units: Dij, cmVsec, for solute flows in mol/(cm2 sec); Ri, (ref. index units) (l.)/mol; K it l./(ohm cm mol).
ACi° gets smaller, we consider the Dtj for composition I and also for compositions II and III, where the sums of AC ° were comparably small, to be identical with differential coefficients within experimental error.
A variance with sum AC ° of the refractometric and conductometric increments, Ri and K t, would contribute somewhat to any observed dependence of Dtj on sum AC °. Values for these increments shown in Table IV for compositions la, I, and lb indicate small but significant variations with sum AC ° , and values for Di} calculated for composition I using R( and K t from compositions la and I showed changes in D(j that were somewhat greater than the estimated error. Since the values at time t for ACt of composition I are closer to the relatively small sum AC ° of composition la than they are to the larger sum AC ° of composition I, it might be argued that the Rt and K t for composition la should be used to calculate D{j, for composition I. However, the accuracy of Rt and K t is somewhat less for composition la than for composition I because of the larger values for An° and AK° for the latter composition; furthermore, any errors in preparation of the solutions for composition I would be minimized to some extent by using values for Rt and K t determined from An° and AK° for those same solutions. We therefore used Ri and K ( at time t for each composition that were determined from the initial data (Table II) for that system.
Almost all of the experiments lasted about 16 hr, but a few experiments were run for 24 hr to test the effect of time on values calculated for the D(j. A comparison of calculated Dtj is given in Table V for compo-
Table V : Apparent Time Dependence of Diffusion Coefficients for Composition IB
A v ßt Du X 10« Du X 10« Dll X 10« Dll X 10®
42,525 0.915 0.078 0.300 1.29361,230 0.950 0.090 0.202 1.264
sition lb. Only for coefficient D21 do the results at the shorter time differ from results at the longer time by more than the estimated experimental error. We
consider this difference to be not significant, partly because of the considerably fewer experiments used to calculate Dtj at the longer time, and partly because the cell constant had been shown by a few experiments at 24 hr for binary systems to be the same within experimental error as its value determined at 16 hr (Table I). Time dependence could result either from poor stirring, which may have a cumulative effect, or from appreciable dependence of the Di} on concentration. The latter cause would seem the most likely for our ternary experiments since the integral coefficients obtained in those experiments were not corrected for concentration dependence as were those for the binary systems used to determine 0.
In Table VI we present calculated and observed values for the refractive index differences (Refr.) and conductance differences (Cond.) between solutions A and B in the diffusion cell at the end of the experiment, time t. Values for z(calcd) were calculated from eq 11 using Du obtained by the least-squares procedure operating on the observed refractive index and conductance differences, z(obsd). Results for this system were typical of those for the other systems: per cent deviations between observed and calculated values for z averaged about 0.3%, a figure which corresponds closely with the estimated reproducibilities in An and AK at time t. The small summary below Table VI indicates no appreciable dependence of the average per cent deviations on the cell used (NC or OC) or on the physical property measured.
Phenomenological Coefficients and Tests of the Onsager Relation. Densities in Table VII were used to calculate the gravimetric quantities in Table VIII which were in turn used to help calculate the coefficients {Da)o from values from Di}. They were also needed to calculate the chemical potential derivatives g (i on a molar scale from literature values for activity coefficient derivatives Ti{ on a molal scale (Table IX ). The number of significant figures in Ct and d, Table VII, is about one more than would be estimated from the reproducibility of the data. Percentage uncertainties in the gravimetric quantities, Table VIII, are estimated to be 6d°, 0.02%; 8Hh 3% ; 8H2, 5% ; 8 Vh 10%; 5P2, 18%; 8?o, 0.1%; 8C0, 0.02%; 8mr and 8nh, 0.1%; 8Bn, 0.1%; SBii, 20%; 8Bn, 10%; and 8Bn, 0.05%.
The Journal o f P hysica l Chem istry, V oi. 74, N o . 14, 1970
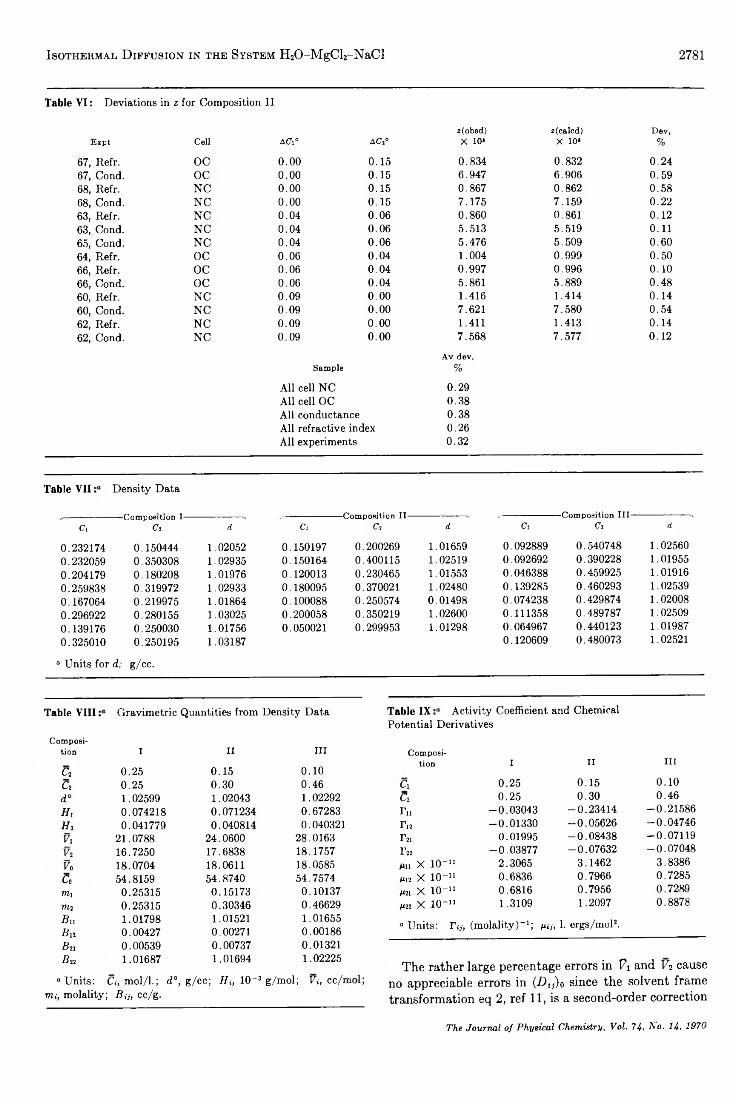
I s o t h e r m a l D if f u s io n in t h e S y s t e m H20-MgCl2-NaCl 2781
Table VI : Deviations in z for Composition I I
z(obsd) z(calcd) Dev,Expt Cell ACi° AC¡° X 10' X 10» %
67, Refr. OC 0.00 0.15 0.834 0.832 0.2467, Cond. o c 0.00 0.15 6.947 6.906 0.5968, Refr. NC 0.00 0.15 0.867 0.862 0.5868, Cond. NC 0.00 0.15 7.175 7.159 0.2263, Refr. NC 0.04 0.06 0.860 0.861 0.1263, Cond. NC 0.04 0.06 5.513 5.519 0.1165, Cond. NC 0.04 0.06 5.476 5.509 0.6064, Refr. OC 0.06 0.04 1.004 0.999 0.5066, Refr. OC 0.06 0.04 0.997 0.996 0.1066, Cond. OC 0.06 0.04 5.861 5.889 0.4860, Refr. NC 0.09 0.00 1.416 1.414 0.1460, Cond. NC 0.09 0.00 7.621 7.580 0.5462, Refr. NC 0.09 0.00 1.411 1.413 0.1462, Cond. NC 0.09 0.00 7.568 7.577 0.12
SampleAv dev,
%
All cell NC 0 .2 9All cell OC 0 .3 8All conductance 0 .3 8All refractive index 0 .2 6All experiments 0 .3 2
Table VII Density Data
,— -------------------------------- —Composition I—Cl C2 d
0.232174 0.150444 1.020520.232059 0.350308 1.029350.204179 0.180208 1.019760.259838 0.319972 1.029330.167064 0.219975 1.018640.296922 0.280155 1.030250,139176 0.250030 1.017560.325010 0.250195 1.03187
“ Units for d : g/cc.
Ci—Composition II—
Cl d
0 .150197 0 .200269 1.016590 .150164 0 .400115 1.025190 .120013 0 .230465 1.015530 .180095 0.370021 1.024800 .100088 0 .250574 0 .014980 .200058 0 .350219 1.026000 .050021 0 .299953 1.01298
Ci—Composition III—
C t d
0 .092889 0 .540748 1.025600 .092692 0 .390228 1 .019550 .046388 0 .459925 1.019160 .139285 0 .460293 1.025390 .074238 0 .4 29874 1.020080 .111358 0 .489787 1 .025090 .064967 0 .440123 1.019870 .120609 0 .480073 1.02521
Table VIII Gravimetric Quantities from Density Data
Composition I II III
Ci 0.25 0.15 0.10c 2 0.25 0.30 0.46d ° 1.02599 1.02043 1.02292K 0.074218 0.071234 0.67283h 2 0.041779 0.040814 0.040321V i 21.0788 24.0600 28.0163Vi 16.7250 17.6838 18.1757Vo 18.0704 18.0611 18.0585Co 54.8159 54.8740 54.7574m i 0.25315 0.15173 0.10137nii 0.25315 0.30346 0.46629B n 1.01798 1.01521 1.01655B n 0.00427 0.00271 0.00186B n 0.00539 0.00737 0.01321B n 1.01687 1.01694 1.02225
“ Units: Ci, mol/1.; d ° , g/cc; H i, 10-3 g/mol; Vi, cc/irmu, molality; B n , cc/g.
Table IX Activity Coefficient and Chemical Potential Derivatives
Composi-tion I II I l l
Cj 0.25 0.15 0.10c 2 0.25 0.30 0.46Tu -0 .03043 -0 .23414 -0 .21586Tu -0 .01330 -0 .05626 -0 .04746Tn 0.01995 -0 .08438 -0 .07119Tn -0 .03877 -0 .07632 -0 .07048m X 10-11 2.3065 3.1462 3.8386M12 X 10-11 0.6836 0.7966 0.7285¿221 X 10-U 0.6816 0.7956 0.7289M22 X IO "11 1.3109 1.2097 0.8878
“ Units: Tij, (molality)-1; in j, 1. ergs/mol2.
The rather large percentage errors in Vi and V2 cause no appreciable errors in (Dtj)0 since the solvent frame transformation eq 2, ref 11, is a second-order correction
The Journal o f P hysica l C hem istry, V ol. 74, Ao. 14, 1970
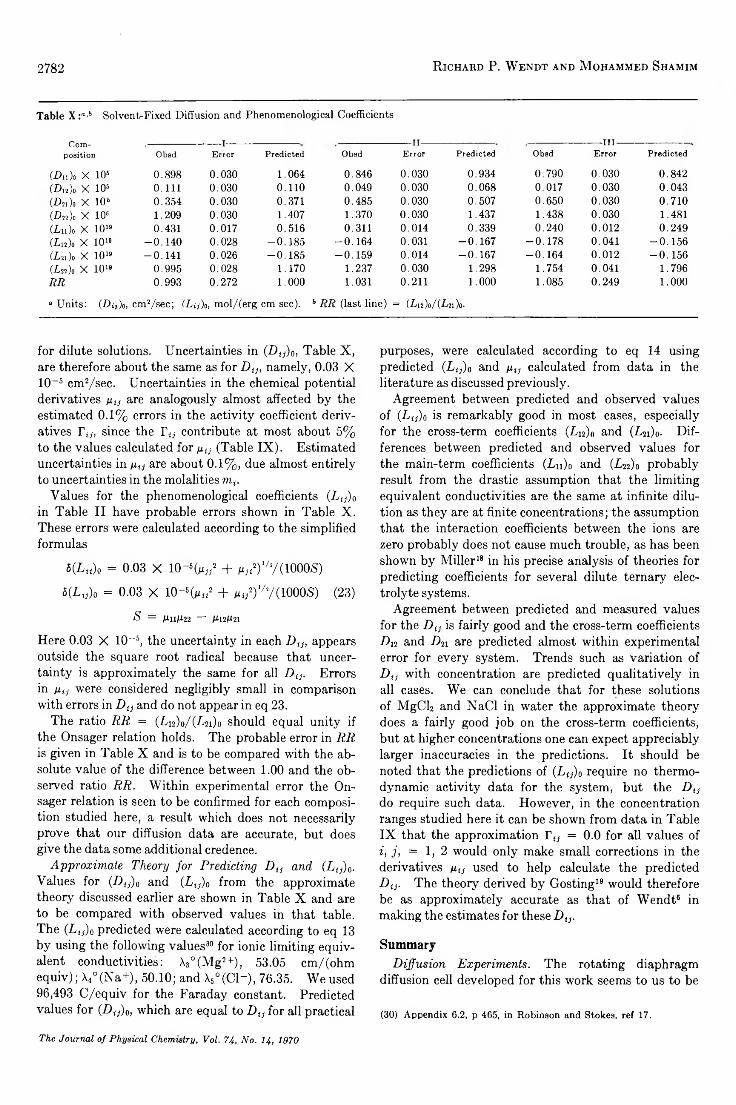
2782 R ic h a r d P . W e n d t a n d M o h a m m e d S h a m im
Table X :“'5 Solvent-Fixed Diffusion and Phenomenological Coefficients
Composition Ob8d
-------1-------Error Predicted Obsd
-------II---------Error Predicted Obsd
-------H I-----Error Predicted
(A 1)0 X 106 0.898 0.030 1.064 0.846 0.030 0 . 9 3 4 0.790 0.030 0.842(D 12)0 X 106 0.111 0.030 0.110 0.049 0.030 0.068 0.017 0.030 0.043(-£*2 1 ) 0 x 1 0 6 0.354 0.030 0.371 0.485 0.030 0.507 0.650 0.030 0.710(£ 22)0 x 1 0 5 1.209 0.030 1.407 1.370 0.030 1.437 1.438 0.030 1.481(L u ) , x 1019 0.431 0.017 0.516 0.311 0.014 0.339 0.240 0.012 0.249(L u ) 0 X 1019 -0 .140 0.028 -0 ,185 -0 .164 0.031 -0 .167 -0 .178 0.041 -0 .1 5 6(L u ) 0 X 1019 -0 .141 0.026 -0 .185 -0 .159 0.014 -0 .167 -0 .164 0.012 -0 .1 5 6(Ado X 1019 0.995 0.028 1.170 1.237 0.030 1.298 1.754 0.041 1.796R R 0.993 0.272 1.000 1.031 0.211 1.000 1.085 0.249 1.000
“ Units: (D ij)o , cm2/sec; ( L a )o, mol/(erg cm sec). b R R (last line) = (Ln)t>/(¿21)0.
for dilute solutions. Uncertainties in (Uw)0, Table X , are therefore about the same as for Dijt namely, 0.03 X 10~5 cm2/sec. Uncertainties in the chemical potential derivatives n{j are analogously almost affected by the estimated 0.1% errors in the activity coefficient derivatives Tij, since the r tj contribute at most about 5% to the values calculated for pi} (Table IX ). Estimated uncertainties in ptj are about 0.1%, due almost entirely to uncertainties in the molalities mt.
Values for the phenomenological coefficients (Lw)0 in Table II have probable errors shown in Table X . These errors were calculated according to the simplified formulas
i(Ltt)0 = 0.03 X IO-Hm« 2 + Mii2)v7(1000,S)
5(L„)0 = 0.03 X 10⁻⁶(mu2 + M«2)V7(1000iS) (23)
S = M11M22 — M12M21
Here 0.03 X 10⁻⁶, the uncertainty in each Dtj, appears outside the square root radical because that uncertainty is approximately the same for all Du. Errors in Hij were considered negligibly small in comparison with errors in Dtj and do not appear in eq 23.
The ratio RR = (¿12)0/(¿21)0 should equal unity if the Onsager relation holds. The probable error in RR is given in Table X and is to be compared with the absolute value of the difference between 1.00 and the observed ratio RR. Within experimental error the Onsager relation is seen to be confirmed for each composition studied here, a result which does not necessarily prove that our diffusion data are accurate, but does give the data some additional credence.
Approximate Theory for Predicting D{] and (Ltj)0. Values for (D{j) 0 and (Lw)0 from the approximate theory discussed earlier are shown in Table X and are to be compared with observed values in that table. The (Ltj)0 predicted were calculated according to eq 13 by using the following values30 for ionic limiting equivalent conductivities: X3°(M g2+), 53.05 cm/(ohmequiv); X4°(Na+), 50.10; and X6°(C1-), 76.35. We used 96,493 C/equiv for the Faraday constant. Predicted values for (DtJ)0, which are equal to D{j for all practical
purposes, were calculated according to eq 14 using predicted (Ltj)0 and \xiS calculated from data in the literature as discussed previously.
Agreement between predicted and observed values of (Ltj)0 is remarkably good in most cases, especially for the cross-term coefficients (L12)0 and (Ln)o- Differences between predicted and observed values for the main-term coefficients ( L n ) o and (¿22)0 probably result from the drastic assumption that the limiting equivalent conductivities are the same at infinite dilution as they are at finite concentrations; the assumption that the interaction coefficients between the ions are zero probably does not cause much trouble, as has been shown by Miller18 in his precise analysis of theories for predicting coefficients for several dilute ternary electrolyte systems.
Agreement between predicted and measured values for the Dtj is fairly good and the cross-term coefficients D12 and Dn are predicted almost within experimental error for every system. Trends such as variation of Di} with concentration are predicted qualitatively in all cases. We can conclude that for these solutions of MgCl2 and NaCl in water the approximate theory does a fairly good job on the cross-term coefficients, but at higher concentrations one can expect appreciably larger inaccuracies in the predictions. It should be noted that the predictions of (Ltj)0 require no thermodynamic activity data for the system, but the Dtj do require such data. However, in the concentration ranges studied here it can be shown from data in Table IX that the approximation Ttj = 0.0 for all values of i, j, = 1, 2 would only make small corrections in the derivatives ptj used to help calculate the predicted Da. The theory derived by Gosting19 would therefore be as approximately accurate as that of Wendt6 in making the estimates for these Dtj.
SummaryDiffusion Experiments. The rotating diaphragm
diffusion cell developed for this work seems to us to be
(30) A p pen d ix 6.2, p 465, in R ob in son and Stokes, ref 17.
The Journal o f P hysical Chem istry, V ol. 74, N o. 14 , 1970
I s o t h e r m a l . D if f u s io n in t h e S y s t e m H 20 - M g C l 2-N a C l 2783
the simplest method yet devised for measuring diffusion coefficients with moderate accuracy. Although it requires calibration, it requires no maintenance or recalibration owing to wear on moving parts. As with all diaphragm cells, the solution concentrations used must be somewhat greater than C — 0.05 M to avoid solute-porous glass disk interactions, and of course, since our cell is made of plastic it cannot be used with nonaqueous sy terns.
For ternary systems studied here we chose to use physical methods of solution analysis instead of chemical methods primarily because of the speed of the former methods. Our particular requirement of linearity between the observed physical difference property z and the solute concentration differences turned out to be somewhat more restrictive than we had anticipated and contained its own built-in limits of accuracy. To obtain high precision in the measurement of An, for example, we needed large concentration differences, ACi) but the diffusion coefficients D tj and the increments W {, such as R\ and jK2 for the case of refractive index measurements, showed a moderate dependence on A Ci (Table IV). Hence the more accurately we measured the difference z = An (in this example), the less certain we could be that the D tj and R t were true differential properties instead of some integrated average that depended on AC t. To obtain maximum accuracy in this method for determining D (j the solutions should be analyzed chemically or physically for each solute, at the perhaps insurmountable cost of a great number of lengthy analyses. Our entire procedure, therefore, represented somewhat of a compromise with high accuracy to obtain interesting and useful results.
D iffu sion Coefficients. The large cross-term coefficients D n and D2i measured for each of the H2Q~ MgCl2-NaCl compositions studied in this work empha
sizes again the magnitude of errors that may be introduced by assuming electrolyte solutes in multicomponent systems diffuse independently. For example, consider a system with average concentrations corresponding to those of composition I and with equal concentration gradients of each solute. Using our results for that composition, we calculate from eq 4 that 89% of the flow of solute 1 , J 1, is due to its own concentration gradient and 1 1 % due to the concentration gradient of solute 2. For solute 2 in the same system, 65% of J2 would be caused by its own concentration gradient and 35% by the equivalent concentration gradient of solute1. If we ignored the existence of cross-term diffusion coefficients and used a diffusion coefficient for each solute with the same value it had in the corresponding binary systems, 31 namely 1 . 1 X 1 0 ~ 5 cm2/sec for MgCl2 and 1.48 X 10 ~ 6 for NaCl, the observed flow J\ would be 1 0 % lower than that predicted from the binary data, and J% would be 20% higher than predicted. In lieu of diffusion data for ternary systems, values for D u predicted from the approximate theory tested here could be readily calculated, but except for very dilute solutions the estimates of all four D tJ may introduce more error than the use of Fick’s law for each solute.
Acknowledgm ents. We wish to thank Mr. ClarenceW. Schuler and Mr. Joseph C. McPherson of the Physics Department Machine Shop, Louisiana StateUni- versity (New Orleans), for their assistance in the design and construction of the rotating diaphragm cell. We also thank Dr. C. J. Hebert of the Loyola University Chemistry Department for loaning us his program LRS, a Fortran matrix-inversion subroutine which we included in our iteration program for calculating D tj.
(31) D for MgCL is from J. L. Richardson, et al., ref 13; D for NaCl is from Robinson and Stokes, ref 13, Appendix 11.2.
The Journal o f P hysica l Chem istry, V ol. 74, N o . 14, 1970
2784 S. P . W a s ik a n d N . M . R o sc h e r
Diffusion Coefficients of Paraffin-Chain Salts and the Formation
Energetics of Micelles
by S. P. Wasik and Nina Matheny RoscherNational Bureau of Standards, Washington, D.C. 20284- (Received January 14, 1970)
The diffusion coefficients of the colloidal electrolytes decyl, dodecyl, and t tradecyltrimethylammonium bromide have been measured as a function of concentration in aqueois solutions at 25°. These values compared favorably with values obtained from the theoretical expression derived by Hartley. A method is presented for determining the standard Gibbs free energy change of micelle formation from diffusion coefficient vs. concentration plots.
In aqueous solutions of paraffin-chain salts there is a tendency for grouping of molecules to take place in which like is associated with like. The nonpolar paraffin chains tend to associate together in some form of fluid arrangement while the polar groups associate with the polar water molecules. These aggregates of molecules, called micelles, fluctuate under the influence of thermal motion and are in equilibrium with neighboring nonaggregated molecules.
A simple form of micelle proposed by Hartley1 consists of a nearly spherical aggregation of paraffin-chain ions with the hydrophobic part of the ion in the center and the polar part of the outside, the electrical charge of the aggregate being partially neutralized by a number of oppositely charged ions adhering electrostatically to the primary groups. Below the critical micelle concentration, cmc, the paraffin-chain salt essentially behaves as a strong electrolyte.
Experimental methods for investigating this phenomenon have varied widely; conductivity, solubilization, light scattering, viscosity, and other physical properties have been reported. Many of these measurements involve application of an external force, or an additive to the paraffin-chain salt solution. Such application of an external agent is liable to vitiate the results as far as calculations of size, shape, and structure of the micelles are concerned.
Diffusion measurements by a free-boundary method provide a sensitive and accurate means of investigating the properties of micellar solutions without extraneous additives and without the limitations imposed by the use of glass disks or porous plates. Although little work has been reported2'3 using this technique it appears to be a good method for studying the physical properties of micellar solution.
Hartley derived an expression for the diffusion of an aggregating electrolyte in the transition range from simple to colloidal solution4 which predicted that the diffusion coefficient should go through a very low minimum in the region where the paraffin-chain salt goes
from the simple to the colloidal form. Hartley lacked detailed knowledge of his compounds to treat his results adequately. Since then light scattering techniques have been developed for measuring the aggregation number and effective charge of the micelle, and it is now possible to evaluate the Hartley diffusion expression explicitly.
In this report are presented diffusion measurements on aqueous solutions of the decyltrimethylammonium bromide, Ci0Br, dodecyltrimethylammonium bromide, Ci2Br, and tetradecyltrimethylammonium bromide, CiiBr, by a free-boundary method. Hartley’s expressions for the diffusion coefficient concentration relationship is shown to explain adequately the experimental data. A method is presented for calculating the standard free-energy change from these measurements.
Experimental SectionThe alkyl bromides, obtained from the Fisher Sci
entific Co., were fractionally distilled through a Piras- Glover spinning-band column, 60 cm in length. The center cuts having the same refractive index were used for the preparations. The n-alkyltrimethylammonium bromides were prepared by refluxing an excess (1 0 %) of freshly distilled trimethylamine with the alkyl bromide in methyl alcohol for several hours. The excess alcohol and trimethylamine were removed by distillation at room temperature under reduced pressure. The quaternary ammonium bromides were then recrystallized four or five times from different solvents. Analyses for bromide content agree with the theoretical amount within experimental precision.
(1) G. S. Hartley, “ Aqueous Solutions of Paraffin-Chain Salts," Hermann, Paris, 1936.(2) N. Bindney and L. Saunders, J. Pharm. Pharmacol., 7, 1012 (1955).(3) R . Parker and S. Wasik, J. Phys. Chem., 6 3 ,1921 (1959).(4) G. S. Hartley, Trans. Faraday Soc„ 35, 1109 (1939).
T he Journal o f P hysica l Chem istry, Vol. 74, N o . 14, 1970
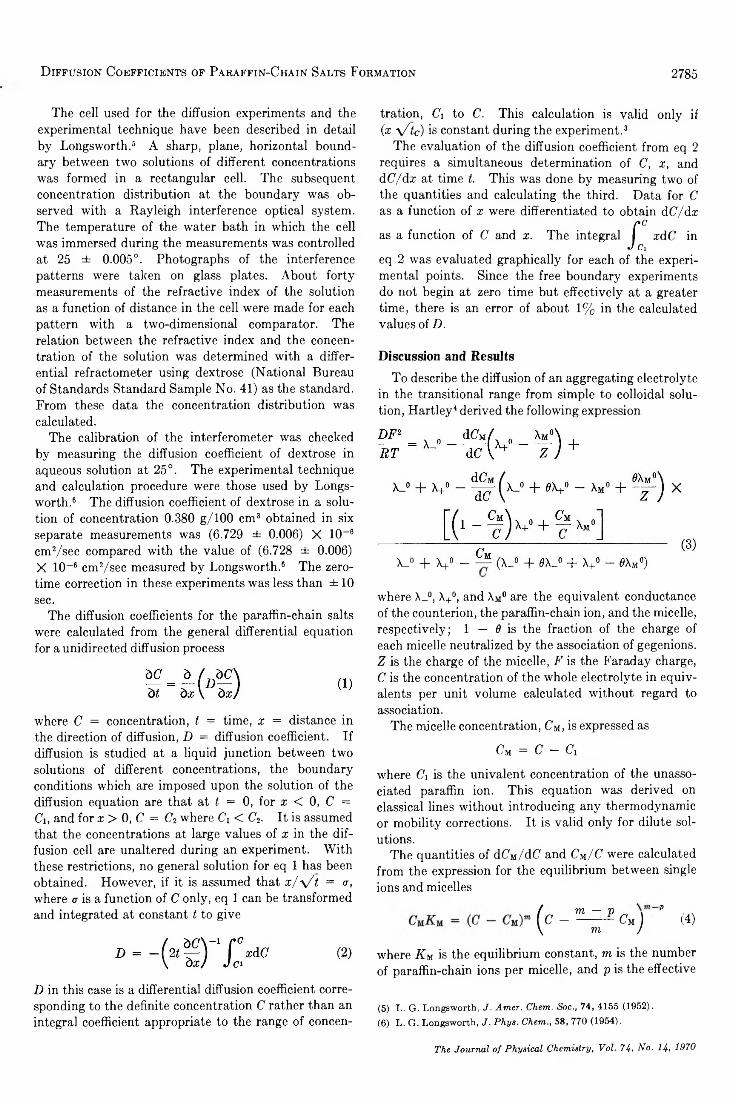
D if f u s io n C o e f f ic ie n t s of P a r a f f in -C h a in Sa l t s F o r m a t io n 2785
The cell used for the diffusion experiments and the experimental technique have been described in detail by Longsworth.6 A sharp, plane, horizontal boundary between two solutions of different concentrations was formed in a rectangular cell. The subsequent concentration distribution at the boundary was observed with a Rayleigh interference optical system. The temperature of the water bath in which the cell was immersed during the measurements was controlled at 25 ± 0.005°. Photographs of the interference patterns were taken on glass plates. About forty measurements of the refractive index of the solution as a function of distance in the cell were made for each pattern with a two-dimensional comparator. The relation between the refractive index and the concentration of the solution was determined with a differential refractometer using dextrose (National Bureau of Standards Standard Sample No. 41) as the standard. From these data the concentration distribution was calculated.
The calibration of the interferometer was checked by measuring the diffusion coefficient of dextrose in aqueous solution at 25°. The experimental technique and calculation procedure were those used by Longsworth.6 The diffusion coefficient of dextrose in a solution of concentration 0.380 g/100 cm3 obtained in six separate measurements was (6.729 ± 0.006) X 10-6 cm2/sec compared with the value of (6.728 ± 0.006) X 10~ 6 cm2/sec measured by Longsworth.6 The zerotime correction in these experiments was less than ± 10
sec.The diffusion coefficients for the paraffin-chain salts
were calculated from the general differential equation for a unidirected diffusion process
where C = concentration, t = time, x = distance in the direction of diffusion, D = diffusion coefficient. If diffusion is studied at a liquid junction between two solutions of different concentrations, the boundary conditions which are imposed upon the solution of the diffusion equation are that at t = 0, for x < 0, C = Ci, and for x > 0, C = C2 where Ci < C2. It is assumed that the concentrations at large values of x in the diffusion cell are unaltered during an experiment. With these restrictions, no general solution for eq 1 has been obtained. However, if it is assumed that x/ \ / t = <r, where a is a function of C only, eq 1 can be transformed and integrated at constant t to give
D in this case is a differential diffusion coefficient corresponding to the definite concentration C rather than an integral coefficient appropriate to the range of concen
tration, Ci to C. This calculation is valid only if (x \/fc) is constant during the experiment.3
The evaluation of the diffusion coefficient from eq 2 requires a simultaneous determination of C, x , and dC/dx at time t. This was done by measuring two of the quantities and calculating the third. Data for C as a function of x were differentiated to obtain dC/dx
C cas a function of C and x. The integral I x d C inJ Ci
eq 2 was evaluated graphically for each of the experimental points. Since the free boundary experiments do not begin at zero time but effectively at a greater time, there is an error of about 1 % in the calculated values of D .
Discussion and ResultsTo describe the diffusion of an aggregating electrolyte
in the transitional range from simple to colloidal solution, Hartley4 derived the following expression
XJ> + X+° - ( \ J + 0XJ> + X+° - 0XM°)
where X_°, X+°, and XM° are the equivalent conductance of the counterion, the paraffin-chain ion, and the micelle, respectively; 1 — 6 is the fraction of the charge of each micelle neutralized by the association of gegenions. Z is the charge of the micelle, F is the Faraday charge, C is the concentration of the whole electrolyte in equivalents per unit volume calculated without regard to association.
The micelle concentration, Cm, is expressed as
Cm = C - Ci
where Ci is the univalent concentration of the unassociated paraffin ion. This equation was derived on classical lines without introducing any thermodynamic or mobility corrections. It is valid only for dilute solutions.
The quantities of dCM/dC and CM/C were calculated from the expression for the equilibrium between single ions and micelles
( YYt — V ^c --------m - CMJ (4)
where X M is the equilibrium constant, m is the number of paraffin-chain ions per micelle, and p is the effective
(5) L. G. Longsworth, J. Amer. Chem. Soc., 74, 4155 (1952).(6) L. G. Longsworth, J. Phys. Chem., 58, 770 (1954).
The Journal o f P h ysica l Chem istry, V oi. 74, N o. 14, 1970
2786 S. P . W a s ik a n d N . M . R o s c h e r
charge. Phillips7 justified using concentration instead of activities in eq 4 by substituting an effective charge for the real charge.
The effective charge, p, may be calculated from the limiting slope of the ¿7(7/r vs. C plot, H being the Einstein constant, t the turbidity and C the micelle concentration.8 Since p can be explained in terms of the Donnon concept and the fluctuation theory, it is not the real charge, Z , but rather an equivalent ideal charge. It may be interpreted as an activity coefficient. With this implication the double-layer interaction of a micelle ion of actual valence Z is equivalent in behavior to an ideal ion of valence p.
Calculations of CM/C and dCM/dC may be simplified by defining a concentration Co by the following relation
K u = Co2™ - * - 1
and the dimensionless quantities S = (Cm/C), C = C/Co■ Substituting S and C into eq 4
/ 'YYl -- yy V= syn _ S)n 1 ------------ S (5)
\ to /
Thus C may be calculated for given values of S, m, and p. Since
C = CCo
and
CM = SCCo
(6)
From eq 5
dS d C
2m — p — 1
C ; +m
; +(to— p ) 2
S 1 — S to — (to — p)S_
(7)
Combining eq 6 and 7 and rearranging terms
- t— ,, + s <«dC 1 to (to — p y
S 1 — S ~ ^ m — (to — p )S
The quantity dCw/dC was calculated for different values of S using values of to and p reported by Debye8 and Wasik and Hubbard9 from light scattering measurements on decyltrimethylammonium bromide, do- decyltrimethylammonium bromide, and tetradecyltri- methylammonium bromide solutions.
The equivalent conductance of the paraffin-chain ion, X+°, was calculated from limiting conductance values reported by Scott and Tartar10 using a value of 78.2 (mol ohm cm) - 1 for the ion conductance of the bromide ion.
Values for the micelle conductance were calculated from the electrophoretic mobility measurements of
Figure 1. Experimental plots of diffusion coefficient against concentration for decyltrimethylammonium bromide, CioBr, dodecyltrimethylammonium bromide, Ci2Br, and tetradecyltrimethylammonium bromide, OnBr, and the theoretical plots from eq 3 using Debye’s and Wasik and Hubbard’s data.
decyl-, dodecyl- and tetradecylamine hydrochloride micelles by Hoyer and Greenfield. 11 These authors state that micelles of paraffin-chain salts of the same carbon chain have essentially the same mobility vs. concentration behavior. Although values for the mobility of the CioBr, C12Br, and Ci4Br micelles obtained by this method are only an approximation, they do not seriously affect the shape of the theoretical diffusion-concentration plots.
From eq 3 and 8 the theoretical diffusion coefficient was calculated as a function of \ / C ■ In order to compare the theoretical with experimental plots, a value for Co had to be estimated by assigning values of Co until the two curves gave a good fit. The value for Co in all cases was close to the concentration where dD /d-\/C was a maximum. In Figure 1 are shown the experimental plots for C10Br, Ci2Br, and (/.¡Br along with the theoretical plots from the data given in Table I. The theoretical curves calculated from Debye’s8 values for to and p gave better agreement than those of Wasik and Hubbard9 because apparently Debye’s values for p are the correct values. The minima of the theoretical curves were very sensitive to p and fairly insensitive to to.
(7) J. N. Phillips, Trans. Faraday Soc., 51, 561 (1955).(8) P. Debye, Ann. N. Y. Acad. Sci., 51, 575 (1949).(9) S. Wasik and W . Hubbard, J. Res. Nat. Bur. Stand., 68A, 539 (1964).(10) A. B. Scott and H. V. Tartar, J. Amer. Chem. Soc., 65, 692 (1943).(11) W . H. Hoyer and A. Greenfield, J. Phys. Chem., 61,735 (1957).
The Journal o f P hysical Chem istry, V ol. 74-, N o . 14, 1970
D if f u s io n C o e f f ic ie n t s o f P a r a f f in - C h a in S a l t s F o r m a t io n 2787
Table I : The Standard Gibbs Free Energy Change, AG °, per Molecule Associated with Micelle Formation for the Paraffin Salts Decyltrimethylammonium Bromide, CioBr, Dodecyltrimethylammonium Bromide, C^Br, and Tetradecyltrimethylammonium Bromide, CuBr, Calculated from Eq 9 and 10 for Debye’s and Wasik, and Hubbard’s Values, for the Number of Paraffin-Chain Ions per Micelle, m , and the Effective Charge, p
Salt ma Va mb Pb
CioBr 36 9 31 6.6Ci„Br 50 10.5 55 13.5C„Br 75 10.5
-A O ° c - A G° d — AO° ‘Co,
molkT kT kT cm "*
11.3 11.4 11.5 0.076714.3 14.3 14.1 0.016417.9 17.8 0.0036
a Debye.8 b Wasik and Hubbard.9 ‘ Equation 10, Debye’s data. d Equation 9, Debye’s data. * Equation 9, Wasik and Hubbard’s data.
The “valley” in the diffusion coefficient-concentration plots results from the fact that dCir/dC increases much faster than C m/C. Since X+° is much bigger than XM°/Z, an increase in dC u / d C will cause a decrease in the second term of eq 3. In the transition region the third term at first decreases when aggregation begins and subsequently increases. The overall effect is that in general the diffusion coefficient should decrease followed by a rise at higher concentration. A mimi- mum in the D vs. C plots for associated colloids has previously been reported for sodium dodecyl sulfate2 and dodecyltrimethylammonium chloride.3
Standard Free Energy ChangeThe standard Gibbs free energy change, AG °, per
molecule associated with micelle formation may be calculated from the expression
k TAG ° = — (2m — p — 1) In Co (9)
m
The value of AG ° depends on the standard states chosen. If the concentrations are expressed in mole fraction then AG ° would be with reference to a state of mole fraction unity.
In Table I are given AG ° values calculated from eq 9 using values for Co obtained from the diffusion experiments and values of m and p obtained by Debye8 and Wasik and Hubbard.9
Phillips7 has derived the following expression for the Gibbs free energy change
AG° In 3 + 2 In m 2m — p — 1 , ,----- = -----------------------b ------------------ In cmc (1 0 /k T m m
where cmc is the critical micelle concentration. This equation was derived by defining the cmc as the point corresponding to the maximum change in gradient in an ideal property-concentration (<f> against C) relationship, being given by
/d >\dC3
Phillips assumed that there exists an equilibrium between the single ions and the micelles and that the micelles are effectively monodispersed. In Table I are given AG ° values for CioBr, Ci2Br, and CuBr calculated by Phillips from light scattering data of Debye.8
The close agreement between the AG ° values calculated from Phillip’s expression and those obtained from eq 9 lend further support to Hartley’s model of the micelle. Both expressions were derived from the assumption that there exists an equilibrium between the single ions and the micelle and that the micelles are effectively monodispersed. The method presented in this report for calculating AG ° requires no knowledge of how the cmc should be defined. This is an advantage since the cmc is probably a range of concentration.
The experimental measurements of D and theoretical values derived from light scattering and conductivity data agree well up to the concentration for the minimum value of D (see Figure 1). Above this value the agreement is poor. The likely explanation is a change in the character of the aggregates. Micelles are statistical in character; they are constantly being formed and broken up by thermal motion. They cannot be thought of as persistent entities having well defined geometrical shapes. Hartley’s1 model for the micelle as a spherical aggregate of amphiphilic molecules with the polar groups on its surface and the hydrocarbon chains forming a fluid core is probably valid at low concentrations. At higher concentrations it is replaced by more extended micellar forms. Equation 3 is valid for the diffusion of an aggregating electrolyte in the transition range from simple ion to a Hartley-like micelle. It does not take into consideration a more extended micellar form. This may be partly the reason why the agreement between the theoretical and experimental curves in Figure 1 is not as good at higher concentrations as it is at concentrations near the cmc.
A cknow ledgm ent. We wish to thank Dr. Frederick Mies for his suggestions and his help with the mathematics in this paper.
= 0' C= cmc
The Journal o f P h ysica l C hem istry, V ol. N o . 14, 1970

2788 J. G . H a w k e a n d I . W h it e
The Temperature Dependence of the Transmission Coefficient (Ts)
for Carbon Dioxide Transport across A Series of
Long-Chain Alcohol Monolayers
by J. G. Hawke1 and I. WhitePhysical Chemistry Laboratories, Department of Pharmaceutical Chemistry, University of Sydney, Sydney, Australia {Received June 9, 1969)
The temperature dependence of the transmission coefficients (T ñ) for carbon dioxide gas across a series of long- chain alcohols from Ci« to C22 has been measured. Radioactive carbon-14 labeled C02 was used to follow the loss of gas from the unstirred aqueous solutions. Monolayers were spread on the gas-liquid interface to their equilibrium spreading pressures (ir„). The diffusion curves were analyzed according to the mathematical model proposed by Hawke and Parts. The transmission coefficients were of the same order as those found by other workers for C02 through similar compounds. However, La Mer found values for water to be about 40 times greater reflecting the smaller size of the water molecule. The nonlinear decrease in permeability with increase in chain length would not be expected if Fickean type diffusion was involved. The activation energies found here (ca. 12 kcal/mol) are comparable with those found by La Mer for water transport and support the energy barrier theory which equates the activation energy with the energy to form a hole in the monolayer. The increment of E per CH2 group of 320 cal/mol also agrees with the water tr nspo t work and the value of 400 cal/mol predicted from considering the Loudon-van der Waals dispersion forces between parallel hydrocarbon chains. The energy barrier theory again would predict an increased barrier height accompanying an increase in monolayer thickness. The data presented here are therefore consistent with the transportation of the C02 molecule, through the monolayer in a single-step process, rather than a series of jumps, as required by the Fickean diffusion mechanism.
IntroductionThe influence of monolayers at the gas-liquid inter
face on the loss of various gases from their aqueous solution has been studied extensively in this group. This paper deals with the effect of temperature on the permeability of a homologous series of long-chain alcohols to C02 gas. La Mer and coworkers2-6 in a series of papers have examined the permeability of a series of long-chain fatty acids and alcohols to water, following the classical work of Langmuir and Schaefer.6 These authors report considerably lower permeabilities for monolayers in their close-packed configuration compared with the expanded state. They have also measured the temperature dependence of the permeability to water. Following Glasstone, Laidler, and Eyring’s7 reasoning, the overall activation energy for each methylene group, terminal methyl group, and residual polar head group has been calculated. Barnes and La Mer3 suggest the data support Langmuir’s energy barrier model consisting of a single-step permeation process. We have applied similar reasoning to the results obtained here for the permeation of mono- layers by C02 gas. Blank8 criticizes certain aspects of the energy barrier theory such as its inability to account for the high permeability of expanded mono- layers and suggests a fluctuating density model might account for these difficulties. Hawke and coworkers9-12
The Journal o f P hysical Chem istry, Vol. 74, N o . 14 , 1970
have examined the permeability of monolayers to C02 and H2S gases at constant temperature and find in common with the results for water permeability that a close-packed configuration is necessary to achieve a high resistance to gas permeation. Values for the permeability in the C02 case we expressed as the transmission coefficient were about 40 times smaller than those found for water vapor. Here the transmission coefficient (T s) is defined as the surface emissivity in grams of gas per second per square centimeter of sur-
(1) Department of Chemistry, Macquarie University, Sydney, Australia, 2113; to whom communications should be addressed.(2) (a) R . J. Archer and V. K . La Mer, J. Phys. Chem., 59, 200 (1955); (b) H. L. Rosano and V. K. La Mer, ibid., 60, 348 (1956).(3) G. T. Barnes and V. K . La Mer in “ Retardation of Evaporation by Monolayers,” V. K. La Mer, Ed., Academic Press, New York, N. Y., 1962, p 9.(4) M . Blank and V. K . La Mer, ref 3, p 59.(5) V. K . La Mer, T . W. Healy, and L. A. G. Aylmore, J . Colloid Sci., 19, 448 (1964).(6) I. Langmuir and I. J. Schaefer, J. Franklin Inst., 235,119 (1943).(7) S. Glasstone, K . J. Laidler, and H. Eyring, “ The Theory of Rate Processes,” McGraw-Hill, New York, N. Y., 1941, pp 8, 195, and 510 ff.(8) M . J. Blank, J. Phys. Chem., 68, 2793 (1964).(9) J. G. Hawke, Aust. At. Energy Symp. Proc., Sydney, 198, 634 (1958).(10) J. G. Hawke, Ph.D. Thesis, University of Sydney, 1959.(11) J. G. Hawke and A. E. Alexander, ref 3, p 67.(12) J. G. Hawke and A. G. Parts, J. Colloid Sci., 20, 253 (1964).
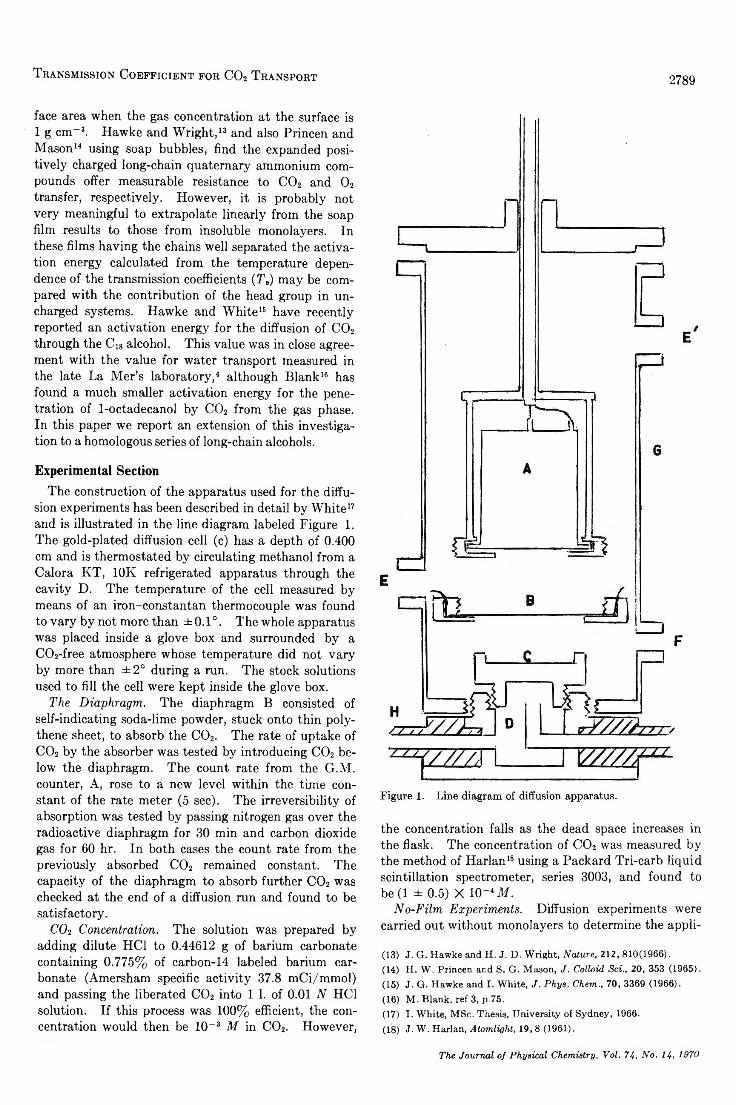
face area when the gas concentration at the surface is 1 g cm-3. Hawke and Wright, 13 and also Princen and Mason14 using soap bubbles, find the expanded positively charged long-chain quaternary ammonium compounds offer measurable resistance to C02 and 0 2 transfer, respectively. However, it is probably not very meaningful to extrapolate linearly from the soap film results to those from insoluble monolayers. In these films having the chains well separated the activation energy calculated from the temperature dependence of the transmission coefficients (Ts) may be compared with the contribution of the head group in uncharged systems. Hawke and White15 have recently reported an activation energy for the diffusion of C02 through the C« alcohol. This value was in close agreement with the value for water transport measured in the late La Mer’s laboratory, 4 although Blank16 has found a much smaller activation energy for the penetration of 1-octadecanol by C02 from the gas phase. In this paper we report an extension of this investigation to a homologous series of long-chain alcohols.
Experimental SectionThe construction of the apparatus used for the diffu
sion experiments has been described in detail by White17 and is illustrated in the line diagram labeled Figure 1. The gold-plated diffusion cell (c) has a depth of 0.400 cm and is thermostated by circulating methanol from a Calora KT, 10 K refrigerated apparatus through the cavity D. The temperature of the cell measured by means of an iron-constantan thermocouple was found to vary by not more than ±0.1°. The whole apparatus was placed inside a glove box and surrounded by a C 02-free atmosphere whose temperature did not vary by more than ± 2 ° during a run. The stock solutions used to fill the cell were kept inside the glove box.
The D iaphragm . The diaphragm B consisted of self-indicating soda-lime powder, stuck onto thin polythene sheet, to absorb the C02. The rate of uptake of C02 by the absorber was tested by introducing C02 below the diaphragm. The count rate from the G.M. counter, A, rose to a new level within the time constant of the rate meter (5 sec). The irreversibility of absorption was tested by passing nitrogen gas over the radioactive diaphragm for 30 min and carbon dioxide gas for 60 hr. In both cases the count rate from the previously absorbed C02 remained constant. The capacity of the diaphragm to absorb further C02 was checked at the end of a diffusion run and found to be satisfactory.
C 0 2 Concentration. The solution was prepared by adding dilute HC1 to 0.44612 g of barium carbonate containing 0.775% of carbon-14 labeled barium carbonate (Amersham specific activity 37.8 mCi/mmol) and passing the liberated C02 into 1 1. of 0.01 N HC1 solution. If this process was 100% efficient, the concentration would then be 10“ 3 M in C02. However,
T r a n s m is s io n C o e f f ic ie n t f o r C 0 2 T r a n sp o r t 2789
the concentration falls as the dead space increases in the flask. The concentration of C 02 was measured by the method of Harlan18 using a Packard Tri-carb liquid scintillation spectrometer, series 3003, and found to be (1 ± 0.5) X 10~1 M .
N o -F ilm E xperim ents. Diffusion experiments were carried out without monolayers to determine the appli-
(13) J. G. Hawke and H. J. D. Wright, Nature, 212, 810(1966).(14) H. W . Princen and S. G . Mason, ./. Colloid S c i., 20, 353 (1965).(15) J. G . Hawke and I. White, J. Phys. Chem., 70, 3369 (1966).(16) M. Blank, ref 3, p 75.(17) I. White, MSc. Thesis, University of Sydney, 1966.(18) J- W. Harlan, Atomlight, 19, 8 (1961).
The Journal o f P hysica l Chem istry, Vol. 74, N o. 14, 1970
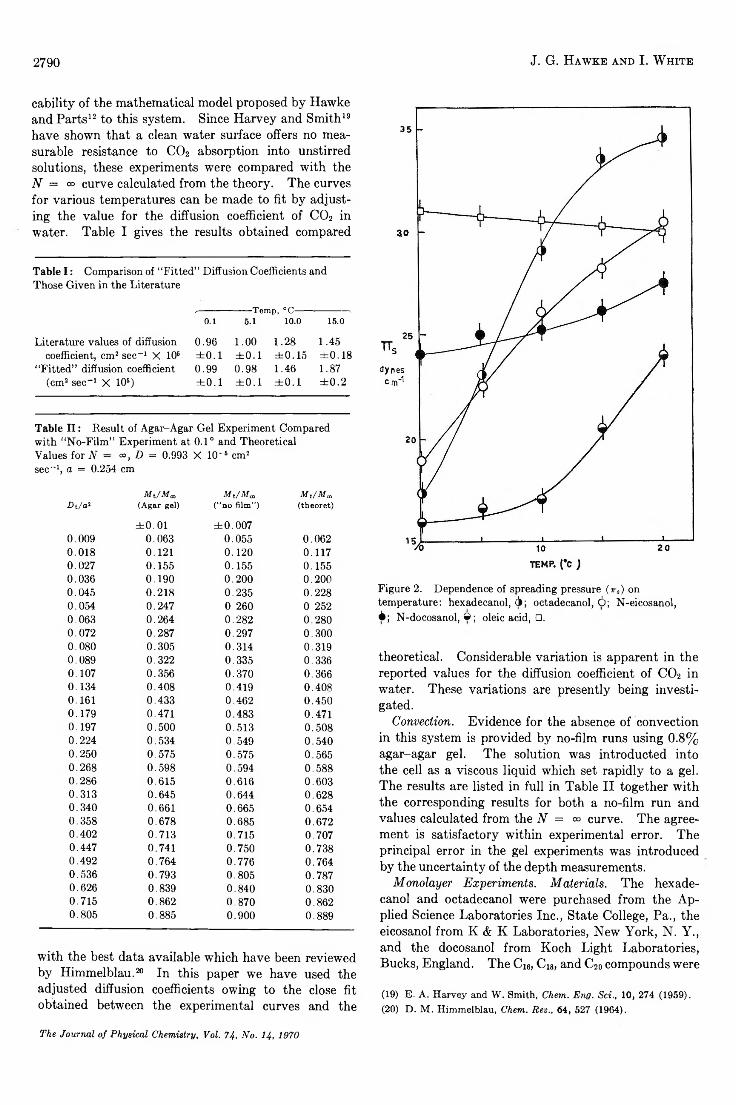
2790 J. G . H a w k e a n d I . W h it e
cability of the mathematical model proposed by Hawke and Parts12 to this system. Since Harvey and Smith19 have shown that a clean water surface offers no measurable resistance to C02 absorption into unstirred solutions, these experiments were compared with the N = <» curve calculated from the theory. The curves for various temperatures can be made to fit by adjusting the value for the diffusion coefficient of C02 in water. Table I gives the results obtained compared
Table I : Comparison of “Fitted” Diffusion Coefficients and Those Given in the Literature
,------------------Temp, °C-----------0.1 5.1 10.0 15.0
Literature values of diffusion 0.96 1.00 1.28 1.45coefficient, cm2 sec-1 X 10⁶ ± 0 .1 ± 0 .1 ± 0 .1 5 ± 0 .1 8
“Fitted” diffusion coefficient 0.99 0.98 1.46 1.87(cm2 sec-1 X 10⁶) ± 0 .1 ± 0 .1 ± 0 .1 ± 0 .2
Table II : Result of Agar-Agar Gel Experiment Compared with “No-Film” Experiment at 0.1° and Theoretical Values for N — <=, D = 0.993 X 10~6 cm2 sec-1, a = 0.254 cm
Dt/o*Mt/Ma
(Agar gel)Mt/Mm
(“ no film” )Mt/Mœ(theoret)
± 0 .0 1 ± 0 .0 0 70 .0 0 9 0 .0 6 3 0 .0 5 5 0 .0 6 20 .0 1 8 0 .1 21 0 .1 2 0 0 .1 1 70 .0 2 7 0 .1 5 5 0 .1 5 5 0 .1 5 50 .0 3 6 0 .1 9 0 0 .2 0 0 0 .2 0 00 .0 4 5 0 .2 1 8 0 .2 3 5 0 .2 2 80 .0 5 4 0 .2 4 7 0 260 0 2520 063 0 .2 6 4 0 .2 8 2 0 .2 8 00 .0 7 2 0 .2 8 7 0 .2 9 7 0 .3 0 00 .0 8 0 0 .3 0 5 0 .3 1 4 0 .3 190 .0 8 9 0 .3 2 2 0 .3 3 5 0 .3 3 60 .1 0 7 0 .3 5 6 0 .3 7 0 0 .3 6 60 .1 3 4 0 .4 0 8 0 .4 19 0 .4 0 80 .1 61 0 .4 3 3 0 .4 6 2 0 .4 5 00 .1 7 9 0 .4 71 0 .4 8 3 0 .4 710 .1 9 7 0 .5 0 0 0 .5 1 3 0 .5 0 80 .2 2 4 0 .5 3 4 0 .5 4 9 0 .5 4 00 .2 5 0 0 .5 7 5 0 .5 7 5 0 .5 6 50 .2 6 8 0 .5 9 8 0 .5 9 4 0 .5 8 80 .2 8 6 0 .6 1 5 0 .6 1 6 0 .6 0 30 .3 1 3 0 .6 4 5 0 .6 4 4 0 .6 2 80 .3 4 0 0 .6 61 0 .6 6 5 0 .6 5 40 .3 5 8 0 .6 7 8 0 .6 8 5 0 .6 7 20 .4 0 2 0 .7 1 3 0 .7 1 5 0 .7 0 70 .4 47 0 .7 41 0 .7 5 0 0 .7 3 80 .4 9 2 0 .7 6 4 0 .7 7 6 0 .7 6 40 .5 3 6 0 .7 9 3 0 .8 0 5 0 .7 8 70 .6 2 6 0 .8 39 0 .8 4 0 0 .8 3 00 .7 1 5 0 .8 6 2 0 .8 7 0 0 .8 6 20 .8 0 5 0 .8 8 5 0 .9 0 0 0 .8 8 9
with the best data available which have been reviewed by Himmelblau. 20 In this paper we have used the adjusted diffusion coefficients owing to the close fit obtained between the experimental curves and the
Figure 2. Dependence of spreading pressure O a) on temperature: hexadecanol, 6 ; octadecanol, 6 ; N-eicosanol, 4; N-docosanol, ©; oleic acid, O.
theoretical. Considerable variation is apparent in the reported values for the diffusion coefficient of C02 in water. These variations are presently being investigated.
Convection. Evidence for the absence of convection in this system is provided by no-film runs using 0 .8 % agar-agar gel. The solution was introducted into the cell as a viscous liquid which set rapidly to a gel. The results are listed in full in Table II together with the corresponding results for both a no-film run and values calculated from the N = °° curve. The agreement is satisfactory within experimental error. The principal error in the gel experiments was introduced by the uncertainty of the depth measurements.
M on olayer E xperim ents. M aterials. The hexadecanol and octadecanol were purchased from the Applied Science Laboratories Inc., State College, Pa., the eicosanol from K & K Laboratories, New York, N. Y., and the docosanol from Koch Light Laboratories, Bucks, England. The Ci6, C18, and C2o compounds were
(19) E. A. Harvey and W . Smith, Chem. Eng. Sci., 10, 274 (1959).(20) D. M . Himmelblau, Chem. Rev.. 64, 527 (1964).
The Journal o f P hysica l Chem istry. Vol. 74, N o . 14, 1970
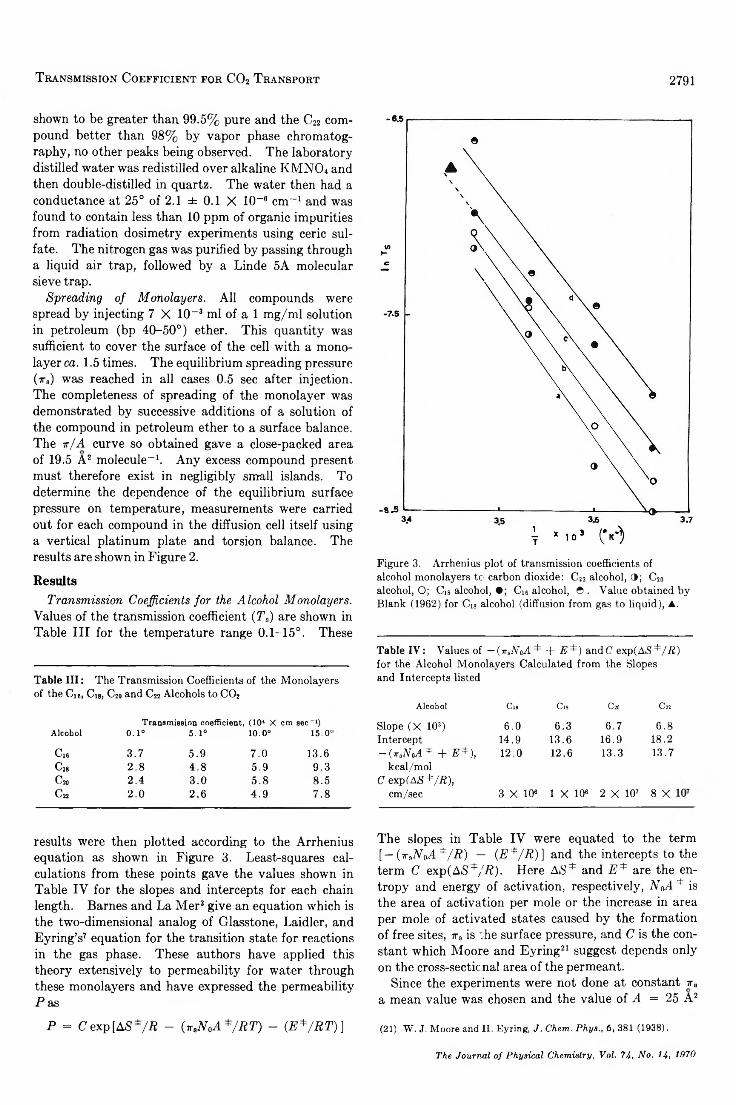
shown to be greater than 99.5% pure and the C22 compound better than 98% by vapor phase chromatography, no other peaks being observed. The laboratory distilled water was redistilled over alkaline K M N04 and then double-distilled in quartz. The water then had a conductance at 25° of 2.1 ± 0.1 X 10~ 6 cm- 1 and was found to contain less than 10 ppm of organic impurities from radiation dosimetry experiments using ceric sulfate. The nitrogen gas was purified by passing through a liquid air trap, followed by a Linde 5A molecular sieve trap.
Spreading o f M onolayers. All compounds were spread by injecting 7 X 10~ 3 ml of a 1 mg/ml solution in petroleum (bp 40-50°) ether. This quantity was sufficient to cover the surface of the cell with a mono- layer ca. 1.5 times. The equilibrium spreading pressure (irs) was reached in all cases 0.5 sec after injection. The completeness of spreading of the monolayer was demonstrated by successive additions of a solution of the compound in petroleum ether to a surface balance. The %/A curve so obtained gave a close-packed area of 19.5 A2 molecule-1. Any excess compound present must therefore exist in negligibly small islands. To determine the dependence of the equilibrium surface pressure on temperature, measurements were carried out for each compound in the diffusion cell itself using a vertical platinum plate and torsion balance. The results are shown in Figure 2 .
ResultsTransm ission Coefficients fo r the A lcohol M onolayers.
Values of the transmission coefficient (T s) are shown in Table III for the temperature range 0.1-15°. These
T r a n s m is s io n C o e f f ic ie n t f o r C 0 2 T r a n s p o r t
Table I I I : The Transmission Coefficients of the Monolayers of the Ci e, Cia, C20 and C22 Alcohols to C 0 2
Transmission coefficient, (10* X cm see-1)Alcohol 0.1° 5.1» 10.0° 15.0'
C„ 3.7 5.9 7.0 13.6Cm 2.8 4.8 5.9 9.3C20 2.4 3.0 5.8 8.5C22 2.0 2 .6 4.9 7.8
results were then plotted according to the Arrhenius equation as shown in Figure 3. Least-squares calculations from these points gave the values shown in Table IV for the slopes and intercepts for each chain length. Barnes and La Mer3 give an equation which is the two-dimensional analog of Glasstone, Laidler, and Eyring’s7 equation for the transition state for reactions in the gas phase. These authors have applied this theory extensively to permeability for water through these monolayers and have expressed the permeability Pas
P = C exp [AS*/P - (irsN o A * / R T ) - (E * / R T ) ]
2791
Figure 3. Arrhenius plot of transmission coefficients of alcohol monolayers to carbon dioxide: C22 alcohol, 3 ; C20 alcohol, O; Cis alcohol, • ; Cu alcohol, © . Value obtained by Blank (1962) for Cis alcohol (diffusion from gas to liquid), ▲.
Table IV : Values of - ( x 3VoA * + E * ) andC ex p (A S */fl) for the Alcohol Monolayers Calculated from the Slopes and Intercepts listed
Alcohol Cl6 Cl8 C20 C nSlope (X 10s) 6.0 6.3 6.7 6.8Intercept 14.9 13.6 16.9 18.2— (irBN oA 4 + E * ) , 12.0 12.6 13.3 13.7
kcal/mol C expiAS^/Æ),
cm/sec 3 X 10« 1 X 10« 2 X 10⁷ 8 X
The slopes in Table IV were equated to the term [— ( ttsN oA ^ / R ) — (F */F )] and the intercepts to the term C exp(AS*/P). Here AS* and F * are the entropy and energy of activation, respectively, N qA * is the area of activation per mole or the increase in area per mole of activated states caused by the formation of free sites, xs is ihe surface pressure, and C is the constant which Moore and Eyring21 suggest depends only on the cross-secticnal area of the permeant.
Since the experiments were not done at constant x8 a mean value was chosen and the value of A = 2 5 A2
(21) W . J. Moore and H. Eyring, J. Chem. P h y s 6, 381 (1938).
The Jourrxd o f P h ysica l Chem istry, Vol. 74, N o. 14, 1970
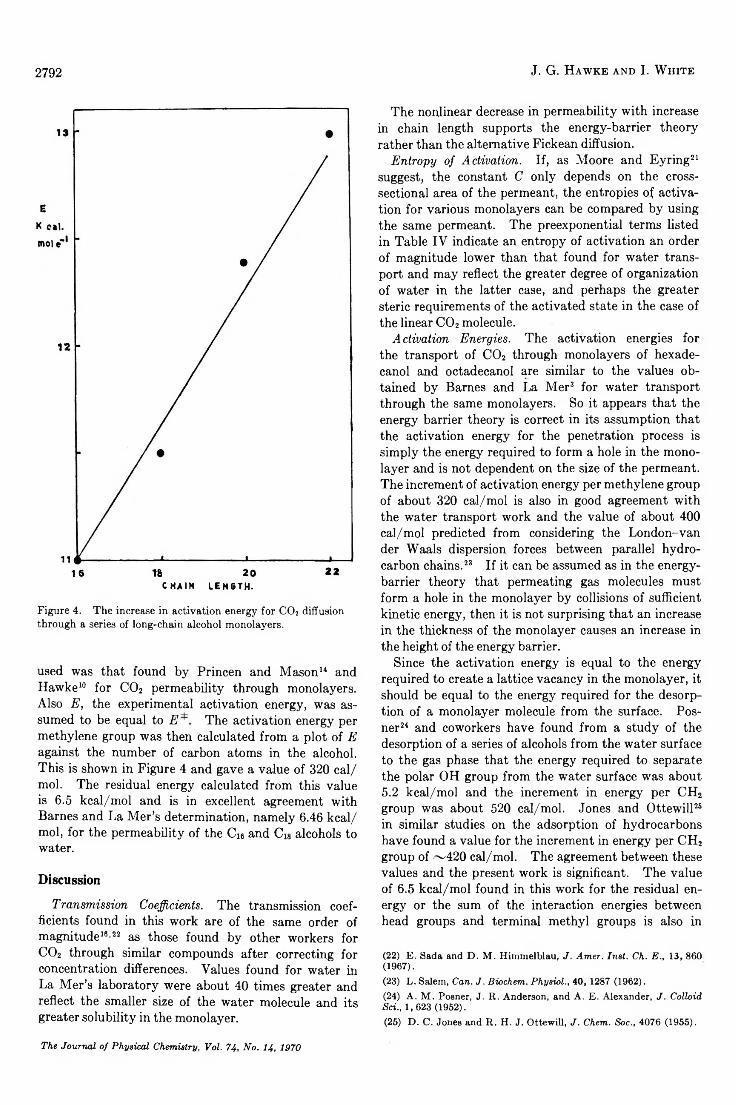
27 92 J. G . H a w k e a n d I . W h it e
CHAIN LEN6TH.
Figure 4. The increase in activation energy for C 0 2 diffusion through a series of long-chain alcohol monolayers.
used was that found by Princen and Mason14 and Hawke10 for C02 permeability through monolayers. Also E , the experimental activation energy, was assumed to be equal to E The activation energy per methylene group was then calculated from a plot of E against the number of carbon atoms in the alcohol. This is shown in Figure 4 and gave a value of 320 cal/ mol. The residual energy calculated from this value is 6.5 kcal/mol and is in excellent agreement with Barnes and La Mer’s determination, namely 6.46 kcal/ mol, for the permeability of the Ci6 and Ci8 alcohols to water.
DiscussionT ransm ission Coefficients. The transmission coef
ficients found in this work are of the same order of magnitude16,22 as those found by other workers for C02 through similar compounds after correcting for concentration differences. Values found for water in La Mer’s laboratory were about 40 times greater and reflect the smaller size of the water molecule and its greater solubility in the monolayer.
The nonlinear decrease in permeability with increase in chain length supports the energy-barrier theory rather than the alternative Fickean diffusion.
E n tropy o f A ctivation . If, as Moore and Eyring21 suggest, the constant C only depends on the cross- sectional area of the permeant, the entropies of activation for various monolayers can be compared by using the same permeant. The preexponential terms listed in Table IV indicate an entropy of activation an order of magnitude lower than that found for water transport and may reflect the greater degree of organization of water in the latter case, and perhaps the greater steric requirements of the activated state in the case of the linear C 02 molecule.
A ctivation E nergies. The activation energies for the transport of C02 through monolayers of hexade- canol and octadecanol are similar to the values obtained by Barnes and La Mer3 for water transport through the same monolayers. So it appears that the energy barrier theory is correct in its assumption that the activation energy for the penetration process is simply the energy required to form a hole in the mono- layer and is not dependent on the size of the permeant. The increment of activation energy per methylene group of about 320 cal/mol is also in good agreement with the water transport work and the value of about 400 cal/mol predicted from considering the London-van der Waals dispersion forces between parallel hydrocarbon chains.23 If it can be assumed as in the energy- barrier theory that permeating gas molecules must form a hole in the monolayer by collisions of sufficient kinetic energy, then it is not surprising that an increase in the thickness of the monolayer causes an increase in the height of the energy barrier.
Since the activation energy is equal to the energy required to create a lattice vacancy in the monolayer, it should be equal to the energy required for the desorption of a monolayer molecule from the surface. Posner24 and coworkers have found from a study of the desorption of a series of alcohols from the water surface to the gas phase that the energy required to separate the polar OH group from the water surface was about5.2 kcal/mol and the increment in energy per CH2 group was about 520 cal/mol. Jones and Ottewill26 in similar studies on the adsorption of hydrocarbons have found a value for the increment in energy per CH2 group of ~420 cal/mol. The agreement between these values and the present work is significant. The value of 6.5 kcal/mol found in this work for the residual energy or the sum of the interaction energies between head groups and terminal methyl groups is also in
(22) E. Sada and D. M . Himmelblau, J. Amer. Inst. Ch. E., 13, 860 (1967).(23) L. Salem, Can. J. Biochem. Physiol., 40, 1287 (1962).(24) A. M . Posner, J. R . Anderson, and A. E. Alexander, J. Colloid Sci., 1,623 (1952).(25) D . C. Jones and R. H. J. Ottewill, J. Chem. Soc., 4076 (1955).
The Journal o f P hysica l Chem istry, Vol. 74, N o . 14 , 1970
P y r o l y s is of NmtoMETHANE-d3 2793
agreement with Posner’s value for the interaction of the OH group. The activation energy for positively charged head groups of the trimethylammonium type are comparable with the residual energy found here. This is surprising in view of the gaseous-like character of these monolayers. However, it may be due to a soft “icelike” structure at the water surface formed by the orientation of the water molecules around the charged head groups leading to a small value of the free surface area. Thus the results presented here are
consistent with the transportation of the C 02 molecules through the monolayer in a single-step process, rather than a series of jumps as required by the Fickean diffusion mechanism.
Acknow ledgm ent. This project has been supported and financed, in part, by the Federal Water Pollution Control Administration, U. S. Department of the Interior, pursuant to the Federal Water Pollution Control Act.
Pyrolysis of Nitromethane-d3
by C. G. Crawforth and D. J. WaddingtonDepartment of Chemistry, University of York, York YOl 5DD, England (Received February 12, 1970)
The pyrolysis of nitromethane-d3 between 300 and 400° has been studied and results are compared with the pyrolysis of nitromethane. It is shown that there is a deuterium isotope effect which may be ascribed to the reactions: CDs* -b CD3N02—► *CD2N02 -b CD4 (3a), CD30* -\- CD3N02—► *CD2H02 ~b CD3OD (7a).
IntroductionAlthough there is considerable evidence that the
initiation reaction in the pyrolysis of nitromethane involves fission of the C-N bond1-3
CH3NO2 — ► CHr + N 02 (1)
it is not clear what part nitrogen dioxide plays in subsequent reactions, for at these temperatures it is able not only to react with radicals such as methyl,4 but it may also abstract hydrogen from saturated aliphatic molecules,6 for example, nitromethane to form nitromethyl.2“
CH3N 0 2 + N 0 2 — ► *CH2N02 + HN02 (2 )
This paper is concerned with the pyrolysis of nitro- methane-d3, both in the presence of added nitrogen dioxide and alone, in order to elucidate whether reaction 2 is important in the pyrolysis of nitromethane.
Experimental SectionM aterials. Nitromethane (BDH Ltd.) was purified
by fractional distillation using a spinning band column (Biichi). It and nitromethane-d3 (Merck) were over 99% pure as determined by gas chromatography and by pmr (Perkin-Elmer R60). Methyl cyanide and methanol (BDH Ltd.) were also purified by fractional distillation. Methane, ethylene, carbon dioxide, nitrous oxide, nitrogen dioxide (Cambrian Chemicals
Ltd.) and methane-d4 (Merck Sharp and Dohme of Canada Ltd.) were stated to be over 99% pure, and hydrogen and nitrogen (British Oxygen Co. Ltd.) over 99.5% pure, and were used without further purification, impurities not being detectable by gas chromatography. Methyl nitrite6 and methyl nitrate7 were prepared from methanol.
A pparatus. A static vacuum apparatus was used. The reactants were introduced into a cylindrical boro- silicate glass reaction vessel (250-ml capacity, surface: volume ratio 0.95 cm-1), suspended in an electrical furnace, maintained at a temperature to within ± 0 .2 °. Pressure measurements were made with a transducer (Consolidated Electrodynamics) linked to a recorder (Goertz RE 511).
(1) (a) C. Frejacques, C. R. Acad. Sci., 231, 1061 (1950); (b) T. L. Cottrell and T . J. Reid, J. Chem. Phys., 18, 1306 (1950); (c) T . L. Cottrell, T. E. Graham, and T. J. Reid, Trans. Faraday Soc., 47, 584 (1951).(2) (a) L. J. Hillenbrand and M. L. Kilpatrick, J. Chem. Phys., 19, 381 (1951); 21, 525 (1953); (b) P. Gray, A. D. Yoffe, and L. C. Roselaar, Trans. Faraday Soc., 51, 1489 (1955).(3) C. G. Crawforth and D. J. Waddington, Trans. Faraday Soc., 65, 1334 (1969).(4) L. Phillips and R. Shaw, “ Tenth Symposium on Combustion,1' Cambridge, England, 1965, p 453.(5) J. H. Thomas, Oxid. Combust. Rev., 1, 137 (1965).(6) J. I. McGarvey and W . D. McGrath, Trans. Faraday Soc., 60, 2196 (1964).(7) A. H. Blatt, Ed., Organic Syntheses, Voi. II, J. Wiley, New York, N. Y., 1943, p 412.
The Journal o f P hysica l Chem istry, V oi. 74, Yo. 14, 1970
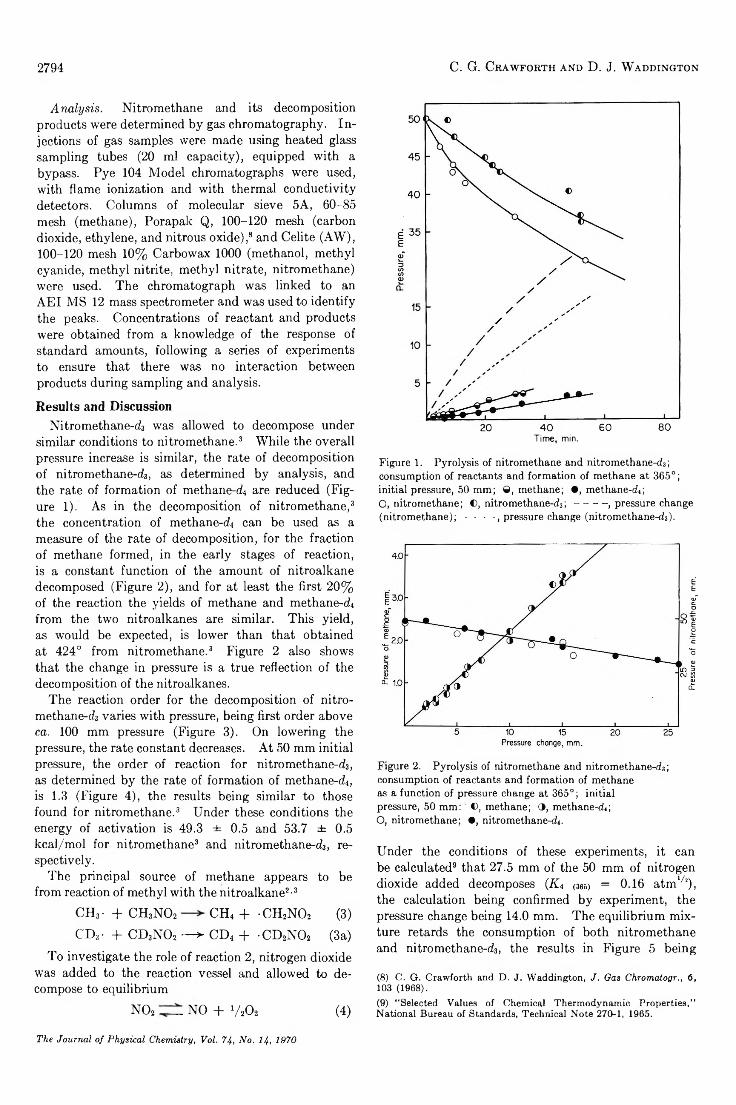
2794 C . G . C r a w f o r t h a n d D . J. W a d d in g t o n
A n a lysis. Nitromethane and its decompositionproducts were determined by gas chromatography. Injections of gas samples were made using heated glass sampling tubes (20 ml capacity), equipped with a bypass. Pye 104 Model chromatographs were used, with flame ionization and with thermal conductivity detectors. Columns of molecular sieve 5A, 60-85 mesh (methane), Porapak Q, 100-120 mesh (carbon dioxide, ethylene, and nitrous oxide) ,8 and Celite (AW), 100-120 mesh 10% Carbowax 1000 (methanol, methyl cyanide, methyl nitrite, methyl nitrate, nitromethane) were used. The chromatograph was linked to an AEI MS 1 2 mass spectrometer and was used to identify the peaks. Concentrations of reactant and products were obtained from a knowledge of the response of standard amounts, following a series of experiments to ensure that there was no interaction between products during sampling and analysis.
Results and DiscussionNitromethane-d was allowed to decompose under
similar conditions to nitromethane.3 While the overall pressure increase is similar, the rate of decomposition of nitromethane-d, as determined by analysis, and the rate of formation of methane-d are reduced (Figure 1). As in the decomposition of nitromethane,3 the concentration of methane-d can be used as a measure of the rate of decomposition, for the fraction of methane formed, in the early stages of reaction, is a constant function of the amount of nitroalkane decomposed (Figure 2 ), and for at least the first 20% of the reaction the yields of methane and methane-d from the two nitroalkanes are similar. This yield, as would be expected, is lower than that obtained at 424° from nitromethane.3 Figure 2 also shows that the change in pressure is a true reflection of the decomposition of the nitroalkanes.
The reaction order for the decomposition of nitromethane-d varies with pressure, being first order above ca. 100 mm pressure (Figure 3). On lowering the pressure, the rate constant decreases. At 50 mm initial pressure, the order of reaction for nitromethane-d, as determined by the rate of formation of methane-di, is 1.3 (Figure 4), the results being similar to those found for nitromethane.3 Under these conditions the energy of activation is 49.3 ± 0.5 and 53.7 ± 0.5 kcal/mol for nitromethane3 and nitromethane-d, respectively.
The principal source of methane appears to be from reaction of methyl with the nitroalkane2,3
CHS- + CH3N 02 CH4 + -CH2N02 (3)CDr + CD3N 02 — ^ CD4 + -CD2N 02 (3a)
To investigate the role of reaction 2, nitrogen dioxide was added to the reaction vessel and allowed to decompose to equilibrium
N 02 — NO + y 20 2 (4)
_________ i_________ i_________ i_20 40 60 80
Time, min.
Figure 1. Pyrolysis of nitromethane and nitrom ethane-d; consumption of reactants and formation of methane at 365°; initial pressure, 50 mm ; ©, methane; • , methane-d,;O, nitromethane; ©, n itrom eth a n e -d ;-----------, pressure change(nitromethane); • • ■ -, pressure change (nitrom ethane-d).
Figure 2. Pyrolysis of nitromethane and nitrom ethane-d; consumption of reactants and formation of methane as a function of pressure change at 365°; initial pressure, 50 mm: ©, methane; 3 , m ethane-d;O, nitromethane; • , nitromethane-d.
Under the conditions of these experiments, it can be calculated9 that 27.5 mm of the 50 mm of nitrogen dioxide added decomposes (A4 (363) = 0.16 atm'/!), the calculation being confirmed by experiment, the pressure change being 14.0 mm. The equilibrium mixture retards the consumption of both nitromethane and nitromethane-d, the results in Figure 5 being
(8) C. G. Crawforth and D. J. Waddington, J. Gas Chromatogr., 6 , 103 (1968).(9) “ Selected Values of Chemical Thermodynamic Properties,” National Bureau of Standards, Technical Note 270-1, 1965.
The Journal o f P h ysica l Chem istry, Vol. 74, N o. 14, 1970
Pres
sure
of
nitro
met
hane
, mm
.
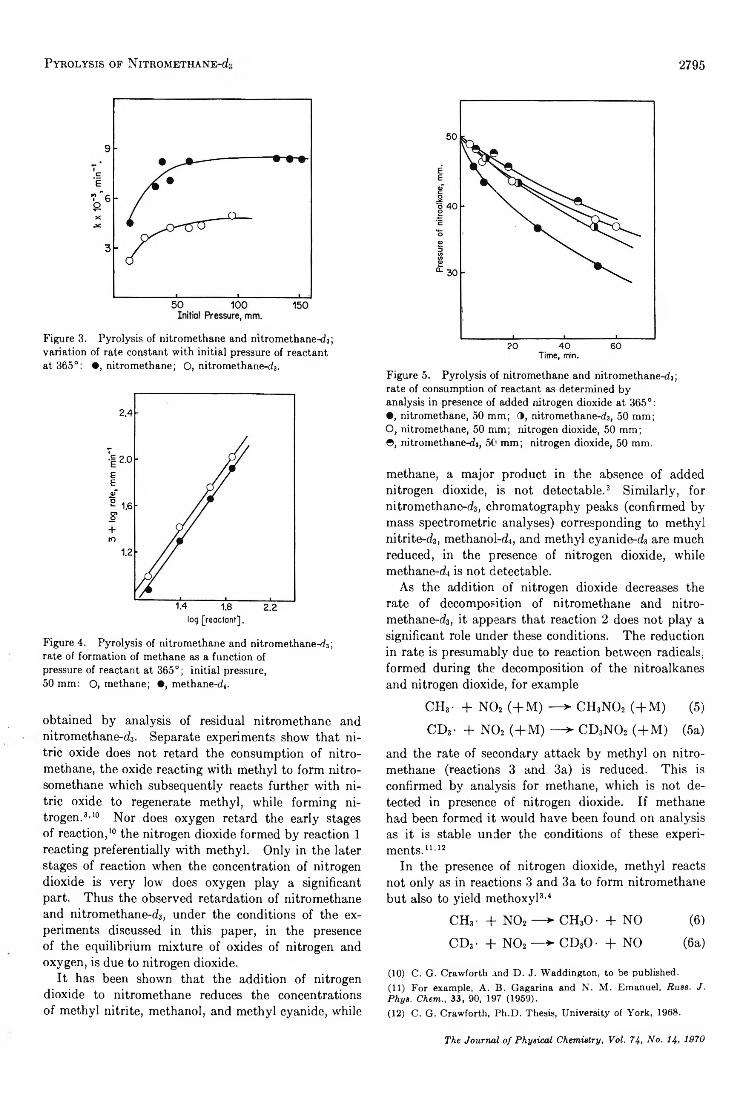
P y r o l y s is o f N it r o m e t h a n e - o!; 2795
Figure 3. Pyrolysis of nitromethane and mtromethane-d3; variation of rate constant with initial pressure of reactant at 365°: • , nitromethane; O, nitromethane-d3.
log [reoctant].
Figure 4. Pyrolysis of nitromethane and nitromethane-d3; rate of formation of methane as a function of pressure of reactant at 365°; initial pressure,50 mm: O, methane; • , methane-cfi.
obtained by analysis of residual nitromethane and nitromethane-d3. Separate experiments show that nitric oxide does not retard the consumption of nitromethane, the oxide reacting with methyl to form nitro- somethane which subsequently reacts further with nitric oxide to regenerate methyl, while forming nitrogen.3’10 Nor does oxygen retard the early stages of reaction, 10 the nitrogen dioxide formed by reaction 1 reacting preferentially with methyl. Only in the later stages of reaction when the concentration of nitrogen dioxide is very low does oxygen play a significant part. Thus the observed retardation of nitromethane and nitromethane-d3, under the conditions of the experiments discussed in this paper, in the presence of the equilibrium mixture of oxides of nitrogen and oxygen, is due to nitrogen dioxide.
It has been shown that the addition of nitrogen dioxide to nitromethane reduces the concentrations of methyl nitrite, methanol, and methyl cyanide, while
Figure 5. Pyrolysis of nitromethane and nitromethane-d3; rate of consumption of reactant as determined by analysis in presence of added nitrogen dioxide at 365°:• , nitromethane, 50 mm ; 9 , nitromethane-d3, 50 mm;O, nitromethane, 50 mm; nitrogen dioxide, 50 mm;9 , nitromethane-d3, 50 mm ; nitrogen dioxide, 50 mm.
methane, a major product in the absence of added nitrogen dioxide, is not detectable. 3 Similarly, for nitromethane-fi3, chromatography peaks (confirmed by mass spectrometric analyses) corresponding to methyl nitrite-d3, methanol-d4, and methyl cyanide-d3 are much reduced, in the presence of nitrogen dioxide, while methane-di is not detectable.
As the addition of nitrogen dioxide decreases the rate of decomposition of nitromethane and nitro- methane-d3, it appears that reaction 2 does not play a significant role under these conditions. The reduction in rate is presumably due to reaction between radicals, formed during the decomposition of the nitroalkanes and nitrogen dioxide, for example
CH3- + N 02 (+M ) — > CH3N 02 (+M ) (5)
CD3- + N 02 (+M ) — > CD3N 0 2 (+ M ) (5a)
and the rate of secondary attack by methyl on nitromethane (reactions 3 and 3a) is reduced. This is confirmed by analysis for methane, which is not detected in presence of nitrogen dioxide. If methane had been formed it would have been found on analysis as it is stable under the conditions of these experiments. 11 '12
In the presence of nitrogen dioxide, methyl reacts not only as in reactions 3 and 3a to form nitromethane but also to yield methoxyl3,4
CH3- + N 02 — > CH30 - + NO (6)
CD3- + N 02 — ► CD30 - + NO (6a)
(10) C. G. Crawforth and D. J. Waddington, to be published.(11) For example, A. B. Gagarina and N. M . Emanuel, Russ. J. Phys. Chem., 33, 90, 197 (1959).(12) C. G. Crawforth, Ph.D. Thesis, University of York, 1968.
The Journal o f P hysica l Chem istry, Vol. 74, N o . 14, 1970
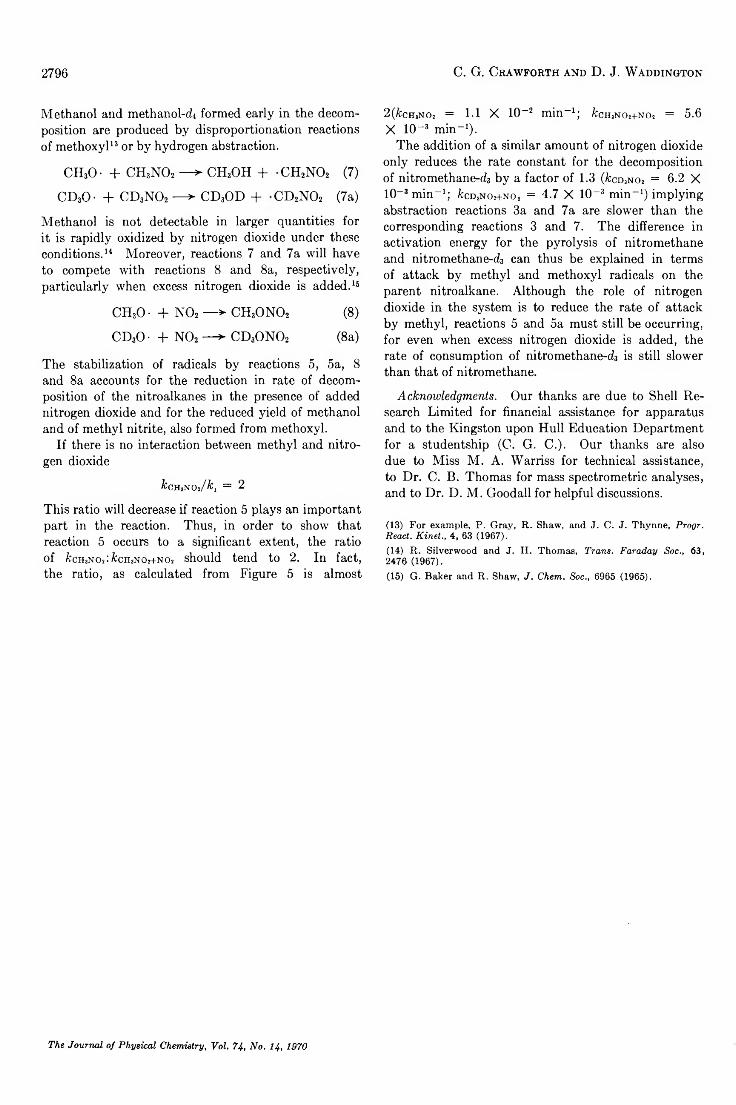
2796 C . G . C r a w f o r t h a n d D . J. W a d d in g t o n
Methanol and methanol-di formed early in the decomposition are produced by disproportionation reactions of methoxyl13 or by hydrogen abstraction.
CH30 - + CH3NO2 — > CH3OH + CH2NO2 (7)
CD30 - + CD3NO2 — > CD3OD + CD2N 02 (7a)
Methanol is not detectable in larger quantities for it is rapidly oxidized by nitrogen dioxide under these conditions. 14 Moreover, reactions 7 and 7a will have to compete with reactions 8 and 8a, respectively, particularly when excess nitrogen dioxide is added. 16
CH30- + N02 — ► CH3ONO2 (8 )
CD30 - + N 02 — > CD3ONO2 (8a)
The stabilization of radicals by reactions 5, 5a, 8 and 8a accounts for the reduction in rate of decomposition of the nitroalkanes in the presence of added nitrogen dioxide and for the reduced yield of methanol and of methyl nitrite, also formed from methoxyl.
If there is no interaction between methyl and nitrogen dioxide
& CH sN 02/ f c , = 2
This ratio will decrease if reaction 5 plays an important part in the reaction. Thus, in order to show that reaction 5 occurs to a significant extent, the ratio of fccH8N02:&CH,N0H-N02 should tend to 2. In fact, the ratio, as calculated from Figure 5 is almost
2(&chjNOi = 1.1 X 10⁻² min-1; fccHjNo2+No2 = 5.6 X 10⁻³ min-1).
The addition of a similar amount of nitrogen dioxide only reduces the rate constant for the decomposition of nitromethane-d3 by a factor of 1.3 (/ccd3no2 = 6 .2 X 10- 3 min-1; fccD3NOH-No2 = 4.7 X 10⁻³ min-1) implying abstraction reactions 3a and 7a are slower than the corresponding reactions 3 and 7. The difference in activation energy for the pyrolysis of nitromethane and nitromethane-rj3 can thus be explained in terms of attack by methyl and methoxyl radicals on the parent nitroalkane. Although the role of nitrogen dioxide in the system is to reduce the rate of attack by methyl, reactions 5 and 5a must still be occurring, for even when excess nitrogen dioxide is added, the rate of consumption of nitromethane-d3 is still slower than that of nitromethane.
Acknowledgm ents. Our thanks are due to Shell Research Limited for financial assistance for apparatus and to the Kingston upon Hull Education Department for a studentship (G. G. C.). Our thanks are also due to Miss M. A. Warriss for technical assistance, to Dr. C. B. Thomas for mass spectrometric analyses, and to Dr. D. M. Goodall for helpful discussions.
(13) For example, P. Gray, R. Shaw, and J. C. J. Thynne, Progr. React. Kinet., 4, 63 (1967).(14) R. Silverwood and J. H. Thomas, Trans. Faraday Soc., 63, 2476 (1967).(15) G. Baker and R. Shaw, J. Chem. Soc., 6965 (1965).
The Journal o f P hysica l Chem istry, V ol. 74, N o . 14, 1970
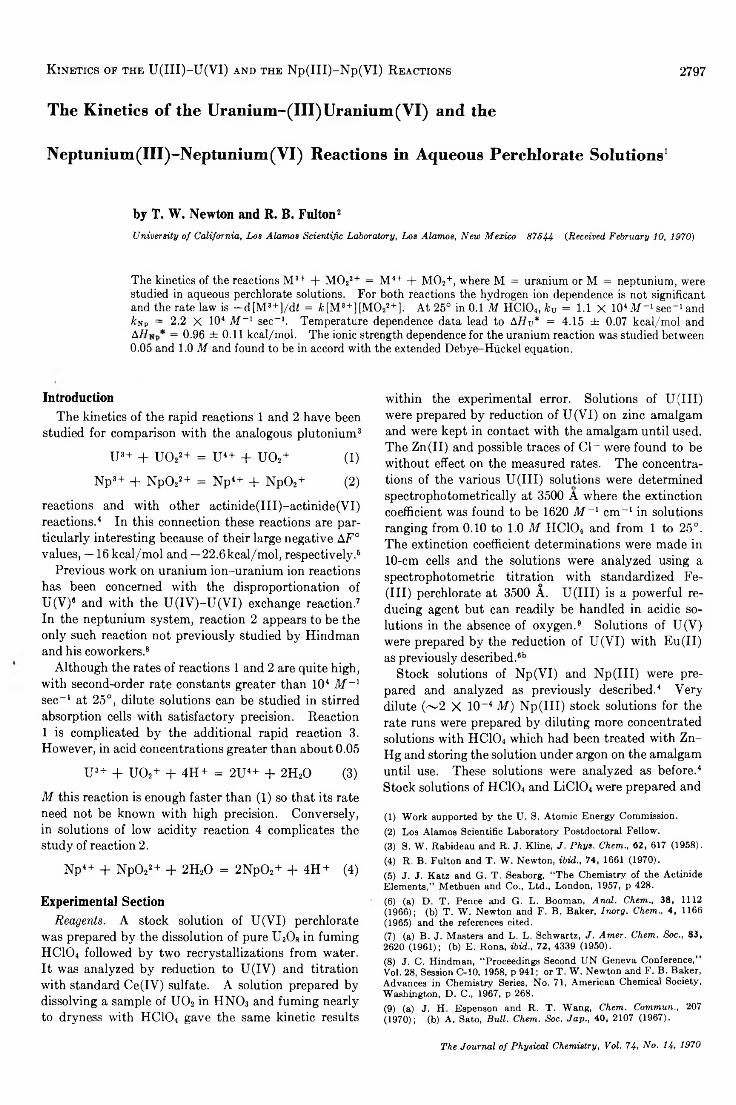
K in e t ic s o f t h e U ( I I I ) -U ( V I ) a n d t h e N p ( I I I ) -N p ( V l ) R e a c t io n s 2797
The Kinetics of the Uranium-(III) Uranium(VI) and the
Neptunium(III)-Neptunium(VI) Reactions in Aqueous Perchlorate Solutions1
by T. W. Newton and R. B. Fulton2University of California, Los Alamos Scientific Laboratory, Los Alamos, New Mexico 87544 (Received February 10, 1970)
The kinetics of the reactions M3+ + M022+ = M4+ + M02+, where M = uranium or M = neptunium, were studied in aqueous perchlorate solutions. For both reactions the hydrogen ion dependence is not significant and the rate law is —d[M3+]/df = &[M8+][M022+]. At 25° in 0.1 M HC104, kv = 1.1 X 10⁴Ai- 1 sec-1and kxp = 2.2 X 10⁴ M ~ x sec-1. Temperature dependence data lead to M ir* = 4.15 ± 0.07 kcal/mol and M I = 0.96 ±0.11 kcal/mol. The ionic strength dependence for the uranium reaction was studied between 0.05 and 1.0 M and found to be in accord with the extended Debye-Hiickel equation.
IntroductionThe kinetics of the rapid reactions 1 and 2 have been
studied for comparison with the analogous plutonium3
U3+ + U 022+ = U4+ + U 02+ (1)
Np3+ + Np022+ = Np4+ + NP0 2+ (2 )
reactions and with other actinide(III)-actinide(YI) reactions.4 In this connection these reactions are particularly interesting because of their large negative AF ° values, —16 kcal/mol and — 2 2 .6 kcal/mol, respectively.6
Previous work on uranium ion-uranium ion reactions has been concerned with the disproportionation of U(V)6 and with the U(IY)-U(VI) exchange reaction.7 In the neptunium system, reaction 2 appears to be the only such reaction not previously studied by Hindman and his coworkers.8
Although the rates of reactions 1 and 2 are quite high, with second-order rate constants greater than 1 0 4 M ~ 1 sec- 1 at 25°, dilute solutions can be studied in stirred absorption cells with satisfactory precision. Reaction 1 is complicated by the additional rapid reaction 3. However, in acid concentrations greater than about 0.05
U3+ + U 02+ + 4H+ = 2U4+ + 2H20 (3)
M this reaction is enough faster than (1 ) so that its rate need not be known with high precision. Conversely, in solutions of low acidity reaction 4 complicates the study of reaction 2 .
Np4+ + Np022+ + 2H20 = 2Np02+ + 4H+ (4)
Experimental SectionReagents. A stock solution of U(VI) perchlorate
was prepared by the dissolution of pure H/Os in fuming HClOi followed by two recrystallizations from water. It was analyzed by reduction to U(IV) and titration with standard Ce(IV) sulfate. A solution prepared by dissolving a sample of U 02 in HN03 and fuming nearly to dryness with HCIO4 gave the same kinetic results
within the experimental error. Solutions of U(III) were prepared by reduction of U (VI) on zinc amalgam and were kept in contact with the amalgam until used. The Zn(II) and possible traces of Cl- were found to be without effect on the measured rates. The concentrations of the various U(III) solutions were determined spectrophotometrically at 3500 A where the extinction coefficient was found to be 1620 M ~ l cm- 1 in solutions ranging from 0 .10 to 1 .0 M HC104 and from 1 to 25°. The extinction coefficient determinations were made in 10 -cm cells and the solutions were analyzed using a spectrophotometric titration with standardized Fe-(III) perchlorate at 3500 A. U(III) is a powerful reducing agent but can readily be handled in acidic solutions in the absence of oxygen.9 Solutions of U(V) were prepared by the reduction of U(VI) with Eu(II) as previously described.6b
Stock solutions of Np(VI) and Np(III) were prepared and analyzed as previously described.4 Very dilute (~ 2 X 10⁻⁴ M ) Np(III) stock solutions for the rate runs were prepared by diluting more concentrated solutions with HC104 which had been treated with Zn- Hg and storing the solution under argon on the amalgam until use. These solutions were analyzed as before.4 Stock solutions of HC104 and LiC104 were prepared and
(1) Work supported by the U. S. Atomic Energy Commission.(2) Los Alamos Scientific Laboratory Postdoctoral Fellow.(3) S. W. Rabideau and R. J. Kline, J. Phys. Chem., 62, 617 (1958).(4) R. B. Fulton and T. W. Newton, ibid., 74, 1661 (1970).(5) J. J. Katz and G. T. Seaborg, “ The Chemistry of the Actinide Elements,” Methuen and Co., Ltd., London, 1957, p 428.(6) (a) D. T. Pence and G. L. Booman, Anal. Chem., 38, 1112 (1966); (b) T. W . Newton and F. B. Baker, Inorg. Chem., 4, 1166 (1965) and the references cited.(7) (a) B. J. Masters and L. L. Schwartz, J. Amer. Chem. Soc., 83, 2620 (1961); (b) E. Rona, ibid., 72, 4339 (1950).(8) J. C. Hindman, “ Proceedings Second UN Geneva Conference,” Vol. 28, Session C-10, 1958, p 941; or T. W. Newton and F. B. Baker, Advances in Chemistry Series, No. 71, American Chemical Society, Washington, D. C„ 1967, p 268.(9) (a) J. H. Espenson and R. T. Wang, Chem. Commun., 207(1970); (b) A. Sato, Bull. Chem. Soc. Jap., 40, 2107 (1967).
The Journal o f P h ysica l Chem istry, Vol. 74, N o . 14, 1970
2798 T . W . N e w t o n a n d R . B . F u l t o n
analyzed as before.4 The concentration units used in this paper are moles per liter (M ) at 23°.
P rocedure. Reaction rates were determined spec- trophotometrically in stirred absorption cells as previously described. 10 Appropriate amounts of HC104, LiC104, and water were put into a cell which was then swept with purified argon and brought to temperature in the thermostat in the light beam of the Cary Model 14 spectrophotometer. Temperatures were determined with a calibrated thermometer in the thermostat. Correction was made for the small ( ~ 0 .1 °) difference between the cell and the thermostat. The necessary quantity of one of the reactant solutions was then injected into the cell and when steady readings were obtained the other reactant was injected. The timing was by means of the recorder which traveled at 8.00 in./ min. For runs at the lowest concentrations the 0-0.1 slide wire was used. All of the reactant solutions were thoroughly deaerated with purified argon and were maintained at temperatures close to the desired run temperature.
The U (III) reactions were followed at 3500 A where the extinction coefficients of all species other than U(III) are negligibly small. The initial concentrations of U(III) were calculated from the initial absorbance values and the extinction coefficient. The initial concentrations of the other reactant, U(VI) or U(V), were determined from the total absorbance change in runs for which U (III) was in excess.
The Np(III) runs were made at 2650 A where the extinction coefficients of Np(III) and Np(VI) are about 1590 M - 1 cm- 1 and 870 M - 1 cm-1, respectively. For the reaction products, Np(IY) and Np(V), the extinction coefficients are much smaller, 40 M _ 1 cm- 1 and 100 M ~ l cm-1, respectively. 11 Initial reactant concentrations were calculated from the volumes of the stock solutions injected into the reaction cells.
Stoichiom etry. Spectrophotometric titrations of U (III) with U (VI) at 3500 A gave linear plots of absorbance vs. milliliters of U(VI) solution added (corrected for the small volume changes) and the end points indicated that in the presence of excess U(III), 1.98 ± 0.02 mol of U(III) are consumed for each mole of U(VI) added. These observations show that reaction 1 is followed by reaction 3. The stoichiometry in the presence of excess U (VI) depends on the relative rates of the two reactions. The rate of reaction 3 was therefore measured under various conditions and calculation shows that, for example, 1.23 mol of U(IV) are formed per mole of U(III) reacted, even when the initial [U (VI) ] / [U(III) ] ratio is as high as 4.
The stoichiometry of the Np(III)-Np(VI) reaction in 1 M HCIO4 was found to be in accord with equation 2
by means of spectrophotometric titrations at 2670 Â. Known amounts of 3 X 10⁻⁶ M Np(VI) were titrated with Np(III). The average Np(III) concentration from three such titrations was 1.96 X 10~ 4 M , with a
range of 1.6%. The value determined by titration with standard Ce(IV) agreed within the experimental error; it was 0.8% lower. The reaction between Np-(III) and Np(V) is too slow to affect the observed stoichiometry and it can be shown that reaction 4 is relatively unimportant except at low acid concentrations and higher temperatures. The rate law for (4) was found12 to be — d[Np(IV) ]/dt = fc4[Np4+][Np022+]- [H + ]- 2 and average values of the rate constant ranged from 3.44 to 2.69 M sec- 1 between p = 0.55 and2.0 M at 25°. Extrapolation gives 0.07 M sec- 1 and1.0 M sec- 1 for p = 0.1 M at 25° and 45°, respectively. In 0.1 M acid the rate constants are small enough to be ignored since the rate constants for reaction 2 are near 2.4 X 10⁴ M ~ l sec- 1 at both temperatures. In 0.01 M acid (p = 0.1 M ), however, the second- order rate constants for (4) are about 700 and 104 M ~ l sec- 1 at 25 and 45°; thus an appreciable effect is to be expected at the higher temperature. Calculations for 45°, 0.01 M [H+] and [Np(VI)]0/[Np-(III) ]o = 2 show that when 10% of the Np(III) is left, 1.43 mol of Np(VI) are consumed for each mole of Np(VI) oxidized.
Calculations. Concentration vs. time data for the U(III)-U(V) reaction (3) were found to be in good agreement with the expected second-order rate law
- d [U(V) ]/d t = h [U(III) ] [U(V) ] (5)
Values for k3 were determined using the integrated form of eq 5 by a least-squares procedure.
When the U(III)-U(VI) reaction (1) is studied, reaction 3 occurs also. By making the approximation that (3) is much faster than (1), runs with excess U(III) were found to be in agreement with
- d [U(VI) ]/di = h [U(III) ] [U(VI) ] (6)
Thus reactions 1 and 3 were treated as competitive, consecutive second-order reactions. The resulting simultaneous differential equations were treated numerically and values for ki which best reproduced the observed absorbance vs. time data were determined by least squares as previously described. 13 The calculated values for ki were found to be relatively insensitive to the values of k3 assumed in the calculations.
The data for the Np(III)-Np(VI) reaction (2) in 0 .1 M HCIO4 are in good agreement with a second- order rate law analogous to eq 5. In some of the runs with excess Np(III) a small decrease in absorbance with time was observed after the Np(VI) was consumed. This is attributed to the reaction of Np-
(10) T. W. Newton and F. B. Baker, J. Phya. Chem., 67, 1425 (1963).(11) R. Sjoblom and J. C. Hindman, J. Amer. Chem. Soc., 73, 1744 (1951).(12) J. C. Hindman, J. C. Sullivan, and D. Cohen, ibid., 76, 3278 (1954).(13) T. W. Newton, G. E. McCrary, and W . G. Clark, / . Phya. Chem., 72, 4333 (1968).
The Journal o f P hysical Chemistry, Vol. 74, N o . 14, 1970
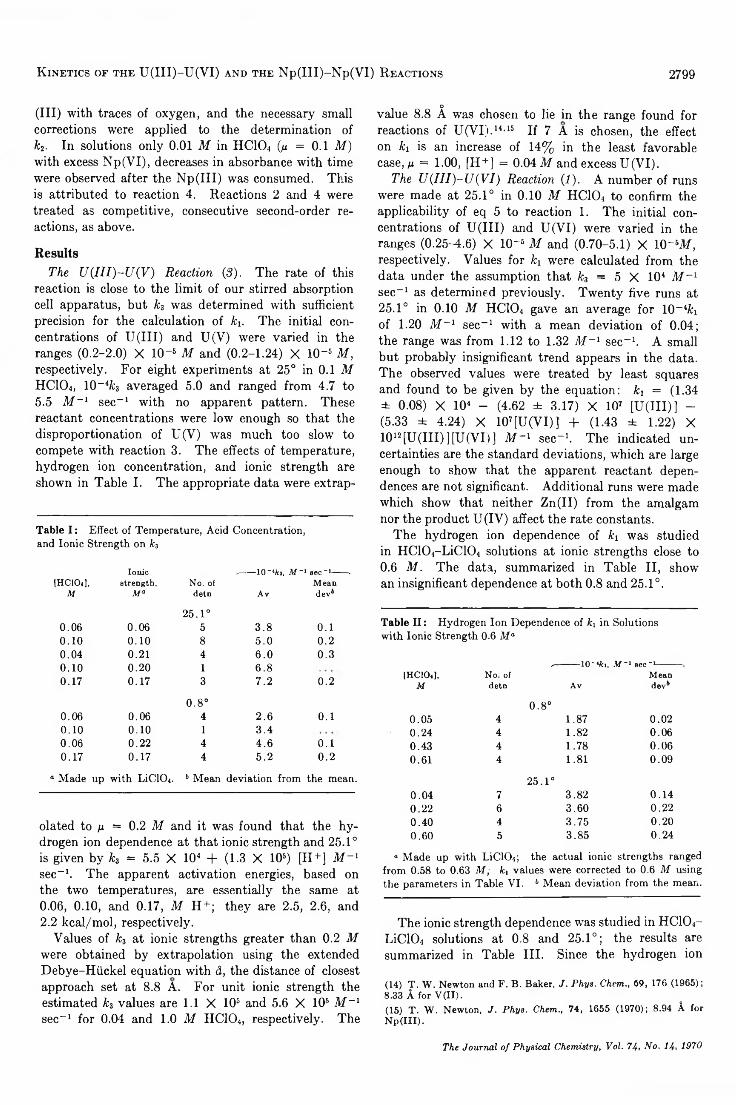
K inetics of the U ( I I I ) -U ( V I ) and the N p (I I I ) -N p ( V I ) R eactions 2799
(III) with traces of oxygen, and the necessary small corrections were applied to the determination of k2. In solutions only 0.01 M in HC104 (n = 0.1 M ) with excess Np(VI), decreases in absorbance with time were observed after the Np(III) was consumed. This is attributed to reaction 4. Reactions 2 and 4 were treated as competitive, consecutive second-order reactions, as above.
ResultsThe U ( I I I ) - U ( V ) R eaction (3 ). The rate of this
reaction is close to the limit of our stirred absorption cell apparatus, but k3 was determined with sufficient precision for the calculation of ki. The initial concentrations of U(III) and U(V) were varied in the ranges (0.2-2.0) X IO-5 M and (0.2-1.24) X 10-5 M , respectively. For eight experiments at 25° in 0.1 M HCIO4, 1 0 - 4fc3 averaged 5.0 and ranged from 4.7 to5.5 M ~ l sec- 1 with no apparent pattern. These reactant concentrations were low enough so that the disproportionation of U(V) was much too slow to compete with reaction 3. The effects of temperature, hydrogen ion concentration, and ionic strength are shown in Table I. The appropriate data were extrap-
Table I: Effect of Temperature, Acid Concentration, and Ionic Strength on k3
Ionic /— 10 “ 4/c3, M ~x sec-1------- .[HClO.l,
Ustrength,
M aNo. of detn Av
Meandev6
0 .0 6 0 .0 62 5 .1 °
5 3 .8 0 .10 .1 0 0 .1 0 8 5 .0 0 .20 .0 4 0 .2 1 4 6 .0 0 .30 .1 0 0 .2 0 1 6 .80 .1 7 0 .1 7 3 7 .2 0 .2
0 .0 6 0 .0 60 .8 °
4 2 .6 0 .10 .1 0 0 .1 0 1 3 .40 .0 6 0 .2 2 4 4 .6 0 .10 .1 7 0 .1 7 4 5 .2 0 .2
0 M a d e up w ith LÌCIO4. b M ean dev iation from the m ean.
olated to n = 0.2 M and it was found that the hydrogen ion dependence at that ionic strength and 25.1° is given by k3 = 5.5 X 10⁴ + (1.3 X 10⁵) [H+] M - 1 sec-1. The apparent activation energies, based on the two temperatures, are essentially the same at 0.06, 0.10, and 0.17, M H+; they are 2.5, 2.6, and2 .2 kcal/mol, respectively.
Values of k3 at ionic strengths greater than 0 .2 M were obtained by extrapolation using the extended Debye-Hiickel equation with &, the distance of closest approach set at 8.8 A. For unit ionic strength the estimated k3 values are 1.1 X 10⁵ and 5.6 X 10⁶ M ~ l sec- 1 for 0.04 and 1 .0 M HC104, respectively. The
ovalue 8.8 A was chosen to lie in the range found for reactions of U(VI) . 14’15 If 7 A is chosen, the effect on ki is an increase of 14% in the least favorable case, n = 1.00, [H+] = 0.04 M and excess U(VI).
The U ( I I I ) - U ( V I ) R eaction (1 ). A number of runs were made at 25.1° in 0.10 M HC104 to confirm the applicability of eq 5 to reaction 1. The initial concentrations of U(III) and U(VI) were varied in the ranges (0.25-4.6) X 10-5 M and (0.70-5.1) X 10- 6M, respectively. Values for k3 were calculated from the data under the assumption that k3 = 5 X 10⁴ M - 1 sec- 1 as determined previously. Twenty five runs at 25.1° in 0 .10 M HCIO4 gave an average for 1 0 -4fci of 1.20 M - 1 sec- 1 with a mean deviation of 0.04; the range was from 1 . 1 2 to 1.32 M - 1 sec-1. A small but probably insignificant trend appears in the data. The observed values were treated by least squares and found to be given by the equation: k 3 = (1.34 ± 0.08) X 104 - (4.62 ± 3.17) X 107 [U(III)] - (5.33 ± 4.24) X 107[U(VI)] + (1.43 ± 1.22) X 10* 12 * 14[U(III)][U(VI)] M ~ 1 sec-1. The indicated uncertainties are the standard deviations, which are large enough to show that the apparent reactant dependences are not significant. Additional runs were made which show that neither Zn(II) from the amalgam nor the product U(IV) affect the rate constants.
The hydrogen ion dependence of k3 was studied in HCICh-LiCICb solutions at ionic strengths close to 0.6 M . The data, summarized in Table II, show an insignificant dependence at both 0.8 and 25.1°.
Table II: Hydrogen Ion Dependence of ki in Solutions with Ionic Strength 0.6 M a
/----------10~4fti, M~l sec-1-[HClOd,
MNo. of detn Av
Meandev6
0.05 40.8°
1.87 0.020.24 4 1.82 0.060.43 4 1.78 0.060.61 4 1.81 0.09
0.04 725.1°
3.82 0.140.22 6 3.60 0.220.40 4 3.75 0.200.60 5 3.85 0.24
a Made up with LiCKfi; the actual ionic strengths ranged from 0.58 to 0.63 M ; ki values were corrected to 0.6 M using the parameters in Table V I. 6 Mean deviation from the mean.
The ionic strength dependence was studied in HCIO4-LiC104 solutions at 0.8 and 25.1°; the results aresummarized in Table III. Since the hydrogen ion
(14) T. W . Newton and F. B. Baker, J. Phys. Chem., 69, 176 (1965) ; 8.33 Â for V (II).(15) T . W. Newton, J. Phys. Chem., 74, 1655 (1970); 8.94 Â for N p(III).
The Journal of Physical Chemistry, Vol. 74, No. 14, 1970
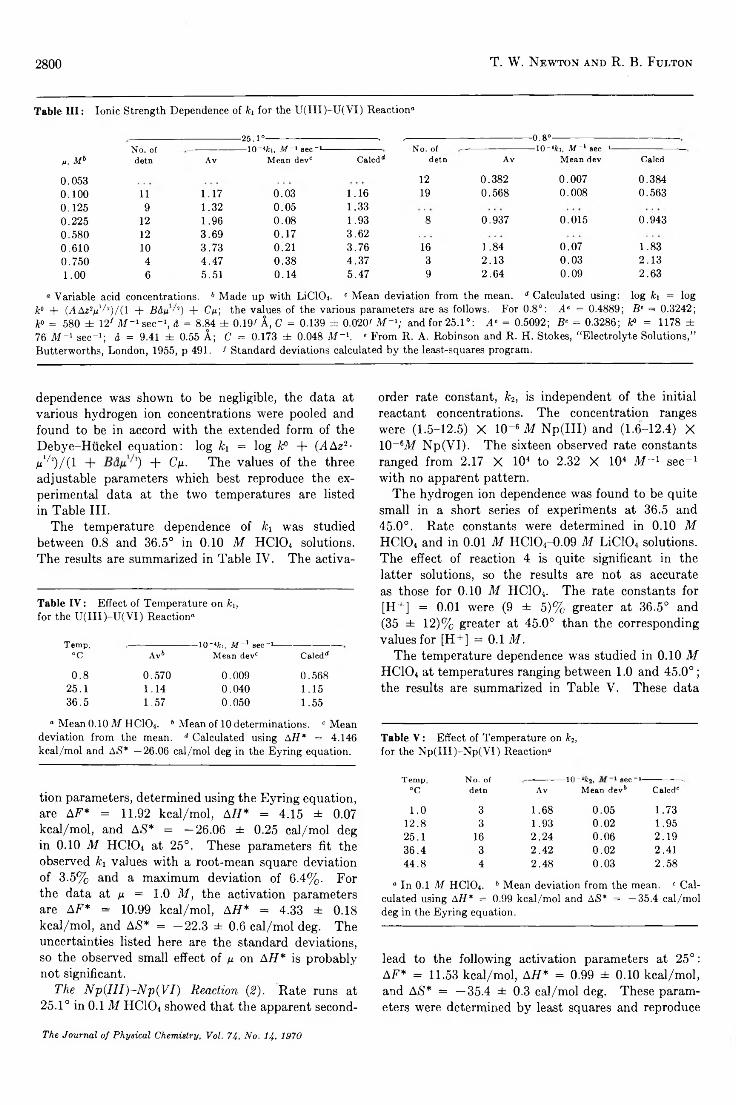
2800 T . W . N e w t o n a n d R . B . F u l t o n
Table III: Ionic Strength Dependence of h for the U ( I I I ) -U (V I) Reaction»
■25.1°----------------------------------------------- . ------------------------------------------------------0 .8 ° -
n, M bNo. of detn Av
— 10-4fci, M ~ l sec"1— Mean devc Calcdd
No. of detn Av
— 10-4fci, M -1 sec-1— Mean dev Calcd
0 .0 53 12 0 .3 8 2 0 .0 0 7 0 .3 8 40 .1 0 0 1 1 1 .1 7 0 .0 3 1 .1 6 19 0 .5 6 8 0 .0 0 8 0 .5 630 .1 2 5 9 1 .32 0 .0 5 1 .3 30 .2 25 12 1 .96 0 .0 8 1 .9 3 8 0 .9 37 0 .0 15 0 .9 4 30 .5 8 0 1 2 3 .6 9 0 .1 7 3 .6 20 .6 1 0 10 3 .7 3 0 .2 1 3 .7 6 16 1 .8 4 0 .0 7 1 .8 30 .7 5 0 4 4 .4 7 0 .3 8 4 .3 7 3 2 .1 3 0 .0 3 2 .1 31 .0 0 6 5 .51 0 .1 4 5 .4 7 9 2 .6 4 0 .0 9 2 .6 3
» Variable acid concentrations. 6 Made up with LiClOi. c Mean deviation from the mean. d Calculated using: log h = log A:0 + (AAzsm1/,!!)/(1 + B&fi A) + Cm; the values of the various parameters are as follows. For 0.8°: A e = 0.4889; B e = 0.3242; k° = 580 ± 12/ M -1 sec-1, & = 8.84 ± 0.19/ A, C = 0.139 db 0.020/ Af-1; and for 25.1°: A ‘ = 0.5092; B ’ = 0.3286; fc° = 1178 ± 76 M -1 sec-1; d = 9.41 ± 0.55 A; C = 0.173 ± 0.048 M -1. c From R. A. Robinson and R. H. Stokes, “Electrolyte Solutions,” Butterworths, London, 1955, p 491. / Standard deviations calculated by the least-squares program.
dependence was shown to be negligible, the data at various hydrogen ion concentrations were pooled and found to be in accord with the extended form of the Debye-Huckel equation: log ki = log k° + ( A Az2- ju1/2) /( l + ’) + Cp. The values of the threeadjustable parameters which best reproduce the experimental data at the two temperatures are listed in Table III.
The temperature dependence of ki was studied between 0.8 and 36.5° in 0 .10 M HCIO4 solutions. The results are summarized in Table IV. The activa-
Table IV: Effect of Temperature on ki,for the U ( I I I ) -U (V I) Reaction»
Temp,°C Avb
— 10~4fci, M - 1 sec"1— Mean devc Calcd'1
0 .8 0 .5 7 0 0 .0 0 9 0 .5 6 82 5 .1 1 .1 4 0 .0 4 0 1 .1 53 6 .5 1 .57 0 .0 5 0 1 .5 5
“ Mean 0.10 M HCIO4. 6 Mean of 10 determinations. c Mean deviation from the mean. d Calculated using AH * = 4.146 kcal/mol and AS* —26.06 cal/mol deg in the Eyring equation.
tion parameters, determined using the Eyring equation, are AF * = 11.92 kcal/mol, A H * = 4.15 ± 0.07 kcal/mol, and AS* = —26.06 ± 0.25 cal/mol deg in 0 . 1 0 M HCIO4 at 25°. These parameters fit the observed ki values with a root-mean square deviation of 3.5% and a maximum deviation of 6.4%. For the data at m = 1.0 M , the activation parameters are AF * = 10.99 kcal/mol, A H * = 4.33 ± 0.18 kcal/mol, and AS* = —22.3 ± 0.6 cal/mol deg. The uncertainties listed here are the standard deviations, so the observed small effect of p on A H * is probably not significant.
The N p ( I I I ) - N p ( V I ) Reaction (2 ). Rate runs at 25.1° in 0 .1 M HCIO4 showed that the apparent second-
order rate constant, fc2, is independent of the initial reactant concentrations. The concentration ranges were (1.5-12.5) X 10-6 M Np(III) and (1.6-12.4) X 10-6M Np(VI). The sixteen observed rate constants ranged from 2.17 X 10⁴ to 2.32 X 10⁴ M - 1 sec- 1 with no apparent pattern.
The hydrogen ion dependence was found to be quite small in a short series of experiments at 36.5 and 45.0°. Rate constants were determined in 0.10 M HCIO4 and in 0 .0 1 M HC104-0.09 M LiC104 solutions. The effect of reaction 4 is quite significant in the latter solutions, so the results are not as accurate as those for 0 .10 M HC104. The rate constants for [H+] = 0.01 were (9 ± 5)% greater at 36.5° and (35 ± 12)% greater at 45.0° than the corresponding values for [H+] = 0.1 M .
The temperature dependence was studied in 0.10 M HCIO4 at temperatures ranging between 1 .0 and 45.0°; the results are summarized in Table V. These data
Table V : Effect of Temperature on k2, for the N p ( I II ) -N p (V I) Reaction“
Temp,°C
No. of detn Av
—10 -4«2, sec-1- Mean devb Calcdc
1.0 3 1.68 0.05 1.7312.8 3 1.93 0.02 1.9525.1 16 2.24 0.06 2.1936.4 3 2.42 0.02 2.4144.8 4 2.48 0.03 2.58
“ In 0.1 M HCIO4 . b Mean deviation from the mean. 0 Calculated using A H * = 0.99 kcal/mol and AS* = —35.4 cal/mol deg in the Eyring equation.
lead to the following activation parameters at 25°: AF * = 11.53 kcal/mol, A H * = 0.99 ± 0.10 kcal/mol, and AS* = —35.4 ± 0.3 cal/mol deg. These parameters were determined by least squares and reproduce
The Journal o f P h ysica l Chemistry, Vol. 74, N o. 14, 1970
R eactions of C F 3 R adicals in the P hotolysis of H exafluoroacetone 2801
the observed rate constants with a root-mean square deviation of 3.8% and a maximum deviation of 8.9%. The uncertainties are the standard deviations calculated by the least-squares program. If the small [H+] dependence mentioned above is assumed to have the form k2 = fc2' + ^ "[H + l-1, the same data lead to slightly different values of the activation parameters: AF * = 11.54 kcal/mol, AH * = 0.90 ± 0.11 kcal/ mol, and AS * = —35.7 ± 0.4 cal/mol deg.
Reaction 2 was studied at n = 0.1 M only; however, it is reasonable to assume that the ionic strength dependence of this reaction will parallel that observed for the U(III)-U(VI) reaction (1). On this basis we estimate the following parameters for it = 1 .0 M : AF * = 10.62 kcal/mol, A H * = 1 kcal/mol, and AS* = —32 cal/mol deg.
DiscussionThe thermodynamic and activation parameters for
the two reactions described in this paper are summarized in Table VI. All of the reactions of this
Table VI: Thermodynamic and Activation Parameters for M 3+ + M (V + = M 4 + + M 0 2+ Reactions-
M = U M = Np
AF °, kcal/m ol AH °, kcal/m ol AiS°, cal/m ol deg k, 1 0 "4 i l f _1 sec- 1 6 AF * , kcal/m ol1 A H * , kca l/m ol6 A S * , cal/m ol, deg6
- 1 6- 2 6 .8-3 3 .8I . 14I I . 92
4.15 ± 0.07 -2 6 .1 ± 0.25
- 22.6- 3 6- 3 82.1811.55
0.96 ± 0.11 - 3 5 .5 ± 0 .4
- 25° and 1 M HClOi except as indicated. 6 0.1 M HC104.
type which have been studied so far are discussed in connection with Table VIII in ref 4.
The most interesting features brought out by the present investigation are (a) the close similarity in the rates in spite of the rather large difference in the AF ° values and (b) the surprisingly large difference in the A S * values for two apparently similar reactions.
Reactions of Trifluoromethyl Radicals in the Photolysis of
Hexafluoroacetone and Hexafluoroazomethane
by Shuang-Ling Chong and Sidney TobySchool of Chemistry, Rutgers, The State University, New Brunswick, New Jersey 08903 (Received September 3, 1969)
The photolysis of hexafluoroacetone (HFA) at 3130 À, and of hexafluoroazomethane (HFZ) at 3660 A was studied in the range 0.1-8 Torr and 30-200°. Conditions were chosen such that 4>(CO) or 4>(N2) was near unity so that primary deactivation was negligible. Addition reactions of CF3 to HFA were not important but, in agreement with previous work, CF3 readily added to HFZ with k (addition)/[k(combination)]= 260e “ 3900/eT j Vi mol-1/ ’ sec~‘/ !. Carbon dioxide was an important product at higher temperatures and low- incident intensities and the mechanism for the heterogeneous formation of this product is considered. The effects of added gases in the photolysis of HFZ were investigated. No third-body effects in the combination of CF3 radicals were seen but the rate of formation of carbon dioxide was found to increase in the presence of added carbon monoxide.
IntroductionThe photolysis of hexafluoroacetone (HFA) and of
hexafluoroazomethane (HFZ) are frequently used sources of trifluoromethyl radicals. The primary pho- tolytic processes for HFA1 -3 and HFZ4 have received considerable attention recently and the basic features
of the secondary processes have been established for
(1) W . R. Ware and M. L. Dutton, J. Chem. Phys., 47, 4670 (1967).(2) J. S. McIntosh and G. B. Porter, ibid., 48, 5475 (1968).(3) A. Gandini, D. A. Whytock, and K. O. Kutschke, Proc. Roy. Soc., Ser. A, 306, 503, 511, 529, 541 (1968).(4) E. C. Wu and O. K. Rice, J. Phys. Chem., 72, 542 (1968).
The Journal of Physical Chemistry, Voi. 74, No. 14, 1970
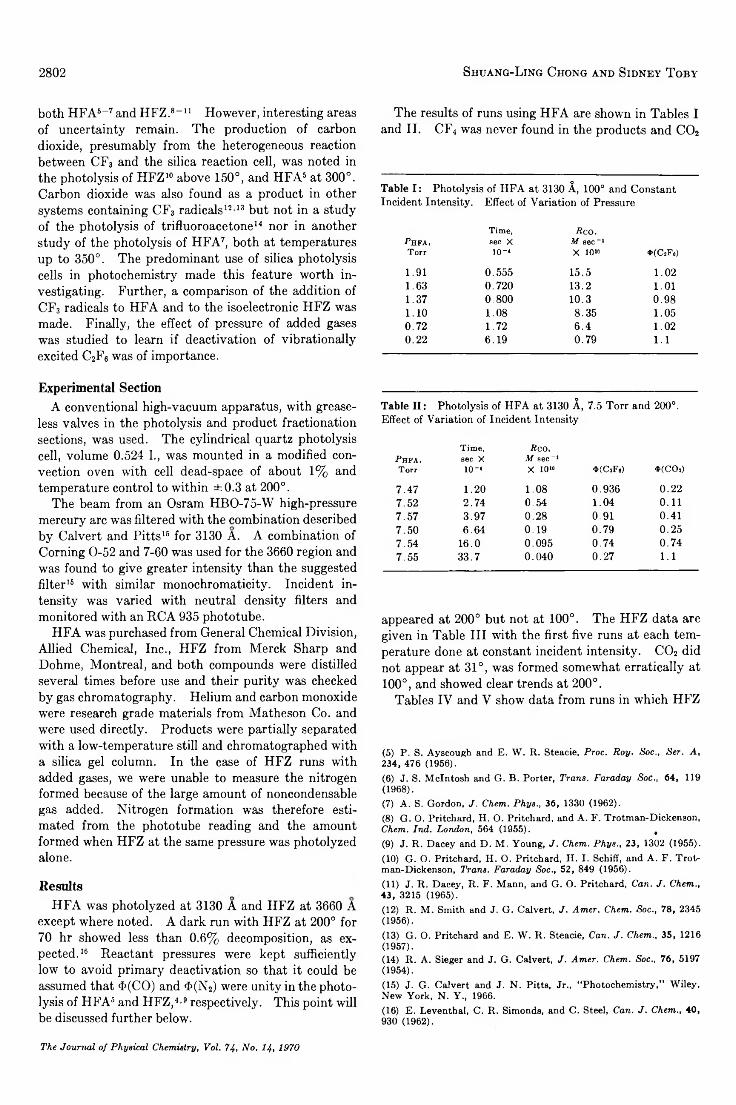
2802 S htjang-L in g C h o n g a n d S id n e y T o b y
both HFA6~ 7 and HFZ.8” 11 However, interesting areas of uncertainty remain. The production of carbon dioxide, presumably from the heterogeneous reaction between CF3 and the silica reaction cell, was noted in the photolysis of HFZ10 above 150°, and HFA5 at 300°. Carbon dioxide was also found as a product in other systems containing CF3 radicals12'13 but not in a study of the photolysis of trifluoroacetone14 nor in another study of the photolysis of HFA7, both at temperatures up to 350°. The predominant use of silica photolysis cells in photochemistry made this feature worth investigating. Further, a comparison of the addition of CF3 radicals to HFA and to the isoelectronic HFZ was made. Finally, the effect of pressure of added gases was studied to learn if deactivation of vibrationally excited C2F6 was of importance.
Experimental SectionA conventional high-vacuum apparatus, with grease
less valves in the photolysis and product fractionation sections, was used. The cylindrical quartz photolysis cell, volume 0.524 1., was mounted in a modified convection oven with cell dead-space of about 1 % and temperature control to within ±0.3 at 200°.
The beam from an Osram HBO-75-W high-pressure mercury arc was filtered with the combination described by Calvert and Pitts15 for 3130 A. A combination of Corning 0-52 and 7-60 was used for the 3660 region and was found to give greater intensity than the suggested filter15 with similar monochromaticity. Incident intensity was varied with neutral density filters and monitored with an RCA 935 phototube.
HFA was purchased from General Chemical Division, Allied Chemical, Inc., HFZ from Merck Sharp and Dohme, Montreal, and both compounds were distilled several times before use and their purity was checked by gas chromatography. Helium and carbon monoxide were research grade materials from Matheson Co. and were used directly. Products were partially separated with a low-temperature still and chromatographed with a silica gel column. In the case of HFZ runs with added gases, we were unable to measure the nitrogen formed because of the large amount of noncondensable gas added. Nitrogen formation was therefore estimated from the phototube reading and the amount formed when HFZ at the same pressure was photolyzed alone.
ResultsHFA was photolyzed at 3130 A and HFZ at 3660 A
except where noted. A dark run with HFZ at 200° for 70 hr showed less than 0.6% decomposition, as expected. 16 Reactant pressures were kept sufficiently low to avoid primary deactivation so that it could be assumed that 4>(CO) and $(N2) were unity in the photolysis of HFA8 and HFZ,4•9 respectively. This point will be discussed further below.
The results of runs using HFA are shown in Tables I and II. CF4 was never found in the products and C02
Table I : Photolysis of HPA at 3130 Â, 100° and ConstantIncident Intensity. Effect of Variation of Pressure
T im e, R eo,P h f a , 86C X M s e c -1T orr 10-* X IO « i»(C2Ffl)
1.91 0.555 15.5 1.021.63 0.720 13.2 1.011.37 0 800 10.3 0.981.10 1.08 8.35 1.050.72 1.72 6.4 1.020.22 6.19 0.79 1.1
Table II: Photolysis of HPA at 3130 Â, 7.5 Torr and 200°.Effect of Variation of Incident Intensity
T im e, Beo,P h f a , sec X M s e c -1T orr 10 -< X 10W 4 (C iF «) 4 (C 0 s )
7 . 4 7 1 . 2 0 1.08 0.936 0 . 2 2
7.52 2 . 7 4 0.54 1.04 0 . 1 1
7.57 3 . 9 7 0.28 0.91 0.417.50 6.64 0.19 0.79 0.257.54 16.0 0.095 0.74 0.747.55 33.7 0.040 0.27 1 .1
appeared at 200° but not at 100°. The HFZ data are given in Table III with the first five runs at each temperature done at constant incident intensity. C02 did not appear at 31°, was formed somewhat erratically at 10 0 °, and showed clear trends at 2 0 0 °.
Tables IV and V show data from runs in which HFZ
(5) P. S. Ayscough and E. W . R. Steacie, Proc. Roy. Soc., Ser. A, 234, 476 (1956).(6) J. S. McIntosh and G. B. Porter, Trans. Faraday Soc., 64, 119 (1968).(7) A. S. Gordon, J. Chem. Phys., 36, 1330 (1962).(8) G. O. Pritchard, H. O. Pritchard, and A. F. Trotman-Dickenson,Chem. Ind. London, 564 (1955). ,(9) J. R . Dacey and D. M. Young, J. Chem. Phys., 23, 1302 (1955).(10) G. O. Pritchard, H. O. Pritchard, H. I. Schiff, and A. F. Trot- man-Dickenson, Trans. Faraday Soc., 52, 849 (1956).(11) J. R . Dacey, R. F. Mann, and G. O. Pritchard, Can. J. Chem., 43, 3215 (1965).(12) R. M . Smith and J. G. Calvert, J. Amer. Chem. Soc., 78, 2345(1956) .(13) G. O. Pritchard and E. W. R. Steacie, Con. J. Chem., 35, 1216(1957) .(14) R. A. Sieger and J. G. Calvert, J. Amer. Chem. Soc., 76, 5197 (1954).(15) J. G. Calvert and J. N. Pitts, Jr., “ Photochemistry,” Wiley, New York, N. Y., 1966.(16) E. Leventhal, C. R. Simonds, and C. Steel, Can. J. Chem., 40, 930 (1962).
The Journal of Physical Chemistry, Voi. 74, No. I4, 1970
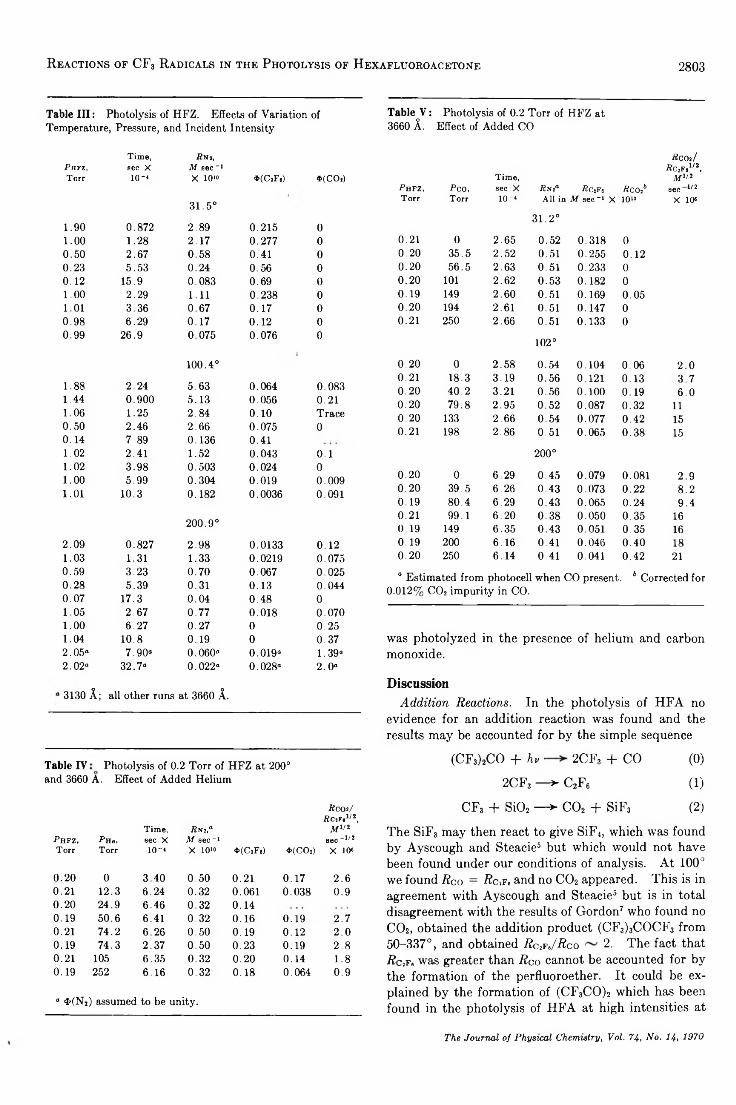
R e a c t io n s o f C F 3 R a d ic a l s in t h e P h o t o l y sis of H e x a f l u o r o a c e t o n e 2803
Table I I I : Photolysis of HFZ. Effects of Variation of Temperature, Pressure, and Incident Intensity
Time, ÄN2,Phfz, sec X M sec -1Torr io-< X 10“ *(CiF,) $(CO.)
31.5°
1.90 0.872 2.89 0.215 01.00 1.28 2.17 0.277 00.50 2.67 0.58 0.41 00.23 5.53 0.24 0.56 00.12 15.9 0.083 0.69 01.00 2.29 1.11 0.238 01.01 3.36 0.67 0.17 00.98 6.29 0.17 0.12 00.99 26.9 0.075 0.076 0
100.4°
1.88 2 24 5.63 0.064 0.0831.44 0.900 5.13 0.056 0.211.06 1.25 2.84 0.10 Trace0.50 2.46 2 .6 6 0.075 00.14 7.89 0.136 0.411.02 2.41 1.52 0.043 0.11.02 3.98 0.503 0.024 01.00 5.99 0.304 0.019 0.0091.01 10.3 0.182 0.0036 0.091
200.9°
2.09 0.827 2.98 0.0133 0.121.03 1.31 1.33 0.0219 0.0750.59 3.23 0.70 0.067 0.0250.28 5.39 0.31 0.13 0.0440.07 17.3 0.04 0.48 01.05 2.67 0.77 0.018 0.0701.00 6.27 0.27 0 0.251.04 10.8 0.19 0 0.372.05« 7.90« 0.060« 0.019“ 1.39“2.02« 32.7« 0.022“ 0.028« 2.0«
3130 A; all other runs at 3660 A.
Table IV Photolysis of 0.2 Torr of H FZ at 200° and 3660 A. Effect of Added Helium
Rcos/RCjF«1/2,
Time, ÄNJ,“ M 112Fhfz, fHe, sec X M sec-1 sec - 1/2Torr Torr 10-« X 10“ «(C 2F i) «(C O !) X 10«
0.20 0 3.40 0.50 0.21 0.17 2.60.21 12.3 6.24 0.32 0.061 0.038 0.90.20 24.9 6.46 0.32 0.140.19 50.6 6.41 0.32 0.16 0.19 2.70.21 74.2 6.26 0.50 0.19 0.12 2.00.19 74.3 2.37 0.50 0.23 0.19 2.80.21 105 6.35 0.32 0.20 0.14 1.80.19 252 6.16 0.32 0.18 0.064 0.9
“ 4>(N2) assumed to be unity.
Table V : Photolysis of 0.2 Torr of HFZ at 3660 A. Effect of Added CO
Ä COi/ ÄC2F«I/2,
Time, M 112Fhfz,Torr
Pco,Torr
sec X10-*
ÄN!« All in
ÄC2F!M s e c "1 X
Rcoib10“
sec m X 10»
31.2°
0.21 0 2.65 0.52 0.318 00.20 35.5 2.52 0.51 0.255 0.120.20 56.5 2.63 0.51 0.233 00.20 101 2.62 0.53 0.182 00.19 149 2.60 0.51 0.169 0.050.20 194 2.61 0.51 0.147 00.21 250 2.66 0.51 0.133 0
O<MOrH
0.20 0 2.58 0.54 0.104 0.06 2 .00.21 18.3 3.19 0.56 0.121 0.13 3.70.20 40.2 3.21 0.56 0.100 0.19 6.00.20 79.8 2.95 0.52 0.087 0.32 110.20 133 2.66 0.54 0.077 0.42 150.21 198 2.86 0.51 0.065 0.38 15
200°
0.20 0 6.29 0.45 0.079 0.081 2.90.20 39.5 6.26 0.43 0.073 0.22 8.20.19 80.4 6.29 0.43 0.065 0.24 9.40.21 99.1 6.20 0.38 0.050 0.35 160.19 149 6.35 0.43 0.051 0.35 160.19 200 6.16 0.41 0.046 0.40 180.20 250 6.14 0.41 0.041 0.42 21
“ Estimated from photocell when CO present. 6 Corrected for 0.012% C 02 impurity in CO.
was photolyzed in the presence of helium and carbon monoxide.
DiscussionA ddition Reactions. In the photolysis of HFA no
evidence for an addition reaction was found and the results may be accounted for by the simple sequence
(CF3)2CO + hv 2CF3 + CO (0)
2CF3 — ^ C2F6 (1)
CF3 + Si02 — > C02 + SiF3 (2)
The SiF3 may then react to give SiF4, which was found by Ayscough and Steacie5 but which would not have been found under our conditions of analysis. At 100° we found R co = R c %f , and no C02 appeared. This is in agreement with Ayscough and Steacie5 but is in total disagreement with the results of Gordon7 who found no C02, obtained the addition product (CF3)3COCF3 from 50-337°, and obtained R cifJ R co 2. The fact that R c ,f, was greater than R co cannot be accounted for by the formation of the perfluoroether. It could be explained by the formation of (CF3CO)2 which has been found in the photolysis of HFA at high intensities at
The Journal o f Physical Chem istry, Vol. 74, N o. 14 , 1970
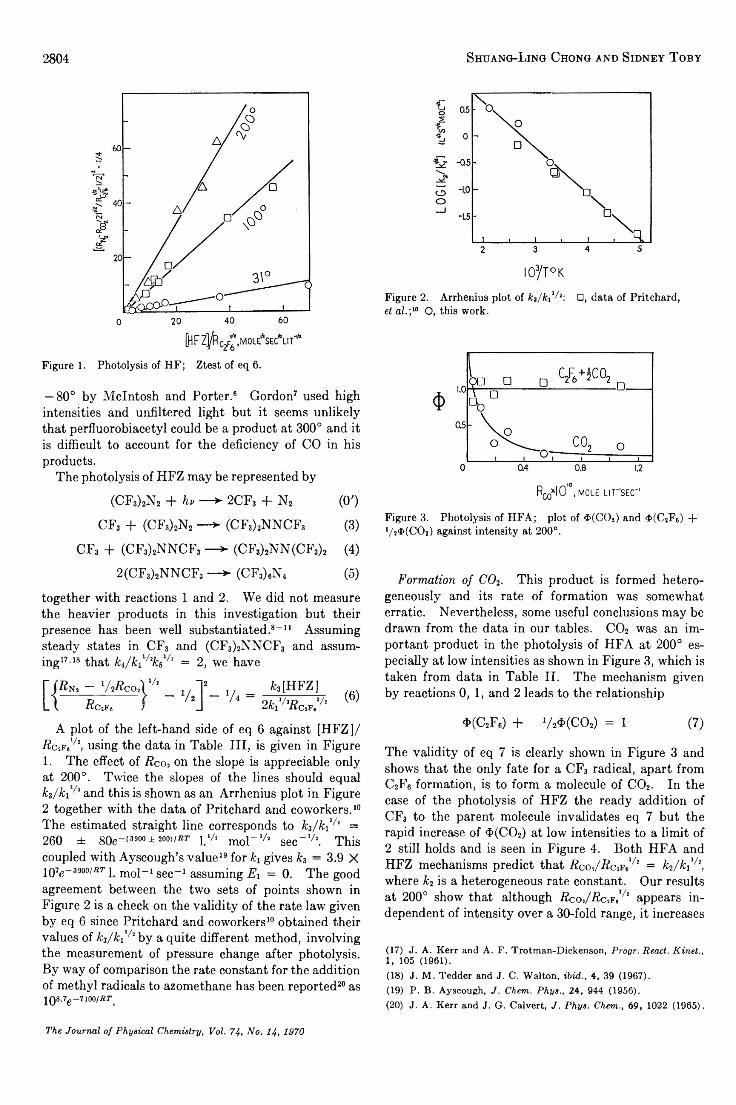
2804 S httang- L in g C h o n g a n d S id n k y T o b y
Figure 1. Photolysis of H F; Ztest of eq 6.
— 80° by McIntosh and Porter.6 Gordon7 used high intensities and unfiltered light but it seems unlikely that perfluorobiacetyl could be a product at 300° and it is difficult to account for the deficiency of CO in his products.
The photolysis of HFZ may be represented by
(CF3)2N2 + hv ■— > 2CF3 + N2 (O')
CF3 + (CF3)2N2 — >► (CF3)2NNCF3 (3)
CF3 + (CF3)2NNCF3 — > (CF3)2NN(CF3)2 (4)
2(CF3)2NNCF3 — > (CF3)6N4 (5)
together with reactions 1 and 2. We did not measure the heavier products in this investigation but their presence has been well substantiated.8 -11 Assuming steady states in CF3 and (CF3)2NNCF3 and assuming17'18 that k i/ k i^ k i^ = 2 , we have
- ‘M co.y 7’RciFt /
k3 [HFZ] 2k11/'Rc * : /l
(6)
A plot of the left-hand side of eq 6 against [HFZ]/ RctF,1 , using the data in Table III, is given in Figure1 . The effect of R c o 2 on the slope is appreciable only at 200°. Twice the slopes of the lines should equal h / k i^ and this is shown as an Arrhenius plot in Figure 2 together with the data of Pritchard and coworkers. 10 The estimated straight line corresponds to h / k f^ = 260 ± 80e~(3900 ± 200),*r l.‘A m o r ‘A sec“ 'A. This coupled with Ayscough’s value19 for ki gives k3 — 3.9 X 10 7g -39°o/ar j mo}-i sec- 1 assuming E\ = 0. The good agreement between the two sets of points shown in Figure 2 is a check on the validity of the rate law given by eq 6 since Pritchard and co workers10 obtained their values of k^/kf^ by a quite different method, involving the measurement of pressure change after photolysis. By way of comparison the rate constant for the addition of methyl radicals to azomethane has been reported20 as 108.7e- 71°°/*r
I03/T°K
Figure 2. Arrhenius plot of k s / k f i1: □, data of Pritchard, et al. ;10 O, this work.
RC0XI0 '°, MOLE Lir'SEC"'
Figure 3. Photolysis of HFA; plot of $>(C02) and 4>(C2F6) + 7 2$ (C 0 2) against intensity at 200°.
Form ation o f C 0 2. This product is formed heterogeneously and its rate of formation was somewhat erratic. Nevertheless, some useful conclusions may be drawn from the data in our tables. C02 was an important product in the photolysis of HFA at 200° especially at low intensities as shown in Figure 3, which is taken from data in Table II. The mechanism given by reactions 0 , 1 , and 2 leads to the relationship
4>(C2F6) + V2$(C02) = 1 (7)
The validity of eq 7 is clearly shown in Figure 3 and shows that the only fate for a CF3 radical, apart from C2F6 formation, is to form a molecule of C02. In the case of the photolysis of HFZ the ready addition of CF3 to the parent molecule invalidates eq 7 but the rapid increase of $(C02) at low intensities to a limit of 2 still holds and is seen in Figure 4. Both HFA and HFZ mechanisms predict that R c o f R c ^ ' ^ = k^/kf^, where h is a heterogeneous rate constant. Our results at 2 0 0 ° show that although Rcot/RciF»1 appears independent of intensity over a 30-fold range, it increases
(17) J. A. Kerr and A. F. Trotman-Dickenson, Progr. React. Kinet., 1, 105 (1961).(18) J. M. Tedder and J. C. Walton, ibid., 4, 39 (1967).(19) P. B. Ayscough, J. Chem. Phys., 24, 944 (1956).(20) J. A. Kerr and J. G. Calvert, J. Phys. Chem., 69, 1022 (1965).
The Journal o f P hysical Chem istry, Vol. 74, N o . 14, 1970
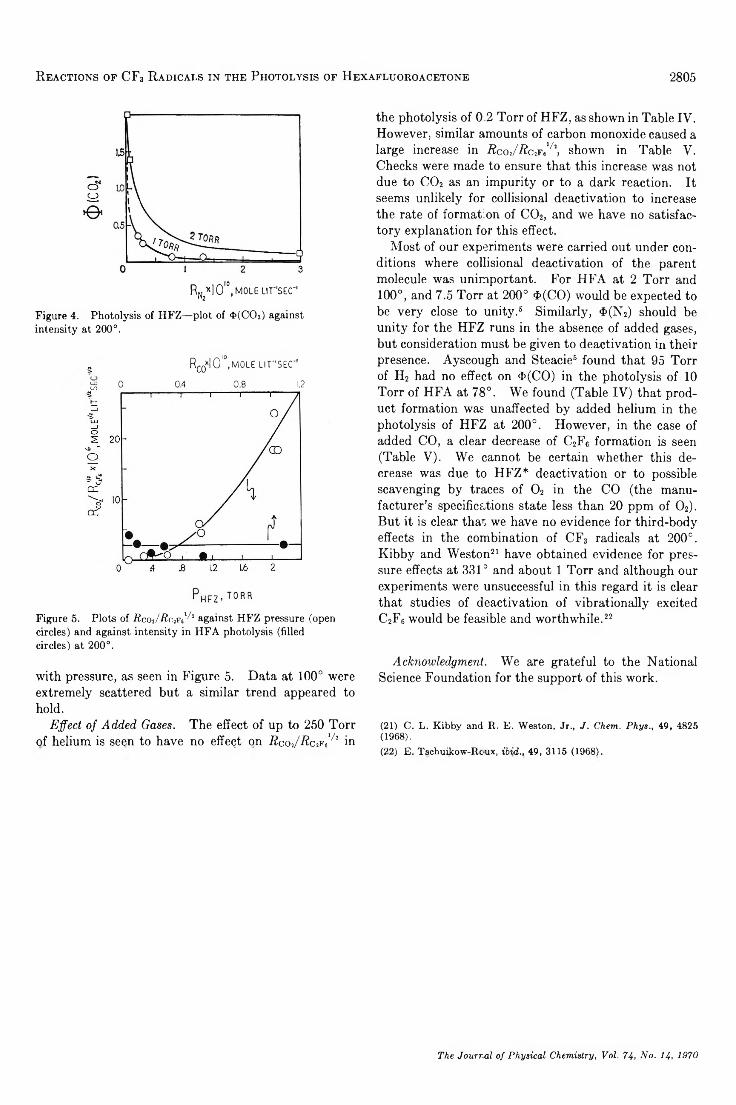
R e a c t io n s o f C F 3 R a d ic a l s in t h e P h o t o l y sis o f H e x a f l u o r o a c e t o n e 2805
RN2x IO '0,MOLEUr’SEC"
Figure 4. Photolysis of H FZ— plot of <i>(C02) against intensity at 200°.
, RcoxIO '° ,mole u r 'S E C '# 0 0.4 0.8 1.2
Figure 5. Plots of R c o t! R c i r f f 2 against HFZ pressure (open circles) and against intensity in HFA photolysis (filled circles) at 200°.
with pressure, as seen in Figure 5. Data at 100° were extremely scattered but a similar trend appeared to hold.
E ffect o f A dded Gases. The effect of up to 250 Torr of helium is seen to have no effect on R c o f f R c ^ 1 in
the photolysis of 0 2 Torr of HFZ, as shown in Table IV. However, similar amounts of carbon monoxide caused a large increase in R c o f f R a e ^ , shown in Table V. Checks were made to ensure that this increase was not due to C02 as an impurity or to a dark reaction. It seems unlikely for collisional deactivation to increase the rate of formation of C02, and we have no satisfactory explanation for this effect.
Most of our experiments were carried out under conditions where collisional deactivation of the parent molecule was unimportant. For HFA at 2 Torr and 100°, and 7.5 Torr at 200° $(CO) would be expected to be very close to unity.8 Similarly, $(N2) should be unity for the HFZ runs in the absence of added gases, but consideration must be given to deactivation in their presence. Ayscough and Steacie5 found that 95 Torr of H2 had no effect on $(CO) in the photolysis of 10 Torr of HFA at 78°. We found (Table IV) that product formation was unaffected by added helium in the photolysis of HFZ at 200°. However, in the case of added CO, a clear decrease of C2F6 formation is seen (Table V). We cannot be certain whether this decrease was due to HFZ* deactivation or to possible scavenging by traces of 0 2 in the CO (the manufacturer’s specifications state less than 20 ppm of 0 2). But it is clear that, we have no evidence for third-body effects in the combination of CF3 radicals at 200°. Kibby and Weston21 have obtained evidence for pressure effects at 331° and about 1 Torr and although our experiments were unsuccessful in this regard it is clear that studies of deactivation of vibrationally excited C2F6 would be feasible and worthwhile.22
Acknowledgm ent. We are grateful to the National Science Foundation for the support of this work.
(21) C. L. Kibby and R. E. Weston, Jr., J. Chem. Phys., 49, 4825 (1968).(22) E. Tschuikow-Rcux, ibid., 49, 3115 (1968),
The Journal o f P hysical Chem istry, Vol. 74, N o . 14, 1970
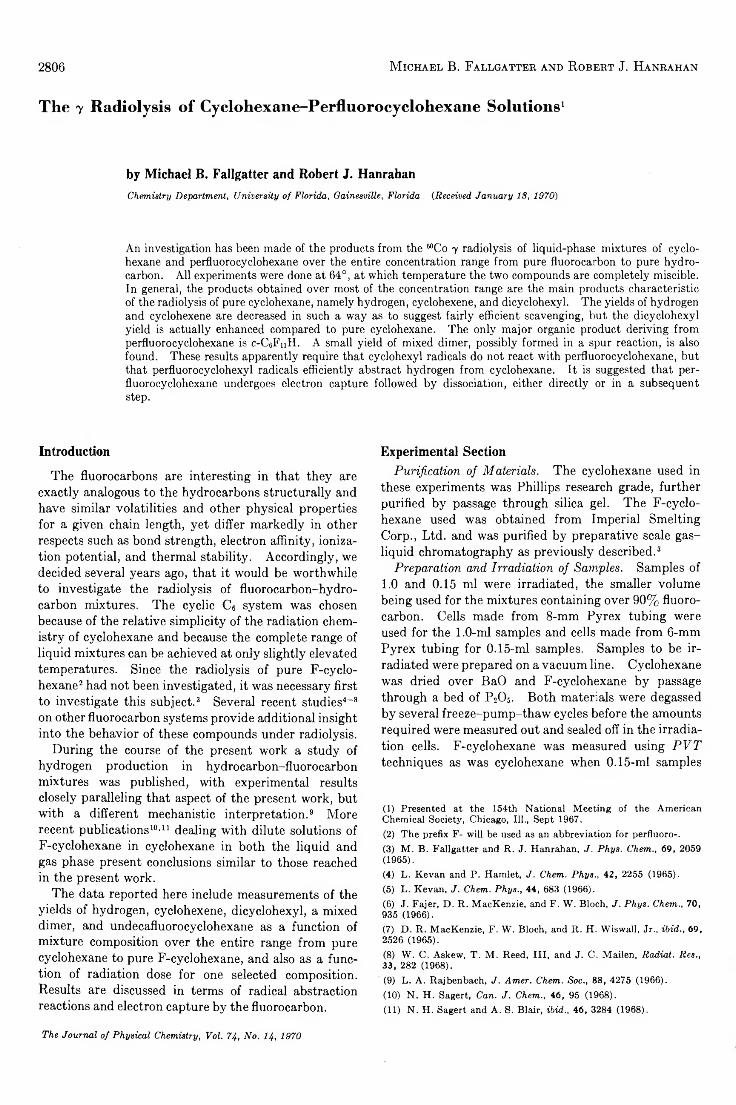
2806 M ic h a e l B . F a l l g a t t e e a n d R o b e r t J. H a n r a h a n
The y Radiolysis of Cyclohexane-Perfluorocyclohexane Solutions1
by Michael B. Fallgatter and Robert J. HanrahanChem istry Department, U niversity o f F lo r id a , Gainesville, F lo rid a {Received Ja n u a ry 18, 1970)
An investigation has been made of the products from the MCo 7 radiolysis of liquid-phase mixtures of cyclohexane and perfluorocyclohexane over the entire concentration range from pure fluorocarbon to pure hydrocarbon. All experiments were done at 64°, at which temperature the two compounds are completely miscible. In general, the products obtained over most of the concentration range are the main products characteristic of the radiolysis of pure cyclohexane, namely hydrogen, cyclohexene, and dicyclohexyl. The yields of hydrogen and cyclohexene are decreased in such a way as to suggest fairly efficient scavenging, but the dicyclohexyl yield is actually enhanced compared to pure cyclohexane. The only major organic product deriving from perfluorocyclohexane is c-CsFnH. A small yield of mixed dimer, possibly formed in a spur reaction, is also found. These results apparently require that cyclohexyl radicals do not react with perfluorocyclohexane, but that perfluorocyclohexyl radicals efficiently abstract hydrogen from cyclohexane. It is suggested that perfluorocyclohexane undergoes electron capture followed by dissociation, either directly or in a subsequent step.
IntroductionThe fluorocarbons are interesting in that they are
exactly analogous to the hydrocarbons structurally and have similar volatilities and other physical properties for a given chain length, yet differ markedly in other respects such as bond strength, electron affinity, ionization potential, and thermal stability. Accordingly, we decided several years ago, that it would be worthwhile to investigate the radiolysis of fluorocarbon-hydrocarbon mixtures. The cyclic C6 system was chosen because of the relative simplicity of the radiation chemistry of cyclohexane and because the complete range of liquid mixtures can be achieved at only slightly elevated temperatures. Since the radiolysis of pure F-eyelo- hexane2 had not been investigated, it was necessary first to investigate this subject. 3 Several recent studies4-8 on other fluorocarbon systems provide additional insight into the behavior of these compounds under radiolysis.
During the course of the present work a study of hydrogen production in hydrocarbon-fluorocarbon mixtures was published, with experimental results closely paralleling that aspect of the present work, but with a different mechanistic interpretation. 9 More recent publications10’11 dealing with dilute solutions of F-cyclohexane in cyclohexane in both the liquid and gas phase present conclusions similar to those reached in the present work.
The data reported here include measurements of the yields of hydrogen, cyclohexene, dicyclohexyl, a mixed dimer, and undecafluorocyclohexane as a function of mixture composition over the entire range from pure cyclohexane to pure F-cyclohexane, and also as a function of radiation dose for one selected composition. Results are discussed in terms of radical abstraction reactions and electron capture by the fluorocarbon.
Experimental SectionP urifica tion o f M aterials. The cyclohexane used in
these experiments was Phillips research grade, further purified by passage through silica gel. The F-cyclohexane used was obtained from Imperial Smelting Corp., Ltd. and was purified by preparative scale gas- liquid chromatography as previously described.3
P reparation and Irradiation o f Sam ples. Samples of1.0 and 0.15 ml were irradiated, the smaller volume being used for the mixtures containing over 90% fluorocarbon. Cells made from 8-mm Pyrex tubing were used for the 1 .0-ml samples and cells made from 6-mm Pyrex tubing for 0.15-ml samples. Samples to be irradiated were prepared on a vacuum line. Cyclohexane was dried over BaO and F-cyclohexane by passage through a bed of P20 5. Both materials were degassed by several freeze-pump-thaw cycles before the amounts required were measured out and sealed off in the irradiation cells. F-cyclohexane was measured using P V T techniques as was cyclohexane when 0.15-ml samples
(1) Presented a t the 154th N ation a l M eetin g o f the A m erican C hem ical S ociety , C hicago, 111., Sept 1967.(2) T h e prefix F - w ill be used as an ab brev ia tion fo r perfluoro-.(3) M . B . F a llgatter and R . J . H anrahan, ,/. P h y s. Chem., 69, 2059 (1965).(4) L . K e v a n and P . H am let, J . Chem. P h ys., 42 , 2255 (1965).(5) L . K ev a n , J . Chem . P h ys., 44 , 683 (1966).(6) J. F a jer, D . R . M a cK en zie , and F . W . B loch , J . P h y s . Chem., 70, 935 (1966).(7) D . R . M a cK en z ie , F . W . B loch , and R . H . W isw all, Jr., ib id ., 69 , 2526 (1965).(8) W . C . A skew , T . M . R eed , I I I , and J. C . M ailen , Radiat. Res., 33 , 282 (1968).(9) L . A . R a jb en b a ch , J . A m er. Chem . Soc., 88 , 4275 (1966).(10) N . H . Sagert, Can. J . Chem., 46 , 95 (1968).(11) N . H . Sagert and A . S. B lair, ib id ., 46 , 3284 (1968).
The Journal o f P hysical Chemistry, Vol. 74, N o. ¡4 , 1970
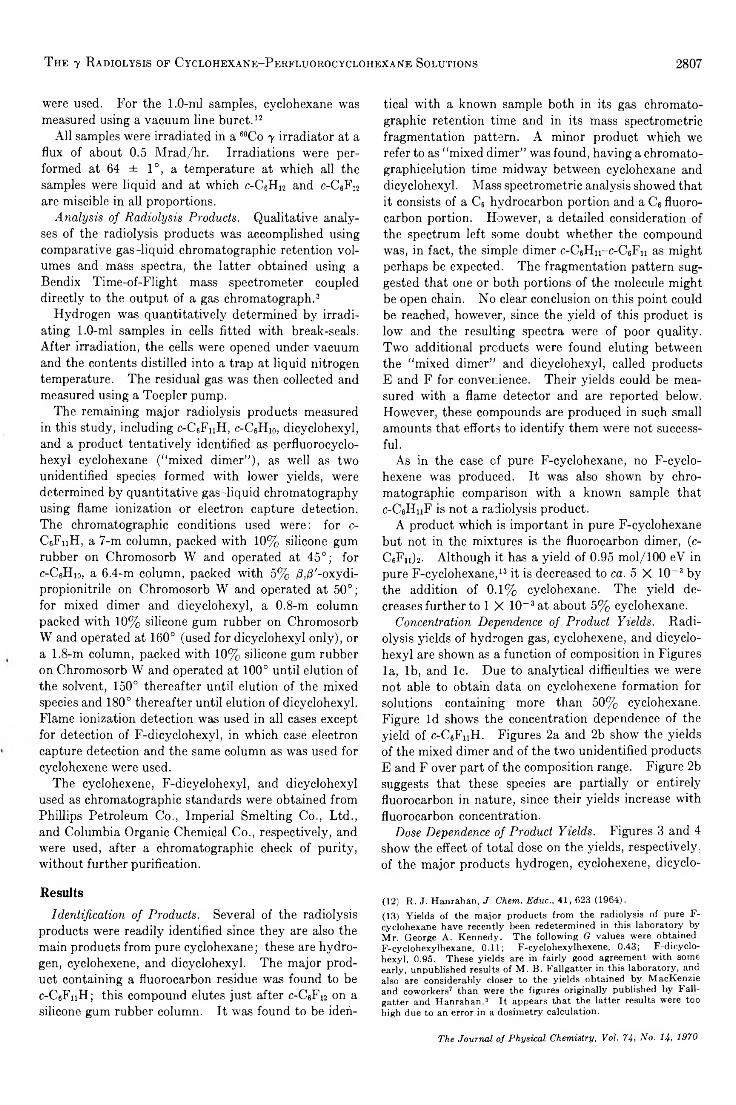
T h e 7 R a d io l y s is of C y c l o h e x a n e - P e r f l u o r o c y c l o h e x a n e S o l u t io n s 2807
were used. For the 1.0-mI samples, cyclohexane was measured using a vacuum line buret. 12
All samples were irradiated in a 60Co y irradiator at a flux of about 0.5 Mrad/hr. Irradiations were performed at 64 ± 1°, a temperature at which all the samples were liquid and at which c-C 6H i 2 and c-C 6F i2 are miscible in all proportions.
A n a lysis o f R adiolysis Products. Qualitative analyses of the radiolysis products was accomplished using comparative gas-liquid chromatographic retention volumes and mass spectra, the latter obtained using a Bendix Time-of-Flight mass spectrometer coupled directly to the output of a gas chromatograph. 3
Hydrogen was quantitatively determined by irradiating 1 .0-ml samples in cells fitted with break-seals. After irradiation, the cells were opened under vacuum and the contents distilled into a trap at liquid nitrogen temperature. The residual gas was then collected and measured using a Toepler pump.
The remaining major radiolysis products measured in this study, including c-C6FnH, c-C 6H i 0, dicyclohexyl, and a product tentatively identified as perfluorocyclo- hexyl cyclohexane (“mixed dimer”), as well as two unidentified species formed with lower yields, were determined by quantitative gas-liquid chromatography using flame ionization or electron capture detection. The chromatographic conditions used were: for c- CeFnH, a 7-m column, packed with 10% silicone gum rubber on Chromosorb W and operated at 45°; for c-C 6H io, a 6.4-m column, packed with 5% /3,|3'-oxydi- propionitrile on Chromosorb W and operated at 50°; for mixed dimer and dicyclohexyl, a 0 .8-m column packed with 10% silicone gum rubber on Chromosorb W and operated at 160° (used for dicyclohexyl only), or a 1 .8-m column, packed with 1 0 % silicone gum rubber on Chromosorb W and operated at 100° until elution of the solvent, 150° thereafter until elution of the mixed species and 180° thereafter until elution of dicyclohexyl. Flame ionization detection was used in all cases except for detection of F-dicyclohexyl, in which case electron capture detection and the same column as was used for cyclohexene were used.
The cyclohexene, F-dicyclohexyl, and dicyclohexyl used as chromatographic standards were obtained from Phillips Petroleum Co., Imperial Smelting Co., Ltd., and Columbia Organic Chemical Co., respectively, and were used, after a chromatographic check of purity, without further purification.
ResultsIdentification o f P roducts. Several of the radiolysis
products were readily identified since they are also the main products from pure cyclohexane; these are hydrogen, cyclohexene, and dicyclohexyl. The major product containing a fluorocarbon residue was found to be c-CeFnH; this compound elutes just after c-C6F12 on a silicone gum rubber column. It was found to be iden
tical with a known sample both in its gas chromatographic retention time and in its mass spectrometric fragmentation pattern. A minor product which we refer to as “mixed dimer” was found, having a chromato- graphicelution time midway between cyclohexane and dicyclohexyl. Mass spectrometric analysis showed that it consists of a C6 hydrocarbon portion and a C6 fluorocarbon portion. However, a detailed consideration of the spectrum left some doubt whether the compound was, in fact, the simple dimer c-C6Hn-c-C6Fii as might perhaps be expected. The fragmentation pattern suggested that one or both portions of the molecule might be open chain. No clear conclusion on this point could be reached, however, since the yield of this product is low and the resulting spectra were of poor quality. Two additional products were found eluting between the “mixed dimer” and dicyclohexyl, called products E and F for convenience. Their yields could be measured with a flame detector and are reported below. However, these compounds are produced in such small amounts that efforts to identify them were not successful.
As in the case of pure F-cyclohexane, no F-cyclo- hexene was produced. It was also shown by chromatographic comparison with a known sample that c-C6HiiF is not a radiolysis product.
A product which is important in pure F-cyclohexane but not in the mixtures is the fluorocarbon dimer, (c- C 6F n )2. Although it has a yield of 0.95 mol/100 eV in pure F-cyclohexane, 18 it is decreased to ca. 5 X 10⁻³ by the addition of 0.1% cyclohexane. The yield decreases further to 1 X 10~ 3 at about 5% cyclohexane.
Concentration D ependence o f Product Yields. Radiolysis yields of hydrogen gas, cyclohexene, and dicyclohexyl are shown as a function of composition in Figures la, lb, and lc. Due to analytical difficulties we were not able to obtain data on cyclohexene formation for solutions containing more than 50% cyclohexane. Figure Id shows the concentration dependence of the yield of c-C6FnH. Figures 2a and 2b show the yields of the mixed dimer and of the two unidentified products E and F over part of the composition range. Figure 2b suggests that these species are partially or entirely fluorocarbon in nature, since their yields increase with fluorocarbon concentration.
D ose D ependence o f P roduct Yields. Figures 3 and 4 show the effect of total dose on the yields, respectively, of the major products hydrogen, cyclohexene, dicyclo-
(12) R. J. Hanrahan, J Chem. Educ., 41, 623 (1964).(13) Yields of the major products from the radiolysis of pure F- cyclohexane have recently been redetermined in this laboratory by Mr. George A. Kennedy. The following G values were obtained; F-cyelohexylhexane, 0.11; F-cyclohexylhexene, 0.43; F-dicyclohexyl, 0.95. These yields are in fairly good agreement with some early, unpublished results of M . B. Fallgatter in this laboratory, and also are considerably closer to the yields obtained by MacKenzie and coworkers7 than were the figures originally published by Fallgatter and Hanrahan.3 It appears that the latter results were too high due to an error in a dosimetry calculation.
The Journal o f P h ysical Chem istry, V ol. 74, N o . 14* 1970
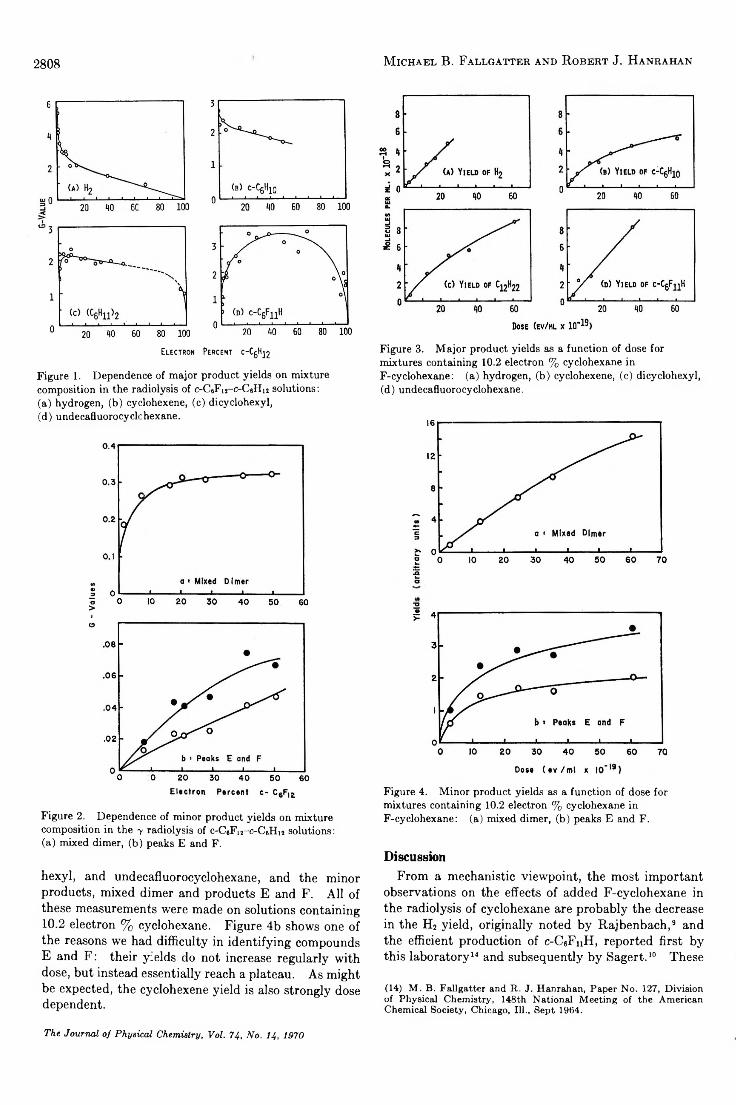
2808 M ic h a e l B . F a l l g a t t e r a n d R o b e r t J. H a n r a h a n
Electron Percent c_c6h12
Figure 1. Dependence of major product yields on mixture composition in the radiolysis of c-CsFu-c-CeHii solutions: (a) hydrogen, (b) cyclohexene, (c) dicyclohexyl,(d) undecafluorocyclohexane.
Figure 2. Dependence of minor product yields on mixture composition in the y radiolysis of c-C«F12-c-C«Hi2 solutions:(a) mixed dimer, (b) peaks E and F.
hexyl, and undecafluorocyclohexane, and the minor products, mixed dimer and products E and F. All of these measurements were made on solutions containing10.2 electron % cyclohexane. Figure 4b shows one of the reasons we had difficulty in identifying compounds E and F: their yields do not increase regularly with dose, but instead essentially reach a plateau. As might be expected, the cyclohexene yield is also strongly dose dependent.
Figure 3. Major product yields as a function of dose for mixtures containing 10.2 electron % cyclohexane in F-cyclohexane: (a) hydrogen, (b) cyclohexene, (c) dicyclohexyl,(d) undecafluorocyclohexane.
Figure 4. Minor product yields as a function of dose for mixtures containing 10.2 electron % cyclohexane in F-cyclohexane: (a) mixed dimer, (b) peaks E and F.
DiscussionFrom a mechanistic viewpoint, the most important
observations on the effects of added F-cyclohexane in the radiolysis of cyclohexane are probably the decrease in the H2 yield, originally noted by Rajbenbach, 9 and the efficient production of c-C6FnH, reported first by this laboratory14 and subsequently by Sagert. 10 These
(14) M . B. Fallgatter and R. J. Hanrahan, Paper No. 127, Division of Physical Chemistry, 148th National Meeting of the American Chemical Society, Chicago, 111., Sept 1964.
The Journal o f P h ysica l Chem istry, Vol. 74, N o. 14, 1970
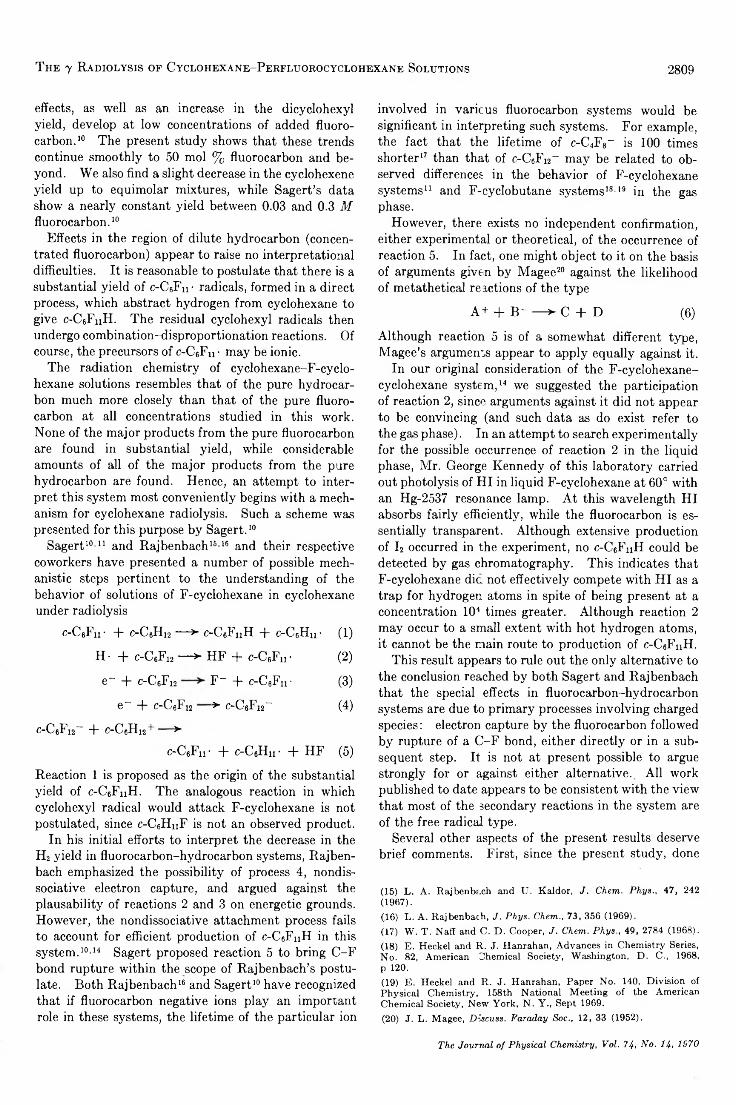
T h e 7 R a d io l y s is o f C y c l o h e x a n e - P e r f l u o r o c y c l o h e x a n e So l u t io n s 2809
effects, as well as an increase in the dicyclohexyl yield, develop at low concentrations of added fluorocarbon. 10 The present study shows that these trends continue smoothly to 50 mol % fluorocarbon and beyond. We also find a slight decrease in the cyclohexene yield up to equimolar mixtures, while Sagert’s data show a nearly constant yield between 0.03 and 0.3 M fluorocarbon. 10
Effects in the region of dilute hydrocarbon (concentrated fluorocarbon) appear to raise no interpretational difficulties. It is reasonable to postulate that there is a substantial yield of c-CeFn- radicals, formed in a direct process, which abstract hydrogen from cyclohexane to give c-C6FnH. The residual cyclohexyl radicals then undergo combination-disproportionation reactions. Of course, the precursors of c-C6Fn • may be ionic.
The radiation chemistry of cyclohexane-F-cyclo- hexane solutions resembles that of the pure hydrocarbon much more closely than that of the pure fluorocarbon at all concentrations studied in this work. None of the major products from the pure fluorocarbon are found in substantial yield, while considerable amounts of all of the major products from the pure hydrocarbon are found. Hence, an attempt to interpret this system most conveniently begins with a mechanism for cyclohexane radiolysis. Such a scheme was presented for this purpose by Sagert. 10
Sagert10'11 and Rajbenbach18 ■ 16 and their respective coworkers have presented a number of possible mechanistic steps pertinent to the understanding of the behavior of solutions of F-cyclohexane in cyclohexane under radiolysis
c-CeFu- + c-C6H12 — > c-CeFuH + c-C6Hn - (1)
H- + c-C6F12 — > HF + c-C6F „- (2)
e~ -f- c-CeFi2 F _ -f- c-CeFn- (3)
e~ + c-CeFi2 > c-CeFi2~ (4)
c-CeFi2_ T c-CeHi2+ >
c-C6F„- + c-C6H„- + HF (5)
Reaction 1 is proposed as the origin of the substantial yield of c-C6FnH. The analogous reaction in which cyclohexyl radical would attack F-cyclohexane is not postulated, since c-C6HnF is not an observed product.
In his initial efforts to interpret the decrease in the H2 yield in fluorocarbon-hydrocarbon systems, Rajbenbach emphasized the possibility of process 4, nondis- sociative electron capture, and argued against the plausability of reactions 2 and 3 on energetic grounds. However, the nondissociative attachment process fails to account for efficient production of c-CeFuH in this system. 10'14 Sagert proposed reaction 5 to bring C-F bond rupture within the scope of Rajbenbach’s postulate. Both Rajbenbach16 and Sagert10 have recognized that if fluorocarbon negative ions play an important role in these systems, the lifetime of the particular ion
involved in various fluorocarbon systems would be significant in interpreting such systems. For example, the fact that the lifetime of c-C4F8- is 100 times shorter17 than that of c-C6Fi2~ may be related to observed differences in the behavior of F-cyclohexane systems11 and F-cyclobutane systems18'19 in the gas phase.
However, there exists no independent confirmation, either experimental or theoretical, of the occurrence of reaction 5. In fact, one might object to it on the basis of arguments given by Magee20 against the likelihood of metathetical reactions of the type
A+ + B~ — > C + D (6)
Although reaction 5 is of a somewhat different type, Magee’s arguments appear to apply equally against it.
In our original consideration of the F-cyclohexane- cyclohexane system, 14 we suggested the participation of reaction 2 , since arguments against it did not appear to be convincing (and such data as do exist refer to the gas phase). In an attempt to search experimentally for the possible occurrence of reaction 2 in the liquid phase, Mr. George Kennedy of this laboratory carried out photolysis of HI in liquid F-cyclohexane at 60° with an Hg-2537 resonance lamp. At this wavelength HI absorbs fairly efficiently, while the fluorocarbon is essentially transparent. Although extensive production of I2 occurred in the experiment, no c-C6FnH could be detected by gas chromatography. This indicates that F-cyclohexane die not effectively compete with HI as a trap for hydrogen atoms in spite of being present at a concentration 104 times greater. Although reaction 2 may occur to a small extent with hot hydrogen atoms, it cannot be the main route to production of c-C6FiiH.
This result appears to rule out the only alternative to the conclusion reached by both Sagert and Rajbenbach that the special effects in fluorocarbon-hydrocarbon systems are due to primary processes involving charged species: electron capture by the fluorocarbon followed by rupture of a C-F bond, either directly or in a subsequent step. It is not at present possible to argue strongly for or against either alternative. All work published to date appears to be consistent with the view that most of the secondary reactions in the system are of the free radical type.
Several other aspects of the present results deserve brief comments. First, since the present study, done
(15) L. A. Rajbenbach and U. Kaldor, J. Chem. Phys., 47, 242 (1967).(.16) L. A. Rajbenbach, J. Phys. Chem., 73, 356 (1969).(17) W. T. Naff and C. D, Cooper, J. Chem. Phys., 49, 2784 (1968).(18) E. Heckel and R. J. Hanrahan, Advances in Chemistry Series, No. 82, American Chemical Society, Washington, D. C., 1968,p 120.(19) E. Heckel and R. J. Hanrahan, Paper No. 140, Division of Physical Chemistry, 158th National Meeting of the American Chemical Society, New York, N. Y ., Sept 1969.(20) J. L. Magee, Discuss. Faraday Soc., 12, 33 (1952).
T he Journal o f P h ysica l Chem istry, Vol. 74, N o. H , 1970
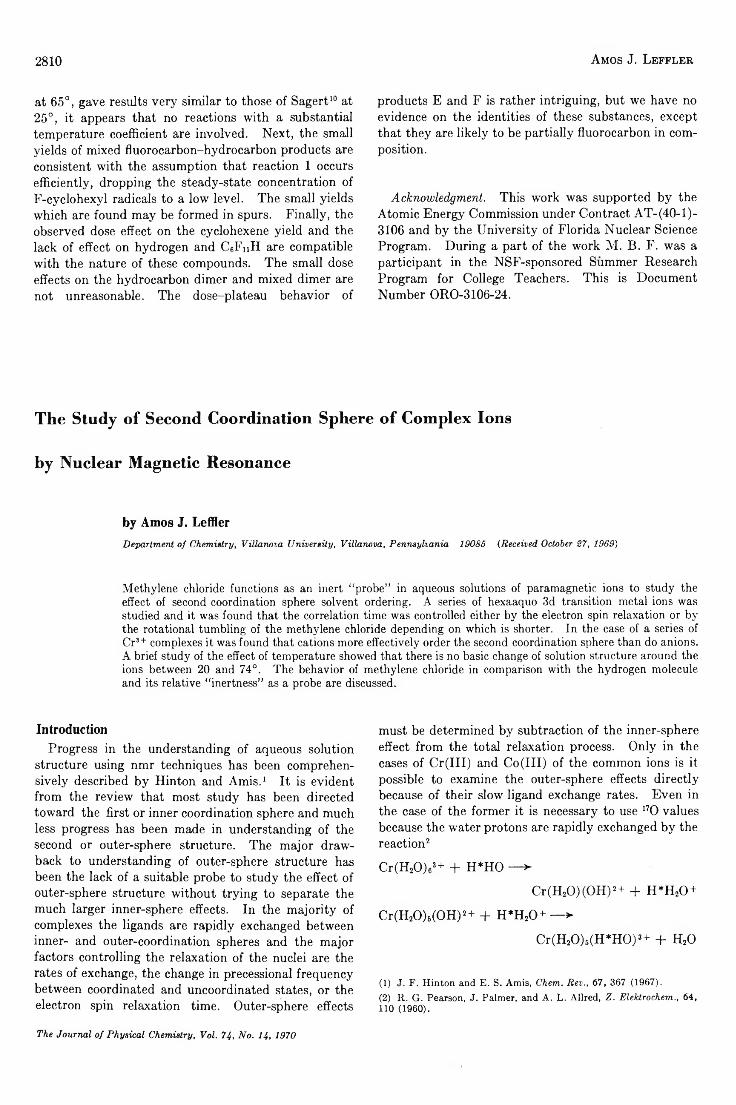
2810 A m os J. L e f f l e r
at 65°, gave results very similar to those of Sagert10 at 25°, it appears that no reactions with a substantial temperature coefficient are involved. Next, the small yields of mixed fluorocarbon-hydrocarbon products are consistent with the assumption that reaction 1 occurs efficiently, dropping the steady-state concentration of F-cyclohexyl radicals to a low level. The small yields which are found may be formed in spurs. Finally, the observed dose effect on the cyclohexene yield and the lack of effect on hydrogen and CeFnII are compatible with the nature of these compounds. The small dose effects on the hydrocarbon dimer and mixed dimer are not unreasonable. The dose-plateau behavior of
products E and F is rather intriguing, but we have no evidence on the identities of these substances, except that they are likely to be partially fluorocarbon in composition.
Acknowledgm ent. This work was supported by the Atomic Energy Commission under Contract AT-(40-l)- 3106 and by the University of Florida Nuclear Science Program. During a part of the work M. B. F. was a participant in the NSF-sponsored Summer Research Program for College Teachers. This is Document Number ORO-3106-24.
The Study of Second Coordination Sphere of Complex Ions
by Nuclear Magnetic Resonance
by Amos J. LefflerDepartment of Chemistry, Villanova University, VUlanova, Pennsylvania 19085 {Received October 27, 1969)
Methylene chloride functions as an inert “probe” in aqueous solutions of paramagnetic ions to study the effect of second coordination sphere solvent ordering. A series of hexaaquo 3d transition metal ions was studied and it was found that the correlation time was controlled either by the electron spin relaxation or by the rotational tumbling of the methylene chloride depending on which is shorter. In the case of a series of Cr3+ complexes it was found that cations more effectively order the second coordination sphere than do anions. A brief study of the effect of temperature showed that there is no basic change of solution structure around the ions between 20 and 74°. The behavior of methylene chloride in comparison with the hydrogen molecule and its relative “inertness” as a probe are discussed.
IntroductionProgress in the understanding of aqueous solution
structure using nmr techniques has been comprehensively described by Hinton and Amis. 1 It is evident from the review that most study has been directed toward the first or inner coordination sphere and much less progress has been made in understanding of the second or outer-sphere structure. The major drawback to understanding of outer-sphere structure has been the lack of a suitable probe to study the effect of outer-sphere structure without trying to separate the much larger inner-sphere effects. In the majority of complexes the ligands are rapidly exchanged between inner- and outer-coordination spheres and the major factors controlling the relaxation of the nuclei are the rates of exchange, the change in precessional frequency between coordinated and uncoordinated states, or the electron spin relaxation time. Outer-sphere effects
must be determined by subtraction of the inner-sphere effect from the total relaxation process. Only in the cases of Cr(III) and Co(III) of the common ions is it possible to examine the outer-sphere effects directly because of their slow ligand exchange rates. Even in the case of the former it is necessary to use 170 values because the water protons are rapidly exchanged by the reaction2
Cr(H20 )63+ + H*HO — >
Cr(H20)(0H )2+ + H*H20+
Cr(H20)6(0H)2+ + H*H20+ — ►
Cr (H20 )6 (H *HO)3+ + H20
(1) J. F. Hinton and E. S. Amis, Chem. Rev., 67, 367 (1967).(2) R. G. Pearson, J. Palmer, and A. L. Allred, Z. Elektrochem., 64, 110 (1960).
The Journal of Physical Chemistry, Vol. 74, No. 14, 1970
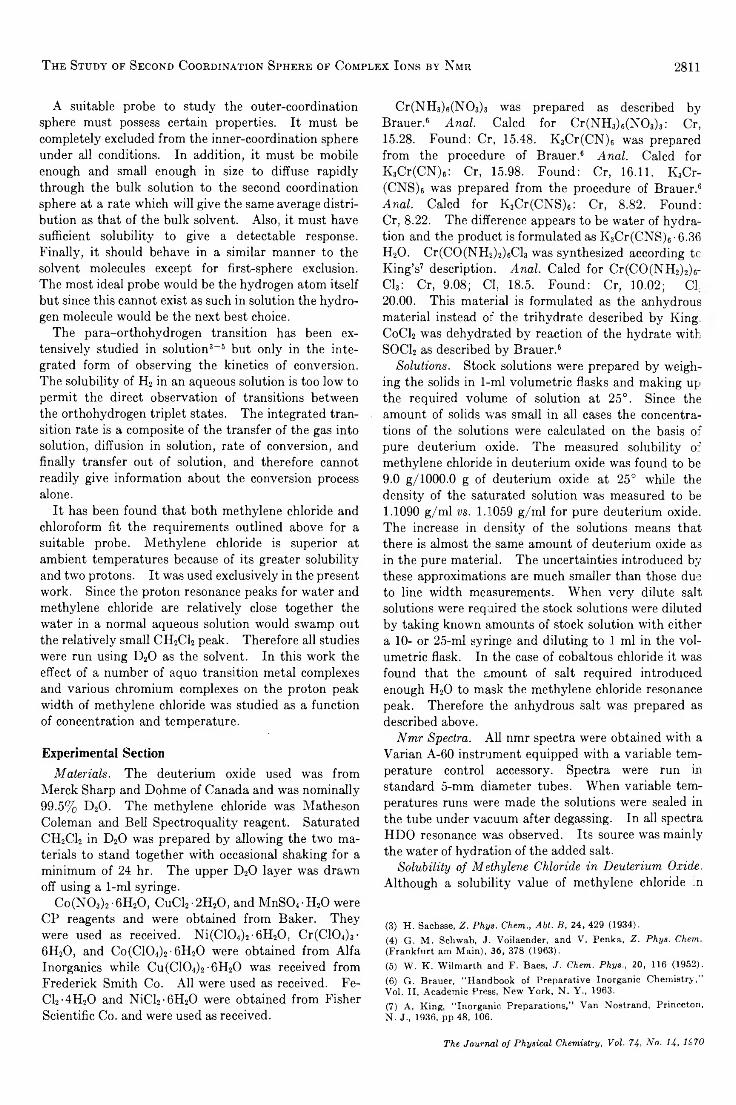
T h e S t u d y of S ec o n d C o o r d in a t io n S p h e r e of C o m p l e x I o n s b y N m r 2811
A suitable probe to study the outer-coordination sphere must possess certain properties. It must be completely excluded from the inner-coordination sphere under all conditions. In addition, it must be mobile enough and small enough in size to diffuse rapidly through the bulk solution to the second coordination sphere at a rate which will give the same average distribution as that of the bulk solvent. Also, it must have sufficient solubility to give a detectable response. Finally, it should behave in a similar manner to the solvent molecules except for first-sphere exclusion. The most ideal probe would be the hydrogen atom itself but since this cannot exist as such in solution the hydrogen molecule would be the next best choice.
The para-orthohydrogen transition has been extensively studied in solution3-5 but only in the integrated form of observing the kinetics of conversion. The solubility of H2 in an aqueous solution is too low to permit the direct observation of transitions between the orthohydrogen triplet states. The integrated transition rate is a composite of the transfer of the gas into solution, diffusion in solution, rate of conversion, and finally transfer out of solution, and therefore cannot readily give information about the conversion process alone.
It has been found that both methylene chloride and chloroform fit the requirements outlined above for a suitable probe. Methylene chloride is superior at ambient temperatures because of its greater solubility and two protons. It was used exclusively in the present work. Since the proton resonance peaks for water and methylene chloride are relatively close together the water in a normal aqueous solution would swamp out the relatively small CH2CI2 peak. Therefore all studies were run using D20 as the solvent. In this work the effect of a number of aquo transition metal complexes and various chromium complexes on the proton peak width of methylene chloride was studied as a function of concentration and temperature.
Experimental SectionM aterials. The deuterium oxide used was from
Merck Sharp and Dohme of Canada and was nominally 99.5% D20. The methylene chloride was Matheson Coleman and Bell Spectroquality reagent. Saturated CH2CI2 in D20 was prepared by allowing the two materials to stand together with occasional shaking for a minimum of 24 hr. The upper D20 layer was drawn off using a 1 -ml syringe.
Co(N03)2-6H20, CuC12 -2H20, and MnS04-H20 were CP reagents and were obtained from Baker. They were used as received. Ni(C104)2-6H20, Cr(C1 0 4)3 - 6H20, and Co(C1 0 4)2 -6H20 were obtained from Alfa Inorganics while Cu(C104)2 -6H20 was received from Frederick Smith Co. All were used as received. Fe- C12-4H20 and NiCl2-6H20 were obtained from Fisher Scientific Co. and were used as received.
Cr(NH3)6(N03) 3 was prepared as described by Brauer.6 A nal. Calcd for Cr(NH3)6(N03)3: Cr,15.28. Found: Cr, 15.48. K3Cr(CN) 6 was prepared from the procedure of Brauer.6 A n al. Calcd for K3Cr(CN)6: Cr, 15.98. Found: Cr, 16.11. K3Cr- (CNS)e was prepared from the procedure of Brauer.6 A nal. Calcd for K3Cr(CNS)6: Cr, 8.82. Found: Cr, 8.22. The difference appears to be water of hydration and the product is formulated as K3Cr(CNS)6 • 6.36 H20. Cr(CO(NH2)2)6Cl3 was synthesized according to King’s7 description. A nal. Calcd for Cr(CO(NH2)2)6- Cl3: Cr, 9.08; Cl, 18.5. Found: Cr, 10.02; Cl.20.00. This material is formulated as the anhydrous material instead of the trihydrate described by King C0CI2 was dehydrated by reaction of the hydrate with SOCl2 as described by Brauer.6
Solutions. Stock solutions were prepared by weighing the solids in 1 -ml volumetric flasks and making up the required volume of solution at 25°. Since the amount of solids was small in all cases the concentrations of the solutions were calculated on the basis of pure deuterium oxide. The measured solubility of methylene chloride in deuterium oxide was found to be9.0 g/1000.0 g of deuterium oxide at 25° while the density of the saturated solution was measured to be 1.1090 g/ml vs. 1.1059 g/ml for pure deuterium oxide. The increase in density of the solutions means that there is almost the same amount of deuterium oxide as in the pure material. The uncertainties introduced by these approximations are much smaller than those due to line width measurements. When very dilute salt solutions were required the stock solutions were diluted by taking known amounts of stock solution with either a 10- or 25-ml syringe and diluting to 1 ml in the volumetric flask. In the case of cobaltous chloride it was found that the amount of salt required introduced enough H20 to mask the methylene chloride resonance peak. Therefore the anhydrous salt was prepared as described above.
N m r Spectra. All nmr spectra were obtained with a Varian A-60 instrument equipped with a variable temperature control accessory. Spectra were run in standard 5-mm diameter tubes. When variable temperatures runs were made the solutions were sealed in the tube under vacuum after degassing. In all spectra HDO resonance was observed. Its source was mainly the water of hydration of the added salt.
Solubility o f M ethylene Chloride in D euterium Oxide. Although a solubility value of methylene chloride :n
(3) H. Sachsse, Z. Phys. Chem., Abt. B, 24, 429 (1934).(4) G. M . Schwab, J. Voilaender, and V. Penka, Z. Phys. Chem. (Frankfurt am Main), 36, 378 (1963).(5) W . K. Wilmarth and F. Baes, J. Chem. Phys., 20, 116 (1952).(6) G. Brauer, “ Handbook of Preparative Inorganic Chemistry,” Vol. II, Academic Press, New York, N. Y ., 1963.(7) A. King, “ Inorganic Preparations,” Van Nostrand, Princeton, N. J., 1936, pp 48, 106.
The Journal o f P hysica l Chem istry, V ol. 74, N o . 14, 1970
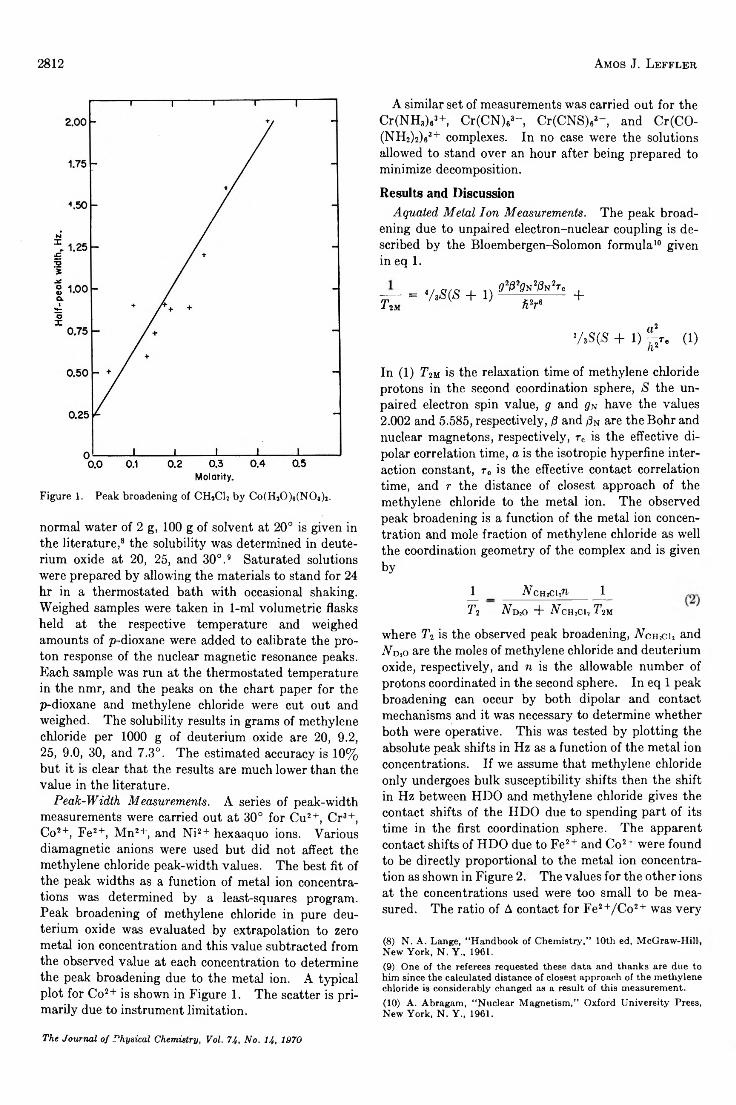
2812 Amos J. Leffler
Molarity.Figure 1. Peak broadening of CH2C12 by Co(H20 )6(NOa)2.
normal water of 2 g, 100 g of solvent at 2 0 ° is given in the literature,8 the solubility was determined in deuterium oxide at 20, 25, and 30°.9 Saturated solutions were prepared by allowing the materials to stand for 24 hr in a thermostated bath with occasional shaking. Weighed samples were taken in 1 -ml volumetric flasks held at the respective temperature and weighed amounts of p-dioxane were added to calibrate the proton response of the nuclear magnetic resonance peaks. Each sample was run at the thermostated temperature in the nmr, and the peaks on the chart paper for the p-dioxane and methylene chloride were cut out and weighed. The solubility results in grams of methylene chloride per 1000 g of deuterium oxide are 20, 9.2, 25, 9.0, 30, and 7.3°. The estimated accuracy is 10% but it is clear that the results are much lower than the value in the literature.
P eak-W id th M easurem ents. A series of peak-width measurements were carried out at 30° for Cu2+, Cr3+, Co2+, Fe2+, Mn2+, and Ni2+ hexaaquo ions. Various diamagnetic anions were used but did not affect the methylene chloride peak-width values. The best fit of the peak widths as a function of metal ion concentrations was determined by a least-squares program. Peak broadening of methylene chloride in pure deuterium oxide was evaluated by extrapolation to zero metal ion concentration and this value subtracted from the observed value at each concentration to determine the peak broadening due to the metal ion. A typical plot for Co2+ is shown in Figure 1 . The scatter is primarily due to instrument limitation.
The Journal o f P hysica l Chem istry, Vol. 74, N o . 14, 1970
A similar set of measurements was carried out for the Cr(NH3)63+, Cr(CN)63- , Cr(CNS)63- , and Cr(CO- (NH2)2)63+ complexes. In no case were the solutions allowed to stand over an hour after being prepared to minimize decomposition.
Results and DiscussionAquated M etal I o n M easurem ents. The peak broad
ening due to unpaired electron-nuclear coupling is described by the Bloembergen-Solomon formula10 given in eq 1 .
7 T - = VaSOS + 1 )i 2Mg8flWflN»T.
ft2r*+
y * s o s + i ) j£ r . (i)
In (1) T m is the relaxation time of methylene chloride protons in the second coordination sphere, S the unpaired electron spin value, g and gu have the values2.002 and 5.585, respectively, /S and /SN are the Bohr and nuclear magnetons, respectively, rc is the effective dipolar correlation time, a is the isotropic hyperfine interaction constant, re is the effective contact correlation time, and r the distance of closest approach of the methylene chloride to the metal ion. The observed peak broadening is a function of the metal ion concentration and mole fraction of methylene chloride as well the coordination geometry of the complex and is given by
Jl _ NchsCi,n 1 . .
T 2 V d,o + V chiCu T m
where T2 is the observed peak broadening, N c men and N o ,o are the moles of methylene chloride and deuterium oxide, respectively, and n is the allowable number of protons coordinated in the second sphere. In eq 1 peak broadening can occur by both dipolar and contact mechanisms and it was necessary to determine whether both were operative. This was tested by plotting the absolute peak shifts in Hz as a function of the metal ion concentrations. If we assume that methylene chloride only undergoes bulk susceptibility shifts then the shift in Hz between HDO and methylene chloride gives the contact shifts of the HDO due to spending part of its time in the first coordination sphere. The apparent contact shifts of HDO due to Fe2+ and Co2+ were found to be directly proportional to the metal ion concentration as shown in Figure 2. The values for the other ions at the concentrations used were too small to be measured. The ratio of A contact for Fe2+/Co2+ was very
(8) N. A. Lange, “ Handbook of Chemistry,” 10th ed, McGraw-Hill, New York, N. Y „ 1961.(9) One of the referees requested these data and thanks are due to him since the calculated distance of closest approach of the methylene chloride is considerably changed as a result of this measurement.(10) A. Abragam, “ Nuclear Magnetism,” Oxford University Press, New York, N. Y., 1961.
T h e S t u d y of S e c o n d C o o r d in a t io n S p h e r e of C o m p l e x I o n s b y N m r 2813
Figure 2. Apparent contact shift of HiO against CH 2CI2 due to Fe(H20),i+ and C o(H ,0),2+ ions.
close to that observed by Wayland and Rice. 11 Therefore it was concluded that only the dipolar broadening mechanism is effective.
Although all peak broadenings were proportional to metal ion concentrations, large differences were found between various metals. The ions Co2+, Fe2+, and Ni2+ were very inefficient in broadening the methylene chloride peak and concentrations up to about 0.1 M were required for appreciable broadening. In the case of Mn2+ the resonance peak disappeared at metal concentrations greater than 0.1 M while Cu2+ and Cr3+ were intermediate between the two extremes. In comparison to these results the reaction rate constants for the para-orthohydrogen reaction in aqueous solution showed a factor of 2 over the same metals when corrected for the number of unpaired electrons. The values are shown in Table I. Since both methylene
Table I : Para to Orthohydrogen Conversion Rate Constants for Hexaaquometal Ions®
Rate Magneticconstant, moments
Metal m in-1 in BM k/n2
Cr3 + 2.22 3.83 0.150Ni2 + 1.84 3.22 0.177Co2+ 5.34 5.04 0.210M n 2 + 7.65 5.91 0.219Fe2+ 5.81 4.91 0.240Cu2+ 1.06 1.94 0.284
0 Normalized to 1 M metal concentration at ambient temperature.
chloride peak broadening and para-orthohydrogen conversion are electron-nuclear interactions the difference in metal ion efficiencies can be due either to the electron or rotational correlation time for the former but only the rotational correlation time for the latter. The rotational correlation time for H2 can be approximated from the Debye relation10
where jj is the viscosity of the solvent and a the radius of the hydrogen molecule. Using a value of 0.075 nm for the latter, a value of 4.3 X 10~ 13 sec at 298°K is obtained. The value is shorter than all electron spin relaxation times of the ions as listed in Table II. The
Table I I : Correlation Times for Heaxaquometal IonsAssuming Distance of Closest Approach of 0.354 nm
Tc, Tg,Metal sec sec (lit.)
Co2+ 5.0 X IO“ 13 5.0 X IO -*3Cr3 + 1.2 X IO“» 5.0 X 1 0 -1»N i2 + 2 .0 X 10~12 3.0 X 10-*2Fe2 + 1.0 X 10~12 1.4 X 10~12Cu2 + 1.6 X 1 0 -“ 2 .0 X 10-8M n 2 + 2.3 X IO“ 11 3.5 X 10"8
value of r T for methylene chloride using a molecular radius of 0.20 nmis8.4 X 10~ 12 sec which is longer than rs for Ni2+, Co2+, and Fe2+. In these cases the rs of the electrons control peak broadening. The remaining ions have long re values so that the rotational correlation time of the methylene chloride is controlling.
The most carefully measured short electron spin relaxation time is that for Co2+ which was found by Fiat and Chmelnick12 to have the value of 5.0 X 10 ~ 13 sec. Using this value in (1) and assuming eight coordination sites in the second sphere13 the distance of closest approach of methylene chloride to Co2+ is found to be 0.354 nm, which is reasonable based on molecular geometry. The calculation assumes that methylene chloride behaves just as does deuterium oxide except that it does not enter the first coordination sphere. Although this cannot be shown conclusively to be the case it must be approximately so. The extreme alternatives can easily be rejected. If methylene chloride “clustered” around the complex ion the proton resonance would be broadened and shifted beyond the instrument range even at very low metal ion concentrations. On the other hand, if methylene chloride did not enter the second coordination sphere then it would not be appreciably broadened by any metal ion con-
(11) B. B. Wayland and W. L, Rice, Inorg. Chem., 5, 54 (1966).(12) A. M. Chmelnick and D. Fiat, J. Chem. Phys., 47, 3986 (1967).(13) K. Wllthrich and R. E. Connick, Inorg. Chem., 7, 1377 (1968).
The Journal o f P hysical Chem istry, Vol. 74, N o. 14, 1970
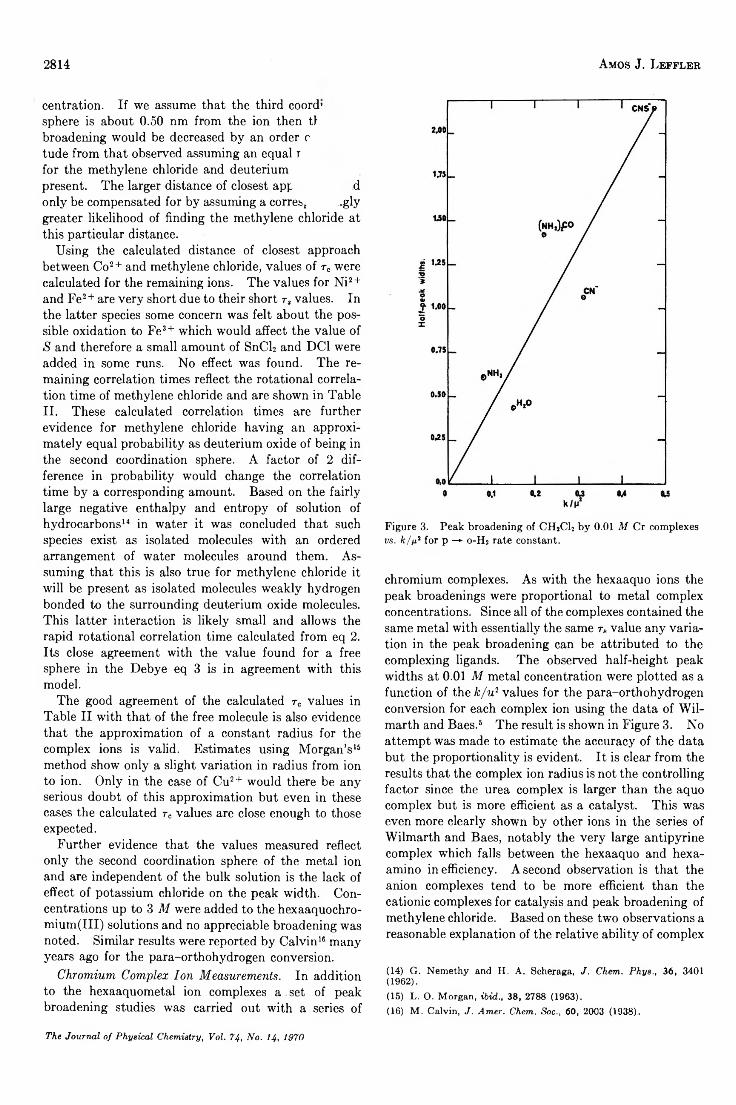
2814 A m o s J. L e f f l e r
centration. If we assume that the third coord’ sphere is about 0.50 nm from the ion then tf broadening would be decreased by an order c tude from that observed assuming an equal r for the methylene chloride and deuterium present. The larger distance of closest app donly be compensated for by assuming a correst .gly greater likelihood of finding the methylene chloride at this particular distance.
Using the calculated distance of closest approach between Co2 + and methylene chloride, values of r0 were calculated for the remaining ions. The values for Ni2 + and Fe2 + are very short due to their short rs values. In the latter species some concern was felt about the possible oxidation to Fe3+ which would affect the value of S and therefore a small amount of SnCl2 and DC1 were added in some runs. No effect was found. The remaining correlation times reflect the rotational correlation time of methylene chloride and are shown in TableII. These calculated correlation times are further evidence for methylene chloride having an approximately equal probability as deuterium oxide of being in the second coordination sphere. A factor of 2 difference in probability would change the correlation time by a corresponding amount. Based on the fairly large negative enthalpy and entropy of solution of hydrocarbons14 in water it was concluded that such species exist as isolated molecules with an ordered arrangement of water molecules around them. Assuming that this is also true for methylene chloride it will be present as isolated molecules weakly hydrogen bonded to the surrounding deuterium oxide molecules. This latter interaction is likely small and allows the rapid rotational correlation time calculated from eq 2 . Its close agreement with the value found for a free sphere in the Debye eq 3 is in agreement with this model.
The good agreement of the calculated rc values in Table II with that of the free molecule is also evidence that the approximation of a constant radius for the complex ions is valid. Estimates using Morgan’s15 method show only a slight variation in radius from ion to ion. Only in the case of Cu2+ would there be any serious doubt of this approximation but even in these cases the calculated r„ values are close enough to those expected.
Further evidence that the values measured reflect only the second coordination sphere of the metal ion and are independent of the bulk solution is the lack of effect of potassium chloride on the peak width. Concentrations up to 3 M were added to the hexaaquochro- mium(III) solutions and no appreciable broadening was noted. Similar results were reported by Calvin16 many years ago for the para-orthohydrogen conversion.
Chrom ium Com plex Io n M easurem ents. In addition to the hexaaquometal ion complexes a set of peak broadening studies was carried out with a series of
Figure 3. Peak broadening of CH 1CI2 by 0.01 M Cr complexes vs. k/p2 for p —► o-H 2 rate constant.
chromium complexes. As with the hexaaquo ions the peak broadenings were proportional to metal complex concentrations. Since all of the complexes contained the same metal with essentially the same rs value any variation in the peak broadening can be attributed to the complexing ligands. The observed half-height peak widths at 0.01 M metal concentration were plotted as a function of the Jc/u2 values for the para-orthohydrogen conversion for each complex ion using the data of Wil- marth and Baes.5 The result is shown in Figure 3. No attempt was made to estimate the accuracy of the data but the proportionality is evident. It is clear from the results that the complex ion radius is not the controlling factor since the urea complex is larger than the aquo complex but is more efficient as a catalyst. This was even more clearly shown by other ions in the series of Wilmarth and Baes, notably the very large antipyrine complex which falls between the hexaaquo and hexa- amino inefficiency. A second observation is that the anion complexes tend to be more efficient than the cationic complexes for catalysis and peak broadening of methylene chloride. Based on these two observations a reasonable explanation of the relative ability of complex
(14) G. Nemethy and H. A. Scheraga, J. Chem. Phys., 36, 3401 (1962).(15) L. O. Morgan, ibid., 38, 2788 (1963).(16) M . Calvin, J . Amer. Chem. Soc.t 60, 2003 (1938).
The Journal o f P hysical Chem istry, Vol. 74, N o . 14, 1970
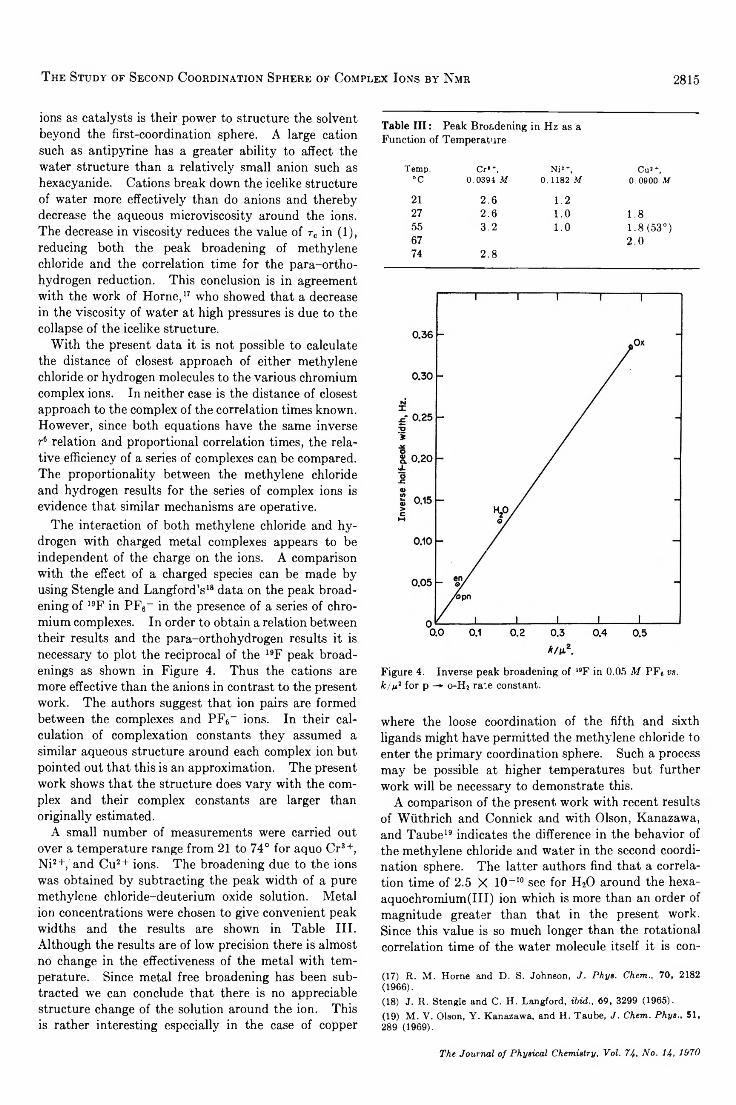
The Study of Second Coordination Sphere of Complex Ions by Nmr 2815
ions as catalysts is their power to structure the solvent beyond the first-coordination sphere. A large cation such as antipyrine has a greater ability to affect the water structure than a relatively small anion such as hexacyanide. Cations break down the icelike structure of water more effectively than do anions and thereby decrease the aqueous microviscosity around the ions. The decrease in viscosity reduces the value of rc in (1), reducing both the peak broadening of methylene chloride and the correlation time for the para-orthohydrogen reduction. This conclusion is in agreement with the work of Horne,17 who showed that a decrease in the viscosity of water at high pressures is due to the collapse of the icelike structure.
With the present data it is not possible to calculate the distance of closest approach of either methylene chloride or hydrogen molecules to the various chromium complex ions. In neither case is the distance of closest approach to the complex of the correlation times known. However, since both equations have the same inverse r6 relation and proportional correlation times, the relative efficiency of a series of complexes can be compared. The proportionality between the methylene chloride and hydrogen results for the series of complex ions is evidence that similar mechanisms are operative.
The interaction of both methylene chloride and hydrogen with charged metal complexes appears to be independent of the charge on the ions. A comparison with the effect of a charged species can be made by using Stengle and Langford’s18 data on the peak broadening of 19F in PF6- in the presence of a series of chromium complexes. In order to obtain a relation between their results and the para-orthohydrogen results it is necessary to plot the reciprocal of the 19F peak broad- enings as shown in Figure 4. Thus the cations are more effective than the anions in contrast to the present work. The authors suggest that ion pairs are formed between the complexes and PF6- ions. In their calculation of complexation constants they assumed a similar aqueous structure around each complex ion but pointed out that this is an approximation. The present work shows that the structure does vary with the complex and their complex constants are larger than originally estimated.
A small number of measurements were carried out over a temperature range from 21 to 74° for aquo Cr8+, Ni2+, and Cu2+ ions. The broadening due to the ions was obtained by subtracting the peak width of a pure methylene chloride-deuterium oxide solution. Metal ion concentrations were chosen to give convenient peak widths and the results are shown in Table III. Although the results are of low precision there is almost no change in the effectiveness of the metal with temperature. Since metal free broadening has been subtracted we can conclude that there is no appreciable structure change of the solution around the ion. This is rather interesting especially in the case of copper
Table III: Peak Broadening in Hz as a Function of Temperature
Temp, Cr>+, Ni!+ , Cu*+,” C 0.0394 M 0.1182 M 0.0900 M
21 2 .6 1 .227 2 .6 1.0 1.855 3.2 1.0 1.8(53°)67 2 .074 2 .8
Figure 4. Inverse peak broadening of 19F in 0.05 M PF« vs. k/ii? for p —<- 0-H2 rate constant.
where the loose coordination of the fifth and sixth ligands might have permitted the methylene chloride to enter the primary coordination sphere. Such a process may be possible at higher temperatures but further work will be necessary to demonstrate this.
A comparison of the present work with recent results of Wiithrich and Connick and with Olson, Kanazawa, and Taube19 indicates the difference in the behavior of the methylene chloride and water in the second coordination sphere. The latter authors find that a correlation time of 2.5 X 10-I° sec for H20 around the hexa- aquochromium(III) ion which is more than an order of magnitude greater than that in the present work. Since this value is so much longer than the rotational correlation time of the water molecule itself it is con-
(17) R. M . Horne and D. S. Johnson, J . Phys. Chem., 70, 2182 (1966).(18) J. R. Stengle and C. H. Langford, ibid., 69, 3299 (1965).(19) M. V. Olson, Y . Kanazawa, and H. Taube, J . Chem. Phys., 51, 289 (1969).
The Journal of Physical Chemistry, Vol. 74, No. 14, 1970
2816 R. G. Lett, L. Petrakis, A. F. Ellis, and R. K. Jensen
eluded that the entire second coordination sphere remains intact during rotation. The present results give a rotational correlation time which is only a factor of 2 greater than that for the methylene chloride in pure deuterium oxide, indicating that the molecule is not held to the complex and has been cited above as evidence that methylene chloride is an “ inert” probe. In both papers there is considerable uncertainty of whether both dipolar and scalar coupling mechanisms are operative in the second coordination sphere. Our evidence of solely dipolar coupling is clear. Wiithrich and Connick estimate distances of 0.314 nm and 0.383
nm for the V -0 and V -H distances, respectively, for water in the second coordination sphere of the V 0 2 + complex. The value of 0.354 nm for the metal proton distance in the present work is a reasonable one assuming that the methylene chloride molecule is rotating so that only the average distance is found.
Acknowledgments. The author wishes to thank Mr. R. Windolph for the analytical data and Mr. Nyal Walker for the Synthesis of the chromium urea complex, and Messrs. V. Spaziano and B. Burns for many of the nmr spectra.
Nuclear Magnetic Resonance Spectral Parameters and Ring
Interconversion of a Series of Piperazines
by R. G. Lett, L. Petrakis,1 A. F. Ellis, and R. K. JensenGulf Research and Development Company, Pittsburgh, Pennsylvania 16230 (Received January 6 , 1970)
Several N,N'-, 2,5-, and 2,6-disubstituted piperazines have been examined by high-resolution proton nmr in a variety of solvents and as a function of temperature. Spectral parameters have been extracted by utilizing proton decoupling and iterative computer fitting techniques. Substituents in the compounds which are locked in a chair conformation at room temperature are shown to occupy equatorial sites. Thermodynamic functions for the chair-chair ring interconversion of piperazine and N,N'-dimethyIpiperazme have been redetermined by line shape methods. N,N'-Dinitroso- and N,N'-diphenylpiperazine interconvert too rapidly at conveniently accessible temperatures for study using 60-MHz apparatus. The trends of the spectral parameters and the free energies for ring interconversion in various solvents are discussed in terms of their structural implications and significance.
IntroductionThe tremendous utility of nuclear magnetic resonance
as a structure determining tool is well established. In addition, nmr spectroscopy has found very wide application as a powerful probe in conformational analysis, in general, and ring inversion of six-membered compounds, in particular.2 The numerous recent publications on this latter subject reflect both the high hopes held for the potential of the technique as well as the care that must be exercised in arriving at conclusions from the nmr data.2,3
At low temperatures, distinct, chemically shifted signals are obtained from axially and equatorially placed groups, but when interconverting rapidly at higher temperatures, only one signal is obtained which is the average of the two distinct signals. From the careful determination of the temperature dependence of the rate of interconversion, one can obtain not
only the Gibbs free energy for inversion but also the energy of activation and the enthalpy and entropy of activation. Among the various approaches that can be taken in the solution of the problem is the double resonance method, the determination of the coalescence temperature, complete line shape analysis, and spin-echo techniques.2-5
We report in this work the detailed investigation of a series of piperazines hereto unreported, as well as the reinvestigation of some that have already been
(1) To whom all correspondence should be addressed.(2) W . A. Thomas, Ann. Rev. NMR Spectrosc., 1, 43 (1968), and references therein.(3) (a) A. Allerhand, H. S. Gutowsky, J. Jonas, and R. A. Meinzer, J. Amer. Chem. Soc., 88, 3185 (1966); (b) F. A. L. Anet and A. J. R. Bourn, ibid., 89, 760 (1967).(4) F. R., Jensen, D . S. Noyce, C. H. Sederholm, and A. J. Berlin, J. Amer. Chem. Soc., 82, 1256 (1960); 84, 386 (1962).(5) L. W. Reeves, Advan. Phys. Org. Chem., 3, 187 (1965)
The Journal of Physical Chemistry, Vol. 74, No. 14, 1970
Nmr Spectral Parameters of a Series of Piperazines 2817reported in certain solvents.6-9 The determination of the thermodynamic parameters has been made by employing the various techniques indicated above. Also, some determinations have been made in a variety of solvents. When feasible, we have extracted as precise spectral parameters as possible by spectral fitting and decoupling techniques, and have examined the role of substituents and solvents in determining both the spectral parameters, as well as the thermodynamic functions of the interconversion of these systems.
Experimental SectionThe dimethylpiperazines were Aldrich Chemical Co.
products used without further purification. The purity of ci’s-2,5-dimethylpiperazine was checked by ir and gc. Since the nmr spectra of the other commercial products were consistent with their expected structure, only routine ir spectra were obtained for verification of their structure. The remaining 2,5-disubstituted piperazines were synthesized by a method developed by Ellis.10 The solid compounds were dried before use by evacuation in a vacuum oven or on a vacuum line. Fresh solutions were run immediately after preparation since samples tend to decompose slowly upon standing. The N,N'-disubstituted piperazines were commercial products also from the Aldrich Chemical Co. and were used without further purification, except for N,N'-dimethylpiperazine which was redistilled before use. Since the quality of the spectra depends on degassing, we bubbled N2 through the sample and used repeated freeze-pump-thaw techniques before running. The solid compounds are poorly soluble in most solvents at room temperature and rapidly precipitate from cold solutions. Freshly prepared samples were used since solutions tend to decompose upon standing also.
Spectra were obtained on a Varían HA-60-IL. Frequency sweep decoupling experiments utilized a Hewlett-Packard 200 AB or Wavetek III VCG as the external oscillator. Chloroform was used as a lock in the decoupling experiments. Frequencies were counted to ±0.1 Hz using an Hewlett-Packard 521C frequency counter and 10-sec counting periods. Frequency measurements were made on 50- or 100-Hz sweeps run at 250- or 500-sec sweep rates. The final frequency measurements were made relative to tetra- methylsilane (TMS) using a TMS lock.
Spectra were fit using LAOCN3 as written by Castellano and Bothner-By.11 The ABC ring proton spectra were analyzed after they were decoupled from the alkyl side chain protons, and then they were checked by comparison of calculated cathrode ray tube plots of five- and six-spin systems (decoupled) vs. observed normal spectra. Iterations were generally convergent to approximately ±0.1 Hz on each measured line. Five per cent solutions were used for temperature measurements. The V-4332 probe was calibrated using a
standard ethanol sample, and temperature was maintained to better than ± 1 ° by means of a V4341 temperature controller. The TMS line width was monitored as an indication of 1\.
ResultsA. Dialkyl Piperazines. The molecules examined
are generally locked in the most stable chair configuration at room temperature, cf.s-2,5-Dimethyl piperazine having one axial substituent is an exception and interconverts rapidly at room temperature. Coalescence temperature was reported9 to be —74°, AG* = 9.6 kcal/mol, and at 100 MHz in CH2C12, ro5aeCH* = 26 Hz. The interconversion can be slowed below — 90° at 60 MHz, but the ring proton multiplet shows insufficient resolution for a detailed analysis. The only significant change noted in the spectra of trans-2,5- dimethylpiperazine and cfs-2,6-dimethylpiperazineupon heating to 180° in nitrobenzene was a slight loss of intensity due to decomposition. The interconversion barrier in these molecules may be as high as 20 kcal/mol, or alternatively, the lack of changes in the spectra may be entirely due to the equilibria involved, since both of these molecules exist primarily in the diequatorial form.
The ring proton multiplets are deceptively simple due to the broad lines observed and extensive overlapping. The ring proton patterns of the trans-2,5- dibutyl and dioctyl derivatives were identical to within the experimental error. The coupling constants Jae- and J aa' were not independently variable in the diethyl, dibutyl, and dioctyl derivatives and iterations were carried out using an assumed value of JM'. Attempts were made to refine the constants characterizing the spectra of the dimethyl and diethyl derivatives by five- and six-spin calculations with only limited success. Due to the poor resolution, it was not possible to accurately determine the coupling constants between the axial ring proton and methylene protons of the dibutyl and dioctyl derivatives. Computer plots indicate the coupling is similar to that of the diethyl. It was necessary to utilize Lorentzian lines of ~ 1 .0 Hz half-width to satisfactorily reproduce the observed spectra although spiking with impurities indicated spectrometer resolution was within 0.4 Hz during the experiments. This may be due to the effect of the 14N quadrupole or small cross-ring coupling constants. Similar line widths are observed in N,N'-dimethyl- piperazine and other six-membered N containing ring compounds. Unless dealing with 14N decoupled spec-
(6) R . K . Harris and R. A. Spragg, Chem. Commun., 134 (1966).(7) R. J. Abraham ar_d D. B. MacDonald, ibid., 188 (1960).(8) J. L. Sudmeier, J . Phys. Chem., 72, 2344 (1968).(9) R . K. Harris and R. A. Spragg, J . Chem. Soc., B , 684 (1968).(10) A. F. Ellis, U. S. Patent 3,453,278 (1969).(11) S. Castellano and A. A. Bothner-By, J . Chem. Phys., 41, 3832 (1964).
The Journal of Physical Chemistry, Vol. 74, 14, 1970
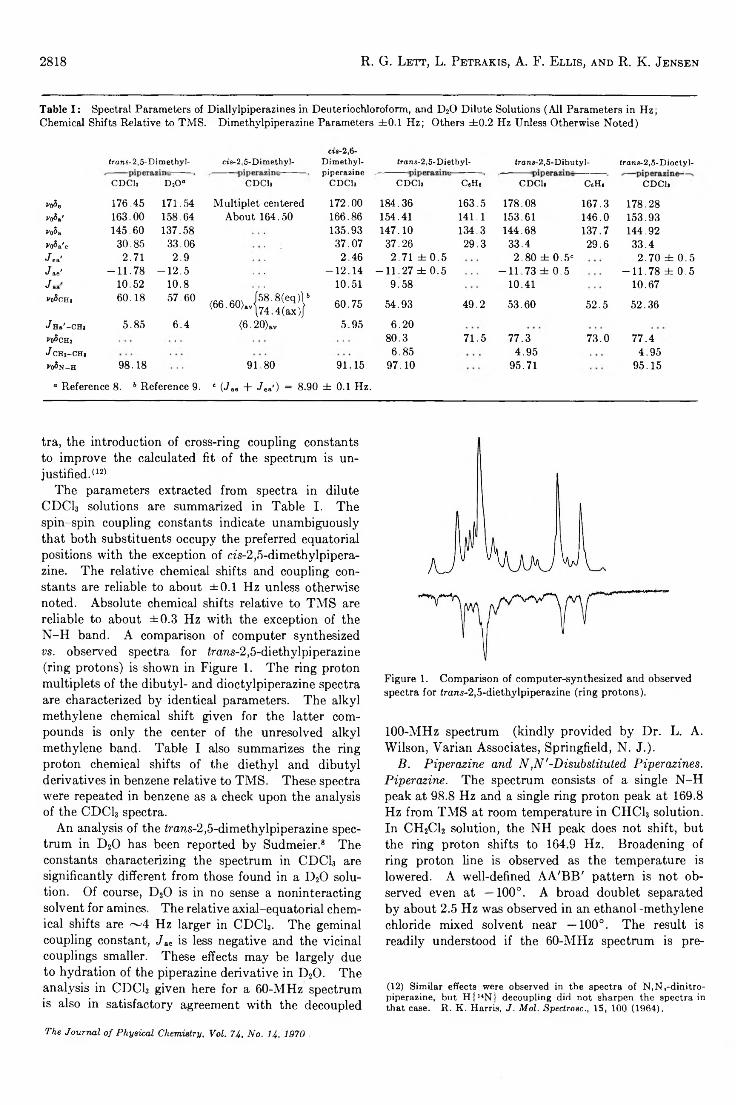
2818 R. G. Lett, L. Petrakis, A. F. Ellis, and R. K. Jensen
Table I : Spectral Parameters of Diallylpiperazines in Deuteriochloroform, and D20 Dilute Solutions (All Parameters in Hz; Chemical Shifts Relative to TMS. Dimethylpiperazine Parameters ±0.1 Hz; Others ±0.2 Hz Unless Otherwise Noted)
«8-2,6-trans-2,5-Dimethyl- «8 -2 ,5-Dimethyl- Dimethyl
piperazineCDCL D .O “ CDCL C D C l.
Me 176.45 171.54 Multiplet centered 172.00Ma' 163.00 158.64 About 164.50 166.86Ma 145.60 137.58 135.93Ma'e 30.85 33.06 37.07J ea* 2.71 2.9 2.46J ae' -11.78 -12 .5 -12.14J && 10.52 10.8 10.51McHj 60.18 57.60 , , , firn j58.8(eq)H<66.60>avj74 4(ax)| 60.75
J Ha'-CHl McH.J CHi-CHi
5.85 6.4 <6.20)av 5.95
Mn-H 98.18 91.80 91.15
“ Reference 8. 6 Reference 9. ° (-Tae + J. a') = 8.90 ± 0.1 Hz.
trans-2,5- Diethyl- trans-2,5-Dibutyl- trans-2,5-D ioctyl-
CDC1> C,H , C D C l. CgH, C D C l.
184.36 163.5 178.08 167.3 178.28154.41 141.1 153.61 146.0 153.93147.10 134.3 144.68 137.7 144.9237.26 29.3 33.4 29.6 33.42.71 ± 0 .5 2.80 ± 0.5' 2.70 ± 0.5
-11.27 ± 0.5 -11.73 ± 0.5 -11.78 ± 0.59.58 10.41 10.67
54.93 49.2 53.60 52.5 52.366.20
80.3 71.5 77.3 73.0 77.46.85 4.95 4.95
97.10 95.71 95.15
tra, the introduction of cross-ring coupling constants to improve the calculated fit of the spectrum is unjustified. (12)
The parameters extracted from spectra in dilute CDCL solutions are summarized in Table I. The spin-spin coupling constants indicate unambiguously that both substituents occupy the preferred equatorial positions with the exception of cfs-2,5-dimethylpipera- zine. The relative chemical shifts and coupling constants are reliable to about ±0.1 Hz unless otherwise noted. Absolute chemical shifts relative to TMS are reliable to about ±0.3 Hz with the exception of the N -H band. A comparison of computer synthesized vs. observed spectra for irans-2,5-diethylpiperazine (ring protons) is shown in Figure 1. The ring proton multiplets of the dibutyl- and dioctylpiperazine spectra are characterized by identical parameters. The alkyl methylene chemical shift given for the latter compounds is only the center of the unresolved alkyl methylene band. Table I also summarizes the ring proton chemical shifts of the diethyl and dibutyl derivatives in benzene relative to TMS. These spectra were repeated in benzene as a check upon the analysis of the CDCI3 spectra.
An analysis of the trans-2,5-dimethylpiperazine spectrum in D20 has been reported by Sudmeier.8 The constants characterizing the spectrum in CDCL are significantly different from those found in a D20 solution. Of course, D20 is in no sense a noninteracting solvent for amines. The relative axial-equatorial chemical shifts are ~ 4 Hz larger in CDCI3. The geminal coupling constant, ,/ae is less negative and the vicinal couplings smaller. These effects may be largely due to hydration of the piperazine derivative in D20. The analysis in CDC13 given here for a 60-MHz spectrum is also in satisfactory agreement with the decoupled
Figure 1. Comparison of computer-synthesized and observed spectra for irans-2,5-diethylpiperazine (ring protons).
100-MHz spectrum (kindly provided by Dr. L. A. Wilson, Yarian Associates, Springfield, N. J.).
B. Piperazine and N,N'-Disubstituted Piperazines. Piperazine. The spectrum consists of a single N -H peak at 98.8 Hz and a single ring proton peak at 169.8 Hz from TMS at room temperature in CHC13 solution. In CH2C12 solution, the NH peak does not shift, but the ring proton shifts to 164.9 Hz. Broadening of ring proton fine is observed as the temperature is lowered. A well-defined AA'BB' pattern is not observed even at —100°. A broad doublet separated by about 2.5 Hz was observed in an ethanol-methylene chloride mixed solvent near —100°. The result is readily understood if the 60-MHz spectrum is pre-
(12) Similar effects were observed in the spectra of N,N,-dinitro- piperazine, but H { 14N j decoupling did not sharpen the spectra in that case. R . K. Harris, J. Mol. Spectrosc., 15, 100 (1964).
The Journal of Physical Chemistry, Voi. 74, No. 14, 1970
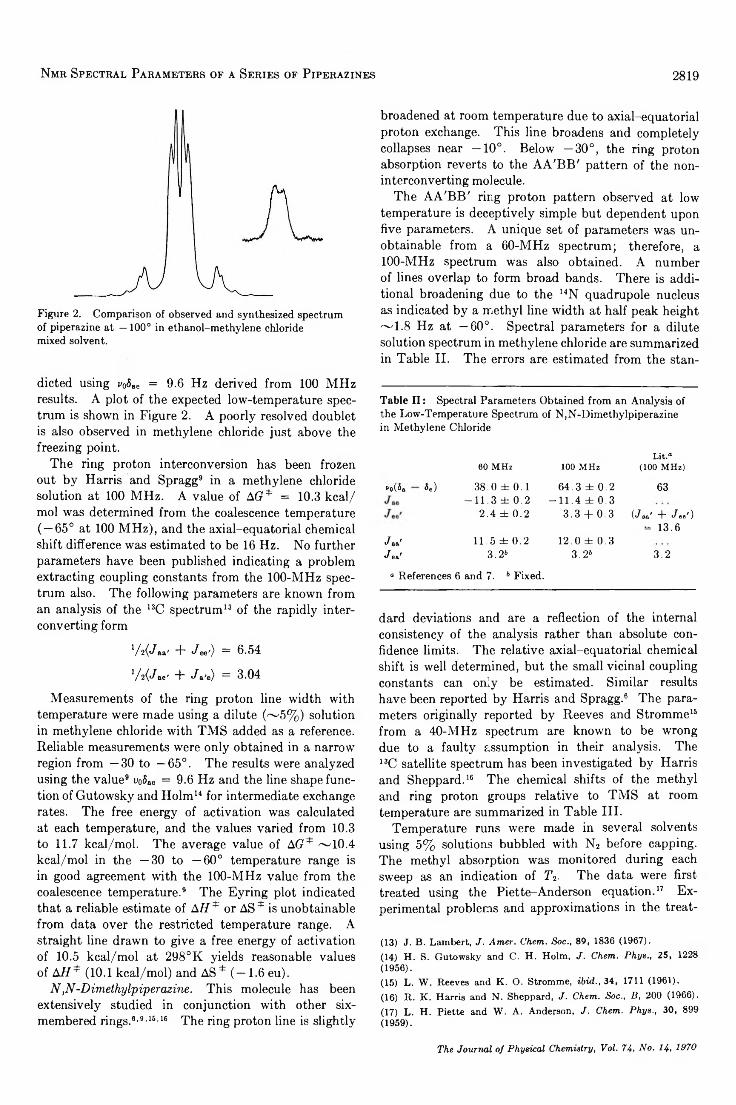
Nmr Spectral Parameters of a Series of Piperazines 2819
Figure 2. Comparison of observed and synthesized spectrum of piperazine at —100° in ethanol-methylene chloride mixed solvent.
broadened at room temperature due to axial-equatorial proton exchange. This line broadens and completely collapses near —10°. Below —30°, the ring proton absorption reverts to the AA 'BB ' pattern of the noninterconverting molecule.
The AA 'BB' ring proton pattern observed at low temperature is deceptively simple but dependent upon five parameters. A unique set of parameters was unobtainable from a 60-MHz spectrum; therefore, a 100-MHz spectrum was also obtained. A number of lines overlap to form broad bands. There is additional broadening due to the 14N quadrupole nucleus as indicated by a methyl line width at half peak height '"'1.8 Hz at —60°. Spectral parameters for a dilute solution spectrum in methylene chloride are summarized in Table II. The errors are estimated from the stan-
dicted using v08Re = 9.6 Hz derived from 100 MHz results. A plot of the expected low-temperature spectrum is shown in Figure 2. A poorly resolved doublet is also observed in methylene chloride just above the freezing point.
The ring proton interconversion has been frozen out by Harris and Spragg9 in a methylene chloride solution at 100 MHz. A value of A(7* = 10.3 kcal/ mol was determined from the coalescence temperature ( — 65° at 100 MHz), and the axial-equatorial chemical shift difference was estimated to be 16 Hz. No further parameters have been published indicating a problem extracting coupling constants from the 100-MHz spectrum also. The following parameters are known from an analysis of the 13C spectrum13 of the rapidly interconverting form
W » ' + Jee') = 6 .5 4
72<Jae' + ./a'e) = 3 .0 4
Measurements of the ring proton line width with temperature were made using a dilute (~ 5 % ) solution in methylene chloride with TMS added as a reference. Reliable measurements were only obtained in a narrow region from —30 to —65°. The results were analyzed using the value9 vo8&e = 9.6 Hz and the line shape function of Gutowsky and Holm14 for intermediate exchange rates. The free energy of activation was calculated at each temperature, and the values varied from 10.3 to 11.7 kcal/mol. The average value of A(7* ~10.4 kcal/mol in the —30 to —60° temperature range is in good agreement with the 100-MHz value from the coalescence temperature.9 The Eyring plot indicated that a reliable estimate of AH * or AS * is unobtainable from data over the restricted temperature range. A straight line drawn to give a free energy of activation of 10.5 kcal/mol at 298°K yields reasonable values of A ff* (10.1 kcal/mol) and AS* ( —1.6eu).
N ,N -Dimethylpiperazine. This molecule has been extensively studied in conjunction with other six- membered rings.6.9.16.16 The ring proton line is slightly
Table II : Spectral Parameters Obtained from an Analysis of the Low-Temperature Spectrum of N,N-Dimethylpiperazine in Methylene Chloride
ro(5. *.)60 M Hz
38.0 ± 0.1 -1 1 .3 ± 0.2
2.4 ± 0.2
11.5 ± 0.2 3 .26
100 M H z
64.3 ± 0.2 -11 .4 ± 0.3
3.3 + 0.3
12.0 ± 0.3 3.26
Lit.“(100 M Hz)
63
(*7sa' T J ee')= 13.6
3.2
“ References 6 and 7. 6 Fixed.
dard deviations and are a reflection of the internal consistency of the analysis rather than absolute confidence limits. The relative axial-equatorial chemical shift is well determined, but the small vicinal coupling constants can only be estimated. Similar results have been reported by Harris and Spragg.6 The parameters originally reported by Reeves and Stromme15 from a 40-MHz spectrum are known to be wrong due to a faulty assumption in their analysis. The 13C satellite spectrum has been investigated by Harris and Sheppard.16 The chemical shifts of the methyl and ring proton groups relative to TMS at room temperature are summarized in Table III.
Temperature runs were made in several solvents using 5% solutions bubbled with N2 before capping. The methyl absorption was monitored during each sweep as an indication of T2. The data were first treated using the Piette-Anderson equation.17 Experimental problems and approximations in the treat-
(13) J. B. Lambert, J . Amer. Chem. Soc., 89, 1836 (1967).(14) H. S. Gutowsky and C. H. Holm, J . Chem. Phys., 25, 1228 (1956).(15) L. W. Reeves and K. O. Stromme, ibid., 34, 1711 (1961).(16) R. K. Harris and N. Sheppard, J . Chem. Soc., B , 200 (1966).(17) L. H. Piette and W. A. Anderson, J . Chem. Phys., 30, 899 (1959).
The Journal of Physical Chemistry, Vol. 74, No- 74, 7970
2820 R. G. Lett, L. Petrakis, A. F. Ellis, and R. K. Jensen
Table III: Observed Chemical Shifts ofN,N'-Dimethylpiperazine at Room Temperature andActivation Parameters Determined by Various Methods
Chemical shifts, Hz, Activation parameters,-relative to TM S---------- - ------------kcal/m ol-
Solvent CHj CH , »»oSae •Ea“ AG ms4 A G * 2»8C
CCh 137.6 129.5 34.0 12.2 13.6 13.1CDCls 146.8 137.0 39.5 16.2 13.5 13.4CH2C12 141.4 132.2 38.5 13.8 13.3 13.2cs2 138.4 129.6 32.6 12.7 12.4 12.7Acetone 136.4 128.5Benzene 138.6 127.3Methanol 148.3 135.9 40.6 14.4 14.1 13.5
« Piette-Anderson equation, ref 17. b Gutowsky-Holm equation, ref 18. c Density matrix treatment for AB system, ref 19.
ment lead to considerable distortion of the plots at both high and low temperature. The uncertainty in the slope of these plots is sufficient to render changes in E& for different solvents of little quantitative significance. Free energies of activation were determined by two methods (Table III). The line shape function derived by assuming two site exchanges in the absence of spin-spin coupling was initially used.18 Eyring plots constructed using rate constants determined from this approach indicate that reliable values of A and AS * cannot be determined without data over a wider temperature range. A reanalysis was made using a program written by Newmark19 * based on density matrix methods. The molecule was assumed to be a strongly coupled AB system. Free energies determined by this approach show little variation over the range of accessible temperatures indicating a relatively small value of A $* ( ¡A S * !^ cal/deg mol). The results are summarized in Table IV also.
Table IV : Observed Spectrum of N,N'-Diphenylpiperazine Chemical Shifts in Hz Relative to TMS
■N,N'-Dipheny lpiperazine-Solvent Aliphatic Aromatic
CCh 196 .2 ± 0 .1 ~ 4 2 0CDCh 1 9 7 .0 ± 0 .1 ~ 4 2 0CH2C12 1 9 5 .2 ± 0 . 1 ~ 4 2 0Acetone 199 .1 ± 0 .1 ~ 4 2 0Benzene 1 7 7 .0 ± 0 .1 ~ 4 2 0
N,N-Diphenylpiperazine. This compound is poorly soluble in most of the suitable nmr solvents. At room temperature, the spectrum consists of only a sharp ring proton line due to rapid axial <-> equatorial conversion and a five-spin multiplet in the aromatic region. The results are summarized in Table IV. The aromaticregion is not completely analyzed but estimates ofthe chemical shifts in chloroform are: vo80nho ~ 415Hz (rel TMS), v08mela ~ 435 Hz, and vahm,a ~ 414 Hz. The ring interconversion process is too rapid
to give any significant temperature effects in the range 25 to —100° in methylene chloride.
N,N'-Dinitrosopiperazine. The observed spectrum consists of two sets of lines corresponding to the cis and trans forms of the compound. In acetone at room temperature,12 approximately 39.7% is in the cis form and 61.3% trans. Thus, the energy difference between the isomers is only ~250 cal/mol but a relatively high barrier, typically 20-25 kcal/mol, must be exceeded before interconverting them. Rotation about the N -N bond is restricted by overlap between the nitrogens. The spectrum indicates that rapid axial-equatorial conversion does occur at room temperature. A pair of sharp lines results for the cis form due to the anisotropy of the nitroso group. In the trans form, the coupled protons do not have the same average chemical shift leading to a multiplet pattern depending on only three parameters. The results obtained on our external lock system in acetone are compared with the results published by Harris12 in Table V. The spectrum was rerun on our internal lock system in CDCfi with resolution ~ 0 .3 Hz. The average RMS error between calculated and observed spectra is less than 0.1 Hz for the parameters in TableV. The assignment of protons A and B previously indicated can be made on the basis that protons cis to the nitroso group are shifted upfield from those trans.™ The value of Jgem = —10.8 Hz has been assumed for comparison with previous work.12 A value of ~ —13.0 Hz is expected on the basis of similar compounds,21 but the value assumed has little effect on the other parameters determined. Attempts were made to observe the spectrum at reduced temperatures although the compound precipitates out of most cold solutions. A sample was taken to its freezing point in methylene chloride (< —97°) with no significant changes in the ring proton pattern other than those due to poor field homogeneity and viscosity.
DiscussionA. Chemical Shifts of DialkyIpiperazines. Chemical
shifts of the amine protons are solvent and concentration dependent, being displaced to higher fields upon increasing dilution or by use of nonhydrogen bonding solvents. Dilute chloroform solutions show a definite upfield shift of the amine proton resonance as expected in proceeding from piperazine to 2,5-dibutylpiperazine. The N -H band of as-2,5-dimethylpiperazine appears to be at lower field than that of the trans-2,5-dimethyl.
(18) J. A. Pople, W . G. Schneider, and H. G. Bernstein, “ High Resolution Nuclear Magnetic Resonance,” McGraw-Hill, New York, N. Y „ 1959, p 223.(19) R. A. Newmark, Thesis, University of California, Berkeley, Calif., Nov 1964.(20) H. W. Brown and D. P. Hollis, J. Mol. Spectrosc., 13, 305 (1964).(21) R. K . Harris and R. A. Spragg, ibid., 23, 158 (1967).
The Journal of Physical Chemistry, Voi. 74, No. 14, 1970
Nmr Spectral Parameters of a Series of Piperazines 2821Table V : Parameters Characterizing the Spectrum of N,N'-Dinitrosopiperazine in Acetone and CDC13
CDCla------cis isomer-----------
In acetone Lit.0 CDCli—trans isomer--------------
In acetone Lit.“
>A-«(A + B) 250.9 ± 0 .2 256 ± 2Hz 253 252.9 253.0 255.7M ab 44.8 4 7 .1 ± 0.1H z 46.9 2 1 .5 30 .1 29.4J trana 6.86 dh 0.05 6.94 7 .17J cis 4.54 ± 0.05 4 .73 4.88J ae
J trana */ :2 { J aa* "f" J ee f) J cia = V 2 i f f ee; J e'a)
— 10.8 (assumed) — 10.8 (assumed)
0 Reference 12.
Since the former is an average between N -H with an equatorial and axial methyl substituent, this implies that the axial methyl substituent is less effective than the equatorial in shielding the amine group. The alkyl methyl absorption also shows the anticipated upfield shift with increasing chain length. The downfield shift of the average methyl absorption in cis-2,5-dimethyl- piperazine indicates that the axial methyl resonance is at lower field than the equatorial.
The relative axial-equatorial chemical shift of protons on the same carbon in a six-membered ring is generally 25-30 Hz in the absence of substituent or heteroatom effects. Jackman22 has shown that this shift difference can be explained in terms of the diamagnetic anisotropy of the neighboring C-C bonds in the chair conformation. This effect is such that the equatorial protons are deshielded relative to the axial protons. In the case of piperazine,9 the nitrogen atoms with lone pairs probably occupying equatorial positions cause a pronounced decrease in the relative shift, v0die, to ~ 9 Hz. Alkyl substitution elsewhere in the ring is not expected to alter the lone pair conformation. However, substituents on the amine group could force the lone pair into an axial position increasing p06ae of ~ 2 0 Hz to 30.7 Hz in £rans-2,5-dimethylpiperazine. The principal change in CDC13 is a 19.4-Hz upfield shift of the axial protons relative to their position in piperazine. The only difference in the immediate environment of the ring methylene protons in trans-2,5- and cis-2,6- dimethylpiperazine is the presence of a d methyl substituent in the cis-2fi derivative. The /3 methyl substituent appears to enhance v0S&e ~ 6 Hz to 37.1 Hz in cis-2,6-dimethylpiperazine. The shielding effect of the d methyl is about twice as great on the axial protons (10.3 Hz) as the equatorial (3.9 Hz).
The effect of substituting ethyl for methyl in the 2,5- derivatives is a deshielding of the equatorial, and to a lesser extent axial, protons resulting in a rather large value of j oSae = 37.3 Hz. However, the deshielding effect is decreased in the longer alkyl chains giving an intermediate value of vo8ae ~33.4 Hz. Chemical shifts of axial protons on the same carbon as the substituent follow the shielding trend expected on the basis of inductive effects.
The relative axial-equatorial chemical shift differences are not particularly solvent dependent. Dilute benzene solutions of 2,5-diethyl and 2,5-dibutylpiper- azine give the expected upfield shift of the spectrum as indicated in Table I. The value of PoSm is somewhat reduced, particularly in 2,5-diethylpiperazine. The reduction is due to a greater upfield shift of the equatorial than axial protons. The two axial ring protons in each molecule undergo nearly identical solvent shifts. The enhanced solvent shifts in ¿rcms-2,5-diethylpiper- azine may indicate a tendency to orient relative to neighboring solvent molecules which is partially destroyed by the introduction of longer alkyl chains.
B. Coupling Constants of Dialkylpiperazines. A self- consistent analysis is obtained by assuming that the geminal coupling constants are of opposite sign to the vicinal constants. The geminal constants are almost certainly negative on the basis of similar compounds and have the magnitude expected for essentially sp3 hybridization of the carbon.23 Geminal coupling constants are sensitive to both the nature and orientation of substituents. For the molecules examined here, the MO approach24 predicts that electronegative substituents in the a position cause negative shifts and electronegative 13 substituents cause positive shifts in these constants. It is interesting to compare values of Jgem in trans-2,5-dimethyl and cis-2,6-dimethylpiperazine. The a substituents are identical in each case. However, the ¡3 substituents in £rans-2,5-dimethylpiperazine are amine and methylene groups; in cis-2,6-dimethyl- piperazine, amine and -C H -C H 3 groups. The coupling constant is slightly more positive in the trans-2,5 derivative as predicted.
The replacement of the methyl by larger alkyl groups would be expected to lead to a small positive shift in J gem if a-substituent effects dominate. It does appear that the value of Jgem becomes less negative upon proceeding from 2,5-dimethyl to 2,5-diethylpiperazine.
(22) L. M . Jackman, ‘ Nuclear Magnetic Resonance Spectroscopy,” Pergamon Press, Oxford, 1959, p 117.(23) Approximate values in cyclohexane are Jgem = 12.6 H z , /aa, = 11.8 Hz, Jae, = 3.9 Hz, Jee, = 3.9 Hz. N. Muller and P. J. Schultz, J. P h y s. Chem., 68, 2026 (1964).(24) J. A. Pople and A. A. Bothner-By, J. Chem. Phys., 42, 1339 (1965).
The Journal of Physical Chemistry, Vol. 74 , No. 1 4 , 1970
2822 R. G. Lett, L. Petrakis, A. F. Ellis, and R. K. Jensen
Results for the trans-2,5-dibutyl and dioctyl derivatives are inconclusive due to the large uncertainties in the values extracted from the spectra.
As predicted by VB theory,25 26 vicinal coupling constants are sensitive to the dihedral angle and electronegativity of substituents among other factors. For a regular chair conformation, Jaa> should be near a maximum value (<> ~180°) and Jae' should be only slightly larger than the minimum value. The value of J aa' 10.5 Hz is only slightly lower than the value of approximately 11.8 Hz in cyclohexane.23 Barring no ring distortion, most of the decrease can be attributed to the substitution of nitrogen in the ring for the less electronegative carbon. One is tempted to attribute the decrease of / aa' in 2,5-diethylpiperazine to a small degree of ring distortion tending to decrease the dihedral angle between C-H bonds. However, the situation is more complex since /aa' apparently increases in the2,5-dibutyl and dioctyl derivatives. A value of J a'e of 2-4 Hz is expected.27 This constant was reliably determined only in the dimethylpiperazines analyzed.
C. N,N'-Disubstituted Compounds. Where determined, the coupling constants have the values expected on the basis of similar molecules. The geminal coupling in NjN'-dimethylpiperazine must be opposite in sign to the vicinal coupling constants for any reasonable analysis. The axial-equatorial vicinal coupling constants in molecules of this type are small, generally in the range 2.0-4.0 Hz. The value of Jcu/Jtrans is usually near 2.0 for molecules such as piperazine, which are thought to exist in a chair form.12 Lower values such as obtained for N,N'-dinitrosopiperazine may indicate the stable configuration is a distorted chair form.1416 The placement of the electronegative N -0 groups on the nitrogen leads to some double bond character in the N -N bond and subsequent flattening of the ring. On the basis of the trends in vicinal coupling constants with dihedral angle, / aa' and / ee' are decreased but / ae' increased from their values in the normal chair form. Hence, a smaller JcU/Jtrans ratio is predicted.
The relative axial-equatorial chemical shift is approximately 30 Hz except in piperazine. It is relatively independent of the particular substituent on the nitrogen. The small value of 9.6 Hz in piperazine can be attributed to a conformational preference of the lone pair for the equatorial position in this molecule. Larger substituents than hydrogen occupy the equatorial position forcing the lone pair into an axial position. Comparison of the CH2 shifts of piperazine and N,N'- dimethylpiperazine indicates that the change in voSae is largely due to an upheld shift of the axial ring protons. Similar results are known in piperidine and N-
methyl piperidine.28 The axial ring protons are anti- coplanar to the nitrogen lone pair if it is axial. The enhanced axial chemical shift has been attributed29 to the bonding of the axial lone pair with the anti-co- planar o-*(C-Hax) orbital.
The interpretation of the free energies of activation requires a model for the ground state and also transition state. It has been proposed30 that for chair <-> chair interconversion the most stable transition state would be one of the possible half chair forms as shown
below. Hendrickson30 has estimated the energies involved for the case of cyclohexane. On the basis of this work, Harris9 has correlated the AG* values for a number of cyclohexane-like molecules assuming that changes in torsional energies dominate changes in the observed enthalpies of activation. Assuming the relative axial-equatorial chemical shifts are similar, the inversion barriers in N,N-diphenyl and N,N-dini- trosopiperazine must be much lower than in N,N-di- methylpiperazine. Similar results9 have been reported at 100 MHz for N-methylpiperazine (7 / = —26°, AG* = 11.5 kcal/mol), l-methyl-4-nitrosopiperazine (Tc < — 95°), N-methylmorpholine (T0 = —31°, AG* =11.5 kcal/mol), and N-phenyl-morpholine (Tc< —95°). In each of these cases, partial delocalization of the nitrogen lone pair onto the substituent gives some double bond character to the C-N or N -N bond. The resulting flattening of the ring in the chair form is expected to reduce the torsional and bond angle strain in going from a chair to a half chair form.
The free energy of activation in N,N'-dimethylpiper- azine is relatively independent of solvent if detailed line shape methods are used in the rate analysis. The slightly higher free energy values observed in “ interacting” solvents such as methanol are probably real. For example, the free energy of activation for N-methyl- morpholine is approximately 0.3 kcal/mol lower in methylcyclohexane than in methylene chloride.9
(25) M . Karplus, J. Chem. Phys., 30, 11 (1959).(26) M. Karplus, J. Amer. Chem. Soc., 85, 2870 (1963).(27) A. A. Bothner-By, Advan. Mag. Res., 1, 195 (1965).(28) J. B. Lambert and R. G. Keske, J. Amer. Chem. Soc., 88, 620 (1966).(29) H. P. Hamlow, S. Okuda, and N. Nakagawa, Tetrahedron Lett., 37, 2553 (1964).(30) J. B. Hendrickson, J. Amer. Chem. Soc., 83, 4537 (1961).
The Journal of Physical Chemistry, Vol. 74, No. 14, 1970
Adsorbed Residues from Formic Acid and Formate Ion 2823Adsorbed Residues from Formic Acid and Formate Ion
Generated under Steady-State Potentiostatic Conditions
by Sigmund Schuldiner and Bernard J. PiersmaNaval Research Laboratory, Electrochemistry Branch, Washington, D. C. 20390 (Received December 15, 1969)
The free radicals generated when formic acid and sodium formate dehydrogenate on a clean platinum surface interact with each other and with the surface to form organic residues that hinder further dehydrogenation. Steady-state potentiostatic current density vs. potential relations were determined. B y rapid switching from potentiostatic to galvanostatic control, the number of coulombs required to oxidize the organic residue adsorbed at a given potential was determined. I t was shown that the amount of residue was time dependent for hours. Both hydrogen and increased pH lowered the number of coulombs of charge required to oxidize the organic residue and allowed higher current densities at low polarization potentials. Activation of a P t electrode by an anodic charging pulse appeared to have long-time effects on increasing the rate of formate oxidation. The effect was most pronounced in hydrogen-saturated 1 M HCOONa.
IntroductionA limitation to the use of organic fuels for low-tem
perature fuel cell applications is the formation of organic residues primarily from the free radicals which are generated at the surface. To better understand these residues it is necessary to study their formation, to characterize their electrochemical behavior, and to determine their chemical composition. Electrochemical studies of bulk species can only avoid the effects of these residues if the measurements are made on a surface before residues are significantly formed; however, such control is very limited. Since the character of the surface is constantly changing, the steady-state behavior is of real importance from both a fundamental and a practical viewpoint.
When a clean platinum electrode is exposed under open circuit conditions to formic acid or sodium formate solutions there is a rapid dehydrogenation reaction followed by a much slower interaction of adsorbed H atoms with formic acid or formate ions to give molecular hydrogen and free radicals.12 The free radicals formed by this reaction and by the initial dehydrogenation reactions interact with the surface and each other to form residues which then hinder further dehydrogenation. Upon anodic potentiostating of the Pt electrode, one would expect that any atomic hydrogen formed by dehydrogenation would be readily oxidized. A previous steady-state potentiostatic study3 on the anodic oxidation of formic acid and hydrogen in formic acid and formic acid-sulfuric acid mixtures showed that even though the initial rates of oxidation are quite high, there is a gradual decrease in rates until at steady- state, the reaction rates are considerably reduced. Apparently, the formation of free radicals also occurs under anodic potentiostatic conditions, and the resulting residue can affect the rates of oxidation of both formate species and hydrogen.
The present investigation was for the purpose of determining the relation between potential and the steady-state amount of charge required to oxidize the organic residue formed on Pt in formic acid and formate ion solutions, both under helium and hydrogen saturated conditions. High current density anodic galvanostatic pulses give charging curves that show an increase in the number of /uC/cm2 required to form a monolayer of adsorbed oxygen atoms on the surface of the Pt electrode (Pt-Oaa). This increase beyond the 420 /iC/cm2 required to form a monolayer of Pt-Oad on a clean Pt electrode plus 36 /¿C/cm2 for double layer charging is attributed4 to oxidation of the organic residue on the electrode. Such measurements only show the number of coulombs of charge required to oxidize adsorbed organic material plus water. Un- reactable species on the surface may not be oxidized by the anodic galvanostatic pulse, but may cause an increase in overvoltage for the formation of oxygen atoms. Because of the complexity of interpretation of the anodic charging curves and because qualitative identification of the organic residues or of the oxidized or desorbed products is extremely difficult, it is not possible to associate the amount of charge actually determined by this technique to specific reactants, reactions, or products. Therefore, the use of such terms as degree of surface coverage has little real meaning. Hence, in this study the number of electrons generated in the atomic oxygen adsorption region (from ~0 .9 to 1.8 V), after subtracting the monolayer contribution due to Pt-Oad plus the double layer, is expressed as
(1) J. Fahrenfort, L. L. Van Reyen, and W. M. H. Sachtler in “ The Mechanisms of Heterogeneous Catalysis,“ J. H. de Boer, Ed., Elsevier, Amsterdam, 1960, pp 23-48.(2) S. Schuldiner and B. J. Piersma, J. Catal., 13, 413 (1969).(3) S. Schuldiner, J. Electrochem. Soc., 116, 767 (1969).(4) S. Schuldiner and R. M . Roe, ibid., 110, 332 (1963).
The Journal of Physical Chemistry, Vol. 7J+, No. 14, 1970
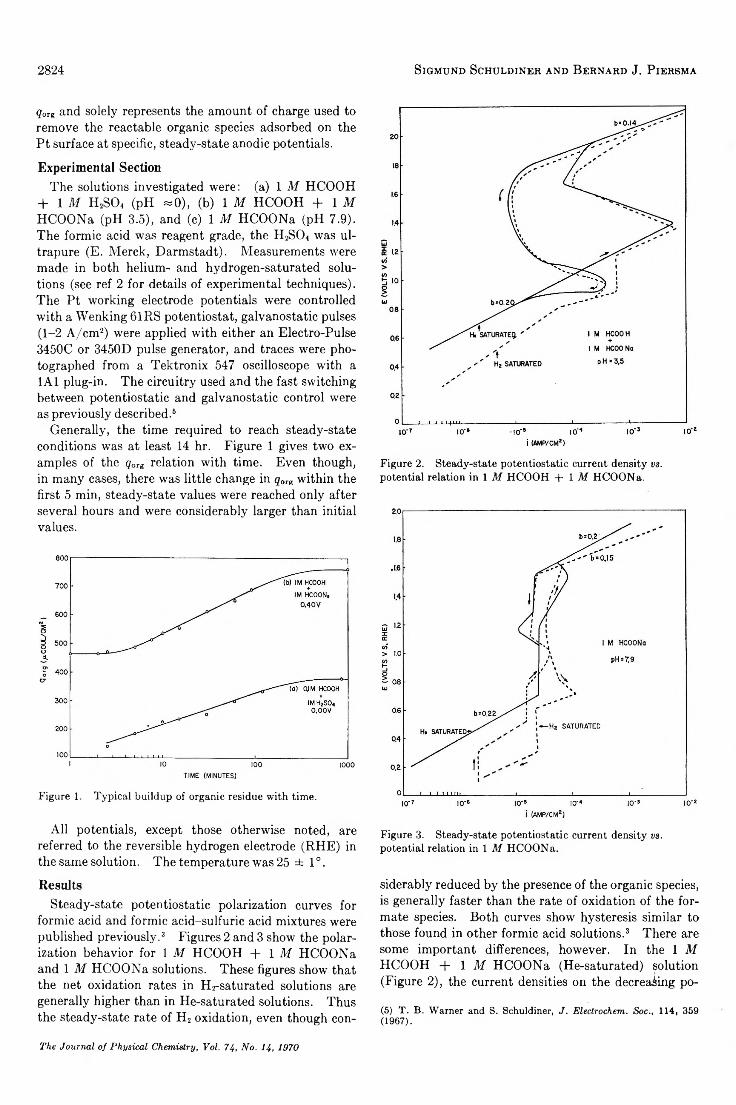
2824 Sigmund Schuldiner and Bernard J. Piersma
q0rg and solely represents the amount of charge used to remove the reactable organic species adsorbed on the Pt surface at specific, steady-state anodic potentials.
Experimental SectionThe solutions investigated were: (a) 1 M HCOOH
+ 1 M H2S04 (pH « 0 ) , (b) 1 M HCOOH + 1 M HCOONa (pH 3.5), and (c) 1 M HCOONa (pH 7.9). The formic acid was reagent grade, the H2S04 was ul- trapure (E. Merck, Darmstadt). Measurements were made in both helium- and hydrogen-saturated solutions (see ref 2 for details of experimental techniques). The Pt working electrode potentials were controlled with a Wenking 61RS potentiostat, galvanostatic pulses (1-2 A /cm 2) were applied with either an Electro-Pulse 3450C or 3450D pulse generator, and traces were photographed from a Tektronix 547 oscilloscope with a 1A1 plug-in. The circuitry used and the fast switching between potentiostatic and galvanostatic control were as previously described.6
Generally, the time required to reach steady-state conditions was at least 14 hr. Figure 1 gives two examples of the <7org relation with time. Even though, in many cases, there was little change in qOIg within the first 5 min, steady-state values were reached only after several hours and were considerably larger than initial values.
Figure 1. Typical buildup of organic residue with time.
All potentials, except those otherwise noted, are referred to the reversible hydrogen electrode (RHE) in the same solution. The temperature was 25 ± 1 ° .
ResultsSteady-state potentiostatic polarization curves for
formic acid and formic acid-sulfuric acid mixtures were published previously.3 Figures 2 and 3 show the polarization behavior for 1 M HCOOH + 1 M HCOONa and 1 M HCOONa solutions. These figures show that the net oxidation rates in H2-saturated solutions are generally higher than in He-saturated solutions. Thus the steady-state rate of H2 oxidation, even though con
Figure 2. Steady-state potentiostatic current density vs. potential relation in 1 M HCOOH + 1 1 HCOONa.
Figure 3. Steady-state potentiostatic current density vs. potential relation in 1 M HCOONa.
siderably reduced by the presence of the organic species, is generally faster than the rate of oxidation of the formate species. Both curves show hysteresis similar to those found in other formic acid solutions.3 There are some important differences, however. In the 1 M HCOOH + 1 M HCOONa (He-saturated) solution (Figure 2), the current densities on the decreasing po-
(5) T. B. Warner and S. Schuldiner, J. Electrochem. Soc., 114, 359 (1967).
The Journal of Physical Chemistry, Vol. 74, No. 14, 1970
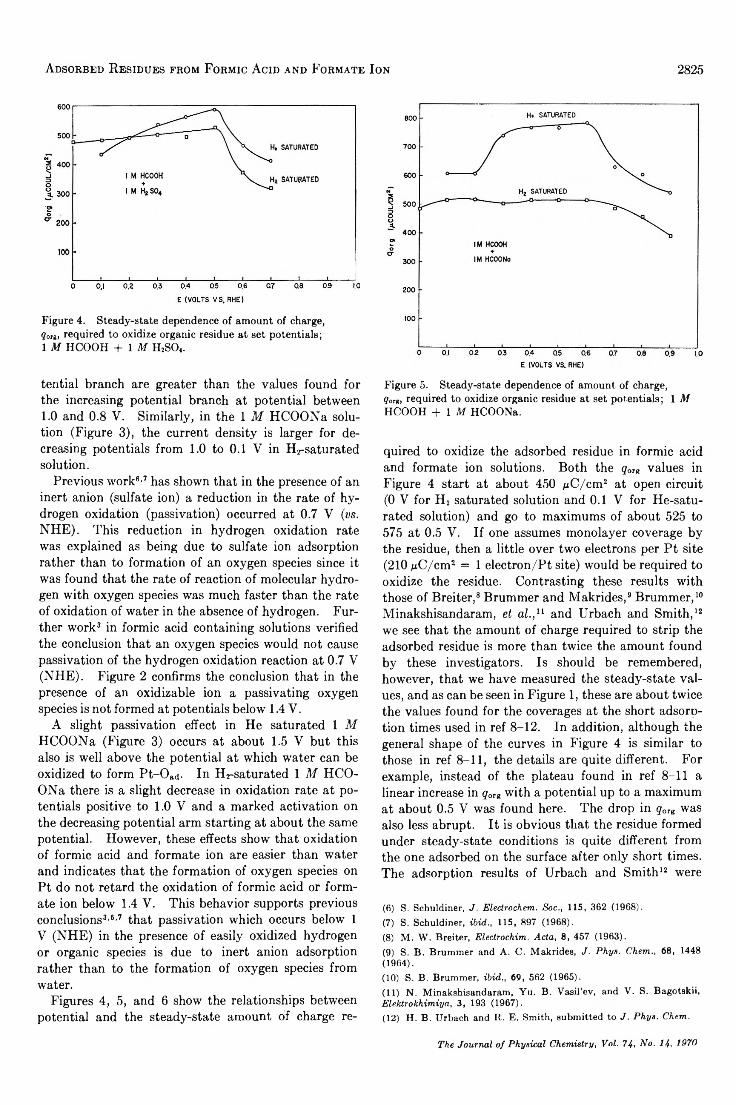
Adsorbed Residues from Formic Acid and Formate Ion 2825
Figure 4. Steady-state dependence of amount of charge, 9ore, required to oxidize organic residue at set potentials; 1 M HCOOH + 1 M H2SO<.
tential branch are greater than the values found for the increasing potential branch at potential between1.0 and 0.8 V. Similarly, in the 1 M HCOONa solution (Figure 3), the current density is larger for decreasing potentials from 1.0 to 0.1 V in H2-saturated solution.
Previous work6'7 has shown that in the presence of an inert anion (sulfate ion) a reduction in the rate of hydrogen oxidation (passivation) occurred at 0.7 V (vs. NHE). This reduction in hydrogen oxidation rate was explained as being due to sulfate ion adsorption rather than to formation of an oxygen species since it was found that the rate of reaction of molecular hydrogen with oxygen species was much faster than the rate of oxidation of water in the absence of hydrogen. Further work3 in formic acid containing solutions verified the conclusion that an oxygen species would not cause passivation of the hydrogen oxidation reaction at 0.7 V (NHE). Figure 2 confirms the conclusion that in the presence of an oxidizable ion a passivating oxygen species is not formed at potentials belowT 1.4 V.
A slight passivation effect in He saturated 1 M HCOONa (Figure 3) occurs at about 1.5 V but this also is well above the potential at which water can be oxidized to form Pt-O ad- In Hi-saturated 1 M HCOONa there is a slight decrease in oxidation rate at potentials positive to 1.0 V and a marked activation on the decreasing potential arm starting at about the same potential. However, these effects show that oxidation of formic acid and formate ion are easier than water and indicates that the formation of oxygen species on Pt do not retard the oxidation of formic acid or formate ion below 1.4 V. This behavior supports previous conclusions3'6'7 that passivation which occurs below 1 V (NHE) in the presence of easily oxidized hydrogen or organic species is due to inert anion adsorption rather than to the formation of oxygen species from water.
Figures 4, 5, and 6 show the relationships between potential and the steady-state amount of charge re
Figure 5. Steady-state dependence of amount of charge,?org, required to oxidize organic residue at set potentials; 1 M HCOOH + 1 M HCOONa.
quired to oxidize the adsorbed residue in formic acid and formate ion solutions. Both the q0rg. values in Figure 4 start at about 450 ftC/cm2 at open circuit (0 V for H2 saturated solution and 0.1 V for He-satu- rated solution) and go to maximums of about 525 to 575 at 0.5 V. If one assumes monolayer coverage by the residue, then a little over two electrons per Pt site (210 /uC/cm2 = 1 electron/Pt site) would be required to oxidize the residue. Contrasting these results with those of Breiter,8 Brummer and Makrides,9 Brummer,10 Minakshisandaram, et al.,n and Urbach and Smith,12 we see that the amount of charge required to strip the adsorbed residue is more than twice the amount found by these investigators. Is should be remembered, however, that we have measured the steady-state values, and as can be seen in Figure 1, these are about twice the values found for the coverages at the short adsorption times used in ref 8-12. In addition, although the general shape of the curves in Figure 4 is similar to those in ref 8-11, the details are quite different. For example, instead of the plateau found in ref 8-11 a linear increase in q0Tg with a potential up to a maximum at about 0.5 V was found here. The drop in qorg was also less abrupt. It is obvious that the residue formed under steady-state conditions is quite different from the one adsorbed on the surface after only short times. The adsorption results of Urbach and Smith12 were
(6) S. Schuldiner, J. Eledrochem. Soc., 115, 362 (1968).(7) S. Schuldiner, ibid., 115, 897 (1968).(8) M . W . Breiter, Electrochim. Acta, 8, 457 (1963).(9) S. B. Brummer and A. C. Makrides, J. Phys. Chem., 68, 1448 (1964).(10) S. B. Brummer, ibid., 69, 562 (1965).(11) N. Minakshisandaram, Yu. B. Vasil’ev, and V. S. Bagotskii, Elektrokhimiya, 3, 193 (1967).(12) H. B. Urbach and R. E. Smith, submitted to J. Phys. Chem.
The Journal of Physical Chemistry, Vol. 74, No. 14, 1970
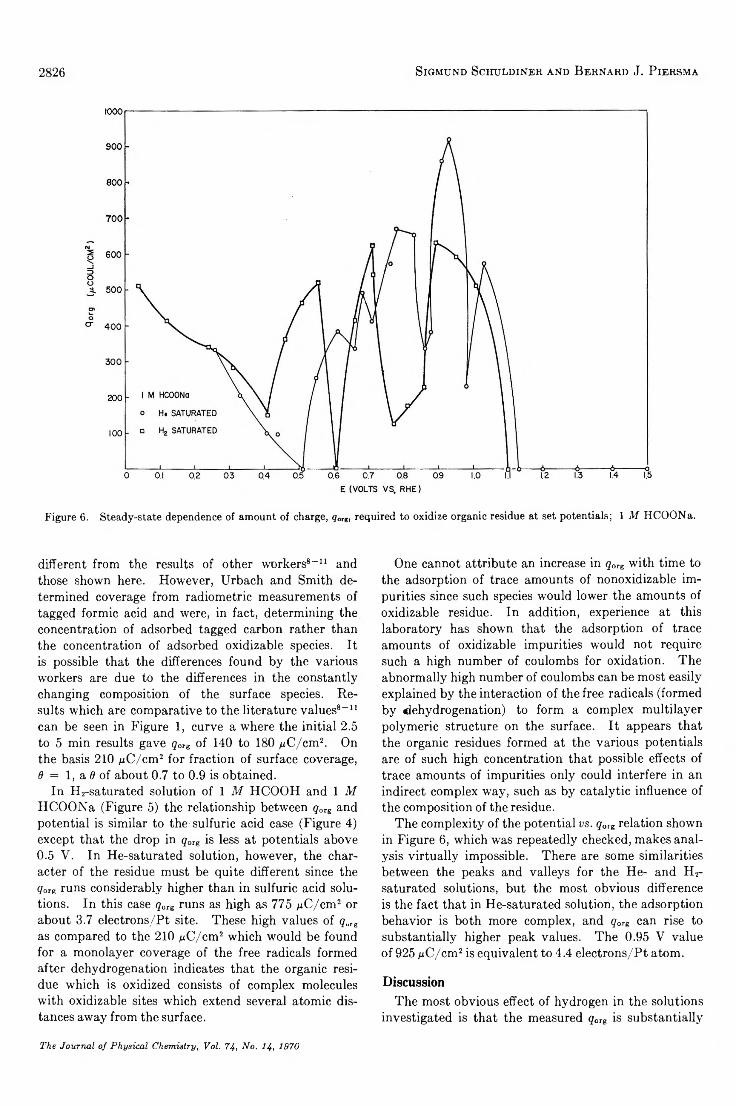
2826 Sigmund Schuldiner and Bernard J. Piersma
Figure 6. Steady-state dependence of amount of charge, qOIg, required to oxidize organic residue at set potentials; 1 M HCOONa.
different from the results of other workers8-11 and those shown here. However, Urbach and Smith determined coverage from radiometric measurements of tagged formic acid and were, in fact, determining the concentration of adsorbed tagged carbon rather than the concentration of adsorbed oxidizable species. It is possible that the differences found by the various workers are due to the differences in the constantly changing composition of the surface species. Results which are comparative to the literature values8-11 can be seen in Figure 1, curve a where the initial 2.5 to 5 min results gave gorg of 140 to 180 juC/cm2. On the basis 210 /¿C/cm2 for fraction of surface coverage, 9 = 1, a 9 of about 0.7 to 0.9 is obtained.
In Hz-saturated solution of 1 M HCOOH and 1 M HCOONa (Figure 5) the relationship between q0Ig and potential is similar to the sulfuric acid case (Figure 4) except that the drop in qorg is less at potentials above0.5 V. In He-saturated solution, however, the character of the residue must be quite different since the g0rE runs considerably higher than in sulfuric acid solutions. In this case qOTg runs as high as 775 /jC /cm 2 or about 3.7 electrons/Pt site. These high values of qUTg as compared to the 210 ¿¿C/cm2 which would be found for a monolayer coverage of the free radicals formed after dehydrogenation indicates that the organic residue which is oxidized consists of complex molecules with oxidizable sites which extend several atomic distances away from the surface.
One cannot attribute an increase in qarg with time to the adsorption of trace amounts of nonoxidizable impurities since such species would lower the amounts of oxidizable residue. In addition, experience at this laboratory has shown that the adsorption of trace amounts of oxidizable impurities would not require such a high number of coulombs for oxidation. The abnormally high number of coulombs can be most easily explained by the interaction of the free radicals (formed by dehydrogenation) to form a complex multilayer polymeric structure on the surface. It appears that the organic residues formed at the various potentials are of such high concentration that possible effects of trace amounts of impurities only could interfere in an indirect complex way, such as by catalytic influence of the composition of the residue.
The complexity of the potential vs. qOTg relation shown in Figure 6, which was repeatedly checked, makes analysis virtually impossible. There are some similarities between the peaks and valleys for the He- and H2- saturated solutions, but the most obvious difference is the fact that in He-saturated solution, the adsorption behavior is both more complex, and gorg can rise to substantially higher peak values. The 0.95 V value of 925 juC/cm2 is equivalent to 4.4 electrons/Pt atom.
DiscussionThe most obvious effect of hydrogen in the solutions
investigated is that the measured qcrg is substantially
The Journal of Physical Chemistry, Voi. 74, No. 14, 1970
Adsorbed Residues from Formic Acid and Formate Ion 2827lower at essentially all potentials. In H2-saturated solutions, the open-circuit potentials were the equilibrium hydrogen potentials, even though the charging curves taken under steady-state conditions showed no visible hydrogen oxidation region. It appears that the trace amounts of hydrogen present on the electrode were sufficient to maintain the equilibrium hydrogen reaction at open circuit.2 Some of the hydrogen from the H2 can associate with the surface and/or organic residue on the surface affecting the structure and composition of this residue. Previously reported work13 has indicated that atomic hydrogen at potentials negative to 0.3 V can interact with C 02 which then prevents oxidation of this hydrogen at potentials below 0.9 V with a high-amplitude galvanostatic pulse. The interaction of hydrogen with formic acid and formate ion is much more complex, but it is apparent that the presence of hydrogen does affect the character of the steady-state organic residue.
Another factor which may also affect the character of the organic residue is the pH, but there is no apparent simple relationship. This can be especially seen for the He-saturated solutions shown in Figures 4, 5, and 6 where the interfering effect of hydrogen is minimized. The fact that the 7.9, 1 M HCOONa solution (Figure6) is more sensitive to potential indicates that in the more alkaline solution the adsorbed species may have a stronger anionic character. At lower pH, adsorption is less dependent on potential and significant desorption does not occur below 0.5 V.
Further evidence for the pH effect on the adsorbed species and its effects on retardation of the net oxidation rate can be seen from the He-saturated potentio- static polarization curves shown in Figures 2 and 3. The higher pH results (Figure 3) show a limiting current density at 2.5 X 10⁻⁶ A /cm 2 from 0.7 to about 1.2 V followed by a range of increasing oxidation rates with increasing potential. The hysteresis effect in the decreasing potential branch is relatively small. This effect and the data in Figure 6 (which shows a strong coverage dependence on potential) indicate that the oxidation of formate ion itself is rate determining and is not limited by the amount or character of the organic residue on the surface. At potentials above 1.2 V, the surface is essentially free of the organic residue, and the rate of oxidation gradually increases as the potential is increased to about 1.5 V.
In Figure 3 there is no pronounced passivation on the increasing potential branch for the He-saturated solution. It also is significant that in H2-saturated solution, the organic residue only slightly passivates the H2 oxidation component to the oxidation rate of the formate itself on the increasing potential branch above1.0 V. In fact, there only is a little difference between the H2- and He-saturated solutions from 0.7 to 1.6 V on the increasing potential branch. On the other hand, for the decreasing potential branch there is a significant
activation effect which reaches a maximum at 0.7 V. The hysteresis at potentials below 1.0 V in H2-saturated solution show increased activity for hydrogen oxidation. This increased activity and the increased activity shown in Figure 2 for decreasing potentials are the first times such increases have been noted in the various formic acid, formate, sulfuric acid, and alkali solutions investigated here. Although these points were repeatedly checked and critical points kept potentio- stated at a given value for three to four days, it is likely that very slow changes in reaction rate may still be occurring and that eventually a return to the values on the potential increasing curve would be obtained. Another possibility is that the residue formed at high positive potentials is different from the one formed at low potentials and that the high-voltage residue does not retard hydrogen oxidation as much as does the low- voltage residue.
Contrasting the behavior in 1 M HCOONa (Figure 3) with that in 1 M HCOOH and 1 M HCOONa (Figure 2), one notes important differences. In the first place, Figure 2 shows little difference in the behavior in He- and H^saturated solutions except in the potential range from open circuit to about 0.9 V. At lower potentials the current densities are higher in the presence of H2. The increased reaction rates for both the data shown in Figure 2 and 3 are due to the contribution cf H2 oxidation which is faster in this potential range than is the oxidation of formate species. The fact that the net oxidation rate in Figure 2 reaches a peak of about 7 X 10 ~3 A /cm 2 at about 1.4 V is of interest because this rate of oxidation is 3.5 times faster than the maximum rate of oxidation of hydrogen in sulfuric acid solution.6 The pronounced passivation which occurs at higher potentials can be explained by adsorbed oxygen atoms generated by the oxidation of water. The marked hysteresis for the decreasing potential arm indicates the strong effect of dermasorbed oxygen atoms on the reaction rates.
ConclusionsThe determination of adsorption isotherms8-12 im
plies an equilibrium between an adsorbed or dissociated species and the original compound in solution. This investigation has shown that such equilibria do not exist for formic acid or formates. There is an irreversible dehydrogenation followed by free radical interaction to form a complex residue at the surface that appears to be dependent on the potential sequence and the presence of H2. It appears that the “ adsorption isotherms” for such systems are, in fact, of kinetic rather than thermodynamic significance.
The work reported here shows that at low polarization potentials the rates of hydrogen, formic acid, and
(13) B. J. Piersma, T. B. Warner, and S. Schuldiner, J. Eledrochem. Soc., 113, 841 (1966).
The Journal of Physical Chemistry, Vol. 74, No. 14, 1970
2828 S. Sircar and A. L. M yers
formate ion oxidation are strongly retarded by the organic residues formed on the surface. This most likely occurs by covering sites at which dehydrogenation of the organic material can take place.2 Dehydrogenation can produce easily oxidizable H atoms which make an organic species an effective fuel for fuel cell applications at low polarization. It appears that oxidation of carbon itself can readily occur at higher potentials, but this reaction would be of no obvious value for fuel cell operation. Dissociation of organic fuels to atomic hydrogen also implies that full low-temperature oxidation of the fuel to C 02 and H20 would not be practicable in many cases, and that a large part of the chem? energy of the fuel could not be utilized in the general of electricity.
Some degree of control of the organic residue results from the presence of molecular hydrogen and by changing the pH. Hydrogen lowers the number of coulombs of charge required to oxidize the organic residue and allows higher anodic current densities at low polarization potentials.
Activation of a Pt electrode by polarizing to high anodic potentials appears to have long-time effects on increasing the rate of fuel oxidation. This effect is most pronounced in H2-saturated 1 M HCOONa.
Acknowledgments. The authors are indebted to a newer and to Drs. Murray Rosen and David R. in for their careful reading and criticisms of this
.per.
Statistical Thermodynamics of Adsorption from Liquid
Mixtures on Solids. I. Ideal Adsorbed Phase
by S. Sircar and A. L. MyersSchool of Chemical Engineering, University of Pennsylvania, Philadelphia, Pennsylvania 19104 (Received June 4, 1969)
The cell model is applied to the adsorption of binary liquid mixtures on solids. The theory is based upon the assumption of an ideal adsorbed phase. Experimental data are reported for the adsorption of seven binary liquid mixtures on silica gel and on activated carbon at 30°. Comparison of the theory with experiment shows that the model is adequate for liquids which form ideal or nearly ideal liquid mixtures.
TheoryThe surface thermodynamics of adsorbed solutions
has been studied for the gas-solid interface.1 The concept of an ideal adsorbed solution has been useful not only for classifying observed data but for predictive purposes as well.2 Unfortunately, the results obtained for mixed gas adsorption do not apply to adsorbed liquid solutions. The reason is that the amount adsorbed at the liquid-solid interface is not a meaningful experimental variable.3 The pertinent experimental variable for the liquid-solid interface is the surface excess. The purpose of this work is the derivation of an expression for the surface excess for the case of an ideal adsorbed phase.
The Thermodynamic System. The system is a liquid phase (the adsorbate) in contact with a solid phase (the adsorbent). The portion of the liquid phase in close proximity to the adsorbent is called the adsorbed phase. Variables which refer to the adsorbed phase will be
identified by the prime symbol ('). The adsorbate and adsorbent are assumed to be mutually insoluble.
Assumptions. The following assumptions are made for the derivation of an expression for the surface excess, (a) The adsorbate may be divided into two parts: an adsorbed phase of N' molecules and a bulk phase of N molecules, (b) The total number of molecules in the adsorbed phase is a constant (N ' = M ). (c) The cell model, with one molecule in each cell, is used for the adsorbed phase and for the bulk phase, (d) The potential energy for the adsorbate-surface interaction, U¡s', is approximated by the square-well potential. For the ith component, U¡s' has a constant value if the molecule is in the adsorbed phase and U¡s has a value of zero if the molecule is in the bulk phase, (e) Adsorbate-adsorbate molecular
(1) A. L. Myers and J. M. Prausnitz, AIChE J., 11, 121 (1965).(2) A. L. Myers, Ind. Eng. Chem., 60, 45 (1968).(3) S. Sircar and A. L. Myers, AIChE J., in press.
The Journal of Physical Chemistry, Vol. 74, No. 14, 1970
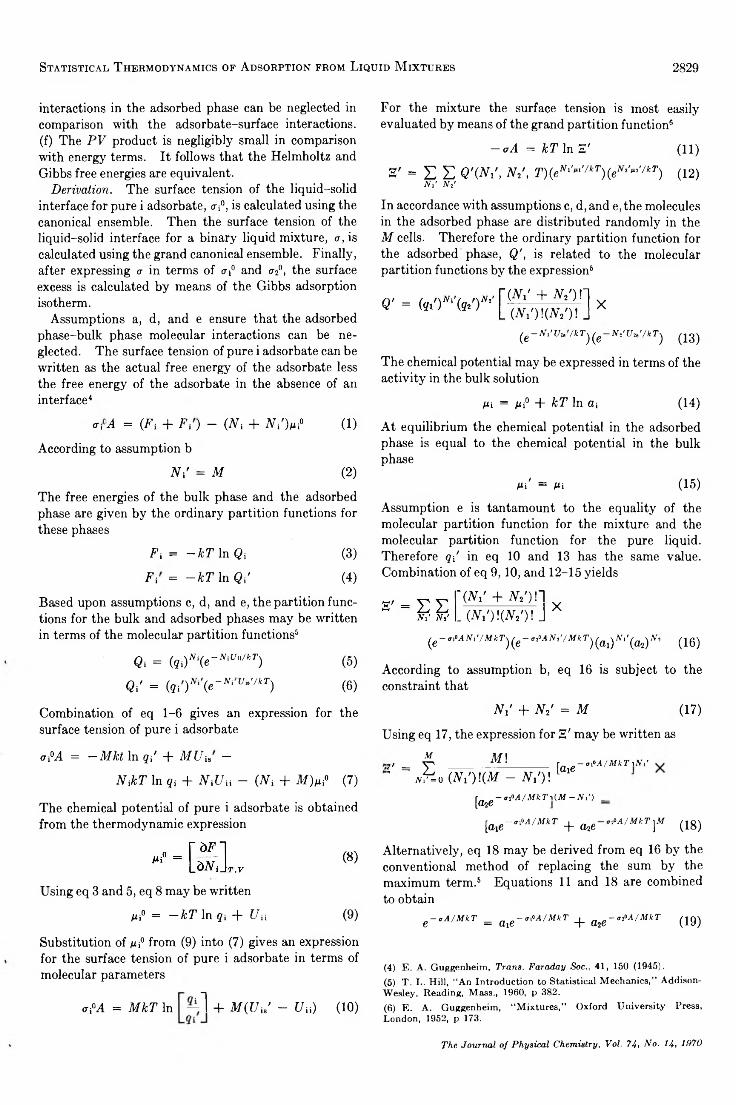
Statistical Thermodynamics of Adsorption from Liquid M ixtures 2829
interactions in the adsorbed phase can be neglected in comparison with the adsorbate-surface interactions, (f) The PV product is negligibly small in comparison with energy terms. It follows that the Helmholtz and Gibbs free energies are equivalent.
Derivation. The surface tension of the liquid-solid interface for pure i adsorbate, d , is calculated using the canonical ensemble. Then the surface tension of the liquid-solid interface for a binary liquid mixture, a, is calculated using the grand canonical ensemble. Finally, after expressing <j in terms of <ri° and 0-2°, the surface excess is calculated by means of the Gibbs adsorption isotherm.
Assumptions a, d, and e ensure that the adsorbed phase-bulk phase molecular interactions can be neglected. The surface tension of pure i adsorbate can be written as the actual free energy of the adsorbate less the free energy of the adsorbate in the absence of an interface4
<T'iA = (Fi + F i) - (A ; + AY)m;° (1)
According to assumption b
AY = M (2)
The free energies of the bulk phase and the adsorbed phase are given by the ordinary partition functions for these phases
F; = -k T In Qi (3)
Fi = —kT In Q i (4)
Based upon assumptions c, d, and e, the partition functions for the bulk and adsorbed phases may be written in terms of the molecular partition functions5
Qi = (qi)N,( e -NiUu/kT) (5)
Qi' = (qi')N' ( e - N' Ui-'/kT) (6)
For the mixture the surface tension is most easily evaluated by means of the grand partition function6
— a A = kT In S ' (11)
H' = EE QW, AY, T)(eNlW/kT)(eNlW/kT) (12)N i ' AV
In accordance with assumptions c, d, and e, the molecules in the adsorbed phase are distributed randomly in the M cells. Therefore the ordinary partition function for the adsorbed phase, Q', is related to the molecular partition functions by the expression5
Q' =(AY + AY)H (AY)!(AY)! J X
(e~Nl'Vu/kT)(e N,'U!,’/kT) (13)
The chemical potential may be expressed in terms of the activity in the bulk solution
Mi = Mi0 + kT In ai (14)
At equilibrium the chemical potential in the adsorbed phase is equal to the chemical potential in the bulk phase
Mi' = Mi (15)
Assumption e is tantamount to the equality of the molecular partition function for the mixture and the molecular partition function for the pure liquid. Therefore qi in eq 10 and 13 has the same value. Combination of eq 9,10, and 12-15 yields
~(AY + A Y )!1 - (AY)!(AY)! J X
( g - maA Ni'/MkT^ ( g - M N i'/ M k T) ( ^ A V ^ ) V , ( l ß )
According to assumption b, eq 16 is subject to the constraint that
Combination of eq 1-6 gives an expression for the surface tension of pure i adsorbate
<7i°A = —Mkt In qi + MUu —
NikT In g; + A Y Y - (AL + M)m° (7)
The chemical potential of pure i adsorbate is obtained from the thermodynamic expression
Using eq 3 and 5, eq 8 may be written
Mi° = — kT In qi + Un (9)
Substitution of mi0 from (9) into (7) gives an expression for the surface tension of pure i adsorbate in terms of molecular parameters
<rM = MkT In 1 + M (Uii - Un) (10)
N i + N i = M (17)
Using eq 17, the expression for S ' may be written as
„ = f Ml' Nh o (Ni)\(M - Ni)\ [die - a P A / M k T i N i '
[<he— m0A/MkT-\(M — NV) _
[cue-a fA / M k T + <he <T2°A/MkT ]Mr (is)
Alternatively, eq 18 may be derived from eq 16 by the conventional method of replacing the sum by the maximum term.5 Equations 11 and 18 are combined to obtain
e - ,A / M k T = ^ - ' M / M k T + ^ - ^ A / M k T (1 Q )
(4) E. A. Guggenheim, Trans. Faraday Soc., 41, 150 (1945).(5) T. L. Hill, “ An Introduction to Statistical Mechanics,” Addison- Wesley, Reading, Mass., 1960, p 382.(6) E. A. Guggenheim, “ Mixtures,” Oxford University Press, London, 1952, p 173.
The Journal of Physical Chemistry, Vol. 74, No. 14, 1070
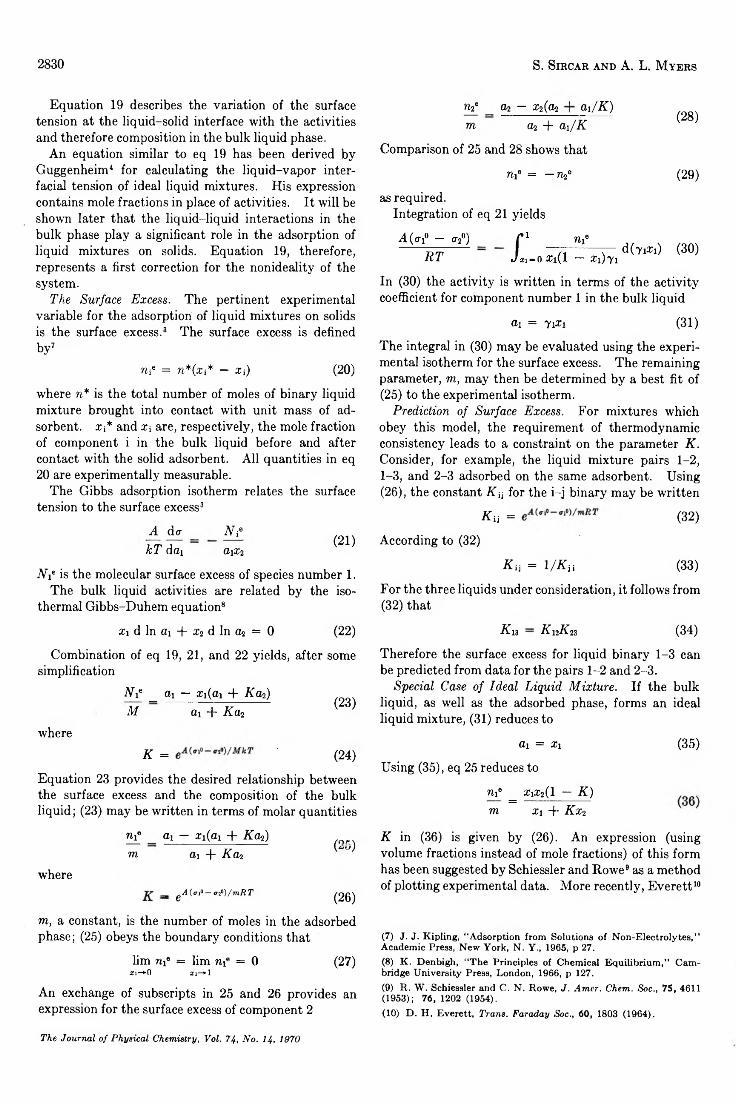
2830 S. Sircar and A. L. M yers
Equation 19 describes the variation of the surface tension at the liquid-solid interface with the activities and therefore composition in the bulk liquid phase.
An equation similar to eq 19 has been derived by Guggenheim4 for calculating the liquid-vapor interfacial tension of ideal liquid mixtures. His expression contains mole fractions in place of activities. It will be shown later that the liquid-liquid interactions in the bulk phase play a significant role in the adsorption of liquid mixtures on solids. Equation 19, therefore, represents a first correction for the nonideality of the system.
The Surface Excess. The pertinent experimental variable for the adsorption of liquid mixtures on solids is the surface excess.3 The surface excess is defined by7
n f = n*(xi* — Xi) (20)
where n* is the total number of moles of binary liquid mixture brought into contact with unit mass of adsorbent. Xi* and Xi are, respectively, the mole fraction of component i in the bulk liquid before and after contact with the solid adsorbent. All quantities in eq 20 are experimentally measurable.
The Gibbs adsorption isotherm relates the surface tension to the surface excess3
A do- N fkT dai aiX'i
(21)
Nie is the molecular surface excess of species number 1.The bulk liquid activities are related by the iso
thermal Gibbs-Duhem equation8
n f _ a2 — x2(a2 ai/K) m 02 + ai/K
Comparison of 25 and 28 shows that
(28)
n f = — n f
as required.Integration of eq 21 yields
(29)
A (cr 1° — 0-2°) RT
n f~ xi)yi
d(7iXi) (30)
In (30) the activity is written in terms of the activity coefficient for component number 1 in the bulk liquid
Ri = 7iXi (31)
The integral in (30) may be evaluated using the experimental isotherm for the surface excess. The remaining parameter, m, may then be determined by a best fit of(25) to the experimental isotherm.
Prediction of Surface Excess. For mixtures which obey this model, the requirement of thermodynamic consistency leads to a constraint on the parameter K. Consider, for example, the liquid mixture pairs 1-2, 1-3, and 2-3 adsorbed on the same adsorbent. Using(26) , the constant K ¡j for the i-j binary may be written
Ka = (32)
According to (32)
K a = 1/Ka (33)
For the three liquids under consideration, it follows from (32) that
xi d In ai + Xi d In a? = 0 (22) Kl 3 — K 12K 2Í (34)
Combination of eq 19, 21, and 22 yields, after some simplification
N f _ 01 — xi{a\ + Kaf) M ai + Ken
(23)
whereK = (24)
Equation 23 provides the desired relationship between the surface excess and the composition of the bulk liquid ; (23) may be written in terms of molar quantities
Therefore the surface excess for liquid binary 1-3 can be predicted from data for the pairs 1-2 and 2-3.
Special Case of Ideal Liquid Mixture. If the bulk liquid, as well as the adsorbed phase, forms an ideal liquid mixture, (31) reduces to
ai = Xi (35)
Using (35), eq 25 reduces to
n f = x M l - K) m x\ -f- Kx 2
n f ax — xi{ai + Kaf) /nrsI V (w )m «i + Kd2
where_ gA(m« - »2“)/mBT (26)
m, a constant, is the number of moles in the adsorbed phase; (25) obeys the boundary conditions that
lim n f = lim n f = 0 (27)£!—►() x i—►!
An exchange of subscripts in 25 and 26 provides an expression for the surface excess of component 2
K in (36) is given by (26). An expression (using volume fractions instead of mole fractions) of this form has been suggested by Schiessler and Rowe9 as a method of plotting experimental data. More recently, Everett10
(7) J. J. Kipling, “ Adsorption from Solutions of Non-Electrolytes,” Academic Press, New York, N. Y., 1965, p 27.(8) K . Denbigh, “ The Principles of Chemical Equilibrium,” Cambridge University Press, London, 1966, p 127.(9) R. W. Schiessler and C. N. Rowe, J. Amer. Chem. Soc., 75, 4611 (1953); 76, 1202 (1954).(10) D. H. Everett, Trans. Faraday Soc., 60, 1803 (1964).
The Journal of Physical Chemistry, Vol. 74, No. 14, 1970
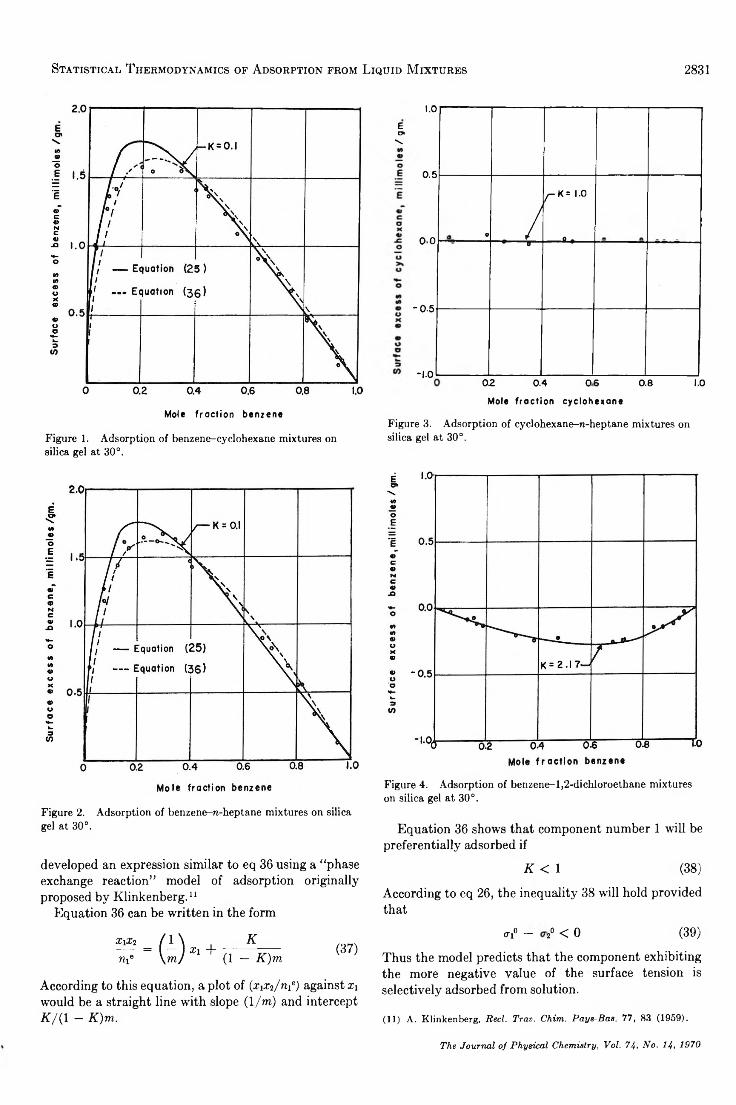
Statistical Thermodynamics of Adsorption from Liquid M ixtures 2831
Mole fraction benzene
Figure 1. Adsorption of benzene-cyclohexane mixtures on silica gel at 30°.
Eots
1.0
0.5
00
-0-5
-1-0
_____! , /^K= 1.0
o r* b
02 0.4 0 6 0.8Mole fraction cyclohexane
1.0
Figure 3. Adsorption of cyclohexane-n-heptane mixtures on silica gel at 30°.
Figure 2. Adsorption of benzene-n-heptane mixtures on silica gel at 30°.
developed an expression similar to eq 36 using a “ phase exchange reaction” model of adsorption originally proposed by Klinkenberg.11
Equation 36 can be written in the form
xixi (1 \ , K— r = ( — ) x\ + — —— (37)n ie \rrij (1 — K)m
According to this equation, a plot of {xiXi/nf) against X\ would be a straight line with slope (1/ra) and intercept K/( 1 - K)m.
Figure 4. Adsorption of benzene-1,2-dichloroethane mixtures on silica gel at 30°.
Equation 36 shows that component number 1 will be preferentially adsorbed if
K < 1 (38)
According to eq 26, the inequality 38 will hold provided that
ci0 — 2° < 0 (39)
Thus the model predicts that the component exhibiting the more negative value of the surface tension is selectively adsorbed from solution.
(11) A. Klinkenberg, Reel. Tran. Chim. Pays-Bas, 77, 83 (1959).
The Journal of Physical Chemistry, Vol. 74-, No. 14» 1970
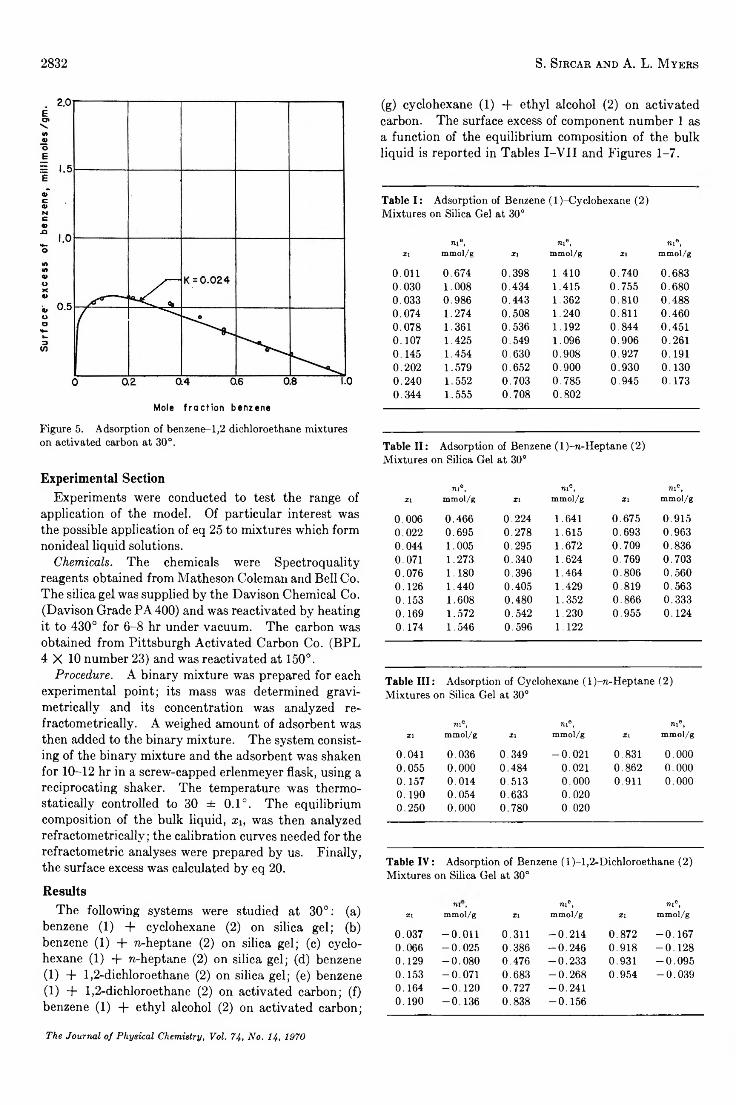
2832 S. Sircar and A. L. M yers
Mole fraction benzene
Figure 5. Adsorption of benzene-1,2 dichloroethane mixtures on activated carbon at 30°.
Experimental SectionExperiments were conducted to test the range of
application of the model. Of particular interest was the possible application of eq 25 to mixtures which form nonideal liquid solutions.
Chemicals. The chemicals were Spectroquality reagents obtained from Matheson Coleman and Bell Co. The silica gel was supplied by the Davison Chemical Co. (Davison Grade PA 400) and was reactivated by heating it to 430° for 6-8 hr under vacuum. The carbon was obtained from Pittsburgh Activated Carbon Co. (BPL 4 X 10 number 23) and was reactivated at 150°.
Procedure. A binary mixture was prepared for each experimental point; its mass was determined gravi- metrically and its concentration was analyzed re- fractometrically. A weighed amount of adsorbent was then added to the binary mixture. The system consisting of the binary mixture and the adsorbent was shaken for 10-12 hr in a screw-capped erlenmeyer flask, using a reciprocating shaker. The temperature was thermostatically controlled to 30 ± 0.1°. The equilibrium composition of the bulk liquid, Xi, was then analyzed refractometrically; the calibration curves needed for the refractometric analyses were prepared by us. Finally, the surface excess was calculated by eq 20.
ResultsThe following systems were studied at 30°: (a)
benzene (1) + cyclohexane (2) on silica gel; (b) benzene (1) + n-heptane (2) on silica gel; (c) cyclohexane (1) + n-heptane (2) on silica gel; (d) benzene (1) + 1,2-dichloroethane (2) on silica gel; (e) benzene (1) + 1,2-dichloroethane (2) on activated carbon; (f) benzene (1) + ethyl alcohol (2) on activated carbon;
(g) cyclohexane (1) + ethyl alcohol (2) on activated carbon. The surface excess of component number 1 as a function of the equilibrium composition of the bulk liquid is reported in Tables I-V II and Figures 1-7.
Table I : Adsorption of Benzene (l)-Cyclohexane (2)Mixtures on Silica Gel at 30°
XInie,
mmol/g XI
0 .0 11 0 .6 7 4 0 .3 9 80 .0 3 0 1 .0 0 8 0 .4 3 40 .0 3 3 0 .9 8 6 0 .4 4 30 .0 7 4 1 .2 74 0 .5 0 80 .0 7 8 1 .361 0 .5 3 60 .1 0 7 1 .4 25 0 .5 4 90 .1 4 5 1 .454 0 .6 3 00 .2 0 2 1 .579 0 .6 5 20 .2 4 0 1 .5 52 0 .7 0 30 .3 4 4 1 .5 55 0 .7 0 8
ni», me.mmol/g Xi mmol/g
1 .4 10 0 .7 4 0 0 .6 8 31 .4 15 0 .7 5 5 0 .6 8 01 .3 62 0 .8 1 0 0 .4 8 81 .2 4 0 0 .8 11 0 .4 6 01 .1 92 0 .8 4 4 0 .4 5 11 .0 96 0 .9 0 6 0 .2 6 10 .9 0 8 0 .9 2 7 0 .1 9 10 .9 0 0 0 .9 3 0 0 .1 3 00 .7 8 50 .8 0 2
0 .9 4 5 0 .1 7 3
Table II: Adsorption of Benzene (l)-n-Heptane (2) Mixtures on Silica Gel at 30°
me,X I mmol/g X I
0 .0 0 6 0 .4 6 6 0 .2 2 40 .0 2 2 0 .6 9 5 0 .2 7 80 .0 4 4 1 .005 0 .2 9 50 .0 71 1 .2 73 0 .3 4 00 .0 7 6 1 .1 80 0 .3 960 .1 2 6 1 .4 40 0 .4 050 .1 5 3 1 .6 08 0 .4 8 00 .1 6 9 1 .5 72 0 .5 4 20 .1 7 4 1 .5 46 0 .5 9 6
me, n i e ,
mmol/g X I mmol/g
1 .641 0 .6 7 5 0 .9 1 51 .615 0 .6 9 3 0 .9 6 31 .6 72 0 .7 0 9 0 .8 3 61 .6 24 0 .7 6 9 0 .7 0 31 .4 64 0 .8 0 6 0 .5 6 01 .4 29 0 .8 1 9 0 .5 6 31 .352 0 .8 6 6 0 .3 3 31 .2 301 .122
0 .9 5 5 0 .1 2 4
Table III: Adsorption of Cyclohexane (l)-re-Heptane (2) Mixtures on Silica Gel at 30°
TU»,XI mmol/g
0 .0 41 0 .0 3 60 .0 5 5 0 .0 0 00 .1 5 7 0 .0 1 40 .1 9 0 0 .0 5 40 .2 5 0 0 .0 0 0
me,XI mmol/g
0 .3 4 9 - 0 .0 2 10 .4 8 4 0 .0210 .5 1 3 0 .0 0 00 .6 3 3 0 .0 2 00 .7 8 0 0 .0 2 0
me.XI mmol/g
0 .8 31 0 .0 0 00 .8 6 2 0 .0 0 00 .911 0 .0 0 0
Table IV : Adsorption of Benzene (1)-1,2-Dichloroethane (2) Mixtures on Silica Gel at 30°
XIm ,
mmol/g
0 .0 3 7 - 0 . 0 1 10 .0 6 6 - 0 . 0 2 50 .1 2 9 - 0 . 0 8 00 .1 5 3 - 0 .0 7 10 .1 6 4 - 0 . 1 2 00 .1 9 0 - 0 . 1 3 6
nie,XI mmol/g
0 .3 11 - 0 . 2 1 40 .3 86 - 0 . 2 4 60 .4 7 6 - 0 . 2 3 30 .6 8 3 - 0 . 2 6 80 .7 2 7 - 0 . 2 4 10 .8 3 8 - 0 . 1 5 6
n i e .
Xl mmol/g
0 .8 7 2 - 0 . 1 6 70 .9 1 8 - 0 . 1 2 80 .9 31 - 0 . 0 9 50 .9 5 4 - 0 . 0 3 9
The Journal of Physical Chemistry, Voi. 74, No. 14, 1970
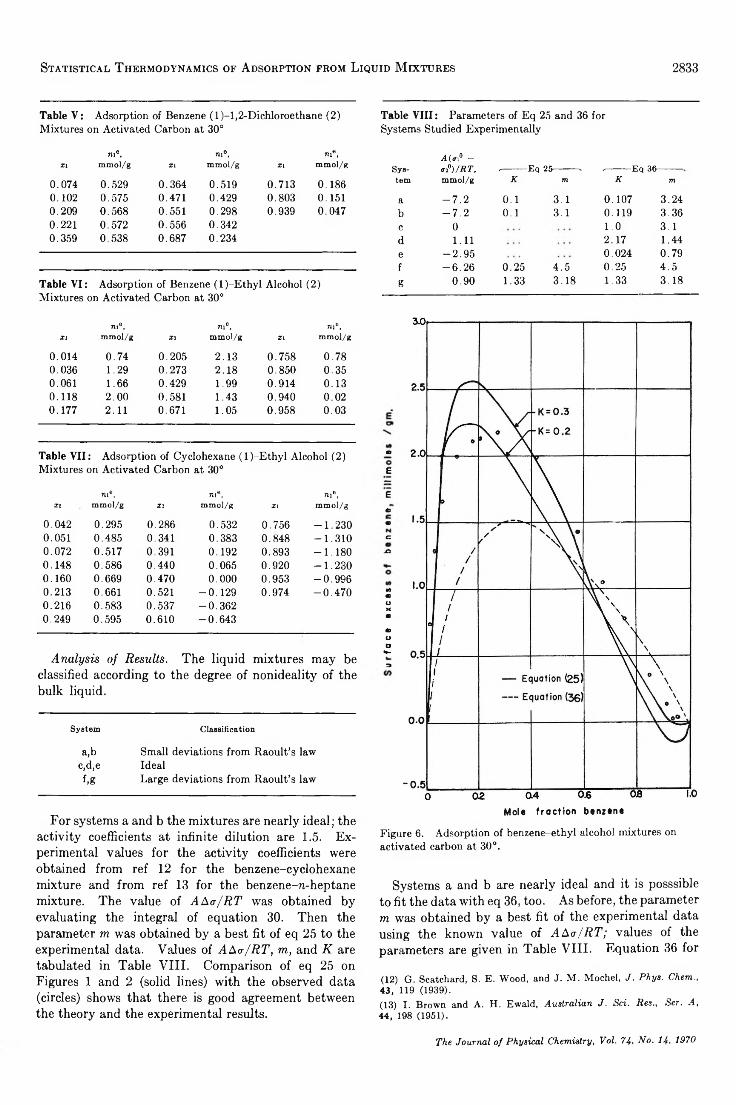
Statistical T hermodynamics of Adsorption from Liquid M ixtures 2833
Table V : Adsorption of Benzene (l)-l,2-Dichloroethane (2) Mixtures on Activated Carbon at 30°
me, me, ni®,X I mmol/g X I mmol/g X I mmol/g
0.074 0.529 0.364 0.519 0.713 0.1860.102 0.575 0.471 0.429 0.803 0.1510.209 0.568 0.551 0.298 0.939 0.0470.221 0.572 0.556 0.3420.359 0.538 0.687 0.234
Table VI : Adsorption of Benzene (l)-Ethyl Alcohol (2)Mixtures on Activated Carbon at 30°
m®, m®, m®,X I mmol/g X I mmol/g x i mmol/g
0.014 0.74 0.205 2.13 0.758 0.780.036 1.29 0.273 2.18 0.850 0.350.061 1.66 0.429 1.99 0.914 0.130.118 2.00 0.581 1.43 0.940 0.020.177 2.11 0.671 1.05 0.958 0.03
Table VII: Adsorption of Cyclohexane (l)-Ethyl Alcohol (2) "Mixtures on Activated Carbon at 30° E
X I
m e,mmol/g X I
711®,mmol/g X l
Til®,mmol/g
E0
0 .0 4 2 0 .2 9 5 0 .2 8 6 0 .5 3 2 0 .7 5 6 - 1 . 2 3 0 ®0 .0 51 0 .4 8 5 0 .3 41 0 .3 8 3 0 .8 4 8 - 1 . 3 1 0 c0 .0 7 2 0 .5 1 7 0 391 0 .1 9 2 0 .8 9 3 - 1 . 1 8 0 -Q
0 .1 4 8 0 .5 8 6 0 .4 4 0 0 .0 6 5 0 .9 2 0 - 1 . 2 3 00 .1 6 0 0 .6 6 9 0 .4 7 0 0 .0 0 0 0 .9 5 3 - 0 . 9 9 60 .2 1 3 0 .6 61 0 .5 21 - 0 . 1 2 9 0 .9 7 4 - 0 . 4 7 0 (ft•0 .2 1 60 .2 49
0 .5 8 30 .5 9 5
0 .5 3 70 .6 1 0
- 0 . 3 6 2- 0 . 6 4 3
OX00
Analysis of Results. The liquid mixtures may be
OO«8-
3classified according to the degree of nonideality of the bulk liquid.
System Classification
a,b Small deviations from Raoult’s lawc,d,e Idealf,g Large deviations from Raoult’s law
Table VIII: Parameters of Eq 25 and 36 for Systems Studied Experimentally
A(ff i° —Sys- <n°)/RT, .---------- Eq 25— -— - ,----------- Eq 3frtern mmol/g K m K m
a -7 .2 0.1 3.1 0.107 3.24b -7 .2 0.1 3.1 0.119 3.36c 0 1.0 3.1d 1.11 2.17 1.44e -2 .95 0.024 0.79f -6 .26 0.25 4.5 0.25 4.5g 0.90 1.33 3.18 1.33 3.18
For systems a and b the mixtures are nearly ideal; the activity coefficients at infinite dilution are 1.5. Experimental values for the activity coefficients were obtained from ref 12 for the benzene-cyclohexane mixture and from ref 13 for the benzene-n-heptane mixture. The value of AAa/RT was obtained by evaluating the integral of equation 30. Then the parameter m was obtained by a best fit of eq 25 to the experimental data. Values of AAa/RT, m, and K are tabulated in Table VIII. Comparison of eq 25 on Figures 1 and 2 (solid lines) with the observed data (circles) shows that there is good agreement between the theory and the experimental results.
Mole fraction benzene
Figure 6. Adsorption of benzene-ethyl alcohol mixtures on activated carbon at 30°.
Systems a and b are nearly ideal and it is posssible to fit the data with eq 36, too. As before, the parameter m was obtained by a best fit of the experimental data using the known value of AAa/RT; values of the parameters are given in Table VIII. Equation 36 for
(12) G. Scatchard, S. E. Wood, and J. M . Mochel, J. Phys. Chem.,43, 119 (1939).(13) I. Brown and A. H. Ewald, Australian J. Sci. Res., Ser. A,44, 198 (1951).
The Journal of Physical Chemistry, Voi. 74, No. 14, 1970
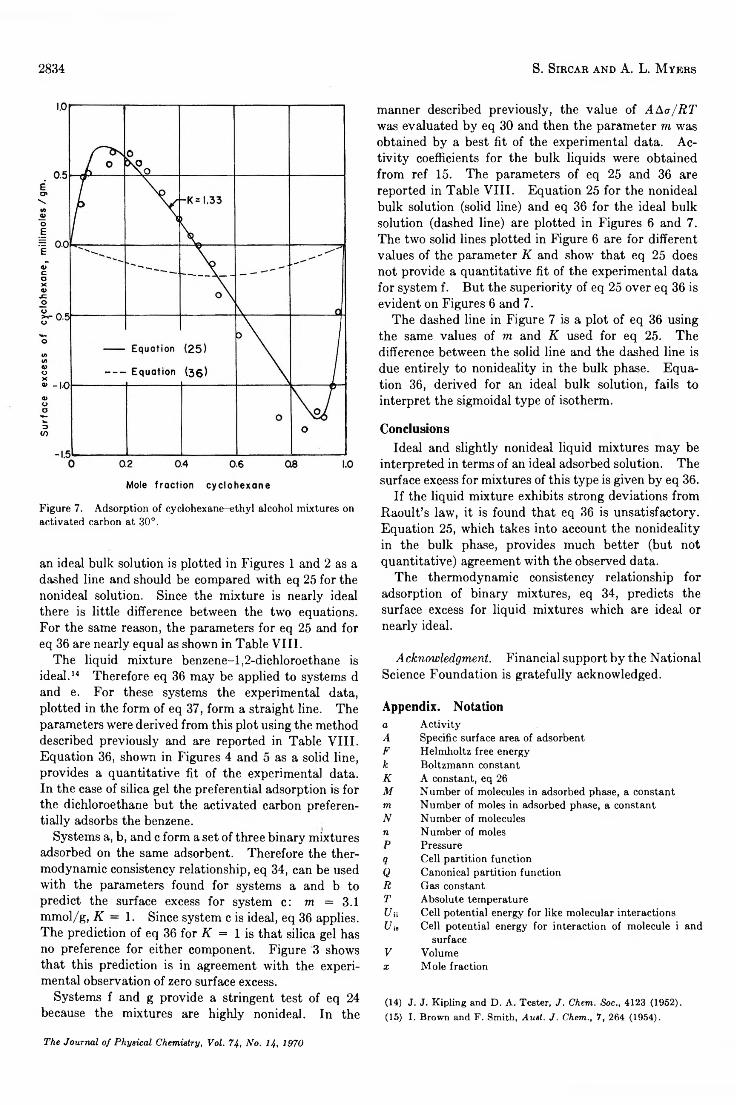
2834 S. Sircar and A. L. M yers
Figure 7. Adsorption of cyclohexane-ethyl alcohol mixtures on activated carbon at 30°.
an ideal bulk solution is plotted in Figures 1 and 2 as a dashed line and should be compared with eq 25 for the nonideal solution. Since the mixture is nearly ideal there is little difference between the two equations. For the same reason, the parameters for eq 25 and for eq 36 are nearly equal as shown in Table VIII.
The liquid mixture benzene-1,2-dichloroethane is ideal.14 Therefore eq 36 may be applied to systems d and e. For these systems the experimental data, plotted in the form of eq 37, form a straight line. The parameters were derived from this plot using the method described previously and are reported in Table VIII. Equation 36, shown in Figures 4 and 5 as a solid line, provides a quantitative fit of the experimental data. In the case of silica gel the preferential adsorption is for the dichloroethane but the activated carbon preferentially adsorbs the benzene.
Systems a, b, and c form a set of three binary mixtures adsorbed on the same adsorbent. Therefore the thermodynamic consistency relationship, eq 34, can be used with the parameters found for systems a and b to predict the surface excess for system c: m = 3.1 mmol/g, K — 1. Since system c is ideal, eq 36 applies. The prediction of eq 36 for K = 1 is that silica gel has no preference for either component. Figure 3 shows that this prediction is in agreement with the experimental observation of zero surface excess.
Systems f and g provide a stringent test of eq 24 because the mixtures are highly nonideal. In the
manner described previously, the value of AAa/RT was evaluated by eq 30 and then the parameter m was obtained by a best fit of the experimental data. Activity coefficients for the bulk liquids were obtained from ref 15. The parameters of eq 25 and 36 are reported in Table VIII. Equation 25 for the nonideal bulk solution (solid line) and eq 36 for the ideal bulk solution (dashed line) are plotted in Figures 6 and 7. The two solid lines plotted in Figure 6 are for different values of the parameter K and show that eq 25 does not provide a quantitative fit of the experimental data for system f . But the superiority of eq 25 over eq 36 is evident on Figures 6 and 7.
The dashed line in Figure 7 is a plot of eq 36 using the same values of m and K used for eq 25. The difference between the solid line and the dashed line is due entirely to nonideality in the bulk phase. Equation 36, derived for an ideal bulk solution, fails to interpret the sigmoidal type of isotherm.
ConclusionsIdeal and slightly nonideal liquid mixtures may be
interpreted in terms of an ideal adsorbed solution. The surface excess for mixtures of this type is given by eq 36.
If the liquid mixture exhibits strong deviations from Raoult’s law, it is found that eq 36 is unsatisfactory. Equation 25, which takes into account the nonideality in the bulk phase, provides much better (but not quantitative) agreement with the observed data.
The thermodynamic consistency relationship for adsorption of binary mixtures, eq 34, predicts the surface excess for liquid mixtures which are ideal or nearly ideal.
A cknowledgment. Financial support by the National Science Foundation is gratefully acknowledged.
Appendix. Notationa ActivityA Specific surface area of adsorbentF Helmholtz free energyk Boltzmann constantK A constant, eq 26M Number of molecules in adsorbed phase, a constant m Number of moles in adsorbed phase, a constant N Number of moleculesn Number of molesP Pressureq Cell partition functionQ Canonical partition function R Gas constantT Absolute temperatureUu Cell potential energy for like molecular interactions U-„ Cell potential energy for interaction of molecule i and
surfaceV Volumex Mole fraction
(14) J. J. Kipling and D. A. Tester, J. Chem. Soc., 4123 (1952).(15) I. Brown and F. Smith, Auet. J. Chem., 7, 264 (1954).
The Journal of Physical Chemistry, Vol. 74, No. 14, 1970
Structure of Liquids and Solids 2835Greek letters7 Activity coefficientn Chemical potentialS Grand partition functiona Surface tensionSubscripts1 Component 1
2 Component 2i Component iSuperscripts ' Adsorbed phase0 Pure liquid adsorbate e Surface excess* Initial value before contacting adsorbent
Association Theory. The Discontinuous Case and the
Structure of Liquids and Solids
by Robert Ginell and Albert S. KirschChemistry Department, Brooklyn College of the City University of New York, Brooklyn, New York 11210 {Received December 12, 1969)
The assumption of the continuous case of association which is that all species of particles are always present is discussed. It is shown that a more appropriate model of the liquid or solid is given by the discontinuous case which postulates that certain smaller species are completely absent. A discussion of the nature and cause of the gas-liquid transition is given. This transition coincides with the change from a treatment by the continuous case to the discontinuous case. Various modifications of the mathematical treatment are derived and discussed.
In previous work1'2 a theory of association of matter was presented which led to an equation of state3 and finally to a derivation of Tait’s equation.4 This theory was applied both to liquids5 and solids6 and showed success in enabling us to calculate the atomic radii7 of the five alkali metals from a knowledge of their compressibility data and their crystal form. However, a further detailed examination of the equations in this theory showed that there were some difficulties both conceptually and mathematically. Among other things, the number of 1-mers in liquids and solids under high pressure calculated by this theory were found to be too great. Careful analysis of the equations traced the difficulties to one assumption in the original derivation; this is the assumption that all species from 1-mer to Twiners were always present. If in these derived equations the concentration of any species became zero, then the mathematical equations broke down giving a singular case. This paper then is devoted to an examination of this assumption and to the consequences of removing its restrictions.
The Assumption of Continuous Distribution. The origin of this assumption probably lies in the kinetic derivation of the distribution equations, which assumes that we start with a hypothetical matrix of single atoms and from this build an associated substance. This is equivalent to assuming that we start a mass of matter at
infinite volume where there are no collisions and suddenly compress it to some arbitrary volume where the molecules start colliding and associating. This is an unnecessary concept, although a convenient one, since the same equations can be obtained by considering the equilibrium situation.8 The concept of this assumption was reinforced by the thought experiment1 in which the individual frames of a hypothetical motion picture of a gas were examined one by one. In such examination, 1-mers, 2-mers, 3-mers, etc., were seen. From a dynamic point of view the 2-mers were static representations of binary collisions, the 3-mers, ternary collisions, etc. This picture is the one presented by the kinetic-molecular theory and is undoubtedly true of a gas. The extrapolation to liquids and solids came with
(1) For a review article see: R . Ginell, p 41-48, “ Advances in Thermophysical Properties at Extreme Temperatures and Pressures,” S. Gratch, Ed., American Society of Mechanical Engineers. New York, N. Y ., 1965.(2) R. Ginell, Ann. N. Y. Acad. Sci., 60, 521 (1955).(3) R. Ginell, J. Chem. Phys., 23, 2395 (1955).(4) R . Ginell, ibid., 34, 1249 (1961); 34, 2174 (1961); 35, 1135 (1961).(5) R. Ginell, ibid., 35, 473 (1961).(6) R. Ginell and T. J. Quigley, J. Phys. Chem. Solids, 26, 1157 (1965).(7) R . Ginell and T. J. Quigley, ibid., 27, 1173 (1966).(8) R . Ginell and J. Shurgan, J. Chem. Phys., 23, 964 (1955).
The Journal of Physical Chemistry, Vol. 74, No. 14, 1970
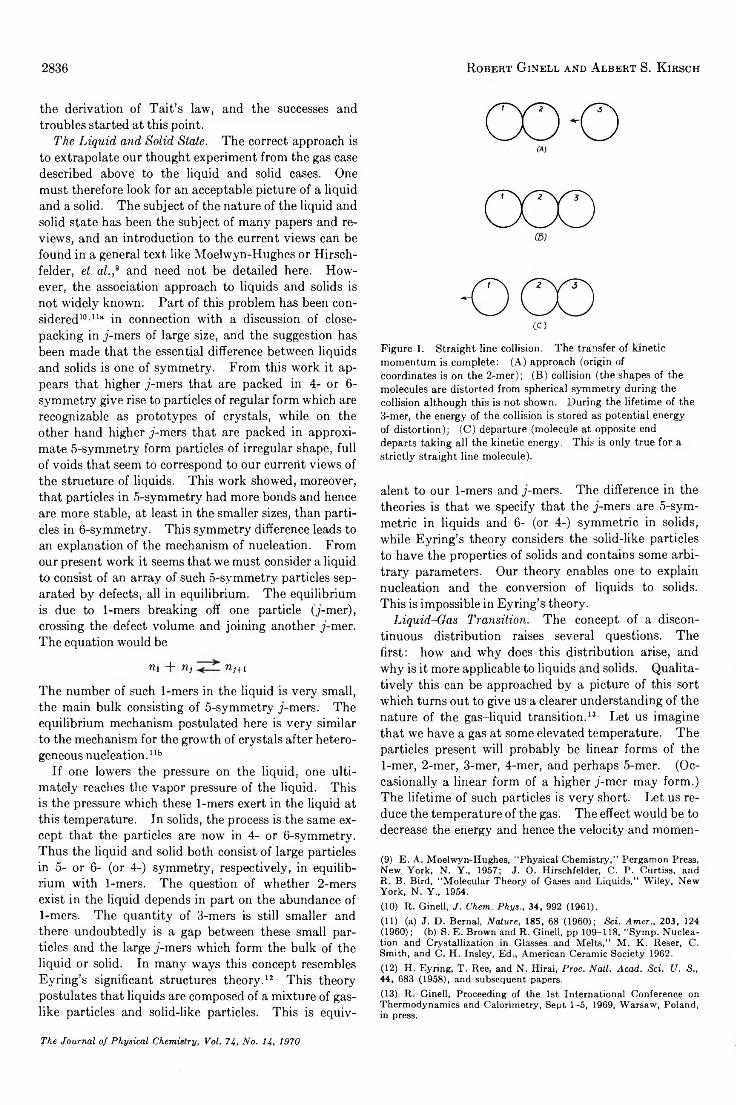
the derivation of Tait’s law, and the successes and troubles started at this point.
The Liquid and Solid State. The correct approach is to extrapolate our thought experiment from the gas case described above to the liquid and solid cases. One must therefore look for an acceptable picture of a liquid and a solid. The subject of the nature of the liquid and solid state has been the subject of many papers and reviews, and an introduction to the current views can be found in a general text like Moelwyn-Hughes or Hirsch- felder, et al.,9 and need not be detailed here. However, the association approach to liquids and solids is not widely known. Part of this problem has been considered10 ,na in connection with a discussion of closepacking in ji-mers of large size, and the suggestion has been made that the essential difference between liquids and solids is one of symmetry. From this work it appears that higher j-mers that are packed in 4- or 6- symmetry give rise to particles of regular form which are recognizable as prototypes of crystals, while on the other hand higher j-mers that are packed in approximate 5-symmetry form particles of irregular shape, full of voids that seem to correspond to our current views of the structure of liquids. This work showed, moreover, that particles in 5-symmetry had more bonds and hence are more stable, at least in the smaller sizes, than particles in 6-symmetry. This symmetry difference leads to an explanation of the mechanism of nucleation. From our present work it seems that we must consider a liquid to consist of an array of such 5-symmetry particles separated by defects, all in equilibrium. The equilibrium is due to 1-mers breaking off one particle (j-mer), crossing the defect volume and joining another j-mer. The equation would be
ni + rij nj+i
The number of such 1-mers in the liquid is very small, the main bulk consisting of 5-symmetry j-mers. The equilibrium mechanism postulated here is very similar to the mechanism for the growth of crystals after heterogeneous nucleation.llb
If one lowers the pressure on the liquid, one ultimately reaches the vapor pressure of the liquid. This is the pressure which these 1-mers exert in the liquid at this temperature. In solids, the process is the same except that the particles are now in 4- or 6-symmetry. Thus the liquid and solid both consist of large particles in 5- or 6- (or 4-) symmetry, respectively, in equilibrium with 1-mers. The question of whether 2-mers exist in the liquid depends in part on the abundance of1-mers. The quantity of 3-mers is still smaller and there undoubtedly is a gap between these small particles and the large j-mers which form the bulk of the liquid or solid. In many ways this concept resembles Eyring’s significant structures theory.12 This theory postulates that liquids are composed of a mixture of gaslike particles and solid-like particles. This is equiv-
2836 Robert Ginell and Albert S. K irsch
CO
Figure 1. Straight line collision. The transfer of kinetic momentum is complete: (A) approach (origin ofcoordinates is on the 2-mer); (B) collision (the shapes of the molecules are distorted from spherical symmetry during the collision although this is not shown. During the lifetime of the 3-mer, the energy of the collision is stored as potential energy of distortion); (C) departure (molecule at opposite end departs taking all the kinetic energy. This is only true for a strictly straight line molecule).
alent to our 1-mers and j-mers. The difference in the theories is that we specify that the j-mers are 5-sym- metric in liquids and 6- (or 4-) symmetric in solids, while Eyring’s theory considers the solid-like particles to have the properties of solids and contains some arbitrary parameters. Our theory enables one to explain nucleation and the conversion of liquids to solids. This is impossible in Eyring’s theory.
Liquid-Gas Transition. The concept of a discontinuous distribution raises several questions. The first: how and why does this distribution arise, and why is it more applicable to liquids and solids. Qualitatively this can be approached by a picture of this sort which turns out to give us a clearer understanding of the nature of the gas-liquid transition.13 Let us imagine that we have a gas at some elevated temperature. The particles present will probably be linear forms of the1-mer, 2-mer, 3-mer, 4-mer, and perhaps 5-mer. (Occasionally a linear form of a higher y-mer may form.) The lifetime of such particles is very short. Let us reduce the temperature of the gas. The effect would be to decrease the energy and hence the velocity and momen-
(9) E. A. Moelwyn-Hughes, “ Physical Chemistry,” Pergamon Press, New York, N. Y., 1957; J. O. Hirschfelder, C. P. Curtiss, and R. B. Bird, “ Molecular Theory of Gases and Liquids,” Wiley, New York, N. Y „ 1954.(10) R. Ginell, J. Chem. Phys., 34, 992 (1961).(11) (a) J. D. Bernal, Nature, 185, 68 (1960); Set. Amer., 203, 124(I960); (b) S. E. Brown and R. Ginell, pp 109-118, “ Symp. Nucleation and Crystallization in Glasses and Melts,” M. K. Reser, C. Smith, and C. H. Insley, Ed., American Ceramic Society 1962.(12) H. Eyring, T. Ree, and N. Hirai, Proc. Natl. Acad. Sci. U. S„ 44, 683 (1958), and subsequent papers.(13) R. Ginell, Proceeding of the 1st International Conference on Thermodynamics and Calorimetry, Sept 1-5, 1969, Warsaw, Poland, in press.
The Journal of Physical Chemistry, Voi. 74, No. 14, 1970
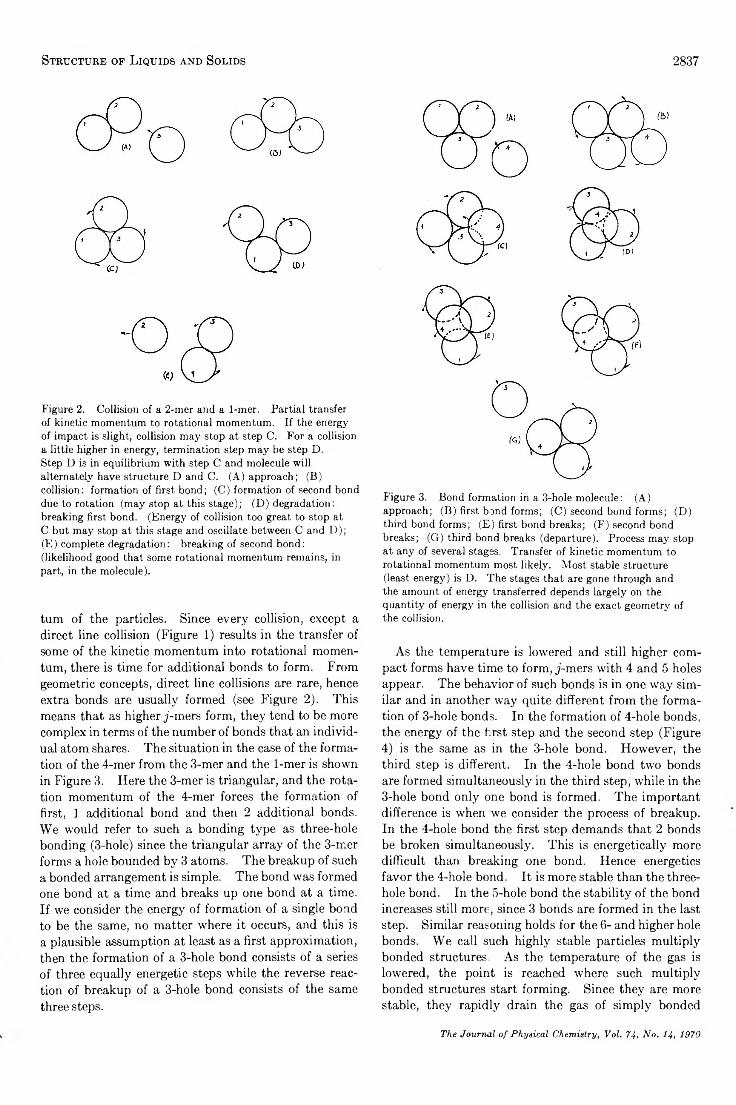
Structure of Liquids and Solids 2837
Figure 2. Collision of a 2-mer and a 1-mer. Partial transfer of kinetic momentum to rotational momentum. If the energy of impact is slight, collision may stop at step C. For a collision a little higher in energy, termination step may be step D.Step D is in equilibrium with step C and molecule will alternately have structure D and C. (A) approach; (B) collision: formation of first bond; (C) formation of second bond due to rotation (may stop at this stage); (D) degradation: breaking first bond. (Energy of collision too great to stop at C but may stop at this stage and oscillate between C and D); (E) complete degradation: breaking of second bond:(likelihood good that some rotational momentum remains, in part, in the molecule).
turn of the particles. Since every collision, except a direct line collision (Figure 1) results in the transfer of some of the kinetic momentum into rotational momentum, there is time for additional bonds to form. From geometric concepts, direct line collisions are rare, hence extra bonds are usually formed (see Figure 2). This means that as higher j-mers form, they tend to be more complex in terms of the number of bonds that an individual atom shares. The situation in the case of the formation of the 4-mer from the 3-mer and the 1-mer is shown in Figure 3. Here the 3-mer is triangular, and the rotation momentum of the 4-mer forces the formation of first, 1 additional bond and then 2 additional bonds. We would refer to such a bonding type as three-hole bonding (3-hole) since the triangular array of the 3-mer forms a hole bounded by 3 atoms. The breakup of such a bonded arrangement is simple. The bond was formed one bond at a time and breaks up one bond at a time. If we consider the energy of formation of a single bond to be the same, no matter where it occurs, and this is a plausible assumption at least as a first approximation, then the formation of a 3-hole bond consists of a series of three equally energetic steps while the reverse reaction of breakup of a 3-hole bond consists of the same three steps.
Figure 3. Bond formation in a 3-hole molecule: (A)approach; (B) first bond forms; (C) second bond forms; (D) third bond forms; (E) first bond breaks; (F) second bond breaks; (G) third bond breaks (departure). Process may stop at any of several stages. Transfer of kinetic momentum to rotational momentum most likely. Most stable structure (least energy) is D. The stages that are gone through and the amount of energy transferred depends largely on the quantity of energy in the collision and the exact geometry of the collision.
As the temperature is lowered and still higher compact forms have time to form, j-mers with 4 and 5 holes appear. The behavior of such bonds is in one way similar and in another way quite different from the formation of 3-hole bonds. In the formation of 4-hole bonds, the energy of the first step and the second step (Figure4) is the same as in the 3-hole bond. However, the third step is different. In the 4-hole bond two bonds are formed simultaneously in the third step, while in the3-hole bond only one bond is formed. The important difference is when we consider the process of breakup. In the 4-hole bond the first step demands that 2 bonds be broken simultaneously. This is energetically more difficult than breaking one bond. Hence energetics favor the 4-hole bond. It is more stable than the three- hole bond. In the 5-hole bond the stability of the bond increases still more, since 3 bonds are formed in the last step. Similar reasoning holds for the 6- and higher hole bonds. We call such highly stable particles multiply bonded structures As the temperature of the gas is lowered, the point is reached where such multiply bonded structures start forming. Since they are more stable, they rapidly drain the gas of simply bonded
The Journal of Physical Chemistry, Vol. 74, No. 1 4 , 1970
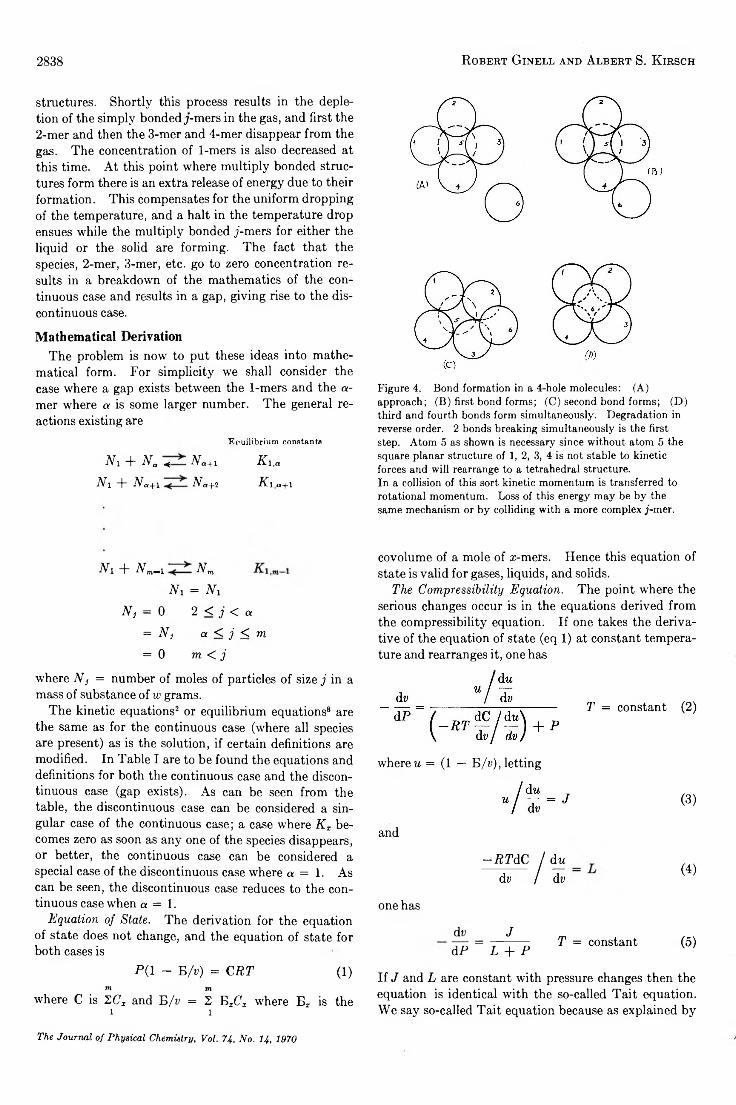
2838 Robert Ginell and Albert S. K irsch
structures. Shortly this process results in the depletion of the simply bonded j-mers in the gas, and first the2-mer and then the 3-mer and 4-mer disappear from the gas. The concentration of 1-mers is also decreased at this time. At this point where multiply bonded structures form there is an extra release of energy due to their formation. This compensates for the uniform dropping of the temperature, and a halt in the temperature drop ensues while the multiply bonded j -mers for either the liquid or the solid are forming. The fact that the species, 2-mer, 3-mer, etc. go to zero concentration results in a breakdown of the mathematics of the continuous case and results in a gap, giving rise to the discontinuous case.
Mathematical DerivationThe problem is now to put these ideas into mathe
matical form. For simplicity we shall consider the case where a gap exists between the 1-mers and the aimer where a is some larger number. The general reactions existing are
Eouilibrium constants
Nl + Na < Na+1 Kl,a
N i + Na+1 Na+2 Kl,a+1
Figure 4. Bond formation in a 4-hole molecules: (A)approach; (B) first bond forms; (C) second bond forms; (D) third and fourth bonds form simultaneously. Degradation in reverse order. 2 bonds breaking simultaneously is the first step. Atom S as shown is necessary since without atom 5 the square planar structure of 1, 2, 3, 4 is not stable to kinetic forces and will rearrange to a tetrahedral structure.In a collision of this sort kinetic momentum is transferred to rotational momentum. Loss of this energy may be by the same mechanism or by colliding with a more complex j-mei.
Ni + Nm„i N m
Ni = Ni
Nj = 0 2 < j < a
= Nj a < j < m = 0 m < j
covolume of a mole of x-mers. Hence this equation of state is valid for gases, liquids, and solids.
The Compressibility Equation. The point where the serious changes occur is in the equations derived from the compressibility equation. If one takes the derivative of the equation of state (eq 1) at constant temperature and rearranges it, one has
where N} = number of moles of particles of size j in a mass of substance of w grams.
The kinetic equations2 or equilibrium equations8 are the same as for the continuous case (where all species are present) as is the solution, if certain definitions are modified. In Table I are to be found the equations and definitions for both the continuous case and the discontinuous case (gap exists). As can be seen from the table, the discontinuous case can be considered a singular case of the continuous case; a case where Kx becomes zero as soon as any one of the species disappears, or better, the continuous case can be considered a special case of the discontinuous case where a = 1. As can be seen, the discontinuous case reduces to the continuous case when a = 1.
Equation of State. The derivation for the equation of state does not change, and the equation of state for both cases is
P ( 1 - B/v) = CRT (1)m m
where C is ~LCX and B/v = 2 BXCZ where Bz is the i i
T = constant (2)
where w = (1 — B/v), letting
and
-RTdC / du dv / dv
(3)
(4)
one has
d« J dP = L + P
T = constant (5)
The Journal of Physical Chemistry, Voi. 74, No. 14, 1970
If J and L are constant with pressure changes then the equation is identical with the so-called Tait equation. We say so-called Tait equation because as explained by
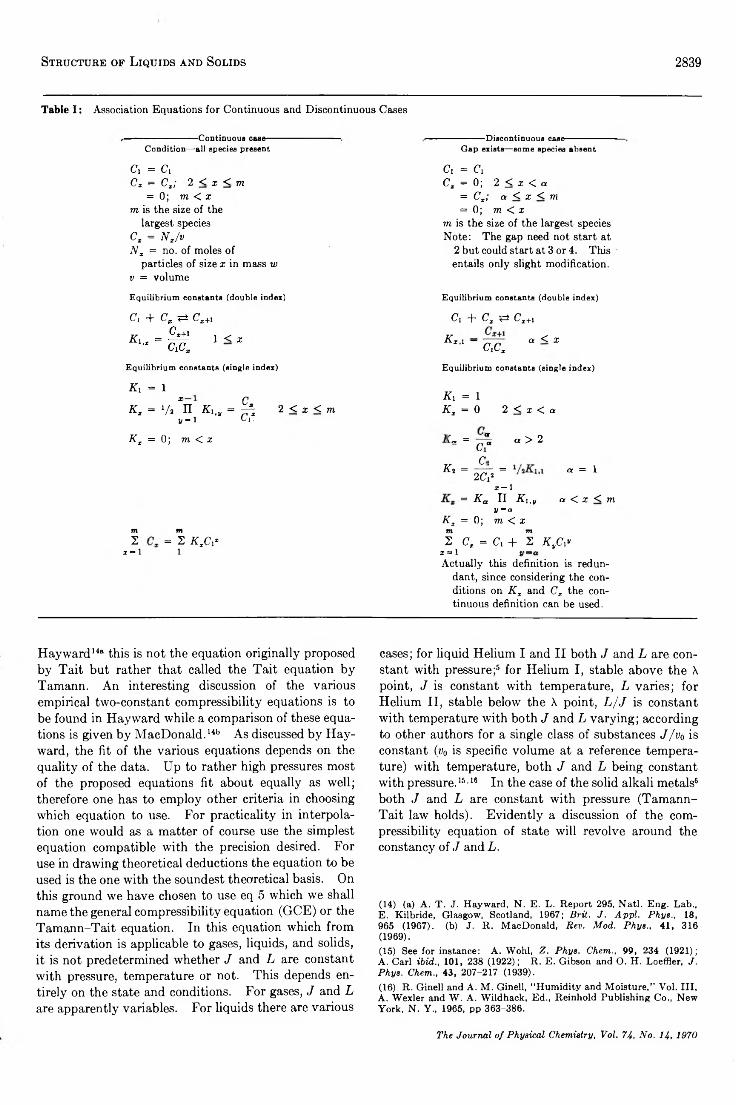
Structure of Liquids and Solids 2839Table I : Association Equations for Continuous and Discontinuous Cases
-------------------------- Continuous case-----Condition— all species present
c, = CiC x = Gx; 2 < x < m
= 0; m < x m is the size of the
largest species C. = NJv Nx = no. of moles of
particles of size x in mass w v = volume
---------------- Discontinuous case------------------Gap exists— some species absent
Cl - ClCx = 0; 2 < x < a
= Cx; a < x < m = 0; m < x
m is the size of the largest species Note: The gap need not start at
2 but could start at 3 or 4. This entails only slight modification.
Equilibrium constants (double index) Equilibrium constants (double index)
Ci + c
Ki,x =C.+1
1 < x
Equilibrium constants (single index)
Ci + Cx <=t C,+1
Kx'' - w x “< X
Equilibrium constants (single index)
Ki = 1Kx = v . *n Khy = %
y 3 * 1 C l
Kx = 0; m < x
2 < x < m
m2
x “ 1m
- 2l X.C,»
Ki = 1A * = 0 2 < x < a
K. - p*. . > 2
*• - J r . - « - 121— 1
= Ka II KltV a < X < mV “ a
Kx = 0; m < xm m
S C. = Cl + s x ,c,»x = l y
Actually this definition is redundant, since considering the conditions on Kx and Cx the continuous definition can be used.
Hayward14“ this is not the equation originally proposed by Tait but rather that called the Tait equation by Tamann. An interesting discussion of the various empirical two-constant compressibility equations is to be found in Hayward while a comparison of these equations is given by MacDonald.14b As discussed by Hayward, the fit of the various equations depends on the quality of the data. Up to rather high pressures most of the proposed equations fit about equally as well; therefore one has to employ other criteria in choosing which equation to use. For practicality in interpolation one would as a matter of course use the simplest equation compatible with the precision desired. For use in drawing theoretical deductions the equation to be used is the one with the soundest theoretical basis. On this ground we have chosen to use eq 5 which we shall name the general compressibility equation (GCE) or the Tamann-Tait equation. In this equation which from its derivation is applicable to gases, liquids, and solids, it is not predetermined whether J and L are constant with pressure, temperature or not. This depends entirely on the state and conditions. For gases, J and L are apparently variables. For liquids there are various
cases; for liquid Helium I and II both J and L are constant with pressure;5 for Helium I, stable above the X point, J is constant with temperature, L varies; for Helium II, stable below the X point, L/J is constant with temperature with both J and L varying; according to other authors for a single class of substances J/v0 is constant (v0 is specific volume at a reference temperature) with temperature, both J and L being constant with pressure.16,16 In the case of the solid alkali metals6 both J and L are constant with pressure (Tamann- Tait law holds). Evidently a discussion of the compressibility equation of state will revolve around the constancy of J and L.
(14) (a) A. T . J. Hayward, N. E. L. Report 295, Natl. Eng. Lab.,E. Kilbride, Glasgow, Scotland, 1967 ; Brit. J. Appl. Phys., 18, 965 (1967). (b) J. R . MacDonald, Rev. Mod. Phys., 41, 316(1969).(15) See for instance: A. Wohl, Z. Phys. Chem., 99, 234 (1921); A. Carl ibid., 101, 238 (1922); R. E. Gibson and O. H. Loeffler, J. Phys. Chem., 43, 207-217 (1939).(16) R. Ginell and A. M . Ginell, “ Humidity and Moisture,” Vol. I ll, A. Wexler and W. A. Wildhack, Ed., Reinhold Publishing Co., New York, N. Y „ 1965, pp 363-386.
The Journal of Physical Chemistry, Vol. 74, No. 1 if, 1970
2840 Robert Ginell and Albert S, K irsch
Some general relationships can be derived. One can rewrite eq 3 as
d In u 1dv J
from whence on integrating
u = E e f i0/J
(6)
(7)E = constant of integration. From eq 7 and eq 1 we get that
PEeSdv/J(8)C = RT
J and L Constant with Pressure. An important case of the compressibility equation is that when J and L are constant with pressure. Here eq 7 becomes
and
( 1 - - ) = Eev/J (9)\ v J
C = ev/J RT(10)
Y,iCi wRT ~ E C , ~ M°vPEev/J
(11)
where Zn is the number average degree of association. Zn exhibits a minimum with an increase in pressure. Differentiating eq 11 with respect to volume, and using eq 5 with J and L constant, we have
d Zn [1 L I* r - z” U _ w j
Since at the minimum dZn/dv = 0, hence at this point
(12)v_ _ J P ~ L
All these equations are the same for both the continuous and the discontinuous cases, and the quantities (1 — E /- v), C and Zn are all ealculatable in terms of constant of integration, E. In previous publications7 on the continuous case, the equations are slightly different from those given above, being given in terms of another integration constant, A. They can be reconciled by setting
E = ARTw/M° (13)
where A is the constant of integration evaluated in ref 7. In that work A was evaluated by making the assumption that Zn = Zw = 1 when P/v = L/J. This is true at the point where Zn is a minimum.1'7 Since Zw and Zn, the weight and number average degrees of association, are comparable quantities their behavior is similar and Zw should show a minimum around the same point where Zn does. However, since from ref 4b
<p = —d In C'i/du = A(L/J)vev/J (14)
and from ref 1, Zw = l/vtp, then
1Zw
A(L/J)v*ë2 „»/J (15)
But the right-hand side of eq 15 exhibits no minimum, hence at pressures less than the pressure at the minimum, Zw becomes less than Zn. This is manifestly impossible, since from the definitions of Zw and Zn, their behavior must be parallel. Zw must always be greater than, or equal to Zn.
Examining the derivation of Zw in ref 1, we see that eq 16 is derived under the assumption that dKx/dv = 0. If all the j-mers are present, as they are in the continuous case, this is probably justified, but if the j-mers between j = 2 and j = a are absent, a being a new variable, the size of the smallest of the multiply packed j- mers, then it is not justified. Since K x = 0 for x < a and Kx 0 for x > a, then as the pressure changes and species appear and disappear, a changes in value. Under these conditions the assumption that dKx/dv = 0 is invalid.
If we redefine <p to be
<P = — (ò In Ci/òv)a (16)
then (dKx/dv)a = 0 and Zw = l/vtp in terms of the new definition of <p. This can readily be seen by rederiving the relationship of <p and Zw in the same way as in ref 4b.
Now from eq 1 we have
=\àPjau/ (òu/òv)a
RT(Ò C /òp)„{òu/òv)a
J .
+ P(17)
where
and
L, + P
J, = u/(àu/àv)a
L . = -R T (à C/àv)a (àu/àv)a
(18)
(19)
These definitions of Jv and Lv are analogous to the definitions of J and L which one defined in terms of the total derivatives; but while J and L are constant with pressure changes, ./„ and Lv are not constants.
Now since C = ^ K xCi
(dC/bv)a = Yl'xKxCT(d In C\/dv)a
= ~ <pJ2xCx (20)
Whence using eq 19
X = y = R T < p Y , x C x/ uJ V
(21)
The Journal of Physical Chemistry, Voi, 74, No, 14, 1910
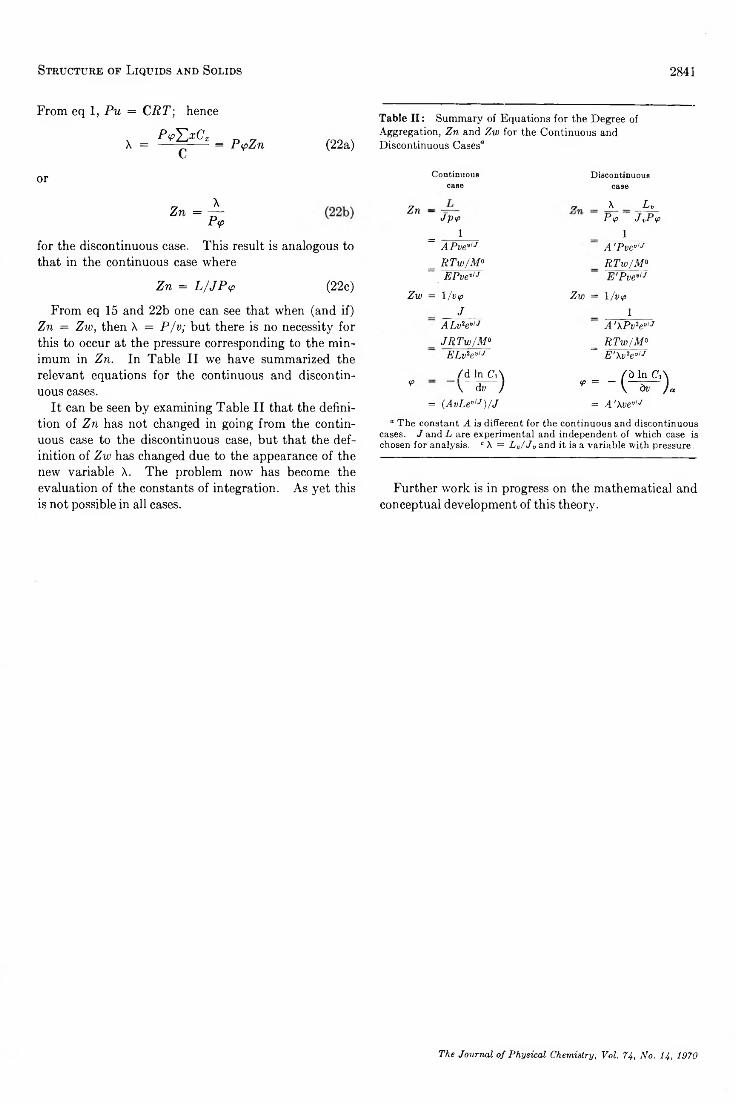
Structure of Liquids and Solids 2841
From eq 1, Pu = CRT-, hence
X = P Æ xÇ *C
= P<pZn
Table II: Summary of Equations for the Degree of Aggregation, Zn and Zw for the Continuous and
(22a) Discontinuous Cases“
or
for the discontinuous case. This result is analogous to that in the continuous case where
Zn = L/JP<p (22c)
From eq 15 and 22b one can see that when (and if) Zn = Zw, then X = P/v; but there is no necessity for this to occur at the pressure corresponding to the minimum in Zn. In Table II we have summarized the relevant equations for the continuous and discontinuous cases.
It can be seen by examining Table II that the definition of Zn has not changed in going from the continuous case to the discontinuous case, but that the definition of Zw has changed due to the appearance of the new variable X. The problem now has become the evaluation of the constants of integration. As yet this is not possible in all cases.
C ontinuouscase
Zn - Jpifl = 1
APvevlJ = RTw/M0
EPvevlJZw = 1/vip
JALv2evlJ
_ J RTw/M0 ELv2e',IJ
/d In C'A * \ àv )
= (AvLevlJ)/J
D iscontinuouscase
7 X L v PV ~ JvPV
1A ’PvevlJ
_ RTw/M0 E'Pve”IJ
Zw = 1/vifi1
A'\PvievlJ = RTw/M°
E'\v1e',IJ
= A'XvevlJ“ The constant A is different for the continuous and discontinuous
cases. J and L are experimental and independent of which case is chosen for analysis. ' X = Lv/Jv and it is a variable with pressure.
Further work is in progress on the mathematical and conceptual development of this theory.
The Journal of Physical Chemistry, Vol. 74, No. 14, 1970
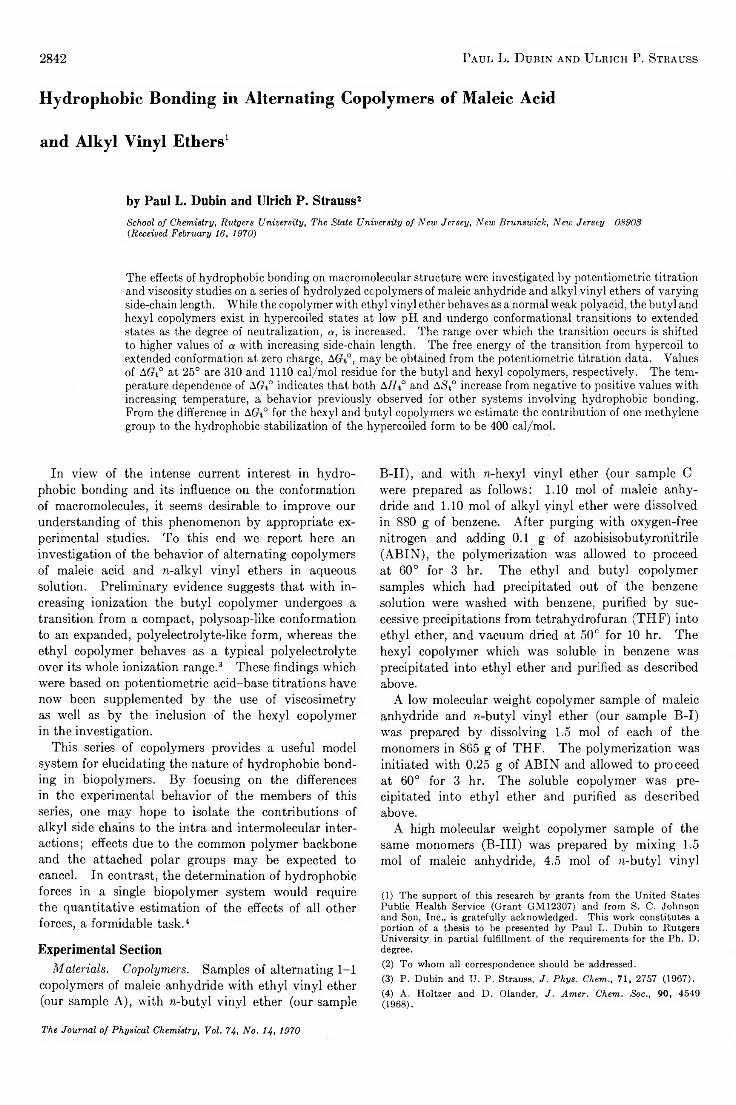
2842 Paul L. Dubin and Ulrich P. Strauss
Hydrophobic Bonding in Alternating Copolymers of Maleic Acid
and Alkyl Vinyl Ethers1
by Paul L. Dubin and Ulrich P. Strauss8School of Chemistry, Rutgers University, The State University of New Jersey, New Brunswick, New Jersey 08903 {Received February 16, 1970)
The effects of hydrophobic bonding on macromolecular structure were investigated by potentiometric titration and viscosity studies on a series of hydrolyzed copolymers of maleic anhydride and alkyl vinyl ethers of varying side-chain length. While the copolymer with ethyl vinyl ether behaves as a normal weak polyacid, the butyl and hexyl copolymers exist in hypercoiled states at low pH and undergo conformational transitions to extended states as the degree of neutralization, a, is increased. The range over which the transition occurs is shifted to higher values of a with increasing side-chain length. The free energy of the transition from hypercoil to extended conformation at zero charge, A0°, may be obtained from the potentiometric titration data. Values of ACrt° at 25° are 310 and 1110 cal/mol residue for the butyl and hexyl copolymers, respectively. The temperature dependence of AG° indicates that both AH° and ASt° increase from negative to positive values with increasing temperature, a behavior previously observed for other systems involving hydrophobic bonding. From the difference in AG° for the hexyl and butyl copolymers we estimate the contribution of one methylene group to the hydrophobic stabilization of the hypercoiled form to be 400 cal/mol.
In view of the intense current interest in hydro- phobic bonding and its influence on the conformation of macromolecules, it seems desirable to improve our understanding of this phenomenon by appropriate experimental studies. To this end we report here an investigation of the behavior of alternating copolymers of maleic acid and n-alkyl vinyl ethers in aqueous solution. Preliminary evidence suggests that with increasing ionization the butyl copolymer undergoes a transition from a compact, polysoap-like conformation to an expanded, polyelectrolyte-like form, whereas the ethyl copolymer behaves as a typical polyelectrolyte over its whole ionization range.3 These findings which were based on potentiometric acid-base titrations have now been supplemented by the use of viscosimetry as well as by the inclusion of the hexyl copolymer in the investigation.
This series of copolymers provides a useful model system for elucidating the nature of hydrophobic bonding in biopolymers. By focusing on the differences in the experimental behavior of the members of this series, one may hope to isolate the contributions of alkyl side chains to the intra and intermolecular interactions; effects due to the common polymer backbone and the attached polar groups may be expected to cancel. In contrast, the determination of hydrophobic forces in a single biopolymer system would require the quantitative estimation of the effects of all other forces, a formidable task.4
Experimental SectionMaterials. Copolymers. Samples of alternating 1-1
copolymers of maleic anhydride with ethyl vinyl ether (our sample A), with m-butyl vinyl ether (our sample
B-II), and with n-hexyl vinyl ether (our sample C were prepared as follows: 1.10 mol of maleic anhydride and 1.10 mol of alkyl vinyl ether were dissolved in 880 g of benzene. After purging with oxygen-free nitrogen and adding 0.1 g of azobisisobutyronitrile (ABIN), the polymerization was allowed to proceed at 60° for 3 hr. The ethyl and butyl copolymer samples which had precipitated out of the benzene solution were washed with benzene, purified by successive precipitations from tetrahydrofuran (THF) into ethyl ether, and vacuum dried at 50° for 10 hr. The hexyl copolymer which was soluble in benzene was precipitated into ethyl ether and purified as described above.
A low molecular weight copolymer sample of maleic anhydride and n-butyl vinyl ether (our sample B-I) was prepared by dissolving 1.5 mol of each of the monomers in 865 g of THF. The polymerization was initiated with 0.25 g of ABIN and allowed to proceed at 60° for 3 hr. The soluble copolymer was precipitated into ethyl ether and purified as described above.
A high molecular weight copolymer sample of the same monomers (B-III) was prepared by mixing 1.5 mol of maleic anhydride, 4.5 mol of n-butyl vinyl
(1) The support of this research by grants from the United States Public Health Service (Grant GM12307) and from S. C. Johnson and Son, Inc., is gratefully acknowledged. This work constitutes a portion of a thesis to be presented by Paul L. Dubin to Rutgers University in partial fulfillment of the requirements for the Ph. D. degree.(2) To whom all correspondence should be addressed.(3) P. Dubin and U. P. Strauss, J. Phys. Chem., 71, 2757 (1967).(4) A. Holtzer and D. Olander, J. Amer. Chem. Soc., 90, 4549 (1968).
The Journal of Physical Chemistry, Voi. 74, No. 14, 1970
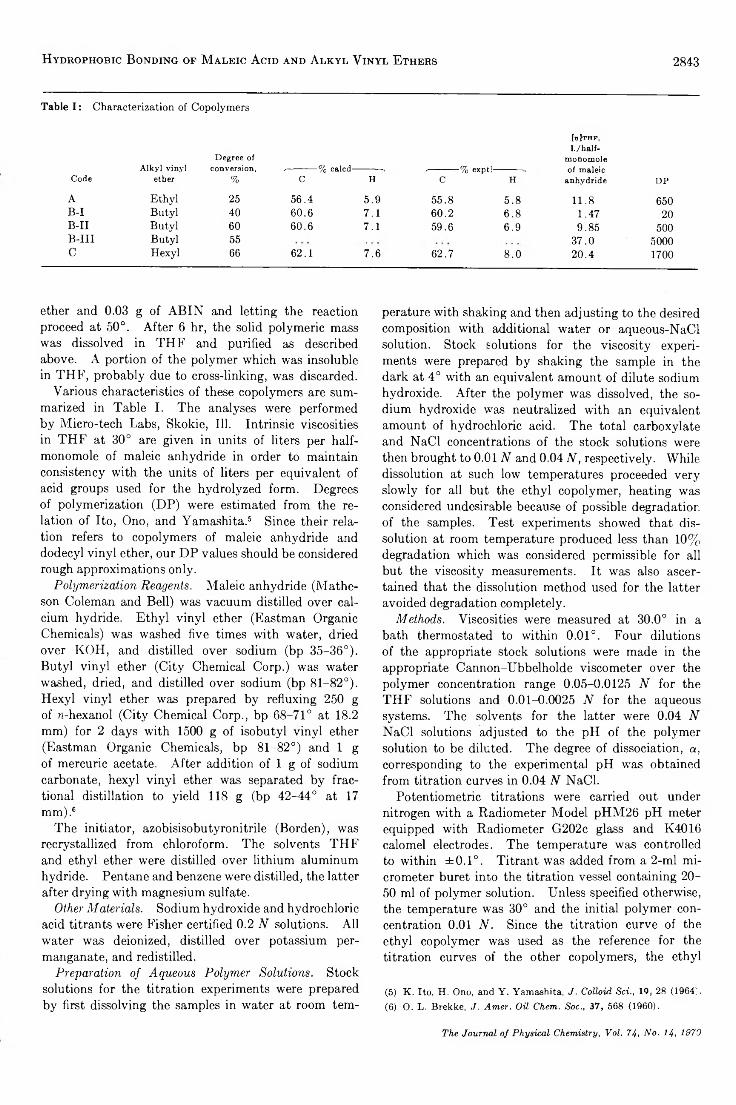
Hydrophobic Bonding of M aleic Acid and Alkyl V inyl Ethers 2843
Table I : Characterization of Copolymers
CodeAlkyl vinyl
ether
Degree of conversion,
%✓------------% calcd—
c H'------------% exptl-
c H
folTHF,l./h a lf-
monomole of maleic
anhydride DP
A Ethyl 25 56.4 5.9 55.8 5.8 11.8 650B-I Butyl 40 60.6 7.1 60.2 6.8 1.47 20B-II Butyl 60 60.6 7.1 59.6 6.9 9.85 500B-III Butyl 55 37.0 5000C Hexyl 66 62.1 7.6 62.7 8.0 20.4 1700
ether and 0.03 g of ABIN and letting the reaction proceed at 50°. After 6 hr, the solid polymeric mass was dissolved in THF and purified as described above. A portion of the polymer which was insoluble in THF, probably due to cross-linking, was discarded.
Various characteristics of these copolymers are summarized in Table I. The analyses were performed by Micro-tech Labs, Skokie, 111. Intrinsic viscosities in THF at 30° are given in units of liters per halfmonomole of maleic anhydride in order to maintain consistency with the units of liters per equivalent of acid groups used for the hydrolyzed form. Degrees of polymerization (DP) were estimated from the relation of Ito, Ono, and Yamashita.6 Since their relation refers to copolymers of maleic anhydride and dodecyl vinyl ether, our DP values should be considered rough approximations only.
Polymerization Reagents. Maleic anhydride (Mathe- son Coleman and Bell) was vacuum distilled over calcium hydride. Ethyl vinyl ether (Eastman Organic Chemicals) was washed five times with water, dried over KOH, and distilled over sodium (bp 35-36°). Butyl vinyl ether (City Chemical Corp.) was water washed, dried, and distilled over sodium (bp 81-82°). Hexyl vinyl ether was prepared by refluxing 250 g of n-hexanol (City Chemical Corp., bp 68-71° at 18.2 mm) for 2 days with 1500 g of isobutyl vinyl ether (Eastman Organic Chemicals, bp 81-82°) and 1 g of mercuric acetate. After addition of 1 g of sodium carbonate, hexyl vinyl ether was separated by fractional distillation to yield 118 g (bp 42-44° at 17 mm).6
The initiator, azobisisobutyronitrile (Borden), was recrystallized from chloroform. The solvents THF and ethyl ether were distilled over lithium aluminum hydride. Pentane and benzene were distilled, the latter after drying with magnesium sulfate.
Other Materials. Sodium hydroxide and hydrochloric acid titrants were Fisher certified 0.2 N solutions. All water was deionized, distilled over potassium permanganate, and redistilled.
Preparation of Aqueous Polymer Solutions. Stock solutions for the titration experiments were prepared by first dissolving the samples in water at room tem
perature with shaking and then adjusting to the desired composition with additional water or aqueous-NaCl solution. Stock solutions for the viscosity experiments were prepared by shaking the sample in the dark at 4° with an equivalent amount of dilute sodium hydroxide. After the polymer was dissolved, the sodium hydroxide was neutralized with an equivalent amount of hydrochloric acid. The total carboxylate and NaCl concentrations of the stock solutions were then brought to 0.01 N and 0.04 N, respectively. While dissolution at such low temperatures proceeded very slowly for all but the ethyl copolymer, heating was considered undesirable because of possible degradation of the samples. Test experiments showed that dissolution at room temperature produced less than 10% degradation which was considered permissible for all but the viscosity measurements. It was also ascertained that the dissolution method used for the latter avoided degradation completely.
Methods. Viscosities were measured at 30.0° in a bath thermostated to within 0.01°. Four dilutions of the appropriate stock solutions were made in the appropriate Cannon-Ubbelholde viscometer over the polymer concentration range 0.05-0.0125 N for the THF solutions and 0.01-0.0025 N for the aqueous systems. The solvents for the latter were 0.04 N NaCl solutions adjusted to the pH of the polymer solution to be diluted. The degree of dissociation, a, corresponding to the experimental pH was obtained from titration curves in 0.04 N NaCl.
Potentiometric titrations were carried out under nitrogen with a Radiometer Model pHM26 pH meter equipped with Radiometer G202c glass and K4016 calomel electrodes. The temperature was controlled to within ±0.1°. Titrant was added from a 2-ml micrometer buret into the titration vessel containing 20- 50 ml of polymer solution. Unless specified otherwise, the temperature was 30° and the initial polymer concentration 0.01 N. Since the titration curve of the ethyl copolymer was used as the reference for the titration curves of the other copolymers, the ethyl
(5) K . Ito, H. Ono, and Y . Yamashita, J . Colloid Sci., 19, 28 (1964).(6) O. L. Brekke, J. Amer. Oil Chem. Soc., 37, 568 (1960).
The Journal of Physical Chemistry, Vol. 74, No. 14, 1970
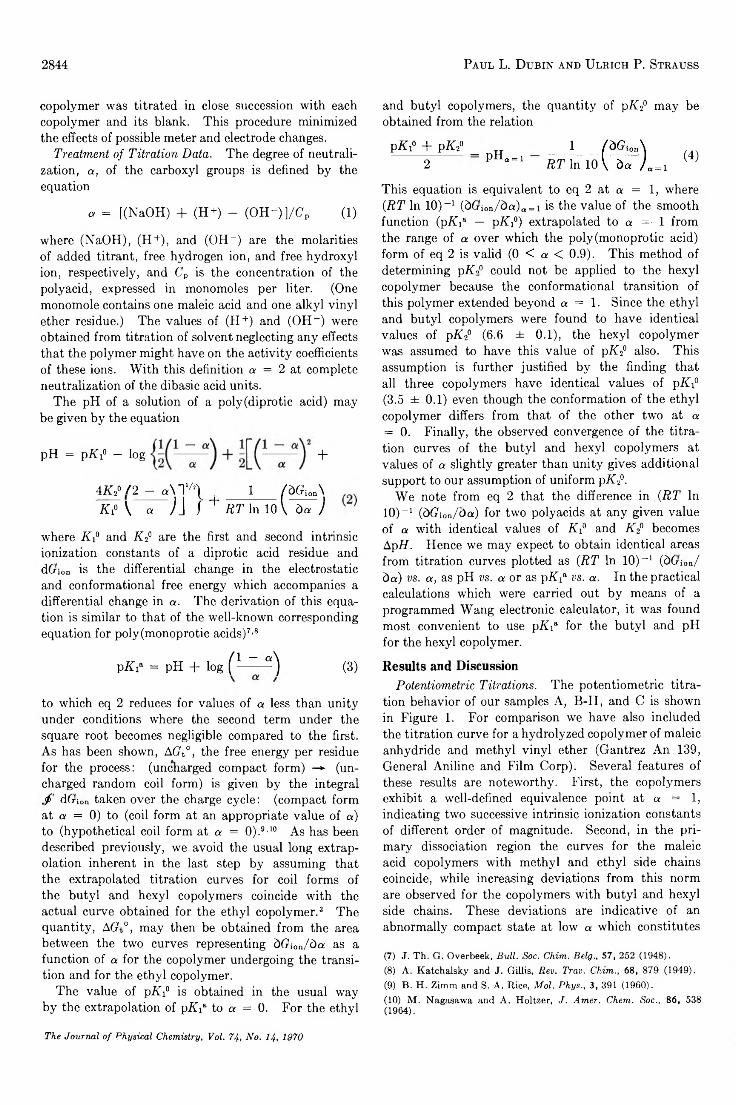
2844 Paul L. Dubin and Ulrich P. Strauss
copolymer was titrated in close succession with each copolymer and its blank. This procedure minimized the effects of possible meter and electrode changes.
Treatment of Titration Data. The degree of neutralization, a, of the carboxyl groups is defined by the equation
CV = [(NaOH) + (H+) - (O H -)]/Cp (1)
where (NaOH), (H+), and (OH- ) are the molarities of added titrant, free hydrogen ion, and free hydroxyl ion, respectively, and Cp is the concentration of the polyacid, expressed in monomoles per liter. (One monomole contains one maleic acid and one alkyl vinyl ether residue.) The values of (H+) and (OH- ) were obtained from titration of solvent neglecting any effects that the polymer might have on the activity coefficients of these ions. With this definition a = 2 at complete neutralization of the dibasic acid units.
The pH of a solution of a poly(diprotic acid) may be given by the equation
pH - piK t - log +
^ / 2 - a\ ll/i\ 1 (òG ion\!» V « J ] j + RT In 10 v òa )
4K, K
where Kf3 and K f are the first and second intrinsic ionization constants of a diprotic acid residue and dCnon is the differential change in the electrostatic and conformational free energy which accompanies a differential change in a. The derivation of this equation is similar to that of the well-known corresponding equation for poly(monoprotic acids)7’8
PKi' = pH + log ( l ~ a) (3)
to which eq 2 reduces for values of a less than unity under conditions where the second term under the square root becomes negligible compared to the first. As has been shown, AGh0, the free energy per residue for the process: (uncharged compact form) —► (uncharged random coil form) is given by the integral <f> dCnon taken over the charge cycle: (compact format a = 0) to (coil form at an appropriate value of a) to (hypothetical coil form at a = 0).9’10 As has been described previously, we avoid the usual long extrapolation inherent in the last step by assuming that the extrapolated titration curves for coil forms of the butyl and hexyl copolymers coincide with the actual curve obtained for the ethyl copolymer.3 The quantity, AG °, may then be obtained from the area between the two curves representing bGi0n/da as a function of a for the copolymer undergoing the transition and for the ethyl copolymer.
The value of pA x0 is obtained in the usual way by the extrapolation of pAxa to a = 0. For the ethyl
and butyl copolymers, the quantity of pK f may be obtained from the relation
pAi° + p g 2° 2 pHa = i
1RT In 10 (4)
This equation is equivalent to eq 2 at a = 1, where (RT In 10)-1 (dCnoii/da)a = i is the value of the smooth function (pAia — pKi°) extrapolated to a = 1 from the range of a over which the poly (monoprotic acid) form of eq 2 is valid (0 < a < 0.9). This method of determining p/G° could not be applied to the hexyl copolymer because the conformational transition of this polymer extended beyond a = 1. Since the ethyl and butyl copolymers were found to have identical values of pK f (6.6 ± 0.1), the hexyl copolymer was assumed to have this value of pK f also. This assumption is further justified by the finding that all three copolymers have identical values of pK f (3.5 ± 0.1) even though the conformation of the ethyl copolymer differs from that of the other two at a = 0. Finally, the observed convergence of the titration curves of the butyl and hexyl copolymers at values of a slightly greater than unity gives additional support to our assumption of uniform pK f.
We note from eq 2 that the difference in (RT In10)-1 (£>(?ion/c)a) for two polyacids at any given value of a with identical values of K-f and K f becomes ApH. Hence we may expect to obtain identical areas from titration curves plotted as (RT In 10)-1 (dCnon/ da) vs. a, as pH vs. a or as \)KT v s . a . In the practical calculations which were carried out by means of a programmed Wang electronic calculator, it was found most convenient to use pKxa for the butyl and pH for the hexyl copolymer.
Results and DiscussionPotentiometric Titrations. The potentiometric titra
tion behavior of our samples A, B-II, and C is shown in Figure 1. For comparison we have also included the titration curve for a hydrolyzed copolymer of maleic anhydride and methyl vinyl ether (Gantrez An 139, General Aniline and Film Corp). Several features of these results are noteworthy. First, the copolymers exhibit a well-defined equivalence point at a = 1, indicating two successive intrinsic ionization constants of different order of magnitude. Second, in the primary dissociation region the curves for the maleic acid copolymers with methyl and ethyl side chains coincide, while increasing deviations from this norm are observed for the copolymers with butyl and hexyl side chains. These deviations are indicative of an abnormally compact state at low a which constitutes
(7) J. Th. G. Overbeek, Bull. Soc. Chim. Belg., 57, 252 (1948).(8) A. Katchalsky and J. Gillis, Rev. Trav. Chim., 68, 879 (1949).(9) B. H. Zimm and S. A. Rice, Mol. Phys., 3, 391 (1960).(10) M. Nagasawa and A. Holtzer, J. Amer. Chem. Soc., 86, 538 (1964).
The Journal of Physical Chemistry, Voi. 74, No. 14, 1970
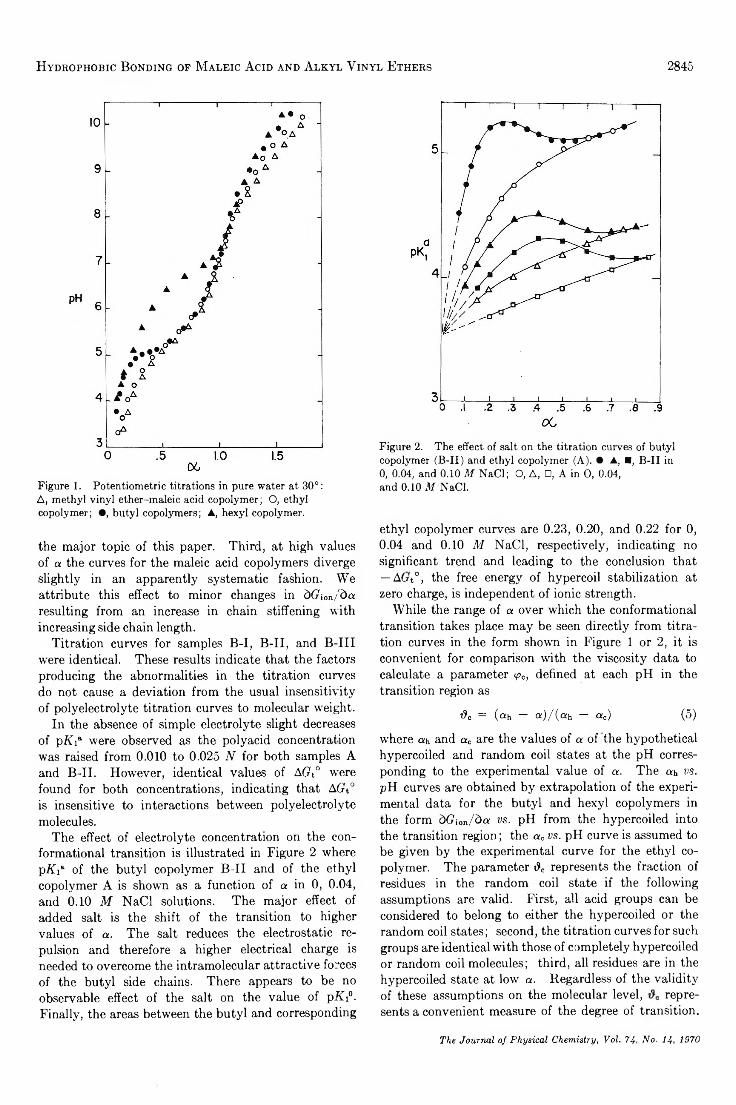
Hydrophobic Bonding of M aleic A cid and Alkyl V inyl Ethers 2845
Figure 1. Potentiometric titrations in pure water at 30°:A, methyl vinyl ether-maleic acid copolymer; O, ethyl copolymer; •, butyl copolymers; A, hexyl copolymer.
the major topic of this paper. Third, at high values of a the curves for the maleic acid copolymers diverge slightly in an apparently systematic fashion. We attribute this effect to minor changes in dGion/da resulting from an increase in chain stiffening with increasing side chain length.
Titration curves for samples B-I, B-II, and B-III were identical. These results indicate that the factors producing the abnormalities in the titration curves do not cause a deviation from the usual insensitivity of polyelectrolyte titration curves to molecular weight.
In the absence of simple electrolyte slight decreases of pAia were observed as the polyacid concentration was raised from 0.010 to 0.025 N for both samples A and B-II. However, identical values of AGt° were found for both concentrations, indicating that AGt° is insensitive to interactions between polyelectrolyte molecules.
The effect of electrolyte concentration on the conformational transition is illustrated in Figure 2 where pAia of the butyl copolymer B-II and of the ethyl copolymer A is shown as a function of a in 0, 0.04, and 0.10 M NaCl solutions. The major effect of added salt is the shift of the transition to higher values of a. The salt reduces the electrostatic repulsion and therefore a higher electrical charge is needed to overcome the intramolecular attractive forces of the butyl side chains. There appears to be no observable effect of the salt on the value of pKi°. Finally, the areas between the butyl and corresponding
Figure 2. The effect of salt on the titration curves of butyl copolymer (B-II) and ethyl copolymer (A). • A, ■, B-II in 0, 0.04, and 0.10 M NaCl; O, A, □, A in O, 0.04, and 0.10 M NaCl.
ethyl copolymer curves are 0.23, 0.20, and 0.22 for 0,0.04 and 0.10 M NaCl, respectively, indicating no significant trend and leading to the conclusion that — A(rt°, the free energy of hypercoil stabilization at zero charge, is independent of ionic strength.
While the range of a over which the conformational transition takes place may be seen directly from titration curves in the form shown in Figure 1 or 2, it is convenient for comparison with the viscosity data to calculate a parameter <pc, defined at each pH in the transition region as
#c = («h — ot)/(a h — ac) (5)
where ah and a0 are the values of a of the hypothetical hypercoiled and random coil states at the pH corresponding to the experimental value of a. The ah vs. pH curves are obtained by extrapolation of the experimental data for the butyl and hexyl copolymers in the form dGion/da vs. pH from the hypercoiled into the transition region; the a0 vs. pH curve is assumed to be given by the experimental curve for the ethyl copolymer. The parameter dc represents the fraction of residues in the random coil state if the following assumptions are valid. First, all acid groups can be considered to belong to either the hypercoiled or the random coil states; second, the titration curves for such groups are identical with those of completely hypercoiled or random coil molecules; third, all residues are in the hypercoiled state at low a. Regardless of the validity of these assumptions on the molecular level, represents a convenient measure of the degree of transition.
The Journal of Physical Chemistry, Vol. 74, No. 14, 1970
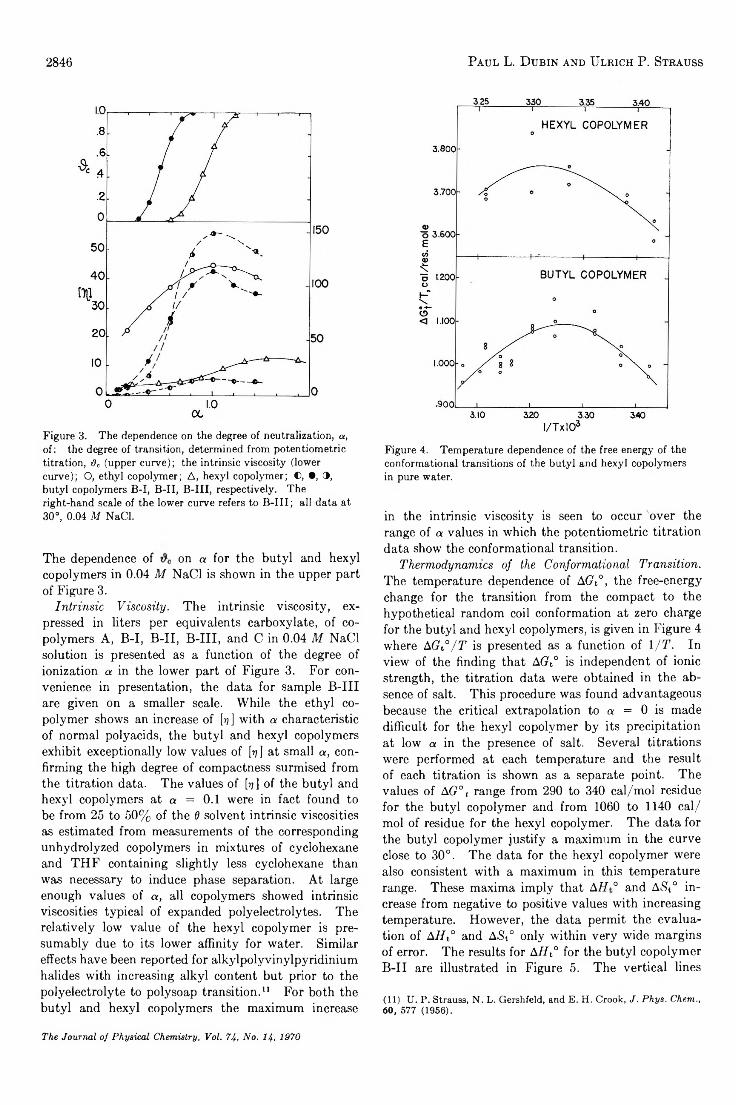
2846 Paul L. Dubin and Ulrich P. Strauss
Figure 3. The dependence on the degree of neutralization, a, of: the degree of transition, determined from potentiometrictitration, dc (upper curve); the intrinsic viscosity (lower curve); O, ethyl copolymer; A, hexyl copolymer; C, •, 9, butyl copolymers B-I, B-II, B-III, respectively. The right-hand scale of the lower curve refers to B-III; all data at 30°, 0.04 M NaCl.
The dependence of on a for the butyl and hexyl copolymers in 0.04 M NaCl is shown in the upper part of Figure 3.
Intrinsic Viscosity. The intrinsic viscosity, expressed in liters per equivalents carboxylate, of copolymers A, B-I, B-II, B-III, and C in 0.04 M NaCl solution is presented as a function of the degree of ionization a in the lower part of Figure 3. For convenience in presentation, the data for sample B-III are given on a smaller scale. While the ethyl copolymer shows an increase of [ij] with a characteristic of normal polyacids, the butyl and hexyl copolymers exhibit exceptionally low values of fo ] at small a, confirming the high degree of compactness surmised from the titration data. The values of [rj ] of the butyl and hexyl copolymers at a = 0.1 were in fact found to be from 25 to 50% of the 6 solvent intrinsic viscosities as estimated from measurements of the corresponding unhydrolyzed copolymers in mixtures of cyclohexane and THF containing slightly less cyclohexane than was necessary to induce phase separation. At large enough values of a, all copolymers showed intrinsic viscosities typical of expanded polyelectrolytes. The relatively low value of the hexyl copolymer is presumably due to its lower affinity for water. Similar effects have been reported for alkylpolyvinylpyridinium halides with increasing alkyl content but prior to the polyelectrolyte to polysoap transition.11 For both the butyl and hexyl copolymers the maximum increase
Figure 4. Temperature dependence of the free energy of the conformational transitions of the butyl and hexyl copolymers in pure water.
in the intrinsic viscosity is seen to occur over the range of a values in which the potentiometric titration data show the conformational transition.
Thermodynamics of the Conformational Transition. The temperature dependence of AGt°, the free-energy change for the transition from the compact to the hypothetical random coil conformation at zero charge for the butyl and hexyl copolymers, is given in Figure 4 where AGt°/T is presented as a function of l/T. In view of the finding that AGt° is independent of ionic strength, the titration data were obtained in the absence of salt. This procedure was found advantageous because the critical extrapolation to a = 0 is made difficult for the hexyl copolymer by its precipitation at low a in the presence of salt. Several titrations were performed at each temperature and the result of each titration is shown as a separate point. The values of AG° t range from 290 to 340 cal/mol residue for the butyl copolymer and from 1060 to 1140 cal/ mol of residue for the hexyl copolymer. The data for the butyl copolymer justify a maximum in the curve close to 30°. The data for the hexyl copolymer were also consistent with a maximum in this temperature range. These maxima imply that AH° and ASt° increase from negative to positive values with increasing temperature. However, the data permit the evaluation of AHt° and ASt° only within very wide margins of error. The results for AHt° for the butyl copolymer B-II are illustrated in Figure 5. The vertical lines
(11) U. P. Strauss, N. L. Gershfeld, and E. H. Crook, J. Phys. Chem., 60, 577 (1956).
The Journal of Physical Chemistry, Voi. 74, No. 14, 1970
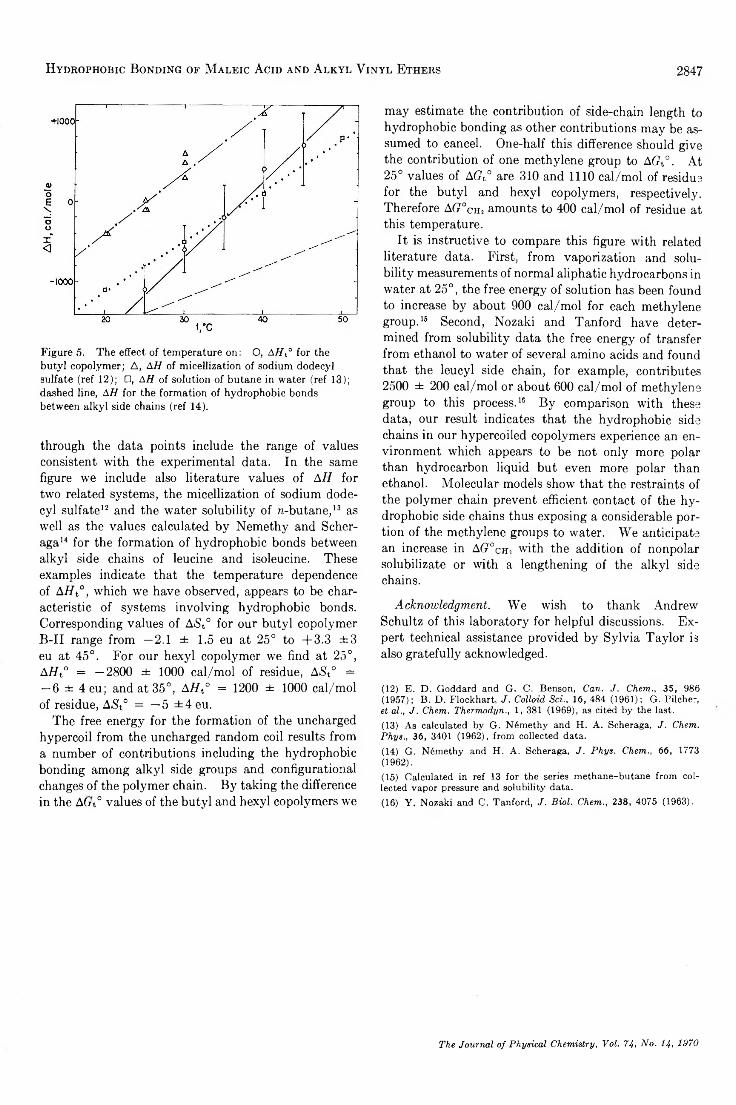
H y d r o p h o b ic B o n d in g o f M a l e ic A cid a n d A l k y l V in y l E t h e r s 2847
Figure 5. The effect of temperature on: O, AHt° for the butyl copolymer; A, AH of micellization of sodium dodecyl sulfate (ref 12); □, AH of solution of butane in water (ref 13); dashed line, AH for the formation of hydrophobic bonds between alkyl side chains (ref 14).
through the data points include the range of values consistent with the experimental data. In the same figure we include also literature values of AH for two related systems, the micellization of sodium dodecyl sulfate12 and the water solubility of n-butane,13 as well as the values calculated by Nemethy and Scher- aga14 for the formation of hydrophobic bonds between alkyl side chains of leucine and isoleucine. These examples indicate that the temperature dependence of AHt°, which we have observed, appears to be characteristic of systems involving hydrophobic bonds. Corresponding values of ASt° for our butyl copolymer B-II range from —2.1 ± 1.5 eu at 25° to +3.3 ± 3 eu at 45°. For our hexyl copolymer we find at 25°, AHt° = —2800 ± 1000 cal/mol of residue, A<St° = — 6 ± 4eu; and at 35°, AHt° = 1200 ± 1000 cal/mol of residue, ASt° = —5 ± 4 eu.
The free energy for the formation of the uncharged hypercoil from the uncharged random coil results from a number of contributions including the hydrophobic bonding among alkyl side groups and configurational changes of the polymer chain. By taking the difference in the A(rt° values of the butyl and hexyl copolymers we
may estimate the contribution of side-chain length to hydrophobic bonding as other contributions may be assumed to cancel. One-half this difference should give the contribution of one methylene group to AGt°. At 25° values of AGt° are 310 and 1110 cal/mol of residue for the butyl and hexyl copolymers, respectively. Therefore AG°cn, amounts to 400 cal/mol of residue at this temperature.
It is instructive to compare this figure with related literature data. First, from vaporization and solubility measurements of normal aliphatic hydrocarbons in water at 25°, the free energy of solution has been found to increase by about 900 cal/mol for each methylene group.16 Second, Nozaki and Tanford have determined from solubility data the free energy of transfer from ethanol to water of several amino acids and found that the leucyl side chain, for example, contributes 2500 ± 200 cal/mol or about 600 cal/mol of methylene group to this process.16 By comparison with these data, our result indicates that the hydrophobic side chains in our hypercoiled copolymers experience an environment which appears to be not only more polar than hydrocarbon liquid but even more polar than ethanol. Molecular models show that the restraints of the polymer chain prevent efficient contact of the hydrophobic side chains thus exposing a considerable portion of the methylene groups to water. We anticipate an increase in AG^cm with the addition of nonpolar solubilizate or with a lengthening of the alkyl side chains.
Acknowledgment. We wish to thank Andrew Schultz of this laboratory for helpful discussions. Expert technical assistance provided by Sylvia Taylor is also gratefully acknowledged.
(12) E. D. Goddard and G. C. Benson, Can. J. Chem., 35, 986 (1957); B. D. Flockhart, J. Colloid Sci., 16, 484 (1961); G. Pilcher, et al., J. Chem. Thermodyn., 1, 381 (1969), as cited by the last.(13) As calculated by G. Nemethy and H. A. Scheraga, J. Chem. Phys., 36, 3401 (1962), from collected data.(14) G. N6methy and H. A. Scheraga, J. Phys. Chem., 66, 1773 (1962).(15) Calculated in ref 13 for the series methane-butane from collected vapor pressure and solubility data.(16) Y. Nozaki and C, Tanford, J. Biol. Chem., 238 , 4075 (1963).
The Journal o f P hysical Chem istry, V ol. 74, N o . 14, 1970
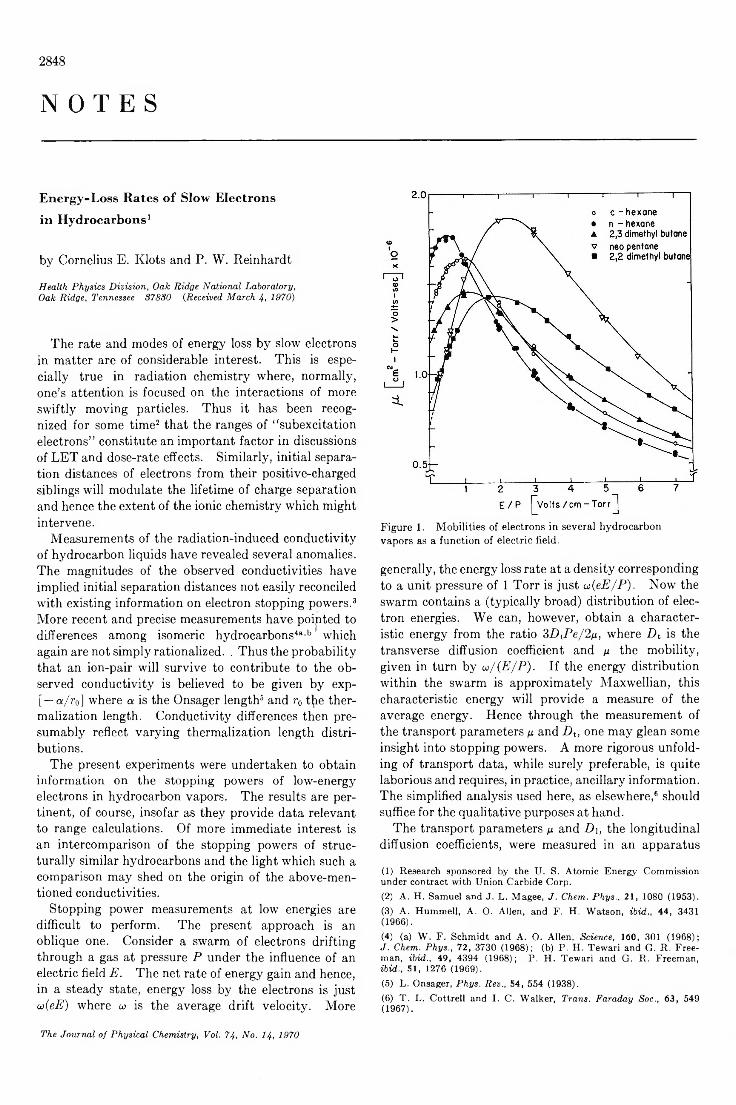
2848
N O T E S
Energy-Loss Rates of Slow Electrons
in Hydrocarbons1
by Cornelius E. Klots and P. W. Reinhardt
Health Physics Division, Oak Ridge National Laboratory,Oak Ridge, Tennessee 37830 (.Received March 4, 1970)
The rate and modes of energy loss by slow electrons in matter are of considerable interest. This is especially true in radiation chemistry where, normally, one’s attention is focused on the interactions of more swiftly moving particles. Thus it has been recognized for some time2 that the ranges of “ subexcitation electrons” constitute an important factor in discussions of LET and dose-rate effects. Similarly, initial separation distances of electrons from their positive-charged siblings will modulate the lifetime of charge separation and hence the extent of the ionic chemistry which might intervene.
Measurements of the radiation-induced conductivity of hydrocarbon liquids have revealed several anomalies. The magnitudes of the observed conductivities have implied initial separation distances not easily reconciled with existing information on electron stopping powers.3 More recent and precise measurements have poipted to differences among isomeric hydrocarbons4“,b which again are not simply rationalized. Thus the probability that an ion-pair will survive to contribute to the observed conductivity is believed to be given by exp- [—a/r0] where a is the Onsager length8 and r0 tlpe ther- malization length. Conductivity differences then presumably reflect varying thermalization length distributions.
The present experiments were undertaken to obtain information on the stopping powers of low-energy electrons in hydrocarbon vapors. The results are pertinent, of course, insofar as they provide data relevant to range calculations. Of more immediate interest is an intercomparison of the stopping powers of structurally similar hydrocarbons and the light which such a comparison may shed on the origin of the above-mentioned conductivities.
Stopping power measurements at low energies are difficult to perform. The present approach is an oblique one. Consider a swarm of electrons drifting through a gas at pressure P under the influence of an electric field E. The net rate of energy gain and hence, in a steady state, energy loss by the electrons is just <j>(eE) where w is the average drift velocity. More
Figure 1. Mobilities of electrons in several hydrocarbon vapors as a function of electric field.
generally, the energy loss rate at a density corresponding to a unit pressure of 1 Torr is just u(eE/P). Now the swarm contains a (typically broad) distribution of electron energies. We can, however, obtain a characteristic energy from the ratio 3i)tPe/2/i, where Dt is the transverse diffusion coefficient and n the mobility, given in turn by w/(E/P). If the energy distribution within the swarm is approximately Maxwellian, this characteristic energy will provide a measure of the average energy. Hence through the measurement of the transport parameters ¡x and Dt, one may glean some insight into stopping powers. A more rigorous unfolding of transport data, while surely preferable, is quite laborious and requires, in practice, ancillary information. The simplified analysis used here, as elsewhere,6 should suffice for the qualitative purposes at hand.
The transport parameters n and D\, the longitudinal diffusion coefficients, were measured in an apparatus
(1) Research sponsored by the TJ. S. Atomic Energy Commission under contract with Union Carbide Corp.(2) A. H. Samuel and J. L. Magee, J. Chem. Phys., 21, 1080 (1953).(3) A. Hummell, A. O. Allen, and F. H. Watson, ibid., 44, 3431(1966) .(4) (a) W . F. Schmidt and A. O. Allen, Science, 160, 301 (1968); J . Chem. Phys., 72, 3730 (1968); (b) P. H. Tewari and G. R. Freeman, ibid., 49, 4394 (1968); P. H. Tewari and G. R. Freeman, ibid., 51, 1276 (1969).(5) L. Onsager, Phys. Rev., 54, 554 (1938).(6) T. L. Cottrell and I. C. Walker, Trans. Faraday Soc., 63, 549(1967) .
The Journal o f P hysica l Chem istry, Voi. 74, N o. 14 , 1970
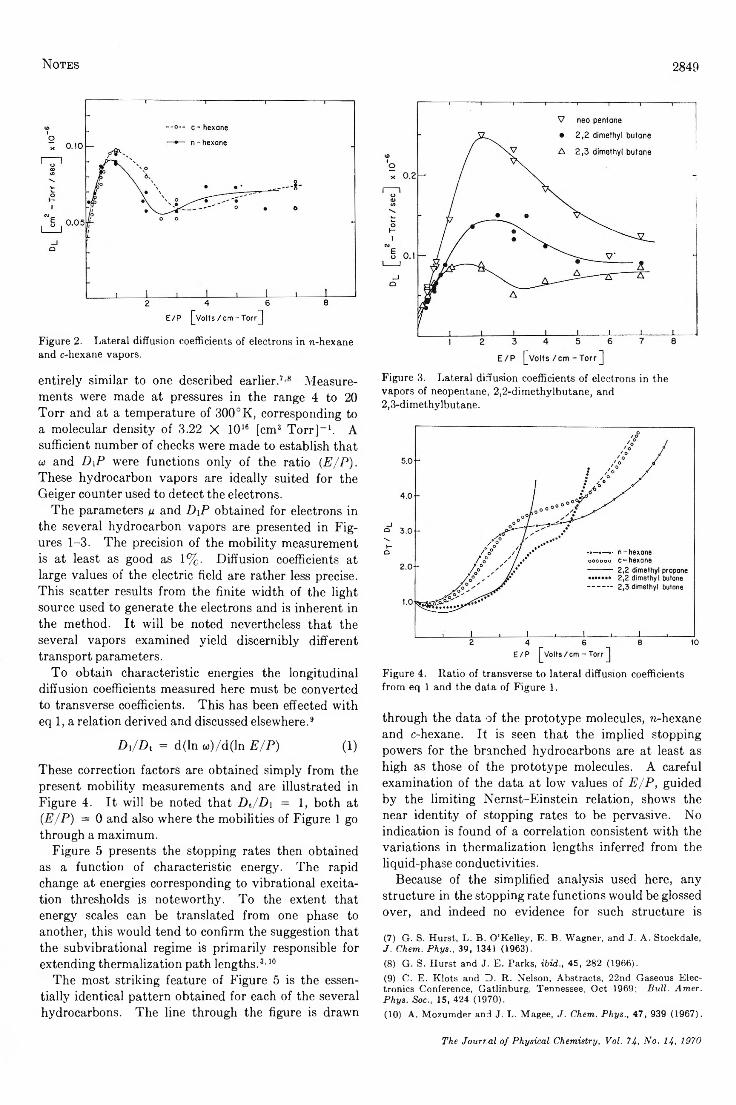
N o tes 2 8 4 9
Figure 2. Lateral diffusion coefficients of electrons in «-hexane and c-hexane vapors.
entirely similar to one described earlier.7 8 Measurements were made at pressures in the range 4 to 20 Torr and at a temperature of 300°K, corresponding to a molecular density of 3.22 X 10¹⁶ [cm3 Torr]-1. A sufficient number of checks were made to establish that co and D\P were functions only of the ratio (E/P). These hydrocarbon vapors are ideally suited for the Geiger counter used to detect the electrons.
The parameters p and D\P obtained for electrons in the several hydrocarbon vapors are presented in Figures 1-3. The precision of the mobility measurement is at least as good as 1%. Diffusion coefficients at large values of the electric field are rather less precise. This scatter results from the finite width of the light source used to generate the electrons and is inherent in the method. It will be noted nevertheless that the several vapors examined yield discernibly different transport parameters.
To obtain characteristic energies the longitudinal diffusion coefficients measured here must be converted to transverse coefficients. This has been effected with eq 1, a relation derived and discussed elsewhere.9
D]/Dt = d(ln co)/d(ln E/P) (1)
These correction factors are obtained simply from the present mobility measurements and are illustrated in Figure 4. It will be noted that Dt/D\ = 1, both at {E/P) = 0 and also where the mobilities of Figure 1 go through a maximum.
Figure 5 presents the stopping rates then obtained as a function of characteristic energy. The rapid change at energies corresponding to vibrational excitation thresholds is noteworthy. To the extent that energy scales can be translated from one phase to another, this would tend to confirm the suggestion that the subvibrational regime is primarily responsible for extending thermalization path lengths.3,10
The most striking feature of Figure 5 is the essentially identical pattern obtained for each of the several hydrocarbons. The line through the figure is drawn
Figure 3. Lateral diffusion coefficients of electrons in the vapors of neopentane, 2,2-dimethylbutane, and 2,3-dimethylbutane.
Figure 4. Ratio of transverse to lateral diffusion coefficients from eq 1 and the data of Figure 1.
through the data of the prototype molecules, n-hexane and c-hexane. It is seen that the implied stopping powers for the branched hydrocarbons are at least as high as those of the prototype molecules. A careful examination of the data at low values of E/P, guided by the limiting Nernst-Einstein relation, shows the near identity of stopping rates to be pervasive. No indication is found of a correlation consistent with the variations in thermalization lengths inferred from the liquid-phase conductivities.
Because of the simplified analysis used here, any structure in the stopping rate functions would be glossed over, and indeed no evidence for such structure is
(7) G. S. Hurst, L. B. O’Kelley, E. B. Wagner, and J. A. Stockdale, J. Chem. Phys., 39, 1341 (1963).(8) G. S. Hurst and J. E. Parks, ibid., 45, 282 (1966).(9) C. E. Klots and D. R. Nelson, Abstracts, 22nd Gaseous Electronics Conference, Gatlinburg, Tennessee, Oct 1969; Bull. Amer. Phys. Soc., 15, 424 (1970).(10) A. Mozumder and J. L. Magee, J. Chem. Phys., 47, 939 (1967).
The Jourr-al o f P hysical Chem istry, Voi. 74, N o . 14, 1970
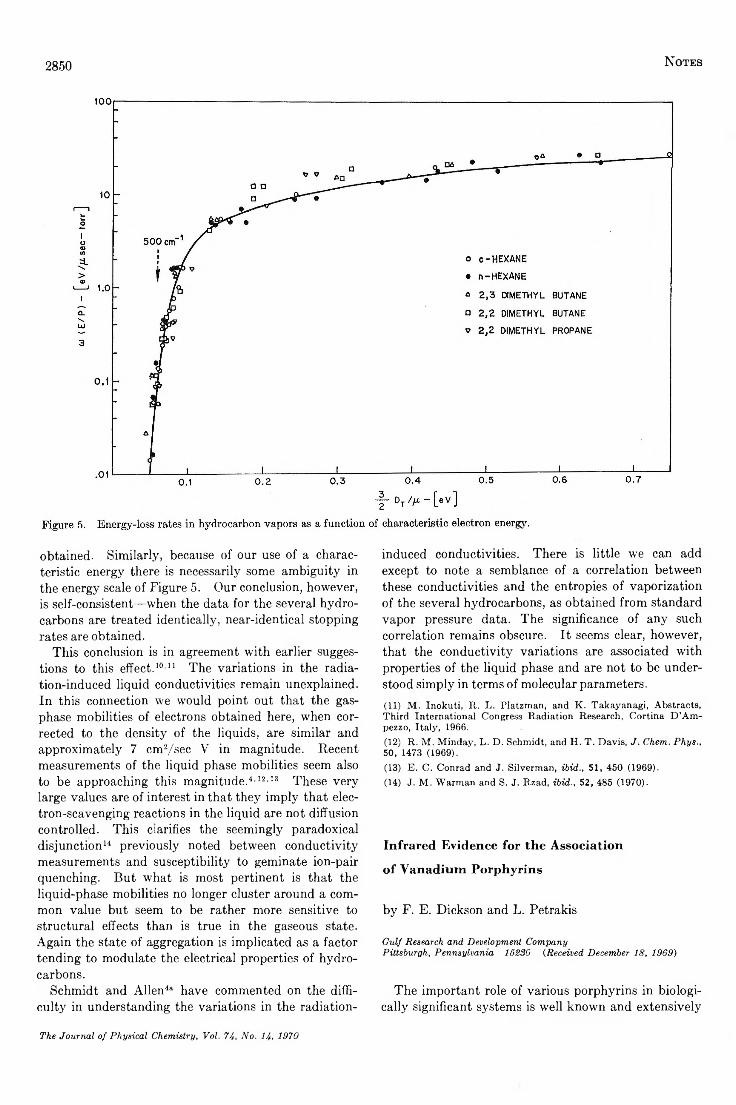
2850 N o t e s
obtained. Similarly, because of our use of a characteristic energy there is necessarily some ambiguity in the energy scale of Figure 5. Our conclusion, however, is self-consistent—when the data for the several hydrocarbons are treated identically, near-identical stopping rates are obtained.
This conclusion is in agreement with earlier suggestions to this effect.10,11 The variations in the radiation-induced liquid conductivities remain unexplained. In this connection we would point out that the gas- phase mobilities of electrons obtained here, when corrected to the density of the liquids, are similar and approximately 7 cm2/sec V in magnitude. Recent measurements of the liquid phase mobilities seem also to be approaching this magnitude.4'12’13 These very large values are of interest in that they imply that electron-scavenging reactions in the liquid are not diffusion controlled. This clarifies the seemingly paradoxical disjunction14 previously noted between conductivity measurements and susceptibility to geminate ion-pair quenching. But what is most pertinent is that the liquid-phase mobilities no longer cluster around a common value but seem to be rather more sensitive to structural effects than is true in the gaseous state. Again the state of aggregation is implicated as a factor tending to modulate the electrical properties of hydrocarbons.
Schmidt and Allen4a have commented on the difficulty in understanding the variations in the radiation-
induced conductivities. There is little we can add except to note a semblance of a correlation between these conductivities and the entropies of vaporization of the several hydrocarbons, as obtained from standard vapor pressure data. The significance of any such correlation remains obscure. It seems clear, however, that the conductivity variations are associated with properties of the liquid phase and are not to be understood simply in terms of molecular parameters.(11) M. Inokuti, R. L. Platzman, and K. Takayanagi, Abstracts, Third International Congress Radiation Research, Cortina D ’Ampezzo, Italy, 1966.(12) R. M. Minday, L. D. Schmidt, and H. T. Davis, J. Chem. Phys., 50, 1473 (1969).(13) E. C. Conrad and J. Silverman, ibid., 51, 450 (1969).(14) J. M . Warman and S. J. Rzad, ibid., 52, 485 (1970).
Infrared Evidence for the Association
of Vanadium Porphyrins
by F. E. Dickson and L. Petrakis
Gulf Research and Development CompanyPittsburgh, Pennsylvania 15230 {Received December 18, 1969)
The important role of various porphyrins in biologically significant systems is well known and extensively
The Journal o f P hysical Chem istry, Voi. 74, N o . 14, 1970
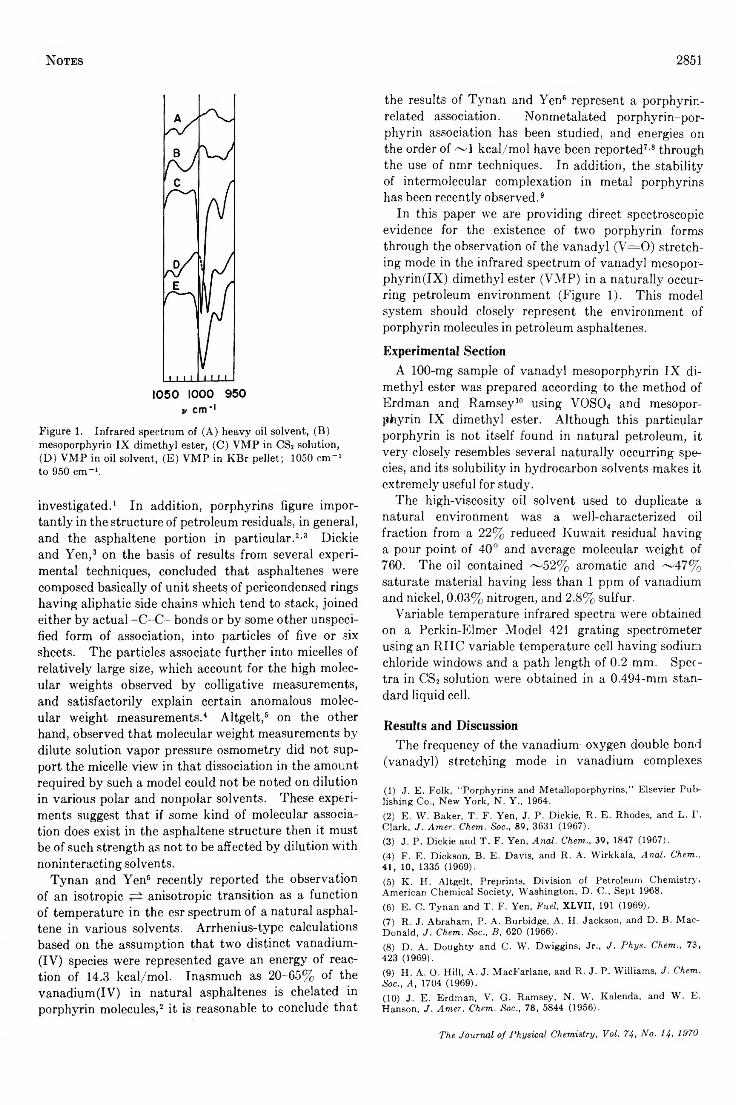
N o t e s 2851
v cm*1Figure 1. Infrared spectrum of (A) heavy oil solvent, (B) mesoporphyrin IX dimethyl ester, (C) VMP in CS2 solution,(D) VMP in oil solvent, (E) VMP in KBr pellet; 1050 cm*1 to 9.50 cm-1.
investigated.1 In addition, porphyrins figure importantly in the structure of petroleum residuals, in general, and the asphaltene portion in particular.2’3 Dickie and Yen,3 on the basis of results from several experimental techniques, concluded that asphaltenes were composed basically of unit sheets of pericondensed rings having aliphatic side chains which tend to stack, joined either by actual -C -C - bonds or by some other unspecified form of association, into particles of five or six sheets. The particles associate further into micelles of relatively large size, which account for the high molecular weights observed by colligative measurements, and satisfactorily explain certain anomalous molecular weight measurements.4 Altgelt,5 on the other hand, observed that molecular weight measurements by dilute solution vapor pressure osmometry did not support the micelle view in that dissociation in the amount required by such a model could not be noted on dilution in various polar and nonpolar solvents. These experiments suggest that if some kind of molecular association does exist in the asphaltene structure then it must be of such strength as not to be affected by dilution with noninteracting solvents.
Tynan and Yen6 recently reported the observation of an isotropic anisotropic transition as a function of temperature in the esr spectrum of a natural asphaltene in various solvents. Arrhenius-type calculations based on the assumption that two distinct vanadium- (IV) species were represented gave an energy of reaction of 14.3 kcal/mol. Inasmuch as 20-65% of the vanadium(IV) in natural asphaltenes is chelated in porphyrin molecules,2 it is reasonable to conclude that
the results of Tynan and Yen6 represent a porphyrin- related association. Nonmetalated porphyrin-porphyrin association has been studied, and energies on the order of ~ 1 kcal/mol have been reported7,8 through the use of nmr techniques. In addition, the stability of intermolecular complexation in metal porphyrins has been recently observed.9
In this paper we are providing direct spectroscopic evidence for the existence of two porphyrin forms through the observation of the vanadyl (V = 0 ) stretching mode in the infrared spectrum of vanadyl mesopor- phyrin(IX) dimethyl ester (VMP) in a naturally occurring petroleum environment (Figure 1). This model system should closely represent the environment of porphyrin molecules in petroleum asphaltenes.
Experimental SectionA 100-mg sample of vanadyl mesoporphyrin IX di
methyl ester was prepared according to the method of Erdman and Ramsey10 using V 0S 04 and mesoporphyrin IX dimethyl ester. Although this particular porphyrin is not itself found in natural petroleum, it very closely resembles several naturally occurring species, and its solubility in hydrocarbon solvents makes it extremely useful for study.
The high-viscosity oil solvent used to duplicate a natural environment was a well-characterized oil fraction from a 22% reduced Kuwait residual having a pour point of 40° and average molecular weight of 760. The oil contained ~ 5 2 % aromatic and ~ 4 7 % saturate material having less than 1 ppm of vanadium and nickel, 0.03% nitrogen, and 2.8% sulfur.
Variable temperature infrared spectra were obtained on a Perkin-Elmer Model 421 grating spectrometer using an RIIC variable temperature cell having sodium chloride windows and a path length of 0.2 mm. Spectra in CS2 solution were obtained in a 0.494-mm standard liquid cell.
Results and DiscussionThe frequency of the vanadium-oxygen double bond
(vanadyl) stretching mode in vanadium complexes
(1) J. E. Folk, “ Porphyrins and Metalloporphyrins,” Elsevier Publishing Co., New York, N. Y., 1964.(2) E. W. Baker, T. F. Yen, J. P. Dickie, R. E. Rhodes, and L. F. Clark, J. Amer. Chem. Soc., 89, 3631 (1967).(3) J. P. Dickie and T. F. Yen, Anal. Chem., 39, 1847 (1967).(4) F. E. Dickson, B. E. Davis, and R. A. Wirkkala, Anal. Chem., 41, 10, 1335 (1969).(5) K. H. Altgelt, Preprints, Division of Petroleum Chemistry, American Chemical Society, Washington, D. C., Sept 1968.(6) E. C. Tynan and T. F. Yen, Fuel, XLVII, 191 (1969).(7) R. J. Abraham, P. A. Burbidge, A. H. Jackson, and D. B, MacDonald, J. Chem. Soc., B, 620 (1966).(8) D. A. Doughty and C. W . Dwiggins, Jr., J. Phys. Chem., 73, 423 (1969).(9) H. A. O. Hill, A. J. MacFarlane, and R. J. P. Williams, J. Chem. Soc., A, 1704 (1969).(10) J. E. Erdman, V. G. Ramsey, N. W. Kalenda, and W. E. Hanson, J. Amer. Chem. Soc., 78, 5844 (1956).
The Journal o f P h ysical Chem istry, Vol. 74, AJo. 14, 1970
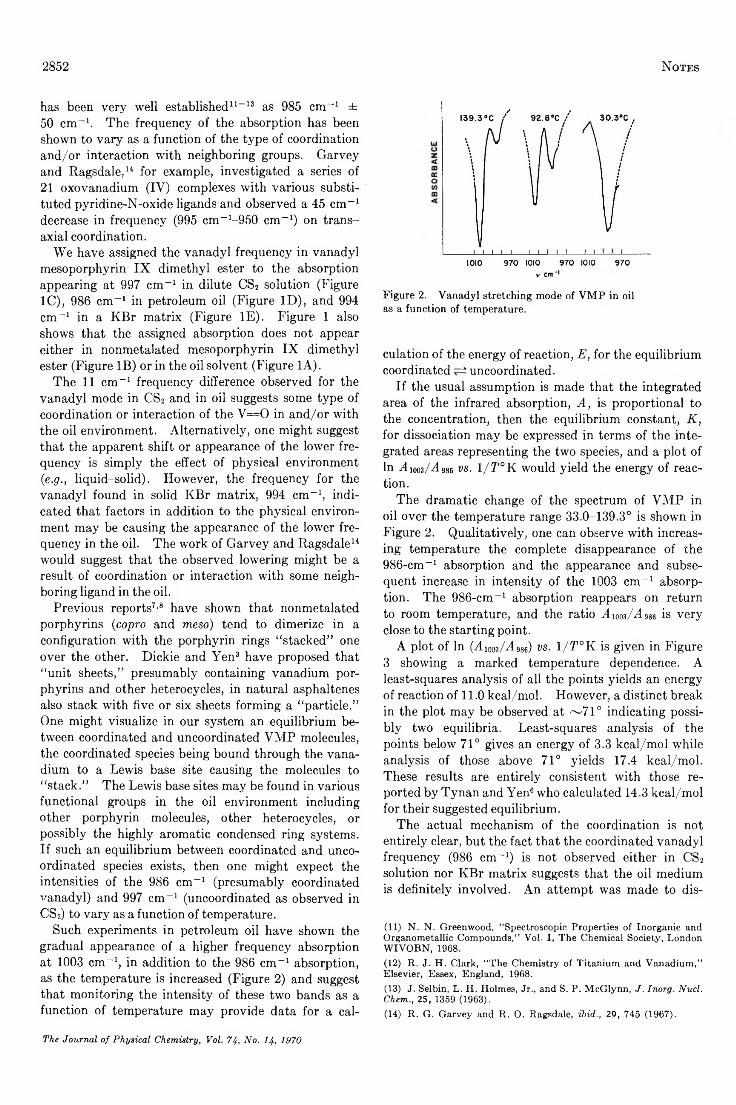
2852 N o t e s
has been very well established11-13 as 985 cm-1 ± 50 cm-1. The frequency of the absorption has been shown to vary as a function of the type of coordination and/or interaction with neighboring groups. Garvey and Ragsdale,14 for example, investigated a series of 21 oxovanadium (IV) complexes with various substituted pyridine-N-oxide ligands and observed a 45 cm-1 decrease in frequency (995 cm-1-950 cm-1) on trans- axial coordination.
We have assigned the vanadyl frequency in vanadyl mesoporphyrin IX dimethyl ester to the absorption appearing at 997 cm-1 in dilute CS2 solution (Figure 1C), 986 cm-1 in petroleum oil (Figure ID), and 994 cm-1 in a KBr matrix (Figure IE). Figure 1 also shows that the assigned absorption does not appear either in nonmetalated mesoporphyrin IX dimethyl ester (Figure IB) or in the oil solvent (Figure 1A).
The 11 cm-1 frequency difference observed for the vanadyl mode in CS2 and in oil suggests some type of coordination or interaction of the V = 0 in and/or with the oil environment. Alternatively, one might suggest that the apparent shift or appearance of the lower frequency is simply the effect of physical environment (e.g., liquid-solid). However, the frequency for the vanadyl found in solid KBr matrix, 994 cm-1, indicated that factors in addition to the physical environment may be causing the appearance of the lower frequency in the oil. The work of Garvey and Ragsdale14 would suggest that the observed lowering might be a result of coordination or interaction with some neighboring ligand in the oil.
Previous reports7'8 have shown that nonmetalated porphyrins (copro and meso) tend to dimerize in a configuration with the porphyrin rings “ stacked” one over the other. Dickie and Yen* 3 * * have proposed that “ unit sheets,” presumably containing vanadium porphyrins and other heterocycles, in natural asphaltenes also stack with five or six sheets forming a “ particle.” One might visualize in our system an equilibrium between coordinated and uncoordinated VMP molecules, the coordinated species being bound through the vanadium to a Lewis base site causing the molecules to “ stack.” The Lewis base sites may be found in various functional groups in the oil environment including other porphyrin molecules, other heterocycles, or possibly the highly aromatic condensed ring systems. If such an equilibrium between coordinated and uncoordinated species exists, then one might expect the intensities of the 986 cm-1 (presumably coordinated vanadyl) and 997 cm-1 (uncoordinated as observed in CS2) to vary as a function of temperature.
Such experiments in petroleum oil have shown the gradual appearance of a higher frequency absorption at 1003 cm-1, in addition to the 986 cm-1 absorption, as the temperature is increased (Figure 2) and suggest that monitoring the intensity of these two bands as a function of temperature may provide data for a cal-
I I i I I__ I I I I I__ I I .11010 970 1010 970 1010 970
v cm"1
Figure 2. Vanadyl stretching mode of VMP in oil as a function of temperature.
culation of the energy of reaction, E, for the equilibrium coordinated ^ uncoordinated.
If the usual assumption is made that the integrated area of the infrared absorption, A, is proportional to the concentration, then the equilibrium constant, K, for dissociation may be expressed in terms of the integrated areas representing the two species, and a plot of In A 1003/A 986 vs. 1 /T °K would yield the energy of reaction.
The dramatic change of the spectrum of VMP in oil over the temperature range 33.0-139.3° is shown in Figure 2. Qualitatively, one can observe with increasing temperature the complete disappearance of the 986-cm-1 absorption and the appearance and subsequent increase in intensity of the 1003 cm-1 absorption. The 986-cm-1 absorption reappears on return to room temperature, and the ratio A i0o3/A986 is very close to the starting point.
A plot of In (A1003/A986) vs. 1 /T °K is given in Figure3 showing a marked temperature dependence. A least-squares analysis of all the points yields an energy of reaction of 11.0 kcal/mol. However, a distinct break in the plot may be observed at ~ 7 1 ° indicating possibly two equilibria. Least-squares analysis of the points below 71° gives an energy of 3.3 kcal/mol while analysis of those above 71° yields 17.4 kcal/mol. These results are entirely consistent with those reported by Tynan and Yen6 who calculated 14.3 kcal/mol for their suggested equilibrium.
The actual mechanism of the coordination is not entirely clear, but the fact that the coordinated vanadyl frequency (986 cm-1) is not observed either in CS2 solution nor KBr matrix suggests that the oil medium is definitely involved. An attempt was made to dis-
(11) N. N. Greenwood, "Spectroscopic Properties of Inorganic and Organometallic Compounds,” Vol. I, The Chemical Society, London WIVOBN, 1968.(12) R. J. H. Clark, “ The Chemistry of Titanium and Vanadium,” Elsevier, Essex, England, 1968.(13) J. Selbin, L. H. Holmes, Jr., and S. P. McGlynn, J. Inorg. Nucl. Chew.., 25, 1359 (1963).(14) R. G. Garvey and R. 0. Ragsdale, ibid., 29, 745 (1967).
The Journal o f P hysica l Chem istry, Vol. 74, N o. 14, 1970
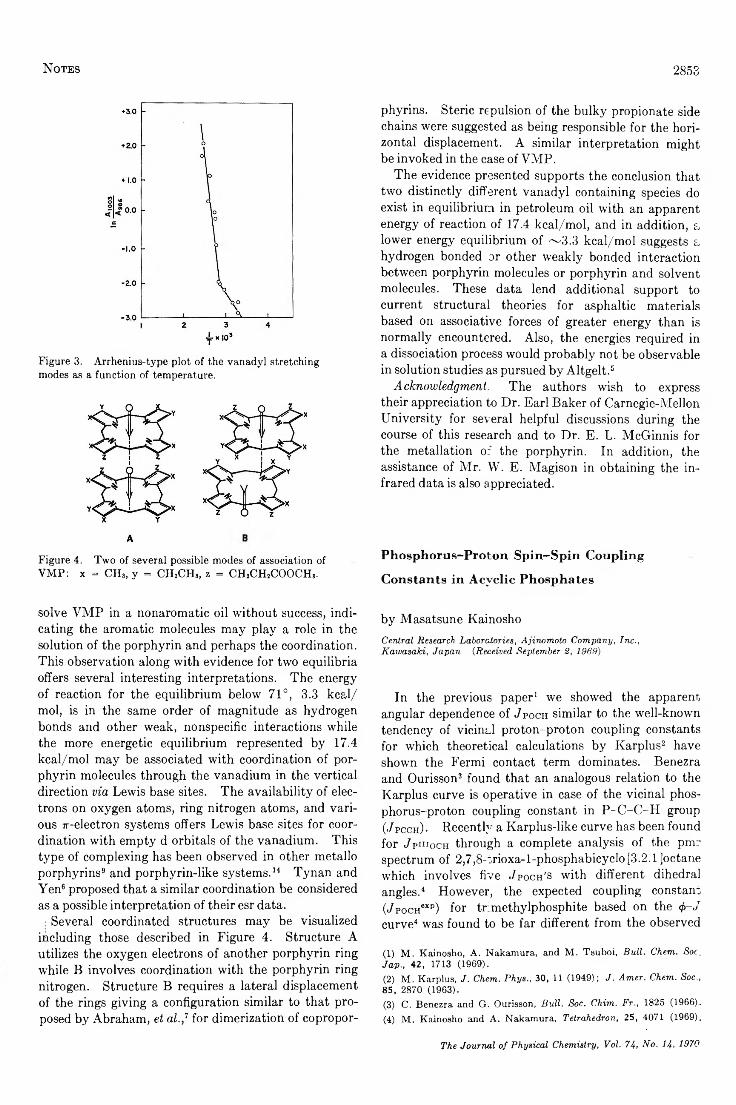
N o tes 2853
Figure 3. A rrhenius-type p lo t o f the van ad y l stretch ing m odes as a fun ction o f tem perature.
F igure 4. T w o o f several possible m odes o f association o f V M P : x = C H 3, y = C H 2C H 3, z = C H 2C H 2C O O C H 3.
solve VMP in a nonaromatic oil without success, indicating the aromatic molecules may play a role in the solution of the porphyrin and perhaps the coordination. This observation along with evidence for two equilibria offers several interesting interpretations. The energy of reaction for the equilibrium below 71°, 3.3 kcal/ mol, is in the same order of magnitude as hydrogen bonds and other weak, nonspecific interactions while the more energetic equilibrium represented by 17.4 kcal/mol may be associated with coordination of porphyrin molecules through the vanadium in the vertical direction via Lewis base sites. The availability of electrons on oxygen atoms, ring nitrogen atoms, and various 7r-electron systems offers Lewis base sites for coordination with empty d orbitals of the vanadium. This type of complexing has been observed in other metallo porphyrins9 and porphyrin-like systems.14 Tynan and Yen6 proposed that a similar coordination be considered as a possible interpretation of their esr data.
: Several coordinated structures may be visualized including those described in Figure 4. Structure A utilizes the oxygen electrons of another porphyrin ring while B involves coordination with the porphyrin ring nitrogen. Structure B requires a lateral displacement of the rings giving a configuration similar to that proposed by Abraham, et al.,7 for dimerization of copropor
phyrins. Steric repulsion of the bulky propionate side chains were suggested as being responsible for the horizontal displacement. A similar interpretation might be invoked in the case of VMP.
The evidence presented supports the conclusion that two distinctly different vanadyl containing species do exist in equilibrium in petroleum oil with an apparent energy of reaction of 17.4 kcal/mol, and in addition, a lower energy equilibrium of ~3 .3 kcal/mol suggests a hydrogen bonded or other weakly bonded interaction between porphyrin molecules or porphyrin and solvent molecules. These data lend additional support to current structural theories for asphaltic materials based on associative forces of greater energy than is normally encountered. Also, the energies required in a dissociation process would probably not be observable in solution studies as pursued by Altgelt.5
Acknowledgment. The authors wish to express their appreciation to Dr. Earl Baker of Carnegie-Mellon University for several helpful discussions during the course of this research and to Dr. E. L. McGinnis for the metallation of the porphyrin. In addition, the assistance of Mr. W. E. Magison in obtaining the infrared data is also appreciated.
Phosphorus-Proton Spin-Spin Coupling
Constants in Acyclic Phosphates
by Masatsune KainoshoCentral Research Laboratories, Ajinomoto Company, Inc.,Kawasaki, Japan {Received September 2, 1969)
In the previous paper1 we showed the apparent angular dependence of J p o c h similar to the well-known tendency of vicinal proton-proton coupling constants for which theoretical calculations by Karplus2 have shown the Fermi contact term dominates. Benezra and Ourisson3 found that an analogous relation to the Karplus curve is operative in case of the vicinal phosphorus-proton coupling constant in P -C -C -H group ( , / p c c h ) • Recently a Karplus-like curve has been found for JpniocH through a complete analysis of the pmr spectrum of 2,7,8-irioxa-l-phosphabicyclo [3.2.1 Joctane which involves five « / p o c h ' s with different dihedral angles.4 However, the expected coupling constant ( < / p o c H e x p ) for trunethylphosphite based on the <j>-J curve4 was found to be far different from the observed
(1) M . K ain osh o , A . N akam ura , and M . T su b o i, Bull. Chem. Soc. Jap., 42 , 1713 (1969).(2) M . K arplus, J. Chem. Phys., 30, 11 (1 949 ); J. Amer. Chem. Soc., 85 , 2870 (1963).(3) C . B enezra and G . O urisson, Bull. Soc. Chim. Fr., 1825 (1966).(4) M . K ain osho and A . N akam ura, Tetrahedron, 25, 4071 (1969).
The Journal o f P h ysical Chem istry, V oi. 74, No. 14, 1970
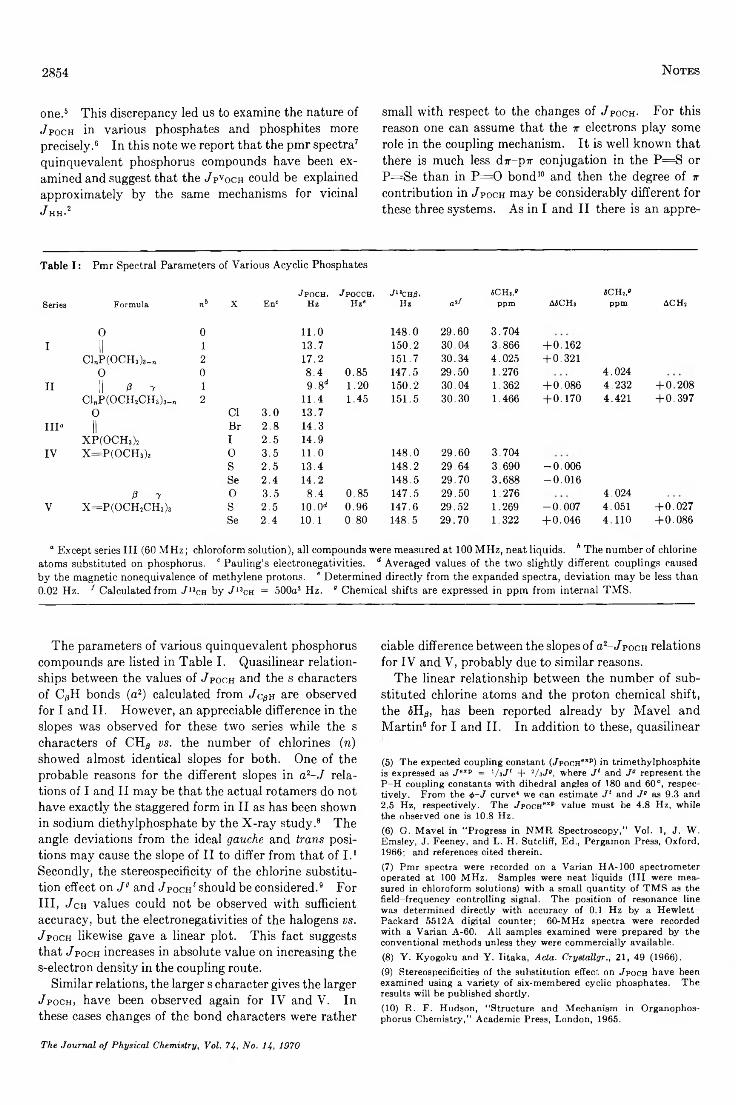
2854 N o t e s
one.5 This discrepancy led us to examine the nature of J p o c h in various phosphates and phosphites more precisely.6 In this note we report that the pmr spectra7 quinquevalent phosphorus compounds have been examined and suggest that the J p v o c h could be explained approximately by the same mechanisms for vicinal J HH-2
small with respect to the changes of J p o c h . For this reason one can assume that the x electrons play some role in the coupling mechanism. It is well known that there is much less dx-px conjugation in the P = S or P =S e than in P = 0 bond10 and then the degree of x contribution in J POc h may be considerably different for these three systems. As in I and II there is an appre-
Table I : Pm r Spectral Param eters o f Various A cy c lic Phosphates
J poch, J POCCH. J u CH0. SCH,,» aCHî.»Series F orm ula nb X E n ' Hz Hz' Hz 0 *f ppm ASCHa ppm ACH,
0 0 1 1 .0 1 4 8 .0 2 9 .6 0 3 .7 0 4I II 1 1 3 .7 1 5 0 .2 3 0 .0 4 3 .8 66 + 0 .1 6 2
C l„P (O C H 3)3_„ 2 1 7 .2 151 .7 3 0 .3 4 4 .0 2 5 + 0 .3 210 0 8 .4 0 .8 5 147 .5 2 9 .5 0 1.276 4 .0 2 4
II II ß 7 1 9 .8 “ 1 .2 0 150 .2 3 0 .04 1 .362 + 0 .0 8 6 4 .2 3 2 + 0 .2 0 8C l„P (O C H 2C H 3)3_„ 2 1 1 .4 1 .45 1 5 1 .5 3 0 .3 0 1 .466 + 0 .1 7 0 4 .4 21 + 0 .3 9 7
0 Cl 3 .0 1 3 .7I I I “ II B r 2 .8 1 4 .3
X P (O C H 3)î I 2 .5 1 4 .9IV X = P ( 0 C H 3)3 0 3 .5 1 1 .0 1 4 8 .0 2 9 .6 0 3 .7 04
s 2 .5 1 3 .4 148 .2 2 9 .6 4 3 .6 9 0 - 0 . 0 0 6Se 2 .4 1 4 .2 1 4 8 .5 2 9 .7 0 3 .6 8 8 - 0 . 0 1 6
ß 7 0 3 .5 8 .4 0 .8 5 147 .5 2 9 .5 0 1 .276 4 .0 2 4V X = P ( 0 C H 2C H 3)3 s 2 .5 10. O'' 0 .9 6 147 .6 2 9 .5 2 1.269 -0.007 4.051 +0.027
Se 2.4 10.1 0.80 148.5 29.70 1.322 +0.046 4.110 +0.086
“ E xcep t series I I I (60 M H z ; ch loroform solution ), all com pounds were m easured at 100 M H z, neat liquids. 5 T h e num ber o f chlorine atom s substituted on phosphorus. c P au ling ’ s electronegativities. d A veraged values o f the tw o slightly different couplings caused b y the m agnetic nonequivalence o f m ethylene protons. " D eterm ined d irectly from the expanded spectra, dev iation m ay be less than 0.02 H z. f C alcu lated from J n c.n b y J 13ch = 500a2 H z. " C hem ical shifts are expressed in p p m from internal T M S .
The parameters of various quinquevalent phosphorus compounds are listed in Table I. Quasilinear relationships between the values of J p o c h and the s characters of CpH bonds (a2) calculated from Jc$h are observed for I and II. However, an appreciable difference in the slopes was observed for these two series while the s characters of CH3 vs. the number of chlorines (n) showed almost identical slopes for both. One of the probable reasons for the different slopes in a2-J relations of I and II may be that the actual rotamers do not have exactly the staggered form in II as has been shown in sodium diethylphosphate by the X-ray study.8 The angle deviations from the ideal gauche and trans positions may cause the slope of II to differ from that of I .1 Secondly, the stereospecificity of the chlorine substitution effect on J° and J p o c h ' should be considered.9 For III, J c h values could not be observed with sufficient accuracy, but the electronegativities of the halogens vs. J p o c h likewise gave a linear plot. This fact suggests that J p o c h increases in absolute value on increasing the s-electron density in the coupling route.
Similar relations, the larger s character gives the larger J p o c h , have been observed again for IV and V. In these cases changes of the bond characters were rather
ciable difference between the slopes of a2- J p o c h relations for IV and V, probably due to similar reasons.
The linear relationship between the number of substituted chlorine atoms and the proton chemical shift, the SHp, has been reported already by Mavel and Martin6 for I and II. In addition to these, quasilinear
(5) The expected coupling constant («/pocHexp) in trimethylphosphite is expressed as / exp = l/s J 1 + 2/z J°, where J1 and J° represent the P -H coupling constants with dihedral angles o f 180 and 60 °, respectively. From the <t>~J curve4 we can estimate J 1 and J° as 9.3 and2.5 H z, respectively. The /p ocH exp value must be 4.8 H z, while the observed one is 10.8 H z .(6) G . M a v e l in “ Progress in N M R S p e ctroscop y ,” V o l. 1, J . W . E m sley, J . F eeney, and L . H . Sutcliff, E d ., P erga m on Press, O xford , 1966; and references c ited therein.(7) P m r spectra were recorded on a V arían H A -100 spectrom eter opera ted at 100 M H z . Sam ples w ere n eat liqu ids (I I I w ere m easured in ch loro form solutions) w ith a sm all q u a n tity o f T M S as the fie ld -freq u en cy con tro llin g signal. T h e p os ition o f resonance line was determ ined d irectly w ith accu racy o f 0.1 H z b y a H e w le t t - P ack ard 5512A d igita l cou n ter; 6 0 -M H z spectra w ere record ed w ith a V arían A -6 0 . A ll sam ples exam ined w ere prepared b y the conven tion a l m eth ods unless th ey w ere com m ercia lly available.(8) Y . K y o g o k u and Y . Iitaka , Acta. Crystallgr., 21 , 49 (1966).(9) Stereospecificities o f the su bstitu tion effect on / poch h a ve been exam ined using a va rie ty o f six-m em bered cy c lic p h osphates. T h e results w ill be published shortly .(10) R . F . H u dson , “ S tru ctu re and M ech an ism in O rganophos- phorus C h em istry ,” A cad em ic Press, L on d on , 1965.
The Journal o f P hysica l Chem istry, Vol. 74, N o. I 4, 1970
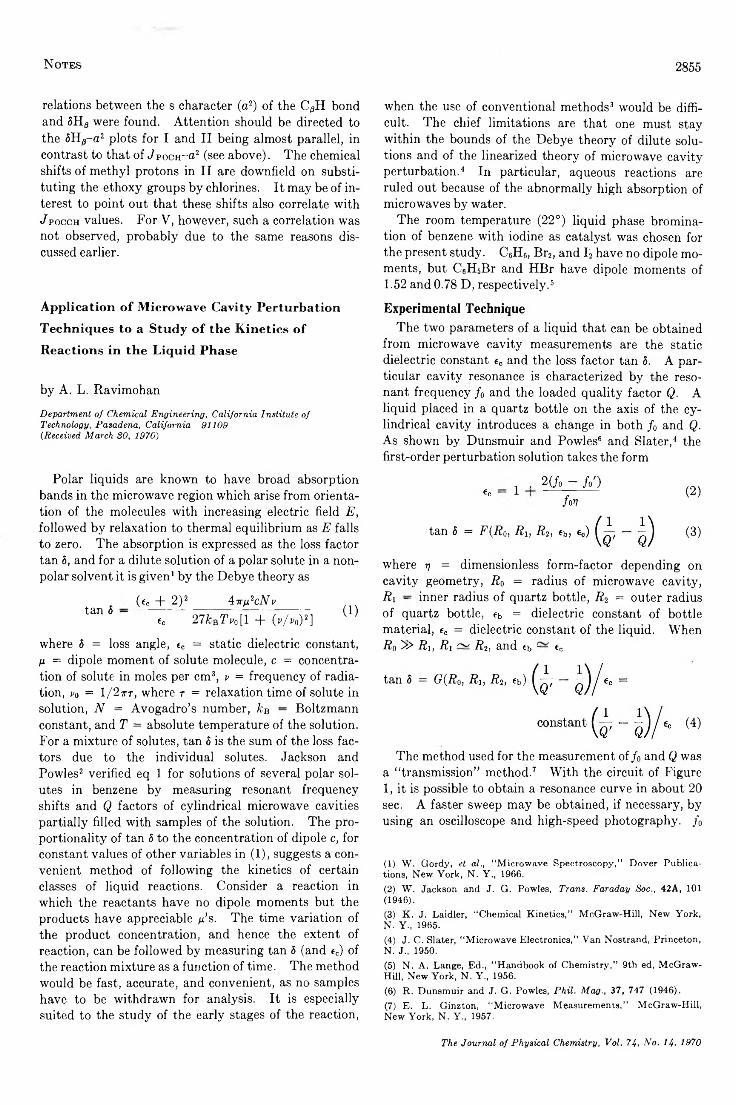
N o t e s 2855relations between the s character (a2) of the C^H bond and SHs were found. Attention should be directed to the SH^-a2 plots for I and II being almost parallel, in contrast to that of JpocH~a2 (see above). The chemical shifts of methyl protons in II are downfield on substituting the ethoxy groups by chlorines. It may be of interest to point out that these shifts also correlate with J p o c c h values. For V, however, such a correlation was not observed, probably due to the same reasons discussed earlier.
Application of Microwave Cavity Perturbation
Techniques to a Study of the Kinetics of
Reactions in the Liquid Phase
by A. L. Ravimohan
Department of Chemical Engineering, California Institute of Technology, Pasadena, California 91109 {Received March SO, 1970)
Polar liquids are known to have broad absorption bands in the microwave region which arise from orientation of the molecules with increasing electric field E, followed by relaxation to thermal equilibrium as E falls to zero. The absorption is expressed as the loss factor tan 5, and for a dilute solution of a polar solute in a nonpolar solvent it is given1 by the Debye theory as
tan 8 —(6C + 2)2 Arp'cNv
60 2 7 â;b 7’ ï'o[1 + ( r / r o ) 2](1)
where 8 = loss angle, ec = static dielectric constant, n = dipole moment of solute molecule, c = concentration of solute in moles per cm3, v = frequency of radiation, v0 = 1/2 itt, where r = relaxation time of solute in solution, N = Avogadro’s number, kB — Boltzmann constant, and T = absolute temperature of the solution. For a mixture of solutes, tan 8 is the sum of the loss factors due to the individual solutes. Jackson and Powles2 verified eq 1 for solutions of several polar solutes in benzene by measuring resonant frequency shifts and Q factors of cylindrical microwave cavities partially filled with samples of the solution. The proportionality of tan 8 to the concentration of dipole c, for constant values of other variables in (1), suggests a convenient method of following the kinetics of certain classes of liquid reactions. Consider a reaction in which the reactants have no dipole moments but the products have appreciable ju’s. The time variation of the product concentration, and hence the extent of reaction, can be followed by measuring tan 8 (and e„) of the reaction mixture as a function of time. The method would be fast, accurate, and convenient, as no samples have to be withdrawn for analysis. It is especially suited to the study of the early stages of the reaction,
when the use of conventional methods3 would be difficult. The chief limitations are that one must stay within the bounds of the Debye theory of dilute solutions and of the linearized theory of microwave cavity perturbation.4 In particular, aqueous reactions are ruled out because of the abnormally high absorption of microwaves by water.
The room temperature (22°) liquid phase broruination of benzene with iodine as catalyst was chosen for the present study. C6H6, Br2, and I2 have no dipole moments, but C6H5Br and HBr have dipole moments of 1.52 and 0.78 D, respectively.6
Experimental TechniqueThe two parameters of a liquid that can be obtained
from microwave cavity measurements are the static dielectric constant ec and the loss factor tan 8. A particular cavity resonance is characterized by the resonant frequency fo and the loaded quality factor Q. A liquid placed in a quartz bottle on the axis of the cylindrical cavity introduces a change in both f0 and Q. As shown by Dunsmuir and Powles6 and Slater,4 the first-order perturbation solution takes the form
«C1 . 2 ( /o - /o Q
fov
tan 8 = F(R0, Ri, R2, eb,
(2)
(3)
where tj = dimensionless form-factor depending on cavity geometry, R0 = radius of microwave cavity, Ri — inner radius of quartz bottle, Rï = outer radius of quartz bottle, eb = dielectric constant of bottle material, e0 = dielectric constant of the liquid. When R0 ïi> Ri, Ri ~ R‘i, and eb — ec
tan 8 = G(R0, Ri, Ri, 6b)
(4 )
The method used for the measurement o f /0 and Q was a “ transmission” method.7 With the circuit of Figure 1, it is possible to obtain a resonance curve in about 20 sec. A faster sweep may be obtained, if necessary, by using an oscilloscope and high-speed photography. / 0
(1) W . G ord y , et al., “ M icrow a v e S p e ctro sco p y ,” D o v e r P u b lica tions, N ew Y ork , N . Y ., 1966.(2) W . Jackson and J. G . P ow les, Trans. Faraday Soc., 42A, 101 (1946).(3) K . J. Laidler, “ C hem ical K in etics ,” M cG ra w -H ill, N ew Y ork , N . Y ., 1965.(4) J. C . Slater, “ M icrow a v e E lectron ics ,” V an N ostrand, P rin ceton , N . J., 1950.(5) N . A . Lange, E d ., “ H a n d b ook o f C h em istry ,” 9th ed, M cG ra w - H ill, N ew Y ork , N . Y ., 1956.(6) R . D u nsm uir and J. G . P ow les, Phil. Mag., 37 , 747 (1946).(7) E . L . G inzton , “ M icrow a v e M easu rem en ts,” M cG ra w -H ill, N ew Y ork , N . Y „ 1957.
The Journal o f P hysica l Chem istry, Voi. 74, N o. 14, 1970
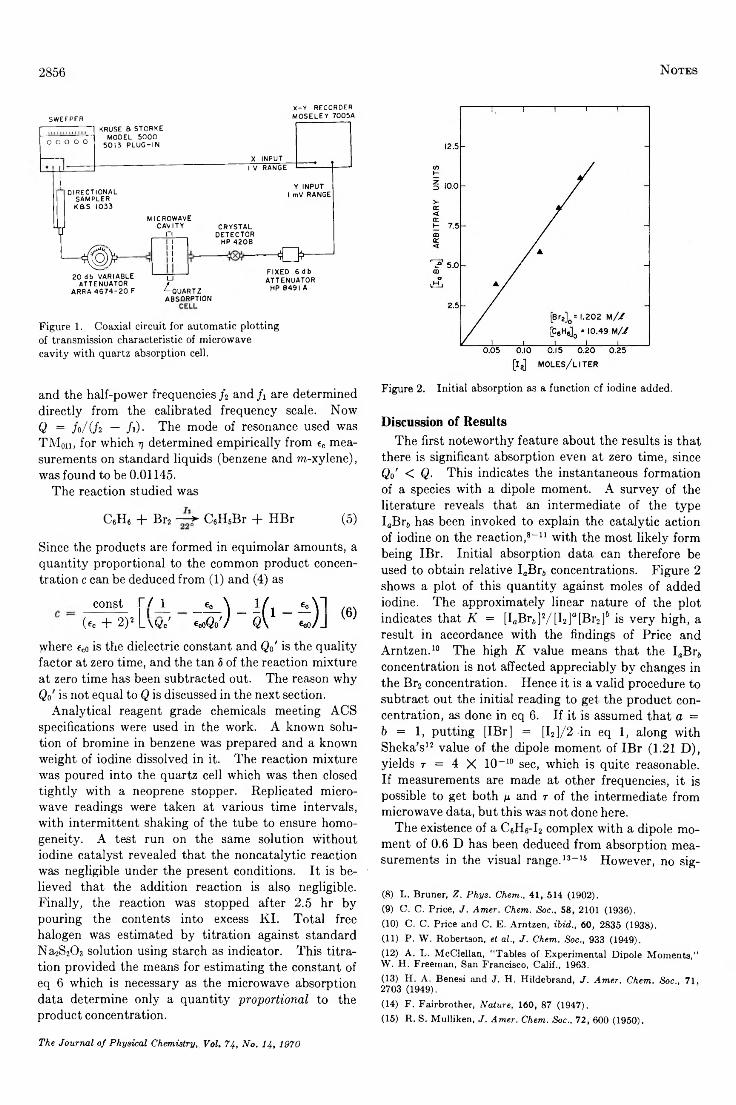
2856 N o t e s
SW EEPERX-Y RECORDER MOSELEY 7005A
O O O O OKRUSE a STORKE
MODEL 5000 5013 PLUG-IN
X INPUTI V RANGE
DIRECTIONAL SAMPLER KSS 1033
TfMICROWAVE
CAVITYn
— ^ § ) > — 20 db VARIABLE
ATTENUATOR ARRA 4674-20 F
U^-QUARTZABSORPTION
Y INPUT I mV RANGE
CRYSTAL DETECTOR
HP 4208
- oFIXED 6 d b ATTENUATOR
HP 8491 A
Figure 1. C oaxia l circuit for autom atic p lotting o f transm ission characteristic o f m icrow ave cav ity w ith quartz absorption cell.
and the half-power frequencies / 2 and fi are determined directly from the calibrated frequency scale. Now Q = / 0/ ( / 2 — /i). The mode of resonance used was TMon, for which 77 determined empirically from ec measurements on standard liquids (benzene and m-xylene), was found to be 0.01145.
The reaction studied was
C6H6 + Br2 - ~ t C6H5Br + HBr (5)
Since the products are formed in equimolar amounts, a quantity proportional to the common product concentration c can be deduced from (1) and (4) as
congt Vf 1(60 + 2 )2 L w 7
where ec0 is the dielectric constant and Q0' is the quality factor at zero time, and the tan 8 of the reaction mixture at zero time has been subtracted out. The reason why Qa is not equal to Q is discussed in the next section.
Analytical reagent grade chemicals meeting ACS specifications were used in the work. A known solution of bromine in benzene was prepared and a known weight of iodine dissolved in it. The reaction mixture was poured into the quartz cell which was then closed tightly with a neoprene stopper. Replicated micro- wave readings were taken at various time intervals, with intermittent shaking of the tube to ensure homogeneity. A test run on the same solution without iodine catalyst revealed that the noncatalytic reaction was negligible under the present conditions. It is believed that the addition reaction is also negligible. Finally, the reaction was stopped after 2.5 hr by pouring the contents into excess KI. Total free halogen was estimated by titration against standard Na^Oa solution using starch as indicator. This titration provided the means for estimating the constant of eq 6 which is necessary as the microwave absorption data determine only a quantity proportional to the product concentration.
Figure 2. Initial absorption as a function cf iodine added.
Discussion of ResultsThe first noteworthy feature about the results is that
there is significant absorption even at zero time, since Q0r < Q. This indicates the instantaneous formation of a species with a dipole moment. A survey of the literature reveals that an intermediate of the type IaBrs has been invoked to explain the catalytic action of iodine on the reaction,8-11 with the most likely form being IBr. Initial absorption data can therefore be used to obtain relative IaBrs concentrations. Figure 2 shows a plot of this quantity against moles of added iodine. The approximately linear nature of the plot indicates that K = [IaBr6]2/ [I2]° [Br2 ]& is very high, a result in accordance with the findings of Price and Arntzen.10 The high K value means that the IaBr4 concentration is not affected appreciably by changes in the Br2 concentration. Hence it is a valid procedure to subtract out the initial reading to get the product concentration, as done in eq 6. If it is assumed that a = 6 = 1, putting [IBr] = [I2]/2 in eq 1, along with Sheka’s12 value of the dipole moment of IBr (1.21 D), yields r = 4 X 10⁻¹⁰ sec, which is quite reasonable. If measurements are made at other frequencies, it is possible to get both n and r of the intermediate from microwave data, but this was not done here.
The existence of a C6H6-I2 complex with a dipole moment of 0.6 D has been deduced from absorption measurements in the visual range.13-16 However, no sig-
(8) L . B runer, Z . Phys. Chem., 41, 514 (1902).
(9) C. C. Price, J. Amer. Chem. Soc., 58, 2101 (1936).(10) C. C. P rice and C. E . A rntzen , ibid., 60, 2835 (1938).(11) P . W . R obertson , el al., J. Chem. Soc., 933 (1949).
(12) A . L . M cC lellan , “ T ab les o f E xperim enta l D ip o le M o m e n ts ,” W . H . F reem an, San F rancisco, C alif., 1963.
(13) H . A . B enesi and J. H . H ildebrand, J. Amer. Chem. Soc., 71. 2703 (1949).(14) F . F airbroth er, Nature, 160, 87 (1947).(15) R . S . M ulliken , J . Amer. Chem. Soc., 72, 600 (1950).
The Journal o f P hysica l Chem istry, V oi. 74 , N o . 14, 1970
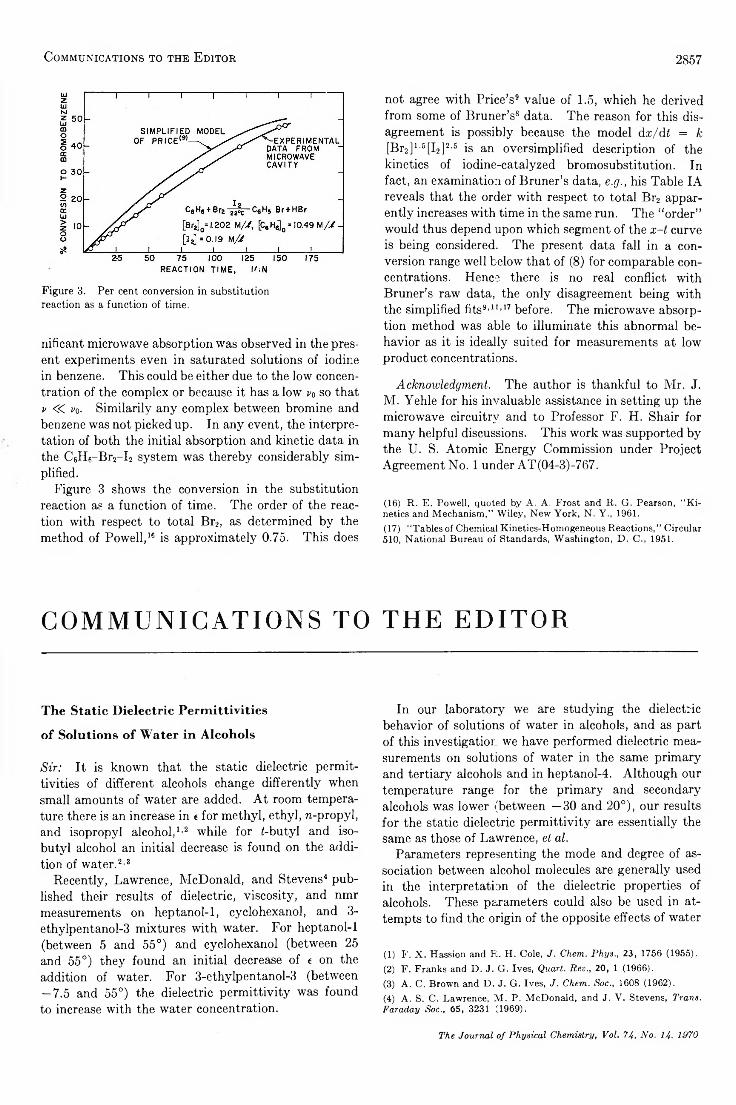
Communications to the E ditor 2857
Figure 3. Per cent conversion in substitution reaction as a function of time.
nificant microwave absorption was observed in the present experiments even in saturated solutions of iodine in benzene. This could be either due to the low concentration of the complex or because it has a low v0 so that v « vq. Similarity any complex between bromine and benzene was not picked up. In any event, the interpretation of both the initial absorption and kinetic data in the CeHf-B^-T system was thereby considerably simplified.
Figure 3 shows the conversion in the substitution reaction as a function of time. The order of the reaction with respect to total Br2, as determined by the method of Powell,16 is approximately 0.75. This does
not agree with Price’s9 value of 1.5, which he derived from some of Bruner’s8 data. The reason for this disagreement is possibly because the model dx/dt = k [Br2]1'5[I2]2’5 is an oversimplified description of the kinetics of iodine-catalyzed bromosubstitution. In fact, an examination of Bruner’s data, e.g., his Table IA reveals that the order with respect to total Br2 apparently increases with time in the same run. The “ order” would thus depend upon which segment of the x-t curve is being considered. The present data fall in a conversion range well below that of (8) for comparable concentrations. Hence there is no real conflict with Bruner’s raw data, the only disagreement being with the simplified fits9,11’17 before. The microwave absorption method was able to illuminate this abnormal behavior as it is ideally suited for measurements at low product concentrations.
Acknowledgment. The author is thankful to Mr. J. M. Yehle for his invaluable assistance in setting up the microwave circuitry and to Professor F. H. Shair for many helpful discussions. This work was supported by the U. S. Atomic Energy Commission under Project Agreement No. 1 under AT(04-3)-767.
(16) R. E. Powell, quoted by A. A. Frost and R. G. Pearson, “ Kinetics and Mechanism,” Wiley, New York, N. Y ., 1961.(17) “ Tables of Chemical Kinetics-Homogeneous Reactions,” Circular 510, National Bureau of Standards, Washington, D. C., 1951.
C O M M U N I C A T I O N S T O T H E E D I T O R
The Static Dielectric Permittivities
o f Solutions o f Water in Alcohols
Sir: It is known that the static dielectric permittivities of different alcohols change differently when small amounts of water are added. At room temperature there is an increase in e for methyl, ethyl, n-propyl, and isopropyl alcohol,1’2 while for ¿-butyl and isobutyl alcohol an initial decrease is found on the addition of water.2’8
Recently, Lawrence, McDonald, and Stevens4 published their results of dielectric, viscosity, and nmr measurements on heptanol-1, cyclohexanol, and 3- ethylpentanol-3 mixtures with water. For heptanol-1 (between 5 and 55°) and cyclohexanol (between 25 and 55°) they found an initial decrease of e on the addition of water. For 3-ethylpentanol-3 (between — 7.5 and 55°) the dielectric permittivity was found to increase with the water concentration.
In our laboratory we are studying the dielectric behavior of solutions of water in alcohols, and as part of this investigation we have performed dielectric measurements on solutions of water in the same primary and tertiary alcohols and in heptanol-4. Although our temperature range for the primary and secondary alcohols was lower (between —30 and 20°), our results for the static dielectric permittivity are essentially the same as those of Lawrence, et al.
Parameters representing the mode and degree of association between alcohol molecules are generally used in the interpretation of the dielectric properties of alcohols. These parameters could also be used in attempts to find the origin of the opposite effects of water
(1) F. X . Hassion and R. H. Cole, J. Chem. Phys., 23, 1756 (1955).(2) F. Franks and D. J. G. Ives, Quart. Rev., 20, 1 (1966).(3) A. C. Brown and D. J. G. Ives, J. Chem. Soc.t 1608 (1962).(4) A. S. C. Lawrence, M . P. McDonald, and J. V. Stevens, Trans. Faraday Soc.t 65, 3231 (1969).
The Journal o f P hysical Chem istry, V oi. 74, N o . 14. 1970
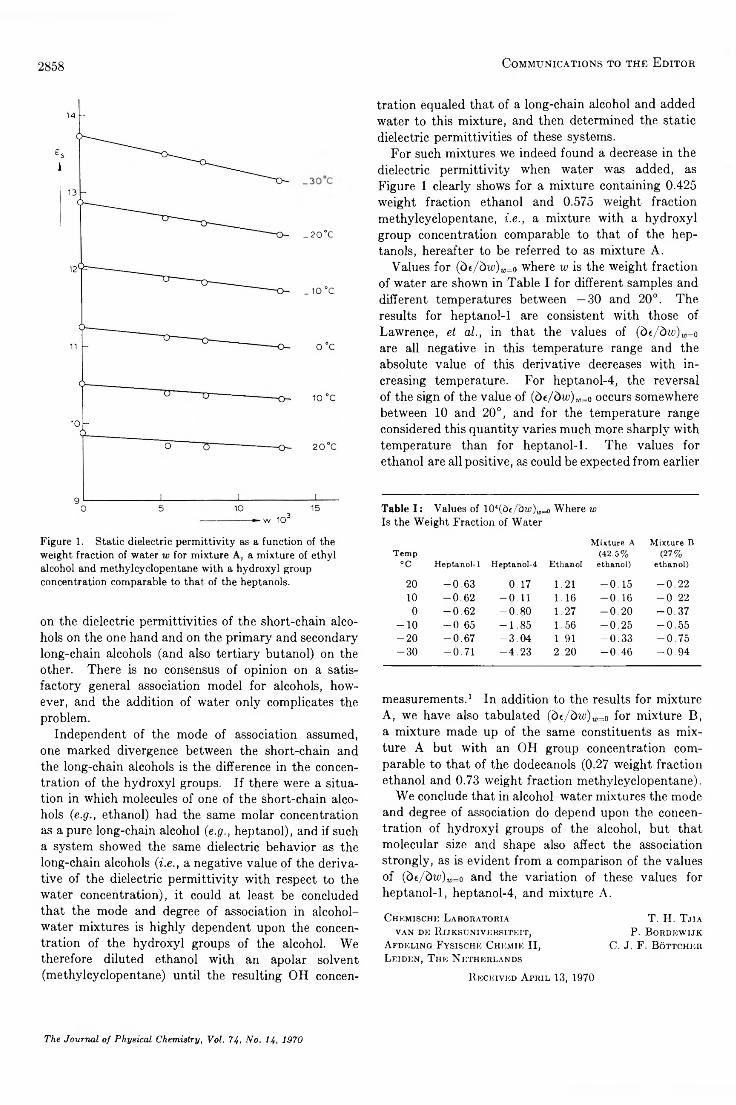
2858 Communications to the E ditor
_20°C
_10°C
Figure 1. Static dielectric permittivity as a function of the weight fraction of water w for mixture A, a mixture of ethyl alcohol and methylcyclopentane with a hydroxyl group concentration comparable to that of the heptanols.
on the dielectric permittivities of the short-chain alcohols on the one hand and on the primary and secondary long-chain alcohols (and also tertiary butanol) on the other. There is no consensus of opinion on a satisfactory general association model for alcohols, however, and the addition of water only complicates the problem.
Independent of the mode of association assumed, one marked divergence between the short-chain and the long-chain alcohols is the difference in the concentration of the hydroxyl groups. If there were a situation in which molecules of one of the short-chain alcohols (e.g., ethanol) had the same molar concentration as a pure long-chain alcohol (e.g., heptanol), and if such a system showed the same dielectric behavior as the long-chain alcohols (i.e., a negative value of the derivative of the dielectric permittivity with respect to the water concentration), it could at least be concluded that the mode and degree of association in alcohol- water mixtures is highly dependent upon the concentration of the hydroxyl groups of the alcohol. We therefore diluted ethanol with an apolar solvent (methylcyclopentane) until the resulting OH concen-
tration equaled that of a long-chain alcohol and added water to this mixture, and then determined the static dielectric permittivities of these systems.
For such mixtures we indeed found a decrease in the dielectric permittivity when water was added, as Figure 1 clearly shows for a mixture containing 0.425 weight fraction ethanol and 0.575 weight fraction methylcyclopentane, i.e., a mixture with a hydroxyl group concentration comparable to that of the heptanols, hereafter to be referred to as mixture A.
Values for (dt/dw)w=a where w is the weight fraction of water are shown in Table I for different samples and different temperatures between —30 and 20°. The results for heptanol-1 are consistent with those of Lawrence, et al., in that the values of (de/dw)w=0 are all negative in this temperature range and the absolute value of this derivative decreases with increasing temperature. For heptanol-4, the reversal of the sign of the value of (de/dw)m=0 occurs somewhere between 10 and 20°, and for the temperature range considered this quantity varies much more sharply with temperature than for heptanol-1. The values for ethanol are all positive, as could be expected from earlier
Table I : Values of 104(de/c>u;)„,_o Where w Is the W eight Fraction of Water
Mixture A Mixture BTemp (42.5% (27%
°C Heptanol-1 Heptanol-4 Ethanol ethanol) ethanol)
20 - 0 . 6 3 0 .1 7 1.21 - 0 . 1 5 - 0 . 2 210 - 0 . 6 2 - 0 . 1 1 1 .1 6 - 0 . 1 6 - 0 . 2 2
0 - 0 . 6 2 - 0 . 8 0 1 .2 7 - 0 . 2 0 - 0 . 3 7- 1 0 - 0 . 6 5 - 1 . 8 5 1 .5 6 - 0 . 2 5 - 0 . 5 5- 2 0 - 0 . 6 7 - 3 . 0 4 1 .91 - 0 . 3 3 - 0 . 7 5- 3 0 - 0 . 7 1 - 4 . 2 3 2 .2 0 - 0 . 4 6 - 0 . 9 4
measurements.1 In addition to the results for mixture A, we have also tabulated (dt/dw)w=l0 for mixture B, a mixture made up of the same constituents as mixture A but with an OH group concentration comparable to that of the dodecanols (0.27 weight fraction ethanol and 0.73 weight fraction methylcyclopentane).
We conclude that in alcohol-water mixtures the mode and degree of association do depend upon the concentration of hydroxyl groups of the alcohol, but that molecular size and shape also affect the association strongly, as is evident from a comparison of the values of (de/dw)w=o and the variation of these values for heptanol-1, heptanol-4, and mixture A.
C h e m isc h e L a b o r a t o r ia T . H . T j i a
VAN DE ItlJKSUNIVERSITElT, P . BoRDKW IJKA f d e lin g F ysisc h e C h e m ie II, C. J. F . B ö t t c h e r
L e id e n , T h e N e t h e r la n d s
R e c e iv e d A p r il 13, 1970
The Journal o f P hysical Chem istry, Voi. 74, N o . 14, 1970