photoinduced changes in photosystem ii pigments
TRANSCRIPT
Photoinduced changes in photosystem II pigments
This article has been downloaded from IOPscience. Please scroll down to see the full text article.
2010 J. Phys.: Conf. Ser. 253 012065
(http://iopscience.iop.org/1742-6596/253/1/012065)
Download details:
IP Address: 195.96.224.8
The article was downloaded on 21/12/2011 at 11:58
Please note that terms and conditions apply.
View the table of contents for this issue, or go to the journal homepage for more
Home Search Collections Journals About Contact us My IOPscience
Photoinduced changes in photosystem II pigments
Atanaska S Andreeva1, Mira C Busheva2, Katerina V Stoitchkova1, 3 and Iren K Tzonova2
1Sofia University, Faculty of Physics, Department of Condensed Matter Physics, 5, J. Bourchier blvd., 1164 Sofia, Bulgaria
2Institute of Biophysics, Bulgarian Academy of Sciences, Acad. G. Bonchev str. bl.21, 1113 Sofia, Bulgaria
E-mail: [email protected]
Abstract The photosynthetic apparatus in higher plants performs two seemingly opposing tasks: efficient harvest of sunlight, but also rapid and harmless dissipation of excess light energy as heat to avoid deleterious photodamage. In order to study this process in pigment-protein supercomplexes of photosystem II (PSII), 77 K fluorescence and room temperature resonance Raman (RR) spectroscopy were applied to investigate the changes in structure and spectral properties of the pigments in spinach PSII membranes. The high-light treatment results in a strong quenching of the fluorescence (being largest when the excitation is absorbed by carotenoids) and a red-shift of the main maximum. Decomposition of the fluorescence spectra into four bands revealed intensive quenching of F685 and F695 bands, possible bleaching of chlorophyll a, enhanced extent of light harvesting complexes (LHCII) aggregation and increased energy transfer to aggregated LHCII. The analysis of RR spectra revealed the predominant contribution of ß-carotene (ß-Car) upon 457.8 and 488 nm excitations and lutein (Lut) at 514.5 nm. During prolonged exposure to strong light no significant bleaching of ß-Car and weak photobleaching of Lut is observed. The results will contribute to the efforts to produce more efficient and robust solar cells when exposed to fluctuations in light intensity.
1. Introduction Pigments in plants absorb almost 100% of the sunlight reaching them and transform it into other forms of energy. Using this energy the membrane bound plant pigment-protein complex of photosystem II catalyses the splitting of water into molecular oxygen via the so-called "oxygen-evolving complex" (OEC) [1-3]. PSII is surrounded by a number of trimeric light harvesting chlorophyll (Chl) a/b protein complexes II and some minor ones, forming the PSII–LHCII supercomplex [4]. PSII comprises core antenna proteins CP47 and CP43, reaction center subunits D1 and D2, three membrane-extrinsic subunits forming OEC and many small proteins. It binds 35 Chl a molecules and 12 ß-Car molecules [4,5].
The photosynthetic apparatus in higher plants performs two seemingly opposing tasks: efficient harvesting of sunlight, but also rapid and harmless dissipation of excess light energy as heat to avoid deleterious photodamage under high light intensities. In order to study this process in pigment-protein supercomplexes of PSII, 77 K steady-state emission fluorescence and room temperature (RT)
3 To whom any correspondence should be addressed.
16 ISCMP: Progress in Solid State and Molecular Electronics, Ionics and Photonics IOP PublishingJournal of Physics: Conference Series 253 (2010) 012065 doi:10.1088/1742-6596/253/1/012065
c© 2010 IOP Publishing Ltd 1
resonance Raman spectroscopy were applied to investigate the changes in structure and spectral properties of the major pigments in spinach PSII membrane preparations due to treatment with strong light intensity.
2. Materials and methods
2.1. Isolation of PSII submembrane particles PSII enriched subchloroplast fraction (BBY) was isolated from market spinach following the modified procedure [6]. BBY particles were resuspended in media containing 20mM Hepes (pH 7.5), 15 mM NaCl, 5 mM MgCl2, 0.4 M sucrose and stored at -20oC. The chlorophyll content of the samples was estimated by using the method of Lichtenthaler [7].
2.2. High-light treatment The illumination of isolated PSII particles was carried out under continuous stirring at room temperature (22oC) with white light. The Chl concentration during illumination was 100 μg/ml. The membranes were illuminated on the vessel surface with intensity of 2400 μE m-2 s-1 and 1250 μE m-2 s-1 for Raman and fluorescence measurements, respectively. Samples for analysis were taken at different time periods (15 and 45 min) during illumination.
2.3. 77 K Fluorescence measurements The 77 K chlorophyll fluorescence emission spectra were measured using a JobinYvon JY3 spectrofluorimeter. The actinic light with low enough intensity was provided by Xenon lamp “Suprasil”- 150W, with slits width of 4 nm. The experimental spectra were corrected for the spectral sensitivity of the detection system. To normalize the emission spectra of BBY 0.5 μM fluorescein (sodium salt) was added as an internal standard to the medium. At this concentration the fluorescein did not interfere with the fluorescence emission [8].
2.4. Decomposition of the fluorescence emission spectra Detailed studies on the fluorescence of PSII complex have shown that four main bands in the 77 K PSII emission contribute to the spectrum, identified as F680, F685, F695 and F700 after their maxima positions in nm [9-13]. The first emission band, F680, is assigned to trimeric LHCII, peaking at 679 nm [10,14-16] originating from the red-most Chl a pigment in LHCII. F685 arises from traps of Chl a (absorbing at 683 nm) in D1-D2 RC complex and CP43, whereas F695 PSII emission from a ‘trap’ Chl a (absorbing at 690 nm) in CP47 [17-19]. The fourth band, F700, is characteristic for the aggregated LHCII [10-13]. It was shown [15,16] that at 77 K the spectral shape of LHCII trimers’ fluorescence coincides with the fluorescence lineshape of monomeric Chl a in a solution [20]. The emission bands F685 and F695 in PSII fluorescence also arise from monomeric Chl a molecules [17-19] with different red shift in their absorption and emission maxima as compared to the maximum of trimeric LHCII, caused by various protein environment and interactions. Komura et al. [19] estimated that although the peak maximum of F685 was red-shifted, the value of its full width at half maximum (FWHM) was very close to the reported one in isolated LHCII. That is why we used the emission spectrum of trimeric LHCII for F680 and F685 spectral line shape with appropriate red shift. It was shown that the 77 K spectrum of F695 was not only red shifted as compared to the trimeric LHCII, but with FWHM about 1.5 times as broad as the trimeric LHCII one [17,19]. At critical micelle concentration (CMC) LHCsII are presented only in trimeric forms, so at this concentration the band F700 is absent and only the bands F680, F685 and F695 contribute to the total PSII spectrum. The subtraction of the sum of F680 and F685 from the total emission spectrum of PSII membranes at CMC should yield the spectral line shape of F695. To determine the scale factors and red shifts of F680 and F685 a program is made, fitting the sum of F680, F685 and F695 to the experimental PSII spectrum in the spectral range from 650 nm to 689.2 nm, where the contribution of F700 is negligibly small, using the least square method. The fitting parameters for the amplitudes of F680, F685 and F695 were the only free-running parameters. The shifts for F680 and F685 were varied in very narrow limits (0.5-1 nm) only, determined from the literature data, while the position of F695 band was fixed at the
16 ISCMP: Progress in Solid State and Molecular Electronics, Ionics and Photonics IOP PublishingJournal of Physics: Conference Series 253 (2010) 012065 doi:10.1088/1742-6596/253/1/012065
2
position of the spectrum obtained at CMC concentration. Considering that the experimental PSII spectrum is composed of the four bands, we obtain the fourth band F700 as a difference between the total spectrum and the sum of F680, F685 and F695.
2.5. Resonance Raman spectra measurements Room temperature Resonance Raman (RR) spectra were measured using a microRaman spectrometer (Jobin-Ivon, HR 800). The excitation was provided by an argon ion laser (Innova 307, Coherent) at 457.8, 488 and 514.5 nm. The laser intensities were 4 mW and the spectral resolution was 0.5 cm-1 for the measurements using a grating of 1800 gr/mm.
3. Results and discussion
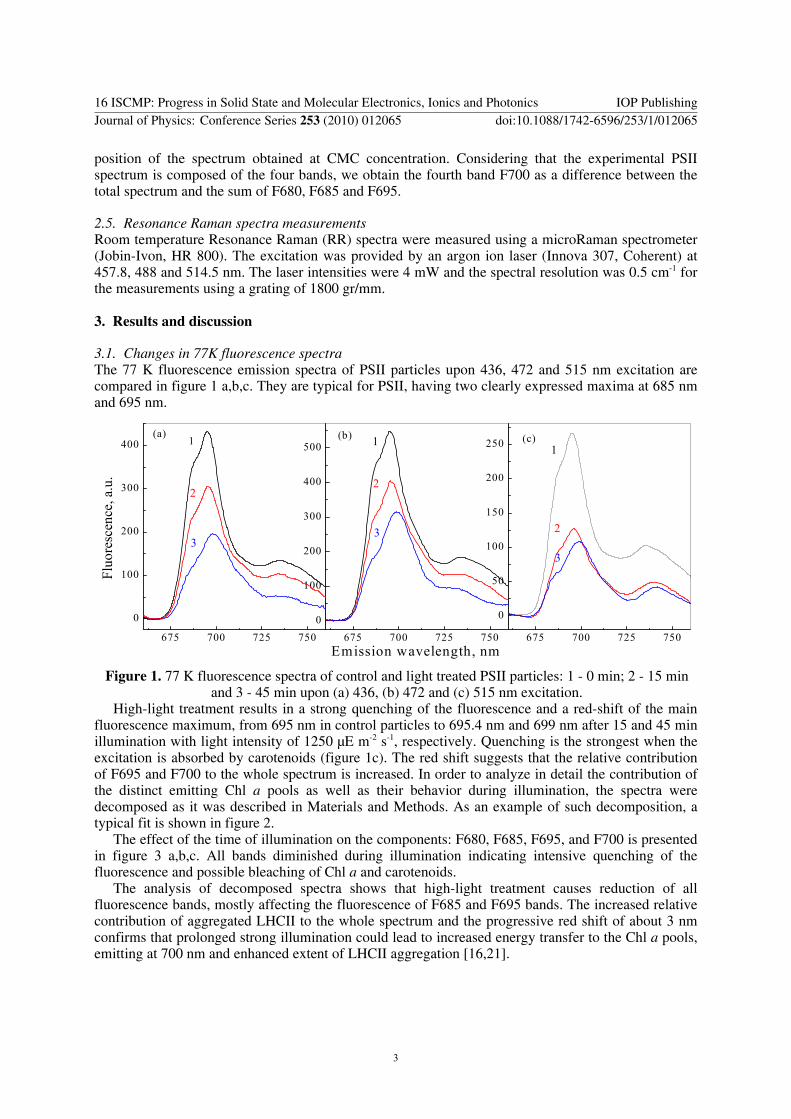
3.1. Changes in 77K fluorescence spectra The 77 K fluorescence emission spectra of PSII particles upon 436, 472 and 515 nm excitation are compared in figure 1 a,b,c. They are typical for PSII, having two clearly expressed maxima at 685 nm and 695 nm.
675 700 725 750
0
50
100
150
200
250
675 700 725 7500
100
200
300
400
500
675 700 725 750
0
100
200
300
400
3
1
2
22
(c)
3
1
Emission wavelength, nm
(b)
3
Flu
ores
cenc
e, a
.u.
(a)1
Figure 1. 77 K fluorescence spectra of control and light treated PSII particles: 1 - 0 min; 2 - 15 min
and 3 - 45 min upon (a) 436, (b) 472 and (c) 515 nm excitation. High-light treatment results in a strong quenching of the fluorescence and a red-shift of the main
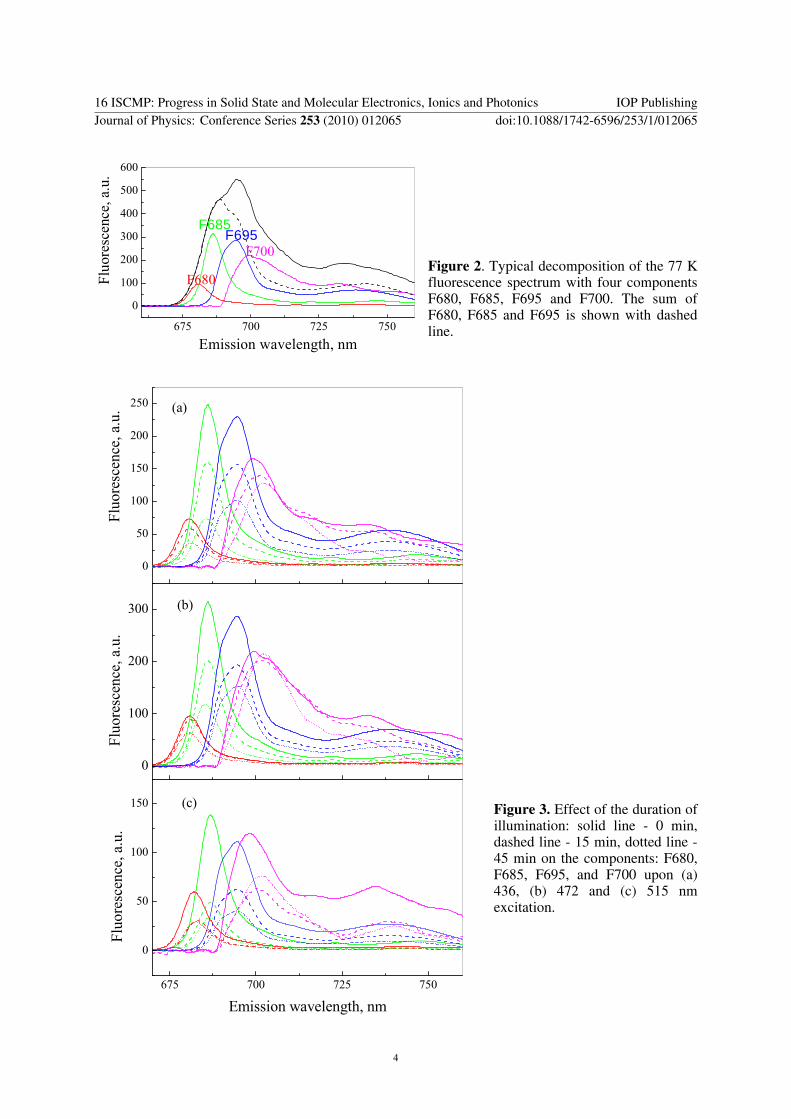
fluorescence maximum, from 695 nm in control particles to 695.4 nm and 699 nm after 15 and 45 min illumination with light intensity of 1250 μE m-2 s-1, respectively. Quenching is the strongest when the excitation is absorbed by carotenoids (figure 1c). The red shift suggests that the relative contribution of F695 and F700 to the whole spectrum is increased. In order to analyze in detail the contribution of the distinct emitting Chl a pools as well as their behavior during illumination, the spectra were decomposed as it was described in Materials and Methods. As an example of such decomposition, a typical fit is shown in figure 2.
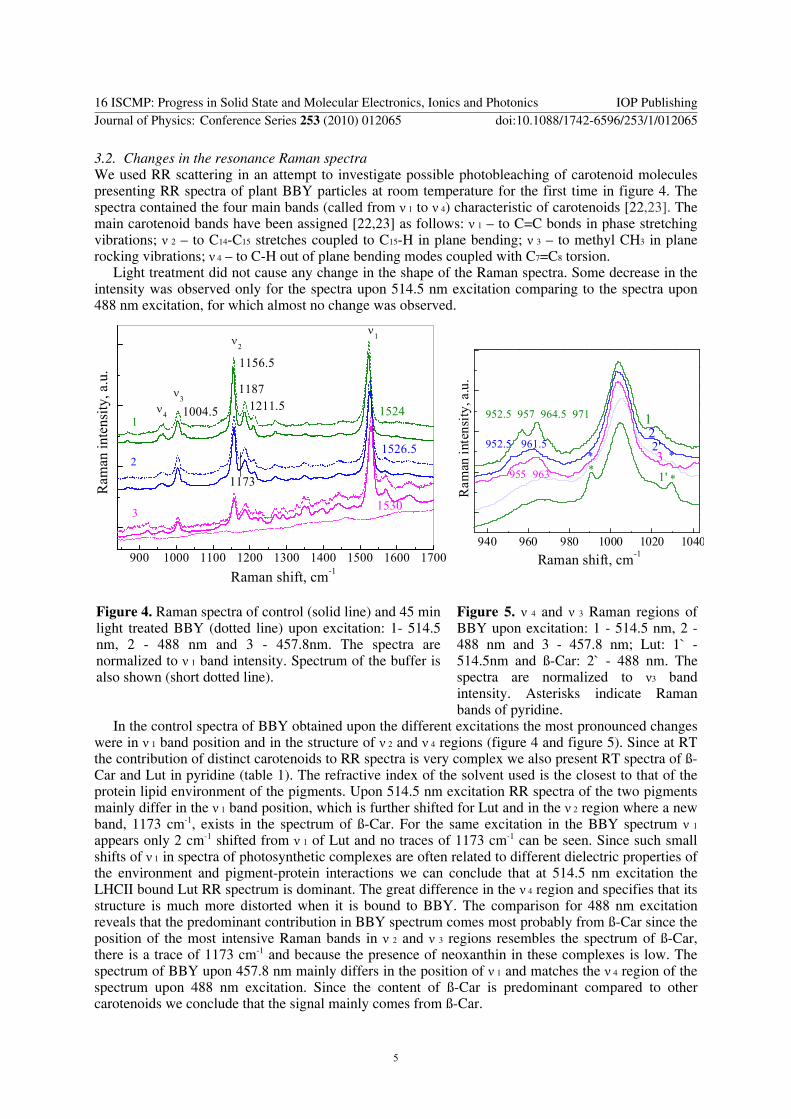
The effect of the time of illumination on the components: F680, F685, F695, and F700 is presented in figure 3 a,b,c. All bands diminished during illumination indicating intensive quenching of the fluorescence and possible bleaching of Chl a and carotenoids.
The analysis of decomposed spectra shows that high-light treatment causes reduction of all fluorescence bands, mostly affecting the fluorescence of F685 and F695 bands. The increased relative contribution of aggregated LHCII to the whole spectrum and the progressive red shift of about 3 nm confirms that prolonged strong illumination could lead to increased energy transfer to the Chl a pools, emitting at 700 nm and enhanced extent of LHCII aggregation [16,21].
16 ISCMP: Progress in Solid State and Molecular Electronics, Ionics and Photonics IOP PublishingJournal of Physics: Conference Series 253 (2010) 012065 doi:10.1088/1742-6596/253/1/012065
3
675 700 725 750
0
100
200
300
400
500
600
Fluo
resc
ence
, a.u
.
Emission wavelength, nm
F685F695
F700
F680
Figure 2. Typical decomposition of the 77 K fluorescence spectrum with four components F680, F685, F695 and F700. The sum of F680, F685 and F695 is shown with dashed line.
0
50
100
150
200
250
Fluo
resc
ence
, a.u
. (a)
0
100
200
300
Fluo
resc
ence
, a.u
.
(b)
675 700 725 750
0
50
100
150
Fluo
resc
ence
, a.u
.
Emission wavelength, nm
(c)
Figure 3. Effect of the duration of illumination: solid line - 0 min, dashed line - 15 min, dotted line - 45 min on the components: F680, F685, F695, and F700 upon (a) 436, (b) 472 and (c) 515 nm excitation.
16 ISCMP: Progress in Solid State and Molecular Electronics, Ionics and Photonics IOP PublishingJournal of Physics: Conference Series 253 (2010) 012065 doi:10.1088/1742-6596/253/1/012065
4
3.2. Changes in the resonance Raman spectra We used RR scattering in an attempt to investigate possible photobleaching of carotenoid molecules presenting RR spectra of plant BBY particles at room temperature for the first time in figure 4. The spectra contained the four main bands (called from ν 1 to ν 4) characteristic of carotenoids [22,23]. The main carotenoid bands have been assigned [22,23] as follows: ν 1 – to C=C bonds in phase stretching vibrations; ν 2 – to C14-C15 stretches coupled to C15-H in plane bending; ν 3 – to methyl CH3 in plane rocking vibrations; ν 4 – to C-H out of plane bending modes coupled with C7=C8 torsion.
Light treatment did not cause any change in the shape of the Raman spectra. Some decrease in the intensity was observed only for the spectra upon 514.5 nm excitation comparing to the spectra upon 488 nm excitation, for which almost no change was observed.
900 1000 1100 1200 1300 1400 1500 1600 1700Raman shift, cm-1
3
2
ν4
ν3
ν2
1530
1526.5
Ram
an in
tens
ity, a
.u.
1524
ν1
11211.5
1187
1173
1156.5
1004.5
940 960 980 1000 1020 1040
*
*
21
1'
2'3
R
aman
inte
nsity
, a.u
.
Raman shift, cm-1
**
952.5 957 964.5 971
952.5 961.5
955 963
Figure 4. Raman spectra of control (solid line) and 45 min light treated BBY (dotted line) upon excitation: 1- 514.5 nm, 2 - 488 nm and 3 - 457.8nm. The spectra are normalized to ν 1 band intensity. Spectrum of the buffer is also shown (short dotted line).
Figure 5. ν 4 and ν 3 Raman regions of BBY upon excitation: 1 - 514.5 nm, 2 - 488 nm and 3 - 457.8 nm; Lut: 1` - 514.5nm and ß-Car: 2` - 488 nm. The spectra are normalized to ν3 band intensity. Asterisks indicate Raman bands of pyridine.
In the control spectra of BBY obtained upon the different excitations the most pronounced changes were in ν 1 band position and in the structure of ν 2 and ν 4 regions (figure 4 and figure 5). Since at RT the contribution of distinct carotenoids to RR spectra is very complex we also present RT spectra of ß-Car and Lut in pyridine (table 1). The refractive index of the solvent used is the closest to that of the protein lipid environment of the pigments. Upon 514.5 nm excitation RR spectra of the two pigments mainly differ in the ν 1 band position, which is further shifted for Lut and in the ν 2 region where a new band, 1173 cm-1, exists in the spectrum of ß-Car. For the same excitation in the BBY spectrum ν 1 appears only 2 cm-1 shifted from ν 1 of Lut and no traces of 1173 cm-1 can be seen. Since such small shifts of ν 1 in spectra of photosynthetic complexes are often related to different dielectric properties of the environment and pigment-protein interactions we can conclude that at 514.5 nm excitation the LHCII bound Lut RR spectrum is dominant. The great difference in the ν 4 region and specifies that its structure is much more distorted when it is bound to BBY. The comparison for 488 nm excitation reveals that the predominant contribution in BBY spectrum comes most probably from ß-Car since the position of the most intensive Raman bands in ν 2 and ν 3 regions resembles the spectrum of ß-Car, there is a trace of 1173 cm-1 and because the presence of neoxanthin in these complexes is low. The spectrum of BBY upon 457.8 nm mainly differs in the position of ν 1 and matches the ν 4 region of the spectrum upon 488 nm excitation. Since the content of ß-Car is predominant compared to other carotenoids we conclude that the signal mainly comes from ß-Car.
16 ISCMP: Progress in Solid State and Molecular Electronics, Ionics and Photonics IOP PublishingJournal of Physics: Conference Series 253 (2010) 012065 doi:10.1088/1742-6596/253/1/012065
5
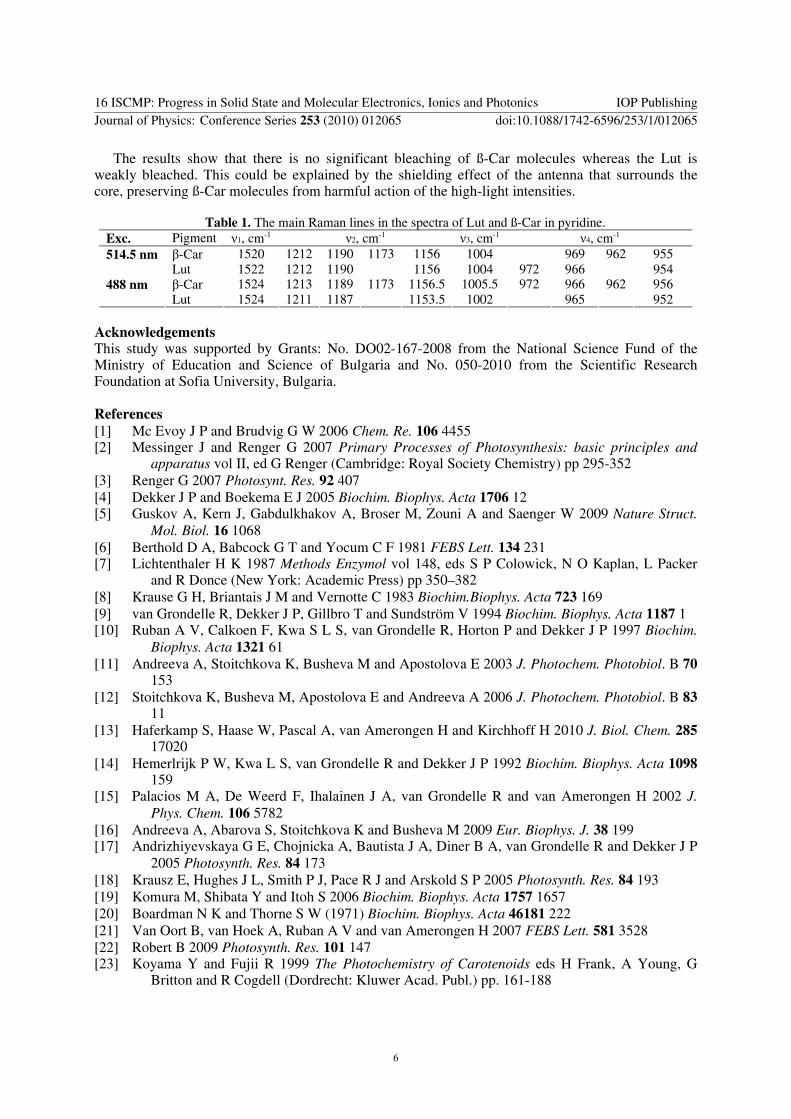
The results show that there is no significant bleaching of ß-Car molecules whereas the Lut is weakly bleached. This could be explained by the shielding effect of the antenna that surrounds the core, preserving ß-Car molecules from harmful action of the high-light intensities.
Table 1. The main Raman lines in the spectra of Lut and ß-Car in pyridine.
Exc. Pigment ν1, cm-1 ν2, cm-1 ν3, cm-1 ν4, cm-1
β-Car 1520 1212 1190 1173 1156 1004 969 962 955 514.5 nm Lut 1522 1212 1190 1156 1004 972 966 954 β-Car 1524 1213 1189 1173 1156.5 1005.5 972 966 962 956 488 nm Lut 1524 1211 1187 1153.5 1002 965 952
Acknowledgements This study was supported by Grants: No. DO02-167-2008 from the National Science Fund of the Ministry of Education and Science of Bulgaria and No. 050-2010 from the Scientific Research Foundation at Sofia University, Bulgaria.
References [1] Mc Evoy J P and Brudvig G W 2006 Chem. Re. 106 4455 [2] Messinger J and Renger G 2007 Primary Processes of Photosynthesis: basic principles and
apparatus vol II, ed G Renger (Cambridge: Royal Society Chemistry) pp 295-352 [3] Renger G 2007 Photosynt. Res. 92 407 [4] Dekker J P and Boekema E J 2005 Biochim. Biophys. Acta 1706 12 [5] Guskov A, Kern J, Gabdulkhakov A, Broser M, Zouni A and Saenger W 2009 Nature Struct.
Mol. Biol. 16 1068 [6] Berthold D A, Babcock G T and Yocum C F 1981 FEBS Lett. 134 231 [7] Lichtenthaler H K 1987 Methods Enzymol vol 148, eds S P Colowick, N O Kaplan, L Packer
and R Donce (New York: Academic Press) pp 350–382 [8] Krause G H, Briantais J M and Vernotte C 1983 Biochim.Biophys. Acta 723 169 [9] van Grondelle R, Dekker J P, Gillbro T and Sundström V 1994 Biochim. Biophys. Acta 1187 1 [10] Ruban A V, Calkoen F, Kwa S L S, van Grondelle R, Horton P and Dekker J P 1997 Biochim.
Biophys. Acta 1321 61 [11] Andreeva A, Stoitchkova K, Busheva M and Apostolova E 2003 J. Photochem. Photobiol. B 70
153 [12] Stoitchkova K, Busheva M, Apostolova E and Andreeva A 2006 J. Photochem. Photobiol. B 83
11 [13] Haferkamp S, Haase W, Pascal A, van Amerongen H and Kirchhoff H 2010 J. Biol. Chem. 285
17020 [14] Hemerlrijk P W, Kwa L S, van Grondelle R and Dekker J P 1992 Biochim. Biophys. Acta 1098
159 [15] Palacios M A, De Weerd F, Ihalainen J A, van Grondelle R and van Amerongen H 2002 J.
Phys. Chem. 106 5782 [16] Andreeva A, Abarova S, Stoitchkova K and Busheva M 2009 Eur. Biophys. J. 38 199 [17] Andrizhiyevskaya G E, Chojnicka A, Bautista J A, Diner B A, van Grondelle R and Dekker J P
2005 Photosynth. Res. 84 173 [18] Krausz E, Hughes J L, Smith P J, Pace R J and Arskold S P 2005 Photosynth. Res. 84 193 [19] Komura M, Shibata Y and Itoh S 2006 Biochim. Biophys. Acta 1757 1657 [20] Boardman N K and Thorne S W (1971) Biochim. Biophys. Acta 46181 222 [21] Van Oort B, van Hoek A, Ruban A V and van Amerongen H 2007 FEBS Lett. 581 3528 [22] Robert B 2009 Photosynth. Res. 101 147 [23] Koyama Y and Fujii R 1999 The Photochemistry of Carotenoids eds H Frank, A Young, G
Britton and R Cogdell (Dordrecht: Kluwer Acad. Publ.) pp. 161-188
16 ISCMP: Progress in Solid State and Molecular Electronics, Ionics and Photonics IOP PublishingJournal of Physics: Conference Series 253 (2010) 012065 doi:10.1088/1742-6596/253/1/012065
6