phosphorus removal mechanisms in soil and slag media
TRANSCRIPT
Phosphorus Removal Mechanisms in Soil and Slag Media
LEE, SEUNG HW AN PhD Thesis Submitted 1995
ABSTRACT
Excessive phosphorus (P) is one of the major pollutants in natural water that are
responsible for algal blooms and eutrophication. P removal by soil and slag is an attractive solution if the P sorption capacity of soil or slag is significant. To design an efficient land treatment facility, basic information on the behaviour of Pin the media-water environment is required. In this study, detailed experiments
were conducted to study P removal under static and dynamic conditions, and mathematical models were developed to describe these processes.
The kinetic studies on P sorption onto a sandy loam soil from North Sydney,
Australia, and dust and cake waste products from the BHP steel industry revealed that P sorption is a slow process. More than 90% of the P was adsorbed within 70, 12 and 60 hours in a mixing system for soil, dust and cake respectively while it was within 240, 24 and 120 hours respectively in a static
(no stirring) system. Dust adsorbed P the most, compared to the other adsorbents (220-225 times and 4-5 times of the sorptivity of soil and cake respectively). P sorption in the batch experiments was described better by an equation using the Langmuir isotherm than one using the Freundlich isotherm. The kinetics of P
sorption were satisfactorily explained by a static, physical, non-equilibrium sorption model (SPNSM).
The pH of the P solution played a critical role in the extent of removal and the
removal mechanisms of P. Removal was at a minimum at pH 2. The effect of pH on P removal varied depending on the type of adsorbents and the initial P concentration. The dominant removal mechanism of P at pH <8 was physical sorption, while it was chemical precipitation at pH> 10. Batch flocculation
experiments revealed that the P removal efficiency increased with an increase of adsorbent dose, flocculation (contact) time and mixing rate. P sorption is affected by the presence of NH4 which competes for available sites on the adsorbents. The amount of P adsorbed by dust and cake in the presence of NH4
was less than that in a single solute system. The reduction percentage of P for dust ranged from 33 to 57%.
Detailed column experiments conducted with soil, dust and cake as media indicated that dust and cake have much higher sorption capacities than soil. The solid phase P concentrations on dust and cake calculated from batch experimental isotherm constants are substantially higher than those estimated
ii
from the dynamic column experiments. A program to fit a generalised, nonlinear, advective, dispersion model (MCMFIT) was used to estimate the optimal model parameter values. All the columns exhibited characteristic S-shaped or curvilinear breakthrough curves. The simulated results from a dynamic physical non-equilibrium sorption model (DPNSM), based on Freundlich isotherm
constants K and N (obtained from column experimental results) satisfactorily matched the corresponding experimental breakthrough data. P removal under dynamic conditions was explained better as a physical non-equilibrium process
than an equilibrium one. The mobility of P is restricted by the adsorbing medium
and it is proportional to the sorption capacity of the adsorbents. The DPNSM predictions were better than those of the equilibrium sorption model (ESM). The
ESM predictions were similar to DPNSM predictions at high influent P
concentrations for dust and cake.
An increase of pH value occurred at the initial stage of P removal. This is due to the liberation of Mg2+ and Ca2+ ions into the solution from the dust and cake
media. The sorption capacity of P in dust and cake columns decreased in the
presence of NH4 due to the competition for sorption sites.
Dust and cake can be applied (i) as an adsorbent in sewage treatment plants, (ii)
as a substratum in constructed wetland systems and (iii) as a suppressing
material for the release of P from sediments due to their high sorption capacity. The effluent concentrations of heavy metals in the dust and cake column were
low enough not to harm any living organisms.
iii

~UTS University of Technology, Sydney
CERTIFICATE
I cettify that this thesis has not already been submitted for any degree
and is not being submitted as part of candidature for any other degree.
I also certify that the thesis has been written by me and that any help
that I have received in preparing this thesis, and all sources used, have been acknowledged in this thesis.
Signature of Candidate
iv
ACKNOWLEDGMENTS
''The Lord will fulfil his purpose for me ; your love, 0 Lord, endures for · ever - do not abandon the works of your hands (Ps 138:9)."
The author wishes to express his profound gratitude to his supervisor A/Prof. S. Vigneswaran for his sincere guidance, invaluable suggestions, sharp criticisms
and continual encouragements. Without his unstinted help in both academic and personal concerns throughout the years of the author's postgraduate studies at the University of Technology, Sydney, this research work could not have been
completed. Sincere thanks and appreciation are due to Dr. Kiran Bajracharya, Dr. Hee Moon and A/Pro f. G. O'Loughlin for their valuable comments and suggestions. A note of appreciation is also extended to Prof. Y ong Chung for his encouragement and interest in this study.
The author thankfully acknowledges the scholarships grant provided by the Australian Government which made possible the completion of his doctoral program. He would like to express his sincere appreciation to the technical staffs
in the School of Civil Engineering for their kind help, especially Mr. Hao Ngo and Mr. David Hooper, for providing the author with the necessary facilities needed in conducting the experiments. He is also very grateful to the special chemist from NSW Dept. of Agriculture, Dr. M. Abdullah for his supports in
analysing the soil, dust and cake samples.
Heartfelt thanks and appreciation are due to his brothers and sisters in the Korean Navigators and the Sydney Asian Navigators, especially brother James
Lee, for their prayers and encouragements throughout his period of study. A word of thanks also goes to his friends, Mr. Illungkoo, Ms Hagare, Mr. Kwon
and Mr. Jega for sharing the burden together in times of need.
A very special debt of deep gratitude is offered to his parents and parents-in-law for their unceasing love and encouragement. Finally to his beloved wife Houkum for her untiring love, constant prayers and sacrificial supporting. His beloved daughter Haejin has been a source of joy and strength. It is to his beloved wife
and daughter that this piece of work is lovingly dedicated.
V
TABLE OF CONTENTS
Chapter
Title Page Abstract Certificate of Originality Acknowledgments Table of Contents Notation List of Tables List of Figures
Title Page
1
11
iv V
Vl
Xl
Xlll
XVlll
I INTRODUCTION 1.1
1.1 General 1.1 1.2 Objectives of the Study 1.5 1.3 Scope of the Study 1.5 1.4 Organisation of the Report 1.6
11 LITERATURE REVIEW 2.1
2.1 Phosphorus 2.1 2.1.1 Nature of Phosphorus 2.1 2.1.2 Main Sources of Phosphorus 2.4
2.1.2.1 Agricultural and Animal Husbandry Run Off 2.4 2.1.2.2 Sewer Overflows 2.5 2.1.2.3 Effluents from Sewage Treatment Plant 2.5
2.1.3 Problems Caused by Elevated Phosphorus Concentrations 2.6 2.1.4 Phosphorus in New South Wales Waterways 2.8
2.2 Physico-chemical Phosphorus Removal Process 2.2.1 Principle of Sorption 2.2.2 Sorption - Desorption 2.2.3 Sorption Equilibrium
2.2.3 .1 Langmuir Sorption Isotherm 2.2.3 .2 Freundlich Sorption Isotherm
2.2.4 Kinetic Sorption Theory 2.2.4.1 Kinetics of Soil and Slag Reactions
vi
2.12 2.13 2.14 2.14 2.15 2.16
2.17 2.19
2.2.4.2 Phosphorus Sorption Kinetics 2.19
2.2.5 Factors Affecting the Rate of P Sorption 2.20
2.2.5.1 Hydrogen Ion Concentration (pH) 2.21 2.2.5.2 Temperature 2.22 2.2.5.3 Liquid Phase Concentration 2.22 2.2.5.4 Molecular Size and Configuration of the Adsorbate 2.22
2.2.5.5 Characteristics of the Waste 2.23 2.2.5.6 Agitation 2.23 2.2.5.7 Characteristics of the Adsorbent 2.24
(a) Iron and Aluminium Oxides and Hydroxides 2.24 (b) Clay 2.25 (c) pH and Supporting Electrolytes 2.25 (d) Organic Matter 2.26 (e) Free Iron 2.27
2.2.6 Kinetic Equations 2.27
2.2.7 Precipitation-Dissolution 2.29 2.2.7.1 Chemistry of Phosphate 2.30
2.2.7.2 Al Compounds asP Precipitants 2.32
2.2.7.3 Fe Compounds asP Precipitants 2.32 2.2.7.4 Ca Compounds asP Precipitants 2.33
2.2.8 Surface Interaction between the Solid and
Liquid Phase Solution 2.33
2.2.8.1 The Surface Charge of the Solid Phase 2.34 2.2.8.2 Properties of Liquid Layer 2.34
2.2.9 Ion Exchange 2.35
2.2.9.1 Cation Exchange Capacity (CEC) 2.36
2.2.9.2 Anion Exchange Capacity (AEC) 2.36
2.3 Past Studies on P Removal Using Soil 2.37
2.4 Past Studies on P Removal Using Slag and Other Media 2.39
2.5 Constructed Wetland Systems (CWS) 2.42
2.5.1 Factors Contributing to Efficiency of Constructed Wetland Systems 2.43 2.5.1.1 Plant Species 2.43
2.5.1.2 Substrata 2.44 2.5 .1.3 Microorganisms 2.45 2.5.1.4 Temperature 2.46
2.5.2 Phosphorus Removal in CWS 2.46
vii
Ill THEORETICAL CONSIDERATIONS 3.1
3.1 P Transport in Static Systems 3.1
3.1.1 Kinetic Non-equilibrium Sorption 3.2
3.1.2 Static Physical Non-equilibrium Sorption Model (SPNSM) 3.2 3.2 P Transport in Dynamic Systems 3.6
3.2.1 Equilibrium Sorption Model (ESM) 3.10
3.2.2 Dynamic Physical Non-equilibrium Sorption Model
(DPNSM) 3.13
3.2.3 MCMFIT: A Program to Fit a Generalised Non-linear
Advective - Dispersion Model 3.14
3 .2.4 Effect of Model Parameters on Breakthrough Curve 3.16
IV EXPERIMENTAL INVESTIGATION 4.1
4.1 Materials Used 4.1
4.1.1 Adsorbents Analysis 4.1
4.1.2 Chemicals Used in Preparing Synthetic Wastewater 4.4
4.2 Design of Batch Experiments 4.5
4.2.1 Batch Sorption Experiments of P in the Mixing System 4.5
4.2.1.1 Experiments to Study the Kinetics of P Sorption 4.6
4.2.1.2 Batch Sorption Experiments at Different pH Levels 4.9
4.2.1.3 Batch Precipitation Experiments at Different
pH Levels 4.9
4.2.1.4 Batch Sorption Experiments in the Presence of
Foreign Material 4.10
4.2.2 Batch Sorption Experiments of Pin the Static System 4.10
4.2.3 Batch Flocculation Experiments 4.11
4.3 Design of Column Experiments
4.3.1 Column Experiments with Soil
4.3.2 Column Experiments with Dust
4.3.3 Column Experiments with Cake
V RESULTS AND DISCUSSION
5.1 Characteristics of the Media
5 .1.1 Physical Characteristics of the Media 5.1.2 Chemical Characteristics of the Media
viii
4.13
4.19
4.20
4.21
5.1
5.1
5.1 5.4
5.2 P Removal in Batch Experiments 5.5
5.2.1 P Sorption in the Mixing System at Equilibrium 5.6 5.2.2 Kinetics of P Sorption in the Mixing System 5.13
5.2.3 P Sorption in the Static System at Equilibrium 5.14
5.2.4 Kinetics of P Sorption in the Static System 5.23
5.2.5 pH Changes in the Static System 5.27 5.2.6 Effect of pH on P Removal 5.30
5.2.7 Effect of Precipitation on P Removal 5.34
5.3 Batch Flocculation Experiments 5.37
5.3.1 Effect of Flocculant (Adsorbent) Dose 5.38 5.3.2 Effect of Flocculation (Contact) Time 5.40
5.3.3 Effect of Mixing 5.42
5.3.4 pH Changes at Batch Flocculation Experiments 5.43
5.4 P Sorption in the Presence of Foreign Material 5.44
5.4.1 Effect of NH4 on P Sorption in Dust 5.44
5.4.2 Effect of NH4 on P Sorption in Cake 5.46
5.4.3 P Sorption in the Synthetic Wastewater 5.46
5.5 P Removal in Column Experiments 5.48
5.5.1 P Removal in the Soil Column 5.48 5.5.1.1 Effect of Influent P Concentration 5.48
(a) Column Sorption Isotherm of P in Soil 5.48 (b) Model Validation 5.50
5.5.1.2 Effect of Pore Water Velocity 5.55
5.5.1.3 Effect of Adsorbent Depth 5.59
5.5.1.4 Effect of Water Level 5.61
5.5 .1.5 Mechanism of P removal in the Soil Column 5.62
5.5.2 P Removal in the Dust Column 5.63 5.5.3 P Removal in the Cake Column 5.70
5.5.4 pH changes in Column Experiments 5.75
5.5.5 Effect of NH4 on P Removal 5.78 5.6 Field Application 5.80
5.6.1 Upgrading of Sewage Treatment Plants (STPs)
with CWS Using Dust 5.82
5.6.1.1 Sewage Treatment Plant (STP) 5.83 5.6.1.2 Constructed Wetland System (CWS) 5.83
5.6.2 Suppression of P Liberation from Sediments
Using Dust and Cake 5.86 5.6.3 Toxicity of the Dust and Cake 5.88
ix

VI CONCLUSIONS 6.1
VII RECOMMENDATIONS FOR FUTURE WORK 7.1
REFERENCES R.1
APPENDICES A.O
Al. Definitions of Abbreviations, Terms and Units A. I
A2. FORTRAN Listing of ALPA A.5
A3. FORTRAN Listing of SPNSM A.9
A4. Program Description of MCMFIT A.12
X
A
er c er ci cm CO Ds D(8)
Di8,w)
f(C)
H
K K(8) N
Q R
Rd ROH
s sl
s2e
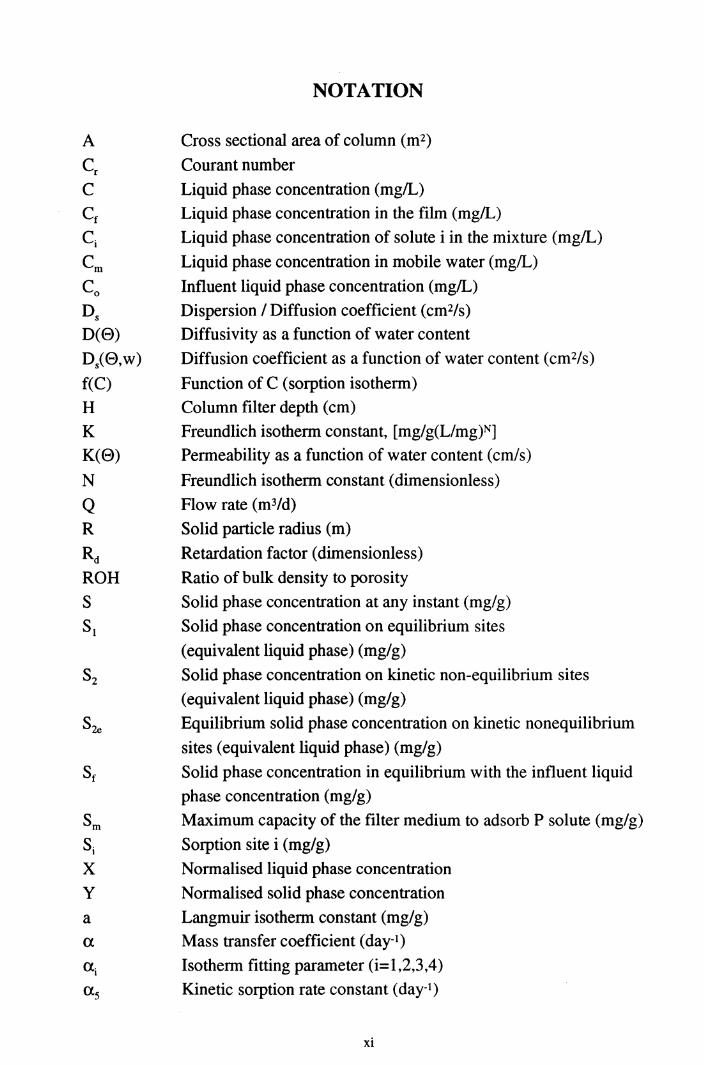
NOTATION
Cross sectional area of column (m2)
Courant number
Liquid phase concentration (mg!L)
Liquid phase concentration in the film (mg!L)
Liquid phase concentration of solute i in the mixture (mg!L)
Liquid phase concentration in mobile water (mg!L)
Influent liquid phase concentration (mg!L)
Dispersion I Diffusion coefficient (cm2/s)
Diffusivity as a function of water content
Diffusion coefficient as a function of water content (cm2/s)
Function of C (sorption isotherm)
Column filter depth (cm)
Freundlich isotherm constant, [mg/g(L/mg)N]
Permeability as a function of water content (cm/s)
Freundlich isotherm constant (dimensionless)
Flow rate (m3/d)
Solid particle radius (m)
Retardation factor ( dimensionless)
Ratio of bulk density to porosity
Solid phase concentration at any instant (mg/g)
Solid phase concentration on equilibrium sites
(equivalent liquid phase) (mg/g)
Solid phase concentration on kinetic non-equilibrium sites
(equivalent liquid phase) (mg/g)
Equilibrium solid phase concentration on kinetic nonequilibrium
sites (equivalent liquid phase) (mg/g)
Solid phase concentration in equilibrium with the influent liquid
phase concentration (mg/g)
Maximum capacity of the filter medium to adsorb P solute (mg/g)
Sorption site i (mg/g)
Normalised liquid phase concentration
Normalised solid phase concentration
Langmuir isotherm constant (mg/g)
Mass transfer coefficient (day-1)
Isotherm fitting parameter (i=l,2,3,4)
Kinetic sorption rate constant ( day-1)
xi
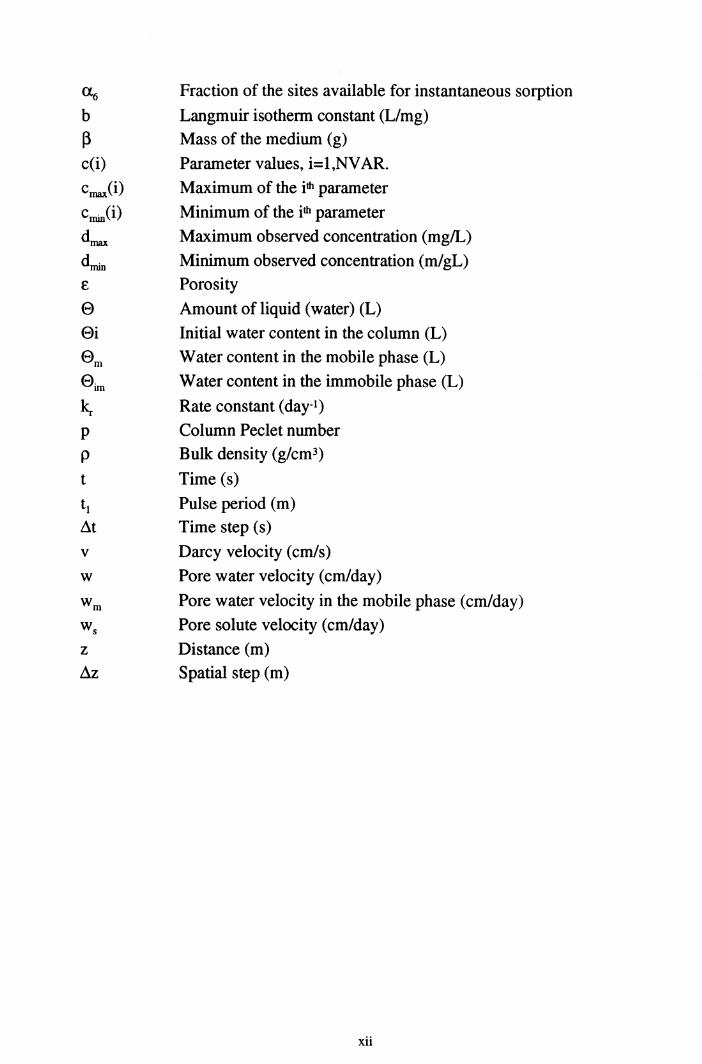
~ b
f3 c(i)
cmax(i) cmin(i) dmax dmin E
e Si
em eim ~ p
p
t
tl
~t
V
w
z ~z
Fraction of the sites available for instantaneous sorption
Langmuir isotherm constant (L/mg) Mass of the medium (g)
Parameter values, i= 1 ,NV AR.
Maximum of the ilh parameter
Minimum of the ilh parameter
Maximum observed concentration (mg/L)
Minimum observed concentration (m/gL)
Porosity
Amount of liquid (water) (L)
Initial water content in the column (L)
Water content in the mobile phase (L)
Water content in the immobile phase (L)
Rate constant (day-t)
Column Peclet number
Bulk density (g/cm3)
Time (s)
Pulse period (m)
Time step (s)
Darcy velocity (cm/s)
Pore water velocity (cm/day)
Pore water velocity in the mobile phase (cm/day)
Pore solute velocity (cm/day)
Distance (m)
Spatial step (m)
xii
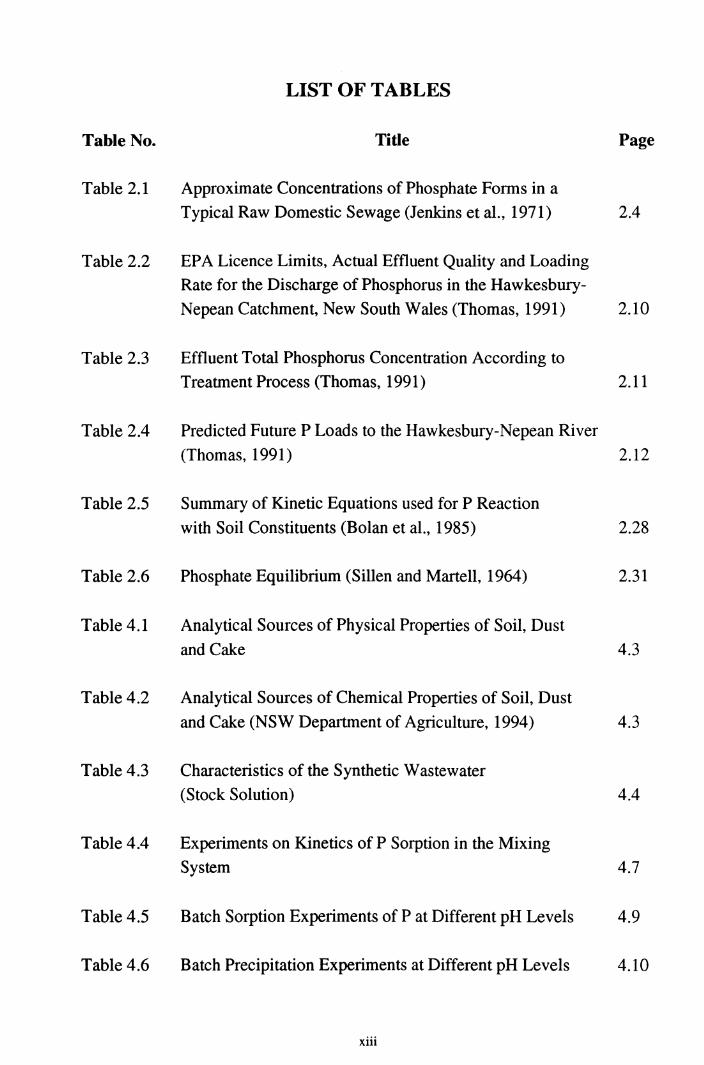
LIST OF TABLES
Table No. Title Page
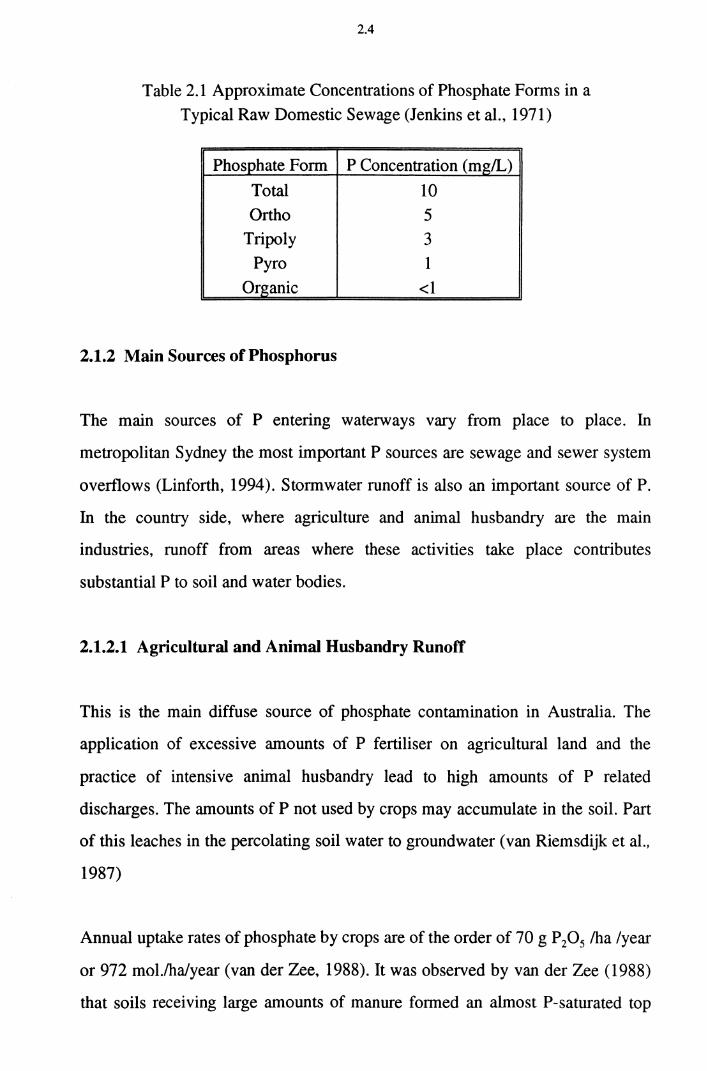
Table 2.1 Approximate Concentrations of Phosphate Forms in a
Typical Raw Domestic Sewage (Jenkins et al., 1971) 2.4
Table 2.2 EP A Licence Limits, Actual Effluent Quality and Loading Rate for the Discharge of Phosphorus in the Hawkesbury-
Nepean Catchment, New South Wales (Thomas, 1991) 2.10
Table 2.3 Effluent Total Phosphorus Concentration According to
Treatment Process (Thomas, 1991) 2.11
Table 2.4 Predicted Future P Loads to the Hawkesbury-Nepean River
(Thomas, 1991) 2.12
Table 2.5 Summary of Kinetic Equations used for P Reaction
with Soil Constituents (Bolan et al., 1985) 2.28
Table 2.6 Phosphate Equilibrium (Sillen and Marten, 1964) 2.31
Table 4.1 Analytical Sources of Physical Properties of Soil, Dust
and Cake 4.3
Table 4.2 Analytical Sources of Chemical Properties of Soil, Dust
and Cake (NSW Department of Agriculture, 1994) 4.3
Table 4.3 Characteristics of the Synthetic Wastewater
(Stock Solution) 4.4
Table 4.4 Experiments on Kinetics of P Sorption in the Mixing
System 4.7
Table 4.5 Batch Sorption Experiments of P at Different pH Levels 4.9
Table 4.6 Batch Precipitation Experiments at Different pH Levels 4.10
xiii
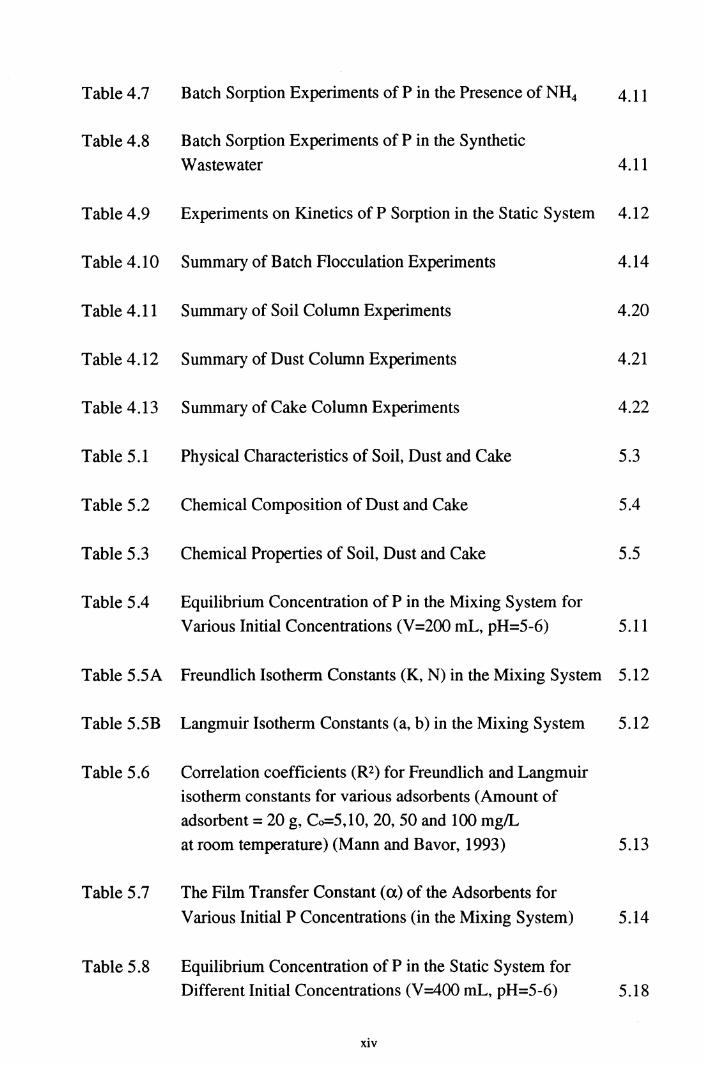
Table 4.7 Batch Sorption Experiments of P in the Presence of NH4 4.11
Table 4.8 Batch Sorption Experiments of P in the Synthetic
Wastewater 4.11
Table 4.9 Experiments on Kinetics of P Sorption in the Static System 4.12
Table 4.10 Summary of Batch Flocculation Experiments 4.14
Table 4.11 Summary of Soil Column Experiments 4.20
Table 4.12 Summary of Dust Column Experiments 4.21
Table 4.13 Summary of Cake Column Experiments 4.22
Table 5.1 Physical Characteristics of Soil, Dust and Cake 5.3
Table 5.2 Chemical Composition of Dust and Cake 5.4
Table 5.3 Chemical Properties of Soil, Dust and Cake 5.5
Table 5.4 Equilibrium Concentration of P in the Mixing System for
Various Initial Concentrations (V =200 mL, pH=5-6) 5.11
Table 5.5A Freundlich Isotherm Constants (K, N) in the Mixing System 5.12
Table 5.5B Langmuir Isotherm Constants (a, b) in the Mixing System 5.12
Table 5.6 Correlation coefficients (R2) for Freundlich and Langmuir
isotherm constants for various adsorbents (Amount of
adsorbent= 20 g, Co=5,10, 20, 50 and 100 mg/L
at room temperature) (Mann and Bavor, 1993) 5.13
Table 5.7 The Film Transfer Constant (a) of the Adsorbents for
Various Initial P Concentrations (in the Mixing System) 5.14
Table 5.8 Equilibrium Concentration of P in the Static System for
Different Initial Concentrations (V=400 mL, pH=5-6) 5.18
xiv
Table 5.9A Freundlich Isotherm Constants (K, N) for Different
Adsorbents in the Static System 5.22
Table 5.9B Langmuir Isotherm Constants (a, b) for Different
Adsorbents in the Static System 5.23
Table 5.10 The Film Transfer Constant (a) of the Different
Adsorbents for Various Initial Concentrations in the
Static System 5.27
Table 5.11 The Amount of P Adsorbed at Different pH levels in the Mixing System (V=200 mL) 5.30
Table 5.12 Amount of Ionic P Removed by Precipitation at Different
pH (C0 for Soil=20.9 mg/L, C0 for Dust=20.4 mg/L,
V=200mL) 5.37
Table 5.13 Major Cations Found in Dust and the Possible Insoluble Compounds Formed in the Solution. 5.42
Table 5.14 Solid Phase Concentration of P and the Percentage of P
Reduction in the Presence of N~ for Dust (NH4=40 mg/L, V =200 mL, ~=0.1 g, pH=5-6) 5.45
Table 5.15 Freundlich and Langmuir Isotherm Constants of P in the
Presence of N~ for Dust (N~=40 mg/L, V=200 mL, ~=0.1 g, pH=5-6) 5.46
Table 5.16 Solid Phase Concentration of P and the Percentage of P
Reduction in the Presence of N~ for Cake (N~=40 mg/L, V =200 mL, ~=0.1 g, pH=5-6) 5.47
Table 5.17 Freundlich and Langmuir Isotherm Constants of P in the
Presence of N~ for Cake (N~=40 mg/L, V=200 mL, ~=1.0g, pH=5-6) 5.47
Table 5.18 Solid Phase P Concentration in the Presence of Synthetic Wastewater for Soil and Dust 5.47
XV
Table 5.19 Amount of P Adsorbed in Soil in the Batch and
Column Experiments 5.49
Table 5.20 Freundlich and Langmuir Isotherm Constants for Soil in
the Dynamic System 5.50
Table 5.21 The Optimal Parameter Values of MCMFIT for Different
Influent Concentrations of P 5.51
Table 5.22 Observed and Predicted Relative Darcy Velocities of P 5.54
Table 5.23 The Model Parameters of DPNSM at Various Pore
Water Velocities 5.56
Table 5.24 The Best Curve Fitting Parameter Values of MCMFIT
at Various Pore Water Velocities 5.58
Table 5.25 Comparison of Soil Column Parameters at Different
Pore Water Velocities 5.58
Table 5.26 Soil Column Parameters at Different Adsorbent Depths 5.61
Table 5.27 Amount of P Adsorbed in the Batch and Column
Experiments for Dust 5.68
Table 5.28 Freundlich and Langmuir Isotherm Constants for Dust 5.68
Table 5.29 Observed and Predicted Relative Darcy Velocities in Dust 5.69
Table 5.30 Amount of P Adsorbed in the Batch and Column
Experiments for Cake 5.74
Table 5.31 Freundlich and Langmuir Isotherm Constants in the Batch
and Column Experiment for Cake 5.74
Table 5.32 Observed and Predicted Relative Darcy Velocities of P
Solution in Cake 5.75
xvi
Table 5.33 Concentration of Mg and Ca ions from Effluent P Solution 5.77
Table 5.34 Concentrations of Several Heavy Metals in Slag
(Yamada et al., 1987 ;*Yamagata, 1977) 5.89
Table 5.35 Concentration of Total Elements from Effluent P
Solutions in the Column Experiment 5.90
Table A.1 Input Data File for the Example
(Soil Column Experiment, Co=S rng/L) A.13
Table A.2 Format of Input File as Required by MCMFIT A.14
Table A.3 Output File for the Example (Soil Column Experiment,
Co=S rng/L) A .IS
xvii
LIST OF FIGURES
Table No. Title Page
Figure 2.1 The Phosphorus Cycle (Reiners, 1984) 2.2
Figure 2.2 Time Scale of Different Processes (Borggaard, 1990) 2.17
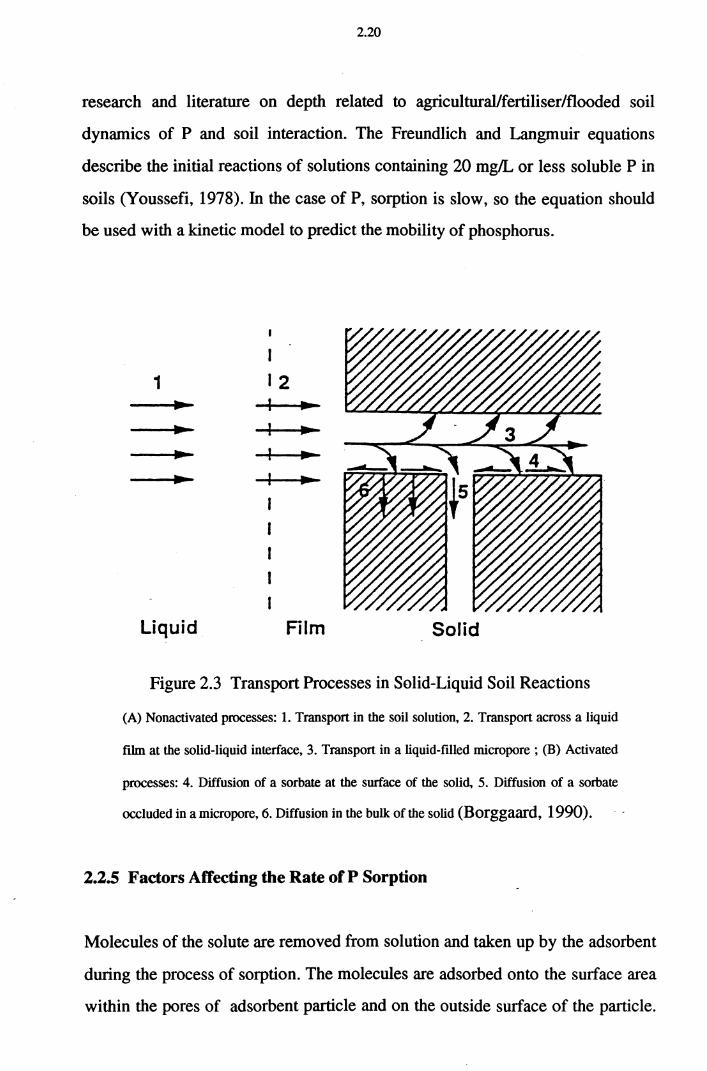
Figure 2.3 Transport Processes in Solid-Liquid Soil Reactions
(Borggaard, 1990). 2.20
Figure 2.4 pH Concentration Diagram for Phosphate Species of Typical
Raw Wastewater (Jenkins et al., 1971) 2.31
Figure 3.1 Comparison of Numerical (Eqns. 3.7 &3.8) and Analytical
(Eqn.3.6) Solutions of Sorption Kinetics for Freundlich
Isotherm Constant N=1 3.7
Figure 3.2 The Shape of Breakthrough Curves (Kjeldsen, 1986) 3.8
Figure 3.3 Equilibrium Sorption Process 3.12
Figure 3.4 Effect of Pore Water Velocity ( w) on the Breakthrough Curve (K=4.26 mg/g(L/mg)N, N=l.ll, D5=1.20 cmZ/day,
a 5=0, a 6=1.0, ROH=3.00 g/cm3, C0 =10 mg/L, H=5 cm) 3.17
Figure 3.5 Effect of Dispersion Coefficient (D5) on the Breakthrough Curve (K=4.26 mg/g(L/mg)N, N=1.11, w=1.50 cm/day,
a 5=0, <X6=1.0, ROH=3.00 g/cm3, C0 =10 mg/L, H=5 cm) 3.18
Figure 3.6 Effect of Kinetic Mass Transfer Coefficient ( a 5) on the
Breakthrough Curve (K=4.26 mg/g(L/mg)N, N=l.ll,
w=1.50 cm/day, D5=1.20 cm2/day,a6=0, ROH=3.00 g/cm3,
C0 =10 mg/L, H=5 cm) 3.18
Figure 3.7 Effect of Freundrich Isotherm Constant K on the Break-
through Curve (N=1.11, w=1.50 cm/day, D5=1.20 cm2/day, a 5=0, <X6=1.0, ROH=3.00 g/cm3, C0 =10 mg/L, H=5 cm) 3.19
xviii
Figure 3.8 Effect of Freundrich Isotherm Constant Non the Break-
through Curve (K=4.26 mg/g(Umg)N, w=1.50 cm/day,
Ds=1.20 cm2/day, a5=0, <X6=1.0, ROH=3.00 g/cm3,
C0 =10 mg/L, H=5 cm) 3.19
Figure 3.9 Effect of Fraction of Equilibrium Site (a6) on the Break-
through Curve (K=4.26 mg/g(Umg)N, N=1.11,
w=1.50 cm/day, D8=1.20 cm2/day, ROH=3.00 g/cm3,
C0=10 mg/L, H=5 cm) 3.20
Figure 3.10 Effect of Influent Concentration (C0 ) on the Break-
through Curve (K=4.26 mg/g(Umg)N, N=l.ll, w=1.50
cm/day, Ds=1.20 cm2/day, a5=0, a 6=1.0, ROH=3.00 g/cm3,
H=5 cm) 3.20
Figure 4.1 Soil Texture Classification (U.S. Department of
Agriculture, 1964) 4.2
Figure 4.2 Batch Sorption Experimental Set-up in the Mixing System 4.6
Figure 4.3 Batch Sorption Experimental Set-up in the Static System 4.12
Figure 4.4A Batch Flocculation Experimental Set-up 4.14
Figure 4.4B Sketch of Batch Flocculation Experimental Set-Up 4.15
Figure 4.5 Column Experimental Set-up 4.17
Figure 4.6 Details of Column Structure 4.18
Figure 5.1 Particle Size Distribution of Soil 5.2
Figure 5.2 Compaction Test for Soil (Blows/Layers=25, No. of
Layers=3, Mass of Hammer=2. 7 kg, Mould diameter=
10.5 cm, Mould height=11.5 cm, V=1 L) 5.3
Figure 5.3A Kinetics of P Sorption in Soil in the Mixing System
(Co = 5,10,15 and 20 mg/L, ~=50.0 g, V=200 mL, pH=5-6) 5.7
xix
Figure 5.3B Kinetics of P Sorption in Soil in the Mixing System (Co = 25,30,35 and 40 mg/L, ~=50.0 g, V=200 mL,pH=5-6) 5.7
Figure 5.4A Kinetics of P Sorption in Dust in the Mixing System
(Co = 5,10,15 and 20 mg/L, ~=0.1 g, V=200 mL, pH=5-6) 5.8
Figure 5.4B Kinetics of P Sorption in Dust in the Mixing System
(Co = 25,30,35 and 40 mg/L, ~=0.1 g, V=200 mL, pH=5-6) 5.8
Figure 5.5A Kinetics of P Sorption in Cake in the Mixing System
(Co = 5,10,15 and 20 mg/L, ~=1.0 g, V=200 mL, pH=5-6) 5.9
Figure 5.5B Kinetics of P Sorption in Cake in the Mixing System (Co = 25,30,35 and 40 mg/L, ~=0.1 g, V=200 mL, pH=5-6) 5.9
Figure 5.6A Observed and Predicted Kinetics of P Sorption in Soil in the
Mixing System (Co = 5,10,15 and 20 mg/L, ~=50.0 g,
V =200 mL, pH=5-6) 5.15
Figure 5.6B Observed and Predicted Kinetics of P Sorption in Soil in the Mixing System (Co =25,30,35 and 40 mg/L, ~=50.0 g,
V=200 mL, pH=5-6) 5.15
Figure 5.7A Observed and Predicted Kinetics of P Sorption in Dust in the Mixing System (Co = 5,10,15 and 20 mg/L, ~=0.1 g,
V=200 mL, pH=5-6) 5.16
Figure 5.7B Observed and Predicted Kinetics of P Sorption in Dust in the Mixing System (Co =25,30,35 and 40 mg/L, ~=0.1 g,
V =200 mL, pH=5-6) 5.16
Figure 5.8A Observed and Predicted Kinetics of P Sorption in Cake in the Mixing System (Co = 5,10,15 and 20 mg/L, ~=1.0 g,
V=200 mL, pH=5-6) 5.17
Figure 5.8B Observed and Predicted Kinetics of P Sorption in Cake in
the Mixing System (Co =25,30,35 and 40 mg/L, ~=1.0 g,
V =200 mL, pH=5-6) 5.17
XX
Figure 5.9A Kinetics of P Sorption in Soil in the Static System
(Co = 5,10 and 15 mg/L, ~=50.0 g, V=200 mL, pH=5-6) 5.19
Figure 5.9B Kinetics of P Sorption in Soil in the Static System
(Co = 20, 25 and 30 mg/L, ~=50.0 g, V=200 mL, pH=5-6) 5.19
Figure 5.10A Kinetics of P Sorption in Dust in the Static System
(Co = 5, 10 and 15 mg/L, ~=0.1 g, V=200 mL, pH=5-6) 5.20
Figure 5.10B Kinetics ofP Sorption in Dust in the Static System (Co = 20, 25 and 30 mg/L, ~=0.1 g, V=200 mL, pH=5-6) 5.20
Figure 5.11A Kinetics of P Sorption in Cake in the Static System
(Co = 5,10 and 15 mg/L, ~=1.0 g, V=200 mL, pH=5-6) 5.21
Figure 5.11B Kinetics of P Sorption in Cake in the Static System
(Co = 20, 25 and 30 mg/L, ~=0.1 g, V=200 mL, pH=5-6) 5.21
Figure 5 .12A Observed and Predicted Kinetics of P Sorption in Soil in the Static System (Co = 5,10 and 15 mg/L, ~=50.0 g,
V=200 mL, pH=5-6) 5.24
Figure 5 .12B Observed and Predicted Kinetics of P Sorption in Soil in the Static System (Co =20,25 and 30 mg/L, ~=50.0 g,
V=200 mL, pH=5-6) 5.24
Figure 5.13A Observed and Predicted Kinetics of P Sorption in Dust in the Static System (Co = 5,10 and 15 mg/L, ~=0.1 g,
V=200 mL, pH=5-6) 5.25
Figure 5.13B Observed and Predicted Kinetics of P Sorption in Dust in the Static System (Co=20,25 and 30 mg/L, ~=0.1 g,
V=200 mL, pH=5-6) 5.25
Figure 5.14A Observed and Predicted Kinetics of P Sorption in Cake in the Static System (Co = 5,10 and 15 mg/L, ~=1.0 g,
V=200 mL, pH=5-6) 5.26
xxi
Figure 5.14 B Observed and Predicted Kinetics of P Sorption in Cake in the Static System (Co =20,25 and 30 mg/L, ~=1.0 g,
V=200 mL, pH=S-6) 5.26
Figure 5.15A pH changes in the Static System for Soil Solution
(Co=S, 10 and 15 mg/L, ~=100.0 g, V=400 mL) 5.28
Figure 5.15B pH changes in the Static System for Dust Solution (Co=S, 10 and 15 mg/L, ~=0.4 g, V=400 mL) 5.29
Figure 5.15C pH changes in the Static System for Cake Solution (Co=S, 10 and 15 mg/L, ~=2.0 g, V=400 mL) 5.29
Figure 5.16 Effect of pH on P Removal in the Mixing System for Soil
Solution (Co=20 mg/L, ~=50.0 g, V=200 mL, Sorption
Time=120 hours) 5.31
Figure 5.17 Effect of pH on P Removal in the Mixing System for Dust
Solution (Co=20 mg/L, ~=0.3 g, V=200 mL, Sorption
Time=120 hours) 5.31
Figure 5.18 Influence of Removal Mechanism on Final pH in the
Mixing System (Amount of Soil=50 g, Amount of Dust=
0.3 g, Co=20 mg/L, V=200 mL, Sorption Time=120 hours) 5.32
Figure 5.19 Effect of pH on P Removal Mechanism (Mixing System ;
Soil as Adsorbent, Co=20 mg/L, ~=50 g, V =200 mL,
Sorption Time=120 hours) 5.33
Figure 5.20 Effect of pH on P Removal Mechanism (Mixing System ;
Dust as Adsorbent, Co=20 mg/L, ~=0.3 g, V=200 mL,
Sorption Time=120 hours) 5.34
Figure 5.21 Effect of pH on P Removal by Precipitation in the Mixing
System (Co=20.9 mg/L for Soil, Co=20.4 mg/L for Dust,
V =200 mL, Precipitation Time= 120 hours) 5.36
xxii
Figure 5.22 Effect of Precipitation on Final pH in the Mixing System
(Co=20.9 mg/L for Soil, Co=20.4 mg/L for Dust,
V =200 mL, Precipitation Time= 120 hours)
Figure 5.23A Effect of Flocculant (Dust) Dose and Initial P Concentration
on P Removal Efficiency (Tr-30 min., Mixing velocity=
5.37
60 rpm, Co=10, 20, 30 mg!L, pH=5-6) 5.39
Figure 5.23B Effect of Flocculant (Dust) Dose and Flocculation Time on
P Removal Efficiency (Mixing Velocity = 60 rpm,
Co= 20 mg/L, pH=5-6) 5.39
Figure 5.24A Effect of Flocculation Time at High Flocculant (Dust) Dose (Mixing velocity = 60 rpm, Dust Dose = 30 g, C0 = 10, 20,
30mg/L, pH=5-6) 5.41
Figure 5.24B Effect of Flocculation Time at Low Flocculant (Dust) Dose
(Mixing velocity = 60 rpm, Dust Dose = 2 g, Co=5 and
10 mg/L, pH=5-6) 5.41
Figure 5.25 Effect of Mixing Velocity on P Removal (Tf = 30 minutes,
Dust Dose= 30 g, Co=10, 20, 30 mg!L, pH=5-6) 5.43
Figure 5.26 pH Changes at Different Flocculation (Mixing) Times
(Mixing Velocity = 60 rpm, Co= 20 mg/L, pH=5-6) 5.44
Figure 5.27(A)(B): Phosphorus Concentration History Curves in Soil
(w=1.53 cm/day, D5=0.58 cm2/day, as =0.23 day-1 for Co=
10 mg/L, as =0.18 day-1 for Co=20 mg!L, K=4.55x10⁻³
mg/g(L/mg)N, N=l.ll, H=5 cm, pH=6-7) 5.52
Figure 5.27(C)(D): Phosphorus Concentration History Curves in Soil (w=1.53 cm/day, D5=0.58 cm2/day, as =0.13 day-1 for Co=
30 mg/L, as =0.10 day-1 for Co=40 mg/L, K=4.55x10⁻³
mg/g(L/mg)N, N=l.ll, H=5 cm, pH=6-7) 5.53
xxiii
Figure 5.28A Observed and DPNSM Predicted Concentration History
Curves of P for Different Pore Water Velocities in Soil (Co=30 mg/L, D5=0.58 cm2/day, a5= 0.25 day-1, K=4.55x10⁻³
mg/g(L/mg)N, N=l.ll, H=5 cm, pH=6-7) 5.57
Figure 5.28B Observed and MCMFIT fitted Concentration History Curves
of P for Different Pore Water Velocities in Soil
(C0 =30mg/L, D5=1.19 cm2/day, H=5 cm, pH=6-7) 5.57
Figure 5.29A Phosphorus Concentration History Curves at Different Soil
Depths (C0 =50 mg/L, H=2 and 3 cm, w=38.0 for 2 cm, w=11.8 cm/day for 3 cm, D5=0.58 cm2/day, a5=0.33 day-1
for 2 cm, a5=0.65 day-1 for 3 cm, K=4.55xlQ-3
mg/g(L/mg)N, N=l.ll, pH=6-7) 5.60
Figure 5.29B Phosphorus Concentration History Curves at Different Soil
Depths (C0 =50 mg/L, H=4 and 5 cm, w=9.21cm/day for 4 cm, w=4.95 cm/day for 5 cm, D5=0.58 cm2/day, a 5=0.98
day-1 for 4 cm, a 5=1.49 day-1 for 5 cm, K=4.55x10⁻³
mg/g(L/mg)N, N=l.ll, pH=6-7) 5.60
Figure 5.30 Phosphorus Concentration History Curves for Different
Water Levels above Soil Column (C0 =30 mg/L; Water
Level=5,15 and 25 cm; K=4.55x10⁻³ mg/g(Umg)N, N=l.ll;
D5=0.58 cm2/day; H=5 cm; pH=6-7; w=1.18 cm/day and a5= 0.28 day-1 for 5 cm; w=1.91 cm/day and a 5=0.35 day-1 for 15
cm ; w=2.89 cm/day and a 5 =0.43 day-1 for 25 cm ) 5.62
Figure 5.31(A)(B)(C)(D) Phosphorus Concentration History Curves in
Dust (w=305 cm/day, D5=l3.68 cm2/day, K=2.61x10⁻¹
mg/g(L/mg)N, N=1.13, a 5=6.24 day-1 , H=l cm, pH=6-7) 5.65
Figure 5.31(E)(F) Phosphorus Concentration History Curves in Dust
(w=37 cm/day for Co=40 mg/L, w=43 cm/day for Co=50
mg/L; D5=l3.68 cm2/day, K=2.61xlQ-1 mg/g(L/mg)N,
N=1.13, a 5=6.24 day-1 , H=l cm, pH=6-7) 5.67
xxiv
Figure 5.32(A)(B) Phosphorus Concentration History Curves in Cake (w=10.2 cm/day, D5=1.42 cm2/day, K=8.17x10⁻² mg/g(L/mg)N, N=1.09, a 5=0.37 day-1, H=3 cm, pH=6-7) 5.71
Figure 5.32(C)(D) Phosphorus Concentration History Curves in Cake
(w=15.6 cm/day for Co=20 mg/L, w=46.0 cm/day for Co=
30 mg/L, Ds=1.42 cm2/day, K=8.17x10⁻² mg/g(L/mg)N,
N=1.09, a5=0.37 day-1, H=3 cm, pH=6-7) 5.72
Figure 5.32(E)(F) Phosphorus Concentration History Curves in Cake
(w=54.0 cm/day for Co=40 mg/L, w=60.0 cm/day for Co=
50 mg/L; Ds=1.42 cm2/day, K=8.17x10⁻² mg/g(L/mg)N, N=1.09, a 5=0.37 day-1, H=3 cm, pH=6-7) 5.73
Figure 5.33 pH Changes in the Dynamic System for the Different
Adsorbents (Co=40 and 50 mg!L, H=5 cm, Initial pH=8.1) 5.76
Figure 5.34A Observed Concentration History Curves and pH Change of
P Solution in Dolomite Column Experiments (Co=25 mg!L,
pH=7.5-8.5) (Roques et al., 1991) 5.79
Figure 5.34B Changes of NH4-N, Ca2+ and Mg2+ with Time in Dolomite
Column Experiments (Roques et al., 1991) 5.79 ·
Figure 5.35A Observed Concentration History Curves of Pin the
Presence of NH4 (Dust as the Adsorbent ; C0 =20 mg/L,
w=305 cm/day, H=1 cm, pH=6-7) 5.81
Figure 5.35B Observed Concentration History Curves of Pin the
Presence of NH4 (Cake as the Adsorbent; C0 =20 mg/L,
w=890 cm/day, H=1 cm, pH=6-7) 5.81
Figure 5.36 Schematic Diagram of Extended STP with CWS for
Wastewater Treatment
XXV
5.85
1.1
I. INTRODUCTION
1.1 General
Limited water resources and increasing urbanisation requrre more advanced
technology to preserve water quality. One of the important factors affecting
water quality is the enrichment of nutrients in water bodies. This causes algal
blooms and eutrophication problems. For example, more than 60% of storages
which have a capacity of more than 30,000 megaliters in New South Wales,
Australia, encounter eutrophication problems. Phosphorus (P) is one of the main
nutrients responsible for eutrophication in closed water systems especially in
lakes and highly enclosed bays where water is stagnant. The problems caused by
phosphorus in waterways are not only introduced by naturally occurring
phosphorus - from weathering of rocks and the decomposition of organic
materials - but also by extra phosphorus which finds its way into rivers and
streams. This additional phosphorus gets into waterways from many different
sources such as: (i) agricultural and urban run-off, (ii) sewer overflows and (iii)
sewage treatment plant (STP) effluents. The main point source of phosphorus
comes from sewage treatment plants. For- example, nutrient levels in the
Hawkesbury- Nepean River to the west and north of Sydney, Australia are high
mainly due to several STP effluent discharges. The present sewage effluent
standard for P discharge into waterways is 1.0 mg/L. This effluent standard for P
will become more stringent by the year 1996, being reduced to 0.3 mg!L to
combat the eutrophication problem (Thomas et al., 1993).
Phosphorus removal consists of its conversion into a solid phase followed by the
removal of this phase from the main waste stream. Chemical precipitation,
biological removal and land treatment are presently used to remove the
phosphorus in sewage treatment plants. Although chemical precipitation is a well
1.2
established technology which is relatively easy to implement in the existing
sewage treatment works, this technique has some major disadvantages due to the
cost of chemicals and the need for handling, treatment and disposal of significant
additional quantities of chemical sludge (Yamada et al., 1986; Kaneko and
Nakajima, 1988; Suzuki and Fujii, 1988; Aulenbach and Meisheng, 1988; Fox et
al., 1989; Roques et al., 1991). Biological processes are not attractive due to
their sensitivity to environmental changes and pH variation. They cannot be
relied upon to effect high removals of phosphorus (>90%) by normal biological
uptake mechanisms (Jenkins et al., 1971). In biological treatment processes, the
conversion of soluble P to a particulate form is by microbial growth and as a
medium for biological growth, most wastewater contains an excess of P. A
detailed review of biological P removal is discussed elsewhere (Raper and
Barnard, 1994). Thus even those treatment plants adopting biological P removal
methods apply chemical treatment as a standby method (Thomas, 1991).
Land treatment is an attractive solution if the particular soil or other media used
has significant sorption (a generalised term of adsorption and absorption;
definitions of terms and units are presented in Appednix A1) capacity for P
(Ebers and Bischofsberger, 1990). The Sydney Water Board (1991)
recommended land application of sewage effluent in areas where there are
serious eutrophication problems. P removal by soil or slag waste by-products
from the steel industry may be a good solution if the media used has a high
sorption capacity for P. P sorption in soil and slag has been suggested· as a
mechanism for P removal in constructed wetland systems which are considered
as an appropriate technology for P treatment in many parts of the world
(Aulenbach and Meisheng, 1988; Yamada et al., 1987; Mann and Bavor, 1993).
The main advantages of this method over a conventional chemical precipitation
process are that it does not produce any excess chemical sludge and does not
bring about excessive consumption of reagents. Furthermore, P removal by
1.3
chemical precipitation (for example, lime precipitation) must be done at pHs in
the range of 10.5 - 11.0. Consequently effluents require pH correction before
being discharged into receiving waters. Lastly, separation of the calcium
phosphate precipitate is not always easily accomplished (Roques et al., 1991).
Several researchers have investigated the utilisation of solid reagents for P
removal (Yamada et al., 1986; Kaneko and Nakajima, 1988; Suzuki and Fujii,
1988; Aulenbach and Meisheng, 1988; Fox et al., 1989; Ho and Kuruvilla, 1990;
Roques et al., 1991; Ho et al.,1992; James et al., 1992; Mann and Bavor, 1993).
Few studies, however, have attempted to study P removal mechanisms in soil
and slag media to provide basic information for the design of efficient land
treatment facilities.
Estimation of the sorption rate and capacity for P in soils and slags is important
in the evaluation of the P removal by these media. In order to study the transport
and mobility of P in the soil or slag environment, the basic mechanisms for the
attenuation of P have to be explored. The dissolved phase of the P is transported
in the soil or slag by advection and dispersion in the water in which the P is
dissolved (Kjeldsen, 1986). The major mechanisms affecting the transpmt of P
are sorption-desorption, complexation and precipitation-dissolution (Borggaard,
1990; Sanyal and De Datta, 1991 ). Plants and micro-organisms also take up the
P and affect the transport. There are numerous complex compounds and
pollutants in landfillleachate, and soil or slag characteristics are very difficult to
ascertain, since these media are not homogenous (Bhuvendralingam, 1987).
Furthermore, the transport of the Pin the solid-liquid environment is determined
by the environmental conditions with which they are associated. The
simultaneous presence of all elements and compounds can inhibit or accelerate
the processes of P sorption, complexation, and precipitation (Crittenden et al.,
1986; Kjeldsen, 1986; Bajracharya, 1989; Sanyal and De Datta, 1991)
1.4
To understand the transport phenomenon, many geochemical transport models
have been developed, but very few experimental data are available to verify
them. A number of models accounting for the process of solute sorption are
available for saturated flow conditions. Models have also been developed
considering the multi-solute sorption process. Crittenden et al. (1986) have
developed sorption models incorporating solute mixing, liquid diffusion,
competitive sorption etc. and have proposed numerical methods to solve the
model equations. Commercial package programs (MYGRT, FASTCHEM etc.)
developed by the Electric Power Research Institute, USA (1989) are available.
These programs incorporate precipitation-dissolution, sorption-desorption, redox
conversions and complexation for modelling chemical attenuation (Bajracharya,
1989).
For the sorption process, there is a basic difference between batch (static) and
continuous (dynamic) processes. In the static process, there is a fixed amount of
solute and the liquid phase concentration decreases with a corresponding
increase in the solid phase concentration. The dynamic process, on the other
hand, provides a continuous supply of solution to replace the solute that has been
adsorbed from the liquid phase. The P solute needs to be carefully monitored
under different conditions. At present, there exist several complex models to
predict solute transport involving many model constants. Simple transport
models with few coefficients are desirable (Bajracharya and Vigneswaran,
1990).
To design an efficient land treatment facility, basic information on the behaviour
of P in the media-water environment is required. This research attempted (i) to
study the transport of Pin soil and slag (waste by-products from the BHP steel
industry) media both under static and dynamic conditions, (ii) to devise
mathematical models which can predict the P transport and removal, and (iii) to
1.5
validate them with experimental data. The model formulation is limited to
sorption processes under varying environmental conditions. The model
coefficients evaluated from batch and column experiments have been
incorporated to predict P transport. P is generally present with high
concentrations of ammonium nitrogen (NH4-N) compounds in most wastewaters.
The effects of NH4-N on the sorption of Pin soil and slag have been studied to
understand competitive sorption processes under static and dynamic conditions.
Field applications of use of slag have also been highlighted.
1.2 Objectives of the Study
The objectives of this study are summarised as follows;
1. To study the kinetics of P, and the effects of pH, precipitation and NH4-N
on P sorption, in selected soil and slag media under static and dynamic
conditions.
2. To develop mathematical models which can describe the transport and
removal of P in the soil and slag studied under static and dynamic
conditions and to verify these results with laboratory scale experiments.
3. To develop the concept of using slag as an adsorbent in sewage treatment,
as a substratum in constructed wetland systems and as a suppressing
material on the release of P from sediments.
1.3 Scope of the Study
This research included laboratory studies and mathematical modelling. They
were performed to study;
1.6
1. The kinetics of P sorption in batch experiments using soil and slag under
static and mixing systems.
2. The effect of pH, precipitation and foreign material as NH4- N on P sorption
in soil and slag media under static conditions.
3. Effects of influent P concentration, pore water velocity, adsorbent depth,
water level above the adsorbent, and foreign material on P sorption onto soil
and slag media under dynamic conditions.
4. The development and experimental validation of mathematical models
under the static and dynamic conditions to predict the kinetics of P.
5. Preliminary calculations for the design of an extended constructed wetland
system using slag as an adsorbent (the toxicity of the slag effluent solution
was evaluated from column experiments to study the side effects of using
slag in the proposed system).
1.4 Organisation of the Report
Following the introductory chapter which describes the objective and scope of
the research in relation to the current status of our understanding of P removal in
soil and slag media, Chapter IT is devoted to a review of the literature associated
with this field. In Chapter ill, mathematical models are presented to describe the
kinetics of P under static conditions and to predict the transport of P under
dynamic conditions. In order to find the optimal model parameters, a program to
fit a generalised, non-linear, advective dispersion model is used. The
experimental investigations carried out in this study are presented in Chapter IV.
Chapter V presents the results and discussions on the experiments and the

1.7
predictions by the mathematical models. The conclusions and recommendations
for future research are given in Chapter VI.
2.1
IT. LITERATURE REVIEW
2.1 Phosphorus
2.1.1 Nature of Phosphorus
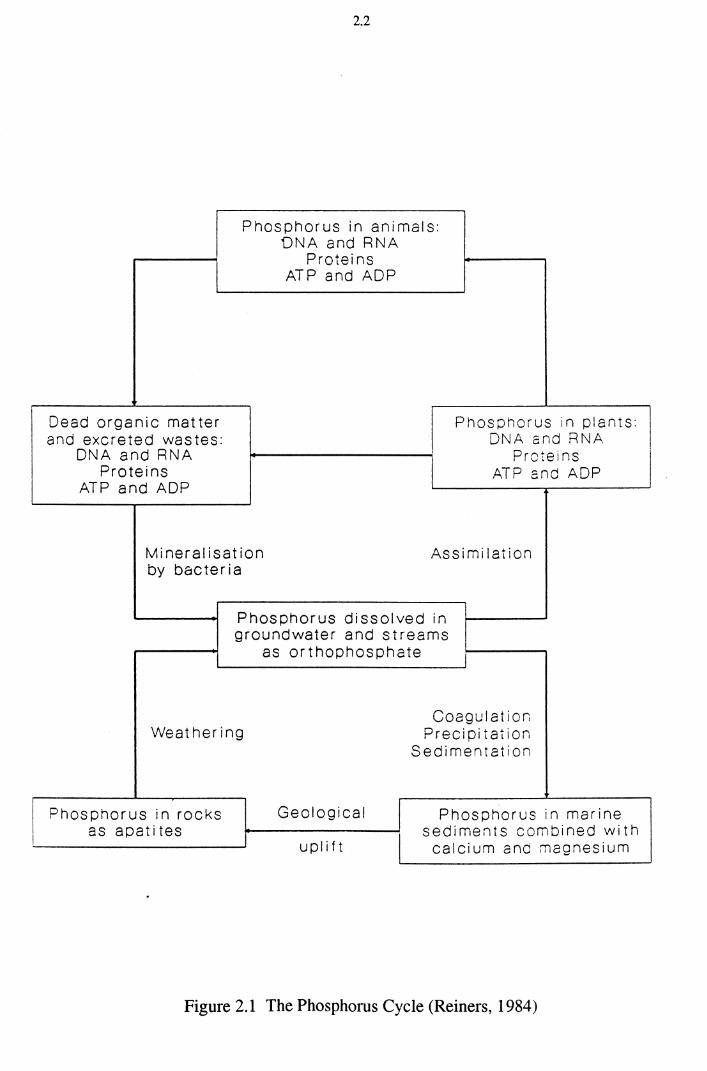
Phosphorus is one of the essential nutrients needed for normal growth in plants
and animals. The circulation of phosphorus through the environment can be
described by the phosphorus cycle (Figure 2.1). In nature most phosphorus
occurs in rocks in the minerals apatite (Ca5(P04) 3F), hydroxy apatite
(Cas{P04) 30H), and to a lesser extent, in combination with magnesium (Reiners,
1984). The weathering of these rocks results in the phosphate becoming
dissolved in groundwater or streams. The dissolved orthophosphates are the
forms that are most readily assimilated by plants (Chiswell and Hammock,
1991). The clearing of forests by man accelerates the weathering process.
Mining of phosphate rock for use as fertiliser ( eg. superphosphate - Ca(H2PO 4 ) 2)
greatly accelerates the transfer of phosphorus from rocks to plants.
Phosphorus in the form of orthophosphates dissolved in groundwater or streams
is readily taken up by plants. Plants convert phosphate to organic forms such as
proteins, nucleic acids (DNA and RNA), the energy producing compound
adenosine triphosphate (ATP) and its by-product adenosine diphosphate (ADP).
Animals obtain their supply of phosphorus by eating plants or other animals. In
human beings phosphorus is found in DNA, RNA, proteins, ATP and ADP.
When plants and animals excrete wastes or die, the various forms of organic
phosphorus in the decaying matter are mineralised by bacteria to the
orthophosphate form (P043·). This becomes dissolved in groundwater or surface
water and the cycle continues. A proportion of the orthophosphate dissolved in
Dead organic matter and excreted wastes:
DNA and RNA Proteins
ATP and ADP
2.2
Phosphorus in animals: DNA and RNA
Proteins ATP and ADP
Phosphorus in plants: DNA and RNA.
Proteins j ATP and ADP
Mineralisation by bacteria
Assimilation
Phosphorus dissolved in groundwater and streams
as orthophosphate
We at her i ng Coagulation
Precipitation Sedimentation
P hos ph or us in rocks as a pat i tes
Geological
up I if t
Phosphorus in marine sediments combined with
calcium and magnesium
Figure 2.1 The Phosphorus Cycle (Reiners, 1984)
2.3
streams is not assimilated but finds its way into the ocean. The abundance of
calcium and magnesium counter-ions in seawater causes coagulation,
precipitation and sedimentation of the previously dissolved orthophosphate.
Geological processes may result in the uplifting of these marine sediments, so
that they are exposed to the weathering process again (Reiners, 1984).
Phosphorus is found in wastewater in three forms (US EP A, 1971 ):
1. Organic phosphorus compounds
2. Condensed phosphates (pyro-, meta-, and polyphosphates)
3. Orthophosphate ions (POl-, HPO/-, H2P04-, H3P04)
The actual form of the orthophosphate (POl-, HPO/-, H2P04-, H3P04) is
dependent on the wastewater's pH. At the usual pH of municipal wastewater
(pH=6.8 to 7.5), the predominant form is HPO/-. Domestic wastewater typically
contains about 10 mg/L of P. In sewage and other natural waters phosphorus is
found in the pentavalent state, tetrahedrally coordinated to oxygen atoms or
hydroxyl groups. The phosphate group occurs as ortho-phosphoric acid, as
condensed phosphates, in which two or more phosphorus atoms are joined by P
O-P bonds, or as organic phosphates in which P-0-C linkages are present. Each
of these forms may exist in solution and as a particulate. Typical concentrations
of these species are given in Table 2.1 (Jenkins et al., 1971).
The bacteria that break down organic phosphorus compounds and condensed
phosphates to orthophosphate are normally found in sewage. The activated
sludge process increases the concentration of these bacteria and therefore speeds
up the conversion to orthophosphate. Phosphorus makes up about 2.5% of the
cell mass of activated sludge (Metcalf and Eddy, 1991).
2.4
Table 2.1 Approximate Concentrations of Phosphate Forms in a Typical Raw Domestic Sewage (Jenkins et al., 1971)
Phosphate Form P Concentration (mg/L)
Total 10 Ortho 5
Tripoly 3 Pyro 1
Organic <1
2.1.2 Main Sources of Phosphorus
The mam sources of P entering waterways vary from place to place. In
metropolitan Sydney the most important P sources are sewage and sewer system
overflows (Linforth, 1994). Stormwater runoff is also an important source of P.
In the country side, where agriculture and animal husbandry are the main
industries, runoff from areas where these activities take place contributes
substantial P to soil and water bodies.
2.1.2.1 Agricultural and Animal Husbandry Runoff
This is the main diffuse source of phosphate contamination in Australia. The
application of excessive amounts of P fertiliser on agricultural land and the
practice of intensive animal husbandry lead to high amounts of P related
discharges. The amounts of P not used by crops may accumulate in the soil. Part
of this leaches in the percolating soil water to groundwater (van Riemsdijk et al.,
1987)
Annual uptake rates of phosphate by crops are of the order of 70 g P 20 5 /ha /year
or 972 mol./halyear (van der Zee, 1988). It was observed by van der Zee (1988)
that soils receiving large amounts of manure formed an almost P-saturated top
2.5
soil. This is hazardous as it leads to surlace water and groundwater
contamination in areas such as the Hawkesbury-Nepean catchment in New South
Wales, where intensive agriculture and animal husbandry are practiced (Thomas,
1991).
2.1.2.2 Sewer Overflows
Within the Sydney region the second most imp01tant source of pollution is sewer
overflows. During intense rainfall periods, sewer overflows occur due to
excessive inflow and infiltration of stormwater into the sewerage system. Once
the hydraulic capacity of the sewerage system is exceeded, sewage may overflow
into waterways. During storms, sewer overflows may occur via approximately
3000 designed overflow structures in Sydney, constructed to ensure emergency
pressure relief and to protect people from direct exposure to sewage effluent in
their homes or property (Linforth, 1994). A large number of surlace fitting
discharge points, such as manholes, may also overflow during wet weather.
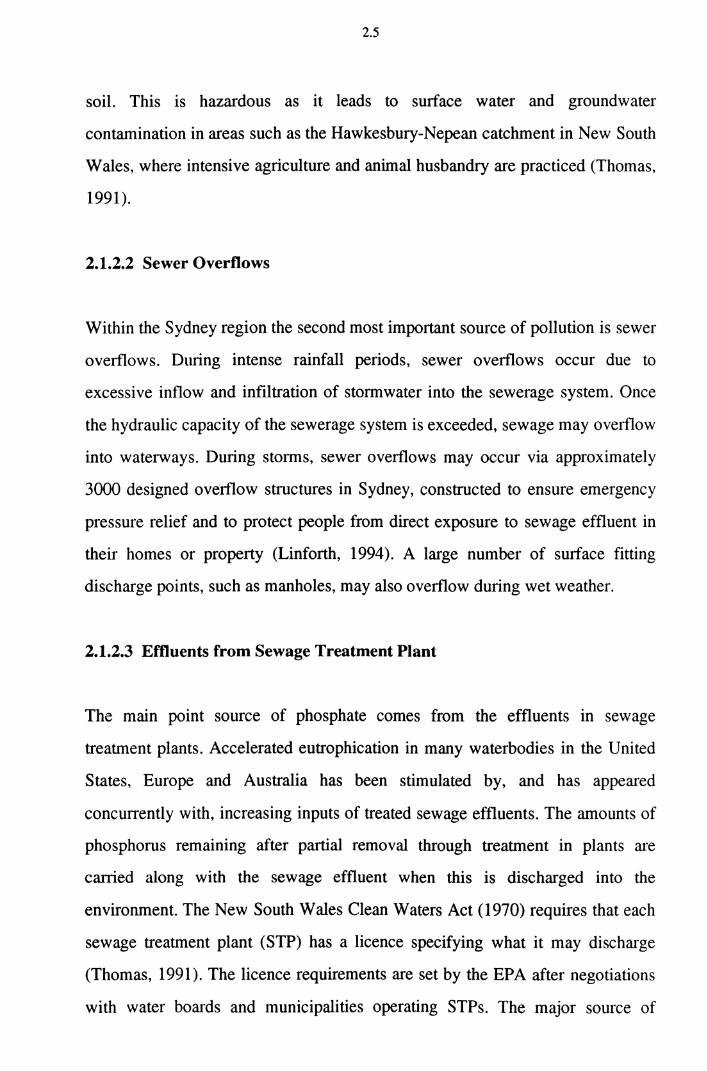
2.1.2.3 Effluents from Sewage Treatment Plant
The mam point source of phosphate comes from the effluents in sewage
treatment plants. Accelerated eutrophication in many waterbodies in the United
States, Europe and Australia has been stimulated by, and has appeared
concurrently with, increasing inputs of treated sewage effluents. The amounts of
phosphorus remaining after partial removal through treatment in plants are
carried along with the sewage effluent when this is discharged into the
environment. The New South Wales Clean Waters Act (1970) requires that each
sewage treatment plant (STP) has a licence specifying what it may discharge
(Thomas, 1991). The licence requirements are set by the EPA after negotiations
with water boards and municipalities operating STPs. The major source of
2.6
phosphorus in municipal wastewater is detergents (Henderson-Sellers, 1984). A
commonly used compound in detergents is sodium tripolyphosphate (NctsP30 4).
Chiswell and Hammock (1991) reported that between 50% and 65% of
phosphates in domestic effluents were due to detergents.
2.1.3 Problems Caused by Elevated Phosphorus Concentrations
Eutrophication is a process that involves the ageing of a body of water
(Henderson-Sellers, 1984). Natural eutrophication occurs over geological time
spans. Of greater concern, however, is the accelerated eutrophication caused by
the activities of today's society which increases the nutrient concentration in
waterways. Nutrient enrichment in waterways causes increased growth of
aquatic plants and phytoplankton. Algal growth in waterways tends to be
seasonal and cyclic (Chung, 1990). In summer, higher water temperatures
encourage increased rates of biological activity. The cycle that algae blooms
follow has a period of rapid exponential growth, and then a period of massive
death and decay of the plant material.
Eutrophication is more likely to occur in places where nutrients tend to
accumulate, such as lakes, reservoirs, sluggish streams, and poorly flushed
estuaries (Bames et al., 1986). The Hawkesbury-Nepean River, NSW, has a
history of problems with eutrophication (SPCC, 1983). These are exacerbated
during periods of low flow in the river and high water temperatures during
summer.
A specific problem associated with eutrophication is blooming of blue green
algae, such as the Microcytes and Cyanophyceae species. Blue green algae
discolour the water, cause taste and odour problems, and release toxins which
can poison aquatic plants and animals, and terrestrial animals that drink the
2.7
water (Sydney Water Board, 1991). For example, it was reported in the media
that during November 1991, blooms of blue green algae in the Darling River,
NSW, caused the death of about 150 cattle and 300 sheep. By killing off
competing organisms, the blue green algae becomes the predominant species.
From an environmental viewpoint an ecosystem with a low diversity of species
is undesirable (Thomas, 1991).
Aquatic plant growth requires a Nitrogen to Phosphorus (N :P) ratio of
approximately 16: 1. If the N :P ratio is lower than 16: 1, then the ecosystem is
said to be nitrogen limited. Under these conditions blue green algae can thrive.
Blue green algae has an ability to fix nitrogen directly from the atmosphere,
whereas most organisms require nitrogen to be in the form of nitrate or
ammonia. Therefore, the growth of blue green algae is limited by the availability
of phosphorus because they will have an abundant supply of nitrogen from the
atmosphere (Henderson-Sellers, 1979).
Blue green algae are primitive photosynthetic organisms which are found in
many environments, notably inland waterways, estuaries and the sea. In
Australian waters, two genera of blue green algae, Microcystis aeruginosa and
Anabaena circinalis, dominate the records of nuisance blooms. For 1991192 the
NSW Blue Green Algae Task Force reported 48 waterways throughout the state
with blue green algae blooms, of which 30 were regarded as serious events,
having the potential to cause problems with water resources use. Maintaining
N :P ratios greater than 16: 1 in a waterway is prudent. It appears that the only
reliable method of preventing blue green algae blooms _is to maintain the
phosphorus concentration in the river below 0.05 mg/L (Sydney Water Board,
1991).
2.8
2.1.4 Phosphorus in New South Wales Waterways
The challenge facing NSW is to minimise the input of phosphorus to the state's
waterways. Various trophic classification models predict that the phosphorus
levels in NSW waters can cause significant water quality problems (NSW Blue
Green Algae Task Force, 1992). The median levels of phosphorus exceed a
nominated desirable level of 0.05 mg/L at 60% of sites sampled throughout the
state; with exceedances occurring in all western river basins and some coastal
basins. Over the past 18 years, total phosphorus levels have risen by an average
rate of 5% per year statewide. There have been significant increases in the
Namoi and Hunter valleys. North-western basins- generally have the highest
phosphorus values (Darling, Intersecting Streams and Border Rivers, Gwydir) or
the greatest upward trend (Stevenson, 1993).
According to the report by the NSW Blue Green Algae Task Force (1992),
estimates of the total nitrogen to total phosphorus ratio (N:P ratio) for the
Darling River at Burtunby from 1978 to 1986 was about 3:1. The N:P ratio less
than 29:1 accelerates algal blooms (NSW Blue Green Algae Task Force, 1992).
Nitrogen to phosphorus ratios of this magnitude favour the growth of nitrogen
fixing blue green algae. In the case of the 1991/92 bloom in the Darling and
Barwon Rivers, the total nitrogen to total phosphorus ratio was 5:1. The
dominant algae present in the bloom was the nitrogen fixer Anabaena circinalis
(Sainty and Jacobs, 1994). The only satisfactory way of changing these ratios
will be the selective management of phosphorus sources in the Darling River
Basin.
The New South Wales Clean Waters Act (1970) requires that STPs have a
licence specifying what they may discharge. The licence requirements are set by
the Environmental Protection Authority (EPA) after negotiations with water
2.9
boards and municipal STP operators. They are set out in probabilistic terms. A
fifty percentile and ninety percentile limit for effluent phosphorus discharge is
specified. To comply with the fifty percentile licence limit, more than fifty
percent of the samples of effluent collected and analysed must be lower than the
limit. Similarly, to comply with the ninety percentile licence limit, more than
ninety percent of the samples must be lower than the limit. Table 2.2 shows the
1991192 financial year licence limits, the actual discharges and the loading rates
for the Sydney Water Board STPs in the Hawkesbury Nepean Catchment.
The Environmental Protection Authority (EPA) asked the Water Board to
investigate the technical feasibility of upgrading the Board's twenty three STPs
that discharge to the Hawkesbury-Nepean River system, so that they would meet
a 90%ile value of 0.3 mg/L for total phosphorus in effluents. Although many
STPs comply with their existing licence conditions for nutrient levels in
discharges, none of the plants are presently achieving this target effluent quality.
In order to achieve the EPA's targets, the Water Board has been reviewing the
available technology (Thomas, 1991).
Currently 12 of the 23 Sydney Water STPs -that discharge to the Hawkesbury
Nepean River system use chemical phosphorus removal. The chemical process
used involves the precipitation of phosphorus by dosing the wastewater with iron
salts. Spent pickle liquor (SPL) from steelworks is one of the sources of the iron
salts. The SPL commonly contains about 10% (by weight) of iron, most of which
is in the ferrous (Fe2+) form (Chung, 1990). The SPL is dosed either before the
primary sedimentation tanks or before the aeration tank. The ferrous iron tends
to be oxidised into ferric iron (Fe3+) after it is dosed to the sewage (I Cl currently
produces an iron salt which is used more than the SPL).
2.10
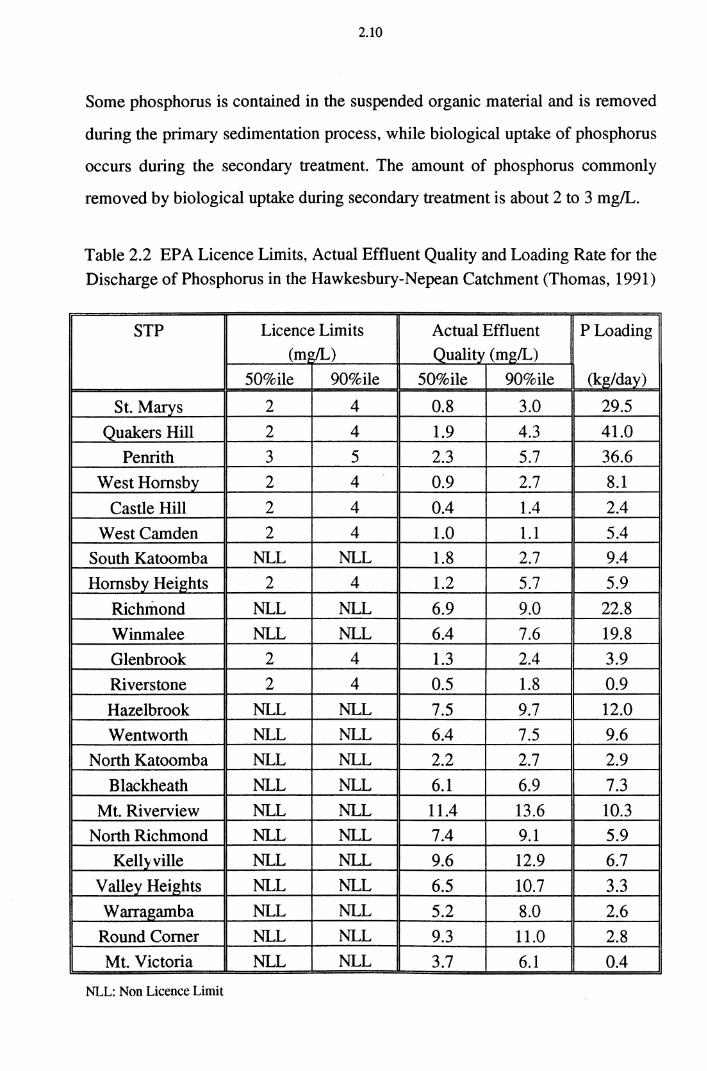
Some phosphorus is contained in the suspended organic material and is removed
during the primary sedimentation process, while biological uptake of phosphorus
occurs during the secondary treatment. The amount of phosphorus commonly
removed by biological uptake during secondary treatment is about 2 to 3 mg/L.
Table 2.2 EPA Licence Limits, Actual Effluent Quality and Loading Rate for the
Discharge of Phosphorus in the Hawkesbury-Nepean Catchment (Thomas, 1991)
STP Licence Limits Actual Effluent PLoading (m~) Quality (mg/L)
50%ile 90%ile 50%ile 90%ile (kg/day)
St. Marys 2 4 0.8 3.0 29.5
Quakers Hill 2 4 1.9 4.3 41.0
Penrith 3 5 2.3 5.7 36.6
West Hornsby 2 4 0.9 2.7 8.1
Castle Hill 2 4 0.4 1.4 2.4
WestCamden 2 4 1.0 1.1 5.4
South Katoomba NLL NLL 1.8 2.7 9.4
Hornsby Heights 2 4 1.2 5.7 5.9
Richmond NLL NLL 6.9 9.0 22.8
Winmalee NLL NLL 6.4 7.6 19.8
Glen brook 2 4 1.3 2.4 3.9
Riverstone 2 4 0.5 1.8 0.9
Hazelbrook NLL NLL 7.5 9.7 12.0
Wentworth NLL NLL 6.4 7.5 9.6
North Katoomba NLL NLL 2.2 2.7 2.9
Blackheath NLL NLL 6.1 6.9 7.3
Mt. Riverview NLL NLL 11.4 13.6 10.3
North Richmond NLL NLL 7.4 9.1 5.9
Kellyville NLL NLL 9.6 12.9 6.7
V alley Heights NLL NLL 6.5 10.7 3.3
Warragamba NLL NLL 5.2 8.0 2.6
Round Corner NLL NLL 9.3 11.0 2.8
Mt. Victoria NLL NLL 3.7 6.1 0.4
NLL: Non Licence Limit
2.11
However, during anaerobic digestion of the sludge from these processes, some
phosphorus is released back into the supematant in the form of dissolved
orthophosphate (P043·). The digester supematant is usually returned to the head
of the works and unless it is treated, the net phosphorus removal from the
wastewater flow stream is reduced (lllungkoo, 1994).
At Penrith STP, a combination of biological and chemical phosphorus removal
processes is used. It is the only Water Board STP designed to remove significant
amounts of phosphorus biologically. The 50 percentile total phosphorus (TP)
concentration in the plant effluent during 1990/91 was 2.3 mg/L (Thomas, 1991).
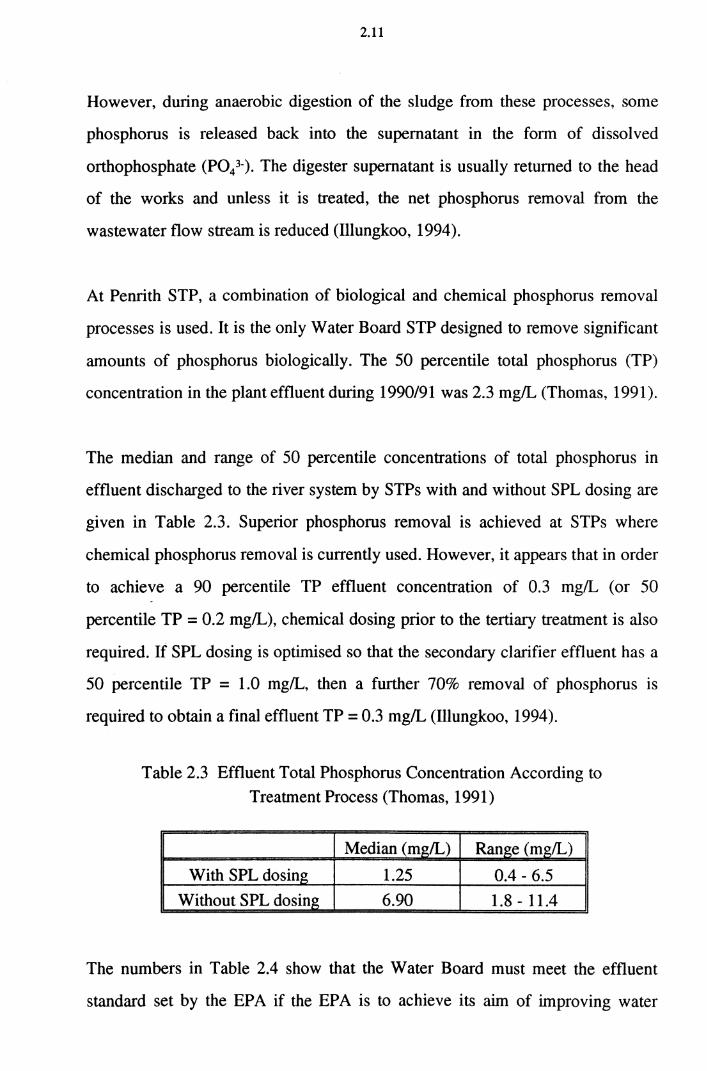
The median and range of 50 percentile concentrations of total phosphorus in
effluent discharged to the river system by STPs with and without SPL dosing are
given in Table 2.3. Superior phosphorus removal is achieved at STPs where
chemical phosphorus removal is currently used. However, it appears that in order
to achieve a 90 percentile TP effluent concentration of 0.3 mg/L (or 50
percentile TP = 0.2 mg/L), chemical dosing prior to the tertiary treatment is also
required. If SPL dosing is optimised so that the secondary clarifier effluent has a
50 percentile TP = 1.0 mg/L, then a further 70% removal of phosphorus 1s
required to obtain a final effluent TP = 0.3 mg/L (Illungkoo, 1994).
Table 2.3 Effluent Total Phosphorus Concentration According to Treatment Process (Thomas, 1991)
Median (mg/L) Range (mg/L)
With SPL dosing 1.25 0.4- 6.5
Without SPL dosing 6.90 1.8- 11.4
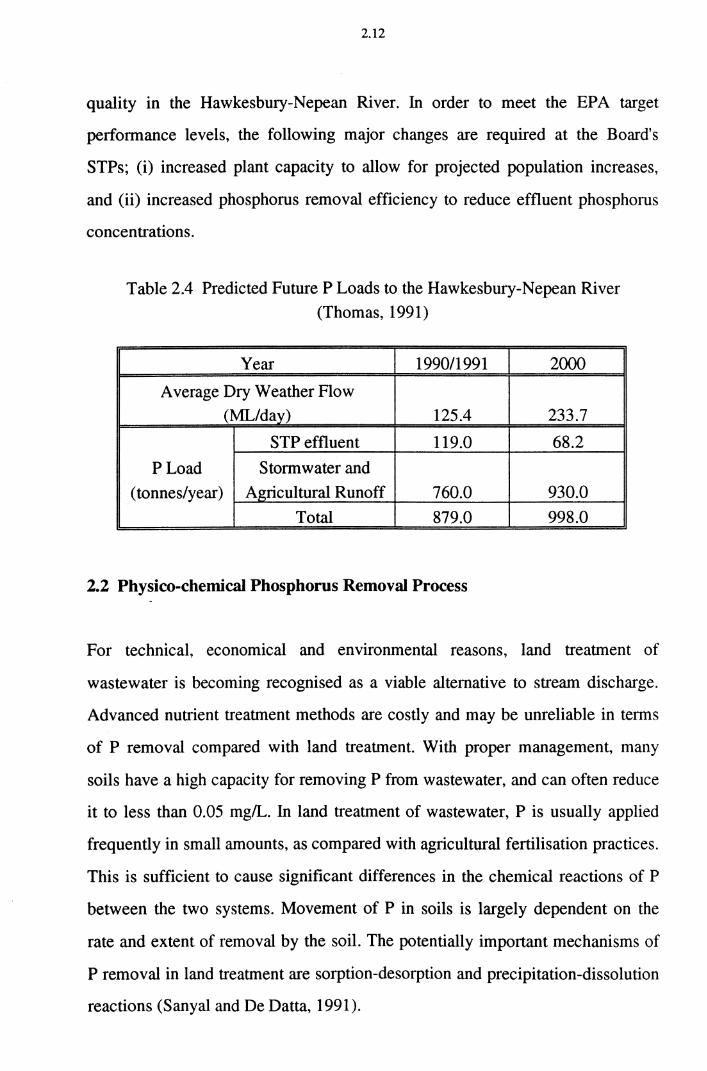
The numbers in Table 2.4 show that the Water Board must meet the effluent
standard set by the EPA if the EPA is to achieve its aim of improving water
2.12
quality in the Hawkesbury-Nepean River. In order to meet the EPA target
performance levels, the following major changes are required at the Board's
STPs; (i) increased plant capacity to allow for projected population increases,
and (ii) increased phosphorus removal efficiency to reduce effluent phosphorus
concentrations.
Table 2.4 Predicted Future P Loads to the Hawkesbury-Nepean River (Thomas, 1991)
Year 1990/1991 2000
Average Dry Weather Flow (ML/day) 125.4 233.7
STP effluent 119.0 68.2
PLoad Stormwater and
(tonnes/year) Agricultural Runoff 760.0 930.0
Total 879.0 998.0
2.2 Physico-chemical Phosphorus Removal Process
For technical, economical and environmental reasons, land treatment of
wastewater is becoming recognised as a viable alternative to stream discharge.
Advanced nutrient treatment methods are costly and may be unreliable in terms
of P removal compared with land treatment. With proper management, many
soils have a high capacity for removing P from wastewater, and can often reduce
it to less than 0.05 mg/L. In land treatment of wastewater, P is usually applied
frequently in small amounts, as compared with agricultural fertilisation practices.
This is sufficient to cause significant differences in the chemical reactions of P
between the two systems. Movement of P in soils is largely dependent on the
rate and extent of removal by the soil. The potentially important mechanisms of
P removal in land treatment are sorption-desorption and precipitation-dissolution
reactions (Sanyal and De Datta, 1991).
2.13
2.2.1 Principle of Sorption
Sorption is a surface phenomenon which is defined as an increase in
concentration of a particular component at the surface or interface between two
phases. In any solid or liquid, atoms at the surface are subject to unbalanced
forces of attraction perpendicular to the surface plane. These forces are merely
extensions of the forces acting within the body of the material and are ultimately
responsible for the phenomenon of sorption. In discussing the fundamentals of
sorption, it is useful to distinguish between physical sorption, involving only
relatively weak intermolecular forces, and chemisorption, which involves
essentially the formation of a chemical bond between the adsorbate molecule and
the surface of the adsorbent. The sorption of solutes from solution by an
adsorbent depends on physical sorption rather than chemisorption. Physical
sorption from the liquid phase is invariably exothermic. Physical sorption can be
distinguished from chemisorption according to one or both of the following
criteria (Samuel and Osman, 1987):
1. Physical sorption does not involve the sharing or transfer of electrons and
thus always maintains the individuality of interacting species. The
interactions are fully reversible, enabling desorption to occur without
changes of temperature, although the process may be slow because of
diffusion effects. Chemisorption involves chemical bonding and Is
irreversible.
2. Physical sorption is not site specific; the adsorbed molecules are free to
cover the entire surface. In contrast, chemisorption is site specific;
chemisorbed molecules are fixed at specific sites.
2.14
2.2.2 Sorption - Desorption
The sorption of phosphorus by soil or slag implies removal from P solution and
retention on soil surfaces. If the P is restricted to the surface this is regarded as
an "adsorption" reaction. This might be followed by a more or less uniform
penetration of P into the solid phase, which is regarded as an "absorption"
reaction. Because of the difficulty in distinguishing these two reactions
(Glasstone, 1959), the less specific overall term "sorption" is frequently used.
The reverse reaction, desorption, describes the release of sorbed P back into
solution. For obvious reasons, the balance between sorption and desorption to a
large extent influences the concentration of P in the soil solution (Sanyal and De
Datta, 1991).
2.2.3 Sorption Equilibrium
Sorption from aqueous solutions involves concentration of the solute on the solid
surface. As the sorption process proceeds, the sorbed solute tends to desorb into
solution. Eventually, the rates of sorption and desorption will attain at
equilibrium state, called "sorption equilibrium". At equilibrium, no change is
observed in the concentration of the solute on the solid surface or in the bulk
solution. The position of equilibrium is characteristic of the entire system, the
solute, adsorbent, solvent, temperature, pH, and so on. Adsorbed quantities at
equilibrium usually increase with an increase in the solute concentration (Samuel
and Osman, 1987).
The relationship between the amount of P adsorbed per unit weight of soil or
slag and the equilibrium P concentration in solution at a constant temperature
has been described by several sets of sorption isotherms. The main motivations
for describing sorption curves were (i) to identify the soil or slag constituents
2.15
involved in sorption (Adams et al., 1987; Loganathan et al., 1987) and (ii) to
study the nature of the sorption process to learn more about the mechanism of
the process (Barrow, 1987).
The shape of the sorption isotherm relating liquid and solid phase concentrations
gives quantitative information about the sorption process and the extent of the
surface coverage by the adsorbate. Smooth sorption isotherms are usually
obtained because of the presence of a sufficiently large number of sites that may
occur in patches of equal energy or randomly distributed sites of unequal energy.
Several types of isotherms are used to describe the sorption data. The Langmuir
and Freundlich sorption isotherms are the most common ones.
2.2.3.1 Langmuir Sorption Isotherm
The basic assumptions underlying Langmuir's model (the ideal localised
monolayer model) are:
1. The molecules are adsorbed on definite sites on the surface of the
adsorbent.
2. Each site can accommodate only one molecule (a monolayer).
3. The area of each site is a fixed quantity determined solely by the geometry
of the surface.
4. The sorption energy is the same at all sites.
The Langmuir equation was originally derived from kinetic considerations
(Langmuir, 1915). Later, it was derived on the basis of statistical mechanics,
thermodynamics, the law of mass action, theory of absolute reaction rates, and
the Maxwell-Boltzmann distribution law (Young and Crowell, 1962). The
Langmuir isotherm is expressed mathematically as follows:
S= abC l+bC
2.16
where, a,b = Langmuir isotherm constants
S = Solid phase concentration (mg/g)
C =Liquid phase concentration (mg!L)
... (2.1)
The Langmuir isotherm is an empirical model which cannot explain precipitation
reactions or changes in the homogeneity of surfaces. Samuel and Osman (1987)
commented that the assumptions in the Langmuir isotherm which include one
layer sorption and consistent sorption energy, limit its usefulness. Phosphorus
can be energetically adsorbed at different sites on a soil surface or occur in
layers on surfaces or precipitate as the phosphate ion (Sanyal and De Datta,
1991).
2.2.3.2 Freundlich Sorption Isotherm
Freundlich sorption equation has been the most widely used mathematical
description of sorption in aqueous systems (Freundlich, 1926; Buchter et al.,
1989). The Freundlich isotherm is expressed as:
S = KC'/N ... (2.2)
where,
K,N = Freundlich isotherm constants
Some researchers tend to attach less significance to the Freundlich equation
because it does not provide any measure of a "sorption maximum" in which soil
scientists are primarily interested. Nevertheless, the Freundlich coefficient, K,
2.17
may be regarded as a hypothetical index of P sorbed from a solution having unit
equilibrium concentration. In a recent study on P sorption in a number of acid
and acid sulphate soils of South and Southeast Asia, a high degree of correlation
was found between the Freundlich K and the Langmuir sorption maximum
(Sanyal and De Datta, 1991).
More importantly, the Freundlich equation, although originally empirical, was
derived rigorously by Sposito (1984). It implies that the affinity (bonding
energy) decreases exponentially with the increasing surface coverage, a
condition which is perhaps nearer to reality than the assumption of constant
bonding energy in the Langmuir equation.
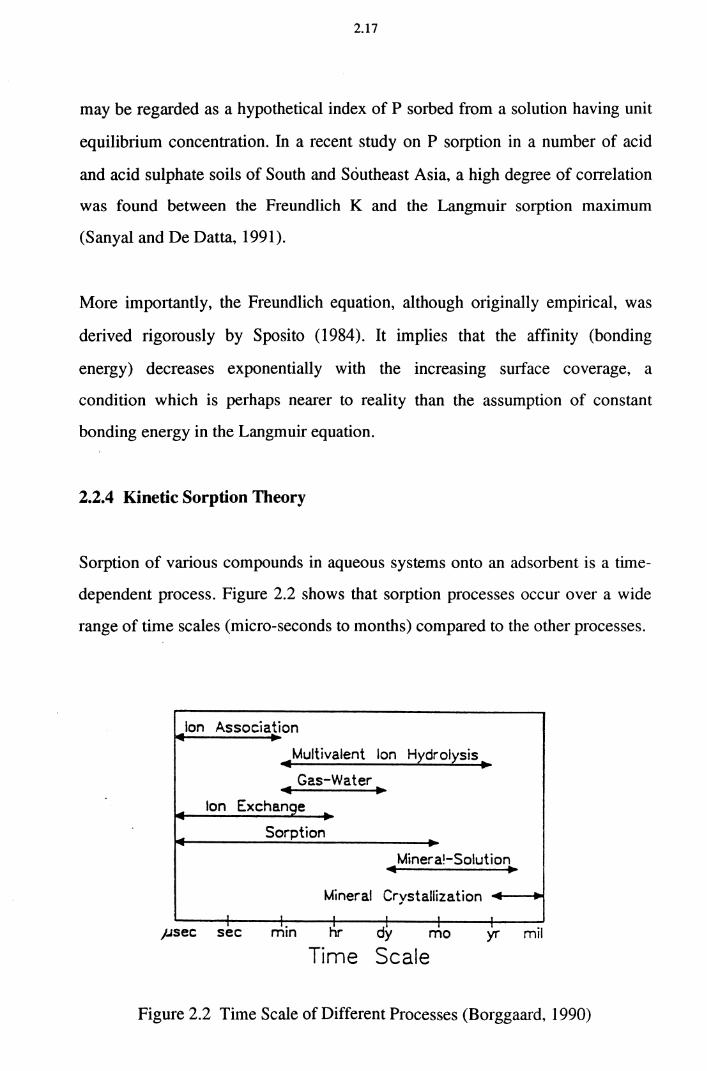
2.2.4 Kinetic Sorption Theory
Sorption of various compounds in aqueous systems onto an adsorbent is a time
dependent process. Figure 2.2 shows that sorption processes occur over a wide
range of time scales (micro-seconds to months) compared to the other processes.
Ion Association
Multivalent Ion H~drolysis ~ ...
Gas-Water 4 ...
Ion Exchange -•
..._ Sorption r
Minera!-Solution
Mineral Crystallization .. I ' ·' )Jsec sec mrn hr dy mo yr mrl
Time Scale
Figure 2.2 Time Scale of Different Processes (Borggaard, 1990)
2.18
It is imperative for design to have knowledge on the rate of uptake of solute by
adsorbents in different processes such as batch reactors, fixed beds and fluidised
beds. It is also important to identify the steps in the adsorptive process, and
which of these controls the rate of sorption.
The first step of transport of the adsorbate from bulk solution to the outer surface
of the adsorbent granule is by molecular diffusion. This is called external or film
diffusion. The concentration gradient in the liquid ftlm around the granule is the
driving force for the ftlm diffusion. The second step, termed internal diffusion,
involves transport of the adsorbate from the particle surface into interior sites by
diffusion within the pore-filled liquid and migration along the solid surface of
the pore (surface diffusion) (Keinath and Weber, 1968; Weber, 1972). Because
these two transport processes act simultaneously, the more rapid one will control
the overall rate of transport. The third step is the sorption of the solute on the
active sites on the interior surfaces of the pores. Since the sorption step is very
rapid, it 4oes not influence the overall kinetics (Smith, 1968; Weber, 1972). The
overall rate of the sorption process, therefore, will be controlled by the slowest
step, which would be either ftlm diffusion or internal diffusion. However,
control might also be distributed between inter-particle and external mechanisms
in some systems (Fritz et al., 1980).
Rates of sorption are usually measured by determining the change in
concentration of the solute in contact with the adsorbent as a function of time.
Variation of the rate with concentration is not linear, which is expected from
diffusion theory. Therefore, the concentration dependence of the sorption rate
can be used to identify the rate-limiting step (Samuel and Osman, 1987).
2.19
2.2.4.1 Kinetics of Soil and Slag Reactions
The kinetics of P are the time-dependent processes, which are also path
dependent (Arnacher, 1988). A number of methods have been developed to
obtain experimental kinetic data and to analyse the data to arrive at a correct
interpretation of the processes responsible for the observed time-dependent
phenomena. Some of the methods that have been developed for obtaining and
analysing kinetic data for soil and slag systems are: relaxation, batch and flow
methods.
Chemical reactions in soils are generally heterogeneous solid-liquid reactions
involving a solid component of the soil and the solution. The main chemical
processes involved are complexation, ion exchange, dissolution etc. In order to
assess the kinetics, one should consider the nature and the rate of the transport
processes associated with the chemical reaction: flow and diffusion in the
solution,_ transport across the solid-liquid interface, diffusion in liquid-filled
pores and micropores, and surface diffusion penetration into the solid adsorbent
(Figure 2.3).
2.2.4.2 Phosphorus Sorption Kinetics
The reaction of P with soil and its kinetics have been studied by Beek and van
Riemsdijk (1982). In the non-calcareous, sandy soils the reaction of P is
predominantly with the oxides of AI found in the solid phase (Beek, 1979).
The reaction of P with soil was described mathematically using a variety of
expressions including the Langmuir and Freundlich isotherms and rate equations
(Sibbesen, 1981). Most of the research on the sorption of P to soil particles had
been related to wastewater irrigation. Recently there is also an extremely large
2.20
research and literature on depth related to agricultural/fertiliser/flooded soil
dynamics of P and soil interaction. The Freundlich and Langmuir equations
describe the initial reactions of solutions containing 20 mg/L or less soluble P in
soils (Youssefi, 1978). In the case of P, sorption is slow, so the equation should
be used with a kinetic model to predict the mobility of phosphorus.
I
1 12 ... ., ., .... .... .... .... ....
Liquid Film Solid
Figure 2.3 Transport Processes in Solid-Liquid Soil Reactions
(A) Nonactivated processes: 1. Transport in the soil solution, 2. Transport across a liquid
film at the solid-liquid interface, 3. Transport in a liquid-filled micropore; (B) Activated
processes: 4. Diffusion of a sorbate at the surface of the solid, 5. Diffusion of a sorbate
occluded in a micropore, 6. Diffusion in the bulk of the solid (Borggaard, 1990).
2.2.5 Factors Affecting the Rate of P Sorption
Molecules of the solute are removed from solution and taken up by the adsorbent
during the process of sorption. The molecules are adsorbed onto the surface area
within the pores of adsorbent particle and on the outside surface of the particle.
2.21
The transfer of solute from solution to adsorbent continues until the
concentration of solute remaining in solution is in equilibrium with the
concentration of solute adsorbed by the adsorbent. When equilibrium is reached,
the transfer of solute stops. At equilibrium, the distribution of solute between the
liquid and solid phases is measurable and well-defined (Samuel and Osman,
1987).
The equilibrium distribution of solute between the liquid and solid phases is an
important property of sorption systems and helps in defming the capacity of a
particular system (Faust and Aly, 1983). Of equal importance to the sewage
engineer are the kinetics of the system which describe the rate at which this
equilibrium is reached. The rate of sorption determines the detention time
required for treatment and thus the size of adsorbent contacting systems (Samuel
and Osman, 1987).
The follo!Ving factors are considered to influence the rate and extent of sorption
reactions (Samuel and Osman, 1987).
2.2.5.1 Hydrogen Ion Concentration (pH)
In general, the H+ (or OH-) affects adsorptive processes through dissociation of
functional groups on the adsorbate and adsorbent. As an example, a pronounced
effect of OH- was observed on the rate of sorption of 4-chlorophenol onto
Columbia LCK carbon (Zogorski, 1976). A sharp decrease in the removal rate
above a pH value of 7.5 was observed. The pKa value for this phenol is 9 .4,
whereupon the anionic form of the phenol is adsorbed at a rate considerably
slower than the associated form. However, the rate of sorption at neutral pH
values was observed to have no adverse effect in the treatment process.
2.22
2.2.5.2 Temperature
The temperature at which a sorption process is conducted affects both the
sorption rate and the extent to which sorption occurs. Sorption rates increase
with the increase in temperature. As sorption is an exothermic process, the
degree of sorption is relatively low at lower temperatures and greater at higher
temperatures (Samuel and Osman, 1987). The well-known Arrhenius equation
describes this effect of temperature on reaction rate. Some investigators offer this
effect as evidence for a diffusion-controlled process (Weber and Morris, 1963).
2.2.5.3 Liquid Phase Concentration
For an experimental study with alkyl benzene sulfonates on activated carbon,
removal rates of alkyl benzene sulfonates were observed to increase non-linearly
with increasing concentration. The removal rate was increased as the initial
concentr~tion of the adsorbate was increased (Zogorski, 1976). Concentration
dependence of the rate of sorption is used to define the rate-limiting step in the
reaction. When intra-particle transport limits the kinetics of a sorption reaction,
the variation in reaction rate is not expected to be linear, whereas the rates of
strictly adsorptive reactions and simple diffusion-controlled processes are
expected to be proportional to the first power of the adsorbate's concentration
(Helfferich, 1962).
2.2.5.4 Molecular Size and Configuration of the Adsorbate
The size of the diffusing molecule affects the overall rate of sorption. The larger
the molecule, the slower is the rate at which it diffuses and also the slower the
rate of sorption. The sorption experiments with detergent and activated carbon
indicated that the length of the aliphatic hydrocarbon chain on the detergent
2.23
molecule affects the rate of uptake (0.126 mm carbon). The larger the chain and
the higher the molecular weight, the slower the rate of sorption (Weber and
Morris, 1963;Zoroski, 1976).
Another molecular property to affect the rate of sorption is the configuration of
the adsorbate. The effects of this property on the removal rate of sorption of
alkyl benzene sulfonates were studied using compounds with the same molecular
weight but with different structures by Weber and Morris (1963). They reported
that within a homologous series of aliphatic acids, aldehydes, or alcohols,
sorption usually increases as the size of the molecules increases.
2.2.5.5 Characteristics of the Waste
The presence of organic and inorganic affects phosphorus speciation. Besides,
there is a competition in the type of complex formation. Competing cations like
Ca2+ in tl)e solution decrease the phosphorus sorption by drastic amounts. The
degree of competition for sorption site for various cations varies (Tiwaree, 1989;
Bajracharya and Vigneswaran, 1990).
2.2.5.6 Agitation
The rate of sorption is controlled by either film diffusion or pore diffusion,
depending on the amount of agitation in the system (Samuel and Osman, 1987).
If relatively little agitation occurs between the particle and the fluid, the surface
film of liquid around the particle is thick and film diffusion will be the rate
limiting step. Providing adequate mixing, the rate of film diffusion increases to
the point that pore diffusion becomes the rate-limiting step (Faust and Aly,
1983). According to Weber (1972), pore diffusion is generally the rate-limiting
factor for batch-type contact systems which provide a high degree of agitation.
2.24
Film diffusion will be the most likely rate-limiting step for continuous-flow
systems.
2.2.5. 7 Characteristics of the Adsorbent
Particle size and surface area are the important properties of adsorbents. Sorption
rates increase as particle size decreases. The total adsorptive capacity of a
adsorbent depends on its total surface area. Characteristics such as cation
exchange capacity (CEC), organic content etc. affect the phosphorus retention
property of soil/slag matrices. The higher the value of CEC, the higher is the
sorption rate. This is also the case with organic matter. The properties of soil
influence P sorption by soil minerals and sediments. These include the nature
and amount of soil components ( eg. clay, organic matter, and hydrous oxides of
iron and aluminium); the concentration of the background electrolyte and the
valency of the constituent cation; and the pH of the sorption system (Sanyal and
De Datta_, 1991).
(a) Iron and Aluminium Oxides and Hydroxides
Of the soil properties tested by Buchter et al.(1989), acid ammonium oxalate
extractable (amorphous) iron and aluminium proved to be an important criterion
for P sorption in several soils. Oxalate extraction is known to dissolve
amorphous and poorly crystalline oxides of iron and aluminium while having
little or no effect on crystalline iron and aluminium minerals. Crystalline iron
oxides are relatively inactive in P sorption (Ryden and Pratt, 1980). The
difference in P sorption capacity between fresh soil, and soil after extraction
with oxalate showed that a high proportion of P sorption was attributable to
poorly ordered minerals (Buchter et al., 1989).
2.25
(b) Clay
A significant correlation of P sorption parameters with clay content has been
reported by several researchers (Loganathan et al., 1987; Solis and Torrent,
1989; Bennoah and Acquaye, 1989). Clays contributed toP sorption in tropical
soils, especially at low pH, when the activity of iron and aluminium is expected
to be higher.
Hydrous oxides of iron and aluminium have been found to occur as fine coatings
on surfaces of clay minerals in soil (Haynes, 1982). These coatings,
characterised by large surface areas, hold an appreciable quantity of P, thereby
implying a secondary role of crystalline alumina-silicates (clays) in P sorption
(Ryden and Pratt, 1980). Agboola and Ayodele (1983), however, reported no
correlation between P sorption maxima and the clay content of soils.
(c) pH ~d Supporting Electrolytes
There is considerable controversy regarding the effect of pH on P sorption in
soils and slags (Barrow, 1987). A decrease in sorption with an increase in pH
was reported when dilute solutions of NaCl or KCl was used to measure P
sorption. But when a dilute CaC12 solution was used, Pretention by a limed soil
increased (N aidu et al., 1990).
It was suggested that the freshly precipitated iron and aluminium oxides (at pH
6.5) were responsible for the increase in P sorption. P sorption on goethite was
found to be less dependent on pH when CaC12 (rather than NaCl) was used as the
electrolyte (Parfitt, 1978). Mokwunye (1975) reported a positive effect of pH on
P sorption by some soils from the savanna zones of Nigeria. He concluded that
this could be associated with the P retention by an activated hydroxy-aluminium
2.26
species (at pH 5.0) that held P through the surlace-exchange of a hydroxyl
group. Naidu et al. (1990) reported an increase in P sorption by strongly acidic
soils on liming. They attributed this rise to the formation of insoluble Ca-P
compounds. Smillie et al. (1987) proposed a chemical association between
sorbed P and Ca in soils as an important P retention mechanism. These soils had
adequate exchangeable Ca.
(d) Organic Matter
Several researchers have reported on the correlation between organic matter
content in soil and P sorption (Bennoah and Acquaye, 1989; Sanyal et al., 1990).
Sanyal and De Datta (1991) reported that P sorption by volcanic soils can be
correlated with organically bound aluminium, and to a lesser extent, with iron
(extracted by sodium pyrophosphate).
ReductiQn of P sorption by organic matter in soils has been observed by Andereg
and Naylor (1988). This can be explained by a possible competitive action
between P and organic matter for sorption sites on, for instance, hydrous oxides
of iron and aluminium. Earl et al. (1979) noted that citrate, tartrate and acetate
were effective (in this order) in reducing P sorption by soils, synthetic iron, and
aluminium oxide gels, in contrast with the behaviour of inorganic anions. Ryden
et al. (1987) have shown that except for the OH· ion, inorganic anions have
alimented ability to compete with P for sites on hydrous ferric oxide gel. Yuan
(1980) also supported the idea that some of the sorption sites for P and organic
matter in soils are common. This leads to a competitive effect. In a study
conducted by Sanyal et al. (1990), P sorption per unit weight of clay or organic
matter was found to increase with a decrease in clay or soil organic matter
content.
2.27
(e) Free Iron
A correlation between initial P sorption and free iron oxides was reported by
Solis and Torrent (1989). Sanyal et al. (1990) obtained significant correlations
for iron oxide (active iron) with the Langumir sorption maximum and the
Freundlich isotherm constant K. The bonding energy, on the other hand, was not
well correlated. Bonding energy was also less strongly correlated with the clay
and the organic matter contents of the soils as compared with the above two
indexes of P sorption. This indicates that the amount of P sorbed is a function of
the number of sorption sites rather than of their bonding energy (Sanyal and De
Datta, 1991).
2.2.6 Kinetic Equations
The study of the kinetics of P sorption and release by soils is of considerable
interest _in soil and environmental science. The time factor is certainly of
relevance for P uptake by plants. However, comparisons among soils on the
basis of rate constants alone do not seem to be of great practical value, since
amounts of P desorbing during any time interval would also depend on the
reserve of desorbable P present (Pavlatou and Polyzopoulou, 1988). On the other
hand, a better understanding of the energetics of P sorption, based on kinetic
studies, may help elucidate mechanisms of P sorption-desorption in soils.
The reaction between P and soils is rapid for the frrst few hours. It then becomes
slow, and continues for a very long time (Bolan et al., 1985; Al-Khateeb et al.,
1986). In many cases, it is doubtful whether a true equilibrium is reached within
a practicable reaction period, although an apparent equilibrium is possible within
a reasonable period. This has led several authors to use a variety of equilibrium
isotherms to describe P sorption and desorption by soils.
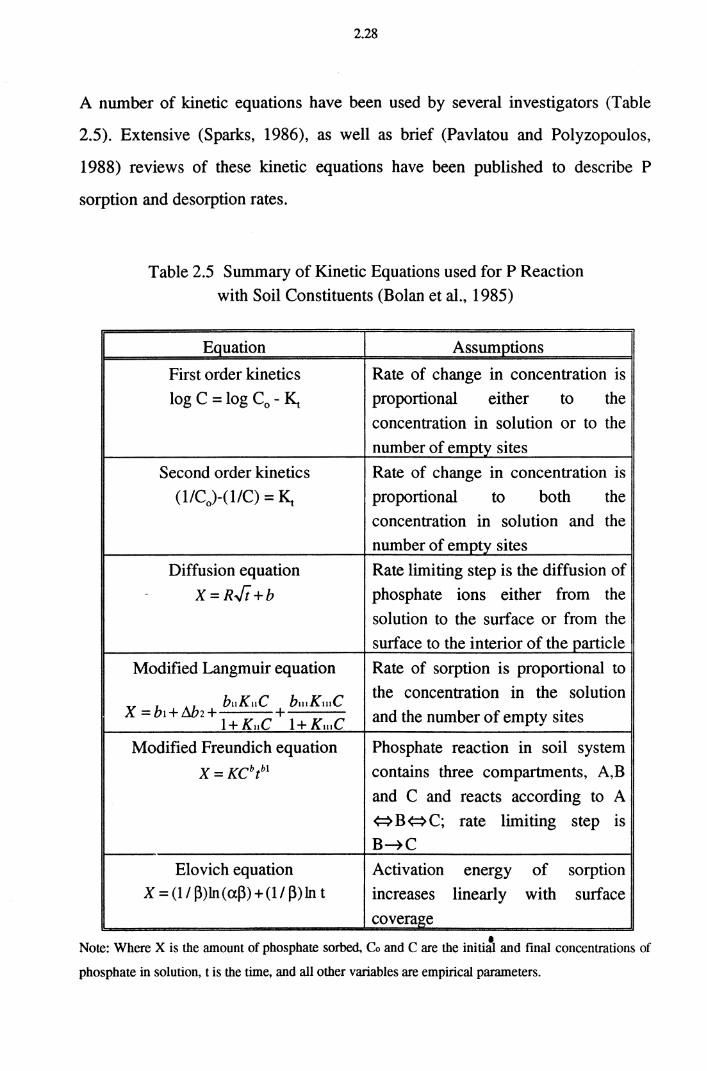
2.28
A number of kinetic equations have been used by several investigators (Table
2.5). Extensive (Sparks, 1986), as well as brief (Pavlatou and Polyzopoulos,
1988) reviews of these kinetic equations have been published to describe P
sorption and desorption rates.
Table 2.5 Summary of Kinetic Equations used for P Reaction
with Soil Constituents (Bolan et al., 1985)
Equation Assumptions
First order kinetics Rate of change in concentration is
log C = log Co - ~ proportional either to the
concentration in solution or to the
number of empty sites
Second order kinetics Rate of change in concentration is
(1/Co)-(1/C) = ~ proportional to both the
concentration in solution and the
number of empty sites
Diffusion equation Rate limiting step is the diffusion of - X=R.Ji+b phosphate lOllS either from the
solution to the surface or from the
surface to the interior of the particle
Modified Langmuir equation Rate of sorption is proportional to
buKuC bl11K111C the concentration in the solution X =b1+Ab2+ + and the number of empty sites 1+ KuC 1+ KIIIC
Modified Freundich equation Phosphate reaction in soil system
X= KCbtb1 contains three compartments, A,B
and C and reacts according to A
<=>B<=>C; rate limiting step lS
B~C
Elovich equation Activation energy of sorption X=(l/~)ln(a~)+(l/~)ln t m creases linearly with surface
coverage
• Note: Where X is tbe amount of phosphate sorbed, Co and C are tbe initial and final concentrations of
phosphate in solution, t is tbe time, and all other variables are empirical parameters.
2.29
In many studies (reviewed by Sparks, 1986), the experimental data were
inadequately described by a single first-order kinetic reaction, and were often
interpreted as a combination of two or three simultaneous first-order reactions,
corresponding to conceptually distinct transformations of different forms of Ca-P
compounds (in soil) having varying degrees of crystallites and solubilities. The
temperature dependence of P sorption and release by several soils and soil
minerals has been found to be generally small, leading to low activated energies
of the processes. This tends to show that sorption-desorption processes are
diffusion controlled (Sparks, 1986).
Enfield et al. (1976) fitted the P sorption kinetic data to five kinetic models,
namely, a linearised first-order sorption, a first-order Freundlich sorption, an
empirical function, a diffusion-limited Langmuir sorption, and a diffusion
limited Freundlich sorption. The best fit was obtained for a diffusion-limited
model based on the Langmuir or Freundlich equation. The regression
coefficients of the models were not correlated with physical and chemical
properties of the soils.
2.2. 7 Precipitation-Dissolution
The sorption process may be regarded as the one leading to net accumulation at
an interface, whereas precipitation is the process that causes an accumulation of
a substance to form a new bulk-solid phase. These processes cause loss of
material from a solution phase. However, the former is essentially two
dimensional, whereas the latter is inherently three-dimensional (Sposito, 1984).
Lin et al. (1983a) proposed that the sorption mechanism prevails at low P
concentrations and precipitation prevails at higher P concentrations in soil.
2.30
Ryden and Pratt ( 1980) pointed out a distinction between sorption and
precipitation. Sorption requires the structure of sorbent to remain essentially
unchanged as the process progresses even though its surface activity decreases.
In the precipitation process, however, the surface activity remains constant
(Sanyal and De Datta, 1991).
2.2.7.1. Chemistry of Phosphate
The anions of phosphoric acid and the most common condensed phosphates,
pyro- and tripoly-phosphate, readily dissociate protons and behave as typical
polyprotic acids. Based on the equilibrium constants presented in Table 2.6 and
on typical concentrations occurring in raw domestic wastewater, the distribution
of ortho-, pyro- and tripoly-phosphate at different pH levels is presented in
Figure 2.4. At pH 7.5 the predominant species are H2P04-, HPOl-. HP30 104-, and
HP20 73-. Because of their complexity, variability and relatively small
concentration, the proton and metal ion binding properties of the wide variety or
organic phosphates in domestic wastewater are neglected, and phosphates in
domestic wastewater can be approximated as a mixture of ortho-, pyro and
tripoly-phosphate (Table 2.6), which in some instances (eg., the condensed
phosphate complexes of Ca2+ and Mg2+) may be sufficiently stable to increase
the phosphate solubility significantly, especially in the alkaline pH region
(Jenkins et al., 1971).
A number of early research investigations on P chemistry in soil postulated the
formation of a variety insoluble inorganic phosphates of Fe, AI and Ca through
precipitation reactions (Vacker and Connell, 1967).
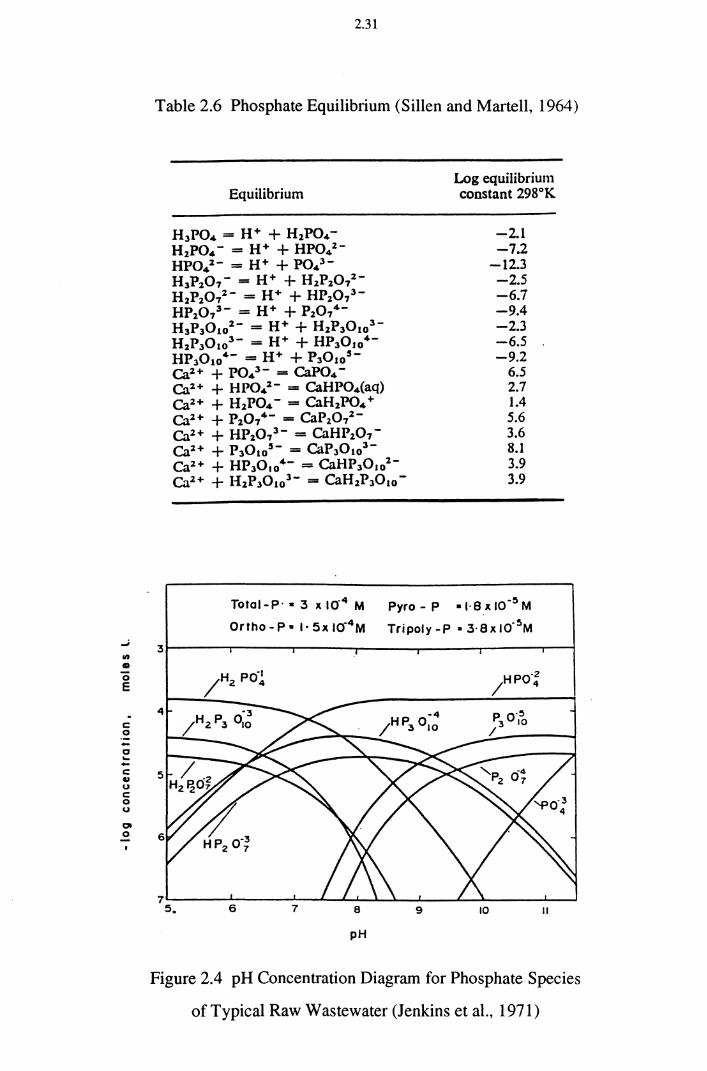
..,;
fll
• 0 e
c 0
0 .... -c • u c 0 u
01 0 -•
2.31
Table 2.6 Phosphate Equilibrium (Sillen and Martell, 1964)
3
4
Equilibrium
H 3PO,. == H+ + HzPO,.H2PO,.- == H+ + HPo,.zHPo,.z- == H+ + P0,.3-H3Pzo7- == H+ + H.2.Pz07zHzPz072- == H+ + HPz073-HPz073- == H+ + P2074-HJP30to2- == H+ + HzPJOto3-HzPJOto3- == H+ + HPJOto4-HP30,o4- == H+ + P30to5 -
CaZ+ + P0,.3- == eaPo,.-CaZ+ + HPo,.z- == CaHPO,.(aq) CaZ+ + HzPO,.- == CaHzPO,. + CaZ+ + Pz074- == CaPz07z-Cal+ + HPz013- == CaHPz07-CaZ+ + PJ0to5 - == CaPJOto3-CaZ+ + HP30to4- == CaHP30to2 -
Cal+ + HzPJOto3 - == CaHzPJOto-
Log equilibrium constant 298oK
-2.1 -7.2
-12.3 -2.5 -6.7 -9.4 -2.3 -6.5 -9.2
6.5 2.7 1.4 5.6 3.6 8.1 3.9 3.9
Totai-P· • 3 x 10"4 M Pyro- P •1·8 x 10-~ M
Ortho-P•I·5xi0"4 M Tripoly-P •3·8xi0" 5M
., /H2 P04 /HPO"!
P3o·.~ /
pH
Figure 2.4 pH Concentration Diagram for Phosphate Species
of Typical Raw Wastewater (Jenkins et al., 1971)
2.32
2.2.7.2 AI Compounds asP Precipitants
Aluminium ions can combine with phosphate ions to form aluminium phosphate
as follows:
Al3+ + PO 3- --7 AlPO 4 4 ... (2.3)
Equation 2.3 indicates that the mole ratio for Al:P04 is 1:1. The principal source
of aluminium in phosphorus precipitation is 'alum', hydrated aluminium sulfate,
having an approximate formula AllS04) 3.14H20 (molecular weight 594). The
weight ratio of alum to phosphorus is, therefore, 9.6:1. The optimum pH for the
removal of phosphorus lies in the range of 5.5 to 6.5, although some removal
occurs above pH 6.5 (Jenkins et. al., 1971).
2.2.7.3 Fe Compounds asP Precipitants
Both ferrous (Fe2+) and ferric (Fe3+) ions can be used in the precipitation of
phosphorus. With Fe3+, the reaction is similar to that shown earlier for
precipitation of aluminium phosphate. The mole ratio for Fe:P04 is also 1:1.
Since the molecular weight of ion is 55.85, the weight ratio of Fe:P is 1.8:1. Just
as in the case of aluminium, a larger amount of iron is required in actual
situations than the amount calculated from the chemistry of the reaction. With
Fe2+, the situation is more complicated and not fully understood. Ferrous
phosphate can be formed. The mole ratio of Fe:P04 , in this case, would be 3:2.
Experimental results indicate, however, that when Fe2+ is used, the mole ratio of
Fe:P is essentially the same as that ofFe3+ (Jenkins et al., 1971).
A number of iron salts are available for phosphorus precipitation. These include
ferrous sulfate, ferric sulfate, ferric chloride, and pickle liquor. Iron salts are
2.33
most effective for phosphorus removal at certain pH values. For Fe3+, the
optimum pH range is 4.5 to 5.0. This is an unrealistically low pH, not occmring
in most wastewaters. Significant removal of P can be also attained at higher pH
values. For Fe2+, the optimum pH is about 8 and good P removal can be obtained
at pHs between 7 and 8 (Illungkoo, 1994 ).
2.2.7.4 Ca Compounds asP Precipitants
The precipitation of calcium phosphate is strongly influenced both by the
kinetics of nucleation and crystal growth and by the chemical composition of the
medium. Hydrogen ions, HC03-, Mg2+ and F are known to influence both the
composition and the activity product of the precipitated calcium phosphate solid
(Ferguson, 1970). The precipitation of phosphate from wastewater by calcium
has most commonly been conducted by the addition of lime to provide a
simultaneous increase in both Ca2+ and OH-. Most calcium phosphate
precipitation schemes involve raising the pH of the waste stream to at least 10.5
(and often above pH 11), because at this pH range, experience has shown that
low dissolved phosphate residuals are obtained together with a settleable
precipitate [possibly due to the simultaneous precipitation of gelatinous
Mg(OH)2] (Jenkins et al., 1971).
2.2.8 Surface Interaction between the Solid and Liquid Phase Solution
The solid and liquid phases of soil were treated previously as separate entities. In
reality, these phases interact with each other along their plane of contact. This
interaction between liquid and solid phases is a very common phenomenon
which is related to the difference in atomic structure of both phases on either
side of the plane of contact. The materials found for phosphorus precipitation
include the ionic forms of aluminium, iron, calcium and magnesium (Bolt,1978).
2.34
2.2.8.1 The Surface Charge of the Solid Phase
In ionic soils, the bonds between the different atoms in the lattice are primarily
electrostatic in nature. When the polar water molecules are brought in contact
with water, they tend to penetrate between the surface atoms, which weakens the
binding force between these atoms and may lead to dissociation of surface ions.
Clay minerals in particular behave in this manner. The internal structure of the
clay mineral has an inbalance of charges due to substitution of Si4+ and AP+ ions
by other cations of lower valence. The electro-neutrality of the clay particle is
then provided by the presence of certain cations (Na+, Ca2+, K+, Mg2+) on the
exterior surface. These exterior cations (which are not part of the crystal lattice)
dissociate completely from the surface if the latter is in contact with water. As a
result, one can conclude that clay minerals in water have a constant surface
charge equal in magnitude to the 'substitution charge' of the lattice (Bolt, 1978).
2.2.8.2 P_roperties of Liquid Layer
In an aqueous environment, a partial dissociation of surface ions takes place
imparting an electric charge to the surface of the solid phase. In contrast to pattly
dissociated molecular acids, where the dissociated H-ions are spread throughout
the solution, the ions dissociated from a solid surface tend to remain in the
neighbourhood of the charged surface. The cause of this phenomenon is their
attraction to the surface charge of the solid phase, preventing them from
spreading themselves throughout the system. Depending on the proximity of the
charges on the surface, the electric fields of the individual charges reinforce each
other, giving rise to a combined electric field in the liquid layer adjacent to the
solid surface. This field will attract the dissociated ions (and other ions of the
same sign) which will accumulate close to the charged surface. The resulting
spatial distribution of charges (eg. a negatively charged surface with an
2.35
accumulation of positively charged ions close to it) is called a 'double layer'. The
accumulated 'counter' ions of the surface can move freely through the solution
phase and are subjected to two opposing tendencies: (a) they are attracted
towards the surface by the electric field (sorption tendency), and (b) they tend to
distribute themselves evenly throughout the solution phase by diffusion
(diffusion tendency) (Bolt, 1978).
2.2.9 Ion Exchange
Ion exchange in soil and slag comprises ionic reactions with mixtures of various
clay minerals, metal oxides, and variable amounts of organic compounds. It
generally involves more than two cations simultaneously. In addition, it is
complicated by the presence of sparingly soluble minerals and soluble salts
(Tucker, 1983). Basic exchangeable cations include the cations of the alkali and
alkaline earth metals (Ca2+, Na+ and K+) and Mg2+ and NH4+. Cations of the trace
metals, such as Zn, Cu or Co, may take part in ion exchange reactions but other
reactions, such as chelation with these trace metals, are much more important in
soil and slag (Tucker, 1983).
Solid phase particles often carry a negative surface charge. The overall electro
neutrality of the system is maintained by the presence of an excess of cations (in
comparison to the anions present) in close proximity to the solid surface. This
excess of cations cannot be separated from the surface (ie. taken out of the
system). It is possible, however, to exchange these cations against others and still
maintain the electro-neutrality of the system. To satisfy electro-neutrality, the
exchange must be equivalent, eg. two monovalent cations are replaced by one
divalent ion. Under favourable conditions, the rate of the reaction is very rapid
(occurring in minutes or less) (Tucker, 1983).
2.36
2.2.9.1 Cation Exchange Capacity (CEC)
The total amount of cations exchangeable by a unit mass (weight) of soil is
termed the cation exchange capacity of the soil, CEC. Unlike that of clays or soil
with permanent charge, the CEC of a soil and slag with variable charge is very
dependent on the method used for its determination (Parfitt, 1980).
Any method used for a soil with variable charge should indicate the negative
charge of the soil as it occurs in the field. Gillman (1979) has tested the validity
of various methods, and proposed the following method for soil : saturating the
soil with unbuffered BaCl2 (final concentration 0.002 M), displacing it by 0.0015
M MgS04, and measuring the amount of Mg2+ retained and Cl- displaced. These
concentrations were selected because they were close to the upper limit of the
ionic strength (0.005 M) for highly weathered Australian soils. The CEC of a
soil may sometimes be estimated from its clay and humus content ( eg. for illicit
clays about40 cmol (+)/kg and for humus 200-300 cmol (+)/kg). Obviously such
estimates are applicable over a limited area in which one knows the type of clay
and organic constituents. The specification of the relative amounts of different
cations adsorbed by the complex (expressed as percentages of the CEC) is
usually referred to as the cationic composition of the sorption complex (Parfitt,
1980).
2.2.9.2 Anion Exchange Capacity (AEC)
The anion exchange capacity (AEC) of soil is the positive charge measured by
Cl- or N03• retention. AEC determinations are less important than those of CEC
because relatively few anions are held by simple ion exchange (electrostatic)
interactions. However, AEC values indicate whether N03- would be retained by
soil or not. For other anions, such as sulphate or phosphate, whose sorption is
2.37
more complex, AEC is not easily related to the amount adsorbed. Hence it is
usually simpler to measure phosphate or sulphate sorption directly (Tucker,
1983).
2.3 Past Studies on P Removal Using Soil
Aulenbach and Meisheng (1988) undertook studies to identify the mechanisms
of P removal from secondary treated wastewater in a rapid infiltration land
application system consisting of delta sand. Column studies confirmed that P
removal is primarily a physico-chemical process rather than a biological one.
Sorption, as measured in shaker batch studies, did not account for all of the
measured P removal by the sand particles. Sand from a sewage treatment plant
rapid infiltration system that had a coating primarily of precipitated CaC03 was
used. Removal of this coating nearly eliminated P removal and its presence was
found to play an important role in P removal.
Fox et al. ( 1989) studied the degree of sorption and release of P from sediments
of a river receiving treated sewage effluent. Chemical analysis of the sediment
samples showed that the percentages of Fe and Fe-bound P decreased with the
increasing distance from sewage treatment plant, whereas the percentage of Ca
and solid P increased. P sorption or desorption was rapid initially, and slow at
the later stages. They found that P sorption followed a reversible second-order
equation. The forward rate constant, kl' was found to be between 1 and 2
dm3/mol./minute, and was dependent on pH, calcium and nitrate ion
concentrations. They found that the bonding of P was weaker in calcareous
sediments compared to iron-containing sediments.
Ebers and Bischofsberger (1990) conducted a series of column experiments with
lysimeters for wastewater treatment. They demonstrated that slightly silty sand
2.38
(under anaerobic conditions) showed better results in eliminating P (86.0 to
99.3%) but has a lower hydraulic loading capacity than fine gravel sand.
Ho et al. (1992) conducted a senes of column experiments to examme the
removal of P from sewage effluent. The sorption medium used was sand
amended with a bauxite refining residue (red mud). An average of 91% P
removal was obtained with 30% red mud, 63% removal with 20% red mud and
50% removal with 10% red mud. The decrease in P removal with decreasing red
mud content was caused by a decrease in the sorption capacity of the soil and an
increase in the infiltration rate. P removal was excellent in the columns packed
with 30% red mud both for primary and secondary effluents.
Wakatsuki et al. (1993) studied the application of a Multi-Soil-Layering (MSL)
column as an on-site domestic wastewater treatment system to remove P. The
MSL unit is composed of a soil layer mixed with 10-25% of metal iron and
pelletised jute. The MSL column was piled in a brick pattern at 5 cm vertical and
10 cm horizontal distances, and was surrounded by layers of zeolite.
W astewaters which were pretreated by septic tanks to the level of TP 6-11 mg/L
could be treated by this system at a loading rate of 100-850 Um2.day without
significant clogging. The mean concentrations of treated waters were 0.86 mg/L
as TP. The researchers found that metal iron and jute pellets were effective in
removing P. The MSL system was found to be capable, not only of purifying
wastewater, but also of producing fertile soil during the treatment. They
suggested that the soil and zeolite can be recycled in agricultural land to improve
soil fertility.
Lam et al. (1993) assessed the feasibility of a soakaway system in treating
piggery wastes with five commonly found soils in HongKong. P removal
efficiency was higher in volcanic soils than in coarse granitic soils. Most of the P
2.39
was removed in the top 1 m of the unsaturated zone of the columns. Analysis of
the effluent collected at the base of the 3 m columns packed with granitic and
volcanic alluvial soil indicated a P removal efficiency of 95%.
2.4 Past Studies on P Removal Using Slag and Other Media
Research has shown that the sorption of dissolved inorganic P depends on pH,
temperature and the concentration of coexisting salt (Y amada et al., 1986).
These researchers found that sorption was proportional to the porosity of
material. The sorption capacity of P was found to be more on soft granulated
slag than on hard granulated slag.
Yamada et al. (1987) studied the suppression of P liberation from sediments by
using iron slag. The suppression efficiency depended on the amount of slag used.
About 85% of P liberation was found to be suppressed by using slag. As for the
suppression mechanisms, three effects of suppressing materials were considered.
The first was the covering effect of iron slag on the surface of the sediments. The
second was the chemical effect of hydrogen sulfide generated in the anaerobic
state. The third was the sorption effect.
Kaneko and Nakajima (1988) studied P removal by crystallisation usmg a
granular activated magnesia clinker. From long term pilot-scale studies (2.5
years) at a sewage treatment plant, they found that effluent P concentrations
were well below 0.5 mg!L.
Ho and Kuruvilla (1990) investigated P removal from agricultural drainage water
(containing P) from the Peel Harvey Estuary in Western Australia using red mud.
They conducted batch tests by mixing P solutions with red mud, and with red
mud neutralised with phosphogypsum or copperas. Red mud amended with
2.40
acidic calcium sulphate and ferrous sulphate had up to 18 times the sorption
capacity of untreated red mud. Experiments were conducted by equilibrating the
P solution with red mud for 24 hours. P removal was observed up to 97%.
Roques et al. (1991) studied the possibility of P removal by fixation with half
burned dolomite grains. Semi-burned dolomite is a commercial product
employed in water treatment processes for water neutralisation and for the
removal of Fe and Mn species. This was obtained from the thermic dissociation
of dolomite [(Ca, Mg (C03) 2] at 650 -750 <>C resulting in a material containing
equal molars of MgO and CaC03• They found that the fixation occurred as a
superficial precipitate of a (nonstoichiometric) badly crystallised calcium
phosphate. The equilibrium phase between the solid and P solution could be
quantified using the Freundlich isotherm; S = 1.19 C0·353 (where Sand Care the
amount of P adsorbed per unit mass of grain, and the concentration of P solution
respectively). The precipitation reaction was sufficiently rapid and near
equilibrium conditions were rapidly attained. The fixation capacity for P was
approximately 20 mg/g for solids with a particle mean diameter of 0.5 mm. They
suggested that this treatment could be used in the tertiary stage of a wastewater
treatment.
James et al. (1992) conducted a senes of laboratory studies to evaluate the
feasibility of adding iron oxides or steel wool to peat and sand to increase P
sorption. Langmuir type batch isotherms and column leaching studies showed
that rust and untreated steel wool markedly increased P sorption. Estimated
useful lives for the iron-amended materials ranged from zero years for
unamended sand to several years for steel wool-amended peat, depending on the
quantities of iron materials added. The results suggested that steel wool offers a
low cost, efficient amendment for peat and sand beds designed for P removal
from wastewater.
2.41
Mann (1992) investigated the importance of the solid matrix substratum in P
removal efficiency in two large-scale, constructed wetlands which received
secondary treated sewage effluent. Two PVC-lined systems were studied, a
gravel filled "control" trench and a simulated wetland, comprising alternate areas
of unplanted gravel, gravel planted with Typha species and open water. The
trench systems removed at best 60 to 80% of the applied P during the frrst two
months of operation and then showed considerably lower performance. Although
P removal in the studied systems involved the immobilisation and removal of P
through chemical precipitation, bacterial action, plant uptake and related
physico-chemical pathways, the sorption capacity of the gravel substratum
mediated most of the removal. The P removal efficiency observed in full-scale
systems corresponded closely to results obtained in the laboratory. These results
showed that the P sorption capacity of a constructed wetland system may be
estimated, prior to construction, through use of conventional ion exchange
capacity studies.
Mann and Bavor (1993) investigated the P removal efficiency of three gravel
based constructed wetland systems (CWS) in which secondary sewage effluent
was treated. The constructed wetland system, 100 m x 4 m x 0.5 m with an
impervious liner, comprised an unplanted gravel "control" trench and gravel
trenches planted with non-culture (natural) stands of either Typha orientalis or
Schoenoplectus validus. P sorption in the large-scale gravel systems was variable
and ranged from -40% to 40%. Ion exchange experiments have been used to
evaluate the gravel and industrial conglomerates, with a view to improve P
immobilisation through substratum selection and effluent flow management. The
maximum sorption capacity of regional gravels ranged from 0.026 to 0.048 mg/g
compared to blast furnace slag (0.16 to 0.42 mg/g) and fly ash (0.26 mg/g).
2.42
2.5 Constructed Wetland Systems (CWS)
Treatment of wastewater in a wetland system is an environmentally friendly,
easily operated and cost effective treatment option for a wide variety of
wastewaters. Basically, wetlands are of two types : Natural and constructed
(artificial) wetlands. Constructed wetlands use the same treatment mechanism of
a natural system, but the process takes place in a more controlled environment.
Both natural and constructed wetland systems have shown considerable potential
for wastewater treatment although the technique is still in the development stage.
Some wetland systems use only soil or gravel as media whereas others use
aquatic vegetation in addition to soil or gravel media to assist in treatment of
wastewater. Pollutant removal mechanisms in this process are complex, and
includes physical, chemical and biological mechanisms. Direct pollutant removal
mechanisms include filtration of suspended solids and pathogen by media,
sedimentation of suspended solids in void spaces, sorption of heavy metals,
nutrients -and dissolved solids, precipitation of metals and phosphorus and
bacterial metabolism processes - nitrification and denitrification (Mohanathansan
et al., 1991).
Practical applications have demonstrated that artificial wetland systems can form
a highly efficient and adaptable wastewater treatment option with a potential to
treat domestic effluents to secondary and tertiary standards; to upgrade
conventional oxidation-stabilisation ponds and secondary treatment systems to
meet high effluent standards, and to treat a range of industrial effluents including
those from abattoirs, pulp and sugar mills, acid mine drainage, leachate, animal
wastes and urban and stormwater runoff (Mackney, 1993).
2.43
2.5.1 Factors Contributing to Efficiency of Constructed Wetland Systems
Wastewaters passing through wetland systems go through bacterial metabolism
and physical sedimentation as do those in conventional wastewater treatment
plants. The fundamental difference between conventional and wetland systems is
that in the former, wastewater is treated rapidly in highly managed energy
intensive environments (ie. reactors) whereas in wetland systems, treatment
occurs at a comparatively slow rate in essentially unmanaged, ecological
environments (Wood, 1993).
2.5.1.1 Plant Species
The direct role of the aquatic plants (macrophytes) in wastewater treatment in
wetlands is the provision of surfaces for bacterial growth, the filtration of solids,
the translocation of oxygen to the plants and the improvement of soil
permeability. The oxygen flux to the root of reeds is a species-related
phenomenon. The common reed, phragmites australis, has been accepted
worldwide as a candidate species for wetland wastewater treatment facilities.
This is principally due to its production of deep roots and rhizomes (1.5 m or
more ) which create a great volume of active aerated root zone per surface area
of reed bed. Other suitable plants are scirpus mucronatus and typha species. The
lower root penetration of typha has encouraged simultaneous nitrification and
denitrification and provides conditions conductive for sulphate removal from
acid mine drainage (Wood, 1988).
The other major function of the reeds is to increase and stabilise the hydraulic
permeability of the substrata in which they are planted and through which the
wastewater flows. Wood (1993) has reported that percolation through soils is
improved by the presence of roots and rhizomes of phragmites. As the roots and
2.44
rhizomes penetrate through the soil, they loosen it, increasing porosity by
forming pores of tubular shape. Upon decay, the roots and rhizomes will leave
horizontally interconnected channels behind. According to Kickuth ( 1980) these
channels will stabilise the hydraulic conductivity in the rhizosphere at a level
equivalent to coarse sand within 2 to 5 years regardless of the initial porosity of
the soil.
The aquatic plants (reeds) also play a role in water management. Water losses to
the atmosphere from a wetland occur from water and soil (through evaporation),
and from the emergent portions of the plants (by transpiration). The combination
of the two processes is termed evapotranspiration. In denser beds, the shelter and
higher humidity caused by the reeds may reduce overall evapotranspiration
compared with open water (Bematowicz and Leszcznska, 1976).
2.5.1.2 Substrata
The substrata in which the reeds are established provide a stable surface area for
microbial attachment, a solid substrate for plant growth, and function directly in
the purification of the wastewater by way of physical and chemical processes.
The substrata affect retention time, contact opportunities for organisms with the
wastewater, and the availability of oxygen, all of which relate directly to
treatment capabilities (Brix, 1987; Good and Partick, 1987; Steiner and Freeman,
1989). To provide maximum permeability of the bed in which the reeds are to be
grown, it is necessary to select a soil or substratum which has a composition
from which a stable structure can evolve through channels created by dead and
decaying rhizomes. Studies by Cooper and Boon (1987) indicated that soils
classed as sandy clay loam, clay loam, silty clay and the lighter part of the clay,
may be suitable, if gravel, river sand, or waste ash is not available.
2.45
Initially, the hydraulic conductivity of the replaced soil should be about 10-3 to
10-5 m/s, with a long term operational permeability of 10-3 m/s. However, it is not
advisable to design a wetland on the expectation of permeability improvement.
Experiences in Europe have indicated that systems where soil hydraulics were
not adequately considered actually have a low hydraulic conductivity (2-3 x 10⁻⁶
m/s) during the first years of performance and function basically as surface flow
systems. This results in channelling and poor vegetation growth in some areas
due to lack of water (Brix, 1987; Cooper, 1986; Davies, 1988; Steiner and
Freeman, 1989).
2.5.1.3 Microorganisms
Microorganisms, which may be either attached to the macrophyte root and stem
structures or free living in the water, form the basic physiological mechanisms
by which pollutants are removed from wastewaters. Although the reeds will be
translocating oxygen to the root zone, the extent of the aerobic region will be
determined by the oxygen demand within the vicinity of the roots, as well as the
photosynthetic and free diffusion characteristics of the reeds. The aerobic zone
extends no further than a few millimetres from the site of oxygen release, and
processes for the oxidation of carbonaceous and nitrogenous materials occur in
this zone. As ammonia is nitrified to nitrate by nitrification, the nitrate acts as
terminal electron acceptor for denitrification through facultative aerobes in
adjacent anoxic zones. In the absence of oxygen and nitrate, and as the redox
potential decreases, anaerobic degradation processes occur using energy from
SOl-, Mn4+, Fe3+ and C02 (Wood, 1993).
It is evident that the presence of such a diverse ecological environment leads to
the occupancy of a wide spectrum of micro-organisms capable of degrading the
variety of organic and inorganic compounds in wastewaters. While the readily
2.46
biodegradable portions of wastewaters are decomposed rapidly, fractions may
also be incorporated into the organic sediment to be anaerobically degraded over
an extended period, extending the overall retention time available for pollutant
removal (Cooper and Boon, 1987; Wood, 1993)
2.5.1.4 Temperature
Variations in the temperature of wastewaters appear to have little effect on
effluent quality because the total number of active bacteria in the soil and
rhizosphere increase in winter months. This allows increased concentrations of
substrate away from the inlet end of the bed, with the effect that the
concentrations of bacteria increase in the middle and outlet zones of a bed
(Cooper, 1986). There are a number of factors which will help to maintain a
relatively high temperature in the rhizosphere during winter:
- Insulating effect from plant cover and litter on the surface
- Production of heat from microbial activity in the rhizosphere
- Influent wastewater temperature.
These factors should prevent the infiltration areas and the rhizosphere from
freezing during winter (Brix, 1987).
2.5.2 Phosphorus Removal in CWS
P removal in a wetland is achieved through plant uptake and the biological and
physico-chemical storage of P in the substrata. Aquatic plants supplied with
sewage effluent tend to show increased growth, and usually have increased
tissue P concentrations. However, P adsorbed in rooted emergent vegetation and
algae is released back into the water body and settles after tissue death.
2.47
The mechanism of P sorption to the substrate involves the exchange of a
phosphate ion with an OH- of a metal hydroxide, MOH, where M =Fe orAl,
and is thought to be essentially irreversible at iso-pH, constant ionic strength,
and in the absence of competing ions. The saturation of the sorption complex is
positively linked to the desorption of P. Phosphorus is also precipitated within
the substrata as salts of the metal ions present. The distinction between sorption
and precipitation reactions has appreciable practical significance. Sorption
theory dictates that the P concentration in solution largely determines the amount
of P sorbed, with surface 'activity' changing accordingly. Precipitation theory,
however, dictates that the P concentration controlled by the solubility product of
the least concentration maintained in solution is greater at high adsorbent
saturations than at low adsorbent saturations. This is directly relevant to
wastewater disposal (Swindell and Jackson, 1990).
It has been observed that soils have the capacity to regain, and in some cases
enhance,- their adsorptive capacities after apparently having reached saturation
and subsequently been allowed to rest (Ellis and Erickson, 1969). The
phenomenon is explained by the slow dissolution of aluminium and iron
compounds creating new sites for sorption of P with time.
Average soils can be expected to contain 2-4% iron and 5.0-7.5% aluminium.
Thus, if all iron and aluminium were dissolved and converted to iron and
aluminium phosphates, nearly 1000 tonnes of P could be precipitated per hectare
m3 (1 hectare area x 1 m deep). However, under normal conditions, ie. near
neutral pH, and moderate temperatures, iron and aluminium are both slow to
dissolve, and only a fraction of the possible capacity of the soil to precipitate P
will be realised in the short term (Swindell and Jackson, 1990).
2.48
2.5.3 Past Studies on P Removal in CWS
Swindell and Jackson (1990) reported that a 494 ha constructed wetland
operating since mid-1987 in Orlando, Florida, U.S.A. produced an effluent in
1989 with average concentrations of 0.08 mg/L as TP. Influent flows were
approximately 0.58 m3/s. Most of the P was removed in the early stage of the
system. P removal efficiency peaked at a detention time of 5 days. P uptake
during 1989 across the same area was 0.41 kglha.day. The fixation of P in
bacteria and algae cells and the eventual storage of these cells in the sediments
were thought to be the primary removal mechanisms. Because of a design that
allows for more control over internal flow rates than most other constructed
wetlands, the system was able to provide an effluent with consistently low P
concentrations.
Mohanathansan et al. (1991) studied on the removal mechanisms and design
criteria in wetland treatment plants. They found that the main factors influencing
the design of wetland systems are hydraulic considerations, substrate media,
vegetation, design configuration and the operating procedure of the system.
Water depth and frequency of flooding are important because they may influence
the light penetration and photosynthesis. Influent wastewater quality parameters
such as turbidity, pH, dissolved oxygen and salt concentration affect the plant
species selection. Media size and type affect the physical and chemical treatment
mechanisms and the selection is based on the cost, degree of treatment and
design requirements. The overall configuration of a wetland system may affect
water velocity, water depth and fluctuation, detention time and distribution
patterns.
Batchelor et al. (1991) reviewed a constructed wetland research program m
South Africa. Their research indicated that artificial wetlands established in
2.49
different substrates and subjected to various domestic wastewaters at different
application rates could effectively reduce P levels, provided that certain design
criteria were met. Under the experimental conditions employed, satisfactory
wetland performance could be achieved at relatively high loading rates (up to
2700 Um2.day) and shallow (0.2 m) substrate depths. Serial arrangement of
wetlands using ash and soil substrates resulted in efficient P removal.
Wood (1991) considered the application of constructed wetlands to be a reliable
and realistic alternative treatment option, particularly suited to small and
medium-sized communities, agriculture and industries in sparsely populated and
developed areas. In South Africa, there are presently approximately thirty
systems either in operation, under construction or in the planning stages.
Masters (1993) designed a low cost treatment system to reduce the water
pollution potential of dairy waste. It incorporates three stages; a sump in which
anaerobic -actively occurs; an aerobic vegetated filter with a base of permeable P
adsorbing material; and an irrigated plantation or crop using water that has
passed through the system. Recent work by West Australian companies and
government departments has shown that a range of materials with a high P
Retention Index (PRI) is available to accomplish this. While high PRI materials
include natural materials such as loams and clays, waste products generated by
mineral processing industries in the South West of Australia are also suitable.
Red mud in particular is physically and chemically suited for use as a P
adsorbing material.
3.1
Ill. THEORETICAL CONSIDERATIONS
This chapter has been divided into two sections. The frrst section deals with the
mathematical formulation of P sorption under static conditions. The second
section discusses the mathematical modelling of saturated column experiments.
3.1 P Transport in Static Systems
Transport of reactive solutes through soil profiles into groundwater is a major
environmental concern. Over the past three decades, numerous researchers have
endeavoured to quantify the processes governing the interactions with soil of
various solutes like pesticides, nutrients, heavy metals, and other toxic
substances. The transport and ultimate disposition of phosphorus in groundwater
systems are mainly affected by sorption-desorption and precipitation-dissolution
reactions between groundwater and aquifer materials. There are two aspects of
sorption reactions that must be quantified and modelled in this context: first, the
form or character of the equilibrium distribution between liquid and solid phases
toward which a particular solute of concern in the system is thermodynamically
driven, and second, the rate at which this distribution is approached (Weber and
Miller, 1989).
Numerous models exist to explain the kinetic behaviour of solutes. Amacher et
al. (1988) stated that single-reaction models did not describe retention release
reactions in soils adequately. They considered that multi-reaction models predict
observed kinetics better but involve too many model parameters, which usually
must be evaluated by curve fitting techniques. Complicated models, involving
many parameters (which are difficult to evaluate), are likely to induce more error
while estimating those parameters. Independent methods for their estimation are
usually unavailable. The method applied in evaluating the parameters in multi-
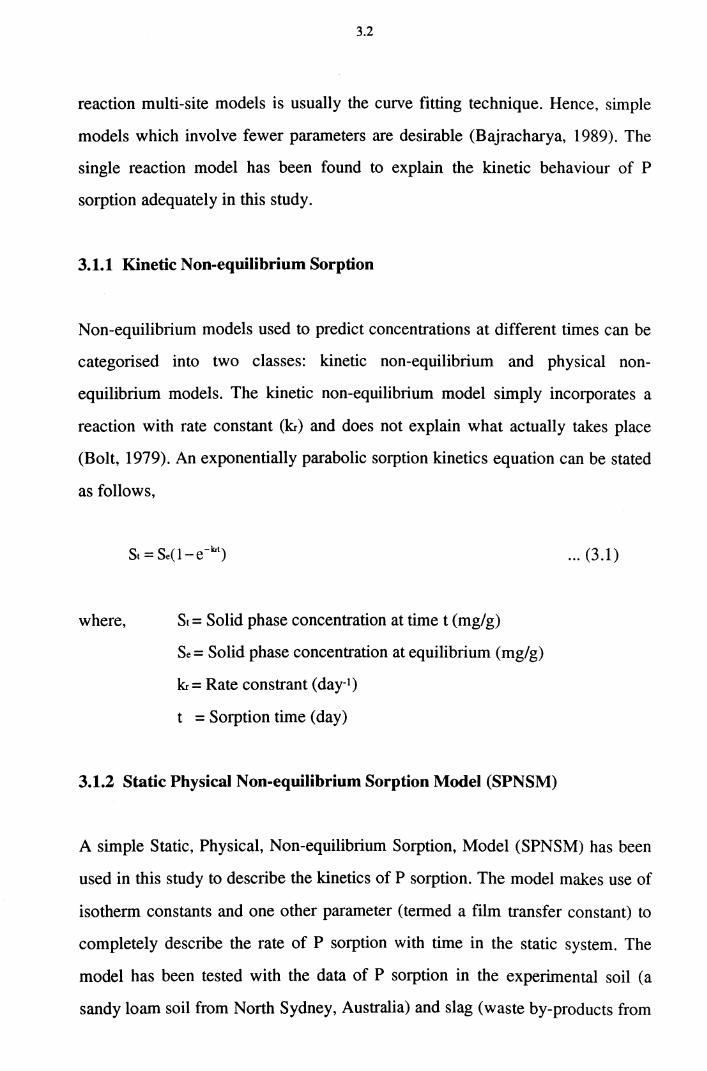
3.2
reaction multi-site models is usually the cutve fitting technique. Hence, simple
models which involve fewer parameters are desirable (Bajracharya, 1989). The
single reaction model has been found to explain the kinetic behaviour of P
sorption adequately in this study.
3.1.1 Kinetic Non-equilibrium Sorption
Non-equilibrium models used to predict concentrations at different times can be
categorised into two classes: kinetic non-equilibrium and physical non
equilibrium models. The kinetic non-equilibrium model simply incorporates a
reaction with rate constant (kr) and does not explain what actually takes place
(Bolt, 1979). An exponentially parabolic sorption kinetics equation can be stated
as follows,
where, St = Solid phase concentration at time t (mg/g)
Se= Solid phase concentration at equilibrium (mg/g)
kr= Rate constrant (day-I)
t = Sorption time (day)
3.1.2 Static Physical Non-equilibrium Sorption Model (SPNSM)
... (3.1)
A simple Static, Physical, Non-equilibrium Sorption, Model (SPNSM) has been
used in this study to describe the kinetics of P sorption. The model makes use of
isotherm constants and one other parameter (termed a film transfer constant) to
completely describe the rate of P sorption with time in the static system. The
model has been tested with the data of P sorption in the experimental soil (a
sandy loam soil from North Sydney, Australia) and slag (waste by-products from
3.3
the BHP steel industry such as dust and cake). The model is based on the
assumption that the particles of adsorbent are surrounded by an immobile water
layer and that the liquid phase concentration of P in this layer exists in
equilibrium with the solid phase concentration on the adsorbent surface (film
diffusion model). The classical film diffusion equation may be referred to in any
Chemical Engineering Handbook (eg. Perry and Chilton, 1978).
It was assumed that there is no concentration gradient within the immobile layer
or in the bulk solution. At any instant the transfer of solute takes place across the
film and the rate at which sorption takes place is proportional to the difference
between the concentration of the bulk P solution and the immobile layer P
concentration at that instant. The constant of proportionality involved is usually
known as the film transfer constant and this factor is denoted as a. When the
bulk solution and the film layer concentrations become equal, there is no more
transfer of solute and the equilibrium point is said to be reached. Initially the
solid phase concentration is assumed to be zero. At any instant, the mass balance
yields,
where,
CO = c + (~/S)S ... (3.2)
C0 = Initial bulk concentration of P (mg/L)
C = P concentration in the bulk solution at any instant (mg/L)
S = Solid phase concentration at any instant (mg/g)
~ = Mass of adsorbent (g)
e =Volume of P solution (L)
3.4
The rate at which sorption is taking place can be written as;
dS --=a(9/~)[C-Cr]
dt ... (3.3)
The following equation is obtained from the classical film diffusion equation,
where,
dC -=-a[C-Cr] dt
a =Film transfer constant (day-1)
... (3.4)
Cf = P concentration in the fixed film layer in equilibrium with the
solid phase concentration (mg/L)
The film diffusion constant can be computed by several methods. One method is
by plotting ( -dC/dt) against [C-Cr]. The slope of the plot is the value of a. The
value of Cf is computed from the amounts which have been adsorbed at that
instant ie., by making use of Eqn. 3.6. The isotherm parameters can be used for
the evaluation of cf since equilibrium exists at all times between the film layer
and the solid phase concentration.
The other method to compute a is from the slope of the curve in a flat of
concentration, C versus time at t=O. At t=O, from Eqn. 3.4 the value of Cr is zero
and the value of a is given by
dC a=--lt=o
Co dt ... (3.5)
In this study the film transfer constant (a) was approximated from the kinetic
data itself. To estimate the most suitable film transfer constant at different initial
3.5
concentrations, the a value which provides the best simulation to the
experimental data by SPNSM was taken as the optimal value. The FORTRAN
list of estimating the optimal film transfer constant is presented in Appendix A2.
The Freundlich isotherm (Eqn. 3.6) is used in this study.
S= KCr 1'N ... (3.6)
where, K, N = Freundlich isotherm constants
For N = 1, using Eqns 3.2 and 3.6, Eqn 3.4 is expressed in normalised form as
d(C/Co) = ae [ 1 -{(~K/S) + 1}~] dt ~K Co
... (3.7)
Integrating Eqn. 3.7 between the limits of initial bulk concentration and the
concentration at any instant t, one obtains
C 1+(~/8)Kexp[-a{1+8/(~K)}t] =--~----~--~--~~~
Co 1+(~/S)K ... (3.7.1)
When N is not equal to 1, Eqn. 3.3 in combination with Eqn. 3.6 becomes non
linear and cannot be solved analytically. Consequently the combined equations
(Eqns 3.3 and 3.6), and Eqn. 3.2 were solved numerically in sequence using the
finite difference technique. The numerical scheme in sequence is as follows:
... (3.8)
... (3.9)
3.6
where, i = time index
8t = time step (days)
In this study the solid phase concentration of P at any time step was
approximated from the difference of the bulk and the equilibrium liquid phase
concentrations at the previous time step. The liquid phase concentration was
computed from Eqn. 3.9. The solid and liquid phase concentrations then march
forward in time based on the initial liquid and solid phase concentrations. The
time step should be chosen carefully to avoid oscillations. The requirement of
effective time step is only for the intermediate period when the system has not
reached the equilibrium state. A large time step gives rise to stability problems.
The smaller the time interval, the better the result. The validity of the numerical
method was checked by solving the problem numerically for N=1 and then
comparing its results with the analytical solution of the ordinary linear equation
(Bajracharya, 1989). The analytical and numerical solutions for N=1 for an
initial P concentration of 20 mg/L are shown in Figure 3.1. The constants used in
computations are shown in the same figure. The FORTRAN listing of SPNSM is
presented in Appendix A3.
3.2 P Transport in Dynamic Systems
Understanding solute transport mechanisms through soils is a requirement for
making correct decisions on waste disposal. The extent of aquifer contamination
by pollutant discharges has to be assessed and proper remedial measures have to
be taken. An enormous growth in the development and use of solute transport
modelling has been witnessed in the last three decades.
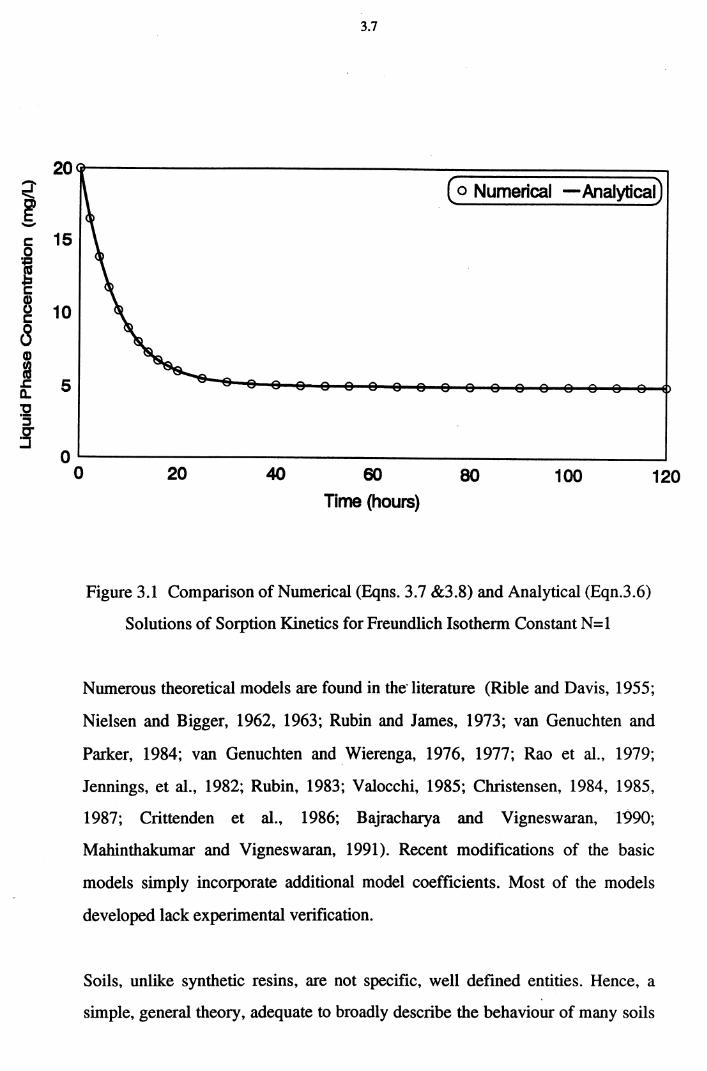
20 ~ ~ -5 15 :R g r:::
B 10 r:::
8 CD
la J: 5 a.. :g ::l g
0 0
3.7
( o Numerical -Analytical)
20 40 60 80 100 Time (hours)
Figure 3.1 Comparison of Numerical (Eqns. 3.7 &3.8) and Analytical (Eqn.3.6)
Solutions of Sorption Kinetics for Freundlich Isotherm Constant N = 1
120
Numerous theoretical models are found in the· literature (Rible and Davis, 1955;
Nielsen and Bigger, 1962, 1963; Rubin and James, 1973; van Genuchten and
Parker, 1984; van Genuchten and Wierenga, 1976, 1977; Rao et al., 1979;
Jennings, et al., 1982; Rubin, 1983; Valocchi, 1985; Christensen, 1984, 1985,
1987; Crittenden et al., 1986; Bajracharya and Vigneswaran, 1990;
Mahinthakumar and Vigneswaran, 1991). Recent modifications of the basic
models simply incorporate additional model coefficients. Most of the models
developed lack experimental verification.
Soils, unlike synthetic resins, are not specific, well defined entities. Hence, a
simple, general theory, adequate to broadly describe the behaviour of many soils
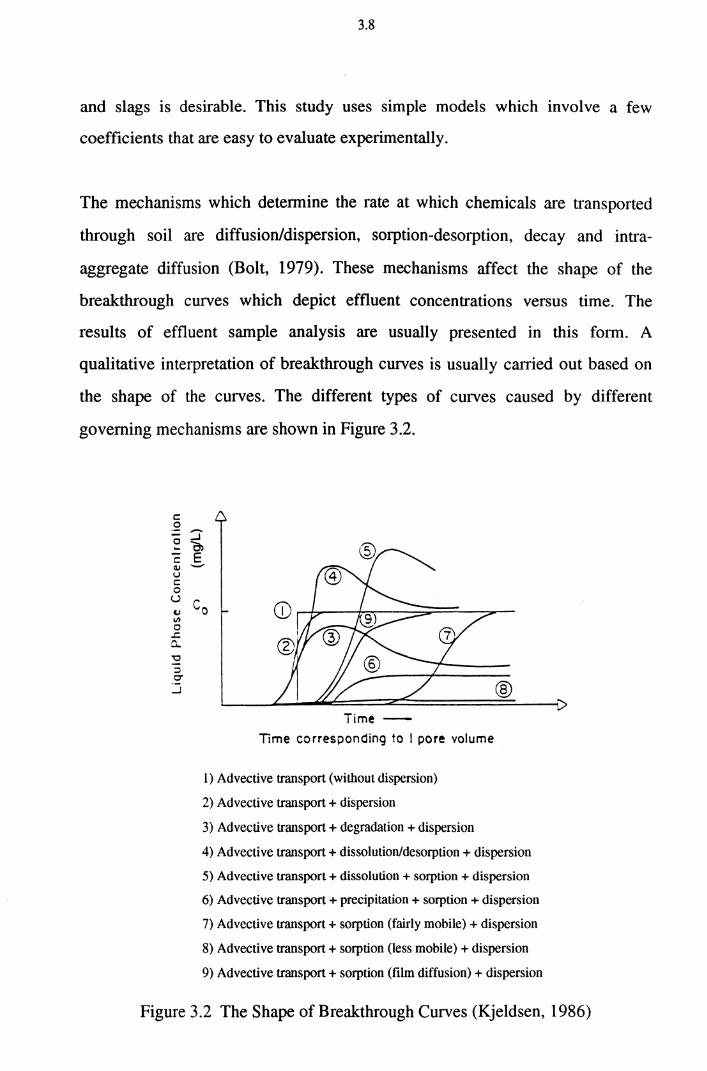
3.8
and slags is desirable. This study uses simple models which involve a few
coefficients that are easy to evaluate experimentally.
The mechanisms which determine the rate at which chemicals are transported
through soil are diffusion/dispersion, sorption-desorption, decay and intra
aggregate diffusion (Bolt, 1979). These mechanisms affect the shape of the
breakthrough curves which depict effluent concentrations versus time. The
results of effluent sample analysis are usually presented in this form. A
qualitative interpretation of breakthrough curves is usually carried out based on
the shape of the curves. The different types of curves caused by different
governing mechanisms are shown in Figure 3.2.
c: 0 -0 ...J ... Cl c: E ~ -u c: 0 u
Co u "' 0 .c. c... "0 :::l 0"
....1 ® Time-
Time corresponding to I pore volume
1) Advective transport (without dispersion)
2) Advective transport+ dispersion
3) Advective transport+ degradation+ dispersion
4) Advective transport+ dissolution/desorption +dispersion
5) Advective transport + dissolution + sorption + dispersion
6) Advective transport+ precipitation+ sorption + dispersion
7) Advective transport+ sorption (fairly mobile)+ dispersion
8) Advective transport+ sorption (less mobile)+ dispersion
9) Advective transport + sorption (film diffusion) + dispersion
Figure 3.2 The Shape of Breakthrough Curves (Kjeldsen, 1986)
3.9
Pollutants subject to several simultaneous mechanisms of a more complex nature
may exhibit other, often non-interpretable results (Kjeldsen, 1986). The present
study, however, was conducted to observe sorption process only. Conditions
were maintained such that sorption was the major governing process.
Sorption processes can be assumed to take place instantaneously or at a certain
rate. The instantaneous sorption concept gives rise to an equilibrium sorption
model, and the rate controlled process gives rise to a non-equilibrium sorption
model. Non-equilibrium sorption is further classified as kinetic equilibrium and
physical non-equilibrium. In this study, a Dynamic, Physical, Non-equilibrium,
Sorption Model (DPNSM) was used to predict the P transport in saturated
column experiments.
The usual method of obtaining isotherm constants is from batch experiments.
The isotherm constants obtained by this procedure are used to predict the
concentration history curve in the dynamic system. This method is generally
unsatisfactory (Tiwaree, 1989; Bajracharya and Vigneswaran, 1990). The
isotherm constants obtained from column experiments describe the observed
breakthrough better than the isotherm constants obtained from batch experiments
(Bajracharya, 1989; Bajracharya and Vigneswaran, 1990). Thus, in this study,
isotherm constants obtained from column experiments were used to predict the
concentration history curve.
Models belonging to the two classes of sorption reaction equilibrium are
discussed in section 3.2.3 and are tested for their validity from the column
experimental results conducted under various conditions.
Exact analytical solutions can be obtained for linear sorption. For non-linear
isotherms, numerical techniques are used to arrive at approximate solutions.
3.10
These approximate solutions are adequate for practical purposes considering the
uncertainties in the accuracy of the model parameters involved.
3.2.1 Equilibrium Sorption Model (ESM)
Many models have been developed in recent years for describing solute
movement in soils. Mostly the one dimensional solute transport equation has
been used to simulate the movement of contaminant in a soil matrix theoretically
or experimentally. The one dimensional solute transport equation with reactions
is given by (eg., Bajracharya and Barry, 1993a),
where,
ac pas -+--i1t e i1t
S = Solid phase concentration of the solute (mg/g)
C =Liquid phase concentration of the solute (mg!L)
Ds= Dispersion coefficient (cm2/day)
w =Pore water velocity (cm/day)
e =Porosity
p = Bulk density (g!L)
t = Time co-ordinate (day)
z =Spatial co-ordinate (cm)
... (3.10)
In developing the Eqn. 3.10 for saturated flow conditions, the following
assumptions are applicable.
- The flow is unidirectional.
- The flow is steady and the process is isothermal.
- The porous media is homogenous.
3.11
-The porosity, specific surface and pore size distribution of the medium
do not change with time.
- The medium has constant water content and density. The density and
viscosity of the fluid do not change with time and space.
- Only the dissolved solute and a few small precipitates are mobile and
other solid associated chemical species are immobile.
Depending on boundary and initial conditions, Eqn. 3.10 can have different
solutions. The left hand side of the equation represents the amount of mass
accumulated per unit time in the elementary system considered. The first and
second terms on the right hand side represent the transport rates by dispersion
and advection respectively.
In order to solve the problem, the rate of sorption has to be specified by a certain
function. A common assumption that can be made in ground water systems is that
the equilibrium of sorption reaction is reached quickly. Therefore, the
expressions of the equilibrium isotherms can be used to quantify the prutitioning
between the liquid and solid phases.
In the case that processes such as sorption and ion exchange are very fast
compared to the bulk fluid flow rate, then reversible sorption reactions can be
assumed to be in a state of local equilibrium (Valocchi, 1985). In this model, the
sorption process is assumed to be very fast or instantaneous, as diagrammatically
shown in Figure 3.3. Having made this local equilibrium assumption, the model
introduces the Freundlich isotherm for the sorption of P.
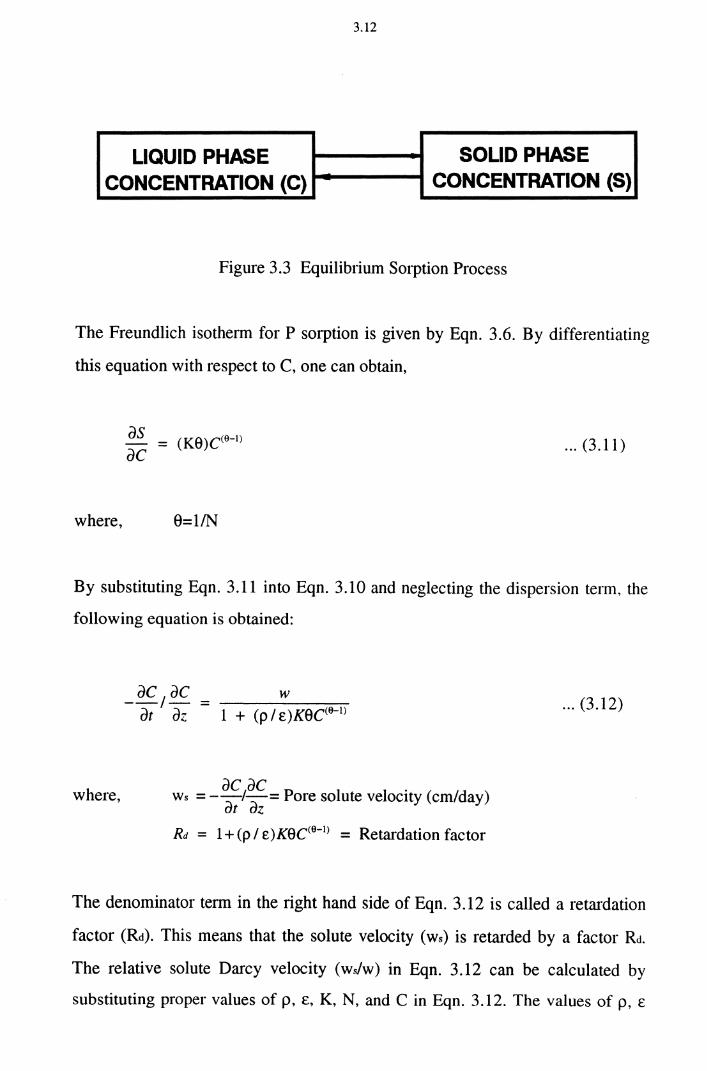
3.12
LIQUID PHASE SOLID PHASE CONCENTRATION (C) CONCENTRATION (S)
Figure 3.3 Equilibrium Sorption Process
The Freundlich isotherm for P sorption is given by Eqn. 3.6. By differentiating
this equation with respect to C, one can obtain,
where,
as = (Ke)c<e-1) ac
e=IIN
... (3.11)
By substituting Eqn. 3.11 into Eqn. 3.10 and neglecting the dispersion term, the
following equation is obtained:
where,
_ ac 1 ac = w at az 1 + (pI E)Kec<e-1)
ac ac . ws = --1-= Pore solute velocity (cm/day) at az Rd = 1 +(pI E)Kec<e-I) = Retardation factor
... (3.12)
The denominator term in the right hand side of Eqn. 3.12 is called a retardation
factor (Rct). This means that the solute velocity (ws) is retarded by a factor Rd.
The relative solute Darcy velocity ( wJw) in Eqn. 3.12 can be calculated by
substituting proper values of p, £, K, N, and C in Eqn. 3.12. The values of p, E
3.13
and C can be estimated from the soil or slag medium and solute used, while K
and N can be obtained from equilibrium batch experiments involving the
pertinent adsorbent and solute. Basically, Eqn. 3.12 expresses the relative solute
pore velocity, which for saturated flow conditions is identical to the relative
solute Darcy velocity.
3.2.2 Dynamic Physical Non-equilibrium Sorption Model (DPNSM)
The second term on the left hand side of Eqn. 3.10 describes the reaction
process. When the reaction process is insufficiently fast, an additional
differential rate equation must be used to solve Eqn. 3.1 0. This results in the
non-equilibrium sorption model. Sorption kinetics can be expressed
mathematically as:
where,
as -=as[f(C)-S] dt
... (3.13)
... (3.14)
The factor a 5 is the rate constant. The solute transport equation is coupled with
the rate equation and then solved for the liquid and solid phase concentrations
using MCMFIT (Mixing Cell Model FIT). The MCMFIT is briefly described in
the following section.
3.14
3.2.3 MCMFIT: A Program to Fit a Generalised Non-linear Advective
Dispersion Model
Recently Bajracharya and Barry (1995) developed a fitting program from an
improved mixing cell model to estimate the parameters of transpmt models. This
code, MCMFIT, makes use of non linear least-squares fitting to find optimal
parameter values by matching improved mixing cell model predictions with
column experimental data. The optimum values of the dispersion coefficient (Ds)
and kinetic mass transfer coefficient ( a.s) in column experiments were obtained
by the fitting program.
In MCMFIT, a two site sorption model (Selim et al., 1976; Cameron and Klute,
1977; Rao et al., 1979) was used to consider equilibrium and non-equilibrium
sorption simultaneously. Sorption on the medium surface is assumed to take
place at two sites. One site is controlled by time dependent sorption reaction and
the other site exhibits instantaneous sorption. The distribution of such sites is
determined from the observed data.
At equilibrium, sorption on both the equilibrium and the non-equilibrium sites is
described by a non linear isotherm given by:
... (3.15)
and
... (3.16)
where, S1 = Solid phase concentration on equilibrium sites (mg/g)
S2 = Solid phase concentration on kinetic non-equilibrium sites (mg/g)
a 6 = Fraction of the total number of sites
3.15
Total sorption ie., (SI + S2) is calculated using Eqn. 3.14 at equilibrium. The two
site model is then given by:
... (3.17)
with the non-equilibrium sorption process defined by:
... (3.18)
This process can be mathematically attributed to the large heterogeneities in
microscopic pore water velocities (van Genuchten, 1981). Two site sorption
processes have been efficiently solved using mixing cell models in MCMFIT.
When a 6 = 1.0 and a 5 = 0, the two site model reduces to equilibrium model. This
model reduces to dynamic non-equilibrium model when a 6 equals to zero.
A general S-curve isotherm has been incorporated in the MCMFIT. The
following equation was used in the development of the fitting program due to its
versatility:
... (3.19)
Eqn. 3.19 reduces to the Freundlich equation when <XI = -1.0 and <:XA = 1.0. When
<XI =-1.0, and <X3 = <l4 =1.0, it reduces to linear form. It reduces to the Langmuir
type when <l4 = -1.0 and <X3 =1.0.
3.16
A FORTRAN program to carry out the non linear least-squares fitting of the
general non linear transport model to experimental data was developed by
Bajracharya and Barry (1995). It was based on the maximum neighbourhood
method of Marquardt (1963) as implemented by van Genuchten (1980, 1981),
Parker and van Genuchten et al. (1984), and Barry et al. (1988). Program
descriptions of MCMFIT and its operation are briefly summarised at the
Appendix A4.
3.2.4 Effect of Model Parameters on Breakthrough Curve
The effects of pore water velocity (w), dispersion coefficient (Ds), kinetic mass
transfer coefficient (as), K and N Freundlich isotherm constants, fraction of
equilibrium site (<X6), and influent P concentration (Co) were studied using
MCMFIT. The effects of these parameter values on the breakthrough curve are
shown in Figures 3.4 to 3.10. Figure 3.4 shows simulated breakthrough curves
for different pore water velocities. The breakthrough curves are nearly S-shaped
with more spreading and longer breakthrough times as the pore water velocity
decreases. This effect may be due to the increase of residence time in the column
for lower pore water velocities, thus increasing the diffusion of the phosphorus
solute into the medium. Figure 3.5 shows that the increase in the dispersion
coefficient (D5) delays the breakthrough time. For the higher dispersion
coefficients (D5>2) the simulated S-shaped breakthrough curve turns out a
curvilinear pattern.
The effect of the kinetic mass transfer coefficient (as) is shown in Figure 3.6. A
lower kinetic mass transfer coefficient ( as<0.05) is found to be valid for the
adsorbing media which have less sorption capacity. The effect of Freundlich
isotherm constant K is shown in Figure 3. 7. Slight changes in the Freundlich
isotherm constant N have a significant effect on the breakthrough time (Figure
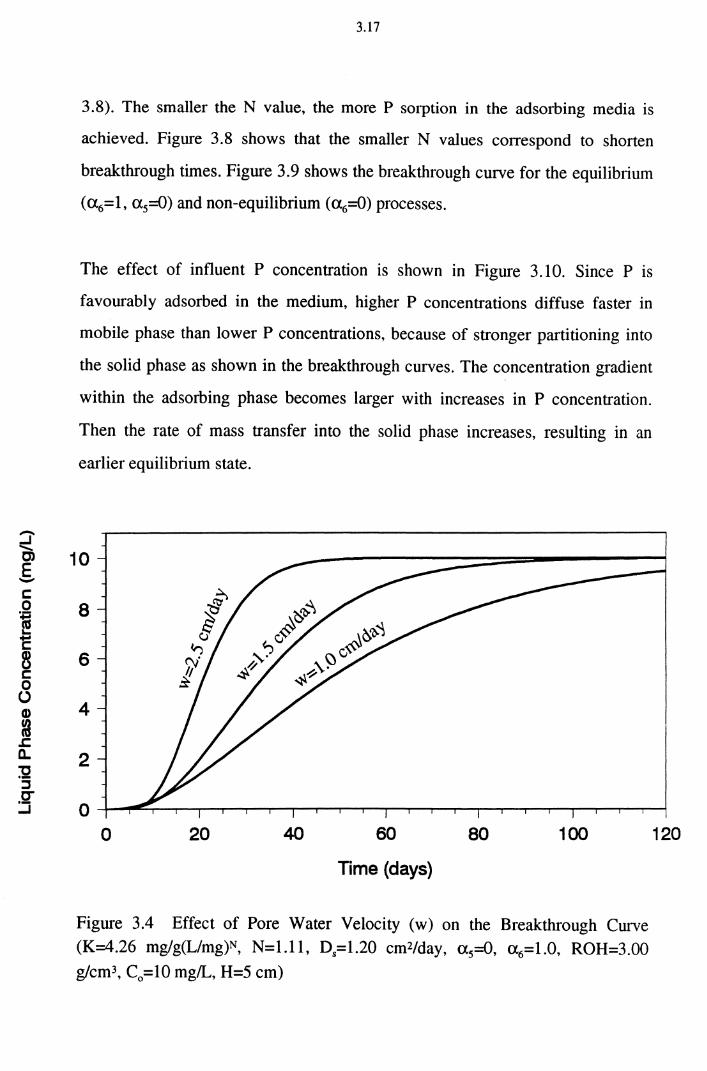
:J' ...... C)
E -c 0 i '-.... c fj c 0 0 G)
m .c a.. :g :::J
.Q"" -1
3.17
3.8). The smaller the N value, the more P sorption in the adsorbing media is
achieved. Figure 3.8 shows that the smaller N values correspond to shorten
breakthrough times. Figure 3.9 shows the breakthrough curve for the equilibrium
(a6=1, a 5=0) and non-equilibrium (a6=0) processes.
The effect of influent P concentration is shown in Figure 3.10. Since P is
favourably adsorbed in the medium, higher P concentrations diffuse faster in
mobile phase than lower P concentrations, because of stronger partitioning into
the solid phase as shown in the breakthrough curves. The concentration gradient
within the adsorbing phase becomes larger with increases in P concentration.
Then the rate of mass transfer into the solid phase increases, resulting in an
earlier equilibrium state.
10
8
6
4
2
0 0 20 40 60
Time (days}
80 100
Figure 3.4 Effect of Pore Water Velocity (w) on the Breakthrough Curve (K=4.26 mg/g(L/mg)N, N=l.ll, Ds=l.20 cm2/day, a 5=0, a 6=1.0, ROH=3.00
g/cm3, C0 =10 mg/L, H=5 cm)
120
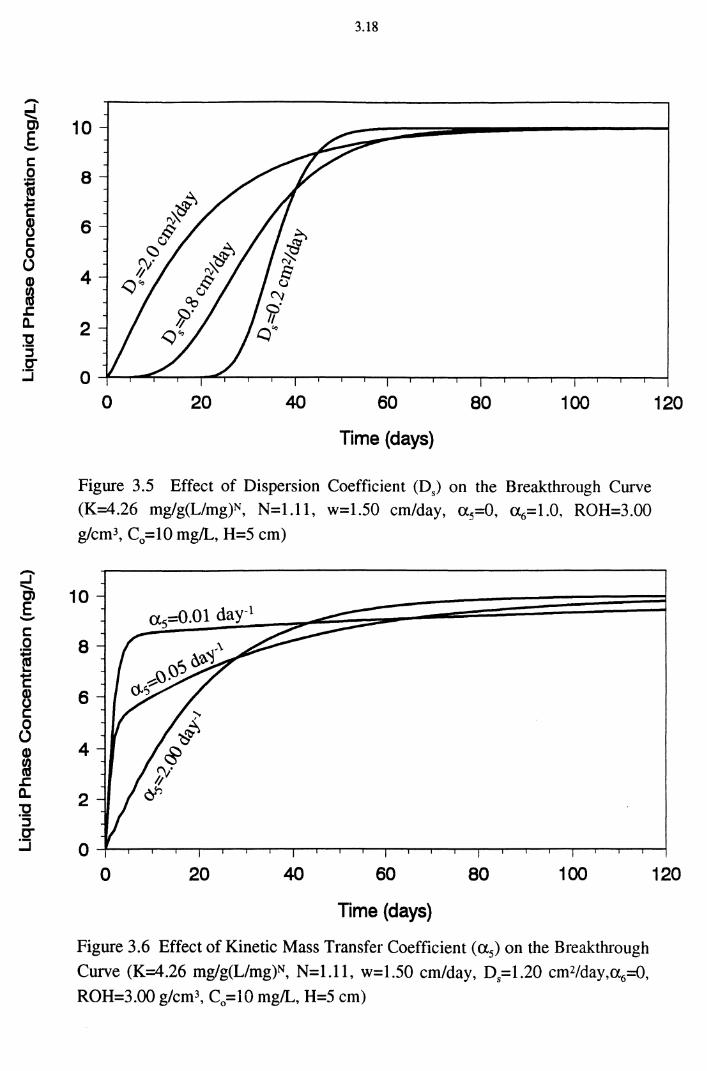
:1 ....... C)
E -r:::: 0 i ... .... r::::
B r:::: 0 (.) Q)
~ .s: a.. :g :s C" :J
:1 ....... CJ)
E -r:::: 0 i ... .... r::::
B c: 0 (.) Q)
~ .s: a.. :g :s
.Q"
...J
3.18
10
8
6
4
2
0 0 20 40 60 80 100
Time (days)
Figure 3.5 Effect of Dispersion Coefficient (D5 ) on the Breakthrough Curve
(K=4.26 mg/g(L/mg)N, N=l.ll, w=1.50 cm/day, a 5=0, a 6=1.0, ROH=3.00
g/cm3, C0 =10 mg/L, H=5 cm)
10
8
6
4
2
0 0 20 40 60
Time (days)
80 100
Figure 3.6 Effect of Kinetic Mass Transfer Coefficient (a5) on the Breakthrough
Curve (K=4.26 mg/g(L/mg)N, N=l.ll, w=1.50 cm/day, D5=1.20 cm2/day,a6=0,
ROH=3.00 g/cm3, C0 =10 mg/L, H=5 cm)
120
120
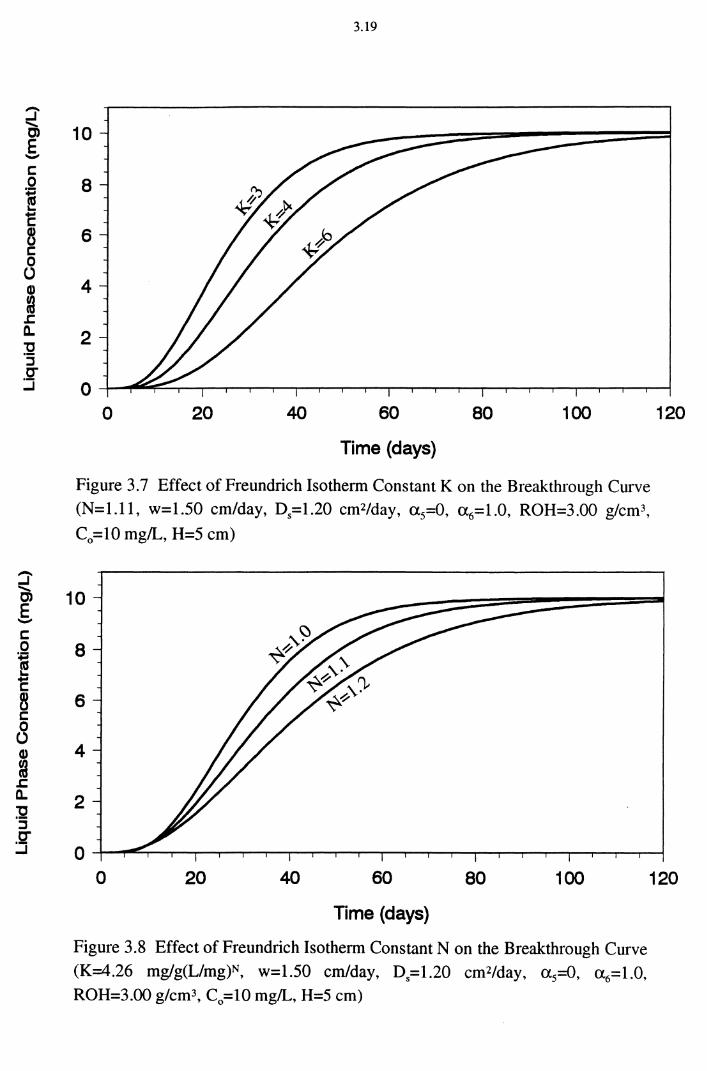
:1 ....... C)
E -r:: 0 i L..
'E ~ r:: 0 u G)
~ ~ ~ :g ::J 0'" :J
:1 ....... C)
E -r:: 0
~ 'E ~ r:: 0 u G)
~ ~ a.. :g ::J
.Q""
...J
3.19
10
8
6
4
2
0 0 20 40 60 80 100
Time (days)
Figure 3.7 Effect of Freundrich Isotherm Constant K on the Breakthrough Curve
(N=l.ll, w=1.50 cm/day, D5=1.20 cm2/day, a 5=0, a 6=1.0, ROH=3.00 g/cm3,
C0 =10 mg/L, H=5 cm)
10
8
6
4
2
0
120
0 20 40 60 80 100 120
Time (days)
Figure 3.8 Effect of Freundrich Isotherm Constant Non the Breakthrough Curve
(K=4.26 mg/g(L/mg)N, w=1.50 cm/day, D5=1.20 cm2/day, a 5=0, a 6=1.0,
ROH=3.00 g/cm3, C0 =10 mg/L, H=5 cm)
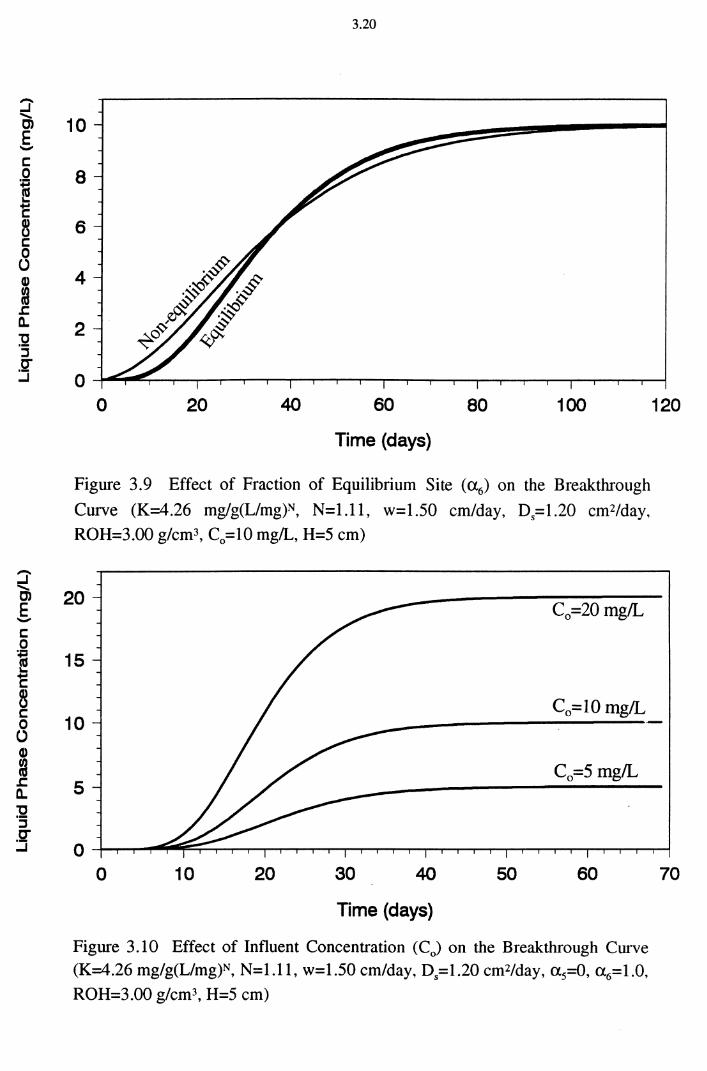
:J ...... Cl E -1: 0 i ..... ~
1:
B 1: 0 (.) G)
~ ~ a.. :g ::J C"
::::i
~ E -
3.20
10
8
6
4
2
0 0 20 40 60 80 100
Time {days}
Figure 3.9 Effect of Fraction of Equilibrium Site (a6) on the Breakthrough
Curve (K=4.26 mg/g(L/mg)N, N=l.ll, w=l.50 cm/day, D5=1.20 cm2/day,
ROH=3.00 g/cm3, C0 =10 mg/L, H=5 cm)
20 Co=20mg/L
15
10 Co=lO mg/L
5 C0 =5 mg/L
0 10 20 30 40 50 60
Time {days}
Figure 3.10 Effect of Influent Concentration (C0 ) on the Breakthrough Curve (K=4.26 mg/g(L/mg)N, N=l.ll, w=l.50 cm/day, D5=1.20 cm2/day, a 5=0, a 6=1.0,
ROH=3.00 g/cm3, H=5 cm)
120
70
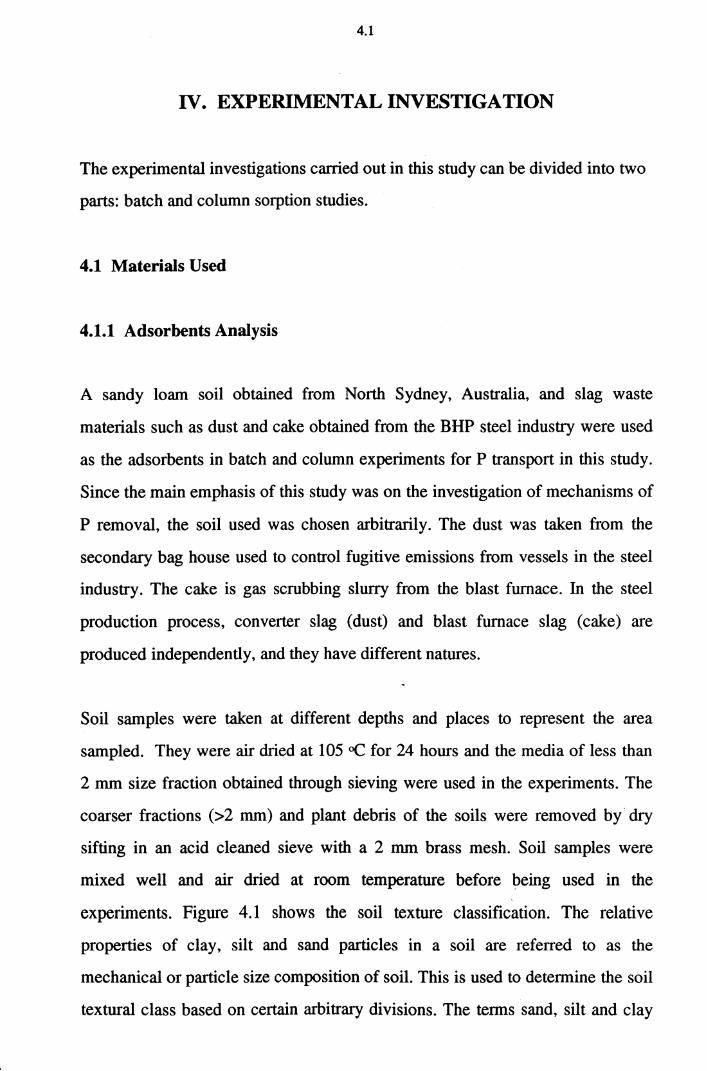
4.1
IV. EXPERIMENTAL INVESTIGATION
The experimental investigations carried out in this study can be divided into two
parts: batch and column sorption studies.
4.1 Materials Used
4.1.1 Adsorbents Analysis
A sandy loam soil obtained from North Sydney, Australia, and slag waste
materials such as dust and cake obtained from the BHP steel industry were used
as the adsorbents in batch and column experiments for P transport in this study.
Since the main emphasis of this study was on the investigation of mechanisms of
P removal, the soil used was chosen arbitrarily. The dust was taken from the
secondary bag house used to control fugitive emissions from vessels in the steel
industry. The cake is gas scrubbing slurry from the blast furnace. In the steel
production process, converter slag (dust) and blast furnace slag (cake) are
produced independently, and they have different natures.
Soil samples were taken at different depths and places to represent the area
sampled. They were air dried at 105 oC for 24 hours and the media of less than
2 mm size fraction obtained through sieving were used in the experiments. The
coarser fractions (>2 mm) and plant debris of the soils were removed by· dry
sifting in an acid cleaned sieve with a 2 mm brass mesh. Soil samples were
mixed well and air dried at room temperature before being used in the
experiments. Figure 4.1 shows the soil texture classification. The relative
properties of clay, silt and sand particles in a soil are referred to as the
mechanical or particle size composition of soil. This is used to determine the soil
textural class based on certain arbitrary divisions. The terms sand, silt and clay
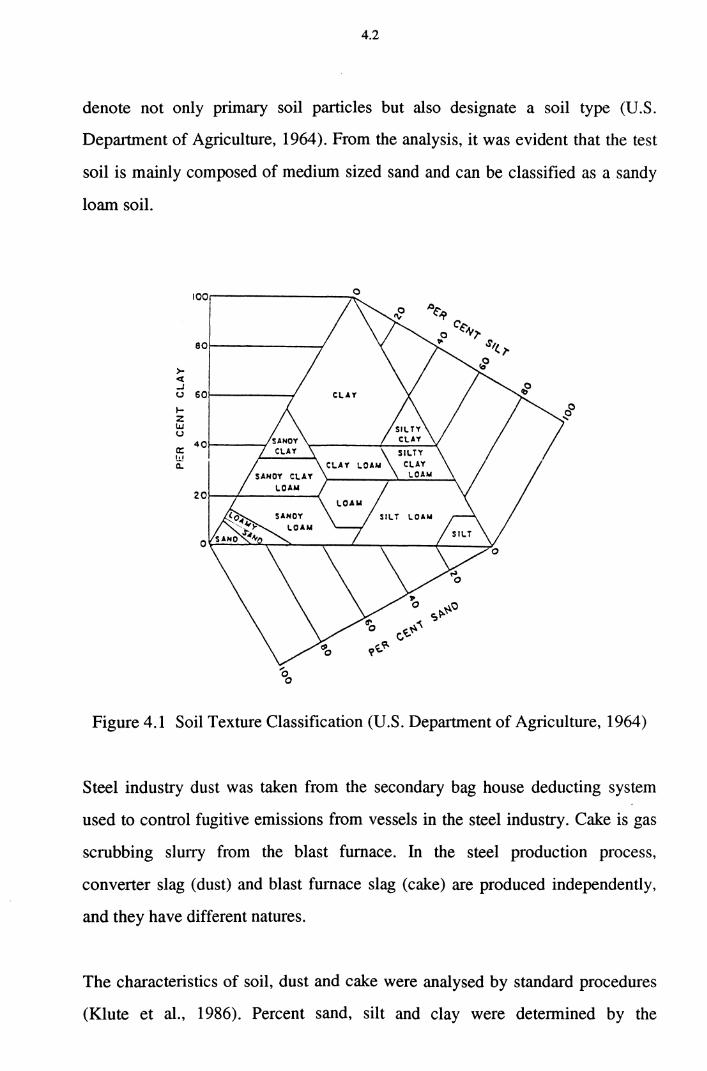
4.2
denote not only primary soil particles but also designate a soil type (U.S.
Department of Agriculture, 1964). From the analysis, it was evident that the test
soil is mainly composed of medium sized sand and can be classified as a sandy
loam soil.
100 .0~
"i'C':
0 ~"'_,. 80 ~ .s,l.. }"
>- ~ et ..J u 60
I-z \JJ u
a:: 40 I~
a..
20
Figure 4.1 Soil Texture Classification (U .S. Department of Agriculture, 1964)
Steel industry dust was taken from the secondary bag house deducting system
used to control fugitive emissions from vessels in the steel industry. Cake is gas
scrubbing slurry from the blast furnace. In the steel production process,
converter slag (dust) and blast furnace slag (cake) are produced independently,
and they have different natures.
The characteristics of soil, dust and cake were analysed by standard procedures
(Klute et al., 1986). Percent sand, silt and clay were determined by the
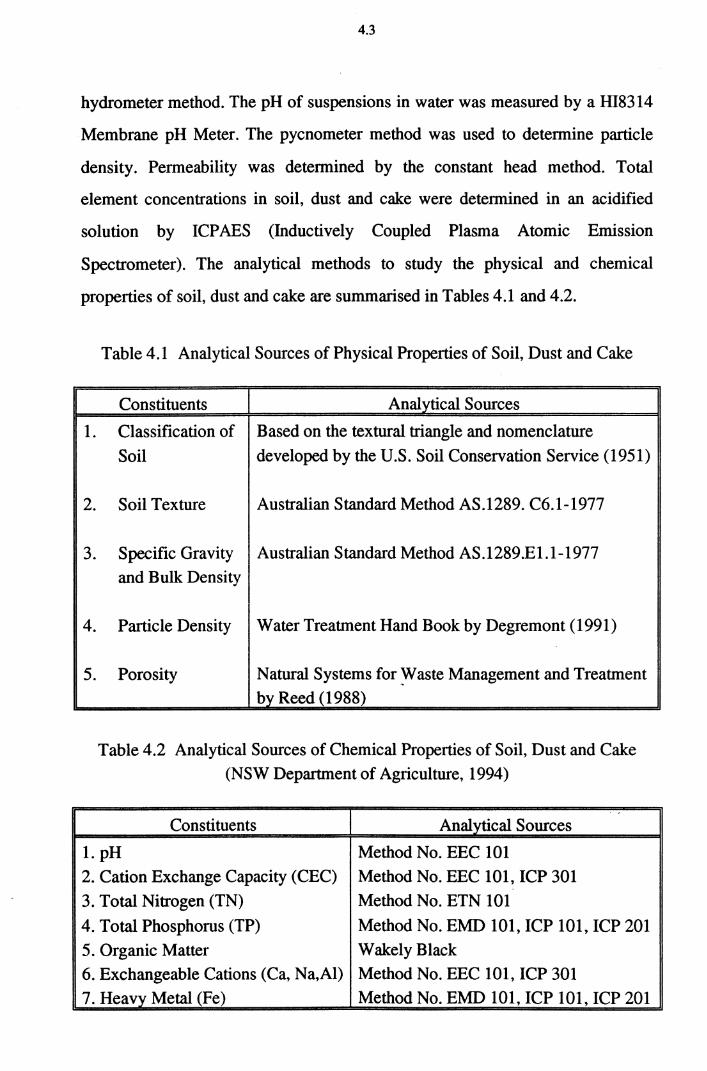
4.3
hydrometer method. The pH of suspensions in water was measured by a HI8314
Membrane pH Meter. The pycnometer method was used to determine particle
density. Permeability was determined by the constant head method. Total
element concentrations in soil, dust and cake were determined in an acidified
solution by ICPAES (Inductively Coupled Plasma Atomic Emission
Spectrometer). The analytical methods to study the physical and chemical
properties of soil, dust and cake are summarised in Tables 4.1 and 4.2.
Table 4.1 Analytical Sources of Physical Properties of Soil, Dust and Cake
Constituents Analytical Sources
1. Classification of Based on the textural triangle and nomenclature
Soil developed by the U.S. Soil Conservation Service (1951)
2. Soil Texture Australian Standard Method AS.1289. C6.1-1977
3. Specific Gravity Australian Standard Method AS.1289.E1.1-1977 and Bulk Density
4. Particle Density Water Treatment Hand Book by Degremont (1991)
5. Porosity Natural Systems for Y'faste Management and Treatment by Reed (1988)
Table 4.2 Analytical Sources of Chemical Properties of Soil, Dust and Cake
(NSW Department of Agriculture, 1994)
.. Constituents Analytical Sources
1. pH Method No. EEC 101
2. Cation Exchange Capacity (CEC) Method No. EEC 101, ICP 301
3. Total Nitrogen (TN) Method No. ETN 101
4. Total Phosphorus (TP) Method No. EMD 101, ICP 101, ICP 201
5. Organic Matter Wakely Black
6. Exchangeable Cations (Ca, Na,Al) Method No. EEC 101, ICP 301
7. Heavy_ Metal (Fe) Method No. EMD 101, ICP 101, ICP 201
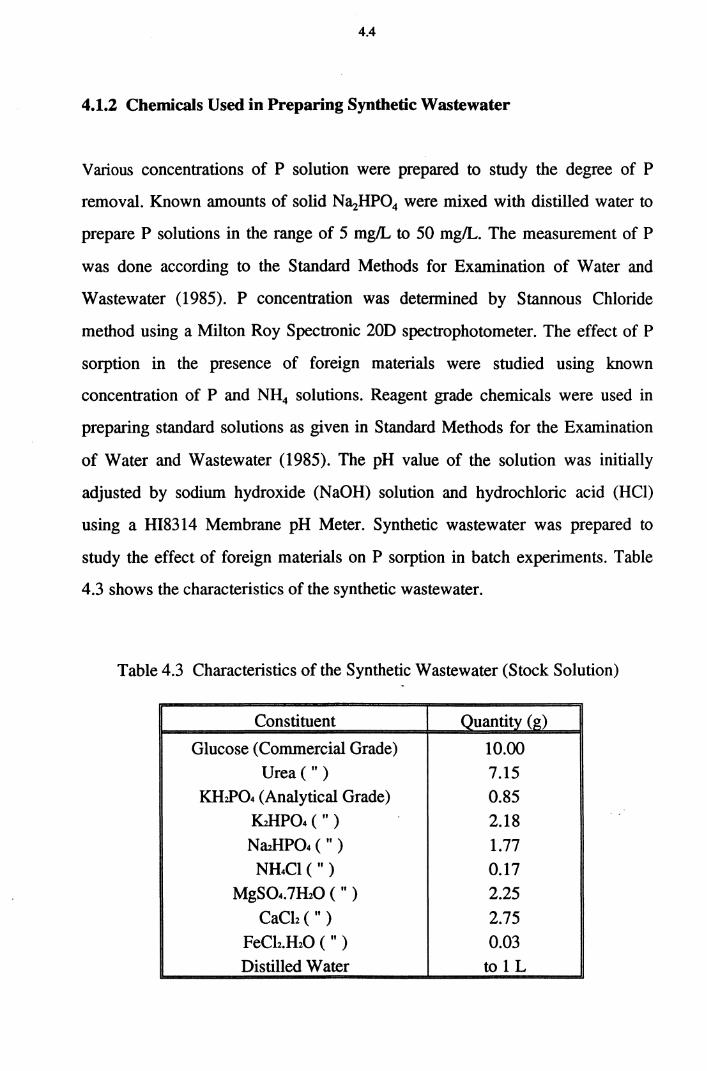
4.4
4.1.2 Chemicals Used in Preparing Synthetic Wastewater
Various concentrations of P solution were prepared to study the degree of P
removal. Known amounts of solid N3.zHP04 were mixed with distilled water to
prepare P solutions in the range of 5 mg/L to 50 mg/L. The measurement of P
was done according to the Standard Methods for Examination of Water and
Wastewater (1985). P concentration was determined by Stannous Chloride
method using a Milton Roy Spectronic 20D spectrophotometer. The effect of P
sorption in the presence of foreign materials were studied using known
concentration of P and NH4 solutions. Reagent grade chemicals were used in
preparing standard solutions as given in Standard Methods for the Examination
of Water and Wastewater (1985). The pH value of the solution was initially
adjusted by sodium hydroxide (NaOH) solution and hydrochloric acid (HCl)
using a HI8314 Membrane pH Meter. Synthetic wastewater was prepared to
study the effect of foreign materials on P sorption in batch experiments. Table
4.3 shows the characteristics of the synthetic wastewater.
Table 4.3 Characteristics of the Synthetic Wastewater (Stock Solution)
Constituent Quantity (g)
Glucose (Commercial Grade) 10.00 Urea ( ") 7.15
KHJ>04 (Analytical Grade) 0.85 ~HP04 ( ") 2.18 NaJIP04 ( " ) 1.77
NH4Cl ( ") 0.17 MgS04.7HzO ( ") 2.25
CaClz ( ") 2.75 FeClz.HzO ( " ) 0.03 Distilled Water to 1 L
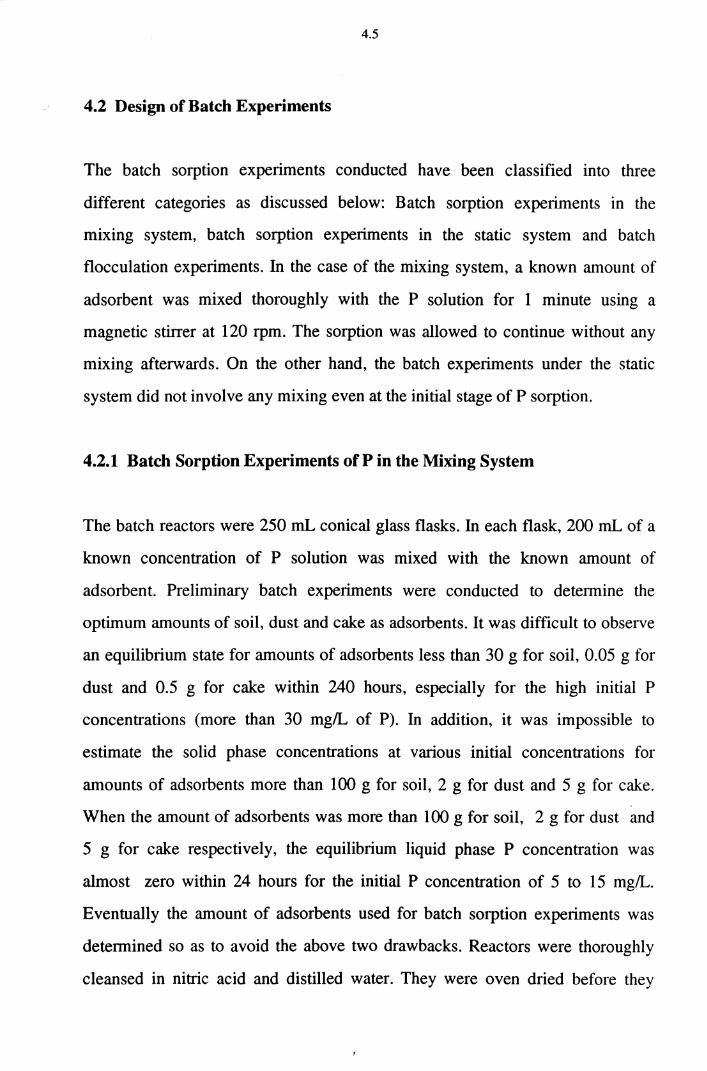
4.5
4.2 Design of Batch Experiments
The batch sorption experiments conducted have been classified into three
different categories as discussed below: Batch sorption experiments in the
mixing system, batch sorption experiments in the static system and batch
flocculation experiments. In the case of the mixing system, a known amount of
adsorbent was mixed thoroughly with the P solution for 1 minute using a
magnetic stirrer at 120 rpm. The sorption was allowed to continue without any
mixing afterwards. On the other hand, the batch experiments under the static
system did not involve any mixing even at the initial stage of P sorption.
4.2.1 Batch Sorption Experiments of Pin the Mixing System
The batch reactors were 250 mL conical glass flasks. In each flask, 200 mL of a
known concentration of P solution was mixed with the known amount of
adsorbent. Preliminary batch experiments were conducted to determine the
optimum amounts of soil, dust and cake as adsorbents. It was difficult to observe
an equilibrium state for amounts of adsorbents less than 30 g for soil, 0.05 g for
dust and 0.5 g for cake within 240 hours, especially for the high initial P
concentrations (more than 30 mg/L of P). In addition, it was impossible to
estimate the solid phase concentrations at various initial concentrations for
amounts of adsorbents more than 100 g for soil, 2 g for dust and 5 g for cake.
When the amount of adsorbents was more than 100 g for soil, 2 g for dust and
5 g for cake respectively, the equilibrium liquid phase P concentration was
almost zero within 24 hours for the initial P concentration of 5 to 15 mg/L.
Eventually the amount of adsorbents used for batch sorption experiments was
determined so as to avoid the above two drawbacks. Reactors were thoroughly
cleansed in nitric acid and distilled water. They were oven dried before they
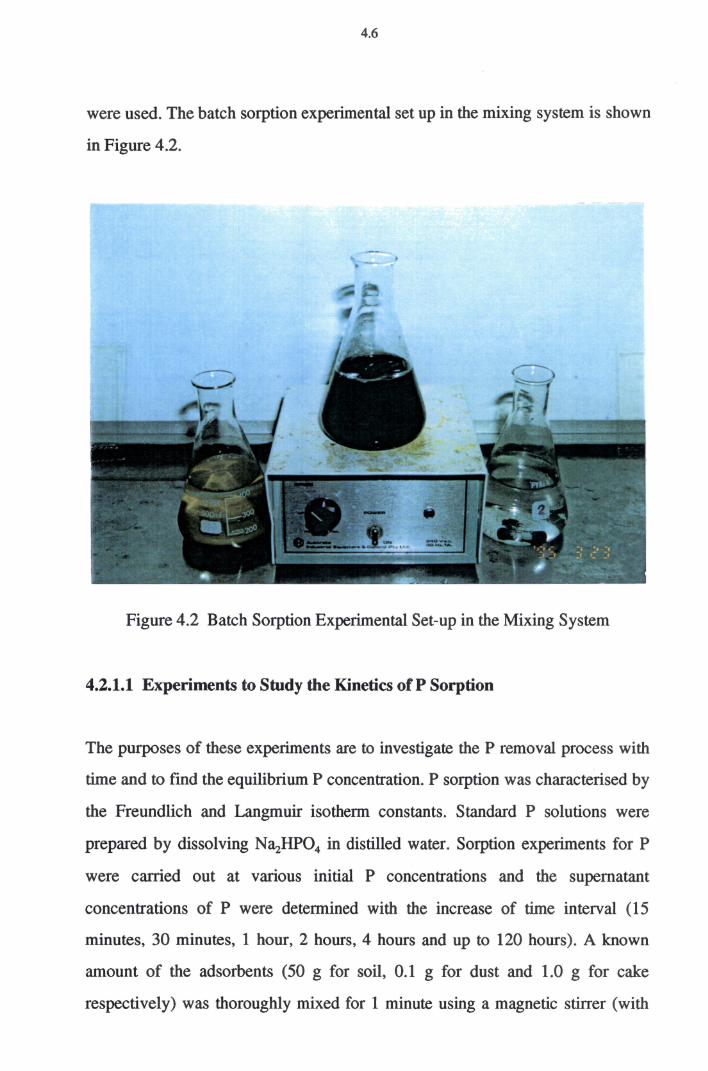
4.6
were used. The batch sorption experimental set up in the mixing system is shown
in Figure 4.2.
Figure 4.2 Batch Sorption Experimental Set-up in the Mixing System
4.2.1.1 Experiments to Study the Kinetics of P Sorption
The purposes of these experiments are to investigate the P removal process with
time and to find the equilibrium P concentration. P sorption was characterised by
the Freundlich and Langmuir isotherm constants. Standard P solutions were
prepared by dissolving N~HP04 in distilled water. Sorption experiments for P
were carried out at various initial P concentrations and the supernatant
concentrations of P were determined with the increase of time interval (15
minutes, 30 minutes, 1 hour, 2 hours, 4 hours and up to 120 hours). A known
amount of the adsorbents (50 g for soil, 0.1 g for dust and 1.0 g for cake
respectively) was thoroughly mixed for 1 minute using a magnetic stirrer (with
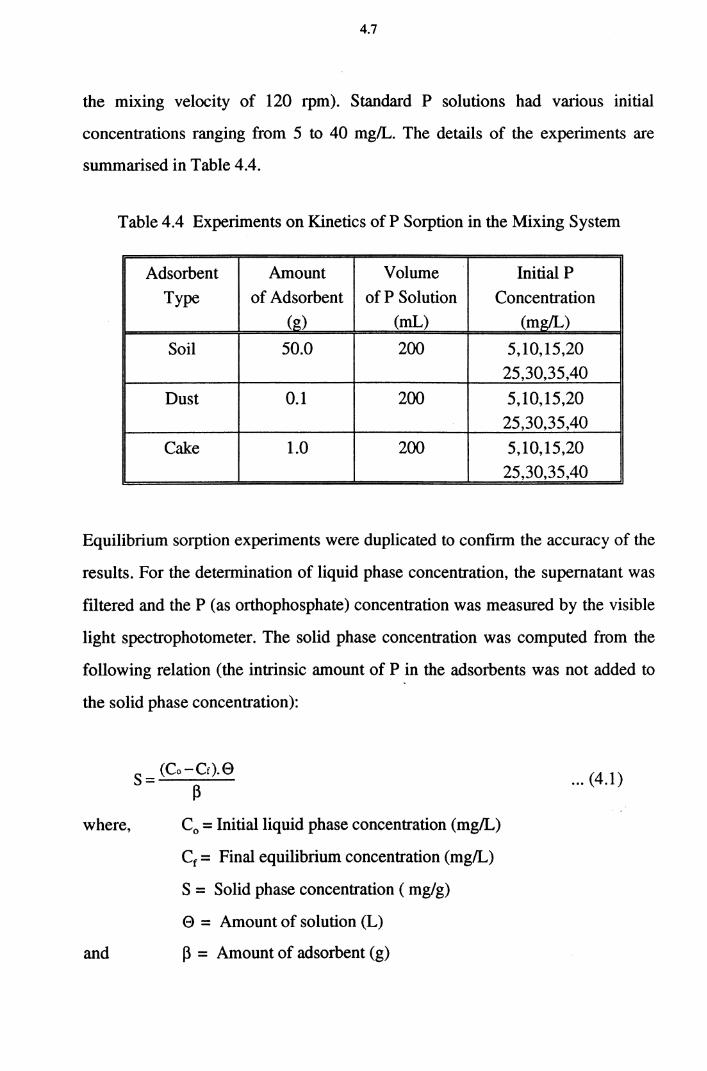
4.7
the miXmg velocity of 120 rpm). Standard P solutions had vanous initial
concentrations ranging from 5 to 40 mg/L. The details of the experiments are
summarised in Table 4.4.
Table 4.4 Experiments on Kinetics of P Sorption in the Mixing System
Adsorbent Amount Volume Initial P
Type of Adsorbent of P Solution Concentration (g) (mL) (mg/L)
Soil 50.0 200 5,10,15,20
25,30,35,40
Dust 0.1 200 5,10,15,20
25,30,35,40
Cake 1.0 200 5, 10,15,20
25,30,35,40
Equilibrium sorption experiments were duplicated to confirm the accuracy of the
results. For the determination of liquid phase concentration, the supernatant was
filtered and the P (as orthophosphate) concentration was measured by the visible
light spectrophotometer. The solid phase concentration was computed from the
following relation (the intrinsic amount of Pin the adsorbents was not added to
the solid phase concentration):
where,
S= (Co-Cr).9
~
C0 =Initial liquid phase concentration (mg/L)
Cr = Final equilibrium concentration (mg/L)
S = Solid phase concentration ( mg/g)
e = Amount of solution (L)
and ~ = Amount of adsorbent (g)
... (4.1)
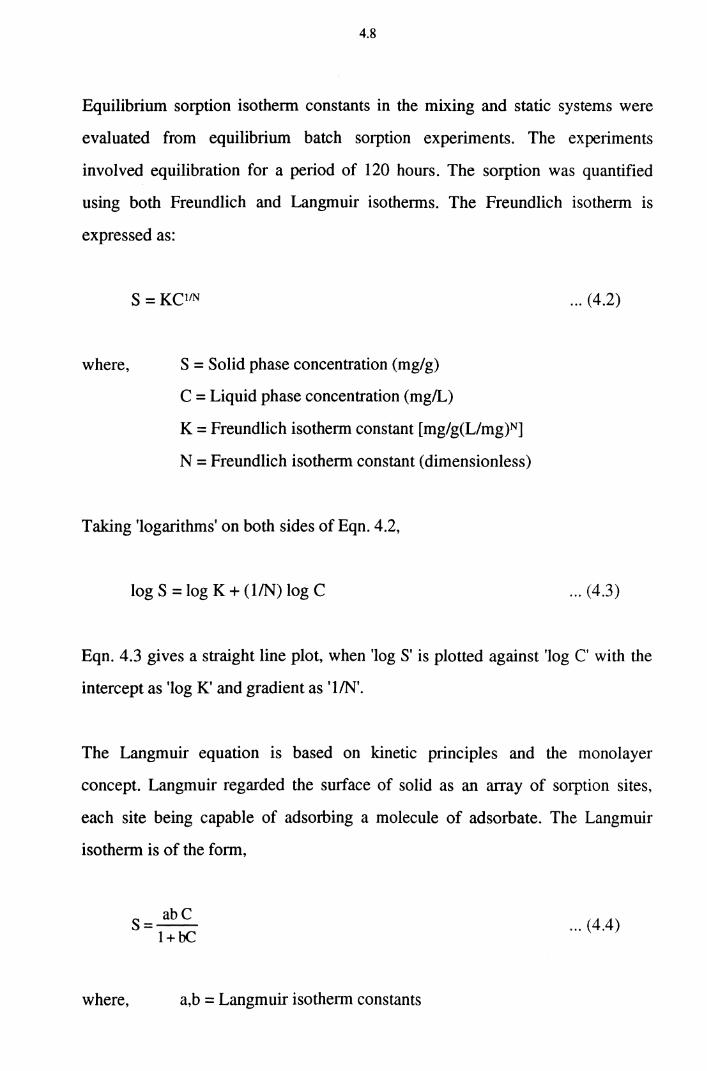
4.8
Equilibrium sorption isotherm constants in the mixing and static systems were
evaluated from equilibrium batch sorption experiments. The experiments
involved equilibration for a period of 120 hours. The sorption was quantified
using both Freundlich and Langmuir isotherms. The Freundlich isotherm is
expressed as:
where,
s = KCIIN
S = Solid phase concentration (mg/g)
C =Liquid phase concentration (mg!L)
K = Freundlich isotherm constant [mg/g(L/mg)N]
N = Freundlich isotherm constant (dimensionless)
Taking 'logarithms' on both sides of Eqn. 4.2,
log S = log K + (1/N) log C
... (4.2)
... (4.3)
Eqn. 4.3 gives a straight line plot, when 'log S' is plotted against 'log C' with the
intercept as 'log K' and gradient as '1/N'.
The Langmuir equation is based on kinetic principles and the monolayer
concept. Langmuir regarded the sutface of solid as an array of sorption sites,
each site being capable of adsorbing a molecule of adsorbate. The Langmuir
isotherm is of the form,
where,
S= abC l+bC
a,b = Langmuir isotherm constants
... (4.4)
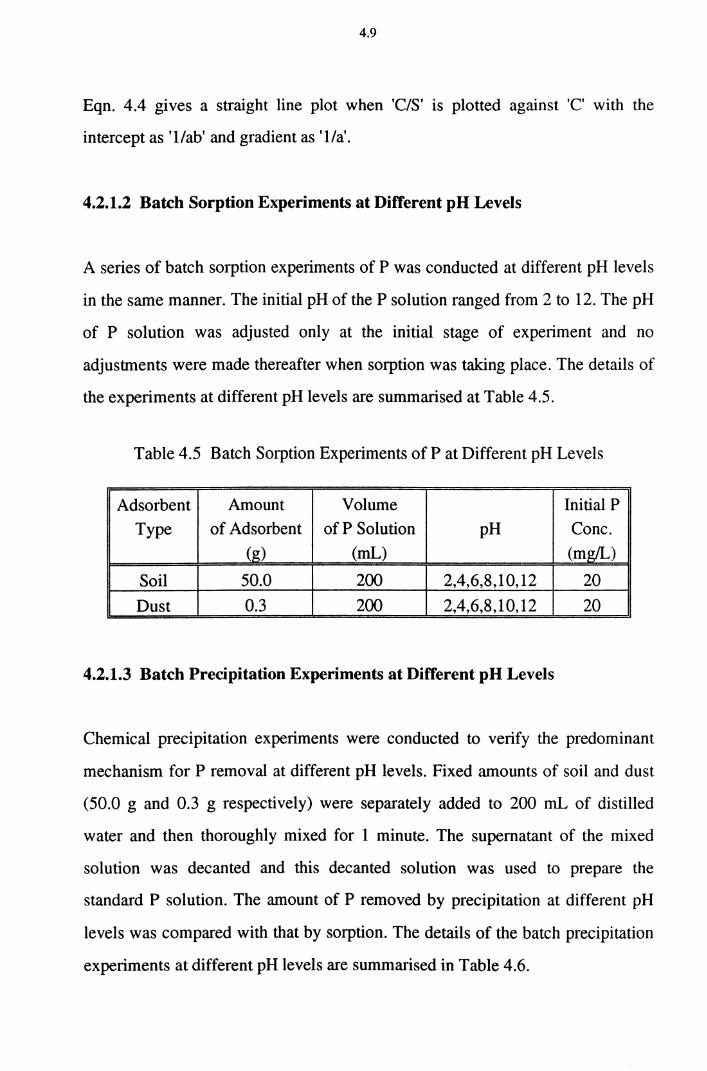
4.9
Eqn. 4.4 gives a straight line plot when 'C/S' is plotted against 'C' with the
intercept as '1/ab' and gradient as '1/a'.
4.2.1.2 Batch Sorption Experiments at Different pH Levels
A series of batch sorption experiments of P was conducted at different pH levels
in the same manner. The initial pH of the P solution ranged from 2 to 12. The pH
of P solution was adjusted only at the initial stage of experiment and no
adjustments were made thereafter when sorption was taking place. The details of
the experiments at different pH levels are summarised at Table 4.5.
Table 4.5 Batch Sorption Experiments of P at Different pH Levels
Adsorbent Amount Volume Initial P
Type of Adsorbent of P Solution pH Cone. (g) (mL) (mgf!.,)
Soil 50.0 200 2,4,6,8,1 0,12 20
Dust 0.3 200 2,4,6,8,10,12 20
4.2.1.3 Batch Precipitation Experiments at Different pH Levels
Chemical precipitation experiments were conducted to verify the predominant
mechanism for P removal at different pH levels. Fixed amounts of soil and dust
(50.0 g and 0.3 g respectively) were separately added to 200 mL of distilled
water and then thoroughly mixed for 1 minute. The supematant of the mixed
solution was decanted and this decanted solution was used to prepare the
standard P solution. The amount of P removed by precipitation at different pH
levels was compared with that by sorption. The details of the batch precipitation
experiments at different pH levels are summarised in Table 4.6.
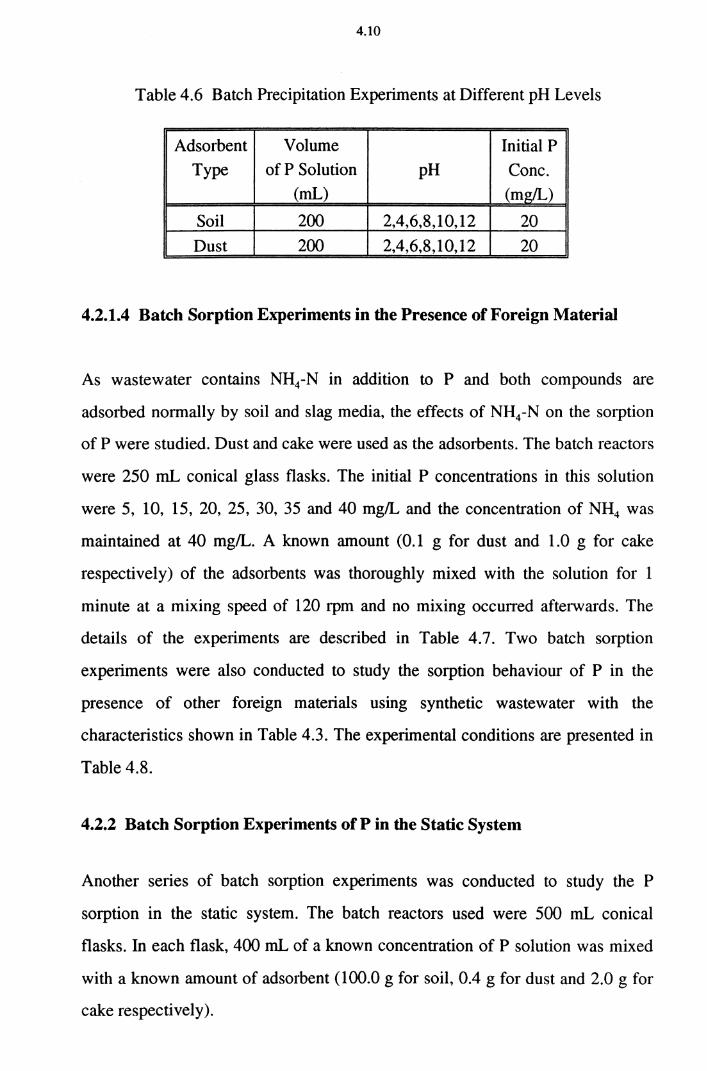
4.10
Table 4.6 Batch Precipitation Experiments at Different pH Levels
Adsorbent Volume Initial P Type of P Solution pH Cone.
(mL) (mg/L)
Soil 200 2,4,6,8,10,12 20
Dust 200 2,4,6,8,10,12 20
4.2.1.4 Batch Sorption Experiments in the Presence of Foreign Material
As wastewater contains NH4-N in addition to P and both compounds are
adsorbed normally by soil and slag media, the effects of NH4-N on the sorption
of P were studied. Dust and cake were used as the adsorbents. The batch reactors
were 250 mL conical glass flasks. The initial P concentrations in this solution
were 5, 10, 15, 20, 25, 30, 35 and 40 mg/L and the concentration of NH4 was
maintained at 40 mg/L. A known amount (0.1 g for dust and 1.0 g for cake
respectively) of the adsorbents was thoroughly mixed with the solution for 1
minute at a mixing speed of 120 rpm and no mixing occurred afterwards. The
details of the experiments are described in Table 4.7. Two batch sorption
experiments were also conducted to study the sorption behaviour of P in the
presence of other foreign materials using synthetic wastewater with the
characteristics shown in Table 4.3. The experimental conditions are presented in
Table 4.8.
4.2.2 Batch Sorption Experiments of P in the Static System
Another series of batch sorption experiments was conducted to study the P
sorption in the static system. The batch reactors used were 500 mL conical
flasks. In each flask, 400 mL of a known concentration of P solution was mixed
with a known amount of adsorbent (100.0 g for soil, 0.4 g for dust and 2.0 g for
cake respectively).
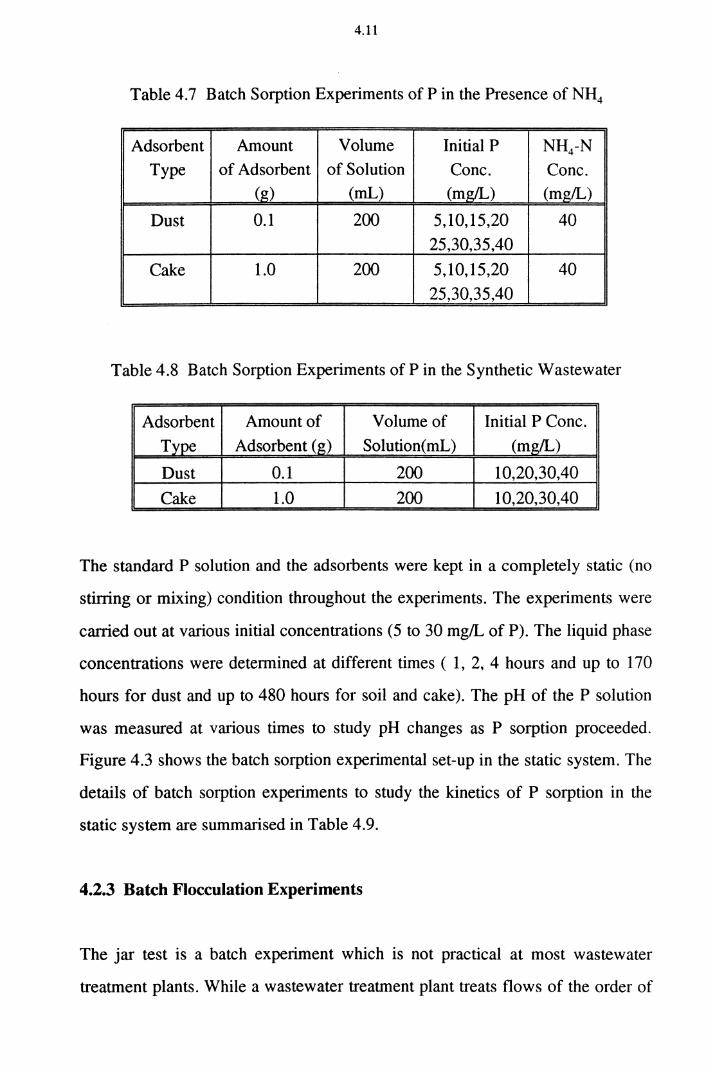
4.11
Table 4.7 Batch Sorption Experiments of Pin the Presence of NH4
Adsorbent Amount Volume Initial P NH4-N Type of Adsorbent of Solution Cone. Cone.
(g) (mL) (m_gfJ,.) (mg/L)
Dust 0.1 200 5,10,15,20 40 25,30,35,40
Cake 1.0 200 5,10,15,20 40
25,30,35,40
Table 4.8 Batch Sorption Experiments of Pin the Synthetic Wastewater
Adsorbent Amount of Volume of Initial P Cone. Type Adsorbent (g) Solution(mL) (mg/L)
Dust 0.1 200 10,20,30,40
Cake 1.0 200 10,20,30,40
The standard P solution and the adsorbents were kept in a completely static (no
stirring or mixing) condition throughout the experiments. The experiments were
carried out at various initial concentrations (5 to 30 mg/L of P). The liquid phase
concentrations were determined at different times ( 1, 2, 4 hours and up to 170
hours for dust and up to 480 hours for soil and cake). The pH of the P solution
was measured at various times to study pH changes as P sorption proceeded.
Figure 4.3 shows the batch sorption experimental set-up in the static system. The
details of batch sorption experiments to study the kinetics of P sorption in the
static system are summarised in Table 4.9.
4.2.3 Batch Flocculation Experiments
The jar test is a batch experiment which is not practical at most wastewater
treatment plants. While a wastewater treatment plant treats flows of the order of
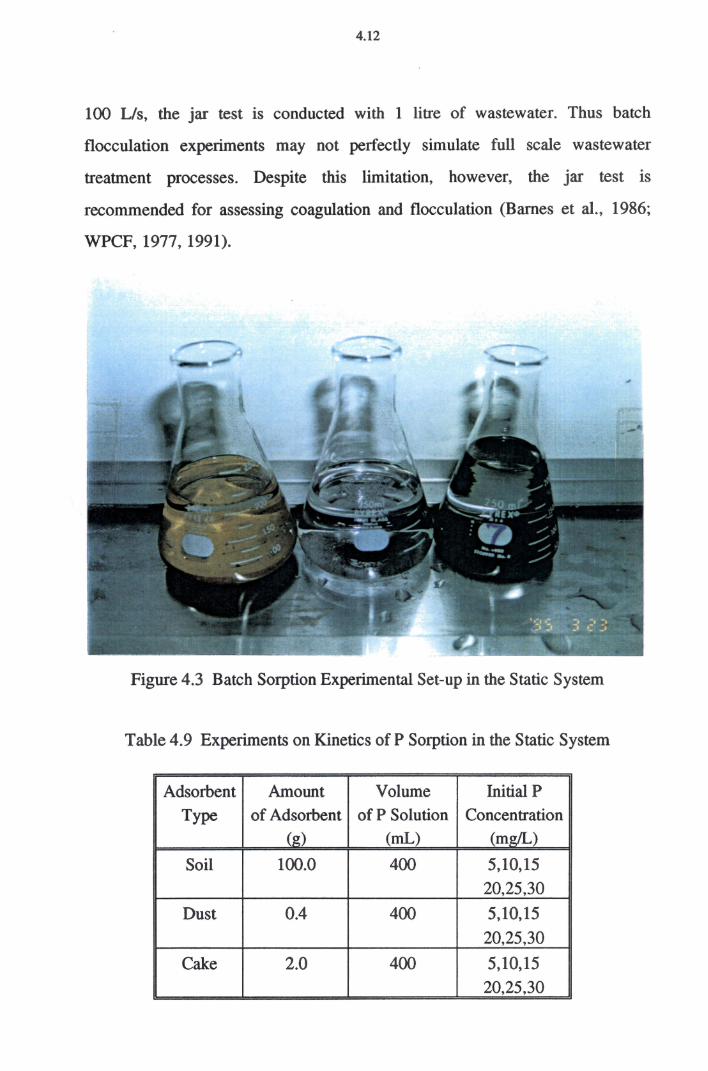
4.12
100 L/s, the jar test is conducted with 1 litre of wastewater. Thus batch
flocculation experiments may not perfectly simulate full scale wastewater
treatment processes. Despite this limitation, however, the jar test is
recommended for assessing coagulation and flocculation (Barnes et al., 1986;
WPCF, 1977, 1991).
Figure 4.3 Batch Sorption Experimental Set-up in the Static System
Table 4.9 Experiments on Kinetics of P Sorption in the Static System
Adsorbent Amount Volume Initial P Type of Adsorbent of P Solution Concentration
(g) (mL) (mg/L)
Soil 100.0 400 5,10,15 20,25,30
Dust 0.4 400 5,10,15
20,25,30
Cake 2.0 400 5,10,15 20,25,30
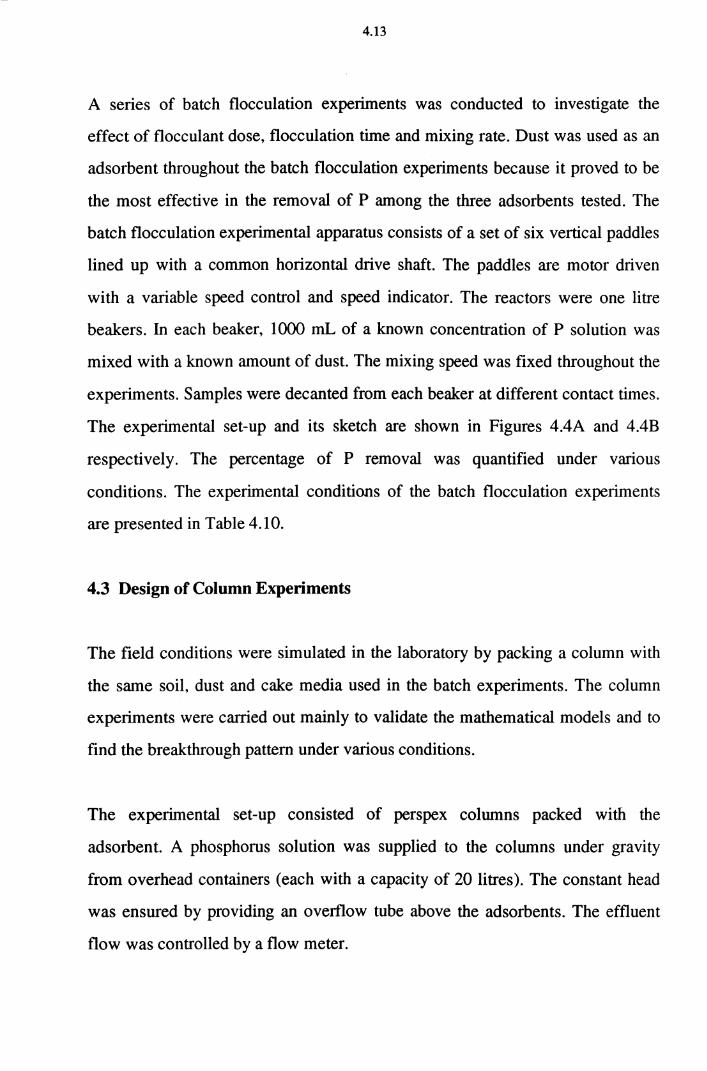
4.13
A senes of batch flocculation experiments was conducted to investigate the
effect of flocculant dose, flocculation time and mixing rate. Dust was used as an
adsorbent throughout the batch flocculation experiments because it proved to be
the most effective in the removal of P among the three adsorbents tested. The
batch flocculation experimental apparatus consists of a set of six vertical paddles
lined up with a common horizontal drive shaft. The paddles are motor driven
with a variable speed control and speed indicator. The reactors were one litre
beakers. In each beaker, 1000 mL of a known concentration of P solution was
mixed with a known amount of dust. The mixing speed was fixed throughout the
experiments. Samples were decanted from each beaker at different contact times.
The experimental set-up and its sketch are shown in Figures 4.4A and 4.4B
respectively. The percentage of P removal was quantified under various
conditions. The experimental conditions of the batch flocculation experiments
are presented in Table 4.1 0.
4.3 Design of Column Experiments
The field conditions were simulated in the laboratory by packing a column with
the same soil, dust and cake media used in the batch experiments. The column
experiments were carried out mainly to validate the mathematical models and to
find the breakthrough pattern under various conditions.
The experimental set-up consisted of perspex columns packed with the
adsorbent. A phosphorus solution was supplied to the columns under gravity
from overhead containers (each with a capacity of 20 litres). The constant head
was ensured by providing an overflow tube above the adsorbents. The effluent
flow was controlled by a flow meter.
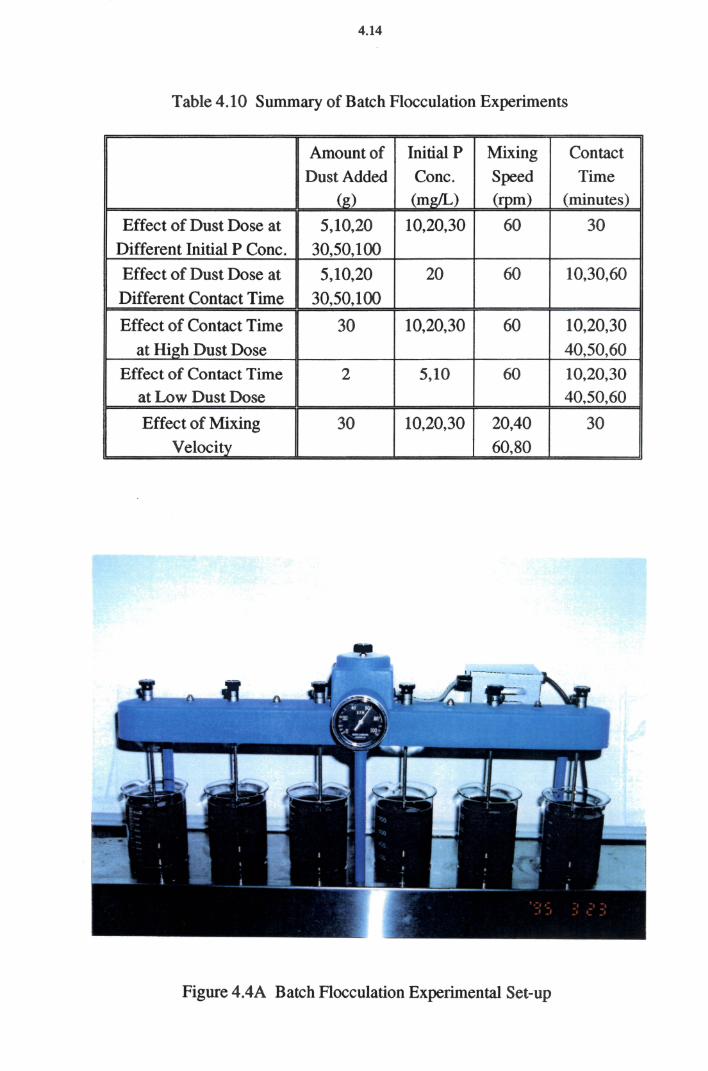
4.14
Table 4.10 Summary of Batch Flocculation Experiments
Amount of Initial P Mixing Contact
Dust Added Cone. Speed Time (g) (mg/L) (rpm) (minutes)
Effect of Dust Dose at 5,10,20 10,20,30 60 30
Different Initial P Cone. 30,50,100
Effect of Dust Dose at 5,10,20 20 60 10,30,60
Different Contact Time 30,50,100
Effect of Contact Time 30 10,20,30 60 10,20,30
at High Dust Dose 40,50,60
Effect of Contact Time 2 5,10 60 10,20,30 at Low Dust Dose 40,50,60
Effect of Mixing 30 10,20,30 20,40 30
Velocity 60,80
Figure 4.4A Batch Flocculation Experimental Set-up
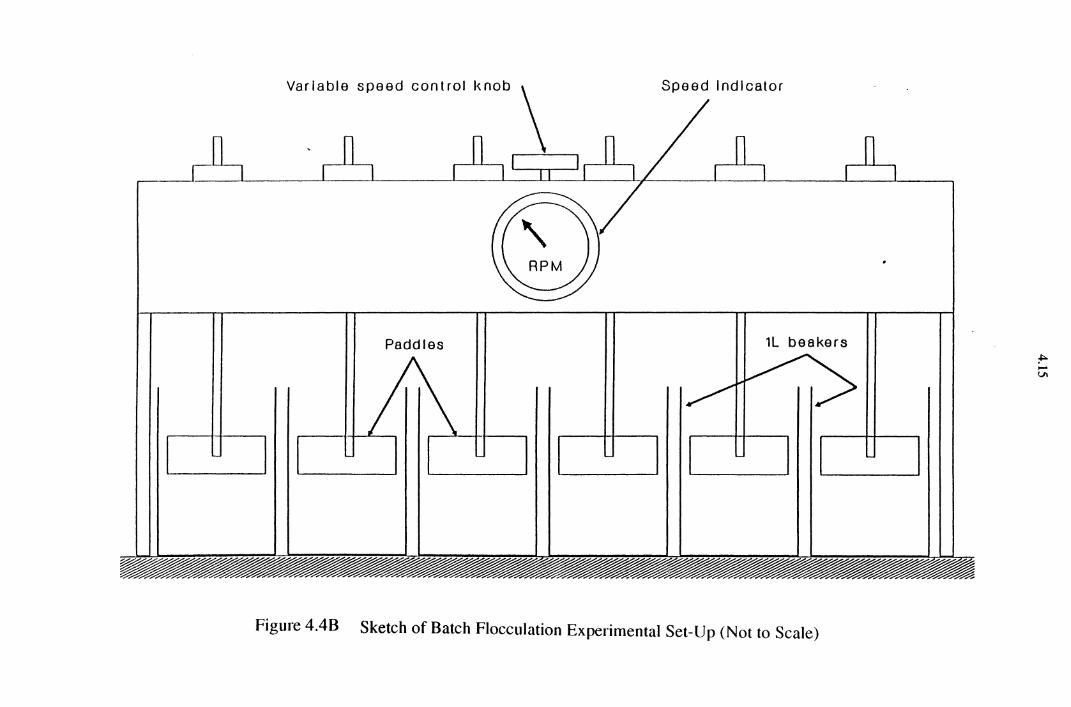
Speed Indicator
Paddles 1L beakers
Figure 4.48 Sketch of Batch Flocculation Experimental Set-Up (Not to Scale)
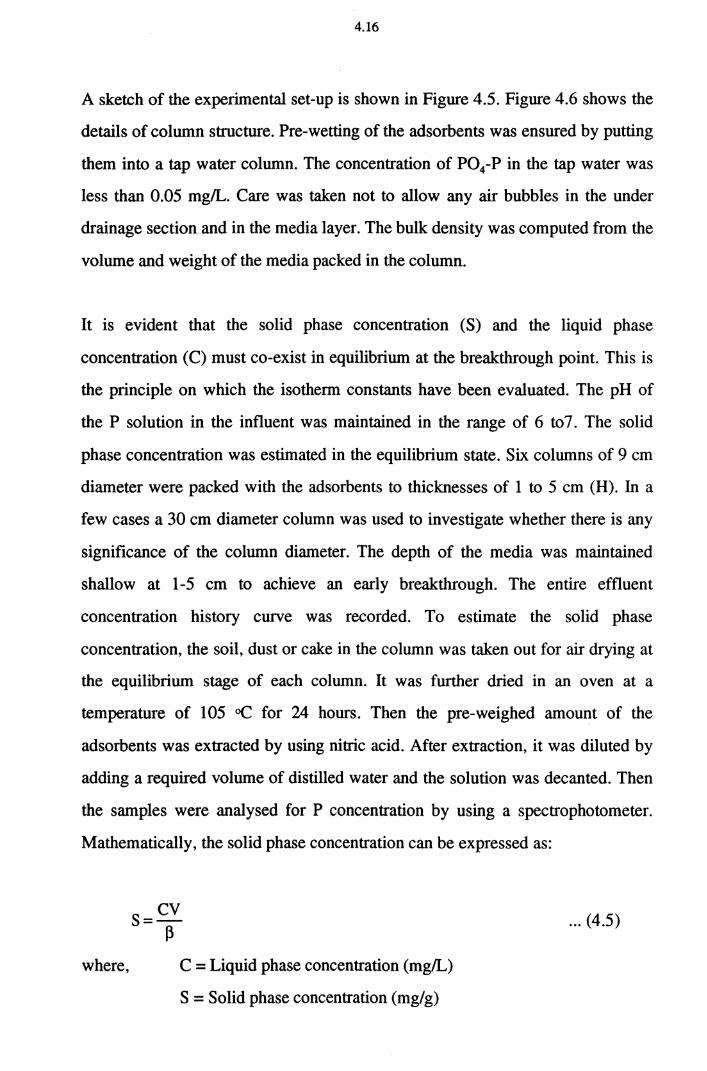
4.16
A sketch of the experimental set-up is shown in Figure 4.5. Figure 4.6 shows the
details of column structure. Pre-wetting of the adsorbents was ensured by putting
them into a tap water column. The concentration of P04-P in the tap water was
less than 0.05 mg/L. Care was taken not to allow any air bubbles in the under
drainage section and in the media layer. The bulk density was computed from the
volume and weight of the media packed in the column.
It is evident that the solid phase concentration (S) and the liquid phase
concentration (C) must co-exist in equilibrium at the breakthrough point. This is
the principle on which the isotherm constants have been evaluated. The pH of
the P solution in the influent was maintained in the range of 6 to7. The solid
phase concentration was estimated in the equilibrium state. Six columns of 9 cm
diameter were packed with the adsorbents to thicknesses of 1 to 5 cm (H). In a
few cases a 30 cm diameter column was used to investigate whether there is any
significance of the column diameter. The depth of the media was maintained
shallow at 1-5 cm to achieve an early breakthrough. The entire effluent
concentration history curve was recorded. To estimate the solid phase
concentration, the soil, dust or cake in the column was taken out for air drying at
the equilibrium stage of each column. It was further dried in an oven at a
temperature of 105 oC for 24 hours. Then the pre-weighed amount of the
adsorbents was extracted by using nitric acid. After extraction, it was diluted by
adding a required volume of distilled water and the solution was decanted. Then
the samples were analysed for P concentration by using a spectrophotometer.
Mathematically, the solid phase concentration can be expressed as:
where, C =Liquid phase concentration (mg!L)
S = Solid phase concentration (mg/g)
... (4.5)
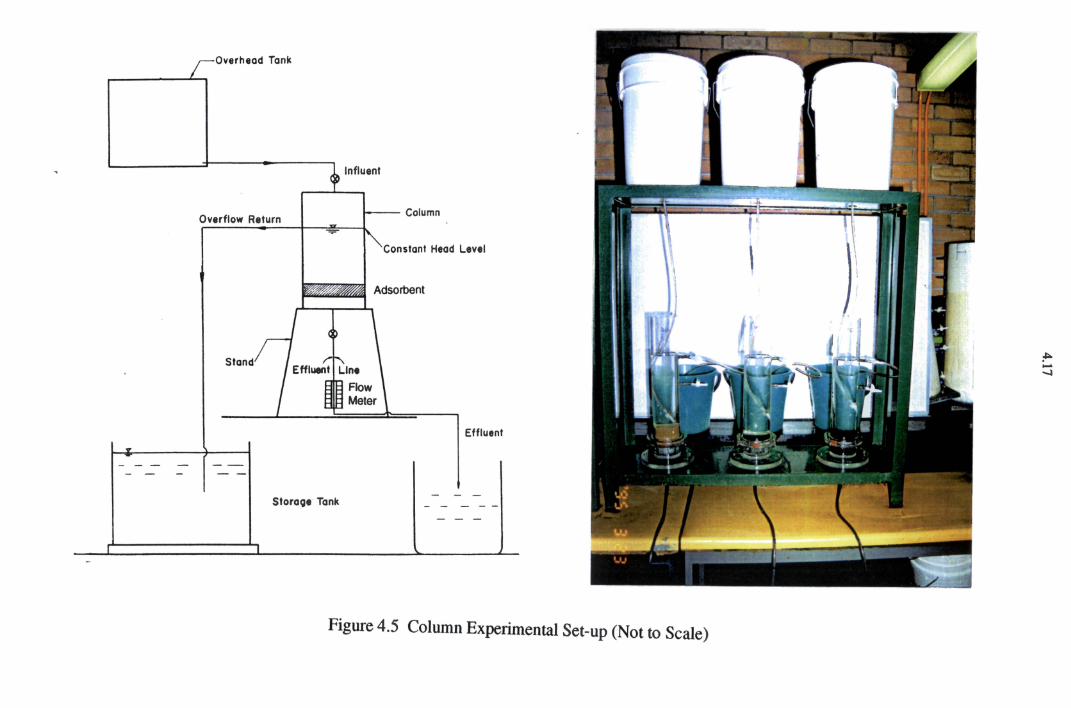
Overhead Tank
Influent
Overflow Return Column
Constant Head Level
Stand
Effluent
Storooe Tank
Figure 4.5 Column Experimental Set-up (Not to Scale)
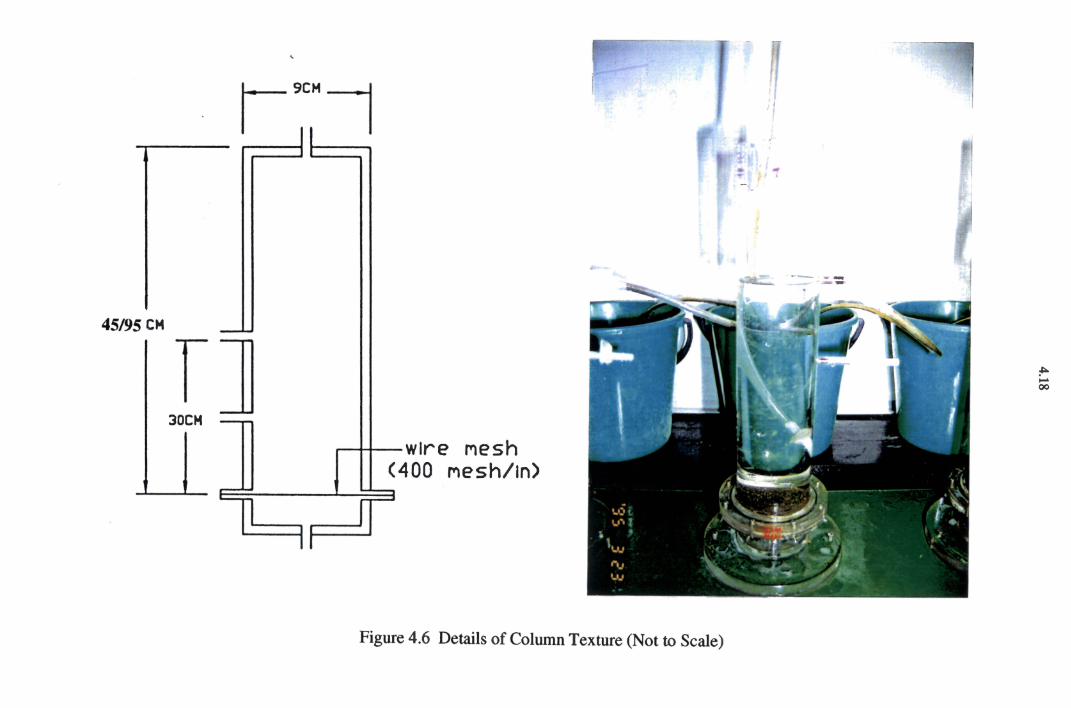
45195 CH
f] 30CH
....--t~-wlre Mesh <400 Mesh/In)
Figure 4.6 Details of Column Texture (Not to Scale)
!"--00
4.19
V = Volume of solution (L)
~ = Amount of the adsorbent (g)
4.3.1 Column Experiments with Soil
A series of four soil column experiments were conducted varying the influent
concentration, pore water velocity, adsorbent depth and the water level above the
soil. The influent P concentration ranged from 10 to 40 mg!L and the soil depth
was maintained at 5 cm of depth. It was difficult to maintain the velocities
exactly equal in all the columns. The pore water velocities reported are the
average values during the experimental run time. The pore water velocity range
studied was 1.53 to 5.14 cm/day. Columns of two different diameters (9 and 30
cm) were used to enable the collection samples of sufficient quantity within a
short time interval. Wire mesh ( 400 meshes/in) was placed below the adsorbent
to distribute effluents uniformly. Each column was flooded with a known
concentration of P solution. Forty litres of P-free water was infiltrated through
the soil column prior to the introduction of the P solution to ensure a uniform
compactness of soil. The effluent P concentration was measured till the effluent
concentration was equal to the influent P concentration.
Another series of column experiments were carried out at different pore water
velocities ( w) to investigate the effect of pore water velocity on P removal. Soil
depth and water level above the adsorbent were kept constant while pore water
velocitis were controlled by a flow meter.
A set of column experiments was also conducted varying the soil depth (1, 2, 3,
4 and 5 cm) to investigate the effect of soil depth on P removal. Water levels
above the soil medium and pore water velocities were varied at different soil
depths.
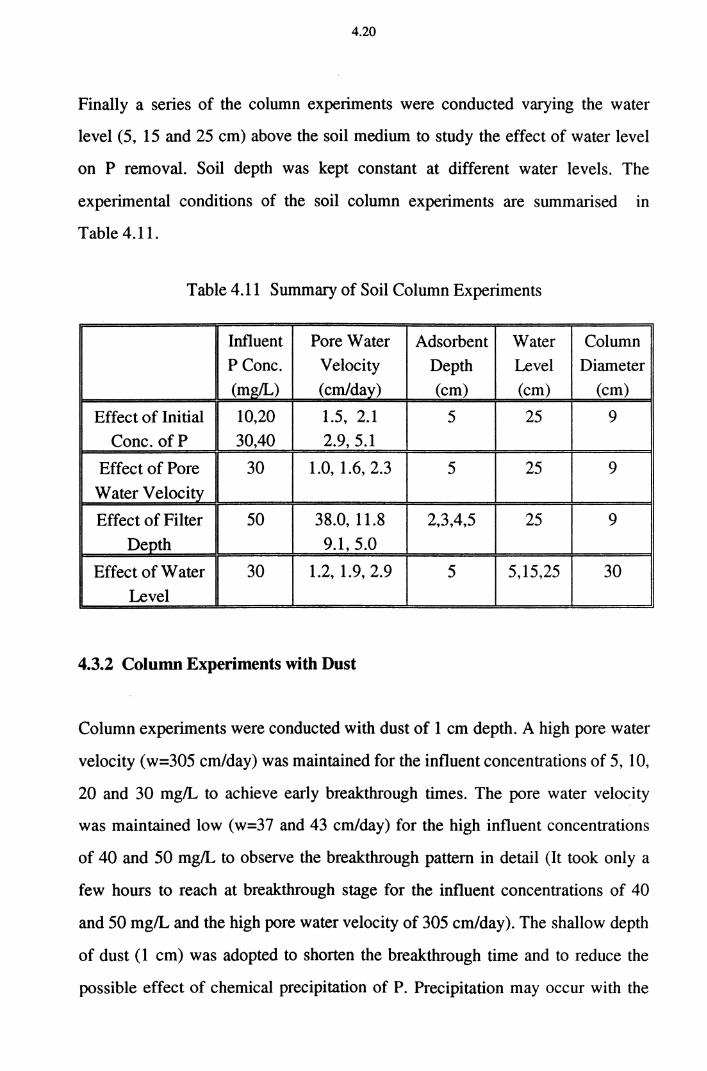
4.20
Finally a series of the column experiments were conducted varying the water
level (5, 15 and 25 cm) above the soil medium to study the effect of water level
on P removal. Soil depth was kept constant at different water levels. The
experimental conditions of the soil column experiments are summarised in
Table 4.11.
Table 4.11 Summary of Soil Column Experiments
Influent Pore Water Adsorbent Water Column
P Cone. Velocity Depth Level Diameter (mg/L) (cm/day) (cm) (cm) (cm)
Effect of Initial 10,20 1.5, 2.1 5 25 9
Cone. ofP 30,40 2.9, 5.1
Effect of Pore 30 1.0, 1.6, 2.3 5 25 9
Water Velocity
Effect of Filter 50 38.0, 11.8 2,3,4,5 25 9
Depth 9.1, 5.0
Effect of Water 30 1.2, 1.9, 2.9 5 5,15,25 30
Level
4.3.2 Column Experiments with Dust
Column experiments were conducted with dust of 1 cm depth. A high pore water
velocity (w=305 cm/day) was maintained for the influent concentrations of 5, 10,
20 and 30 mg/L to achieve early breakthrough times. The pore water velocity
was maintained low (w=37 and 43 cm/day) for the high influent concentrations
of 40 and 50 mg/L to observe the breakthrough pattern in detail (It took only a
few hours to reach at breakthrough stage for the influent concentrations of 40
and 50 mg/L and the high pore water velocity of 305 cm/day). The shallow depth
of dust ( 1 cm) was adopted to shorten the breakthrough time and to reduce the
possible effect of chemical precipitation of P. Precipitation may occur with the
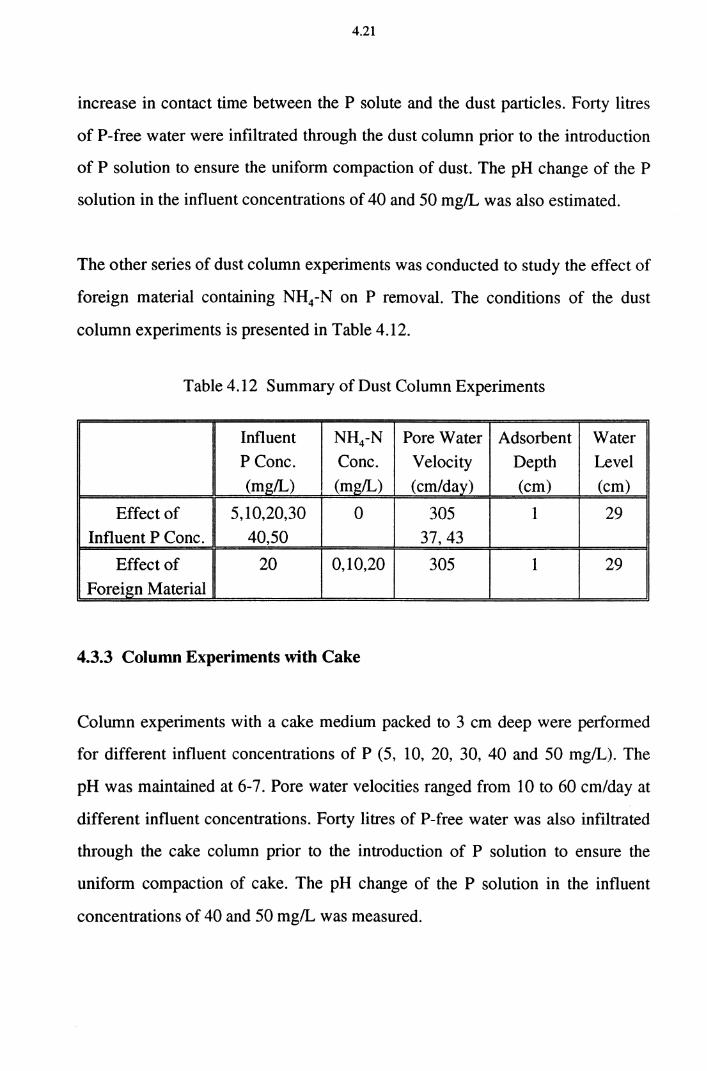
4.21
increase in contact time between the P solute and the dust particles. Forty litres
of P-free water were infiltrated through the dust column prior to the introduction
of P solution to ensure the uniform compaction of dust. The pH change of the P
solution in the influent concentrations of 40 and 50 mg/L was also estimated.
The other series of dust column experiments was conducted to study the effect of
foreign material containing NH4-N on P removal. The conditions of the dust
column experiments is presented in Table 4.12.
Table 4.12 Summary of Dust Column Experiments
Influent NH4-N Pore Water Adsorbent Water P Cone. Cone. Velocity Depth Level (mg/L) (mg/L) (cm/day) (cm) (cm)
Effect of 5,10,20,30 0 305 1 29 Influent P Cone. 40,50 37,43
Effect of 20 0,10,20 305 1 29
Foreign Material
4.3.3 Column Experiments with Cake
Column experiments with a cake medium packed to 3 cm deep were performed
for different influent concentrations of P (5, 10, 20, 30, 40 and 50 mg/L). The
pH was maintained at 6-7. Pore water velocities ranged from 10 to 60 cm/day at
different influent concentrations. Forty litres of P-free water was also infiltrated
through the cake column prior to the introduction of P solution to ensure the
uniform compaction of cake. The pH change of the P solution in the influent
concentrations of 40 and 50 mg/L was measured.
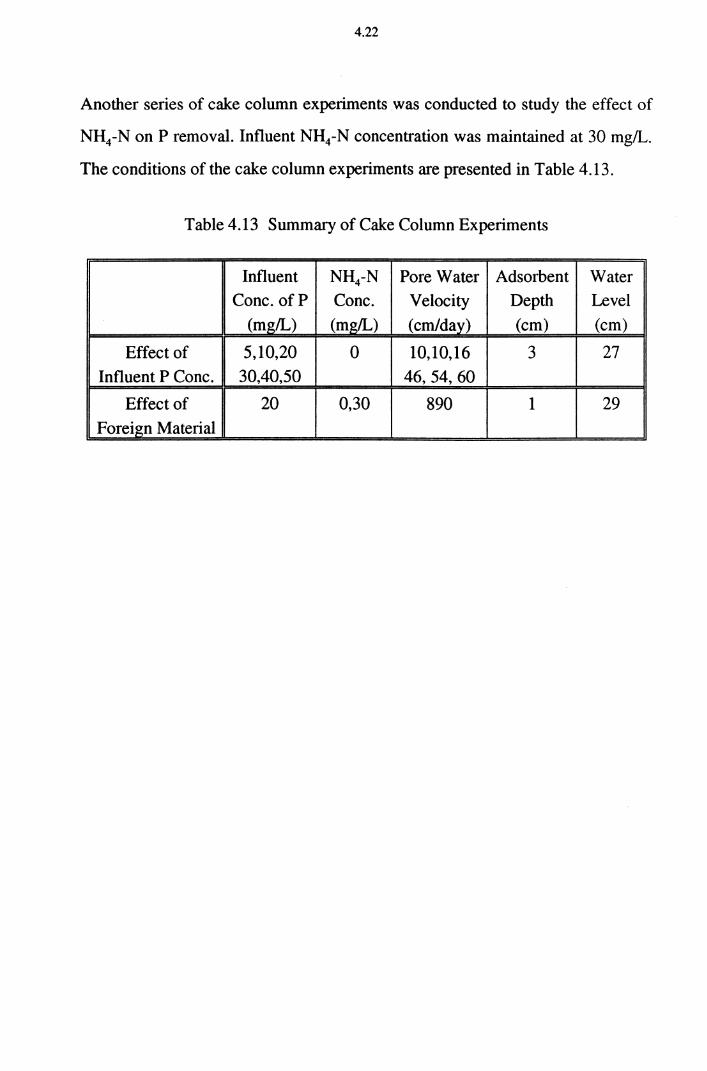
4.22
Another series of cake column experiments was conducted to study the effect of
NH4-N on P removal. Influent NH4-N concentration was maintained at 30 mg/L.
The conditions of the cake column experiments are presented in Table 4.13.
Table 4.13 Summary of Cake Column Experiments
Influent NH4-N Pore Water Adsorbent Water Cone. ofP Cone. Velocity Depth Level
(mg/L) (mg/L) (cm/day) (cm) (cm)
Effect of 5,10,20 0 10,10,16 3 27
Influent P Cone. 30,40,50 46,54,60
Effect of 20 0,30 890 1 29
Foreign Material
5.1
V. RESULTS AND DISCUSSION
The experimental results obtained from this study are presented in this chapter
with qualitative and quantitative interpretations. They have been grouped into six
sections. The ftrst section presents the physical and chemical characteristics of
the adsorbents used such as soil, dust and cake. The next three sections discuss
the batch experiments and the fifth section covers the column experiments
conducted. Practical aspects of the fteld application of dust and cake are
discussed in the sixth section.
5.1 Characteristics of the Media
Since P transport from the liquid phase to the solid phase is influenced by the
intrinsic characteristics of the media, the physical and chemical properties of
soil, dust and cake need to be investigated for proper interpretation of P sorption.
The details. of the analytical methods used are given in Chapter IV (Section
4.1.1).
5.1.1 Physical Characteristics of the Media
The grain size analysis for the soil is presented in Figure 5.1. Sieve analysis
showed that the average soil particle size (0.3 mm) was in the range of a fine to
medium sand fraction. The physical characteristics of soil, dust and cake tested
are presented in Table 5 .1. The soil is composed of higher sand fractions than
the dust and cake. The permeability of the soil was the highest and was in the
moderate permeability class. The value of the permeability of soil (2.1x10⁻³
cm/s) shows that this type of soil can be used in rapid infiltration systems in land
applications of wastewater (Reed et al., 1988). For rapid infiltration, a sand or
gravel of high permeability is recommended as a substratum (Steiner and
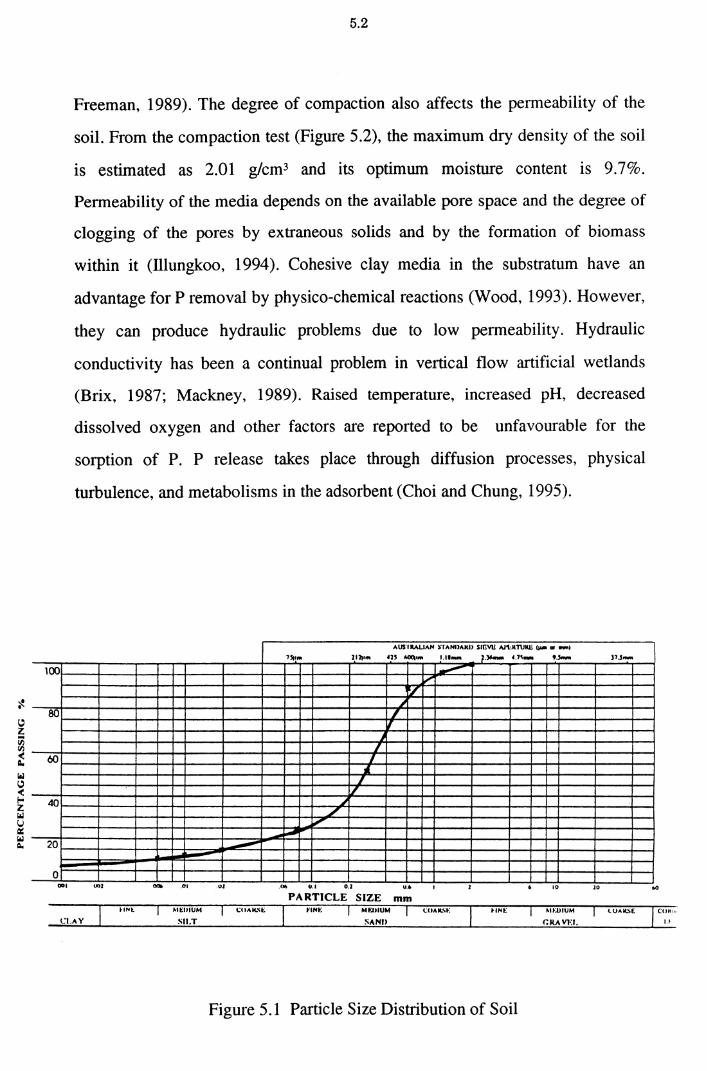
::t •
lOO
80
6IJ
40
20
0 ...
5.2
Freeman, 1989). The degree of compaction also affects the permeability of the
soil. From the compaction test (Figure 5.2), the maximum dry density of the soil
is estimated as 2.01 g/cm3 and its optimum moisture content is 9.7%.
Permeability of the media depends on the available pore space and the degree of
clogging of the pores by extraneous solids and by the formation of biomass
within it (lllungkoo, 1994). Cohesive clay media in the substratum have an
advantage for P removal by physico-chemical reactions (Wood, 1993). However,
they can produce hydraulic problems due to low permeability. Hydraulic
conductivity has been a continual problem in vertical flow artificial wetlands
(Brix, 1987; Mackney, 1989). Raised temperature, increased pH, decreased
dissolved oxygen and other factors are reported to be unfavourable for the
sorption of P. P release takes place through diffusion processes, physical
turbulence, and metabolisms in the adsorbent (Choi and Chung, 1995).
AUS"IItALIAN .S"IANUAkU SU!Vll AJ'l·.KnJit.E o,&. u tftM) ,,., .. Jllfam 'll ~ ... 1.11- 1·- 4.7~- '·""'" )1..5.-. !__,..... lr"
~/
" , V ,
I • 1
1/ _,
""' ...... __...
""' .... 01 .Ul '"' U.l 0.
CI.AY
Figure 5.1 Particle Size Distribution of Soil
COKI>
U
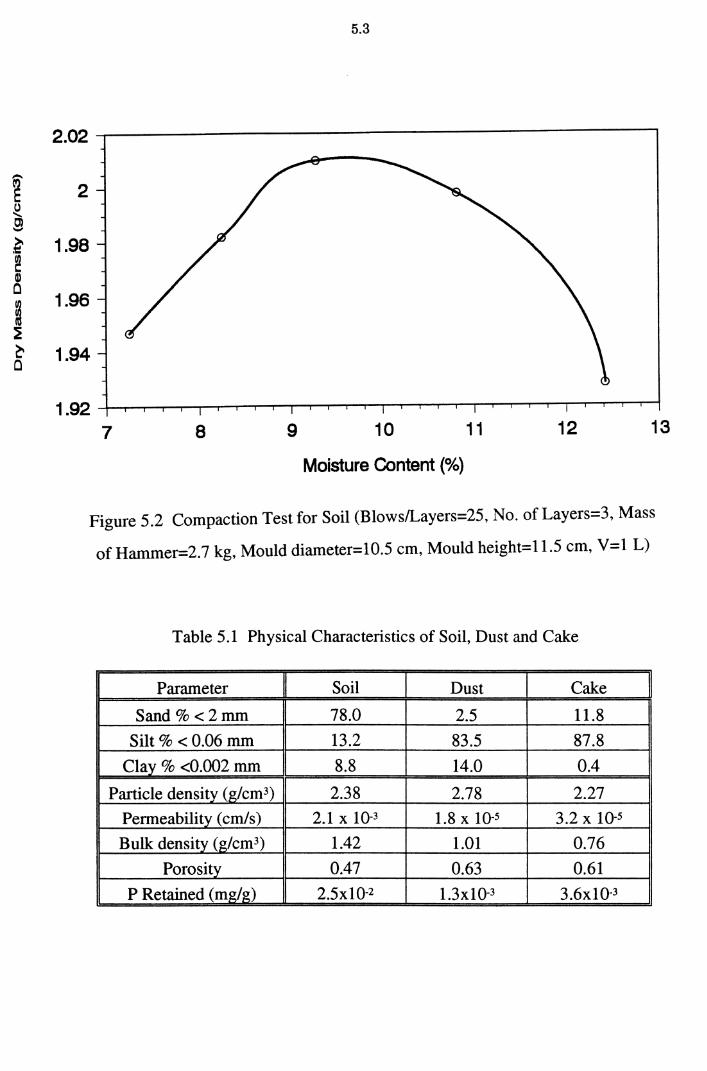
~ ~ C) '"' ~ ~ G) Cl
~ ~ ~ Cl
5.3
2.02
2
1.98
1.96
1.94
1.92 7 8 9 10 11 12 13
Moisture Content(%)
Figure 5.2 Compaction Test for Soil (Blows/Layers=25, No. of Layers=3, Mass
of Hammer=2.7 kg, Mould diameter=l0.5 cm, Mould height=l1.5 cm, V=l L)
Table 5.1 Physical Characteristics of Soil, Dust and Cake
Parameter Soil Dust Cake
Sand% <2mm 78.0 2.5 11.8
Silt % < 0.06 mm 13.2 83.5 87.8
Clay % <0.002 mm 8.8 14.0 0.4
Particle density (g/cm3) 2.38 2.78 2.27
Permeability (cm/s) 2.1 X 10⁻³ 1.8 X 10⁻⁵ 3.2 X 10⁻⁵
Bulk density (g/cm3) 1.42 1.01 0.76
Porosity 0.47 0.63 0.61
P Retained (mg/g) 2.5x10⁻² 1.3x10⁻³ 3.6xl0-3
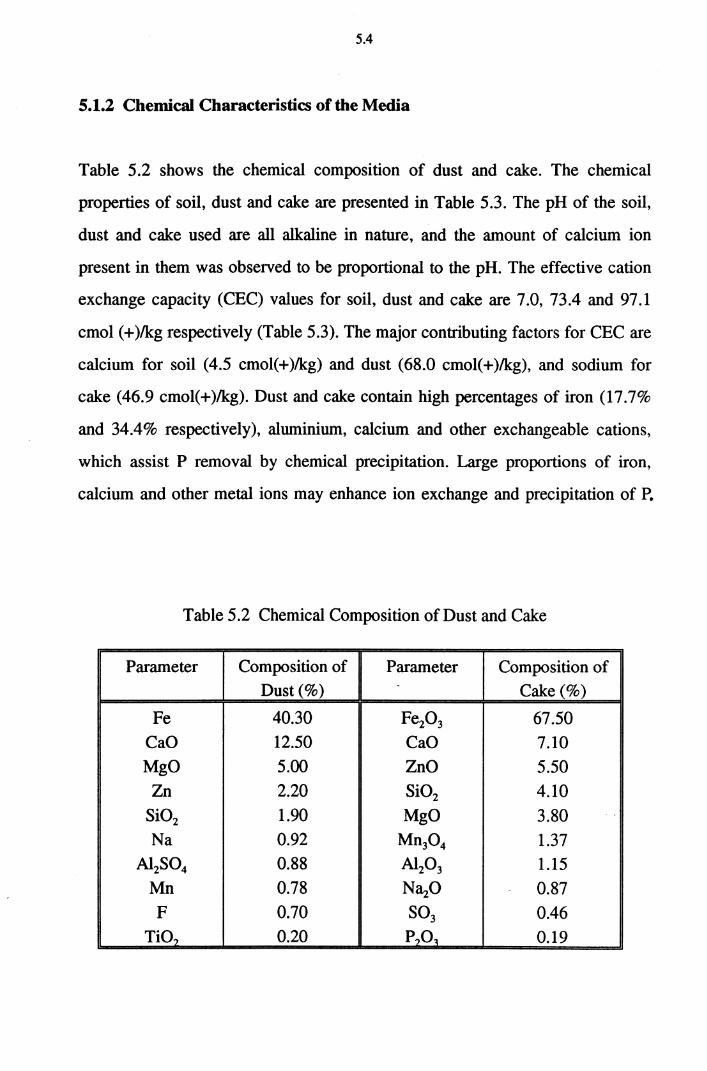
5.4
5.1.2 Chemical Characteristics of the Media
Table 5.2 shows the chemical composition of dust and cake. The chemical
properties of soil, dust and cake are presented in Table 5.3. The pH of the soil,
dust and cake used are all alkaline in nature, and the amount of calcium ion
present in them was observed to be proportional to the pH. The effective cation
exchange capacity (CEC) values for soil, dust and cake are 7.0, 73.4 and 97.1
cmol (+)/kg respectively (Table 5.3). The major contributing factors for CEC are
calcium for soil (4.5 cmol(+)lkg) and dust (68.0 cmol(+)/kg), and sodium for
cake (46.9 cmol(+)lkg). Dust and cake contain high percentages of iron (17.7%
and 34.4% respectively), aluminium, calcium and other exchangeable cations,
which assist P removal by chemical precipitation. Large proportions of iron,
calcium and other metal ions may enhance ion exchange and precipitation of P.
Table 5.2 Chemical Composition of Dust and Cake
Parameter Composition of Parameter Composition of Dust(%) - Cake(%)
Fe 40.30 Fe20 3 67.50 CaO 12.50 CaO 7.10 M gO 5.00 ZnO 5.50
Zn 2.20 Si02 4.10 Si02 1.90 MgO 3.80 Na 0.92 Mn30 4 1.37
A12S04 0.88 Al203 1.15 Mn 0.78 N~O 0.87 F 0.70 so3 0.46
TiO? 0.20 P70~ 0.19
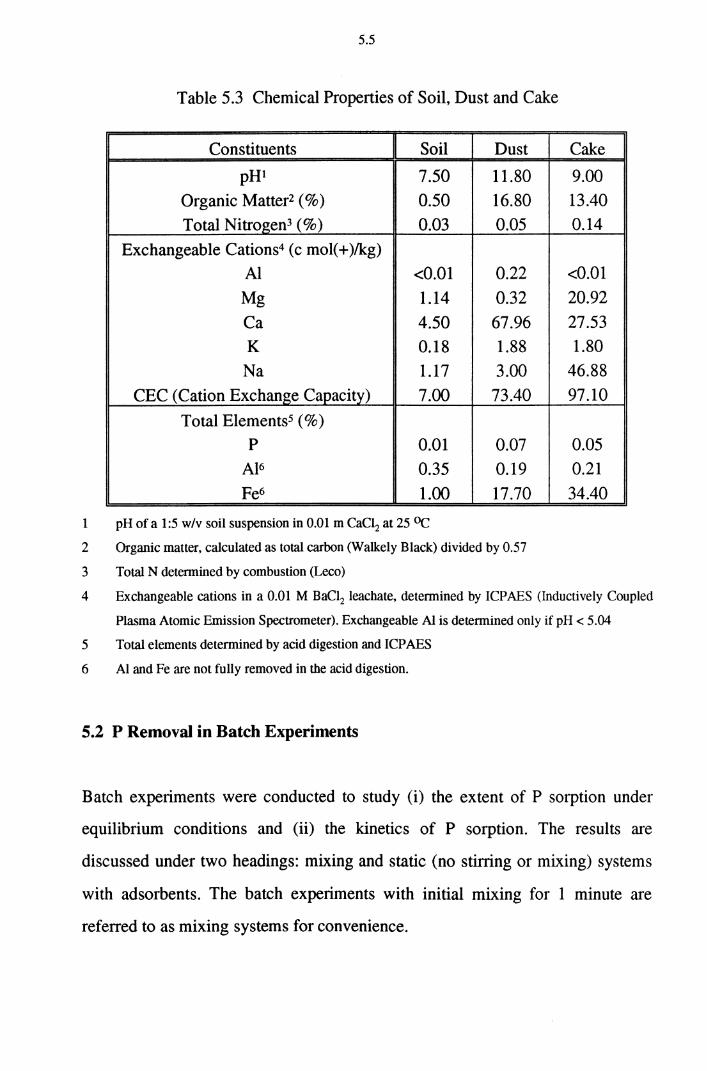
5.5
Table 5.3 Chemical Properties of Soil, Dust and Cake
Constituents Soil Dust Cake
pHI 7.50 11.80 9.00
Organic Matter2 (%) 0.50 16.80 13.40
Total Nitrogen3 (%) 0.03 0.05 0.14
Exchangeable Cations4 ( c mol(+ )/kg)
Al <0.01 0.22 <0.01
Mg 1.14 0.32 20.92
Ca 4.50 67.96 27.53
K 0.18 1.88 1.80
Na 1.17 3.00 46.88
CEC (Cation Exchange Capacity) 7.00 73.40 97.10
Total Elementss (%) p 0.01 0.07 0.05
Al6 0.35 0.19 0.21
Fe6 1.00 17.70 34.40
1 pH of a 1:5 w/v soil suspension in 0.01 m CaCI2 at 25 OC
2 Organic matter, calculated as total carbon (Walkely Black) divided by 0.57
3 Total N determined by combustion (Leco)
4 Exchangeable cations in a 0.01 M BaCI2 leachate, determined by ICPAES (Inductively Coupled
Plasma Atomic Emission Spectrometer). Exchangeable Al is determined only if pH < 5.04
5 Total elements determined by acid digestion and ICP AES
6 AI and Fe are not fully removed in the acid digestion.
5.2 P Removal in Batch Experiments
Batch experiments were conducted to study (i) the extent of P sorption under
equilibrium conditions and (ii) the kinetics of P sorption. The results are
discussed under two headings: mixing and static (no stirring or mixing) systems
with adsorbents. The batch experiments with initial mixing for 1 minute are
referred to as mixing systems for convenience.
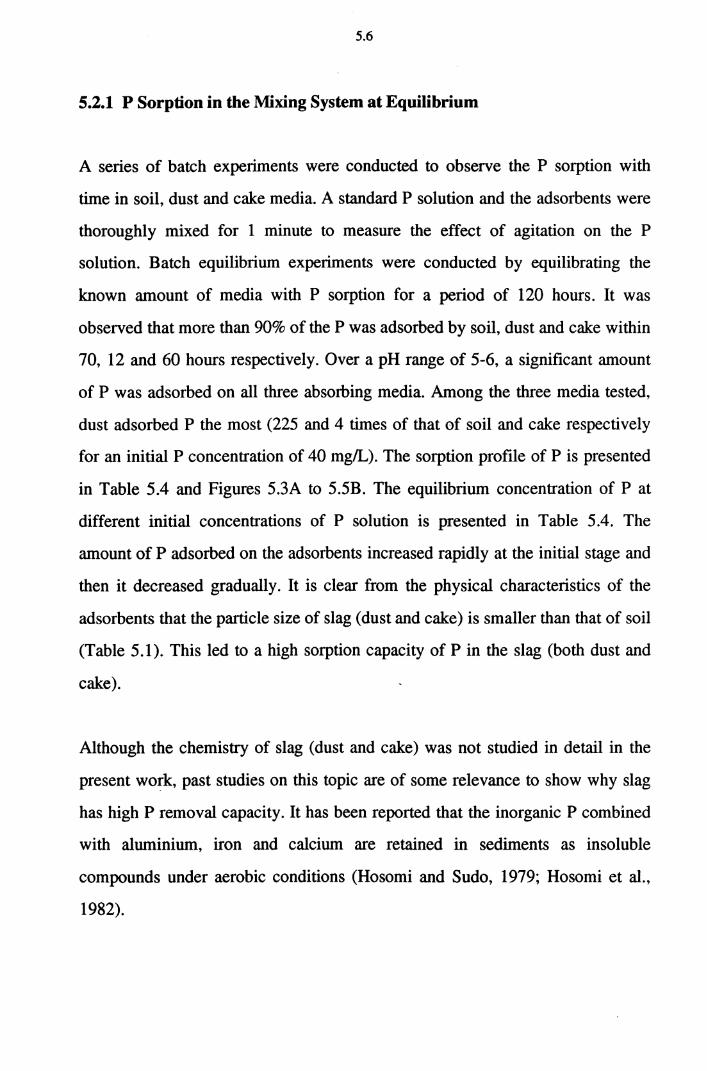
5.6
5.2.1 P Sorption in the Mixing System at Equilibrium
A series of batch experiments were conducted to observe the P sorption with
time in soil, dust and cake media. A standard P solution and the adsorbents were
thoroughly mixed for 1 minute to measure the effect of agitation on the P
solution. Batch equilibrium experiments were conducted by equilibrating the
known amount of media with P sorption for a period of 120 hours. It was
observed that more than 90% of the P was adsorbed by soil, dust and cake within
70, 12 and 60 hours respectively. Over a pH range of 5-6, a significant amount
of P was adsorbed on all three absorbing media. Among the three media tested,
dust adsorbed P the most (225 and 4 times of that of soil and cake respectively
for an initial P concentration of 40 mg/L). The sorption profile of Pis presented
in Table 5.4 and Figures 5.3A to 5.5B. The equilibrium concentration of P at
different initial concentrations of P solution is presented in Table 5.4. The
amount of P adsorbed on the adsorbents increased rapidly at the initial stage and
then it decreased gradually. It is clear from the physical characteristics of the
adsorbents that the particle size of slag (dust and cake) is smaller than that of soil
(Table 5.1). This led to a high sorption capacity of P in the slag (both dust and
cake).
Although the chemistry of slag (dust and cake) was not studied in detail in the
present work, past studies on this topic are of some relevance to show why slag
has high P removal capacity. It has been reported that the inorganic P combined
with aluminium, iron and calcium are retained in sediments as insoluble
compounds under aerobic conditions (Hosomi and Sudo, 1979; Hosomi et al.,
1982).
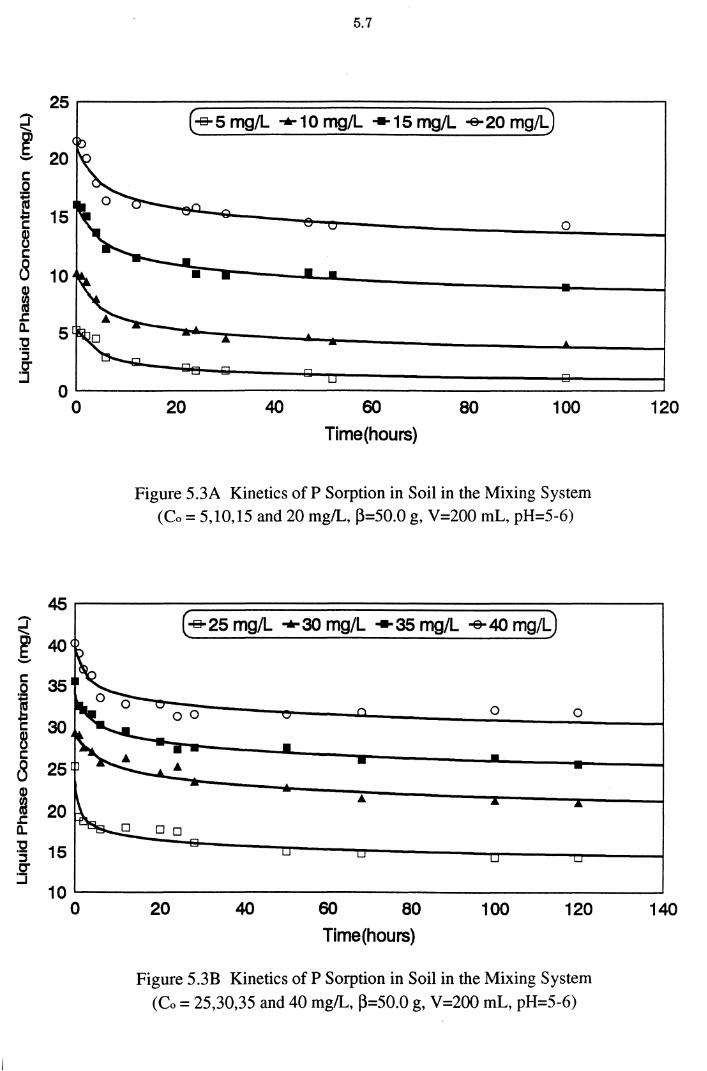
25 ~ g
20 c: .Q i ... 15 E 8 c: 8 10 G)
i .c: a. 5 :2 ::l C" ::J
0 0
5.7
( -s- 5 mg/L ..... 1 0 mg/L .... 15 mg/L -e-20 mg!L)
0
20 40 60 80 100 Time(hours)
Figure 5.3A Kinetics of P Sorption in Soil in the Mixing System (Co = 5,10,15 and 20 mg/L, (3=50.0 g, V=200 mL, pH=S-6)
120
~r-----~~======================~~-----. ( -s-25 mg/L ..... 30 mg/L .... 35 mg/L -e- 40 mg!L) ~ g 40
.~ 35 g r:: 30 8 r:: 8 25
I 20 .t:. CL.
~ 15 g
0 0
10~------------------------------------------------~ 0 ~ 40 60 00 100 1~ 140
Time(hours)
Figure 5.3B Kinetics of P Sorption in Soil in the Mixing System
(Co = 25,30,35 and 40 mg/L, (3=50.0 g, V=200 mL, pH=5-6)
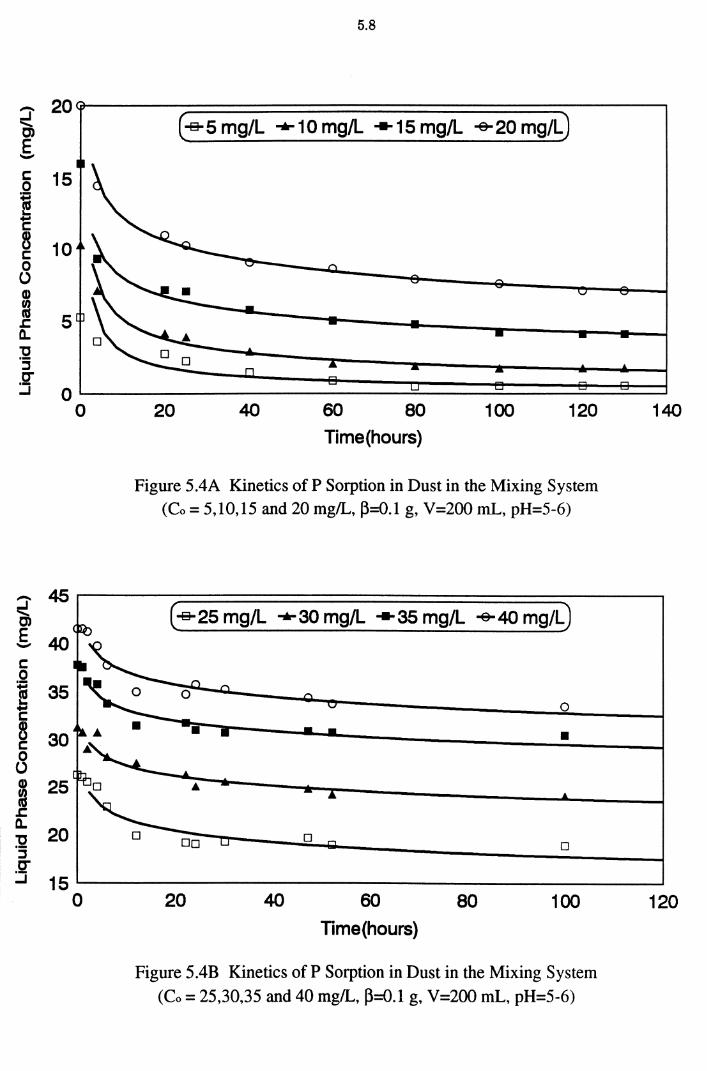
5.8
~ 20~----~========================~----~ ~ (-s-s mg/L ... 10 mg/L ... 15 mg/L -e-20 mg/L) .s c: 15 0 ~ "-E ~ 10 0 0
! ..c: 5 a.. :2 :::l
g oL-~=====::::::=:::!!:::=:::i~;;;;;;;;;d 0
~ 45
E 40 -c: 0 i to.;,
35 .... c: B 30 c: 0 0 G) 25 ~
..c: a.. 20 :2
:::l C"'
:.:::i 15 0
20 40 60 80 100 120 Time(hours)
Figure 5.4A Kinetics of P Sorption in Dust in the Mixing System
(Co = 5,10,15 and 20 mg/L, ~=0.1 g, V=200 mL, pH=5-6)
( -s-25 mg/L ... 30 mg/L ... 35 mg/L -e- 40 mg/L)
20 40
0
60
Time(hours)
0
•
0
80 100
Figure 5.4B Kinetics of P Sorption in Dust in the Mixing System
(Co = 25,30,35 and 40 mg/L, ~=0.1 g, V=200 mL, pH=5-6)
140
120
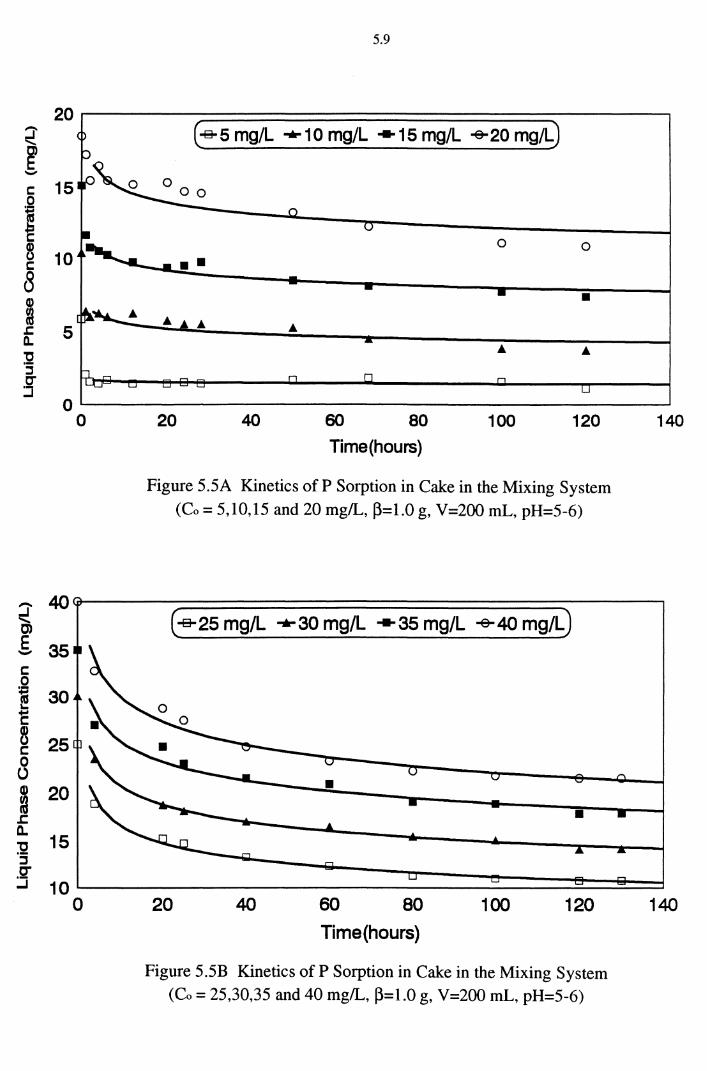
5.9
20r-------~======================~~-----, ( -s- 5 mg/L .... 1 0 mg/L +15 mg/L -e-20 mg/L)
c: 15 .Q
~ c: ~ 10 c: 8 I .c: 5 a. :g :I C" :J
0 0
•• •
OL-------------------------------------------------~ 0
:r 40 ....... C)
E 35 -c: 0 i '-
30 'E B 25 c: 0 0 Q) 20 ~ J: 0..
15 '0 '5 0"' :J 10
0
20 40 60 80 100 120
Time(hours)
Figure 5.5A Kinetics of P Sorption in Cake in the Mixing System (Co = 5,10,15 and 20 mg/L, ~=1.0 g, V=200 mL, pH=5-6)
( -s-25 mg/L .... 30 mg/L .... 35 mg/L -e- 40 mg/L)
• •
20 40 60 80 100 120
Time(hours)
Figure 5.5B Kinetics of P Sorption in Cake in the Mixing System (Co = 25,30,35 and 40 mg/L, ~=1.0 g, V=200 mL, pH=5-6)
140
140
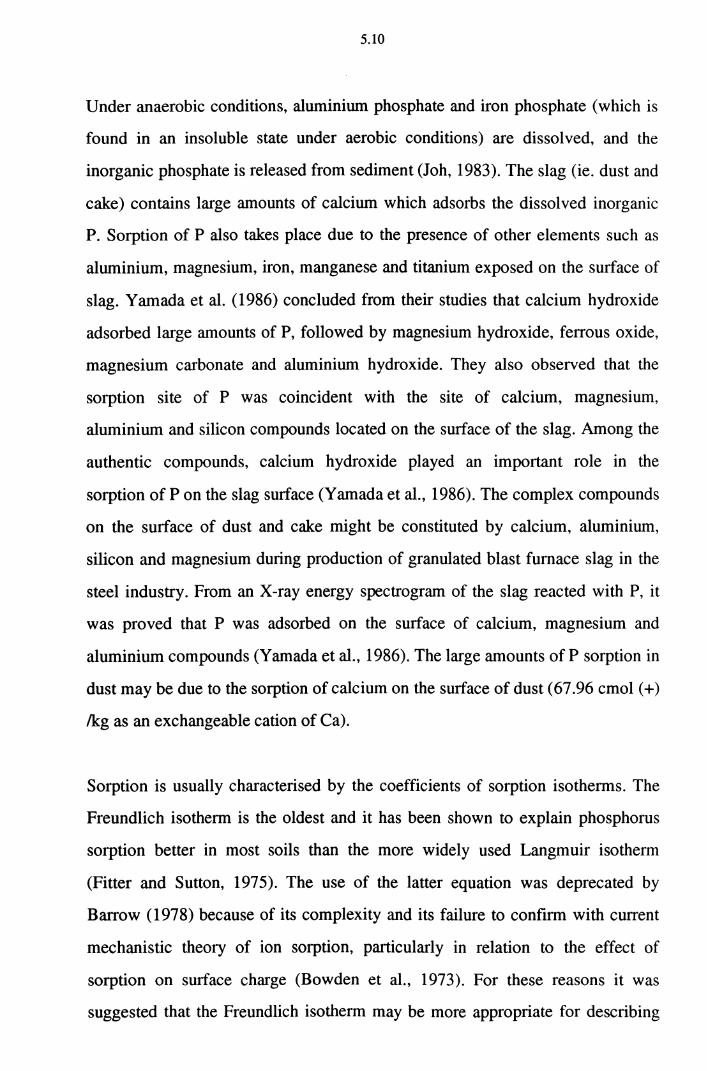
5.10
Under anaerobic conditions, aluminium phosphate and iron phosphate (which is
found in an insoluble state under aerobic conditions) are dissolved, and the
inorganic phosphate is released from sediment (Joh, 1983). The slag (ie. dust and
cake) contains large amounts of calcium which adsorbs the dissolved inorganic
P. Sorption of P also takes place due to the presence of other elements such as
aluminium, magnesium, iron, manganese and titanium exposed on the surface of
slag. Y amada et al. (1986) concluded from their studies that calcium hydroxide
adsorbed large amounts of P, followed by magnesium hydroxide, ferrous oxide,
magnesium carbonate and aluminium hydroxide. They also observed that the
sorption site of P was coincident with the site of calcium, magnesium,
aluminium and silicon compounds located on the surface of the slag. Among the
authentic compounds, calcium hydroxide played an important role in the
sorption of P on the slag surface (Yamada et al., 1986). The complex compounds
on the surface of dust and cake might be constituted by calcium, aluminium,
silicon and magnesium during production of granulated blast furnace slag in the
steel industry. From an X-ray energy spectrogram of the slag reacted with P, it
was proved that P was adsorbed on the surface of calcium, magnesium and
aluminium compounds (Y amada et al., 1986). The large amounts of P sorption in
dust may be due to the sorption of calcium on the surface of dust ( 67.96 cmol ( +)
/kg as an exchangeable cation of Ca).
Sorption is usually characterised by the coefficients of sorption isotherms. The
Freundlich isotherm is the oldest and it has been shown to explain phosphorus
sorption better in most soils than the more widely used Langmuir isotherm
(Fitter and Sutton, 1975). The use of the latter equation was deprecated by
Barrow ( 1978) because of its complexity and its failure to confmn with current
mechanistic theory of ion sorption, particularly in relation to the effect of
sorption on surface charge (Bowden et al., 1973). For these reasons it was
suggested that the Freundlich isotherm may be more appropriate for describing
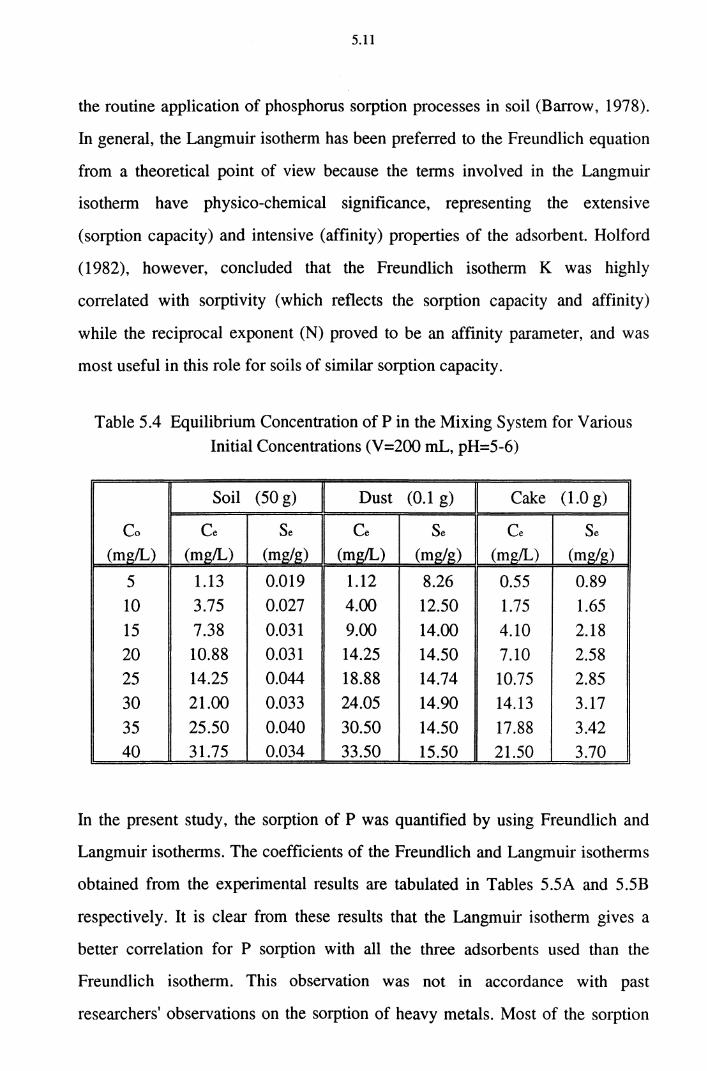
5.11
the routine application of phosphorus sorption processes in soil (Barrow, 1978).
In general, the Langmuir isotherm has been preferred to the Freundlich equation
from a theoretical point of view because the terms involved in the Langmuir
isotherm have physico-chemical significance, representing the extensive
(sorption capacity) and intensive (affinity) properties of the adsorbent. Holford
(1982), however, concluded that the Freundlich isotherm K was highly
correlated with sorptivity (which reflects the sorption capacity and affinity)
while the reciprocal exponent (N) proved to be an affinity parameter, and was
most useful in this role for soils of similar sorption capacity.
Table 5.4 Equilibrium Concentration of Pin the Mixing System for Various Initial Concentrations (V =200 mL, pH=5-6)
Soil (50 g) Dust (0.1 g) Cake (1.0 g)
Co Ce Se Ce Se Ce Se (mg/L) (mg/L) (mg/g) (mg!L) (mg/g) (mg/L) (mg/g)
5 1.13 0.019 1.12 8.26 0.55 0.89 10 3.75 0.027 4.00 12.50 1.75 1.65
15 7.38 0.031 9.00 14.00 4.10 2.18 20 10.88 0.031 14.25 14.50 7.10 2.58 25 14.25 0.044 18.88 14.74 10.75 2.85
30 21.00 0.033 24.05 14.90 14.13 3.17
35 25.50 0.040 30.50 14.50 17.88 3.42 40 31.75 0.034 33.50 15.50 21.50 3.70
In the present study, the sorption of P was quantified by using Freundlich and
Langmuir isotherms. The coefficients of the Freundlich and Langmuir isotherms
obtained from the experimental results are tabulated in Tables 5.5A and 5.5B
respectively. It is clear from these results that the Langmuir isotherm gives a
better correlation for P sorption with all the three adsorbents used than the
Freundlich isotherm. This observation was not in accordance with past
researchers' observations on the sorption of heavy metals. Most of the sorption
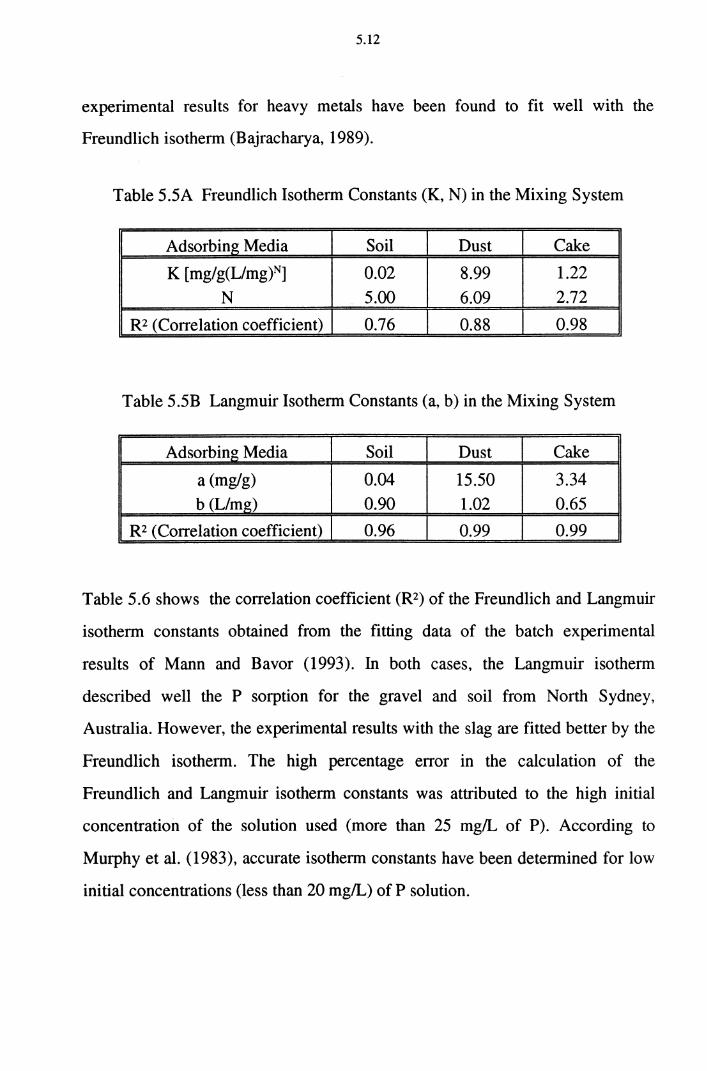
5.12
experimental results for heavy metals have been found to fit well with the
Freundlich isotherm (Bajracharya, 1989).
Table 5.5A Freundlich Isotherm Constants (K, N) in the Mixing System
Adsorbing Media Soil Dust Cake
K [mg/g(L/mg)N] 0.02 8.99 1.22
N 5.00 6.09 2.72
R2 (Correlation coefficient) 0.76 0.88 0.98
Table 5.5B Langmuir Isotherm Constants (a, b) in the Mixing System
Adsorbing Media Soil Dust Cake
a (mg/g) 0.04 15.50 3.34 b (L/mg) 0.90 1.02 0.65
R2 (Correlation coefficient) 0.96 0.99 0.99
Table 5.6 shows the correlation coefficient (R2) of the Freundlich and Langmuir
isotherm constants obtained from the fitting data of the batch experimental
results of Mann and Bavor (1993). In both cases, the Langmuir isotherm
described well the P sorption for the gravel and soil from North Sydney,
Australia. However, the experimental results with the slag are fitted better by the
Freundlich isotherm. The high percentage error in the calculation of the
Freundlich and Langmuir isotherm constants was attributed to the high initial
concentration of the solution used (more than 25 mg/L of P). According to
Murphy et al. (1983), accurate isotherm constants have been determined for low
initial concentrations (less than 20 mg/L) of P solution.
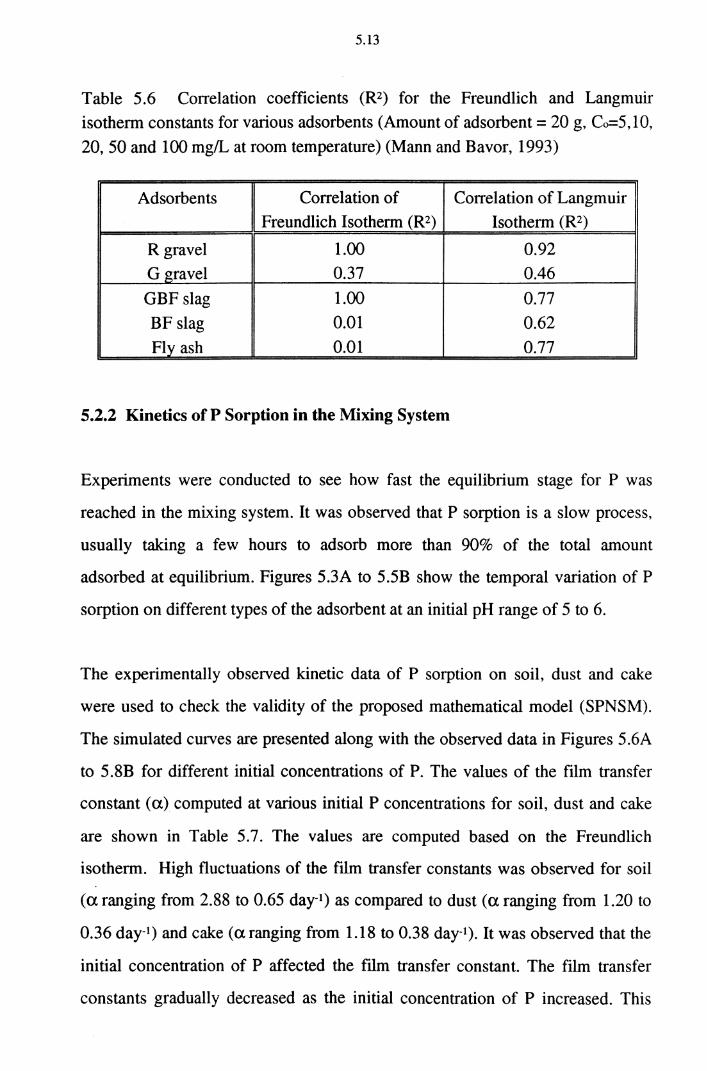
5.13
Table 5.6 Correlation coefficients (R2) for the Freundlich and Langmuir
isotherm constants for various adsorbents (Amount of adsorbent= 20 g, Co=5,10,
20, 50 and 100 mg!L at room temperature) (Mann and Bavor, 1993)
Adsorbents Correlation of Correlation of Langmuir Freundlich Isotherm (R2) Isotherm (R2)
R gravel 1.00 0.92 G gravel 0.37 0.46
GBF slag 1.00 0.77
BF slag 0.01 0.62
Fly ash 0.01 0.77
5.2.2 Kinetics of P Sorption in the Mixing System
Experiments were conducted to see how fast the equilibrium stage for P was
reached in the mixing system. It was observed that P sorption is a slow process,
usually taking a few hours to adsorb more than 90% of the total amount
adsorbed at equilibrium. Figures 5.3A to 5.5B show the temporal variation of P
sorption on different types of the adsorbent at an initial pH range of 5 to 6.
The experimentally observed kinetic data of P sorption on soil, dust and cake
were used to check the validity of the proposed mathematical model (SPNSM).
The simulated curves are presented along with the observed data in Figures 5.6A
to 5.8B for different initial concentrations of P. The values of the film transfer
constant (a) computed at various initial P concentrations for soil, dust and cake
are shown in Table 5.7. The values are computed based on the Freundlich
isotherm. High fluctuations of the film transfer constants was observed for soil
(a ranging from 2.88 to 0.65 day-1) as compared to dust (a ranging from 1.20 to
0.36 day-1) and cake (a ranging from 1.18 to 0.38 day-I). It was observed that the
initial concentration of P affected the film transfer constant. The film transfer
constants gradually decreased as the initial concentration of P increased. This
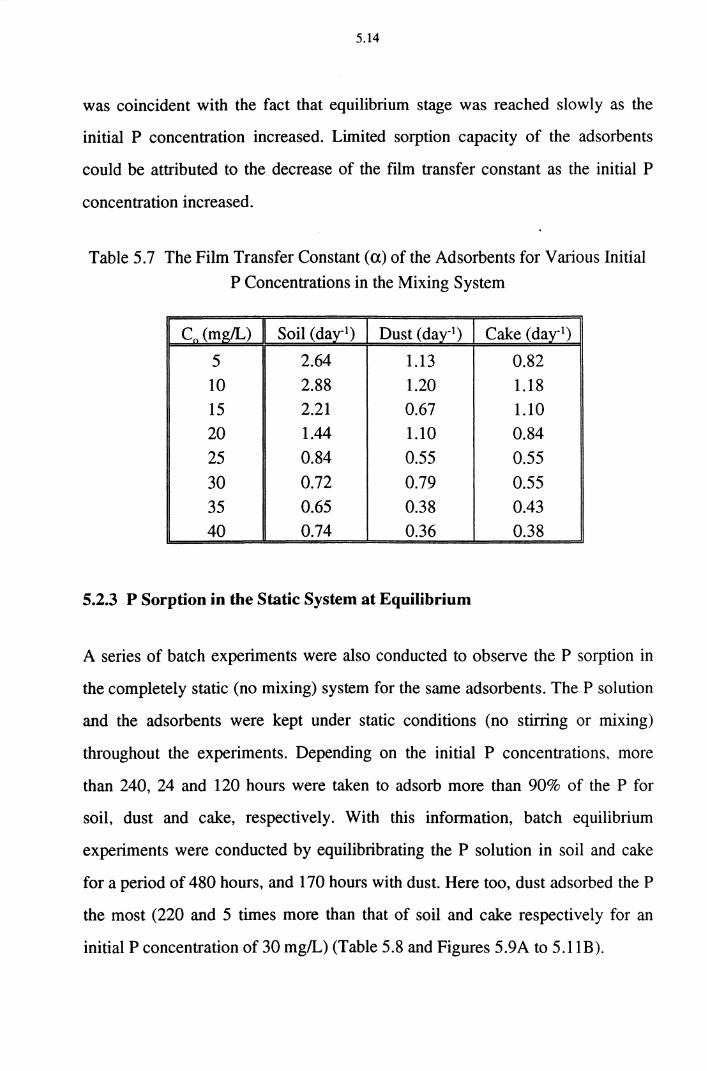
5.14
was coincident with the fact that equilibrium stage was reached slowly as the
initial P concentration increased. Limited sorption capacity of the adsorbents
could be attributed to the decrease of the film transfer constant as the initial P
concentration increased.
Table 5.7 The Film Transfer Constant (a) of the Adsorbents for Various Initial
P Concentrations in the Mixing System
Co (mg/L) Soil (day-1) Dust (day-1) Cake (day-1)
5 2.64 1.13 0.82
10 2.88 1.20 1.18 15 2.21 0.67 1.10 20 1.44 1.10 0.84
25 0.84 0.55 0.55
30 0.72 0.79 0.55
35 0.65 0.38 0.43 40 0.74 0.36 0.38
5.2.3 P Sorption in the Static System at Equilibrium
A series of batch experiments were also conducted to observe the P sorption in
the completely static (no mixing) system for the same adsorbents. The P solution
and the adsorbents were kept under static conditions (no stirring or mixing)
throughout the experiments. Depending on the initial P concentrations. more
than 240, 24 and 120 hours were taken to adsorb more than 90% of the P for
soil, dust and cake, respectively. With this information, batch equilibrium
experiments were conducted by equilibribrating the P solution in soil and cake
for a period of 480 hours, and 170 hours with dust. Here too, dust adsorbed the P
the most (220 and 5 times more than that of soil and cake respectively for an
initial P concentration of 30 mg!L) (Table 5.8 and Figures 5.9A to 5.11B).
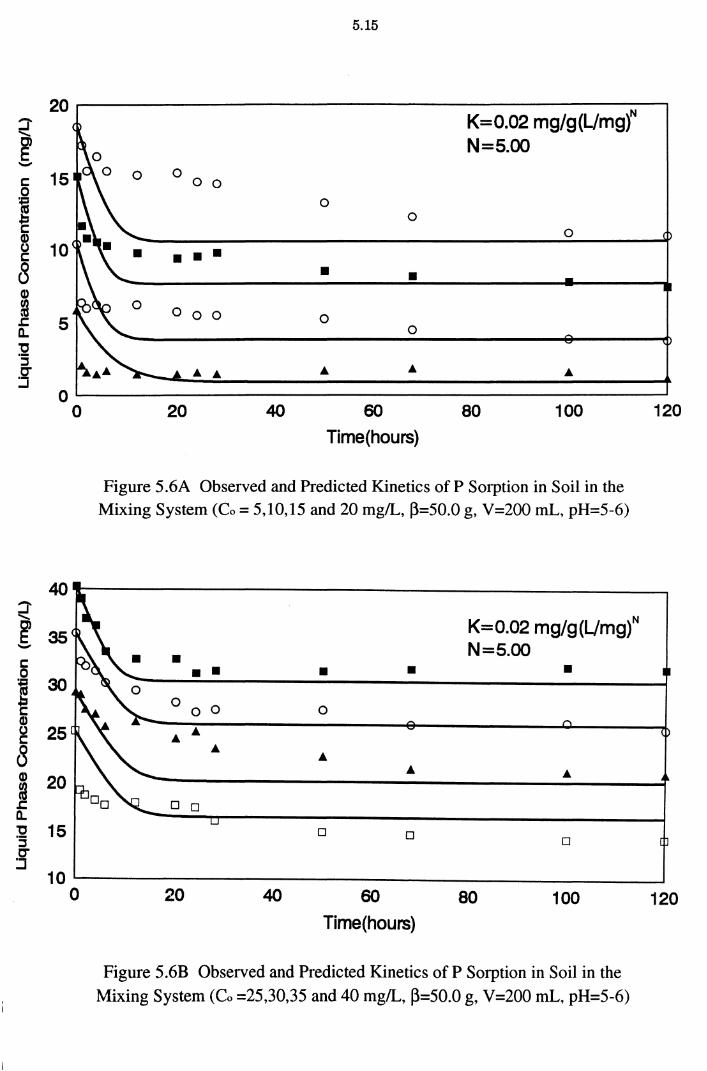
5.15
20~-----------------------------------------------.
K=0.02 mg/g{L/mgt
5 15 i ~ g 8 CD
~ .c 5 D.. "0 ·:; g
0 0 0
• • •
0 0 0
N=S.OO
0 0
0
• • 0
0
0~--------------------------------------------------~
0 20 40 60
Time(hours) 80 100
Figure 5.6A Observed and Predicted Kinetics of P Sorption in Soil in the Mixing System (Co = 5,10,15 and 20 mg/L, ~=50.0 g, V=200 mL, pH=5-6)
120
40~--------------------------------------------~
ias 5 ~ 30
~ g 25 8 j 20 ll. "0 15 '5 g
• • • • 0 0 0 0
0
•
0
K=0.02 mg/g{L/mg)N N=5.00
•
0
10~--------------------------------------------~ 0 20 40 60
Time(hours) 80 100
Figure 5.6B Observed and Predicted Kinetics of P Sorption in Soil in the
Mixing System (Co =25,30,35 and 40 mg/L, ~=50.0 g, V=200 mL, pH=5-6)
120
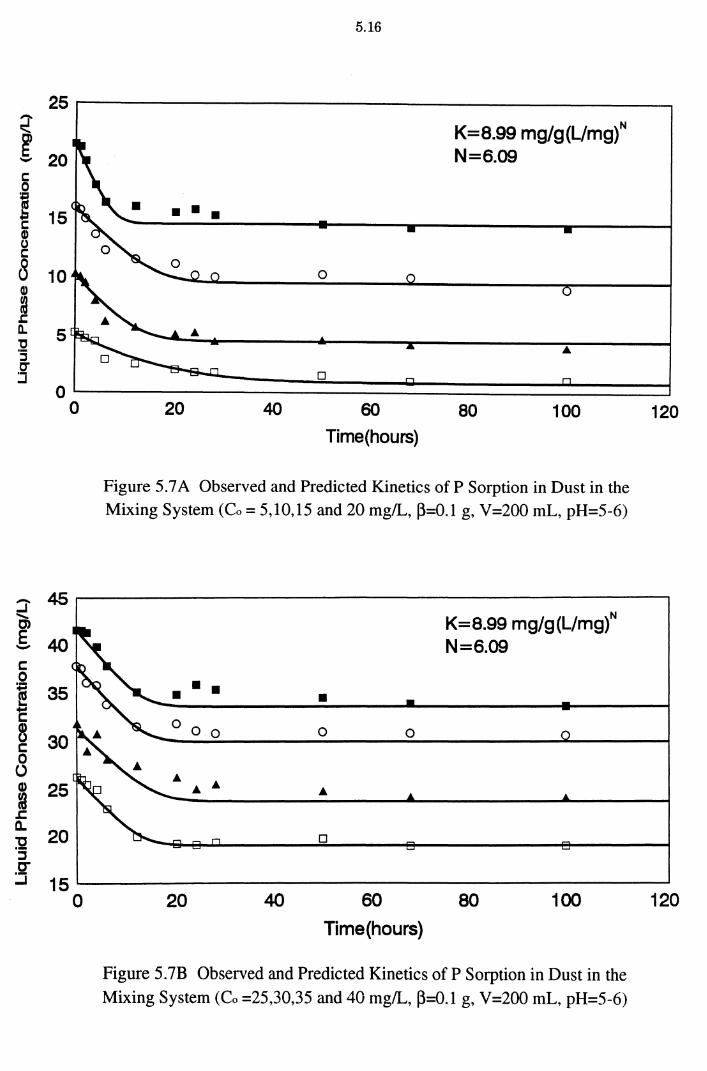
25 ~ ~ 20 -c: 0 :j:! g 15 c: Q) 0 c:
8 10 Q)
~ .r: a. 5 "C '5 g
0 0
::J' 45 0; E 40 -c 0 i '-
35 c 8 30 c 0 (.) Q) 25 ~ .c a.
20 "C '3 C" ::i 15
0
5.16
K=8.99 mg/g(L/mg)N N=6.09
• • •
0
0
20 40 60 80 100 Time(hours)
Figure 5. 7 A Observed and Predicted Kinetics of P Sorption in Dust in the Mixing System (Co = 5,10,15 and 20 mg!L, ~=0.1 g, V=200 mL, pH=5-6)
• • •
20 40
• 0 0
0
60
Time(hours)
K=8.99 mg/g{L/mg) N
N=6.09
80 100
Figure 5. 7B Observed and Predicted Kinetics of P Sorption in Dust in the Mixing System (Co =25,30,35 and 40 mg!L, ~=0.1 g, V=200 mL, pH=5-6)
120
120
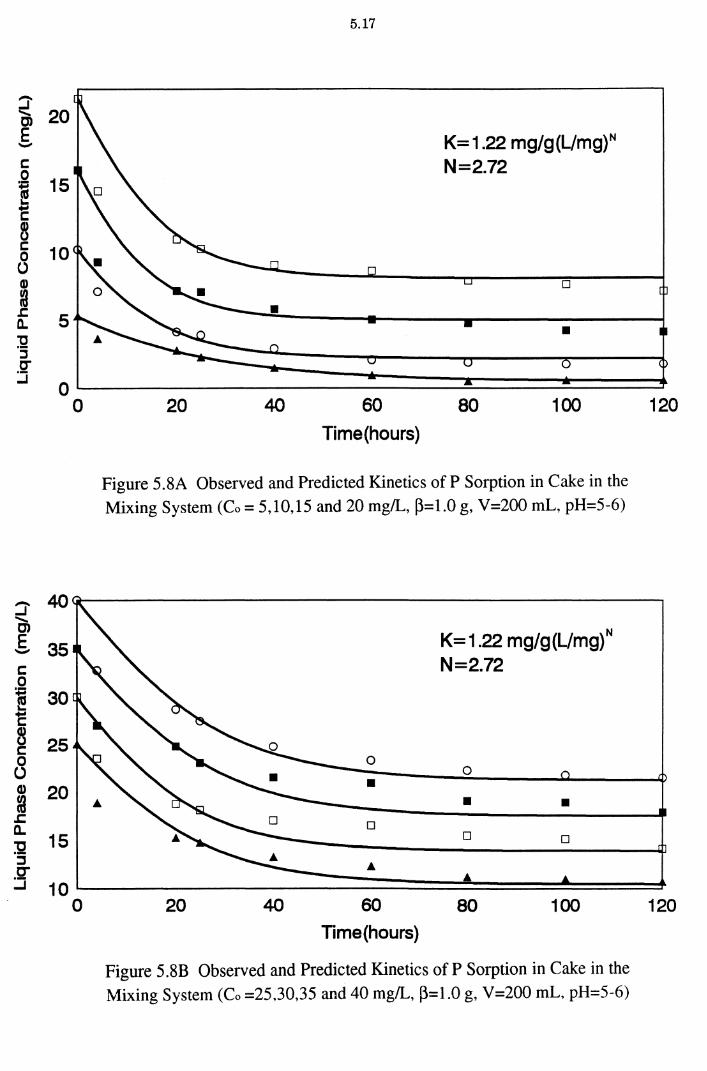
:r 0; 20 E -1: 0 i 15 .... c 8 1: 10 0 0 Q)
I J:. 5 a. :g :::J ,g" ..J 0
0
::J' 40 ....... C)
E 35 -1: 0
~ 30 'E ~ 25 1: 0 0 Q) 20 fa ..c: a..
15 32 :::J .2'" ..J 10
0
5.17
K= 1.22 mg/g{L/mg)N N=2.72
0
•
20 40 60 80 100 Time(hours)
Figure 5. 8A Observed and Predicted Kinetics of P Sorption in Cake in the Mixing System (Co = 5,10,15 and 20 mg/L, ~=1.0 g, V=200 mL, pH=5-6)
0
• 0
A
K= 1.22 mg/g{L/mg)N N=2.72
0
• • 0 0
A
120
20 40 60 80 100 120 Time(hours)
Figure 5.8B Observed and Predicted Kinetics of P Sorption in Cake in the Mixing System (Co =25,30,35 and 40 mg/L, ~=1.0 g, V=200 mL, pH=5-6)
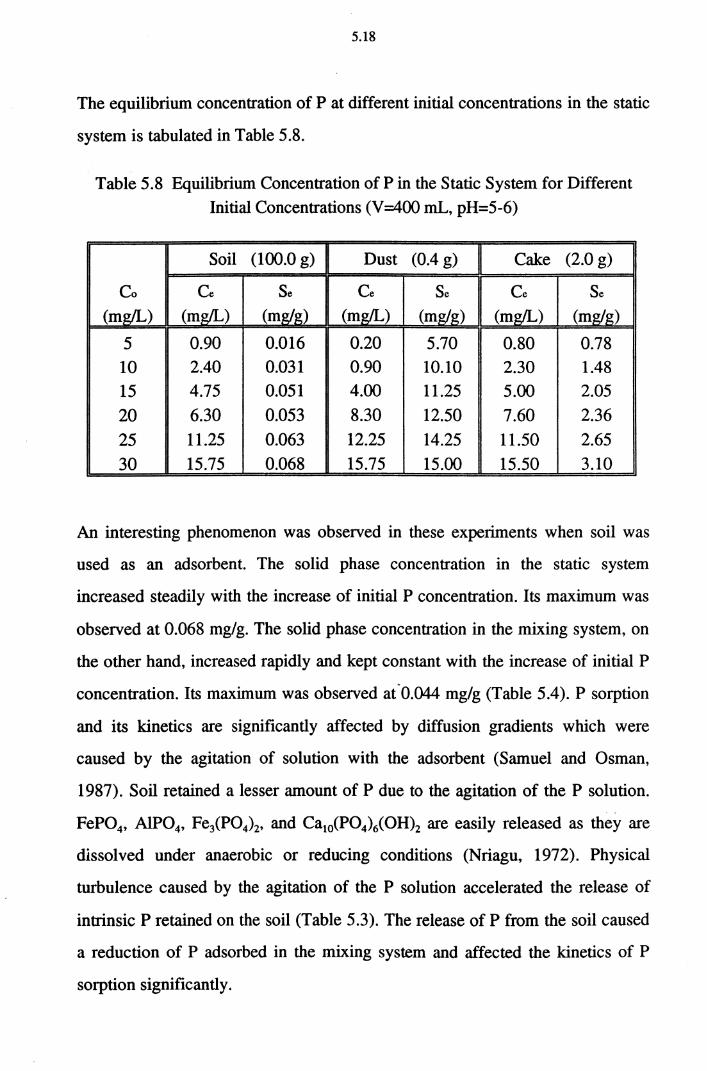
5.18
The equilibrium concentration of P at different initial concentrations in the static
system is tabulated in Table 5.8.
· Table 5.8 Equilibrium Concentration of Pin the Static System for Different Initial Concentrations (V =400 mL, pH=5-6)
Soil (100.0 g) Dust (0.4 g) Cake (2.0 g)
Co Ce Se Ce Se Ce Se (mg!L) (mg!IJ (mg/g) (mg/L) (mg/g) (mg!L) (mg/g)
5 0.90 0.016 0.20 5.70 0.80 0.78 10 2.40 0.031 0.90 10.10 2.30 1.48 15 4.75 0.051 4.00 11.25 5.00 2.05
20 6.30 0.053 8.30 12.50 7.60 2.36
25 11.25 0.063 12.25 14.25 11.50 2.65
30 15.75 0.068 15.75 15.00 15.50 3.10
An interesting phenomenon was observed in these experiments when soil was
used as an adsorbent. The solid phase concentration in the static system
increased steadily with the increase of initial P concentration. Its maximum was
observed at 0.068 mg/g. The solid phase concentration in the mixing system, on
the other hand, increased rapidly and kept constant with the increase of initial P
concentration. Its maximum was observed at'0.044 mg/g (Table 5.4). P sorption
and its kinetics are significantly affected by diffusion gradients which were
caused by the agitation of solution with the adsorbent (Samuel and Osman,
1987). Soil retained a lesser amount of P due to the agitation of the P solution.
FeP04, AlP04, Fe3(P04)z, and Ca10(P04) 6(0H)2 are easily released as they are
dissolved under anaerobic or reducing conditions (Nriagu, 1972). Physical
turbulence caused by the agitation of the P solution accelerated the release of
intrinsic P retained on the soil (Table 5.3). The release of P from the soil caused
a reduction of P adsorbed in the mixing system and affected the kinetics of P
sorption significantly.
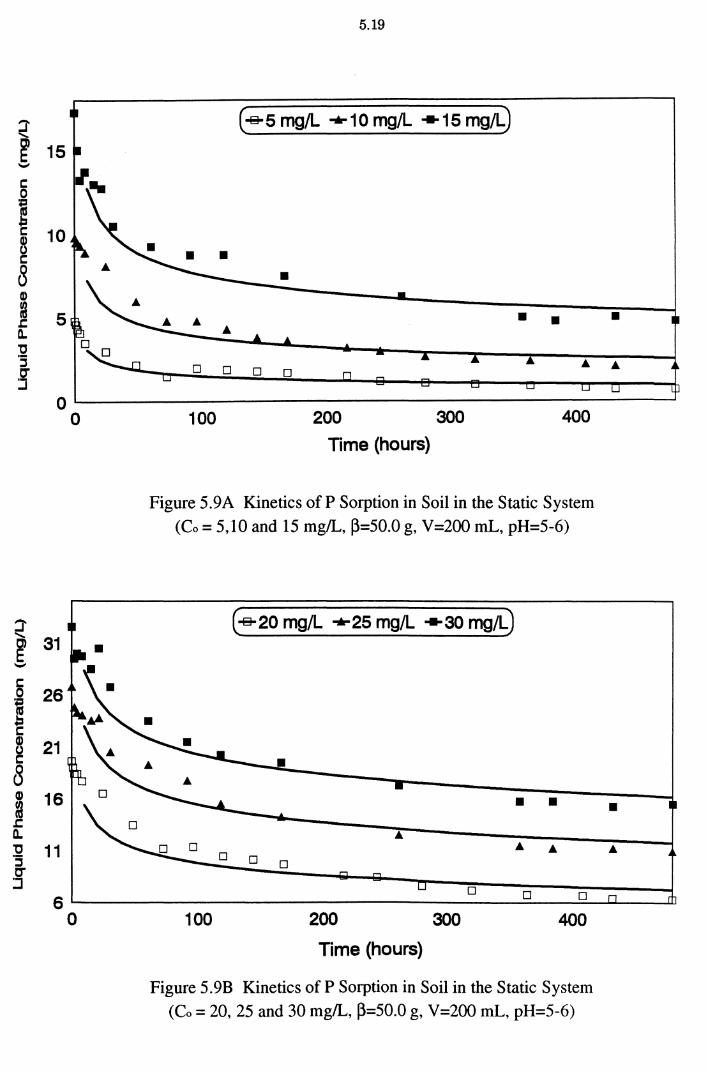
i 15 ..... c 0
~ 10 ~ c 8 G)
~ 5 .c D.. "C '5 C" :I
0 0
i 31 -5 26 g c ~ 21 c 8 G) 16 ~
..s::: D.. "'C 11 ·:; 0" ::J
6 0
5.19
(-&5 mg/L .... 10 mg/L ... 15 mg/L)
•
0 0
100 200 300 400
Time (hours)
Figure 5.9A Kinetics of P Sorption in Soil in the Static System
(Co = 5,10 and 15 mg/L, ~=50.0 g, V=200 mL, pH=5-6)
(-& 20 mg/L .... 25 mg/L ... 30 mg/L)
• • •
0 0
0 0 0
100 200 300 400
Time (hours)
Figure 5.9B Kinetics of P Sorption in Soil in the Static System
(Co = 20, 25 and 30 mg/L, ~=50.0 g, V=200 mL, pH=S-6)
•
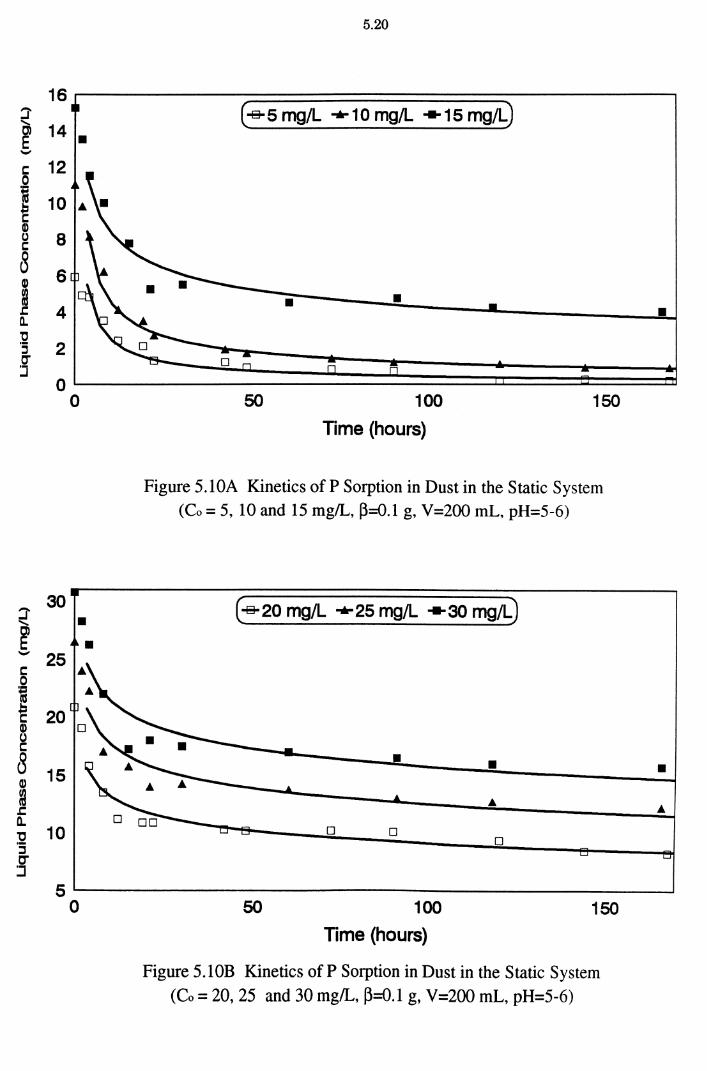
16 ~
14 ~ ......
1: 12 0
+=! g 10 1: Q) (J 8 1:
8 6 Q)
m r:. 4 a. "C ·:; 0"
2 ::1
0
J" ...... 30
~ ...... 25
1: 0
+=!
~ 20 Q) (J 1:
8 15 Q)
m .c: Q. "0 10 ·s 0'
:::J 5
0
• •
0
5.20
(-s-s mg/L '*10 mg/L ... 15 mg!L)
•
50
•
100
Time (hours}
150
Figure 5.10A Kinetics of P Sorption in Dust in the Static System (Co = 5, 10 and 15 mg/L, ~=0.1 g, V=200 mL, pH=5-6)
( -s- 20 mg/L '* 25 mg/L ... 30 mg/L)
• • ...
0 0 0
50 100 150
Time (hours}
Figure 5.10B Kinetics ofP Sorption in Dust in the Static System
(Co = 20, 25 and 30 mg/L, ~=0.1 g, V=200 mL, pH=5-6)
•
•
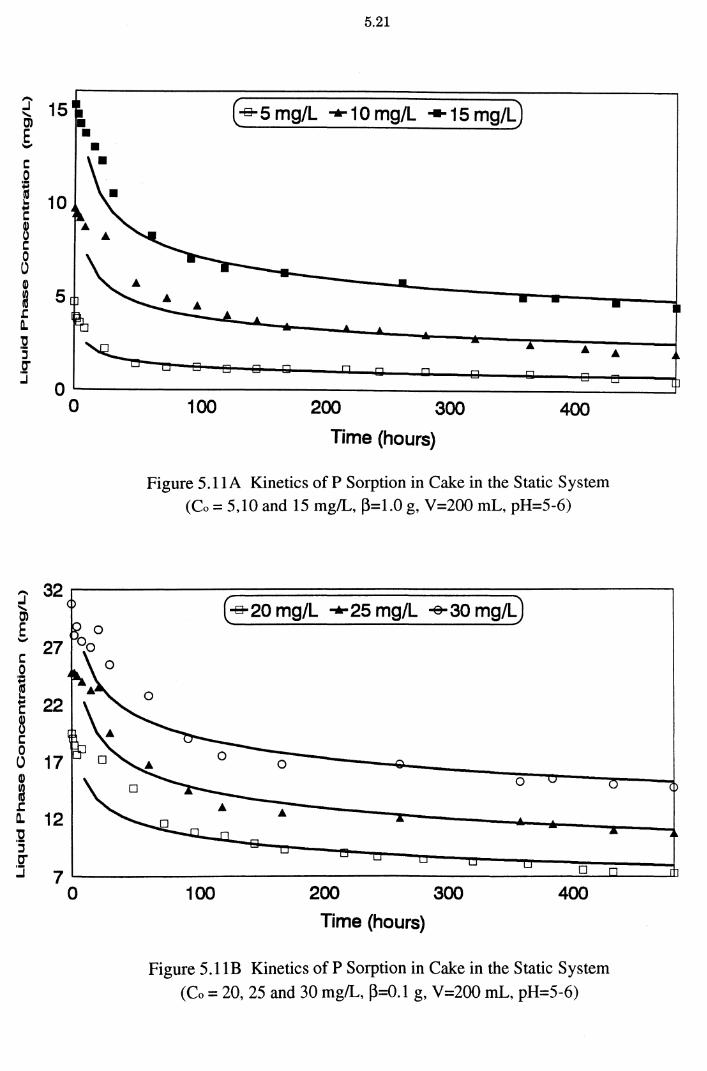
:r 15 ..... Cl E ..... c: 0
~ 10 c 8 c: 0 0 Gl
~ 5 .c: 0.. :g :I g .J
0
:r 32 ..... Cl E .....
27 c: 0 i ...
22 c 8 c: 0 () 17 G)
~ .c a. 12 'C '5 .2" ..I 7
0
0
5.21
(~5 mg/L "*"10 mg/L ... 15 mg!L)
100 200 300 400
Time (hours)
Figure 5.11A Kinetics ofP Sorption in Cake in the Static System (Co = 5,10 and 15 mg/L, ~=1.0 g, V=200 mL, pH=5-6)
( ~ 20 mg/L "'*" 25 mg/L -e- 30 mg/L)
0
0 0
0
100 200 300 400
Time (hours)
Figure 5.11B Kinetics of P Sorption in Cake in the Static System
(Co = 20, 25 and 30 mg/L, ~=0.1 g, V=200 mL, pH=5-6)
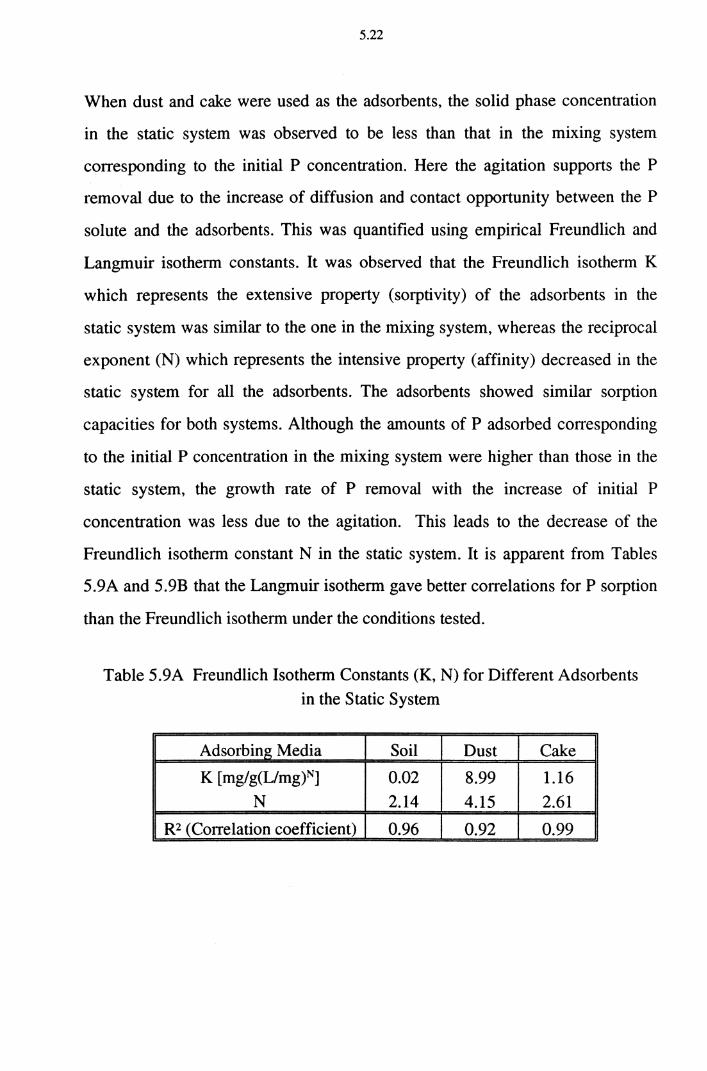
5.22
When dust and cake were used as the adsorbents, the solid phase concentration
in the static system was observed to be less than that in the mixing system
corresponding to the initial P concentration. Here the agitation supports the P
removal due to the increase of diffusion and contact opportunity between the P
solute and the adsorbents. This was quantified using empirical Freundlich and
Langmuir isotherm constants. It was observed that the Freundlich isotherm K
which represents the extensive property (sorptivity) of the adsorbents in the
static system was similar to the one in the mixing system, whereas the reciprocal
exponent (N) which represents the intensive property (affinity) decreased in the
static system for all the adsorbents. The adsorbents showed similar sorption
capacities for both systems. Although the amounts of P adsorbed corresponding
to the initial P concentration in the mixing system were higher than those in the
static system, the growth rate of P removal with the increase of initial P
concentration was less due to the agitation. This leads to the decrease of the
Freundlich isotherm constant N in the static system. It is apparent from Tables
5.9A and 5.9B that the Langmuir isotherm gave better correlations for P sorption
than the Freundlich isotherm under the conditions tested.
Table 5.9A Freundlich Isotherm Constants (K, N) for Different Adsorbents
in the Static System
Adsorbing Media Soil Dust Cake
K [mg/g(L/mg)N] 0.02 8.99 1.16 N 2.14 4.15 2.61
R2 (Correlation coefficient) 0.96 0.92 0.99
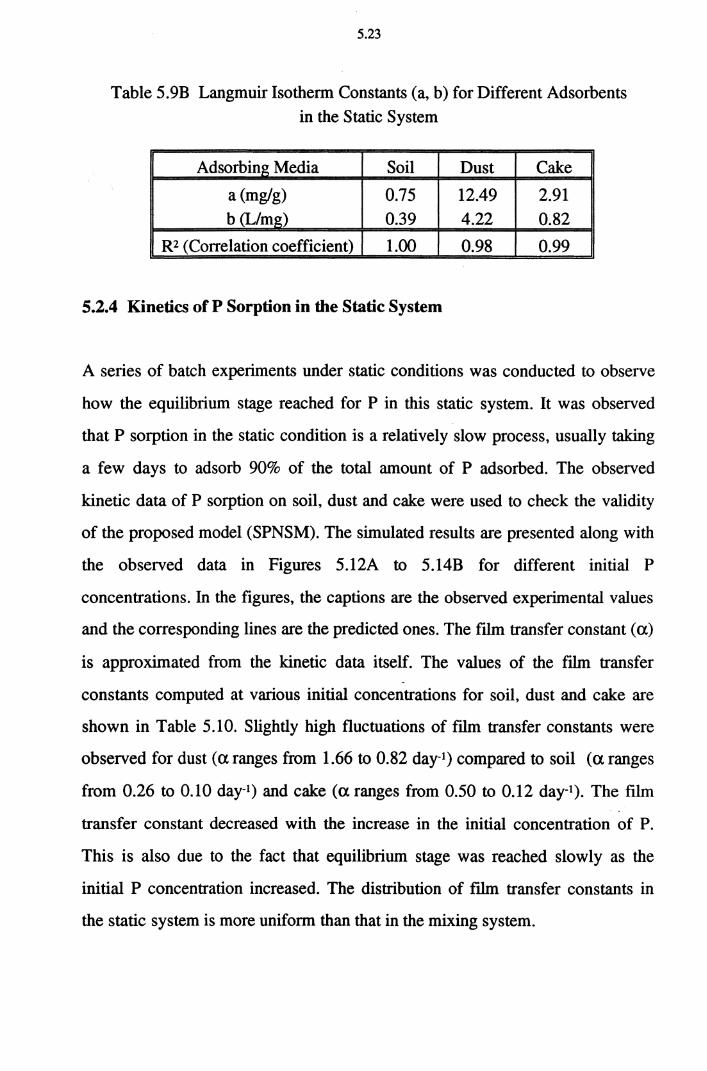
5.23
Table 5.9B Langmuir Isotherm Constants (a, b) for Different Adsorbents
in the Static System
Adsorbing Media Soil Dust Cake
a (mg/g) 0.75 12.49 2.91 b (L/mg) 0.39 4.22 0.82
R2 (Correlation coefficient) 1.00 0.98 0.99
5.2.4 Kinetics of P Sorption in the Static System
A series of batch experiments under static conditions was conducted to observe
how the equilibrium stage reached for P in this static system. It was observed
that P sorption in the static condition is a relatively slow process, usually taking
a few days to adsorb 90% of the total amount of P adsorbed. The observed
kinetic data of P sorption on soil, dust and cake were used to check the validity
of the proposed model (SPNSM). The simulated results are presented along with
the observed data in Figures 5.12A to 5.14B for different initial P
concentrations. In the figures, the captions are the observed experimental values
and the corresponding lines are the predicted ones. The film transfer constant (a)
is approximated from the kinetic data itself. The values of the film transfer -
constants computed at various initial concentrations for soil, dust and cake are
shown in Table 5.10. Slightly high fluctuations of film transfer constants were
observed for dust (a ranges from 1.66 to 0.82 day-1) compared to soil (a ranges
from 0.26 to 0.10 day-1) and cake (a ranges from 0.50 to 0.12 day-1). The film
transfer constant decreased with the increase in the initial concentration of P.
This is also due to the fact that equilibrium stage was reached slowly as the
initial P concentration increased. The distribution of film transfer constants in
the static system is more uniform than that in the mixing system.
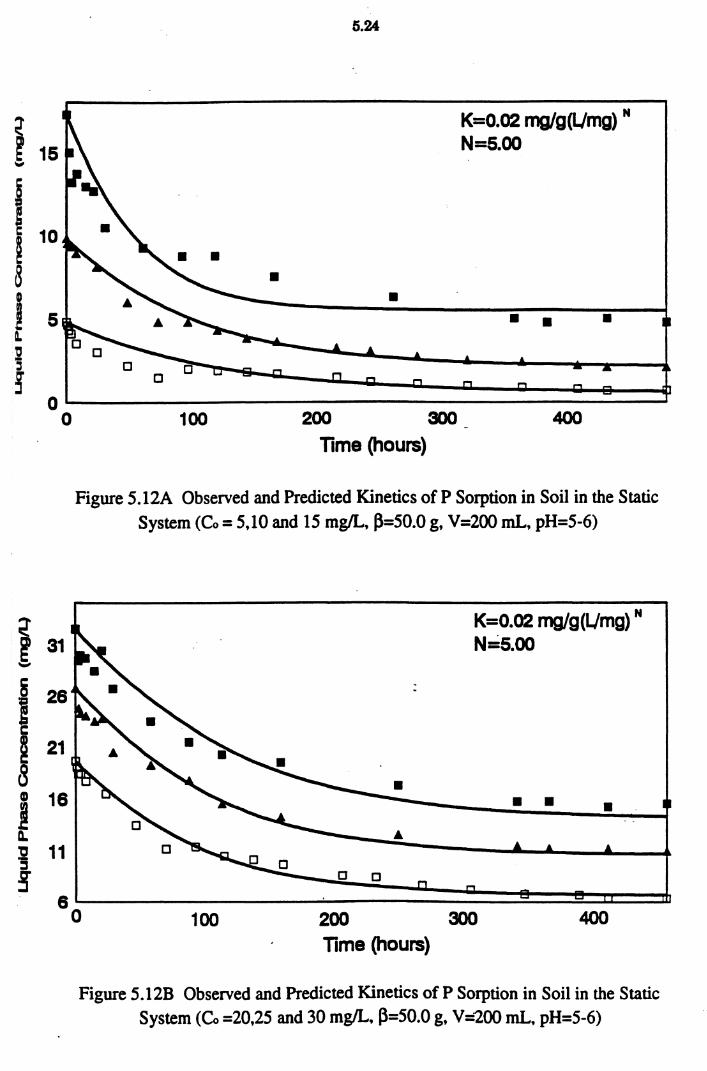
i 15
I 10
8 I
I 5 D. '0 -:I ~
0 0
i 31
26
21
GJ 18
l :g 11
!
5.24
K=0.02 mg/g(lJmg) " N=S.OO
• • • • •
c
100 200 300 400
Time (hours)
Figure 5.12A Observed and Predicted Kinetics of P Sorption in Soil in the Static System (Co = 5,10 and 15 mg/L, P=50.0 g, V=200 mL, pH=5-6)
•
a a
100 200 Time (hours)
K=0.02 mg/g(lJmg) " N=s.oo
• • • •
300 400
Figure 5.12B Observed and Predicted Kinetics of P Sorption in Soil in the Static System (Co =20,25 and 30 mg/L. (}=50.0 g, V=200 mL, pH=5-6)
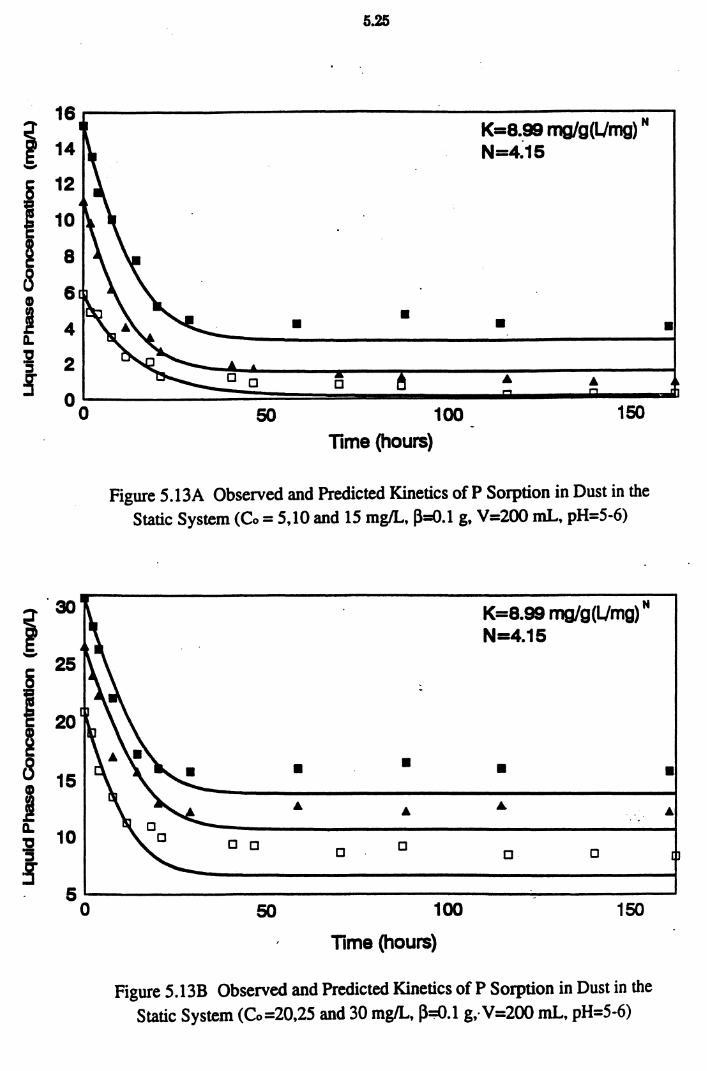
16
i 14 -g 12
I 10
~ 8
B 6 G)
~ 4 Q.
:2 2 :::2
:9" 00
i 30
- 25 s i 20
~ 8 15
i Q. :g 10 :I
:9" 5
0
5.25
• •
50
Time (hours) 100
K=8.~ mg/g(Umg) N
N=4.15
•
150
Figure 5.13A Observed and Predicted Kinetics ofP Sorption in Dust in the Static System (Co = 5,10 and 15 mg/L, ~::0.1 g, V=200 mL, pH=S-6)
K=8.99 mg/g(Umg)" N=4.15
• • • A A A
. -. -
0 0 0 0
0 0
50 100 150
Time (hours)
Figure 5.l3B Observed and Predicted Kinetics of P Sorption in Dust in the Static System (Co=20,25 and 30 mg/L, ~:;0.1 g,. V-200 mL, pH=5-6)
•
• A
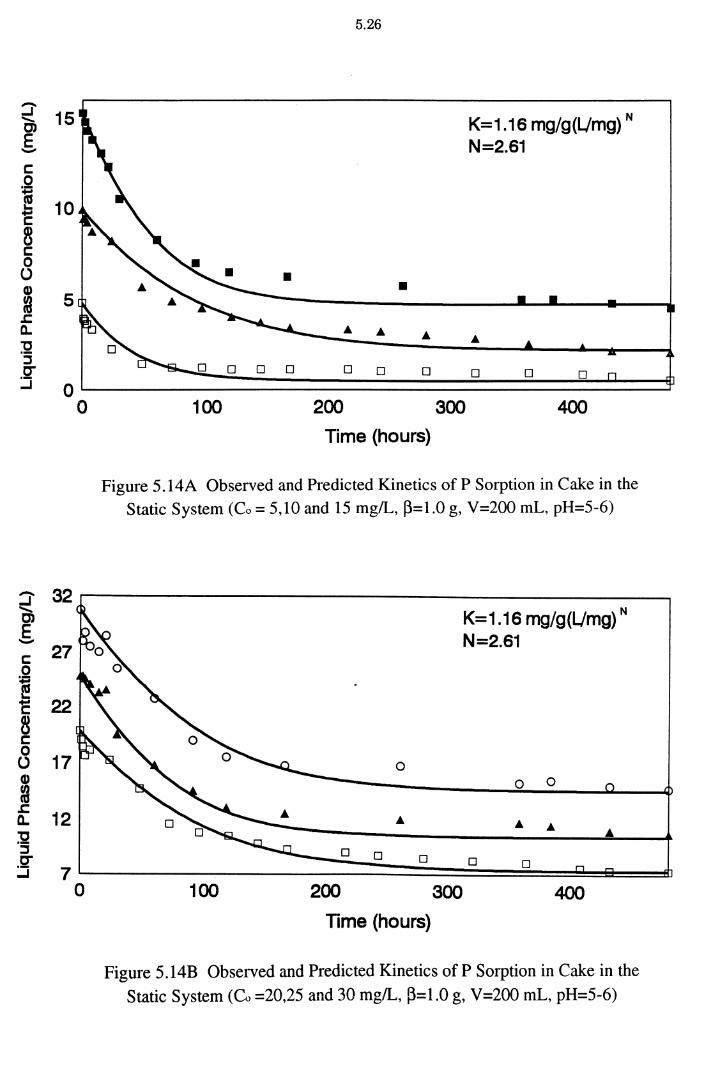
::J 15 ....... m E -c 0 i
10 '-~ c B c 0 () G)
m 5 .c a. :g :I C" ::i 0
0
::J 32 ....... m E -c 27 0
~ ~ 22 c B c 0
17 () G)
~ .c 12 a.
:g :I .5r ..J 7
0
5.26
K= 1.16 mg/g {L/mg) N
N=2.61
• • • • •
0 0 0 0 0 0 0 0 0 0
100 200 300 400
Time (hours}
Figure 5.14A Observed and Predicted Kinetics of P Sorption in Cake in the Static System (Co = 5,10 and 15 mg/L, 13=1.0 g, V=200 mL, pH=5-6)
K=1.16 mg/g(L/mg} N
N=2.61
0 0 0
• • • 0 0 0 0 0
100 200 300 400
Time (hours}
Figure 5.14 B Observed and Predicted Kinetics of P Sorption in Cake in the
Static System (Co =20,25 and 30 mg/L, 13=1.0 g, V=200 mL, pH=5-6)
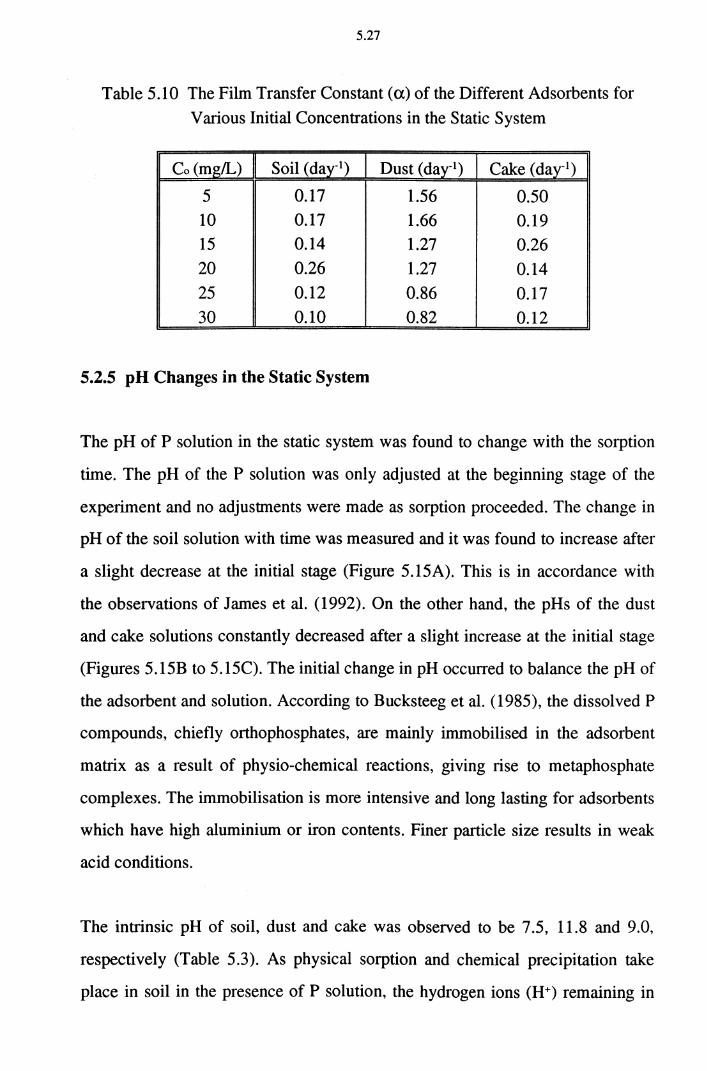
5.27
Table 5.10 The Film Transfer Constant (a) of the Different Adsorbents for
Various Initial Concentrations in the Static System
Co (mg/L) Soil (day-1) Dust (day-1) Cake (day-1)
5 0.17 1.56 0.50 10 0.17 1.66 0.19 15 0.14 1.27 0.26 20 0.26 1.27 0.14 25 0.12 0.86 0.17 30 0.10 0.82 0_12
5.2.5 pH Changes in the Static System
The pH of P solution in the static system was found to change with the sorption
time. The pH of the P solution was only adjusted at the beginning stage of the
experiment and no adjustments were made as sorption proceeded. The change in
pH of the soil solution with time was measured and it was found to increase after
a slight decrease at the initial stage (Figure 5.15A). This is in accordance with
the observations of James et al. (1992). On the other hand, the pHs of the dust
and cake solutions constantly decreased after a slight increase at the initial stage
(Figures 5.15B to 5.15C). The initial change in pH occurred to balance the pH of
the adsorbent and solution. According to Bucksteeg et al. (1985), the dissolved P
compounds, chiefly orthophosphates, are mainly immobilised in the adsorbent
matrix as a result of physio-chemical reactions, giving rise to metaphosphate
complexes. The immobilisation is more intensive and long lasting for adsorbents
which have high aluminium or iron contents. Finer particle size results in weak
acid conditions.
The intrinsic pH of soil, dust and cake was observed to be 7.5, 11.8 and 9.0,
respectively (Table 5.3). As physical sorption and chemical precipitation take
place in soil in the presence of P solution, the hydrogen ions (H+) remaining in
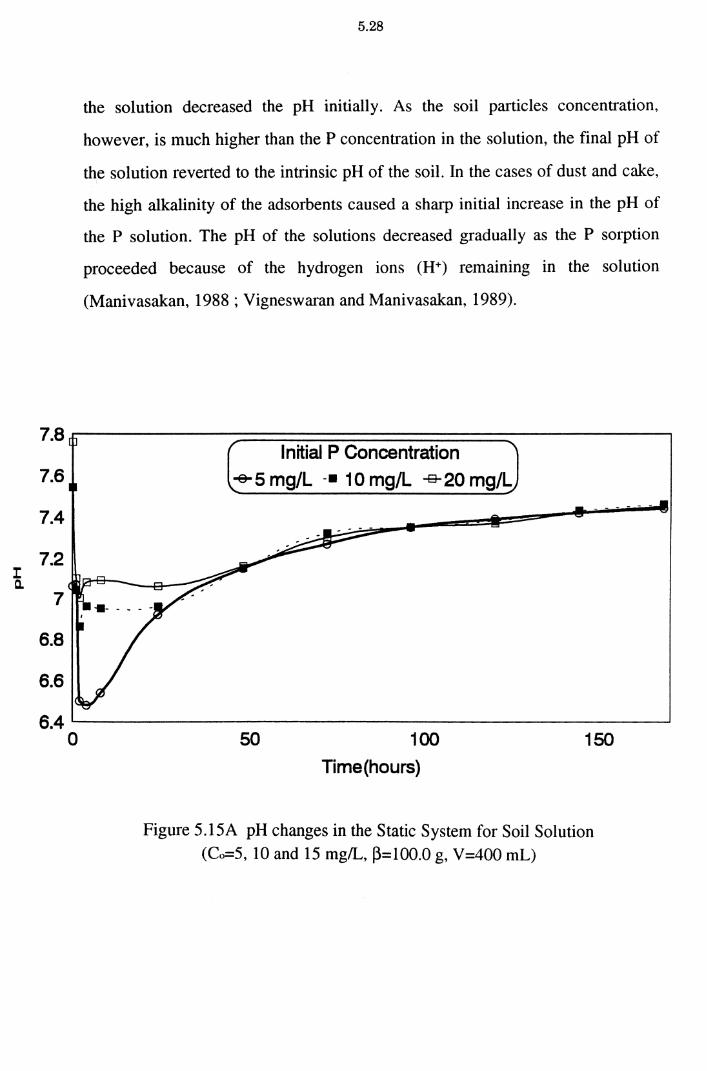
7.8
7.6
7.4
7.2 I Q.
7
6.8
6.6
6.4 0
5.28
the solution decreased the pH initially. As the soil particles concentration,
however, is much higher than the P concentration in the solution, the final pH of
the solution reverted to the intrinsic pH of the soil. In the cases of dust and cake,
the high alkalinity of the adsorbents caused a sharp initial increase in the pH of
the P solution. The pH of the solutions decreased gradually as the P sorption
proceeded because of the hydrogen ions (H+) remaining in the solution
(Manivasakan, 1988; Vigneswaran and Manivasakan, 1989).
Initial P Concentration -e- 5 mg/L -• 1 0 mg/L -s- 20 mg/L
50 100
Time(hours) 150
Figure 5.15A pH changes in the Static System for Soil Solution (Co=5, 10 and 15 mg/L, ~=100.0 g, V=400 mL)
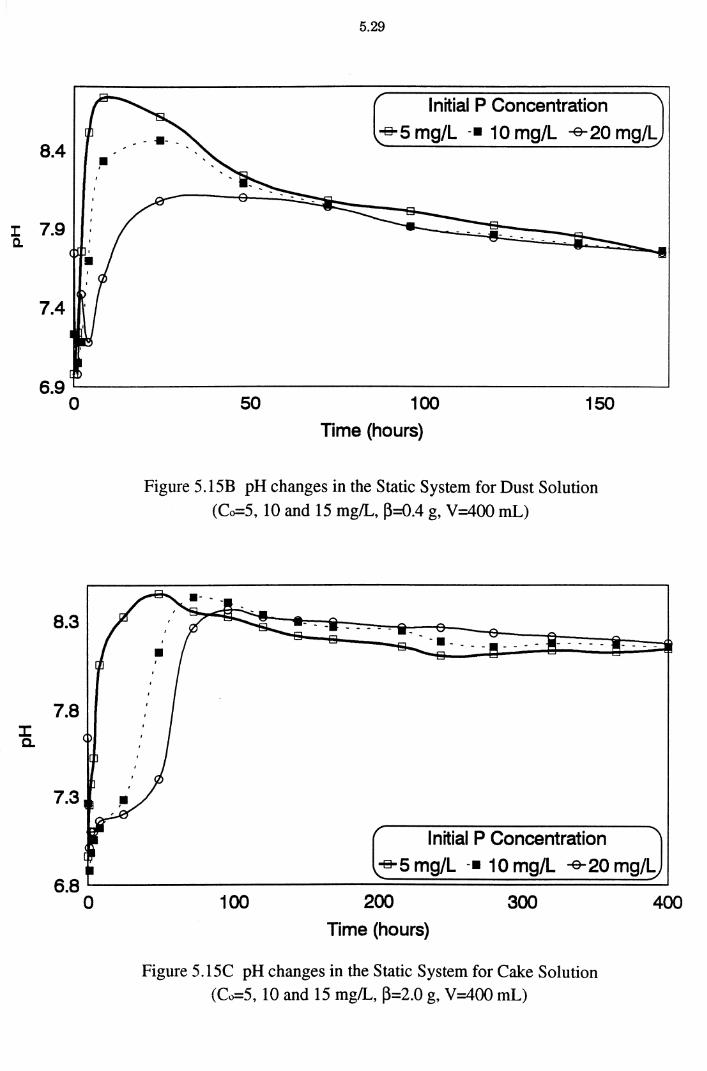
8.4
:r: 7.9 c.
5.29
Initial P Concentration
-s- 5 mg/L -• 1 0 mg/L -e-20 mg/L
6.9~------------------------------------------------~
:X: Q.
0
8.3
7.8
7.3
50 100
Time (hours}
150
Figure 5.15B pH changes in the Static System for Dust Solution
(Co=5, 10 and 15 mg/L, ~=0.4 g, V=400 mL)
Initial P Concentration
-s- 5 mg/L -• 1 0 mg/L -e-20 mg/L 6.8 L__-----------===========:::....J
0 1 00 200 300 400
Time (hours}
Figure 5.15C pH changes in the Static System for Cake Solution (Co=5, 10 and 15 mg/L, ~=2.0 g, V=400 mL)
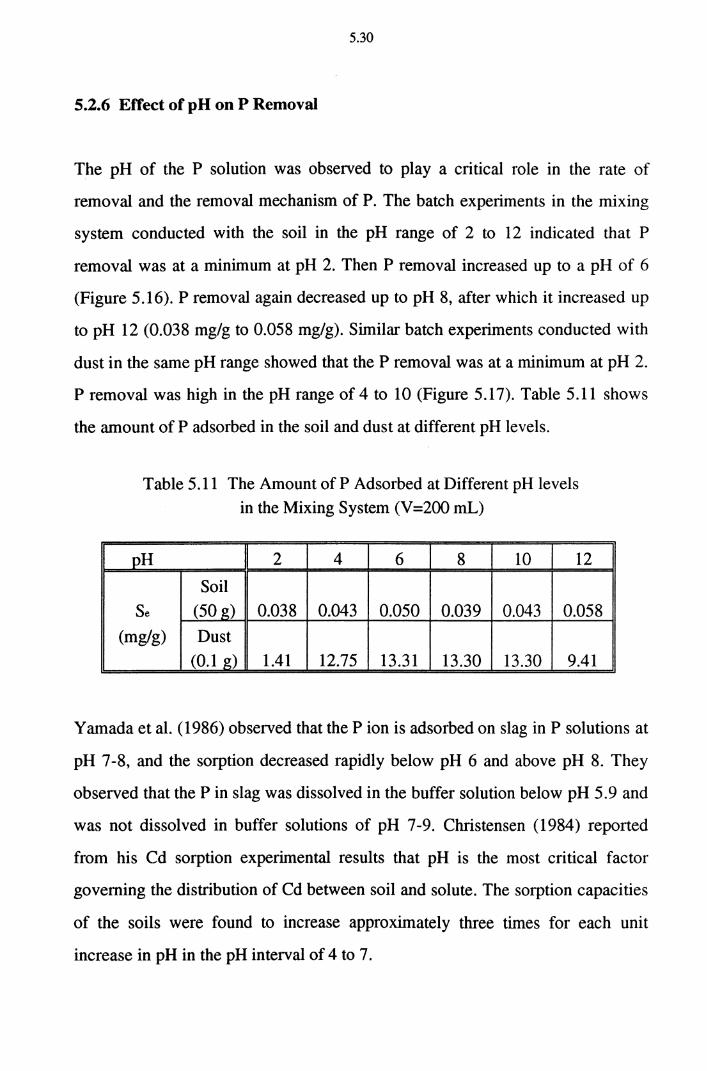
5.30
5.2.6 Effect of pH on P Removal
The pH of the P solution was observed to play a critical role in the rate of
removal and the removal mechanism of P. The batch experiments in the mixing
system conducted with the soil in the pH range of 2 to 12 indicated that P
removal was at a minimum at pH 2. Then P removal increased up to a pH of 6
(Figure 5.16). P removal again decreased up to pH 8, after which it increased up
to pH 12 (0.038 mg/g to 0.058 mg/g). Similar batch experiments conducted with
dust in the same pH range showed that the P removal was at a minimum at pH 2.
P removal was high in the pH range of 4 to 10 (Figure 5.17). Table 5.11 shows
the amount of P adsorbed in the soil and dust at different pH levels.
Table 5.11 The Amount of P Adsorbed at Different pH levels in the Mixing System (V=200 mL)
pH 2 4 6 8 10 12
Soil
Se (50 g) 0.038 0.043 0.050 0.039 0.043 0.058
(mg/g) Dust (0.1 g) 1.41 12.75 13.31 13.30 13.30 9.41
Y amada et al. (1986) observed that the P ion is adsorbed on slag in P solutions at
pH 7-8, and the sorption decreased rapidly below pH 6 and above pH 8. They
observed that the Pin slag was dissolved in the buffer solution below pH 5.9 and
was not dissolved in buffer solutions of pH 7-9. Christensen ( 1984) reported
from his Cd sorption experimental results that pH is the most critical factor
governing the distribution of Cd between soil and solute. The sorption capacities
of the soils were found to increase approximately three times for each unit
increase in pH in the pH interval of 4 to 7.
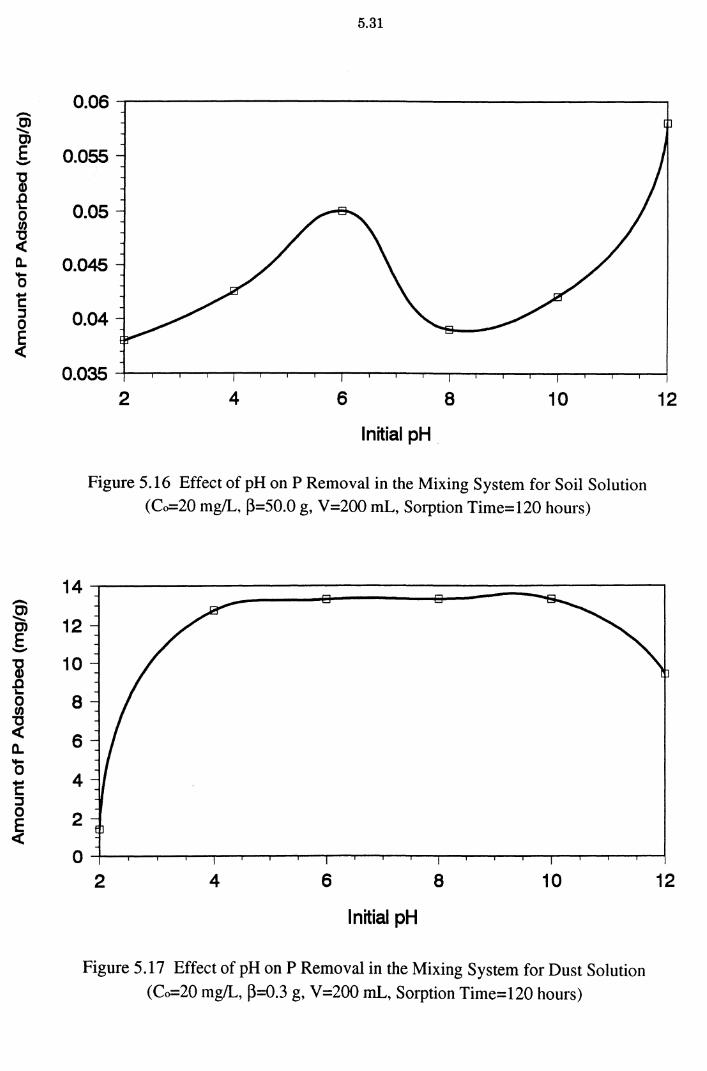
-~ 0)
E -'i .a '-0 Cl)
"C < 0..
'6 'E ::l 0 E <C
-~ 0)
E -~ '-0 Cl)
"C <C a. '5 'E ::l 0 E
<C
5.31
0.06
0.055
0.05
0.045
0.04
0.035 2 4 6 8 10
Initial pH
Figure 5.16 Effect of pH on P Removal in the Mixing System for Soil Solution
(Co=20 mg/L, ~=50.0 g, V=200 mL, Sorption Time=120 hours)
14
12
10
8
6
4
2
0 2 4 6 8 10
Initial pH
Figure 5.17 Effect of pH on P Removal in the Mixing System for Dust Solution
(Co=20 mg!L, ~=0.3 g, V=200 mL, Sorption Time=120 hours)
12
12
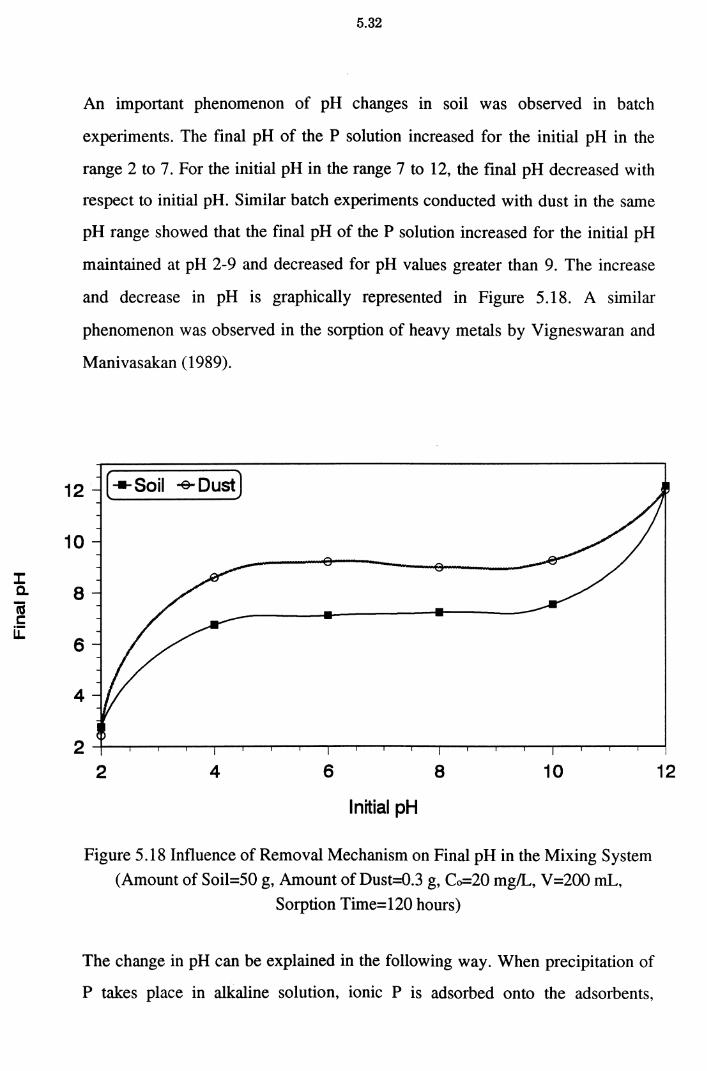
l: a. cu c::
u::
5.32
An important phenomenon of pH changes in soil was observed in batch
experiments. The final pH of the P solution increased for the initial pH in the
range 2 to 7. For the initial pH in the range 7 to 12, the final pH decreased with
respect to initial pH. Similar batch experiments conducted with dust in the same
pH range showed that the final pH of the P solution increased for the initial pH
maintained at pH 2-9 and decreased for pH values greater than 9. The increase
and decrease in pH is graphically represented in Figure 5.18. A similar
phenomenon was observed in the sorption of heavy metals by Vigneswaran and
Manivasakan (1989).
12 ( ...... Soil -e- Dust)
10
8
6
4
2 4 6 8 10
Initial pH
Figure 5.18 Influence of Removal Mechanism on Final pH in the Mixing System
(Amount of Soil=50 g, Amount of Dust=0.3 g, Co=20 mg/L, V =200 mL,
Sorption Time= 120 hours)
The change in pH can be explained in the following way. When precipitation of
P takes place in alkaline solution, ionic P is adsorbed onto the adsorbents,
12
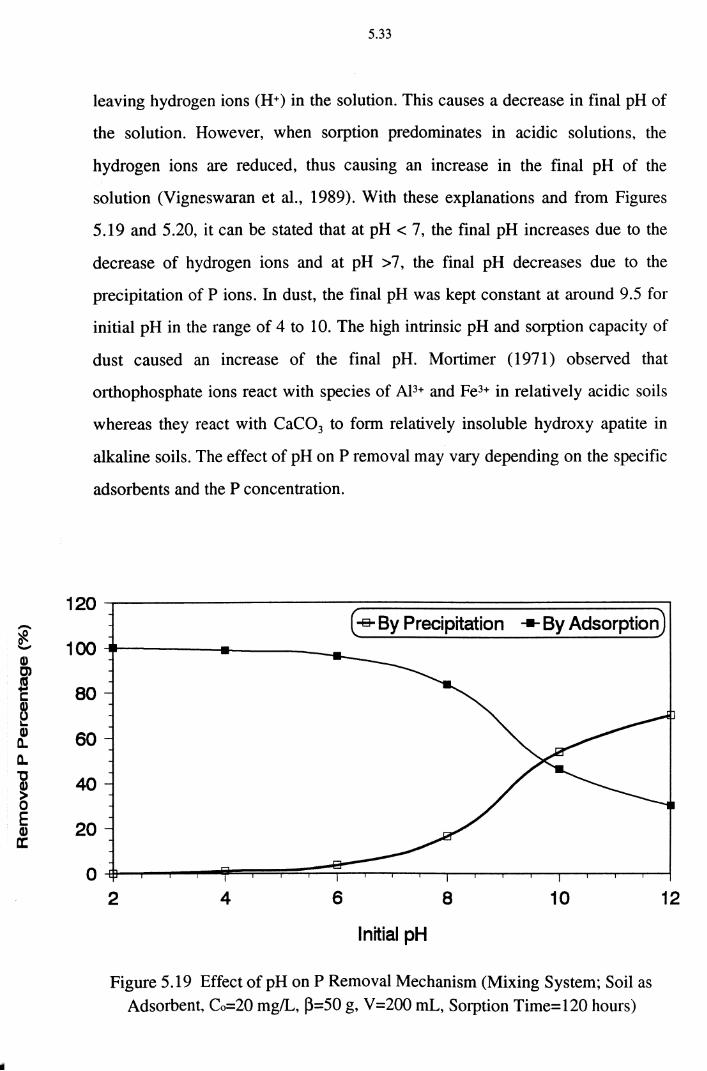
-~ L Cl) C) 1\1 ... c: ~ Cl) a.. a.. "C ~ 0 E Cl) a:
5.33
leaving hydrogen ions (H+) in the solution. This causes a decrease in final pH of
the solution. However, when sorption predominates in acidic solutions, the
hydrogen ions are reduced, thus causing an increase in the final pH of the
solution (Vigneswaran et al., 1989). With these explanations and from Figures
5.19 and 5.20, it can be stated that at pH< 7, the final pH increases due to the
decrease of hydrogen ions and at pH > 7, the final pH decreases due to the
precipitation of Pions. In dust, the final pH was kept constant at around 9.5 for
initial pH in the range of 4 to 10. The high intrinsic pH and sorption capacity of
dust caused an increase of the final pH. Mortimer ( 1971) observed that
orthophosphate ions react with species of AP+ and Fe3+ in relatively acidic soils
whereas they react with CaC03 to form relatively insoluble hydroxy apatite in
alkaline soils. The effect of pH on P removal may vary depending on the specific
adsorbents and the P concentration.
120
100
80
so
40
20
0
( -s- By Precipitation ---By Adsorption)
2 4 s 8 10
lnttial pH
Figure 5.19 Effect of pH on P Removal Mechanism (Mixing System; Soil as Adsorbent, Co=20 mg!L, ~=50 g, V =200 mL, Sorption Time= 120 hours)
12
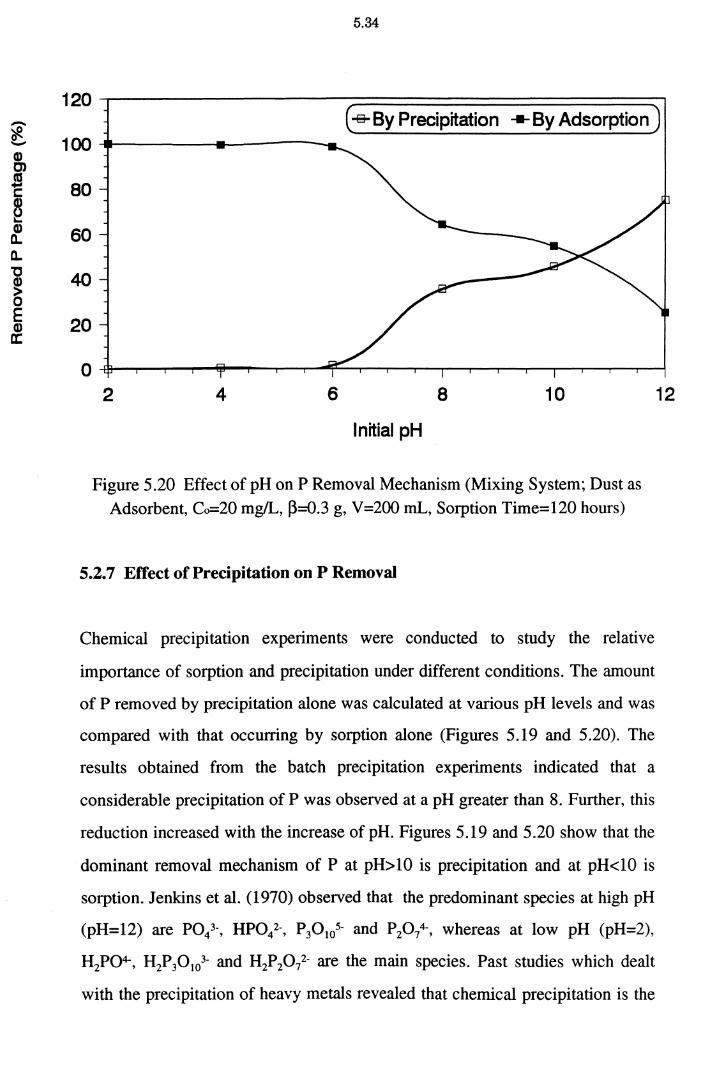
-~ ~ G) C) ea ... c:
~ G) a.. a.. "'C
~ 0 E G) a:
5.34
120 ( -s- By Precipitation _._By Adsorption)
100
80
60
40
20
0 2 4 6 8 10
Initial pH
Figure 5.20 Effect of pH on P Removal Mechanism (Mixing System; Dust as
Adsorbent, Co=20 mg/L, ~=0.3 g, V=200 mL, Sorption Time=120 hours)
5.2. 7 Effect of Precipitation on P Removal
Chemical precipitation experiments were conducted to study the relative
importance of sorption and precipitation under different conditions. The amount
of P removed by precipitation alone was calculated at various pH levels and was
compared with that occurring by sorption alone (Figures 5.19 and 5.20). The
results obtained from the batch precipitation experiments indicated that a
considerable precipitation of P was observed at a pH greater than 8. Further, this
reduction increased with the increase of pH. Figures 5.19 and 5.20 show that the
dominant removal mechanism of P at pH>10 is precipitation and at pH<10 is
sorption. Jenkins et al. (1970) observed that the predominant species at high pH
(pH=12) are POl-, HPOl-, P30 105- and P20 74-, whereas at low pH (pH=2),
H2P04-, H2P30 103- and H2P20l- are the main species. Past studies which dealt
with the precipitation of heavy metals revealed that chemical precipitation is the
12
5.35
predominant mechanism at high pH (Bhuvendralingam and Vigneswaran, 1987;
Christensen, 1984). Manivasakan (1988) observed that the precipitation of heavy
metals depends mainly on pH, mixing rate and settling time.
Figure 5.21 graphically shows the effect of precipitation on P removal at various
pH levels. The reduction of P concentration by precipitation was found to be
insignificant for a pH range of 2 to 6, both for soil and dust. Thus the dominant
removal mechanism of P at pH <6 is physical sorption, and the effect of chemical
precipitation can be neglected over this pH range. A significant reduction of P,
however, was observed over a pH range of 6 to 12. The reduction of the P
concentration was greater for dust than for soil. This may be due to the presence
of high amounts of calcium ions (Ca2+) in dust compared to soil. The calcium
ions (Ca2+) retained in dust (67.96 cmol (+)/kg) assist in P complexation. CaC03
may encourage P removal by raising the pH and shifting the chemical
equilibrium toward precipitation of calcium phosphate (Effer and Driscoll,
1985). CaC03 was observed to enhance P removal by coprecipitation and
sorption of P by replacement of water, hydroxyl ions or bicarbonate ions at the
coordinate positions (Aulenbach and Meisheng, 1988). These results reinforce
past studies on precipitation of heavy metals. Aulenbach and Meisheng (1988)
suggested that sorption may be responsible for initial P removal, but it was not
the mechanism for continuous P removal. They also concluded that calcium
present in the wastewater enhanced precipitation of P. Crystallisation of hydroxy
apatite (HAP), Ca5(P04) 30H, in aqueous solution is described by the following
equation:
... (5.1)
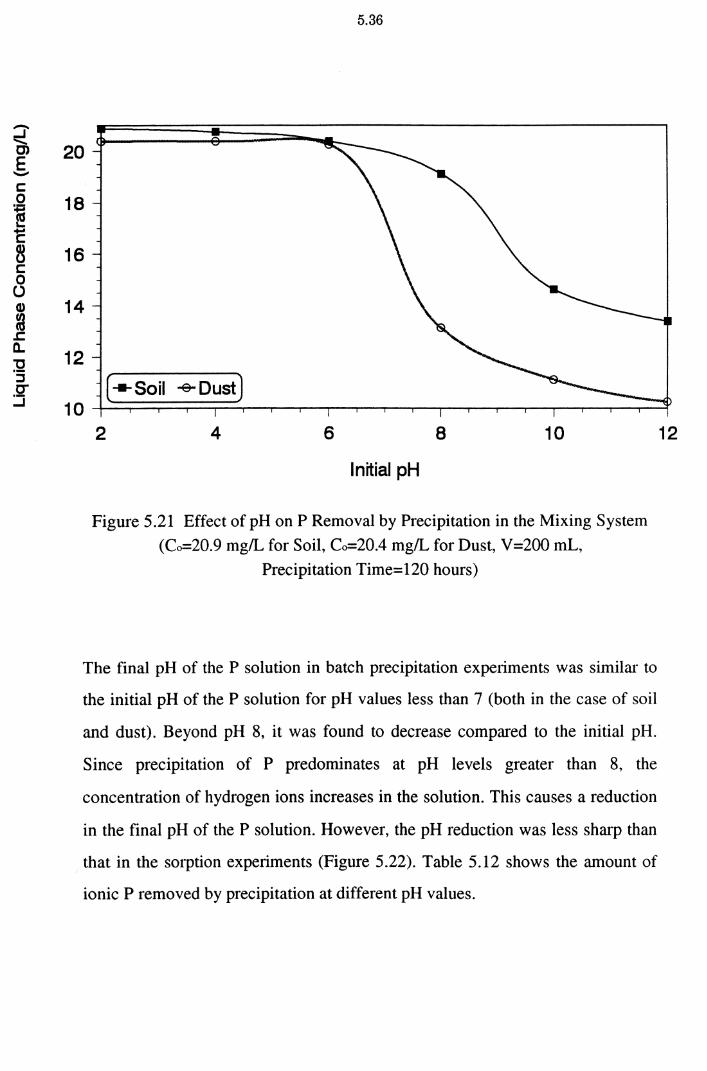
-_J ....... C> E -c: 0 i L.. ..... c: ~ c: 0 (.) Q)
m J: a.. :2
:::::J
.2"' _J
20
18
16
14
12
10
5.36
( ..... Soil ..e- Dust)
2 4 6 8 10
lnrtial pH
Figure 5.21 Effect of pH on P Removal by Precipitation in the Mixing System
(Co=20.9 mg/L for Soil, Co=20.4 mg/L for Dust, V=200 mL,
Precipitation Time=120 hours)
The final pH of the P solution in batch precipitation experiments was similar to
the initial pH of the P solution for pH values less than 7 (both in the case of soil
and dust). Beyond pH 8, it was found to decrease compared to the initial pH.
Since precipitation of P predominates at pH levels greater than 8, the
concentration of hydrogen ions increases in the solution. This causes a reduction
in the final pH of the P solution. However, the pH reduction was less sharp than
.·that in the sorption experiments (Figure 5.22). Table 5.12 shows the amount of
ionic P removed by precipitation at different pH values.
12
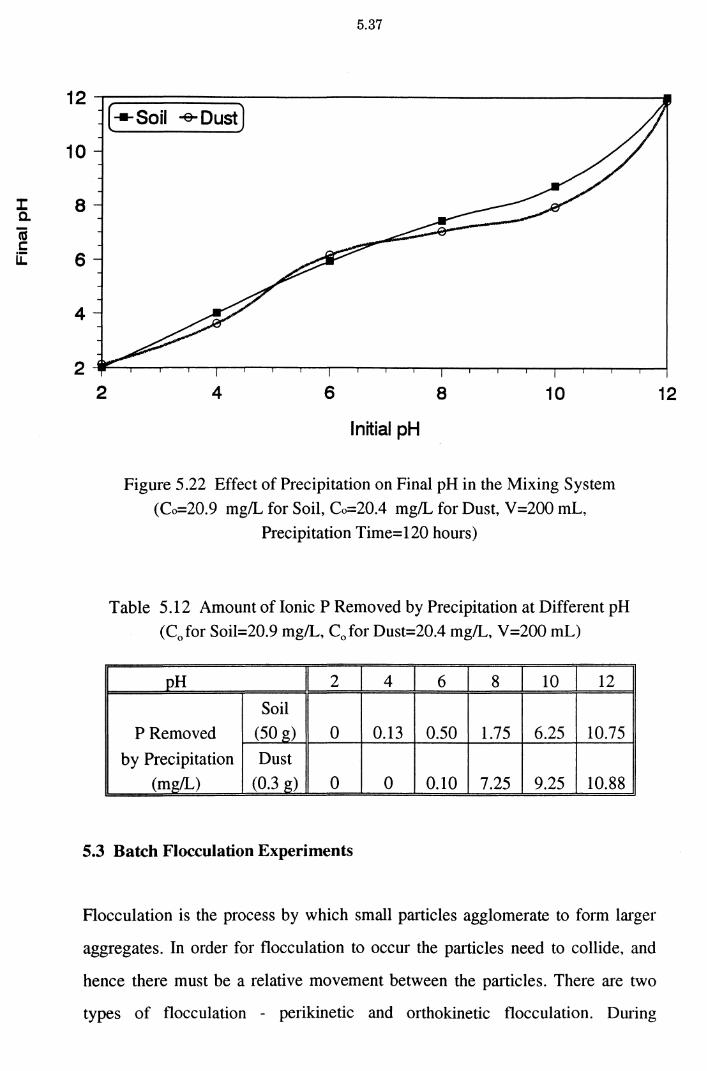
I: c. ea 1: u:
12
10
8
6
4
2 2
5.37
( -11- Soil -e. Dust)
4 6 8 10
Initial pH
Figure 5.22 Effect of Precipitation on Final pH in the Mixing System (Co=20.9 mg/L for Soil, Co=20.4 mg/L for Dust, V=200 mL,
Precipitation Time=120 hours)
Table 5.12 Amount of Ionic P Removed by Precipitation at Different pH (C0 for Soil=20.9 mg/L, C0 for Dust=20.4 mg/L, V=200 mL)
pH 2 4 6 8 10 12
Soil
P Removed (50 g) 0 0.13 0.50 1.75 6.25 10.75
by Precipitation Dust (mg/L) (0.3g) 0 0 0.10 7.25 9.25 10.88
5.3 Batch Flocculation Experiments
Flocculation is the process by which small particles agglomerate to form larger
aggregates. In order for flocculation to occur the particles need to collide, and
hence there must be a relative movement between the particles. There are two
types of flocculation - perikinetic and orthokinetic flocculation. During
12
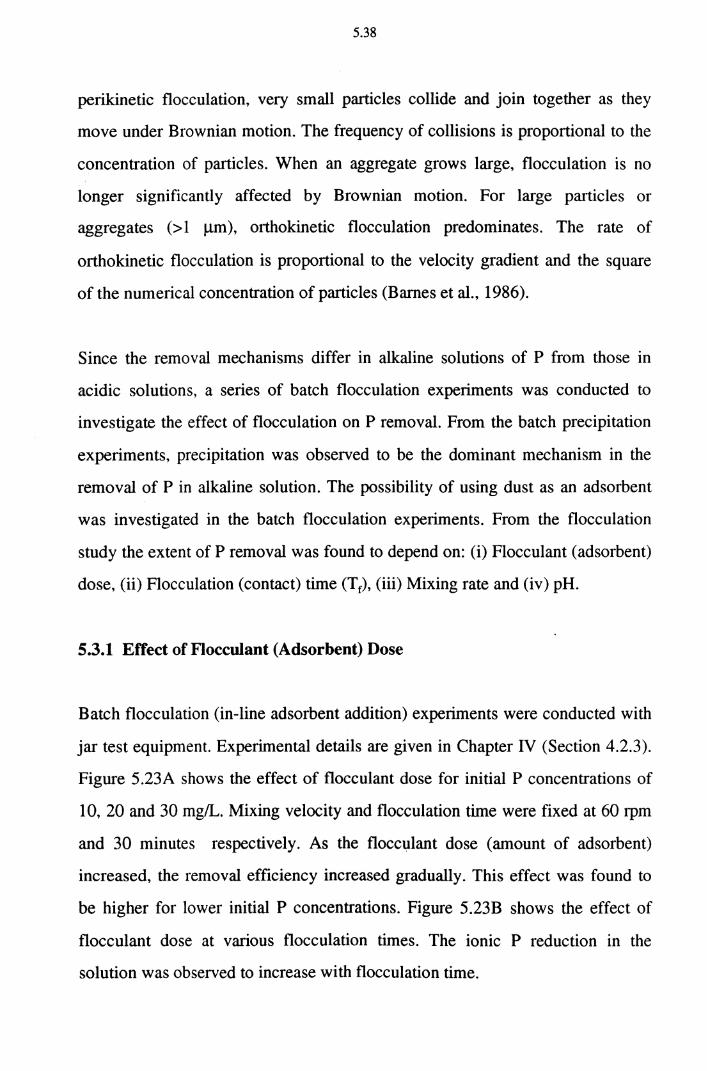
5.38
perikinetic flocculation, very small particles collide and join together as they
move under Brownian motion. The frequency of collisions is proportional to the
concentration of particles. When an aggregate grows large, flocculation is no
longer significantly affected by Brownian motion. For large pruticles or
aggregates (> 1 J..Lm), orthokinetic flocculation predominates. The rate of
orthokinetic flocculation is proportional to the velocity gradient and the square
of the numerical concentration of particles (Barnes et al., 1986).
Since the removal mechanisms differ in alkaline solutions of P from those in
acidic solutions, a series of batch flocculation experiments was conducted to
investigate the effect of flocculation on P removal. From the batch precipitation
experiments, precipitation was observed to be the dominant mechanism in the
removal of P in alkaline solution. The possibility of using dust as an adsorbent
was investigated in the batch flocculation experiments. From the flocculation
study the extent of P removal was found to depend on: (i) Flocculant (adsorbent)
dose, (ii) Flocculation (contact) time (Tr), (iii) Mixing rate and (iv) pH.
5.3.1 Effect of Flocculant (Adsorbent) Dose
Batch flocculation (in-line adsorbent addition) experiments were conducted with
jar test equipment. Experimental details are given in Chapter IV (Section 4.2.3).
Figure 5.23A shows the effect of flocculant dose for initial P concentrations of
10, 20 and 30 mg/L. Mixing velocity and flocculation time were fixed at 60 rpm
and 30 minutes respectively. As the flocculant dose (amount of adsorbent)
increased, the removal efficiency increased gradually. This effect was found to
be higher for lower initial P concentrations. Figure 5.23B shows the effect of
flocculant dose at various flocculation times. The ionic P reduction in the
solution was observed to increase with flocculation time.
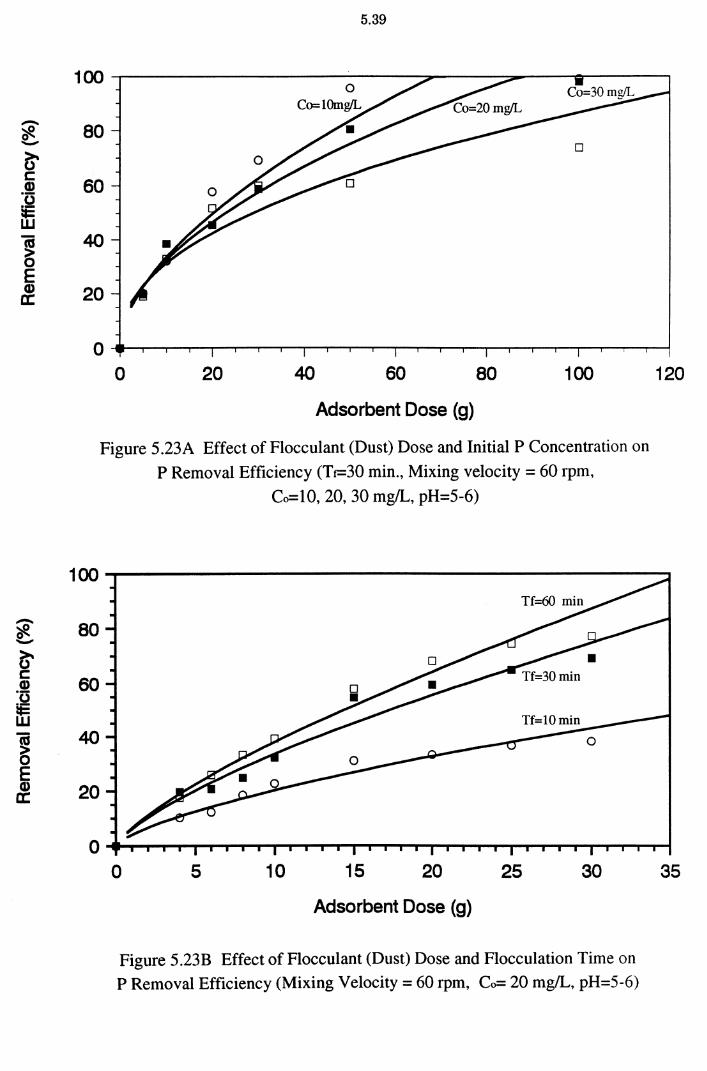
-'#. -() 1:: G) ·o lE w
~ E G) a:
-~ e..... () 1:: G)
~ w ea ~ E G) a:
5.39
100
80
60
40
20
0 20 40 60 80 100
Adsorbent Dose (g)
Figure 5.23A Effect of Flocculant (Dust) Dose and Initial P Concentration on
P Removal Efficiency (Tr-30 min., Mixing velocity= 60 rpm,
100
80
60
40
20
Co=IO, 20, 30 mg!L, pH=5-6)
0 5 10 15 20 25 30
Adsorbent Dose (g)
Figure 5.23B Effect of Flocculant (Dust) Dose and Flocculation Time on
P Removal Efficiency (Mixing Velocity = 60 rpm, Co= 20 mg/L, pH=5-6)
120
35
5.40
5.3.2 Effect of Flocculation (Contact) Time
Flocculation time was found to play an important role in the reduction of ionic P
concentrations in solution. The removal efficiency of P was observed to increase
with flocculation time both for very high (30,000 mg/L) and comparatively low
(2,000 mg/L) flocculant doses (Figures 5.24A and 5.24B). P complexation with
Al, Ca, Fe and other chemicals present in dust is expected to be high with the
increase in flocculant dose and flocculation time. In the presence of dust (as
adsorbent), P in the solution undergoes chemical precipitation followed by
physical sorption on the surface of dust particles. This process was enhanced by
the provision of mixing gradient and flocculation time (Figures 5.24A and
5.24B).
Flocculation involves changes in the physical properties of solids whereas
precipitation involves changes in the chemical properties of P. The process of P
precipitation involves a chemical reaction in which P ions combine chemically to
form insoluble compounds which are easily adsorbed to the surface of the
adsorbent (dust).
Precipitation followed by flocculation involves a chemical reaction between ions
that are dissolved in the P solution, and the reaction product is a solid
(suspended in the solution or adsorbed on the surface of dust). Precipitation will
occur if the product of concentration of ions (as measured by the solubility
product) is greater than the solubility product constant (Ksp). The precipitation
reaction can be written as follows:
mAn++ nBm- <=>A B m n ... (5.2)
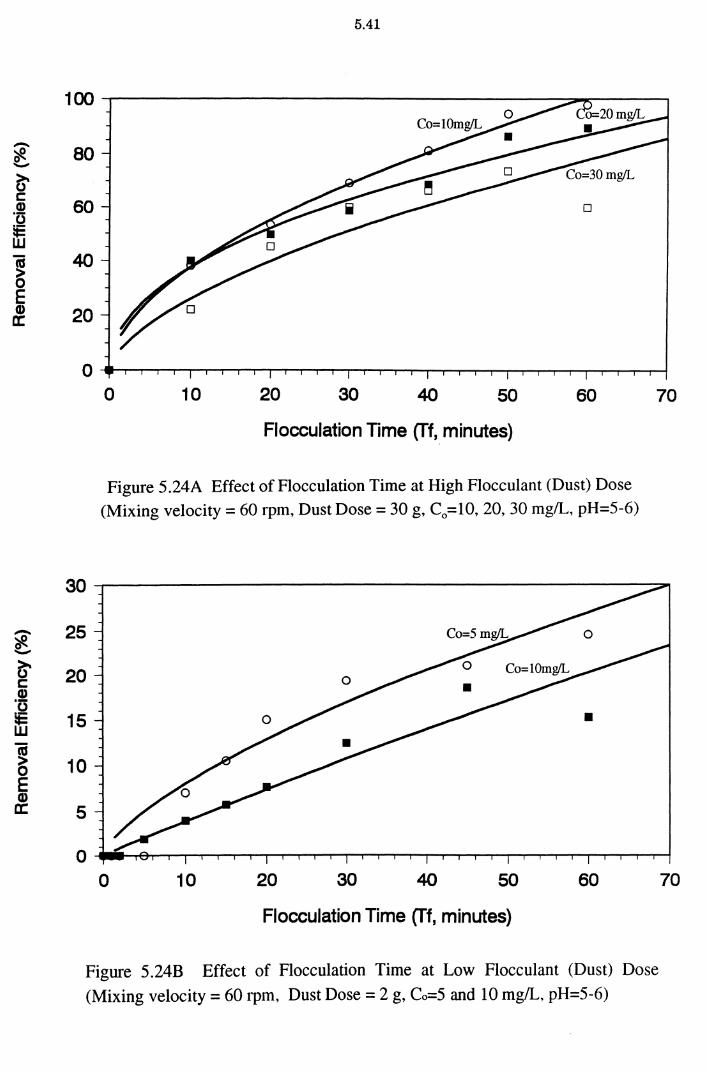
-';~?. e..,
~ c (I) ·a iE w
~ E (I) a:
-';~?. e..,
~ c (I) ·a :e w
~ 0 E (I) a:
5.41
100
80
60
40
20
0 10 20 30 40 50 60 70
30
25
20
15
10
5
0
Flocculation Time (Tf, minutes)
Figure 5.24A Effect of Flocculation Time at High Flocculant (Dust) Dose (Mixing velocity= 60 rpm, Dust Dose= 30 g, Co=lO, 20, 30 mg/L, pH=5-6)
0 10 20 30 40 50 60
Flocculation Time (Tf, minutes)
Figure 5.24B Effect of Flocculation Time at Low Flocculant (Dust) Dose
(Mixing velocity= 60 rpm, Dust Dose= 2 g, Co=5 and 10 mg/L, pH=5-6)
70
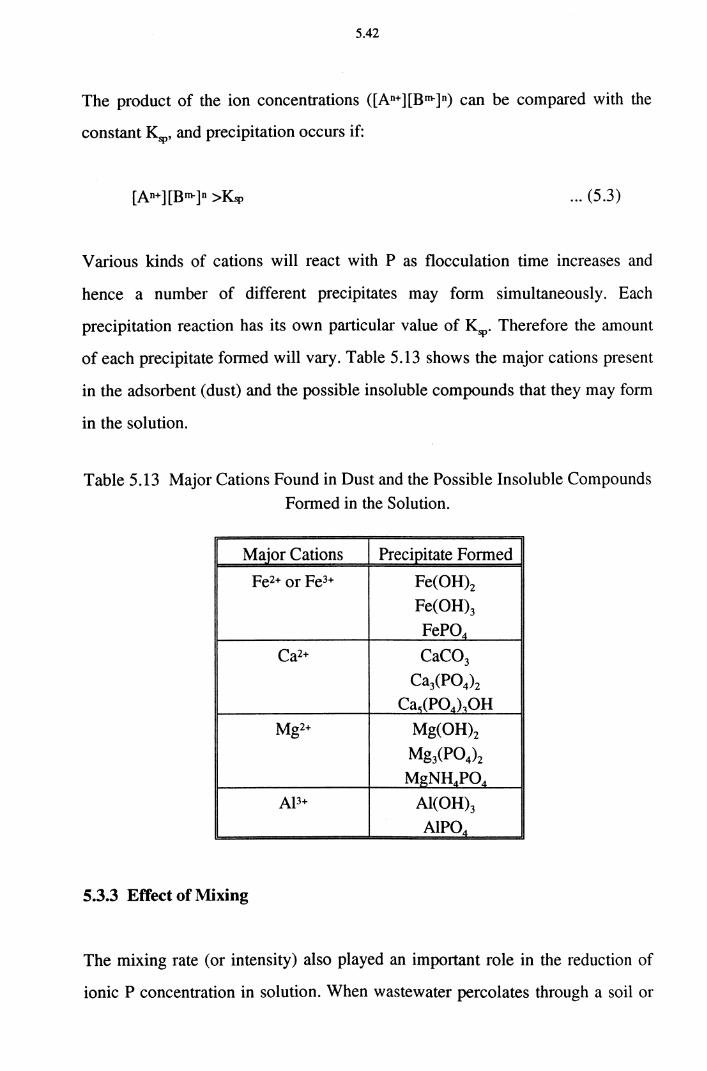
5.42
The product of the ion concentrations ([An+ ][Bm-]n) can be compared with the
constant Ksp, and precipitation occurs if:
... (5.3)
Various kinds of cations will react with P as flocculation time increases and
hence a number of different precipitates may form simultaneously. Each
precipitation reaction has its own particular value of Ksp. Therefore the amount
of each precipitate formed will vary. Table 5.13 shows the major cations present
in the adsorbent (dust) and the possible insoluble compounds that they may form
in the solution.
Table 5.13 Major Cations Found in Dust and the Possible Insoluble Compounds
Formed in the Solution.
Major Cations Precipitate Formed
Fe2+ or Fe3+ Fe(OH)2 Fe(OH)3
FeP04
Ca2+ CaC03 CaiP04)2
Ca.,(PO,)~OH
Mg2+ Mg(OH)2
Mg3(P04)z
MgNH"'PO"' AP+ Al(OH)3
AlPO"'
5.3.3 Effect of Mixing
The mixing rate (or intensity) also played an important role in the reduction of
ionic P concentration in solution. When wastewater percolates through a soil or
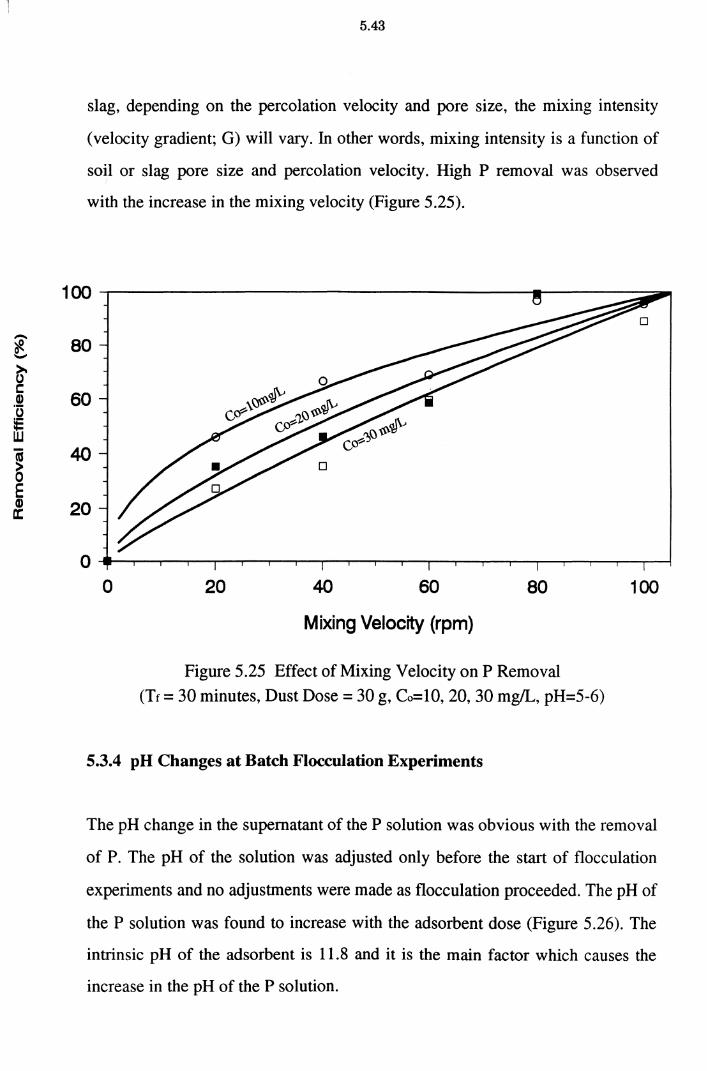
r
-t ~ 1: Q)
~ ~ E Q) a:
5.43
slag, depending on the percolation velocity and pore size, the mixing intensity
(velocity gradient; G) will vary. In other words, mixing intensity is a function of
soil or slag pore size and percolation velocity. High P removal was observed
with the increase in the mixing velocity (Figure 5.25).
100
80
60
40
20
0 0 20 40 60 80 100
Mixing Velocity (rpm)
Figure 5.25 Effect of Mixing Velocity on P Removal
(Tc = 30 minutes, Dust Dose= 30 g, Co=lO, 20, 30 mg/L, pH=5-6)
5.3.4 pH Changes at Batch Flocculation Experiments
The pH change in the supematant of the P solution was obvious with the removal
of P. The pH of the solution was adjusted only before the start of flocculation
experiments and no adjustments were made as flocculation proceeded. The pH of
the P solution was found to increase with the adsorbent dose (Figure 5.26). The
intrinsic pH of the adsorbent is 11.8 and it is the main factor which causes the
increase in the pH of the P solution.
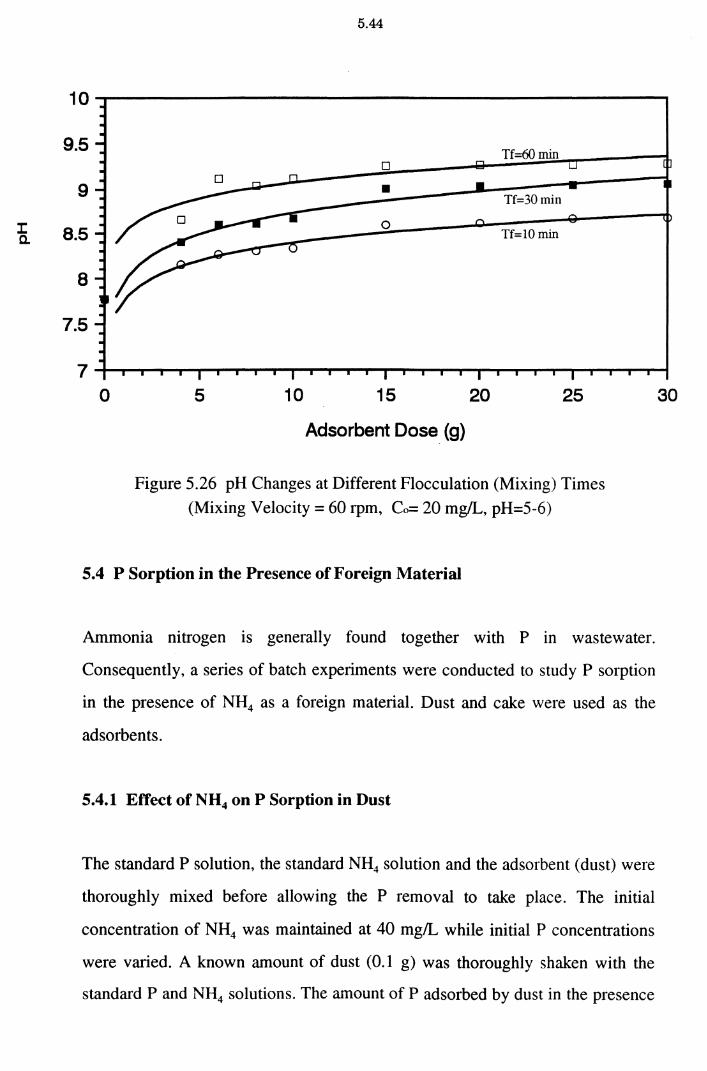
5.44
10----------------------------------------------~
9.5
9
:a 8.5
8
7.5
0 5 10 15 20 25
Adsorbent Dose (g)
Figure 5.26 pH Changes at Different Flocculation (Mixing) Times
(Mixing Velocity= 60 rpm, Co= 20 mg/L, pH=5-6)
5.4 P Sorption in the Presence of Foreign Material
Ammonia nitrogen is generally found together with P in wastewater.
Consequently, a series of batch experiments were conducted to study P sorption
in the presence of NH4 as a foreign material. Dust and cake were used as the
adsorbents.
5.4.1 Effect of NH4 on P Sorption in Dust
The standard P solution, the standard NH4 solution and the adsorbent (dust) were
thoroughly mixed before allowing the P removal to take place. The initial
concentration of NH4 was maintained at 40 mg/L while initial P concentrations
were varied. A known amount of dust (0.1 g) was thoroughly shaken with the
standard P and NH4 solutions. The amount of P adsorbed by dust in the presence
30
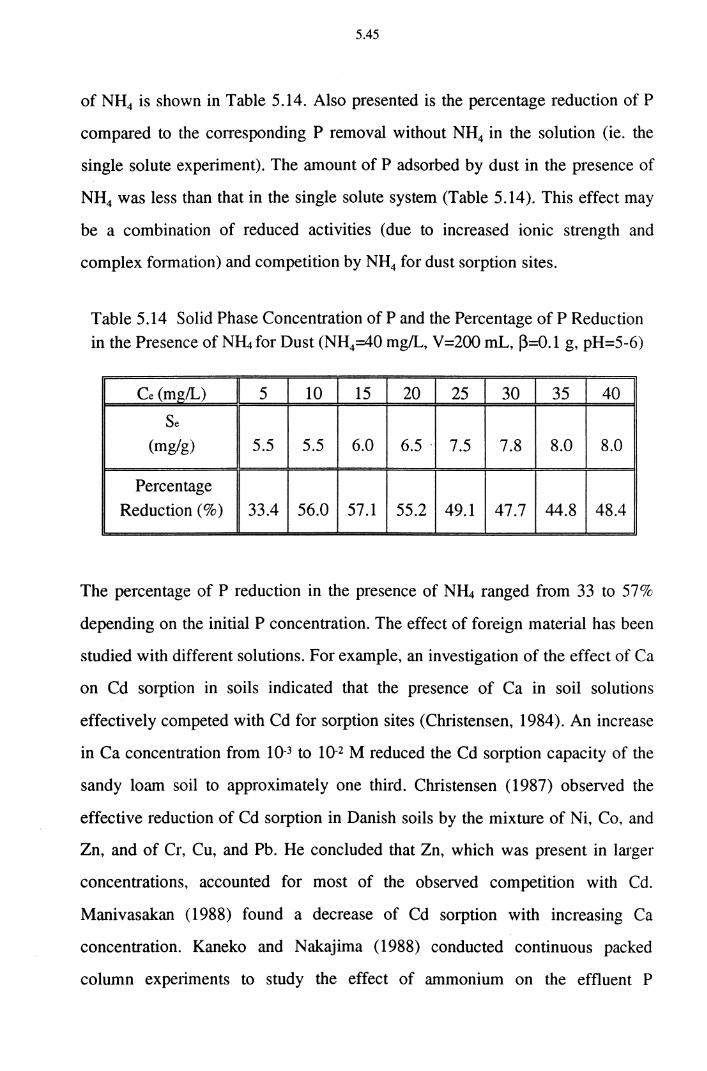
5.45
of NH4 is shown in Table 5.14. Also presented is the percentage reduction of P
compared to the corresponding P removal without NH4 in the solution (ie. the
single solute experiment). The amount of P adsorbed by dust in the presence of
NH4 was less than that in the single solute system (Table 5.14 ). This effect may
be a combination of reduced activities (due to increased ionic strength and
complex formation) and competition by NH4 for dust sorption sites.
Table 5.14 Solid Phase Concentration of P and the Percentage of P Reduction in the Presence of N~ for Dust (NH4=40 mg/L, V=200 mL, ~=0.1 g, pH=5-6)
Ce (mg/L) 5 10 15 20 25 30 35 40
Se (mg/g) 5.5 5.5 6.0 6.5' 7.5 7.8 8.0 8.0
Percentage
Reduction (%) 33.4 56.0 57.1 55.2 49.1 47.7 44.8 48.4
The percentage of P reduction in the presence of N~ ranged from 33 to 57%
depending on the initial P concentration. The effect of foreign material has been
studied with different solutions. For example, an investigation of the effect of Ca
on Cd sorption in soils indicated that the presence of Ca in soil solutions
effectively competed with Cd for sorption sites (Christensen, 1984). An increase
in Ca concentration from 10-3 to 10-2 M reduced the Cd sorption capacity of the
sandy loam soil to approximately one third. Christensen (1987) observed the
effective reduction of Cd sorption in Danish soils by the mixture of Ni, Co, and
Zn, and of Cr, Cu, and Pb. He concluded that Zn, which was present in larger
concentrations, accounted for most of the observed competition with Cd.
Manivasakan ( 1988) found a decrease of Cd sorption with increasing Ca
concentration. Kaneko and Nakajima (1988) conducted continuous packed
column experiments to study the effect of ammonium on the effluent P
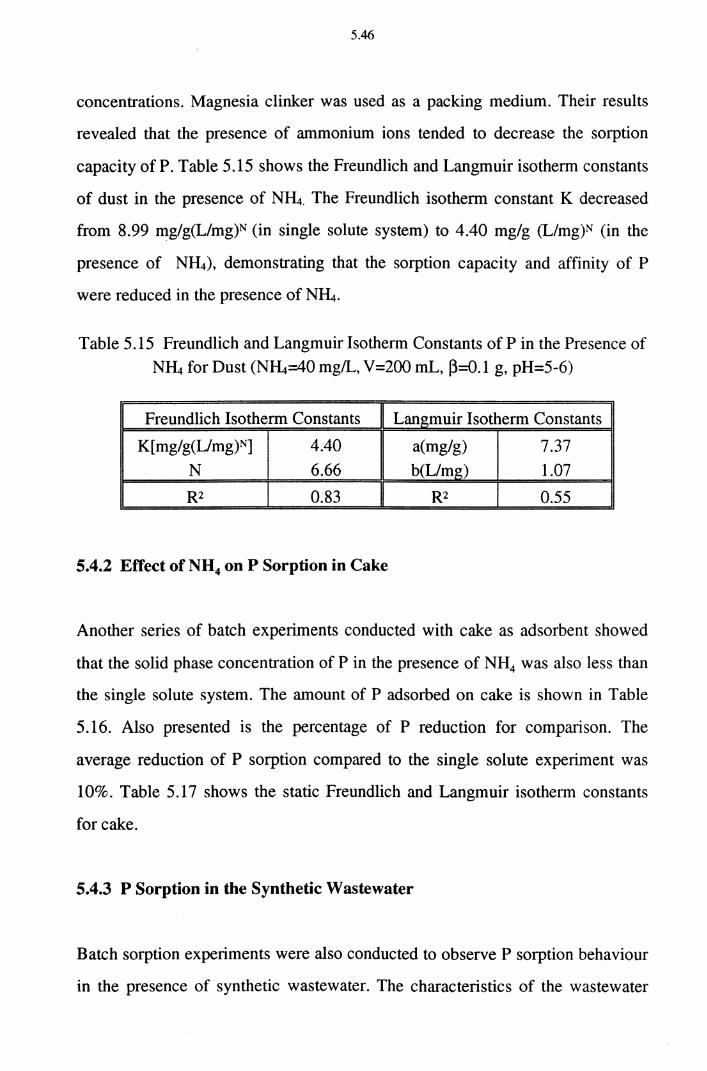
5.46
concentrations. Magnesia clinker was used as a packing medium. Their results
revealed that the presence of ammonium ions tended to decrease the sorption
capacity of P. Table 5.15 shows the Freundlich and Langmuir isotherm constants
of dust in the presence of NIL. The Freundlich isotherm constant K decreased
from 8.99 mg/g(L/mg)N (in single solute system) to 4.40 mg/g (L/mg)N (in the
presence of NIL), demonstrating that the sorption capacity and affinity of P
were reduced in the presence of NIL.
Table 5.15 Freundlich and Langmuir Isotherm Constants of P in the Presence of NH4 for Dust (NIL=40 mg/L, V=200 mL, B=0.1 g, pH=5-6)
Freundlich Isotherm Constants Langmuir Isotherm Constants
K[mg/g(Umg)N] 4.40 a(mg/g) 7.37
N 6.66 b(Umg) 1.07
RZ 0.83 Rz 0.55
5.4.2 Effect of NH4 on P Sorption in Cake
Another series of batch experiments conducted with cake as adsorbent showed
that the solid phase concentration of P in the presence of NH4 was also less than
the single solute system. The amount of P adsorbed on cake is shown in Table
5.16. Also presented is the percentage of P reduction for comparison. The
average reduction of P sorption compared to the single solute experiment was
10%. Table 5.17 shows the static Freundlich and Langmuir isotherm constants
for cake.
5.4.3 P Sorption in the Synthetic Wastewater
Batch sorption experiments were also conducted to observe P sorption behaviour
in the presence of synthetic wastewater. The characteristics of the wastewater
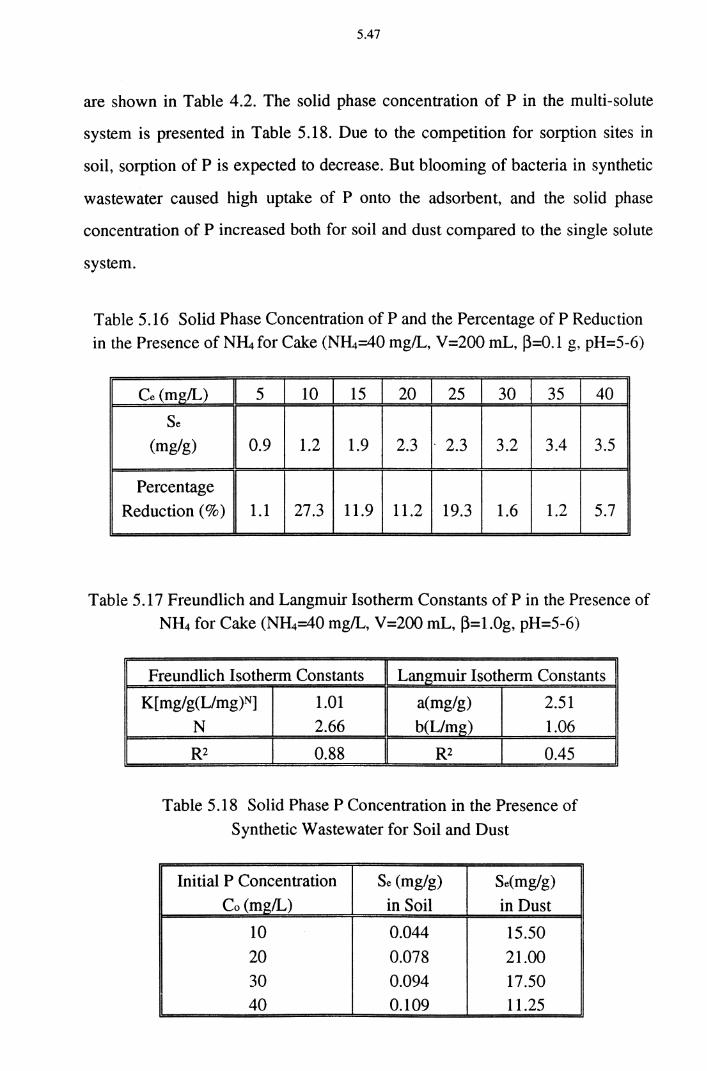
5.47
are shown in Table 4.2. The solid phase concentration of P in the multi-solute
system is presented in Table 5.18. Due to the competition for sorption sites in
soil, sorption of Pis expected to decrease. But blooming of bacteria in synthetic
wastewater caused high uptake of P onto the adsorbent, and the solid phase
concentration of P increased both for soil and dust compared to the single solute
system.
Table 5.16 Solid Phase Concentration of P and the Percentage of P Reduction
in the Presence of NIL for Cake (NJL=40 mg/L, V=200 mL, ~=0.1 g, pH=5-6)
Ce (mg/L) 5 10 15 20 25 30 35 40
Se
(mglg) 0.9 1.2 1.9 2.3 2.3 3.2 3.4 3.5
Percentage
Reduction(%) 1.1 27.3 11.9 11.2 19.3 1.6 1.2 5.7
Table 5.17 Freundlich and Langmuir Isotherm Constants of P in the Presence of
NH4 for Cake (NJL=40 mg/L, V=200 mL, j3=1.0g, pH=5-6)
Freundlich Isotherm Constants Langmuir Isotherm Constants
K[ mg/g(L/mg)N] 1.01 a(mg/g) 2.51
N 2.66 b(L/mg) 1.06
R2 0.88 R2 0.45
Table 5.18 Solid Phase P Concentration in the Presence of
Synthetic Wastewater for Soil and Dust
Initial P Concentration Se (mg/g) Se(mglg)
Co (mg/L) in Soil in Dust
10 0.044 15.50
20 0.078 21.00
30 0.094 17.50
40 0.109 11.25
5.48
5.5 P Removal in Column Experiments
The field conditions were simulated in the laboratory by packing the columns
with the same soil, dust and cake used in batch experiments. The results from
column (dynamic) experiments at various influent concentrations, pore water
velocities and adsorbent depths are described systematically below. The column
experiments were carried out mainly; (i) to compare the P sorption under the
batch (mixing and static system) and column experiments, (ii) to find the
breakthrough pattern of P under various conditions and (iii) to validate the
mathematical model used. The pH of the P solution in the influent was
maintained in the range of 6 to 7.
5.5.1 P Removal in the Soil Column
P sorption rates into soil at different influent concentrations, pore water
velocities, soil depths and water levels above the soil medium in the soil column,
are presented below.
5.5.1.1 Effect of Influent P Concentration
(a) Column Sorption Isotherm of P in Soil
Column sorption experiments were performed in a column packed with 5 cm
deep soil for different influent concentrations of P (5, 10, 20, 30, 40 and 50
mg/L). Other experimental details are given in Chapter IV (Section 4.3.1). The
velocity could not be kept constant for different influent concentrations of P and
it varied from 1.53 to 5.14 cm/day. The equilibrium liquid phase concentration
and the corresponding solid phase P concentration determined experimentally
are presented in Table 5.19. The solid phase concentrations from batch
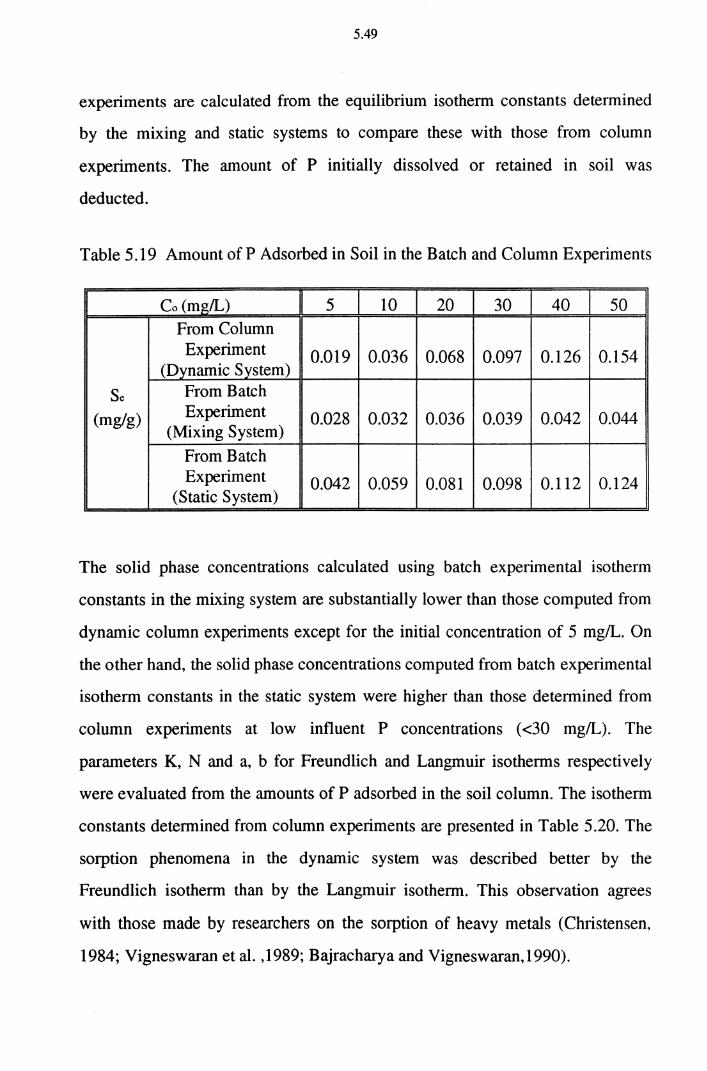
5.49
experiments are calculated from the equilibrium isotherm constants determined
by the mixing and static systems to compare these with those from column
experiments. The amount of P initially dissolved or retained in soil was
deducted.
Table 5.19 Amount of P Adsorbed in Soil in the Batch and Column Experiments
Co (mg/L) 5 10 20 30 40 50 11
From Column Experiment
(Dynamic System) 0.019 0.036 0.068 0.097 0.126 0.154
Se From Batch
(mg/g) Experiment 0.028 0.032 (Mixing System)
0.036 0.039 0.042 0.044
From Batch Experiment 0.042 0.059
(Static System) 0.081 0.098 0.112 0.124
The solid phase concentrations calculated using batch experimental isotherm
constants in the mixing system are substantially lower than those computed from
dynamic column experiments except for the initial concentration of 5 mg/L. On
the other hand, the solid phase concentrations computed from batch experimental
isotherm constants in the static system were higher than those determined from
column experiments at low influent P concentrations ( <30 mg/L). The
parameters K, N and a, b for Freundlich and Langmuir isotherms respectively
were evaluated from the amounts of P adsorbed in the soil column. The isotherm
constants determined from column experiments are presented in Table 5.20. The
sorption phenomena in the dynamic system was described better by the
Freundlich isotherm than by the Langmuir isotherm. This observation agrees
with those made by researchers on the sorption of heavy metals (Christensen,
1984; Vigneswaran et al. , 1989; Bajracharya and Vigneswaran, 1990).
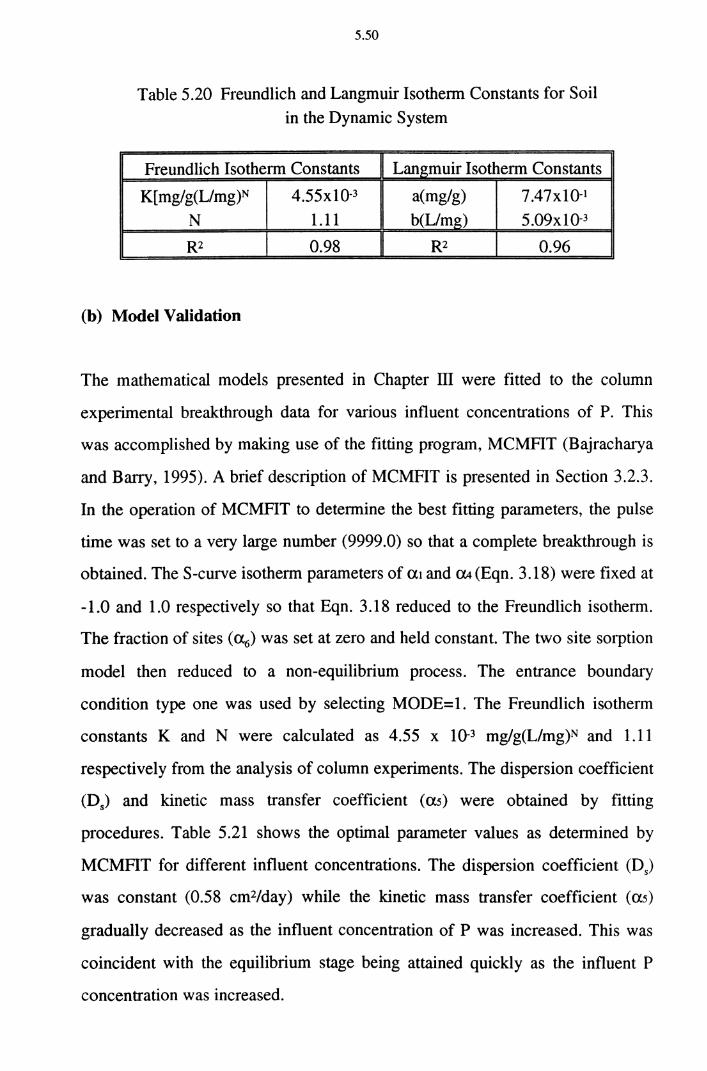
5.50
Table 5.20 Freundlich and Langmuir Isotherm Constants for Soil in the Dynamic System
11 TC. undlich Isotherm Constants 11 Lan2"muir Isotherm Constants
K[mg/g(Umg)N 4.55x10⁻³ a(mg/g) 7.47x10⁻¹
N 1.11 b(Umg) 5.09x10⁻³
R2 0.98 R2 0.96
(b) Model Validation
The mathematical models presented in Chapter m were fitted to the column
experimental breakthrough data for various influent concentrations of P. This
was accomplished by making use of the fitting program, MCMFIT (Bajracharya
and Barry, 1995). A brief description of MCMFIT is presented in Section 3.2.3.
In the operation of MCMFIT to determine the best fitting parameters, the pulse
time was set to a very large number (9999.0) so that a complete breakthrough is
obtained. The S-curve isotherm parameters of a1 and U4 (Eqn. 3 .18) were fixed at
-1.0 and 1.0 respectively so that Eqn. 3.18 reduced to the Freundlich isotherm.
The fraction of sites ( a 6) was set at zero and held constant. The two site sorption
model then reduced to a non-equilibrium process. The entrance boundary
condition type one was used by selecting MODE=l. The Freundlich isotherm
constants K and N were calculated as 4.55 x 10⁻³ mg/g(L/mg)N and 1.11
respectively from the analysis of column experiments. The dispersion coefficient
(D5) and kinetic mass transfer coefficient (as) were obtained by fitting
procedures. Table 5.21 shows the optimal parameter values as determined by
MCMFIT for different influent concentrations. The dispersion coefficient (D5)
was constant (0.58 cm2/day) while the kinetic mass transfer coefficient (as)
gradually decreased as the influent concentration of P was increased. This was
coincident with the equilibrium stage being attained quickly as the influent P
concentration was increased.
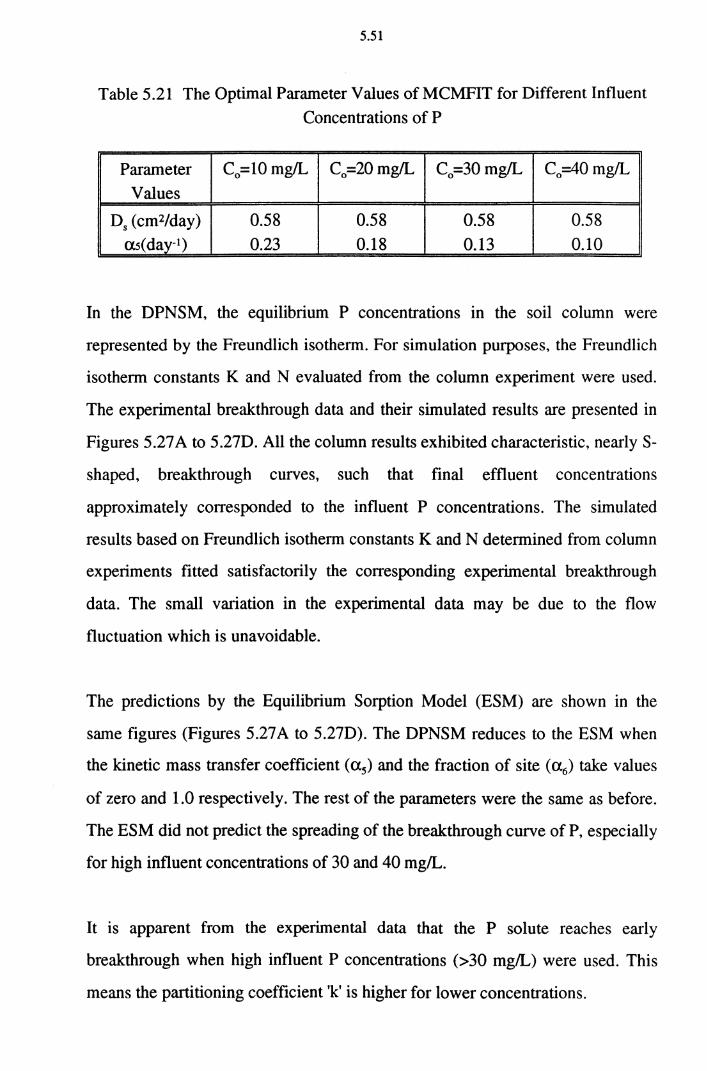
5.51
Table 5.21 The Optimal Parameter Values ofMCMFIT for Different Influent
Concentrations of P
Parameter C0 =10 mg!L C0 =20mg!L Co=30 mg!L C0 =40mg/L
Values
Ds (cm2/day) 0.58 0.58 0.58 0.58 a.s(day-1) 0.23 0.18 0.13 0.10
In the DPNSM, the equilibrium P concentrations in the soil column were
represented by the Freundlich isotherm. For simulation purposes, the Freundlich
isotherm constants K and N evaluated from the column experiment were used.
The experimental breakthrough data and their simulated results are presented in
Figures 5.27 A to 5.27D. All the column results exhibited characteristic, nearly S
shaped, breakthrough curves, such that final effluent concentrations
approximately corresponded to the influent P concentrations. The simulated
results based on Freundlich isotherm constants K and N determined from column
experiments fitted satisfactorily the corresponding experimental breakthrough
data. The small variation in the experimental data may be due to the flow
fluctuation which is unavoidable.
The predictions by the Equilibrium Sorption Model (ESM) are shown in the
same figures (Figures 5.27A to 5.27D). The DPNSM reduces to the ESM when
the kinetic mass transfer coefficient (a5) and the fraction of site (a6) take values
of zero and 1.0 respectively. The rest of the parameters were the same as before.
The ESM did not predict the spreading of the breakthrough curve of P, especially
for high influent concentrations of 30 and 40 mg/L.
It is apparent from the experimental data that the P solute reaches early
breakthrough when high influent P concentrations (>30 mg/L) were used. This
means the partitioning coefficient 'k' is higher for lower concentrations.
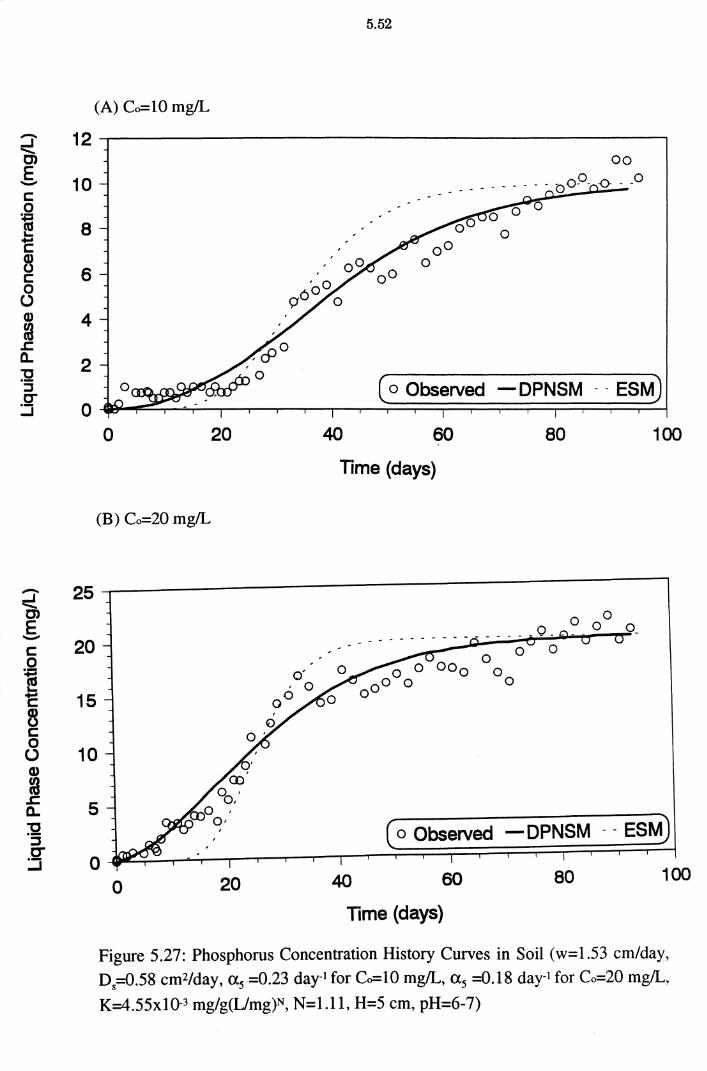
-..J ........ C)
E -c: 0 i .... ... c: B c: 0
(.) Q)
fa .c: 0.. :-g
:::::J c-:J
~ C)
E -c: 0 ii .... "E B c: 0 (.)
CD fd
.J:: a.. :g ::J C" :::i
5.52
(A) Co=lO mg/L
12 oo
10
8 0
6
4
2 ( o Observed - DPNSM - - ESM)
0 0 20 40 60 80 100
Time (days)
(B) Co=20 mg/L
25 0 0_
20
15
10
5 ( o Observed - DPNSM - - ESM)
0 0 20 40 60 80 100
Time (days)
Figure 5.27: Phosphorus Concentration History Curves in Soil (w=1.53 cm/day,
D5=0.58 cm2/day, as =0.23 day-1 for Co=lO mg/L, as =0.18 day-I for Co=20 mg/L,
K=4.55x10⁻³ mg/g(Umg)N, N=l.ll, H=5 cm, pH=6-7)
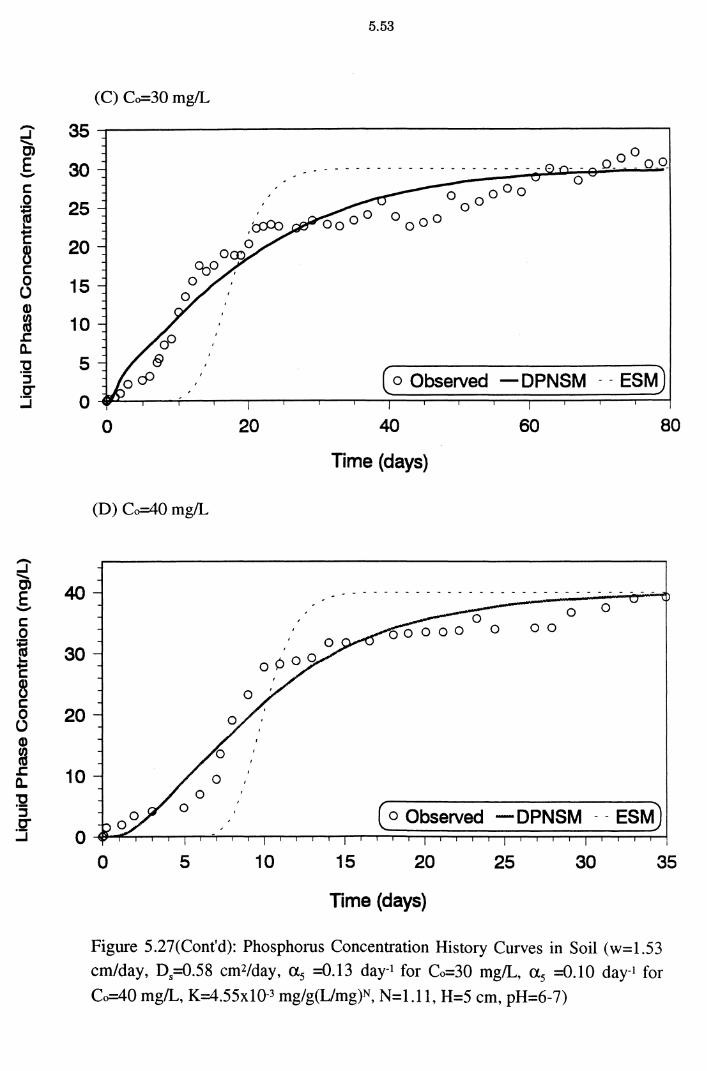
::J' 35 ........ C)
E 30 -s:::: 0 25 i ..... 'E 20 B s:::: 0 15 (.) Q)
~ 10 J: a. ~ 5 ::::J tr :J 0
~ E 40 -
30
20
10
(C) Co=30 mg/L
0 20
(D) Co=40 mg/L
0 5 10
5.53
oo o_ _ o o_
( o Observed - DPNSM - - ESM)
40
Time (days)
60
-----------------------------
0 0
0 0 0
15 20 25 30
Time (days)
80
35
Figure 5.27(Cont'd): Phosphoms Concentration History Curves in Soil (w=l.53
cm/day, Ds::0.58 cm2/day, a 5 ::0.13 day-1 for Co=30 mg/L, a 5 ::0.10 day-1 for
Co=40 mg/L, K=4.55x10⁻³ mg/g(L/mg)N, N=l.ll, H=5 cm, pH=6-7)
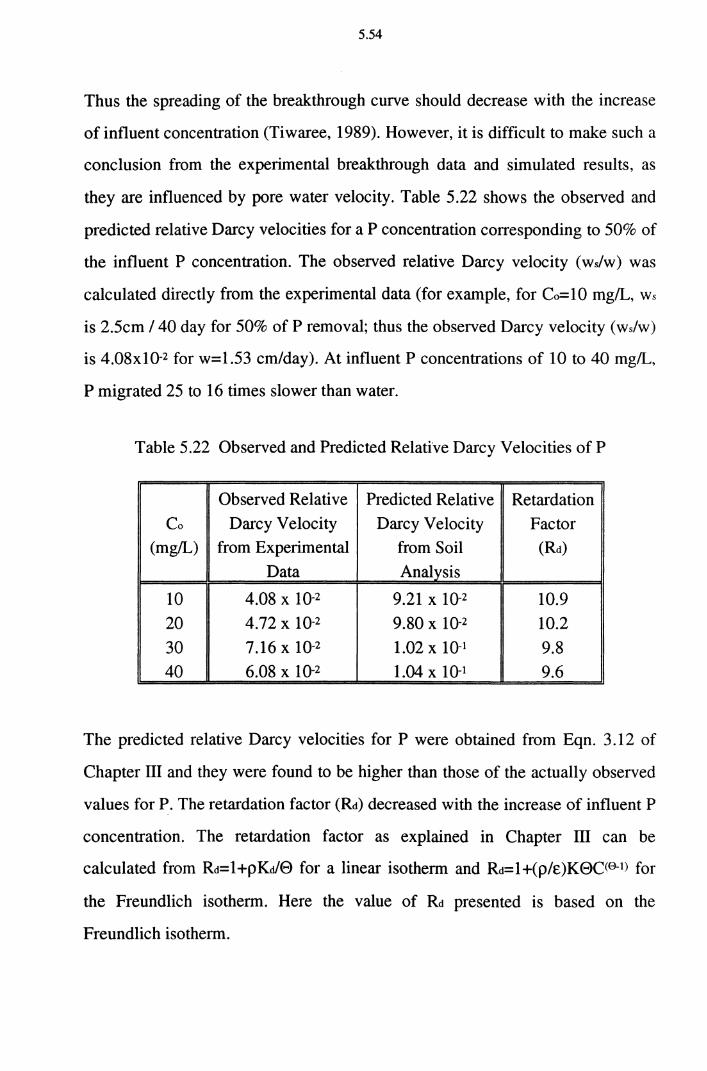
5.54
Thus the spreading of the breakthrough curve should decrease with the increase
of influent concentration (Tiwaree, 1989). However, it is difficult to make such a
conclusion from the experimental breakthrough data and simulated results, as
they are influenced by pore water velocity. Table 5.22 shows the observed and
predicted relative Darcy velocities for a P concentration corresponding to 50% of
the influent P concentration. The observed relative Darcy velocity (ws/w) was
calculated directly from the experimental data (for example, for Co=10 mg/L, ws
is 2.5cm I 40 day for 50% of P removal; thus the observed Darcy velocity (ws/w)
is 4.08xl0·2 for w=1.53 cm/day). At influent P concentrations of 10 to 40 mg/L,
P migrated 25 to 16 times slower than water.
Table 5.22 Observed and Predicted Relative Darcy Velocities of P
Observed Relative Predicted Relative Retardation Co Darcy Velocity Darcy Velocity Factor
(mg!L) from Experimental from Soil (Rd)
Data Analysis
10 4.08 X 10⁻² 9.21 X 10⁻² 10.9 20 4.72 X 10⁻² 9.80 X 10⁻² 10.2
30 7.16 X 10·2 1.02 X 10-I 9.8 40 6.08 X 10⁻² 1.04 X 10·1 9.6
The predicted relative Darcy velocities for P were obtained from Eqn. 3.12 of
Chapter Ill and they were found to be higher than those of the actually observed
values for P. The retardation factor (Rd) decreased with the increase of influent P
concentration. The retardation factor as explained in Chapter m can be
calculated from Rd=l+pKd/8 for a linear isotherm and Rd=1+(p/e)K8C<E>-I) for
the Freundlich isotherm. Here the value of Rd presented is based on the
Freundlich isotherm.
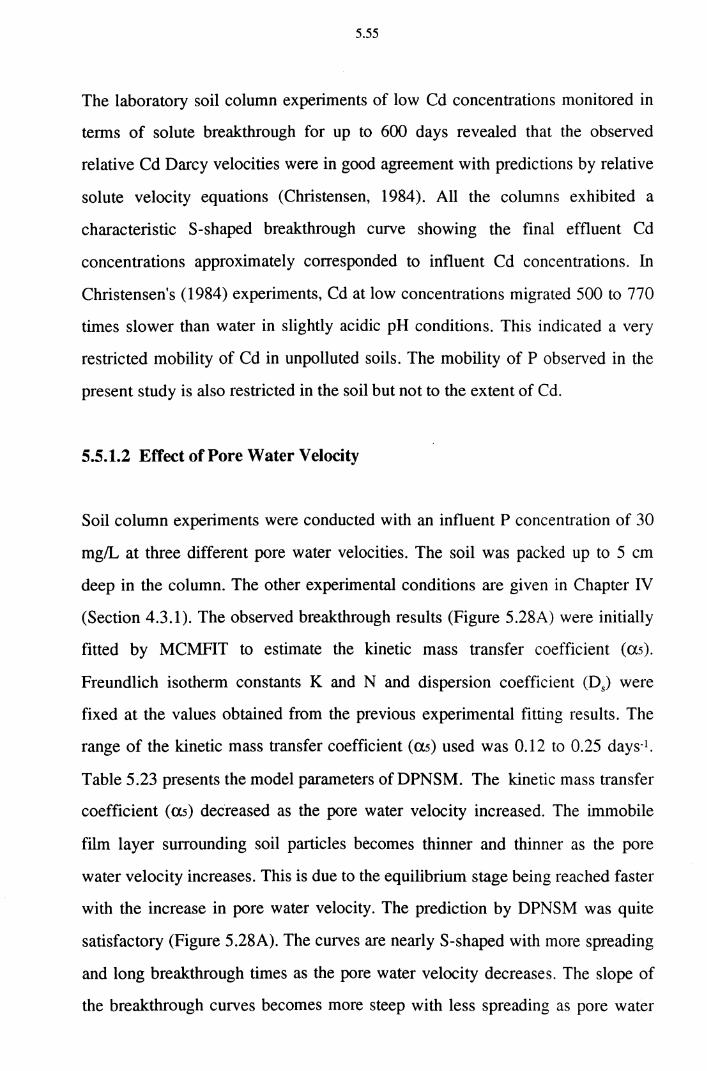
5.55
The laboratory soil column experiments of low Cd concentrations monitored in
terms of solute breakthrough for up to 600 days revealed that the observed
relative Cd Darcy velocities were in good agreement with predictions by relative
solute velocity equations (Christensen, 1984). All the columns exhibited a
characteristic S-shaped breakthrough curve showing the final effluent Cd
concentrations approximately corresponded to influent Cd concentrations. In
Christensen's (1984) experiments, Cd at low concentrations migrated 500 to 770
times slower than water in slightly acidic pH conditions. This indicated a very
restricted mobility of Cd in unpolluted soils. The mobility of P observed in the
present study is also restricted in the soil but not to the extent of Cd.
5.5.1.2 Effect of Pore Water Velocity
Soil column experiments were conducted with an influent P concentration of 30
mg/L at three different pore water velocities. The soil was packed up to 5 cm
deep in the column. The other experimental conditions are given in Chapter IV
(Section 4.3.1). The observed breakthrough results (Figure 5.28A) were initially
fitted by MCMFIT to estimate the kinetic mass transfer coefficient (as).
Freundlich isotherm constants K and N and dispersion coefficient (D 5) were
fixed at the values obtained from the previous experimental fitting results. The
range of the kinetic mass transfer coefficient (as) used was 0.12 to 0.25 days-1•
Table 5.23 presents the model parameters of DPNSM. The kinetic mass transfer
coefficient (as) decreased as the pore water velocity increased. The immobile
ftlm layer surrounding soil particles becomes thinner and thinner as the pore
water velocity increases. This is due to the equilibrium stage being reached faster
with the increase in pore water velocity. The prediction by DPNSM was quite
satisfactory (Figure 5.28A). The curves are nearly S-shaped with more spreading
and long breakthrough times as the pore water velocity decreases. The slope of
the breakthrough curves becomes more steep with less spreading as pore water
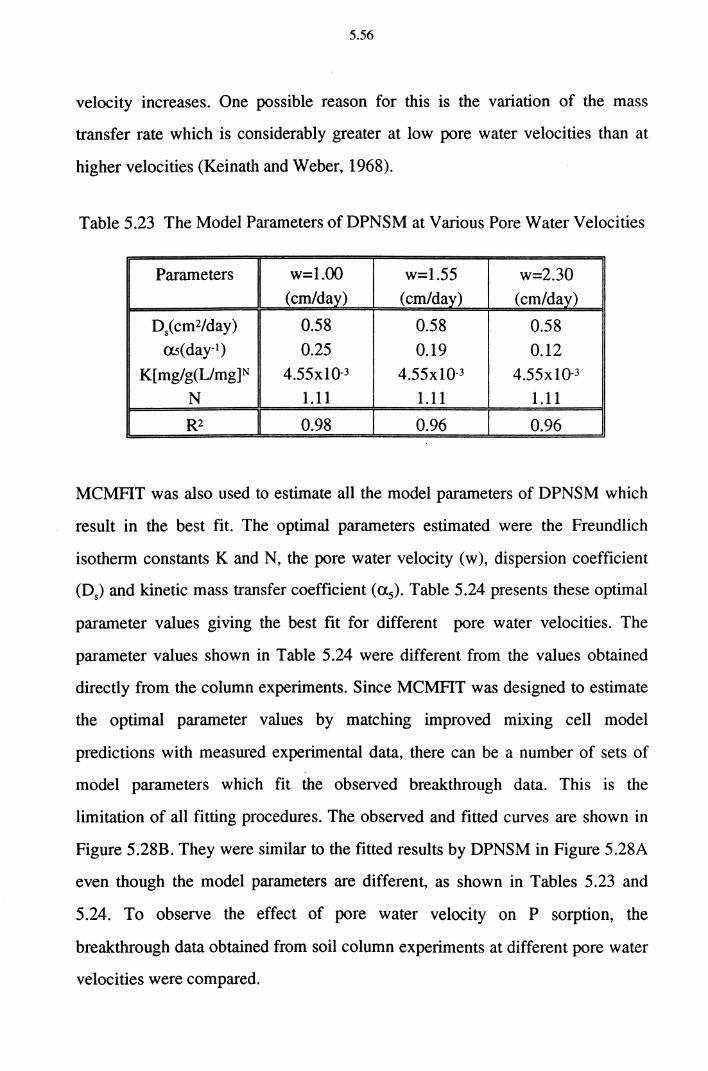
5.56
velocity increases. One possible reason for this is the variation of the mass
transfer rate which is considerably greater at low pore water velocities than at
higher velocities (Keinath and Weber, 1968).
Table 5.23 The Model Parameters ofDPNSM at Various Pore Water Velocities
Parameters w=l.OO w=1.55 w=2.30 (cm/day) (cm/day) (cm/day)
D5(cm2/day) 0.58 0.58 0.58 as(day-1) 0.25 0.19 0.12
K[mg/g(Umg]N 4.55x1Q-3 4.55x10⁻³ 4.55x10⁻³
N 1.11 1.11 1.11
R2 0.98 0.96 0.96
MCMAT was also used to estimate all the model parameters of DPNSM which
result in the best fit. The optimal parameters estimated were the Freundlich
isotherm constants K and N, the pore water velocity (w), dispersion coefficient
(D5) and kinetic mass transfer coefficient (a5). Table 5.24 presents these optimal
parameter values giving the best fit for different pore water velocities. The
parameter values shown in Table 5.24 were different from the values obtained
directly from the column experiments. Since MCMAT was designed to estimate
the optimal parameter values by matching improved mixing cell model
predictions with measmed experimental data, there can be a number of sets of
model parameters which fit the observed breakthrough data. This is the
limitation of all fitting procedures. The observed and fitted curves are shown in
Figure 5.28B. They were similar to the fitted results by DPNSM in Figure 5.28A
even though the model parameters are different, as shown in Tables 5.23 and
5.24. To observe the effect of pore water velocity on P sorption, the
breakthrough data obtained from soil column experiments at different pore water
velocities were compared.
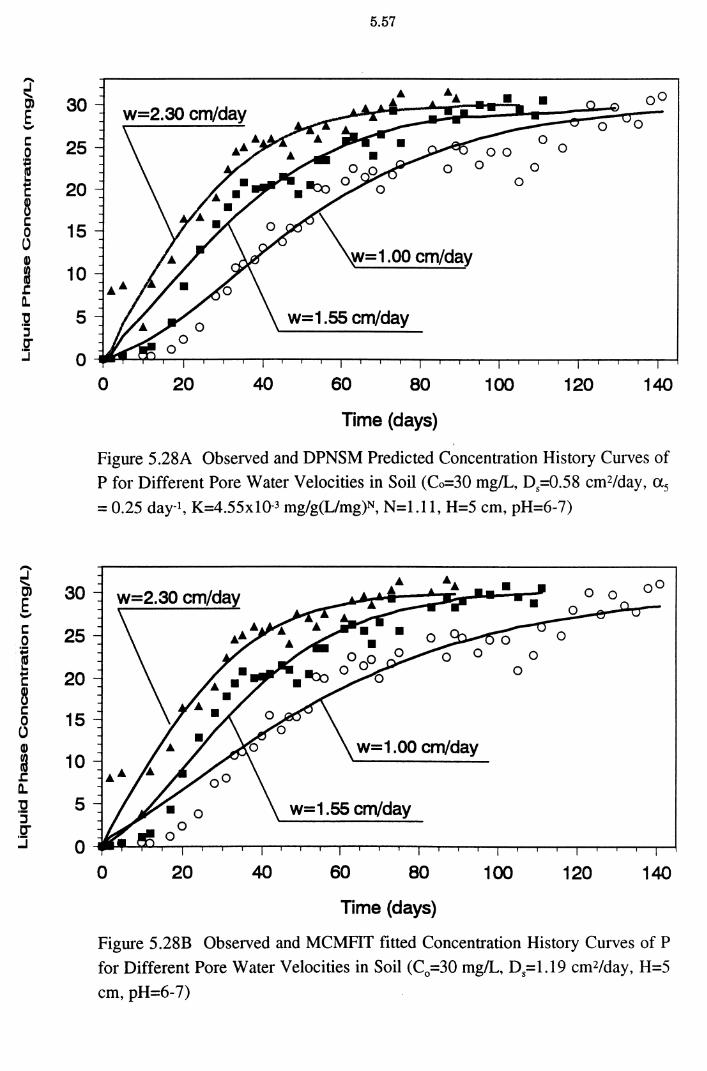
~ 30 C)
E ....... c: 25 0
~ ... 20 c: 8 c: 15 0 () G)
~ 10 .c: a. :g 5 :I .Q" .J 0
,..... .J .......
30 Cl E -c: 25 0 ~ ... ... 20 c: 8 c: 15 0 u G)
~ 10 .c: a. :g 5
::::s 0" :::i 0
5.57
\w=1.00 cm/day
w=1.55 cm/day
0 20 40 60 80
Time (days)
100
0 0
0
120
0
140
Figure 5.28A Observed and DPNSM Predicted Concentration History Curves of
P for Different Pore Water Velocities in Soil (Co=30 mg/L, D5=0.58 cm2/day, a5
= 0.25 day-t, K=4.55x10⁻³ mg/g(L/mg)N, N=l.ll, H=5 cm, pH=6-7)
w=1.00 cm/day
w=1.55 cm/day
0 20 40 60 80
Time (days)
100
0 0
120 140
Figure 5.28B Observed and MCMFIT fitted Concentration History Curves of P
for Different Pore Water Velocities in Soil (C0 =30 mg/L, D5=1.19 cm2/day, H=5
cm, pH=6-7)
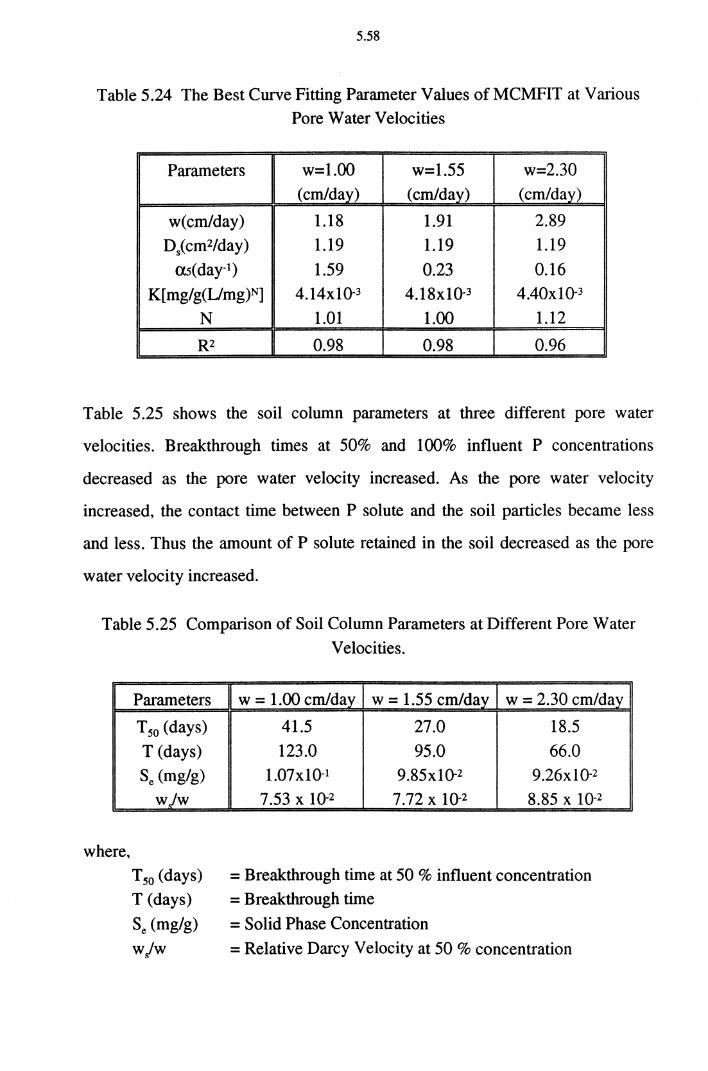
5.58
Table 5.24 The Best Curve Fitting Parameter Values of MCMFIT at Various
Pore Water Velocities
Parameters w=l.OO w=1.55 w=2.30 (cm/day) (cm/day) (cm/day)
w(crn/day) 1.18 1.91 2.89
Ds<cm2/day) 1.19 1.19 1.19
ru(day-1) 1.59 0.23 0.16
K[ mg/g(L/mg)N] 4.14x10⁻³ 4.18x10⁻³ 4.40x10⁻³
N 1.01 1.00 1.12
R2 0.98 0.98 0.96
Table 5.25 shows the soil column parameters at three different pore water
velocities. Breakthrough times at 50% and 100% influent P concentrations
decreased as the pore water velocity increased. As the pore water velocity
increased, the contact time between P solute and the soil particles became less
and less. Thus the amount of P solute retained in the soil decreased as the pore
water velocity increased.
Table 5.25 Comparison of Soil Column Parameters at Different Pore Water
Velocities.
where,
Parameters
T50 (days)
T (days)
se (mg/g) wjw
T50 (days)
T (days)
se (mg/g)
wjw
w - 1.00 cm/day w - 1.55 cm/day w 2.30 cmlrl-:m 11
41.5 27.0 18.5
123.0 95.0 66.0 1.07x10-I 9.85x10⁻² 9.26x10⁻²
7.53 X 1Q-2 7.72 X 1Q-2 8.85 X 10-2
= Breakthrough time at 50 % influent concentration
= Breakthrough time
= Solid Phase Concentration
=Relative Darcy Velocity at 50% concentration
5.59
The relative Darcy velocity at 50% concentration increased with the increase in
the pore water velocity. As the pore water velocity increased, the residence time
of P solute reduced resulting in a lesser sorption of P. On the other hand, the
high pore water velocity supplies larger amount of P solute within the same
period of time. The driving force to propel the P solute on the soil surface is
greater with the increase of pore water velocity due to the increase of bulk
solution concentration of P solute per unit time. This also leads to early
breakthroughs at high pore water velocities. A similar trend was observed in an
earlier study with Cd through soil (Tiwaree, 1989).
5.5.1.3 Effect of Adsorbent Depth
The effect of adsorbent depth in the mobility of P was also studied. The
experimental and simulated P breakthrough curves by DPNSM for soil depths of
2 to 5 cm are shown in Figures 5. 29A and 5.29B. As expected, the soil column
with the greater depth gave a later breakthrough than that with a shallower depth.
As soil depth increases, P sorption increases in soil particles due to the increase
of surface area mass loading which leads to a delayed breakthrough.
The breakthrough times to achieve 50% and 100% influent concentrations
increased significantly with the increase of soil depth (Table 5.26). As the soil
depth increases, the contact time between P solute and soil medium increases,
thus increasing the amount of P solute retained in soil medium. The relative
Darcy velocity at different depths was observed to be in the range of 1.04x1 0-1 to
1.97x10⁻¹•
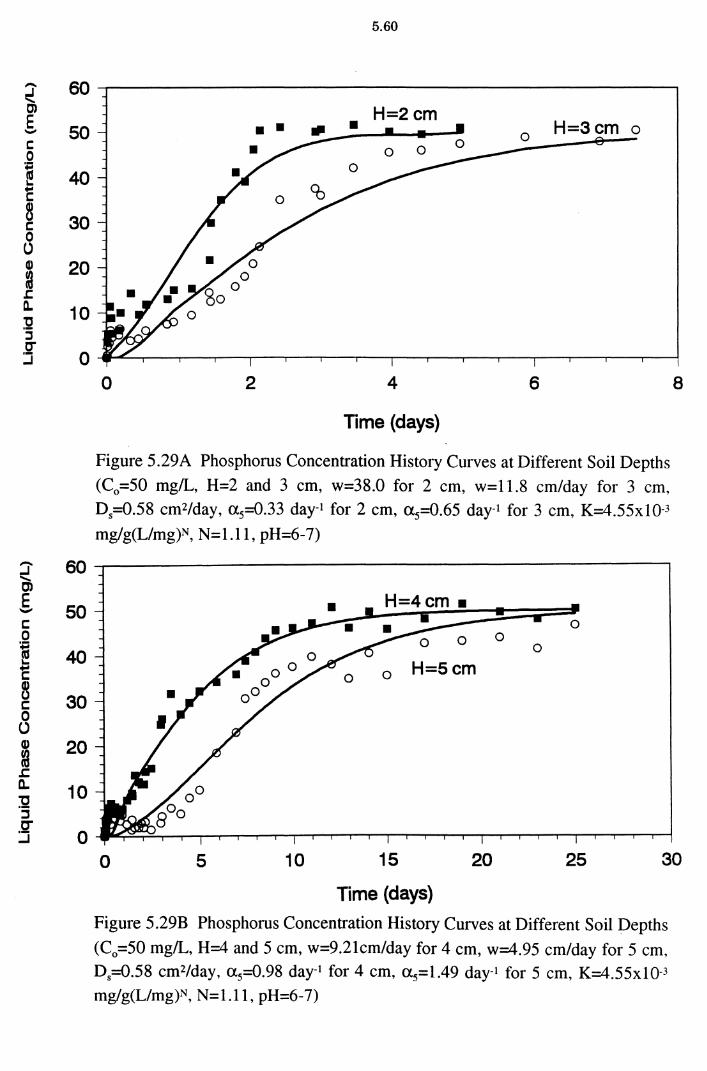
....... 60 .J ...... C)
E 50 ......
c: 0 i 40 I., c B 30 c: 0 t) Q) 20 ~ !:. ll. 10 :g ::J C" J 0
~ 60 Cl
§. 50 c: 0 i "-'E ~ r:::: 0 u
40
30
20
10
0 2
5.60
H=2cm
4
Time (days)
0 H=3cm o
6
Figure 5.29A Phosphorus Concentration History Curves at Different Soil Depths
(C0 =50 mg/L, H=2 and 3 cm, w=38.0 for 2 cm, w=l1.8 cm/day for 3 cm, D5=0.58 cm2/day, a 5=0.33 day-1 for 2 cm, a 5=0.65 day-1 for 3 cm, K=4.55xl0-3
mg/g(L/mg)N, N=l.ll, pH=6-7)
0 0 0
0 H=Scm
8
0 5 10 15 20 25 30
Time (days)
Figure 5 .29B Phosphorus Concentration History Curves at Different Soil Depths
(C0 =50 mg/L, H=4 and 5 cm, w=9.2lcm/day for 4 cm, w=4.95 cm/day for 5 cm, D5=0.58 cm2/day, a 5=0.98 day-1 for 4 cm, a 5=1.49 day-1 for 5 cm, K=4.55xiQ-3 mg/g(L/mg)N, N=l.ll, pH=6-7)
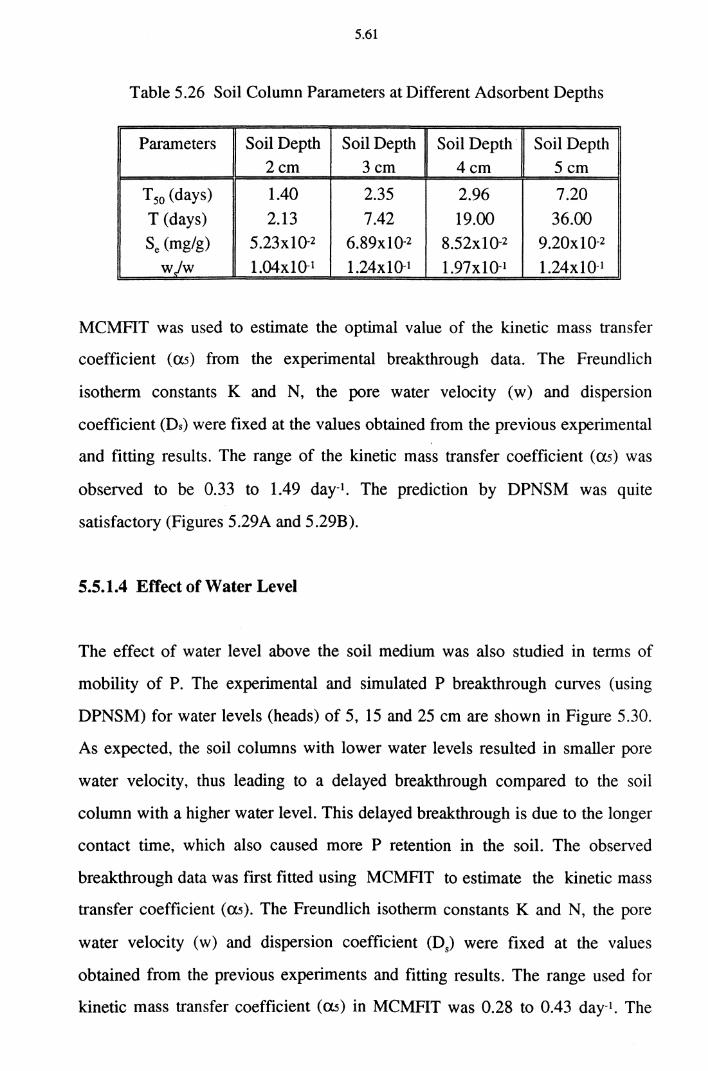
5.61
Table 5.26 Soil Column Parameters at Different Adsorbent Depths
Parameters Soil Depth Soil Depth Soil Depth Soil Depth 2cm 3cm 4cm 5cm
T50 (days) 1.40 2.35 2.96 7.20
T (days) 2.13 7.42 19.00 36.00 se (mg/g) 5.23x1Q-2 6.89xlQ-2 8.52x10⁻² 9.20x10⁻²
wjw 1.04x10⁻¹ 1.24x10⁻¹ 1.97x1Q-1 1.24x10⁻¹
MCMFIT was used to estimate the optimal value of the kinetic mass transfer
coefficient (as) from the experimental breakthrough data. The Freundlich
isotherm constants K and N, the pore water velocity (w) and dispersion
coefficient (Ds) were fixed at the values obtained from the previous experimental
and fitting results. The range of the kinetic mass transfer coefficient (as) was
observed to be 0.33 to 1.49 day-1• The prediction by DPNSM was quite
satisfactory (Figures 5.29A and 5.29B).
5.5.1.4 Effect of Water Level
The effect of water level above the soil medium was also studied in terms of
mobility of P. The experimental and simulated P breakthrough curves (using
DPNSM) for water levels (heads) of 5, 15 and 25 cm are shown in Figure 5.30.
As expected, the soil columns with lower water levels resulted in smaller pore
water velocity, thus leading to a delayed breakthrough compared to the soil
column with a higher water level. This delayed breakthrough is due to the longer
contact time, which also caused more P retention in the soil. The observed
breakthrough data was first fitted using MCMFIT to estimate the kinetic mass
transfer coefficient (as). The Freundlich isotherm constants K and N, the pore
water velocity (w) and dispersion coefficient (D5) were fixed at the values
obtained from the previous experiments and fitting results. The range used for
kinetic mass transfer coefficient (as) in MCMFIT was 0.28 to 0.43 day-1• The
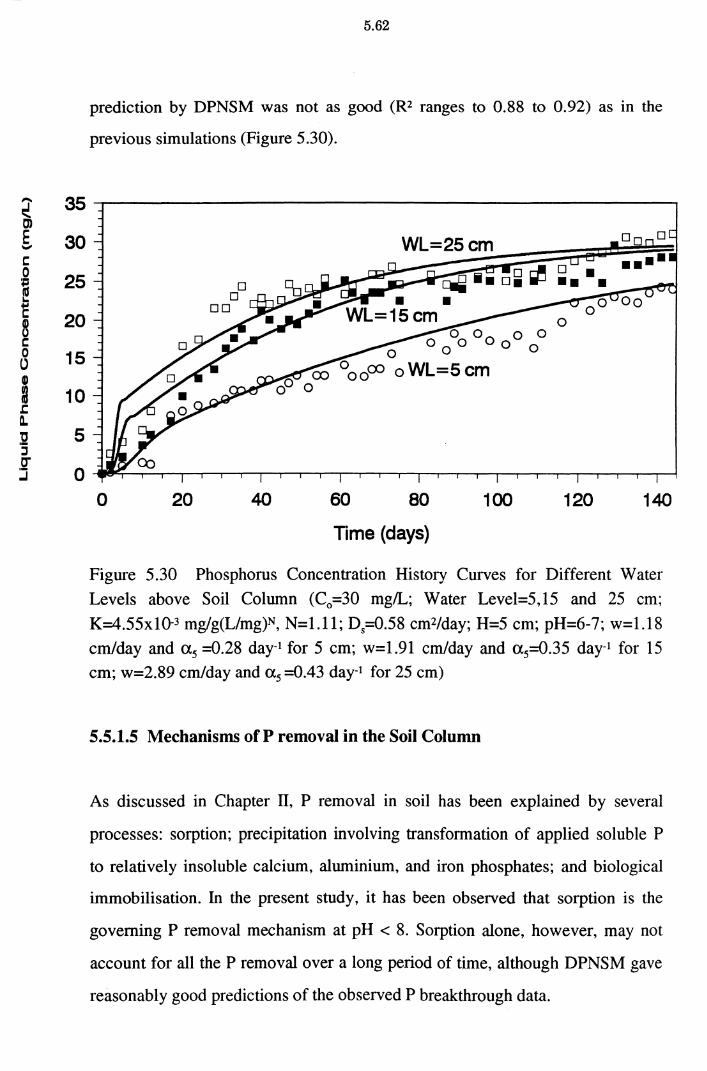
~ 35
E 30 ..... c: 0 25 .. ~ c 20 B c: 0 15 0 ID ~ 10 J:. 0.. "C 5 '5 .Q"
0 ..I
5.62
prediction by DPNSM was not as good (R2 ranges to 0.88 to 0.92) as in the
previous simulations (Figure 5.30).
0 20 40 60 80 100 120 140
Time {days)
Figure 5.30 Phosphorus Concentration History Curves for Different Water
Levels above Soil Column (C0 =30 mg/L; Water Level=5,15 and 25 cm;
K=4.55x10⁻³ mg/g(L/mg)N, N=l.ll; D5=0.58 cm2/day; H=5 cm; pH=6-7; w=1.18
cm/day and as =0.28 day-1 for 5 cm; w=l.91 cm/day and as=0.35 day-1 for 15 cm; w=2.89 cm/day and as =0.43 day-1 for 25 cm)
5.5.1.5 Mechanisms of P removal in the Soil Column
As discussed in Chapter II, P removal in soil has been explained by several
processes: sorption; precipitation involving transformation of applied soluble P
to relatively insoluble calcium, aluminium, and iron phosphates; and biological
immobilisation. In the present study, it has been observed that sorption is the
governing P removal mechanism at pH < 8. Sorption alone, however, may not
account for all the P removal over a long period of time, although DPNSM gave
reasonably good predictions of the observed P breakthrough data.
5.63
From biotic and sterile column experiments, Aulenbach and Meisheng (1988)
demonstrated that biological activity did not enhance total phosphorus removal.
They found that physico-chemical reactions, not the biological activity,
controlled the P removal process. Sorption may be responsible for initial P
removal, but it is not the sole mechanism for continuous P removal. They also
detected a large amount of CaC03, some CaHP04 , a little CaH2P20 7 , and a small
amount of AlP04 from their X-ray diffraction analysis in soil columns. The
presence of the phosphate precipitates strongly supports the assumption that a
slowly accumulated chemical precipitation process accomplishes the phosphorus
removal. Some metal ions existing in the liquid phase, such as Ca2+, Mg2+, Al3+,
and Fe3+, can precipitate phosphorus under favourable conditions (possibly at
pH> 7). Calcium is the most important ion, which results in CaC03 precipitation
and fixation on the soil. This not only supplies the right alkaline pH condition to
precipitate phosphorus, but also CaC03 itself can remove P (Effler and Driscoll,
1985). The intrinsic pH of the soil in the present study, however, is only 7.5 and
the pH of the standard P solution ranged from 6 to 7. Therefore the effect of
precipitation in P removal on the soil medium can be neglected although the
sorption time was prolonged to up to 150 days.
5.5.2 P Removal in the Dust Column
The results of P sorption experiments in the column packed with dust (the BHP
steel industry waste product) are presented below. Also included is the
verification of the mathematical models using the observed experimental data.
Column sorption experiments with different influent concentrations of P (5, 10,
20, 30, 40 and 50 mg/L) were performed in a column packed with 1 cm depth of
dust. The pH was maintained at 6-7. Since the sorption capacity of dust was very
high (15.5 mg/g for Co=40 mg/L from the batch experiments) the entire cycle of
5.64
sorption time taken to achieve breakthrough was long. The depth of the dust
column was kept at 1 cm to shorten the breakthrough time and to reduce the
possible effects of chemical precipitation. The possibility of P precipitation will
increase as the contact time between P and dust particle increases. Experiments
were conducted at a high pore water velocity ( w=305 cm/day) with a view to
reducing the breakthrough time (for the influent concentrations of 5, 10, 20 and
30 mg/L). Some experiments were conducted at low pore water velocities (w=37
and 43 cm/day respectively for the influent concentrations of 40 and 50 mg!L) to
observe the concentration breakthrough pattern in detail. In the later
experiments, the pore water velocity was kept low as it took only few hours to
reach the breakthrough point for the influent concentrations of 40 and 50 mg/L at
the high pore water velocity of 305 cm/day. The breakthrough curves were not
very smooth and had minor crests and depressions. This is mainly due to the
fluctuations of the pore water velocity with time which could not be controlled
in the experiments. It was very difficult to maintain the velocities exactly equal
in the dust columns. The pore water velocities reported are the average values for
the entire run.
The breakthrough curves obtained with six different influent concentrations are
shown in Figures 5.31A to 5.31F. Early breakthrough was observed with the
increase of influent P concentration. The equilibrium liquid phase concentrations
and the corresponding solid phase concentrations estimated experimentally are
presented in Table 5.27. The experimental solid phase concentration was
computed by extracting P from the dust in HN03 solution. This was done after
the saturation of the dust medium was achieved. The amount initially dissolved
in dust (1.30x1Q-4 mg/g) should be deducted from this value, which any case is
negligible.
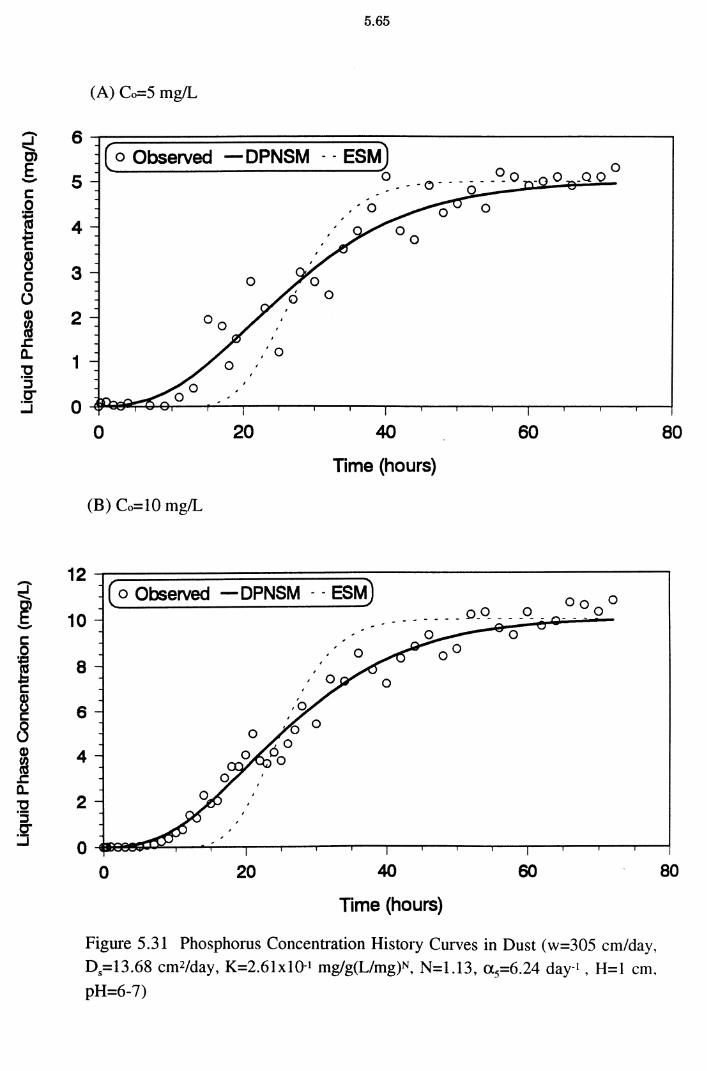
~ E -
:::r t -
5.65
(A) Co=5 mg!L
6~==================~------------------~ ( o Observed - DPNSM - - ESM) 0
5
4
3
2
1
0
(B) Co=lO mg/L
0
.· 0
20
o _ 0 ___ ;...- .::.-;_-0.:..._ o~~-e--..... o_o_ - - Q
40
Time (hours)
60 80
12~================~--------------------, ( o Observed - DPNSM - - ESM)
10
8
6
4
2
0 20 40
Time (hours)
60
o 0 o 0
Figure 5.31 Phosphorus Concentration History Curves in Dust (w=305 cm/day, 0 5=13.68 cm2/day, K=2.61x10⁻¹ mg/g(L/mg)N, N=l.13, a 5=6.24 day-1 , H=l cm. pH=6-7)
80
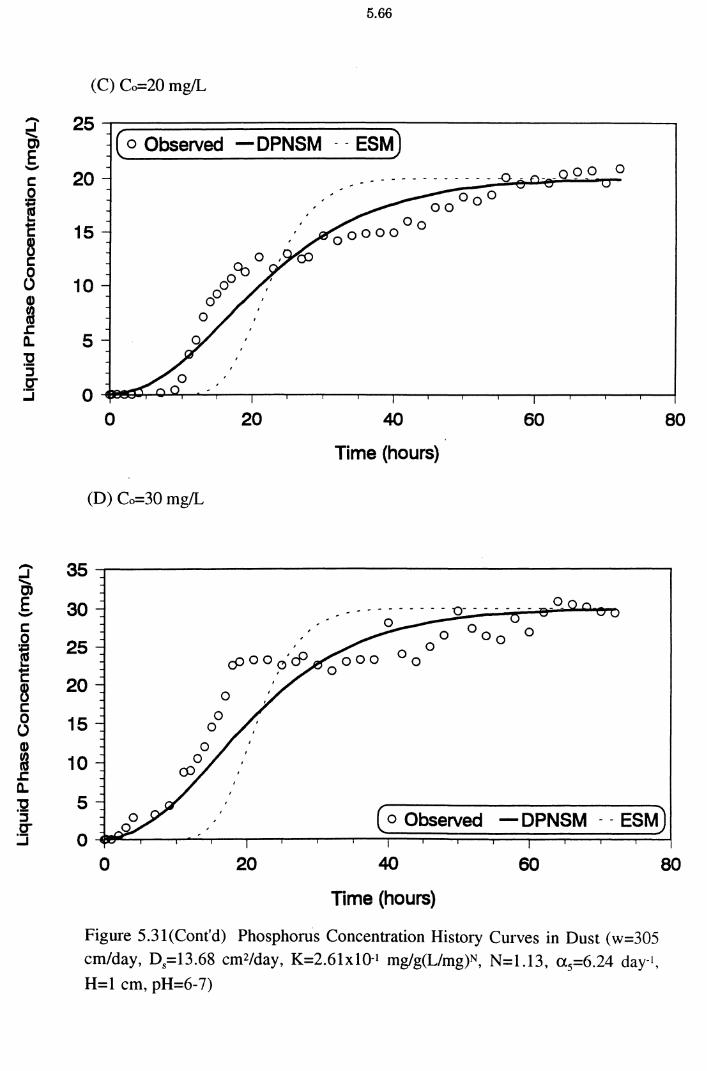
~ E -
~ C)
E -c 0 i .... c B c 0 () Q)
~ .c a. "C ·:; ,g" ...J
5.66
(C) Co=20 mg!L
25~================~~----------------~ ( o Observed - DPNSM - - ESM)
20
15
10
5
0
0 ' OCb '
00 ' 0
0
20
(D) Co=30 mg/L
35
30
25
20 0
15
10
40
Time (hours)
60 80
5 ( o Observed -DPNSM -- ESM)
0 0 20 40 60
Time (hours)
Figme 5.3l(Cont'd) Phosphorus Concentration History Curves in Dust (w=305 cm/day, 0 5=13.68 cm2/day, K=2.61x10⁻¹ mg/g(L/mg)N, N=l.l3, a 5=6.24 day-r,
H=l cm, pH=6-7)
80
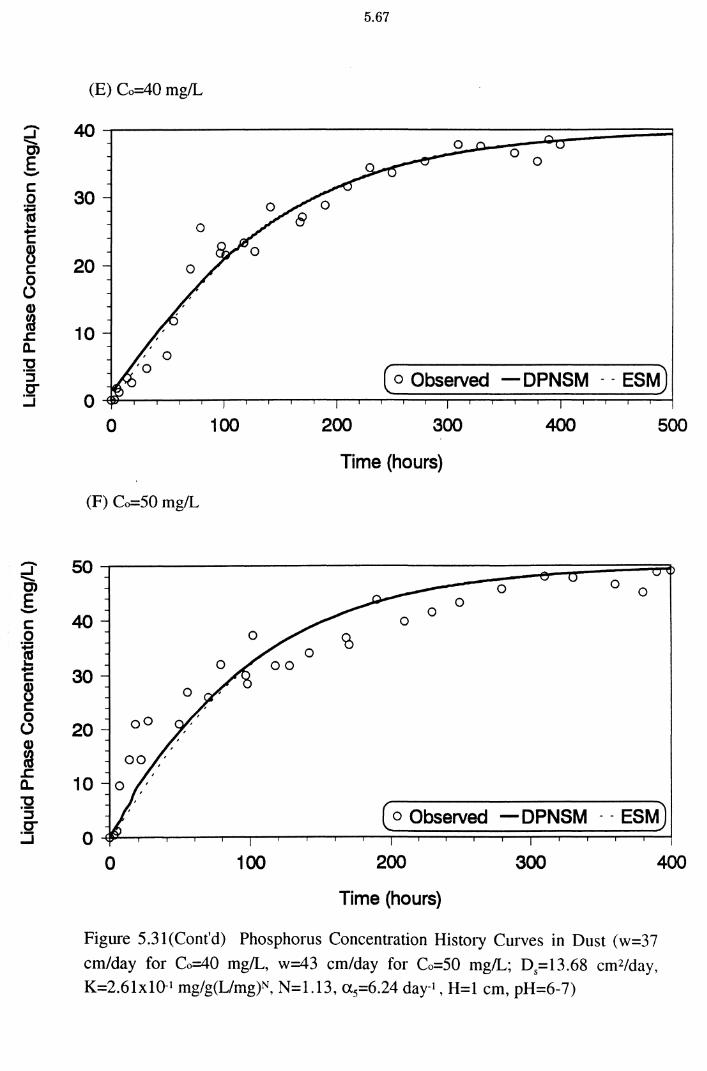
~ C)
E -c 0 i t...
"E ~ c 0 (.) Q)
~
5.67
(E) Co=40 mg/L
0 100 200 300 400 500
Time (hours)
(F) Co=50 mg/L
sor-----------------~==~~~~~~ 0 0 0
0
40 0 0
0
30
20
f. 10 32 :l C"
:.:J 0 100 200
Time (hours)
300 400
Figure 5.3l(Cont'd) Phosphorus Concentration History Curves in Dust (w=37
cm/day for Co=40 mg/L, w=43 cm/day for Co=50 mg/L; D5=13.68 cm2/day, K=2.61x10⁻¹ mg/g(L/mg)N, N=1.13, a5=6.24 day-1 , H=l cm, pH=6-7)
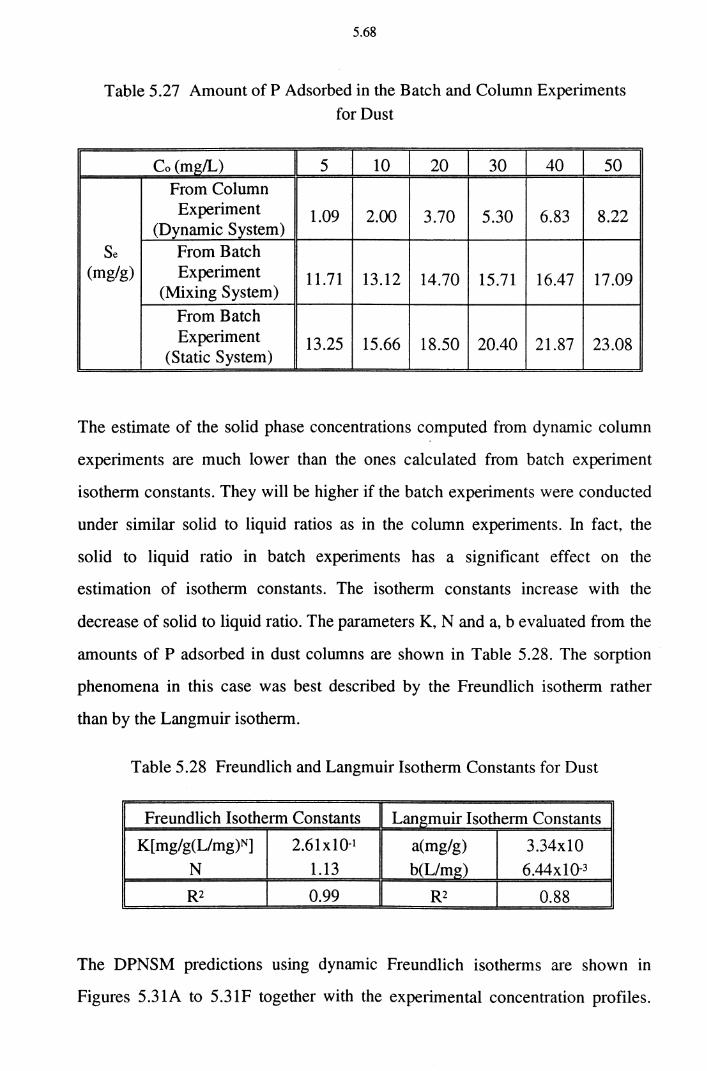
5.68
Table 5.27 Amount of P Adsorbed in the Batch and Column Experiments for Dust
Co (mg/L) 5 10 20 30 40 50 From Column Experiment
(Dynamic System) 1.09 2.00 3.70 5.30 6.83 8.22
Se From Batch (mg/g) Experiment
(Mixing System) 11.71 13.12 14.70 15.71 16.47 17.09
From Batch Experiment
(Static System) 13.25 15.66 18.50 20.40 21.87 23.08
The estimate of the solid phase concentrations computed from dynamic column
experiments are much lower than the ones calculated from batch experiment
isotherm constants. They will be higher if the batch experiments were conducted
under similar solid to liquid ratios as in the column experiments. In fact, the
solid to liquid ratio in batch experiments has a significant effect on the
estimation of isotherm constants. The isotherm constants increase with the
decrease of solid to liquid ratio. The parameters K, N and a, b evaluated from the
amounts of P adsorbed in dust columns are shown in Table 5.28. The sorption
phenomena in this case was best described by the Freundlich isotherm rather
than by the Langmuir isotherm.
Table 5.28 Freundlich and Langmuir Isotherm Constants for Dust
Freundlich Isotherm Constants Langmuir Isotherm Constants
K[ mg/g(Umg)N] 2.61x10⁻¹ a(mg/g) 3.34x10 N 1.13 b(L/mg) 6.44x10⁻³
R2 0.99 R2 0.88
The DPNSM predictions using dynamic Freundlich isotherms are shown in
Figures 5.31A to 5.31F together with the experimental concentration profiles.
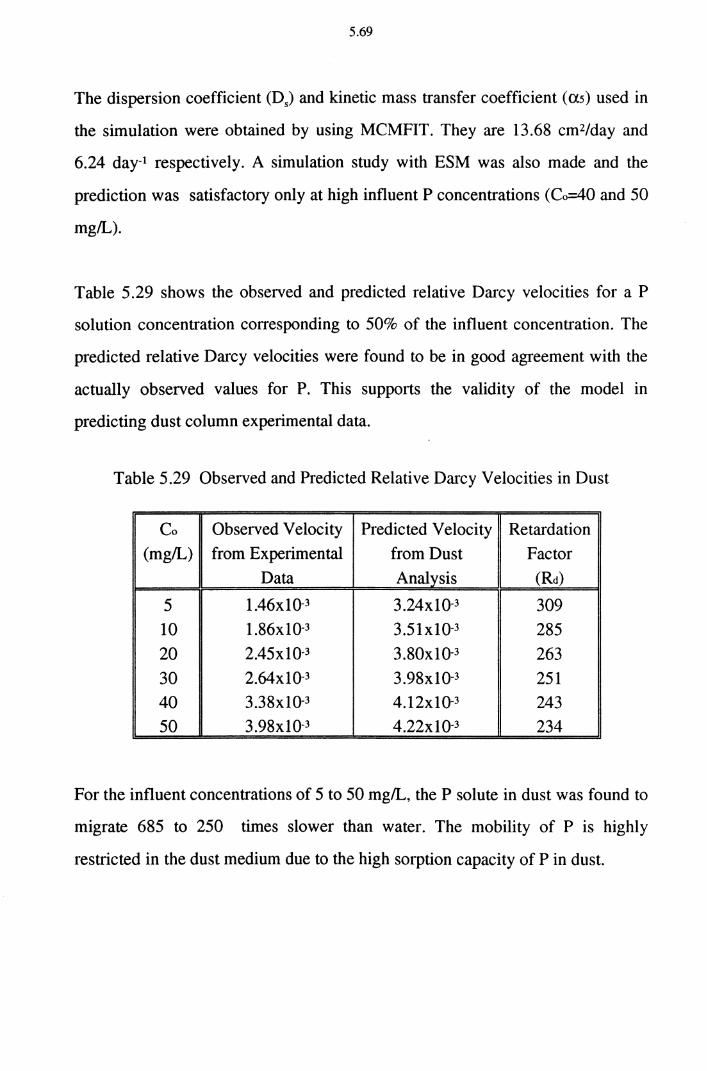
5.69
The dispersion coefficient (Ds) and kinetic mass transfer coefficient (as) used in
the simulation were obtained by using MCMFIT. They are 13.68 cm2/day and
6.24 day-1 respectively. A simulation study with ESM was also made and the
prediction was satisfactory only at high influent P concentrations (Co=40 and 50
mg/L).
Table 5.29 shows the observed and predicted relative Darcy velocities for a P
solution concentration corresponding to 50% of the influent concentration. The
predicted relative Darcy velocities were found to be in good agreement with the
actually observed values for P. This supports the validity of the model in
predicting dust column experimental data.
Table 5.29 Observed and Predicted Relative Darcy Velocities in Dust
Co Observed Velocity Predicted Velocity Retardation
(mg/L) from Experimental from Dust Factor
Data Analysis (Rd)
5 1.46xlQ-3 3.24xl0-3 309 10 1.86x10⁻³ 3.51x10⁻³ 285
20 2.45x10⁻³ 3.80x10⁻³ 263
30 2.64x10⁻³ 3.98xlQ-3 251 40 3.38xl0-3 4.12xlQ-3 243
50 3.98xl0-3 4.22x1Q-3 234
For the influent concentrations of 5 to 50 mg/L, the P solute in dust was found to
migrate 685 to 250 times slower than water. The mobility of P is highly
restricted in the dust medium due to the high sorption capacity of P in dust.
5.70
5.5.3 P Removal in the Cake Column
The P sorption m the cake column was investigated at vanous influent
concentrations of P. The characteristics of cake are presented in Chapter IV
(Tables 4.1, 4.2 and 4.3). The verification of the mathematical models are
included in this section.
Column sorption experiments for various influent concentrations of P (5, 10, 20,
30, 40 and 50 mg/L) were performed with 3 cm deep cake columns with a view
to calculating the isotherm constants under dynamic conditions. The pH varied
from 6 to 7. Pore water velocities ranged from 10.2 to 60.0 cm/day. The
breakthrough curves were not smooth and had minor crests and depressions
because of velocity variations. It was difficult to maintain the pore water
velocities exactly constant throughout the entire experiments.
The breakthrough curves obtained with six different influent concentrations are
shown in Figures 5.32A to 5.32F. There was an earlier breakthrough at high
influent concentrations. The equilibrium liquid phase concentrations and the
corresponding solid phase concentrations estimated experimentally are presented
in Table 5.30. The estimates of the solid phase concentrations corresponding to
the liquid phase concentrations using batch experiment isotherm constants are
substantially higher than those computed from dynamic column experiments.
The amount of P initially dissolved in cake was deducted. This amount (3.50 x
104 mg/g) was negligible.
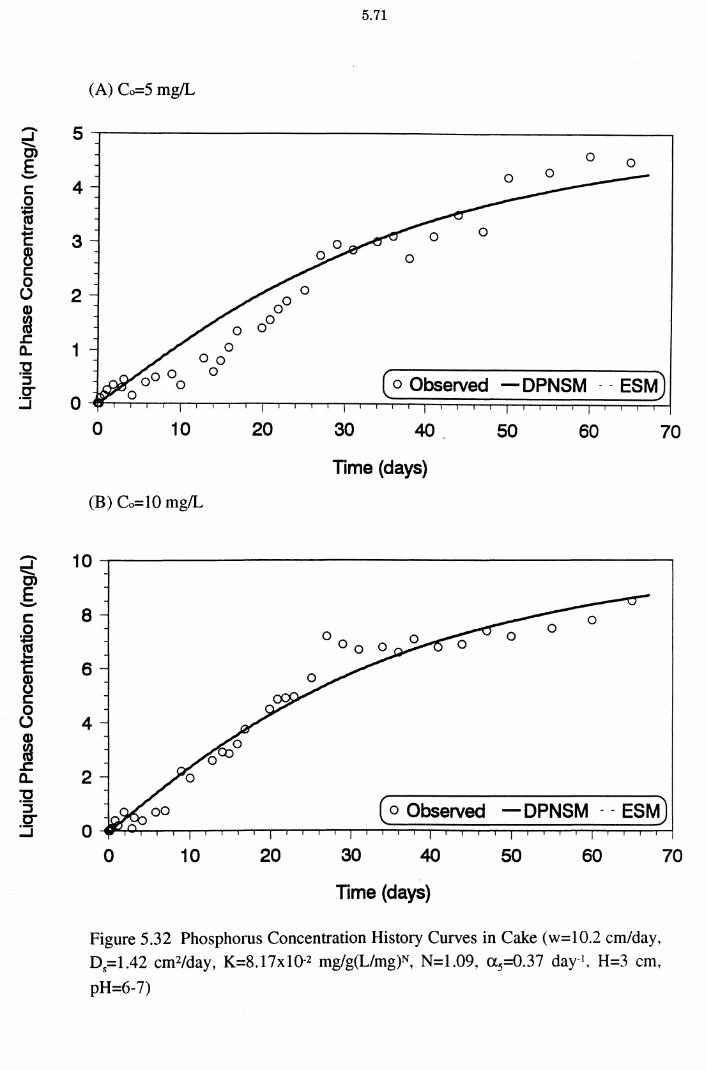
~ E -
5.71
(A) Co=5 mg/L
5.-----------------------------------------------~
0 0
4 0
3 0
0
2
1
0 10 20 30 40 50 60 70
Time (days}
(B) Co=lO mg/L
10~------------------------------------------------~
0 10 20 30 40 50 60
Time (days}
Figure 5.32 Phosphorus Concentration History Curves in Cake (w=10.2 cm/day, Ds=1.42 cm2/day, K=8.17xl0-2 mg/g(L/mg)N, N=1.09, a 5=0.37 day-1, H=3 cm,
pH=6-7)
70
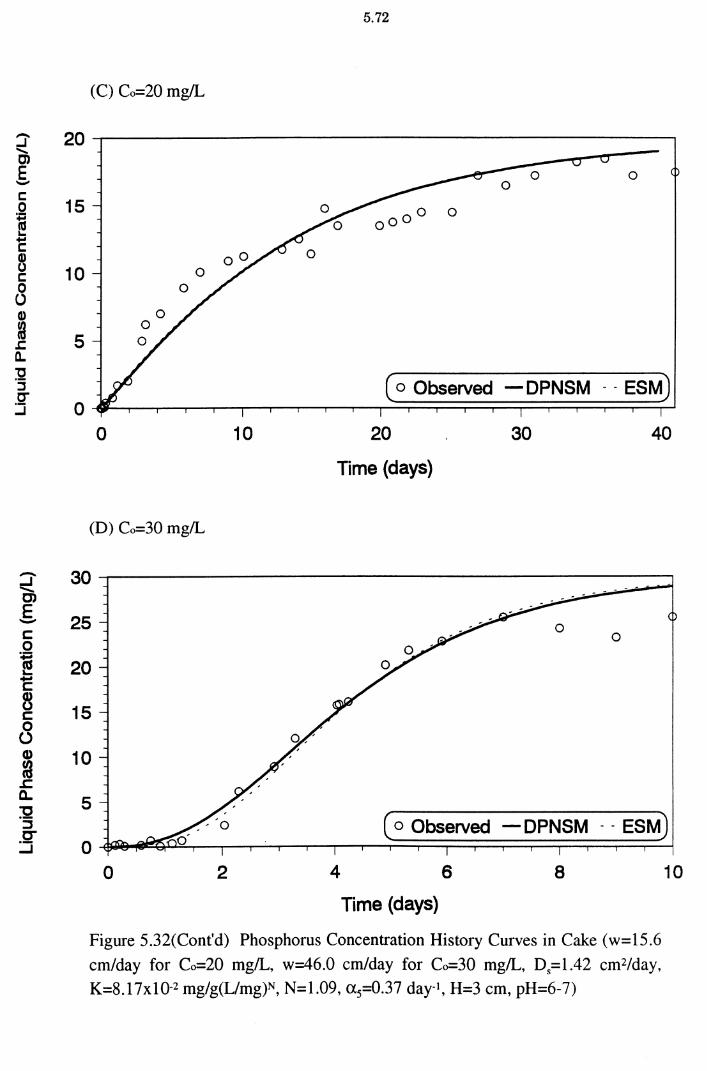
~ E -
-...J ........ C)
E -c: 0 i ... -c: ~ c: 0
(.) Q)
~ .c: a.. :g
::::s C'" ::i
5.72
(C) Co=20 mg/L
20
0
15 0 0 ooo
10 0 0
0 10 20
Time (days)
30 40
(D) Co=30 mg/L
30
25 0 0
20
15
10
5 ( o Observed - DPNSM - - ESM)
0 0 2 4 6 8
Time (days)
Figure 5.32(Cont'd) Phosphorus Concentration History Curves in Cake (w=l5.6
cm/day for Co=20 mg/L, w=46.0 cm/day for Co=30 mg/L, Ds=l.42 cm2/day,
K=8.17xl0-2 mg/g(L/mg)N, N=l.09, a 5=0.37 day-1, H=3 cm, pH=6-7)
10
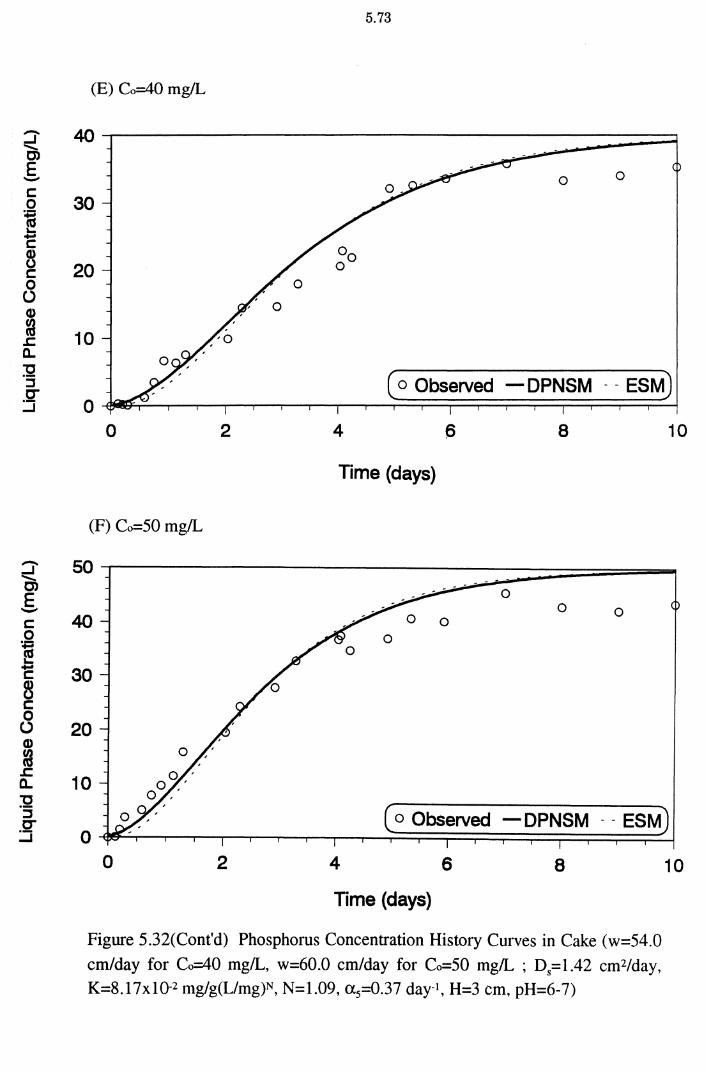
5.73
(E) Co=40 mg/L
~ 40~--------------------------------------------~
§.
§ 30 i .... c ~ 20 0 (.) CD
~ 10 a..
0 0
' 0
~ ( o Observed - DPNSM - - ESM) g 0~~~--r-,-,--,-,--,-,-~=r~~==~~=r~~==~
:J ........ C)
E -s::::: 0 :; .... -s::::: B s::::: 0 (.) CD
fa .r:. a.. 32
::::::s 0'"
:.:J
0 2 4 6 8 10
Time (days)
(F) Co=50 mg/L
50 0
40 0 0
0 0
30
20
10
0 ( o Observed - DPNSM - - ESM)
0 2 4 6 8
Time (days)
Figure 5.32(Cont'd) Phosphorus Concentration History Curves in Cake (w=54.0
cm/day for Co=40 mg/L, w=60.0 cm/day for Co=50 mg/L ; D5=1.42 cm2/day, K=8.17xi0-2 mg/g(L/mg)N, N=1.09, a 5=0.37 day-I, H=3 cm, pH=6-7)
10
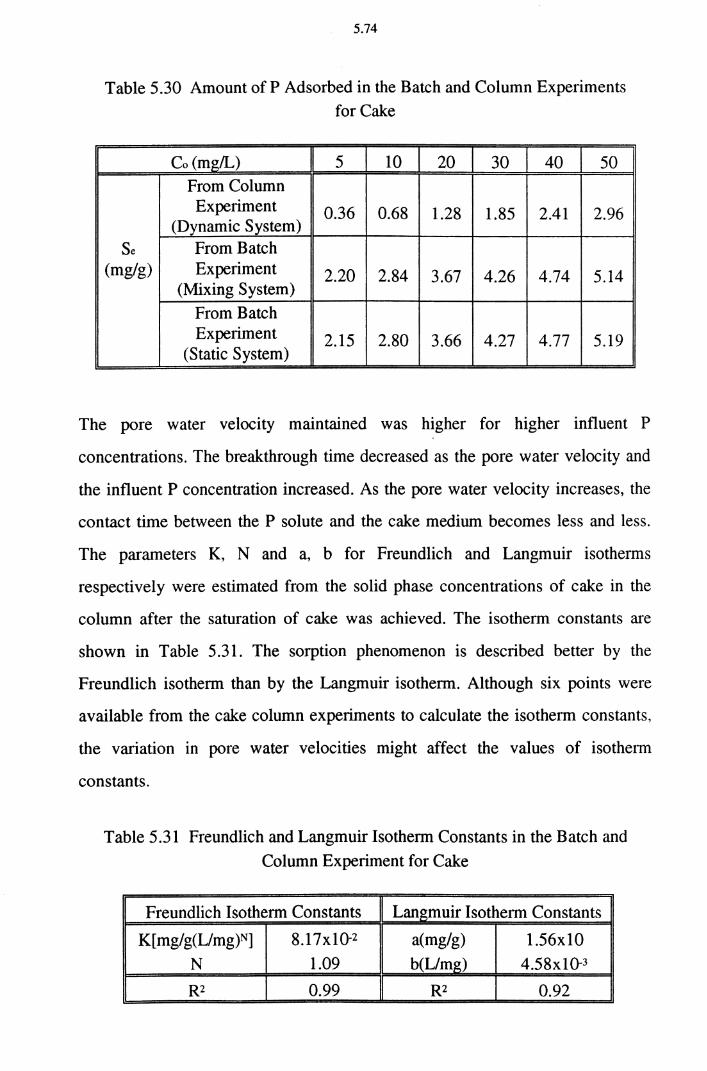
5.74
Table 5.30 Amount ofP Adsorbed in the Batch and Column Experiments for Cake
Co(m~IL) 5 10 20 30 40 50 From Column Experiment 0.36 0.68 1.28 1.85 2.41 2.96
(Dynamic System) Se From Batch
(mg/g) Experiment (Mixing System)
2.20 2.84 3.67 4.26 4.74 5.14
From Batch Experiment
(Static System) 2.15 2.80 3.66 4.27 4.77 5.19
The pore water velocity maintained was higher for higher influent P
concentrations. The breakthrough time decreased as the pore water velocity and
the influent P concentration increased. As the pore water velocity increases, the
contact time between the P solute and the cake medium becomes less and less.
The parameters K, N and a, b for Freundlich and Langmuir isotherms
respectively were estimated from the solid phase concentrations of cake in the
column after the saturation of cake was achieved. The isotherm constants are
shown in Table 5.31. The sorption phenomenon is described better by the
Freundlich isotherm than by the Langmuir isotherm. Although six points were
available from the cake column experiments to calculate the isotherm constants,
the variation in pore water velocities might affect the values of isotherm
constants.
Table 5.31 Freundlich and Langmuir Isotherm Constants in the Batch and
Column Experiment for Cake
Freundlich Isotherm Constants Lan~muir Isotherm Constan~ 11
K[ mg/g(L/mg)N] 8.17x10⁻² a(mg/g) 1.56x10
N 1.09 b(L/m~) 4.58x10-J
R2 0.99 R2 0.92
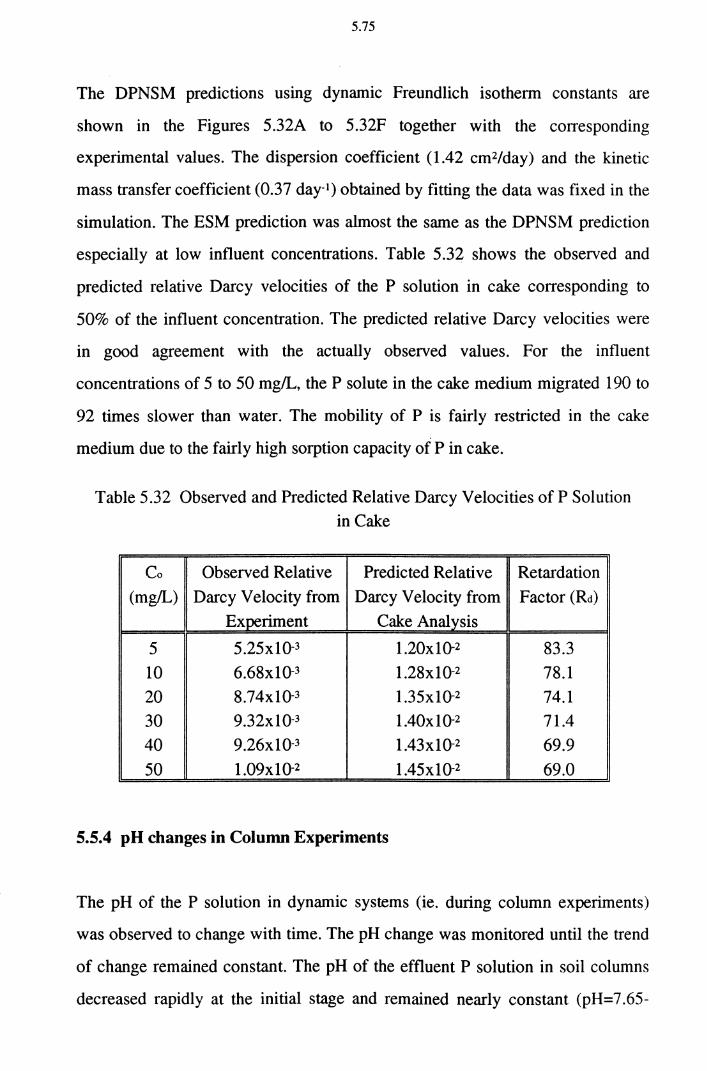
5.75
The DPNSM predictions using dynamic Freundlich isotherm constants are
shown in the Figures 5.32A to 5.32F together with the corresponding
experimental values. The dispersion coefficient (1.42 cm2/day) and the kinetic
mass transfer coefficient (0.37 day·1) obtained by fitting the data was fixed in the
simulation. The ESM prediction was almost the same as the DPNSM prediction
especially at low influent concentrations. Table 5.32 shows the observed and
predicted relative Darcy velocities of the P solution in cake corresponding to
50% of the influent concentration. The predicted relative Darcy velocities were
in good agreement with the actually observed values. For the influent
concentrations of 5 to 50 mg/L, the P solute in the cake medium migrated 190 to
92 times slower than water. The mobility of P is fairly restricted in the cake
medium due to the fairly high sorption capacity of P in cake.
Table 5.32 Observed and Predicted Relative Darcy Velocities of P Solution in Cake
Co Observed Relative Predicted Relative Retardation
(mg/L) Darcy Velocity from Darcy Velocity from Factor (Rct)
Experiment Cake Analysis
5 5.25x10⁻³ 1.20x10⁻² 83.3 10 6.68x10⁻³ 1.28x10⁻² 78.1
20 8.74x10⁻³ 1.35x1Q-2 74.1
30 9.32x10⁻³ 1.40x10⁻² 71.4 40 9.26x10⁻³ 1.43x1Q-2 69.9
50 1.09x10⁻² 1.45x10⁻² 69.0
5.5.4 pH changes in Column Experiments
The pH of the P solution in dynamic systems (ie. during column experiments)
was observed to change with time. The pH change was monitored until the trend
of change remained constant. The pH of the effluent P solution in soil columns
decreased rapidly at the initial stage and remained nearly constant (pH=7.65-
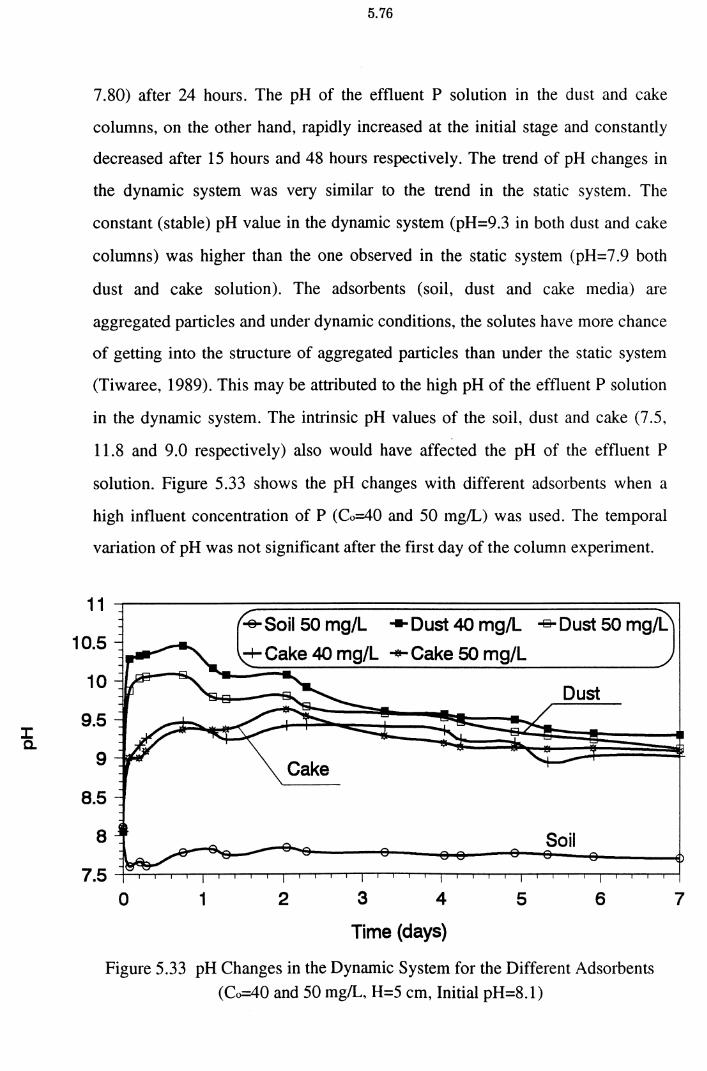
I: a.
5.76
7.80) after 24 hours. The pH of the effluent P solution in the dust and cake
columns, on the other hand, rapidly increased at the initial stage and constantly
decreased after 15 hours and 48 hours respectively. The trend of pH changes in
the dynamic system was very similar to the trend in the static system. The
constant (stable) pH value in the dynamic system (pH=9.3 in both dust and cake
columns) was higher than the one observed in the static system (pH=7.9 both
dust and cake solution). The adsorbents (soil, dust and cake media) are
aggregated particles and under dynamic conditions, the solutes have more chance
of getting into the structure of aggregated pruticles than under the static system
(Tiwaree, 1989). This may be attributed to the high pH of the effluent P solution
in the dynamic system. The intrinsic pH values of the soil, dust and cake (7 .5,
11.8 and 9.0 respectively) also would have affected the pH of the effluent P
solution. Figure 5.33 shows the pH changes with different adsorbents when a
high influent concentration of P (Co=40 and 50 mg/L) was used. The temporal
variation of pH was not significant after the first day of the column experiment.
11 ~soil 50 mg/L ---oust 40 mg/L -e-Oust so mg/L
10.5 -+-Cake 40 mg/L ,..... Cake 50 mg/L
10 Dust
9.5
9 Cake
8.5
8 Soil
7.5 0 1 2 3 4 5 6
Time {days)
Figure 5.33 pH Changes in the Dynamic System for the Different Adsorbents
(Co=40 and 50 mg/L, H=5 cm, Initial pH=8.1)
7
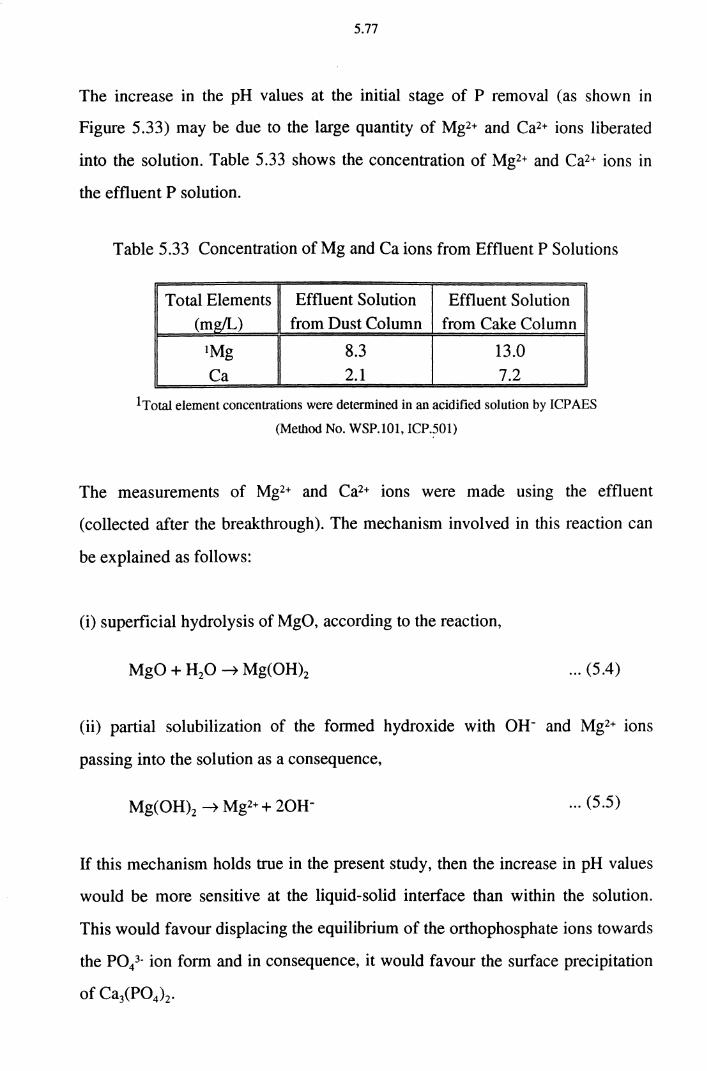
5.77
The increase in the pH values at the initial stage of P removal (as shown in
Figure 5.33) may be due to the large quantity of Mg2+ and Ca2+ ions liberated
into the solution. Table 5.33 shows the concentration of Mg2+ and Ca2+ ions in
the effluent P solution.
Table 5.33 Concentration of Mg and Ca ions from Effluent P Solutions
Total Elements Effluent Solution Effluent Solution
(mg/L) from Dust Column from Cake Column
IMg 8.3 13.0
Ca 2.1 7.2
1 Total element concentrations were determined in an acidified solution by ICPAES
(Method No. WSP.lOl, ICP.501)
The measurements of Mg2+ and Ca2+ ions were made using the effluent
(collected after the breakthrough). The mechanism involved in this reaction can
be explained as follows:
(i) superficial hydrolysis of MgO, according to the reaction,
... (5.4)
(ii) partial solubilization of the formed hydroxide with OH- and Mg2+ ions
passing into the solution as a consequence,
Mg(OH)2 ~ Mg2+ + 20H- ... (5.5)
If this mechanism holds true in the present study, then the increase in pH values
would be more sensitive at the liquid-solid interface than within the solution.
This would favour displacing the equilibrium of the orthophosphate ions towards
the P043- ion form and in consequence, it would favour the surface precipitation
of CaiP04 ) 2 •
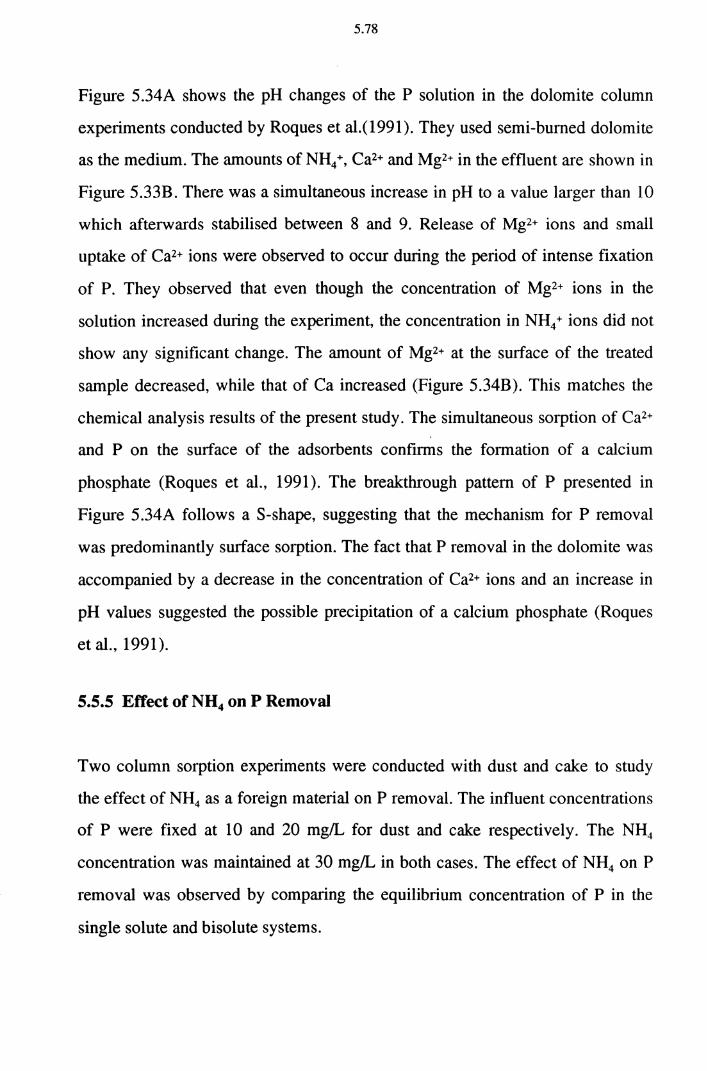
5.78
Figure 5.34A shows the pH changes of the P solution in the dolomite column
experiments conducted by Roques et al.(1991). They used semi-burned dolomite
as the medium. The amounts of NH4 +, Ca2+ and Mg2+ in the effluent are shown in
Figure 5.33B. There was a simultaneous increase in pH to a value larger than 10
which afterwards stabilised between 8 and 9. Release of Mg2+ ions and small
uptake of Ca2+ ions were observed to occur during the period of intense fixation
of P. They observed that even though the concentration of Mg2+ ions in the
solution increased during the experiment, the concentration in NH4 + ions did not
show any significant change. The amount of Mg2+ at the surface of the treated
sample decreased, while that of Ca increased (Figure 5.34B). This matches the
chemical analysis results of the present study. The simultaneous sorption of Ca2+
and P on the surface of the adsorbents confirms the formation of a calcium
phosphate (Roques et al., 1991). The breakthrough pattern of P presented in
Figure 5.34A follows a S-shape, suggesting that the mechanism for P removal
was predominantly surface sorption. The fact that P removal in the dolomite was
accompanied by a decrease in the concentration of Ca2+ ions and an increase in
pH values suggested the possible precipitation of a calcium phosphate (Roques
et al., 1991).
5.5.5 Effect of NH4 on P Removal
Two column sorption experiments were conducted with dust and cake to study
the effect of NH4 as a foreign material on P removal. The influent concentrations
of P were fixed at 10 and 20 mg/L for dust and cake respectively. The NH4
concentration was maintained at 30 mg/L in both cases. The effect of NH4 on P
removal was observed by comparing the equilibrium concentration of P in the
single solute and bisolute systems.
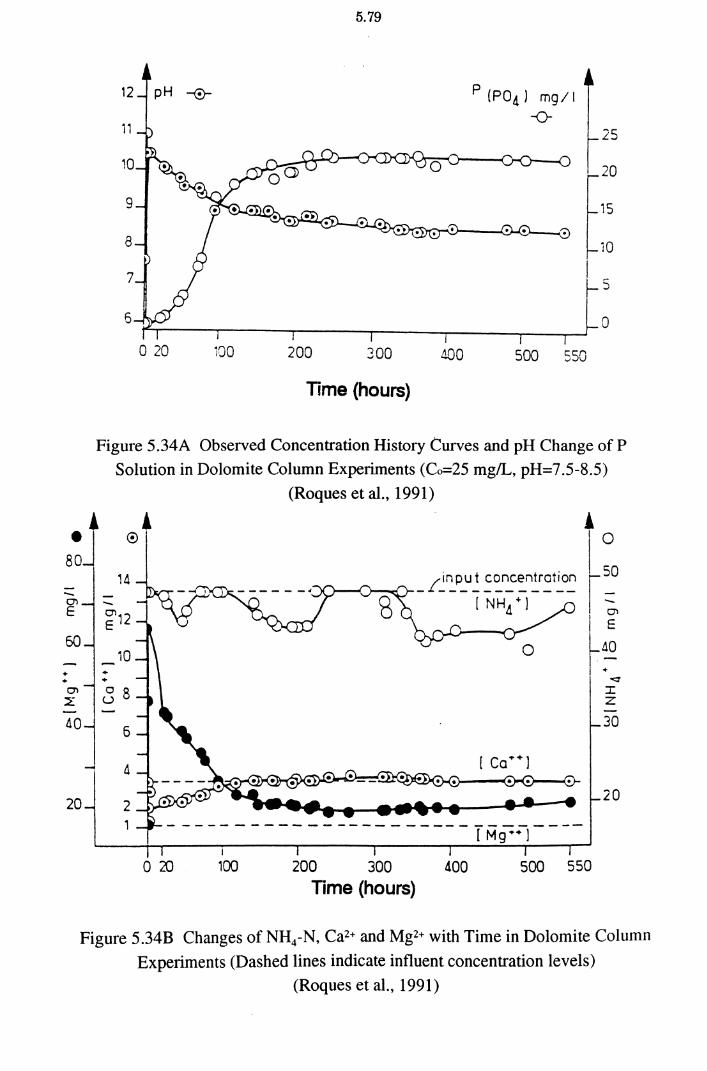
5.79
12
11
9
8
7
6
0 20 100 200 300
Time (hours)
I
400
p (P04l mg/1
-o-
20
15
iO
~5 0
500 550
Figure 5.34A Observed Concentration History Curves and pH Change of P
Solution in Dolomite Column Experiments (Co=25 mg/L, pH=7.5-8.5)
(Roques et al., 1991)
' ' • s~J -O'l E
50
+ + O'l ~
40
20
-
0'
14 /input concentration _.L, ___________ _
[ NH.1 + l
2
----------------------[Mg·~----
I
IQ
I so l:: lA~ 1:-
<: I z 30
20
020 100 200 300 400 500 550
Time (hours)
Figure 5.34B Changes of NH4-N, Ca2+ and Mg2+ with Time in Dolomite Column
Experiments (Dashed lines indicate influent concentration levels)
(Roques et al., 1991)
5.80
The results obtained are presented in Figures 5.35A and 5.35B. The sorption
capacity of P in dust and cake media decreased in the presence of NH4 even
though the reduced amount is not significant. Due to the competition for sorption
sites, P removal decreased in both experiments. The breakthrough curves of P in
the presence of NH4 were also S-shaped, but with less spreading. Breakthrough
time was shorter than the single solute system.
5.6 Field Application
Most of the chemical and advanced biological treatment technologies used for P
removal in sewage treatment plants are expensive to install, difficult to operate
efficiently, and produce considerable volumes of phosphorus-rich sludges
requiring disposal. Most sewage treatment plants (including small community
plants) in Australia are required to meet more stringent P discharge standards
with limited funding. Hence, there is a need for low-cost treatment systems that
are efficient, and that do not create problems of frequent sludge disposal.
Because of these limitations of advanced tertiary treatment technologies, natural
wetlands and ones rich in organic matter are becoming important for P removal.
W etland treatment schemes have been successful in removing enteric bacteria,
lowering biochemical oxygen demand, and decreasing nitrate concentrations in
the effluent. However, they have been less effective in lowering phosphorus
concentrations to acceptable levels (Finlayson, 1991; Mann and Bavor, 1993).
This is due to the lack of substrata capable of adsorbing phosphorus and
suppressing soil-retained P liberation from sediments to prevent it from passing
into surface waters in soluble and bio-available forms. Sorption and precipitation
reactions of phosphorus with iron-, aluminium- and calcium-containing materials
appear to be principally responsible for phosphorus removal in wetlands
(Yamada et al., 1986; Mann and Bavor, 1993; Choi and Chung, 1995).
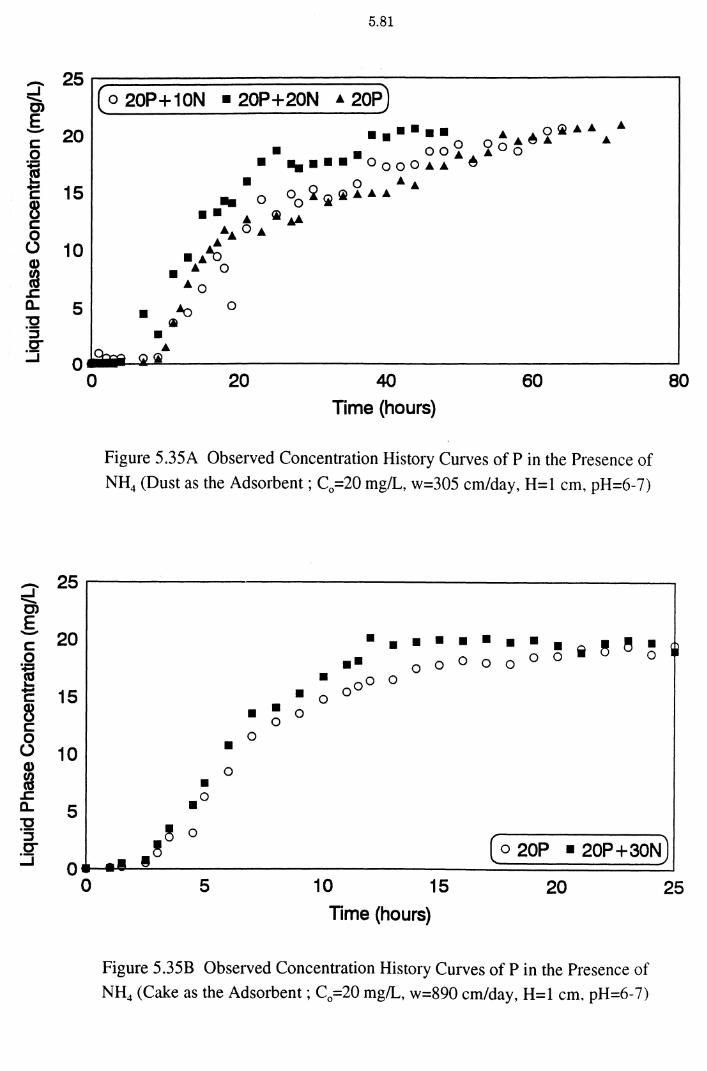
5.81
~ ~ ) C; ( 0 20P+10N • 20P+20N A 20P
§. 20 •••••• • o~•• • c o oo•~• • o • • oo.._~.._ o :S • ..... OooOAA .... • 0 ...... 'E 15 .. O 00 2 ~ ~ A A A
~ •. A ~ ... 0 AA 0 A
(.) 10 .... ~ ~ • A 0
..s::::: Ao
5 • 0 a.. "C ·s C"' :.:i o .. ~~A---------------------------------------------~
0
~ 25
-. C)
E - 20 c 0 :s '-..... 15 c ~ c: 0 (.) 10 Q)
m ..s::::: a.. 32
5 ::::s C"'
:.:i 0 0
20 40
Time (hours) 60
Figure 5.35A Observed Concentration History Curves of Pin the Presence of
NH4 (Dust as the Adsorbent; C0 =20 mg/L, w=305 cm/day, H=l cm, pH=6-7)
• • • • i ~ ~ • • • • • • 0 0 0 0 0 •• 0 0 0
• 0 o o
• 0 0
• • 0 0
0 • 0
• .o
80
"~ ~ 0
( o 20P • 20P+30N)
5 10 15 20 Time (hours)
Figure 5.35B Observed Concentration History Curves of Pin the Presence of
NH4 (Cake as the Adsorbent; Co=20 mg/L, w=890 cm/day, H=l cm, pH=6-7)
25
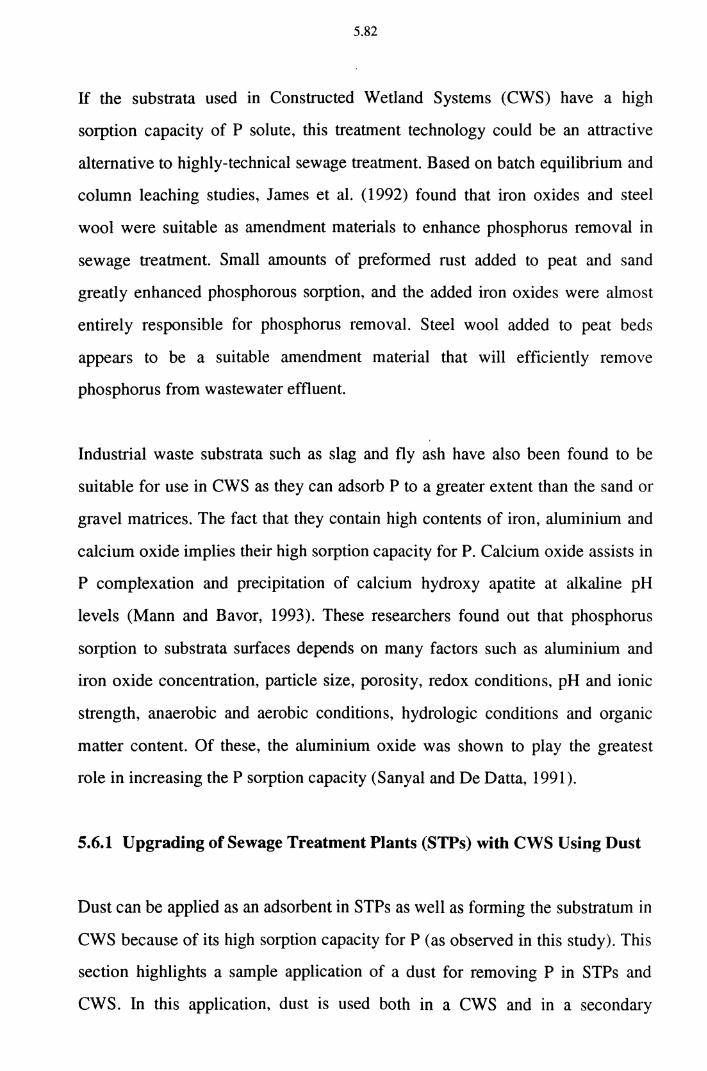
5.82
If the substrata used in Constructed Wetland Systems (CWS) have a high
sorption capacity of P solute, this treatment technology could be an attractive
alternative to highly-technical sewage treatment. Based on batch equilibrium and
column leaching studies, James et al. (1992) found that iron oxides and steel
wool were suitable as amendment materials to enhance phosphorus removal in
sewage treatment. Small amounts of preformed rust added to peat and sand
greatly enhanced phosphorous sorption, and the added iron oxides were almost
entirely responsible for phosphorus removal. Steel wool added to peat beds
appears to be a suitable amendment material that will efficiently remove
phosphorus from wastewater effluent.
Industrial waste substrata such as slag and fly ash have also been found to be
suitable for use in CWS as they can adsorb P to a greater extent than the sand or
gravel matrices. The fact that they contain high contents of iron, aluminium and
calcium oxide implies their high sorption capacity for P. Calcium oxide assists in
P complexation and precipitation of calcium hydroxy apatite at alkaline pH
levels (Mann and Bavor, 1993). These researchers found out that phosphorus
sorption to substrata surfaces depends on many factors such as aluminium and
iron oxide concentration, particle size, porosity, redox conditions, pH and ionic
strength, anaerobic and aerobic conditions, hydrologic conditions and organic
matter content. Of these, the aluminium oxide was shown to play the greatest
role in increasing the P sorption capacity (Sanyal and De Datta, 1991).
5.6.1 Upgrading of Sewage Treatment Plants (STPs) with CWS Using Dust
Dust can be applied as an adsorbent in STPs as well as forming the substratum in
CWS because of its high sorption capacity for P (as observed in this study). This
section highlights a sample application of a dust for removing P in STPs and
CWS. In this application, dust is used both in a CWS and in a secondary
5.83
treatment step to remove P, and soil is used in a CWS to further polish the P
effluent. Figure 5.36 provides a schematic diagram of the treatment system
proposed. This design is suitable for a small community wastewater treatment
system (eg. 5,000 population equivalents). The free water surface system is
selected for ease of maintenance. Elements of the wetlands can be isolated for
harvesting or dredging if required.
5.6.1.1 Sewage Treatment Plant (STP)
In the STP, dust is used as a dosing agent in secondary treatment. Assuming a
per capita wastewater production per day of 240 L and a design population of
5,000 PE, then the hydraulic loading capacity (Q) will work out to be 1.2
ML/day. Assuming the secondary influent from the STP contains 10 mg/L of P,
and the removal target is 1 mg/L of P (ie. 10.8 kg of P/1.2 ML). The sorption
capacity of dust based on the batch experiment in mixing system is 12.5 mg/g
(for the initial concentration of 10 mg/L). In other words, about 784 kg of dust is
necessary on a daily basis to adsorb this 10.8 kg of P.
At present, Spent Pickle Liquor (SPL), alum or lime is used as a dosing agent.
The use of dust instead needs further study. The dust can be easily settled in the
sludge lagoon (particle density=2.78 g/cm3). Because of the presence of lead
(Pb) in the dust ( 450 mg/kg), one should make sure that lead does not leach out
with the effluent. The analysis of heavy metals conducted from the dust column
effluents indicated that very little or no heavy metals is leached out (Table 5.35).
5.6.1.2 Constructed Wetland System (CWS)
The effluent after sorption with dust which contains 1 mg/L of P is directed to a
CWS. Here the CWS design considered is a surface flow wetland type. The
5.84
wetland made of the dust substratum (Cells 1 and 2 in Figure 5.36) is used for P
removal and that with the soil substratum (Cell 3 in Figure 5.36) for polishing
the secondary effluent wastewater.
Assume that the removal efficiency of P by the dust substratum (in Cell 1 or 2)
in the CWS is 30% (ie. P concentration will be reduced from 1.0 mg/L to 0. 7
mg!L). Assume also that plant and associated bio-film have an additional
removal efficiency of 80% in Cell 3; then the P will further be reduced from 0.7
mg!L to 0.14 mg!L. The macrophytes usually planted in the CWS are phragmites
and scirpus sp. and the density of planting is 8 plants/m2. Assuming a further
20% removal by the flow through Cell 3, the effluent P concentration will be
reduced to 0.112 mg!L.
The effluent P concentration can be calculated from the following equation
which takes into account only the P uptake (Brix, 1987). The P uptake constant
for this type of CWS is of the order of 13 m3/(m2.year).
... (5.6)
where, Cm = Concentration in the wetland inlet.
C001 = Concentration in the wetland outlet.
HLR =Hydraulic Loading Rate [m3/(m2.year)]
k = P uptake constant [m3/(m2.year)]
If the inlet P concentration of 1.0 mg/L at the CWS were to be reduced to 0.112
mg/L with a densely vegetated marsh, the design HLR would be:
-13 HLR = = 5.94 m3 I (m 2 .year)
ln(0.112/1.00) ... (5.7)
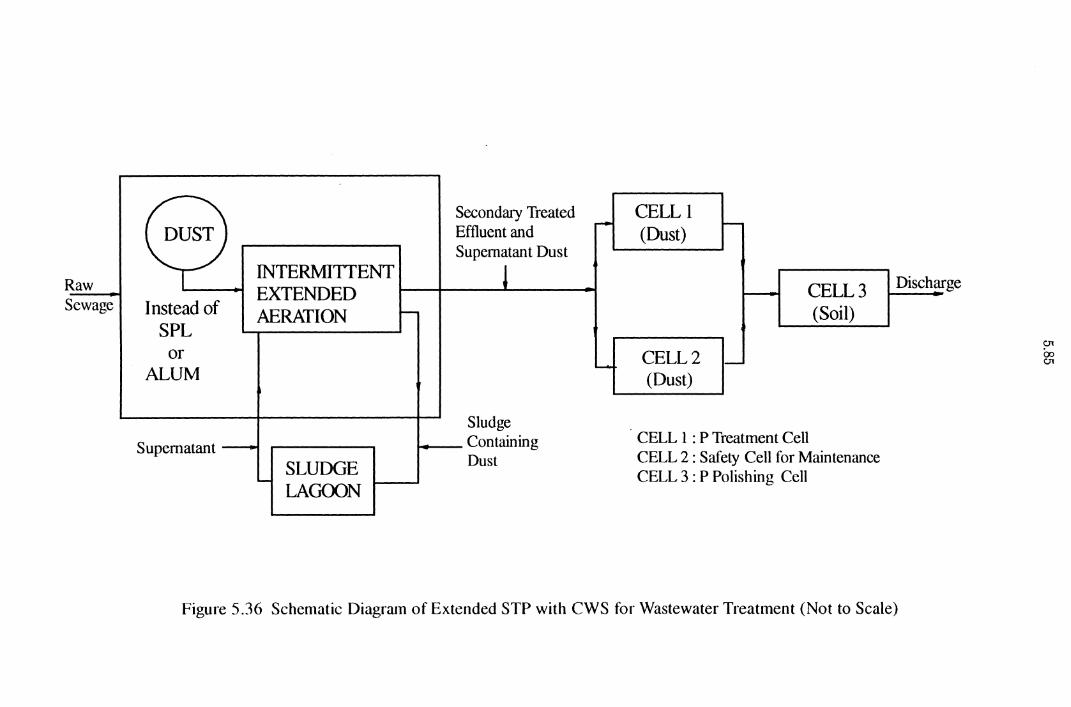
aw R s ewage
8 Secondary Treated CELL I Effluent and
~
(Dust) -
Supematant Dust
T INTERMITTENT J Disch EXTENDED CELL3 1----
Instead of AERATION - (Soil) SPL
arge
or CELL2 !-
ALUM - (Dust)
Sludge
Supematant - Containing CELL 1 : P Treatment Cell
SLUDGE Dust CELL 2 : Safety Cell for Maintenance ...._
LAGOON CELL 3 : P Polishing Cell
Figure 5.36 Schematic Diagram of Extended STP with CWS for Wastewater Treatment (Not to Scale)
5.86
Modifications to Eqn. 5. 7 are required if there are significant changes in flow
through the wetland due to rainfall, evaporation, or seepage (Brix, 1987).
Asswning that the average depth of the CWS to be 500 mm and that there is no
short-circuiting in the flow, then the detention time will be 30.7 days [500
mm/(5940 mm I 365 days)]. To treat the wastewater quantity of 1.2 ML/day, the
surface area necessary will be 6,145 m2 [365,000 (m3/year) /5.94 (m/year)]. That
is, a well designed CWS would reduce the effluent P concentration from 1.00
mg/L to 0.112 mg/L over an area of 6,145 m2• In winter time the P removal
efficiency could be enhanced by increasing the detention time or by decreasing
the flow rate.
Additional factors to be considered in the design of the extended-STP with CWS
are the slope of pond, facilities to control mosquitoes in ponds, and frequency of
vegetation removal (1-5 years). The economic feasibility of the application of
this system might be the most crucial factor. The cost of construction of the
CWS will vary according to the type, area, place of wetland and number of
plants and detention time of the wastewater (lllungkoo, 1994).
5.6.2 Suppression of P Liberation from Sediments Using Dust and Cake
The accwnulated P in shallow and coastal sediments plays an important role in
the eutrophication of closed water bodies. The supply of P from the sediments is
one of the main sources, and has an influence in the change of P concentration.
The suppression of P liberation from sediments has been recognised as one of
the most important measures to control the eutrophication caused by excessive P
discharges into the waterways (Y amada et al., 1987).
Sediments act as a sink of P under certain circumstances, causmg the
accwnulation of various materials. On the other hand, some conditions stimulate
5.87
the release of P and produce negative effects on P removal from the water. This
phenomenon, often called "internal loading", keeps the water quality
unfavourable. In other words, even if there are efforts to eliminate the external
source of P, there will still be a considerable amount of P released from the
sediments. Raised temperature, increased pH, decrease in dissolved oxygen,
along with other environmental factors are found to provide favourable
conditions for P release (Davis et al., 1975). P release may take place through a
diffusion and desorption process, physical turbulence, and metabolism of the
microorganisms in the sediment (Forsberg, 1989). The release or internal loading
of P, however, cannot be explained fully by any of the release mechanisms
proposed. Many factors related to the release of P have not been fully elucidated
or quantified yet. In fact, there are a number of known and unknown processes
involved and often they are interrelated (Choi and Chung, 1995). According to
Lee et al. (1976), Lijkleme (1976) and Banoub (1976), orthophosphate
precipitate on sediment has been found in dissolved form under anaerobic
conditions. Hosomi et al. (1982) divided phosphorus type (state) in lake
sediments into five forms, viz., inorganic phosphorus adsorbed on clay particles;
inorganic phosphorus precipitated with aluminium (Al-P), iron (Fe-P), and
calcium (Ca-P); and organic phosphorus. In order to suppress the liberation of
phosphorus from sediments, many kinds of substances which adsorb P have been
investigated by several researchers. It was found that slag removes phosphorus
from natural sea water by adsorbing P on its surface.
Kinetic results on the desorption of phosphorus from sediments showed an initial
fast release, observed within 10 minutes, followed by a slower desorption. The
rate and extent of release increased as the pH increased (Fox and Malati, 1985).
In the case of sediments, beside sorption at the edges of the clay particles,
phosphorus ions may be held in an amorphous iron and/or aluminium hydrated
oxide gel on the lateral faces of the particles (Forsberg, 1989).
5.88
The suppression of phosphorus liberation can be performed by covering the
sediment surface with suppressing materials or by mixing them with the
sediment (Y amada et al., 1987). From Y amada et al.'s study (1987), suppression
efficiency depended on the amount of slag used. The concentration of sulphide
ions in the sea water was observed to decrease in the presence of slag. Sulphide
ion generated under the strongly anaerobic conditions reacted with some metals
(Fe, Mn) on the surface of the slag to produce metal sulphides. As the reaction of
sulfide ions with precipitated phosphate was inhibited, the liberation of
phosphorus was suppressed. As for the suppression mechanisms of phosphorus
liberation by covering materials, the chemical effect of hydrogen sulfide
generated in the anaerobic state and the sorption of P were considered (Y amada
et al., 1987; Choi and Chung, 1995). Since dust and cake have most of these
properties, they can be used as a suppressing material for P liberation from
sediments. The suppression of phosphorus liberation by them will mainly occur
due to covering and sorption effects.
5.6.3 Toxicity of the Dust and Cake
Y amada et al. ( 1987) studied the influence of slag on the mortality of organisms
such as zooplankton and juvenile fish, on the growth rates of fish and on the
biomass and fauna of benthic organisms. The materials used in their research
were soft and hard granulated slag, sand and glass beads. Slag used in their study
was manufactured and supplied by Nippon Kokan Co. Ltd. at Fukuyama, Japan.
The concentration of several heavy metals - cadmium, lead, copper, zinc and
chromium - in the four kinds of slag used are shown in Table 5.34. The
concentration of cadmium was low and almost the same as that in the earth's
crust. The concentrations of lead, copper, zinc and chromium were even lower
than that in the earth's crust (Yamagata, 1977). The concentrations of cadmium,
lead, copper and zinc in the sediments of coastal areas like Tokyo Bay, Japan
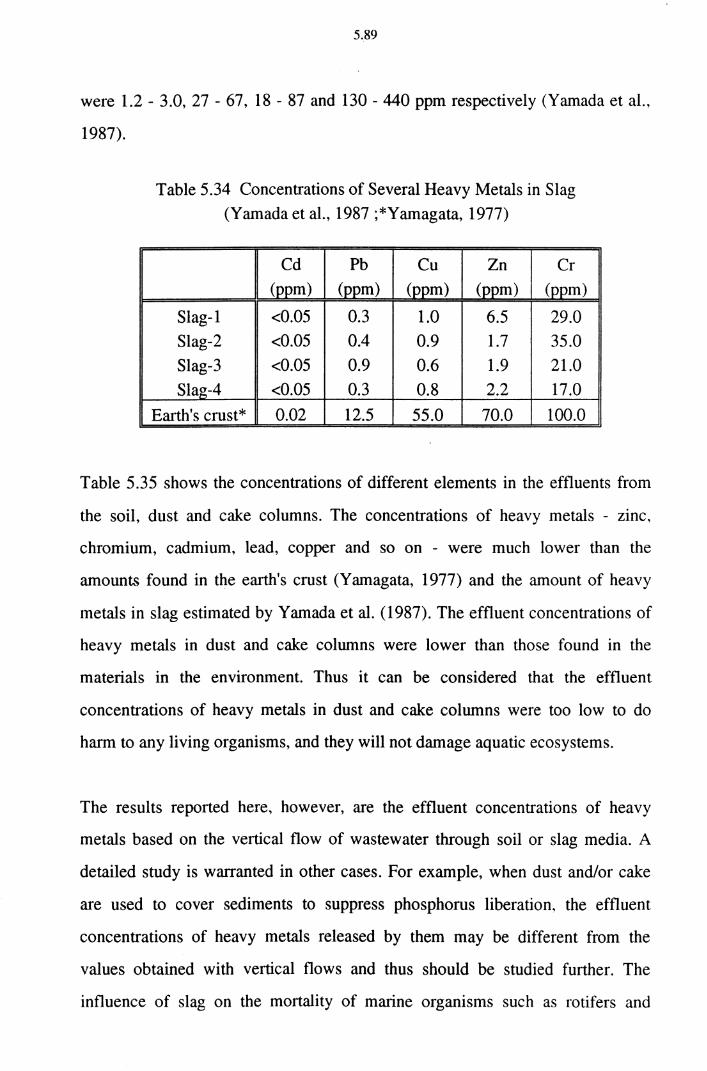
5.89
were 1.2- 3.0, 27 - 67, 18- 87 and 130- 440 ppm respectively (Yamada et al.,
1987).
Table 5.34 Concentrations of Several Heavy Metals in Slag (Yamadaetal., 1987 ;*Yamagata, 1977)
Cd Pb Cu Zn Cr (ppm) (ppm) (ppm) (ppm) (ppm)
Slag-1 <0.05 0.3 1.0 6.5 29.0 Slag-2 <0.05 0.4 0.9 1.7 35.0 Slag-3 <0.05 0.9 0.6 1.9 21.0
Slag-4 <0.05 0.3 0.8 2.2 17.0
Earth's crust* 0.02 12.5 55.0 70.0 100.0
Table 5.35 shows the concentrations of different elements in the effluents from
the soil, dust and cake columns. The concentrations of heavy metals - zinc.
chromium, cadmium, lead, copper and so on - were much lower than the
amounts found in the earth's crust (Y amagata, 1977) and the amount of heavy
metals in slag estimated by Y amada et al. (1987). The effluent concentrations of
heavy metals in dust and cake columns were lower than those found in the
materials in the environment. Thus it can be considered that the effluent
concentrations of heavy metals in dust and cake columns were too low to do
harm to any living organisms, and they will not damage aquatic ecosystems.
The results reported here, however, are the effluent concentrations of heavy
metals based on the vertical flow of wastewater through soil or slag media. A
detailed study is warranted in other cases. For example, when dust and/or cake
are used to cover sediments to suppress phosphorus liberation, the effluent
concentrations of heavy metals released by them may be different from the
values obtained with vertical flows and thus should be studied further. The
influence of slag on the mortality of marine organisms such as rotifers and
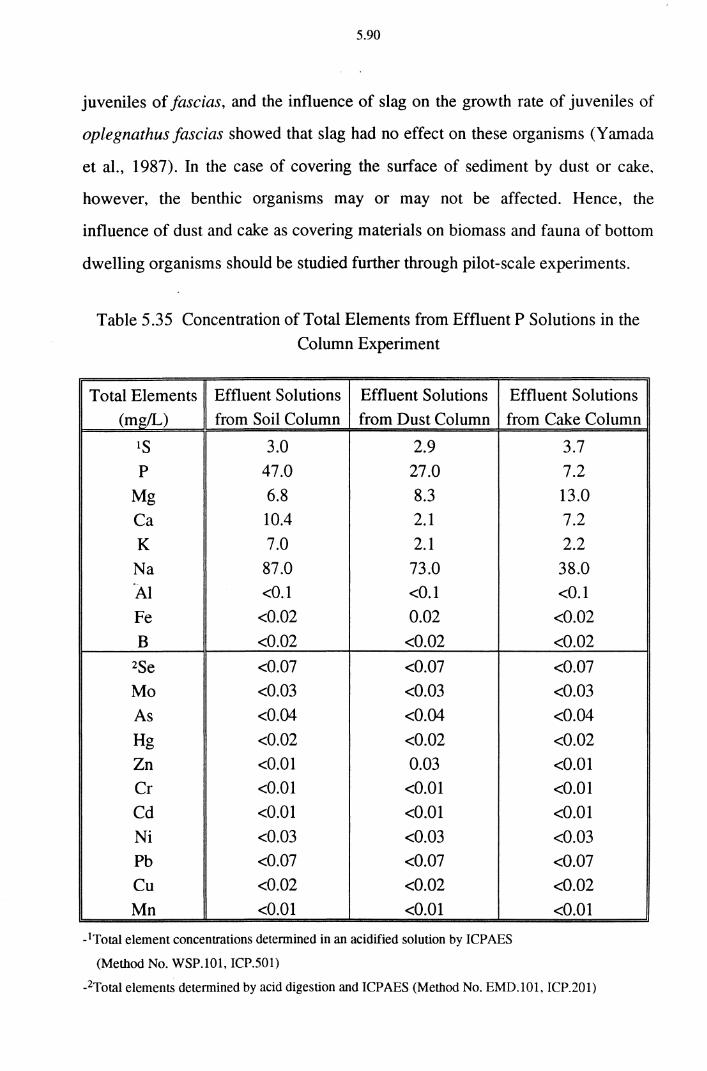
5.90
juveniles of fascias, and the influence of slag on the growth rate of juveniles of
oplegnathus fascias showed that slag had no effect on these organisms (Y amada
et al., 1987). In the case of covering the surface of sediment by dust or cake,
however, the benthic organisms may or may not be affected. Hence, the
influence of dust and cake as covering materials on biomass and fauna of bottom
dwelling organisms should be studied further through pilot-scale experiments.
Table 5.35 Concentration of Total Elements from Effluent P Solutions in the
Column Experiment
Total Elements Effluent Solutions Effluent Solutions Effluent Solutions
(mg/L) from Soil Column from Dust Column from Cake Column
IS 3.0 2.9 3.7 p 47.0 27.0 7.2
Mg 6.8 8.3 13.0
Ca 10.4 2.1 7.2
K 7.0 2.1 2.2
Na 87.0 73.0 38.0
AI <0.1 <0.1 <0.1
Fe <0.02 0.02 <0.02
B <0.02 <0.02 <0.02 2Se <0.07 <0.07 <0.07
Mo <0.03 <0.03 <0.03
As <0.04 <0.04 <0.04
Hg <0.02 <0.02 <0.02
Zn <0.01 0.03 <0.01
Cr <0.01 <0.01 <0.01
Cd <0.01 <0.01 <0.01
Ni <0.03 <0.03 <0.03
Pb <0.07 <0.07 <0.07
Cu <0.02 <0.02 <0.02
Mn <0.01 <0.01 <0.01
- 1Total element concentrations determined in an acidified solution by ICPAES
(Method No. WSP.lOl, ICP.501)
-2Total elements determined by acid digestion and ICPAES (Method No. EMD.lOl, ICP.201)
6.1
VI CONCLUSIONS
A. From the batch (static) experimental results, the following conclusions can be
made:
1. P sorption in soil and slag media is a slow process. More than 90% of the P
was adsorbed within 70, 12 and 60 hours in the mixing system, and 240, 24
and 120 hours in the static system for soil, dust and cake respectively,
depending on the initial P concentrations. Dust adsorbed P the most,
compared to the other adsorbents (220-225 times and 4-5 times of that of
soil and cake respectively). Kinetic studies revealed that the amount of P
adsorbed on the adsorbents increased rapidly at the initial stage and the
percentage of P adsorbed decreased gradually. The changes became smaller
with the increase of initial P concentration.
2. The Langmuir isotherm gave a better correlation to experimental results
than the Freundlich isotherm. The Freundlich isotherm constant K in the
static system was similar to the one in the mixing system. while the
reciprocal exponent (N) was less. The agitation of the P solution had a
significant effect on the kinetics of P. The amounts of P adsorbed in the
static system were less than those in the mixing system.
3. The kinetics of P sorption are satisfactorily explained by a static physical
non-equilibrium sorption model (SPNSM). The equations developed were
based on the concept that the P solute is transferred by the process of film
diffusion into the immobile water layer surrounding the adsorbent. The film
transfer constant (a) decreased with an increase in the initial P
concentration. The distribution of the film transfer constant for the mixing
system was more scattered than that in the static system.
6.2
4. The pH of the P solution played a critical role in the rate of removal and the
removal mechanisms of P. P removal was at a minimum at pH 2 for the soil
and dust adsorbents. During the experiments, the pH of the P solution in the
soil adsorbent for the static system constantly increased with time while
those of the P solutions in the dust and cake adsorbents decreased. The final
pH of the P solution in the soil adsorbent increased for the experiments with
an initial pH < 7. For experiments with an initial pH greater than 7, the final
pH decreased during the experiments. On the other hand, the final pH of the
P solution in the dust adsorbent increased during the experiments for initial
pH levels from 2 to 9, and decreased for initial levels beyond pH 9. In the
dust adsorbent, the final pH remained constant at 9.5 for initial pH levels in
the range of 4 to 10. The high intrinsic pH and high sorption capacity of P
in the dust increased the final pH. The pH variation was dependent not only
on the type of adsorbents but also on the initial P concentrations.
5. Batch precipitation experiments indicated that the precipitation mechanism
was significant for pH levels greater than 8. P reduction by this means
increased with an increase of pH. The dominant removal mechanism of P at
pH levels less than 8 was sorption and at pH levels greater than 10 it was
precipitation.
6. Batch flocculation experiments revealed that P removal depended on
adsorbent dose, flocculation (contact) time and mixing rate. With the
increase in the adsorbent dose and flocculation time, the removal efficiency
of P also increased. This effect was more significant at high initial P
concentrations. P complexation with Al, Ca, Fe and other chemicals was
observed with the increase of time starting from high adsorbent doses. P
removal by dust may be enhanced by flocculation (perikinetic and
orthokinetic) and precipitation followed by sorption.
6.3
7. The sorptivity of P on dust particles was suppressed by the presence of
NH4 • This is due to the competition for the available sites. The percentage
reduction of P sorption ranged from 33 to 57%.
B. From the soil column (dynamic) experiments, the following conclusions can
be made:
8. The solid phase concentrations using batch experimental isotherms in the
static system are similar to those computed from the dynamic column
experiments. The sorption phenomena in the dynamic system were
described better by the Freundlich isotherm. The equilibrium stage was
reached faster as the influent P concentration increased. All the columns
exhibited characteristic nearly S-shaped breakthrough curves. The
simulated results using a dynamic physical non-equilibrium sorption model
(DPNSM) and Freundlich isotherm constants K and N (calculated from the
column experiments) have satisfactorily fitted the corresponding
experimental breakthrough curves.
9. A program to fit a generalised non-linear advection-dispersion modeL
MCMFIT, was used to estimate the optimum model parameter values. It
was used in conjunction with a dynamic physical non-equilibrium sorption
model (DPNSM) or an equilibrium sorption model (ESM). P sorption in the
dynamic system was explained better by the physical non-equilibrium
process than by the equilibrium process. The ESM could not predict
satisfactorily the breakthrough pattern of P for high influent P
concentrations (>30 and 40 mg!L). P solute movement was fast through the
column at high influent P concentrations. At the influent concentrations of
10 to 40 mg/L, P migrates 25 to 16 times slower than water. The mobility of
P is restricted by the soil medium.
6.4
10. The kinetic mass transfer coefficient (as) appearing in the model was found
to decrease with the increase in the pore water velocity. The immobile film
layer surrounding the soil particle becomes thinner with the increase in P
diffusion. This leads to an early breakthrough. The DPNSM gave rise to
satisfactory predictions, with the variation of pore water velocities, soil
depths and water levels being described well. The curves are nearly S
shaped or curvilinear, with more spreading and longer breakthrough times
with a decrease of pore water velocity or an increase of soil depth.
C. From the dust and cake column (dynamic) experiments, the following
conclusions can be made:
11. Both dust and cake columns had a higher sorption capacity than the soil
column. As noticed in the soil column, there was an early breakthrough with
the increase of influent P concentration in the dust and cake columns.
Unlike the case of soil, the solid phase concentrations using batch
experiment isotherm constants are substantially higher than those computed
from dynamic column experiments. The sorption phenomena were
described better by the Freundlich isotherm.
12. The P removal process in the dust column was explained better by the
physical non-equilibrium process than the equilibrium one. The DPNSM
predicted the observed breakthrough data while the ESM prediction was
satisfactorily only at high influent P concentrations (C0=40 and 50 mg/L).
The P solute in the dust medium migrates 250 to 685 times slower than
water. The mobility of P is highly restricted in the dust medium due to its
high sorption capacity of P.
6.5
13. The ESM prediction of the P concentration history in the cake column
(using Freundlich isotherm constants estimated from the dynamic
conditions) was almost the same as the DPNSM prediction and in both
cases, one could predict the observed data satisfactorily. The breakthrough
data from DPNSM and ESM both exhibited a curvilinear curve. The P
solute in the cake medium migrates 92 to 190 times slower than water.
14. The trend of pH changes in the column experiment was similar to that in the
batch experiment. In the case of dust and cake, an increase of pH values
occurred at the initial stage of P removal. This pH change can be correlated
to the quantity of Mg2+ and Ca2+ ions liberated into the solution from the
dust and cake media.
15. Due to the competition for sorption sites, P removal in the dust and cake
medium decreased in the presence of NH4 • The breakthrough curves of P
followed a S-shape, but with less spreading and shorter breakthrough times
than that in the single solute system.
16. Dust and cake, due to their high sorption capacity for P, can be applied as
(i) an adsorbent in a sewage treatment plant, (ii) as a substratum in
constructed wetland system and (iii) as a suppressing material for P
liberation from sediments. The effluent concentrations of heavy metals in
the dust and cake column were lower than those in the materials found in
the environment.
7.1
VII RECOMMENDATIONS FOR FUTURE RESEARCH
One the basis of this research the following works are recommended for future
study:
1. The applicability of the Freundlich and Langmuir isotherm constants
derived from batch experiments of P at low initial P concentrations (less
than 5 mg/L) should be investigated. In this study, the Freundlich isotherm
constants derived from batch experiments were significantly different from
those of column experiments and they could not predict satisfactorily the
observed breakthrough data.
2. Laboratory (batch and column experiments) and field scale experiments are
needed to study the mobility of nitrogen (NH4, N03-N and N02-N) in soil
and slag media. Rational mathematical models for saturated steady flow
conditions need to be developed to simulate the spatial and temporal
distribution of nitrogen and to predict the transport of nitrogen in soil and
slag media.
3. A development of the mathematical equations for bi-solute and multi-solute
systems is recommended to simulate the P sorption in the presence of
foreign materials, such as NH4-N, Ca and heavy metals.
4. In addition to the soil and slag sorption studies, desorption and
precipitation-dissolution (at high pH) experiments can also be performed.
This will simulate the real situation in a land treatment system, where P
sorption takes place up to the equilibrium condition during the application
of wastewater to land, and then desorption or dissolution of P into the
wastewater and groundwater may take place.
7.2
5. The investigation into the applicability of other media such as fly ash,
dolomite and another type of slag from the steel industry can also be carried
out to study the possibility of using them in similar roles to the media
studied here.
6. A pilot-scale experiment of the effluent concentrations of heavy metals
released by the adsorbents in horizontal flow is warranted.
7. Additional experiments and mathematical modelling should be carried out
under unsaturated conditions.
8. The impact of pH and characterisation of a pH related precipitant should be
developed under the static and dynamic conditions.
9. The experiments conducted were with artificial suspensions and only upto
the breakthrough stage. Many of processes and interactions characterised in
the study are expected to be strongly influenced by biological and resultant
physical/chemical changes in a wastewater treatment system. Biofilm
development, accretion of biological -sediments, biological uptake and
dissolution all need to be recognised as playing a significant, if not
predominant, role in the long term operation of soil and slag media sorption
systems. Thus a long term study with wastewater effluents should be
conducted to study these factors.
R.l
REFERENCES
Adams, W.A. Gafoor, S.N. and Karim, M.I. (1987), Composition and properties of poorly ordered minerals in Welsh soils, IT. Phosphate adsorption and reactivity towards NaP solution, J. Soil Sci., Vol. 38, pp. 95- 103.
Agboola, A.A. and Ayodele, O.J. (1983), An attempt to evaluate plant available phosphorus in Western Nigeria savannah soils under traditional fallow systems, In Proc. 3rd lnt. Congr. on Phosphorus Compounds, (Brussels, Belgium),
Institut Mondial du Phosphate, Casablanca, Morocco, pp. 261 - 267.
Al-Khateeb, I.K., Raihan, M.J. and Asker, S.R. (1986), Phase equilibria and
kinetics of orthophosphate in some Iraqi soils, J. Soil Sci., Vol. 141, pp. 31- 37.
Amacher, M.C., Selim, H.M. and Iskandar, I.K. (1988), Kinetics of chromium (VI) and cadmium retention in soils ; a non-linear multi-reaction model, Soil Sci.
Soc. Am. J., Vol. 52, No. 2, pp. 389-408.
Anderegg, J.C. and Naylor, D.V. (1988), Phosphorus and pH relationships in an Andic soil with surface and incorporated organic amendment, Plant Soil, Vol.
107' pp. 273 - 278.
Aulenbach, D.B. and Meisheng, N. (1988), Studies on the mechanism of phosphorus removal from treated wastewater by sand, J. Wat. Pollut. Control
Fed., No.60, pp. 2089-2094.
Australian Standard, AS 1289 (1977), Methods of testing soils for engineering
purposes, Standards Association of Australia, North Sydney, Australia.
Bajracharya, K. (1989), Transport of cadmium in soil, Ph.D Thesis, DISS-EV-89-4, Asian Institute of Technology, Bangkok, Thailand.
Bajracharya, K. and Barry, D.A. (1993a), Mixing cell models for non-linear
equilibrium single species adsorption and transport, J. Contam. Hydro[., Vol.12, pp. 227- 243.
R.2
Bajracharya, K. and Barry, D.A. (1993b), Mixing cell models for non-linear
non-equilibrium single species adsorption and transport, Wat. Resour. Res., Vol.
29, pp.1405- 1414.
Bajracharya, K. and Barry, D.A. (1995), MCMFIT: Efficient optimal fitting of a
generalised nonlinear advection-dispersion model to experimental data,
Computers and Geosciences, In press.
Bajracharya, K. and Vigneswaran, S. (1990), Adsorption of cadmium and zinc in
saturated soil columns: mathematical models and experiments, Envir. Tech., Vol.
11, pp. 9- 24.
Barnes, D.B., Gould, B.W., Vallentine, H.R. and Bliss, P. (1986), Water and
wastewater engineering systems, Longman Scientific and Technical, UK.
Barrow, N.J. (1978), The description of phosphate adsorption curves, J. Soil
Sci., Vol. 29, pp. 447- 462.
Barrow, N.J. (1987), Reactions with Variable - Charge soils, Martinus Nijhoff
Pub., Dordrecht.
Barry, D.A. (1992), Modelling contaminant transport in the sub-surface: theory
and computer programs, Modelling chemical transport in soil: natural and
applied contaminants, Ghadiri, H. and Rose, C.W. (eds.), Lewis Publishers,
Chelsea, Michigan, pp. 105- 144.
Barry, D.A. and Sposito, G. (1988), Application of the convection dispersion
model to solute transport in finite soil columns, Soil Sci. Soc. Am. J., No.52, 3-9.
Barry, D.A., Sposito, G. and Coves, J. (1988), TFMFIT : A program to fit a
generalised convection dispersion model to experimental data, Department of
Soil and Environmental Sciences, University of California, Riverside.
Batchelor, A., Scott, W.E. and Wood, A. (1991), Constructed wetland research
program in South Africa, Constructed wetlands in water pollution control, P.F.
Cooper and Findlater (eds.), Pergamon Press, pp. 373- 381.
R.3
Bavor, H.J., Roser, D.J., McKersie, S.A. and Breen, P. (1988), Joint study on
sewage treatment using shallow lagooon~aquatic plant systems - treatment of secondary effluent, Water Research Laboratory, Univ. of Western Sydney;
CSIRO Center for Irrigation Research and Sydney Water, NSW, Australia.
Beek, J. (1979), Phosphate retention by soil in relation to waste disposal, Ph.D
thesis, Agricultural University, Wageningen.
Beek, J. and van Riemsdijk, W.H. (1982), Interactions of orthophosphate ions
with soil, In: Soil chemistry B, physico-chemical models (ed. Bolt, G.H.),
Elsevier Sci. Publ. Co. Amsterdam.
Bennoah, E.O. and Acquaye, D.K. (1989), Phosphate sorption characteristics of
selected major Ghanian soils, J. Soil Sci., Vol. 148, pp. 114- 123.
Bematowicz, S. and Leszcznska, S. (1976), The influence of transpiration by
emergent plants on the water balance in lakes, Aquatic Botany, Vol. 2, pp. 275-
288.
Beveridge, G.S.G. and Schechter, R.S. (1970), Optimisation: theory and
practice, pp. 773, McGraw-Hill Book Company.
Bhuvendralingam, S. (1987), Modelling of cadmium transport in soils, AIT
Masters thesis, No. EV87-3, Asian Institute of Technology, Bangkok, Thailand.
Bhuvendralingam, S. and Vigneswaran, S. (1987), A semi-empirical approach to
describe trace element transport through soil, World conference on hazardous waste, Published by Elsevier Science Publishers B. V., North Holland.
Bolan, N.S., Barrow, N.J. and Posner, A.M. (1985), Describing the effect of time
on sorption of phosphate by iron and aluminum hydroxides, J. Soil Sci., Vol. 36,
pp. 187- 197.
Bolt, G.H. (1978), Surface interaction between the soil solid phase and the soil
solution, In : G.H. Bolt and M.G.M. Bruggenwert (eds.), Soil chemist)' part A:
basic elements, pp. 43-53.
R.4
Bolt, G.H. (1979), Movement of solutes in soil: Principles of adsorption I
exchange chromatography; Soil Chemistry: B. Physico-chemical models,
Elsevier Sci. Publ. Company, Amsterdam, pp. 285- 348.
Bonoub, M.W. (1976), Experimental investigation on the release of phosphorus in relation to iron in freshwater mud system, Proceedings of international
symposium on interaction between sediments and freshwater, Amsterdam, pp. 324-330.
Borggaard, O.K. (1990), Dissolution and adsorption properties of soil and iron
oxides, Royal Veterinary and Agricultural University, Denmark, pp.l-91.
Bowden, J.W., Holland, M.D.A., Posner, A.M., and Quirk, J.P. (1973),
Generalised model for anion and cation adsorption at oxide surfaces, Nature
(London), Vol. 245, pp. 81 - 83.
Brix, H. (1987), Treatment of wastewater in the rhizosphere of wetland plants -the root zone method, Wat. Sci. Tech., 19 (1/2), pp. 107-118.
Buchter, B., Davidoff, B., Amacher, M.C., Hinz, C., Iskandar, I.K. and Selim, H.M. (1989), Correlation of Freundlich Kd and N retention parameters with soils and elements, J. Soil Sci., Vol. 148, pp. 370- 379.
Bucksteeg, K., et al. (1985), Initial experience with 12 German plant treatment systems, KorrespondenzAbwasser, Vol. 32, pp. 376.
Cameron, D.A. and Klute, A. (1977), Convective - dispersive solute transport with a combined equilibrium and kinetic adsorption model, Water Resour. Res.,
No.13, pp. 183- 188.
Chiswell, B. and Hammock, D. (1991), Phosphate detergent ban ... Yes or No, Wastewatermanagementand treatment, October 1991, pp. 29-31.
Choi, Y.C. and Chung, T.H. (1995), Phosphorus release from the sediment of a polluted urban stream, Australia-Korea joint symposium on recent advances in
water quality management, University of New South Wales, Sydney, Australia, pp. 63-78.
R.5
Christensen, T.H. (1984), Cadmium soil sorption at low concentrations: II. Reversibility, effect of time, cadmium load, pH and calcium, Water, Air and Soil
Pollut., Vol. 21, No. 1-4, pp 105- 114.
Christensen, T.H. (1985), Cadmium soil sorption at low concentrations: Ill. Prediction and observation of mobility, Water, Air and Soil Pollut., Vol. 26,
No.3, pp 255 - 264.
Christensen, T.H. (1986), Cadmium soil sorption at Low Concentrations: IV.
Effect of waste leachates on distribution coefficients, Water, Air and Soil Pollut.,
Vol. 26, No. 3, pp 265- 274.
Christensen, T.H. (1987), Cadmium soil sorption at low concentrations: V. Evidence of competition by other heavy metals, Water, Air and Soil Pollut., Vol.
34, No. 3, pp 293 - 303.
Chung, S.L. (1990), Phosphorus removal studies at the West Hornsby Sewage
Treatment Plant, University of New South Wales, Australia, Thesis
(Undergraduate).
Cooper, J.D.(1986), Measurement of hydraulic conductivity for root-zone
sewage treatment beds, Institute of Hydrology, Recommendations to Water
Research Center, April, 1986.
Cooper, P.F. and Boon, A.G. (1987), The use of Phragmites for wastewater
treatment by the root zone method - the UK approach, Aquatic plants for water
treatment and resource recovery (eds. K.R. Reddy and W.H. Smith) Magnolia
Publ., Inc., Orlando, Florida.
Crittenden, J.C., Hutzler, N.J., Geyer, D.G., Oravitz, J.L. and Friedman, G.
(1986), Transport of organic compounds with saturated groundwater flow:
Model development and parameter sensitivity, Water Resour. Res., Vol. 22, No.
3, pp. 272 - 284.
Davis, T.H. (1988), Reed bed treatment of wastewater- A European perspective,
Water, Sydney, Vol. 15, pp. 32-33, 39.
R.6
Davis, R.B., Thurlow, D.L. and Brewster, F.E. (1975), Effects of the burrowing tribuficid worms on the exchange of phosphorus between lake and sediment and overlying water, Verh. int. Ver. Limnol., No.l9, pp. 382-394.
Degremont, S.A. (1991), Water treatment handbook: 6th Edition, Lavoisier
Publishing, Paris, France.
Earl, K.D., Syers, J.K. and McLaughlin, J.R. (1979), Origin of the effects of
citrate, tartarate, and acetate on phosphate sorption by soils and synthetic gels,
Soil Sci. Soc. Am. J., Vol. 43, pp. 674- 678.
Ebers, T. and Bichofsberger, W. (1990), Wastewater treatment by soil
absorption systems, Water Sci. Tech., Vol. 22, No. 7/8, pp. 311- 312.
Effler, S.W., and Driscoll, C.T., (1985), Calcium chemistry and deposition in
ionically enriched Onondaga lake, New York, Environ. Sci. Technol., Vol. 19,
pp. 716.
Ellis, B.G. and Erickson, A.E. (1969), Transformation of various phosphorus
compounds in soils, Report to Michigan Water Resources Commision.
Enfield, C.G., Harlin, Jr.C.C. and Bledsoe, B.E. (1976), Comparison of five
kinetic methods for orthophosphate reactions in mineral soils, Soil Sci. Soc. Am. J., Vol. 40, pp. 241 - 249.
Faust, S.D. and Aly, O.M. (1983), Chemistry of water treatment, Butterworths, Stoneham, Mass.
Ferguson, J.F. (1970), The precipitation of calcium phosphates from fresh waters
and wastewaters, Ph.D dissertation, Stanford University, Standford, California,
USA.
Finlayson, M.C. (1991). Use of aquatic plants to treat wastewater in irrigation
areas of Australia, CSIRO Centre of Irrigation Research (Draft), Sydney,
Australia.
Fitter, A.H. and Sutton, C.D. (1975), The use of the Freundlich isotherm for soil phosphate sorption data, J. Soil Sci., Vol. 26, pp. 241 - 246.
R.7
Forsberg, C.(l989), Importance of sediments in understanding nutrient cycling in
lakes, Hydrobiol., Vol. 1761177, pp. 263-277.
Fox, I. and Malati, M.A. (1985), Cycling of phosphorus in rivers, Final report to
the Department of the Environment (Contact PECD 717/038).
Fox, 1., Malati, M.A. and Perry, R. (1989), The adsorption and release of
phosphate from sediments of a river receiving sewage effluent, Wat. Resour.
Res., Vol.23, No.6, pp. 725 - 732.
Freeman, J.S. and Rowell, D.L. (1981), The adsorption and precipitation of
phosphate onto calcite, J. Soil Sci., Vol. 32, pp. 75- 84.
Freundlich, H. (1926), Colloid and capillary chemistry, Methuen and Co.,
London.
Fritz, W., et al. (1980), Competitive adsorption of dissolved organics on
activated carbon, Chapter 9 in Activated carbon adsorption of organics from the
aqueous phase, Vol. 1, Suffet, I.H. and McGuire, M.J. (eds.), Ann Arbor Science
Publishers, Ann Arbor, Mich.
Gillman, G.P. (1979), A proposed method for the measurement of exchange
properties of highly weathered soils, Aust. J. of Soil Res., Vol. 17, pp. 129- 139.
Glassstone, S. (1959), Textbook of phsical chemistry, Van Nostrand Co.,
Prince ton.
Good, B.J. and Patrick, Jr.W.H. (1987), Root-water-sediment interface
processes, Aquatic plants for water treatment and resources recovery (eds.
Reddy, K.R. and Smith, W.H.) Magnolia Publ., Inc., Orlando, Florida.
Haynes, R.J. (1982), Effects of liming on phosphate availability in acid soils, A
critical review, Plants Soil, Vol. 68, pp. 289- 308.
Helfferich, F. (1962), Ion exchange, McGraw-Hill, New York.
Henderson-Sellers, B. (1979), Reservoirs, Macmillan Press Ltd, Melbourne,
Australia.
R.8
Henderson-Sellers, B. (1984), Engineering limnology, Pitman Publishing Ltd.,
Melbourne, Australia.
Ho, G.E. and Kuruvilla, M. (1990), Phosphorus removal using Bauxite refining
residue (red mud), Institute for Environmental Science Murdoch University, Perth, Western Australia.
Ho, G.E, Kuruvilla, M. and Gibbs, R. (1992), Nitrogen and phosphorus removal
from sewage effluent in amended sand columns, Water Resour. Res., Vol. 26,
No.3, pp. 295 - 300.
Holford, I.C.R (1982), The comparative significance and utility of the Freundlich
and Langmuir parameters for characterising sorption and plant availability of phosphate in soils, Aust. 1. Soil Res., No.20, pp. 233- 242.
Hosomi, M., Okada, M. and Sudo, R. ( 1982), Release of phosphorus from lake
sediments, Envir. int., Vol. 7, pp. 93 - 98.
Hosomi, M. and Sudo, R. (1979), Some observations on phosphorus release from
lake sediments, lap. 1. Wat. Pollut. Res., Vol. 2, pp. 157- 162.
Illungkoo, K. (1994), Phosphorus treatment in wastewater by soil and slag
medium, University of Technology, Sydney, Australia, Master's Thesis.
James, R.R., Rabenhorst, M.C. and Frigon, G.A. (1992), Phosphorus sorption by
peat and sand amended with Iron Oxides or Steel Wool, Water Environ. Res.,
No.64, pp. 699- 705.
Jenkins, D., Ferguson, T.F. and Menar, A.B. (1971), Chemical processes for phosphate removal, Wat. Resour. Res., Vol. 5, pp. 369-389.
Jennings, A.A., Kirkner, D.J. and Theis, T.L. (1982), Multi-component equilibrium chemistry in groundwater quality models, Wat. Resour. Res., Vol.
18, No. 4, pp. 1089- 1096.
Joh, H. (1983), Fractionation of phosphorus and releasable fraction in sediment
mud of Osaka Bay, Bull. lap. Soc. Sci. Fish., Vol. 49, pp. 447-454.
R.9
Kaneko, S. and Nakajima, K. (1988), Phosphorus removal by crystallisation
using a granular activated Magnesia Clinker, J. of Wat. Pollut. Control Fed.,
No.60, pp. 1239- 1244.
Keinath, T. M. and Weber, Jr. W. J. (1968), A predictive model for the design of
fluid- bed adsorbers, J. of Wat. Pollu. Control Fed., Vol. 40, No. 5, Part 1, pp.
741-765.
Kickuth, R. (1980), Abwassereinigung in Mosaikmatrizen aus aeroben und
anaeroben teilbezirken, Verhandl. verem. Osterrweichischer chemiker,
Abwassertechniches Symp., Graz, pp. 639- 655.
Kjeldsen, P. (1986), Attenuation of landfillleachate in soil and aquifer material,
Ph.D Thesis, Technical University of Denmark.
Klute, A. (1986), Physical and mineralogical methods, Methods of soil analysis,
Am. Soc. of Agronomy, Inc., Soil Se. Soc. of Am., Inc. Madison, Washington,
USA.
Lam, K.C., Ng, S.L. and Neller, R.J. (1993), Fate of biological and chemical
contaminants from on-site disposal of liquid Piggery Wastes: Results from a soil
column study, Wat. Sci. Tech., Vol.27, No.l, pp. 63 - 75.
Langmuir, I.J. (1915), J. Amer. Chem. Soc., Vol. 37, pp. 1139.
Leary, A. and Stevenson, A. (1992), Major efforts to resurrect river system, The
Daily Telegraph Mirror, Sydney, 22 Dec. 1992.
Lee, G.F., Sonzogni, W.C. and Spear, R.D. (1976), Significance of oxic vs
anoxic condition for Lake Mendota sediment phosphorus release, Proc. of
international symposium on interaction between sediments and freshwater,
Amsterdam, pp. 294- 306.
Lijkleme, L. (1976), The role of iron in exchange of phosphate between water
and sediments, Proc. of international symposium on interaction between
sediments and freshwater, Amsterdam, pp. 313 - 317.
R.lO
Lin, P.W. (1975), Wastewater treatment with an S02- removal by-product, J.
Wat. Pollut. Control Fed., Vol. 47, pp. 2271 - 2280.
Lin, C., Busscher, W.J. and Douglas, L.A. (1983a), Multifactor kinetics of
phosphate reactions with minerals in acidic soils: I. Modeling and simulation,
Soil Sci. Soc. Am. J., Vol. 47, pp. 1097- 1103.
Linforth, S. (1994), Monitoring and modelling of Sydney's waterways for wastewater planning, Syney Water, Australia.
Loganathan, P., Isirimah, N.O. and Nwachuku, D.A. (1987), Phosphorus
sorption by Ultisols and Inceptisols of the Niger delta in southern Nigeria, Soil
Sci., Vol. 144, pp. 330- 338.
Mackney, B.J. (1993), The design of wetlands for wastewater treatment : an
Australian perspective, Constructed wetlands in water pollution control, Cooper,
P.F. and Findlater (eds.), Pergamon Press, pp. 471 - 479.
Mahinthakumar, G. and Vigneswaran, S. (1991), Solute transpmt through
saturated soils: a study of the physical non-equilibrium model, Wat. Air and Soil
Poll. USA, Vol. 51, pp. 161 - 180.
Manivasakan, N. (1988), Investigation of cadmium transport mechanisms in
soil: mathematical models and experiments, Master's Thesis, EV-88-17, Asian Institute of Technology, Bangkok, Thailand.
Mann, R.A. (1991), Phosphorus removal by constructed wetlands: Substratum
adsorption, Constructed Wetlands in Water Pollution Control, Cooper, P.F. and Findlater (Eds.). Pergamon Press. pp. 97- 105.
Mann, R.A. and Bavor, H.J. (1993), Phosphorus removal in constructed wetlands using gravel and industrial waste substrata, Wat. Sci. & Tee., Vol. 27, No.l, pp 107-113.
Marquardt, D.W. (1963), An algorithm for least-squares estimation of non-linear parameters, J. of Soc. Ind. Appl. Math., No.ll, pp. 431 - 441.
R.ll
Masters, B.K. (1993), Management of dairy waste: A low cost treatment system using phosphorus adsorbing materials, Wat. Sci. Tech., Vol.27, No.l, pp. 159 -
169.
Metcalf and Eddy (1991), Wastewater engineering: Treatment, disposal and
reuse, McGraw-Hill, New York, 3rd Edition.
Mohanathasan, V., Mamoon, A.A. and Vigneswaran, S. (1991), Removal
mechanisms and design criteria in wetland treatment plants: An overview,
Pollution Abatement Branch, Sydney Water, Australia.
Mokwunye, U. (1975), The influence of pH on the adsorption of phosphate by
soils from the Guiner and Sudan savannah zones of Nigeria, Soil Sci. Soc. Am
Proc., Vol. 39, pp. 1100- 1107.
Mortimer, C.H. (1941), The exchange of dissolved substances between mud and
water in lakes, I and 11, J. of Ecology, Vol. 29, pp. 280- 329.
Mortimer, C.H. (1971), Chemical exchange between sediments and water in the
Great Lakes - speculation on probable regulatory mechanisms, Limnol.
Oceanogr, Vol. 16, pp. 387 - 404.
Murphy, B.W. (1991), Soils-their properties and management, 1st ed., Sydney
University Press, pp. 115-149.
Murphy, T.P., Hall, K,J. and Yesaki, I. (1983), eo-precipitation of phosphate
with calcite in a naturally eutrophic lake, Limnol. Oceanogr., Vol. 28, pp. 58 -
69.
Naidu, R., Syers, J.K., Tillman, R.W. and Kirkman, J.H. (1990), Effect of liming
on phosphate sorption by acid soils, J. Soil Sci., Vol. 41, pp. 165- 175.
New South Wales Blue Green Algae Task Force (1992), Sydney, Australia.
New South Wales Clean Waters Act (1970) and New South Wales Clean Waters Regulations (1972), NSW Government, Australia.
New South Wales Department of Agriculture (1994), Biological and Chemical Research Institute, Sydney, Australia.
R.12
Nielsen, D.R. and Bigger, J.W. (1962), Miscible displacement in soils: m. Theoretical considerations, Soil Sci. Soc. Amer. Proc., Vol. 26, No. 3, pp. 216-
221.
Nielsen, D.R. and Bigger, J.W. (1963), Miscible displacement in soils: IV. Mixing in glass beads, Soil Sci. Soc. Amer. Proc., Vol. 25, No. 1, pp. 10- 13.
Noye, J. (1982), Finite difference methods for partial differential equations, Numerical solutions of partial differential equations, Noye, J. (ed.), pp. 647, North-Holland Publishing Company, Amsterdam, Netherlands.
Nriagu, J.O. (1972), Stability of vivianite and ion-pair formation in the system Fe3(P04)-H3P04-H20, Geochim et Cosmochim, Vol. 36, pp. 450-470.
Parfitt, R.L. (1977). Phosphorus adsorption on oxisol, Soil Sci. Soc. Am., Vol.
41, pp. 1064-1067.
Parfitt, R.L. (1978), Anion adsorption by soils and soil materials, Adv. Agron,
Vol. 30, pp. 1- 50 .
. Parfitt, R.L. (1980), Chemical properties of variable charge soils, In: Soils with variable charge, pp. 167- 194, B.K.G. Theng (ed.), NZ., Soc. of Soil Sci. offset
Publ: Palmerston North.
Parker, J.C. and van Genuchten, M.T. (1984), Determining transport parameters
from laboratory and field tracer experiments, pp. 96, Bull. 84-3, Virginia Polytechnic Institute and State Univ., Blacksburg, Virginia, USA.
Pavlatou, A. and Polyzopoulos, N .A. (1988), The role of diffusion in the kinetics of phosphate desorption: The relevance of the Elovich equation, J. Soil Sci., Vol. 39, pp. 425 - 436.
Perry, R.H. and Chilton, C.H. (1978), Chemical engineer's handbook, Fifth Edition, McGraw - Hill, Inc ..
Rao, P.S.C., Davidson, J.M., Jessup, R.E. and Selim, H.M. (1979), Evaluation of conceptual models for describing non-equilibrium adsorption-desorption of pesticides during steady flow in soils, Soil Sci. Soc. Am. J., No. 43, pp. 22-28.
R.13
Raper and Barnard (1994), BNR2 Conference, Albury, N.S.W, Australia.
Reed, S.C., Meddlebrooks, E.J. and Crites, R.W. (1988), Natural systems for
waste management and treatment, 1st Edition, McGraw-Hill Inc., USA 1-264.
Reiners, W.A. (1984), Phosphorus cycle, World Book Encyclopedia, Vol. 15,
World Book Incorp., Chicago, USA.
Reiners, W.A. (1984), Phosphorus cycle, World Book Encyclopedia, Vol. 15,
World Book Inc., Chicago, USA.
Rible, J.M. and Davis, L.E. (1955), Ion exchange in soil columns, Soil Sci. Soc.
Am. J., Vol. 79, No. 1, pp. 41 - 47.
Roques, H., Jeudy, L.N. and Lebugle, A. (1991), Phosphorus removal from
wastewater by half-burned Dolomite, Wat. Resour. Res. Vol. 25, No.8, pp. 959-
963.
Rubin, J. (1983), Transport of reacting solutes in porous media: Relation
between mathematical nature of reactions, Wat. Resour. Res., Vol. 19, No. 5, pp.
1231 - 1252.
Rubin, J. and James, R.V. (1973), Dispersion affected transport of reacting
solutes in saturated porous media: Galerkin method applied to equilibrium
controlled exchange in unidirectional flow, Wat. Resour. Res., Vol 9, No. 5, pp. 1332- 1356.
Ryden, J.C. and Pratt, P.F. (1980), Phosphorus removal from wastewater applied
to land, Hilgardia, Vol. 48, pp. 1 - 36.
Ryden, J.C., Syers, J.K. and Tillman, R.W. (1987), Inorganic anion sorption and
interactions with phosphate sorption by hydrous ferric oxide gel., J. Soil Sci.,
Vol. 38, pp. 211-217.
Sainty, G.R. and Jacobs, S.W. (1994), Wetlands in Australia, Royal Botanic
Gardens, Sydney, Australia.
R.l4
Samuel, D.F. and Osman, M.A. (1987), Adsorption processes for water
treatment, 2nd Edition, Butterworths Publishers, London.
Sanyal, S.K., Chan, P.Y. and De Datta, S.K. (1990), Phosphate sorption -
desorption behavior of some acidic soils in South and Southease Asia, The 6th
Philippine Chemistry Congress, Cebu City, Philippines, 24 - 26 May 1990.
Sanyal, S.K and De Datta, S.K. (1991), Chemistry of phosphorus transformation
in soil, Advan. in Soil Sci., Vol. 16, pp.l-120.
Selim, H.M., Davidson, J.M. and Mansell, R.S. (1976), Evaluation of a two site
adsorption-desorption model for describing solute transport in soils, Proc. of the
1976 summer computer simulation conference, July 1976, La Jolla, Calf.,
Simulation Councils, pp. 444 - 448.
Sibbesen, E. ( 1981 ), Some new equations to describe phosphate sorption by
soils, J. Soil Sci., Vol. 32, pp. 67- 74.
Sillen, L.G. and Martell, A.E. (1964), Stability constants of metal-ion complexes,
The Chemical Society, London.
Smillie, G.W., Curtin, D. and Syers, J.K. (1987), Influence of exchangeable
calcium on phosphate retention by weakly acid soils, Soil Sci. Soc. Am. J .. Vol.
51,pp.1169-1172.
Smith, J.M. (1968), Kinetics of adsorption, Chapter 2 m Adsorption from
aqueous solution, Advances in chemistry series 79, Am. Chem. Soc.,
Washington, D.C.
Solis, P. and Torrent, J. (1989), Phosphate sorption by calcareous Vertisols and
Inceptisols of Spain, Soil Sci. Soc. Am. 1., Vol. 53, pp. 456- 459.
Sparks, D.L. (1986), Kinetics of reactions in pure and mixed systems, In: Soil
Physical Chemistry, C.R.C. Press, Florida, pp. 83- 145.
Sposito, G. ( 1984 ), The swface chemistry of soils, Clarendon Press, Oxford.
R.15
Sposito, G. (1989), The chemistry of soils, pp. 277, Oxford Univ. Press, New
York.
Sriananthakumar, K. (1988), Investigation of cadmium mobility in sub-suiface environment, Masters Thesis, EV-88-11, Asian Institute of Technology, Bangkok, Thailand.
Standard methods for the examination of water and wastewater (1985), 16th Edition, Am. Public Health Assoc., Am. Water Works Assoc. and Wat. Pollut. Cont. Fed., Washington. DC.
State Pollution Control Commission (SPCC) (1986), Water quality in the Hawkesbury-Nepean river, New South Wales Government Printer, Sydney, Australia.
Steiner, G.S. and Freeman, R.J. (1989), Configulation and substrate design
considerations for constructed wetlands wastewater treatment, In: Constructed
wetlands in wastewater treatment, D. Hammer (ed.), Lewis Publishers Inc., Michigan, pp. 363- 377.
Stevenson, A. (1993), Red Algae Hits Sydney Harbour, The Daily Telegraph Mirror, Sydney, 17 Jan. 1993, Australia.
Suzuki, M. and Fujii, T. (1988), Simultaneous removal of phosphate and ammonium ions from wastewater by composite adsorbent, In Proc. Wat. Poll.
Cont. in Asia, Bangkok, pp. 239-245.
Swindell, C.E. and Jackson, J.A. (1990), Constructed wetlands design and operation to maximise nutrient removal capabilities, Constructed wetlands in
water pollution control, P.F. Cooper and Findlater (eds.), Pergamon Press, pp. 107- 114.
Sydney Water Board (1991), Technical feasibility report to upgrade sewage
treatment plants in the Nepean-Hawkesbury catchment, Nutrient reduction
program, Volume 1- Report, Volume 2- Appendices, Sydney, Australia.
R.16
Thomas, M.P. (1991), The use of magnesium oxide for nutrient removal at
sewage treatment plants, School of Civil Engineering, University of Technology, Sydney, Thesis (Undergraduate).
Thomas, M., Vigneswaran, S. and Ngo, N.H. (1993), Phosphorus Removal from Sewage Using Magnesium Oxide, Proceedings, 15th AWWA Federal Convention, Gold Coast, Australia.
Tucker, B.M. (1983), Basic exchangeable cations, In: Soils - an Australian
viewpoint, Division of soils, CSIRO, pp. 401 - 416, (CSIRO: Melbourne I
Academic Press London).
United States Department of Agriculture (1964), Washington. DC, USA.
United States Environmental Protection Agency (USEPA) (1971), Process
design manual for phosphorus removal.
Vacker, D. and Connell, C.H. (1967), Phosphorus removal through municipal wastewater treatment at San Antonio, Texas, J. of Wat. Pollut. Cont. Fed., Vol.
19, pp. 750.
Valocchi, A.J. (1985), Validity of the local equilibrium assumption for modelling sorbing solute transport through homogeneous soils, Wat. Resour.
Res., Vol. 21, No. 6, pp 808.
van der Zee, S. (1988), Transport of reactive contaminants in heterogeneous soil
systems, Agricultural University, The Netherlands, pp. 1-279.
van Genuchten, M.T. (1980), Determining transport parameters from solute displacement experiments, Research report No. 118, U.S. Salinity Laboratory, Riverside, California, pp.37.
van Genuchten, M.T. (1981), Non-equilibrium transport parameters from miscible displacement experiments, Research report No. 119, U.S. Salinity Laboratory, Riverside, California, pp.88.
R.l7
van Genuchten, M.T. and Parker, J.C. (1984), Boundary conditions for
displacement experiments through short laboratory soil columns, Soil Sci. Soc.
Am. J., No.48, pp. 703 - 708.
van Genuchten, M.T., Tang, D.H. and Guennelon, R. (1984), Some exact
solutions for solute transport through soils containing large macropores, Wat. Resour. Res., Vol. 20, No. 3, pp. 335- 346.
van Genuchten, M.T. and Wierenga, P.J. (1976), Mass transfer studies in sorbing
porous media: I. Analytical Solutions, Soil Sci. Soc. Am. J., Vol. 40, No. 4, pp.
473-480.
van Genuchten, M.T. and Wierenga, P.J. (1977), Mass transfer studies in sorbing
porous media: 11. Experimental evaluation with Tritium (3H20), Soil Sci. Soc. Am. J., Vol. 41, No. 2, pp. 272- 278.
van Riemsdijk, W.H., Lexmond, Th.M., Enfield, C.G. and van der Zee,
S.E.A.T.M. (1987), Phosphorus and heavy metals: Accumulation and
consequences, In: Animal manure on grassland and fodder crops, fertilizer or
waste?, van der Meer H.G. et al. (eds.), Martnus Nijhoff Pub I., Dordrecht, pp.
213- 228.
Vigneswaran, S. and Manivasakan, M. (1988), Detailed investigation of
transport mechanisms of cadmium in soil, 3rd International Conference on
Environmental Contamination, Venice, pp. 26 - 29.
Vigneswaran, S., Manivasakan, M. and Bajracharya, K. (1989), Investigation of
transport mechanism of heavy metals in soil, 76th Indian Science Congress.
Madurai, India.
Wakatsuki, T., Esumi, H. and Omura, S. (1993), High performance and nitrogen
and phosphorus removable on-site domestic wastewater treatment system by
multi-soil-laying method, Wat. Sci. Tech., Vol. 27, No. 1, pp. 31 -40.
Water Pollution Control Federation (WPCF) (1977), Wastewater treatment plant
design, A manual of practice, Published Jointly by WPCF and American Society
of Civil Engineers, USA.
R.18
Water Pollution Control Federation (WPCF) (1991), Operation of Municipal Wastewater Treatment Plants, Vol. 3, Alexandria, Virginia, USA.
Weber, Jr.W.J. (1972), Physico-chemical processes for water quality control, Wiley-Interscience, New York.
Weber, Jr.W.J. and Miller, C.T. (1989), Modelling the sorption of hydrophobic
contaminants by aquifer materials - I. Rates and equilibria, Wat. Resour. Res.,
Vol. 22, No. 4, pp. 457-464.
Weber, Jr.W.J. and Morris, J.C. (1963), J. Sanit. Eng. Div., ASCE SA2, pp. 31.
Wood, A. (1988), Research to develop engineering guidelines for the implementation of artificial wetlands for wastewater treatment in South Africa,
Pres. Int. Conf., Constructedwetlands, Chattanoonga Tennessee, pp. 12- 17.
Wood, A. (1991), The application of artificial wetlands in South Africa, Constructed wetlands in water pollution control, Cooper, P.F. and Findlater (eds.), Pergamon Press, pp. 235- 244.
Wood, A. (1993), Constructed wetlands for wastewater treatment- engineering
and design considerations, Constructed wetlands in water pollution control, P.F. Cooper and Findlater (eds.), Pergamon Press, pp. 481 -493.
Y amada, H., Kayama, M., Saito, K. and Hara, M. (1986), A fundamental research on phosphate removal by using slag, Wat. Resour. Res. Vol. 20, No. 5,
pp. 547- 557.
Yamada, H., Kayama, M., Saito, K. and Hara, M. (1987), Suppression of
phosphate liberation from sediment by using iron slag, Wat. Resour. Res. Vol. 21, No. 3, pp. 325- 333.
Yamagata, N. (1977), Biryogenso, Kankyo Kagaku Tokuron Sangyotosho, Tokyo.
Young, D.M. and Crowell, A.D. (1962), Physical adsorption of gases, Butterworths, London.
R.l9
Younos, T.M. (1987), Land application of wastewater, Am. Soc. of Civil
Engineers, New York, pp. 10- 24.
Youssefi, M. (1978), The determination, formation, and removal of
Halogeniated pollutants, Ph.D dissertation, Department of Environmental
Sciences, Rutgers, The State University, New Brunswick, N.J.
Yuan, T. (1980), Adsorption of phosphate and water-extractable soil organic
material by synthetic aluminium silicates and soils, Soil Sci. Soc. Am. J., Vol. 44,
pp. 951 - 955.
Zogorski, J.S., et al. (1976), J. of Colloid Interf. Sci., Vol. 55, pp. 329.
Zoltak, J.Jr. (1976), Identification of orthophosphate solids formed by lime
precipitation, J. Wat. Pollut. Control Fed., Vol. 48, pp. 179- 182.
APPENDICES
Al. Definitions of Abbreviations, Terms and Units A2. FORTRAN Listing of ALPA A3. FORTRAN Listing of SPNSM A4. Program Description of MCMFIT
A.l
Al. Definitions of Abbreviations, Terms and Units
ABSORPTION: A surface phenomenon which is defined as an mcrease m
concentration of a particular component (adsorbate) in the interfaces of the solid
phases of a particular adsorbing medium (adsorbent) from liquid phases or solid phases. In this study, phosphorus was used as adsorbate and adsorbents were
soil, dust and cake particles
ADSORPTION: A surface phenomenon which is defined as an increase in
concentration of a particular component on the surface between the liquid and
solid phases
ALGAL BLOOM: A sudden growth of algae, water weed or other primitive plant, which may be undesirable aesthetically or because on dying the algae decays, causing deoxygenation of the water which may kill fish
ANION EXCHANGE CAPACITY (AEC): Total amount of anions. This is the positive charge measured by Cl- or N03- retention
BLUE-GREEN ALGAE (BGA): Primitive plants called cyanobacteria. Because
of their distinctive colour and characteristics, they are more commonly known as
BGA. Mass aggregations of BGA cause blooms and some are toxic
oC: Degree Celsius
CATION EXCHANGE CAPACITY (CEC): The total sum of exchangeable
cations which can be can be adsorbed by adsorbents, sometimes called total
exchange, base exchange capacity or cation absorption capacity expressed in
milli-equivalents per 100 g or per gram of soil (or of other materials, such as clay)
CONSTRUCTED WETLAND SYSTEM (CWS): A man-made wetland used for
the purpose of water and wastewater treatment
DESORPTION: Release of sorbed P back into solution as an opposite reaction of
sorption
DPNSM: Dynamic Physical Non-equilibrium Sorption Model
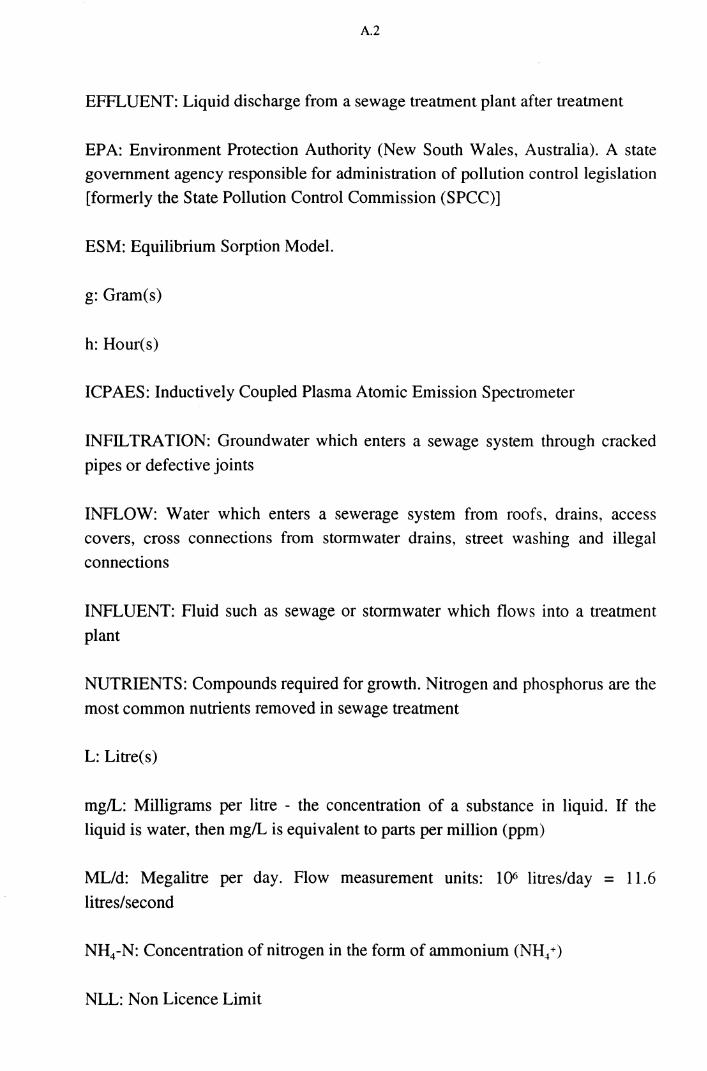
A.2
EFFLUENT: Liquid discharge from a sewage treatment plant after treatment
EPA: Environment Protection Authority (New South Wales, Australia). A state government agency responsible for administration of pollution control legislation
[formerly the State Pollution Control Commission (SPCC)]
ESM: Equilibrium Sorption Model.
g: Gram(s)
h: Hour(s)
ICPAES: Inductively Coupled Plasma Atomic Emission Spectrometer
INFILTRATION: Groundwater which enters a sewage system through cracked
pipes or defective joints
INFLOW: Water which enters a sewerage system from roofs, drains, access covers, cross connections from stormwater drains, street washing and illegal
connections
INFLUENT: Fluid such as sewage or stormwater which flows into a treatment
plant
NUTRIENTS: Compounds required for growth. Nitrogen and phosphorus are the
most common nutrients removed in sewage treatment
L: Litre(s)
mg/L: Milligrams per litre - the concentration of a substance in liquid. If the liquid is water, then mg/L is equivalent to parts per million (ppm)
ML/d: Megalitre per day. Flow measurement units: 1()6 litres/day = 11.6
litres/second
NH4-N: Concentration of nitrogen in the form of ammonium (NH4 +)
NLL: Non Licence Limit
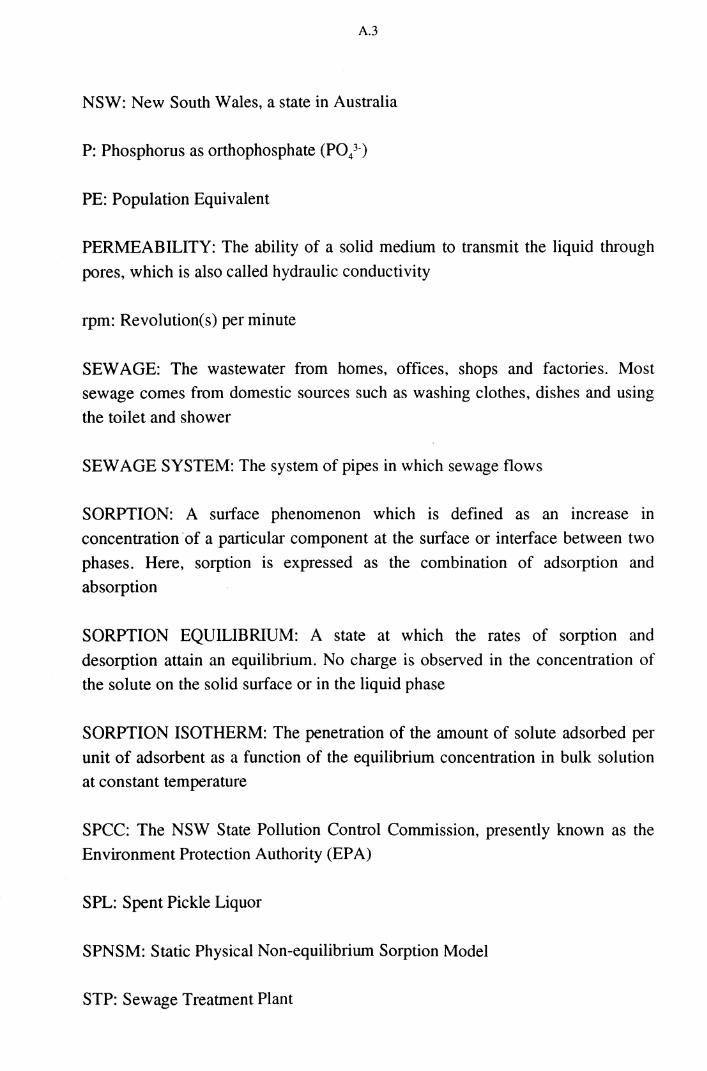
A.3
NSW: New South Wales, a state in Australia
P: Phosphorus as orthophosphate (PO/)
PE: Population Equivalent
PERMEABILITY: The ability of a solid medium to transmit the liquid through
pores, which is also called hydraulic conductivity
rpm: Revolution(s) per minute
SEW AGE: The wastewater from homes, offices, shops and factories. Most
sewage comes from domestic sources such as washing clothes, dishes and using
the toilet and shower
SEW AGE SYSTEM: The system of pipes in which sewage flows
SORPTION: A surface phenomenon which is defined as an mcrease m
concentration 'of a particular component at the surface or interface between two
phases. Here, sorption is expressed as the combination of adsorption and
absorption
SORPTION EQUILIBRIUM: A state at which the rates of sorption and
desorption attain an equilibrium. No charge is observed in the concentration of the solute on the solid surface or in the liquid phase
SORPTION ISOTHERM: The penetration of the amount of solute adsorbed per
unit of adsorbent as a function of the equilibrium concentration in bulk solution
at constant temperature
SPCC: The NSW State Pollution Control Commission, presently known as the
Environment Protection Authority (EP A)
SPL: Spent Pickle Liquor
SPNSM: Static Physical Non-equilibrium Sorption Model
STP: Sewage Treatment Plant
AA
TP: Total Phosphorus concentration (mg/L)
PRI: Phosphorus Retention Index
W ASTEW A TER: Another word for sewage
WL: Water Level above the adsorbent in column experiments
jlg: Microgram; 10-6 g
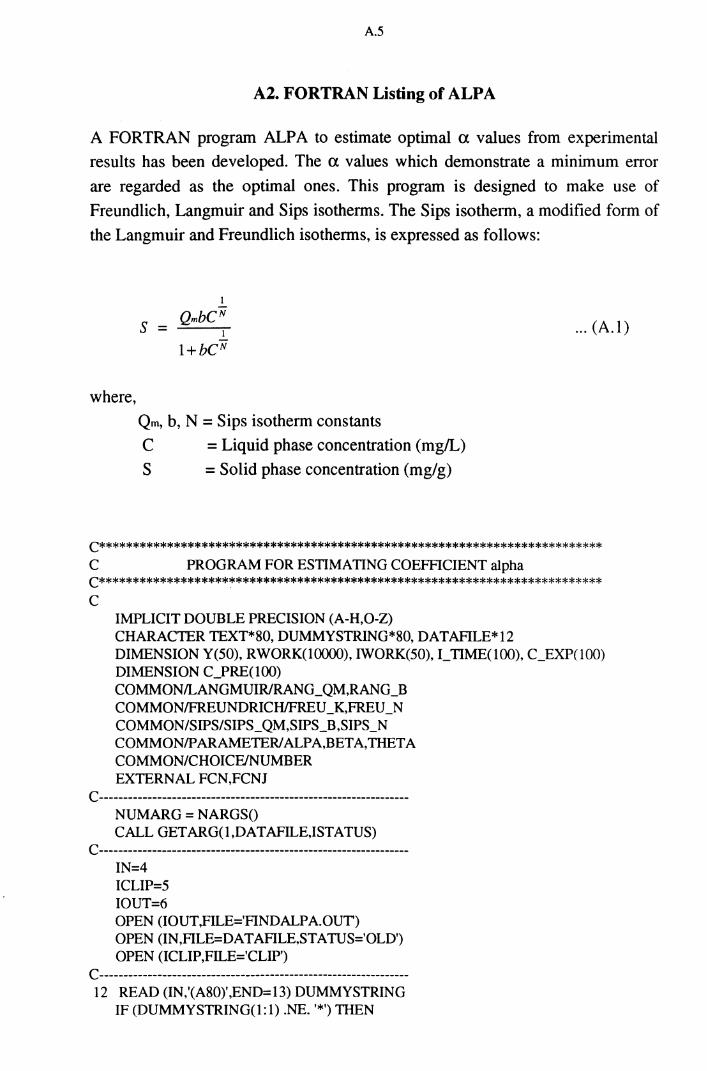
A.5
A2. FORTRAN Listing of ALPA
A FORTRAN program ALPA to estimate optimal a values from experimental results has been developed. The a. values which demonstrate a minimum error
are regarded as the optimal ones. This program is designed to make use of
Freundlich, Langmuir and Sips isotherms. The Sips isotherm, a modified form of the Langmuir and Freundlich isotherms, is expressed as follows:
where,
s =
I
QmbCN I
l+bCN
Qm, b, N = Sips isotherm constants C = Liquid phase concentration (mg/L)
S = Solid phase concentration (mg/g)
... (A.l)
C************************************************************************** c PROGRAM FOR ESTIMATING COEFFICIENT alpha C************************************************************************** c
IMPLICIT DOUBLE PRECISION (A-H,O-Z) CHARACTER TEXT*80, DUMMYSTRING*80, DATAFILE*12 DIMENSION Y(50), RWORK(lOOOO), IWORK(50), I_TIME(lOO), C_EXP(IOO) DIMENSION C_PRE(lOO) COMMONILANGMUIRIRANG_QM,RANG_B COMMONIFREUNDRICH/FREU_K,FREU_N COMMON/SIPS/SIPS_QM,SIPS_B,SIPS_N COMMON/PARAMETER/ ALPA,BETA,THETA COMMON/CHOICE/NUMBER EXTERNAL FCN,FCNJ
C----------------------------------------------------------------NUMARG = NARGS() CALL GET ARG(l,DATAFILE,ISTATUS)
C----------------------------------------------------------------IN=4 ICLIP=5 IOUT=6 OPEN (IOUT,FILE='FINDALP A. OUT) OPEN (IN ,FILE=DATAFILE,STA TUS='OLD') OPEN (ICLIP,FILE='CLIP')
C----------------------------------------------------------------12 READ (IN,'(A80)',END=13) DUMMYSTRING
IF (DUMMYSTRING(l:l) .NE.'*') THEN
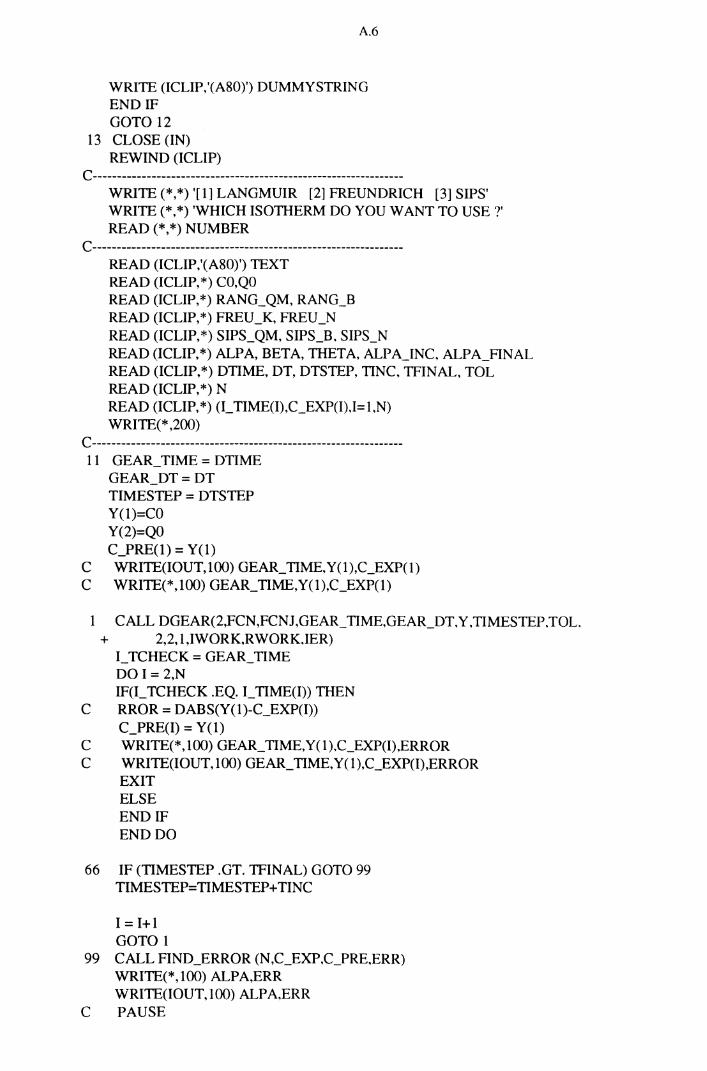
A.6
WRITE (ICLIP,'(A80)') DUMMYSTRING END IF GOTO 12
13 CLOSE (IN) REWIND (ICLIP)
C----------------------------------------------------------------WRITE (*,*) '[1] LANGMUIR [2] FREUNDRICH [3] SIPS' WRITE(*,*) 'WHICH ISOTHERM DO YOU WANT TO USE ?' READ(*,*) NUMBER
C----------------------------------------------------------------READ (ICLIP,'(A80)') TEXT READ (I CLIP,*) CO,QO READ (ICLIP,*) RANG_QM, RANG_B READ (ICLIP,*) FREU_K, FREU_N READ (ICLIP,*) SIPS_QM, SIPS_B. SIPS_N READ (ICLIP,*) ALPA, BETA, THETA, ALPA_INC. ALPA_ANAL READ (ICLIP,*) DTIME, DT, DTSTEP, TINC. TFINAL, TOL READ (ICLIP,*) N READ (I CLIP,*) (I_ TIME(I),C_EXP(I).I= l.N) WRITE(* ,200)
C----------------------------------------------------------------11 GEAR_ TIME = DTIME
GEAR_DT=DT TIMESTEP = DTSTEP Y(l)=CO Y(2)=QO C_PRE(l) = Y(l)
C WRITE(IOUT,100) GEAR_TIME,Y(l),C_EXP(l) C WRITE(*,100) GEAR_TIME,Y(l),C_EXP(l)
1 CALL DGEAR(2,FCN,FCNJ,GEAR_TIME,GEAR_DT,Y,TIMESTEP,TOL. + 2,2, 1 ,IWORK,RWORKJER)
I_ TCHECK = GEAR_ TIME DO I= 2,N IF(I_TCHECK .EQ. I_TIME(I)) THEN
C RROR = DABS(Y(1)-C_EXP(I)) C_PRE(I) = Y(1)
C WRITE(*,100) GEAR_TIME,Y(l).C_EXP(I),ERROR C WRITE(IOUT,l 00) GEAR_ TIME, Y(l ),C_EXP(I),ERROR
EXIT ELSE END IF END DO
66 IF (TIMESTEP .GT. TFINAL) GOTO 99 TIMESTEP=TIMESTEP+ TINC
I= 1+1 GOTO 1
99 CALL AND_ERROR (N,C_EXP,C_PRE,ERR) WRITE(*,100) ALPA,ERR WRITE(IOUT,100) ALPA,ERR
C PAUSE
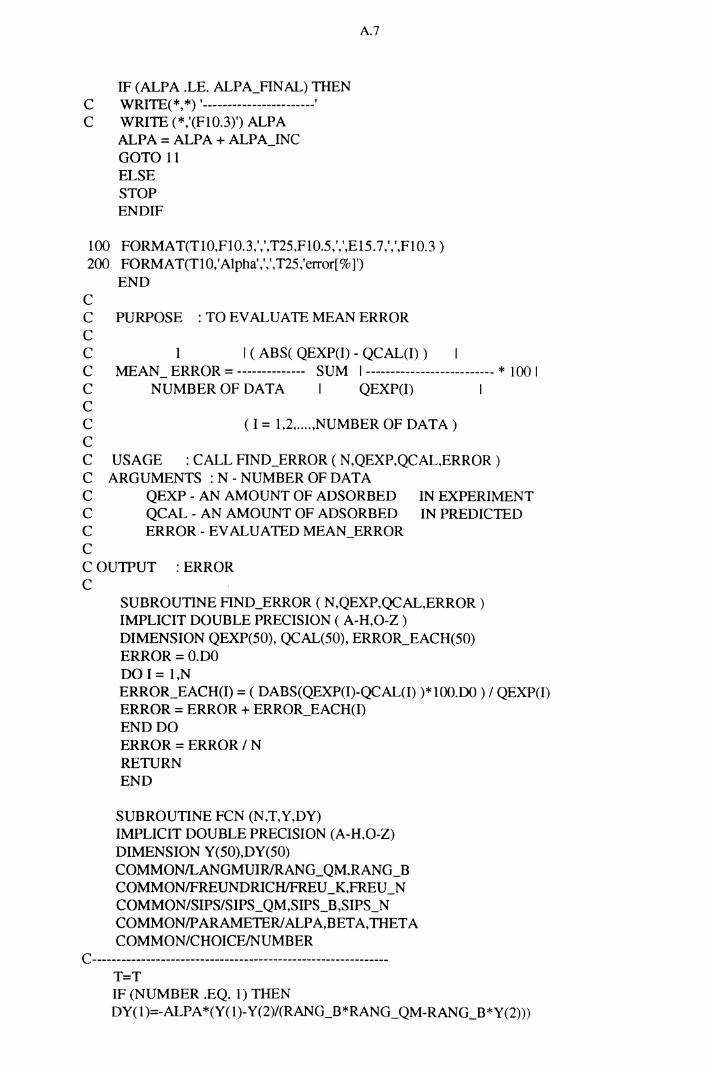
A.7
IF (ALPA .LE. ALPA_FINAL) THEN C WRITE(*,*) '-----------------------' C WRITE (*,'(F10.3)') ALPA
ALPA = ALPA + ALPA_INC GOTO 11 ELSE STOP END IF
100 FORMAT(T10,Fl0.3,',',T25,F10.5,',',E15.7,',',F10.3) 200 FORMA T(TlO,' Alpha',',', T25 ,'error[%]')
c c c c c c c c c
END
PURPOSE :TO EVALUATE MEAN ERROR
I ( ABS( QEXP(I) - QCAL(I) ) MEAN ERROR = -------------- SUM I -------------------------- * 100 I
NUMBER OF DATA I QEXP(I) I
(I= 1,2, .... ,NUMBER OF DATA)
C USAGE :CALL FIND_ERROR ( N,QEXP,QCAL,ERROR) C ARGUMENTS : N- NUMBER OF DATA C QEXP - AN AMOUNT OF ADSORBED IN EXPERIMENT C QCAL - AN AMOUNT OF ADSORBED IN PREDICTED C ERROR-EVALUATED MEAN_ERROR c C OUTPUT : ERROR c
SUBROUTINE FIND_ERROR ( N,QEXP,QCAL,ERROR) IMPLICIT DOUBLE PRECISION ( A-H,O-Z) DIMENSION QEXP(50), QCAL(50), ERROR_EACH(50) ERROR=O.DO DO I= 1,N ERROR_EACH(I) = ( DABS(QEXP(I)-QCAL(I) )* 100.00 ) I QEXP(I) ERROR = ERROR+ ERROR_EACH(I) END DO ERROR = ERROR I N RETURN END
SUBROUTINE FCN (N,T,Y,DY) IMPLICIT DOUBLE PRECISION (A-H,O-Z) DIMENSION Y(50),DY(50) COMMONILANGMUIR/RANG_QM,RANG_B COMMON/FREUNDRICHIFREU _K,FREU_N COMMON/SIPS/SIPS_QM,SIPS_B,SIPS_N COMMON/PARAMETER/ ALP A,BETA,THETA COMMON/CHOICE/NUMBER
C-------------------------------------------------------------T=T IF (NUMBER .EQ. 1) THEN DY(1)=-ALPA*(Y(1)-Y(2)/(RANG_B*RANG_QM-RANG_B*Y(2)))
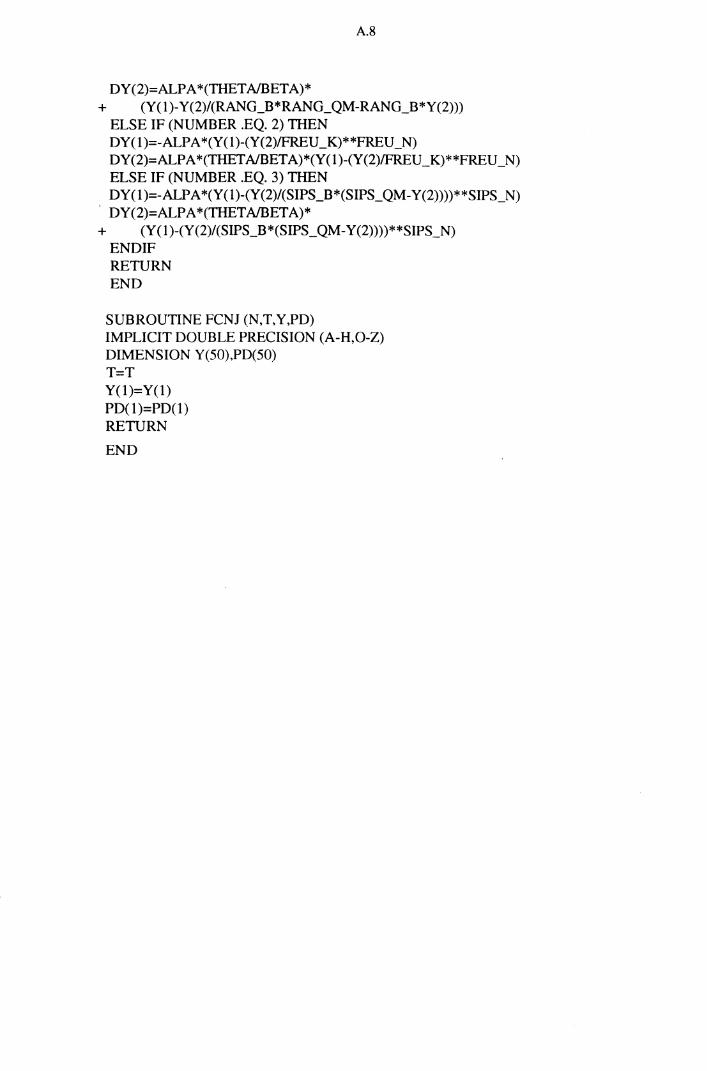
A.8
DY(2)=ALPA *(THETA/BET A)* + (Y(l)-Y(2)/(RANG_B*RANG_QM-RANG_B*Y(2)))
ELSE IF (NUMBER .EQ. 2) THEN DY(l)=-ALPA*(Y(l)-(Y(2)1FREU_K)**FREU_N) DY(2)=ALPA*(THETA/BETA)*(Y(l)-(Y(2)1FREU_K)**FREU_N) ELSE IF (NUMBER .EQ. 3) THEN DY( 1)=-ALP A *(Y(l)-(Y(2)/(SIPS_B*(SIPS_QM-Y(2))))**SIPS_N)
, DY (2)=ALP A *(THETA/BETA)* + (Y(l)-(Y(2)/(SIPS_B*(SIPS_QM-Y(2))))**SIPS_N)
END IF RETURN END
SUBROUTINE FCNJ (N,T,Y,PD) IMPLICIT DOUBLE PRECISION (A-H,O-Z) DIMENSION Y(50),PD(50) T=T Y(l)=Y(l) PD(l)=PD(l) RETURN
END
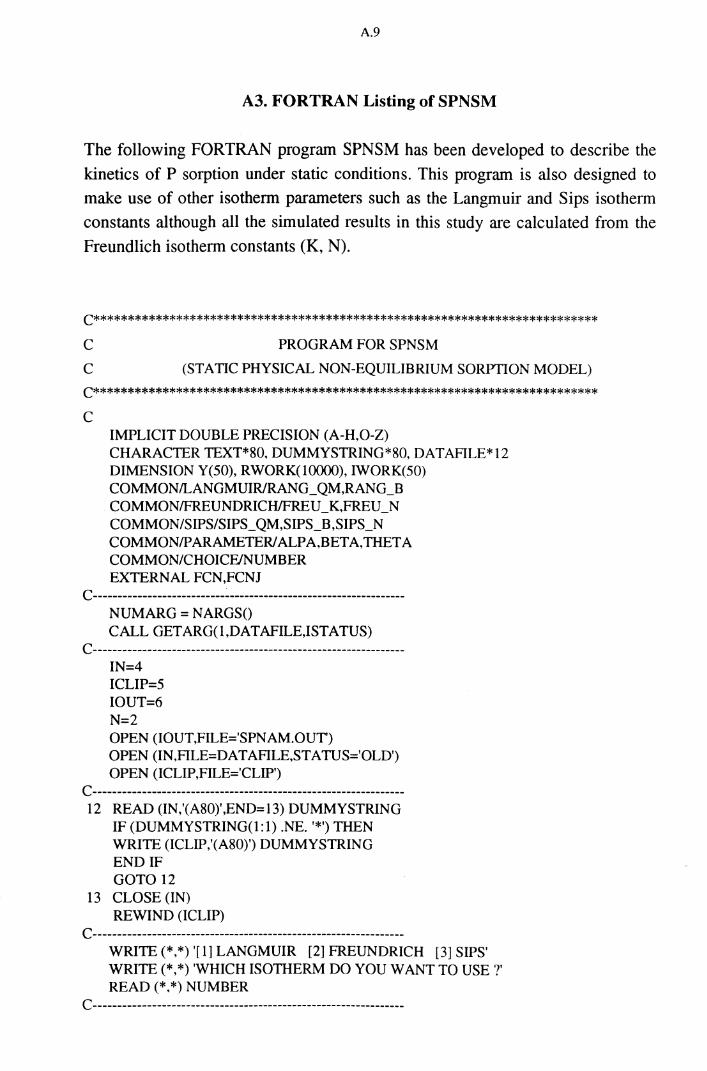
A.9
A3. FORTRAN Listing of SPNSM
The following FORTRAN program SPNSM has been developed to describe the
kinetics of P sorption under static conditions. This program is also designed to make use of other isotherm parameters such as the Langmuir and Sips isotherm
constants although all the simulated results in this study are calculated from the Freundlich isotherm constants (K, N).
C**************************************************************************
c c
PROGRAM FOR SPNSM
(STATIC PHYSICAL NON-EQUILIBRIUM SORPTION MODEL)
C**************************************************************************
c IMPLICIT DOUBLE PRECISION (A-H,O-Z) CHARACTER TEXT*80, DUMMYSTRING*80, DATAFILE*12 DIMENSION Y(50), RWORK(10000), IWORK(50) COMMONILANGMUIRIRANG_QM,RANG_B COMMONIFREUNDRICH/FREU_K,FREU_N COMMON/SIPS/SIPS_QM,SIPS_B,SIPS_N COMMON/P ARAMETERI ALPA,BETA,THET A COMMON/CHOICFJNUMBER EXTERNAL FCN,FCNJ
C---------------------------~------------------------------------NUMARG = NARGS() CALL GETARG(l,DATAFILE,ISTATUS)
C----------------------------------------------------------------IN=4 ICLIP=5 IOUT=6 N=2 OPEN (IOUT,FILE='SPNAM.OUT) OPEN (IN ,FILE=DA TAFILE,ST A TUS='OLD') OPEN (ICLIP,FILE='CLIP')
C----------------------------------------------------------------12 READ (IN,'(A80)',END=l3) DUMMYSTRING
IF (DUMMYSTRING(1:1) .NE.'*') THEN WRITE (ICLIP,'(A80)') DUMMYSTRING END IF GOTO 12
13 CLOSE (IN) REWIND (ICLIP)
C----------------------------------------------------------------WRITE (*,*) '[1] LANGMUIR [2] FREUNDRICH [3] SIPS' WRITE(*,*) 'WHICH ISOTHERM DO YOU WANT TO USE ?' READ(*,*) NUMBER
C----------------------------------------------------------------
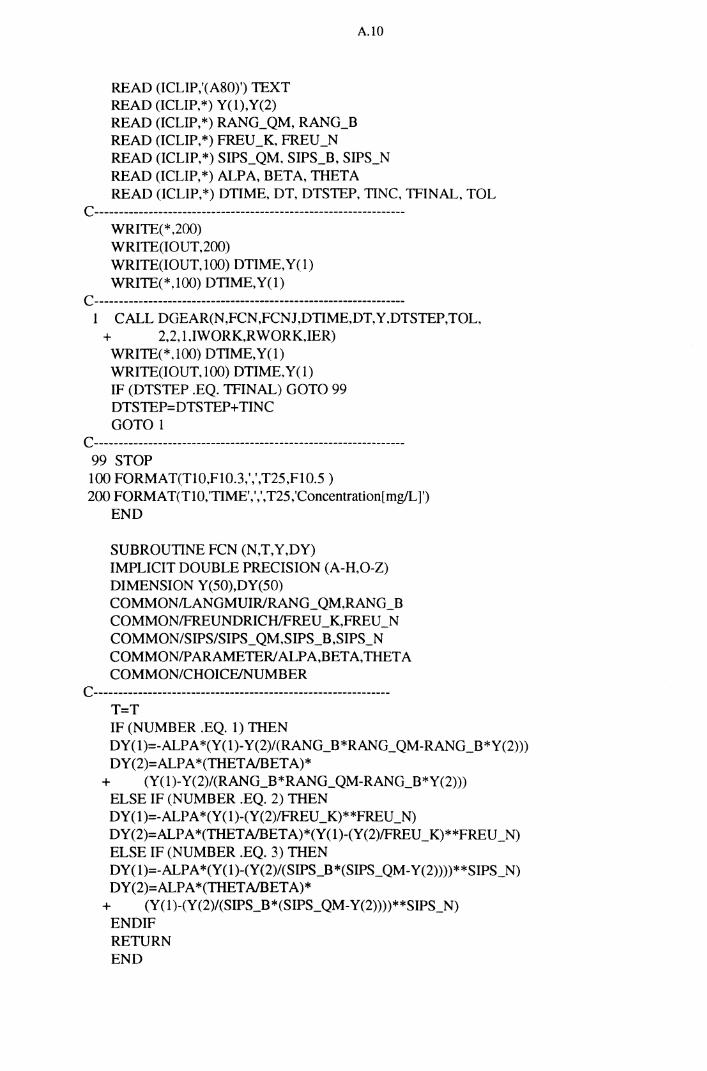
READ (ICLIP,'(A80)') TEXT READ (!CLIP,*) Y(l),Y(2) READ (ICLIP,*) RANG_QM, RANG_B READ (!CLIP,*) FREU_K, FREU_N
A.lO
READ (!CLIP,*) SIPS_QM, SIPS_B, SIPS_N READ (!CLIP,*) ALPA, BETA, THETA READ (!CLIP,*) DTIME, DT, DTSTEP, TINC, TFINAL, TOL
<=----------------------------------------------------------------WRITE(* ,200) WRITE(IOUT,200) WRITE(IOUT,lOO) DTIME,Y(l) WRITE(*,lOO) DTIME,Y(l)
C:----------------------------------------------------------------1 C:ALL DGEAR(N ,FC:N ,FC:NJ ,DTIME,DT. Y ,DTSTEP,TOL.
+ 2,2,l.IWORK,RWORK,IER) WRITE(*.lOO) DTIME,Y(l) WRITE(IOUT,lOO) DTIME,Y(l) IF (DTSTEP .EQ. TFINAL) GOTO 99 DTSTEP=DTSTEP+ TINC: GOTO 1
C:----------------------------------------------------------------99 STOP 100 FORMAT(Tl0,F10.3,',',T25,F10.5) 200 FORMAT(Tl0,'TIME',',',T25,'C:oncentration[mg!L]')
END
SUBROUTINE FCN (N,T,Y,DY) IMPLIGT DOUBLE PREC:ISION (A-H,O-Z) DIMENSION Y(50),DY(50) C:OMMONILANGMUIR/RANG_QM,RANG_B C:OMMONIFREUNDRIC:H/FREU_K,FREU_N C:OMMON/SIPS/SIPS_QM,SIPS_B,SIPS_N C:OMMON/PARAMETER/ALPA,BETA,THETA C:OMMON/CHOIC:FJNUMBER
C:-------------------------------------------------------------T=T IF (NUMBER .EQ. 1) THEN DY(l)=-ALPA*(Y(l)-Y(2)/(RANG_B*RANG_QM-RANG_B*Y(2))) DY(2)=ALPA *(THET NBET A)*
+ (Y(l)-Y(2)/(RANG_B*RANG_QM-RANG_B*Y(2))) ELSE IF (NUMBER .EQ. 2) THEN DY(l)=-ALPA*(Y(1)-(Y(2)/FREU_K)**FREU_N) DY(2)=ALPA*(THETNBETA)*(Y(l)-(Y(2)1FREU_K)**FREU_N) ELSE IF (NUMBER .EQ. 3) THEN DY(l)=-ALPA*(Y(l)-(Y(2)/(SIPS_B*(SIPS_QM-Y(2))))**SIPS_N) DY(2)=ALPA *(THET NBETA)*
+ (Y(l )-(Y(2)/(SIPS_B*(SIPS_QM-Y(2))))**SIPS_N) END IF RETURN END

A.ll
SUBROUTINE FCNJ (N,T,Y,PD) IMPLICIT DOUBLE PRECISION (A-H,O-Z) DIMENSION Y(50),PD(50) T=T Y(l)=Y(l) PD(l)=PD(l) RETURN
END
A.12
A4. Program Description of MCMFIT
A FORTRAN program to carry out the nonlinear least squares fitting of the general nonlinear transport model to generalised experimental data has been developed in MCMFIT. The program MCMFIT was based on the maximum
neighbourhood method of Marquardt (1963) as implemented by van Genuchten
(1980, 1981), Parker and van Genuchten (1984) and Barry et al. (1988). MCMFIT fits nine parameters, viz., the pore water velocity (VEL), dispersion
coefficient (Ds), pulse duration (PULSET), the four sorption isotherm coefficients (at, az, <X3, cu), the rate coefficient (ru) and the fraction of sorption
site (<X6). The program consists of the main program, MCMFIT, and the
subroutines MATINV, MODEL, FUNC1, FUNC2, FNC2, FUNC3, FUNC4,
NLSYST and ran3. The main program handles the input and output of data,
generates the parameter data set for which the sum of residual squares is a
minimum and implements the fitting program. MATINV performs matrix
inversion as required by the fitting program for parameter estimation. MODEL
organises data predicted by the system of non linear equation solver, and
FUNC4. FNC2 is the function as required by NLSYST. The subroutine RAN3
generates random numbers between 0 and 1. The system time in seconds has
been used as the seed for the random generator in MCMFIT.
Upon execution, MCMFIT looks for an input file (MCMFIT.DAT is the default)
containing the necessary information on the model to be fitted and the experimental data. Once this file name is entered, the program prompts for the results file name. A plot file name which consists of the obsetved and the fitted
results is created. Table A4.1 shows example parameter values required by the
MCMFIT in the soil column experimental data for the influent concentration of 5 mg/L. The line by line formation of this file is presented in Table A4.2.
The output file consists of:
1. Descriptive title
2. Initial values of coefficients (obtained from the random search)
3. Iteration number and sum-of-squares for the given parameter values
4. Correlation matrix of the fitted parameters 5. The R2 value for the regression
6. Optimised parameter values and their 95% confidence limits
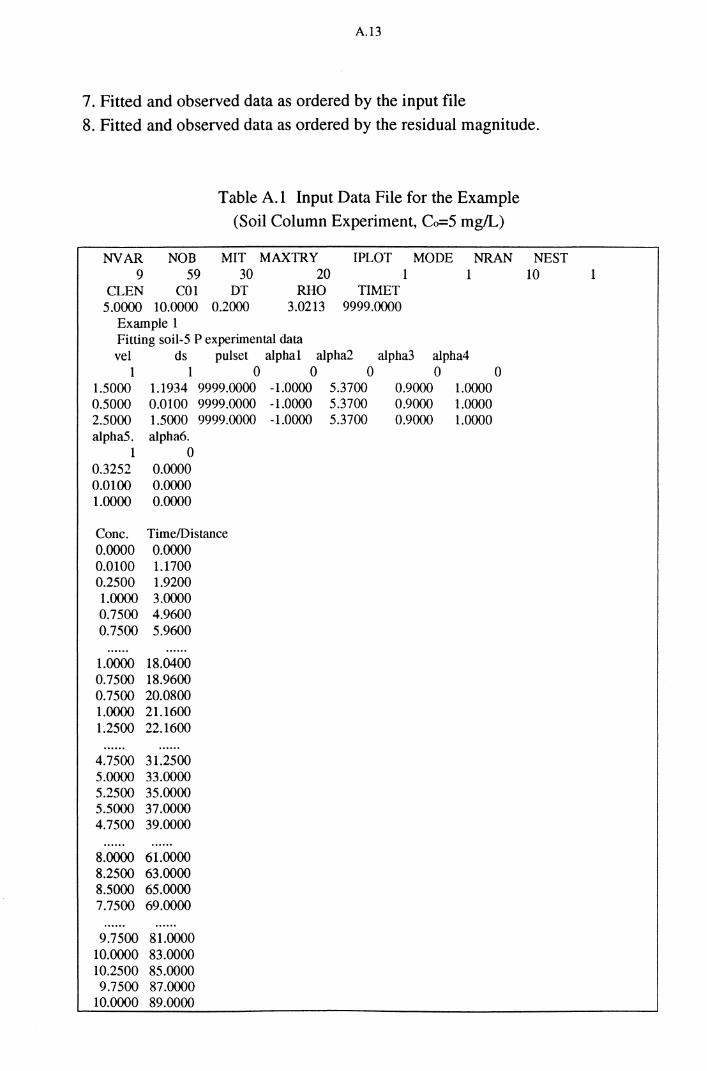
A.13
7. Fitted and observed data as ordered by the input file
8. Fitted and observed data as ordered by the residual magnitude.
Table A. I Input Data File for the Example
(Soil Column Experiment, Co=5 mg/L)
MIT MAXTRY IPLOT MODE NVAR 9
CLEN 5.0000
NOB 59
COl 10.0000
30 20 1 NRAN
1 DT RHO
0.2000 3.0213 Example 1 Fitting soil-S P experimental data
TIMET 9999.0000
vel ds pulset alpha! alpha2 alpha3 alpha4 0
0.9000 0.9000 0.9000
1 1 0 1.5000 1.1934 9999.0000 0.5000 0.0100 9999.0000 2.5000 1.5000 9999.0000 alphaS. alpha6.
1 0 0.3252 0.0000 0.0100 0.0000 1.0000 0.0000
Cone. Time/Distance 0.0000 0.0000 0.0100 1.1700 0.2500 1.9200 1.0000 3.0000 0.7500 4.9600 0.7500 5.9600
1.0000 18.0400 0.7500 18.9600 0.7500 20.0800 1.0000 21.1600 1.2500 22.1600
4.7500 31.2500 5.0000 33.0000 5.2500 35.0000 5.5000 37.0000 4.7500 39.0000
8.0000 61.0000 8.2500 63.0000 8.5000 65.0000 7.7500 69.0000
9.7500 81.0000 10.0000 83.0000 10.2500 85.0000 9.7500 87.0000
10.0000 89.0000
0 -1.0000 -1.0000 -1.0000
0 5.3700 5.3700 5.3700
0 1.0000 1.0000 1.0000
NEST 10 1
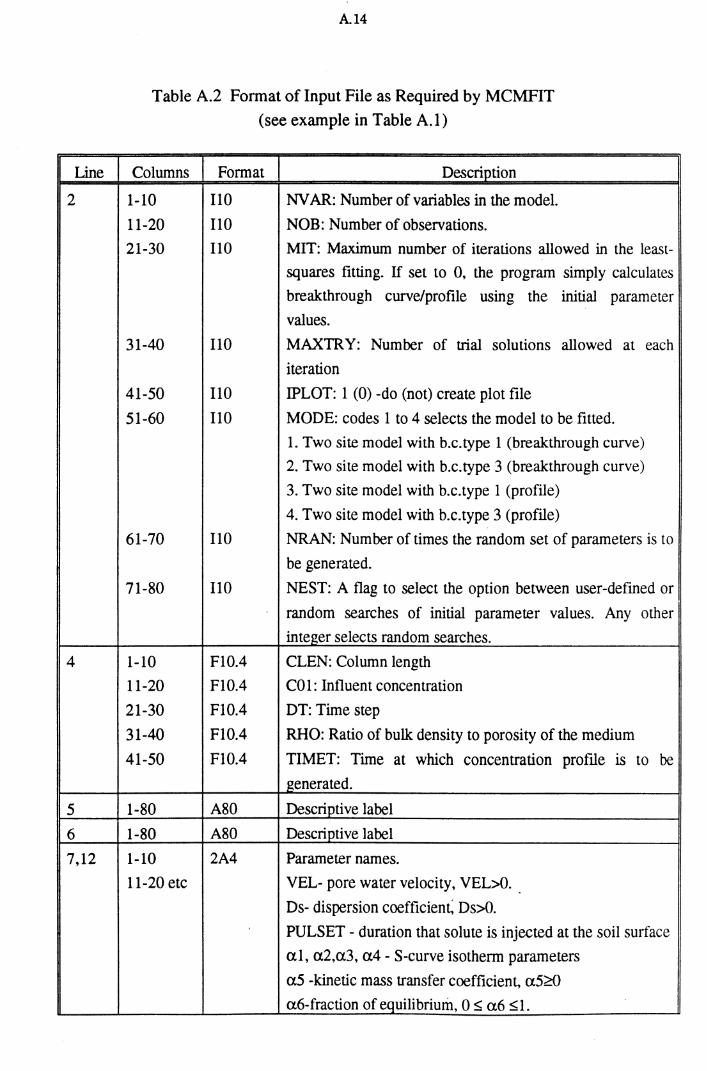
A14
Table A.2 Format of Input File as Required by MCMFIT
(see example in Table A.l)
Line Columns Format Descri_Qtion
2 1-10 110 NV AR: Number of variables in the model.
4
5
6
7,12
11-20
21-30
31-40
41-50
51-60
61-70
71-80
1-10
11-20
21-30
31-40
41-50
1-80
1-80
1-10
11-20 etc
110
110
IIO
IIO
110
IIO
IIO
F10.4
F10.4
F10.4
F10.4
F10.4
A80
A80
2A4
NOB: Number of observations.
MIT: Maximum number of iterations allowed in the least
squares fitting. If set to 0, the program simply calculates
breakthrough curve/profile using the initial parameter
values.
MAXTRY: Number of uial solutions allowed at each
iteration
IPLOT: 1 (0) -do (not) create plot file
MODE: codes 1 to 4 selects the model to be fitted.
1. Two site model with b.c.type 1 (breakthrough curve)
2. Two site model with b.c.type 3 (breakthrough curve)
3. Two site model with b.c.type 1 (profile)
4. Two site model with b.c.type 3 (profile)
NRAN: Number of times the random set of parameters is to
be generated.
NEST: A flag to select the option between user-defined or
random searches of initial parameter values. Any other
integer selects random searches.
CLEN: Column length
CO 1: Influent concentration
DT: Time step
RHO: Ratio of bulk density to porosity of the medium
TIMET: Time at which concentration prof:tle is to be
generated.
Descriptive label
Descriptive label
Parameter names.
VEL- pore water velocity, VEL>O.
Ds- dispersion coefficien~ Ds>O.
PULSET- duration that solute is injected at the soil surface
a.1, a.2,a.3, a.4- S-curve isotherm parameters
a.5 -kinetic mass transfer coefficient, a.5~
a6-fraction of equilibrium, 0 :5: a6 :5:1.
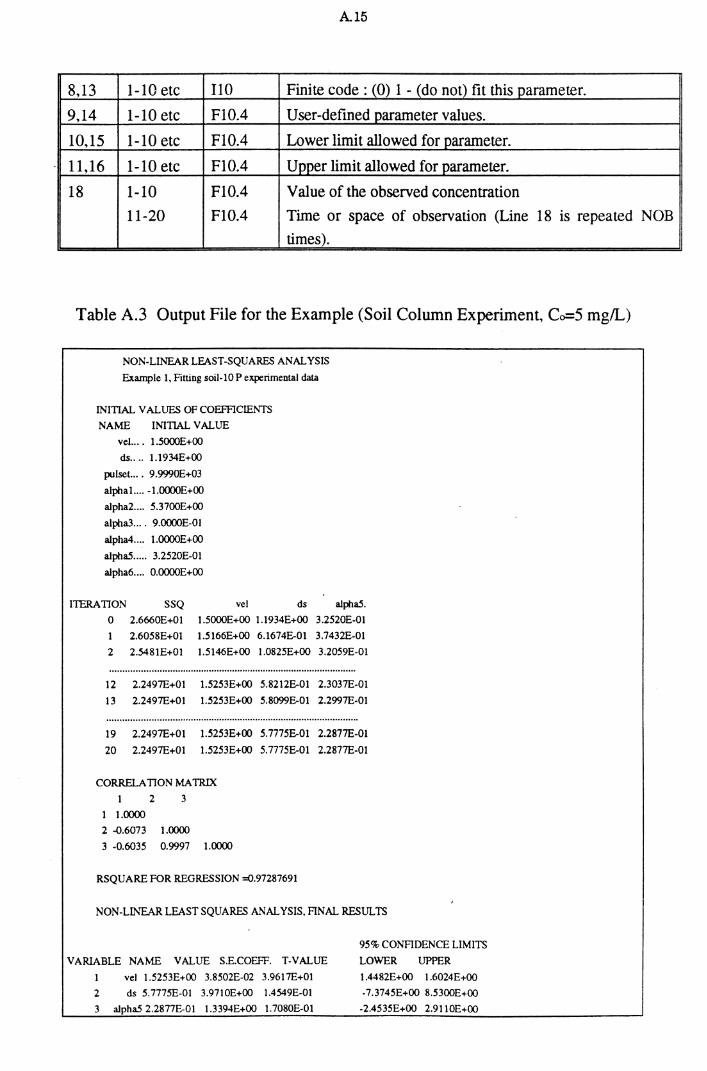
A.15
8,13 1-10 etc 110 Finite code : (0) 1 - (do not) fit this parameter.
9,14 1-10 etc F10.4 User-defined parameter values.
10,15 1-10 etc F10.4 Lower limit allowed for parameter.
11,16 1-10 etc F10.4 Upper limit allowed for parameter.
18 1-10 F10.4 Value of the observed concentration
11-20 F10.4 Time or space of observation (Line 18 is repeated NOB
times).
Table A.3 Output File for the Example (Soil Column Experiment, Co=5 mg!L)
NON-LINEAR LEAST-SQUARES ANALYSIS
Example l, Fitting soil-10 P experimental data
INITIAL V ALlTES OF COEFFICIENTS
NAME INITIAL VALUE
vel... . 1.5000E+OO
ds .... 1.1934E+00
pulset. ... 9.9990E+03
alphal.... -l.OOOOE+OO
alpha2 .... 5.3700E+00
alpha3 .... 9.0000E-OI
alpha4.... l.OOOOE+OO
alphaS..... 3.2520E-Ol
alpha6.... O.OOOOE+OO
ITERATION SSQ vel ds alphaS.
0 2.6660E+01
1 2.6058E+01
2 2.548!E+O!
!.5000E+00 1.1934E+00 3.2520E-OI
!.5166E+00 6.!674E-01 3.7432E-Ol
1.5!46E+00 1.0825E+00 3.2059E-OI
12 2.2497E+01 1.5253E+00 5.8212E-Ol 2.3037E-OI
13 2.2497E+01 1.5253E+00 5.8099E-Ol 2.2997E-OI
19 2.2497E+01 1.5253E+00 5. 7775E-01 2.2877E-01
20 2.2497E+01 1.5253E+00 5.7775E-Ol 2.2877E-OI
CORRELATION MATRIX
2 3
I 1.0000
2 -0.6073 1.0000
3 -0.6035 0.9997 1.0000
RSQUARE FOR REGRESSION =0.97287691
NON-Lll\'EAR LEAST SQUARES ANALYSIS, ANAL RESULTS
VARIABLE NAME VALUE S.E.COEFF. T-VALUE
1
2
vel 1.5253E+00 3.8502E-02 3.9617E+01
ds 5.7775E-01 3.97!0E+00 1.4549E-01
3 alphaS 2.2877E-01 1.3394E+00 !.7080E-01
95% CONFIDENCE LIMITS
LOWER UPPER
!.4482E+00 !.6024E+OO
-7.3745E+00 8.5300E+OO
-2.4535E+00 2.9!!0E+00
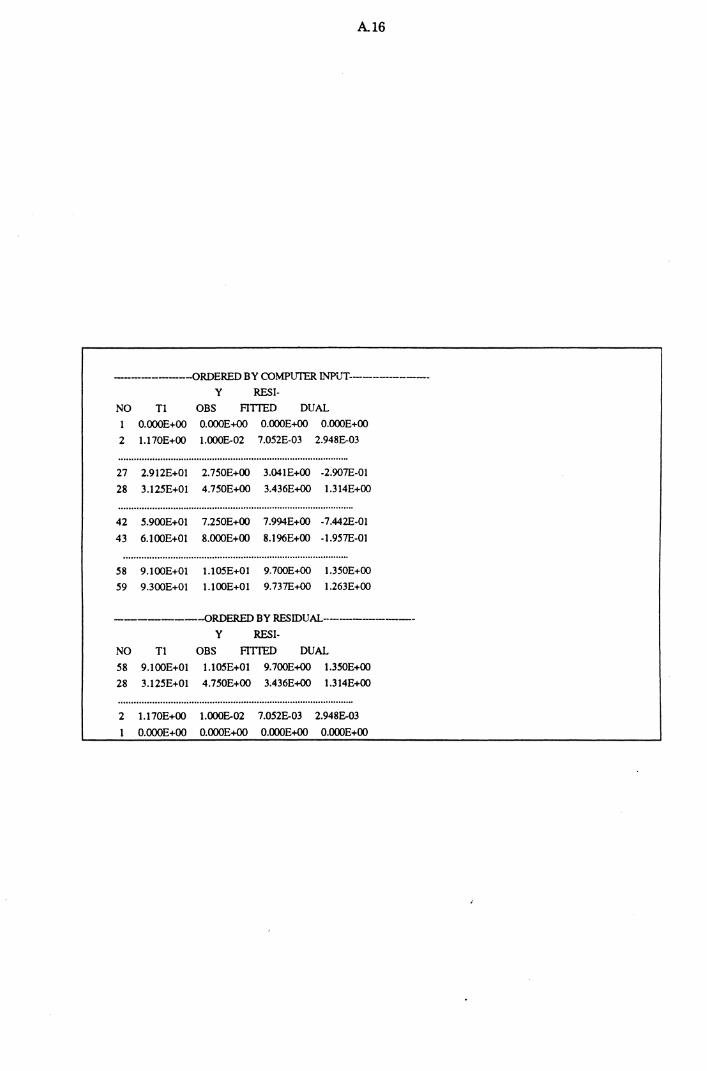
A16
---------ORDERED BY COMPUTER INPUT---------y RESI-
NO Tl OBS FITIED DUAL
O.OOOE+OO O.OOOE+<Xl O.OOOE+<Xl O.OOOE+OO
2 1.170E+OO l.OOOE-02 7.052E-03 2.948E-03
27 2.912E+01 2.750E+00 3.041E+00 -2:907E-01
28 3.125E+Ol 4.750E+00 3.436E+<Xl 1.314E+00
42 5.900E+Ol 7.250E+00 7.994E+00 -7.442E-01
43 6.100E+01 8.000E+00 8.196E+00 -1.957E-01
58 9.100E+01 1.105E+01 9.700E+<Xl 1.350E+00
59 9.300E+Ol l.lOOE+Ol 9.737E+<Xl 1.263E+00
--------ORDERED BY RESIDUAL---------
y RESI-
NO Tl OBS FITIED DUAL
58 9.100E+01 1.105E+Ol 9.700E+<Xl 1.350E+00
28 3.125E+Ol 4.750E+OO 3.436E+<Xl 1.314E+00
2 1.170E+00 l.OOOE-02 7.052E-03 2.948E-03
O.OOOE+OO O.OOOE+<Xl O.OOOE+<Xl O.OOOE+OO