experimental study on alkali activated slag
TRANSCRIPT
EXPERIMENTAL STUDY ON ALKALI
ACTIVATED SLAG CONCRETE MIXES BY
INCORPORATING PS BALL AS FINE
AGGREGATE
Thesis
submitted in partial fulfilment of the requirements for the degree of
DOCTOR OF PHILOSOPHY
by
AVINASH H TALKERI
(165136CV16F05)
DEPARTMENT OF CIVIL ENGINEERING
NATIONAL INSTITUTE OF TECHNOLOGY KARNATAKA
SURATHKAL, MANGALORE-575025
OCTOBER, 2020

i
DECLARATION
I hereby declare that the Research Thesis entitled “Experimental Study on Alkali
Activated Slag Concrete Mixes by Incorporating PS Ball as Fine Aggregate”
Which is being submitted to the National Institute of Technology Karnataka, Surathkal
in partial fulfilment of the requirements for the award of the Degree of Doctor of
Philosophy in the Department of Civil Engineering is a bonafide report of the research
work carried out by me. The material contained in this Research Thesis has not been
submitted to any University or Institution for the award of any degree.
(Avinash H Talkeri)
Registration No. 165136CV16F05
Department of Civil Engineering
Place: NITK-Surathkal
Date: 19-10-2020

ii
iii
CERTIFICATE
This is to certify that the Research Thesis entitled “Experimental Study on Alkali
Activated Slag Concrete Mixes by Incorporating PS Ball as Fine Aggregate”
submitted by AVINASH H TALKERI (Register Number: 165136CV16F05) as the
record of the research work carried out by him/her, is accepted as the Research
Thesis submission in partial fulfillment of the requirements for the award of degree of
Doctor of Philosophy.
Research Guide
Chairman - DRPC

iv

v
DEDICATED TO
MY PARENTS,
FAMILY MEMBERS,
TEACHERS,
FARMERS AND FRIENDS

vi

vii
ACKNOWLEDGEMENT
I would like to express my sincere gratitude to my research supervisor Prof. A.U. Ravi
Shankar for his motivation and invaluable guidance throughout my research work. I am
grateful to him for his keen interest in the preparation of this thesis. It has been my
pleasure to work with him.
I acknowledge my sincere thanks to Prof. B. B. Das, Dept. of Civil Engineering, Prof.
Ravi Shankar. K, Dept. of Metallurgy for being the members of the Research Progress
Assessment Committee and giving valuable suggestions and the encouragement provided
at various stages of this work. I would like to thank Prof. M. C. Narasimhan and Prof.
Raviraj. M. for their valuable suggestions and encouragement.
I wish to thank Director NITK Surathkal, Prof. D. Venkat Reddy and Prof. Varghese
George, former Heads of the Civil Engineering Department, and Prof. K. Swaminathan,
Head of the Civil Engineering, for their support and encouragement throughout my stay
at the NITK campus.
I appreciate the co-operation and help rendered by the staff of laboratories and the office
of the Civil Engineering Department. My special thanks to Mr. Nataraja R, Mr. Ramesh.
Paul, Mr. Purushotham, Mr. Yathish S, and Mr. Shashikant. Devadiga for their help in
completing my experimental work. I thank Mr. Manohar Shanbhogue for helping me to
conduct the chemical analysis of all the materials.
I would especially like to thank Mr. Manjunath. R, who helped in laboratory works,
discussions, and constant support throughout my research work. Also, I am fortunate to
have friends, Mr. Panditharadhya B. J, Mrs. Amulya, Mr. Chethan, B. A, Mr. Raghuram
K, Mr. Chiranjeevi K, Mr. Hemanth, Ms. Ningappa, Mr. Marsh, and Mr. Akash, whose
encouragements have taken me this far. The informal support and encouragement of
many friends has been indispensable. I also acknowledge the good company and help
received by PG students, Mr. Ajay. Poojari, Mr. Sanjay. Nagrale, while conducting
experiments.

viii
I am incredibly grateful to my father, Sri. Huchappa, mother Smt. Sharada and my uncle
Sri. D. R Ramachandra, my Aunty Mrs. Rekha, for providing me the best available
education and encouraged in all my endeavours. I gratefully acknowledge the support and
help rendered by my family members during this research work. They have always been
a source of inspiration for me. Finally, I am grateful to everybody who helped and
encouraged me during this research work.
NITK Surathkal AVINASH H TALKERI
Date: 19-10-2020
ix
ABSTRACT
Improved road connectivity is essential for any country to progress. Well
designed and constructed concrete pavements are essential for the development of
sustainable highway infrastructure. The increase in infrastructure and urban development
activities desire to discover sustainable materials, replacing the natural raw materials
required for concrete production. The higher demand for concrete roads and other
construction projects has increased Ordinary Portland Cement (OPC) production.
However, cement production is associated with environmental issues such as a higher
carbon footprint, highly energy-intensive, and exploitation of natural resources. Cement
production uses a significant amount of natural resources. Nearly 2tonnes of raw material
required to produce 1ton of cement, which emits 850kg of carbon-di-oxide into the
atmosphere. The present research community is focusing on developing alternative
binders to minimize the production of OPC. Alkali Activated Binders (AABs) such as
Alkali Activated Slag (AAS), Alkali Activated Slag Fly Ash (AASF), Geopolymers, etc.,
can be considered as potential alternatives to OPC. Precious Slag (PS) ball is an industrial
by-product obtained from Ecomaister steel beads. PS ball has been identified as an
alternative to fine aggregates for concrete production.
In the present study, PS ball was considered fine aggregates to evaluate the
performance of in Alkali Activated Slag Concrete (AASC) and Alkali Activated Slag Fly
Ash Concrete (AASFC). The AASC and AASFC mixes are designed to attain a minimum
strength of M40 grade and compared with conventional concrete. Sodium Silicate (SS)
and Sodium Hydroxide (SH) are used as the alkaline activators. The alkaline liquid to
binder ratio of 0.35 was kept constant for all the mixes. The influence of SH (i.e., 8, 10,
12, and 14M) and SS to SH ratios (i.e., 1, 1.5, 2, and 2.5) on the properties of fresh and
hardened concrete were analyzed. AASC mixes are prepared with 100% GGBFS as a
sole binder, while AASFC mixes are prepared by mixing GGBFS and Fly ash (FA) in
different proportions, i.e., 90:10, 80:20, 70:30, and 60:40. Preliminary tests were carried
out to identify the optimal NaOH concentration and dosage of alkaline activators for
AASC and AASFC mixes.

x
The fresh and hardened properties such as workability, setting time, compressive
strength, split tensile strength, modulus of elasticity, flexural strength, and abrasion
resistance of different concretes were evaluated as per the standard test procedure. The
durability of concrete mixes was evaluated by conducting resistance to sorptivity,
hydrochloric acid, sulphuric acid, nitric acid. The water absorption and Volume of
Permeable Voids (VPV) were evaluated. The flexural fatigue performance of various
concrete mixes was evaluated by carrying out repeated load test on beam specimens. The
fatigue life data obtained were represented and analyzed using S-N curves. Probabilistic
analysis of fatigue data was carried out using Weibull distribution. Survival probability
analysis to predict the fatigue lives of concrete mixes with required probability of failure
was carried out.
The laboratory test results indicate that the incorporation of PS ball as fine
aggregates in AASC and AASFC mixes improved mechanical strength. The fatigue life
improved in AASC and AASFC mixes. The fatigue data of concrete mixes can be
modeled by using Weibull distribution. Improved durability performance of AASC and
AAFC mixes were observed. The higher water absorption and subsequent increase
inVolume of Permeable Voids (VPV) was observed at the low NaOH concentration and
silicate content, due to lower hydroxyl ion concentration in the activator solution. It was
observed that the activator concentration has a larger influence on the mechanical
properties of AASC and AASFC mixes. High sorptivity was reported for the mixes with
8M NaOH with a gradual drop in compressive strength. The permeability property of
alkali activated material was dependent on total Na2O content in the activator solution.
The alkali activated mix showed good resistance towards sulphate, nitrate, and chloride
attacks. The AASC and AASFC mix with PS ball as fine aggregates proved to be a good
concrete for pavement.
Keywords: AASC; AASFC; PS ball; SS/SH ratio; Fatigue analysis.

i

xi
CONTENTS
GLOSSARY OF TERMS
LIST OF TABLES
LIST OF FIGURES
xv
vii
xix
1
1.1
1.2
1.3
1.4
1.5
1.6
1.7
INTRODUCTION
GENERAL
AN OVERVIEW ON CEMENT
PRECIOUS SALG BALL
NEED AND SIGNIFICANCE OF PRESENT STUDY
SCOPE OF WORK
OBJECTIVES
THESIS OUTLINE
1-9
1
4
4
5
7
8
8
2
2.1
2.2
2.3
2.4
2.5
2.6
LITERATURE REVIEW
ALKALI ACTIVATION OF CONCRETE
FACTORS AFFECTING ACTIVATION OF SLAG
EFFECT OF SODIUM HYDROXIDE
EFFECT OF SODIUM SILICATE
OTHER MATERIALS USED AS FINE AGGREGATE
PAST STUDIES ON PS BALL
11-32
11
12
22
26
29
30
xii
3
3.1
3.1.1
3.1.2
3.1.3
3.1.4
3.1.5
3.1.6
3.2
3.2.1
3.2.2
3.2.3
3.2.4
3.3
3.4
METHODOLOGY
DESCRIPTION OF MATERIAL
FLYASH
GROUND GRANULATED BLAST FURNACE SLAG
ALKALI ACTIVATORS
COARSE AGGREGATE
FINE AGGREGATE
PRECIOUS SLAG BALL
TEST METHODS
FLEXURAL STRENGTH
MODULUS OF ELASTICITY
ABRASION RESISTANCE
FLEXURAL FATIGUE TEST
SYNTHESIS OF ALKALI ACTIVATED MIXTURE
MIXTURE DESIGN
33-49
33
33
34
35
36
36
36
39
40
42
42
43
45
46
4
4.0
4.1
4.2
ALKALI ACTIVATED SLAG CONCRETE
INTRODUCTION
WORKABILITY
SETTING TIME
51-74
51
51
52

xiii
4.3
4.3.1
4.3.2
4.4
4.5
4.6
4.7
4.8
4.9
4.10
COMPRESSIVE STRENGTH
EFFECT OF SODIUM HYDROXIDE
EFFECT OF SODIUM SILICATE
SPLIT TENSILE AND YOUNGS MODULUS
FLEXURAL STRENGTH
FATIGUE BEHAVIOUR
ABRASION RESISTANCE
WEIBULL DISTRIBUTION
SEM ANALYSIS
XRD ANALYSIS
53
54
55
56
58
60
64
65
70
72
5
5.0
5.1
5.2
5.3
5.3.1
5.3.2
5.3.3
5.4
ALKALI ACTIVATED SLAG-FLYASH CONCRETE
INTRODUCTION
WORKABILITY
SETTING TIME
COMPRESSIVE STRENGTH
EFFECT OF FLYASH
EFFECT OF SODIUM HYDROXIDE
EFFECT OF SODIUM SILICATE
SPLIT TENSILE AND YOUNGS MODULUS
75-92
75
75
76
77
78
79
80
81

xiv
5.5
5.6
5.7
FLEXURAL STRENGTH OF AASFC MIXES
FATIGUE BEHAVIOUR OF AASFC MIXES
ABRASION RESISTANCE
84
86
90
6
6.1
6.2
6.3
6.4
6.4.1
6.4.2
6.4.3
DURABILITY PROPERTIES
INTRODUCTION
SORPTIVITY
EVALUATION OF PERMEABLE PORES
ACID ATTACK
EFFECT OF HYDROCHLORIC ACID
EFFECT OF SULPHURIC ACID
EFFECT OF NITRIC ACID
93-107
93
93
96
98
102
104
105
7
7.1
7.2
CONCLUSIONS
GENERAL
SCOPE FOR FURTHER STUDIES
APPENDIX
REFERENCES
PUBLICATIONS
109-112
109
111
113
115
127
xv
GLOSSARY OF TERMS
ACM
OPC
GGBFS
FA
AAM
AAS
AASC
AASFC
CASH
CSH
NASH
PS BALL
SCM
SEM
SH
SS
XRD
ALTERNATIVE CEMENTITOUS MATERIAL
ORDINARY PORTLAND CEMENT
GROUND GRANULATED BLAST FURNACE SLAG
FLYASH
ALKALI ACTIVATED MATERIAL
ALKALI ACTIVATED SLAG
ALKALI ACTIVATED SLAG CONCRETE
ALKALI ACTIVATED SLAG-FLYASH CONCRETE
CALCIUM ALUMINIUM SILICATE HYDRATE
CALCIUM SILICATE HYDRATE
SODIUM ALUMINIUM SILICATE HYDRATE
PRECIOUS SLAG BALL
SUPPLEMENTARY CEMENTITIOUS MATERIAL
SCANNING ELECTRON MICROSCOPE
SODIUM HYDROXIDE
SODIUM SILICATE
X-RAY DIFFRACTION

xvi
xvii
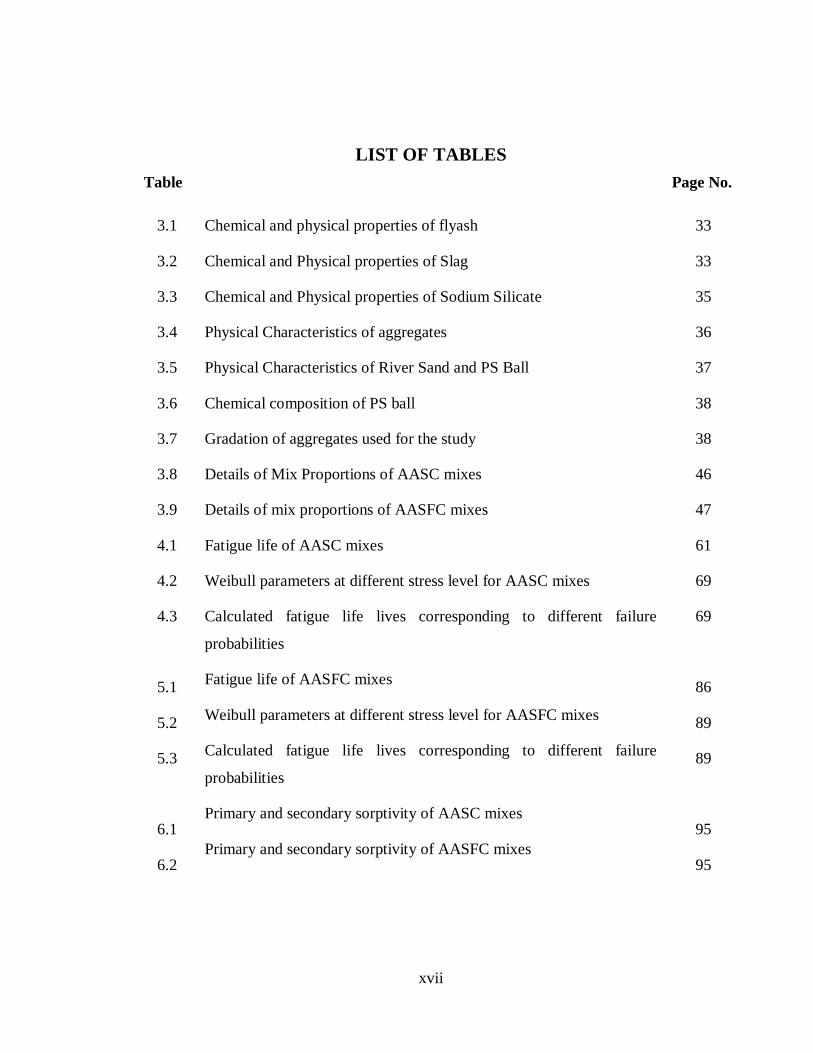
LIST OF TABLES
Table Page No.
3.1
3.2
3.3
3.4
3.5
3.6
3.7
3.8
3.9
4.1
4.2
4.3
5.1
5.2
5.3
6.1
6.2
Chemical and physical properties of flyash
Chemical and Physical properties of Slag
Chemical and Physical properties of Sodium Silicate
Physical Characteristics of aggregates
Physical Characteristics of River Sand and PS Ball
Chemical composition of PS ball
Gradation of aggregates used for the study
Details of Mix Proportions of AASC mixes
Details of mix proportions of AASFC mixes
Fatigue life of AASC mixes
Weibull parameters at different stress level for AASC mixes
Calculated fatigue life lives corresponding to different failure
probabilities
Fatigue life of AASFC mixes
Weibull parameters at different stress level for AASFC mixes
Calculated fatigue life lives corresponding to different failure
probabilities
Primary and secondary sorptivity of AASC mixes
Primary and secondary sorptivity of AASFC mixes
33
33
35
36
37
38
38
46
47
61
69
69
86
89
89
95
95

xviii
xix
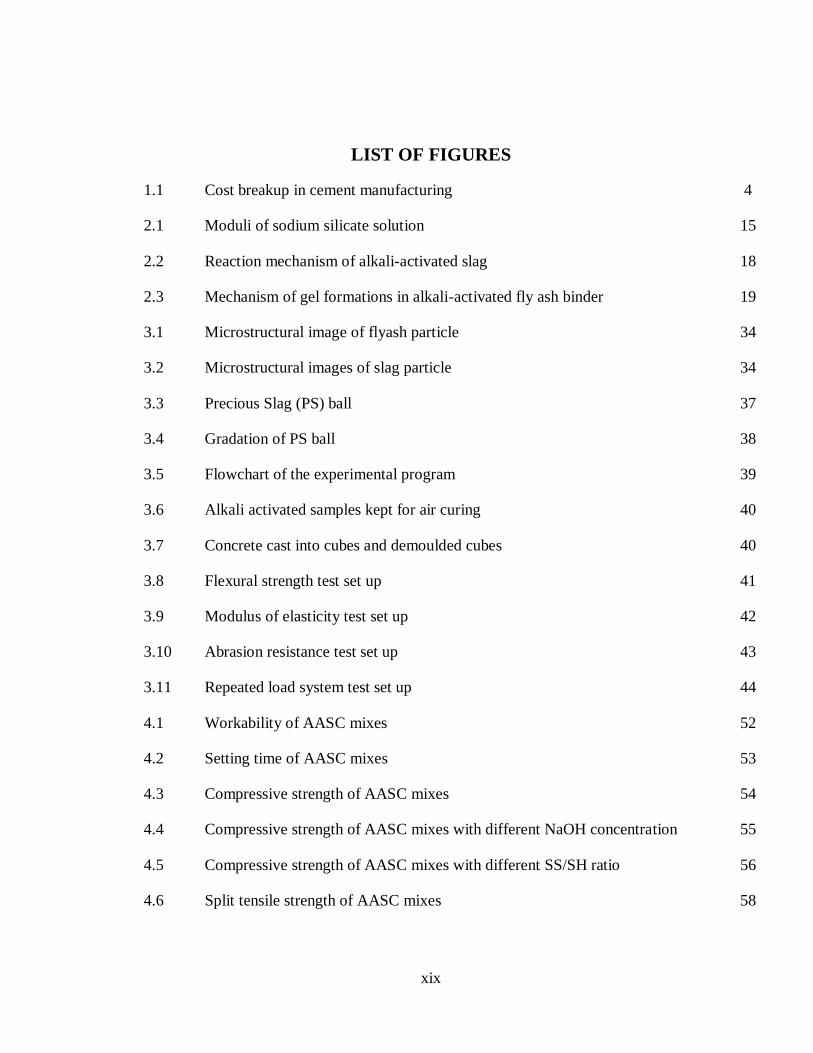
LIST OF FIGURES
1.1
2.1
2.2
2.3
3.1
3.2
3.3
3.4
3.5
3.6
3.7
3.8
3.9
3.10
3.11
4.1
4.2
4.3
4.4
4.5
4.6
Cost breakup in cement manufacturing
Moduli of sodium silicate solution
Reaction mechanism of alkali-activated slag
Mechanism of gel formations in alkali-activated fly ash binder
Microstructural image of flyash particle
Microstructural images of slag particle
Precious Slag (PS) ball
Gradation of PS ball
Flowchart of the experimental program
Alkali activated samples kept for air curing
Concrete cast into cubes and demoulded cubes
Flexural strength test set up
Modulus of elasticity test set up
Abrasion resistance test set up
Repeated load system test set up
Workability of AASC mixes
Setting time of AASC mixes
Compressive strength of AASC mixes
Compressive strength of AASC mixes with different NaOH concentration
Compressive strength of AASC mixes with different SS/SH ratio
Split tensile strength of AASC mixes
4
15
18
19
34
34
37
38
39
40
40
41
42
43
44
52
53
54
55
56
58
xx
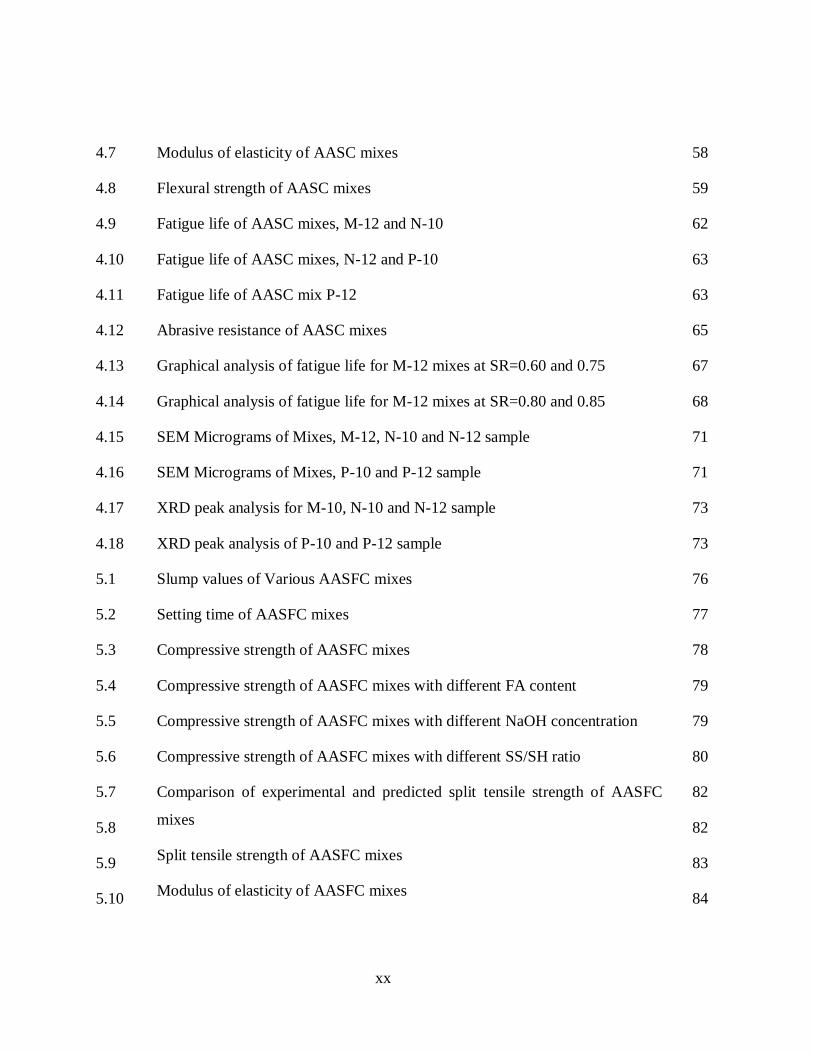
4.7
4.8
4.9
4.10
4.11
4.12
4.13
4.14
4.15
4.16
4.17
4.18
5.1
5.2
5.3
5.4
5.5
5.6
5.7
5.8
5.9
5.10
Modulus of elasticity of AASC mixes
Flexural strength of AASC mixes
Fatigue life of AASC mixes, M-12 and N-10
Fatigue life of AASC mixes, N-12 and P-10
Fatigue life of AASC mix P-12
Abrasive resistance of AASC mixes
Graphical analysis of fatigue life for M-12 mixes at SR=0.60 and 0.75
Graphical analysis of fatigue life for M-12 mixes at SR=0.80 and 0.85
SEM Micrograms of Mixes, M-12, N-10 and N-12 sample
SEM Micrograms of Mixes, P-10 and P-12 sample
XRD peak analysis for M-10, N-10 and N-12 sample
XRD peak analysis of P-10 and P-12 sample
Slump values of Various AASFC mixes
Setting time of AASFC mixes
Compressive strength of AASFC mixes
Compressive strength of AASFC mixes with different FA content
Compressive strength of AASFC mixes with different NaOH concentration
Compressive strength of AASFC mixes with different SS/SH ratio
Comparison of experimental and predicted split tensile strength of AASFC
mixes
Split tensile strength of AASFC mixes
Modulus of elasticity of AASFC mixes
58
59
62
63
63
65
67
68
71
71
73
73
76
77
78
79
79
80
82
82
83
84

xxi
5.11
5.12
5.13
5.14
5.15
5.16
6.1
6.2
6.3
6.4
6.5
6.6
6.7
6.8
6.9
6.10
6.11
6.12
6.13
6.14
6.15
Comparison of experimental and static elastic modulus of AASFC mixes
Flexural strength of AASFC mixes
Comparison of experimental and predicted flexural strength of AASFC mixes
Fatigue life of AASFC specimen for D-8 mix
Fatigue life of AASFC specimen for D-10 mix
Fatigue life of AASFC specimen for D-14 mix
Abrasive resistance of various AASFC mixes
Sorptivity characteristics of alkali activated mixture for mix M-8
Water absorption and permeable voids in AASC mixes
Water absorption and permeable voids in AASFC mixes
Cubes immersed in acid solution for durability test
Change in mass of AASC samples immersed in HCl Solution
Change in mass of AASFC samples immersed in HCl Solution
Change in mass of AASC samples immersed in H2SO4 Solution
Change in mass of AASFC samples immersed in H2SO4 Solution
Change in a mass of AASC samples immersed in HNO3 Solution
Change in a mass of AASFC samples immersed in HNO3 Solution
Change in compressive strength of AASC samples immersed in HCl solution
Change in compressive strength of AASFC samples immersed in HCl solution
Change in compressive strength of AASC samples immersed in H2SO4
solution
Change in compressive strength of AASFC samples immersed in H2SO4
solution
85
85
87
88
88
91
94
97
97
98
99
100
100
101
101
102
103
103
104
105
106
xxii
6.16
6.17
Change in compressive strength of AASC samples immersed in HNO3 solution
Surface cracks and pop outs on AASC specimens immersed in sulphuric acid
106
107

1

1
CHAPTER 1
INTRODUCTION
1.1 GENERAL
India has the second-largest road network in the world, spanning a total length of
5.89 million kilometers (km). This road network transport 64.5% of all goods, and 90%
of India’s total passenger traffic uses the road network to commute in the country. Road
transportation has gradually increased over the years, with improved connectivity
between cities, towns, and villages in the country (https://www.ibef.org/industry/roads-
india.aspx).
Highways play an integral role in enabling economic productivity and
competitiveness by providing the mobility needed to access employment, recreation, and
to transport goods between different markets. Road transportation has gradually increased
over the years with the improvement in connectivity between cities, towns, and villages.
The Government of India has set a target of construction of 10,000 km of national
highways in Fiscal Year (FY) 2019. In 2017-18, the total length of roads constructed
under Prime Minister Gram Sadak Yojana (PMGSY) was 47,447 km
(http://omms.nic.in/).
Rigid concrete pavements are widely used in the construction of long-lasting roads as
they enable a better distribution of load over the subgrade and require overall smaller
structural depth, compared to flexible pavements. However, pavement slabs are subjected
to continuous vehicular traffic and thermal stresses due to temperature variation
(Perdikaris et al. 1986, Lee and Barr 2004, Graeff et al. 2012). The initial cost of
construction of flexible pavement is much lesser than rigid pavement, but when it comes
to the service life, it is un-comparable. The rigid pavement lasts for 30-40 years, whereas
the flexible pavement lasts for 10-15 years. As far as the maintenance cost is concerned,
the cost of flexible pavement is around 10-15% of the total cost of pavement per year. On
2
the other hand, the maintenance cost of rigid pavement is around 1-2% per km
(http://pmgsy.nic.in/downloads/10janjun06_eng.pdf).
Rigid pavements are preferred over flexible pavement due to low maintenance cost and
high service life with minimum distresses. Due to this, a developing country like India
gives prime importance to construct rigid pavements (Singh et al. 2017). Portland cement
concrete is one material that is widely used to pave highways, airports, parking lots, and
other similar types of infrastructure. These pavements typically provide years of service
with little or no maintenance needs when properly designed and constructed (Delatte
2009). The concrete industry is currently facing an acute shortage of natural aggregates;
this has led to extensive research and the industry to find an alternative material replacing
coarse and fine aggregate. By incorporating marginal materials, the environmental impact
and construction cost can be reduced (FHWA 2012). The extraction of aggregates from
the quarry and mining of the sand from the river creates severe environmental problems.
Due to the scarcity of aggregates, the construction cost is escalating enormously (Singh et
al. 2017). Consequently, the construction industry exploring more economical and
environmentally friendly pavement materials to make the concrete pavements more
efficient and long-lasting. The locally available Alternative Cementitious Material
(ACM) like Ground Granulated Blast Furnace Slag (GGBFS), Fly Ash (FA), rice husk
ash, Red mud, Metakaolin can be used the production of concrete (Duxson et al. 2007).
Hence an alkaline activator solution is required to activate the ACM to improve the
mechanical properties. The activated source material with an alkali activator solution
produces alkali-activated concrete mixtures (Chindaprasirt et al. 2007, Wongpa et al.
2010).
The present investigation aims to develop the concrete with marginal materials by the
alkali activation technique. The cement production is associated with environmental
issues such as the release of nearly 1-ton CO2 to the atmosphere for producing 1-ton
cement. This contributes to5% of worldwide greenhouse gas emissions (Ding et al.
2016). Nearly 2-tons of raw materials are consumed for producing 1-ton of cement,
3
resulting in the depletion of natural resources (limestone and shale, etc.),which is
extremely energy-intensive that requires 4GJ (Giga Joules) of energy. GGBFS,
a byproduct material obtained from the iron and steel industry, can be effectively used as
a binder activated under an alkaline medium to produce the concrete. The GGBFS
contains a significant amount of constituents like calcium, silicon, and aluminium; it can
be activated in an alkaline medium to develop Alkali Activated Slag Concrete (AASC).
In recent studies, AASC mixes have also gained more attention to produce sustainable
concrete (Wang et al. 1995, Bakharev et al. 2000).
Alkali activated mixtures are developed with less energy consumption along with
reduced carbon footprint. GGBFS and FA are the solid precursors in producing the Alkali
Activated Materials (AAM) with the aid of an alkaline activator solution (Shi et al. 2006).
The decreased outflow of CO2 has been related to the generation of AASC. The
commonly used activator for polymerization of a mix is Sodium Hydroxide (SH) or
Potassium Hydroxide (Palomo et al. 1999, Xu and Deventer 2002). These AASC blends
have indicated high strength at the early stages of curing and better resistance towards an
aggressive environment (Collin and Sanjayan 1999, 2000, Chang 2003, Bakharev 2003,
Khale and Chaudhary 2007). Slag and flyash have been progressively considered to be
appropriate crude materials for alkali-activated materials because of its availability and
the presence of silica and alumina content in it. The past studies on AASC mixtures have
shown that physical and mechanical properties of alkali-activated mixtures were
significantly affected by binder content, activator concentration, and alkaline liquid to
binder ratio (Bernal et al. 2012, Qureshi and Ghosh 2014). The chemical composition of
slag, particle size distribution, glass content, and phases of crystalline material have
significant contribution on strength development (Wang et al. 2005, Chi 2012, Junaid et
al. 2015). The final reaction products in AASC mixtures will be hydrated complexes of
calcium alumina-silicate gels (C-A-S-H) with a low ordered Ca/Si ratio, a minimum
content of calcium silicate hydrate (C-S-H), and sodium alumina-silicate (N-A-S-H) gel
(Puertas et al. 2011, Ismail et al. 2014, Fernandez-Jimenez et al. 2003).

4
1.2 AN OVERVIEW ON CEMENT
Cement production in the year 2018 was 502 Million Tonnes (MT), and the
addition of 20 MT per annum (MTPA) is expected in FY 2019-20. In India, there are 210
cement plants with a capacity of 410MT. The cement industry is an energy-intensive and
third-largest coal consumer in the country after the power and steel sectors. It needs both
electrical as well as thermal energy for its operation. On average, cement plants are
spending around 35-50% of the total manufacturing cost of cement to meet their energy
demands, as shown in Fig 1.1
(http://www.indiaenvironmentportal.org.in/files/file/cement.pdf).
Figure 1.1 Cost breakup in cement manufacturing
(http://www.indiaenvironmentportal.org.in)
1.3 PRECIOUS SLAG (PS) BALL
PS ball is a by-product obtained from molten slag generated from the steelmaking
process. It is a solid spherical ball obtained by Slag Atomizing Technology (SAT).In the
Electric Arc Furnace (EAF) of high efficiency, the molten slag was formed into small
droplets. There is no free CaO present in the product. The surface of the PS ball is shiny
having stable spinel structure with a combination of CaO-Fe2O3, CaO-SiO2. SAT is the
process of changing the liquid slag (1500°C-1550°C) into small balls with a diameter
ranging from 0.1 mm to 4.5mm. In the process, a high-speed wind system with a catalyst

5
and water were used to convert the liquid slag into balls of different sizes. The surface of
the PS ball formed by the oxide compound does not allow easy movement of ions or
electrons. Due to this, the ion or electron movement from the PS ball required for the
chemical reaction to take place becomes difficult, and therefore it can be considered as
stable material that offers very strong resistance to chemical and physical weathering. It
is an Eco-friendly material since it is pollution-free and non-toxic as it does not contain
free silica. When this material is compared to sand, it exhibits superior characteristics,
showing higher crushing strength (35%), hardness (43), and anti-weathering properties.
The slag byproducts are used for various applications ranging from agriculture, landfills,
cement making, paver blocks, and construction of roads to railway ballast. In India, the
current production of steel slag is around 12 million tonnes per annum. While only a little
quantity of the steel slag generated in India is recycled, a large portion of the steel slag
generated is disposed in stockpiles or dump yards. This causes problem due to the paucity
of land, dumping costs, and other environmental aspects. However, the production of PS
ball by SAT eliminated the problem of landfills or dumping. The utilization of PS ball in
concrete can lower the environmental impacts along with a reduction in valuable landfill
space and protection of natural aggregates for the future. The use of PS ball as fine
aggregates in the construction industry will solve the sand mining problem. The
awareness of the utilization of PS ball as road material is limited in India. However,
before promoting such a material, there is a need for extensive research to be carried out
to check its suitability in road applications.
1.4 NEED AND SIGNIFICANCE OF PRESENT INVESTIGATION
The growth of vehicular traffic has led to the construction of new highways.
Improved road connectivity is essential for any country’s development. The roads need to
be durable and sustainable. The high demand of concrete for roads and other construction
purposes has resulted in the augmented production of OPC.
6
The development of eco-friendly and sustainable construction materials has gained major
attention from the construction industry. With the augmented emissions of greenhouse
gases, high energy consumption, and environmental hazards from the increased OPC
production, the researchers focus on developing possible alternatives to OPC. Alkali
activated binders can be looked upon as an alternative to conventional OPC binders,
which have the capabilities to be used in the construction industry, causing a significant
reduction in OPC production (Rashad 2013). Alkali activated binders include clinker-free
binders, such as AAS, AASF, Geopolymers, etc., which include the use of a strong
alkaline activator along with calcium or silicate rich precursor material such as GGBFS,
FA, etc., to form a final product, having properties equivalent or better than OPC. The
energy required for the production of alkali-activated binders is less than that required for
OPC concrete and are further associated with low CO2 emissions.
Over the years, the natural aggregates have been used as the filler material in concrete.
The present-day research has been concentrated on seeking alternative materials as a
replacement for natural fine aggregates in concrete. PS ball, which is generally
considered as an industrial by-product from the iron and steel industry, can be viewed as
a potential replacement for natural fine aggregates. The utilization of PS ball in concrete
mixes will have several advantages such as elimination of cost of dumping, minimization
of environmental problems related to disposal of unused slag, conservation of natural
aggregates, etc. Despite of satisfactory performance of PS ball as fine aggregates in both
normal and high-performance OPC concrete, there is limited research available regarding
the incorporation of PS ball as fine aggregates to produce AAB based concrete mixes.
The present experimental study focuses on the possible utilization of industrial waste
materials such as GGBFS, FA, and PS ball in the production of sustainable concrete. The
aim of the study is not just to protect the natural raw materials, but to recycle the disposal
wastes generated from the industries. Since the kind of curing adopted in the present
research is air curing, this type of concrete will be of great advantage in arid and desert
regions, where there is an acute shortage of water. Presently in India, there limited field
7
application of AAB based concrete in pavements or any other structures, mainly due to
limited research, non-acceptability of new materials, lack of expertise and confidence,
etc. The scenario can be changed by conducting proper research and communicating the
performance of AAB concrete for different applications.
1.5 SCOPE OF WORK
The IRC:58 (2015) recommends a minimum grade of M40 with a minimum
flexural strength of 4.5 MPa for concrete roads. As per the requirements, AASC and
AASFC mixes were designed to attain a minimum strength of M40 and compared with a
control mix. AASC mixes were prepared with 100% GGBFS as a sole binder, while
AASFC mixes were prepared by mixing GGBFS and FA in different proportions, i.e.,
90:10, 80:20, 70:30, and 60:40. Preliminary tests were carried out to identify the optimal
NaOH concentration and dosage of alkaline activators for each AASC and AASFC
mixes. PS ball as fine aggregates were incorporated in the AASC and AASFC mixes by
replacing the natural fine aggregates by volume replacement method at 100%
replacement level. The fresh and hardened properties such as workability, setting time,
compressive strength, split tensile strength, modulus of elasticity, flexural strength, and
abrasion resistance of different concrete mixes was evaluated as per standard test
procedures. The durability of concrete mixes in terms of resistance to sulphuric acid,
hydrochloric acid, nitric acid were investigated. The water absorption and volume of
permeable voids are also evaluated. Flexural fatigue performance of various concrete
mixes was determined by carrying out repeated load tests on beam specimens. The
fatigue life data obtained were represented and analyzed using S-N curves. Probabilistic
analysis of fatigue data was carried out using two-parameter Weibull distribution method.
Survival probability analysis to predict the fatigue lives of concrete mixes was carried
out.

8
1.6 OBJECTIVES
It is observed that attempts have already been made by researchers to understand
the mechanism of Alkali Activated Slag Concrete (AASC) and Alkali Activated Slag-Fly
Ash Concrete (AASFC). However, there is limited research on the incorporation of PS
ball as fine aggregates to produce AASC and AASFC mixes. The aim of the proposed
study is to focus on a detailed experimental investigation to address the suitability and
performance of air-cured AASC and AASFC mixes by incorporating PS ball as fine
aggregate.
Evaluate the workability and engineering properties of AASC and AASFC
mixes developed using PS ball.
Study the flexure, fatigue behavior of the AASC, and AASFC mixes.
Evaluates the durability performance of AASC and AASFC mixes
Selection of mixes for concrete pavement.
1.7 THESIS OUTLINE
The research work is reported in 7 chapters. The first chapter is an introduction to the
topic; other chapters are organized as follows:
Chapter-1 introduces the topic.
In Chapter-2, the literature related to Alkali-Activated Slag Concrete, including the
definition of the materials and the properties of concrete, SH and SS as activator
solutions including the reaction process involved and solubility of silicates are discussed.
Chapter-3 presents the materials, experimental design, mix proportions, and research
methodology adopted.
Chapter-4 deals with the engineering properties of AASC, including compressive
strength, splitting tensile strength, modulus of elasticity, abrasion resistance, flexural
strength and fatigue behavior of different mixes and influencing factors.

9
Chapter-5 deals with the effect of alkaline concentration on the fresh and hardened
properties of AASFC.
Chapter-6 covers the durability properties of alkali-activated mixtures.
The main conclusions and recommendations for future work are discussed in Chapter-7.
The list of references is presented at the end of the thesis.

10

11
CHAPTER 2
LITERATURE REVIEW
In this chapter, available literature on alkali-activated concrete along with various
factors influencing the development of alkali-activated concrete and its implications are
discussed.
2.1 ALKALI ACTIVATION OF CONCRETE
Several attempts have been made in discovering alternatives to Portland cement
by considering environmental effects and higher energy-intensive production procedures
of cement. The material used as alternatives to cement should be pozzolanic in nature.
Pozzolana is a material of ash type, essentially consisting of silica and alumina as major
components in the glassy structural phase of the source material. On reaction with
hydroxides of calcium in the presence of water at room temperature, hydrated products of
Calcium Silicate Hydrate (CSH) compound having cementitious properties are formed.
The pozzolanic materials such as slag, FA, silica fume, rice husk ash, etc., are industrial
by-products that can be used as Supplementary Cementitious Material (SCM).
Slag is the by-product of the iron and steel industry. The main chemical constituent
includes calcium, magnesium, aluminium, and silicate with 95% glass content. The
composition of slag differs with crude materials and the manufacturing process. The
cooling procedure and composition are the two factors that essentially impact the
structure and properties of slag. Specifically, Blast Furnace Slag (BFS) refers to the slag
delivered from the pig iron manufacturing process. If the molten slag is quenched
sufficiently, it forms a material called granulated blast furnace slag quickly. Slag has
latent hydraulic properties. If slag comes in contact with water alone, it dissolves to a
smaller extent; however, a defensive film insufficient in Calcium (Ca2+
) is immediately
formed, which suppresses the further reaction process involved. The reaction proceeds if
the pH is adequately high.
12
The pore structure of cement, which is basically one of the alkaline hydroxides, is an
appropriate medium. The contribution of Potassium (K+) and Sodium (Na
+) particles is
constrained; however, these ions are partially utilized for hydration products, and the
occurrence of strong calcium hydroxide guarantees the supply of OH- in hydrated phases.
The slag can also be activated by OH- particles provided in different ways; for example,
the inclusion of SH or SS (Taylor 1997). The major component of slag includes calcium
oxide, silicon dioxide, aluminium trioxide, magnesium oxide, etc. The alkali-activation of
slag results in the formation of amorphous CSH compounds with a significant amount of
alumina content (Pacheco et al. 2007). This shows that slag can be activated by Ordinary
Portland Cement (OPC), which is the most common procedure and furthermore with
alkali solution in alkali activated mixtures. The alkali solution can be alkaline hydroxide
(MOH), non-silica salts of weak acids (M2CO3, M2S, MF), and silica salts of M2O(n)SiO2
type or combination of blends of these, where M represents an alkaline metal such as Na,
K, Lithium (Li). Of all these alkaline solutions, SS (Na2SiO3) is the best activator
solution (Wang et al. 1995).
2.2 FACTORS AFFECTING ACTIVATION OF SLAG
The factors affecting slag activation can be summarized as:
a) Type of slag
Slag chemical composition plays a vital role in the hydraulic activity of binder
particles. Thus, the micro-structural and hardened concrete properties are produced. The
high alumina content brings about high early strength where a significant amount of slag
reacts and hardens quickly. Subsequently, the A12O3/SiO2 proportion is viewed as a
quality modulus, and slag with 12-15% of A12O3is preferred. Minor constituents of
Phosphorous, Fluoride, Sulphur, Manganese, and Titanium regularly have a significant
influence on strength development. The excess Fe2O3 content diminishes the slag
reactivity (Wang et al. 1994). The mineralogical composition of slag has a greater
influence on reactivity; the crystalline mixes found to be less reactive compared to the
amorphous type, determined by XRD technique.
13
b) Fineness of slag
Slag reactivity depends on the fineness, grain size distribution, and the specific
surface area. It is well known that increasing the fineness of slag enhances the strength
with a decreased setting time of slag blends. The fineness of slag for alkali-activated slag
ranges between 450-500 m2/kg by Blaine’s permeability (Wang et al. 1994).
c) Type of Activator
Activators used include Potassium Hydroxide (KOH), SH, Sodium Sulphate
(Na2SO4), Sodium Carbonate (Na2CO3), and SS, which is the best activator according to
several researchers (Wang et al. 1994).
d) Method of Adding Activator
Alkaline activator solution is added to the binder system in three ways: solution,
solid precursor, and in the solid-state where the alkali activator is added separately as one
of the mix constituents. The addition of alkali in the solid-state represents lower strengths
compared to the solution form but also produces fluctuation in the test results, which can
be attributed to lower solubility and lesser dissociation of alkalis. Due to the hydrophilic
nature of solid alkalis, it might absorb moisture during storage, which inhibits the
activation process. Anhydrous sodium meta-silicate/sodium silicate (containing
chemically bound water) in the solid form produces very low strength under a normal
curing regime. But, when the same alkali is added in solution form, a similar type
activation mechanism can be achieved with sodium silicate solution. A combination of
sodium hydroxide with sodium silicate has been found to provide the best strength
performance for the activation of alkali-activated binders (Rashad 2013). When Na2CO3
is added in solid alkali form with ground Na2CO3, slag gives high strength. Due to higher
solubility, SH pellets and solution can act as a good activator solution (Wang et al. 1994).
In general, the alkali solution shows better performance in strength development with
loss in workability and reduced setting time.
14
e) Activator Dosage
Several authors have made an attempt to optimize the alkaline dosage with
inconsistency in test results. Alkali-activated mixtures can be developed with SH (by
binder weight) range between 1-10%. A variation in SH dosage (3-11%) shows a
remarkable loss in strength. Alkali dosage can also be expressed in terms of Na2O
content; high Na2O content tends to increase strength. However, Na2O content beyond
the threshold limit (the type of slag, the concentration of activator solution and curing
regime) decreases the strength of the activated mixture. This tends to produce detrimental
properties like an increase in efflorescence and brittleness due to the availability of free
alkaline ions. The Na2O content from 3-5.5% with sodium SS can be used as an activator
solution (Wang et al. 1994). Alkali-activated mixtures developed using different alkali
solutions such as SH, Na2CO3, SS, and Na2SO4 or a combination of these solutions can
be used as activator solutions. The best results are obtained for the mixes with silica
modulus 0.75 and 5% Na2O content. The strength properties of alkali-activated slag
mixture were influenced by the activator solution, alkaline dosage, and the observed
optimum dosage of Na2O was in the range between 3-5% (Fernandez-Jimenez et al.
1999). The high strength concrete can be developed using a slag-cement blend activated
by SS with a modulus of 1.6-1.5 (Krizan and Zivanovic 2002). The strength of alkali-
activated fly ash mixes activated with SH variation in Na2O content between 5-15% is
influenced by alkaline liquid/binder (a/b) ratio (Fernandez and Palomo 2005).
f) Silica Modulus
Silica modulus (Ms) refers to the molar ratio of SiO2/Na2O. These main reactive
components are primarily responsible for the hydration reaction and strength
development. Alkali-activation of slag particles converts amorphous silica (SiO2) forms
to silica-gel. For constant Na2O content, high strength can be achieved with an increase in
silica mineral. But limiting the solid content in the activator solution has to be considered
for solubility. Therefore, high silica modulus utilizes more solid content to achieve high
Na2O content. The strength of AABs is governed by the type of alkaline activator,
15
activator modulus, and dosage of alkaline activator (Fernandez-Jimenez et al. 1999). The
Ms is a ratio of the mass of SiO2/Na2O components present in the alkaline activator, while
the dosage (usually referred to as Na2O%) is the total sum of the mass of Na2O present in
the alkaline activator (mass of Na2O present in sodium silicate + mass of Na2O equivalent
in SH if the combination of SS and SH is used as an alkaline activator). Also, SS with
high modulus results in a quick setting of alkali-activated slag mixtures, which
necessitates optimizing the silica modulus. Good test results were obtained for the alkali-
activated mixtures with silica modulus range between 1 to 2.
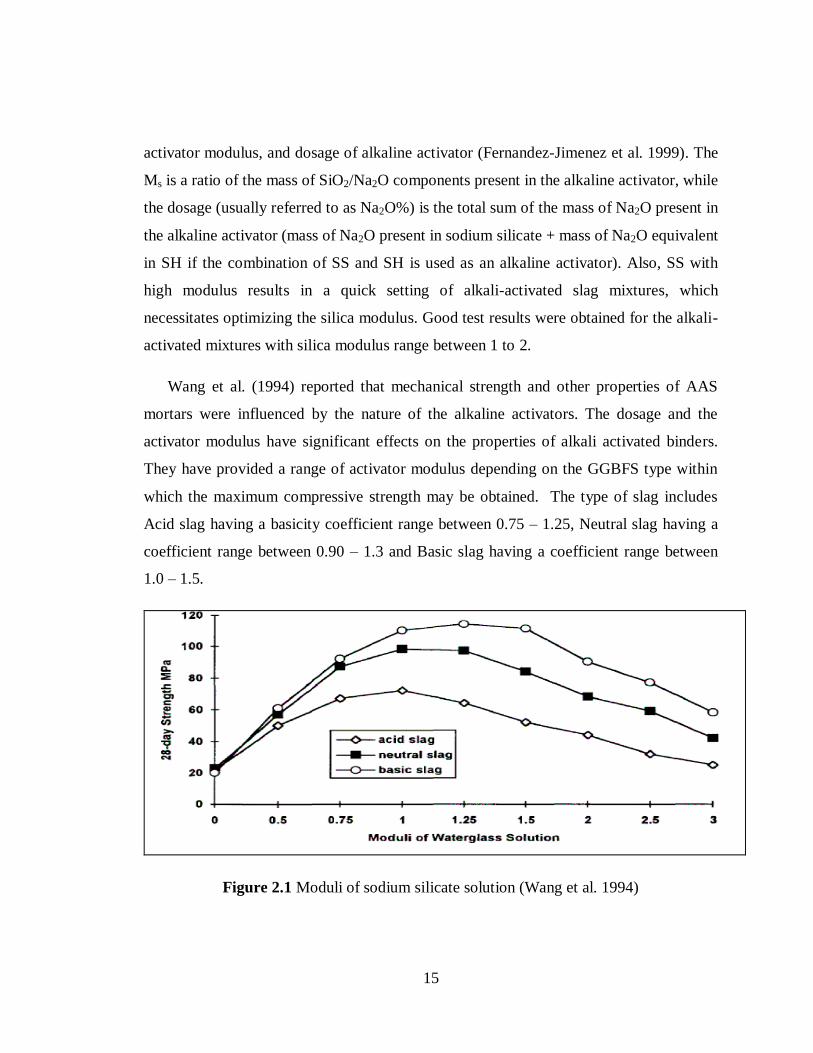
Wang et al. (1994) reported that mechanical strength and other properties of AAS
mortars were influenced by the nature of the alkaline activators. The dosage and the
activator modulus have significant effects on the properties of alkali activated binders.
They have provided a range of activator modulus depending on the GGBFS type within
which the maximum compressive strength may be obtained. The type of slag includes
Acid slag having a basicity coefficient range between 0.75 – 1.25, Neutral slag having a
coefficient range between 0.90 – 1.3 and Basic slag having a coefficient range between
1.0 – 1.5.
Figure 2.1 Moduli of sodium silicate solution (Wang et al. 1994)
16
g) Curing regime
The hydration reaction of alkali activated mixtures with slag is dependent on the
curing temperature. The high-temperature curing leads to the formation of crystalline
products, whereas ambient cured mixes result in the formation of amorphous products
(Wang et al. 1994). Past studies on alkali activated mixtures have been studied at
different curing conditions such as heat curing, steam curing, normal room temperature
curing (air curing), water curing, etc. Altan and Erdogan (2012) studied AAS mortar
mixes activated using a combination of sodium silicate and sodium hydroxide at room
and elevated temperatures. They observed that heat-cured samples gained strength
rapidly; however, samples cured at room temperature gained strength gradually. It is also
reported that the heat liberated in alkali activated mixtures during the hydration process
was lesser compared to hydration in OPC.
Bilim et al. (2015) investigated the AAS mixes with Na2O dosages of 4% and 6% by
mass of slag. The test results reported that the curing conditions affected the mechanical
behavior of AAS mixes as compared to OPC mixes. The AAS mixes attained high early
strength at elevated temperatures when compared to OPC mixes. For example, an alkali-
activated mixture of phosphorus-based slag (neutral or acid type) had strength of 30 MPa
when air-cured, 62 MPa on heat curing, and 71-76 MPa on autoclave curing. Whereas, an
alkali-activated slag (basic) attained the strength of 80 MPa on air curing and 85-95 MPa
on autoclave curing. The autoclave curing of sodium hydroxide activated alkali activated
mixtures reported an increase in compressive strength compared to the conventional
curing.
Aydin and Baradan (2012) reported that high strength mortars with strengths upto
70 MPa can be produced with alkaline activators with alkali content of 2% (by mass of
binder) under autoclave curing. In the case of heat curing, the curing time and
temperature are the critical factors in determining the strength of alkali-activated mixes
(Shekhovtsova et al. 2014). Qureshi and Ghosh (2014) studied the effect of curing regime
on the strength behavior of AAS pastes under different curing conditions such as water

17
curing at 270C, heat curing at 50
0C and controlled curing with relative humidity 50%,
70% and 90 % at 270C respectively and reported that maximum strength was obtained
under water curing condition. They concluded that the mechanical behavior of AAS paste
was significantly affected by the curing conditions.
Activation of slag (GGBFS), the reaction begins with the attack of alkalis on slag
particles, thus breaking the outer layer and then continued by poly-condensation of
reaction products. Although the initial reaction products are formed due to the process of
dissolution and precipitation, at later stages, a solid-state mechanism is followed where
the reaction occurs on the surface of formed particles dominated by slow diffusion of the
ionic species into the un-reacted core (Wang et al. 1994). In the initial stages of
hydration, alkali cation (R+) behaves like as mere catalyst cat-ion exchange with the Ca
2+
ions for the reaction, as shown in the following equations 2.1, 2.2, and 2.3 (Glukhovsky
1994,Krivenko 1994).
Si-O- + R+ = Si-O-R ... (2.1)
Si-O-R + OH- =Si-O-R-OH
- ... (2.2)
Si-O-R-OH- + Ca2+
=Si-O-Ca-OH + R+ ... (2.3)
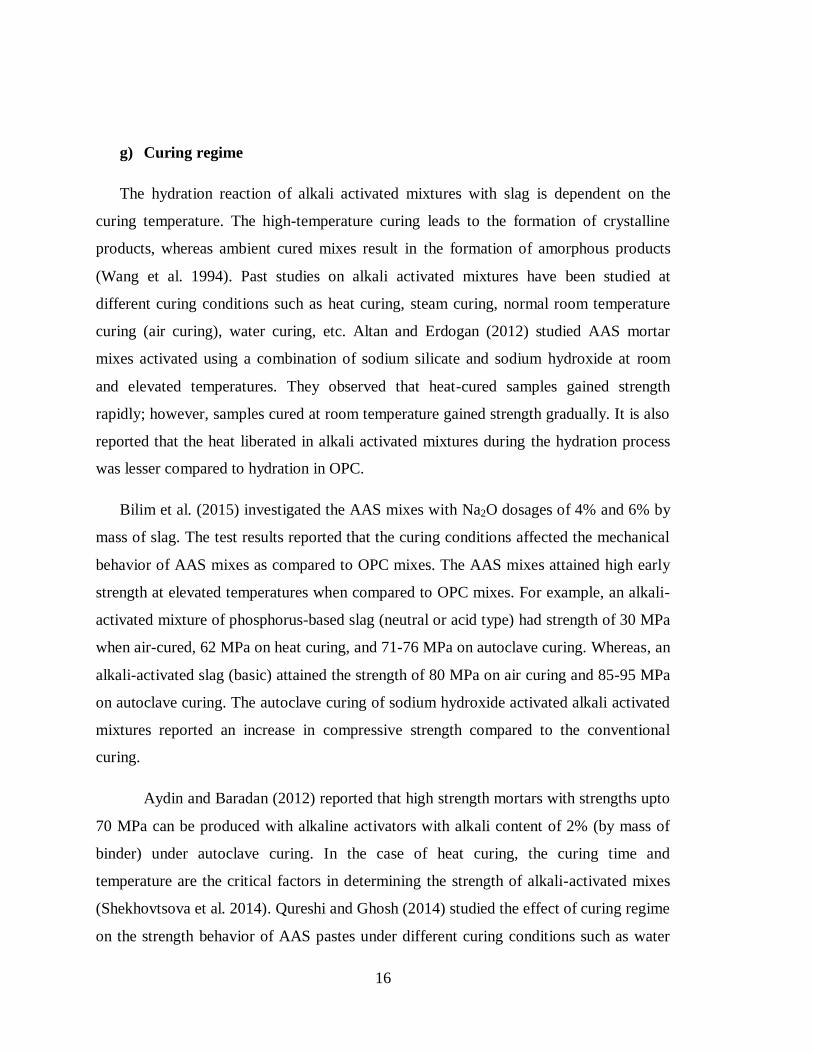
While the alkaline cation act as structure creators, the nature of anion in the
solution plays a significant role in activation, especially during the early stages,
particularly concerning paste setting (Fernández-Jiménez and Puertas 2001). A
descriptive model showing the reaction mechanism is presented in Figure 2.2.
Final hydration products in case of activation of slag are similar to the products of
OPC hydration i.e. Calcium-Silicate-Hydrate (C-S-H), but with a low Ca/Si ratio.
However, the rate and intensity of activation of slag differ majorly as compared to that
hydration of OPC. It is reported that the alkalis are not freely available in the pore
solution since they are bound to the reaction products, thereby negating the potential for
alkali-silica reactivity; however, this depends on the concentration of alkali used.
18
Figure 2.2 Reaction mechanism of alkali-activated slag (Palomo et al. 2014)
The hydration mechanism of Alkali Activated Slag-Fly Ash (AASF) is very
similar to that of AAS; however, they slightly differ in the rate of hydration. There have
been certain contradictions on the reaction products in the hydration of AASF. Studies
carried out by researchers (Puertas et al. 2000) claim the main product formed in AASF
to be C-S-H with no existence of A-S-H, while others (Chi and Huang 2013) have
reported the presence of both. Chi and Huang (2013) reported that amorphous alkaline
alumina-silicate and C-S-H gel, to be the products of hydration of AASF. Idawati et al.
(2013) found the C-A-S-H phase and hybrid C-(N)-A-S-H phases in smaller quantities.
The dissolution of calcium present in slag affects both early and later age properties
significantly, and the availability of free calcium prolongs the FA dissolution and
enhances geopolymer gel formation. They proposed that the hardening process was
initiated with the precipitation of C-S-H/C-A-S-H, while rapid hardening continues due
to accelerated geopolymerization. It was also reported AASF display a basic network
formation due to the formation of alumina-silicate geopolymer at a very early age, and
that product formation was observed on both slag as well as FA spheres.
The polymerization process is an exothermic polycondensation reaction which
involves alkali activation by cation, thus leading to the formation of a polysialic
geopolymer (Davidovits1999).A chemical reaction occurs between alumino-silicate
oxides (Si2O5, Al2O2) and alkali polysiliates forming polymeric Si – O – Al bonds.
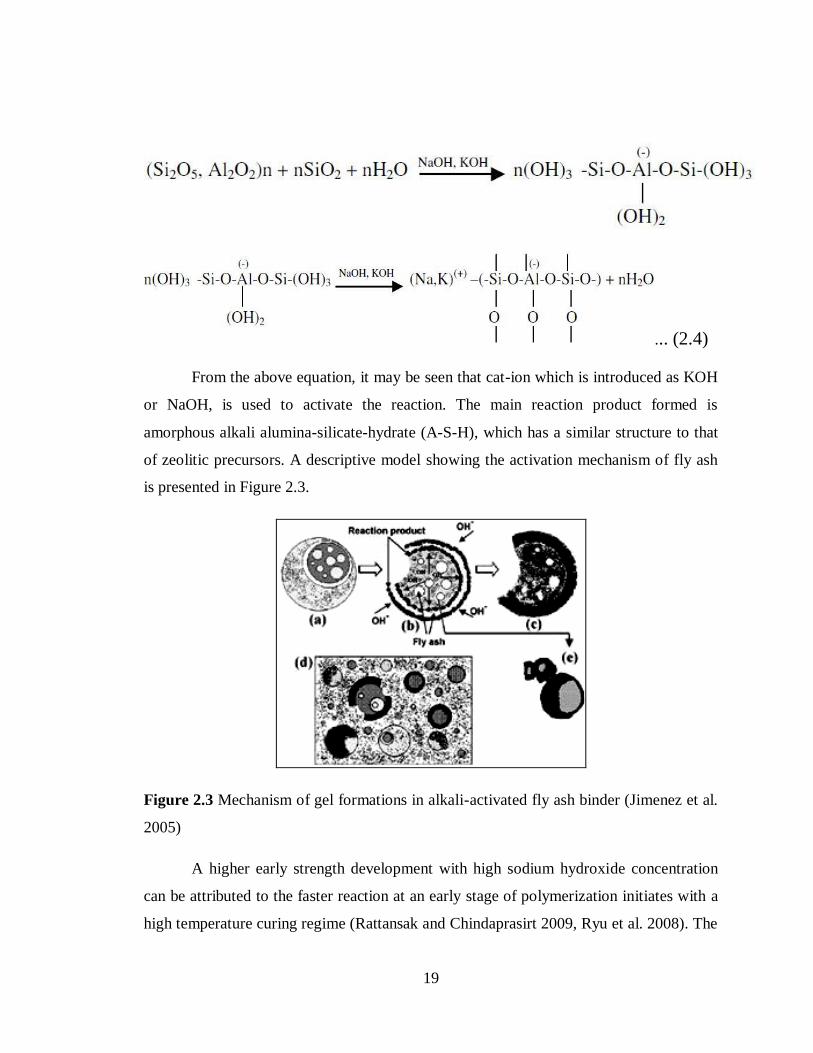
Equation 2.4 shows an example of polycondensation by alkali into poly (sialate).
19
... (2.4)
From the above equation, it may be seen that cat-ion which is introduced as KOH
or NaOH, is used to activate the reaction. The main reaction product formed is
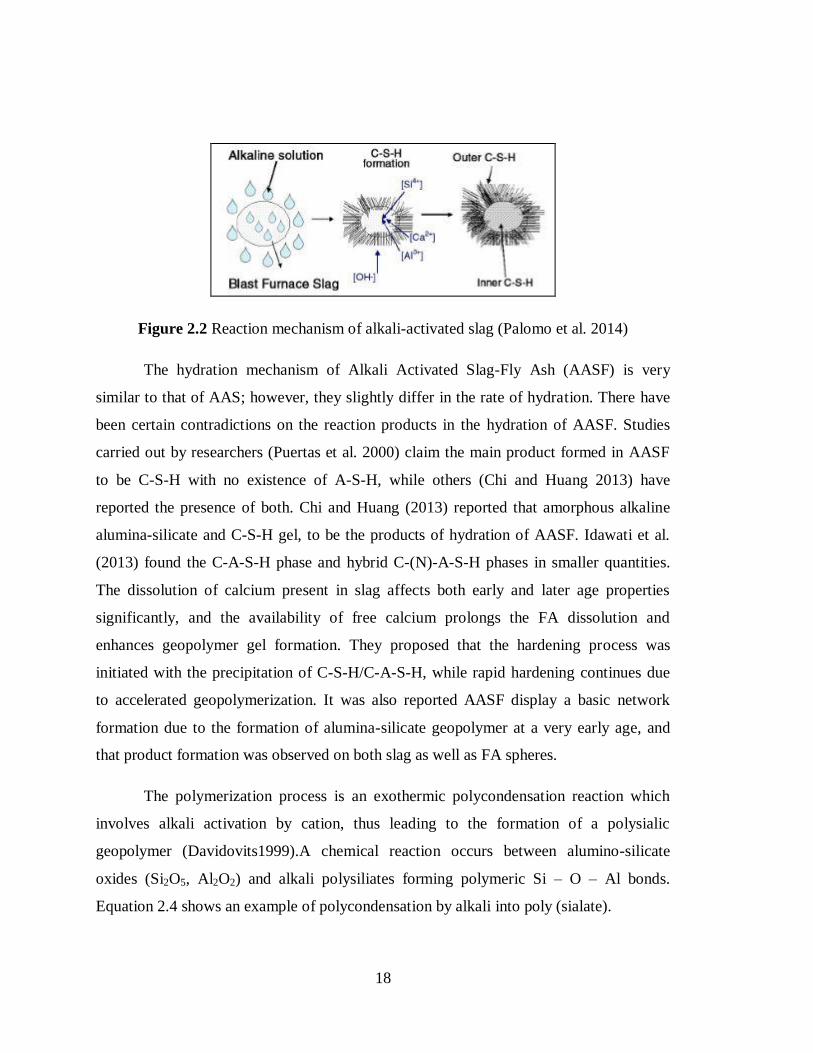
amorphous alkali alumina-silicate-hydrate (A-S-H), which has a similar structure to that
of zeolitic precursors. A descriptive model showing the activation mechanism of fly ash
is presented in Figure 2.3.
Figure 2.3 Mechanism of gel formations in alkali-activated fly ash binder (Jimenez et al.
2005)
A higher early strength development with high sodium hydroxide concentration
can be attributed to the faster reaction at an early stage of polymerization initiates with a
high temperature curing regime (Rattansak and Chindaprasirt 2009, Ryu et al. 2008). The
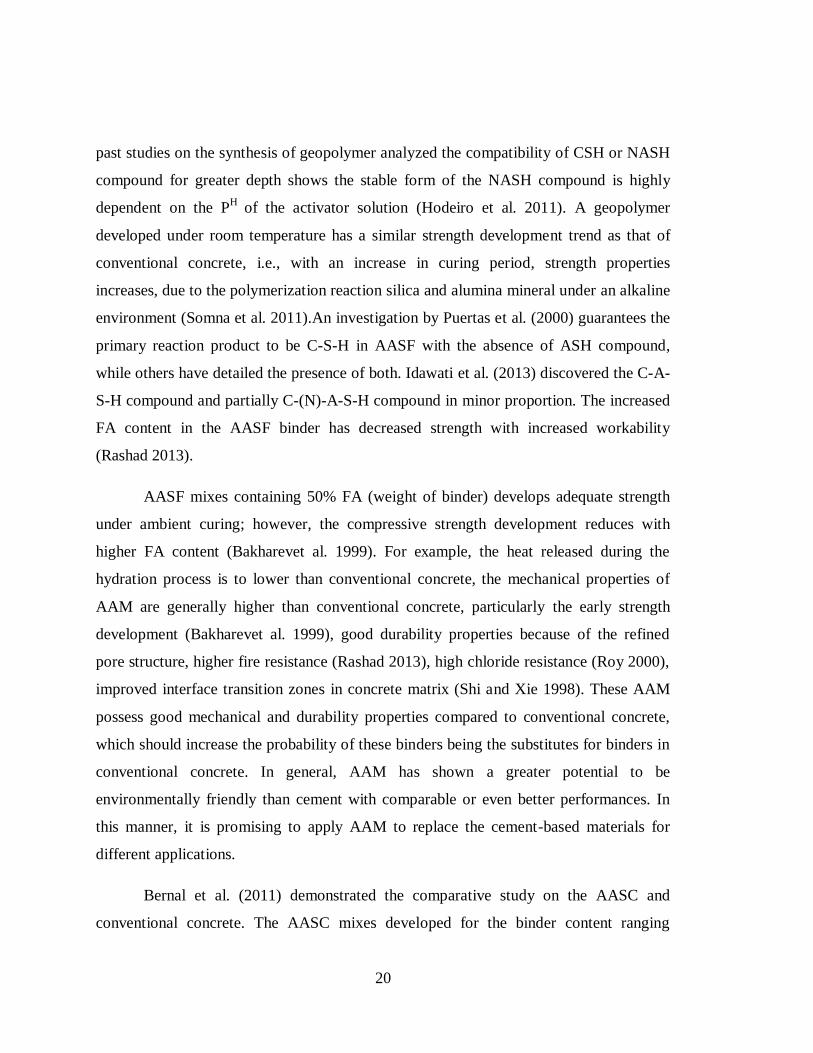
20
past studies on the synthesis of geopolymer analyzed the compatibility of CSH or NASH
compound for greater depth shows the stable form of the NASH compound is highly
dependent on the PH
of the activator solution (Hodeiro et al. 2011). A geopolymer
developed under room temperature has a similar strength development trend as that of
conventional concrete, i.e., with an increase in curing period, strength properties
increases, due to the polymerization reaction silica and alumina mineral under an alkaline
environment (Somna et al. 2011).An investigation by Puertas et al. (2000) guarantees the
primary reaction product to be C-S-H in AASF with the absence of ASH compound,
while others have detailed the presence of both. Idawati et al. (2013) discovered the C-A-
S-H compound and partially C-(N)-A-S-H compound in minor proportion. The increased
FA content in the AASF binder has decreased strength with increased workability
(Rashad 2013).
AASF mixes containing 50% FA (weight of binder) develops adequate strength
under ambient curing; however, the compressive strength development reduces with
higher FA content (Bakharevet al. 1999). For example, the heat released during the
hydration process is to lower than conventional concrete, the mechanical properties of
AAM are generally higher than conventional concrete, particularly the early strength
development (Bakharevet al. 1999), good durability properties because of the refined
pore structure, higher fire resistance (Rashad 2013), high chloride resistance (Roy 2000),
improved interface transition zones in concrete matrix (Shi and Xie 1998). These AAM
possess good mechanical and durability properties compared to conventional concrete,
which should increase the probability of these binders being the substitutes for binders in
conventional concrete. In general, AAM has shown a greater potential to be
environmentally friendly than cement with comparable or even better performances. In
this manner, it is promising to apply AAM to replace the cement-based materials for
different applications.
Bernal et al. (2011) demonstrated the comparative study on the AASC and
conventional concrete. The AASC mixes developed for the binder content ranging
21
between 300-500 kg/m3. Irrespective of the binder content in the AASC mix, the AASC
mixes developed high compressive strength than conventional mixes. It was concluded
that, by controlling the mix design parameters, it is possible to develop the AASC mixes
with greater mechanical strength and durability properties compared to the conventional
mixes.
The performance of fly ash-based geopolymer blend has been reported for the
acid-resistance test (Bakharev 2005, Song et al. 2005), sulphate attack (Bakharev 2005),
and chloride attack (Miranda et al. 2005). Metakaolin based alkali-activated material
remains unaffected by the various acid solutions such as Sea-water, Deionized water,
sodium sulphate, and sulphuric acid (Palomo et al. 1999). Satisfactory performance of
alkali-activated fly ash material was observed on sulphate attack and sea-water. When
exposed to sulphates, a negligible amount of sodium sulphate is formed as a deterioration
product. In sea-water, the sodium (Na+) ions are interchanged by Magnesium (Mg
+) ions
results in the formation of more porous products affecting the microstructure. Low-
calcium fly ash-based geopolymer tends to degenerate aluminium particles under highly
acidic conditions results in substantial mass loss with a decrease in strength (Fernández -
Jimenez et al. 2007). Fly ash-based geopolymer exposed to 5% sodium sulphate for 52-
weeks reported no-sign of sulphate attack or deterioration. However, the samples exposed
to 2% sulphuric acid significantly reduce compressive strength (Wallah and Rangan
2005).
Fly ash (low calcium) based alkali-activated material on alkali-silica reaction as
per ASTM C 1260-84. (Fernández -Jimenez et al. 2007). The long-term properties of fly
ash (low calcium) based geopolymer found to be a low creep and dry shrinkage
properties on heat curing. After 52-week dry shrinkage strain was approximately 100x10-
6, and creep factor varies between 0.44-0.63 with compressive of 60 MPa (Wallah and
Rangan 2005). Fly ash (low calcium) based geopolymer shows better resistance towards
acidic attack; the fly ash mortar contains a substantial amount of Mesopore size pores
(Kong et al. 2007, Sindhunata 2006).

22
Pore structure development of activated material is considerably lower than
cement mortar, which prolongs the curing period. The increased silica and alkali
concentration have a relative influence on pore structure and porosity (Ma et al. 2013).
Lower water absorption and sorptivity exhibited by fly ash-based geopolymer on heat-
curing. An alkaline liquid/ binder ratio, aggregate content, and alkaline concentration are
the major parameters influencing the permeability properties (Olivia et al. 2008). The
past studies have shown heat-cured geopolymer concrete has great potential to be an
alternative for conventional concrete. However, the durability of these mixtures has to be
established, particularly air-cured alkali-activated material. The experimental study
present in this chapter utilizes ambient curing to the alkali-activated mixtures for
durability properties.
2.3 EFFECT OF SODIUM HYDROXIDE
Alkali-activator solution has a prime role in dissolving the silica and alumina
minerals to produce a geopolymer solid precursor with alumina-silica complexes as final
reaction products. SH and KOH are commonly used for activator solutions (Davidovits
1999, Palomo et al. 1999, Fernandez et al. 1999, Swanepoel and Strydom 2002, Xue et al.
2002). The alkaline solution prime role in the alkali-activated system is similar to the
addition of water to cement blended with slag/fly ash. Suppose the water is added directly
to the slag mix, the hydration reaction is interrupted by the passive layer/coat formation
on slag particle. An alkaline solution of a strong base such as NaOH and KOH is
necessary to breakdown the passive layer for enhancing the polymerization (Taylor
1997).
Three different types of slag (acidic, basic, and neutral) with sodium silicate have an
activator solution with different activator modulus. The test results indicate that the
optimum activator modulus was found to be 0.75-1.25 (acidic), 0.9-1 (neutral), and 1-1.5
(basic). At a lower PH (>11), the solubility of silica mineral is very low, which is a major
constituent of slag. The PH
of the activator solution is expected to have a significant effect
on the final reaction products (Song and Jennings 1999). The activator solution with high

23
SH concentration is directly related to the dissolution of alumina-silica mineral. Since the
dissolubility of silica mineral enhances with the PH of activator solution with the greater
dissolution of silica-alumina mineral complex (>4M SH) (Moruf et al. 2014).The
increase in SH concentration beyond 10M does not contribute to strength development
due to the lower rate of polymerization. This prompted the increase in strength properties
at a high concentration of sodium hydroxide; thus, CASH formed as the final reaction
product (Zuhua et al. 2009). The excess hydroxyl ion produced with high SH
concentration prompts ionic blockage that may prevent oligomeric polymerization, i.e.,
Al(OH)4 and Si(OH)4 exchanges, which restrains the formation of CASH. This could
decrease the strength properties, observed for the mixes with 12M and 16M SH.
Activator solution with a high concentration of SH enhances the dissolution process; it
suppresses ettringite mineral and calcium hydroxide phases during the formation of
reaction products (Khale and Chaudary2007). It was observed that geopolymer mixes
activated with SH develops a greater crystalline compound, which enhances the
durability properties (Criado et al. 2007). Fly ash-based alkali-activated concrete with
sodium hydroxide (8M-12M) as an alkali-activator solution; oven cured for 24-hours at
850C produces the concrete having a compressive strength range between 35-40 MPa.
This attains the strength of 90 MPa (SiO2/Na2O =1.23) (Palomo et al. 1999). The high
molarity of SH used as an activator solution enhances the strength properties with a
substantial effect on early strength (Ryu et al. 2013).
Increased SH concentrations from 8M-18M positively affect setting time (Hanjitsuwan et
al. 2014).The lower Na/Al ratio represents the lower SH concentration and vice-versa. A
Na/Al ratio of 1 and 2 have the lower dissolution of fly ash particles due to lower SH
content results in the lower polymerization. Hence, the rapid setting of a geopolymer is
achieved (Siyal et al. 2016). An increase in Na/Al ratio of 1.4 leads to the greater
dissolution of the FA particle produces more silica, and alumina with low calcium
content enhances the polymerization reaction. The early stage of polymerization requires
24
more time for a complete reaction, which was greatly influenced by the setting time of
geopolymer paste (Chindaprasirt et al. 2012, Alonso and Palomo 2001).
Alkali-activated fly ash concrete developed with 6M SH at SS/SH ratio=1; the setting
time was significantly high compared to the mixes of SS/SH ratio 0.5 and 1.5. The faster
setting time was reported for the mixes with 4M and 6M SH at the SS/SH ratio of 1.5.
However, the setting time was greatly influenced by the interaction between the aqueous
phase of SS and SH (Lee and Lee 2013). The addition of gypsum to the alkali-activated
slag matrix shows a significant reduction in the setting time with an increase in
compressive strength. Meanwhile, the addition of phosphoric acid enhanced the setting
time affecting the early strength of concrete (Rashad 2013).
A Phosphoric and Malic acid is used as a retarder in alkali-activated slag material and
sodium silicate-based mixtures to enhance the setting time (Brough et al. 2000). Palacios
and Puertas (2005) investigated the different types of superplasticizers (Melamine, poly-
carboxylates, naphthalene and based polymers) and shrinkage reducing agents (poly-
propylene glycerol and its derivatives) admixtures affecting the fresh and hardened
concrete properties of alkali-activated material. This study showed naphthalene-based
admixtures along with sodium hydroxide, reported high strength compared to the alkali-
activated slag mixes without admixture. Hardjito et al. (2015) asserted the effect of SH
concentration on the strength properties of FA blended geopolymer mixes. The test
result's activator concentration is directly related to the strength development of
geopolymer mixes. They also claim the strength development of geopolymer mixes were
dependent on the SH concentration.
Synthesis of metakolinite based geopolymer mixes with a higher concentration of SH
enhances the dissolving ability of metakaolinite mineral and produces a more reactive
form of monomer units, with an increase in intermolecular bond strength. They also
claimed the mechanical properties of geopolymer concrete of metakaolin based activated
by SH and SS solution were primarily dependent on the SH concentration (Wang et al.
2018). A lower concentration of SH results in the lower dissolution of the source

25
material. This tends to use the high concentration of sodium hydroxide to improve the PH
of activator solution and speed up the dissolution of the source material. The lower heat
evolution attributes to the passive layer formation on the un-reacted binder particles
formed due to reaction products derived from the source material (Wang et al. 2018). The
essential polymerization of a geopolymer is highly dependent on the SH concentration
and type of source material.
NaOH concentration up to 8M has a reasonable variation in setting time. However, the
sodium hydroxide concentration of 14M significantly delayed the setting time (Yasser et
al. 2019). An increase in SH concentration geopolymer matrixes, the setting time of the
geopolymer blend reduces so as to surge the solid content of sodium hydroxide. The test
results claim higher cohesion of geopolymer composites observed at the lower solution/
powder ratio. The setting time of geopolymer mixes with 5M and 10M sodium hydroxide
concentration is within EN-193guidelines except for the mixes with 1M (Tekin2016).
The aqueous phase of SH in the alkaline medium initiates the dissolution process in
geopolymeric system with a significant effect on final reaction products. FA on contact
with SH enables leaching of calcium, silica, alumina and other traces of minerals from
source material.
The leaching effect is predominantly dependent on the SH concentration and duration of
leaching (Rattanasak and Chindaprasirt 2009). The increase in SH concentration from
4.5M-9.5M increase the compressive strength of geopolymer paste, marginal
improvement in strength was reported for the mixes with 9-14M (Somna et al. 2011). The
compressive strength increases with an increase in SH concentration, due to leaching of
silica and alumina minerals from the source material with high SH concentration
(Chindaprasirt et al. 2009).
Geopolymer mixes with SH concentration varying from 9.5-14M reported a high
compressive strength range between 23-25MPa. However, 16M SH shows a reduction in
strength. The excess hydroxyl ion concentration accelerates the dissolution of FA
particles hindering the polymerization reaction (Zaharieva et al. 2009). An increase in
26
alkali-activator concentration enhances the strength development of geopolymer mixes,
but excess hydroxyl ion leads to the precipitation of alumina-silica gel during the early
stages of polymerization, results in low strength geopolymer matrixes (Lee and Van
2002). FA based geopolymer concrete activated by sodium hydroxide cured under room
temperature produces remarkable strength. The strength properties and microstructure
formation of polymeric material depended on SH content (Somna et al. 2011).
Mustafa et al. (2012) reported an effect of sodium hydroxide (6M, 8M, 10M,
12M, 14M, and 16M) on FA based geopolymer mortar. The test results reported the
geopolymer mixes with 12M SH concentration produced the high strength at 700C for 24
hours curing regime. Wang et al. (2018) investigated an effect of SH concentration on the
rheological properties, microstructure and geometrical property of geopolymer paste.
They claim fluidic properties of geopolymer mixes were influenced by the sodium
hydroxide content. Lower activator concentration has the zeta potential of fresh
geopolymer paste of less than 3 mV due to the lower rate of dissolution of silica and
alumina minerals from the source material.
2.4 EFFECT OF SODIUM SILICATE
Reaction capability and solubility of the pozzolanic silicates were affected by PH
of the activator solution. A final reaction product was dependent on the activator
concentration and binder type; the calcium-silicate-hydrate (CSH) may be the main
hydrated product with small traces of alumina content (Pacheco et al. 2007). Sodium
silicate cannot be used as an independent activator unit in an alkaline-activator solution.
Since it does not contain a significant amount of hydroxyl ion to initiate the series of
polymerization. Generally, the SS is mixed with SH solution as a catalytic substance to
enable alkalinity of the activator solution for strength development (Kong et al. 2007).
An effect of activator modulus and fineness of slag have a significant contribution
towards the strength development of alkali-activated material.

27
Douglas et al. (1991) activated the slag with SH, SS, and Calcium Hydroxide as
activating reagents. The test result shows SS can be efficiently used as an activator
solution for desired workability and strength. Wang et al. (1995) reported the fineness of
slag, activator modulus (Na2O/ SiO2), and water/solid ratio are the most influencing
parameters affecting the fresh and hardened concrete properties of alkali-phosphorous
slag cement. The anions from sodium silicate react with Ca2+
ions, dissolves the surface
layer of slag granules, results in the formation of CSH at the early stages of reaction. The
main reaction products formed are CASH with a low ca/si ratio (Wang et al. 1995).
Bakharev et al. (1999) developed AASC concrete with NaOH, Na2CO3, Na2SiO3, and
Na2SO4 as an activator solution. The test results reported the compressive strength range
between 20-40 MPa with SS as the most effective form of activator solution. The liquid
SS decreases the saturation of alkali metal ions in hydrated phases of the pore solution
and enhances the inter-molecular bonding properties (Feng et al. 2004). A polymeric
blend of series-A (40% activator solution) and series-B (35% activator solution)
exhibited low workability with an increase in slag content and decreased by SS/SH ratio.
The basic polymeric blend with an alkaline solution of 35% showed a remarkable loss in
workability compared to the series-A mix without extra water (Deb et al. 2014).
The concentration of activator solution plays a vital role in the formation of a successful
geopolymeric system with improved strength properties compared to conventional
concrete. An increase in alkaline concentration enhances the rate of reaction; lower
porosity and high strength of FA blended geopolymer concrete (Chareerat et al. 2016).
The AASC mixes with high alkali-activator concentration and silica modulus above 1.2,
enhances the setting time (Atis et al. 2009, Bakharev et al. 1999). The past studies on
alkali-activated materials reported a remarkable loss in the strength for the mixes with
silica modulus greater than 1(Wang et al. 1994).
For flyash based geopolymer, the optimum SiO2/Al2O3 ratio of 1.6 is sufficient to
produce the high strength geopolymer mixtures (Song-Piriyakij et al. 2010). An increase
in Si/Al ratio has silica in larger content with an increase in sodium oxide content
28
enhances the polymerization reaction. It requires less time to complete the dissolution
process before the setting of mixes leads to the rapid setting of geopolymer mixes with a
reduction in setting time (Allahverdi et al. 2011). Chindaprasirt et al. (2012) investigated
an effect of SiO2 and Al2O3 on fly ash-based geopolymers with high calcium content and
observed the increase in SiO2 and Al2O3 content reduced the setting time. An increase in
SiO2/Al2O3 ratio from 2-5 improved the setting time for metakaolin based geopolymer
(Silva et al. 2007). The workability of alkali-activated concrete produced with slag and
fly ash as solid precursor material decrease with the increase in the SS/SH ratio, which
was in good agreement with the past studies (Deb et al. 2014, Nath and Sarkar 2014).
Since a sodium silicate is the most viscous solution in the activator solution, with an
increase in SS/SH ratio 1.5-2.5, the viscosity of alkali-activated concrete tends to
increase, results in the lower workability (Fang et al. 2018).
The setting time of alkali-activated material was significantly affected by the SS/SH
ratio. The setting time of the alkali-activated flyash-slag blend decrease from 2-2.5. The
variation in the effect of SS/SH ratio on setting time may attribute to the strong
interaction between SS and SH. A high compressive strength AASC can be produced
using SS with a silica modulus range between 0.6-1.5 (Gao et al. 2016, Krizan and
Zivanovic 2002).
The higher silica content has a significant effect on the formation of a geopolymer
matrix; due to quick stiffening of the geopolymer paste decreases the synthesis of
geopolymer paste (Siyal et al. 2016). The consistency of FA based geopolymer mixtures
were primarily affected by the variation in the SS/SH ratio. Since SS is more viscous than
SH, the viscosity of the activator solution tends to increase with SS/SH ratio. This shows
the relative influence of an activator solution on the physical properties of geopolymer
mixes. An SS/SH ratio increases, the amount of reactive silica increases in the mixtures.
This accelerates the polymerization reaction to a smaller extent. Hence, reduction in
setting was observed for the mixtures with a high ratio of SS/SH observed for SS/SH
ratios 1.5, 2, and 2.5 have an activator modulus of 0.99, 1.13, and 1.9, respectively (Nath
29
and Sarker 2014). The dissolution of silica mineral increased with an SS/SH ratio of 2-
2.5, thus reducing setting time. A substantial increase in silica content accelerates the
alkali-activation system and hinders the dissolution reaction. As a result, a reduction in
setting time was observed (Fang et al. 2018). An increase in alkaline liquid concentration
and silica modulus accelerates the rate of hydration with reduced setting time. The
alkaline concentration (6.5%) and silica modulus (0.85) reported high compressive
strength. The AASC mixes with higher strength development were observed for the
mixes with high silica modulus (Hamed et al. 2016).
2.5 OTHER MATERIALS USED AS FINE AGGREGATE
Wang et al. (2005) reported that superfine slag exhibits a much higher activity at
early ages and middle ages, but it exhibits a lower activity at later ages; the concrete
containing steel slag shows lower compressive strength with high porosity and
permeability. Bakharev et al. (2000) reported that the strength of geopolymer concrete is
increased with an increase in the percentage of M.Sand in various percentages; for E-
waste, 20% maximum is the replacement. An increase in the amount of E-waste
proportion in geopolymer requires a higher dosage of superplasticizer to get good
workability. Albitar et al. (2015) reported that utilization of granulated lead smelter slag
as fine aggregate results in significant improvement in compressive strength when flyash
acting as a binder reduced by 50%, also granulated lead smelter slag may act as a
supplementary binder when there is insufficient flyash to complete polymerization
reaction. Joy and Mini Mathew (2015) reported that workability decrease with an
increase in the foundry sand since foundry sand is hydrophilic in nature, and it attracts
water to its surface, and there is no significant increase in compressive strength on 7 days
curing. Singh et al. (2017) reported that the addition of granite cutting waste fines ensures
effective packing of cement aggregate matrix (micro filler action), leading to a reduction
in space for free water and large dispersion of cement particles resulting in a better-
hydrated condition and increased bonding components of concrete. Mithun et al. (2016)
reported that AASC mixes with copper slag, as a replacement of sand up to 100% by
30
volume, show no marked loss in strength characteristics. AASC mix with either sand and
copper slag possess similar modulus of elasticity, lower porosity, less water absorption,
and reduced chloride ion penetration as compared to ordinary Portland cement concrete
mixes. Priyadarshini et al. (2017) reported that the molarity of NaOH is a significant
factor that affects all the properties of geopolymer mortar with different fine aggregate,
workability reduced with increasing NaOH concentration, also higher curing temperature
helps in Geopolymerization makes matrix dense and stiff, resulting in better mortar
properties.
2.6 PAST STUDIES ON PS BALL AS FINE AGGREGATE
Concrete produced with 100% PS ball as fine aggregate results in an increase of
compaction factor by 40% compared to the conventional mix. This fact is attributed to
low water absorption, and it possesses a round shape, which helps in increasing the
workability of concrete with increasing content of PS Ball as fine aggregates. With PS
balls content more than 40% of fine aggregates, even though the density of the concrete
increased with an increase in substitution for sand with PS balls, the compressive strength
decreased. This decrease in strength may be attributed to the smooth surface of the PS
ball (Sharath et al. 2019). Uses of steel slag in the form of PS Ball enhance the
mechanical properties of concrete, such as compressive strength and flexural strength of
concrete (Tan 2015). The PS Ball incorporated mortar exhibited 10% lower strength at
28-day age; it showed stronger and less porous aggregate- matrix interface between (from
particle surface up to 35 μm width) as compared to that of normal mortar containing
sand, which is justifiable by the chemical composition of PS Ball attributed to the
potential chemical binding (Hyeongi et al. 2020). The effects of replacing sand by
different percentages of PS Balls (9, 12, 15, 18, 27 and 36%) by weight of used fine
aggregate were analyzed for fresh and hardened concrete properties. Test results indicate
a better performance of mixtures containing PS Balls compared with reference concrete
in terms of mechanical properties and durability cement reference concrete in mechanical

31
properties and durability aspects (Jagadish et al. 2020). Two replacement materials,
namely slag aggregate and recycled coarse aggregate, were used to replace the natural
aggregate in M40-grade concrete by proportions of 0%, 15%, 25%, 35%, and 45% by
weight, and the performance of the resulting mixes was compared against that of the
original M40-grade concrete. The test results showed by introducing SS into the concrete
containing RCA caused an increment in the mechanical properties. Also, the best result
was produced with a mix consisting of 25% steel slag and 15% recycled concrete
aggregate (Amjad 2019). However, there is limited research available on the effect of PS
ball as fine aggregates on the properties of alkali activated binder concrete mixes.
SUMMARY
It was observed that the strength and durability of alkali activated concrete mixes
are affected by many factors such as type of binder, the chemical composition of the
binder, water-to-binder ratio, percentage of sodium oxide dosage (Na2O), type of alkali
activator, modulus of alkali activator, water content, type of curing, etc. Alkali Activated
Slag Concrete (AASC) and Alkali Activated Slag-Flyash concrete (AASFC) mixes, if
designed properly, may obtain higher strength and better durability as compared to
conventional concrete. Alkali activated mixes containing higher quantities of GGBFS can
attain sufficient strength if subjected to air curing. The inclusion of higher amounts of
flyash in AASFC concrete mixes increases the strength properties; however, the
workability decreases. The activation energy required for alkali-activated mixes
containing large proportions of flyash is higher, and hence the replacement of GGBFS
with FA beyond 50% in AASFC mixes require a higher dosage of the alkaline activator
solution. A proper combination of sodium hydroxide and liquid sodium silicate gives the
best activator combination for these materials. The strength and durability properties of
alkali activated concrete mixes are significantly influenced by the sodium oxide dosage
(Na2O) and silicate content of the alkaline solution. There exist optimal sodium
hydroxides to sodium silicate ratio at which the maximum strength of mixes can be

32
attained. The optimal sodium hydroxide dosage varies between 10M and 12M, SS/SH
ratio 1.5-2, whereas higher dosages may lead to uneconomical mixtures and efflorescence
problems. Alkaline liquid to binder ratio, sodium hydroxide (Molarity), SS/SH ratio
(silicate content), etc., needs to be controlled in order to obtain mixes of the required
strength and workability. PS ball, an industrial byproduct that can be considered as a
potential replacement for traditional fine aggregates in concrete. Improved or satisfactory
performance of PS ball aggregates has been reported by few researchers when used in
conventional OPC concrete. The use of PS ball as fine aggregates in concrete does not
lead to volume expansion and reaction with binder particles. The PS ball is a treated
material, and it does not require any weathering process before using it as an aggregate
for concrete production. However, limited research is available on the strength,
durability, and fatigue performance of alkali activated concrete mixes incorporating PS
ball as fine aggregate. The present research focuses on studying the properties of
sustainable air-cured AASC and AASFC mixes with PS ball as fine aggregate. The
methodology adopted in developing alkali activated slag and slag-flyash concrete using
PS ball as fine aggregate is discussed in Chapter-3.
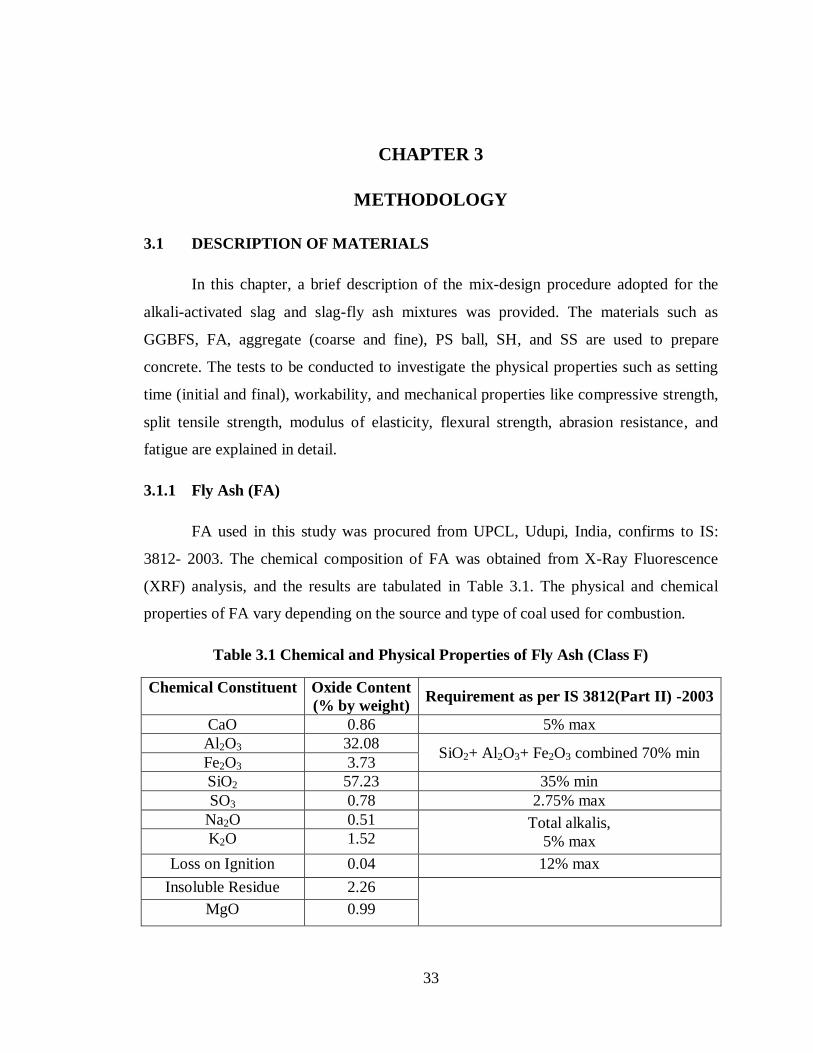
33
CHAPTER 3
METHODOLOGY
3.1 DESCRIPTION OF MATERIALS
In this chapter, a brief description of the mix-design procedure adopted for the
alkali-activated slag and slag-fly ash mixtures was provided. The materials such as
GGBFS, FA, aggregate (coarse and fine), PS ball, SH, and SS are used to prepare
concrete. The tests to be conducted to investigate the physical properties such as setting
time (initial and final), workability, and mechanical properties like compressive strength,
split tensile strength, modulus of elasticity, flexural strength, abrasion resistance, and
fatigue are explained in detail.
3.1.1 Fly Ash (FA)
FA used in this study was procured from UPCL, Udupi, India, confirms to IS:
3812- 2003. The chemical composition of FA was obtained from X-Ray Fluorescence
(XRF) analysis, and the results are tabulated in Table 3.1. The physical and chemical
properties of FA vary depending on the source and type of coal used for combustion.
Table 3.1 Chemical and Physical Properties of Fly Ash (Class F)
Chemical Constituent Oxide Content
(% by weight) Requirement as per IS 3812(Part II) -2003
CaO 0.86 5% max
Al2O3 32.08 SiO2+ Al2O3+ Fe2O3 combined 70% min
Fe2O3 3.73
SiO2 57.23 35% min
SO3 0.78 2.75% max
Na2O 0.51 Total alkalis,
5% max K2O 1.52
Loss on Ignition 0.04 12% max
Insoluble Residue 2.26
MgO 0.99
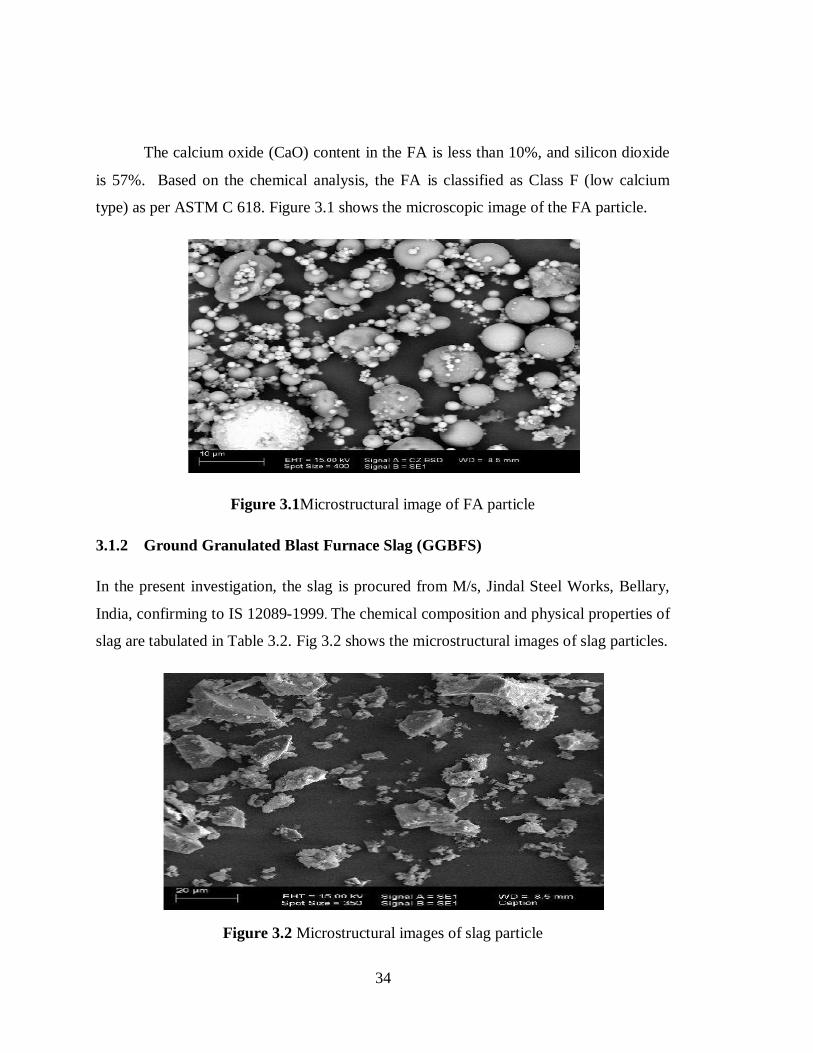
34
The calcium oxide (CaO) content in the FA is less than 10%, and silicon dioxide
is 57%. Based on the chemical analysis, the FA is classified as Class F (low calcium
type) as per ASTM C 618. Figure 3.1 shows the microscopic image of the FA particle.
Figure 3.1Microstructural image of FA particle
3.1.2 Ground Granulated Blast Furnace Slag (GGBFS)
In the present investigation, the slag is procured from M/s, Jindal Steel Works, Bellary,
India, confirming to IS 12089-1999. The chemical composition and physical properties of
slag are tabulated in Table 3.2. Fig 3.2 shows the microstructural images of slag particles.
Figure 3.2 Microstructural images of slag particle

35
Table 3.2 Chemical and Physical properties of Slag
Chemical Constituent Slag (%)
CaO 37.34
Al2O3 14.42
Fe2O3 1.11
SiO2 37.73
MgO 8.71
MnO 0.02
Sulphur 0.39
Loss on Ignition 1.41
Insoluble Residue 1.59
Glass content 92
Chemical module:
1. CaO+Mgo+1/3 Al2O3
SiO2+2/3 Al2O3
1.07
Loss of Ignition 1.59
Blaine’s Fineness (m2/kg) 375
Specific gravity 2.91
Particles retained on 45 microns 8%
3.1.3 Alkali- activators
To activate the slag and slag-fly ash mixtures, a combination of SH and SS
solution were used. The industrial-grade SH flakes with 97% purity were used to prepare
the varying molar concentration, and the potable water was used for the preparing
activator solution preparation. The SH solution was prepared by dissolving the flakes in
water. The mass of NaOH solids varies depending on the concentration of the NaOH
solution, expressed as molarity. NaOH solids per litre of activator solution for desired
NaOH concentration can be obtained by multiplying the NaOH molecular weight (40g)
with desired molarity. For example, 10M NaOH solution, 10x40=400 grams (NaOH
flakes) were dissolve in water and made it to 1 litre. The chemical composition of SS is
presented in Table 3.3. The alkaline activator solution was prepared one day prior to
mixing, to dissociate the ions, reduce the heat liberated during exothermic reaction, and
to prevent the quick setting of fresh concrete during mixing.
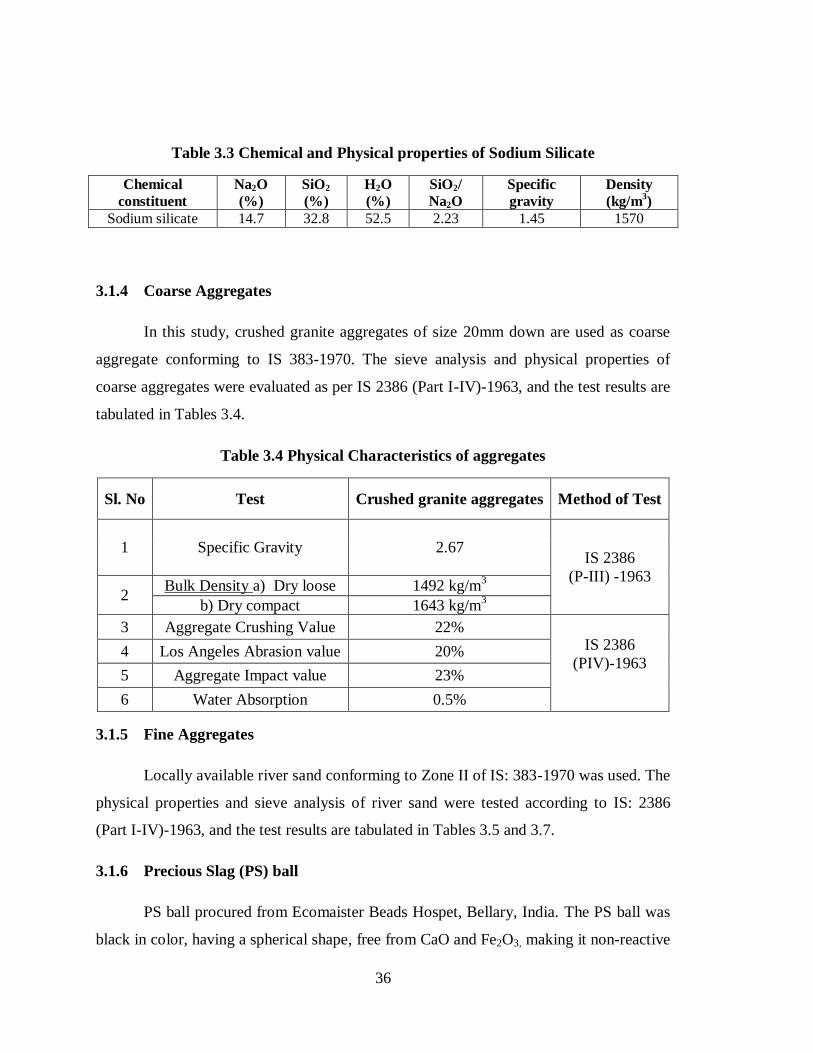
36
Table 3.3 Chemical and Physical properties of Sodium Silicate
Chemical
constituent
Na2O
(%)
SiO2
(%)
H2O
(%)
SiO2/
Na2O
Specific
gravity
Density
(kg/m3)
Sodium silicate 14.7 32.8 52.5 2.23 1.45 1570
3.1.4 Coarse Aggregates
In this study, crushed granite aggregates of size 20mm down are used as coarse
aggregate conforming to IS 383-1970. The sieve analysis and physical properties of
coarse aggregates were evaluated as per IS 2386 (Part I-IV)-1963, and the test results are
tabulated in Tables 3.4.
Table 3.4 Physical Characteristics of aggregates
Sl. No Test Crushed granite aggregates Method of Test
1 Specific Gravity 2.67 IS 2386
(P-III) -1963
2 Bulk Density a) Dry loose 1492 kg/m
3
b) Dry compact 1643 kg/m3
3 Aggregate Crushing Value 22% IS 2386
(PIV)-1963
4 Los Angeles Abrasion value 20%
5 Aggregate Impact value 23%
6 Water Absorption 0.5%
3.1.5 Fine Aggregates
Locally available river sand conforming to Zone II of IS: 383-1970 was used. The
physical properties and sieve analysis of river sand were tested according to IS: 2386
(Part I-IV)-1963, and the test results are tabulated in Tables 3.5 and 3.7.
3.1.6 Precious Slag (PS) ball
PS ball procured from Ecomaister Beads Hospet, Bellary, India. The PS ball was
black in color, having a spherical shape, free from CaO and Fe2O3, making it non-reactive
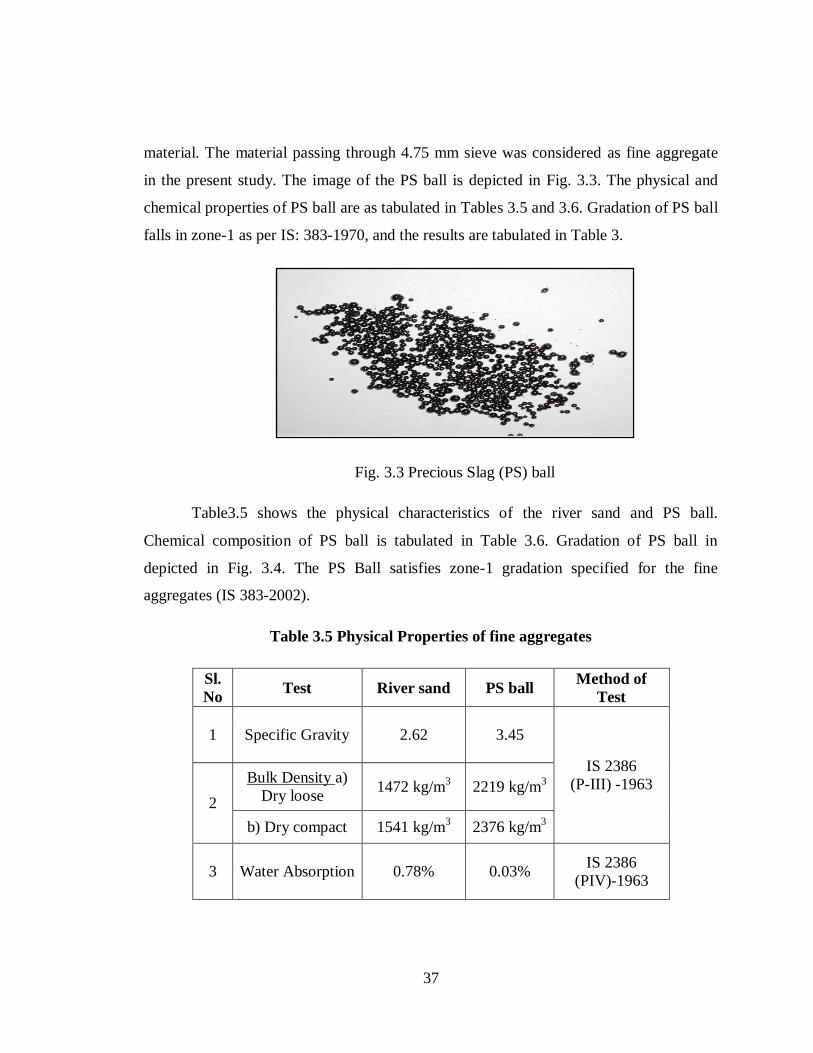
37
material. The material passing through 4.75 mm sieve was considered as fine aggregate
in the present study. The image of the PS ball is depicted in Fig. 3.3. The physical and
chemical properties of PS ball are as tabulated in Tables 3.5 and 3.6. Gradation of PS ball
falls in zone-1 as per IS: 383-1970, and the results are tabulated in Table 3.
Fig. 3.3 Precious Slag (PS) ball
Table3.5 shows the physical characteristics of the river sand and PS ball.
Chemical composition of PS ball is tabulated in Table 3.6. Gradation of PS ball in
depicted in Fig. 3.4. The PS Ball satisfies zone-1 gradation specified for the fine
aggregates (IS 383-2002).
Table 3.5 Physical Properties of fine aggregates
Sl.
No Test River sand PS ball
Method of
Test
1 Specific Gravity 2.62 3.45
IS 2386
(P-III) -1963
2
Bulk Density a)
Dry loose 1472 kg/m
3 2219 kg/m
3
b) Dry compact 1541 kg/m3 2376 kg/m
3
3 Water Absorption 0.78% 0.03% IS 2386
(PIV)-1963
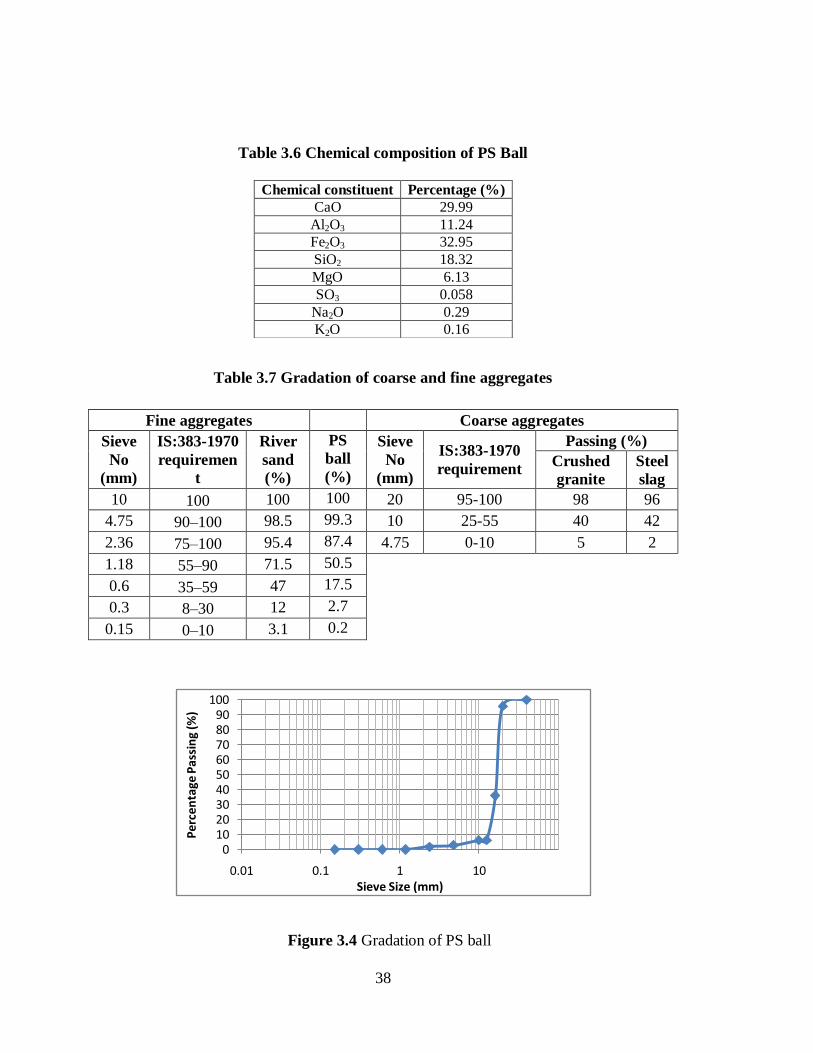
38
Table 3.6 Chemical composition of PS Ball
Table 3.7 Gradation of coarse and fine aggregates
Fine aggregates Coarse aggregates
Sieve
No
(mm)
IS:383-1970
requiremen
t
River
sand
(%)
PS
ball
(%)
Sieve
No
(mm)
IS:383-1970
requirement
Passing (%)
Crushed
granite
Steel
slag
10 100 100 100 20 95-100 98 96
4.75 90–100 98.5 99.3 10 25-55 40 42
2.36 75–100 95.4 87.4 4.75 0-10 5 2
1.18 55–90 71.5 50.5
0.6 35–59 47 17.5
0.3 8–30 12 2.7
0.15 0–10 3.1 0.2
Figure 3.4 Gradation of PS ball
0102030405060708090
100
0.01 0.1 1 10
Per
cen
tage
Pas
sin
g (%
)
Sieve Size (mm)
Chemical constituent Percentage (%)
CaO 29.99
Al2O3 11.24
Fe2O3 32.95
SiO2 18.32
MgO 6.13
SO3 0.058
Na2O 0.29
K2O 0.16

39
The details of the experiments conducted along with the test sequence are depicted in a
flow chart (Figure 3.5).
Figure 3.5 Flowchart of the experimental program
3.2 TEST METHODS
After proper mixing of the ingredients, the specimens are prepared to test the hardened
and durability properties of concrete. All the tests were conducted as per the relevant
standard codes. The mixtures were tested for the modulus of elasticity, abrasion
resistance, flexural strength, and fatigue.
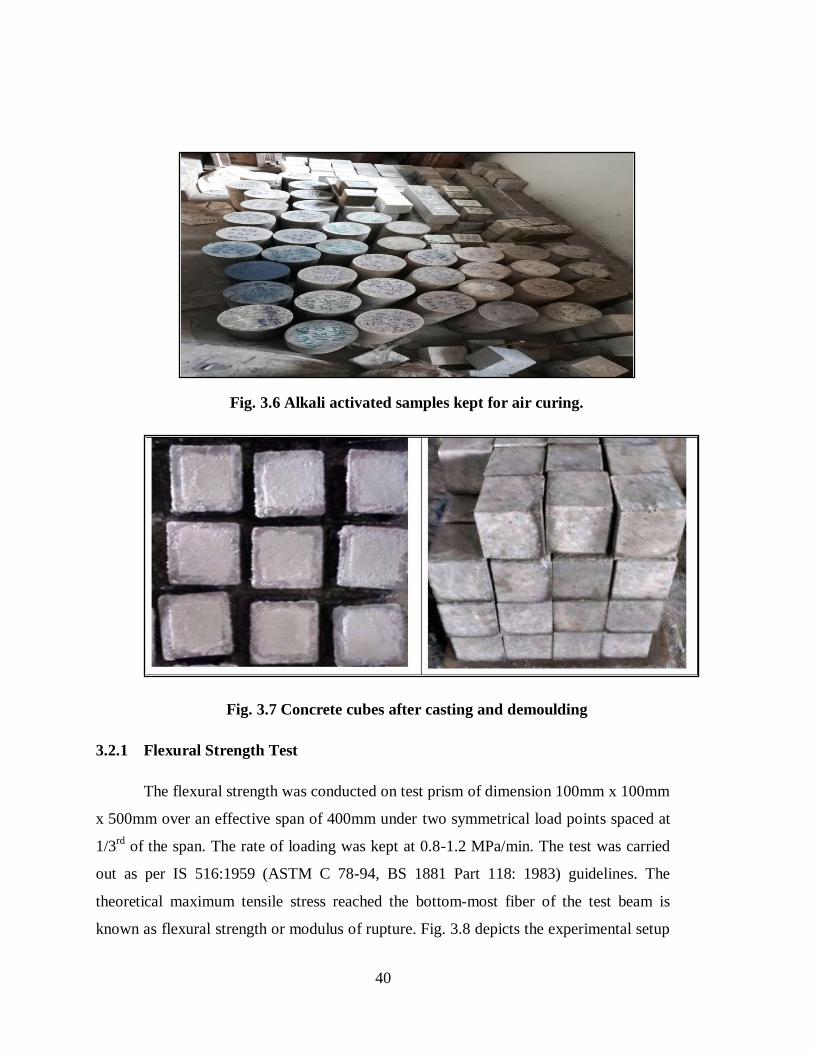
40
Fig. 3.6 Alkali activated samples kept for air curing.
Fig. 3.7 Concrete cubes after casting and demoulding
3.2.1 Flexural Strength Test
The flexural strength was conducted on test prism of dimension 100mm x 100mm
x 500mm over an effective span of 400mm under two symmetrical load points spaced at
1/3rd
of the span. The rate of loading was kept at 0.8-1.2 MPa/min. The test was carried
out as per IS 516:1959 (ASTM C 78-94, BS 1881 Part 118: 1983) guidelines. The
theoretical maximum tensile stress reached the bottom-most fiber of the test beam is
known as flexural strength or modulus of rupture. Fig. 3.8 depicts the experimental setup
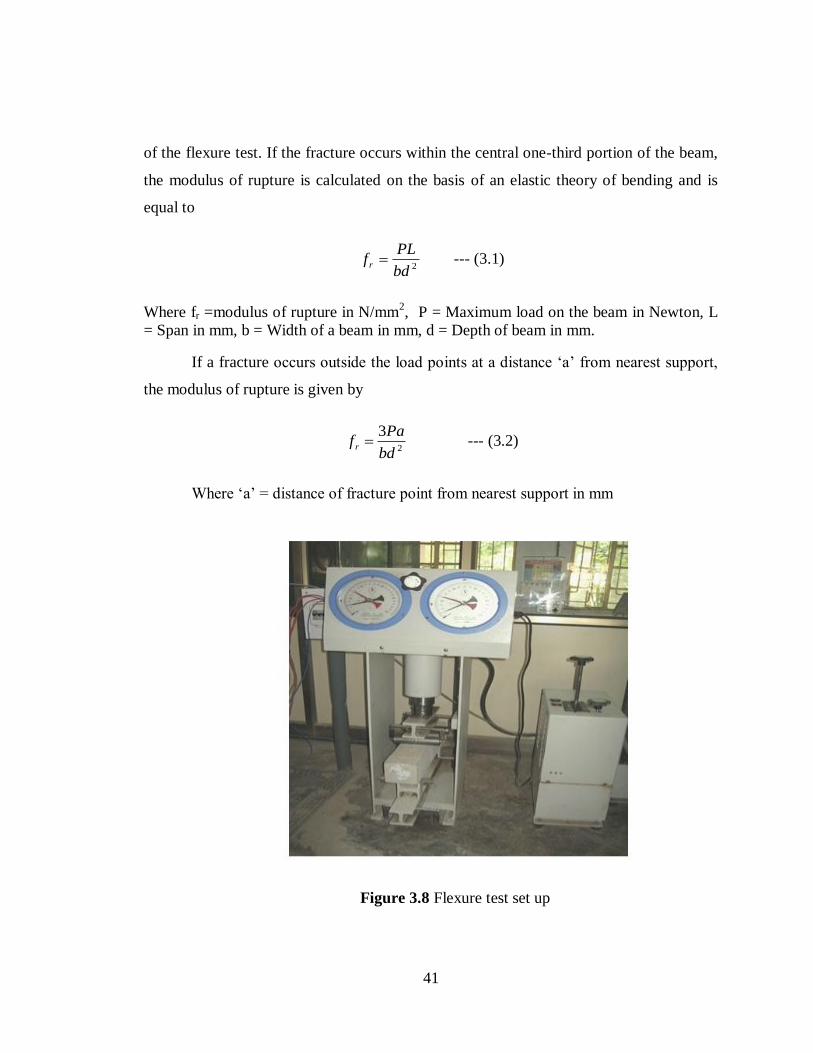
41
of the flexure test. If the fracture occurs within the central one-third portion of the beam,
the modulus of rupture is calculated on the basis of an elastic theory of bending and is
equal to
2bd
PLf r --- (3.1)
Where fr =modulus of rupture in N/mm2, P = Maximum load on the beam in Newton, L
= Span in mm, b = Width of a beam in mm, d = Depth of beam in mm.
If a fracture occurs outside the load points at a distance ‘a’ from nearest support,
the modulus of rupture is given by
2
3
bd
Paf r --- (3.2)
Where ‘a’ = distance of fracture point from nearest support in mm
Figure 3.8 Flexure test set up

42
3.2.2 Modulus of Elasticity
The modulus of elasticity of material under compression or tension is given by the
slope of the stress-strain relationship of concrete under uniaxial loading. The cylindrical
specimen of 150mm in diameter and 300mm height was tested. Young’s modulus (E)
describes tensile elasticity, or the tendency of an object to deform along an axis when
opposing forces are applied along that axis. It is the ratio of tensile stress to tensile strain.
The test for Modulus of Elasticity was conducted as per IS 516:1959. Fig. 3.9 shows the
experimental setup of the Modulus of elasticity test.
Figure 3.9 Modulus of elasticity test set up
3.2.3 Abrasion resistance
The abrasion resistance test was performed as per IS 9284:1979 on a cube
specimen of 10 cm size using a pneumatic sandblasting machine with the operating
condition of air pressure of 0.14 N/mm2, 4000g of the abrasive charge passing 10mm and
retained on 0.5mm IS sieve. The revolving disk type abrasion resistance test set up is
depicted in Figure 3.10. The test is repeated on the other three surfaces after the sample is
made to rotate by 1800
in the horizontal plane till two impressions are made on the
surface. Then the sample is removed by cleaning its surface and weighed.
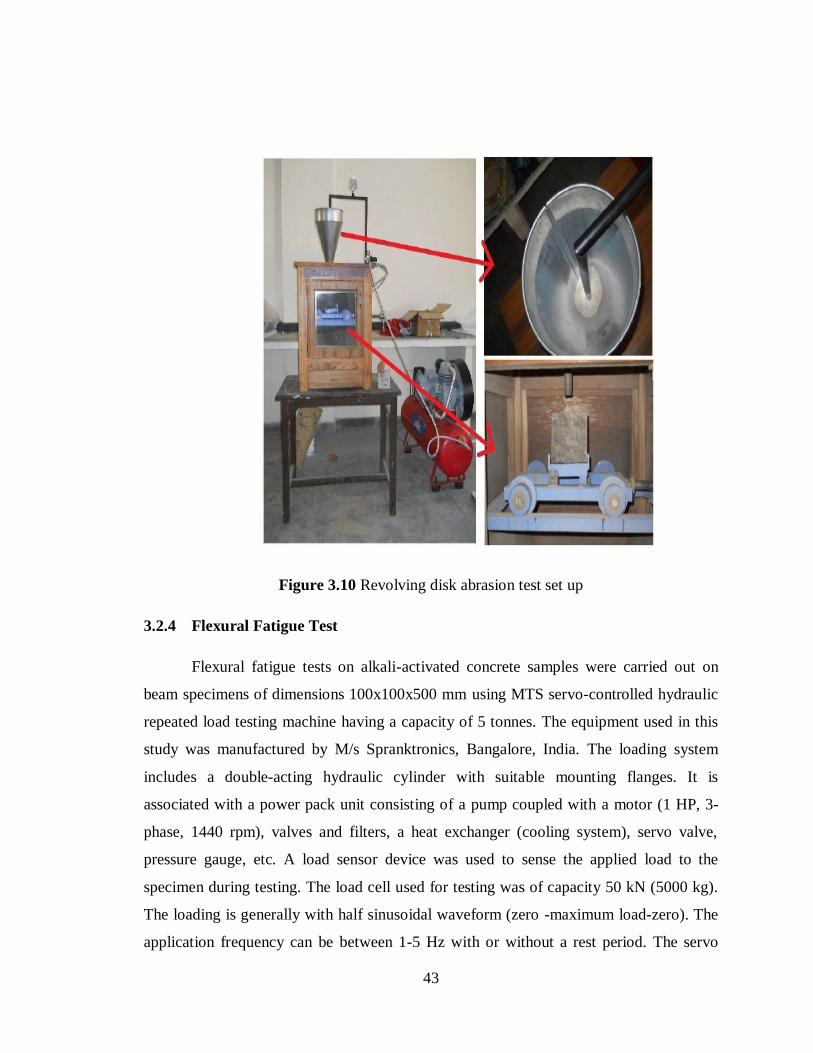
43
Figure 3.10 Revolving disk abrasion test set up
3.2.4 Flexural Fatigue Test
Flexural fatigue tests on alkali-activated concrete samples were carried out on
beam specimens of dimensions 100x100x500 mm using MTS servo-controlled hydraulic
repeated load testing machine having a capacity of 5 tonnes. The equipment used in this
study was manufactured by M/s Spranktronics, Bangalore, India. The loading system
includes a double-acting hydraulic cylinder with suitable mounting flanges. It is
associated with a power pack unit consisting of a pump coupled with a motor (1 HP, 3-
phase, 1440 rpm), valves and filters, a heat exchanger (cooling system), servo valve,
pressure gauge, etc. A load sensor device was used to sense the applied load to the
specimen during testing. The load cell used for testing was of capacity 50 kN (5000 kg).
The loading is generally with half sinusoidal waveform (zero -maximum load-zero). The
application frequency can be between 1-5 Hz with or without a rest period. The servo

44
amplifier system is used to link the function generator and the servo valve. The Control
Unit is used to monitor the load and the repetitions. It is connected to the PC with an
ADD ON card to acquire or log the data.
The flexural test of all samples was carried out before starting this test. The flexural load
corresponding to flexural strength to 4.5MPa is kept constant for the study (i.e., the
minimum value selected from the lot). The fatigue tests were conducted on alkali-
activated mixtures containing 100% PS ball as fine aggregates. Three specimens were
tested for each mix at each stress level.
The beam specimen was loaded at the same span (i.e., 400 mm) as it was loaded in case
of static flexural tests. The specimens were subjected to loading using constant amplitude
half sinusoidal waveform at a frequency of 3Hz without any rest period until the failure
of specimen. In this study, the stress ratios were limited to 0.65, 0.75, 0.80, and 0.85 to
obtain a relationship between different stress ratios (S) and the number of cycles (N). The
Fatigue life (N) of the samples was recorded (i.e., the number of cycles up to failure).
Figure 3.11Repeated load testing set up
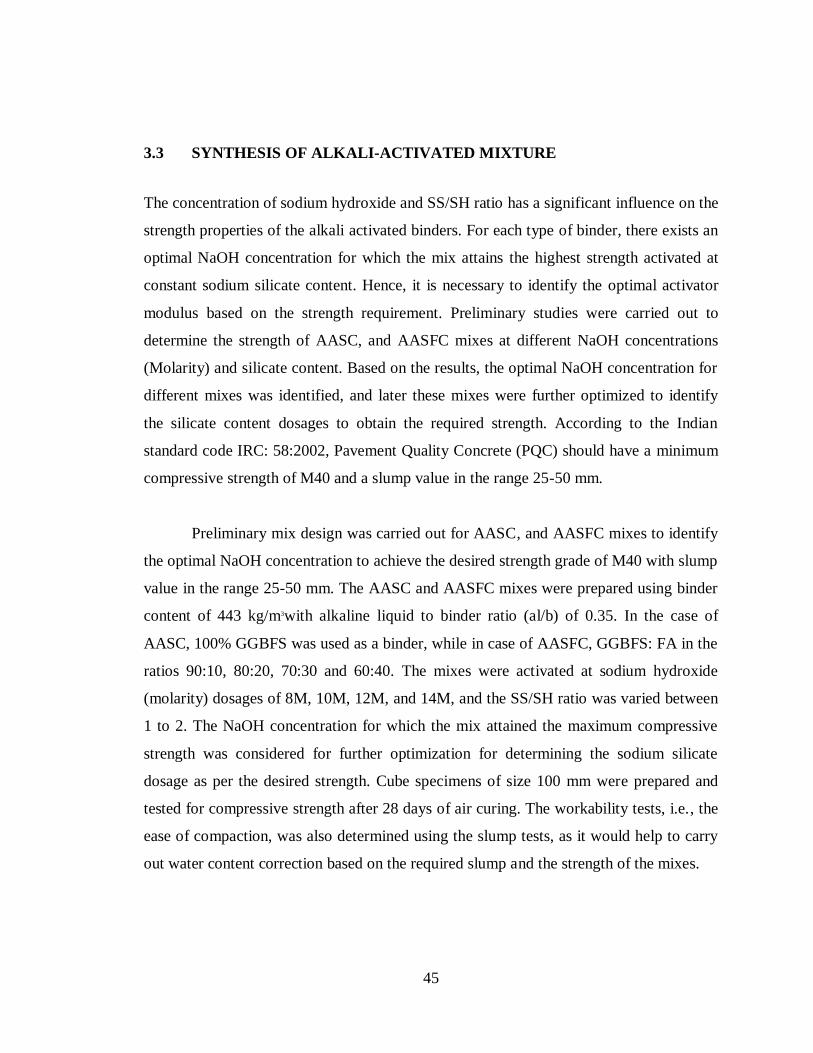
45
3.3 SYNTHESIS OF ALKALI-ACTIVATED MIXTURE
The concentration of sodium hydroxide and SS/SH ratio has a significant influence on the
strength properties of the alkali activated binders. For each type of binder, there exists an
optimal NaOH concentration for which the mix attains the highest strength activated at
constant sodium silicate content. Hence, it is necessary to identify the optimal activator
modulus based on the strength requirement. Preliminary studies were carried out to
determine the strength of AASC, and AASFC mixes at different NaOH concentrations
(Molarity) and silicate content. Based on the results, the optimal NaOH concentration for
different mixes was identified, and later these mixes were further optimized to identify
the silicate content dosages to obtain the required strength. According to the Indian
standard code IRC: 58:2002, Pavement Quality Concrete (PQC) should have a minimum
compressive strength of M40 and a slump value in the range 25-50 mm.
Preliminary mix design was carried out for AASC, and AASFC mixes to identify
the optimal NaOH concentration to achieve the desired strength grade of M40 with slump
value in the range 25-50 mm. The AASC and AASFC mixes were prepared using binder
content of 443 kg/m3with alkaline liquid to binder ratio (al/b) of 0.35. In the case of
AASC, 100% GGBFS was used as a binder, while in case of AASFC, GGBFS: FA in the
ratios 90:10, 80:20, 70:30 and 60:40. The mixes were activated at sodium hydroxide
(molarity) dosages of 8M, 10M, 12M, and 14M, and the SS/SH ratio was varied between
1 to 2. The NaOH concentration for which the mix attained the maximum compressive
strength was considered for further optimization for determining the sodium silicate
dosage as per the desired strength. Cube specimens of size 100 mm were prepared and
tested for compressive strength after 28 days of air curing. The workability tests, i.e., the
ease of compaction, was also determined using the slump tests, as it would help to carry
out water content correction based on the required slump and the strength of the mixes.

46
3.4 Mixture design
The mixture proportion involves various factors influencing the mix design. A
conventional mix design procedure is not applicable to alkali-activated material, and no
standard mix design is available. The reactivity and chemical composition of the source
material and alkaline-activator type are the two major contributors to the properties of
alkali-activated materials. Apart from effective reaction kinetics between binder particle
and activator solution is primarily dependent on the curing regime (temperature, curing
period, and relative humidity).
However, it is very difficult to generalize the concept of mix design for alkali-
activated concrete, considering the alumina-silicate source, activator concentration, and
its chemical composition. Hence, by trial and error method, the final mix will be
obtained. The detailed procedure is explained in Appendix-1. The mix proportions
adopted for various combinations of mixes are tabulated in Tables 3.8 and 3.9.
Table 3.8 Details of Mix Proportions of AASC mixes (kg/m3)
Mix ID SS/SH ratio Molar Slag SH SS PS
ball
Sand Coarse aggregate
M-8
M-10
M-12
M-14
N-8
N-10
N-12
N-14
P-8
P-10
P-12
P-14
C-8
C-10
1
1
1
1
1.5
1.5
1.5
1.5
2
2
2
2
1
1
8
10
12
14
8
10
12
14
8
10
12
14
8
10
443
443
443
443
443
443
443
443
443
443
443
443
443
443
66.5
66.5
66.5
66.5
53
53
53
53
44
44
44
44
66.5
66.5
66.5
66.5
66.5
66.5
80
80
80
80
89
89
89
89
66.5
66.5
657
657
657
657
657
657
657
657
657
657
657
657
--
--
--
--
--
--
--
--
--
--
--
--
--
--
657
657
1167
1167
1167
1167
1167
1167
1167
1167
1167
1167
1167
1167
1167
1167
Where SS- Sodium Silicate, SH- Sodium Hydroxide and PS ball- Precious Slag ball
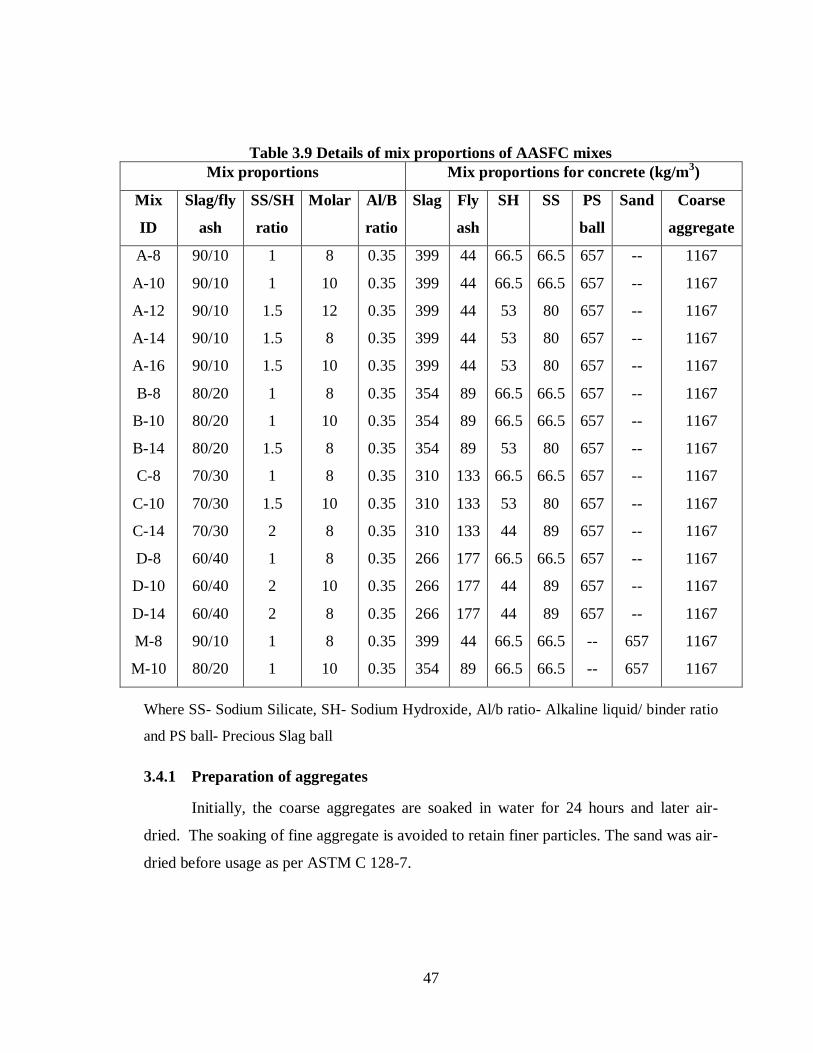
47
Table 3.9 Details of mix proportions of AASFC mixes
Mix proportions Mix proportions for concrete (kg/m3)
Mix
ID
Slag/fly
ash
SS/SH
ratio
Molar Al/B
ratio
Slag Fly
ash
SH SS PS
ball
Sand Coarse
aggregate
A-8
A-10
A-12
A-14
A-16
B-8
B-10
B-14
C-8
C-10
C-14
D-8
D-10
D-14
M-8
M-10
90/10
90/10
90/10
90/10
90/10
80/20
80/20
80/20
70/30
70/30
70/30
60/40
60/40
60/40
90/10
80/20
1
1
1.5
1.5
1.5
1
1
1.5
1
1.5
2
1
2
2
1
1
8
10
12
8
10
8
10
8
8
10
8
8
10
8
8
10
0.35
0.35
0.35
0.35
0.35
0.35
0.35
0.35
0.35
0.35
0.35
0.35
0.35
0.35
0.35
0.35
399
399
399
399
399
354
354
354
310
310
310
266
266
266
399
354
44
44
44
44
44
89
89
89
133
133
133
177
177
177
44
89
66.5
66.5
53
53
53
66.5
66.5
53
66.5
53
44
66.5
44
44
66.5
66.5
66.5
66.5
80
80
80
66.5
66.5
80
66.5
80
89
66.5
89
89
66.5
66.5
657
657
657
657
657
657
657
657
657
657
657
657
657
657
--
--
--
--
--
--
--
--
--
--
--
--
--
--
--
--
657
657
1167
1167
1167
1167
1167
1167
1167
1167
1167
1167
1167
1167
1167
1167
1167
1167
Where SS- Sodium Silicate, SH- Sodium Hydroxide, Al/b ratio- Alkaline liquid/ binder ratio
and PS ball- Precious Slag ball
3.4.1 Preparation of aggregates
Initially, the coarse aggregates are soaked in water for 24 hours and later air-
dried. The soaking of fine aggregate is avoided to retain finer particles. The sand was air-
dried before usage as per ASTM C 128-7.
48
3.4.2 Preparation of the alkaline activator solution
SH solution was prepared one day prior to mixing and allowed to cool to room
temperature and then stored in an air-tight container. For the alkali solution, both SH and
SS solution were mixed together. An exothermic reaction is evolved during mixing,
liberating heat; hence, it is allowed to cool before adding to dry ingredients. The final
alkali-activator solution was prepared at least 30-60 minutes before to final mixing with
the dry ingredients.
3.4.3 Final mixing of concrete
The mixing was done in a 120-liters capacity ribbon type concrete mixer. The
concrete mix was done in accordance with IS 10262:2009.
The steps adopted are as follows:
The concrete mixer should be cleaned thoroughly before using it. The inner
surface of the pan was moistened slightly to minimize the interaction of water
from the mixture.
First, the coarse aggregate was loaded to the mixing pan then followed by sand;
and mixed thoroughly for 2-3 minutes.
Then binders (slag and slag-fly ash blend) were added and thoroughly mixed for
about 2-3 minutes before the addition of alkali-activator solution.
Premixed activator solution was added gradually, while the mixing of raw
material was in progress. Mixing was continued for another 3-5 minutes to get a
homogenous mixture.
3.4.4 Casting and curing of samples
Before casting, all concrete moulds were checked for the presence of any foreign
materials. The inner surfaces of moulds were cleaned and oil-greased. Test samples were
cast soon after mixing. The moulds for compression, abrasion resistance
49
(150x150x150mm), and flexure tests (100x100x150mm) were filled in two-layers,
whereas for split tensile and modulus of elasticity tests (cylinder of 150mm diameter
300mm height) were filled in three-layers. After pouring the concrete, it is compacted
using a vibratory table. The compaction effort was continued until the voids are expelled
out, aggregates were submerged in a mortar, and the top surface was leveled with a
trowel. The concrete moulds were stored at 22-250C with a relative humidity of 55± 10%.
SUMMARY
Preliminary investigations are carried out to arrive at the optimized mix design.
The dosage of sodium hydroxide, optimal silicate content and water content for different
binder types was identified as per the strength (M40) and workability (slump value of 25-
50 mm) requirements. The AASC and AASFC mixes were prepared using binder content
of 443 kg/m3 with alkaline liquid to binder ratio (al/b) of 0.35. In case of AASC, 100%
GGBFS was used as the binder; while in case of AASFC, GGBFS: FA in the ratios
90:10, 80:20, 70:30 and 60:40 were used as binders. The preparation of the concrete
specimen, properties investigated, the test methodologies followed for testing specimens
are also explained in detail here. The results and discussion will be elaborated in chapter-
4.

50

51
CHAPTER 4
ALKALI ACTIVATED SLAG CONCRETE
4.0 INTRODUCTION
In this chapter, the test results of AASC mixes by complete replacement of river
sand with PS ball, both in the fresh and hardened state, are discussed. The workability
and setting time, compressive strength, split tensile strength, modulus of elasticity,
flexural strength, fatigue behavior, and abrasion resistance were discussed in detail.
Weibull distribution and analysis is carried out to determine the fatigue response of
AASC mixes.
4.1 WORKABILITY
A slump of around 25+15mm was aimed. The workability results of AASC mixes
are depicted in Fig. 4.1. The workability of mixes decreased with the increased molar
concentration of NaOH. The workability of 8M specimen is found to be higher when
compared to the 10, 12, and 14M. The decrease is due to increased viscosity of the
activator solution. For M-series 8M, 10M, 12M, 14M, the workability was reduced
gradually by 55, 49, 43, 38mm, respectively. For N-series, slump value decreases by52,
45.5, 39.5, 34.5mm for N-8, N-10, N-12, and N-14, respectively, as compared to the M-8
of 55mm. In P-series, the slump decreases by 48, 41.5, 35, 30mm for P-8, P-10, P-12, and
P-14, respectively, as compared to N-8 of 52mm.
The effect of molar concentration of sodium hydroxide is most obvious with high
silicate. The workability of AASC mixes decreased with the increase of the SS/SH ratio,
where the viscosity of AASC mixes tends to increase, results in lower workability.
Conversely, the increased molar of NaOH enhanced the viscosity by draining the silica
and alumina mineral from the source material, which decreases the workability; a similar
trend was observed by Rattanasak and Chindaprasirt (2009). For the mix with lower

52
NaOH content SS/SH=1.5 and 2, the workability was influenced by the soluble silicate
concentration.
Figure 4.1 Workability of AASC mixes
4.2 SETTING TIME
Setting time was affected by the increased concentration of NaOH, the reaction
mechanism controlled by the polymerization and the calcium mineral present in the
binder governs the setting time; a similar trend was observed by Fernández-Jiménez et al.
(2003). Fig. 4.2 depicts the variation of setting time with variation in NaOH
concentration. M-series had an initial setting time of 54, 59, and 62, 49 minutes, final
setting time of 103, 112, 117, 92 minutes for M-8, M-10, M-12, and M-14, respectively.
While N-series had an initial setting time of 47, 52, 58, 43minutes, final setting time of
89, 99, 110, 82minutes for N-8, N-10, N-12, N-14, respectively. The P-series had an
initial setting time of 49, 47, 55, and 40minutes and final setting time of 83, 89, 94,
75minutes for P-8, P-10, P-12, P-14, respectively. An increase in SS/SH ratio from 1 (M-
series), 1.5 (N-series), and 2 (P-series) indicates that the dissolute silica content was
increased with the increase of SS/SH ratio. Higher content of dissolute silica would
0
10
20
30
40
50
60
M-8 M-10 M-12 M-14 N-8 N-10 N-12 N-14 P-8 P-10 P-12 P-14 C-8 C-10
Slu
mp
(mm
)
Mix ID

53
enhance the alkali activation process and reduce the time to complete the dissolution
reaction resulting in the decrease of setting time.
Initial setting time of 54, 47, 49 minutes, final setting time of 103, 89, 83 minutes
for M-8, N-8, P-8, respectively, were observed. Whereas, for 10M, the initial setting time
of 59, 52, 47 minutes, final setting time of 112, 99, 89minutes for M-10, N-10, P-10
respectively were observed. The 12M specimens had a relatively higher initial setting
time of 62, 58, 55minutes, the final setting time of 117, 110, 94 minutes for M-12, N-12,
P-12, respectively, was observed.
Figure 4.2 Setting time of AASC mixes
4.3 COMPRESSIVE STRENGTH
The compressive strength test was conducted in accordance with IS 516:1999.
The test results are depicted in Fig. 4.3. The increase in NaOH concentration enhances
the strength of AASC blends. At a higher concentration of NaOH greater dissolution of
the solid precursor material in the binders restrains the polymerization reaction;
subsequently, there was an improvement in strength. The reason is being the silica and
alumina having a more significant dissolution from the solid precursor minerals by the
binders in the aqueous phase from 8M-12M. The reaction process is more effective in the
0
20
40
60
80
100
120
140
M-8 M-10 M-12 M-14 N-8 N-10 N-12 N-14 P-8 P-10 P-12 P-14 C-8 C-10
Sett
ing
tim
e (m
in)
Mix ID
Initial setting time Final setting time

54
amorphous phase of binder molecules, which enhances the polymerization. Further, the
increased NaOH beyond 12M results in excess hydroxyl ion concentration, which hinders
the polymerization process. An increase in hydroxyl ion concentration that accelerates the
dissolution of raw materials. It means that increasing the SH molarity would also affect
the silica modulus (molar ratio of SiO2/Na2O) of the alkaline liquid, which would
influence the alkaline process. Thus, a decrease in strength is observed for 14M mixes.
Figure 4.3 Compressive strength of AASC mixes
4.3.1 Effect of Sodium Hydroxide
It can be noted that an increase in the NaOH concentration from 8M-12M, the
compressive strength gradually increased. Fig. 4.4 shows the effect of NaOH
concentration on the compressive strength of AASC mixes. The 28-days compressive
strength of AASC mixes with 8M NaOH increased by 3.11%, 1.95%, 17.62% for M-8,
N-8, P-8, respectively, when compared to the control mix of C-8.Similarly, for 10M
compressive strength was increased by 3.11%, 10.3%, 16.95% for M-10, N-10, P-
10,respectively, compared to the control mix of C-10. For 12M NaOH, strength was
increased by 7.3%, 14.1%, for N-12, P-12, respectively, when compared to the M-12
mix.The14M results in a gradual drop in the compressive strength due to excess hydroxyl
0
10
20
30
40
50
60
70
M-8 M-10 M-12 M-14 N-8 N-10 N-12 N-14 P-8 P-10 P-12 P-14 C-8 C-10
Co
mp
ress
ive
stre
ngt
h (M
Pa)
Mix ID
3-d 7-d 14-d 28-d 90-d

55
ion concentration. This affected the polymerization reaction and hence decreased in
strength was observed by 11.4% for M-14 compared to M-8, 11.92% for N-14 compared
to N-8, and 11.89% for D-14 compared to P-8. By an increase in the molarity of NaOH
from 8M-12M, the compressive strength gradually increases, which is due to the internal
reaction of Ca, Al, and Si minerals causing the increased breakage of T-O-T bond into
Ca-O and Si-O bonds in slag. At the higher NaOH concentrations, the leaching of
alumina and silica was enhanced, which increased polymerization, leading to strength.
Figure 4.4 Compressive strength of AASC mixes with different NaOH concentration
4.3.2 Effect of Sodium Silicate
At SS/SH=1, the compressive was slightly higher than that of mixes with
SS/SH=1.5 and 2 at 28-days of curing. The reduction in strength is due to the increased
soluble silicate concentration in the activator solution influencing the polymerization
reaction (Gao et al. 2014, Nath and Sarker 2014). Fig. 4.5 shows the compressive
strength of AASC mixes with different SS/SH ratios of 1 (M-8, M-10, M-12, and M-14),
1.5 (N-8, N-10, N-12, and N-14), and 2 (P-8, P-10, P-12, and P-14). The 3 day
compressive strength of AASC mixes with lower SS/SH ratio was slightly higher than
that of specimens with a higher SS/SH ratio at later ages of curing (Lee and Van
Deventer 2002).
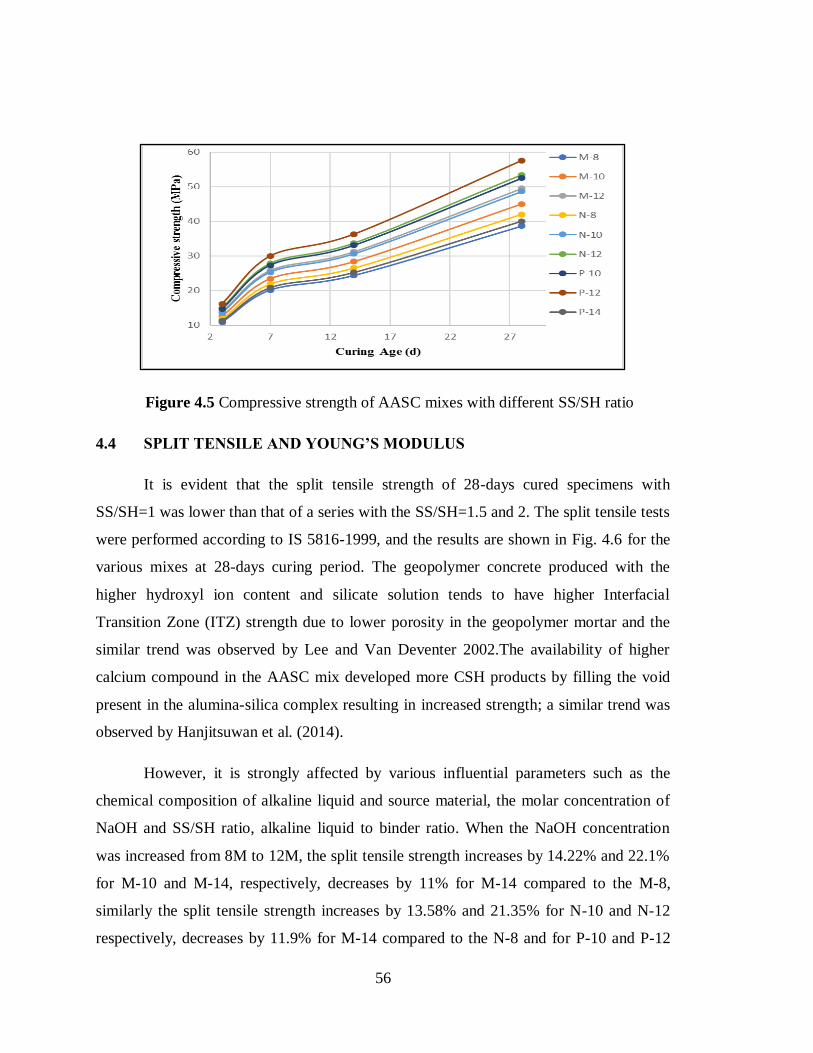
56
Figure 4.5 Compressive strength of AASC mixes with different SS/SH ratio
4.4 SPLIT TENSILE AND YOUNG’S MODULUS
It is evident that the split tensile strength of 28-days cured specimens with
SS/SH=1 was lower than that of a series with the SS/SH=1.5 and 2. The split tensile tests
were performed according to IS 5816-1999, and the results are shown in Fig. 4.6 for the
various mixes at 28-days curing period. The geopolymer concrete produced with the
higher hydroxyl ion content and silicate solution tends to have higher Interfacial
Transition Zone (ITZ) strength due to lower porosity in the geopolymer mortar and the
similar trend was observed by Lee and Van Deventer 2002.The availability of higher
calcium compound in the AASC mix developed more CSH products by filling the void
present in the alumina-silica complex resulting in increased strength; a similar trend was
observed by Hanjitsuwan et al. (2014).
However, it is strongly affected by various influential parameters such as the
chemical composition of alkaline liquid and source material, the molar concentration of
NaOH and SS/SH ratio, alkaline liquid to binder ratio. When the NaOH concentration
was increased from 8M to 12M, the split tensile strength increases by 14.22% and 22.1%
for M-10 and M-14, respectively, decreases by 11% for M-14 compared to the M-8,
similarly the split tensile strength increases by 13.58% and 21.35% for N-10 and N-12
respectively, decreases by 11.9% for M-14 compared to the N-8 and for P-10 and P-12

57
the increase in split tensile strength by 13.52% and 21.18% respectively, decreases by
11.9% for P-14 compared to the P-8. The split tensile strength increases from SS/SH=1
(M-8, M-10, M-12, and M-14) to SS/SH=2 (P-8, P-10, P12, and P14). The influence of
NaOH concentration on the split tensile, compressive strength was found to be similar.
Hardjito et al. (2015) and Diaz Loya et al. (2011) proposed the following equations 4.1
and 4.2 to determine the young`s modulus values.
Ec= 4834 ft +5300 …(4.1)
Ec = 4834ft …(4.2)
Where,
Ec= Young’s Modulus (MPa),
ft= Splitting tensile strength (Predicted),
𝑓𝑡 = 0.56√𝑓𝑐 (as per ACI 318R-92)
AASC mixes produced with a higher concentration of sodium hydroxide, and sodium
silicate tends to have higher Interfacial Transition Zone (ITZ) strength due to lower
porosity in the concrete mixture. A similar trend was observed by Lee and Van Deventer
(2002). Availability of high calcium content from source material developed more
CASH product by filling the void present in alumina-silica complex resulting in increased
strength observed for the mixes of 8M, 10M, and 12M.
AASC mixes were tested for modulus of elasticity according to IS 516:1959 after 28-
days cured samples, and the results are shown in Fig. 4.7. The static elastic modulus of
AASC mixes steadily increases with an increase in molar concentration of NaOH
increased from 8M to 12M.

58
Figure 4.6 Split tensile strength of AASC mixes.
Figure 4.7 Modulus of elasticity of AASC mix.
4.5 FLEXURAL STRENGTH
The flexural strength was determined as per IS 516:1959. The static type flexural
strength tests were conducted for 28-days of cured samples, and the results are depicted
in Fig. 4.8. It is observed that the higher alkaline concentration in AASC mixes increases
the flexural strength at 28-days curing; only M-12, N-10, N-12, P-10, and P-12 mixes
0
0.5
1
1.5
2
2.5
3
3.5
M-8 M-10 M-12 M-14 N-8 N-10 N-12 N-14 P-8 P-10 P-12 P-14 C-8 C-10
Split
te
nsi
le s
tre
nth
(MP
a)
Mix ID
28-d 90-d
0
5000
10000
15000
20000
25000
30000
35000
40000
45000
50000
M-8 M-10 M-12 M-14 N-8 N-10 N-12 N-14 P-8 P-10 P-12 P-14 C-8 C-10
Mo
du
lus
of E
last
icit
y (M
Pa)
Mix ID
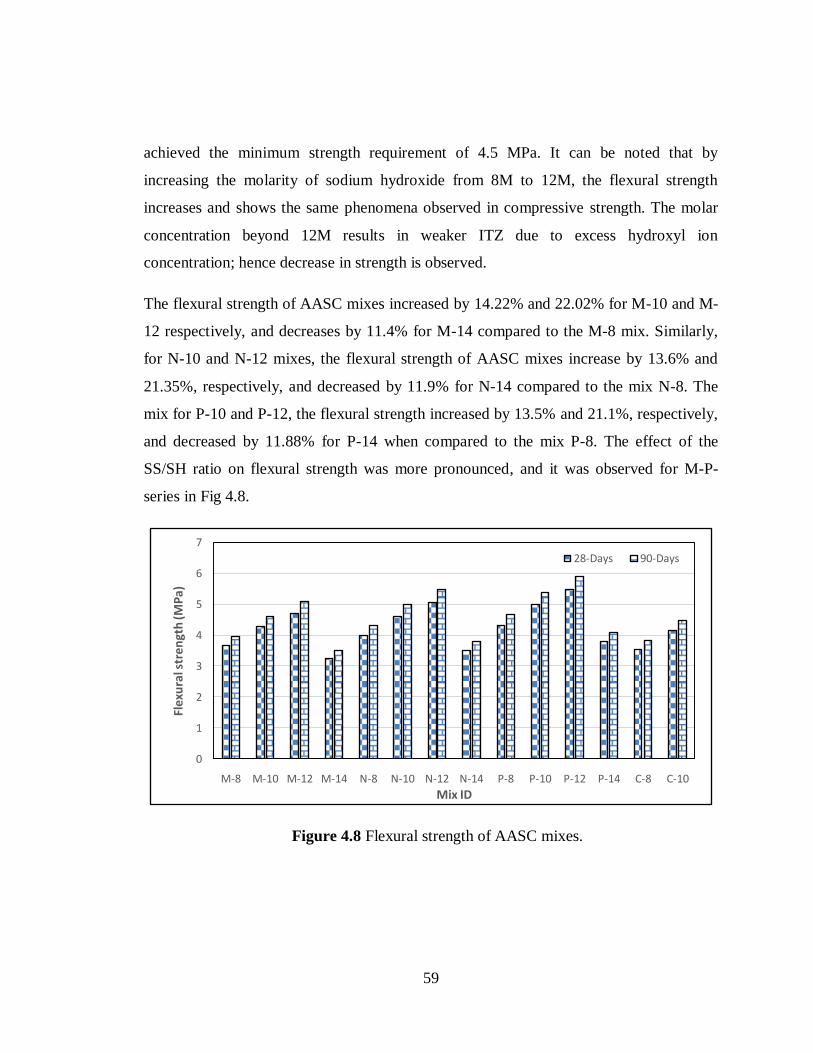
59
achieved the minimum strength requirement of 4.5 MPa. It can be noted that by
increasing the molarity of sodium hydroxide from 8M to 12M, the flexural strength
increases and shows the same phenomena observed in compressive strength. The molar
concentration beyond 12M results in weaker ITZ due to excess hydroxyl ion
concentration; hence decrease in strength is observed.
The flexural strength of AASC mixes increased by 14.22% and 22.02% for M-10 and M-
12 respectively, and decreases by 11.4% for M-14 compared to the M-8 mix. Similarly,
for N-10 and N-12 mixes, the flexural strength of AASC mixes increase by 13.6% and
21.35%, respectively, and decreased by 11.9% for N-14 compared to the mix N-8. The
mix for P-10 and P-12, the flexural strength increased by 13.5% and 21.1%, respectively,
and decreased by 11.88% for P-14 when compared to the mix P-8. The effect of the
SS/SH ratio on flexural strength was more pronounced, and it was observed for M-P-
series in Fig 4.8.
Figure 4.8 Flexural strength of AASC mixes.
0
1
2
3
4
5
6
7
M-8 M-10 M-12 M-14 N-8 N-10 N-12 N-14 P-8 P-10 P-12 P-14 C-8 C-10
Fle
xura
l str
en
gth
(MP
a)
Mix ID
28-Days 90-Days

60
4.6 FATIGUE BEHAVIOR
In the present study, the flexural fatigue performance of AASC and AASFC
mixes incorporating 100% (by volume) PS ball as fine aggregate was investigated. The
specimens were subjected to different stress ratios (0.60, 0.75, 0.80, and 0.85) and the
number of cycles for failure of the specimen at each stress ratio was determined. A
probabilistic analysis of fatigue test data was carried out to ascertain the fatigue life of the
material.
The fatigue life of AASC mixes represented by the S-N curve, where the Stress ratio (S)
versus No. of cycles (N) plots for fatigue life analysis is shown in Figs. 4.9-4.11. The
statistical equation obtained from the S-N curve may be applied for predicting the fatigue
life cycle at the required stress level. The specimens which have passed minimum
flexural strength were selected for the fatigue life analysis, i.e. (M-12, N-10, N-12, P-10,
and P-12). The AASC mixes SS/SH= 2, indicating a strong bond of ITZ between the
mortar and aggregate matrix, preventing the early crack initiation and its propagation
towards the inner structure of concrete compared to the mixes with SS/SH=1. The AASC
mixes reported a reasonably good fatigue life cycle compared to the control mixes as
shown in Figs. 4.9-4.11.
As the fatigue test data of concrete shows a considerable scatter and is random in nature,
a probabilistic approach can be introduced for analyzing the fatigue data and evaluating
the probability of unfavorable performance. The fatigue life data at a given stress level
were arranged in ascending order of cycles to failure. The empirical survivorship function
LN(n) for each fatigue life data ranked in the order of number of cycles to failure; at a
given stress level is calculated using mean rank. The fatigue life (N), i.e., the number of
cycles up to failure for AASC mixes with PS ball slag aggregates are shown in Figs. 4.9
to 4.11. The equations obtained from the S-N curves can be utilized for the estimation of
fatigue cycles at any stress level. The statistical correlation ranging from 0.978- 0.991 for
AASC mixes, indicating good correlation together with significant of fatigue life.
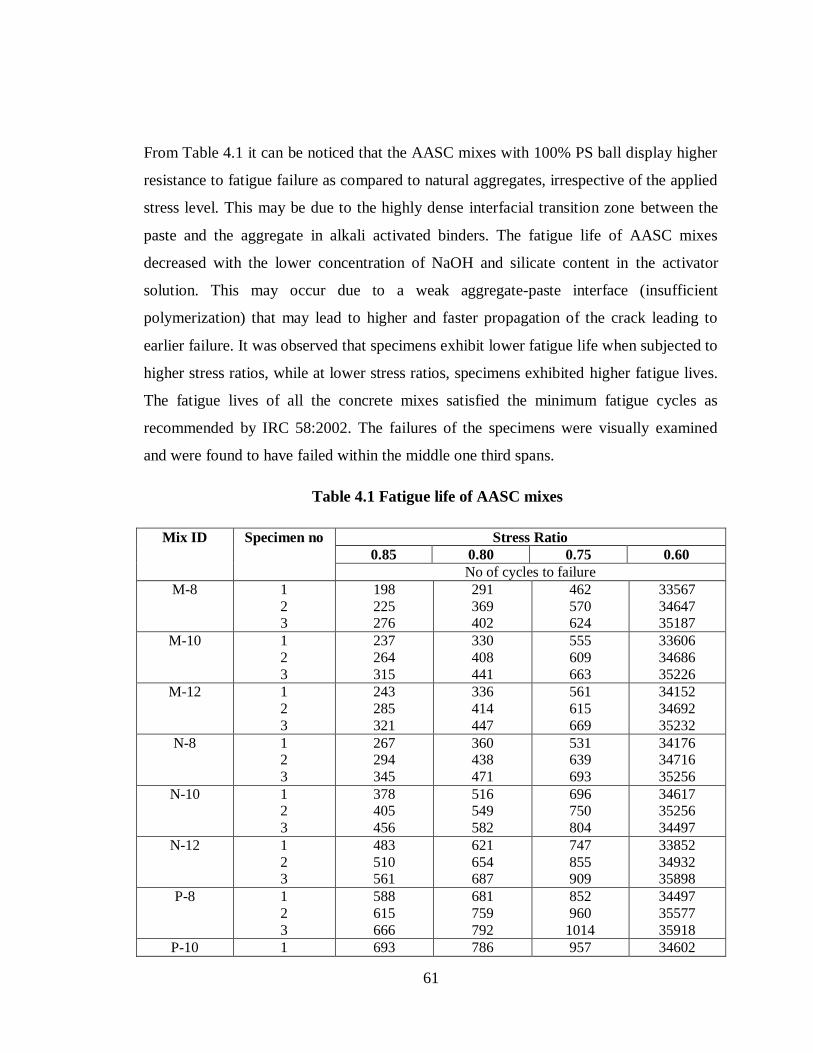
61
From Table 4.1 it can be noticed that the AASC mixes with 100% PS ball display higher
resistance to fatigue failure as compared to natural aggregates, irrespective of the applied
stress level. This may be due to the highly dense interfacial transition zone between the
paste and the aggregate in alkali activated binders. The fatigue life of AASC mixes
decreased with the lower concentration of NaOH and silicate content in the activator
solution. This may occur due to a weak aggregate-paste interface (insufficient
polymerization) that may lead to higher and faster propagation of the crack leading to
earlier failure. It was observed that specimens exhibit lower fatigue life when subjected to
higher stress ratios, while at lower stress ratios, specimens exhibited higher fatigue lives.
The fatigue lives of all the concrete mixes satisfied the minimum fatigue cycles as
recommended by IRC 58:2002. The failures of the specimens were visually examined
and were found to have failed within the middle one third spans.
Table 4.1 Fatigue life of AASC mixes
Mix ID Specimen no Stress Ratio
0.85 0.80 0.75 0.60
No of cycles to failure
M-8 1
2 3
198
225 276
291
369 402
462
570 624
33567
34647 35187
M-10 1
2
3
237
264
315
330
408
441
555
609
663
33606
34686
35226
M-12 1
2
3
243
285
321
336
414
447
561
615
669
34152
34692
35232
N-8
1 2
3
267 294
345
360 438
471
531 639
693
34176 34716
35256
N-10 1 2
3
378 405
456
516 549
582
696 750
804
34617 35256
34497
N-12 1
2 3
483
510 561
621
654 687
747
855 909
33852
34932 35898
P-8 1
2
3
588
615
666
681
759
792
852
960
1014
34497
35577
35918
P-10 1 693 786 957 34602

62
2
3
720
771
864
892
1065
1119
35682
36023
P-12 1 2
3
834 861
914
927 1077
1257
1107 1251
1395
34680 35874
36128
C-10 1 2
3
132 159
210
225 270
336
396 504
558
33501 34581
35226
Figure 4.9 Fatigue life of AASC mixes, M-12 and N-10

63
Figure 4.10 Fatigue repetitions of AASC mixes, N-12 and P-10
Figure 4.11 Fatigue life of AASC mix P-12
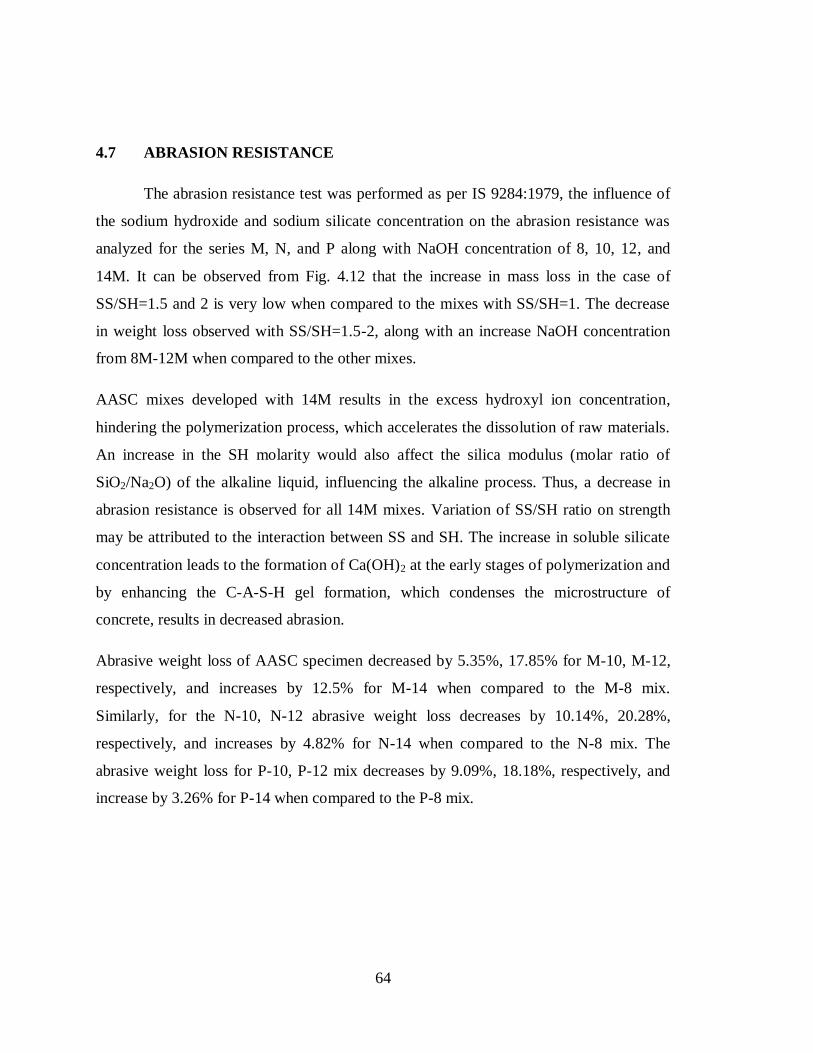
64
4.7 ABRASION RESISTANCE
The abrasion resistance test was performed as per IS 9284:1979, the influence of
the sodium hydroxide and sodium silicate concentration on the abrasion resistance was
analyzed for the series M, N, and P along with NaOH concentration of 8, 10, 12, and
14M. It can be observed from Fig. 4.12 that the increase in mass loss in the case of
SS/SH=1.5 and 2 is very low when compared to the mixes with SS/SH=1. The decrease
in weight loss observed with SS/SH=1.5-2, along with an increase NaOH concentration
from 8M-12M when compared to the other mixes.
AASC mixes developed with 14M results in the excess hydroxyl ion concentration,
hindering the polymerization process, which accelerates the dissolution of raw materials.
An increase in the SH molarity would also affect the silica modulus (molar ratio of
SiO2/Na2O) of the alkaline liquid, influencing the alkaline process. Thus, a decrease in
abrasion resistance is observed for all 14M mixes. Variation of SS/SH ratio on strength
may be attributed to the interaction between SS and SH. The increase in soluble silicate
concentration leads to the formation of Ca(OH)2 at the early stages of polymerization and
by enhancing the C-A-S-H gel formation, which condenses the microstructure of
concrete, results in decreased abrasion.
Abrasive weight loss of AASC specimen decreased by 5.35%, 17.85% for M-10, M-12,
respectively, and increases by 12.5% for M-14 when compared to the M-8 mix.
Similarly, for the N-10, N-12 abrasive weight loss decreases by 10.14%, 20.28%,
respectively, and increases by 4.82% for N-14 when compared to the N-8 mix. The
abrasive weight loss for P-10, P-12 mix decreases by 9.09%, 18.18%, respectively, and
increase by 3.26% for P-14 when compared to the P-8 mix.
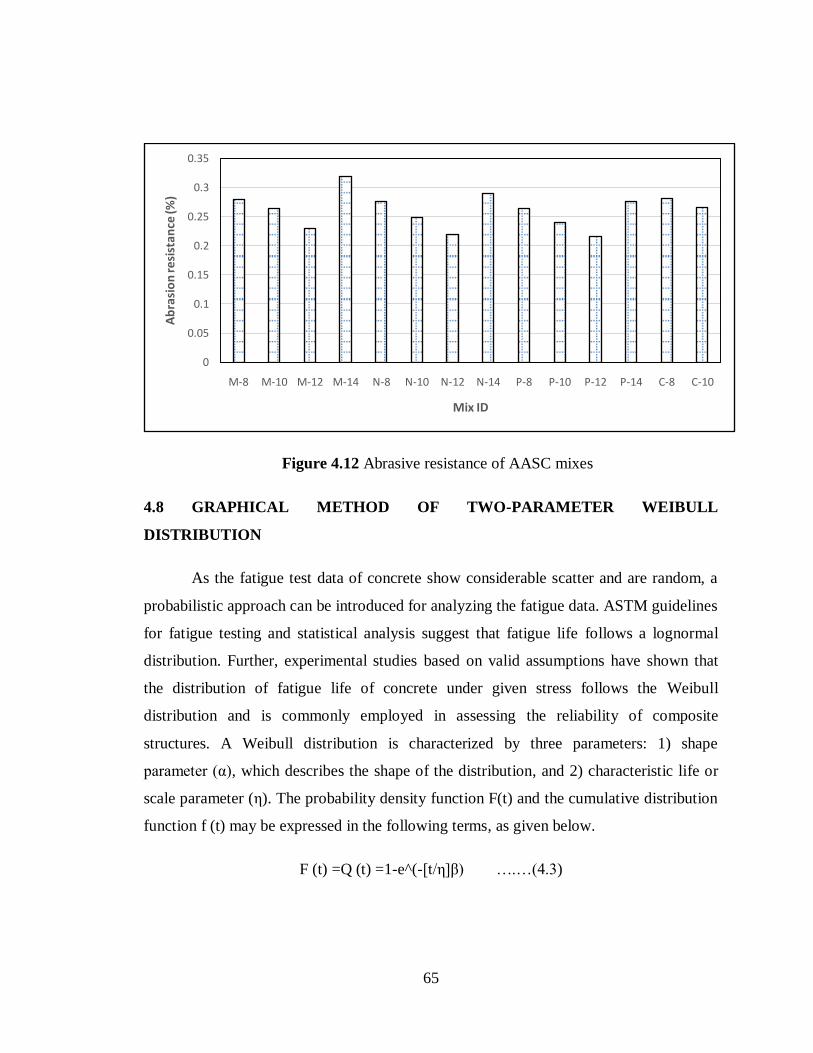
65
Figure 4.12 Abrasive resistance of AASC mixes
4.8 GRAPHICAL METHOD OF TWO-PARAMETER WEIBULL
DISTRIBUTION
As the fatigue test data of concrete show considerable scatter and are random, a
probabilistic approach can be introduced for analyzing the fatigue data. ASTM guidelines
for fatigue testing and statistical analysis suggest that fatigue life follows a lognormal
distribution. Further, experimental studies based on valid assumptions have shown that
the distribution of fatigue life of concrete under given stress follows the Weibull
distribution and is commonly employed in assessing the reliability of composite
structures. A Weibull distribution is characterized by three parameters: 1) shape
parameter (α), which describes the shape of the distribution, and 2) characteristic life or
scale parameter (η). The probability density function F(t) and the cumulative distribution
function f (t) may be expressed in the following terms, as given below.
F (t) =Q (t) =1-e^(-[t/η]β) ….…(4.3)
0
0.05
0.1
0.15
0.2
0.25
0.3
0.35
M-8 M-10 M-12 M-14 N-8 N-10 N-12 N-14 P-8 P-10 P-12 P-14 C-8 C-10
Ab
rasi
on
resi
stan
ce (%
)
Mix ID
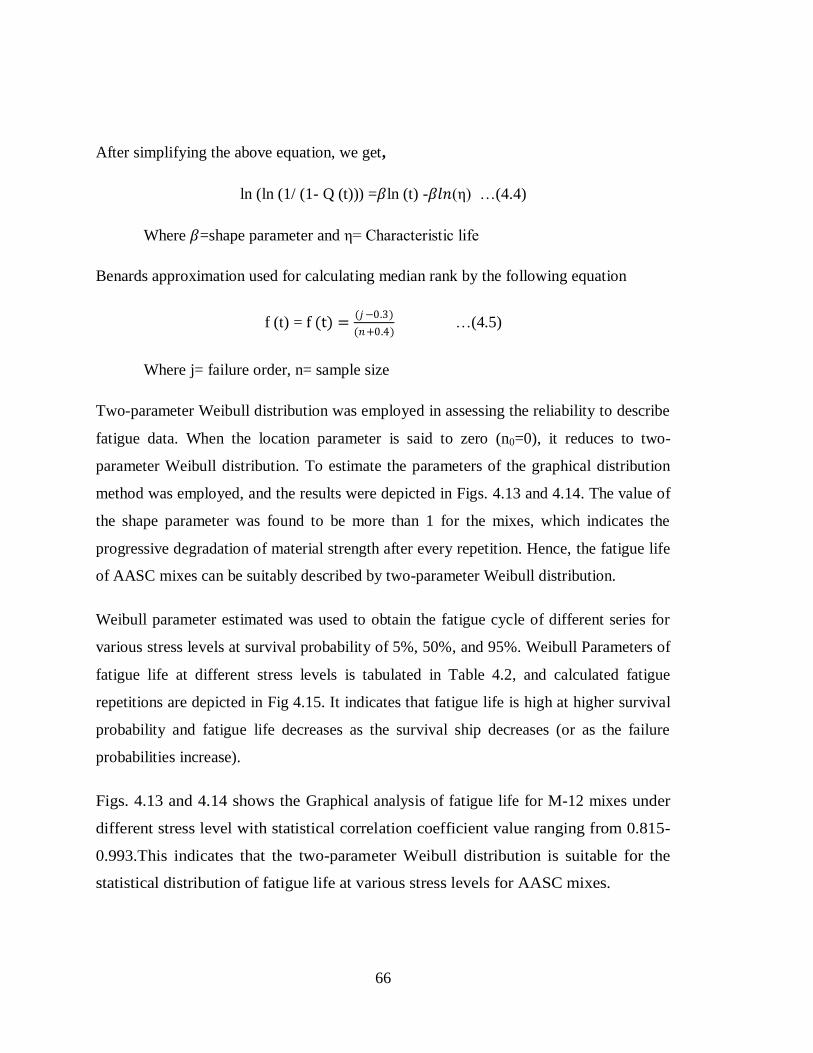
66
After simplifying the above equation, we get,
ln (ln (1/ (1- Q (t))) =𝛽ln (t) -𝛽𝑙𝑛(η) …(4.4)
Where 𝛽=shape parameter and η= Characteristic life
Benards approximation used for calculating median rank by the following equation
f (t) = f (t) =(𝑗−0.3)
(𝑛+0.4) …(4.5)
Where j= failure order, n= sample size
Two-parameter Weibull distribution was employed in assessing the reliability to describe
fatigue data. When the location parameter is said to zero (n0=0), it reduces to two-
parameter Weibull distribution. To estimate the parameters of the graphical distribution
method was employed, and the results were depicted in Figs. 4.13 and 4.14. The value of
the shape parameter was found to be more than 1 for the mixes, which indicates the
progressive degradation of material strength after every repetition. Hence, the fatigue life
of AASC mixes can be suitably described by two-parameter Weibull distribution.
Weibull parameter estimated was used to obtain the fatigue cycle of different series for
various stress levels at survival probability of 5%, 50%, and 95%. Weibull Parameters of
fatigue life at different stress levels is tabulated in Table 4.2, and calculated fatigue
repetitions are depicted in Fig 4.15. It indicates that fatigue life is high at higher survival
probability and fatigue life decreases as the survival ship decreases (or as the failure
probabilities increase).
Figs. 4.13 and 4.14 shows the Graphical analysis of fatigue life for M-12 mixes under
different stress level with statistical correlation coefficient value ranging from 0.815-
0.993.This indicates that the two-parameter Weibull distribution is suitable for the
statistical distribution of fatigue life at various stress levels for AASC mixes.

67
Figure 4.13 Graphical analysis of fatigue life for M-12 mixes at SR=0.60 and 0.75
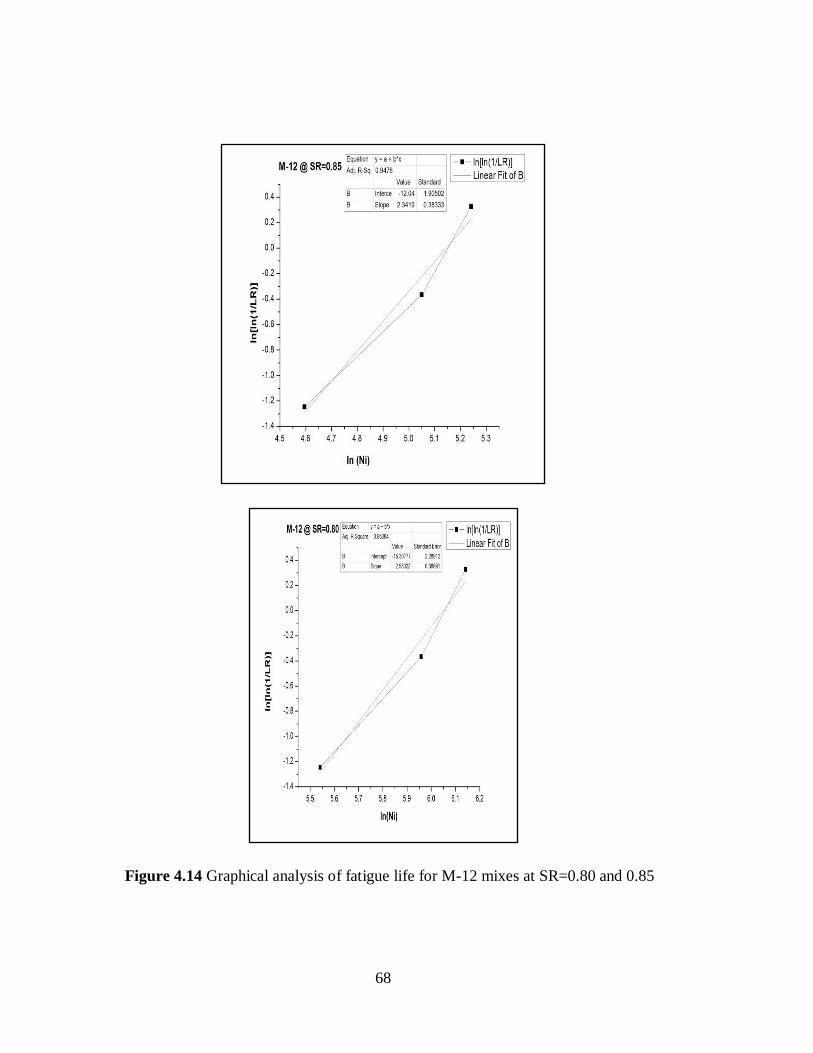
68
Figure 4.14 Graphical analysis of fatigue life for M-12 mixes at SR=0.80 and 0.85
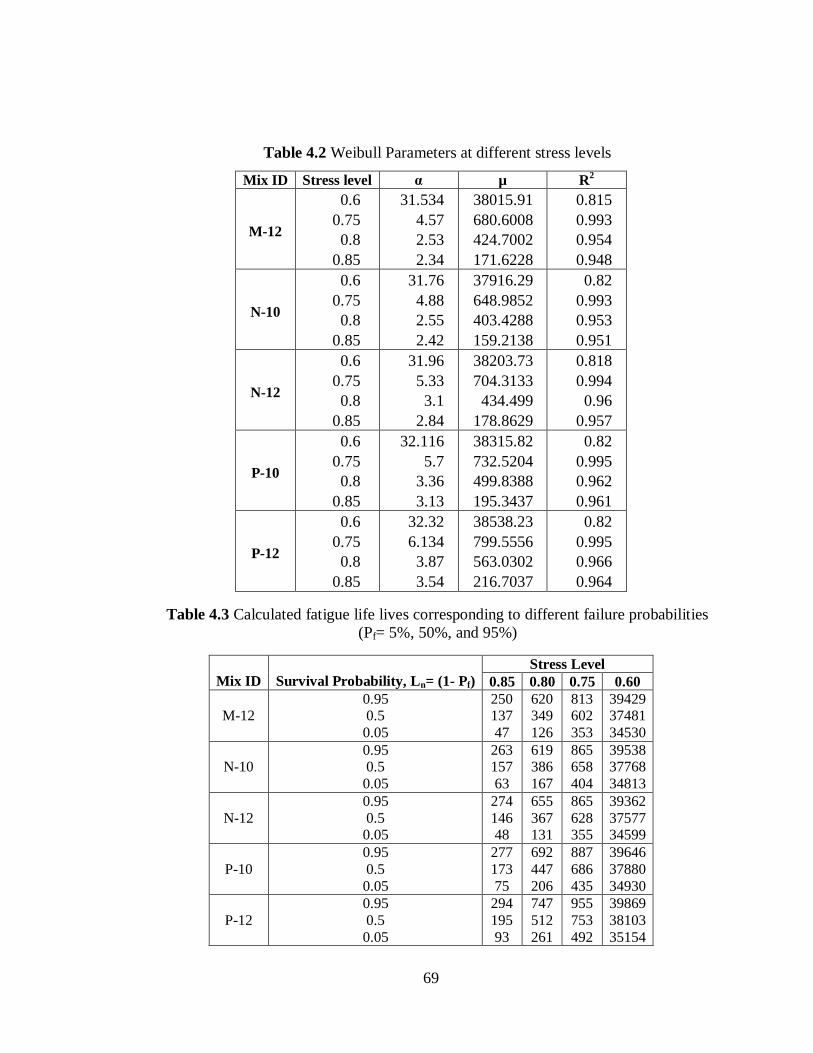
69
Table 4.2 Weibull Parameters at different stress levels
Mix ID Stress level α µ R2
M-12
0.6
0.75
0.8
0.85
31.534
4.57
2.53
2.34
38015.91
680.6008
424.7002
171.6228
0.815
0.993
0.954
0.948
N-10
0.6
0.75
0.8
0.85
31.76
4.88
2.55
2.42
37916.29
648.9852
403.4288
159.2138
0.82
0.993
0.953
0.951
N-12
0.6
0.75
0.8
0.85
31.96
5.33
3.1
2.84
38203.73
704.3133
434.499
178.8629
0.818
0.994
0.96
0.957
P-10
0.6
0.75
0.8
0.85
32.116
5.7
3.36
3.13
38315.82
732.5204
499.8388
195.3437
0.82
0.995
0.962
0.961
P-12
0.6
0.75
0.8
0.85
32.32
6.134
3.87
3.54
38538.23
799.5556
563.0302
216.7037
0.82
0.995
0.966
0.964
Table 4.3 Calculated fatigue life lives corresponding to different failure probabilities
(Pf= 5%, 50%, and 95%)
Mix ID
Survival Probability, Ln= (1- Pf)
Stress Level
0.85 0.80 0.75 0.60
M-12
0.95 0.5
0.05
250 137
47
620 349
126
813 602
353
39429 37481
34530
N-10
0.95 0.5
0.05
263 157
63
619 386
167
865 658
404
39538 37768
34813
N-12
0.95
0.5 0.05
274
146 48
655
367 131
865
628 355
39362
37577 34599
P-10
0.95
0.5
0.05
277
173
75
692
447
206
887
686
435
39646
37880
34930
P-12
0.95
0.5
0.05
294
195
93
747
512
261
955
753
492
39869
38103
35154
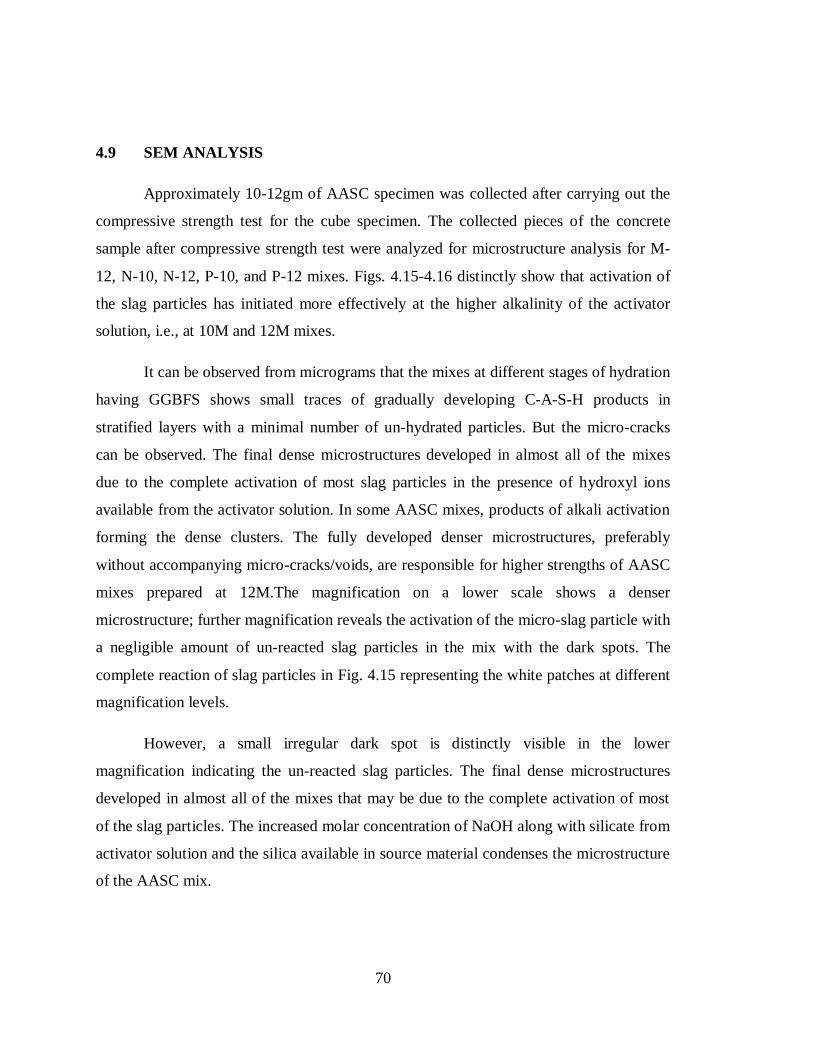
70
4.9 SEM ANALYSIS
Approximately 10-12gm of AASC specimen was collected after carrying out the
compressive strength test for the cube specimen. The collected pieces of the concrete
sample after compressive strength test were analyzed for microstructure analysis for M-
12, N-10, N-12, P-10, and P-12 mixes. Figs. 4.15-4.16 distinctly show that activation of
the slag particles has initiated more effectively at the higher alkalinity of the activator
solution, i.e., at 10M and 12M mixes.
It can be observed from micrograms that the mixes at different stages of hydration
having GGBFS shows small traces of gradually developing C-A-S-H products in
stratified layers with a minimal number of un-hydrated particles. But the micro-cracks
can be observed. The final dense microstructures developed in almost all of the mixes
due to the complete activation of most slag particles in the presence of hydroxyl ions
available from the activator solution. In some AASC mixes, products of alkali activation
forming the dense clusters. The fully developed denser microstructures, preferably
without accompanying micro-cracks/voids, are responsible for higher strengths of AASC
mixes prepared at 12M.The magnification on a lower scale shows a denser
microstructure; further magnification reveals the activation of the micro-slag particle with
a negligible amount of un-reacted slag particles in the mix with the dark spots. The
complete reaction of slag particles in Fig. 4.15 representing the white patches at different
magnification levels.
However, a small irregular dark spot is distinctly visible in the lower
magnification indicating the un-reacted slag particles. The final dense microstructures
developed in almost all of the mixes that may be due to the complete activation of most
of the slag particles. The increased molar concentration of NaOH along with silicate from
activator solution and the silica available in source material condenses the microstructure
of the AASC mix.
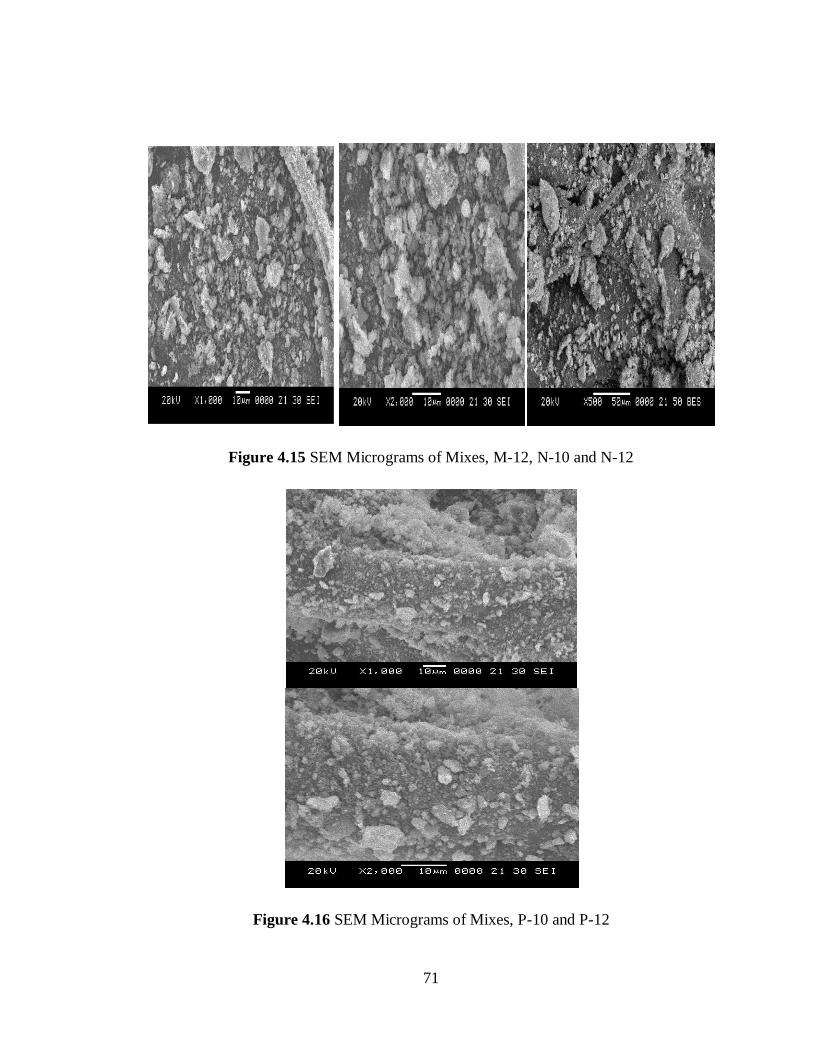
71
Figure 4.15 SEM Micrograms of Mixes, M-12, N-10 and N-12
Figure 4.16 SEM Micrograms of Mixes, P-10 and P-12

72
From Figs. 4.15 and 4.16, it is apparent that in a given sample, reacted slag particles are
more in quantity as the molar concentration of NaOH and SS/SH ratio increases from
10M-12M and 1-2, respectively. The excess hydroxyl ion concentration due to increased
molarity and soluble silica concentration from alkaline liquid enhances the
polymerization reaction, a similar observation made by Nath and Sarker (2014). The
increased NaOH concentration leads to adequate solubilization and accelerates the
formation of CASH gel. Thus, an increase in strength is observed, since larger particles
(>20 µm) do not react chemically, but become physically embedded in the glassy matrix.
4.10 XRD Analysis
Approximately 10-12gm of AASC specimen was collected after the compressive
strength test from the specimen. The XRD patterns were obtained by scanning at a rate of
two degrees per minute from 100-80
0 (2θ). A single letter was assigned to each phase to
facilitate easier representation. Typical EDX-plots obtained for the AASC mixes M-10,
M-12, N-10, N-12, P-10, and P-12 are shown in Fig. 4.17 and 4.18. In each of these plots,
peaks that correspond to various elements like SiO2, CASH, Calcite, and Hydrotalcite are
seen, suggesting the presence of O2, Ca, Si, Na, and Al elements in the mixes. The details
of average atomic percentages measured over a small region in the microgram of the
corresponding mix are obtained from the analyzer. Generally, the range of values of the
three elemental atomic ratios – Ca/Si, Na/Si, and Al/Si governs the mechanical properties
of the AASC mixes. Here, in the present set of high strength mixes, these ratios are
predominantly in the narrow ranges, 0.67–0.75, 0.4–0.55, and 0.3– 0.4 respectively, for
12M mixes. While the corresponding low values of the three ratios (amongst the fifteen
mixes) are 0.42, 0.29, and 0.22, respectively, for 10M mixes. Thus all the AASC mixes,
the elemental order occur with mass-wise, in the order Si > Ca > Na > Al, which possibly
as constitutes the formation of C-A-S-H gels.
Sharpening peak in the calcite region revealed a Quartz mineral, which indicates a
continuous chain reaction of polymerization involved. Due to a more reactive form of the
amorphous phase, there is an increase in the mechanical strength, which cannot be

73
determined by X-ray diffraction. It was observed that change in phases of the Quartz
mineral due to its reaction with the hydroxyl ion indicating higher concentrations of
NaOH enhances the reaction kinetics of the process, the sharp diffraction peak in the
region 200-40
0, represents the occurrence of alumina-silicate glass complex with low
ordered crystalline structure as the main reaction product, which is more reactive form
with water compared to the glassy structure of silica compound and forming the
compound of CASH, resulting in increased strength of the hardened concrete matrix.
Figure 4.17 XRD peak analysis for M-10, N-10 and N-12 sample
Figure 4.18XRD peak analysis of P-10 and P-12 sample
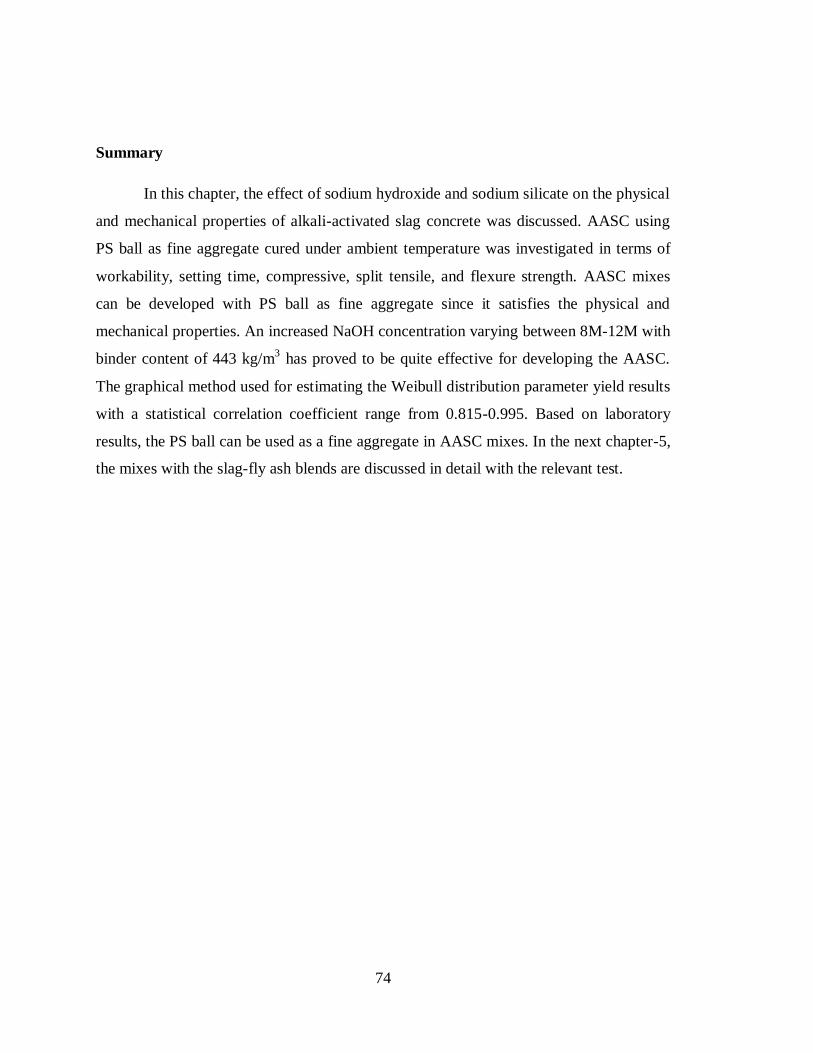
74
Summary
In this chapter, the effect of sodium hydroxide and sodium silicate on the physical
and mechanical properties of alkali-activated slag concrete was discussed. AASC using
PS ball as fine aggregate cured under ambient temperature was investigated in terms of
workability, setting time, compressive, split tensile, and flexure strength. AASC mixes
can be developed with PS ball as fine aggregate since it satisfies the physical and
mechanical properties. An increased NaOH concentration varying between 8M-12M with
binder content of 443 kg/m3 has proved to be quite effective for developing the AASC.
The graphical method used for estimating the Weibull distribution parameter yield results
with a statistical correlation coefficient range from 0.815-0.995. Based on laboratory
results, the PS ball can be used as a fine aggregate in AASC mixes. In the next chapter-5,
the mixes with the slag-fly ash blends are discussed in detail with the relevant test.
75
CHAPTER 5
ALKALI-ACTIVATED SLAG-FLYASH CONCRETE
5.0 INTRODUCTION
In this chapter, the physical and mechanical properties of the Alkali Activated Slag
Flyash concrete (AASFC) mixes by complete replacement of river sand with PS ball,
both in the fresh and hardened state, are discussed. The properties of fresh concrete, such
as workability, setting time, and the properties of hardened concrete like compressive
strength, split tensile strength, modulus of elasticity, flexural strength, fatigue behavior,
and abrasion resistance, were analyzed. Weibull distribution is used to analyze the
laboratory results.
5.1 WORKABILITY
AASFC mixes are characterized by lower workability due to the presence of silica
mineral from the source material, attributed to viscous mix in the alkali-activated slag
concrete. For the relatively low slump mix, the vibrating table is used for compaction for
AASFC mixes. The addition of flyash to the sole binder adversely affected the
workability also the setting time of the AASFC mixes, and hence Trisodium phosphate
was used as a retarder. No additional water was added to any mixtures. The workability
of AASFC mixes for different percentages of flyash is represented in Fig. 5.1.
AASFC mix with series A indicates slag/fly ash combination 90/10, series B 80/20, series
C 70/30, and series D 60/40. The slump values decreased with the increase of FA content
in the AASFC mixes, which is due to the acceleration of reaction kinetics of calcium
minerals and the angular shape of slag particles. The slump of A-8, B-8, C-8, D-8, A-16
are 57mm, 53mm, 49mm, 45mm respectively, when compared to M-8 and M-10, these
values are higher. For series A, the slump value for A-10, A-12, A-14, A-16 are 49, 52,
44, 47.5mm, respectively, and these values are less when compared to the A-8 mix of
57mm.For series B, the slump value for B-10, B-14,is 49.5mm, 50mm, respectively, and
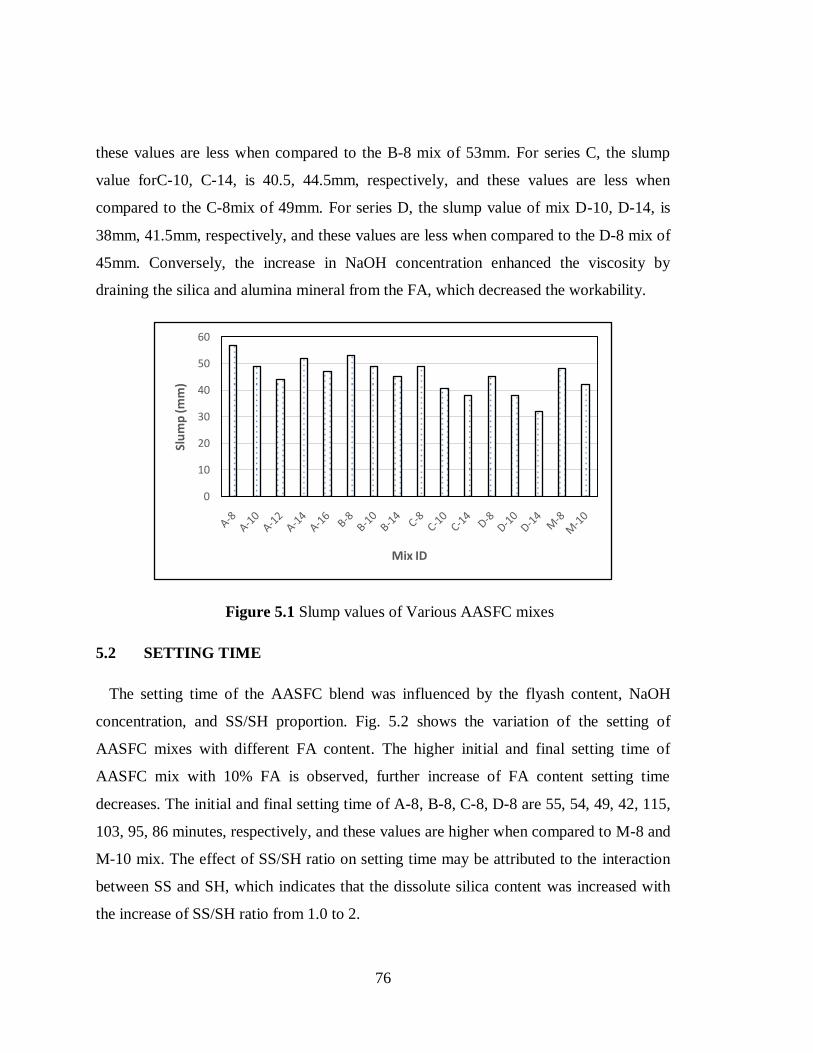
76
these values are less when compared to the B-8 mix of 53mm. For series C, the slump
value forC-10, C-14, is 40.5, 44.5mm, respectively, and these values are less when
compared to the C-8mix of 49mm. For series D, the slump value of mix D-10, D-14, is
38mm, 41.5mm, respectively, and these values are less when compared to the D-8 mix of
45mm. Conversely, the increase in NaOH concentration enhanced the viscosity by
draining the silica and alumina mineral from the FA, which decreased the workability.
Figure 5.1 Slump values of Various AASFC mixes
5.2 SETTING TIME
The setting time of the AASFC blend was influenced by the flyash content, NaOH
concentration, and SS/SH proportion. Fig. 5.2 shows the variation of the setting of
AASFC mixes with different FA content. The higher initial and final setting time of
AASFC mix with 10% FA is observed, further increase of FA content setting time
decreases. The initial and final setting time of A-8, B-8, C-8, D-8 are 55, 54, 49, 42, 115,
103, 95, 86 minutes, respectively, and these values are higher when compared to M-8 and
M-10 mix. The effect of SS/SH ratio on setting time may be attributed to the interaction
between SS and SH, which indicates that the dissolute silica content was increased with
the increase of SS/SH ratio from 1.0 to 2.
0
10
20
30
40
50
60
Slu
mp
(mm
)
Mix ID

77
Thus, the decrease of setting time with the increase of SS/SH ratio from 1.0 to 2 may be
related to the dissolute silica content. Higher content of dissolute silica would enhance
the alkali activation process and reduce the time to complete the dissolution reaction
resulting in the decrease of setting time. The 8M mix with 10% FA had an initial setting
time 65min and final setting time of 115minutes, and these values are higher when
compared to the 10M mix. A similar trend is observed for the mixes with 20%FA. As
SS/SH ratio increases, the dissolution of silica component takes place and thus decreases
the setting time.
Figure 5.2 Setting time of AASFC mixes
5.3 COMPRESSIVE STRENGTH
The compressive strength test was conducted in accordance with IS 516:1999.
The test results are depicted in Fig. 5.3. The addition of FA to the sole binder increased
the compressive strength along with increased NaOH concentration. For the AASFC
blends, the increment of FA from 10% to 40% increases the strength compared to the
control mixes, whereas the increased SS/SH ratio enhances the lubricating effect in the
mix and due to this segregation of the PS ball from mixture, take place and hence
decrease in the strength.
0
20
40
60
80
100
120
140
A-8 A-10 A-12 A-14 A-16 B-8 B-10 B-14 C-8 C-10 C-14 D-8 D-10 D-14 M-8 M-10
Sett
ing
tim
e (m
in)
Mix ID
Initial set Final set
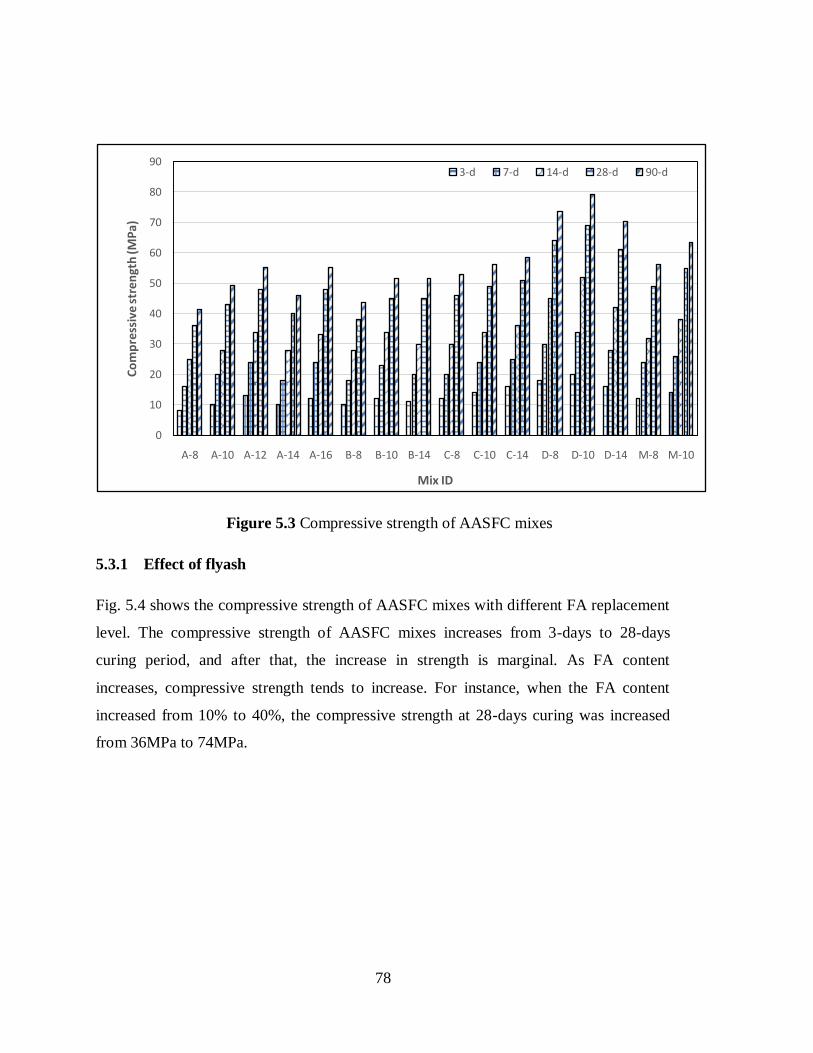
78
Figure 5.3 Compressive strength of AASFC mixes
5.3.1 Effect of flyash
Fig. 5.4 shows the compressive strength of AASFC mixes with different FA replacement
level. The compressive strength of AASFC mixes increases from 3-days to 28-days
curing period, and after that, the increase in strength is marginal. As FA content
increases, compressive strength tends to increase. For instance, when the FA content
increased from 10% to 40%, the compressive strength at 28-days curing was increased
from 36MPa to 74MPa.
0
10
20
30
40
50
60
70
80
90
A-8 A-10 A-12 A-14 A-16 B-8 B-10 B-14 C-8 C-10 C-14 D-8 D-10 D-14 M-8 M-10
Co
mp
ress
ive
str
en
gth
(MP
a)
Mix ID
3-d 7-d 14-d 28-d 90-d

79
Figure 5.4 Compressive strength of AASFC mixes with different FA content
5.3.2 Effect of Sodium Hydroxide (SH)
The effect of the molar concentration of NaOH on the compressive strength of
AASFC mixes is depicted in Fig. 5.5.
Figure 5.5 Compressive strength of AASFC mixes with different NaOH concentration
0
10
20
30
40
50
60
70
0 5 10 15 20 25 30
Com
pre
ssiv
e st
ren
gth
(M
Pa)
Curing Age (d)
A-8 B-8 C-8 D-8
0
10
20
30
40
50
60
70
0 5 10 15 20 25 30
Com
pre
ssiv
e st
ren
gth
(M
Pa)
Curing Age (d)A-8 A-10 A-12 B-8B-10 C-8 C-10 D-8D-10 M-8 M-10
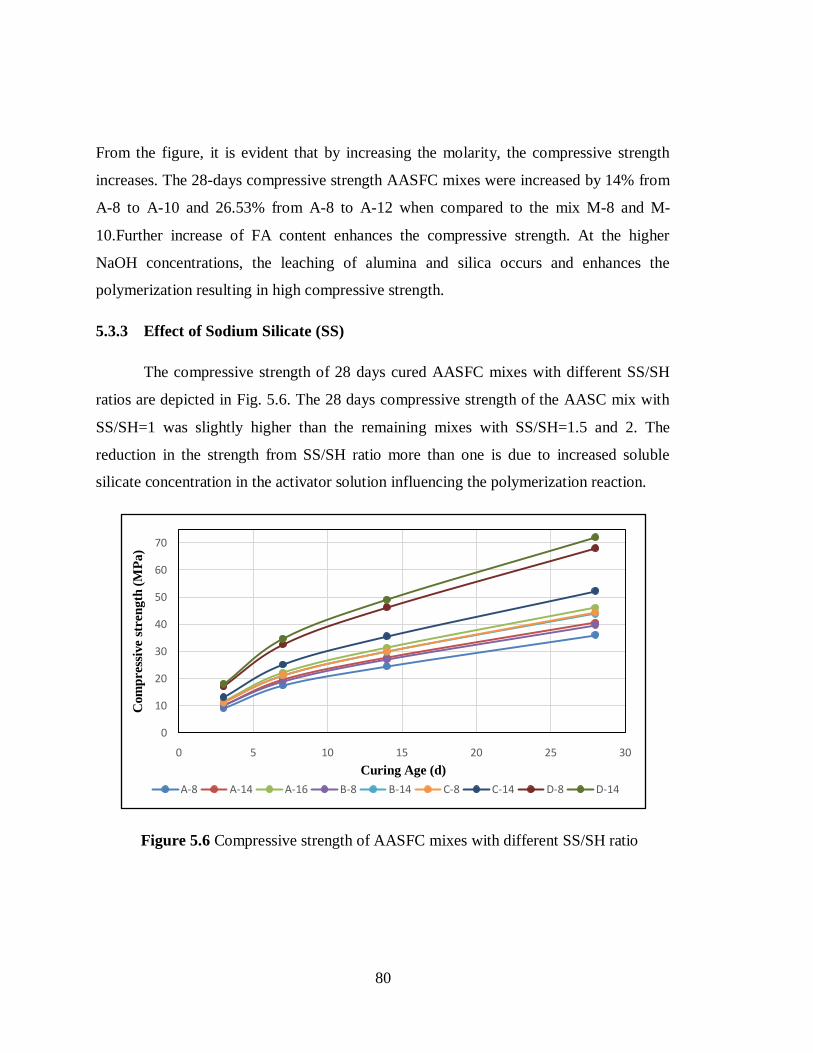
80
From the figure, it is evident that by increasing the molarity, the compressive strength
increases. The 28-days compressive strength AASFC mixes were increased by 14% from
A-8 to A-10 and 26.53% from A-8 to A-12 when compared to the mix M-8 and M-
10.Further increase of FA content enhances the compressive strength. At the higher
NaOH concentrations, the leaching of alumina and silica occurs and enhances the
polymerization resulting in high compressive strength.
5.3.3 Effect of Sodium Silicate (SS)
The compressive strength of 28 days cured AASFC mixes with different SS/SH
ratios are depicted in Fig. 5.6. The 28 days compressive strength of the AASC mix with
SS/SH=1 was slightly higher than the remaining mixes with SS/SH=1.5 and 2. The
reduction in the strength from SS/SH ratio more than one is due to increased soluble
silicate concentration in the activator solution influencing the polymerization reaction.
Figure 5.6 Compressive strength of AASFC mixes with different SS/SH ratio
0
10
20
30
40
50
60
70
0 5 10 15 20 25 30
Com
press
ive s
tren
gth
(M
Pa
)
Curing Age (d)
A-8 A-14 A-16 B-8 B-14 C-8 C-14 D-8 D-14

81
5.4 SPLIT TENSILE AND YOUNG’S MODULUS
The split tensile tests were performed according to IS 5816-1999 for 28 days
cured specimen, and the results are shown in Fig. 5.7. The split tensile strength for
SS/SH=1 is higher when compared to other ratios of 1.5 and 2 due to increased soluble
silicate concentration in the activator solution influencing the polymerization reaction.
For the conventional concrete, the ACI 318-05 and Eurocode are commonly used for
predicting the split tensile strength. The equations developed and presented by ACI 318-
05 and Eurocode are given in equations 5.1 and 5.2.
Fct = 0.56√Fck …(5.1)
Fct=1
3 Fck2/3
for Fck< 50 MPa …(5.2)
Where
Fct is Split tensile strength (MPa) and
Fck is average compressive strength (MPa)
For the AASFC mixes, it was found that most of the experimental results of split tensile
strength were lower than those predicted with a linear relationship between Fct and √Fck
with constant 0.48 and 0.45, respectively (Sofi 2007, Lee and Lee 2013). The addition of
flyash to the sole binder increased the compressive strength along with increased NaOH
concentration. For the AASFC blends, the increment of FA from 10% to 40% increases
the strength compared to the AASC mixes. At the higher NaOH concentrations, leaching
of alumina and silica takes place, enhancing the polymerization resulting in high strength
of AASFC mixtures. However, it is strongly affected by various influential parameters
such as the chemical composition of alkaline liquid and source material, the molar
concentration of NaOH and SS/SH ratio, alkaline liquid to binder ratio.
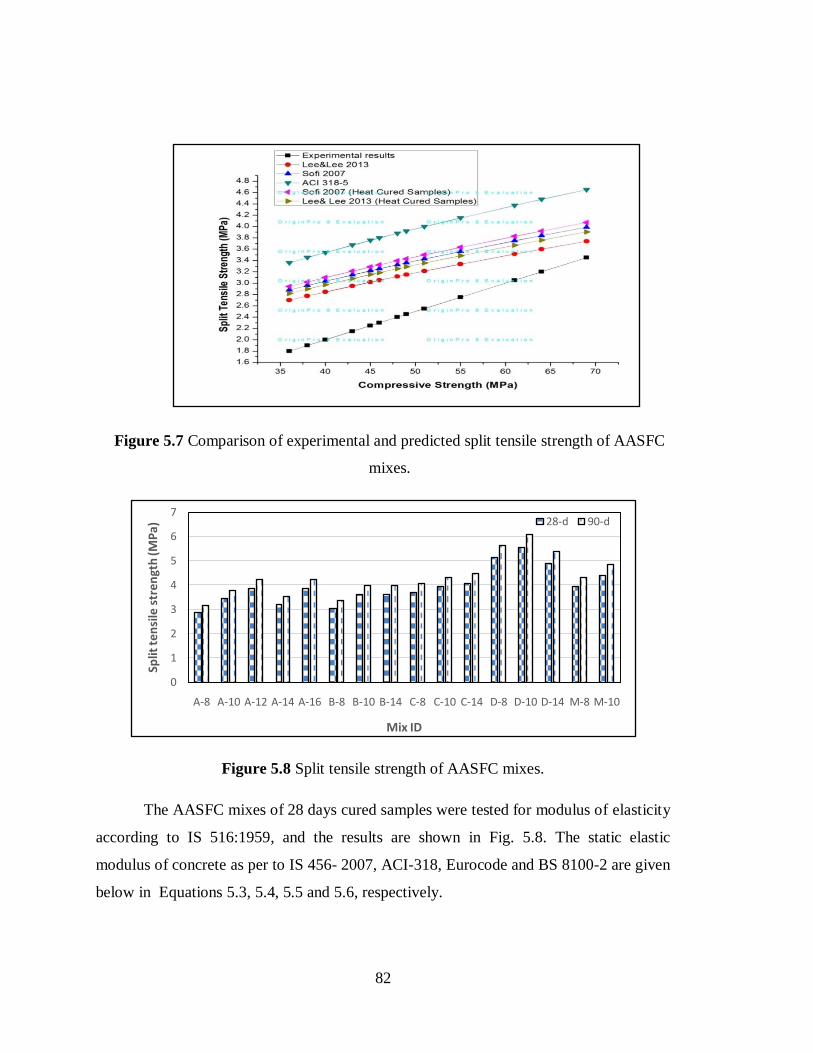
82
Figure 5.7 Comparison of experimental and predicted split tensile strength of AASFC
mixes.
Figure 5.8 Split tensile strength of AASFC mixes.
The AASFC mixes of 28 days cured samples were tested for modulus of elasticity
according to IS 516:1959, and the results are shown in Fig. 5.8. The static elastic
modulus of concrete as per to IS 456- 2007, ACI-318, Eurocode and BS 8100-2 are given
below in Equations 5.3, 5.4, 5.5 and 5.6, respectively.
0
1
2
3
4
5
6
7
A-8 A-10 A-12 A-14 A-16 B-8 B-10 B-14 C-8 C-10 C-14 D-8 D-10 D-14 M-8 M-10
Split
ten
sile
str
en
gth
(MP
a)
Mix ID
28-d 90-d
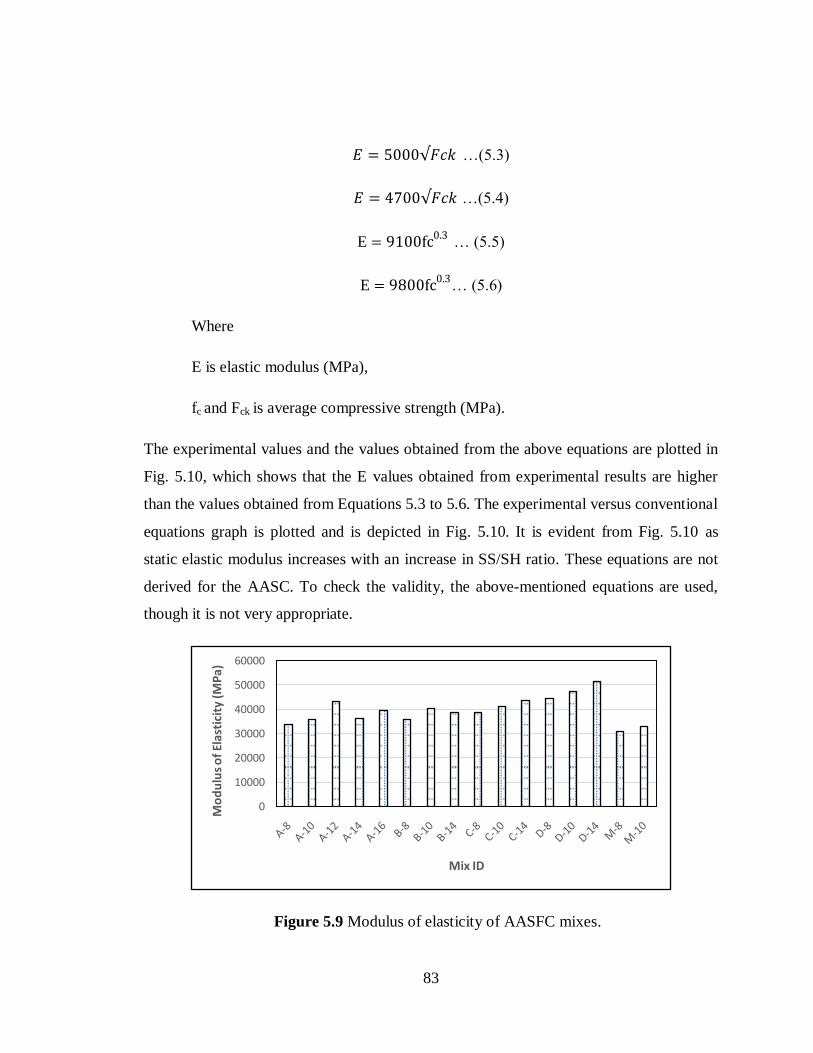
83
𝐸 = 5000√𝐹𝑐𝑘 …(5.3)
𝐸 = 4700√𝐹𝑐𝑘 …(5.4)
E = 9100fc0.3 … (5.5)
E = 9800fc0.3… (5.6)
Where
E is elastic modulus (MPa),
fc and Fck is average compressive strength (MPa).
The experimental values and the values obtained from the above equations are plotted in
Fig. 5.10, which shows that the E values obtained from experimental results are higher
than the values obtained from Equations 5.3 to 5.6. The experimental versus conventional
equations graph is plotted and is depicted in Fig. 5.10. It is evident from Fig. 5.10 as
static elastic modulus increases with an increase in SS/SH ratio. These equations are not
derived for the AASC. To check the validity, the above-mentioned equations are used,
though it is not very appropriate.
Figure 5.9 Modulus of elasticity of AASFC mixes.
0
10000
20000
30000
40000
50000
60000
Mo
du
lus
of E
last
icit
y (M
Pa)
Mix ID
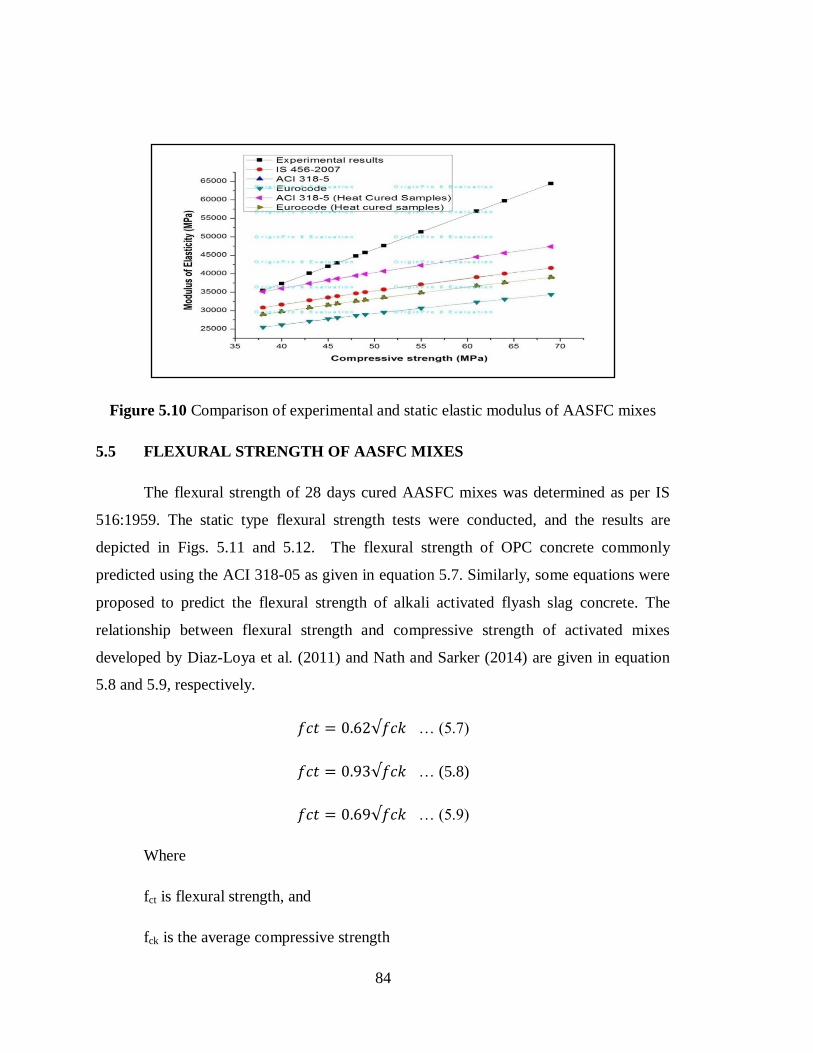
84
Figure 5.10 Comparison of experimental and static elastic modulus of AASFC mixes
5.5 FLEXURAL STRENGTH OF AASFC MIXES
The flexural strength of 28 days cured AASFC mixes was determined as per IS
516:1959. The static type flexural strength tests were conducted, and the results are
depicted in Figs. 5.11 and 5.12. The flexural strength of OPC concrete commonly
predicted using the ACI 318-05 as given in equation 5.7. Similarly, some equations were
proposed to predict the flexural strength of alkali activated flyash slag concrete. The
relationship between flexural strength and compressive strength of activated mixes
developed by Diaz-Loya et al. (2011) and Nath and Sarker (2014) are given in equation
5.8 and 5.9, respectively.
𝑓𝑐𝑡 = 0.62√𝑓𝑐𝑘 … (5.7)
𝑓𝑐𝑡 = 0.93√𝑓𝑐𝑘 … (5.8)
𝑓𝑐𝑡 = 0.69√𝑓𝑐𝑘 … (5.9)
Where
fct is flexural strength, and
fck is the average compressive strength

85
The values obtained from above mentioned equations and experimental results are plotted
in Fig. 5.11. The flexural strength predicted using IS code is closer to the experimental
results. It can be seen from Fig. 5.12 the flexural strength of AASFC mixes increases
with FA content and NaOH concentration. The flexural strength of AASFC mixes with
10% FA for mixes A-10, A-12, A-14, A-16 are 6.2, 6.8, 5.8, 6.5 MPa respectively. These
values are higher than the A-8 mix. As the FA content increases, the flexural strength
increases, and it is evident from Fig. 5.12
Figure 5.11 Flexural strength of AASFC mixes.
Figure 5.12 Comparison of experimental and predicted flexural strength of AASFC
mixes
0
2
4
6
8
10
12
Flex
ura
l str
en
gth
(MP
a)
Mix ID
28-d 90-d

86
5.6 FATIGUE BEHAVIOR OF AASFC MIXES
The fatigue tests were performed on the prism specimens of dimension
100x100x500 mm on an MTS servo-controlled hydraulic repeated load testing machine
of 5-ton capacity with a 2-ton loading cell unit. The fatigue life is represented in terms of
the S-N curve shown in Figs. 5.12- 5.14. The specimens which have passed minimum
flexural strength were considered for the fatigue test, i.e. (D-8, D-10, and D-14).
Irrespective of the flexural failure load for all the mixes, a constant load (1125 kg) was
selected to know the fatigue behavior of all the mixes.
Fatigue repetitions of AASC and AASFC mixes improves with increase in Sodium
Hydroxide up to 12M which is due to internal reaction of Si, Al and Ca components
caused by the increased breakage of the ionic bonds such as Ca-O and Si-O bonds in
GGBFS and flyash provoked by the higher alkalinity resulting from the increasing
molarity of Sodium Hydroxide. Increased FA content of 40% with SS/SH=1 showed
higher fatigue life than that of control mixes. The AASFC mixes SS/SH= 2 showed
higher fatigue life due to strong bonding between the mortar and aggregate matrix,
preventing the early crack initiation and its propagation towards the inner structure of
concrete compared to the mixes with SS/SH=1. The obtained statistical correlation is
ranging from 0.991 to 0.987 for AASFC mixes, indicating a good fit.
Table 5.1 Fatigue life of AASFC mixes
Mix ID Specimen no Stress Ratio
0.85 0.80 0.75 0.60
No of cycles to failure
A-8 1 2
3
243 270
321
339 417
450
516 624
678
33642 34722
35301
A-10 1
2 3
288
315 366
384
462 495
570
678 732
33834
34914 35493
A-12 1
2
3
333
360
411
429
507
540
624
702
786
34026
35106
35685
A-14 1 303 399 576 33672

87
2
3
330
381
477
510
654
738
34752
35332
A-16 1 2
3
384 411
432
480 558
591
684 762
846
34191 35271
35850
B-8 1 2
3
273 306
351
369 447
480
546 654
708
33696 34776
35361
B-10 1
2 3
318
345 396
414
492 525
603
708 762
33888
34968 35547
B-14 1
2
3
297
324
375
393
471
504
588
666
750
33972
35052
35631
C-8 1
2
3
318
351
396
414
492
525
591
699
753
33948
34836
35421
C-10 1 2
3
363 390
441
459 537
570
648 753
807
33948 35028
35607
C-14 1 2
3
411 438
489
507 585
618
698 801
855
34017 35109
35712
M-10 1
2 3
294
345 456
438
474 585
642
672 810
34719
34746 34503
Figure 5.13Fatigue life of AASFC specimen for D-8 mix.
y = -0.04ln(x) + 1.045R² = 0.991
0.5
0.55
0.6
0.65
0.7
0.75
0.8
0.85
0.9
50 500 5000 50000
Stes
s Le
vel
No. of Cycles
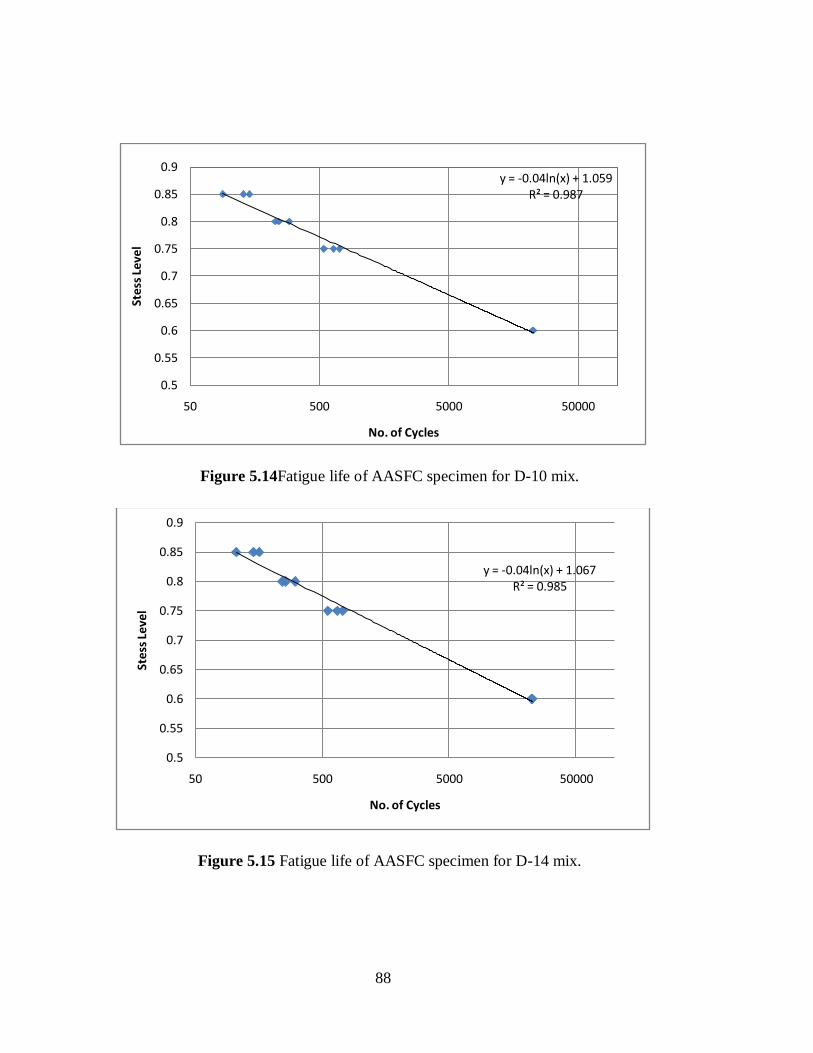
88
Figure 5.14Fatigue life of AASFC specimen for D-10 mix.
Figure 5.15 Fatigue life of AASFC specimen for D-14 mix.
y = -0.04ln(x) + 1.059R² = 0.987
0.5
0.55
0.6
0.65
0.7
0.75
0.8
0.85
0.9
50 500 5000 50000
Ste
ss L
eve
l
No. of Cycles
y = -0.04ln(x) + 1.067R² = 0.985
0.5
0.55
0.6
0.65
0.7
0.75
0.8
0.85
0.9
50 500 5000 50000
Stes
s Le
vel
No. of Cycles

89
Table 5.2 Weibull parameters of fatigue life at different stress levels
Mix ID Stress level α µ R2
D-8
0.6
0.75
0.8
0.85
32.41
6.92
4.3
3.9
39061
1322.3
1085.7
739.4
0.819
0.994
0.959
0.962
D-10
0.6
0.75
0.8
0.85
32.63
7.31
4.462
4.017
39284
1545.3
1768
1991
0.82
0.996
0.959
0.994
D-12
0.6
0.75
0.8
0.85
32.76 7.79
4.69
4.37
39553 1814.3
2037
2260
0.82 0.953
0.994
0.962
M-8
0.6
0.75
0.8
0.85
29.78 6.45
3.8
3.1
33261 1126
928
659
0.802 0.914
0.926
0.921
M-10
0.6
0.75
0.8
0.85
31.29 6.5
4.1
3.6
36657 1296
1027
736
0.997 0.894
0.904
0.916
Table 5.3 Calculated fatigue lives corresponding to different failure probabilities
(Pf= 5%, 50%, and 95%)
Mix ID
Survival Probability, Ln= (1- Pf)
Stress Level
0.85 0.80 0.75 0.60
D-8
0.95
0.5
0.05
980
673
345
1401
997
544
1550
1254
861
40406
38622
35640
D-10
0.95 0.5
0.05
2616 1817
950
2261 1629
908
1795 1470
1029
40627 38845
35866
D-14
0.95
0.5 0.05
2905
2078 1145
2573
1834 1081
2089
1731 1239
40900
39113 36123
M-8
0.95
0.5 0.05
735
428 98
989
585 132
935
639 246
24779
22995 20013
M-10
0.95
0.5
0.05
888
581
251
1270
866
413
1256
960
567
27879
26095
23113

90
Analysis of fatigue data showed that the failure pattern could be convincingly explained
by Weibull distribution. The estimated values of Weibull parameters using the graphical
method are tabulated in Table 5.1. The estimated statistical correlation coefficient R2, for
different test series at various stress level, are in between 0.985-0.991, which indicates
that the graphical method used for the estimation of Weibull parameter shows the best
approximation. The Weibull parameter estimated was used to obtain the fatigue cycle of
different series for various stress levels for survival probability of 5%, 50%, and 95%.
The calculated fatigue lives corresponding to different failure probabilities are presented
in Fig 5.16. It indicates that fatigue life is high at higher survival probability and fatigue
life decreases as the survival ship decreases (or as the failure probabilities increase).
5.7 ABRASION RESISTANCE
The abrasion resistance test was performed as per IS 9284:1979, and the test
results are depicted in Fig. 5.16. The percentage increase in weight loss of the specimen
in case of SS/SH=1.5 and 2 are less comparable to the mixes with SS/ SH =1. It is
evident from Fig 5.16 that the abrasive weight loss of AASFC mixes decreased with the
increase in FA content. Since SS is the most viscous solution in the alkaline liquid, the
increase of the SS/SH ratio from 1 to 2 enhances the polymerization reaction. It is evident
from Fig 5.16 that the abrasive weight loss of AASFC mixes decreased with the increase
in FA content. The abrasive weight loss of AASFC specimen with 10% FA (A-series)
decrease by 71%, 4%, 7.4%, 9% for A-10, A-12, A-14, A-14 respectively, when
compared to A-8mix. A similar trend was observed for the mixes with high FA content.

91
Figure 5.16 Abrasive resistance of various AASFC mixes
Summary
This chapter has provided extensive experimental results and analysis on the
setting time, workability, compressive strength, flexure and fatigue behavior, and
abrasive resistance of AASFC mixes consisting of PS ball as fine aggregate with slag and
FA as binders. The workability of AASFC mixes was significantly affected by an
increase in FA content, along with an increase in molarity of SH and SS concentration
levels. A significant loss in workability was observed for the 40% FA mixes with
increased SH concentration. The combined effect of SH and SS with the increase of FA
has a greater influence on the setting time of AASFC mixes. The SS/SH ratio is the key
parameter that affects the strength of AASFC. In the next chapter-6, the durability of
alkali activated mixtures is discussed in detail.

92

93
93
CHAPTER 6
DURABILITY PROPERTIES
6.1 INTRODUCTION
It is also essential to study the durability properties of these mixtures against the
aggressive environment. The past studies were carried out for durability for the heat-
cured alkali-activated material. This chapter presents some of the durability tests
conducted on air-cured alkali-activated materials. The test includes the evaluation of
permeable pores, capillary sorptivity, and strength determination of alkali activated
mixtures exposure to sulphuric acid, nitric acid, and hydrochloric acid.
6.2 SORPTIVITY
The sorptivity test characterizes the ability of a material to transport fluids under
capillary action, which is a key factor in determining the service life of structures on
exposure to acidic conditions. The relationship between water absorption and elapsed
time square root for the M-8 mix is shown in Fig. 6.1. Initial/primary sorptivity (360
minutes) and secondary sorptivity (24hours) were determined, and test results of AASC
and AASFC mixes are tabulated in Tables 6.1 and 6.2. The primary sorption may be due
to the quick saturation of capillary pores and secondary sorption due to the gradual filling
of larger air voids. The slopes of the first linear and second linear portion are primary and
secondary sorptivity values, starting from 1min-360min and 24 hrs-8 day as per ASTM
C-1585.
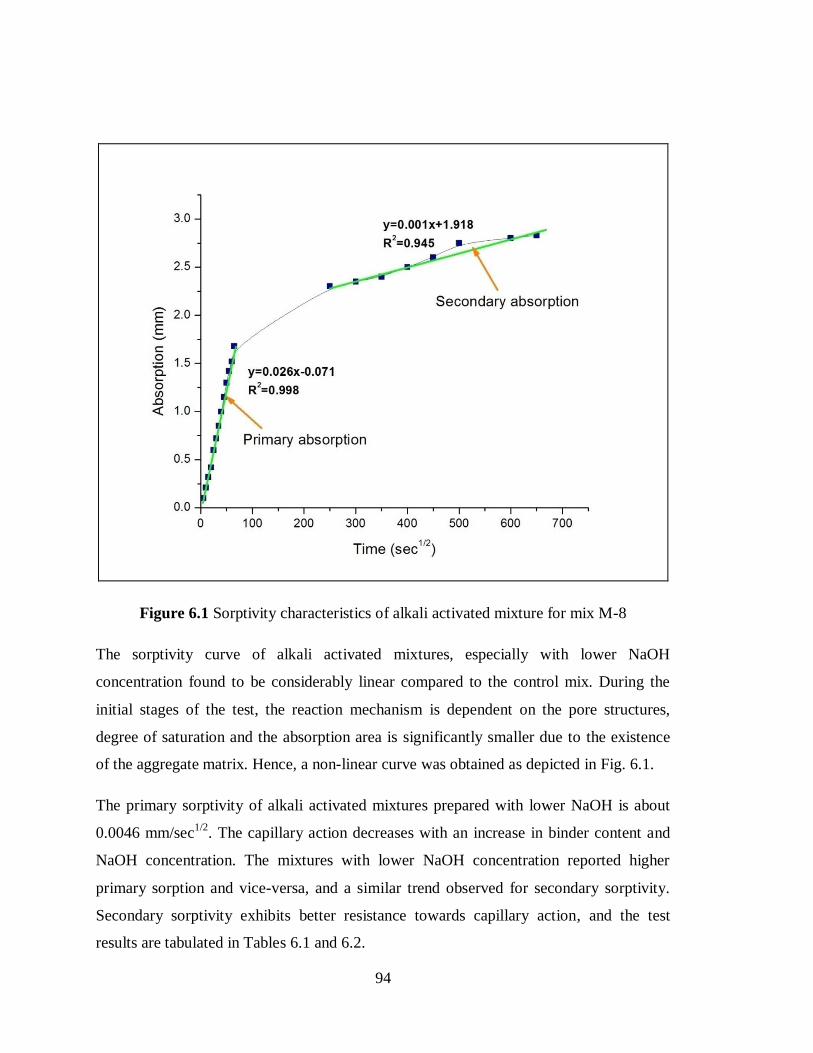
94
Figure 6.1 Sorptivity characteristics of alkali activated mixture for mix M-8
The sorptivity curve of alkali activated mixtures, especially with lower NaOH
concentration found to be considerably linear compared to the control mix. During the
initial stages of the test, the reaction mechanism is dependent on the pore structures,
degree of saturation and the absorption area is significantly smaller due to the existence
of the aggregate matrix. Hence, a non-linear curve was obtained as depicted in Fig. 6.1.
The primary sorptivity of alkali activated mixtures prepared with lower NaOH is about
0.0046 mm/sec1/2
. The capillary action decreases with an increase in binder content and
NaOH concentration. The mixtures with lower NaOH concentration reported higher
primary sorption and vice-versa, and a similar trend observed for secondary sorptivity.
Secondary sorptivity exhibits better resistance towards capillary action, and the test
results are tabulated in Tables 6.1 and 6.2.
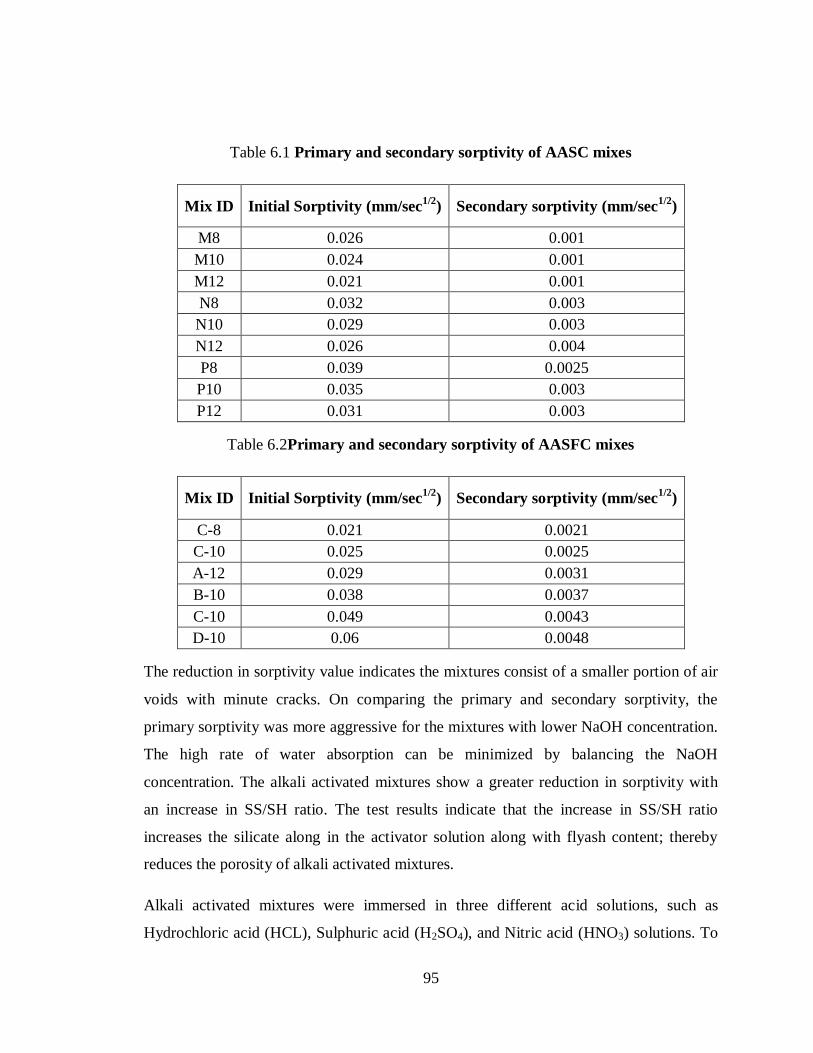
95
Table 6.1 Primary and secondary sorptivity of AASC mixes
Mix ID Initial Sorptivity (mm/sec1/2
) Secondary sorptivity (mm/sec1/2
)
M8 0.026 0.001
M10 0.024 0.001
M12 0.021 0.001
N8 0.032 0.003
N10 0.029 0.003
N12 0.026 0.004
P8 0.039 0.0025
P10 0.035 0.003
P12 0.031 0.003
Table 6.2Primary and secondary sorptivity of AASFC mixes
Mix ID Initial Sorptivity (mm/sec1/2
) Secondary sorptivity (mm/sec1/2
)
C-8 0.021 0.0021
C-10 0.025 0.0025
A-12 0.029 0.0031
B-10 0.038 0.0037
C-10 0.049 0.0043
D-10 0.06 0.0048
The reduction in sorptivity value indicates the mixtures consist of a smaller portion of air
voids with minute cracks. On comparing the primary and secondary sorptivity, the
primary sorptivity was more aggressive for the mixtures with lower NaOH concentration.
The high rate of water absorption can be minimized by balancing the NaOH
concentration. The alkali activated mixtures show a greater reduction in sorptivity with
an increase in SS/SH ratio. The test results indicate that the increase in SS/SH ratio
increases the silicate along in the activator solution along with flyash content; thereby
reduces the porosity of alkali activated mixtures.
Alkali activated mixtures were immersed in three different acid solutions, such as
Hydrochloric acid (HCL), Sulphuric acid (H2SO4), and Nitric acid (HNO3) solutions. To
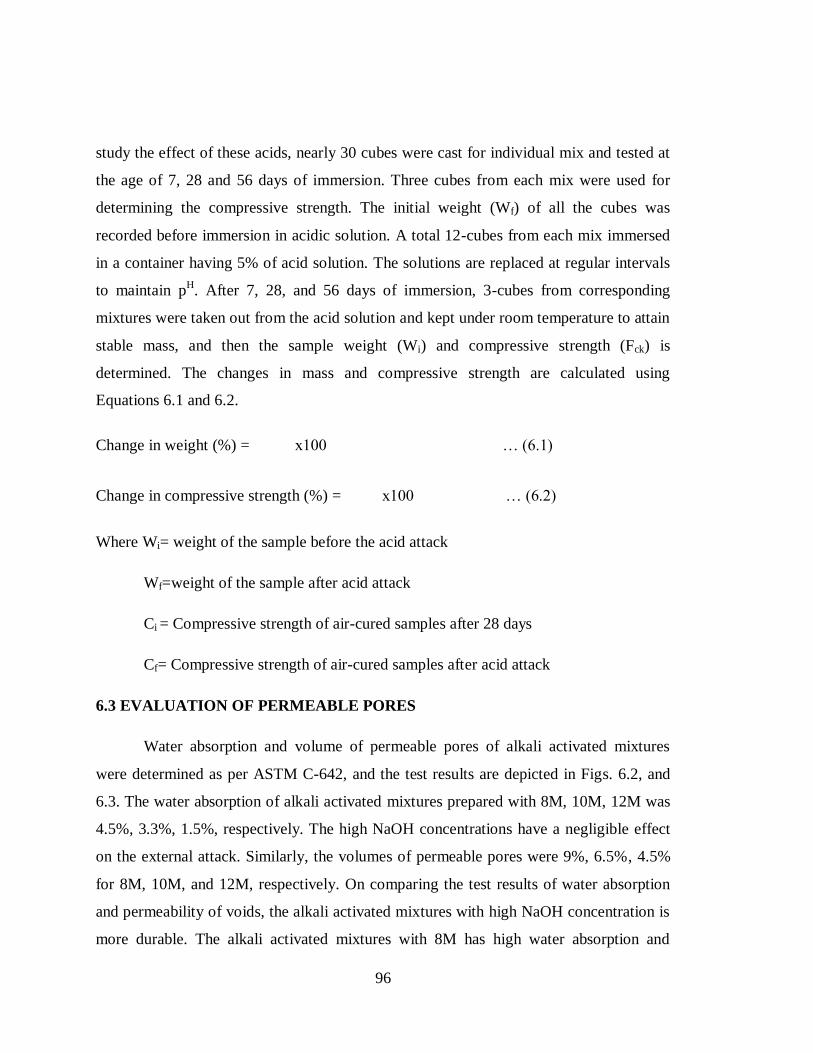
96
study the effect of these acids, nearly 30 cubes were cast for individual mix and tested at
the age of 7, 28 and 56 days of immersion. Three cubes from each mix were used for
determining the compressive strength. The initial weight (Wf) of all the cubes was
recorded before immersion in acidic solution. A total 12-cubes from each mix immersed
in a container having 5% of acid solution. The solutions are replaced at regular intervals
to maintain pH. After 7, 28, and 56 days of immersion, 3-cubes from corresponding
mixtures were taken out from the acid solution and kept under room temperature to attain
stable mass, and then the sample weight (Wi) and compressive strength (Fck) is
determined. The changes in mass and compressive strength are calculated using
Equations 6.1 and 6.2.
Change in weight (%) = x100 … (6.1)
Change in compressive strength (%) = x100 … (6.2)
Where Wi= weight of the sample before the acid attack
Wf=weight of the sample after acid attack
Ci = Compressive strength of air-cured samples after 28 days
Cf= Compressive strength of air-cured samples after acid attack
6.3 EVALUATION OF PERMEABLE PORES
Water absorption and volume of permeable pores of alkali activated mixtures
were determined as per ASTM C-642, and the test results are depicted in Figs. 6.2, and
6.3. The water absorption of alkali activated mixtures prepared with 8M, 10M, 12M was
4.5%, 3.3%, 1.5%, respectively. The high NaOH concentrations have a negligible effect
on the external attack. Similarly, the volumes of permeable pores were 9%, 6.5%, 4.5%
for 8M, 10M, and 12M, respectively. On comparing the test results of water absorption
and permeability of voids, the alkali activated mixtures with high NaOH concentration is
more durable. The alkali activated mixtures with 8M has high water absorption and
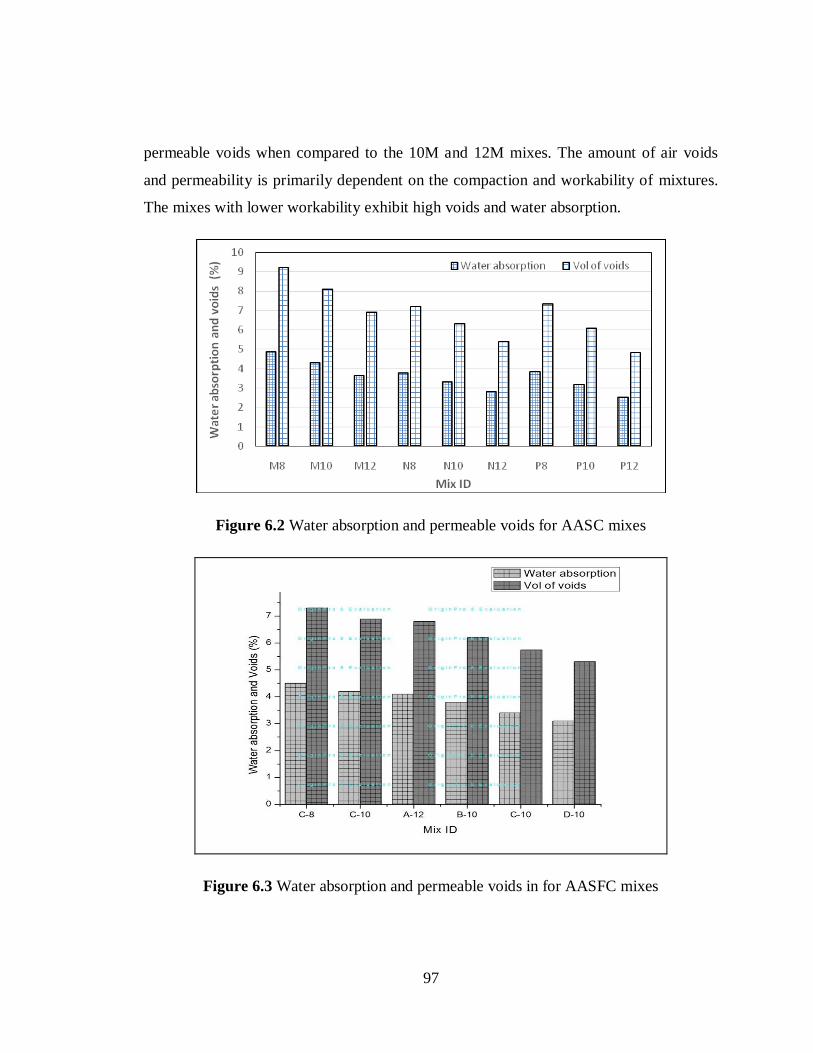
97
permeable voids when compared to the 10M and 12M mixes. The amount of air voids
and permeability is primarily dependent on the compaction and workability of mixtures.
The mixes with lower workability exhibit high voids and water absorption.
Figure 6.2 Water absorption and permeable voids for AASC mixes
Figure 6.3 Water absorption and permeable voids in for AASFC mixes
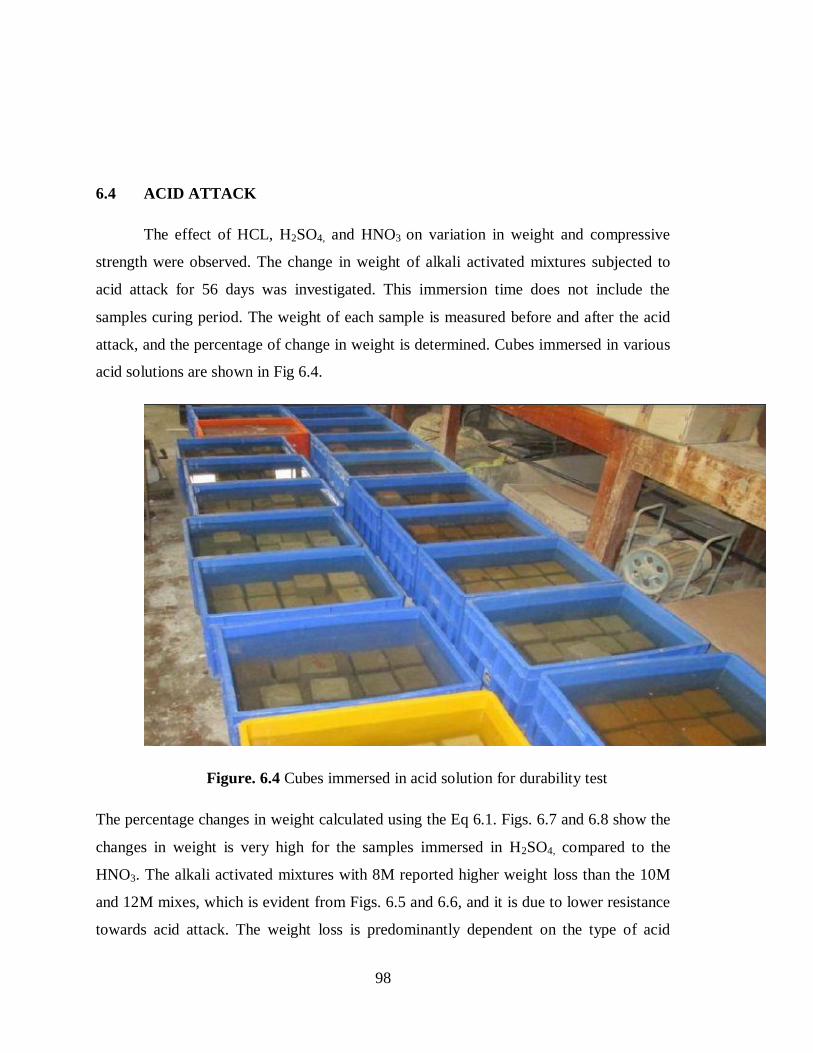
98
6.4 ACID ATTACK
The effect of HCL, H2SO4, and HNO3 on variation in weight and compressive
strength were observed. The change in weight of alkali activated mixtures subjected to
acid attack for 56 days was investigated. This immersion time does not include the
samples curing period. The weight of each sample is measured before and after the acid
attack, and the percentage of change in weight is determined. Cubes immersed in various
acid solutions are shown in Fig 6.4.
Figure. 6.4 Cubes immersed in acid solution for durability test
The percentage changes in weight calculated using the Eq 6.1. Figs. 6.7 and 6.8 show the
changes in weight is very high for the samples immersed in H2SO4, compared to the
HNO3. The alkali activated mixtures with 8M reported higher weight loss than the 10M
and 12M mixes, which is evident from Figs. 6.5 and 6.6, and it is due to lower resistance
towards acid attack. The weight loss is predominantly dependent on the type of acid
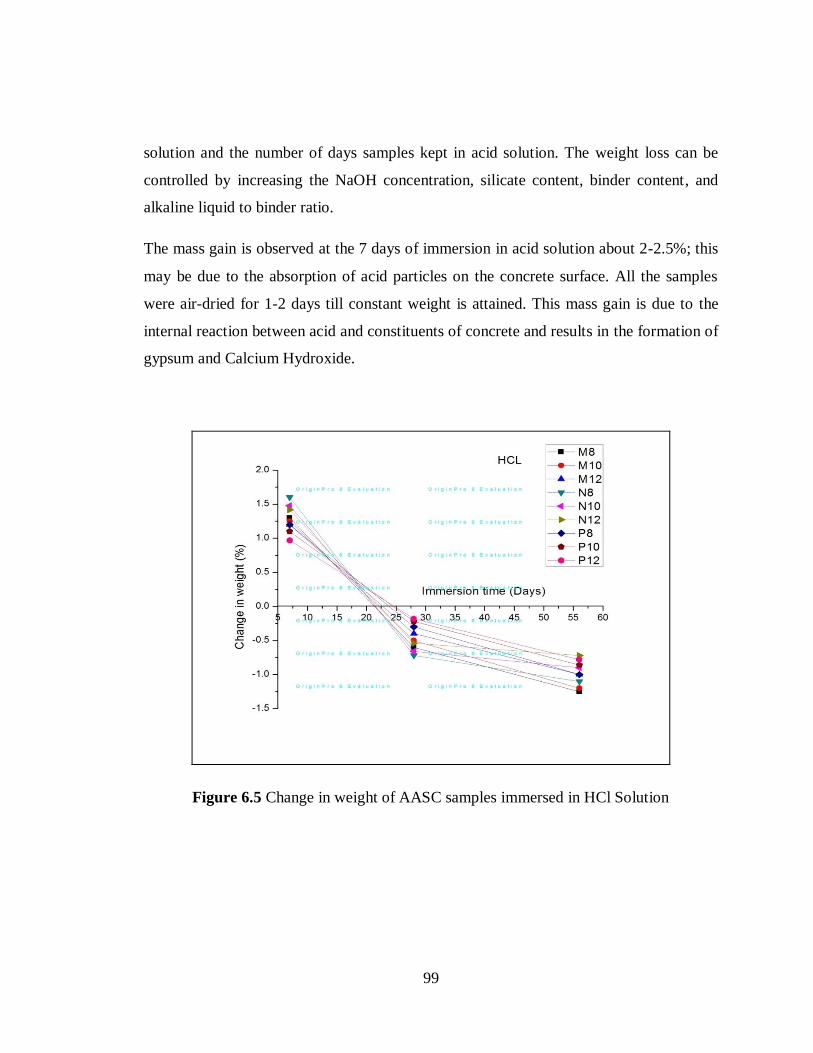
99
solution and the number of days samples kept in acid solution. The weight loss can be
controlled by increasing the NaOH concentration, silicate content, binder content, and
alkaline liquid to binder ratio.
The mass gain is observed at the 7 days of immersion in acid solution about 2-2.5%; this
may be due to the absorption of acid particles on the concrete surface. All the samples
were air-dried for 1-2 days till constant weight is attained. This mass gain is due to the
internal reaction between acid and constituents of concrete and results in the formation of
gypsum and Calcium Hydroxide.
Figure 6.5 Change in weight of AASC samples immersed in HCl Solution
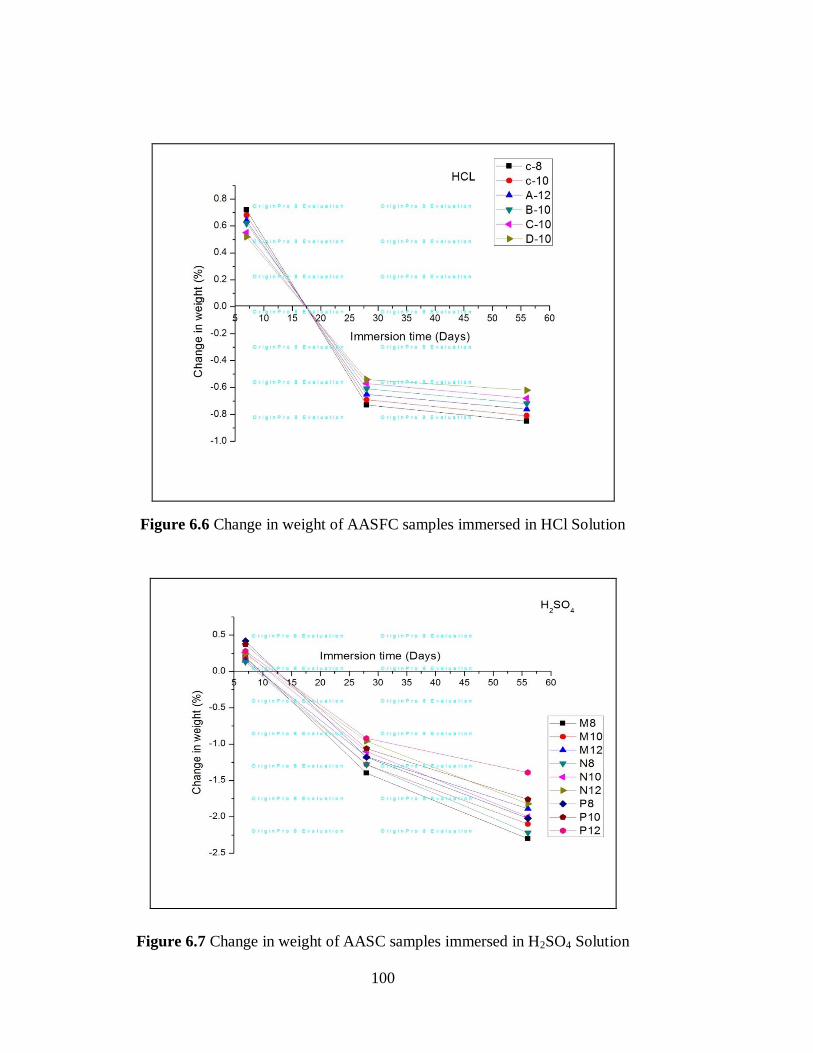
100
Figure 6.6 Change in weight of AASFC samples immersed in HCl Solution
Figure 6.7 Change in weight of AASC samples immersed in H2SO4 Solution
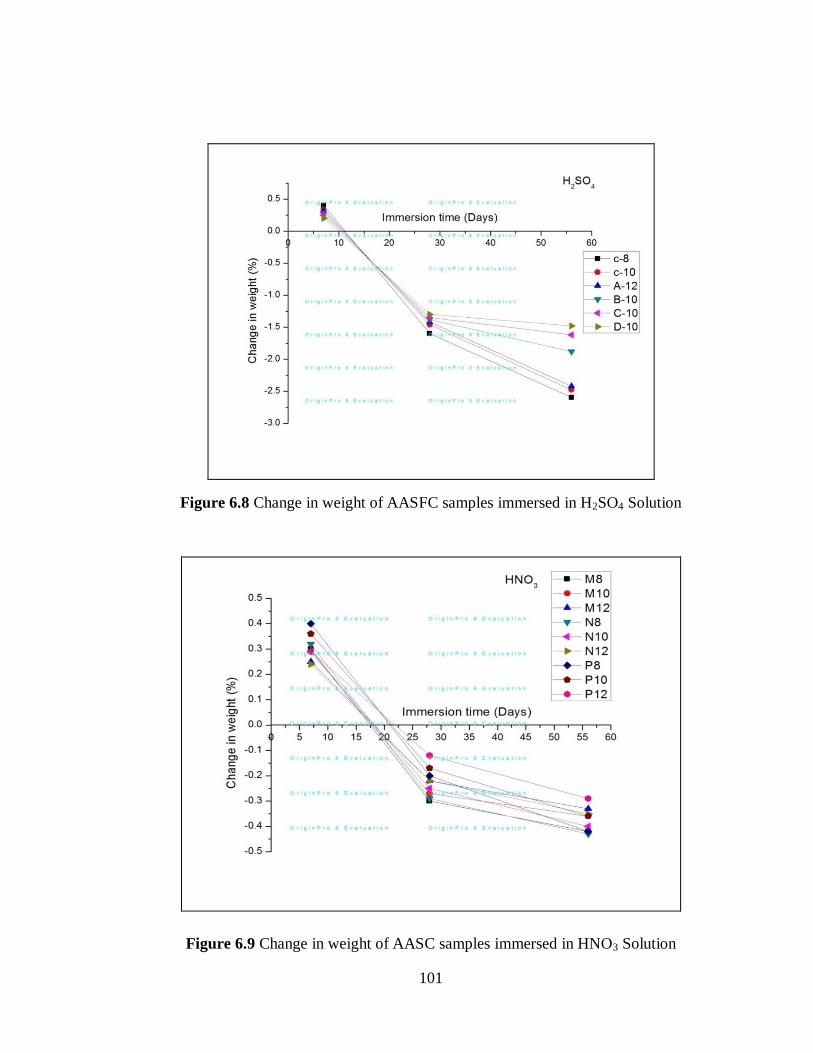
101
Figure 6.8 Change in weight of AASFC samples immersed in H2SO4 Solution
Figure 6.9 Change in weight of AASC samples immersed in HNO3 Solution

102
Figure 6.10 Change in weight of AASFC samples immersed in HNO3 Solution
6.4.1 Effect of Hydrochloric acid (HCL)
The compressive strength of alkali activated mixtures subjected to HCL solution
decreases with an increase in the immersion period, and the test results are depicted in
Figs.6.11 and 6.12. The decrease in strength is observed for the mixes with 8M NaOH
concentration due to the ingress of chloride ions. The resistance towards acid attack can
be improved with an increase in NaOH concentration, binder content, and silicate content
in the activator solution. The HCL acid reacts with calcium compound results in the
formation of Calcium Chloride (CaCl2), which will have a detrimental effect on the
properties of concrete. CASH will be the final reaction product formed in alkali activated
material, which on reaction with HCL, produces CaCl2. It reduces the calcium content
responsible for the strength development in alkali activated mixtures.
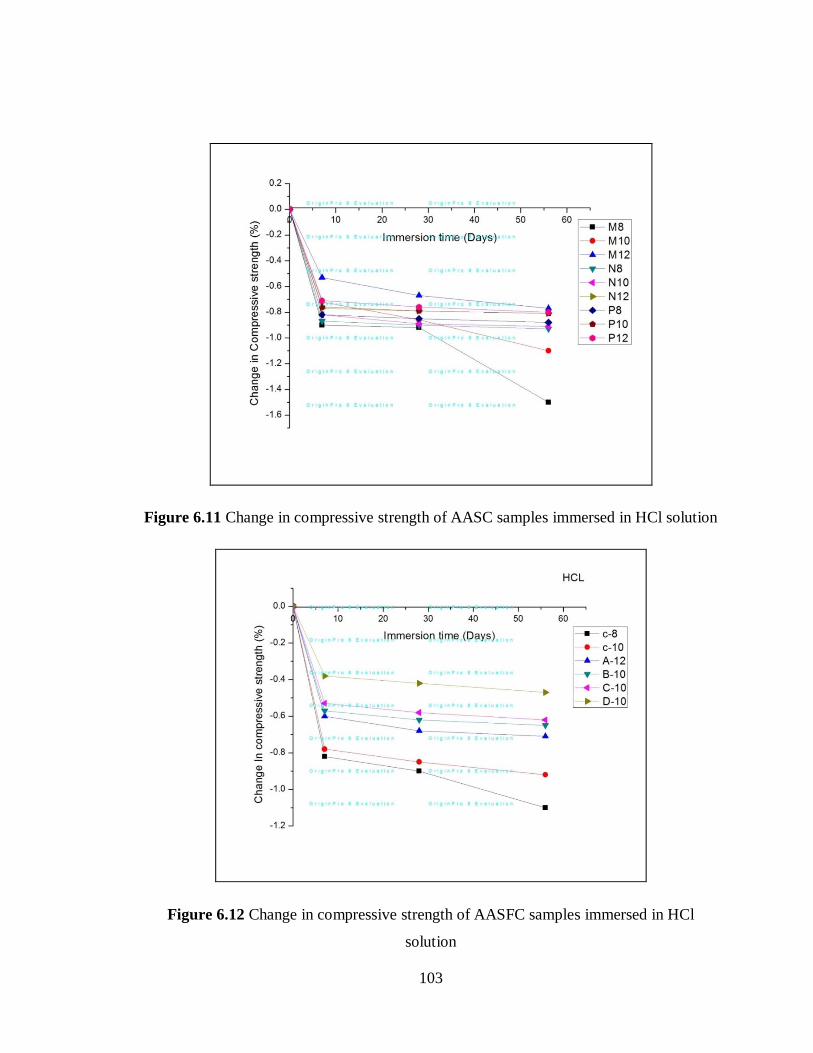
103
Figure 6.11 Change in compressive strength of AASC samples immersed in HCl solution
Figure 6.12 Change in compressive strength of AASFC samples immersed in HCl
solution

104
6.4.2 Effect of Sulphuric acid (H2SO4)
Alkali activated mixtures exposed to H2SO4 solution result in higher mass loss
with a reduction in compressive strength, and the test results are depicted in Figs. 6.13
and 6.14. The alkali activated mixtures of 10M and 12M with a high concentration of
NaOH exhibited better resistance towards acid attack compared to the 8M mix. The
sulphate ion reacts with calcium compounds to produce gypsum (CaSO4) to form calcium
sulfo-aluminates. The final reaction, such as CASH undergoes decalcification to form
CaSO4 reduces the concrete density. The effect of decalcification of the CASH compound
and variation in volume caused by CaSO4 tends to produce the concrete with lesser
strength.
Figure 6.13 Change in compressive strength of AASC samples immersed in H2SO4
solution
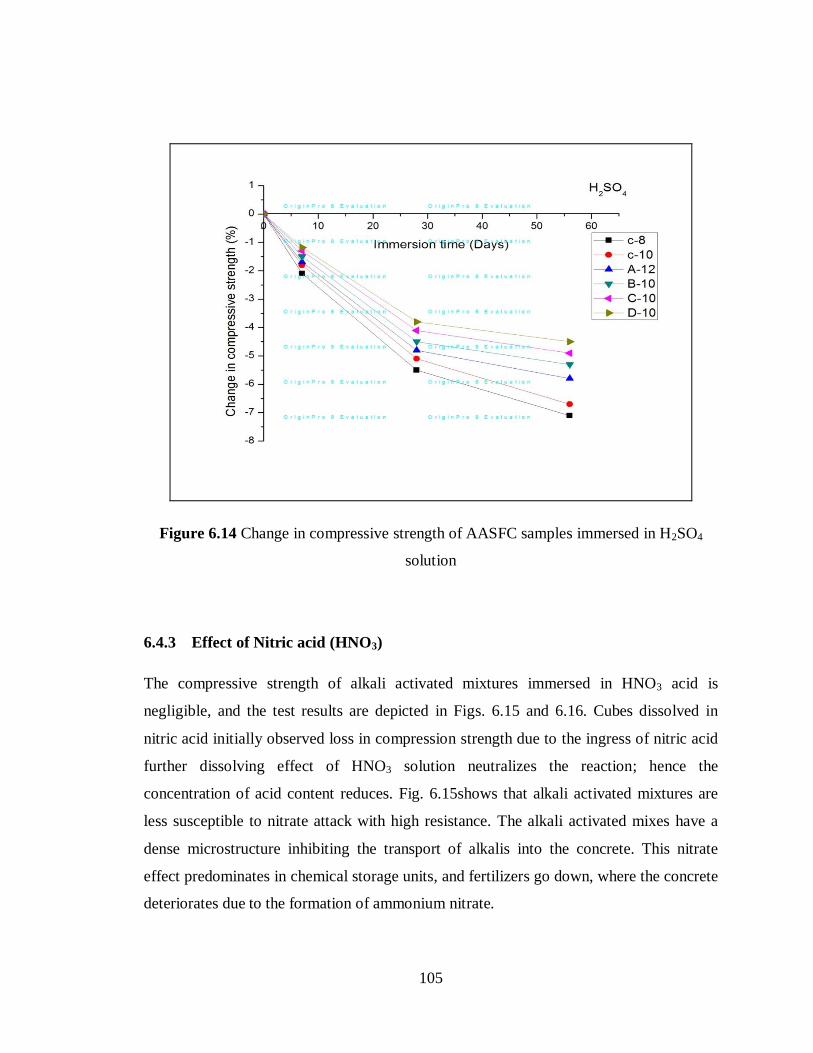
105
Figure 6.14 Change in compressive strength of AASFC samples immersed in H2SO4
solution
6.4.3 Effect of Nitric acid (HNO3)
The compressive strength of alkali activated mixtures immersed in HNO3 acid is
negligible, and the test results are depicted in Figs. 6.15 and 6.16. Cubes dissolved in
nitric acid initially observed loss in compression strength due to the ingress of nitric acid
further dissolving effect of HNO3 solution neutralizes the reaction; hence the
concentration of acid content reduces. Fig. 6.15shows that alkali activated mixtures are
less susceptible to nitrate attack with high resistance. The alkali activated mixes have a
dense microstructure inhibiting the transport of alkalis into the concrete. This nitrate
effect predominates in chemical storage units, and fertilizers go down, where the concrete
deteriorates due to the formation of ammonium nitrate.
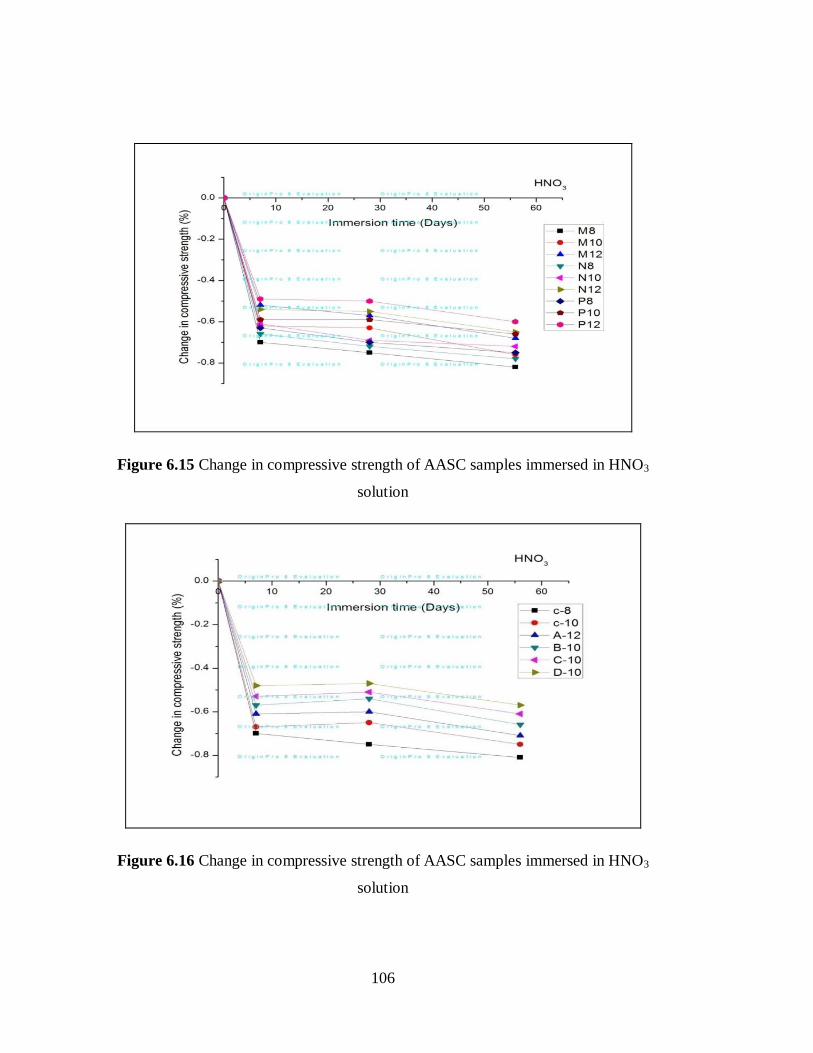
106
Figure 6.15 Change in compressive strength of AASC samples immersed in HNO3
solution
Figure 6.16 Change in compressive strength of AASC samples immersed in HNO3
solution
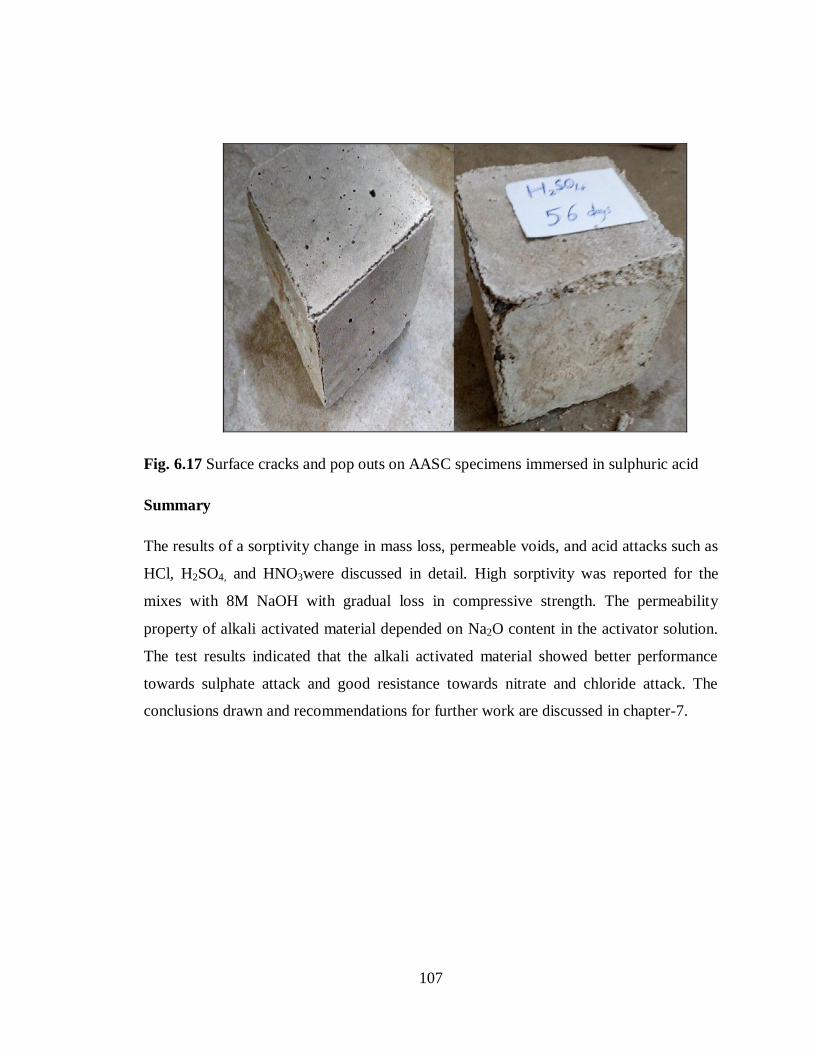
107
Fig. 6.17 Surface cracks and pop outs on AASC specimens immersed in sulphuric acid
Summary
The results of a sorptivity change in mass loss, permeable voids, and acid attacks such as
HCl, H2SO4, and HNO3were discussed in detail. High sorptivity was reported for the
mixes with 8M NaOH with gradual loss in compressive strength. The permeability
property of alkali activated material depended on Na2O content in the activator solution.
The test results indicated that the alkali activated material showed better performance
towards sulphate attack and good resistance towards nitrate and chloride attack. The
conclusions drawn and recommendations for further work are discussed in chapter-7.

108
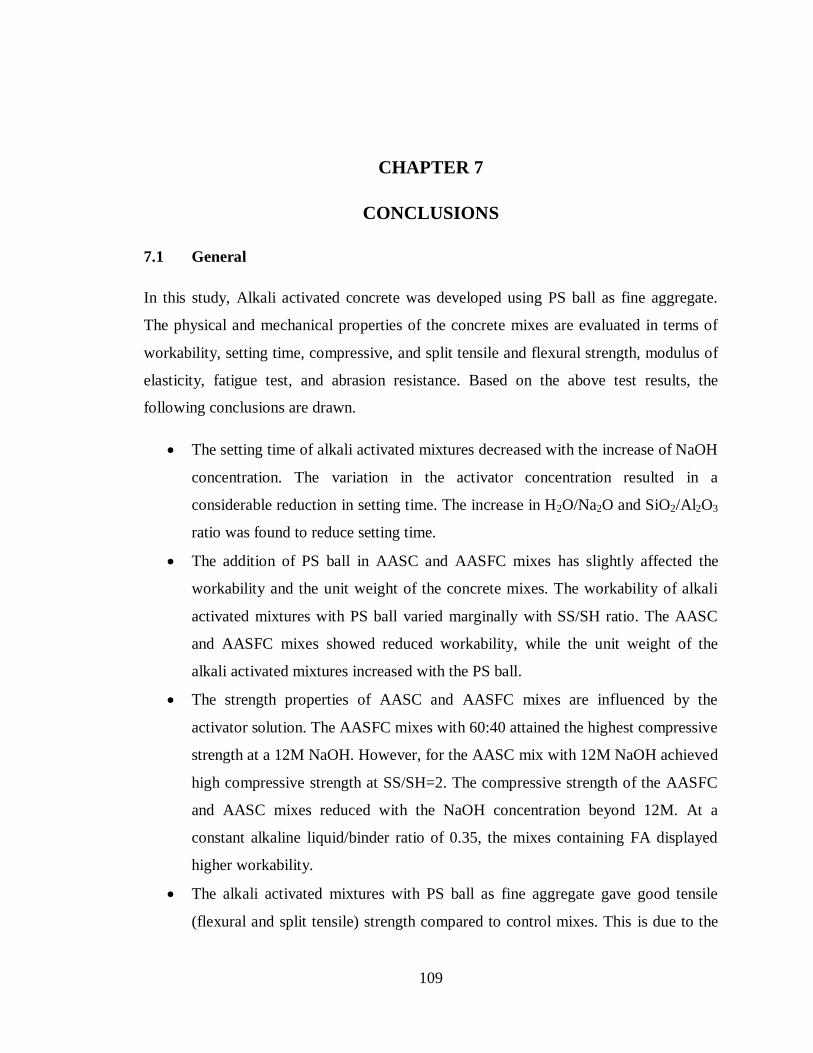
109
CHAPTER 7
CONCLUSIONS
7.1 General
In this study, Alkali activated concrete was developed using PS ball as fine aggregate.
The physical and mechanical properties of the concrete mixes are evaluated in terms of
workability, setting time, compressive, and split tensile and flexural strength, modulus of
elasticity, fatigue test, and abrasion resistance. Based on the above test results, the
following conclusions are drawn.
The setting time of alkali activated mixtures decreased with the increase of NaOH
concentration. The variation in the activator concentration resulted in a
considerable reduction in setting time. The increase in H2O/Na2O and SiO2/Al2O3
ratio was found to reduce setting time.
The addition of PS ball in AASC and AASFC mixes has slightly affected the
workability and the unit weight of the concrete mixes. The workability of alkali
activated mixtures with PS ball varied marginally with SS/SH ratio. The AASC
and AASFC mixes showed reduced workability, while the unit weight of the
alkali activated mixtures increased with the PS ball.
The strength properties of AASC and AASFC mixes are influenced by the
activator solution. The AASFC mixes with 60:40 attained the highest compressive
strength at a 12M NaOH. However, for the AASC mix with 12M NaOH achieved
high compressive strength at SS/SH=2. The compressive strength of the AASFC
and AASC mixes reduced with the NaOH concentration beyond 12M. At a
constant alkaline liquid/binder ratio of 0.35, the mixes containing FA displayed
higher workability.
The alkali activated mixtures with PS ball as fine aggregate gave good tensile
(flexural and split tensile) strength compared to control mixes. This is due to the
110
dense microstructure and the interfacial transition zone between the paste and
aggregates in alkali activated concrete mixes.
The AASC and AASFC mixes exhibited high early strength as compared to the
control mix. Alkali activated mixtures mixes with complete replacement of river
sand with PS ball attained 28 days compressive strength range between 40 to
65MPa and flexural strengths greater than 4.5 MPa. The incorporation of PS ball
as fine aggregate improved the mechanical properties in both AASC and AASFC
mixes.
The modulus of elasticity of alkali activated mixtures with PS ball was higher
than that of AASC, and AASFC mixes with natural aggregate. Modulus of
elasticity of AASFC mixes exhibit higher values by replacing GGBFS with FA,
which is due to the differences in the microstructure and binding chemistry. The
modulus of elasticity of AASC and AASFC mixes increases by replacing river
sand with PS ball due to a strong aggregate-paste interface.
Alkali activated mixtures with PS ball as fine aggregate improved the fatigue life
compared to the control mixes. The dense interfacial transition zone existing
between the aggregate matrix and the binder resulted in higher fatigue life.
AASC and AASFC mixes with PS ball exhibited high resistance towards abrasion
compared to the control mixes. The strong bond between PS ball and the
constituents of concrete results in dense microstructure and ITZ improved the
abrasion resistance.
Alkali activated concrete mixes with PS ball exhibits better resistance to
hydrochloric, sulphuric, and nitric acid as compared to river sand, which is due to
the properties/structure of the binders. The inclusion of higher FA in AASFC
mixes improved the resistance to acid attack due to a decrease in calcium content
in the binder with the addition of FA content, which tends to make the binder
further resistant to acid attack. The acid resistance of alkali activated mixes
increased with the replacement of river sand with PS ball.

111
The mixtures of AASC can be suggested for pavement quality concrete with
replacement of fly ash from 30% to 40%, AL/B ratio of 0.35, 12 M of SH, and
SS/SH ratio 1.5 to 2.
7.2 SCOPE FOR FURTHER STUDIES
This study can be extended in the following areas:
The results focus on the SH concentration, and SS/SH ratio in the alkali activated
mixtures when the alkaline liquid to binder ratio remains almost constant;
however, the effect of alkaline liquid to binder ratio requires extensive studies to
validate the test results.
Currently, there are no standard mix design guidelines available for alkali
activated concrete or geopolymer concrete, which will be a considerable
challenge for field application. Extensive research is required in this regard.
The extensive microstructural analysis is required to understand the
polymerization and final reaction product of the slag- fly ash blended alkali
activated concrete with additives.
The porosity of slag- fly ash blended alkali activated concrete tends to reduce
with an increase in finer materials such as silica fume, quartz powder, or ultrafine
fly ash as a ternary binder. However, a laboratory study is essential to explore this
material.
In this study, the durability test is limited to sorptivity, the volume of permeable
voids, and acid attacks such as HCl, H2SO4, and HNO3. The performance of these
alkali activated mixtures against drying shrinkage, rapid chloride penetration, and
carbonation test need to be investigated.
The preparation of alkaline activator solution requires a minimum of 24 hours; it
is essential to look for the material rich in sodium and silicate like feldspar
mineral, which can be easily dissolved in water.
112
Alkali activated material is produced with traditional coarse aggregate and PS ball
as fine aggregate. For sustainable concrete, the coarse aggregate needs to be
replaced by industrial byproducts or marginal material such as steel slag,
construction, and demolition waste, or recycled aggregates.
This study was limited only to short term structural application and durability
properties. The long term performance of the slag- fly ash mixture needs to be
investigated.
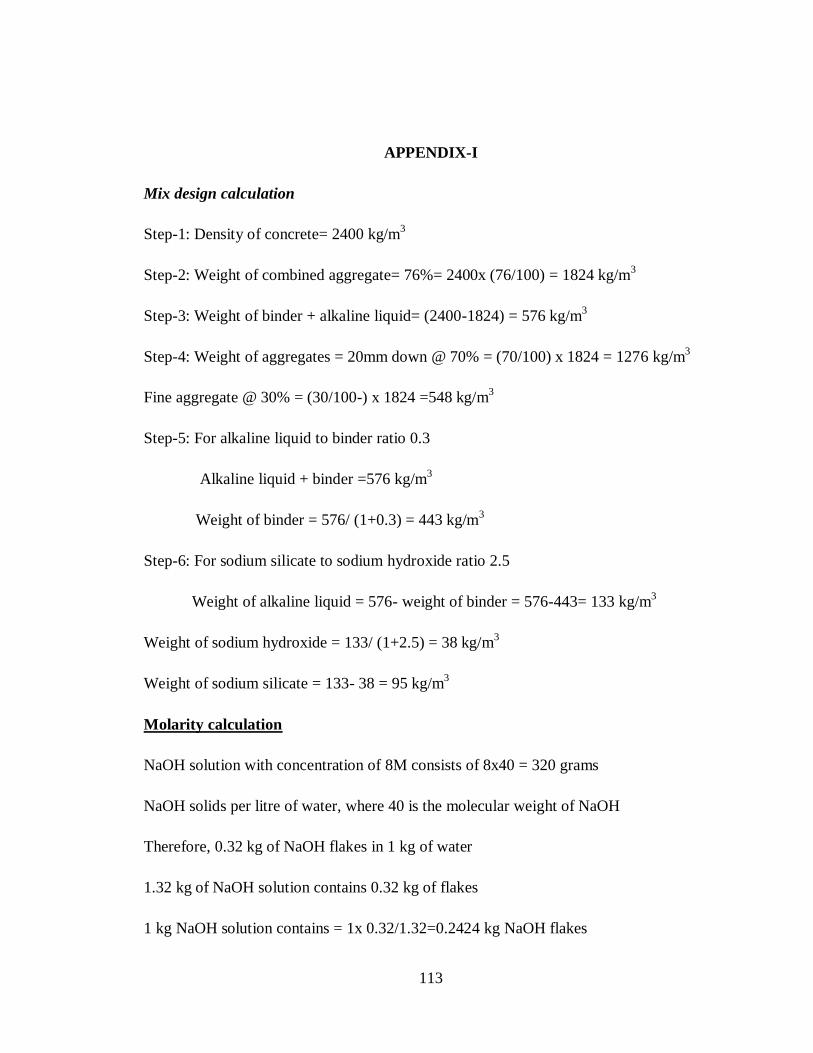
113
APPENDIX-I
Mix design calculation
Step-1: Density of concrete= 2400 kg/m3
Step-2: Weight of combined aggregate= 76%= 2400x (76/100) = 1824 kg/m3
Step-3: Weight of binder + alkaline liquid= (2400-1824) = 576 kg/m3
Step-4: Weight of aggregates = 20mm down @ 70% = (70/100) x 1824 = 1276 kg/m3
Fine aggregate @ 30% = (30/100-) x 1824 =548 kg/m3
Step-5: For alkaline liquid to binder ratio 0.3
Alkaline liquid + binder =576 kg/m3
Weight of binder = 576/ (1+0.3) = 443 kg/m3
Step-6: For sodium silicate to sodium hydroxide ratio 2.5
Weight of alkaline liquid = 576- weight of binder = 576-443= 133 kg/m3
Weight of sodium hydroxide = 133/ (1+2.5) = 38 kg/m3
Weight of sodium silicate = 133- 38 = 95 kg/m3
Molarity calculation
NaOH solution with concentration of 8M consists of 8x40 = 320 grams
NaOH solids per litre of water, where 40 is the molecular weight of NaOH
Therefore, 0.32 kg of NaOH flakes in 1 kg of water
1.32 kg of NaOH solution contains 0.32 kg of flakes
1 kg NaOH solution contains = 1x 0.32/1.32=0.2424 kg NaOH flakes

114

115
REFERENCES
Albitar, M., Mohamed Ali., M. S., Vistin, P. and Drenchsler, B. M. (2015), “Effect of
Granulated lead smelter slag on strength of flyash based Geopolymer concrete”,
Construction and Building materials, 83, 128-135
Allahverdi, A., Bakhtiyari, A., Rais-Ghasemi, A. and Zarrabi, B. A. (2011). “Self
compacting concrete containing different powders at elevated temperatures- mechanical
properties and changes in phase composition.” Thermochimica Acta, 514 (2), 74-81.
Alonso, S. and Palomo, A. (2001). “Alkaline activation of metakaolin and calcium
hydroxide mixtures: Influence of temperature, activator concentration and solid
ratio.” Material Letters, 47(1-2), 55-62.
Altan, E. and Erdogan, S. T. (2012). “Alkali activation of slag at ambient and elevated
temperatures.” Cement and concrete Research, 34 (2), 131-139.
Amjad, A. S. (2019). “The Efficiency of Steel Slag and Recycled Concrete Aggregate on
the Strength Properties of Concrete.” KSCE journal of civil engineering, 23, 4846-4851
Atis, C. D., Bilim, C., Celik, O. and Karahan, O. (2009). “Influence of activator on the
strength and drying shrinkage of alklai activated slag mortar.” Constructon and Building
Materials, 23, 548-555.
Aydin, S. and Baradan, B. (2012). “Mechanical and microstructural properties of heat
cured alkali activated slag mortars.” Materials and Design, 35, 374-383.
Bakharev, T. (2003). “Geopolymeric materials prepared using Class F fly ash and
elevated temperature curing.” Cement and Concrete Research, 35(6), 1224-1232.
Bakharev, T. (2005). “Geopolymeric materials prepared using class-F flyash and elevated
temperature curing.” Cement and concrete research, 35, 1224-32
Bakharev, T., Sanjayan, J. G. and Cheng, Y. B. (1999). “Effect of elevated temperature
curing regime on properties of alkali activated slag concrete.” Cement and Concrete
Research, 29 (10), 1619-1625.

116
Bakharev, T., Sanjayan, J. G. and Cheng, Y. B. (2000). “Effect of admixtures on
properties of alkali activated slag concrete.” Cement and Concrete Research, 30, 1367-
1374.
Bernal, S. A., Provis, J. L., Rose, V. and De-Gutierrez, R. M. (2011). “Evolution of
binder structure in sodium silicate activated slag-metakaolin blends.” Cement and
Concrete Composites, 33, 46-54.
Bernal, S., De-Gutierrez, M. R. and Provis, L. P. (2012). “Durability and engineering
properties of AASC mixes.” Construction and Building Materials, 33, 99-108.
Bilim, C., Atis, C. D., Gorur, E. B. and Luga, B. (2015). “Very high strength (120 MPa)
class F fly ash geopolymer mortar activated at different NaOH amount, heat curing
temperature and heat curing duration.” Construction and Building Material, 96, 673-678.
Brough, A. R., Holloway, M., Sykes, J. and Atkinson, K. (2000). “Sodium silicate-based
alkali activated slag mortars part II; Sodium chloride or malic acid as a retarder.” Cement
and Concrete Research, 30, 1375-1379.
Chang, J. J. (2003). “A study on the setting characteristics of sodium silicate-activated
slag pastes.” Cem. Concr. Res., 33 (7), 1005–1011.
Chareerat, T., Chindaprasirt, P., Hatanaka, S. and Cao, T. (2016). “High strength
geopolymer using fine high calcium flyash.” Journal of materials in Civil Engineering, 23
(3), 264-270.
Chi, M. (2012). “Effect of dosage of alkali-activated solution and curing conditions on
the properties and durability of alkali-activated slag concrete.” Constr. Build. Mater., 35
(10), 240–245.
Chi, M. and Huang. R. (2013). “Binding mechanism and properties of alkali activated
flyash/slag mortars.” Construction and Building Materials, 40, 291-298.

117
Chindaprasirt, P., Chai, J. and Theerawat, S. (2007). “Effect of flyash fineness on
microstructure of blended cement paste.” Construction and Building Materials, 21 (7),
1534-1541.
Chindaprasirt, P., Chareerat, T. and Sirivivatnanon, V. J. (2009). “Workability and
strength of high calcium fly ash geopolymer.” Cement and Concrete Composites, 29(3),
224-229.
Chindaprasirt, P., De-Silva, P., Sagoe-Crentsil, K. and Hanjitsuwan, S. (2012). “Effect of
SiO2 and Al2O3 on the setting and hardening of high calcium fly ash-based geopolymer
systems.” Journal of Materials Science, 47(12), 4876-4883.
Collins, F. and Sanjayan, J. G. (2000). “Effect of pore size distribution on drying
shrinking of alkali activated slag concrete. Cem. Concr. Res., 30 (9), 1401–1406.
Collins, F. G. and Sanjayan, J. G. (1999). “The study on the workability and strength of
AASC using ultra-fine materials and slag as the binder.” Cement and Concrete Research,
29, 459-462.
Criado, M., Fernández-Jiménez, A. and Palomo, A. (2007). “Alkali activation of fly ash:
Effect of the SiO2/Na2O ratio.” Microporous and Mesoporous Materials, 106(1-3), 180-
191.
Davidovits, J. (1999). “Chemistry ofgeopolymeric systems, terminology.” Proceeding
of Geopolymer ’99 International Conference, Saint-Quentin, France.
Deb, P. S., Pradip, N. and Prabir, K. S. (2014). “Effect of GGBS blending with flyash and
activator content on the workability and strength properties of geopolymer concrete cured
at ambient temperature.” Materials and Design, 62, 32-39.
Delatte, H. (2009). “Failure, distress and repair of concrete structures.” Woodhead
publishing series in civil and structural engineering, 1, 13-15.
Diaz-Loya, E, I., Allouche, E.N. and Vaidya, S. (2011). “Mechanical properties of fly-ash
based polymer concrete.” Journal of ACI materials, 108, 300-306.

118
Ding, Yao., Jian-Guo, Dai. and Cai-jun, Shi. (2016). “Mechanical properties of alkali
activated concrete: a state of art review.” Construction and building materials, 127, 68-
79.
Douglas, E., Bilodeau, A., Brandstetr, J. and Malhotra, L. (1991). “Alkali activated
ground granulated blast furnace slag concrete; preliminary investigation.” Cement and
Concrete Research, 21, 101-108.
Duxson, P., Fernández-Jiménez, A., Provis, J. L., Lukey, G. C., Palomo, A. and Van
Deventer, J. S. J. (2007). “Geopolymer technology: the current state of the art.” Journal
of Materials Science, 42(9), 2917-2933.
Fang, Guohao., Wing, Kei., Wenlin, Ho., Mingzhong, Tu. and Zhang. (2018). “The
mechanical properties and workability of fly ash- slag concrete cured under ambient
temperature.” Construction and Building Material, 172, 476-487.
Feng, D., Tan, H. and van Deventer, J. S J. (2004). “Ultrasound enhanced
geopolymerisation.” Journal of Materials Science, 39(2), 571-580.
Fernández-Jiménez, A. and Palomo, A. (2003). “Characterisation of fly ashes. Potential
reactivity as alkaline cements.” Fuel, 82(18), 2259-2265.
Fernandez-Jimenez, A. and Palomo, A. (2005). “Mid infrared spectroscopic studies of
alkali activated flyash structure.” Microporous and Mesoporous Materials, 86 (3), 207-
214.
Fernandez-Jimenez, A., Palomo, J. and Puertas, G. (1999). “Alkali-activated slag mortars
mechanical strength behaviour.” Cement and Concrete Research, 29(8), 1313-21.
Fernandez-Jimenez, F., García-Lodeiro, A. and Palomo. A. I. (2007). “Durability of
alkali activated fly ash cementitious materials.” J. Mater. Sci., 42 (9), 3055– 3065.
Fernández-Jiménez, F., Puertas, I., Sobrados. and Sanz. (2003). “Structure of calcium
silicate hydrates formed in alkaline activated slag; influence of the type of alkaline
activator.” J. Am. Ceram. Soc., 86, 1389–1394.

119
FHWA, (2012). “User guidelines for byproducts and secondary use materials in
pavement construction.” Publication Number: FHWA-RD-97-148.
Gao, K., Lin, K., Wang, D., Hwang, C., Shiu, H., Chang, Y. and Cheng, T. (2014).
“Effect of molar ratio on the microstructure and mechanical properties of meatkolin
based geoplymer.” Construction and Building Material, 53, 503-510.
Gao, X., Yuan, B., Yu, Q. L. and Brouwers, H. J (2016). “Characterization and
application of municipal solid waste incineration bottom ash and waste granite powder in
alkali activated slag.” Journal of Cleaner Production, 164, 410-419.
Glukhovsky, V.D. (1994). “Ancient, Modern and Future Concretes.” In Krivenko, P. V.
(Ed.), Proceedings of the First International Conference on Alkaline Cements and
Concretes, VIPOL Stock Company, Kiev, Ukraine, (pp. 1–9).
Graeff, A. G., Pilakoutas, K., Neocleous, K. and Vania, N. (2012), “Fatigue resistance
and cracking mechanism of concrete pavements reinforced with recycled steel fibres
recovered from post-consumer tyres.” Engineering Structures, 45(7), 385–395.
Hamed, M., Farshad, R., Carlo, G. P. and William, D. Burgos. (2016). “ Effect of calcium
on dissolution and precipitation reactions of amorphoys silica at high alkalinity.” Cement
and concrete research, 87, 1-13.
Hanjitsuwan, S., Hunpratub. P., Thongbai, S., Maensiri, V., Sata. S. and Chindaprasirt, P.
(2014). “Effects of higher concentration of NaOH on the physical and electrical
conductivity properties of fly ash-based geopolymer paste.” Cement and Concrete
Composites, 45: 9-14.
Hardjito, D., Antoni. K. and Chandra. L. (2015). “The impact of flyash, silica fume and
calcium carbonate on the workability and compressive strength of mortar.” Procedia
Engineering, 125, 773-779.
120
Hoderio, M. I., Garcia. M., Ana. F., Angel, P and Donald, M. (2011). “Compatibility
studies between N-A-S-H and C-A-S-H gels; Study in the ternary diagram Na2O–CaO–
Al2O3–SiO2–H2O.” Cement and Concrete Research, 41 (9), 923-931.
Hyeongi, Lee., Asad, Hanif., Muhammad, Usman., Younghwan, Kim., Hongseob, Oh.
and Seong, K. Kim. (2020). “Interfacial characteristics of cement mortars containing
aggregate derived from industrial slag waste.” Journal of structural integrity and
maintenance, 5, 236-243.
Idawati, I., Susan, A., Bernal, A., John, L. P., Rackel, S. N., David, G. B., Adam, R. K.,
Sinin, H. and Jannie, S. D. (2013). “Influence of flyash on the water and chloride
permeability of alkali activated slag mortars and concretes.” Construction and Building
Materials. 48, 1187-1201.
IS 456-2007, Code for practice- Plain and reinforced concrete. Bureau of Indian standard.
Ismail, S., Bernal, A., John, L. P., Rackel, S. N., Sinin, H. and Jannie, S. D. (2014)
“Modification of phse evolution in alkali activated blast furnace slag by the incorporation
of flyash.” Construction and Building Material, 45, 125-135
Jagadish, Mallick., Shakti, Soumya. and Pratap, K. P. (2020). “Strength and durability
study of concrete using precious slag balls.” Materials today: proceedings,
https://doi.org/10.1016/j.matpr.2020.02.923
Joy, S. J. and Mini, Mathew.(2015), “Experimental study on Geopolymer concrete with
partial replacement of fine aggregate with foundry sand”, IJATES, volume no.3, special
issue no.01, September (2015), 559-569.
Junaid, T. M., Obada, K., Amar, K. and Jarvis. B. (2015). “A mix design procedure for
low calcium alkali activated flyash based concrete.” Construction and Building Materials,
79, 301-310.
Khale, D. and Chaudary, R. (2007). “Mechanism of geopolymerization and factors
influencing its development a review.” Journal of material science, 42 (3), 729-746.
121
Kong, D. L., Sanjayan, J. G. and Sagoe-Crentsil, K. (2007). “Comparative performance
of geopolymers made with metakaolin and flyash exposed to elevated temperature.”
Cement and Concrete Research, 37(12), 1583-1589.
Krivenko, P. (1994). “Progress in alkaline cements.” Proceedings of the 1st Inter. Conf.
Alkaline Cements and Concrete, 11-29.
Krizan, D. and Zivanovic, B. (2002). “Effects of dosage and modulus of water glass on
early hydration of alkali-slag cement.” Cem. Concr. Res., 32, 1181–1188.
Lee, M. K. and Baar B. I. (2004). “An overview of the fatigue behavior of plain and
reinforced concrete.” Cement and Concrete Composites, 26, 299-305.
Lee, N. K. and Lee, H. K. (2013). “Development of alkali activated fly ash/ slag concrete
for setting and mechanical properties at room temperature.” Construction and Building
Material. 47:1201-1209.
Lee, W. K. and Van Deventer, J. S. J. (2002). “The effect of ionic contaminants on the
early-age properties of alkali-activated fly ash-based cements.” Cement and Concrete
Research, 32(4), 577-584.
Ma, Y., Hu, J. and Ye, G. (2013). “The pore structure and permeability of alkali activated
fly ash.” Fuel, 104, 771-780.
Miranda, J. M., Fernandez, J. A., Gonzalez, J. A. and Palomo, A. (2005). “Corrosion
resistance in activated flyash mortars.” Cement and Concrete Research, 35 (6), 1210-
1217.
Mithun, B. M. and Narasimhan, M. C. (2016). “Performance of alkali activated slag
concrete mixes incorporating copper slag as fine aggregate.” Journal of cleaner
production, 112, 837-844.
Moruf, O. Y., Megat, A. M. J., Zainal, A. and Mohammad. M. (2014). “Evoluton of
alkaline activated ground granulated blast furnace slag-ultrafine palm oil fuel ash based
concrete.” Materials and Design, 55, 387-393.

122
Mustafa, A. B., Kamarudin, A., Banhussain, H., Rafiza, A. and Zarina, Y. (2012). “Effect
of SS/SH ratios and NaOH molarities on compressive strength of flyash based
geopolymer.” ACI Material Journal, 109(5), 503-508.
Nath, P. and Sarker. (2014). “The setting, workability and early strength properties of
slag and FA based geopolymer under ambient temperature”. Construction and Building
Material, 66, 163-171.
Olivia, M., Sarker, P. and Nikraz, H. (2008). “Water Penetrability of Low Calcium Fly
Ash Geopolymer Concrete.” In proceedings of The International Conference on
Construction and Building Technology 2008 (ICCBT 2008), 16 – 20 June, KualaLumpur.
Pacheco-Torgal, F., Joao, C. and Said, J. (2007). “Investigations about the effect of
aggregates on strength and microstructure of geopolymeric mine wste mud binders.”
Cement and Concrete Research, 37(6), 933-941.
Palacio, M. and Puertas, F. (2005). “Effect of superplasticizer and shrinkage reducing
admixtures on alkali activated slag pastes and mortars.” Cement and Concrete Research,
35(7), 1358-1367.
Palomo, A., Blanco-Varela, M. T., Granizo, M. L., Puertas, F., Vazquez, T. and
Grutzeck, M. W. (1999). “Chemical stability of cementitious materials based on
metakaolin.” Cement and Concrete Research, 29(7), 997-1004.
Palomo, A., Grutzeck, M. W. and Blanco, M. T. (1999). “Alkali-activated fly ashes.”
Cement and Concrete Research, 29(8), 1323-1329.
Palomo, A., Krivenko, P., Garcia-Lodeiro, I., Kavalerova, E., Maltseva, O. and
Fernández- Jiménez, A. (2014). “A review on alkaline activation: new analytical
perspectives.” Materiales de Construcción, 64(315), e022. doi:10.3989/mc.2014.00314
Perdikaris, P., Calomino, A. M. and Chudnovsky, A. (1986). “Effect of fatigue on
fracture toughness of concrete.” Journal of Engineering Mechanics, 8, 112

123
Priyadarshini, P., Ramamurty, K. and Retnamony, G. R. (2017). “Excavated soil waste as
fine aggregate in fly ash based geopolymer mortar.” Applied clay science, 146, 81-91.
Puertas, F., Martı́nez-Ramı́rez, S., Alonso, S. and Vázquez, T. (2000). “Alkali-activated
fly ash/slag cements; Strength Behaviour and Hydration Products.” Cement and Concrete
Research, 30(10), 1625-1632.
Puertas, F., Palacios, M., Manzano, H., Dolado, J.S., Rico, A. and Rodríguez. J. (2011).
“A model for the C-A-S-H gel formed in alkali-activated slag cements.” J. Euro Cera
Soc., 31 (12), 2043–2056.
Qureshi, M. N. and Ghosh, S. (2014). “Effect of silicate content on the properties of
alkali-activated blast furnace slag paste.” Arab. J. Sci. Eng., 39 (8), 5905–5916.
Rangan, B. V., Hardjito, D., Wallah, S. E. and Sumajouw, D. M. J. (2005). “Flyash based
geopolymer concrete: a construction material for sustainable development.” Concrete in
Australia, 31, 25-30.
Rashad, A. (2013). “A comprehensive overview about the influence of different
admixtures and additives on the properties of alkali-activated fly ash.” J. Materials &
Design., 53, 1005-1025.
Rattanasak, U. and Chindaprasirt, P. (2009). “The study on NaOH influences on a
synthesis of FA based geopolymer.” Mineral Engineering, 22(12), 1073-78.
Roy, D. (2000). “Alkali activated cements- opportunites and challenges.” Cement and
concrete Research, 29 (2), 249-254.
Ryu, G. S., Lee, Y. B., Koh, K. T. and Chung. Y. S. (2013). “The mechanical properties
of fly ash-based geopolymer concrete with alkaline activators.” Constr. Build. Mater.,
47,409–418.
Ryu, G. S., Young, B. L., Kyung, T. K. and Young, S. C. (2008). “The mechanical
properties of fly ash-based geopolymer concrete with alkaline activators.” Construction
and Building Material, 47, 409-418.
124
Sharath, S., Gayana, B., Krishna, Reddy. and Ramachandra, K. (2019). “Experimental
investigations on performance of concrete incorporating PS ball as fine aggregate.”
Advances in concrete construction.” 8 (3), 239-246
Shekhovtsova, J., Zehernovsky, I., Kovtun, M., Kozhukhova, N. and Kearsley, E. (2014).
“Estimation of fly ash reactivity for use in alkali-activated cements - A step towards
sustainable building material and waste utilization.” Journal of cleaner production, 178,
22-23.
Shi, C. and Xie, P. (1998). “Interface between cement paste and quartz sand in alkali
activated slag mortars.” Cement and Concrete Research, 28(6), 887-896.
Shi, C., Krivenko, P. V. and Roy, D. (2006). “Alkali activated cement and concretes”.
Taylor Francis, Abington, UK.
Silva, P., Sagoe-Crenstil, K. and Sirivivatnanon, V. (2007). “Kinetics of
geopolymerization: Role of Al2O3 and SiO2.” Cement and Concrete Research, 37(4),
512-518.
Sindhunata, (2006a). “A Conceptual Model of Geopolymerisation.” The University of
Melbourne, Melbourne.
Sing, N. and Singh, S. P. (2017). “Carbonation resistance and microstrucral analysis of
low and high volume flyashself compacting concrete containing recycled aggregates.”
Construction and Building material, 127, 824-842.
Siyal, A., Khairun, A. A. and Zakaria, M. (2016). Effects of parameters on setting time of
flyash based geopolymers using taguchi method.” Procedia Engineering, 148, 302-307.
Sofi, M. (2007). “Determining the mechanical properties of polymer concretes of
inorganic type.” Cement and Concrete Research, 37, 251-257.
Somna, K., Jaturapitakkul, C., Kajitvichyanukul, P. and Chindaprasirt, P. (2011). “NaOH
activated ground fly ash geopolymer cured at ambient temperature.” Fuel, 90(6), 2118-
2124.
125
Song, S. and Jennings, H. M. (1999). “Pore solution chemistry of alkali-activated ground
granulated blast-furnace slag.” Cement and Concrete Research, 29(2), 159-170.
Song, X., Munn, R., Marosszeky, M. and Brungs, M. (2005). “Durability of fly ash based
geopolymer concrete against sulphuric acid attack.” In Proceedings of 10DBMC
international conference on durability of building materials and components, Lyon
France, 17-20 April.
Song-piriyakil, S., Kubprasit, T., Jaturapitakkul, C. and Chindaprasirt P. (2010).
“Compressive strength and degree of reaction of biomass- and fly ash-based
Geopolymer.” Construction and Building Materials, 24, 236–240.
Swanepoel, J. C. and Strydom, C. A. (2002). “Utilization of flyash in geopolymeric
material.” Applied Geochemistry. 17(8), 1143-1148.
Tan, Lie., Ronald, Simatupang. and Deni, Setiawan. (2015). “Comprehensive study effect
of steel waste into mechanical properties of concrete.” International journal of advances
in mechanical and civil engineering, 2(6), 14-19
Taylor. (1997). HFW. Cement Chemistry. 2nd
London: Thomas Teford press, Newyork.
Tekin, I. (2016). “Properties of NaOH activated geopolymer with marble, travertine and
volcanic tuff wastes.” Construction and Building Materials, 127, 607-617.
Wallah, S. E and Rangan, B. V. (2005). “Low calcium flyash based geopolymer concrete:
long term properties.” Research report, Curtin University of Technology, Perth.
Wang, H., Li, H. and Yan, F. (2005). “Reduction wear of metakolinite based geopolymer
composite through filling of PTFE.” Wear, 258 (10), 156-1566.
Wang, S. D., Pu, X., Scrivener, K. L. and Pratt, P. L. (1995) “Alkali-Activated Slag
Cement and Concrete: a review of properties and problems.” Advances in Cement
Research, No. 27, pp. 93-102.
126
Wang, S. D., Scrivener, K. L. and Pratt, P. L. (1994). “Factors Affecting the Strength of
Alkali-Activated Slag.” Cement and Concrete Research, 24 (6), 1033-1043.
Wang, Y. S., Provis, J. L. and Dai, J. G. (2018b). “Role of soluble aluminum species in
the activating solution for synthesis of silico-alumino phosphate geopolymers.” Cement
Concrete Compos., 93, 186–195.
Wongpa, J., Kiattikomol, K., Jaturapitakkul, C. and Chindaprasirt, P. (2010).
„„Compressive strength, modulus of elasticity, and water permeability of inorganic
polymer concrete.‟‟, Mater. Des., 31(10), 4748–4754.
Xu, H. and Van Deventer, J. S. J. (2002). “The effect of alkali metals on the formation of
geopolymeric gels from alkali-feldspars.” Colloids and Surfaces A: Physicochemicaland
Engineering Aspects, 216(1-3), 27-44.
Yaseer, M. M., Taha, M. J., Kow, K. and Jason, Y. (2019). “Novel cement curing
technique by using controlled release of carbon dioxide coupled with nanosilica.”
Construction and Building Material, 223, 692-704.
Zaharieva, R., Buyle-Bodin. F., Skoczylas, F. and Wirquin, E. (2009). “Assessment of
the surface permeation properties of recycled aggregate concrete.”Cem. Concr.
Composit., 25 (2), 223-232
Zuhua, Z., Xiao, Y., Huajun, Zhu. and Yue. C. (2009). “Geopolymerization process of
alkali metakaolinite characterized by isothermal calorimetry.” Thermochemica Acta. 493
(1), 49-54.
127
PUBLICATIONS
International Journals
Avinash.H.T and A.U. Ravi Shankar. “Alkali Activated Slag-Fly Ash Concrete
Incorporating PS Ball as Fine Aggregate for Rigid Pavements.”Journal of Traffic and
Transportation Engineering, Elsevier Publications., Article in press, 2019.
Avinash.H.T and A.U. Ravi Shankar. “A study on initial setting time and the
mechanical properties using the PS ball as fine aggregate.” International Journal of
Pavement Research and Technology, Springer nature publication,DOI:
https://doi.org/10.1007/s42947-019-0078-0
Avinash.H.T and A.U. Ravi Shankar. “Experimental study on AASC using PS ball as
fine aggregate at the higher concentration of sodium silicate.”International Journal of
Research in Engineering and
Technologyhttps://www.ijret.org/Archive?VI=20180713.
Avinash.H.T and A.U. Ravi Shankar. “Laboratory investigation on alkali activated
slag-fly ash concrete for rigid pavement.” International Journal of Pavement Research
and Technology, springer nature publication (under review)
International/National Conference
Avinash.H.T and A.U. Ravi Shankar. “A study on initial setting time and the
mechanical properties using the PS ball as fine aggregate.” WCTR-2019, IIT Bombay,
26-31May 2019.
Avinash.H.T and A.U. Ravi Shankar. “Experimental study on AASC using PS ball as
fine aggregate at the higher concentration of sodium silicate.”Indian Concrete Institute
IWC-2018, Bengaluru, Nimhans Convention Center, 20-23 Oct 2018.

128
Avinash.H.T and A.U. Ravi Shankar. “Effective utilization of fly ash as binder in alkali
enacted slag-fly ash concrete incorporating precious slag as fine aggregate” Next
frontiers in civil engineering-2018, IIT Bombay. (Best paper award)
129
CURRICULUM VITAE
Name: AVINASH H TALKERI
Contact No.: +91-9481643343
E-mail ID:[email protected]
Date of Birth: 30-08-1990
Permanent Address: H No 8/60, Plot no-81,
Prashant Nagar ‘A’
Gulbarga- 585105
Educational Qualifications:
Degree Subject University Year Division
Ph.D Transportation
Engineering
(Civil Engineering)
National Institute of
Technology
Karnataka, Surathkal
2016-2020 ---
M.
Tech
Transportation
Engineering and
Management
VTU Belgaum 2012-2014 Distinction
B.
Tech
Civil Engineering VTU Belgaum 2008-2012 First Class
Teaching Experience:
Name of Institute Post held Period
National Institute of Technology
Karnataka Surathkal
Assistant Lecturer 29-12-2014 to 10-07-2015
& 27-12-2015 to 16-05-2016

130
Subject studied in M. Tech Degree
Traffic Engineering-I
Transport Planning
Applied Statistics
Pavement Materials and
Construction
Applied Soil Mechanics
Traffic Engineering-II
Analysis, Design and Evaluation of
Pavements
Road Safety and Management
Urban Public Transport
Rural Roads
Geometric design of Transportation
Facilities
Infrastructure Management
Software Known
SPSS
IIT Pave
X-Pert High Score
Minitab-16
Awards
Best Paper Award for the research paper entitled “Effective utilization of fly ash
as binder in alkali enacted slag-fly ash concrete incorporating precious slag as
fine aggregate” Next frontiers in civil engineering -2018, IIT Bombay.
International Conference
Avinash, H. T., A, U. Ravi Shankar., Chethan, B. A. and Raghuram, K. C. (2020).
“Development of alkali activated slag concrete by partial replacement of sand with
granulated blast sand.”Challenges of Resilient and Sustainable Infrastructure
Development in Emerging Economies. ASCE India 2020 Conference.
Raghuram, K. C., A, U. Ravi Shankar., Avinash, H. T. and Chethan, B. A. (2020).
“Comparison of performance of Stone Matrix Asphalt (SMA) using ViaTop pellets and
131
Sisal Fibers.”Challenges of Resilient and Sustainable Infrastructure Development in
Emerging Economies. ASCE India 2020 Conference.
Chethan, B. A., Ravi Shankar, A, U Avinash, H. T. and Raghuram, K. C. (2020).
“Strength and Durability Characteristics of Fly Ash Admixed Black Cotton Soil.”
Challenges of Resilient and Sustainable Infrastructure Development in Emerging
Economies. ASCE India 2020 Conference.
Webinar
Recent Advancements in Concrete Technology (RACT-2020) 22nd
to 26th
June 2020
organized by B.M.S. College of Engineering, Bangalore-560019.
1st Indo-Japan webinar series on “Geotechnics for Disaster Mitigation”8
th to 13
th June
2020 organized by NITK Surathkal, IGS Surathkal Chapter, IIT Tirupati, Kyushu
University Fukuoka 819 0395 Japan.
Recycling of Asphalt pavements for sustainable road construction 29th
May 2020
organized by MIT-ADT University, Pune Maharashtra.
Application of Intelligent Transportation System (ITS) in road safety 30th
May 2020
organized by MIT-ADT University, Pune Maharashtra.
The secret of publishing your research in High Impact Journal 17th
June 2020
organized by Rasayanika Biotechnologies India Pvt Ltd.
Plumbing for High-Rise Buildings, 16th
June 2020 organized by B.V. Raju Institute of
Technology, Narsapur, Hyderabad.