peripheral blood b-cell death compensates for excessive proliferation in lymphoid tissues and...
TRANSCRIPT
2006, 80(19):9710. DOI: 10.1128/JVI.01022-06. J. Virol.
Kettmann and Luc WillemsPierre Kerkhofs, Jack Hay, André Théwis, Richard Isabelle Schwartz-Cornil, Michel Bonneau, Geneviève Jean,Teresa Sanchez-Alcaraz, Arnaud Florins, Mathieu Boxus, Christophe Debacq, Nicolas Gillet, Becca Asquith, Maria Virus-Infected SheepHomeostasis in Bovine Leukemia Lymphoid Tissues and MaintainsCompensates for Excessive Proliferation in Peripheral Blood B-Cell Death
http://jvi.asm.org/content/80/19/9710Updated information and services can be found at:
These include:
SUPPLEMENTAL MATERIAL Supplemental material
REFERENCEShttp://jvi.asm.org/content/80/19/9710#ref-list-1at:
This article cites 35 articles, 16 of which can be accessed free
CONTENT ALERTS more»articles cite this article),
Receive: RSS Feeds, eTOCs, free email alerts (when new
http://journals.asm.org/site/misc/reprints.xhtmlInformation about commercial reprint orders: http://journals.asm.org/site/subscriptions/To subscribe to to another ASM Journal go to:
on Novem
ber 21, 2014 by guesthttp://jvi.asm
.org/D
ownloaded from
on N
ovember 21, 2014 by guest
http://jvi.asm.org/
Dow
nloaded from
JOURNAL OF VIROLOGY, Oct. 2006, p. 9710–9719 Vol. 80, No. 190022-538X/06/$08.00�0 doi:10.1128/JVI.01022-06Copyright © 2006, American Society for Microbiology. All Rights Reserved.
Peripheral Blood B-Cell Death Compensates for Excessive Proliferationin Lymphoid Tissues and Maintains Homeostasis in Bovine
Leukemia Virus-Infected Sheep†Christophe Debacq,1 Nicolas Gillet,1 Becca Asquith,2 Maria Teresa Sanchez-Alcaraz,3 Arnaud Florins,1
Mathieu Boxus,1 Isabelle Schwartz-Cornil,4 Michel Bonneau,4 Genevieve Jean,5 Pierre Kerkhofs,6Jack Hay,7 Andre Thewis,5 Richard Kettmann,1 and Luc Willems1*
Molecular and Cellular Biology, FNRS-FUSAG, Gembloux, Belgium1; Department of Immunology, Imperial College, London,United Kingdom2; Department of Medical Genetics and Microbiology, University of Toronto, Toronto, Ontario, Canada3;
U892 INRA, Jouy-en-Josas, France4; Zootechny Unit, FUSAG, Gembloux, Belgium5; Department of Virology,Veterinary and Agrochemical Research Centre, Uccle, Belgium6; and Department of Immunology,
University of Toronto, Toronto, Ontario, Canada7
Received 18 May 2006/Accepted 7 July 2006
The size of a lymphocyte population is primarily determined by a dynamic equilibrium between cellproliferation and death. Hence, lymphocyte recirculation between the peripheral blood and lymphoid tissuesis a key determinant in the maintenance of cell homeostasis. Insights into these mechanisms can be gatheredfrom large-animal models, where lymphatic cannulation from individual lymph nodes is possible. In this study,we assessed in vivo lymphocyte trafficking in bovine leukemia virus (BLV)-infected sheep. With a carboxyfluo-rescein diacetate succinimidyl ester labeling technique, we demonstrate that the dynamics of lymphocyterecirculation is unaltered but that accelerated proliferation in the lymphoid tissues is compensated for byincreased death in the peripheral blood cell population. Lymphocyte homeostasis is thus maintained bybiphasic kinetics in two distinct tissues, emphasizing a very dynamic process during BLV infection.
In vertebrates, continuous recirculation of lymphocytes fromblood through tissues and lymph nodes is critical for protectionof the host during pathological inflammatory processes, as wellas physiological emigration of lymphocytes that participate inimmune surveillance (1, 4, 6, 11, 16, 33). The network ofexchange between blood and lymph through the lymph node isabsolutely required to maintain normal cell homeostasis. Thepresence of homeostatic control of lymphocyte numbers en-sures an equilibrium where cell production equals cell loss. Inan immune system where lymphocyte production is continuousand the total number of cells is constant, each newly producedlymphocyte can only survive if another one dies; i.e., the rate ofperipheral cell renewal depends on the life span of peripheralcells. However, the life expectancy of a lymphocyte is not anintrinsic property of the cell but is determined by factors suchas the environment, viral infections, and the presence or ab-sence of another, competing, cell population. We previouslystudied lymphocyte homeostasis, more particularly, lympho-cyte proliferation and death, in different animal models ofchronic leukemia, including sheep infected by the bovine leu-kemia virus (BLV) (7–9). In this model, proliferation was es-timated by intravenous injection of bromodeoxyuridine(BrdU), a thymidine analog which is incorporated into thenewly synthesized DNA via the pyrimidine salvage pathway.Although BrdU uptake by cells might occur in blood, its in-
corporation is thought to occur mainly, if not exclusively, inlymphoid tissues such as the lymph nodes, the spleen, or thebone marrow (7). By this approach, the estimated B-cell pro-liferation rates in infected and control sheep were 0.020 day�1
and 0.011 day�1, respectively, meaning that 2.0 and 1.1% ofthe cells were produced by proliferation in 1 day. In contrast,the death rates of BrdU-labeled cells were not significantlydifferent between the two categories of animals (average deathrate, 0.089 day�1 versus 0.094 day�1, respectively). The imbal-ance created by the net increase in proliferation in the absenceof compensating cell death was estimated at 7% growth in aday (7), leading to a theoretical very fast doubling of the cellpopulation. However, this considerable increase in lymphocytenumbers is, in fact, not observed in vivo. Therefore, otherprocesses, including a reduction of cell recirculation throughthe lymph node, as well as massive elimination of cells insecondary lymphoid tissues (28, 29), could play a role in main-taining homeostasis.
The goal of this study was to test these hypotheses by track-ing B cells from blood to lymph and back from lymph to blood.The strategy that we used was based on a single intravenousinjection of carboxyfluorescein diacetate succinimidyl ester(CFSE) into BLV-infected sheep. In vivo administration of thedye has achieved a blood leukocyte labeling index of �95%,making it feasible to track lymphocyte migration through thelymph node in vivo (3, 27). While most studies of lymphocyterecirculation and homing have been done with rodents (12),sheep offer the opportunity to study recirculation of lympho-cytes through tissues by direct cannulation of individual lym-phatic vessel (15). Therefore, lymphatic cannulation of sheep,combined with CFSE injection, provided quantitative and
* Corresponding author. Mailing address: National Fund for Scien-tific Research, Molecular and Cellular Biology Laboratory, 13 avenueMarechal Juin, 5030 Gembloux, Belgium. Phone: 32-81-622157. Fax:32-81-613888. E-mail: [email protected].
† Supplemental material for this article may be found at http://jvi.asm.org/.
9710
on Novem
ber 21, 2014 by guesthttp://jvi.asm
.org/D
ownloaded from
qualitative physiological measurements of the recirculationand death of lymphocytes through lymph nodes for extendedperiods of time in normal and pathological situations.
MATERIALS AND METHODS
Cannulation of efferent lymphatics. Eleven sheep were kept under controlledconditions at the Veterinary and Agrochemical Research Centre (Machelen,Belgium). Five animals (2147, 2149, 2152, 4533, and 4534) were used as unin-fected controls, whereas sheep 107, 1095, 2091, 2158, 4535, and 4536 wereexperimentally infected with a BLV wild-type cloned provirus (strain 344) asdescribed previously (31). Table 1 illustrates the percentages of B cells in theblood and lymph, as well the type of cannulated lymph node (prescapular ormesenteric), in the experimental sheep. Total leukocyte counts were determinedby using a Coulter counter ZN, and the number of lymphocytes was estimatedunder a microscope after staining with May-Grunwald-Giemsa. In parallel, theserum of each sheep was analyzed for BLV seropositivity by immunodiffusionand enzyme-linked immunosorbent assay techniques (25). Cannulae were surgi-cally established in intestinal or prescapular efferent lymphatics to allow chronicsampling of lymph as previously described (34). Briefly, sheep were fasted for24 h preceding surgery and anesthetized by intravenous injection of pentobar-bital sodium (Nembutal; Abbott) or fluothane (Covely) with closed-circuit an-esthetic equipment. Aseptic surgical techniques were used throughout the sur-gery. Silicone (Vygon) or vinyl (Scientific Commodities) catheters were filledwith heparin (Sigma) and positioned in efferent lymphatic vessels. Followingsurgery, animals were allowed to recover for at least 24 h prior to cell collection.Lymph samplings were performed arbitrarily at short intervals of time in thebeginning of the experiment in order to precisely define the best kinetics ofCFSE-labeled cell migration. All animals were housed in metabolism cagesduring lymph collection and allowed free access to food and water during theexperiment. Handling of animals and experimental procedures were conductedin accordance with institutional and national guidelines for animal care and use.
In vivo CFSE cell labeling and immunophenotyping. Twenty-five milligrams ofCFSE dissolved in 4 ml of dimethyl sulfoxide and 40 �l of heparin (1,000 U/ml)was directly injected into the peripheral blood via the jugular vein in order tolabel blood leukocytes (27). At regular intervals of time, blood was collected byjugular venipuncture and peripheral blood mononuclear cells (PBMCs) wereisolated by Percoll gradient centrifugation (Sigma). Lymph was collected insterile bottles attached to bottle holders pasted to the skin of animals andcontaining 1,000 U of heparin. Lymphocytes were harvested by low-speed cen-trifugation, and cell viability was estimated by trypan blue dye exclusion.
Cells were labeled with monoclonal antibodies directed against surface immu-noglobulin M (anti-sIgMs, clone 1H4, mouse IgG1; Pig45A2, mouse IgG2b),CD4 (ST4, mouse IgG1), CD5 (CC17, mouse IgG1), CD8 (CC58, mouse IgG1),CD11b (CC125, mouse IgG1), �� T cells (86D, mouse IgG1), CD21 (GB25A,mouse IgG1), and L-selectin (DU1-29, IgG1) provided by C. Howard (Institutefor Animal Health, Compton, United Kingdom) and by one of us (I.S.-C.) or
obtained from VMRD Inc. Cells were then labeled with a rat anti-mouse IgG1phycoerythrin-conjugated antibody or with a rat anti-mouse IgG2a�b peridininchlorophyll protein (PerCp) antibody (Becton Dickinson Immunocytometry Sys-tems). For detection of the p24 major capsid antigen, PBMCs were cultivated at37°C in a 5% CO2–air atmosphere in RPMI 1640 medium supplemented with10% fetal calf serum, 2 mM L-glutamine, 100 U of penicillin, and 100 �g ofstreptomycin per ml (Sigma). After 24 h of culture, PBMCs were collected andwashed once with phosphate-buffered saline–0.5% bovine serum albumin. Thecells were fixed and permeabilized with the IntraStain reagent (DAKO). Internaldetection of the p24 viral protein was performed by sequential incubation with4�G9 monoclonal antibody and a rat anti-mouse IgG1 phycoerythrin conjugate(Becton Dickinson Immunocytometry Systems). Finally, cells were analyzed incombination with CFSE by flow cytometry on a Becton Dickinson FACScan flowcytometer. Ten thousand events were collected for each sample, and data wereanalyzed with the CellQuest software (Becton Dickinson Immunocytometry Sys-tems).
Mathematical model. To estimate the proliferation and disappearance rates ofdifferent cell populations, a mathematical model was constructed (details wereprovided by Asquith et al. [2]). Briefly, the model uses two pieces of data fromthe flow cytometry analyses, i.e., the proportion of CFSE� cells (P) and the ratioof the mean fluorescence intensity of the CFSE� population to the CFSE�
population (I), to estimate the rate of proliferation and the rate of death ofCFSE-labeled B lymphocytes. To develop the model, we first estimated thenumber of divisions (halving of fluorescence) between an average CFSE� celland an average CFSE� cell at time zero. It was found to be five for sheep 2152,4533, 4534, 2091, 2158, 4535, and 4536 and six for sheep 2147. The model for fivedivisions is x0 � �(p � d)x0, x1 � 2px0 � (p � d)x1, x2 � 2px1 � (p � d)x2, x3 �2px2 � (p � d)x3, x4 � 2px3 � (p � d)x4, and x5 � 2px4 � (p � d)x5 � , wherexi is the proportion of B cells that have undergone i divisions since CFSElabeling. In the model, the cells in the x5 category are CFSE� (either becausethey have divided five times since labeling and therefore lost their fluorescenceor because they were not labeled by the initial injection). The average prolifer-ation rate of cells is p, the average disappearance rate is d, and the averagereplacement rate is . These equations can be solved analytically and then usedto find expressions for I, the ratio of the mean fluorescence intensity (MFI) of theCFSE� population to the CFSE� population, and P, the proportion of CFSE�
cells, as follows:
I �Jx0 � J/2x1 � J/4x2 � J/8x3 � J/16x4
x0 � x1 � x2 � x3 � x4�
J/32x5
x5
�424 � 24pt � 12p2t2 � 4p3t3 � p4t4�
3 � 6pt � 6p2t2 � 4p3t3 � 2p4t4
P �x0 � x1 � x2 � x3 � x4
x0 � x1 � x2 � x3 � x4 � x5� Fe�p�d�t1 � 2pt � 2p2t2 � 4/3p3t3 � 2/3p4t4�
Here, J is the MFI of the CFSE label in undivided cells and F is the proportion
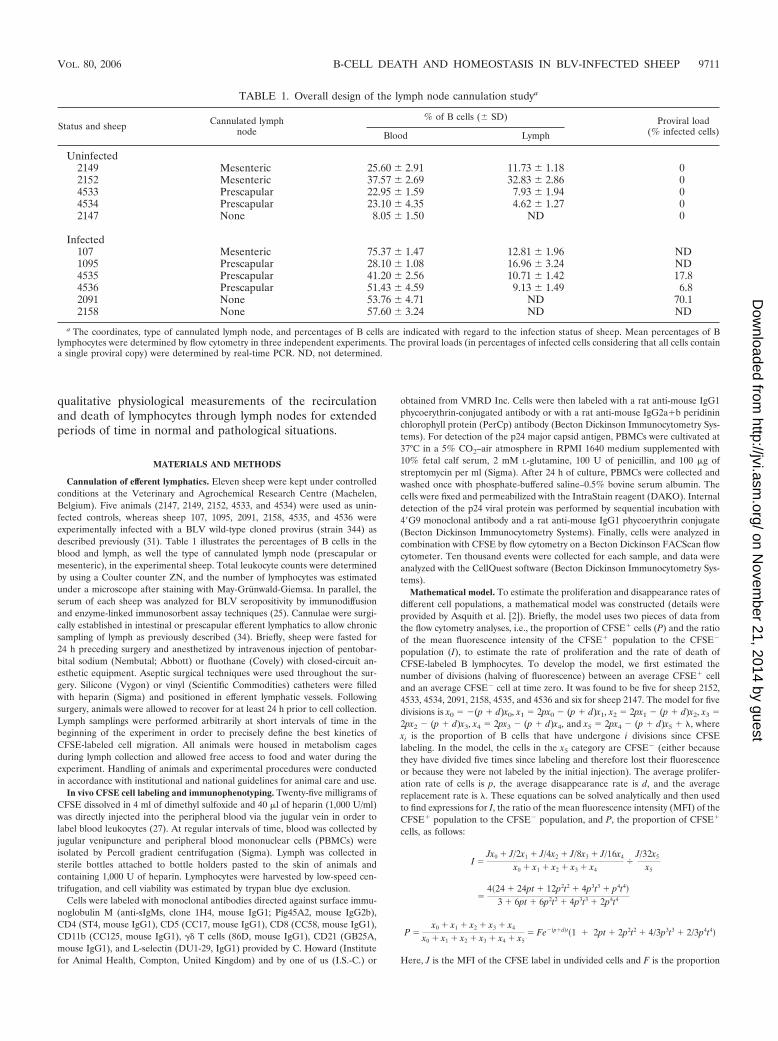
TABLE 1. Overall design of the lymph node cannulation studya
Status and sheep Cannulated lymphnode
% of B cells (� SD) Proviral load(% infected cells)Blood Lymph
Uninfected2149 Mesenteric 25.60 � 2.91 11.73 � 1.18 02152 Mesenteric 37.57 � 2.69 32.83 � 2.86 04533 Prescapular 22.95 � 1.59 7.93 � 1.94 04534 Prescapular 23.10 � 4.35 4.62 � 1.27 02147 None 8.05 � 1.50 ND 0
Infected107 Mesenteric 75.37 � 1.47 12.81 � 1.96 ND1095 Prescapular 28.10 � 1.08 16.96 � 3.24 ND4535 Prescapular 41.20 � 2.56 10.71 � 1.42 17.84536 Prescapular 51.43 � 4.59 9.13 � 1.49 6.82091 None 53.76 � 4.71 ND 70.12158 None 57.60 � 3.24 ND ND
a The coordinates, type of cannulated lymph node, and percentages of B cells are indicated with regard to the infection status of sheep. Mean percentages of Blymphocytes were determined by flow cytometry in three independent experiments. The proviral loads (in percentages of infected cells considering that all cells containa single proviral copy) were determined by real-time PCR. ND, not determined.
VOL. 80, 2006 B-CELL DEATH AND HOMEOSTASIS IN BLV-INFECTED SHEEP 9711
on Novem
ber 21, 2014 by guesthttp://jvi.asm
.org/D
ownloaded from
9712 DEBACQ ET AL. J. VIROL.
on Novem
ber 21, 2014 by guesthttp://jvi.asm
.org/D
ownloaded from
of peripheral blood B cells labeled by the initial injection. These formulas werefitted to the experimental data by nonlinear regression, and lymphocyte kineticswere estimated.
RESULTS
B lymphocytes from BLV-infected and control sheep recir-culate at similar rates. The kinetics of the whole peripheralblood population can be investigated by in vivo administrationof CFSE (i) because cells are labeled regardless of their divi-sion state; (ii) because CFSE labels all of the cells in the wholeperipheral blood; (iii) because of instability of the succinimidylester moiety, initial labeling by CFSE ends within a few min-utes; and (iv) because insufficient CFSE reaches the lymphnodes to directly label cells in this compartment (27). Cellmigration from the peripheral blood through individual lymphnodes can then be identified by placing indwelling cathetersinto the efferent lymphatic vessels and subsequent analysis byflow cytometry. We first verified that no CFSE-labeled cellswere detectable in the efferent lymph immediately after CFSEinjection (see Fig. S1 in the supplemental material).
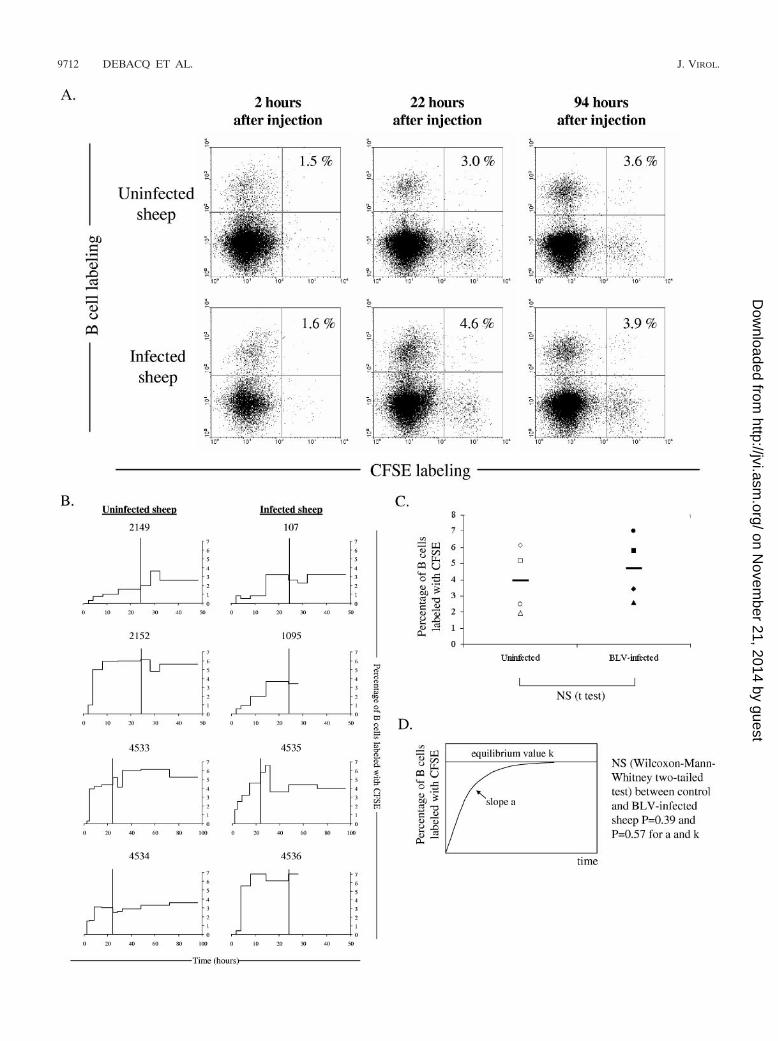
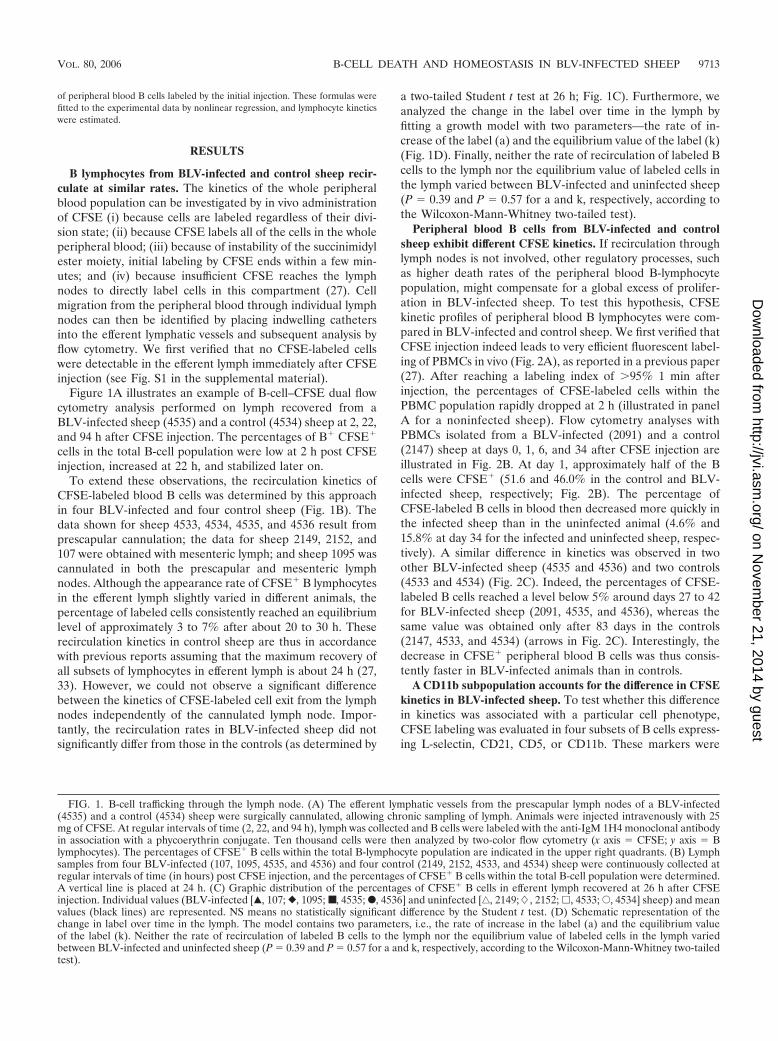
Figure 1A illustrates an example of B-cell–CFSE dual flowcytometry analysis performed on lymph recovered from aBLV-infected sheep (4535) and a control (4534) sheep at 2, 22,and 94 h after CFSE injection. The percentages of B� CFSE�
cells in the total B-cell population were low at 2 h post CFSEinjection, increased at 22 h, and stabilized later on.
To extend these observations, the recirculation kinetics ofCFSE-labeled blood B cells was determined by this approachin four BLV-infected and four control sheep (Fig. 1B). Thedata shown for sheep 4533, 4534, 4535, and 4536 result fromprescapular cannulation; the data for sheep 2149, 2152, and107 were obtained with mesenteric lymph; and sheep 1095 wascannulated in both the prescapular and mesenteric lymphnodes. Although the appearance rate of CFSE� B lymphocytesin the efferent lymph slightly varied in different animals, thepercentage of labeled cells consistently reached an equilibriumlevel of approximately 3 to 7% after about 20 to 30 h. Theserecirculation kinetics in control sheep are thus in accordancewith previous reports assuming that the maximum recovery ofall subsets of lymphocytes in efferent lymph is about 24 h (27,33). However, we could not observe a significant differencebetween the kinetics of CFSE-labeled cell exit from the lymphnodes independently of the cannulated lymph node. Impor-tantly, the recirculation rates in BLV-infected sheep did notsignificantly differ from those in the controls (as determined by
a two-tailed Student t test at 26 h; Fig. 1C). Furthermore, weanalyzed the change in the label over time in the lymph byfitting a growth model with two parameters—the rate of in-crease of the label (a) and the equilibrium value of the label (k)(Fig. 1D). Finally, neither the rate of recirculation of labeled Bcells to the lymph nor the equilibrium value of labeled cells inthe lymph varied between BLV-infected and uninfected sheep(P � 0.39 and P � 0.57 for a and k, respectively, according tothe Wilcoxon-Mann-Whitney two-tailed test).
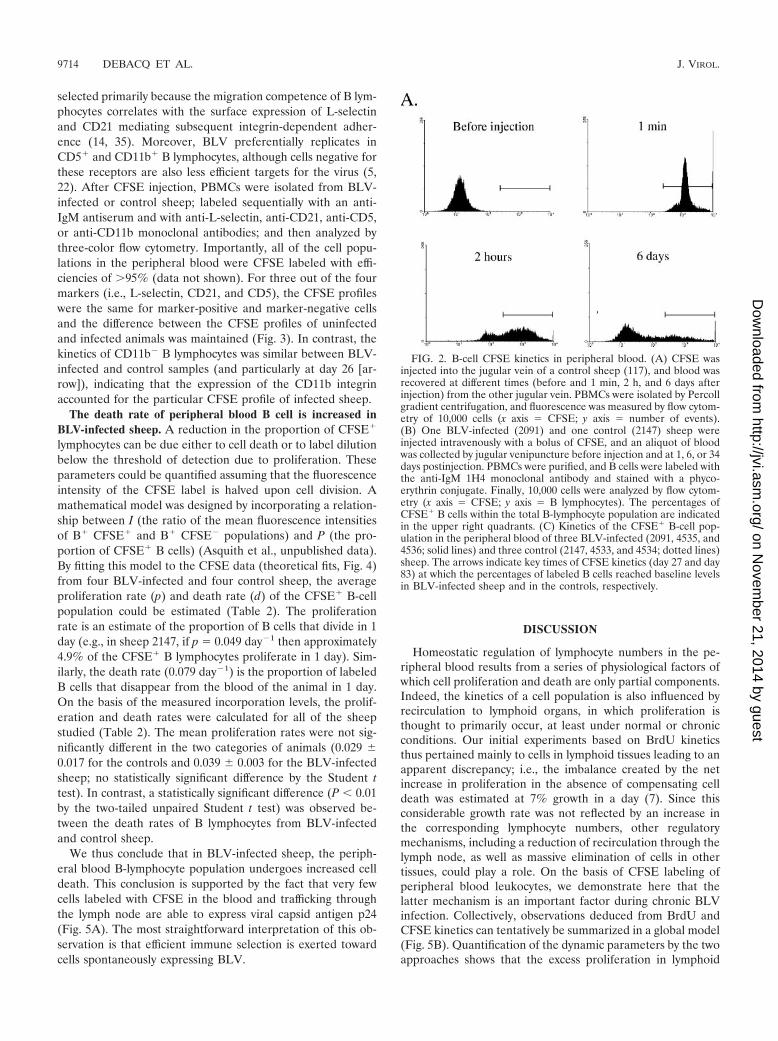
Peripheral blood B cells from BLV-infected and controlsheep exhibit different CFSE kinetics. If recirculation throughlymph nodes is not involved, other regulatory processes, suchas higher death rates of the peripheral blood B-lymphocytepopulation, might compensate for a global excess of prolifer-ation in BLV-infected sheep. To test this hypothesis, CFSEkinetic profiles of peripheral blood B lymphocytes were com-pared in BLV-infected and control sheep. We first verified thatCFSE injection indeed leads to very efficient fluorescent label-ing of PBMCs in vivo (Fig. 2A), as reported in a previous paper(27). After reaching a labeling index of �95% 1 min afterinjection, the percentages of CFSE-labeled cells within thePBMC population rapidly dropped at 2 h (illustrated in panelA for a noninfected sheep). Flow cytometry analyses withPBMCs isolated from a BLV-infected (2091) and a control(2147) sheep at days 0, 1, 6, and 34 after CFSE injection areillustrated in Fig. 2B. At day 1, approximately half of the Bcells were CFSE� (51.6 and 46.0% in the control and BLV-infected sheep, respectively; Fig. 2B). The percentage ofCFSE-labeled B cells in blood then decreased more quickly inthe infected sheep than in the uninfected animal (4.6% and15.8% at day 34 for the infected and uninfected sheep, respec-tively). A similar difference in kinetics was observed in twoother BLV-infected sheep (4535 and 4536) and two controls(4533 and 4534) (Fig. 2C). Indeed, the percentages of CFSE-labeled B cells reached a level below 5% around days 27 to 42for BLV-infected sheep (2091, 4535, and 4536), whereas thesame value was obtained only after 83 days in the controls(2147, 4533, and 4534) (arrows in Fig. 2C). Interestingly, thedecrease in CFSE� peripheral blood B cells was thus consis-tently faster in BLV-infected animals than in controls.
A CD11b subpopulation accounts for the difference in CFSEkinetics in BLV-infected sheep. To test whether this differencein kinetics was associated with a particular cell phenotype,CFSE labeling was evaluated in four subsets of B cells express-ing L-selectin, CD21, CD5, or CD11b. These markers were
FIG. 1. B-cell trafficking through the lymph node. (A) The efferent lymphatic vessels from the prescapular lymph nodes of a BLV-infected(4535) and a control (4534) sheep were surgically cannulated, allowing chronic sampling of lymph. Animals were injected intravenously with 25mg of CFSE. At regular intervals of time (2, 22, and 94 h), lymph was collected and B cells were labeled with the anti-IgM 1H4 monoclonal antibodyin association with a phycoerythrin conjugate. Ten thousand cells were then analyzed by two-color flow cytometry (x axis � CFSE; y axis � Blymphocytes). The percentages of CFSE� B cells within the total B-lymphocyte population are indicated in the upper right quadrants. (B) Lymphsamples from four BLV-infected (107, 1095, 4535, and 4536) and four control (2149, 2152, 4533, and 4534) sheep were continuously collected atregular intervals of time (in hours) post CFSE injection, and the percentages of CFSE� B cells within the total B-cell population were determined.A vertical line is placed at 24 h. (C) Graphic distribution of the percentages of CFSE� B cells in efferent lymph recovered at 26 h after CFSEinjection. Individual values (BLV-infected [Œ, 107; }, 1095; ■, 4535; F, 4536] and uninfected [‚, 2149;�, 2152; �, 4533; E, 4534] sheep) and meanvalues (black lines) are represented. NS means no statistically significant difference by the Student t test. (D) Schematic representation of thechange in label over time in the lymph. The model contains two parameters, i.e., the rate of increase in the label (a) and the equilibrium valueof the label (k). Neither the rate of recirculation of labeled B cells to the lymph nor the equilibrium value of labeled cells in the lymph variedbetween BLV-infected and uninfected sheep (P � 0.39 and P � 0.57 for a and k, respectively, according to the Wilcoxon-Mann-Whitney two-tailedtest).
VOL. 80, 2006 B-CELL DEATH AND HOMEOSTASIS IN BLV-INFECTED SHEEP 9713
on Novem
ber 21, 2014 by guesthttp://jvi.asm
.org/D
ownloaded from
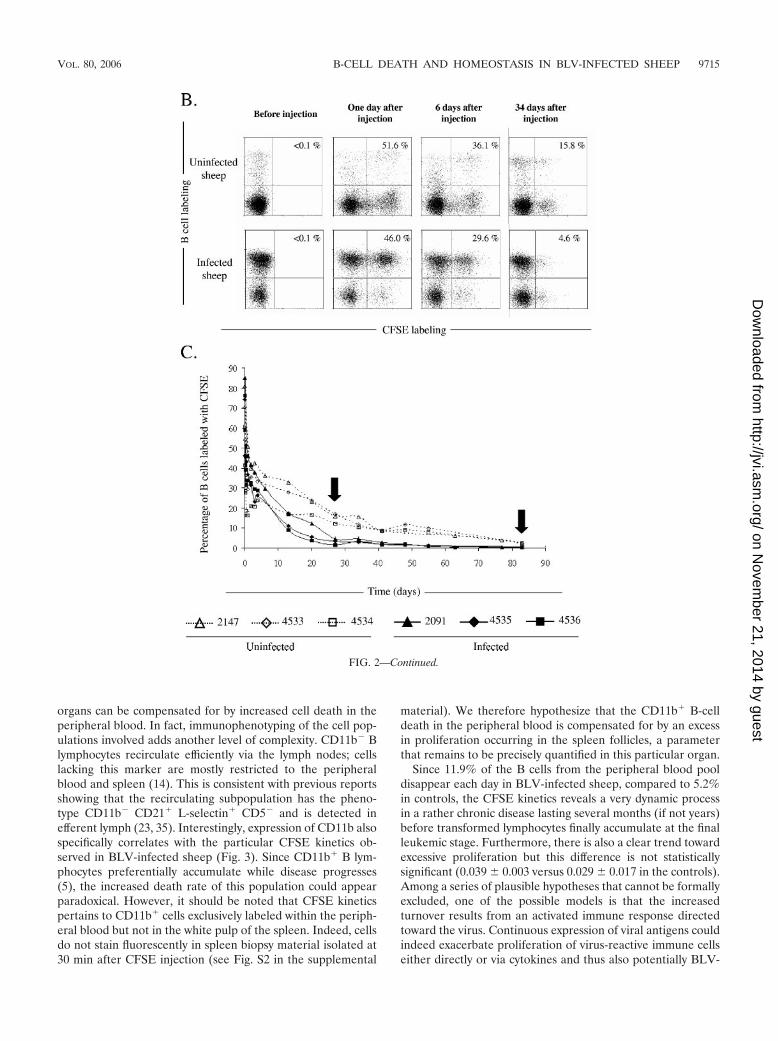
selected primarily because the migration competence of B lym-phocytes correlates with the surface expression of L-selectinand CD21 mediating subsequent integrin-dependent adher-ence (14, 35). Moreover, BLV preferentially replicates inCD5� and CD11b� B lymphocytes, although cells negative forthese receptors are also less efficient targets for the virus (5,22). After CFSE injection, PBMCs were isolated from BLV-infected or control sheep; labeled sequentially with an anti-IgM antiserum and with anti-L-selectin, anti-CD21, anti-CD5,or anti-CD11b monoclonal antibodies; and then analyzed bythree-color flow cytometry. Importantly, all of the cell popu-lations in the peripheral blood were CFSE labeled with effi-ciencies of �95% (data not shown). For three out of the fourmarkers (i.e., L-selectin, CD21, and CD5), the CFSE profileswere the same for marker-positive and marker-negative cellsand the difference between the CFSE profiles of uninfectedand infected animals was maintained (Fig. 3). In contrast, thekinetics of CD11b� B lymphocytes was similar between BLV-infected and control samples (and particularly at day 26 [ar-row]), indicating that the expression of the CD11b integrinaccounted for the particular CFSE profile of infected sheep.
The death rate of peripheral blood B cell is increased inBLV-infected sheep. A reduction in the proportion of CFSE�
lymphocytes can be due either to cell death or to label dilutionbelow the threshold of detection due to proliferation. Theseparameters could be quantified assuming that the fluorescenceintensity of the CFSE label is halved upon cell division. Amathematical model was designed by incorporating a relation-ship between I (the ratio of the mean fluorescence intensitiesof B� CFSE� and B� CFSE� populations) and P (the pro-portion of CFSE� B cells) (Asquith et al., unpublished data).By fitting this model to the CFSE data (theoretical fits, Fig. 4)from four BLV-infected and four control sheep, the averageproliferation rate (p) and death rate (d) of the CFSE� B-cellpopulation could be estimated (Table 2). The proliferationrate is an estimate of the proportion of B cells that divide in 1day (e.g., in sheep 2147, if p � 0.049 day�1 then approximately4.9% of the CFSE� B lymphocytes proliferate in 1 day). Sim-ilarly, the death rate (0.079 day�1) is the proportion of labeledB cells that disappear from the blood of the animal in 1 day.On the basis of the measured incorporation levels, the prolif-eration and death rates were calculated for all of the sheepstudied (Table 2). The mean proliferation rates were not sig-nificantly different in the two categories of animals (0.029 �0.017 for the controls and 0.039 � 0.003 for the BLV-infectedsheep; no statistically significant difference by the Student ttest). In contrast, a statistically significant difference (P 0.01by the two-tailed unpaired Student t test) was observed be-tween the death rates of B lymphocytes from BLV-infectedand control sheep.
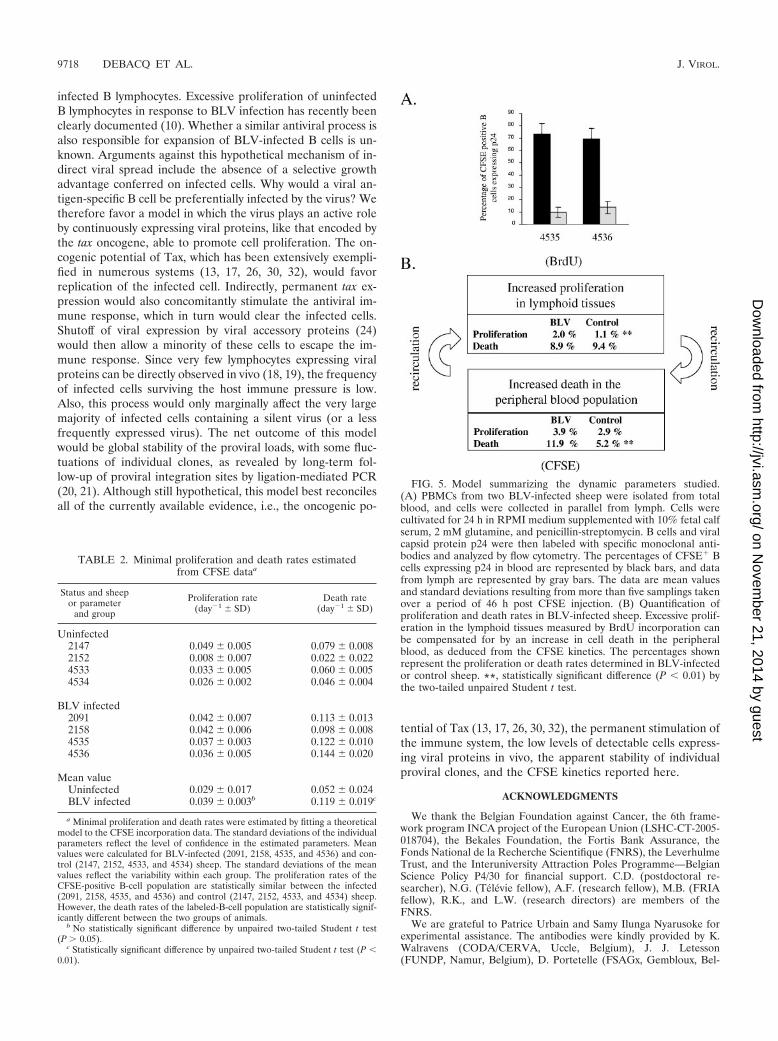
We thus conclude that in BLV-infected sheep, the periph-eral blood B-lymphocyte population undergoes increased celldeath. This conclusion is supported by the fact that very fewcells labeled with CFSE in the blood and trafficking throughthe lymph node are able to express viral capsid antigen p24(Fig. 5A). The most straightforward interpretation of this ob-servation is that efficient immune selection is exerted towardcells spontaneously expressing BLV.
DISCUSSION
Homeostatic regulation of lymphocyte numbers in the pe-ripheral blood results from a series of physiological factors ofwhich cell proliferation and death are only partial components.Indeed, the kinetics of a cell population is also influenced byrecirculation to lymphoid organs, in which proliferation isthought to primarily occur, at least under normal or chronicconditions. Our initial experiments based on BrdU kineticsthus pertained mainly to cells in lymphoid tissues leading to anapparent discrepancy; i.e., the imbalance created by the netincrease in proliferation in the absence of compensating celldeath was estimated at 7% growth in a day (7). Since thisconsiderable growth rate was not reflected by an increase inthe corresponding lymphocyte numbers, other regulatorymechanisms, including a reduction of recirculation through thelymph node, as well as massive elimination of cells in othertissues, could play a role. On the basis of CFSE labeling ofperipheral blood leukocytes, we demonstrate here that thelatter mechanism is an important factor during chronic BLVinfection. Collectively, observations deduced from BrdU andCFSE kinetics can tentatively be summarized in a global model(Fig. 5B). Quantification of the dynamic parameters by the twoapproaches shows that the excess proliferation in lymphoid
FIG. 2. B-cell CFSE kinetics in peripheral blood. (A) CFSE wasinjected into the jugular vein of a control sheep (117), and blood wasrecovered at different times (before and 1 min, 2 h, and 6 days afterinjection) from the other jugular vein. PBMCs were isolated by Percollgradient centrifugation, and fluorescence was measured by flow cytom-etry of 10,000 cells (x axis � CFSE; y axis � number of events).(B) One BLV-infected (2091) and one control (2147) sheep wereinjected intravenously with a bolus of CFSE, and an aliquot of bloodwas collected by jugular venipuncture before injection and at 1, 6, or 34days postinjection. PBMCs were purified, and B cells were labeled withthe anti-IgM 1H4 monoclonal antibody and stained with a phyco-erythrin conjugate. Finally, 10,000 cells were analyzed by flow cytom-etry (x axis � CFSE; y axis � B lymphocytes). The percentages ofCFSE� B cells within the total B-lymphocyte population are indicatedin the upper right quadrants. (C) Kinetics of the CFSE� B-cell pop-ulation in the peripheral blood of three BLV-infected (2091, 4535, and4536; solid lines) and three control (2147, 4533, and 4534; dotted lines)sheep. The arrows indicate key times of CFSE kinetics (day 27 and day83) at which the percentages of labeled B cells reached baseline levelsin BLV-infected sheep and in the controls, respectively.
9714 DEBACQ ET AL. J. VIROL.
on Novem
ber 21, 2014 by guesthttp://jvi.asm
.org/D
ownloaded from
organs can be compensated for by increased cell death in theperipheral blood. In fact, immunophenotyping of the cell pop-ulations involved adds another level of complexity. CD11b� Blymphocytes recirculate efficiently via the lymph nodes; cellslacking this marker are mostly restricted to the peripheralblood and spleen (14). This is consistent with previous reportsshowing that the recirculating subpopulation has the pheno-type CD11b� CD21� L-selectin� CD5� and is detected inefferent lymph (23, 35). Interestingly, expression of CD11b alsospecifically correlates with the particular CFSE kinetics ob-served in BLV-infected sheep (Fig. 3). Since CD11b� B lym-phocytes preferentially accumulate while disease progresses(5), the increased death rate of this population could appearparadoxical. However, it should be noted that CFSE kineticspertains to CD11b� cells exclusively labeled within the periph-eral blood but not in the white pulp of the spleen. Indeed, cellsdo not stain fluorescently in spleen biopsy material isolated at30 min after CFSE injection (see Fig. S2 in the supplemental
material). We therefore hypothesize that the CD11b� B-celldeath in the peripheral blood is compensated for by an excessin proliferation occurring in the spleen follicles, a parameterthat remains to be precisely quantified in this particular organ.
Since 11.9% of the B cells from the peripheral blood pooldisappear each day in BLV-infected sheep, compared to 5.2%in controls, the CFSE kinetics reveals a very dynamic processin a rather chronic disease lasting several months (if not years)before transformed lymphocytes finally accumulate at the finalleukemic stage. Furthermore, there is also a clear trend towardexcessive proliferation but this difference is not statisticallysignificant (0.039 � 0.003 versus 0.029 � 0.017 in the controls).Among a series of plausible hypotheses that cannot be formallyexcluded, one of the possible models is that the increasedturnover results from an activated immune response directedtoward the virus. Continuous expression of viral antigens couldindeed exacerbate proliferation of virus-reactive immune cellseither directly or via cytokines and thus also potentially BLV-
FIG. 2—Continued.
VOL. 80, 2006 B-CELL DEATH AND HOMEOSTASIS IN BLV-INFECTED SHEEP 9715
on Novem
ber 21, 2014 by guesthttp://jvi.asm
.org/D
ownloaded from
FIG. 3. Kinetic analyses of B-cell subsets. At regular time intervals of the CFSE kinetic analysis of three BLV-infected sheep (2091, 4535, and4536) and three controls (2147, 4333, and 4534) (Fig. 2), PBMCs were labeled with a B-lymphocyte-specific antibody and with a peridinin-chlorophyll-protein conjugate. The PBMCs were then incubated with monoclonal antibodies directed against L-selectin, CD21, CD5, or CD11band with a phycoerythrin conjugate. Finally, 10,000 events of thrice-labeled cells were analyzed by flow cytometry. The percentages of CFSE� Bcells expressing L-selectin, CD21, CD5, or CD11b in the corresponding B-lymphocyte subsets were determined at different time intervals (in days).At day 26, the percentages of CFSE� CD11b� B cells reached baseline levels in both infected sheep and controls (arrow).
9716
on Novem
ber 21, 2014 by guesthttp://jvi.asm
.org/D
ownloaded from
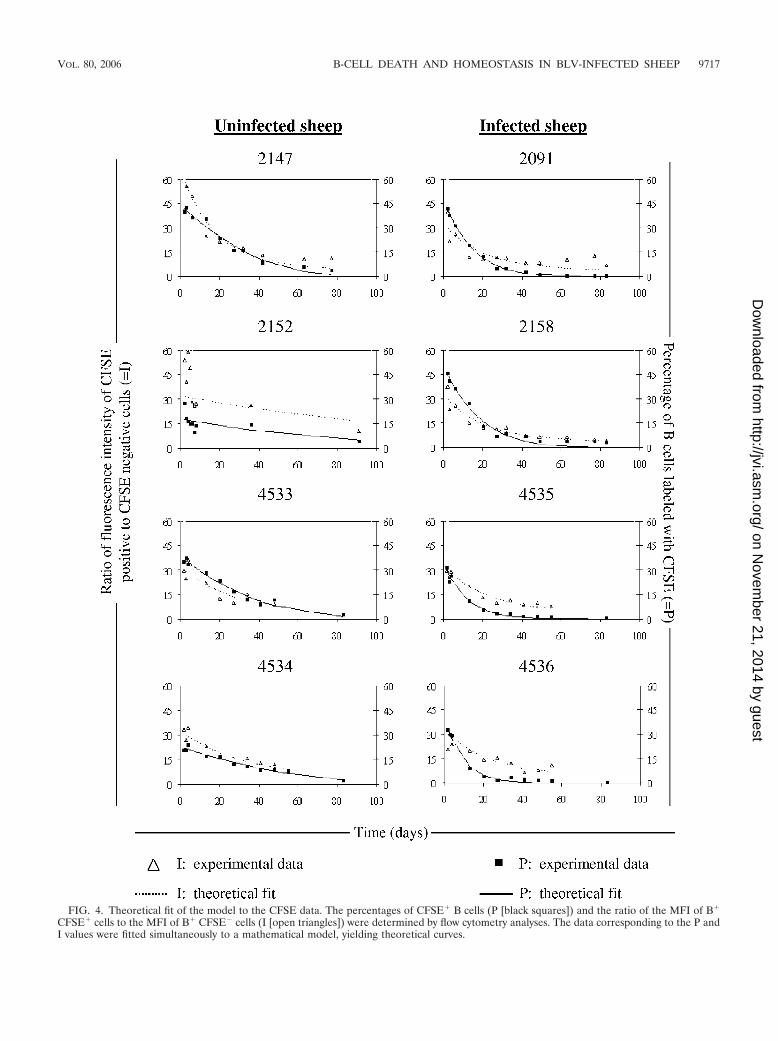
FIG. 4. Theoretical fit of the model to the CFSE data. The percentages of CFSE� B cells (P [black squares]) and the ratio of the MFI of B�
CFSE� cells to the MFI of B� CFSE� cells (I [open triangles]) were determined by flow cytometry analyses. The data corresponding to the P andI values were fitted simultaneously to a mathematical model, yielding theoretical curves.
VOL. 80, 2006 B-CELL DEATH AND HOMEOSTASIS IN BLV-INFECTED SHEEP 9717
on Novem
ber 21, 2014 by guesthttp://jvi.asm
.org/D
ownloaded from
infected B lymphocytes. Excessive proliferation of uninfectedB lymphocytes in response to BLV infection has recently beenclearly documented (10). Whether a similar antiviral process isalso responsible for expansion of BLV-infected B cells is un-known. Arguments against this hypothetical mechanism of in-direct viral spread include the absence of a selective growthadvantage conferred on infected cells. Why would a viral an-tigen-specific B cell be preferentially infected by the virus? Wetherefore favor a model in which the virus plays an active roleby continuously expressing viral proteins, like that encoded bythe tax oncogene, able to promote cell proliferation. The on-cogenic potential of Tax, which has been extensively exempli-fied in numerous systems (13, 17, 26, 30, 32), would favorreplication of the infected cell. Indirectly, permanent tax ex-pression would also concomitantly stimulate the antiviral im-mune response, which in turn would clear the infected cells.Shutoff of viral expression by viral accessory proteins (24)would then allow a minority of these cells to escape the im-mune response. Since very few lymphocytes expressing viralproteins can be directly observed in vivo (18, 19), the frequencyof infected cells surviving the host immune pressure is low.Also, this process would only marginally affect the very largemajority of infected cells containing a silent virus (or a lessfrequently expressed virus). The net outcome of this modelwould be global stability of the proviral loads, with some fluc-tuations of individual clones, as revealed by long-term fol-low-up of proviral integration sites by ligation-mediated PCR(20, 21). Although still hypothetical, this model best reconcilesall of the currently available evidence, i.e., the oncogenic po-
tential of Tax (13, 17, 26, 30, 32), the permanent stimulation ofthe immune system, the low levels of detectable cells express-ing viral proteins in vivo, the apparent stability of individualproviral clones, and the CFSE kinetics reported here.
ACKNOWLEDGMENTS
We thank the Belgian Foundation against Cancer, the 6th frame-work program INCA project of the European Union (LSHC-CT-2005-018704), the Bekales Foundation, the Fortis Bank Assurance, theFonds National de la Recherche Scientifique (FNRS), the LeverhulmeTrust, and the Interuniversity Attraction Poles Programme—BelgianScience Policy P4/30 for financial support. C.D. (postdoctoral re-searcher), N.G. (Televie fellow), A.F. (research fellow), M.B. (FRIAfellow), R.K., and L.W. (research directors) are members of theFNRS.
We are grateful to Patrice Urbain and Samy Ilunga Nyarusoke forexperimental assistance. The antibodies were kindly provided by K.Walravens (CODA/CERVA, Uccle, Belgium), J. J. Letesson(FUNDP, Namur, Belgium), D. Portetelle (FSAGx, Gembloux, Bel-
FIG. 5. Model summarizing the dynamic parameters studied.(A) PBMCs from two BLV-infected sheep were isolated from totalblood, and cells were collected in parallel from lymph. Cells werecultivated for 24 h in RPMI medium supplemented with 10% fetal calfserum, 2 mM glutamine, and penicillin-streptomycin. B cells and viralcapsid protein p24 were then labeled with specific monoclonal anti-bodies and analyzed by flow cytometry. The percentages of CFSE� Bcells expressing p24 in blood are represented by black bars, and datafrom lymph are represented by gray bars. The data are mean valuesand standard deviations resulting from more than five samplings takenover a period of 46 h post CFSE injection. (B) Quantification ofproliferation and death rates in BLV-infected sheep. Excessive prolif-eration in the lymphoid tissues measured by BrdU incorporation canbe compensated for by an increase in cell death in the peripheralblood, as deduced from the CFSE kinetics. The percentages shownrepresent the proliferation or death rates determined in BLV-infectedor control sheep. **, statistically significant difference (P 0.01) bythe two-tailed unpaired Student t test.
TABLE 2. Minimal proliferation and death rates estimatedfrom CFSE dataa
Status and sheepor parameter
and group
Proliferation rate(day�1 � SD)
Death rate(day�1 � SD)
Uninfected2147 0.049 � 0.005 0.079 � 0.0082152 0.008 � 0.007 0.022 � 0.0224533 0.033 � 0.005 0.060 � 0.0054534 0.026 � 0.002 0.046 � 0.004
BLV infected2091 0.042 � 0.007 0.113 � 0.0132158 0.042 � 0.006 0.098 � 0.0084535 0.037 � 0.003 0.122 � 0.0104536 0.036 � 0.005 0.144 � 0.020
Mean valueUninfected 0.029 � 0.017 0.052 � 0.024BLV infected 0.039 � 0.003b 0.119 � 0.019c
a Minimal proliferation and death rates were estimated by fitting a theoreticalmodel to the CFSE incorporation data. The standard deviations of the individualparameters reflect the level of confidence in the estimated parameters. Meanvalues were calculated for BLV-infected (2091, 2158, 4535, and 4536) and con-trol (2147, 2152, 4533, and 4534) sheep. The standard deviations of the meanvalues reflect the variability within each group. The proliferation rates of theCFSE-positive B-cell population are statistically similar between the infected(2091, 2158, 4535, and 4536) and control (2147, 2152, 4533, and 4534) sheep.However, the death rates of the labeled-B-cell population are statistically signif-icantly different between the two groups of animals.
b No statistically significant difference by unpaired two-tailed Student t test(P � 0.05).
c Statistically significant difference by unpaired two-tailed Student t test (P 0.01).
9718 DEBACQ ET AL. J. VIROL.
on Novem
ber 21, 2014 by guesthttp://jvi.asm
.org/D
ownloaded from
gium), and C. Howard (Institute for Animal Health, Compton, UnitedKingdom).
REFERENCES
1. Agenes, F., M. M. Rosado, and A. A. Freitas. 2000. Considerations on B cellhomeostasis. Curr. Top. Microbiol. Immunol. 252:68–75.
2. Asquith, B., C. Debacq, A. Florins, N. Gillet, T. Sanchez-Alcaraz, A. Mosley,and L. Willems. 2006. Quantifying lymphocyte kinetics in vivo using carboxy-fluorescein diacetate succinimidyl ester (CFSE). Proc. Biol. Sci. 273:1165–1171.
3. Becker, H. M., M. Chen, J. B. Hay, and M. I. Cybulsky. 2004. Tracking ofleukocyte recruitment into tissues of mice by in situ labeling of blood cellswith the fluorescent dye CFDA SE. J. Immunol. Methods 286:69–78.
4. Campbell, D. J., C. H. Kim, and E. C. Butcher. 2003. Chemokines in thesystemic organization of immunity. Immunol. Rev. 195:58–71.
5. Chevallier, N., M. Berthelemy, D. Le Rhun, V. Laine, D. Levy, and I.Schwartz-Cornil. 1998. Bovine leukemia virus-induced lymphocytosis andincreased cell survival mainly involve the CD11b� B-lymphocyte subset insheep. J. Virol. 72:4413–4420.
6. Cunningham, C. P., W. G. Kimpton, J. E. Holder, and R. N. Cahill. 2001.Thymic export in aged sheep: a continuous role for the thymus throughoutpre- and postnatal life. Eur. J. Immunol. 31:802–811.
7. Debacq, C., B. Asquith, P. Kerkhofs, D. Portetelle, A. Burny, R. Kettmann,and L. Willems. 2002. Increased cell proliferation, but not reduced celldeath, induces lymphocytosis in bovine leukemia virus-infected sheep. Proc.Natl. Acad. Sci. USA 99:10048–10053.
8. Debacq, C., B. Asquith, M. Reichert, A. Burny, R. Kettmann, and L. Wil-lems. 2003. Reduced cell turnover in bovine leukemia virus-infected, persis-tently lymphocytotic cattle. J. Virol. 77:13073–13083.
9. Debacq, C., J. M. Heraud, B. Asquith, C. Bangham, F. Merien, V. Moules, F.Mortreux, E. Wattel, A. Burny, R. Kettmann, M. Kazanji, and L. Willems.2005. Reduced cell turnover in lymphocytic monkeys infected by humanT-lymphotropic virus type 1. Oncogene 24:7514–7523.
10. Debacq, C., M. T. Sanchez Alcaraz, F. Mortreux, P. Kerkhofs, R. Kettmann,and L. Willems. 2004. Reduced proviral loads during primo-infection ofsheep by bovine leukemia virus attenuated mutants. Retrovirology 1:31.
11. Freitas, A. A., and B. Rocha. 2000. Population biology of lymphocytes: theflight for survival. Annu. Rev. Immunol. 18:83–111.
12. Gaudin, E., M. Rosado, F. Agenes, A. McLean, and A. A. Freitas. 2004. B-cellhomeostasis, competition, resources, and positive selection by self-antigens.Immunol. Rev. 197:102–115.
13. Grassmann, R., M. Aboud, and K. T. Jeang. 2005. Molecular mechanisms ofcellular transformation by HTLV-1 Tax. Oncogene 24:5976–5985.
14. Gupta, V. K., I. McConnell, R. G. Dalziel, and J. Hopkins. 1998. Two B cellsubpopulations have distinct recirculation characteristics. Eur. J. Immunol.28:1597–1603.
15. Hall, J. G., and B. Morris. 1963. The lymph-borne cells of the immuneresponse. Q. J. Exp. Physiol. Cogn. Med. Sci. 48:235–247.
16. Hein, W. R., and P. J. Griebel. 2003. A road less travelled: large animalmodels in immunological research. Nat. Rev. Immunol. 3:79–84.
17. Jeang, K. T., C. Z. Giam, F. Majone, and M. Aboud. 2004. Life, death, andtax: role of HTLV-I oncoprotein in genetic instability and cellular transfor-mation. J. Biol. Chem. 279:31991–31994.
18. Lagarias, D. M., and K. Radke. 1989. Transcriptional activation of bovine
leukemia virus in blood cells from experimentally infected, asymptomaticsheep with latent infections. J. Virol. 63:2099–2107.
19. Moritoyo, T., S. Izumo, H. Moritoyo, Y. Tanaka, Y. Kiyomatsu, M. Nagai, K.Usuku, M. Sorimachi, and M. Osame. 1999. Detection of human T-lympho-tropic virus type I p40tax protein in cerebrospinal fluid cells from patientswith human T-lymphotropic virus type I-associated myelopathy/tropicalspastic paraparesis. J. Neurovirol. 5:241–248.
20. Mortreux, F., I. Leclercq, A. S. Gabet, A. Leroy, E. Westhof, A. Gessain, S.Wain-Hobson, and E. Wattel. 2001. Somatic mutation in human T-cell leu-kemia virus type 1 provirus and flanking cellular sequences during clonalexpansion in vivo. J. Natl. Cancer Inst. 93:367–377.
21. Moules, V., C. Pomier, D. Sibon, A. S. Gabet, M. Reichert, P. Kerkhofs, L.Willems, F. Mortreux, and E. Wattel. 2005. Fate of premalignant clonesduring the asymptomatic phase preceding lymphoid malignancy. Cancer Res.65:1234–1243.
22. Murakami, K., K. Okada, Y. Ikawa, and Y. Aida. 1994. Bovine leukemiavirus induces CD5� B cell lymphoma in sheep despite temporarily increasingCD5� B cells in asymptomatic stage. Virology 202:458–465.
23. Naessens, J. 1997. Surface Ig on B lymphocytes from cattle and sheep. Int.Immunol. 9:349–354.
24. Nicot, C., R. L. Harrod, V. Ciminale, and G. Franchini. 2005. Human T-cellleukemia/lymphoma virus type 1 nonstructural genes and their functions.Oncogene 24:6026–6034.
25. Portetelle, D., M. Mammerickx, and A. Burny. 1989. Use of two monoclonalantibodies in an ELISA test for the detection of antibodies to bovine leu-kaemia virus envelope protein gp51. J. Virol. Methods 23:211–222.
26. Ratner, L. 2005. Pathogenesis and treatment of human T-cell leukemia virusinfection. Immunol. Res. 32:217–224.
27. Ristevski, B., A. J. Young, L. Dudler, R. N. Cahill, W. Kimpton, E. Wash-ington, and J. B. Hay. 2003. Tracking dendritic cells: use of an in situ methodto label all blood leukocytes. Int. Immunol. 15:159–165.
28. Schenkel, A. R., H. Uno, and C. D. Pauza. 1999. Asymptomatic simianimmunodeficiency virus infection decreases blood CD4� T cells by accumu-lating recirculating lymphocytes in the lymphoid tissues. J. Virol. 73:601–607.
29. Wang, L., J. J. Chen, B. B. Gelman, R. Konig, and M. W. Cloyd. 1999. Anovel mechanism of CD4 lymphocyte depletion involves effects of HIV onresting lymphocytes: induction of lymph node homing and apoptosis uponsecondary signaling through homing receptors. J. Immunol. 162:268–276.
30. Willems, L., A. Burny, D. Collete, O. Dangoisse, F. Dequiedt, J. S. Gatot, P.Kerkhofs, L. Lefebvre, C. Merezak, T. Peremans, D. Portetelle, J. C. Twizere,and R. Kettmann. 2000. Genetic determinants of bovine leukemia viruspathogenesis. AIDS Res. Hum. Retrovir. 16:1787–1795.
31. Willems, L., R. Kettmann, F. Dequiedt, D. Portetelle, V. Voneche, I. Cornil,P. Kerkhofs, A. Burny, and M. Mammerickx. 1993. In vivo infection of sheepby bovine leukemia virus mutants. J. Virol. 67:4078–4085.
32. Yoshida, M. 2005. Discovery of HTLV-1, the first human retrovirus, itsunique regulatory mechanisms, and insights into pathogenesis. Oncogene24:5931–5937.
33. Young, A. J. 1999. The physiology of lymphocyte migration through thesingle lymph node in vivo. Semin. Immunol. 11:73–83.
34. Young, A. J., and J. B. Hay. 1995. Rapid turnover of the recirculatinglymphocyte pool in vivo. Int. Immunol. 7:1607–1615.
35. Young, A. J., W. L. Marston, M. Dessing, L. Dudler, and W. R. Hein. 1997.Distinct recirculating and non-recirculating B-lymphocyte pools in the pe-ripheral blood are defined by coordinated expression of CD21 and L-selec-tin. Blood 90:4865–4875.
VOL. 80, 2006 B-CELL DEATH AND HOMEOSTASIS IN BLV-INFECTED SHEEP 9719
on Novem
ber 21, 2014 by guesthttp://jvi.asm
.org/D
ownloaded from